Fingersomatotopy in area 3b: an fMRI-study
6
BioMed Central Page 1 of 6 (page number not for citation purposes) BMC Neuroscience Open Access Research article Fingersomatotopy in area 3b: an fMRI-study Danielle van Westen* 1 , Peter Fransson 2 , Johan Olsrud 1 , Birgitta Rosén 3 , Göran Lundborg 3 and Elna-Marie Larsson 1 Address: 1 Dept of Diagnostic Radiology, Lund University Hospital, 221 85 Lund, Sweden, 2 Cognitive Neurophysiology, MR Research Centre, N8, Dept of Clinical Neuroscience, Karolinska University Hospital, 171 76 Stockholm, Sweden and 3 Dept of Hand Surgery, University Hospital, 205 02 Malmö, Sweden Email: Danielle van Westen* - [email protected]; Peter Fransson - [email protected]; Johan Olsrud - [email protected]; Birgitta Rosén - [email protected]; Göran Lundborg - [email protected]; Elna-Marie Larsson - [email protected] * Corresponding author Abstract Background: The primary sensory cortex (S1) in the postcentral gyrus is comprised of four areas that each contain a body map, where the representation of the hand is located with the thumb most laterally, anteriorly and inferiorly and the little finger most medially, posteriorly and superiorly. Previous studies on somatotopy using functional MRI have either used low field strength, have included a small number of subjects or failed to attribute activations to any area within S1. In the present study we included twenty subjects, who were investigated at 3 Tesla (T). We focused specifically on Brodmann area 3b, which neurons have discrete receptive fields with a potentially more clearcut somatotopic organisation. The spatial distribution for all fingers' peak activation was determined and group as well as individual analysis was performed. Results: Activation maps from 18 subjects were of adequate quality; in 17 subjects activations were present for all fingers and these data were further analysed. In the group analysis the thumb was located most laterally, anteriorly and inferiorly with the other fingers sequentially positioned more medially, posteriorly and superiorly. At the individual level this somatotopic relationship was present for the thumb and little finger, with a higher variability for the fingers in between. The Euclidian distance between the first and fifth finger was 17.2 mm, between the first and second finger 10.6 mm and between the remaining fingers on average 6.3 mm. Conclusion: Results from the group analysis, that is both the location of the fingers and the Euclidian distances, are well comparable to results from previous studies using a wide range of modalities. On the subject level the spatial localisation of the fingers showed a less stringent somatotopic order so that the location of a finger in a single subject cannot be predicted from the group result. Background The first somatotopic maps of the homuncular organisa- tion of the primary somatosensory cortex (S1) were estab- lished in 1937 by using intra-operative electrical stimulation of the brain surface [1]. Subsequent, non- invasive investigations in humans on the hand Published: 20 August 2004 BMC Neuroscience 2004, 5:28 doi:10.1186/1471-2202-5-28 Received: 26 January 2004 Accepted: 20 August 2004 This article is available from: http://www.biomedcentral.com/1471-2202/5/28 © 2004 van Westen et al; licensee BioMed Central Ltd. This is an open-access article distributed under the terms of the Creative Commons Attribution License (http://creativecommons.org/licenses/by/2.0 ), which permits unrestricted use, distribution, and reproduction in any medium, provided the original work is properly cited.
-
Upload
independent -
Category
Documents
-
view
2 -
download
0
Transcript of Fingersomatotopy in area 3b: an fMRI-study

BioMed CentralBMC Neuroscience
ss
Open AcceResearch articleFingersomatotopy in area 3b: an fMRI-studyDanielle van Westen*1, Peter Fransson2, Johan Olsrud1, Birgitta Rosén3, Göran Lundborg3 and Elna-Marie Larsson1Address: 1Dept of Diagnostic Radiology, Lund University Hospital, 221 85 Lund, Sweden, 2Cognitive Neurophysiology, MR Research Centre, N8, Dept of Clinical Neuroscience, Karolinska University Hospital, 171 76 Stockholm, Sweden and 3Dept of Hand Surgery, University Hospital, 205 02 Malmö, Sweden
Email: Danielle van Westen* - [email protected]; Peter Fransson - [email protected]; Johan Olsrud - [email protected]; Birgitta Rosén - [email protected]; Göran Lundborg - [email protected]; Elna-Marie Larsson - [email protected]
* Corresponding author
AbstractBackground: The primary sensory cortex (S1) in the postcentral gyrus is comprised of four areasthat each contain a body map, where the representation of the hand is located with the thumb mostlaterally, anteriorly and inferiorly and the little finger most medially, posteriorly and superiorly.Previous studies on somatotopy using functional MRI have either used low field strength, haveincluded a small number of subjects or failed to attribute activations to any area within S1. In thepresent study we included twenty subjects, who were investigated at 3 Tesla (T). We focusedspecifically on Brodmann area 3b, which neurons have discrete receptive fields with a potentiallymore clearcut somatotopic organisation. The spatial distribution for all fingers' peak activation wasdetermined and group as well as individual analysis was performed.
Results: Activation maps from 18 subjects were of adequate quality; in 17 subjects activationswere present for all fingers and these data were further analysed. In the group analysis the thumbwas located most laterally, anteriorly and inferiorly with the other fingers sequentially positionedmore medially, posteriorly and superiorly. At the individual level this somatotopic relationship waspresent for the thumb and little finger, with a higher variability for the fingers in between. TheEuclidian distance between the first and fifth finger was 17.2 mm, between the first and secondfinger 10.6 mm and between the remaining fingers on average 6.3 mm.
Conclusion: Results from the group analysis, that is both the location of the fingers and theEuclidian distances, are well comparable to results from previous studies using a wide range ofmodalities. On the subject level the spatial localisation of the fingers showed a less stringentsomatotopic order so that the location of a finger in a single subject cannot be predicted from thegroup result.
BackgroundThe first somatotopic maps of the homuncular organisa-tion of the primary somatosensory cortex (S1) were estab-
lished in 1937 by using intra-operative electricalstimulation of the brain surface [1]. Subsequent, non-invasive investigations in humans on the hand
Published: 20 August 2004
BMC Neuroscience 2004, 5:28 doi:10.1186/1471-2202-5-28
Received: 26 January 2004Accepted: 20 August 2004
This article is available from: http://www.biomedcentral.com/1471-2202/5/28
© 2004 van Westen et al; licensee BioMed Central Ltd. This is an open-access article distributed under the terms of the Creative Commons Attribution License (http://creativecommons.org/licenses/by/2.0), which permits unrestricted use, distribution, and reproduction in any medium, provided the original work is properly cited.
Page 1 of 6(page number not for citation purposes)

BMC Neuroscience 2004, 5:28 http://www.biomedcentral.com/1471-2202/5/28
representation in S1 have described a somatotopic organ-isation along the central sulcus with the thumb locatedlaterally, anteriorly and inferiorly to the little finger [2-6].Studies in non-human primates have revealed the cytoar-chitectonic subdivisions of S1, namely areas 3a, 3b, 1 and2, that outline the cortex in the postcentral gyrus [7]. Area3a occupies the fundus of the central sulcus, area 3b theanterior wall of the postcentral gyrus, area1 its crown andarea 2 its posterior wall. Each area contains a fairly com-plete map of the body surface and is the cortical represen-tation of different somatosensory receptors. In area 3b theneurons are predominantly responsive to stimulation ofcutaneous receptors. As opposed to neurons in area 1, thatalso receive input from cutaneous receptors, those in area3b possess discrete receptive fields with a homuncularorganisation that may be more distinct [8].
Previous studies on somatotopy in the hand area usingfunctional Magnetic Resonance Imaging (fMRI) haveyielded varying results. Gelnar et al. failed to show asomatotopy in S1 when applying vibratory stimuli tothree of the fingers of the right hand [5]. Maldjian et al.demonstrated somatotopy in 3 out of 5 subjects [3]. Sim-ilarly, Kurth et al., using electrical stimulation of two fin-gers, found somatotopically arranged activation patternsin 5 out of 20 subjects [9]. In a follow-up study where acti-vation of all fingers in area 3b was found in 7 out of 10subjects, the same authors reported a general somatotopy,without further specification [4].
Methods differ considerably between these three studieswith regard to anatomical considerations, number of sub-jects studied, and the field strength used. Maldjian et al.used the highest field strength, 4 Tesla (T), while bothKurth et al. and Gelnar et al. used 1.5 T [3-5]. However,Maldjian et al. did not contribute activations to any areain S1. Also Maldjian et al. included the smallest numberof subjects (5); data from one were discarded due tomotion artefacts and group analysis was based on datafrom the remaining 4.
In the present study we readdressed the issue of somatot-opy in the hand area as assessed with fMRI. Our aim wasto optimise results by including a larger number of sub-jects, by focussing on area 3 b, where homuncular organ-isation expectedly is most distinct and by performingfMRI at 3 Tesla (T).
ResultsTactile stimulation of the fingers of the dominant handyielded activation in contra-and ipsilateral S1, contra- orbilateral secondary sensory cortex (S2), ipsilateral cerebel-lum, and in some subjects the contralateral thalamus. Sig-nificant activation for all five fingers in area 3b waspresent in seventeen subjects and these data were further
analyzed. In the one volunteer excluded from the analysis,activation was present for four fingers. The spatial distri-bution of the activations in the contralateral S1 for tactilestimulation versus rest in one subject is shown in Figure 2.
A somatotopic organisation with the representation of thethumb located laterally to the little finger was present in16 out of 17 subjects, with the thumb located anteriorly tothe little finger in 14 out of 17 subjects and with thethumb located inferiorly to that of the little finger in 16out of 17 subjects.
Group averages of the distances from D2 to D1 (D2-D1),D3 to D1(D3-D1), D4 to D1 (D4-D1) and D5 to D1 (D5-D1) are presented in the Table and shown as graphs in Fig-ure 3. Combined these indicate a strict somatotopy withthe distance to D1 increasing for every finger in each of thethree directions. Distances to D1 were compared forneighbouring fingers. In the medial-lateral direction, thedistance D4-D1 was different from D3-D1. In theanterior-posterior direction a significant difference wasobserved between D4-D1 and D3-D1. Finally, in the supe-rior-inferior direction the distances D2-D1 and D3-D1 aswell as D3-D1 and D4-D1 differed; the location of D2, asdetermined by its distance to D1, was different from thelocation of D1 [0, 0, 0]; no difference was found betweenthe distances D5-D1 and D4-D1. Considering that thethree coordinates [x, y and z] together define one point inthe 3D Cartesian space, the coordinates of D3, D4 andD5, differed from those of D1, p now <0.05/3, correctedfor multiple comparisons (not in Table).
The Euclidian distance from D1 to D2 was 10.6 mm (SEM± 1.5). The distance from D2 to D3 was 5.5 mm (± 0.9),from D3 to D4 7.4 mm (± 1.1) and from D4 to D5 6.8mm (± 1.2), resulting in an average for D2-D3, D3-D4and D4-D5 of 6.6 mm.
The spatial extension of the representation of the hand inarea 3b, defined as the Euclidian distance between D1 andD5 was 17.2 mm (± 2.0 mm).
DiscussionIn the group average from the present study the strictsomatotopic organisation in the primary sensory cortexknown from studies using a variety of modalities, wasreproduced [2-6]. The fingers' average activations werelaid out on the body map, with the thumb located mostlaterally, anteriorly and inferiorly and the little fingermost medially, posteriorly and superiorly and the remain-ing fingers in between, the distance to the thumb increas-ing for every finger in each of the three directions. Inindividual subjects the arrangement in the hand represen-tation with the thumb located laterally, anteriorly andinferiorly to the little finger is frequently found, while the
Page 2 of 6(page number not for citation purposes)

BMC Neuroscience 2004, 5:28 http://www.biomedcentral.com/1471-2202/5/28
remaining fingers may or may not display the orderly lat-eral-to-medial, anterior-to-posterior and inferior-to-supe-rior organisation 'D1-D2-D3-D4-D5' [2,3,10,11]. Wechose to present group averages as it is our belief ourresults would have greater significance if a regular soma-totopy was present at the group level. Body maps in non-human primates demonstrating the regular sequencementioned above, were established with cortical singleunit recordings and are supposedly the golden standard.The present study is based on data from 20 subjects, gen-erating results available for analysis from 18 of these; thespatial representation of all fingers in area 3b of the pri-mary somatosensory cortex was localised in 17 subjects.
The average extension of the hand representation in area3b of 17 mm with a somatotopic arrangement of fingers1-5 as described above is consistent with results from pre-vious studies using a range of modalities [2-4,7]. Also themean distance between D2-D3, D3-D4 and D4-D5 of 6.6mm and 6.3 mm for main and differential effects, respec-tively, is in good agreement with human electrophysio-logical and fMRI data [2,4]. The larger distance betweenthe thumb and index finger as compared to distancesbetween subsequent fingers suggests a larger representa-tion for the thumb. This finding is in agreement withresults from a study using electrocorticography with sub-dural electrodes in three patients [1,12].
With the spatial resolution used in this study, 3 × 3 × 3mm3, resampled to 1.5 × 1.5 × 1.5 mm3, activation for allfive fingers was found in 17 of 18 subjects. For compari-son, Kurth et al. used a resolution of 1.7 × 1.7 × 1.7 mm3and electrical stimulation with ring electrodes and foundactivation in area 3b for all five fingers in 7 out of 10 sub-jects (70%) [4]. The present study showed activations forall fingers in 94 % of subjects. This difference might bedue to the higher field strength used in this study as thehigher magnetisation vector and sensitivity to changes insusceptibility increase the signal-to-noise ratio.
In one subject excluded from the analysis, activation waspresent for four fingers and another was excluded due togeneral lack of activation. Lack of activation may be dueto subjects being 'low-activators' in fMRI experiments, dueto inadequate stimulation or to some other, unknownfactor.
The type of stimulation used is decisive of what area in S1can be expected to be activated. For example, neurons inarea 3a are responsive to deep receptor and proprioceptivestimulation and in one study punctate tactile stimulationdid not activate area 3a [13]. Also, receptive fields aremaximally focused in area 3b, while in area 1 receptivefields become larger and more complex. In area 2, recep-tive fields are even more complex with reduplications.This combined knowledge made area 3b the area of ourchoice to study somatotopy and explains why we chosenot to report on activations in areas 3a, 1 and 2.
We found activation in the anterior wall of the postcentralgyrus, defined as area 3b according to our operational def-inition during tactile stimulation (Fig 1). More pro-nounced activation was noticed frequently in the crownor posterior wall of the postcentral gyrus, defined as areas1 and 2 (Fig 2). Similar observations have been made inother studies using both fMRI and PET [5,14]. Accordingto studies in non-human primates the representation ofthe distal fingertips in area 1 points posteriorly, a findingconfirmed in a recent fMRI-study on humans [15]. Area 2then is the mirror-image of area 1 with the fingertipspointing anteriorly. The activation in the posterior wallmight represent activation in both areas 1 and 2 localisedat their meeting point, i.e. the fingertips. The larger clustersize of this activation is explained by the clusters arisingfrom area 1 and 2 being contiguous and therefore addi-tive. In the present study the activation of area 1 and 2 isprobably due to hierarchical processing in the rostrocau-dal direction within S1. A previous observation that elec-trical stimulation of the cutaneous afferents of the mediannerve resulted in evoked potentials in area 3b after 30
Table
Distance to finger 1Finger x L → M y A → P z I → S Euclidian
D1 0 (0) 0 (0) 0 (0) 0 (0)D2 2.9 (1.6) 0.4 (1.8) 4.8 (1.0) 10.6 (1.5)D3 3.6 (1.4) 1.4 (1.5) 6.8 (1.2) 11.2 (1.5)D4 6.9 (1.4) 4.6 (1.7) 9.4 (1.4) 15.4 (1.7)D5 7.4 (1.7) 6.8 (1.2) 10.4 (2) 17.2 (2.0)
Distance from each finger (D2, D3, D4, D5) to the thumb (D1) ± standard error of the mean (SEM) (mm). The lateral-to-medial direction is named 'x', the anterior-to-posterior direction 'y' and the inferior-to-superior direction 'z'. Underlined are those distances to D1 that differ significantly from the distance of the previous finger to D1 (Wilcoxon matched pairs test, p < 0.05).
Page 3 of 6(page number not for citation purposes)

BMC Neuroscience 2004, 5:28 http://www.biomedcentral.com/1471-2202/5/28
msec while a potential in area 1 was seen after another 5msec lends support to this assumption [16].
ConclusionIn the group analysis, a somatotopic organisation for allthe fingers in the hand representation of area 3b could bedemonstrated using fMRI; the Euclidian distance betweenthe thumb and the little finger was well comparable tothat determined in previous studies. On the subject levelthe cortical somatosensory representation of the thumbwas located laterally, anteriorly, and inferiorly to that ofthe little finger in 14 out of 17 subjects. The spatial local-isation of the remaining fingers showed a less stringentsomatotopic order when compared individually.
MethodsSubjectsTwenty healthy, self-reportedlly right-handed volunteers(6 male and 14 female, age 21–43 years, mean 29.4 years)were included in the study. The protocol was approved by
the local ethics committee and written informed consentwas obtained. All volunteers had normal images on afluid-attenuated inversion recovery (FLAIR) sequence.
StimulationTactile stimulation consisted of brushing the glabrousskin of the two distal phalanges of each finger continu-ously forwards and backwards with a commercially avail-able tooth brush. During the experiment, volunteers werepositioned on the MR table with their right arm from theelbow down in a padded cast, that also provided supportfor the dorsal part of the hand. They were instructed to resttheir arm against the magnet bore so that both arm andhand were relaxed. Pieces of soft cloth were placedbetween the fingers in order to avoid that stimulation alsoinvolved a neighbouring finger.
The frequency was 1 Hz; no forced pressure was exerted.Consistency was tested on a finger model firmly taped
Areas of S1 as defined in cytoarchitectonic studies on 10 post-mortem brains [18, 19]Figure 1Areas of S1 as defined in cytoarchitectonic studies on 10 post-mortem brains [18, 19]: area 3a occupies the fundus of the central sulcus (dark blue), area 3b the anterior wall of the postcentral gyrus (red), area1 its crown (light blue) and area 2 its posterior wall (green). The black arrow indicates the central sulcus.
Activation in the contralateral somatosensory cortex during tactile stimulation of the fingers of the right hand versus rest ('main effects') in a single subjectFigure 2Activation in the contralateral somatosensory cortex during tactile stimulation of the fingers of the right hand versus rest in a single subject. The first column shows transverse ana-tomical image with z-coordinate indicated. Subsequent col-umns show the activation patterns in S1 overlayed on magnified T1-weighted images for each finger. The location of the peak voxel in area 3b is indicated by blue crosshairs.
Page 4 of 6(page number not for citation purposes)

BMC Neuroscience 2004, 5:28 http://www.biomedcentral.com/1471-2202/5/28
onto a computerized electronic scale (Biopac Systems, DA100B, MP 100A; Macintosh Powerbook G3 with softwareAcqKnowledge 3.5): the intra-examiner error was 18%based on a mean pressure of 6.64 g, standard deviation1.199 g.
ImagingMRI was performed using a 3 T head scanner (SiemensAllegra) with a quadrature birdcage coil. MorphologicalT1-weighted images with a resolution of 1 × 1 × 1 mm3
using a magnetisation prepared gradient echo sequence(MPRAGE) were acquired. Functional echo-planar imagevolumes of the whole brain (number of slices = 49, thick-ness = 3 mm, voxel size = 3 × 3 × 3 mm3) sensitised to theBlood Oxygenation Level Dependent (BOLD)-effect(echo time = 30 ms) were acquired. Five scanning sessionswere performed. Each session included 92 functional vol-umes with a temporal resolution of 3 seconds. The firsttwo volumes in each session were discarded from furtheranalysis to allow for initial T1-equilibrium effects.
Experimental protocolFingers 1 to 5 (D1 = thumb, D5 = little finger) of the righthand were stimulated sequentially in separate sessionsaccording to a block design that included four periods ofstimulation and five of rest for each finger. The epochlength for both stimulation and rest periods was 30seconds.
PostprocessingImage processing and analysis were carried out using theSPM99 soft ware package [17]. All functional images wereresliced to a voxel size of 1.5 × 1.5 × 1.5 mm3 and then rea-ligned to the first image and coregistered to the T1-weighted image volume. All data were spatially filteredusing an isotropic 4 mm, full-width, half-maximum Gaus-sian kernel. A high pass filter (cut off frequency 0.008 Hz)was applied to eliminate low frequency signal fluctua-tions. In order to preserve each subject's somatotopicarrangement in area 3b no normalization to a commonbrain atlas was performed.
Data analysisFunctional data from two subjects were excluded due tomajor motion artefacts (subject no. 7) and global lack ofactivation (subject no.18). Task specific effects were esti-mated using the general linear model (GLM) thatincluded a box car function convolved with the canonicalhemodynamic response function in SPM99. The effect ofsensory stimulation of each finger versus rest was deter-mined using a one-sample t-test of pertinent linear con-trasts of parameter estimates in each subject with asignificance level of p < 0.001 (uncorrected). Then thespatial coordinates of the peak activation voxel in area 3bwere determined. Due to lack of neuroanatomical land-marks, exact delineation of the cytoarchitectonicallydefined areas within S1 cannot be achieved in MR images.Therefore we used an operational definition based oncytoarchitectonic studies of S1 on 10 post-mortem brains.In >50 % of these brains area 3a was located in the fundusof the central sulcus, area 3b in the rostral bank of thepostcentral gyrus and area 1 on its crown reaching downinto the postcentral sulcus [18,19]. Fig 1 illustrates theselocations, that continue along the central sulcus. As inter-areal borders vary across brains, the same authors con-structed probability maps for each area by superimposinghistological volumes of the individual brains on a compu-terized reference brain. Volumes of interest (VOIs) weredefined for each area in which >50 % of the brains had arepresentation of that area. Despite close relationship ofareas 3a, 3b and 1 in the postcentral gyrus, the three VOIsoverlapped by <1% of their volumes. These probabilitymaps were at hand when the spatial coordinates of thepeak activation voxel in area 3b were determined. Acti-vated peak voxels were labelled as belonging to area 3bwhen they were located within the anterior wall of thepostcentral gyrus (Figure 1).
The spatial coordinates of the peak voxel for the thumb(D1) was defined as being at origo [0, 0, 0] in a 3D Carte-sian coordinate system.When the spatial coordinates forall fingers were known in all subjects, somatotopy wasassessed by determining the average distances for thewhole group from each finger to the thumb.
Distance to the thumb (D1) for each finger (mm), mean (dia-monds) and SEM (errorbars), as presented in TableFigure 3Distance to the thumb (D1) for each finger (mm), mean (dia-monds) and SEM (errorbars), as presented in Table. The coordinates for D1 are defined as origo [0, 0, 0]. Distances to D1 are shown in the medial-lateral (M-L) direction, in the left panel also in the posterior-anterior (P-A) direction and in the right panel also in the superior-inferior (S-I) direction. The fingers are sequentially positioned more medially, poste-riorly and superiorly.
Page 5 of 6(page number not for citation purposes)
BMC Neuroscience 2004, 5:28 http://www.biomedcentral.com/1471-2202/5/28
Publish with BioMed Central and every scientist can read your work free of charge
"BioMed Central will be the most significant development for disseminating the results of biomedical research in our lifetime."
Sir Paul Nurse, Cancer Research UK
Your research papers will be:
available free of charge to the entire biomedical community
peer reviewed and published immediately upon acceptance
cited in PubMed and archived on PubMed Central
yours — you keep the copyright
Submit your manuscript here:http://www.biomedcentral.com/info/publishing_adv.asp
BioMedcentral
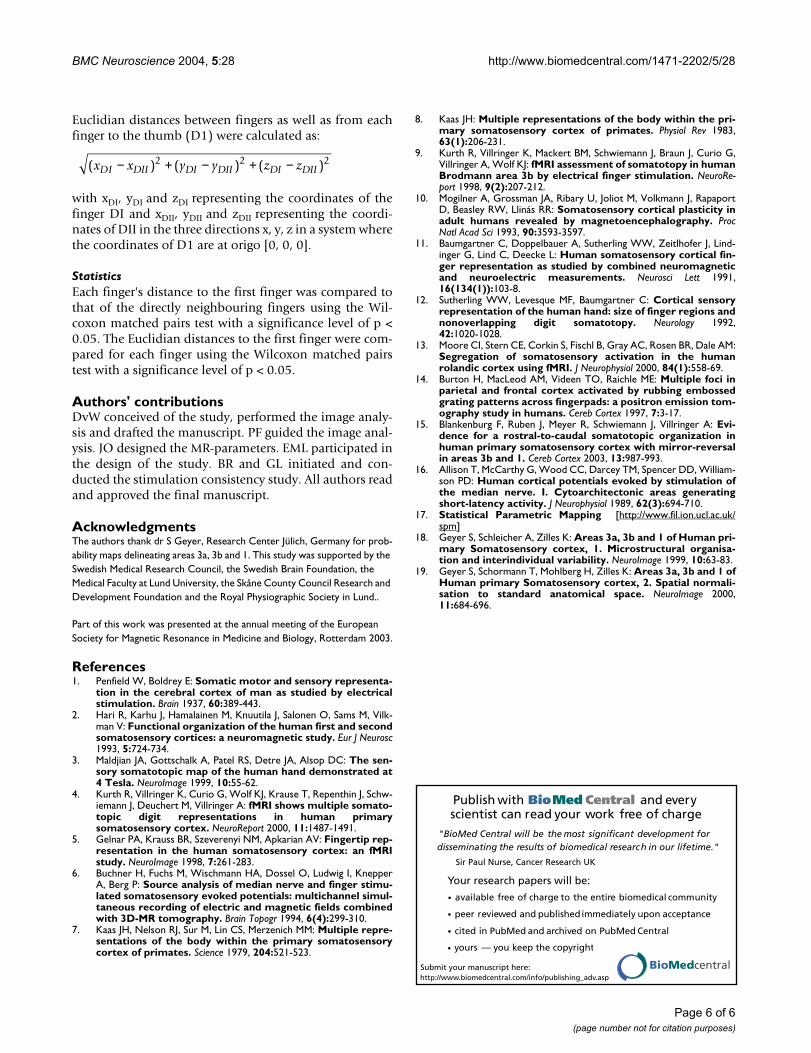
Euclidian distances between fingers as well as from eachfinger to the thumb (D1) were calculated as:
with xDI, yDI and zDI representing the coordinates of thefinger DI and xDII, yDII and zDII representing the coordi-nates of DII in the three directions x, y, z in a system wherethe coordinates of D1 are at origo [0, 0, 0].
StatisticsEach finger's distance to the first finger was compared tothat of the directly neighbouring fingers using the Wil-coxon matched pairs test with a significance level of p <0.05. The Euclidian distances to the first finger were com-pared for each finger using the Wilcoxon matched pairstest with a significance level of p < 0.05.
Authors' contributionsDvW conceived of the study, performed the image analy-sis and drafted the manuscript. PF guided the image anal-ysis. JO designed the MR-parameters. EML participated inthe design of the study. BR and GL initiated and con-ducted the stimulation consistency study. All authors readand approved the final manuscript.
AcknowledgmentsThe authors thank dr S Geyer, Research Center Jülich, Germany for prob-ability maps delineating areas 3a, 3b and 1. This study was supported by the Swedish Medical Research Council, the Swedish Brain Foundation, the Medical Faculty at Lund University, the Skåne County Council Research and Development Foundation and the Royal Physiographic Society in Lund..
Part of this work was presented at the annual meeting of the European Society for Magnetic Resonance in Medicine and Biology, Rotterdam 2003.
References1. Penfield W, Boldrey E: Somatic motor and sensory representa-
tion in the cerebral cortex of man as studied by electricalstimulation. Brain 1937, 60:389-443.
2. Hari R, Karhu J, Hamalainen M, Knuutila J, Salonen O, Sams M, Vilk-man V: Functional organization of the human first and secondsomatosensory cortices: a neuromagnetic study. Eur J Neurosc1993, 5:724-734.
3. Maldjian JA, Gottschalk A, Patel RS, Detre JA, Alsop DC: The sen-sory somatotopic map of the human hand demonstrated at4 Tesla. NeuroImage 1999, 10:55-62.
4. Kurth R, Villringer K, Curio G, Wolf KJ, Krause T, Repenthin J, Schw-iemann J, Deuchert M, Villringer A: fMRI shows multiple somato-topic digit representations in human primarysomatosensory cortex. NeuroReport 2000, 11:1487-1491.
5. Gelnar PA, Krauss BR, Szeverenyi NM, Apkarian AV: Fingertip rep-resentation in the human somatosensory cortex: an fMRIstudy. NeuroImage 1998, 7:261-283.
6. Buchner H, Fuchs M, Wischmann HA, Dossel O, Ludwig I, KnepperA, Berg P: Source analysis of median nerve and finger stimu-lated somatosensory evoked potentials: multichannel simul-taneous recording of electric and magnetic fields combinedwith 3D-MR tomography. Brain Topogr 1994, 6(4):299-310.
7. Kaas JH, Nelson RJ, Sur M, Lin CS, Merzenich MM: Multiple repre-sentations of the body within the primary somatosensorycortex of primates. Science 1979, 204:521-523.
8. Kaas JH: Multiple representations of the body within the pri-mary somatosensory cortex of primates. Physiol Rev 1983,63(1):206-231.
9. Kurth R, Villringer K, Mackert BM, Schwiemann J, Braun J, Curio G,Villringer A, Wolf KJ: fMRI assessment of somatotopy in humanBrodmann area 3b by electrical finger stimulation. NeuroRe-port 1998, 9(2):207-212.
10. Mogilner A, Grossman JA, Ribary U, Joliot M, Volkmann J, RapaportD, Beasley RW, Llinás RR: Somatosensory cortical plasticity inadult humans revealed by magnetoencephalography. ProcNatl Acad Sci 1993, 90:3593-3597.
11. Baumgartner C, Doppelbauer A, Sutherling WW, Zeitlhofer J, Lind-inger G, Lind C, Deecke L: Human somatosensory cortical fin-ger representation as studied by combined neuromagneticand neuroelectric measurements. Neurosci Lett 1991,16(134(1)):103-8.
12. Sutherling WW, Levesque MF, Baumgartner C: Cortical sensoryrepresentation of the human hand: size of finger regions andnonoverlapping digit somatotopy. Neurology 1992,42:1020-1028.
13. Moore CI, Stern CE, Corkin S, Fischl B, Gray AC, Rosen BR, Dale AM:Segregation of somatosensory activation in the humanrolandic cortex using fMRI. J Neurophysiol 2000, 84(1):558-69.
14. Burton H, MacLeod AM, Videen TO, Raichle ME: Multiple foci inparietal and frontal cortex activated by rubbing embossedgrating patterns across fingerpads: a positron emission tom-ography study in humans. Cereb Cortex 1997, 7:3-17.
15. Blankenburg F, Ruben J, Meyer R, Schwiemann J, Villringer A: Evi-dence for a rostral-to-caudal somatotopic organization inhuman primary somatosensory cortex with mirror-reversalin areas 3b and 1. Cereb Cortex 2003, 13:987-993.
16. Allison T, McCarthy G, Wood CC, Darcey TM, Spencer DD, William-son PD: Human cortical potentials evoked by stimulation ofthe median nerve. I. Cytoarchitectonic areas generatingshort-latency activity. J Neurophysiol 1989, 62(3):694-710.
17. Statistical Parametric Mapping [http://www.fil.ion.ucl.ac.uk/spm]
18. Geyer S, Schleicher A, Zilles K: Areas 3a, 3b and 1 of Human pri-mary Somatosensory cortex, 1. Microstructural organisa-tion and interindividual variability. NeuroImage 1999, 10:63-83.
19. Geyer S, Schormann T, Mohlberg H, Zilles K: Areas 3a, 3b and 1 ofHuman primary Somatosensory cortex, 2. Spatial normali-sation to standard anatomical space. NeuroImage 2000,11:684-696.
( ) ( ) ( )x x y y z zDI DII DI DII DI DII− + − + −2 2 2
Page 6 of 6(page number not for citation purposes)
http://www.ncbi.nlm.nih.gov/entrez/query.fcgi?cmd=Retrieve&db=PubMed&dopt=Abstract&list_uids=9626668
http://www.ncbi.nlm.nih.gov/entrez/query.fcgi?cmd=Retrieve&db=PubMed&dopt=Abstract&list_uids=7946929
http://www.ncbi.nlm.nih.gov/entrez/query.fcgi?cmd=Retrieve&db=PubMed&dopt=Abstract&list_uids=7946929
http://www.ncbi.nlm.nih.gov/entrez/query.fcgi?cmd=Retrieve&db=PubMed&dopt=Abstract&list_uids=7946929
http://www.ncbi.nlm.nih.gov/entrez/query.fcgi?cmd=Retrieve&db=PubMed&dopt=Abstract&list_uids=6401864
http://www.ncbi.nlm.nih.gov/entrez/query.fcgi?cmd=Retrieve&db=PubMed&dopt=Abstract&list_uids=6401864
http://www.ncbi.nlm.nih.gov/entrez/query.fcgi?cmd=Retrieve&db=PubMed&dopt=Abstract&list_uids=9507956
http://www.ncbi.nlm.nih.gov/entrez/query.fcgi?cmd=Retrieve&db=PubMed&dopt=Abstract&list_uids=9507956
http://www.ncbi.nlm.nih.gov/entrez/query.fcgi?cmd=Retrieve&db=PubMed&dopt=Abstract&list_uids=8386377
http://www.ncbi.nlm.nih.gov/entrez/query.fcgi?cmd=Retrieve&db=PubMed&dopt=Abstract&list_uids=1579225
http://www.ncbi.nlm.nih.gov/entrez/query.fcgi?cmd=Retrieve&db=PubMed&dopt=Abstract&list_uids=1579225
http://www.ncbi.nlm.nih.gov/entrez/query.fcgi?cmd=Retrieve&db=PubMed&dopt=Abstract&list_uids=1579225
http://www.ncbi.nlm.nih.gov/entrez/query.fcgi?cmd=Retrieve&db=PubMed&dopt=Abstract&list_uids=9023428
http://www.ncbi.nlm.nih.gov/entrez/query.fcgi?cmd=Retrieve&db=PubMed&dopt=Abstract&list_uids=2769354
http://www.ncbi.nlm.nih.gov/entrez/query.fcgi?cmd=Retrieve&db=PubMed&dopt=Abstract&list_uids=2769354