2 3 Environmental Monitoring and Assessment An International Journal Devoted to Progress in the Use...
16
1 23 Environmental Monitoring and Assessment An International Journal Devoted to Progress in the Use of Monitoring Data in Assessing Environmental Risks to Man and the Environment ISSN 0167-6369 Volume 186 Number 5 Environ Monit Assess (2014) 186:2965-2978 DOI 10.1007/s10661-013-3594-4 Physical characterization, magnetic measurements, REE geochemistry and biomonitoring of dust load accumulated during a protracted winter fog period and their implications Munmun Chakarvorty, Jayanta Kumar Pati, Shiva Kumar Patil, Swati Shukla, Ambalika Niyogi & Arun Kumar Saraf
-
Upload
independent -
Category
Documents
-
view
3 -
download
0
Transcript of 2 3 Environmental Monitoring and Assessment An International Journal Devoted to Progress in the Use...

1 23
Environmental Monitoring andAssessmentAn International Journal Devoted toProgress in the Use of Monitoring Datain Assessing Environmental Risks toMan and the Environment ISSN 0167-6369Volume 186Number 5 Environ Monit Assess (2014)186:2965-2978DOI 10.1007/s10661-013-3594-4
Physical characterization, magneticmeasurements, REE geochemistry andbiomonitoring of dust load accumulatedduring a protracted winter fog period andtheir implicationsMunmun Chakarvorty, Jayanta KumarPati, Shiva Kumar Patil, Swati Shukla,Ambalika Niyogi & Arun Kumar Saraf

1 23
Your article is protected by copyright and all
rights are held exclusively by Springer Science
+Business Media Dordrecht. This e-offprint
is for personal use only and shall not be self-
archived in electronic repositories. If you wish
to self-archive your article, please use the
accepted manuscript version for posting on
your own website. You may further deposit
the accepted manuscript version in any
repository, provided it is only made publicly
available 12 months after official publication
or later and provided acknowledgement is
given to the original source of publication
and a link is inserted to the published article
on Springer's website. The link must be
accompanied by the following text: "The final
publication is available at link.springer.com”.

Physical characterization, magnetic measurements, REEgeochemistry and biomonitoring of dust load accumulatedduring a protracted winter fog period and their implications
Munmun Chakarvorty & Jayanta Kumar Pati & Shiva Kumar Patil &Swati Shukla & Ambalika Niyogi & Arun Kumar Saraf
Received: 29 January 2013 /Accepted: 23 December 2013 /Published online: 10 January 2014# Springer Science+Business Media Dordrecht 2014
Abstract The winter fog in India is a recurrent phenom-enon for more than a decade now affecting the entireHimalayan and sub-Himalayan regions covering an areaof nearly 500,000 km2. Every winter (December–January), the air and surface transports in cities of north-ern India (Amritsar, New Delhi, Agra, Gwalior, Kanpur,Lucknow, and Allahabad) are severely disrupted withvisibility reduced to <50 m at times. Since dust particlesare known to act as nuclei for the fog formation, thisstudy is aimed to carry out physicochemical characteri-zation of the dust particulates accumulated during aprotracted fog period from one of the severely fog affect-ed cities of north India (Allahabad; 25°27′33.40″N–81°52′45.47″E). The dust-loaded tree leaves belongingto Ficus bengalensis and Ficus religiosa from 50 differ-ent locations between January 24 and 31, 2010 are sam-pled and characterized. The mass of dust, color, grainshape, size, phase constituents, and mineral magneticparameters, such as magnetic susceptibility, SIRM,χfd%, and S-ratio, show minor variation and the regionalinfluence outweighs local anthropogenic contributions.
The dust compositions show fractionated rare earth ele-ment pattern with a pronounced negative Eu anomalysimilar to upper continental crust and further suggestingtheir derivation from sources located in parts of north andcentral India.
Keywords Physical characterization .Magneticsusceptibility . Particulate matter .Winter fog .
Biomonitoring
Introduction
Fog disrupts surface and air transport in the entire northernIndia between themonths of November and January everyyear (Ali et al. 2004; Prasad & Singh 2007; Singh et al.2011; Jenamani & Tyagi 2011; Saraf et al. 2011; Tiwariet al. 2011) and similar conditions are observed in otherparts of the world as well (Biswas et al. 2008; Cerecedaet al. 2008). In India, so far, the studies have been confinedto the analysis of fogwater (Ali et al. 2004), anthropogeniccauses of fog formation (Prasad & Singh 2007;Choudhury et al. 2007), monitoring (Jenamani & Tyagi2011) and spatio-temporal variation of fog pattern (Sarafet al. 2011), experimental study pertaining fog formationand dissipation (Singh et al. 2011), and algorithm devel-opment for night time fog detection (Chaurasia et al.2011). Saraf et al. (2011) studied the winter fog patternobserved in Indo-Gangetic plains between 2005 and 2008using remote sensing and geographic information system(GIS) techniques. They observed that the fog in Indo-Gangetic plains has varied significantly during 2005–
Environ Monit Assess (2014) 186:2965–2978DOI 10.1007/s10661-013-3594-4
M. Chakarvorty : J. K. Pati (*) : S. Shukla :A. NiyogiDepartment of Earth and Planetary Sciences, University ofAllahabad, Allahabad 211 002, Indiae-mail: [email protected]
S. K. PatilDr. K.S. Krishnan Geomagnetic Research Laboratory,Leelapur Road, Hanumanganj, Allahabad 221 505, India
A. K. SarafDepartment of Earth Sciences, Indian Institute of Technology,Roorkee, Uttarakhand 247667, India
Author's personal copy

2008 [575,800 km2 (2005–2006), 594,100 km2 (2006–2007), and 478,000 km2 (2007–2008)] and further attrib-uted that such variations may be the consequence of highfluctuations in the meteorological parameters prevailed inthe area.
This study has been carried out in parts of AllahabadCity, north central India for the first time to study thedust load accumulated during a dense fog period ob-served in the month of January 2010 (Chaurasia et al.2011) pertaining to their physical properties (absolutemass of the dust load, color, grain size, particulate shape,and phase characterization), magnetic properties, rareearth element (REE) geochemistry of the dust load,and biomonitoring using two well-known natural sinks(Ficus bengalensis and Ficus religiosa). The objectiveof the present study is to physicochemically characterizethe dust matter collected during a winter fog period innorth India and link the sink particulate to its possiblesource.
Materials and methods
Study area
The city of Allahabad spread over 70 km2 area is locatedin the northern Indian state of Uttar Pradesh and is afamous centre of pilgrimage with a population of1,206,785 inhabitants (2001 Census; http://en.wikipedia.org/wiki/Allahabad; December 20, 2011) 21and Yamuna rivers and at an elevation of 98 m from themean sea level. Of the nine major cities of north Indiaaffected by winter fog, the least numbers of industriesare located in Allahabad. The city experiences a humidsubtropical climate, common to cities in north-centralIndia. Allahabad witnesses mainly three seasons: hotdry summer, cool dry winter, and warm humid mon-soon. The summer season lasts from April to June withthe maximum temperatures ranging from 40 to 47 °C.Monsoon begins in early July and lasts till September.The Allahabad City receives an average rainfall of about97 cm year-1. The winter season lasts from December toFebruary with the minimum and maximum tempera-tures between 3 and 22 °C, respectively. Like all majorcities in the north India occurring in the foreland basin,Allahabad experiences dense fog between Decemberand January every year (Saraf et al. 2011) disruptingsurface and air transports severely.
Sampling
Various types of particle collectors are employed for thesampling of the fog-related particulate matter. The road-side tree leaves are one of them and known as bettersinks for the collection of large number of samples(Gautam et al. 2005). This biomonitoring tool has beenused extensively in various thematic studies involvingatmospheric aerosols (Gautam et al. 2005; Lorenziniet al. 2006; Prajapati & Tripathi 2008; Maher et al.2007; Power et al. 2009; Tomaˇsevi’c et al. 2005),mineralogical characterization of the particulate matter(Charlesworth & Lees 1997; Abdul-Razzaq & Gautam2001), geochemical analysis of dust load (Petrovsky &Ellwood 1999; Hanesch & Scholger 2002; Muxworthyet al. 2002; Wong et al. 2006; Lu et al. 2008; Yang &Chen 2002), and magnetic measurements (Blaha et al.2008; Lu et al. 2007; Shu et al. 2000; Goddu et al. 2004;Flanders 1994; Gautam et al. 2005; Hoffmann et al.1999; Maher et al. 2007; Moreno et al. 2003; Haneschet al. 2003; Oldfield et al. 1985). The road-side treeleaves are also considered as extremely suitable to ac-cess and monitor the source of particulate matter (Chenet al. 1999; Spassov etal. 2004) and to ascertain theirspatio-temporal distribution pattern.
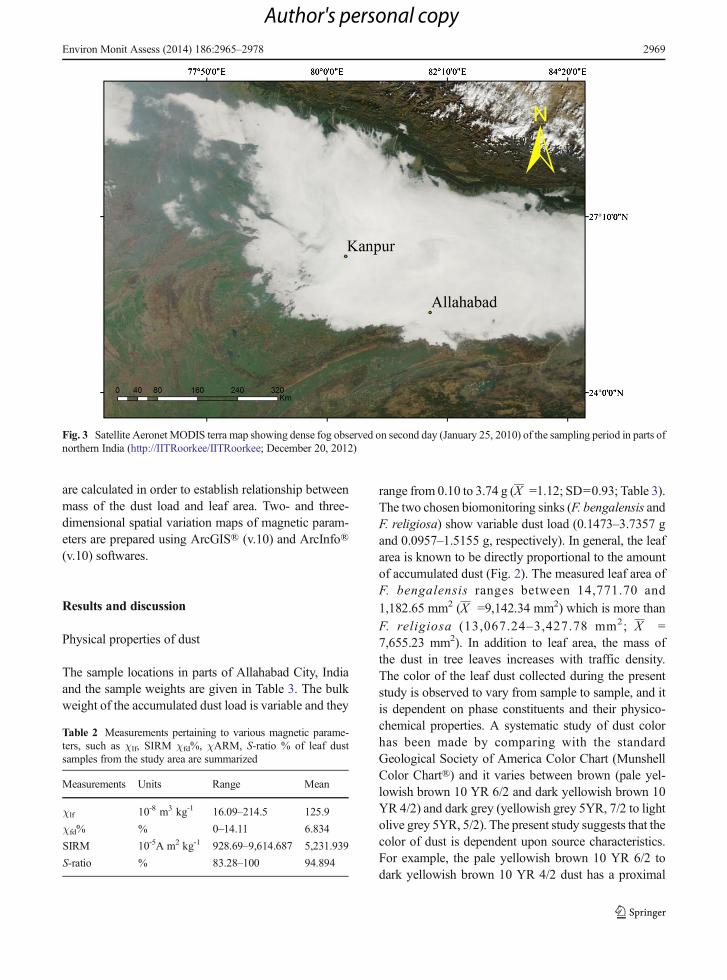
The dust samples were collected from 50 representa-tive locations close to various roads within AllahabadCity, India (Fig. 1) from two species of deciduous Ficustrees (F. bengalensis and F. religiosa) with samplingconfined to branches facing the road and at a height of2–2.5 m above ground level. Each sample represents totalmass of particulate matter collected from ten morpholog-ically identical dust-loaded Ficus leaves. The dust sam-ples were stored in precleaned plastic dust collectors ofknown magnetic susceptibility and preserved at ambienttemperature. The color, leaf area, leaf weight, andmass ofthe dust (Fig. 2; Table 1) were observed in each case. Thesampling was carried out between January 24 and 30,2010 during a marked fog (Fig. 3) phase preceded by about of heavy to moderate rain fall on January 21, 2010.The leaf dust samples were collected 3 days after therainfall assuming total washout of the pre-rain dust loadand further suggesting the collected dust samples to rep-resentative of the fog phase.
Grain size analysis
The SEM and BSE-SEM images of five representativedust samples (Nos. 6, 20, 28, 36 and 44) are obtained
2966 Environ Monit Assess (2014) 186:2965–2978
Author's personal copy
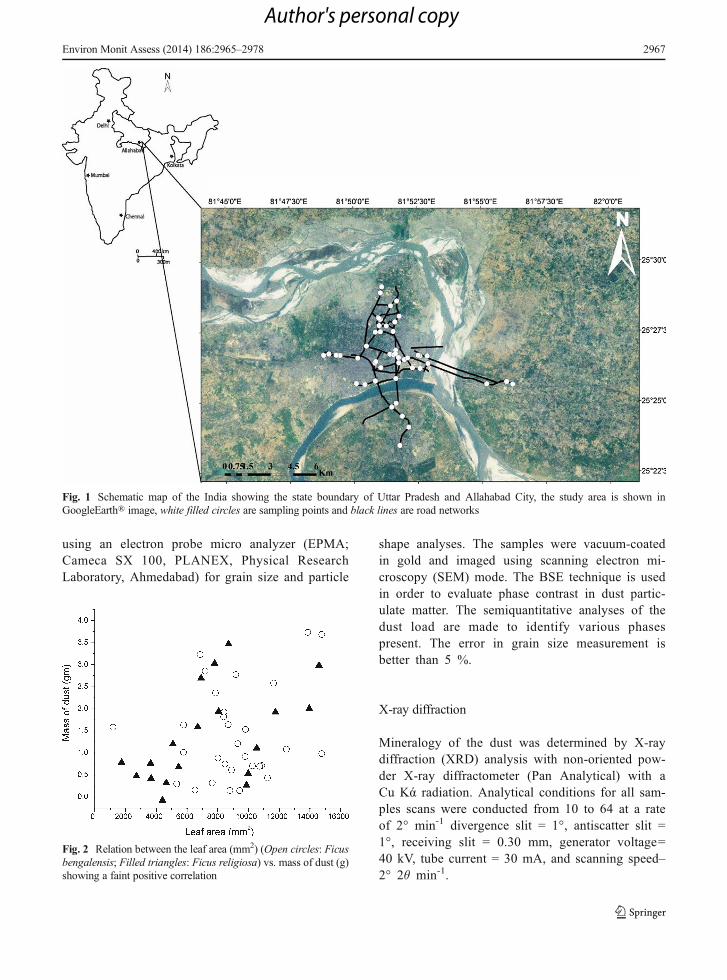
using an electron probe micro analyzer (EPMA;Cameca SX 100, PLANEX, Physical ResearchLaboratory, Ahmedabad) for grain size and particle
shape analyses. The samples were vacuum-coatedin gold and imaged using scanning electron mi-croscopy (SEM) mode. The BSE technique is usedin order to evaluate phase contrast in dust partic-ulate matter. The semiquantitative analyses of thedust load are made to identify various phasespresent. The error in grain size measurement isbetter than 5 %.
X-ray diffraction
Mineralogy of the dust was determined by X-raydiffraction (XRD) analysis with non-oriented pow-der X-ray diffractometer (Pan Analytical) with aCu Kά radiation. Analytical conditions for all sam-ples scans were conducted from 10 to 64 at a rateof 2° min-1 divergence slit = 1°, antiscatter slit =1°, receiving slit = 0.30 mm, generator voltage=40 kV, tube current = 30 mA, and scanning speed–2° 2θ min-1.
Fig. 1 Schematic map of the India showing the state boundary of Uttar Pradesh and Allahabad City, the study area is shown inGoogleEarth® image, white filled circles are sampling points and black lines are road networks
Fig. 2 Relation between the leaf area (mm2) (Open circles: Ficusbengalensis; Filled triangles: Ficus religiosa) vs. mass of dust (g)showing a faint positive correlation
Environ Monit Assess (2014) 186:2965–2978 2967
Author's personal copy

Magnetic measurements of particulate matter
The dust samples were weighed on Mettler (Germany)electronic balance and the magnetic susceptibility ofdust samples was measured (in SI unit) using a dualfrequency (0.47 and 4.7 kHz) magnetic susceptibilitymeter (MS2B; Bartington, UK). Susceptibility mea-surements are made within 24 h of their collection topreserve their natural moisture. The frequency-dependent magnetic susceptibility (χfd%) was also cal-culated. All magnetic measurements except the mag-netic susceptibility are made using the facilities avail-able in Dr. K.S. Krishnan Geomagnetic ResearchLaboratory (Government of India), Allahabad. TheMolspin pulse magnetizer and Molspin spinner magne-tometer are used for isothermal remanent magnetization(IRM) experiments. The saturation induced remanentmagnetization (SIRM) and S-ratios were calculated byusing the formula given by Bloemendal et al. (1992) andnoted in Table 2. The χfd% reflects the relative impor-tance of ferromagnetic grains close to superparamagnetic(SP)/single domain (SD) and SIRM/χlf may be used asan indicator of the fine-grain (diameter < 1.4 μm) mag-netic minerals (Dunlop 1973). Magnetic susceptibilitydepends on the whole composition of the dust depositedon the leaves and is, however, dominated by ferromag-netic minerals that have much higher susceptibilityvalues than other common paramagnetic and diamagnet-ic minerals like clay or quartz (Moreno et al. 2003).
REE analyses
The REE geochemistry of ten representative dust sam-ples showing variable magnetic susceptibility is inves-tigated using inductively coupled plasma-mass spec-trometry (ICP-MS, Varian) technique (ChemicalDivision, Geological Survey of India, Lucknow).Approximately 0.1 g of each sample is digested by8 ml aqua regia in a microwave oven (Mars-5; CEM,USA). After digestion, the solution is filtered and dilut-ed with deionized water to get 50 ml of solution and theelemental concentrations of La, Ce, Pr, Nd, Pm, Sm,Eu, Gd, Tb, Dy, Ho, Er, Tm, Yb, and Lu are determinedby ICP-MS and GSD-10 was used as internal standard.
Statistical analysis
For all the measurements, the rank, mean, and standarddeviation are calculated. The correlation coefficientsT
able1
The
massof
dust,theircolor,grainshape,leaf
type
andleaf
area
forfive
representativ
eleafdustsamples
aresummarized
Sample
Sample
no.
Location
Physically
derived
from
place
Treetype
Amount
ofdust
(massof
dust
pertenleaves)(g)
Color
ofdust
(Munshellcolor
chart®)
Grain
shape(%
)Leafarea
(mm
2 )
Latitu
de(N
°)Longitude
(E°)
Elevatio
n(m
)
16
25°26′23.7″N
81°51′45.8″E
50±3
NationalH
ighw
ayBaihrana(near
Power
House)
Ficus
bengalensis
1.0166
Olivegray
5YR4/1
Needleshape0.69,subrounded41.24
5,768
220
25°26′30.3″N
81°51′58.9″E
80±7
Tularam
bagh
Crossing
(nearSabziM
andi)
F.bengalensis
3.7357
Lightolivegray
5YR5/2
Needleshape0.52
subrounded
40.94
1,386
328
25°25′37.7″N
81°55′11.9″E
86±3
Chack
Jhunsi(infront
ofAllahabadBank)
F.bengalensis
3.6892
Paleyello
wishbrow
n10
YR6/2
Needleshape1.82,subrounded43.15
14,770
436
25°26′40.5vN
81°48′49.4″E
93±3
Lukerganj
(nearFlour
Mill
Com
pany)
Ficus
relig
iosa
0.9021
Lightolivegray
5YR5/2
Needleshape3.6,
subrounded
43.17
6,212
544
25°29′05.9″N
81°51′06.8″E
84±4
BeliR
oad(Cantonm
entA
rea)
F.relig
iosa
0.2949
Olivegray
5YR4/1
Needleshape1.5,
subrounded
38.86
4,869
2968 Environ Monit Assess (2014) 186:2965–2978
Author's personal copy
are calculated in order to establish relationship betweenmass of the dust load and leaf area. Two- and three-dimensional spatial variation maps of magnetic param-eters are prepared using ArcGIS® (v.10) and ArcInfo®(v.10) softwares.
Results and discussion
Physical properties of dust
The sample locations in parts of Allahabad City, Indiaand the sample weights are given in Table 3. The bulkweight of the accumulated dust load is variable and they
Fig. 3 Satellite Aeronet MODIS terra map showing dense fog observed on second day (January 25, 2010) of the sampling period in parts ofnorthern India (http://IITRoorkee/IITRoorkee; December 20, 2012)
Table 2 Measurements pertaining to various magnetic parame-ters, such as χlf, SIRM χfd%, χARM, S-ratio % of leaf dustsamples from the study area are summarized
Measurements Units Range Mean
χlf 10-8 m3 kg-1 16.09–214.5 125.9
χfd% % 0–14.11 6.834
SIRM 10-5A m2 kg-1 928.69–9,614.687 5,231.939
S-ratio % 83.28–100 94.894
Environ Monit Assess (2014) 186:2965–2978 2969
range from 0.10 to 3.74 g (X =1.12; SD=0.93; Table 3).The two chosen biomonitoring sinks (F. bengalensis andF. religiosa) show variable dust load (0.1473–3.7357 gand 0.0957–1.5155 g, respectively). In general, the leafarea is known to be directly proportional to the amountof accumulated dust (Fig. 2). The measured leaf area ofF. bengalensis ranges between 14,771.70 and
1,182.65 mm2 (X =9,142.34 mm2) which is more than
F. religiosa (13,067.24–3,427.78 mm2; X =7,655.23 mm2). In addition to leaf area, the mass ofthe dust in tree leaves increases with traffic density.The color of the leaf dust collected during the presentstudy is observed to vary from sample to sample, and itis dependent on phase constituents and their physico-chemical properties. A systematic study of dust colorhas been made by comparing with the standardGeological Society of America Color Chart (MunshellColor Chart®) and it varies between brown (pale yel-lowish brown 10 YR 6/2 and dark yellowish brown 10YR 4/2) and dark grey (yellowish grey 5YR, 7/2 to lightolive grey 5YR, 5/2). The present study suggests that thecolor of dust is dependent upon source characteristics.For example, the pale yellowish brown 10 YR 6/2 todark yellowish brown 10 YR 4/2 dust has a proximal
Author's personal copy

Table 3 Description of sampling locations from different parts of Allahabad City, India
Sample no. Place Latitude (N°) Longitude (E°) Weight of dustsample (g)
1 Trans New Yamuna Bridge (Crossing) 25°24′49.3″N 81°51′28.6″E 0.5426
2 Arail Turning, Naini (Tricrossing) 25°24′06.2″N 81°52′08.4″E 0.3178
3 Mewa Lal Baghia, Naini near Station Road (Tricrossing) 25°23′27.2″N 81°51′47.3″E 2.8578
4 Central Jail, Naini (Tricrossing) 25°24′29.9″N 81°51′53.4″E 0.0957
5 New Yamuna Bridge, Naini near Toll Tax Office 25°24′57.4″N 81°51′38.9″E 0.2991
6 National Highway, Baiharana near Power House 25°26′23.7″N 81°51′45.8″E 1.0166
7 Bai Ka Bagh (Crossing) 25°26′13.5″N 81°51′03.8″E 3.2333
8 Nehru Science Centre Gate, University of Allahabad 25°27′30.1″N 81°51′03.1″E 0.7618
9 Sumitra Nandan Pant Children's Park Gate (Elephant Park) 25°27′29.6″N 81°50′51.1″E 0.9288
10 Hanumat Niketan, Civil Lines 25°26′59.7″N 81°50′30.1″E 0.4319
11 Hanuman Mandir, Rambagh (Crossing) 25°26′23.5″N 81°50′50.2″E 0.8957
12 Rambagh near Railway Crossing 25°26′26.5″N 81°50′51.8″E 1.8189
13 Bank Road (Tricrossing) 25°25′50.1″N 81°51′38.6″E 1.3198
14 M. G. Marg in front of K. P. Inter College 25°26′42.2″N 81°51′25.3″E 0.6138
15 C.M.P. Degree College (Tricrossing) 25°26′40.5″N 81°51′34.1″E 1.9295
16 George Town 25°26′50.5″N 81°51′38.6″E 0.4390
17 George Town 25°26′50.5″N 81°51′38.6″E 1.5841
18 Malaviya Road George Town 25°26′43.3″N 81°51′38.1″E 1.6430
19 In front of Bharat Shevashram Sangh, Tularambagh 25°26′35.1″N 81°51′45.1″E 0.8887
20 Tularambagh Crossing near Sabzi Mandi 25°26′30.3″N 81°51′58.9″E 3.7357
21 Fort Road Pared Ground (Tricrossing) 25°26′12.9″N 81°52′17.7″E 0.4351
22 Triveni Road Kumbh Mela Region 25°26′11.5″N 81°52′35.8″E 1.2116
23 Daraganj Bandh Road 25°26′21.9″N 81°52′54.4″E 0.9189
24 Daraganj Tricrossing near Railway Station 25°26′38.0″N 81°52′52.6″E 0.2557
25 Alopibagh (Tricrossing) 25°26′38.1″N 81°52′35.2″E 1.0860
26 Sardar Patel Tricrossing Baghmbri Road, Allahapur 25°26′39.7″N 81°52′31.2″E 2.7765
27 Shastri Bridge, Chungi 25°26′33.9″N 81°52′06.7″E 1.5360
28 Chack Jhunsi in front of Allahabad Bank 25°25′37.7″N 81°55′11.9″E 3.6892
29 Andava Bypaas, Jhunsi 25°25′42.4″N 81°55′58.9″E 1.3372
30 Andava Turning, Jhunsi 25°25′36.9″N 81°56′12.9″E 0.7504
31 Katghar (Crossing) 25°25′37.9″N 81°50′26.1″E 0.9856
32 Dariyabad Police Chauki 25°25′40.0″N 81°50′06.1″E 0.1473
33 Johnstonganj (Crossing) 25°26′34.1″N 81°50′09.6″E 1.2048
34 Railway Station, Leader Road in front of V.I.P. Gate 25°26′40.0″N 81°49′28.1″E 0.3985
35 Lukerganj near Aaj Press 25°26′43.5″N 81°49′01.9″E 0.7143
36 Lukerganj near Flour Mill 25°26′40.5″N 81°48′49.4″E 0.9021
37 Khusru Bagh Gateway, Leader Road 25°26′40.8″N 81°49′18.8″E 1.5155
38 Manmohan Park (Crossing) 25°27′43.3″N 81°51′00.3″E 0.1505
39 Gate of Science Faculty, University of Allahabad 25°27′42.5″N 81°51′16.9″E 0.7069
40 Gaughat Fish Market (Crossing) 25°25′45.2″N 81°50′50.7″E 2.5858
41 Netram Crossing, Katra 25°27′56.9″N 81°51′03.0″E 0.6070
42 Katchery Road, Katra 25°28′00.3″N 81°50′58.0″E 0.1604
43 Auto Stand, Katra 25°27′59.1″N 81°50′59.5″E 0.2346
44 Beli Road, Cantonment Area 25°29′05.9″N 81°51′06.8″E 0.2949
2970 Environ Monit Assess (2014) 186:2965–2978
Author's personal copy

alluvium/crustal source. However, the dust color variesfrom yellowish grey 5YR, 7/2 to light olive grey 5YR,5/2 in traffic congested and industrial areas, respectively.The size of 1,811 individual dust particles varies from1.5 to 100 μm (Table 1; Figs. 4 and 5). The particle sizewas measured using five BSE images covering 2,600×2,000 μm2 area in each case. It is interesting to note that59.08% of the grains fall within the well-established fogparticulate size range (0.23 and 20μm; Pant et al. 2010).Nearly 75% of the grainsmeasure between 1 and 40μmand about 24 % to 34% of the grains occur within PM10
and PM1.5. The BSE-SEM images of the dust particlesshow variable shapes (subrounded, rounded, well-rounded, angular and acicular; Fig. 4). The most domi-nant particle shape is subrounded (35.92%) followed byrounded (23.56 %), angular (28.97 %), well-rounded
(6.78 %), and acicular (3.09 %). The shapes of about1.68 % particles could not be analyzed due to blurredportions.
X-ray diffraction
The XRD patterns of the dust samples are identical andonly three representative spectra are shown in Fig. 6.The analyses reveal the presence of feldspar,quartz, mica, ilmenite, calcite, albite, and musco-vite. The relative peak intensities and respectiveposition (2θ) of various phases present in thesamples are also similar, suggesting their identicalcomposition and modal volume in respectivesamples.
Table 3 (continued)
Sample no. Place Latitude (N°) Longitude (E°) Weight of dustsample (g)
45 Noorabad Drain, Beli Road (Pulia) 25°28′53.2″N 81°51′03.6″E 1.6359
46 Lala Lajpat Rai Road Mumfordganj in frontof Master Zahurul Hasan Road
25°28′25.5″N 81°51′27.3″E 0.3189
47 Near Bharat Scouts and Guide School in frontof Ganga Vihar
25°28′35.5″N 81°51′41.8″E 0.7000
48 Lalla Ki Chungi near Women Hostel 25°28′3.31″N 81°51′47.5″E 0.5703
49 University of Allahabad Arts faculty Gate(K.P.U.C. Side)
25°27′′50.9″N 81°51′37.0″E 0.3406
50 In front of Anand Bhawan, M. G. Marg 25°27′30.9″N 81°51′33.1″E 2.3622
Fig. 4 The plot between relativeabundance vs. grain size of leafdust shows a polymodaldistribution pattern
Environ Monit Assess (2014) 186:2965–2978 2971
Author's personal copy

REE geochemistry
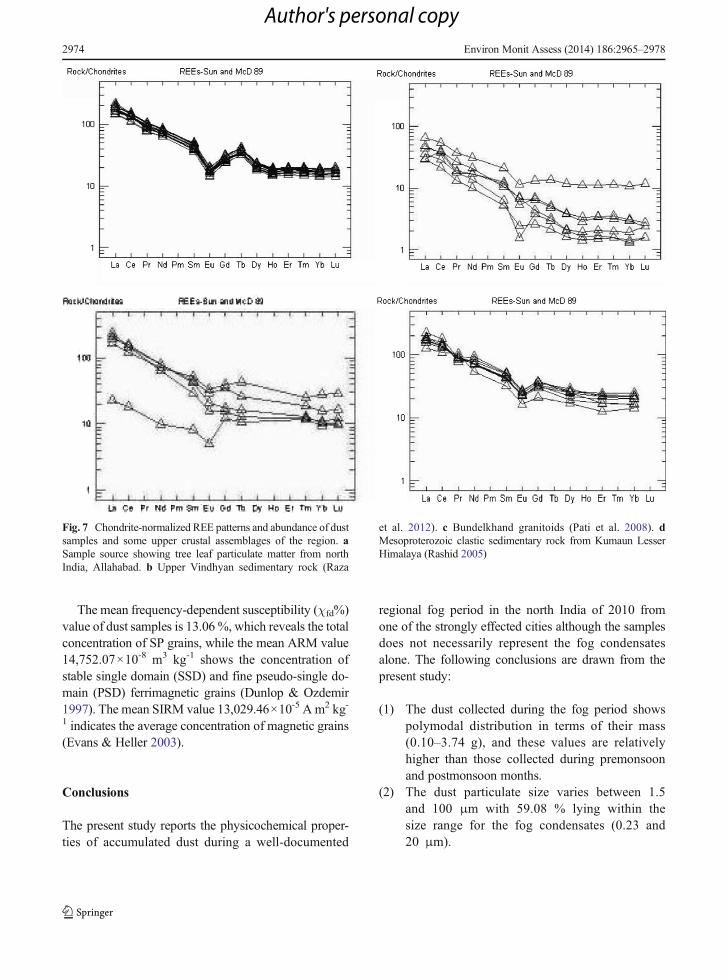
The chondrite normalized (Sun & McDonough 1989)REE pattern of ten representative dust samples for 13REEs is shown in Fig. 7 and the data is summarized inTable 4. The sample selection for REE analysis wasbased on their mass magnetic susceptibility variation(Table 2). The REE values of all the samples collectedduring the fog period are identical. They show a frac-tionated REE pattern with light REE (LREE) enrich-ment, nearly flat heavy REE (HREE) and a pronouncednegative Eu anomaly (Eu/Eu*<1). All samples have anegative Eu anomaly (Eu/Eu*=0.15–0.17) with an av-erage Eu/Eu* of 0.16. A positive Tb enrichment is alsonoted possibly due to the effect of standard (GSD-10)used for calibration by ICP-MS. The LaN/YbN valuesshow un-differentiated fractionated pattern. Since thestudy area is situated close to the confluence of twomajor rivers (Ganga and Yamuna; Fig. 1) of India hav-ing large expanse of sandbars comprising sedimentsderived from the central India and the Himalayas main-ly, a comparison of REE patterns with the rocks ofVindhyan Supergroup (Raza et al. 2012), Bundelkhandcraton (Pati et al. 2008), and Himalayas (Rashid 2005)has been made. The REE contents and the normalizedREE patterns of the rocks from Archean Bundelkhandcraton (central India) and Kumaun Lesser Himalayas are
found to be similar to the dust particles accumulatedduring the fog period in Allahabad, whereas, in general,the REE contents of sediments (Upper Vindhyan)though fractionated are relatively less in concentration.
Magnetic measurements
The magnetic measurements of the leaf dust are summa-rized in Table 2. The data show a moderate to highconcentration of magnetic minerals in the analyzed sam-ples. In case of total suspended particulatematter, themeanlow-frequency magnetic susceptibility value is χlf
189.15×10⁻⁷ m kg-1 lying in the range between 16.08×10⁻⁷ and 848.10×10⁻⁷ m kg-1, and the SIRM values varyfrom 928.6 to 81,554.1×10-5 A m2 kg-1 (Fig. 8). TheSIRM is known to provide a rough measure in terms ofconcentration of all minerals having high magnetic rema-nence. The higher SIRM measurements are observed inheavy traffic areas (like Alopibagh tricrossing and NehruScience Gate tricrossing) and the samples contain magne-tite and ilmenite, the two ubiquitous ferromagnetic min-erals. The lower SIRM values are observed in areas withless vehicular pollution (near Bharat Scouts and GuideSchool in front of Ganga Vihar). The raised χlf values inareas with high traffic volume (Bai Ka Bagh and Netramcrossings, Katra) suggest the dominant contribution fromFe-bearing minerals in the mineral assemblage derived
Fig. 5 BSE image showing various phases present in leaf dust samples. The variation in terms of grain shapes (angular, sub-angular,rounded, subrounded, well-rounded and needle shaped) is clearly visible and some microspherules are also present
2972 Environ Monit Assess (2014) 186:2965–2978
Author's personal copy

from vehicular exhaust (Thompson &Oldfield 1986). TheSIRMvalue increaseswith an increase in the concentrationof fine-size magnetic fractions (single domain;Bloemendal et al. 1992). The SIRM measurements alsosuggest that maximum concentrations of magnetic min-erals occur in areas with high traffic density (Kushrubaghand Manmohan Park Gate intersections). The S-ratio is<90 % in less polluted area (Tularambagh side) indicatingthe presence of hematite. However, more magnetic min-erals (100%) are present in traffic junctions (George Townarea). Overall the S-ratio shows a polymodal distribution inthe entire sample area further supporting only localizedminimal effect due to vehicular pollution in terms of theabundance ofmagneticminerals. In general, the SIRMand
S-ratio show the concentration of ferromagnetic constitu-ents and fine grains of magnetic minerals as a magneticproxy in the roadside leaf dust. The variation of χlf andSIRM in the study area are shown with the help of colorcontour spatial distribution maps (Fig. 9a and b), and theyshow minor variability in terms of χlf and SIRM, respec-
tively. The quotient ΧARM/SIRM (X = 0.49 × 10⁻⁵ A m-1;Table 2) may be used as an indicator of the relativeimportance of fine magnetic grains (Dunlop & Ozdemir1997). The high S-ratio reflects convergence in which themagnetic properties are controlled by magnetite/maghemite, while the lower values indicate the greatercontributions from anti-ferromagnetic minerals (Fig. 9c;Evans & Heller 2003) like hematite.
Fig. 6 The XRD patterns of thethree representative samplesshowing quartz, biotite,dolomite, apatite minerals inthe leaf dust sample
Environ Monit Assess (2014) 186:2965–2978 2973
Author's personal copy
The mean frequency-dependent susceptibility (χfd%)value of dust samples is 13.06 %, which reveals the totalconcentration of SP grains, while the mean ARM value14,752.07×10-8 m3 kg-1 shows the concentration ofstable single domain (SSD) and fine pseudo-single do-main (PSD) ferrimagnetic grains (Dunlop & Ozdemir1997). The mean SIRM value 13,029.46×10-5 A m2 kg-1 indicates the average concentration of magnetic grains(Evans & Heller 2003).
Conclusions
The present study reports the physicochemical proper-ties of accumulated dust during a well-documented
regional fog period in the north India of 2010 fromone of the strongly effected cities although the samplesdoes not necessarily represent the fog condensatesalone. The following conclusions are drawn from thepresent study:
(1) The dust collected during the fog period showspolymodal distribution in terms of their mass(0.10–3.74 g), and these values are relativelyhigher than those collected during premonsoonand postmonsoon months.
(2) The dust particulate size varies between 1.5and 100 μm with 59.08 % lying within thesize range for the fog condensates (0.23 and20 μm).
Fig. 7 Chondrite-normalized REE patterns and abundance of dustsamples and some upper crustal assemblages of the region. aSample source showing tree leaf particulate matter from northIndia, Allahabad. b Upper Vindhyan sedimentary rock (Raza
et al. 2012). c Bundelkhand granitoids (Pati et al. 2008). dMesoproterozoic clastic sedimentary rock from Kumaun LesserHimalaya (Rashid 2005)
2974 Environ Monit Assess (2014) 186:2965–2978
Author's personal copy

Table 4 The rare earth element analyses of eight selected leaf dust samples carried out by ICP-MS technique is given below
Sample 6 8 12 23 35 36 43 45 Average SD
La 46.97 41.83 43.71 49.42 51.94 41.84 35.54 45.78 44.62 5.10
Ce 93.64 80.97 83.52 90.7 93.05 9.89 69.96 90.13 85.23 8.18
Pr 10.14 8.80 9.26 9.97 10.18 8.90 7.46 9.72 9.30 0 .91
Nd 37.19 34.37 36.05 38.93 40.13 35.45 29.63 39.04 36.34 3.35
Sm 7.75 6.62 6.87 7.45 7.53 6.70 5.42 7.16 6.93 0.73
Eu 1.19 1.01 1.05 1.12 1.15 1.03 0.84 1.02 1.05 0.10
Gd 6.24 5.63 5.97 6.43 6.54 5.95 4.83 6.29 5.98 0.55
Tb 1.54 1.36 1.46 1.56 1.57 1.45 1.18 1.53 1.45 0.13
Dy 5.86 5.21 5.71 6.05 6.00 5.58 4.55 5.82 5.59 0.499
Ho 1.05 0.93 1.02 1.09 1.08 1.0 0.82 1.03 1.0 0.08
Er 3.17 2.87 3.12 3.33 3.32 3.06 2.50 3.20 3.07 0.27
Tm 0.50 0.44 0.47 0.51 0.50 0.46 0.38 0.49 0.46 0.042
Yb 3.08 2.80 2.95 3.24 3.22 2.92 2.38 3.14 2.96 0.28
Lu 0.50 0.45 0.46 0.50 0.50 0.46 0.36 0.51 0.46 0.05
EuN/Eu* 0.17 0.17 0.16 0.16 0.16 0.16 0.16 0.15 0.16 0.16
LaN/YbN 15.25 14.93 14.81 15.25 16.13 14.32 14.93 14.57 15.07 18.21
Fig. 8 Variation in different properties of magnetic coefficient in the leaf dust samples of the study area
Environ Monit Assess (2014) 186:2965–2978 2975
Author's personal copy

Fig. 9 Contour map showingmagnetic susceptibility, SIRMand S-ratios variationsemphasizing the magneticproperties of leaf dust in the studyarea
2976 Environ Monit Assess (2014) 186:2965–2978
Author's personal copy

(3) The particulate shapes vary from subangular, an-gular, well-rounded, and needle-shaped, indicatingtheir derivation from proximal as well as distalsources.
(4) The phases present in the samples include variousinorganic (minerals like feldspar, quartz, mica, il-menite, calcite, albite, magnetite, muscovite, andmetallic phases), organic (husk and dried leafletsetc.), and other rare phases (glass and opaquespherules).
(5) The color of the dust samples observed during thefog period is strikingly different from thepremonsoon and postmonsoon periods. The vari-ous hues of color have a direct bearing on theirmagnetic susceptibility values. The samples withdarker hues have higher magnetic susceptibility.
(6) The REE patterns of dust samples exhibit identicalfractionated patterns and are very similar to terres-trial upper crustal compositions. They show chem-ical similarity to cratonic and Himalayan litholo-gies with a possible contribution from the present-day point bar sediments of Ganga and Yamunarivers.
(7) The magnetic measurements χlf, χfd%, SIRM,SIRM/χlf, and S-ratio suggest the presence of finegrained magnetite (with or without ilmenite) dis-tributed uniformly over the entire study area andreflect localized anthropogenic contribution to thedust load.
Acknowledgments The authors gratefully acknowledge theDeputy Director General (NR), Geological Survey of India,Lucknow for the REE analyses, and the PLANEX, PRL, Depart-ment of Space, Government of India, (Ahmedabad) for electronprobe microanalyzer analyses used in the present study, respec-tively. The GIS facilities kindly provided to JKP through theGRBM project, MoE&S, Government of India is also thankfullyacknowledged.
References
Abdul-Razzaq, W., & Gautam, M. (2001). Discovery of magnetitein the exhausted material from a diesel engine. AppliedPhysics Letters, 78, 2018–2019.
Ali, K., Momin, G. A., Tiwari, S., Safai, P. D., Chate, D. M., &Rao, S. P. (2004). Fog and precipitation chemistry at Delhi,North India. Atmospheric Environment, 38, 4215–4222.
Biswas, K. F., Ghauri, B. M., & Husain, L. (2008). Gaseous andaerosol pollutants during fog and clear episodes in South
Asian urban atmosphere. Atmospheric Environment, 42,7775–7785.
Blaha, U., Sapkota, B., Apple, E., Stanjek, H., & Rosler, W.(2008). Micro-scale grain-size analysis and magnetic proper-ties of coal-fired power plant fly ash and its relevance forenvironmental magnetic pollution studies. AtmosphericEnvironment, 42, 359–837.
Bloemendal, J., King, J. W., Hall, F. R., & Doh, S. J. (1992). Rockmagnetism of Late Neogene and Pleistocene deep sediments:relationship to sediments source, genetic process and sedi-ments lithology. Journal of Geophysical Research, 97, 4361–4375.
Cereceda, P., Larrain, H., Osses, P., Farías, M., & Egaña, I. (2008).The spatial and temporal variability of fog and its relation tofog oases in the Atacama Desert, Chile. AtmosphericResearch, 7, 312–323.
Charlesworth, S. M., & Lees, J. A. (1997). The use of mineralmagnetic measurements in polluted urban lakes and deposit-ed dusts, Coventry, UK. Physics and Chemistry of the Earth,22, 203–206.
Chaurasia, S., Sathiyamoorthy, V., Paul Shukla, B., Simon, B.,Joshi, P. C., & Pal, P. K. (2011). Night time fog detectionusing MODIS data over Northern India. MeteorologicalApplications, 18(4), 483–494.
Chen, F. H., Yang, L. P., Wang, J. M., & Zhang, J. W. (1999).Study on atmospheric particulate pollution of Lanzhou usingmagnetic measurements. Journal of Environmental Science,11(3), 73–77.
Choudhury, S., Rajpal, H., & Saraf, A. K. (2007). Mapping andforecasting of North Indian winter fog: an application ofspatial technologies. International Journal of RemoteSensing, 28(16), 3649–3663.
Dunlop, D. J. (1973). Superparamagnetic and single domainthreshold sizes in magnetite. Journal of GeophysicalResearch, 78, 780–1793.
Dunlop, D. J., & Ozdemir, O. (1997). Rock magnetism: funda-mentals and frontiers. Cambridge: Cambridge UniversityPress.
Evans, M. E., & Heller, F. (2003). Environmental magnetism.Principles and applications of enviromagnetics (p. 99). SanDiego: Academic Press.
Flanders, P. J. (1994). Collection, measurements and analysis ofairborne magnetic particulates from pollution in the environ-ment. Journal of Applied Physics, 5, 931–5936.
Gautam, P., Blaha, U., &Apple, E. (2005). Magnetic susceptibilityy of dust-loaded leaves as a proxy of traffic-related heavymetal pollution in Kathmandu City, Nepal. AtmosphericEnvironment, 39, 2201–2211.
Goddu, S. R., Appel, E., Jordanova, D., & Wehland, R. (2004).Magnetic properties of road dust from Vishakhapatnam(India)—relationship to industrial pollution and road traffic.Physics and Chemistry of the Earth, 9, 985–995.
Hanesch, H., & Scholger, R. (2002). Mapping of heavy metalloadings in soil by means of magnetic susceptibility mea-surements. Environmental Geology, 42, 857–870.
Hanesch, H., Scholger, R., & Rey, D. (2003). Mapping dust distri-bution around an industrial site by measuring parameters oftree leaves. Atmospheric Environment, 37, 5125–5133.
Hoffmann, V., Knab, M., & Appel, E. (1999). Magnetic suscepti-bility mapping of roadside pollution. Journal of GeochemicalExploration, 6, 13–326.
Environ Monit Assess (2014) 186:2965–2978 2977
Author's personal copy

http://en.wikipedia.org/wiki/Allahabad. Accessed 20 December2011.
http://IITRoorkee/IITRoorkee . Accessed on 20 December 2012.Jenamani, R. K., & Tyagi, A. (2011). Monitoring fog at IGI Airport
and analysis of its runway-wise spatio-temporal variationsusing meso-RVR network. Current Science, 100, 491–501.
Lorenzini, G., Grassi, C., Nali, C., Petiti, A., Loppi, S., & Tognotti,L. (2006). Leaves of Pittosporum toriba as indicators ofairborne trace element and PM10 distribution in centralItaly. Atmospheric Environment, 40, 4025–4036.
Lu, S. G., Bai, S. Q., & Xue, Q. F. (2007). Magnetic properties asindicators of heavy metals pollution in urban topsoils: a casestudy from the city of Luoyang, China. Geophysical JournalInternational, 171, 68–580.
Lu, S. G., Zheng, Y. W., & Bai, S. Q. (2008). A HRTEM/EDXapproach to identification of the source of dust particles onurban tree leaves. Atmospheric Environment, 42, 431–6441.
Maher, B. A., Moore, C., & Matzka, J. (2007). Spatial variation invehicle-derived metal pollution identified by magnetic andelemental analysis of roadside tree leaves. AtmosphericEnvironment, 42, 364–373.
Moreno, E., Sagnotti, L., Turell, J. D., Winkler, A., & Cascella, A.(2003). Biomonitoring of traffic air pollution in Rome usingmagnetic properties of tree leaves. Atmospheric Environment,7, 2967–2977.
Muxworthy, A. R., Schmidbauer, E., & Petersen, N. (2002).Magnetic properties and Mossbauer spectra of urban atmo-spheric particulate matter: a case study from Munich,Germany.Geophysical Journal International, 150, 558–570.
Oldfield, F., Hunt, A., Jones, M. D. H., Chester, R., Dearing, J. A.,Olsson, L., et al. (1985). Magnetic differentiation of atmo-spheric dusts. Nature, 317, 516–518.
Pant, V., Deshpande, C. G., & Kamra, A. K. (2010). Changes inconcentration and size distribution of aerosols during fog overthe south Indian Ocean. Journal of Earth System Science, 119,479–487.
Pati, J. K., Reimold, W. U., Koeberl, C., & Pati, P. (2008). TheDhala structure, Bundelkhand Craton, Central India—erodedremanant of a large Paleoproterozoic impact structure.Meteoritics and Planetary Science, 43, 1383–1398.
Petrovsky, E., & Ellwood, B. B. (1999). Magnetic monitoring ofpollution of air, land and water. In B. A. Maher & R.Thomposon (Eds.), Quaternary climates, environments andmagnetism (pp. 279–322). Cambridge: Cambridge UniversityPress.
Power, L. A., Worsley, T. A., & Booth, C. (2009). Magneto-biomonitoring of intra-urban spatial variations of particulatematter using tree leaves. Environmental Geochemistry andHealth, 31, 315–325.
Prajapati, S. K., & Tripathi, B. D. (2008). Management of hazard-ous road derived respirable particulates using magnetic prop-erties of tree leaves. Environmental Monitoring andAssessment, 139, 351–354.
Prasad, A. K., & Singh, R. P. (2007). Comparison of MISR-MODIS aerosol optical depth over the Indo-Gangetic basinduring the winter and summer seasons (2000–2005). RemoteSensing of Environment, 107, 109–119.
Rashid, S. A. (2005). The geochemistry of Mesoproterozoicclastic sedimentary rocks from the Rautgara Formation,Kumaun Lesser Himalaya: implications for provenance,mineralogical control and weathering. Current Science,88(11), 1832–1836.
Raza, M., Khan, A., Bhardwaj, V. R., & Rais, S. (2012).Geochemistry of Mesoproterozoic sedimentary rocks of up-per Vindhyan Group, southeastern Rajasthan and implica-tions for weathering history, composition and tectonic settingof continental crust in the northern part of Indian shield.Journal of Asian Earth Sciences, 48, 160–172.
Saraf, A. K., Bora, A. K., Das, J., Rawat, V., Sharma, K., & Jain, S.K. (2011). Winter fog over the Indo-Gangetic Plains: map-ping and modeling using remote sensing and GIS. NaturalHazards, 201(58), 199–220.
Shu, J., Dearing, J. A., Morse, A. P., Yu, L. Z., & Li, C. Y. (2000).Magnetic properties of daily sampled total suspended partic-ulates in Shanghai.Environmental Science & Technology, 34,2393–2400.
Singh, V. K., Gupta, T., Tripathi, S. N., Jariwala, C., & Das, U.(2011). Experimental study of the effects of environmentaland fog condensation nuclei parameters on the rate of fogformation and dissipation using a new laboratory scale foggeneration facility. Aerosol and Air Quality Research, 11,140–154.
Spassov, S., Egli, R., Heller, F., Nourgaliev, D. K., & Hannam, J.(2004). Magnetic quantification of urban pollution sources inatmospheric particulate matter. Geophysical JournalInternational, 59, 555–564.
Sun, S. S., & McDonough, W. F. (1989). Chemical and isotopicsystematics of oceanic basalts: implications for mantle com-position and processes. Geological Society London SpecialPublications, 42, 313–345.
Thompson, R., & Oldfield, F. (1986). Environmental magnetism.London: Allen & Unwin. ISBN-0–04–538003, 277.
Tiwari, S., Payra, S., Mohan,M., Verma, S., & Bisht, D. S. (2011).Visibility degradation during foggy period due to anthropo-genic urban aerosol at Delhi, India. Atmospheric PollutionResearch, 2, 116–120.
Tomaˇsevi’c, M., Vukmirovic’, Z., Rajsˇic’, S., Tasic’, M., &Stevanovic’, B. (2005). Characterization of trace metal parti-cles deposited on some deciduous tree leaves in an urbanarea. Chemosphere, 61, 753–760.
Wong, C. S. L., Li, X. D., & Thornton, I. (2006). Urban environ-mental geochemistry of trace metals. EnvironmentalPollution, 142, 1–16.
Yang, L. P., & Chen, F. H. (2002). Chemical characteristics ofatmospheric dust in Lanzhou. Acta Scientiae Circumstantiae,22(4), 499–502.
2978 Environ Monit Assess (2014) 186:2965–2978
Author's personal copy