Assessment An International Journal Devoted to Progress in the Use of Monitoring Data in Assessing...
16
1 23 Environmental Monitoring and Assessment An International Journal Devoted to Progress in the Use of Monitoring Data in Assessing Environmental Risks to Man and the Environment ISSN 0167-6369 Volume 185 Number 10 Environ Monit Assess (2013) 185:8259-8272 DOI 10.1007/s10661-013-3171-x Assessment of geochemical processes occurring in groundwaters in the coastal alluvial aquifer V. V. S. Gurunadha Rao, G. Tamma Rao, L. Surinaidu, J. Mahesh, S. T. Mallikharjuna Rao & B. Mangaraja Rao
-
Upload
independent -
Category
Documents
-
view
3 -
download
0
Transcript of Assessment An International Journal Devoted to Progress in the Use of Monitoring Data in Assessing...

1 23
Environmental Monitoring andAssessmentAn International Journal Devoted toProgress in the Use of Monitoring Datain Assessing Environmental Risks toMan and the Environment ISSN 0167-6369Volume 185Number 10 Environ Monit Assess (2013)185:8259-8272DOI 10.1007/s10661-013-3171-x
Assessment of geochemical processesoccurring in groundwaters in the coastalalluvial aquifer
V. V. S. Gurunadha Rao, G. TammaRao, L. Surinaidu, J. Mahesh,S. T. Mallikharjuna Rao & B. MangarajaRao

1 23
Your article is protected by copyright and all
rights are held exclusively by Springer Science
+Business Media Dordrecht. This e-offprint
is for personal use only and shall not be self-
archived in electronic repositories. If you wish
to self-archive your article, please use the
accepted manuscript version for posting on
your own website. You may further deposit
the accepted manuscript version in any
repository, provided it is only made publicly
available 12 months after official publication
or later and provided acknowledgement is
given to the original source of publication
and a link is inserted to the published article
on Springer's website. The link must be
accompanied by the following text: "The final
publication is available at link.springer.com”.

Assessment of geochemical processes occurringin groundwaters in the coastal alluvial aquifer
V. V. S. Gurunadha Rao & G. Tamma Rao &
L. Surinaidu & J. Mahesh &
S. T. Mallikharjuna Rao & B. Mangaraja Rao
Received: 20 May 2012 /Accepted: 25 March 2013 /Published online: 17 April 2013# Springer Science+Business Media Dordrecht 2013
Abstract Groundwater samples are collected from 30observation wells in the study area to analyze thehydrochemical quality for determining the seawater en-croachment in the part of Central Godavari Delta, Bayof Bengal, India. In order to establish the baselinehydrochemical conditions and processes determiningthe groundwater quality, an integrated investigationcoupled with multivariate statistical analysis andhydrochemical methods are used to identify and inter-pret the groundwater chemistry of the aquifer system.The major land use is irrigated agriculture and aquacul-ture in the study area. The ground waters affected by theseawater intrusion featured high levels of sodium (Na+),chloride (Ca+), and TDS, which are the simplest com-mon indicators for seawater influence. The elevatedlevels of NO3–N at some monitoring wells indicatenitrate pollution of groundwater due to anthropogenicorigin such as septic effluents or chemical fertilizers.Besides the major chemical compositions, it was alsodemonstrated that ionic ratios would be useful to delin-eate seawater intrusion and they include Na+/Ca2+,Mg2+/Ca2+, SO4
2−/Ca2+, Na+/(Na++Cl−), and Ca−/sumof anions. This paper demonstrates the variations inhydrochemical quality of groundwater and its evolution
processes in two different seasons in the coastal aquiferalluvial settings
Keywords Hydrochemical analysis . Ionic ratios .
Saturation indices . Factor analysis . Bayof Bengal
Introduction
Salinization is the most widespread form of groundwa-ter contamination, especially in coastal aquifers, and isrepresented by the increases of total dissolved solids(TDS) and some specific chemical constituents such asCa+, Na+, Mg+, and SO4
2− (Nadler et al. 1981; Morell etal. 1996; Sukhija et al 1996). The hydrochemical differ-entiation of salinization processes in coastal areas isvery complex as there is considerable amount ofhydrogeochemical variability due to the superpositionof different processes, such as seawater intrusion andpollution phenomena (Morell et al. 1996). Biksham andSubramanian (1988) had reported major ion composi-tion and chemical erosion rate based on the elementalflux of the Godavari Basin, as part of their work, todetermine fluxes of various elements transported bythese systems to the Bay of Bengal.
Groundwater chemistry based on hydrochemicaldata is useful for providing preliminary informationon water types, classification of water for variouspurposes as well as identification of different ground-water aquifers and study of different chemical processes
Environ Monit Assess (2013) 185:8259–8272DOI 10.1007/s10661-013-3171-x
V. V. S. Gurunadha Rao :G. Tamma Rao (*) :L. Surinaidu : J. Mahesh : S. T. Mallikharjuna Rao :B. Mangaraja RaoNational Geophysical Research Institute,Council of Scientific and Industrial Research,Uppal Road, Hyderabad 500007, Indiae-mail: [email protected]
Author's personal copy
(Saxena et al. 2003; Jalali 2007; Sarwade et al. 2007).Groundwater chemistry plays an important role for thestudy of groundwater quality in the coastal aquifers(Hem 1970). In the assessment of fresh groundwaterpotential, hydrochemistry plays an important role incoastal regions. Hydrochemical parameters were usedto evaluate the seawater intrusion process, the knowl-edge of which can be helpful to control the water qualityin the coastal areas (Mercado 1985). A number ofstudies on groundwater quality with respect to drinkingand irrigation purposes have been carried out in thedifferent parts of India (Subba Rao et al. 1999; Sujathaand Reddy 2003; Sunitha et al. 2005). The study area ispredominantly an agricultural zone with dense agricul-tural activities. Majority of the people in this regiondepend on agriculture (i.e., cultivators and agriculturallaborers). Substantial amount of groundwater is beingused in this area for both drinking as well as irrigationpurposes. The purpose of the present study is to deter-mine the hydrochemistry of groundwater, factors affect-ing the groundwater quality, and classify the water inorder to evaluate its suitability for domestic and agricul-tural uses. For this purpose, we have performed aregional hydrochemical survey and applied an integrat-ed interpretation on acquired hydrochemical datasets inorder to discriminate the effect of seawater mixing,anthropogenic contamination and regional water–rockinteraction.
Materials and methods
Study area
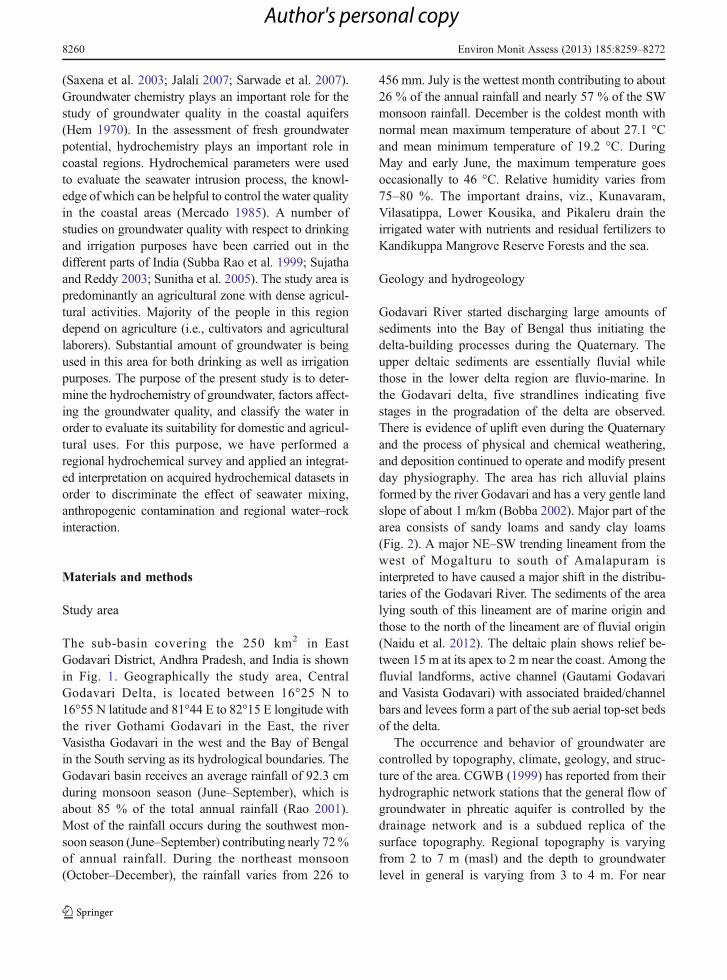
The sub-basin covering the 250 km2 in EastGodavari District, Andhra Pradesh, and India is shownin Fig. 1. Geographically the study area, CentralGodavari Delta, is located between 16°25 N to16°55 N latitude and 81°44 E to 82°15 E longitude withthe river Gothami Godavari in the East, the riverVasistha Godavari in the west and the Bay of Bengalin the South serving as its hydrological boundaries. TheGodavari basin receives an average rainfall of 92.3 cmduring monsoon season (June–September), which isabout 85 % of the total annual rainfall (Rao 2001).Most of the rainfall occurs during the southwest mon-soon season (June–September) contributing nearly 72%of annual rainfall. During the northeast monsoon(October–December), the rainfall varies from 226 to
456 mm. July is the wettest month contributing to about26 % of the annual rainfall and nearly 57 % of the SWmonsoon rainfall. December is the coldest month withnormal mean maximum temperature of about 27.1 °Cand mean minimum temperature of 19.2 °C. DuringMay and early June, the maximum temperature goesoccasionally to 46 °C. Relative humidity varies from75–80 %. The important drains, viz., Kunavaram,Vilasatippa, Lower Kousika, and Pikaleru drain theirrigated water with nutrients and residual fertilizers toKandikuppa Mangrove Reserve Forests and the sea.
Geology and hydrogeology
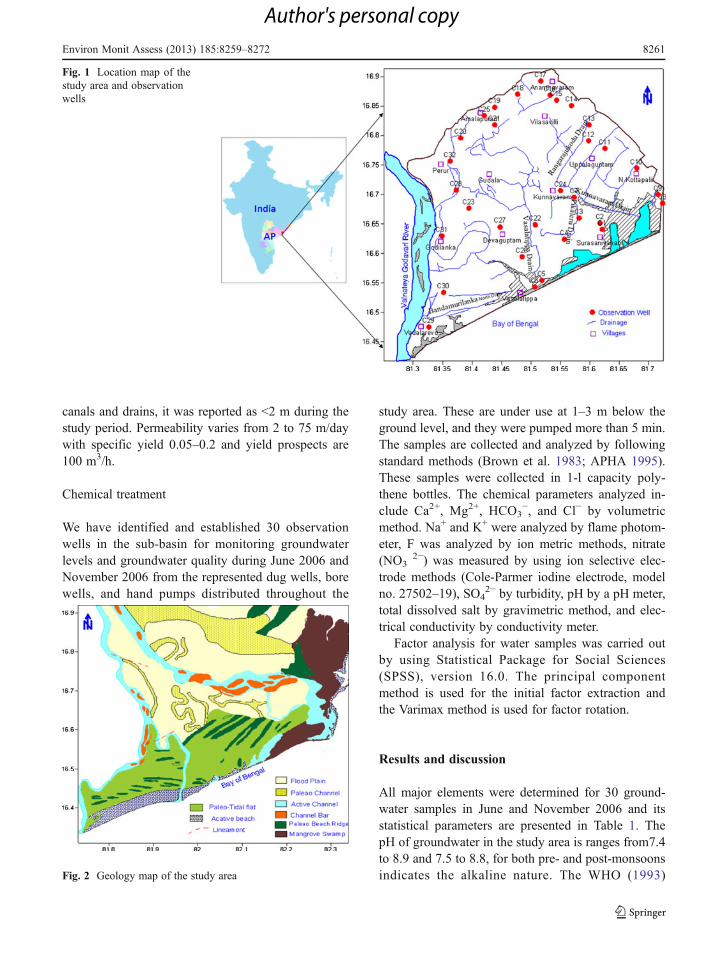
Godavari River started discharging large amounts ofsediments into the Bay of Bengal thus initiating thedelta-building processes during the Quaternary. Theupper deltaic sediments are essentially fluvial whilethose in the lower delta region are fluvio-marine. Inthe Godavari delta, five strandlines indicating fivestages in the progradation of the delta are observed.There is evidence of uplift even during the Quaternaryand the process of physical and chemical weathering,and deposition continued to operate and modify presentday physiography. The area has rich alluvial plainsformed by the river Godavari and has a very gentle landslope of about 1 m/km (Bobba 2002). Major part of thearea consists of sandy loams and sandy clay loams(Fig. 2). A major NE–SW trending lineament from thewest of Mogalturu to south of Amalapuram isinterpreted to have caused a major shift in the distribu-taries of the Godavari River. The sediments of the arealying south of this lineament are of marine origin andthose to the north of the lineament are of fluvial origin(Naidu et al. 2012). The deltaic plain shows relief be-tween 15 m at its apex to 2 m near the coast. Among thefluvial landforms, active channel (Gautami Godavariand Vasista Godavari) with associated braided/channelbars and levees form a part of the sub aerial top-set bedsof the delta.
The occurrence and behavior of groundwater arecontrolled by topography, climate, geology, and struc-ture of the area. CGWB (1999) has reported from theirhydrographic network stations that the general flow ofgroundwater in phreatic aquifer is controlled by thedrainage network and is a subdued replica of thesurface topography. Regional topography is varyingfrom 2 to 7 m (masl) and the depth to groundwaterlevel in general is varying from 3 to 4 m. For near
8260 Environ Monit Assess (2013) 185:8259–8272
Author's personal copy
canals and drains, it was reported as <2 m during thestudy period. Permeability varies from 2 to 75 m/daywith specific yield 0.05–0.2 and yield prospects are100 m3/h.
Chemical treatment
We have identified and established 30 observationwells in the sub-basin for monitoring groundwaterlevels and groundwater quality during June 2006 andNovember 2006 from the represented dug wells, borewells, and hand pumps distributed throughout the
study area. These are under use at 1–3 m below theground level, and they were pumped more than 5 min.The samples are collected and analyzed by followingstandard methods (Brown et al. 1983; APHA 1995).These samples were collected in 1-l capacity poly-thene bottles. The chemical parameters analyzed in-clude Ca2+, Mg2+, HCO3
−, and Cl− by volumetricmethod. Na+ and K+ were analyzed by flame photom-eter, F was analyzed by ion metric methods, nitrate(NO3
2−) was measured by using ion selective elec-trode methods (Cole-Parmer iodine electrode, modelno. 27502–19), SO4
2− by turbidity, pH by a pH meter,total dissolved salt by gravimetric method, and elec-trical conductivity by conductivity meter.
Factor analysis for water samples was carried outby using Statistical Package for Social Sciences(SPSS), version 16.0. The principal componentmethod is used for the initial factor extraction andthe Varimax method is used for factor rotation.
Results and discussion
All major elements were determined for 30 ground-water samples in June and November 2006 and itsstatistical parameters are presented in Table 1. ThepH of groundwater in the study area is ranges from7.4to 8.9 and 7.5 to 8.8, for both pre- and post-monsoonsindicates the alkaline nature. The WHO (1993)
Fig. 1 Location map of thestudy area and observationwells
Fig. 2 Geology map of the study area
Environ Monit Assess (2013) 185:8259–8272 8261
Author's personal copy

recommended limit for potable water is 6.5–8.5. Allthe samples are fall within the permissible limits. Theelectrical conductivity (EC) varies from 428 to19,950 μS/cm and from 388 to 13,840 μS/cm. Mostof the samples that are shown high electrical conduc-tivity in the upstream were due to the accumulation ofin situ clay formation of subsurface and those in thedownstream of the study area was due to the seawatercontamination by Kunnavaram and Pikaleru drains(Rao et al. 2011). Based on this value, the water sam-ples of the study area were classified as brackish innature. The TDS of groundwater varies from 274 to12,768 mg/l and from 572 to 8,858 mg/l for both pre-and post-monsoon seasons. According to the salinityclassification by Rabinove et al. (1958), groundwaterwere classified into non-saline/fresh water (TDS<1,000 mg/l), slightly saline (TDS=1,000–3,000 mg/l),moderately saline (TDS=3,000–10,000mg/l), and high-ly saline (TDS>10,000 mg/l). They were: 10, 33, 40,and17; 26, 22 and 52; and 0 % of the sampled ground-waters, respectively, in both the seasons. This may indi-cate the possibility of high rate of incursion/intrusion ofsaline water.
The sodium (Na+) concentration varies from 24 to7,590 mg/l and from 24 to 2,725 mg/l for both pre-and post-monsoons. The main source of sodium con-centration in the area was the weathering of silicate
mineral along with supply from saline deposit incatchment area. The calcium (Ca2+) concentrationvaries from 12 to 816 mg/l and from 12 to 160 mg/lfor both pre- and post-monsoons. Calcium in the riverwater was attributed from weathering of carbonate andsilicate mineral in the study area. The potassium (K+)concentration varied from 2 to 803 mg/l and from 2 to562 mg/l for both pre- and post-monsoons. Elango etal. (2003) reported that concentrations of potassium innatural waters are usually less than 10 mg/l, whereasconcentrations of 100 and 25,000 mg/l can occurs inbrines. Therefore, high levels of K+ concentrationsindicate the saline water contamination in the area.The magnesium (Mg2+) concentration varies from5 to 238 mg/l and from 4 to 234 mg/l with anaverage of 0.2 mg/l for both pre- and post-monsoons and this indicates that dolomite dissolu-tion or Mg enrichment caused by mixing withseawater. The chloride (Cl−) concentration variesfrom 57 to 2,741 mg/l and from 64 to 2,912 mg/lfor both pre- and post-monsoons. Further highTDS, Cl−, and Na+ concentrations have beenfound due to the in situ salinity of the overlyingclay formations in the upstream and downstreamof the study area (Rao et al. 2011). The sulfate(SO4
2−) concentration varies from 20 to 220 mg/land from 20 to 140 mg/l for both pre- and post-
Table 1 Statistical parameters of groundwater samples
WHO (1993) Pre-monsoon Post-monsoon
Parameter Desired limit Maximumpermissible limit
Min Max Mean SD Min Max Mean SD
pH 6.5 8.5 7.4 8.9 8.28 0.37 7.5 8.8 8.01 0.30
EC, uS/cm 1,500 400 23,200 3,532 4,640 220 9,720 3,013 2,544
TDS, mg/l 500 2,000 274 12,768 4,992 4,123 572 8,858 3,160 2,757
Na, mg/l 200 24 7,590 2,197 2,066 24 2,725 649 672
K, mg/l 12 2 803 232 197 2 562 89 116
Ca, mg/l 75 200 12 816 55 48 12 160 59 55
Mg, mg/l 30 100 5 238 66 57 4 243 77 61
HCO3, mg/l 380 37 220 120 48 61 1,037 257 161
Cl, mg/l 250 1,000 57 2,741 766 572 64 2,912 824 822
F, mg/l 1 1.5 0.25 0.95 0.62 0.22 0.25 1.02 0.71 0.19
SO4, mg/l 200 400 20 220 75 31 61 1,037 29 48
NO3–N, mg/l 12 0.5 18 12 12 1.1 22 119 153
TH, mg/l 110 3,657 652 711 91 1,480 500 347
SD standard deviation
8262 Environ Monit Assess (2013) 185:8259–8272
Author's personal copy
monsoons. The WHO (1993) recommended guide-line for sulfate in groundwater is 400 mg/l. TheSO4
2− concentrations fell within the permissiblelimits. The nitrate as (NO3–N) concentration variesfrom 0.5 to 18 mg/l and from 1.1 to 22 mg/l forboth pre- and post-monsoons. The WHO (1993)recommended upper limit of NO3–N is 10 mg/l.The high concentration of NO3–N in both mon-soons indicates contribution from the leaching of fertil-izers from the agriculture residues in the study areas. Thepost-monsoon samples are also shown high concentra-tion of nitrate which may be due to mineralization ofN-containing compounds bymicroorganisms (Hakanson1980). The relatively low concentration of NO3–N
−
in pre-monsoon was due to its consumption inbiological processes. The bicarbonate (HCO3
−)concentration varies from 37 to 220 mg/l and from61 to 1,037 mg/l for both pre- and post-monsoons.The WHO (1993) recommended limit for HCO3
−
is 384 mg/l. Chapelle et al. (1987) also attributedHCO3
− concentration in natural waters to the dis-sociation of HCO3
−. The elevated concentrationsof HCO3
− reflect the contribution from water–rockinteraction.
Major ion distribution and temporal variation
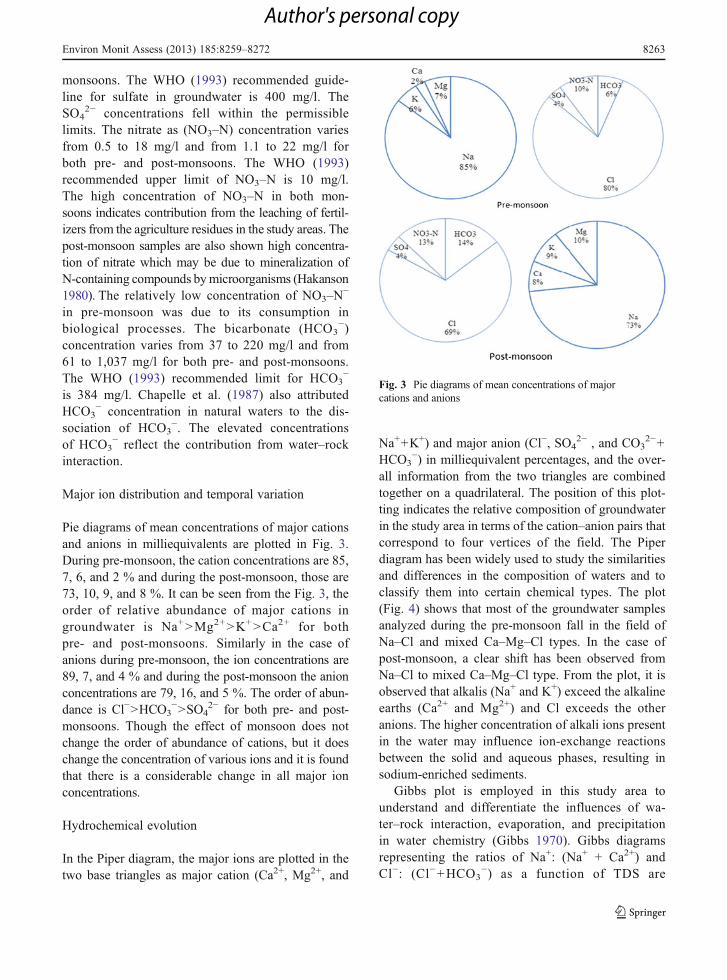
Pie diagrams of mean concentrations of major cationsand anions in milliequivalents are plotted in Fig. 3.During pre-monsoon, the cation concentrations are 85,7, 6, and 2 % and during the post-monsoon, those are73, 10, 9, and 8 %. It can be seen from the Fig. 3, theorder of relative abundance of major cations ingroundwater is Na+>Mg2+>K+>Ca2+ for bothpre- and post-monsoons. Similarly in the case ofanions during pre-monsoon, the ion concentrations are89, 7, and 4 % and during the post-monsoon the anionconcentrations are 79, 16, and 5 %. The order of abun-dance is Cl−>HCO3
−>SO42− for both pre- and post-
monsoons. Though the effect of monsoon does notchange the order of abundance of cations, but it doeschange the concentration of various ions and it is foundthat there is a considerable change in all major ionconcentrations.
Hydrochemical evolution
In the Piper diagram, the major ions are plotted in thetwo base triangles as major cation (Ca2+, Mg2+, and
Na++K+) and major anion (Cl−, SO42− , and CO3
2−+HCO3
−) in milliequivalent percentages, and the over-all information from the two triangles are combinedtogether on a quadrilateral. The position of this plot-ting indicates the relative composition of groundwaterin the study area in terms of the cation–anion pairs thatcorrespond to four vertices of the field. The Piperdiagram has been widely used to study the similaritiesand differences in the composition of waters and toclassify them into certain chemical types. The plot(Fig. 4) shows that most of the groundwater samplesanalyzed during the pre-monsoon fall in the field ofNa–Cl and mixed Ca–Mg–Cl types. In the case ofpost-monsoon, a clear shift has been observed fromNa–Cl to mixed Ca–Mg–Cl type. From the plot, it isobserved that alkalis (Na+ and K+) exceed the alkalineearths (Ca2+ and Mg2+) and Cl exceeds the otheranions. The higher concentration of alkali ions presentin the water may influence ion-exchange reactionsbetween the solid and aqueous phases, resulting insodium-enriched sediments.
Gibbs plot is employed in this study area tounderstand and differentiate the influences of wa-ter–rock interaction, evaporation, and precipitationin water chemistry (Gibbs 1970). Gibbs diagramsrepresenting the ratios of Na+: (Na+ + Ca2+) andCl−: (Cl−+HCO3
−) as a function of TDS are
Fig. 3 Pie diagrams of mean concentrations of majorcations and anions
Environ Monit Assess (2013) 185:8259–8272 8263
Author's personal copy

widely employed to assess the functional sourcesof dissolved chemical constituents, such as precip-itation dominance, rock dominance, and evapora-tion dominance. The chemical data of surface andgroundwater samples are plotted in Gibbs diagram(Fig. 5). Majority of samples suggest that theevaporation dominance, with minor representationsof groundwater samples falling in weathering ofrock-forming minerals that are influencing thegroundwater quality. Evaporation increases salinity
by increasing Na+ and Cl− with relation to increaseof TDS. This is also supported by Piper plot,having significant increase of Na+ and Cl− in thegroundwater. Anthropogenic activities (agriculturalfertilizers and irrigation-return flows) also influencethe evaporation by increasing Na+ and Cl− and thusTDS (Gupta et al. 2008).
Possibility of seawater intrusion
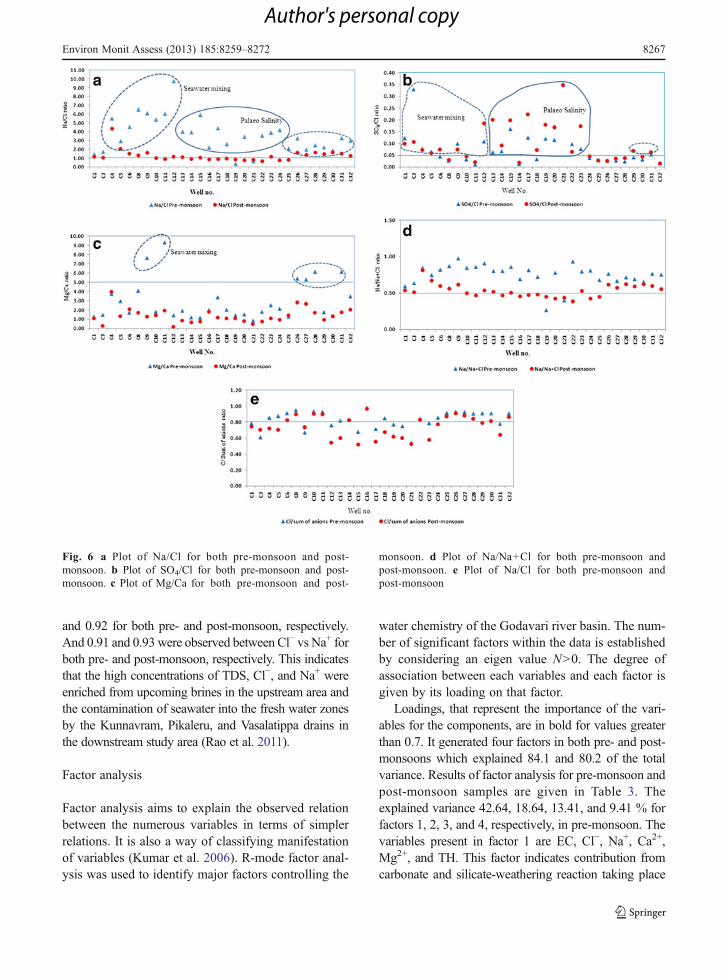
Characteristic ionic ratios have been used to identifythe possibility of seawater intrusion and contributionfrom saline sources (Raghunath 2005; Vengosh andRosenthal 1994). In this study, a few ionic ratios likeNa+/Cl−, Mg2+/Ca2+, SO4
2−/Cl−, Na+/(Na++Cl−), andCl−/sum of anions were calculated for groundwater.Groundwater quality data analyzed for the major ionshas been utilized to calculate the different ionic ratios(Table 2) to delineate probable sea water intrusion andto distinguish the source of the salinity in the centralGodavari Deltaic region.
The average value of Na+/Cl− ratio, 0.85-1 (Vengoshand Rosenthal 1994, Lee and Song 2007), SO4
2−/Cl−<0.05 (Vengosh et al. 1999, Arslan 2012) for the seawaterindicates that fresh groundwater contaminated with sa-line water. Most of the samples that fall above theseawater line in Fig. 6a, b in pre-monsoon representinfluence of seawater contamination. However, the sa-linity in upstream stream wells is due to palaeo salinitythat existed in the study area (C13 to C23) with elevatedNa+/Cl− and SO4
2−/Cl−; but in post-monsoon, rainfall
Fig. 4 Piper diagram
Fig. 5 Gibbs plot
8264 Environ Monit Assess (2013) 185:8259–8272
Author's personal copy

Tab
le2
Sum
meryof
ionicratio
s
S.No.
Na/Cl
Mg/Ca
SO4/Cl
Na/Na+
Cl
Cl/sum
ofanions
Pre-m
onsoon
Post-mon
soon
Pre-m
onsoon
Post-mon
soon
Pre-m
onsoon
Post-mon
soon
Pre-m
onsoon
Post-mon
soon
Pre-m
onsoon
Post-mon
soon
C1
1.44
1.15
1.27
1.08
0.12
0.10
0.59
0.53
0.78
0.74
C3
1.71
1.03
1.45
0.30
0.33
0.11
0.63
0.51
0.61
0.70
C4
5.51
4.32
3.70
3.96
0.08
0.07
0.85
0.81
0.85
0.72
C5
2.94
2.03
2.93
1.35
0.06
0.06
0.75
0.67
0.88
0.71
C6
4.54
1.47
1.71
2.08
0.04
0.07
0.82
0.60
0.91
0.82
C8
6.52
1.27
4.05
1.71
0.03
0.03
0.87
0.56
0.95
0.90
C9
6.09
1.58
7.64
1.31
0.10
0.07
0.97
0.61
0.67
0.74
C10
5.38
0.99
1.80
1.42
0.03
0.05
0.84
0.50
0.94
0.90
C11
6.04
0.86
9.31
1.95
0.01
0.02
0.86
0.46
0.93
0.90
C12
9.75
1.15
1.41
0.19
0.11
0.19
0.91
0.53
0.76
0.55
C13
4.00
1.07
1.90
0.86
0.06
0.20
0.80
0.52
0.82
0.60
C14
3.93
0.86
1.18
0.68
0.07
0.09
0.80
0.46
0.83
0.82
C15
5.92
1.02
1.15
0.79
0.16
0.20
0.86
0.50
0.68
0.52
C16
2.20
0.83
1.98
1.82
0.01
0.02
0.69
0.45
0.98
0.97
C17
4.39
0.90
3.33
1.21
0.12
0.22
0.81
0.47
0.71
0.56
C18
2.58
0.92
2.01
1.10
0.03
0.07
0.72
0.48
0.85
0.68
C19
0.36
0.80
1.42
1.09
0.12
0.18
0.26
0.45
0.77
0.62
C20
3.42
0.73
1.50
0.80
0.11
0.17
0.77
0.42
0.75
0.60
C21
0.65
0.77
0.83
0.49
0.35
0.35
0.39
0.44
0.54
0.53
C22
3.56
0.62
1.79
0.77
0.10
0.06
0.93
0.38
0.84
0.83
C23
3.90
1.11
2.50
1.11
0.08
0.17
0.80
0.53
0.79
0.58
C24
4.18
0.72
2.13
0.94
0.04
0.05
0.81
0.42
0.86
0.77
C25
2.09
0.80
1.25
1.41
0.03
0.03
0.68
0.44
0.92
0.87
C26
3.24
1.57
5.38
2.81
0.03
0.03
0.76
0.61
0.93
0.91
C27
1.97
1.31
5.28
2.66
0.03
0.04
0.66
0.57
0.93
0.88
C28
2.46
1.61
6.11
1.73
0.02
0.04
0.71
0.62
0.91
0.84
C29
2.23
1.44
1.75
0.94
0.04
0.07
0.69
0.59
0.91
0.79
C30
1.87
1.65
1.32
1.35
0.03
0.04
0.65
0.62
0.91
0.81
C31
3.27
1.48
6.11
1.77
0.05
0.06
0.77
0.60
0.78
0.64
C32
2.99
1.22
3.44
2.04
0.02
0.02
0.75
0.55
0.91
0.86
Environ Monit Assess (2013) 185:8259–8272 8265
Author's personal copy
dilutes the salinity. The wells in which are affected bysurface water drains because tidal action during post-monsoon season due to inadequate surface water infil-tration through mainly the Pikaleru drain and to someextent rarely through Kunnvaram andVasalatippa drainsin the downstream area.
The hydrochemical ratios of the deltaic region wellsdid not show any elevated concentrations which rep-resented saline water intrusion. The observed geo-chemical ratio describes that the salinity in thisdeltaic region was mainly due to the dissolution ofmarine sediments. A high SO4
2−/Cl− ratio can beattributed to the application of gypsum fertilizers(Vengosh et al. 2002), and low Na/Cl (<0.85) ratiovalues than the seawater ratio is due to the upcomingof deep brines (Vengosh and Ben-Zvi 1994). Ionicratios can be a very effective method to understandthe dynamic behavior of the coastal aquifer chemistry.The groundwater with Cl−/Σ sum of anions>0.8 andhaving Na/(Na++Cl−) ratio approximately equal to 0.5indicates that they are either derived from the dissolu-tion of halite or evaporate minerals from marine sed-imentary formations (Hounslow 1995; Fig. 6d, e). Inpre-monsoon, most of the samples were indicatinghigh values than post-monsoon.
The excesses concentrations of Na+ and Ca2+ arecommon in alluvial coastal aquifers with a clayey frac-tion, when direct or reverse cation exchange processesparticipate. The same cannot be held true for Mgbecause its behavior is not always so clearly defined inthese reactions. Mg2+/Ca2+ ratio is a direct indication ofsea water intrusion, if it is 1–5, then it indicates upcom-ing of brines. Mg2+/Ca2+ ratio has been found to be <4in all groundwater samples in the deltaic region ofpre- and post-monsoon seasons except C9, C11,C26, C27, C28, and C31 in pre-monsoon thus showingthat salinity in the study area was due to upcomingbrines (Fig. 6c).
Saturation indices
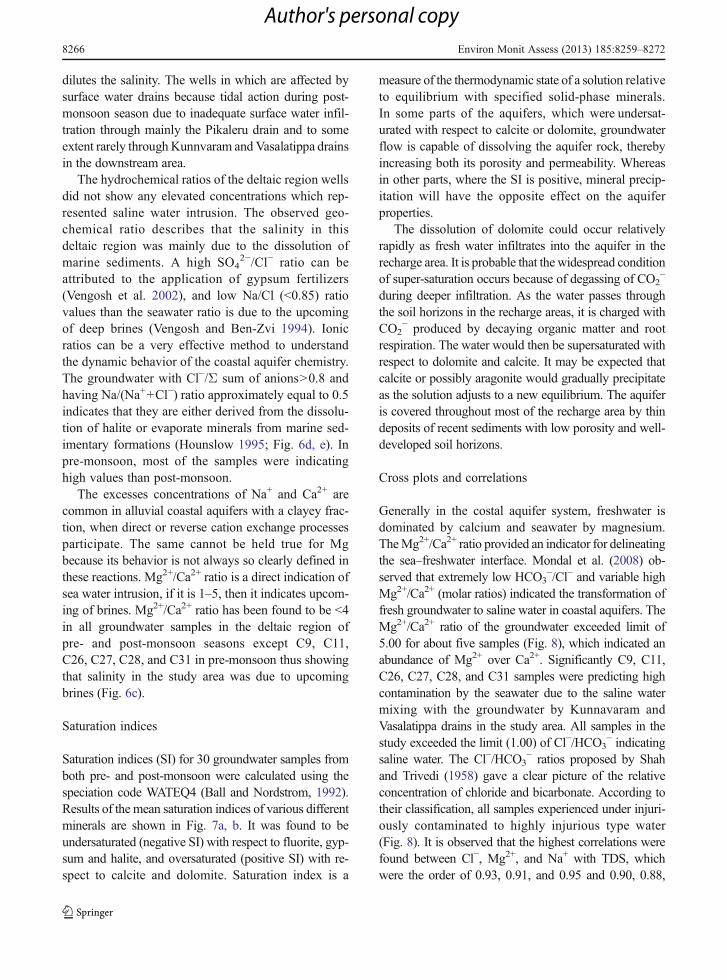
Saturation indices (SI) for 30 groundwater samples fromboth pre- and post-monsoon were calculated using thespeciation code WATEQ4 (Ball and Nordstrom, 1992).Results of the mean saturation indices of various differentminerals are shown in Fig. 7a, b. It was found to beundersaturated (negative SI) with respect to fluorite, gyp-sum and halite, and oversaturated (positive SI) with re-spect to calcite and dolomite. Saturation index is a
measure of the thermodynamic state of a solution relativeto equilibrium with specified solid-phase minerals.In some parts of the aquifers, which were undersat-urated with respect to calcite or dolomite, groundwaterflow is capable of dissolving the aquifer rock, therebyincreasing both its porosity and permeability. Whereasin other parts, where the SI is positive, mineral precip-itation will have the opposite effect on the aquiferproperties.
The dissolution of dolomite could occur relativelyrapidly as fresh water infiltrates into the aquifer in therecharge area. It is probable that the widespread conditionof super-saturation occurs because of degassing of CO2
−
during deeper infiltration. As the water passes throughthe soil horizons in the recharge areas, it is charged withCO2
− produced by decaying organic matter and rootrespiration. The water would then be supersaturated withrespect to dolomite and calcite. It may be expected thatcalcite or possibly aragonite would gradually precipitateas the solution adjusts to a new equilibrium. The aquiferis covered throughout most of the recharge area by thindeposits of recent sediments with low porosity and well-developed soil horizons.
Cross plots and correlations
Generally in the costal aquifer system, freshwater isdominated by calcium and seawater by magnesium.TheMg2+/Ca2+ ratio provided an indicator for delineatingthe sea–freshwater interface. Mondal et al. (2008) ob-served that extremely low HCO3
−/Cl− and variable highMg2+/Ca2+ (molar ratios) indicated the transformation offresh groundwater to saline water in coastal aquifers. TheMg2+/Ca2+ ratio of the groundwater exceeded limit of5.00 for about five samples (Fig. 8), which indicated anabundance of Mg2+ over Ca2+. Significantly C9, C11,C26, C27, C28, and C31 samples were predicting highcontamination by the seawater due to the saline watermixing with the groundwater by Kunnavaram andVasalatippa drains in the study area. All samples in thestudy exceeded the limit (1.00) of Cl−/HCO3
− indicatingsaline water. The Cl−/HCO3
− ratios proposed by Shahand Trivedi (1958) gave a clear picture of the relativeconcentration of chloride and bicarbonate. According totheir classification, all samples experienced under injuri-ously contaminated to highly injurious type water(Fig. 8). It is observed that the highest correlations werefound between Cl−, Mg2+, and Na+ with TDS, whichwere the order of 0.93, 0.91, and 0.95 and 0.90, 0.88,
8266 Environ Monit Assess (2013) 185:8259–8272
Author's personal copy
and 0.92 for both pre- and post-monsoon, respectively.And 0.91 and 0.93 were observed between Cl− vs Na+ forboth pre- and post-monsoon, respectively. This indicatesthat the high concentrations of TDS, Cl−, and Na+ wereenriched from upcoming brines in the upstream area andthe contamination of seawater into the fresh water zonesby the Kunnavram, Pikaleru, and Vasalatippa drains inthe downstream study area (Rao et al. 2011).
Factor analysis
Factor analysis aims to explain the observed relationbetween the numerous variables in terms of simplerrelations. It is also a way of classifying manifestationof variables (Kumar et al. 2006). R-mode factor anal-ysis was used to identify major factors controlling the
water chemistry of the Godavari river basin. The num-ber of significant factors within the data is establishedby considering an eigen value N>0. The degree ofassociation between each variables and each factor isgiven by its loading on that factor.
Loadings, that represent the importance of the vari-ables for the components, are in bold for values greaterthan 0.7. It generated four factors in both pre- and post-monsoons which explained 84.1 and 80.2 of the totalvariance. Results of factor analysis for pre-monsoon andpost-monsoon samples are given in Table 3. Theexplained variance 42.64, 18.64, 13.41, and 9.41 % forfactors 1, 2, 3, and 4, respectively, in pre-monsoon. Thevariables present in factor 1 are EC, Cl−, Na+, Ca2+,Mg2+, and TH. This factor indicates contribution fromcarbonate and silicate-weathering reaction taking place
Fig. 6 a Plot of Na/Cl for both pre-monsoon and post-monsoon. b Plot of SO4/Cl for both pre-monsoon and post-monsoon. c Plot of Mg/Ca for both pre-monsoon and post-
monsoon. d Plot of Na/Na+Cl for both pre-monsoon andpost-monsoon. e Plot of Na/Cl for both pre-monsoon andpost-monsoon
Environ Monit Assess (2013) 185:8259–8272 8267
Author's personal copy

in catchment area added alongwith the contribution fromatmospheric precipitation and anthropogenic activity.The high loading of Na+ and Cl− representing seawater
mixing with fresh water zones at Amalapuram (C19,C20, C21, and C25), Anantavaram (C14, C15, C16,C17, and C18), and Perur (C28 and C32) villages due
Fig. 7 a Saturation indicesplot of pre-monsoonsamples. b Saturation indi-ces plot of post-monsoonsamples
Fig. 8 Cross plot Cl/HCO3
vs Mg/Ca
8268 Environ Monit Assess (2013) 185:8259–8272
Author's personal copy

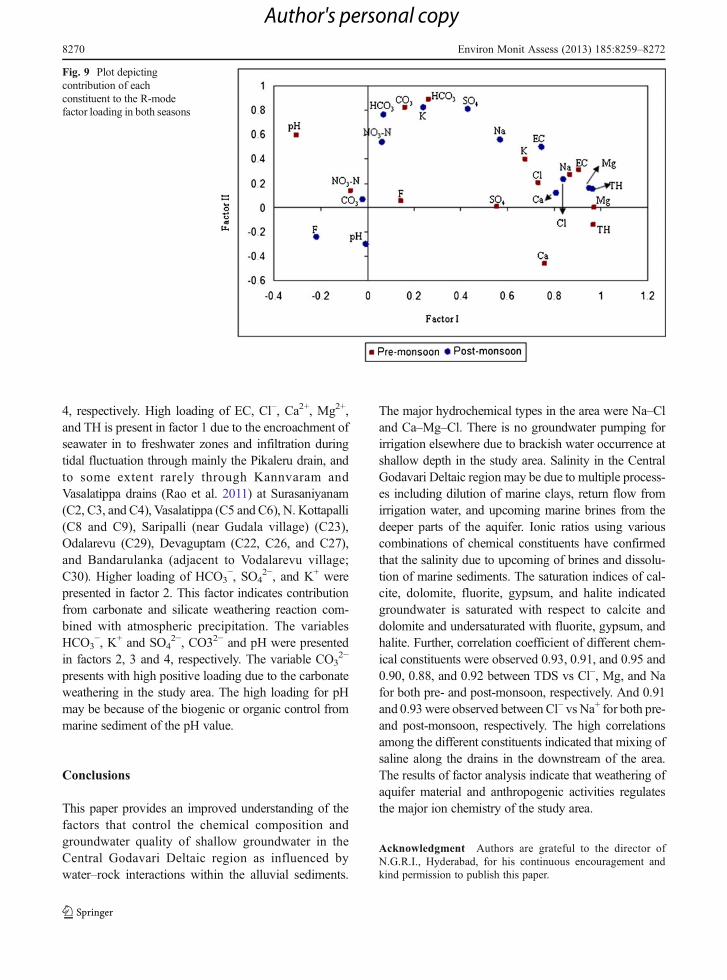
to the in situ salinity of the overlying clay formations atupstream area Although EC of groundwater was largelyinfluenced by factor 1, natural processes as well asanthropogenic inputs may determine its level. It was alsoevident from the decreased loading of EC in the post-monsoon season. Both NO3–N and pHwere shown to bediscriminating characteristic in both the seasons. Theshifts in parameters were quite significant and can beexplained by the interaction of external sources. The plotof factor loadings and factor scores for the first twofactors are presented in Fig. 9. The factors 1 and 2 forboth seasons were plotted against each other. In bothcases, factor 1 was plotted along the x-axis and factor 2along the y-axis. This figure illustrates the governingprocesses in the study area. Pre-monsoon, tight cluster-ing, and high positive loading of EC, Na+, Cl−, Mg2+,and TH for both factors 1 and 2 showed that groundwaterchemistry was controlled by different geochemical pro-cesses, such as weathering, dissolution, and ion-exchange involving major ions (see Fig. 9) except forCa2+ in pre-monsoon and SO4
2− in post-monsoon.Pre-monsoon shift for Ca2+ is towards y-axis andpost-monsoon shift for SO4
2− is towards the x-axis, butpositive for both loading for both Ca2+ and SO4
2−, thismay indicate the carbonate aquifer dissolution as wells as
aquifer recharge and discharge processes. High positiveloading of HCO3
− andCO32− are present in factor 2, high
positive loading of F− and high negative loadingof SO4
2− are present in factor 3, and high positiveloading of NO3–N in factor 4, respectively. As there isno evidence of fluoride minerals in the study area inliterature, the only possible source for fluoride concen-tration in river water is leachates from agriculture landsoil (Kumar et al. 2008). High factor loadings of param-eters reflecting natural hydrogeochemical processes aregrouped in factors 2 and 3. The most important is factor4, which includes the highest factor loadings of NO3–N.The high loading for NO3–N for different factorshighlighted the domestic sewer and industrial input tothe groundwater. It is also true that NO3–N has noknown lithological source (Handa 1975).
In post-monsoon season, a number of factors remainthe same but the cumulative variance explained by thesefactors has decreased to 80.2 % (Table 3). This isbecause of several processes operating altogether in thegroundwater aquifer environment, such as dilution andleaching by runoff, rainfall and flood water, ion-exchange, reverse ion exchange, and anthropogenic in-puts (Rao et al. 2011). The explained variance 33.69,23.18, 12.38, and 10.96 % for factors 1, 2, 3, and
Table 3 Extracted factors for both monsoons
Parameter June November
Factor 1 Factor 2 Factor 3 Factor 4 Communalities Factor 1 Factor 2 Factor 3 Factor 4 Communalities
pH −0.302 0.597 0.598 0.009 0.805 −0.004 −0.302 0.301 0.806 0.832
EC 0.905 0.307 −0.161 0.028 0.939 0.748 0.497 0.315 0.124 0.921
CO3 0.161 0.82 0.246 0.099 0.769 −0.019 0.064 0.841 0.012 0.711
HCO3 0.261 0.885 −0.147 0.061 0.876 0.072 0.763 0.166 0.402 0.776
Cl 0.732 0.204 −0.001 −0.181 0.61 0.839 0.231 0.369 0.001 0.893
F 0.144 0.048 0.929 −0.022 0.887 −0.216 −0.24 0.355 −0.715 0.741
NO3–N −0.07 0.136 −0.086 0.946 0.925 0.065 0.538 −0.099 −0.138 0.323
SO4 0.555 0.005 −0.612 0.325 0.788 0.432 0.805 −0.119 −0.064 0.852
Na 0.867 0.267 0.08 −0.209 0.874 0.569 0.556 0.457 0.179 0.873
K 0.677 0.394 0.08 0.152 0.644 0.239 0.819 0.233 −0.053 0.785
Ca 0.76 −0.459 −0.03 0.317 0.89 0.809 0.118 −0.349 −0.046 0.792
Mg 0.973 −0.004 −0.118 −0.032 0.961 0.952 0.157 0.01 0.143 0.953
TH 0.969 −0.139 −0.07 0.087 0.971 0.966 0.153 −0.121 0.085 0.978
Total 5.546 2.424 1.744 1.224 4.38 3.014 1.61 1.426
% of variance 42.664 18.648 13.413 9.412 33.696 23.188 12.381 10.968
Cumulative % 42.664 61.312 74.725 84.137 33.696 56.884 69.266 80.234
Environ Monit Assess (2013) 185:8259–8272 8269
Author's personal copy
4, respectively. High loading of EC, Cl−, Ca2+, Mg2+,and TH is present in factor 1 due to the encroachment ofseawater in to freshwater zones and infiltration duringtidal fluctuation through mainly the Pikaleru drain, andto some extent rarely through Kannvaram andVasalatippa drains (Rao et al. 2011) at Surasaniyanam(C2, C3, and C4), Vasalatippa (C5 and C6), N. Kottapalli(C8 and C9), Saripalli (near Gudala village) (C23),Odalarevu (C29), Devaguptam (C22, C26, and C27),and Bandarulanka (adjacent to Vodalarevu village;C30). Higher loading of HCO3
−, SO42−, and K+ were
presented in factor 2. This factor indicates contributionfrom carbonate and silicate weathering reaction com-bined with atmospheric precipitation. The variablesHCO3
−, K+ and SO42−, CO32− and pH were presented
in factors 2, 3 and 4, respectively. The variable CO32−
presents with high positive loading due to the carbonateweathering in the study area. The high loading for pHmay be because of the biogenic or organic control frommarine sediment of the pH value.
Conclusions
This paper provides an improved understanding of thefactors that control the chemical composition andgroundwater quality of shallow groundwater in theCentral Godavari Deltaic region as influenced bywater–rock interactions within the alluvial sediments.
The major hydrochemical types in the area were Na–Cland Ca–Mg–Cl. There is no groundwater pumping forirrigation elsewhere due to brackish water occurrence atshallow depth in the study area. Salinity in the CentralGodavari Deltaic region may be due to multiple process-es including dilution of marine clays, return flow fromirrigation water, and upcoming marine brines from thedeeper parts of the aquifer. Ionic ratios using variouscombinations of chemical constituents have confirmedthat the salinity due to upcoming of brines and dissolu-tion of marine sediments. The saturation indices of cal-cite, dolomite, fluorite, gypsum, and halite indicatedgroundwater is saturated with respect to calcite anddolomite and undersaturated with fluorite, gypsum, andhalite. Further, correlation coefficient of different chem-ical constituents were observed 0.93, 0.91, and 0.95 and0.90, 0.88, and 0.92 between TDS vs Cl−, Mg, and Nafor both pre- and post-monsoon, respectively. And 0.91and 0.93 were observed between Cl− vs Na+ for both pre-and post-monsoon, respectively. The high correlationsamong the different constituents indicated that mixing ofsaline along the drains in the downstream of the area.The results of factor analysis indicate that weathering ofaquifer material and anthropogenic activities regulatesthe major ion chemistry of the study area.
Acknowledgment Authors are grateful to the director ofN.G.R.I., Hyderabad, for his continuous encouragement andkind permission to publish this paper.
Fig. 9 Plot depictingcontribution of eachconstituent to the R-modefactor loading in both seasons
8270 Environ Monit Assess (2013) 185:8259–8272
Author's personal copy

References
APHA. (1995). Standard methods for the examination of waterand wastewater (19th ed.). Washington: American WaterWorks Association, Water Environment Federation.
Arslan, H. (2012). Application of multivariate statistical tech-niques in the assessment of groundwater quality in seawa-ter intrusion area in Bafra Plain, Turkey. EnvironmentalMonitoring and Assessment, 185, 2439–2452. doi:10.1007/s10661-012-2722-x.
Ball, J. W., & Nordstrom, D. K. (1992). Geochemical model tocalculate speciation of major, trace and redox elements innatural waters. U.S. Geological Survey, InternationalGroundwater Modelling Center. 189 pp.
Biksham, G., & Subramanian, V. (1988). Nature of solute trans-port in the Godavari Basin, India. Journal of Hydrology,103, 375–392.
Bobba, A. G. (2002). Numerical modeling of salt-water intrusiondue to human activities and sea- level change in the GodavariDelta, India. Hydrological Sciences Journal, 47, S67–S80.
Brown, E., Skougstad, M. W., & Fishmen, M. J. (1983).Method for collection and analyzing of water samplesfor dissolved minerals and gases. Washington: US Govt.Printing Office.
CGWB. (1999). Groundwater resources and development pros-pects in East Godavari District, Andhra Pradesh. Ministryof Water Resources, Government of India. UnpublishedReport, 210 pp.
Chapelle, F. H., Zelibor, J. L., Jr., Grimes, D. J., & Knobel, L. L.(1987). Bacteria in deep coastal plain sediments ofMaryland.A possible source of CO2 to groundwater. Water ResourcesResearch, 23(8), 1625–1632.
Elango, L., Kannan, R., & Senthil Kumar, M. (2003). Majorion chemistry and identification of hydrogeochemicalprocesses of groundwater in a part of Kancheepuramdistrict, Tamil Nadu. Environmental Geosciences, 4,157–166.
Gibbs, R. J. (1970). Mechanisms controlling world water chem-istry. Science, 170, 1088–1090.
Gupta, S., Mahato, A., Roy, P., &Datta, J. K. (2008). Geochemistryof groundwater, Burdwan District, West Bengal, India.Environmental Geology, 53, 1271–1282.
Hakanson, L. (1980). An ecological risk index for aquaticpollution control. A sedimentological approach. WaterResources, 14, 975–1001.
Handa, B. K. (1975). Geochemistry and genesis of fluoridecontaining groundwater in India. Groundwater, 13, 275–281.
Hem, J. D. (1970). Study and interpretation of chemicalcharacterization of natural water. US Geol Surveypaper (1473).
Hounslow, A. W. (1995). Water quality data analysis and inter-pretation. Boca Raton: Lewis Publishers.
Jalali, M. (2007). Hydrochemical identification of groundwaterresources and their changes under the impacts of humanactivity in the Chah Basin in Western Iran. EnvironmentalMonitoring and Assessment, 130, 347–364.
Kumar, M., Ramanathan, A. L., Rao, M. S., & Kumar, B.(2006). Identification and evaluation of hydrogeochemical
processes in the groundwater environment of Delhi, India.Environmental Geology, 50, 1025–1039.
Kumar, M., Ramanathan, A. L., & Keshari, A. K. (2008).Understanding the extent of interactions between ground-water and surface water through major ion chemistry andmultivariate statistical techniques. Hydrological Processes,23, 297–310.
Lee, J. Y., & Song, S. H. (2007). Evaluation of groundwaterquality in coastal areas: implications for sustainable agri-culture. Environmental Geology, 52, 1231–1242.
Mercado, A. (1985). The use of hydrogeochemical patterns incarbonate, sand and sandstone aquifer to identify intru-sion and flushing of saline water. Groundwater, 23, 635–645.
Mondal, N. C., Singh, V. S., Saxena, V. K., & Prasad, R. K.(2008). Improvement of groundwater quality due to freshwater ingress in Potharlanka Island, Krishna delta, India.Environmental Geology, 55, 595–603.
Morell, I., Gime’nez, E., & Esteller, M. V. (1996). Application ofprincipal components analysis to the study of salinization onthe Castellon Plain (Spain). Science of the Total Environment,177, 161–171.
Nadler, A., Magaritz, M., &Mazor, E. (1981). Chemical reactionsof seawater with rocks and freshwater experimental and fieldobservations on brackish waters in Israel. GeochemicaCosmotica Acta, 44, 879–886.
Naidu, L. S., G. Rao, V. V. S., T. Rao, G., Mahesh, J.,Padalu, G., Sarma, V. S., Prasad, P. R., Rao, S. M., &R. Rao, B. M. (2012). An integrated approach to inves-tigate saline water intrusion and to identify the salinitysources in the Central Godavari delta, Andhra Pradesh,India. Arabian Journal of Geosciences. doi:10.1007/s12517-012-0634-2.
Rabinove, C. L., Longford, R. H., & Brookhart, J. W. (1958).Saline Water Resources of North Dakota. US GeographicalSurvey Water Supply Paper, pp. 1418, 364.
Raghunath, H. M. (2005). Text book of ground water, 3rdedition. New Delhi: New Age International publishers.
Rao, N. G. (2001). Occurrence of heavy rainfall around the con-fluence line in monsoon disturbances and its importance incausing floods. Proceedings of the Indian Academy ofSciences. Earth and Planetary Science, 110, 87–94.
Rao, V. V. S. G., Tamma Rao, G., Surinaidu, L., Rajesh, R., &Mahesh, J. (2011). Geophysical and geochemical approachfor seawater intrusion assessment in the godavari deltabasin, A.P., India. Water Air Soil Pollution. doi:10.1007/s11270-010-0604-9.
Sarwade, D. V., Nandakumar, M. V., Kesari, M. P., Mondal, N.C., Singh, V. S., & Singh, B. (2007). Evaluation of seawater ingress into an Indian atoll. Environmental Geology,52, 1475–1483.
Saxena, V. K., Singh, V. S., Mondal, N. C., & Jain, S. C.(2003). Use of chemical parameters to delineation freshgroundwater resources in Potharlanka Island, India.Environmental Geology, 44, 516–521.
Shah, R. K., & Trivedi, A. M. (1958). Chemical properties ofgroundwater in North Gujarat. In: Proceedings ofSymposium Groundwater. Central Board of Geophysics, 4,246–259.
Subba Rao, N., Srinivasa Rao, G., Venkateswara Rao, S.,Madhusudhana Reddy, P., & John Devadas, D. (1999).
Environ Monit Assess (2013) 185:8259–8272 8271
Author's personal copy

Environmental control of groundwater quality in a tribalregion of Andhra Pradesh, India. Journal of Geology, 71,299–304.
Sujatha, D., & Reddy, R. B. (2003). Quality characterization ofgroundwater in the south-eastern part of the Ranja Reddydistrict, Andhra Pradesh, India. Environmental Geology,44, 579–586.
Sukhija, B. S., Varma, V. N., Nagabhushanam, P., &Reddy, D. V. (1996). Differentiation of paleomarineand modern seawater intruded salinities in coastalgroundwaters (of Karaikal and Tanjavur, India) basedon inorganic chemistry, organic biomarker fingerprintsand radiocarbon dating. Journal of Hydrology, 174,173–201.
Sunitha, V., Sudarsha, V., & Rajeswara Reddy, B. (2005).Hydrogeochemistry of groundwater, Gooty area, Anantapurdistrict, Andhra Pradesh, India. Pollution Research, 24, 217–224.
Vengosh, A., & Ben-Zvi, A. (1994). Formation of a salt plumein the coastal plain aquifer of Israel: the Be’er Toviyyaregion. Journal of Hydrology, 160, 21–52.
Vengosh, A., & Rosenthal, E. (1994). Saline groundwater inIsrael: its bearing on the water crisis in the country. Journalof Hydrology, 156, 389–430.
Vengosh, A., Spivack, A. J., Artzi, Y., & Ayalon, A. (1999).Geochemical and boron, strontium, and oxygen isotopicconstraints on the origin of the salinity in groundwaterfrom the Mediterranean coast of Israel. Water ResourceResearch, 35, 1877–1894.
Vengosh, A., Gill, J., Lee Davisson, M., & Bryant Hudson, G.(2002). A multi-isotope (B, Sr, O, H, and C) and age dating(3H-3He and 14C) study of groundwater from SalinasValley, California: hydrochemistry, dynamics, and contam-ination processes. Water Resource Research, 38(91), 9–17.
WHO. (1993). Guidelines for drinking water quality, vol. 1recommendations. Geneva, Switzerland.
8272 Environ Monit Assess (2013) 185:8259–8272
Author's personal copy