(*** rtV Environmental Monitoring Report for Commercial Low ...
193
DOE/LLW-241 (*** rtV .V-i Environmental Monitoring Report for Commercial Low-Level Radioactive Waste Disposal Sites (1960's through 1990 J s) Conference of Radiation Control Program Directors, Inc. November 1996 ! fc» i V *••=> STI SSTmcunoN OF THIS DOCUMENT IS UNLIMTTffl!
-
Upload
khangminh22 -
Category
Documents
-
view
2 -
download
0
Transcript of (*** rtV Environmental Monitoring Report for Commercial Low ...

DOE/LLW-241
(***
rtV
.V-i
Environmenta l Moni tor ing Report forCommerc ia l Low-Leve l Radioact iveWaste Disposal Sites(1960's through 1990Js)
Conference of Radiation ControlProgram Directors, Inc.
November 1996
! fc» i V *••=>
STI
SSTmcunoN OF THIS DOCUMENT IS UNLIMTTffl!

DISCLAIMERS
The information contained in this document is for guidance. The implementationand use of the information and recommendations contained in this document areat the discretion of the user. The implications from the use of this document aresolely the responsibility of the user.
This document has been developed by a working group of the Conference ofRadiation Control Program Directors, Inc. (CRCPD) and endorsed by the Boardof Directors. The contents contained herein, however, may not necessarilyrepresent the views of the entire membership of the CRCPD or any federalagency supporting the work contained in this document. The mention ofcommercial products, their sources, or their use in connection with materialreported herein is not to be construed as either an actual or implied endorsementof such products by the CRCPD or any federal agency.
This publication was supported in part by grant number NRC-04-88-149 from theU.S. Nuclear Regulatory Commission.
Neither the United States Government nor any agency thereof, nor any of theiremployees, makes any warranty, express or implied, or assumes any legalliability or responsibility for the accuracy, completeness, or usefulness of anyinformation, apparatus, product or process disclosed, or represents that its usewould not infringe on privately owned rights. References herein to any specificcommercial product, process, or service by trade name, trademark, manufacturer,or otherwise, does not necessarily constitute or imply its endorsement,recommendation, or favoring by the United States Government or any agencythereof. The views and opinions of authors expressed herein do not necessarilystate or reflect those of the United States Government or any agency thereof.

DOE/LLW-241
Environmental Monitoring Reportfor Commercial Low-Level Radioactive
Waste Disposal Sites(1960's through early 1990's)
November 1996
Report prepared byCRCPD Committee on Radioactive Waste Management
and endorsed byCRCPD Board of Directors
This document did not undergo the CRCPD editorial process
Published byNational Low-Level Waste Management Program
Prepared forU.S. Nuclear Regulatory Commission
under Grant No. NRC-04-88-149and
U.S. Department of EnergyOffice of Environmental Restoration and Waste Management
Under DOE Idaho Operations OfficeContract DE-AC07-94ID13223

11

DISCLAIMER
Portions of tbis document may be illegiblein electronic image products* Images areproduced from the best available originaldocument.

ABSTRACT
During the time period covered in this report (1960's throughearly 1990's), six commercial low-level radioactive waste (LLRW)disposal facilities have been operated in the United States. This reportprovides environmental monitoring data collected at each site. Thereport summarizes: (1) each site's general design, (2) each site'sinventory, (3) the environmental monitoring program for each site andthe data obtained as the program has evolved, and (4) what theprogram has indicated about releases to off-site areas, if any, includinga statement of the actual health and safety significance of any release.A summary with conclusions is provided at the end of each site'schapter.
The six commercial LLRW disposal sites discussed are located near:
• Sheffield, Illinois• Maxey Flats, Kentucky• Beany, Nevada• West Valley, New York• Barnwell, South Carolina• Richland, Washington
m

IV
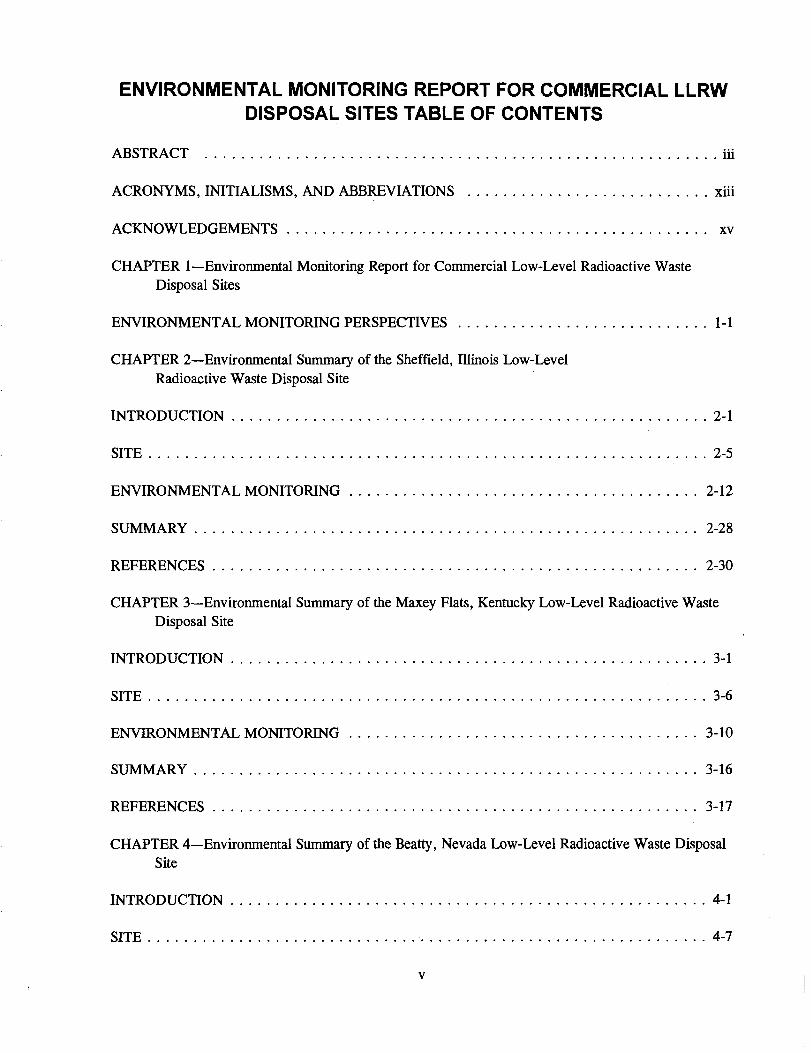
ENVIRONMENTAL MONITORING REPORT FOR COMMERCIAL LLRWDISPOSAL SITES TABLE OF CONTENTS
ABSTRACT iii
ACRONYMS, INITIALISMS, AND ABBREVIATIONS xiii
ACKNOWLEDGEMENTS xv
CHAPTER 1—Environmental Monitoring Report for Commercial Low-Level Radioactive WasteDisposal Sites
ENVIRONMENTAL MONITORING PERSPECTIVES 1-1
CHAPTER 2—Environmental Summary of the Sheffield, Illinois Low-LevelRadioactive Waste Disposal Site
INTRODUCTION 2-1
SITE 2-5
ENVIRONMENTAL MONITORING 2-12
SUMMARY 2-28
REFERENCES 2-30
CHAPTER 3—Environmental Summary of the Maxey Flats, Kentucky Low-Level Radioactive WasteDisposal Site
INTRODUCTION 3-1
SITE 3-6
ENVIRONMENTAL MONITORING 3-10
SUMMARY 3-16
REFERENCES 3-17
CHAPTER 4—Environmental Summary of the Beatty, Nevada Low-Level Radioactive Waste DisposalSite
INTRODUCTION 4-1
SITE 4-7

ENVIRONMENTAL MONITORING 4-11
SUMMARY 4-28
REFERENCES 4-33
CHAPTER 5—Environmental Summary of the West Valley, New York Low-Level Radioactive WasteDisposal Site
INTRODUCTION 5-1
SITE 5-6
ENVIRONMENTAL MONITORING 5-7
SUMMARY 5-23
REFERENCES 5-25
OTHER REFERENCES 5-27
CHAPTER 6—Environmental Summary of the Barnwell, South Carolina Low-Level Radioactive WasteDisposal Site
INTRODUCTION 6-1
SITE 6-8
ENVIRONMENTAL MONITORING 6-12
SUMMARY 6-19
REFERENCES 6-22
CHAPTER 7—Environmental Summary of the Richland, Washington Low-Level Radioactive WasteDisposal Site
INTRODUCTION 7-1
SITE 7-3
ENVIRONMENTAL MONITORING 7-12
NON-RADIOLOGICAL ENVIRONMENTAL PROGRAM 7-33
SUMMARY 7-35
vi

REFERENCES 7-39
FIGURES
1-1. Location of the six commercial LLW disposal facilities discussed
in this report 1-5
2-1. Location of the Sheffield site 2-2
2-2. Plan view of Sheffield low-level radioactive waste and chemical disposal areas 2-3
2-3. Location of geologic cross section for the Sheffield site 2-6
2-4. Geologic cross section for the Sheffield site 2-7
2-5. Stratigraphy of northern Illinois and the Sheffield site 2-8
2-6. Map of well locations, trenches and tunnels at the Sheffield site 2-9
2-7. Ground water flow boundaries, direction of flow and principal flow paths for the
Sheffield site 2-10
2-8. Trout Lake sampling locations at the Sheffield site 2-16
2-9. Well locations and tritium concentrations in water at the Sheffield site 2-18
2-10. Tritium concentrations in northeast pathway wells at the Sheffield site 2-20
2-11. Tritium concentrations in Trout Lake near the Sheffield site 2-21
2-12. Environmental sampling around the Sheffield site 2-23
3-1. Location of Maxey Flats site 3-2
3-2. General map of the restricted area at the Maxey Flats site 3-3
3-3. Trench locations as of 1987 at the Maxey Flats site 3-4
3-4. Downslope location of forested areas relation to the Maxey Flats site 3-10
3-5. Well locations and tritium concentrations (pCi/mL) at the Maxey Flats site 3-14
4-1. Vicinity map of the Beatty LLW site .4 -2
4-2. Facility map of trench locations at the Beatty LLW site 4-3
VII

4-3. Airborne activity monitoring stations of the Beatty LLW site 4-4
4-4. Monitoring wells of the Beatty LLW site 4-5
4-5. Site geology of the Beatty LLW site 4-9
4-6. Gross alpha ground water samples: Beatty, Nevada 4-14
4-7. Gross beta ground water samples: Beatty, Nevada 4-15
4-8. Tritium ground water samples: Beatty, Nevada 4-16
4-9. Gross alpha soil samples: Beatty, Nevada 4-22
4-10. Gross beta soil samples: Beatty, Nevada 4-23
4-11. Gross alpha vegetation samples: Beatty, Nevada 4-26
4-12. Gross beta vegetation samples: Beatty, Nevada 4-27
4-13. Ambient gamma: Beatty, Nevada 4-29
5-1. Principal facilities at the West Valley LLW site 5-3
5-2. State-licensed trenches at the West Valley LLW site 5-5
5-3. Geological cross-section at the West Valley LLW site 5-10
5-4. Strontium-90 on Cattaraugus Creek at Springville Dam 5-12
5-5. Tritium on Cattaraugus Creek at Springville Dam 5-13
5-6. On-site surface water sampling locations at the West Valley
LLW site 5-16
5-7. West Valley demonstration project sampling site 5-17
5-8. West Valley demonstration project on-site sampling 5-19
5-9. West Valley on-site ground water monitoring network 5-21
5-10. H-3 at Springville Dam 5-22
5-11. Sr-90 at Springville Dam 5-23
6-1. Location of Barnwell site 6-2
viii

6-2. Plan view of the Barnwell site showing adjacent land owners 6-3
6-3. Typical disposal trench at the Barnwell site 6-5
6-4. Barnwell site enhanced cap cross section 6-8
6-5. Stratigraphic and lithographic interpretation of the Barnwell site 6-10
6-6. Plan view of the Barnwell site showing adjacent land owners/boundary sampling
stations 6-14
6-7. Approximate tritium plume outline south of the Barnwell site 6-21
7-1. DOE Hanford site 7-2
7-2. Low-level radioactive waste management facility, US Ecology, Inc.,
Richland, Washington 7-4
7-3. Environmental radiation sampling stations at the US Ecology site 7-5
7-4. Environmental radiation sampling stations in the vicinity of the Hanford site 7-6
7-5. Geological cross-section of the Hanford site 7-10
7-6. Off-site ground water sampling stations near the Hanford site 7-14
7-7. Ambient gamma (mrem/yr) 7-34
TABLES1-1. Conversion units 1-4
2-1. Estimated key radionuclides (half-lives greater than five years) at the
Sheffield site 2-4
2-2. Examples of biota found near the Sheffield site 2-13
2-3. Tritium concentrations in Trout Lake in nCi/L 1981-1994 at the Sheffield site 2-17
2-4. Tritium concentrations in streams and creeks in nCi/L 1981-1994 at the
Sheffield site 2-24
2-5. Air sampling results in fCi/m31977-1994 at the Sheffield site 2-26
2-6. Direct radiation (TLD) results in mR/y 1977-1994 at the Sheffield site 2-27
IX
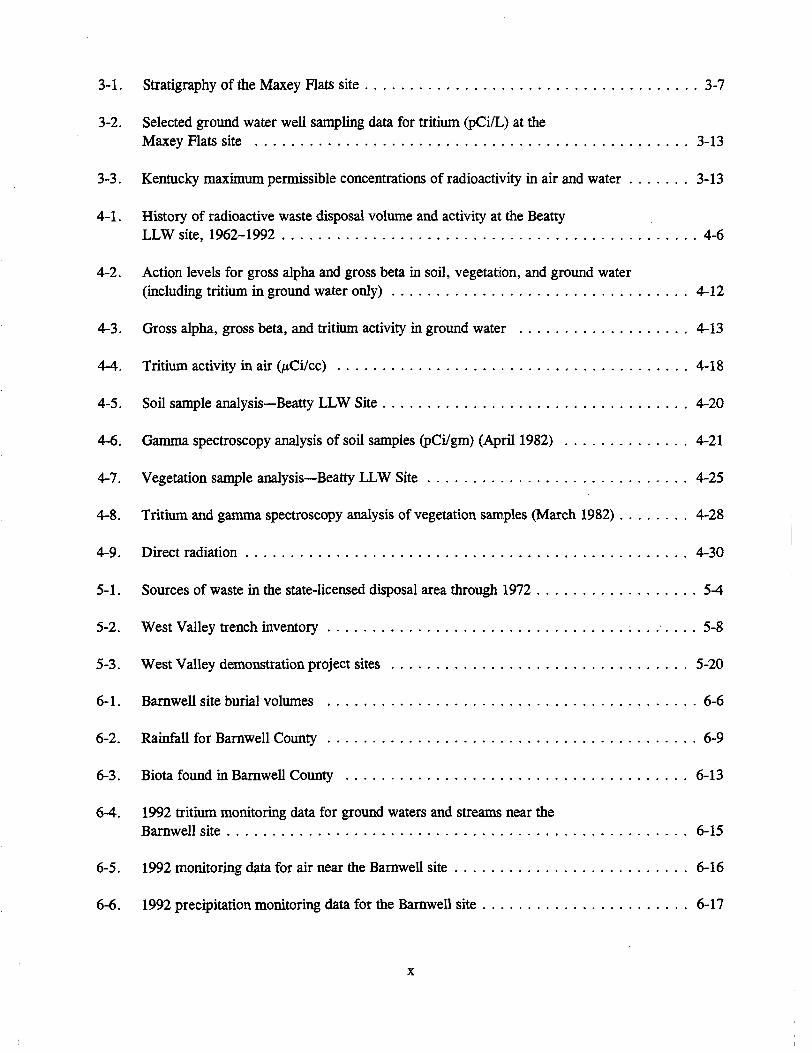
3-1. Stratigraphy of the Maxey Flats site 3-7
3-2. Selected ground water well sampling data for tritium (pCi/L) at the
Maxey Flats site 3-13
3-3. Kentucky maximum permissible concentrations of radioactivity in air and water 3-13
4-1. History of radioactive waste disposal volume and activity at the Beatty
LLW site, 1962-1992 4-6
4-2. Action levels for gross alpha and gross beta in soil, vegetation, and ground water
(including tritium in ground water only) 4-12
4-3. Gross alpha, gross beta, and tritium activity in ground water 4-13
4-4. Tritium activity in air (/iCi/cc) 4-18
4-5. Soil sample analysis—Beatty LLW Site 4-20
4-6. Gamma spectroscopy analysis of soil samples (pCi/gm) (April 1982) 4-21
4-7. Vegetation sample analysis—Beatty LLW Site 4-25
4-8. Tritium and gamma spectroscopy analysis of vegetation samples (March 1982) 4-28
4-9. Direct radiation 4-30
5-1. Sources of waste in the state-licensed disposal area through 1972 5-4
5-2. West Valley trench inventory 5-8
5-3. West Valley demonstration project sites 5-20
6-1. Barnwell site burial volumes 6-6
6-2. Rainfall for Barnwell County 6-9
6-3. Biota found in Barnwell County 6-13
6-4. 1992 tritium monitoring data for ground waters and streams near the
Barnwell site 6-15
6-5. 1992 monitoring data for air near the Barnwell site 6-16
6-6. 1992 precipitation monitoring data for the Barnwell site 6-17

6-7. 1992 direct radiation levels of South Carolina locations 6-17
6-8. 1992 monitoring data for soil near the Barnwell site 6-18
6-9. 1992 monitoring data for sediment near the Barnwell site 6-18
6-10. 1992 monitoring data for vegetation near the Barnwell site 6-19
7-1. Monthly climatological data from the Hanford Meteorological Station, 1991 7-8
7-2. Common species of mammals, birds, and vegetation 7-12
7-3. Environmental/occupational monitoring requirements 7-15
7-4. Action required when action level met or exceeded 7-19
7-5. Required minimum detectable concentrations (MDCs) for gamma spectroscopy
analysis of environmental samples 7-20
7-6. Airborne radon gas measurements 7-21
7-7. Analysis results (alpha, beta, and tritium) for ground water wells 7-22
7-8. Maximum tritium concentration in ground water (on-site) wells (pCi/L) 7-23
7-9. Maximum tritium concentrations in U.S. DOE ground water wells located in the
vicinity of the 200 East and 200 West areas 7-23
7-10. Analytical results for isotopic uranium 7-25
7-11. Gross beta and gross alpha measurements of particulate air samples from
1978 to 1992 7-26
7-12. Maximum 1-125 concentration in the air 7-26
7-13. Tritium air moisture concentrations at environmental monitoring
stations 1, 2, and 5 (1012 juCi/mL) 7-27
7-14. Soil analysis (pCi/gm) 7-29
7-15. Vegetation sample analysis (pCi/gm) 7-31
7-16. Ambient gamma (penetrating radiation) (mrem/yr) 7-33
7-17. Chemical analysis of on-site well samples—1992 7-36XI

Xll

ACRONYMS, INITIALISMS, AND ABBREVIATIONS
AEC U.S. Atomic Energy CommissionALARA as low as reasonably achievableARMS Aerial Radiological Measuring SurveysASDA New York State Atomic and Space Development Authority
BLM Bureau of Land ManagementBq Becquerel
CFR Code of Federal RegulationsCi curieCNSI Chem-Nuclear Systems, Inc.CRCPD Conference of Radiation Control Program Directors
DEC Department of Environmental ConservationDHEC Department of Health and Environmental ControlDOE U.S. Department of EnergyDOH Department of Health
EIS Environmental Impact Statement
EPA U.S. Environmental Protection Agency
FAR Facility Assessment Report
HDPE high density polyethylene
HIC high integrity containerHMS Hanford Meteorological StationHTO tritiated waterHWMF hazardous waste management facilityKAR Kentucky Administrative RegulationsLLDs lower limits of detectionLLW low-level radioactive wasteLLRW low-level radioactive wasteLSA low specific activity
MDC minimum detectable concentration
NDA NRC-licensed disposal areaNECO Nuclear Engineering CompanyNFS Nuclear Fuel Services, Inc.NRC U.S. Nuclear Regulatory CommissionNYCR New York Code of RegulationsNYSERDA New York State Energy Research and Development AuthorityNYSGS New York State Geological Survey
xm

PCBsPLppbPVC
QAQC
polychlonnated biphenylspublic lawparts per billionpolyvinyl chloride
quality assurancequality control
RCRA Resource Conservation and Recovery Act
SARA Superfund Amendments and Reauthorization ActSDA State-licensed disposal area
TDS total dissolved solidsTLDs thermoluminescent dosimetersTOC total organic carbon
USGS U.S. Geological Survey
WAC Washington State Administrative CodeWVDP West Valley Demonstration ProjectWVNS West Valley Nuclear Services, Inc.
xiv

ACKNOWLEDGEMENTS
This report was a cooperative effort over more than a decade. Eachmember of the CRCPD Committee on Radioactive Waste Management, led bycommittee chairs Bill Dornsife, Virgil Autry, Ken Weaver, and Paul Merges,contributed in some measure to drafting and editing this report.
Committee E-5 membership since 1985 has included:
Virgil Autry (SC)Darice Bailey (CA)Harold Borchert (NE)Bill Dornsife (PA)Stan Marshall (NV)Kevin McCarthy (CT)Paul Merges (NY)Charles R. Meyer (TX)Steven Oberg (ID)Henry Porter (SC)Richard Ratliff (TX)Gary Robertson (WA)Marjorie Walle (IL)Ken Weaver (CO)
Many other state radiation control program staff also assisted, includingJamil Ahmad (WA), Pat Dostie (ME), Dave Ed (IL), Mikel Elsen (WA),Kristin Felix (WA), Joe Jones (NY), Hank Kocol (CA), and William Tetley(NY). Each, especially Pat and Joe, has volunteered significant expertise.
Special thanks are thus due to the directors of the state radiation controlprograms who either encouraged the participation of their staff in CommitteeE-5 efforts or, being from a state hosting a site, provided much of theinformation on which this summary report is based.
Reviewers familiar with particular site histories have included Bill Houseand Jim Shaffner, as well as Frank Bordell, Stan Huber, Carl (Ed) Johnson,Art Palmer, and Stewart Thompson.
Committee federal resource persons have included Jim Gruhlke of theU.S. Environmental Protection Agency, Ed Regnier of the U.S. Department ofEnergy, and Joe Kane, Paul Lohaus, Bill Lahs, and John Thoma from the U.S.Nuclear Regulatory Commission. Without Mr. Lohaus' longstandingencouragement, this dauntingly difficult endeavor would not have beencompleted.
xv
Essential support also came from the office of the Conference ofRadiation Control Program Directors, Inc., particularly from Pat Gorman,Executive Director Chuck Hardin, and Terry Devine.
The final push in editing and publishing this report came from staff of theU.S. Department of Energy's National Low-Level Waste ManagementProgram, especially Don Harmon and Tom Kerr as well as Bill Newberry,Roger Scott, and Phil Wheatley.
This compilation and presentation of environmental monitoringinformation for commercial low-level radioactive waste disposal sites in theUnited States is the collective volunteer effort of state staff, federal resourcepersons and affiliate advisors serving with CRCPD's Committee on RadioactiveWaste Management. It has no individual author or authors. This report wascompleted in the spirit of cooperation and partnership which represents CRCPDat its best and most uniquely productive activity.
Cenneth L. K. Weaver Paul MergesE-5 Chair, 1989-1993 E-5 Chair, 1993-1995
xyi

CHAPTER 1
Environmental Monitoring Reportfor Commercial Low-Level Radioactive
Waste Disposal Sites
ENVIRONMENTAL MONITORING PERSPECTIVES
Environmental monitoring results have always been the most significant quantitative measure oflow-level radioactive waste (LLW) disposal facilities' compliance with regulatory standards. In thisreport, the E-5 Committee on Radioactive Waste Management of the Conference of Radiation ControlProgram Directors (CRCPD) has assembled environmental monitoring results from the six commercialLLW disposal facilities which have operated within the United States.
The environmental results included in this report are not new. Except for the more recentmeasurements reported herein, results presented in this report have been available for many years andwere used as evidence of regulatory compliance for the facilities they represent based upon thestandards and regulations existing during applicable eras. Historically, many of these data were usedby regulatory professionals to determine compliance status. The perspective that forms the conclusionsin this report about site performance is one which looks back at the data from the 1960's through theearly 1990's.
The data for air, water, soil, and vegetation summarized in this report vary from site to site inboth the time period covered and the level of detail. While comparisons between and among some data,sets are appropriate, this must be done with care and caution. Differences in the time periodsrepresented, the media sampled, and the types and level of analyses limit the ability to makemeaningful comparisons. In this report, comparative analyses are limited to sets of data representingspecific media for a specific site. Because of the data available, different statistical parameters (e.g.,means, extremes, variances) were used for different subsets of data.
Environmental monitoring programs have significantly evolved and improved since the 1960's.Changes have occurred in the nature and frequency of sampling, sampling and analysis protocols,media sampled, quality assurance/quality control (QA/QC), and perhaps most importantly, theregulatory framework within which environmental monitoring occurs.
In the early days of environmental monitoring, samples were collected almost on an ad hoc basis,often with limited sampling procedures. Few, if any, protocols were employed for sample handling,packaging, shipping, or receipt inspection. Analytical laboratories made few quality control checksduring sample preparation or analytical procedures. Counting equipment was less sophisticated thantoday's equipment. The lower limits of detection (LLDs) for results were several orders of magnitudegreater than those available and used today. Required analyses were often limited to gross indicatorparameters such as alpha, beta, and sometimes tritium. Trend analyses of results were often limited to
1-1

very basic statistical parameters. In contrast, sophisticated computer software codes now rapidlyproduce results which used to involve many weeks' worth of time.
Still, results were used as they are today for comparison with a regulatory standard or fractionthereof. If the standard was exceeded, action was mandated. In this regard, all references tocompliance with regulatory standards in this report are made relative to regulatory standards in effect atsuch time as measurements were made or environmental samples were collected and analyzed.
The scope of environmental monitoring programs has changed significantly for the nextgeneration of LLW sites.
Current regulations call for extensive pre-operational baseline environmental monitoring toestablish a basis against which to measure future monitoring results. Naturally occurring radioactivematerial is often present in the soil, air, vegetation, and water under pristine conditions inconcentrations at or near levels of significance for today's LLW sites. When no baseline monitoring isperformed, little basis exists for back-comparison of sampling results.
Today's sampling protocols are sophisticated compared to the days of extracting samples by thebest of a limited number of methods available. Today there are rigorous procedures for samplecollection and preservation as well as procedures to eliminate cross contamination from one sample toanother.
Currently, a multi-tiered system is used to look at environmental results:
• An investigating level, typically tied statistically to the baseline mean or multiple of an LLD, maytrigger an increased awareness and watchfulness regarding a specific radionuclide. Data at thislevel may also lead to more investigation, explanation, and more frequent or detailed analyses.
• An action level, typically some fraction of a regulatory limit, implies proactive response on thepart of a licensee to mitigate the circumstances, usually involving administrative controls, impactanalysis, and sometimes, increased regulatory oversight.
• Regulatory limits, if exceeded, call for immediate regulatory action, such as mitigation,enforcement actions, or cessation of operations.
Because of the complexity of all phases of environmental monitoring, sampling, packaging,shipping, analysis, recording, and reporting, many opportunities exist for data errors on individualresults. This increases the need for rigorous validation and verification. Such validation andverification were not always part of the process, so some individual data results must be viewed withcaution.
Often, the only recourse to sample anomalies was to re-sample the same media at the samelocation and analyze the sample. If the facility program called for replicate sampling, the otherrecourse was to run a duplicate analysis on the backup sample.
1-2

All data must be reviewed in context. There is often a temptation, particularly in a highlypoliticized and controversial arena, to take one result as representative of the actual situation. Aproperly designed monitoring program will emphasize the relationship between samples for differenttime periods and even for results from different media. Sampling results should be scrutinized withinthe context of known physical relationships. For example, certain nuclides are known to exist inexpected ratios with one another in specific media. If data suggest deviation from these ratios, theresults are suspect.
Often, older data do not allow deeper analysis because only gross indicator parameters werecollected. Therefore, some of the tools for data validation were absent.
Gross alpha and beta:
Early radiological reporting relied heavily on using screening techniques such as gross alpha andbeta levels as indicators that radionuclides were present above some predetermined level. Theseparameters were reported rather than specific radionuclides, because, at that time, there were fewfacilities that maintained the more costly equipment necessary to perform gamma or alphaspectroscopy. If increases in gross alpha and beta levels were observed, samples could be sent tooff-site laboratories for more specific analyses.
Gross alpha and beta measurements are still frequently made and occasionally still used asscreening criteria. However, even small laboratories can now afford spectral analysis and, as aresult, specific radionclides are reported instead of just the gross alpha and beta results.
Tritium:
Tritium is an isotope of hydrogen, which has an atomic mass of three, two neutrons and oneproton. Tritium is worthy of note because, in the form of its oxide, it is one of the most mobileof the radionuclides likely to be found in radioactive waste, will probably be present as asignificant fraction of the total activity of the radioactive waste, and has a half-life of 12.3 years.Therefore, tritium would be the most likely radionuclide to be detected first should waste betransported by ground water out of the disposal area at a shallow land disposal facility.
Studies at the Hanford site and other locations have demonstrated that tritium in ground water willmove in the same direction and at the same rate as the ground water (with some slight retardationin clay).a
Certain behavioral trends within certain media for migration of certain radionuclides are knownand expected. Significantly different behavior patterns are subject to question. For instance, tritiumconcentrations associated with a "chronic" site release are expected to gradually increase with time to asteady state condition (known as "buildup") then gradually dissipate as radioactive decay takes place.
a. National Low-Level Waste Management Program Radionuclide Report Series, Volume 5: Tritium, IdahoNational Engineering Laboratory, Idaho Falls, Idaho, 1994.
1-3

The E-5 Committee decided to keep tables of data in the units originally reported. Most of thediscussion in the narrative text follows CRCPD's policy of listing values using the International Systemof Units (with conventional units in parentheses), but in some sections the historical units were kept forclarity. Conversion units are provided in Table 1-1 for convenience in converting units for comparisonof results appearing throughout the report.
Table 1-1. Conversion units.
Activity3
pCi = juCi x 1.0E-06pCi = nCi x 1.0E-03pCi = fCi x 1.0E+03
37 GBq (37E+09 Bq) = 1 Ci37 mBq = 1 pCi1 Bq = 27 pCi37 kBq = 1
= 37 kBq/L10 juCi/L = 370 kBq/L100 ^Ci/L = 1000 kBq/L
Dose
100 rem = 1 sievert (Sv)1 rem = 10 mSv1 mrem = 1 0 /*Sv100 rads = 1 gray (Gy)1 rad = 10 mGy1 mrad = 10
Temperature
°F = (°C x 9/5) + 32 = (°C x 1.8) +32°C = (°F - 32)5/9 = (°F - 32) 0.556
Activity Concentration
Ci/mL = (E+15)pCi/LCi/mL = (E+18)pCi/m3
Mass
pounds = 0.4536 kilogram (kg)pounds (lb) = 453.6 grams (gm)kilograms (kg) - 2.21 pounds
Length
inches = 2.54 centimeters (cm)centimeters (cm) = 0.394 inchmillimeters = 0.001 meterfeet = 0.305 meters (m)meters (m) = 3.281 feet (ft)miles = 1.609 kilometers (km)kilometers (km) = 0.6214 mile1 hectare = square kilometer + 100
Area
acre = 43,560 square feet (ft2)hectares = 2.471 acressquare feet (ft2) = 0.0929 square meter (m2)square meter (m2) = 10.76 square feet (ft2)square inches (in2) = 0.00065 square meter (m2)square inches (in2) = 6.45 square centimeter (cm
Volume
cubic feet (ft3) = 0.0283 cubic meter (m3)cubic meter (m3) = 35.31 cubic feet (ft3)liters (L) = 1000 cubic centimeters (cc)cubic centimeter (cc) = 0.001 liter (L)liters (L) = 100 centiliters (cL)gallons = 3.785 liters (L) = 0.1337 ft3
cubic centimeter (cc) = 1 milliliter (mL)
Time
days = 1440 minutes = 86,400 secondsyears = 3.15 EH-07 seconds
Velocity
miles per hour (mph) = 44.70 cm/seccm/sec = 0.0360 km/hrft/min = 0.508 cm/sec
1-4

Table 1-1. (continued).
af
Pn
m
attofemtopiconanomicromilli
E-18E-15E-12E-09E-06E-03
kMGTPE
kilomegagigaterapetaexa
E+03E+06E+09E+12E+15E+18
a. For powers of ten, the notation 106 or IP"* is the same as E+06 or E-06.
• Open as of 1/1/95• Closed as of 1/1/95
Figure 1-1. Location of the six commercial LLW disposal facilities discussed in this report.
Purpose and Organization of Report
Six commercial LLW disposal facilities have been operated in the United States (see Figure 1-1).All are now regulated by states under agreements with the U.S. Nuclear Regulatory Commission
1-5

(NRC). Such states are referred to as Agreement States. The NRC still licenses special nuclearmaterial at the Barnwell and Richland sites in coordination with the host state.
This report summarizes each site's (1) general design, (2) environmental monitoring program andthe data obtained as the program has evolved, and (3) what the program has indicated about releases tooff-site areas, if any, including an estimate of the actual health and safety significance of any releases.
Three sites have been closed since the mid-1970's: West Valley, New York (1975), Maxey Flats,Kentucky (1977), and Sheffield, Illinois (1978). The Beatty, Nevada site closed at the end of 1992.The Barnwell, South Carolina site has plans to remain open to nationwide LLW generators for the nextseveral years. The Richland, Washington site receives LLW from only generators in the Northwestand Rocky Mountain compact regions.
The sites are discussed Chapter-by-Chapter in alphabetical order by host state.
Chapter 2 Sheffield, IllinoisChapter 3 Maxey Flats, KentuckyChapter 4 Beatty, NevadaChapter 5 West Valley, New YorkChapter 6 Barnwell, South CarolinaChapter 7 Richland, Washington
1-6

CHAPTER 2
Environmental Summary of theSheffield, Illinois Low-Level
Radioactive Waste Disposal Site
INTRODUCTION
Background
The Sheffield low-level radioactive waste (LLW) disposal site operated by NECo, and itssuccessor, US Ecology, from 1966 to 1978.2' During that time, about 3.2 million cubic feet of low-level radioactive waste were buried in 21 earthen trenches.
Disposal operations were regulated under the provisions of a license issued by the U.S. AtomicEnergy Commission which later became the U.S. Nuclear Regulatory Commission. The State ofIllinois regulated the site under the provisions of a license and lease issued by the Illinois Department ofPublic Health. The lease was necessary because federal law required that low-level radioactive wastebe disposed on government-owned land and, accordingly, the 20-acre LLW site was (and is) owned bythe state. In 1980, the state's regulatory functions dealing with the LLW site were transferred to thenewly created Department of Nuclear Safety. Regulation of the adjoining hazardous chemical sites isthe responsibility of the Illinois Environmental Protection Agency.
In 1979, the site operator attempted to unilaterally terminate its state and federal licenses and thestate lease. Both state and federal regulators objected to the unilateral terminations, arguing that thesite operator must first safely close the site before terminating either of the licenses. The state furtherargued that the term of its lease with the site operator was 99 years (expiring in 2065) and that the leasecould not be unilaterally terminated until then.
All of this resulted in both federal and state litigation. The federal litigation was administrativelyargued before the Atomic Safety and Licensing Board which eventually ruled against the operator on allcounts. The state's complaint was argued before the Bureau County Circuit Court. After ten years ofnegotiation, the state and the site operator came to agreement about how the site was to be safely closedand the litigation was resolved in the form of an Agreed Order, signed May 25, 1988. Illinois becamean Agreement State on June 1, 1987. At that time, the Atomic Energy Act licensing authority for theSheffield site was transferred to the Illinois Department of Nuclear Safety.
Location
The Sheffield commercial low-level radioactive waste disposal facility is located in BureauCounty, Illinois. The Sheffield LLW site is south of Interstate Highway 80 about 200 km (120 mi)west of Chicago, about 65 km (40 mi) northwest of Peoria, and 60 km (35 mi) east of RockIsland/Moline (Figure 2-1).
2-1

SHEFFIELD SITE
2-2Figure 2-1. Location of the Sheffield site.
Two hazardous chemical waste disposal areas are to the north and northwest of the radioactivewaste disposal site (Figure 2-2), separated from the radioactive waste site by approximately 45 m(150 ft). The first area accepted hazardous chemical waste from 1968 to 1974 and the second areafrom 1974 to 1983.
Facility
The Sheffield LLW site first received wastes in 1967 and operated until the 21 trenches were fullin 1976. The disposal trenches were generally in parallel with a buffer approximately 3 m (10 ft) widebetween trenches, constructed in a cut-and-cover operation, and were 60 to 150 m (200-500 ft) long,12 to 25 m (40-80 ft) wide, and 6 to 12 m (20-40 ft) deep (Figure 2-2). The wastes were mainlypackaged in steel drums, fiberboard boxes, fiberboard drums, and steel liners.
2-2

New Chemical Waste Site
22 21 29
B
Old Chemical Waste Site
14C
1tC
18EW
IS
18B
IBEW
0 200 400
Seal* In FnlLow-Level Waste Site
3ooa.
Figure 2-2. Plan view of Sheffield low-level radioactive waste and chemical disposal areas.22
Volume
The estimated 88,000 m3 (3,100,000 ft3) total inventory is listed in Table 2-1. Three separatestudies23'2"42"5 have estimated the isotopic inventory since the site operator was not required to keep aprecise inventory of radioactive waste buried in each trench. The more than 61,000 curies ofradioactive waste consisted primarily of tritium, strontium-90, cesium-137, and cobalt-60, with lesseramounts of carbon-14, iodine-129, plutonium, and americium.
Stabilization and Closure
The 1988 Agreed Order between US Ecology (NECo's successor) and the Illinois Department ofNuclear Safety specifies what the site operator must do to safely close the site and assure its continuingsafety into the future. The closure plan requires the operator to:
2-3

1. Construct a new low-permeability (less than 10~7 cm/s)a clay cap over all the trenches. Capconstruction began and was completed in 1989.
2. Purchase a 170+ acre buffer zone around the site.
3. Monitor and maintain the site and buffer zone until June 1998, when responsibility willtransfer to the state. To compensate the state for its future obligations at the site, theoperator must pay $2.5 million in quarterly installments of $62,500.00 over a ten yearperiod (1988-1998). These monies, plus accrued interest, remain on deposit in a specialfund of the state treasury reserved exclusively for Sheffield-related expenses.26
4. Take remedial action as needed to prevent discharge beyond the buffer zone of radioactivematerials in excess of Illinois Department of Nuclear Safety limits. The operator hasestablished financial assurance in the form of an irrevocable letter of credit for $1.9 millionfor remedial action.26
Table 2-1. Estimated key radionuclides (half-lives greater than five years) at the Sheffield site.
Radionuclide
H-3
C-14
1-129
Sr-90
Cs-137
Co-60
Pu-238
Pu-239
Pu-240
Pu-241
Am-241
Activity (Ci) at timeof emplacement
5,990.
450.
0.01
3,690.
15,500.
20,000.
7.5
4,870.
—
—
137.5
Half-lifeb
(y)
12.3
5,730.
15,700,000.
29.1
30.17
5.27
87.7
24,100.
6,560.
14.4
432.7
a. Permeability is expressed as hydraulic conductivity measured in units of centimeters per second (cm/sec).10"7 cm/sec is equivalent to one-tenth of one-millionth of a centimeter per second. A centimeter is a measure oflength equal to about 0.4 inch. Converting units, 10~7 cm/sec equates to about 1.25 inches per year.
b. Chart of the Nuclides, 14th ed., updated through April 1988.
2-4
SITE
Topography
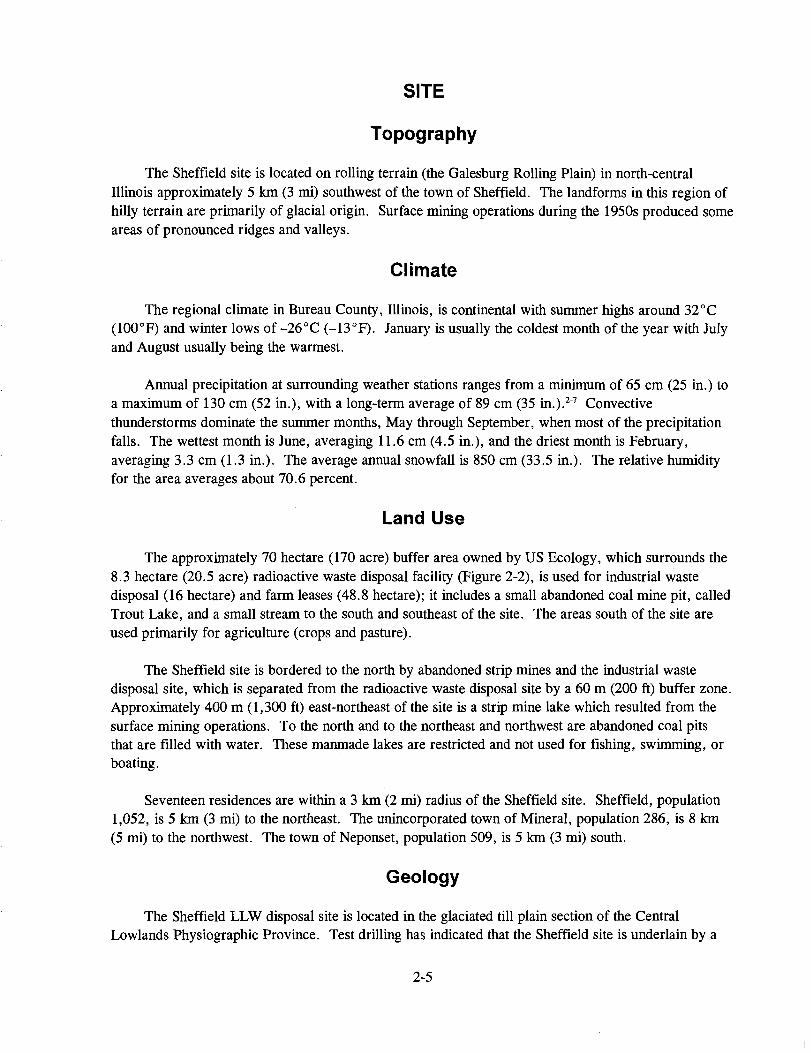
The Sheffield site is located on rolling terrain (the Galesburg Rolling Plain) in north-centralIllinois approximately 5 km (3 mi) southwest of the town of Sheffield. The landforms in this region ofhilly terrain are primarily of glacial origin. Surface mining operations during the 1950s produced someareas of pronounced ridges and valleys.
Climate
The regional climate in Bureau County, Illinois, is continental with summer highs around 32°C(100°F) and winter lows of -26°C (-13°F). January is usually the coldest month of the year with Julyand August usually being the warmest.
Annual precipitation at surrounding weather stations ranges from a minimum of 65 cm (25 in.) toa maximum of 130 cm (52 in.), with a long-term average of 89 cm (35 in.).2"7 Convectivethunderstorms dominate the summer months, May through September, when most of the precipitationfalls. The wettest month is June, averaging 11.6 cm (4.5 in.), and the driest month is February,averaging 3.3 cm (1.3 in.). The average annual snowfall is 850 cm (33.5 in.). The relative humidityfor the area averages about 70.6 percent.
Land Use
The approximately 70 hectare (170 acre) buffer area owned by US Ecology, which surrounds the8.3 hectare (20.5 acre) radioactive waste disposal facility (Figure 2-2), is used for industrial wastedisposal (16 hectare) and farm leases (48.8 hectare); it includes a small abandoned coal mine pit, calledTrout Lake, and a small stream to the south and southeast of the site. The areas south of the site areused primarily for agriculture (crops and pasture).
The Sheffield site is bordered to the north by abandoned strip mines and the industrial wastedisposal site, which is separated from the radioactive waste disposal site by a 60 m (200 ft) buffer zone.Approximately 400 m (1,300 ft) east-northeast of the site is a strip mine lake which resulted from thesurface mining operations. To the north and to the northeast and northwest are abandoned coal pitsthat are filled with water. These manmade lakes are restricted and not used for fishing, swimming, orboating.
Seventeen residences are within a 3 km (2 mi) radius of the Sheffield site. Sheffield, population1,052, is 5 km (3 mi) to the northeast. The unincorporated town of Mineral, population 286, is 8 km(5 mi) to the northwest. The town of Neponset, population 509, is 5 km (3 mi) south.
Geology
The Sheffield LLW disposal site is located in the glaciated till plain section of the CentralLowlands Physiographic Province. Test drilling has indicated that the Sheffield site is underlain by a
2-5

complex series of interbedded and interfmgering glacial sediments. The disposal trenches cut through acomplex series of quaternary deposits (Figures 2-3 through 2-5), which are composed primarily of silts,clays, and sands ranging in thickness from 3 to 20 m (10-65 ft).
A -
• " •S
553 533y • . __
—— —
/
/536 At
550
\
-k
v A
e
Tow
nshi
p R
oad
/
Base from U.S. Geological Survey, 1979
Explanation
• Observation WellA A1 Line Of Section
0 200 400 FEET
Figure 2-3. Location of geologic cross section for the Sheffield site.28
2-6

Soils Withinthe Unsaturated Zone
Soils Withinthe Saturated Zone
770
750-
A—|
4]1
WELL553•I
WELL^ ^ S33
• ^TOULON MBR (SANDY"SiLTft
WELLfe^ 545 >
TOULON MBR (PEBBLY SAND
690
670
650
100 200 300 FEETi
VERTICAL EXAGGERATION X5 .DATUM IS SEA LEVEL
Geologic Section A - A1 of Sheffield Site
EXPLANATION
GLASFORD FORMATION
SCREENED SECTION OF WELL
WELL DESIGNATION
690
670
650
Figure 2-4. Geologic cross section for the Sheffield site.28
2-7

Ttoa/Roc*
flElSTOCENC- Uand
PENNSYLVANIA*: Cartxmdala Fom\anon. tftaMtfw> u n k t m .
: Shaia. g/«r.
OEVONIAN: Lvnaalona
SILURIAN: Dokmx. lo~«t part chary
MAQUOKETA: w»U» kn-iaaiona and
GAL£NA-»\>TTEVlLLfcw»m i/tata and torwatona t
GLENWOOO-ST. PE7EA: Sanctaiona. n n»A»ia bads, l a m ct«v •( B*»
OuCHltN: OdomixnVi
Ookxr.ta.bad* may occur
FftANCONIA: Ct»»n uraKtona. the* and
iftONTON-GAlESVILLE: Sandnon*
£AU CLAIRE: PradoattunOy ( M M and dotomn*In uppar porson grading «3 undsUona
MT. SIMON: Sand«ton*. INn tftaM two*
.CAMBRIAN: G/anna
TTirtnaaa (ml
0-150
0-160
0-4
1S-X
30-IS0
30-40
90-1«
tS-130
0-60
25-33
O- 75
120-1*0
306-410
tIwt
r>3
Z
f
1xi
Suai
Sana»«on«n
iaxoi«wSuga
Hoc S^«> .^T
i3
I-?o
i
?
I
1«o
ftadnor raM.nC.
Huto Ta
Ouxun MJIfal«T<tM>
Figure 2-5. Stratigraphy of northern Illinois and the Sheffield site.22
In ascending order and beginning with the bedrock, the stratigraphy of the site includes theweathered shale of the Carbondale Formation, the Duncan Hills Member, the Hulick Till Member, theToulon Member, the Radnor Till Member, and the Berry Clay Member of the Glasford Formation (allbedrock); the Roxana Silt; the Peoria Loess; and the Cahokia Alluvium. More recent units on the siteinclude a modern soil and coal mine spoils.
Surface Water
The two major drainage features of western Illinois are the Mississippi and Illinois Rivers. TheSheffield site is located within the Mississippi River Basin near the drainage divide between two creeks,Lawson Creek and King Creek. The divide separating the Illinois and Mississippi drainage basins runsin a northeasterly direction about 1.5 km (1 mi) south of the site and passes through the town ofKewanee about 11 km (7 mi) southwest of the site.
The small, intermittent (ephemeral) streams draining the site formerly discharged to theabandoned coal mine pit 400 m (1,250 ft) east-northeast, but now discharge downstream of this stripmine lake (Figure 2-6). Lawson Creek eventually discharges to the Green River, about 15 km (10 mi)north of the site. The Green River flows westerly to the confluence with the Rock River near Moline,Illinois, where the Rock River joins the Mississippi River.
2-8

Ground Water
Two aquifer systems lie beneath the Sheffield site each with a different direction of flow (Figure2-7). A regional confined aquifer system is contained in deep sandstone and carbonate bedrock. Thelocal aquifer system contains ground water mainly under water table conditions. This shallow,unconfined aquifer, which is in unconsolidated deposits comprised of weathered shale, till, andalluvium and ranging from 1.5 to 14 m (5-46 ft) thick, is generally of low permeability. The shallowaquifer overlies a 140 m (450 ft) thick sequence of Pennsylvanian bedrock shale of low porosity andpermeability.
Hazardous-WasteBoundary LLW Site
Boundarysir /
M an
H I M . ; »H1B1O\
*QMB 1
can
W34
(OBI
G-1-StoG-2-D IEPA WellsG-200toG-2H lEPA WeilsSP-1toSP-5 Tracer Study WellsAloV US Ecology Wells501 to 615 USGS WellsMOVV-1 to MOW-2 US Ecology WellsA A' Cross Section of Figure 3B B' Cross Section ol Figure 6
2-2Figure 2-6. Map of well locations, trenches and tunnels at the Sheffield site.
The groundwater is recharged in the topographically high areas in southeast and southwestportions of the site. It flows toward discharge areas along the unnamed tributary to Lawson Creek andthe strip mine area. The site aquifer is recharged locally from the direct precipitation falling on andimmediately west of the site, infiltration in areas where loess is thin or absent, and downwardpercolation through the loess.
The depth to water beneath the site ranges from 1.8 to 6 m (6-20 ft). Flow in the shallow aquiferis within three ground water basins. The aquifer's configuration is similar to surface topography.Ground water movement is generally in two predominant directions (Figure 2-7); (1) northeast to easttoward Trout Lake, a strip mine lake, and (2) south to southeast toward small tributary channelsbelonging to Lawson Creek, which formerly drained into Trout Lake. Ground water flow divides are
2-9

Low-Level WasteDisposal Site
Base from U.S. Geological Survey. 1979
BEDROCKArea where bedrock elevationis at or above the water table
PEBBLY-SAND UNITPartially or completelysaturated
200 400 FEET
T
EXPLANATION
PRIMARY FLOW PATH
SECONDARY FLOW PATH
Figure 2-7. Ground water flow boundaries, direction of flow and principal flow paths for the Sheffield
site.2-8
2-10

found west of the disposal facility, north of the facility in strip mine spoil materials, and on atopographic high found in the southeast corner of the site.
Ground water moves from the hill areas toward the valleys to the north and south. As itapproaches the axis of the valley, flow direction changes to the east. Moisture infiltrating the surficialsediments and underflow from the area adjacent to the western disposal site boundary provides all thewater moving through the shallow ground water system. The ground water gradients are relatively flatover much of the site. The maximum ground water fluctuations in the disposal area are generally lessthan 3 m (10 ft). Larger fluctuations may occur in recharge areas where the depth to ground water isgreatest. The depth to ground water was found to be usually less than 3 m (10 ft) in the areas of theunnamed tributary to Lawson Creek and the strip mine area.
Precipitation, which annually averages just under 90 cm (35 in.), is the source of recharge for theshallow hydrogeologic system and yields approximately 5 cm (2 in.) of recharge per year. Over the 8hectare (20.5 acre) disposal site, this translates to roughly one million gallons of moisture penetratingthe soil of the shallow hydrogeologic system. Runoff is estimated to be 23 cm (9 in.) per year andevapotranspiration accounts for 60 cm (24 in.) per year. Trench covers installed prior to 1988 toprevent the infiltration of moisture from precipitation were only partially effective. Indications are thatwater movement into the trenches occurs primarily along the periphery of the cover and secondarilythrough the center of the cover.
The primary path of the shallow aquifer originates west of the disposal site and extends beneaththe upper southwest quadrant through the central northeast quadrant. It is joined by flow from theupper northwest quadrant of the disposal site and migrates in a northeast direction toward Trout Lakewhere surface discharge is observable as small springs emptying into the lake. This pathway is througha section of the pebbly sand of the Toulon Member which is significant because it connectshydraulically to most saturated and unsaturated sediments on site. The Toulon Member unit underlies67 percent of the disposal site and is recognized as controlling the flow of ground water through thedisposal site. The pathway extending eastward from the northeast corner of the disposal site is througha narrow, channel-like depression in the Hulick Till Member which is filled with course gravelly sandfrom the Toulon Member. As mentioned previously this channel connects the Sheffield sitehydraulically to the lake. The ground water speed through this narrow, short channel has beenestimated to be about 750 m/y (2400 ft/y). Due to the connection with the disposal site, tritium wasdetected in the ground water along the entire channel-like depression, as well as in seeps along the bankof Trout Lake.
The secondary path originates beneath the lower southwest quadrant of the disposal site and flowsinto the valley to the south through the Peoria Loess silt, but because of smaller flow volume and lowervelocities this pathway represents a less significant migration path. This secondary pathway is alsocontrolled by a buried bedrock channel partially filled with pebbly sand. However, the sand in thischannel was found to have no relation to the Toulon Member previously identified as a conduit forground water exiting the disposal site. This sand was found to belong to the Henry Formation, ayounger deposit having a lesser potential for significant exit migration along this pathway.
2-11

Ecology
The area contains woody vegetation, natural grasses, and revegetated grasses. Approximately 20percent of the site is forested.
A wide diversity of terrestrial vertebrates is found in central Illinois. The habitats available toterrestrial animals on the site include intermittent stream-forest, forest-edge, and disturbed prairie.These systems support various animal and bird species.
Table 2-2 lists some of the vegetation, mammals, and birds found near the Sheffield site in BureauCounty.
ENVIRONMENTAL MONITORING
Overview
Environmental samples were collected at the Sheffield site and analyzed by the site operator andthe Illinois Department of Public Health between 1967 and 1980. An ongoing monitoring andsurveillance program has been conducted by the Illinois Department of Nuclear Safety since 1980.
The environmental monitoring program is designed to evaluate the site performance bymonitoring any movement, or lack of movement, of tritium and other radionuclides, to evaluate thegeneral environment, and to evaluate any potential or actual exposure to radionuclides. The major partof the environmental monitoring program involved the sampling and analysis of ground water andsurface water at or near the site. According to the provisions of the Agreed Order, the limits fordischarge beyond the buffer zone were (and will continue to be) those that were in force as of the datethe Agreed Order was signed (May 25, 1988).
The following components comprise the Illinois Department of Nuclear Safety monitoringprogram:
1. Surface water, drinking water, and ground water are sampled at monthly to quarterlyintervals, depending on how significant the sampling location is and how frequently itcontains sufficient water for sampling. All samples are analyzed for gross alpha, gross beta,and tritium levels. Analysis for specific gamma-emitting radionuclides is performed onthose samples found to have elevated alpha or beta levels. Strontium-90 analysis isconducted on those samples with elevated beta levels.
2. Air samples are collected continuously by a low-volume sampler and are analyzed weeklyfor airborne particulates.
2-12

Table 2-2. Examples of biota found near the Sheffield site.
Common name Scientific name
Vegetation
Bur oakHickoriesSumacBlackberrySnoberryLittle bluestemSideoats gramaKentucky bluegrassOrchard grassBromeSweet clover
Mammals
OpossumRaccoonBadgerCoyoteRed foxGray foxWoodchuckEastern gray squirrelEastern cottontailWhite tailed deer
Birds
Common loonWhistling swanCanada gooseMallardBlue-winged tealWood duckTurkey vultureBobwhiteRing-necked pheasantKilldeerMourning doveScreech owlDowny woodpeckerCommon crowAmerican robin
Quercus macrocarpaCarya spp.Rhus sp.Rubus sp.Symphoricorpos sp.Andropogon scopariusBouteloua curtipendulaPoa pratensisDactylis glomerataBromus sp.Trifoluim sp.
Didelphis marsupialisProcyon latorTaxidea toxusCanis latransVulpes fulvaUrocyon cinerecargentausMarmata monaxSciurus carolinensisSylvilagus floridanusOdocoileus virginianus
Gavia immerOlor columbianusBrunta canadensisAnas olatyshynchosAnas discorsAix sponsaCathartas auraColinus virginianusPhasianus colchicusCharodrius vociferusZenaida macrouraOtus asio
Dendrocopos pubescansCorvus brachyrhonchosTurdus migratorius
2-13

3. Direct radiation is measured by thermoluminescent dosimeters (TLDs). The TLDs arecollected and analyzed quarterly.
4. Soil samples are collected intermittently and analyzed for radionuclides which may haveleached out of the radioactive waste into soil.
5. Vegetation samples are collected intermittently and analyzed for radionuclides that may havebeen absorbed from the environment and incorporated into plant tissue.
6. Samples of fish and ground squirrels are collected intermittently and analyzed forradionuclides which may have been consumed and accumulated in tissue.
All environmental samples are analyzed for total alpha and bete radioactivity, a method ofscreening for radionuclides in the disposal trenches which emit either alpha or beta particles. Sincetritium emits a very low energy beta particle, tritium cannot be detected by ordinary procedures forevaluating gross beta activity. To measure the concentration of tritium, all of the water samples aredistilled and analyzed using a liquid scintillation detector, an instrument that measures radioactiveemissions with very low energies and in very low concentrations.
Some samples are analyzed for strontium-90 (a beta-emitter) and gamma-emitting radionuclidessuch as cesium-137. Strontium-90 is easily masked by other radionuclides, including those which arenaturally-occurring. Selected samples which may contain strontium undergo preliminary chemicalseparation so that the strontium can be isolated for analysis. Gamma-emitting radionuclides areanalyzed in a process called gamma spectroscopy using a high purity germanium detector whichenables the identification of radionuclides individually.
The Illinois Department of Nuclear Safety laboratory developed a procedure for analysis ofenvironmental carbon-14. Since carbon-14 occurs naturally in the environment along with the carbonpresent in vegetation and water, the laboratory performs an analysis for total organic carbon as well asthe analysis for carbon-14.
The standard unit of measurement for radioactivity has been the curie (Ci). Multiples or fractionsof a curie follow standard metric system prefixes. The Illinois Department of Nuclear Safety expressesresults of the radioactivity monitoring in terms of picocuries per liter (pCi/L) for water; femtocuries percubic meter (fCi/m3) for air; picocuries per gram (pCi/g) for soil; picocuries per kilogram (pCi/kg) foranimals and fish; and nanocuries per liter (nCi/L)c for tritium in water distilled from vegetationsamples. The direct radiation measurements are expressed in milliroentgens per year (mR/y).
In 1976, tritium (a radioactive form of hydrogen) was discovered in shallow groundwater beneaththe 20-acre site. This was the first evidence of radioactivity leaking from the burial trenches. In 1981,tritium was discovered in groundwater to the east of the site. This was the first evidence of radioactivematerial moving off the 20-acre site. Since then, tritium movement has been traced to the east where it
e. A nanocurie (nCi) is a measure of radioactivity equivalent to 37 nuclear transitions per second. A liter (L) is ameasure of volume equal to 1.05 quarts.
2-14

discharges into a small lake (Trout Lake) located about 1000 feet from the site (Figures 2-8 and 2-9).The groundwater carrying the tritium away from the site and Trout Lake are both located within the170-acre buffer zone that surrounds the site. Trout Lake serves to both dilute and impound the vastmajority of tritium moving from the site.
The new, low permeability cap was completed in late summer 1989. The graph of tritium in theNortheast Pathway Wells (Figure 2-10) illustrates the tritium concentrations prior to the completion ofthe cap and subsequent to it. Prior to installation of the cap, the tritium concentrations averaged about400 nanocuries per liter (nCi/L) around the rising trend line. After installation of the cap, theconcentrations continued to increase at an average rate of approximately 107 nCi/L and peaked at 890nCi/L in well No. 575 about the third quarter of 1990. Subsequently, the concentrations havedecreased at a rate of 86 nCi/L per year. These data suggest that the decrease in concentrations may bedue to the effectiveness of the low permeability cap.
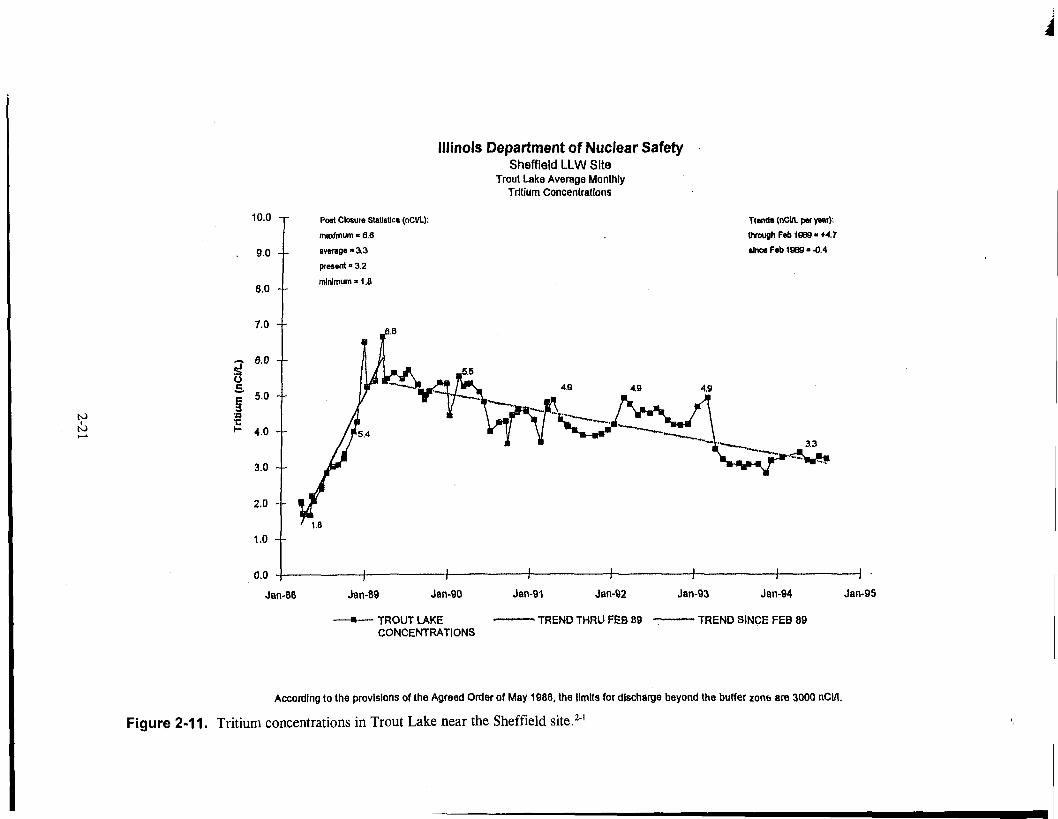
Recently, levels of tritium in Trout Lake have averaged between 3 and 5 nanocuries per liter(Table 2-3). This is less than 0.2% of the Department's limit (3,000 nCi/L) for discharge beyond thebuffer zone. Since February 1989, tritium concentrations in Trout Lake have been decreasing at anaverage rate of about 0.4 nCi/L per year; in August 1994 the concentration in Trout Lake was3.2 nCi/L. Again, this decreasing trend is likely due to the new cap. Trace amounts of tritium mayexit the buffer zone by seeping from Trout Lake into adjacent groundwater, flowing over the damspillway during periods of heavy precipitation, or evaporating into the atmosphere. In each case, thetritium is rapidly dispersed and diluted to levels indistinguishable from natural background. Thehighest levels of tritium observed beyond the buffer zone have been 2.4 nCi/L and 0.8 nCi/L ingroundwater and surface water, respectively.
Ground Water
From 1967 to 1976, most of the ground water monitoring was conducted on samples from wellsinstalled by the site operator. Figure 2-8 indicates sample locations at the Sheffield site. Only grossalpha and beta analyses were conducted during most of this period. Tritium counting capability wasdeveloped in 1974. Generally during this period, only background levels of naturally-occurringradionuclides were measured in the monitoring wells. Several anomalous readings were recorded, butadditional analyses were unable to repeat them, possibly due to high levels of naturally occurringdissolved solids in the samples. This problem still exists but is now routinely resolved using gammaspectroscopy. Table 2-3 summarizes tritium concentrations in Trout Lake during the period 1981 to1994.
The U.S. Geological Survey (USGS) began a hydrogeological study of the Sheffield site in 1976and installed the wells designated 501 to 524, as indicated in Figure 2-9. Tritium was detected inUSGS Well 523 in October of 1976. The presence of tritium was verified upon resampling of the well.Tritium was also detected in USGS Well 507 at about the same time. This was the first evidence ofradionuclide migration at Sheffield and indicated a slow migration to the southeast.
2-15

Buffer ZoneBoundary
LLW Disposal Site
Springs
Figure 2-8. Trout Lake sampling locations at the Sheffield site.2"2
2-16

Table 2-3. Tritium concentrations in Trout Lake in nCi/L 1981-1994 at the Sheffield site.
1981 1982 1983 1984 1985 1986 1987 1988 1989 1990 1991 1992 1993 1994*
Trout Lake A
Trout Lake B
Number
Maximum
Minimum
Average
Number
Maximum
Minimum
Average
Trout Lake C Number
Maximum
Minimum
Average
Trout Lake D Number
Maximum
Minimum
Average
Trout Lake E Number
Maximum
Minimum
Average
2 7 4 40.5 1.0 0.6 0.9
<MDC <MDC <MDC <MDC0.3 0.4 0.4 0.4
0 0 0 0
31.30.60.6
31.00.60.8
2
0.9
<MDC0.5
0
0
81.80.81.2
41.90.91.3
0
0
0
62.01.61.8
11.61.61.6
0
0
0
186.51.72.7
104.41.43.0
7
4.5
0.9
3.3
0
0
166.54.45.4
139.05.05.9
12
7.6
4.8
5.6
13
5.9
4.7
5.2
13
5.5
4.4
5.0
155.62.24.5
155.63.84.J3
14
5.4
4.0
4.8
21
5.74.1
4.9
14
5.43.6
4.6
134.91.24.1
105.73.84.4
11
4.9
3.2
4.1
11
7.6
3.8
4.7
11
4.6
3.13.9
124.84.14.4
115.14.24.6
11
4.8
4.1
4.4
12
5.4
4.1
4.5
9
4.6
3.9
4.2
113.51.02.9
34.73.13.7
4
4.8
3.0
3.7
11
5.7
3.1
3.9
3
3.0
2.8
2.9
63.42.73.1
23.33.33.3
3
3.6
3.1
3.3
6
3.5
3.2
3.3
1
3.0
3.0
3.0
* - Data thru August 1994

UWSON CREEK
V —. (• WASTE DISPOSAL StTE
I I set ) • SP-1toSP-5 Tracer Study Wellse s " o i » V • 0131 to 0157 Spring Siamples
'"•""-Jj • 003A1O003E Lake Samplesi • A t o V US Ecology Wells
• 501 to 615 USGS Wells• 012 Creek Sample
• MOW-1 to MOW-2 US Ecology Wells f"A A' Cross Section of Figure 3 /
• • 1 1,000 -10,000 pCl/L )•T
NOHTH
10,000-100,000 pCl/L /
L
> 100,000 pCl/L
COUMTY ROAD
/
I
|- J L
SHEFFIELD
BASE FROM U.S. GEOLOGICAL SURVEY
FEET
0 200 400
AUGUSTS, 1988
Figure 2-9. Well locations and tritium concentrations (shaded) in water at the Sheffield site.2"2
From the summer of 1977 to the fall of 1981, the objective of the environmental monitoring wasto continue to investigate the movement of ground water in the southeast quadrant of the site and toperform general hydrogeologic studies. The USGS installed additional monitoring wells in the series525 to 559 and the Illinois Department of Nuclear Safety continued to conduct sampling and analysis.In 1977, tritium was found in USGS wells 527 and 528, providing further evidence of tritiummovement in the southeasterly direction. On-site Well 523 continued to exhibit the highestconcentration of tritium in this area through the end of 1981. In 1981, a single measurement of133,000 pCi/L was obtained. For comparison, the maximum permissible concentration of tritium inwater released into unrestricted areas was 3,000,000 pCi/L.
Since the general hydrogeologic studies indicated ground water movement to the north and east,the USGS installed wells 560 to 576 in this area in the summer of 1981. Tritium was found in USGSwell 563 in November 1981, which was the first time that tritium had been detected beyond the originalsite boundary. Based on this finding, USGS Wells 577 to 596 were installed northeast of the propertyin the summer of 1982 to determine the source, velocity, and extent of the tritium movement. Anarrow northeast pathway was found to be about 6 to 12 m (20 to 40 ft) wide through the sampling andanalysis of the new wells. This plume is bounded on the southwest by the original 8 hectare (20 acre)site and by Trout Lake on the northeast. About 250 m (800 ft) separate the site from Trout Lake.
2-18

Since 1982, the focus of the ground water monitoring program has been to monitor tritiumconcentrations in both the southeast and the northeast pathways, in order to determine whether apotential exists for exposure to the general public. The monitoring of wells 501 to 559 has continued ata lower frequency, because the efforts have been shifted further to the northeast.
In preparation for trench recapping, several of the wells on or near the original site were sealed in1987. This included on-site well 523, which had exhibited exceptionally high tritium concentrationsuntil it was closed. One of the last 1987 measurements was found to be greater than 1,300,000 pCi/L.
Monitoring of Springs
The three springs which empty into Trout Lake from the west (Figure 2-9) were found to containtritium in October 1982. These springs are the end of the northeast pathway. The USGS conducted atracer dye study in 1984 to determine ground water velocities along the northeast pathway. This studyfound that the ground water velocity was about 800 m (2,500 ft) per year downgradient of USGS well601. This measurement represents the highest ground water velocity in that area; due to the variabilityin hydrogeologic characteristics, inferences regarding other ground water velocities are difficult tomake.
Northeast Pathway Tritium
The Illinois Department of Nuclear Safety has expended considerable effort toward describing thetritium concentrations in the wells and springs of the northeast pathway (Figures 2-7 through 2-11).Factors which appear to have an interdependent influence on concentrations at a given time in a givenwell are:
1. Precipitation on the disposal site
2. The condition of the trench caps during precipitation
3. Precipitation in the areas which recharge the pathway wells.
Precipitation variations on the disposal site result in variable amounts of tritium available for transport.A cyclical pattern of tritium concentrations occurs in many of the northeast pathway wells due to acombination of the variables.
USGS wells 577, 580, 583, 563, 575, 592, 597, 600, and 601 (Figure 2-9) are placed along thenortheast pathway. Tritium concentrations increased in these wells until reaching peak concentrationsabove 100,000 pCi/L. Tritium concentration has tended to change over longer periods of time incontrast to the on-site wells. USGS well 528 (near the trenches) exhibits sharp spikes in concentrationwhich are related to single or closely-grouped rainfall events.
Southeast Pathway Tritium
The USGS installed wells 608 to 615 (Figure 2-9) in May 1983. The purpose of these wells wasto determine the path of ground water to the southeast after it crosses the boundary of the disposal site.
2-19

Illinois Department of Nuclear SafetySheffield LLW Site
Tritium in Northeast Pathway Wells
1000 - r
900 - -
800 - -
700
* 600 - -
o
«
500 - -
400 - -
300 --
Post Closure Statistics
Concentrations (nCi/L)
Maximum = 890
Minimum = 6.2
Average • 351
614
Trends (nCi/L per year):
through July 1990 « +107
since July 1 9 9 0 * - 8 6
overall = -22
440
Jan-88 Jan-89 Jan-90 Jan-91
563 575
Jan-92
577
Jan-93
600
Jan-94
• Trends
\330
Jan-95
According to the provisions of the Agreed Order of May 1988, the limits for discharge beyond the buffer zone are 3000 nCi/l.
Figure 2-10. Tritium concentrations in northeast pathway wells at the Sheffield site.2"2
to
U
10.0 - -
9.0 - -
8.0 - -
7.0 - -
6.0
5.0 +
4.0
3.0
2.0 —
1.0 - -
0.0
Illinois Department of Nuclear SafetySheffield LLW Site
Trout Lake Average MonthlyTritium Concentrations
Post Closure Statistic. (nCl/L):
maximum « 6.6
average" 3.3
present« 3.2
minimum »1.8
Jan-88
4.9
Jan-89 Jan-90
TROUT LAKECONCENTRATIONS
Jan-91 Jan-92
TREND THRU FEB 89
Trends (nClfl. pet year):
through Feb 1969 « +4.7
since Feb 1989 «-0.4
3.3
Jan-93 Jan-94
TREND SINCE FEB 89
Jan-95
According to the provisions of the Agreed Order of May 1988, the limits for discharge beyond the buffer zone are 3000 nCl/l.
Figure 2-11. Tritium concentrations in Trout Lake near the Sheffield site.21

The samples obtained from these wells indicated that the tritium does not continue to move to thesoutheast but turns toward the northeast. Although the migration rate along this pathway has not beenmeasured directly, it appears to be slower than along the northeast pathway. Data from the wellsnumbered 603 and 604 indicated little or no tritium. However, samples from wells numbered 602,611, and 613 indicate up to 6,400 pCi/L. Information from these wells generally corroborated theground water flow information from earlier studies.
Surface Water
Surface water monitoring consisted of periodic sampling of the intermittent streams around thesite, Lawson Creek, and a single location at Trout Lake (Figure 2-9 and 2-12) during the early years ofoperation. The springs that discharge into Trout Lake have been sampled regularly since October1982. Samples from as many as five different locations in Trout Lake have been taken on a regularbasis. The tritium concentrations at the different sampling locations in Trout Lake appear to depend onthe following variables:
1. The flow of water from the springs
2. The runoff from surrounding areas
3. The discharge to the Lawson Creek tributary, if any
4. The presence of ice on the lake.
Evidence of uneven mixing has been observed under some exceptional conditions. The samplinglocation E on Trout Lake has been lower than the overall mean concentration when ice is on the lakeand when discharge occurs from the opposite end. A summary of the tritium results from the TroutLake sampling is contained in Table 2-3 and shown in Figure 2-11. A summary of the tritium resultsfrom the stream and creek sampling is contained in Table 2-4.
Drinking water samples have been taken from off-site locations (Figure 2-12) in the Sheffield areato assure that there has been no impact on local water supplies since the site opened in 1967. Onlynaturally occurring radionuclides have been found in samples of these water supplies. Noradionuclides attributable to activities from the radioactive waste disposal site were found in any ofthese water suppllies. Figure 2-12 indicates the locations of the sampling sites.
Air
Figure 2-9 indicates an air monitoring station located near the northeast quadrant of the site, nearTrenches 23 and 24. This sampler has been used to continuously collect particulate samples sinceFebruary 1977. The filters have been analyzed weekly for gross alpha and beta activity. For themajority of the monitoring periods, the air monitoring results did not indicate any statisticallysignificant increases over natural background. Nuclear weapons testing in 1977 and 1980 and theChernobyl accident in 1986 were the exceptions when the airborne concentrations of radionuclideswere elevated over most of the northern hemisphere due to the release of fission products. The
2-22

Note: Big Bend Conservation Area Is25 miles north-northwest ofSheffield and not shown on this map
US
JohnsonSauk TrailState Park
1-80
US 6 / US 34
Stark CountyIII 88
1,5 Mile Circles Streams and Lakes
Sampling Locations
1 - Mineral Public Water System 6 - Pencock Hill2—Sheffield Public Water System 7 - US Ecology Lunchroom Tap3— Lorenson Farm4— Bennett Farm5— Moore Farm
8— Blake Farm9— Neponset Public Water System
Figure 2-12. Environmental sampling around the Sheffield site.22
2-23

Table 2-4. Tritium concentrations in streams and creeks in nCi/L 1981-1994 at the Sheffield site.
1981 1982 1983 1984 1985 1986 1987 1988 i"989 i"99O 199"i i"992 1993 1994*
to
Coal Creek
Lawson Creek
Stream Northwestof Site
Stream Southof Site
NumberMaximumMinimumAverage
NumberMaximumMinimumAverage
NumberMaximumMinimumAverage
NumberMaximumMinimumAverage
0
0
3
0.4
<MDC0.3
3
0.4
<MDC0.2
0
0
4
0.6
<MC
0.3
7
0.7
0.3
0.5
2<MDC<MDC<MDC
3 3 4 5 4 7 12 8 10.5 <MDC <MDC <MDC <MDC <MDC <MDC <MDC <MDC
<MDC <MDC <MDC <MDC <MDC <MDC <MDC <MDC <MDC<MDC <MDC <MDC <MDC <MDC <MDC <MDC <MDC <MDC
3 2 3 4 3 5 14 18 11 12<MDC <MDC <MDC 0.5 0.3 1.2 <MDC 0.5 0.7 0.4
. <MDC <MDC <MDC <MDC <MDC <MDC <MDC <MDC <MDC <MDC<MDC <MDC <MDC <MDC <MDC 0.4 <MDC 0.2 0.3 0.2
110.50.20.3
70.4
<MDC<MDC
5 3 3 4 3 3 5 4 9 12 8 1<MDC <MDC <MDC 0.4 <MDC <MDC <MDC <MDC <MDC 0.2 <MDC <MDC
<MDC <MDC <MDC <MDC <MDC <MDC <MDC <MDC <MDC <MDC <MDC <MDC <MDC <MDC<MDC <MDC <MDC 0.2 <MDC <MDC <MDC <MDC <MDC <MDC <MDC <MDC
7 3 1 4 3 3 5 5 9 11 4 6
<MDC <MDC <MDC 0.6 <MDC <MDC <MDC <MDC <MDC <MDC <MDC 0.3<MDC <MDC <MDC <MDC <MDC <MDC <MDC <MDC <MDC <MDC <MDC <MDC<MDC <MDC <MDC <MDC <MDC <MDC <MDC <MDC <MDC <MDC <MDC <MDC
* - Data thru August 1994

sampling results do not indicate any airborne releases from the Sheffield site. Air sampling results aresummarized in Table 2-5.
Direct Radiation
Thermoluminescent dosimeters (TLDs) were used for direct radiation measurements. Thenumber of monitoring sites has varied over the years as a result of occasional badge losses,malfunctioning of equipment, and changes in the scope of the program. The dosimeters that wereclosest to the site entrance were exposed to the incoming shipments of radioactive wastes. ElevatedTLD readings resulted from this placement. During 1976, the highest on-site levels of direct radiationwere 234 mRem/y. According to the waste receipt and burial records, 1976 was a peak period forvolume and curie quantity of radioactive waste in storage above ground. Since the cessation of wasteburial at the site, all readings have been typical of natural background in northern Illinois, about 65mRem/y. A summary of the cumulative total exposures measured since 1971 is contained in Table 2-6.
Soil
Soil samples have been taken to determine whether surface contamination exists from theunloading of shipments and from burial operations. A sample taken and analyzed in 1976 indicated nocontamination was present. Only potassium-40 and radium-226, naturally occurring radionuclides,were reported in the sample. Cesium-137 was found in two samples taken near USGS wells 507 and512 in 1977. Duplication of samples did not verify the results, which thus remain anomalies. Wells507 and 512 are located in the southeast quadrant and just east of the southeast quadrant, respectively.
Biota
Vegetation samples have been taken periodically since the site opened. These samples were takento determine whether any bioaccumulation of radionuclides from the Sheffield site has occurred. Theresults demonstrate that no detectable release from the Sheffield site has occurred. Only radionuclidescontributed from radioactive fallout (cesium-137, niobium-95, zirconium-95, ruthenium-103, strontium-89, strontium-90) and naturally occurring radioactive materials were identified.
Tritium concentrations found in vegetation appear to relect the concentrations of tritium in theground water near a plant's root system. When the origin of the tritium is ground water, theconcentrations found in the deeper rooted plants (such as alfalfa) are usually higher than those detectedin more shallow rooted grasses. Tritium conentrations have ranged from 1,300 to 16,000 pCi/L ingrass samples, from 200 to 35,800 pCi/L in clover, and from 6,300 to 89,000 pCi/L in alfalfa.Tritium levels have been measured at 31,900 pCi/L in brome grass and at 10,400 pCi/L in tree leaves.The higher concentrations were found on the tops of the trench caps.
Fish samples have been taken to determine whether any bioaccumulation of radioactive materialhas occurred in aquatic life in Trout Lake. The results of samples collected in 1977 and 1982 indicatedthat only naturally occurring radionuclides were found at levels greater than the minimum detectableconcentration (MDC). Improvements in laboratory analytical techniques resulted in a more sensitiveMDC in 1988. Strontium-90 concentrations from 10-17 pCi/kg were found in samples collected in1988. The strontium levels in fish will generally be 20 times higher than the strontium level in the
2-25

Table 2-5. Air sampling results in fCi/m3 1977-1994 at the Sheffield site.
Gross Alpha
Gross Beta
NumberMaximumMinimumAverage
NumberMaximumMinimumAverage
1977
3712
<MDC4
374551
21100
1978
363
<MDC0
361101038
1979
3512
<MDC1
3520210
1980
19200'
012
1928001
3180
1981
11612
11335'
6108
1982
8702
8100731
1983
3402
343219
1984
181127
18311218
1985
461815
46' 731022
1986
511616
51420'
1349
1987
481013
47419
24
1988
5321
<MDC5
53441222
1989
5521
<MDC5
551101228
1990 1991 1992 1993 19942
ON Gross Alpha
Gross Beta
NumberMaximumMinimumAverage
NumberMaximumMinimumAverage
50 45 50 49 3412 4 3 4 2
<MDC <MDC <MDC <MDC <MDC3 1 1 0 0
51711227
47 .34718
5036414
4942617
3442515
1 - Elevated concentrations coincide with general northern hemisphere conditions due to atmospheric releases offission products, including nuclear weapons testing in 1977 and 1980 and the Chernobyl accident in 1986.
2 - Data thru August 1994.

Table 2-6. Direct radiation (TLD) results in mR/y 1977-1994 at the Sheffield site.
10 Location 1971 1972 1973 1974 1975 1976 1977 1978 1979 1980 1983 1984 1987 1988 1989'
1 Air Sampler Housing2 Above Change Romm Door3 South Fence Near West End4 Near White Fence by Office6 Northeast Corner of Fence7 Northwest Corner of Fence8 Southwest Corner of Fence9 Southeast Comer of Fence
124 86335198239
215
114194138140
147
9913410699
110
100469188.
121
220
115470163186
234
128161
93112200189216190
161
6468607579
117186102124146179153179
148
7284588495
806947
65
48
504162
58755738
54
50615768
6258696266807373
68
5169476966100
9544444347777562
61
4364684660
121
5465535144
65
5342545651575146
51
54
4330494742484228
41
45
On-Site Average
5 In Sheffield10 1 Mile North of Site11 1.5 Miles East of Site12 1 Mile South of Site13 1.5 Miles West of Site14 Big Bend Conservation Area
124
Off-Site Average 69 79 48 59 67 56 54 45
ID Location 1989" 1990 1991 1992 1993 1994'
1 Nothwest Corner of Fence2 Southeast Corner of Fence3 Middle Of Fence South Side4 Southwest Corner of Fence5 Middle of Fence West Side6 On Fence at Well C-1507 Middle of Fence North Side8 Middle of Fence East Side9 Air Sampler Housing10 Adjacent to Well C-43411 Southwest Corner of Buffer Zone Fence12 Buffer Zone Fence at End of Lake Road13 Buffer Zone Fence at NW Corner of Lake
61546258666663604057646260
61505861576460564062575458
57475459596259554361545455
55475259586155494258525454
51455056535850464053475051
49435154575651463955485154
Site Average 59 56 55 53 49 50
1-Data Prior to August 1989 2 - Data Since August 1989 3-Data Thru October 1994

body of water from which the fish was obtained, especially in a freshwater aquatic environment. Forthis reason, strontium in fish is a sensitive indicator and strontium is seldom routinely measured inwater. Strontium that has been detected in bottom sediment samples in many control areas of Illinois isattributed to global fallout from nuclear weapons testing.
Burrowing animals have been observed occasionally in the vicinity of the trenches and couldtransport contamination to the surface of the ground if they burrowed through contaminated soil. Twoground squirrels caught in 1984 in the southwest corner of the site were analyzed at Argonne NationalLaboratory using gamma spectroscopy. Only naturally occurring potassium-40 was reported.
SUMMARY
The Sheffield LLW site operated from 1966 until 1978. It has been closed in accordance with theAgreed Order of 1988 which specifies the actions required to safely close the site and assure itcontinuing safety in the future.
Environmental monitoring of the Sheffield site started in 1967. No radioactive material abovenatural background was found in any of the monitoring wells until 1976. In 1976, tritium was detectedmigrating in a narrow pathway extending to the northeast and terminating in Trout Lake. Thequantities of tritium migrating remain below the applicable maximum permissible concentration set inthe Agreed Order of 1988. The tritium concentrations in the public and private drinking water suppliesremain at background levels. By 1988, the buffer zone was extended to include Trout Lake.
The new, low permeability cap was completed in late summer 1989. The graph of tritium in theNortheast Pathway Wells demonstrates the tritium concentrations prior to the completion of the cap andsubsequent to it. Prior to installation of the cap, the tritium concentrations averaged about 400nanocuries per liter (nCi/L) around the rising trend line. After installation of the cap, theconcentrations continued to increase at an average rate of approximately 107 nCi/L and peaked at 890nCi/L in well No. 575 about the third quarter of 1990. Subsequently, the concentrations havedecreased at a rate of 86 nCi/L per year. These data suggest that the decrease in concentrations may bedue to the effectiveness of the low permeability cap.
Only background radioactivity has been found from the air sampling data. Potassium-40 andradium-226, naturally occurring radionuclides, have been found in the soil samples. Radionuclidesfrom fallout and tritium from the trenches have been detected in vegetation samples. The fish sampleshave contained strontium-90 from fallout and naturally occurring radionuclides. Only naturallyoccurring potassium-40 was found in squirrels.
Direct radiation measurements indicate that although the direct radiation levels were elevatedduring the period that radioactive waste was temporarily stored above ground at the site, directradiation levels returned to background after the waste was placed in the trenches and covered.
Data collected through 1994 indicate that the closure activities specified in the Agreed Order arefunctioning as designed. Levels of tritium in both ground and surface water are decreasing; residualcontamination is mostly contained within the buffer zone and only minute quantities of radioactivematerial from the site are detected in ground and surface water beyond the buffer zone.21 Results of
2-28

sampling and analysis have not detected any off-site exposures attributable to the Sheffield low-levelradioactive waste facility. No known exposure to nearby residents has occurred.21
2-29
REFERENCES
2-1. D. D. Ed, "Sheffield Low-Level Radioactive Waste Disposal Site: A Brief Synopsis, IllinoisDepartment of Nuclear Safety," December 12, 1992.
2-2. Illinois Department of Nuclear Safety, Environmental Monitoring Report Sheffield Low-LevelRadioactive Waste Disposal Site 1967-1988, 1991.
2-3. Nuclear Engineering Company, Inc., Environmental Report for the Sheffield Low-LevelRadioactive Waste Disposal Facility Near Sheffield, Illinois, 1979.
2-4. K. Dragonette, et al., 1979.
2-5. MacKenzie, etal., 1985.
2-6. D. D. Ed, "Sheffield Low-Level Radioactive Waste Disposal Site: A Brief Synopsis, IllinoisDepartment of Nuclear Safety," November 15, 1994.
2-7. Richard W. Healy, Results of Some Geohydrologic Studies at the Low-Level RadioactiveWaste Repository Site Near Sheffield, Illinois, In: Safe Disposal of Radionuclides inLow-Level Radioactive Waste Repository Sites, Low-Level Radioactive Waste DisposalWorkshop, U.S. Geological Survey, July 11-16, 1987, Big Bear Lake, California,U.S. Geological Survey Circular 1036, pp. 13-16, 1987.
2-8. Foster, et al., Water Resources Investigations Report No. 83-4125, 1984.
2-30

CHAPTER 3
Environmental Summary of theMaxey Flats, Kentucky Low-LevelRadioactive Waste Disposal Site
INTRODUCTION
Background
The Maxey Flats site has been owned by the State of Kentucky since 1963 and was leased byNECo in that year. The site was used for radioactive waste disposal from May 1963 until December1977. The Cabinet Health Services (Cabinet for Human Resources) issued an order closing the site tothe receipt of commercial waste in December of 1977. In May 1978, the Commonwealth purchasedthe site from U.S. Ecology (NECO); in addition, the Commonwealth indemnified U.S. Ecology via thisagreement.
Kentucky is an Agreement State with licensing authority delegated from the U.S. NuclearRegulatory Commission (NRC). The Kentucky Natural Resources and Environmental ProtectionCabinet is the licensee, while the Cabinet for Health Services (Cabinet for Human Resources) is theagency responsible for the licensing of material in Kentucky.
In 1986, the U.S. Environmental Protection Agency (EPA) placed the Maxey Flats site on itsNational Priorities List of hazardous sites, based on a Hazard Ranking System score of 31.7. Thehazard ranking is the method by which the EPA uses site investigation data in a mathematical formulato rate the magnitude of hazards presented by a particular site. If the hazard ranking is 28.5 or greater,a site is placed on the National Priorities List, making it eligible for cleanup under the ComprehensiveEnvironmental Response, Compensation and Liability Act (CERCLA, commonly referred to as theSuperfund law) and the Superfund Amendments and Reauthorization Act (SARA). CERCLA isintended to protect public health and the environment from uncontrolled releases of hazardoussubstances into the environment. Whenever possible, the tax money spent on cleanup of a designatedsite is recovered from potentially responsible parties. Over 832 organizations shipped LLW to theMaxey Flats site. The federal government, cooperatively with the Commonwealth of Kentucky, hasthe CERCLA oversight lead for conducting additional work at the site.3'1
LocationThe Maxey Flats commercial low-level radioactive waste disposal facility is located on 102
hectares (252 acres) in Fleming County, Kentucky (Figure 3-1).
3-1

Figure 3-1. Location of Maxey Flats site.
Facility
The designated restricted area (Figure 3-2), where entry is controlled for the purpose of radiationprotection, is 17 hectares (42 acres). Wastes were buried (Figure 3-3) in 52 trenches of variedgeometry, a number of wells and several special pits. Most of the wastes were solids and were buriedin rectangular trenches about 8 m (25 ft) deep. The sides of the trenches were essentially vertical,
3-2

• iOUTH DRAINMEASURING WCm
' (ASTDETENTION rOND
— - — — MAIN DRAIN
^ — —— GRAVEL AREA
— . _ . _ . — FENCE I1S86I
*- fAITORAIN j | BOILOIKC
ite H i H » )
Figure 3-2. General map of the restricted area at the Maxey Flats site.
and adjacent trenches were separated by approximately 3 to 6 m (10-20 ft) of undisturbed soil androck. The trenches are separated by about 1.5 to 2 m (5-10 ft) of shale containing several thin (lessthan a meter thick) sandstone beds
Most of the wastes were received in steel drums. Other packages included concrete and steeltanks, concrete vaults, and wooden and cardboard boxes. The materials included animal tissue, paper,cardboard, wood, plastics, organic chemicals, clothing, protective apparel, laboratory glassware,obsolete equipment, duct work, radiopharmaceuticals, plastic tubing, and rubble. Other materialsincluded solidified liquids, shielding, filters, ion-exchange resins, activated metals, and evaporatorsludges.
To minimize exposure to site workers, the waste containers were placed in the trench bottom in arandom manner. The waste was covered with soil on a regular basis to limit possible direct radiationexposure from the trench. No special attempt was made to fill voids between the waste containers withbackfill soil.
When filled, the trenches were covered with approximately 1 to 3 m (3 to 10 ft) of compactedclay and crushed shale.
Trenches 45-51 were filled after the site was closed to the receipt of commercial waste and wereused for the disposal of wastes resulting from the site water management program and rubble from thedismantling of surplus facilities and equipment. Most of the trenches were unlined, with dimensions of
3-3

the trenches ranging from 3 to 200 m (15 to 670 ft) long, 3 to 20 m (10 to 70 ft) wide and 3 to 10 m(10 to 35 ft) deep. The burial media consisted predominately of a poorly fissile shale interbedded with
@
• 'i
! '
.'SI (H; 'V
(1
Mil
G
1 H~ '>Lr<
1 II I
JO)
hOTC SMALL LIQUlOWAJIf iniNCIKJ AI1J NOT S»0*N»0«CU«HT
Figure 3-3. Trench locations as of 1987 at the Maxey Flats site.
lenses of fine-grained sandstone and siltstone. The clay-rich cover soils range in depth from less than 1to 5 m (3 to 15 ft).
As site operations progressed, difficulties occurred due to the method of trench construction,waste placement, and closure.3'23 3 Because the soils under the trenches were generally low inpermeability, water collected in the open trenches during site operations (over the 1 to 1-1/2 yearsbefore trench cover installation). In addition, precipitation infiltrated through the trench covers andsome water entered laterally from adjacent areas.
The waste form also became a significant factor. The original packages contained large voidspaces. Degradation and decomposition (a process enhanced by contact with water) producedadditional voids. The voids resulted in trench cap subsidence. Surface cracks or depressions wererepaired regularly by placing additional fill over the affected area.
3-4

Additional water filtered into the trenches and continued the cycle of water entry.3"4 By the early1970s, sufficient water had accumulated in the completed trenches that a water management programwas implemented. Excess water was pumped out and either solidified or evaporated. Dewateringcontinued as rainfall infiltrated the trench area.3 2
Because the water volume was large and continually replenished by infiltration, pumping andtreating was unable to remove all trench water. In addition, chemical agents present in the wasteaccelerated the leaching of radionuclides. To reduce the likelihood of water contacting the buriedwaste, site operations were modified, by grading to improve surface drainage, recapping older trenchesto reduce cap permeability, improving new trench-capping procedures, establishing a vegetative coverover completed trenches (subsequently eliminated in favor of plastic), eliminating on-site ponds,installing additional trench sumps to facilitate water removal, routinely backfilling waste as it wasplaced in the trenches, and removing precipitation from the trenches while they were open and beingfilled.
Because of the Commonwealth's efforts to prevent vertical infiltration, removal of water ceasedand the evaporator was shutdown in 1986.
Volume
Approximately 140,000 m3 (4.8 million ft3) of waste, containing over 89,000 TBq (2.4 millioncuries) of byproduct material, 431 kg (950 lb) of special nuclear material, and 240,000 kg (533,000 lb)of source material were buried during the period of commercial operation. The waste includedplutonium, strontium, and gamma-emitting radionuclides. The most abundant radionuclide in the wastewas tritium. Uncertainty exists regarding the activity of the waste because much of the waste sent tothe site was labeled mixed fission products. In some trenches, approximately 50% of the waste wasmixed fission products.
Stabilization and Closure
The radioactive materials license issued to the site operator required that disposal be halted whenthe waste had reached a level approximately 1 m (3 ft) below the original ground surface. One meter(3 ft) of soil was required to be placed over the waste. This soil cover was emplaced and contoured topromote drainage away from the trench. Figure 3-3 is a 1987 map showing the trench boundaries asbest identified from old records, geophysical surveys, and trench dewatering well (sump) installations.
Since 1981, over 11 hectares (28 acres) of the site surface have been covered with a polymermembrane (polyvinyl chloride). This trench surface cover, which limits the infiltration of surfacewater into the trenches, reduces the formation of trench leachate. Trench leachate is formed whenwater frees constituents from the waste. Several radionuclides have been leached and moved into theenvironment at differing rates. Although the trench surface cover is effective in reducing theinfiltration of water from the surface, some leachate is still being produced.
In order to greatly reduce or prevent the percolation of water into the trenches,3"4 remedial actionsare now being directed toward meeting the Kentucky's regulatory requirement for longer-termstability—both by building a long-lasting, water-repellant closure cap to shed rain water and snow melt
3-5

(likely to extend over an area greater than is presently covered) and by horizontal ground water flowbarriers.
SITE
Topography
The Maxey Flats site is in the Knobs region of Kentucky on a flat-topped ridge. This region wasonce a near-flat, upland area. Over time, the terrain was dissected by erosion and, as a result, nowconsists of a series of elevated, nearly-flat erosional terraces which are separated from wide, flat streamvalleys at lower elevation by side slopes which have steep gradients, in excess of 40%.
Maxey Flats is the name given to one of the larger terraces in the region, approximately 6 km (4mi) in length, with an average width of about 450 m (1,500 ft). The terrace lies about 85 m (280 ft)above the wide valley floors of Crane Creek to the north and Rock Lick Creek to the south. Surfacetopography of the terrace varies from 320 to 330 m (1,040 to 1,060 ft) above sea level.
The portion of Maxey Flats occupied by the disposal site is a large southern spur of the terrace.The width of the terrace at the site varies from 400 to 600 m (1,200 to 2,000 ft). The spur crest slopesgently to the south, while the disposal site area slopes gently to the west, east, and south.35
Climate
The climate at the site is typical of the central part of the United States, which has a Koeppenclassification of Continental, characterized by warm humid summers and cold winters. Frontal systemsmove across this portion of the United States from both west and north out of the Gulf of Alaska andCanada, and from southwest to northeast out of Gulf of Mexico.
The average annual precipitation measured (1941-1970) at Fanners, Kentucky, eight miles southof the site, is 102 cm (44.3 in.). The fall season characteristically has the least rainfall, while springand early summer are the wettest seasons. Precipitation occurs in conjunction with major weathersystems and from short-duration spring and summer thunderstorms. Rainfall which occurs during thehigh-intensity thunderstorms frequently exceeds 5 to 8 cm (2 to 3 in.) and occasionally 12 to 15 cm (5to 6 in.).
Winds generally blow from the southwest in spring and early summer and from the south in thefall. The total annual evaporation rate, as determined from the U.S. Weather Bureau Climatic Atlas, isabout 90 cm (35 in.). Approximately 75% of the evaporation occurs from May to October.
Land Use
The Maxey Flats site includes 102 hectares (252 acres) of rural land. Within the 17-hectare(42-acre) restricted area (Figure 3-2), 10 hectares (24 acres) were used for waste disposal.
3-6
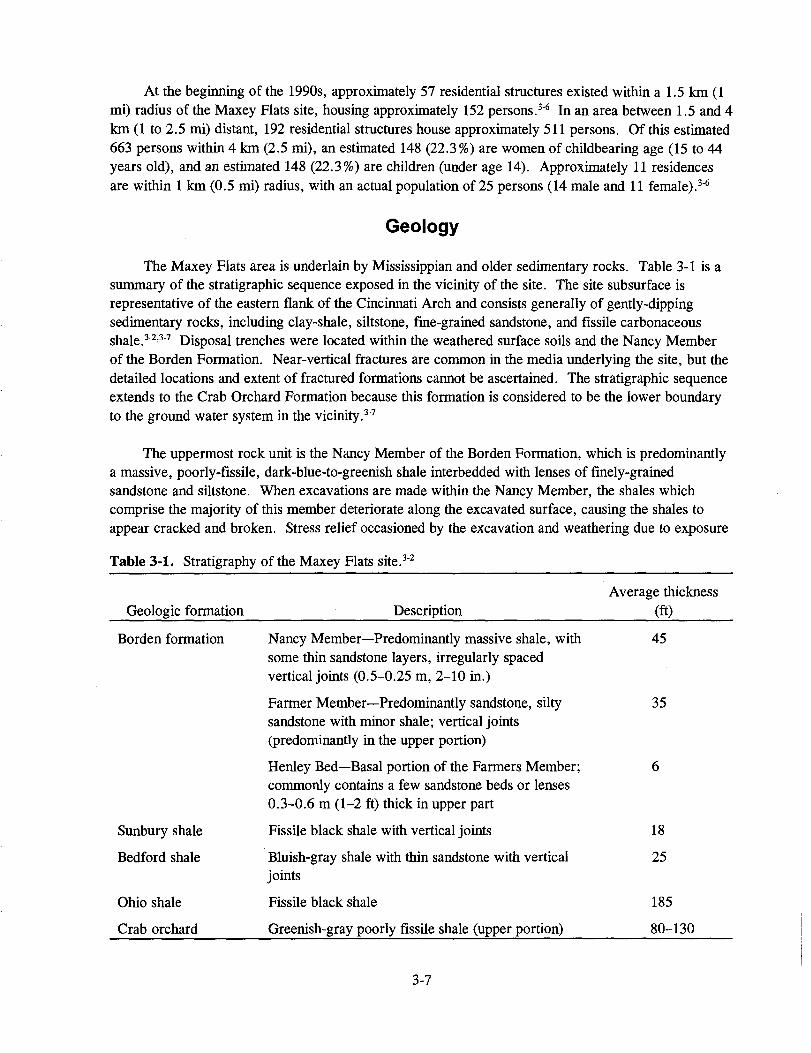
At the beginning of the 1990s, approximately 57 residential structures existed within a 1.5 km (1mi) radius of the Maxey Flats site, housing approximately 152 persons.3"6 In an area between 1.5 and 4km (1 to 2.5 mi) distant, 192 residential structures house approximately 511 persons. Of this estimated663 persons within 4 km (2.5 mi), an estimated 148 (22.3%) are women of childbearing age (15 to 44years old), and an estimated 148 (22.3%) are children (under age 14). Approximately 11 residencesare within 1 km (0.5 mi) radius, with an actual population of 25 persons (14 male and 11 female).36
Geology
The Maxey Flats area is underlain by Mississippian and older sedimentary rocks. Table 3-1 is asummary of the stratigraphic sequence exposed in the vicinity of the site. The site subsurface isrepresentative of the eastern flank of the Cincinnati Arch and consists generally of gently-dippingsedimentary rocks, including clay-shale, siltstone, fine-grained sandstone, and fissile carbonaceousshale.3"2-3"7 Disposal trenches were located within the weathered surface soils and the Nancy Memberof the Borden Formation. Near-vertical fractures are common in the media underlying the site, but thedetailed locations and extent of fractured formations cannot be ascertained. The stratigraphic sequenceextends to the Crab Orchard Formation because this formation is considered to be the lower boundaryto the ground water system in the vicinity.37
The uppermost rock unit is the Nancy Member of the Borden Formation, which is predominantlya massive, poorly-fissile, dark-blue-to-greenish shale interbedded with lenses of finely-grainedsandstone and siltstone. When excavations are made within the Nancy Member, the shales whichcomprise the majority of this member deteriorate along the excavated surface, causing the shales toappear cracked and broken. Stress relief occasioned by the excavation and weathering due to exposure
Table 3-1. Stratigraphy of the Maxey Flats site.32
Average thicknessGeologic formation Description (ft)
Borden formation Nancy Member—Predominantly massive shale, with 45some thin sandstone layers, irregularly spacedvertical joints (0.5-0.25 m, 2-10 in.)
Farmer Member—Predominantly sandstone, silty 35sandstone with minor shale; vertical joints(predominantly in the upper portion)
Henley Bed—Basal portion of the Fanners Member; 6commonly contains a few sandstone beds or lenses0.3-0.6 m (1-2 ft) thick in upper part
Sunbury shale Fissile black shale with vertical joints 18
Bedford shale Bluish-gray shale with thin sandstone with vertical 25
joints
Ohio shale Fissile black shale 185
Crab orchard Greenish-gray poorly fissile shale (upper portion) 80-130
3-7

of the shale to the atmosphere is the likely cause.3"2 This condition is not representative of the NancyMember where the shales are not weathered or exposed at the surface.
Weathering of the Nancy Member forms the regolith at Maxey Flats. The sandstone beds arevery fine grained silty sandstones in some areas, but are siltstones in others. An upper sandstone bed isnear the top and ranges in thickness from less than 0.1 m (4 in.) to about 1 m (3 ft), averaging about0.5 m (1.5 ft). The lower sandstone bed is near the middle of the regolith and ranges in thickness from0.1 to 1 m (less than 4 in. to 3 ft), and averages about 0.3 m (1 ft). The sandstone beds are absentlocally due to nondeposition or erosion of the upper bed in places but both are present over most of theMaxey Flats site.32
The Farmer Member (a sandstone unit) is exposed in the East Main Drainage Channel to the eastand south of the site, where it stands nearly vertically and serves as a barrier to erosion. The FarmerMember is not exposed on the western slope which is covered with regolith to the valley floor.
The hillsides at the site are covered with a layer of rock fragments and soil materials referred toas colluvium. The colluvium extends to the valleys, where it is referred to as alluvium.
Surface Water
The entire Maxey Flats region lies in the watershed basin of the Licking River, which drains intothe Ohio River near Cincinnati, Ohio. Greater than 90% of the water draining the 102 hectare (252acres) site discharges to Rock Lick Creek, which empties into Fox Creek. Fox Creek enters theLicking.
Drainage to the east carries approximately 62% of the surface water exiting the restricted area.Discharge over the eastern slope is regulated by a detention pond which discharges into an unnamedhollow (referred to as No Name Creek).
Approximately 15% of the site restricted area drains to the south directly into Rock Lick Creek.Approximately 20% discharges via the west detention pond into Drip Springs Creek which empties intoRock Lick Creek.
Ground Water
The shales and fine-grained sandstones of the site generally have low primary permeability.Ground water flow occurs mainly in joints and fractures in these rocks.
Water is found in the rock structure beneath the site, in at least two separate units. Water levelsin these units are about 8 m (25 ft) and over 90 m (300 ft) below land surface. Other distincthydrologic units may be present, but have not been identified.
The hydrological characteristics of the relatively shallow (average 12 m or 40 ft) Nancy Memberof the Borden Formation are of particular importance because all waste burial trenches were
3-8

constructed in these strata. Also, most problems, such as the accumulation of water in the trenches andsubsurface lateral migration of leachate, result from movement of water in these strata.
The importance of the upper and lower sandstone beds to ground water recharge and dischargebecame more apparent after drilling by the U.S. Geological Survey (USGS). Abrupt changes in theoccurrence, thickness, amount of fracturing and its orientation (particularly with regard to the lowerbed) were found to be characteristic of, and appear to determine, the movement of water from thetrenches to perimeter wells.38
Previous estimates32'37 of ground water flow in the lower sandstone bed were 15 m/y (50 ft/y).Based on yields of wells on the west hillside, this estimate may be low by one or more orders ofmagnitude. Radionuclide and organic chemical movement has been found in ground water flowing inthe lower sandstone bed in a triangular shaped area in the northwestern section of the site.
The extent of contaminated ground water appears to be controlled by the thickness of the lowersandstone bed beneath the south edge of Trench 41, the plugging of fractures with colluvium just insidethe western hillside outcrop area, and the complete absence of the lower bed along a line from the eastend of Trench 41 to a point near the northwest fence. The absence of this lower bed apparentlyprohibits the lateral movement of contaminated water from reaching other subsurface or outcropareas.38 Subsurface migration occurs from trenches south of Trench 41. Trench 41 received littlewaste and was closed early; furthermore, Trench 35 is the only major trench north of Trench 41.3 1 1
The rate at which rainfall percolates to the ground water system is low because of the silty natureof the surface soils and the consistently high runoff of incident precipitation. Ground water circulationwithin shallow ground water systems is influenced by the topography of the areas. Extreme reliefenhances lateral ground water flow toward topographically low areas. Because of the presence of lowpermeability shales, much of the water which does percolate to the ground water system dischargesthrough hillsides rather than recharging the deeper strata. Only about 10% of the water whichinfiltrates the bedrock at the burial site is estimated to percolate to the Ohio shale.37 This conceptualflow model of the site indicates that 70% of the water which infiltrates the site bedrock discharges tothe hillside above the lower part of the Farmers Member.3"7
Ground water discharging to the ground surface on hillsides may be evaporated, transpired, ormay eventually flow into the valley alluvium of Rock Lick Creek. Ground water discharge from rocksunderlying the trench area may contribute as much as 0.5% of the mean annual base flow of Rock LickCreek.3"7 This percentage is further diluted by surface runoff. An average dilution factor of 2,000 isestimated at the USGS gaging station on Rock Lick Creek,37 with mean annual base flow at the USGSgaging station estimated to be 7 m3/s-d (240 ftVs-d).
Ecology
The site is in a humid environment. Predominantly oak-hickory forests occupy the steep slopeson the eastern, southern, and western sides of the site. The forests, because of their locations inrelation to the burial trenches, are in a position to intercept radionuclides that might be transporteddownslope (Figure 3-4) by surface water runoff or subterranean water flow from the site.3"4
3-9

ENVIRONMENTAL MONITORING
Overview
In October 1974, Kentucky informed the U.S. Atomic Energy Commission (predecessor of NRC)of the results of a special six-month environmental study at Maxey Flats.39 The study concluded thatthe disposal site was contributing trace amounts of radioactivity to the local environment, although the
Buiial Tr«ncn
G'til
Qak-HiCkOfv
Orip SpringsHollow
Alluviumand Soil
Downslope Location of Forested Areas Relative to theDisposal Trenches at Maxey Flats
Figure 3-4. Downslope location of forested areas relation to the Maxey Flats site.
3-10

levels did not represent a public health hazard. Tritium, cobalt-60, strontium-89, strontium-90,cesium-134, cesium-137, plutonium-238, and plutonium-239 were identified in individual samples inthe unrestricted environment. Kentucky recommended longer-term studies at the facility to assess thehealth and safety significance of their findings.
In 1977, radioactivity in water was detected moving through the joints of a sandstone bed, adistance of approximately 90 m (300 ft) from the apparent source trench. In May 1977, Trench 46 wasopened and water was detected on the side wall. The events associated with this subsurface movementresulted in closure of the site to commercial waste by the Cabinet in December 1977.311
Interpreting data from the site environs is complicated by the fact that other past routes existed forradionuclide movement besides subsurface aquifer transport. Radioactive liquids were spilled.Reworking of trench subsidence areas to form new caps resulted in localized spread of contamination,although removal action has reduced the amount of this radioactivity now available for surface dispersalto the off-site environment. At least four pathways have been identified since the 1970's by studiescarried out by the Commonwealth of Kentucky, Commonwealth contractors, the NRC, the U.S.Geological Survey (USGS), and the U.S. Department of Energy (DOE):
1. Surface water runoff
2. Atmospheric fallout from the evaporator (prior to closing in 1986)
3. Lateral movement of liquids from trenches through the soil
4. Movement of liquids from the trenches through fractures in the surrounding rock.
Features of the site which create ongoing conditions which affect the environmental monitoring
are:
The very low overall permeability of the rock formations at the site which allowaccumulation of liquids within the trenches
Fractures, which exhibit a much greater permeability than the unfractured bulk of the rock,creating uncertainty regarding the direction and occurrence of ground water movement andmaking a thorough understanding of hydrologic conditions at the site difficult. This in turnmakes it difficult to implement a ground water monitoring program that will give a highlevel of assurance that migration will be observed, should it occur
Long-term consolidation of loosely placed waste in the trenches, leading to subsidenceevents which can damage trench cover and increase infiltration of precipitation
Accumulation of water in contact with the waste for a period of time sufficient to becomecontaminated, creating a potential environmental hazard if the leachate exits the trench byfracture flow or overflow
3-11

• The controlled migration of radionuclides and other hazardous materials to theenvironment—leachate buildup within the trenches was controlled by pumping it andprocessing it through the leachate evaporator system for volume reduction, with somerelease of radionuclides to the atmosphere.310 Leachate is no longer removed from thetrenches. The site has stabilized in regards to infUtration/exfiltration because of thepresence of covers.
The Kentucky Radiation Control Branch routine environmental monitoring program at the MaxeyFlats site is designed to address these features of and pathways for potential release of radioactivityfrom the site. For example, sampling in 1991 included surface water (off-site and washes), drinkingwater wells, USGS test wells, and soil lysimeters. During 1991, 2,209 water samples were collected toa distance of 7 km (4.5 air mi). The Kentucky Radiation Control Branch Laboratory conducted 7,788analyses and 4,894 additional quality control analyses to insure the accuracy and precision of the tests.
All water samples collected are analyzed for tritiated water (HTO) and gross alpha and betaradioactivity. Water samples from selected locations are analyzed for gamma-emitters, strontium-90,and specific alpha-emitters by alpha spectroscopy. Extended radionuclide and other analyses (gamma-emitters, cafbon-14, strontium-90, plutonium, uranium, HTO, pH conductivity, and gross alpha andbeta) are conducted on water from the USGS test wells surrounding ihe site and the seeps on the easthillside. The radionuclide analyses of the water samples provide valuable information regarding thespread of contamination from the burial trenches. Sampling frequency and locations are such that anychanges in radionuclide levels would be detected within sufficient time for remedial action to beformulated.311
Ground Water
In order to characterize the ground water conditions of the site, over 100 wells have been drilledas part of the site evaluation and site monitoring activities. Locations of all wells (except the initialeight wells installed prior to site operation) are shown in Figure 3-5. None of these sampling points areusable as drinking water sources because of their locations in and around the controlled area. A historyof the drilling program and details of the well designs are available.37 3-12,3-13,3-14
Many of the wells have very low water yields. As a result, representative periodic samplingproved to be difficult. Samples were bailed mechanically from the wells or sampled with anon-contaminating pump (peristaltic).
Generally, ground water samples are analyzed for tritium oxide concentrations and specificconductance. When the volume of the sample is sufficient, analysis includes gross alpha activityconcentrations, gross beta activity concentrations, and concentrations of gamma-emitting radionuclides.Since the ground water monitoring program is intended to provide advance warning of radionuclideescape, analysis of samples for tritium activity is given priority. This is appropriate since tritium,appearing in the form of tritiated water, travels at the same rate as the ground water; dissolved orsuspended radionuclides travel at slower rates. Tritium will likely precede the escape of otherradioactive materials by a considerable period. Data from well samples collected during 1987-1989are presented in Table 3-2.
3-12

Table 3-2. Selected ground water well sampling data for tritium (pCi/L) at the Maxey Flatssite.3"10-315-3-16
Well name
N2BUE-1UE-2UE-3
UG-1UG-2UG-12UK-1UK-2UK-4UK-6
UF-1UF-2UF-11UF-20UF-38UF-47
8.71.41.16.2
6.51.51.56.02.31.08.0
8.78.71.02.07.01.1
1987
X 108
X 109
X 109
X 108
x 108
x 108
X 108
X 108
x 109
x 103
x 102
x 108
x 108
x 103
x 103
x 103
x 10"
1988
1.8 x1.7 X
1.3 x5.2 x
1.2 x1.6 x8.5 x1.1 X
1.2 x<4.0 x
6.0 x
8.2 x7.2 x8.0 X1.4 X5.0 X1.9 X
108
109
109
108
108
108
107
109
109
102
102
108
108
102
103
103
10"
5.81.91.73.6
1.21.58.89.71.85.02.6
8.28.54.01.15.01.1
1989
x 108
X 109
x 109
x 108
x 108
x 108
x 107
x 109
x 109
x 102
x 103
x 108
x 108
x 102
x 103
x 103
x 10"
Table 3-3. Kentucky maximum permissible concentrations of radioactivity in air and water.317
Tritium
Cobalt-60
Cesium-137
Strontium-90
Plutonium-238
Plutonium-239/240
Soluble
2 X 10⁵
1 x 10"
2 x 10³
3 x 101
7 x 10"2
6 x 10*
Air(pCi/m3)
Insoluble
2 x 10⁵
3 x 10²
5 x 10²
2 x 10²
1
1
Soluble
3 x 10⁶
5 x 10"
2 x 10"
3 x 10²
5 x 10³
5 x 10³
Water(pCi/L)
Insoluble
3 x 10⁶
3 x 10"
4 x 10"
4 x 10"
3 x 10"
3 x 10"
3-13

u ' <
U»«t£
t«
u » «
U* 19 C
U»M<1
ft
a u ' M e
u » l
l « <
a u»4«
U •*t II1 »<
1 H1 '*1 1*1 " '
1 ' ** • •% M• * *$
a
At U»M ,.
Uf . . ,
1 a
» > j
uot
a
U»,l
uo«a
a
M l
. - C D u «
U«IA
UCIt USXA Q A
UCIt
5—a s 3 21
ftp «jt
C3( 1
I 1rzicr.,
UCIJ
J u»5« ^ \ u "" u»>»
aA
o*
U C I
•it a *
uc:i •
UC3 ^
UC49
'»i'i.
• " a ' ";'
u C H
UCJ 9
UCIO
UC4A
9 U C *
UflU
. W.I
a
UMJ UM, UO
M.
T L.-HTOCo«<
Mad»r«<< HrOCanumii
r Hifft HTO C»»<
•
UCIJ•
euCIl
BJ]
. w l "*»l l l l
lull]
j
11\
11
' &UII
i l a u# •«
X(««A | 8 < I W M A 10 > H 10 J Ci/m(|
a»fttf«llo«t (O»*r 10 p C«/«•!(
Figure 3-5. Well locations and tritium concentrations (pCi/mL) at.the Maxey Flats site.
Water collected from wells located on the western boundary of the site restricted area contain thehighest tritium levels. These may be compared to Kentucky regulations (Table 3-3). The highestaverage annual concentration of tritium observed was 9.7 x 10⁹ pCi/L at Well UK-1 (Figure 3-5),which is located near Trench 35 along the site restricted area fence. Generally, as illustrated inFigure 3-5, the highest concentrations of tritium oxide in ground water were observed in this area. Thehigh concentrations in the wells in the northwest quadrant of the site suggest that trench leachate hasmoved via the lower sandstone marker bed to distances of over 150 rn (500 ft) from the trench area.Of the 78 wells sampled in both 1986 and 1987, 14 wells demonstrated an increase in average tritiumconcentrations, 33 had declines, and 33 showed no significant change.
Surface Water
Surface water samples are collected on the site and off-site, including washes, to a distance of 7km (4.5 air mi).
Mean tritiated water concentrations for off-site sample locations—outside of at the siteboundary—ranged from 1.1 x 10⁵ pCi/L at the site boundary in the 32ast Main Drainage Channel to
3-14

100 pCi/L in Rock Lick Creek about 3 km (2 mi) upstream from where No Name Creek empties intoRock Lick Creek.
Erosion continues to be a problem in all drainage areas and especially in the East Main DrainageChannel and Wash 7 on the west hillside. If erosion continues in these drainage areas, migrationpathways could be intercepted leading to an increased release of radionuclides. Erosion control in theEast Main Drainage Channel is critical to the stability of the site in light of the finding of seeps andsprings along the east hillside.
Locations in the north drain of Trench 33L on the west hillside and the East Main DrainageChannel showed mean HTO concentrations which ranged from 3 x 10³ to 2 x 10⁶ pCi/L; however,many of these locations were dry for a substantial part of 1991. In the East Main Drainage Channel (atapproximately 250 m—800 ft—above mean sea level, which can be sampled throughout the year), themean HTO concentration was 3.1 x 10⁵ pCi/L for 1991, compared to 2.7 x 10⁵ pCi/L for 1990.311
The elevated HTO at surface water location 144 is a result of the leaching of radionuclides from EPAsolidified leachate stored on-site until November 1991 and from subsurface movement to the eastdrainage areas from the disposal trenches. The activity of HTO at location 144 did increase by theplacement of waste solidified and stored on-site; however, migration is occurring from the 40 Seriestrenches to the east hillside and then into the main drainage channel. Seeps were first detected inAugust 1990 by the Radiation Control Branch and these seeps are routinely monitored. The soils in thearea of the seeps are saturated at the ground surface during all seasons. The saturated area isexpanding down slope towards the east main drain. Since the activity of HTO in the seep water isapproximately 20,000 pCi/ml, saturation movement closer to the main drainage area could have amajor impact on activity levels at location 144.3n
Biota
Vegetation samples have been taken from pasture fields adjacent to the site and from a gardenlocated almost 500 m (550 yd) north of the site's main office building. Vegetation samples areanalyzed by various methods to determine the concentrations of tritium, strontium-90, plutonium-238,Pu-239/240, and gamma-emitting nuclides present. Tritium, strontium, and plutonium are present inmeasurable concentrations for all samples except cucumbers and tomatoes; tritium was not detected inthe cucumber and tomato samples. No gamma-emitting radionuclides were reported above theminimum detection limits.
Nonradiological samples collected in the food crop study area indicate no site-related hazardouschemical contamination in these off-site locations. Dieldrin, a pesticide detected in one food cropsample, is likely to be related to fanning activities rather than the site.
Soils
Toluene was the most widely-detected chemical contaminant at the Maxey Flats site, ranging from40 to 250 parts per billion (ppb). Other volatile organic contaminants detected in soils include acetoneand methylene chloride in low concentrations. Pesticides, polychlorinated biphenyls (PCBs), and semi-volatile contaminants were not detected in study area soil, with the exception of dieldrin, which wasdetected in a food crop study area. All soil samples showed inorganic chemical concentrations within
3-15

ranges considered normal for soils, with the exception of arsenic, which was found at 60 to 106 partsper million. Organic and inorganic analyses performed on these soil samples indicate that standardtoxicity test (EP toxicity and TCLP) results would be negative and that other hazardous constituentswould be within standards (under regulations of the Resource Conseirvation and Recovery Act).
SUMMARY
Radioactive materials, as described in the previous sections, were released to the environment asa result of the ongoing operations to stabilize and decommission the Maxey Flats site. These materialsinclude radionuclides such as tritium (generally, in the form of tritiated water), strontium-90, plutonium(in Pu-238, Pu-239, and Pu-240), and various gamma-emitting radionuclides, such as cesium-137.
The Kentucky Radiation Control Branch has concluded341 that analyses of test wells, soilmoisture, seeps and surface water indicate that water continues to accumulate in the trenches andexfiltration from the trenches continues to occur. The radioactive material leaving the site is dilutedsubstantially as it enters the environment. Direct measurement of the impact of the dilutedconcentrations of radioactive material is impractical; pathways followed by these materials to humansare evaluated using computer models and potential doses are calculated. All such calculations havedocumented very low exposures for all pathways. No exposures to the general public exceed federal orKentucky regulatory standards.311
3-16

REFERENCES
3-1. U.S. Environmental Protection Agency, Summary of Remedial Alternative Selection, Recordof Decision Remedial Alternative Selection, Maxey Flats Disposal Site, Fleming County,Kentucky, U.S. EPA Region IV, Atlanta, Georgia (1992).
3-2. H. H. Zehner, Hydrogeologic Investigation of the Maxey Flats Radioactive Waste Burial Site,Fleming County, Kentucky, U.S. Geological Survey Open File Report 83-133, Louisville,Kentucky (1983).
3-3. Grant (1982).
3-4. L. J. Kirby, "Radionuclide Distributions and Migration Mechanisms at Shallow Land BurialSites," U.S. Nuclear Regulatory Commission NUREG/CR-4670, PNL-7582, prepared byPacific Northwest Laboratory, Richland, Washington (1991).
3-5. Kentucky Department of Natural Resources and Environmental Protection, Results of theEnvironmental Monitoring Program at the Maxey Flats Disposal Site in Fleming County,Kentucky, Westinghouse Electric Corporation, Madison, Pennsylvania (ETD-DN-00044)(1987).
3-6. U.S. Environmental Protection Agency, Summary of Remedial Alternative Selection, Recordof Decision Remedial Alternative Selection, Maxey Flats Disposal Site, Fleming County,Kentucky, U.S. EPA Region IV, Atlanta, Georgia (1992).
3-7. H. H. Zehner, Preliminary Hydrogeologic Investigation of the Maxey Flats Radioactive WasteBurial Site, Fleming County, Kentucky, U.S. Geological Survey Open File Report 79-1329,Louisville, Kentucky (1979).
3-8. M. A. Lyverse, Movement of Tritiated Leachate through Fractured Rocks at a Low-LevelRadioactive Waste Disposal Site Near Morehead, Kentucky. Proc. 3d Ann RegionalGround-Water Conf., Nat. Water Well Assoc. (1986).
3-9. Kentucky Department of Human Resources, Six-month Study of Radiation Concentrations andTransport Mechanisms at the Maxey Flats Area of Fleming County, Kentucky, Open FileReport (1974).
3-10. Kentucky Department of Natural Resources and Environmental Protection, "EnvironmentalMonitoring Program Results," Maxey Flats Disposal Site, January 1987 through December1987, Fleming County, Kentucky.
3-11. J. A. Volpe, Commonwealth of Kentucky, Cabinet for Human Resources, Radiation ControlBranch, Personal Communication on Environmental Monitoring Program at the Maxey FlatsSite (1992 and 1996).
3-17

3-12. EMCON Associates, "Geotechnical Investigation and Waste Management Studies," NuclearWaste Disposal Associates, San Jose, California (1975).
3-13. Westinghouse Hittman Nuclear Incorporated, "Results of the Environmental MonitoringProgram at the Maxey Flats Disposal Site in Fleming County, KY- January 1984 throughDecember 1984," Columbia, Maryland.
3-14. Westinghouse Hittman Nuclear Incorporated, "Results of the Environmental MonitoringProgram at the Maxey Flats Disposal Site in Fleming County, KY- January 1986 throughDecember 1986," Columbia, Maryland.
3-15. Kentucky Department of Natural Resources and Environmental Protection, "EnvironmentalMonitoring Program Results," Maxey Flats Disposal Site, January 1988 through December1988, Fleming County, Kentucky (June 29, 1990).
3-16. Kentucky Department of Natural Resources and Environmental Protection, "EnvironmentalMonitoring Program Results," Maxey Flats Disposal Site, January 1989 through December1989, Fleming County, Kentucky (June 30, 1990).
3-17. Kentucky Administrative Regulations, 902 KAR 100:025, Table II, Frankfort, Kentucky(1992).
3-18

CHAPTER 4
Environmental Summary of theBeatty, Nevada Low-Level
Radioactive Waste Disposal Site
INTRODUCTION
Background
The Beatty, Nevada low-level radioactive waste (LLW) disposal facility operated by US Ecologywas the first commercial low-level radioactive waste site in the United States. The Beatty site beganoperations in September 1962, and was closed on December 31, 1992. The LLW facility occupies0.17 square kilometers (40 acres) of a 0.34 square kilometers (80 acres) tract which is leased to USEcology by the State of Nevada (Figure 4-1). The remainder of the approximately0.14 square kilometers (33 acres) is used for the disposal of hazardous chemical and toxic wastes(including PCBs). The hazardous waste site was licensed in 1970 under EPA Permit No. 330010000.
The Beatty site was originally operated by California Nuclear, Inc., and then by NuclearEngineering Company (NECO), which is now known as US Ecology. Activities at the site areregulated by the Radiological Health Section of the Nevada State Department of Human Resources.Nevada is an Agreement State, with licensing authority delegated by the U.S. Nuclear RegulatoryCommission (NRC). The site operator (US Ecology) holds a radioactive material license from the Stateof Nevada.
Although the State of Nevada assumed licensing responsibility for the site in 1972, the AEC, andlater the NRC, retained regulatory responsibility for special nuclear material until 1977, during whichtime the state regulated source and byproduct materials. In 1977, the NRC license was cancelled andthe state assumed licensing responsibility for all activities at the site.
Location
The Beatty LLW facility is located in Nye County, Nevada (latitude N 36° 46' 69", longitude W116° 41' 23"), in the Amargosa Desert, approximately 17.7 km (11 mi) south of the town of Beatty,and 169 km (105 mi) northwest of Las Vegas, Nevada (Figure 4-1).
Facility
From September 1962 through December 1992, the site received a total volume of 139,500 cubicmeters (4.93 million cubic feet) of low-level radioactive waste, with a total radioactivity ofapproximately 2.65 E+16 becquerels (0.715 million curies) (Table 4-1). The LLW facility is separated
4-1

It&o
i11
18o
-e
^ i & r - c :
i :
4-4

GOU ©#313
00K
L Tl i ta «3i7 ja
Entiaiico
Low-LovelI — — — • Radioactive
Wasto Management - —__ —. i( FacHily " '
I __JCrisz-~zszszsz.~
309
002302
603 605
Monitoring Wells0 IOQT 2o<r 3ocr *oar1 I I I I
SCALE
Figure 4-4. Monitoring wells of the Beatty (NV) LLW site.

Table 4-1. History of radioactive waste disposal volume and activity at the Beatty LLW site,1962-1992.
Year Cubic feet Curies
1962-1965 371,500 19,400
1966 173,800 14,000
1967 94,300 11,000
1968 131,800 7,100
1969 159,900 9,800
1970 145,900 6,700
1971 173,600 4,000
1972 151,900 5,800
1973 134,700 10,600
1974 144,900 23,000
1975 174,200 15,800
1976 136,400 2,500
1977 177,500 22,800
1978 301,700 4,800
1979 230,700 9,800
1980 450,100 146,300
1981 188,300 46,100
1982 52,700 80,800
1983 39,200 1,400
1984 72,900 500
1985 48,800 500
1986 92,000 700
1987 336,000 11,000
1988 93,400 86,900
1989 116,200 42,700
1990 59,500 11,300
1991 160,300 29,700
1992 514,700 90,200
TOTAL 4,926,900 715,200
4-6
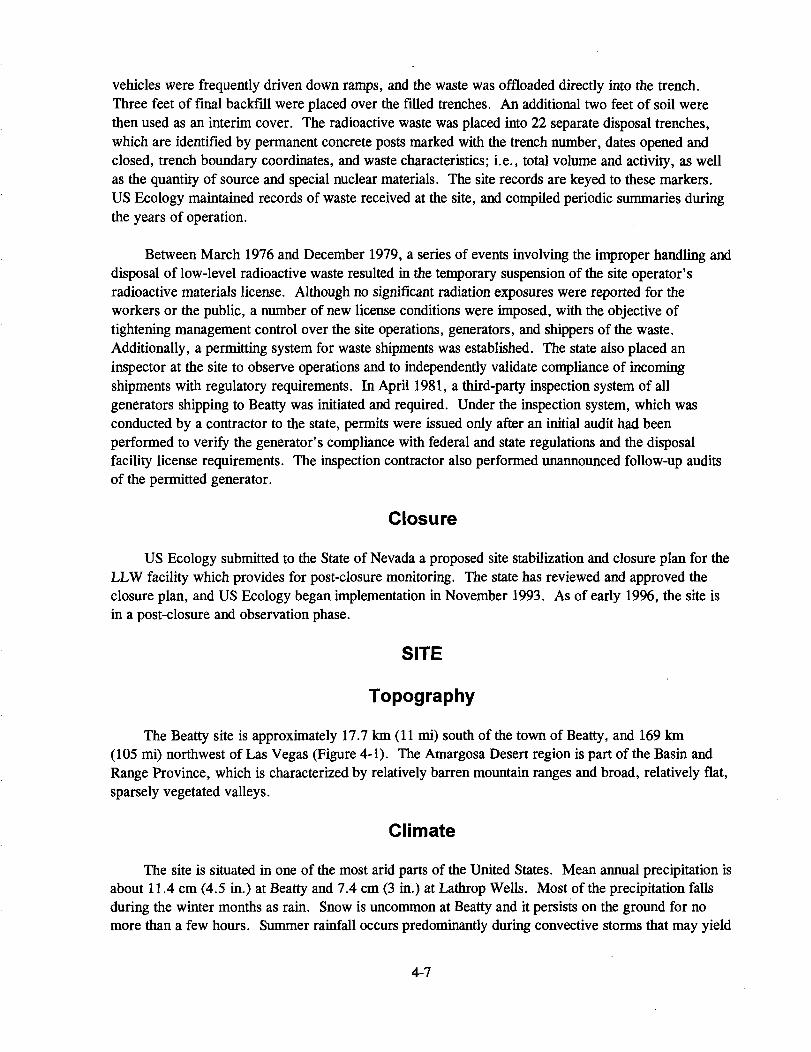
vehicles were frequently driven down ramps, and the waste was offloaded directly into the trench.Three feet of final backfill were placed over the filled trenches. An additional two feet of soil werethen used as an interim cover. The radioactive waste was placed into 22 separate disposal trenches,which are identified by permanent concrete posts marked with the trench number, dates opened andclosed, trench boundary coordinates, and waste characteristics; i.e., total volume and activity, as wellas the quantity of source and special nuclear materials. The site records are keyed to these markers.US Ecology maintained records of waste received at the site, and compiled periodic summaries duringthe years of operation.
Between March 1976 and December 1979, a series of events involving the improper handling anddisposal of low-level radioactive waste resulted in the temporary suspension of the site operator'sradioactive materials license. Although no significant radiation exposures were reported for theworkers or the public, a number of new license conditions were imposed, with the objective oftightening management control over the site operations, generators, and shippers of the waste.Additionally, a permitting system for waste shipments was established. The state also placed aninspector at the site to observe operations and to independently validate compliance of incomingshipments with regulatory requirements. In April 1981, a third-party inspection system of allgenerators shipping to Beatty was initiated and required. Under the inspection system, which wasconducted by a contractor to the state, permits were issued only after an initial audit had beenperformed to verify the generator's compliance with federal and state regulations and the disposalfacility license requirements. The inspection contractor also performed unannounced follow-up auditsof the permitted generator.
Closure
US Ecology submitted to the State of Nevada a proposed site stabilization and closure plan for theLLW facility which provides for post-closure monitoring. The state has reviewed and approved theclosure plan, and US Ecology began implementation in November 1993. As of early 1996, the site isin a post-closure and observation phase.
SITE
Topography
The Beatty site is approximately 17.7 km (11 mi) south of the town of Beatty, and 169 km(105 mi) northwest of Las Vegas (Figure 4-1). The Amargosa Desert region is part of the Basin andRange Province, which is characterized by relatively barren mountain ranges and broad, relatively flat,sparsely vegetated valleys.
Climate
The site is situated in one of the most arid parts of the United States. Mean annual precipitation isabout 11.4 cm (4.5 in.) at Beatty and 7.4 cm (3 in.) at Lathrop Wells. Most of the precipitation fallsduring the winter months as rain. Snow is uncommon at Beatty and it persists on the ground for nomore than a few hours. Summer rainfall occurs predominantly during convective storms that may yield
4-7

intense rainfall over small areas. On several occasions during late August or in September, tropicalstorms have come inland from the Pacific Ocean, crossing the California coast between San Diego andLos Angeles, and moved northeast across southern Nevada. Such a storm, in August 1977, producednearly 5 cm (2 in.) of rain in 24 hours at Beatty. During 1981 through 1988, an annual average of12.4 cm (4.9 in.) of precipitation, ranging from as little as 4.4 cm (1.73 in.) in 1985 to as much as22.5 cm (8.9 in.) in 1983, was recorded at the waste disposal facility. Estimated mean annual potentialevaporation at Beatty is about 190 cm (75.0 in.). Seasonal variation in potential evaporation rangesfrom 4.0 cm (1.58 in.) in December to 33.0 cm (13 in.) in July. There are no perennial streams withinabout 16 km (10 mi) of the site.
The temperature distribution and ranges at Lathrop Wells are similar to those at Beatty. Themean annual maximum daily temperature for the period 1949-79 is 25 °C (77 °F). The mean annualminimum daily temperature is 6°C (42.8°F), and the mean annual daily temperature is 15°C (59°F).The mean daily maximum temperature exceeds 32°C (89.6°F) from June through September. Thehottest month is July, with a mean daily maximum temperature of 37°C (98.6°F); the mean dailyminimum temperature for this month is 18°C (64.4°F). Average daily minimum temperatures fallbelow 0°C (32°F) during December, January, and February. The coldest month is January, with amean daily minimum temperature of -3°C (26.6°F); several days in early January have long-term meandaily minimum temperatures below -5°C (23 °F).
Land Use
The US Ecology facility is located in Nye County, Nevada, approximately 19.2 km (12 mi)southeast of the town of Beatty, in the Amargosa Desert. The facility is located approximately 48 km(30 mi) northwest of the town of Lathrop Wells and 9.7 km (6 mi) west of the Nevada Test Site. Landin the area is owned by the U.S. Government and is managed by the Bureau of Land Management.
The buffer zone between the 0.34 square kilometer (80 acre) LLWF/HWMF and the federallyowned land is approximately 402 m (1320 ft) wide.
As the facility is located in a desert, there are no business, recreational, or residential activitiesconducted in the area adjacent to the facility. The region is maintained as open range land withoccasional mineral extraction activities. A gold mine is operated approximately 6.4 km (4 mi) west ofthe town of Beatty. The town of Beatty is also located approximately 9.6 km (6 mi) east of thenorthern entrance to Death Valley National Park. As a result, the town experiences some tourist trade.
Geology
The site is located on unconsolidated deposits of alluvial sand, clay, silt, and gravel approximately183 m (600 ft) thick, formed by weathering action on the adjacent mountain ranges (Figure 4-5).Underlain by folded metamorphic and sedimentary bedrock, the site surface is approximately 854 m(2,800 ft) above sea level. A regional ground water table lies at a depth of 79 to 101 m (260 to 330 ft)below the surface in the alluvial soils.
4-8

0 -r
150 •
Q.<OQ
300 •
500 - •
570
Unconsolidated gravel with sand and boulders
Consolidated sand and gravel conglomerate
Clay with gravel
Consolidated sand and gravel conglomerate
Clay
BouldersClay and limestoneClay and gravelClayey limestone
Consolidated sand and gravel conglomerate
8edrocK
Figure 4-5. Site geology of the Beatty LLW site.
4-9

The Amargosa Desert is bounded, in large part, by mountain ranges composed of lower Paleozoiccarbonate and clastic sedimentary and metasedimentary rocks. The valley floor is presumablyunderlain at depth by rocks of these same types. Tertiary volcanic rocks also occur in several of theridges between the southern end of Bare Mountain and Lathrop Weils on the east side of the valley.
The geologic structure of the region surrounding the Amargosa Desert is complex. The majorstructural features include large-scale normal and thrust faults. Many of the surrounding mountainranges are bounded by normal faults producing the typical Basin-and-Range structure shown by thetopography of the area. Within the surrounding ranges, the rocks are folded and for the most partintensely faulted by small-scale thrust, tear, normal, and strike-slip faults. Superimposed on this highlycomplex pattern of folding and faulting are several shear zones including the Las Vegas Valley shearzone which extends northwestward to Mercury, Nevada, just south of the Amargosa Desert, and shearzones in Death Valley and the Amargosa Desert.
Surface Water
The intermittently flowing Amargosa River is 8 km (5 mi) from the site and is the principaldrainage channel in the area. No source of perennial water is found within 16.1 km (10 mi) of the site(Figure 4-1). Precipitation is sparse in the area, averaging less than 10 cm (4 in.) a year, but surfacerunoff is even more rare. The dry channel of the Amargosa passes about 3 km (1.86 mi) west of thewaste burial site.
The waste burial site is located in the drainage basin of the Amargosa River which is part of theDeath Valley hydrographic area. The terminus of the dry channel of the Amargosa River is at thesouthern end of Death Valley, but no flow has been observed along that part of the river in historictimes.4"1
Ground Water
Few wells have been drilled in the northern Amargosa Desert and, consequently, knowledge ofthe ground water system beneath the area is poorly known.
Knowledge of the ground water system beneath the waste burial site is based almost solely on theinformation obtained from the drilling and testing of a well at the waste burial site in 1961. The dataobtained from this well suggests the presence of a principal water bearing zone in the valley-filldeposits in the depth interval from 99 to 103 m (325 to 338 ft) below land surface. Another, lessproductive zone exists from 132 to 173 m (433 to 568 ft). This zone may be in hydraulic continuitywith the water-bearing bedrock aquifer that is presumed to underlie the valley fill. Depth to waterbeneath the waste burial facility is approximately 85 m (280 ft).
The ground water system beneath the site eventually terminates in Death Valley.
4-10

Ecology
Perennial plant species that occur in the vicinity of the Beatty site include: Larrea tridentata(creosote bush), Ambrosia dumosa (bur-sage or burro bush), Krameriaparvifolia (range ratanyl),Acamptopappus shockleyi (goldenhead), Atriplex confertifolia (shadscale), Atriplex canescens(four-winged salt bush), Ephedra nevadensis (mormon tea), Lycium andersonii (desert thorn orwolfberry), and Lycium pallidum (box-thorn).
Winter and early spring rains are more important for growth than the local, infrequent summerrains. As soil moisture is depleted and soil temperatures rise in the summer, some species start to losetheir leaves and become dormant. Some species also can have a dormancy period in the winter. Shrubspecies that never shed all their leaves and are therefore considered evergreens and are able to growafter spring, summer, or fall rains include Larrea tridentata and the Atriplex species. The Larreatridentata vegetational grouping contains 23 species. The Larrea tridentata grouping is the mostwidespread and diversified, and is considered the most stable vegetation cover in this area andconsequently represents a climax community. The soil surface itself is structured into highly andpoorly productive areas which is of major importance to the maintenance of perennial desertecosystems.
Wildlife is dominated by rodents. These include Thomomys bottae (pocket gophers), Lepuscalifornicus and Sylvilagus audobonii (rabbits), Dipodomys merriami (kangaroo rats), and Onychomystorridus and Peromyscus spp. (mice).
ENVIRONMENTAL MONITORING
Overview
Environmental monitoring at the Beatty LLW facility is performed to demonstrate compliancewith federal, state, and local regulations; to confirm adherence to environmental protection policies;and to support the environmental management decisions. These regulations require that effluents to thegeneral environment be maintained as low as reasonably achievable (ALARA) and that annual dosesdue to effluents not exceed 0.25 millisieverts (25 millirems) to the whole body, 0.75 millisieverts(75 millirems) to the thyroid, and 0.25 millisieverts (25 millirems) to any other organ of any member ofthe public.
The major goals of the environmental radiation program are to identify, assess and initiateappropriate corrective actions needed to prevent any potential exposure to the public or contaminationof the environment before a significant problem develops. The program is designed to evaluateradioactivity levels in the environment over a period of time, both to assess compliance withappropriate standards and to determine trends. Trend analysis is necessary to identify a potentialproblem and to initiate corrective action to reverse the trend.
Environmental monitoring started in May 1961 prior to site operations. Soil and vegetationsamples were taken from the vicinity of the four facility corners. Ground water sampling from the on-
4-11

site well started in October 1962. Monitoring locations and the analysis performed on environmentalsamples were modified from time to time over the 30 years of operations.
Environmental monitoring included radioanalysis of ground water, air particulates, air tritium,surface soil, vegetation, and ambient gamma measurements using thermoluminescent dosimeters(TLDs). Monitoring of the LLW disposal facility is conducted on-site by the site operator, USEcology, Inc. The Nevada Radiological Health Section conducts independent monitoring on-site andoff-site, with all samples analyzed by a contract laboratory. The samples are scanned for gamma-emitters and analyzed for gross alpha and gross beta activity.
Action levels for gross alpha and gross beta in soil and vegetation were established by the State ofNevada in 1977. These are shown in Table 4-2.
Gross alpha, gross beta, and hazardous constituent data obtained from monitoring of the adjacentchemical waste disposal site are also reviewed by the Nevada Radiological Health Section.
Ground Water
The Beatty Site Well (a specific well) was completed on July 17, 1961, and has a 175 m (575 ft)boring with the screened area starting at 84 m (275 ft) from the bottom. Beginning in the fourthquarter of 1962, the Beatty site well was analyzed for gross alpha, gross beta and, beginning in January1972, for tritium concentration. From 1962 through 1972, only the on-site well was sampled. In thethird quarter of 1982, sampling from two new wells—an upgradient well (#301) and a downgradientwell (#302)—was started (Figure 4-4).
The results of the gross alpha, gross beta and tritium concentration in ground water samples arelisted in Table 4-3 and Figures 4-6, 4-7, and 4-8. The mean concentration of gross alpha and beta inthe Beatty Site Well samples from 1962 to 1972 were 0.22 Bq/L and 0.92 Bq/L (5.9 and 24.8 pCi/L)
Table 4-2. Action levels for gross alpha and gross beta in soil, vegetation/ and ground water(including tritium in ground water only).
Material Gross Alpha Gross Beta Tritium
Soil l .UBq/gm 3.33 Bq/gm
(30.0 pCi/gm) (90.0 pCi/gm)
Vegetation 0.74 Bq/gm 7.4 Bq/gm
(20.0 pCi/gm) (200.0 pCi/gm)
Ground water 1.11 Bq/L 3.3 Bq/L 74 Bq/L
(30.0 pCi/L) (90 pCi/L) (2,000 pCi/L)
a. Dry plant mass.
4-12
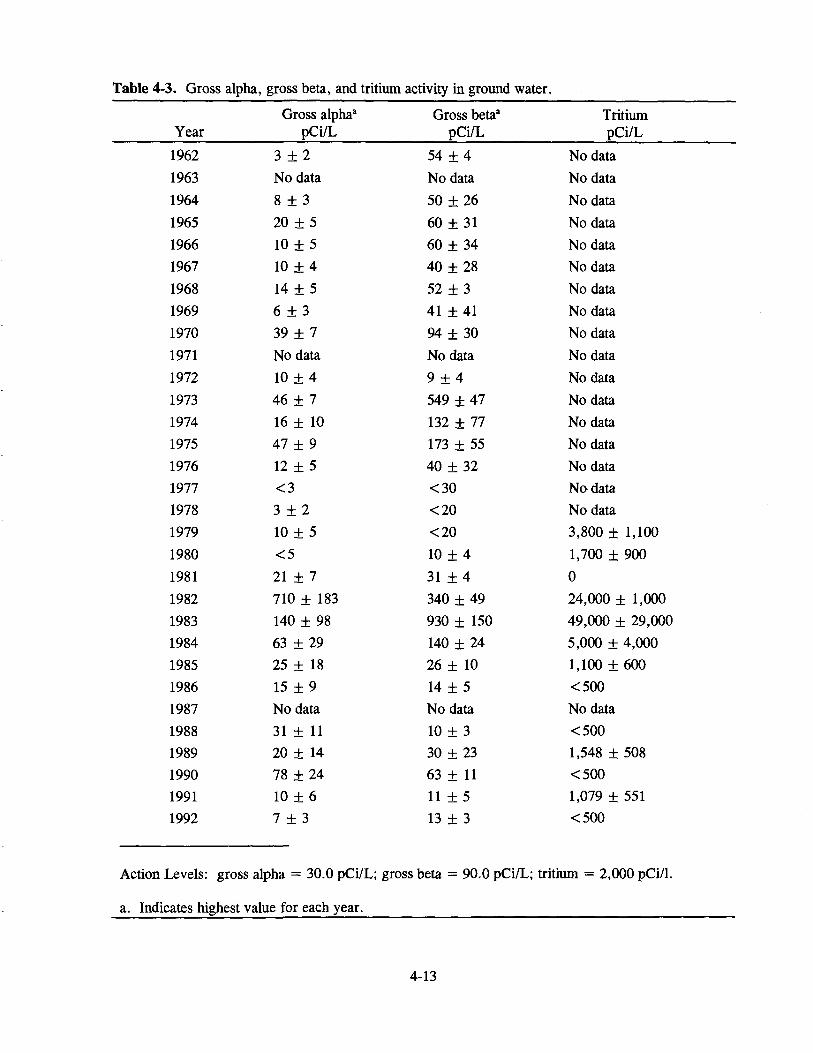
Table 4-3. Gross alpha, gross beta, and tritium activity in ground water.
Year
1962
1963
1964
1965196619671968
1969
1970
19711972
19731974197519761977
1978
19791980
19811982
1983198419851986
198719881989199019911992
Gross alpha*pCi/L
3 ±2No data8 + 320 ± 510 ± 510 ± 414 ± 56 ± 339 ± 7No data10 ± 446 ± 716 ± 1047 ± 912 ± 5< 3
3 + 210 ± 5< 5
21 ± 7710 + 183140 + 9863 ±2925 ± 1815 ± 9No data31 ± 1120 ± 1478 ±2410 ± 67 + 3
Gross betaa
pCi/L
54 ±4No data50 ±26
60 ± 3160 + 3440 ±28
52 + 341 +4194 ± 30No data9 ± 4549 ± 47132 ± 77173 ± 5540 ± 32<30
<20
<20
10 ± 431 ± 4340 ± 49930 ± 150140 ± 2426 + 1014 + 5No data10 ± 330 ±23
63 ± 1111 ±513 + 3
TritiumpCi/L
No data
No data
No dataNo data
No dataNo data
No dataNo dataNo data
No dataNo data
No data
No dataNo dataNo dataNo dataNo data
3,800 ±1,100
1,700 ± 900
024,000 ± 1,00049,000 ± 29,0005,000 ± 4,0001,100 ± 600<500No data<5001,548 ± 508<5001,079 ± 551<500
Action Levels: gross alpha = 30.0 pCi/L; gross beta = 90.0 pCi/L; tritium = 2,000 pCi/1.
a. Indicates highest value for each year.
4-13

. Error Marg Act. Data
1000pCi/L
800 -
600 -
400 -
200 -
1962 1964 1966 1968 1970 1972 1974 1976 1978 1980 1982 1984 1986 1988 1990 1992
YearMaximum Values For Each Year (Action Level = 30 pCi/L)
Figure 4-6. Gross alpha groundwater samples: Beatty, Nevada.

Error Marg Act. Data
1500pCi/L
1000 -
~500
500 -
1962 1964 1966 1968 1970 1972 1974 1976 1978 1980 1982 1984 1986 1988 1990 1992
YearMaximum Values For Each Year (Action Level = 90 pCi/L)
Figure 4-7. Gross beta groundwater samples: Beatty, Nevada.

Error Marg Act. Data
pCi/L
as
80000
60000
40000 -
19/9 1980 1981 1982 1983 1984 1985 1986 198/ 1988 1989 1990 1991 1992
Year
Maximum Values For Each Year (MPC 2,000 pCi/L)
Figure 4-8. Tritium groundwater samples: Beatty, Nevada.

respectively. The gross alpha concentration varied from less than detectable to 0.74 Bq/L (20 pCi/L)for a December 1965 sample. The gross beta concentration varied from less than detectable to3.5 Bq/L (94 pCi/L) in July 1970. The trend during these years was a reduction in both the gross alphaand beta concentration, most likely due to changes in the instrumentation and methodology used by thevendor laboratories.
In 1974, water from the Lathrop Wells was used as a control or background comparison to thesite wells sample analysis. In 1979, analysis for tritium was performed on all ground water samples.From 1974 until September 1982, there was no significant difference between the concentration ofgross alpha, gross beta and tritium in any of the ground water samples.4"2
A review of the analysis results for tritium in ground water (Table 4-3 and Figure 4-8) indicatethat for most years the tritium activity has been below the action level of 74 Bq/L (2000 pCi/L). Theexceptions have been the years 1979, 1982, 1983, and 1984, when the tritium concentration exceededthe action levels and showed activities as high as 15,170 ± 370 Bq/L (410,000 ± 10,000 pCi/L)during 1982 (not included in Table 4-3 or Figure 4-8) for the downgradient well #302. Theseabnormally high values are still well below the federal regulatory limits for tritium in water for bothrestricted areas (0.41 % 10 CFR 20 values) and unrestricted areas (13.7% 10 CFR 20 values).4"2
After 1984, a gradual reduction in the concentration occurred. The results of ground watersamples of Well 302 since February 1986 have been less than the minimum detection limits, 18.5 Bq/L(500 pCi/L).
Subsequent to the detection of tritium in Wells 301 and 302, the monitoring frequency wasincreased. Sampling was increased from quarterly to monthly and during 1983 it went to bi-weekly.Ground water samples were evaluated by analyzing both the dissolved and suspended fraction. Thesediments in the ground water were analyzed using gamma spectroscopy and fluoroscopy to evaluatewhether non-natural radionuclides were contributing to the gross alpha and beta concentrations.Sediments from Well #301 were positive for Co-60 in a May 1985 sample at 0.1 + .02 Bq/L (2.7 ±0.6 pCi/L). All other elevated gross alpha and beta concentrations were shown to be due to K-40,natural uranium and its decay products, and natural thorium and its decay products.
The maximum tritium concentrations in Well 302 were less than 14 % of the allowedconcentration listed in the Nevada Administrative Code, Section 459.334, Table of Concentrations inAir and Water Above Background, Table II, Column 2."~2
Since the July 1984 sample, there have been only two positive tritium samples, both from Well302. The gross alpha, beta, and tritium concentrations in the ground water samples have not variedsignificantly between sample locations. An upward trend has been identified in the gross betaconcentration since the second quarter of 1980, which is most likely due to a reduction in the minimumdetectable concentration of gross beta activity in water. The gross beta concentration increased andthen remained constant with no significant difference between the three sampling locations.
Analysis demonstrated that the gross alpha, gross beta, and tritium concentrations were seldomgreater than the minimum detectable concentration.4"2
4-17

Surface Water
The intermittently flowing Amargosa River is 8 km (5 mi) from the site and is the principaldrainage channel in the area. No source of perennial water is found within 16.1 km (10 mi) of the site,and therefore no surface water monitoring has been conducted.
Air
The continuous air monitoring program was instituted in June 1989. Air sampling was performedat the three monitoring points (Figure 4-3) to determine the concentration of airborne tritium and airparticulate.
Tritium was sampled using a silica gel cartridge which was changed on a monthly basis in orderto allow for the collection of a sufficient amount of moisture in the silica gel column. Results of tritiumconcentration in air (1989-1992) are provided in Table 4-4. None of the values exceeded the actionlevel of 7.4 E-4 Bq/cc (2.0 E-8
Air particulate sampling was performed at the same three locations as tritium sampling(Figure 4-3). Filters were analyzed for gross alpha and gross beta concentration on an approximatelyweekly basis. Results of this analysis444"7 showed that the concentrations of gross alpha and gross betain air particulate samples were below the action levels of 1.9 E-9 and 1.1 E-5 Bq/cc (5 E-13 /tCi/cc and3.0 E-9 /iCi/cc) for gross alpha and beta, respectively.
Soil
Regular soil sampling started in December 1963. Soil samples were originally taken from drywells located near the disposal trenches and the vicinity of the four corners of the disposal site. Thedry wells were constructed in order to intersect any potential subsurface migration from completedtrenches. Dry wells were normally located at the south side of the completed trenches and extended toa minimum of 3.0 m (10 ft) below the established bottom of the trench. In addition to the dry wellsassociated with each completed burial trench, two dry wells were located south of the site. The samplemedium in all of the dry wells is the soil at the bottom. Surface soil samples were also taken fromlocations outside the licensed disposal area. The soil samples taken outside the site are locatedTable 4-4. Tritium activity in air (/nCi/cc).a
1989 0.92 ± 0.75 E-10
1990 4.50 ± 0.50 E-10
1991 8.70 ± 0.75 E-10
1992 1.56 ± 0.50 E-10
Action level of tritium in air = 2.0 E-8 fid/cc
a. Indicates the highest value for each year.
4-18

approximately 61 m (200 ft) from the fenced disposal area, to the north, southeast, east, and west.These areas are identified by markers in the ground to ensure sample reproductivity. Samples aretaken within a 4.6 m (15 ft) radius of these markers. Starting in May 1977, control samples for soilwere taken from the Lathrop Wells area. The Lathrop Wells area has similar flora and geologicformations to the Beatty LLW disposal facility.
By 1977, the soil sampling locations had become standardized and consisted of 19 sampling areas.Soil samples were taken quarterly and analyzed for gross alpha and beta. Occasionally, additionallocations were sampled. The primary soil sampling locations included:
• The control sample from Lathrop Wells
Dry wash 305 m (1,000 ft) southeast of LLW disposal site
• Office area
• West Quadrant 61m (200 ft) outside the fence
• North Quadrant 61m (200 ft) outside the fence
• East Quadrant 61m (200 ft) outside the fence
Dry Wells R-l through R-6, R-14, R-16, R-19, P-l, P-3, and P-4.
Surface soil samples were taken from undisturbed areas, using a ring of approximately 10 cm(4 in.) inside diameter, pressed into the soil 5 cm (2 in.) deep. Dry wells were sampled by pouringapproximately 500 ml of clean tap water or, after 1983, deionized water in the dry well; and afterapproximately a three-hour wait, a sample collection tube was allowed to free-fall down the dry well tocompact a sample into the tube.
The soil samples were analyzed for gross alpha and beta concentrations. Action levels wereestablished in 1977 and were 1.1 Bq/gm (30 pCi/gm) for gross alpha and 3.3 Bq/gm (90 pCi/gm) forgross beta concentrations. When action levels were exceeded, the State of Nevada representative wasnotified and a gamma spectrum analysis was performed on the sample. Radioanalysis results of grossalpha, gross beta, and gamma spectrometry in soil samples are provided in Tables 4-5 and 4-6,respectively. Graphical presentations of gross alpha and gross beta are shown in Figures 4-9 and 4-10,respectively.
In September 1984, the State of Nevada deleted the requirement for soil sampling of the drywells. Dry well soil sampling was discontinued because most of the soil had been removed from thedry wells during the years of sampling and only rocks were present in the bottom of many of the wellsmaking it no longer possible to extract a representative soil sample.
The analysis of the dry well soil samples during the previous seven year period never resulted in aconcentration exceeding the established action levels.
4-19

Table 4-5. Soil sample
Year
1962
1963
1964
1965
1966
1967
1968
1969
1970
1971
1972
1973
1974
1975
1976
1977
1978
1979
1980
1981
1982
1983
1984
1985
1986
1987
1988
1989
1990
1991
1992
analysis—Beatty LLW Site.
Gross alpha*pCi/gm
No data
No data
No data
1.9 ± 0.63
2.7 ± 1.2
1.7 ± 0.64
2.94 ± 0.41
9.5 ± 3.7
No data
8.9 ± 3.8
13 ±5
6 + 3
18.2 ± 8.2
64 ± 15
42 ± 7.7
20 ±6.1
18 ± 6
31 ± 13
23 ± 6.1
32 ± 9.8
25 ± 6
24 ± 7
25 ± 7
16 ± 3
10.2 ± 1.6
1.3 ± 0.3
5.7 ± 1.1
9.3 ± 2.5 (wet)
12.8 + 3 (dry)
3.5 + 1.0 (dry)
5.4 + 2.7 (dry)
Gross betaa
pCi/gm
No data
No data
No data
72 ± 4.4
73 ± 5.3
3.5 ± 0.34
5.03 + 0.57
37 ±4.1
No data
80 ± 4.9
108 ± 32
110 ± 40
253.6 ±111
614 ± 60
257 ± 28
60 ±24
60 ±24
80 ± 31
90 ± 16
60 ± 15
66 ± 18
79 ± 4
52 ± 15
40 ± 17
9.6 + 1.0
7.0 ± 0.8
6.6 ± 0.9
21.5 + 1.3 (wet)
51.5 + 7 (dry)
22.0 + 1.3 (dry)
28.4 ± 2.3 (dry)
Action Levels: gross alpha = 30.0 pCi/gm; gross beta = 90.0 pCi/gm.
a. Indicates highest value for each year.
4-20

Table 4-6. Gamma spectroscopy analysis of soil samples (pCi/gm) (April 1982).a
Location
320 ft. south of Trench 18, 70 ft.
east of Rad/Buffer Zone, 10 ft.
NW sample point
320 ft. south of Trench 18, 70 ft.
east of Rad/Buffer Zone, 10 ft. SW
sample point
320 ft. south of Trench 18, 70 ft.
east of Rad/Buffer Zone, 10 ft.
NE sample point
320 ft. south of Trench 18, 70 ft.
east of Rad/Buffer Zone, 10 ft.
NW sample point
Analysis
K-40
Mn-54
Cs-137
Ra-226
Ra-228
Th-228
K-40
Co-60
Mn-54
Cs-137
Ra-226
Ra-228
Th-228
K-40
Mn-54
Co-60
Cs-137
Ra-226
Ra-228
Th-228
K-40
Mn-54
Co-60
Cs-137
Ra-226
Ra-228
Th-228
Concentration
26 ±0.41
0.019 ± 0.013
0.29 ± 0.017
1.00 ± 0.076
2.0 ± 0.076
1.9 ± 0.027
25 ± 0.4
0.02 ± 0.013
0.04 ± 0.0085
0.72 ± 0.021
1.0 + 0.032
2.0 ± 0.075
1.9 ± 0.027
25 ± 0.39
0.037 ± 0.007
0.064 ± 0.014
0.2 ± 0.021
0.95 ± 0.031
1.9 ± 0.07
1.8 ± 0.025
26.3 ± 0.4
0.021 ± 0.01
0.087 ± 0.015
0.45 + 0.019
0.99 ± 0.032
1.9 + 0.072
1.8 + 0.026
a. Data for other years are not available.
4-21
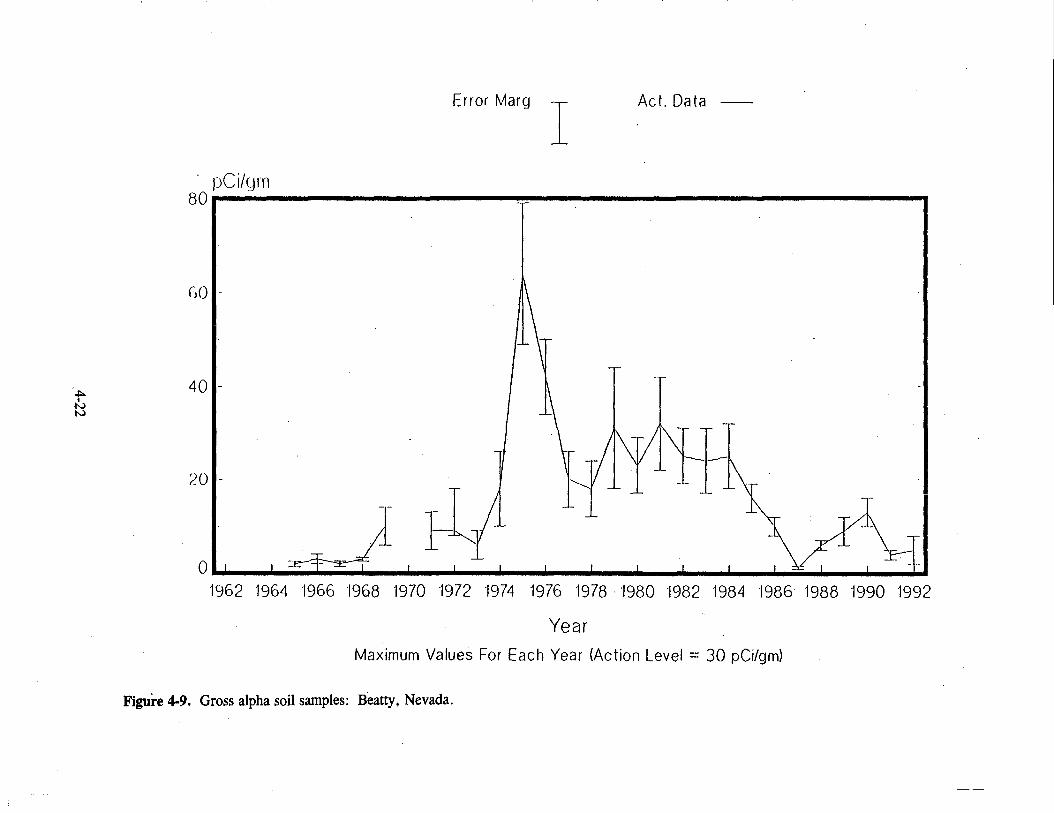
pCi/gm80
GO
40
Error Marg Act. Data
0 •
1962 1964 1966 1968 1970 1972 1974 1976 1978 1980 1982 1984 1986 1988 1990 1992
Year
Maximum Values For Each Year (Action Level = 30 pCi/gm)
Figure 4-9. Gross alpha soil samples: Beatty, Nevada.

Error Marg -r- Ach Data
800pCi/gm
600
to
400 -
200 -
1962 1964 1966 1968 1970 1972 1974 1976 1978 1980 1982 1984 1986 1988 1990 1992
Year
Maximum Values For Each Year (Action level = 90 pCi/gm)
Figure 4-10. Gross beta soil samples: Beatty, Nevada.

Biota
The protocol for the sampling and analysis of vegetation samples parallels that of soil. Vegetationsamples were analyzed for gross alpha and beta concentrations beginning in 1961. Sample locationsand time periods during which samples were gathered varied substantially from 1961 until 1977. By1977, samples were being taken quarterly in Lathrop Wells as the control sample, at a dry wash 306 m(1,000 ft) southeast of the site, in the office area, and at 61 m (200 ft) outside the north, west, and eastquadrants of the site. The results of the radioanalysis of the vegetation samples for gross alpha andgross beta concentration are listed in Table 4-7. Graphical presentations of these data are shown inFigures 4-11 and 4-12.
Vegetation samples consisted of pruned green leafy or foliage material from plants in the samplearea. At least 250-300 grams were required for laboratory analysis. Often there was not sufficientgreen material present, and an analysis could not be performed. Action levels were established in 1977as 0.74 Bq/gm (20 pCi/gm) of dry plant mass for gross alpha contamination and 7.4 Bq/gm(200 pCi/gm) of dry plant mass for gross beta contamination. If an action level was exceeded, theState of Nevada was notified and gamma spectral analysis of the vegetation sample was performed.
Tritium and gamma spectroscopy analyses of vegetation were performed in 1982 from samplescollected outside the facility boundary. The results are listed in Table 4-8.
Direct Radiation
External dose rate monitoring of direct (penetrating) radiation began in 1965. Measurementswere performed using film dosimeters placed at the north, east, south, and west fencelines. The filmbadges were posted quarterly or semiannually and were analyzed by Radiation Detection Company.Monitoring during the early years of operations showed fenceline exposures higher than the monitoringresults obtained for later years. During the fourth quarter of 1965, the west fence film dosimeter read5.30 millisieverts (530 mrem) and two film dosimeters placed at the north side of the burial groundread 6.80 and 6.40 millisieverts (680 and 640 mrem), the south fence film dosimeter read12.0 millisieverts (1200 mrem) during the second quarter of 1966, and the west fence film dosimeterread 4.80 millisieverts (480 mrem) during the second quarter of 1967. In 1968, the federal governmentbegan monitoring the site boundary and a control location at US Highway 95. Seven locations weremonitored on a quarterly basis. Only six measurements since 1968 have exceeded1.0 millisievert/quarter (100 mrem/quarter). The maximum exposure was 11.40 millisieverts(1,140 mrem) at the south fenceline during the third quarter of 1976.42 The south boundary exposurerates were significantly higher than the other locations. In 1977, in addition to the federalgovernment's monitoring, the facility operator performed area monitoring at 14 locations, usingenvironmental thermoluminescent dosimeters (TLDs). The annual maximum exposures (1977-1992)are listed in Table 4-9, and shown in Figure 4-13. Exposure rates have trended down over the years ofoperations. The maximum annual exposure was 4.15 millisieverts (415 mrem) at the east boundary in1978. The south boundary exposure rate remained significantly higher than all other locations. Noneof the locations exceeded the 1.25 millisieverts/quarter (125 mrem/quarter) action level.
4-24

Table 4-7. Vegetation sample analysis-Beatty LLW Site.
Year
1962
19631964
1965
19661967
1968196919701971
1972
19731974
197519761977
19781979198019811982198319841985
1986198719881989199019911992
Gross alpha3
pCi/gm
0.73 ± 0.32No data
No data
0.13 ± 0.04
0.9 ± 0.450.39 ± 0.220.16 ± 0.040.17 ± 0.12
No data0.19 ± 0.16
1.4 ± 1.0
0.36 ± 0.323.8 ±4.1
3.49 ± 2.29 ± 30.3 ± 0.006
0.7 ± 0.030.7 ± 0.62.4 ± 19 ± 4
2.4 ± 26 ± 3
6.3 ± 1.87.2 ± 1.30.8 ± 0.25.3 ± 2.73.2 ± 0.40.6 ± 0.2 (dry)3.1 ±2.4 (dry)0.5 ± 0.2 (dry)11.4 ±2.3 (dry)
Gross betaa
pCi/gm
126 ± 3.1No data
No data21 ± 0.5
110 ± 5.48.0 ± 0.413.3 ± 0.231.3 ± 0.27No data2.8 ± 0.3722 ± 35
27.2 ± 3
420 ± 110146 ± 30220 ± 2039.6 ± 14.536.9 ± 929.3 ± 4.250 ± 5.1
17.6 ± 1.430 ± 4.955.7 ± 4.915.5 ± 2.316 ± 15.8 ± 0.277.6 ± 2.510 ± 0.365.5 ± 8.1 (dry)
16.3 ± 3.6 (dry)5.9 ± 0.3 (dry)48.9 ± 2.8 (dry)
Action Levels: gross alpha = 20.0 pCi/gm; gross beta = 200.0 pCi/gm.
a. Indicates highest value for each year.
4-25

Error Marg
pCi/grn
Act. Data
i i i i i i
1962 1964 1966 1968 1970 1972 1974 1976 1978 1980 1982 1984 1986 1988 1990 1992
Year
Maximum Values For Each Year (Action Level = 20 pCi/gm)
Figure 4-11. Gross alpha vegetation samples: Beatty, Nevada.

Error Marg Act. Data
800pCi/gm
600
400
200
0 1 ir
1962 1964 1966 1968 1970 19/2 1974 1976 1978 1980 1982 1984 1986 1988 1990 1992
Year
Maximum Values For Each Year (Action Level = 200 pCi/gm)
Figure 4-12. Gross beta vegetation samples: Beatty, Nevada.

Table 4-8. Tritium and gamma spectroscopy analysis of vegetation samples (March 1982)."
Location Analysis Concentration
200 ft southeast of south fence in dry wash
240 ft southeast of south fence in dry wash
300 ft southeast of south fence in dry wash
400 ft southeast of south fence in dry wash
320 ft south of south fence, NE
320 ft south of south fence, SE
320 ft south of south fence, SW
320 ft south of south fence, NWo
H-3
Cs-137
H-3
Cs-137
H-3
Cs-137
H-3
Cs-137
H-3
Cs-137
H-3
Cs-137
H-3
Cs-137
H-3
Cs-137
34 + 2 pCi/mL
1 + 0 . 4 pCi/gm
1,000 + lOOpCi/mL
1.5 ± 0.6pCi/gm
630 ± 10 pCi/mL
1.4 + 0.5pCi/gm
340 + 10 pCi/mL
0.9 ± 0.5 pCi/gm
60 pCi/mL
0.8 + 0.3 pCi/gm
170 ± 10 pCi/mL
1.5 ± 0.4pCi/gm
15 + 1 pCi/mL
0.5 ±0.3 pCi/gm
11 ± 1 pCi/mL
1.3 + 0.4pCi/gm
a. Data for other years are not available.
SUMMARY
The environmental monitoring program began in May 1961 at ithe Beatty LLW facility. On-siteenvironmental monitoring has been conducted by the site operator (US Ecology, Inc.) to demonstratecompliance with federal, state and local regulations; to confirm adherence to environmental protectionpolicies; and to support the environmental management decisions.
An oversight environmental radiation program at the Beatty LLW facility has been conducted bythe Nevada Radiological Health Section to provide independent on-site and off-site monitoring toensure the adequacy and accuracy of the licensee's program. The environmental data summary reportincludes radioanalysis of ground water, air particulate, air tritium, surface soil, vegetation, and ambientgamma measurements using thermoluminescent dosimeters (TLDs).
4-28

millirem400
300
200
1977 1978 1979 1980 1981 1982 1983 1984 1985 1986 1987 1988 1989 1980 1991 1992
Year
Maximum Values For Each Year
Figure 4-13. Ambient gamma: Beatty, Nevada.

Table 4-9. Direct radiation.
Year mrem/yr"
1977 330
1978 225
1979 280
1980 245
1981 185
1982 385
1983 180
1984 125
1985 90
1986 115
1987 No data
1988 60
1989 70
1990 70
1991 70
1992 140
a. Indicates the highest value for each year.
Results of the ground water samples (collected from site wells, the office area, and from LathropWells) analyzed for gross alpha, gross beta, and tritium concentrations are presented in Table 4-3. Theground water was also analyzed for the presence of gamma-emitting radionuclides. Results of analysisfrom 1985 through the end of 1992 indicate a downward trend in both gross alpha and betaconcentration in ground water.
Tritium activity in ground water for most years has remained below the action level of 74 Bq/L(2,000 pCi/L) with the exception of 1979, 1982, 1983, and 1984, when a marked increase in tritiumconcentrations was observed from the downgradient well (#302). These values were well below thefederal regulatory limits for tritium in water for both restricted areas (0.41 % 10 CFR 20 values) andunrestricted areas (13.7% 10 CFR 20 values). After 1984, tritium concentrations in ground water haveremained below the action level.
4-30

The gamma isotopic analysis of well water samples has indicated no detectable concentrations ofmanmade radionuclides in ground water.4"2"4"7
Sampling for airborne tritium was performed at three monitoring stations on the site (Figure 4-3).All samples were less than the action level of 7.4 E-4 Bq/cc (2.0 E-8 /xCi/cc).
Air particulate sampling was performed at the same three locations as air tritium sampling. Allsamples analyzed for gross alpha and gross beta airborne activity concentrations were less than actionlevels of 18.5 E-9 Bq/cc (5.0 E-13 /iCi/cc) for alpha activity and 11.1 E-5 Bq/cc (3.0 E-9 jtCi/cc) for betaactivity.4"4^"7
No trends were indicated in the gross alpha concentration data during site operations. Theenvironmental sampling program has demonstrated that alpha-emitting radionuclides are not migratingthrough the soil to off-site locations.
During 1972-1976, gross beta concentration in soil samples showed an upward trend. Thechange in concentration is believed to be more a function of the vendor performing the analysis thanany actual change in radioactivity in the soil.4"2 From 1977 to October 1985, the gross betaconcentration in soil did not vary significantly. The mean remained about 1.3 Bq/gm (35 pCi/gm)throughout every sampling period.42 Subsequent to October 1985, the gross beta concentration in soilhas been below the action level of 3.3 Bq/gm (90 pCi/gm).
A review of the historical data presented in environmental reports for the Beatty site4"2"4"7 showsthat the gamma spectrometry analysis of soil was performed only once during April 1982. The resultsof this analysis are presented in Table 4-6.4"2 Although no action levels were exceeded, Cs-137, Co-60,and Mn-54 were detected at concentrations less than 0.03 Bq/gm (0.8 pCi/gm) for Cs-137, 0.003Bq/gm (0.09 pCi/gm) for Co-60, and 0.002 Bq/gm (0.04 pCi/gm) for Mn-54. The State of Nevadawas notified and soil and vegetation samples were split between US Ecology and the state for analysis.
Vegetation samples were collected from locations near the facility boundaries, as well as fromLathrop Wells. There was no significant difference between the different sampling points, nor anytrends with respect to time at any of the sampling points.4"2"4"7
The gross beta concentration in vegetation samples varied from a low of 0.1 Bq/gm (2.8 pCi/gm)in 1971 to a high of 26.7 ± 1.3 Bq/gm (722 ± 35 pCi/gm) taken in 1972. Several trends in the grossbeta activity in the vegetation samples have been observed during the years 1972-1976. Subsequent to1976, a general downward trend was observed in the gross beta concentration, which has remainedmuch below the action level of 7.4 Bq/gm (200 pCi/gm).4"2"4"7
In 1982, tritium and gamma spectral analyses of vegetation from samples outside the facilityboundary were performed. The results are listed in Table 4-8. The tritium concentrations varied from0.4 Bq/ml to 37.0 Bq/ml (11 to 1,000 pCi/ml). The State of Nevada split samples of the vegetation andthe analysis varied from 2.3 E-4 to 2.4 E-4 Bq/ml (0.0061 to 0.0065 pCi/ml). The difference wasstriking and not easily explained. The most probable explanation to the differing laboratory results ischemiluminescence.4"2 Chemiluminescence can significantly interfere with liquid scintillation analysisfor tritium and can be the result of the organic components in the liquid, which is derived from the
4-31

vegetation samples. The gamma spectral analysis identified Cs-137 with concentrations varying from0.02 to 0.06 Bq/gm (0.5 to 1.5 pCi/gm).
A review of the historical direct radiation data *~2 demonstrated that during the early years ofoperation, the fenceline exposures were 5.3 mSv (530 mrem) for 1965, and 12 mSv (1200 mrem) for1966 and decreased in later years from 3.30 mSv (330 mrem) in 1977 to 0.60 mSv (60 mrem) in 1988.
4-32

REFERENCES
4-1. William D. Nichols "Geohydrology of the Unsaturated Zone at the Burial Site for LLW Near Beatty, Nye County,Nevada," U.S. Geological Survey, Carson City, Nevada (1986).
4-2. Beatty Site Environmental Reports -1962-1987, US Ecology.
4-3. Beatty Site Environmental Report - 1988, US Ecology.
4-4. Beatty Site Environmental Report -1989, US Ecology.
4-5. Beatty Site Environmental Report - 1990, US Ecology.
4-6. Beatty Site Environmental Report - 1991, US Ecology.
4-7. Beatty Site Environmental Report - 1992, US Ecology.
4-33

CHAPTER 5
Environmental Summary of the West Valley,New York
Low-Level Radioactive Waste Disposal Site
INTRODUCTION
Background
The state-licensed disposal area (SDA) was constructed and operated by Nuclear Fuel Services,Inc. (NFS), during a period extending from 1963 until 1975, at which time disposal activities at theSDA were discontinued. From 1975 until March 1983, the SDA was actively maintained by the NFS.From March 1983 until present the New York State Energy Research and Development Authority(NYSERDA) has been responsible for the continued maintenance of the SDA. The SDA is presentlyunder active maintenance. Ultimate disposition of the SDA is still undetermined.
Location
The Western New York Nuclear Service Center (Center) is located 20 miles south of Buffalo,New York, near the town of West Valley. The 3,340 acre Center is the site of the world's firstcommercial nuclear fuel reprocessing plant. Facilities at the Center include the nuclear fuelreprocessing plant and its ancillary facilities consisting of a fuel receiving and storage pool, high-levelliquid waste storage tanks, two radioactive waste disposal areas, and a low-level liquid waste treatmentplant. One of the disposal areas is the State-Licensed Commercial Low-Level Radioactive DisposalArea (SDA). All major facilities are located on a 200 acre plot near the center of the site (Figure 5-1).
Facility
Nuclear Fuel Services Co., Inc. (NFS) operated the site from 1963 to 1982 under a lease with theState of New York. The fuel reprocessing plant has not operated since 1972, and the SDA has beenshut down since 1975. In February 1982, the U.S. Department of Energy (DOE) took possession offacilities at the Center (except for the SDA) for the purpose of carrying out the West ValleyDemonstration Project (WVDP). The primary purpose of the WVDP, pursuant to the West ValleyDemonstration Project Act (PL 96-368), is to solidify the high-level liquid wastes stored at the Centerand to decontaminate and decommission the facilities used in the project. On March 30, 1983,responsibility for the SDA was officially transferred to NYSERDA.
The radioactive waste burial activities at West Valley, New York, consisted of two distinctactivities: (1) commercial low-level radioactive waste burial under a New York Agreement Statelicense from 1963 to 1975, when NFS voluntarily stopped accepting LLW, and (2) NRC-licensed
5-1

burial of the higher activity reprocessing plant waste from 1966 to 1986 at the NRC-licensed DisposalArea (NDA), sometimes also referred to as the "hulls burial area." These licenses were issued toco-licensees NFS and the former New York State Atomic and Space Development Authority (ASDA).The two activities and the operation of the reprocessing plant were carried out in close physicalproximity. Both activities were initially carried out by the site operator and co-licensee, NFS.
This chapter will address primarily the SDA. The SDA was licensed to handle three types ofradioactive wastes: (1) by-product materials including tritium, carbon-14, cobalt-60, iodine-125,iodine-131, cesium-137, and americium-241; (2) source materials including thorium-232, uranium-238,and natural uranium; and (3) special nuclear materials including uranium-235, plutonium-238, andplutonium-239. From 1963 to 1975, about 2.35 million cubic feet of wastes (equivalent to 319,60055-gallon drums) containing approximately 740,000 curies were disposed of in the SDA. The wastewas received from a variety of sources including medical and academic institutions, industries,government facilities, nuclear power plants, waste brokers, decontamination companies, and the NFSoperations at the site.
The SDA occupies approximately 6 hectares (15 acres), located about 300 m (1,000 ft) southeastof the reprocessing plant and is adjacent to the NRC-licensed disposal area (NDA). The SDA consistsof two distinct sets of parallel trenches, identified as north and south disposal areas as shown in Figure5-2. The northern area consists of five trenches (1, 2, 3, 4, 5), and two "special" trenches (6 and 7).Trench 7 is a narrow, shallow concrete vault in which wastes were disposed of and Trench 6 is actuallya series of holes for the disposal of high-activity wastes requiring immediate shielding. Disposaloperations were conducted in this area from 1963 to 1969, except for Trench 6 which was used until1973. The southern disposal area consists of seven trenches (8-14). This area was developed from1969 to 1975 and incorporated a number of changes in construction practices based upon theexperience gained from the northern area of the SDA: (1) topsoil and coarse surface materials wereremoved, (2) separation distance between trenches was increased to 3 m, from 1.2 to 1.8 m (10 ft,from 4 to 6 ft), (3) trench floors were sloped southward from wastes previously disposed of, and (4) thetrenches were covered with individual caps. The trenches had nominal dimensions of approximately180 m long x 8.25 m wide x 6 m deep (600 ft long, 27.5 ft wide and 20 ft deep). Construction andoperational practices by NFS at the SDA have resulted in surface contamination of soils in and near theSDA. This contamination has the potential to complete the interpretation of data from the ongoingenvironmental monitoring program.
The commercial low specific activity (LSA) waste, having radiation levels of less than200 mRem/hr at the surface, was buried in the trenches. According to NFS estimates, approximately55 % of the available volume in the disposal trenches was utilized resulting in an overall activity level ofless than 0.1 curie per cubic foot of trench space. The volume per trench actually used varies from23% to 82% of that excavated. The difference reflects the use of soil for shielding and backfilling andthe existence of air spaces between the containers. Because of the presence of non-compacted wasteforms, the buried material is undergoing a gradual volume reduction through biodegradation andcompaction, causing voids and some difficulties in maintaining the integrity of the caps on the trenches.
5-2

ROCK SPRINCS
APPRQX. 1CM.L
Figure 5-1. Principal facilities at the West Valley LLW site.

Table 5-1 summarizes the sources of the material buried through 1972. Most of the material wasburied in the original shipping containers: steel drums, wooden crates, and cardboard boxes. Thewaste that originated at nuclear power plants consists primarily of evaporator bottoms, filter sludges,and filters, all in 55-gallon drums or in disposal liners.
A detailed summary of the wastes disposed of in the SDA through 1972 is contained in a NewYork State Department of Environmental Conservation (DEC) report.51
Table 5-1. Sources of waste in the state-licensed disposal area through 1972.5-2
Type of facility
Medical and educationalinstitutions
Industrial, pharmaceutical,research and developmentinstitutions
Federal government
Waste disposal anddecontamination companies
Nuclear fuel services
Nuclear power plants
Number offacilities
30
70
7
9
1
8
125
New Yorkbased facilities
21
38
4
5
1
3
72
Waste volume
(%)
1.8
21.5
12.0
19.2
23.0
22.5
100.0
Recently, as part of the environmental impact statement (EIS) for site closure, work has beendone to estimate the radionuclide source term for waste management areas at the Center including theSDA. NFS estimates of the radioactivity of wastes disposed of at the SDA are shown in Table 5-2.
Since the SDA accepted waste for disposal prior to the U.S. Environmental Protection Agency(EPA) hazardous waste regulations, little indication of chemical constituents exists in the disposalrecords. Disposal records maintained by NYSERDA do not contain sufficient information to determinewhether hazardous wastes were disposed of at the SDA. However, NYSERDA, has made an effort tochemically characterize the leachate contained in the SDA. The data provide an indirect indication ofchemical constituents in each of the trenches from which samples were taken and analyzed. The resultsof these analyses show that in the SDA the water collecting in the trenches may come into contact withburied waste and become contaminated with chemical and radiological constituents. Due to thepresence of radionuclides, these materials would be mixed wastes.
The SDA lagoon was located approximately 15 m (50 ft) west of Trench 14 in the southern partof the SDA. From 1975 to 1981, the lagoon was used to store and pre-treat leachate pumped from theSDA burial trenches. The lagoon was approximately 27 m (90 ft) long, 12 m (40 ft) wide andoriginally could accumulate liquid to a maximum depth of 2.1 m (7 ft). Maximum capacity was about100,000 gallons. The lagoon was unlined, and was filled in 1991 with soil over a liner. Figure 5-2shows the location of the lagoon.
5-4

NY7SOO3A
f
SCALE IN FEET
250 500 750Adopted from drawings supplied by NYSERDA
LEGEND
WEST VALLEYDEMONSTRATIONPROJECT
r = = = = r UNPAVED ROAD
ecology and environment .
• STREAM LINE
— x x — FENCE
— x — x — SDA BOUNDARY
NOA BOUNDARY
FILLED LAGOONS
Figure 5-2. State-licensed trenches at the West Valley LLW site.
5-5

Two other lagoons were excavated adjacent to the north trenches. The lagoons held rainwaterthat was pumped out of the open trenches during disposal operations to provide reasonably dry workingconditions. These two lagoons were closed by filling them with soil in 1975 and 1977. In 1975, athird lagoon was constructed adjacent to the south trenches to hold water pumped from the completedtrenches that were accumulating water. This lagoon was closed in 1991 by installing a barriermembrane over the sediments, then filling it with native soil and adding a clay cap.
During the fall of 1990, and the spring, summer, and fall of 1991, new equipment was installed atthe SDA, including an enclosed storage tank to hold contaminated water from Trench 14 and severalFRAC tanks intended to provide emergency storage for trench water should levels rise unexpectedly.In the summer of 1992, a slurry wall was constructed on the west side of Trench 14 in order tominimize water infiltration into the southern SDA trenches. Trenches 14, 13, and half of trench 12were recapped using membrane liners. These developments will be reviewed in subsequent sections ofthis report. Subsequently, a new geomembrane cover was placed over all trenches other than Trench 9which had a bioengineered cover added to it.
SITE
Climate
Prior to the opening of the site, extensive climatological studies were undertaken by the U.S.Department of Commerce Weather Bureau. The average temperature was found to be 9°C (48DF), andrain and snowfall averaged 1 and 2.25 m (40 and 90 in.), respectively, over a 10- to 15-year period.54
Land Use
The area surrounding the site is rural/residential. Significant crops include trees and shrubs (fortransplant) and a variety of grains and vegetables. Beef and dairy products are also produced.Population density for Cattaraugus County is less than 100 persons per square mile.
Topography and Surface Water
The West Valley site occupies a plateau which is cut by the Buttermilk Creek and its tributaries.Buttermilk Creek empties into Cattaraugus Creek which in turn flows into Lake Erie, approximately 40miles to the northwest. The site includes most of the Buttermilk Creek Valley. At this time, andduring the operating history of the site, none of the villages or cities located downstream from the siteto Lake Erie uses surface water from the Buttermilk or Cattaraugus Creeks for domestic purposes.However, people do fish in the Buttermilk and Cattaraugus Creeks. The burial site is bounded byErdmann Brook and by a small seasonal tributary of this creek (Frank's Creek). Erdmann Brook flowsinto the Buttermilk Creek.
The burial sites are located in the central area of the reservation, about 414 m (1,380 ft) abovesea level. Buttermilk Creek and its tributaries cut through the area at an elevation of approximately400 m (1,300 ft). The valley walls of Buttermilk Creek and its tributaries are steep, and badly slumped
5-6

in places. The site is generally well drained with the exception of a marshy area to the south of theburial area.
Geology and Ground Water
Extensive geologic and hydrologic studies were undertaken by the New York State GeologicalSurvey (NYSGS) and the United States Geological Survey (USGS) before and during 1963. Thesestudies included a boring program of 108 augured holes and 14 deep wells.5"5 These wells and boringsindicated deep, low-permeability clays, which were thought at the time to make the site promising for adisposal area. Figure 5-3 shows a geological cross section of the West Valley site. Subsequentexperience with the site has shown that burial trenches have a tendency to fill with water and that thepotential for horizontal leachate migration is not as minimal as originally thought due to the presence ofsand lenses and other permeable structures within the weathered till and upper layers of unweatheredtill. The primary direction of ground water flow at the SDA is downward. The disposal trenches wereexcavated into the native Lovery till, which because of its high clay content and high degree of over-consolidation, is highly impermeable at depth. Samples taken from boreholes have indicated, however,that the upper three meters of the till are weathered as a result of desiccation. The weathered till ishighly fractured and is generally more permeable than the unweathered till.
ENVIRONMENTAL MONITORING
Overview
The SDA began operations in 1963, three years prior to the beginning of operations at the NFSreprocessing plant. During this three year period, environmental monitoring at West Valley wascarried out by the New York State Department of Health to establish background levels for thesubsequent monitoring of the reprocessing plant. Also, during this period, the off-site monitoringprogram consisted of the following: (1) monthly surface water sampling for gross beta and selectedradionuclides including iodine-131, cesium-137, barium-140, strontium-89, and strontium-90 carriedout in the Cattaraugus Creek watershed at the Springville Dam and upstream of the NFS plant; (2) airmonitoring for gross beta at several locations in the immediate vicinity of the NFS plant; and (3)monthly analysis of milk from 16 local dairy herds for iodine-131, cesium-137, barium-140,strontium-90, and strontium-89. All data prior to April 1966 were regarded by Nuclear Fuels Servicesand the State Health Department as background data. Gross beta levels in water were 1-3 pCi/L, airgross beta was generally less than 1 pCi/L, and no significant concentration of radionuclides wasobserved in milk.
In November 1966, gross beta concentrations increased from about an average of 3 pCi/L to anaverage of 252 pCi/L in the Cattaraugus Creek at the Springville Dam. During this same period, othersampling sites upstream of the plant showed levels between 1 and 3 pCi/L. Levels in air and dairyherd levels showed no significant change. By the end of 1966, the downstream creek environment hadconcentrations of various nuclides significantly higher than before plant operation. No off-site samples,however, showed levels that exceeded the concentration limits set forth in 10 CFR 20 of the U.S.Atomic Energy Commission regulations. There was no detectable rise in radioactivity due to stackdischarges in the area surrounding the plant up to the end of 1966.
5-7

Table 5-2. West Valley trench inventory.5-3
TrenchNo.
1
2
3
4
5
6b
T
8
9
10
11
12
13
14
Total (without 6)Total (with 6)
Length(feet)
365
335
695
660
535
160
73
565
560
560
560
555
610
655
Trench volume
(ft3)3
233,000
213,000
443,000
421,000
341,000
112,300
11,000
360,000
360,000
360,000
360,000
355,000
390,000
420,000
4,297,000
Wastevolume
(ft3)
55,300
114,200
198,000
274,400
278,400
500
2,500
252,400
175,800
185,800
182,800
196,700
207,800
229,800
2,354,6002,355,100
Activity(curies)
4,100
2,200
17,100
67,100
92,800
339,600
1,600
38,700
34,200
54,900
53,500
11,200
7,400
12,300
397,100736,700
a. Excavated trench volume calculated by using an average width of 8.7 m (29 ft), average depth of 6.6 m (22ft) times the length, except for trenches Nos. 6 and 7.
b. Trench No. 6 consists of 19 separate holes in an area 4.5 m (15 ft) wide and 48 m (160 ft) long. Depthaveraged 36 m (12 ft). Utilization rate based on the total hold volume is 4%, and 2% based on the overalltrench excavation volume.
c. Trench No. 7—special purpose concrete vault—21.9 m (73 ft) long, about 3 m (10 ft) wide, and about 4.5m (15 ft) deep.
5-8

During this period, the effects of the discharges from the NFS plant were evident on theButtermilk and Cattaraugus Creeks sampling stations. The U.S. Atomic Energy Commission did notestablish limits for the section of Buttermilk Creek which received the wastes because that section waswithin the NFS site boundary and under the control of NFS. Concentration limits were applied toCattaraugus Creek after the confluence of Buttermilk Creek. The limits for gross beta were consideredto be 300 and 600 pCi/L for the yearly and maximum values, respectively, if an isotopic analysis wasnot made. The allowable concentrations in pCi/L for each specific radionuclide averaged over a year'speriod were as follows: strontium-90 - 300, cesium-137 - 20,000, zirconium-Nb-95 - 60,000,barium-140 - 30,000, strontium-89 - 3,000, and tritium - 3 million.
Through 1968, the program and the results thereof were essentially unchanged. On a yearlybasis, the average concentrations allowed by the U.S. Atomic Energy Commission in CattaraugusCreek were not exceeded. A single sample taken from Cattaraugus Creek on September 23, 1968, atFelton Bridge showed a gross beta concentration of 721 pCi/L. This sample was analyzed for specificnuclides and reported.56 The sample was within limits allowed by the U.S. Atomic EnergyCommission.
In 1968, the New York State Department of Health published the first analysis of deer and fishfrom the West Valley area and the Cattaraugus Creek. The first three deer were taken from the 36hectare (90 acre) exclusionary zone within the site for sampling in December of 1967. The highestconcentration of cesium-137 was found to be approximately 67,000 pCi/kilogram. It was thought thatthe deer ingested the radioactive material by drinking the relatively highly contaminated water in thewaste lagoons or from the discharges of these lagoons. Also, cesium-134 was present, which isindicative of wastes from spent fuel. Based on these results, the New York State Department of Healthinstituted a regular sampling program for deer in the 1320 hectare (3,300 acre) preserve, but outsidethe 27 hectare (90 acre) exclusion area. Deer taken from outside the exclusion area were found to havemuch lower concentrations of radionuclides. The State Health Department subsequently requiredbarriers at the deer access points to the high exclusion area and NFS erected them. The exclusion area,however, is not considered to be deer-proof.
In the same time period, fish samples began to be taken in the creek system above and below theNFS discharge point. In most cases, the entire fish including bone, flesh, intestines, and scales wasanalyzed. The results indicated that fish, mostly suckers, tend to reconcentrate strontium 90. Suckersare taken from Cattaraugus Creek for food especially in the springtime. The State Health Departmentcollected samples and determined that some of the highest values for strontium-90 found in the fish anddetermined that the Radiation Protection Guide for an individual might be exceeded if that person wereto eat 78 lbs. of fish per year. It is considered unlikely that one individual would be able to take thisamount of fish from Cattaraugus Creek in the vicinity of Buttermilk Creek. However, because of thepossibility that in the future the concentrations might go higher, the matter was brought to the attentionof the U.S. Atomic Energy Commission with an expression of concern on the part of the New YorkState Department of Health. The AEC at this point (1968) requested that NFS reduce the level ofradioactivity in the discharges.
During March, June, and September of 1968, three separate releases of airborne contaminantsoccurred due to filter failures at the main plant. The New York State Department of Healthinvestigation concluded that contamination from the incidents was contained within the parking lot
5-9

FACILITYDISPOSAL AHEA
STATE LICENSEDauniAL cnouNO
440
430
420
410
oi 400t5- 39U
ODr 380
370
360
350
340
WEATHERED LAVERY TILLAND TOPSOIL
KAME DELTA
50 100 160 METERSI | I
VERTICAL EXAGGERATION X 5
Source: Went Vniipy Cronnduater Monitoring Prop,rnm, Engineering Science, 1988SOURCE: Bergeron el. al. - Nicholson, T.J. 1985
Figure 5-3. Geological cross-section at the West Valley LLW site.

adjacent to the plant and did not migrate off-site. Several Aerial Radiological Measuring Surveys(ARMS) were conducted by EG&G in 1968, 1969, and 1970 using Nal detector arrays. These surveysdid not show significant contamination from the filter failures. Subsequent ARMS carried out in 1979and 1984 with more sensitive instrumentation indicated a cesium prong extending NW of the site. Off-site sampling carried out in 1982 showed elevated levels in soil samples taken from the prong area.Between 1993 and 1995, NYSERDA characterized this area.
In 1970, extensive studies of ingestion dose pathways for radionuclides from the NFS plant werebegun by the EPA [3]. Three major pathways were examined: (1) dose from ingestion of fish fromthe Cattaraugus Creek, (2) dose from consumption of venison taken near the West Valley site, and (3)dose from radionuclide concentrations in diets of populations living in the vicinity of the NFS plant.The last study used a 'market basket' approach sampling selected dietary items purchased in Ricevilleand West Valley which could have originated locally and homegrown garden vegetables and fruits fromseven homeowners near the plant perimeter. The vegetables and fruit were consumed by the familiesand not sold commercially. Vegetables and fruits from produce farms in Chafee, New York andWinchester, Massachusetts served as controls. These samples were analyzed for gamma-emitters,strontium-90, and tritium. The results of these studies were published in 1974.5? From the results ofthese studies, the following estimates were made by the Health Department concerning the dosecommitments to the population fishing and hunting in the vicinity of NFS resulting from wastedischarges from the plant:
1. Whole body doses to population fishing the Cattaraugus Creek during 1971:
Integrated population dose—0.06 person-rem (0.04 person-rem external, 0.02 person-remfrom ingestion)Maximum individual dose—1.4 mrem (1 mrem external, 0.4 mrem from ingestion)
2. Dose to bone from ingestion of strontium-90 for population fishing Cattaraugus Creekduring 1971:
Integrated population dose—0.3 person-remMaximum individual dose—0.7 mrem
3. Whole-body doses to population from ingestion of venison from deer kill in 1970:
Integrated population dose—0.1 person-remMaximum individual dose—1.4 mrem
4. Dose to bone from ingestion of strontium-90 in venison resulting from the NFS dischargescould not be determined from the available data.
The sampling of fish, venison, and farm produce has continued to date as part of the regular WestValley monitoring program.
Levels of strontium-90 in Cattaraugus Creek continued to rise through 1970 despite NFS effortsto reduce concentrations. Figures 5-4 and 5-5 show strontium-90 and tritium concentrations in the
5-11

oc
70
60
5Q
40
o 3CQ.
20
067 69 71 73 75 77 79 81 83 85 87 89
68 70 72 74 76 78 80 82 84 86 88 90YEAR
Figure 5-4. Strontium-90 in Cattaraugus Creek at Springville Dam.
Cattaraugus Creek from 1967 to 1989. In November of 1971, NFS suspended fuel reprocessingoperations.
All of the monitoring procedures discussed above were intended to monitor releases from the NSFplant. Monitoring of the low-level radioactive waste disposal site was only incidental. In the early1970' s, however, the newly created DEC assumed responsibility for the monitoring of environmentalradiation levels in New York State. Awareness of the need to monitor the SDA burial trenches forpossible release of radionuclides into ground or surface waters increased. Therefore, beginning in1972, additional surface locations near the trenches were sampled for radionuclides, and a samplingprogram for wells, springs, and public water supplies in the area surrounding the NFS plant was begun.Iodine-129 and -125 were given specific attention in these new sampling programs using a liquidscintillation technique. Additionally, various fauna including rabbits and woodchucks were taken andanalyzed for radionuclide content, particularly 1-129 contained in the thyroid. Also during 1972, aregular program of sampling radionuclide concentrations in the lagoons was initiated, as was sedimentsampling at water sampling locations downstream of the NFS facility.
Prior to 1972, precipitation entering an open trench, which came in contact with waste packagesbefore covering, was pumped to the surface or to holding lagoons in order to provide dry workingconditions for workers in the trench. The waters in the lagoons were analyzed and discharged at acontrolled rate into Erdmann Brook. This direct discharge was eliminated during November 1972 andwater from the burial site holding lagoons was thereafter pumped to the main NFS plant for treatment
5-12

in the low-level radioactive waste treatment plant. This change in procedure contributed to the lowerradionuclide levels observed in the Cattaraugus Creek in the early 1970' s.
In 1975, radioactivity levels in watercourses below the NFS main plant and below the low-levelradioactive waste disposal site increased because of the trench water seepage out of the cover and thesubsequent pump out of the trenches at the low-level burial site. The water levels in Trenches 4 and 5at the north end of the burial site reached elevations such that a physical breakthrough of the trenchwater through the soil cover was observed in the north end of Trench 4 and along the west side ofTrench 5 in early March. The breakthrough caused increased activity in streams below the burial siteand main plant. It was necessary to pump 270,000 gallons of water from Trenches 3,4, and 5 to lowerthe water level in the trenches and prevent further breakthrough. The water was pumped out of thetrenches to the burial site holding lagoons and eventually transferred to the main plant for treatment anddischarge. An increase in activity, primarily tritium, in streams below the NFS main plant dischargeoccurred from June 14 to July 1, 1975, due to the controlled release of the treated trench water.
30
0 "-! 1 1 1 r—i 1 1 1 1 1 1 1 1 1 1 1 P—r
67 69 71 73 75 77 79 81 83 85 87 . 8968 70 72 74 76 78 80 82 84 86 83 90
YEARFigure 5-5. Tritium on Cattaraugus Creek at Springville Dam.
A second pump-down, designed to prevent further trench water breakthrough, was initiated onSeptember 29, 1975. On October 6, 1975, during a routine monitoring visit to the burial site, a DECrepresentative discovered there had been leakage from the north burial site holding lagoon. Uponnotifying NFS officials, it was learned that the seepage through the wall of the lagoon had beenobserved on October 5, 1975. The level in the lagoon had been lowered on October 5 by pumping thewaste to the south lagoon until the seepage had ceased. DEC estimated that approximately 7,000gallons of untreated trench water had been released to the environment.
5-13

Figure 5-6 shows the NFS plant area and the LLW burial area and on-site surface water samplinglocations. The highest gross beta, tritium, and strontium-90 concentrations for 1975 were found at sites53 (Erdmann Brook), 35 (Buttermilk Creek), and 42 (Cattaraugus Creek). They were obtained fromsamples collected on October 6, 1975, and were a direct result of the burial site lagoon seepage. Themaximum concentration of tritium in the weekly composite samples at Springville Dam following thelagoon seepage was 10.7% of the NFS's maximum allowed levels for Cattaraugus Creek.Strontium-90 maximum level reached 15% of the technical specifications for Cattaraugus Creek. [TheNFS technical specifications in 1975 stated that the concentration of radioactivity in the CattaraugusCreek would not exceed either: (1) 10% of the prorated concentration listed in Appendix B, Table II,10 CFR Part 20 averaged over any quarterly period; or (2) 20% of the prorated concentration listed inAppendix B, Table II, 10 CFR Part 20 for any weekly composite sample taken in accordance withTechnical Specification 5.1.1.].
During 1975, the other routine monitoring programs at West Valley (air, venison, fish, farmproduce, water supplies, milk, fauna, etc.) showed generally decreasing levels of radioactivity.
From 1976 to 1981, the overall monitoring program remained essentially unchanged. There wereno significant incidents involving release of radionuclides to the environment. Water levels in sometrenches, however, showed a consistent tendency to rise. Water was pumped from several trenchesduring this period. This water was pumped out of the trenches to the burial site holding lagoons andeventually transferred to the main plant for treatment and discharge. An increase in tritium in streamsbelow the NFS main plant discharge point occurred due to the controlled release of the treated trenchwater. At no time during this period did the radionuclide concentrations at Springville Dam orCattaraugus Creek approach the technical specifications for the site.
In October 1982, the New York State Department of Health reassumed responsibility for themonitoring of environmental radiation levels in the state, a task previously performed by theDepartment of Environmental Conservation. This did not have a major impact on the format of themonitoring program. Some of the biological sampling programs, specifically the sampling of thyroidsfrom rabbits and woodchucks, were curtailed about 1982.
From 1982 to 1986, the monitoring program continued unchanged and with uneventful results. In1987, a remedial action program was instituted for Trench 14 including removal of a sand lens toprevent potential ground water migration of radionuclides from the trench. This program wascompleted late in the summer of 1987. The effectiveness of the sand lens removal in slowing the rateof rise in water levels in Trench 14 initially appeared to be good. Recent developments, discussed inlater sections of this report, have further reduced the rate of water infiltration into Trench 14.
Figure 5-7 shows the location of the SDA and the nearby currently used air, milk, and watersampling locations and Figure 5-8 shows the locations of all on-site sampling. Table 5-3 shows the1989 locations and sampling frequencies of TLD sites used to monitor radiation levels.
Ground Water Monitoring
Prior to 1990, ground water has been monitored less for the SDA than would be required bycurrent standards for new LLW facilities. From 1975 to 1983, the USGS conducted ground water
5-14
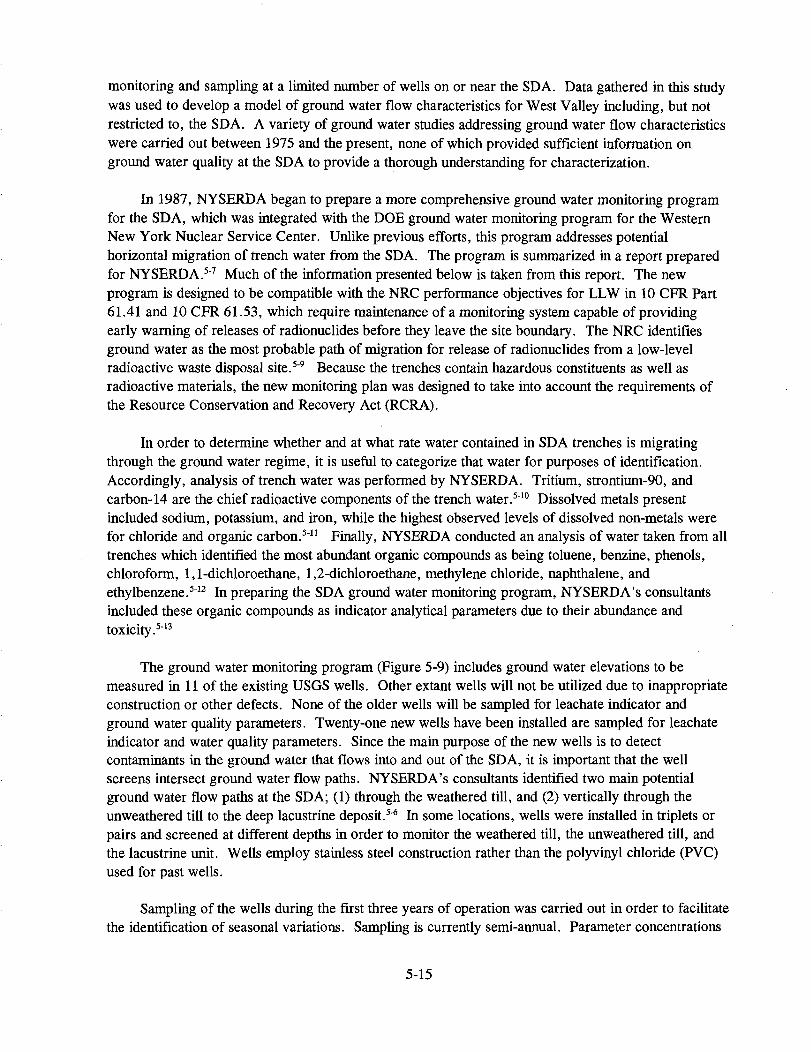
monitoring and sampling at a limited number of wells on or near the SDA. Data gathered in this studywas used to develop a model of ground water flow characteristics for West Valley including, but notrestricted to, the SDA. A variety of ground water studies addressing ground water flow characteristicswere carried out between 1975 and the present, none of which provided sufficient information onground water quality at the SDA to provide a thorough understanding for characterization.
In 1987, NYSERDA began to prepare a more comprehensive ground water monitoring programfor the SDA, which was integrated with the DOE ground water monitoring program for the WesternNew York Nuclear Service Center. Unlike previous efforts, this program addresses potentialhorizontal migration of trench water from the SDA. The program is summarized in a report preparedfor NYSERDA.5"7 Much of the information presented below is taken from this report. The newprogram is designed to be compatible with the NRC performance objectives for LLW in 10 CFR Part61.41 and 10 CFR 61.53, which require maintenance of a monitoring system capable of providingearly warning of releases of radionuclides before they leave the site boundary. The NRC identifiesground water as the most probable path of migration for release of radionuclides from a low-levelradioactive waste disposal site.5"9 Because the trenches contain hazardous constituents as well asradioactive materials, the new monitoring plan was designed to take into account the requirements ofthe Resource Conservation and Recovery Act (RCRA).
In order to determine whether and at what rate water contained in SDA trenches is migratingthrough the ground water regime, it is useful to categorize that water for purposes of identification.Accordingly, analysis of trench water was performed by NYSERDA. Tritium, strontium-90, andcarbon-14 are the chief radioactive components of the trench water.510 Dissolved metals presentincluded sodium, potassium, and iron, while the highest observed levels of dissolved non-metals werefor chloride and organic carbon.511 Finally, NYSERDA conducted an analysis of water taken from ailtrenches which identified the most abundant organic compounds as being toluene, benzine, phenols,chloroform, 1,1-dichloroethane, 1,2-dichloroethane, methylene chloride, naphthalene, andethylbenzene.512 In preparing the SDA ground water monitoring program, NYSERDA's consultantsincluded these organic compounds as indicator analytical parameters due to their abundance andtoxicity.5"13
The ground water monitoring program (Figure 5-9) includes ground water elevations to bemeasured in 11 of the existing USGS wells. Other extant wells will not be utilized due to inappropriateconstruction or other defects. None of the older wells will be sampled for Ieachate indicator andground water quality parameters. Twenty-one new wells have been installed are sampled for leachateindicator and water quality parameters. Since the main purpose of the new wells is to detectcontaminants in the ground water that flows into and out of the SDA, it is important that the wellscreens intersect ground water flow paths. NYSERDA's consultants identified two main potentialground water flow paths at the SDA; (1) through the weathered till, and (2) vertically through theunweathered till to the deep lacustrine deposit.5"6 In some locations, wells were installed in triplets orpairs and screened at different depths in order to monitor the weathered till, the unweathered till, andthe lacustrine unit. Wells employ stainless steel construction rather than the polyvinyl chloride (PVC)used for past wells.
Sampling of the wells during the first three years of operation was carried out in order to facilitatethe identification of seasonal variations. Sampling is currently semi-annual. Parameter concentrations
5-15

250 500•
GRAPHIC SCALE
Figure 5-6. On-site surface water sampling locations at the West Valley LLW site.
5-16

^FVNEAR (BEANS, SWEET CORN)J(On Rt. 240: 1/2 Mile
)( /North of Rt. 39)
TO SPRINGVILLE(6 km)
BFBNEAR (BEEF)
TO DUNKIRK WFWEL04/O(50 km) - ^ • . '
oWFWEL03
, WFWEL01
BFMHAUR
TO WEST VALLEY(5.6 km)
9nO
DAIRY FARM
BIOLOGICAL SAMPLING POINT
DRINKING WATER WELL SUPPLY
WNYNSC BOUNDARY
PROJECT SITE BOUNDARY
2 KILOMETERS
APPROX SCALE
Figure 5-7. West Valley demonstration project sampling site.
5-17

in down-gradient wells exceeding three times the background level will trigger resampling and possiblesampling for additional parameters with the additional parameters selected from the same group ofcompounds, elements, or radionuclides.
Results for several rounds of sampling for radionuclides are now available. Tritium levels in well1107A near Trench 5 have leveled out at 20,000 pCi/L.
During the winters of 1990-1991 and 1991-1992, water levels in several trenches at the SDA,particularly Trenches 13 and 14, rose substantially. Trench water level data from these two trenchesseemed to imply a hydraulic connection between them just below the boundary between the weatheredand unweathered till. In an attempt to arrive at a better understanding of the source of the intrusivewater and in order to develop corrective measures to prevent further influx, NYSERDA and itsconsultants, in conjunction with DEC technical staff, installed a network of 20 new piezometers at andaround the SDA concentrated in the Trench 14 area. In order to minimize further rises in trench waterlevels, a slurry wall approximately thirty feet deep was installed on the west site of Trench 14 duringthe summer of 1992. In conjunction with this, all trenches (except Trench 9) have been recapped usinga geo-membrane liner. Nine slit wells have been installed around the southwest SDA perimeter tomonitor the effects of slurry wall installation and recapping.
Until the winter of 1990-1991, NYSERDA monitored water levels in all trenches on a monthlybasis. Rising water levels in several trenches, particularly Trenches 13 and 14 have promptedbi-weekly monitoring of trench water levels in 1991 and 1992. Also, during the summer of 1991,preliminary closure of the SDA lagoon was undertaken. Monitoring of radionuclide levels in lagoonwater has been replaced by additional ground water monitoring efforts in the lagoon area.
An issue with geology and groundwater is the fact that the trenches will slowly fill with water dueto the "bathtub effect." If left uncontrolled, the contaminated water would eventually overflowlaterally into the environment. Therefore, it is important to monitor water levels in the trenches tomake sure that appropriate actions can be taken to ensure this does not happen.
The recent improvements in ground water monitoring at the SDA are likely to lead, within a fewyears time, to an enhanced understanding of the potential for contaminant migration at this facility. Asdata are accumulated, additions, modifications, and improvements will be made to the existingmonitoring system.
Surface Water
In accordance with the NYCRR Part 380 Land Burial Permit, NYSERDA is also samplingsurface water. The north and east slopes of the SDA are steep ravines leading to Frank's Creek andErdman Brook, respectively. These slopes may intersect lateral flow in the weathered till resulting in aseep. Samples taken from seeps and other surface water may provide a useful check on possiblemigration of ground water from the SDA trenches. Samples taken to date, however, give no clearindication of extensive horizontal migration. There are four off-site surface water monitoring pointshistorically used by NFS that continue to be used by WVDP: two in Buttermilk Creek, one inCattaraugus Creek, and one at Springville Dam. Figures 5-10 and 5-11 show tritium and strontium-90
5-18

LEGEND 11*1001 MONITORING WELLS II
PIEZOMETERS
PERIMETERGAMMA RADIATIONMONITORING POINTS
t > N T L D 1 8 TLD MONITORINGPOINTS
* l lUMcnAr \D SURFACE OR STORMT V N 6 U A U K WATER MONITORING
LOCATIONS
• 9 2 SLIT-TRENCH WELLS
SOIL MOISTUREMONITORING LOCATIONS
TRENCH AND LAGOONMONUMENTSTRENCH SUMPS
XR-5 GEOMEMBRANE
VLDPE MEMBRANE
Figure 5-8. West Valley demonstration project on-site sampling.
5-19

concentrations at the Springville Dam from 1967 to 1991. Tritium levels in 1975, 1976, and 1981 areindicative of pumping of trenches at the SDA. Prior levels are attributed to NSF plant discharges.
Air
Currently there are nine perimeter and offsite air sampling locations associated with the Center.In addition, each individual emission point is routinely sampled. For the SDA, air is sampled from theT-l tank stack semiannually. Ambient air is sampled and analyzed at the SDA near Trench 9 inaccordance with the NYCRR Part 380 permit for the bioengineering project.
Direct Radiation
There are seven thermoluminescent dosimeter (TLD) locations which are sampled quarterly.These measure direct radiation. Additionally, area radiation monitoring system (ARMS) surveys were
Table 5-3. West Valley demonstration project sites.5-8
Maplocation
12
3
4
5
67
Type
AirMilkMilkWaterWater
WaterWater
Water
Water
WaterWaterWaterSedimentSedimentVegetationVegetationDeerBeefFishTLD
Location
NE of site 1 mileN of site 1 mileWNWofsite 1.9 mileSwamp drainageButtermilk Creek (at Fox Valley Rd. bridge)Erdman Brook on siteCattaraugus Creek (at Bigelow bridge)Buttermilk Creek (at Thomas Corners Rd.)Cattaraugus Creek (at Felton bridge)Erdman BrookBrook near burial siteSpringville damButtermilk CreekSpringville damNear siteNear siteWithin site boundaryFarm near siteSpringville dam7 locations
Frequency
WeeklyMonthlyMonthlyMonthlyMonthly
MonthlyQuarterly
Monthly
Monthly
MonthlyMonthlyMonthlyAnnuallySemi-AnnuallyAnnuallyAnnuallyAnnuallyAnnuallyAnnuallyQuarterly
5-20

30 500
GRAPHIC SCALE
Figure 5-9. West Valley on-site ground water monitoring network.
5-21

ECID
/LIT
0
0)TJc
usa
i
0
70 72 74 76 78 80 82 84 86 88 90YEAR
Figure 5-10. H-3 at Springville Dam.
conducted in 1968, 1969, 1970, 1979, and 1984. Direct radiation levels at the SDA are routinelymonitored by NYSERDA and the DEC during inspections. Much of the direct radiation observedduring these inspections is attributable to the proximity of the main plant and a nearby drum-storagefacility.
Soil
Soil samples are routinely taken on and around the SDA by NYSERDA and the DEC during thecourse of scheduled inspections. Additionally, soil samples are taken in support of constructionprojects such as the recent slurry wall project. Exploratory soil borings were taken in preparation forthe excavation carried out at the SDA. Borings taken in preparation for the slurry wall projectindicated elevated levels of tritium in several borings located to the west of Trench 14.
Surveys of previously installed slump-monitoring stakes were undertaken during the fall of 1991,by NYSERDA, in order to determine the overall rate of soil movement on the north slope of the SDA.Preliminary results indicate a soil movement rate not greater than six inches in 20 years. This result,coupled with recent stabilization efforts, such as hydroseeding of the north slope, should assure slopestability for the immediate future.
5-22

68 70 72 74 76 78 80 82 84 86 88 90Figure 5-11. Sr-90 at Springville Dam. YEAR
Biota
Two local dairy farms are monitored on a monthly basis for radionuclides in milk. Area farmproduce and venison are sampled on a yearly basis, and fish are now taken from the Cattaraugus Creeknear Springville on a semiannual basis and monitored for radionuclide content.
SUMMARY
Prior to 1975, the monitoring of the SDA was carried out solely as part of the monitoring of theNFS plant at West Valley. Aside from occasional monitoring of water levels in the covered trenchesand pump-outs of open trenches, the SDA received little individual scrutiny. Releases of radionuclidesto the environment were primarily attributable to the operations of the NFS plant. This has resulted insome confusion with respect to the record of the SDA prior to 1975.
In 1975, significant problems at the SDA developed due to the "overflowing" of Trenches 4 and 5and the subsequent pumpings needed to prevent more overflow incidents. At no time during or after1975 did the levels of radionuclides released by the SDA approach the levels released by the NSF plantprior to its closing in 1971. The 1975 overflow incident did increase regulatory awareness of thepotential for contaminant migration through ground and surface water from the SDA and resulted in theestablishment of several monitoring stations designed to detect the entrance of contaminants from theSDA into Erdman Brook. Results were consistently negative and the State Health Department nolonger consistently monitors these stations. The milk, produce, and animal flesh monitoring programshave provided better estimates of dose pathways to the general population. However, the effects of theSDA are difficult to separate from those of the Fuel Reprocessing Plant.
5-23

The newly installed ground water monitoring wells and piezometers at the SDA have eliminatedthe most serious deficiency in the environmental monitoring program for the SDA providing a morereliable method of estimating the extent of ground water migration of radionuclides from the SDA.Additionally, the new monitoring program serves as a preparation for remedial actions and eventualclosure of the SDA.
Releases of radionuclides from the SDA have been trivial when compared to the Fuels ReprocessingPlant. This makes a precise evaluation of the SDA's effect on the environment difficult. The releasesfrom the SDA have not exceeded regulatory standards at the site boundary and, to 1995, the SDA hasnot posed a significant threat to human health and safety. The SDA has required active maintenanceand remedial measures to ensure that releases are kept to a minimum. Further work must be done tostabilize the site, especially with respect to water levels in the SDA trenches.
Disposal records for the SDA are being examined in depth as part of a New York State EnergyResearch and Development Authority project to inventory wastes in Trenches 12 through 14. Thisinventory will provide a much needed supplement to the 1972 DEC report for Trenches 1 through 11.
NYSERDA (or New York State) has focused its efforts on minimizing water infiltration throughan active maintenance program, establishing a comprehensive environmental monitoring program, andcollecting site-specific data to allow for decisions to be made on eventual stabilization and closure ofthe SDA. The strategy for closure of the SDA will be developed as part of an ongoing (joint DOE/NYSERDA) effort to review the impacts from all waste management areas at the Center including theSDA.
5-24

REFERENCES
5-1. W. J. Kelleher and E. J. Michael, "Low-Level Radioactive Waste Burial Site Inventory for theWest Valley Site," Cattaraugus County, New York, New York State Department ofEnvironmental Conservation, 1973.
5-2. United States Department of Energy, Western New York Nuclear Service Center Study, TID-28-905, United States Department of Energy, 1978.
5-3. J. P. Duckworth, "Compilation of West Valley Solid Radioactive Waste Burial Operations,"Fuel Services, Inc., Unpublished Report, February 16, 1981.
5-4. U.S. Department of Commerce, Climatography of the United States, No. 60 - Climate of NewYork, U.S. Department of Commerce, National Climatic Data Center, Asheville, NorthCarolina, 1977.
5-5. J. R. Albanese, S. L. Anderson, R. H. Fakundiny, S. M. Potter, W. B. Rogers, andL. F. Whitbeck, "Geologic and Hydrologic Research at the Western New York NuclearService Center," West Valley, New York, Final Report, August 1982 - December 1983, NewYork State Geological Survey for the U.S. Nuclear Regulatory Commission,NUREG/CR-3782, June, 1984.
5-6. New York State Department of Health, Environmental Radioactivity in New York State, 1968.
5-7. United States Environmental Protection Agency, EPA-520/3-74-001, 1974.
5-8. New York State Department of Health, 1989 Annual Report of Environmental Radiation Levelsin New York State.
5-9. D. H. Denham, R. D. Stenner, P. A. Eddy, R. E. Jaquish, J. V. Ramsdell, Jr.,"Recommendations to the NRC for Review Criteria for Alternative Methods of Low-LevelRadioactive Waste Disposal, by Pacific Northwest Laboratory," Richland, Washington, PNL6553 for U.S. Nuclear Regulatory Commission, NUREG/CR5054, 1988.
5-10. T. J. Nicholson and R. D. Hurt, "Information on the Confinement Capability of the FacilityDisposal Area at West Valley, New York," U.S. Nuclear Regulatory Commission,Washington, DC, NUREG-1164, 1985.
5-11. A. J. Weiss and P. Columbe, "Evaluation of Isotope Migration - Land Burial, Status Reportthrough September 30, 1977," Brookhaven National Laboratory, Upton, New York,NUREG-GR-1289, BNL-NUREG-51143, 1980.
5-12. D. B. Anderson, Response to Questions Regarding Solid Waste Management Units Located atthe Western New York Nuclear Service Center, from the Energy Authority to the U.S.Environmental Protection Agency, March 30, 1988.
5-25

5-13. Engineering Science, Liverpool New York Groundwater Monitoring Program West ValleyLow-Level Radioactive Waste Disposal Area, September, 1989.
5-26

OTHER REFERENCES
Anderson, D. B., Response to Questions Regarding Solid Waste Management Units Located at theWestern New York Nuclear Service Center, from the Energy Authority to the U.S.Environmental Protection Agency, March 30, 1988.
Bergeron, M. P., W. M. Kappel, and Richard M. Yager, Geohydrologic Conditions at the NuclearFuels Reprocessing Plant and Waste Management Facilities at the Western New York NuclearService Center, Cattaraugus County, New York, U.S. Geological Survey, Water-ResourceInvestigations Report 85-4185, Ithaca, New York, 1987.
Duckworth, J. P. , M. J. Jump, and B. E. Knight, 1974. Low-Level Radioactive Waste ManagementResearch Project, Final Report, Nuclear Fuel Services, Inc., Report to New York StateAtomic and Space Development Authority.
Duckworth, J. P., Compilation of West Valley Solid Radioactive Waste Burial Operations, 1981.
Ecology and Environment, Inc., RFI Work Plan for NYSERDA - Maintained Portions of the WesternNew York Nuclear Service Center, May 1992.
Kelleher, W. J., Addendum to Low-Level Radioactive Waste Burial Site Inventory for the West ValleySite, Cattaraugus County, New York, New York State Department of EnvironmentalConservation, 1979.
Kelleher, W. J., Environmental Surveillance around a Nuclear Fuel Reprocessing Installation 1965-67Radiological Health Data and Reports, 10:329-339, New York State Department of Health,1969.
Kelleher, W. J., and E. J. Michael, Low-Level Radioactive Waste Burial Site Inventory for the WestValley Site, Cattaraugus County, New York, New York State Department of EnvironmentalConservation, 1973.
New York State Department of Environmental Conservation, Bureau of Radiation, Annual Report ofEnvironmental Radiation in New York State, 1975.
New York State Department of Health, Bureau of Environmental Radiation Protection, 1986 AnnualReport of Environmental Radiation Levels in New York State.
New York State Energy Research and Development Authority, Summary of Information Relating toWNY Nuclear Services Center Cesium Prong, 1993.
U.S. Department of Energy, Environmental Assessment for Disposal of Project Low-Level Waste,West Valley Demonstration Project; Part 1, Environmental Assessment, U.S. Department ofEnergy, West Valley Project Office, West Valley, New York DOE/EA - 0295, 1986.
5-27
West Valley Nuclear Services, Inc., West Valley Demonstration Site Environmental Report forCalendar Year 1990, May 1991, U.S. Contract DE-AC07-81NE44139.
5-28

CHAPTER 6
Environmental Summary of theBamwell, South Carolina
Low-Level Radioactive Waste Disposal Site
INTRODUCTION
Background
A commercial low-level radioactive waste disposal facility near Barnwell, South Carolina hasbeen operated by Chem-Nuclear Systems, Inc. since 1971. The site is owned by the State of SouthCarolina and is leased to Chem-Nuclear by the State Budget and Control Board.
South Carolina is an Agreement State, with authority delegated from the U.S. Nuclear RegulatoryCommission (NRC). Most activities at the site are regulated by the South Carolina Department ofHealth and Environmental Control. The site operator holds a license from the state for possession anddisposal of source and byproduct material as well as a license from NRC for possession and disposal ofspecial nuclear material.
Location
The Barnwell site is located about 8 km (5 miles) west of the town of Barnwell, South Carolina(Figure 6-1). The site (Figure 6-2) is adjacent to the closed Allied General Nuclear Services BarnwellFuel Facility on the west; International Paper Company on the north; Osborne Road on the south;Barnwell County Road 585 on the east; and St. Paul Church at the southeast corner. The site isapproximately 0.3 km (0.2 mi) from the easterly boundaries of the U.S. Department of EnergySavannah River Site and is 0.8 km (0.5 mi) from South Carolina Highway 64. The facility is anirregular polygon covering 121 hectares (300 acres) of land measuring roughly 1,500 m (4,950 ft) inthe north-south direction and 750 m (2,475 ft) in an east-west direction.
Facility
Waste disposal was initiated at the Barnwell site in 1971. Approximately 75% of the wastevolume received at the site is fuel cycle waste. All other generators—including medical, industrial,academic, and research facilities—generate the remaining waste volume.
Class A, B, and C wastes (as defined in 10 CFR 61) are accepted for disposal at the site.Approximately 97 % of the volume of waste received at the site is Class A waste. The majority of theremaining 3% is Class B waste with less than 1% by volume being Class C waste. The Class C waste,however, composes the majority of the radioactivity in curies of the waste received.
6-1

Figure 6-1. Location of Barnwell site.
6-2

I N T E N T I O N A L PAPER' CO.WOODLANDS
AGN'SWOODLANDS
/ / St. PAL/ / CHURCH
I W.W. MOORE/ MOBILE HOtE
WOODLANDS
Figure 6-2. Plan view of the Barnwell site showing adjacent land owners.
6-3
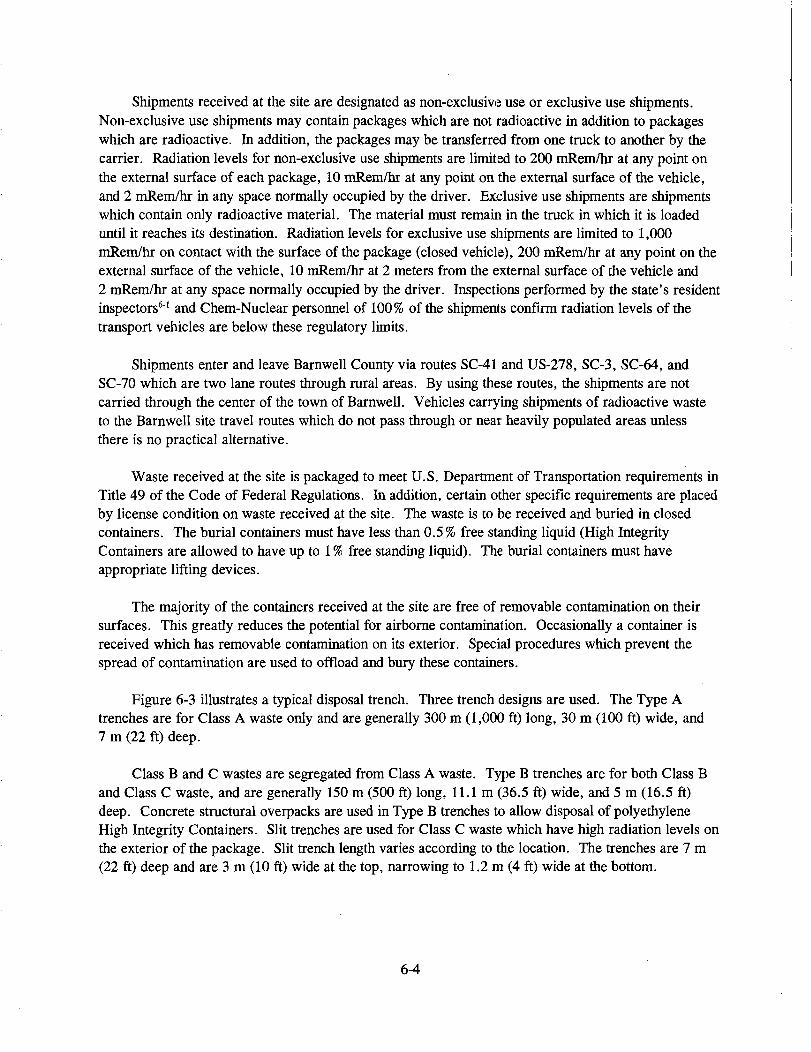
Shipments received at the site are designated as non-exclusive use or exclusive use shipments.Non-exclusive use shipments may contain packages which are not radioactive in addition to packageswhich are radioactive. In addition, the packages may be transferred from one truck to another by thecarrier. Radiation levels for non-exclusive use shipments are limited to 200 mRem/hr at any point onthe external surface of each package, 10 mRem/hr at any point on the external surface of the vehicle,and 2 mRem/hr in any space normally occupied by the driver. Exclusive use shipments are shipmentswhich contain only radioactive material. The material must remain in the truck in which it is loadeduntil it reaches its destination. Radiation levels for exclusive use shipments are limited to 1,000mRem/hr on contact with the surface of the package (closed vehicle), 200 mRem/hr at any point on theexternal surface of the vehicle, 10 mRem/hr at 2 meters from the external surface of the vehicle and2 mRem/hr at any space normally occupied by the driver. Inspections performed by the state's residentinspectors61 and Chem-Nuclear personnel of 100% of the shipments confirm radiation levels of thetransport vehicles are below these regulatory limits.
Shipments enter and leave Barnwell County via routes SC-41 and US-278, SC-3, SC-64, andSC-70 which are two lane routes through rural areas. By using these routes, the shipments are notcarried through the center of the town of Barnwell. Vehicles carrying shipments of radioactive wasteto the Barnwell site travel routes which do not pass through or near heavily populated areas unlessthere is no practical alternative.
Waste received at the site is packaged to meet U.S. Department of Transportation requirements inTitle 49 of the Code of Federal Regulations. In addition, certain other specific requirements are placedby license condition on waste received at the site. The waste is to be received and buried in closedcontainers. The burial containers must have less than 0.5% free stamding liquid (High IntegrityContainers are allowed to have up to 1 % free standing liquid). The burial containers must haveappropriate lifting devices.
The majority of the containers received at the site are free of removable contamination on theirsurfaces. This greatly reduces the potential for airborne contamination. Occasionally a container isreceived which has removable contamination on its exterior. Special procedures which prevent thespread of contamination are used to offload and bury these containers.
Figure 6-3 illustrates a typical disposal trench. Three trench designs are used. The Type Atrenches are for Class A waste only and are generally 300 m (1,000 ft) long, 30 m (100 ft) wide, and7 m (22 ft) deep.
Class B and C wastes are segregated from Class A waste. Type B trenches are for both Class Band Class C waste, and are generally 150 m (500 ft) long, 11.1m (36.5 ft) wide, and 5 m (16.5 ft)deep. Concrete structural overpacks are used in Type B trenches to allow disposal of polyethyleneHigh Integrity Containers. Slit trenches are used for Class C waste which have high radiation levels onthe exterior of the package. Slit trench length varies according to the location. The trenches are 7 m(22 ft) deep and are 3 m (10 ft) wide at the top, narrowing to 1.2 m (4 ft) wide at the bottom.
6-4

Trench standplpe (number varies with trench)
Sump
Surface sand
French drain
Buffer land
Compacted clayey sand
Undisturbed clayey sand
Figure 6-3. Typical disposal trench at the Barnwell site.
After waste has been placed and covered in the slit trench, a 15 cm (6 in.) thick concrete intrusionbarrier is constructed over the trench. All trenches are required to have a minimum of 2.4 m (8 ft) ofseparation between adjacent trench and a minimum of 1.5 m (5 ft) of separation between the trenchfloor and the highest recorded level of the water table in order to prevent water infiltrating from belowinto a trench. The trench drainage system consists of a sand floor, French drain along one longitudinalwall, sumps, and standpipes.
Disposal Volume
During the first year of operation, approximately 1,400 m3 (50,000 ft3) of waste containing 160TBq (4,200 Ci) of byproduct material was accepted and disposed. The disposal rate rose steadily overthe next nine years to the point where the annual rate reached over 63,000 m3 (over 2.2 million ft3) in1979. Table 6-1 shows volumes of waste disposed.
6-5

Table 6-1. Barnwell site burial volumes.
Year
1971
1972
1973
1974
1975
1976
1977
1978
1979
1980
1981
1982
1983
1984
1985
1986
1987
1988
1989
1990
1991
1992
1993
Total
Volumea
(Feet3)
50,219.34
159,933.47
599,886.28
624,759.55
643,564.44
1,393,587.55
1,636,425.12
2,220,519.72
2,238,322.13
2,444,810.72
1,543,278.67
1,228,200.83
1,240,668.21
1,231,715.28
1,214,422.99
1,053,791.68
958,275.82
931,974.01
1,103,299.56
788,031.88
789,082.85
828,750.74
605,443.07
25,528,962.76
(Meters3)
1,422
4,529
16,987
17,691
18,224
39,462
46,830
62,878
63,383
69,230
43,701
34,779
35,132
34,878
34,388
29,840
27,135
26,391
31,242
22,315
22,344
23,467
17,144
722,904
a. Values include waste volumes, pallets under waste packages, waste generated during siteoperations and waste received by approved exemptions.
6-6

By late 1979, the Barnwell site was the most heavily used site in commercial radioactive wastedisposal history and, for a brief time, was the only operating commercial low-level radioactive wastedisposal site in the United States. In October of 1979, when the monthly waste acceptance rate hadrisen to over 7,000 m3 (about 250,000 ft3) implying an annual rate of 68,000 m3 (2.4 million ft3), theGovernor of South Carolina announced that the monthly acceptance would have to be reduced to justover 2,800 m3 (100,000 ft3) by October 31, 1981. The 1980 disposal rate was reduced due torestriction on the annual volume of waste received. Waste received through 1980 totaled 323,523 m3
(11,424,900 ft3). The total volume received through 1993 is almost 723,000 m3 (about 25,500,000 ft3).
Through 1993, wastes containing about 272,000 TBq (7,137,000 Ci) of radioactivity have beendisposed. The decay corrected radioactivity through 1993 is approximately 113,200 TBq (2,971,000Ci). In addition, about 15.3 million kg (33.6 million lb) of source material and approximately 3,056 kg(6,732 pounds) of special nuclear material have been disposed through 1993.
Stabilization and Closure
Individual trenches are closed and capped with compacted on-site clay materials as they are filled.The conceptual topography of the site at closure was identified in the early 1980's and trench surfaceshave been completed near those grades since that time. Due to the migration of tritium in thegroundwater from some of the early disposal trenches, enhanced caps are being installed on the earlydisposal trenches. These enhanced caps have a cross section as shown in Figure 6-4.
In 1991, an area of approximately 5 hectares (12.5 acres) was covered and in 1993, an area ofapproximately 4 hectares (10 acres) was covered with an enhanced cap. Plans are underway to installanother enhanced cap over approximately 10 hectares (25 acres) of disposal trenches during 1994. Theenhanced caps virtually eliminate infiltration into the trenches thereby eliminating the water sourcedriving the contaminants.62
After the completion of the third cap, all disposal trenches completed through 1982 withsignificant quantities of tritium will be covered. Enhanced caps may not be necessary on the laterdisposal trenches for the following reasons, but this would require substantial evaluation. Highintegrity containers have been used for high concentration wastes (waste with radionuclideconcentrations of one microcurie per cubic centimeter or greater of radionuclides with five year orlonger half-lives) since 1981. Improved solidification media were required in 1983 with theimplementation of the NRC Branch Technical Position on Waste Form. Also in 1983, 10 CFR Part 61required more detailed characterization and classification of waste and stability requirements for ClassB and C waste materials. The lower concentration Class A wastes were also required to be segregatedfrom the Class B and C waste materials.
After the remaining closure activities are completed, the site will have gently sloping surfaces ofnative grass vegetation. Surface water runoff will be directed towards an on-site retention pond.Maintenance of the site surface and environmental monitoring will continue through the institutionalcontrol period.
6-7

-'% "tC" i<^r'* v f t
Vegetation Cover
Drain
HDPEBentonite Mat
Recompacted CNS! Cap
Figure 6-4. Barnwell site enhanced cap cross section.
SITE
Topography
The Barnwell site is in the Upper Coastal Plain Physiographic Province, with flat to gently-rollingtopography at elevations averaging 74 to 80 m (243 to 262 ft) above mean sea level. Drainage on andaround the site is considered good with the exception of undrained "sinks" or "Carolina Bays."Carolina Bays are circular depressions of undetermined origin which occur throughout the area.Several Carolina Bays exist on the disposal site and represent areas which are generally unsuitable forwaste disposal under existing conditions.
Climate
The climate of the Barnwell site is mild and relatively humid, with mean temperatures rangingfrom 9°C (48°F) in January to 27°C (81 °F) in July. The precipitation averages 108 cm (42.7 in.) peryear. Historical rainfall data are given for Barnwell County in Table 6-2. Ice storms and damagingwinds are rare. Measurable snow occurs at approximately 10 year intervals and usually does notremain for great periods of time. The largest recorded snowfall for the area was 45.7 cm (18 in.) over
6-8

Table 6-2. Rainfall for Barnwell County.
Year Total inches
1984 48.43
1985 44.04
1986 33.21
1987 42.10
1988 36.25
1989 49.53
1990 45.60
1991 54.44
1992 53.66
National Weather Service, Blackville, South Carolina.
a two-day period in February 1973. Freeze/thaw cycling of the soil, waste, and disposal containers arenot a concern since less than one third of the winter days have a minimum temperature below freezing.
Land Use
A buffer zone of 30 m (100 ft) is provided within the outermost perimeter fencing around the 95hectare (236 acre) exclusion area. Approximately 35 hectares (86.6 acres) of the site had been used fordisposal of waste through 1993 and approximately 15 hectares (36.7 acres) remain for disposal ofwaste.
The site is bounded by woodlands on the north, west, and south, and farmland on the east. Thenearest residence is less than one-tenth of a mile from the site boundary.
The 1990 estimated population of Barnwell County was 20,293 in the 1,444 square kilometers(553 square mile) area giving a population density of about 37 per square mile. Approximately one-third of the population of the county is in the city of Barnwell. During the period between 1980 and1986, the county experienced a 5.7% population growth. During the period between 1986 and 1990,the county experienced a 3.4% population decline. Manufacturing represents over one-third of thecounty's employment. Fanning provides less than 15% of the county's employment.
Geology
The site is near the eastern edge of the Aiken Plateau portion of the Atlantic Coastal Plain on alayer approximately 300 m (1,000 ft) thick of southeasterly-dipping, loose, unconsolidated sediments ofupper Cretaceous, Tertiary, and Quaternary ages (Figure 6-5) which unconformably overlie an older,well-consolidated Triassic Age basement. The Quarternary age soils, which immediately underlay the
6-9

Stratigraphic Unit
Hawthorn and Bamwell Formations
McBean Formation
Congaree Formation
Btenton FormationClay Unit
Sand Unit
Middendorf Formation
0
100
200
300
400
500
600
700
800
900
TOGO
1100
Lithology
Red, yellow, and purple sandydays with white and dark brownsands
Medium to coarse brown, white,and yellow sands
Coarse white and brown sands withsome quartz gravel
Dark gray to black micaceous clayand sandy clay
Medium to coarse white and graysand with streaks of brown day andquartz gravel
Brown and white, coarse sand andgravel with streaks of brown andwhite day
Hard brown day
Depth (Te«t)
Figure 6-5. Stratigraphic and lithographic interpretation of the Barnwell site.
6-10

topsoil, consist of loose to moderately dense fine and silty sands and range from a few centimeters tometers in thickness. Underlying this sandy layer is the Tertiary System which consists of theHawthorn, Barnwell, McBean, and Congaree Formations. The Hawthorn Formation, which is about8 m (26 ft) thick, consists of tan to reddish color sandy clay with patches of kaolinite materialdisseminated throughout in the upper part of the formation, and yellow clayey sand to dark red sandyclay at the base of the formation. The Barnwell Formation underlies the Hawthorn Formation, isapproximately 15 m (50 ft) in thickness, and is composed of brown, maroon, and red clayey sandwhich changes to yellow sand near the contact with the McBean Formation. The McBean Formation isabout 35 m (115 ft) thick and consists of white, tan, brown, and yellow clays interbedded with mediumto course quartz sand. Beds of McBean Formation limestone occur east and southeast of the burial site.The Congaree Formation, with a thickness of about 44 m (144 ft), provides the interface with theCretaceous system and consists of sands to sandy gravel.
The Cretaceous System includes the Ellenton Formation and the Middendorf Formation. TheEllenton Formation consists of an upper clay unit composed of dark grey to black clay and sandy clay,and a lower sand unit composed of medium to course white and grey sand with streaks of brown clayand quartz gravel. The Middendorf Formation consists of course sand and gravel interbedded withdiversely colored clay beds or lenses. Figure 6-5 provides a stratigraphic and lithographicinterpretation of a well at the Allied General Nuclear Services Plant adjacent to the Barnwell site.
Surface Water
The Barnwell site is geographically located between the Salkehatchie River on the east and theSavannah River on the west. The Salkehatchie, at 4.1 km (2.5 mi), is the closest river, but the site isin the surface drainage area of a Savannah River tributary, called Lower Three Runs Creek. There isno flowing stream on the site. The nearest seepage point, named Mary's Creek, is 1 km (0.6 mi) to thesouth and originates as a small constant flowing stream. Mary's Creek is a tributary of Lower ThreeRuns Creek and part of its 470 square kilometer (180 square mile) watershed area.
Surface run-off from the site is directed away from the trenches and is collected for infiltrationand evaporation in two surface collection ponds, formally a Carolina Bay, located along the westernboundary of the site. Active trenches are constructed with a slight upward grade to the edge of thetrench to prevent surface water from flowing into the trenches. Water which collects in the opentrenches is allowed to evaporate and is not transferred to the surface collection ponds except underextreme conditions of heavy rainfall, and then only after it is monitored to assure no elevation inradioactivity.
The closest reach of the Savannah River is approximately 22.5 km (14 mi) southwest of the site.Downstream, the Savannah River is used for sport fishing and pleasure boating. The Savannah Riveris a drinking water supply for Port Wentworth, Georgia, providing for a consumer population of about20,000, and at Hardeeville, South Carolina, providing for a consumer population of approximately80,000. There is commercial shipping on the 27 m (90 ft) wide, 3 m (10 ft) deep channel maintainedbetween Augusta and Savannah, Georgia.
6-11

Ground Water
The ground water table at the site is contained within the Hawthorn Formation and ranges indepth from about 9 to 18 m (30 to 60 ft) with a mean of about 12 m (40 ft). The ground water in thearea is acidic with a pH ranging from 4.8 to 6.5 and is therefore corrosive to metals.
There are no potable water wells in service as drinking water wells on the site. There are nousers of ground water directly downstream of the site. The town of Barnwell is the nearest municipaluser of ground water. The water is withdrawn from fairly-permeable zones within the McBeanFormation which extends to about 90 m (300 ft) below the surface in the Barnwell area. Ground waterat the site does not flow toward the town of Barnwell. Water from the underlying CretaceousMiddendorf Formation forms the principal ultimate source of potable water for the area.
Ecology
The Barnwell area is composed of habitats varying from very sandy, dry uplands to continuouslyflooded swamps. Organic matter thrives in the low-lying areas due to the supply of nutrients. Thelocal vegetation includes wild grass, scrub oak, and pine. The area developed for the waste disposalfacility was previously used for pulpwood production and agriculture.
The Carolina Bays support natural systems such as ponds, swamp forests, and herbaceousvegetation. These systems support animal populations including tree frogs, cricket frogs and otheramphibians; several bird species, and small snakes. Larger predators which include hawks, owls,snakes, weasels, and foxes, prey on cotton rats and amphibians. The Barnwell county ecosystemsupports over 68 species of land animals and birds. A list of some of the mammals and birds found inBarnwell County are given in Table 6-3.
ENVIRONMENTAL MONITORING
Environmental monitoring is performed at the Barnwell site by both Chem-Nuclear and the SouthCarolina Department of Health and Environmental Control. The monitoring programs include groundwater, surface water, air, precipitation, soil, sediments, vegetation, and direct radiation. Samplefrequency is continuous for air and external gamma radiation, quarterly for groundwater and annuallyfor all other samples. Groundwater samples are collected by Chem-Nuclear and are split for analysisby both Chem-Nuclear and by the state. All other sampling is performed independently and results arecompared for consistency.
Ground Water
Figure 6-6 shows the locations of boundary monitor stations which include well clusters (WB-)screened at approximately 12, 15, and 18 meter depths. The depths of the shallow wells vary from11 to 12 m (35 to 40 ft). The depths of the intermediate wells vary from 12 to 15 m (40 to 50 ft). Thedepths of the deep wells vary from 15 to 21 m (50 to 70 ft).
6-12

Table 6-3. Biota found in Bamwell County.
Mammals
Common Name Scientific Name
OpossumEastern CottontailGray SquirrelGray FoxRaccoonWhite Tail DeerBobcatBeaverSouthern Flying Squirrel
Didelphis marsupialisSylvilagus floridanus mallurusSciurus carolinensis carolinensisUrocyon dnereoagenteus cinereoagenteusProcyon lotor solatuaOdocoileus viginianus viginianusLynx rufus floridanusCastor canadensis carolinensisClaucomys volens saturatus
Birds
Common Name Scientific Name
Mallard DuckWood DuckTurkey VultureRed-Tailed HawkSparrow HawkBobwhiteMorning DoveScreech OwlCommon CrowCarolina Wren
Anas platyrhynchosAix sponsaCathartes auraButeo jamicensisFalco sparveriusColinus virginianusEnaidura asisticaOtus asioCorvus brachyrhynchosThryothorus ludovicanus
Table 6-4 shows the concentrations of tritium for the boundary wells and for several streams(WC-) in the vicinity of the site. Liquid scintillation analysis is used to detect the presence of tritium.In 1992, the average tritium level in boundary wells was just over 1,300 pCi/L (1,306 pCi/L). Thehighest was just over 2,000 pCi/L (2,040 pCi/L).63
The boundary monitoring wells were installed in the early 1980s. These wells have been sampledroutinely and the results of analyses have been reported to the South Carolina Department of Healthand Environmental Control. These analyses show no significant concentrations of tritium abovebackground. The records of the analyses are maintained by Chem-Nuclear and the Department.
6-13

EASTING
t i i i i i i i i i i i i i i i i i
I I I I I I I I I I I I I I I 1 I I I I I 1 I I I I 1 r ! ! I 1 I 1 1 1 ! 1 I 1
Figure 6-6. Plan view of the Barnwell site showing adjacent land owners/boundary sampling stations.
6-14
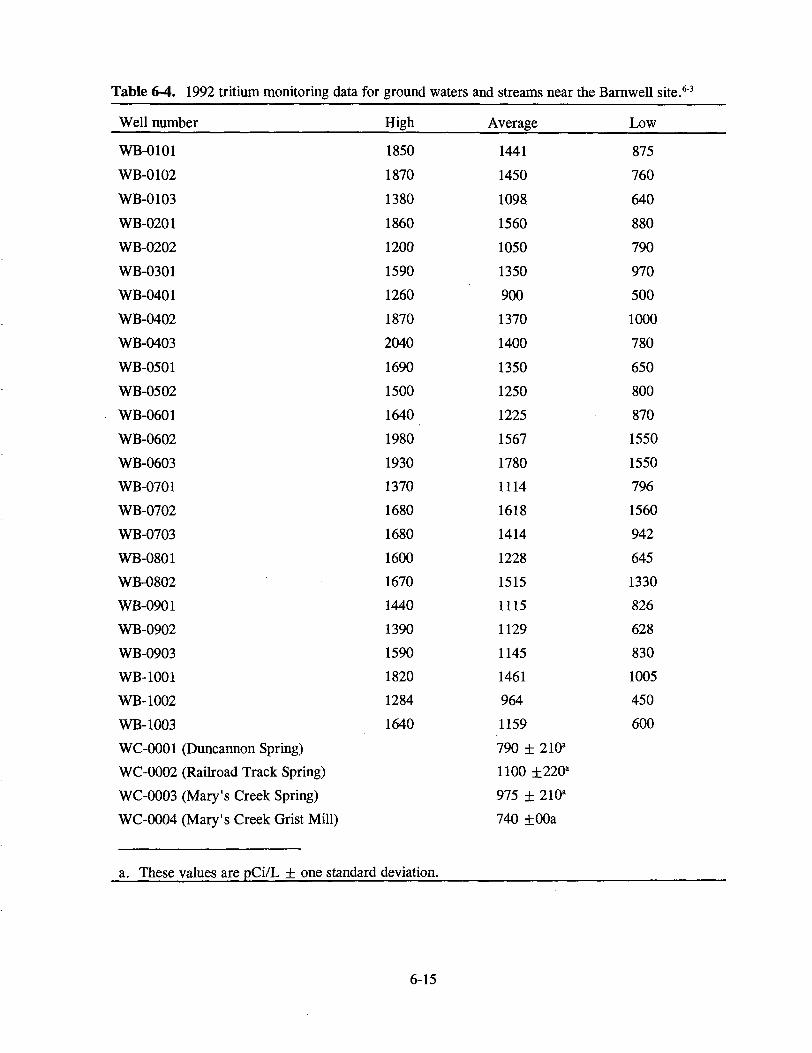
Table 6-4. 1992 tritium monitoring data for ground waters and streams near the Barnwell site.6-3
Well number
WB-0101
WB-0102
WB-0103
WB-0201
WB-0202
WB-0301
WB-0401
WB-0402
WB-0403
WB-0501
WB-0502
WB-0601
WB-0602
WB-0603
WB-0701
WB-0702
WB-0703
WB-0801
WB-0802
WB-0901
WB-0902
WB-0903
WB-1001
WB-1002
WB-1003
WC-0001 (Duncannon Spring)
WC-0002 (Railroad Track Spring)
WC-0003 (Mary's Creek Spring)
WC-0004 (Mary's Creek Grist Mill)
a. These values are pCi/L + one standard
High
1850
1870
1380
1860
1200
1590
1260
1870
2040
1690
1500
1640
1980
1930
1370
1680
1680
1600
1670
1440
1390
1590
1820
1284
1640
deviation.
Average
1441
1450
1098
1560
1050
1350
900
1370
1400
1350
1250
1225
1567
1780
1114
1618
1414
1228
1515
1115
1129
1145
1461
964
1159
790 ± 210a
1100 +220a
975 ± 210a
740 ±00a
Low
875
760
640
880
790
970
500
1000
780
650
800
870
1550
1550
796
1560
942
645
1330
826
628
830
1005
450
600
6-15
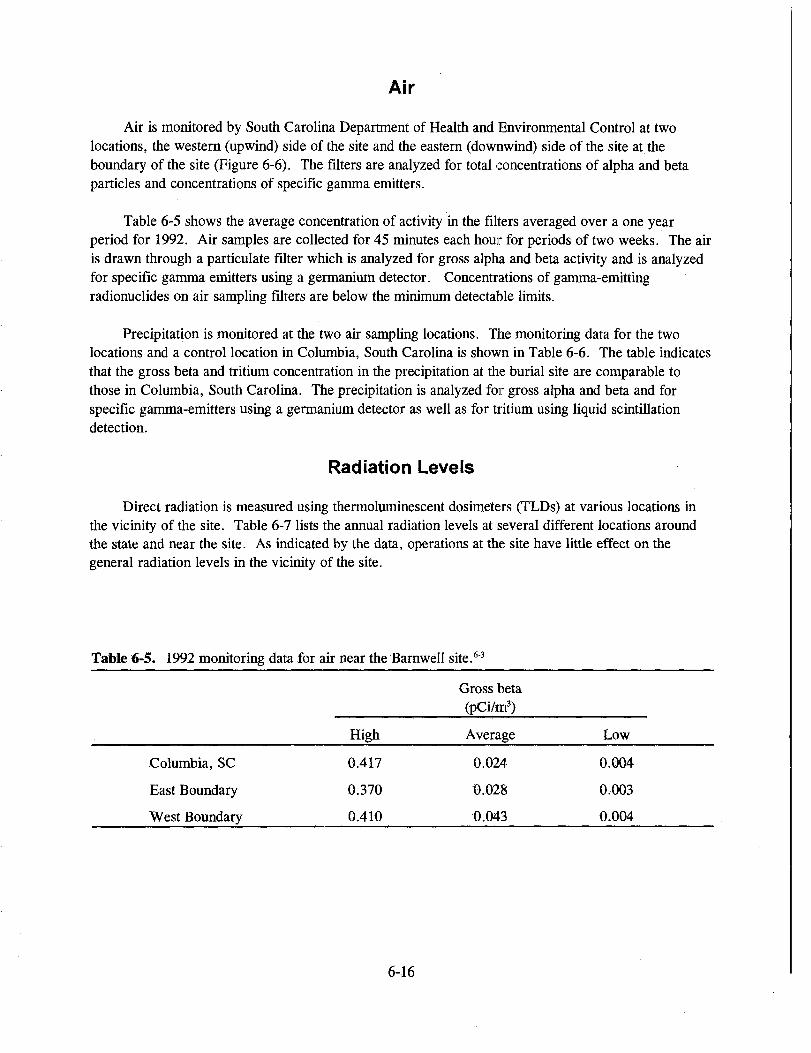
Air
Air is monitored by South Carolina Department of Health and Environmental Control at twolocations, the western (upwind) side of the site and the eastern (downwind) side of the site at theboundary of the site (Figure 6-6). The filters are analyzed for total concentrations of alpha and betaparticles and concentrations of specific gamma emitters.
Table 6-5 shows the average concentration of activity in the filters averaged over a one yearperiod for 1992. Air samples are collected for 45 minutes each hour for periods of two weeks. The airis drawn through a particulate filter which is analyzed for gross alpha and beta activity and is analyzedfor specific gamma emitters using a germanium detector. Concentrations of gamma-emittingradionuclides on air sampling filters are below the minimum detectable limits.
Precipitation is monitored at the two air sampling locations. The monitoring data for the twolocations and a control location in Columbia, South Carolina is shown in Table 6-6. The table indicatesthat the gross beta and tritium concentration in the precipitation at the burial site are comparable tothose in Columbia, South Carolina. The precipitation is analyzed for gross alpha and beta and forspecific gamma-emitters using a germanium detector as well as for tritium using liquid scintillationdetection.
Radiation Levels
Direct radiation is measured using thermoluminescent dosimeters (TLDs) at various locations inthe vicinity of the site. Table 6-7 lists the annual radiation levels at several different locations aroundthe state and near the site. As indicated by the data, operations at the site have little effect on thegeneral radiation levels in the vicinity of the site.
Table 6-5. 1992 monitoring data for air near the Barnwell site.6-3
Columbia, SC
East Boundary
West Boundary
High
0.417
0.370
0.410
Gross beta(pCi/m3)
Average
0.024
0.028
0.043
Low
0.004
0.003
0.004
6-16

Table 6-6. 1992 precipitation monitoring data for the Barnwell site.6-3
(pCi/L ± one standard deviation)
Gross beta pCi/Lannual average
Tritium pCi/Lannual average
Columbia, SC
East Boundary
West Boundary
2.9 ± 0.2
5.4 ± 0.5
2.0 ± 0 . 1
830 ± 200
1500 ± 250
1170 + 230
Table 6-7. 1992 direct radiation levels of South Carolina locations.6'3
80-0001
80-0940
80-1451
80-0614
80-0660
80-0661
a. Within 10 miles of the Barnwell Site.
Columbia, SC
Charleston, SC
Osborne Roada
Williston, SCa
Barnwell Airporf
Williston, SCa
0.20 mRem/day
0.19mRem/day
0.23 mRem/day
0.20 mRem/day
0.21 mRem/day
0.21 mRem/day
Soil
Surficial soil samples are taken from the 10 boundary monitor stations at the site. The samplesare analyzed for gamma-emitters using a germanium detector. Table 6-8 shows the concentrations ofcesium-137, which is the only gamma-emitter detected in the samples. The concentrations areanticipated background levels.
In addition to surficial soil samples, bore hole samples are taken by Chem-Nuclear and analyzedfor tritium and other radionuclides. Sediment samples taken from two surface water sources in thevicinity of the site are analyzed for gamma-emitters using a germanium detector. The concentrations ofcesium-137, which is the only gamma-emitter detected, are shown in Table 6-9. The data indicate thatthe concentrations of radionuclides in the sediment are approximately that of background.
6-17

Table 6-8. 1992 monitoring data for soil near the
(pCi/g ± one
Barnwell site.6"3
standard deviation)
Cesium-137
SS-O1O1 0.10 + 0.02
SS-0201 0.13 ± 0.02
SS-0301 0.19 ± 0.02
SS-0401 0.10 ± 0.03
SS-0501 0.16 ±0.02
SS-0601 0.25 ± 0.03
SS-0701 0.06 ± 0.02
SS-0801 0.10 + 0.02
SS-0901 0.08 ± 0.02
SS-1001 0.52 ± 0.03
Biota
Vegetation samples are taken at the 10 boundary monitor stations at the site and are analyzed forgamma-emitters using a germanium detector. The concentration data in Table 6-10 indicate thatcesium-137 in the vegetation samples are approximately that of background.
Table 6-9. 1992 monitoring data for sediment near the Barnwell site.6 3
(pCi/g dry weight)
Cesium-137
SD-0001 Duncannon Spring 0.3 ± 0 . 1
SD-0002 Railroad Track Spring < 0.01
SD-0003 Grist Mill 0.11 + 0.05
SD-0004 Mary's Creek Spring 0.05 ± 0.02
6-18
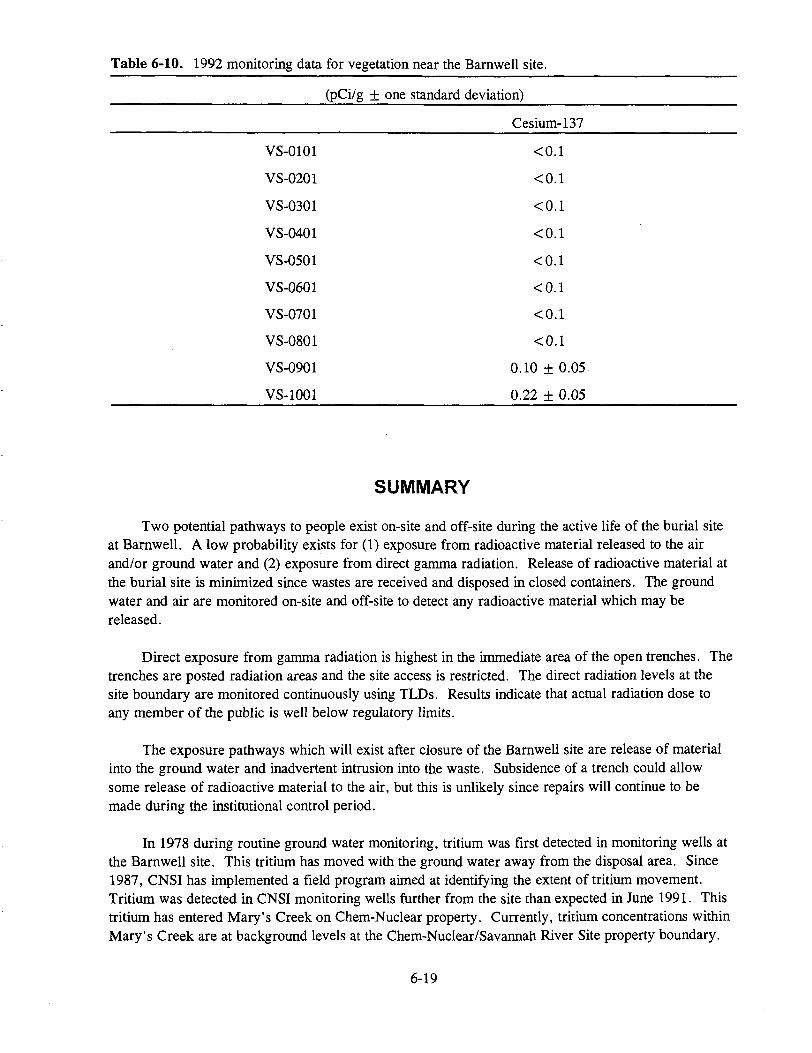
Table 6-10. 1992 monitoring data for vegetation
(pCi/g ± one
near the
standard
Barnwell site.
deviation)
Cesium-137
VS-0101 <0.1
VS-0201 <0.1
VS-0301 <0.1
VS-0401 <0.1
VS-0501 <0.1
VS-0601 <0.1
VS-0701 <0.1
VS-0801 <0.1
VS-0901 0.10 ±0.05
VS-1001 0.22 ± 0.05
SUMMARY
Two potential pathways to people exist on-site and off-site during the active life of the burial siteat Barnwell. A low probability exists for (1) exposure from radioactive material released to the airand/or ground water and (2) exposure from direct gamma radiation. Release of radioactive material atthe burial site is minimized since wastes are received and disposed in closed containers. The groundwater and air are monitored on-site and off-site to detect any radioactive material which may bereleased.
Direct exposure from gamma radiation is highest in the immediate area of the open trenches. Thetrenches are posted radiation areas and the site access is restricted. The direct radiation levels at thesite boundary are monitored continuously using TLDs. Results indicate that actual radiation dose toany member of the public is well below regulatory limits.
The exposure pathways which will exist after closure of the Barnwell site are release of materialinto the ground water and inadvertent intrusion into the waste. Subsidence of a trench could allowsome release of radioactive material to the air, but this is unlikely since repairs will continue to bemade during the institutional control period.
In 1978 during routine ground water monitoring, tritium was first detected in monitoring wells atthe Barnwell site. This tritium has moved with the ground water away from the disposal area. Since1987, CNSI has implemented a field program aimed at identifying the extent of tritium movement.Tritium was detected in CNSI monitoring wells further from the site than expected in June 1991. Thistritium has entered Mary's Creek on Chem-Nuclear property. Currently, tritium concentrations withinMary's Creek are at background levels at the Chem-Nuclear/Savannah River Site property boundary.
6-19

During 1991, CNSI installed an enhanced trench cap over 5 hectares (12.5 acres) of the oldtrench area. The cap consists of multi-layered synthetic and earthen materials as shown in Figure 6-4.The cap was designed to eliminate virtually all rainfall infiltration and thereby reduce further tritiummigration from these early trenches.
During 1992, a year long drilling and geologic mapping project was performed by CNSI toidentify the size and location of the plume. These new data show that most of the tritium south of thesite is in a long narrow band within the plume. Also, most of the plume area has tritium concentrationsless than EPA safe drinking water standard of 20,000 pCi/liter. Figure 6-7 shows the approximateplume outline.6"4 The geological maps developed during this study show that most of the tritium travelsin a high transmissivity zone and eventually exits in a spring in Mary's Creek. The primary findings ofthe study are summarized below.
1. The tritium plume geometry and flow direction are affected by the nature of theHawthorn/Barnwell formation contact as well as the potentiometric contours of thehorizontal transport zone.
2. The tritium plume is approximately 230 m (750 ft) wide and 940 m (3,100 ft) long for anapproximate surface area of about 20 hectares (50 acres). Three-fourths of the plumevolume contains tritium concentrations less than 10,000 pCi/L. About 1% of the plumevolume is in an elongate narrow projection which has tritium concentrations in excess of 1x 10⁶pCi/L.
The tritium plume is entirely on CNSI property except for two state-owned road right-of-ways.No private or public use is made of the ground water zone in which tritium is being transported.
6-20

Figure 6-7. Approximate tritium plume outline south of the Barawell site.
6-21

REFERENCES
6-1. State Inspection Videotape, CRCPD, Inc., 1993.
6-2. Interim Site Stabilizdtion and Closure Plan for the Bamwell Low-Level Radioactive WasteDisposal Facility, 1993 Closure Plan Revision, Chem-Nuclear Systems, Inc., September1993.
6-3. South Carolina Department of Health and Environmental Control (DHEC), 1992 SummaryReport Radiological Environmental Monitoring Around Chem-Nuclear Systems, Inc., Bureauof Radiological Health, June 1993.
6-4. Characterization Report Tritium Migration South of the Bamwell Site (BEDL-93-006), Chem-Nuclear Systems, Inc., Environmental and Dosimetry Laboratory, September 1993.
6^22

CHAPTER 7
Environmental Summary of the Richland, WashingtonLow-Level Radioactive Waste Disposal Site
INTRODUCTION
Background
The Richland commercial low-level radioactive waste (LLW) burial site operated by US Ecologybegan operations in 1965. It is unique among comparable sites in that it is the only one located onfederal land. The LLW facility occupies 0.4 square kilometers (100 acres) of land leased by USEcology, Inc., on the Hanford Reservation that is in turn leased by the State of Washington from theU.S. Department of Energy (DOE).
Location
The burial site is located in north central Benton County, in the southeastern part of the state, about 37km (23 mi) northwest of Richland, Washington (Figure 7-1). It is just southwest of the 200-East .(200-E) Area and about 4.0 km (2.5 mi) east of the 200-West (200-W) Area, within the SeparationsArea of the Hanford Site (Figure 7-1). The Separations Area near the center of the Hanford site covers212 square kilometers (82 square miles) and includes the 200-East and 200-West Areas, where severalretired reactors, irradiated uranium fuels processing facilities, plutonium separation facilities, as well asmajor radioactive waste storage and disposal facilities are located and are still in active use.
Facility
The Richland site was originally operated by California Nuclear, Inc., and then by NuclearEngineering Company, which is now known as US Ecology. The site received approximately0.35 million cubic meters (12.3 million cubic feet) of low-level radioactive waste, with a totalradioactivity of approximately 8.14 E+16 becquerels (2.2 million curies), as of December 31, 1992.The waste consists of solid or solidified materials, contaminated equipment, cleaning wastes, tools,protective clothing, gloves, and laboratory wastes. Unless specifically authorized by the WashingtonDepartment of Health, all radioactive waste is required to be received and buried in closed containers.Cardboard, corrugated paper, wood, and fiberboard (although in use during the early years) areprohibited burial containers.71
All waste and waste containers have been emplaced in trenches excavated into the surficialsediments. When completely filled, each trench is covered with at least 2.44 m (8 ft) of soil to grade,capped with a 15.24 cm (6 in.) layer of gravel, and then surcharged with spoils. Older trenches werecovered with 0.915 m (3 ft) of soil prior to gravel placement. At present, the waste is contained in
7-1

• Seattle / Spofcane*
Washington
Vancouver
Portland
PriestRapidsDam
cWhite Bluff
100-B,CQWest Lake
Gable B u t t e dOW Han-fordTowns ite
U.S. EcologyVHanford Site
400 Area(FFTF)
AdvancedNuclear Fuels3000 Area
nog. AreaRichiandPumphouse
Arid LandsEcology Reserve
Saddle MountainNational WildlifeRefuge
Kilometers4 S
Washington StateDepartment of Game
Figure 7-1. DOE Hanford site.
7-2

19 separate trenches located on about 0.128 square kilometers (32 acres) in the southeast and east-central part of the facility (Figure 7-2). Trench size is variable, but the newer trenches are up to 45.75m (150 ft) wide, 305 m (1,000 ft) long, and 13.73 m (45 ft) deep, with a horizontal to vertical sloperatio of 1:1.
Radioactive wastes received at the Richland LLW facility are inspected by a permanent on-siteDepartment of Health (DOH) inspector. The inspector reviews all shipping documents; surveystransport vehicles for radiation levels; visually inspects individual packages for appropriate markings,labels, and container integrity; and randomly inspects contents of containers. The inspector alsoverifies compliance with the radioactive materials license (WN-I019-2) issued by the State ofWashington to US Ecology, Inc.7"1
A final Resource Conservation and Recovery Act (RCRA) Facility Assessment Report (FAR) wascompleted at the commercial LLW site by PRC Environmental Management, Inc. under contract fromthe U.S. Environmental Protection Agency (EPA). The FAR was performed to evaluate the facility'spast and present solid waste practices. The US Ecology facility is not presently authorized to receivemixed or hazardous waste, but did dispose of material that is currently considered mixed waste such asscintillation fluids in Trenches 1 through 11A prior to EPA's determination that such waste was subjectto RCRA. The U.S. DOE Hanford site is seeking a RCRA permit to handle hazardous waste, andaccording to the EPA, the US Ecology facility, as part of the site, is therefore subject to investigationfor corrective action.
The FAR concluded that Trenches 1 through 11A would require further investigation, whichwould include soil borings and additional ground water sampling. Soil borings would be analyzed tohelp determine whether constituents have migrated from the units. Ground water samples from theexisting monitoring wells would be collected and analyzed for specific hazardous constituents (such asbenzene and toluene) to determine if migration has occurred in those trenches.
SITE
Topography
The Hanford site occupies an area of about 1,450 square kilometers (560 square miles), north ofthe confluences of the Snake and Yakima rivers with the Columbia River (Figures 7-1, 7-3, and 7-4).Adjoining lands to the west, north, and east are principally flat or rolling range and agricultural land inBenton and Franklin Counties.
Climate
The Cascade Mountains to the west greatly influence the climate of the Hanford site. This rangecreates a rain shadow effect and also serves as a source of cold air drainage, which has a considerableeffect on the wind regime. The prevailing wind direction on the 200 Area plateau, which includes theLLW site, is from the northwest in all months of the year. The secondary wind direction is from the
southwest. Summaries of wind direction indicate that winds from the northwest quadrant occur mostoften during the winter and summer. During the spring and fall, the frequency of southwesterly windsincreases with a corresponding decrease in the northwest flow. Monthly average wind speeds are
7-3

Ho Oi c;o • =
c ~ •
-•"* ^2
s 5 :•* *.§
§3 S3 If
4- §2
J ^
1srsr <§2 £3] I H3N3S1 j l ° » _ _ " • ' Q •
5 H3N3H1
0 S,
N 5
S H
'f "7"
I I"a =
IIn
u
3 s
a I
I »s i2 >
3 §
t 3 - 2 ;Nv 007 so
Figure 7-2. Low-level radioactive Waste management facility, US Ecology, Inc., Richland,Washington.
74

* TLD
• Soil
gH Vegetat ion
A Ground Water
Figure 7-3. Environmental radiation sampling stations at the US Ecology site.
7-5

HanfcrdRiver Miie
•2. Wtll * 22-S23. Wei! * -33-S5•4. Weil#3*-S235. Weil #2-1-51
OFTSITE GROUND WATER SAMPLING STATIONS
Figure 7-4. Environmental radiation sampling stations in the vicinity of the Hanford site.
lowest during the winter months, averaging 2.68 to 3.13 m/sec (6 to 7 miles per hour), and highestduring the summer, averaging 4 to 4.5 m/sec (9 to 10 miles per hour). Wind speeds that are wellabove average are usually associated with southwesterly winds. However, the summertime drainagewinds are generally northwesterly and frequently reach 13.4 m/sec (30 miles per hour). These windsare most prevalent over the northern portion of the site.
The record maximum temperature is 46°C (115°F), and the record minimum temperature is-32.8°C (-27°F). The average monthly temperatures have ranged from a low of -1.5°C (29.3°F) in
7-6

January to a high of 24.7°C (76°F) in July. During the winter, the highest monthly averagetemperature at the Hanford Meteorological Station (HMS) was 6.9°C (44.4°F), and the record lowestwas -5.9°C (21.4°F); both occurred during February. During the summer, the record maximummonthly average temperature was 27.9°C (82.2°F) in July, and the record lowest was 17.2°C (63°F)in June. The annual average relative humidity at the HMS is 54%. It is highest during the wintermonths, averaging about 75%, and lowest during the summer, averaging about 35%. Average annualprecipitation at the HMS is 16 cm (6.3 in.). Most of the precipitation occurs during the winter, withnearly half of the annual amount occurring in the months of November through February. Monthlyclimatological data from the HMS for 1991 is provided in Table 7-1,7"2
Good dispersion conditions associated with neutral and unstable stratification exist about 57% ofthe time during the summer. Less favorable dispersion conditions (when the wind speed is light and themixing layer is shallow) are most common during the winter, when moderately to extremely stablestratification exists about 66% of the time. Occasionally there are extended periods, primarily duringwinter months, of poor dispersion conditions that are associated with stagnant air in stationary high-pressure systems.
Land Use
The Hanford site in southcentral Washington State is about 1,450 square kilometers (560 squaremiles) of semiarid shrub-steppe located just north of the confluence of the Snake and Yakima rivers.This land, with restricted public access, provides a buffer for the smaller areas historically used for theproduction of nuclear materials, waste storage, and waste disposal. About 6% of the land area hasbeen disturbed and is actively used.
The Hanford site was acquired by the federal government in 1943. For more than 20 years,Hanford site facilities were dedicated primarily to the production of piutonium for national defense andmanagement of the resulting wastes. In later years, programs at the Hanford site were diversified toinclude research and development for advanced reactors, renewable energy technologies, wastedisposal technologies, and cleanup of contamination from past practices. The U.S. DOE has ended theproduction of defense-related nuclear materials at Hanford.
Non-DOE operations and activities include commercial power production (near the 400 Area), acommercial low-level radioactive waste burial facility (near the 200 Areas), a commercial nuclear fuelfabrication facility, and a low-level radioactive waste decontamination, supercompaction, andpackaging disposal facility adjacent to the southern boundary of the Hanford site.
Land use in surrounding environs includes urban and industrial development, irrigated anddryland farming, and grazing. In 1989, wheat represented the largest single crop in terms of areaplanted in Benton and Franklin counties, with 864 square kilometers (216,000 acres). Corn, alfalfa,potatoes, asparagus, apples, cherries, and grapes are other major crops in Benton and Franklincounties. More than 20 processors in Benton and Franklin counties produce food products, includingpotato products, canned fruits and vegetables, wine, and animal feed.7"4
7-7

Table 7-1. Monthly climatological data from the Hanford Meteorological Station, 1991.
HANFORD METEOROLOGY STATION, 25 MILES N.W. OF RICIILAND, WALatitude 46°34'N, Longitude 119°35'W, Elevation 733 Feet
00
Mon
th
JF
MA
MJ
J
A
S
0
N
D
If)Y
Temperature (°C)D
aily
Max
imum
2.6
12.8
13.119.5
22.7
25.8
33.9
34.3
29.6
18.9
8.8
6.9
19.1
AverD
aily
Min
imum
-6.3
1.0
0.4
r>.o8.8
11.5
17.2
17.8
12.3
4.3
1.5
-0.5
6.1
)ges
Mon
thly
-1.86.9
6.7
12.2
15.818.7
25.6
26.1
20.9
11.6
5.2
3.2
12.6
14-113a.
-1.4
+3.6
-0.8
+0.7
-0.5
-2.3
+1.0
+2.1
+2.2
0
+0.6
+3.6
+0.7
Extremes
Hig
hest
, 15.0
18.9
20.6
27.8
28.3
33.9
40.6
39.4
35.0
31.1
18.3
15.0
40.6
Dat
e
13
19
31
21
21
10
3
21+
6+
1
12
11
Jul3
Low
est
-15.0
-3.3
-5.6
-0.6
3.3
6.7
12.8
8.3
5.6
-5.0
-5.0
-6.7
-15.0
Dat
e
4
28+lC)
2
8+
25+
17
20+
26
22
30
30+
19+
Jan4
Tot
al
0.80.5
2.8
1.1
1.2
3.7
0.7
0.2
0
1.4
3.7
1.0
17.1
Precipitation
Dep
artu
re
-1.2
-1.1
+ 1.6
+0.1
-0.1
+2.7
+0.3
-0.5
-0.8
+0.4
+1.4
-1.6
+1.2
cm)
Snowfall
Tot
al
9.70
0.3
0
0
0
0
0
0
3.0
T
1.5
14.5
Dep
artu
re
-0.2
-5.1
-0.5
T ( d )
_(e)
-
. -
-
-
+2.8
-4.6
-13.0
-20.6
RelativeHumidity
(%)
Ave
rage
78.3
68.1
58.7
43.7
45.8
48.1
34.6
36.4
36.6
47.8
78.2
82.1
54.9
Dep
artu
re
+ 1.9
-2.2
+2.8
-3.5
+3.1
+9.3
+1.1
+0.6
-6.1
-7.4
+4.8
+1.8
+0.6
50-Foot Wind(a>
Ave
rage
Spee
dfk
m/h
)
8.4
10.5
12.4
16.1
14.3
13.4
13.7
12.4
11.4
10.8
9.6
9.3
11.9
Dep
artu
re
-2.1
-1.1
-1.0
+ 1.6
-0.3
-1.4
-0.5
-0.3
-0.5
+0.3
-0.6
-0.2
-0.5
Spee
d(k
m/h
)
69
71
98
80
72
76
74
68
69
88
77
90
98
Peak
Dir
ectio
n -
SSESW
SW
g
NW
WNW
SSW
WNW
WSW
N
W
SW
Gusts
Dat
e
1319+
3
3
30
29
31
18
20+
16
28+
12
Mar3
(a) Measured on a tower 50 ft above the ground.(h) Departure columns indicate positive or negative departure of meteorological parameters from 30-year (1961-1990) climatological normals.(c) + niter dale indicates latest of several occurrences.(d) Trace.(e) - means no record of any snowfall during these months,(fl Yearly averages, extremes, and totals.

Estimates by the U.S. Census Bureau for 1990 place the population totals for Benton and Franklincounties at 112,560 and 37,473, respectively. The 1990 estimates for the Tri-Cities populations areRichland, 32,315; Kennewick, 42,159; and Pasco, 20,337. The populations of Benton City, Prosser,and West Richland totaled 10,244 in 1990. The population of Benton and Franklin counties ispredominantly young, with 56% of the total population under the age of 35, compared with 54% of thetotal state population. An examination of age groups in 5 year increments reveals that the largest agegroup in Benton and Franklin counties ranges from 5 to 9 years old, representing 9.3% of the total bi-county population; the largest group in the state ranges from 30 to 34 years, which represents about 9%of the total state population.74
Geology
The Hanford site lies within the Pasco Basin on the semi-arid alluvial plain of the ColumbiaRiver. The burial site is situated in glaciofluvial deposits from the ancestral Columbia River, whichconsists of sand, silt, and gravel in various combinations. These deposits range to about 61m (200 ft)in depth and overlay the Ringold Formation, which is a layer of sedimentary material ranging to 366 m(1,200 ft) thick. Below this formation is bedrock consisting of the Yakima Basalt.7"4 Near the200-West Area, the Ringold and Hanford Formations are separated by well-developed buried soil andfine-grained wind deposits. The stratigraphic and structural relationships between these units aredisplayed in Figure 7-5.1A
Surface Water
The Columbia River is the dominant surface water body on the Hanford site and is approximately12.9 km (8 mi) from the LLW site. The Columbia, which originates in the mountains of eastern BritishColumbia, Canada, drains a total area of approximately 70,680 square kilometers (27,300 square miles)en route to the Pacific Ocean. Flow of the Columbia River is regulated by 11 dams within the UnitedStates, 7 upstream and 4 downstream of the site. Priest Rapids is the nearest dam upstream of the site,and McNary is the nearest dam downstream. The Hanford Reach of the Columbia River extends fromPriest Rapids Dam to the head of Lake Wallula (created by McNary Dam), near Richland. This Reachis the last stretch of the Columbia River in the United States above Bonneville Dam that remainsunimpounded. The width of the river varies from approximately 300 to 1,000 m (984 ft to 3,281 ft)within the Hanford site.
The Columbia River flows eastward through the northern part of the Hanford site and then turnssouth, forming part of the eastern boundary. The Yakima River runs along part of the southernboundary and joins the Columbia River below the city of Richland. The Columbia River flows throughthe reservation about 27.4 km (17 mi) from the waste disposal site.
No surface water bodies are on or near the Hanford site. A number of man-made ponds havebeen created by U.S. DOE for the disposal of reactor cooling water and liquid wastes.
Typical flow rates of the Columbia River range from 999 to 6,995 cubic m/sec (35,310 to247,170 cubic ft/sec), with peak spring runoff flows of up to 12,590 cubic m/sec (444,906 cubicft/sec). The minimum regulated flow is 1,019 cubic m/sec (36,016 cubic ft/sec).
7-9

GEOLOGIC CROSS-SECTION OF THE SITE
UnconfinedWater Table 200-West 200-East
Columbia River
= 122-j
9 12 15
Distance. Kilometers
Figure 7-5. Geological cross-section of the Hanford site.
The temperature of the Columbia River varies seasonally. Minimum temperatures are observedduring January and February, and maximum temperatures typically occur during August andSeptember. Mean monthly temperatures for the river range from approximately 3°C (37°F) to about20°C (68°F).
7-10

Ground Water
Both confined and unconfined aquifers are present beneath the Hanford site. The confinedaquifers, where ground water is under pressure greater than that of the atmosphere, are found primarilywithin the Columbia River basalts. In general, the unconfined or water table aquifer is located in theRingold Formation and glaciofluvial sediments, as well as some more recent alluvial sediments in areasadjacent to the Columbia River. This relatively shallow aquifer has been affected by wastewaterdisposal by U.S. DOE. Therefore, the unconfined aquifer is the most thoroughly monitored aquiferbeneath the Hanford Reservation.
The unconfined aquifer is bounded below by either the basalt surface or, in places, the relativelyimpervious clays and silts of the Ringold Formation. The water table defines the upper boundary of theunconfined aquifer. Laterally, the unconfined aquifer is bounded by the basalt ridges that surround thebasin and by the Yakima and Columbia Rivers. The basalt ridges have a low permeability and act as abarrier to lateral flow of ground water where they rise above the water table. Depth from the groundsurface to the water table ranges from less than 0.30 m (1 ft) at the Columbia River to more than 106 m(348 ft) in the center of the Hanford site. The depth to ground water at the US Ecology LLW site isabout 97 m (317 ft).
The operational discharge of water by U.S. DOE facilities has created ground water mounds neareach of U.S. DOE's major waste water disposal facilities in the 200 Areas. These mounds have alteredthe aquifer's local flow pattern, which is generally from the recharge areas in the west to the dischargeareas (primarily the Columbia River) in the east. Water levels in the unconfined aquifer have changedcontinually during site operations because of variations in the volume of waste water discharged.Consequently, the movement of ground water and its associated constituents has also changed withtime.7"4
Ground water mounding also occurs in the 100 and 300 Areas. Ground water mounding in theseareas is not as significant as in the 200 Areas because of differences in discharge volumes andsubsurface geology. In the 100 and 300 Areas, water levels are also greatly influenced by river stage.
Ecology
The Hanford site is a relatively large, undisturbed area of shrub-steppe that contains numerousplant and animal species adapted to the region's semiarid environment. Table 7-2 lists some of themammals, birds, and vegetation found in the area.
More than 240 species of plants have been identified on the entire Hanford site, and cheatgrass isthe dominant plant on fields that were cultivated 40 years ago.M
More than 300 species of terrestrial and aquatic insects, 12 species of reptiles and amphibians, 44species of fish, 187 species of birds, and about 39 species of mammals have been found on the Hanfordsite. Deer and elk are the major large mammals on the site; coyotes are plentiful, and the Great Basinpocket mouse is the most abundant mammal. Waterfowl are numerous on the Columbia River; thebald eagle is a regular winter visitor along the river. Salmon and steelhead are the fish species of mostinterest.
7-11

Table 7-2. Common species of mammals, birds, and vegetation.
Mammals and birds Vegetation
Mule deer (Odocoileus hemionus)
Coyote (Canis latrans)
Badger (Taxidea taxus)
Black-tailed hare (Lepus californicus)
Great basin pocket mouse (Perognathusparvus)
Deer mouse (Peromyscus maniculatus)
Western meadowlark (Sturnella neglecta)
Bluebunch wheatgrass (Agropyronspicaturri)
Cheatgrass (Bromus tectroum)
Bitterbrush (Purshia tridentatd)
Greasewood/saltgrass (Sarcobatusvermiculatus)
Winterfat (Eurotia lanata)
Thyme buckwheat {Eriogonum thymoides)
Tumble mustard (Sisymbrium altissimum)
Willow (Salicaceae)
Sandberg's bluegrass (Poa sandbergii)
Sagebrush {Artemisia tridentatd)
No federally designated threatened or endangered animal species are known to inhabit the facilityor the leasehold. However, the bald eagle {Haliaeetus leucocephalus), a threatened species, and theperegrine falcon (Falcoperegrinus), an endangered species, have been seen on the Reservation andmay pass over the facility.
ENVIRONMENTAL MONITORING
Overview
Environmental monitoring is performed at the Richland LLW facility to demonstrate compliancewith federal, state, and local regulations; confirm adherence to environmental protection policies; andsupport the environmental management decisions. These regulations require that effluents to thegeneral environment be maintained as low as reasonably achievable (ALARA) and that annual dosesdue to effluents not exceed 0.25 millisievert (25 millirems) to the whole body, 0.75 millisievert (75millirems) to the thyroid, and 0.25 millisievert (25 millirems) to any other organ of any member of thepublic.
The Department, with assistance from many other agencies, operates a statewide environmentalradiation monitoring program. It also audits surveillance programs required of licensees and other
7^12

nuclear facilities. The state's independent program also serves to verify the adequacy and accuracy ofa facility's program.
The major goals of the environmental radiation program are to identify, assess, and initiateappropriate corrective actions needed to prevent any potential exposure to the public, or contaminationof the environment before a significant problem develops.
The environmental monitoring program at the Richland LLW facility monitors all pathwaysthrough which individuals living outside the Hanford site could be exposed to radiation or radioactivematerials released from the site. These include direct radiation, atmospheric exposure, and fromradionuclide releases into the ground water.
Environmental monitoring programs are conducted by the State of Washington and US Ecology,Inc. at the LLW facility. The monitoring of potential environmental pathways of exposure include ninefixed environmental air stations, routine monitoring of both soil and live vegetation (when available),environmental thermoluminescent dosimeters, five ground water wells (Figures 7-2 and 7-3), andvadose zone monitoring. The specific requirements for environmental monitoring are defined in theFacility Standards Manual7"3 and are described in detail in the US Ecology Annual EnvironmentalReports.7"4
Environmental monitoring began in the first quarter of 1966. Soil and vegetation samples weretaken from the vicinity of the four facility corners by the facility operators (US Ecology, Inc., formerlyCalifornia Nuclear, Inc., then NECo). Starting in the first quarter of 1964, the U.S. AEC provided thelicensee with the results of the analysis of ground water samples taken from wells near the 200-W and200-E areas (Figure 7-6) which were closest to the facility. Until the first quarter of 1973, only grossbeta concentrations were monitored in ground water. Beginning in 1977, Battelle gathered the groundwater samples, U.S. Testing analyzed the samples and provided the analytical results to the State ofWashington, and Battelle then distributed the data to the facility operator (US Ecology). In 1986, USEcology began performing ground water sampling in the newly constructed on-site ground water wells,with U.S. Testing performing the analysis.
Environmental sampling for air and particulate airborne radioactivity was initiated inJanuary 1987. Prior to that time (beginning in December 1978), downwind operational low-volume airsampling was performed at a location near the east fence. As new trenches became operational, thislocation was moved to the south fence.
Ambient gamma measurements were performed, using thermoluminescent dosimeters (TLDs)posted at the facility corners, which were then collected quarterly. Monthly TLDs were posted at thenorth, south, east, and west fencelines and at a downwind location.
Monitoring of the milk pathway at the Hanford site is not possible because no farms or cattle arenear the site. However, milk is collected every other week throughout the year from farms east of theHanford Reservation (approximately 32 km (20 mi), in the prevailing downwind direction) andanalyzed for radionuclides. Wildlife is collected at the Reservation and is analyzed annually. Analysisof vegetation samples serves to provide an indication of any radionuclides which could be included inthe diet of wildlife.
7-13

ENVIRONMENTAL RADIATION SAMPLING STATIONSIN THE VICINITY OF HANFORD
Walla Walla
LEGEND
FISH
Figure 7-6. Off-site ground water sampling stations near the Hanford site.
Table 7-3 describes the environmental monitoring program and action levels as required by theWashington State Department of Health. Actions required whenever environmental action levels areexceeded are given in Table 7-4. Table 7-5 summarizes the requirements for minimum detectableconcentrations for gamma spectroscopy of environmental samples. Figures 7-2, 7-3, 7-4, and 7-6 showthe locations of all environmental monitoring stations on the facility; these are described in Table 7-3.
7-14

Table 7-3. Environmental/occupational monitoring requirements.
U i
MEDIUM /
DirectGaimaDose(TLD)
LOCATION
m, NE, sw,SE Comers andN, S, E,WFencel ines
N, S, E, WFencel 1nesandFencel Ineposit ion(s)nearest each activedisposal trench
TYPE, FREQUENCY
Continuous,Quarterly
Continuous,Monthly
ANALYSIS
Tissue doseusing thermo-lumine scentdosineters
• Tissue doseusing thermo-lunine scentdosimeters
PCTLCH
INVESTIGATIONLEVEL
120 mrem/qtr
40 rnrem/fnontii
LEVELS
REPORTINGLEVEL
500 mrem/year
500 mran/year
#TICNCATEGORY1
3,4
3,4
NOTES 1) Table 6.4 presents Uie action reqiired based upon action categories.
2) I f Ac-227 is 1 isted on manifest or knowi to be present, the reporting level is 3.0 x 10"^3 uCi/cc.
3) The regjired mininuii detection concentrations (NDC's) are l i s ted In Table 4 . 3 .
4) MA = Not applicable or none established.
5) Dry to wet rat io w i l l be obtained
6) Total uraniun analysis is defined as the sun of the concentrations of uranium Isotopes reported.
7) These are Interim reporting levels
0) Concentrations w i l l be evaluated and reported annually In the envirormental report.
9) Field blark analysis 1s the sane as wall sanple analysis.
10) Used for sample QA.

Table7-3. (continued).
LEVELS
So i l 5
Vegetation5
.O\
LOCATION
Env. ManitaringStations 1-9 andt £ , Nl Cornars
TYPE, FREQUENCY
Grab, Quarterly
Env. MDnitoringStations 1-9 andt£,NWCorns rs
Grab, Quarterlyfor deep rooted
Fi l led and cappedtrenches
Grab, Annually
ANALYSIS
Gross BetaTotal Uranlun6
Pu-230Pu-239/240Co-60Cs-137Garnia Spec
INVESTIGATIONLEVEL
35 pCi/g (dry)1 pCi/g (dry)
0.03 pCi/g (dry)0.03 pCI/g (dry)0.3 pCI/g (dry)0.25 pCI/g (dry)5 x MX)3
Gross BetaTotal Uraniuii6
Pu-230Pu-239/240Co-60Cs-137Ganroa Spec
Gross BetaTotal Uranium6
Pu-230Pu-239/240Co-60Cs-137Garma SpecH-3
100 pC1/g (dry)0.25 pCi/g (dry)0.02 pCi/g (dry)0.02 pC1/g (dry)0.1 pC1/g (dry)0.2 pCI/g (dry)
5 x M X : 3
100 pCI/g (dry)0.25 pCi/g (dry)0.02 pCi/g (dry)0.02 pCf/g (dry)0.1 pC1/g (dry)0.2 pCI/g (dry)5 x MX3
m\4,o
REPUTINGLEVEL
36 pCI/g (dry)7
1 pCI/g (dry)7
0.03 pCi/g (dry)7
0.03 pCi/g (dry)7
0.3 pC1/g (dry)7
0.25 pCI/q (dry)7
5 x MX)3 '7
100 pC1/g (dry)7 n
0.25 pC1/g (dry)7
0.02 pCI/g (dry)7
0.02 pCVg (dry j7
0.1 pCJ/g (dry)7
0.2 pC1/g (dry)7
5 x M E 3 . I
100 pCI/g (dry)7
0.25 pCi/g (dry)7
0.02 jCI /g (dry)7
0.02 pCI/g (dry)7
0.1 pC1/g (dry)7
0.2 pCI/q (dry)7
5 x Mx3>'
CATEGORY1
3,3.3.3.3,3.3.
3.3.3.3.3.3.3.
3,3.3.3.3.3.3.
4444444
4444444
4444444

Table 7-3. (continued).
LEVELS
MEDIUM
GrourxXvater
F ie ld 01 arkDeionizedWater
LOCATION
Wells#013 (upgradient)#010#000#005#003
TYPE, FREQUENCY
Grab, Quarterly
1 blark per10 sanplescollected
ANALYSIS
Gross AlphaGross BetaH-3C-14Total Uranium6
Pu-230Pu-239/240Co-60Cs-137Gaima Spec
Speci f ieConductance
TDSTOCNitratesTaupe ratu re
Note 9
INVESTIGATIONLEva
12pCi/L12 pCi/L
3,600 pCi/L250 pCi/L4.5 pCi/L
0.03 pCi/L0.03 pCi/L
6pCi/L7 pCI/L
5 x MX3
NA4» ^
NA4' 8
NA4» 8'Wfl. 8(4/\4, 8
m 4 . 10
REPCRTTN3LEva
15 pCi/L50 pCi/L
20,000 pCi/L2,000 pCi/L
30pCi/LSee Pu-239/24040 pCi/L (total Pu)
100 pCi/L200 pC1/L
5xMDC3» 1
NA4» ^
KA4, 8NA4.8NA » 8H^4.8
/CT10NCATEQOfW1
3.3.3.3,3.3,3.3.3.3,
NA4
NA4
NA4
NA4
NA4
HA4
4444444444

Table 7-3. (continued).
oo
HEOIUM
ENVIRONMENTAL
AIR
OCCUPATIONALAIR
LOCATION
Envlr . Monitoring
Stations 1-9
Envlr . MonitoringStations 1-9
Envlr . Monitoring
Stations 1,2,5
One downwindplus one at
each locat ion
of potential
exposure
TYPEi FREQUENCY
Continuous,
changed weekly
Continuous,
Monthly
Composite of
weekly samples
Continuous,
changed monthly
Continuous
during
operations
or 1 hour/day;
whichever Is
greater
ANALYSIS
Gross Alpha
Gross Beta
1-125
Co-60
Cs-137
Gamma Spec
11-3
Gross Alpha
Gross Beta
1-125
ACTION
INVESTIGATION
LEVEL
1 x 1 0 " 1 4 UCI/cc
1 x l O " 1 3 uC I /cc
3.5 x 1 0 " 1 4 uCI /cc
5 x 1 0 " 1 4 uCI /cc
5 x 10~ 1 4 uCI /cc
5 x MDC3
2 x 10" 1 1 uCI /cc
NA4
NA4
NA4
LEVELS
1.72 . 6
2 .3
2 . 6
1.9
5 x
6.1
3 X
1 X
5 x
REPORTING
LEVEL
X 10~ 1 4 uCI /cc1 1
x 1 0 " 1 1 uCI /cc
x 1 0 " 1 0 uCI /cc
x 10" 1 1 uCI /cc
x 1 0 " 1 0 uCI /cc
MDC3
x 10" 8 uCI /cc
1 0 " 1 3 uC1/cc
1 0 ' 1 2 uC I /cc 2
1 0 ~ 1 0 uCI /cc
ACTION
CATEGORY1
3,3 ,
3 ,
3 ,
3 .
3 .
3,
11
1
44
4
4
4
4
4

Table 7-4. Action required when action level met or exceeded.
1. Type 1 EventFollow reporting level requirementsPotential for bioassay examined by facility and corporate radiation office
2. Type 2 EventImmediate notification of on-site inspectorTake corrective action
3. Investigation LevelNotify the facility and corporate radiation officeTake corrective actions described in facility safety manual 6.1.5
4. Reporting LevelNotify the facility and corporate radiation office, the Department, the US NRC within 24hours upon confirmation
Take corrective actions described in facility safety manual 6.1.5Make reports in accordance with facility safety manual 6.1.4.C
5. Resurvey with dose rate instrument for fixed contamination/radiation level and smears forloose contamination. If does rate <0.1 mR/hr and loose contamination <220 dpm/100 cm2,no further action is required. If does rate is ^0.1 mr/hr or loose contamination is ^220dpm/100 cm2, then take actions per #2 above.
Radon gas monitoring was initiated in 1993 at selected air monitoring stations. This programutilizes track etch detectors to provide data on airborne radon concentrations. Table 7-6 provides theresults of this study.
Ground Water
Ground water samples are analyzed for radiological as well as non-radiological constituents.Radiological analyses include gross alpha, gross beta, tritium, C-14, gamma-emitters, isotopicplutonium (Pu-238 and Pu-239/240), and isotopic uranium (U-234, U-235, and U-238).Non-radiological parameters include temperature, specific conductivity, total organic carbon (TOC),nitrates, and total dissolved solids (TDS).
Starting in the first quarter of 1964, the U.S. AEC provided the Richland LLW facility operatorwith the results of analysis of ground water samples taken from the wells in the vicinity of the LLWdisposal site (Figure 7-6). Until the first quarter of 1973, only gross beta concentration was monitoredin ground water. Starting in 1974, the samples were analyzed for gross alpha, gross beta, tritium, andby gamma spectroscopy. Samples of US Ecology's on-site wells (Figures 7-2 and 7-3) began duringthe first quarter of 1986.
7-19

Table 7-5. Required minimum detectable concentrations (MDCs) for gamma spectroscopy analysis ofenvironmental samples.
Radionuclide
76As
140BaLa
141Ce
144CePr
58Co
6OC0
134Cs
137Cs
152Eu
154Eu
155Eu
59Fe
1311
1331
54Mn
99Mo
22Na
103Ru
106Ru
124Sb
125Sb
65Zn
95ZrNb
Water(pCi/L)
16
24
10
92
10
11
11
10
56
27
24
17
10
11
10
69
10
10
85
10
24
21
17
Airborne Activity(pCi/m3)
0.02
0.02
0.01
0.09
0.01
0.01
0.01
0.01
0.06
0.03
0.02
0.02
0.02
0.01
0.01
0.07
0.01
0.01
0.09
0.01
0.02
0.02
0.02
Soil(pCi/g-dry)
0.03
0.05
0.02
0.18
0.02
0.02
0.02
0.02
0.11
0.05
0.05
0.03
0.02
0.02
0.02
0.14
0.02
0.02
0.17
0.02
0.05
0.04
0.03
Vegetation (pCi/g-dry)
0.05
0.07
0.03
0.10
0.03
0.03
0.03
0.03
0.17
0.08
0.07
0.05
0.03
0.03
0.03
0.21
0.03
0.03
0.26
0.03
0.07
0.06
0.05
Note: The gamma nuclide library used by the analytical laboratory will contain additional radionuclidesas specified by US Ecology. Naturally occurring gamma ray emitters which will be monitored andreported in the annual environmental report are not included in this listing.
7-20

Table 7-6. Airborne radon gas measurements.
May
Jun
Jul
Aug
Sep
Oct
Nov
Dec
a. Radon gas monitoring was
Radon in Air
AirSta. 1(pCi/L)
<1.2
<1.0
<0.9
<1.1
<0.9
<0.9
<1.3
1.1
started in May 1993.
1993a
Air Sta. 2(pCi/L)
<1.2
<1.0
<0.9
<1.1
<0.9
<0.9
<1.3
1.0
Air Sta. 5(pCi/L)
<1.2
<1.0
<0.9
<1.1
<0.9
<0.9
<1.3
<0.9
Analysis results (alpha, beta, and tritium) for the ground water wells are presented in Table 7-7.The facility's on-site wells consist of four wells downgradient from the disposal unit (wells 3, 5, 8, and10) and an upgradient well (well 13). Ground water samples are collected quarterly. The meanconcentrations of gross alpha, gross beta, and tritium from 1964 to 1986 in the off-site wells (Table7-7) were 0.26, 0.5, and 21.4 Bq/L (7.1, 13.5, and 581 ± 725 pCi/L), respectively.73 It should benoted that the US Ecology LLW disposal facility is located adjacent to the 200-East and 200-Westfacilities of the U.S. DOE Hanford Reservation (Figure 7-6). U.S. DOE's Hanford site EnvironmentalReport for Calendar Year 19907"4 states that tritium concentrations in the unconfined aquifer exceed 7.4E+3 Bq/L (2E+5 pCi/L) in the regions surrounding the 200-East and 200-West areas. It is expectedthat tritium concentrations from these plumes could increase the levels observed in US Ecology'smonitoring wells over the next several years. New wells may be required at the LLW site in order todetect the tritium plumes coming from the U.S. DOE areas. The concentrations in ground water at theU.S. DOE Hanford site regional wells (outside of the 200 Area) range from 0.15 to 11.5 Bq/L (4 to310 pCi/L) for alpha, 0.6 to 19.6 Bq/L (16 to 530 pCi/L) for beta, and 11.1 to 74.7 Bq/L (300 to 2020pCi/L) for tritium.7"4
Gross Alpha and Beta Activities in Ground Water
The gross alpha activity concentration in the on-site ground water samples varied from less thandetectable to a maximum of about 0.43 Bq/L (11.5 pCi/L) (Table 7-7). The investigation level forgross alpha activity is 0.44 Bq/L (12 pCi/L). Gross beta activity varied from a low of 0.16 Bq/L (4.2pCi/L), to a high of about 0.43 Bq/L (11.6) (Table 7-7). The investigation level for gross beta activityis also 0.44 Bq/L (12 pCi/L).
7-21

Table 7-7. Analysis results (alpha, beta, and tritium) for ground water wells."
US Ecology On-site Wells (Figure 3)
(Operations started in 1986) pCi/L
Year
1986
1987
1988
1989
1990
1991
1992
Well #13 (upgradient well)
1992
Gross alphaa
11.50
3.68
3.06
4.82
4.75
4.0
3.6
3.6
Gross beta3
10.7
9.16
11.60
8.44
7.73
7.0
7.2
7.2
Tritium3
3,550
3,000
1,680
1,590
1,610
1,520
2,450
2.450
a. Indicates the highest value for the year from all five wells.
U.S. DOE Wells (located in the vicinity of the 200 East and 200 West Area of the Hanford facility,Figure 7-4). Some of these wells are located in areas with known ground water impact by U.S. DOEoperations.
Year
Gross alpha
Gross beta
Tritium
1966-85
7.1
13.5
581 3,700
1986 1987
(pCi/L)
1988 1989 1990 1991 1992
2,020 2,360 32,000 39,000 41,100 . 44,100
Vatees for 1966-1985 are mean concentration.
Values for 1987-1992 are the highest concentration from all off-site wells for the year.
Gross beta and alpha activity results for 1992 compare favorably with those for previous years.Results from upgradient and downgradient wells are also similar. It can be concluded from upgradientand downgradient ground water monitoring well data that site operations have not resulted in anydisceraable trends.
7-22

Table 7-8. Maximum tritium concentration in ground water (on-sitea) wells (pCi/L).
Year
1986
1987
1988
1989
1990
1991
1992
a. On-site
Well #3
3,550
3,000
1,680
1,590
1,610
1,520
2,150
wells began operation
Well #5
952
1,140
690
—
1,550
1,570
1,740
in 1986 (Figure 3).
Well #8
1,180
1,010
690
—
1,140
997
1,707
Well #10
884
883
690
870
952
928
1,270
(Upgradient)Well #13
1,190
1,120
1,090
1,490
1,570
1,440
2,450
Tritium Activity in Ground Water
Tritium is present in ground water at the Hanford site, due to both natural processes and tritium-contaminated liquid waste discharged to the ground from Hanford U.S. DOE facilities. Tables 7-7,7-8, and 7-9 present maximum yearly tritium concentrations of ground water measured at USEcology's on-site wells and U.S. DOE's wells in the vicinity of the 200-East and 200-West Areas. Theinvestigation level for tritium in ground water well samples is 133 Bq/L (3600 pCi/L). No analyticalresults for the US Ecology on-site ground water wells exceeded investigation levels. The reportinglevel for tritium is 740 Bq/L (20,000 pCi/L) (Table 7-3).
Table 7-9. Maximum tritium concentrations in U.S. DOE ground water wells located in the vicinity ofthe 200 East and 200 West areas.
Concentration ConcentrationYear (pCi/L) Year (pCi/L)
1976 1100 1985 -
1977 1600 1986 3700
1978 3300 1987 2020
1979 2100 1988 2360
1980 2300 1989 32,000
1981 2400 1990 39,400
1982 410 1991 41,100
1983 1600 1992 44,100
1984 2200
7-23

Carbon-14 in Ground Water
Analyses for carbon-14 in ground water are also provided in the US Ecology Historical andAnnual Environmental Reports.7'3 All samples for 1991 and 1992 were reported as being less than theminimum detectable concentration of 7.4 Bq/L (200 pCi/L). The investigation level for carbon-14 inground water is 9.25 Bq/L (250 pCi/L). Analytical results do not indicate any trends in carbon-14concentrations.
Gamma-Emitting Radionuclides in Ground Water
Water samples from the five on-site environmental monitoring wells were analyzed by gammaspectral analysis to determine the presence of gamma-emitting radionuclides. Results of these analysesare covered extensively in the US Ecology Historical and Annual Environmental Monitoring Reports.7"3
No positive values were reported for man-made radionuclides in ground water.7'3 For 1992, Co-60,Cs-137, and Ru-106 samples were less than the minimum detectable concentrations of 0.4 Bq/L (11pCi/L), 0.37 Bq/L (10 pCi/L), and 3.1 Bq/L (85 pCi/L), respectively. These results were seen to beconsistent with historical values reported for previous years. In 1991, ground water samples,cobalt-60, cesium-137, and ruthenium-106 were reported as less than detectable. Based on comparisonof 1992 analyses with results reported for previous years, no trends are apparent in the data, and it maybe concluded that site operations had no effect on ground water gamma-emitting nuclideconcentrations.
Plutonium in Ground Water
Ground water samples taken from site monitoring wells were analyzed for plutonium-238 andplutonium-239/240. Both plutonium-238 and plutonium-239/240 ground water concentrations havebeen consistently below the reporting level of 1.5 Bq/L (40 pCi/L), and as such, there has never beenany problem associated with plutonium in ground water. The plutonium-238 and plutonium-239/240investigation levels are 1.1 E-3 Bq/L (3.0 E-2 pCi/L).
The results reported for isotopic plutonium are consistent with historical values. Results for 1991plutonium-238 and 239/240 were all less than 3.7 E-4 Bq/L (1.0 E-2 pCi/L).
Uranium in Ground Water
Analytical results for isotopic uranium for 1989 through 1991 are presented below in Table 7-10.
The maximum values reported in 1992 for uranium-234, uranium-235, and uranium-238 areconsistent with results reported in previous years. The data indicate that only natural uranium ispresent.
Surface Water
Because no surface water occurs on the US Ecology site, no surface water monitoring isperformed. The nearest surface water is West Lake, which is located on the U.S. DOE Hanford Site,
7-24
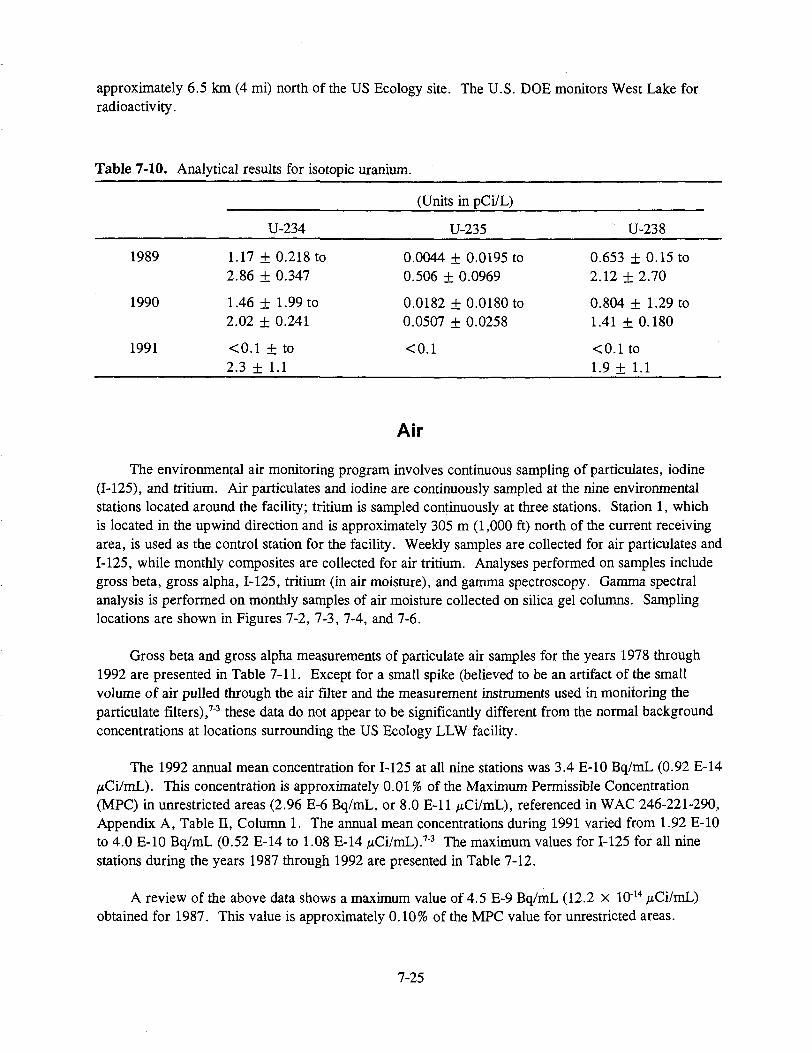
approximately 6.5 km (4 mi) north of the US Ecology site. The U.S. DOE monitors West Lake forradioactivity.
Table 7-10. Analytical results for isotopic uranium.
1989
1990
1991
U-234
1.17 ± 0.218 to2.86 ± 0.347
1.46 ± 1.99 to2.02 ± 0.241
<0.1 ± to2.3 ± 1.1
(Units in pCi/L)
U-235
0.0044 ± 0.0195 to0.506 ± 0.0969
0.0182 ± 0.0180 to0.0507 + 0.0258
<0.1
U-238
0.653 ± 0.15 to2.12 ± 2.70
0.804 + 1.29 to1.41 ±0.180
<0.1 to1.9 ± 1.1
Air
The environmental air monitoring program involves continuous sampling of particulates, iodine(1-125), and tritium. Air particulates and iodine are continuously sampled at the nine environmentalstations located around the facility; tritium is sampled continuously at three stations. Station 1, whichis located in the upwind direction and is approximately 305 m (1,000 ft) north of the current receivingarea, is used as the control station for the facility. Weekly samples are collected for air particulates and1-125, while monthly composites are collected for air tritium. Analyses performed on samples includegross beta, gross alpha, 1-125, tritium (in air moisture), and gamma spectroscopy. Gamma spectralanalysis is performed on monthly samples of air moisture collected on silica gel columns. Samplinglocations are shown in Figures 7-2, 7-3, 7-4, and 7-6.
Gross beta and gross alpha measurements of particulate air samples for the years 1978 through1992 are presented in Table 7-11. Except for a small spike (believed to be an artifact of the smallvolume of air pulled through the air filter and the measurement instruments used in monitoring theparticulate filters),7"3 these data do not appear to be significantly different from the normal backgroundconcentrations at locations surrounding the US Ecology LLW facility.
The 1992 annual mean concentration for 1-125 at all nine stations was 3.4 E-10 Bq/mL (0.92 E-14(iCi/mL). This concentration is approximately 0.01 % of the Maximum Permissible Concentration(MPC) in unrestricted areas (2.96 E-6 Bq/mL, or 8.0 E-ll juCi/mL), referenced in WAC 246-221-290,Appendix A, Table II, Column 1. The annual mean concentrations during 1991 varied from 1.92 E-10to 4.0 E-10 Bq/mL (0.52 E-14 to 1.08 E-14 /xCi/mL).73 The maximum values for 1-125 for all ninestations during the years 1987 through 1992 are presented in Table 7-12.
A review of the above data shows a maximum value of 4.5 E-9 Bq/mL (12.2 x 10"14 jiCi/mL)obtained for 1987. This value is approximately 0.10% of the MPC value for unrestricted areas.
7-25

Table 7-11. Gross beta and gross alpha measurements of particulate air samples from 1978 to 1992.
Year
1978
1979
1980
1981
1982
1983
1984
1985
1986
1987
1988
1989
1990
1991
1992
(
Lowest value
0.10
0.02
0.036
0.022
0.022
0.028
0.003
0.011
0.043
0.008
0.003
0.007
0.004
—
—
Gross Beta
Averagevalue
0.50
0.66
1.1
1.1
0.26
0.30
0.62
0.31
0.73
—
—
—
—
—
—
Highestvalue
1.4
3.7
210.0
80.0
1.7
2.2
46.0
3.1
3.6
0.08
0.08
0.09
0.047
0.08
0.71
Gross alpha(xlO-'VCi/mL)
Lowest value Averagevalue
Bkgd
Bkgd
Bkgd
"Bkgd
Bkgd
Bkgd
8.6
0.98
1.1
0.08
0.016
0.010
0.001
—
—
Bkgd
Bkgd
Bkgd
Bkgd
Bkgd
Bkgd
26
3.2
4.8
—
—
—
—
—
—
Highestvalue
Bkgd
Bkgd
Bkgd
Bkgd
Bkgd
Bkgd
63
22
65
0.7
0.8
0.96
0.096
0.38
0.03
Table 7-12. Maximum 1-125 concentration in the air.
Year Bq/mL
4.5
1.16
3.6
2.0
2.6
2.18
Maximum 1-125Concentration in Air (1014
/aCi/mL)
12.20
3.13
9.77
5.40
7.0
5.90
1987
1988
1989
1990
1991
1992
7-26

The results of gamma spectral analysis of the monthly composites of the weekly particulate airsamples have been evaluated, and of the 108 composite samples, no man-made radionuclides weredetected at concentrations above the required laboratory detection level. Naturally occurring Be-7 andK-40 were detected in expected concentrations.
Table 7-13 lists the results of the tritium analysis for the water vapor collected in the monthlysilica gel cartridges for the years 1987 through 1992. The highest value for these years (except 1991)is shown to be 3.8 E-6 Bq/mL (103 E-12 jiCi/mL), which represents about 0.05% of the MPC (7.4 E-3Bq/mL, or 2.0 E-7 /xCi/mL) as stated in 10 CFR 20, Appendix B, Table II, Column 1. References 7-3and 7-4 give values of air moisture tritium concentration for the 200 Areas (on-site) and distantcommunities. The upper values for these locations are 2.62 E-6 Bq/mL (71 E-12 /*Ci/mL) and 3.3 E-7Bq/mL (9 E-12 /nCi/mL), respectively.
Table 7-13 also shows the 1991 values for the air moisture tritium concentration to be inconsistentwhen compared with the values obtained for other years. This discrepancy was due to a change inlaboratories in August 1991. Upon reexamination and investigation, laboratory procedures werecorrected. This resulted in 1992 data being more consistent with the historical data.
Table 7-13. Tritium air moisture concentrations at environmental monitoring stations 1,2, and 5
Year
1987
1988
1989
1990
1991
1992
Station 1
3.70
6.37
3.95
15.40
585.03
14.7
Station 2
3.97
4.28
2.70
103.03
563.03
14.0
Station 5
56.1
13.4
21.3
31.3
633.03
24.5
Hanford
On site
200 area
—
—
3.1
71.0
31.0
—
report
Distant
communities
—
—
2.4
3.4
9.0
—
Note: (1) Values given in this table are the highest values for the year.
(2) The Maximum Permissible Concentration (MPC) value for tritium for air in unrestricted areas is 2 x10"7 /iCi/mL (10 CFR 20, Appendix B, Table II, Column 1).
(3) For 1991, there is a degree of uncertainty in data reliability, due to the laboratory proceduralproblems which occurred during 1990. Procedure corrections were made, and the 1992 data showedconsistency with historical values. Even though the tritium concentrations in air for 1991 show highervalues in comparison to the historical data, the maximum monthly tritium concentration measured atStation 5 was 633.0 E-12, which is approximately 0.3 percent of the value for unrestricted area tritiumconcentrations in air (2E-7 /xCi/mL) listed in 10 CFR 20, Appendix B, Table II, Column 1 (also WAC246-221-290).
7-27

US Ecology also monitors the ventilation exhaust from the on-site package inspection facility.Samples are evaluated for gross beta, gross alpha, and 1-125 concentrations. All samples were belowaction levels during 1992.
The averages of the measured gross beta concentrations during 1991 and 1992 were 1.63 E-8 and1.73 E-8 Bq/mL (4.4 E-13 and 4.68 E-13 ^Ci/mL), respectively. These are noted to be less than0.015% of the MPC for restricted areas as given in WAC 246-221-290, Appendix A, Table I,Column 1.
The averages of the measured gross alpha concentrations during 1991 and 1992 were 3.48 E-9and 2.48 E-9 Bq/mL (9.4 E-14 and 6.7 E-14 fid/mL), respectively. These values are well below theMPC for restricted areas as given in the regulations. It should be recognized, however, that airemissions from the facility only occurred during package inspection activities. Therefore, the trueannual average would be well below 1% of the MPC.
For 1-125, the average concentrations (conservatively calculated) during 1991 and 1992 werebelow 5.55 E-8 Bq/mL (1.5 E-12 ptCi/mL). This is much less than 1% of the MPC.7"3 Additionally,none of the nine environmental air monitoring stations exceeded the MPC for unrestricted areas.
Soil
Soil samples are collected and analyzed from Stations 1 through 9 and at the northeast andnorthwest corners. Analysis is performed for gross beta, total uranium, isotopic plutonium (Pu-238and Pu-239/240), and gamma-emitters. The results of the quarterly soil samples presented in Table7-14 are the highest values for the year as reported in the US Ecology Historical Report and the AnnualEnvironmental Monitoring Report.
A review of the data shows a decreasing trend in gross beta concentrations in soil, whencompared with the early years. Since 1984, the gross beta concentration in soil has remained below, orvery close to the reporting level of 1.3 Bq/g (35 pCi/g) (Table 7-3). The values reported for gross betaactivity are consistent with typical values found in the region; therefore, no contribution from the site isapparent for gross beta in the soil.
The results of the quarterly analysis for uranium activity in soil are presented in Table 7-14. Thesoil is analyzed for uranium on a mass basis. The mass of uranium is then converted to an activity,using the conversion factor of 2.5 E-8 Bq/g (6.77 E-7 pCi/g) from 10 CFR 20. All sample results(except 1990) for uranium were below the reporting level of 3.7 E-2 Bq/g (1 pCi/g). The 1990 resultsshow a total maximum value exceeding 3.7 E-2 Bq/g (1 pCi/g), which may be related to the change inanalytical laboratories in 1990. Total uranium and isotopic plutonium exceeded reporting levels invarious samples; but upon resampling, the concentrations either fell below the reporting level or wereconsistent with those found throughout the region.
Gross alpha concentration in soil (Table 7-14) has varied from less than detectable to a maximumof 0.53 Bq/g (14.3 pCi/g). In 1987, US Ecology ceased to analyze gross alpha concentration in soil.Since 1987, soil samples are monitored for total uranium and isotopic plutonium concentration. Gross
7-28

Table 7-14. Soil analysis (pCi/gm).a
r1
Year
Action level(in pCi/gm)
1977
1978
1979
1980
1981
1982
1983
1984
1985
1986
1987
1988
1989
1990
1991
1992
a. Data in this table are
Gross Alpha
—
—
—
1.74
0.82
0.72
0.84
13.40
7.01
14.30
—
—
—
—
—
—
Gross Beta
35.0
47.0
46.0
42.0
20.4
42.6
36.3
57.8
23.9
24.6
23.9
23.2
24.9
24.8
40.1
13.5
20.6
the highest values reported in the US Ecology
Cs-137
0.25
—
—
0.81
0.54
0.66
0.84
1.39
0.07
0.05
0.07
0.22
0.35
0.31
0.11
0.75
0.34
Co-60
0.3
—
—
0.0
0.0
0.0
0.0
0.04
0.02
0.00
0.00
0.04
0.23
0.01
0.10
0.16
0.09
Historical Reports and the Annual
Pu-238
0.03
—
—
0.01
0.05
0.114
0.003
0.0
0.002
0.0
0.001
16.3
8.46
23.7
154.0
<0.01
0.07
Pu-239/40
0.03
—
—
0.003
0.04
0.02
0.02
0.03
0.004
0.007
0.015
0.004
0.020
0.009
0.010
<0.01
0.03
Total U
1.0
—
—
—
—
—
—
—
—
—
—
0.74
0.57
0.66
1.97
0.33
0.70
Environmental Monitoring Reports (Reference 1).
K-40
1.75
—
—
—
—
—
—
—
—
—
15.4
15.8
15.7
15.2
29.6
113.6
Th-232
—
—
—
—
—
—
—
—
—
—
. —
0.82
0.85
0.86
—
—
—
alpha concentration in soil is not monitored at the Hanford site, nor in the vicinity of the site, by U.S.DOE or its contractors.
Potassium-40 exceeded the action level of 6.5 E-2 Bq/g (1.75 pCi/g). This is due to the currentaction level for K-40, which is based on laboratory detection limits and is currently set significantlybelow natural background concentrations. Potassium-40 is naturally occurring and was encountered atlevels characteristic of normal background.
Cs-137 is distributed worldwide from nuclear weapons testing and the nuclear accident atChernobyl. Concentrations of Cs-137 at the Richland LLW facility were not abnormal, considering thelocation of the facility within the Hanford Reservation and the historical levels found in soil in pastyears.
Other radionuclides which have been identified are Eu-155, Be-7, Fe-59, Zr-95, Mn-54, Ru-103,Co-60, Ce-144, and Th-232. Based on the infrequent occurrences of positive values together with theirsmall magnitude and the distance to population areas, radiation dose from soil pathways to the generalpublic is very unlikely.
Biota
The protocol for the sampling and analysis of vegetation taken from the US Ecology site parallelsthat of the soil. Vegetation is sampled in the vicinity of the nine environmental air monitoring stationsand at the northeast and northwest corners of the site on a quarterly basis whenever there is sufficientvegetation. Vegetation samples are also collected annually from the trench caps when sufficientvegetation is available. Sampling procedures require the collection of new growth whenever possible.Vegetation samples are analyzed for gross beta activity, total uranium, isotopic plutonium (Pu-238 andPu-239/240), gamma-emitters, and tritium. The control location for vegetation monitoring, as for allsample media, is at Station 1. This station is in the upwind location and is located away from theoperations area. Only deep rooted vegetation was targeted for sample collection.
Gross beta concentrations in vegetation taken at environmental monitoring stations are presentedin Table 7-15, and are shown to be below the action level of 3.7 Bq/g (100 pCi/g). The US EcologyHistorical Report7"3 for the years 1986 and before gives a range of beta activity in vegetation of 8.7 E-2to 4.3 Bq/g (2.36 to 117.0 pCi/g), with a mean concentration of 0.94 Bq/g (25.3 pCi/g). The high forthe years between 1987 through 1992 was 3.05 Bq/g (82.5 pCi/g). Gross beta concentration invegetation is not monitored at the Hanford Reservation by U.S. DOE or its contractors. Typical valuesworldwide reported for gross beta concentration in vegetation range between 0.3 and 4.55 Bq/g (8.0and 123.0 pCi/g) of gross weight, and are mainly due to K-40, lead-210, bismuth-210, and the uraniumand thorium series.7"3
Gross alpha concentration in vegetation is listed in Table 7-15, and was below 0.37 Bq/g(10 pCi/g). The typical concentration of gross alpha in plants worldwide is 5.0 E-3 to 0.12 Bq/g(0.14 to 3.1 pCi/g). There is no significant difference in the gross alpha concentration found invegetation samples taken from the Richland LLW facility (US Ecology) and the concentration ofnatural alpha found in plants in the surrounding areas.
7-30

Table 7-15. Vegetation sample analysis (pCi/gm).
Year
1980
1981
1982
1983
1984
1985
1986
1987
1988
1989
1990
1991
1992
Gross alpha
0.97
0.82
0.87
0.0
0.0
4.15
3.43
—
—
—
—
—
—
Gross
beta
53.2
42.6
40.5
41.0
36.1
55.6
70.6
63.5
81.3
82.5
81.1
15.6
70.1
Ru-106
—
<0.76
0.33
2.24
<0.6
<0.45
<0.3
0.20
0.04
—
—
—
—
Cs-137
0.16
—
—
0.15
0.15
0.07
0.20
0.15
0.03
0.04
—
0.08
0.03
Zr-95
—
<0.04
0.56
0.34
<0.1
0.9
—
—
0.001
—
—
—
—
Pu-238
0.007
0.114
0.003
0.0
0.001
0.002
0.001
—
0.004
0.001
—
<0.01
<0.01
Pu-238/40
0.04
0.02
0.02
0.03
0.01
0.61
0.015
0.005
0.002
0.002
0.0015
<0.01
<0.01
Total U
—
—
—
—
—
—
—
0.08
0.31
0.15
8.8
0.18
<0.1
Co-60
—
0.15
0.12
0.05
0.05
0.04
0.04
0.05
0.01
0.04
2.8
0.12
—
Note: (1) Data in this table are the highest values for the year reported in US Ecology's Historical Reports and Annual Environmental Monitoring Reports(Reference 1).
(2) Action levels for radionuclides in vegetation are provided in Table 7-3, "Environmental/Occupational Monitoring Requirements."
(3) The unusually high reading (8.8 pCi/gm) for total uranium for 1990 was due to laboratory procedures; since then, there has been achange of vendor.

Total uranium concentration in vegetation is measured on a mass basis and then transformed to anactivity, using the relationship of 6.77 E-7 Ci/g from 10 CFR 20, Appendix B. Although the reportinglevel for total uranium was exceeded in 1990, the total uranium concentrations for samples taken at theUS Ecology site compare favorably with regional environmental samples.
Vegetation samples from environmental monitoring stations and trench caps were analyzed forPu-23 9/240 and Pu-238. Yearly results of plutonium concentrations are provided in the US EcologyHistorical and the Annual Environmental Monitoring Reports.73 Analytical results of plutoniumsamples on the LLW site are consistent with those obtained from the U.S. DOE Hanford MonitoringProgram. Consequently, no increase in the Pu-238, Pu-239/240 concentration in vegetation isattributable to LLW facility operations.
Historical data of gamma spectral analysis for vegetation samples are provided in the US EcologyHistorical and Annual Environmental Monitoring Reports.7 3 The detected radionuclides were Cs-137,Pu-239/240, Co-60, Zr-95, Eu-154, and Cs-134. These seven radionuclides have historicallyaccounted for about 91% of the positive indications.
From 1980-1986, the mean concentrations of Cs-137 in the vegetation samples have varied from2.3 E-3 to 4.4 E-3 Bq/g (0.063 pCi/g to 0.12 pCi/g). Concentrations of Cs-137 in vegetation fromHanford on-site samples vary from less than detectable to 2.1 E-2 Bq/g (0.57 pCi/g). Off-siteconcentrations varied from less than detectable to 1.0 E-2 Bq/g (0.27 pCi/g).7"3 These values are notsignificantly different from values measured at the US Ecology facility.
Although the potassium-40 levels were greater than the action levels, the results reported areconsistent with natural background levels of the region.
Iodine-131, cerium-141, and barium/lanthanum-140 were positively identified, but the valueswere within the range of historical data.
Selected annual trench cap samples of vegetation have been analyzed for tritium for trendingpurposes. Tritium results from this program have varied from less than detectable to greater than 1.5E+5 Bq/L (4 E + 6 pCi/L) during 1988-1992. Because of this variability, alternative methods are beinginvestigated for performing tritium vegetation analysis.
Direct Radiation
Direct radiation monitoring was conducted using thermolummescent dosimeters (TLDs) thatsurround the facility. TLDs are changed monthly at locations on the north, south, east, and west fencelines and at fence line positions nearest each active disposal trench. Quarterly dosimeters are placed atthe north, south, east, and west fence lines (the same as for monthly) and at the northeast, northwest,southeast, and southwest corners of the facility. Two control dosimeters (one monthly, one quarterly)are located at environmental air monitoring Station 1.
7-32

Table 7-16. Ambient gamma (penetrating radiation) (mrem/yr).
Year mrem/yr
1978 106.0
1979 103.0
1980 87.0
1981 113.5
1982 94.5
1983 93.6
1984 94.0
1985
178.6
1986 172.0
1987 175.0
1988 118.0
1989 130.0
1990 161.0
1991 172.0
1992 174.0
Note: (1) The above data indicate the highest annual ambient gamma values from all samplestations at the Richland (US Ecology) LLW facility, as reported in the AnnualEnvironmental Reports, DOH, State of Washington (Reference 8).
(2) The action level for direct gamma radiation is 500 mrem/yr, and is provided inTable 3, "Environmental/Occupational Monitoring Requirements."
TLD data (1978-1992) for the Richland LLW facility are provided in Table 7-16 and shown inFigure 7-7. These data are the highest ambient gamma values for each year obtained from TLDslocated around the facility perimeter. A review of these data indicates that the annual readingsremained well below the regulatory limit of 5.0 E-3 sievert/y (500 mrem/year) during the years ofoperation of the LLW facility. The highest value (1.78 E-3 sievert/y for 1985, or 178 mrem) is onlyabout 35% of the applicable regulatory limit at that tune.
NON-RADIOLOGICAL ENVIRONMENTAL PROGRAM
The non-radiological environmental monitoring program consists of ground water monitoring atthe five wells (the same as those used also for radiological monitoring), and the experimental vadosezone soil gas monitoring program.
7-33

600mRem/yr
500
400
300
200
0
Recorded onTLD
Regulatorylimit
1978 1979 1980 1981 1982 1983 1984 1985 1986 1987 1988 1989 1990 1991 1992
YearFigure 7-7. Ambient gamma (mrem/yr).

Non-Radiological Ground Water Analysis
Ground water monitoring for non-radiological constituents is performed quarterly. Theprocedure for gathering these samples is the same as that for radiological samples, with the exceptionthat non-radiological samples are placed in an ice chest and maintained at 4°C (39°F). On-site groundwater samples are analyzed for specific conductivity, total organic carbon, nitrates, and total dissolvedsolids. A review of the results of these analyses (Table 7-17) shows that specific conductivity of theground water samples (1992) varied from 300 umho/cm to 439 umho/cm. These data, when comparedwith previous years, show that the trend has not changed appreciably since analysis began in 1986.Likewise, results for total organic carbon (TOC), nitrates, and total dissolved solids (TDS) wereconsistent with the values received for previous years.73
Vadose Zone Monitoring Program
In November 1991, US Ecology installed three wells into the unsaturated soil zone as part of atwo-year research project required by the Washington State Department of Health. Well VW-101 wasinstalled between Trenches 4 and 5 at the east end of the site. Well VW-102 was installed betweenTrenchs 10 and 11A, also on the east end. A background well VW-100 was installed away fromcurrent disposal areas in the northwest corner of the site.
Organic vapors of xylene, toluene, and methane/combustible gases are included in the vadosezone monitoring testing program.
SUMMARY
The Richland facility performs environmental monitoring to demonstrate compliance with federal,state, and local regulations; confirm adherence to environmental protection policies; and supportenvironmental management decisions.
Due to the location of the facility within the Hanford Reservation, there is an extremely lowprobability of any effluents reaching the general population. Analysis of vegetation samples serves toprovide an indication of any radionuclides which could be included in the diet of wildlife;
The Washington State Department of Health conducts an independent environmental radiationmonitoring program at the Richland (US Ecology) facility. This program conducts extensive dataevaluation and selective monitoring to ensure the adequacy and accuracy of the licensee's program.
The results from past environmental monitoring demonstrate that disposal operations have notresulted in measurable increases on a long-term basis in the concentration of radioactivity in air, soil,vegetation, or ground water in the vicinity of the facility. However, some of the media have exhibitedapparent short-term increases from time to time. Due to the location of the facility within the HanfordReservation, the origin of the radioactivity is not easily determined. With this in mind, the siting ofenvironmental monitoring points at locations surrounding the disposal facility has assisted in providingenvironmental data that can be used to determine the radiological impact from the disposal facility.
7-35

Table 7-17. Chemical analysis of on-site well samples—1992.
Wellnumber
3
5
8
10
13C
Qtr.
1
2
3
4
1
2
3
4
1
2
3
4
1
2
3
4
1
2
3
4
Temp °C
19.4
21.2
22.5
19.7
18.6
20.0
22.3
18.8
19.4
21.1
23.1
18.0
18.0
21.5
21.4
18.7
19.3
20.8
21.7
19.5
B - TOC results reported as less
C - Upgradient well.
Specificconductivity(umho/cm)
424
310
360
439
392
300
360
435
388
300
360
430
403
300
350
428
397
300
350
429
TOC
PI
B
B
B
B
B
1200
B
B
B
B
1300
B
B
B
B
B
B
B
B
B
(ppb)
P2
B
B
B
B
B
1200
B
B
B
B
1700
B
B
3400
B
B
B
B
B
B
than 1000 ppb minimum detectable
P2
B
B
B
B
B
B
B
B
B
1600
1200
B
B
B
B
B
•B
B
B
B
P4
B
B
B
B
B
B
B
B
B
B
1200
B
B
1900
®
B
B
1300
B
B
concentration.
Nitrates(ppm)
4.6
4.6
5.8
4.4
4.6
4.3
4.7
4.3
4.1
4.2
5,1
4.3
4.3
4.0
2.0
3.7
3.7
4.9
4.5
4.4
TDS(ppm)
277
258
235
219
269
258
224
123
275
255
232
216
278
270
209
224
287
266
202
228
7-36

The environmental monitoring data are summarized below:
• The gross alpha and gross beta results for air are consistent with background concentrationsreported in previous years, and no trends were found which would indicate a contributionfrom the site.
• The results of gamma spectral analysis of the monthly composites of the weekly particulateair samples showed that no man-made radionuclides were detected. Naturally-occurringBe-7 and K-40 were detected in expected concentrations. The US Ecology air samplingprogram" found no man-made nuclides (e.g., Pu-238 and Pu-239/240, Cs-137, Fe-59,Mn-54, Eu-155, Ba/La-140, Zr/Nb-95, Ru-103, Co-60, Ce-141, and Ce-144).
• The tritium in air moisture collected at the US Ecology facility is consistent with the resultsobtained from surrounding areas and facilities.
• All samples taken from the ventilation exhaust system at the package inspection facility isevaluated for gross beta, gross alpha, and 1-125 concentrations. All samples were belowaction levels during 1992, and none of the nine environmental air monitoring stationsexceeded the maximum permissible concentration for unrestricted areas.
Vegetation is sampled in the vicinity of the nine environmental air monitoring stations and at thenortheast and northwest corners of the site on a quarterly basis whenever there is sufficient vegetation.Vegetation samples are also collected annually from the trench caps when sufficient vegetation isavailable. Sampling procedures require the collection of new growth whenever possible. Vegetationsamples are analyzed for gross beta activity, total uranium, isotopic plutonium (Pu-238 andPu-239/240), gamma-emitters, and tritium. Concentrations of radionuclides measured in vegetationwere below DOH action levels (Table 7-3).
Direct radiation monitoring is performed using thermoluminescent dosimeters (TLDs) whichsurround the facility. Results of TLD surveys are given in Table 7-16 and Figure 7-7. The highestdirect radiation value recorded was approximately 35 percent of the applicable regulatory limit.
Ground water samples are collected quarterly from US Ecology's on-site wells (3, 5, 8, 10, and13). Ground water samples are analyzed for radiological as well as non-radiological constituents.Radiological analyses include gross alpha, gross beta, tritium, C-14, gamma-emitters, isotopicplutonium (Pu-238 and Pu-239/240), and isotopic uranium (U-234, U-235, and U-238). Non-radiological parameters include temperature, specific conductivity, total organic carbon (TOC),nitrates, and total dissolved solids (TDS).
Gross alpha and gross beta concentrations for the on-site ground water wells (Table 7-7) havebeen at normal background concentrations. Since their operation in 1986, the concentrations of grossalpha and beta have remained below the action levels (Table 7-3). Tritium in ground water is present,due to past operations by the Department of Energy. Tritium concentrations (Table 7-7) for USEcology's on-site wells have been below the investigation level of 133.0 Bq/L (3600 pCi/L).
7-37

Carbon-14 in ground water was reported below the minimum detectable concentration of7.4 Bq/L (200 pCi/L) throughout 1992, as well as for previous years.
Gamma spectral analysis of ground water samples did not reveal the presence of any man-madegamma-emitters above the action levels. Isotopic plutonium concentrations for various samplesreported positive results, but all were less than the investigation level.
Isotopic uranium occurred at normally expected concentrations (natural background) throughout1992, and is consistent with the data for previous years.
The results from the environmental monitoring of radiological and non-radiological analysisdemonstrate that disposal operations have not resulted in any measurable increases in the concentrationof radioactivity in air, soil, vegetation, or ground water in the vicinity of the facility, and that the 25mrem annual dose limit has not been exceeded.
7-38

REFERENCES
7-1. State of Washington Radioactive Materials License (WN-1019-2), Amendment No. 18, 1992,issued by the State of Washington to US Ecology, Inc., Olympia, Washington.
7-2. Hanford Site Environmental Report for 1991, Pacific Northwest Laboratory, Richland,Washington.
7-3. US Ecology Richland Facility Standards Manual, US Ecology, Inc., Richlandj Washington.
7-4. US Ecology's Historical Environmental Monitoring Report (1966-1986) and AnnualEnvironmental Monitoring Reports (1987-1992) for US Ecology's Low-Level RadioactiveWaste Disposal Facility, US Ecology, Inc., Richland, Washington.
7-39