1959 - THE FOREST SERVICE
125
PROVINCE OF BRITISH COLUMBIA DEPARTMENT OF LANDS AND FORESTS HON. R. G. WILLISTON, Minister R. G. MCKEE, Deputy Minister of Forests REPORT of THE FOREST SERVICE YEAR ENDED DECEMBER 31sT 1959 Printed by mN MCDUIMID, Printer to the Quectl’s Most Excellent Majesty in ri&t of the Province of British Columbia. 1960
-
Upload
khangminh22 -
Category
Documents
-
view
0 -
download
0
Transcript of 1959 - THE FOREST SERVICE

PROVINCE OF BRITISH COLUMBIA
DEPARTMENT OF LANDS AND FORESTS HON. R. G. WILLISTON, Minister R. G. MCKEE, Deputy Minister of Forests
REPORT
of
THE FOREST SERVICE
YEAR ENDED DECEMBER 31sT
1959
Printed by mN MCDUIMID, Printer to the Quectl’s Most Excellent Majesty in ri&t of the Province of British Columbia.
1960

VICTORIA, B.C., March, 1960.
To Group Captain the Honourable FRANK MACKENZIE Ross, C.M.G., M.C., U.D., Lieutenant-Governor of the Province of British Columbia.
MAY IT PLEASE YOUR HONOUR:
Herewith I beg respectfully to submit the Annual Report of the Forest Service of the Department of Lands and Forests for the calendar year 1959.
R. G. WILLISTON, Minister of Lands and Forests.

The Honourable R. G. Williston, Minister of Lands and Forests, Victoria, B.C.
&x,-There is submitted herewith the Annual Report on activities of the Forest Service during the calendar year 1959.
R. G. MCKEE, Deputy Minister of Forests.

CONTENTS ITEM PAGE
1. Chief Forester’s Summary- . . . . . . . .._..._....._... --.- _..._ ------~--...~--- ._... . . . . . . . ~-~ . ..__.. 11


REPORT OF FOREST SERVICE, 1959 7
ITEM PAGE
8. Grazing-Continued Co-operation. .. _ ........ _ .... 49 ................... _ ........... .._.__......__ _ ... .._.-..~ ......... ___._.__
Administration.. .. ................ _ ... __..___......._ _ .... ._______._ ~.----.__-- ___._ ........ ______..._ 50 Grazing and Hay Permits _.___........___......~ - ........................... ._ .......... 50
Grazing and Hay-cutting Fees.----_-. .. . -_-__----_~. ................................. 51 Live-stock Counts .____ -_--__- ____..________..____.--.- - ----___~. ..... -.-------_.~~ ......... 51 Violations and Prosecutions.. ...... . . _......___ .. .._ ----.-----_- ______ ---_---- ____ .... 5 1
9. Engineering Services . . . ~~~ ____....._..._....._~...~....~---~~~-~ ------------------ _________....... 52
Engineering Section . . .._... ---- ____....._..._ - ..____.___ ----__---__-------_- ______.______._.._.. 52 Development Planning .._._ ----.__---- . . . . . . . . .._....__ ~~ . . . . . ..-...._.... ~..~~ . . . . . . . 53 Road Locations-----_.------- __......._ -..~~~~--------.--- . . . . .._...._. ~- . . . . . . ~..~~..~ 53 Construction --.--~~~-_----_----___--- . . . ----------~~..~.----- . . . . . . . . . ~~~. 54 General Engineering.---.- .._...... ~.~- .._.. ~_.-----~~-----.-.---.--~---------.------- 54
Mechanical Section~-------------..--.....~--..~~~~----..~-~-----~~~~--.-.-----~----..-.---. .--.--- 55
Building Design and Construction and Marine Design...-----~--------.---------- 57
Forest Service Marine Station-.-~----------~---------~~---~-~~ _...... . . ---~..~~.~~~ . . 58 Marine Work---_..- __.._ -- __... -----------_--_----..-- _....... --~_- __.... ----~~~-~~~~ . . . . 58 Prefabrication and Carpenter-shop---------.-.--~.~~~~..~~~~~---------~---.~.~~~.. 58 Machine-shop..---~~--------~-- _._.. . . . . . ~--.~~~~~~~----.-.-_---------~~-~--~ --~----- 59
Radio Section ~~~~~~~~~~~~~..----_~~~~~----..~~------~~-.-----.-~..-----~~--------------~~....------~- 59
Fire-control Planning and Research.- ..___ - _......__........__ ---- .._..___._....... -_--_ 63 Fire Atlas and Statistics Ledgers ._____ --------..----___--~~~--- . . . . . . . . . .._.__ --___- 63 Visibility Mapping and Lookout Photography.......---~.~--~-----------~.~~ 63 Fuel-moisture Sticks- -_.....______ ---- __...-............... ~~------- . . . . . ~~----- . . 63 Protection Planning in Public Working Circles and Sustained-
yield Units . . .._.___.__-_ - ._._.__--...._...__ - .._._ ~.----~~~---...~__--------------.~~~ 63 Air-photo Mosaics .___...._____________ -- __________._____ _____. --------_--.--~~-~~..~ . .._ 64
Fire-weather Records and Investigations . . . . . . . . . . . . . __... -_~__- . . . . ..__ ---_------- ._.. 64
Fire-suppression Crews _....._...______ --__-- ..___ -- . . ..__. ___.. ~.. _______._..._____ ----- ______. 65
Aircraft.- . . . . ..-.....__........--........--...~....-~-.- _-........__...__... -.~-~ . . . . . . . . . --~~- . . . 65
Roads and Trails . . .._....__......... -------~--..~..--~~..--.-----~~~~~.~ . . . -----_- _..._..._....... 66
Slash-disposal and Snag-falling.--------- .._....... -__~.~~_----- . . . . -_-_--~ . . . . .._......__..._ 66

8 DEPARTMENT OF LANDS AND FORESTS
ITEM
10. Forest Protection-Continued PAGE
Fire-law Enforcement.------ _________..___-_____...--..----- -___-----_--__-----_-- ____....__..._.. 66
Forest Closures~.--~~-------...- ____ ~_- __.._________........ -_.---------.----------------- ___......... 66
11. Forest Biology Division---------- __....._....____ _ -_--__------_---_._--~-.- _........._.._.._.._...--- .. 67
Accommodation and Facilities .._ _ --_--- __._ ------__----. ........ ____......_.._ .............. 67
Forest-insect Investigationss.. .................... ..~......-.._. .---.---.---._---.-~-----~~-- 67 Forest-insect Survey .. ..___...__________ _ ---_-_- ______ -_- _______ ............... __._. ~~__ .... 67 Projects.. ....... _ .... -_- __ .._ .... ____ ----------_.-------.----------- _.._....._._.._ ..... __..._ ... 68
Forest-disease Investigations .___ .. ..____ _ ... ____ -_--_---------_.- _._..._ .. ___.............___. 69 Forest-disease Survey .___.....______ _ . .______ ---~~~-------~---~----~------- ____ ........ ---_ 69 Diseases of Immature Forests....-.~~......-~....-....~. ..................... ___ ..... 70 Diseases of Mature Forests.--.-~~~-.------~--.----~~-. .............. ___.._ ............ 70
14. Personnel.---...------~~~..~~~~.~~~~ .__..._ -- . . ----..----_--_.~----~.~~..-----------~----- _________ --_~._~ . . . 75
Organization ~.~-__----..--___- ___..__ - __________ - _._. ---- _____. ----_--~--------~~----- ____ ~---_--~ 75
Services..------..-~---------- . . . . --- ____ _....___._ ------_~ . . . -------------.----------------~ . -------- 75
Communications and Training .-~-~~~....... ~~~~~~..~~~~...~~~ ----------------------------- 77
Establishment, Recruitment, and Staff Tumover~...--~--------------------..------- 77
Classifications, Salaries, and Working Conditions~~~~~_-~--~-~------------------~- 78
15. Personnel Directory, 1960 . . . . .._ -----._- . .._... --~ . . . . . . . ---~-. ~~.- _--___-_--___------- ..__ --__ 79
16. Appendix-Tabulated Detailed Statements to Supplement Report of Forest Service~--.--------..-~~~~.~~~~..~~~.~--.--~.~~~~~~--.--~---~..~~~~---~~~--------.----.-------------------- 81

The highlight of 1959 was the heaviest Coastal seed-crop in twenty-two years and a
Y bumper crop throughout the rest of the Province, with a seed yield averaging over 0.60 pound per bushel.

REPORT OF THE FOREST SERVICE, 1959
CHIEF FORESTER’S SUMMARY
INTRODUCTION AND LEGISLATION
Although the 1959 amendments to the Forest Act were of an incidental nature, there were three phases of the legislation of public significance.
The section dealing with farm wood-lot licences-that is, section 19-was amended to require that the sum of $100 be deposited, and the former scheme of depositing $50 and then collecting an amount with the stumpage for the deposit was discontinued.
On the death of the Honourable Mr. Sloan, the section dealing with tree-farm licences was amended to permit the Minister to hold hearings and consider proposals which would have been considered by the Forest Adviser as part of the procedure on the application for a tree-farm licence.
The part of the Act dealing with forest protection was amended to allow equipment required for forest-fire suppression to be requisitioned by any officer of the Forest Service. The rates to be paid for the use of such equipment are to be fixed by regulation.
Provision for the charging of forest-protection tax was amended to provide for computing the rates on the certification of a tree-farm under the Taxation Act where the product grown is Christmas trees.
Early in the year, all regulations under the Forest Act and the Grazing Act were revised and published in one issue of The British Columbia Gazette under the Regulations Act.
SURVEYS ANDINVENTORY
The Division completed the second of the ten-year maintenance inventory programme with continued financial assistance from the Government of Canada under provisions of the Canada Forestry Act. Forest classification and sampling crews covered 25,715,954 acres during the year, with over 50 per cent of the work being concentrated in the Prince Rupert Forest District.
Increased use of modem radio facilities improved communications between field parties and headquarters. Of the 1,111 hours of flying-time logged by survey crews, 85 per cent of it was in helicopters.
An intensive forest-cover mapping of the Cape Scott Public Working Circle was completed, and one set of these maps was produced in colour, on an experi- mental basis. Over 13,300 maps were distributed to the public during the year.
Sample plots were established on 4,476 sites, and reconnaissance surveys covered 46,960 acres of logged and burned land. In the Yale Sustained-yield Unit, 22,660 acres of productive forest land were examined, as were 22,829 acres in the Babine Public Working Circle.
Work continued in the fields of photo mensuration, growth studies, volume tables, loss factors, and depletion projects. Efforts to bring surveys of all Crown forest units up to an acceptable standard were limited due to lack of funds.
FOREST RESEARCH
Three major studies were instituted during the year as a result of the oppor- tunity afforded by the record Coastal cone production-the b’ggest in twenty-two years.
11
12 DEPARTMENT OF LANDS AND FORESTS
The seIection of “ plus ” trees for a high-elevation seed-orchard was greatly assisted by the Plus-tree Board, a sub-committee of the Tree Farm Forestry Com- mittee, which promoted industrial co-operation in the search for outstanding trees.
This marked the first full year in which a permanent Research Officer operated in the Prince Rupert Forest District, and several projects were initiated there as a result.
A comprehensive report on the work of the Division is to be found in the Forest Research Review, published annually.
REFORESTATION
The year was marked by the heaviest Coastal seed-crop in twenty-two years and a bumper crop throughout the Province. The Service collected 9,575 bushels of cones; the forest industry, 5,000 bushels; and an estimated 100,000 bushels were harvested by commercial seed-dealers.
The remodelled seed-extraction plant at the Duncan nursery worked well, processing 300 bushels of wet cones in forty-eight hours.
Although heavy spring rains caused severe losses of one-year stock in the Green Timbers and East Kootenay nurseries, total production of field planting stock from all Forest Service nurseries amounted to 8,250,700 seedlings during the year.
The total area planted throughout the Province by all agencies using seedlings raised in Service nurseries amounted to 18,607 acres.
Pilot tests on costs of brush-clearing were carried out in the Robertson River valley, with interesting results.
WORKING PLANS
Three new sustained-yield units and nine tree-farm licences were approved or awarded during the year. As a result, there are now in operation thirty-six tree- farm licences, sixty-four sustained-yield units (including public working circles), thirty-six Taxation Act tree-farms, and fifty farm wood-lot licences.
Total area now under management amounts to 41,212,700 acres, with a total allowable annual cut of 677,540.OOO cubic feet, equivalent to 64.5 per cent of the total Provincial scale for 1959.
PUBLIC INFORMATION AND EDUCATION
The facilities of the Division were tested severely to meet the continued high public demand for forestry information. Staff and financial limitations of the Divi- sion became increasingly noticeable.
The volume of still photographic production by the Division rose 100 per cent over the previous year, and more than 1,500 prints were supplied to the press, trade journals, and television stations. There was also an increase in specialized photog- raphy of all types.
A total of 123,179 persons saw films from the Divisional Film Library, and the commercial-theatre audience seeing the special protection trailer was estimated at 305,000.
The publication, editorial, and printing volume was maintained to the limit of facilities available, as was the regular radio flash campaign during the fire season.
The school lecture programme was active in all forest districts and covered 3 14 schools, with 394 lectures to 58,507 students.
A mobile exhibit was designed and circulated throughout various fall fairs in the Interior with good results.

REPORT OF FOREST SERVICE, 1959 13
Twenty new sites were added to the “ Keep B.C. Green-Use Your Ashtray ” highway sign coverage. There are now 225 of these signs on the black-topped highways throughout the Province.
FOREST MANAGEMENT
Despite the ten-week strike in the Coastal industry during the summer, the total value of all forest products set a new record high of $637,715,000 during 1959, over $6,000,000 more than the previous record year of 1955, and $94,927,- 573 over 1958. Lumber, at $291,500,000, continued to lead in the individual value categories, followed by pulp and paper with $234,529,000 and plywood at $75,500,000.
Compared with 1958, lumber value was up $65,873,139; pulp and paper, up $43,778,583; and plywood value, down $14,500,000, although production of plywood was down less than 1 per cent.
A measure of the degree of industrial recovery over the depressed years of 1957 and 1958 is shown by an increased weizhted average price of $5.34 per thou- sand board-feet over 1958 for all species shipped by the Interior. A decline was noted, however, in the last quarter of the year.
The 1959 total cut of 1,049,145,125 cubic feet was up 15 per cent over 1958 and only 2 per cent less than the record-cut year of 1956. Of the total scale, 574,451,278 cubic feet originated on the Coast and 474,693,847 cubic feet from the Interior. This was a new record high for the Interior, exceeding its previous high in 1956 by 54,000,OOO cubic feet.
DougIas fir’s 369,832,059 cubic feet maintained it as the principal species cut, followed by hemlock (201,225,091 cubic feet), spruce ( 182,48 1,529 cubic feet), and cedar (140,110,952 cubic feet). It is significant, however, that the Coastal hemlock cut exceeded that of Coastal Douglas fir by over 7,500,OOO cubic feet.
Water-borne lumber shipments amounted to 1,197,653,000 board-feet, down 116,708,OOO board-feet from 1958. Shipments to the United Kingdom were the lowest since 1950. Fifty per cent of all water-borne lumber volume went to the United States.
Competitive bidding on timber sales was the most active on record, with 243 sales being bid over the upset price. At the end of 1959 there were 7,139 timber sales active, a reduction of 444 from 1958. Security deposits held by the Service amounted to $15,150,213, some $400,000 more than at the end of the previous year.
Silvicultural activity increased noticeably during the year, with 823 timber sales receiving stand treatment over an area of 207,528 acres, some 66,000 acres more than in 1958.
Scaling supervision in the Interior was intensified, with scaling examinations being held in forty-seven centres and 1,058 candidates participating, of which 394 were successful in passing the exams.
GRAZING
A dry spring, following the drought conditions of 1958, resulted in pr forage production in the north. In the south, forage production ranged from average to above average.
The drop in the number of sheep using Crown range is a reflection of the rising costs and inadequate returns which are forcing many sheep-ranchers out of business.

14 DEPARTMENT OF LANDS AND FORESTS
Weighted average prices for cattle were $17.52 per hundredweight, as against $19.57 in 1958. Lamb prices were also down, but total shipments of cattle were up 4.5 per cent over the previous year.
Live-stock losses were higher than normal, with hunting accidents and sus- pected theft in a number of cases contributing seriously toward losses.
A total of 420,720 acres were covered by range surveys during the year, and some $49,000 was spent on various range improvements.
Close co-operation continued during the year between the Forest Service and the fifty-three livestock associations approved under the Grazing Act.
Although the grazing personnel establishment was brought up to full strength for the first time in two years, the continually increasing work load resulted in much necessary field work remaining undone.
This year, 1,683 grazing permits were issued for the depasturing of 124,425 cattle, 4,377 horses, and 20,604 sheep on Crown range-an increase in all cate- gories but sheep, now at their lowest number since 1928.
ENGINEERING SERVICES
Forest-development road work continued, with a high level of activity in such aspects as engineering investigations, route reconnaissance, location, and construc- tion. Considerable work was done on forest-protection access-road construction, assisted in part by the Federal-Provincial agreement for cost-sharing.
During 1959 a total of 604 miles of reconnaissance survey was carried out on all types of forest roads; 237.4 miles of potential road was located; and 68 miles of new road constructed.
Designs were completed for six creosoted “ glue-lam ” girder bridges, one of which is the first designed for Coastal loading conditions. The construction of two “ glue-lam ” bridges in the Chilliwack Public Working Circle was completed, and they contain the largest glue-laminated wood girders ever constructed in Canada.
Motor-vehicle purchases amounted to 105 units, of which 102 were replace- ments for worn-out units. Eight light-weight portable tank-and-pump protection units were built and tested, with good results.
The major building construction undertaken during the year was the erection of the new seed-extraction plant at the Duncan nursery. A matter of interest was the testing of two Fiberglas protection lookout cupolas obtained from the Alberta Forest Service.
A total of sixty-four marine overhauls were completed during the year, and considerable repowering of operational craft was carried out. One outboard cruiser and eight river-boats were built. and the prefabrication of a new loo-foot float and ramp for the Echo Bay Ranger Station continued.
Radio field work continued apace. One hundred and thirty-eight new units, A.M. and F.M., were purchased throughout the year, and sixty-two sets were written off, leaving a net increase of seventy-six serviceable units.
FOREST PROTECTION
Fire occurrence was above normal for the first half of the 1959 fire season but below normal for the last half.
A total of 2,010 forest fires burned over 273,631 acres and caused damage estimated at $1,342,849. Forest Service fire-fighting costs amounted to $768,084.
Although operating railways continued to be the principal cause of fires (31 per cent of the total), they burned over only 243 acres, cost the Forest Service $1,057, and did $1,470 damage. Camper- and smoker-caused fires burned over
REPORT OF FOREST SERVICE, 1959 15
36,678 acres, cost the Forest Service $81,912, and did $254,090 damage. Even so, the heaviest fire-suppression cost (54.5 per cent of the total cost) was attribu- table to range-burning activities in the Cariboo and Peace River areas, costing $418,360 and causing $955,062 damage.
The Canada Forestry Branch, Fire Research Section, completed field studies for the development of a fire-danger rating system for the Province. In co-operation with this Service, trials were carried out in various parts of the Province.
Experiments with various chemical fire-retardants continued during the year.
FOREST BIOLOGY
After five years of heavy defoliating activity in the Lillooet and Fraser Valley areas, the outbreak of one-year-cycle spruce budworm collapsed during the year.
Early counts indicated that the two-year-cycle budworm larva population at Babine Lake was as heavy as any previously recorded, and that defoliation of the current year’s growth averaged about 75 per cent.
The black-headed budworm outbreak on the Queen Charlotte Islands increased to heavy proportions, and the known range of the balsam woolly aphid spread significantly during the year.
The Douglas fir bark-beetle is currently the most serious insect pest of that tree species in the Interior of the Province.
Needle-blight of pine continued at a high level in the Kamloops, Clinton, and Merritt areas, and the incidence of Douglas fir needle-blight north of Cranbrook was responsible for considerable depreciation of Christmas-tree stock.
Severe die-back and top-kill of pole-sized to mature Douglas fir, as a result of 1958 drought conditions, was observed on Vancouver Island and in lodgepole pine near Prince George and Vanderhoof. Yellow pine near Clinton and western red cedar throughout the Interior Wet Belt were also affected.
A disease study within a 15-year-old Douglas fir plantation on Vancouver Island shows 25 per cent of the trees were infected with root-rot, the most severely infected fir plantations yet encountered in sampling.
FOREST RANGER SCHOOL
During the year the tenth Ranger School class graduated in the spring and the eleventh class was enrolled in September. This latter class of twenty-one men will graduate in December, 1960.
There were no major changes in the curriculum, but the constant revision of the subject-matter of the courses continued in order to keep pace with changes of Service policy.
ACCOUNTING
Due to the increase over the previous year in the total Provincial scale of all forest products, Forest Service billings against logging operations were up 13.8 per cent to $27,464,756.19 and direct Forest Service collections were up 7.8 per cent to $26,843,188.71. Despite the Coast industry strike during the summer, the Coastal forest districts contributed considerably to these increases.
Timber-sale stumpage, the largest single revenue class, was up 8.1 per cent, and timber royalty increased by 9.9 per cent. Grazing revenue from permits and fees was up 18.3 per cent, primarily due to an increase in fees, but miscellaneous collections were off 8.7 per cent from 1958.
There were 279 active log-salvage permits in effect at the end of 1959, five more than in 1958.

16 DEPARTMENT OF LANDS AND FORESTS
PERSONNEL
A major change in Forest Service organization became effective on April lst, with the appointment of Mr. F. S. McKinnon as Chief Forester and the formal division of responsibilities between the Deputy Minister and the Chief Forester.
All five forest districts changed District Foresters during the year, and two new Ranger districts were set up at Chetwynd and Bella Coola.
An increase of fifteen personnel in the establishment of the Service brought the total to 832 positions, twently-eight less than in 1957. Permanent-staff turnover averaged 10.3 per cent, ranging from 29.1 per cent at Prince George to 2.6 per cent at Nelson.
A general salary revision averaging 8 per cent was granted, effective April 1st.
F. S. MCKINNON,
Chief Forester.

REPORT OF FOREST SERVICE, 1959 17
FOREST SURVEYS AND INVENTORY
INTRODUCTION
The Division completed the second year of the ten-year maintenance inventory programme. Financial assistance was continued by the Government of Canada according to the agreement for inventory implemented under the Canada Forestry Act. This assistance is limited to surveys at the Provincial inventory level, and it is becoming increasingly evident that further assistance is required to facilitate the carrying-out of intensive management surveys in Crown forest units. Sustained- yield forestry practice is highly dependent on the availability of reliable information concerning the lands and forests within public and private sustained-yield units. Intensive management surveys are required to provide this information.
Forest classification and sampling were carried out over an area of 25,715,954 acres in the five forest districts, as detailed below:-
Forest District A cl-es
Vancouver ~~~~~.-.~~..~~-~.---~~~._--.~~~.~~._-~-~~~...~.-~~~~ . ~.. -~~~~..~~..~~~~. 3,301,562 Prince Rupert ~~-...~.._--..~~~~..~~~~~.--~~----..~~~~~----~-.--.~-----~~.~~~.-.~~ 13,972,634 Prince George ~~~---~~..~~--~-.~ . . ~~-~--.----.-.-~~.------- __._ ----~~ . .._ -~~.~~..~. 4,199,057 Kamloops ~~--~~..~ ~-~.~ . ~.~~--_..~--------~-.--..~~-~---~.~-~.-~-..--~~..-~-.~~~.~. 2,831,358 Nelson .~~~---~_.-.-.~~~~ . . .._ ~--~~--_.~~.~~-..~-~.~~ . ~-~--- . . . . ~.~-~.~..~ .._. ~~~~ . 1,411,343
Total ~~~~~~ ~~~~~~ _...... ~---..~-~----~--.------~~-..~~~---~~..----.--~ 25,715,954
OPERATIONS
As in previous years, the work of survey crews was supervised from field head- quarters in each forest district. A modem radio network between crews and head- quarters provided rapid communication and essential control of the work. Radio equipment included 59 S.P.F. units, 11 Model B sets, 14 Mobile sets, 3 marine radios, and 12 L.R.T. units. Two new Marconi CM 85 transmitters were installed on forest survey launches.
Two specially designed field-office trailers, equipped with radio units, proved invaluable to forest classification crews working with helicopters over large regions. Two field-kitchen trailers, constructed from portable buildings, were used exten- sively in conjunction with the oftice trailers. Three forest survey launches provided bases for numerous crews working on the west and east coasts of Vancouver Island and on the Mainland.
During the year, forest survey crews flew a total of 1,111 hours, of which 85 per cent was in helicopters.
Two “ trouble-shooting ” mechanics travelled 17,000 miles carrying out in- spections and repairs on vehicles and other units in use by survey crews throughout the Province.
FOREST CLASSIFICATION
During the year, 10,500,OOO acres were examined and classified by two par- ties of foresters using two Bell helicopters and one party using one De Haviland Beaver aircraft. The amount of flying-time logged in the helicopters and Beaver aircraft was, respectively, 853 and 113 hours. Sixteen hours of this were used in assisting forest districts and the Engineering Services Division. In this work the crews recorded detailed observations of forest and land, with the aid of tape re- corders, at 15,403 individual locations throughout the Province. The cost for this aerial classification averaged 2 cents per acre in the areas intensively examined.
2

18 DEPARTMENT OF LANDS AND FORESTS
FOREST MAPPING
In 1959, plotting of forest-cover and topographic detail from aerial photo- graphs on to maps provided a total of 275 completely checked large-scale maps. A further 151 maps were plotted, and are currently undergoing final checking. In the maintenance inventory-mapping programme, forty-three maps of the new l-inch-to-l-mile forest-cover series were completed.
A particularly significant achievement was the completion of very intensive forest-cover mapping of the Cape Scott Public Working Circle, where a complete set of l-inch-to-l-mile forest-cover maps was published. As an experiment in the production of coloured lithographed maps, a set of the Cape Scott maps was col- oured by means of transparent zipatone, cut out to fit the map detail. These sheets are currently being photographed, using a colour separation process, after which metal master plates will be made and coloured map-prints produced on an offset press.
During the year, 13,382 maps were distributed at the request of various public and private agencies. This was an increase of 7 per cent over the 1958 volume of maps distributed.
FOREST SAMPLING
PROVINCIAL INVENTORY MAINTENANCE
In the second year of Provincial inventory maintenance, 4,476 sample plots were established in the programme to provide more reliable estimates of forest area and volume throughout Crown forests. Sampling crews achieved good coverage with the aid of hehcopters and a Beaver float-plane, in which a total of 145 hours were flown.
REGENERATION SURVEYS
Reconnaissance surveys were carried out over 46,960 acres of logged, burned, and logged-and-burned land. The purpose of this work was to investigate the ade- quacy of restocking on designated areas.
In the Yale Sustained-yield Unit, 22,660 acres of productive forest land were examined, bringing the total area examined in a two-year study of this unit up to 36,590 acres. Analysis of the data showed that 58 per cent of all quadrats exam- ined were not stocked. When these data were interpreted in the light of the Refor- estation Division standards, it was estimated that 16,460 acres were not satisfac- torily stocked out of the total area of 36,590 acres.
Examination of 22,829 acres of disturbed forest land in the Babine Public Working Circle indicated that 15,492 acres were not satisfactorily stocked. A re- generation survey in the Giscome burned area, east of Prince George, was termi- nated before completion due to lack of funds and time. Data collected in this project provided an assessment of 2,300 acres.
In the Sechelt Public Working Circle. an examination was made of the Brittain River burned area. The results of this work are currently being analysed.
SAMPLING OF MARKED FOREST STANDS
Seven timber-sale areas, on which the timber was marked for selective cutting, were sampled systematically before logging commenced. On these areas, totalling 2,120 acres, 261 plots were established. Remeasurement of the plots will be car- ried out subsequent to logging.
Fourteen timber-sale areas, in which the marked trees had been felled and removed, were sampled systematically. A total of 1,039 plots was examined in a total timber-sale area of 4,975 acres during the course of this project.

REPORT OF FOREST SERVICE, 1959 19
Data collected in the twenty-one timber sales are currently being analysed and a report will be issued early in 1960.
PHOTO MENSURATION
An aerial-photo stand volume table was developed for South Central British Columbia (Zone 5). This table was constructed by least-squares solution of a linear regression of the form-
Vi1 =b, +b,H+&D where-
Vi, is gross cubic-foot volume per acre, close utilization standard, live merchantable trees 11.1 inches d.b.h. and over. Determined by ground sampling.
H is average height of dominants, measured with a parallax bar on aerial photographs.
D is crown density, expressed as a percentage of ground covered by tree crowns, as determined from aerial photographs in comparison with a crown density ” scale.”
b,,, b1 , and b2 are coefficients derived from the data by the least-squares method.
Values of the regression coefficients and other pertinent statistics concerning this work are shown in the following table:-
Zone 5 (South Central Interior) Mature Immature Cooiferous Coniferous
Lodgepole Pine and Deciduous
SPKieS
-1,144 j d;3,“,” ) -2,112 +31.98 -f-39.16 -c 10.88 $8.01 +4.88
.48 .56 .84 42 28 21
The new aerial-photo stand volume table was used to determine volume esti- mates on 1,570 photo samples established in twenty-three compartments of Sub- zone 965, Zone 5 (South Central Interior). Five hundred and twenty-eight sam- ples were also established in Sub-zone 971, Zone 6 (South-east Interior). An L.G.P. 30 computer programme developed to compute the volume of a photo sample was invaluable in these projects.
GROWTH
Permanent Growth and Yield Plots
Stand tables were constructed for 1,599 permanent plots. All existing data on these plots, many of which have been established for twenty years or more, were recompiled by use of the latest standard cubic-foot volume tables.
During the year, fifty-four permanent plots were remeasured in Lower Coastal areas.
Empirical Growth Estimates
The empirical growth estimates published in the report, “ Continuous Forest Inventory of British Columbia-Initial Phase, 1957,” were revised, with the excep- tion of those for Zone 3 (North-west Interior). The revised estimates will be pub- lished in due course.

20 DEPARTMENT OF LANDS AND FORESTS
VOLUME TABLES, Loss FACTOR, AND DEPLETION PROJECTS
Volume Tables
During the year, emphasis was placed on recompiling the tree measurement data on file, with the object of producing revised standard cubic-foot volume tables and cull factors for the commercial tree species of British Columbia. A close re- examination of all data available netted 32,105 tree measurements suitable for the

REPORT OF FOREST SERVICE. 1959 21
volume table and approximately 26,000 for the cull factors. Modern data-proces- sing equipment has facilitated an otherwise laborious process. It is expected that the revised volume tables and cull factors will be available for distribution by 1961. The new volume tables will include tables for yellow cedar and broadleaf maple, heretofore excluded for lack of sufficient data.
During the year, taper curves were prepared for the following Coast species: Douglas fir, western red cedar, balsam, and Sitka spruce. These curves show aver- age diameters inside bark at various points above ground for trees in each 2-inch d.b.h. class and lo-foot-height class. The curves were drawn to meet an increasing demand from forest officers and industrial foresters for taper information through- out the entire length of the tree. With the increasing interest in quality cruisinc, taper tables provide the basis for estimates of log volume for specified grades. A sample of a set of taper curves for Douglas fir in the 100-foot-height class is shown on page 20. Taper curves for other commercial tree species will be pre- pared as time permits.
Logging Studies
Logging studies were continued during the 1959 field season. These studies were carried out on typical Coast and Tnterior logging operations to nrovide realistic reduction factors applicable to gross volume summaries, to account for losses attrib- uted to defect, breakage, and utilization practices. In addition, estimates of the volume and condition of loggino residues were made and appraisals of the damage to residual stands were obtained. The tield procedure for these studies involved a detailed loo-per-cent cruise of a sample area equallinn approximately one-half the area of the logging setting: the measurement of all felled and bucked trees to deter- mine gross, net, and breakage volumes; the measurement of all breakage incurred in the cold-decking, yarding, and loading operation; and, finally, a re-examination of the sample area to determine the volume and condition of logging residues and the condition of residual stems. During the 1959 field season. four studies were carried out-one on the South Coast and three in the Southern Interior. Compila- tion of the data gathered is proceeding, and the results obtained will be incorpo- rated in the revised cull factors.
Forest Depletion
To provide the estimates of annual forest depletion necessary for continuous inventory, estimates of annual cut, disease losses, and fire losses were prepared for each sub-zone, region, and compartment.
As in previous years, a number of requests for information and advice with regard to cull factors and volume tables were answered. Liaison was also maintained with the Western International Forest Disease Work Conference.
SURVEYS IN CROWN FOREST UNITS
Continued efforts were made to bring surveys of all Crown forest units up to an acceptable standard. Due to financial limitations, only two units-Sechelt and Chilliwack Public Working Circles-received the required additional field work to bring them up to a management survey standard. In the Sechelt unit, this work involved the establishment of 174 samples, while in the Chilliwack unit the entire area was reclassified, or “ retyped,” using 1: 15,840-scale aerial photographs, taken in 1959. The latest forest-cover maps and statistics for these units will be issued in due course.

22 DEPARTMENT OF LANDS AND FORESTS
Forest Resources Bulletins, which, with the exception of Bulletin No. 12, were based on Provincial inventory data, were issued for the following units during 1959:-
Bulletin No. 12-Gape Scott. Bulletin No. 34-Williams Lake. Bulletin No. 20-Quesnel Lake. Bulletin No. 38-Lac la Hache. Bulletin No. 21-Similkameen. Bulletin No. 42-Upper Kootenay. Bulletin No. 22-Nicola Lake. Bulletin No. 45-Babine Lake. Bulletin No. 24-Big Bar. Bulletin No. 46-Stuart Lake. Bulletin No. 26-Salmon Arm. Bulletin No. 51-Burns Lake. Bulletin No. 29-West Lake. Bulletin Nos. 24, 38, and 51 were first issues for the units concerned, while
the remaining bulletins were amendments to previously issued reports.
CONTINUOUS FOREST INVENTORY
The comprehensive report “ Continuous Forest Inventory of British Colum- bia-Initial Phase, 1957,” provided a datum for Provincial forest statistics at the start of the second phase of continuous inventory in 1958. Maintenance inventory work carried out in the second phase is providing the basis for revising the existing forest statistics. Revised statistics for six sub-zones examined in 1958 were com- piled during 1959.
A set of statistical tables supplementing the “ Continuous Forest Inventory of British Columbia ” report was published. These tables, known as the V-18 series, present sound-wood cubic-foot volumes reduced for waste and breakage to a rough utilization standard by species, age-class, accessibility, and three d.b.h. limits. These statistics apply to all commercial forests regardless of site, and are broken down by major geographic divisions, known as “ zones.” Two other series of tables, V-l 9 and V-20, were completed during the year and are currently being printed.
COMPUTATIONS OF STATISTICS
Fifty-four requests were received for statistical summaries on designated areas. These summaries were mostly utilized for management planning and the develop- ment of access roads in key areas. The speed at which compilations were com- pleted is evidenced by the fact that the requests involved a total area of 27 million acres, mature forest area of 10 million acres, and timber volume of more than 33 billion cubic feet.
Late in the year, an L.G.P. 30 electronic computer and supplementary process- ing equipment became available for use in solving a variety of complex analyses of data. It is quite clear that equipment of this nature is essential to meet the con- tinuing demand for rapid and detailed answers on forest resources. The trend for several years has been that increasingly intensive forest management has necessitated increasincly reliable and detailed statements of forest resources in specified areas. Without high-speed computing equipment, the demand cannot be satisfied.
Numerous requests were received for a further breakdown of statistics pre- sented in the report “ Continuous Forest Inventory of British Columbia-Initial Phase, 1957.” One of these requests involved a presentation of cedar-pole re- sources by forest districts, and another a summary of the forest resources of the Prince Rupert Forest District.
A paper entitled “ Forestry in the North ” was prepared for the Twelfth Natural Resources Conference. The statistics compiled for this paper provided some interesting information on the potential sustained productive capacity of the northern half of the Province.

REPORT OF FOREST SERVICE, 1959 23
LIAISON WORK
The Forest Service Work Committee continued to provide useful liaison between this Division and other public agencies. In addition, several projects were completed, as follows : -
( 1) Fire-hazard and fuel-type maps were prepared for six Crown forest units. (2) Cutting priority analyses were made in six Crown forest units. (3) A key map was prepared, showing the latest information on status within
the boundaries of the Esquimalt and Nanaimo Railway Grant. (4) Operational maps showing the nature and location of the field projects of
six Government agencies were made for forest district use. (5) Key maps were prepared depicting the current g-inch focal length aerial-
photography programme in an area totalling 28,000 square miles.

24 DEPARTMENT OF LANDS AND FORESTS
FOREST RESEARCH
Technical details of research projects are published annually in the Forest Research Review, hence this is a very brief statement of the activities of the Division during 1959.
COWICHAN LAKE EXPERIMENT STATION
During the past year, 20 acres were logged. The slash and debris are now being piled and burned prior to using the area for the planting of select genetic stock. A thinning in 30 acres of 47-year-old Douglas fir was completed. A num- ber of sample plots in areas previously thinned were remeasured.
During March, research officers met at the station for a three-day discussion of current projects and the co-ordination of future programmes.
ALEZA LAKE EXPERIMENT STATION
The Aleza Lake Station was opened in May and remained in operation until the end of the year. The facilities were again used for a period of a week for the training of district siIvicultura1 crews. There was an unusually high number of visitors this year, due to the annual meeting of the Canadian Institute of Forestry being held at Prince George.
As in previous years, the main emphasis was on developing access to different parts of the station. On the West Branch Road, a further three-quarters of a mile of rough grade was constructed. This extends the grade to the nursery-site. Unfor- tunately, the summer was extremely wet and it was impossible to gravel any of the new construction. During the winter, 3 miles of right-of-way of the East Branch Road were logged and 1 mile was cleared. Logging was restricted to cleaning up previously awarded sales. A new sale in the Long-term Selection Working Circle is being prepared for auctioning this winter.
FIELD PROGRAMME
Possibly as a result of 1958’s dry summer, there was a good cone-crop in most species throughout the Province. Douglas fir cone production on the Coast was the largest in twenty-two years of record. This fact enabled studies on cone- crops and seed to be actively pursued, and plans are being made to study next year the natural regeneration resulting from this seed-fall. One of these studies was initiated on the west coast of Vancouver Island to determine seed-fall distance and direction in relation to weather conditions and seedling survival on a variety of sites and seed-beds. Another study was concerned with methods of determining seed maturity so that timing of cone-collecting may be most effective. A third study concentrated on the problems associated with the storing of cones and the extraction of seed. Some very interesting information on pollen dispersion was gathered this year. This was a result of developing equipment for sampling and recording pollen dispersion on a continuous basis.
Thinning on the East Thurlow Island experiment forest was renewed and, currently, 160 acres in a 60-year-old hemlock stand is being thinned as a com- mercial venture. A number of sample plots previously thinned to various densities were remeasured.
The selection of “ plus ” trees for the high-elevation seed-orchard occupied much of the year. The work was greatly assisted by the Plus-tree Board, a sub- committee of the Tree Farm Forestry Committee, which promoted industrial co- operation in the search for outstanding trees.

REPORT OF FOREST SERVICE, 1959 2s
In the Kamloops Forest District, a number of studies were maintained but no new ones initiated. It is disappointing to find that regeneration of logged spruce- alpine fir types in a number of cases is still unsatisfactory, seven years after logging. It is, of course, too soon to evaluate the current seed-fall in terms of stocking.
The most interesting development in the research programme in the Nelson Forest District is the effect of peat-moss dressings on the rate of “ damping off ” in the East Kootenay nursery. Dressings of peat-moss applied to the “ beds ” at the time of sowing resulted in both increased germination and decreased mortality.
This was the first full year in which a Research Officer has been assigned to the Prince Rupert Forest District. A number of projects were started. A planta- tion of white spruce, Douglas fir, and European larch was established at Tachek Creek. Adjoining this, spacing trials with white spruce were established. Initial spacings of 4’ x 4’, 8’ x 8’, 12’ x 12’, and 16’ x 16’ were made.
An ecological study of lodgepole pine site types was extended from the South- em Interior to the Bulkley Valley. A new site type, Pinus contorta-Lathyrus, was distinguished, as were possible other sub-types of those previously defined.
In Prince George, ecological studies of cone production and seed of northern conifers were continued. New trials of direct seedinc to obtain regeneration were made. Several plantations of white spruce were established-one to determine the feasibility of planting throughout the whole of the growing season, and another consisting of a spacing trial. Ten additional scarification trials were conducted and a detailed study of scarified seed-beds continued.
The following is a tabulation of projects active in 1959:-
Experimental Project No.
226 274 296
297,298
368 370 373
3R4,385 388 392 418 428 435 438 442 449 458
459
460 463 465 467 468 474 477 478 479 480 482 483
1 ,
I I
I ,
-
Tabulation of Active Research Projects, 1959 ~~-. -______
Title
Cone production in immature stands of Douglas fir . . . . ~~~_.~ Cone production in mature stands of Douglas fir.-- _............. ~~~ . . . ~~~~..~..~~~... Effect of selective logging on wind-throw, growth, and reproduction in
spruce-alpine fir .- .~~~..~~...~.~~~~~~.~~ ~.. .._ . . ~..~ ~~~ . ~~~~.~~ _............. ._._ Effect of selective logging on wind-throw, growth, and reproduction in ponde-
Partial cutting study, In&or Wet Belt .......... .- .... .............................. ~~.-_.~. ............ Ecological investigations in spruce-alpine fir forests ..... ~...- ................ -_-__. ..... ~_.~ ... Lodgepole pine thinning .......... ...................................................................... - .............. Commercial thinning in hemlock .................................................................... -...~.~~~~ ... Field survival of experimentally treated nursery stock.. ............................. ~~~. ..~_ ... Douglas fir thinning in plantations ................ ................................. ._ ......................... Plantation trials ....... ...................... ~~~...-.~~ .................................................................... Yellow pine thinning...-- .......... .~._.~~~~..~ .................... ....................... .................... ....... Effects of slash-burning on forest soils and tree growth.. ........................ . -. . .._ ......... Planting trials ................. ....... -..-.~...~..~~..~ ........................................ ~.~~~..~-.- . ..-. ....... Yellow pine thinning .~~ ................... ~...-...~ .............. -. ................ ................ .._ .......... Seed product’on and dispersal under various stand conditions in the spruce-
alpine fir type ....... .................. ............ ~..~ ............... .......................... ... ............ Seed production of spruce in relation to its morphological characteristics in
the spruce-alpine fir type ~~~._~~~~. ...... ............................... - . .._ .............. ............ .._. Seed production of conifers in relation to climate ........................ ~_~. ........................ Seed-fall and regeneration study ....... .._. -. ...... ..- .... .._ ........ . _. .... --_--. .......... .._.._ ... Plantation of exotic species in the Southern Inter.or~.-.~. ..... ~_- .................... ...... .._._ Regeneration studies in the spruce-alpine fir type ...................................... -...~~ ..__ .. Cone-crop studies .......... -..~~~ .... ._ .......................................... ..--.....- ........... .._. ... .......... inbreeding experiments with Douglas fir.. ............................................................. .._ ... Study of phenotypes in Douglas firs _.._ ............................. ~.~ .............. .._ ...... ............... Phenotypic selection in open-grown Douglas fir .. .._ ........ ~.-. ........... -. .... -. ............... Plus-tree selection for Douglas fir seed-orchards ....... _ ............................................ Co-operative seed provenance study of Douglas fir.. ............ ~~_~~. .......................... .._ .. Climate and the altitudinal distribution of conifers ... ..-. .............................. .._ ..... Record of plantations of exotic species throughout British Columbia ................ .
Region
Vancouver Island. Vancouver Island.
Kamloops. vancouver Island. Nelson. Prince George. Nelson. Thurlow Island. Vancouver Island. Vancouver Island. Kamloops. Nelson. Vancouver Island. Prince George. Nelson.
Prince George.
Prince George. Pr:nce George. Nelson. Kamloops. Kamloops. Kamloops. Vancouver Island. Vancouver Island. Vancouver Island. Vancouver Island. Vancouver Island. Vancouver Island.

26
Experime”:al Project No.
485 487 497 501 502 505 506
510 511 512 513 516 517 521 522 523 525 526 527 528 529 530 531 533 537 538 539 540 541 544
DEPARTMENT OF LANDS AND FORESTS
Tabulation of Active Research Projects, I959-Continued
Title
Claaslflcatio” of lodgepole pine sites on a” ecological basis.. ............... .._........--. Studies on seed-dispersal of Douglas fir-. ..-. ~- . .._..._......-.--....- .... ..- .... _...._..._ _ Experimental thinning in spruce ....................... .._ .. -. ............................................. - .. Comparative study of scarification equipment.. .. --.-...-...~ .- _...._. --. ....... ..-...._ ..- Plantation trials .............. .._ ........... . ...... -- _..._ _ ~_._-. ...... -. ....... - ..-. ........... - Planting of white spruce throughout the growing season ~~~...-- ...... -. .... __.-.-_._ A study of microclimate and soil conditions in a thinned and ““thinned stand
of Douglas fir.. ............. -...~ . ..-. ........ -. .............. - .. ..- .... _~. ...... - ......... ..-- .. -_.-._ Planting-stock trials ........ _ ... ....... - ............ -. ......... .._ .......... -. .... ~~--_- ..... -._- .._ ....... Crop-tree thinning in western larch ................................................ - ._ .. -. .... -.--. ..... - Seeding and planting trials .._ ..... -. .. . ~.-. .............. -. .... - ............... - ...... -.-. ............ Plant:ng of exotic conifers for future hybridization ....... -...- -. ................ -..-- ..-. ... Direct seeding of Douglas fir.. ......................... .._ ........... .._ ............. .._ .. - . ..- _____ Experimental thinning in ponderosa pine .-- ................. -.- ............ --...__.-. Experimental seeding of spruce.. .. -__-. ........ - .._ ... -. ... -___-___.__ _-__ -_ Experimental direct seeding.. ............................ . -. ........ - ._ .......... ..__......_.._._ .. ..- Seed-bed soil amendment trials ...... .............. .._ ... ~~_~~. . .._..._......_ ........ - ___.__ Swamp regeneration project .~._. .................... - .............. -. ..... _ .............. _......_ .. -. ...... Fertilizing a plantation of juvenile Douglas fir ..-- .... -- .____. ~-- .... -.- ........ .._._ ..... -. Fertilizing a Douglas fir plantation on a recent slash-burned area.. ...... -.._ ............ Influence of time on the effectiveness of scarified seed-beds in sprucw&ine fir ... Regeneration problems in decadent cedar-hemlock stands.-. ....... .._ ...................... Morphological characteristics of selected trees and their progeny---~. ........ ~.-.~ ....... Anatomical characteristics of selected trees .. ..-. ......... .._ - - ..... _ ...... _~.~. ........ _~. ........ Scarification trials in spruce-alpine fir .......... -. ................... - . ..-. ....................... -.- Spacing trials ...................................................... -. .......... ..- .. - .-.__.............._ ........... - .. Seed dissemination and the influence of weather conditions .._~ ..... ..-. ............ _ ...... Stodies in the improvement of cone-handling and seed-processing.. ........ .._._........-. Cone maturity and seed-ripening study.. .. .._. .-.~~~ ..- .. _ - .... - .._ ........... ..__ ................ Natural nurseries _.__ --__.---- _ .................. - ...... --. ... ...... .._ ................................. Spacing and growth studies of white spruce.. ................... -. ... ..-......_. ................... -~.
Region
Central Interior. Kamloops. Kamloops. Prince George. Prince Rupert. Prince George.
Vancouver Island. N&O”. Nelson. Nelson. Vancouver Island. Vancouver Island. Kamloops. Kamloops. N!ZlSQ”. Nelson. N&o”. Vancouver Island. Vancouver Island. Priace George. Kamloops. Vancouver Island. Vancouver Island. Kamloops. Prince Rupert. Vancouver Island. Vancouver Island. Vancouver Island. Prince Rupett. Vancouver Island.
RESEARCH PUBLICATIONS, 1959
Forest Research Review for the year ending March, 1959. Warrack, G. C.: Forecast of Yield Related to Thinning Regimes in Douglas Fir.
B.C. Forest Service Technical Publication T 5 1, 1959. Warrack, G. C.: Crown Dimension, Initial Diameter, and Diameter Growth in a
Juvenile Stand. Forestry Chronicle, Vol. 35, p. 150, 1959. Orr-Ewing, A. L., and Prideaux, D. C.: Grafting Methods for the Douglas Fir.
Forestry Chronicle, Vol. 35, p. 192, 1959, reprinted as B.C. Forest Service Technical Publication T 52.

REPORT OF FOREST SERVICE, 1959 27
REFORESTATION
FOREST NURSERIES
Heavy rains in the early spring, followed by clear, frosty nights, caused severe losses in one-year seedlings at Green Timbers and East Kootenay nurseries. Seed- lings were either “heaved out ” or, where roots were too well developed to permit heaving, the bark at the root-collar stripped. The bark of large numbers of two- year-old seedlings was lacerated at the root-collar by ice crystals in the surface soil or winter mulch. The root systems of numerous other seedlings were severely deformed by partial frost heaving. At Duncan, cool, moist spring weather caused an outbreak of grey mould twig-blight (Borrytis cinerea Fries), which killed or damaged 10 per cent of the second-year seedlings before the onset of dry, warm weather stopped the disease. Treatment with 4-4-50 Bordeaux solution appeared to have little effect.
The three Coast nurseries shipped out 6,797,050 two-year seedlings and 803,925 other classes. The East Kootenay nursery produced 649,725 seedlings, mainly two-year-olds. Total production of field planting stock was 8250,700 seedlings. An additional 781,125 seedlings were transplanted at Duncan, Green Timbers, East Kootenay, Hixon, Telkwa, and Okanagan Mission. Two-year spruce, growing at Green Timbers, did not reach plantable size and will be held over for a third year, when a sufficiently high percentage should be of good size.
A very wet spring delayed completion of sowing at some nurseries until June 18th. A total of 1,925 50-foot seed-beds were sown, including seventy-seven beds of Interior spruce at Green Timbers. The use of raised beds seems to have promise in preventing frost-heaving in this species. A new type of sprinkler, which throws a finer spray in a rectangular pattern, has also given good results.
Preliminary trials of fall-sown Douglas fir for the purpose of producing a better class of one-year planting stock have indicated that a much sturdier seedling can be produced. Fall sowing.of hemlock in raised beds has also given encouraging results, and little frost-heaving 1s evident to date.
This year’s seed-beds now contain an estimated 13,000,OOO seedlings, most of which are destined to be planted out as two-year root-pruned seedlings. This total is made up of seventy different seed-lots.
SEED AND EXTRACTION
The highlight of the year was the bumper cone-crop over the whole of the Province for most commercial species, with the possible exception of ponderosa pine. On the Coast the cone-crop on Douglas fir was the best since 1937, and crops of well-filled cones occurred up to the top elevation-range of the species. Cool damp weather from September on prevented cones from drying out and dropping their seed. Samples of Douglas fir collected at the end of the year contained up to one-half pound of seed per bushel of cones, which augurs well for a good catch of reproduction in the spring. Similar conditions existed throughout the Interior forest districts.
In the collection of cones, the principles of the tree-seed improvement pro- gramme were adhered to as closely as possible. On the Coast, many young stands which, due to age and stocking, were deemed good potential cone-producers were examined for cone yield and stand quality and periodically for seed count and development. Actual picking on Vancouver Island was done by high-school students under supervision of Reforestation Division staff.

28 DEPARTMENT OF LANDS AND FORESTS
In the Chilliwack Public Working Circle, an excellent job of collecting was done by inmate crews of the Attorney-General’s Department, who secured nearly 1,800 bushels of cones. In the Vancouver Forest District, 8,919 bushels of Douglas fir and 92 bushels of other species were collected. In the other forest districts, collections were made or supervised by members of the stand-treatment crews. In the Kamloops District, the cool, damp, late summer so retarded spruce cone development that collections were not made until after the first snowfall. In the Prince George and Prince Rupert Districts, spruce cones were heavily infected by a seed-destroying cone-rust, Chrysumyxa pyr&ta Winter. In spite of these dilli- culties, 425 bushels of spruce and 139 bushels of Douglas fir were collected in districts other than Vancouver. In all, the Forest Service collected 9,575 bushels of cones. Approximately 5,000 bushels were collected by the forest industry and an estimated 100,000 bushels by commercial tree-seed dealers.
All Forest Service cones are extracted in the remodelled seed-extraction plant at the Duncan nursery. The new oil-fired hot-water-heated Moore kiln worked well, processing 300 bushels of wet cones in forty-eight hours.
In the past, it has always been the practice of the Service to either sun-dry Douglas fir cones before sacking or to store green cones in well-ventilated trays 3 to 5 inches deep. In 1959 the practice of leaving green cones in sacks was used extensively. Due to a cool, wet fall, cones from sacks were still extremely wet when extraction commenced (95 per cent moisture content in some cases). While most lots were quite mouldy, it was found that this mould was mostly superficial. On the whole, seed yield was very good from sack-stored cones, averaging over 0.60 pound per bushel. The average yield of all Coast Douglas fir collections since 1944 was 0.44 pound per bushel of dried cones. This increase can be attributed partly to easier and more complete extraction and partly to careful examination of cones for filled-seed count and selection of only well-formed stands with a high percentage of filled seeds.
Germination tests on some of the first lots extracted were completed before the end of the year. These averaged approximately 90 per cent. In all, over eighty routine germination tests were carried out during the year.
RECONNAISSANCE AND SURVEY WORK
Reconnaissance and survey work were kept to a minimum on the Coast during the 1959 field season. Early in the spring, it was evident that a bumper cone-crop was on the way, and personnel ordinarily employed on regeneration surveys were switched to cone-crop reconnaissance, supervision of collections, etc. One recon- naissance, covering 2,000 acres, was carried out in the Sechelt Peninsula, and a very small survey covered 260 acres on the Gordon River area, Vancouver Island.
For the third year, a reforestation crew under the supervision of the Forest Surveys and Inventory Division conducted fairly general surveys to secure basic information on restocking in certain areas. Work begun the previous year in the Yale Sustained-yield Unit was completed with the survey of 27,660 acres. An analysis of figures for the complete survey covering 36,590 acres of larger cut-over types indicates 16,460 acres (46 per cent) not satisfactorily restocked. Natural restocking is expected to take place eventually on 53 per cent of this. Of the balance, 4,051 acres (25 per cent) is plantable and 3,656 acres (22 per cent) not plantable, due to unfavourable surface conditions. This party spent the latter part of the season in the Prince Rupert District, where 22,000 acres were examined in the Babine Public Working Circle. The season was finished doing a more intensive survey of 2,300 acres of the Giscome burn in the Prince George District.

REPORT OF FOREST SERVICE, 1959 29
In the East Kootenay, site classification of not satisfactorily stocked pine sites continued. Of thirteen examined, a total of six, covering 10,000 acres, were assessed as having an apparent site index over 65. These will be given first priority in planting plans.
A preliminary reconnaissance was carried out on two areas in the Kootenays, totalling 4,500 acres. These will be mapped in detail later as the greater part of the acreage involved requires restocking.
PLANTING
Planting commenced at lower elevations on the southern part of Vancouver Island in mid-January and was somewhat hampered by snow. At higher elevations, planting commenced in mid-February and crews had to fight snow throughout the operation. In the Campbell River area, planting was started on February 2nd, but, after three days, heavy snow forced crews to discontinue until February 23rd. During the spring, Reforestation Division crews planted 1,246 acres of Crown land and 3,016 acres of private lands under contracts mainly required under section 167 of the Forest Act. The forest industry and others planted 7,754 acres, mainly on tree-farm licences.
In the fall, the Division completed one project of 266 acres on the Coast. Industry planted a total of 4,880 acres,
In the Southern Interior, Reforestation crews planted 625 acres in the East Kootenay and 436 in the Christina Lake region, near Grand Forks. Stand-treatment crews planted another 10 acres in the Nelson District and 15 in the Kamloops District. Spruce seedlings grown at the Green Timbers nursery were planted on 110 acres in the Prince George District and 49 acres in the Prince Rupert District.
In the Southern Interior, two companies planted 72 acres on their tree-farm licences. Several companies also undertook pilot-scale plantings on 24 acres in the northern districts.
The Forest Service carried out only one small project of approximately 12 acres in the Kamloops District during the autumn.
Total planting in the Province for the year by all agencies amounted to 8,250,700 trees on 18,607 acres (see Table 2 of Appendix for statistics of planting over the past ten years).
Periodic plantings to test the feasibility of cold storage of seedlings and use of one-year seedlings were repeated with promising results. Since 1959 was a com- parative cool, moist year, results cannot be deemed conclusive, and tests are to be repeated for several years.
PLANTATION IMPROVEMENT AND MAINTENANCE
The cultural practice of removing competing brush and weeds from young plantations was carried on at Green Timbers during the slack season. Approxi- mately 10 acres were cleaned during the year. The programme of road maintenance in plantations was continued. A total of 160 miles of road was graded and, where necessary, ditches were improved and brush cut out.
In the East Kootenay, a further 66 acres of young overstocked ponderosa pine stands were thinned during the winter months, to bring the total area thus treated to 377 acres.
PREPARATION OF PLANTING-SITES
In line with the policy of carrying on pilot-scale tests of various means of brush eradication to secure information on feasibility and costs, a lo-acre block of vine

30 DEPARTMENT OF LANDS AND FORESTS
maple in the Robertson Valley was cleared, using Rowco Brushking saws. Decidu- ous cover was classed as heavy to medium (60 to 80 per cent of area covered). It was found that this type of stand, with stems from 1 to 3 inches in diameter, could be cut down for $14.80 per acre. However, the accumulation of slash on the ground was too dense to permit planting, and windrowing this material by hand raised the cost to $93.59 per acre. Tests carried out by other agencies indicate that caterpillar tractors of the D-8 class or better with the right equipment can do this same job for $20 to $25 per acre.
Inmate crews from the Attorney-General’s Department hand-cleared the brush from 10 acres in preparation for planting.
Reforestation crews felled snags on 4,184 acres which are to be planted or are adjacent to planting sites.
PERMANENT IMPROVEMENTS
Remodelling of the seed-extraction plant was completed. A new pump-house was built at Mesachie Lake, and an electric pump and underground pipes were installed for a permanent fire-protection system. A new pump-house was built and an electric pump installed for nursery irrigation at the Campbell River nursery. Similarly, at the East Kootenay nursery a new electric pumping system was installed to bring irrigation-water from Perry Creek. Eight acres were also cleared on the upper field, which is of a better soil type. At the Duncan nursery, grading of some land which was formerly too low lying for seed-beds has reclaimed sufficient area to sow 100 additional beds.

REPORT OF FOREST SERVICE, 1959 31
WORKING PLANS
INTRODUCTION
There are now in operation, thirty-six tree-farm licences, sixty-four sustained- yield units*, thirty-six tree-farms (under the Taxation Act), and fifty farm wood-lot licences. The combined productive area of these management units, committed to continuous forest production, is 41,212,700 acres. Their total current allowable cut of 677,540,OOO cubic feet is equivalent to 64.5 per cent of the total 1959 Provincial scale. The future potential of these lands is much greater than this.
As a result of present Government policy, the award of further tree-farm licences will be confined to a relatively few special cases. This will permit personnel of this Division to devote the greater part of their time to work related to the initiation of new sustained-yield units and management planmng on units already established.
Of particular interest during the year was the preparation, by Working Plans staff, of a stand-treatment plan for the immature stands and inadequately restocked cut-over lands in the Chilliwack Public Working Circle. The available working force of prisoners from the Provincial gaol at Oakalla will make it possible to carry out the plan at minimum cost to the Government. The lessons in practical forestry learned here will be of immeasurable value in the development of workable plans for the many other sustained-yield units in the Province.
SUSTAINED-YIELD UNITS*
New units approved during the year were the Granby, Kitimat, and Monkman. Five existing units-the Lac la Hache, Longworth, Nicola, Parsnip, and Quesnel Lake-were enlarged and allowable annual cuts revised. Improved inventory data also permitted allowable-cut reviews for a number of other units.
There are now sixty-four approved sustained-yield units in operation, com- prising a total productive forest area of 34,606,543 acres and a combined allowable annual cut of 418620,000 cubic feet. They are listed below by forest districts.
Vancouver Forest District
Name of Sustained-yield Unit Produ~;rucsjArea
Barclay ___-_-_-_--_._-_- ____ ---._---_~---_~--._-_____ _... ----._- 47,665 Broughton -_--~---.----_.~--- _.__ ------- _.._ --- _.._ --~--._- _.._ - 355,421 Cape Scott ---.---.._--._-----_-----_~_---.~----~..-.-------_~--- 104,873 Chilliwack ------.._---------~._----~-----..-----..---~--.~-~~.-- 73,023 Harrison _--___----~-.---_.-----~.~--~~~--- ._._ -- _..._ -.--_~-_.--- 164,653 Kyuquot ---.---.--~_.---__-----..---_~----_---__----__--.~~--- 362,635 Redonda --~._-----.-.---__-----.----~~.---~-----~.~---~~----.~.-- 257,099 Sayward _.--_-...---_..~- ___.._ _... - __._ - ._.....__.._._.._. - _.... 111,876 Sechelt ----.---._----_-.---.~--~-~~----~~---~----- _.._ --_--_---._-- 304,881 Seymour _----_-.-- ____ ---_--_--_~----..-.-.--~--~.----~~-~---.--- 224,815 Soo _..... - _.... - . . .._ - _.._ --__-._- _..._ -...- ._.._ --- ._..__..___ - _.._ 214,799 Yale . . . _._.. - _._____.._ -- _.__. _.._ -- _..___.__._ -._- ._.._ ---.._ 402,726
Totals~----.--~--~-~--~~~--~~----.~---~.--- _.._ --_ 2,624,466
* Forests, including public working circles, which are managed by the Forest Service.
Annual Allowable Cut (M C.F.)
2,500 13,000
2,250 3,000 6,400
19,650 17,000
3,500 15,000 4,200 8,300
20,000
114,800

DEPARTMENT OF LANDS AND FORESTS
Annual Allowable Cut (M C.F.)
6,900 5,500 8,600
15,500 4,400 3,000 7,000 9,300 7,500 4,500 6,400
78,600
Annual Allowable Cut (M C.F.)
6,000 8,000 6,600 5,350 8,740 9,200 4,950 4,000 6,720 7,000 2,500 7,000 7,500 6,000 7,000
96,560
Annual Allowable Cut (M CF.)
1,800 12,000 5,600 2,600
13,000 2,000 7,000 2,350 3,000
14,900 1,760

REPORT OF FOREST SERVICE, 1959
Kamloops Forest District-Continued
Name of Sustained-yield Unit Produ~u;e; jArea
Similkameen ---.---.---------_--_____________ . . . . . ..____..__ 706,403 Spallumcheen _------- ____._._ -_-- _.____._ - _____........_.____._ 561,428 Stum --~.-- . .._ ----~~-~ . .._ ------...--_-------_~--~~~--.---.-- _...._ 994,430 Taseko ~------~~-----.---_.~.~----.--~.~---~----- _.....__ -- ..__. ~__ 2,006,885 Williams Lake ----.~_~~---~-----_ _..__. ---_- _._..... - ____...__ 741,645 Yalakom -.._-------.--.~~---_--~.-~~-~~----~~-- _.__. ------- _...__ 425,515
Totals.---~.---~--~~-~~-~------~-~-.~---------~- .._. 12,090,654
Nelson Forest District
Name of Sustained-yield Unit Pro~u~;~~~~Area
Arrowhead _---.~_----- __.. ~~------.--__-_----- _...._ ---.-- _..... 129,072 Creston --~~---.-..~---~ _-.---.-.-- ._._ ------.-- _._...._ ---- _._... 568,018 Edgewood .~~ ~..~-.~~-_-.--~~--.-~~..--.~-..-~~-~..-~---.~ _..... 214,205 Granby --~..--.~----.-.~-~-------~--___--.------.-~--..~~.--- __... 491,290 Kettle ~--~--~~~~-.-.-.--~-.------_~.-_-----..----_~__-------- __.___ 679,011 Nakusp ~- ~.-~.-------.--.-~-.------ __..._ ---_-- __.. --.~-._- _._... 64,946 Slocan .~~.~~~.------~.--_------- .._._ ------ _..... -.---------__---- 188,852 Upper Kootenay -~..-----~~~-~~_----~----~._---.-----.~_----- 186,506 Windermere -~~.-~_.-._.---~~...~...---.--~.~.~------~..-.~----. 503,073
Totals..-~..---.-.~~-~..--~~---~~~.~------..--.-~--- 3,024,973
Grand totals _----_~-.--.-_----..-.-.------ . .._ -34,606,543
TREE-FARM LICENCES
33
Annual Allowable Cut CM CF.)
$000 9,700 3,000 4,200 6,300 3,000
95,210
Annual Allowable Cut (M C.F.)
2,000 6,000 2,800 3,000 5,750 2,200 2,500 4,700 4,500
33,450
418,620
Nine tree-farm licences were awarded during the year, bringing the total number in operation to thirty-six. One existing licence, No. 13 (Bull River), was extended. The new licences and the extension were recommended for award by the late Commissioner Sloan in his 1956 Report. Listed below are the licences awarded in 1959 : -
Tree-farm Licences Awarded, 1959
T.F.L. NO. Forest District 1 Name of Licence 1 Licensee 1 3: 1 ag
13 1 28 j
:; 1 31 32 /
I 33 34 35 36
Bull Riverl~ _..... ~~~...~~~ Shelley . . . . . . ..__........ ~~~ El;270
Prince George .._~ Eagle Lake ._........... ~. 96,820 Prince George .- -... Prince George .._..... -...
Sinclair...- . . . .._ ~~~~..~~ 71,090 McGregor _.. ~... 42,530
Kamloops.- . . . . ~.~.. Bolean .- . . .._.... ~.~ 31,320 Kamloops . . . _ Sicamous . . . . . . . . 14,840 Prince George...~.~ Seebach . . ..-...._....... 42,070 Kamloops . . . . .._....._........ Jam&on Creek-... ~~. 97,240 Vancouver..- . .._..._ - _....... Corder0 ~.. . . - ~.~.. 13,390
,
Galloway Lumber Co. Ltd.~ .__.. ...~~~~. Shelley Development Ltd . . . . -_._~..~~~ Eagle Lake Sawmills Ltd. ~. Sinclair Spruce Lumber Co. Ltd. ..~ Upper Fraser Spruce Mills Ltd ..__.... Vernon Box & Pine Co. Ltd. . . . . .._......... Shuswap Timbers Ltd . . . -... _.... Church Sawmill Ltd. . . . .._.. ~.. _.... . . B.C. Interior Sawmills Ltd.~.-~ . . . . F. & R. Logging Co. Ltd . . . . .._ ~~~~...~
38.860 1,100 2,800 2,ooo 1,073 1.038
-550 385 822
1,170 870
1 Amended to include extension area.
The thirty-six tree-farm licences in operation have a combined productive forest area of 5,851,980 acres and a total allowable annual cut of 226,140,OOO cubic feet.
3

34 DEPARTMENT OF LANDS AND FORESTS
TREE-FARM LANDS
No new tree-farms under the Taxarion Act were certified in 1959, @though approximately 4,000 acres were certified for addition to existing tree-farms, bring- ing the total productive area under this classification to 742,120 acres with a com- bined allowable cut of 32,460,OOO cubic feet plus 387,000 Christmas trees.
FARM WOOD-LOT LICENCES
The processing of farm wood-lot licence applications, including the preparation of working plans, is now the responsibility of the districts rather than the Working Plans Division. This Division will continue to receive and recommend for approval those plans submitted by district staff and will be responsible for the preparation of licence documents.
Only one new wood-lot licence was awarded during the year, and, as one was also cancelled, the number in good standing remains at fifty. However, thirty-one new applications were received in 1959, and, even allowing for a number of the applicants not having the necessary qualifications, this represents a considerable increase in interest over the preceding year.
Due to the greater priority of work related to the establishment and manage- ment of sustained-yield units, the activities of wood-lot personnel have had to be redirected, in part, to this phase of the Division’s work.


REPORT OF FOREST SERVICE, 1959 35
PUBLIC INFORMATION AND EDUCATION
INTRODUCTION
The demand for forestry information by the news media, schools, industry, and the general public continued on a high level. The ability of the Division to meet this demand satisfactorily was hampered by lack of funds and field personnel. Every effort was made with the resources available to meet the need, principally by greatly expanding the duties and responsibilities of the school lecturers and certain clerical staff.
The Service’s prime need in its information programme continues to be the establishment of information officers at the forest district headquarters level. In addition, assistance in the editorial and writing phases of the work is becoming a serious requirement.
PHOTOGRAPHY AND MOTION PICTURES
The photographic laboratory processed and printed 180 rolls of black-and- white film for other divisions of the Forest Service during the year. A certain amount of negative colour material is also now being used by some divisions. The photographic staff took a total of 656 black-and-white and 81 colour negatives, and over 2,500 black-and-white negatives and 200 35mm. colour slides were added to the files. This represents a loo-per-cent increase over last year, and the encroach- ment of storage space on the studio working area, which has long been a problem, is now reaching an acute stage.
In the early summer, several visits were made to logging settings to increase the variety and up-date the selection of logging photographs. Due to the industrial strike, however, this project was not completed. Complete coverage was provided by a photographer-writer team for an experimental bum conducted in the Kamloops Forest District. A set of colour slides was also taken for the Kamloops protection section to illustrate sawmill waste-disposal methods.
Over 2,548 8- by IO-inch photographic prints were produced, an increase of over 1,000 over 1958. Approximately 1,500 of these prints were supplied to the press and periodicals for use with news and feature articles. With the steady increase of this type of work, existin g equipment is rapidly becoming inadequate and breakdowns are more frequent.
In April the Division’s 16-mm. sound, colour production “ Mark of Progress ” was shown for the first time at a public “ forestry forum ” held in Prince George and attended by over 800 members of the public. The film is now receiving good circu- lation through the film library.
Primarily due to shortage of funds and writing staff, new motion-picture foot- age this year was limited to coverage of a helicopter air-lift of a prefabricated lookout to Mount Artaban, in the Vancouver Forest District.
Some new projects were undertaken this year. A total of 157 metalphotos were made for use as placards in exhibits and for the use of Engineering Services Division. The bulk were required for the newly designed Christmas-tree scaling- stick.
Several Forest Service exhibits were supplied with design layouts and photo- graphs, the most notable being the mobile trailer exhibit which toured fall fairs in the Nelson and Kamloops Forest Districts. Thirty-eight large exhibition prints were provided in various sizes, including a 30- by 30-inch colour print to the Surveys and Inventory Division. There is a need for the precision photographic equipment to be brought up to date in order to meet the growing demand for quality.work.

36 DEPARTMENT OF LANDS AND FORESTS
FILMSTRIPS
A copy of each of the three filmstrips produced last year has been placed with the Canadian Forestry Association, and copies have also been placed with both Victoria and Vancouver visual education departments for circulation through the schools.
A colour filmstrip on cone collection, seed extraction, and planting is being produced for the Reforestation Division. To date, forty colour photographs have been taken, and it is hoped to have the strip completed by late spring.
Art work for filmstrips and exhibit displays required 137 individual drawings to be made.
COMMERCIAL THEATRES
For the fifth consecutive year a 35-mm. forest-protection trailer was circulated through the commercial theatres in the Province. Exterior shooting was carried out by Divisional photographers. This trailer was shown for one week in each of seventy-one theatres during July and August, to a total estimated audience of 305,000.
FILM LIBRARY
During the year, a total of 123,179 individuals viewed Forest Service films. This figure includes attendances of schools serviced by the Division’s lecturers. The film library started the year with eighty-three individual subjects; ten were with- drawn during the year; and nineteen new subjects were added, making a total of ninety-two subjects available at the year’s end (see Table 55 of Appendix).
Television use of library films is steadily increasing. and loans were extended to organizations in many parts of the world. British Columbia House, London, England, continues to make good use of Service films on deposit there.
Amongst the more interesting additions to the library was a series of four films devoted to the proper use of fire-fighting hand tools, produced cooperatively by this Service and a United States agency.
During the year, seventy-seven special evening programmes were given by Division staff members. The demand for this type of showing has greatly increased during the past two years.
Greater use of Divisional motion-picture equipment was made by other members of the Service. A total of 103 individual loans to authorized personnel were made. This increase was a contributing factor in the greater cost of opera- tion and maintenance of these units.
PUBLICATIONS AND PRINTING
The 1958 Annual Report of the Forest Service was edited, synopsized, its printing supervised, and distributed. Other major printing projects included 76,000 school scribblers, 31,000 calendars for 1960, two issues of Protection bul- letins, the 1959 “ Research Review,” and two technical publications-T.51 “ Fore- cast of Yield in Relation to Thinning Regimes in Dou,glas Fir,” by G. C. Warrack, of the Research Division, and T. 52 “ Grafting Methods for Douglas Fir,” by A. L. Or-r-Ewing and D. C. Prideaux, Research Division, reprinted from The Forestry Chronicle, September, 1959. A special Christmas edition of the Forest Service news-letter was authorized this year and distributed throughout the Service.
Eight publications were reprinted during the year in order to keep up with the demand, but is was not possible to reprint one major item because no funds were available. Three lay bulletins were reprinted twice during the year. The demand

REPORT OF FOREST SERVICE, 1959 37
for forestry lay and technical printed information far outstrips the supply and the Division’s resources available to meet the demand. As in the past few years, more and more funds are being devoted to purely maintaining the supply of existing material, leaving no margin for development of sorely needed new media.
The Division distributed Survey Note No. 2, “ Helicopter Use in Forest Surveys,” maintained the supply of display posters, decals, and minor materials, and produced and distributed a personnel directory for use in the field.
To assist in the dissemination of factual up-to-date forest policy and general forestry information throughout the Service field staffs, a new medium of mimeo- graphed information items was distributed from time to time during the year to all Rangers, the Ranger School, and district headquarters staffs. This programme appears to be filling a real need if reactions from the field are to be any guide.
RADIO AND TELEVISION
The annual forest-protection and educational radio campaign was maintained during the year. With the exception of radio stations CBU (Vancouver) and CFPR (Prince Rupert), all stations in the Province carried thirty-two 15-second flash announcements and sixteen l-minute spot announcements for a period of eight weeks during the 1959 fire season. A pattern of twenty-four 45-second spot announcements was broadcast on C.B.C. stations at Vancouver and Prince Rupert and over thirty-one repeater stations.
It was noted that greater use was made by most forest districts of the special hazard flashes available to each District Forester or Forest Ranger over local stations during periods of serious fire-hazard.
All copy for the radio series was written and scheduled by members of the Division.
Members of the Division also participated in and arranged for several special radio programmes dealing with such items as the school lecture programme and general forestry matters. Radio station CKDA (Victoria), with the co-operation of this Division, broadcast four 15-minute programmes on reforestation and forest research.
No funds were available for commercial use of television. However, the Division did participate in several public service programmes and supplied the stations with video material.
NEWS MEDIA LIAISON
The volume of news and informational press releases, articles, and the supply- ing of background material to daily and weekly press, radio, television, and trade journals remained at a high level.
The school lecture staff participated in this work for the first time this year and with satisfactory results. While working in the various districts, they acted, in part, as district information personnel and worked to assist in liaison with local news media.
For the first time, a record was maintained of the results of the Division news and information releases. This record, from March to December only and covering but eight daily newspapers, showed that the sixty-two individual press releases made by the Division during the period resulted in 6,150 column inches of space in these principal dailies. No record was kept of trade journal, radio, or television coverage. Considerably better coverage could have been obtained had the staff been available to produce it.

38 DEPARTMENT OF LANDS AND FORESTS
Two special press tours were arranged by the Division during the year. A group including both press representatives and cattlemen was conducted on a visit to planting areas in the East Kootenay region. During the early part of the fire season, a tour was made of Forest Service and industrial protection and research facilities on Vancouver Island for a group of press and radio representatives.
New forest fire hazard rating sign.
SIGNS AND EXHIBITS
With the exception of Scotchlite “ Prevent Forest Fires ” design, all sign requirements were filled through the services of the Forest Service Marine Station. The demand for Scotchlite “ Prevent Forest Fires ” signs again far exceeded the supply. The design and production of this sign were revamped during the year to use facilities of the Department of Public Works sign-shop, and the results were very worth while. Eight pilot models were distributed throughout the Province.
Sixty fire-hazard rating signs were constructed and erected at various Ranger stations throughout the Province as a public information media indicating the degree of fire-hazard existing in each locality.
The placement and repainting of the “ Keep B.C. Green-Use Your Ashtray ” signs was continued. To date, 225 such signs have been placed on black-topped highways.
During the year, an attempt was made to meet the demand from exhibition organizations for this Service to enter displays in their fall fairs and conventions. With this in mind, the new highway sign-crew trailer was designed so as to be suitable for conversion into a mobile display unit. The interior of the trailer con- tained material depicting the major phases of Forest Service work. In addition,

REPORT OF FOREST SERVICE, 1959 39
provisions were made for the showing of motion-picture films to an audience gathered under a large awning extending from the roof of the trailer. The unit visited fairs at Chase, Grand Forks, Nelson, Creston, and Castlegar. Records show that approximately 12,000 people visited the unit.
Special exhibits were placed in Teacher Federation conventions at Prince George, Fort St. John, and Courtenay.
The permanent Forest Service exhibit located in the British Columbia Build- ing, Pacific National Exhibition grounds, Vancouver, was completely redesigned.
Surveys and Engineering Sections of the mobile trailer unit exhibit.
SCHOOL LECTURES
Two school lecturers were active during the school terms January to June and September to December. For the third time since its inception, the lecture pro- gramme covered all five forest districts in one calendar year. Coverage in the districts was as follows:-
, I I
Forest District Number of Lectures Attendance

40 DEPARTMENT OF LANDS AND FORESTS
LIBRARY
The forest library experienced a year marked by staff changes. In May the librarian for the past seven years resigned, and the present librarian did not assume her duties until September. During this four-month hiatus, the library was adminis- tered by the first assistant.
In addition, a reorganization of functions in the library and throughout the Division permitted the library staff to be reduced by one clerical position late in the year.
Each month, 321 accession lists, which give a complete record of all publica- tions entering the library, are circulated throughout the Forest Service. An average of 110 titles per month were circulated within and without the Service during the year.
The domestic-subject catalogue was closed down at the end of 1958, and information is now traced by subject through cards classified according to the Oxford decimal classification (ODC) and which are prepared and distributed from Oxford.
A collection of books in the Reforestation Division was classified according to the ODC and indexed by subject and author.
A limited (Russian and German) translation service for technical titles is now available through the library, and a considerable amount of use was made of this service during the last four months of the year.
CO-OPERATION
The commercial radio and television stations, and their agencies, and all segments of the press continued to offer a high degree of co-operation. Their support of the Service’s information programme is again gratefully acknowledged.
The Department of Education continued its active support, for the eighth consecutive year, of the Service school lecture programme.
The Division and the Service as a whole continued to co-operate closely with the Canadian Forestry Association (British Columbia Branch) in the organizing of Forest Conservation Week and the Annual Fire Control Courses.
A member of the Division co-operated with the Girl Guide Association head- quarters in presenting three six-week courses leading to qualification for the Guides’ woodsman’s badge. A total of 132 Guides participated.
A Division lecturer, on request, presented a week-long series of forest fire- fighting lectures to the regular forces of the Canadian Army at Work Point Barracks, Victoria.

REPORT OF FOREST SERVICE, 1959 41
FOREST MANAGEMENT
GENERAL
Despite the ten-week strike which curbed production on the Coast from July 6th to September 13th, the total estimated value of production of all forest products reached $637,715,000, surpassing the previous peak year of 1955 by over $6,000,000.
The value of lumber products maintained its leading position, accounting for $291,500,000, 46 per cent of the total value. Pulp and paper products valued at $234,529,000, comprised 37 per cent of the total, while plywood and shingles accounted for 12 and 3 per cent of the total value respectively. The value of pulp and paper production represented a 23-per-cent increase over 1958, while total pulp production of 1,875,236 tons showed an increase of 32 per cent over the previous year. It is estimated that one-third of the total pulp production came from 1,457,015 units of wood-chips made from mill residues. In addition, 260,529 units of chips were exported from the Province. Comparable figures for 1958 were 1,816,753 units with 404,049 units exported. Plywood production was down by less than 1 per cent, but lower prices reduced its total value to $75,500,000 from the $90,000,000 estimated for 1958.
On the whole, the industry had a good year, with the weighted average lumber price for all species shipped from the Interior of the Province about $5.34 per thousand board measure higher than that for 1958, but the decline in prices in the fourth quarter may portend a more difficult year in 1960.
The total cut for the Province amounted to 1,049,145,125 cubic feet. This showed an increase of 15 per cent over 1958, but was almost 2 per cent less than the record volume cut in 1956. Of this scaled volume, 574,451,278 cubic feet was cut from the Coast region, while 474,693,847 cubic feet originated in the Intericr. The Coast scale of all products was 72,000,OOO cubic feet higher than the 1958 total, but was still 81,000,OOO cubic feet lower than in 1955. By contrast, the total Interior scale attained a new record, surpassing the 1956 peak by 54,000,OOO cubic feet.
For the Province as a whole, Douglas fir still ranked first, with a total cut of 369,832,059 cubic feet. It is of major significance, however, that, for the first time, the volume of hemlock cut on the Coast exceeded that of Douglas fir. The total volume of hemlock scaled on the Coast was 182,881,206 cubic feet, compared with 175,376,885 cubic feet for Douglas fir. The scale of fir has been diminishing on the Coast since 1953, while the hemlock production has fluctuated from year to year. In the Interior, the scale of spruce continues to rank second to that of Douglas fir. The order of volume scaled for the entire Province continues to be Dougals fir, hemlock, spruce, and cedar, with these four species accounting for 85 per cent of the total cut.
On the basis of land tenures of origin, 832,964,602 cubic feet, or 79 per cent, came from Crown lands and, of this total, 562,504,152 cubic feet, or 68 per cent, came from timber sales, while 80,006,821 cubic feet, or 10 per cent, originated on the portions of tree-farm licences not previously alienated under some other form of tenure.
Water-borne lumber shipments for 1959 amounted to 1,197,653,000 f.b.m. This volume was almost equal to the average for the last ten years but was 116,708,OOO f.b.m. lower than the 1958 total. Shipments to the United Kingdom declined to 267,363,OOO f.b.m., the lowest volume since 1950. Water-borne ship-

42 DEPARTMENT OF LANDS AND FORESTS
merits to the United States accounted for 595,170,OOO f.b.m., being almost equal to the 1958 volume and accounting for 50 per cent of all water-borne shipments.
Awarded during 1959 were 2,160 timber sales, containing a total estimated volume of 739,347,750 cubic feet of saw-timber. Comparable figures for 1958 were 2,145 sales with 682,221,469 cubic feet. The total estimated revenue from 1959 saIes is $29,823,289.07; this value is 45 per cent greater than the 1958 total, reflecting higher stumpage rates as a result of improved market conditions, but is considerably lower than the record value of 1956 sales. The decline in the number of timber sales in the last few years may be attributed to several factors: a more liberal policy in granting extensions of time to existing contracts, resulting in fewer resales; a trend toward larger sales; the existence of tree-farm licences where timber is sold on a cutting-permit basis rather than by timber sale; and regulation of cut in fully committed sustained-yield units where the volume of timber sold is limited to the allowable cut.
Competitive bidding on timber sales offered for public auction showed a marked increase in 1959, surpassing the 1956 record. Stumpage rates higher than the upset prices were bid on 243 sales, or 12.6 per cent of all sales other than cash sales. These competitive sales comprised 28.3 per cent of the total sawlog volume. In the case of 104 sales containing 13.6 per cent of the total volume, the final stumpage rates bid were more than double the upset rates. Most of the competitive bidding occurred in the Nelson and Vancouver Forest Districts.
At the end of 1959, there were 7,139 timber-sale contracts in existence, the number having been reduced by 444 during the year. The total amount of security deposits held under timber-sale contracts increased to $15,150,213 from the $14,710,518 held at the close of the previous year.
MARKET PRICES AND STUMPAGE TRENDS
LUMBER PRICES
The Department relies upon the Interior dressed-lumber shippers to provide data regarding their sales and, as in previous years, co-operation has been excellent. These prices are necessary to determine stumpage rates and also provide the basis of stumpage adjustments under sliding scale. Three-month average prices f.o.b. car are used, as in past years, as well as seasonal corrections to fir-larch and spruce prices. There are now five lumber-price zones in effect since the Peace River Zone has been included in the Prince George-Blue River Zone.
The seasonally corrected fir-larch price and the cedar and yellow pine prices rose during the first half of the year and fell in the second half. The seasonally corrected spruce price and the white pine price were relatively stable. Uncorrected quarterly average prices for the Interior are shown below.
I959 Uncorrected Quarterly Average Dressed-lumber Prices (Interior)
Jan.-Mar. Apr.-June July-Sept. Oct.-Dec.
Fir-larch ~_.--~._.-- 146.229 $S7.R7 200 078 200,500 Spruce-.-.~..~~ .._. ~.~_-.._ 164,044 ) 58.93 i 226:122 i %; 247,541 Cedar -._-_-..---- 5,398 ( 54.70 I 8,280 1 60.83 6,713 White pine-.--- -....._ -.__ 3,698 I 93.41 I 6,524 1 97.33 7,238 Yellow pine... .-..-.-...- 2,034 1 60.27 I 7.479 1 66.17 5,810
i I I i
-I I Average Rasis. 1
Price MB.M. ) “;;$
$64.26 / 145 929 / $55.77 62.10 1 177:584 1 57.92 65.86 ( 5,309 58.28 96.53 1 3,522 99.21 62.28
-

REPORT OF FOREST SERVICE, 1959 43
Loo PRICES
With the exception of hemlock and balsam prices, which remained at the low 1958 level, log prices generally were moderately higher during 1959. Fir and spruce prices rose throughout the year, whereas cedar and white pine prices rose and fell again toward the end of the year. Quarterly average prices for log sales reported to the British Columbia Loggers’ Association are shown below.
1959 Quarterly Average Log Prices per M B.M. (Lower Coast)
Species Jan.-Mar. Apr.-June July-Sept. Oct.-Dec.
fSS.01 i $59.96 1 $63.53 / $64.46 48.28 ; 51.30 50.03 / 47.10 38.67 1 40.57 42.21 I 42.92 36.88 ( 36.94 39.69 ! 39.23 40.93 ) 42.51 43.60 I 45.90 53.22 I 60.29 / 58.56 I 58.46 1 /
STUMPAGE PRICES
Stumpage rates for timber on unalienatd land, or on land not held under other tenure within tree-farm licences, are determined by Forest Service appraisal. Timber-sale stumpage rates are established by bid, and the bid rates may not be less than the appraised rates. A brief description of the general appraisal method is contained in the 1957 Report of the Forest Service.
Stumpage rates for fir, larch, and spruce were higher than in 1958. The rates for cedar, hemlock, balsam, and yellow pine were the same, or only slightly higher, than their 1958 values. White pine stumpage was lower. These figures reflect improved log and lumber prices for the year.
The average bid prices for all species was $3.88 per hundred cubic feet for 1957, $2.98 for 1958, and $4.03 for 1959. For detailed figures see Tables 20 and 21 of the Appendix to this Report.
SLIDING-SCALE ADJUSTMENTS
There were 6,400 sliding-scale adjustments of stumpage rates during 1959. Most of these resulted in stumpage increases. This compares to 3,877 adjustments, mostly downwards, in 1958. The general application of the sliding-scale method to timber sales, without the option of reappraisal, was made in 1958.
All tree-farm licence cutting permits issued after January Ist, 1959, were made subject to stumpage-rate adjustment under sliding scale during the periods between the normal reappraisal of stumpage values. Previously, sliding scale had been in- cluded at the option of the licensee when each permit was issued.
STUMPAGE-APPRAISAL COST STUDIES
The field party with headquarters at Vernon completed time studies on five logging operations, four sawmilling operations, and one planer-mill operation. Lumber recovery studies were undertaken at three sawmills.
ADMINISTRATION OF MANAGED UNITS
Three new sustained-yield units were set up, to bring the totals to thirty-two public working circles and thirty-two sustained-yield units, or a total of sixty-four publicly managed areas, from which a cut of 310,000,000 cubic feet was recorded.

44 DEPARTMENT OF LANDS AND FORESTS
Work is progressing on plans to bring the publicly managed units on to the estab- lished licensee priority system for administrative purposes. This system is based on the premise that applications for further timber will be accepted only from the licensees of expiring timber sales. It has been found necessary to insert restrictive- cut clauses in timber sales to allow this system to work effectively.
SILVICULTURE
The programme implemented during 1959 included stand treatment, silvi- cultural studies, working-circle planning, and road location in public working circles and sustained-yield units.
The main effort during the year was centred on stand treatment. The Interior districts were again active in this field, and some 823 timber sales received stand treatment. This involved treating some 207,528 acres, as compared with 141,577 acres in 1958. For the most part, sales are treated to attain either increment or natural regeneration. The methods most commonly employed are single-tree selec- tion in the case where increment is the objective and strips, blocks, patches, or single seed-trees where natural regeneration is desired. Of the 207,528 acres treated in 1959, 24,936 were marked under single-tree selection; 62,961 were laid out in blocks, strips, or patches; and 119,631 acres were marked for either single or groups of selected seed-trees.
Where natural regeneration is desired, it is often necessary to prepare a satis- factory seed-bed. This is often accomplished by either burning or scarification. Since 1956 the Forest Service has been developing a scarification programme as a means of obtaining natural regeneration in certain types of stands. In 1959 some twenty-two timber sales were scarified, involving approximately 1,757 acres.
In the 1958 Report, mention was made of the proposed developments in respect to planting. Planting was carried out during 1959 in all Interior districts. Altogether, some 200,000 trees were planted, which included the following species: Larch, yellow pine, spruce, and Douglas fir.
In order to develop the planting programme, considerable effort was expended in collecting suitable seed. This will be needed for future planting stock and also in connection with the direct-seeding programme which will be developed in the near future. In 1959, some 350 bushels of cones were collected and shipped to the Reforestation Division for extraction.
In addition to the cone-collecting programme, the stand-treatment crews, in conjunction with Reforestation Division, developed and maintained a number of small nurseries at different locations throughout the Interior, principally at Telkwa, Hixon, and Creston.
Of the many technical problems on which work was carried out during the year, the most significant was the preliminary work done in connection with second- growth management on the Lower Coast. Co-operative studies were also under- taken with several different agencies. Among the more noteworthy were the logging damage survey in the Prince George District and the Douglas fir bark-beetle survey of the damage to selected seed sources in the Cariboo.
SCALING
Scaling supervision in all Interior forest districts was intensified during the year, with field time apportioned among check scaling and investigations, instruc- tional classes in preparing candidates for scaling examinations, and holding ex- aminations. Scaling examinations were held at forty-seven centres throughout the

REPORT OF FOREST SERVICE, 1959 45
Interior, with 1,058 candidates sitting for the examinations. Three hundred and ninety-four candidates were successful in passing. In preparation for the exami- nation, 193 instructional classes in scaling were held, each class being of two hours’ duration.
Mill checks and investigations carried out during the year resulted in twenty- five prosecutions under Part VIII of the Forest Act. It was also necessary to suspend the licences of fifteen scalers because of scaling irregularities.

46 DEPARTMENT OF LANDS AND FORESTS
GRAZING
GENERAL CONDITIONS
The winter of 1958/59 was mild, with snowfall lighter than usual in the northern areas and about average in the south. At low elevations, snow melted early in the spring but subsequent cool weather retarded plant growth, and the range was not ready for use until considerably later than normal. Supplies of hay were generally good, and there was no undue hardship caused by the late forage develop- ment.
With the exception of the south-easterly portion of the range country, drought conditions prevailed until early August. Thereafter, precipitation was extremely heavy throughout.
The dry spring, following the drought conditions of 1958, resulted in poor forage production on both grassland and forest ranges in the north. Ranges in this area did not respond to the late summer rains due to relatively low temperatures and the advanced stage of growth which had been reached before the rains came. In the south, and particularly the south-east, forage production ranged from average to far above normal. Stock came off the range in generally good condition.
Hay production was light in many areas due to dry, cool conditions early in the growing season and also as the result of severe kill of alfalfa due to late winter icing conditions. Following the onset of heavy rains in August, haying conditions became extremely difficult. In many areas very little hay could be harvested, and much is of very poor quality. There is a general shortage of hay throughout most of the ranching area. This, combined with the early onset of winter conditions in all except the south part of the Kamloops District, has forced many stockmen to reduce their herds.
Rising costs and inadequate returns are causing many sheep-ranchers to go out of business or convert to cattle. This is reflected in the drop of sheep numbers on Crown range.
The trend toward the sale of calves and yearlings, rather than 2-year-olds, continues. This is resulting in a higher percentage of mature cows on the Crown range. Thus, forage demands are also increasing apart from the influence of stock numbers.
MARKETS AND PRICES
Cattle prices remained relatively steady until early in October, when some weakness in the market developed due to heavy shipments and a reduced demand on the part of the United States buyers. Weighted average prices received by cattle- men through the British Columbia Livestock Producers’ Co-operative Association were $17.52 per hundredweight, compared to $19.57 in 1958. Lamb prices were also lower than the previous year. Total shipments of cattle were 4.5 per cent higher than in 1958.
LIVE-STOCK LOSSES
Losses of stock on the range appeared to be higher than normal in 1959. Although natural causes, such as poisonous plants, predatory animals, and severe weather conditions in the late fall, took their toll, artificial hazards were more important. Hunting accidents were particularly serious, and theft was suspected in a number of cases of unexplained loss. Losses due to highway traffic and rail traffic were also reported.

REPORT OF FOREST SERVICE, 1959 47
RANGE MANAGEMENT
Range-management plans must be revised to meet constantly changing con- ditions. During 1959, special attention was given to minimize any possible effects of the yellow pine planting programme on grazing interests in the East Kootenay Valley.
Forage-yield studies were intensified to determine the productive capacity of various sites. A variety of range-improvement techniques were also applied on a trial basis to find ways of increasing forage production.
Studies were also continued to determine the type of management required to maintain and improve forage production on suitable areas in the Peace River District. These lands revert to brush, and ultimately, if untreated, to a forest type without under-story forage. Special techniques, including the use of fire, herbicides, and rough cultivation, appear to be necessary.
RANGE SURVEYS
Range inventories provide the resource manager with information which enables him to develop a range-management programme which will lead to the best use of the forage. In 1959, a total of 440,720 acres were covered by grazing surveys, as follows :-
Acres
Femie and Elk Valley Stock Ranges --~~~~~~~..- --~.~-~~~~.~~~-.--.-..-~~~~~ 38,240 Hawkins Creek unit of Creston Stock Range .-.-.---.----~~~~-.---.---.-. 80,480 Upper Cache Creek Stock Range ~.~.----.~~--~~.~-.----.--.-.---~~~~~--~.------ 100,000 Westwold Stock Range ~~~~~ . . . ~~~~~~~---..---.~~~~~~----~- . . . . . . . . . ~~~~~~-. 202,000
Total -----~~-~~~~~~~~~~ ---._.~~~~~~~~~~.- . . . ~~~~~~~~~~~-..~~..~...~~~~.. 420,720
From 1945 to 1959, a total of 9,399, 885 acres have been covered by range surveys and resurveys. The resurveys are necessary to keep the range inventory information up to date.
RANGE IMPROVEMENTS
During the year, $48,760.70 was spent from the Range Improvement Fund. In addition, material to the value of $1,428.72 on hand at the end of 1958, was assigned to projects during 1959. The following work was completed:-
One stock-bridge ~~~~-----.~~~~~~-~-----.-_~~~~---.----~~-~---.-.- .---~_-----.---~-- $2OO.P0 Fourteen cattle-guards --. .~~~-..--.-- -~~~~~~------~~-~~~~~-.--.--.-_~~~~~~-.--.- 6,170.Ol Thirty-one drift-fences --.~~~~~~-....--~-~~.~~~-.-------...---.---.---~.~~~~------- 10,514.38 Seven experimental plots . ..--~-~~~...._--.----~-~....~--------~~~--.~------------ 185.32 One hazard-removal ----~.---.---.--~~~----.-----.---~-~-----.---.---~~..~-------- 17.15 Four holding-grounds -...~~~~~~-...--~_.~~~~~---------~ ~~~~.-------_.._.~...~~~~ 374.62 Two mud-hole fences . ------~~~ ._...._ ---.-~ . . . . . . .._. ~--~~~..~ . . .._ ---.-------- 850.00 One hundred and twenty-one range seedings .-.-~.~~......_---~-~-~~~~. 5,593.67 Twenty-eight stock-trails . ..~-~-----.---...~~~---------~.-~-.----------..~-~~~----- 8,090.43 Nineteen water developments ~~~--._..~~~~-----.--_.~~-- --.-----_~~-----.---- 2,031 .OO Wild-horse disposal --..-_~~~~-~~-------.-~~-----.------~~.--.-.------~------------- 453.50 Machinery and equipment (purchase) --.--~~-~-~-.---.------_------.---- 225.61 Maintenance and operation of equipment ~-~_-.------~~~~~~_---.--~~---~ 1,009.48 Material purchased but not assigned to projects ~~~~...._---.--~~~~~~ 3,188.70 Supervision, surveys, and technical studies ._.--~~~ . . . .._.._ --~~~~ _..... 11,285.55

48 DEPARTMENT OF LANDS AND FORESTS
In addition to the costs charged to the Range Improvement Fund, range-users made considerable contributions of labour to a number of the above projects. Also, a number of these projects were constructed or repaired by fire-suppression crews and other Forest Service personnel without cost to the Range Improvement Fund.
Authority was also extended to permittees to construct and maintain, at their own expense, one breeding-pasture, two cattle-guards, five corrals, twelve drift- fences, two grazing-enclosures, one holding-ground, two horse pastures, one stock- trail, and two water developments.
Range seeding was reduced in 1959, due mainly to the fact that no major fires occurred which were suitable for seeding. Some 17,150 pounds of seed were used in 1959, compared to 21,615 pounds in 1958. The seeding of logged forest range and other similarly disturbed areas was at about the same level as the pre- vious year. Fall seeding was curtailed due to unsuitable weather conditions. One prescribed burn in the Peace River area was seeded from the air. The costs reported previously covered only the cost of seed and other supplies. Labour, which is a major cost in seeding, was supplied by stockmen and Forest Service personnel.
Steel-rail decks were installed on ten cattle-guards on heavily used roads. Experience to date indicates that maintenance costs for this type of deck should be considerably less than that for wooden decks. One painted cattle-guard was installed across an asphalt highway in 1959, and preliminary results indicate that this new type of guard was relatively successful in holding cattle. Trials with electric cattle-guards were continued, but these guards do not appear to be entirely satisfactory in remote areas where maintenance is difficult.
Seeding grass on logging-roads has produced forage for live stock.

REPORT OF FOREST SERVICE, 1959 49
All of the Kamloops Grazing District and the major part of the Nelson Grazing District were closed to horses during the winter of 1958/59. Forty-eight horse- disposal licences were issued and sixty horses were cleared for shipment. Bounties remained at $5 on mares and geldings and $7.50 on stallions. The problem of horses on Crown range is now largely under control. High prices being paid for horses has encouraged horse-owners to take better care of their animals and to round up and ship their own excess horses. However, it is considered necessary to continue horse closures to further ensure that large numbers of useless horses do not again accumulate on Crown range.
During the yearj studies were continued on the biological control of goat-weed (Hypericum perforatum). The two species of Chrysoline beetles, which were first introduced a number of years ago, are still disappointingly ineffective. However, the beetles continue to survive. The release of Chrydina varians, made in 1958, showed some promise, but it is still too soon to draw conchrsions as to the effective- ness of this species.
RANGE RESEARCH
The Canada Range Experimental Farm at Kamloops is responsible for basic range research in British Columbia. Studies were continued on a number of problems of special interest to the Forest Service, including range seeding, timber milk-vetch poisoning, range carrying capacities, and weight gains on forest range. Valuable assistance was obtained from the farm during the year on a wide variety of subjects, including technical guidance in connection with much of the work being done in the East Kootenay area.
CO-OPERATION
Local live-stock associations are the media through which much of the co- operation between ranchers and the Forest Service is achieved. There are now fifty-three such associations approved under the Grazing Act. Three new associa- tions were incorporated in 1959. One of these has already been recognized under the Grazing Act, and negotiations with the other two are under way. Meetings were held with the North Okanagan ranchers in 1959 to organize local live-stock associa- tions, but no associations have been formed to date. Several recently inactive live-stock associations were reactivated in 1959.
The British Columbia Beef Cattle Growers’ Association and the British Columbia Sheep Breeders’ Association were active, and several matters of general concern to the industry were referred to them for their consideration.
A total of 124 association meetings were reported, and Forest Service officers attended 115 of these. Fifteen meetings were held with other live-stock and tech- nical groups during the year.
A co-operative arrangement was entered into between the United States and British Columbia Forest Services and affected permittees for the fencing of a part of the International Boundary on Pasayten Mountain where intermingling of stock had become a problem.
Grazing personnel assisted in organizing and participated in several technical meetings during the year. At the instigation of the Forest Service, a short course in range management was arranged by the University. This course was held at the Range Experimental Farm in June and was attended by technical personnel from various agencies interested in range use. Early in the year, the Director of Grazing was appointed to the Beef Cattle Advisory Committee, set up to advise the Govem- ment on matters affecting the industry generally.
4

50 DEPARTMENT OF LANDS AND FORESTS
ADMINISTRATION
For the first time in over two years, the grazing personnel establishment was brought up to full strength, the last vacant position being suitably filled in May. Also, owing to the lighter fire season, the Ranger staff was able to give more attention to grazing work than during the previous year. However, in spite of this more favourable situation, the continually increasing work load resulted in much necessary field work remaining undone.
In 1959, two minor amendments were made to the Grazing Act to simplify administration and clarify the application of the Act to certain lands. Revised grazing regulations were published early in the year to meet the requirements of the Regulations Act. Grazing district boundaries were also revised to coincide with altered forest district boundaries.
For a number of years, grazing fees have been on a sliding scale, reflecting live- stock prices on the Vancouver market, as reported by the Canada Department of Agriculture. At the end of May, the public stockyards in Vancouver were closed and price reporting on the Vancouver market discontinued. It therefore became necessary to find a new basis for the sliding scale. After considerable research, it was finally determined that live-stock price information available from the British Columbia Livestock Producers’ Co-operative Association would be the most suitable basis for the sliding scale.
Although the character of the problem did not change, the pressure of other land uses in the range country continued to grow during the year. Increased efforts were required to minimize conflict between grazing and these other uses. Further, land diverted to home-site, commercial, industrial, and recreational uses results in increased grazing pressure on the remaining range lands. More intensive manage- ment is thus required even to maintain total grazing use at its present level without damage to the range.
Logging on forest ranges continued to result in some conflict with grazing. However, this problem is not as acute as it was due to careful supervision by the Forest Service and growing co-operation between the logging and ranching industries.
In some cases, Indians have not been complying with the provisions of the Grazing Act in the use of Crown range. This has made proper management of the range difficult and, from time to time, has led to conflict with legitimate grazing permittees, both white and Indian. Special attention was given to these matters during the year and some progress was made.
During the year, a large number of ranches changed hands. This involved a considerable amount of work in connection with the transfer of grazing privileges and the explanation of grazing regulations and management plans to the new opera- tors, many of whom were completely unfamiliar with range practices in this Province.
The growing importance of beef production in the Prince George District, particularly in the Peace River area, necessitated assignment of a Grazing Officer to that district for six and one-half months in 1959. The necessity of administration and range development in additional areas throughout the Peace River area was carefully investigated. Administration was commenced in the Sunset Prairie area. There are now three stock ranges in the Peace River District being managed under the provisions of the Grazing Act.
GRAZING AND HAY PERMITS
This year, 1,683 grazing permits were issued authorizing the depasturing of 124,425 cattle, 4,377 horses, and 20,604 sheep on Crown range. This represents an increase of 112 permits over 1958. Cattle numbers were up 1,936 head and

REPORT OF FOREST SERVICE, 1959 51
horses 208 head over the previous year. Sheep numbers were slightly reduced, being at the lowest level since 1928. (See Table 58 in Appendix.)
A total of 164 hay-cutting permits were issued authorizing the harvesting of 1,415 tons of hay and rushes from Crown range. Unfortunately, much of this hay could not be harvested owing to extremely wet weather, and many permits were cancelled. Such hay as could be harvested was of low quality.
A number of special-use permits for hay-cutting and for fenced pastures were issued under the Provincial Forest Regulations.
GRAZING AND HAY-CUTTING FEES
Grazing fees are on a sliding scale, based on live-stock prices received by the producers the previous year. Fees per head per month for 1959 were 15 cents for cattle, 18.5 cents for horses, and 3 cents for sheep.
This represents an increase of 3 cents per head per month for cattle and 3% cents per head per month for horses, reflectin g the considerably higher prices received by stockmen in 1958. Sheep fees remained constant from 1958 to 1959. Hay-cutting fees, which are not on a sliding scale, remained at $1 per ton for wild hay and 70 cents per ton for rushes.
Total billings for grazing and hay-cutting fees were up from the 1958 level due to both increased fees and the larger numbers of stock on the Crown range. Billings exceeded collections, resulting in larger “ outstandings ” at the end of the year. (See Table 59 in Appendix.)
LIVE-STOCK COUNTS
Cattle counts were carried out in four areas where management problems had arisen. Accurate knowledge of the number of stock owned by ranchers is necessary to ensure actual grazing use is in line with permitted use and also as a basis for equitable allocation of Crown range.
VIOLATIONS AND PROSECUTIONS
Several cases of serious violations of grazing permit conditions occurred during the year. Some stock were seized under the provisions of section 17 of the Grazing Act for too early turnout on spring range.

52 DEPARTMENT OF LANDS AND FORESTS
ENGINEERING SERVICES ENGINEERING SECTION
Work continued on forest-development roads with an extensive programme of engineering investigations, route reconnaissance, location, and construction. In addition, work was carried out on a number of access roads required primarily for fire-protection and administrative purposes. Much of this work was undertaken as part of a winter work programme under a Federal-Provincial agreement for sharing the cost of constructing forest roads built during the first six months of 1959. Despite severe winter conditions, both location and construction crews maintained a high level of production during this period. Construction work was scheduled so that right-of-way clearing, rock work, bridge construction, and other operations least affected by winter conditions, proceeded during the worst weather.
Forest-road Programme, 1959
Project
= I
Mount Bruce Lookout Road~...m~~ . . . .._.. ___ Port Hardv F.D.R. .._~.~~~ ..-....-. __
Morrison Lake ~~~ ~... Tochcha Lake F.D.R . . . . . . . . . . - . .._
Sukunka River ~~~~ . . . ..___ Swift River F.D.R. ..~ - -.~. Tzenraicut Road ~.~~ . . ~~~ Willow River F.D.R. ~~.~...~ ._..............
Kamloops Forest District
Lawless Creek F.D.R. - ~.~_~. Nicoamen-Mowhokam Slok Creek ~~~~..~~~..~ -.~ . . .._ Stein River -~...-...~ . . . ~~.~~
Nelson Forest District
Damfino Creek F.D.R . . . . . . . . -.~~ _..___..... Granby River ~~~ ._........... - _.._ . . .._.. Horsethief F.D.R. ..-...~~ ~~.~ ._................. Lodgepole F.D.R. ..-.. -~..~-~ - _.._ ~_~ White River F.D.R . . . . - ..- .._............_.....
Total 1959 programme ~~~_.~~ Previous works..- ~~..-~ Totals, forest-road programme
1950-59 -...~~~~~ _....... ~~...
F.D.R.=Forest-development road. P.W.C.=Public working circle. S.Y.U.=Sustained-yield unit. T.S.=Timber Sale.
1 -
Regulation Unit Reconnais- sance
Miles Kyuquot P.W.C. ~.~~~ ~~~~~~.~~~ 14 Chilliwack P.W.C.~~.~ Barclay P.W.C. ..~ ~.- 7 Broughton P.W.C. ..- ~..~~. 4
Cape Scott P.W.C. ..-..-.. Yale P.W.C. .._~~~..._..~~~ ._.. ~~~~~.. Sechelt P.W.C. -..-.. So0S.Y.U. ~. ~~-..- - ~.~~ Broughton P.W.C. ~..~ ..~ . . . . . . Barclay P.W.C . . . ~~..~_.~~~~
13
13 13
68 Morice S.Y.U.. ............ -. ... -...~~~ Babine P.W.C.. ....... -._~~~. ..... _ .... 15 Babine P.W.C .... _.~-. ................ 4
West Lake P.W.C . . . . . ~~..~~.._~ 20
Longworth S.Y.U.~mm.~~ . .._..........
Yalakom S.Y.U. -~ . .._.. Lac la Hache S.Y.U. Similkameen P.W.C. ~~~ Botanic S.Y.U. . . . . . . ~.. Yalakom S.Y.U. ~~~ ~~.~.._
56 3
24 22 40
Kettle P.W.C. ~...~..~...~ ~. Granby S.Y.U . . . . . . . . ~~~ . .._ .._._.. 22 Windermere P.W.C. ..-...~~...-.~~ 8 Flathead S.Y.U . . . . . ...~~.~ .~ . . ..__.. _...... Upper Kootenay P.W.C. ~~~.~... 40
---------- I 6u4 ~1 1,635
22.2
20.0 0.4 30.4 6.0 19.8 12.5
237.4 68.0 474.0 214.3
-..I 2,239 711.4
Miles
9.8
21.7 0.5
.-..
4.6 9.3
1.1
.--- 16.2
2.9 3.1 3.4
--
10.7
. ..-..
20.0 6.7
34.4
Construction
Miles -.....
5.0
11.0 0.5 2.5
-.-...
0.6
. . ..-
. ..-...
.-- -.....
1.5
8.0 -...-.
3.0
..~._.. 16.5
0.5
-- 282.3

REPORT OF FOREST SERVICE, 1959 53
Other activities of the Engineering Section included maintaining 207 miles of previously constructed road; operating highway transport units for moving heavy equipment, Porta-buildings, and other materials to Forest Service installations throughout the Province; and providing professional engineering assistance on problems encountered in the day-to-day operations of the Service.
DEVELOPMENT PLANNING
Development plannin, u continued as an important phase of the Engineering Services programme. Engineering investigations and route reconnaissance in fifteen forest areas encompassing some 2,815,OOO acres of productive forest lands, with a current recoverable mature volume of 3 billion cubic feet, were undertaken during the year.
This work was accomplished by three field crews utilizing both the old and the new in personnel transport. During the field season, helicopters were used on a limited basis to check their application to route investigation. General use was made of fixed-wing aircraft, vehicles, boats, and foot in traversing the diversified terrain encountered by the field crews.
In the Prince Rupert Forest District, the proposed developments of the Kispiox River valley and the Morrison Lake area of the Babine Public Working Circle were investigated. Primary field investigations of the Sukunka, Hasler, and Mountain Creek drainages, the McGregor River drainage, and the Morkill River drainage, all in the Prince George Forest District, were completed. Development studies were undertaken for areas in the Quesnel Lake Public Working Circle and the Yalakom and Botanie Sustained-yield Units in the Kamloops Forest District. In the Vancou- ver Forest District, drainages were studied in the Kyuquot, Broughton, and Barclay Public Working Circles and the Yale Sustained-yield Unit.
ROAD LOCATION
During the 1959 field season, engineering location was completed on 237.4 miles of forest roads. This programme included the initiation of location work on several new forest-development roads, the extension of existing road systems, and the compilation of road designs and estimates. The analysis of the use of survey data during construction has been continued. The result of these studies is a more flexible application of surveying procedures to the various road classes and design requirements.
Location work was initiated on the Soo River and Stakawus Creek Forest- development Roads, and the Chilliwack and Kingcome River road systems were extended. All these developments were in the Vancouver Forest District. Location work in the Prince Rupert Forest District included the completion of the Fire Moun- tain Lookout Road and the commencement of the Tochcha Lake road system. In the Prince George Forest District, the Swift River road system was extended, and location of the Hasler Creek and the Mountain Creek roads began. The Hendrix Creek road system in the Kamloops Forest District was extended with the location of both primary and secondary roads. In the Nelson Forest District, the Lodgepole and the Horsethief road systems were extended, and the Damfino Creek Forest Road was initiated.
A note of interest in this year’s programme has been the work done on roads required primarily for forest administration and protection. Projects in this classi- fication are the Gregg Creek Road, the Tzenzaicut Road, and the Hutchison Moun- tain Road in the Prince George Forest District.

54 DEPARTMENT OF LANDS AND FORESTS
CONSTRUCTION
Favourable weather during April, May, and June made possible the attainment of record production figures despite unusually poor weather during the fall. Sixty- eight miles of road was constructed during 1959. This was up 25 per cent from the previous year, and involved the movement of 1,l 10,000 cubic yards of common material, an increase of 48 per cent over the 1958 figure. Production during the 1959 construction programme also included the clearing and grubbing of 680 acres of right-of-way, movement of 42,000 cubic yards of solid rock, installation of 11,400 lineal feet of culvert pipe, stock-piling of 100,000 tons of crushed surfacing material, and the erection of six creosoted timber bridges.
Two noteworthy, two-lane, almost identical bridges were built over the Chilli- wack River in the Chilliwack Public Working Circle. The glued-laminated wood girders in the main spans are 101 feet 9 inches long, 12% inches wide, and 65 inches deep. They are the largest ever laminated in Canada and rest on reinforced-concrete piers, with 27-foot approach spans from each road embankment.
Another accomplishment was the construction of the Kingcome River Bridge in the Broughton Public Working Circle. Erected in an area accessible only by sea, its 340-foot length is the longest of any Forest Service bridge. The piers are of creosoted fir piling and are protected from debris and ice by pile dolphins and sheathing of wood and steel.
The decks of these and the other three bridges built in 1959 are of the laminated type, consisting of 2-inch planks laid on edge, nailed to each other, and anchored to the girders at intervals by cast aluminum brackets of Forest Service design.
Erection procedures have been designed to reduce to a minimum the number of specialized trades involved, and to use the type of heavy equipment normally available in woods operations. The main girders of the Chilliwack bridges were placed with a logging-arch, logging-donkey, tractors, and truck-mounted cranes. The Kingcome Bridge was erected using a skid-mounted pile-driver on the falsework and permanent piers, with a crawler tractor providing assistance in placing the main girders.
The initiation of construction on the Kingcome River Forest Development Road presented an interesting transportation problem. Access to the job was only possible by boat or aircraft. Two Forest Service self-propelled landing-barges, one of five tons and the other of 25 tons capacity, were used to transport construction supplies and light construction equipment. Heavy construction equipment and supplies were handled by commercial towing companies. A total of over 850 tons of equipment and supplies were moved to the job.
Recent developments in crawler-tractor attachments received considerable study, and both replacement tractors purchased this year were equipped with hydraulic tilting U-blades. By eliminating time-consuming manual blade changes, a considerable increase in productivity may be obtained with these units. One of these machines was also equipped with a hydraulic-controlled ripper, which has been used successfully to break up material which would otherwise have required blasting.
GENERAL ENGINEERING
Designs were completed during the year for six creosoted “ glue-lam ” girder bridges for crossings of Fontaine Creek, Little Swift River, and Swift River on the Swift River Forest Development Road, Boss Creek on the Hendrix Creek Forest Development Road, Willow River on the Naver-Ahbau Forest Development Road, and Kingcome River on the Kingcome River Forest Development Road. The

REPORT OF FOREST SERVICE, 1959 55
latter is the largest Forest Service bridge to date, having three main spans of 84 feet each, and 44 feet of approach trestle at each end. This bridge is also the first designed for Forest Service “ coastal loading,” which consists of frequent crossings of an 83-ton logging-truck or occasional crossings of a 115-ton low-bed vehicle representing a low-bed semi-trailer truck carrying a 2.5-cubic-yard shovel. Pre- liminary designs and estimates were also prepared for bridges over Morrissey Creek on the Lodgepole Forest Development Road and Atlatzi River on the Kingcome River Forest Development Road.
A soils technician with a trailer laboratory was maintained in the field during the summer to assist the road location and construction crews with soil problems, and laboratory classification tests were carried out on 360 soil samples.
Other work included a pile-foundation design for a freezer building at the Duncan nursery, a field investigation to determine the feasibility of using piling for a wharf and float at Echo Bay, and an analysis of possibilities for improving the performance of the small hydro-electric installation at Thurston Bay.
Hundred-gallon-capacity light-weight portable tank and pump unit used in fire-fighting.
MECHANICAL SECTION
Motor-vehicle purchases were somewhat higher in number than in the previous year, there being 102 replacements and three additions to the fleet. The increased number of replacements was due in part to deterioration of units during the extreme- ly heavy fire season in 1958. Purchases of four-wheel-drive units fell slightly as more two-wheel-drive, limited-slip differential types were put in service. The num- ber of replacement trucks in the 14,000 to 24,000 G.V.W. (2 to 4 tons) class was

56 DEPARTMENT OF LANDS AND FORESTS
one less than last year, but one 35,000 G.V.W. (6 to 8 tons) heavy-duty unit was provided for tractor transport and road gravelling in the Prince Rupert District, replacing a truck-lowbed combination.
Other major expenditures included two heavy-duty (D-8 and D-9) tractors for the Engineering Section and ten dwelling trailers for crew housing in various districts and divisions.
Ten 1 OO-gallon-capacity, light-weight, portable tank and pump units designed by the Mechanical Section and constructed at the Forest Service Marine Station were put into service and given a thorough test. These proved most acceptable to the districts and, with minor modifications, should become a standard piece of fire- fighting equipment.
Forest Service Mechanical Equipment
Total Units, Jan. 1,
1959 TYPE
2:: 22
155 38 51
8
Removed from
Service
Total Units.
Dec. 31, 1959
I
8 34
3.54 83
17 10
115 145
4 6 4
1 22
9 6 3
19 7 3 5
2: 2
22 6 1
I 5 ’ 48
13 I 89 3 1 25
20 i 64
::: 1 2:; b 142 21
8 40 4 I 54
4 1 1 I 5 1 I ! 9
102 I 105 ’ 804
29 3
2 1 2
1
2
39 9
3 1
10 18
1 1
10 34
2 364
89 1
20 9
124 161
4 6 5
1 22
9 6 3
General supervision and inspection of mechanical units followed approximately the procedures developed in past years, with each piece of equipment receiving at least one check-over. In the case of major units (cars, trucks, etc.), two recorded inspections were completed. Maintenance generally has improved throughout the years and is now of a comparatively high standard.
Surveys and Inventory Division continues to operate mobile inspection and repair crews during the field season and a repair-shop during the winter months. This has resulted in a definite lowering of repair costs to the Division. Engineer-

REPORT OF FOREST SERVICE, 1959 57
ing Division set up a small workshop in Victoria and employed four mechanics through the 1958/59 winter months, with satisfactory results.
Short courses in the operation and maintenance of equipment were again held in Victoria for Departmental personnel, and two weeks’ theoretical and practical instruction were given at the Ranger School.
Repair costs and time-losses resulting from road accidents are a significant item of expense for the Forest Service fleet each year. Consequently, safety and accident prevention were given special attention in an effort to reduce the accident rate through driver education.
BUILDING DESIGN AND CONSTRUCTION AND MARINE DESIGN
The major undertaking of the Section during the year was the design and build- ing of the seed-extraction plant at the Duncan nursery. The plant has now been in operation since the first of October, and at the end of the year was in full produc- tion at a daily rate of 220 bushels. Due to the coincidence of a very heavy cone year and poor pre-drying weather for cones. the plant will be operating well into the new year to extract the seed available. In coniunction with the seed-extraction plant, a combination freezer and cold-storaue building is under construction on the same site to (a) hold the surplus seed at 0” F. until needed and (b) to hold seed- lings ,grown at Duncan at 34” F. for shipment to northern sites when weather permits. The building is expected to be completed in time to receive the bulk of the seed extracted.
Another undertaking of some consequence was an initial survey of the housing needs of the Aleza Lake Experimental Station. and preliminary plans of all phases have been prepared.
This year, two octagonal Fiberglas lookout cupolas were obtained from the Alberta Forest Service for experimental purposes. First reports indicate low erec- tion and transportation costs. but the building is somewhat cramped for space. Currently, an investigation is being made relative to different types of lookouts, with particular emphasis on the suitability of new materials now on the market from the standpoint of both construction and maintenance costs.
Design of specialized trailers required a significant share of the staff time available. Seven such units came off the drawing-boards, together with a modified design for the residential type of Porta-building.
It was rather a quiet year in regard to marine design. Some modifications were made to the design of the high-speed 40-foot Ranger launch. A second craft of the same type as the “Western Hemlock,” but powered by a pair of four-cylinder turbo-charged diesel engines instead of a pair of six-cylinder naturally aspirated diesel engines, is destined for service in the Vancouver District.
The problem of providing adequate transportation facilities for road-construc- tion projects located at isolated points on the Coast and large inland lakes received considerable attention. The landing-craft “L.C. 5,” which was originally built for military use during World War II and has since spent much of her time on the beach at Great Central Lake, was successfully moved to salt water and utilized for carrying supplies and equipment during construction of the Kingcome Forest Development Road. Modifications to both hull and superstructure should make this craft of even greater use in the future. In addition, tentative design of a scow has been completed which will be capable of transporting a 40-ton bulldozer and can be disassembled into units small enough to be transported by truck and trailer without too much difiiculty over secondary roads.

58 DEPARTMENT OF LANDS AND FORESTS
Construction at various points throughout the Province which involved design and building supervision by the Section are detailed in the following table:-
Building and Construction Undertaken during I959
Location
Carry-over from 1958159 Cranbrook .... -.-- .... -_._-- .-_ .... Duncan .... - ................. --.~.~. ..... Mesachie Lake. ......................... Vancouver ... .._ ...... -.~ . ..-. .... - .. Various points ........... -.-. ........
Propramme for 1959160 Aleza Lake .... ..-. .... ..- .. -__~~~. .... Courtenay ................... ~_-. ........ Cranbrook.. .......... ...... .._ .. -.--. Cranbrook ......... ~~...-.~~ .-. .... -. Chetwynd .......... ....... -. ............ Duncan .-. ................. ..__.._.._. Duncan...~...~..~~ ........... .._......_ .. Duncan~. ....................... ..-.- - Duncan .................. ........... ._ .. Duncan ... - ........................... - .. Echo Bay ......... -..~.~~..~.~~ .......... Likely ..-~ ..-. ... -. .... .._ ......... Slocan City.. .. -.- . ..- __........__. Smithers ~~.-~ - ......................... - Various points .........................
-
Project Construction Agency
Irr:gation pumping system. ..__ .... . ............ Forest Service ........ Extension, seed-extraction plant .. ._ ........... Forest Service ....... . Fire-orotection system .__.___ -_.--...-...-. Forest Service ........ Retaining-works-and derrick- . . . . ..__..... . .._.. Forest Service . .._. - Porta-buildings (six) - .._._ -...-_- Forest Service
Experimental-station development - _....._ Forest Service ._..... Office extension~~...~~~...~ . .._... - ._... --.~~~ _........... Forest Service..- Office extension . . . . . . . . . .._.......... -- .._...... ~~_.. Forest Service . . .._
Contract ~~~- - Forest Service . . . . . . . . Forest Service...- Contract .._...__......... Contract . . . . . Contract ...~~..~~~~.~~~... Contract ~.. Contract ..~~..~~...~~.. Forest Service . Forest Service ~~....-. Forest Service ~~~...... Forest Service . .
Paving ..~...- . . . . . .._......._...... . . . . . . . . . . . . Office and stores building . . . . . . . -..- - ._...... Freezer and cold-storage building
Roofing for freezer building . .._............ Refriaeration for freezer buildinn Elect;ical for freezer building ~...y ~.~~ 1
Three-car garagee _ ......... -~. .... -..~.~~~~~~ .......... Headquarters warehouse.. .. ~_~ _ ............... .._ _ Porta-buildings (seven) ........................ ..- ....
Stage of Construction
Completed. Completed. Completed. Completed. Completed.
Design proceeding. Completed. Completed. Completed. Work proceeding. Work proceeding. Completed. Work proceeding. Design proceeding. Design proceeding. Tenders called. Work proceeding. Completed. Design completed. Completed.
FOREST SERVICE MARINE STATION
MARINE WORK
The marine ways were occupied fifty-eight times during the year. Launch overhauls totalled sixty-four, forty-one of which were major overhauls. Ninety small craft, comprised of dinghies, rowboats, outboard cruisers, and river-boats, were repaired, reconditioned, and in some cases rebuilt. Extensive repairs and remodelling were carried out on the 36-foot landing-craft “L.C. 2,” and a similar programme has been started on the 50-foot “L.C. 5.”
Alterations to and repowering of the “Conifer,” started in late 1958, were completed early in the year. The “B.C. Scaler” was repowered with a pair of heavy-duty diesels of 225 horse-power each.
A portion of the crew has been on new construction throughout the year. The 45-foot “ Whitesail,” designed for Ootsa Lake and started in 1958, was finished and placed in operation. A new 40-foot Ranger vessel is 60 per cent complete. One 23-foot outboard cruiser and eight 30-foot river-boats were built. Four moulded-plywood unfinished hulls were assembled and superstructure completed, and a similar 27-foot hull is 30 per cent complete.
PREFABRICATION AND CARPENTER-SHOP
The major undertaking of the Subsection has been the prefabrication of the new lOO-foot float, gangway, and approach ramp which will be installed at the Echo Bay Ranger Station after the structural members have been pressure-treated with preservative. Other important jobs were the construction of four Porta-buildings and a refrigerated seedling-carrier, partial completion of three other Porta-buildings, prefabrication of twelve lookout buildings, and the rebuilding of four old dwelling trailers.

REPORT OF FOREST SERVICE, 1959 59
In addition to these major jobs, the carpenter-shop produced many specialty items, such as lookout furniture, fire-finder stands, epidiascope cabinets, fuel- moisture balance boxes, survey rods, and a new instrument-the Christmas-tree scaling-stick. Construction of crates and boxes for pumps, outboard motors, chain- saws, and other small units also absorbed a fair share of the productive time.
MACHINE-SHOP
The machine-shop completed 450 overhauls on pumps, outboards, chain-saws, and lighting plants. Sixty-five new units were tested and numbered prior to ship- ment to the field. Over 1,500 pieces of pump and hose accessories were machined. Ten fire-finders and forty-five epidiascopes were completed. In addition, numerous pieces of marine hardware were machined and sixteen sets of lookout lightning- arrestor equipment made up.
A new feature was the development of a unit known as the “B.P.T.,” which is a light-weight portable lOO-gallon tank and pump unit for carrying on the half-ton vehicles. It produces low-density fog, and a trial run of ten units in the field proved very successful.
RADIO SECTION
This year, radio field work was aided by favourable weather and started earlier than usual. Progress was badly delayed later on, however, by the non-delivery of prefabricated repeater buildings as a result of the Coast forest industry strike. Equipment purchases were applied to the completion of frequency-modulated repeat- ers in the Kootenay area, to replacement of units made obsolete by Federal specification, and to the building-up of depleted stocks of fire and other portable equipment.
New transmitting units purchased during the year totalled 138, and sixty-two sets were written off during the same period.
Total purchases, A.M. .~~~~~------..~~~- ._...__ ~-------.~ _....._ -- ..__... ~~. 56 Ranger station and repeater, 30-60-watt, F.M .-......._.. ~.--- . . ..___ ------ 15 Lookout and fire portables, F.M . . . . . . . . ~~~_------.--.~-.---.--~~~~~ . . . . ..___.... 67
- Total purchases, F.M. ~~~~~~.-.---~~~.~~- _....... ~~-.--~--~~ ._._ ._....... ~~ 82
Total purchases, all types ............................. ~~~...._._.....~- ... 138 Written off during year ........................................ ~~.......__....._ ............ 62
Net increase ..~~~.~ ~_~ _......... _........ ~~ . . . . .._ -..-.-..-----~------~ _... 76
Department of Transport regulations continue to increase, but some relief from Specification 116 has been obtained as a result of a protest made by the Western Canada Telecommunications Council. The previous implementation date has been

60 DEPARTMENT OF LANDS AND FORESTS
set forward to April Ist, 1960, with a three-year amortization period, thus reducing to a small extent the urgency for replacement of present types of A.M. equipment. All lookout stations appear to fall in the Specification 116 category and, as a solu- tion to this replacement problem, the Model B portable has been specification- approved with one small modification, units complete with modification being already available from at least one manufacturer. Replacement of nine marine units brought complete modernization closer but, at the present rate of replacement, it is unlikely that the entire fleet will be refitted in time for the expiry of Specification 112.
An important regulation is now being enforced requiring the operator of a Coastal motor-vessel to obtain his radiotelephone operator’s restricted certificate. This affects the sea-going Ranger and (or) his engineer, and preliminary steps have been taken to ensure the certification of those concerned.
Although the main point-to-point communication continues to be handled by A.M., a start has been made in the Prince Rupert District to convert the Ranger station-to-lookout circuits to F.M., and results on a small scale have been excellent. Testing was carried out during the summer for a repeater at Smithers, to connect Smithers. Telkwa, and Houston. Plans were also completed for the conversion to F.M. of fourteen lookouts, eieht Ranger stations, and one Assistant Ranger staticln. A second repeater at Bums Lake is at present being tested by commercial interests and is entirely suitable for Forest Service use.
At Prince George, the shortage of fire portables, which was so much in evidence during the 1958 season, has been partly corrected. The F.M. network was cpm- pletely overhauled in the spring after gradually weakening circuits between repeaters had virtually wiped out normal communications. While operation was restored and has been maintained, the entire F.M. system must be considered as being on a temporary basis while only two repeater sites with power are available. A power- line up Fraser Mountain, planned for the spring of 1959, with four services sharing the cost, failed to materialize. but is still an active project, with a building and equipment in hand for the third repeater out of the five required.
The Vancouver District maintained the SZU~US quo with the majority of Ranger stations on Vancouver Island and Lower Mainland being served by the F.M. net- work with almost 100 per cent continuity. Through the new repeater on Mount Bruce, two more voice circuits were added&-one to Green Timbers and the Marine Station, and the other between Civil Defence headquarters at Victoria and Abbots- ford. A.M. transmission to launches and stations north of Seymour Narrows and to Pemberton proved to be unsatisfactory a good deal of the time, the district frequency being too low for this distance at the present peak of sunspot activity. Tests are being carried out using 5915 kilocycles and three of the older transmitters have been replaced. While the changes have apparently corrected the situation, it must be considered a temporary solution until transmission during the hot weather has been proven.
In the Kamloops District, the year saw extension of the F.M. network to Williams Lake, Horsefly, and Ashcroft, and Protection F.M. to Barriere, Clinton, 100 MiIe, and Alexis Creek. Only five Ranger districts are now dependent on A.M., and one of these is in the process of conversion. Silver Star repeater, the key station for the entire area, remains on generator power, but a new power plant and automatic change-over have made this repeater more reliable. Timothy and Greenstone repeater buildings were completed in the late autumn, and the former has now replaced Begbie repeater, with greatly extended range, while at Greenstone adequate space and heating facilities ensure proper operation and improved main- tenance.

REPORT OF FOREST SERVICE, 1959 61
To complete the F.M. network from the western end of the Nelson District, Red Mountain repeater was set up on a temporary basis in the spring but proved unsatisfactory. All attempts to construct the Santa Rosa repeater in time for summer use were defeated by the industry strike. Both Santa Rosa and the new repeater building at Red Mountain were finally completed in the late autumn and, through the repeater chain, Phoenix-Santa Rosa-Red Mountain-Beasley, the western end of the district was connected with Nelson. In the east, Femie not included, F.M. reaches to Invermere, with plans already in hand for extension to Golden. Due to the broken terrain throughout the Kootenays, the A.M. portable remained the source of communication for fires. Such F.M. portables as were available were found invaluable on lookouts, aircraft, and for internal use only on large fires.
The Victoria staff, following a complete overhaul and maintenance tour in the Prince George area, constructed the foundations and power wiring at Santa Rosa and Red Mountain during the summer, returning later to complete the build- ings and installation of equipment. Extensive propagation testing continued be- tween Mount Bruce and Blackwall Mountain in Manning Park, with the object of further proving the F.M. circuit between Victoria, Kamloops, and Prince George. Tests proved successful, but further information must be obtained before the circuit can be completed. Laboratory work included the almost continuous assembly and modification of F.M. Ranger station units and repeaters, mass production of beam and other types of ante=, research into inexpensive methods of remote control, and transistorization of the Model B receiver. Maintenance of all installations on Vancouver Island was again a Victoria responsibility, and no significant outage occurred during the year.
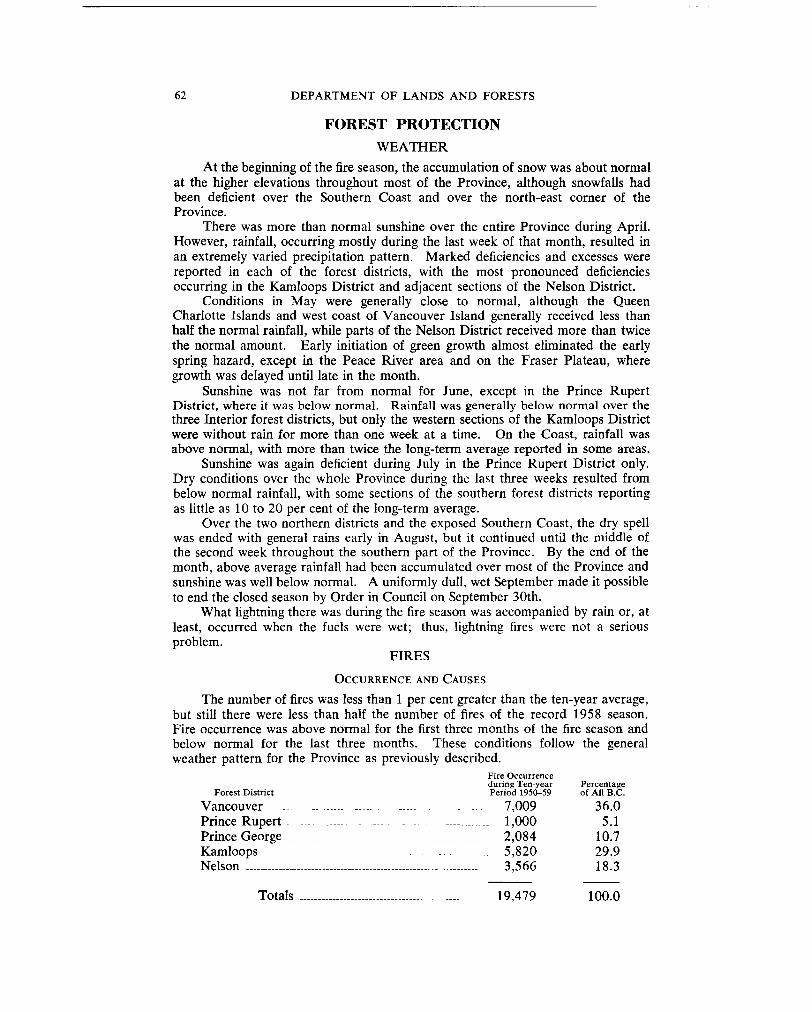
62 DEPARTMENT OF LANDS AND FORESTS
FOREST PROTECTION
WEATHER At the beginning of the fire season, the accumulation of snow was about normal
at the higher elevations throughout most of the Province, although snowfalls had been deficient over the Southern Coast and over the north-east comer of the Province.
There was more than normal sunshine over the entire Province during April. However, rainfall, occurring mostly during the last week of that month, resulted in an extremely varied precipitation pattern. Marked deficiencies and excesses were reported in each of the forest districts, with the most pronounced deficiencies occurring in the Kamloops District and adjacent sections of the Nelson District.
Conditions in May were generally close to normal, although the Queen Charlotte Islands and west coast of Vancouver Island generally received less than half the normal rainfall, while parts of the Nelson District received more than twice the normal amount. Early initiation of green growth almost eliminated the early spring hazard, except in the Peace River area and on the Fraser Plateau, where growth was delayed until late in the month.
Sunshine was not far from normal for June, except in the Prince Rupert District, where it was below normal. Rainfall was generally below normal over the three Interior forest districts, but only the western sections of the Kamloops District were without rain for more than one week at a time. On the Coast, rainfall was above normal, with more than twice the long-term average reported in some areas.
Sunshine was again deficient during July in the Prince Rupert District only. Dry conditions over the whole Province during the last three weeks resulted from below normal rainfall, with some sections of the southern forest districts reporting as little as 10 to 20 per cent of the long-term average.
Over the two northern districts and the exposed Southern Coast, the dry spell was ended with general rains early in August, but it continued until the middle of the second week throughout the southern part of the Province. By the end of the month, above average rainfall had been accumulated over most of the Province and sunshine was well below normal. A uniformly dull, wet September made it possible to end the closed season by Order in Council on September 30th.
What lightning there was during the fire season was accompanied by rain or, at least, occurred when the fuels were wet; thus, lightning fires were not a serious problem.
FIRES
OCCURRENCE AND CAUSES
The number of fires was less than 1 per cent greater than the ten-year average, but still there were less than half the number of fires of the record 1958 season. Fire occurrence was above normal for the first three months of the fire season and below normal for the last three months. These conditions follow the general weather pattern for the Province as previously described.
Fire Occurrence during Ten-year Percentage
Forest District Period 19X-59 of All B.C.
Vancouver . . --- ---..----~~~-.--.-.~~...---..~~~-~~ -~~~---~. 7,009 36.0 Prince Rupert -~~~---.~.~.--..-~-~.~-..-..-~~~-~~.-~-~~~~.---- 1,000 5.1 Prince George . . . . . . . . . ~~.~~~~ 2,084 10.7 Kamloops . . ~~..~~.~~...~~~~ . . . . . . . . . . . . . ~~ -....._ _........ -- 5,820 29.9 Nelson . . . . . . . . . . ~~.~ . . . . . ..- ~..~...~...~ . ~~ . . . . . . . ~-- 3,566 18.3
Totals _---._--.._-.---~------.---.-----.~.-~..---- . . . . 19,479 100.0

REPORT OF FOREST SERVICE, 1959 63
For the fourth consecutive year the principal cause of fires was railway opera- tions, which accounted for 31 per cent of the fires, a slightly higher percentage than last year. Twenty-two per cent of the 1959 fires fell into the “ miscellaneous known causes ” classification, which includes “ range burning.”
COST OF FIRE-FIGHTING
The cost of fire-fighting in 1959 totalled $768,084, or slightly less than the ten-year average. Further details are available from Tables 37, 50, and 52 in the Appendix.
This year the heaviest fire-suppression cost (54.5 per cent) resulted from range-burning activities in the Cariboo and Peace River areas. Lightning fires dropped from 75 per cent of the total suppression cost in 1958 to 23 per cent in 1959.
DAMAGE
The 273,631 acres burned over in 1959 was 62 per cent of the average burned area for the past ten years. This contrasts with a damage figure of $1,342,849 for 1959, which is almost identical with the average of the past ten years (see Table 49 in the Appendix).
FIRE-CONTROL PLANNING AND RESEARCH
FIRE ATLAS AND STATISTICS LEDGERS
The Provincial Fire Atlas has been brought up to date, and fire statistics ledgers and fire classification atlas are currently being brought up to date.
VISIBILITY MAPPING AND LOOKOUT PHOTOGRAPHY
Work was concentrated on lookout photography in 1959. Photographs were taken at forty-one lookouts, and fourteen of these photographs were taken on behalf of the National Parks Service.
FUEL-MOISTURE STICKS
Approximately 680 sets of fuel-moisture sticks, or “ hazard sticks,” were dis- tributed in 1959, with the forest industry absorbing 430 of this number. The cost of preparation of these sets for this season is calculated at $3.79 per set. There has been a steadily increasing demand for these sticks over the past few years, as indicated by a 50-per-cent increase in production from five years ago.
PROTECTION PLANNING IN PUBLIC WORKING CIRCLES AND SUSTAINED-YIELD UNITS
Preliminary field work, preparatory to drawing up protection plans, was carried out in Arrowhead and Willow Public Working Circles and Eagle and Nicola Sus- tained-yield Units.
A more intensive examination was made in Hixon Ranger District (Naver Public Working Circle), with a view to preparing a standard outline for more detailed protection plans on such areas.
In the fire-protection access-road programme, work was continued in the Yahk River area in Nelson Forest District. Some 20.5 miles of access road was con- structed, and 2 miles of old fire road regraded as part of the road system.

64 DEPARTMENT OF LANDS AND FORESTS
AIR-PHOTO MOSAICS
The balance of available high-level R.C.A.F. photographs was utilized to increase the coverage in Prince George Forest District.
In order to obtain mosaic coverage of Vancouver Island, B.C. photographs are being utilized at contact size to obtain the standard l-inch-to-l-mile scale.
FIRE-WEATHER RECORDS AND INVESTIGATIONS
The two field parties from the Canada Forestry Branch Fire Research Section have completed field studies necessary for the development of a fire-danger rating system in the fuel types under investigation. Preliminary trials were made during the latter half of the fire season in the Vancouver Forest District using interim tables and in the north-eastern corner of the Prince George Forest District using the tables developed for Northern Alberta.
Measurement of the moisture content of 3-inch logs was continued by co- operative industrial observers and at one Forest Service lookout on Vancouver Island.
Employment of a student assistant during the summer months made it possible to summarize rainfall and moisture measurements to date in the Vancouver Forest District. This information is available in mimeographed form.
Three years of records of the Model 8 Burning Index rating system from the Nelson District were analysed in terms of fire occurrence and behaviour. The following table gives the rate of occurrence of fires which reached one-quarter acre or more, expressed as number of fires per hundred days per 10,000 square miles, based on 133 man-caused fires and 204 lightning fires which reached this size. The percentage of all fires started by lightning which reached one-quarter acre or more is given in terms of the danger class on the day the fire started.
Danger Class / Low / Moderate / Average / High / Extreme
I I Man-caused fires .._................._ . . . . . . . . . . . . . . .._........ ~.~ ~... 0.8 1 2.5 15.6 Lightning fires -.............-.- . . . . . . . . . . . . . . . . . . . . . . ..-.......... -. 1.1 1 3.5 / 1::: -_..- Percentage of all lightning fires reaching 1% acre ~~~
19.8 1 12 29 31
I I / 4o / ------
Complete results of this analysis are available in mimeographed form. During the current year, the meteorologist seconded from the Canadian Mete-
orological Branch has been acting as chairman of an international working group of the World Meteorological Organization charged with the responsibility of sum- marizing the methods and techniques being used by those countries currently providing specialized fire-weather services. Information has been received from approximately forty countries or territories, about one-third of which provide some form of specialized fire-weather service. Most of the work of the group has been done by correspondence, although it was possible to arrange a meeting in Toronto with the Australian member of the group, Mr. J. W. Lillywhite, during October.
Lectures in fire weather were given at the Northern Interior Fire Control Course at Prince George, and to forestry students at the University of British Columbia. A popular article on the meteorological features of the 1958 fire season has been prepared for publication in the British magazine “ Weather.”
This year, in addition to his regular duties in the Vancouver Forest District, the weather-instrument checker was able to make a brief trip through the Prince George Forest District. He also spent several days in the Kamloops District setting up weather stations in connection with a sanitation burn and relaying observations

REPORT OF FOREST SERVICE, 1959 65
to the Vancouver public weather office, which provided special forecasts on the basis of these observations. Although burning conditions were anything but favor- able, the experience gained should be helpful in planning future operations of this type. Several days were also spent at the Forest Service Marine Station making individual calibrations of the fuel-moisture balance manufactured there this season.
FIRE-SUPPRESSION CREWS
Sixteen suppression crews, averaging ten men each, were again employed during the summer for approximately 100 days each. They attended 164 fires, of which 80 per cent were held to a size of 5 acres or less.
The crews at Castlegar and Alexis Creek proved extremely valuable in con- trolling numerous incendiary and unauthorized range fires in those areas.
Analysis of Suppression-crew Fire-fighting Activities
I I Subsequent Spread (by Number of Fires)
AIRCRAFT
Protection flying was continued under contract with Pacific Western Airlines Limited, who supplied six float-planes. A total of 2,469 flying-hours were logged throughout the Province during the period April 15th to November 15th under the contract, as follows :-
Forest District Base Type of Aeroplane Hours Flown
One helicopter, under a four months’ contract, was used for a total of 382 flying-hours. It was used in cargo-hauling, reconnaissance, ferrying, and fire patrol.
In addition to these machines under contract, limited use was made of both fixed-wing aircraft and helicopters on fire-suppression work. Two hundred and eighty-seven hours were logged on fixed-wing and 158 hours on helicopters in addition to the contracts.
Water bombing was carried out on only a few fires this year, as these specially fitted aircraft were not always available when they could have been used to ad- vantage. The water bombing that was done was effective because pilots are gaining in experience, and the Junkers and Avengers aircraft proved most suitable.
Helicopters were not used to water-bomb fires as no large types were available. 5

66 DEPARTMENT OF LANDS AND FORESTS
Sodium calcium borate was used in limited quantities only. A sanitation bum was carried out in the Kamloops District, using the borate, but the weather was not conducive to good burning, with the result that the experiment was only considered a limited success. It is proposed to continue experiments with borate and a substance called “ bentonite ” during the coming year. Both of these products have apparent merits, but the difficulties of mixing and applying will tend to limit their use in fire suppression.
ROADS AND TRAILS
The Service continued to maintain and add to the network of roads and trails throughout the Province, as shown in the table below:-
Construction of Protection Roads and Trails
Light Medium Heavy Total
Miles 72,0 / Miles / Miles Miles New road construction . ..-._ - . . . . ..-...................... - ..-. 87.0 I 55.5 1 214.5 Road maintenance . . . . ..-..___.-.. - .-..._.. -._--.- . . . .._. - _................. 816.0 1 508.0 j 105.5 1 1.429.5
Total road construction and ma!ntenance -.. .._ 888.0 ) 595.0 I 161.0 1 1,644.0
New trail construction . .._. ___- -.~_.- -_.- . . . ..____......... -..-. 94.5 ( 39.5 I 31.0 1 111.0 Trail maintenance ~_ ._.........-... -_ . . - - . . . . . . ~~~ 387.0 / 208.0 ! 71.5 1 666.5
Total trail construction and maintenance ~~~.~~.~~~ ...~~~ 481.5 / 247.5 I 108.5 837.5- I I
SLASH-DISPOSAL AND SNAG-FALLING
The summer of 1959 was marked by a ten-week strike in the logging industry, ending in early September. There was a heavier than average September rainfall, which meant that if slash-burning was not attempted by early September, it became almost impossible to obtain satisfactory results later.
In spite of these limiting conditions, many operators took advantage of every opportunity to burn early, with the result that the net total was surprisingly adequate.
Snag-falling has proceeded satisfactorily over the whole of the Vancouver Forest District since the elimination of the former “ exempt zones.”
For statistical data on slash-disposal and snag-falling in Vancouver District, see Tables 39 to 43, inclusive, in the Appendix.
In addition to the snag-falling done by the logging industry, Protection Division felled 3,355 acres of snags under contract in 1959, and provided funds for 2,033 acres felled by Reforestation Division snag-falling crews. In addition, Reforestation Division felled snags on 2,151 acres, including a 5 1 ‘I-acre area in Nelson Forest District, a 512-acre area in Manning Park, and a smaller area in Prince George Forest District.
FIRE-LAW ENFORCEMENT
Information was laid in a total of thirty-two cases. Two were withdrawn and thirty convictions with fines were obtained. This is far below the ten-year average of fifty-three convictions per season.
FOREST CLOSURES
No regional forest closures were imposed in any section of the Province during the 1959 fire season. Under section 162, subsection (3) of the Forest Act, the Horsefly-Guesnel Lake Road was closed on April 5th, 1959, and closure was lifted December 3rd, 1959.

REPORT OF FOREST SERVICE, 1959 67
FOREST BIOLOGY DIVISION*
ACCOMMODATION AND FACILITIES
Construction of a new field laboratory for use by the Forest Biology Division, Canada Department of Agriculture, and the Forestry Branch, Department. of Northern Affairs and National Resources, was started in December, 1959, at the Cowichan Lake Experiment Station. The building will contain seven private offices, a large laboratory, and basement storage and workshop areas.
FOREST-INSECT INVESTIGATIONS-l
FOREST-INSECT SURVEY
The outbreak of the one-year-cycle spruce budworm in the Lillooet and Fraser River valleys collapsed in 1959, after causing heavy defoliation annually since 1954. Tree recovery appeared to be good. Top-killing was evident, but no tree mortality was recorded.
The two-year-cycle budworm outbreak at Babine Lake was not mapped in 1959 as this was the first year of the cycle and, normally, defoliation is not heavy enough to be detected from the air. Early counts indicated that the larval popula- tion was as heavy as any recorded to date. Defoliation of the current year’s growth averaged about 75 per cent. There was a small increase in populations in the southern portion of the Prince George Forest District. Moderate to heavy popula- tions were present at Genevieve Lake, Willow River, Strathnaver, Manson Creek Road, Takla Lake, Tudyah Lake, and Silver Sands Creek.
The black-headed budworm on the Queen Charlotte Islands increased to heavy outbreak proportions in 1959. The heaviest defoliation occurred from Cumshewa Inlet south to Jedway. Some hemlock stands have not recovered from the previous black-headed budworm outbreak, which subsided in 1955. Control operations are planned for 1960 on three blocks of timber between Skidegate and Cumshewa Inlets, totalling about 31,000 acres.
The known range of the balsam woolly aphid increased in 1959. Groups of heavily attacked amabilis fir were observed at Dakota Creek, Rainy River, and Potlatch Creek, on the west side of Howe Sound. The insect was also found attack- ing grand fir in Thetis Lake Park and in Beacon Hill Park, Victoria. A total of 3,900 dead and dying trees was recorded in the Howe Sound, West and North Vancouver areas.
The Douglas fir beetle persisted in the Cariboo region at about the same level as in 1958. Elsewhere in the Province there was an apparent decline.
The mountain pine beetle continued to kill white, ponderosa, and lodgepole pine in parts of the Kamloops and Nelson Forest Districts. A new infestation on lodgepole pine was discovered along a new roadway in the Kettle River valley. between Damfino and Winnifred Creeks. The severe outbreak in lodgepole pine along the east shore of Babine Lake and eastward to Takla Lake continued to decline in intensity.
The Engelmann spruce beetle persisted at low levels throughout the sub-alpine forests of the Nelson and Kamloops Forest Districts.
A usually innocuous insect, the western cedar bark-beetle was very conspicuous in cedar stands of the Vancouver Forest District in 1959. Attacks were observed from Cultus Lake northward as far as Lund on the Mainland, on Texada Island,
* Research Branch, Canada Department of Agriculture. t Prepared by R. R. Lejeune, Forest Biology Laboratory, Victoria, B.C

68 DEPARTMENT OF LANDS AND FORESTS
and Southern Vancouver Island. Numerous dead trees and heavy top-kill resulted from the attacks.
Although no serious infestations developed in 1959, hemlock looper larva were present in Coastal hemlock stands as far north as the Bella Coola Valley. The looper increased in the Interior, but the population is still at a low level. Popu- lations in Stanley Park, Vancouver, were not heavy enough to cause tree mortality, but the esthetic value of the mature and overmature hemlock warranted control action to prevent possible top-kill. Aircraft sprayed about 550 acres of parkland with DDT on JuIy 23rd.
PROJECTS
The Douglas fir bark-beetle is the most serious insect pest of Douglas fir in the Interior of British Columbia. For several years, intensive studies of attack- patterns, flight behaviour, and factors regulating the insect’s population have been in progress in order to explain how and why infestations develop, and to gather information for developing control methods.
It has been demonstrated that four to eight beetle attacks per square foot of cambial surface produce the largest number of progeny per square foot. Below this density, percentage survival of progeny is higher, but total productivity lower. Above this density, both percentage survival and total productivity decrease. At attack densities of twelve to sixteen per square foot, the percentage of progeny surviving about equals the original parent population. Beyond that density, the population begins to decline. In the field, variable attack densities ranging as high as twenty-four per square foot are encountered. Under conditions of continuous logging in time and place, Douglas fir beetle infestations seldom develop. It is believed that beetles tend to remam in the logged areas, being attracted by the green slash, which they attack in densities high enough to prevent population increase.
Douglas fir beetles prefer to attack freshly felled trees. However, overflow populations drawn to this material may attack and kill near-by green trees. This characteristic of their behaviour was used in a co-operative pilot control project near Quesnel. In an area heavily infested with beetles, freshly felled “ attractor ” trees were placed in strategic accessible locations in the spring of 1959 before beetle attacks took place. Supplementary measures involved the removal of the beetle- infested trees and cull logs of 1958 and the peeling of stumps during the winter of 1958/59. When the 1959 attack flights took place, beetles were drawn to the “ attractor ” trees and to adjacent green trees. All the infested material was then removed and utilized to destroy the beetle broods. Comparison with a near-by untreated area indicated that the control measures reduced the loss from an esti- mated 4,000,OOO to 41,000 cubic feet.
Experiments were carried out in 1959 to determine if the spraying with insecti- cides of logs in the woods by helicopter could prevent attacks by ambrosia-beetles. This was a co-operative project between the British Columbia Loggers’ Association, British Columbia Forest Service, and Forest Biology Division. The results were not particularly encouraging, mainly because the spray did not reach the undersides of the logs, which is the area most susceptible to attack. Experiments conducted by the British Columbia Loggers’ Association using a helicopter to spray logs in booms were promising, and this technique may be used on an operational basis in 1960. Biological studies carried out in association with the helicopter spraying tests in the woods are expected to yield much more extensive information than hitherto avail- able on the over-wintering sites of the beetles.
Light infestations of Douglas fir by cone and seed insects were anticipated in 1959. This was because the heavy cone-crop of 1959, following a light seed year, was expected to dilute the insect population. As anticipated, infestation by the

REPORT OF FOREST SERVICE, 1959 69
Douglas fir cone-moth was very light, but infestation by the Douglas fir cone-midge was surprisingly heavy, comparing in intensity with the severe damage of 1958.
Studies were started on the biology of the poplar and willow borer, Sterno- chetus lap&hi (L.). The preferred hosts of this long-established, introduced pest are native willows and black cottonwoods but, in recent years, infestations of exotic poplar plantations in the Fraser Valley have been reported. This borer occurs throughout the Lower Mainland and Southern Interior.
FOREST-DISEASE INVESTIGATIONS*
Publications distributed during the year included the following:- Bloomberg, W. J.: Root formation of black cottonwood cuttings in relation
to region of parent shoot. For. Chron. 35 (1) : 13-17. 1959. Molnar, A. C., and Silver, G. T.: Build-up of PuZluluriu pullulans (deBary)
Berkhout within a severe spruce budworm infestation at Babine Lake, British Columbia. For. Chron. 35 (3) : 227-231. 1959.
Parker, A. K.: An unexplained decline in vigor of lodgepole pine. For. Chron. 35 (4): 298-303. 1959.
Ziller, W. G.: Studies of western tree rusts. IV, Uredinopsis hashiokai and and U. pteridis causing perennial needle rust of fir. Can. J. Bot. 37 (1) : 93-107. 1959.
Ziller, W. G.: Studies of western tree rusts. V, The rusts of hemlock and fir caused by Melampsoru epitea. Can. J. Bot. 37 (1) : 109-l 19. 1959.
In addition, six multigraphed reports were prepared for regional distribution. These reports referred to forest-disease sampling studies in Douglas fir plantations, observations of a condition of sun-scald in Douglas fir, methods of fungus and bacterial isolation from tree roots, a condition of die-back and canker on young Douglas fir following low-temperature injury, and the collection of forest fungi in the Victoria herbarium. Contributions to the bi-monthly progress report dealt with observations on pole blight and climate, the appraisal of nematodes in some forest and nursery soils, high-temperature damage to Douglas fir seedlings, and a study of canker disease in native and exotic poplar.
A co-operative study to prepare an ecological classification for white pine forests in the Interior region of British Columbia was continued. This study, spon- sored by the Forest Biology Division, was carried out under the direction of Dr. V. J. Krajina, Department of Biology and Botany, University of British Columbia.
FOREST-DISEASE SURVEY
Collections of forest-disease specimens submitted during 1959 by co-operators, Forest Biology Rangers, and other laboratory personnel totalled 2,419. Included in this number were eight fungi listed for the first time in the forest-disease herbarium and six fungi recognized as having a more extensive host range or geographical distribution than previously believed.
Needle-blight of pine, caused by Elytroderma deformans (Weir) Darker, con- tinued at a high Ievel of infection in yehow and lodgepole pine in the Kamloops, Clinton, and Merritt areas. Several new areas of moderate to severe infection were noted. Mortality of lower branches in heavily infected stands was common and small trees showed a marked decline in vigour. The incidence of Douglas fir needle- blight, caused by Rhabdocline pseudotswae Syd., continued at a high level in the East Kootenay region north of Cranbrook and was responsible for considerable depreciation of Christmas-tree stock.
* Prepared by R. E. Foster. Forest Biology Laboratory. Victoria, B.C.

70 DEPARTMENT OF LANDS AND FORESTS
Further observations were made of a condition of decline in vigour with attendant mortality in Douglas fir in Interior Wet Belt forests.
Damage resulting from the 1958 summer drought was reported from severa regions of the Province. Severe die-back was observed in western hemlock repro- duction on Vancouver Island. Die-back and top-kill of pole-sized and mature Douglas fir were observed on Lower Vancouver Island and near Lillooet, in lodge- pole pine near Prince George and Vanderhoof, in yellow pine near Clinton, and in western red cedar generally throughout the Interior Wet Belt region. HaiI injury was reported in the Prince George Forest District; in one local area, alder and aspen suffered 80 per cent defoliation.
Thirty-nine additional plantations, of exotic forest tree species were brought to the attention of the laboratory during the year, bringing the total number registered to 157. Infection centres of the root-rot fungus Armilluriu mellea (Vahl ex Fr.) QuCI. were recorded in plantations of European larch, Scats pine, and red pine on Vancouver Island. Yellow leaf-blister, caused by Taphrina populina Fr., was reported for the first time on two varieties of hybrid poplar.
DISEASES OF IMMATURE FORESTS
Damage from damping-off remained at endemic levels at the Cranbrook, Green Timbers, and Duncan nurseries. Late damping-off was moderately severe at Quin- sam, where up to 25 per cent of 1-O stock in some beds was damaged. Grey mould blight, caused by Botrytis cinerea Pers. ex Fr., resulted in slight damage within the more densely stocked beds of 2-O fir at Green Timbers and in losses of up to 14 per cent at Duncan.
Studies of the distribution of disease within DougIas fir plantations were con- tinued on Vancouver Island, with the total enumeration of a 15-year-old population of 3,670 trees on 4.32 acres near Buckley Bay. Conditions encountered, in descending order of their frequency of occurrence, were sun-scald, root-rot, frost lesions, and terminal leader injury. Approximately 25 per cent of the fir were infected with root-rot caused by Armillaria mellea. This latter condition is note- worthy in that it constitutes the most severely infected Douglas fir plantation yet to be encountered in sampling.
Studies of Poria root-rot of Douglas fir were postponed pending the return from educational leave of the research officer responsible for this phase of the laboratory programme.
Investigations of pole blight of western white pine were continued. Permanent plots in the Arrow Lakes region were remeasured and further evidence of partial recovery recorded. Bioclimatological studies were undertaken to assess the tem- perature and drought tolerance of pine and associated species, and a survey of the incidence and severity of pole blight in relation to an ecological site classification was continued.
Investigations of a canker disease in native and exotic Populus spp. were con- tinued. These studies, largely confined to the Lower Fraser Valley area, have demonstrated a correlation between susceptibility to this disease and moisture status of the host. Anatomical differences have been noted between certain species and hybrids that may serve to explain differences in water economy and thus differences in resistance.
DISEASES OF MATURE FORESTS
Preliminary analysis of data was carried out on two projects, field sampling of which was completed in 1958-deterioration of wind-damaged spruce and alpine fir (Prince George Forest District) and deterioration of killed Douglas fir (Kamloops

REPORT OF FOREST SERVICE, 1959 71
Forest District). During 1959, a study was initiated to assess the importance of logging scars in Douglas fir (Kamloops Forest District) as avenues of entrance for wood-destroying and wood-staining fungi. A preliminary analysis of data indicates considerable differences in the incidence of infection between different localities. Volumes of decay were negligible in scars of the oldest age sampled, namely, 8 years.

72 DEPARTMENT OF LANDS AND FORESTS

REPORT OF FOREST SERVICE, 1959 73
ACCOUNTING
FISCAL
This Division experienced another very active year during 1959. Unlike 1958, when the record fire season and depressed lumber-market prices curtailed woods operations, there were no forest closures in 1959 and lumber prices improved sub- stantially.
In spite of a strike lasting forty-nine working-days in the Coast forest industry, the total Provincial scale of forest products was greater by 15.2 per cent than that of 1958. As a result, total Forest Service charges against logging operations increased by 13.8 per cent, to a value of $27,464,756.19 and, of this total, direct Forest Service collections increased 7.8 per cent to $26,843,188.71. These were the third highest totals of these items on record, being exceeded only in 1956 and 1957. Detailed tables of these and other accounting items appear in the Appendix (Tables 28 to 36, inclusive). It is interesting to note that the Coast forest districts con- tributed materially to the increase in charges in spite of the loss in man-hours due to the strike.
Timber-sale stumpage, the largest single revenue class, was up 8.1 per cent to $23,092,737.28, with increases also being recorded in the related items of tirnber- sale rental and fees, and cruising and advertising charges. Timber royalty increased somewhat surprisingly by 9.9 per cent to $1,890,590.96, reversing a steady decline since 1955. Rentals and fees on timber licences, berths, and leases remained almost static, which was to be expected, as these tenures are no longer issued and are gradually dwindling as they become fully logged. Grazing permits and fees increased 18.3 per cent, to $86,506.29, due to an increase in fees, and the only decrease of consequence in any revenue class occurred in miscellaneous collections, which, at $121,287.96, totalled 8.7 per cent less than in 1958.
Tables of forest revenue and expenditure for the fiscal year 1958/59 are to be found in the Appendix (Tables 30, 33, and 34), and details of the latter will be found in the Public Accounts, published annually by the Department of Finance.
ADMINISTRATION
Some changes in staff took place in the Division during the year due to retirement, resignations, and transfer.
With the backlog of accounting for 1958 fire-suppression costs liquidated early in the year, activities in the Expenditure Section of the Headquarters Accounts Office returned to normal. By some revision of procedures and reorganization, it was possible to eliminate two positions in this Section, with casual help to be pro- vided should the fire situation in any year cause undue pressure.
The increased volume of revenue accounting kept the Revenue and Cashier’s Section and Timber Sales Records Section fully occupied. with the latter being affected by continued activity in sliding-scale stumpage adjustments due to the improvement in lumber-market prices.
Visits to the district offices for internal audit and procedure inspection by the Chief Accountant and Assistant Accountant were somewhat curtailed due to illness, but these will be resumed on schedule in the future.
In addition to the normal checking of mill records and collection of lumber prices, investigators from the Comptroller’s Office assisted the Forest Management

74 DEPARTMENT OF LANDS AND FORESTS
Division in special projects and also collected data for the Grazing Division as a basis for establishing grazing fees.
The improved conditions in the industry contributed to some easing in the collection picture, although continued “ tight ” financing made close surveillance essential. District office accounting sections continued to be hampered by staff turn- over and replacement problems, but reports to headquarters were maintained on a current basis.
Activity in log-salvage permits remained fairly constant, with the 279 active permits as at December 31st being only five more than at the end of 1958.

REPORT OF FOREST SERVICE, 1959 75
PERSONNEL
ORGANIZATION
A major change in Forest Service organization became effective on April lst, with the appointment of Mr. F. S. McKinnon as Chief Forester and the formal division of responsibilities between Deputy Minister and Chief Forester. Under this new organization, the Deputy Minister is responsible to the Minister for the over-all results of Forest Service activities. He is the liaison between the Minister and the Service. In addition, he is the chief liaison between the industry, the public, and the Service. The Chief Forester is responsible for the operation of the Service. The organization chart (see page 76) shows the new lines of district and divisional responsibility and the delegation of authority. One of the major changes is that the District Foresters are now responsible directly to the Chief Forester in all matters of general policy. This change in organization, together with numerous organizational and promotional transfers, resulted in a number of senior staff changes. All five forest districts changed District Foresters and two Assistant District Foresters as well. In Victoria, a change took place in the posi- tions of head of the Protection and Management Divisions. At the end of the year, postings were still continuing at the intermediate levels, resulting in the most complete reorganization of personnel since 1952.
A new Ranger district was created with headquarters at Chetwynd and another at Bella Coola by splitting the former Pouce Coupe and Ocean Falls Ranger Dis- tricts. Both of the new headquarters had previously been staffed on a full-time basis by Deputy Rangers. The Atlin District was vacated late in the fall and will be staffed for the summer months only until the work load requires a full-time Ranger.
At the Forest Service Marine Station, a Shipwright Foreman position was established, somewhat parallel to the Carpenter and Prefab Shop Foreman, to improve efficiency and allow more general supervision by the General Foreman in charge of the boat repairs and construction, woodworking, and maintenance branches of the station. In Victoria, all Forest Protection staff personnel files, records, and general administration were tuned over by the Protection Division to the Personnel Office at the end of the fire season. This completed the centralization of all per- sonnel records and general administration at the Personnel Office.
SERVICES
Records kept in the newly reclassified position of Personnel Assistant indicated that during the first six months of the year the incumbent conducted 419 interviews, of which 268 were with applicants for employment and 150 were for more general employment inquiries. During the same period, 231 letters of application were answered. Incoming telephone calls to the Personnel Assistant averaged fifteen per day.
It is gratifying to note that during the year no formal grievances were presented by the Government Employees’ Association. Employees and supervisory staff alike, at all levels, are to be congratulated on this fine record for settling problems at the first-line level.
The Personnel Othcer served on a committee, under the Chairman of the Civil Service Commission, studying various proposals for changes in the sick- and vaca- tion-leave regulations. Numerous Forest Service officers also took part in the vocation day programmes at high schools throughout the Province.

ASST
.CHt
, V-
c OP
ERA1
I 1
MIN
ISTE
R
OF
LAh
DEPU
TY
MIN
IS
CH
IEF
Fs
F FO
REST
ER
ONS
BRAN
CH
I 1
FORE
ST
COUN
SEL-
PERS
ONNE
L
PROT
ECTI
ON
- EN
GINE
ERIN
G *
MAN
AGEM
ENT-
RA
NGER
- GR
AZIN
G-
SERV
ICES
SC
HOOL
IS
AND
FOR
ES
TS
ER
OF
FORE
STS
REST
ER
ASST
. CH
IEF
k PL
ANNl
h
1 UiIJN
TfNB
~ PU
BLIC
IN
FORM
ATIO
N Aw
EDUC
ATIO
N
I I
I
‘ORE
STER
i
BRAN
CH
1 SU
RVEY
S *N
D -
RESE
ARCH
*
WOR
KING
-
REFO
REST
ATIO
N IN
VENT
ORY
PLAN
S
FORE
ST
D’IS
TRIC
TS
I I
I I
VANC
OUVE
R.
PR.R
UPER
T .
PR
GEOR
GE
. KA
MLOO
PS
. NE
LSON
.
Effe
ct/'v
e Ap
ril
I, 19
5.9.
1
FOR
ES
T S
ER
VIC
E
OR
GA
NIZ
ATI
ON

REPORT OF FOREST SERVICE. 1959 77
COMMUNICATIONS AND TRAINING
The only Ranger meeting of the year was held in the spring at Prince Rupert. Partly because of the complete change of District Foresters and partly for reasons of economy, no District Forester, Protection, Management, or Silviculture meetings were held during the year.
The Civil Service Commission called three interdepartmental meetings of per- sonnel Officers during the year. The meetings are intended primarily for instruction and discussion of new or amended policies. At one meeting the Personnel Officer was called on to present a paper on “ Morale in the Public Service.”
In the field of training, eight members of the Forest Service, representing foresters and protection officers in district administration, were selected for the fourth class of the Executive Development Training Plan sponsored by the Govern- ment through the University of British Columbia. The course this year was made available to staffs outside the Vancouver-Victoria area, with instruction to take place at Kamloops for one week in the fall and the spring, followed by two weeks at the University of British Columbia in May. Each of the northern and Interior districts were represented. A Forest Service engineer and a forester were among the first graduating class this year. Arrangements were made for two foresters to take part in a two-day Camp Management Training Conference sponsored by the British Columbia Loggers’ Association, and for the Forest Service representative on the Provincial Government Safety Committee to attend and report on the British Columbia Safety Council’s Fourth Annual Provincial Conference. Twenty-three forest officers attended a one-day training seminar in Human Relations, Com- munications, Leadership, and Accident Prevention sponsored at several centres throughout the Province by the British Columbia Safety Council and the Department of Extension of the University of British Columbia. The Vancouver and Kamloops Districts set up formal Safety and Accident Prevention Committees. Various in- service training programmes were continued, such as Lookout and Assistant Ranger schools, first-aid courses and field training courses organized by the districts and divisions concerned.
ESTABLISHMENT, RECRUITMENT AND STAFF TURNOVER
The permanent Civil Service establishment approved for the Forest Service by the Legislative Assembly for the fiscal year commencing April lst, 1959, was 832, an increase over the previous year of fifteen, but still twenty-eight less than the 1957 total of 860. The fifteen new positions were for Rangers-Grade 1, newly graduated from the Ranger School. Nevertheless, in view of the increasing costs of salaries and expenses, the total number of continuously employed staff (see Table 1 in Appendix) dropped by sixteen positions, notably in the engineering, survey, and marking crew categories. The number of seasonally employed personnel rose quite sharply, largely due to the employment of some 120 additional reforestation labour- ers engaged in cone collection and planting.
During 1959, 120 persons received Civil Service appointments and eighty-five left the permanent Service. One 25year service badge was earned. There were seven retirements during the year. Sixty-three transfers of permanent staff took place. Permanent-staff turnover for the year averaged 10.3 per cent, unchanged from the previous year. This year there were extreme differences between locations, however, ranging from 29.1 per cent at Prince George and 18.6 per cent at Van- couver to only 2.6 per cent at Nelson. Professional-staff turnover was 4 per cent, only one-third of the previous year, and the permanent technical-staff turnover remained steady at 3.1 per cent. The reason for leaving given most frequently by

78 DEPARTMENT OF LANDS AND FORESTS
the professional and technical groups was for better salary. Amongst the office staff, better salary was the reason given by 26.9 per cent, and personal reasons accounted for over 50 per cent. Clerical-, stenographic- and draughting-staff turn- over rose somewhat to an average of 22.8 per cent, with Prince George suffering an unprecedented 77.8 per cent turnover of its permanent office staff, followed by Vancouver with 34.2 per cent. Ten graduate foresters and seven engineers left tie Service, and fifteen foresters and ten engineers were hired, including eleven forestry graduates from the University of British Columbia.
Some 535 applications for employment, down 6 per cent from last year, were handled by correspondence in the Personnel Office alone, apart from many others handled through divisional and district o5ces. Written examinations were held for fifteen promotional positions, and oral examinations and panel interviews were em- ployed in filling sixteen other positions. The Personnel Officer and Assistant also participated in making selections for 103 other Civil Service positions.
At the annual spring examinations for Assistant Rangers, 272 candidates sat, of whom 129 passed. As there were only twenty-three vacancies for Assistant Rangers, there was no problem in securing qualified men.
There were no fatal accidents involving Forest Service employees in 1959.
CLASSIFICATIONS, SALARIES, AND WORKING CONDITIONS Changes were made in the Civil Service classification system affecting eight
groups of employees. The classification of Chief Forester was established and, due to resulting organizational changes and the elevation of the Reforestation Division to Forester 6 status, the position specifications were revised for all grades of forester above Grade 3. The specifications for various positions and grades were rewritten in line with current practice.
Numerous individual position classification reviews were carried out. Of the sixty-one which were submitted to the Civil Service Commission, fifty-one were approved, six rejected, and four were undecided at the end of the year.
Effective April lst, a general salary revision averaging an g-per-cent increase was granted. Some anomalies occurred affecting Marine Station tradesmen, Assistant Radio Superintendent, Ranger Supervisors, and the various Forest Agrologist categories. Adjustments were made to the Marine Station group, and agreement was reached for future amendment of the other groups, with the exception of Forest Agrologists, whose rates were still under discussion with the Civil Service Commission at the end of the year. Numerous cases of individual salary interpre- tation and adjustment were settled as they occurred.
There was an increasing concentration and activity on accident prevention following receipt of accident statistics from the Workmen’s Compensation Board. Recommendations were placed before the Civil Service Commission for changes in sick- and vacation-leave regulations, special living allowances in northern areas, and a policy of assisting with removal expenses on recruitment when qualified candidates are not available locally. The qualifications for Ranger School entrance were modified, with the addition of a Forest Service ,aeneral knowledge examination to supplement the mathematics test. A small experimental survey of employee attitudes regarding supervisory attributes was carried out in one Victoria division. Good use was made by Forest Service emplovees of the facilities provided through the Employee’s Occupational Health Office in Victoria for receiving inoculations and vaccinations against the common diseases likely to be contracted in field work. The policy was continued of restricting the employment or re-employment of persons over 65 years of age to a few cases individually approved by Order in Council.

REPORT OF FOREST SERVICE, 1959
PERSONNEL DIRECTORY, 1960
VICTORIA HEADQUARTERS
79
R.G.McKEE - - - - - - F. S. MCKINNON - - - - -
L. F. Swannell - - - - - J. S. Stokes - - - - -
Sfuff Division Heads:
Cooper, C. - - - - - Hicks, W. V. - - - - Monk, D. R. - - - - Williams, W. J. - - - -
Operations Branch Division Heads:
Forse, H. B. - - - - Greggor, R. D. - - - - Hughes, W. G. - - - - Pendray, W. C. - - - - Robinson, E. W. - - - -
Planning Branch Division Heads:
Pogue, H. M. - - - - Young, W. E. L. - - - - Silburn, G. - - - - - Spilsbury, R. H. - - - -
- - _ DEPUTY MINISTER OF FORESTS. - - _ - - - CHIEF FORESTER. Assistant Chief Forester i/c Operations Branch. - Assistant Chief Forester i/c Planning Branch.
_ - - _ - - Forest Counsel. _ - - - Department Comptroller. _ _ _ _ Director, Public Information. - - _ _ - - Personnel OtIicer.
- _ - Forester i/c Protection Division. - Forester i/c Engineering Services Division. _ _ Forester i/c Management Division. _ _ _ _ Director, Grazing Division. _ _ - Forester i/c Forest Ranger School.
_ _ Forester i/c Working Plans Division. - Forester i/c Surveys and Inventory Division. - _ Forester i/c Reforestation Division. _ _ _ Forester i/c Research Division.
FOREST DISTRICTS
VANCOWER DJSTRICT
I. T. CAMERON - - - - - - - - - - DISTRICT FORESTER. Boulton, L. B. B. - - - - - - - - Assistant District Forester.
Forest Rangers:
Carr, W. S. (Chilliwack); McDaniel, R. W. (Hope) ; Wilson, R. (Harrison Lake); Web- ster, J. B. (Mission); Mudge, M. H. (Port Moody); Henderson, J. E. (Squamish); Cham- berlin, L. C. (Sechelt); McKinnon, C. G. (Madeira Park); Hollinshead, S. B. (Powell River); Norbirg, H. (Lund); Gill, D. E. (Thurston Bay East); (vacant) (Thurston Bay West); Bertram, G. D. (Chatham Channel); Thomas, R. W. (Echo Bay); Howard, W. (Alert Bay) ; Sykes, S. J. (Port Hardy): Ormond, L. D. (Campbell River) ; Antonelli,
M. W. (Courtenay); Glassford, R. J. (Parksville); Haley, K. (Nanaimo); Bell, P. A. (Duncan): Lorentsen, L. H. (Ganges); Jones, R. W. (Langford) ; Morley, K. A. (Lake Cowichan); Brooks, F. T. (Alberni); McArthur, E. J. (Tofino); Carradice, J. H. (Pem- berton).
PRINCE RUPERT DISTRICT
J. R. JOHNSTON - - - - - - - - - - DISTRICT FORESTER. Lehrle, L. W. W. - - - - - - - - Assistant District Forester.
Forest Rangers:
Berard, R. K. (Ocean Falls); Crosby, D. K. (Queen Charlotte City); Brooks, R. L. (Prince Rupert); Lindstrom, W. C. (Terrace); Antonenko, J. (Kitwanga); Petty, A. P. (Hazelton); Mould, J. (Smithers); Clay, W. D. (Telkwa); Keefe, J. J. (Houston); Kullander, M. 0. (Pendleton Bay); Mastin, T. (Burns Lake); Hawkins, R. M. (Bella Coola); Pement, A. R. (Southbank) ; Morris, D. S. (Atlin).
PRINCE GEORGE DISTRICT A. H. DIXON - - - - - - _ _ _ _ _ DISTRICT FORESTER.
Bennett, C. E. - - - - - - - - - Assistant District Forester.

80 DEPARTMENT OF LANDS AND FORESTS
Forest Rangers:
French, C. L. (McBride); Rohn, K. (Penny); Meents, G. E. (Prince George); Pearce, F. (Prince George) ; Northrup, K. A. (Fort St. James) ; Kuiy, A. (Quesnel (S.) ); Barbour, H. T. (Pouce Coupe); Hamblin, R. A. (Aleza Lake); Graham, G. W. (Vanderhoof); Cosens, A. S. (Fort St. John); Baker, F. M. (Fort Fraser); Waller, T. (Summit Lake); Thornton, S. H. (Quesnel); Flynn, D. (Prince George) ; Anderson, 0. J. (Hixon); Mitchell, B. A. (QuesneI (E.) ): Angly, R. B. (QuesneI (N.) ); McQueen, L. (Chetwynd).
KAMLOOPS DISTRICT
w. c. PHILLIPS - - - - - - - - - - DISTRICT FORESTER. McRae, N. A. - - - - - - - Assistant District Forester.
Forest Rangers:
Specht, G. H. (Lumby); Williams, R. V. (Birch Island); Bailey, J. D. (Barriere); Hill. A. F. (Kamloops (S.) ); Paquette, 0. (Chase); Gibson, C. L. (Salmon Arm); Jones, G. G. (Sicamous); Cameron, A. G. (Lillooet); Johnson, M. A. (Vernon); Scott, E. L. (Pentic- ton); Dearing, I. H. (Princeton); Robertson, C. E. (Clinton); Cawston, J. B. (Williams Lake); Bodman, G. F. (Alexis Creek); Hewlett, H. C. (Kelowna); Noble, J. 0. (Ash- croft); Dewitt, D. 0. (Merritt); Monteith, M. E. (Blue River); Collins, B. G. (Enderby); Janning, H. A. W. (110 Mile (N.) ); Weinard, I. P. (Kamloops (N.) ); Wittner, D. J. (Horsefly); Hamilton, T. J. (100 Mile (S.)).
NELSON DISTRICT p. y-O”NG _ - - - - - - - - - _ DISTRICT FORESTER.
Bruce, J. B. - - - - - - - - - Assistant District Forester.
Forest Rangers:
Hopkins, H. V. (Invermere); Humphrey, J. L. (Fernie); (vacant) (Golden) ; Gierl, J. B. (Cranbrook (E.)); Ross, A. I. (Creston); Stilwell, L. E. (Kaslo); Benwell, W. G. (Lardeau); Robinson, R. E. (Nelson); Jupp, C. C. (New Denver); Raven, J. H. (Nakusp); Wood, H. R. (Castlegar) ; Reid, E. W. (Grand Forks) ; Uphill, W. T. (Kettle Valley) ; Cartwright, G. M. (Canal Flats); (vacant) (Arrowhead); Haggart, W. D. (Edgewood); Hesketh, F. G. (Elko); Reaney, R. J. (Spillimacheen); Bailey, J. F. (Cranbrook (W.)); Ivens, J. H. (Beaverdell) ; Webster, G. R. (Slocan City) ; Jackson, R. C. (Revelstoke).

APPENDIX

REPORT OF FOREST SERVICE, 1959 83
TABULATED DETAILED STATEMENTS TO SUPPLEMENT REPORT OF FOREST SERVICE
CONTENTS
GENERAL TABLE No. PAGE
1. Distribution of Personnel, 1959 . . .._.. ~~ .._.._.__ --------~-_._----__- .._........_..._. . . . . . . . . . . 85
REFORESTATION
3. Estimated Value of Production, Including Loading and Freight within the Province, 1950-59.-.- . . . . ~_~ _.......__ ----_----._~ _...___ - _.... -_~~ _.._ ~..~ . . . .._. ..-.-..._.- ~.. 87
4. Paper Production (in Tons), 1950-59 . . ..___ --------_-_..---.---~ _._........---..-..---.--.. 87 5. Water-borne Lumber Trade (in M B.M.), 1950-59-----_- _..._-_________________ 88 6. Total Amount of Timber Scaled in British Columbia during the Years
1958 and 1959: (A) in F.B.M., (B) in Cubic Feet---- _._.. -------- ..__._ -_-- _..... 89 7. Species Cut, All Products, 1959: (A) in F.B.M., (B) in Cubic Feet----_-.... 90 8. Total Scale of All Products, 1959 (Segregated by Land Status and For-
est Districts: (A) in F.B.M., (B) in Cubic Feet._--- __....._ --------__.--------- _..._ - 91 9. Timber Scaled in British Columbia in 1959 (by Months and Forest Dis-
tricts) .-~~---.---...~_.~~ ~~_~~~ . . . . . . . . . .._..... ~~~---.~~~~-~----~~-- _.... ------._---------- . . . . . . . .._ _... 92 10. Volume of Wood Removed under Relogging at Reduced Royalty and
Stumpage, 1950-59, in Thousand Cubic Feet . .._ ~..~~ . . ~~.~~~~~~~ .-....-.-._....- 93 11. Number of Acres Managed and Operated under Approved Working Plans,
1950-59 . ~~ .._ .~.. . . . . .._. ..~~~~~..... . . . . . .._ ---~-- . . .._-____ ._.~ -.-- ----- ._....... ----~...~~~~ .-..... 93 12. Total Scale of All Products from Managed Lands, 1950-59.._-- _........._. ~~.. 93 13. Logging Inspections, 1959 . . . .._..... ~~...--~- . ~~_----------_.-~~----~~ _..____._ -- _..._........ ~~_ 94 14. Trespasses, 1959 -----~ ._.....__._.._ -~------_.--.------~- . . . -___-- _.__ ----__-~~_--- ._............... ~~. 95 15. Areas Examined by the Forest Service for Miscellaneous Purposes of the
Land Act, 1959.. . . . . . . . .._............... ~~ ._._.... . .._. --- . . .._.._ ---- . . .._._.........._ ------~~~.----- 96 16. Classification of Areas Examined by the Forest Service, 1959---~~~..~-----.~... 96 17. Areas Cruised for Timber Sales, 1959 . . .._ ~.._-~~~~-- .._. - . ..__.... -- _......___......._. --... 96 18. Timber-sale Record, 1959 . . . .._.........._ ----~~~--.------.--~-.-...---- _- _____..____.__...__._____ 97 19. Timber Sales Awarded by Forest Districts, 1959.-~.--------.~ ..__.... ~._- _........ -.~~. 98 20. Average Stumpage Prices as Bid, by Species and Forest Districts, on
Saw-timber Sold on Timber Sales in 1959, per C C.F. Log-scale . . . . . . . . . . . . . . . 99 2 1. Average Appraised Stumpage Prices, by Species and Forest Districts, on
Saw-timber on Tree-farm Licence Cutting Permits Issued in 1959.....~~....... 100 22. Timber Cut from Timber Sales, 1959 .~~-~~~~-~.~----~~.~~ . ~~ .___....._._______....~~... 101 23. Saw and Shingle Mills, 1959 ..~~~ 102 24. Export of Logs (in F.B.M.), 1959~~~--- .._...._ -- __......_ -..~ . . . . . .~~~ . . ._.... ~~~ . .._. ~~. 102 25. Shipments of Poles, Piling, Mine-props, Fence-posts, Railway-ties, etc.,
1959---.---~..--- . . . -- . . . --...-~.~~ ._.. _........_....._.. ~.~ _..._......_..__....____________________-.~~~~.. 103 26. Summary of Exports, Minor Products, 1959 . . . . . . ..__..........________________ ~~ . .._.... 103 27. Timber Marks Issued, 1950-59 . . .._._......_.________________________ . ~~~ . .._.. ~~~ . ..- ~~.. 104
FOREST FINANCE
28. Crown-granted Timber Lands Paying Forest-protection Tax as Compiled from Taxation Records, 1950-59---- ._........_. -- _________..._______ . . . . . . . . . . . . . ~~~~~.-~... 104

84 DEPARTMENT OF LANDS AND FORESTS
TABLENO. PAGE
29. Acreage of Timber Land by Assessment Districts.--- . . . ~~----~~ . . . . . . . ~~~~ _._._..._ - 104 30. Forest Revenue...~...... . . .._.......___..__... ~.--- _..__ ----__-- _... --__----.-_~~.~ . . . . . ..__ --~~..~~~ . .._ 105 3 1. Amounts Charged against Logging Operations, 1959~~-.----------~~~~-~~--.----.--~. 106 32. Amounts Charged against Logging Operations, Fiscal Year 1958/59~~~~..-- 107 33. Forest Revenue: (A) Fiscal Year 1958/59, (B) Fiscal Years 1949/50 to
1958/59X . . .._ ------------- .._.... ~.~~-~ . . . . . . . . . . . .._ ~- . -------~~~~~~~~~---~-~~~~~~.--..~-~.--.-~~~~~~-~ 108 34. Forest Service Expenditures, Fiscal Year 1958/59---.-~--~~~~~.~..--~~.~~~.......~.~.~ 109 35. Scaling Fund.--------~---~~-..~-~.-----~..~...--..~~~~~----------~~---.-~~-.~.~-~~------~~-.~-~----~~~..~~-- 109 36. Grazing Range Improvement Fund ~~ .._..---.-~.--~-~~~.~~-~~~~~~~_~.----....-_~.-----------~ 109
FOREST PROTECTION
37. Forest-protection Expenditure for Twelve Months Ended March 31st, 1959, by the Forest Servk..~.._~~ . . . . . . . . . . ~~~~~-~~..~~~~~-.~~.-~~~----~~~~~. --~~~~ . . . . 110
38. Reported Approximate Expenditure in Forest Protection by Other Agencies, 1959_.-------- _... --__-_---- ._.._._._. --..~-----..---~_.~---------~.-~~-~~~ . . ~~~ . . . . . . . . ..__ 111
39. Summary of Snag-falling, 1959, Vancouver Forest District--- . ~~~ . . . . . . . . . .._ - 111 40. Summary of Logging Slash Created, 1959, Vancouver Forest District~~..~~.. 111 41. Acreage Analysis of Slash-disposal Required, 1959, Vancouver Forest
District --.~~----..~~--~~~~---.~~~~~~~.~~--~........~..~.~~~-----.~-~~~---------~~.-~~~~-~--~~~~-~~~~~------~~~~ 112 42. Analysis of Progress in Slash-disposal, 1959, Vancouver Forest District...- 112 43. Summary of Slash-burn Damage and Costs, 1959, Vancouver Forest
District~~--~~----~.~~-.~~~----.~-~~~-.~~---~.~- . . .._ -.~~_~~~.~~.-~~~~~~----~~--~~..-. ~~~~~~...~.--.~~ ~~~~~ 113 44. Fire Occurrences by Months, 1959--..~_~~..~~~ . . ~.-~~ . . . . ~.~..--~~~~.---~.--- . ~~.~~~.. 113 45. Number and Causes of Forest Fires, 1959 . . ~~~~~~.~ . ~~~ _----------_---~ . . . . . . -~ 113 46. Number and Causes of Forest Fires for the Last Ten Years~~~~--- . . . . .._..- ~.. 114 47. Fires Classified by Size and Damage, 1959~~~.-~-..~.~~~--~~-.~.~~~-~~~----~...~~~~~~~~.~~~ 115 48. Damage to Property Other than Forests, 1959~--.-~~.. ~~~._~------------~~~-------~..-- 116 49. Damage to Forest-cover Caused by Forest Fires, 1959-Parts I and II
--~... 116, 117 50. Fire Causes, Area Burned, Forest Service Cost, and Total Damage, 1959 118 51. Comparison of Damage Caused by Forest Fires in Last Ten Years........~~~. 119 52. Fires Classified by Forest District, Place of Origin, and Cost per Fire of
Fire-fighting, 1959 ~~~..~~~~-...~~---~~~~.-~~-..-_~~..~~ . . . . . . . -~~~~~~..~~~.~--__---_.~ ._... --~ . . ~~~ 119 53. Prosecutions, 1959 ~~.-~..~~~~~~---- ~--..-..~~.-~-.~~~-~._--~ ~~ . . . . . . . . . -~~- _..... ~~---.--.~ 120
RANGERSCHOOL
54. Enrolment at Ranger School, 1959.~~..~---~--~.-~....~~..~~~~..-~-~---------~~~~-----.-.--.-.. 121
PUBLIC INFORMATIONANDEDUCATION
55. Motion-picture Library, 1 95O-59..~~-...-.~~-.-~-.~~-~~~-.-------.-~.-------~-~~-~~-----------~~ 122 56. Summary of Coverage by School Lectures, 195O-59.~~~~.~~~~~~~~....~-------------.~ 123 57. Forest Service Library, 195O-59~~~----..~----~.-~..~~~--~---~---~.~-- . . . . . . . . . .._ ~.~~~~ _.._.._.. 124
GRAZING 58. Grazing Permits Issued ~~------- _... ~-~---..-~------------~-.~ . . --~~--..~...~~ . . . . .._.......... ~~.~~ 124 59. Grazing Fees Billed and Collected.-----..~--.--------~.~.~~~---~~~--..~~ . . . . ~~..~ . . . . . .._.. 124
FOREST SURVEYS ANDINVENTORY
60. Area Classification by Ownership~~-.--.~--~~-...---- ._.. ------...~ _..___................~~~~ ~.~. 125 61. Sound-wood Volume in Commercial Forests of All Ages by Ownership
and Species~~-.--~~~.--~~.~-------~-~---.~~~---~~~-~-..----------.~~~~- . . ..__.._.._ . . . . . . . . . . . . . . . . . ~~~~ ._.. 126

REPORT OF FOREST SERVICE, 1959
(1) DISTRIBUTION OF PERSONNEL, 1959
85
XI
I T I
1
=
, -
= I i
Van- :ouwr
Prince Rupert
Prince George
Ka”l- loops
-_
2 13 5
--
: 31
3
3
4
14
5 31
44 17
50
\lelson
4
8
3 22
42 8
23 3 -...._
----- . . . . . . -...... -.-A- 2
226 163
Vic- toria Total
4 4 8 8 2 2 3 3
Personnel
Continuously Employed
Deputy Minister, Chief Forester, and Ass&tan1 Chief Foresters...~..-~ ~~-...~~ -............ - . . . . . . . .
Division Foresters~~-~ ~.- . .._ ~~~~..~ -_.... ~~.-...~~.~. Directors of Grazing and Public Information--~.. Forest Counsel and Personnei Officers ~~._~~....~~~~.. District Foresters and Assistant District For-
esters -~~~~~~~ ~~~.~~~~~~~~ . . . . . . . . . . Foresters and Foresters-in-Training . ..~~~~.......-.~ Agrologists and Agrologists-in-Training~.~~....~.~.-. Eneineers and Eneineers-in-Trainine ~~~....~~~~~~~ Forest Protectionbfficers.. .. -..-.-- . ..I.. ........ .......... Supervisors of Rangers ..~~...~~~~~_ ............................
10 135
11 26 12
1:; 21 16 41
7 85
52 78
4 50
32X
6 42 27
179 60
186 16 16 26
2 11
1
2 9
2 11 82
3 26
3 3 2 3 2
32 18 11 2 74 2 38 ..~
41 2
1 3
26 3
Rangers-Grades 1 and 2 ~~~ . . . . .._............................. Swerintendent of Scaline and Assistants........-~~.
Comptroller, Accountant, and Audit Assistants Eneineerine. Mechanical and Radio ..- . . . . ~~~.-.~~ 6: /
I :$ (
27 I 114 I
I 6 I
38 I 3 I I
4
6 1
Teghnical Forest and Public Information As- sistants ..-..-.-..-..- __.._.. -_-- _...._......
Reforestation, Research, and Survey Assistants Nursery Superintendents -._..~ _...................... Draughtsmen and Mapping Assistants ~~~~
7
6 103
5 29
T I j I
I- T -
Clerks, Stenographers; and Messengers ~~~~~ ~. .~~~ Suoerintendent and Foremen. Forest Service
Marine Station.. ... ---...~.~~~~~...y ........................... Mechanics, Carpenters, and Technicians .......... Launch Crewmen~- _ ... --. ... ~~~~..~~..~~_~~ ..................... Assistant and Acting Rangers---. ......... - ........ ~~-~ Dispatchers .......................... ..__ ...... -- _._ ......... Cru:sers, Compassmen, and Silviculture Crew-
men ......... ..- ...... ~~~~-. ............ ..- ........... -. ............. Truck, Tractor, and Equipment Operators ......... Foremen .......... ~~~- .......... -..~~ .................................. Miscellaneous .............. ...... ..___ _ -~.--..- ._ .......
Totals, continuous personnel ..............
Seasonally Employed
Assistant and Acting Rangers ~.~_~. ....................... Patrolmen ---......-.- .... -..- ..- - .......... -.-..-..~ ..
4 18 31 17
22
6 26
8
33 1
2
155
6 4
22 3
30 10
58 4 1 1
200
8 15 20
527
1
389
19
36 8
58
T L I
I
- 1,660
36 25
155 39
144 370
48
121 _....
37 141
1,116
2,776
s
--_ 6 6
120 346
14 41
:;
4
5 10
118 281
Lookoutme” ..--.... -.-.... --_.---_-- Disuatchers. Radio Ouerators. and Clerks ..~.~.~~~ Fird-s”ppre&o” Crewmen :.---.-~~...~~ ..~... Reforestation-Snag-fallers, Planters, etc...-~....... Cruisers and Compassma-.-mm ~~~ ..~ ~.~.-~~.~~~.. Truck, Tractor, and Equipment Operators .~~~~~ Student and Survey Assistants and Eng’neer-
ing Aides ..~...~ . . . .._.... - ~~~..~~ .__.......... . . . . Silvicultural Crewmen ~~~~~~~... .._._.... ~.~~~ Foremen . . . . . . . .._..... ~~- . . ~~- ~~~ . Miscellaneous ..~ . . . . . . . . . . . . ..____...._........ ~~~
Totals, seasonal personnel ~..~~~...~~ Total, all personnel . . . . . . . . . . ~~~ . .._.. . . . .
9
370
31
121
4 4
8 11
144
533
1 8
48 203
2 10 44
244
15 96
642
1,169
I T T L
- -
-

f2J
SUM
MAR
Y OF
PL
ANTI
NG,
1950
-59
Priva
te
Com
panie
s Pr
ivate
Pl
antin
gs
and
Farm
W
ood-
lots
Fore
st
Serv
ice
on
Crow
n La
nd
Tree
s in
rhou
sand
s Ac
res
Tree
s in
Thou
sand
s
R12.
2 1,
447.
0 6,
150.
7 86
1.8
1,05
1.o
7,02
0.4
294.
0 43
5.0
2.99
2.5
954.
3 1,
682.
0 1,
428.
7 2,
174.
6 3,
410.
o 4.
623.
4 5.
679.
0 7,
135.
0 3,
302.
O
2,37
7.0
2,86
0.O
2,
740.
l 4.
228.
4 4,
865.
0 1.
664.
2 5,
733.
9 6.
070.
0 1.
808.
0 6,
261.
6 6.
670.
0 55
3.1
56,7
63.5
70
,270
.O
9.56
3.3
86.1
40.3
10
5,89
5.O
41,8
46.4
765.
9 47
1.4
137.
9 19
2.1
215.
8 59
0.9
282.
3 16
7.2 0.2
1.29
3.0
76.8
59
2.0
70.7
17
9.0
88.8
25
9.0
121.
4 28
8.0
81.0
1,
007.
o 94
.0
284.
0 35
.0
292.
0 2.
0
--g82
3.7
88,9
64.0
1,57
8.1
__
- 4,
194.
0
110,
089.
O
2,77
0.O
569.
7
42,4
16.l
6,22
7,s
Expe
rimen
tal
Tota
l
Year
- t
Acre
s Ac
res
14,7
66.0
’ 13
,568
.0
7,43
0.o
3,53
6.0
7,07
6.O
5.
024.
0 3.
808.
0 2,
065.
O
2,23
5.0
680.
0 11
,916
.3
72,1
04.3
100.
0 11
1.0
114.
0 19
2.0
105.
0 10
9.0
47.0
Tree
s in
rhow
ands
Ac
res
Tree
s in
rhou
sand
s 44.3
65
.0
24.6
20
.0
11.7
13
.0
30.6
29
.0
10.0
15
.0
27.5
30
.0
28.5
33
.0
8.1
5.0
12.0
20
.0
728.
7
926.
0 L i
636.
7
866.
7
Tree
s in
IIous
ands
100.
0 38
.0
8.0
1.2
40.0
59
.5
25.0
13
7.4
110.
0 52
.0
309.
0
880.
1
Tree
s in
Thou
sand
s
281.
5 64
.5
20.4
58
.7
62.2
73
.7
21.0
40
.9
31.2
20
.9
158.
1 --.
-~
- 83
3.1 9.2
2.4
16.6
16
.3
12.2
7.
2 10
.4
3.1
1.2
0.1
78.7
911.
8
290.
7
Acre
s 177.
0 60
.0
10.0
2.
0 15
.0
36.0
31
.0
210.
0 13
0.0
50.0
32
2.0
1.04
3.0
-.-
_~..~
30.0
_~
~ . . . .
. . .._
_.
._. ~
..~ ._.._
. . .
~.~
. . .
.
. .
. . . . .
. _~
._.._
._..
30.0
1,07
3.o
177.
0
Acre
s 715.
0 69
.0
30.0
90
.0
80.0
72
.0
6.0
15.0
25
.0
137.
0 ~.
1,23
9.0 12.0
2.
4 17
.0
10.0
10
.0
9.0
17.0
4.
0 1.0
82.4
1,32
1.4
727.
0
17,1
70.o
14
,768
.O
7,91
8.O
5,
339.
0 10
.596
.0
12,2
97.0
6,
738.
0 7,
160.
O
8,48
0.O
7.
400.
0 83
.282
.0
-~
181,
148.
0
1,43
7.2
710.
8 38
2.0
507.
0 40
5.0
1,13
3.0
350.
0 33
4.0
79.0
30
.0
5,36
8.0
186,
516.
O
1860
7.2
7,38
8.7
8.00
9.3
3,32
6.b
2,47
3.5
6,91
0.2
9.14
1.7
5,19
1.6
6.07
9.0
7,69
5.l
6,88
7.6
67.5
22.6
130,
625.
9
862.
0 54
8.3
294.
4 36
4.5
310.
5 69
7.7
329.
7 19
9.3
58.4
21
.3
3,69
2.l
134,
318.
0
8,25
0.7
I -i I I L
/
10.1
3.
8 31
.1
34.7
::2
2.0
27.0
56
.5
27.2
199.
5
1.12
5.5
32.2
5.
4 42
.0
46.0
2.
0 8.
0
3:::
78.0
30
.0
283.
7
1.15
0.4
20.0
0.5
Tota
ls to
da
te
All
plante
d to
da
te
.~
All
plante
d th
is ye
ar
~~~.
~.~.
--_ 77
8.0
72,8
82.3
14,8
66.0
20.5
900.
6
100.
0 54
.4
I 97
.2
1 Th
e Fo
rest
Se
rvice
pla
nted
l,S7S
,OO
O
trees
on
3,
016
acre
s of
pr
ivate
lan
ds
unde
r re
fore
statio
n ag
reem
ents
(For
est A
rt,
secti
on
166)
.

(3)
ESTI
MAT
ED
VALU
E OF
PR
ODUC
TION
, IN
CLUD
ING
LOAD
ING
AND
FREI
GHT
WIT
HIN
THE
PROV
INCE
, 19
50-5
9 _,
-_
_I-
Prod
uct
1 19
50
1 19
Sl
/ 19
52
) 19
53
1 19
54
) 19
55
) 19
56
) 19
57
1 19
58
) 19
59
) $5;
Lu
mbe
r .
. .
~~..
. ..~
$303
,384,3
04
$278
.904.2
66
$280
,006,4
90
$279
,979,5
07
$270
,109,9
48
$348
.264.1
90
$328
,262,7
72
$275
,373,7
64
$225
,626,8
61
$291
,5O
O,O
OO
$2
88,14
1,210
Pu
lp an
d pa
per
.._.._
......
. . .
. .._
_ 78
.739
.573
13
5,16
7,76
1 12
9238
,520
135,
871,
797
156,
178,
180
166,
902,
992
176.
295.
267
177.4
3111
3 19
4750
,417
234,
529,
OO
O
158,
110,
502
Shing
les
~~~.
.._
_....
. .
. .._
37.5
02.9
58
32.5
37.4
42
23,8
78,8
80
26,7
00,1
53
28.0
77.4
16
29.4
88,7
30
24,4
07,8
17
18,4
21.9
52
19,5
46,4
49
19,7
69,O
OO
26
,033
,080
Bo
xes
_....
......
_....
...
.~~
.._.
3,83
7,06
7 4,
062,
133
2,36
7,45
0 1,
810,
376
1.48
1.05
1 1,
374,
984
647,1
12
1.08
9.40
0 85
4,922
1,
822,
850
Plyw
ood
..~ ~
~~.
._...
._..
26.2
50.0
00
704,0
00
34,5
00,O
Oa
36.5
72.0
00
45,2
40,o
OO
53
JmO.
000
68,0
00,0
00
80,0
00,O
OO
71
,845
,OO
O
90,0
00,0
00
Piles
, po
les,
and
mine
-timbe
r 75
,500
,OO
o 5,
127,
681
58,0
90,7
00
5.80
5.74
5 9,
540.
340
8,64
6,61
1 5,
087,
052
6,28
3,90
9 9,
301,
902
12,8
34,1
52
5.68
6,59
.2
Cord
wood
, fe
nce-
posts
. an
d 4,
854,
OO
O
7,31
6,79
8
laggin
g .._
.._...
. ._
....
2.18
9.24
9 2,
349,
720
2,67
5,87
0 2,
581,
806
2,28
2,99
6 1,
447,
950
1,39
1,96
0 91
9,538
76
S.27
0 Ti
es,
railw
ay
~~~~
~~~~
.. 66
9,000
1.
727.
336
.._
281,3
08
633,0
89
963.2
00
669,0
07
445,7
77
306,6
25
615,4
91
1,06
8,28
0 29
6,919
Ad
dition
al va
lue
cont
ribut
ed
202,0
00
548,1
70
by
the
wood
-usin
g ind
ustry
2.
250.
000
2,81
2,50
0 2,
530,
OO
O
2,53
0.O
OO
2,
530,
OO
O
2,53
0,O
OO
2,
750,
OO
O
Lath
s an
d ot
her
misc
ellan
e-
2,50
0,O
OO
2,
200,
OO
O
2,70
0,O
OO
2.
533.
250
ous
prod
ucts
..~ . . .
. . .._
......
_....
.. 1,
723,
616
1.99
4.34
0 2,
164,
660
2,68
8.00
7 1.
845,
901
1,59
5,90
0 1,
306,
988
Logs
ex
porte
d ~.
.~
~..~
.~~ ._
......
.. 98
6,082
1,
226,
OO
O
5,74
1,78
4 4.
981.
597
5,40
1,41
0 75
7,058
1.
628.
855
4,51
4,77
7 5,
918,
306
4,41
3,50
8 2,
342,
700
Pulpw
ood
. . .
. 1,
343,
090
474,5
20
1,24
3,O
OO
3.
637.
469
expo
rted
.~
741,1
28
99,37
5 23
6,900
37
,296
85,71
6 48
0 . .
. . . .
.~~.
~....
~~...
. _.._
......
._...
_....
_...
__.._
____
.._
......
......
_.._
...
Woo
d-ch
ips
expo
rted
. . . . .
._._
. 12
0,089
_._
____
__
__
. . . . .
. . -9
39,3
90
.~...
.~...
912,
760
. . . . .
. . . .
. . 9a~
. . . . .
. . ~-
968,
047
. . . . .
. . .
.- . .
. . . -.
_--
Chris
tmas
6,
87S,
OO
O
4,85
4,23
2 3,
126,
OO
O
trees
__
....._
-_
58
3,549
1,
485,
523
1,08
5,04
5 1,
258,
443
1,68
9,O
OO
Ca
scar
a ba
rk
-...~
. . . .
. . .
1,12
6,91
8 96
4,985
1,
052,
724
.~_
18,92
5 20
,572
18,13
0 20
,160
12,39
3 5,
249
6,51
1 14
,880
9,20
2 4.
m
13,O
m
__-
Tota
ls .._
._...
_....
..-
$468
,371,1
42
$504
,807,9
30
$496
,506,5
50
~-
---
$512
,288,6
56
$528
,022,7
83
$631
,699,5
62
$628
,586,9
63
$571
,829,5
69
$542
,787,4
27
$637
,715
,OO
O
$552
,261
,55&
l
(4)
PAPE
R PR
ODUC
TION
(IN
TO
NS),
1950
-59
Prod
uct
1 19
50
1 19
51
/ 19
52
1 19
53
1 19
54
1 19
55
( 19
56
( 19
57
( 19
58
1 19
59
( gg
News
. .
.-._.
..__.
.__.
__ -_
__---
O
ther
pa
pers
~...
..__ -
..__.
____
__ -_
--
In
addit
ion
to
1,01
6,O
O9
tons
of
pu
lp m
anuf
actu
red
into
pape
r in
the
Prov
ince,
86
7,790
to
ns
were
sh
ipped
ou
t of
th
e Pr
ovinc
e du
ring
the
year
.

(5)
WAT
ER-B
ORNE
LU
MBE
R TR
ADE
(IN
M B.
M.),
1950
-59
Desti
natio
n 19
50
1951
19
52
- - .- -
1953
19
54
195s
19
56
-__ 19
57
Easte
rn Ca
nada
..I_
.____
..___
_~__
__
Austr
alia..
.- .._
.-_.._
......_
____
..-.
New
Zeala
nd
..~....
.__.__
.__.__
..__ -
South
Am
erica
-..--.
.- . . .
. . . . ..
_ Ch
ina,
Hong
Ko
ng,
and
For-
Unite
d Ki
ngdo
m
and
Conti
- ne
nt ~~
~..~
~~.~
.~~~
~~
~ ~~~
Afric
a ~_
..~ ._...
...._
....._
......
......
......
In
dia.-.
~..-
__...
......
...._
......
.. .._
.....
Unite
d St
ates
.._...
._...
._...
.__.
......
Ph
ilippin
e an
d Ha
waiian
Is-
lan
ds
..~~
. . . .
. . .
. .
. . .
Wes
t Ind
ies
. . .._.
....__
_..__
___
~.._
So
uth
Sea
Islan
ds
_.._
.... -
._~ _
....
Mexic
o an
d Ce
ntral
Amer
ica
Egyp
t, Ar
abia,
an
d Isr
ael
._._
Belgi
um
.-....
......
......
......
.....-
.. Fr
ance
..--..
- . . .
. .
- . . . .
. . ..__
.____
_._
Germ
any
.._.._
-_-
_.._
...._
....._
..,
Hollan
d.-
.__. -
__... -
__..
.._.._
....__
__
Italy
_ . . ..
_..._
- . . .
. ..___
. - _
._._
.._.._
. Fo
reign
, un
class
ified
. . .._
...
Belgi
um
and
Hollan
d .
.._.._
De
nmar
k, No
rway
, an
d Sw
e-
deny
. .
. .
. . . .
. . .
. . .
Tota
ls.-..
- _..
.._..._
___
I -
-.....
......
. _ .
. ~~~
~~
. . . .
90,93
6 93
,566
8,823
13
,311
2.221
2,0
67
36,06
0 7,8
39
2,164
7,087
21
,382
7,915
86
10
1 82
243,6
32
763.2
67
772.5
27
89,15
2 94
.412
52,34
4 2,6
21
7,396
1,0
29
736.8
31
71,31
6 22
9,809
13,11
2 8,6
54
7,751
89
7,634
8.9
58
11.35
3 9,6
69
9,917
76
2 22
,426
(1)
1,672
29
1 (‘1
1,2
21
13,33
5 7,7
20
9,558
3,4
04
8,538
46
3 49
8 2,3
90
1,172
73
1,217
63
7 10
,107
.~...
_.~ .
1,917
54
9 20
,423
_...-
._- 71
4 1,1
07
227
1.251
.196
1.146
.291
1,148
,053
1958
19
59
6,708
5,6
70
3.037
4,9
17
2,102
5,4
82
10,48
1 89
,658
115,4
64
137,3
08
99,82
9 87
,213
98,80
8 80
,115
6,036
13
,465
12,58
8 14
,097
11,03
0 8,3
97
5,212
3,9
24
648
5,756
16
,541
25,50
3 8,8
16
10,17
8
9,206
3,5
99
1,909
1.2
75
1,256
23
,742
8,216
10
,725
S.85
2 3,7
13
597
999
509
7,614
502,8
14
697,2
98
611,4
51
320,2
93
123,0
64
145,3
08
188,5
67
145,1
32
16,69
5 4,3
97
1,745
41
6 54
2,472
50
9,661
34
5,694
28
3,834
385,2
37
337,9
59
267,3
63
181,5
60
139,5
23
94,59
8 46
8 3,3
12
27,58
1 27
5,452
60
2,427
59
5,170
7,571
4,9
98
12,71
5 13
.183
7,668
3,1
66
12,23
5 12
,062
10,51
6 11
,599
12,08
5 13
,492
8,563
8,4
02
16,14
0 15
,339
8,147
11
,841
269
29,19
2 33
,788
41,93
7 49
,885
51,84
2 2,1
91
2,368
1,3
20
1,394
5,7
66
213
8,951
4,9
77
3,121
2,6
28
s,o9
5 10
,790
1,382
2,9
50
2,845
3,1
91
4,110
3,2
65
103
15
732
177
169
22
4.524
4,1
23
4,042
3,8
02
3,952
6,0
91
1,084
2,2
84
4,349
3,0
07
6,530
4,5
60
20,21
7 4,6
74
3.603
1,2
21
2,363
2,6
81
2,133
8,4
78
8,068
62
,826
1,340
4,0
80
3,184
4,569
2,8
05
1,333
_.
247
--__ 1,3
91,66
4
175
1,579
,946
-...
- . . . .
. -
109
1,412
,060
_ . . .._
-- _.
.. 98
9,664
-....
-- . . .
.
14
1.078
.918
18
16
1,314
,361
1,197
,653
- - -
3,840
92
,896
10,08
0 7,7
82
5,473
6,1
13
490,1
84
125,3
66
6,572
41
9,267
8,546
11
0,219
10
,271
27,10
5 4,5
15
5,099
2,3
77
158
3,384
2,7
03
7,996
77
2
263
1,250
,980
1 Be
lgium
an
d Ho
lland
comb
ined
in 19
51.

REPORT OF FOREST SERVICE, 1959 89
TOTAL AMOUNT OF TIMBER SCALED IN BRITISH COLUMBIA DURING YEARS 1958 AND 1959 IN F.B.M.
(6‘4) (All products converted to f.b.m.)
Forest District I
1958 I
1959 I
Gain
Vancouver.--. ......... .. - ..- .............. ..... ~~._~..-._ ............ -. .... . -. ......... 2,745,804,238 3,143,091,743 397,287,505 Prince Rupert (C.). ........................ ~...-..-~~ .......... ..- ......... . -. ......... 271,497,350 303,61%925 32,118,575
Totals, Coast.. ...... .._ ..... -.-. .... - ..-. .... -.-~ _......__ .. ..- - .... 3,017,301,588 1 3,446,707,668 1 429,406,080 Prince Rupert (I.) ~~~~~ ~~~ .... .... ~~..~~--.-..-- .-. .... -.-.~.-.- .- ... 206,677,534 226,334,064 1 19,656,530 Prince George ...................................... -. .... .._.._ .. -. . .._._ ..... -- .._ 661,169,290 839,661,106 1 178,491,816 Kamloops. ..-..._ ............. .............. .... _.-..-- -. ... -. .............. -. ......... 972,550,354 I 1,130,756,141 158,205,787 Nelson .. ..- .................................. ~_~ .._ ..... -..-..-.- ..- ._._._ -. ............ 491,808,784 I 532,738,310 40,929,526 ~-
Totals, Interior . ..-. ...... ................... --.~. . .._ ..... -.---. 2,332,205,962 / 2,729,489,621 1 397,283,659 Grand totals...- ..-. ............................ -.~.~~ _....._......_._ 5,349,507,550 1 6,176,197,289 I 826;689,739
I I
(6B)
TOTAL AMOUNT OF TIMBER SCALED IN BRITISH COLUMBIA DURING YEARS 1958 AND 1959 IN CUBIC FEET
(Conversion factor: Coast-6 f.b.m.=l cu. ft.; Interior-5.75 f.b.m.=l cu. ft.) (AU products converted to cubic feet.)
Forest District
Vancouver -.-..- .___............... . . ..___.__..____.... ~_-..~_~._ Prince Rupert (C. )-.m~ . . . . .._. ..-..- ~- . . .._............. ~~~._ ._._ ~.
Totals, Coast ~.~~..~~~...~.--~.--~-~--- ..__ -._- --.._.... Prince Rupert (I.) - ~~..~~..~~.~ ~.~ . .._....__ _..... Prince George . . . . . . .._ - .._ . . . . . . . -.- ._.._._..._...__ ~-- __...._ Kamloops .._~- . . -.- - _..... _... -_- . . .._.___..._. _____ Nelson ..-.. ~.-~...~~..~-.-.- _........_. -___ ___.______
Totals, Interior-- ~.- ._.. -...-- ._.. - . . . . .._ - ___._ Grand totals-.- - . . . . . -.~...- ._..._._..._._.__.
1958 I 1959 I Gain
457,634,040 523,848,624 66,214,584 45,249,558 50,602,654 5,353,096
502,883,598 1 574,451,278 1 71,567,680 35,943,919 39,362,446 3,418,527
114.985.963 146.028.018 31,042,055 169,139;192 196;653;242 27,514,050
85,531,962 92,650,141 7,118,179
405,601,036 ) 474,693,847 I 69,092,811 908,484,634 ) 1,049,145,125 ) 140,660,491
I 1

(7‘4)
SP
ECIE
S CU
T,
ALL
PRO
DUCT
S,
1959
, IN
F.
B.M
.
Vanc
ouve
r .._
.._...
1,
028,
046,
083~
708,
082,
132
44,6
31,6
20
278,0
02i
973,
747,
729/
334,
794,
039
19.6
14.9
471
3,03
1,99
2i22,
699,
200
..~~~
.~...
......
.. Pr
ince
Rupe
rt (C
.) .._
~.~_
__~
24,2
15,2
281
52,0
73,4
00
83.2
26.1
70
5,750
1 12
3,53
9,50
6]
11,9
48,4
82
5,64
6/
....~
~~~ . .
..I
1.36
7.73
6 .-_
_-.-.
-
Tota
ls,
Coas
t.~..
1,05
2,26
1,31
1~76
0,15
5,53
2~
127,
857,
790
283,
752(
i,O97
.287
3?51
346,
742,
52?
19.6
20.5
931
1,03
1,99
2)24
,066
,936
1....
.....~
..~...
...
5,32
2,17
9~12
,077
,827
~3,4
46,7
07,6
68
Princ
e Ru
pert
(I.).
..~..
.~__
. 11
,571
Pran
ce
Geo
rne~
_.
......
......
._ ~
___
126.
749.
955
I I
8.13
7.07
6 88
,011
,109
44
,136
.112
1 51
,949
,086
1 32
.883
.469
~.
~ ~~~
~..~
I
~~~~
~ ..~
.._
~~
~ . . . .
I.__-
.._
_. -~
_._
_..
1.54
1.27
5 55
5.31
2.77
5 13
9.230
.4971
2.1
351
14.0
42.1
58
. ..~
...I
..~
-~-.
~~~
I.-
. . .
. . .
. Ka
mloo
ps
y....
...
. . . .
. . ~~
~. 8
33;04
7;878
’
t
20;2
57;6
011
148;
722;
636
29;9
32;8
21
i 17
,202
;587
’ 12
;576
,891
13
,367
,228
’33,5
72,2
75j.m
~~
.~. )
21
,710
,584
15
8,30
7,85
2 47
.219
.634
1 13
4.69
1.88
9 16
,072
,706
1 36
,323
,530
12
,592
,893
18
.734
,651
9,
270,
779~
..~.~
...~.
.....
1 99
,256
,184
‘15
7;919
1 ‘20
7;72
1’1,1
30;7
56;1
41
Nelso
n ~.
___
......
...__
.__.
_._
22.49
01
245.7
02
532,
738,
310
$
Tota
ls,
Inte
rior
1.11
8,11
7,25
6~
77.1
55.5
861
926,
738,
409
229,3
72,13
61
105,4
77,33
81
72,0
95,4
11
32,1
01,8
79/4
2,84
3,05
41
. . . .
~~..
1120
.966.7
68
1,74
9,46
11
2,87
2,32
312,
729,
489,
621
-___
Gr
and
tota
ls _.
.~~.
2,1
70,3
78,5
67~8
37,3
11,1
18~1
,054
,596
,199
22
9,65
5,88
8~1,
202,
764,
573]
418,
837,
932
51,7
22,4
7214
3,X7
5,04
6 24
,066
,936
12
0,96
6,76
8 7,
071,
640/
14,9
50,1
50~6
,176
,197
,289
2
I I
I I
I ,+
(78)
I I
1 !
I I
I I
I I
I I
e $ SP
ECIE
S CU
T,
ALL
PRO
DUCT
S,
1959
, IN
C
UBI
C
FEET
(C
onve
rsion
fa
ctor
: Co
ast-6
f.b
.m.=
l cu
. ft.
: In
terio
r-5.7
5 f.b
.m.=
l cu
. ft.
)
Fore
st
Dist
rict
1 Fi
r 1
Ceda
r /
Spru
ce
1 ‘g
( He
mloc
k 1
Balsa
m
/ xz
1
yii&w
1
Cypr
ess
1 La
rch
1 w”
o”,‘$
1
‘$ti$
1 To
tal
Vanc
ouve
r ...
......
......
......
Pr
ince
Rupe
rt (C
.) ..-
....
....
55.7
99.0
06
3,26
9,15
X/
j 3,
783,
200
227
956i
......
.._
_ ...
....
9581
20
.589
.918
1 1.
991.
414
, ...
......
. .
......
i
""%i
1 :3
:::i
5%%
ft~
, , ,
, ,
To
tals,
Co
ast
..~
l75,37
6,885
1126
,692,5
89i
21,3
09,6
31
47,29
21
182.8
81.20
6i 57
,790
,420
3,
270,
099/
17
1,999
i 4,
011,
156~
._...
____
_.._
......
. 88
7,030
i 2,
012,
971/
57
4,45
1,27
8
Princ
e Ru
pert
(I.)
._.~
. .._.
.. 15
,306
,280
7,
675,
846
9,03
4,62
41
5.71
8.86
4 ~.
. ~~
. I ~
~~~~
~~~.
~.. .
___~
_....
...~.
...~.
...~.
....._
_~__
__
..~~
205,5
20l
39,3
62,4
46
Princ
e Ge
orge
~.
.~
96
,576
,135
24
,213
,999
37
11
2,44
2,11
5 ~.
.~~~
..~~ ~
.~. I~
--~ .._
. . ..
_ ~.
. ~.~
~ ~.
-.~...
~ _...
26
8,722
21
5,158
14
6.02
8.01
8 Ka
mloo
ps
~..
.~~
25.8
64.8
07
5.20
5.70
8 2,
991,
7541
2,
187,
285
2.32
4.73
61
5,83
8,65
6 -
._..
21,46
4 Ne
lson
~~~ ~
~~ ~.
.~
23,4
24,6
76
2,79
5,25
31
6,31
7,13
61
2.19
0.06
8 3,
258,
200
1,61
2,31
0 ..-
..-.--
.-
4,15
6 I
3,91
2 36
,125 I 196,6
53,2
42
42,73
1 92
,650
,141
Tota
ls,
Inte
riors
. 19
4,455
,1741
13
,418
,363
/ 16
1.17
1.89
8 39
,890
,806
/ 18
.343
.885
1 12
,538
,332
5,
582,
9361
7,
45O
,966
~.-.-
-- ._
___ (
21.0
37.6
99
304,2
54l
499,5
34j
474,
693,
847
Gran
d to
tals
......
.. 36
9,83
2,05
9~14
0,11
0,95
2~
182.
481.
529
39,9
38,0
981
201,
225,
091
70,3
28,7
52
2,51
2,50
5 1,
049,
145,
125
I I
I X,
853,
035)
7,
622,
965/
4,
011,
196
21.0
37.6
99
1,19
1,28
41
1 1
I

REPORT OF FOREST SERVICE, 1959 91
TOTAL SCALE OF ALL PRODUCTS, 1959, IN F.B.M. (SEGREGATED BY @A) LAND STATUS AND FOREST DISTRICTS)
Timber licences _....-. Timber berths-.-~ . . . - .-._ -_ Timber leases ._.. ._.._........_ Pulp leases-.- . . ~-..--. Pulp licences . . . . ..-..-...-_. Hand-loggers’ licences~.... Farm wood-lots .._..........._ Timber sales _............ -.. Pulptimber sales~ . . . . . . . . . . .._ No mark visible---~.-.- . . . .._
I 669,812,5851 _.~__~ -! . .._ ~___ 104,743,242/-.-w-- ._..-.-_
83,465,9781 - ..--.. 1-m ---_ 15,511,9631 9,679,9611_..--._-
42,3151~ ._... I__ 565:378/..- - _..-. -... _.__.._-
998,803,613j120,263,162 153,469,501 ._...... 21,959,161 -.-.--
68.937.397 -. -- . ..- - _-~ ___. Tree-farm licences ~~~....-.. 231;552;088i 66,244,033/ 62,273,514 Miscellaneous .._..-........._... 10,875,122] 4,792,3841 1,262,670
Sub-totals, Crown /
lands . . . . . . . 2,203,770,0971266,086,496 217,005,685 Federal lands ~._.~~ . . . . . . . . ..-. 16,879,256! 277,129 95,194 Crown grants-
To 1887 .~~ _._._... - . . . . . . . ._... - ..-...! ~.. -_.~_.-__ 1887-1906 ~.~~-~~..~~_~~..~~...
754,093,480/ 73,570,268’ 13.084.4471 95,630
1906-1914 . . . . . . 20,825,5991 6,146,6361 2,198,779 1914 to dates . . . . . . . . . . 73,953,0431 18,021,2171 6,938,776
Totals .~~~~~ ..~_~ ! 3.143.091,743~303,615,925~226,334,064 I
Prince 1 Kamloops 1 Nelson / Total George
-1 I I I I
1,903,351’ 8,227,7021 21,890 8591 701 834 497 _..._._...-._... -1 10,808,4601 12,423:755 I 127:975:457 . . . .._... .._. /bum __-. . .._.... I--- _...... - __.. ( 83,465,978
I.... _........... -- .._ .._... 1 /-.. _~ . -..j_..m . .._..._._.. 1
25,191,924 62,;;;,;:):
203,728’ 256,1221.._~ .._ - .._.. i 1,025,228 60,294,9971 892,628,6661355,566,716 3,281,026,655
, . . . . . . . . / ..-._ ~_- 21,959,167
96,867,473: 955,709,479~453,017,929;4,892,457,159 _..._.. I l8,021,795j 1,623,223! 36,896,597
I I
340,032; 231,475;
39,707,827’ 2,321,1521 796,462,491 l&625,360, 46,134,350’ 151,741,530
4,315,422’ 31,928,2351 11,918,192. 77,332,863 37,906,704/ 66,763,445 I 17,723,464 221,306,649
39,661,106~1,130,756,141 532,738,310,6,176,197,289 I
TOTAL SCALE OF ALL PRODUCTS, 1959, IN CUBIC FEET (SEGREGATED BY LAND STATUS AND FOREST DISTRICTS)
fBB) (Conversion factor: Coast-6 f.b.m.=l cu. ft., Interior-5.75 f.b.m.=l cu. ft.)
Land Status
Timber l!cences . . . - Timber berths .~ . . . . . . .._. - Timber leases .._... ~_-._-- Pulp leases - . . . . . . . . - Pulp licences ~~~~~~ -.~~... Hand-loggers’ licences....
Farm wood-lots-.-- . .._... Timber sales . ..--- --. Pulptimber sale.-- . .._ No mark visible- -....... Tree-farm licences-.-..-- Miscellaneous . .._.-.... ~.-
Sub-totals, Crown lands-- ._........ -..-
Federal lands -_.......... -. Crown grants-
To 1887 ~~-.- . . . . . . . . 1887-1906..- __............ ~. 1906-1914.- 1914 to date . .._. -
Totals ..__.... - . .._ _
XI=
-
:I
-I
I- -
, !
‘I 111,635.431( .._. ~... ...~~ / ~-~ -.._ -_. 331,017/ l,430,905i 3 807 1061
17,457,207 . . . .._..... -[_.--.-.- 13,910,996 .- .._...... _-.. -.._-.-_.
’ I
. . . . . - _._..! 1,879,732 21163,653 ’ I -.-........_-- /~m..~.--.~ . .._ ~~...I-----.-
2,585,3271 1,613,327 -.-___ _-........ - . . ...! . . . . - _....._... -.I . .._......_._.. 1 ‘,‘:;,X;j 7,184.246/ ._.. -.---_ .._... ~.~ . . . . m-1 . . . . --. . . . . . -1~ -_..-. -.__
7,052\m-~ _.._ ~__ 94:2301~... .._. - -)-----
. . . . . .._.. I..~- _._~~ --~I_-~ ._._ ~_.. 35,431/ 44,543/.... ~-..- _._.~I
166,467,2% 20,043,860 26,690,348 132,225,X7/ 155,239,768/ 61,837,690/ 3,659,861 .._._-._ -- --.-......_. I ..- ~.~ _... m-1 _.. _..-.. ~__I
11.489.5661.- -.-..~~.- ~--.I _._..-. -._\-..m.m.~...- -.I-- --.... --.-I
117,204,459 21,499,592 13,910,996
4.196.654 10.389.463
52,290 174,204
562,504,152 3,659,861
11.489.566 38;592;015j 11,040,672/ 10,830,176 3,296,249\ 6,088,8251 lO,158,884i 80;~6;821
1,812,520/ 798,731( 219,595 2,697,733/ 1,526,5711 821.3941 79876,544 1 I I I I I
367,295,016/ 44,347,749j 37,740,119 l38,585,647i l66,210,344i 78,785,727’ 832,964,602 2,813,2091 46,1881 16,556 .-_........._... -_ j 3,134,2251
I 282*299i 6,292,477
I I 125,568,247/-.. .~~~..- .-.~~I . -_-- __ 59,136’ 6,905,7091 403.6791 133,050,771
12,261,712\ 2,180,741/ 16,631 40,257) 3.239,193 8,023,3651 25,761,899 3.470.933 I 1,024,4401 382,396 750,508’ 5,552,737 2,072,7291 13,253,743
12,325,5071 3,003,5361 1,206,744 6.592.470: 11,611,034/ 3,082,342( 37.821.633 523,848,624( 50,602.6541 39,362,446
I I 146,028,018[ 196,653,2421 92.650,14111,049,145,125
I I

(9)
_~
-
TIM
BER
SCAL
ED
IN
BRIT
ISH
COLU
MBI
A IN
19
59
(BY
MON
THS
AND
FORE
ST
DIST
RICT
S)
if2
~ Ja
IlWIry
)
Febr
uary
)
Mar
ch
1 Ap
ril Ih
(ryi
1 Ju
ly (
Augu
st Fe
ptem
ber
1 O
ctobe
r 1
Nove
mbe
r 1
Dece
mbe
r 1
Tota
l -.-
___
~.
~~~~
--.__
I I
I I
I I
I I
80.1
77,7
051
90,8
95,9
W~ll
l,6%
3.12
4 14
7,712
,180j1
36,14
1,233
15
5,43
2,73
7 12
8,89
8,lO
S~
21,6
74,5
261
32,2
13.4
92
111,
561,
%62
/143
,568
,007
14
3.77
0,31
3~1,
303,
729,
18%
12
,X97
,552
/ 17
,07%
,530
1 20
,902
,295
30
,23%
,147
1 2%
,4%
5,15
91
3%,2
%2,
361
34,1
36,3
511
7,64
7,57
%1
11,2
52,%
53
30,%
41,0
5%(
35,0
77,8
%4
30,6
%,6
461
297,
536,
414
445,1
%31
22
9,77
4(
426,0
72
551,%
251
923,7
561
707,5
43
597.8
691
113,%
371
138,2
62
562,0
02
1 66
3,962
77
0,955
/
6.13
1.04
0 6,l
lll 4,7
391
6,41
1 7,3
05i
5,763
1 8,
164
4,66
3 I
5,%49
1 4,
912
4,51
1)
6,99
9 8,0
311
73,45
8
F.b.
m.
3,51
0,%
03i
4.%
21,6
99j
2.90
6.26
2 6,
392.
6%6/
13
.029
,752
1 1%
,%2%
,6O
O
11.0
27.2
25i
7.01
6,59
1 j
3,23
6.10
6 9,
041,
5R2i
20,9
55,3
19
13.5
17,9
011
114
2“4
526
Cubic
fe
et
g .--
1,
441.
167/
76
7.740
1 1,
443,
396
1,77
9.79
71
3,47
3,71
11
4,30
6,47
%
3,45
2,42
6/
2,42
7,60
%1
811,0
86
3,17
0.6%
51
4,49
1,81
4 3,
901,
410
31,4
67.3
18
Linea
l fe
et
4,27
0(
7.922
1 50
0 1,
511/
21
,402j
19,55
2 30
,625
/ 11
,6951
5,
800
12,5
25/
29,71
0 25
,5101
17
1 02
2 10
1 12
(
%
Cord
s 6
Hewn
tie
s ~~
I
Princ
e Ru
pert
(I.)-
F.b.
m.
Cubic
fe
et
Tota
ls-
F.b.
m.
~.._
~~~~
Cu
bic
feet
.._
...__
.....
~..
Linea
l fe
et
.._
Cord
s . .
. . .._
_._.
.___
.....
I I
I I
358.6
861
521.9
571
774,7
07
l.lh7.
266/
31
7.676
1 39
8,389
3.
%55
,243
1 4,
093.
1311
5.
046,
574
5,60
2,32
X1
2,35
2,05
21
2.42
2,49
1 66
.2601
%
O,Y
Y31
96,09
5 13
6,%
OO
( 13
4,3x
1 18
9,931
50
1 95
1 2,
%Z
5%/
871
22
3,55
1/
.~ .~
. .~
/
7,503
1 15
,2111
63
4 I
I I
I 3.4
6135
721
6.87
9.49
41
4.50
0.66
8 6.
737,
399/
4,
696.
67%
( 3.
065.
975
5.23
5.72
51
16.0
07,%
39/
22,9
94,2
1%
2597
74,66
3 16
,717
,136
/ 3,
935,
600
81.55
01
42,67
01
100,6
70
122,2
70
15%
,751
/ 12
9,658
11
21
491
1,02
9 8x
1 57
81
291
1951
~~
~. I
..~
~.
.. 43
01
24,9
11I
3,lO
R I
1 R.
%37
,547
( I
X.50
9.07
3/
10,1
59,9
%X(
11
.226
.712
11
,472
.659
/ 15
,032
,552
12
,%53
,R35
1 15
,211
,470
( 16
,241
.2%
0 12
,692x
4791
%
,212
,7%
71
10.48
6 34
7 12
1,070
1 43
,070
RO.6
29
47.16
31
87.61
91
111,3
25
2651
1%
9/
2YO
X2
5 1
6X2/
55
4 .--
-. I
I I
94X
I . .
~~~
I 65
0,84
5/
1,5%
9,57
lI 19
9.967
1 371
3,65
1,77
%1
4.13
7,61
4/
227.4
401 297
I 9.5
901
I 19
,795
,150
( 14
,5X4
,221
1
54.9
xni
59x1
I 1,
205,
7471
83
4,893
2,
152,
5341
1.
781.
746
189,5
75
/ 20
5.394
57
1 55
9,
250:
5,
367
I 4,
9%6.
019(
7,
331,
%94
7,
335.
420(
13
,434
,542
17
7,425
1 13
8,101
73
71
4.80
9 X,
299/
4%
!
16,9
40,0
16/
15,5
46,2
59
17,6
29,5
751
16,%
79,4
90
340,2
95
/ 48
7,610
1.2
581
417
I
I 44
0.932
1 1
,O67
,755
2.
399.
6401
2.
X92,
41
1 15
3,59
%/
180,4
33
2171
25
7 3.7
321
1,25
2 I
4.29
2.32
51
2,15
5,%
69
%,0
26,1
53/
4,9%
2.54
%
124,
2%0\
62
,660
4441
57
%
,ll%l
11,18
1 I
13,5
h%,1
2XJ
14kW
4.53
2 14
,649
5181
14
,340
.279
14
3.040
1 1,
226.
679
3741
3,
515
I
I 43
2,557
1 2.
534.
2491
73
,506
J 391 I
4,4%
%,0
01/
5,%
80,6
%0)
9%
,160
/ 161
6,44
9 1 I
12,5
1%,1
64/
12,9
79,3
011
468.2
501 ‘3261
8.17
1.41
0 36
,721
,97O
3
1,70
6.X%
7 0
1,01
9 ‘II
49
,354
p
56,2
54,6
72
%
134.
462.
138
in 1.
463.
635
In
8.50
7 >
72,32
9
15%
,410
,7%
0 i?
166,
760,
5X2
3,21
1.73
0 9,
293
3
94%
8
I I
I I
I I
I I
9,25
1),1
03l
7.2%
5,65
21
6,1X
3,33
5 Y,
210,
474/
5.
817.
5651
6.
356,
966
6,74
5,52
5/
14.1
08.4
86~
15
038,5
90
12.6
10,7
401
11,1
X6,2
47
X,50
9,43
21
112,
303,
115
4,36
5,62
7/
5.33
4.25
41
4,83
3,91
6 5,
755,
5371
1,
91X,
24%
1 3.
076,
46%
3,
919.
1121
30
4,95
7(
199,9
90
65,72
0 6.
275,
867/
9.
852.
473
X,60
2,26
0(
9.34
3,26
5 7,
245,
0831
70
,522
,llO
1.512
1 76
81
626
42,1
53,
4&5X
7(
56,21
0 20
8,708
/
227,9
72
I 62
4,464
57
6,%55
1 54
0,308
1,
005
j .%
y 1,
503
8541
31
9,195
j 3,
215,
119
1,48
8I
563
491
I (
1,234
1 2,
015
5701
13
,013
.~~_
~~
~ ~~
~ ~~
~ ~~~
~~~~
~1
.~.
..~~
_ ~.
..I
.._. 1
1,
303
I I
1 I
.I 1,
000
915)
3,
709
105,
274,
942(
120,
564,
694’1
37,2
74,%
0%
1%0,
057,
552/
171,
475,
563~
199,
115,
219
I I
170,7
6%,62
81
40,6
49,1
491
5%,4
92,9
641
71,4
61,6
79
65,9
31,3
%51
74
,201
,234
15
1,51
5,56
9/19
3,73
7,72
9 1%
3,23
6,36
%~1
,753
.153
,691
%
1,%
42,9
511
61,1
59,0
931
62,5
09,7
45
54,0
12,1
90
1.02
3,29
01
604.4
191
769,6
86
61,%
19,2
951
43,4
68.5
%2/
67
,6%
9,31
41
71,1
2%,2
01
63,2
37,3
69/
737,
470,
532
1,59
9,63
1 X,
060/
5,
840)
8.
401
90;,;
72;i
1,37
4,45
01
1,21
4,21
9 1,
319,
5%9/
1,
060,
799
1,57
2,30
01
2,70
3,75
2 .
7.985
1 10
.546
1,75
5,57
61
15,%
99,4
33
6.449
1 9.3
891
10.78
4 6.7
801
12.84
9 %
.9X2
1 10
5.346
He
wn
ties
1 4.2
371
. . ..I
2,
854
1 7.9
331
41;07
01
3,742
1 9.5
901
17
s49i
6.718
1 I
1,xso
i 13
,433
1 .-.
- 7,3
64i
126,3
40

REPORT OF FOREST SERVICE, 1959 93
VOLUME OF WOOD REMOVED UNDER RELOGGING AT REDUCED ROYALTY (10) AND STUMPAGE, 1950-59, IN THOUSAND CUBIC FEET
Year Salvage Wood Year Salvage Wood (M C.F.) (M C.F.)
1950 . . . . ..__ --..~ . . . . . .._._ -._.-.-...--.. 324 1955 ..~~~~..~ _........._............... 1,209 1951......_..... --..- -..- 420 1956 . . . . . . . . . . -~... 1,795 1952 . . . . .._.... - -- -...~.._ 732 1957 ...~~~ --.~...~ _.... ~-.~~~-.-- 3,663 1953 . . . . .._..... 1,053 1958~m..m ~.~~~..~_~.~..-...- 1,427 1954 ~~~.~-.~.-..~~.~ ~~...~.......... 1,888 1959...- . . . . . . . . . . . . . . . . . . . . . . . . . . ~~~~ 1,257
Ten-year average, 1950-59, 1,377.
NUMBER OF ACRES MANAGED AND OPERATED UNDER APPROVED (11) WORKING PLANS, 1950-59
I Tree-farm Licences
- I
= Public Working Circles and Sus
t&ted-yield Unit@ Chr;JisTtre FarIll
Wood-lots Total Acres Year I- -
-
- I
.- 1
-
-
- I T
-
1
-
_-
1
-i-
-
Productive Acres
%nn- ber
Num- ber
-.-
ProAdcyeive rlum- ber
3 28 33 47 58
2
31
PrE2ve Productive Acres
1,668,663 1.953.754 2;071;918 2,158,898 2,788,313 4,685,492 4,680,846 4,871,237 5.349.773 5,851,979
129 45,360 135 47,250 145 49,986 163 64,835 174 68,689 209 72,603 221 76,451 283 80,651 277 83,500 279 83,210
3,608,087 201 67,254
-
I L
1.714.023 2,001,456 2,122,631 7,877,466 9,882,310
14.092.997 26,433,033 33,783,152 37.836.274 40,553,791
17,629,713
1950..---. 7 1951--..... 10 1952~...- 13 1953 -_..... 14 1954..--.. 1955....-- :: 1956-m-- 23 1957 -_-.... 23 1958 21 1959 ~~.....~~ 36 Ten-year
average, 1950-59 19
3 452 5 727
20 4,571 25 5,549 29 6,455 37 8,320 44 10,488 53 13,108 50 12,059
27 I - 6,173
5.649.162 7,019,759 9.328.447
2L667.410 28,820,776 32,389,893 34,606,543
13,948,199
i 1 Approved public working circles and sustained-yield units.
(12) TOTAL SCALE OF ALL PRODUCTS FROM MANAGED LANDS, 1950-59 (In Table 8B, ‘I tree-farm licences ” includes only the cut from Crown lands within tree-farm licences.
The cut from “ other tenures ” is shown under appropriate headings. In this table, all the cut from managed lands under regulation is combined.)
= = I
-
1 t n
-
-
=
FaTIll Wood-lots
Public Working Circles and Sus-
tained-yield Units Total Tree-farm
Licences
rlum- slumber ber of Trees
Year
i !
Num- ber 22’
_- 1
T
-
.-
P
-
-
-
-
-
-- 3
2: 25 29 37 44 53 50
27
-
Number )f Christ- nas Trees
-- -- 232
17.497 26,939 64,482 92.124 70,116
139,396 205,676
61.646
129 135 145 163 174
fE 283 277 279
174,609 175,755 195.803 267,182 326,106 301,319 430,447 498,286 408,874 398,504
201 317,688
I I 1950.-- 7 --.-.- 1951--.. 10 27,440,866 1952.--m 13 33.532.810 1953-..-- 14 40.442.745 1954~.--.- 19 47.631.411 1955-e 23 69,715,422 1956-v - 23 121,869,721 1957_..__.~ 23 125,622,175 1958.---. 27 1144.260.543 1959-----.. 36 178,742,435 Ten-year
174,609 _- 175,755 27,440,866 195,803 33,533,042 267,182 130.191.242 326,106 147.825.014 301,319 184,871.133 433,8501 310,425,826’ 500,7865 333,584,825 411,574’ 399.276.1856 404,249‘~ 490,997,098
I
319,123 1205,814,523 I
14 89,731,oOo 28 100,166,664 33 115.091.229 47 188.455.411 58 207.892.534 61 254.809.622 64 )312,048,987
I 78,925,813 31 126,819,545
1
1 Includes 3,403 Christmas trees cut on treefann lfcences and farm wood-lots. 2 Includes 8,570 cubic feet cut from Christmas-tree permits. * Includes 2.500 Christmas trees cut on treefarm licences. 4 Includes 2,700 Christmas trees cut on treefarm licences. 6 Includes 66,624 cubic feet cut from Christmas-tree permits. 6 Includes 5,402 Christmas trees cut from tree-farm licences and 343 trees cut from farm wood-lots.

94 DEPARTMENT OF LANDS AND FORESTS
(13) LOGGING INSPECTIONS, 1959
Type of Tenure Operated
i ’ Vancouver . . .._.. ___-..-___-.-_._~. 1,332 1 Prince RuperL 195 I 1
1,168 i 2,501 8382
Prince George-.------..--- 1,804 -..
I --
189 I 985 1 2:929 1,307 3,111 6,610
Kamloops---..-----.-- 1,706 - 1,472 3,178 5,459 Nelson---..-------- 636 760 I 1,396 1 3,532 - -1
Totals, 1959--- -_.. -.~-.-_--. 6,273 1 2 4,896 / 11,171 1 26,912 Totals, 1958 .~~-_--.~ 5,936 1 2 4,339 1 10,257 1 23,802
Totals. 1957~--- 7,503 1 3 5,937 I 13,443 I 25,253 Totals, 1956-.---w---- 7,492 1 3 5,838 1 13.333 1 22,038
Totals. 1955---..-..- 6,818 1 3 4,673 1 11.494 1 22.35s
Totals. 1954- 5,855 1 3 4,874 I 10.732 1 21,011 Totals, 1953-.-----.-.-.- 5.8Sl 1 3 1 4,859 -- Totals, 1952..e..--~-- 5,822 1 6 5,710 1 11.S38 ) 20,264
Totals, 1951 5,448 I 6 4,766 ) 10,220 1 17,754
Totals, 1950.--_--- 5,189 I 6 3,812 I 9,007 I 16.221 ~~- Ten-year average, 1950-59--m 6.217 1 4 4,970 i 11,191 1 21,577

Num
- Fo
rest
Di
stric
t z2
Vanc
ouve
r ...
......
......
......
......
...
..-...
.....-
. 14
6 Pr
ince
Rupe
rt ...
......
......
......
......
.....
.._ .
.. 90
Pr
ince
Geor
ge
......
......
......
......
...
- ._
... -_
__
172
Kam
loops
...
......
......
......
......
...
_....
....._
._.
167
Nelso
n ...
......
......
......
......
......
......
......
.. .
52
Tota
ls,
1959
.. ...
......
......
......
.....
627
Tota
ls,
1958
...
......
.. ...
......
51
3
Tota
ls,
1957
...
......
....
....
668
Tota
ls,
1956
...
......
......
~~
_~~~
63
0
Tota
ls,
1955
...
...
......
......
...
499
Tota
ls,
1954
...
......
......
.....
463
Tota
ls,
1953
...
......
.. 44
6
Tota
ls,
1952
...
......
......
......
.....
419
Tota
ls,
1951
~mm
~m.. ...
......
......
......
45
4 To
tals,
19
50
......
- ...
......
......
...
276
Ten-
year
av
erag
e,
195&
59X
499
TRES
PASS
ES,
1959
__
---.--
---
-- ~
556
111,0
85
__...
.....
3,68
0 99
5 1,
033,
172
..~
_....
33
,209
1,49
3 78
6,850
39
,644
3,12
4 I
766,7
02
I I::
::::::
:::::
38.35
0 -5
00
143,2
06
1 (
2;16
0 ._
__
-- 6’
358
2,84
1,01
5 1
.~
( 11
7,043
--
6,43
5 4,
100,
971
1 . ..
____
....
1 12
6,12
7-
--- 8,
032
4.94
9.78
4 I
..~ ~
...
~~.
I 38
6.520
7,74
4 5,
692,
862
i .~
~~~
~ ‘t3
84;2
3-
__~-
6,
098
4.21
8.70
5 I
~~~.
..~ 1
45
8,426
5,91
0 4,
373,
368
1 1
266,
8j6-
10,18
8 4.
072.
874
I 46
6,401
I
230,
636-
-5,7
68
372,7
88
24.2
47.3
27
I 1
272,7
70
- 5.
999
-545
,775
- ( -
159,
oa4-
3,(n
2-
. . .
.._...
.....
12,7
53,4
05
I 1
- 36
0,19
0-~
-6,5
91-
---
- 3,
827,
796]
15
,503
,227
9
I I 1
276J
86-
-
10
I ..~
I
759
84
3,47
3 /
. . . .
. 5,
689 31
5,81
4 1
3,47
3 )
26,39
8 ao
8~2,
i%i--
j-l@~-
6,54
5-)2
,071
-[-7,
-a-
___-
-~
1,32
1 1
1,36
7 1
14,79
4
1.6’17
1
963
1 14
,100
270
I 5,
083
1 14
,914
-___
2.91
7 1
6,33
5 1
16,31
4
1,14
7 I
5.23
7 I
10.92
1
1,77
9 )
20,97
6 I
28,12
1
1,47
5 1
1,80
6 1
6,31
2
2,34
8 1
4,99
7 I
15,44
4 I
I
Ceda
r Sh
akes
, Ca
r-sta
kes
Num
- be
r of
Re
- su
lt-
Asse
ssm
ent
ing
in Do
llars
Tree
s Se
iz-
“ES
12
$57
187
05
39,16
1’74
45:4
73:2
5 72
.138
.36
282
( 87
843
( .._
.....
1 1
7,23
2.24
133,3
63
( 7,
149
( 2,
922
13
1 $2
21.1
92.6
4
21,92
4 )
765
1 _.
.._...
13
I
$221
.931
.11
664,5
69
1 :
“’ ’
22,b
lr ,
.z
--__
~. -
-. ,
” !
“3
““80,
057.
83
177,5
59
128,5
73
1 ~~
~~~~
~~
5 1
$489
.065
.90
66,97
5 1
5,60
7 (
. 4
1 $2
12,1
83.4
9
119,3
64
1 9,
750
1 . .
7
I $1
98,2
20.1
5
116,3
68
1 : 30
,663
) ~~
.. 1
4 I$
221,
00
‘0.12
227,2
67
1 3,
991
) . .
13
1
$3
~~
12,7
74.3
3 .-;
- *-
- . .
. .
1 13
,3~>
,
~~..
4,
/ $r
37,5
88.0
0 -~
____
~ 75
,309
1 7,
550
1 .._
I6
1
$87,
589.
23
____
. 16
0,270
-T
1
13,01
9 ) I
13
1 $2
58,1
60.2
8 I
I
1 Cu
bic
feet
-eigh
t-yea
r av
erag
e.
2 Fe
et
b.m
.-fou
r-yea
r av
erag
e.

96 DEPARTMENT OF LANDS AND FORESTS
AREAS EXAMINED BY THE FOREST SERVICE FOR MISCELLANEOUS (15) PURPOSES OF THE LAND ACT, 1959
Applications Applications for Hay and Applications
to Purchase Miscellaneous Total Forest District Grazing Leases
for ;;;;xor
“E- ACRS
Vancouver...-.--..-~ . . Prince Rupert~..--... 2,562 Kamloops- _............
: . .
i /
““IL Totals 2,562
CLASSIFICATION OF AREAS EXAMINED BY THE FOREST (16) SERVICE, 1959
Vancouver- - . . . . . . . . . ~_~...~ . . . . .._ Prince Rupert ._...-.-.._..... -~~~~~ Kamloops . . . . . . - .-._... ~-.
Totals - -.._ -- _...
ACES Acres ACPS ACRS M F.B.M. 751 5 746 138 468
3,968 286 3,682 315 7,993 242 67 175 90 316
4,961 358 4,603 543 8,771
(17) AREAS CRUISED FOR TIMBER SALES. 1959
I I I
Vancouver ~.~...- - .._... 750 I 99,197 ~~~ Prince Roper? .-.. ~~... 305 / 78,850 .._............. Prince George - ..-.... 465 I 141,355 . . ..-- Kamloops . . - _-..__.... 545 ( 259,449 -......_ Nelson ..__........._ ~~...~ 252 / 102,699 ~. ~. -~
Totals, 1959m...~ .._.. 2,317 [ 681,550 . ..- ~~ Totals, 1958 .._-.... 1,922 1 609,563 ~.~~ .~~ ~~ Totals, 1957 . . . . . ..-.- 2,582 1 781,748 ..~~~ ~~.. Totals, 1956 .---.- 3,089 1 1,095,150 ~.~~.~ . .._ Totals, 1955 . . . .._. 3,354 [ 1,077,986 ~~_.~~~...~-_ Totals, 1954~ -.--... 3,085 1 781,665 ._.-~_~ _..._
Totals,1953..- ..-.._. 2,579 1 719,234 _.... ..- Totals, 1952...- _...... 2,340 ) 1,029,199 2,543,890 Totals, 1951-..--. 2,704 1 934,475 6,577,298 Totals, 195O~m.---. 2,196 1 333,435 1.777.025
Ten-year average, I 1950-59~-.~~ - .__. I 2,617 1 804,400 3,632,738
I I
Pit-props, PoIPe;ie:nd
(Lin. Ft.)
348,247 1,896,823 1.610.420 1,512,300 2,020,170
7,387,960
8.772.888
16,099,489
13,981,856
9,885,451 10,532,164 12.887.882 40,005,329
20,674,280
7,388,875
14,761,617
Shingle- Jolts and
Cord- wood
(Cords)
6,133 2,609 3,800
12,456 2,755
27,753
24,316
39,254
44,287
16,819
76,859
12.328
13,405
25,630
24,522
II
I
-
.
.
.
_
.
_
.
_
_
_
-
Railway- ties
(No.)
l,ooO 25,875
26,875
34,430
95,209 128,432
145,525
76,310
141,313
989,144 316,954
123,091
207,728
:ar-stakes. Posts, SSV-
Shakes. timber etc. CM C.F.)
(No. )
..-...--. 234,167 3,600 121,781
103,770 203,145 75,350 ) 240,028
941,680 1 78,249
1,124,400 I 877,370
1.146.719 1 890,289
1,149,133 1 1,171,283 1.916.510 I 1.273.970
'5011820 i 1;131:521
1.127.346 1 697,421
694,182 1 561,601
518,652 1 1.188.361 ?32,000 ( __....
352,440 ( -.--....
896,320 1 973,976
I
M B.M.-threeyear average; M c.f.--eight-year average.

REPORT OF FOREST SERVICE, 1959 97
I I Vancouver~ ..-.--~. .......... ..~..~..~~ 650 1 662 1,916 1 607,517 559,324 $6,274,490.19 Prince Rupert ........................ 254 / 393 1,118 j 377,812 366,162 i 1,294,145.92 Prince George ................... .._. 355 1 500 1,301 1 653,992 602,333 / 2,126,246.43 Kamloops .............................. 434 1 549 1,992 1 1,179,187 1,168,227 ( 3,573,623.95 Nelson- ..--. ......... -. ................. 233 1 267 812 1 603,513 592,594 1 1,881,106.26
Totals.. ..................... 1,926 1 2,371 7,139 i 3,422,021 3,288,640 1 $15,150,212.75
Cash sales-.-. ..... -.~. ............. 234 1 ...... . ........ ) .... - ..-. ... .......... -. ] ..~~~~~..-.--- -
Total sales.. ............. 2,160 1 _ ....... .~~~..~. / ...... .._ ...... ........ -- .. ........ --.-. ... -- I
7

. . . . . . . j . . .
. 1 g6E‘S
1 .
~- 1
’ $)L~~L,t‘Z‘E8
,zzs’5.6
18'16L'ZS1'6$ 1
---------- IO
ZL'CII I....
------ ,
ooL'l ,
OO
t
pss‘IEE’zI I ~-.--..~~------~------..
I I
’ . . .
z96’Isg z
-.-..__
6L'PSZ'IZ9‘PZ$~ ---------
IOSZ'EIF
,_ z~!+I~S~~'t~ 19L6‘E6L
LOs'Isv'zIIO
Os'991‘8Z9'I
-----~--- ----~
--.- __ .
, .<-I-
. . . . . . . . . . . .~
, O
sl'Z (
ZE6'g.-'^-..- I^..‘...
, ~.
6P'IPCVESXZSI ---------
IOO
L'PLI
6ZX6‘ZZE‘LI$I ---~ ---
hOI‘
8L'6P0'8E6‘8I$i SEZ
kBOP‘S6
bZltW5Z
It5t.bIY E8E'Z18'Z11000'561'908~Z
000'S iIIS'SO
91 Z96‘2
-~ ~~~~-
-- IS61
'SIWO
~ --......
I ~~~ -~~-- I
OO
L I
OO
E EEP'8IZl?P~'O
Z(~P‘S.~'I 6ES'8PI'P1/O
O0'68S‘IZZ'Z
E6L'6ZL'LS%1
P6S'Z ~~.._~ . .
. . . . . .
00s IO
OO
'ZI I 018'9
I
zs61 'sIelo=
PP1‘961108S'ZZ iStZ‘S6L
z~~8‘o6o‘zzlooz'9PP 000'001'19Pi0sP's091
188‘2. . . . . . -
cs61 ---~~~---
Ioos‘SI I 009‘L I O
OE
SLZ’L9 IO
L9’SS9~86O’LIO
‘!~ 09P'O
IZ'OI~
---------~~ _~~~
‘s(elo~ -___-_
S06'LIB‘OES~ESI‘E69/
6OO
'E . . -.-..~
--------- klO
O'SP
1 000'1 1 O
OE
Z86%i3j$jii5im
- O
PS'ZIB'P9L~OEZ'EZ6I
8&E ---- -~_-~--~-
---~~ ps61 's,e,o~
LLO‘9SI~O
6S‘ZZ 1068‘LSL
I~.-. .~ .~. , ,
_____ -......
- ~~
~~~ ~~~.~~____
SE61 ‘W
lOL
OO
Z'E ~~~.
18S‘OSI~PIZ‘ZI
ILZP‘66L 009'009'CI~
---~ ~~- O
EP'SZP‘Z08~ILI‘OL8/
6SX‘Z ~~..._ .
.._ 9s61
'sIeloL ZI'ZZP'LO
S‘OP$I
IS6'1 ~O
OP‘O
II
99’LSL’E96’SS$l --~ -~~~ 109E'IL
86'P98'089'PZ$I ----
--- IO
EE‘08 OEE'08looo'E
I OO
s‘o1l
L9'86Z'LIS'OZ$I
006 1006'OZ
..- --. ,
.~~ I
00E'EI, O
IZ'S9116S~'91 iSLE'911‘1
69E'EPL'ZIi------. ..---
006‘SSI‘LI9101E'SS9/~~S'Z~ -...~~
---___-.---..--~ --...--_
‘s61 'sIe,o~
ool PEE'SE
1228'11 1069‘8S6
I:~, :~xzr j-&g
~1::~:~ --
zzz'969'8
L0'68Z‘&Z8‘6Z$i O
OP
hO‘Z91
,._ . 6W
'IZZ'Z89~L9P'L19~ SPI'Z
~~~~. ..~~~~
- 8s61
'sIe,o~
~~-
Zt’6LL’96L‘P 1 O
OP
6561 ‘sxm
usIa LS~XO
~I AH a3axvM
v s3w
s m
um.
(61)

AVER
AGE
STUM
PAG
E PR
ICES
AS
BI
D,
BY
SPEC
IES
AND
FORE
ST
DIST
RICT
S,
ON
SAW
-TIM
BER
SOLD
O
N TI
MBE
R SA
LES
(20)
1N
19
59,
PER
C
CF.
LO
G-S
CALE
ZZ __ - -- -_
Doug
las
Fir
Ceda
r sp
ruce
Ba
lsam
Price
Pr
ice
Per
C C.
F.
RFE
Y
Hem
lock
I _ -
- = - _
-
- Fo
rest
Di
stric
t
EY . .
Price
Pe
r C
C.F
$3.5
2 2.
48
2.91
0.
80
2.96
2.
46
$3.3
3
Price
Pr
ice
Per
C C.
F.
RFEp
Pe’
Price
Pr
ice
Per
RFFp
per
CCF.
.
.
Price
RF
EFpe
r Pr
ice
Price
Pe
r C
C.F.
RF
:“EFP
e’
116,5
56
7,92
4 2,
206
3,09
8 8,
842
138,6
26
i $3
.05
1$2.
1&
9.20
1.
84
) 1.
3&
2.50
1.
54
1 0.
6&
3.10
1.
99
1 0.
75-
8.00
2.
32
1 0.
25-
5.20
2.
29
1 0.
25-
8.90
$2.7
3 \$
0.25
- 9.
20
64,17
3 2,
137
I $8
.69
$1.0
0-31
.30
5.97
4.
80-1
0.20
4.81
0.
7%
9.50
4.
86
0.50
-17.
50
4.42
1
0.75
-12.
50
$6.2
3 1$
0.50
-31.
36
$2.8
1 1,
.00-
6.
00
2.40
/
0.85
- 5.
30
2.46
1
0.7%
4.
20
3.75
0.
75-1
0.50
3.
43
1.30
- 8.
20
3.85
1
0.75
-10.
30
$3.5
5 1$
0.75
-10.
50
1
I
,
$3.1
4 iw
oo-1
5.60
2.39
0.
85-
4.00
2.
00
0.5s
2.
40
. 1
~.~
2.09
0.
25-1
0.50
2.
55
0.50
- 8.
50
$3.0
2 1$
0.25
-15.
60
I
Larc
h O
ther
Sp
ecies
61.0
0-23
.00
0.85
- 4.
90
0.60
- 7.
70
0.80
0.
2%
6.90
0.
50-
8.50
60
.25-
23.0
0
72,67
8 7,
118 266 1
1,89
7 X.
081
90,04
1
4,72
9 5,
654
15,11
4 90
,019
17,03
3 3
1,92
9
164,4
78
60,65
0 3.
140
6,30
0 6,
908
2,04
6 7,
540
86,58
4
10,11
8 84
,110
14,54
1
175,0
79
I __
_ __
--
~---
W
hite
Pine
W
este
rn
Yello
w Pi
ne
All
Spec
ies
Fore
st
Dist
rict
VOlU
IllC
Price
I I
Price
M
CF.
cpTF
RF
:“FFP
e’
. .
. .
Price
Rp
:“EFP
e’ .
Price
RF
FFpe
r . .
_I_-
I !
-L-..
-- 1,23
1 (
$4.2
7 ($
0.75
- 7.
90
..~
1 _-
-.._
1 -.-
Va
ncou
ver
.~~
.._
Princ
e Ru
pert
(C.)
Princ
e Ru
pert
(I.)
~.
.._
Princ
e Ge
orge
~~
. ~.
4,59
8 (
$2.8
0 /$
0.75
- 8.
80
2,14
1 1
2.51
1
0.85
- 4.
90
xi I
;:3as
00
:;:
67%
9,
054
) 1.
88
0.50
- 9.
10
4,79
2 1
3.17
0.
75-1
2.50
._
___
62,81
8 I
$2.4
5 1$
0.5&
12.5
0
I I
324,6
18
’ $4
.30
/$0.
75-3
1.30
28
,114
1 2.
64
34,73
1 (
2.24
I
0.85
-10.
20
0.50
- 7.
20
138,4
34
1 3.
46
I 0.
75-1
0.50
12
3.548
1
4.47
1
0.25
-18.
60
89,90
2 1
4.12
1
0.25
-20.
90
739,3
47
I $4
.03
1$0.
25-3
1.30
3 i
$2.6
0 i
$2.6
0
z ..I
:::.
j :I:
:::
1,50
9 5.
32
1 2.
70-
6.90
64
3 1
4.73
1
0.75
-12.
90
2,15
5 (
$5.1
3 /$
0.75
-12.
90
I I
11,32
0 1
6.44
1
0.75
-12.
50
-13,
461
1 $6
.22
)$0.
75-1
7.50
I
I
~___
-- 6,
105
1$11
.63
1$0.
75-2
0.90
To
tals
for
Prov
ince

8
AVER
AGE
APPR
AISE
D ST
UMPA
GE
PRIC
ES,
BY
SPEC
IES
AND
FORE
ST
DIST
RICT
, ON
SA
W-T
IMBE
R ON
TR
EE-F
ARM
LI
CENC
E (2
1)
CUTT
ING
PERM
ITS
ISSU
ED
IN
1959
Ceda
r SpW
X I
Hem
lock
Balsa
m
Doug
las
Fir
Fore
st
Dist
rict
6,54
2.7
575.
4
Price
Pr
ice
Per
RpgF
per
ZC.F
. .
.
Price
Pr
ice
Per
: C.
F.
RFgp
er
7
-
7,85
4.4
1.7Y
I.O
1.X8
4.7
3,58
9.X
15,llY
.Y
i 6,
073.
6 i $
2.03
1$
1.80
- 2.
60
3,01
4.6
1 1.
36
I 0.
50-
1.90
42
.0
/ 2.
00
/ 0.
60-
2.70
16
3.6
I 1.
25
/ 0.
90..
2.40
12
X.8
I 1.
37
/ 1.
2%
3.60
Y,42
2.6
I $1
.79
l$O.5
0-
3.60
$5.7
9 \$
3.1&
12.2
0
0.2
1,10
0.9
8.21
9.2
I $2
.72
]$2.
2&
3.90
2.
40
( l.Y
O-
2.80
~I
~~~
‘I ...
..;30
. -~
2.14
I
2.0&
4.
60
$2.6
2 1$
173&
4.
60
I ._
._~~
_
1 ,?
YO.5
1.
262.
3 1,
316.
O
3.56
0.9
2.33
6.8
9,76
6,s -_-I
,
$2.3
3 i$
Z.O
G-
4.60
16
,101
.4
/ $2
.23
/$2.
00-
3.30
1.
60
I 0.
7&
3.50
1
7,64
7.1
1 1.
32
1 0.
50-
2.10
2.
24
1 O
.YCL
4.
30
1.99
1
1.40
- 6.
80
2.24
1
2.00
- 6.
00
842.
4 I
1.37
I
l.l&
3.20
$2.0
8 /$
0.7C
- 6.
80
24,5
90.Y
1
$l.Y
Z j$
O.S
@-
3.30
I
I I
Wes
tern
Ye
llow
Pine
La
rch
I O
ther
Sp
ecies
Tota
ls fo
r Pr
ovinc
e
~.~.
, ~_
~~~_
..~~.
2.
14
I O
&O-
4.10
2.
YY
I 1.
4s
6.80
2.
32
i l.Y
O-
5.30
$4.1
8 ~$
0.60
-12.
20
I
Whit
e Pi
ne
All
Spec
ies
-
,
T
E’~
Y
Price
’ I Pr
ice
Per
I c
CF.
R”C”
S&,C
Pr
ice
RaC”
Ef,C
’ Vo
lume
M
CF.
-..-_
_
I
~~~~
~~
~~
1 ~~
~ .~ .
148.
0 31
0.2
$1.8
8 1$
1.3&
2.
40
103.
0 1,
437.
l I
2.17
/
2.1&
5.
30
58.9
1,
747.
3 /
$2.1
2 $1
.3&
5.30
51
9.8
I
Fore
st
Dist
rict
Volum
e Pr
ice
1 i
Price
M
C.F.
cp
;fF.
RFgF
per
Price
Pr
ice
Per
Z CF
. Rg
&&VJ
Pr
ice
Price
Pe
r Rf
W’F
9”
CC.F
. .
*---’
--
- $2
.53
/$2.
00-
3.70
2.
63
/ 2.
50-
3.00
1.
26
1 0.
6&
1.50
2.
06
/ 1.
1s
4.20
1.
71
1 1.
5s
5.30
$2.0
2-
I
I I
38.0
24.7
/
$3.0
3 ($
1.8&
12.2
0 12
,679
.9
1 1.
42
1 0.
5s
3.00
3,
297.
O
/ 2.
14
I 0.
6s
4.50
6,
109.
9 /
2.28
1
0.90
- 6.
80
10.1
93.9
1
2.92
I
1.1~
19.0
0
70,3
05.4
/
$2.6
2 $O
.S%
lY.O
O
I t
132.
7 j
$5.0
2 /$
2.2&
6.
60
( ~~
~~
1 .~
~~...
__.._
.._.
~.~
I . .
. . .
. . ~.
. 1
. . . .
.._
508.
8 16
.37
I 7.
60-1
9.00
641.
5 1$
14.02
~$
2.20
-19.
00
87.3
19
0.4
277.
7
I I
- ,

588‘9L6‘EPZi 8E1‘98Z‘ll
ES8’90C’S I
czL*ELI 1 LLL‘9S6
1 8L8‘08P‘P
OW
‘Z 1 LCL‘Z60‘1
t E99‘800’L‘
a> 1 LI8‘6ZL
1 668‘SOS’E
88E‘ISZ‘~L I
OSP’EBL
I PEP‘ESL‘P
p_ZZ‘SLP‘SOZ~
850'29Z'I/ 869'O
EO‘P
~P7P0‘09E1 8L1‘961’11
FIE’996‘S
S&+“E_ZP1 96l“O
M)‘I
/ PZI‘EP6’S
ZP9’9OE‘Z6E/
EOS‘068‘d 995-819'1
I
68O‘Z6I‘IW
006‘226
1 LZS‘9i’s’t-
-__ EOS‘EE0'6ES1
19P'986 1 8ZP‘PIZ‘9
__~ LIz'Los‘Ls
1 ,
.~-~~~~~...~ ~~~ -. -. - -
zoz
SZ6
OPE
LO1
019
__. 81
zz
zz
.__-.---. 059‘6
LBZ’E 1 668’89P
/ ERL’SE
-._---_- EP6‘SLZ
I S9E.188
/ 16E‘9EZ
E01'81 1
IOE‘181‘ZI
1 ZLO
’XOS’SS6
I I
8l'O'PLI
1 PZL’IOI‘I
1 SO
b'SLI 09Z‘PZ
I Z6O
'E6E‘II 1
IZP'ZPS'ZZS' ____-
-~ _--___
.sZO'I
-.I 9EE‘8_10'1/
j89‘9LZ_ Z89‘SI
1 6L6’P6L‘8 I
L98’ZS8‘19L’
ZE‘LLI 1 60E‘891‘1
/ 86S'O6C
198‘PI 1 69Z‘E9P‘SI
I BZL’6SE‘ES8’
~LO'~O
Z~IZ'sOZ'~
/ EIS'SPE
196'PI 1 196'1L9'PI
1 OO
E'ZI8'E6S'
&Z’PEZm!6E6’ELLm
mm
1 6LS’IPZ
VIZ‘S1 I
189'6PZ‘6e~&PES'S86'ZLO‘ -__
OZB‘CIE
I EIO
‘ZJL I
XPL‘XSI 6C8'6[
1 IOZ'9t9'01
1 ZEE‘SL6‘LOL -.--
__ SP6'89Z
1 8ZS’LO9 1 9L0‘80E
6ZS'EI 1
6OS‘9ZP‘II
I 9LS'O
S6‘IOS
j>9'Z9S /
9PZ'pPS /
6ZE‘t'O~m
68P'Pt
1 P99’SLP‘SZ 1 6ZP‘EO
P‘18Z
LS9’6LP I
L06’L99 1 61P'8P
_ ~-~
JP9'8 1 SIO
‘SE6‘L 1 88Z'IIO
'~.~ -__~.
_8@‘6E_E.
/_EE9‘60L /
9SO'PII
155'6 I
SE9’9SL’9 1 EPZ‘L81‘66
86S‘6EE 1 O
IE‘P9P t
16t 886
1 PP9‘888‘I 1 LPl‘188’91
..~
--~--~
~
, L01‘8S1
, ~
_.
E98‘E 1 E98‘LPE‘Z
I P86‘8PP‘RI
19S‘I 1 6LL’6LS
L98’OZS‘tS
*apls!a Isam
&
__. --_..--
----
(ZZ)

102 DEPARTMENT OF LANDS AND FORESTS
(231 SAW AND SHINGLE MILLS, 1959 ZI I Shut Down operating
Sawmills Shingle-mills
_
_
-
.
.
.
.
.
-
Sawmills Shinghxnills
Forest District Estimated Estimated
Number Eight-hour Daily Number
EigAhyr
c&P;~;;;, cfiP;f;;
Estimated Estimated
2 1 6 Vancouver- ._.....-_.-- 211 1 8,125 60 \ 1,122 70 / 273 131 1 758 197 / 1,600 104 / 746 85 I 598
587 j 3,975
586 I 4,007
Prince Rupert -__ __.. 271 ’ . . ..-- Prince Georee- _._-.._.. 648 I Kamloops~.-I.- __...._..-. 580 j 7,036 a Nelson-- .._.__ -..___. 295 / 3,631 8
1 - Totals. 1959 . . ..~ 2.005 I 28.280 65 I 1.138 1:
6 I 23
9 I 31
10 I 121
8 I 1S
3 I 19
13 I 22
‘2 I 47
24 1 117 16 I 78
11 I 23 I
LI 27,694 56 I 1,141 Totals, 1958 ._-.. 2,010
Totals, 1957.- .._.- 2,255
Totals, 1956- 2,435
Totals, 1955 .._ - 2,489
Totals, 1954.-..- 2,346
Totals. I953 . . . .._._- 2,413
514 i 3,124
390 / 2,013
404 1 2,285
367 I 2.281
1 26,752 58 I 1,390
) 29,080 66 I 1,381
) 28,016 72 I 1,804
1 25,602 57 I 1,108
I 23.300 59 I 1.121 286 I 21186 Totals; 1952.- 2,223 1 23;433 59 I 1,173 Totals, 1951-..._.... 2,100 ) 21,748 60 I 1,169
Totals, 1950-w.- 1,826 ) 19,143 65 t 1,234 Ten-year average, I
1950-59 ~~~~... 2,210 / 25,305 62 / 1,266 I I
332 / 2,092 294 / 1,474
234 ( 1,462 I
399 i 2,490 11 50
(241 EXPORT OF LOGS (IN F.B.M.), 1959 = I
=
-
_
.
. .
.
.
.
_
.
I
Species Grade No. 1 Grade No. 2
Fir _- . . . . . _~ .._...... --..-.-.._~- 395,464 Cedar . ..-._.........._ - ..-.. - . .._.._ 169,372 1,042,982 spruce .._.. ~~~ ._._. - . . . . .._.. _~~~~...~. ...;lrsu ! 12,356 Hemlock ~..~--.--- . .._ --._- -_.._ , 929,371 Balsam . . . .._.. ~~~.~..~ ._........_...... - .~~~... ~~~~.~. ~...- White pine ..__.............. .~~ 1 720 Cypress .-- .._____.... -...- ._.. - _.... _ 191,780 ~ 220,760 Hardwoods . . . . . . . . . . . . . . . . ..___ ~..~~~.._~~ ~~~ . ..- ---~. I . . . . Cottonwood ._._... - _............... ~~~ ~.~. .---- 1 ---- . . . ---------..
Totals, 1959 .~~~~~~~ 486,685 / 2,601,653
Totals, 1958 - . . ~~~~~~~.. 734,991 i 3,727,452
Totals, 1957 . . ~.~ .__.......... 524,180 1 3,987,443
Totals, 1956 -____ 183,859 1 2,933,12F
Totals, 1955--.ww.-.-.w.w 906,141 ( 7.468.949
Totals, 1954--w---- 3,948,345 1 19,595,544
Totals, 1953~.-..-- ____. 5,341,576 I 15.853.076
Totals, 1952- .-._-_ 4.732,890 1 V&944,292
Totals, 1951- ____-_ 5.901.140 1 12,229,159 Totals, 1950..-..-.---. 8,659,552 1 21.625.295
Ten-year average, 1950-59 3,141,936 / 10,596,599
I
Ungraded Fuel-logs Total
I I
Grade No. 3
539,812 5,076,803
204,014 13,287,651
j 1,X38,183 68
2.7739459 6.289.225
.216,370 14.343.172
3,997,323 4,379
861,903 2,614
47.032
3,997,287 3,533
449,363 I 126
47,M2 --.- - 19,608,208
16,164,689 .____ 22,016,291 -~ 27,433,037
58.863.477
90.691.771
74,187,464 --~__ 84,757.110
51,699,605 ----- 88,031,088
-~- 53,345,214
3,999,901 i 1,839,030 I 28,535,4771
3.715.124 i 3,762,411 i 28,104,667
5,625,910 ) 3,421,354 I 35,575,178
12,929,722 / 3,530,479 1 47.010326
16,974,165 I 49754.796 I 88.967528
17.465.267 1 9.274.99s i 140;975;922
18,974,550 1 5.788.905 I 120,14S,571
18,400,266 1 1,161,660 I 124.996.218
10,202,844 I 2,224,693 1 82,257,441
19.210.615 1 ---- 1 137,526J50
12,749,836, I 3,575,832 I 83,409,478 I I
1 Of this total, 20,137,157 f.b.m. were exported from Crown-granted lands carrying the export privilege: 8.398,320 f.b.m. were exported under permit from other areas.

(25)
REPORT OF FOREST SERVICE, 1959
SHIPMENTS OF POLES, PILING, MINE-PROPS, FENCE-POSTS, RAILWAY-TIES, ETC., 1959
103
= I
=
-
- -
-
Where Exported
Quantity Exported
Appri$rate
F.0.B: Forest District and Product
-
T
- I I
2.985.896 14,150
189,070
Other Countria
126,005 533,625
..~_..._ .
Canada
286,021 380,849
22,976 19,080
733,176 49,354
546,820 65,403 92,361
239
1,554,735 392.945
1,732
Vancouver- Poles ._._...._. .............. .............. lin. ft. Poling .......... - ..-. ..... ~_~ ............. . ,, Stakes and sticks . ..-. ........... .._ _ Fence-posts ........ -...~ .. ..-. ......... &yes Cedar shakes ........................ - ,, Christmas trees .................. -- ,,
3.397.922 928,624 189,070
22,976 19,688,069
62,861
$1,160,196.37 268,892.92
1.460.50 5,744.OO
1,257,847.00 19,587,989 18,858.30 62,861
1,832,940 692.616.66 49,354 76,992.24
1,099,764
641,760 180,2CKMO 65,654 11o.OOO.co 92,361 23,100.OO
239 3,350.OO
94,940 251
3.019.775 607,955.OO 1,485,040 816,130 106,096.90 423,185
2,030 81,480.OO 298 707,619 212,285.70 707,619
81,000
Prince Rupert- Poles and piline . .._. - . . . . lin. ft.
1,409,245
Fence-posts ~- . . .._._ ..-.-... cords Christmas trees .._..... ~-~.~...~pieces
Nelson- Poles and piling ~..~~..~ ..~~~ ~~~~~ lin. ft. Corral-rails ~...~ . . . . ~_- -.. ,, Orchard-props - ,, Mine-timbers .._.......... .~ -._ ,, Mine-props .._ . . .._- _.~~..._.- __. cords Cedar shakes ..~~.~_ .._ .._... ~~-- ,, Cordwood -.~ ~.~..- ,, Fence-posts ~~~~~...~.-. . . . . . . .._ ,, Ties -.-.- - .- . . . . . pieces Christmas trees ..- __... ..~.~ . . . .._.._
Total value, 1959 I:.-- Total value, 1958 ..~~~~ . ~~~~
1,043,cr25 / 123,990 1 __... ~~.--__
-246,714 1 _..~ . . -.-.
230 1 . . . . . ..--.. c33 1 r...- ---..
5,413 ( -...--.... 3,218 1 -._~.--_
106,168 1 --..-.-_
2,452,270 1,130.037.00 123.990 1.488.00
24:ooO 240,714
230 138
45 6,744 3,218
1.434.521
'312.00 9,219.OO 3.635.00 1.932.00
635.00 282,627.CKI
5,825.OO 832,022.OO
$7,074,807.59
$6,307,059.25
24,000
1,331
1.328.353 L I
T i II
--- , -.___
I
(26) SUMMARY OF EXPORTS, MINOR PRODUCTS, 1959
ProdUct I -
Poles ~..~ _... ~-..- -..-...~~- . . . . . . . . --._-___- lin. ft. Piling . . . . ..-.._.... ~...~-~~ .~~~ ..~~~~~...~~ . . .._..---_-_._ ,, Other poles and piling ~..~~..~ __ .I Mine-timbers ..~..~..~~~ . . .._. __-- ,, Corral-rails ~~~ ~.~.~ ._~~ .._ ______._ n Stakes and sticks ~~~. _......... -.- ..__._.._._ ,, Orchard-props -~ . . . ~~~~ ..-_. ~~...-.-.__--.- ,, Fence-posts ..-.. -~--__ . . . . . . -...--pieces Cedar shakes -...- . . . . .._... ~~.. -- ..__...._.__ ,, Christmas trees . . ..__.. --- _._.._.__ n Hewn ties..- -.-.._.- . . .._ _~ - ___. __._ Cordwood . . . .._ _ ..-....... ~.~... -..- . ..___..__.... C&s Fence-posts _..... -. ~.- .~~ .._____ --- ”
Value Per Cent of Total Value Volume
7,079,457 928.6%
5,101,340 240,714 123,990 189,070
24,000 115,337
19,688,069 2.205,OOl
118,226 284
8,774 230 138
$1,948,351.37 I
27.5393 268.892.92 3.8007
27.2622 1,928,750.56 9,219.OO 1,488.OO lpl60.50
312.00 28,844.CMl
1.257,847.00 1,063.166.00
192.81724 3,985.OO
364,107.OO 3,635.OO L932.00
$7.074.807.59
0.1303 0.0210 omo7 0.0044 0.4077
17.7793 15.0275
2.7254 0.0563 5.1465
Mine-props ..-.- -...~.~..~.. .~~.. -___ _____ ” Cedar shakes -...- - .--...---~._ _
0.0514 0.0273
100.0000 Total value...-~..- . . - _.._____ - __.__._._. I.- __---_

104 DEPARTMENT OF LANDS AND FORESTS
(27) TIMBER MARKS ISSUED, 1950-59
1951
1,062 269 218 714 108
3 6
41 2,962
13
2
5,458
1,086
299 514 103 168 125 154 524 530 108 84
9 21
,926
4 7
27 2,587
85 1
66 3
201 T- 4.144
1952 i 1953 ! /
1956 i 19s7
I
I 480 / 320 207 / 108 172 / 97 655 ( 460
82 I 59
696 / 381 201 1 134 204 1 136 538 / 409
62 I 95
528 609 175 218 160 171 485 653
69 95
: 30
2,786 ..-....
44 43 1 6
4,280 4,968 -. 780 - 867
21s 93 93
362 89
80 I
2.855
549 169 165 505
69
Old Crown grants ~..... ~.~~ Crown grants, 1887-1906 Crown grants, 1906-1914 Section 55, Foresf Art Stumpage reservations Pre-emptions under sec-
tions 28 and 29, Land Ad ~~~ .._...... -~~~ ._... ~~.
Timber berths ~~~ . .._...... Indian reserves .~...~ Timber sales ~~~~ . . .
461 23 2,859 ( 2,239
5 8
32 2,591
7”; 10 3 131 24
2,594 I 2,881
98 / 63
3,428 I 4,139
71 / 74 1 I
. . . . . I . . . -f
4,589 / 3,389 I T
669 ’ 598 873 / 615
CROWN-GRANTED TIMBER LANDS PAYING FOREST-PROTECTION TAX (28) AS COMPILED FROM TAXATION RECORDS, 1950-59
I = I coast Interior i -
T Logged Logged Timber
Acres 238,285 271.717 288;046 389,396 429,350 429.037 444,014 433,496 410.037
ACXS
125,883 133.100 146,535 205,503 221,934 236,350 201,264 203,249 191,435 207,308
Acres Acres 71,509 1 66,324
194,640 ) 99,013 88,580 90,934 64,606 63,598 69,822 1 62,411 69,416 67,180 27,692 84,546 29,418 52,121 31,333 49,941
8,635 37.039
1957 ............ ~.~~~.-......._..-......-....~.~-.-..-- .. 614;095 1956 .-.............-.------.---- - 723,103 19s5 .-...~.~.-.......-.....-.~........~~~~~~-...-...~~~~ ..... 783,517 1954 _.___.___. -. .._. -. .......................... 801,983 1953 ............. .-. ......... ~~-. . ..- ......................... 757,516 1952 ......... .._ ............................................. 1 718,284 1951 ..... - - ........................ -. ............................. ; 682.746
378;985
(29) ACREAGE OF TIMBER LAND BY ASSE.SSMENT DISTRICTS
ACES
90,171 800
11,796 2,887
40 33,654
4,032 639
35,460

(30)
FO
REST
RE
VENU
E
Twplv
e M
onth
s to
Tw
elve
Mon
ths
to
Dec.
31,
1955
De
c. 31
. 19
56
$365
.300
.19
19,6
95.5
1 72
23
8.83
313,
865.
18
19,5
38.2
02.7
1 26
0,58
3.65
2,
368,
344.
78
75,2
50.3
2
113,
555.
93
$23.
127,
037.
10
I I I I I I
$369
,821
.07
$365
.193
.26
20,2
45.1
3 19
,486
.74
72.0
36.7
5 70
,455
.47
379
821.9
8 38
0,96
3.43
26
,335
.715
.53
26,3
27.1
50.0
6 25
5,91
6.89
24
5.54
2.40
2.
069,
424.
19
1,83
8,16
2.25
79
,247
.61
69,0
41.1
5 36
4.38
8.20
45
9,3
12.2
6 14
1,47
8.88
15
6,06
0.04
$30,
088,
096.
23
$29,
931,
367.
06
rwelv
e M
onth
s to
Tw
elve
Mon
ths
to
rwelv
e M
onth
s to
De
c. 31
. 19
57
Dec.
31.
1958
De
c. 31
. 19
59
$362
.192
.71
19,3
35.4
8 70
,780
.38
425,
867.
87
21.3
55.8
73.1
8 22
5.79
0.42
1.
719,
957.
61
73.0
93.1
6 50
0,91
4.85
13
2,91
7.72
$24.
8116
,723
.38
$362
,825
.25
19.9
10.6
1 70
.094
.39
435:
589.
31
23.0
9X73
7.28
25
2,98
5.19
1.
890,
590.
96
86,5
06.2
9 51
0,66
1.47
12
1.28
7.96
$26,
843,
188.
71
I I i
$373
,290
.55
20,0
34.7
2 63
02
2.08
271,
346.
10
17,2
73,2
41.5
1 18
1,36
8.71
2,
069.
635.
47
86,1
65.8
8
96.4
50.1
9
$20,
434,
555.
21

(31)
AM
OUNT
S CH
ARGE
D AG
AlNS
T LO
GGIN
G OP
ERAT
IONS
, 19
59
Roya
lty
$1.4
18.3
65.4
9 18
1,78
6.06
57
.761
.07
128,
414.
54
97J2
2.26
1 .X8
3,84
9.42
$1,6
56,5
22.X
6
$1,X
88,0
13.1
4
‘$2,1
53,8
63.6
5
$2,3
52,6
34.4
6
$2.2
34,3
08.?
9
$2.2
61,1
X3.3
$
$2,0
97,0
I 1.
42
$222
69.34
8.68
$2,4
66,5
28.2
3
$2,1
26,3
36.4
2
I
-
GOVN
I- Sc
aling
Fu
nd
Seim
re
Fore
st
Silvi
cul-
Fore
at
mer
it Re
serv
e 3x
pens
es
SC&l
g +r
EEt
ture
De
velop
Expe
nses
Sc
aling
Ex
pens
es
sEzg
Tota
l Fu
nd
mer
it Fu
nd
--,- $2
07.50
’ $1
,771
.44)
$196
,814
.29j
$950
,889
.9X
112.9
0 90
3.351
11
,482
.421
62
,407
.54
I 1,
673.
501
/ ~.
. . .
. . -.
;;;:S
;l 3,
653.
56/
~.
~~.
1~~
~~..~
...~~
~ . . . . .
&
X89.
00
) ~.
._
$1,4
30.5
4/
$8.8
90.8
5/$2
08,2
%.7
1/$1
,013
,297
.52
$3,8
77.6
71
$9,8
42.4
$$16
9,51
7.28
1 $7
88,9
29.5
3 .._
__
$3,7
15.5
5/
$12,2
15.30
1$21
2,273
.831
$909
,138
.97
$810
.22)
$1
1,19
6.9X
)$21
6,05
0.36
) $7
79.1
04.1
5
$765
.881
$10.
258.
85~$
176.
151.
17~
$452
,171
.32
$1,3
93.0
7/
$9.2
91.0
3/$1
44,5
89.2
lj $5
56,7
79.3
9
$1,1
34.9
91
$X,5
78.3
0~$1
26,6
13.3
2~
$552
,705
.46
$2.0
75.4
0/
$10.
043.
93,$
119,
689.
20(
$555
,735
.85
$720
.211
$4,S
X9.3
7~$1
03,3
02.8
7~
$444
,068
.21
.-~
$733
.181
$4,X
71.5
8/$1
00,5
55.3
0/
$376
,945
.27
$1.6
65.6
7 I
I I
$9,0
07.X
6 $1
57,70
3.921
$6
42,X
87.5
6
$X,X
30,6
39.9
2/
$338
,002
.86/
-..
.._
.~ . .
._...
1,
580,
3X0.
621
.~
) 11
1,33
1.57
.
..~.
$57.
X61$
11,7
36,7
49.3
4
3,85
1,11
3.38
/ 16
5,33
2.24
~.
.~~
.~~~
..~
~~~~
. ~.~~
.~ /
5,26
2.11
1 1,
953,
666.
57
..~
/ 11
7J74
.241
4,19
3,05
4.43
6,
256,
870.
021
252,
943.
81/..
~-
~.
2,61
0,62
4.97
1 15
3,03
5.09
1 ~.
~.~
~ ~.
~~~
~. ~
. I
31,7
77.4
8/
6,67
4,58
1.31
/
44,4
44.9
81
2,90
6,70
4.54
$2
3,12
9.62
8.91
~$1.
020,
645.
57~
._..
~.~~
1$
198,
716.
671$
27,4
64,7
56.1
9
$20,
385,
679.
74/
$970
,108
.77/
.~
.__.
_._.
..-.
~. ~
~~~~
~~.~
~..~
~~
/$13
9,09
1.73
~$24
,123
,570
.03
$26,
163,
3X7.
79/
$939
,036
.10/
...-~
.
. . . . .
. ..
_....
......
. /$
131,
384.
091$
30,2
59,1
64.7
7
$2X,
X28,
870.
26)
$915
.277
.46)
.-..w
. . .
. ..-.
...
$316
,796
.43)
$182
.552
.57~
$33,
404,
522.
08
$19,
950,
410.
73/
$817
,677
.771
+ .
.~..
$891
,076.6
51
$71,
861.
56~$
24,7
23,0
18.3
9
$14,
596,
633.
951
$5X6
,983
.411
.-~.
$1,1
63,5
96&I
/ $3
2,78
5.07
1$19
,326
.360
.56
$14,
961,
152.
261
$453
,745
.791
.--...
.-.---
-. $l,
C66,
676.
88~
$22,
501.
38/$
19,4
54,2
91.7
7 -_
_ $1
4,95
0,X9
5.47
( $4
21,9
24.4
X/$1
2,00
8.53
$1
53,75
2.261
$8
,871
.32~
$18,
332,
0@7.
86
$10,
151,
067.
981
$358
,394
.681
$33,
9X6.
75
$93.
127.
151
____
_--
~~~.
~~
.._..
~.~~
~~1$
13,4
58,9
OS.
90
$6,2
61.5
42.M
$2
53,4
X6.0
41
. ..-._
_.__
...
$694
.948
.82)
$li.9
~7~$
~3,7
28.0
0~
~~..
-
..~~.
~$
10,1
63,1
25.2
6
I I
I 1$
22,0
70,9
72.2
X
NoTF
..--”
Tax
” co
lumn
prev
iously
sh
own
now
com
bined
un
der
“ Ro
yally
”
head
ing.

(3.2
) AM
OUN
TS
CHAR
GED
AG
AINS
T LO
GG
ING
O
PERA
TIO
NS,
FISC
AL
YEAR
19
58/5
9
Dist
rict
Roya
lty
=
GO
VWII-
Sc
aling
Fu
nd
Re?t
als,
Silvi
cul-
Fore
st
Seizu
re
mer
it Cz
;fgF
Expe
nses
SC
ilk
stum
page
ExPe
”ses
Ex
pens
es
tising
, tu
re
Rese
rve
Fees
‘*ie
Fund
Ac
coun
t
‘I i
‘I ‘I
I I
I I
$1,3
05,6
00.4
5/
$221
.90
$l,48
2.62j$
lR0,2
65.54
j$810
,152.l
3i $8
,447
,615
.80
$318
.964.8
4’ ~~
~~ ~~
~~~
. .._
. j ~~
. 16
3,88
0.76
\ 60
2.36
60.1
13.3
21
381.5
61
9,46
8.05
/ 47
.203
.90)
1,
493,
659.
22
118,
170.
12
.__.
......
.._
___
I.....
...
38.0
0 2,
266.
M
~.
3,48
7,67
3.22
10
3,92
1.88
) 92
1.07
3942
1.91
5,27
8,11
5.80
90
,819
.36[
12
4.00
819.3
01
~~~
2,33
2,45
9.82
I_
_.._
__-
$1,7
24,3
35.7
7/
$1.9
07.3
3 $8
,371
.391
$189
,733
.59/
$857
,356
~~
$980
,609
.33/
....
.~~.
~.
I...
......
......
....
-~-~
__
-- $1
,876
,624
.77)
$5
,652
.05
$12,
765.
99~$
200,
348.
04l$8
90,5
47.8
2~$2
4,86
0,33
3.41
$9
30.78
0.331
.
.._...
..___
. I _.
.. __
_._.
__.._
-_
____
-~..
__~_
_ -_
__,
$2,1
00,5
95.6
0)
$980
.14
$11,
837.
04j$2
23,1
10.6
5~$8
25,2
45.6
9~$2
9,54
4,63
6.65
$9
17,77
5.181
.._
~.~
.._...
i=
-___
_-
$2,2
83,3
21.7
21
$781
.20
$9,7
97.1
6~$1
76,4
32.5
2~$4
61,4
66.5
4~$2
1.22
.76
$903
,301
.94~
$1,1
14,1
31.6
2~
. . .
. . .
__
_-
__-
$2.3
16.7
36.1
11
$740
.25
$10,
465.
61($
151,
213.
86~$
550,
878.
38($
15,7
74,3
17.4
6 $6
09,9
94.4
1~$1
,018
,9Ci
b.39
~ ._
......
..._.
._
$2,1
51,9
85.5
8)
$1.6
20.0
6 $7
,862
.82~
$123
,420
.80]
$523
,584
.391
$13,
672,
473.
41
$408
,143
.52~
$1,0
77,4
46.4
7~
. .
__...
....
$2,0
94,4
96.3
7/
$2,0
42.1
5 $1
0,73
4.56
~$11
8,79
4.61
~$52
5,39
1.14
~$15
,17S
,379
.22
$289
,757.8
91
$381
,467.6
21
$8,9
91.4
1 __
-- $2
,316
,222
.37(
$8
56.75
$5
,179
.84)
$110
,524
.80~
$527
,790
.82~
$11,
596,
883.
33
$261
.783.4
01
‘$6.0
25.1
71
$37,
003.
87
$2,5
69,1
93.7
6/
$756
.14
$4,8
72.8
5~$1
08,5
94.6
5~$3
99,8
34.ti~
~~i~
.~~
$265
.649
.10)
$6
63.4
75.8
51==
~_
__.
___-
$2
.543
.634
.821
$9
32.34
$5
.351
.541
$9
2.195
.041$
288.1
18.35
1 $4
.950
.699
.50
$209
.680.2
31
$482
.808
.181
.....
. . . .
. .
$2,1
97,7
14.6
9(
$1.6
26.8
4 $8
,723
.88;
$149
,436
.86/
$585
,02L
32;$
16.4
42,0
36.8
3 $5
77,7
47.5
3)
I
I I
I 1
I I
I -
1
= - :. : : I -
Fore
st
Deve
lop-
men
t Fu
nd
$1,2
90.6
; 11
1,35
0.5:
22
,561
.2!
4,47
9.7t
$139
,682
.22
$137
,679
.6t
-~
$176
,767
.5t
$115
.441
.0~
$46,
371.
7!
Tota
l z ;1
1,06
4,30
3.28
P
1,83
4,65
6&I
rl 3,
810,
007.
02
0 5,
660,
175.
67
q 2,
572,
376.
9’2
;24,
941,
519.
53
8
628,
914,
732.
07
____
i?l
;3
3,80
0,94
8.51
3
____
;2
6,34
9,69
6.54
__
_ .-
320,
479,
627.
22
%
___-
El
7,96
6,53
7.05
-_
__
5 ;1
8,6@
7,05
4.97
5
~--_
_ 61
4,85
0,22
0.01
,J
El1
033,4
75
13
tiib
g 2 62
0,55
1,50
5.60
NOTL
--”
Tax
” co
lumn
prev
iously
sh
own
now
com
bined
un
der
“ Ro
yally
”
head
ing.

108 DEPARTMENT OF LANDS AND FORESTS
(33A) FOREST REVENUE. FISCAL YEAR 1958/59 Ten-year Average
Timber-licence rentals and fees $357,213.39 $378,577.09 Timber-berth rentals and fees .~ .~.. ~~~ ~... 19,244.08 17,971.37 Timber-lease rentals and fees ~.....~~~~. .~~~ 69,364.69 60,008.88 Timber-sale rentals and fees ~~~~ _...~~~~.~ ..~~~ 423,430.93 235,909.35 Timber-sale stumpage ~~~...~~~~ .~~.~ ~~~... 21,529,804.34 14,820,807.05 Timber-sale cruising and advertising ._....~ 225,693.62 155,446.36 Timber royalties ~.~~~ ~~~~_~~~ ~.~..~. 1,754,344.26 2.198,680.84 Grazing permits and fees ~~~~ ~~~ 71.919.21 7 1,468.27 Forest-protection tax .~~~~~~ .~~~~~~.....~~~~.~~...- 512.614.84 (1) Miscellaneous ~~~~ ~~~~~...~~~~~...~...~ 118,186.23 83,959.47
$25,08 1,8 15.59 $18,022,828.68 Taxation from Crown - granted timber
lands .~~~ . . . ~~~~ .-... ~~~~...~.~~~~.~..~~~~~~..~~~~. -... 5 16,669.53 545J93.43 Taxation collected under authority of Es-
qtrimalt and Nnnaiwo Railuq Belt Land Tax Act ~..~ .~~~~...~ .~~~~~~.~..~~~~~.~~~~~ 738,039.35”
Taxation collected on forest land (section 32~, Taxation Act) .~~.~~~~. ..~ ~~~~..~.. .~~... 609,136.45s
Taxation collected on tree-farm land tsec- tion 331\, Taxation Act) ~~~~~~~.. ~~~~~.~.... 155,087.79~
$27,100,748.71 --_
1 Formerly credited to Forest Protect’on Fund. 2 Collection of this tax has been authorized only daring the last nine fiscal years. ‘3 Collection of this tax has been authorized only during the last five fiscal years. 4 Collection of this tax has been authorized only durmg the last six fiscal years.
13381 FOREST REVENUE BY FISCAL YEARS, 1949/50 TO 1958/59
Fiscal Year
Taxation Col- Taxation Col- Taxation from lected under lected under
DiE&Gp”OUfst Crown-granted Sets. 32~ and Authoritv nf E. & N. Rail- Total
Lands 33A of Taxa- tion Act way Belt Land
Tax Act
1958/59 ~..~ . .._ .~~~.~~~~ $25,081,815.59 ; $516,669.53 1957.158~ ~~~~... .~ 29,054,657.56 597,118.52 1956/57 . 31,240,260.37 / 675,079.21 1955/56 ~.~ ~~~ 23.867,705.50 1 681.50326 1954/55 .~ ...~~~~~~ .~ ~.. 19,130,835.31 1 621.527.16 L953/54 ..~~ ~.~.. .~~ ~~~...~.~~~... 17.578.625.58 I 612.865.29 1952/53 .~~ . ~~. ~~~.. 18,016,025.17 588.821.78 1951/52 . .._............ ~~~..~ ..~~ 13,703,715.41 484,475.51 1950/51.~ ._......._. .~~ ~~~~~~ 10.089.884.69 440,213.07 1949150 .~~~~~....~.~.~ -- 8,331,497.19 445,632.68
$764,2?4.24 $738,039.35 883,674.75 1,060,884.36 685,611.49 1.147.535.38 532,010.OO 940,632.27 518.648.74 879.822.00
863,116.21 418.395.59 972,156.13 345,220.16 - . ..-.. ---
. . . . ..-... --
$27,100,748.71 31,596,335.19 33,748,486.45 26,021,851.03 21.150,833.21 19.054.607.08 19,023,242.54 15.160.347.05 10,875,317.92
8,777,129.87

REPORT OF FOREST SERVICE, 1959 109
(34) FOREST SERVICE EXPENDITURES, FISCAL YEAR 1958/59’
Forest District I Salaries Expenses Total
VXW3UVer~-...~...~~ . . . . ~~.~ . . . . . . . . . . . . . . ..-. ~.-.-..~ . . . --___ $522,387.31 $167,865.24 Prince Rupert ..~ .._.-.. ~~-~...~-.~...- . . . . -~ . . . . . . . . . . . . ..__ - 337,181.65 110,507.59 Prince George .~~~~ . . . . . . . . . .._ . . . ..__. ~- ._._... . . ..__ 390,131.36 119,881.89 Kamfoops...- -~~.._~~ ~_..~~-..-~~~ . . . . . . . . . - . . . . . . ..___ 505,278.69 129,321.02 Nelson . . . . . . ~...~ ._. ~.-...~.~ . . . . -~~-..~ . .._ ~..~_~ . . . . . .._._ _... 406,563.38 101,504.17 Victoria .~-..~~.~~...~ . . . ~~...~ ..__. - . . .._.. . . . . . . . ~...~ .._... 259,188.86 299,421.09
Totalsm . . . . . ..-. ~..~..._.~..._...~ . . . . ..-.-... --- . ..-____ - $2,420,731.25 $928.501.00
$690,252.55 447.689.24 510;013.25 634.599.71 508,067.55 558,609.95
$3.349,232.25
450,105.23 420,240.37 166,868.Ol 93.545.69 93,147.74 10,000.00
27,551.57 1,255,862.24
898,488.88 2,497,702.98 1,078,517.85
55,838.31 1,897,497.62 4,913,670.17
26,767.64
$17,235,036.55
1 True gross expenditures. 2 Separate statement provided in this Report.
(35) SCALING FUND
Balance for April lst, 1958 (debit) . ..-. ....... _ .................. .._. -.~. ..... . $209,492.79 Collections, fiscal year 1958159.. ............ .._ ........... . ... .................. . 1,031,227.78
$821,734.99 Expenditures, fiscal year 1958159 ._... ~~-~.~ ~~. $1,080,698.87
Less refunds . .._ ~.~ -....... .._.. ~...~...~ . . . . . . . ~. 1,015.15 ~ 1,079,683.72
Deficit, March 3 lst, 1959 (debit) -~~ ~~~ -...... . .._.. ~~.~ ~.~~...~-... $257,948.73 Collections, nine months, April to December, 1959- . . . . . . 962,094.56
$704,145.83 Expenditures, nine months, April to December, 1959- . . . . ~.~ . . . . . . ~. 880,476.13
(36)
Balance, December 31st, 1959 (debit) . .._....... _.... ..___._ ..__. ____.. $176,330.30
GRAZING RANGE IMPROVEMENT FUND
Balance, April lst, 1958 (credit)) ~~~ . . . . . . ~~..-..~.-- . . . .._. ._........... $28,679.60 Government contribution (section 14, Grazing Acr) . .._~~_..~.~.. 34,888.93
$63,568.53 Expenditures, fiscal year 1958159 . . . . . . . . . . .._. ..- ~_ $55,858.31
Less refunds .~~.-_.. . . . .._._......__..._....-...... - -- ._._. 37.50 55,820.8 1
Balance, March 3 lst, 1959 (credit) -- . .._... . . . . . . . . .._... . . . . . . . $7,747.72 Government contribution (section 14, Grazing Act) . . .._..... 35,959.60
$43,707.32 Expenditures, April lst, 1959, to December 31st, 1959 . . . . . -.~~ . . . . . . 34,008.20
Balance, December 3 lst, 1959 (credit)-..--.- . . . . . . . . . .._............. ~_._ $9,699.12

=:
0
(37)
FO
REST
-PRO
TECT
ION
EXPE
NDIT
URE
FOR
TWEL
VE
MON
THS
ENDE
D M
ARCH
3lw
, 19
59,
BY
THE
FORE
ST
SERV
ICE
Un’fo
rms
Tools
an
d Eq
uipm
ent
Fire
s
-
Airc
raft
Plan
ning
and
Rese
arch
Haza
rd
Redu
ction
$22,
518.
89
_.._
_~~~
$2
2,51
8.89
Salar
ies
and
Expe
nses
__
_
Tem
pora
ry
$288
.989
.58
142,
519.
27
169.
214.
96
286,
374.
98
292,
893.
83
15,3
23.1
4
1,19
5,31
5.76
-
1 M
iscel-
ht
lCO
US
Tota
l Il?
lprOV
C-
mer
its
$769
,05X
.67
$19,
434.
47
583.
359.
88
51,0
07.n
1,
971,
894.
51
WJ8
6.38
62
2,44
3.21
80
,235
.54
819.
344.
24
75,9
76.9
9 14
7,56
9.66
44
,488
.35
;4,9
13,6
70.1
7 $3
51,5
28.&
X8
Dist
rict
Perm
anen
t
$32,
870.
70
41,0
77.1
7 13
,463
.54
52.6
77.8
3 57
.410
.67
21.5
54.9
4
$279
,054
.85
NCW
$624
.36
1,31
0.68
2.
193.
66
1.97
6.74
I ,
989.
Ol
359.
536.
11
6367
,630
.56
- ..-
-
$27,
649.
30
27.2
26.8
2 32
,622
.54
41,9
13.7
9 49
,229
.33
21.2
92.8
4
;199
,934
.62
Vanc
ouve
r ~~
.. Pr
ince
Rupe
rt Pr
ince
Geor
ge
Kam
loops
~~
. Ne
lssn
Victo
ria
$1.7
04.7
0 2,
486.
70
2,67
8.21
5.
239.
92
5,24
0.87
3,
2%.6
3
$20,
647.
03
$2,2
77.1
2 j$l
,l42,
608.
90
2,51
5.21
1
851,
502.
88
2.68
5.54
I
2.33
5.13
9.34
$2,4
99.6
5
-$2,
499.
65
1;50
2.73
j
1,09
2,36
4.74
1.
437.
13
1 1,
303,
522.
67
14.9
01.5
6 1
6863
234.6
2 -$
25,3
19.8
9 1$
7,41
1,37
3.15
I
I I T
$33,
252.
85
$33,
252.
85
9 -.
3 -

REPORT OF FOREST SERVICE, 1959 111
REPORTED APPROXIMATE EXPENDITURE IN FOREST PROTECTION (38) BY OTHER AGENCIES, 1959
Expenditures
Forast District Patrols and Len 1 ~&$~~~~ / Fires 1 Improvements 1 Total
Vancouver.- - . . . . . . -~ .._... $126,425 Prince Rupert.-- ._........_.. - . . ~,~ Prince George- ____... ._.. _ ~~~. 32,000 Kamloops.-.-- ._.......__..-.._. - . .._. - 32,500 Nelson . . . . .._.._.....-.... -.-..- _.._......... 18,900
~ ~- Totals-..-- _.._ -__- .._........ $234,225 Ten-year average, 195&59 pm_ $277,874
$248,760 $41,245 $196,800 $613,230 47,765 898 67,300 140,363 ~woo 20,120 120,ooo 184,120
170,000 10,166 611,000 823,666 49,668 26,581 22,954 118,103
$528,193 $99,010 $1,018,054 $1,879,482
$381,626 q345,478- $212,457 $1,217,435
(391 SUMMARY OF SNAG-FALLING, 1959, VANCOUVER FOREST DISTRICT
ACreS Total area logged, 1959 . . . . . . --..~~~~~ . . . . . . . . . . . . . . . . . . . . . . . . .._.... ~.~. ~~~~~~~... 72,392 Logged in small exempted operations’..--. -.- .-~~.-~~ .~~.~ 308 Assessed for non-compliance, less 833 acres subsequently felled 1,350
- 1,658
Balance logged acres snagged, 1959-.~~~~..- ._.......................... ~~~ 70,734 Snags felled in 1959 by Forest Service Protection Division~~~.....~......... 5,388 Snags felled in 1959 by Forest Service Reforestation Divisions........... 1,077
Total area snagged, 1959 .._......... . . . . . ..____...._..... . . . . . . . . . . . . .._ __._.. 77,199
’ Exemption granted under subsection (3). section 113, Forest Act.
(40) SUMMARY OF LOGGING SLASH CREATED, 1959, VANCOUVER
FOREST DISTRICT Acres
Total area logged, 1959.--.-~ . . . . . . . . . . . . . . . . . . . . . . . . -~ _... -...-...~_~.~ . . . . . . . . . . . . . . -.~~-.-.-_.. 72,392 Area covered by full hazard reports ~~~~~...~ ~~.~..~~~~ ~~~~ 34,222 Covered by snag reports but exempted from slash-disposal-L 26,571 Covered by acreage reports only (exempted from slash and
snag-disposal) I . . . . . ~~ . . . . . . . ~~ . . . . . . . . . . . . . . -.-...- ~---- ..___. ---... 308 - 61,101
Slash created and not reported in 1959..---- . . . . . --- . . . . . . . .._ _...._._ 11,291 -
’ Exemption granted under subsection (31, section 113, Forest Act.

112
1411
DEPARTMENT OF LANDS AND FORESTS
ACREAGE ANALYSIS OF SLASH-DISPOSAL REQUIRED, 1959, VANCOUVER FOREST DISTRICT
1959 reports not recommending slash-disposal ~~~~.~~.~ ..~.~..~... 26,57 1 1959 slash on very small operations exempted without special
examnation .~~~ . . . .._ ~~..~~..~~.~.~ ~~~.~...~~~~ . . . . . ~~~~ .-._.... . . .._.. ~~~ 308 - 26,879
1 Above table does not include the estimated 11,ZYI acres (see Table 42) created too late to be dealt with in 1959.
(42) ANALYSIS OF PROGRESS IN SLASH-DISPOSAL, 1959,
VANCOUVER FOREST DISTRICT ACKS.
Total disposal required (see Table 41 ).-..---...--..- ~...~ ~.~~~ ~~~~. 34,222
Type of Disposal Acres of Slash
Prior to 1959 1959 Total Acres Spring broadcast burning ...~~~~ . . . . 541 _..... ~~.. 541 Spring spot burning . . . . . ~~~~~...~~ .~~~~-.. 1,176 1,176 Fall broadcast burning ~~~ ~..~~~ 2,502 4,013 6,515 Fall spot burning .~~~..~~..~~~ . . . ~...~~...~.. 8,633 9,437 18,070
- - Total burning completed ~. 12,852 13,450 26,302
Burning by accidental fires .~. ..~~~ . . . . . . . . .._... . . . .._. ~~~-...~..~~ 566 Lopping, scattering, land-clearin g, etc. ~........_~~~......._~........~. ~.........
Balance reported slash not yet abated ............................... ._ ................... 7,354 Slash created, 1959-acres assessed ...................................................... .......... Plus slash created too late to be dealt with, 19599.. ............................. 11,291
Total area of slash carried over to 1960 for disposition*.... 18,645 -
’ Does not show the acreage instructed in 1959 to be extended or assessed in 1960. Actual area burned in spring spot burning, 78 acres. Actual area burned in fall spot burning, 1,928 acres. The above figures do not include 1958 slash-burn reports received too late for inclusion in 1959 Annual
Report, 1,052 acres.

REPORT OF FOREST SERVICE, 1959 113
SUMMARY OF SLASH-BURN DAMAGE AND COSTS, 1959, (43) VANCOUVER FOREST DISTRICT
Total acres of forest-cover burned in slash fires, 1959-- . . . . . . . . . . . ..-- ~... Nil
Net damage to forest-cover ..___... -...~- _...... ~- . . . . . . . . ..___....... Nil Net damage to cut products . . . . . . . . . . . . . ~~- ~.~.~~~~ --~~.. $850.00 Net damage to equipment and property ~~..~ . . .._ ~~-- . . . . . . ..__ - ..__ 3,580.OO
Total damage . . . . . . . . . . . . . . . . . . . . ~~_~~~~~~ ~~~~...~~ $4,430.00
Cost of Slash-burning as Reported by Operators
CM”“:, p;.r cost per Total cost ACES ACX
(a) Spring broadcast burning......~ $1,843.85 (b) Spring spot burning . . . . . . . . . . .._.. 1,798.OO (c) Fall broadcast burning . . . . . . . . . . 33,139.68 (d) Fall spot burning . . . . . . . . . _._..._.. 41,160.59
(a) and (c) based on volume of 40 M b.f. per BCTC. (b) and (d) based on volume of 30 M b.f. per acre.
541 $0.09 $3.39 1,176 .05 1,53 6,515 .13 5.09
18,070 .08 2.22
(44) FIRE OCCURRENCES BY MONTHS, 1959
Forest District 1 March ( April 1 May 1 June ( July
Vancouver ~~..~.~...~... Prince Rupert Prince George -............. Kamloops . . . . . . . .._ ~... Nelson - . . . ~-.~ _... -._~
Totals 78 I 174 1 424 1 304 1 663 Per cent 3.9 1 8.7 / 21.1 / 15.1 1 33.0 Ten-year aver-
age, 195cL59 24 / 77 1 388 1 238 1 543 Per cent 1.2 I 4.0 / 19.9 1 12.2 1 27.9
I i i I 128
6 18
21 I
1 826 / 41.1 ----
1 Ix:: I 49 I 2.4
207 I 10.3 74 / 16 .-- ( 651 j 32.4 981 4 / 277 / 13.8
324 1 42 1 1 1 2,010 1 loo.0 16.1 1 2.1 1 .-... 1 100.0 1
I I I I 450 I 191 \ 37 / 1,948 / .~.-
23.1 / 9.8 / 1.9 I I I lcwJ.o I ------
(45) NUMBER AND CAUSES OF FOREST FIRES, 1959
Forest District
Vancouvercy.. .. .._ ... - 34 33 Prince Rupert ... . ..- ........ Prince George.-.-- ..- .... :I :i KamIoops ........ - ..-. ......... 26
I 71
Nelson--.--. ...... --. ...... 72 19 - 172 - 8.6
Totals.- . . .._........ -.~ -iq- Per cent ..-...-......... 9.2 I
Ten-year average, I 1950-59 ~~~ -... 462 1 216
Per cent ..-.-......... 23.7 1 11.1 I
548 1
3: 37
624 31.0
456 23.4
651 16
71 3 12 1 22 81 1 18 461 16
211 1 75 10.5 1 3.7
264 / 87 13.5 1 4.5
I
4 29 34
1.7 -
86 12 42
278 25
443 22.0
25 233 1.3 12.0
14 826 1 3 2:
10 651 5 277
33 i 2,010 1.6 1 100.0
I 46 1 1,948
2.3 100.0
41.1 2.4
10.3 32.4 13.8
100.0 -.-.
1 Uncontrolled range-burning fires. 8

114 DEPARTMENT OF LANDS AND FORESTS
NUMBER AND CAUSES OF FOREST FIRES FOR THE
LAST TEN YEARS (46)
CaUSeS 1950
Railways operating ~~~ -...I 197 Smokers ..~ . .._ _ . . . .._ ~-...~ 291 Brush-bumine (not railwav-
line construction - Industrial werations -..-.~
25 94
Incendiari& ~-~- ~-...~.~.~~~- 7 Miscellaneous (known causes)~..~ 196 Unknown causes~-.- 35
Totals .___ ._.___...... -~~ 1,515
1951 1952 1953 1954 - - - 574 431 597 116 228 298 174 157 211 255 184 118 354 349 171 120
128 140 47 63
1:: 28
205 42
,923 I -i -
1::
2::: 36
,914 I1 -
10 83 10
116 28
,420 i -
11 64 12 82 21
764
I -!-
-ii L
1955 1956 -
418 497 195 214 206 1,090 206 281
47
24 89 15
134 50
,384 p -
112
1::
2:: 73
1,810 1
-
- 1957 1958
307 1,150 170 296 455 1,224 182 478
65 120
46 18 107 246
22 53 220 441
45 94
,619 1,120
-
1959
184 172 624 211
75
30 204
4% 33
,010
I I-
!-
Total
4,616 2,155 4,564 2,643
874
274 1,317
245 2,334
457 19,479
1 Uncontrolled range-burning fires in 1959.

_I’b 08-
9'b
E6 --- 01
OS
zz E 8
poor
8'6 6'9s S'IZ 9'Z 2'6
-T- . . . . . .
O’O
OI
LX1 8'EZ 6'S 6'1 L'PE
/ CI6
k'b
16 1 LLL‘I
P’S /
0'06
501 1 806‘7
)I LSZ
15 ISE
1E PSI
; Ib
:r 508
$y-
PVZ‘I _ 9’L9
6SE‘I
981 PZE D8 9z EPL
2'6
K .L'6
.X- 61 III Zb s 81
E’PZ
ELb
O'O
Z - ZO
P
IL b61 SS 11 SY
-
3 8
-
0'001
jp6'1
0'001
OIO
'Z
LLZ IS9 LO
Z 6b 928
YSZ 8’6Z 9’9Z L’PE 6’L
- -
~~JJVOI
01%
6~61 ‘m
vpwa
aw 3zis A8 am
rssvm
smd

116 DEPARTMENT OF LANDS AND FORESTS
(48) DAMAGE TO PROPERTY OTHER THAN FORESTS, 19591
Forest District
Forest Products in Pr$a;;-of Buildings R:ilT?y Miscel-
Logku IaIleOUS Total FT%Y
facture Equipment
$22,600.00
89.00 59,900.OO
100.00
$82.689.00
I 1 $3,000.00 / $172,550.00
5,300.oo / 500,000.00 2,ooo.oo 1 20,310.OO
40,300.OO I 2o,OlNoo 2,075.OO / ~~...~ -..
I $52,675.00 1 $712,860.00
$885.00
1,500.Oo 18,960.oO
$21,345.00
$199,035.00 / 22.9 505,300.OO 1 58.1
23,899.W , 2.7 139,160.OO / 16.0
2,175.OO 1 0.3
$869,569.00 I 100.0
9.5 , 6.1 1 82.0 2.4 i 100.0 / -.~~. $150.436.00 1 $28,742.00 1 $242,902.00 $31,102.00 1 $453,182.00 / ~.
33.2 ~ 6.3 53.7 6.8 1 100.0 ~~~~.. I 1 I I
1 Does not include intentional slash-burns. (For this item see page 112.)
(49) DAMAGE TO FOREST-COVER CAUSED BY FOREST
FIRES. 1959-PART I’
Forest District
Accessible Merchantable Timber Inaccessib$m~~chantable Immature Timber
Acres 72
303 265
6,326 678
7,644
2.8
19,196 I 4.4
?
MB.F. j MB.F. 772 1 359 604 I --___
50,232 I 12,659
98.7 25.2
I 217,551 ! 96,515
75.6 I 44.4
22,997 ~ 234 / 455 59 j 1,974 j 52,714
132,001 1 2.51 I 655 63 ) 67,885 /1,048,243
9.8 0.1 1.3 0.0 / 24.8 I 78.1
I I 1 ! 498,797 i 18,417 ‘i 70,201 13,353 j 45,771 i 627,156
38.4 1 4.2 / 24.4 1.0 I 10.4 ’ 48.2 I I I
1 Does not include intentional slash-burns. (For this item see page 112.)

(49)
DAM
AGE
TO
FORE
ST-C
OVER
CA
USED
BY
FO
REST
FI
RES,
19
59-P
ART
111
Not
Satis
factor
ily
Resto
cked
Fore
st Di
strict
Non-c
omm
ercial
Gr
azing
or
COW
* Pa
sture
Land
Gr
and
Tota
ls
zi
I I
Acres
/
MB.
F.
1 $
1,832
(
912
1 45
,908
8,069
1
604
1 11
.558
188,2
92
/ 49
8 1
338.4
98
70,65
9 1
44,59
5 1
865,8
04
4,119
/
4218
I
81,08
1 !73
,631
1 50
,887
1 1,3
42,84
9 10
0.0
1 10
0.0
/ 10
0.0
139,2
68
) 28
7,752
1
1.299
.801
100.0
I
100.0
/
100.0
I
I
- - f I
Burne
d. No
t Lo
gged
Acres
/ I
1,920
I
25,75
8 /
3,383
1
219
( -31
,280
/ 11
.4 I
--30,2
41
I 6.9
/ I
Area
Da
man
: Bu
rned
Acres
150
2.020
13
4,964
3.4
63
1.118
14
1,715
51.8
202,5
08
46.1
Dam
age
I- L I I I
\cres
565 24
1
848
776 143
3;356
1.2
6,748
1.5
609 81
3
723
-~
0.3
2,193
0.6
$ 27
.234 84
0 23
,286
69,50
5 4,9
58
125,8
23 9.4
89
,651. 6.9
$ AC
WS X2
8 4
s 32
1 17
9 4.8
94
391
262
8 23
6
$ 34
50
5 3
1.763
I77
6 27
8 33
,456 2.5
5
1.498
4.0
ACES
2 15
4,690
6,2
95
174
11
236 4.1
35
810.
8.2
$ 203 830
1.544
37
67
2,681
0.2
17 3
67
1.3
582
9,541
-__
0.0
3.5
1,919
77
,784
0.2
17.1
- -__
-A-
1 Do
es
not
includ
e int
entio
nal
slash
-hum
s. (F
or
this
item
se
e pa
ge
112.)

118 DEPARTMENT OF LANDS AND FORESTS
FIRE CAUSES, AREA BURNED, FOREST SERVICE COST, (50) AND TOTAL DAMAGE, 1959
CaUSeS
Lightning -- . . . . . . . . . . ~..- . . - - Campers-..- .-._..__ ---..- - Railways operating..- -- . . . . . . .
= I
Smokers.--- - -...- . . . . . .._... Brush-burning (not railway-clear-
ing) - ._....__....__ -_.~~..~. Road and power- and telephone-
line construction.. ._... - Industrial operations---~~.~.-.-- Incendiarism . . . . . . . . .._... ~.~~~ - Miscellaneous (known causes)l... Unknown causes ._..............__._... -_..
Totals . . . . . . . -- -.~~~ .--_..
-
-
Fire Causes
Number
184 172 624 211
15
30 204
34 443
33
2,010
- I T-
I
Per Cent Acres
9.2 93,7s4 8.6 35,754
31.0 243 10.5 924
3.7 3&087
1.5 1,895 10.2 1,678
1.7 227 22.0 108,944
1.6 125
100.0 273,631
Area Burned Forest Service cost
Per cent cost Per
Cent
34.3 $178,182 13.1 25,122
0.1 1,057 0.3 56,790
- ,
T 23.2 3.3 0.1 7.4
11.0 11,496 1.5
82 0.1
39.8 0.0
100.0
14,294 40,134 20,802
418,360 1,847
$768,084
1.9 5.2
5::: 0.2
100.0
= I -
-
7 -
Total Damage
Damage Per Cent
$56,845 j 2.6 23::;; 1
19:250
1;::
i 0.9
I 14,038 0.6
28,170 I 1.3 894,533 1 40.4
1,910 1 0.1 955,062 I 43.1
6,300 ! 0.3
62,212,418 / 100.0 I
1 Uncontrolled range-burning fires.

9’6E
ZLL
8’LP
096
ZP 8L zs PI VLL
0’001
896 I
__. 0’001
010‘2
LLZ IS9 LO
Z 6P 9Z8
- -
-i- -r i 4 I i -
1’1
zz -- 6’0
s[ 9
9’0
ZI
L’O
PI
1 L E
E’E
59
E’t -- L8
PI 62: IE
0’8P
9E6
S’IP
PE8
zoz 81E 8Pl sz 1PI
p’o9
9Ll’l
Z’ZS 050‘1 SEZ ELS SSl SE zs
Z’El 8’6Z
9sz--- 18s
ETL.zz
OO
’EZP‘OPB
0’001
I’OE
S’OE
9’91 6’L 631 v c 6 F!
S’BS 1 -----
t
Lx I
I’LZ I
9LI’I 9T90E’I
T--- SL’PLL‘I
EEE O
O’SL6
6S Il’E98
PZ OO’BEP’Z
Oo’P80’89L
OO
’RIL‘OEZ
00’ooo‘PEz O
O’IPL‘LZI
00’8P6’09 O
O’LL9’PI
I
652 9SP
-zi- O
S 901
ELI ss
LS L
I
Ll IV
8L I’VE
1 6’28 1 S89
~SI’EOE‘I
656[ ‘~)NI.LH~~x-I-~‘~I~
do m
m
XId .Lso3
(INV ‘NIOIXO
do 33V-Id
‘,mm
sIa .Lsm
ocI A.8
akm1ssv13
smm
(ZS)
i T - i =
119’ZLLO __- P61‘Ett7 LIP’6SEO
SO8’L Z88‘Ll 9PZ‘BP8 SIS’I
OO
I’ES6‘Z$
sZI‘S&s‘l SL6’LIP‘l$ SEZ‘LBl Z9P’S6Z PS6‘O
ZP EZ6‘1 IS61
OS61
E88’tLl$ OS9‘09Z9
611’166$ PSS‘IEI
E69‘PlI PPE‘Z6P
6ZE’EP$ LS6‘SP19
SLL’86P$ -.
~__ LLI‘I
089%
9P1‘6ZI 981%
80E’8
6SL’8LZ 6OE’Ol
SP9‘8E 9OP‘ZSl
P9L OZP‘I
Pl6’1
PS61 I
I ES6 I
ZS6l
____
~zl‘ssr$ ESl‘P9 IL6’06$ S19‘1 9IE’S P69’W
P8E’l SE61
IE8‘6ZS‘LI$ ZZB‘IES’P 6w’866‘Zl$ 6PI’S96 LlS‘LLB‘Z 089‘Z6E’P 6Li7‘61
8Ii+ZIZ‘Z$ 819’SZE‘B$
659’ZI E01‘16S
L88‘OS 968‘8bl’Z
IE9‘ELZ EZP‘S9O’Z
OIO’Z OZI’P
6561 I
8S61 --
ZLZ‘IEP‘IS EO
B’ZLE 69P’8SO
O’I$
98E’LZ OS1’19 8p9’69P 018‘Z 9561
9EZ‘ESZO
POZ‘O
EI ZCO
‘fZIP
EPE‘Z lL9’L
tZL’99 619’1 LS61
I “I-
= ----
SXVBA NELL
.LSV-I NI
SEIXId .LS’illIO
d M
l aTSilk’
BDVRVa 30
NOSI’dVdMO3
(16)

120 DEPARTMENT OF LANDS AND FORESTS
I I* ji)jj; i i -------
/ j ; j j ! I
jm

REPORT OF FOREST SERVICE, 1959 121
(54) ENROLMENT AT RANGER SCHOOL, 1959
Forest District ( Azi$,ts 1 Rangers / ,$$$s 1 $sitlEEt 1 Clerks / Total / “:ke-
VZlCOllV~~...~..- ~- . . . I
Prince Rupert . . . . . . . . . . . . . . . . -~~~ Prince George .._._.._. ~~~ _.......... Kamloops --._- . . . . - . ..___ -.. Nelson ~~~.- . . . . . . . . .-.-.......-.. -- - I 4 4 1 -.
Attendance, 1959 ~~ 4 / .~.. / -~- 1 17 -- 21 ) - Attendance, 1959 I
I --- I 21 Attendance, 19%..... I .~~ i 21 Attendance, 1957- . . . . 4 1 .- ) _- i 26 - ) 30 1 30 Attendance, 1956 - . . . 4 I -~~~ I Attendance, 1956~ ~~..~ , Attendance, 1955 Attendance, 1954 Attendance, 1953 ~~~~~~~~ -- 1 -. Attendance, 1953 ~~~ ; Attendance, 1952 .~ Attendance, 1951.~~ ~~. Attendance, 1950 .~~~~~.~ Attendance, 1949 ~~~ ~ Attendance, 1948 1 Attendance, 1947 , Attendance, 1946~...--.. 1
NOTE.-Commencing with the class of 1949-50, each class takes one and onehalf years to complete the course.

(55)
MOT
ION-
PICT
URE
LIBR
ARY,
19
50-5
9
STOC
K RE
CORD
S
15
15
14
17
80
9 8
3 24
9
6 3
8 15
77
4 1
II 80
64
16
71
I
12
79
64
...--_
____
_-
I A-
I CI
RCUL
ATIO
N RE
CORD
S
Numb
er of
loans
m
ade
durin
g ye
ar ~.
.~~
~~~.
Nu
mber
of film
loa
ns
durin
g ye
ar (on
e film
loa
ned
one
time)
Nu
mber
of sh
owing
s du
ring
year
Numb
er of
audie
nces
- Ad
ults
Childr
en
Mixe
d ~~
.
Tota
ls .~
416
1,046
1,8
80
26,98
8 95
.102’
43,28
2 16
5.372
1
461
492
1,057
1,2
18
2,943
2,1
64
13,54
2 13
,655
264,2
45’
157,0
85”
26,70
6 59
,182
-_~
~-
304,4
93x
I
234,3
96e
.- 49
0 42
2
1,158
1,4
14
2,288
2,6
64
12,64
0 12
,333
118,6
22?
102,0
13*
43,09
9 54
,069
174,3
67’
168,4
15’
..-__
1955
64 2 9 71
70
429
1,280
1,9
98
14,35
3 13
1,844
l 41
,346
187,5
371
Z-I
T I
1956
I
1957
19
58
71
78
80
3 1
10
2 4
78
80
83
80
79
84
413
455
1,743
1,7
58
1,909
1,9
56
14,53
7 18
,983
157,0
86x
86,82
9’ 42
,587
38,14
3 21
8,27
51-
148.1
241
-
1 Inc
luding
att
enda
nces
of
lectur
e tou
r of
two
scho
ol lec
turer
s. 2
Includ
ing
atten
danc
es
of lec
ture
tour
of thr
ee
scho
ol lec
turer
s.
LEAS
ED
FILM
S,
1959
~~
-~---
. .-
---.
Numb
er in
Audfe
nce
Title
Adult
1
Childr
en
( Mi
xed
1 To
tal
“ Be
aver
Valley
“Y
~~
~~~~
~. ~
~~
. ~~
~.~~
57
21
7 71
13
,411
“ Be
ar Co
untry
”
. .
. . ~.
. _.
....__
...__
104
120
. .
11,19
3 “
I’m
No
Fool
with
Fire
“...
.._...
_..
263
120
71
3279
9 To
tals
.~
~~
---
424
457
56,78
4 14
2 /
57,38
3
--..-_
_ I
I
604
1,253
1,1
75
10,33
0 69
,316r
42,93
8 -~
126,2
16’
xz
_i-
- T i -
1959
83
10
19
92
83
468
1,454
1,6
22
17,32
9 54
,429
51,42
1 12
3,179
r

--
--
_-
123

124 DEPARTMENT OF LANDS AND FORESTS
(57) FOREST SERVICE LIBRARY, 1950-59
I Items Catalogued and Indexed Ten-year - Average. 195g 1950-59
Classification I
1950 : 1951 i 1952 1 1953 1954 I
1955
190 94
136 141
1,090
1956 I- +
1957 1958
45 48
179 266 177 170 109 159 151 155 133 177 214 230
1,321 1,417 1,139
-
~-
43 39
142 / 198 165 1 151 130 I 127 362 / ..~
1,502 ( 1,601
I 1 Prelious to 1953, included with Feriodicals, bulletins, and reports.
(58) GRAZiNG PERMITS ISSUED
District
Number of Stock under Permit
Cattle Horses Sheep
106,815 3,112 19,482
Totals, 1953~ . .._.... - ._...._ ~- . . .._.. ~~_ .~..~~..-~~. 1,730 1 108.894 / 4,133 j 23.172
Totals, 1952~m . . .._ - ~. . ..__.......... ~~..~ 1,621 ! 104,610 1 4,040 ( 23,565
Totals, 1951L . .._........ . . . . . . . . . . . . . . . . . . . . . . . . . . . . . . . . . . . . . . 1.561 1 100,082 ) 4,350 ) 22,282
Totals, 1950~-..~-..~~ . . ..__...... ~.~~ . .._ . . . . . . ~~.~ ~... 1,562 / 98,484 1 4,650
I I I 23,100
NB.-Some of the figures in this table for the years 1950 and 1951 have been revised and differ from those shonn in previous Reports. Past tables have shown net figures for some years and gross figures for others. This table shows the total number of permits issued and the net number of live stock covered for each of the years
listed.
(59) GRAZING FEES BILLED AND COLLECTED
Year Fees Billed Fees Collected1 I
Outstanding
1959 .................................... 1958 .~~.......~....-..........-.....-.....~ ... .._..............~.~-......-.-. 1957................-..--...........~~......~-~.......-..........-........~ ~........_ 1956 .... ..--...._..--.-....-..-..------...............-................- .. 1955 .................... -- .-........- - - _ .............. .................. -. ... 1954.._._-..-__--...--.--..-...----~..- .- 1953 __-- ....... -.~ .... -..- ..-. ... -_ ..- .._ ............... -. ............. ....... 1952 .-....._............~~...~~......-..~..-~.- ...................... .._. 195 l.........._ --_-----.-..-- - . .._..._ ..... - .___ -.-. ... ..-- _ 1950 .... -.-..--.--- -. .. . - . ..- _ ... ---.-...- .-. ... -. . ..-.
I $91,636.13 %84,595.04 $18,417.62 $69.986.23 / $71.726.71 $11,3xX53
67,593.88 1 68,131.94 13,117.01 76,155.51 1 79,247.61 13,655.07 76.061.32 ) 75,250.32 80.191.97 I 85.043.96 /
163577.24 15.766.24
95;088.64 i 102hso.011 i ’ ~~ 20.618.23 125.495.09 110.731.32 j 27;989.59 108,400.14 106,161.36 ) 13,225.82
80,178.43 74.305.08 10,986.74
1 Includea statutory penalties.

REPORT OF FOREST SERVICE, 1959
(60) AREA CLASSIFICATION BY OWNERSHIP
COAST
125
Area Chssiflcation
Forest land- Commercial forest-
Mature ~.-~ . . . . . . ..__........... - -~... Old immature ._.~ . . . ~~- . . . ~~~.~...~ Young immatute~ ._.. ~.. ..~ -.... ~~..
Total, commercial for& ~..... Selectively logged forest ~~.. ~.. Not satisfactorily restocked forest--~ Noncommercial forest ..-~~ . .._ .~~~..
Total, all forest land . .._..
Non-forest land- Barren .- .._........... ~~..~ __.... ~.~.._~~..~~~ Swamp -.......... ~_.~ .._........... .~ ~~. ~..~ ~~~ Argricultural and urban_.-.- -. ~._. Range and meadow--- Non-productive tree-cover ._.~~
Total, all non-forest lan-...-
Water-Lakes and rivers...~ ..~ ~...~.~.~~.~
Total, land and Waters..- ~.
= I -i
-
Acres 1 Acres j Acres I I
8,507,862 ’ 905,948 ( 1,508,601 378,222 ] 74,129
; : 40,942
1,970,913 ! 1,014,220 262,340
10,856,997 ( 1,994,297 i 1,811,883 1,272 / 384 i 1,169
306,637 1 280,245 / 228,778 I,319643 / 170,409 ) 56,939
12.484,549 j 2,445,335 j 2,098,769
Forest land- Acres Commercial forest-
Mature . ~..~.~~ -..-..~..~ ..~.~ ...~~...~~. 43,498,844 Old immature ~..- _....... ~..~ . . . . ~~.~.._ 11,170,663 Young immature _.... -..~..~..~.. 44,227,859
Total, commercial forest ~~....~ 98,897,366 Selectively logged forest ~~.~ .~-~ ..- 207,930 Not satisfactorily restocked forest--~. 5,372,339 Non-commercial forest ~... .._.. _.~~... 9,582,190
Total, all forest land .._ . 114,059,825
Non-forest land- Barren . ..~~--...- ._.. .._...... . ..- .~~...~~ ._.. ~... Swamp . ~...~_ .._......_.. ~...~ _ . .._.. ~-~ ~~~...~~ . Argricultural and urban . . .._.-.. ~..-._ .~~..~~~~...~~._ Range and meadow . . . . . . . . . .._.. ~.-- . . . . . . -... ~~. Non-productive treexover... - . . . . -...~ -.... ~.
Total, all non-forest lands. -. ~~...~~~ ..-._ Water-Lakes and rivers . . . ~~~~ ._.. ~~~. ..- . . .
Total, land and Waters-... . ~~. ..- . . . . .._ -..
T
I -T
Acres
857,761 292,896
2,059,509
3,210,166 75,649
195,977 667,957
4,149,749
T
I I
7-
I
I T-
Acres
224,267 32,105 65,661
322,033 8,733
11,178 13,375
355,319
.................. / .- ....... -. ... - - _ .............. 1 _.~.._.._ -
---.- ... ..-. ( _..._......-. .-.
Acres j
I 61,347 10,983,758
5.731 I 499.024 44;6& ’ 3,292:073
111,678 , 14,774,855 124 2,949
8,416 ! 824,076 32,566 ( 1,519,557
152.784 17.181.437
I ; 11,960,510
172,587 576,540
.~ . . . . ~~~ 14,915 : 9.597.448
..~~_. 1 22,322&O
~..~.~ ( 1.022.693
._... 1 40,526,130
Acres
284,720 84,843
351,789
721,352 4,675
T
I
-
Acres
44,865,592 11,580,507 46,704,818
103,150,917 296,987
S,610,214 30,720 ( 179,245 ’ 10,442,767
935,992 119.500,885 I
~. : 38,052,164 ---- j 2,643,724
’ 862,890 ~...~_ 1 2,420,394
. . . ~~...~ .._ ! 25.008.464
~..~~ i 68.987.636 . ~.- ..-.... ( 5,100.680
_..~~. I 193.589.201
PROVINCB
Forest land- 1 1 1 Acres ( Acres ACRS ACT.3 (- Acres
Commercial forest- Mature ~~~~ _.~~~ ..-.._.. ~~.~~.~~ ._.... .-.~... Old immature--~.- . . .._......... _~ _.....- Young immature ._._- -_-..--.-
Total, commercial fore& .._. ~.. Selectively logged forest ~..~.__~.. Not satisfactorily restocked forest.. Non-commercial forest _......_....... .._..
Total, all forest land -.._._.
Non-forest land- Barren- . .._- - ..__... - _._...-. _ ._.. . . . . .._... Swamp . . . . - .._...... -.._~~ . .._... -.- .._. ~_~...~. Argricultural and urban...-...-..~..~.-. Range and meadow . . . .._....._.._ - . . .._... Non-productive tree-cover..--.-..
Total, all non-forest land-....-
Water-Lakes and rivers .._..._......_.......
I I I 52,006,706 1 1,763,709 I 1,732,868 346,067 1 55,849,350 11,548,885 1 367,025 / 73,047 90,574 j 12.079.531 46,198,772 \ 3,073,729 i 328,001 396,389 / 49,996,891
109,754,363 ( K204.463 ( 2,133,916 833,030 ( 117,925,772 209,202 1 76,033 1 4,799 I 299,936
5.678.976 ) 476,222 ) 39,136 1 6,434.290 10,9(X,833 1 838,366 I 211,811 ! 12.022.324
126.544,374 ( 6,595,084 / 2,454,088 ( 1,088,776 1 136.682,322 / I I I
...... / ........ .._ ..... - / _- __ ..... -_ . ..-. ............ 1 50,012674
j ....... . ~_.~ ..... ) _ .. .._ ...... .L .................. 1 2,816,311
...... ....... . _.._ .. -- / _ .._........_
1 -. ............................... - I 1,439,430 .. - 1 _.-.-. ...... - _._ -.-_- 1 2,435,309
..... 1 ................. / ....... -~. ....... ..... .._ _ - .... . 1 34,605,912
..- .. ) .. .._ ......... .._ / _-._ -. ...... -- ................. 1 91,309636
..-~ I : ................. 1 ................ . .......... .- .... 6.123.373
Total, land and water--..-. 1 .~ _._....._. - / ..~~ _... . . . . ..-. I ..~..~~ ..~_ I .~ ._........_.... 234.115.331

126 DEPARTMENT OF LANDS AND FORESTS
SOUND-WOOD VOLUME IN COMMERCIAL FORESTS OF ALL AGES, (611 BY OWNERSHIP AND SPECIES
(Gross volumes reduced for decay, at a close utilization standard, in thousands of cubic feet.)
COAST
CNWXI
=
-
-
-
-
-
CKIWII Granted
337.026 203,814 6.523,744 3,175,979
559,264 93,364 15,895,966 1,289.288
2.442,074 297,883 26,634,596 2,684,164
587,180 46,175 10,5X6,052 950,480
61,376 7,515 5.114,733 392,445
180,004 11,283 1,996,120 116,136
18,177 16,839 257,810 185,872 145,123 34,998 306,290 48,760
709 26 3.922 277
X743.230 330,147
4,457,746 85,479
1 1,903,786 / 7,770 1 166,718
35,607 : 345.770 I 2,735 r 38.110
1,784 265,833
99,653 384.028
3,999 64,955 20,574 59,528
169 12.054
19,080 39,378
13 , 10s
1,126 36.184 65;199
161,103 1,408
23,017 11,016 24,007
380 37,169 14.221
11 459
so;084 677
18,283 7,270
11,zcMl 11
3.162
4.463.112 791,257 637,555 68.105,631 9,088,171 11,745,600
INTERIOR
? 2.111,469 ’ 242,135
17.327.364 ) 1,584,286 681,824 I 50,593
7.087.162 388,380 2.254.727 56,429
20,941,594 452,045 7,559,358 220,557
21,293,0X2 270,393 20.029,289 ’ 195,957 84.692,856 1,157,236
15,225 142,762
16,299 274,344
22.465 324,449
22.483 94,803 14,882
263,932
216,321 1.007,249
24.220.742
25,152 91.940
598.570 39,682,833
51,787 1.724,266
369,987 1.655,205
462,210 3,104,304
7,030 44.844
768,357 17,346
’ 592,565 42,805
’ 157,824 19,987 78,941
6::
4,186 30,222 21,288 42.288
227 14,733
2.429 26,479
185 2,573
1 10
1,886.236 52,724 ! 4,836 2.531,612 114,459 1 12,119 2.674.012 94,780 ’ 1,118 6.997.262 229,394 I 4.379
62.524.992 1,617,064 ’ 125,624 208,089,633 i 5,886,424 1 1.233,093
=
-
.-
-
-
_-
-
Canada Control
1.356 80,289
8,783 124,787
24,779 194,259
3,817 51,015
2,683 63,660
1,920 12,739
365 2,993 3,321 6,208
18 150
128 7,726 4.214
10,922 104
1,190 363 672
2 434
57,853 557,044
ZZ
T
,
f -
T
I
I
i
50,000 398,372
13,028 122,952
19,932 197,431
53,060 131,098
50,801 373,276
4,340 22,034
124,174 188,189
9,398 137,410
5,686 36,282
789 7,469
23 588
6,608 14,267
6,663 21,968
344,502 1,651,336
Species and D.B.H. Limits Total
579,602 11,110,811
764,170 20,053,271
3,094,883 33,970,76S
722,65 1 13,491,333
85,344 6,337,616
228,814 2,470,765
38,116 484,785 202,522 400,636
766 4,454
3,418 346,912 183,887 606,137
6,188 107,445
39,223 95,407
193 16,109
5,949,777 89,496,446
2,418,829 19,452,784
761,744 7,872,838 2,353,553
21,915,519 7,855,458
21,789,376 20,290,929 86,487,300
249,999 1,151.445
24,964,774 40,681,667
78,758 2,468,974
420,907 1,875,790
483,171 3,193,287
7,083 46,046
1,950,404 2,672,457 2.776.573 7.253.003
-- 64,612,1X2
!16,860,486
Totals, all species .~ .~~ -49” . . . . ~~- ~~...~l(Y’-c

REPORT OF FOREST SERVICE, 1959 127
SOUND-WOOD VOLUME IN COMMERCIAL FORESTS OF ALL AGES, (61) BY OWNERSHIP AND SPECIES-Continued
(Gross volumes reduced for decay, at a close utilization standard, in thousands of cubic feet.)
Species and D.B.H. Limits
=
-
: -
PROVINCE
I crown crown
Granted I
I
2,448,495 j 445,949 23.851,108 I 4,760,265
1,241,088 / 143,957 22,983,128 / 1,677,668
49696,801 ' 354,312 47,576,190
8,146,538 31,879,134 20,096,665 89.807.589
18O,c@O 1,996,120
234,496 I.265059
24,365,871 39,989,123
52,496 1,728,188
369.987 1,655,205
463,991 3.370,137
106,686 428,872
3,998 64,955
1,906,811
3,136;209 266,732
1,220,873 203,472
1,549,681 11,283
116,136 41,991
277,812 633,568 817,117
17,372 592,842
42,805 157.824 21,113 1
115,125 / 65,828 '
161,707 1,408
23,017 63,740
46,631 1,473,561
119,058 3,017.574
352,612 4,782.195
107,962 1.998.589
1 22;652
,030,710 35,611
345,770 6,923
68,332 40,362 81.666
240 14,838
2,429 26.479
568 39,742 14,219 50,094
678 18.283 12,105 23,319 2,591,140 138,466
2,674,181 94,791 1,129 7,009,316 229,853 7,541
66,988,104 / 2,408,321 ' 763,179 !76,195,264 j 14,974,595 / 12,978,693
1 I
XII
-
. -
-
Canada COlltiOl
57,356 478,661
21,811 247,739
44,711 391,690
56,877 182,113
53,484 436,936
1,920 12,739 4,705
25,027 127,495 194,397
9.416 137,560
5,686 36,282
917 15,195
4,237 11,510
104 1,190 6,971
14,939 6,665
22,402
402,355 2,208,380
=
T
I
L I, !-
Total
2,998,431 30,563,595
1,525,914 27,926,109
S/WI,436 55,886,284
8,578,109 35,280,709 20,376,273 92,824,916
228,814 2,470,765
288,115 1.636,230
25,167,296 41,082,303
79,524 2,473,428
420,907 1,875,790
486,589 3,540,199
190,970 652,183
6,188 107,445
1,989,627 2,767,864 2,776,766 7,269,112
70,561,959 306,356,932
Printed by DON McDua~m, Printer to the Queen's Most Excellent Majesty in right of the Province of British Columbia.
1960
1,360-26@2542