1
238
Solutions Manual FINANCIAL MANAGEMENT Principles and Practice Fourth Edition Timothy J. Gallagher Colorado State University Joseph D. Andrew, Jr. Webster University
-
Upload
punjabiuniversity -
Category
Documents
-
view
5 -
download
0
Transcript of 1
Solutions Manual
FINANCIALMANAGEMENTPrinciples and Practice
Fourth Edition
Timothy J. GallagherColorado State University
Joseph D. Andrew, Jr.Webster University

2006 Freeload Press, Madison Wisconsin

(Insert publication data on this page)
i
Solutions Manualto accompany
Financial Management: Principles and Practice
4rd Edition
by Timothy J. Gallagher and Joseph D. Andrew, Jr.
This solutions manual provides the answers to all the review questions and end-of-chapter problems in Financial Management: Principles and Practice, by Gallagher and Andrew. The answers and the steps taken to obtain the answers are shown.
We remind our readers that in finance there is often more than one answer to a question or to a problem, depending on one’s viewpoint and assumptions. We provide one answer to each question and show one approach to solving each problem. Other answers and approaches may be equally valid, or judged even better according to each individual’s preference.
ii
TABLE OF CONTENTS
Chapter 1 Solutions............................................5
Chapter 2 Solutions............................................9
Chapter 3 Solutions...........................................13
Chapter 4 Solutions...........................................16
Chapter 5 Solutions...........................................24
Chapter 6 Solutions...........................................34
Chapter 7 Solutions...........................................41
Chapter 8 Solutions...........................................53
Chapter 9 Solutions...........................................61
Chapter 10 Solutions..........................................67
Chapter 11 Solutions..........................................79
Chapter 12 Solutions..........................................93
Chapter 13 Solutions.........................................103
Chapter 14 Solutions.........................................113
Chapter 15 Solutions.........................................120
Chapter 16 Solutions.........................................124
Chapter 17 Solutions.........................................131
Chapter 18 Solutions.........................................138
Chapter 19 Solutions.........................................147
iii

Chapter 20 Solutions.........................................163
Chapter 21 Solutions.........................................167
iv
Chapter 1 Solutions
Answers to Review Questions
1. How is finance related to the disciplines of accounting and economics?
Financial management is essentially a combination of accounting andeconomics. First, financial managers use accounting information—balance sheets, income statements, and so on—to analyze, plan, and allocate financial resources for business firms. Second, financial managers use economic principles to guide them in making financial decisions that are in the best interest of the firm. In other words, finance is an applied area of economics that relies on accounting for input.
2. List and describe the three career opportunities in the field of finance.
Finance has three main career paths: financial management, financial markets and institutions, and investments.
Financial management involves managing the finances of a business. Financial managers—people who manage a business firm's finances—perform a number of tasks. They analyze and forecast a firm's finances; assess risk, evaluate investment opportunities, decide when and where to find money sources and how much money to raise, and decide how much money to return to the firm's investors.
Bankers, stockbrokers, and others who work in financial markets andinstitutions focus on the flow of money through financial institutions and the markets in which financial assets are exchanged. They track the impact of interest rates on the flow of that money.
People who work in the field of investments locate, select, and manage income-producing assets. For instance, security analysts andmutual fund managers both operate in the investment field.
5
3. Describe the duties of the financial manager in a business firm.
Financial managers measure the firm's performance, determine what the financial consequences will be if the firm maintains its present course or changes it, and recommend how the firm should useits assets. Financial managers also locate external financing sources and recommend the most beneficial mix of financing sources,and they determine the financial expectations of the firm's owners.
All financial managers must be able to communicate, analyze, and make decisions based on information from many sources. To do this,they need to be able to analyze financial statements, forecast and plan, and determine the effect of size, risk, and timing of cash flows.
4. What is the basic goal of a business?
The primary financial goal of the business firm is to maximize the wealth of the firm's owners. Wealth, in turn, refers to value. Ifa group of people owns a business firm, the contribution that firm makes to that group's wealth is determined by the market value of that firm.
5. List and explain the three financial factors that influence the value of a business.
The three factors that affect the value of a firm's stock price arecash flow, timing, and risk.
The Importance of Cash Flow: In business, cash is what pays the bills. It is also what the firm receives in exchange for its products and services. Cash is therefore of ultimate importance, and the expectation that the firm will generate cash in the future is one of the factors that gives the firm its value.
The Effect of Timing on Cash Flows: Owners and potential investorslook at when firms can expect to receive cash and when they can expect to pay out cash. All other factors being equal, the sooner companies expect to receive cash and the later they expect to pay
6
out cash, the more valuable the firm and the higher its stock pricewill be.
The Influence of Risk: Risk affects value because the less certainowners and investors are about a firm's expected future cash flows,the lower they will value the company. The more certain owners and investors are about a firm's expected future cash flows, the higherthey will value the company. In short, companies whose expected future cash flows are doubtful will have lower values than companies whose expected future cash flows are virtually certain.
6. Explain why accounting profits and cash flows are not the same thing.
Stock value depends on future cash flows, their timing, and their riskiness. Profit calculations do not consider these three factors. Profit, as defined in accounting, is simply the difference between sales revenue and expenses. It is true that more profits are generally better than less profits, but when the pursuit of short-term profits adversely affects the size of future cash flows, their timing, or their riskiness, then these profit maximization efforts are detrimental to the firm.
7. What is an agent? What are the responsibilities of an agent?
An agent is a person who has the implied or actual authority to acton behalf of another. The owners whom the agents represent are theprincipals. Agents have a legal and ethical responsibility to makedecisions that further the interests of the principals.
8. Describe how society's interests can influence financial managers.
Sometimes the interests of a business firm's owners are not the same as the interests of society. For instance, the cost of properly disposing of toxic waste can be so high that companies maybe tempted to simply dump their waste in nearby rivers. In so doing, the companies can keep costs low and profits high, and drivetheir stock prices higher (if they are not caught). However, many people suffer from the polluted environment. This is why we have
7
environmental and other similar laws: So that society's best interests take precedence over the interests of individual company owners.
When businesses take a long-term view, the interests of the owners and society often (but not always) coincide. When companies encourage recycling, sponsor programs for disadvantaged young people, run media campaigns promoting the responsible use of alcohol, and contribute money to worthwhile civic causes, the goodwill generated as a result of these activities causes long-termincreases in the firm's sales and cash flows, which translate into additional wealth for the firm's owners.
9. Briefly define the terms proprietorship, partnership, and corporation.
A proprietorship is a business owned by one person.
Two or more people who join together to form a business make up a partnership. This can be done on an informal basis without a written partnership agreement, or a contract can spell out the rights and responsibilities of each partner.
A limited liability company is a hybrid between a partnership and acorporation. Profits and losses pass through to the members. Members generally enjoy limited liability.
Corporations are legal entities separate from their owners. To forma corporation, the owners specify the governing rules for the running of the business in a contract known as the articles of incorporation. They submit the articles to the government of the state in which the corporation is formed, and the state issues a charter that creates the separate legal entity.
10. Compare and contrast the potential liability of owners of proprietorships, partnerships (general partners), and corporations.
The sole proprietor has unlimited liability for matters relating tothe business. This means that the sole proprietor is responsible for all the obligations of the business, even if those obligations exceed the amount the proprietor has invested in the business.
8
Each partner in a partnership is usually liable for the activities of the partnership as a whole. Even if there are a hundred partners, each one is technically responsible for all the debts of the partnership. If ninety-nine partners declare personal bankruptcy, the hundredth partner still is responsible for all the partnership's debts.
A corporation is a legal entity that is liable for its own activities. Stockholders, the corporation's owners, have limited liability for the corporation's activities. They cannot lose more than the amount they paid to buy the corporation’s stock.
Answers to End-of-Chapter Problems
1. An accountant prepares financial statements while a financial analyst interprets them.
2. A financial manager’s role in a publicly traded company is to make financial decisions so as to best serve the principal stockholders.
3. a. The value of the firm would go down due to the increase in theamount of time it takes to receive the cash inflows.
b. The value of the firm would go up due to the increase in expected cash inflows.
c. If expected future cash flows do not change the value of the firm would go down due to the increased riskiness of the firm.
4. This practice obviously takes advantage of people who are in a difficult financial situation. This transaction is voluntary, however, and high risk loans have high interest rates.
9
5. LLCs have a small number of members like partnerships and each ofthese members is likely to have an active voice in the company like a partnership. The LLC is taxed like a partnership. Unlikea partnership, and more like a corporation, the owners generally enjoy limited liability.
10
Chapter 2 Solutions
Answers to Review Questions
1. What are financial markets? Why do they exist?
Financial markets are where financial securities are bought and sold. They exist primarily to bring deficit economic units (those needing money) and surplus economic units (those having extra money) together.
2. What is a security?
Securities are claims on financial assets. They can be described as “claim checks” that give their owners the right to receive fundsin the future. Securities are traded in both the money and capitalmarkets. Money market securities include Treasury bills, negotiablecertificates of deposit, commercial paper, and banker’s acceptances. Capital market securities include bonds and stock.
3. What are the characteristics of an efficient market?
The term market efficiency refers to the ease, speed, and cost of trading securities. In an efficient market, securities can be traded easily, quickly, and at low cost. Markets lacking these qualities are considered to be inefficient.
4. How are financial trades made on an organized exchange?
Each exchange-listed security is traded at a specified location on the trading floor called the post. The trading is supervised by specialists who act either as brokers (bringing together buyers andsellers) or as dealers (buying or selling the stock themselves). Prominent international securities exchanges include the New York Stock Exchange (NYSE) and major exchanges in Tokyo, London, Amsterdam, Frankfurt, Paris, Hong Kong, and Mexico.
11
5. How are financial trades made in an over-the-counter market? Discuss the role of a dealer in the OTC market.
In contrast to the organized exchanges, which have physical locations, the over-the-counter market has no fixed location,or more correctly, it is everywhere. The over-the-counter market, or OTC, is a network of dealers around the world who maintain inventories of securities for sale. If you wanted to buy a securitythat is traded OTC, you would call your broker, who would then shopamong competing dealers who have the security in their inventory. After locating the dealer with the best price, your broker would buy the security on your behalf.
The role of dealers: Dealers make their living buying securities and reselling them to others. They operate just like car dealers who buy cars from manufacturers for resale to others. Dealers makemoney by buying securities for one price (called the bid price) andselling them for a higher price, (called the ask price). The difference, or spread, between the bid price and the ask price represents the dealer’s fee.
6. What is the role of a broker in security transactions? How are brokers compensated?
Brokers handle orders to buy or sell securities. Brokers are agentswho work on behalf of an investor. When investors call with an order, brokers work on their behalf to find someone to take the other side of the proposed trade. If investors want to buy, brokersfind sellers. If investors want to sell, brokers find buyers. Brokers are compensated for their services when the person whom they represent, the investor, pays them a commission on the sale orpurchase of securities.
7. What is a Treasury bill? How risky is it?
Treasury bills are short-term debt instruments issued by the U.S. Treasury that are sold at a discount and pay face value at maturity. They are very nearly risk-free as they are backed by the
12
U.S. Government which could, if need by, print money to pay their holders at maturity.
8. Would there be positive interest rates on bonds in a world with absolutely no risk (no default risk, maturity risk, and so on)? Whywould a lender demand, and a borrower be willing to pay, a positiveinterest rate in such a no-risk world?
Yes, there would be a positive rate of interest in a risk-free world. This is because regardless of risk, lenders of money must postpone spending during the time the money is loaned. Lenders, then, lose the opportunity to invest their money for that period oftime. To compensate for the cost of losing investment opportunitieswhile they postpone their spending, lenders demand, and borrowers pay, a basic rate of return, the real rate of interest.
Answers to End of Chapter Problems
2-1. a. Surplus economic units have income that exceeds their expenditures. Wealthy families in the household sector and most states (which have balanced budget requirements) are surplus economic units.
b. Deficit economic units have expenditures that exceed their incomes. Home buyers and college students are likely to be deficiteconomic units.
2.2. a. falseb. falsec. falsed. false
2-3. a. 2 3 4 1
b. The money market is dominated by large institutional traders and there is much competition. The New York Stock Exchange tends to have larger more actively traded stocks. The over-the-counter market tends to have smaller less actively traded securities. The
13
real estate market has very high transaction costs and trades take months.
2.4. a. A money market security is short term and actively traded.
b. Treasury bills and commercial paper are both traded in the moneymarket.
2-5. $66.25/$1,000 = 6 5/8 % coupon rate
2-6. The yield on a Bonds-R-Us bond:
Real rate of interest...................... 2%Inflation premium........................ 3%Default risk premium................... 1%Liquidity risk premium................ 1%Maturity risk premium................. 1%
Total yield on Bonds-R-Us Bond: 8%
(reference figure 2-2)
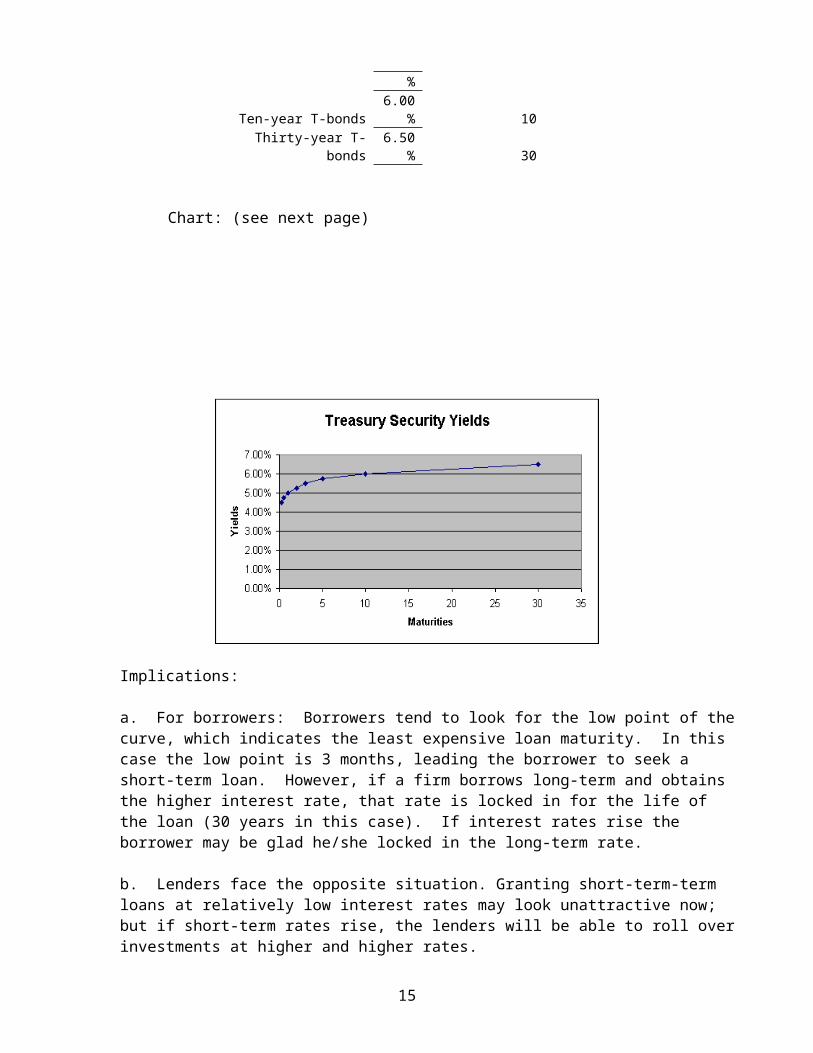
2-7. Treasury Yield Curve:
Given:
Treasury SecurityYields:
Maturity in Years (for Chart)
Three-month T-bills
4.50% 0.25
Six-month T-bills4.75
% 0.5
One-year T-notes5.00
% 1
Two-year T-notes5.25
% 2Three-year T-
bonds5.50
% 3Five-year T-bonds 5.75 5
14
%
Ten-year T-bonds6.00
% 10Thirty-year T-
bonds6.50
% 30
Chart: (see next page)
Implications:
a. For borrowers: Borrowers tend to look for the low point of thecurve, which indicates the least expensive loan maturity. In this case the low point is 3 months, leading the borrower to seek a short-term loan. However, if a firm borrows long-term and obtains the higher interest rate, that rate is locked in for the life of the loan (30 years in this case). If interest rates rise the borrower may be glad he/she locked in the long-term rate.
b. Lenders face the opposite situation. Granting short-term-term loans at relatively low interest rates may look unattractive now; but if short-term rates rise, the lenders will be able to roll overinvestments at higher and higher rates.
15

16
Chapter 3 Solutions
Answers to Review Questions
1. Define intermediation.
The financial system makes it possible for surplus and deficit economic units to come together, exchanging funds for securities, to their mutual benefit. When funds flow from surplus economic units to a financial institution to a deficit economic unit, the process is known as intermediation. The financial institution acts as an intermediary between the two economic units.
2. What can a financial institution often do for a surplus economic unit that it would have difficulty doing for itself if the surplus economic unit (SEU) were to deal directly with a deficit economic unit (DEU)?
Surplus economic units do not usually have the expertise to determine whether deficit economic units can and will make good on their obligations, so it is difficult for them to predict when a would-be deficit economic unit will fail to pay what it owes. Sucha failure is likely to be devastating to a surplus economic unit that has lent a proportionately large amount of money. In contrast, a financial institution is in a better position to predict who will pay and who won't. It is also in a better position, having greater financial resources, to occasionally absorb a loss when someone fails to pay. (This is just one example of the beneficial things financial institutions do for SEUs)
3. What can a financial institution often do for a deficit economic unit (DEU)that it would have difficulty doing for itself if the DEUwere to deal directly with an SEU?
SEUs typically want to supply a small amount of funds, while DEUs typically want to obtain a large amount of funds. Thus it is oftendifficult for surplus and deficit economic units to come together
17
on their own to arrange a mutually beneficial exchange of funds forsecurities. A financial institution can step in and save the day. A bank, savings and loan, or insurance company can take in small amounts of funds from many individuals, form a large pool of funds,and then use that large pool to purchase securities from individualbusinesses and governments. (This is just one example of the beneficial things financial institutions do for DEUs)
4. What are a bank's primary reserves? When the Fed sets reserve requirements, what is its primary goal?
Vault cash and deposits in the bank's account at the Fed are used to satisfy these reserve requirements; they are called primary reserves. These primary reserves are non-interest-earning assets held by financial institutions.
The Federal Reserve requires all commercial banks to keep a minimumamount of reserves on hand to meet the withdrawal demands of its depositors and to pay other obligations as they come due. Many would argue, however, that the reserve requirement is set more withmonetary policy in mind than to ensure that banks meet their depositors' withdrawal requests.
5. Compare and contrast mutual and stockholder-owned savings and loan associations.
Some savings and loan associations are owned by stockholders, just as commercial banks and other corporations are owned by their stockholders. Other S&Ls, called mutuals, are owned by their depositors. When a person deposits money in an account at a mutualS&L, that person becomes a part owner of the firm. The mutual S&L's profits (if any) are put into a special reserve account from which dividends are paid from time to time to the owner/depositors.
6. Who owns a credit union? Explain.
Credit unions are owned by their members. When credit union members put money in their credit union, they are not technically "depositing" the money. Instead, they are purchasing shares of the
18
credit union. In general, credit unions exist to pay interest on shares bought by, and collect interest on loans made to, the members.
7. Which type of insurance company generally takes on the greater risks: a life insurance company or a property and casualty insurance company?
The risks protected against by property and casualty companies are much less predictable than are the risks insured by life insurance companies. Hurricanes, fires, floods, and trial judgments are all much more difficult to predict than the number of sixty-year-old females who will die this year among a large number in this risk class. This means that property and casualty insurance companies must keep more liquid assets than do life insurance companies.
8. Compare and contrast a defined benefit and a defined contribution pension plan.
In a defined benefit plan, retirement benefits are determined by a formula that usually considers the worker's age, salary, and years of service. The employee and/or the firm contribute the amounts necessary to reach the goal. In a defined contribution plan, the contributions to be made by the employee and/or employer are spelled out, but retirement benefits depend on the total accumulation in the individual's account at the retirement date.
9. Special security software is used such that customers who enter their identification and password information can keep sensitive information out of the hands of hackers.
19
Answers to End-of-Chapter Problems
3-1. a) If there were no financial institutions the SEUs and the DEUs would find that the amount of money needed by a given DEU did not match the amount of money available by a given SEU. The money available would not be put to work and the economic activity that would have otherwise taken place would not.
b) If financial institutions were available in this society they could position themselves between the SEUs and DEUs. The financialinstitution could pool the $1,000 available (100 SEUs times $10 each) and pass that money along in $100 increments to the DEUs. This could be done via either a debt or equity claim that the financial institution would accept from the DEU in return for the money.
3-2. a) .10 rate on loans made - .05 rate paid to depositors = .05 = 5%interest rate spread
b) (.5 x .10) + (.5 x .12) = .11 = 11% weighted average loan rate (.5 x .05) + (.5 x .07) = .06 = 6% weighted average deposit rate 11% - 6% = 5% interest rate spread
3-3. ($48,300,000 - $7,800,000) x .03) + (($60,000,000 - $48,300,000) x .10) + ($20,000,000 x 0) + ($10,000,000 x 0) = $6,732,000
3-4. a) The FOMC should buy government securities in the open market. This would increase the reserves of the banking system and would put downward pressure on the federal funds rate.
b) The Fed’s trader at the New York Federal Reserve Bank would contact various government securities dealers and would buy the Treasury securities from them. Payment would be made by crediting the accounts at the Fed of these dealers. This would make more funds available and would tend to put downward pressure on the costof these funds, the federal funds rate.
3-5. a) ($1,000,000 x .08) – ($1,000,000 x .07) = $10,000 a profit of $10,000
20

b) ($1,000,000 x .08) – ($1,000,000 x .09) = -$10,000 a loss of $10,000
21
Chapter 4 Solutions
Answers to Review Questions
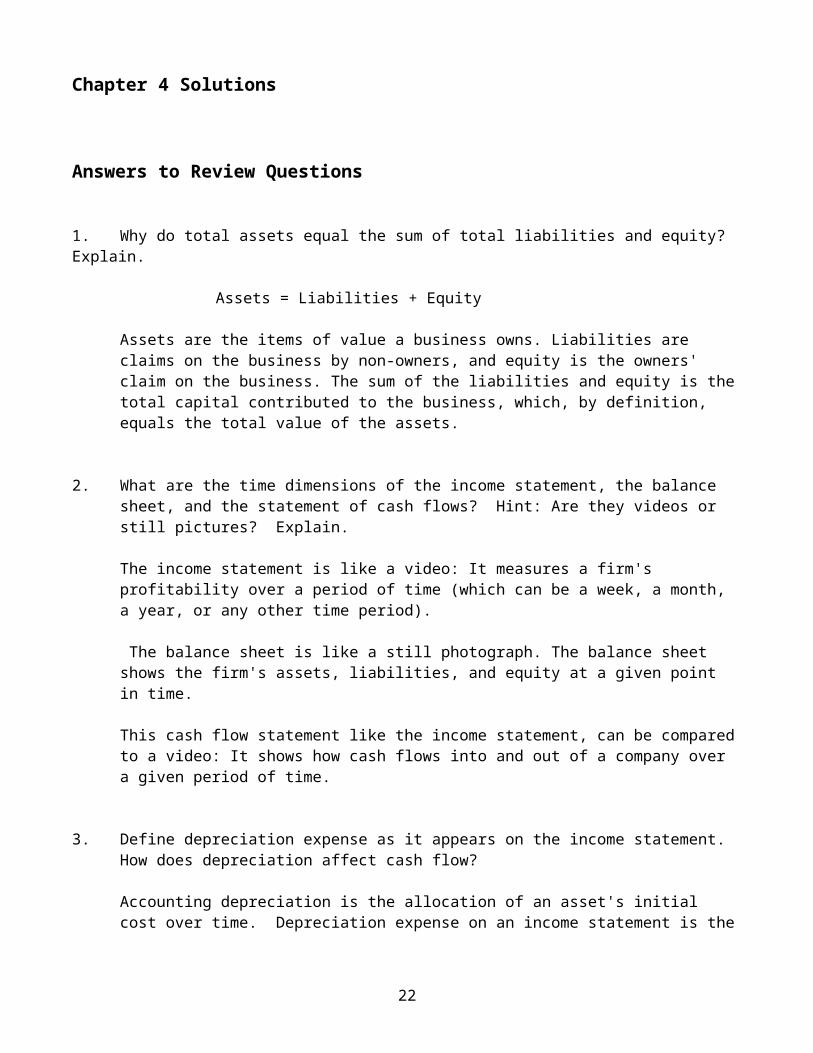
1. Why do total assets equal the sum of total liabilities and equity? Explain.
Assets = Liabilities + Equity
Assets are the items of value a business owns. Liabilities are claims on the business by non-owners, and equity is the owners' claim on the business. The sum of the liabilities and equity is thetotal capital contributed to the business, which, by definition, equals the total value of the assets.
2. What are the time dimensions of the income statement, the balance sheet, and the statement of cash flows? Hint: Are they videos or still pictures? Explain.
The income statement is like a video: It measures a firm's profitability over a period of time (which can be a week, a month, a year, or any other time period).
The balance sheet is like a still photograph. The balance sheet shows the firm's assets, liabilities, and equity at a given point in time.
This cash flow statement like the income statement, can be comparedto a video: It shows how cash flows into and out of a company over a given period of time.
3. Define depreciation expense as it appears on the income statement. How does depreciation affect cash flow?
Accounting depreciation is the allocation of an asset's initial cost over time. Depreciation expense on an income statement is the
22
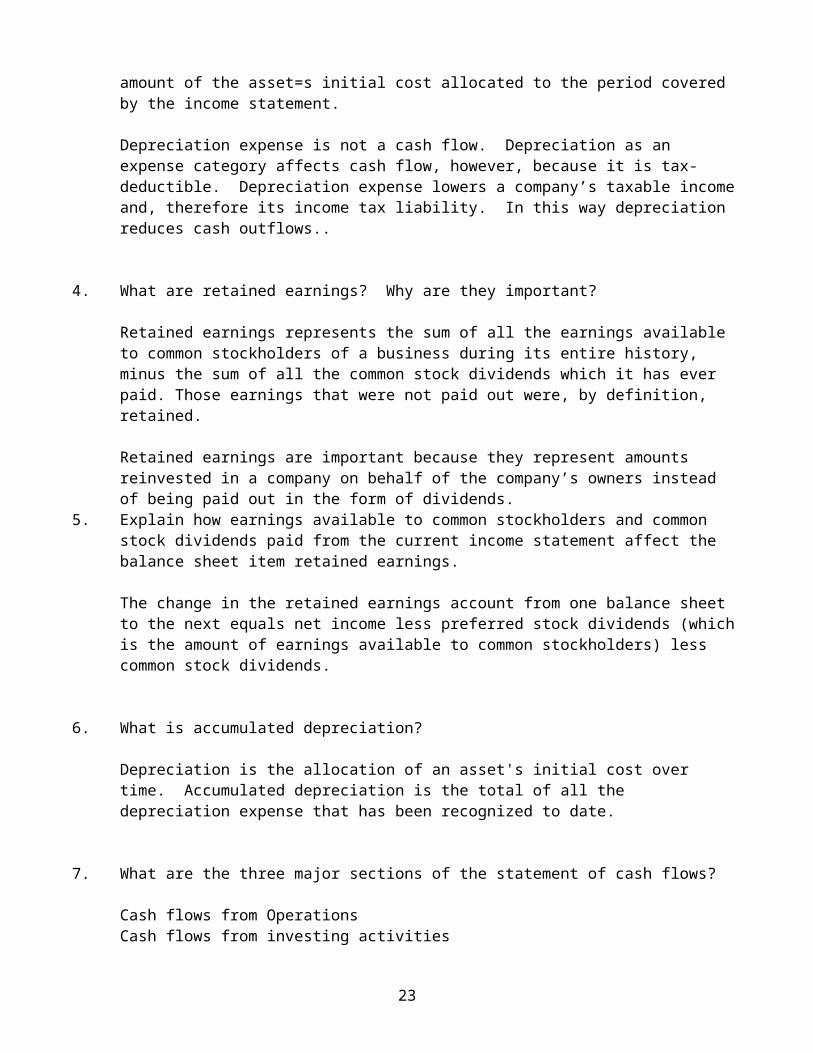
amount of the asset=s initial cost allocated to the period covered by the income statement.
Depreciation expense is not a cash flow. Depreciation as an expense category affects cash flow, however, because it is tax-deductible. Depreciation expense lowers a company’s taxable incomeand, therefore its income tax liability. In this way depreciation reduces cash outflows..
4. What are retained earnings? Why are they important?
Retained earnings represents the sum of all the earnings available to common stockholders of a business during its entire history, minus the sum of all the common stock dividends which it has ever paid. Those earnings that were not paid out were, by definition, retained.
Retained earnings are important because they represent amounts reinvested in a company on behalf of the company’s owners instead of being paid out in the form of dividends.
5. Explain how earnings available to common stockholders and common stock dividends paid from the current income statement affect the balance sheet item retained earnings.
The change in the retained earnings account from one balance sheet to the next equals net income less preferred stock dividends (whichis the amount of earnings available to common stockholders) less common stock dividends.
6. What is accumulated depreciation?
Depreciation is the allocation of an asset's initial cost over time. Accumulated depreciation is the total of all the depreciation expense that has been recognized to date.
7. What are the three major sections of the statement of cash flows?
Cash flows from OperationsCash flows from investing activities
23
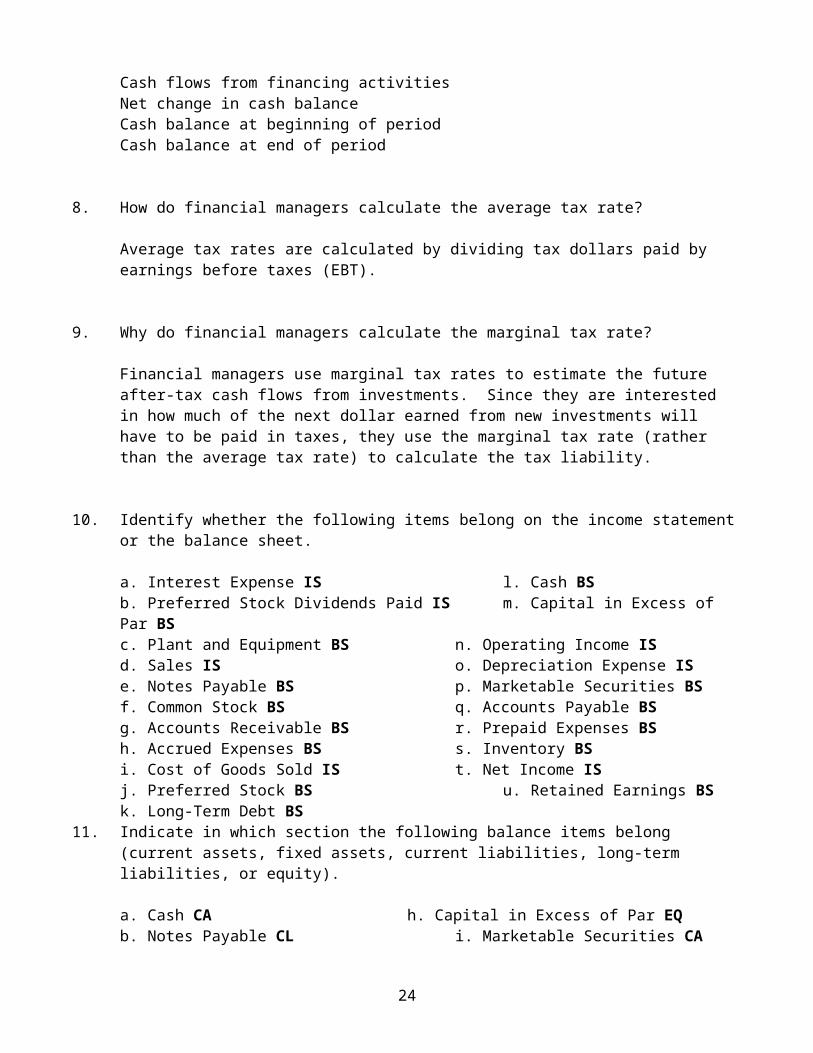
Cash flows from financing activitiesNet change in cash balanceCash balance at beginning of periodCash balance at end of period
8. How do financial managers calculate the average tax rate?
Average tax rates are calculated by dividing tax dollars paid by earnings before taxes (EBT).
9. Why do financial managers calculate the marginal tax rate?
Financial managers use marginal tax rates to estimate the future after-tax cash flows from investments. Since they are interested in how much of the next dollar earned from new investments will have to be paid in taxes, they use the marginal tax rate (rather than the average tax rate) to calculate the tax liability.
10. Identify whether the following items belong on the income statementor the balance sheet.
a. Interest Expense IS l. Cash BSb. Preferred Stock Dividends Paid IS m. Capital in Excess of Par BSc. Plant and Equipment BS n. Operating Income ISd. Sales IS o. Depreciation Expense ISe. Notes Payable BS p. Marketable Securities BSf. Common Stock BS q. Accounts Payable BSg. Accounts Receivable BS r. Prepaid Expenses BSh. Accrued Expenses BS s. Inventory BSi. Cost of Goods Sold IS t. Net Income ISj. Preferred Stock BS u. Retained Earnings BSk. Long-Term Debt BS
11. Indicate in which section the following balance items belong (current assets, fixed assets, current liabilities, long-term liabilities, or equity).
a. Cash CA h. Capital in Excess of Par EQb. Notes Payable CL i. Marketable Securities CA
24
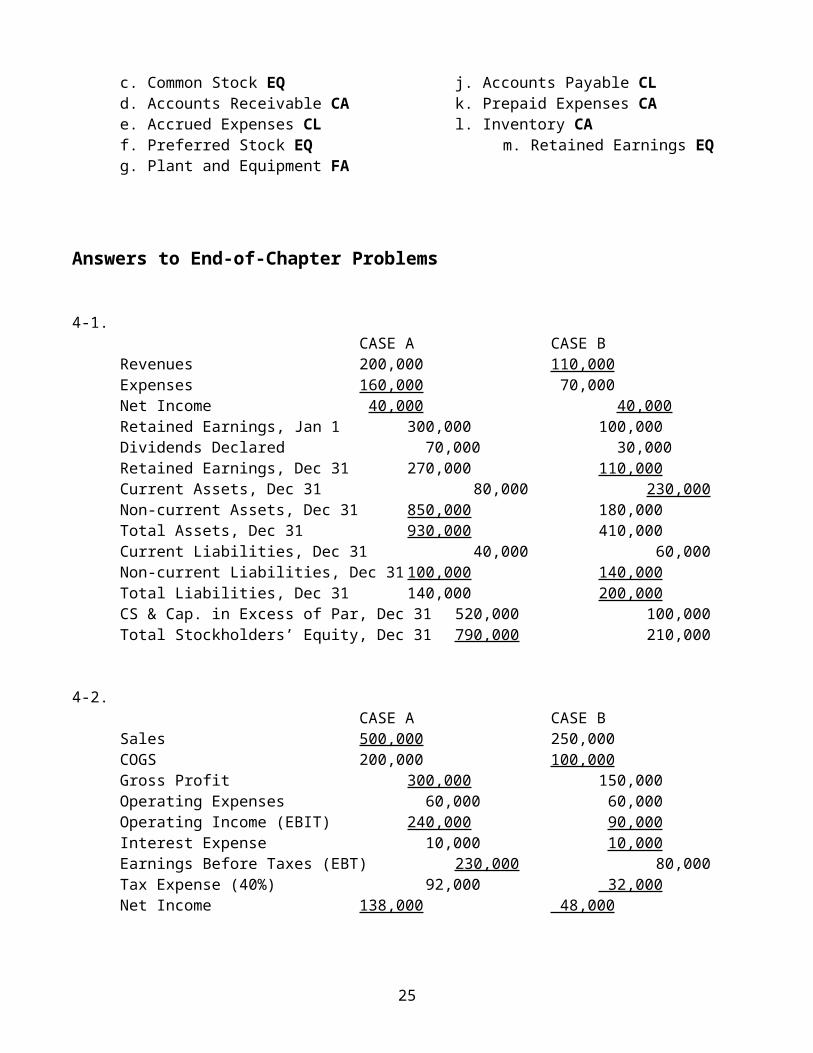
c. Common Stock EQ j. Accounts Payable CLd. Accounts Receivable CA k. Prepaid Expenses CAe. Accrued Expenses CL l. Inventory CAf. Preferred Stock EQ m. Retained Earnings EQg. Plant and Equipment FA
Answers to End-of-Chapter Problems
4-1. CASE A CASE B
Revenues 200,000 110,000Expenses 160,000 70,000Net Income 40,000 40,000 Retained Earnings, Jan 1 300,000 100,000Dividends Declared 70,000 30,000Retained Earnings, Dec 31 270,000 110,000Current Assets, Dec 31 80,000 230,000Non-current Assets, Dec 31 850,000 180,000Total Assets, Dec 31 930,000 410,000Current Liabilities, Dec 31 40,000 60,000Non-current Liabilities, Dec 31 100,000 140,000Total Liabilities, Dec 31 140,000 200,000CS & Cap. in Excess of Par, Dec 31 520,000 100,000Total Stockholders’ Equity, Dec 31 790,000 210,000
4-2. CASE A CASE B
Sales 500,000 250,000COGS 200,000 100,000Gross Profit 300,000 150,000Operating Expenses 60,000 60,000Operating Income (EBIT) 240,000 90,000Interest Expense 10,000 10,000Earnings Before Taxes (EBT) 230,000 80,000Tax Expense (40%) 92,000 32,000Net Income 138,000 48,000
25
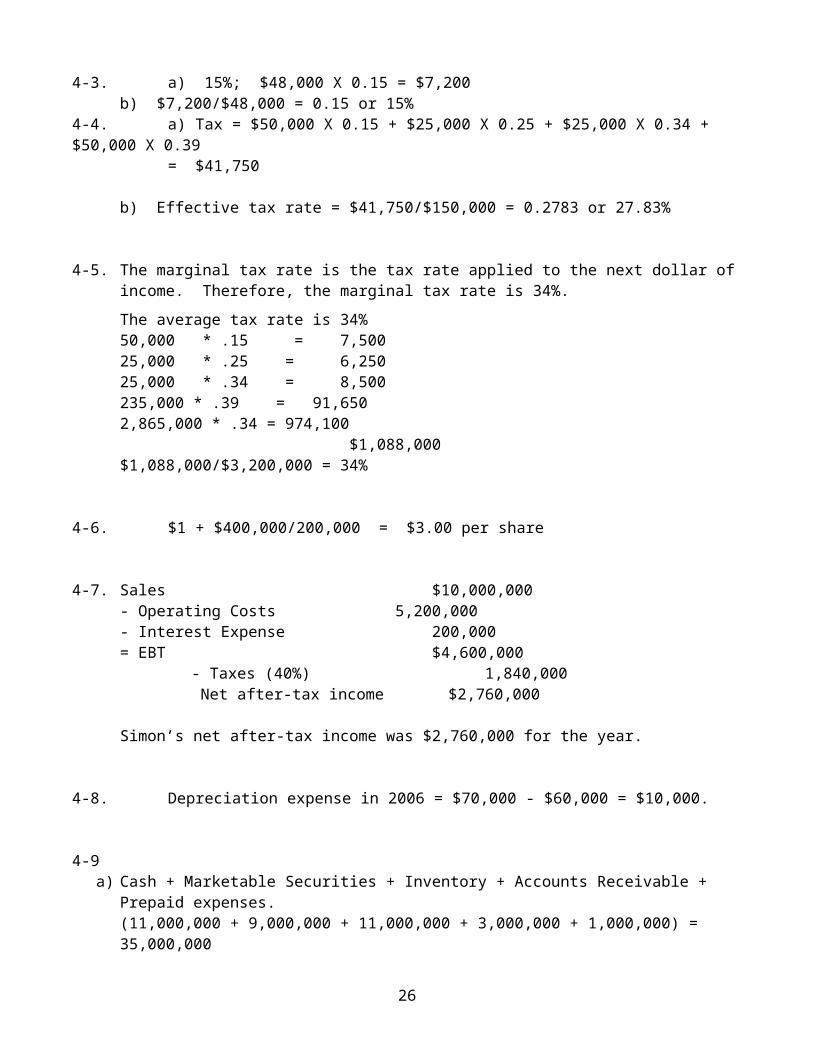
4-3. a) 15%; $48,000 X 0.15 = $7,200b) $7,200/$48,000 = 0.15 or 15%
4-4. a) Tax = $50,000 X 0.15 + $25,000 X 0.25 + $25,000 X 0.34 + $50,000 X 0.39
= $41,750
b) Effective tax rate = $41,750/$150,000 = 0.2783 or 27.83%
4-5. The marginal tax rate is the tax rate applied to the next dollar ofincome. Therefore, the marginal tax rate is 34%.The average tax rate is 34%50,000 * .15 = 7,50025,000 * .25 = 6,25025,000 * .34 = 8,500235,000 * .39 = 91,6502,865,000 * .34 = 974,100 $1,088,000$1,088,000/$3,200,000 = 34%
4-6. $1 + $400,000/200,000 = $3.00 per share
4-7. Sales $10,000,000- Operating Costs 5,200,000- Interest Expense 200,000= EBT $4,600,000
- Taxes (40%) 1,840,000 Net after-tax income $2,760,000
Simon’s net after-tax income was $2,760,000 for the year.
4-8. Depreciation expense in 2006 = $70,000 - $60,000 = $10,000.
4-9a) Cash + Marketable Securities + Inventory + Accounts Receivable +
Prepaid expenses.(11,000,000 + 9,000,000 + 11,000,000 + 3,000,000 + 1,000,000) = 35,000,000
26
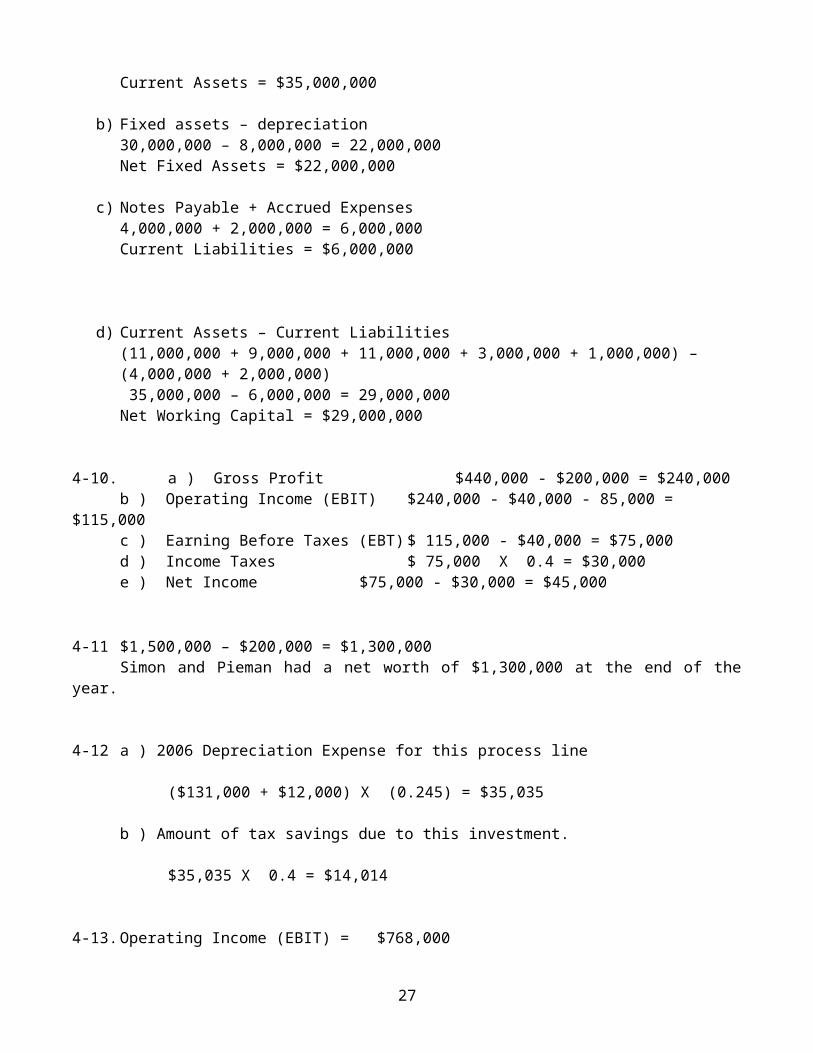
Current Assets = $35,000,000
b) Fixed assets – depreciation30,000,000 – 8,000,000 = 22,000,000Net Fixed Assets = $22,000,000
c) Notes Payable + Accrued Expenses4,000,000 + 2,000,000 = 6,000,000Current Liabilities = $6,000,000
d) Current Assets – Current Liabilities(11,000,000 + 9,000,000 + 11,000,000 + 3,000,000 + 1,000,000) – (4,000,000 + 2,000,000) 35,000,000 – 6,000,000 = 29,000,000Net Working Capital = $29,000,000
4-10. a ) Gross Profit $440,000 - $200,000 = $240,000b ) Operating Income (EBIT) $240,000 - $40,000 - 85,000 =
$115,000c ) Earning Before Taxes (EBT) $ 115,000 - $40,000 = $75,000 d ) Income Taxes $ 75,000 X 0.4 = $30,000e ) Net Income $75,000 - $30,000 = $45,000
4-11 $1,500,000 – $200,000 = $1,300,000Simon and Pieman had a net worth of $1,300,000 at the end of the
year.
4-12 a ) 2006 Depreciation Expense for this process line
($131,000 + $12,000) X (0.245) = $35,035
b ) Amount of tax savings due to this investment.
$35,035 X 0.4 = $14,014
4-13.Operating Income (EBIT) = $768,000
27

+ Depreciation = $42,000+ Amortization = $15,000
$825,000
Target Telecom’s EBITDA = $825,000.
4-14 a ) The company's 2006 taxable income = ($400,000 - $130,000 X
0.2)
= $374,000
b ) Income tax = $374,000 X 0.34 = $127,160
4-15. a) Earnings = [($600,000 - 50,000) X (1 - .34) - $63,000] =
$300,000
Earnings per share = $300,000 / 100,000 = $3 per share
b) Addition to Retained Earnings = $300,000 - 100,000 = $200,000
4-16. a ) Current Assets: 2005: $5,534 + 14,745 + 10,733 + 952 + 3,234 = $35,198
2006: $9,037 + 15,943 + 11,574 + 1,801 + 2,357=$40,712
b ) Total Assets: 2005: $35,198+(57,340 - 29,080)+1,010+2,503 = $66,971
2006: $40,712+(60,374 - 32,478)+1,007+4,743 = $74,358
c ) Current Liabilities: 2005: $3,253 + 6,821 = $10,0742006: $2,450 + 7,330 = $9,780
d ) Total Liabilities: 2005: $10,074 + 2,389 = $12,4632006: $9,780 + 2,112 = $11,892
e ) Total Stockholders' Equity: 2005: $8,549 + 45,959 = $54,5082006: $10,879 + 51,587 = $62,466
28
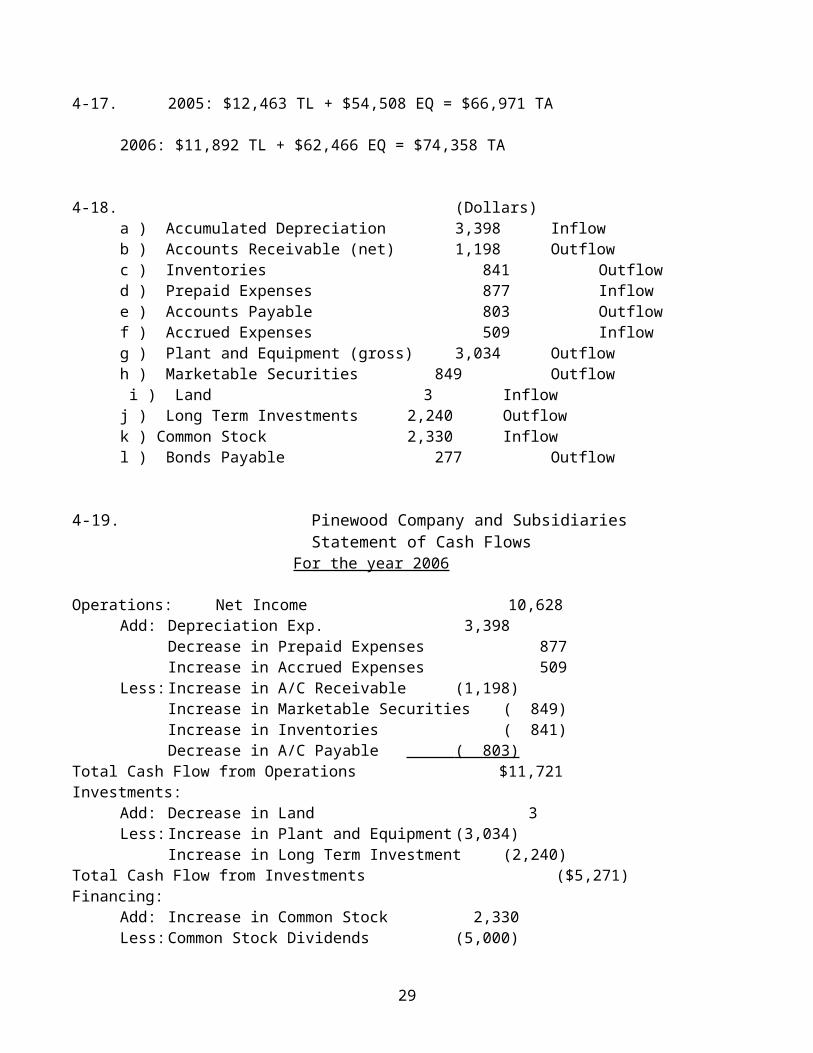
4-17. 2005: $12,463 TL + $54,508 EQ = $66,971 TA
2006: $11,892 TL + $62,466 EQ = $74,358 TA
4-18. (Dollars)a ) Accumulated Depreciation 3,398 Inflowb ) Accounts Receivable (net) 1,198 Outflowc ) Inventories 841 Outflowd ) Prepaid Expenses 877 Inflowe ) Accounts Payable 803 Outflowf ) Accrued Expenses 509 Inflowg ) Plant and Equipment (gross) 3,034 Outflowh ) Marketable Securities 849 Outflow i ) Land 3 Inflowj ) Long Term Investments 2,240 Outflowk ) Common Stock 2,330 Inflowl ) Bonds Payable 277 Outflow
4-19. Pinewood Company and SubsidiariesStatement of Cash Flows
For the year 2006
Operations: Net Income 10,628Add: Depreciation Exp. 3,398
Decrease in Prepaid Expenses 877Increase in Accrued Expenses 509
Less:Increase in A/C Receivable (1,198)Increase in Marketable Securities ( 849)Increase in Inventories ( 841)Decrease in A/C Payable ( 803)
Total Cash Flow from Operations $11,721Investments:
Add: Decrease in Land 3Less:Increase in Plant and Equipment (3,034)
Increase in Long Term Investment (2,240)Total Cash Flow from Investments ($5,271)Financing:
Add: Increase in Common Stock 2,330Less:Common Stock Dividends (5,000)
29
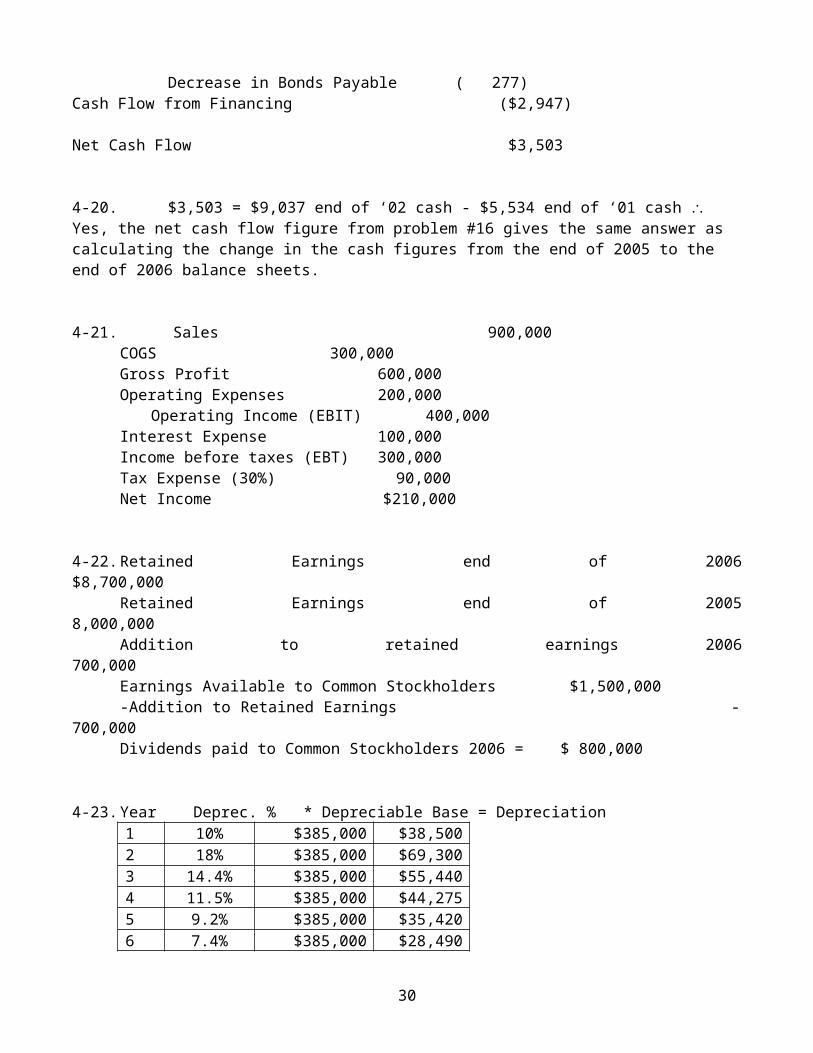
Decrease in Bonds Payable ( 277)Cash Flow from Financing ($2,947)
Net Cash Flow $3,503
4-20. $3,503 = $9,037 end of ‘02 cash - $5,534 end of ‘01 cash Yes, the net cash flow figure from problem #16 gives the same answer as calculating the change in the cash figures from the end of 2005 to the end of 2006 balance sheets.
4-21. Sales 900,000COGS 300,000Gross Profit 600,000Operating Expenses 200,000
Operating Income (EBIT) 400,000Interest Expense 100,000Income before taxes (EBT) 300,000Tax Expense (30%) 90,000Net Income $210,000
4-22.Retained Earnings end of 2006$8,700,000
Retained Earnings end of 20058,000,000
Addition to retained earnings 2006700,000
Earnings Available to Common Stockholders $1,500,000-Addition to Retained Earnings -
700,000Dividends paid to Common Stockholders 2006 = $ 800,000
4-23.Year Deprec. % * Depreciable Base = Depreciation1 10% $385,000 $38,5002 18% $385,000 $69,3003 14.4% $385,000 $55,4404 11.5% $385,000 $44,2755 9.2% $385,000 $35,4206 7.4% $385,000 $28,490
30
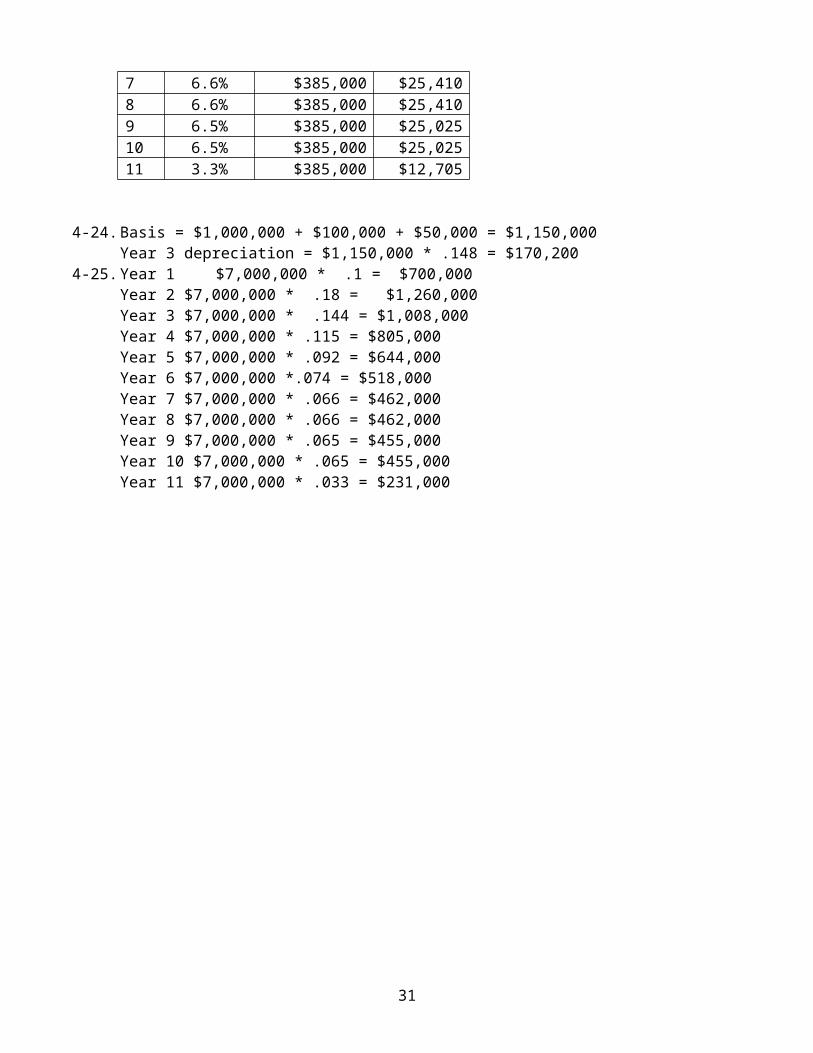
7 6.6% $385,000 $25,4108 6.6% $385,000 $25,4109 6.5% $385,000 $25,02510 6.5% $385,000 $25,02511 3.3% $385,000 $12,705
4-24.Basis = $1,000,000 + $100,000 + $50,000 = $1,150,000Year 3 depreciation = $1,150,000 * .148 = $170,200
4-25.Year 1 $7,000,000 * .1 = $700,000Year 2 $7,000,000 * .18 = $1,260,000Year 3 $7,000,000 * .144 = $1,008,000Year 4 $7,000,000 * .115 = $805,000Year 5 $7,000,000 * .092 = $644,000Year 6 $7,000,000 *.074 = $518,000Year 7 $7,000,000 * .066 = $462,000Year 8 $7,000,000 * .066 = $462,000Year 9 $7,000,000 * .065 = $455,000Year 10 $7,000,000 * .065 = $455,000Year 11 $7,000,000 * .033 = $231,000
31
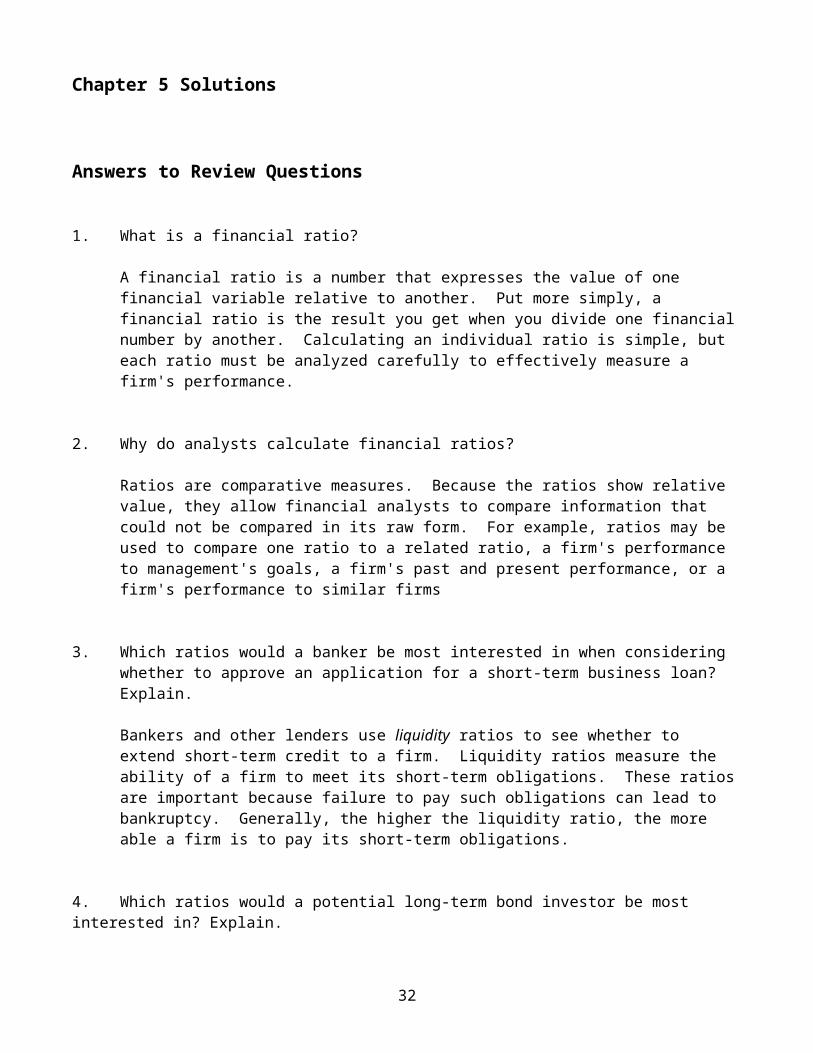
Chapter 5 Solutions
Answers to Review Questions
1. What is a financial ratio?
A financial ratio is a number that expresses the value of one financial variable relative to another. Put more simply, a financial ratio is the result you get when you divide one financialnumber by another. Calculating an individual ratio is simple, but each ratio must be analyzed carefully to effectively measure a firm's performance.
2. Why do analysts calculate financial ratios?
Ratios are comparative measures. Because the ratios show relative value, they allow financial analysts to compare information that could not be compared in its raw form. For example, ratios may be used to compare one ratio to a related ratio, a firm's performance to management's goals, a firm's past and present performance, or a firm's performance to similar firms
3. Which ratios would a banker be most interested in when considering whether to approve an application for a short-term business loan? Explain.
Bankers and other lenders use liquidity ratios to see whether to extend short-term credit to a firm. Liquidity ratios measure the ability of a firm to meet its short-term obligations. These ratiosare important because failure to pay such obligations can lead to bankruptcy. Generally, the higher the liquidity ratio, the more able a firm is to pay its short-term obligations.
4. Which ratios would a potential long-term bond investor be most interested in? Explain.
32
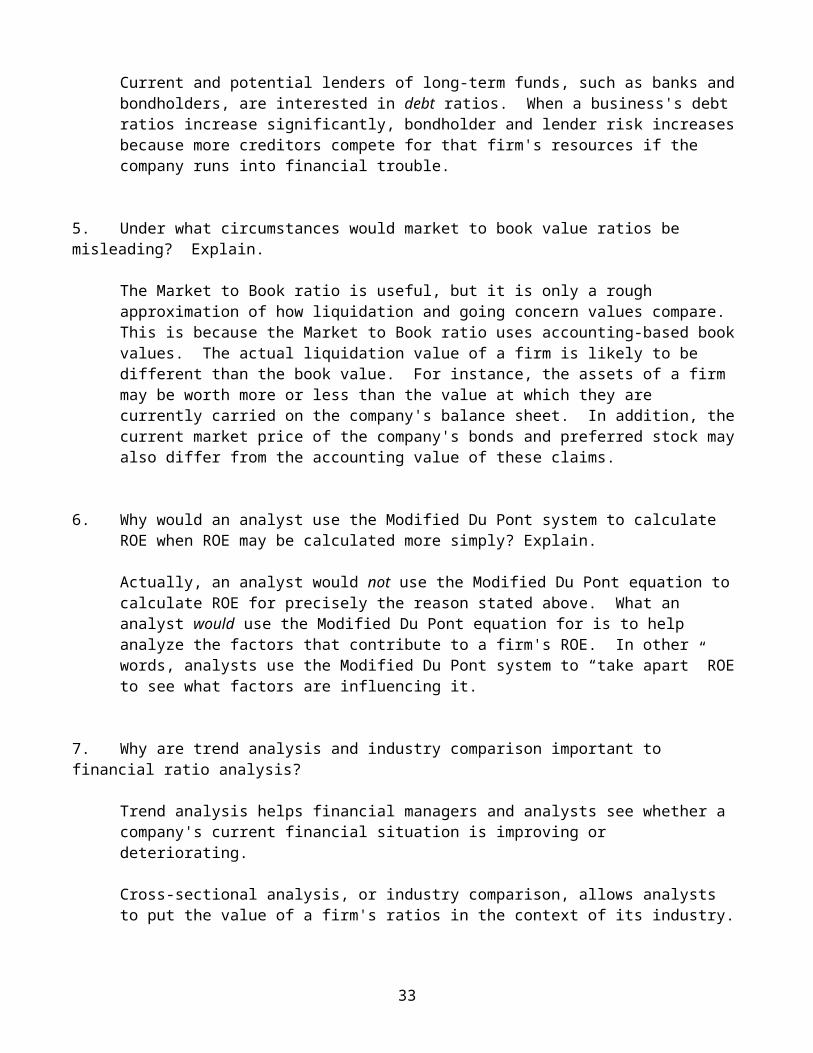
Current and potential lenders of long-term funds, such as banks andbondholders, are interested in debt ratios. When a business's debt ratios increase significantly, bondholder and lender risk increasesbecause more creditors compete for that firm's resources if the company runs into financial trouble.
5. Under what circumstances would market to book value ratios be misleading? Explain.
The Market to Book ratio is useful, but it is only a rough approximation of how liquidation and going concern values compare. This is because the Market to Book ratio uses accounting-based bookvalues. The actual liquidation value of a firm is likely to be different than the book value. For instance, the assets of a firm may be worth more or less than the value at which they are currently carried on the company's balance sheet. In addition, thecurrent market price of the company's bonds and preferred stock mayalso differ from the accounting value of these claims.
6. Why would an analyst use the Modified Du Pont system to calculate ROE when ROE may be calculated more simply? Explain.
Actually, an analyst would not use the Modified Du Pont equation to calculate ROE for precisely the reason stated above. What an analyst would use the Modified Du Pont equation for is to help analyze the factors that contribute to a firm's ROE. In other words, analysts use the Modified Du Pont system to “take apart” ROEto see what factors are influencing it.
7. Why are trend analysis and industry comparison important to financial ratio analysis?
Trend analysis helps financial managers and analysts see whether a company's current financial situation is improving or deteriorating.
Cross-sectional analysis, or industry comparison, allows analysts to put the value of a firm's ratios in the context of its industry.
33
Answers to End-of-Chapter Problems
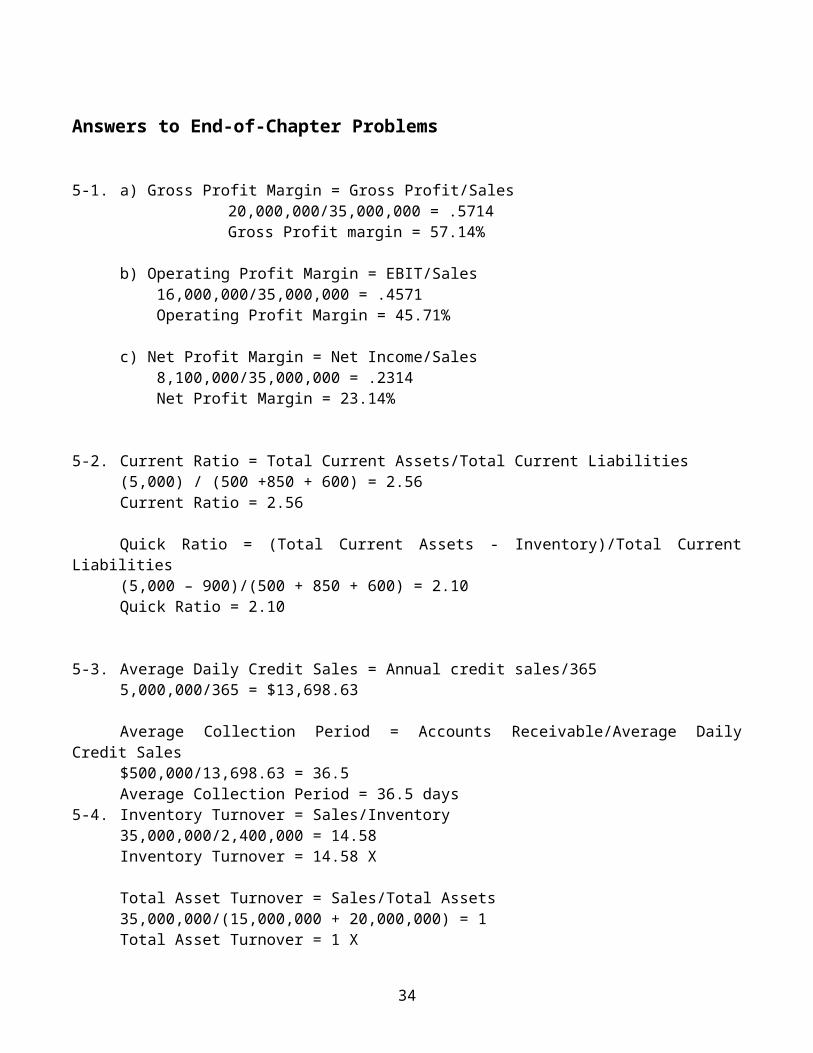
5-1. a) Gross Profit Margin = Gross Profit/Sales 20,000,000/35,000,000 = .5714 Gross Profit margin = 57.14%
b) Operating Profit Margin = EBIT/Sales 16,000,000/35,000,000 = .4571 Operating Profit Margin = 45.71%
c) Net Profit Margin = Net Income/Sales 8,100,000/35,000,000 = .2314 Net Profit Margin = 23.14%
5-2. Current Ratio = Total Current Assets/Total Current Liabilities(5,000) / (500 +850 + 600) = 2.56Current Ratio = 2.56
Quick Ratio = (Total Current Assets - Inventory)/Total CurrentLiabilities
(5,000 – 900)/(500 + 850 + 600) = 2.10Quick Ratio = 2.10
5-3. Average Daily Credit Sales = Annual credit sales/3655,000,000/365 = $13,698.63
Average Collection Period = Accounts Receivable/Average DailyCredit Sales
$500,000/13,698.63 = 36.5Average Collection Period = 36.5 days
5-4. Inventory Turnover = Sales/Inventory35,000,000/2,400,000 = 14.58Inventory Turnover = 14.58 X
Total Asset Turnover = Sales/Total Assets35,000,000/(15,000,000 + 20,000,000) = 1Total Asset Turnover = 1 X
34

5-5. a) Book value per shareBook price per share = Common Stock Equity/Number of shares
Outstanding$4,500,000/650,000 =$6.92BPS = $6.92
b) Market to book value ratio Market to book value ratio = Market price per share/Bookvalue per share $25.00/$6.92 = 3.61 Market to book value ratio = 3.61
5-6. a) Gross profit margin: $47,378/$94,001 = 50.40%b) Operating profit margin $12,941/$94,001 = 13.77%c) Net profit margin $8,620/$94,001 = 9.17%d) Return on assets $8,620/$66,971 = 12.87%e) Return on equity $8,620/$54,508 = 15.81%
While the Net profit margin is higher than the industry average, the Return on assets is lower. Pinewood may consider increasing its debtto leverage profits.
5-7. a) Current assets = $5,534 + $14,745 + $10,733 + $952 + $3,234 = $35,198
Current ratio = $35,198/$10,074 = 3.494b) Quick ratio = ($35,198 - $10,733)/$10,074 = 2.429Pinewood seems highly capable of paying off short-term debts.
5-8. a) Total debt = $3,253 + $6,821 + $2,389 = $12,463 Debt to total assets = $12,463/$66,971 = 18.61%b) Times interest earned = $12,941/$48 = 270 times
Yes. The Pinewood has very low debt and its earnings are extremelyhigh compared to its interest expense.
35

5-9. a. Average collection period $14,745/($94,001 / 365) =57.25 days
b. Inventory turnover $94,001/$10,733 = 8.76c. Total asset turnover $94,001/$66,971 = 1.404
We would need to know the industry averages for these figures, and also know about Pinewood’s credit and inventory management practices to comment meaningfully on the above figures.
5-10. Modified Du Pont: ROE = Net Profit Margin X Total Asset Turnover XAssets over Equity
= 0.0917 X 1.404 X $66,971/$54,508 = 15.82%
5-11.a) EVA = EBIT (1- tax rate) – (invested capital * investor’s required rate of return)
EVA = $12,941,000 * (1 - 0.35) – ($77,389,000 * 0.10) = $672,750
b) Pinewood has a true economic profit of $672,750. This is the amount by which its earnings exceed the returned expected by the firm’s investors.
c) MVA = Total market value – invested capital MVA = ($75,000,000 + $2,389,000) – ($54,508,000 + $2,389,000) =
$20,492,000
d) Pinewood has a total market value that is $20,492,000 greater that the amount of capital invested in the firm.
5-12.a) EVA = EBIT (1 – Tax Rate) – (invested capital * investors required rate of return) EVA = $8,000 (.65) – ($33,000 * .12) = $5,200 – $3,960 EVA = $1,240
b) The economic value is positive; therefore, Eversharp earned asufficient amount during the year to provide more thanthe expected rate of return from the investors and lenders who
contributed to the capital of the company.
36
c) MVA = Total market value – invested capital MVA = $33,000 - $21,000 = $12,000
d) Eversharp’s total market value exceeds its invested capital by$12,000.
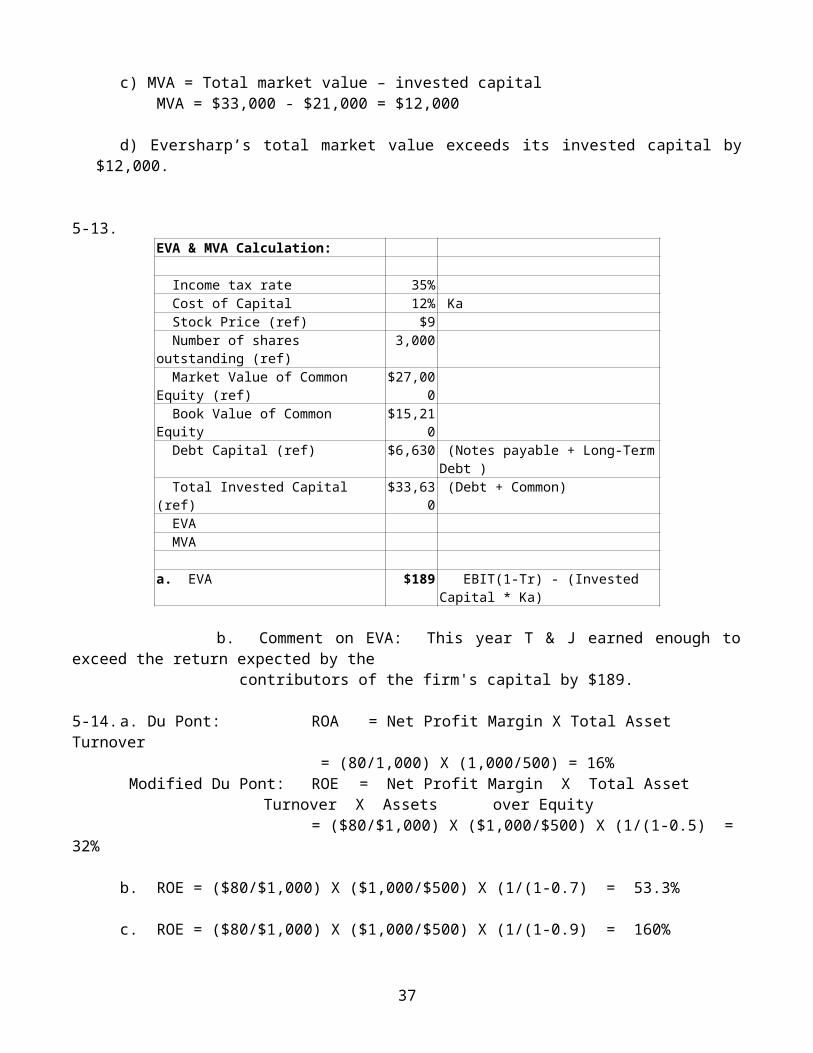
5-13.EVA & MVA Calculation:
Income tax rate 35% Cost of Capital 12% Ka Stock Price (ref) $9 Number of shares outstanding (ref)
3,000
Market Value of Common Equity (ref)
$27,000
Book Value of Common Equity
$15,210
Debt Capital (ref) $6,630 (Notes payable + Long-TermDebt )
Total Invested Capital (ref)
$33,630 (Debt + Common)
EVA MVA
a. EVA $189 EBIT(1-Tr) - (Invested Capital * Ka)
b. Comment on EVA: This year T & J earned enough toexceed the return expected by the
contributors of the firm's capital by $189.
5-14.a. Du Pont: ROA = Net Profit Margin X Total Asset Turnover
= (80/1,000) X (1,000/500) = 16% Modified Du Pont: ROE = Net Profit Margin X Total Asset
Turnover X Assets over Equity = ($80/$1,000) X ($1,000/$500) X (1/(1-0.5) =
32%
b. ROE = ($80/$1,000) X ($1,000/$500) X (1/(1-0.7) = 53.3%
c. ROE = ($80/$1,000) X ($1,000/$500) X (1/(1-0.9) = 160%
37
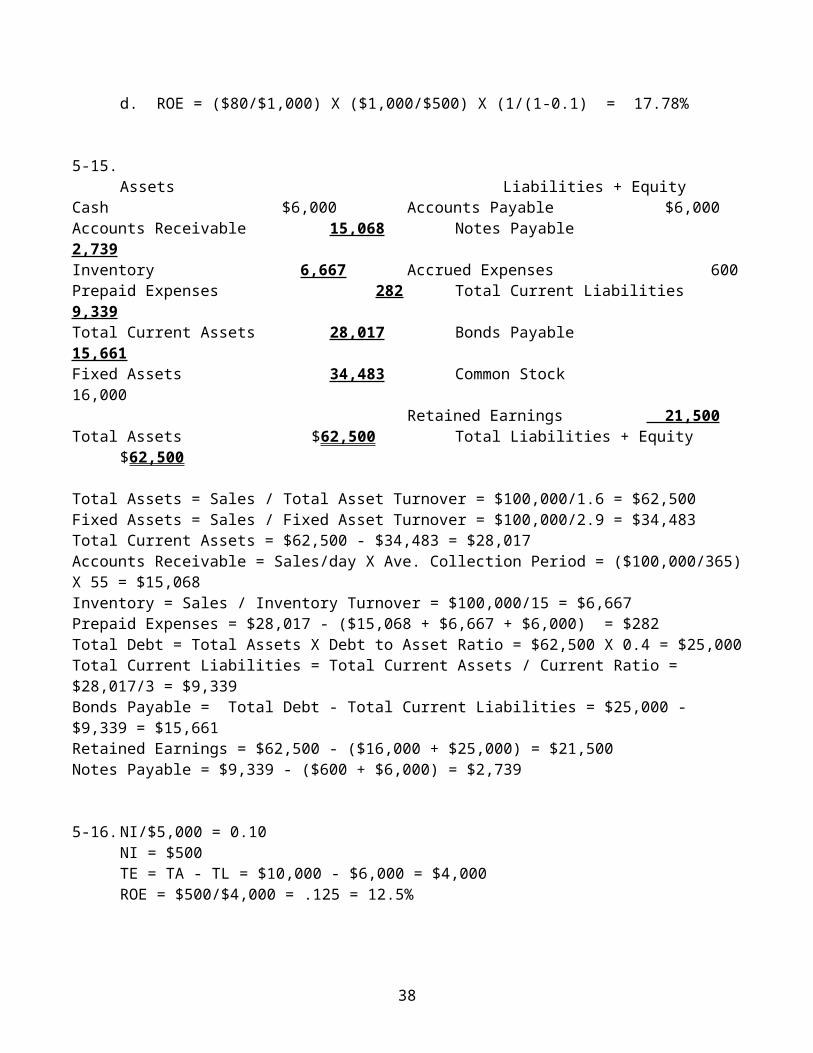
d. ROE = ($80/$1,000) X ($1,000/$500) X (1/(1-0.1) = 17.78%
5-15. Assets Liabilities + Equity
Cash $6,000 Accounts Payable $6,000Accounts Receivable 15,068 Notes Payable 2,739Inventory 6,667 Accrued Expenses 600Prepaid Expenses 282 Total Current Liabilities 9,339Total Current Assets 28,017 Bonds Payable 15,661Fixed Assets 34,483 Common Stock 16,000
Retained Earnings 21,500Total Assets $62,500 Total Liabilities + Equity
$62,500
Total Assets = Sales / Total Asset Turnover = $100,000/1.6 = $62,500Fixed Assets = Sales / Fixed Asset Turnover = $100,000/2.9 = $34,483Total Current Assets = $62,500 - $34,483 = $28,017Accounts Receivable = Sales/day X Ave. Collection Period = ($100,000/365)X 55 = $15,068Inventory = Sales / Inventory Turnover = $100,000/15 = $6,667Prepaid Expenses = $28,017 - ($15,068 + $6,667 + $6,000) = $282Total Debt = Total Assets X Debt to Asset Ratio = $62,500 X 0.4 = $25,000Total Current Liabilities = Total Current Assets / Current Ratio = $28,017/3 = $9,339Bonds Payable = Total Debt - Total Current Liabilities = $25,000 - $9,339 = $15,661Retained Earnings = $62,500 - ($16,000 + $25,000) = $21,500Notes Payable = $9,339 - ($600 + $6,000) = $2,739
5-16.NI/$5,000 = 0.10NI = $500TE = TA - TL = $10,000 - $6,000 = $4,000ROE = $500/$4,000 = .125 = 12.5%
38
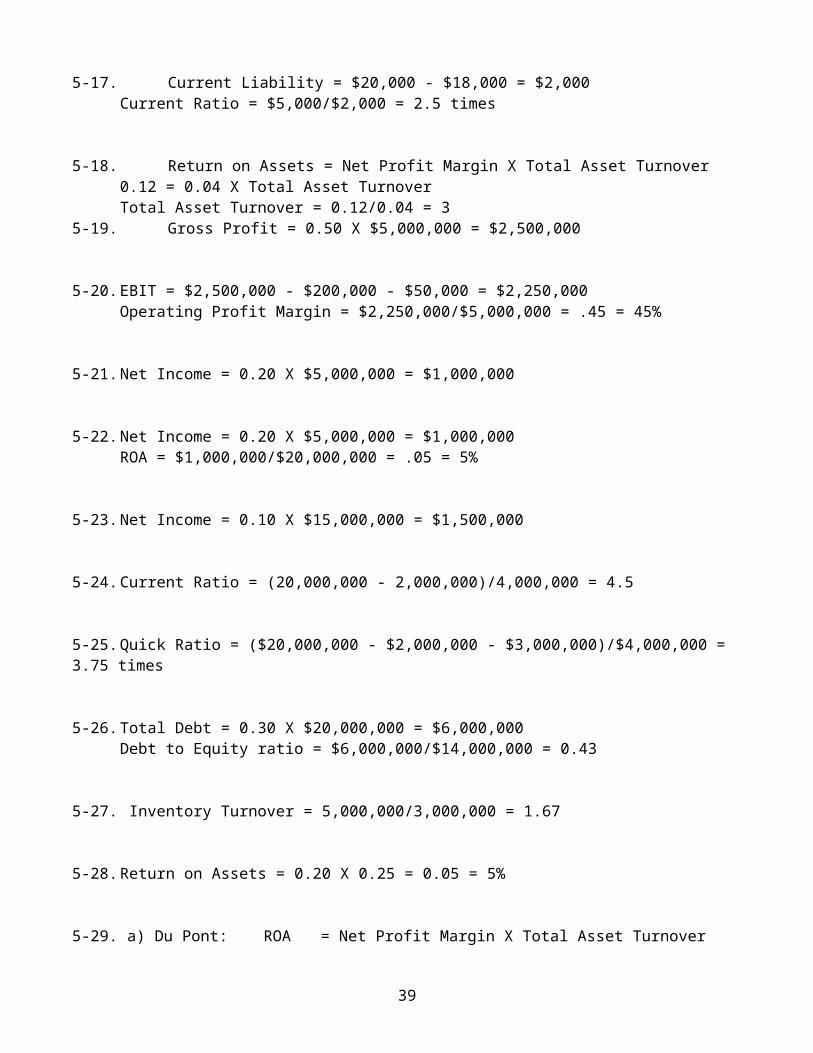
5-17. Current Liability = $20,000 - $18,000 = $2,000Current Ratio = $5,000/$2,000 = 2.5 times
5-18. Return on Assets = Net Profit Margin X Total Asset Turnover0.12 = 0.04 X Total Asset TurnoverTotal Asset Turnover = 0.12/0.04 = 3
5-19. Gross Profit = 0.50 X $5,000,000 = $2,500,000
5-20.EBIT = $2,500,000 - $200,000 - $50,000 = $2,250,000Operating Profit Margin = $2,250,000/$5,000,000 = .45 = 45%
5-21.Net Income = 0.20 X $5,000,000 = $1,000,000
5-22.Net Income = 0.20 X $5,000,000 = $1,000,000ROA = $1,000,000/$20,000,000 = .05 = 5%
5-23.Net Income = 0.10 X $15,000,000 = $1,500,000
5-24.Current Ratio = (20,000,000 - 2,000,000)/4,000,000 = 4.5
5-25.Quick Ratio = ($20,000,000 - $2,000,000 - $3,000,000)/$4,000,000 = 3.75 times
5-26.Total Debt = 0.30 X $20,000,000 = $6,000,000Debt to Equity ratio = $6,000,000/$14,000,000 = 0.43
5-27. Inventory Turnover = 5,000,000/3,000,000 = 1.67
5-28.Return on Assets = 0.20 X 0.25 = 0.05 = 5%
5-29. a) Du Pont: ROA = Net Profit Margin X Total Asset Turnover
39
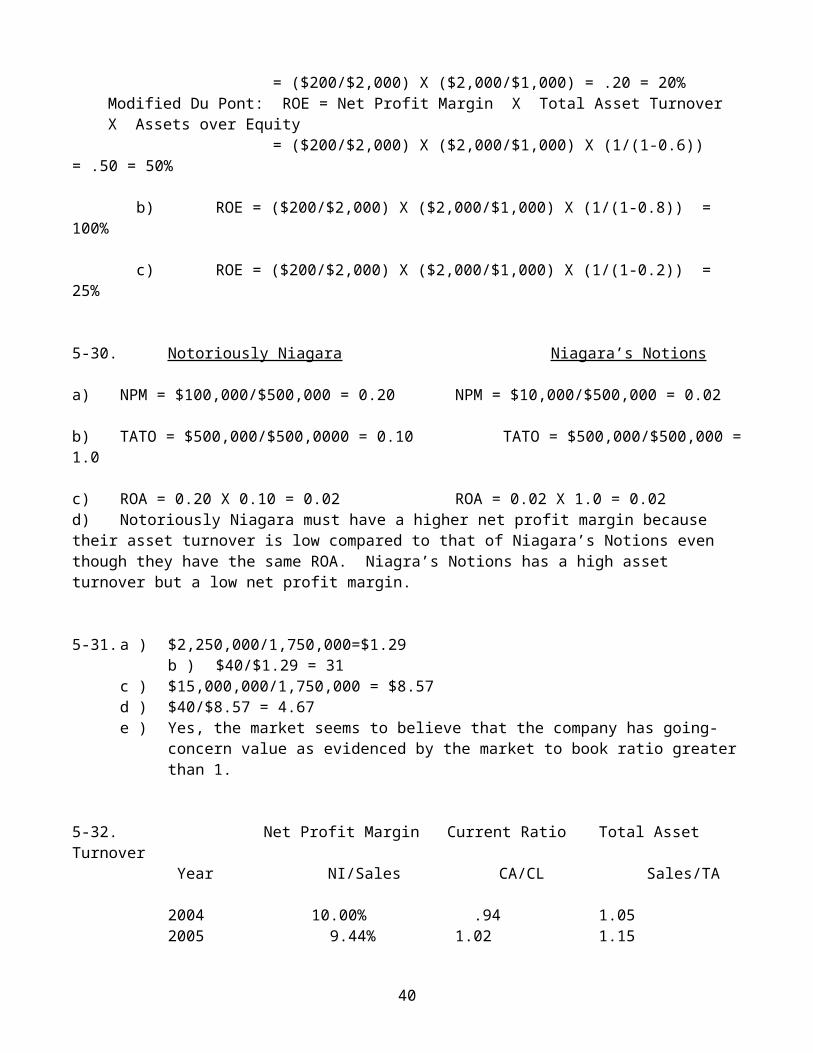
= ($200/$2,000) X ($2,000/$1,000) = .20 = 20%Modified Du Pont: ROE = Net Profit Margin X Total Asset Turnover X Assets over Equity
= ($200/$2,000) X ($2,000/$1,000) X (1/(1-0.6)) = .50 = 50%
b) ROE = ($200/$2,000) X ($2,000/$1,000) X (1/(1-0.8)) = 100%
c) ROE = ($200/$2,000) X ($2,000/$1,000) X (1/(1-0.2)) = 25%
5-30. Notoriously Niagara Niagara’s Notions
a) NPM = $100,000/$500,000 = 0.20 NPM = $10,000/$500,000 = 0.02
b) TATO = $500,000/$500,0000 = 0.10 TATO = $500,000/$500,000 =1.0
c) ROA = 0.20 X 0.10 = 0.02 ROA = 0.02 X 1.0 = 0.02d) Notoriously Niagara must have a higher net profit margin because their asset turnover is low compared to that of Niagara’s Notions even though they have the same ROA. Niagra’s Notions has a high asset turnover but a low net profit margin.
5-31.a ) $2,250,000/1,750,000=$1.29 b ) $40/$1.29 = 31 c ) $15,000,000/1,750,000 = $8.57 d ) $40/$8.57 = 4.67 e ) Yes, the market seems to believe that the company has going-
concern value as evidenced by the market to book ratio greaterthan 1.
5-32. Net Profit Margin Current Ratio Total Asset Turnover
Year NI/Sales CA/CL Sales/TA
2004 10.00% .94 1.052005 9.44% 1.02 1.15
40

2006 9.36% 1.08 1.18
Golden ProductsIndustry averages: 9.42% 1.13 2.00
The NPM is about average, although it is deteriorating. The liquidity, as measured by the current ratio, is below average but improving. Asset utilization, as measured by the total asset turnover isway below average.
5-33. The Industry averages are:
Fixed Asset Turnover Return on Assets Debt to Assets RatioReturn on equity
1.33 11.00% 0.60 26%
YEAR PM CR TATO FATO ROA D/A ROE2004 10.00% 0.94 1.05 1.21 10.53% 0.68 33.33%2005 9.44% 1.02 1.15 1.33 10.90% 0.64 30.36%2006 9.36% 1.08 1.18 1.36 11.00% 0.60 27.50%
Golden Products has an improving ROA that now equals that of the industry norm. The ROE has slipped a little, but is still above the industry norm in spite of the fact that Golden has a little less debt in its capital structure in 2006. Overall, Johnny shouldbe pleased.
5-34. ( Figures in $ '000) Mining Smelting Rolling Extrusion Whole Company
NPM 3.3% 8.7% 11.7% 10.0% 9.7%
ROA 4.2% 10.4% 17.9% 13.9% 13.4%
41
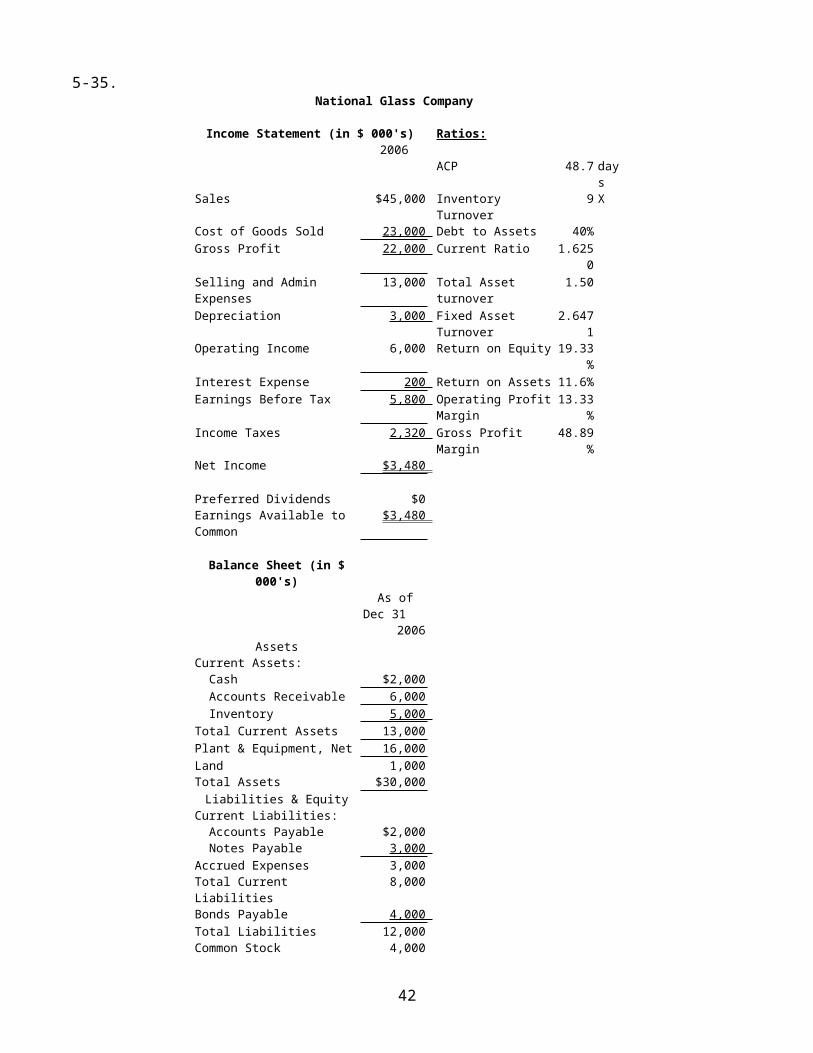
5-35. National Glass Company
Income Statement (in $ 000's) Ratios:2006
ACP 48.7 days
Sales $45,000 Inventory Turnover
9 X
Cost of Goods Sold 23,000 Debt to Assets 40%Gross Profit 22,000 Current Ratio 1.625
0 Selling and Admin Expenses
13,000 Total Asset turnover
1.50
Depreciation 3,000 Fixed Asset Turnover
2.6471
Operating Income 6,000 Return on Equity 19.33%
Interest Expense 200 Return on Assets 11.6%Earnings Before Tax 5,800 Operating Profit
Margin13.33
%Income Taxes 2,320 Gross Profit
Margin48.89
%Net Income $3,480
Preferred Dividends $0 Earnings Available to Common
$3,480
Balance Sheet (in $000's)
As of Dec 31
2006Assets
Current Assets: Cash $2,000 Accounts Receivable 6,000 Inventory 5,000 Total Current Assets 13,000 Plant & Equipment, Net 16,000 Land 1,000 Total Assets $30,000 Liabilities & Equity
Current Liabilities: Accounts Payable $2,000 Notes Payable 3,000 Accrued Expenses 3,000 Total Current Liabilities
8,000
Bonds Payable 4,000 Total Liabilities 12,000 Common Stock 4,000
42
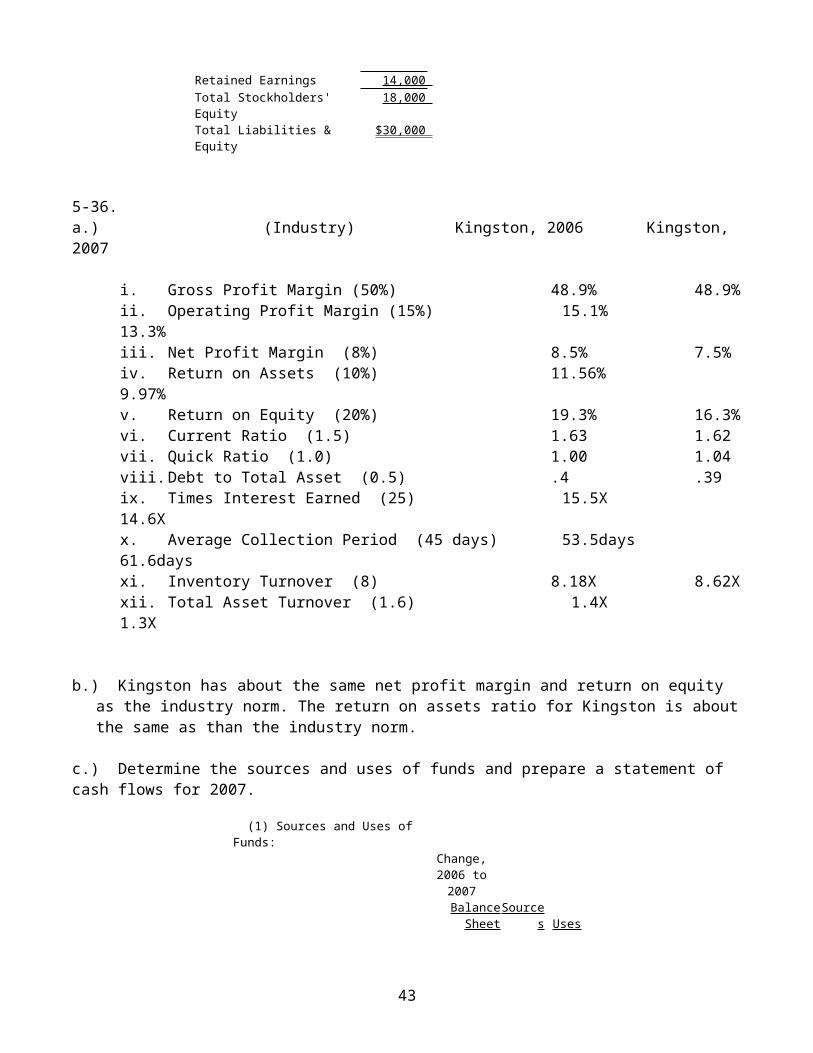
Retained Earnings 14,000 Total Stockholders' Equity
18,000
Total Liabilities & Equity
$30,000
5-36. a.) (Industry) Kingston, 2006 Kingston, 2007
i. Gross Profit Margin (50%) 48.9% 48.9%ii. Operating Profit Margin (15%) 15.1%13.3%iii. Net Profit Margin (8%) 8.5% 7.5%iv. Return on Assets (10%) 11.56%9.97%v. Return on Equity (20%) 19.3% 16.3%vi. Current Ratio (1.5) 1.63 1.62vii. Quick Ratio (1.0) 1.00 1.04viii.Debt to Total Asset (0.5) .4 .39ix. Times Interest Earned (25) 15.5X14.6Xx. Average Collection Period (45 days) 53.5days61.6daysxi. Inventory Turnover (8) 8.18X 8.62Xxii. Total Asset Turnover (1.6) 1.4X1.3X
b.) Kingston has about the same net profit margin and return on equity as the industry norm. The return on assets ratio for Kingston is aboutthe same as than the industry norm.
c.) Determine the sources and uses of funds and prepare a statement of cash flows for 2007.
(1) Sources and Uses of Funds:
Change,2006 to2007BalanceSheet
Sources Uses
43
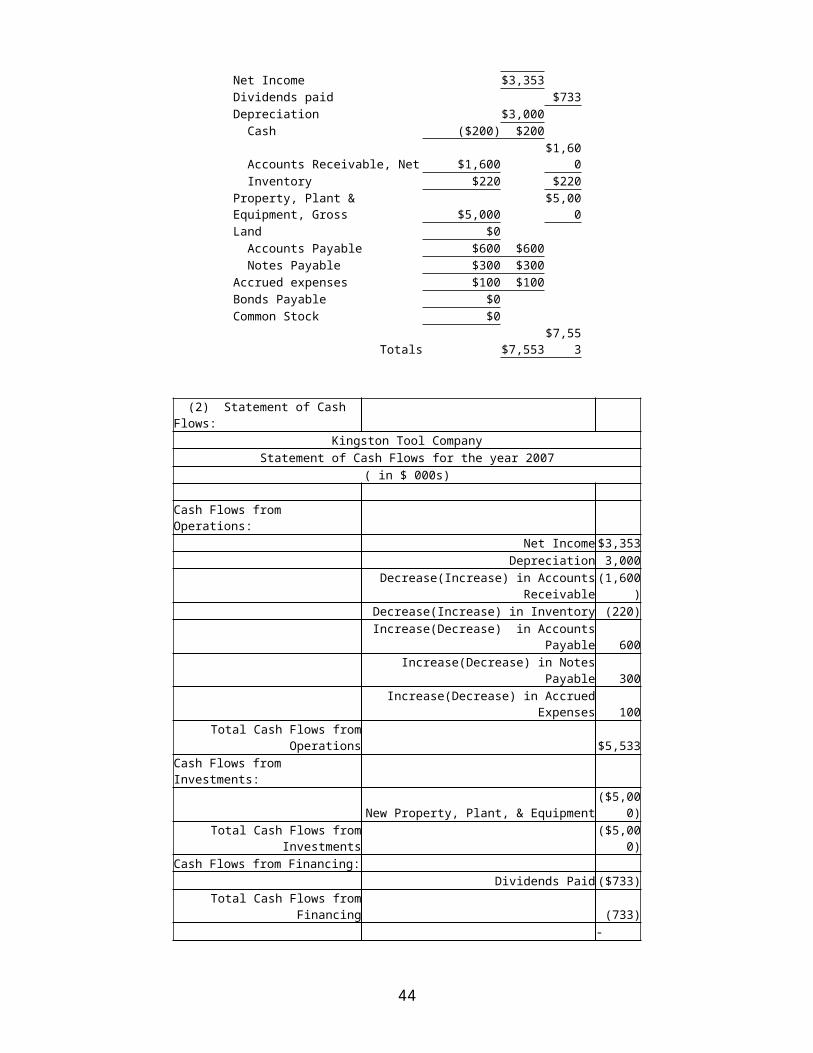
Net Income $3,353 Dividends paid $733 Depreciation $3,000 Cash ($200) $200
Accounts Receivable, Net $1,600 $1,60
0 Inventory $220 $220 Property, Plant & Equipment, Gross $5,000
$5,000
Land $0 Accounts Payable $600 $600 Notes Payable $300 $300 Accrued expenses $100 $100 Bonds Payable $0 Common Stock $0
Totals $7,553 $7,55
3
(2) Statement of Cash Flows:
Kingston Tool CompanyStatement of Cash Flows for the year 2007
( in $ 000s)
Cash Flows from Operations:
Net Income $3,353 Depreciation 3,000
Decrease(Increase) in AccountsReceivable
(1,600)
Decrease(Increase) in Inventory (220)Increase(Decrease) in Accounts
Payable 600 Increase(Decrease) in Notes
Payable 300 Increase(Decrease) in Accrued
Expenses 100 Total Cash Flows from
Operations $5,533 Cash Flows from Investments:
New Property, Plant, & Equipment($5,00
0)Total Cash Flows from
Investments($5,00
0)Cash Flows from Financing:
Dividends Paid ($733)Total Cash Flows from
Financing (733)-
44
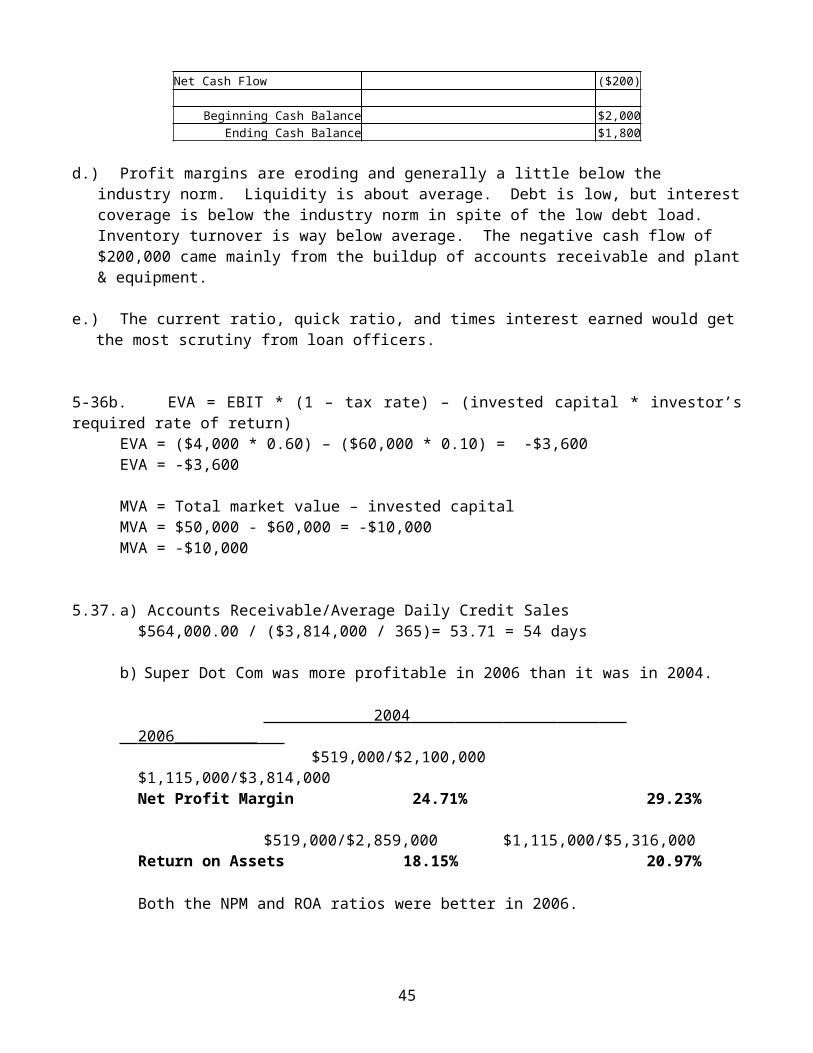
Net Cash Flow ($200)
Beginning Cash Balance $2,000 Ending Cash Balance $1,800
d.) Profit margins are eroding and generally a little below the industry norm. Liquidity is about average. Debt is low, but interestcoverage is below the industry norm in spite of the low debt load. Inventory turnover is way below average. The negative cash flow of $200,000 came mainly from the buildup of accounts receivable and plant& equipment.
e.) The current ratio, quick ratio, and times interest earned would getthe most scrutiny from loan officers.
5-36b. EVA = EBIT * (1 – tax rate) – (invested capital * investor’srequired rate of return)
EVA = ($4,000 * 0.60) – ($60,000 * 0.10) = -$3,600EVA = -$3,600
MVA = Total market value – invested capitalMVA = $50,000 - $60,000 = -$10,000MVA = -$10,000
5.37.a) Accounts Receivable/Average Daily Credit Sales $564,000.00 / ($3,814,000 / 365)= 53.71 = 54 days
b) Super Dot Com was more profitable in 2006 than it was in 2004.
2004 2006_________ $519,000/$2,100,000$1,115,000/$3,814,000Net Profit Margin 24.71% 29.23%
$519,000/$2,859,000 $1,115,000/$5,316,000Return on Assets 18.15% 20.97%
Both the NPM and ROA ratios were better in 2006.
45
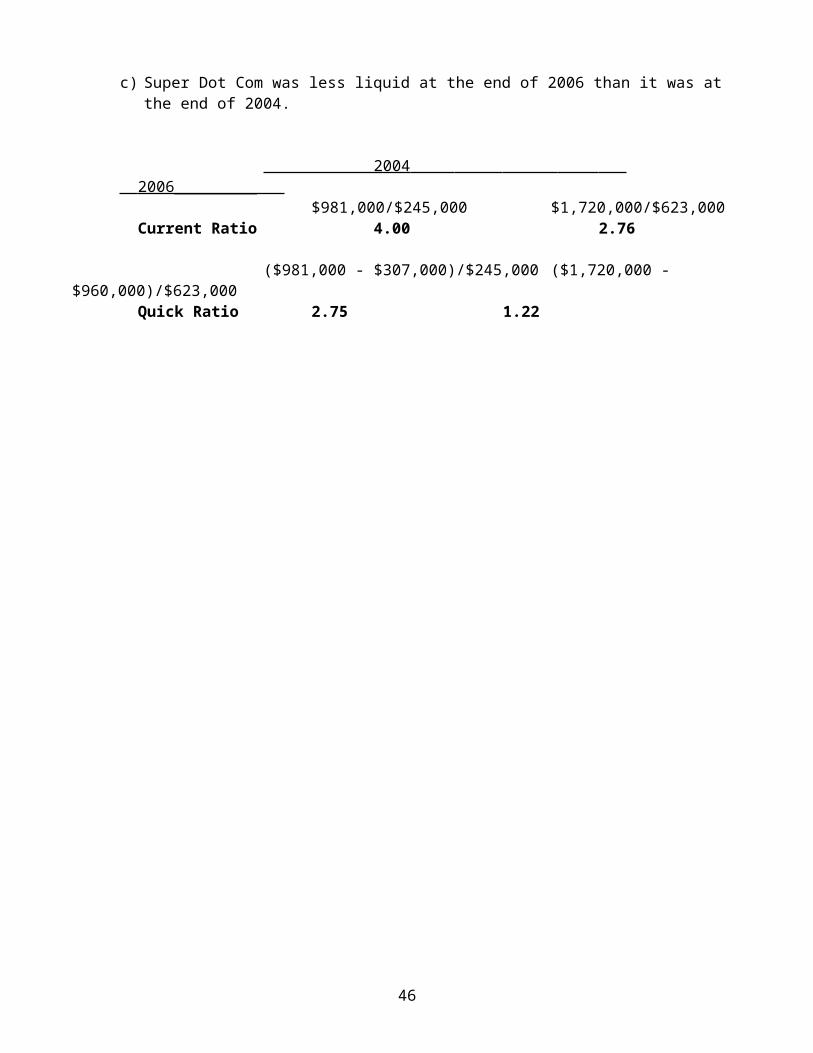
c) Super Dot Com was less liquid at the end of 2006 than it was at the end of 2004.
2004 2006_________ $981,000/$245,000 $1,720,000/$623,000Current Ratio 4.00 2.76
($981,000 - $307,000)/$245,000 ($1,720,000 - $960,000)/$623,000
Quick Ratio 2.75 1.22
46
Chapter 6 Solutions
Answers to Review Questions
1. Why do businesses spend time, effort, and money to produce forecasts? Explain.
Businesses succeed or fail depending on how well prepared they are to deal with the situations they confront in the future. Thereforethey expend considerable sums making estimates (forecasts) of what the future situation is likely to be. Businesses develop new products, set production quotas, and select financing sources basedon forecasts about the future economic environment and the firm's condition. If economists predict interest rates will be relativelyhigh, for example, firms may plan to limit borrowing and defer expansion plans.
2. What is the primary assumption behind the experience approach to forecasting?
The experience approach to forecasting is based on the assumption that things will happen a certain way in the future because they happened that way in the past. For instance, if it has always takenyou fifteen minutes to drive to the grocery store, then you will probably assume that it will take you about fifteen minutes the next time you drive to the store. Similarly, financial managers often assume sales, expenses, or earnings will grow at certain rates in the future because they grew at that rate in the past.
3. Describe the sales forecasting process.
Sales forecasting is a group effort. Sales and marketing personnel usually provide assessments of demand and the competition. Production personnel usually provide estimates of manufacturing capacity and other production constraints. Top management will make strategic decisions affecting the firm as a whole. Financial managers coordinate, collect, and analyze the sales forecasting
47
information. Figure 6-1 in the text shows a diagram of the process.
4. Explain how the cash budget and the capital budget relate to pro forma financial statements.
The cash budget shows the projected flow of cash in and out of the firm for specified time periods. The capital budget shows planned expenditures for major asset acquisitions. Forecasters incorporatedata from these budgets into pro forma financial statements under the assumption that the budget figures will, in fact, occur.
5. Explain how management goals are incorporated into pro forma financial statements.
Management sets a target goal, and forecasters produce pro forma financial statements under the assumption that the goal will be reached. For example, if management’s goal is to pay off all short-term notes during the coming year, forecasters would incorporate this into the pro forma balance sheet by setting Notes Payable to zero.
6. Explain the significance of the term additional funds needed.
When the pro forma balance sheet is completed, total assets and total liabilities and equity will rarely match. The discrepancy between forecasted assets and forecasted liabilities and equity results when either too little or too much financing is projected for the amount of asset growth expected. The discrepancy is calledadditional funds needed (AFN) when forecast assets exceed forecast liabilities and equity, and excess financing when forecast liabilities and equity exceed forecast assets.
7. What do financial managers look for when they analyze pro forma financial statements?
After the pro forma financial statements are complete, financial managers analyze the forecast to determine (1) what current trends suggest what will happen to the firm in the future, (2) what effect
48
management's current plans and budgets will have on the firm, and (3) what actions to take to avoid problems revealed in the pro forma statements
8. What action(s) should be taken if analysis of pro forma financial statements reveals positive trends? Negative trends?
When analyzing the pro forma statements, managers often see signs of emerging positive or negative conditions. If forecasters discover positive indicators, they will recommend that current plans be continued. If forecasters see negative indicators, they will recommend corrective action.
Answers to End-of-Chapter Problems
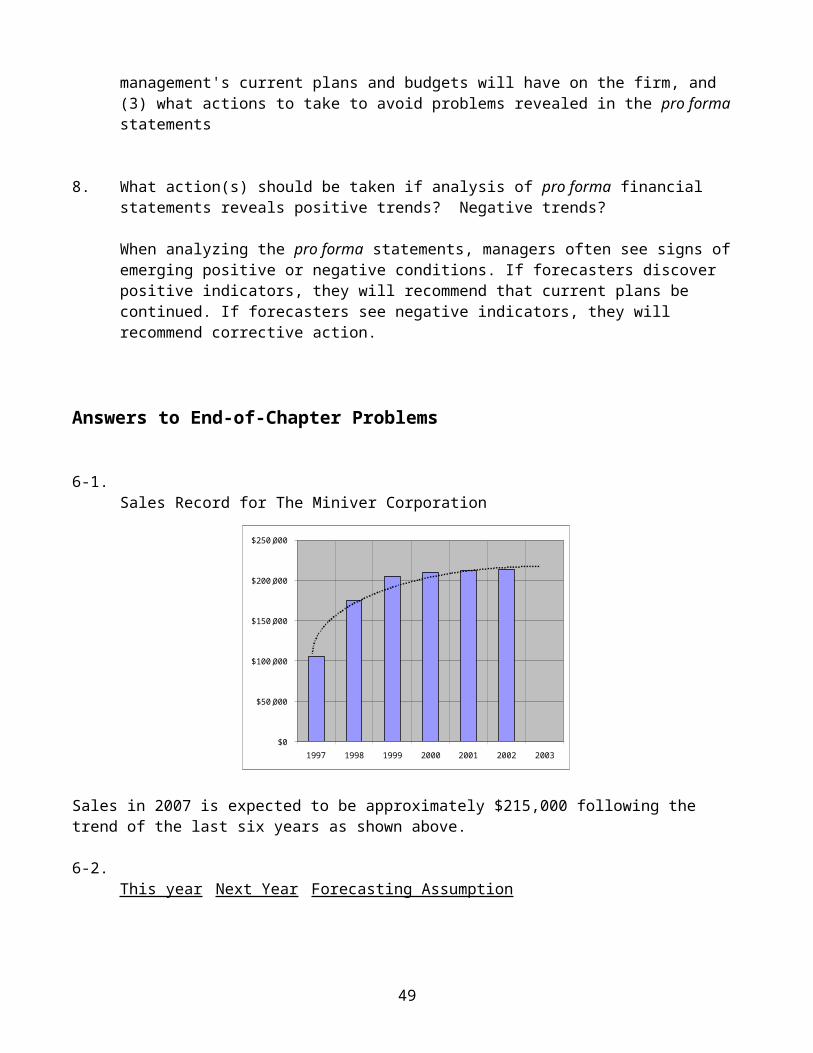
6-1. Sales Record for The Miniver Corporation
Sales in 2007 is expected to be approximately $215,000 following the trend of the last six years as shown above.
6-2. This year Next Year Forecasting Assumption
49
$0
$50,000
$100,000
$150,000
$200,000
$250,000
1997 1998 1999 2000 2001 2002 2003
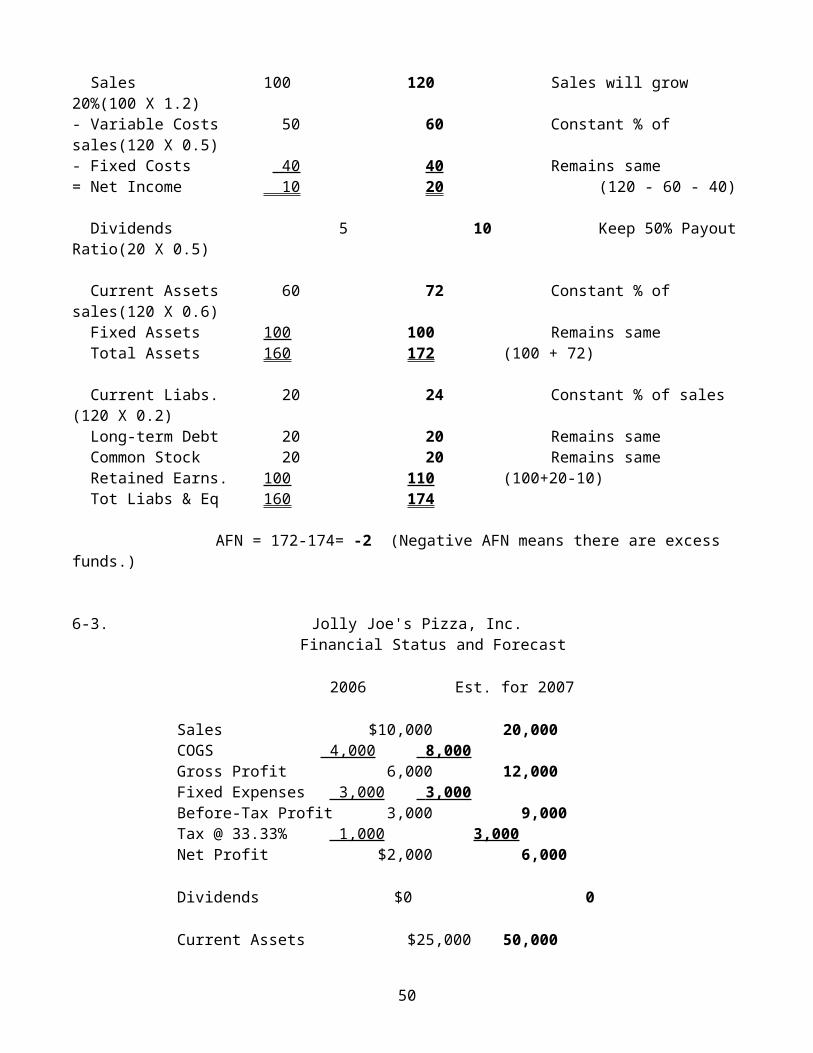
Sales 100 120 Sales will grow 20%(100 X 1.2)- Variable Costs 50 60 Constant % of sales(120 X 0.5)- Fixed Costs 40 40 Remains same= Net Income 10 20 (120 - 60 - 40)
Dividends 5 10 Keep 50% PayoutRatio(20 X 0.5)
Current Assets 60 72 Constant % of sales(120 X 0.6) Fixed Assets 100 100 Remains same Total Assets 160 172 (100 + 72)
Current Liabs. 20 24 Constant % of sales (120 X 0.2) Long-term Debt 20 20 Remains same Common Stock 20 20 Remains same Retained Earns. 100 110 (100+20-10) Tot Liabs & Eq 160 174
AFN = 172-174= -2 (Negative AFN means there are excess funds.)
6-3. Jolly Joe's Pizza, Inc. Financial Status and Forecast
2006 Est. for 2007 Sales $10,000 20,000 COGS 4,000 8,000 Gross Profit 6,000 12,000 Fixed Expenses 3,000 3,000 Before-Tax Profit 3,000 9,000 Tax @ 33.33% 1,000 3,000 Net Profit $2,000 6,000 Dividends $0 0 Current Assets $25,000 50,000
50
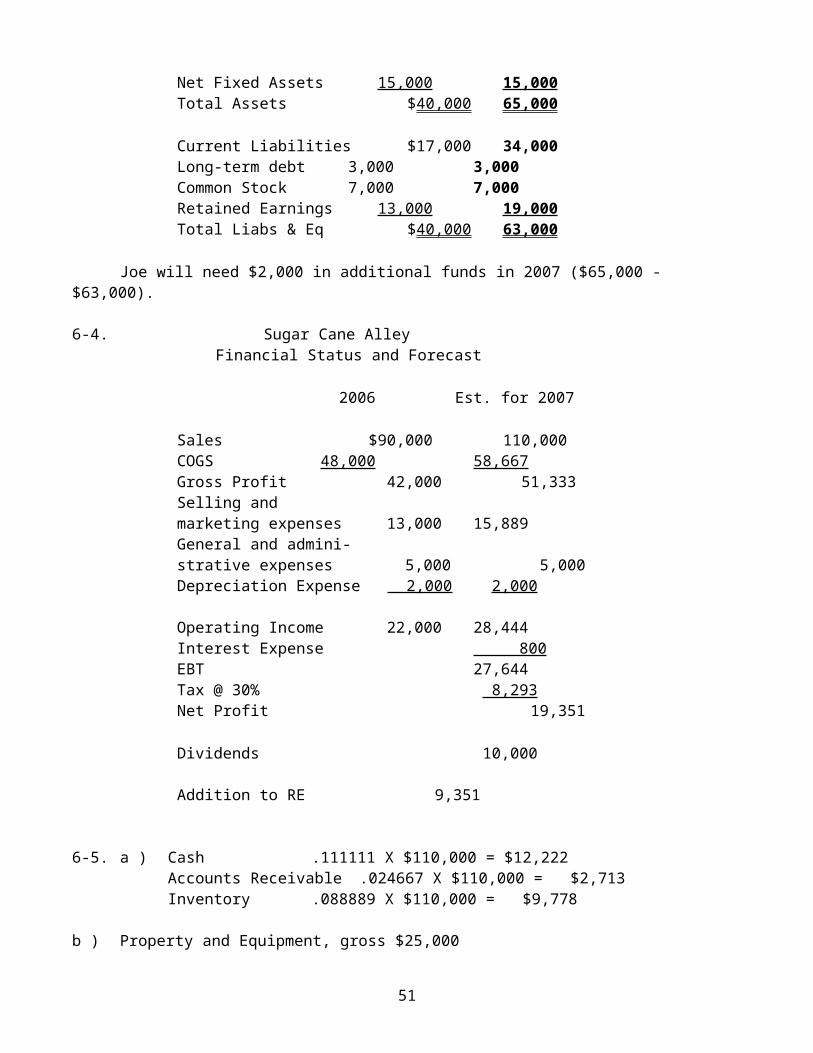
Net Fixed Assets 15,000 15,000 Total Assets $40,000 65,000 Current Liabilities $17,000 34,000 Long-term debt 3,000 3,000 Common Stock 7,000 7,000 Retained Earnings 13,000 19,000 Total Liabs & Eq $40,000 63,000
Joe will need $2,000 in additional funds in 2007 ($65,000 - $63,000).
6-4. Sugar Cane Alley Financial Status and Forecast
2006 Est. for 2007
Sales $90,000 110,000 COGS 48,000 58,667 Gross Profit 42,000 51,333 Selling and marketing expenses 13,000 15,889 General and admini- strative expenses 5,000 5,000 Depreciation Expense 2,000 2,000
Operating Income 22,000 28,444 Interest Expense 800 EBT 27,644 Tax @ 30% 8,293 Net Profit 19,351 Dividends 10,000
Addition to RE 9,351
6-5. a ) Cash .111111 X $110,000 = $12,222Accounts Receivable .024667 X $110,000 = $2,713Inventory .088889 X $110,000 = $9,778
b ) Property and Equipment, gross $25,000
51

Accumulated Depreciation $6,000Property and Equipment, net $19,000Total Assets $19,000 + $12,222 + $2,713 + $9,778 = $43,713
c ) Accounts Payable .015333 X $110,000 = $1,687
d ) Total Liabilities = $8,000 + $1,687 = $9,687
e ) Total Liabilities and Equity = $9,687 + $9,351 + $5,000 + $26,840= $50,878
f ) Total Assets = $12,222 + $2,713 + $9,778 + $19,000 = $43,713AFN = $43,713 - $50,878 = -$7,165There are excess funds of $7,165.
g ) 2006: Net Profit Margin = $14,840/$90,000 = 16.49%2007: Net Profit Margin = $19,351/$110,000 = 17.6%
6-6.
Assets 2006 2007 Liabilities 2006 2007
Cash $10,000 $12,500 Accounts Payable $10,500 $13,125Acct Rec. 25,000 31,250 Notes Payable 10,000 12,500Inventory 20,000 25,000 Accrued Expenses 11,000 13,750Prepaid Exp 2,000 2,500 Long Term Debt 15,000 15,000Total Current Common Equity 38,500 38,500Assets 57,000 71,250 Total LiabilitiesFixed Assets 32,000 32,000 Equity 85,000 $92,875Depreciation 4,000 4,000Total Assets 85,000 $99,250
*Net Sales for 2007 = $150 million * 1.25 = $187.5 million Additional funds needed = $99,250 - $92,875 = $6,375
52
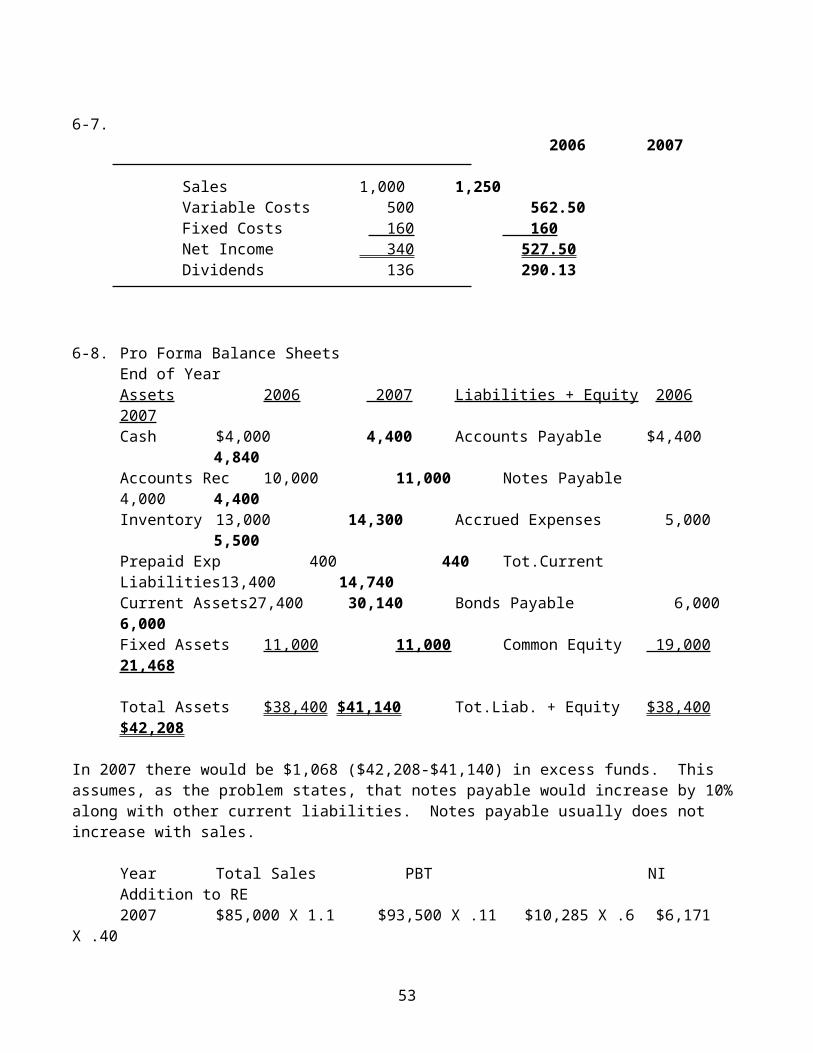
6-7. 2006 2007
Sales 1,000 1,250 Variable Costs 500 562.50 Fixed Costs 160 160 Net Income 340 527.50 Dividends 136 290.13
6-8. Pro Forma Balance SheetsEnd of YearAssets 2006 2007 Liabilities + Equity 2006 2007Cash $4,000 4,400 Accounts Payable $4,400
4,840Accounts Rec 10,000 11,000 Notes Payable 4,000 4,400Inventory 13,000 14,300 Accrued Expenses 5,000
5,500Prepaid Exp 400 440 Tot.Current Liabilities13,400 14,740Current Assets27,400 30,140 Bonds Payable 6,000 6,000Fixed Assets 11,000 11,000 Common Equity 19,000 21,468
Total Assets $38,400 $41,140 Tot.Liab. + Equity $38,400 $42,208
In 2007 there would be $1,068 ($42,208-$41,140) in excess funds. This assumes, as the problem states, that notes payable would increase by 10% along with other current liabilities. Notes payable usually does not increase with sales.
Year Total Sales PBT NIAddition to RE2007 $85,000 X 1.1 $93,500 X .11 $10,285 X .6 $6,171
X .40
53
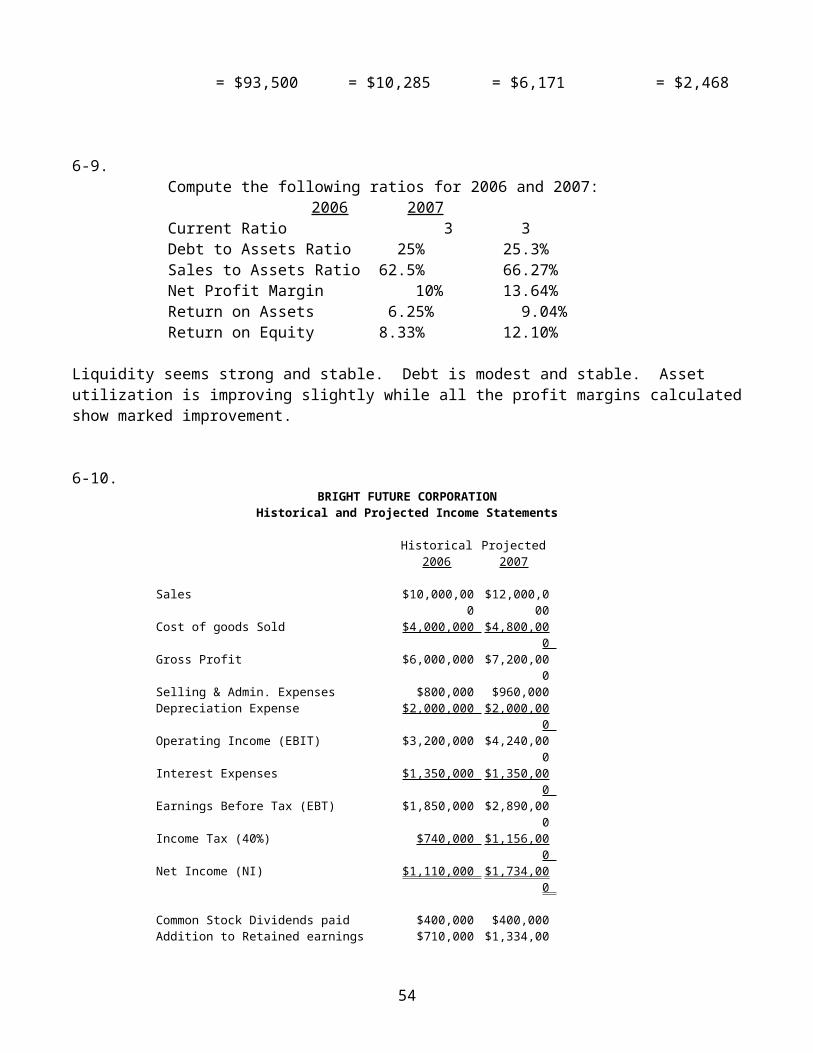
= $93,500 = $10,285 = $6,171 = $2,468
6-9. Compute the following ratios for 2006 and 2007: 2006 2007Current Ratio 3 3Debt to Assets Ratio 25% 25.3%Sales to Assets Ratio 62.5% 66.27%Net Profit Margin 10% 13.64%Return on Assets 6.25% 9.04%Return on Equity 8.33% 12.10%
Liquidity seems strong and stable. Debt is modest and stable. Asset utilization is improving slightly while all the profit margins calculatedshow marked improvement.
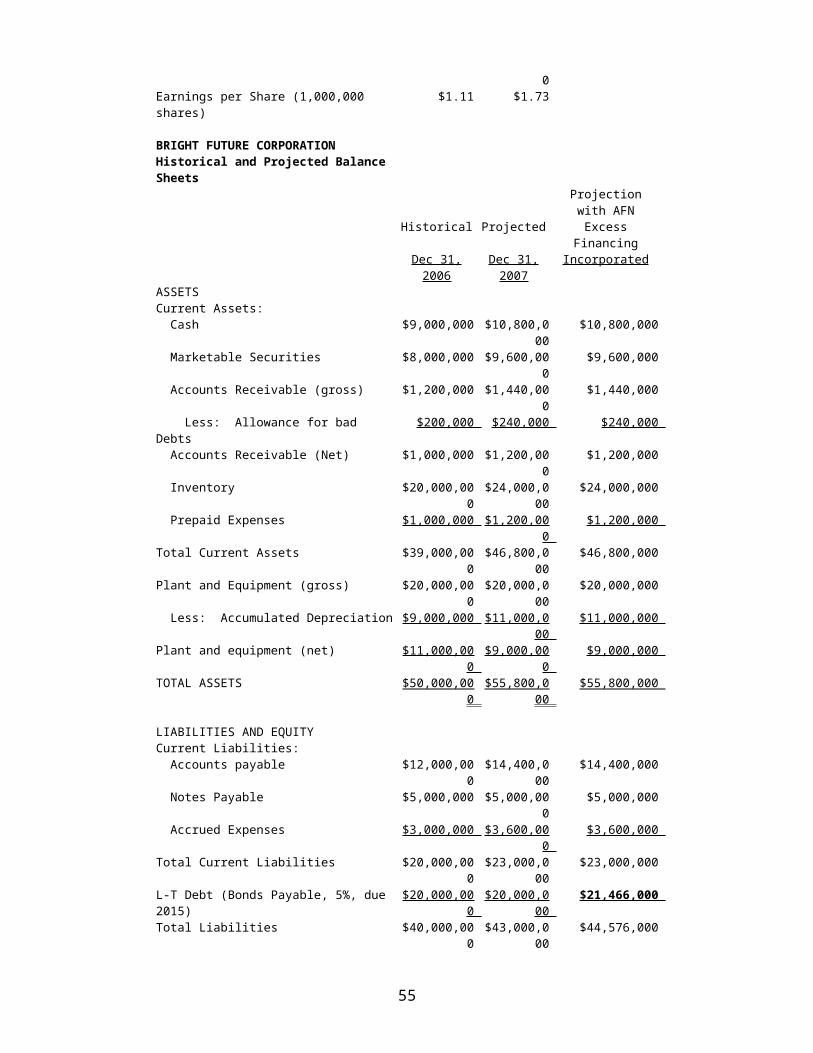
6-10.BRIGHT FUTURE CORPORATION
Historical and Projected Income Statements
Historical Projected2006 2007
Sales $10,000,000
$12,000,000
Cost of goods Sold $4,000,000 $4,800,000
Gross Profit $6,000,000 $7,200,000
Selling & Admin. Expenses $800,000 $960,000 Depreciation Expense $2,000,000 $2,000,00
0 Operating Income (EBIT) $3,200,000 $4,240,00
0 Interest Expenses $1,350,000 $1,350,00
0 Earnings Before Tax (EBT) $1,850,000 $2,890,00
0 Income Tax (40%) $740,000 $1,156,00
0 Net Income (NI) $1,110,000 $1,734,00
0
Common Stock Dividends paid $400,000 $400,000 Addition to Retained earnings $710,000 $1,334,00
54
0 Earnings per Share (1,000,000 shares)
$1.11 $1.73
BRIGHT FUTURE CORPORATIONHistorical and Projected Balance Sheets
Projectionwith AFN
Historical Projected ExcessFinancing
Dec 31,2006
Dec 31,2007
Incorporated
ASSETSCurrent Assets: Cash $9,000,000 $10,800,0
00 $10,800,000
Marketable Securities $8,000,000 $9,600,000
$9,600,000
Accounts Receivable (gross) $1,200,000 $1,440,000
$1,440,000
Less: Allowance for bad Debts
$200,000 $240,000 $240,000
Accounts Receivable (Net) $1,000,000 $1,200,000
$1,200,000
Inventory $20,000,000
$24,000,000
$24,000,000
Prepaid Expenses $1,000,000 $1,200,000
$1,200,000
Total Current Assets $39,000,000
$46,800,000
$46,800,000
Plant and Equipment (gross) $20,000,000
$20,000,000
$20,000,000
Less: Accumulated Depreciation $9,000,000 $11,000,000
$11,000,000
Plant and equipment (net) $11,000,000
$9,000,000
$9,000,000
TOTAL ASSETS $50,000,000
$55,800,000
$55,800,000
LIABILITIES AND EQUITYCurrent Liabilities: Accounts payable $12,000,00
0 $14,400,0
00 $14,400,000
Notes Payable $5,000,000 $5,000,000
$5,000,000
Accrued Expenses $3,000,000 $3,600,000
$3,600,000
Total Current Liabilities $20,000,000
$23,000,000
$23,000,000
L-T Debt (Bonds Payable, 5%, due 2015)
$20,000,000
$20,000,000
$21,466,000
Total Liabilities $40,000,000
$43,000,000
$44,576,000
55
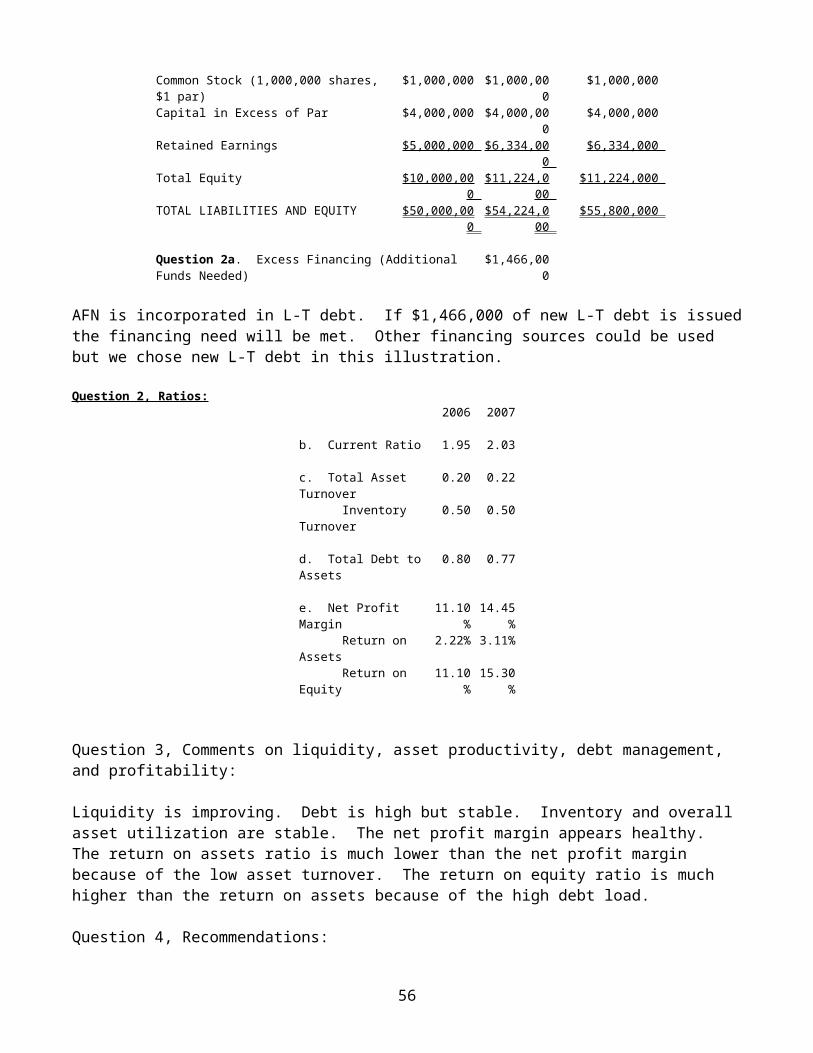
Common Stock (1,000,000 shares, $1 par)
$1,000,000 $1,000,000
$1,000,000
Capital in Excess of Par $4,000,000 $4,000,000
$4,000,000
Retained Earnings $5,000,000 $6,334,000
$6,334,000
Total Equity $10,000,000
$11,224,000
$11,224,000
TOTAL LIABILITIES AND EQUITY $50,000,000
$54,224,000
$55,800,000
Question 2a. Excess Financing (Additional Funds Needed)
$1,466,000
AFN is incorporated in L-T debt. If $1,466,000 of new L-T debt is issuedthe financing need will be met. Other financing sources could be used but we chose new L-T debt in this illustration.
Question 2, Ratios:2006 2007
b. Current Ratio 1.95 2.03
c. Total Asset Turnover
0.20 0.22
Inventory Turnover
0.50 0.50
d. Total Debt toAssets
0.80 0.77
e. Net Profit Margin
11.10%
14.45%
Return on Assets
2.22% 3.11%
Return on Equity
11.10%
15.30%
Question 3, Comments on liquidity, asset productivity, debt management, and profitability:
Liquidity is improving. Debt is high but stable. Inventory and overall asset utilization are stable. The net profit margin appears healthy. The return on assets ratio is much lower than the net profit margin because of the low asset turnover. The return on equity ratio is much higher than the return on assets because of the high debt load.
Question 4, Recommendations:
56
A 20% projected increase in sales is quite impressive. Management shouldprepare now, however, to raise the $1,466,000 that will be needed in 2007to support the necessary new investments if the projected sales increase is to be achieved.
57
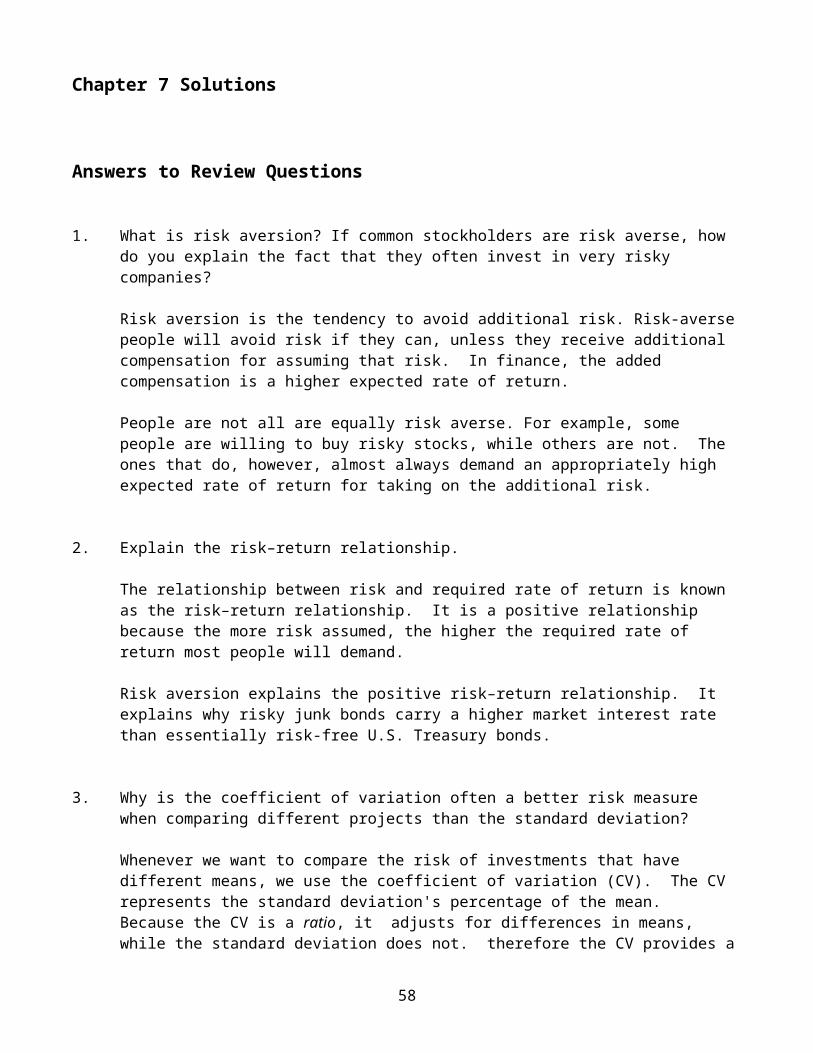
Chapter 7 Solutions
Answers to Review Questions
1. What is risk aversion? If common stockholders are risk averse, how do you explain the fact that they often invest in very risky companies?
Risk aversion is the tendency to avoid additional risk. Risk-aversepeople will avoid risk if they can, unless they receive additional compensation for assuming that risk. In finance, the added compensation is a higher expected rate of return.
People are not all are equally risk averse. For example, some people are willing to buy risky stocks, while others are not. The ones that do, however, almost always demand an appropriately high expected rate of return for taking on the additional risk.
2. Explain the risk–return relationship.
The relationship between risk and required rate of return is known as the risk–return relationship. It is a positive relationship because the more risk assumed, the higher the required rate of return most people will demand.
Risk aversion explains the positive risk–return relationship. It explains why risky junk bonds carry a higher market interest rate than essentially risk-free U.S. Treasury bonds.
3. Why is the coefficient of variation often a better risk measure when comparing different projects than the standard deviation?
Whenever we want to compare the risk of investments that have different means, we use the coefficient of variation (CV). The CV represents the standard deviation's percentage of the mean. Because the CV is a ratio, it adjusts for differences in means, while the standard deviation does not. therefore the CV provides a
58
standardized measure of the degree of risk that can be used to compare alternatives.
4. What is the difference between business risk and financial risk?
Business risk refers to the uncertainty a company has with regard to its operating income (also known as earnings before interest andtaxes or EBIT). Business risk is brought on by sales volatility and intensified by the presence of fixed operating costs.
Financial risk is the additional volatility of net income caused bythe presence of interest expense. Firms that have only equity financing have no financial risk because they have no debt on whichto make fixed interest payments. Conversely, firms that operate primarily on borrowed money are exposed to a high degree of financial risk.
5. Why does the riskiness of portfolios have to be looked at differently than the riskiness of individual assets?
The riskiness of portfolios has to be looked at differently than the riskiness of individual assets because the weighted average of the standard deviations of returns of individual assets does not result in the standard deviation of a portfolio containing the assets. There is a reduction in the fluctuations of the returns ofportfolios which is called the diversification effect.
6. What happens to the riskiness of a portfolio if assets with very low correlations (even negative correlations) are combined?
How successfully diversification reduces risk depends on the degreeof correlation between the two variables in question. When assets with very low or negative correlations are combined in portfolios, the riskiness of the portfolios (as measured by the coefficient of variation) is greatly reduced.
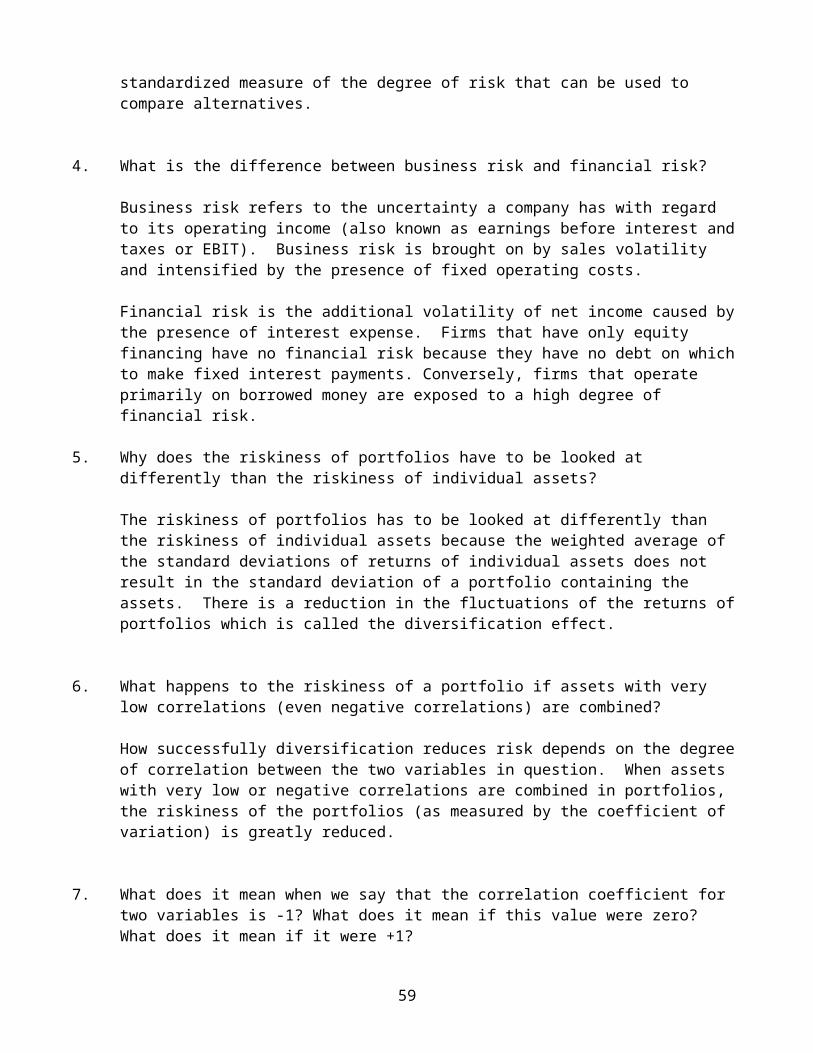
7. What does it mean when we say that the correlation coefficient for two variables is -1? What does it mean if this value were zero? What does it mean if it were +1?
59
Correlation is measured by the correlation coefficient, representedby the letter r. The correlation coefficient can take on values between +1.0 (perfect positive correlation) to -1.0 (perfect negative correlation). The closer r is to +1.0, the more the two variables will tend to move with each other at the same time. The closer r is to -1.0, the more the two variables will tend to move opposite each other at the same time. An r value of zero indicatesthat the variables’ values aren't related at all. This is known asstatistical independence.
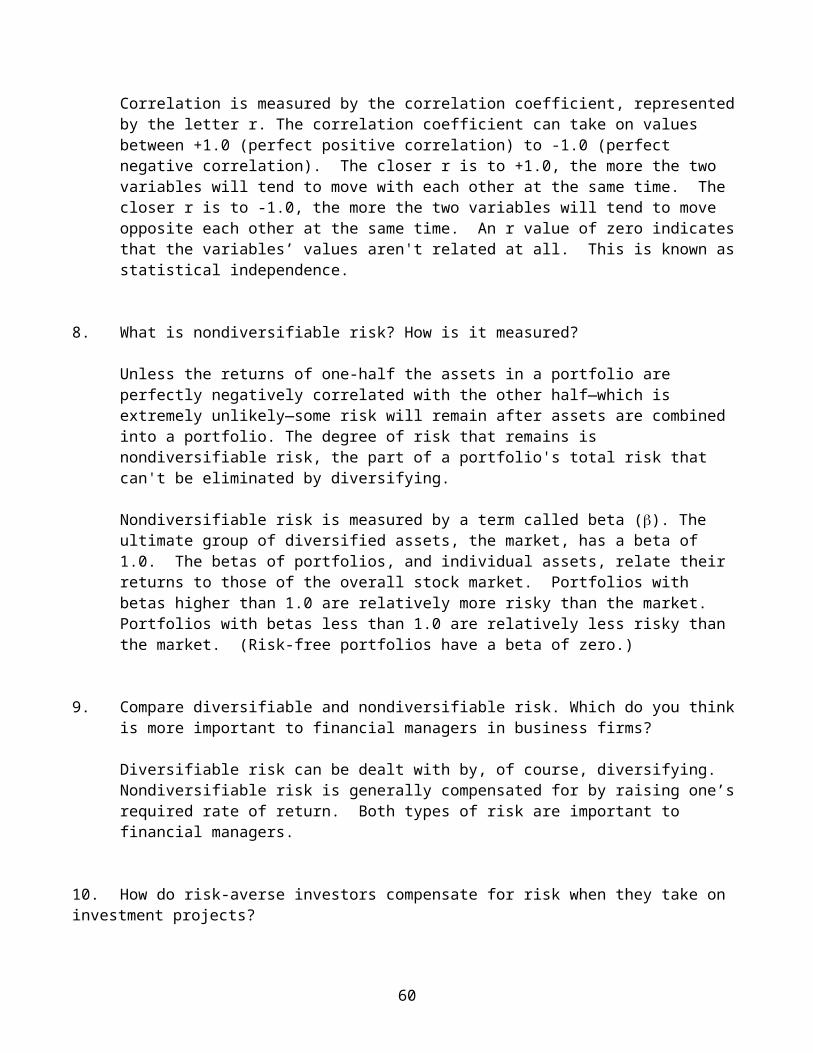
8. What is nondiversifiable risk? How is it measured?
Unless the returns of one-half the assets in a portfolio are perfectly negatively correlated with the other half—which is extremely unlikely—some risk will remain after assets are combined into a portfolio. The degree of risk that remains is nondiversifiable risk, the part of a portfolio's total risk that can't be eliminated by diversifying.
Nondiversifiable risk is measured by a term called beta (). The ultimate group of diversified assets, the market, has a beta of 1.0. The betas of portfolios, and individual assets, relate their returns to those of the overall stock market. Portfolios with betas higher than 1.0 are relatively more risky than the market. Portfolios with betas less than 1.0 are relatively less risky than the market. (Risk-free portfolios have a beta of zero.)
9. Compare diversifiable and nondiversifiable risk. Which do you thinkis more important to financial managers in business firms?
Diversifiable risk can be dealt with by, of course, diversifying. Nondiversifiable risk is generally compensated for by raising one’srequired rate of return. Both types of risk are important to financial managers.
10. How do risk-averse investors compensate for risk when they take on investment projects?
60

Because of risk aversion, people demand higher rates of return for taking on higher-risk projects.
11. Given that risk-averse investors demand more return for taking on more risk when they invest, how much more return is appropriate for, say, a share of common stock, than is appropriate for a Treasury bill?
Although we know that the risk–return relationship is positive, thequestion of much return is appropriate for a given degree of risk is especially difficult. Unfortunately, no one knows the answer for sure. One well-known model used to calculate the required rateof return of an investment, given its degree of risk, is the Capital Asset Pricing Model (CAPM).
12. Discuss risk from the perspective of the Capital Asset Pricing Model (CAPM).
The Capital Asset Pricing Model, or CAPM, can be used to calculate the appropriate required rate of return for an investment project given its degree of risk as measured by beta (). A project's betarepresents its degree of risk relative to the overall stock market.In the CAPM, when the beta term is multiplied by the market risk premium term, the result is the additional return over the risk-free rate that investors demand from that individual project. High-risk (high-beta) projects have high required rates of return, and low-risk (low-beta) projects have low required rates of return.
Answers to End-of-Chapter Problems
7-1.Cash Flow Probability
Estimate of Occurrence
CF P CF x P CF - mean (CF - mean)2 P x (CF -mean)2
61
$10,000 5.00% $500 ($9,000) $81,000,000 $4,050,000$13,000 10.00% $1,300 ($6,000) $36,000,000 $3,600,000$16,000 20.00% $3,200 ($3,000) $9,000,000 $1,800,000$19,000 30.00% $5,700 $0 $0 $0$22,000 20.00% $4,400 $3,000 $9,000,000 $1,800,000$25,000 10.00% $2,500 $6,000 $36,000,000 $3,600,000$28,000 5.00% $1,400 $9,000 $81,000,000 $4,050,000Sum of (R x P) = mean: $19,000
Sum of P x (CF- mean)2 = variance: $18,900,000 Square root of variance = standard deviation of
the variance: $4,347
Coefficient of Variation = std.dev./mean = 22.88%
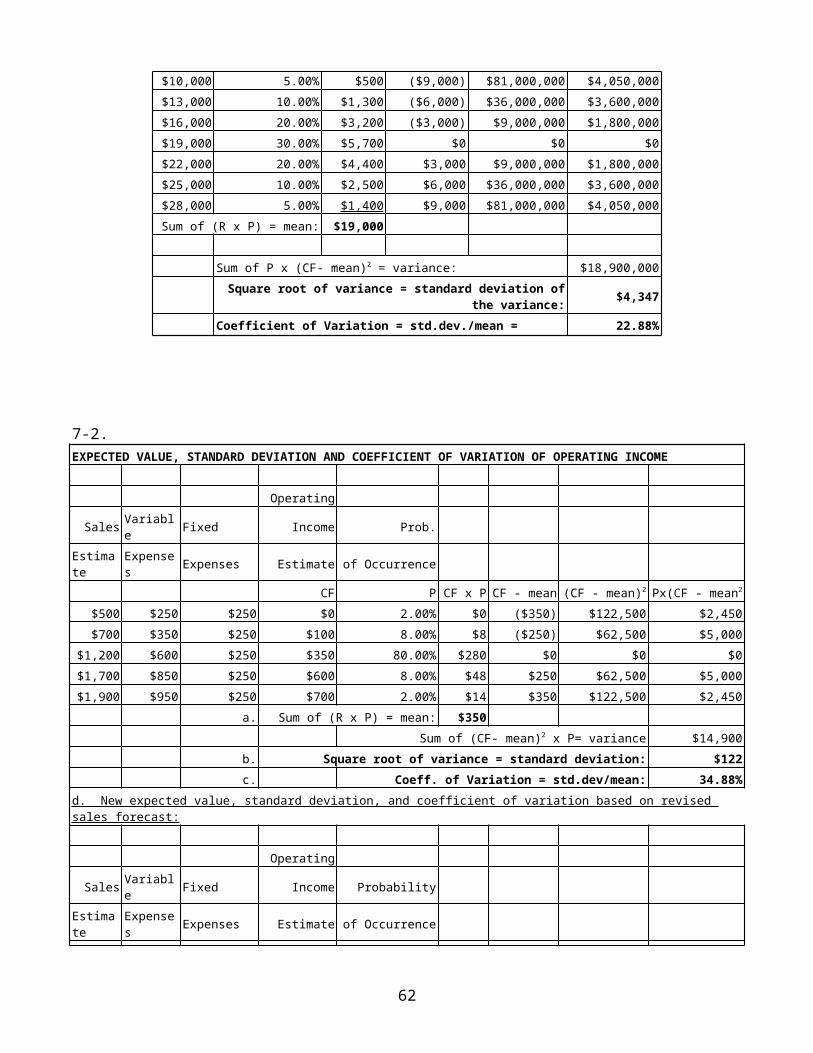
7-2.EXPECTED VALUE, STANDARD DEVIATION AND COEFFICIENT OF VARIATION OF OPERATING INCOME
Operating
Sales Variable Fixed Income Prob.
Estimate
Expenses Expenses Estimate of Occurrence
CF P CF x P CF - mean (CF - mean)2 Px(CF - mean2
$500 $250 $250 $0 2.00% $0 ($350) $122,500 $2,450$700 $350 $250 $100 8.00% $8 ($250) $62,500 $5,000
$1,200 $600 $250 $350 80.00% $280 $0 $0 $0$1,700 $850 $250 $600 8.00% $48 $250 $62,500 $5,000$1,900 $950 $250 $700 2.00% $14 $350 $122,500 $2,450
a. Sum of (R x P) = mean: $350Sum of (CF- mean)2 x P= variance $14,900
b. Square root of variance = standard deviation: $122c. Coeff. of Variation = std.dev/mean: 34.88%
d. New expected value, standard deviation, and coefficient of variation based on revised sales forecast:
Operating
Sales Variable Fixed Income Probability
Estimate
Expenses Expenses Estimate of Occurrence
62
CF P CF x P CF - mean (CF - mean)2 Px(CF -mean)2
$500 $250 $250 $0 10.00% $0 ($350) $122,500 $12,250$700 $350 $250 $100 15.00% $15 ($250) $62,500 $9,375
$1,200 $600 $250 $350 50.00% $175 $0 $0 $0$1,700 $850 $250 $600 15.00% $90 $250 $62,500 $9,375$1,900 $950 $250 $700 10.00% $70 $350 $122,500 $12,250
a. Sum of (R x P) = mean: $350Sum of P x (CF - mean)2 = variance: $43,250
b. Square root of variance = standard deviation: $208c. Coeff. of Variation = std. dev./mean: 59.43%
e. Comments: Note how the increased possibilities that sales will be other than $1,200 caused the standard deviation and coefficient of variation of operating income to nearly double.
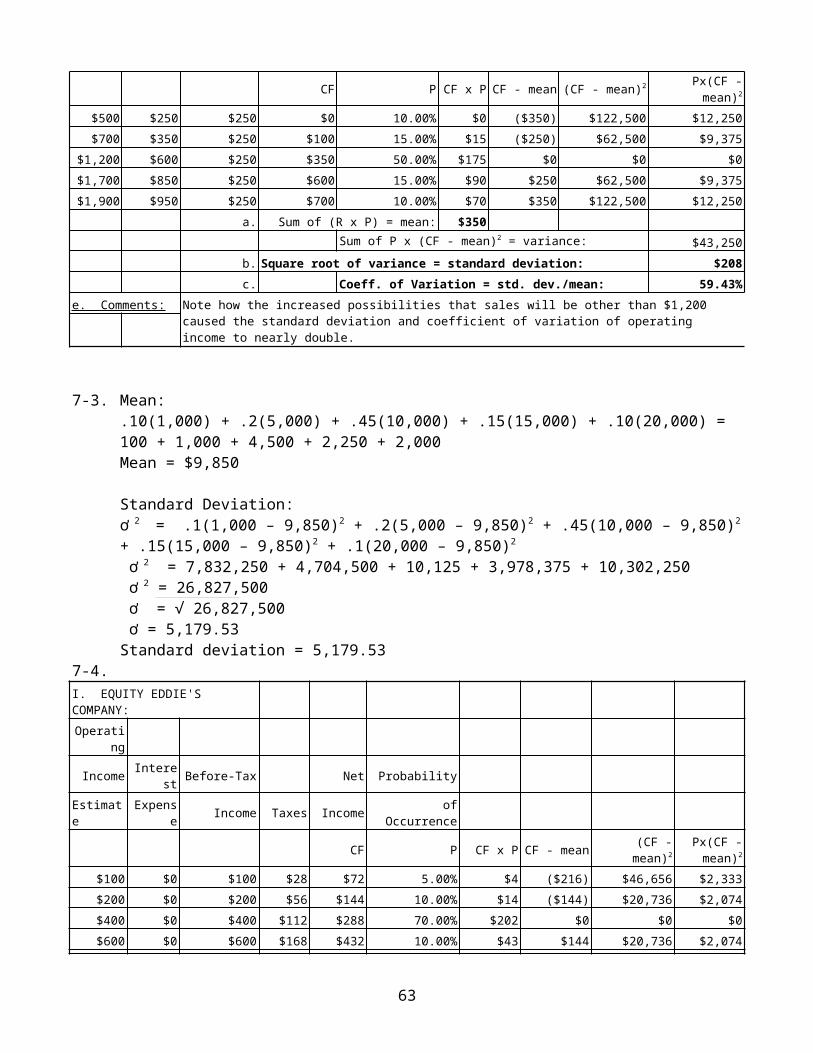
7-3. Mean:.10(1,000) + .2(5,000) + .45(10,000) + .15(15,000) + .10(20,000) =100 + 1,000 + 4,500 + 2,250 + 2,000Mean = $9,850
Standard Deviation:ơ 2 = .1(1,000 – 9,850)2 + .2(5,000 – 9,850)2 + .45(10,000 – 9,850)2
+ .15(15,000 – 9,850)2 + .1(20,000 – 9,850)2
ơ 2 = 7,832,250 + 4,704,500 + 10,125 + 3,978,375 + 10,302,250 ơ 2 = 26,827,500
ơ = √ 26,827,500 ơ = 5,179.53
Standard deviation = 5,179.537-4.I. EQUITY EDDIE'S COMPANY:Operati
ng
Income Interest Before-Tax Net Probability
Estimate
Expense Income Taxes Income of
Occurrence
CF P CF x P CF - mean (CF -mean)2
Px(CF -mean)2
$100 $0 $100 $28 $72 5.00% $4 ($216) $46,656 $2,333$200 $0 $200 $56 $144 10.00% $14 ($144) $20,736 $2,074$400 $0 $400 $112 $288 70.00% $202 $0 $0 $0$600 $0 $600 $168 $432 10.00% $43 $144 $20,736 $2,074
63
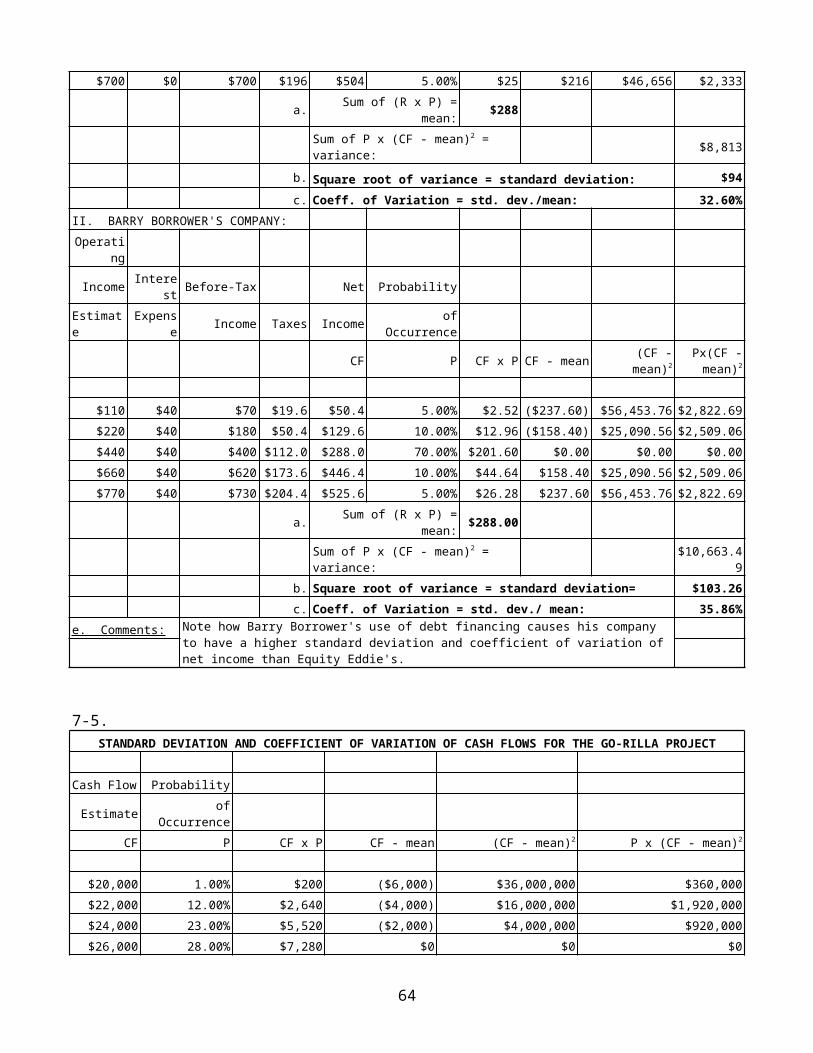
$700 $0 $700 $196 $504 5.00% $25 $216 $46,656 $2,333
a. Sum of (R x P) =mean: $288
Sum of P x (CF - mean)2 = variance: $8,813
b. Square root of variance = standard deviation: $94c. Coeff. of Variation = std. dev./mean: 32.60%
II. BARRY BORROWER'S COMPANY:Operati
ng
Income Interest Before-Tax Net Probability
Estimate
Expense Income Taxes Income of
Occurrence
CF P CF x P CF - mean (CF -mean)2
Px(CF -mean)2
$110 $40 $70 $19.6 $50.4 5.00% $2.52 ($237.60) $56,453.76 $2,822.69$220 $40 $180 $50.4 $129.6 10.00% $12.96 ($158.40) $25,090.56 $2,509.06$440 $40 $400 $112.0 $288.0 70.00% $201.60 $0.00 $0.00 $0.00$660 $40 $620 $173.6 $446.4 10.00% $44.64 $158.40 $25,090.56 $2,509.06$770 $40 $730 $204.4 $525.6 5.00% $26.28 $237.60 $56,453.76 $2,822.69
a. Sum of (R x P) =mean: $288.00
Sum of P x (CF - mean)2 = variance:
$10,663.49
b. Square root of variance = standard deviation= $103.26c. Coeff. of Variation = std. dev./ mean: 35.86%
e. Comments: Note how Barry Borrower's use of debt financing causes his company to have a higher standard deviation and coefficient of variation of net income than Equity Eddie's.
7-5.STANDARD DEVIATION AND COEFFICIENT OF VARIATION OF CASH FLOWS FOR THE GO-RILLA PROJECT
Cash Flow Probability
Estimate ofOccurrence
CF P CF x P CF - mean (CF - mean)2 P x (CF - mean)2
$20,000 1.00% $200 ($6,000) $36,000,000 $360,000$22,000 12.00% $2,640 ($4,000) $16,000,000 $1,920,000$24,000 23.00% $5,520 ($2,000) $4,000,000 $920,000$26,000 28.00% $7,280 $0 $0 $0
64
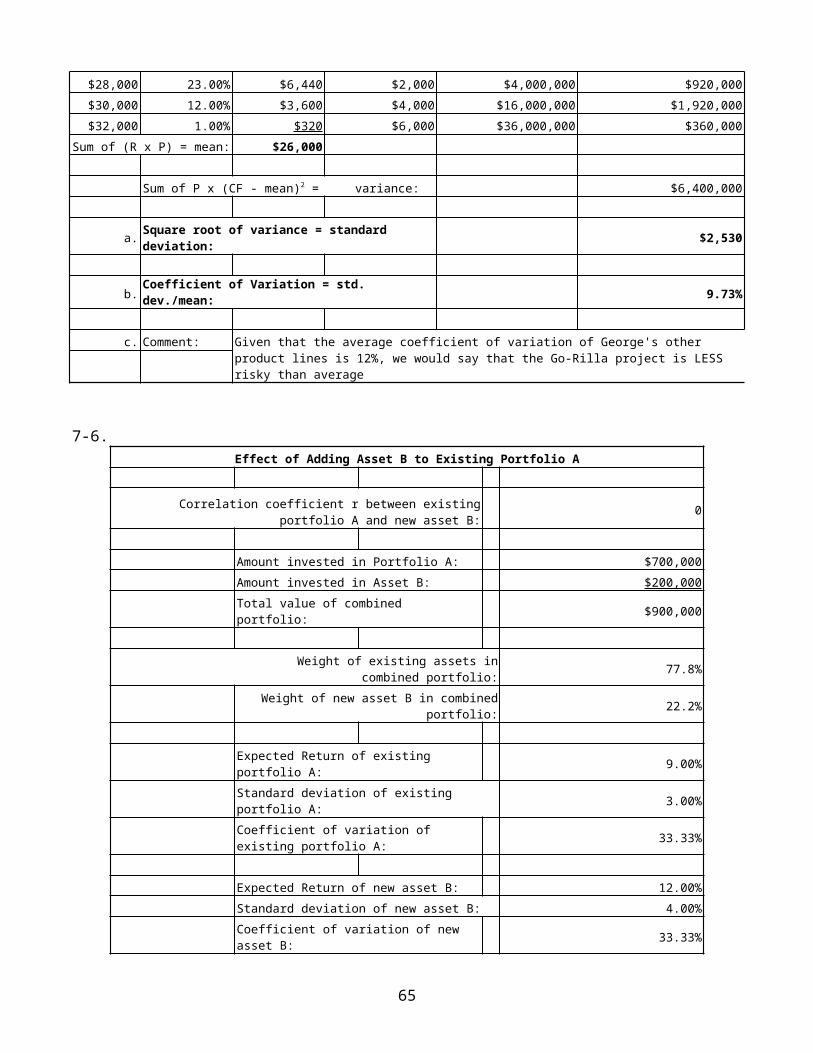
$28,000 23.00% $6,440 $2,000 $4,000,000 $920,000$30,000 12.00% $3,600 $4,000 $16,000,000 $1,920,000$32,000 1.00% $320 $6,000 $36,000,000 $360,000
Sum of (R x P) = mean: $26,000
Sum of P x (CF - mean)2 = variance: $6,400,000
a. Square root of variance = standard deviation: $2,530
b.Coefficient of Variation = std. dev./mean: 9.73%
c. Comment: Given that the average coefficient of variation of George's other product lines is 12%, we would say that the Go-Rilla project is LESS risky than average
7-6.Effect of Adding Asset B to Existing Portfolio A
Correlation coefficient r between existingportfolio A and new asset B:
0
Amount invested in Portfolio A: $700,000Amount invested in Asset B: $200,000Total value of combined portfolio: $900,000
Weight of existing assets incombined portfolio: 77.8%
Weight of new asset B in combinedportfolio: 22.2%
Expected Return of existing portfolio A: 9.00%
Standard deviation of existing portfolio A: 3.00%
Coefficient of variation of existing portfolio A: 33.33%
Expected Return of new asset B: 12.00%Standard deviation of new asset B: 4.00%Coefficient of variation of new asset B: 33.33%
65
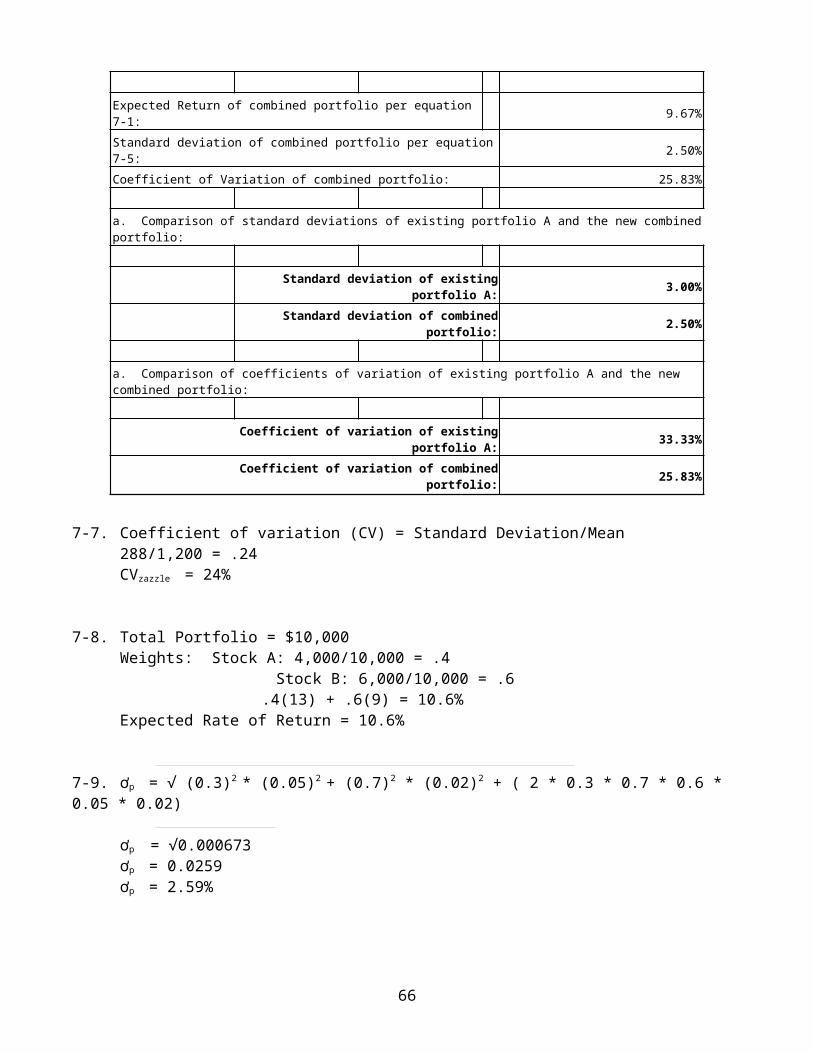
Expected Return of combined portfolio per equation 7-1: 9.67%
Standard deviation of combined portfolio per equation7-5: 2.50%
Coefficient of Variation of combined portfolio: 25.83%
a. Comparison of standard deviations of existing portfolio A and the new combinedportfolio:
Standard deviation of existingportfolio A: 3.00%
Standard deviation of combinedportfolio: 2.50%
a. Comparison of coefficients of variation of existing portfolio A and the new combined portfolio:
Coefficient of variation of existingportfolio A: 33.33%
Coefficient of variation of combinedportfolio: 25.83%
7-7. Coefficient of variation (CV) = Standard Deviation/Mean288/1,200 = .24CVzazzle = 24%
7-8. Total Portfolio = $10,000 Weights: Stock A: 4,000/10,000 = .4 Stock B: 6,000/10,000 = .6
.4(13) + .6(9) = 10.6%Expected Rate of Return = 10.6%
7-9. ơp = √ (0.3)2 * (0.05)2 + (0.7)2 * (0.02)2 + ( 2 * 0.3 * 0.7 * 0.6 * 0.05 * 0.02)
ơp = √0.000673ơp = 0.0259ơp = 2.59%
66
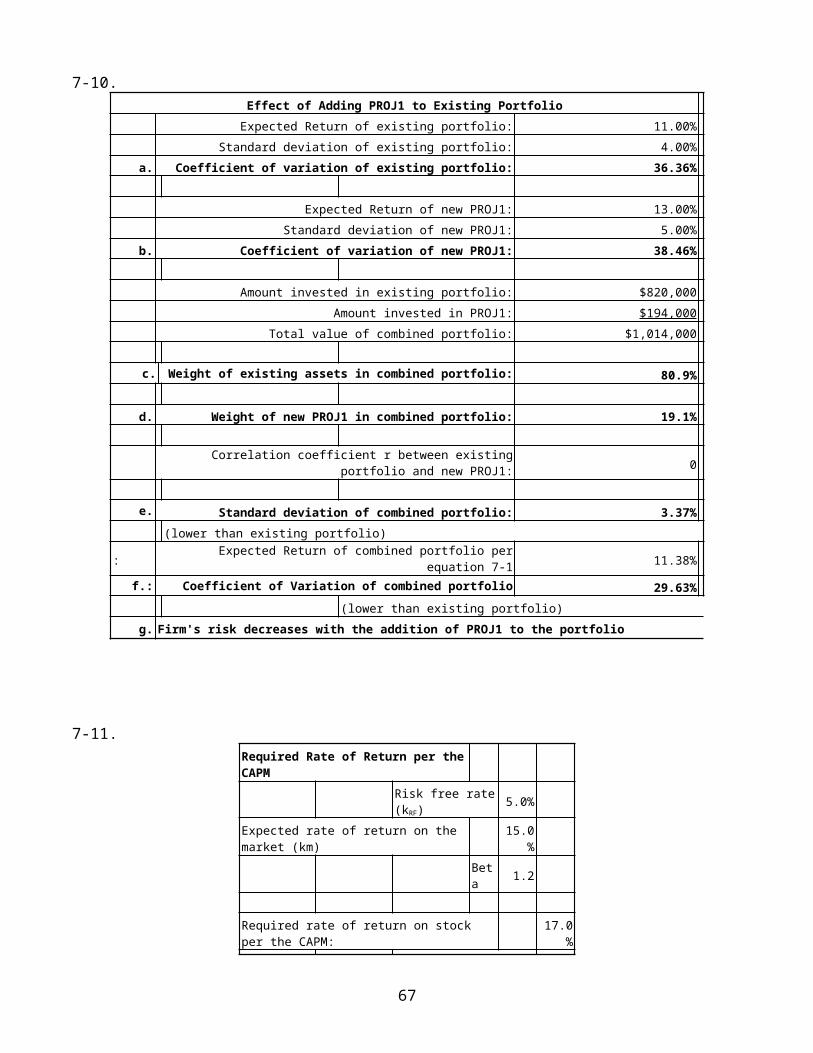
7-10.Effect of Adding PROJ1 to Existing PortfolioExpected Return of existing portfolio: 11.00%
Standard deviation of existing portfolio: 4.00%a. Coefficient of variation of existing portfolio: 36.36%
Expected Return of new PROJ1: 13.00%Standard deviation of new PROJ1: 5.00%
b. Coefficient of variation of new PROJ1: 38.46%
Amount invested in existing portfolio: $820,000Amount invested in PROJ1: $194,000
Total value of combined portfolio: $1,014,000
c. Weight of existing assets in combined portfolio: 80.9%
d. Weight of new PROJ1 in combined portfolio: 19.1%
Correlation coefficient r between existingportfolio and new PROJ1: 0
e. Standard deviation of combined portfolio: 3.37%(lower than existing portfolio)
:Expected Return of combined portfolio per
equation 7-1 11.38%
f.: Coefficient of Variation of combined portfolio 29.63%(lower than existing portfolio)
g. Firm's risk decreases with the addition of PROJ1 to the portfolio
7-11.Required Rate of Return per theCAPM
Risk free rate(kRF) 5.0%
Expected rate of return on the market (km)
15.0%
Beta 1.2
Required rate of return on stock per the CAPM:
17.0%
67
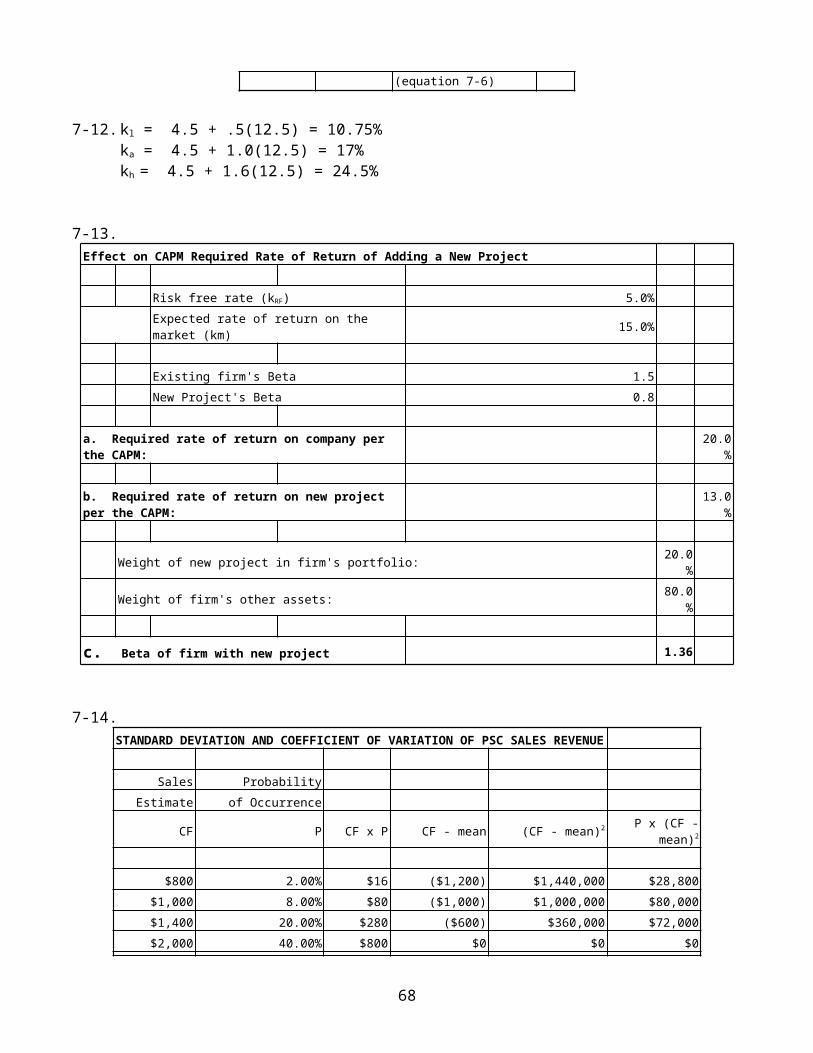
(equation 7-6)
7-12.kl = 4.5 + .5(12.5) = 10.75% ka = 4.5 + 1.0(12.5) = 17% kh = 4.5 + 1.6(12.5) = 24.5%
7-13.Effect on CAPM Required Rate of Return of Adding a New Project
Risk free rate (kRF) 5.0%Expected rate of return on the market (km) 15.0%
Existing firm's Beta 1.5New Project's Beta 0.8
a. Required rate of return on company per the CAPM:
20.0%
b. Required rate of return on new project per the CAPM:
13.0%
Weight of new project in firm's portfolio: 20.0%
Weight of firm's other assets: 80.0%
c. Beta of firm with new project 1.36
7-14.STANDARD DEVIATION AND COEFFICIENT OF VARIATION OF PSC SALES REVENUE
Sales ProbabilityEstimate of Occurrence
CF P CF x P CF - mean (CF - mean)2 P x (CF -mean)2
$800 2.00% $16 ($1,200) $1,440,000 $28,800$1,000 8.00% $80 ($1,000) $1,000,000 $80,000$1,400 20.00% $280 ($600) $360,000 $72,000$2,000 40.00% $800 $0 $0 $0
68
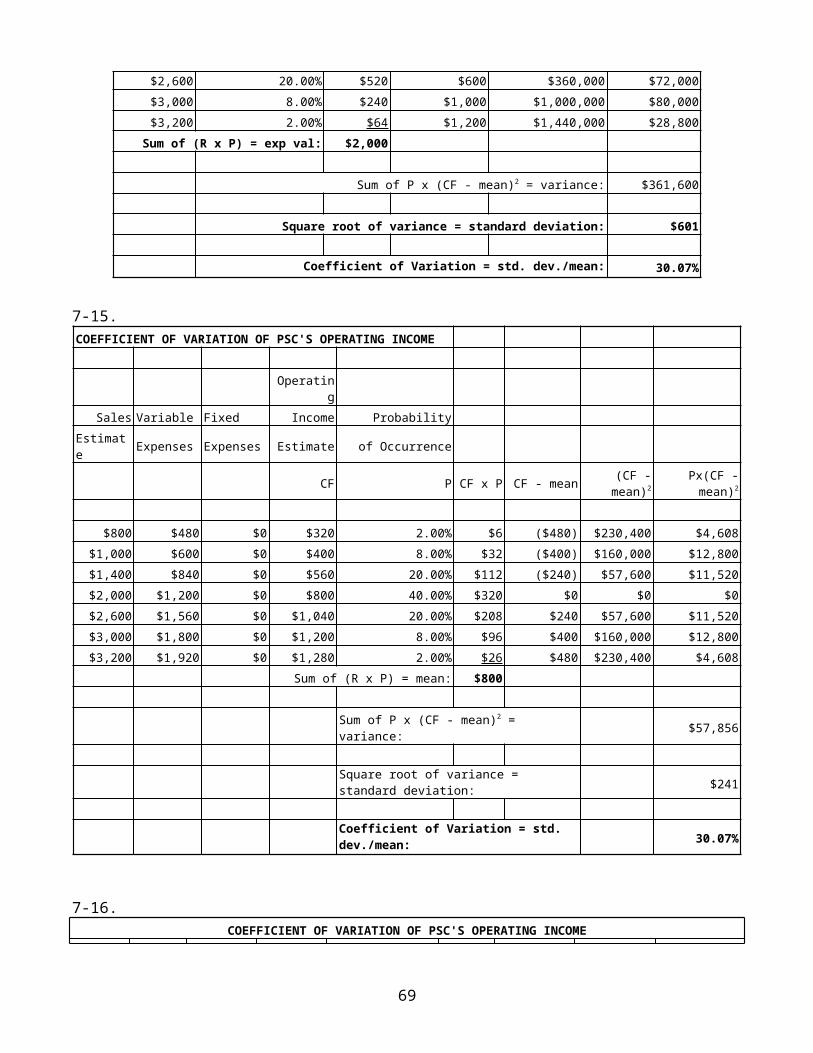
$2,600 20.00% $520 $600 $360,000 $72,000$3,000 8.00% $240 $1,000 $1,000,000 $80,000$3,200 2.00% $64 $1,200 $1,440,000 $28,800
Sum of (R x P) = exp val: $2,000
Sum of P x (CF - mean)2 = variance: $361,600
Square root of variance = standard deviation: $601
Coefficient of Variation = std. dev./mean: 30.07%
7-15.COEFFICIENT OF VARIATION OF PSC'S OPERATING INCOME
Operating
Sales Variable Fixed Income ProbabilityEstimate Expenses Expenses Estimate of Occurrence
CF P CF x P CF - mean (CF -mean)2
Px(CF -mean)2
$800 $480 $0 $320 2.00% $6 ($480) $230,400 $4,608$1,000 $600 $0 $400 8.00% $32 ($400) $160,000 $12,800$1,400 $840 $0 $560 20.00% $112 ($240) $57,600 $11,520$2,000 $1,200 $0 $800 40.00% $320 $0 $0 $0$2,600 $1,560 $0 $1,040 20.00% $208 $240 $57,600 $11,520$3,000 $1,800 $0 $1,200 8.00% $96 $400 $160,000 $12,800$3,200 $1,920 $0 $1,280 2.00% $26 $480 $230,400 $4,608
Sum of (R x P) = mean: $800
Sum of P x (CF - mean)2 = variance: $57,856
Square root of variance = standard deviation: $241
Coefficient of Variation = std. dev./mean: 30.07%
7-16.COEFFICIENT OF VARIATION OF PSC'S OPERATING INCOME
69
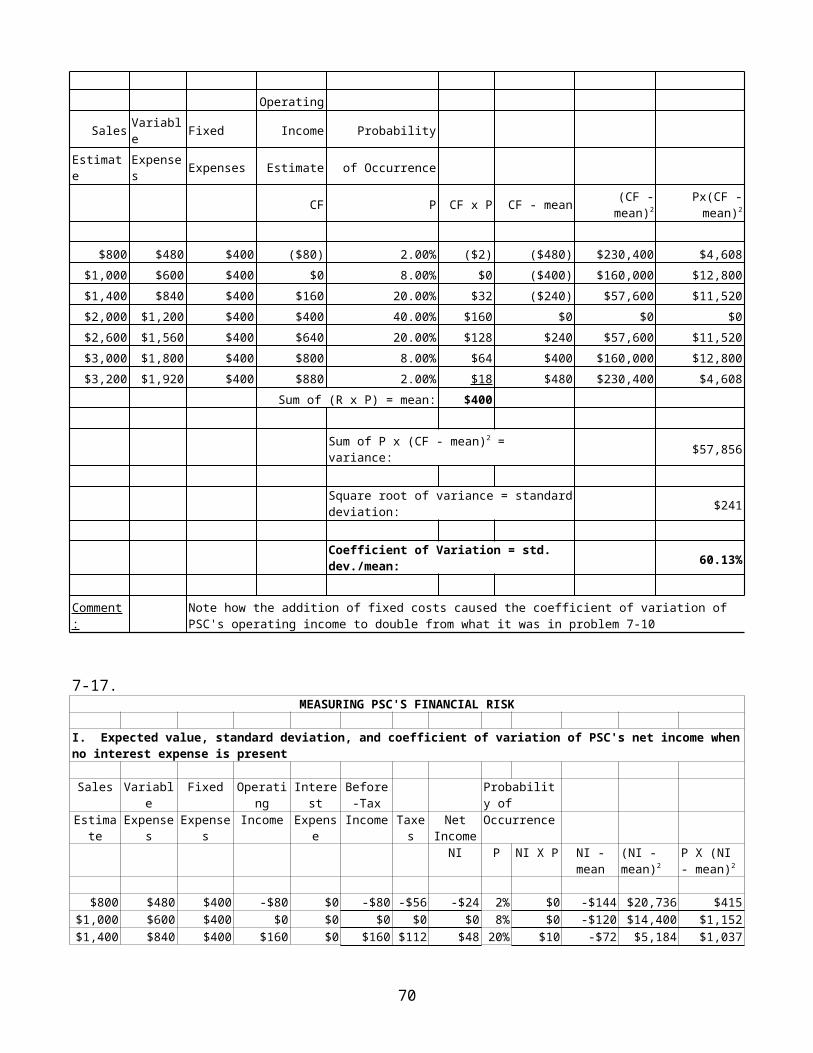
Operating
Sales Variable Fixed Income Probability
Estimate
Expenses Expenses Estimate of Occurrence
CF P CF x P CF - mean (CF -mean)2
Px(CF -mean)2
$800 $480 $400 ($80) 2.00% ($2) ($480) $230,400 $4,608$1,000 $600 $400 $0 8.00% $0 ($400) $160,000 $12,800$1,400 $840 $400 $160 20.00% $32 ($240) $57,600 $11,520$2,000 $1,200 $400 $400 40.00% $160 $0 $0 $0$2,600 $1,560 $400 $640 20.00% $128 $240 $57,600 $11,520$3,000 $1,800 $400 $800 8.00% $64 $400 $160,000 $12,800$3,200 $1,920 $400 $880 2.00% $18 $480 $230,400 $4,608
Sum of (R x P) = mean: $400
Sum of P x (CF - mean)2 = variance: $57,856
Square root of variance = standarddeviation: $241
Coefficient of Variation = std. dev./mean: 60.13%
Comment:
Note how the addition of fixed costs caused the coefficient of variation of PSC's operating income to double from what it was in problem 7-10
7-17. MEASURING PSC'S FINANCIAL RISK
I. Expected value, standard deviation, and coefficient of variation of PSC's net income whenno interest expense is present
Sales Variable
Fixed Operating
Interest
Before-Tax
Probability of
Estimate
Expenses
Expenses
Income Expense
Income Taxes
NetIncome
Occurrence
NI P NI X P NI -mean
(NI - mean)2
P X (NI - mean)2
$800 $480 $400 -$80 $0 -$80 -$56 -$24 2% $0 -$144 $20,736 $415$1,000 $600 $400 $0 $0 $0 $0 $0 8% $0 -$120 $14,400 $1,152$1,400 $840 $400 $160 $0 $160 $112 $48 20% $10 -$72 $5,184 $1,037
70
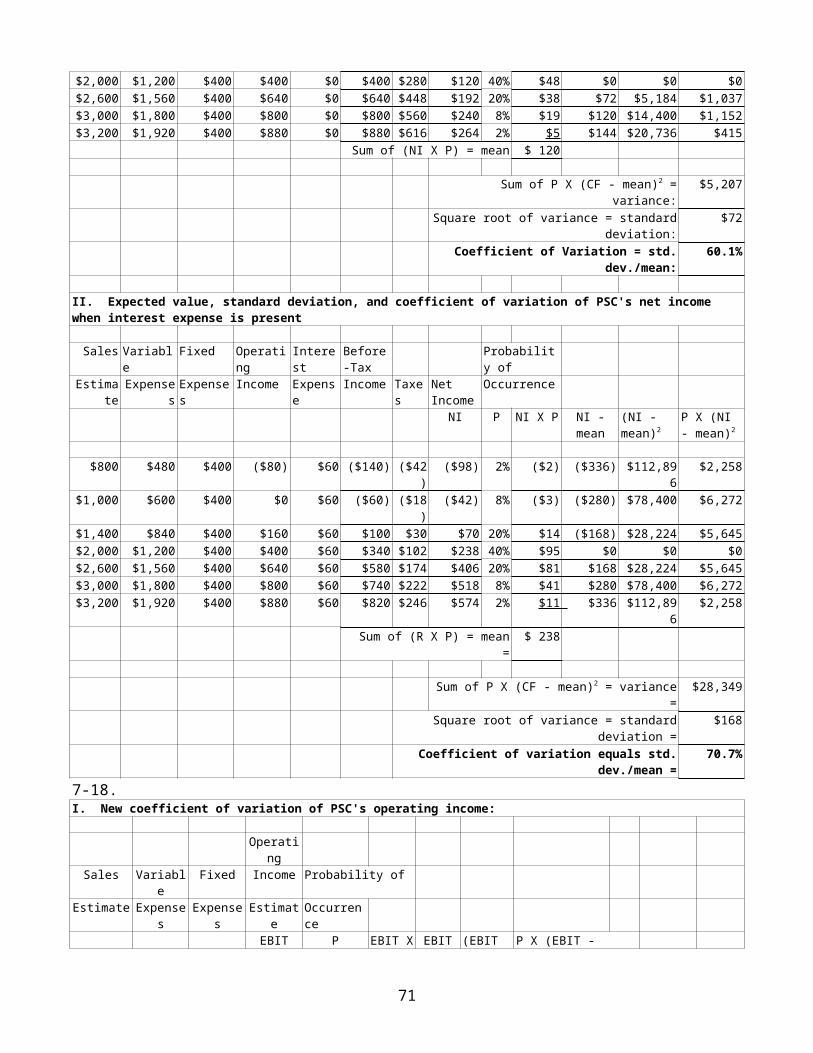
$2,000 $1,200 $400 $400 $0 $400 $280 $120 40% $48 $0 $0 $0$2,600 $1,560 $400 $640 $0 $640 $448 $192 20% $38 $72 $5,184 $1,037$3,000 $1,800 $400 $800 $0 $800 $560 $240 8% $19 $120 $14,400 $1,152$3,200 $1,920 $400 $880 $0 $880 $616 $264 2% $5 $144 $20,736 $415
Sum of (NI X P) = mean $ 120
Sum of P X (CF - mean)2 =variance:
$5,207
Square root of variance = standarddeviation:
$72
Coefficient of Variation = std.dev./mean:
60.1%
II. Expected value, standard deviation, and coefficient of variation of PSC's net income when interest expense is present
Sales Variable
Fixed Operating
Interest
Before-Tax
Probability of
Estimate
ExpensesExpenses
Income Expense
Income Taxes
Net Income
Occurrence
NI P NI X P NI -mean
(NI - mean)2
P X (NI - mean)2
$800 $480 $400 ($80) $60 ($140) ($42)
($98) 2% ($2) ($336) $112,896
$2,258
$1,000 $600 $400 $0 $60 ($60) ($18)
($42) 8% ($3) ($280) $78,400 $6,272
$1,400 $840 $400 $160 $60 $100 $30 $70 20% $14 ($168) $28,224 $5,645 $2,000 $1,200 $400 $400 $60 $340 $102 $238 40% $95 $0 $0 $0 $2,600 $1,560 $400 $640 $60 $580 $174 $406 20% $81 $168 $28,224 $5,645 $3,000 $1,800 $400 $800 $60 $740 $222 $518 8% $41 $280 $78,400 $6,272 $3,200 $1,920 $400 $880 $60 $820 $246 $574 2% $11 $336 $112,89
6 $2,258
Sum of (R X P) = mean=
$ 238
Sum of P X (CF - mean)2 = variance=
$28,349
Square root of variance = standarddeviation =
$168
Coefficient of variation equals std.dev./mean =
70.7%
7-18.I. New coefficient of variation of PSC's operating income:
Operating
Sales Variable
Fixed Income Probability of
Estimate Expenses
Expenses
Estimate
Occurrence
EBIT P EBIT X EBIT (EBIT P X (EBIT -
71

P -mean
- mean)2
mean)2
$800 $480 $250 $70 1% $0.70 ($480)
$230,400
$2,304
$1,000 $600 $250 $150 6% $9.00 ($400)
$160,000
$9,600
$1,400 $840 $250 $310 13% $40.30 ($240)
$57,600
$7,488
$2,000 $1,200 $250 $550 60% $330.00
$0 $0 $0
$2,600 $1,560 $250 $790 13% $102.70
$240 $57,600
$7,488
$3,000 $1,800 $250 $950 6% $57.00 $400 $160,000
$9,600
$3,200 $1,920 $250 $1,030 1% $10.30 $480 $230,400
$2,304
Sum of (EBIT X P) = mean=$550.0
0
Sum of P X (CF - mean)2 =variance =
$38,784
Square root of variance = standarddeviation =
$197
Coefficient of Variation = std.dev./mean =
35.8%
II. New coefficient of variation of PSC's net income when no interest expense is present
Sales Variable
Fixed Operating
Interest Before-Tax
Net Probability of
Estimate Expenses
Expenses
Income Expense Income Taxes Income Occurrence
NI P NIX P
(NI - mean)2
P X (NI - mean)2
$800 $480 $250 $70 $0 $70 $21 $49 1% $0 $112,896 $1,129
$1,000 $600 $250 $150 $0 $150 $45 $105 6% $6 $78,400 $4,704 $1,400 $840 $250 $310 $0 $310 $93 $217 13% $28 $28,224 $3,669 $2,000 $1,200 $250 $550 $0 $550 $165 $385 60% $23
1 $0 $0
$2,600 $1,560 $250 $790 $0 $790 $237 $553 13% $72 $28,224 $3,669 $3,000 $1,800 $250 $950 $0 $950 $285 $665 6% $40 $78,400 $4,704 $3,200 $1,920 $250 $1,030 $0 $1,030 $309 $721 1% $7 $112,89
6 $1,129
Sum of (NI X P) = mean = $385
Sum of P X (CF - mean)2 = variance = $19,004
72
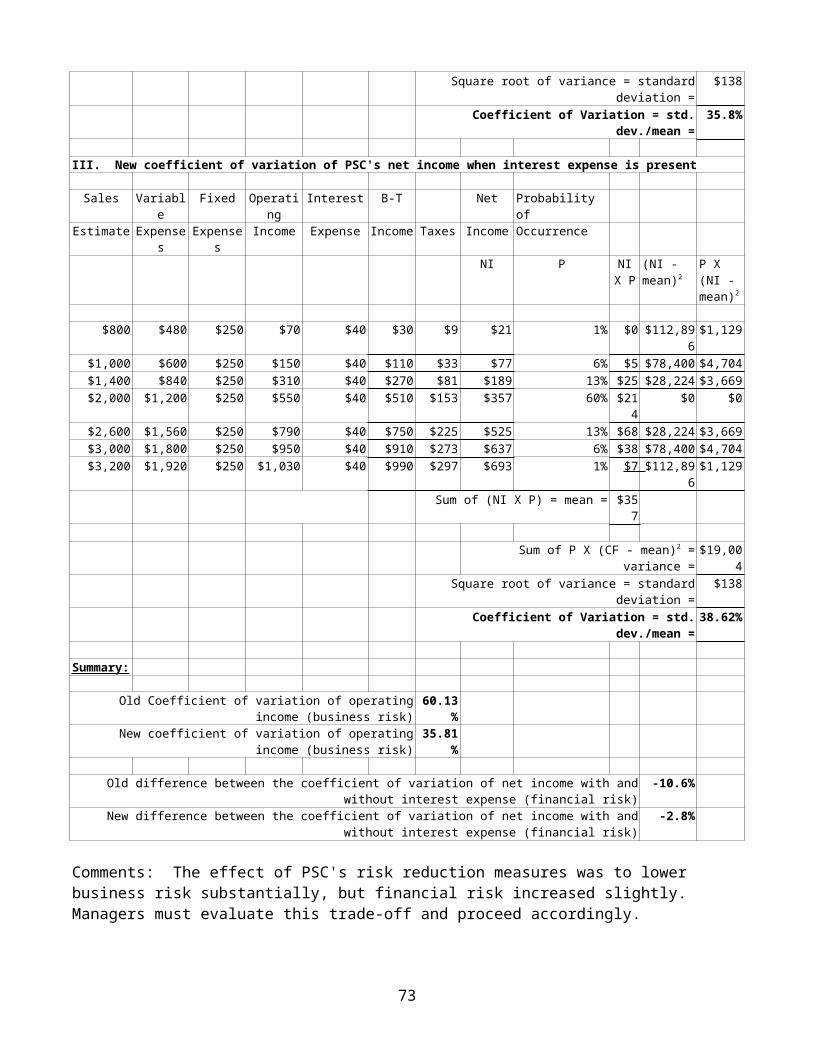
Square root of variance = standarddeviation =
$138
Coefficient of Variation = std.dev./mean =
35.8%
III. New coefficient of variation of PSC's net income when interest expense is present
Sales Variable
Fixed Operating
Interest B-T Net Probability of
Estimate Expenses
Expenses
Income Expense Income Taxes Income Occurrence
NI P NIX P
(NI - mean)2
P X (NI - mean)2
$800 $480 $250 $70 $40 $30 $9 $21 1% $0 $112,896$1,129
$1,000 $600 $250 $150 $40 $110 $33 $77 6% $5 $78,400 $4,704 $1,400 $840 $250 $310 $40 $270 $81 $189 13% $25 $28,224 $3,669 $2,000 $1,200 $250 $550 $40 $510 $153 $357 60% $21
4 $0 $0
$2,600 $1,560 $250 $790 $40 $750 $225 $525 13% $68 $28,224 $3,669 $3,000 $1,800 $250 $950 $40 $910 $273 $637 6% $38 $78,400 $4,704 $3,200 $1,920 $250 $1,030 $40 $990 $297 $693 1% $7 $112,89
6 $1,129
Sum of (NI X P) = mean = $357
Sum of P X (CF - mean)2 =variance =
$19,004
Square root of variance = standarddeviation =
$138
Coefficient of Variation = std.dev./mean =
38.62%
Summary:
Old Coefficient of variation of operatingincome (business risk)
60.13%
New coefficient of variation of operatingincome (business risk)
35.81%
Old difference between the coefficient of variation of net income with andwithout interest expense (financial risk)
-10.6%
New difference between the coefficient of variation of net income with andwithout interest expense (financial risk)
-2.8%
Comments: The effect of PSC's risk reduction measures was to lower business risk substantially, but financial risk increased slightly. Managers must evaluate this trade-off and proceed accordingly.
73
Chapter 8 Solutions
Answers to Review Questions
1. What is the time value of money?
The time value of money means that money you hold in your hand today is worth more than money you expect to receive in the future.Similarly, money you must pay out today is a greater burden than the same amount paid in the future.
2. Why does money have time value?
Positive interest rates indicate that money has time value. When one person lets another borrow money, the first person requires compensation in exchange for reducing current consumption. The person who borrows the money is willing to pay to increase current consumption. The required rate of return on an investment reflectsthe pure time value of money, an adjustment for expected inflation,and any risk premiums present.
3. What is compound interest? Compare compound interest to discounting.
Compound interest occurs when interest is earned on interest and onthe original principal of an investment. Discounting is the inverse of compounding. Compound interest causes the value of a beginning amount to increase at an increasing rate. Discounting causes the present value of a future amount to decrease at an increasing rate.
4. How is present value affected by a change in the discount rate?
Present value is inversely related to the discount rate. In other words, present value moves in the opposite direction of the discount rate. If the discount rate increases, present value
74
decreases. If the discount rate decreases, present value increases.
5. What is an annuity?
An annuity is a series of equal cash flows, spaced evenly over time.
6. Suppose you are planning to make regular contributions in equal payments to an investment fund for your retirement. Which formula would you use to figure out how much your investments will be worthat retirement time, given an assumed rate of return on your investments?
To figure out how much your investments will be worth at retirementtime, given an assumed rate of return on your investments, you would use the future value of an annuity formula:
Future Value of an Annuity Formula
FVA=PMT[ (1+k)n−1k ]
where: FVA = Future Value of an AnnuityPMT = Amount of each annuity payment k = Interest rate per time period n = Number of annuity payments
7. How does continuous compounding benefit an investor?
The effect of increasing the number of compounding periods per yearis to increase the future value of the investment. The more frequently interest is compounded, the greater the future value. The smallest compounding period is used when we do continuous compounding--compounding that occurs every tiny unit of time (the smallest unit of time imaginable).
75
8. If you are doing PVA and FVA problems, what difference does it makeif the annuities are "ordinary annuities" or "annuities due"?
In FVA or a PVA of annuity due problems, annuity payments earning interest one period sooner than in ordinary annuity problems. So, higher FVA and PVA values result with an annuity due. The first payment occurs sooner in the case of a future value of an annuity due. In present value of annuity due problems, each annuity paymentoccurs one period sooner, so the payments are discounted less severely.
9. Which formula would you use to solve for the payment required for acar loan if you know the interest rate, length of the loan, and theborrowed amount? Explain.
To solve for k when the known values are PVA, n, and PMT, start with the present value of an annuity formula, Equation 8-3b, as follows:
Present Value of an Annuity Formula, Table Method
PVA = PMT(PVIFA k, n)
Next, rearrange terms and solve for (PVIFA k, n) as follows
PVA / PMT = (PVIFA k, n)
Now refer to the PVIFA values in the text, Table IV. You know n, so find the n row corresponding to the number of periods in your problem on the left hand side of the table. You have also determined the PVIFA, so move across the n row until you find (or come close to) the value of PVIFA that you have solved for. The percent column in which the value is located is the interest rate.
Answers to End-of-Chapter Problems
8-1. $1,000 X (1 + 0.07)5 = $1,402.55
76
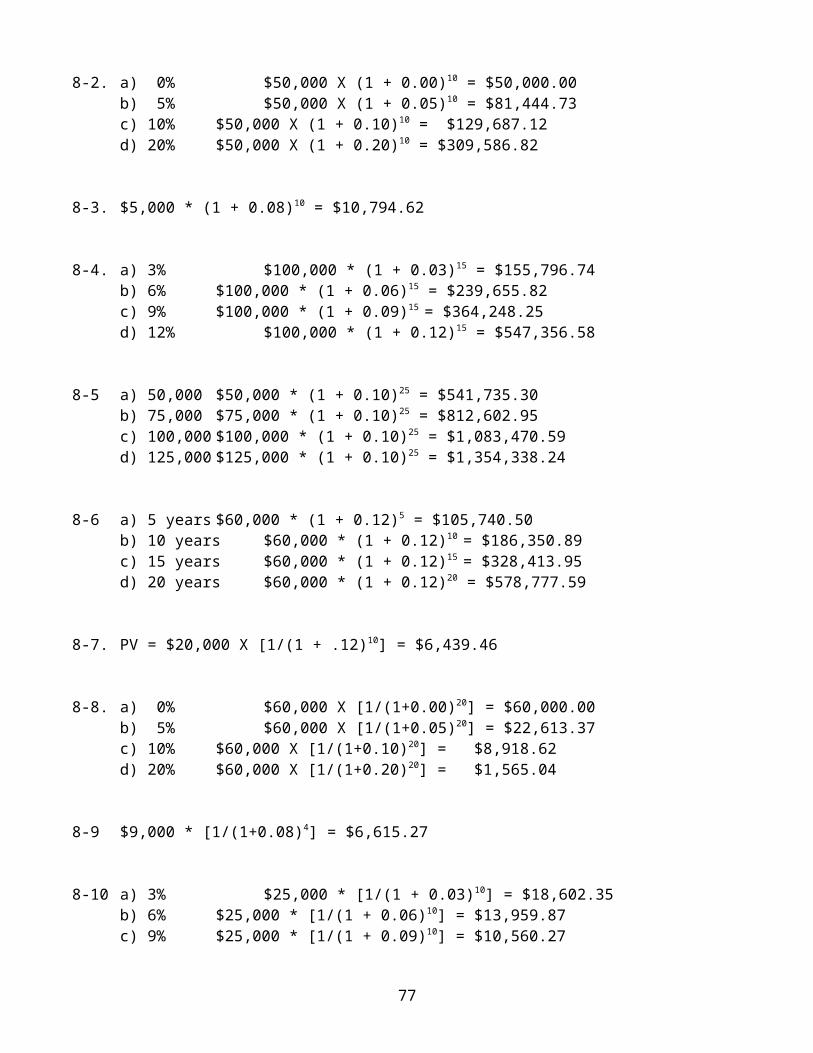
8-2. a) 0% $50,000 X (1 + 0.00)10 = $50,000.00b) 5% $50,000 X (1 + 0.05)10 = $81,444.73c) 10% $50,000 X (1 + 0.10)10 = $129,687.12d) 20% $50,000 X (1 + 0.20)10 = $309,586.82
8-3. $5,000 * (1 + 0.08)10 = $10,794.62
8-4. a) 3% $100,000 * (1 + 0.03)15 = $155,796.74b) 6% $100,000 * (1 + 0.06)15 = $239,655.82c) 9% $100,000 * (1 + 0.09)15 = $364,248.25d) 12% $100,000 * (1 + 0.12)15 = $547,356.58
8-5 a) 50,000 $50,000 * (1 + 0.10)25 = $541,735.30b) 75,000 $75,000 * (1 + 0.10)25 = $812,602.95
c) 100,000 $100,000 * (1 + 0.10)25 = $1,083,470.59d) 125,000 $125,000 * (1 + 0.10)25 = $1,354,338.24
8-6 a) 5 years $60,000 * (1 + 0.12)5 = $105,740.50b) 10 years $60,000 * (1 + 0.12)10 = $186,350.89c) 15 years $60,000 * (1 + 0.12)15 = $328,413.95d) 20 years $60,000 * (1 + 0.12)20 = $578,777.59
8-7. PV = $20,000 X [1/(1 + .12)10] = $6,439.46
8-8. a) 0% $60,000 X [1/(1+0.00)20] = $60,000.00b) 5% $60,000 X [1/(1+0.05)20] = $22,613.37c) 10% $60,000 X [1/(1+0.10)20] = $8,918.62d) 20% $60,000 X [1/(1+0.20)20] = $1,565.04
8-9 $9,000 * [1/(1+0.08)4] = $6,615.27
8-10 a) 3% $25,000 * [1/(1 + 0.03)10] = $18,602.35b) 6% $25,000 * [1/(1 + 0.06)10] = $13,959.87c) 9% $25,000 * [1/(1 + 0.09)10] = $10,560.27
77
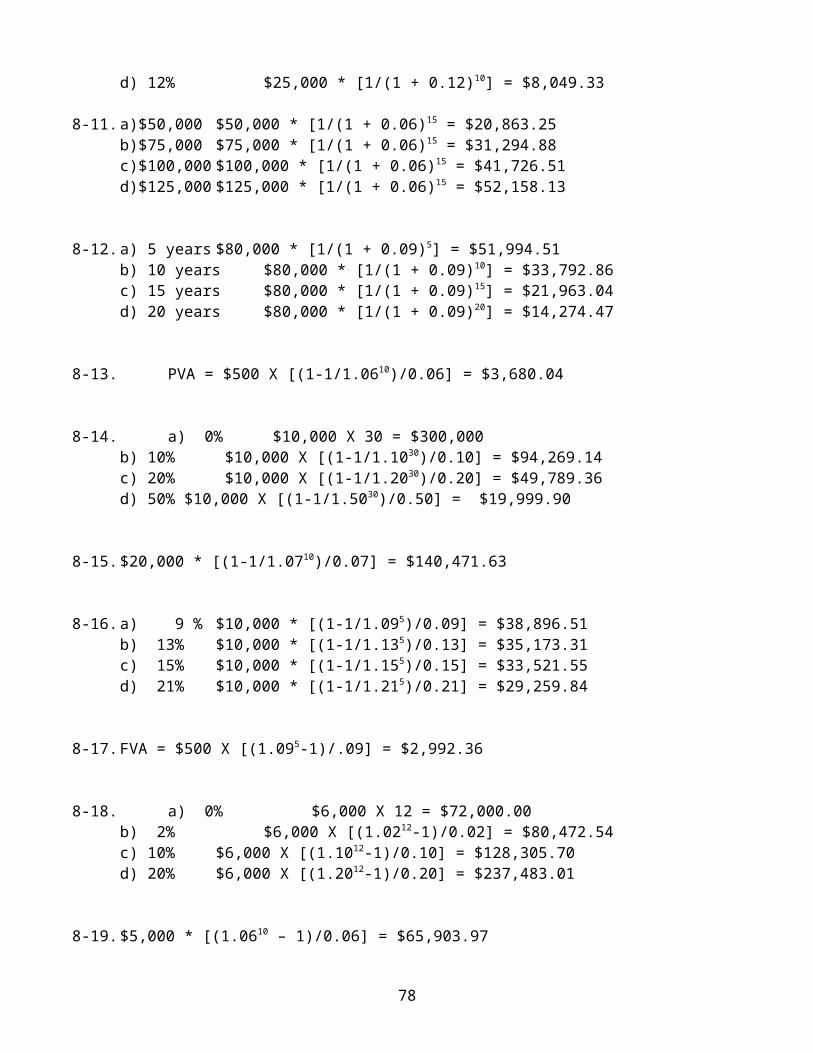
d) 12% $25,000 * [1/(1 + 0.12)10] = $8,049.33
8-11.a)$50,000 $50,000 * [1/(1 + 0.06)15 = $20,863.25b)$75,000 $75,000 * [1/(1 + 0.06)15 = $31,294.88c)$100,000 $100,000 * [1/(1 + 0.06)15 = $41,726.51d)$125,000 $125,000 * [1/(1 + 0.06)15 = $52,158.13
8-12.a) 5 years $80,000 * [1/(1 + 0.09)5] = $51,994.51b) 10 years $80,000 * [1/(1 + 0.09)10] = $33,792.86c) 15 years $80,000 * [1/(1 + 0.09)15] = $21,963.04d) 20 years $80,000 * [1/(1 + 0.09)20] = $14,274.47
8-13. PVA = $500 X [(1-1/1.0610)/0.06] = $3,680.04
8-14. a) 0% $10,000 X 30 = $300,000b) 10% $10,000 X [(1-1/1.1030)/0.10] = $94,269.14c) 20% $10,000 X [(1-1/1.2030)/0.20] = $49,789.36d) 50% $10,000 X [(1-1/1.5030)/0.50] = $19,999.90
8-15.$20,000 * [(1-1/1.0710)/0.07] = $140,471.63
8-16.a) 9 % $10,000 * [(1-1/1.095)/0.09] = $38,896.51b) 13% $10,000 * [(1-1/1.135)/0.13] = $35,173.31c) 15% $10,000 * [(1-1/1.155)/0.15] = $33,521.55d) 21% $10,000 * [(1-1/1.215)/0.21] = $29,259.84
8-17.FVA = $500 X [(1.095-1)/.09] = $2,992.36
8-18. a) 0% $6,000 X 12 = $72,000.00b) 2% $6,000 X [(1.0212-1)/0.02] = $80,472.54c) 10% $6,000 X [(1.1012-1)/0.10] = $128,305.70d) 20% $6,000 X [(1.2012-1)/0.20] = $237,483.01
8-19.$5,000 * [(1.0610 – 1)/0.06] = $65,903.97
78
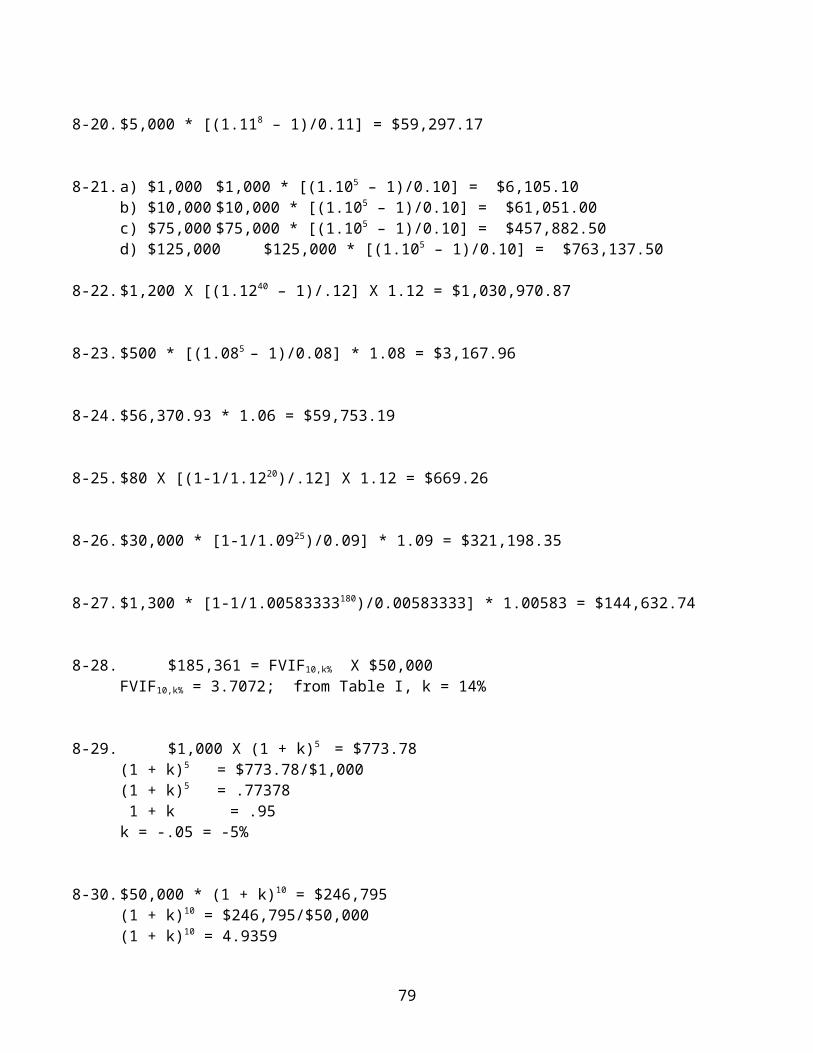
8-20.$5,000 * [(1.118 – 1)/0.11] = $59,297.17
8-21.a) $1,000 $1,000 * [(1.105 – 1)/0.10] = $6,105.10b) $10,000 $10,000 * [(1.105 – 1)/0.10] = $61,051.00c) $75,000 $75,000 * [(1.105 – 1)/0.10] = $457,882.50d) $125,000 $125,000 * [(1.105 – 1)/0.10] = $763,137.50
8-22.$1,200 X [(1.1240 – 1)/.12] X 1.12 = $1,030,970.87
8-23.$500 * [(1.085 – 1)/0.08] * 1.08 = $3,167.96
8-24.$56,370.93 * 1.06 = $59,753.19
8-25.$80 X [(1-1/1.1220)/.12] X 1.12 = $669.26
8-26.$30,000 * [1-1/1.0925)/0.09] * 1.09 = $321,198.35
8-27.$1,300 * [1-1/1.00583333180)/0.00583333] * 1.00583 = $144,632.74
8-28. $185,361 = FVIF10,k% X $50,000FVIF10,k% = 3.7072; from Table I, k = 14%
8-29. $1,000 X (1 + k)5 = $773.78(1 + k)5 = $773.78/$1,000(1 + k)5 = .77378 1 + k = .95k = -.05 = -5%
8-30.$50,000 * (1 + k)10 = $246,795(1 + k)10 = $246,795/$50,000(1 + k)10 = 4.9359
79
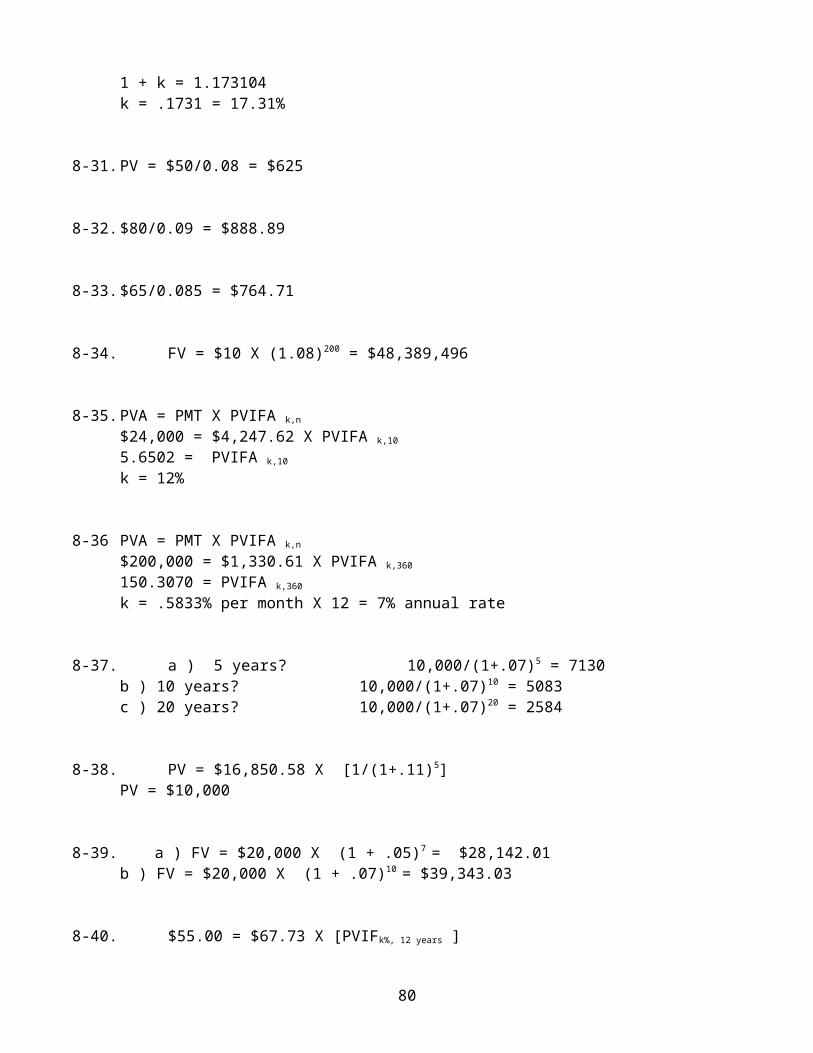
1 + k = 1.173104k = .1731 = 17.31%
8-31.PV = $50/0.08 = $625
8-32.$80/0.09 = $888.89
8-33.$65/0.085 = $764.71
8-34. FV = $10 X (1.08)200 = $48,389,496
8-35.PVA = PMT X PVIFA k,n
$24,000 = $4,247.62 X PVIFA k,10
5.6502 = PVIFA k,10
k = 12%
8-36 PVA = PMT X PVIFA k,n
$200,000 = $1,330.61 X PVIFA k,360
150.3070 = PVIFA k,360
k = .5833% per month X 12 = 7% annual rate
8-37. a ) 5 years? 10,000/(1+.07)5 = 7130b ) 10 years? 10,000/(1+.07)10 = 5083c ) 20 years? 10,000/(1+.07)20 = 2584
8-38. PV = $16,850.58 X [1/(1+.11)5]PV = $10,000
8-39. a ) FV = $20,000 X (1 + .05)7 = $28,142.01 b ) FV = $20,000 X (1 + .07)10 = $39,343.03
8-40. $55.00 = $67.73 X [PVIFk%, 12 years ]
80
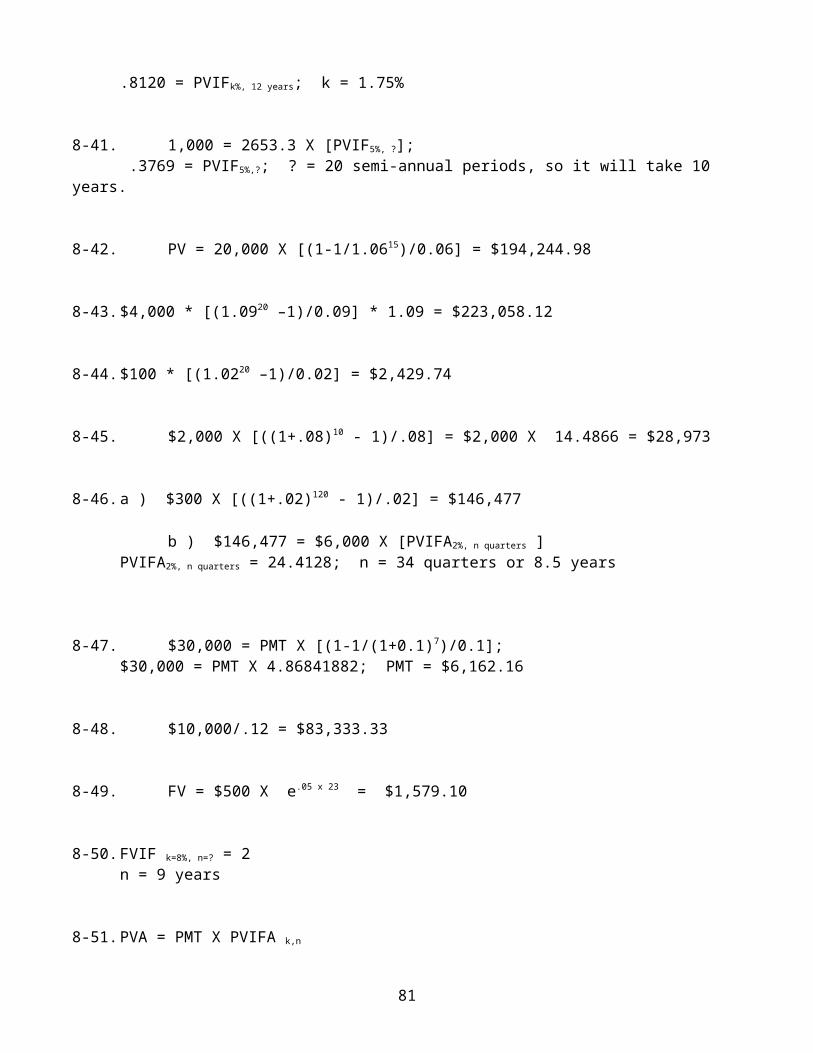
.8120 = PVIFk%, 12 years; k = 1.75%
8-41. 1,000 = 2653.3 X [PVIF5%, ?]; .3769 = PVIF5%,?; ? = 20 semi-annual periods, so it will take 10
years.
8-42. PV = 20,000 X [(1-1/1.0615)/0.06] = $194,244.98
8-43.$4,000 * [(1.0920 –1)/0.09] * 1.09 = $223,058.12
8-44.$100 * [(1.0220 –1)/0.02] = $2,429.74
8-45. $2,000 X [((1+.08)10 - 1)/.08] = $2,000 X 14.4866 = $28,973
8-46.a ) $300 X [((1+.02)120 - 1)/.02] = $146,477 b ) $146,477 = $6,000 X [PVIFA2%, n quarters ] PVIFA2%, n quarters = 24.4128; n = 34 quarters or 8.5 years
8-47. $30,000 = PMT X [(1-1/(1+0.1)7)/0.1];$30,000 = PMT X 4.86841882; PMT = $6,162.16
8-48. $10,000/.12 = $83,333.33
8-49. FV = $500 X e.05 x 23 = $1,579.10
8-50.FVIF k=8%, n=? = 2n = 9 years
8-51.PVA = PMT X PVIFA k,n
81
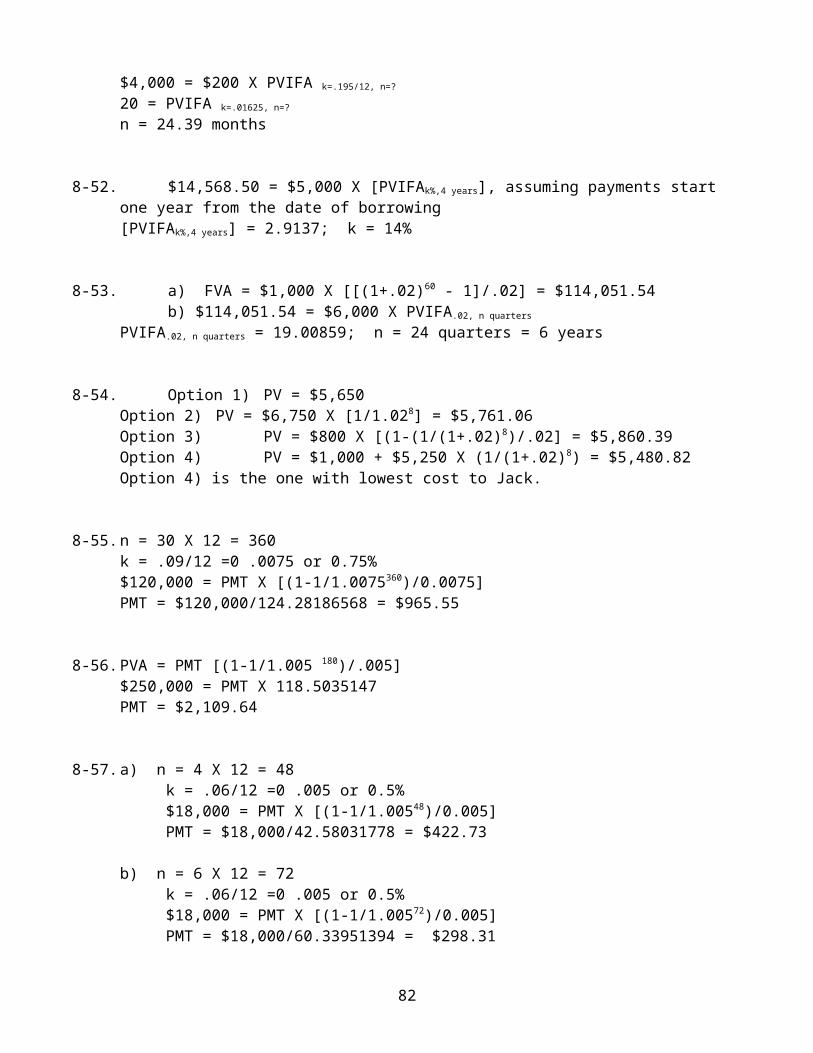
$4,000 = $200 X PVIFA k=.195/12, n=?
20 = PVIFA k=.01625, n=?
n = 24.39 months
8-52. $14,568.50 = $5,000 X [PVIFAk%,4 years], assuming payments start one year from the date of borrowing[PVIFAk%,4 years] = 2.9137; k = 14%
8-53. a) FVA = $1,000 X [[(1+.02)60 - 1]/.02] = $114,051.54 b) $114,051.54 = $6,000 X PVIFA.02, n quarters
PVIFA.02, n quarters = 19.00859; n = 24 quarters = 6 years
8-54. Option 1) PV = $5,650Option 2) PV = $6,750 X [1/1.028] = $5,761.06Option 3) PV = $800 X [(1-(1/(1+.02)8)/.02] = $5,860.39Option 4) PV = $1,000 + $5,250 X (1/(1+.02)8) = $5,480.82Option 4) is the one with lowest cost to Jack.
8-55.n = 30 X 12 = 360k = .09/12 =0 .0075 or 0.75%$120,000 = PMT X [(1-1/1.0075360)/0.0075]PMT = $120,000/124.28186568 = $965.55
8-56.PVA = PMT [(1-1/1.005 180)/.005]$250,000 = PMT X 118.5035147PMT = $2,109.64
8-57.a) n = 4 X 12 = 48 k = .06/12 =0 .005 or 0.5% $18,000 = PMT X [(1-1/1.00548)/0.005] PMT = $18,000/42.58031778 = $422.73
b) n = 6 X 12 = 72 k = .06/12 =0 .005 or 0.5% $18,000 = PMT X [(1-1/1.00572)/0.005] PMT = $18,000/60.33951394 = $298.31
82
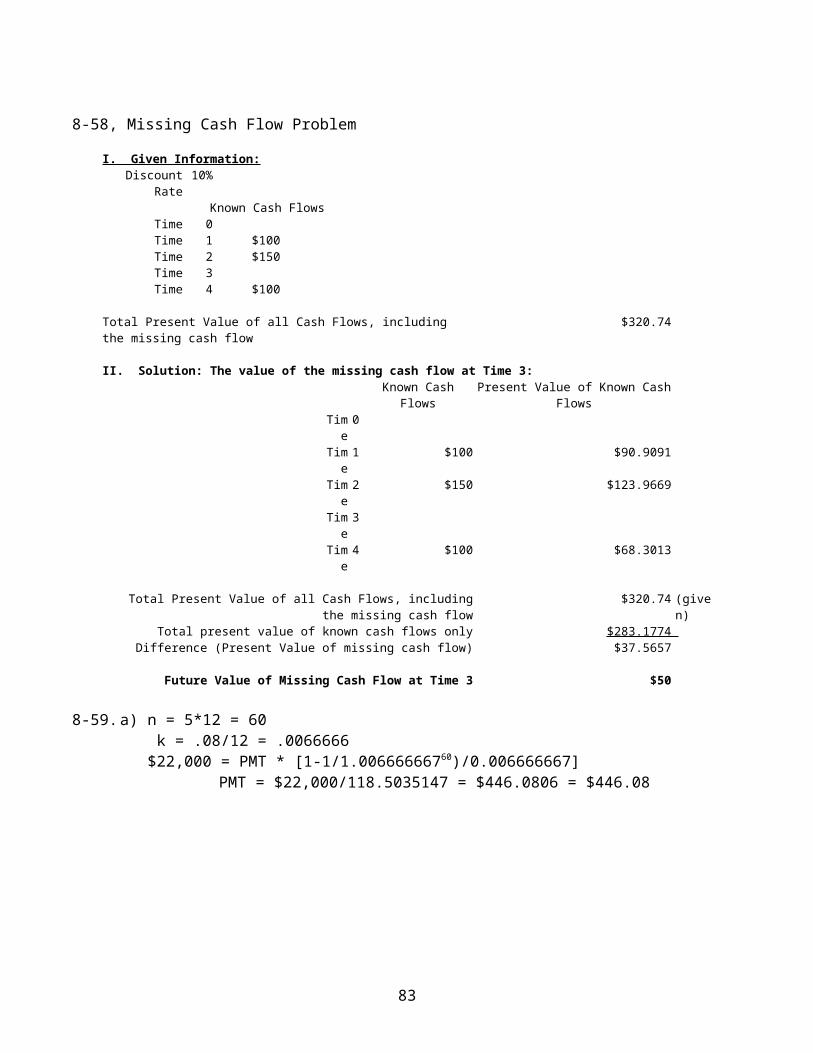
8-58, Missing Cash Flow Problem
I. Given Information:Discount
Rate10%
Known Cash FlowsTime 0 Time 1 $100Time 2 $150Time 3 Time 4 $100
Total Present Value of all Cash Flows, including the missing cash flow
$320.74
II. Solution: The value of the missing cash flow at Time 3:Known Cash
FlowsPresent Value of Known Cash
FlowsTim
e0
Time1 $100 $90.9091
Time2 $150 $123.9669
Time3
Time4 $100 $68.3013
Total Present Value of all Cash Flows, includingthe missing cash flow
$320.74 (given)
Total present value of known cash flows only $283.1774 Difference (Present Value of missing cash flow) $37.5657
Future Value of Missing Cash Flow at Time 3 $50
8-59.a) n = 5*12 = 60 k = .08/12 = .0066666 $22,000 = PMT * [1-1/1.00666666760)/0.006666667] PMT = $22,000/118.5035147 = $446.0806 = $446.08
83
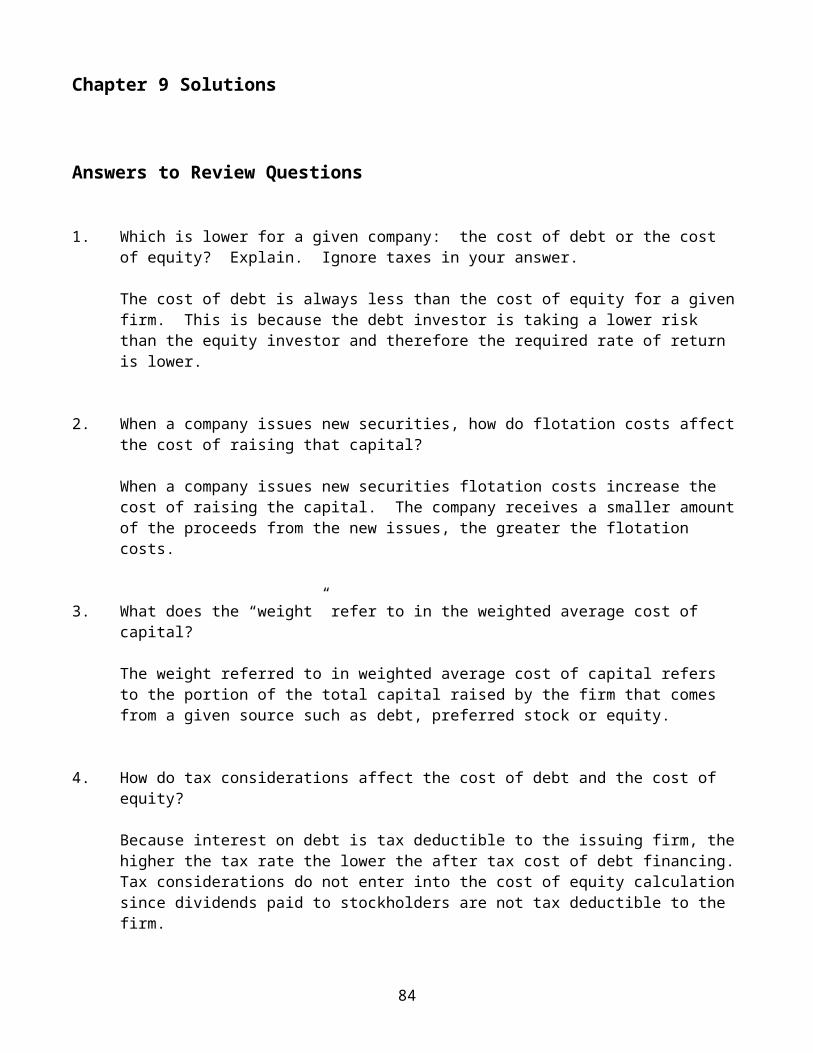
Chapter 9 Solutions
Answers to Review Questions
1. Which is lower for a given company: the cost of debt or the cost of equity? Explain. Ignore taxes in your answer.
The cost of debt is always less than the cost of equity for a givenfirm. This is because the debt investor is taking a lower risk than the equity investor and therefore the required rate of return is lower.
2. When a company issues new securities, how do flotation costs affectthe cost of raising that capital?
When a company issues new securities flotation costs increase the cost of raising the capital. The company receives a smaller amountof the proceeds from the new issues, the greater the flotation costs.
3. What does the “weight” refer to in the weighted average cost of capital?
The weight referred to in weighted average cost of capital refers to the portion of the total capital raised by the firm that comes from a given source such as debt, preferred stock or equity.
4. How do tax considerations affect the cost of debt and the cost of equity?
Because interest on debt is tax deductible to the issuing firm, thehigher the tax rate the lower the after tax cost of debt financing.Tax considerations do not enter into the cost of equity calculationsince dividends paid to stockholders are not tax deductible to the firm.
84
5. If dividends paid to common stockholders are not legal obligations of a corporation, is the cost of equity zero? Explain your answer.
Although common stockholders do not have a contractual claim on dividends the funds supplied by stockholders definitely have a cost. Equity investors are paid last and so they are taking the greatest risk among all the suppliers of capital. If the company does not earn a higher rate of return on equity funds to compensatefor the higher risk taken by equity investors, the price of the stock will fall and therefore the value of the firm.
6. What is the investment opportunity schedule (IOS)? How does it help financial managers make business decisions?
The investment opportunity schedule shows graphically proposed capital budgeting projects depicting the IRR and dollar amount of investment for each project. This helps the financial manager makebusiness decisions since the investment opportunity schedule and the marginal cost of capital schedule can be plotted together, withthose projects on the IOS schedule above the MCC being acceptable.
7. What is a marginal cost of capital schedule (MCC)? Is the schedulealways a horizontal line? Explain.
The marginal cost of capital schedule is a graphic depiction of theweighted average cost of capital at different levels of financing. The MCC schedule is not always a horizontal line. For many firms the MCC schedule increases, usually at discreet intervals, as the amount of funds to be raised increases.
8. For a given IOS and MCC, how do financial managers decide which proposed capital budgeting projects to accept, and which to reject?
For a given IOS and MCC, all independent projects that plot on the IOS above the MCC are accepted. Those projects on the IOS below the MCC are rejected.
85
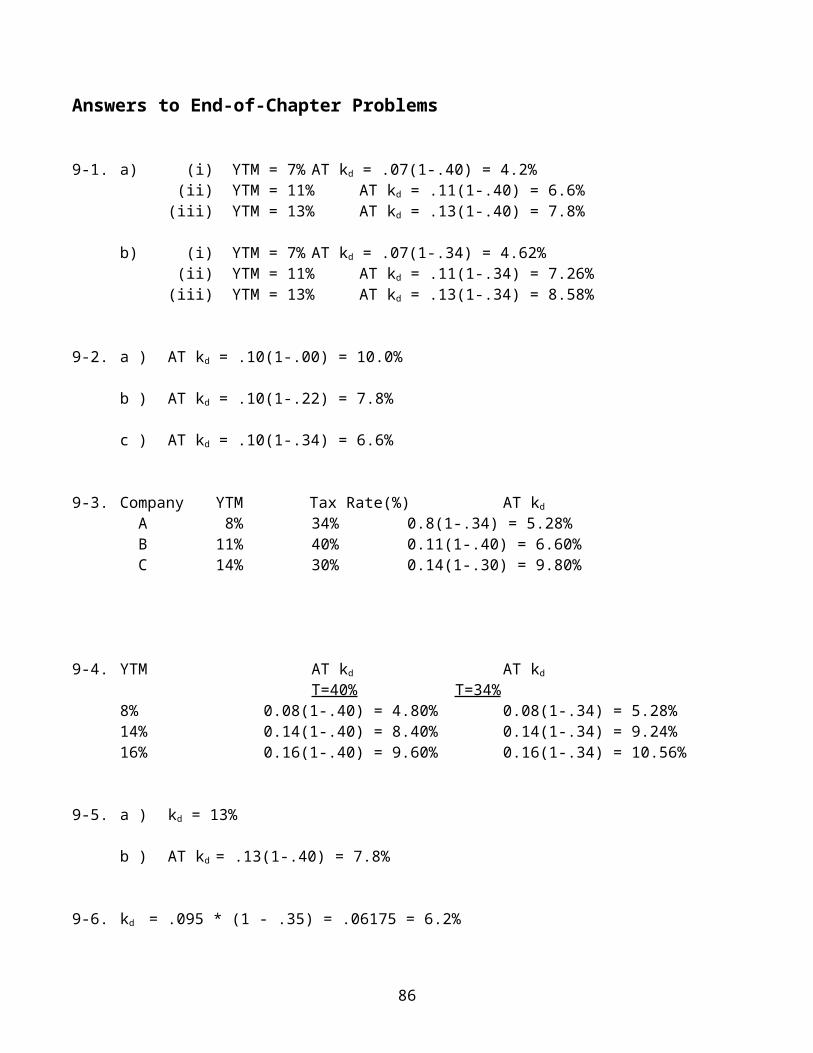
Answers to End-of-Chapter Problems
9-1. a) (i) YTM = 7% AT kd = .07(1-.40) = 4.2% (ii) YTM = 11% AT kd = .11(1-.40) = 6.6%(iii) YTM = 13% AT kd = .13(1-.40) = 7.8%
b) (i) YTM = 7% AT kd = .07(1-.34) = 4.62% (ii) YTM = 11% AT kd = .11(1-.34) = 7.26%(iii) YTM = 13% AT kd = .13(1-.34) = 8.58%
9-2. a ) AT kd = .10(1-.00) = 10.0%
b ) AT kd = .10(1-.22) = 7.8%
c ) AT kd = .10(1-.34) = 6.6%
9-3. Company YTM Tax Rate(%) AT kd
A 8% 34% 0.8(1-.34) = 5.28% B 11% 40% 0.11(1-.40) = 6.60% C 14% 30% 0.14(1-.30) = 9.80%
9-4. YTM AT kd AT kd
T=40% T=34%8% 0.08(1-.40) = 4.80% 0.08(1-.34) = 5.28%14% 0.14(1-.40) = 8.40% 0.14(1-.34) = 9.24%16% 0.16(1-.40) = 9.60% 0.16(1-.34) = 10.56%
9-5. a ) kd = 13%
b ) AT kd = .13(1-.40) = 7.8%
9-6. kd = .095 * (1 - .35) = .06175 = 6.2%
86
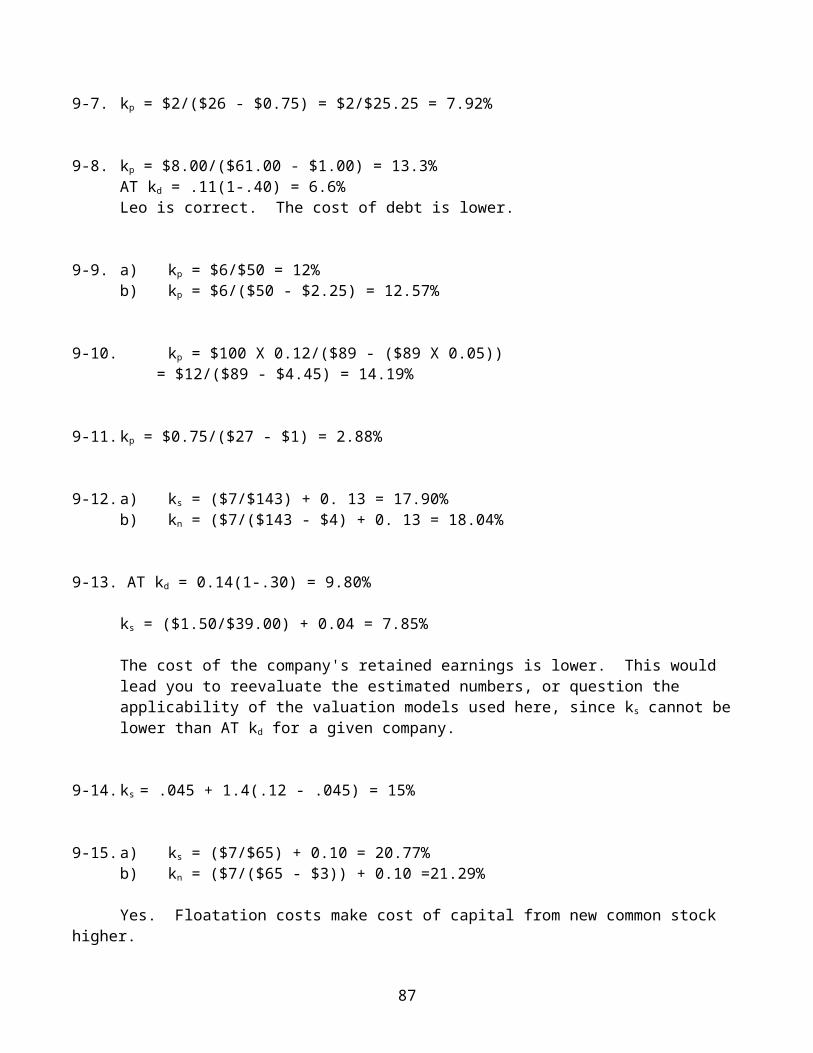
9-7. kp = $2/($26 - $0.75) = $2/$25.25 = 7.92%
9-8. kp = $8.00/($61.00 - $1.00) = 13.3%AT kd = .11(1-.40) = 6.6%Leo is correct. The cost of debt is lower.
9-9. a) kp = $6/$50 = 12%b) kp = $6/($50 - $2.25) = 12.57%
9-10. kp = $100 X 0.12/($89 - ($89 X 0.05)) = $12/($89 - $4.45) = 14.19%
9-11.kp = $0.75/($27 - $1) = 2.88%
9-12.a) ks = ($7/$143) + 0. 13 = 17.90%b) kn = ($7/($143 - $4) + 0. 13 = 18.04%
9-13. AT kd = 0.14(1-.30) = 9.80%
ks = ($1.50/$39.00) + 0.04 = 7.85%
The cost of the company's retained earnings is lower. This would lead you to reevaluate the estimated numbers, or question the applicability of the valuation models used here, since ks cannot be lower than AT kd for a given company.
9-14.ks = .045 + 1.4(.12 - .045) = 15%
9-15.a) ks = ($7/$65) + 0.10 = 20.77%b) kn = ($7/($65 - $3)) + 0.10 =21.29%
Yes. Floatation costs make cost of capital from new common stock higher.
87
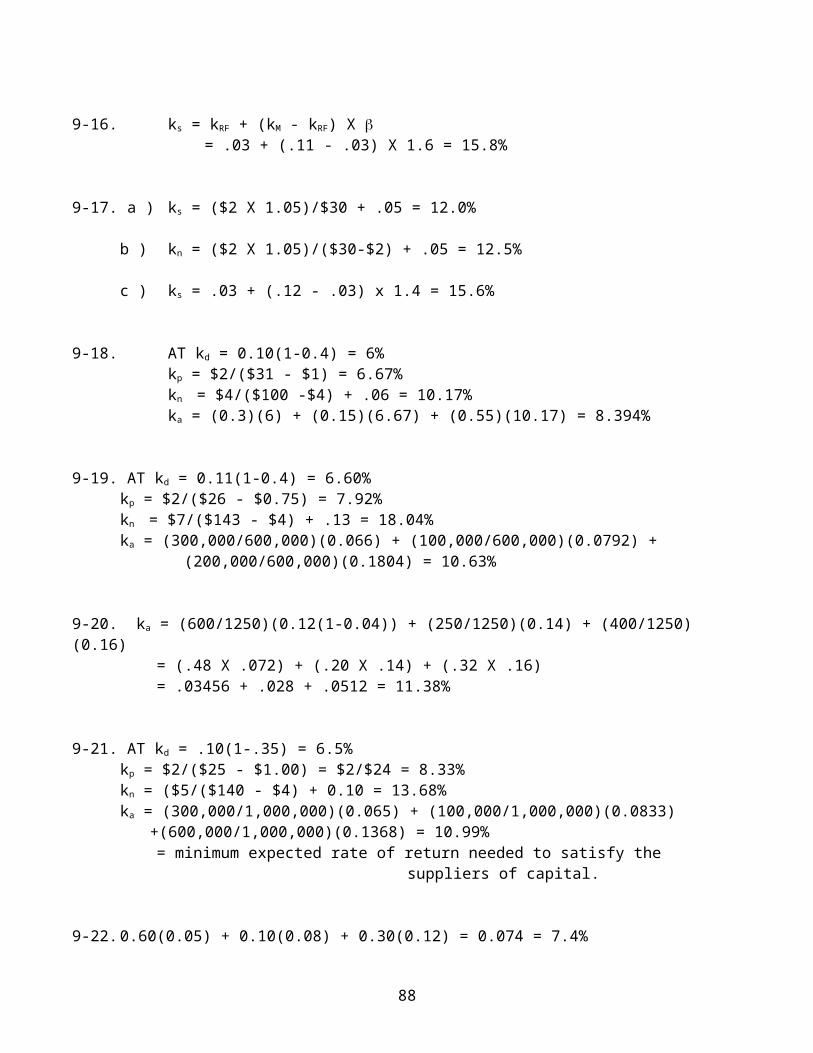
9-16. ks = kRF + (kM - kRF) X = .03 + (.11 - .03) X 1.6 = 15.8%
9-17. a ) ks = ($2 X 1.05)/$30 + .05 = 12.0%
b ) kn = ($2 X 1.05)/($30-$2) + .05 = 12.5%
c ) ks = .03 + (.12 - .03) x 1.4 = 15.6%
9-18. AT kd = 0.10(1-0.4) = 6%kp = $2/($31 - $1) = 6.67%kn = $4/($100 -$4) + .06 = 10.17%ka = (0.3)(6) + (0.15)(6.67) + (0.55)(10.17) = 8.394%
9-19. AT kd = 0.11(1-0.4) = 6.60%kp = $2/($26 - $0.75) = 7.92%kn = $7/($143 - $4) + .13 = 18.04%ka = (300,000/600,000)(0.066) + (100,000/600,000)(0.0792) + (200,000/600,000)(0.1804) = 10.63%
9-20. ka = (600/1250)(0.12(1-0.04)) + (250/1250)(0.14) + (400/1250)(0.16)
= (.48 X .072) + (.20 X .14) + (.32 X .16) = .03456 + .028 + .0512 = 11.38%
9-21. AT kd = .10(1-.35) = 6.5%kp = $2/($25 - $1.00) = $2/$24 = 8.33%kn = ($5/($140 - $4) + 0.10 = 13.68%ka = (300,000/1,000,000)(0.065) + (100,000/1,000,000)(0.0833)
+(600,000/1,000,000)(0.1368) = 10.99% = minimum expected rate of return needed to satisfy the
suppliers of capital.
9-22.0.60(0.05) + 0.10(0.08) + 0.30(0.12) = 0.074 = 7.4%
88
9-23.kd = .095(1 - 0.35) = .06175 = 6.2%kp = $10/$50 = 0.20 = 20%ks = 0.04 + 1.1(0.12 – 0.04) = 12.8%
Weight:Debt = 230,000/430,000 = 0.54Preferred Stock = 100,000/430,000 = 0.23Common Equity = 100,000/430,000 = 0.23
WACC = .54(0.062) + .23(0.20) + .23(0.128) = .10892 = 10.892%
9-24. a ) $200,000/0.40 = $500,000 equity break-point
b ) $500,000/0.60 = $833,333 debt break-point
9-25. $1,000,000/.4 = $2,500,000 total capital raised before BPd1 is reached.
$2,000,000/.4 = $5,000,000 total capital raised before BPd2 is reached.$2,750,000/.5 = $5,500,000 total capital raised before BPe is reached.
a ) ka = (0.40)(0.11(1 - 0.40)) + (0.5)(0.13) + (0.1)(0.12) = 10.34%
b ) ka = (0.40)(0.13(1 - 0.40)) + (0.5)(0.13) + (0.1)(0.12) = 10.82%
c ) ka = (0.40)(0.15(1 - 0.40)) + (0.5)(0.13) + (0.1)(0.12) = 11.30%
9-26. INVESTMENT OPPORTUNITIES
PROJECT INVESTMENT RETURNOPTIMAL CAPITAL
STRUCTURE:DEBT 35.00% EQUITY 65.00% A $500,000 0.16
TAX RATE 40.00% B $1,600,000 0.12 NET INCOME NEXT YEAR: $1,200,0
00 C $600,000 0.15
89
ADDITION TO RETAINED EARNINGS $1,000,000
D $1,500,000 0.18
LOAN INTEREST RATE 10.00% FOR LOAN UPTO $750,000 $4,200,00012.00% FOR LOAN ABOVE
$750,000COMMON STOCK PRICE PER SHARE $50
DIVIDEND PER SHARE $5 GROWTH RATE 9.00%
FLOATATION COST 8.00%
a.
COST OF NEW EQUITY 19.87%
COST OF RETAINED EARNINGS 19.00%AT COST OF DEBT 6.00% FOR LOAN UPTO $750,000
7.20% FOR LOAN ABOVE $750,000
b.
EQUITY BREAK POINT $1,538,462
DEBT $538,462 DEBT BREAK POINT $2,142,8
57 DEBT $750,000 TOTAL EQUITY $1,392,8
57
c.
MCC UPTO TOTAL CAPITAL OF $1,538,462 = 14.45%
MCC BETWEEN $1,538,462 AND $2,142,857 15.02%
MCC ABOVE $2,142,857 15.44%
d.
INVESTMENT OPPORTUNITY SCHEDULE
PROJECT INVESTMENT RETURND $1,500,000 0.18 A $500,000 0.16 C $600,000 0.15 B $1,600,000 0.12
e.
90
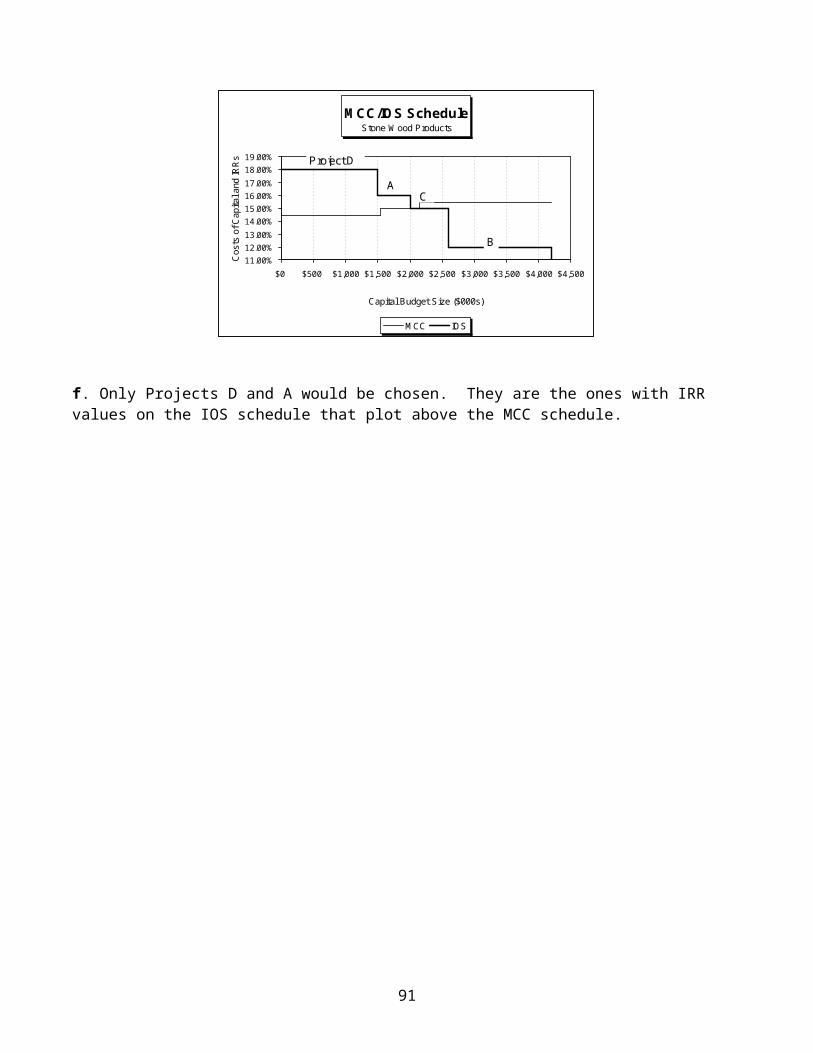
f. Only Projects D and A would be chosen. They are the ones with IRRvalues on the IOS schedule that plot above the MCC schedule.
91
M CC/IO S ScheduleStone W ood Products
11.00%12.00%13.00%14.00%15.00%16.00%17.00%18.00%19.00%
$0 $500 $1,000 $1,500 $2,000 $2,500 $3,000 $3,500 $4,000 $4,500
Capital Budget Size ($000s)
Costs of Ca
pital and IRRs
M CC IOS
Project D
AC
B
Chapter 10 Solutions
Answers to Review Questions
1. How do we calculate the payback period for a proposed capital budgeting project? What are the main criticisms of the payback method?
We calculate the payback period for a proposed project by adding a project’s positive cash flows, one period at a time, until the sum equals the initial investment. The number of time periods it takesto cover this investment is the payback period. The main criticisms of the payback method are that cash flows after the payback period are ignored and the time value of money is not considered.
2. How does the net present value relate to the value of the firm?
The net present value is the dollar amount of the change to the value of the firm if the project under consideration is accepted.
3. What are the advantages and disadvantages of the internal rate of return method?
The internal rate of return method is a discounted cash flow methodand a number expressed as a percentage. These are typically seen as advantages. The main disadvantage of the internal rate of return is that it is somewhat more difficult to calculate, althoughthis is less true with the ready availability of financial calculators.
4. Provide three examples of mutually exclusive projects.
Mutually exclusive projects are projects that compete against each other for our selection. If a firm were considering the purchase
92
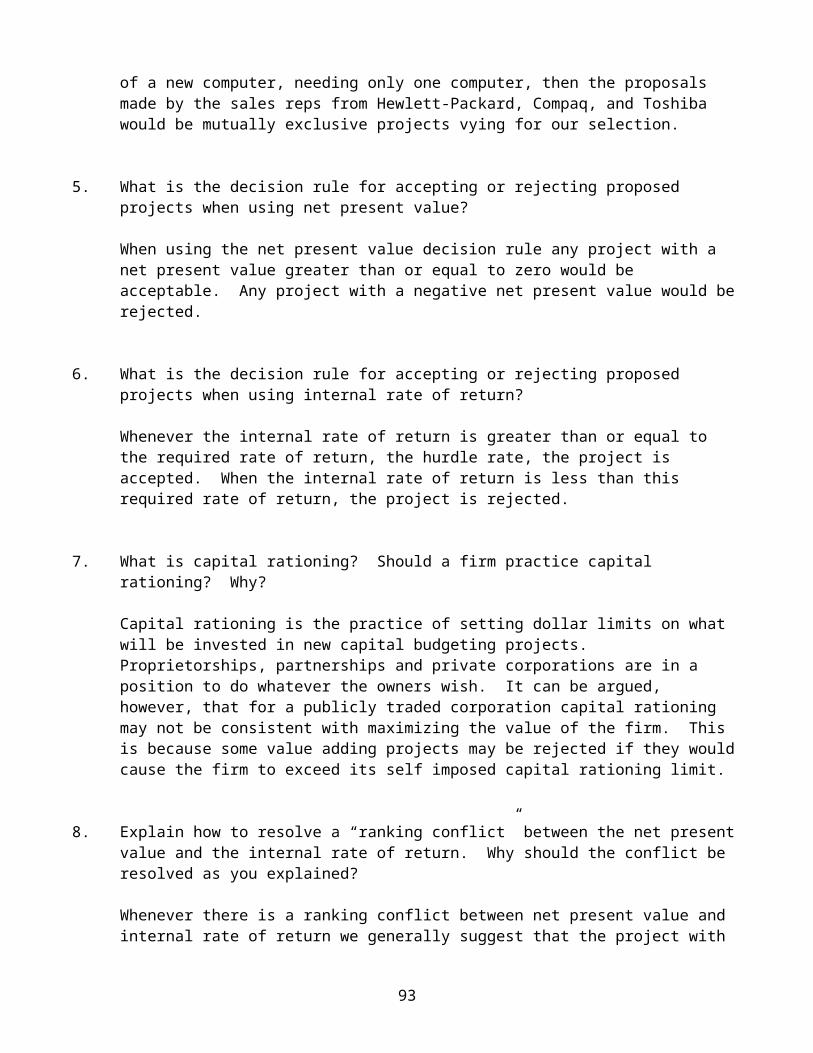
of a new computer, needing only one computer, then the proposals made by the sales reps from Hewlett-Packard, Compaq, and Toshiba would be mutually exclusive projects vying for our selection.
5. What is the decision rule for accepting or rejecting proposed projects when using net present value?
When using the net present value decision rule any project with a net present value greater than or equal to zero would be acceptable. Any project with a negative net present value would berejected.
6. What is the decision rule for accepting or rejecting proposed projects when using internal rate of return?
Whenever the internal rate of return is greater than or equal to the required rate of return, the hurdle rate, the project is accepted. When the internal rate of return is less than this required rate of return, the project is rejected.
7. What is capital rationing? Should a firm practice capital rationing? Why?
Capital rationing is the practice of setting dollar limits on what will be invested in new capital budgeting projects. Proprietorships, partnerships and private corporations are in a position to do whatever the owners wish. It can be argued, however, that for a publicly traded corporation capital rationing may not be consistent with maximizing the value of the firm. This is because some value adding projects may be rejected if they wouldcause the firm to exceed its self imposed capital rationing limit.
8. Explain how to resolve a “ranking conflict” between the net presentvalue and the internal rate of return. Why should the conflict be resolved as you explained?
Whenever there is a ranking conflict between net present value and internal rate of return we generally suggest that the project with
93
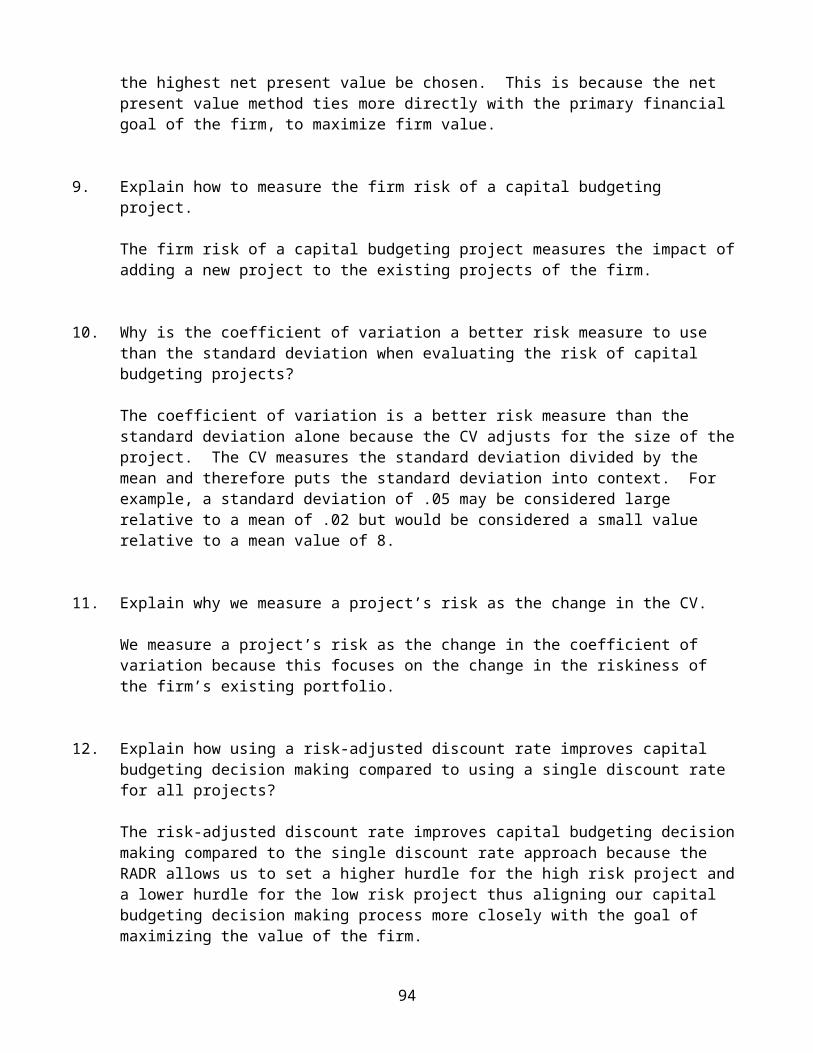
the highest net present value be chosen. This is because the net present value method ties more directly with the primary financial goal of the firm, to maximize firm value.
9. Explain how to measure the firm risk of a capital budgeting project.
The firm risk of a capital budgeting project measures the impact ofadding a new project to the existing projects of the firm.
10. Why is the coefficient of variation a better risk measure to use than the standard deviation when evaluating the risk of capital budgeting projects?
The coefficient of variation is a better risk measure than the standard deviation alone because the CV adjusts for the size of theproject. The CV measures the standard deviation divided by the mean and therefore puts the standard deviation into context. For example, a standard deviation of .05 may be considered large relative to a mean of .02 but would be considered a small value relative to a mean value of 8.
11. Explain why we measure a project’s risk as the change in the CV.
We measure a project’s risk as the change in the coefficient of variation because this focuses on the change in the riskiness of the firm’s existing portfolio.
12. Explain how using a risk-adjusted discount rate improves capital budgeting decision making compared to using a single discount rate for all projects?
The risk-adjusted discount rate improves capital budgeting decisionmaking compared to the single discount rate approach because the RADR allows us to set a higher hurdle for the high risk project anda lower hurdle for the low risk project thus aligning our capital budgeting decision making process more closely with the goal of maximizing the value of the firm.
94
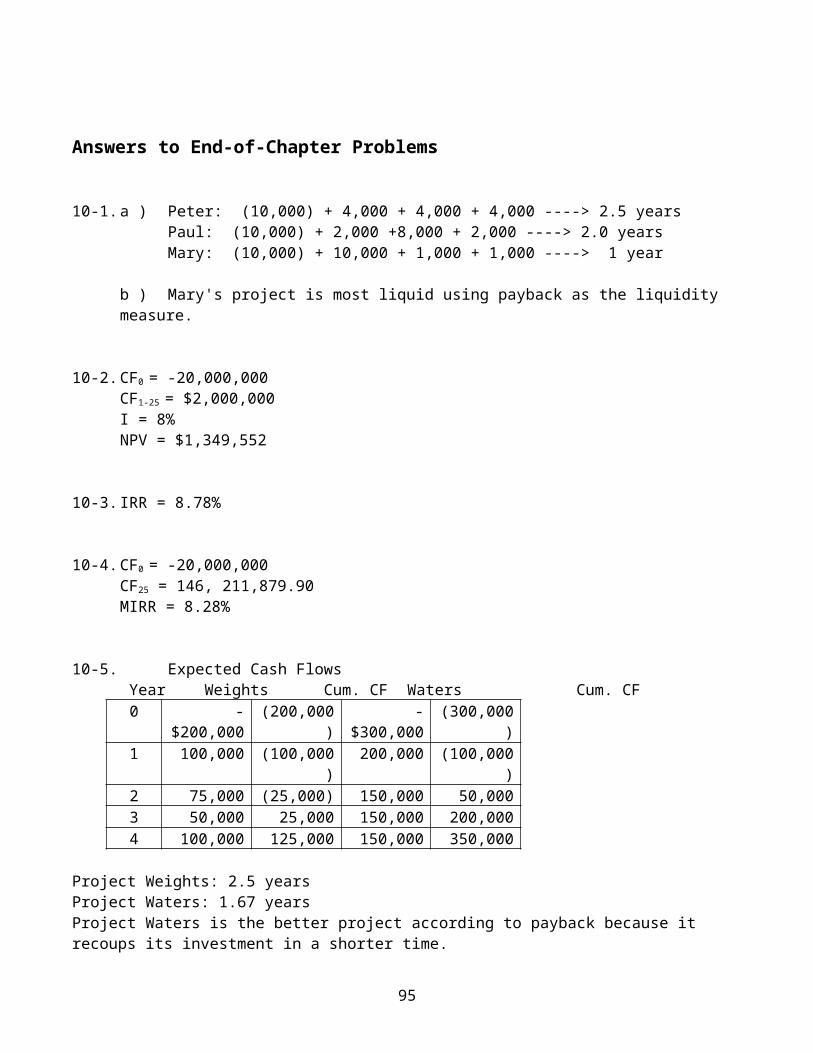
Answers to End-of-Chapter Problems
10-1.a ) Peter: (10,000) + 4,000 + 4,000 + 4,000 ----> 2.5 yearsPaul: (10,000) + 2,000 +8,000 + 2,000 ----> 2.0 yearsMary: (10,000) + 10,000 + 1,000 + 1,000 ----> 1 year
b ) Mary's project is most liquid using payback as the liquidity measure.
10-2.CF0 = -20,000,000CF1-25 = $2,000,000I = 8%NPV = $1,349,552
10-3.IRR = 8.78%
10-4.CF0 = -20,000,000CF25 = 146, 211,879.90MIRR = 8.28%
10-5. Expected Cash Flows Year Weights Cum. CF Waters Cum. CF0 -
$200,000(200,000
)-
$300,000(300,000
)1 100,000 (100,000
)200,000 (100,000
)2 75,000 (25,000) 150,000 50,0003 50,000 25,000 150,000 200,0004 100,000 125,000 150,000 350,000
Project Weights: 2.5 yearsProject Waters: 1.67 yearsProject Waters is the better project according to payback because it recoups its investment in a shorter time.
95
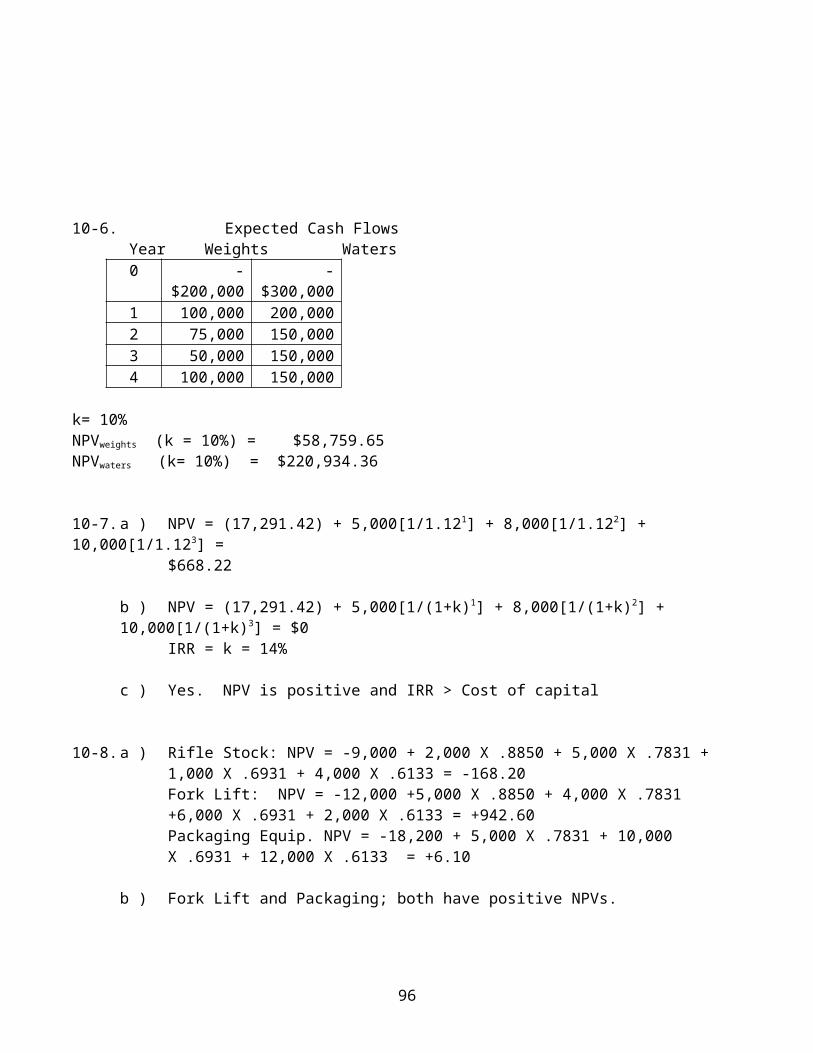
10-6. Expected Cash Flows Year Weights Waters0 -
$200,000-
$300,0001 100,000 200,0002 75,000 150,0003 50,000 150,0004 100,000 150,000
k= 10%NPVweights (k = 10%) = $58,759.65NPVwaters (k= 10%) = $220,934.36
10-7.a ) NPV = (17,291.42) + 5,000[1/1.121] + 8,000[1/1.122] + 10,000[1/1.123] =
$668.22
b ) NPV = (17,291.42) + 5,000[1/(1+k)1] + 8,000[1/(1+k)2] + 10,000[1/(1+k)3] = $0
IRR = k = 14%
c ) Yes. NPV is positive and IRR > Cost of capital
10-8.a ) Rifle Stock: NPV = -9,000 + 2,000 X .8850 + 5,000 X .7831 + 1,000 X .6931 + 4,000 X .6133 = -168.20Fork Lift: NPV = -12,000 +5,000 X .8850 + 4,000 X .7831 +6,000 X .6931 + 2,000 X .6133 = +942.60Packaging Equip. NPV = -18,200 + 5,000 X .7831 + 10,000 X .6931 + 12,000 X .6133 = +6.10
b ) Fork Lift and Packaging; both have positive NPVs.
96
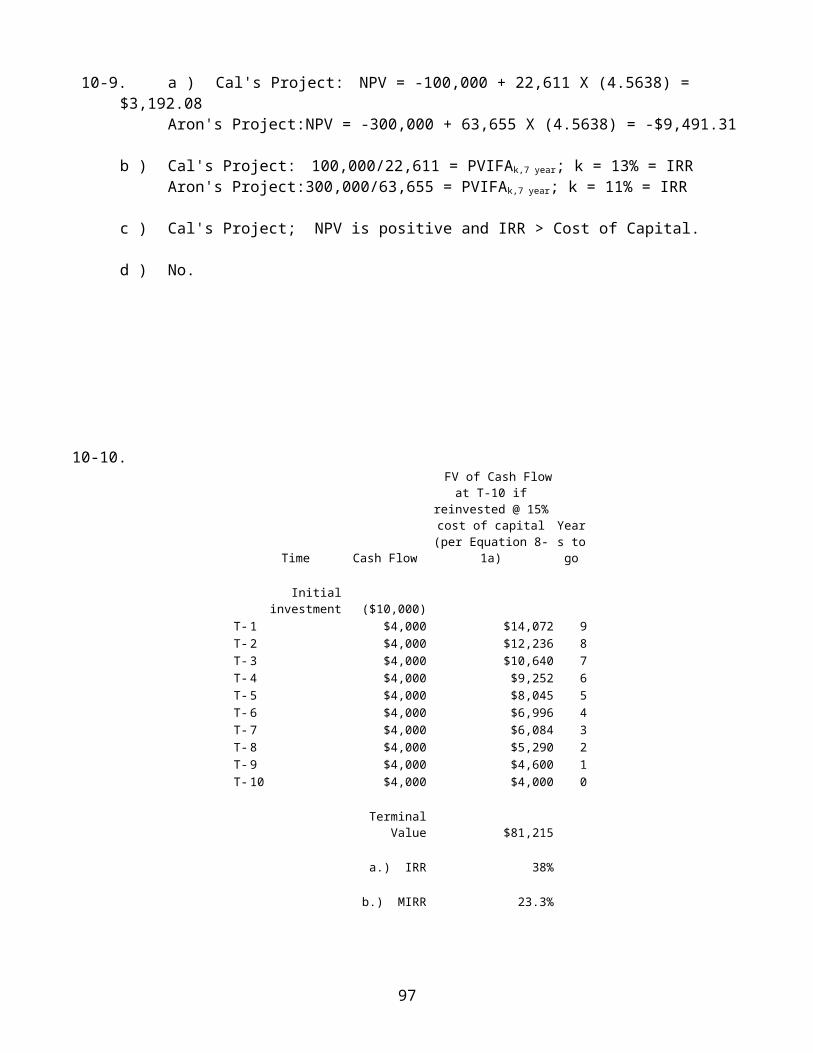
10-9. a ) Cal's Project: NPV = -100,000 + 22,611 X (4.5638) = $3,192.08
Aron's Project:NPV = -300,000 + 63,655 X (4.5638) = -$9,491.31
b ) Cal's Project: 100,000/22,611 = PVIFAk,7 year; k = 13% = IRRAron's Project:300,000/63,655 = PVIFAk,7 year; k = 11% = IRR
c ) Cal's Project; NPV is positive and IRR > Cost of Capital.
d ) No.
10-10.
Time Cash Flow
FV of Cash Flowat T-10 if
reinvested @ 15%cost of capital(per Equation 8-
1a)
Years togo
Initialinvestment ($10,000)
T-1 $4,000 $14,072 9T-2 $4,000 $12,236 8T-3 $4,000 $10,640 7T-4 $4,000 $9,252 6T-5 $4,000 $8,045 5T-6 $4,000 $6,996 4T-7 $4,000 $6,084 3T-8 $4,000 $5,290 2T-9 $4,000 $4,600 1T-10 $4,000 $4,000 0
TerminalValue $81,215
a.) IRR 38%
b.) MIRR 23.3%
97

10-11. a ) Printer #1: Payback = 2 yearsPrinter #2: Payback = 1.77 years
b ) Printer #1: NPV = -2,000 +900 X .9091 + 1,100 X .8264 + 1,300 X .7513 = +703.92Printer #2: NPV = -2,500 + 1,500 X .9091 + 1,300 X .8264
+ 800 X .7513 = +539.01
c ) Printer #1: NPV = 0 = -2,000 + 900 X [1/(1+k)1] + 1,100 X [1/(1+k)2] + 1,300 X [1/(1+k)3]
IRR = k = .2782 = 27.82%
Printer #2: NPV = 0 = -2,500 + 1,500 X [1/(1+k)1] + 1,300 X [1/(1+k)2] + 800 X [1/(1+k)3]
IRR = k = .2325 = 23.25%
d ) Printer #1 with higher NPV and higher IRR
e ) Printer #1: NPV = -2,000 + 900 X .8621 + 1,100 X .7432 + 1,300X .6407 = +426.32
Printer #2: NPV = -2,500 + 1,500 X .8621 + 1,300 X .7,432 +800 X .6407
= +271.87
No. NPV of Printer #1 is still higher.
10-12. Expected Cash Flows Year Program0 -
20,000,000
1 1,000,000
2 2,000,000
98
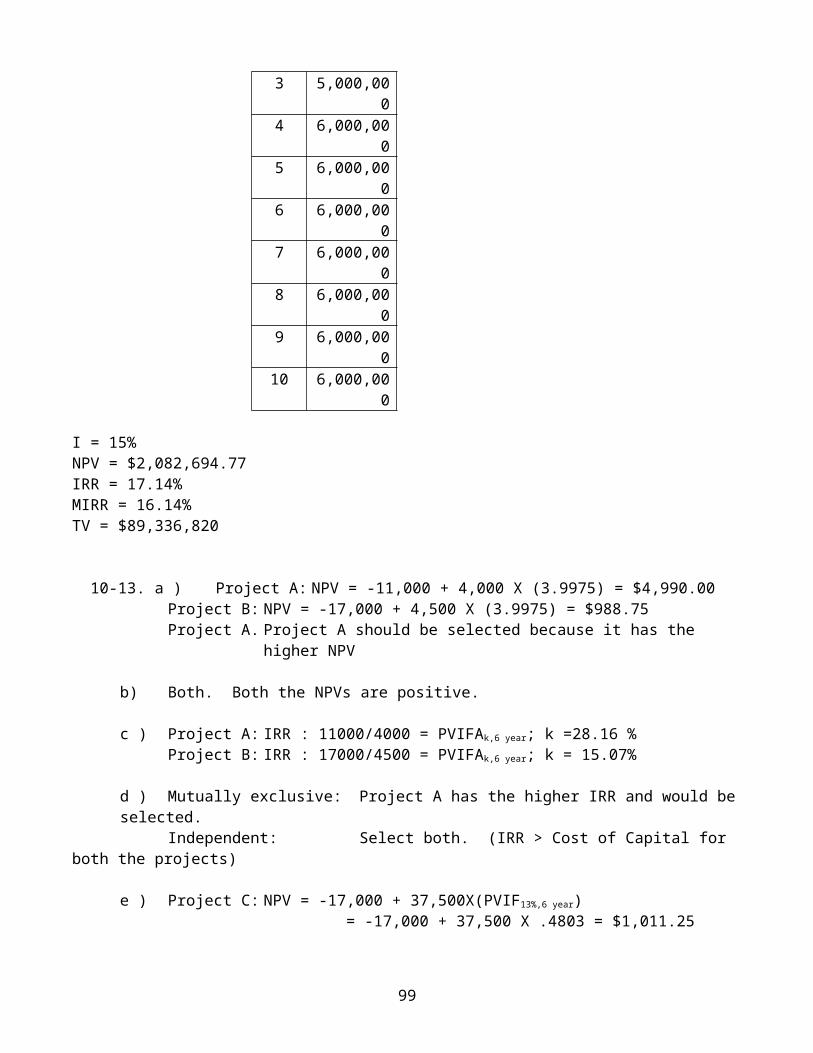
3 5,000,000
4 6,000,000
5 6,000,000
6 6,000,000
7 6,000,000
8 6,000,000
9 6,000,000
10 6,000,000
I = 15%NPV = $2,082,694.77IRR = 17.14%MIRR = 16.14%TV = $89,336,820
10-13. a ) Project A: NPV = -11,000 + 4,000 X (3.9975) = $4,990.00Project B: NPV = -17,000 + 4,500 X (3.9975) = $988.75Project A. Project A should be selected because it has the
higher NPV
b) Both. Both the NPVs are positive.
c ) Project A: IRR : 11000/4000 = PVIFAk,6 year; k =28.16 %Project B: IRR : 17000/4500 = PVIFAk,6 year; k = 15.07%
d ) Mutually exclusive: Project A has the higher IRR and would beselected. Independent: Select both. (IRR > Cost of Capital for
both the projects)
e ) Project C: NPV = -17,000 + 37,500X(PVIF13%,6 year) = -17,000 + 37,500 X .4803 = $1,011.25
99
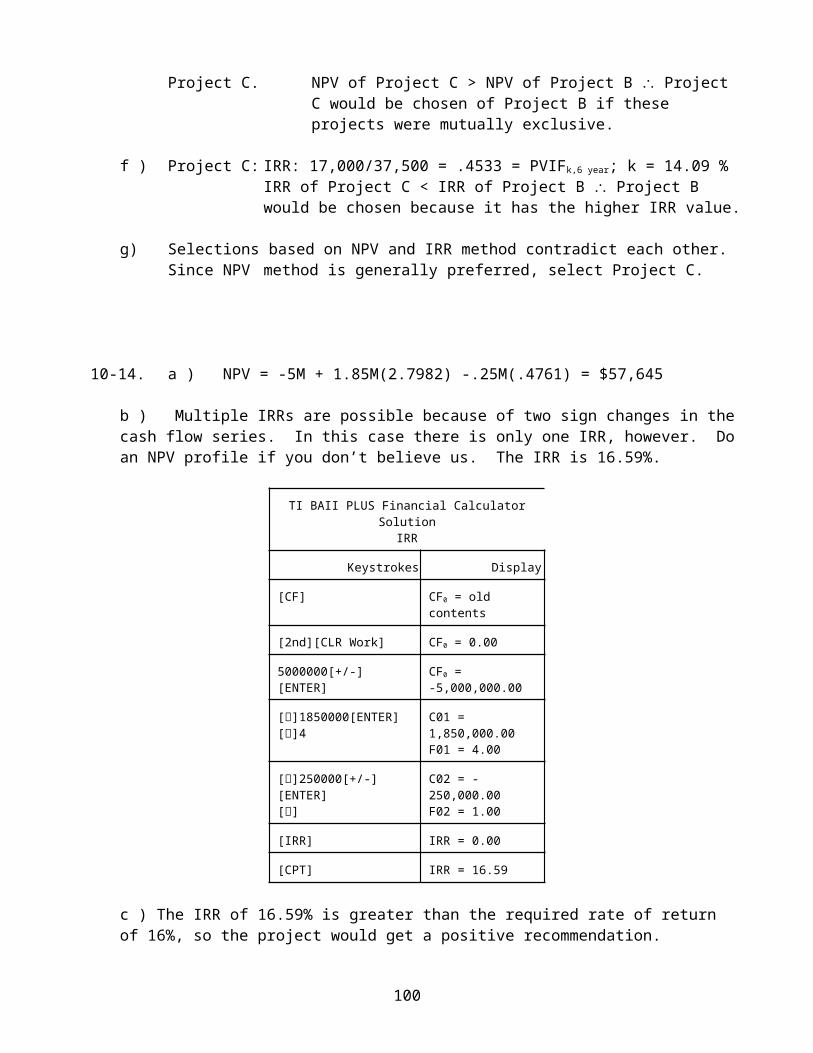
Project C. NPV of Project C > NPV of Project B Project C would be chosen of Project B if these projects were mutually exclusive.
f ) Project C: IRR: 17,000/37,500 = .4533 = PVIFk,6 year; k = 14.09 %IRR of Project C < IRR of Project B Project B would be chosen because it has the higher IRR value.
g) Selections based on NPV and IRR method contradict each other. Since NPV method is generally preferred, select Project C.
10-14. a ) NPV = -5M + 1.85M(2.7982) -.25M(.4761) = $57,645
b ) Multiple IRRs are possible because of two sign changes in thecash flow series. In this case there is only one IRR, however. Doan NPV profile if you don’t believe us. The IRR is 16.59%.
TI BAII PLUS Financial CalculatorSolution
IRR
Keystrokes Display
[CF] CF0 = old contents
[2nd][CLR Work] CF0 = 0.00
5000000[+/-][ENTER]
CF0 =-5,000,000.00
[]1850000[ENTER][]4
C01 = 1,850,000.00F01 = 4.00
[]250000[+/-][ENTER][]
C02 = -250,000.00F02 = 1.00
[IRR] IRR = 0.00
[CPT] IRR = 16.59
c ) The IRR of 16.59% is greater than the required rate of return of 16%, so the project would get a positive recommendation.
100
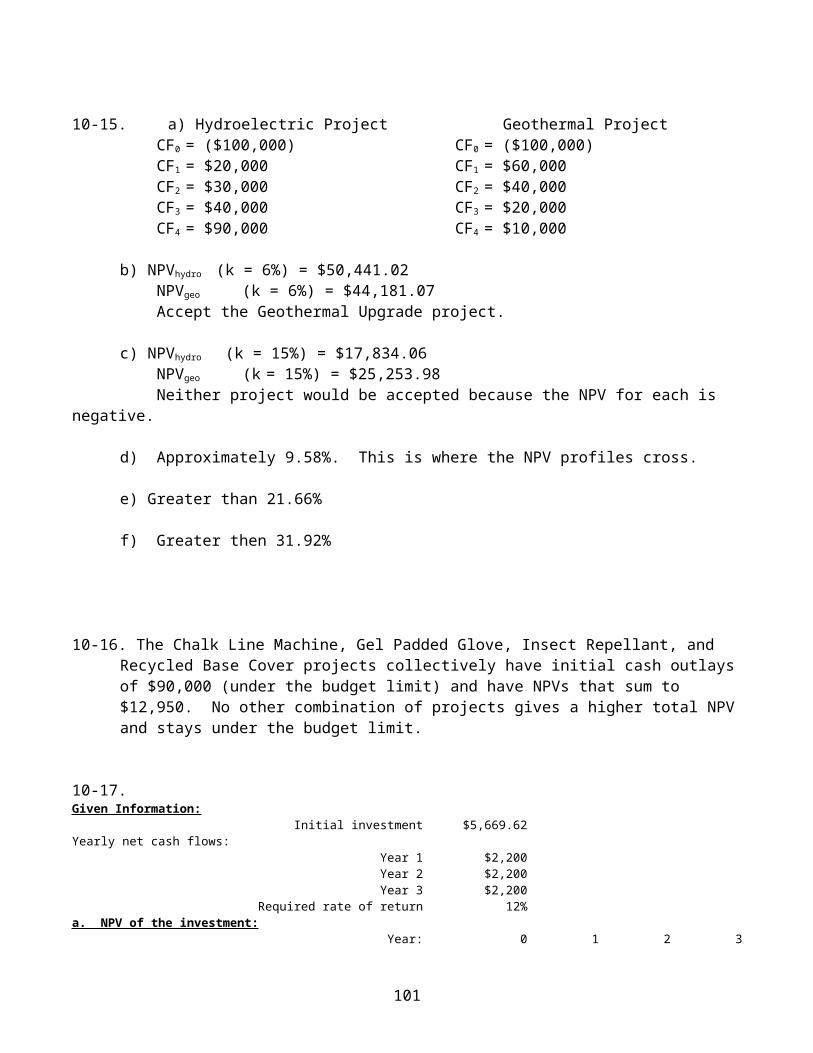
10-15. a) Hydroelectric Project Geothermal Project CF0 = ($100,000) CF0 = ($100,000) CF1 = $20,000 CF1 = $60,000 CF2 = $30,000 CF2 = $40,000 CF3 = $40,000 CF3 = $20,000 CF4 = $90,000 CF4 = $10,000
b) NPVhydro (k = 6%) = $50,441.02 NPVgeo (k = 6%) = $44,181.07 Accept the Geothermal Upgrade project.
c) NPVhydro (k = 15%) = $17,834.06 NPVgeo (k = 15%) = $25,253.98 Neither project would be accepted because the NPV for each is
negative.
d) Approximately 9.58%. This is where the NPV profiles cross.
e) Greater than 21.66%
f) Greater then 31.92%
10-16. The Chalk Line Machine, Gel Padded Glove, Insect Repellant, and Recycled Base Cover projects collectively have initial cash outlaysof $90,000 (under the budget limit) and have NPVs that sum to $12,950. No other combination of projects gives a higher total NPVand stays under the budget limit.
10-17.Given Information:
Initial investment $5,669.62 Yearly net cash flows:
Year 1 $2,200 Year 2 $2,200 Year 3 $2,200
Required rate of return 12%a. NPV of the investment:
Year: 0 1 2 3
101
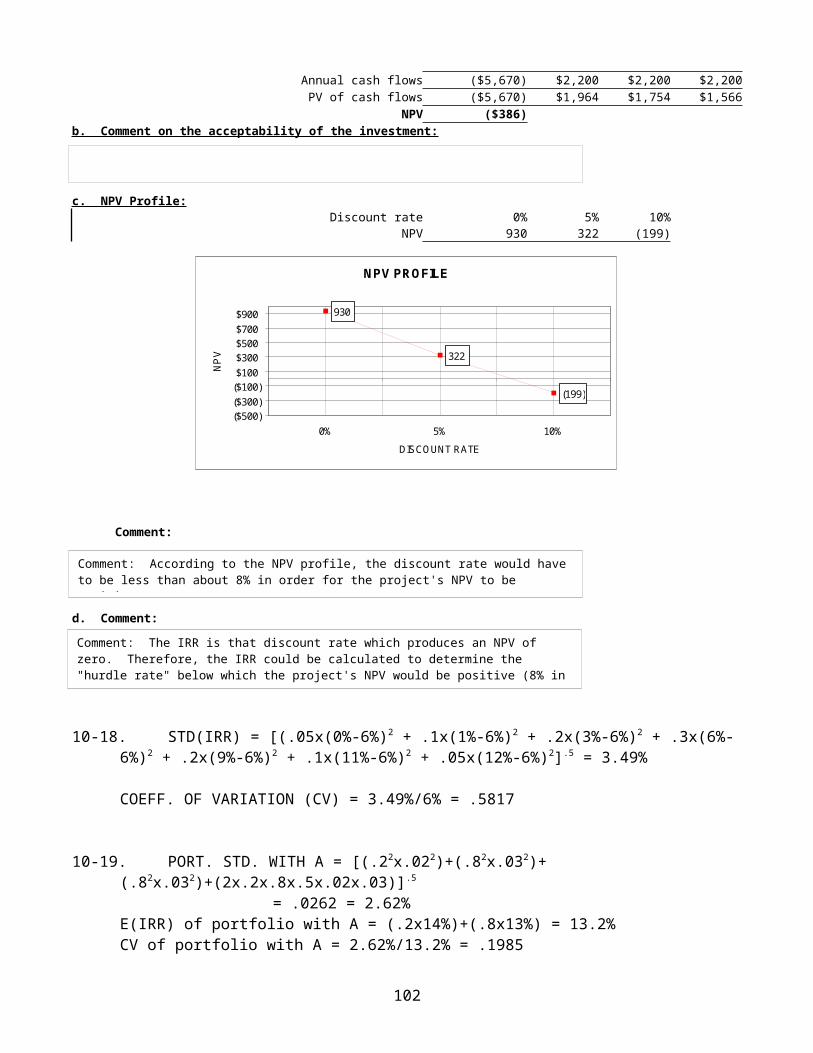
Annual cash flows ($5,670) $2,200 $2,200 $2,200 PV of cash flows ($5,670) $1,964 $1,754 $1,566
NPV ($386)b. Comment on the acceptability of the investment:
c. NPV Profile:Discount rate 0% 5% 10%
NPV 930 322 (199)
Comment:
d. Comment:
10-18. STD(IRR) = [(.05x(0%-6%)2 + .1x(1%-6%)2 + .2x(3%-6%)2 + .3x(6%-6%)2 + .2x(9%-6%)2 + .1x(11%-6%)2 + .05x(12%-6%)2].5 = 3.49%
COEFF. OF VARIATION (CV) = 3.49%/6% = .5817
10-19. PORT. STD. WITH A = [(.22x.022)+(.82x.032)+(.82x.032)+(2x.2x.8x.5x.02x.03)].5
= .0262 = 2.62%E(IRR) of portfolio with A = (.2x14%)+(.8x13%) = 13.2%CV of portfolio with A = 2.62%/13.2% = .1985
102
Comment: According to the NPV profile, the discount rate would haveto be less than about 8% in order for the project's NPV to be positive.
Comment: The IRR is that discount rate which produces an NPV of zero. Therefore, the IRR could be calculated to determine the "hurdle rate" below which the project's NPV would be positive (8% inthis case).
NPV PROFILE
930
322
(199)
($500)($300)($100)$100$300$500$700$900
0% 5% 10%DISCOUNT RATE
NPV
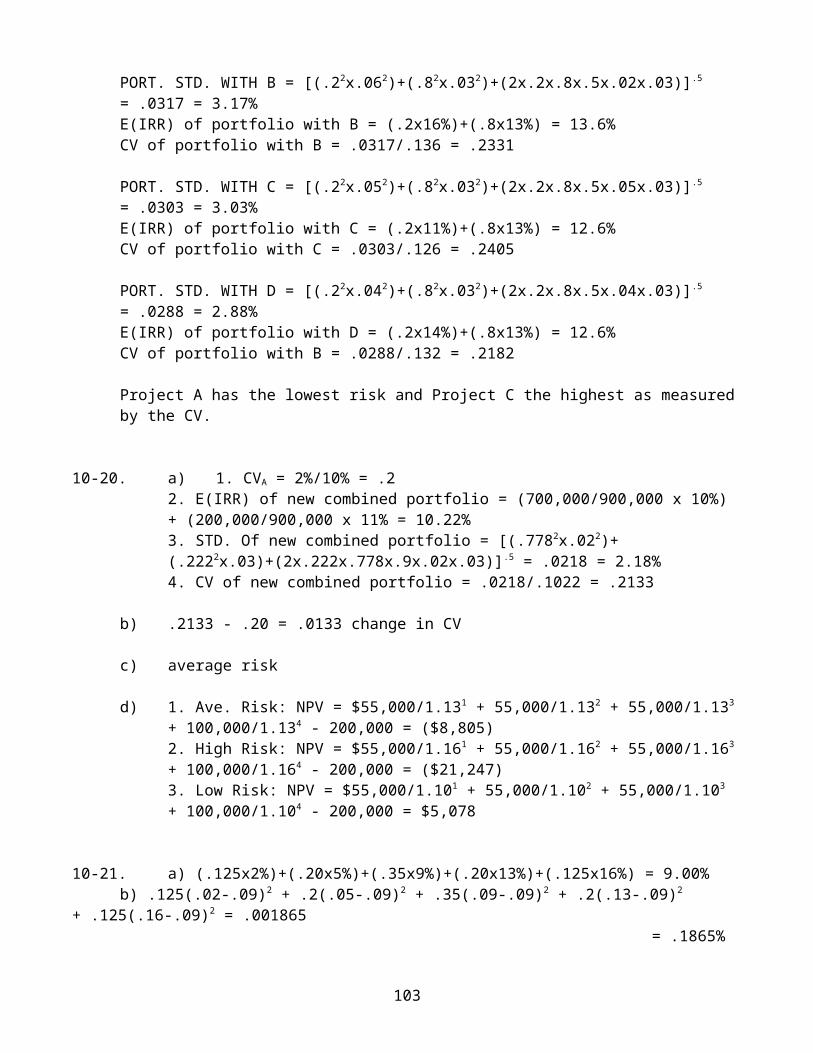
PORT. STD. WITH B = [(.22x.062)+(.82x.032)+(2x.2x.8x.5x.02x.03)].5 = .0317 = 3.17%E(IRR) of portfolio with B = (.2x16%)+(.8x13%) = 13.6%CV of portfolio with B = .0317/.136 = .2331
PORT. STD. WITH C = [(.22x.052)+(.82x.032)+(2x.2x.8x.5x.05x.03)].5 = .0303 = 3.03%E(IRR) of portfolio with C = (.2x11%)+(.8x13%) = 12.6%CV of portfolio with C = .0303/.126 = .2405
PORT. STD. WITH D = [(.22x.042)+(.82x.032)+(2x.2x.8x.5x.04x.03)].5 = .0288 = 2.88%
E(IRR) of portfolio with D = (.2x14%)+(.8x13%) = 12.6%CV of portfolio with B = .0288/.132 = .2182
Project A has the lowest risk and Project C the highest as measuredby the CV.
10-20. a) 1. CVA = 2%/10% = .22. E(IRR) of new combined portfolio = (700,000/900,000 x 10%) + (200,000/900,000 x 11% = 10.22%3. STD. Of new combined portfolio = [(.7782x.022)+(.2222x.03)+(2x.222x.778x.9x.02x.03)].5 = .0218 = 2.18%4. CV of new combined portfolio = .0218/.1022 = .2133
b) .2133 - .20 = .0133 change in CV
c) average risk
d) 1. Ave. Risk: NPV = $55,000/1.131 + 55,000/1.132 + 55,000/1.133
+ 100,000/1.134 - 200,000 = ($8,805)2. High Risk: NPV = $55,000/1.161 + 55,000/1.162 + 55,000/1.163
+ 100,000/1.164 - 200,000 = ($21,247)3. Low Risk: NPV = $55,000/1.101 + 55,000/1.102 + 55,000/1.103 + 100,000/1.104 - 200,000 = $5,078
10-21. a) (.125x2%)+(.20x5%)+(.35x9%)+(.20x13%)+(.125x16%) = 9.00%b) .125(.02-.09)2 + .2(.05-.09)2 + .35(.09-.09)2 + .2(.13-.09)2
+ .125(.16-.09)2 = .001865 = .1865%
103
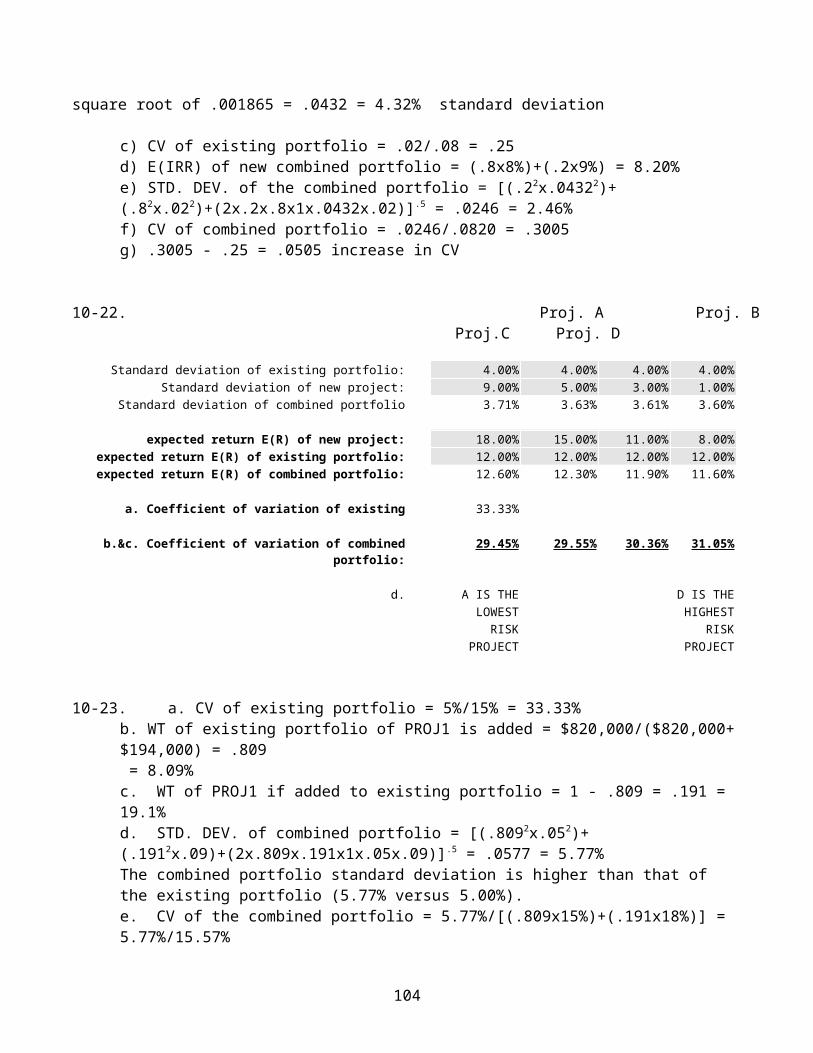
square root of .001865 = .0432 = 4.32% standard deviation
c) CV of existing portfolio = .02/.08 = .25d) E(IRR) of new combined portfolio = (.8x8%)+(.2x9%) = 8.20%e) STD. DEV. of the combined portfolio = [(.22x.04322)+(.82x.022)+(2x.2x.8x1x.0432x.02)].5 = .0246 = 2.46%f) CV of combined portfolio = .0246/.0820 = .3005g) .3005 - .25 = .0505 increase in CV
10-22. Proj. A Proj. B Proj.C Proj. D
Standard deviation of existing portfolio: 4.00% 4.00% 4.00% 4.00%Standard deviation of new project: 9.00% 5.00% 3.00% 1.00%
Standard deviation of combined portfolio 3.71% 3.63% 3.61% 3.60%
expected return E(R) of new project: 18.00% 15.00% 11.00% 8.00%expected return E(R) of existing portfolio: 12.00% 12.00% 12.00% 12.00%expected return E(R) of combined portfolio: 12.60% 12.30% 11.90% 11.60%
a. Coefficient of variation of existingportfolio:
33.33%
b.&c. Coefficient of variation of combinedportfolio:
29.45% 29.55% 30.36% 31.05%
d. A IS THE D IS THELOWEST HIGHEST
RISK RISKPROJECT PROJECT
10-23. a. CV of existing portfolio = 5%/15% = 33.33%b. WT of existing portfolio of PROJ1 is added = $820,000/($820,000+$194,000) = .809 = 8.09%c. WT of PROJ1 if added to existing portfolio = 1 - .809 = .191 = 19.1%d. STD. DEV. of combined portfolio = [(.8092x.052)+(.1912x.09)+(2x.809x.191x1x.05x.09)].5 = .0577 = 5.77%The combined portfolio standard deviation is higher than that of the existing portfolio (5.77% versus 5.00%).e. CV of the combined portfolio = 5.77%/[(.809x15%)+(.191x18%)] = 5.77%/15.57%
104
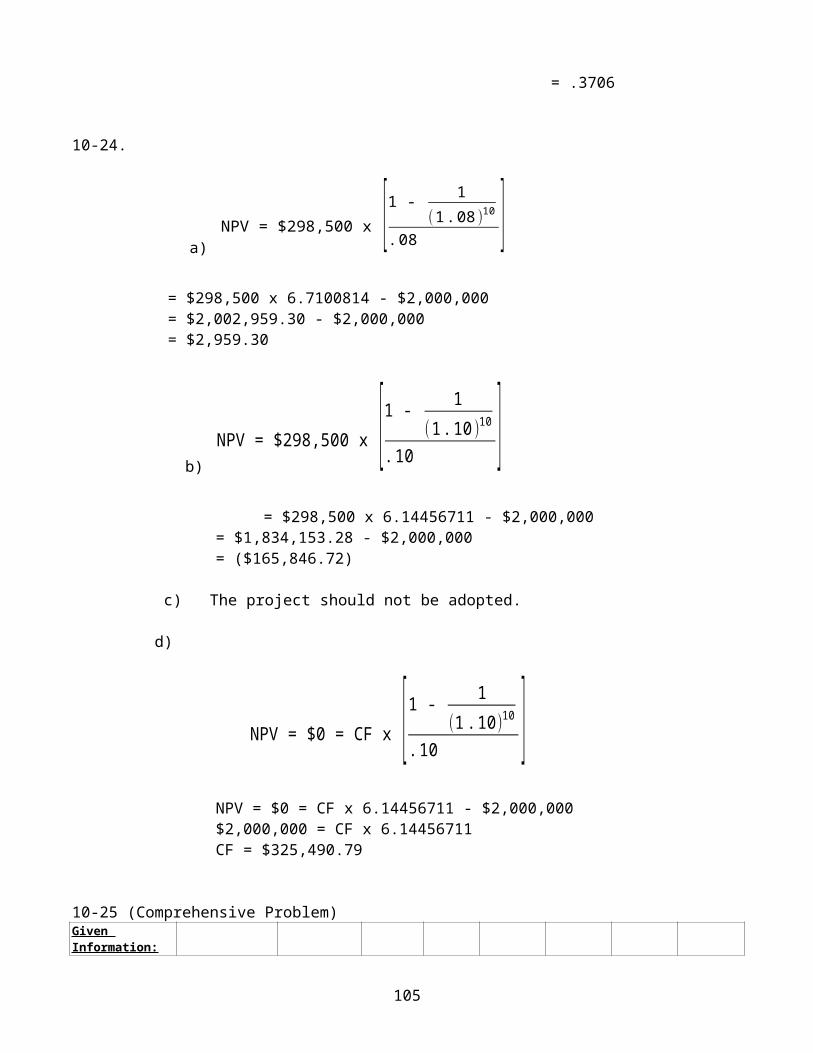
= .3706
10-24.
= $298,500 x 6.7100814 - $2,000,000= $2,002,959.30 - $2,000,000= $2,959.30
= $298,500 x 6.14456711 - $2,000,000= $1,834,153.28 - $2,000,000= ($165,846.72)
c) The project should not be adopted.
d)
NPV = $0 = CF x 6.14456711 - $2,000,000$2,000,000 = CF x 6.14456711CF = $325,490.79
10-25 (Comprehensive Problem)Given Information:
105
a) NPV = $298,500 x [1 - 1
(1.08 )10
.08 ]
b) NPV = $298,500 x [1 - 1
(1.10 )10
.10 ]
NPV = $0 = CF x [1 - 1(1.10)10
.10 ]
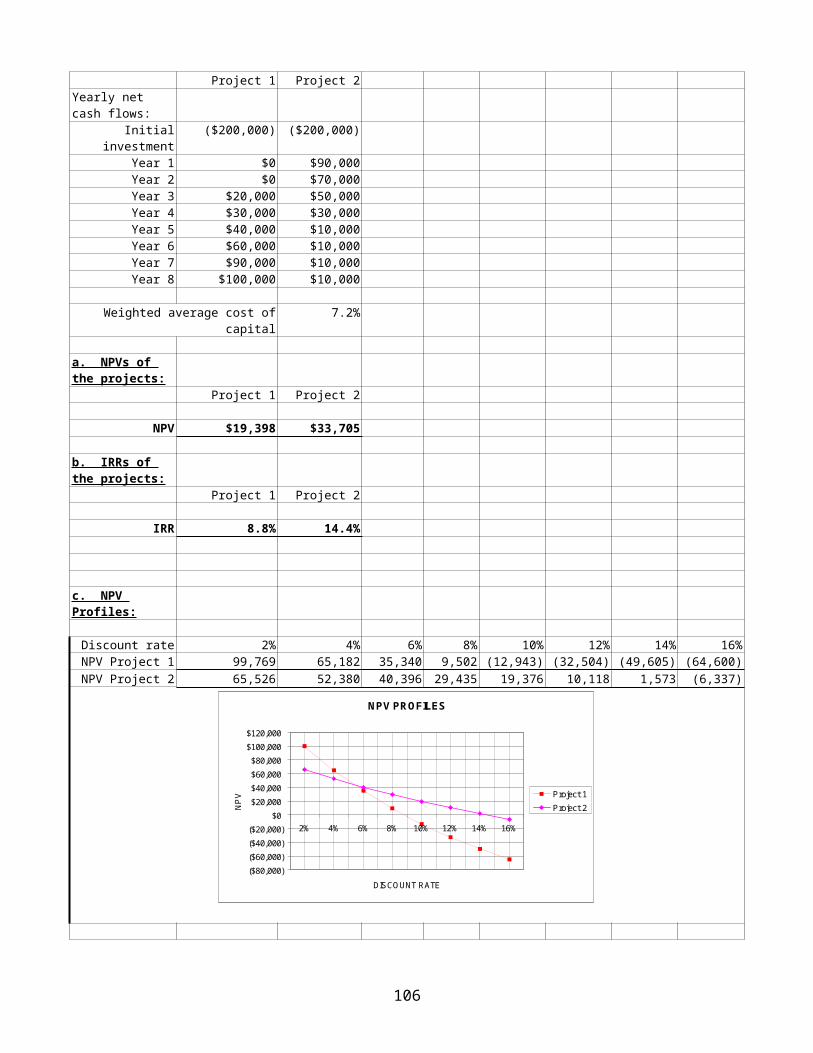
Project 1 Project 2 Yearly net cash flows:
Initialinvestment
($200,000) ($200,000)
Year 1 $0 $90,000 Year 2 $0 $70,000 Year 3 $20,000 $50,000 Year 4 $30,000 $30,000 Year 5 $40,000 $10,000 Year 6 $60,000 $10,000 Year 7 $90,000 $10,000 Year 8 $100,000 $10,000
Weighted average cost ofcapital
7.2%
a. NPVs of the projects:
Project 1 Project 2
NPV $19,398 $33,705
b. IRRs of the projects:
Project 1 Project 2
IRR 8.8% 14.4%
c. NPV Profiles:
Discount rate 2% 4% 6% 8% 10% 12% 14% 16%NPV Project 1 99,769 65,182 35,340 9,502 (12,943) (32,504) (49,605) (64,600)NPV Project 2 65,526 52,380 40,396 29,435 19,376 10,118 1,573 (6,337)
106
NPV PROFILES
($80,000)($60,000)($40,000)($20,000)
$0$20,000$40,000$60,000$80,000$100,000$120,000
2% 4% 6% 8% 10% 12% 14% 16%
DISCOUNT RATE
NPV Project 1
Project 2
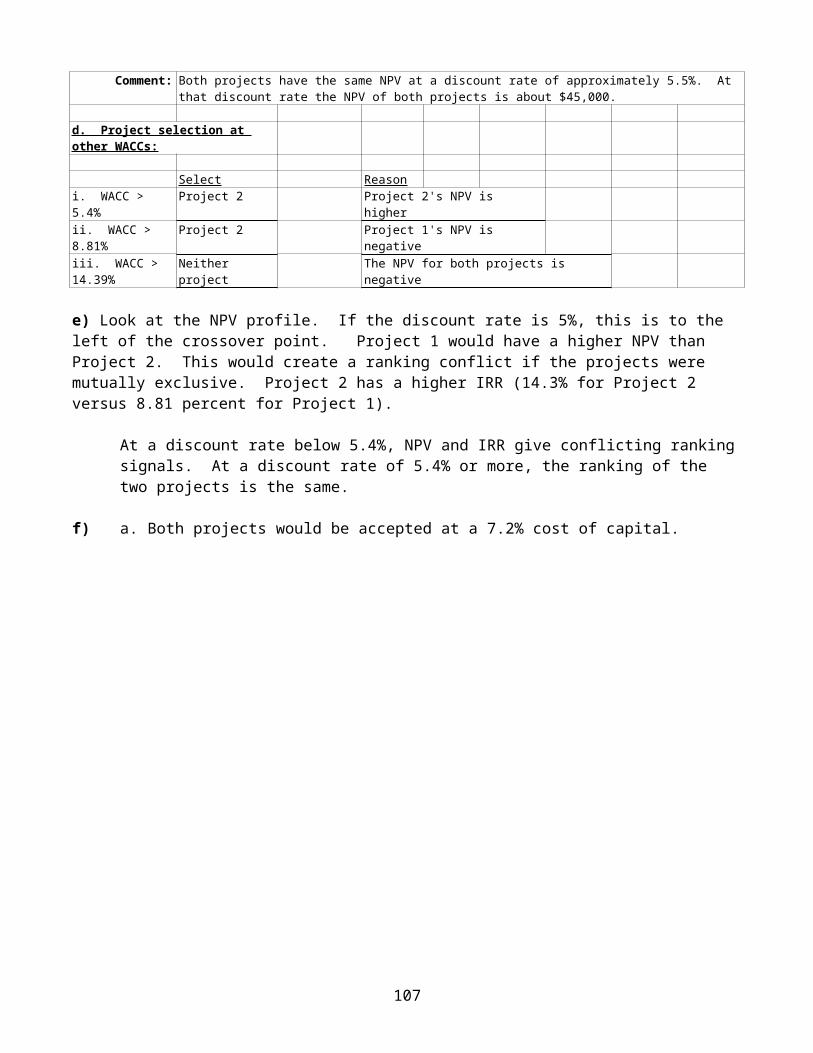
Comment: Both projects have the same NPV at a discount rate of approximately 5.5%. At that discount rate the NPV of both projects is about $45,000.
d. Project selection at other WACCs:
Select Reasoni. WACC > 5.4%
Project 2 Project 2's NPV is higher
ii. WACC > 8.81%
Project 2 Project 1's NPV is negative
iii. WACC > 14.39%
Neither project
The NPV for both projects is negative
e) Look at the NPV profile. If the discount rate is 5%, this is to the left of the crossover point. Project 1 would have a higher NPV than Project 2. This would create a ranking conflict if the projects were mutually exclusive. Project 2 has a higher IRR (14.3% for Project 2 versus 8.81 percent for Project 1).
At a discount rate below 5.4%, NPV and IRR give conflicting rankingsignals. At a discount rate of 5.4% or more, the ranking of the two projects is the same.
f) a. Both projects would be accepted at a 7.2% cost of capital.
107
Chapter 11 Solutions
Answers to Review Questions
1. Why do we focus on cash flows instead of profits when evaluating proposed capital budgeting projects?
We focus on cash flows instead of profits when evaluating proposed capital budgeting projects because it is cash flow that changes thevalue of a firm. You can spend cash but you can not spend profit.
2. What is a sunk cost? Is it relevant when evaluating a proposed capital budgeting project? Explain.
A sunk cost is a cash flow that has already occurred, or that will occur, whether a project is accepted or rejected. It is irrelevantwhen evaluating a proposed project.
3. How do we estimate expected incremental cash flows for a proposed capital budgeting project?
We estimate expected incremental cash flows for a proposed project by estimating the changes in sales and expenses that are incremental to the project, adding back the incremental depreciation expense since depreciation expense is a non-cash expense.
4. What role does depreciation play in estimating incremental cash flows?
Depreciation expense is a tax deductible expense and therefore affects cash flow through its effect on taxes. Depreciation expense that is incremental to a proposed project therefore affectsincremental cash flows.
108
5. How and why does working capital affect the incremental cash flow estimation for a proposed large capital budgeting project? Explain.
Many large projects require additional working capital. This investment in additional working capital becomes part of the initial investment. This investment is recovered at the end of theproject’s life. There may be some spontaneous increase in current liabilities associated with a project, but the change in net working capital, if any, is likely to be a positive value requiringan increase in the initial investment of that amount.
6. How do opportunity costs affect the capital budgeting decision-making process?
Opportunity costs reflect the foregone benefits of the alternative not chosen when a capital budgeting project is selected. Any decrease in the cash flows of the firm directly tied to the selection of a new project could be part of the opportunity cost value and included in our capital budgeting analysis.
7. How are financing costs generally incorporated into the capital budgeting analysis process?
Financing costs are usually captured in the discount or hurdle ratewhen doing NPV or IRR analysis. The operating cash flows usually do not include financing costs because this would be double counting.
Answers to End-of—Chapter Problems
11-1.Price of Selected Model $6,000Attachments 5,000Paint Name 300Garage and Maint. Facility12,000
$23,300
Cash Flow t0 = ($23,300)
109
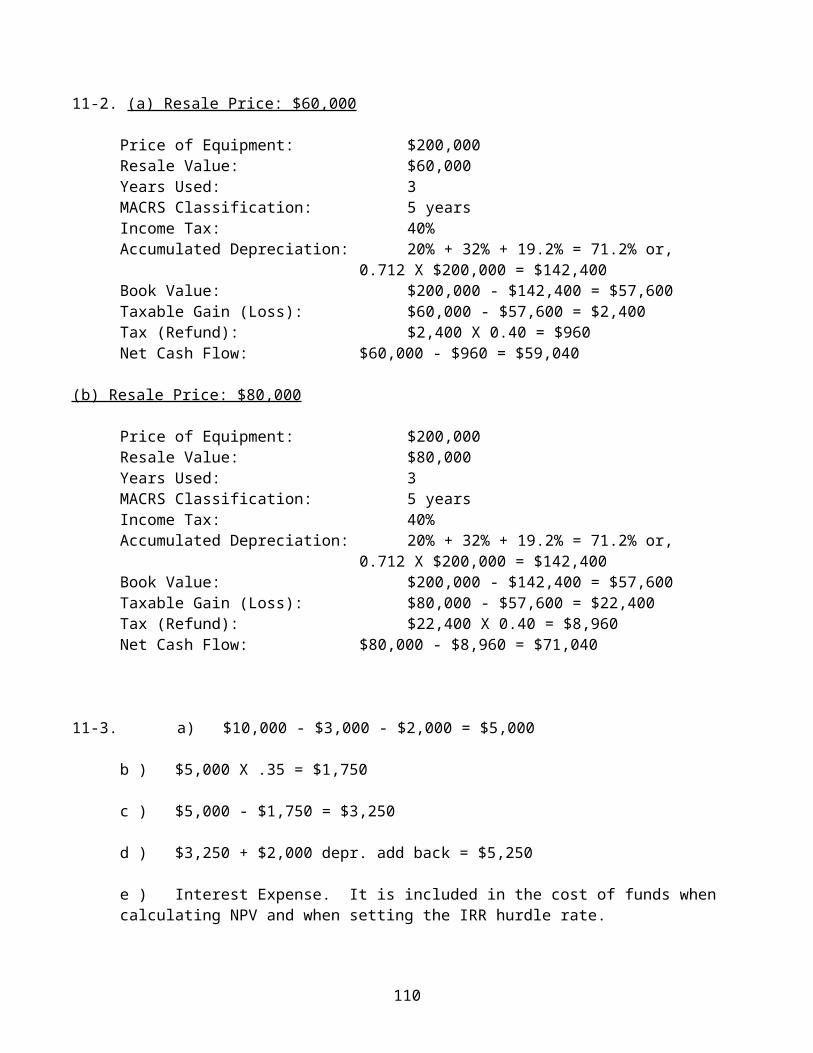
11-2. (a) Resale Price: $60,000
Price of Equipment: $200,000Resale Value: $60,000Years Used: 3MACRS Classification: 5 yearsIncome Tax: 40%Accumulated Depreciation: 20% + 32% + 19.2% = 71.2% or,
0.712 X $200,000 = $142,400Book Value: $200,000 - $142,400 = $57,600Taxable Gain (Loss): $60,000 - $57,600 = $2,400Tax (Refund): $2,400 X 0.40 = $960Net Cash Flow: $60,000 - $960 = $59,040
(b) Resale Price: $80,000
Price of Equipment: $200,000Resale Value: $80,000Years Used: 3MACRS Classification: 5 yearsIncome Tax: 40%Accumulated Depreciation: 20% + 32% + 19.2% = 71.2% or,
0.712 X $200,000 = $142,400Book Value: $200,000 - $142,400 = $57,600Taxable Gain (Loss): $80,000 - $57,600 = $22,400Tax (Refund): $22,400 X 0.40 = $8,960Net Cash Flow: $80,000 - $8,960 = $71,040
11-3. a) $10,000 - $3,000 - $2,000 = $5,000
b ) $5,000 X .35 = $1,750
c ) $5,000 - $1,750 = $3,250
d ) $3,250 + $2,000 depr. add back = $5,250
e ) Interest Expense. It is included in the cost of funds when calculating NPV and when setting the IRR hurdle rate.
110
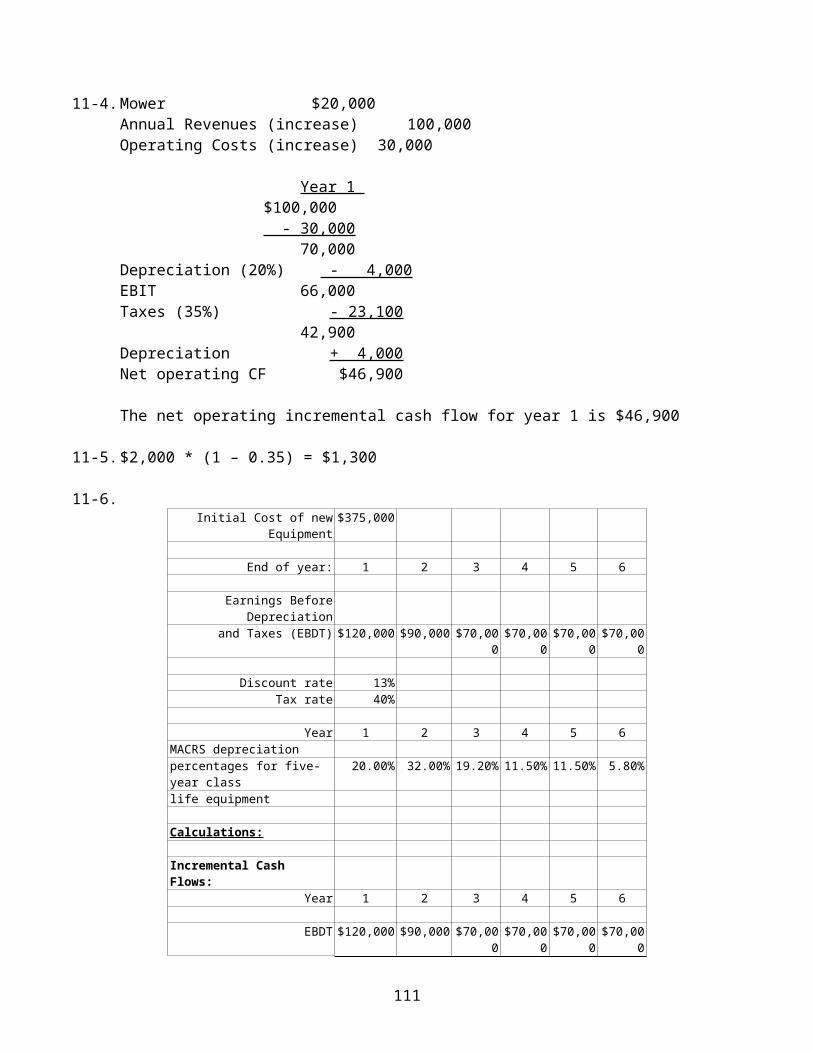
11-4.Mower $20,000Annual Revenues (increase) 100,000Operating Costs (increase) 30,000
Year 1 $100,000
- 30,000 70,000
Depreciation (20%) - 4,000EBIT 66,000Taxes (35%) - 23,100
42,900Depreciation + 4,000Net operating CF $46,900
The net operating incremental cash flow for year 1 is $46,900
11-5.$2,000 * (1 – 0.35) = $1,300
11-6. Initial Cost of new
Equipment$375,000
End of year: 1 2 3 4 5 6
Earnings BeforeDepreciation
and Taxes (EBDT) $120,000 $90,000 $70,000 $70,00
0 $70,00
0 $70,00
0
Discount rate 13%Tax rate 40%
Year 1 2 3 4 5 6 MACRS depreciationpercentages for five-year class
20.00% 32.00% 19.20% 11.50% 11.50% 5.80%
life equipment
Calculations:
Incremental Cash Flows:
Year 1 2 3 4 5 6
EBDT $120,000 $90,000 $70,000 $70,00
0 $70,00
0 $70,00
0
111
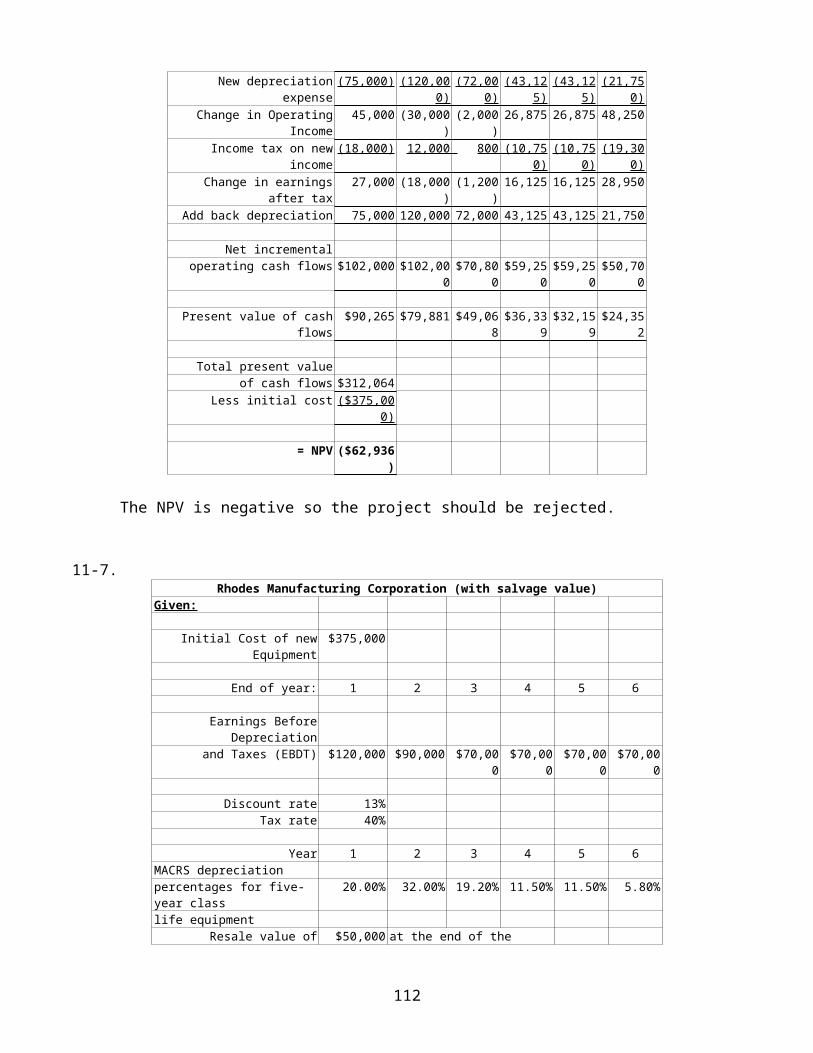
New depreciationexpense
(75,000) (120,000)
(72,000)
(43,125)
(43,125)
(21,750)
Change in OperatingIncome
45,000 (30,000)(2,000
)26,875 26,875 48,250
Income tax on newincome
(18,000) 12,000 800 (10,750)
(10,750)
(19,300)
Change in earningsafter tax
27,000 (18,000)(1,200
)16,125 16,125 28,950
Add back depreciation 75,000 120,000 72,000 43,125 43,125 21,750
Net incrementaloperating cash flows $102,000 $102,00
0 $70,80
0 $59,25
0 $59,25
0 $50,70
0
Present value of cashflows
$90,265 $79,881 $49,068 $36,33
9 $32,15
9 $24,35
2
Total present valueof cash flows $312,064
Less initial cost ($375,000)
= NPV ($62,936)
The NPV is negative so the project should be rejected.
11-7. Rhodes Manufacturing Corporation (with salvage value)
Given:
Initial Cost of newEquipment
$375,000
End of year: 1 2 3 4 5 6
Earnings BeforeDepreciation
and Taxes (EBDT) $120,000 $90,000 $70,000
$70,000
$70,000
$70,000
Discount rate 13%Tax rate 40%
Year 1 2 3 4 5 6 MACRS depreciationpercentages for five-year class
20.00% 32.00% 19.20% 11.50% 11.50% 5.80%
life equipmentResale value of $50,000 at the end of the
112
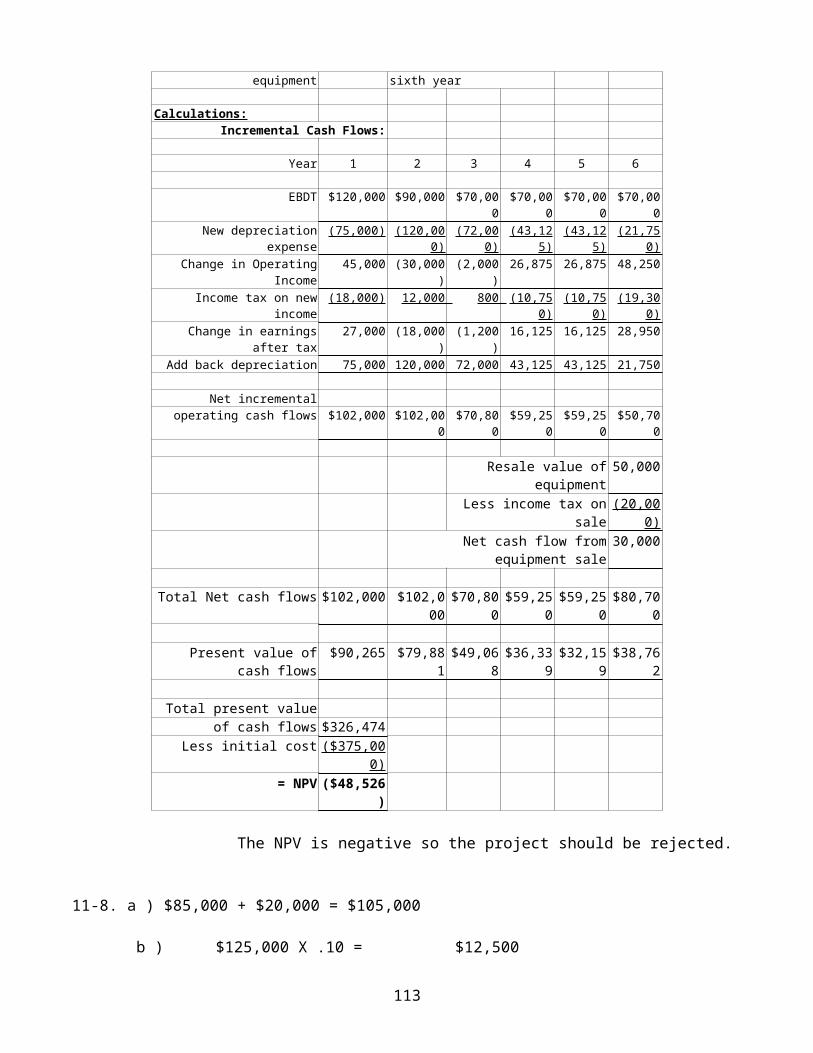
equipment sixth year
Calculations:Incremental Cash Flows:
Year 1 2 3 4 5 6
EBDT $120,000 $90,000 $70,000
$70,000
$70,000
$70,000
New depreciationexpense
(75,000) (120,000)
(72,000)
(43,125)
(43,125)
(21,750)
Change in OperatingIncome
45,000 (30,000)
(2,000)
26,875 26,875 48,250
Income tax on newincome
(18,000) 12,000 800 (10,750)
(10,750)
(19,300)
Change in earningsafter tax
27,000 (18,000)
(1,200)
16,125 16,125 28,950
Add back depreciation 75,000 120,000 72,000 43,125 43,125 21,750
Net incrementaloperating cash flows $102,000 $102,00
0 $70,80
0 $59,25
0 $59,25
0 $50,70
0
Resale value ofequipment
50,000
Less income tax onsale
(20,000)
Net cash flow fromequipment sale
30,000
Total Net cash flows $102,000 $102,000
$70,800 $59,25
0 $59,25
0 $80,70
0
Present value ofcash flows
$90,265 $79,881 $49,06
8 $36,33
9 $32,15
9 $38,76
2
Total present valueof cash flows $326,474
Less initial cost ($375,000)
= NPV ($48,526)
The NPV is negative so the project should be rejected.
11-8. a ) $85,000 + $20,000 = $105,000
b ) $125,000 X .10 = $12,500
113
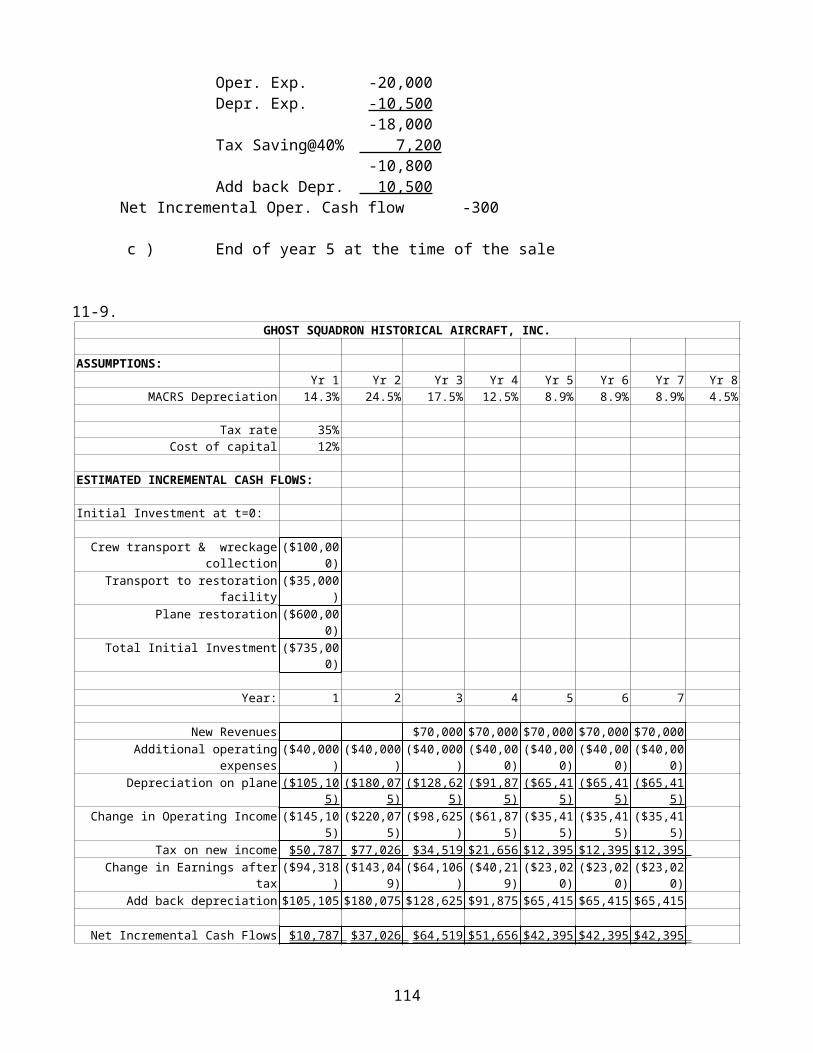
Oper. Exp. -20,000Depr. Exp. -10,500
-18,000Tax Saving@40% 7,200
-10,800Add back Depr. 10,500
Net Incremental Oper. Cash flow -300
c ) End of year 5 at the time of the sale
11-9.GHOST SQUADRON HISTORICAL AIRCRAFT, INC.
ASSUMPTIONS:Yr 1 Yr 2 Yr 3 Yr 4 Yr 5 Yr 6 Yr 7 Yr 8
MACRS Depreciation 14.3% 24.5% 17.5% 12.5% 8.9% 8.9% 8.9% 4.5%
Tax rate 35%Cost of capital 12%
ESTIMATED INCREMENTAL CASH FLOWS:
Initial Investment at t=0:
Crew transport & wreckagecollection
($100,000)
Transport to restorationfacility
($35,000)
Plane restoration ($600,000)
Total Initial Investment ($735,000)
Year: 1 2 3 4 5 6 7
New Revenues $70,000 $70,000 $70,000 $70,000 $70,000 Additional operating
expenses($40,000
)($40,000
)($40,000
)($40,00
0)($40,00
0)($40,00
0)($40,00
0)Depreciation on plane ($105,10
5)($180,07
5)($128,62
5)($91,87
5)($65,41
5)($65,41
5)($65,41
5)Change in Operating Income ($145,10
5)($220,07
5)($98,625
)($61,87
5)($35,41
5)($35,41
5)($35,41
5)Tax on new income $50,787 $77,026 $34,519 $21,656 $12,395 $12,395 $12,395
Change in Earnings aftertax
($94,318)($143,04
9)($64,106
)($40,21
9)($23,02
0)($23,02
0)($23,02
0)Add back depreciation $105,105 $180,075 $128,625 $91,875 $65,415 $65,415 $65,415
Net Incremental Cash Flows $10,787 $37,026 $64,519 $51,656 $42,395 $42,395 $42,395
114
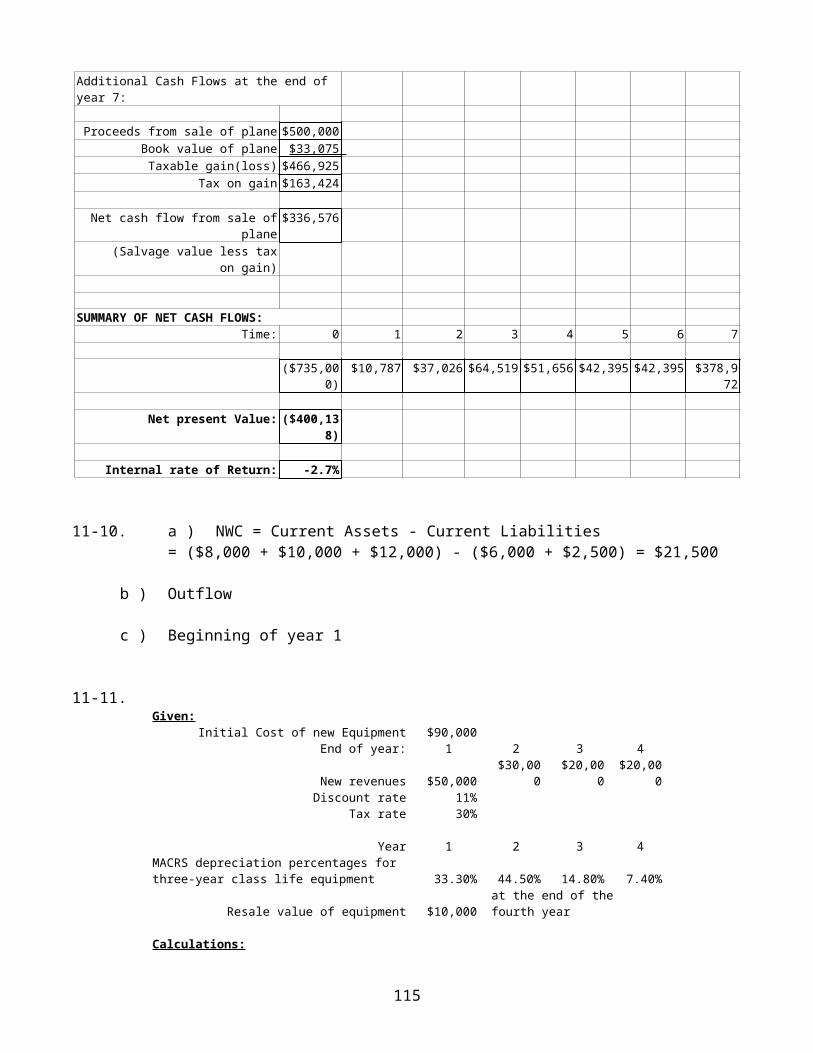
Additional Cash Flows at the end of year 7:
Proceeds from sale of plane $500,000 Book value of plane $33,075 Taxable gain(loss) $466,925
Tax on gain $163,424
Net cash flow from sale ofplane
$336,576
(Salvage value less taxon gain)
SUMMARY OF NET CASH FLOWS:Time: 0 1 2 3 4 5 6 7
($735,000)
$10,787 $37,026 $64,519 $51,656 $42,395 $42,395 $378,972
Net present Value: ($400,138)
Internal rate of Return: -2.7%
11-10. a ) NWC = Current Assets - Current Liabilities= ($8,000 + $10,000 + $12,000) - ($6,000 + $2,500) = $21,500
b ) Outflow
c ) Beginning of year 1
11-11.Given:
Initial Cost of new Equipment $90,000 End of year: 1 2 3 4
New revenues $50,000 $30,00
0 $20,00
0 $20,00
0 Discount rate 11%
Tax rate 30%
Year 1 2 3 4 MACRS depreciation percentages forthree-year class life equipment 33.30% 44.50% 14.80% 7.40%
Resale value of equipment $10,000 at the end of the fourth year
Calculations:
115
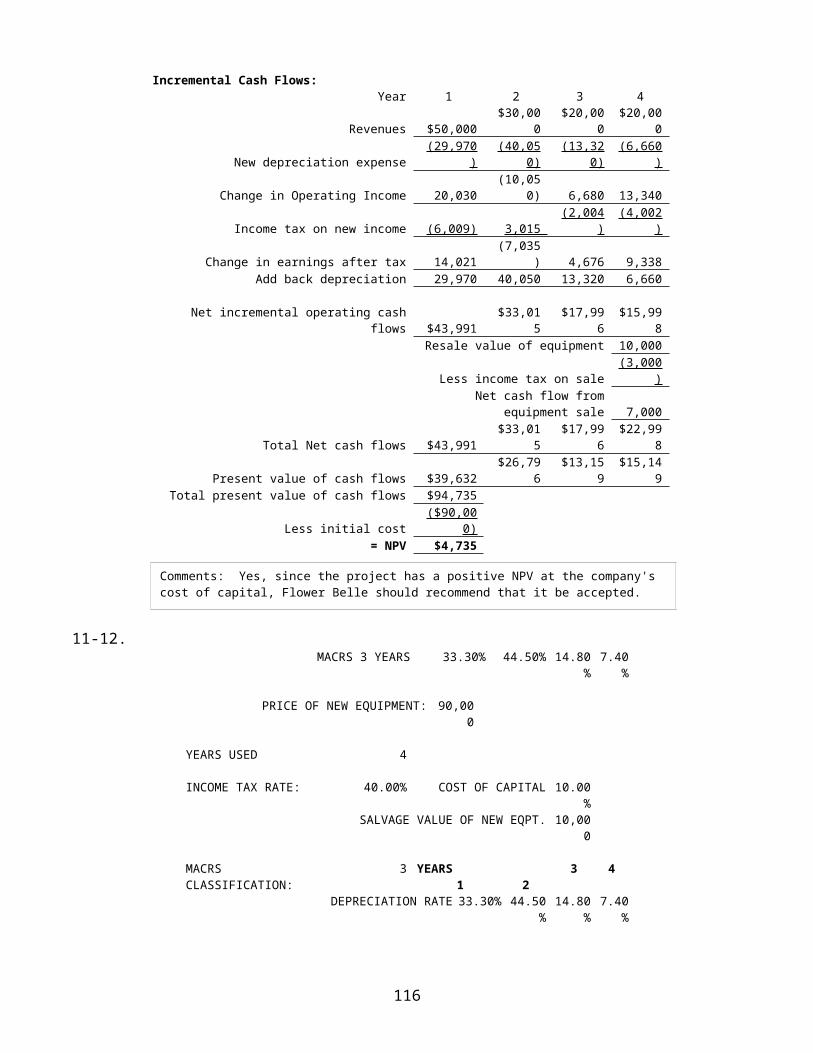
Incremental Cash Flows:Year 1 2 3 4
Revenues $50,000 $30,00
0 $20,00
0 $20,00
0
New depreciation expense(29,970
)(40,05
0)(13,32
0)(6,660
)
Change in Operating Income 20,030 (10,05
0) 6,680 13,340
Income tax on new income (6,009) 3,015 (2,004
)(4,002
)
Change in earnings after tax 14,021 (7,035
) 4,676 9,338 Add back depreciation 29,970 40,050 13,320 6,660
Net incremental operating cashflows $43,991
$33,015
$17,996
$15,998
Resale value of equipment 10,000
Less income tax on sale(3,000
)Net cash flow from
equipment sale 7,000
Total Net cash flows $43,991 $33,01
5 $17,99
6 $22,99
8
Present value of cash flows $39,632 $26,79
6 $13,15
9 $15,14
9 Total present value of cash flows $94,735
Less initial cost($90,00
0)= NPV $4,735
11-12.MACRS 3 YEARS 33.30% 44.50% 14.80
%7.40
%
PRICE OF NEW EQUIPMENT: 90,000
YEARS USED 4
INCOME TAX RATE: 40.00% COST OF CAPITAL 10.00%
SALVAGE VALUE OF NEW EQPT. 10,000
MACRSCLASSIFICATION:
3 YEARS 1
2
3 4
DEPRECIATION RATE 33.30% 44.50%
14.80%
7.40%
116
Comments: Yes, since the project has a positive NPV at the company's cost of capital, Flower Belle should recommend that it be accepted.

ACCUM. DEP. %) 100%
CASH FLOW FROM SALE OF NEW EQUIPMENT 6,000
CASH FLOW FROM SALE OF OLD EQUIPMENT
SALE PRICE 10,000 BOOK VALUE 20,000
TAXABLE GAIN (LOSS) (10,000)
TAX (REFUND) (4,000)
NET CASH FLOW 14,000
INCREMENTAL CASH FLOWYEAR 1 1 2 3 4
REVENUE STREAM 50,000 30,000 20,00
0 20,00
0 DEPRECIATION EXPENSE 29,97
0 40,050 13,32
0 6,660
CHANGE IN OPERATING INCOME 20,030 (10,05
0)6,680 13,34
0 TAX ON NEW INCOME 8,012 (4,020
)2,672 5,336
CHANGE IN EARNINGS 12,018 (6,030
)4,008 8,004
ADD BACK DEPRECIATION 29,970 40,050 13,32
0 6,660
NET INCREMENTAL OP. CASH FLOW 41,988 34,020 17,32
8 14,66
4
NET CASH FLOW0 1 2 3 4
NEW EQUIPMENT (90,000)OLD EQUIPMENT 14,000
OPERATING CF 41,988 34,020 17,32
8 14,66
4 SALVAGE VALUE
NET CASH FLOW (76,000) 41,988 34,020 17,32
8 14,66
4
DISCOUNT RATE 10.00%NPV $17,419.18
117
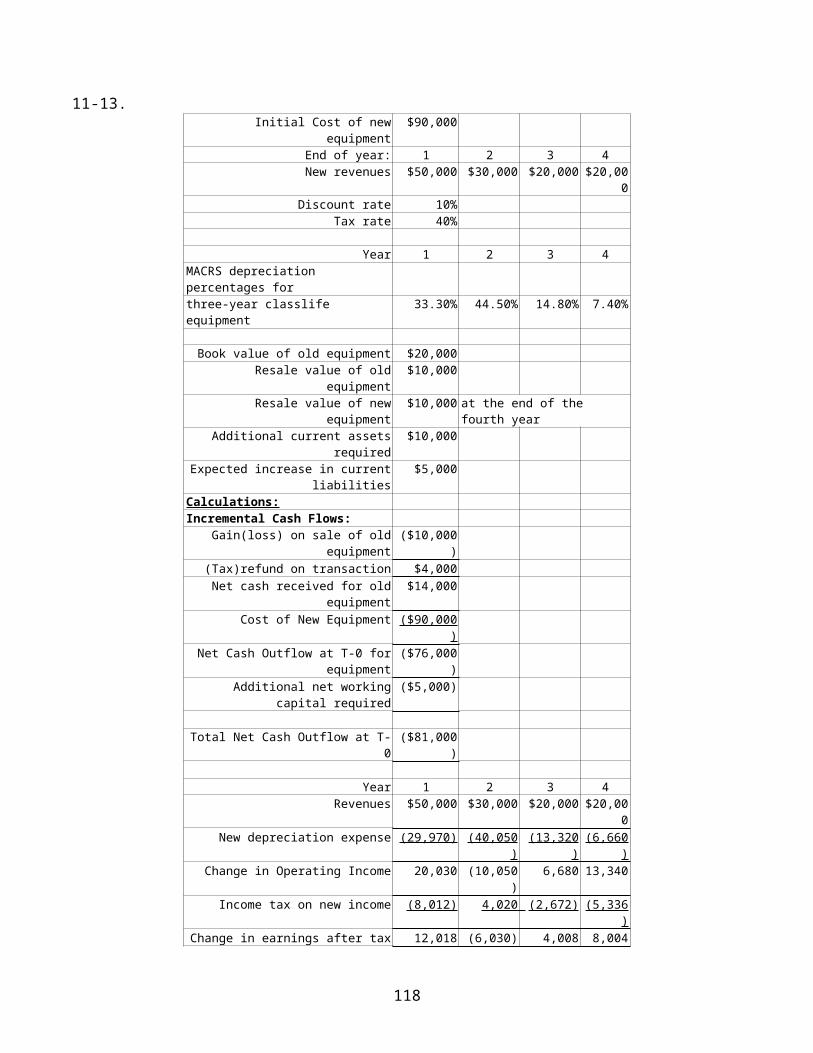
11-13. Initial Cost of new
equipment$90,000
End of year: 1 2 3 4 New revenues $50,000 $30,000 $20,000 $20,00
0 Discount rate 10%
Tax rate 40%
Year 1 2 3 4 MACRS depreciation percentages forthree-year classlife equipment
33.30% 44.50% 14.80% 7.40%
Book value of old equipment $20,000 Resale value of old
equipment$10,000
Resale value of newequipment
$10,000 at the end of the fourth year
Additional current assetsrequired
$10,000
Expected increase in currentliabilities
$5,000
Calculations:Incremental Cash Flows:
Gain(loss) on sale of oldequipment
($10,000)
(Tax)refund on transaction $4,000 Net cash received for old
equipment$14,000
Cost of New Equipment ($90,000)
Net Cash Outflow at T-0 forequipment
($76,000)
Additional net workingcapital required
($5,000)
Total Net Cash Outflow at T-0
($81,000)
Year 1 2 3 4 Revenues $50,000 $30,000 $20,000 $20,00
0 New depreciation expense (29,970) (40,050
)(13,320
)(6,660
)Change in Operating Income 20,030 (10,050
)6,680 13,340
Income tax on new income (8,012) 4,020 (2,672) (5,336)
Change in earnings after tax 12,018 (6,030) 4,008 8,004
118
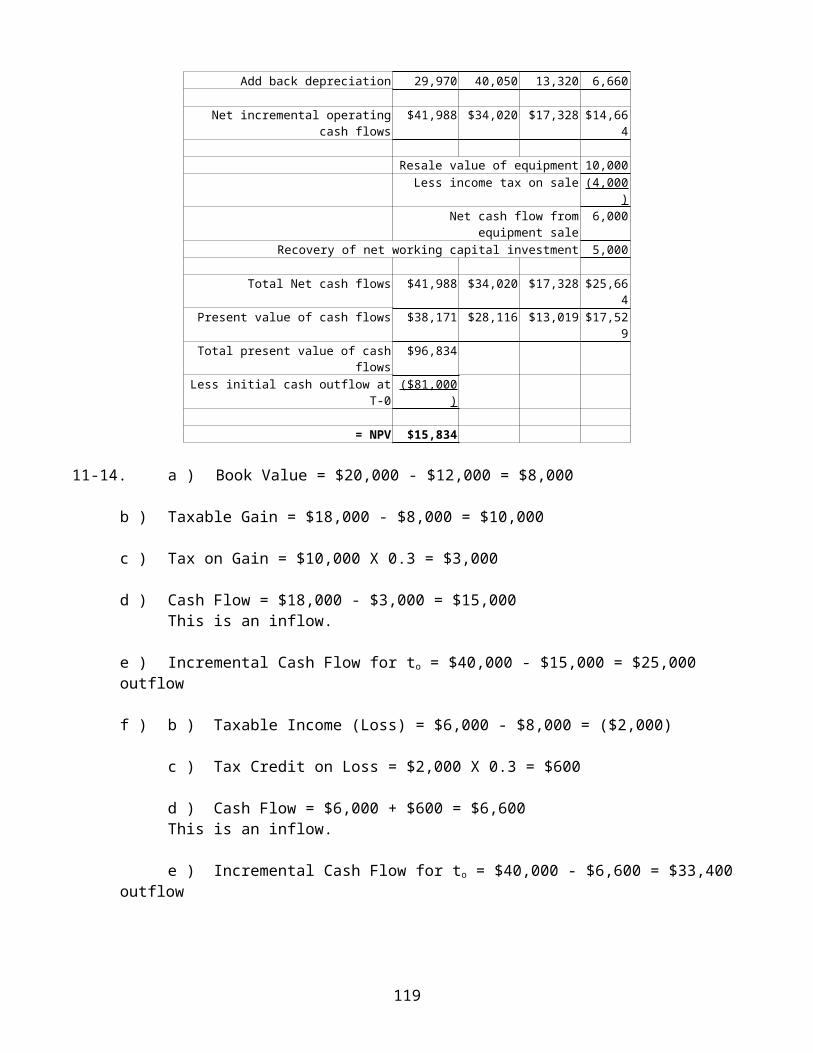
Add back depreciation 29,970 40,050 13,320 6,660
Net incremental operatingcash flows
$41,988 $34,020 $17,328 $14,664
Resale value of equipment 10,000 Less income tax on sale (4,000
)Net cash flow from
equipment sale6,000
Recovery of net working capital investment 5,000
Total Net cash flows $41,988 $34,020 $17,328 $25,664
Present value of cash flows $38,171 $28,116 $13,019 $17,529
Total present value of cashflows
$96,834
Less initial cash outflow atT-0
($81,000)
= NPV $15,834
11-14. a ) Book Value = $20,000 - $12,000 = $8,000
b ) Taxable Gain = $18,000 - $8,000 = $10,000
c ) Tax on Gain = $10,000 X 0.3 = $3,000
d ) Cash Flow = $18,000 - $3,000 = $15,000This is an inflow.
e ) Incremental Cash Flow for to = $40,000 - $15,000 = $25,000 outflow
f ) b ) Taxable Income (Loss) = $6,000 - $8,000 = ($2,000)
c ) Tax Credit on Loss = $2,000 X 0.3 = $600
d ) Cash Flow = $6,000 + $600 = $6,600This is an inflow.
e ) Incremental Cash Flow for to = $40,000 - $6,600 = $33,400 outflow
119
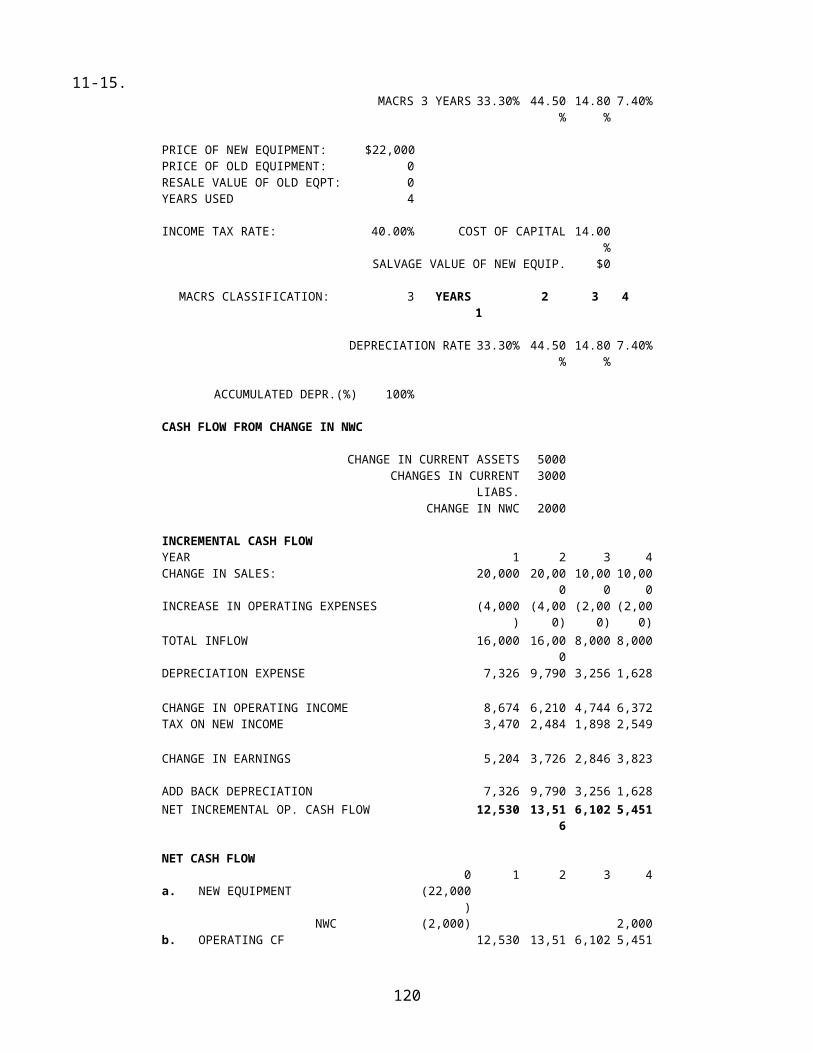
11-15.MACRS 3 YEARS 33.30% 44.50
%14.80
%7.40%
PRICE OF NEW EQUIPMENT: $22,000 PRICE OF OLD EQUIPMENT: 0 RESALE VALUE OF OLD EQPT: 0 YEARS USED 4
INCOME TAX RATE: 40.00% COST OF CAPITAL 14.00%
SALVAGE VALUE OF NEW EQUIP. $0
MACRS CLASSIFICATION: 3 YEARS 1
2 3 4
DEPRECIATION RATE 33.30% 44.50%
14.80%7.40%
ACCUMULATED DEPR.(%) 100%
CASH FLOW FROM CHANGE IN NWC
CHANGE IN CURRENT ASSETS 5000 CHANGES IN CURRENT
LIABS.3000
CHANGE IN NWC 2000
INCREMENTAL CASH FLOWYEAR 1 2 3 4 CHANGE IN SALES: 20,000 20,00
0 10,00
0 10,00
0 INCREASE IN OPERATING EXPENSES (4,000
)(4,00
0)(2,00
0)(2,00
0)TOTAL INFLOW 16,000 16,00
0 8,000 8,000
DEPRECIATION EXPENSE 7,326 9,790 3,256 1,628
CHANGE IN OPERATING INCOME 8,674 6,210 4,744 6,372 TAX ON NEW INCOME 3,470 2,484 1,898 2,549
CHANGE IN EARNINGS 5,204 3,726 2,846 3,823
ADD BACK DEPRECIATION 7,326 9,790 3,256 1,628 NET INCREMENTAL OP. CASH FLOW 12,530 13,51
6 6,102 5,451
NET CASH FLOW0 1 2 3 4
a. NEW EQUIPMENT (22,000)
NWC (2,000) 2,000 b. OPERATING CF 12,530 13,51 6,102 5,451
120
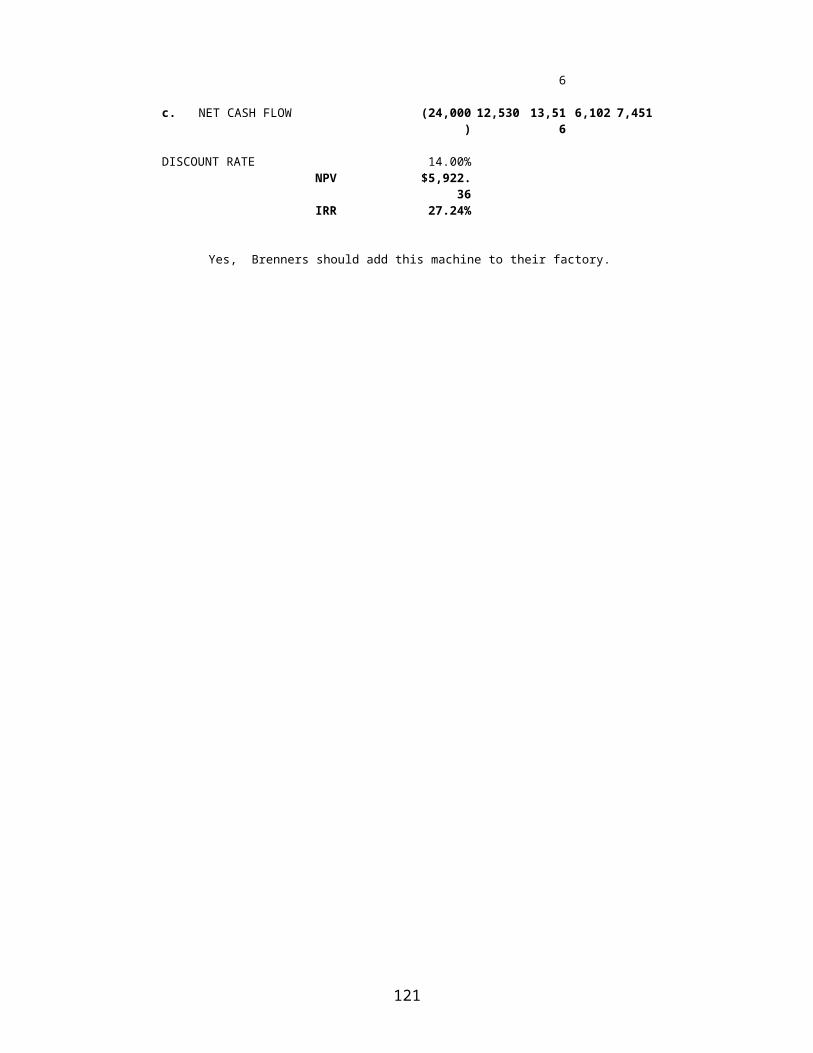
6
c. NET CASH FLOW (24,000)12,530 13,51
6 6,102 7,451
DISCOUNT RATE 14.00%NPV $5,922.
36 IRR 27.24%
Yes, Brenners should add this machine to their factory.
121
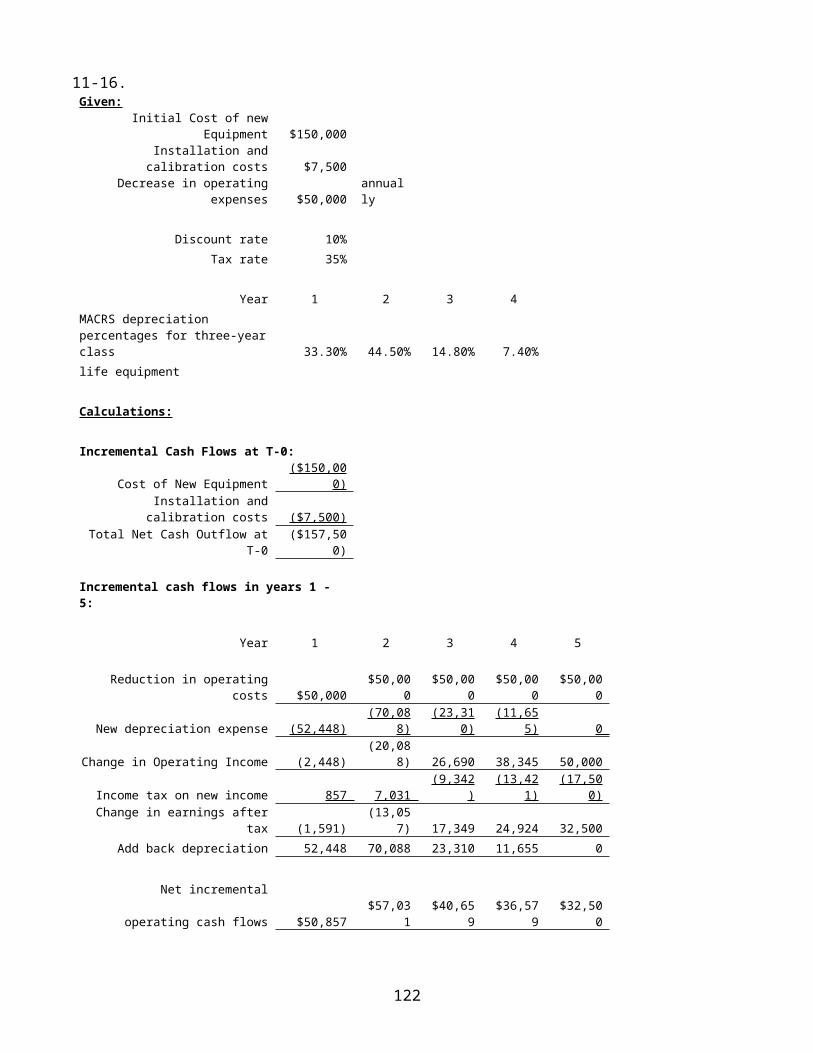
11-16.Given:
Initial Cost of newEquipment $150,000
Installation andcalibration costs $7,500
Decrease in operatingexpenses $50,000
annually
Discount rate 10%Tax rate 35%
Year 1 2 3 4 MACRS depreciationpercentages for three-yearclass 33.30% 44.50% 14.80% 7.40%life equipment
Calculations:
Incremental Cash Flows at T-0:
Cost of New Equipment($150,00
0)Installation andcalibration costs ($7,500)
Total Net Cash Outflow atT-0
($157,500)
Incremental cash flows in years 1 - 5:
Year 1 2 3 4 5
Reduction in operatingcosts $50,000
$50,000
$50,000
$50,000
$50,000
New depreciation expense (52,448)(70,08
8)(23,31
0)(11,65
5) 0
Change in Operating Income (2,448)(20,08
8) 26,690 38,345 50,000
Income tax on new income 857 7,031 (9,342
)(13,42
1)(17,50
0)Change in earnings after
tax (1,591)(13,05
7) 17,349 24,924 32,500 Add back depreciation 52,448 70,088 23,310 11,655 0
Net incremental
operating cash flows $50,857 $57,03
1 $40,65
9 $36,57
9 $32,50
0
122
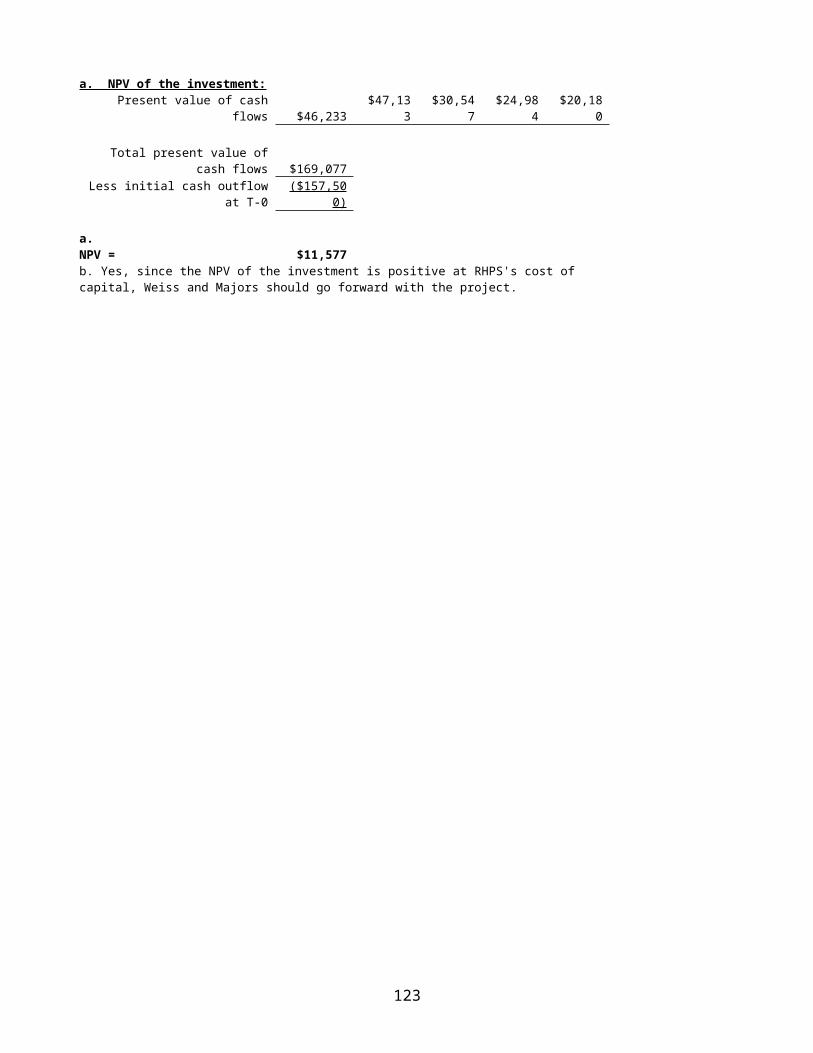
a. NPV of the investment:Present value of cash
flows $46,233 $47,13
3 $30,54
7 $24,98
4 $20,18
0
Total present value ofcash flows $169,077
Less initial cash outflowat T-0
($157,500)
a. NPV = $11,577 b. Yes, since the NPV of the investment is positive at RHPS's cost of capital, Weiss and Majors should go forward with the project.
123
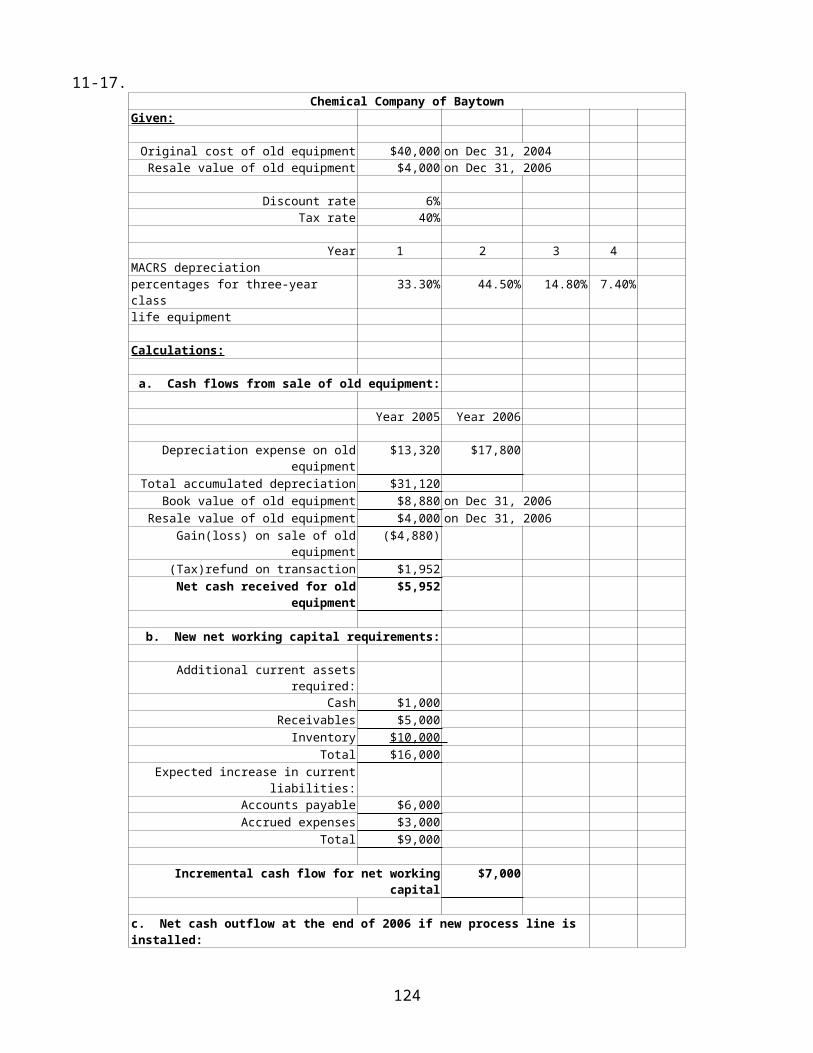
11-17.Chemical Company of Baytown
Given:
Original cost of old equipment $40,000 on Dec 31, 2004Resale value of old equipment $4,000 on Dec 31, 2006
Discount rate 6%Tax rate 40%
Year 1 2 3 4 MACRS depreciationpercentages for three-year class
33.30% 44.50% 14.80% 7.40%
life equipment
Calculations:
a. Cash flows from sale of old equipment:
Year 2005 Year 2006
Depreciation expense on oldequipment
$13,320 $17,800
Total accumulated depreciation $31,120 Book value of old equipment $8,880 on Dec 31, 2006
Resale value of old equipment $4,000 on Dec 31, 2006Gain(loss) on sale of old
equipment($4,880)
(Tax)refund on transaction $1,952 Net cash received for old
equipment$5,952
b. New net working capital requirements:
Additional current assetsrequired:
Cash $1,000 Receivables $5,000
Inventory $10,000 Total $16,000
Expected increase in currentliabilities:
Accounts payable $6,000 Accrued expenses $3,000
Total $9,000
Incremental cash flow for net workingcapital
$7,000
c. Net cash outflow at the end of 2006 if new process line is installed:
124
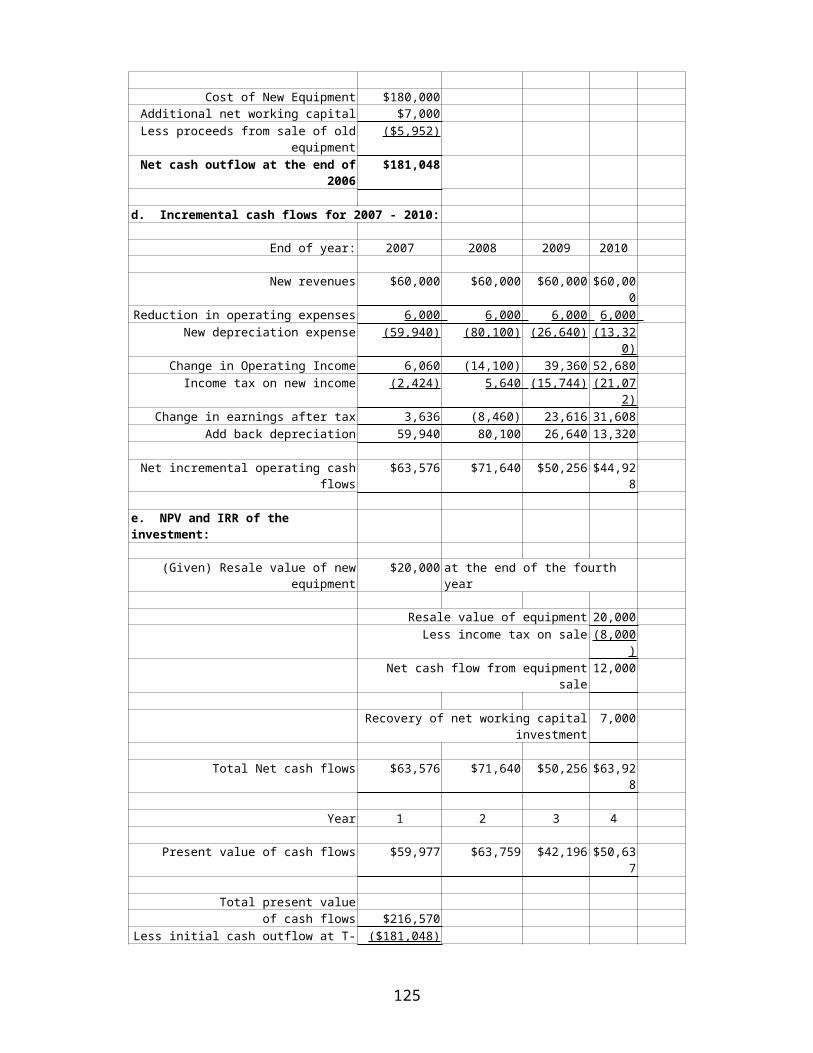
Cost of New Equipment $180,000 Additional net working capital $7,000 Less proceeds from sale of old
equipment($5,952)
Net cash outflow at the end of2006
$181,048
d. Incremental cash flows for 2007 - 2010:
End of year: 2007 2008 2009 2010
New revenues $60,000 $60,000 $60,000 $60,000
Reduction in operating expenses 6,000 6,000 6,000 6,000 New depreciation expense (59,940) (80,100) (26,640) (13,32
0)Change in Operating Income 6,060 (14,100) 39,360 52,680
Income tax on new income (2,424) 5,640 (15,744) (21,072)
Change in earnings after tax 3,636 (8,460) 23,616 31,608 Add back depreciation 59,940 80,100 26,640 13,320
Net incremental operating cashflows
$63,576 $71,640 $50,256 $44,928
e. NPV and IRR of the investment:
(Given) Resale value of newequipment
$20,000 at the end of the fourth year
Resale value of equipment 20,000 Less income tax on sale (8,000
)Net cash flow from equipment
sale12,000
Recovery of net working capitalinvestment
7,000
Total Net cash flows $63,576 $71,640 $50,256 $63,928
Year 1 2 3 4
Present value of cash flows $59,977 $63,759 $42,196 $50,637
Total present valueof cash flows $216,570
Less initial cash outflow at T- ($181,048)
125
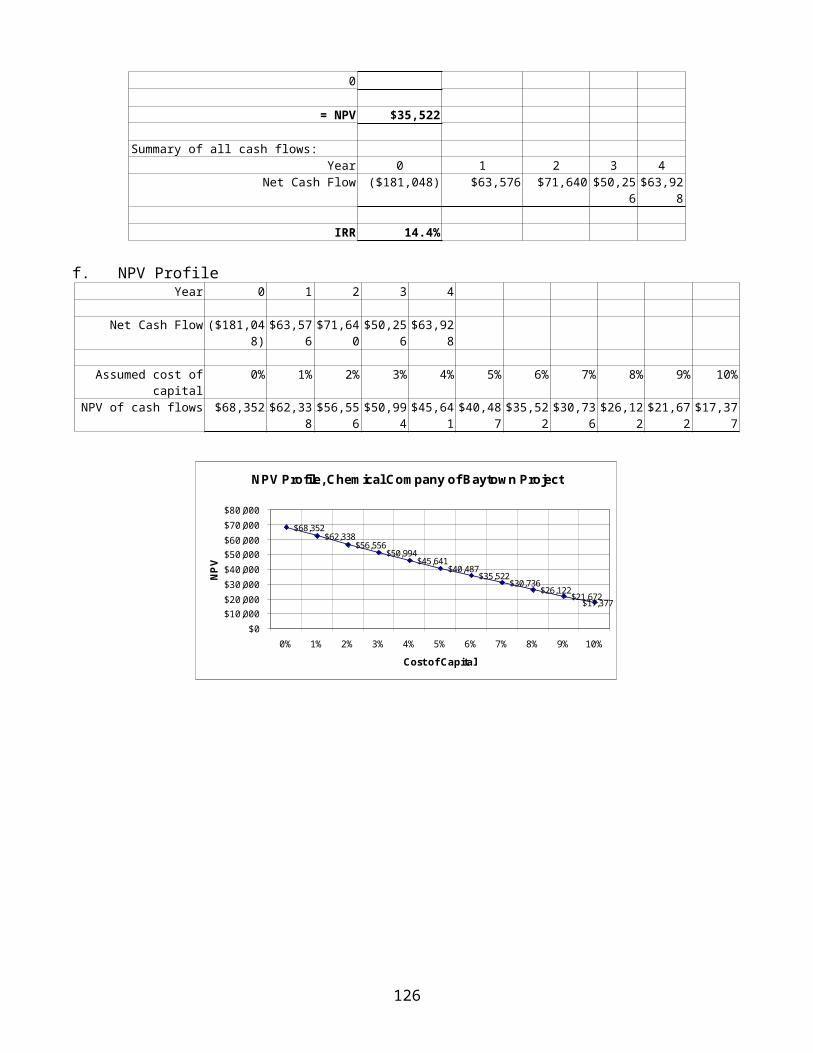
0
= NPV $35,522
Summary of all cash flows:Year 0 1 2 3 4
Net Cash Flow ($181,048) $63,576 $71,640 $50,256 $63,92
8
IRR 14.4%
f. NPV ProfileYear 0 1 2 3 4
Net Cash Flow ($181,048)
$63,576 $71,64
0 $50,25
6 $63,92
8
Assumed cost ofcapital
0% 1% 2% 3% 4% 5% 6% 7% 8% 9% 10%
NPV of cash flows $68,352 $62,338 $56,55
6 $50,99
4 $45,64
1 $40,48
7 $35,52
2 $30,73
6 $26,12
2 $21,67
2 $17,37
7
126
NPV Profile, Chem ical Com pany of Baytow n Project
$68,352$62,338
$56,556$50,994
$45,641$40,487$35,522
$30,736$26,122$21,672$17,377
$0$10,000$20,000$30,000$40,000$50,000$60,000$70,000$80,000
0% 1% 2% 3% 4% 5% 6% 7% 8% 9% 10%Cost of Capital
NPV
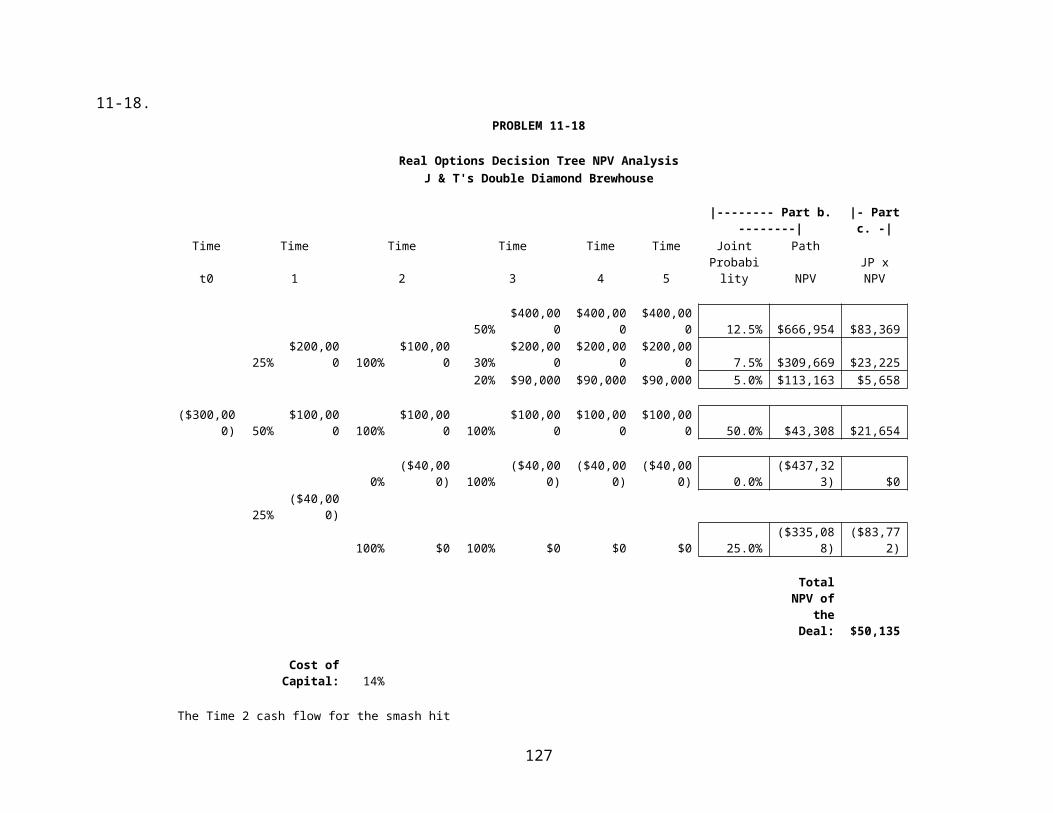
11-18.PROBLEM 11-18
Real Options Decision Tree NPV AnalysisJ & T's Double Diamond Brewhouse
|-------- Part b.--------|
|- Partc. -|
Time Time Time Time Time Time Joint Path
t0 1 2 3 4 5Probability NPV
JP xNPV
50%$400,00
0 $400,00
0 $400,00
0 12.5% $666,954 $83,369
25%$200,00
0 100%$100,00
0 30%$200,00
0 $200,00
0 $200,00
0 7.5% $309,669 $23,225 20% $90,000 $90,000 $90,000 5.0% $113,163 $5,658
($300,000) 50%
$100,000 100%
$100,000 100%
$100,000
$100,000
$100,000 50.0% $43,308 $21,654
0%($40,00
0) 100%($40,00
0)($40,00
0)($40,00
0) 0.0%($437,32
3) $0
25%($40,00
0)
100% $0 100% $0 $0 $0 25.0%($335,08
8)($83,77
2)
TotalNPV of
theDeal: $50,135
Cost ofCapital: 14%
The Time 2 cash flow for the smash hit
127
scenariois $200,000 from operations minus $100,000for the expansion.
128
Chapter 12 Solutions
Answers to Review Questions
1. Describe the general pattern of cash flows from a bond with a positive coupon rate.
Cash flows from a bond with a positive coupon rate consist of periodic interest payments and the face value payment at maturity. Coupon interest payments occur at regular intervals throughout the life of the bond. The face value payment occurs on the maturity date.
2. How does the market determine the fair value of a bond?
The fair value of a bond is the present value of the bond's coupon interest payments plus the present value of the face value payment at maturity, discounted at the market’s required rate of return forthe bond in question. Equation 9-1 in the text is use to solve forthe fair (present) value of a bond.
3. What is the relationship between a bond's market price and its promised yield to maturity? Explain.
A bond's market price depends on its yield to maturity (YTM). Whena bond has a YTM greater than its coupon rate, it sells at a discount from its face value. When the YTM is equal to the coupon rate, the market price equals the face value. When the YTM is lessthan the coupon rate, the bond sells at a premium over face value.
4. All other things held constant, how would the market price of a bond be affected if coupon interest payments were made semiannuallyinstead of annually?
Most bonds issued in the United States pay interest semiannually (twice per year). With semiannual interest payments, we must
129
adjust the bond valuation model (Equation 9-1 in the text) by multiplying n, the number of years to maturity, by two, and dividing k, the annual interest rate, by two.
5. What is the usual pattern of cash flows for a share of preferred stock? How does the market determine the value of a share of preferred stock, given these promised cash flows?
Preferred stock has no maturity date, so it has no maturity value. Its future cash payments are dividend payments that are paid to preferred stockholders at regular time intervals for as long as they (or their heirs) own the stock. Cash payments from preferred stock dividends are scheduled to continue forever. To value preferred stock, we adapt the discounted cash flow model to reflectthat preferred stock dividends are a perpetuity. See Equation 9-4 in the text.
6. Name two patterns of cash flows for a share of common stock. How does the market determine the value of the most common cash flow pattern for common stock?
Cash flows for a share of common stock consist of dividend paymentsand the price received for the eventual sale of the share. Common stock valuation is complicated by the fact that common stock dividends are difficult to predict compared to the interest and principal payments on a bond, or dividends on preferred stock. Indeed, corporations may pay common stock dividends irregularly, ornot pay dividends at all.
As with bonds and preferred stock, the market values common stock by estimating the present value of the expected future cash flows from the common stock. See Equation 9-6 in the text.
7. Define the P/E valuation method. Under what circumstances should a stock be valued using this method?
The P/E ratio indicates how much investors are willing to pay for each dollar of a stock's earnings. A high P/E ratio indicates that
130
investors believe the stock's earnings will increase, or that the risk of the stock is low, or both.
Financial analysts often use a P/E model to estimate common stock value for businesses that are not public. First, analysts compare the P/E ratios of similar companies within an industry to determinean appropriate P/E ratio for companies in that industry. Second, analysts calculate an appropriate stock price for firms in the industry by multiplying each firm's earnings per share (EPS) by theindustry average P/E ratio. See Equation 9-9 in the text.
8. Compare and contrast the book value and liquidation value per sharefor common stock. Is one method more reliable? Explain.
The Book Value of a firm's common stock is found by subtracting thevalue of the firm's liabilities, and preferred stock, if any, as recorded on the balance sheet, from the value of its assets. The result is the book value or net worth of the company's common stock. To find the book value per share of common stock, divide the company's book value by the number of outstanding common stock shares. See Equation 9-10 in the text.
The liquidation value and book value valuation methods are similar,except that the liquidation method uses the market values of the assets and liabilities, not book values. The market values of the assets are the amounts the assets would earn on the open market if they were sold (or liquidated). The market values of the liabilities are the amounts of money it would take to pay off the liabilities.
Since it is based on market values, the liquidation value method ismore reliable than the book value method. However, liquidation value is a worst-case valuation assessment. A company's common stock should be worth at least the amount generated per share at liquidation.
9. Answer the following questions about the discounted free cash flow model illustrated in Figure 12-4:
a. What are “free cash flows?”
131
Free cash flows represent the total cash flows from business operations that are available to be distributed to the suppliers ofa firm’s capital each year either in the form of interest to the debt holders, or dividends to the stockholders.
b. Explain the terminal value calculation at the end of the forecastperiod. Why is it necessary?
The firm whose business operation is being valued is not expected to suddenly cease operating at the end of the discrete forecasting period, but to continue operating indefinitely into the future as agoing concern. The terminal value calculation estimates the valuesof the cash flows that occur in the year following the discrete forecasting period and beyond.
c. Explain the term “present value of the firm’s operations” (alsoknown as Enterprise Value). What does this number represent?
The present value of the company’s free cash flows represents the market value of the firm’s core income producing operations. In the world of finance and investing this is sometimes called the firm’s Enterprise Value. It is not the total market value of the entire company, however, or the total market value of the company’sassets, because the current, or non-operating assets of the companyhave not yet been accounted for.
d. Explain the adjustments necessary to translate enterprise value tothe total present value of common equity.
To obtain the value of the company’s common stock, add the value ofthe firm’s current assets to the enterprise value (this producesthe value of the firm’s total assets). Next, subtract the valuesof current liabilities, long-term debt, and preferred stock. Theresult is the present value of common equity.
10. Explain the difference between the discounted free cash flow model as it is applied to the valuation of common equity and as it is applied to the valuation of complete businesses.
132
The Free Cash Flow Model values the complete business as a part ofthe procedure to value common equity. The value of a completebusiness is the sum of the values of the operating, or income-producing assets, plus the value of the non-operating, or currentassets. All that is necessary to use the Free Cash Flow Model tovalue a complete business, then, is to add the value of thecompany’s operations to the value of the company’s current assets.
11. Why is the replacement value of assets method not generally used to value complete businesses?
The replacement value of assets method is not often applied to complete business valuations because it is frequently very difficult to locate similar assets for sale on the open market, andbecause some of a business’s assets are difficult to define and quantify.
Answers to End-of-Chapter Problems
12-1. a ) $1,000 X .06 = $60b ) $60 X [(1-1/1.0810)/.08] + $1,000 X [1/1.0810] = $865.80c ) Yes.
12-2. a ) $1,000 X .12 = $120b ) $120 X [(1-1/1.0815)/.08] + $1,000 X [1/1.0815] =
$1,342.38c ) $60 X [(1-1/1.0430)/.04] + $1,000 X [1/1.0430] = $1,345.84
12-3. 3 X $2,000 = $6,000
12-4. Semi-annual interest payment = .10 X $1,000 X 6/12 = $50Price = $50 X [(1-1/1.0410)/.04] + $1,000 X [1/1.0410] = $1,081.11
133
12-5.Since $1,100 > $1,000, YTM < Coupon Rate; YTM < 9%$90 * [1-1/ (1 + k)10/k] + $1,000 * (1/1 + k10) = $1,100k = 7.54%
12-6. a ) Since, $1,125 > $1,000, YTM < Coupon Rate YTM < 12%b ) $120 X [(1-1/1.1010)/.10] + $1,000 X [1/1.1010] = $1,122.89; YTM 10%c ) YTM = 12%; YTM = Coupon Rate if Market Price = Par
12-7. Since $872 < $1,000, k > 7%$70 X [(1-1/(1+k)10/k] + $1,000 X [1/(1+k)10] = $872If k=8%, VB = $932.90If k=9%, VB = $871.65. So, k 9%.
12-8. $10/0.12 = $83.33 per share
12-9. kP = $1.75 /$ 20 = 0.0875 or 8.75%
12-10. a ) VP = $8/0.13 = $61.54 per shareb ) kP = $8/$50 = 16 %
12-11. a ) $4/(.16-.01) = $26.67b) $4/$26.67 = 15%
12-12. $2/$15 + .04 = 17.33%
12-13. a ) P0 = $8/(.14 - .03) = $72.72b ) ks = $8/$65 + .03 = 15.31%
12-14. $90 * [1-1/ (1.12)5/0.12] + $1,000 * (1/1.125) = $891.86
134

12-15. $35 * [1-1/ (1.055)20/0.055] + $1,000 * (1/1.05520) = $761
12-16. $80/ (1 + 0.23)1 = $65.04 $150/ (1 + 0.23)2 = $99.15 $1,500/ (1 + 0.23)3 = $806.08 $65.04 + $99.15 + $806.08 = $970.27
12-17. $3.00/0.12 = $25.00
12-18. $2.20/(0.18 - 0.09) = $2.20/0.09 = $24.44
12-19. D6 = $1.22 (1+ 0.10) = $1.342 $1.342/ (0.12 – 0.10) = $67.10
$0.70 / (1+0.12)1 + $0.83 / (1+0.12)2 + $0.96 / (1+0.12)3 + $1.09 / (1+0.12)4 + $1.22 / (1+0.12)5 + $67.10 / (1+.12)6
0.625 + 0.66167 + 0.6833 + 0.6927 + 0.6923 + $33.99=$37.34
12-20. D1 = 3.82(1 + 0.07) = 4.09 k = 4.09/82 + 0.07 k = .1199 = 11.99%
12-21. $85 * [1-1/ (1 + k)10/k] + $1,000 * (1/1 + k10) = $1,250 k = 5.23%
12-22. $2,100,000 / (0.18 – 0.09) = $23,333,333.33
12-23. Find the present values of cash flows for each year. Add themtogether to get the present value of the firm.
Year 1 = $1,231,920,000 * [1/ (1 + 0.12)1] = $1,099,928,571Year 2 = $1,453,665,600 * [1/ (1 + 0.12)2] = $1,158,853,316Year 3 = $1,686,252,096 * [1/ (1 + 0.12)3] = $1,200,240,935Year 4 = $1,922,327,389 * [1/ (1 + 0.12)4] = $1,221,673,808
135
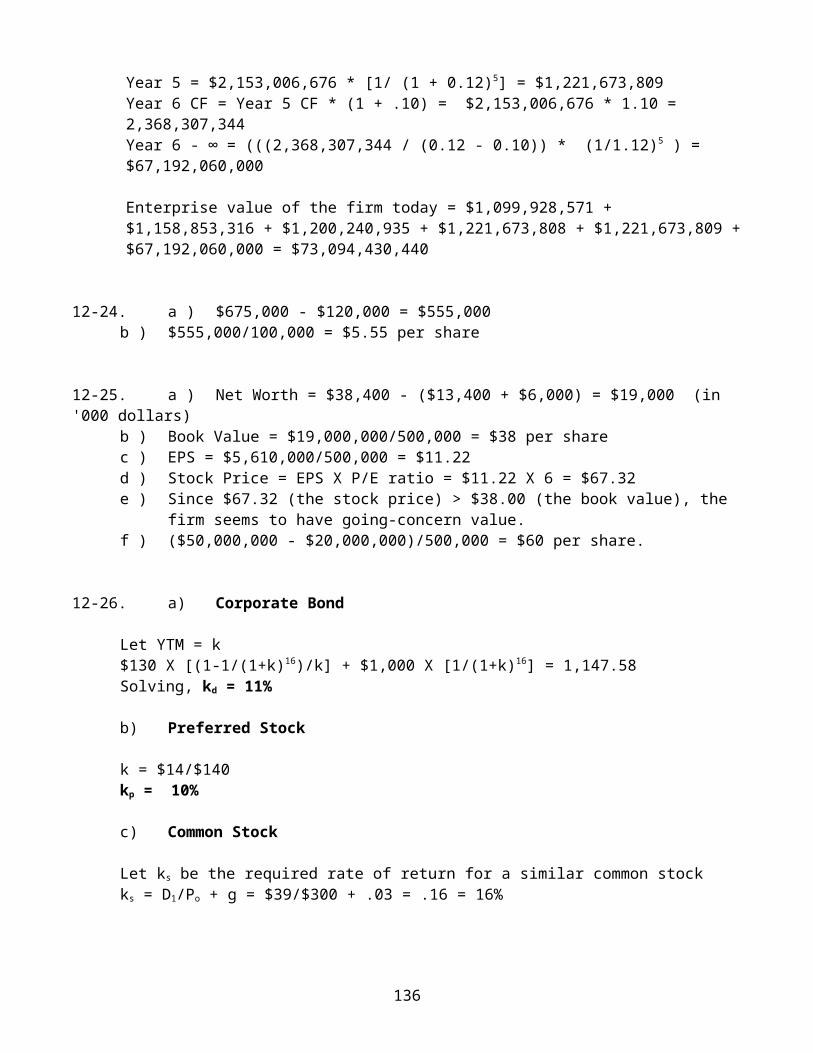
Year 5 = $2,153,006,676 * [1/ (1 + 0.12)5] = $1,221,673,809Year 6 CF = Year 5 CF * (1 + .10) = $2,153,006,676 * 1.10 = 2,368,307,344Year 6 - ∞ = (((2,368,307,344 / (0.12 - 0.10)) * (1/1.12)5 ) = $67,192,060,000
Enterprise value of the firm today = $1,099,928,571 + $1,158,853,316 + $1,200,240,935 + $1,221,673,808 + $1,221,673,809 +$67,192,060,000 = $73,094,430,440
12-24. a ) $675,000 - $120,000 = $555,000b ) $555,000/100,000 = $5.55 per share
12-25. a ) Net Worth = $38,400 - ($13,400 + $6,000) = $19,000 (in '000 dollars)
b ) Book Value = $19,000,000/500,000 = $38 per share c ) EPS = $5,610,000/500,000 = $11.22
d ) Stock Price = EPS X P/E ratio = $11.22 X 6 = $67.32e ) Since $67.32 (the stock price) > $38.00 (the book value), the
firm seems to have going-concern value.f ) ($50,000,000 - $20,000,000)/500,000 = $60 per share.
12-26. a) Corporate Bond
Let YTM = k$130 X [(1-1/(1+k)16)/k] + $1,000 X [1/(1+k)16] = 1,147.58Solving, kd = 11%
b) Preferred Stock
k = $14/$140 kp = 10%
c) Common Stock
Let ks be the required rate of return for a similar common stockks = D1/Po + g = $39/$300 + .03 = .16 = 16%
136
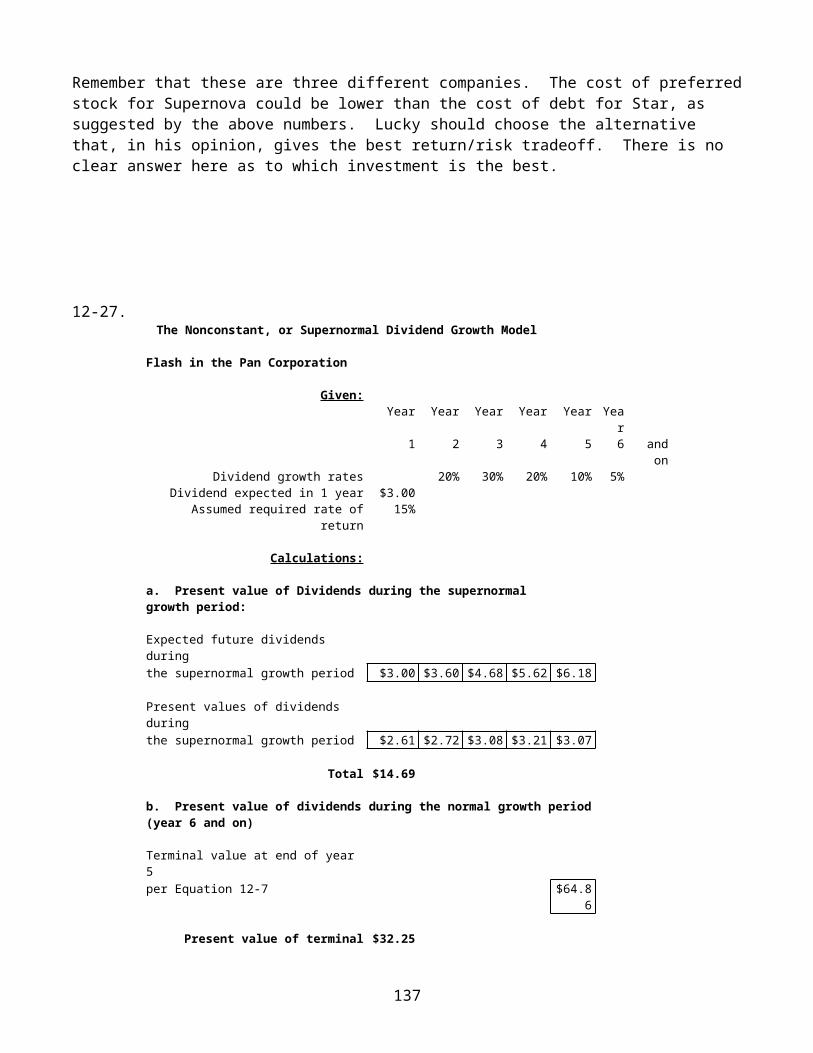
Remember that these are three different companies. The cost of preferredstock for Supernova could be lower than the cost of debt for Star, as suggested by the above numbers. Lucky should choose the alternative that, in his opinion, gives the best return/risk tradeoff. There is no clear answer here as to which investment is the best.
12-27.The Nonconstant, or Supernormal Dividend Growth Model
Flash in the Pan Corporation
Given:Year Year Year Year Year Yea
r1 2 3 4 5 6 and
onDividend growth rates 20% 30% 20% 10% 5%
Dividend expected in 1 year $3.00 Assumed required rate of
return15%
Calculations:
a. Present value of Dividends during the supernormal growth period:
Expected future dividends duringthe supernormal growth period $3.00 $3.60 $4.68 $5.62 $6.18
Present values of dividends duringthe supernormal growth period $2.61 $2.72 $3.08 $3.21 $3.07
Total $14.69
b. Present value of dividends during the normal growth period(year 6 and on)
Terminal value at end of year 5per Equation 12-7 $64.8
6
Present value of terminal $32.25
137

value
c. Total present value per share of Flash in the Pan Corp. stock
$46.94
138
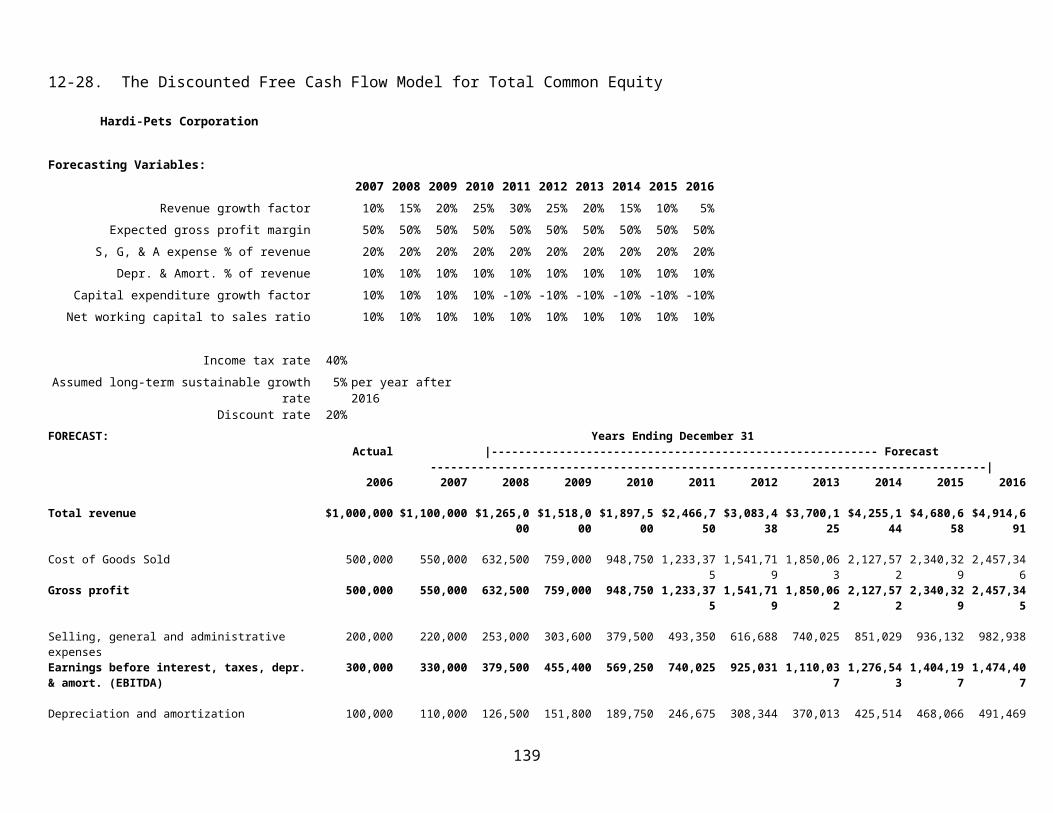
12-28. The Discounted Free Cash Flow Model for Total Common Equity
Hardi-Pets Corporation
Forecasting Variables:2007 2008 2009 2010 2011 2012 2013 2014 2015 2016
Revenue growth factor 10% 15% 20% 25% 30% 25% 20% 15% 10% 5%Expected gross profit margin 50% 50% 50% 50% 50% 50% 50% 50% 50% 50%
S, G, & A expense % of revenue 20% 20% 20% 20% 20% 20% 20% 20% 20% 20%Depr. & Amort. % of revenue 10% 10% 10% 10% 10% 10% 10% 10% 10% 10%
Capital expenditure growth factor 10% 10% 10% 10% -10% -10% -10% -10% -10% -10%Net working capital to sales ratio 10% 10% 10% 10% 10% 10% 10% 10% 10% 10%
Income tax rate 40%Assumed long-term sustainable growth
rate5% per year after
2016Discount rate 20%
FORECAST: Years Ending December 31Actual |--------------------------------------------------------- Forecast
----------------------------------------------------------------------------------|2006 2007 2008 2009 2010 2011 2012 2013 2014 2015 2016
Total revenue $1,000,000 $1,100,000 $1,265,000
$1,518,000
$1,897,500
$2,466,750
$3,083,438
$3,700,125
$4,255,144
$4,680,658
$4,914,691
Cost of Goods Sold 500,000 550,000 632,500 759,000 948,750 1,233,375
1,541,719
1,850,063
2,127,572
2,340,329
2,457,346
Gross profit 500,000 550,000 632,500 759,000 948,750 1,233,375
1,541,719
1,850,062
2,127,572
2,340,329
2,457,345
Selling, general and administrative expenses
200,000 220,000 253,000 303,600 379,500 493,350 616,688 740,025 851,029 936,132 982,938
Earnings before interest, taxes, depr. & amort. (EBITDA)
300,000 330,000 379,500 455,400 569,250 740,025 925,031 1,110,037
1,276,543
1,404,197
1,474,407
Depreciation and amortization 100,000 110,000 126,500 151,800 189,750 246,675 308,344 370,013 425,514 468,066 491,469
139
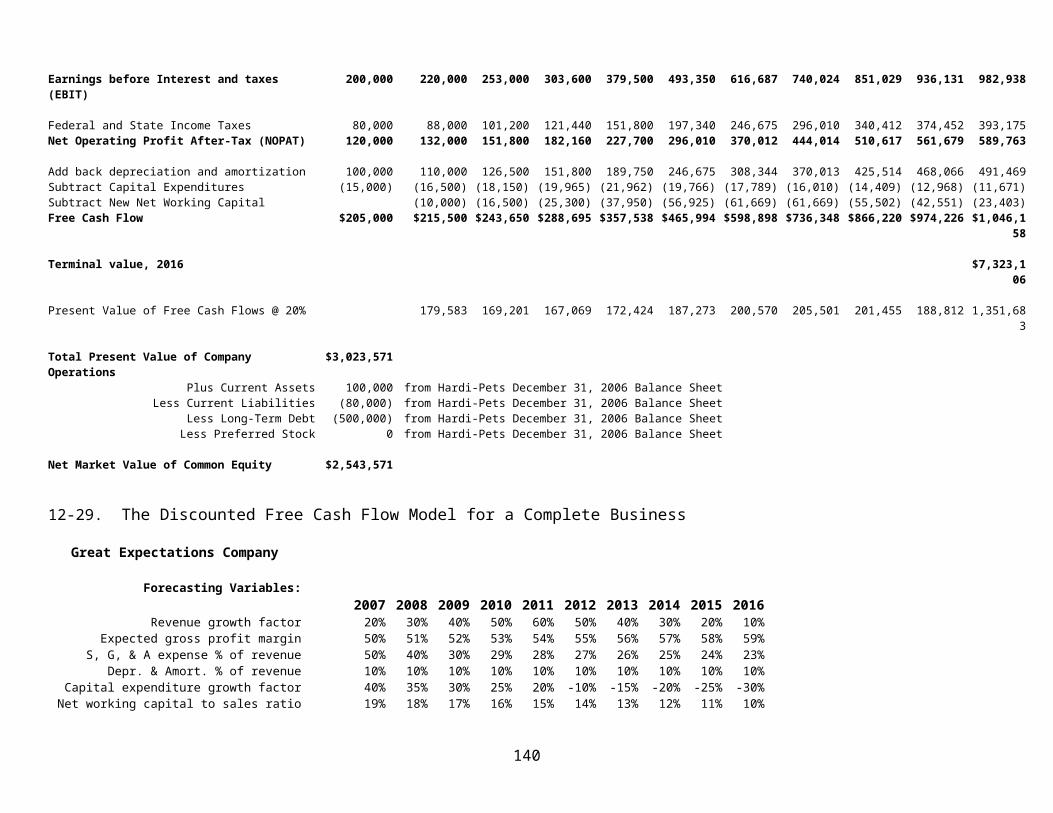
Earnings before Interest and taxes (EBIT)
200,000 220,000 253,000 303,600 379,500 493,350 616,687 740,024 851,029 936,131 982,938
Federal and State Income Taxes 80,000 88,000 101,200 121,440 151,800 197,340 246,675 296,010 340,412 374,452 393,175 Net Operating Profit After-Tax (NOPAT) 120,000 132,000 151,800 182,160 227,700 296,010 370,012 444,014 510,617 561,679 589,763
Add back depreciation and amortization 100,000 110,000 126,500 151,800 189,750 246,675 308,344 370,013 425,514 468,066 491,469 Subtract Capital Expenditures (15,000) (16,500) (18,150) (19,965) (21,962) (19,766) (17,789) (16,010) (14,409) (12,968) (11,671)Subtract New Net Working Capital (10,000) (16,500) (25,300) (37,950) (56,925) (61,669) (61,669) (55,502) (42,551) (23,403)Free Cash Flow $205,000 $215,500 $243,650 $288,695 $357,538 $465,994 $598,898 $736,348 $866,220 $974,226 $1,046,1
58
Terminal value, 2016 $7,323,106
Present Value of Free Cash Flows @ 20% 179,583 169,201 167,069 172,424 187,273 200,570 205,501 201,455 188,812 1,351,683
Total Present Value of Company Operations
$3,023,571
Plus Current Assets 100,000 from Hardi-Pets December 31, 2006 Balance SheetLess Current Liabilities (80,000) from Hardi-Pets December 31, 2006 Balance Sheet
Less Long-Term Debt (500,000) from Hardi-Pets December 31, 2006 Balance SheetLess Preferred Stock 0 from Hardi-Pets December 31, 2006 Balance Sheet
Net Market Value of Common Equity $2,543,571
12-29. The Discounted Free Cash Flow Model for a Complete Business
Great Expectations Company
Forecasting Variables:2007 2008 2009 2010 2011 2012 2013 2014 2015 2016
Revenue growth factor 20% 30% 40% 50% 60% 50% 40% 30% 20% 10%Expected gross profit margin 50% 51% 52% 53% 54% 55% 56% 57% 58% 59%
S, G, & A expense % of revenue 50% 40% 30% 29% 28% 27% 26% 25% 24% 23%Depr. & Amort. % of revenue 10% 10% 10% 10% 10% 10% 10% 10% 10% 10%
Capital expenditure growth factor 40% 35% 30% 25% 20% -10% -15% -20% -25% -30%Net working capital to sales ratio 19% 18% 17% 16% 15% 14% 13% 12% 11% 10%
140
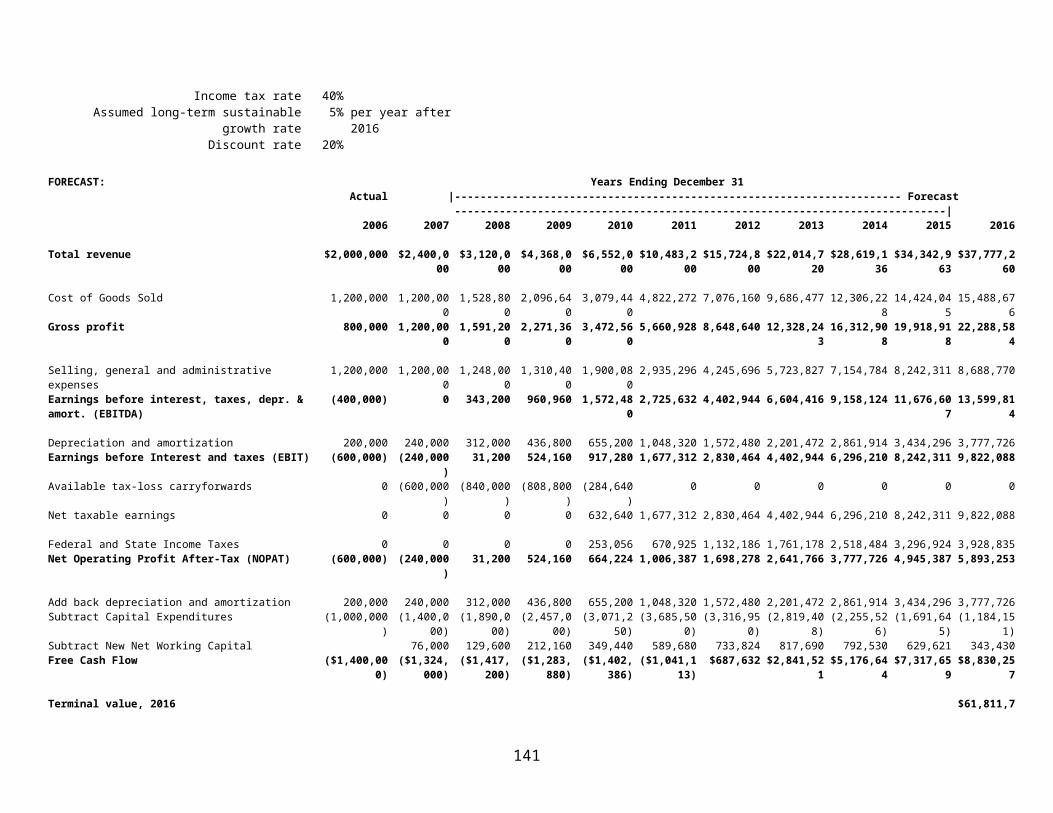
Income tax rate 40%Assumed long-term sustainable
growth rate5% per year after
2016Discount rate 20%
FORECAST: Years Ending December 31Actual |---------------------------------------------------------------------- Forecast
-----------------------------------------------------------------------------|2006 2007 2008 2009 2010 2011 2012 2013 2014 2015 2016
Total revenue $2,000,000 $2,400,000
$3,120,000
$4,368,000
$6,552,000
$10,483,200
$15,724,800
$22,014,720
$28,619,136
$34,342,963
$37,777,260
Cost of Goods Sold 1,200,000 1,200,000
1,528,800
2,096,640
3,079,440 4,822,272 7,076,160 9,686,477 12,306,22
8 14,424,04
5 15,488,67
6 Gross profit 800,000 1,200,00
0 1,591,20
0 2,271,36
0 3,472,56
0 5,660,928 8,648,640 12,328,24
3 16,312,90
8 19,918,91
8 22,288,58
4
Selling, general and administrative expenses
1,200,000 1,200,000
1,248,000
1,310,400
1,900,080 2,935,296 4,245,696 5,723,827 7,154,784 8,242,311 8,688,770
Earnings before interest, taxes, depr. & amort. (EBITDA)
(400,000) 0 343,200 960,960 1,572,480 2,725,632 4,402,944 6,604,416 9,158,124 11,676,60
7 13,599,81
4
Depreciation and amortization 200,000 240,000 312,000 436,800 655,200 1,048,320 1,572,480 2,201,472 2,861,914 3,434,296 3,777,726 Earnings before Interest and taxes (EBIT) (600,000) (240,000
)31,200 524,160 917,280 1,677,312 2,830,464 4,402,944 6,296,210 8,242,311 9,822,088
Available tax-loss carryforwards 0 (600,000)
(840,000)
(808,800)
(284,640)
0 0 0 0 0 0
Net taxable earnings 0 0 0 0 632,640 1,677,312 2,830,464 4,402,944 6,296,210 8,242,311 9,822,088
Federal and State Income Taxes 0 0 0 0 253,056 670,925 1,132,186 1,761,178 2,518,484 3,296,924 3,928,835 Net Operating Profit After-Tax (NOPAT) (600,000) (240,000
)31,200 524,160 664,224 1,006,387 1,698,278 2,641,766 3,777,726 4,945,387 5,893,253
Add back depreciation and amortization 200,000 240,000 312,000 436,800 655,200 1,048,320 1,572,480 2,201,472 2,861,914 3,434,296 3,777,726 Subtract Capital Expenditures (1,000,000
)(1,400,0
00)(1,890,0
00)(2,457,0
00)(3,071,2
50)(3,685,50
0)(3,316,95
0)(2,819,40
8)(2,255,52
6)(1,691,64
5)(1,184,15
1)Subtract New Net Working Capital 76,000 129,600 212,160 349,440 589,680 733,824 817,690 792,530 629,621 343,430 Free Cash Flow ($1,400,00
0)($1,324,
000)($1,417,
200)($1,283,
880)($1,402,
386)($1,041,1
13)$687,632 $2,841,52
1 $5,176,64
4 $7,317,65
9 $8,830,25
7
Terminal value, 2016 $61,811,7
141
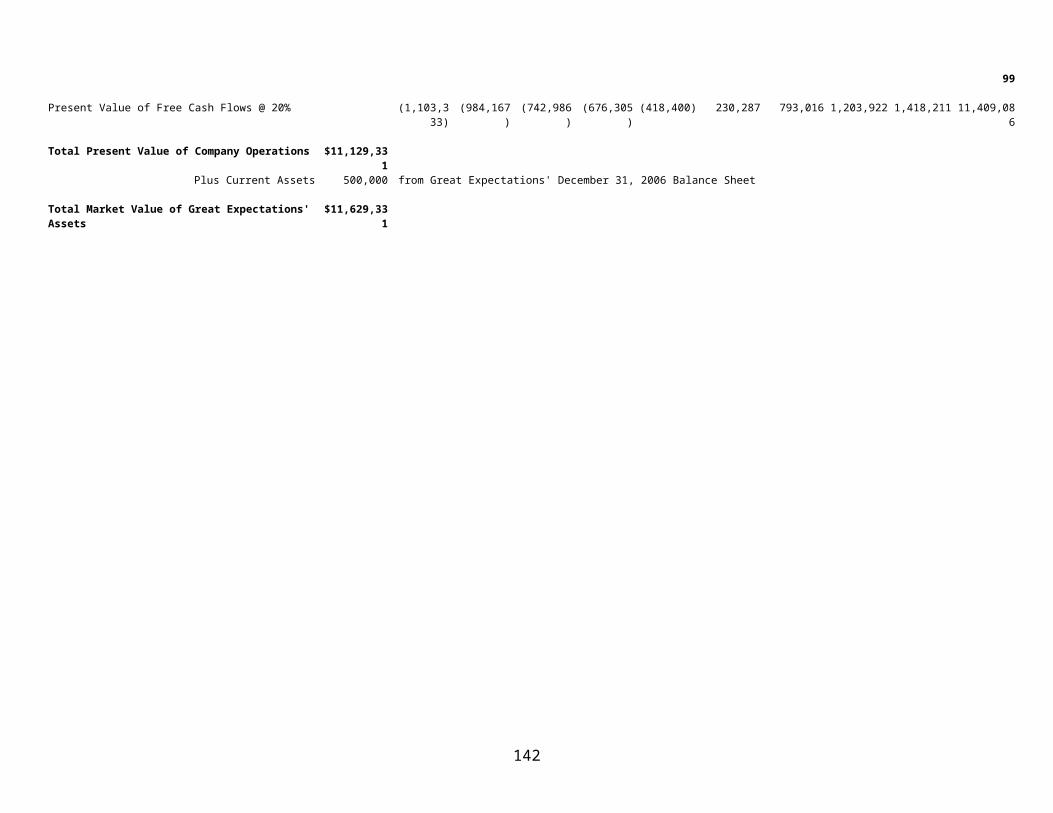
99
Present Value of Free Cash Flows @ 20% (1,103,333)
(984,167)
(742,986)
(676,305)(418,400) 230,287 793,016 1,203,922 1,418,211 11,409,08
6
Total Present Value of Company Operations $11,129,331
Plus Current Assets 500,000 from Great Expectations' December 31, 2006 Balance Sheet
Total Market Value of Great Expectations'Assets
$11,629,331
142
Chapter 13 Solutions
Answers to Review Questions
1. What is the operating leverage effect and what causes it? What arethe potential benefits and negative consequences of high operating leverage?
The operating leverage effect is the phenomenon whereby a small change in sales triggers a relatively large change in operating income. It is caused by the presence of fixed operating costs. The potential benefits are that if sales are rising operating income will rise more quickly. The negative consequences are that falling sales will cause operating income to fall more quickly, including negative values.
2. Does high operating leverage always mean high business risk? Explain.
High operating leverage does not always mean high business risk. If the companies sales are quite stable then the variation in operating income would be small even if the degree of operating leverage were large.
3. What is the financial leverage effect and what causes it? What arethe potential benefits and negative consequences of high financial leverage?
Financial leverage is the additional volatility of net income caused by the presence of fixed-cost funds. The potential benefits are that if operating income is rising net income will rise more quickly. The negative side is that if operating income is falling net income will fall more quickly, including possibly negative values.
143
4. Give two examples of types of companies likely to have high operating leverage. Find examples other than those cited in the chapter.
Long distance telephone companies and electricity generating companies are likely to have operating leverage. These two types of companies have very high fixed costs, because they are capital intensive, and have relatively low variable costs.
5. Give two examples of types of companies that would be best able to handle high debt levels.
Companies that handle local telephone service and those that handlenatural gas delivery to consumers would be expected to comfortably be able to handle high debt levels. This is because the sales of these two types of companies tend not to react very much to the business cycle. Their sales tend to grow with the population. They are often regulated and protected from competition, although this is not so much true as it was a few years ago.
6. What is an LBO? What are the risks for the equity investors and what are the potential rewards?
A leveraged buyout is a purchase of a publicly owned corporation bya small group of investors using a large amount of borrowed money. The risks for the equity investors are those that exist whenever a high degree of financial leverage exists. So too are the rewards, where small returns become large returns because of leverage.
7. If an optimal capital structure exists, what are the reasons why too little debt is as undesirable as is too much debt?
Too little debt may be as undesirable as too much debt because if a firm has a very conservative capital structure it may be losing the opportunity to reap the positive benefits of financial leverage. A company with a bright future is probably not maximizing shareholder wealth if it has a very small amount of debtin its capital structure. A more aggressive capital structure may create more value for the owners.
144
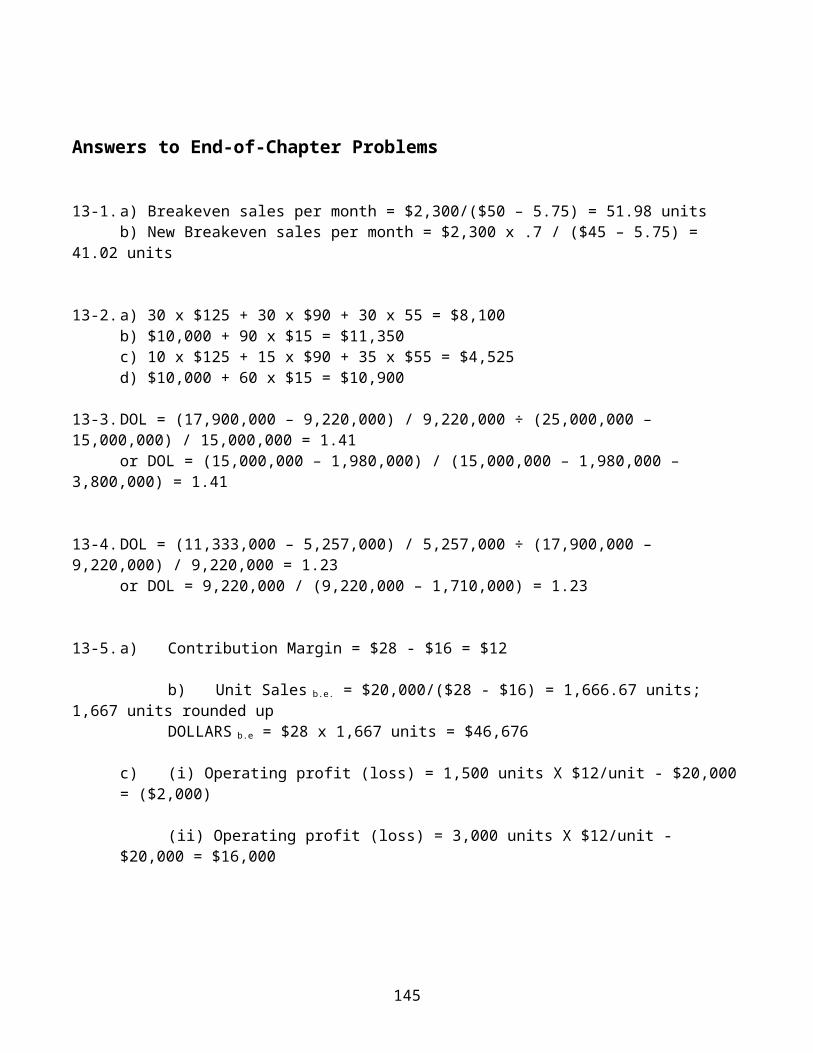
Answers to End-of-Chapter Problems
13-1.a) Breakeven sales per month = $2,300/($50 – 5.75) = 51.98 unitsb) New Breakeven sales per month = $2,300 x .7 / ($45 – 5.75) =
41.02 units
13-2.a) 30 x $125 + 30 x $90 + 30 x 55 = $8,100b) $10,000 + 90 x $15 = $11,350c) 10 x $125 + 15 x $90 + 35 x $55 = $4,525d) $10,000 + 60 x $15 = $10,900
13-3.DOL = (17,900,000 – 9,220,000) / 9,220,000 ÷ (25,000,000 – 15,000,000) / 15,000,000 = 1.41
or DOL = (15,000,000 – 1,980,000) / (15,000,000 – 1,980,000 – 3,800,000) = 1.41
13-4.DOL = (11,333,000 – 5,257,000) / 5,257,000 ÷ (17,900,000 – 9,220,000) / 9,220,000 = 1.23
or DOL = 9,220,000 / (9,220,000 – 1,710,000) = 1.23
13-5.a) Contribution Margin = $28 - $16 = $12
b) Unit Sales b.e. = $20,000/($28 - $16) = 1,666.67 units; 1,667 units rounded up
DOLLARS b.e = $28 x 1,667 units = $46,676
c) (i) Operating profit (loss) = 1,500 units X $12/unit - $20,000= ($2,000)
(ii) Operating profit (loss) = 3,000 units X $12/unit - $20,000 = $16,000
145
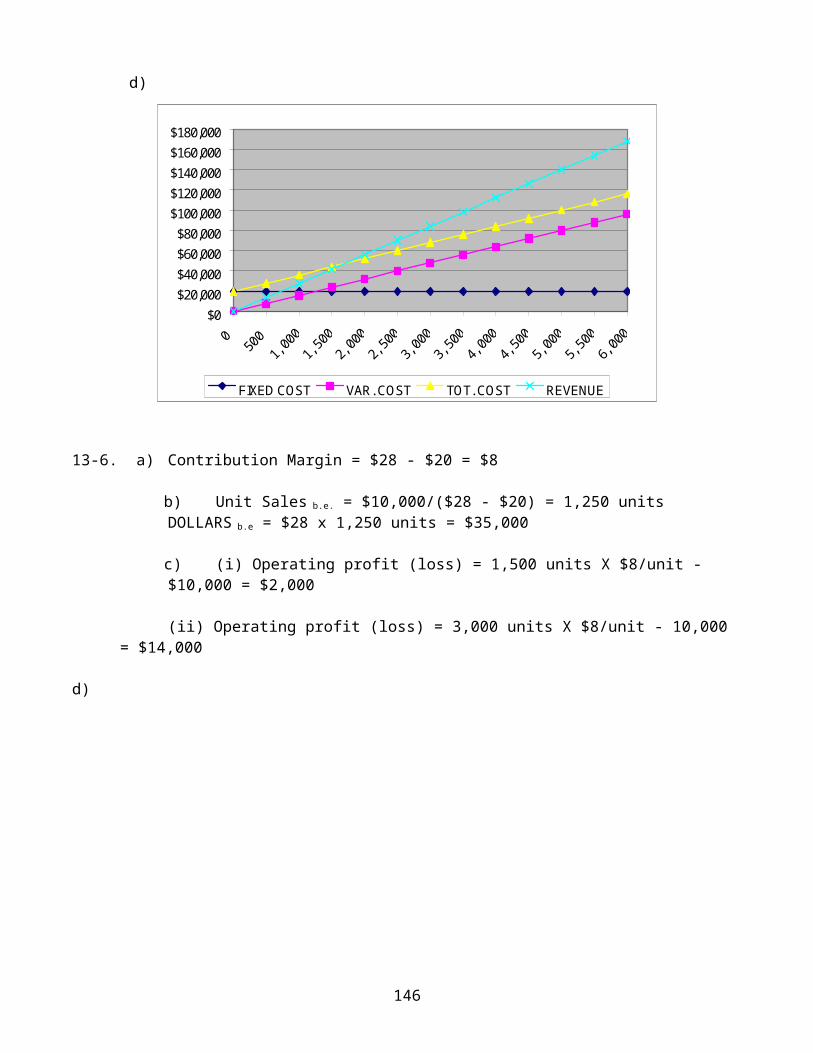
d)
13-6. a) Contribution Margin = $28 - $20 = $8
b) Unit Sales b.e. = $10,000/($28 - $20) = 1,250 unitsDOLLARS b.e = $28 x 1,250 units = $35,000
c) (i) Operating profit (loss) = 1,500 units X $8/unit - $10,000 = $2,000
(ii) Operating profit (loss) = 3,000 units X $8/unit - 10,000 = $14,000
d)
146
$0$20,000$40,000$60,000$80,000$100,000$120,000$140,000$160,000$180,000
0 500 1,000
1,500
2,000
2,500
3,000
3,500
4,000
4,500
5,000
5,500
6,000
FIXED COST VAR. COST TOT. COST REVENUE
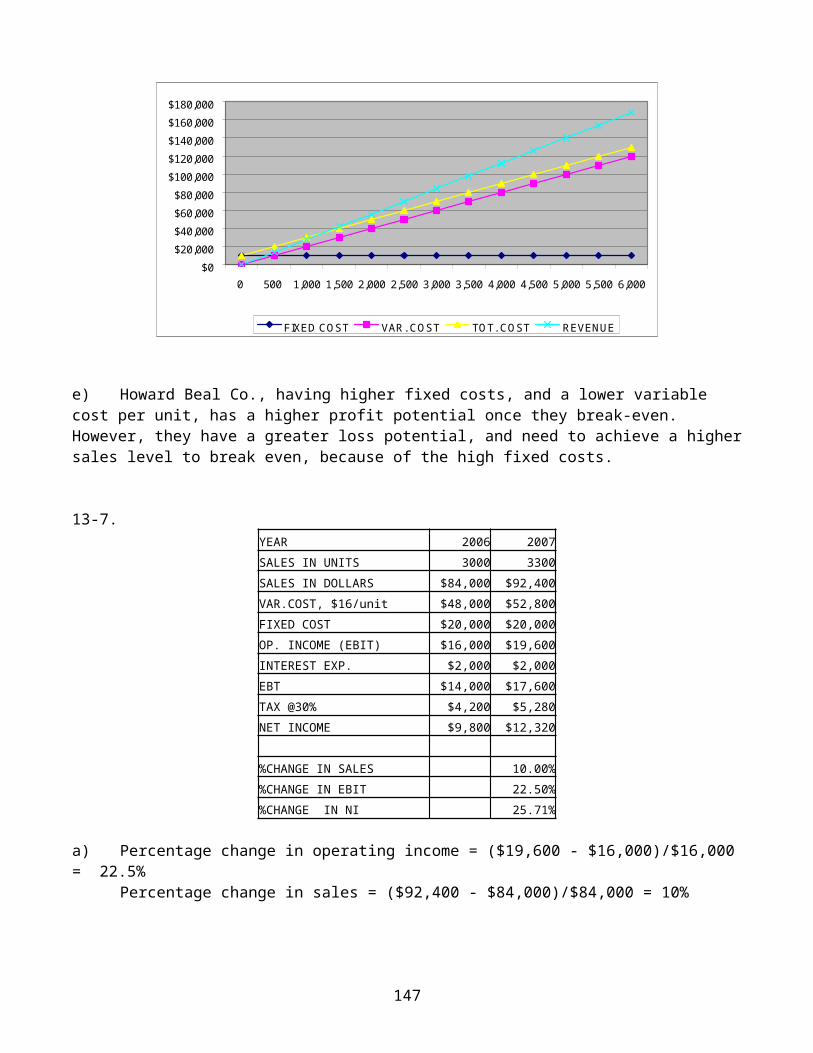
e) Howard Beal Co., having higher fixed costs, and a lower variable cost per unit, has a higher profit potential once they break-even. However, they have a greater loss potential, and need to achieve a highersales level to break even, because of the high fixed costs.
13-7. YEAR 2006 2007 SALES IN UNITS 3000 3300SALES IN DOLLARS $84,000 $92,400 VAR.COST, $16/unit $48,000 $52,800 FIXED COST $20,000 $20,000 OP. INCOME (EBIT) $16,000 $19,600 INTEREST EXP. $2,000 $2,000 EBT $14,000 $17,600 TAX @30% $4,200 $5,280 NET INCOME $9,800 $12,320
%CHANGE IN SALES 10.00%%CHANGE IN EBIT 22.50%%CHANGE IN NI 25.71%
a) Percentage change in operating income = ($19,600 - $16,000)/$16,000= 22.5%
Percentage change in sales = ($92,400 - $84,000)/$84,000 = 10%
147
$0$20,000$40,000$60,000$80,000$100,000$120,000$140,000$160,000$180,000
0 500 1,000 1,500 2,000 2,500 3,000 3,500 4,000 4,500 5,000 5,500 6,000
FIXED COST VAR. COST TOT. COST REVENUE
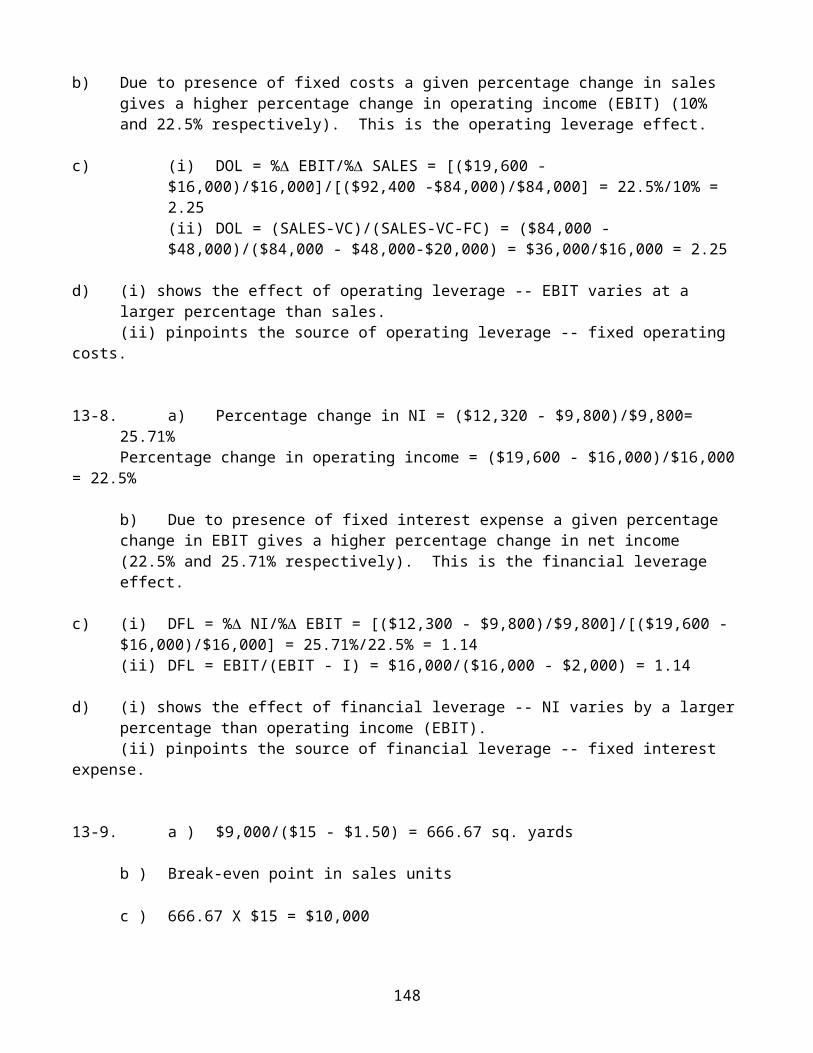
b) Due to presence of fixed costs a given percentage change in sales gives a higher percentage change in operating income (EBIT) (10% and 22.5% respectively). This is the operating leverage effect.
c) (i) DOL = % EBIT/% SALES = [($19,600 - $16,000)/$16,000]/[($92,400 -$84,000)/$84,000] = 22.5%/10% = 2.25(ii) DOL = (SALES-VC)/(SALES-VC-FC) = ($84,000 - $48,000)/($84,000 - $48,000-$20,000) = $36,000/$16,000 = 2.25
d) (i) shows the effect of operating leverage -- EBIT varies at a larger percentage than sales.(ii) pinpoints the source of operating leverage -- fixed operating
costs.
13-8. a) Percentage change in NI = ($12,320 - $9,800)/$9,800= 25.71%Percentage change in operating income = ($19,600 - $16,000)/$16,000
= 22.5%
b) Due to presence of fixed interest expense a given percentage change in EBIT gives a higher percentage change in net income (22.5% and 25.71% respectively). This is the financial leverage effect.
c) (i) DFL = % NI/% EBIT = [($12,300 - $9,800)/$9,800]/[($19,600 - $16,000)/$16,000] = 25.71%/22.5% = 1.14(ii) DFL = EBIT/(EBIT - I) = $16,000/($16,000 - $2,000) = 1.14
d) (i) shows the effect of financial leverage -- NI varies by a largerpercentage than operating income (EBIT).(ii) pinpoints the source of financial leverage -- fixed interest
expense.
13-9. a ) $9,000/($15 - $1.50) = 666.67 sq. yards
b ) Break-even point in sales units
c ) 666.67 X $15 = $10,000
148
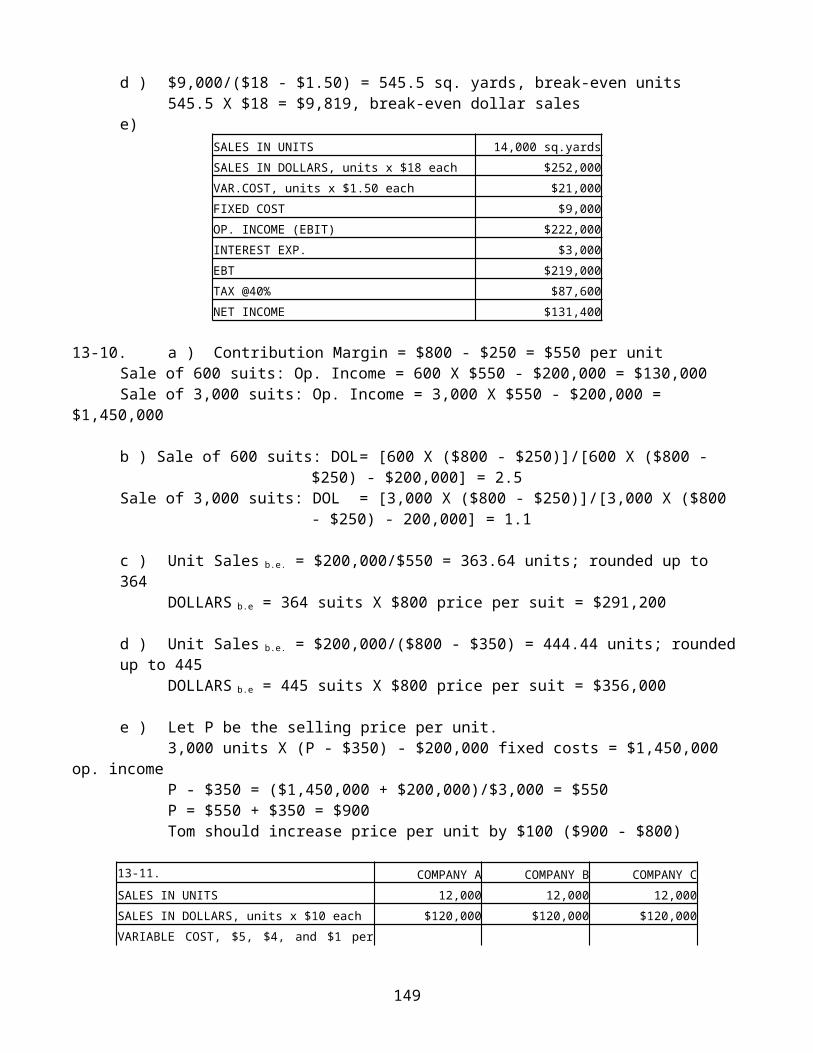
d ) $9,000/($18 - $1.50) = 545.5 sq. yards, break-even units545.5 X $18 = $9,819, break-even dollar sales
e)SALES IN UNITS 14,000 sq.yardsSALES IN DOLLARS, units x $18 each $252,000 VAR.COST, units x $1.50 each $21,000 FIXED COST $9,000 OP. INCOME (EBIT) $222,000 INTEREST EXP. $3,000 EBT $219,000 TAX @40% $87,600 NET INCOME $131,400
13-10. a ) Contribution Margin = $800 - $250 = $550 per unitSale of 600 suits: Op. Income = 600 X $550 - $200,000 = $130,000Sale of 3,000 suits: Op. Income = 3,000 X $550 - $200,000 =
$1,450,000
b ) Sale of 600 suits: DOL= [600 X ($800 - $250)]/[600 X ($800 - $250) - $200,000] = 2.5
Sale of 3,000 suits: DOL = [3,000 X ($800 - $250)]/[3,000 X ($800 - $250) - 200,000] = 1.1
c ) Unit Sales b.e. = $200,000/$550 = 363.64 units; rounded up to 364
DOLLARS b.e = 364 suits X $800 price per suit = $291,200
d ) Unit Sales b.e. = $200,000/($800 - $350) = 444.44 units; roundedup to 445
DOLLARS b.e = 445 suits X $800 price per suit = $356,000
e ) Let P be the selling price per unit.3,000 units X (P - $350) - $200,000 fixed costs = $1,450,000
op. incomeP - $350 = ($1,450,000 + $200,000)/$3,000 = $550P = $550 + $350 = $900Tom should increase price per unit by $100 ($900 - $800)
13-11. COMPANY A COMPANY B COMPANY CSALES IN UNITS 12,000 12,000 12,000SALES IN DOLLARS, units x $10 each $120,000 $120,000 $120,000VARIABLE COST, $5, $4, and $1 per
149
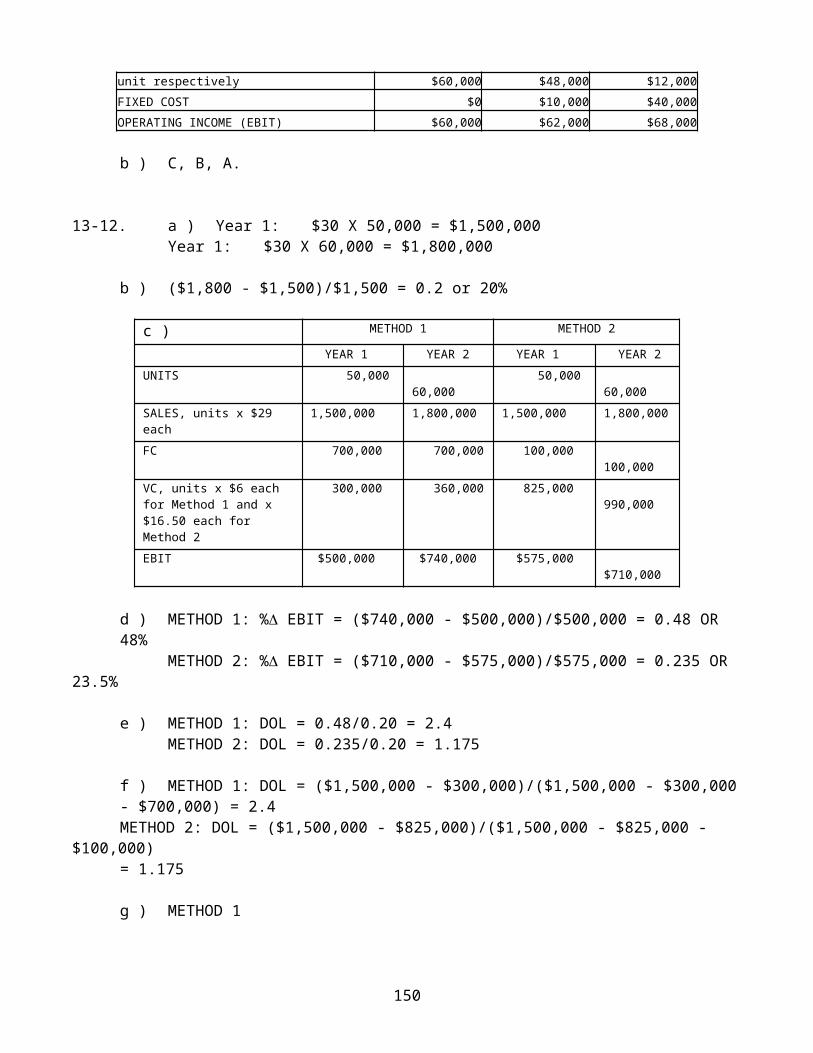
unit respectively $60,000 $48,000 $12,000FIXED COST $0 $10,000 $40,000OPERATING INCOME (EBIT) $60,000 $62,000 $68,000
b ) C, B, A.
13-12. a ) Year 1: $30 X 50,000 = $1,500,000Year 1: $30 X 60,000 = $1,800,000
b ) ($1,800 - $1,500)/$1,500 = 0.2 or 20%
c ) METHOD 1 METHOD 2
YEAR 1 YEAR 2 YEAR 1 YEAR 2UNITS 50,000
60,000 50,000
60,000SALES, units x $29 each
1,500,000 1,800,000 1,500,000 1,800,000
FC 700,000 700,000 100,000 100,000
VC, units x $6 each for Method 1 and x $16.50 each for Method 2
300,000 360,000 825,000 990,000
EBIT $500,000 $740,000 $575,000 $710,000
d ) METHOD 1: % EBIT = ($740,000 - $500,000)/$500,000 = 0.48 OR 48% METHOD 2: % EBIT = ($710,000 - $575,000)/$575,000 = 0.235 OR
23.5%
e ) METHOD 1: DOL = 0.48/0.20 = 2.4METHOD 2: DOL = 0.235/0.20 = 1.175
f ) METHOD 1: DOL = ($1,500,000 - $300,000)/($1,500,000 - $300,000- $700,000) = 2.4METHOD 2: DOL = ($1,500,000 - $825,000)/($1,500,000 - $825,000 -
$100,000)= 1.175
g ) METHOD 1
150
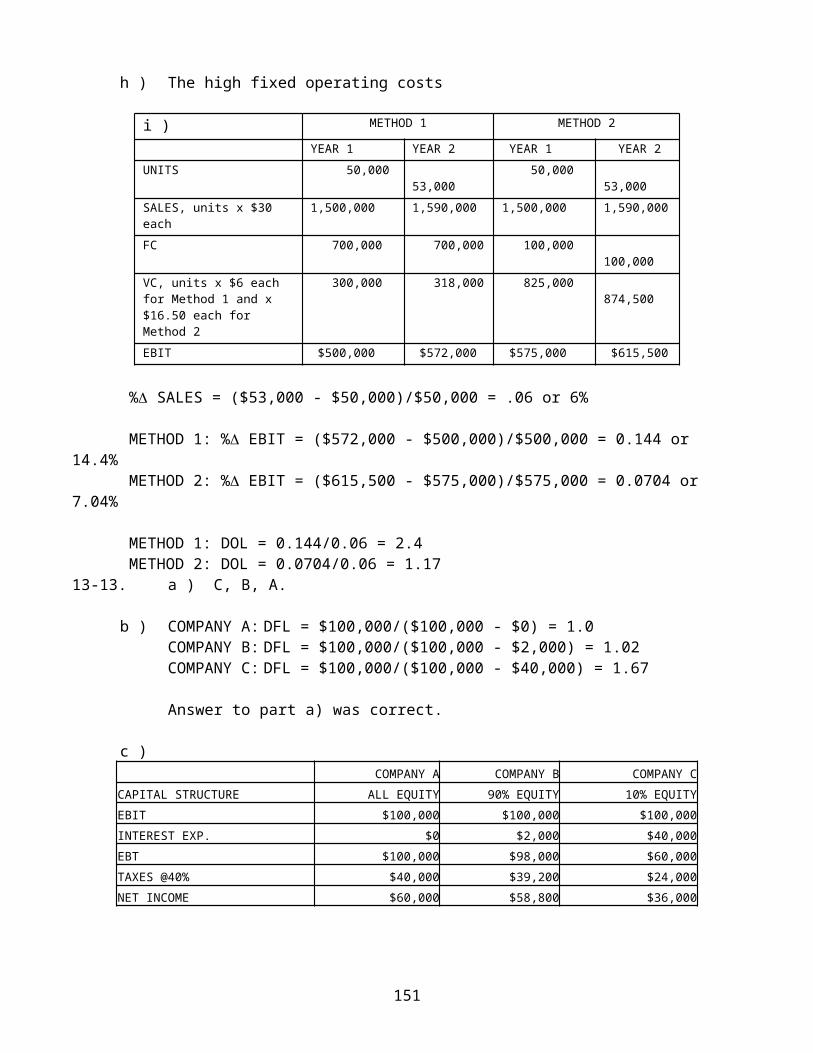
h ) The high fixed operating costs
i ) METHOD 1 METHOD 2
YEAR 1 YEAR 2 YEAR 1 YEAR 2UNITS 50,000
53,000 50,000
53,000SALES, units x $30 each
1,500,000 1,590,000 1,500,000 1,590,000
FC 700,000 700,000 100,000 100,000
VC, units x $6 each for Method 1 and x $16.50 each for Method 2
300,000 318,000 825,000 874,500
EBIT $500,000 $572,000 $575,000 $615,500
% SALES = ($53,000 - $50,000)/$50,000 = .06 or 6%
METHOD 1: % EBIT = ($572,000 - $500,000)/$500,000 = 0.144 or 14.4%
METHOD 2: % EBIT = ($615,500 - $575,000)/$575,000 = 0.0704 or 7.04%
METHOD 1: DOL = 0.144/0.06 = 2.4 METHOD 2: DOL = 0.0704/0.06 = 1.17
13-13. a ) C, B, A.
b ) COMPANY A: DFL = $100,000/($100,000 - $0) = 1.0COMPANY B: DFL = $100,000/($100,000 - $2,000) = 1.02COMPANY C: DFL = $100,000/($100,000 - $40,000) = 1.67
Answer to part a) was correct.
c ) COMPANY A COMPANY B COMPANY C
CAPITAL STRUCTURE ALL EQUITY 90% EQUITY 10% EQUITYEBIT $100,000 $100,000 $100,000INTEREST EXP. $0 $2,000 $40,000EBT $100,000 $98,000 $60,000TAXES @40% $40,000 $39,200 $24,000NET INCOME $60,000 $58,800 $36,000
151
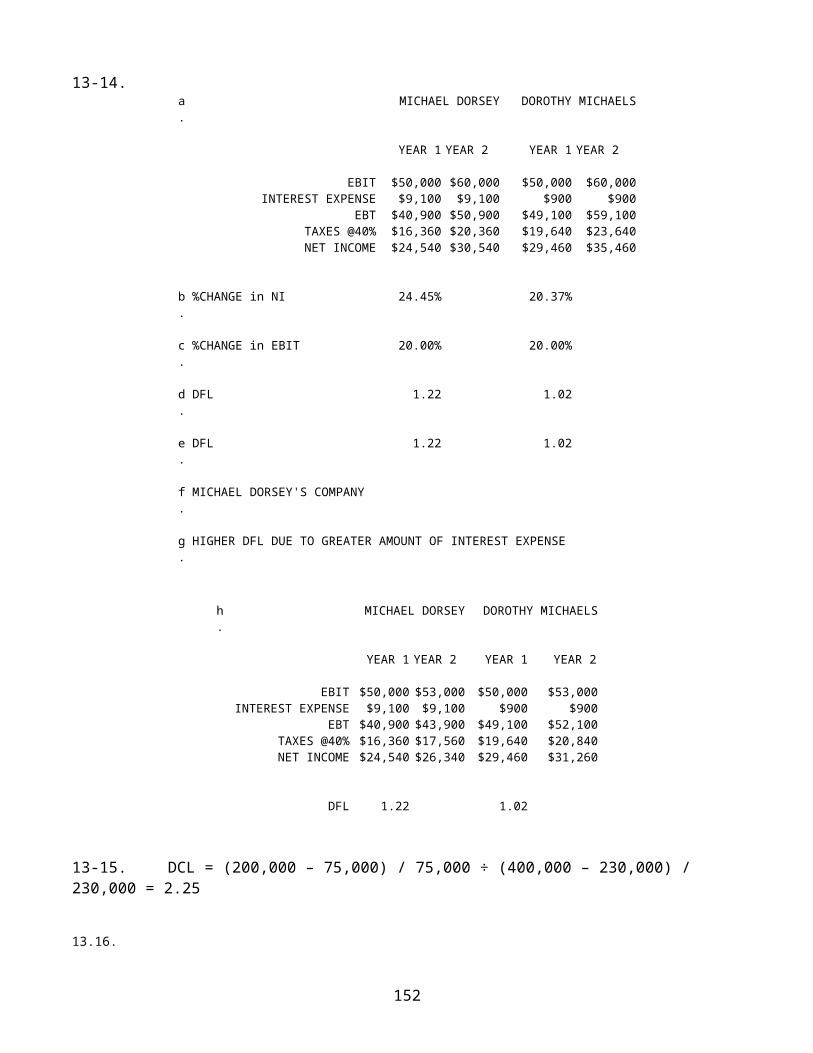
13-14.a.
MICHAEL DORSEY DOROTHY MICHAELS
YEAR 1 YEAR 2 YEAR 1 YEAR 2
EBIT $50,000 $60,000 $50,000 $60,000 INTEREST EXPENSE $9,100 $9,100 $900 $900
EBT $40,900 $50,900 $49,100 $59,100 TAXES @40% $16,360 $20,360 $19,640 $23,640 NET INCOME $24,540 $30,540 $29,460 $35,460
b.%CHANGE in NI 24.45% 20.37%
c.%CHANGE in EBIT 20.00% 20.00%
d.DFL 1.22 1.02
e.DFL 1.22 1.02
f.MICHAEL DORSEY'S COMPANY
g.HIGHER DFL DUE TO GREATER AMOUNT OF INTEREST EXPENSE
h.
MICHAEL DORSEY DOROTHY MICHAELS
YEAR 1 YEAR 2 YEAR 1 YEAR 2
EBIT $50,000 $53,000 $50,000 $53,000 INTEREST EXPENSE $9,100 $9,100 $900 $900
EBT $40,900 $43,900 $49,100 $52,100 TAXES @40% $16,360 $17,560 $19,640 $20,840 NET INCOME $24,540 $26,340 $29,460 $31,260
DFL 1.22 1.02
13-15. DCL = (200,000 – 75,000) / 75,000 ÷ (400,000 – 230,000) / 230,000 = 2.25
13.16.
152

FUNNY GIRLS COMICS
153
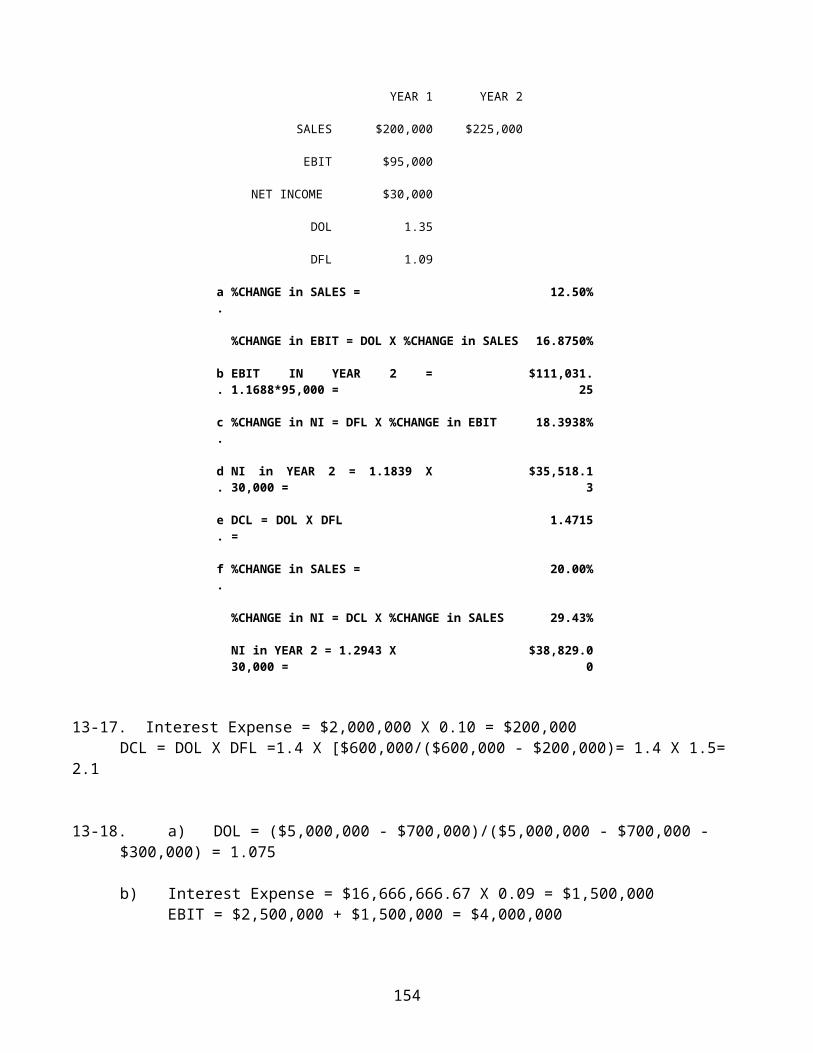
YEAR 1 YEAR 2
SALES $200,000 $225,000
EBIT $95,000
NET INCOME $30,000
DOL 1.35
DFL 1.09
a.
%CHANGE in SALES = 12.50%
%CHANGE in EBIT = DOL X %CHANGE in SALES 16.8750%
b.
EBIT IN YEAR 2 =1.1688*95,000 =
$111,031.25
c.
%CHANGE in NI = DFL X %CHANGE in EBIT 18.3938%
d.
NI in YEAR 2 = 1.1839 X30,000 =
$35,518.13
e.
DCL = DOL X DFL=
1.4715
f.
%CHANGE in SALES = 20.00%
%CHANGE in NI = DCL X %CHANGE in SALES 29.43%
NI in YEAR 2 = 1.2943 X 30,000 =
$38,829.00
13-17. Interest Expense = $2,000,000 X 0.10 = $200,000 DCL = DOL X DFL =1.4 X [$600,000/($600,000 - $200,000)= 1.4 X 1.5= 2.1
13-18. a) DOL = ($5,000,000 - $700,000)/($5,000,000 - $700,000 - $300,000) = 1.075
b) Interest Expense = $16,666,666.67 X 0.09 = $1,500,000EBIT = $2,500,000 + $1,500,000 = $4,000,000
154
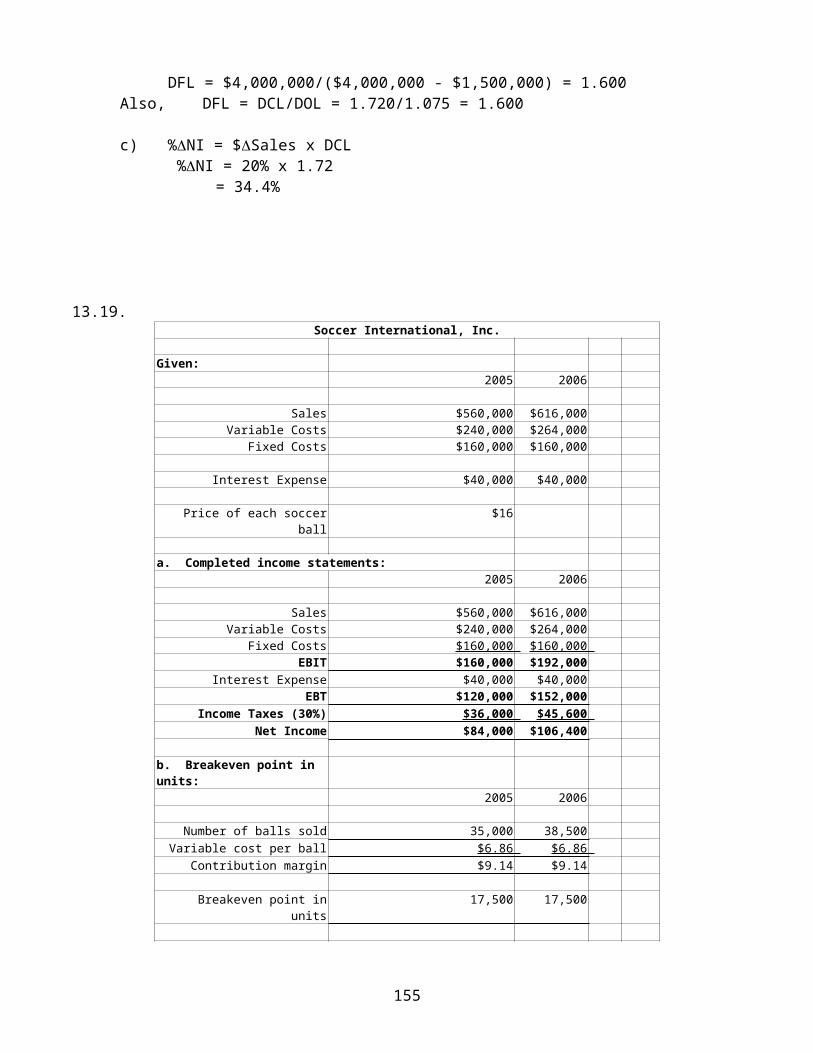
DFL = $4,000,000/($4,000,000 - $1,500,000) = 1.600Also, DFL = DCL/DOL = 1.720/1.075 = 1.600
c) %NI = $Sales x DCL %NI = 20% x 1.72
= 34.4%
13.19.Soccer International, Inc.
Given:2005 2006
Sales $560,000 $616,000 Variable Costs $240,000 $264,000
Fixed Costs $160,000 $160,000
Interest Expense $40,000 $40,000
Price of each soccerball
$16
a. Completed income statements:2005 2006
Sales $560,000 $616,000 Variable Costs $240,000 $264,000
Fixed Costs $160,000 $160,000 EBIT $160,000 $192,000
Interest Expense $40,000 $40,000 EBT $120,000 $152,000
Income Taxes (30%) $36,000 $45,600 Net Income $84,000 $106,400
b. Breakeven point in units:
2005 2006
Number of balls sold 35,000 38,500 Variable cost per ball $6.86 $6.86
Contribution margin $9.14 $9.14
Breakeven point inunits
17,500 17,500
155
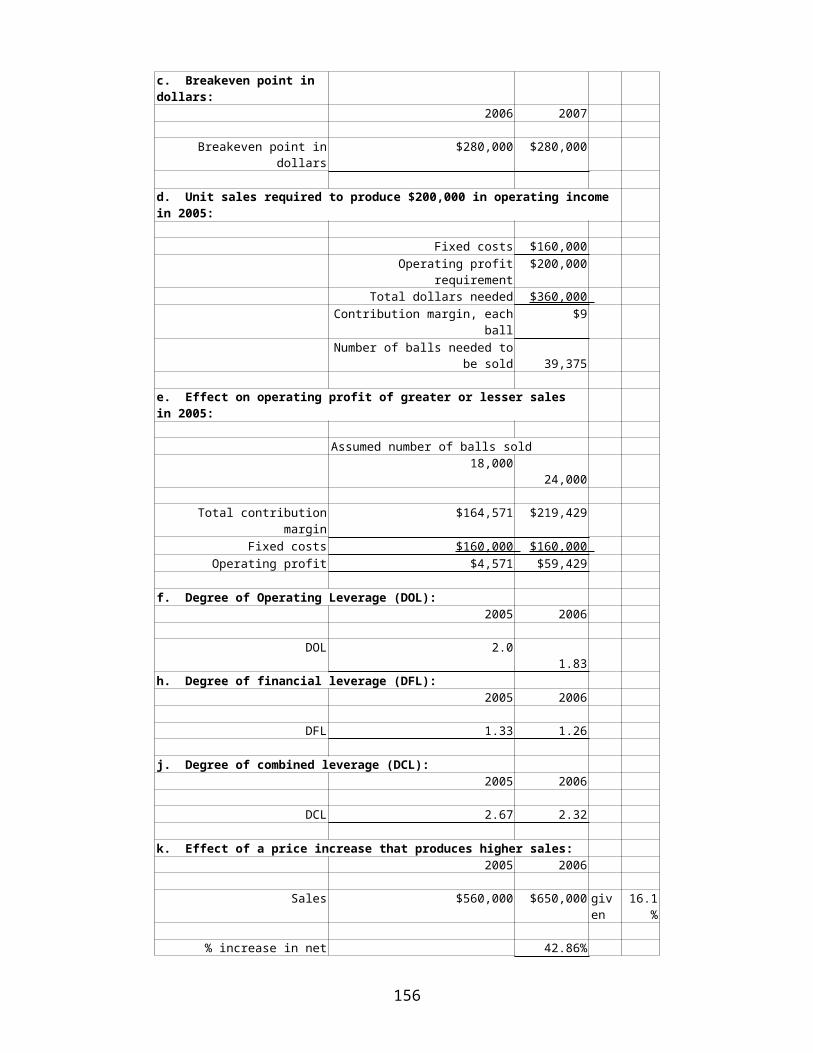
c. Breakeven point in dollars:
2006 2007
Breakeven point indollars
$280,000 $280,000
d. Unit sales required to produce $200,000 in operating income in 2005:
Fixed costs $160,000 Operating profit
requirement$200,000
Total dollars needed $360,000 Contribution margin, each
ball$9
Number of balls needed tobe sold
39,375
e. Effect on operating profit of greater or lesser sales in 2005:
Assumed number of balls sold 18,000
24,000
Total contributionmargin
$164,571 $219,429
Fixed costs $160,000 $160,000 Operating profit $4,571 $59,429
f. Degree of Operating Leverage (DOL):2005 2006
DOL 2.0 1.83
h. Degree of financial leverage (DFL):2005 2006
DFL 1.33 1.26
j. Degree of combined leverage (DCL):2005 2006
DCL 2.67 2.32
k. Effect of a price increase that produces higher sales:2005 2006
Sales $560,000 $650,000 given
16.1%
% increase in net 42.86%
156
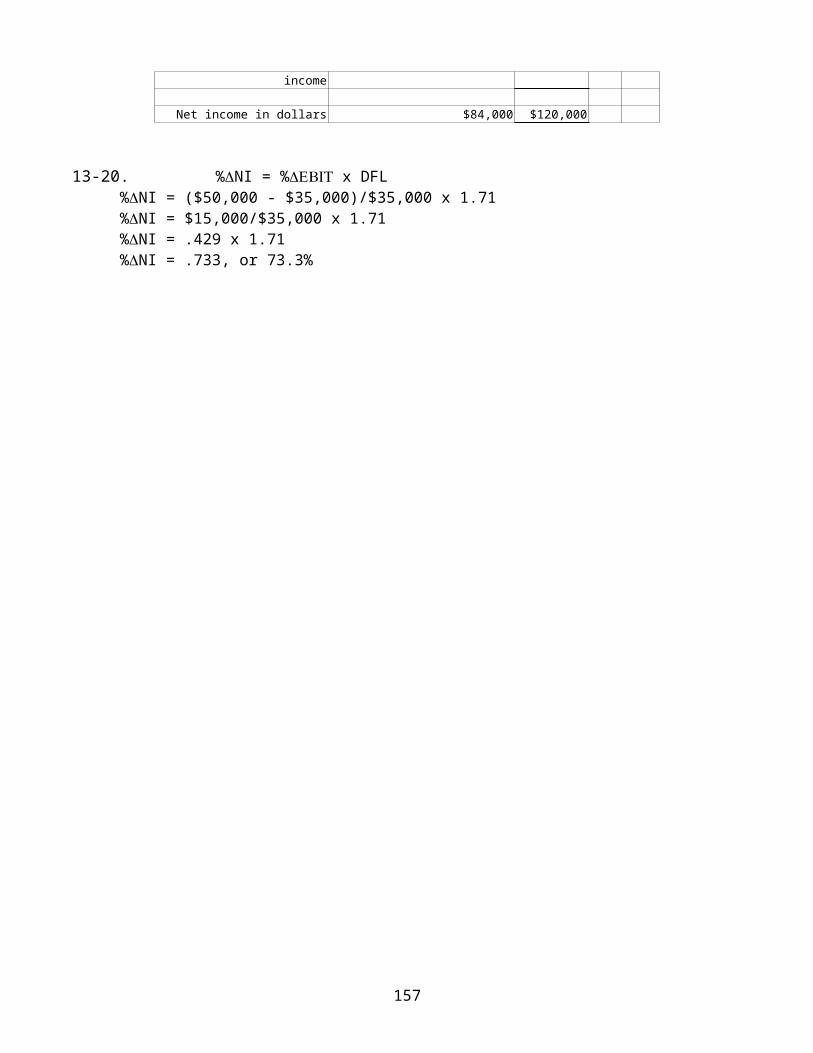
income
Net income in dollars $84,000 $120,000
13-20. %NI = % x DFL%NI = ($50,000 - $35,000)/$35,000 x 1.71%NI = $15,000/$35,000 x 1.71%NI = .429 x 1.71%NI = .733, or 73.3%
157
Chapter 14 Solutions
Answers to Review Questions
1. How does a mortgage bond compare to a debenture?
A mortgage bond is a secured bond while a debenture is an unsecuredbond.
2. How does a sinking fund function in the retirement of an outstanding bond issue?
A sinking fund is where a company puts payments that are then used to buy back outstanding bonds.
3. What are some examples of restrictive covenants that might be specified in a bond’s indenture?
An indenture might include limitations on future borrowings, restrictions on dividend payments, and/or requirements that workingcapital be maintained at least at some minimum level.
4. Define the following terms that relate to a convertible bond: conversion ratio, conversion value, and straight bond value.
The conversion ratio is the number of shares of common stock that would be obtained if a convertible bond were converted. The conversion value is the total value of the common stock that would be obtained. The straight bond is the value a convertible bond would have without the conversion feature.
5. If a convertible bond has a conversion ratio of 20, a face value of$1,000, a coupon rate of 8 percent, and the market price for the company’s stock is $15 per share, what is the convertible bond’s conversion value?
158
The conversion value would equal the conversion ratio of 20 times the $15 market price of the stock or $300.
6. What is a callable bond? What is a putable bond? How do each of these features affect their respective market interest rates?
A callable bond can be retired early at the discretion of the issuer. A putable can be retired early at the discretion of the investor. A call provision increases the market interest rate and a put provision decreases it.
Answers to End-of-Chapter Problems
14-1. VB = $80 X [(1 - 1/1.1210)/.12] + $1,000 X 1/1.1210 = $773.99
14-2. VB = $40 X [(1 - 1/1.0620)/.06] + $1,000 X 1/1.0620 = $770.60
14-3. Conversion Value = $60 X 20 = $1,200
14-4.$32 * 26.5 = $848$848 * 6 = $5,088.00
14-5.22.5 [ 1-(1/(1.0375)60)/0.0375] + 1,000/(1.0375)60
22.5 * 23.7379 + 109.828 = $643.93
14-6.$85 * 30 = $2,550
14-7. 33.75 [1 – (1/1.0430)/0.04] + 1,000/1.0430 = $891.92
159
14-8. Funds required to buy 1,000 bonds from the open market = $800 X 1,000 = $800,000. Therefore savings from buying the bonds back instead of depositing $1 million in the sinking fund = $1,000,000 -$800,000 = $200,000.
14-9.(7.0% - 5.0%) * 30,000 * 1,000 = $600,000
14-10. Yearly savings = (10% - 8%) X 20,000 X $1,000 = $400,000
14-11. Face Value + Call Premium = $1,000 + 0.5 X $1,000 = $1,050Annual interest paid over last ten years = 0.10 X $1,000 = $100$950 = $100 X (PVIFAk,10) + $1,050 X (PVIFk,10)Realized return for Brooks = k = 11.15%
YEARS0 1 2 3 4 5 6 7 8 9 10 1
1 12 13 14
15 16
17 18 19
20
-950 100 100 100 100 100 100 100 100 100 100
1050
-950 100 100 100 100 100 100 100 100 100 115
0
11.15%
IRR
14-12. a) Annual interest to be paid over next ten years = 0.08 X $1000
= $80$950 = $80 X (PVIFAk,10) + $1,000 X (PVIFk,10)Return for Brooks for the newly issued bond = k = 8.77%Overall return if the is bond held to maturity = 10.52% (See table below)
b) Return on the bond in Problem #4 if they had not been called =10.61% (See table below). Brooks didn't welcome the recall (10.61% > 10.52%).
YEARS
160
0 1 2 3 4 5 6 7 8 9 10 11 12 13 14 15 16 17 18 19 20 PROB 14-
12a-950 80 80 80 80 80 80 80 80 80 80
1000
-950 80 80 80 80 80 80 80 80 80 1080
8.77% IRR
-950 100 100 100 100 100 100 100 100 100 100 80 80 80 80 80 80 80 80 80 80
1050
1000
-950
-950 100 100 100 100 100 100 100 100 100 200 80 80 80 80 80 80 80 80 80 108
0 10.52
%IRR
PROB 14-12b
-950 100 100 100 100 100 100 100 100 100 100 10
0 100 100 100 100 100 100 100 100 100
1000
-950 100 100 100 100 100 100 100 100 100 100 10
0 100 100 100 100 100 100 100 100 1100
10.61%
IRR
14-13. Conversion Value = $70 X 20 = $1,400
14-14. VB = $90 X [(1 - 1/1.0714)/.07] + $1,000 X 1/1.0714 = $1,174.90
He would consider converting, but since the market value of the convertible bond would be greater than the larger of the conversionvalue or straight bond value he would sell the bond instead if he wanted to cash out.
14-15. Conversion Value = $30 X 30 = $900VB = 110 X [(1 - 1/1.135)/.13] + 1,000 X 1/1.135 = $929.66
161
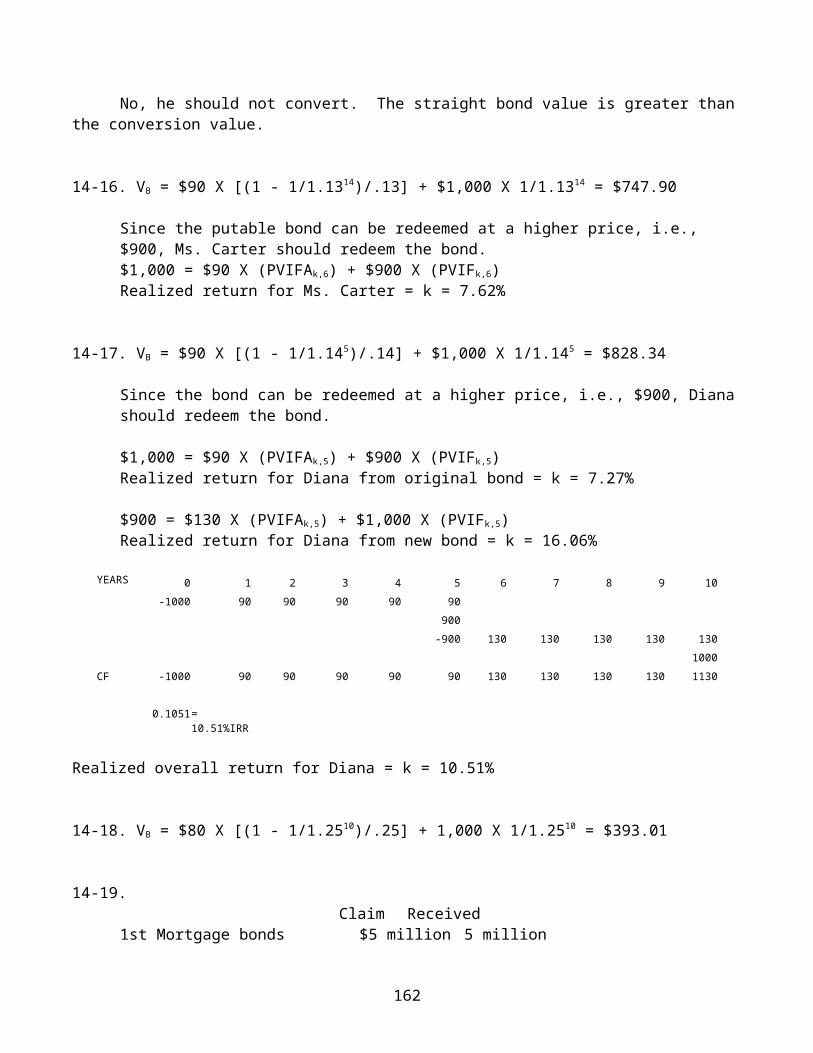
No, he should not convert. The straight bond value is greater thanthe conversion value.
14-16. VB = $90 X [(1 - 1/1.1314)/.13] + $1,000 X 1/1.1314 = $747.90
Since the putable bond can be redeemed at a higher price, i.e., $900, Ms. Carter should redeem the bond.$1,000 = $90 X (PVIFAk,6) + $900 X (PVIFk,6)Realized return for Ms. Carter = k = 7.62%
14-17. VB = $90 X [(1 - 1/1.145)/.14] + $1,000 X 1/1.145 = $828.34
Since the bond can be redeemed at a higher price, i.e., $900, Dianashould redeem the bond.
$1,000 = $90 X (PVIFAk,5) + $900 X (PVIFk,5)Realized return for Diana from original bond = k = 7.27%
$900 = $130 X (PVIFAk,5) + $1,000 X (PVIFk,5)Realized return for Diana from new bond = k = 16.06%
YEARS 0 1 2 3 4 5 6 7 8 9 10 -1000 90 90 90 90 90
900 -900 130 130 130 130 130
1000 CF -1000 90 90 90 90 90 130 130 130 130 1130
0.1051 =10.51%IRR
Realized overall return for Diana = k = 10.51%
14-18. VB = $80 X [(1 - 1/1.2510)/.25] + 1,000 X 1/1.2510 = $393.01
14-19. Claim Received
1st Mortgage bonds $5 million 5 million
162
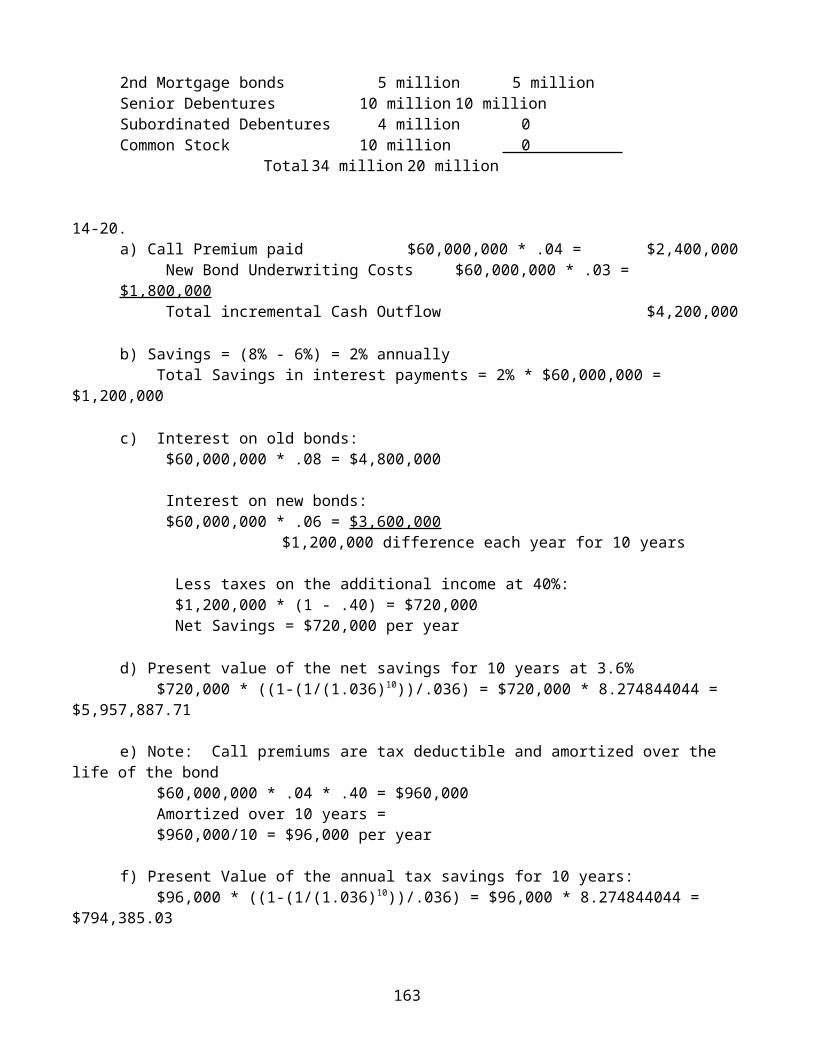
2nd Mortgage bonds 5 million 5 millionSenior Debentures 10 million 10 millionSubordinated Debentures 4 million 0Common Stock 10 million 0
Total34 million 20 million
14-20. a) Call Premium paid $60,000,000 * .04 = $2,400,000 New Bond Underwriting Costs $60,000,000 * .03 = $1,800,000 Total incremental Cash Outflow $4,200,000 b) Savings = (8% - 6%) = 2% annually Total Savings in interest payments = 2% * $60,000,000 =
$1,200,000
c) Interest on old bonds: $60,000,000 * .08 = $4,800,000
Interest on new bonds: $60,000,000 * .06 = $3,600,000 $1,200,000 difference each year for 10 years
Less taxes on the additional income at 40%: $1,200,000 * (1 - .40) = $720,000 Net Savings = $720,000 per year d) Present value of the net savings for 10 years at 3.6% $720,000 * ((1-(1/(1.036)10))/.036) = $720,000 * 8.274844044 =
$5,957,887.71
e) Note: Call premiums are tax deductible and amortized over the life of the bond
$60,000,000 * .04 * .40 = $960,000 Amortized over 10 years = $960,000/10 = $96,000 per year
f) Present Value of the annual tax savings for 10 years: $96,000 * ((1-(1/(1.036)10))/.036) = $96,000 * 8.274844044 =
$794,385.03
163
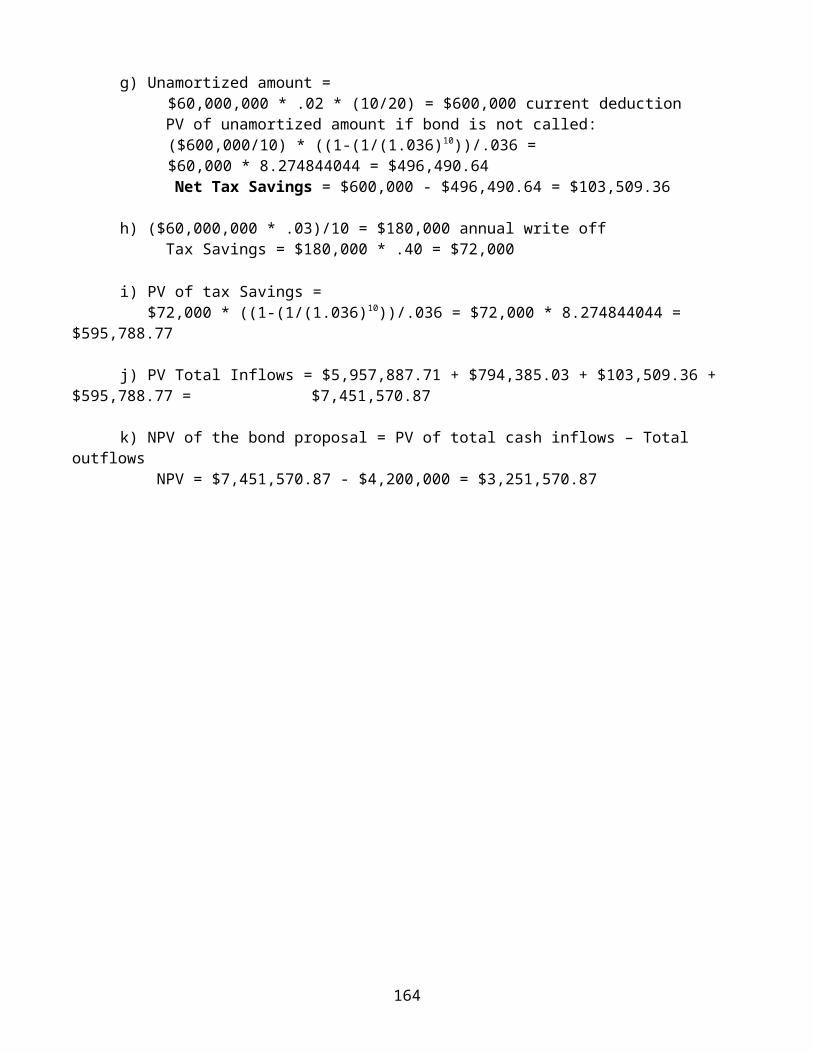
g) Unamortized amount = $60,000,000 * .02 * (10/20) = $600,000 current deduction
PV of unamortized amount if bond is not called: ($600,000/10) * ((1-(1/(1.036)10))/.036 = $60,000 * 8.274844044 = $496,490.64 Net Tax Savings = $600,000 - $496,490.64 = $103,509.36
h) ($60,000,000 * .03)/10 = $180,000 annual write off Tax Savings = $180,000 * .40 = $72,000
i) PV of tax Savings = $72,000 * ((1-(1/(1.036)10))/.036 = $72,000 * 8.274844044 =
$595,788.77
j) PV Total Inflows = $5,957,887.71 + $794,385.03 + $103,509.36 + $595,788.77 = $7,451,570.87
k) NPV of the bond proposal = PV of total cash inflows – Total outflows
NPV = $7,451,570.87 - $4,200,000 = $3,251,570.87
164
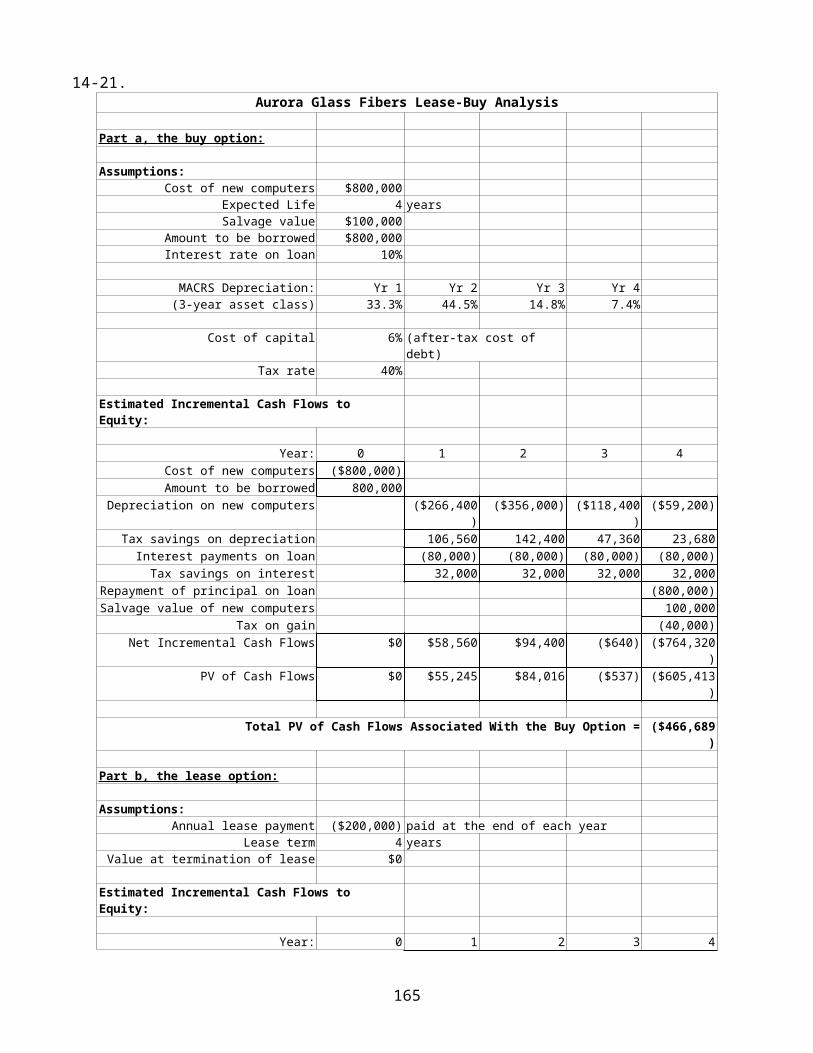
14-21.Aurora Glass Fibers Lease-Buy Analysis
Part a, the buy option:
Assumptions:Cost of new computers $800,000
Expected Life 4 yearsSalvage value $100,000
Amount to be borrowed $800,000 Interest rate on loan 10%
MACRS Depreciation: Yr 1 Yr 2 Yr 3 Yr 4(3-year asset class) 33.3% 44.5% 14.8% 7.4%
Cost of capital 6% (after-tax cost of debt)
Tax rate 40%
Estimated Incremental Cash Flows to Equity:
Year: 0 1 2 3 4Cost of new computers ($800,000)Amount to be borrowed 800,000
Depreciation on new computers ($266,400)
($356,000) ($118,400)
($59,200)
Tax savings on depreciation 106,560 142,400 47,360 23,680 Interest payments on loan (80,000) (80,000) (80,000) (80,000)
Tax savings on interest 32,000 32,000 32,000 32,000 Repayment of principal on loan (800,000)Salvage value of new computers 100,000
Tax on gain (40,000)Net Incremental Cash Flows $0 $58,560 $94,400 ($640) ($764,320
)PV of Cash Flows $0 $55,245 $84,016 ($537) ($605,413
)
Total PV of Cash Flows Associated With the Buy Option = ($466,689)
Part b, the lease option:
Assumptions:Annual lease payment ($200,000) paid at the end of each year
Lease term 4 yearsValue at termination of lease $0
Estimated Incremental Cash Flows to Equity:
Year: 0 1 2 3 4
165

Lease payment ($200,000)
($200,000) ($200,000)
($200,000)
Tax savings on lease payment $80,000 $80,000 $80,000 $80,000 Net Incremental Cash Flows $0 ($120,000
)($120,000) ($120,000
)($120,000
)PV of Cash Flows $0 ($113,208
)($106,800) ($100,754
)($95,051)
Total PV of Cash Flows Associated With the Lease Option = ($415,813)
Part c, comparison of alternatives and decision:
Total PV of Cash Flows Associated With the Buy Option = ($466,689)
Total PV of Cash Flows Associated With the Lease Option = ($415,813)
Net Advantage to Leasing (NAL) = $50,877
Decision: Lease
166
Chapter 15 Solutions
Answers to Review Questions
1. What are some of the government requirements imposed on a public corporation that are not imposed on a private, closely held corporation?
Public corporations must submit audited financial statements to thegovernment for release to the public. Private corporations can keep their financial information confidential.
2. How are the members of the board of directors of a corporation chosen and to whom do these board members owe their primary allegiance?
Members of a corporation’s board of directors are elected by the common stockholders and owe their allegiance to these stockholders
3. What are the advantages and the disadvantages of a new stock issue?
A new stock issue raises funds and decreases the riskiness of the firm. It also tends to send a negative signal to the market since many investors believe a company would only sell new stock if future financial prospects were dim.
4. What does an investment banker do when underwriting a new security issue for a corporation?
When underwriting a new security issue an investment banker buys itand then resells it to investors.
5. How does a preemptive right protect the interests of existing stockholders?
167
A preemptive right protects the interests of existing stockholders by giving them the opportunity to preempt other investors in the purchase of new shares. If these rights are exercised, existing shareholders would maintain their same percentage of ownership after the new stock issue as before.
6. Explain why warrants are rarely exercised unless the time to maturity is small?
Warrants are rarely exercised until the time to expiration is smallbecause the market price of the warrant is greater than the exercise value. The holder of the warrant would therefore sell it in the secondary market instead of exercising it if he or she wanted to cash in.
7. Under what circumstances is a warrant’s value high? Explain.
A warrant’s value would be high when the stock price, time to expiration, and/or expected stock price volatility are high.
Answers to End-of-Chapter Problems
15-1.Original Ownership = 20,000/1,000,000 = 2%Diluted Ownership = 20,000 /1,500,000 = 1.33%
15-2. 1. Book Value Approach: (200mil. - 150mil.)/5mil. = $10 per share
2. Liquidation Value Approach: (250 - 150)/5 = $20 per share3. Replacement Value Approach: (400 - 150)/5 = $50 per share4. Dividend Growth Model: $2/(0.13 - 0.08) = $40 per share
Ms. Phinlay should buy the stock as the share is selling at a price ($20)which is lower than what she is prepared to pay ($40) to get her requiredrate of return.
168
15-3.a) .45(2,500,000) = 1,125,000 [(1,125,000 - 1) * (5 + 1)] / 2,500,000 = 2.669 2 directors
b) .55(2,500,000) = 1,375,000 [(1,375,000 – 1) * (5 + 1)] / 2,500,000 = 3.299 3 directors
15-4. a) [(1 * 2,500,000) / (5 + 1)] + 1 = 416,667 b) [(3 * 2,500,000) / (5 + 1)] + 1 = 1,250,001
c) [(5 * 2,500,000) / (5 + 1)] + 1 = 2,083,334
15-5.a) .35 (2,500,000) = 875,000 [(875,000 – 1) (5 + 1)] / 2,500,000 = 2.1 2 directors
b) [(2 * 2,500,000)/ (5 + 1)] + 1 = 833,334
15-6. Length of term = (9/3) X 3 = 9 years for each board members
15-7. NUM DIR = [(0.35 X 1,000,000 - 1) X (4 + 1)]/1,000,000 = 1.75 rounded down to 1
The minority group can elect 1 of their people to the board out of the 4 to be elected.
15-8. NUM VOTING SHARES NEEDED = [(1 X 200,000)/(7 + 1)] + 1 = 25,001. Since Ms. O'Niel holds more shares than required, she can elect herself to the board.
15-9. a) How many directors can the young stockholders elect under(i) cumulative voting procedure
NUM DIR = (600,000 X 0.30-1) X (13 + 1)/600,000 = 4.2 rounded down to 4
169
(ii) majority rule: NONE
b) What percentage of voting shares and/or proxies the dissident group must have to be able to elect 7 out of the 13 board members?
NUM VOTING SHARES NEEDED=[(7 X 600,000)/(13 + 1)] + 1=300,001
Percentage of voting shares and/or proxies = 300,001/600,000 50% (slightly greater than 50%)
15-10. Number of rights required to buy a share = 500,000/50,000 = 10
15-11. N = 2,000,000/500,000 = 4Approx. Market Value of a Right = R = (65 - 55)/(4 + 1) = $2
15-12. Market Price of stocks selling ex-rights = 65 - 2 = $63Approx. Market Value of a Right = R = (63 - 55)/(4) = $2
15-13. N = 7Approx. Market Value of a Right = R = (77 - 65)/(7 + 1) = $1.50Market Price of stocks selling ex-rights = 77 - 1.5 = $75.50
15-14. a) Approx. Market Value of a Right = R = (72 - 60)/(4 + 1) = $2.40
b) Maximum number of new shares that Johnny can buy = 700/4 = 175
c) Amount Johnny would spend = 175 X 60 = $10,500
d) Selling price of all of Johnny's rights = 700 X 2.40= $1,680
15-17. a) Approx. Market Value of a Right = R = (62 - 50)/(4 + 1) = $2.40
b) Ex-rights price = $62 - $2.40 = $59.60 per shareDiluted price after issue of new stock = $59.6 X 4/5 = $47.68
170
Option I: Sell rights and hold stocks at diluted value:
Amount obtained by selling rights = $2.40 X 60 = $144.00
Value of stocks held at diluted price = 60 X $47.68 = $2,860.80
Unused Cash = $750.00
Net worth from Option I = $3,784.80
Option II: Buy new shares:
Number of shares Selena can buy = 60/4 = 15Amount to be spent to buy 15 shares = $50 X 15 = $750. So, Selena can buy all the 15 new shares with her available cash.
Diluted price of stocks = $47.68
Net worth from Option II = $47.68 X (60 + 15) = $3,576.00
So, Selena should go for Option I, that is, Sell rights and hold her stocks at diluted value.
15-18. XV = (100 - 85) X 5 = $75
What happens to the exercise value of the warrant if the stock price changes to
a) $110 : XV = (110 - 85) X 5 = $125b) $80 : XV = $0
15-19. Issue of new common stock by Wilkerson Corporation:
Current Market Price per share of Common Stock $40 Number of Common Shares outstanding 600,000 Amount of additional funds needed $2,000,0
00 Net Income for the year $1,000,0
00 Number of shares owned by Guy Hamilton 10,000
171
Possible Subscription Prices $36 $33 $29 $26
a. Number of shares to beissued
55,556 60,606 68,966 76,923
Number of Rights required to buyone share
10.8 9.9 8.7 7.8
b. EPS before the rightsissue
$1.67 $1.67 $1.67 $1.67
EPS after the rightsissue
$1.53 $1.51 $1.49 $1.48
c. Max number of new shares Guy canbuy
926 1,010 1,149 1,282
Guy's claim to earning before therights issue
$16,667 $16,667 $16,66
7 $16,66
7 Guy's claim to earning after the
rights issue$16,667 $16,66
7 $16,66
7 $16,66
7
172
Chapter 16 Solutions
Answers to Review Questions
1. Explain the role of cash and of earnings when a corporation is deciding how much, if any, cash dividends to pay to common stockholders.
In the long-run earnings are necessary to maintain dividend payments, but at the time an actual dividend payment is made, adequate cash is necessary.
2. Are there any legal factors that could restrict a corporation in its attempt to pay cash dividends to common stockholders? Explain.
A firm may be legally restricted as to the dividends it can pay by existing bond indentures or loan agreements. It may also be restricted as to the payment of common stock dividends is scheduledpreferred stock dividends have not been paid.
3. What are some of the factors that common stockholders consider whendeciding how much, if any, cash dividends they desire from the corporation in which they have invested?
Common stockholders would consider the company’s investment opportunity, their need for income, and their tax bracket when deciding on their desire for dividends.
4. What is the Modigliani and Miller theory of dividends? Explain.
The Modigliani-Miller theory of dividends says that dividend theoryis irrelevant. They claim that it is the income produced by assetsthat is important, not how funds are distributed.
173
5. Do you believe an increased common stock cash dividend can send a signal to the common stockholders? If so, what signal might it send?
An increase in cash dividends is often seen as a positive signal. A company would be unlikely to increase its dividend if it did not believe its future prospects were good enough to sustain the higherlevel of dividends. This is because the market usually frowns upona cut in dividends.
6. Explain the bird in the hand theory of cash dividends.
The bird in the hand dividends theory says that dividends received now are better than a promise of future dividends. Uncertainty is resolved when a dividend is paid.
7. What is the effect of stock (not cash) dividends and stock splits on the market price of common stock? Why do corporations declare stock splits and stock dividends?
Stock splits and stock dividends decrease the price per share of the common stock but should not increase the total market value of all common stock outstanding unless other positive things are perceived to occur. Many companies believe that a stock split or stock dividend makes their stock more affordable and therefore moreattractive to a wider range of potential investors.
Answers to End-of-Chapter Problems
16-1. Retention Ratio = $600/$1,000 = 0.6 or 60%∴ Payout Ratio = 1-.6 = .4 = 40%
16-2. Dividend Paid = 0.4 X $50 million = $20 millionAddition to Retained Earnings = $50 mil. - $20 mil. = $30 million
174
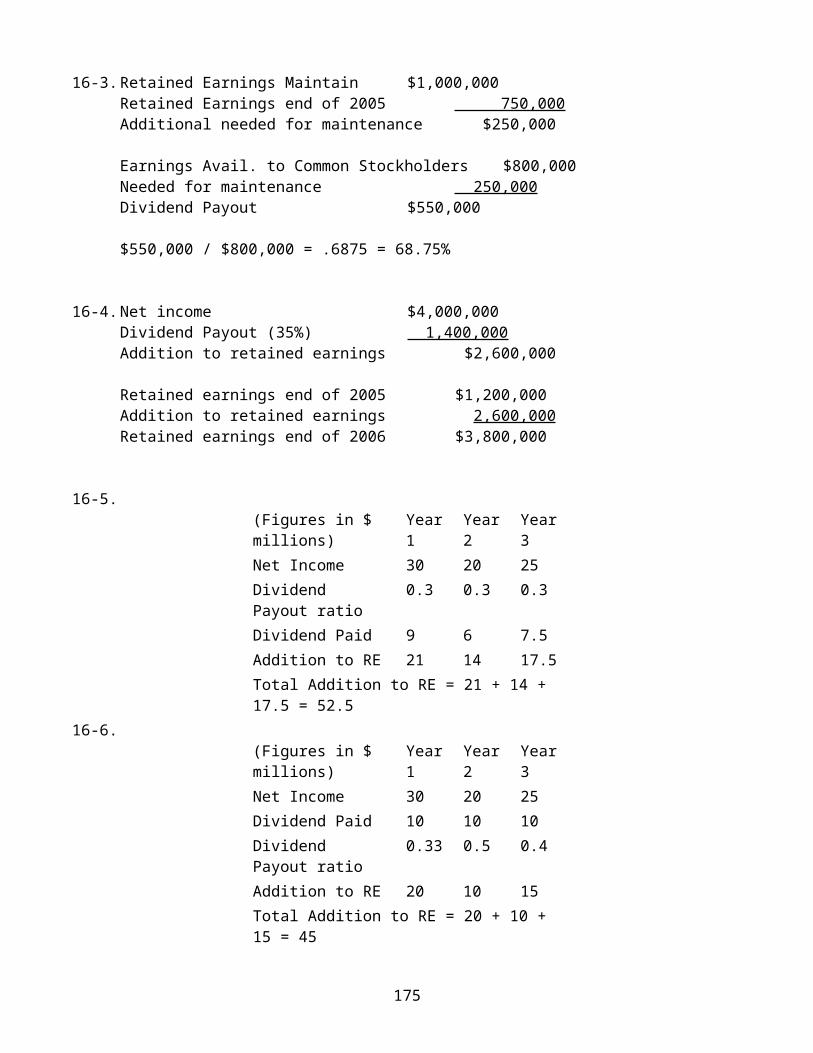
16-3.Retained Earnings Maintain $1,000,000Retained Earnings end of 2005 750,000Additional needed for maintenance $250,000
Earnings Avail. to Common Stockholders $800,000Needed for maintenance 250,000Dividend Payout $550,000
$550,000 / $800,000 = .6875 = 68.75%
16-4.Net income $4,000,000Dividend Payout (35%) 1,400,000Addition to retained earnings $2,600,000
Retained earnings end of 2005 $1,200,000Addition to retained earnings 2,600,000Retained earnings end of 2006 $3,800,000
16-5. (Figures in $ millions)
Year1
Year2
Year3
Net Income 30 20 25Dividend Payout ratio
0.3 0.3 0.3
Dividend Paid 9 6 7.5Addition to RE 21 14 17.5Total Addition to RE = 21 + 14 + 17.5 = 52.5
16-6. (Figures in $ millions)
Year1
Year2
Year3
Net Income 30 20 25Dividend Paid 10 10 10Dividend Payout ratio
0.33 0.5 0.4
Addition to RE 20 10 15Total Addition to RE = 20 + 10 + 15 = 45
175
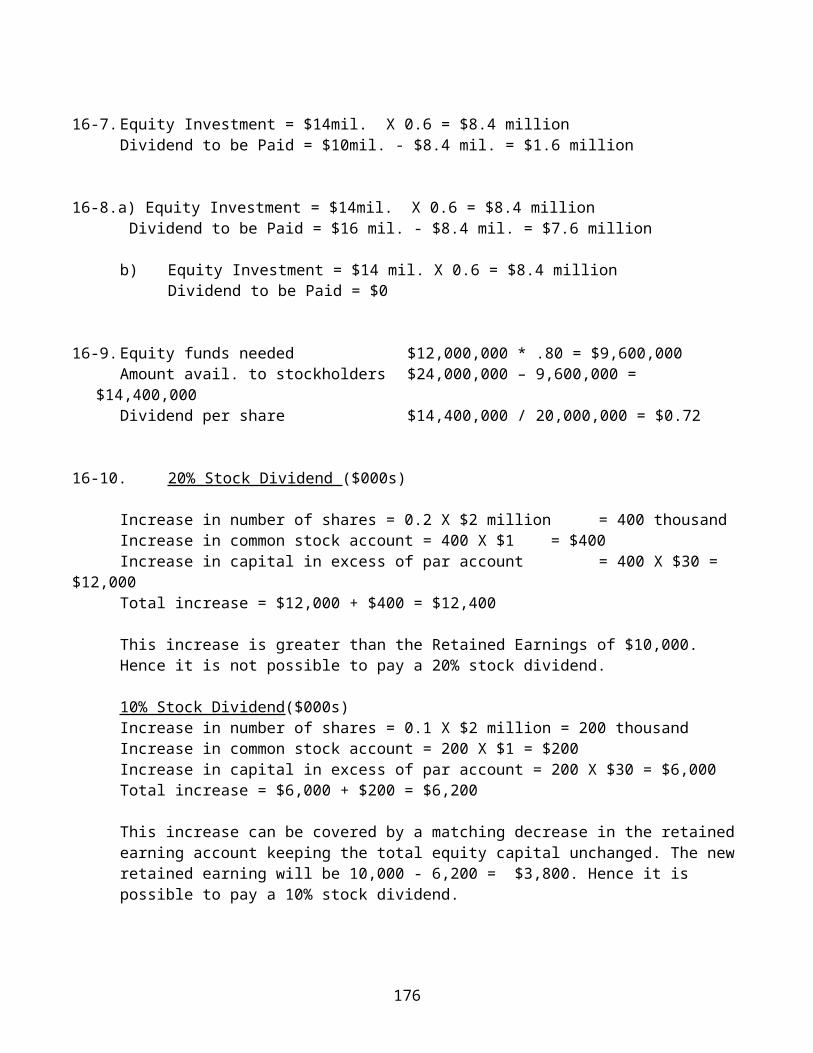
16-7.Equity Investment = $14mil. X 0.6 = $8.4 millionDividend to be Paid = $10mil. - $8.4 mil. = $1.6 million
16-8.a) Equity Investment = $14mil. X 0.6 = $8.4 million Dividend to be Paid = $16 mil. - $8.4 mil. = $7.6 million
b) Equity Investment = $14 mil. X 0.6 = $8.4 millionDividend to be Paid = $0
16-9.Equity funds needed $12,000,000 * .80 = $9,600,000Amount avail. to stockholders $24,000,000 – 9,600,000 =
$14,400,000Dividend per share $14,400,000 / 20,000,000 = $0.72
16-10. 20% Stock Dividend ($000s)
Increase in number of shares = 0.2 X $2 million = 400 thousandIncrease in common stock account = 400 X $1 = $400Increase in capital in excess of par account = 400 X $30 =
$12,000Total increase = $12,000 + $400 = $12,400
This increase is greater than the Retained Earnings of $10,000. Hence it is not possible to pay a 20% stock dividend.
10% Stock Dividend($000s)Increase in number of shares = 0.1 X $2 million = 200 thousandIncrease in common stock account = 200 X $1 = $200Increase in capital in excess of par account = 200 X $30 = $6,000Total increase = $6,000 + $200 = $6,200
This increase can be covered by a matching decrease in the retainedearning account keeping the total equity capital unchanged. The newretained earning will be 10,000 - 6,200 = $3,800. Hence it is possible to pay a 10% stock dividend.
176
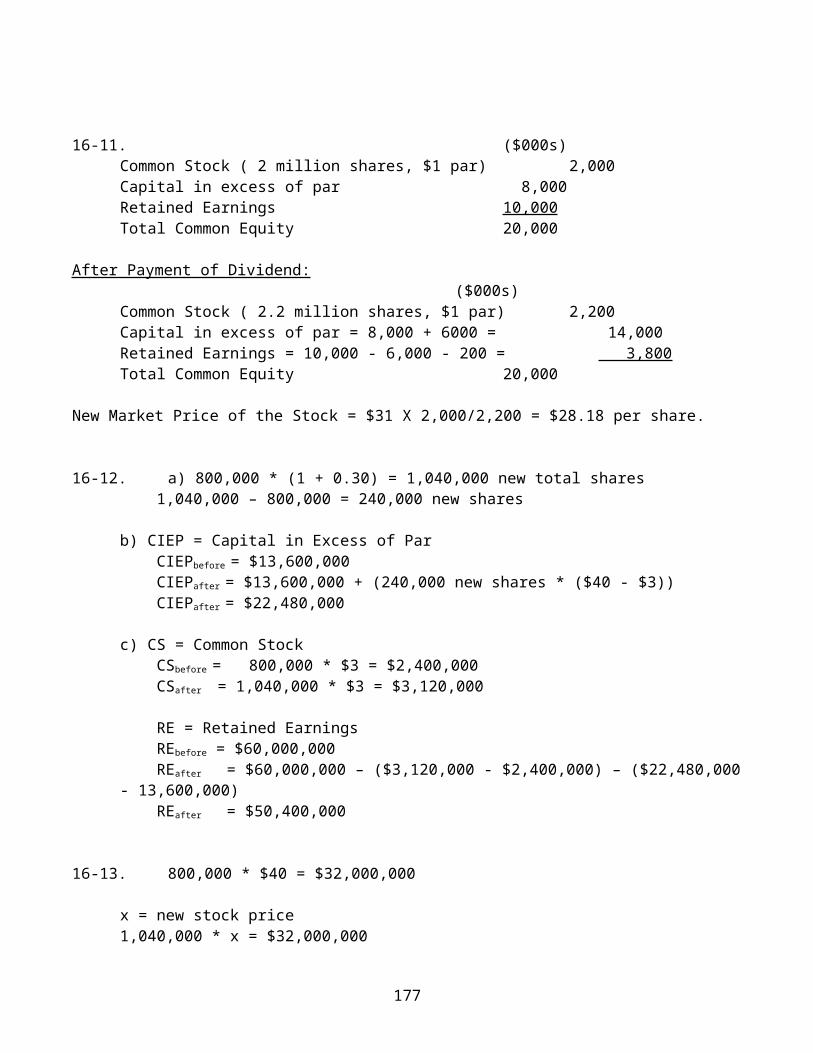
16-11. ($000s)Common Stock ( 2 million shares, $1 par) 2,000Capital in excess of par 8,000Retained Earnings 10,000Total Common Equity 20,000
After Payment of Dividend:($000s)
Common Stock ( 2.2 million shares, $1 par) 2,200Capital in excess of par = 8,000 + 6000 = 14,000Retained Earnings = 10,000 - 6,000 - 200 = 3,800Total Common Equity 20,000
New Market Price of the Stock = $31 X 2,000/2,200 = $28.18 per share.
16-12. a) 800,000 * (1 + 0.30) = 1,040,000 new total shares 1,040,000 – 800,000 = 240,000 new shares
b) CIEP = Capital in Excess of Par CIEPbefore = $13,600,000 CIEPafter = $13,600,000 + (240,000 new shares * ($40 - $3)) CIEPafter = $22,480,000
c) CS = Common Stock CSbefore = 800,000 * $3 = $2,400,000 CSafter = 1,040,000 * $3 = $3,120,000
RE = Retained Earnings REbefore = $60,000,000 REafter = $60,000,000 – ($3,120,000 - $2,400,000) – ($22,480,000- 13,600,000) REafter = $50,400,000
16-13. 800,000 * $40 = $32,000,000
x = new stock price1,040,000 * x = $32,000,000
177
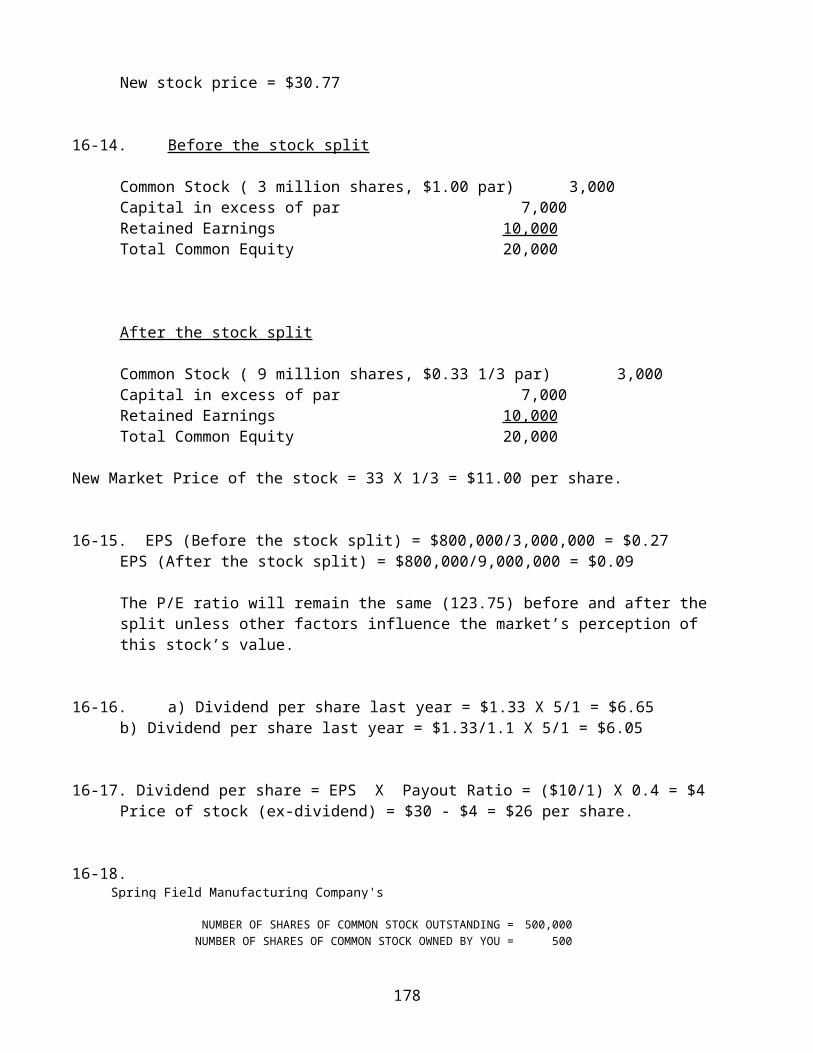
New stock price = $30.77
16-14. Before the stock split
Common Stock ( 3 million shares, $1.00 par) 3,000Capital in excess of par 7,000Retained Earnings 10,000Total Common Equity 20,000
After the stock split
Common Stock ( 9 million shares, $0.33 1/3 par) 3,000Capital in excess of par 7,000Retained Earnings 10,000Total Common Equity 20,000
New Market Price of the stock = 33 X 1/3 = $11.00 per share.
16-15. EPS (Before the stock split) = $800,000/3,000,000 = $0.27EPS (After the stock split) = $800,000/9,000,000 = $0.09
The P/E ratio will remain the same (123.75) before and after the split unless other factors influence the market’s perception of this stock’s value.
16-16. a) Dividend per share last year = $1.33 X 5/1 = $6.65b) Dividend per share last year = $1.33/1.1 X 5/1 = $6.05
16-17. Dividend per share = EPS X Payout Ratio = ($10/1) X 0.4 = $4Price of stock (ex-dividend) = $30 - $4 = $26 per share.
16-18.Spring Field Manufacturing Company's
NUMBER OF SHARES OF COMMON STOCK OUTSTANDING = 500,000NUMBER OF SHARES OF COMMON STOCK OWNED BY YOU = 500
178

NET CAPITAL EQUITY DIVIDEND DIVIDEND DIVIDENDYEAR INCOME INVESTMENTS FINANCING PAYMENT PER SHARE RECEIVED
2007 $1,000,000 $800,000 $480,000 $520,000 $1.04 $520 2008 $1,100,000 $1,000,000 $600,000 $500,000 $1.00 $500 2009 $1,200,000 $2,000,000 $1,200,00
0 $0 $0.00 $0
2010 $1,300,000 $800,000 $480,000 $820,000 $1.64 $820 2011 $1,400,000 $1,000,000 $600,000 $800,000 $1.60 $800
16-19.Spring Field Manufacturing Company'sDividend Payments:
NUMBER OF SHARES OF COMMON STOCK OWNED BY YOU = 500
AMOUNT NO. OFNET CAPITAL EQUITY FROM SHARES DIVIDEND DIVIDEND DIVIDEND
YEAR INCOME INVESTMENTS FINANCING NEW SHARES OUTSTANDING PAYMENT PER SHARE RECEIVED
2007 $1,000,000
$800,000 $480,000 500,000 $520,000 $1.04 $520
2008 $1,100,000
$1,000,000 $600,000 500,000 $500,000 $1.00 $500
2009 $1,200,000
$2,000,000 $1,200,000 $600,000 600,000 $600,000 $1.00 $500
2010 $1,300,000
$800,000 $480,000 600,000 $820,000 $1.37 $683
2011 $1,400,000
$1,000,000 $600,000 600,000 $800,000 $1.33 $667
16-20. Comprehensive Problem:
a) Expected Dividend per share = $3,000,000 X 0.5/500,000 = $3Repurchase Price = $47 + $3 = $50 per share
179
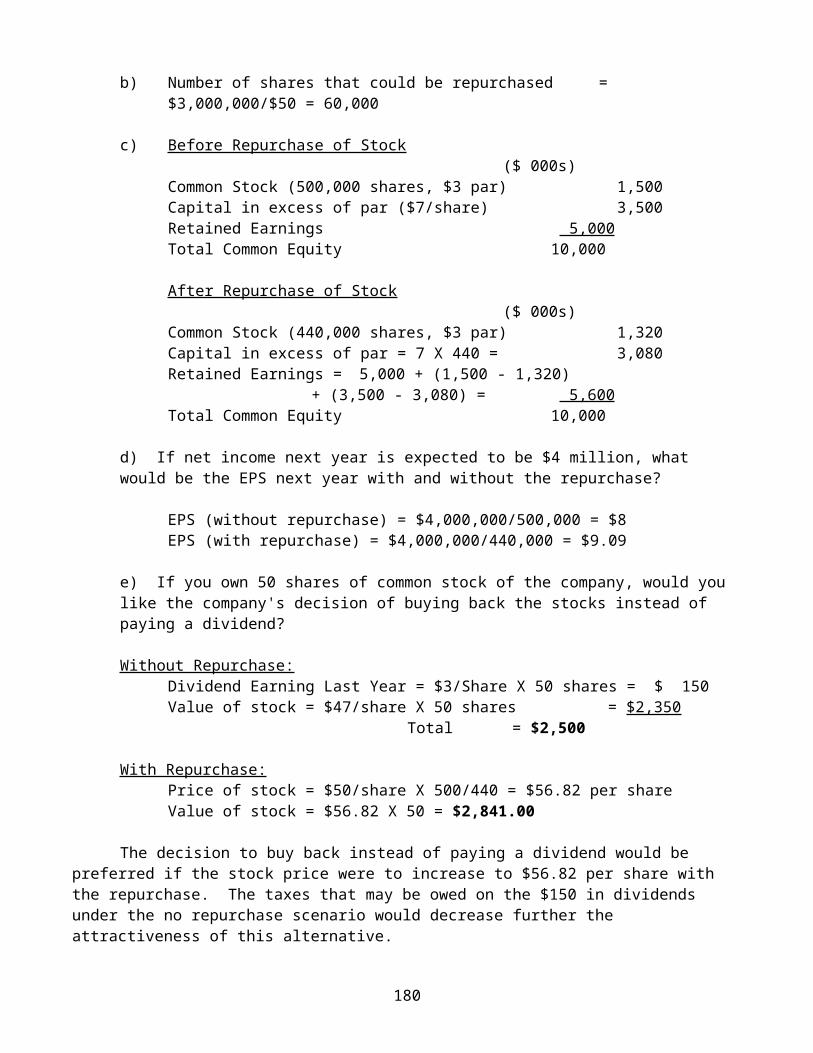
b) Number of shares that could be repurchased = $3,000,000/$50 = 60,000
c) Before Repurchase of Stock($ 000s)
Common Stock (500,000 shares, $3 par) 1,500Capital in excess of par ($7/share) 3,500Retained Earnings 5,000Total Common Equity 10,000
After Repurchase of Stock($ 000s)
Common Stock (440,000 shares, $3 par) 1,320Capital in excess of par = 7 X 440 = 3,080Retained Earnings = 5,000 + (1,500 - 1,320)
+ (3,500 - 3,080) = 5,600Total Common Equity 10,000
d) If net income next year is expected to be $4 million, what would be the EPS next year with and without the repurchase?
EPS (without repurchase) = $4,000,000/500,000 = $8EPS (with repurchase) = $4,000,000/440,000 = $9.09
e) If you own 50 shares of common stock of the company, would you like the company's decision of buying back the stocks instead of paying a dividend?
Without Repurchase:Dividend Earning Last Year = $3/Share X 50 shares = $ 150Value of stock = $47/share X 50 shares = $2,350
Total = $2,500
With Repurchase:Price of stock = $50/share X 500/440 = $56.82 per shareValue of stock = $56.82 X 50 = $2,841.00
The decision to buy back instead of paying a dividend would be preferred if the stock price were to increase to $56.82 per share with the repurchase. The taxes that may be owed on the $150 in dividends under the no repurchase scenario would decrease further the attractiveness of this alternative.
180
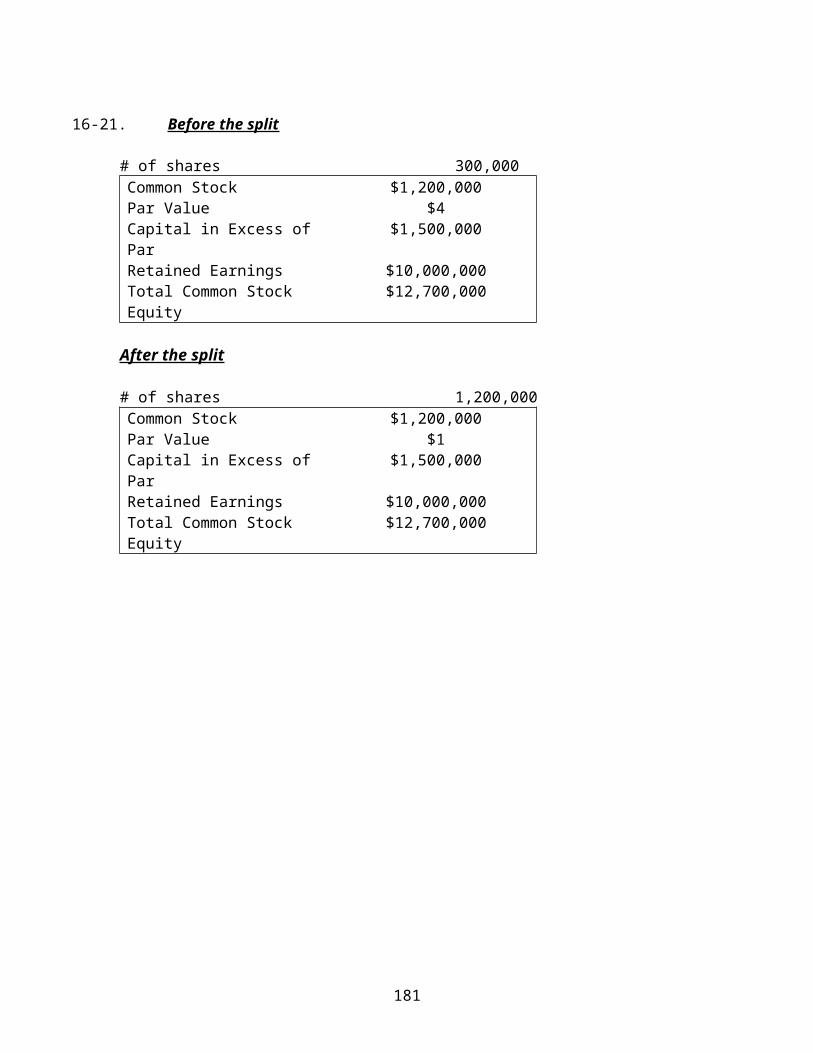
16-21. Before the split
# of shares 300,000Common Stock $1,200,000Par Value $4Capital in Excess of Par
$1,500,000
Retained Earnings $10,000,000Total Common Stock Equity
$12,700,000
After the split
# of shares 1,200,000Common Stock $1,200,000Par Value $1Capital in Excess of Par
$1,500,000
Retained Earnings $10,000,000Total Common Stock Equity
$12,700,000
181
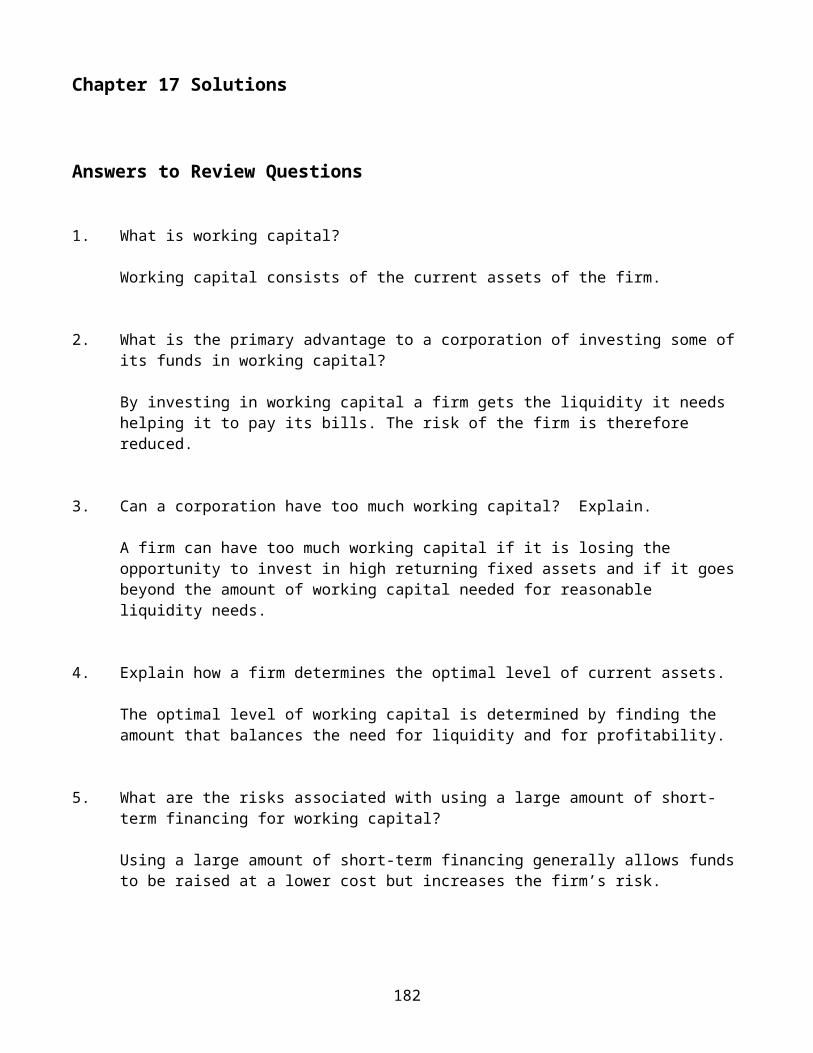
Chapter 17 Solutions
Answers to Review Questions
1. What is working capital?
Working capital consists of the current assets of the firm.
2. What is the primary advantage to a corporation of investing some ofits funds in working capital?
By investing in working capital a firm gets the liquidity it needs helping it to pay its bills. The risk of the firm is therefore reduced.
3. Can a corporation have too much working capital? Explain.
A firm can have too much working capital if it is losing the opportunity to invest in high returning fixed assets and if it goesbeyond the amount of working capital needed for reasonable liquidity needs.
4. Explain how a firm determines the optimal level of current assets.
The optimal level of working capital is determined by finding the amount that balances the need for liquidity and for profitability.
5. What are the risks associated with using a large amount of short-term financing for working capital?
Using a large amount of short-term financing generally allows fundsto be raised at a lower cost but increases the firm’s risk.
182
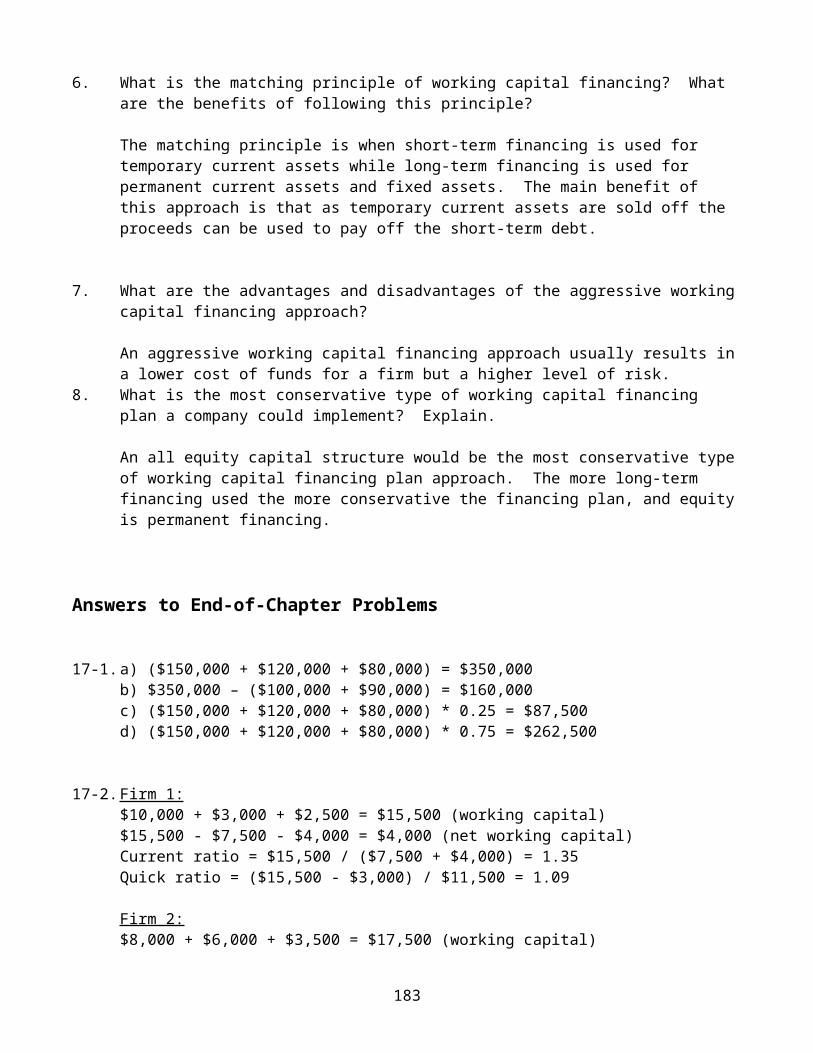
6. What is the matching principle of working capital financing? What are the benefits of following this principle?
The matching principle is when short-term financing is used for temporary current assets while long-term financing is used for permanent current assets and fixed assets. The main benefit of this approach is that as temporary current assets are sold off the proceeds can be used to pay off the short-term debt.
7. What are the advantages and disadvantages of the aggressive workingcapital financing approach?
An aggressive working capital financing approach usually results ina lower cost of funds for a firm but a higher level of risk.
8. What is the most conservative type of working capital financing plan a company could implement? Explain.
An all equity capital structure would be the most conservative typeof working capital financing plan approach. The more long-term financing used the more conservative the financing plan, and equityis permanent financing.
Answers to End-of-Chapter Problems
17-1.a) ($150,000 + $120,000 + $80,000) = $350,000b) $350,000 – ($100,000 + $90,000) = $160,000c) ($150,000 + $120,000 + $80,000) * 0.25 = $87,500d) ($150,000 + $120,000 + $80,000) * 0.75 = $262,500
17-2.Firm 1: $10,000 + $3,000 + $2,500 = $15,500 (working capital)$15,500 - $7,500 - $4,000 = $4,000 (net working capital)Current ratio = $15,500 / ($7,500 + $4,000) = 1.35Quick ratio = ($15,500 - $3,000) / $11,500 = 1.09
Firm 2:$8,000 + $6,000 + $3,500 = $17,500 (working capital)
183
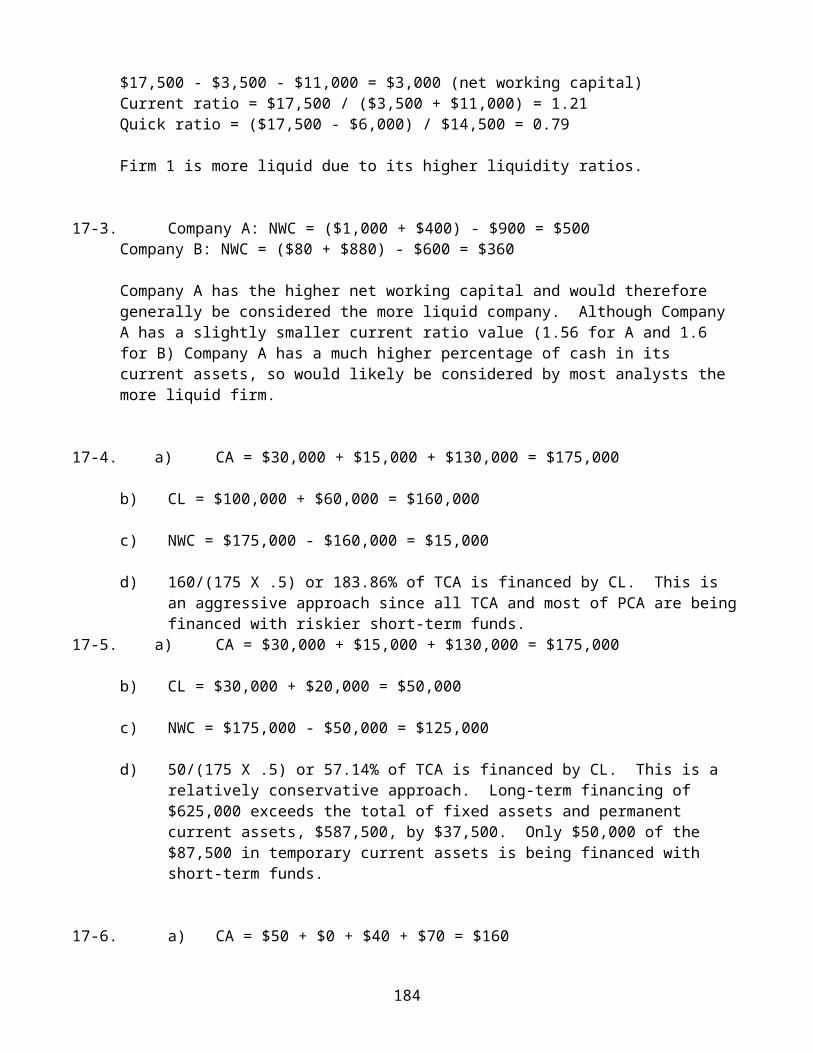
$17,500 - $3,500 - $11,000 = $3,000 (net working capital)Current ratio = $17,500 / ($3,500 + $11,000) = 1.21Quick ratio = ($17,500 - $6,000) / $14,500 = 0.79
Firm 1 is more liquid due to its higher liquidity ratios.
17-3. Company A: NWC = ($1,000 + $400) - $900 = $500Company B: NWC = ($80 + $880) - $600 = $360
Company A has the higher net working capital and would therefore generally be considered the more liquid company. Although Company A has a slightly smaller current ratio value (1.56 for A and 1.6 for B) Company A has a much higher percentage of cash in its current assets, so would likely be considered by most analysts the more liquid firm.
17-4. a) CA = $30,000 + $15,000 + $130,000 = $175,000
b) CL = $100,000 + $60,000 = $160,000
c) NWC = $175,000 - $160,000 = $15,000
d) 160/(175 X .5) or 183.86% of TCA is financed by CL. This is an aggressive approach since all TCA and most of PCA are beingfinanced with riskier short-term funds.
17-5. a) CA = $30,000 + $15,000 + $130,000 = $175,000
b) CL = $30,000 + $20,000 = $50,000
c) NWC = $175,000 - $50,000 = $125,000
d) 50/(175 X .5) or 57.14% of TCA is financed by CL. This is a relatively conservative approach. Long-term financing of $625,000 exceeds the total of fixed assets and permanent current assets, $587,500, by $37,500. Only $50,000 of the $87,500 in temporary current assets is being financed with short-term funds.
17-6. a) CA = $50 + $0 + $40 + $70 = $160
184
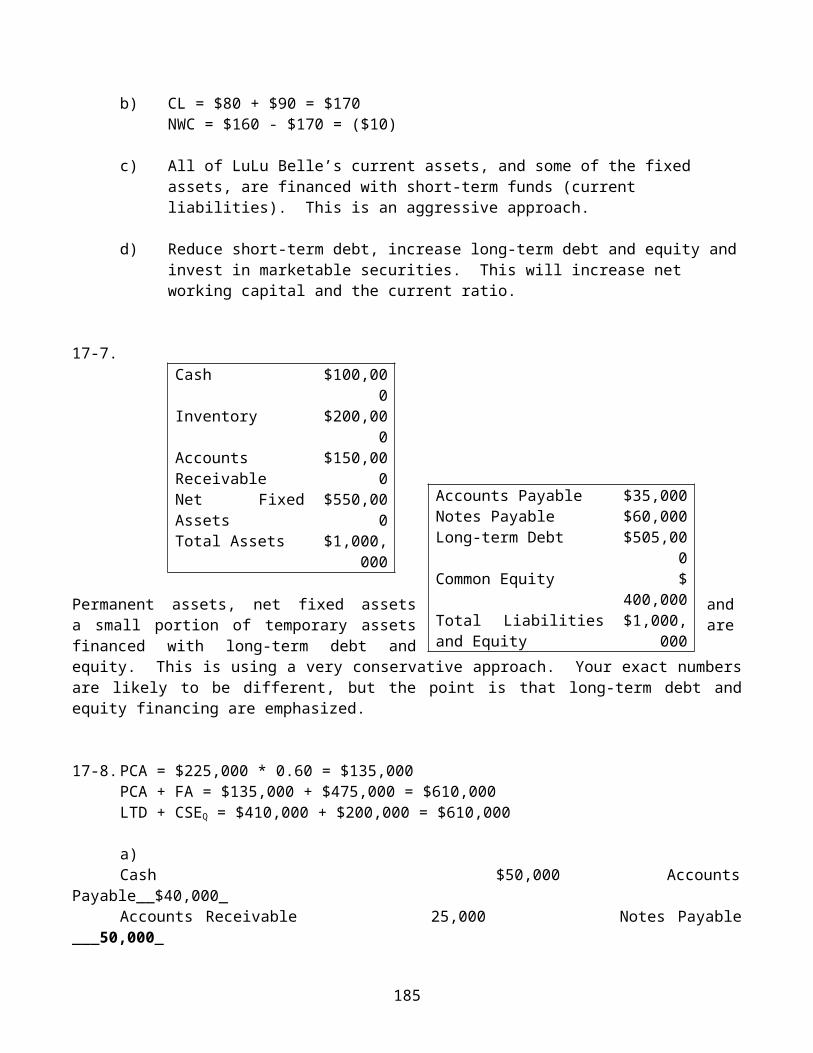
b) CL = $80 + $90 = $170NWC = $160 - $170 = ($10)
c) All of LuLu Belle’s current assets, and some of the fixed assets, are financed with short-term funds (current liabilities). This is an aggressive approach.
d) Reduce short-term debt, increase long-term debt and equity andinvest in marketable securities. This will increase net working capital and the current ratio.
17-7.Cash $100,00
0Inventory $200,00
0AccountsReceivable
$150,000
Net FixedAssets
$550,000
Total Assets $1,000,000
Permanent assets, net fixed assets anda small portion of temporary assets arefinanced with long-term debt andequity. This is using a very conservative approach. Your exact numbersare likely to be different, but the point is that long-term debt andequity financing are emphasized.
17-8.PCA = $225,000 * 0.60 = $135,000PCA + FA = $135,000 + $475,000 = $610,000LTD + CSEQ = $410,000 + $200,000 = $610,000
a) Cash $50,000 Accounts
Payable__$40,000_ Accounts Receivable 25,000 Notes Payable___50,000_
185
Accounts Payable $35,000Notes Payable $60,000Long-term Debt $505,00
0Common Equity $
400,000Total Liabilitiesand Equity
$1,000,000
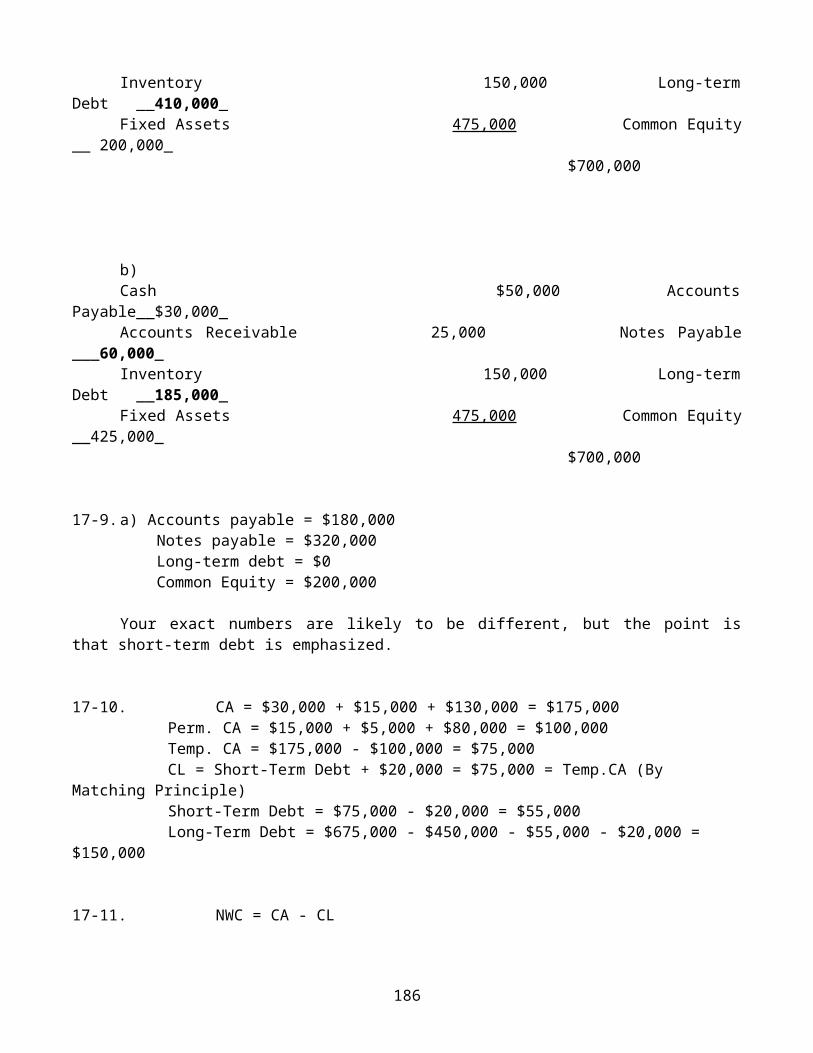
Inventory 150,000 Long-termDebt __410,000_ Fixed Assets 475,000 Common Equity__ 200,000_ $700,000
b)Cash $50,000 Accounts
Payable__$30,000_ Accounts Receivable 25,000 Notes Payable___60,000_ Inventory 150,000 Long-termDebt __185,000_ Fixed Assets 475,000 Common Equity__425,000_ $700,000
17-9.a) Accounts payable = $180,000 Notes payable = $320,000 Long-term debt = $0 Common Equity = $200,000
Your exact numbers are likely to be different, but the point isthat short-term debt is emphasized.
17-10. CA = $30,000 + $15,000 + $130,000 = $175,000Perm. CA = $15,000 + $5,000 + $80,000 = $100,000Temp. CA = $175,000 - $100,000 = $75,000CL = Short-Term Debt + $20,000 = $75,000 = Temp.CA (By
Matching Principle)Short-Term Debt = $75,000 - $20,000 = $55,000Long-Term Debt = $675,000 - $450,000 - $55,000 - $20,000 =
$150,000
17-11. NWC = CA - CL
186
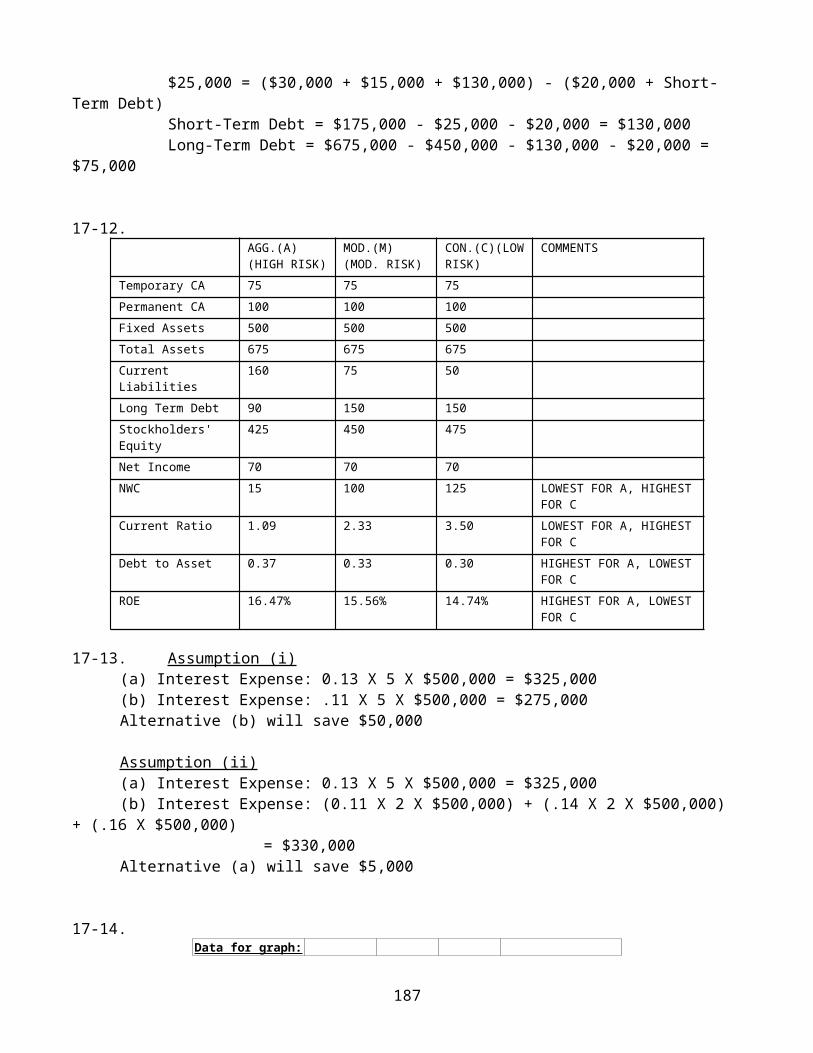
$25,000 = ($30,000 + $15,000 + $130,000) - ($20,000 + Short-Term Debt)
Short-Term Debt = $175,000 - $25,000 - $20,000 = $130,000Long-Term Debt = $675,000 - $450,000 - $130,000 - $20,000 =
$75,000
17-12. AGG.(A)(HIGH RISK)
MOD.(M)(MOD. RISK)
CON.(C)(LOWRISK)
COMMENTS
Temporary CA 75 75 75Permanent CA 100 100 100Fixed Assets 500 500 500Total Assets 675 675 675Current Liabilities
160 75 50
Long Term Debt 90 150 150Stockholders' Equity
425 450 475
Net Income 70 70 70NWC 15 100 125 LOWEST FOR A, HIGHEST
FOR CCurrent Ratio 1.09 2.33 3.50 LOWEST FOR A, HIGHEST
FOR CDebt to Asset 0.37 0.33 0.30 HIGHEST FOR A, LOWEST
FOR CROE 16.47% 15.56% 14.74% HIGHEST FOR A, LOWEST
FOR C
17-13. Assumption (i)(a) Interest Expense: 0.13 X 5 X $500,000 = $325,000(b) Interest Expense: .11 X 5 X $500,000 = $275,000Alternative (b) will save $50,000
Assumption (ii)(a) Interest Expense: 0.13 X 5 X $500,000 = $325,000(b) Interest Expense: (0.11 X 2 X $500,000) + (.14 X 2 X $500,000)
+ (.16 X $500,000)= $330,000
Alternative (a) will save $5,000
17-14. Data for graph:
187

Permanent
Temporary
Current Liabilities
Total assets
Fixed assets
Current Current if Matching Principle
Date (given) (given) Assets Assets is Followed
31-Jan
$45 $14 $14 $17 $17
28-Feb
$46 $14 $14 $18 $18
31-Mar
$34 $14 $14 $6 $6
30-Apr
$48 $14 $14 $20 $20
31-May
$40 $14 $14 $12 $12
30-Jun
$30 $14 $14 $2 $2
31-Jul
$28 $14 $14 $0 $0
31-Aug
$39 $14 $14 $11 $11
30-Sep
$45 $14 $14 $17 $17
31-Oct
$39 $14 $14 $11 $11
30-Nov
$52 $14 $14 $24 $24
31-Dec
$50 $14 $14 $22 $22
17-15.
188
W orking Capital Trends
$30
$35
$40
$45
$50
$55
$60
Jan Apr Jul OctJan Apr Jul OctJan Apr Jul OctJan Apr Jul OctJan Apr Jul OctM ONTH/ YEAR
Tem porary Current Assets
Perm anent Current Assets
Fixed Assets
W orking Capital Trends
$0
$10
$20
$30
$40
$50
$60
31-Jan
28-Feb
31-M ar
30-Apr
31-M ay
30-Jun
31-Jul
31-Aug
30-Sep
31-Oct
30-Nov
31-Dec
Fixed Assets
Perm enant Current Assets
Tem porary Current AssetsTem porary Current Assets
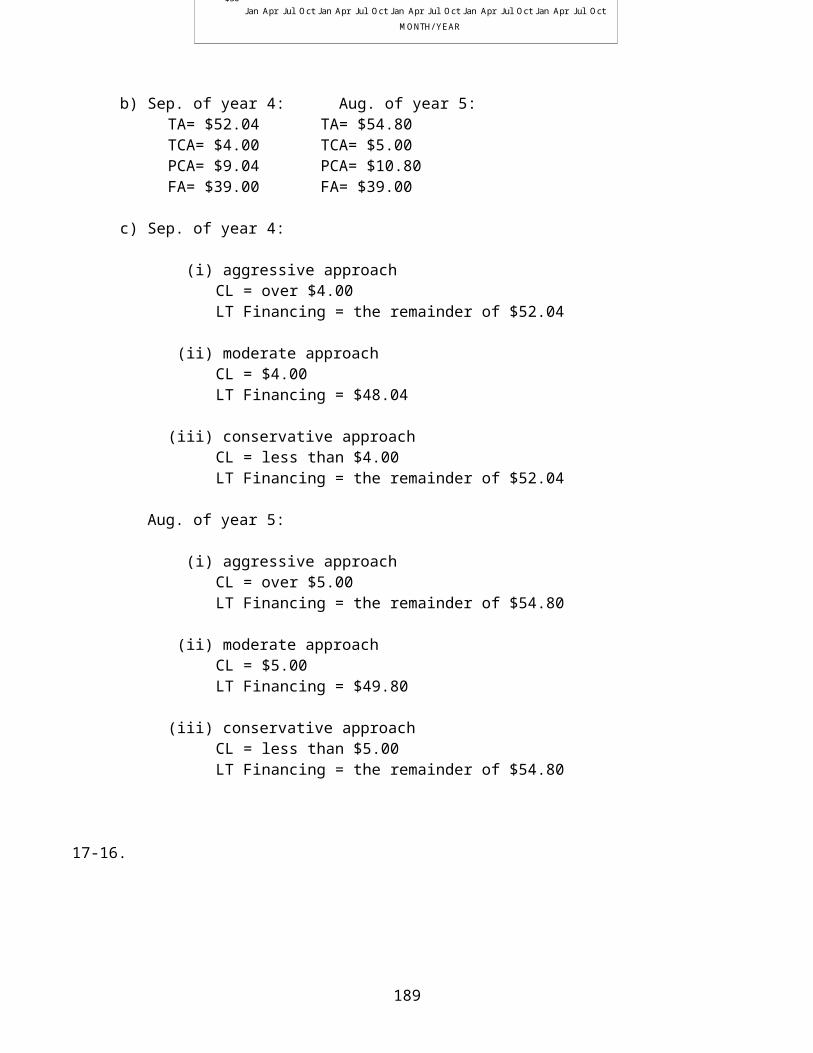
b) Sep. of year 4: Aug. of year 5:TA= $52.04 TA= $54.80TCA= $4.00 TCA= $5.00PCA= $9.04 PCA= $10.80FA= $39.00 FA= $39.00
c) Sep. of year 4:
(i) aggressive approachCL = over $4.00LT Financing = the remainder of $52.04
(ii) moderate approachCL = $4.00LT Financing = $48.04
(iii) conservative approach CL = less than $4.00LT Financing = the remainder of $52.04
Aug. of year 5:
(i) aggressive approachCL = over $5.00LT Financing = the remainder of $54.80
(ii) moderate approachCL = $5.00LT Financing = $49.80
(iii) conservative approach CL = less than $5.00LT Financing = the remainder of $54.80
17-16.
189
W orking Capital Trends
$30
$35
$40
$45
$50
$55
$60
Jan Apr Jul OctJan Apr Jul OctJan Apr Jul OctJan Apr Jul OctJan Apr Jul OctM ONTH/ YEAR
Tem porary Current Assets
Perm anent Current Assets
Fixed Assets
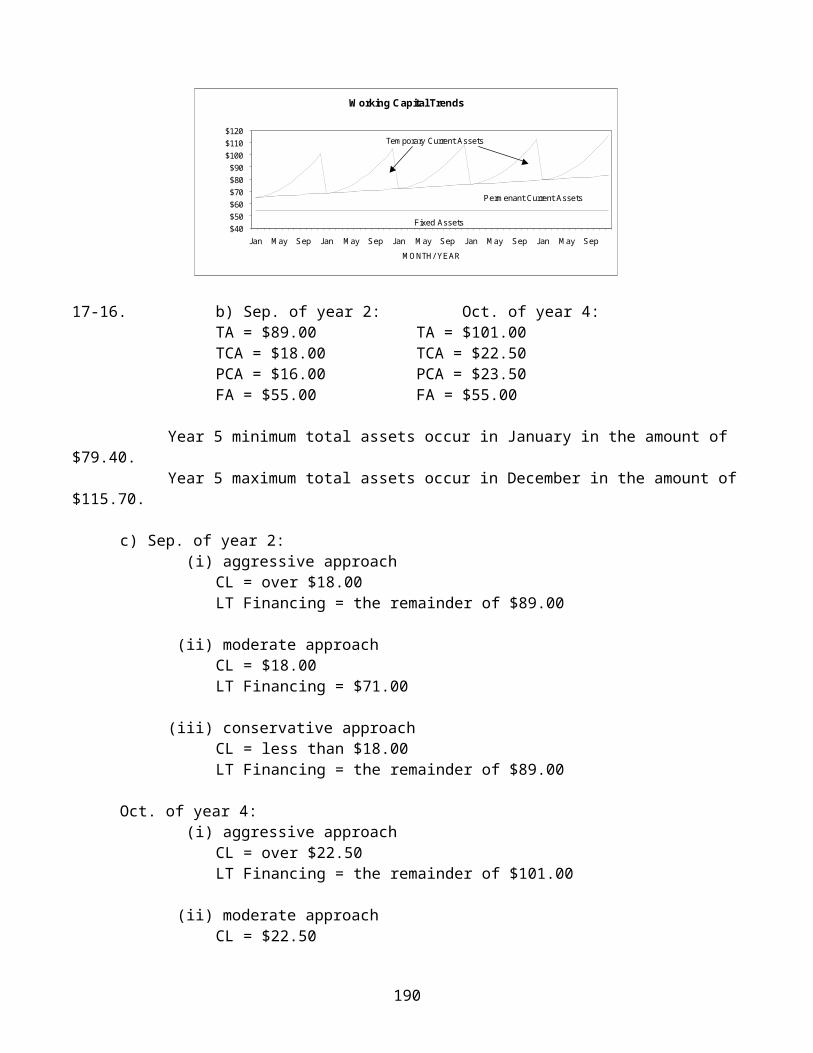
17-16. b) Sep. of year 2: Oct. of year 4:TA = $89.00 TA = $101.00TCA = $18.00 TCA = $22.50PCA = $16.00 PCA = $23.50FA = $55.00 FA = $55.00
Year 5 minimum total assets occur in January in the amount of $79.40.
Year 5 maximum total assets occur in December in the amount of$115.70.
c) Sep. of year 2: (i) aggressive approach
CL = over $18.00LT Financing = the remainder of $89.00
(ii) moderate approachCL = $18.00LT Financing = $71.00
(iii) conservative approach CL = less than $18.00LT Financing = the remainder of $89.00
Oct. of year 4: (i) aggressive approach
CL = over $22.50LT Financing = the remainder of $101.00
(ii) moderate approachCL = $22.50
190
W orking Capital Trends
$40$50$60$70$80$90$100$110$120
Jan M ay Sep Jan M ay Sep Jan M ay Sep Jan M ay Sep Jan M ay SepM O NTH/ YEAR
Tem porary Current Assets
Perm enant Current Assets
Fixed Assets

LT Financing = $78.50
(iii) conservative approach CL = less than $22.50LT Financing = the remainder of $101.00
191
Chapter 18 Solutions
Answers to Review Questions
1. What are the primary reasons that companies hold cash?
Companies hold cash to make necessary payments, to take advantage of opportunities as they arise, and to cover unforeseen emergencies.
2. Explain the factors affecting the choice of a minimum cash balance amount.
The minimum cash balance amount is determined by how easy it is to raise funds when needed, how predictable the cash flows are, and how risk averse managers are.
3. What are the negative consequences of a company holding too much cash?
A company holding too much cash would be giving up the opportunity to invest more in income producing assets
4. Explain the factors affecting the choice of a maximum cash balance amount.
The maximum cash balance amount is determined by available investment opportunities, the expected return on investments, and the transaction cost of making investments.
5. What is the difference between pro forma financial statements and a cash budget? Explain why pro forma financial statements are not usedto forecast cash needs.
192
Pro forma income statements deal with revenues and expenses that are not always cash flows while cash budgets deal only with projected cash inflows and outflows.
6. What are the benefits of “collecting early” and how do companies attempt to do this?
Money has time value. The sooner cash is collected, the better. Companies use regional collection centers and lock boxes to facilitate this.
7. What are the benefits of “paying late” (but not too late) and how do companies attempt to do this?
Because money has time value, the later cash is paid, but not too late, the better. Companies use remote disbursement banks to facilitate holding onto funds longer.
8. Refer to the Bulldog battery company’s cash budget in Table 18-7. Explain why the company would probably not issue $1 million worth of new common stock in January to avoid all short-term borrowing during the year.
Common stock financing is long-term financing so it would probably not be used to meet this short-term financing need.
Answers to End-of-Chapter Problems
18-1. Miller-Orr Model:H = 3Z - 2LTarget Cash Balance = Z = (H + 2L)/3 = ($9,000 + 2 X $3,000)/
3 = $5,000
18-2. Miller-Orr Model:
a)
193
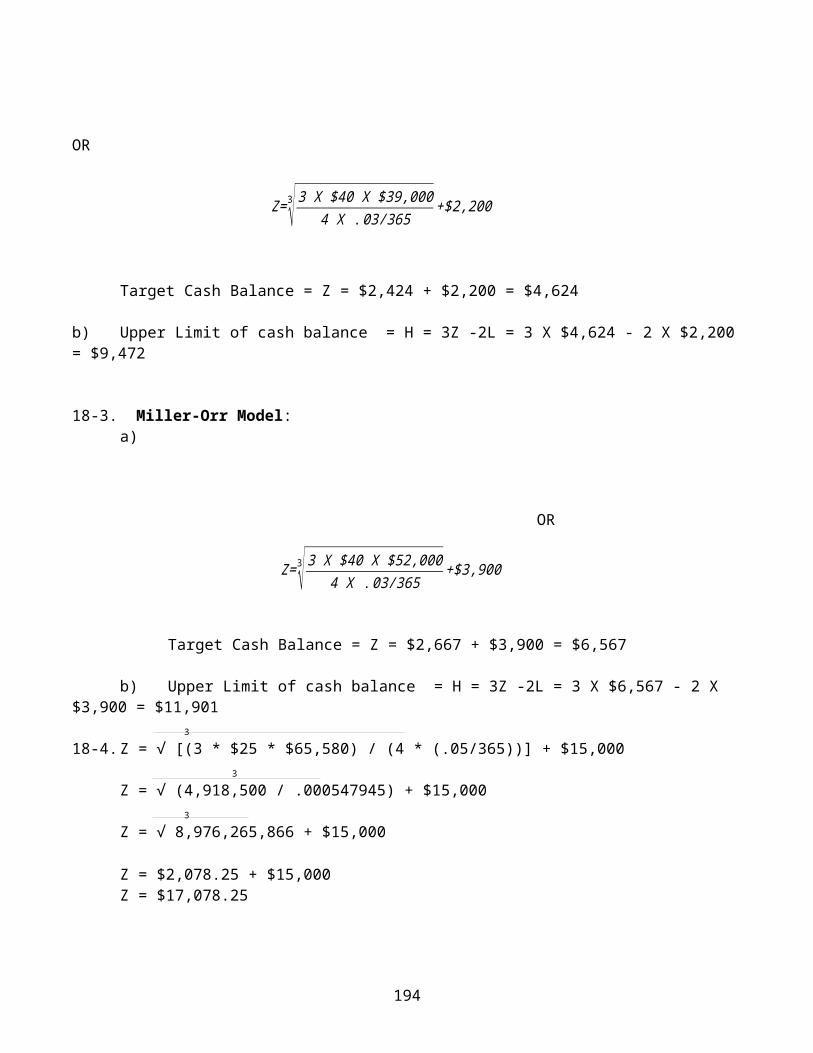
OR
Target Cash Balance = Z = $2,424 + $2,200 = $4,624
b) Upper Limit of cash balance = H = 3Z -2L = 3 X $4,624 - 2 X $2,200= $9,472
18-3. Miller-Orr Model:a)
OR
Target Cash Balance = Z = $2,667 + $3,900 = $6,567
b) Upper Limit of cash balance = H = 3Z -2L = 3 X $6,567 - 2 X $3,900 = $11,901
3
18-4.Z = √ [(3 * $25 * $65,580) / (4 * (.05/365))] + $15,000 3
Z = √ (4,918,500 / .000547945) + $15,000 3
Z = √ 8,976,265,866 + $15,000 Z = $2,078.25 + $15,000Z = $17,078.25
194
Z=3√3 X $40 X $39,0004 X .03/365+$2,200
Z=3√3 X $40 X $52,0004 X .03/365+$3,900
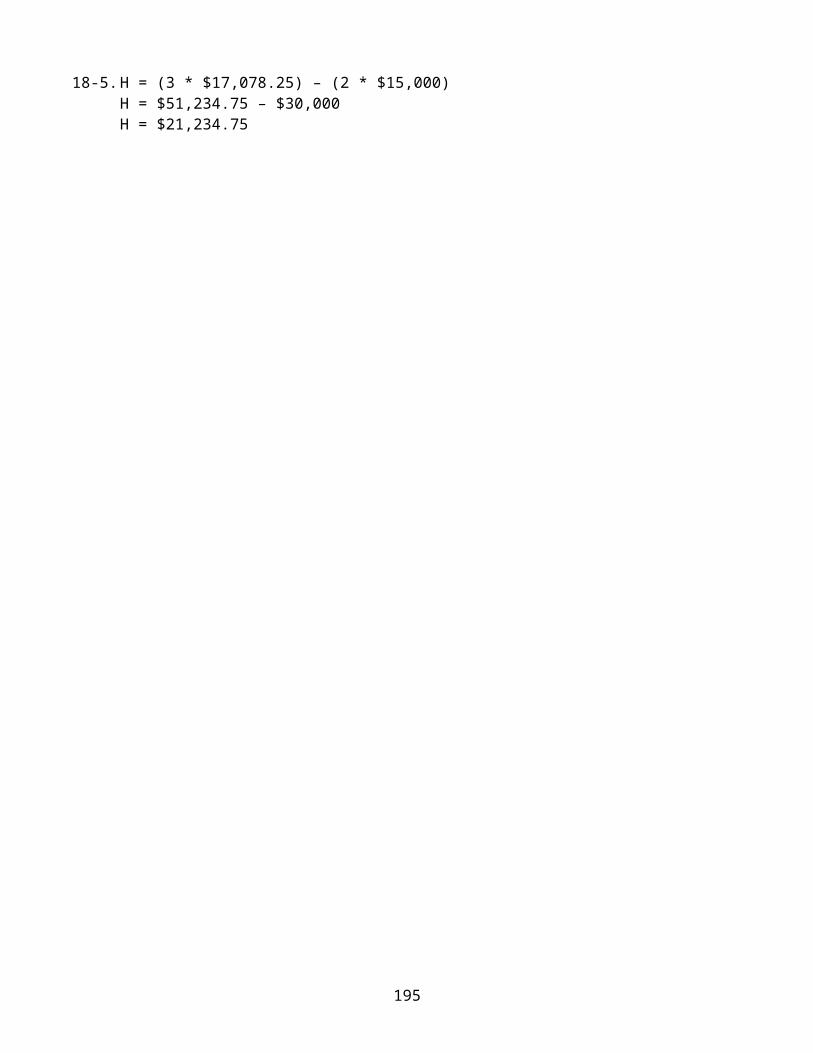
18-5.H = (3 * $17,078.25) – (2 * $15,000)H = $51,234.75 – $30,000H = $21,234.75
195
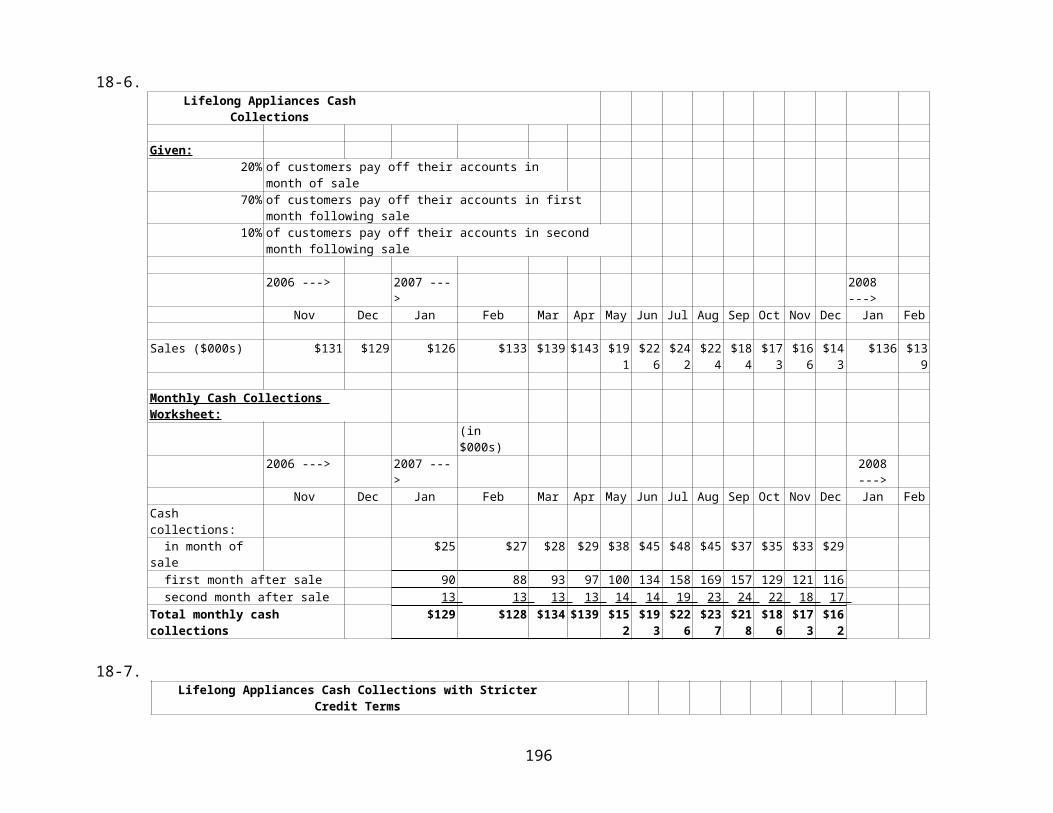
18-6.Lifelong Appliances Cash
Collections
Given:20% of customers pay off their accounts in
month of sale70% of customers pay off their accounts in first
month following sale10% of customers pay off their accounts in second
month following sale
2006 ---> 2007 --->
2008 --->
Nov Dec Jan Feb Mar Apr May Jun Jul Aug Sep Oct Nov Dec Jan Feb
Sales ($000s) $131 $129 $126 $133 $139 $143 $191
$226
$242
$224
$184
$173
$166
$143
$136 $139
Monthly Cash Collections Worksheet:
(in $000s)
2006 ---> 2007 --->
2008--->
Nov Dec Jan Feb Mar Apr May Jun Jul Aug Sep Oct Nov Dec Jan FebCash collections: in month of sale
$25 $27 $28 $29 $38 $45 $48 $45 $37 $35 $33 $29
first month after sale 90 88 93 97 100 134 158 169 157 129 121 116 second month after sale 13 13 13 13 14 14 19 23 24 22 18 17 Total monthly cash collections
$129 $128 $134 $139 $152
$193
$226
$237
$218
$186
$173
$162
18-7.Lifelong Appliances Cash Collections with Stricter
Credit Terms
196
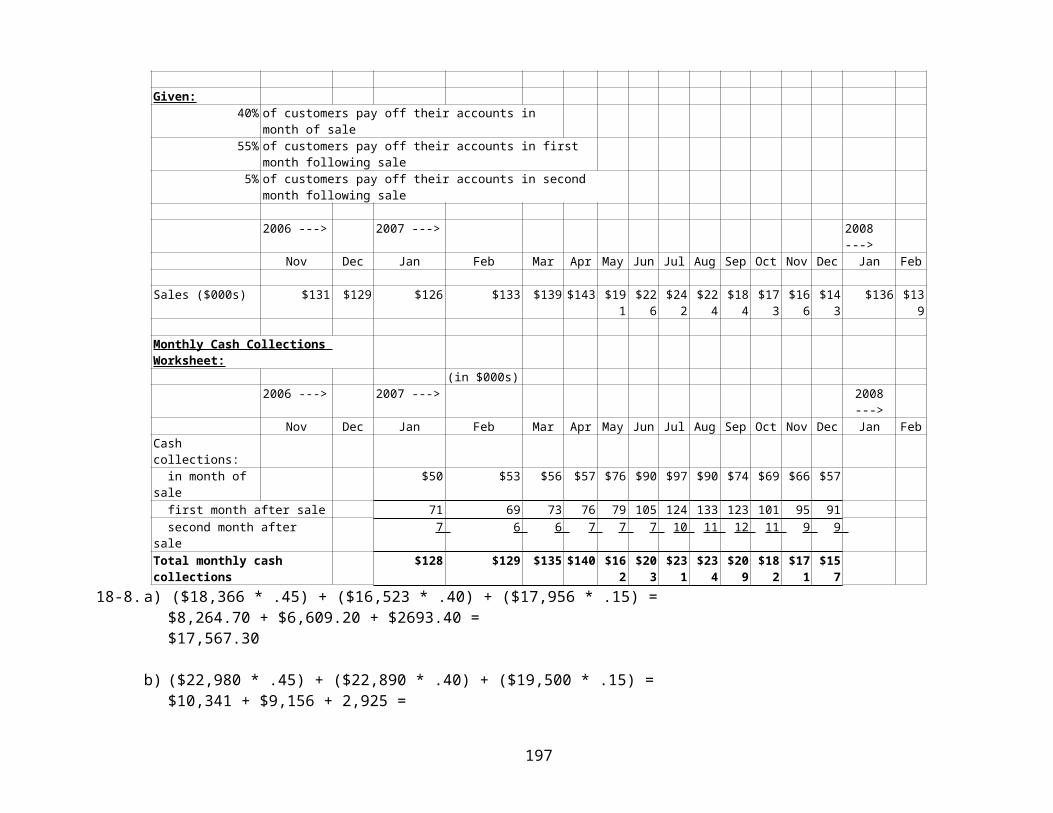
Given:40% of customers pay off their accounts in
month of sale55% of customers pay off their accounts in first
month following sale5% of customers pay off their accounts in second
month following sale
2006 ---> 2007 ---> 2008 --->
Nov Dec Jan Feb Mar Apr May Jun Jul Aug Sep Oct Nov Dec Jan Feb
Sales ($000s) $131 $129 $126 $133 $139 $143 $191
$226
$242
$224
$184
$173
$166
$143
$136 $139
Monthly Cash Collections Worksheet:
(in $000s)2006 ---> 2007 ---> 2008
--->Nov Dec Jan Feb Mar Apr May Jun Jul Aug Sep Oct Nov Dec Jan Feb
Cash collections: in month of sale
$50 $53 $56 $57 $76 $90 $97 $90 $74 $69 $66 $57
first month after sale 71 69 73 76 79 105 124 133 123 101 95 91 second month after sale
7 6 6 7 7 7 10 11 12 11 9 9
Total monthly cash collections
$128 $129 $135 $140 $162
$203
$231
$234
$209
$182
$171
$157
18-8.a) ($18,366 * .45) + ($16,523 * .40) + ($17,956 * .15) = $8,264.70 + $6,609.20 + $2693.40 =$17,567.30
b) ($22,980 * .45) + ($22,890 * .40) + ($19,500 * .15) =$10,341 + $9,156 + 2,925 =
197
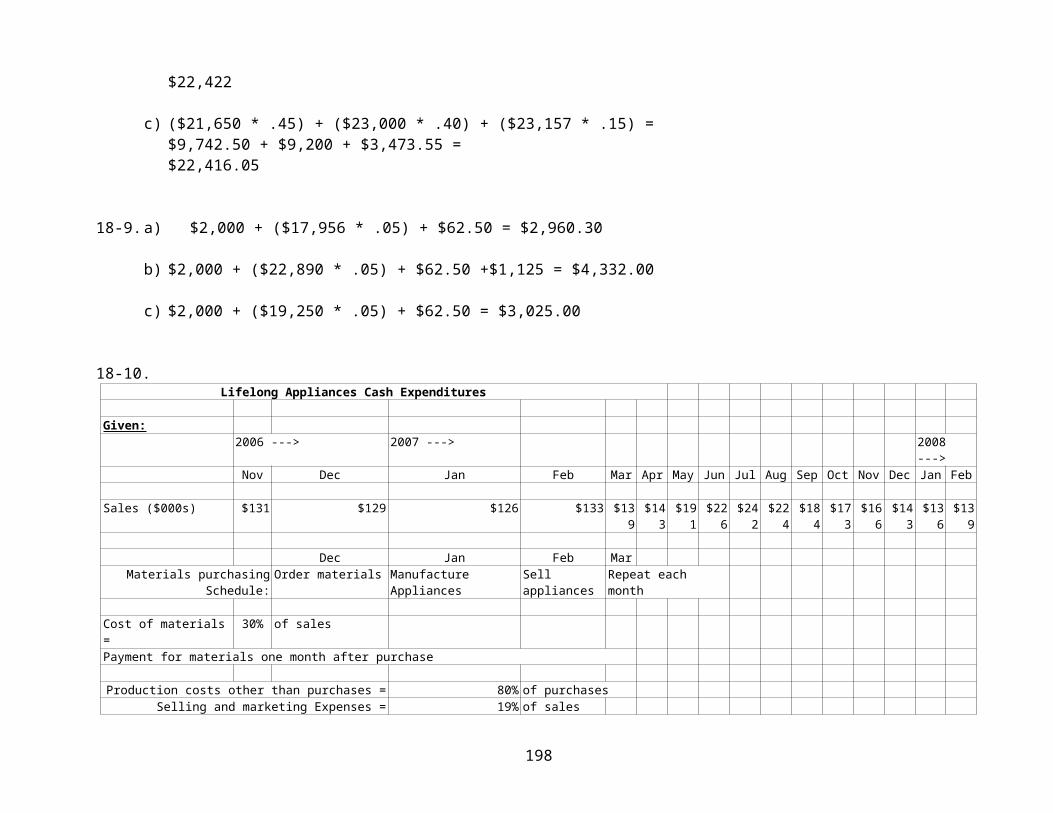
$22,422
c) ($21,650 * .45) + ($23,000 * .40) + ($23,157 * .15) =$9,742.50 + $9,200 + $3,473.55 = $22,416.05
18-9.a) $2,000 + ($17,956 * .05) + $62.50 = $2,960.30
b) $2,000 + ($22,890 * .05) + $62.50 +$1,125 = $4,332.00
c) $2,000 + ($19,250 * .05) + $62.50 = $3,025.00
18-10.Lifelong Appliances Cash Expenditures
Given:2006 ---> 2007 ---> 2008
--->Nov Dec Jan Feb Mar Apr May Jun Jul Aug Sep Oct Nov Dec Jan Feb
Sales ($000s) $131 $129 $126 $133 $139
$143
$191
$226
$242
$224
$184
$173
$166
$143
$136
$139
Dec Jan Feb MarMaterials purchasing
Schedule:Order materials Manufacture
AppliancesSell appliances
Repeat each month
Cost of materials=
30% of sales
Payment for materials one month after purchase
Production costs other than purchases = 80% of purchasesSelling and marketing Expenses = 19% of sales
198
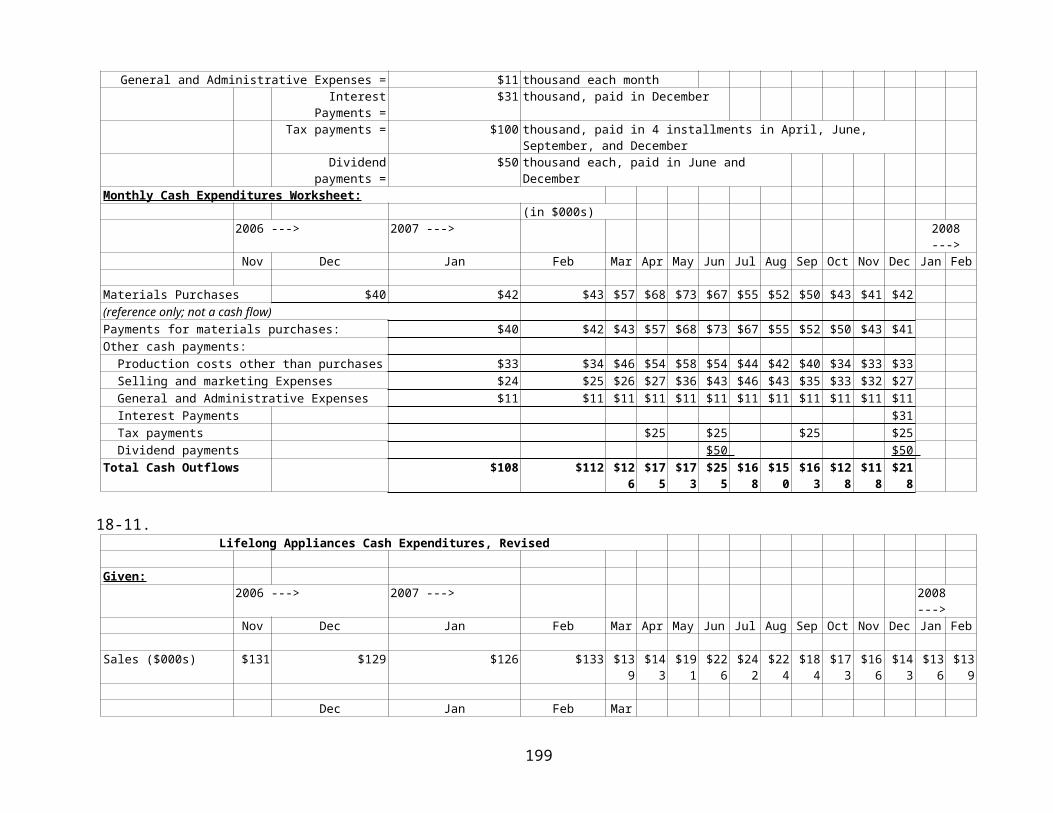
General and Administrative Expenses = $11 thousand each monthInterest
Payments =$31 thousand, paid in December
Tax payments = $100 thousand, paid in 4 installments in April, June, September, and December
Dividendpayments =
$50 thousand each, paid in June and December
Monthly Cash Expenditures Worksheet:(in $000s)
2006 ---> 2007 ---> 2008--->
Nov Dec Jan Feb Mar Apr May Jun Jul Aug Sep Oct Nov Dec Jan Feb
Materials Purchases $40 $42 $43 $57 $68 $73 $67 $55 $52 $50 $43 $41 $42 (reference only; not a cash flow)Payments for materials purchases: $40 $42 $43 $57 $68 $73 $67 $55 $52 $50 $43 $41 Other cash payments: Production costs other than purchases $33 $34 $46 $54 $58 $54 $44 $42 $40 $34 $33 $33 Selling and marketing Expenses $24 $25 $26 $27 $36 $43 $46 $43 $35 $33 $32 $27 General and Administrative Expenses $11 $11 $11 $11 $11 $11 $11 $11 $11 $11 $11 $11 Interest Payments $31 Tax payments $25 $25 $25 $25 Dividend payments $50 $50 Total Cash Outflows $108 $112 $12
6 $17
5 $173
$255
$168
$150
$163
$128
$118
$218
18-11.Lifelong Appliances Cash Expenditures, Revised
Given:2006 ---> 2007 ---> 2008
--->Nov Dec Jan Feb Mar Apr May Jun Jul Aug Sep Oct Nov Dec Jan Feb
Sales ($000s) $131 $129 $126 $133 $139
$143
$191
$226
$242
$224
$184
$173
$166
$143
$136
$139
Dec Jan Feb Mar
199
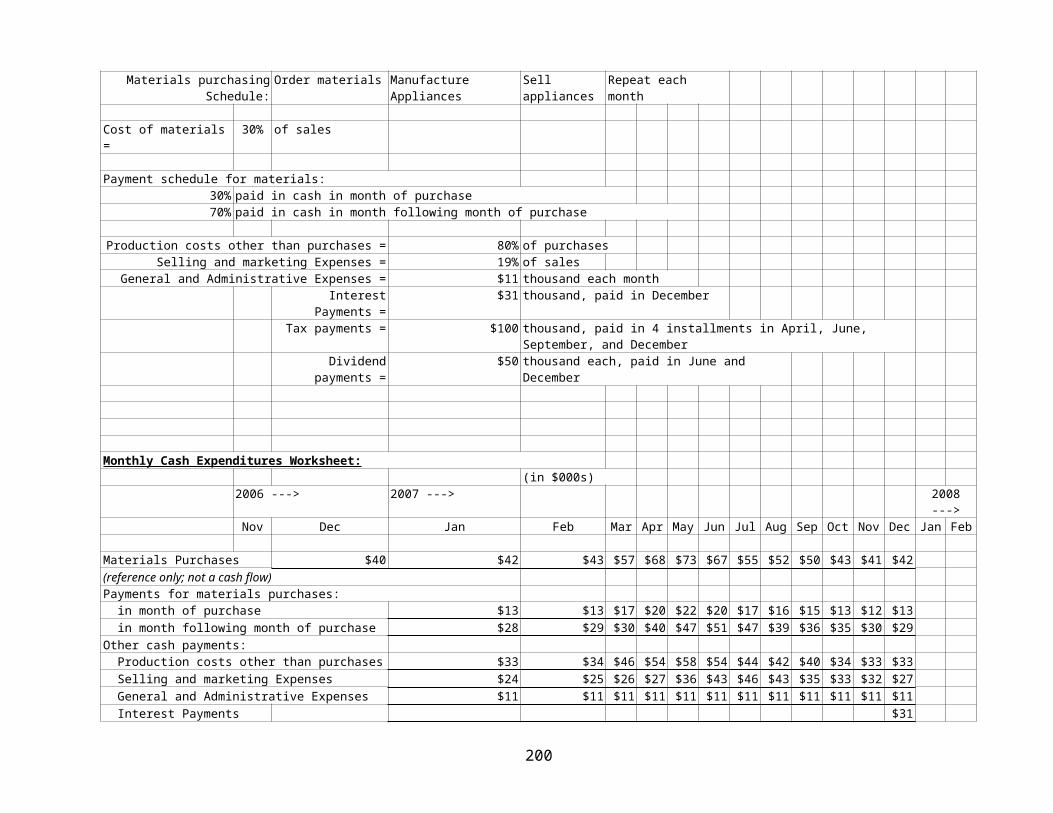
Materials purchasingSchedule:
Order materials Manufacture Appliances
Sell appliances
Repeat each month
Cost of materials=
30% of sales
Payment schedule for materials:30% paid in cash in month of purchase70% paid in cash in month following month of purchase
Production costs other than purchases = 80% of purchasesSelling and marketing Expenses = 19% of sales
General and Administrative Expenses = $11 thousand each monthInterest
Payments =$31 thousand, paid in December
Tax payments = $100 thousand, paid in 4 installments in April, June, September, and December
Dividendpayments =
$50 thousand each, paid in June and December
Monthly Cash Expenditures Worksheet:(in $000s)
2006 ---> 2007 ---> 2008--->
Nov Dec Jan Feb Mar Apr May Jun Jul Aug Sep Oct Nov Dec Jan Feb
Materials Purchases $40 $42 $43 $57 $68 $73 $67 $55 $52 $50 $43 $41 $42 (reference only; not a cash flow)Payments for materials purchases: in month of purchase $13 $13 $17 $20 $22 $20 $17 $16 $15 $13 $12 $13 in month following month of purchase $28 $29 $30 $40 $47 $51 $47 $39 $36 $35 $30 $29 Other cash payments: Production costs other than purchases $33 $34 $46 $54 $58 $54 $44 $42 $40 $34 $33 $33 Selling and marketing Expenses $24 $25 $26 $27 $36 $43 $46 $43 $35 $33 $32 $27 General and Administrative Expenses $11 $11 $11 $11 $11 $11 $11 $11 $11 $11 $11 $11 Interest Payments $31
200
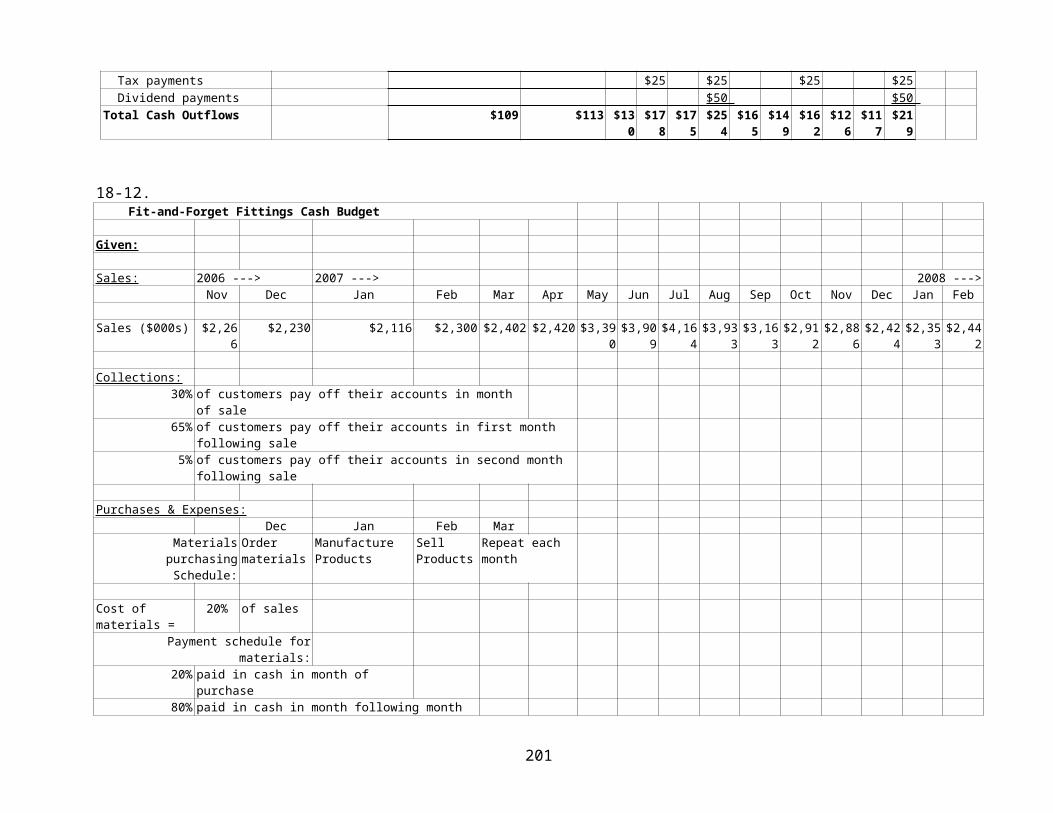
Tax payments $25 $25 $25 $25 Dividend payments $50 $50 Total Cash Outflows $109 $113 $13
0 $17
8 $175
$254
$165
$149
$162
$126
$117
$219
18-12.Fit-and-Forget Fittings Cash Budget
Given:
Sales: 2006 ---> 2007 ---> 2008 --->Nov Dec Jan Feb Mar Apr May Jun Jul Aug Sep Oct Nov Dec Jan Feb
Sales ($000s) $2,266
$2,230 $2,116 $2,300 $2,402 $2,420 $3,390 $3,90
9 $4,16
4 $3,93
3 $3,16
3 $2,91
2 $2,88
6 $2,42
4 $2,35
3 $2,44
2
Collections:30% of customers pay off their accounts in month
of sale65% of customers pay off their accounts in first month
following sale5% of customers pay off their accounts in second month
following sale
Purchases & Expenses:Dec Jan Feb Mar
MaterialspurchasingSchedule:
Order materials
Manufacture Products
Sell Products
Repeat each month
Cost of materials =
20% of sales
Payment schedule formaterials:
20% paid in cash in month of purchase
80% paid in cash in month following month
201
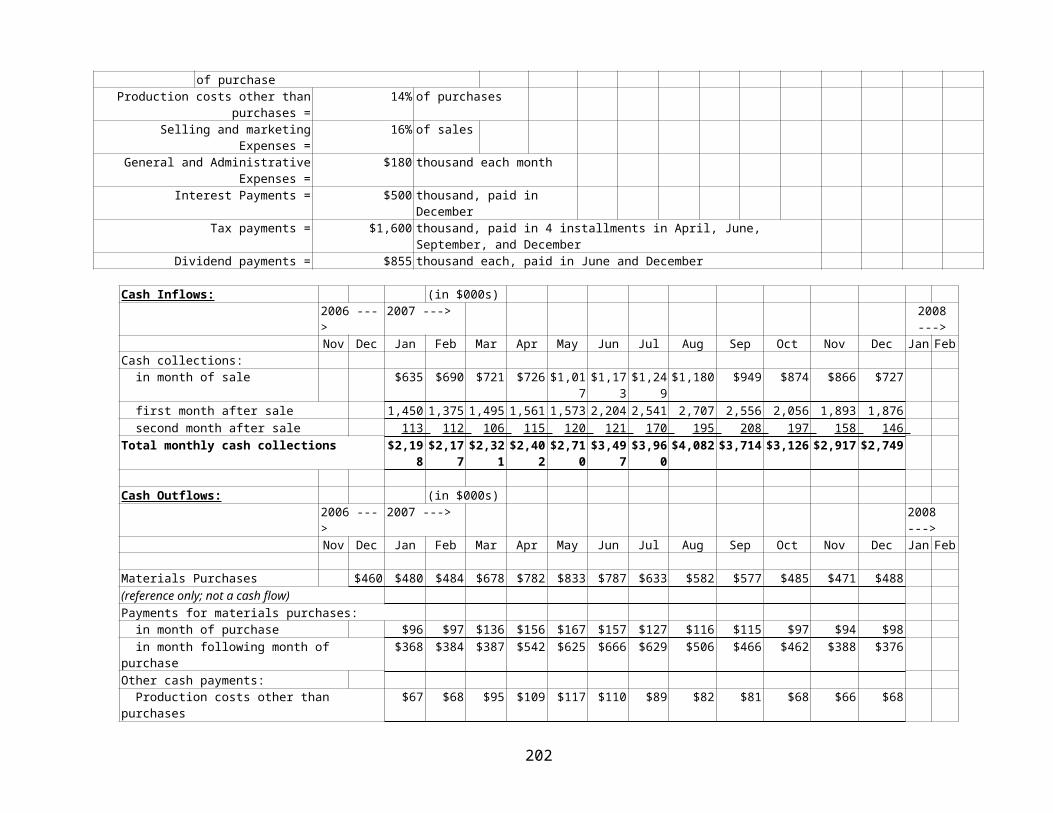
of purchaseProduction costs other than
purchases =14% of purchases
Selling and marketingExpenses =
16% of sales
General and AdministrativeExpenses =
$180 thousand each month
Interest Payments = $500 thousand, paid in December
Tax payments = $1,600 thousand, paid in 4 installments in April, June, September, and December
Dividend payments = $855 thousand each, paid in June and December
Cash Inflows: (in $000s)2006 --->
2007 ---> 2008--->
Nov Dec Jan Feb Mar Apr May Jun Jul Aug Sep Oct Nov Dec Jan FebCash collections: in month of sale $635 $690 $721 $726 $1,01
7 $1,17
3 $1,24
9 $1,180 $949 $874 $866 $727
first month after sale 1,450 1,375 1,495 1,561 1,573 2,204 2,541 2,707 2,556 2,056 1,893 1,876 second month after sale 113 112 106 115 120 121 170 195 208 197 158 146 Total monthly cash collections $2,19
8 $2,17
7 $2,32
1 $2,40
2 $2,71
0 $3,49
7 $3,96
0 $4,082 $3,714 $3,126 $2,917 $2,749
Cash Outflows: (in $000s)2006 --->
2007 ---> 2008 --->
Nov Dec Jan Feb Mar Apr May Jun Jul Aug Sep Oct Nov Dec Jan Feb
Materials Purchases $460 $480 $484 $678 $782 $833 $787 $633 $582 $577 $485 $471 $488 (reference only; not a cash flow)Payments for materials purchases: in month of purchase $96 $97 $136 $156 $167 $157 $127 $116 $115 $97 $94 $98 in month following month of purchase
$368 $384 $387 $542 $625 $666 $629 $506 $466 $462 $388 $376
Other cash payments: Production costs other than purchases
$67 $68 $95 $109 $117 $110 $89 $82 $81 $68 $66 $68
202
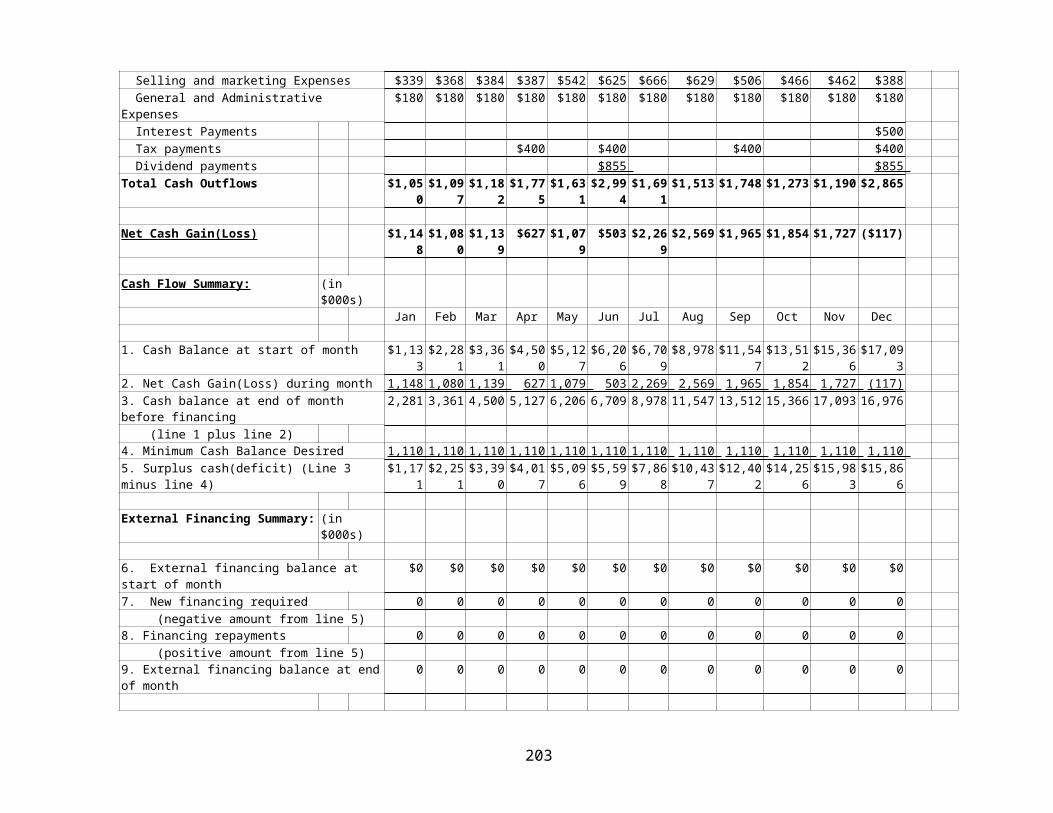
Selling and marketing Expenses $339 $368 $384 $387 $542 $625 $666 $629 $506 $466 $462 $388 General and Administrative Expenses
$180 $180 $180 $180 $180 $180 $180 $180 $180 $180 $180 $180
Interest Payments $500 Tax payments $400 $400 $400 $400 Dividend payments $855 $855 Total Cash Outflows $1,05
0 $1,09
7 $1,18
2 $1,77
5 $1,63
1 $2,99
4 $1,69
1 $1,513 $1,748 $1,273 $1,190 $2,865
Net Cash Gain(Loss) $1,148 $1,08
0 $1,13
9 $627 $1,07
9 $503 $2,26
9 $2,569 $1,965 $1,854 $1,727 ($117)
Cash Flow Summary: (in $000s)
Jan Feb Mar Apr May Jun Jul Aug Sep Oct Nov Dec
1. Cash Balance at start of month $1,133 $2,28
1 $3,36
1 $4,50
0 $5,12
7 $6,20
6 $6,70
9 $8,978 $11,54
7 $13,51
2 $15,36
6 $17,09
3 2. Net Cash Gain(Loss) during month 1,148 1,080 1,139 627 1,079 503 2,269 2,569 1,965 1,854 1,727 (117)3. Cash balance at end of month before financing
2,281 3,361 4,500 5,127 6,206 6,709 8,978 11,547 13,512 15,366 17,093 16,976
(line 1 plus line 2)4. Minimum Cash Balance Desired 1,110 1,110 1,110 1,110 1,110 1,110 1,110 1,110 1,110 1,110 1,110 1,110 5. Surplus cash(deficit) (Line 3 minus line 4)
$1,171 $2,25
1 $3,39
0 $4,01
7 $5,09
6 $5,59
9 $7,86
8 $10,43
7 $12,40
2 $14,25
6 $15,98
3 $15,86
6
External Financing Summary: (in $000s)
6. External financing balance at start of month
$0 $0 $0 $0 $0 $0 $0 $0 $0 $0 $0 $0
7. New financing required 0 0 0 0 0 0 0 0 0 0 0 0 (negative amount from line 5)8. Financing repayments 0 0 0 0 0 0 0 0 0 0 0 0 (positive amount from line 5)9. External financing balance at endof month
0 0 0 0 0 0 0 0 0 0 0 0
203
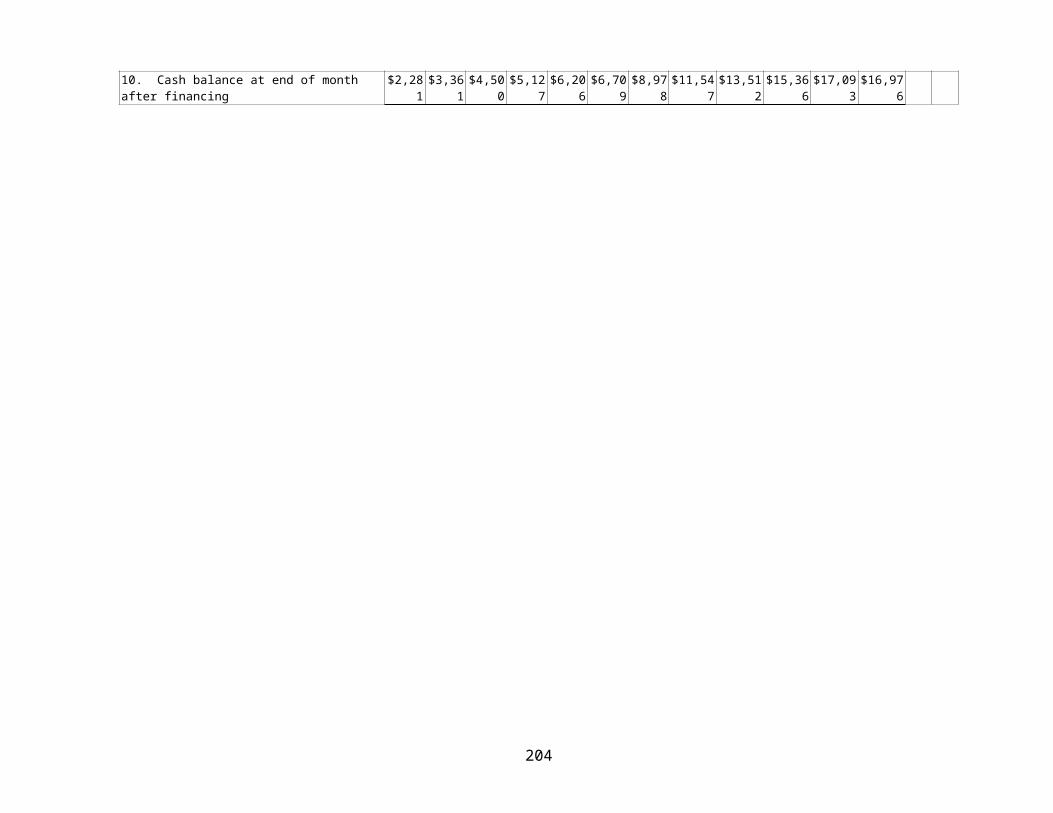
10. Cash balance at end of month after financing
$2,281 $3,36
1 $4,50
0 $5,12
7 $6,20
6 $6,70
9 $8,97
8 $11,54
7 $13,51
2 $15,36
6 $17,09
3 $16,97
6
204
Chapter 19 Solutions
Answers to Review Questions
1. Accounts receivable are sometimes not collected. Why do companies extend trade credit when they could insist on cash for all sales?
Extending trade credit almost always leads to more sales. If the incremental cashflows, including the investment in accounts receivable give a positive NPV, the decision to extend trade creditwould increase the value of the firm.
2. Inventory is sometimes thought of as a necessary evil. Explain.
Inventory ties up funds and these funds are not earning an explicitreturn. Some inventory is often necessary, however, as companies try to hold the lowest acceptable amount.
3. What are the primary variables being balanced in the EOQ inventory model? Explain
The primary variables being balanced in the EOQ model are carrying costs and ordering costs. The more frequent orders are placed the lower the firm’s carrying costs and the higher its ordering costs.
4. What are the benefits of the JIT inventory control system?
The just-in-time (JIT) inventory control system lowers inventory carrying costs and tends to increase quality.
5. What are the primary requirements for a successful JIT inventory control system?
205
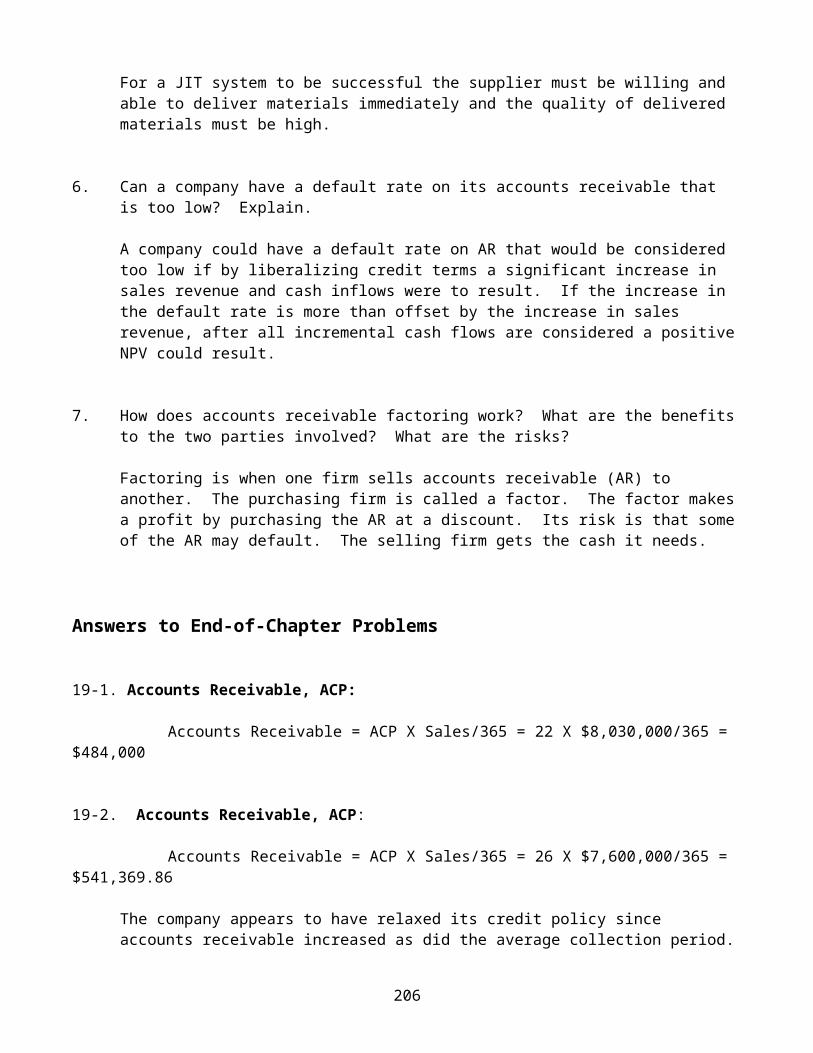
For a JIT system to be successful the supplier must be willing and able to deliver materials immediately and the quality of delivered materials must be high.
6. Can a company have a default rate on its accounts receivable that is too low? Explain.
A company could have a default rate on AR that would be considered too low if by liberalizing credit terms a significant increase in sales revenue and cash inflows were to result. If the increase in the default rate is more than offset by the increase in sales revenue, after all incremental cash flows are considered a positiveNPV could result.
7. How does accounts receivable factoring work? What are the benefitsto the two parties involved? What are the risks?
Factoring is when one firm sells accounts receivable (AR) to another. The purchasing firm is called a factor. The factor makesa profit by purchasing the AR at a discount. Its risk is that someof the AR may default. The selling firm gets the cash it needs.
Answers to End-of-Chapter Problems
19-1. Accounts Receivable, ACP:
Accounts Receivable = ACP X Sales/365 = 22 X $8,030,000/365 = $484,000
19-2. Accounts Receivable, ACP:
Accounts Receivable = ACP X Sales/365 = 26 X $7,600,000/365 = $541,369.86
The company appears to have relaxed its credit policy since accounts receivable increased as did the average collection period.
206
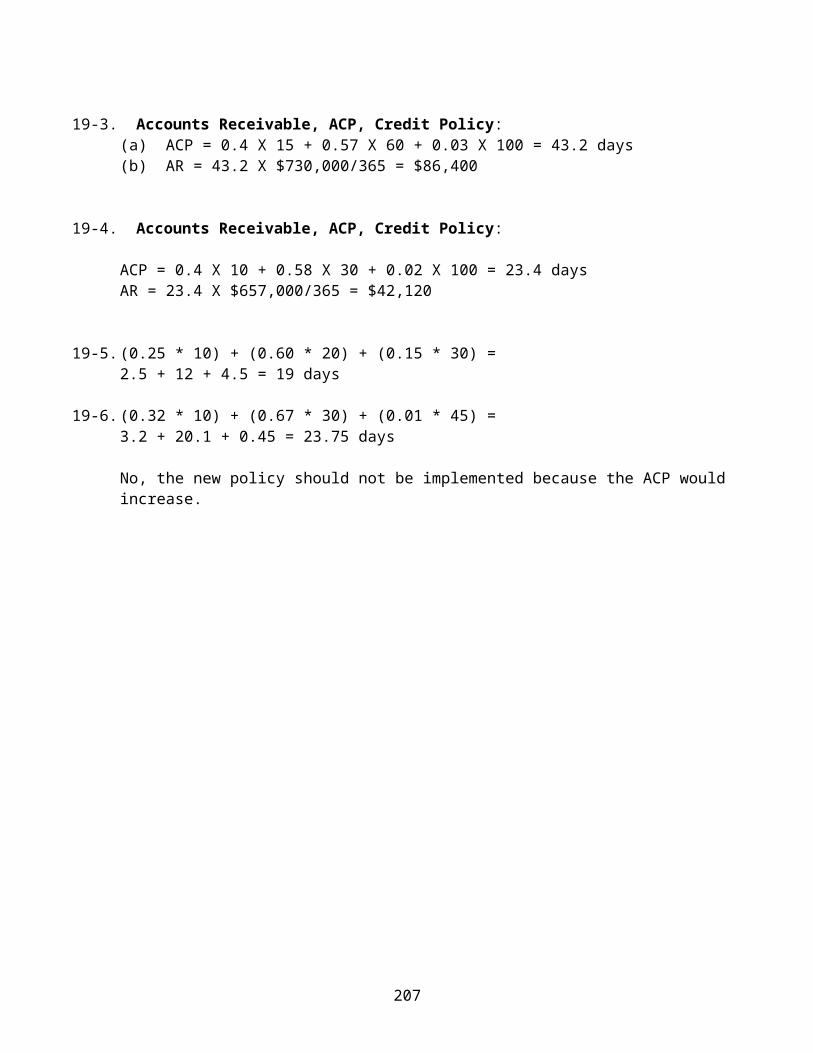
19-3. Accounts Receivable, ACP, Credit Policy:(a) ACP = 0.4 X 15 + 0.57 X 60 + 0.03 X 100 = 43.2 days(b) AR = 43.2 X $730,000/365 = $86,400
19-4. Accounts Receivable, ACP, Credit Policy:
ACP = 0.4 X 10 + 0.58 X 30 + 0.02 X 100 = 23.4 daysAR = 23.4 X $657,000/365 = $42,120
19-5.(0.25 * 10) + (0.60 * 20) + (0.15 * 30) = 2.5 + 12 + 4.5 = 19 days
19-6.(0.32 * 10) + (0.67 * 30) + (0.01 * 45) =3.2 + 20.1 + 0.45 = 23.75 days
No, the new policy should not be implemented because the ACP would increase.
207
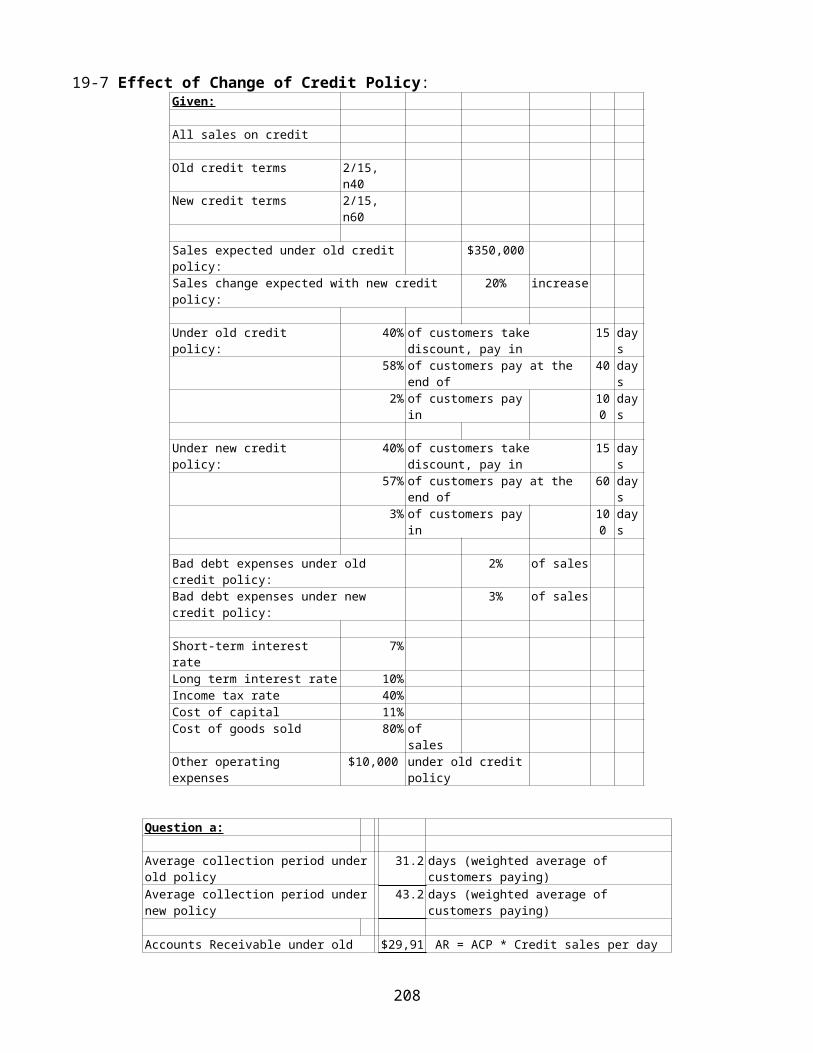
19-7 Effect of Change of Credit Policy:Given:
All sales on credit
Old credit terms 2/15, n40
New credit terms 2/15, n60
Sales expected under old credit policy:
$350,000
Sales change expected with new credit policy:
20% increase
Under old credit policy:
40% of customers take discount, pay in
15 days
58% of customers pay at the end of
40 days
2% of customers payin
100
days
Under new credit policy:
40% of customers take discount, pay in
15 days
57% of customers pay at the end of
60 days
3% of customers payin
100
days
Bad debt expenses under old credit policy:
2% of sales
Bad debt expenses under new credit policy:
3% of sales
Short-term interest rate
7%
Long term interest rate 10%Income tax rate 40%Cost of capital 11%Cost of goods sold 80% of
salesOther operating expenses
$10,000 under old creditpolicy
Question a:
Average collection period underold policy
31.2 days (weighted average of customers paying)
Average collection period undernew policy
43.2 days (weighted average of customers paying)
Accounts Receivable under old $29,91 AR = ACP * Credit sales per day
208
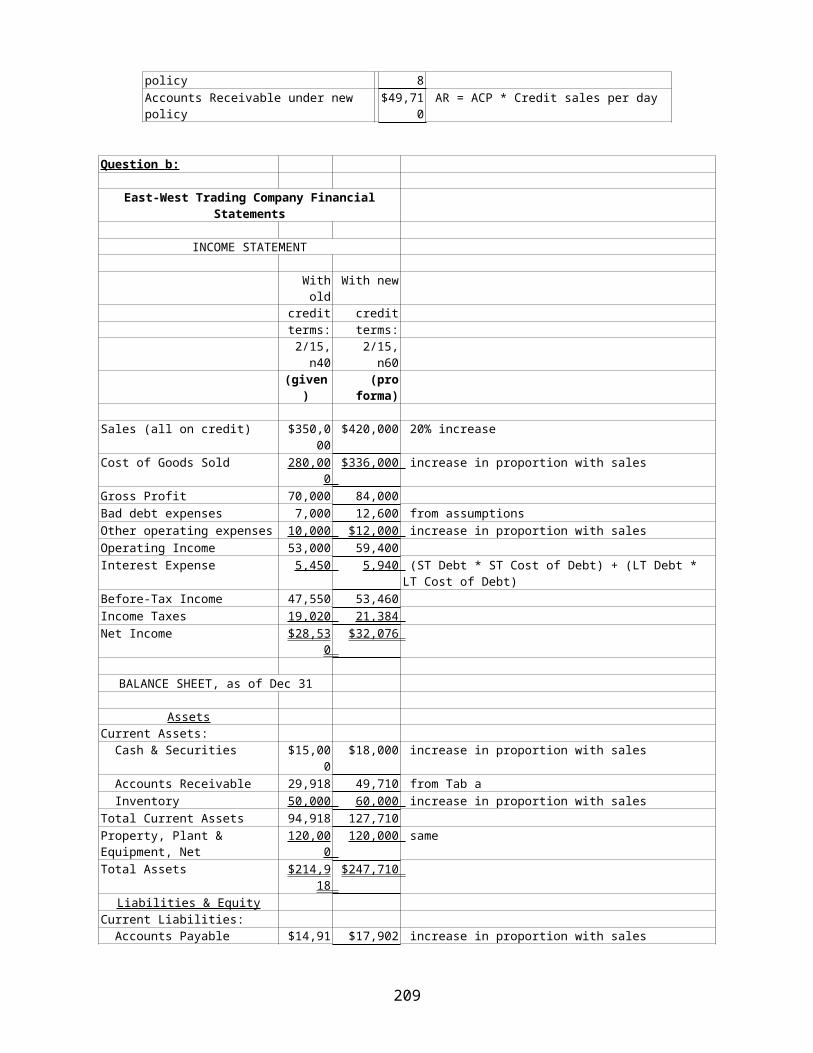
policy 8 Accounts Receivable under new policy
$49,710 AR = ACP * Credit sales per day
Question b:
East-West Trading Company FinancialStatements
INCOME STATEMENT
Withold
With new
credit creditterms: terms:2/15,
n402/15,
n60(given
)(pro
forma)
Sales (all on credit) $350,000
$420,000 20% increase
Cost of Goods Sold 280,000
$336,000 increase in proportion with sales
Gross Profit 70,000 84,000 Bad debt expenses 7,000 12,600 from assumptionsOther operating expenses 10,000 $12,000 increase in proportion with salesOperating Income 53,000 59,400 Interest Expense 5,450 5,940 (ST Debt * ST Cost of Debt) + (LT Debt *
LT Cost of Debt)Before-Tax Income 47,550 53,460 Income Taxes 19,020 21,384 Net Income $28,53
0 $32,076
BALANCE SHEET, as of Dec 31
AssetsCurrent Assets: Cash & Securities $15,00
0 $18,000 increase in proportion with sales
Accounts Receivable 29,918 49,710 from Tab a Inventory 50,000 60,000 increase in proportion with salesTotal Current Assets 94,918 127,710 Property, Plant & Equipment, Net
120,000
120,000 same
Total Assets $214,918
$247,710
Liabilities & EquityCurrent Liabilities: Accounts Payable $14,91 $17,902 increase in proportion with sales
209

8 Notes Payable 35,000 $42,000 increase in proportion with salesTotal Current Liabilities
49,918 59,902
Long-Term Debt 30,000 30,000 sameTotal Liabilities 79,918 89,902 Common Stock 25,000 25,000 sameCapital in Excess of Par 60,000 60,000 sameRetained Earnings 50,000 50,000 sameTotal Stockholders' Equity
135,000
135,000
Total Liabilities & Equity
$214,918
$224,902
AFN to balance: $22,808 obtain from ST sources
Question c:
Incremental cash flows associated with the credit policy change
Initial investment at T-0 ($22,808) AFN from Tab B
Future incremental cash flows, T-1 onward:
Inflows:Increase in Sales $70,000 Outflows:Increase in Cost of Goods Sold
$56,000
Increase in Bad Debt Expense $5,600 Increase in Other Operating Exps
$2,000
Increase in Interest Expense $490 Increase in Taxes $2,364 Total Outflows $66,454
Net future incremental cash flows
$3,546 each year from T-1 onward
Question d, Investment Decision:
NPV of the Credit Policy Change:
InitialInvestment
Future Cash Flows
($22,808) $3,546 per year
NPV = $9,428 at a cost of capital 11%
210

of
19-8.
Given:
All sales on credit
Old credit terms 2/15, n40
New credit terms 2/15, n60
Sales expected under old credit policy:
$350,000
Sales change expected with new credit policy:
20% increase
Under old credit policy: 40% of customers take discount, pay in
15 days
58% of customers pay at the end of
40 days
2% of customers payin
100
days
Under new credit policy: 30% of customers take discount, pay in
15 days
60% of customers pay at the end of
60 days
10% of customers payin
100
days
Bad debt expenses under old credit policy:
2% of sales
Bad debt expenses under new credit policy:
4% of sales
Short-term interest rate 7%Long term interest rate 10%Income tax rate 40%Cost of capital 11%Cost of goods sold 80% of
salesOther operating expenses $10,000 under old credit
policy
Question a:
211
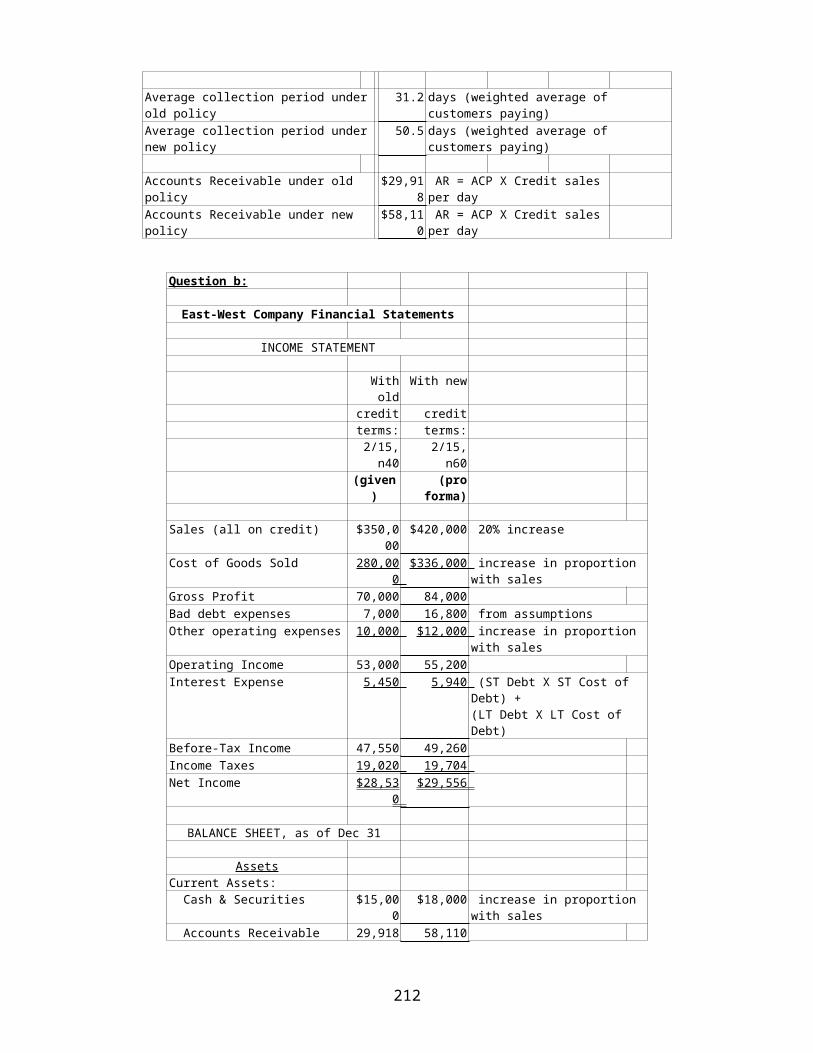
Average collection period underold policy
31.2 days (weighted average of customers paying)
Average collection period undernew policy
50.5 days (weighted average of customers paying)
Accounts Receivable under old policy
$29,918 AR = ACP X Credit sales per day
Accounts Receivable under new policy
$58,110 AR = ACP X Credit sales per day
Question b:
East-West Company Financial Statements
INCOME STATEMENT
Withold
With new
credit creditterms: terms:2/15,n40
2/15,n60
(given)
(proforma)
Sales (all on credit) $350,000
$420,000 20% increase
Cost of Goods Sold 280,000
$336,000 increase in proportion with sales
Gross Profit 70,000 84,000 Bad debt expenses 7,000 16,800 from assumptionsOther operating expenses 10,000 $12,000 increase in proportion
with salesOperating Income 53,000 55,200 Interest Expense 5,450 5,940 (ST Debt X ST Cost of
Debt) +(LT Debt X LT Cost of Debt)
Before-Tax Income 47,550 49,260 Income Taxes 19,020 19,704 Net Income $28,53
0 $29,556
BALANCE SHEET, as of Dec 31
AssetsCurrent Assets: Cash & Securities $15,00
0 $18,000 increase in proportion
with sales Accounts Receivable 29,918 58,110
212
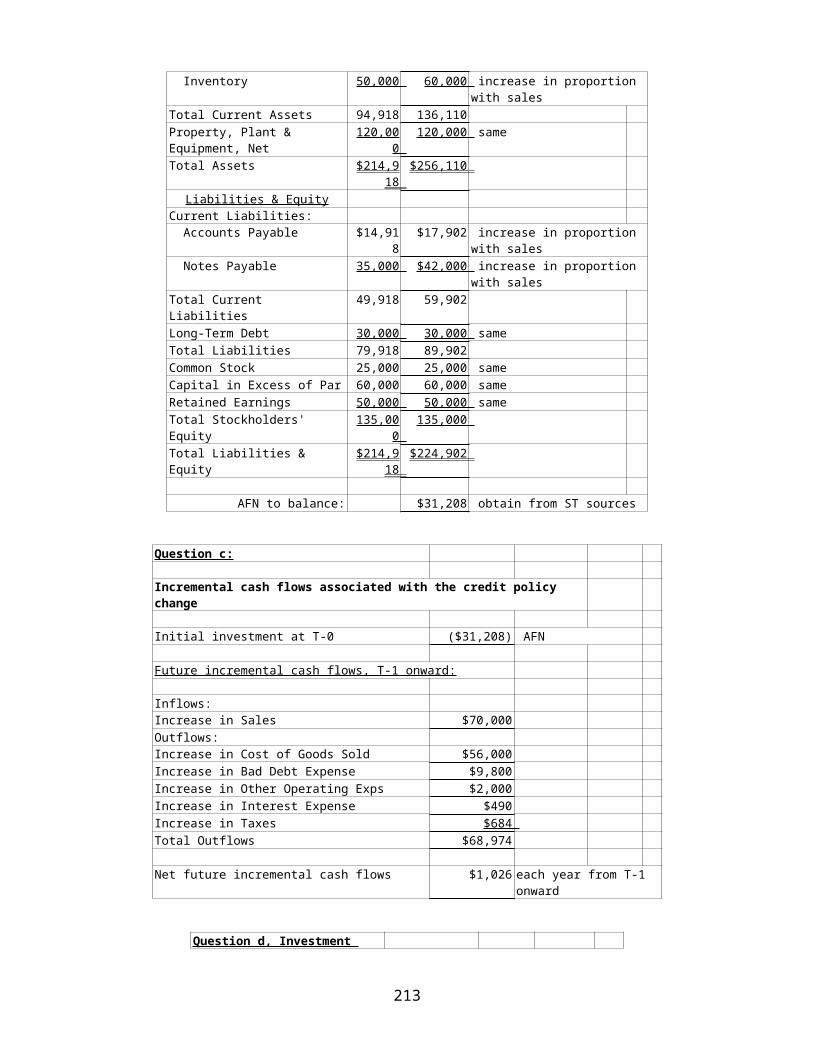
Inventory 50,000 60,000 increase in proportion with sales
Total Current Assets 94,918 136,110 Property, Plant & Equipment, Net
120,000
120,000 same
Total Assets $214,918
$256,110
Liabilities & EquityCurrent Liabilities: Accounts Payable $14,91
8 $17,902 increase in proportion
with sales Notes Payable 35,000 $42,000 increase in proportion
with salesTotal Current Liabilities
49,918 59,902
Long-Term Debt 30,000 30,000 sameTotal Liabilities 79,918 89,902 Common Stock 25,000 25,000 sameCapital in Excess of Par 60,000 60,000 sameRetained Earnings 50,000 50,000 sameTotal Stockholders' Equity
135,000
135,000
Total Liabilities & Equity
$214,918
$224,902
AFN to balance: $31,208 obtain from ST sources
Question c:
Incremental cash flows associated with the credit policy change
Initial investment at T-0 ($31,208) AFN
Future incremental cash flows, T-1 onward:
Inflows:Increase in Sales $70,000 Outflows:Increase in Cost of Goods Sold $56,000 Increase in Bad Debt Expense $9,800 Increase in Other Operating Exps $2,000 Increase in Interest Expense $490 Increase in Taxes $684 Total Outflows $68,974
Net future incremental cash flows $1,026 each year from T-1 onward
Question d, Investment
213
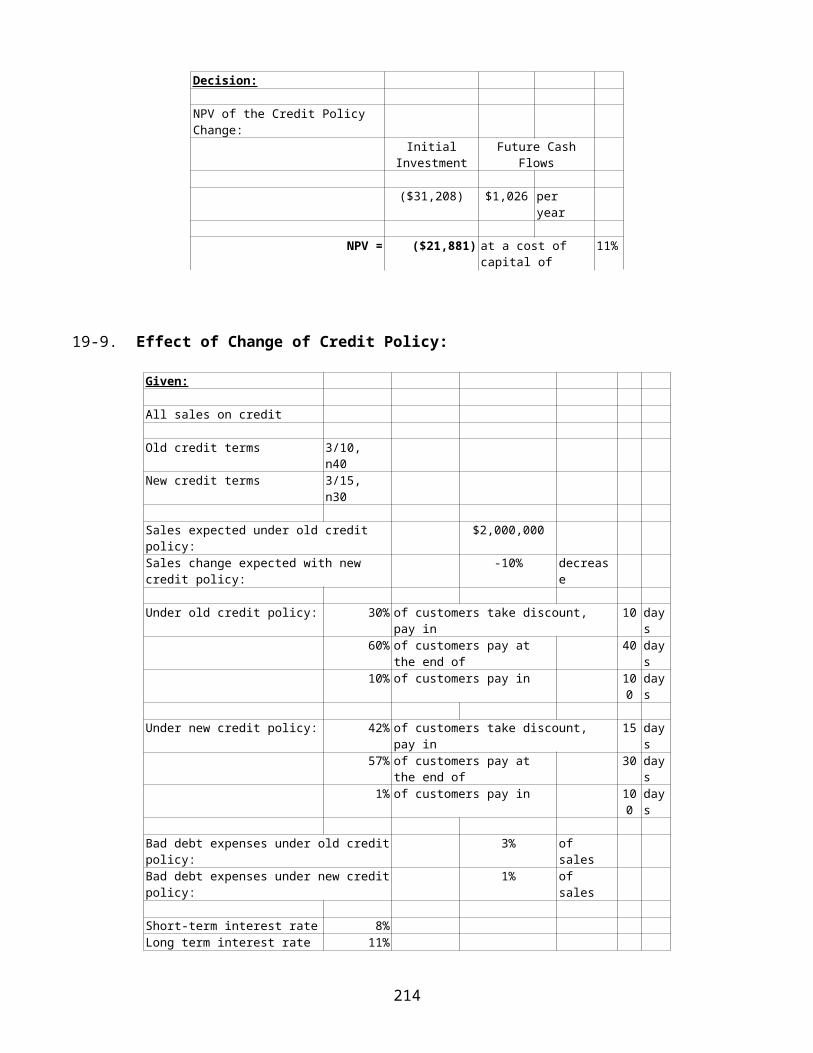
Decision:
NPV of the Credit Policy Change:
InitialInvestment
Future CashFlows
($31,208) $1,026 per year
NPV = ($21,881) at a cost of capital of
11%
19-9. Effect of Change of Credit Policy:
Given:
All sales on credit
Old credit terms 3/10, n40
New credit terms 3/15, n30
Sales expected under old credit policy:
$2,000,000
Sales change expected with new credit policy:
-10% decrease
Under old credit policy: 30% of customers take discount, pay in
10 days
60% of customers pay at the end of
40 days
10% of customers pay in 100
days
Under new credit policy: 42% of customers take discount, pay in
15 days
57% of customers pay at the end of
30 days
1% of customers pay in 100
days
Bad debt expenses under old creditpolicy:
3% of sales
Bad debt expenses under new creditpolicy:
1% of sales
Short-term interest rate 8%Long term interest rate 11%
214
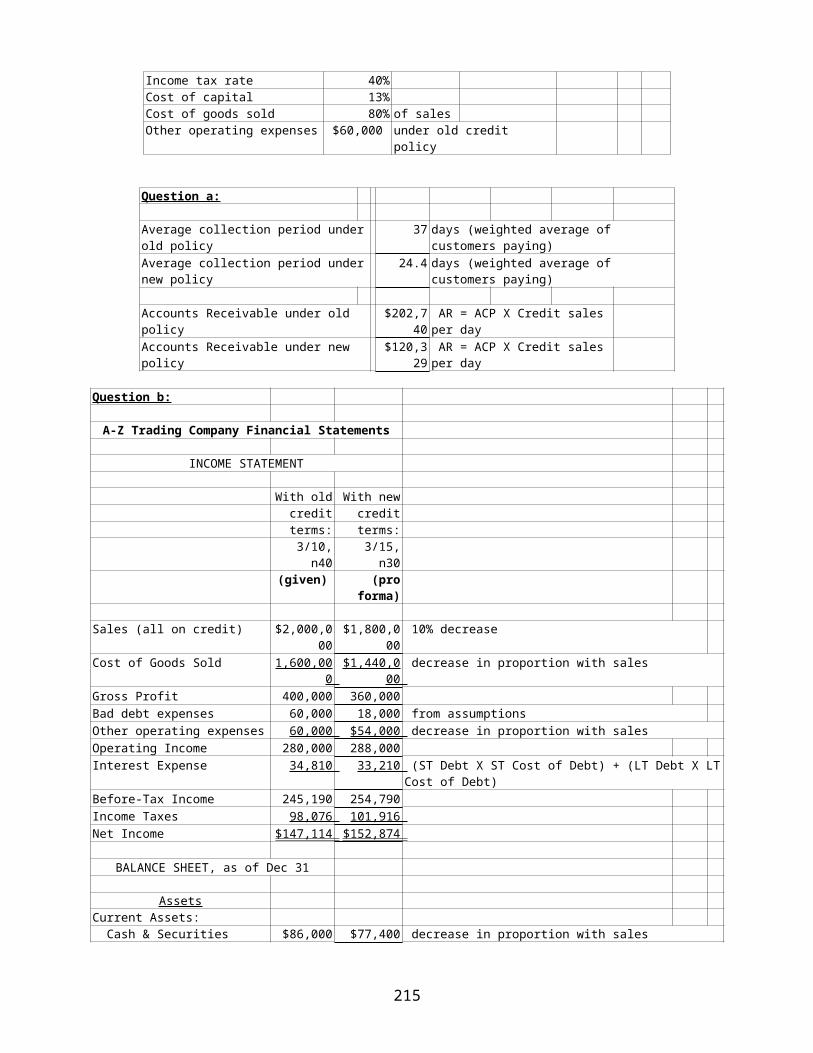
Income tax rate 40%Cost of capital 13%Cost of goods sold 80% of salesOther operating expenses $60,000 under old credit
policy
Question a:
Average collection period underold policy
37 days (weighted average of customers paying)
Average collection period undernew policy
24.4 days (weighted average of customers paying)
Accounts Receivable under old policy
$202,740
AR = ACP X Credit sales per day
Accounts Receivable under new policy
$120,329
AR = ACP X Credit sales per day
Question b:
A-Z Trading Company Financial Statements
INCOME STATEMENT
With old With newcredit creditterms: terms:3/10,
n403/15,n30
(given) (proforma)
Sales (all on credit) $2,000,000
$1,800,000
10% decrease
Cost of Goods Sold 1,600,000
$1,440,000
decrease in proportion with sales
Gross Profit 400,000 360,000 Bad debt expenses 60,000 18,000 from assumptionsOther operating expenses 60,000 $54,000 decrease in proportion with salesOperating Income 280,000 288,000 Interest Expense 34,810 33,210 (ST Debt X ST Cost of Debt) + (LT Debt X LT
Cost of Debt)Before-Tax Income 245,190 254,790 Income Taxes 98,076 101,916 Net Income $147,114 $152,874
BALANCE SHEET, as of Dec 31
AssetsCurrent Assets: Cash & Securities $86,000 $77,400 decrease in proportion with sales
215
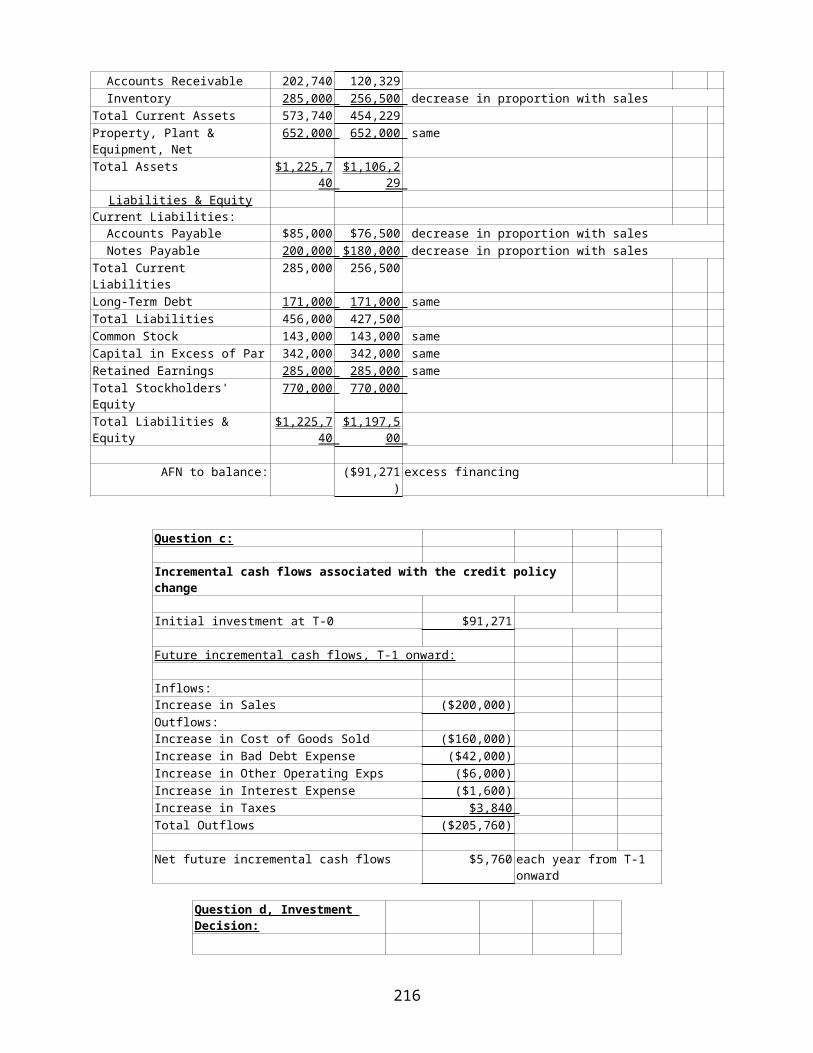
Accounts Receivable 202,740 120,329 Inventory 285,000 256,500 decrease in proportion with salesTotal Current Assets 573,740 454,229 Property, Plant & Equipment, Net
652,000 652,000 same
Total Assets $1,225,740
$1,106,229
Liabilities & EquityCurrent Liabilities: Accounts Payable $85,000 $76,500 decrease in proportion with sales Notes Payable 200,000 $180,000 decrease in proportion with salesTotal Current Liabilities
285,000 256,500
Long-Term Debt 171,000 171,000 sameTotal Liabilities 456,000 427,500 Common Stock 143,000 143,000 sameCapital in Excess of Par 342,000 342,000 sameRetained Earnings 285,000 285,000 sameTotal Stockholders' Equity
770,000 770,000
Total Liabilities & Equity
$1,225,740
$1,197,500
AFN to balance: ($91,271)excess financing
Question c:
Incremental cash flows associated with the credit policy change
Initial investment at T-0 $91,271
Future incremental cash flows, T-1 onward:
Inflows:Increase in Sales ($200,000)Outflows:Increase in Cost of Goods Sold ($160,000)Increase in Bad Debt Expense ($42,000)Increase in Other Operating Exps ($6,000)Increase in Interest Expense ($1,600)Increase in Taxes $3,840 Total Outflows ($205,760)
Net future incremental cash flows $5,760 each year from T-1 onward
Question d, Investment Decision:
216
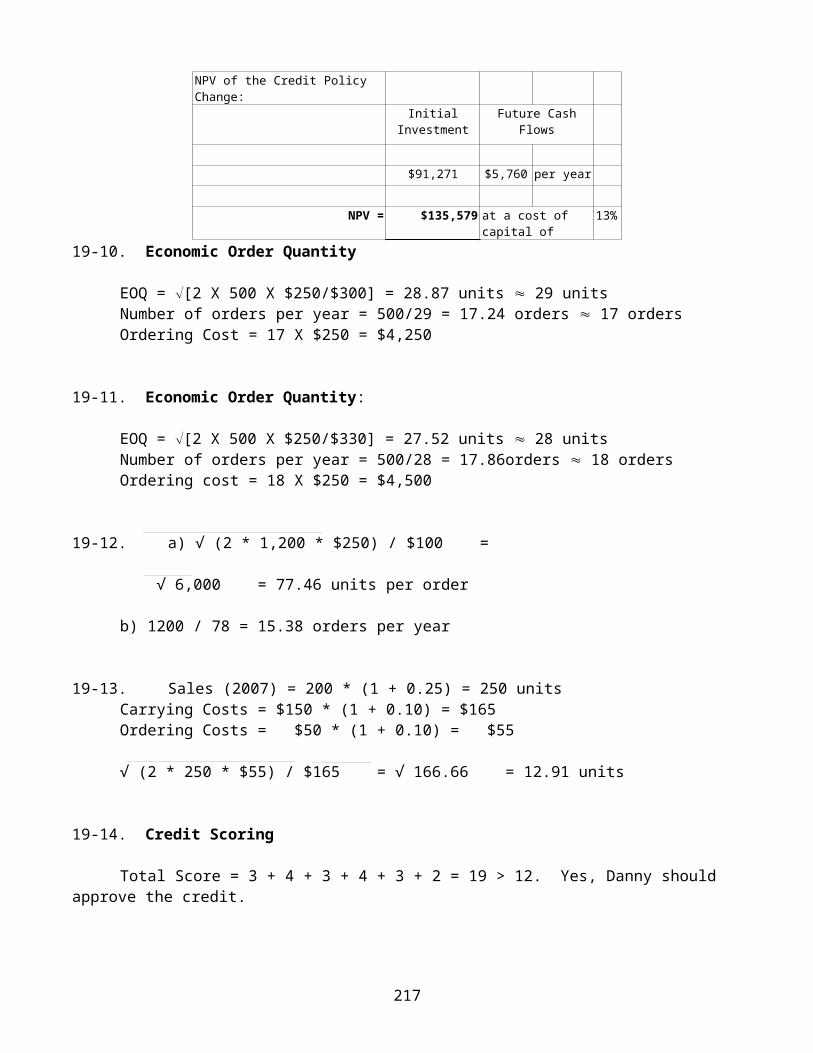
NPV of the Credit Policy Change:
InitialInvestment
Future CashFlows
$91,271 $5,760 per year
NPV = $135,579 at a cost of capital of
13%
19-10. Economic Order Quantity
EOQ = [2 X 500 X $250/$300] = 28.87 units 29 unitsNumber of orders per year = 500/29 = 17.24 orders 17 ordersOrdering Cost = 17 X $250 = $4,250
19-11. Economic Order Quantity:
EOQ = [2 X 500 X $250/$330] = 27.52 units 28 unitsNumber of orders per year = 500/28 = 17.86orders 18 ordersOrdering cost = 18 X $250 = $4,500
19-12. a) √ (2 * 1,200 * $250) / $100 =
√ 6,000 = 77.46 units per order
b) 1200 / 78 = 15.38 orders per year
19-13. Sales (2007) = 200 * (1 + 0.25) = 250 unitsCarrying Costs = $150 * (1 + 0.10) = $165Ordering Costs = $50 * (1 + 0.10) = $55
√ (2 * 250 * $55) / $165 = √ 166.66 = 12.91 units
19-14. Credit Scoring
Total Score = 3 + 4 + 3 + 4 + 3 + 2 = 19 > 12. Yes, Danny should approve the credit.
217
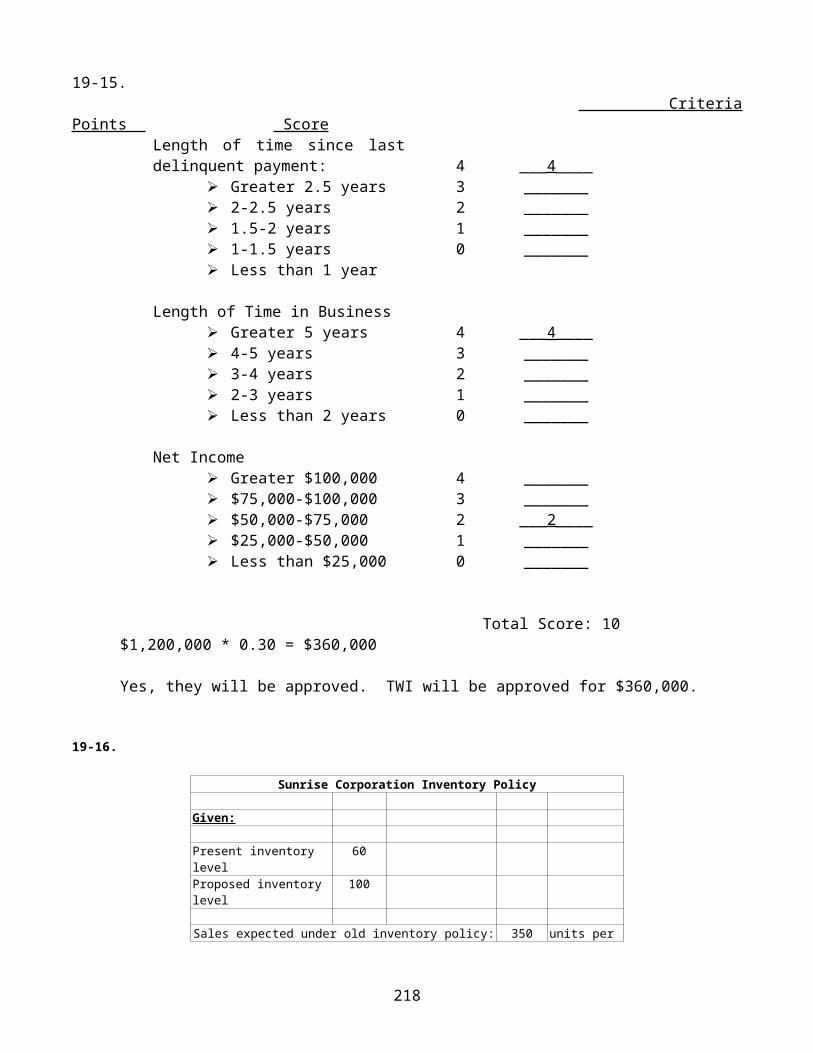
19-15. CriteriaPoints Score
Length of time since lastdelinquent payment:
Greater 2.5 years 2-2.5 years 1.5-2 years 1-1.5 years Less than 1 year
43210
___4________________________________
Length of Time in Business Greater 5 years 4-5 years 3-4 years 2-3 years Less than 2 years
43210
___4________________________________
Net Income Greater $100,000 $75,000-$100,000 $50,000-$75,000 $25,000-$50,000 Less than $25,000
43210
_________________2__________________
Total Score: 10$1,200,000 * 0.30 = $360,000
Yes, they will be approved. TWI will be approved for $360,000.
19-16.
Sunrise Corporation Inventory Policy
Given:
Present inventory level
60
Proposed inventory level
100
Sales expected under old inventory policy: 350 units per
218
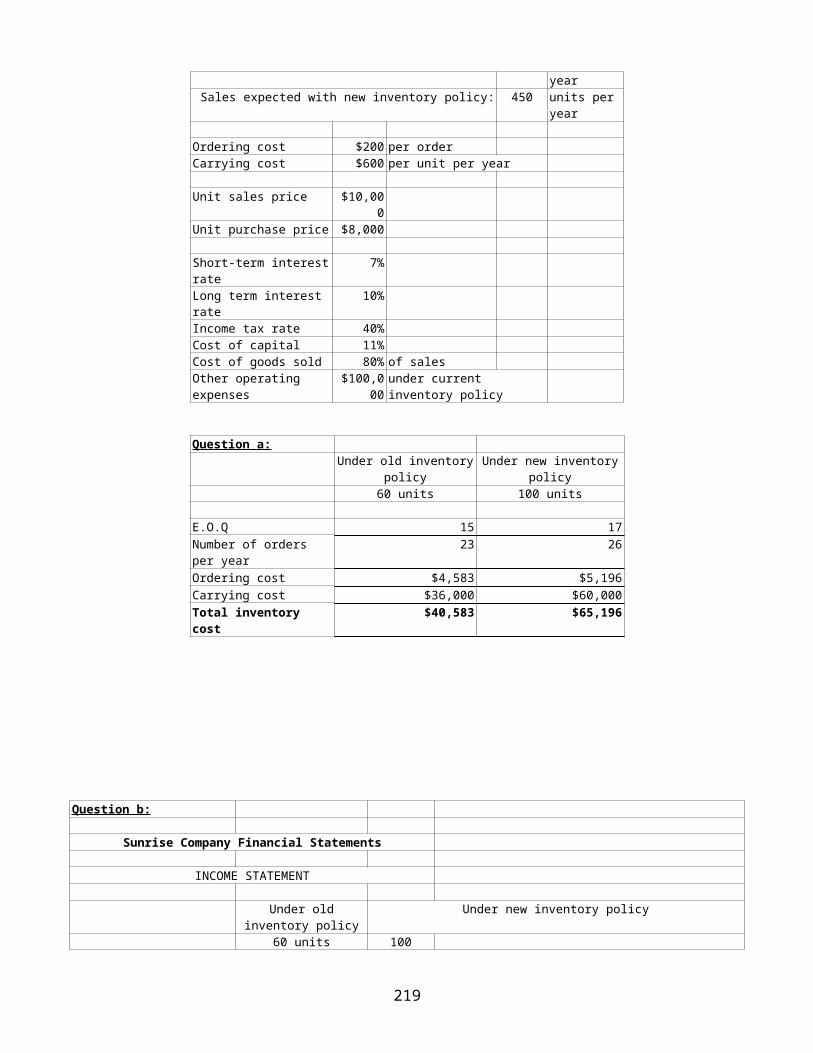
yearSales expected with new inventory policy: 450 units per
year
Ordering cost $200 per orderCarrying cost $600 per unit per year
Unit sales price $10,000
Unit purchase price $8,000
Short-term interestrate
7%
Long term interest rate
10%
Income tax rate 40%Cost of capital 11%Cost of goods sold 80% of salesOther operating expenses
$100,000
under current inventory policy
Question a:Under old inventory
policyUnder new inventory
policy60 units 100 units
E.O.Q 15 17 Number of orders per year
23 26
Ordering cost $4,583 $5,196 Carrying cost $36,000 $60,000 Total inventory cost
$40,583 $65,196
Question b:
Sunrise Company Financial Statements
INCOME STATEMENT
Under oldinventory policy
Under new inventory policy
60 units 100
219
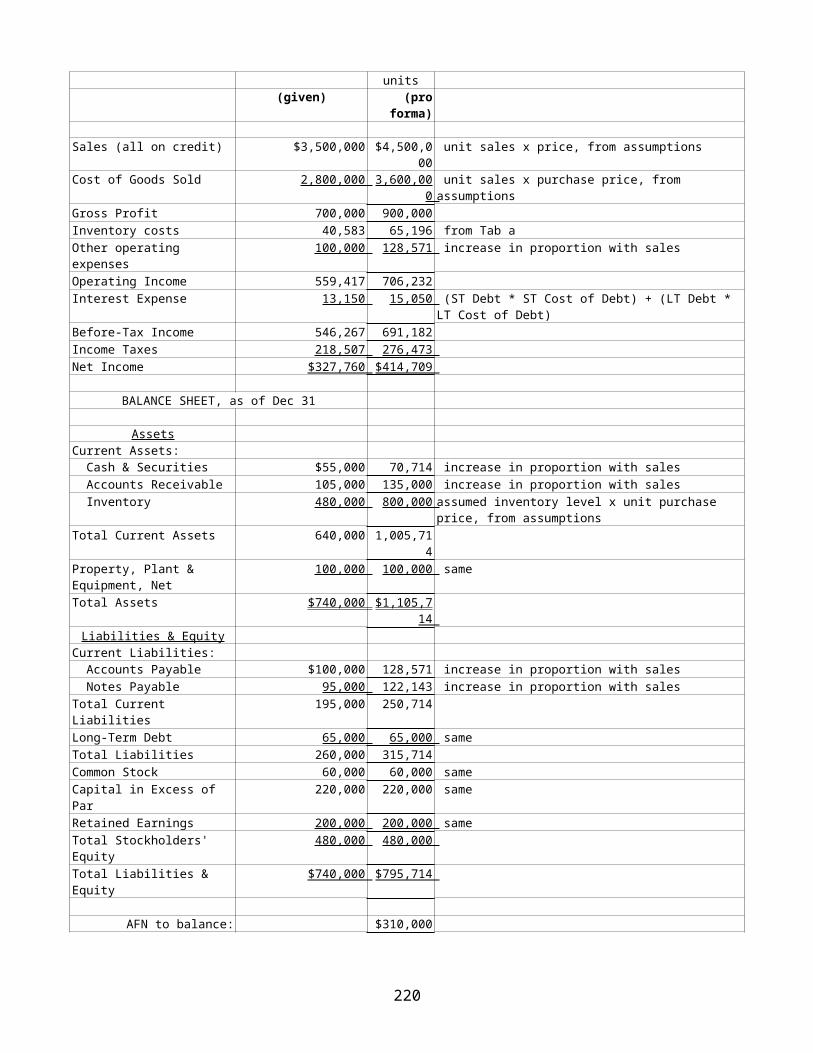
units(given) (pro
forma)
Sales (all on credit) $3,500,000 $4,500,000
unit sales x price, from assumptions
Cost of Goods Sold 2,800,000 3,600,000 unit sales x purchase price, from assumptions
Gross Profit 700,000 900,000 Inventory costs 40,583 65,196 from Tab aOther operating expenses
100,000 128,571 increase in proportion with sales
Operating Income 559,417 706,232 Interest Expense 13,150 15,050 (ST Debt * ST Cost of Debt) + (LT Debt *
LT Cost of Debt)Before-Tax Income 546,267 691,182 Income Taxes 218,507 276,473 Net Income $327,760 $414,709
BALANCE SHEET, as of Dec 31
AssetsCurrent Assets: Cash & Securities $55,000 70,714 increase in proportion with sales Accounts Receivable 105,000 135,000 increase in proportion with sales Inventory 480,000 800,000 assumed inventory level x unit purchase
price, from assumptionsTotal Current Assets 640,000 1,005,71
4 Property, Plant & Equipment, Net
100,000 100,000 same
Total Assets $740,000 $1,105,714
Liabilities & EquityCurrent Liabilities: Accounts Payable $100,000 128,571 increase in proportion with sales Notes Payable 95,000 122,143 increase in proportion with salesTotal Current Liabilities
195,000 250,714
Long-Term Debt 65,000 65,000 sameTotal Liabilities 260,000 315,714 Common Stock 60,000 60,000 sameCapital in Excess of Par
220,000 220,000 same
Retained Earnings 200,000 200,000 sameTotal Stockholders' Equity
480,000 480,000
Total Liabilities & Equity
$740,000 $795,714
AFN to balance: $310,000
220
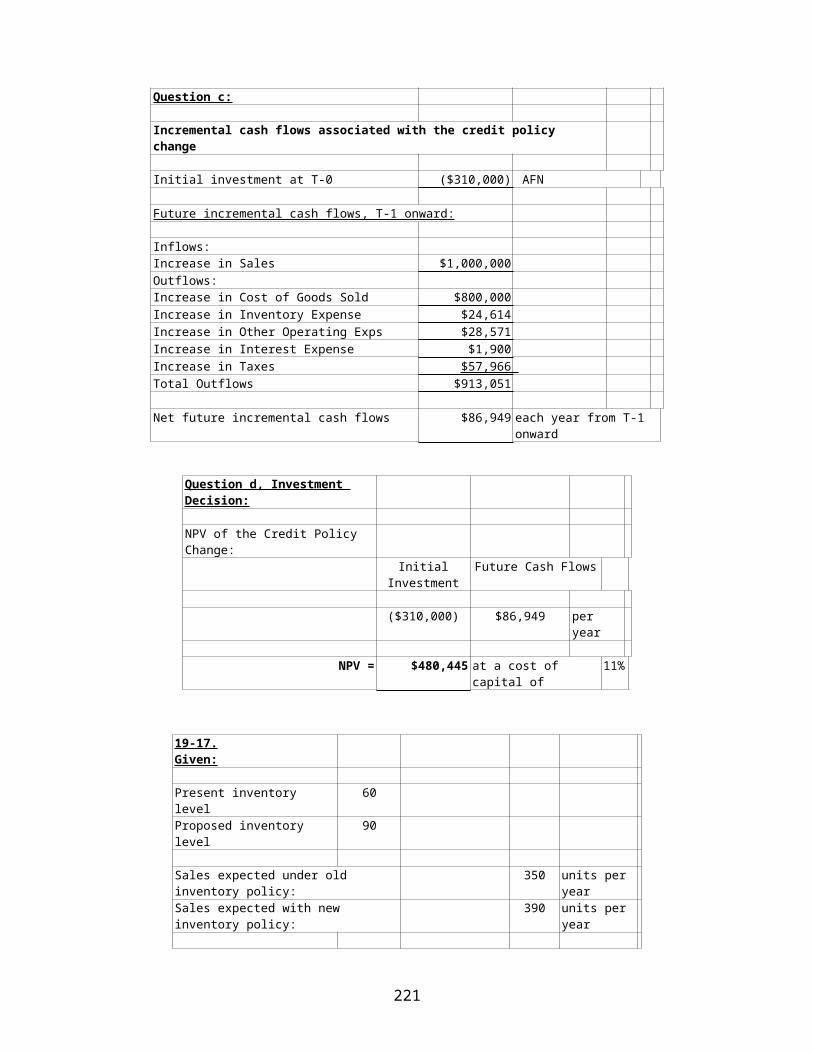
Question c:
Incremental cash flows associated with the credit policy change
Initial investment at T-0 ($310,000) AFN
Future incremental cash flows, T-1 onward:
Inflows:Increase in Sales $1,000,000 Outflows:Increase in Cost of Goods Sold $800,000 Increase in Inventory Expense $24,614 Increase in Other Operating Exps $28,571 Increase in Interest Expense $1,900 Increase in Taxes $57,966 Total Outflows $913,051
Net future incremental cash flows $86,949 each year from T-1 onward
Question d, Investment Decision:
NPV of the Credit Policy Change:
InitialInvestment
Future Cash Flows
($310,000) $86,949 per year
NPV = $480,445 at a cost of capital of
11%
19-17.Given:
Present inventory level
60
Proposed inventory level
90
Sales expected under old inventory policy:
350 units per year
Sales expected with new inventory policy:
390 units per year
221
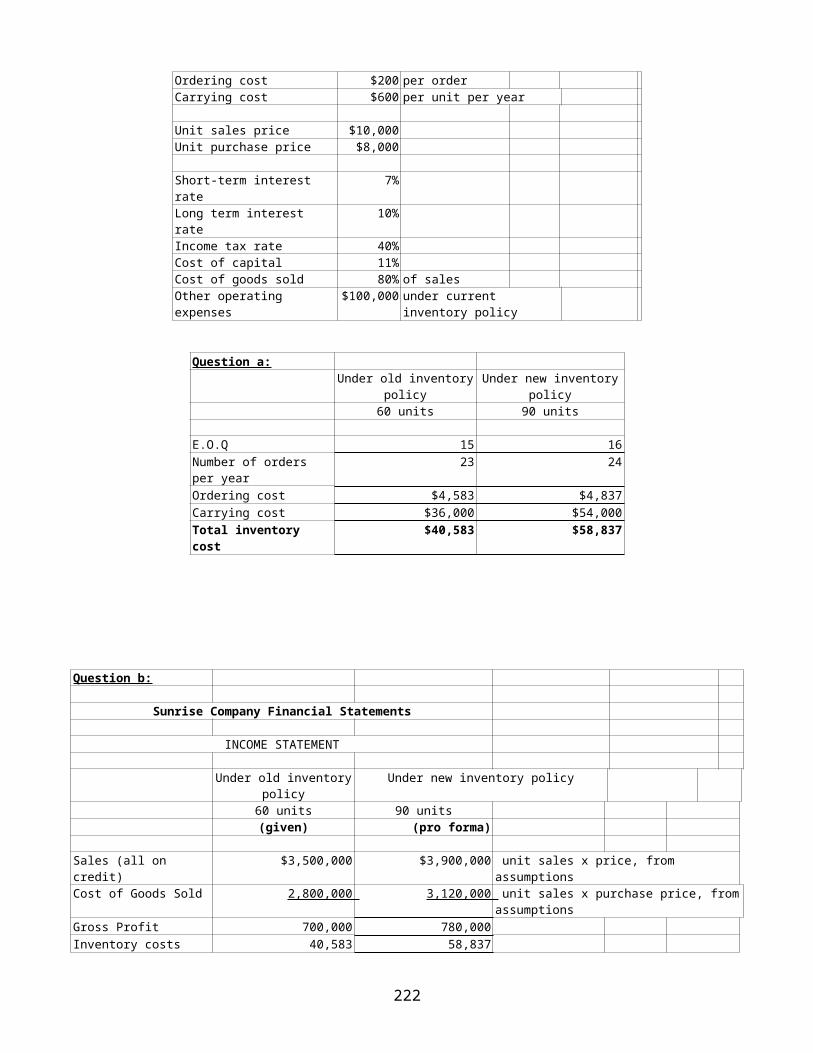
Ordering cost $200 per orderCarrying cost $600 per unit per year
Unit sales price $10,000 Unit purchase price $8,000
Short-term interest rate
7%
Long term interest rate
10%
Income tax rate 40%Cost of capital 11%Cost of goods sold 80% of salesOther operating expenses
$100,000 under current inventory policy
Question a:Under old inventory
policyUnder new inventory
policy60 units 90 units
E.O.Q 15 16 Number of orders per year
23 24
Ordering cost $4,583 $4,837 Carrying cost $36,000 $54,000 Total inventory cost
$40,583 $58,837
Question b:
Sunrise Company Financial Statements
INCOME STATEMENT
Under old inventorypolicy
Under new inventory policy
60 units 90 units(given) (pro forma)
Sales (all on credit)
$3,500,000 $3,900,000 unit sales x price, from assumptions
Cost of Goods Sold 2,800,000 3,120,000 unit sales x purchase price, fromassumptions
Gross Profit 700,000 780,000 Inventory costs 40,583 58,837
222
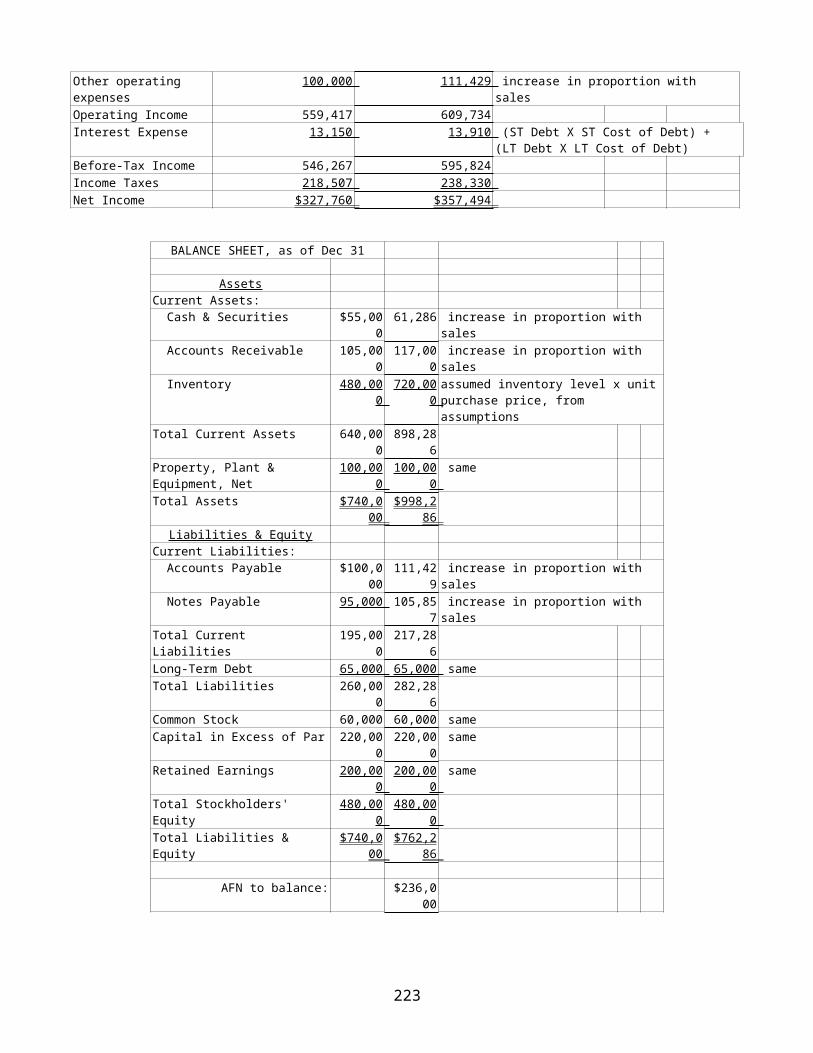
Other operating expenses
100,000 111,429 increase in proportion with sales
Operating Income 559,417 609,734 Interest Expense 13,150 13,910 (ST Debt X ST Cost of Debt) +
(LT Debt X LT Cost of Debt)Before-Tax Income 546,267 595,824 Income Taxes 218,507 238,330 Net Income $327,760 $357,494
BALANCE SHEET, as of Dec 31
AssetsCurrent Assets: Cash & Securities $55,00
0 61,286 increase in proportion with
sales Accounts Receivable 105,00
0 117,00
0 increase in proportion with sales
Inventory 480,000
720,000 assumed inventory level x unitpurchase price, from assumptions
Total Current Assets 640,000
898,286
Property, Plant & Equipment, Net
100,000
100,000 same
Total Assets $740,000
$998,286
Liabilities & EquityCurrent Liabilities: Accounts Payable $100,0
00 111,42
9 increase in proportion with sales
Notes Payable 95,000 105,857 increase in proportion with sales
Total Current Liabilities
195,000
217,286
Long-Term Debt 65,000 65,000 sameTotal Liabilities 260,00
0 282,28
6 Common Stock 60,000 60,000 sameCapital in Excess of Par 220,00
0 220,00
0 same
Retained Earnings 200,000
200,000 same
Total Stockholders' Equity
480,000
480,000
Total Liabilities & Equity
$740,000
$762,286
AFN to balance: $236,000
223
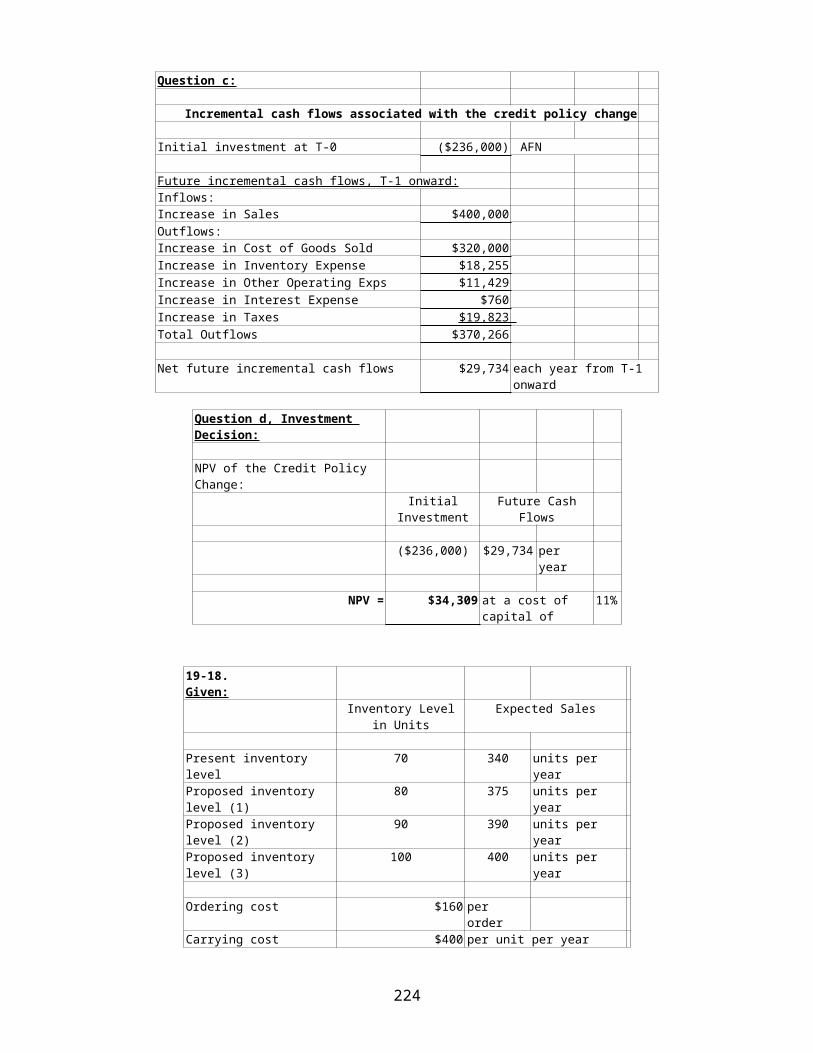
Question c:
Incremental cash flows associated with the credit policy change
Initial investment at T-0 ($236,000) AFN
Future incremental cash flows, T-1 onward:Inflows:Increase in Sales $400,000 Outflows:Increase in Cost of Goods Sold $320,000 Increase in Inventory Expense $18,255 Increase in Other Operating Exps $11,429 Increase in Interest Expense $760 Increase in Taxes $19,823 Total Outflows $370,266
Net future incremental cash flows $29,734 each year from T-1 onward
Question d, Investment Decision:
NPV of the Credit Policy Change:
InitialInvestment
Future CashFlows
($236,000) $29,734 per year
NPV = $34,309 at a cost of capital of
11%
19-18.Given:
Inventory Levelin Units
Expected Sales
Present inventory level
70 340 units per year
Proposed inventory level (1)
80 375 units per year
Proposed inventory level (2)
90 390 units per year
Proposed inventory level (3)
100 400 units per year
Ordering cost $160 per order
Carrying cost $400 per unit per year
224
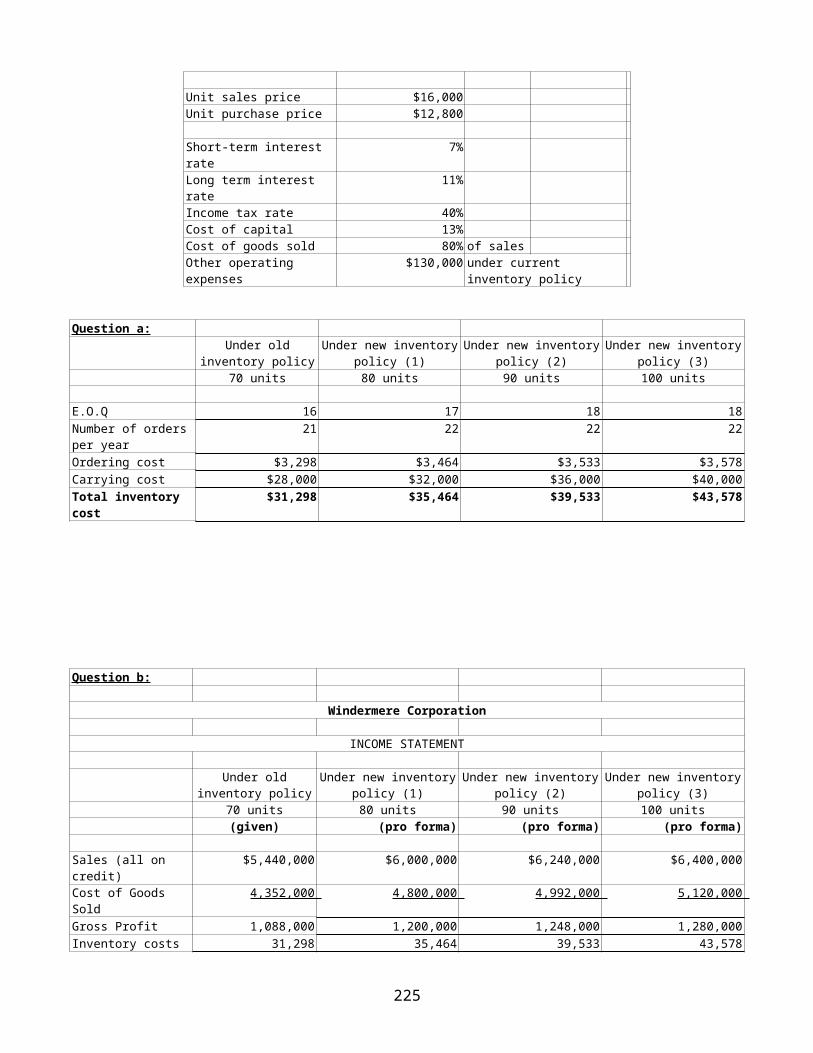
Unit sales price $16,000 Unit purchase price $12,800
Short-term interest rate
7%
Long term interest rate
11%
Income tax rate 40%Cost of capital 13%Cost of goods sold 80% of salesOther operating expenses
$130,000 under current inventory policy
Question a:Under old
inventory policyUnder new inventory
policy (1)Under new inventory
policy (2)Under new inventory
policy (3)70 units 80 units 90 units 100 units
E.O.Q 16 17 18 18 Number of orders per year
21 22 22 22
Ordering cost $3,298 $3,464 $3,533 $3,578 Carrying cost $28,000 $32,000 $36,000 $40,000 Total inventory cost
$31,298 $35,464 $39,533 $43,578
Question b:
Windermere Corporation
INCOME STATEMENT
Under oldinventory policy
Under new inventorypolicy (1)
Under new inventorypolicy (2)
Under new inventorypolicy (3)
70 units 80 units 90 units 100 units(given) (pro forma) (pro forma) (pro forma)
Sales (all on credit)
$5,440,000 $6,000,000 $6,240,000 $6,400,000
Cost of Goods Sold
4,352,000 4,800,000 4,992,000 5,120,000
Gross Profit 1,088,000 1,200,000 1,248,000 1,280,000 Inventory costs 31,298 35,464 39,533 43,578
225
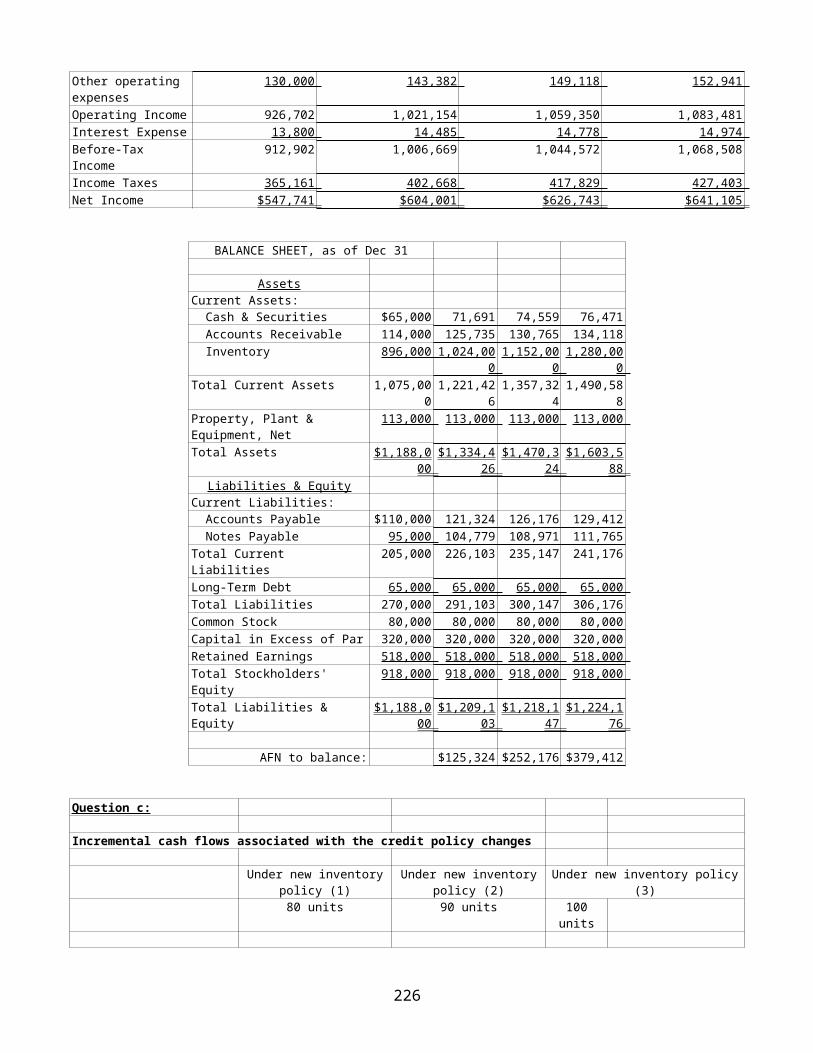
Other operating expenses
130,000 143,382 149,118 152,941
Operating Income 926,702 1,021,154 1,059,350 1,083,481 Interest Expense 13,800 14,485 14,778 14,974 Before-Tax Income
912,902 1,006,669 1,044,572 1,068,508
Income Taxes 365,161 402,668 417,829 427,403 Net Income $547,741 $604,001 $626,743 $641,105
BALANCE SHEET, as of Dec 31
AssetsCurrent Assets: Cash & Securities $65,000 71,691 74,559 76,471 Accounts Receivable 114,000 125,735 130,765 134,118 Inventory 896,000 1,024,00
0 1,152,00
0 1,280,00
0 Total Current Assets 1,075,00
0 1,221,42
6 1,357,32
4 1,490,58
8 Property, Plant & Equipment, Net
113,000 113,000 113,000 113,000
Total Assets $1,188,000
$1,334,426
$1,470,324
$1,603,588
Liabilities & EquityCurrent Liabilities: Accounts Payable $110,000 121,324 126,176 129,412 Notes Payable 95,000 104,779 108,971 111,765 Total Current Liabilities
205,000 226,103 235,147 241,176
Long-Term Debt 65,000 65,000 65,000 65,000 Total Liabilities 270,000 291,103 300,147 306,176 Common Stock 80,000 80,000 80,000 80,000 Capital in Excess of Par 320,000 320,000 320,000 320,000 Retained Earnings 518,000 518,000 518,000 518,000 Total Stockholders' Equity
918,000 918,000 918,000 918,000
Total Liabilities & Equity
$1,188,000
$1,209,103
$1,218,147
$1,224,176
AFN to balance: $125,324 $252,176 $379,412
Question c:
Incremental cash flows associated with the credit policy changes
Under new inventorypolicy (1)
Under new inventorypolicy (2)
Under new inventory policy(3)
80 units 90 units 100units
226
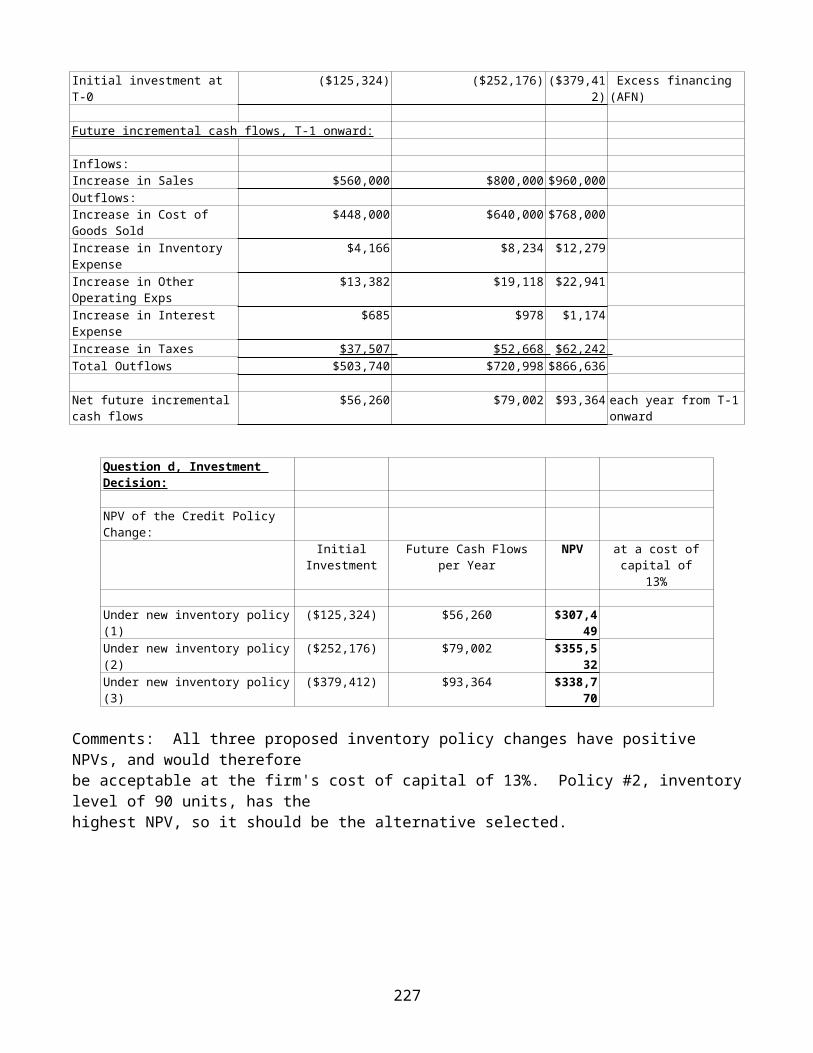
Initial investment at T-0
($125,324) ($252,176) ($379,412)
Excess financing(AFN)
Future incremental cash flows, T-1 onward:
Inflows:Increase in Sales $560,000 $800,000 $960,000 Outflows:Increase in Cost of Goods Sold
$448,000 $640,000 $768,000
Increase in Inventory Expense
$4,166 $8,234 $12,279
Increase in Other Operating Exps
$13,382 $19,118 $22,941
Increase in Interest Expense
$685 $978 $1,174
Increase in Taxes $37,507 $52,668 $62,242 Total Outflows $503,740 $720,998 $866,636
Net future incrementalcash flows
$56,260 $79,002 $93,364 each year from T-1onward
Question d, Investment Decision:
NPV of the Credit Policy Change:
InitialInvestment
Future Cash Flowsper Year
NPV at a cost ofcapital of
13%
Under new inventory policy(1)
($125,324) $56,260 $307,449
Under new inventory policy(2)
($252,176) $79,002 $355,532
Under new inventory policy(3)
($379,412) $93,364 $338,770
Comments: All three proposed inventory policy changes have positive NPVs, and would thereforebe acceptable at the firm's cost of capital of 13%. Policy #2, inventorylevel of 90 units, has the highest NPV, so it should be the alternative selected.
227
Chapter 20 Solutions
Answers to Review Questions
1. Companies with rapidly growing levels of sales do not need to worryabout raising funds from outside the firm. Do you agree or disagree with this statement? Explain.
Disagree. Rapidly growing firms need more assets to accommodate the increasing sales. Such firms are more likely, not less, to seek outside financing. Internal funds are often insufficient.
2. Banks like to make short-term, self-liquidating loans to businesses. Why?
Banks like to be able to see where the funds are likely to come from such that the borrower is able to use to make the required loan payments. Short term, self-liquidating loans do this since the borrowed funds are used to purchase assets that generate the needed funds.
3. What are compensating balances and why do banks require them from some customers? Under what circumstances would banks be most likely to impose compensating balances?
Compensating balances are funds that a bank requires a customer to maintain in a non-interest bearing account until the loan is retired. Banks sometimes impose compensating balance requirements so as to increase the bank’s return on a loan. Compensating balances are most likely to be used when the stated interest rate on a loan is below the bank’s required rate of return.
4. What happens when a bank charges discount interest on a loan?
When a bank charges discount interest on a loan the required interest payment is subtracted from the loan proceeds at the time
228
the loan is made. This makes the effective interest rate greater than the stated rate.
5. What is trustworthy collateral from the lenders’ perspective? Explain whether accounts receivable and inventory are trustworthy collateral.
Assets that are readily marketable, of stable value, and not likelyto “disappear” make for trustworthy collateral. Accounts receivable and inventory could meet this test depending upon their particular characteristics.
6. Trade credit is free credit. Do you agree or disagree with this statement? Explain.
Trade credit is not free. It has a cost. Who bears that cost depends on the terms of the transaction between the grantor and therecipient of the trade credit.
7. What are the pros and cons of commercial paper relative to bank loans for a company seeking short-term financing?
Commercial paper is usually a cheaper source of short-term financing for a firm, compared to bank loans. Also, a larger amount of funds can often be raised by issuing commercial paper. Bank loans are usually a more flexible source of short-term financing and establishing an on-going business relationship with abank may prove beneficial when money is tight.
Answers to End-of-Chapter Problems
20-1. a) at the end of the year $1,600/$20,000 = 8%
b) at the beginning of the year (discount loan) $1,600/($20,000- $1,600) = 8.696%
229
20-2. Effective annual interest = $2,400/($40,000 - $2,400 - $40,000X 0.10)
= $2,400/$33,600 = 7.143%
20-3. a) Effective annual interest = 1,800/20,000 = 9%b) Interest = $20,000 X 0.08 = $1,600 Effective annual interest = 1,600/(20,000-1,600) =
1,600/18,400 = 8.70%c) Interest = $20,000 X 0.075 = $1500 Compensating balance = $20,000 X 0.10 = $2,000 Effective annual interest = $1,500/($20,000 - $2,000) =
1,500/18,000 = 8.33%
(i) Which alternative is best for Ralph from minimum effective interest rate point of view?
Alternative c
(ii) Let B be the amount Ralph should borrowSo, X - 0.1 X B = $20,000Solving, B = $22,222.22So, Ralph should borrow $22,222.22 andInterest payment = 22,222.22 X .075 = $1,666.67
20-4. Interest = 14,000 X (0.16/4) = $560Compensating Balance = 14,000 X 0.10 = $1400Effective annual interest = {1 + [560/(14,000 - 1,400 - 560)]}4 - 1
= 19.94%
20-5. Duration of loan = 2 weeks = 1/26 yearInterest = 10,000 X (0.07/26) = $26.92Compensating Balance = 10,000 X 0.10 = $1,000Effective annual interest = [1 + 26.92/(10,000 - 1,000 - 26.92)]26 -
1 = 8.10%
20-6. a) Discount = 0.06 X $1,000,000 X 60/360 = $10,000b) Price = $1,000,000 - $10,000 = $990,000
230
c) Effective annual interest rate = [$1,000,000/$990,000]365/60 - 1 = 6.305%
20-7. Discount = 0.04 X $2,000,000 X 60/360 = $13,333.33Price = $2,000,000 - $13,333.33 = $1,986,666.67Effective annual interest rate = [$2,000,000/$1,986,666.67]365/60 - 1
= 4.15%
20-8. [1 + 2/98]365/(45 - 15) - 1 = 27.86%
20-9. a) 3/10, n 60 [1 + 3/97]365/(60 - 10) - 1 = 24.90%
b) 2/15, n 30 [1 + 2/98]365/(30 - 15) - 1 = 63.49%
Re-calculate the costs assuming payments were made on the 40th day in each of the above cases. Compare your results.
a) 3/10, n 60 [1 + 3/97]365/(40 - 10) - 1 = 44.86% (Higher)
b) 2/15, n 30 [1 + 2/98]365/(40 - 15) - 1 = 34.31% (Lower)
20-10. k = [1 + (3 / (100 – 3)) (365 / (45 –15))] – 1k = .4486 = 44.86%
20.11. a) (.038 * $2,000,000 * 90) / 360 = $19,000b) $2,000,000 - $19,000 = $1,981,000c) ($2,000,000 / $1,981,000)(365/90) – 1 = .03947 = 3.95%
20-12. $20,000 * 0.065 = $1,300 (interest)$1,300 / ($20,000 - $1,300) = .0695 = 6.95%
20-13. $30,000 * 0.10 = $3,000$30,000 * 0.13 = $3,900$3,000 / ($30,000 - $3,900) = .1149 = 11.5%
231
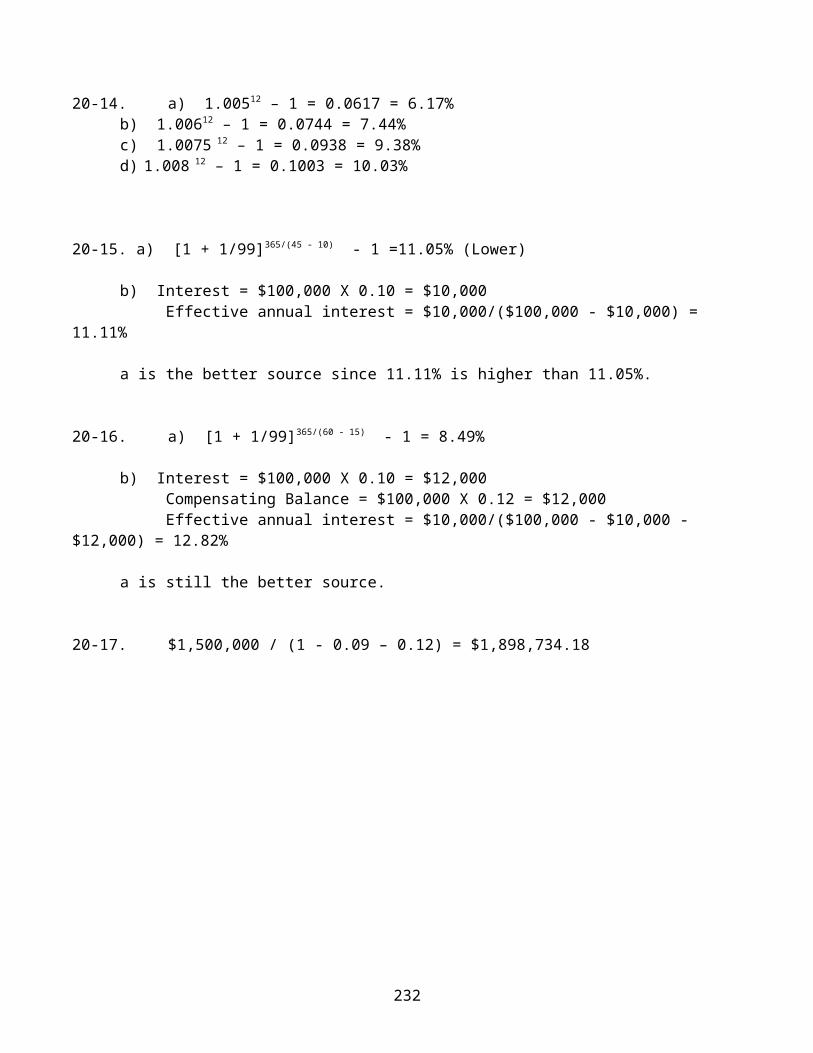
20-14. a) 1.00512 – 1 = 0.0617 = 6.17%b) 1.00612 – 1 = 0.0744 = 7.44%c) 1.0075 12 – 1 = 0.0938 = 9.38%d) 1.008 12 – 1 = 0.1003 = 10.03%
20-15. a) [1 + 1/99]365/(45 - 10) - 1 =11.05% (Lower)
b) Interest = $100,000 X 0.10 = $10,000 Effective annual interest = $10,000/($100,000 - $10,000) =
11.11%
a is the better source since 11.11% is higher than 11.05%.
20-16. a) [1 + 1/99]365/(60 - 15) - 1 = 8.49%
b) Interest = $100,000 X 0.10 = $12,000 Compensating Balance = $100,000 X 0.12 = $12,000 Effective annual interest = $10,000/($100,000 - $10,000 -
$12,000) = 12.82%
a is still the better source.
20-17. $1,500,000 / (1 - 0.09 – 0.12) = $1,898,734.18
232
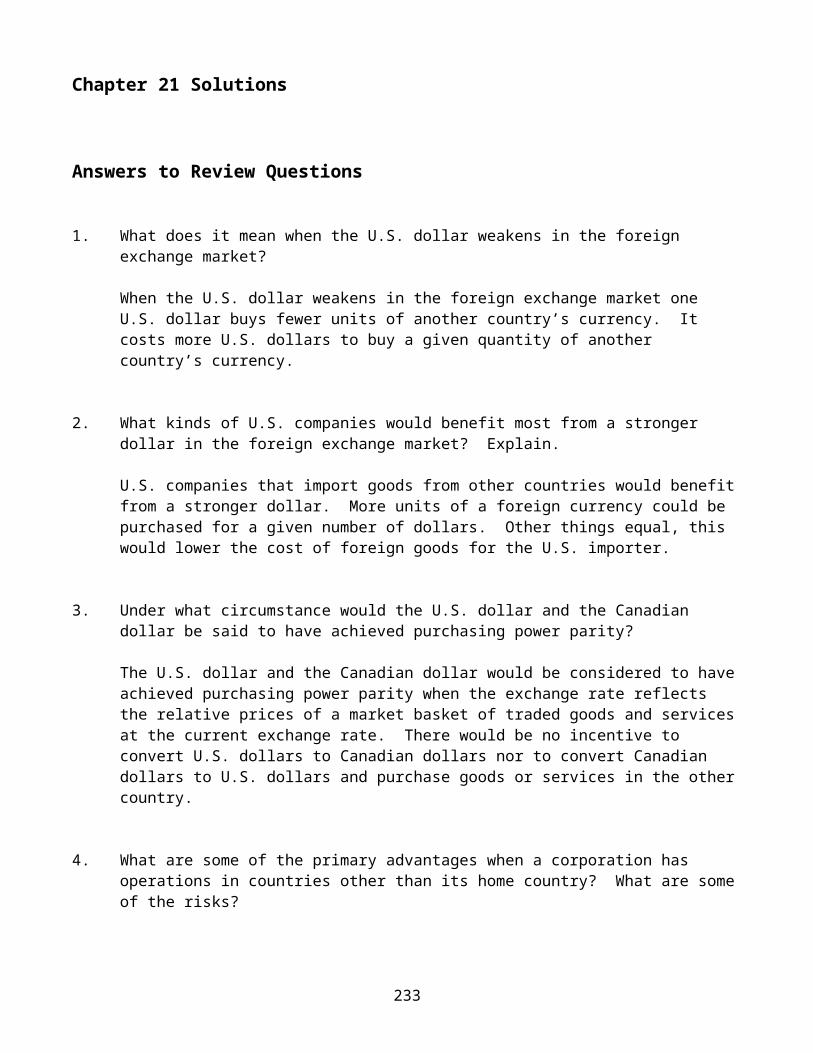
Chapter 21 Solutions
Answers to Review Questions
1. What does it mean when the U.S. dollar weakens in the foreign exchange market?
When the U.S. dollar weakens in the foreign exchange market one U.S. dollar buys fewer units of another country’s currency. It costs more U.S. dollars to buy a given quantity of another country’s currency.
2. What kinds of U.S. companies would benefit most from a stronger dollar in the foreign exchange market? Explain.
U.S. companies that import goods from other countries would benefitfrom a stronger dollar. More units of a foreign currency could be purchased for a given number of dollars. Other things equal, this would lower the cost of foreign goods for the U.S. importer.
3. Under what circumstance would the U.S. dollar and the Canadian dollar be said to have achieved purchasing power parity?
The U.S. dollar and the Canadian dollar would be considered to haveachieved purchasing power parity when the exchange rate reflects the relative prices of a market basket of traded goods and servicesat the current exchange rate. There would be no incentive to convert U.S. dollars to Canadian dollars nor to convert Canadian dollars to U.S. dollars and purchase goods or services in the othercountry.
4. What are some of the primary advantages when a corporation has operations in countries other than its home country? What are someof the risks?
233
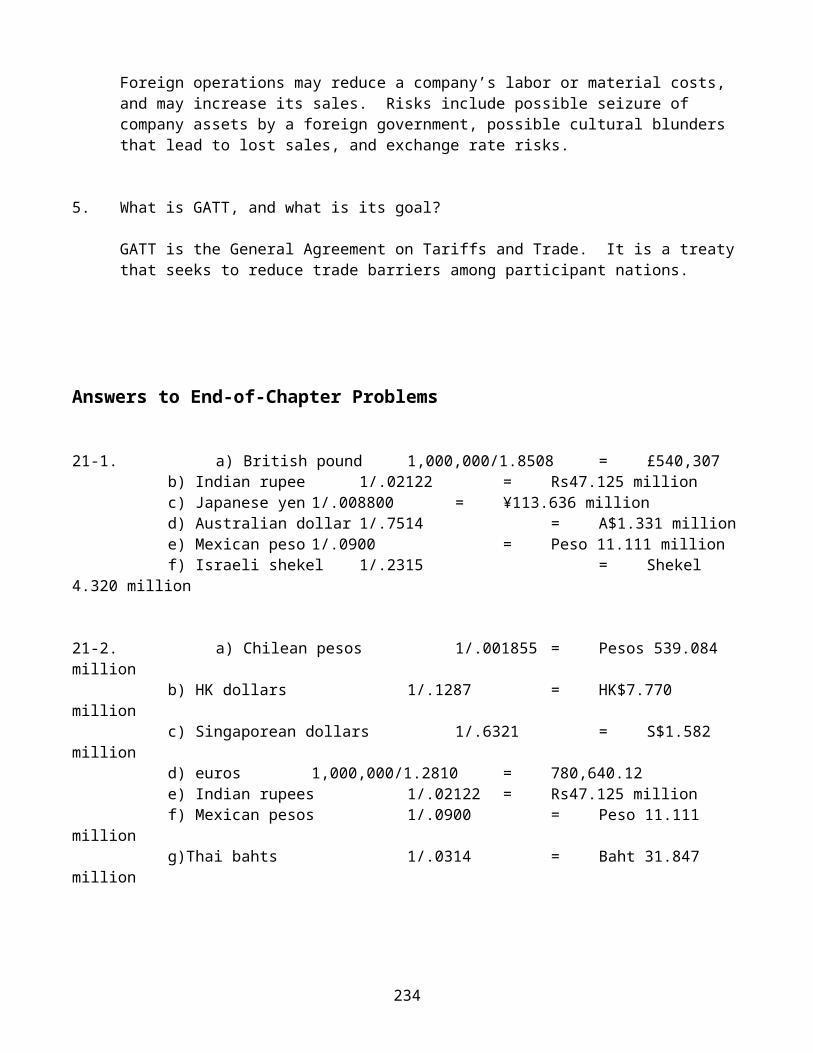
Foreign operations may reduce a company’s labor or material costs, and may increase its sales. Risks include possible seizure of company assets by a foreign government, possible cultural blunders that lead to lost sales, and exchange rate risks.
5. What is GATT, and what is its goal?
GATT is the General Agreement on Tariffs and Trade. It is a treatythat seeks to reduce trade barriers among participant nations.
Answers to End-of-Chapter Problems
21-1. a) British pound 1,000,000/1.8508 = £540,307b) Indian rupee 1/.02122 = Rs47.125 millionc) Japanese yen 1/.008800 = ¥113.636 milliond) Australian dollar 1/.7514 = A$1.331 millione) Mexican peso 1/.0900 = Peso 11.111 millionf) Israeli shekel 1/.2315 = Shekel
4.320 million
21-2. a) Chilean pesos 1/.001855 = Pesos 539.084 million
b) HK dollars 1/.1287 = HK$7.770 million
c) Singaporean dollars 1/.6321 = S$1.582 million
d) euros 1,000,000/1.2810 = 780,640.12e) Indian rupees 1/.02122 = Rs47.125 millionf) Mexican pesos 1/.0900 = Peso 11.111
milliong)Thai bahts 1/.0314 = Baht 31.847
million
234
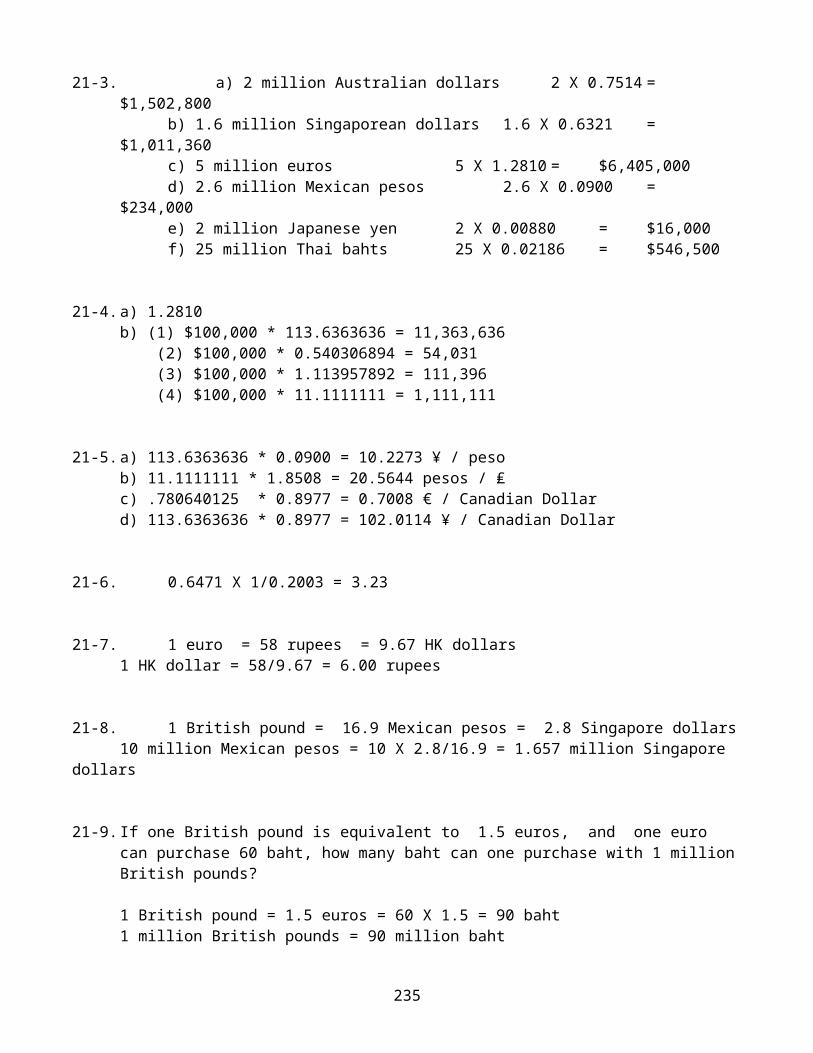
21-3. a) 2 million Australian dollars 2 X 0.7514 =$1,502,800
b) 1.6 million Singaporean dollars 1.6 X 0.6321 =$1,011,360
c) 5 million euros 5 X 1.2810 = $6,405,000d) 2.6 million Mexican pesos 2.6 X 0.0900 =
$234,000e) 2 million Japanese yen 2 X 0.00880 = $16,000f) 25 million Thai bahts 25 X 0.02186 = $546,500
21-4.a) 1.2810b) (1) $100,000 * 113.6363636 = 11,363,636 (2) $100,000 * 0.540306894 = 54,031 (3) $100,000 * 1.113957892 = 111,396 (4) $100,000 * 11.1111111 = 1,111,111
21-5.a) 113.6363636 * 0.0900 = 10.2273 ¥ / pesob) 11.1111111 * 1.8508 = 20.5644 pesos / ₤c) .780640125 * 0.8977 = 0.7008 € / Canadian Dollard) 113.6363636 * 0.8977 = 102.0114 ¥ / Canadian Dollar
21-6. 0.6471 X 1/0.2003 = 3.23
21-7. 1 euro = 58 rupees = 9.67 HK dollars1 HK dollar = 58/9.67 = 6.00 rupees
21-8. 1 British pound = 16.9 Mexican pesos = 2.8 Singapore dollars10 million Mexican pesos = 10 X 2.8/16.9 = 1.657 million Singapore
dollars
21-9.If one British pound is equivalent to 1.5 euros, and one euro can purchase 60 baht, how many baht can one purchase with 1 millionBritish pounds?
1 British pound = 1.5 euros = 60 X 1.5 = 90 baht1 million British pounds = 90 million baht
235
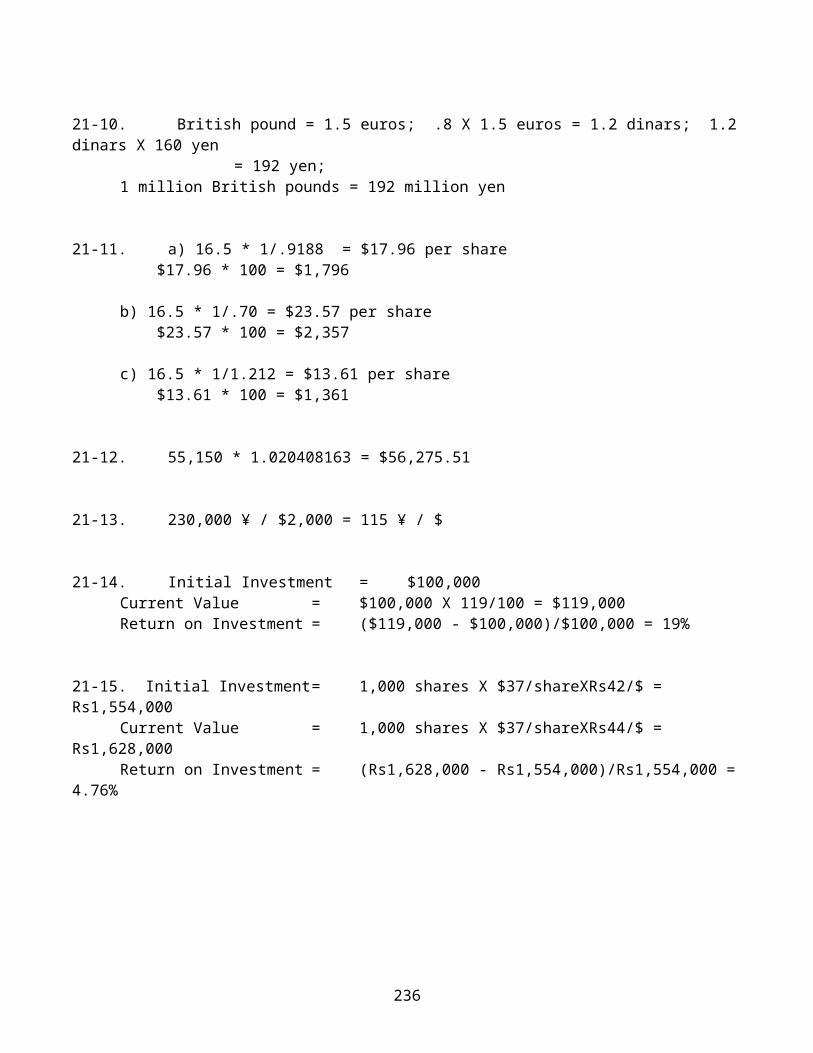
21-10. British pound = 1.5 euros; .8 X 1.5 euros = 1.2 dinars; 1.2dinars X 160 yen
= 192 yen; 1 million British pounds = 192 million yen
21-11. a) 16.5 * 1/.9188 = $17.96 per share $17.96 * 100 = $1,796
b) 16.5 * 1/.70 = $23.57 per share $23.57 * 100 = $2,357
c) 16.5 * 1/1.212 = $13.61 per share $13.61 * 100 = $1,361
21-12. 55,150 * 1.020408163 = $56,275.51
21-13. 230,000 ¥ / $2,000 = 115 ¥ / $
21-14. Initial Investment = $100,000Current Value = $100,000 X 119/100 = $119,000Return on Investment = ($119,000 - $100,000)/$100,000 = 19%
21-15. Initial Investment= 1,000 shares X $37/shareXRs42/$ = Rs1,554,000
Current Value = 1,000 shares X $37/shareXRs44/$ = Rs1,628,000
Return on Investment = (Rs1,628,000 - Rs1,554,000)/Rs1,554,000 =4.76%
236


![1 INCOTERMS 2010 (1)[1]](https://static.fdokumen.com/doc/165x107/631de3d1dc32ad07f3074e54/1-incoterms-2010-11.jpg)