EFBD Assignmentv1 1 1
19
APPENDIX – 1 Title : Indian Budget Analysis Subject : Economic Framework for Business Decisions Level / Trimester : IV Programme : GPBL Part Time Subject Tutor : Mr. Xavier Dsouza Name of Student : Ravinandan D Basappa Student’s Registration Number : PGD-BPT/FEB11/14 Date of Submission : 22 nd April 2012 Word Count : 2200 (Approx) Word Limit : 2000 words.
-
Upload
independent -
Category
Documents
-
view
1 -
download
0
Transcript of EFBD Assignmentv1 1 1

APPENDIX – 1
Title : Indian Budget Analysis
Subject : Economic Framework for Business Decisions
Level / Trimester : IV
Programme : GPBL Part Time
Subject Tutor : Mr. Xavier Dsouza
Name of Student : Ravinandan D Basappa
Student’s Registration Number : PGD-BPT/FEB11/14
Date of Submission : 22nd April 2012
Word Count : 2200 (Approx)
Word Limit : 2000 words.
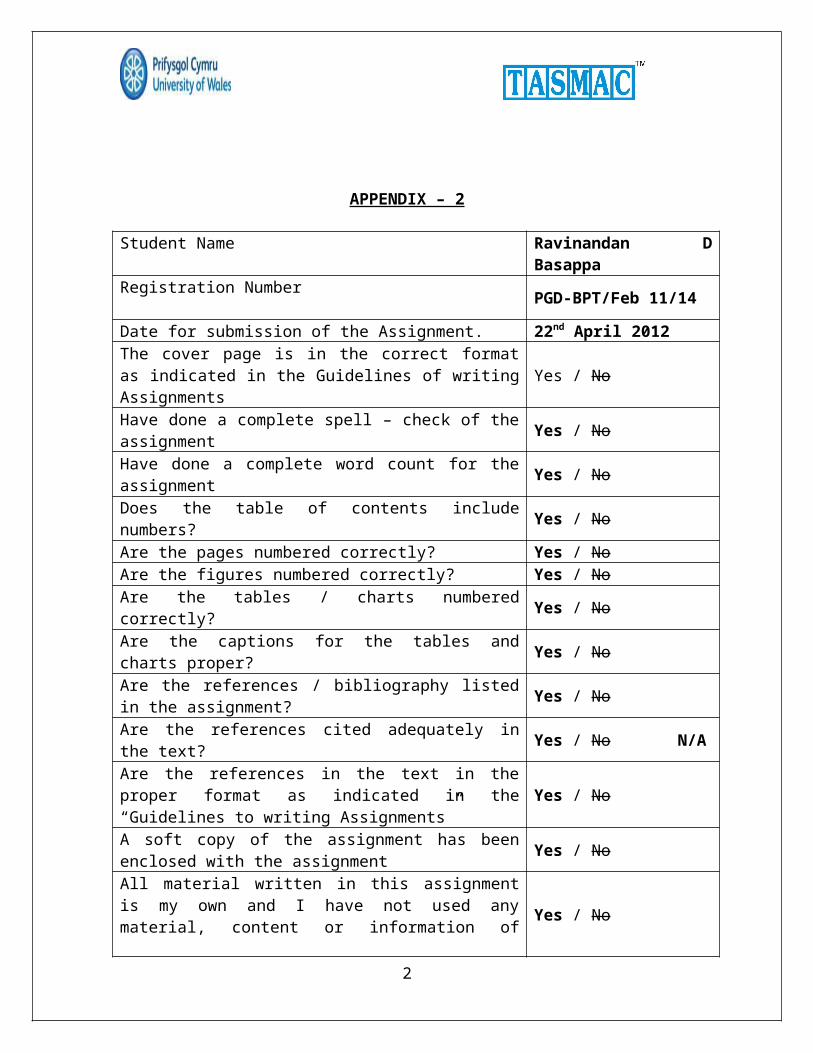
APPENDIX – 2
Student Name Ravinandan DBasappa
Registration Number PGD-BPT/Feb 11/14
Date for submission of the Assignment. 22nd April 2012The cover page is in the correct formatas indicated in the Guidelines of writingAssignments
Yes / No
Have done a complete spell – check of theassignment Yes / No
Have done a complete word count for theassignment Yes / No
Does the table of contents includenumbers? Yes / No
Are the pages numbered correctly? Yes / NoAre the figures numbered correctly? Yes / NoAre the tables / charts numberedcorrectly? Yes / No
Are the captions for the tables andcharts proper? Yes / No
Are the references / bibliography listedin the assignment? Yes / No
Are the references cited adequately inthe text? Yes / No N/A
Are the references in the text in theproper format as indicated in the“Guidelines to writing Assignments”
Yes / No
A soft copy of the assignment has beenenclosed with the assignment Yes / No
All material written in this assignmentis my own and I have not used anymaterial, content or information of Yes / No
2
others claiming them to be mine. Wherevermaterials have been used, proper citationhas been done in the text. I am fullyaware of the rules and regulationsgoverning the Plagiarism applicable tothe dissertation and should at any pointof time my work is suspected /investigated and established to haveplagiarized some other work. Am aware ofthe consequences if such cases aredetected and have read the StudentHandbook in detail.
Signature of the student Date: 22nd
April 2012
Table of Contents
1 Union Budget of India- Introduction....................42 Economic Survey:.......................................52.1 Economic Survey – for the period 2009:..............52.2 Economic Survey – for the period 2010...............72.3 Economic Survey – for the period 2011...............8
3 Plan and Non Plan expenditures:........................93.1 Plan and Non Plan expenditure – for the period 2009-2010:....................................................93.2 Plan and Non Plan expenditure – for the period 2010-2011:....................................................9
3
3.3 Plan and Non Plan expenditure – for the period 2011-2012:....................................................9
4 Deficits- Fiscal, Revenue and Primary:................105 Impact of Budget on various sectors:..................116 Overall direction of the economy:.....................117 Aggregate demand, Price and GDP:......................128 Conclusion:...........................................139 Appendix I – References...............................14
1 Union Budget of India- Introduction
4
In this report reader will witness the result analysis ofthe union budget of Government of India based on three yearsof budget data – fiscal year 2009-2010, 2010-2011 and 2011-2012.
The Budget is the annual fiscal exercise that attracts ahuge amount of interest, as the objective is a plan thatsets goals, outlines resources to meet these goals, providesdetails of the government's receipts and payments, andframes the taxation policies for the country. Governmentforms planning committee which makes Economic survey acrossthe country to have foundation for this fiscal plan.Committee represents formulation and implementation ofgovernment sector activities through budget. It balancesthough size of government, type of budget financing andrevenue & expenditure composition. Seeks internal & externalbalance, lowers debt, and ensures long-term sustainability.Provides public goods; promotes private investment;engineers pro-poor growth. Reduces poverty and provides goodgovernance. Figure-1 illustrates the overview of budgetstructure.
Initially budget’s major attention was paid towards theagriculture sector but as the economy evolved, the focusshifted from agriculture to other sectors like industrial,financial etc. During the early fifties, Indian budgethighlights revolved around the public sector and publicfinance and hence, back then - taxation, inflation, publicsavings etc were much talked about topics. This trendcontinued till the finance budget 1985-86. The change in the approach began in late 1980’s wasinstrumental in head starting the new phase of economicliberalization. This approach reduced the control ofGovernment over public sector units through disinvestment.
5

The Figure-1 illustrates Budget and the Citizen.
2 Economic Survey:2.1 Economic Survey – for the period 2009:
The overall growth of GDP at factor cost at constant pricesin 2008-09, as per revised estimates released by the CentralStatistical Organization (CSO) was 6.7 per cent. The growthof GDP at factor cost (at constant 1999-2000 prices) at 6.7per cent in 2008-09 nevertheless represents a decelerationfrom high growth of 9.0 per cent and 9.7 per cent in 2007-08and 2006-07 respectively as shown in the Table 1.1.
6

Table 1.1: Rate of growth at factor cost at 1999-2000 prices(per cent)
The retardation of growth in 2008-09 was spread across allsectors except mining & quarrying and community, social andpersonal services. The growth in agriculture and alliedactivities decelerated from 4.9 per cent in 2007-08 to 1.6per cent in 2008-09, mainly on account of the high baseeffect of 2007-08 and due to a fall in the production ofnon-food crops including oilseeds, cotton, sugarcane andjute. The production of wheat was also marginally lower thanin 2007-08. The manufacturing, electricity and constructionsectors decelerated to 2.4, 3.4 and 7.2 per centrespectively during 2008-09 from 8.2, 5.3 and 10.1 per centrespectively in 2007-08. The slowdown in manufacturing couldbe attributed to the combined impact of a fall in exportsfollowed by a decline in domestic demand. The increase inthe costs of construction due to a rise in the prices ofinputs like steel and cement and interest costs had startedimpacting the industry. The higher growth in community,social and personal services during 2008-09 was mainly dueto an expansionary fiscal policy that was reflected in thedemand side of GDP as higher growth of Governmentconsumption expenditure.
7
In budget 2009-2010, in order to uplift the growth ofagriculture development government has increased agriculturecredit flow set at Rs.3,25,000 crore. Debt Relief forFarmers has declared to the farmers having more than twohectares of land to pay 75% cent of their over dues underDebit Waiver and Debit Relief Scheme and also acceleratedirrigation benefit programme. To support manufacture sector,list of specified raw materials and equipment imported bymanufacturer-exporters of leather goods, textile productsand footwear industry which are fully exempt from customsduty. Basis needs, like electricity, gas and water supply istaken into account with allocation under Accelerated PowerDevelopment and Reform Programme (APDRP) increased by 160per cent to Rs.2,080 crore. Planned long distance gaspipelines leading to a National Gas Grid to facilitatetransportation of gas across the length and breadth of thecountry. Provision for the project BRIMSTOWA initiated in2007 and funded through Central Assistance to address theproblem of flooding in Mumbai, enhanced from Rs.200 crore.
2.2 Economic Survey – for the period 2010
Table 1.2 illustrate the rate of growth, as per the advanceestimates of GDP for 2009-10, released by the CSO, theeconomy is expected to grow at 7.2 per cent in 2009-10, withthe industrial and the service sectors growing at 8.2 and8.7 per cent respectively. This recovery is impressive forat least three reasons. First, it has come about despite adecline of 0.2 per cent in agricultural output, which wasthe consequence of sub-normal monsoons. Second, itforeshadows renewed momentum in the manufacturing sector,which had seen continuous decline in the growth rate foralmost eight quarters since 2007-08. Indeed, manufacturinggrowth has more than doubled from 3.2 per cent in 2008-09 to8.9 per cent in 2009-10. Third, there has been a recovery inthe growth rate of gross fixed capital formation, which haddeclined significantly in 2008-09
8
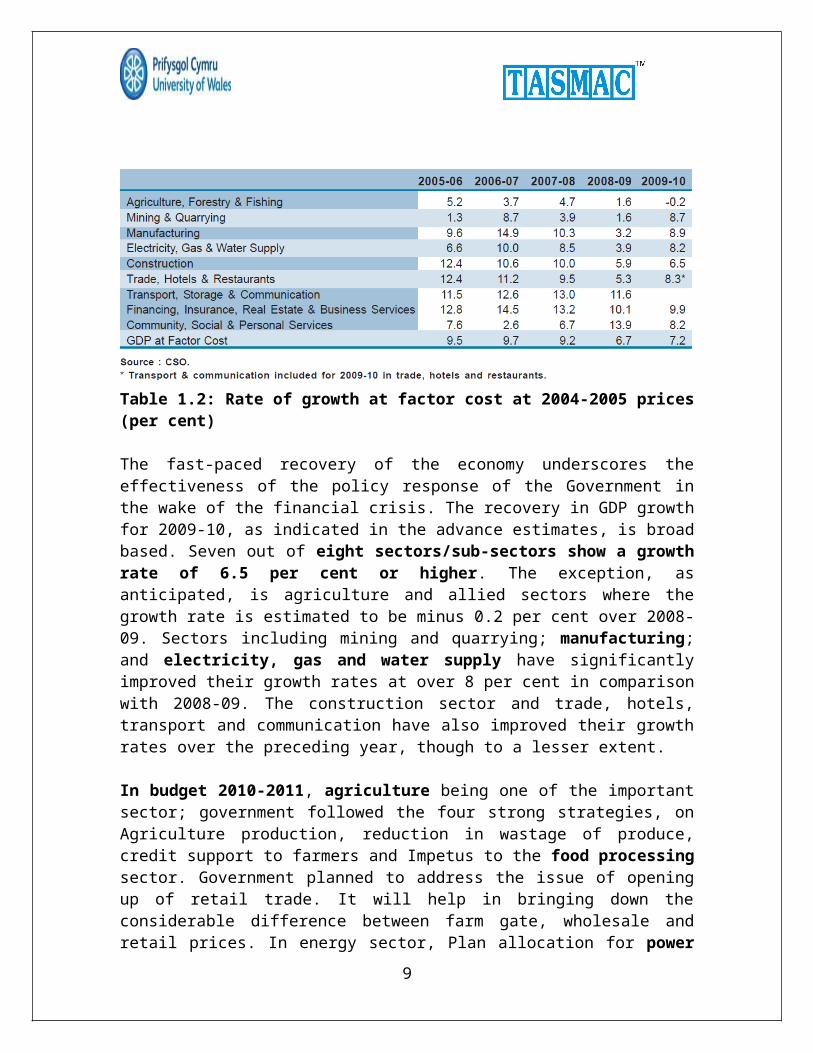
Table 1.2: Rate of growth at factor cost at 2004-2005 prices(per cent)
The fast-paced recovery of the economy underscores theeffectiveness of the policy response of the Government inthe wake of the financial crisis. The recovery in GDP growthfor 2009-10, as indicated in the advance estimates, is broadbased. Seven out of eight sectors/sub-sectors show a growthrate of 6.5 per cent or higher. The exception, asanticipated, is agriculture and allied sectors where thegrowth rate is estimated to be minus 0.2 per cent over 2008-09. Sectors including mining and quarrying; manufacturing;and electricity, gas and water supply have significantlyimproved their growth rates at over 8 per cent in comparisonwith 2008-09. The construction sector and trade, hotels,transport and communication have also improved their growthrates over the preceding year, though to a lesser extent.
In budget 2010-2011, agriculture being one of the importantsector; government followed the four strong strategies, onAgriculture production, reduction in wastage of produce,credit support to farmers and Impetus to the food processingsector. Government planned to address the issue of openingup of retail trade. It will help in bringing down theconsiderable difference between farm gate, wholesale andretail prices. In energy sector, Plan allocation for power
9
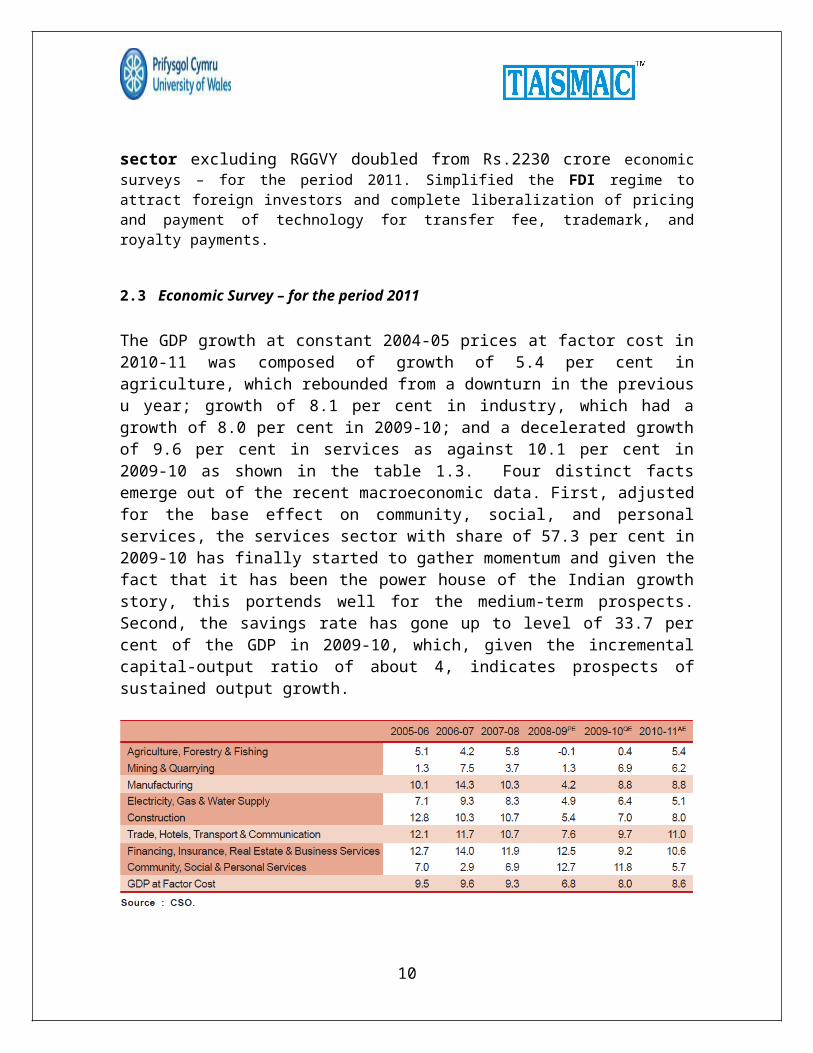
sector excluding RGGVY doubled from Rs.2230 crore economicsurveys – for the period 2011. Simplified the FDI regime toattract foreign investors and complete liberalization of pricingand payment of technology for transfer fee, trademark, androyalty payments.
2.3 Economic Survey – for the period 2011
The GDP growth at constant 2004-05 prices at factor cost in2010-11 was composed of growth of 5.4 per cent inagriculture, which rebounded from a downturn in the previousu year; growth of 8.1 per cent in industry, which had agrowth of 8.0 per cent in 2009-10; and a decelerated growthof 9.6 per cent in services as against 10.1 per cent in2009-10 as shown in the table 1.3. Four distinct factsemerge out of the recent macroeconomic data. First, adjustedfor the base effect on community, social, and personalservices, the services sector with share of 57.3 per cent in2009-10 has finally started to gather momentum and given thefact that it has been the power house of the Indian growthstory, this portends well for the medium-term prospects.Second, the savings rate has gone up to level of 33.7 percent of the GDP in 2009-10, which, given the incrementalcapital-output ratio of about 4, indicates prospects ofsustained output growth.
10
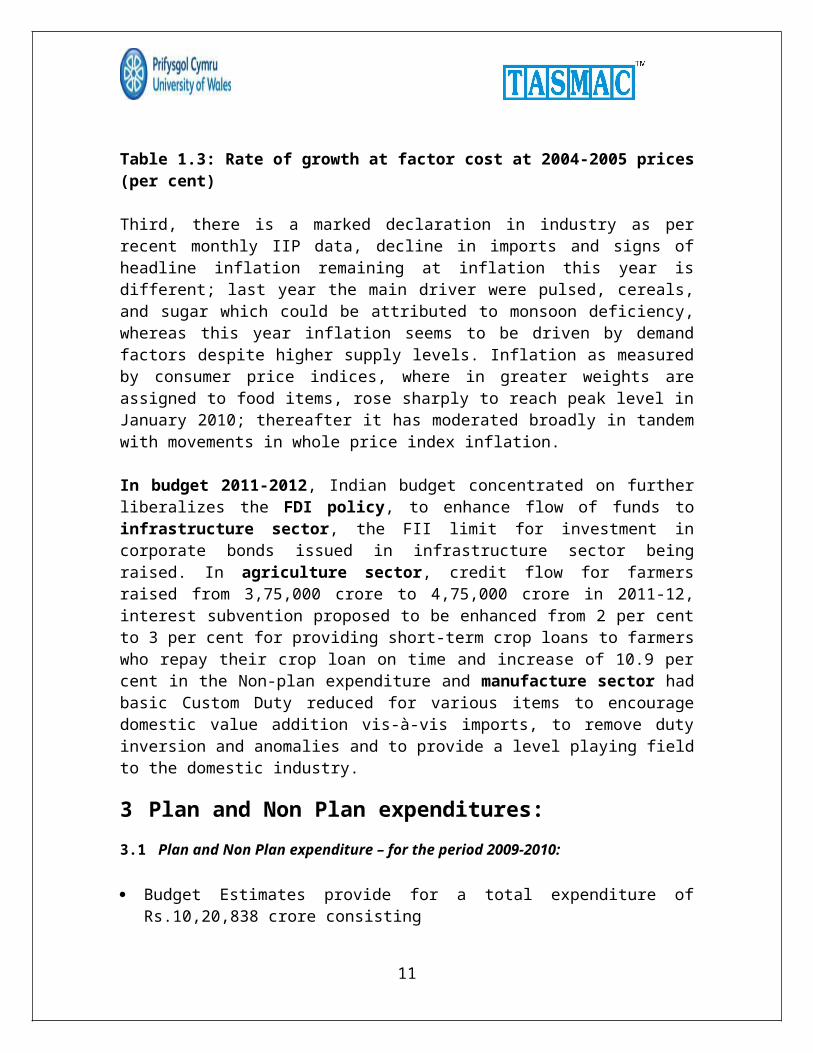
Table 1.3: Rate of growth at factor cost at 2004-2005 prices(per cent)
Third, there is a marked declaration in industry as perrecent monthly IIP data, decline in imports and signs ofheadline inflation remaining at inflation this year isdifferent; last year the main driver were pulsed, cereals,and sugar which could be attributed to monsoon deficiency,whereas this year inflation seems to be driven by demandfactors despite higher supply levels. Inflation as measuredby consumer price indices, where in greater weights areassigned to food items, rose sharply to reach peak level inJanuary 2010; thereafter it has moderated broadly in tandemwith movements in whole price index inflation.
In budget 2011-2012, Indian budget concentrated on furtherliberalizes the FDI policy, to enhance flow of funds toinfrastructure sector, the FII limit for investment incorporate bonds issued in infrastructure sector beingraised. In agriculture sector, credit flow for farmersraised from 3,75,000 crore to 4,75,000 crore in 2011-12,interest subvention proposed to be enhanced from 2 per centto 3 per cent for providing short-term crop loans to farmerswho repay their crop loan on time and increase of 10.9 percent in the Non-plan expenditure and manufacture sector hadbasic Custom Duty reduced for various items to encouragedomestic value addition vis-à-vis imports, to remove dutyinversion and anomalies and to provide a level playing fieldto the domestic industry.
3 Plan and Non Plan expenditures:3.1 Plan and Non Plan expenditure – for the period 2009-2010:
Budget Estimates provide for a total expenditure ofRs.10,20,838 crore consisting
11

of Rs.6,95,689 crore under Non-plan and Rs.3,25,149 croreunder Plan registeringan increase of 37 per cent in Non-plan expenditure and 34per cent in Plan expenditure over B.E. 2008-09.
Total expenditure in B.E. 2009-10 increased by 36 percent over B.E. 2008-09.
Increase in Non-plan expenditure is mainly due toimplementation of Sixth Central Pay Commissionrecommendations, increased food subsidy and higherinterest payment arising out of larger fiscal deficit in2008-09.
Interest payments estimated at Rs.2,25,511 croreconstituting about 36 per cent ofNon-plan revenue expenditure in B.E. 2009-10.
Subsidies up from Rs.71,431 crore in B.E. 2008-09 toRs.1,11,276 crore in B.E.2009-10.
Outlay for Defense up from Rs.1,05,600 crore in B.E.2008-09 to Rs.1,41,703crore in B.E. 2009-10.
3.2 Plan and Non Plan expenditure – for the period 2010-2011:
The total expenditure proposed in the Budget Estimates isRs. 11,08,749 crore, which is an increase of 8.6 per centover last year.
The Plan and Non Plan expenditures in BE 2010-11 areestimated at Rs. 3,73,092 crore and Rs. 7,35,657 crorerespectively. While there is 15 per cent increase in Planexpenditure, the increase in Non Plan expenditure is only6 per cent over the BE of previous year.
Fiscal deficit for BE 2010-11 at 5.5 per cent of GDP,which works out to Rs.3,81,408 crore
3.3 Plan and Non Plan expenditure – for the period 2011-2012:
Total expenditure proposed at 12,57,729 crore.
12
Increase of 18.3 per cent in total Plan allocation. Increase of 10.9 per cent in the Non-plan expenditure. Increase of 23 per cent in Plan and Non-plan transfer to
States and UTs.
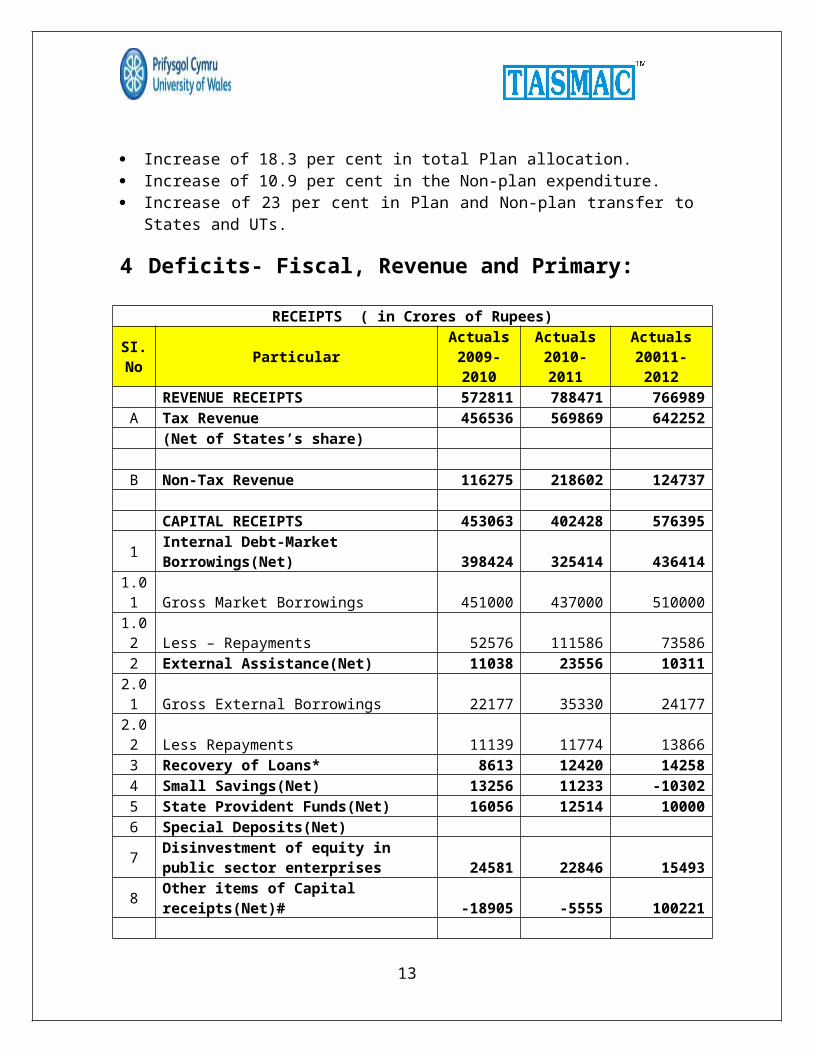
4 Deficits- Fiscal, Revenue and Primary:
RECEIPTS ( in Crores of Rupees)
SI.No Particular
Actuals2009-2010
Actuals2010-2011
Actuals20011-2012
REVENUE RECEIPTS 572811 788471 766989A Tax Revenue 456536 569869 642252 (Net of States’s share) B Non-Tax Revenue 116275 218602 124737 CAPITAL RECEIPTS 453063 402428 576395
1 Internal Debt-Market Borrowings(Net) 398424 325414 436414
1.01 Gross Market Borrowings 451000 437000 5100001.02 Less – Repayments 52576 111586 735862 External Assistance(Net) 11038 23556 103112.01 Gross External Borrowings 22177 35330 241772.02 Less Repayments 11139 11774 138663 Recovery of Loans* 8613 12420 142584 Small Savings(Net) 13256 11233 -103025 State Provident Funds(Net) 16056 12514 100006 Special Deposits(Net)
7 Disinvestment of equity in public sector enterprises 24581 22846 15493
8 Other items of Capital receipts(Net)# -18905 -5555 100221
13
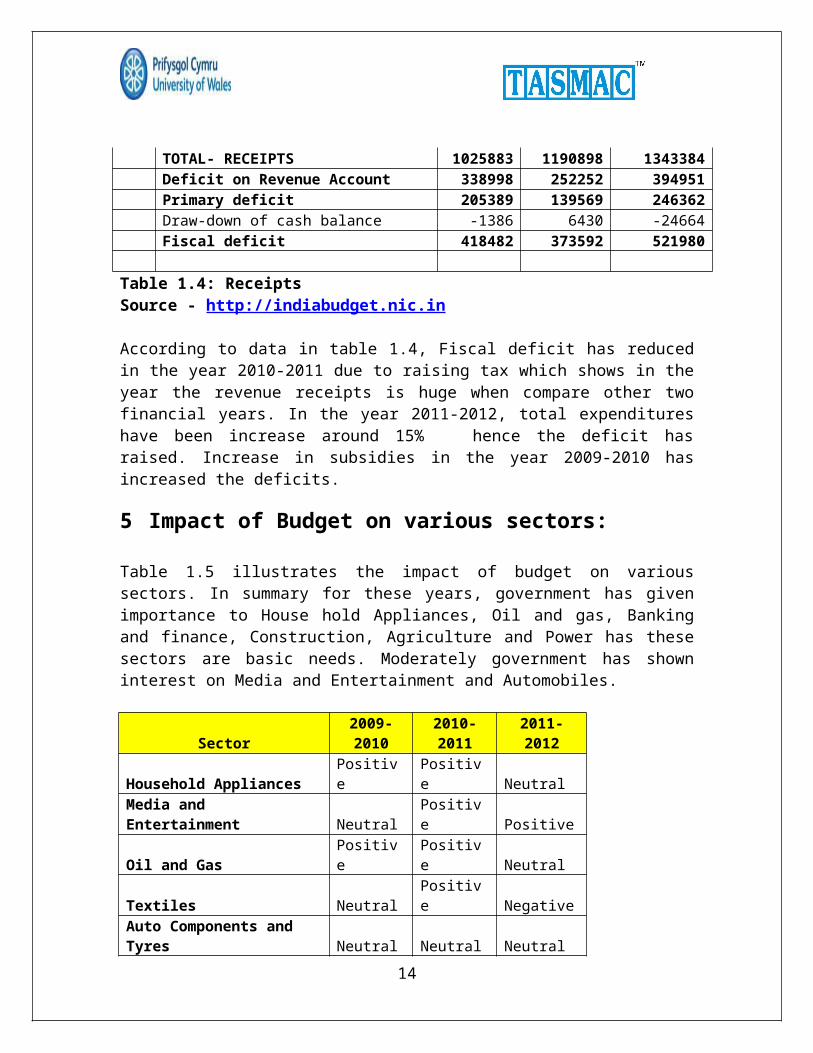
TOTAL- RECEIPTS 1025883 1190898 1343384 Deficit on Revenue Account 338998 252252 394951 Primary deficit 205389 139569 246362 Draw-down of cash balance -1386 6430 -24664 Fiscal deficit 418482 373592 521980
Table 1.4: Receipts Source - http://indiabudget.nic.in
According to data in table 1.4, Fiscal deficit has reducedin the year 2010-2011 due to raising tax which shows in theyear the revenue receipts is huge when compare other twofinancial years. In the year 2011-2012, total expenditureshave been increase around 15% hence the deficit hasraised. Increase in subsidies in the year 2009-2010 hasincreased the deficits.
5 Impact of Budget on various sectors:
Table 1.5 illustrates the impact of budget on varioussectors. In summary for these years, government has givenimportance to House hold Appliances, Oil and gas, Bankingand finance, Construction, Agriculture and Power has thesesectors are basic needs. Moderately government has showninterest on Media and Entertainment and Automobiles.
Sector2009-2010
2010-2011
2011-2012
Household AppliancesPositive
Positive Neutral
Media and Entertainment Neutral
Positive Positive
Oil and GasPositive
Positive Neutral
Textiles NeutralPositive Negative
Auto Components and Tyres Neutral Neutral Neutral
14

Automobiles Neutral Neutral Positive
AgriculturePositive
Positive Positive
Banking and financePositive Neutral Positive
ConstructionPositive Neutral Positive
Fertilizers Neutral Neutral NeutralHotels Neutral Neutral Positive
PowerPositive Neutral Positive
Real Estate – Residential Neutral Neutral PositiveSteel Neutral Neutral Positive
Airport Infrastructure NeutralNegative Neutral
CementPositive
Negative Negative
Information TechnologyPositive
Negative Negative
Roads NeutralNegative Positive
Telecom NeutralNegative Positive
Table 1.5: Sector budget analysis
6 Overall direction of the economy: The direct tax concessions in the form of broadening of taxslabs will put more money in the hands of individualtaxpayers, boosting consumption as well as saving. In thisway individual contribution towards economy by havingtransaction in the market will leads to balanced economy. Byconcentrating on infrastructure and opening up FDI in majorsector, this allowed the FII to invest more on Indianindustry and lifted the economic growth in these years. Thegrowth in agriculture to improve significantly to 5.4% withan estimated surge in overall acreage of the crops to 164.8
15
million ha in 2010-11 as compared to 156.4 million ha in2009-10, up by 5.08% year on year.
7 Aggregate demand, Price and GDP:
Table 1.6 illustrates the aggregate demand, price and GDP.Comparing year 2009-10, 2010-11 and 2011-12, aggregatedemand increased hence the GDP is marked higher with growthrate of 18.8 and decrease in price level to 10.4 from 12.4.
16
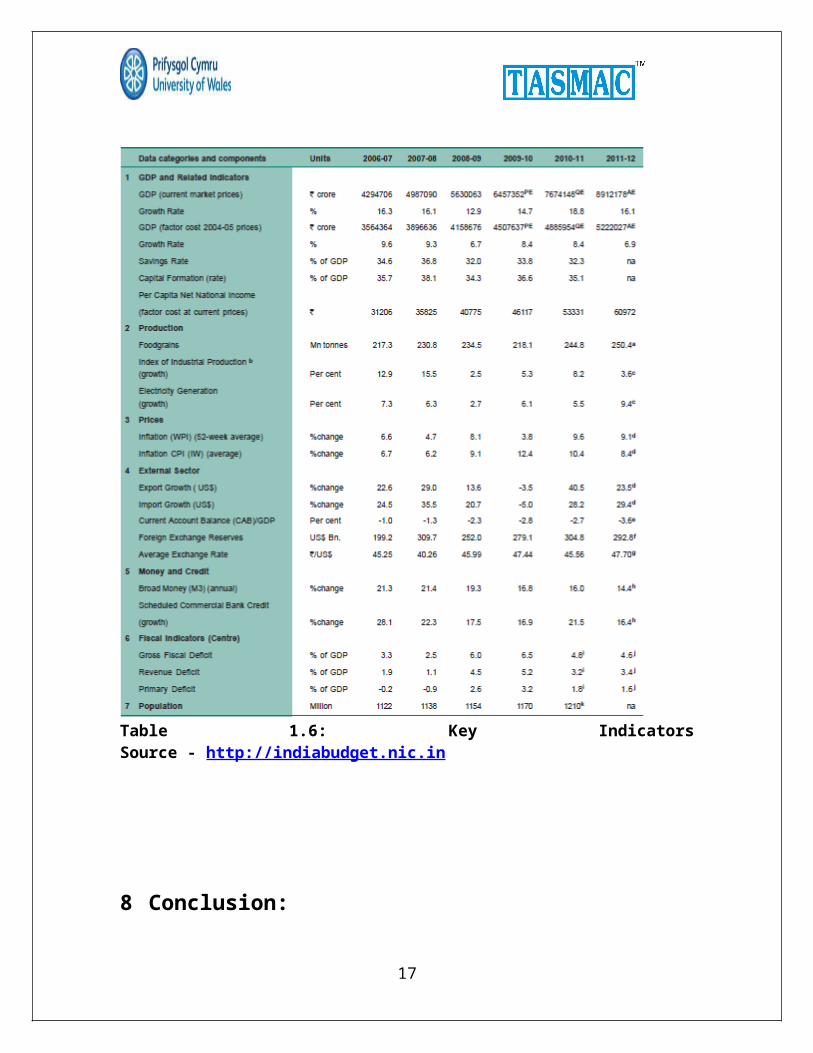
Table 1.6: Key IndicatorsSource - http://indiabudget.nic.in
8 Conclusion:
17
In the year 2009-2010, The Budget has shown more importancetowards basic needs like agriculture, water supply, Oil andgas, power, electricity sector which provided strongpositive sentiments to grow in economy.
In the year 2010-2011, The Budget has emphasized on theGovernment’s intent towards moving forward on the reformagenda. The focus on improving food security should aid incontaining food price inflation. Overall trend wasmarginally positive.
In the year 2011-2012, The Budget also gave a strong signalon containing inflation and continued the focus on spendingon infrastructure, agriculture and education. In general,the markets have taken the Budget with positive sentiments.
18
9 Appendix I – References
http://www.cmie.com/ http://www.investopedia.com/university/budgeting http://www.moneycontrol.com/news/ http://indiabudget.nic.in/index.asp http://en.wikipedia.org/wiki/Union_budget_of_India http://outlookmoney.com/ http://trak.in/tags/business/2009/07/03/india-economy-
survey-2009-analysis-full-report/ http://nitawriter.wordpress.com/2008/02/29/india-
budget-2008-2009/ http://business.rediff.com/money/budget09-sector-
analysis.html http://www.ey.com/IN/en/Services/Tax/Tax---Budget-
impact-2010 http://business.mapsofindia.com/india-budget/2010/
impact-it-sector.html http://www.wahiandcompany.com/industry_wise%5B1%5D.pdf Class section from Mr. Xavier Dsouza Articles on Union Budget of India
19


![1 INCOTERMS 2010 (1)[1]](https://static.fdokumen.com/doc/165x107/631de3d1dc32ad07f3074e54/1-incoterms-2010-11.jpg)