
x/rtfcww-zvm - International Nuclear Information System (INIS)
221
x/rtfcww-zvm ,S / \ Vv International Atomic Energy Agency IWGFR/72 INTERNATIONAL WORKING GROUP ON FAST REACTORS SPECIALISTS' MEETING ON INSTRUMENTATION FOR SUPERVISION OF CORE COOLING IN FBRs KALPAKKAM, INDIA DECEMBER 12-15,1989 INDIRA GANDHI CENTRE FOR ATOMIC RESEARCH KALPAKKAM, INDIA
-
Upload
khangminh22 -
Category
Documents
-
view
2 -
download
0
Transcript of x/rtfcww-zvm - International Nuclear Information System (INIS)
x/rtfcww-zvm
,S / \ Vv International Atomic Energy Agency IWGFR/72
INTERNATIONAL WORKING GROUP ON FAST REACTORS
SPECIALISTS' MEETING ON INSTRUMENTATION FOR SUPERVISION OF
CORE COOLING IN FBRs
KALPAKKAM, INDIA
DECEMBER 12-15,1989
INDIRA GANDHI CENTRE FOR ATOMIC RESEARCH KALPAKKAM, INDIA
IWGFR/72
SPECIALISTS' MEETING ON INSTRUMENTATION FOR SUPERVISION OF
CORE COOLING IN FBRs
KALPAKKAM, INDIA
DECEMBER 12-15,1989
INDIRA GANDHI CENTRE FOR ATOMIC RESEARCH KALPAKKAM, INDIA

t
SPECIALISTS' MEETING ON INSTRUMENTATION FOR SUPERVISION OF CORE COOLING IN FBRs KALPAKKAM, INDIA, 1989
IWGFR/72
Printed by Indira Gandhi Centre for Atomic Research, Kalpakkam, India
. . . .March 1991 . . . ; . ,
, : • ( . • > . : . . - . - ; • • • • • . ! ' • / • •
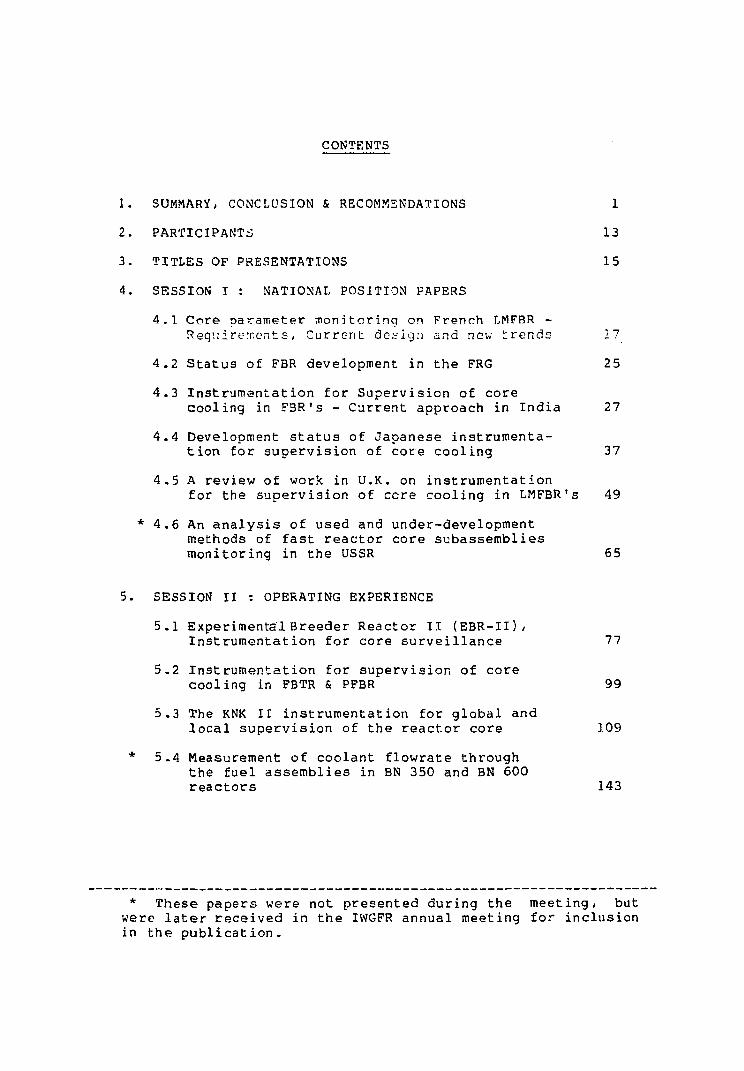
CONTENTS
1. SUMMARY, CONCLUSION & RECOMMENDATIONS 1
2. PARTICIPANTS 13
3. TITLES OF PRESENTATIONS 15
4. SESSION I : NATIONAL POSITION PAPERS
4.1 Core parameter monitoring on French LMFBR -Requirements, Current design and new trends 17
4.2 Status of FBR development in the FRG 25
4.3 Instrumentation for Supervision of core cooling in FBR's - Current approach in India 27
4.4 Development status of Japanese instrumentation for supervision of core cooling 37
4.5 A review of work in U.K. on instrumentation for the supervision of cere cooling in LMFBR's 49
* 4.6 An analysis of used and under-development methods of fast reactor core subassemblies monitoring in the USSR 65
5. SESSION II : OPERATING EXPERIENCE
5.1 Experimental Breeder Reactor II (EBR-II), Instrumentation for core surveillance 77
5.2 Instrumentation for supervision of core cooling in FBTR & PFBR 99
5.3 The KNK II instrumentation for global and local supervision of the reactor core 109
* 5.4 Measurement of coolant flowrate through the fuel assemblies in BN 350 and BN 600 reactors 143
* These papers were not presented during the meeting, but were later received in the IWGFR annual meeting for inclusion in the publication.
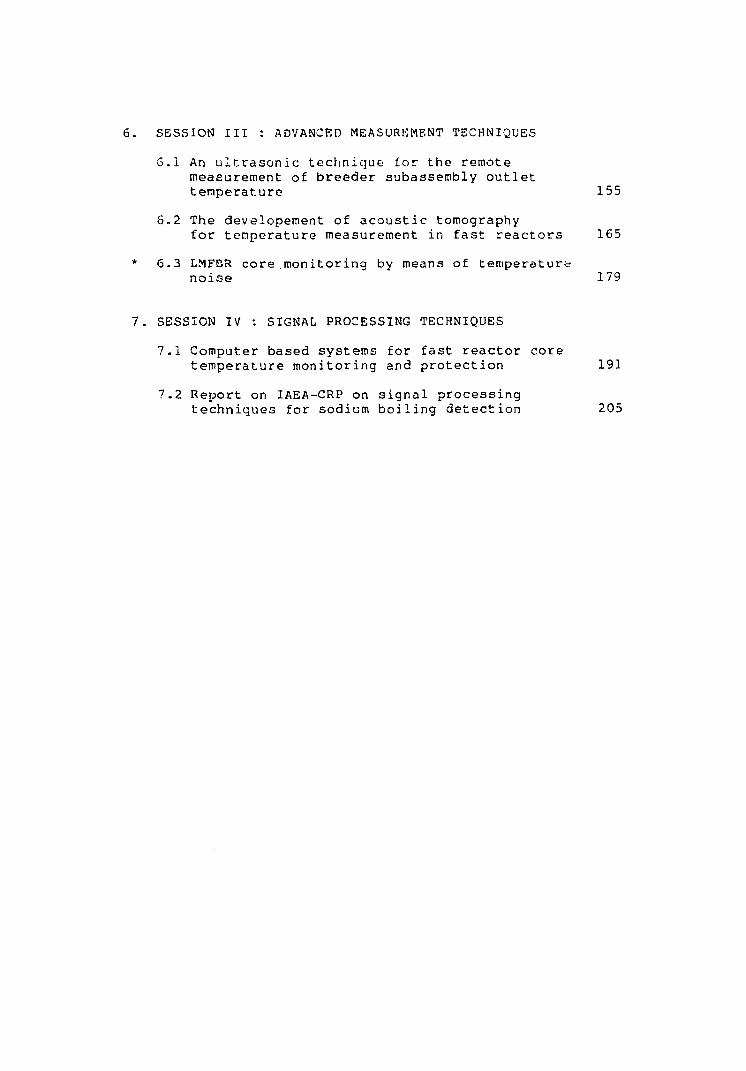
SESSION III : ADVANCED MEASUREMENT TECHNIQUES
6.1 An ultrasonic technique for the remote measurement of breeder subassembly outlet temperature 155
6.2 The developement of acoustic tomography for tenperature measurement in fast reactors 165
6.3 LMFBR core .monitoring by means of temperature noise 179
SESSION IV : SIGNAL PROCESSING TECHNIQUES
7.1 Computer based systems for fast reactor core temperature monitoring and protection 191
7.2 Report on IAEA-CRP on signal processing techniques for sodium boiling detection 205
IAEA-IWGFR SPECIALISTS' MEETING ON
"INSTRUMENTATION FOR SUPERVISION Or CORE COOLING IN FBRS"
Kalpakkam, 12-15 Dec. 1989.
SUMMARY, CONCLUSION _& RECOMMENDATIONS
1.0 INTRODUCTION
The Specialists' aeting on "Instrumentation for
Supervision of core cooling in FBRs" was held at Indira Gandhi
Centre for Atomic Research, Kalpakkam/ India during 12-15
December, 1989. The meeting was sponsored by International
Atonic Energy Agency (IAEA) on the recommendation of the
International Working Group on Fast Reactors (IWGFR). The
meeting was presided over by Mr. S.3. Shoje (General Chairman) of
India and v/as attended by 11 participants from Federal Republic
of Germany, France, India, Japan, the United Kingdom, the United
States of America and the IAEA.
The purpose of the meeting was to provide a foruii to discuss
instrumentation provisions required for the assurance of core
cooling in all operating conditions covering needs for both
global and local supervision. The presentations by participants
were divided into four topical sessions.
During the meeting papers were presented by the participants on
behalf of their countries or organisations. Each presentation
was followed by an open discussion in the subject covered by the
presentation. After the formal sessions were completed, a final
discussion session was held and general conclusions and
recommendations were reached.
1
The summary of the technical sessions and the conclusions and
recommendations are given below. The agenda of the meeting & the
list of participants are appended.
2.0 SUMMARY OF SESSION I_
The first session in the meeting was customarily devoted
to national position papers from the participating countries.
2.1 J.Ph. Girard from France presented details of the
instrumentation system being used in SPX1 and evolving trend with
respect to EFR. SPX1 has already logged about 100 EFPD of
operation. The instrumentation system has run well ensuring high
reactor availability. The 6 acoustic transducers in the reactor
have been validated by cavitation noise in the dummy core; but
their validation in the operating reactor using a whistling s/a
had to be abandoned due to storage vessel leak. The French
experience with neutron noise monitoring indicates that it may
not be suitable for large cores.
The improvements contemplated over the existing SPX1
system are with regard to neutronic channels and the DND system.
The neutron detectors at the bottom/ below main vessel, require
neutron guides in the core and impose certain constraints over
core catcher leading to higher cost. As an improvement over
this/ high temperature fission chambers are proposed to be fitted
in the above core structure. The DND system in the SPXl has an
average response time of 50 s. In order to improve upon it, it
is proposed to locate high temperature DND detectors behind IHX
in the inner vessel. This would reduce the response time to
2

25 s. This concept is being incorporated in the SPX.l itself for
qualification.
Provision of acoustic boiling detectors in EFR is yet to
be decided. This detection system is yet to be established to be
included in the trip circuit.
7."?. W.O. S*"oigc*r f r n n FPH i -pviowod +-h° R^?=t•^p o f fpst"
breeder programme in FRG. Two zero energy reactors STARK & SNEAK
were built and operated and are already decommissioned. KNKII/ a
20 MW(e) fast test reactor, in operation from 1978, has been
shut down for the last 2 years for renewing the licence to extend
the life time of core and also due to problems related to drive
mechanisms of the shut dcwn system. The reactor is likely to
operate from Jan. 90. SNR-300, a 300 MW(e) prototype reactor, is
ready for fuelling and the fuel elements are also ready. But due
to licencing problems, the reactor is yet to start operating.
The present FBR R&D activities in Germany are related to the
common clFR project.
2.3 S. Govindarajan of India presented the rationale behind
the Choice of instrumentation system for core supervision of
PFBR, a 500 MW(e) prototype fast breeder reactor, planned to be
built at Kalpakkam during the next decade. The design limits of
core components and various design basis events were discussed.
PFBR will have monitoring of all fuel subassembly cutlet
temperatures by Chrbmel-Alumel thermocouples. Miniature
flowmeters will be installed in 4 positions at core outlet to
take safety action in the event of rupture of inlet pipe from
3
pump to grid plate. DND system will be used to prevent unsafe
local blockages due tc debris from failed pins. Acoustic boiling
detectors and fast response T/C's will be provided for
experimental purposes.
2.4 Masuo Sato of Toshiba» Japan presented the details of
instrumentation system contemplated for a large scale breeder
reactor oroDosed in Japan. For the Japanese prototype loop type
F3R "Honju", temperature monitoring of outlet of all fuel
subassemblies and part of blanket is provided. 34 of the
positions also have flowmeters at the outlet. Other systems that
complete supervision of core cooling are level detection in
vessel/ neutron detectors and fuel failure detectors. It was
also mentioned that the localizing fuel failure by gas tagging
takes a long time/ about 10 h. A s/a outlet sipping method might
be followed in future.
Advanced system contemplated for future FBRs are signal
validation/ on-line diagnosis for anamoly detection and
operational guidance scheme.
2.5 I.D. Macleod of U.K. highlighted the work being carried
out in U.K. on detection of anamolies in breeder region and
on detection of boiling in core. R&D work on development of co
axial thermocouples with response time of 50 ms was also
described. Details of analytical work on predicting the
temperature noise at the outlet of subassemblies were also
presented. The ultrasonic method developed for detection of
temperature anomalies in blanket subassemblies was found feasible
4
from the laboratory scale experiments carried out.
2.6 L.J. Christensen explained the efforts in USA to develop
inherently safe fast reactors which would be economically
competitive also. Current trend is to go for compact modular
reactors of size about 400 MWe for each module for enabling
factory fabrication, easy shipment etc. The other advantages of
5Tia 1 1 - r = 1 7 ° = v o i - o r t l . e o h i n h ' 1 1 o h t ar^ . T h » flosiap riot a i ] s o f
Advanced Liquid Metal Reac to r (ALMR) PRISM being proposed by GE
were p r e s e n t e d . The IFR program a t Argonne was d i s c u s s e d a long
with the fuel r e p r o c e s s i n g program us ing pyrochemical p r o c e s s .
The ALMR w i l l u s e m e t a l l i c fue l wi th o x i d e fuel as an
a l t e r n a t i v e . The p r e s e n t p lan e n v i s a g e s commercial p l a n t d e s i g n
update by the t u r n of t h i s c e n t u r y . The cos t of energy from ALMR
i s expec ted to be a s cheap a s t h a t from LWR and lower t.ian from
c o a l . The m e t a l l i c fue l s have been used in EBR-II and t h e
i n h e r e n t s a f e t y of smal l s i z e meta l f u e l l e d r e a c t o r s has a l s o
been conf i rmed by v a r i o u s t e s t s in EBR-II .
3 . 0 SUMMARY OF SESSION _II_
3.1 EBR-II pape r s t r e s s e d t h e need for r e p l a c e a b l e flow and
t e m p e r a t u r e s e n s o r s as s e v e r a l of t h e s e have f a i l e d dur ing t h e
p a s t 25 y e a r s of o p e r a t i o n . Unl ike o t h e r r e a c t o r s , t h e r e i s
p r o v i s i o n on ly for t e m p e r a t u r e moni to r ing of s e l e c t e d
s u b a s s e m b l i e s a t t h e o u t l e t a s t h e fue l subassembly d e s i g n r u l e s
out t o t a l b lockage of a subassembly . EBR-II has programme t o u s e
d i g i t a l pump speed as a pa rame te r for flow t r i p and e f f o r t s a r e
on t o i n s t a l l two r e p l a c e a b l e u l t r a s o n i c flow s e n s o r s in t h e
5

r e a c t o r low p r e s s u r e plenum p i p e s . Severa l f u l l y i n s t r u m e n t e d
subassembl i e s with e x t e n s i v e t e m p e r a t u r e and flow measurement
c a p a b i l i t i e s have been used in EBR-II for g e n e r a t i o n of da ta s e t s
t o v a l i d a t e t he rma l h y d r a u l i c b e h a v i o u r of s i n g l e subassembly and
whole co re b e h a v i o u r . Through t h e s e e x p e r i m e n t s i t was a l s o
shown t h a t EBR-II core can w i t h s t a n d a l o s s of pr imary flow
wi thou t scram and l o s s of hea t s i n k wi thou t scram from f u l l
yo^r-eor power wi Mr->n*- <r>r«=> damaao. EBR-II has a very s imple RSS
(scram) sys tem. I t w i l l t r i p on 2 /3 s e i s m i c d e t e c t o r s , 2 /3
n u c l e a r s i g n a l s / 2/4 o u t l e t t e m p e r a t u r e s and 2 /4 l o s s of f low.
The RSS has two independen t s e c t i o n s (A and B) .
3.2 The paper on i n s t r u m e n t a t i o n for s u p e r v i s i o n of co re
c o o l i n g for t h e proposed PFBR s t r e s s e d the need for a d d i t i o n a l
i n s t r u m e n t a t i o n for core m o n i t o r i n g . The use of f a s t r e s p o n s e
t h e r m o c o u p l e s , a c o u s t i c b o i l i n g d e t e c t o r s and eddy c u r r e n t
f lowmeters i s recommended for PFBR; however t h e s e d e t e c t o r s a r e
p r e s e n t l y under deve lopment .
3 .3 KNK paper h i g h l i g h t e d t h e e v o l u t i o n of i n s t r u m e n t a t i o n
system for co re s u r v e i l l a n c e from KNK-I ( t he rma l core) t o KNK-II
(Fas t core ) for l o c a l and g loba l s a f e t y of t h e c o r e . KNK-II h a s
two d i v e r s e shutdown systems a c t u a t e d by p a r a m e t e r s r e l a t e d t o
neu t ron f l u x , t e m p e r a t u r e , flow, r e a c t o r v e s s e l l e v e l , l e ak
d e t e c t i o n sys tem, DND and r a t i o s of power and pr imary flow and
pr imary and secondary f lows . The paper a l s o h i g h l i g h t e d t h e
number of scrams (54 nos . ) e n c o u n t e r e d by t h e r e a c t o r ove r t h e
p a s t 10 y e a r s and t h e i r c a t e g o r i z a t i o n i n t o o p e r a t o r e r r o r ,
p re sence of g a s b u b b l e s and f a i l u r e of mechanica l and e l e c t r i c a l
6
equipment. From this experience it was emphasized that there is
also a need for threefold redundant measurement of component
protection system/ exact failure analysis to prevent recurrence
of the event and performance of extensive tests, such as thermal
cycling test, at the time of replacement of failed/defective
components.
3.4 All the delegates agreed that as the reactors are built
to last for a period of 30 to 40 years/ there is a need to
eliminate the use of non-replaceable sensors and qualify the
sensors by rigorous testing for core cooling and supervision.
4.0 SUMMARY OF SESSION III
4.1 The first presentation discussed the R&D programme in
U.K. to develop a method/ using ultrasonic pulse echo techniques/
for measuring the outlet temperature of breeder subassemblies.
Measurement depends on the variation of velocity of sound in
sodium with temperature. This ultrasonic technique is also
capable of detecting temperature noise. Mr. Macleod described
the experimental programme which consisted of tests in static
sodium; turbulent water jets and flowing sodium and based on the
experimental results he concluded that this method gives
satisfactory accuracy for temperature measurement and seems to
have potential for use in LMFBRs. During discussions/ Mr.
Macleod indicated that this concept will be tested in PFR.
4.2 In his presentation, Mr. Girard explained the
subassembly outlet temperature measurement system provided in
7
Superphenixl. Thermowells at the outlet of subassemblies contain
two Chromel-Alumel thermocouples and one intrinsic SS-Na
thermocouple. Signal from one of the two Chromel-Alumel
thermocouples is used in one of the two plant protection systems
while the second thermocouple is connected to the second shutdown
system to provide protection aqainst fuel melting and excessive
clad temperature. Mr. Girard briefly described the different
computers involved in the evaluation of various parameters. He
then explained the features of intrinsic SS-Na thermocouple
system and the results obtained from the temperature noise
measurements at SPX1. Due to mixing, noise at breeder
subassembly outlet was found to be more. Comparison between
Cr-Al thermocouple signal and low pass filtered intrinsic SS-Na
thermocouple signal from a breeder subassembly was found to be
good.
4.3 Mr. Macleod described the R&D programme at U.K. to apply
acoustic tomography for the remote measurement of temperature,
using an array of ultrasonic transducers. Basic measurement
principle depends on the variation of velocity of sound with
temperature. After explaining the principle of acoustic
tomography, Mr. Macleod discussed the results obtained from a
water tank experiment. Results confirmed the feasibility of the
method for making steady state and transient temperature
measurements. Mr. Macleod explained that this is a basic
research work and further teste are necessary to confirm
applications in LMFBR.
8
5.0 SUMMARY OF SESSION IV
5.1 Mr. Macleod explained about the computer based
supervision of fast reactor core. The system is a fail safe
microprocessor based system utilising low level multiplexing of
the signals from fast response (50 ms) coaxial thermocouples.
Dynamic logic is used and the correct functioning of the lines is
continuously checked. This ensures failsafe operation. Test
signals are interleaved with the true signals to produce a
pattern which changes with every cycle of the multiplexer. A
pattern recognition computer checks that the pattern is correct
to confirm the correct operation of the multiplexer. Pulses from
the pattern recognition logic are converted to DC signal which
are routed to routing logic. The computer based temperature
monitoring system (ISAT). is under test on reactors but is not yet
used as part of a safety system in UK.
5.2 The second paper presented by Mr. Girard, France was
part of the review presentation and focussed on core computer
monitoring. The Diagnosis and Detection of Core Defects (DDDC)
concept was explained. Two dedicated computers (TRTC) monitor
the power generated in every fuel subassembly in the core. The
multiplexer of the core thermocouple signals is placed in the
reactor building. The digital information is sent to TRTC
computer through data link.
A dedicated computer (CAROL) is used for calculating the
reactivity balance. Noise analysis on core temperature signals
and neutronic signals are being done on another computer
(ANABEL). A central computer (CORA) receives information from
9
all other computers about the process signals. The graphic
system in the control room are connected to the central computer
(CORA) .
5.3 Mr. I.D. Macleod explained the origin of the CRP and the
test data used. Dr. Om Pal Singh presented IAEA CRP work on
signal processing techniques for sodium boiling noise detection.
He explained several conventional and new techniques tested and
evolved during the execution of CRP. The techniques were
evaluated in terms of their capability to indicate boiling with -1
probability of spurious detection less than 10 per year. In a
large core; the signal pattern from acoustic sensors should be
memorised. The change in the signal pattern should be 'learnt'
through experiments and stored as 'knowledge base' in the expert
system.
5.4 IWGFR has agreed to extend the work in another CRP to
include steam generator leak detection. USSR will join the
existing group for this work.
6.0 CONCLUSIONS S RECOMMENDATIONS
6.1 The meeting provided a useful forum for frank exchange
of ideas on CInstrumentation for Core Cooling'. All participants
agreed that good work has been carried out in this area and all
the presentations reflected the experience gained. It was also
expressed that more such specialists' meetings are desirable.
6.2 Detailed discussions on the various options available
for safe and reliable instrumentation for core cooling indicated
10

the following views:
- The requirements of instrumentation depend on the type of fuel
used, complete analyses have to be done for all the DBAs on
fuel,blanket/control subassemblies and fuel at invessel storage
position to give conclusive requirements of instrumentation.
- An important safety consideration will be whether the melting
o£ one subassembly will caose whole core accident.
Additionally/ one should consider if -neltir. j o_ one
subassembly calls for permanent shutting down of the reactor,
i.e. loss of plant investments.
- It was generally agreed that Cr-Al thermocouples with low
response time for each fuel subassembly are desirable. These
thermocouples should be replaceable and they are reliable to be
put into the safety logic.
- Use of Na-SS thermocouple is not recommended for safety logic
from considerations of lower sensitivity, noise problems and
non- linearity. It can be used for experimental purposes and
also for determining in-situ Cr-Al thermocouple response time.
The co- axial Cr-Al thermocouple is better than the Na-SS.
- Flow monitoring by eddy current flowmeters is yet to be
developed to be considered for inclusion in the safety logic.
Their reliability for long term accurate measurement is at
present not good enough. They are useful for detecting sudden
flow variations.
- Boiling detectors can serve as an alaram to operator and as a
trip only for large event like bulk boiling in core. Their
usefulness for detection of local boiling is yet to be
established. It was also mentioned that advantage must be
11
taken of the capability af boiling detectors to monitor
component vibration, ncioc due to loccc parts in vessel and
also for leak detection in steam generators. Another area of
application is to monitor breeder subassemblies.
- Ultrasonic method of temperature profiling at the outlet of
breeder subassemblies id promising. Hcvevcr, th° monitoring
requirements of breeder subassemblies for temperature should be
based on analyses of DBAs.
- It was expressed that DND system for global detection is
required in addition to the localisation system.
- There was a consensus among participants that multiplexing of
signals is acceptable. Location of signal processors on pile
was also considered as suitable if processors are qualified for
functional and environmental conditions.
- During the discussions on reliability of computer software, the
participants expressed that this topic would by itself require
a specialists' meeting.
- Monitoring of primary sodium flow through reactor was also
discussed. It was concluded that direct measurement of primary
flow is required as the pump speed is representative of primary
flow only when the core configuration is unaltered and the
integrity of the pipe as well as pump drive shaft from motor to
impeller is ensured. Flow measurement by flowmeter is a more
direct method. The replaceability of the flowmeter was
stressed by all the participants.
12
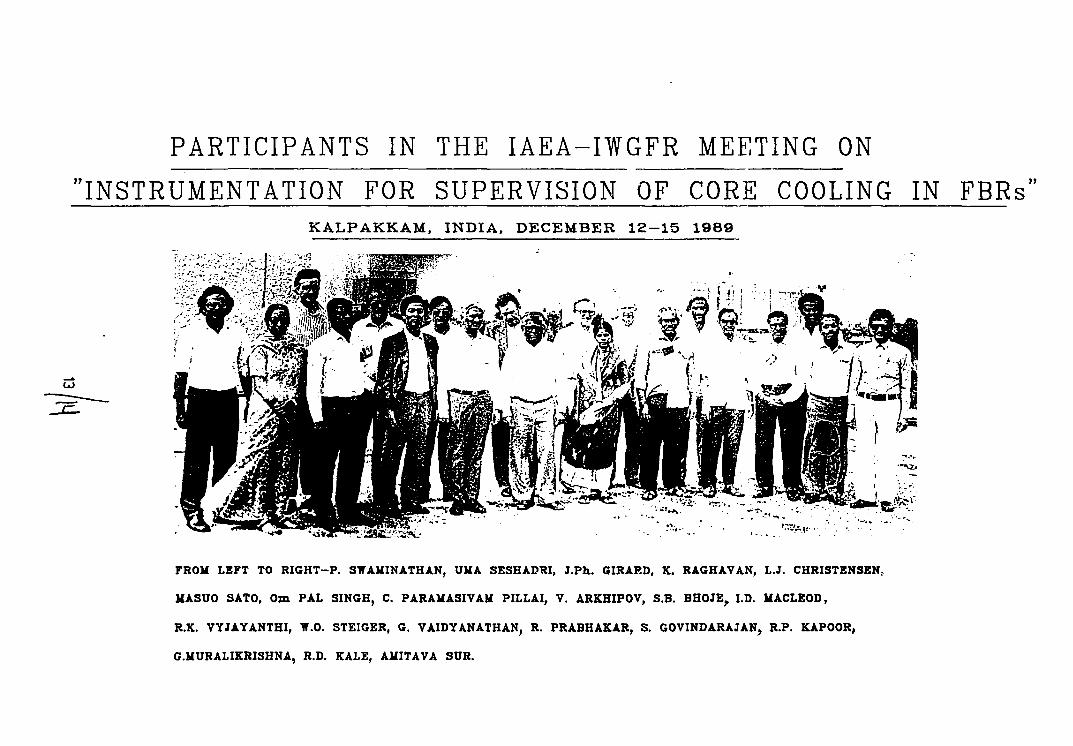
PARTICIPANTS IN THE IAEA-IWGFR MEETING ON
"INSTRUMENTATION FOR SUPERVISION OF CORE COOLING IN FBRs" KALPAKKAM, INDIA, DECEMBER 1 2 - 1 5 1 9 8 9
CJ
FROM LEFT TO RIGHT-P. STTAMINATHAN, UkA SESHADRI, J.Ph. GIRARD, K. RAGHAVAN, L.J. CHRISTENSEN..
MASUO SATO, Om PAL SINGH, C. PARAMASIVAM PILLAI, V. ARKHIPOV, S.B. BHOJE, I.D. MACLEOD,
R.K. VYJAYANTHI, TT.O. STEIGER, G. VAIDYANATHAN, R. PRABHAKAR, S. GOVINDARAJAK, R.P. KAPOOR,
G.MURALIXRISHNA, R.D. KALE, AMITAVA SUR.
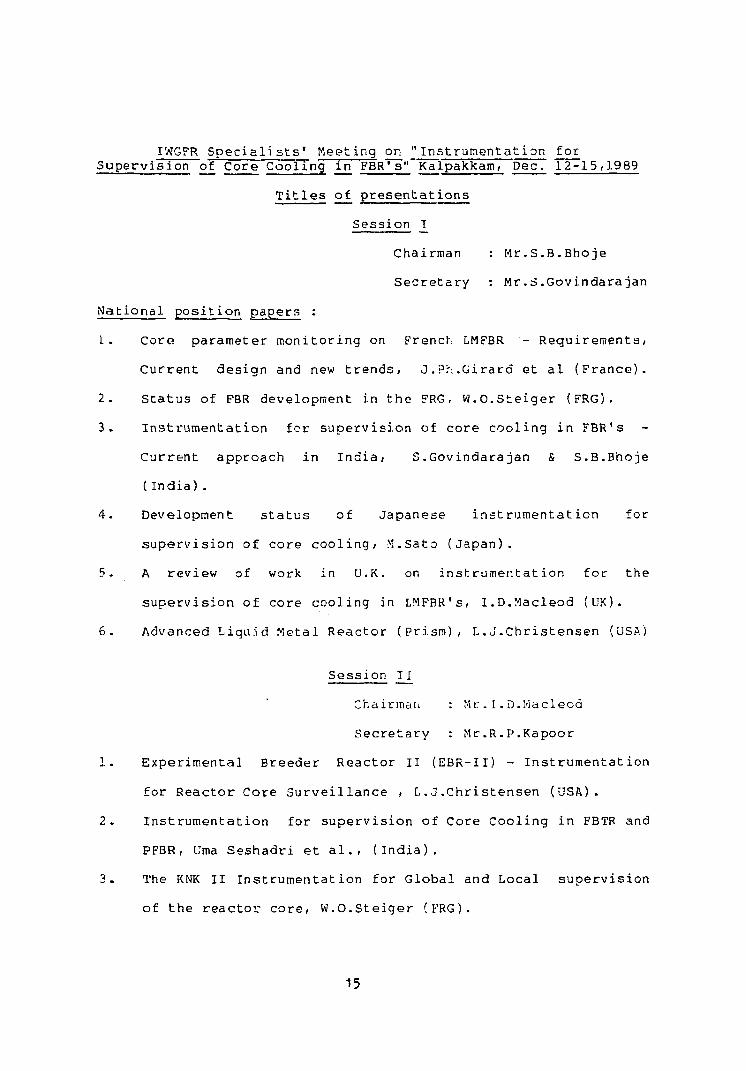
IWGFR Speciali sts' Meeting on "Instrumentation for Supervision of Core Cooling in FBR's" Kalpakkam, Dec. 12-15,1989
Titles of presentations
Session T_
Chairman : Mr.S.B.Bhoje
Secretary : Mr.3.Govindarajan
National position papers :
1- Core parameter monitoring on French LMFBR - Requirements,
Current design and new trends, O.Ph.Girard et al (France).
2. Status of FBR development in the FRG, W.O.Steiger (FRG).
3. Instrumentation for supervision of core cooling in FBR's
Current approach in India; S.Govindarajan & S.B.Bhoje
{India).
4. Development status of Japanese instrumentation for
supervision of core cooling/ M.Sato (Japan).
5. A review of work in U.K. on insfcrumer.tat ion for the
supervision of core cooling in LMFBR's, I.D.Macleod (UK).
6. Advanced Liquid Metal Reactor (Prism)/ L.J.Christensen (USA)
Session _I_I
Chairman : Mr. . I. D.Macleod
Secretary : Mr.R.P.Kapoor
1 . Expe r imen ta l Breeder Reac to r I I (EBR-1I) - I n s t r u m e n t a t i o n
for Reac to r Core S u r v e i l l a n c e , L . J . C h r i s t e n s e n (USA).
2 . I n s t r u m e n t a t i o n for s u p e r v i s i o n of Core Cool ing in FBTR and
PFBR, Uma S e s h a d r i e t a l . , ( I n d i a ) .
3 . The KNK I I I n s t r u m e n t a t i o n for Global and Local s u p e r v i s i o n
of t h e r e a c t o r c o r e , W.O.S te iger (FRG).
15
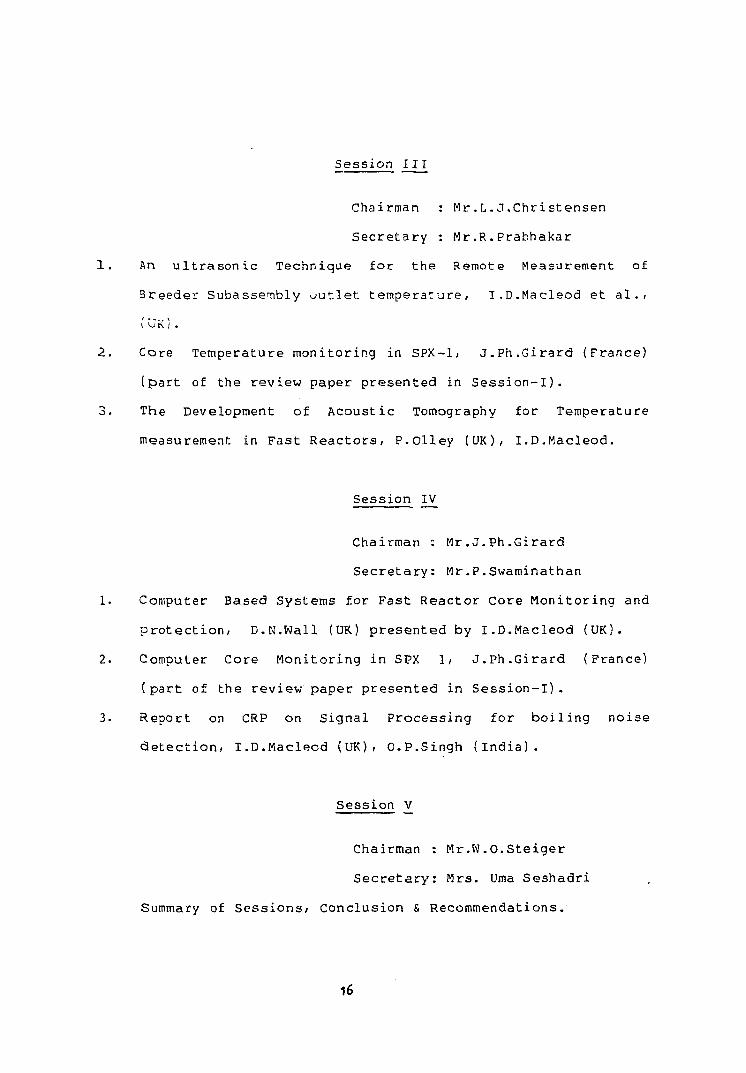
Sess ion I I I
Chairman : Mr . L . J . C h r i s t e n s e n
S e c r e t a r y : Mr .R . P rabhakar
An u l t r a s o n i c Technique for t h e Remote Measurement of
Breeder Subassembly o u t l e t t e m p e r a t u r e , I .D.Macleod e t a l . ,
i UK) .
Core Temperature mon i to r ing in SPX-1, J . P h . G i r a r d (France)
( p a r t of the rev iew paper p r e s e n t e d in S e s s i o n - I ) .
The Development of Acous t i c Tomography for Tempera ture
measurement in F a s t R e a c t o r s , P . O l l e y (UK), I .D .Macleod .
Sess ion IV
Chairman : M r . J . P h . G i r a r d
S e c r e t a r y : Mr.P.Swatninathan
Computer Based Systems for Fas t R e a c t o r Core Moni to r ing and
p r o t e c t i o n / D.N.Wall (UK) p r e s e n t e d by I .D.Macleod (UK).
Computer Core Moni to r ing i n SPX 1, J . P h . G i r a r d (France)
( p a r t of t h e rev iew p a p e r p r e s e n t e d in S e s s i o n - I ) .
Repor t on CRP on S igna l P r o c e s s i n g fo r b o i l i n g n o i s e
d e t e c t i o n , I .D.Macleod (UK), O.P .Singh ( I n d i a ) .
Sess ion V
Chairman : Mr .W.O.S te ige r
S e c r e t a r y : Mrs. Uma S e s h a d r i
Summary of S e s s i o n s / Conclus ion & Recommendations.
16
IAEA Specialist Meeting on Instrumentation for supervision of core in fast breeder reactors
12-15 December 1989 - KALPAKKAM INDIA
CORE PARAMETER MONITORING ON FRENCH LMFBR Requirements, current design and new trends
J.Ph. GffiARD* - J.P. TRAPP* - P. RENAUD**
Commissariat a l'Energie Atomique Centre d'Etudes Nucieaires de Cadarache
13108 SAINT-PAUL-LEZ-DURANCE - FRANCE "NOVATOME B.P. 3087 - 69398 LYON CEDEX 03 - FRANCE
SUMMARY
Monitoring of fast breeder reactors is aimed at safety and control purposes. In order to prevent consequences of main core accident, fast and reliable core parameter monitoring is needed. *'
Experience feed-back is now available for the three reactor cores that are or were operated in FRANCE (RAPSODIE 40 MWth/loop, PHENIX 250 MWe/pool and SPX1 1200 MWe/pool). R and D work have been performed for the 1500 MWe SPX2 project and is under progress for the future European Fast Reactor.
The major features and outcomes of main core parameters are :
- Neutron flux monitoring : cold chambers outside of the plenum were used with success in the past, high temperature chamber were temporarily used on SUPER-PHENIX and are now in a qualification phase for continuous monitoring of core flux from handling state to full power. They should be placed in the upper plenum.
-Delayed neutrons emitted by tho failed fuel fission products is performed today through a sodium sipping system. Though highly sensitive this method should be replaced in future core by neutron measurement system directly integrated on the pool. Simplification, lower cost and faster detection should result from this new concept.
- Temperature monitoring is performed through individual S/A control and automatic processing by a computer. 500 S/As temperature can be checked every second. Main efforts are today concentrated on economic basis with attempt to reduce wiring length.
17
-This main core parameter surveillance is completed by other measurements such as flowrate, acoustic monitoring, and using advance processing of the data to control the reactivity (reactivity balance meter), to calculate indirect core parameters and perform early detection through noise analysis.
Fast and reliable detection systems are needed. High availability, redundancy through duplication or diversity is required. With an equal safety assessment, lower cost equipment have to be design. Here are some of the aspects under consideration for running and future plants.
I - PURPOSE OF CORE PARAMETER MONITORING
Core parameters are both monitored for safety and operational purposes. Safety regulations lead to limits in radioactive release in the atmosphere in normal and adverse conditions. These limits are usually expressed versus probability of occurrence. Though it is the final consequence of a given sequence the maximum authorized release usually leads to limitation of core parameters such as :
-jfc
- local and total power, power slope, - clad temperature, usually before sodium temperature, - linear power in individual pin, - failed fuel detection.
Operational purposes, for instance to produce a given power at a given time and/or to extract the maximum power of a given S/A load, require also to monitor core parameters. Physical quantity that are of importance could this time be :
- total power including mean and increase of temperature of the primary loop in order to satisfy steam conditions,
- power distribution throughout the core to optimize power production.
Physical quantities to monitor, are elaborated using a limited number of transducers measurements. Missing informations could be fed to surveillance computer using simulation code in order to define threshold for automatic scram system or for pilot advice.
Main signals directly monitored are :
- instantaneous neutronic power, - individual S/A temperature, - inlet temperature, - total flowrate - primary pump speed, - delayed neutron emission.
18

Core parameters are then calculated taking into account computed individual S/A temperature and clad temperature coefficients (versus burn-up), individual S/A flowrate and so on.
II - INSTRUMENTATION FOR GLOBAL SUPERVISION
II. 1 - Neutronic Power Measurement
Nuclear measurements are of course of main importance for global supervision of core. Both PHENIX and SUPER-PHENIX are equipped with cold neutronic chambers. For instance the neutronic monitoring of SPX1 core is done through neutron collector and chambers located under the main vessel and safety tank. Helium comptrollers are used for low power measurement, fission chambers for high level and an ionisation chamber for control room display and study of neutronic fluctuations. Monitoring has to be performed from 1 W (handling condition) to 3000 MW that is over 1010. An additional apparatus equipped with high temperature fission chamber was used to meet the very low compting rate of the start-up core (. 5 c/s).
The core is monitored with two diversed systems of three sets of chambers. Automatic scram due to over-power, reactivity (positive and negative threshold) and neutron multiplication factor is done by 2 out of 3 on each system.
For the future reactors it is intended to use high temperature fission chambers directly installed in the hot plenum above the core. This should enable the designer to build a reactor with an anchored safety tank, withdraw the neutron guide and nevertheless control the power from a few watts to full power. Cross qualification of French and UK chambers is underway on the German reactor, KNKII, within the frame of the FBR European agreement.
11.2 - Failed Fuel Detection
This is a typical safety measurement as failed pin could induce in case of fuel release local S/A accident. Small core could easily be monitored by gas tagging techniques. For larger core global delayed neutron detection has been chosen. SPX1 core is thus controlled by fission product detection in sodium. Sipping of sodium is performed through two systems of pipes with, on each system, a diverse set of three chambers located over the foof. Sodium is fed to the measuring block by an electromagnetic pump equipped with a flowmeter. Scram is automatic with a 2 out of 3 vote for each channel. Response time of this system, due to the sodium transit from the S/A to the detector, is estimated to 50 s for a small rupture.
19
The availability of high temperature neutronic chambers leads to a new design of the failed fuel detection system. Called Integrated DND and tested on SPX1, this new design includes a set of three high temperature chambers "hidden" behind each intermediate heat exchanger. Less sensitive but faster this new design is the basic option for the next European breeder.
II.3 - Complementary whole core monitoring system
Cover gas monitoring, sodium flowrate, sodium level and acoustic measurement are also performed. In this field only few new concepts should be developed for future plants. Accuracy of flowmeter is around 2 %,. both permanent magnet and eddy current flow meters are used on French power plants.
III - LOCAL SUPERVISION OF THE CORE
Individual S/A monitoring is performed on existing and scheduled French and European plants by two different types of instruments :
- for safety and control purposes each fuel S/A is fitted with a set of thermocouples and,
- secondly, in order to be able to start rapidly again the plant after a clad failure each S/A is equipped with a pipe and a rotating sipping system to localize the failed S/A.
The thermocouples used are either thimble type TCs or immersed probes. Time constant of SPX1 type K thermocouple is 1 s, vote is done in 2 out of 2 for indmdual monitoring and 1 out of 2 for global monitoring of increase of temperature and instantaneous clad maximum temperature. The precision of the measurement is the intrinsic precision of the thermocouple and the process error due to fluid mixing at the S/A exit. Scanning of the 500 twinned thermocouples is performed every second with two different computers. Each probe equipped with two TCs is easily replaceable.
IV -DATA PROCESSING AND COMPUTER USED FOR PARAMETER MONITORING
The SUPER PHENIX core safety is organized around the socalled "DDDC" Core Diagnosis and Defect Detection system including, apart from the plant computer a set of five interacting computers devoted to core surveillance.
The two first are safety computers linked to thermocouple measurements (Fast Temperature Processing Computer - TRTC), then the central Core Data Surveillance Computer (CORA) which receives all core
20
measurements, and calculates all individual S/A characteristics (S/A power, linear power, clad temperatures) together with complementary global quantity (temperature histogram, proportional DN level, failed fuel localisation processing). In addition this computer has a screen in the control room for operator information of the core status.
The two last computers elabored not compulsory surveillance :
CAROL the reactivity balance meter and, ANABEL the parameter noise monitoring computer dealing with vibration, acoustic, neutronic and temperature fluctuations.
V - OPERATIONAL EXPERIENCE
V.l - Availability
Redundancy of safety equipment, regulations on partial nonavailability of equipment did not lead to any loss of production on either PHENIX and SUPER PHENIX. Spurious trips induced by operator error in the use of the system (during periodic maintenance for instance) have been only few for all systems over the 10 years of PHENIX and the first years of SPX1 start-up.
V.2 - Efficiency
Most scram algorithm are designed to prevent consequence of global or local overheating. An individual temperature monitoring equation protect the S/A from plugging.
Efficiency of protection system was proven during early failures of fuel and a small number of rod drops.
Monitoring of the margin towards plugging was shown to be efficient with the detected swelling of a prototype S/A on PHENIX, and a plug S/A during the start-up of SPX1. The use of a special differential algorithm on both reactors is very sensitive and both detections were performed before the automatic scram occured.
21
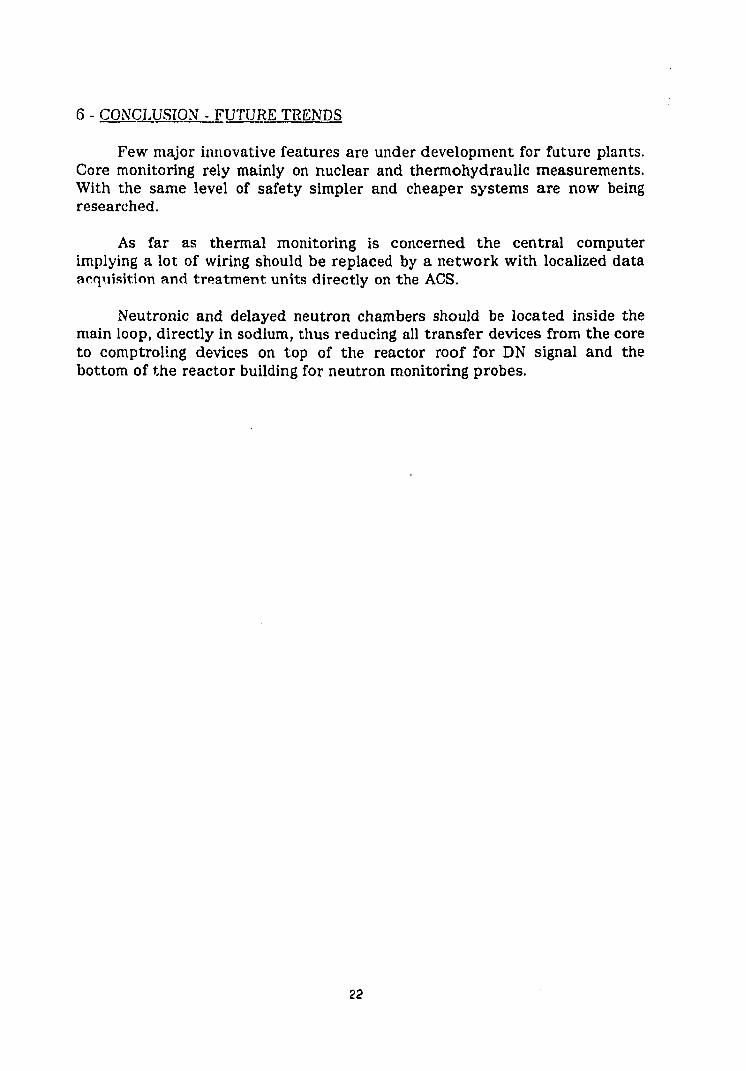
6 - CONCLUSION - FUTURE TRENDS
Few major innovative features are under development for future plants. Core monitoring rely mainly on nuclear and thermohydraulic measurements. With the same level of safety simpler and cheaper systems are now being researched.
As far as thermal monitoring is concerned the central computer implying a lot of wiring should be replaced by a network with localized data acquisition and treatment units directly on the ACS.
Neutronic and delayed neutron chambers should be located inside the main loop, directly in sodium, thus reducing all transfer devices from the core to comptroling devices on top of the reactor roof for DN signal and the bottom of the reactor building for neutron monitoring probes.
22
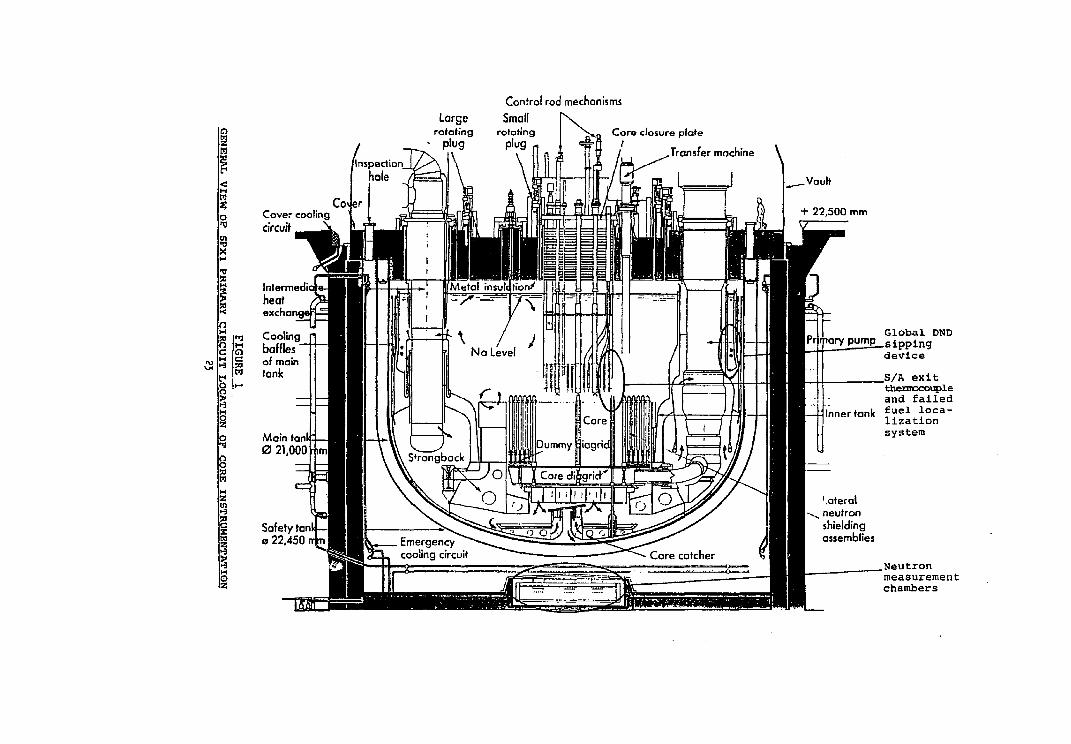
Large rotating rotating
plug plug
Control rod mechanisms
Small Core closure plate
Transfer machine \
Cover cooling circuit
Intermedii heat exchai
>q Cooling S baffles jg of main H tank
Main tank 0 21,000 -jim
Safety tanl —| 0 22,450 nr nr>
_Vault
+ 22,500 mm
Global DND sipping device
S/R exit thermocouple and failed fuel localization system
Neutron measurement chambers
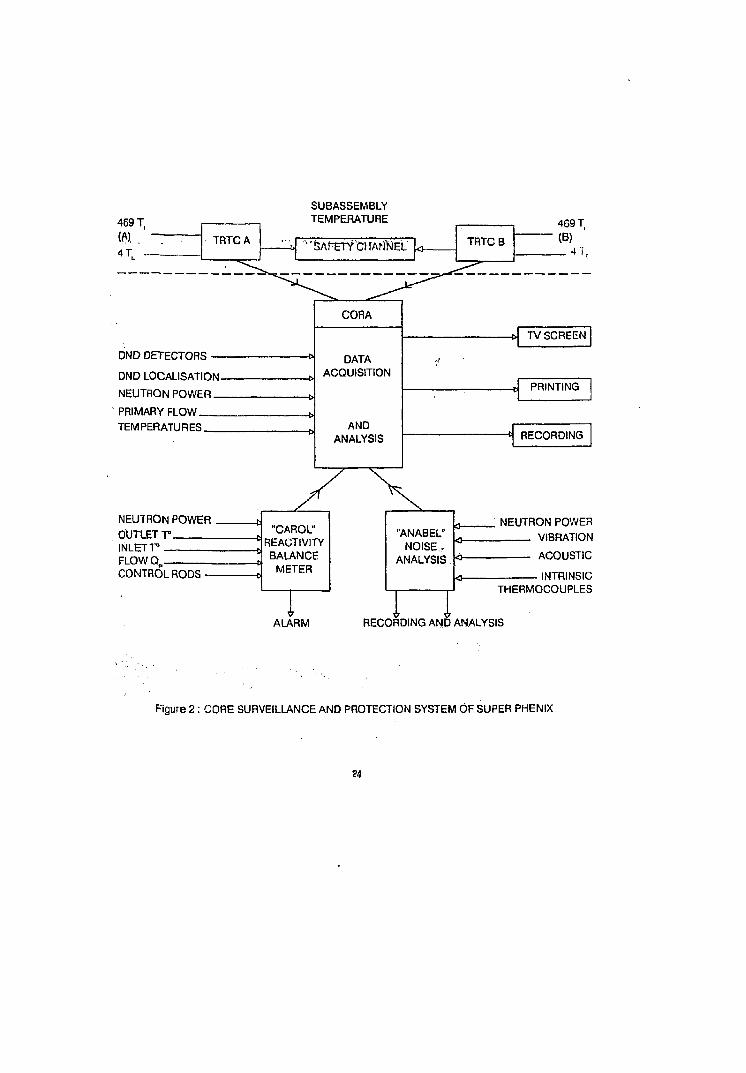
DND DETECTORS
DND LOCALISATION-
NEUTRON POWER _
PRIMARY FLOW TEMPERATURES
SUBASSEMBLY TEMPERATURE
CORA
DATA ACQUISITION
AND ANALYSIS
*. TV SCREEN
e PRINTING
* RECORDING
NEUTRON POWER OUTLET r INLET V FLOWQ„ CONTROL RODS
"CAROL" REACTIVITY BALANCE
METER
ALARM
"ANABEL" NOISE.-
ANALYSIS h*
NEUTRON POWER VIBRATION
ACOUSTIC
INTRINSIC THERMOCOUPLES
RECORDING AND ANALYSIS
Figure 2 : CORE SURVEILLANCE AND PROTECTION SYSTEM OF SUPER PHENIX
24
STATUS OF FBR DEVELOPMENT IN THE FRG
by Werner 0. Steiger (KBG), FRG
Up to this day 4 fast nuclear reactors were built in the FRG:
STARK, SNEAK, KNK II, and SNR 300.
STARK and SNEAK, two zero-power reactors, built and operated by KfK, are decommissioned.
KNK II, ordered by KfK, built by Interatom and operated by KBG, started operation in 1978.
Due to licensing and technical problems the plant has been shut down the last two years. One year of shut-down was caused by the licensing procedure together with the life extension of the second core-loading from 455 up to 720 EFPDs.
Another year of stoppage was caused by torque increase problems of the driving mechanism as well of the 5 shim-safety-rods as of the 3 diverse safety-rods. The requalification of the driving mechanism was a very time consuming task.
The restart of the plant is scheduled for January 1990.
SNR 300 is ready for fuelling the reactor. The fuel elements were manufactured and the sodium systems are in operation. The licensing procedure however is in an impasse. The State Government of NRW, which is the licensing authority, is presently not willing to give the license for the next step, the fuelling of the reactor. There is a quarrel between the Federal and the State Government about the validity of the German atomic law together with plutonium breeding FBRs. A decision on this subject of the Supreme Court is expected in spring 1990.
For the future the FRG supports the Common European projects for an EFR. The R&D programs of KfK are already mainly directed on this project. So Mr. Marth, the former head of the FBR-project within KfK, has become Executive Director of the Management Group for R&D in this European Cooperation. The activities of KfK in this field are merged now with R&D programs in the field of light water reactor safety. Thus a new KfK project Nuclear Safety Research (PSF) will be formed. (More details on EFR were given by Mr. Marth during the 22nd IAEA-XWGFR Annual Meeting, April 18-22, 1989, Vienna).
»Wt

INSTRUMENTATION FOR SUPERVISON OF CORE COOLING _IN FBRs -
CURRENT APPROACH IN INDIA
S.Govindarajan & S.B.Bhoje Nuclear Systems Division
Indira Gandhi Centre for Atomic Research Kalpakkam 603 102, Tamil Nadu
1. INTRODUCTION
Safety in Nuclear Power Plants is ensured by adopting a 3 -
level defence-in-depth approach. The first level involves
adequate design of the systems with margins of safety. The
second level concerns monitoring of the plant during
operation and taking appropriate safety actions to prevent
accidents and damage to components. The third level attempts
to mitigate consequences of accidents. It is obvious that
the three levels are inter-related and the requirements of
instrumentation and control will have to be tailored to fit
into a comprehensive plan for safety.
Apart from safety requirements, instrumentation is also
required as an aid to operator to monitor the health of a
system and to provide valuable data to the designer to
verify his design and to improve upon it.
As far as core cooling is concerned, the major objective of
monitoring devices is to prevent large scale core-melt down
due to loss of flow, resulting in a major radioactivity
release from the primary containment. Though the concern is
mainly with regard to a global event, the possibility of
21
fault - propagation from local event necessitates monitoring
locai malfunctions too.
It is recognized that core cooling cannot be judged in
isolation without reference to heat generation. The adequacy
of core cooling in fact means proper balance between coolant
flow and heat generation.
While considering the requirements of instruments to
supervise core cooling it is necessary to consider events
involving power increase in addition to those involving
flow reduction.
While the main requirement is detectability of an event by
an instrumentation system, reliability and replaceability
without impairing primary containment integrity are also
important.
2. DESIGN BASIS EVENTS
The first step in defining Instrumentation requirements is
to consider the design events that affect the core cooling.
These events can be classified into two large groups
global events and local events. Under each category they can
be further divided into four categories according to
probability of occurrence and consequences. A typical list
of events is shown in Table I.
28
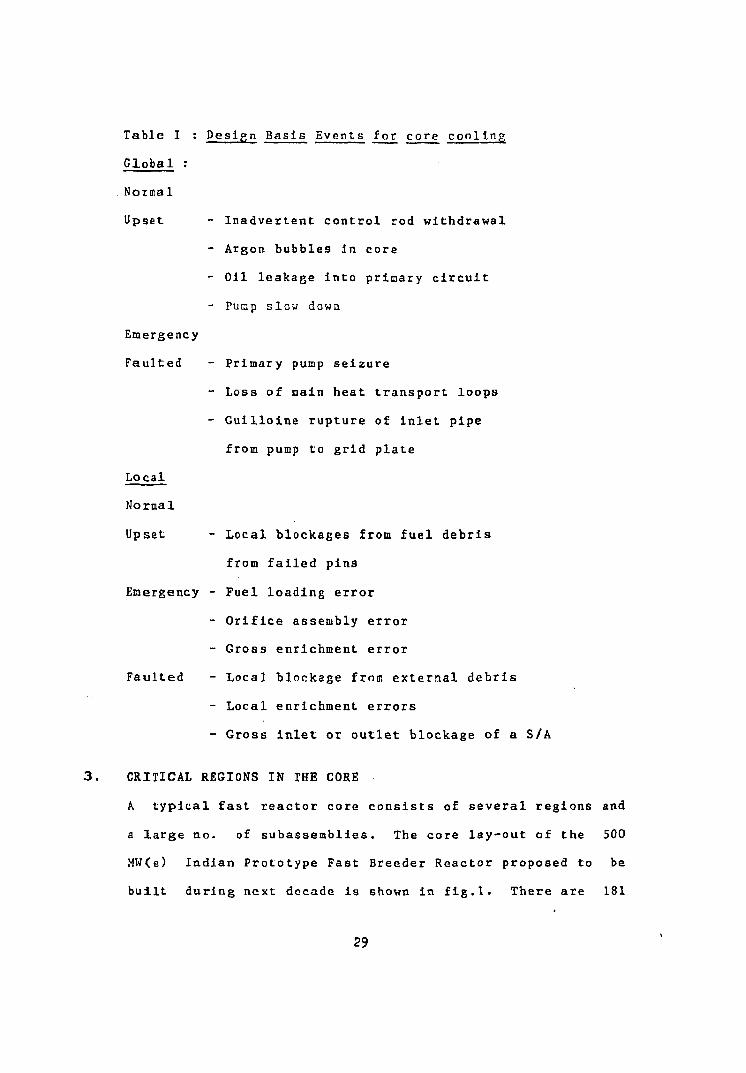
Table I : Design Basis Events for core cooling
Global :
Normal
Upset - Inadvertent control rod withdrawal
- Argon bubbles In core
- Oil leakage into primary circuit
- Pump slow down
Emergency
Faulted - Primary pump seizure
- Loss of main heat transport loops
- Guilloine rupture of inlet, pipe
from pump to grid plate
Local
Normal
Upset - Local blockages from fuel debris
from failed pins
Emergency - Fuel loading error
- Orifice assembly error
- Gross enrichment error
Faulted - Local blockage from external debris
- Local enrichment errors
- Gross inlet or outlet blockage of a S/A
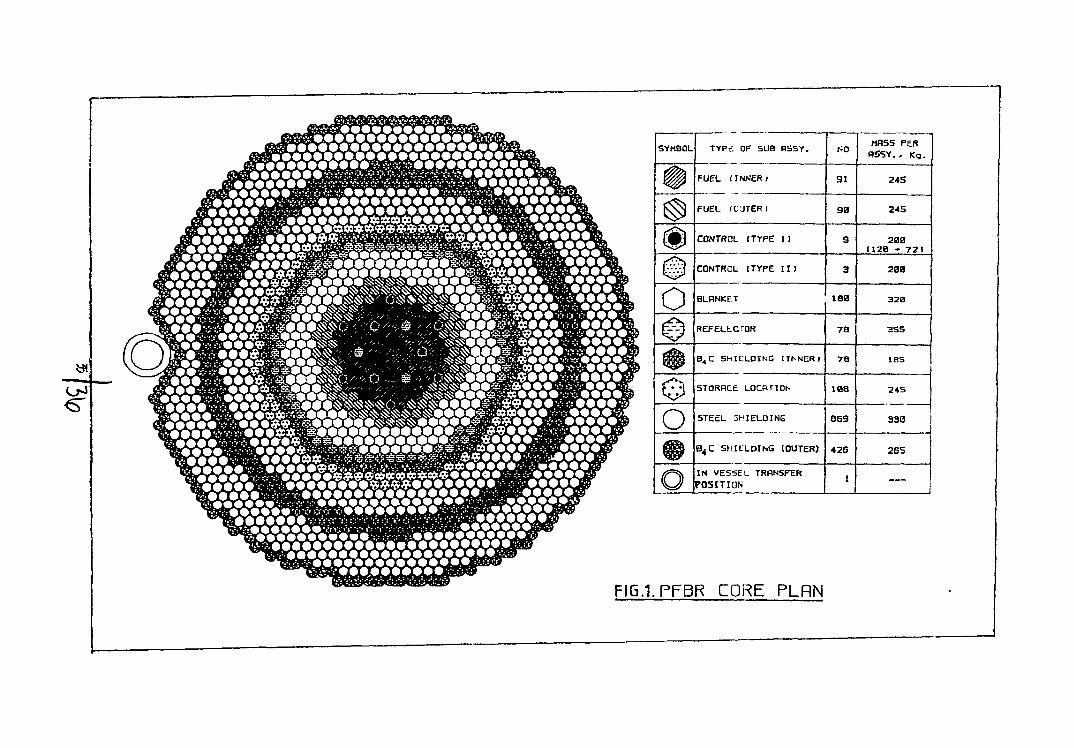
3. CRITICAL REGIONS IN THE CORE
A typical fast reactor core consists of several regions and
a large no. of subassemblies. The core lay-out of the 500
MW(e) Indian Prototype Fast Breeder Reactor proposed to be
built during next decade is shown in fig.l. There are 181
29
fuel subassemblies and 12 control rods in the central core
region surrounded by blanket, reflector and inner shielding
subassemblies. Last of rows of subassemblies cooled by
coolant flow from pumps is reserved for spent fuel storage.
The outer shielding subassemblies are cooled by natural
convection.
The large no. of subassemblies makes it impossible to
monitor each subassembly for local events. The priority with
regard to local monitoring goes with reference to the
probability of a local event propagating to large scale fuel
melt down. In this respect fuel subassemblies alone require
monitoring. Coolant boiling and fuel melt down in the fuel
region could lead to reactivity increase due to positive
void coefficient and core compaction, resulting in global
power increase and large scale fuel melt down. Therefore it
has been decided to confine local monitoring only to fuel
region in PFBR.
DESIGN LIMITS
The following design limits are imposed to define
instrumentation requirements with regard to the design basis
events.
1. No fuel melting or coolant boiling in fuel region for any
event
2. Clad hot spot temperature < 800 C for upset events
3. Clad hot spot temperature < 700°C for normal events
50

INSTRUMENTATION FOR GLOBAL EVENTS
Global power increase and flow reduction result in coolant
temperature increase at the core outlet. However detection
of the event by temperature measurement is a slow method
because of large response time of thermocouples. Detection
of power increase by neutronic channels and of flow
reduction due to pump slow down or seizure by pump rpm
monitoring should be the first level defence and temperature
measurement can be at best the second level defence.
However, the guillotine rupture of inlet pipe from pump to
grid plate cannot be detected at the pump level and will
require flow monitoring at the core outlet. It is proposed
to install miniature eddy current flow meters at the outlet
of a few selected subassemblies to monitor this event.
INSTRUMENTATION FOR LOCAL EVENTS
Events like incorrect unsafe loading of a subassembly, gross
enrichment error in a subassembly, orifice assembly error In
a subassembly and BOL gross blockage in a subassembly can
be safely detected by monitoring the individual subassembly
outlet *\emperature at reduced power level. Conventional
Chromel-Alumel thermocouples are adequate for this. However,
local enrichment error in a subassembly or local blockage in
a subassembly canno* be detected by monitoring the outlet
temperature by slow response thermocouples. A temperature
noise analysis system using fast resonse thermocouples is
called for to detect such local anomalies. Though this
51
method looks feasible,' enough experience has not been
gathered on this as yet.
Fuel debris from failed pin can be detected by DND system
before they accumulate beyond allowable limits. The
likelihood of external debris resulting in local blockage
has to be realistically assessed. The local enrichment error
should be made Impossible by proper manufacturing procedure.
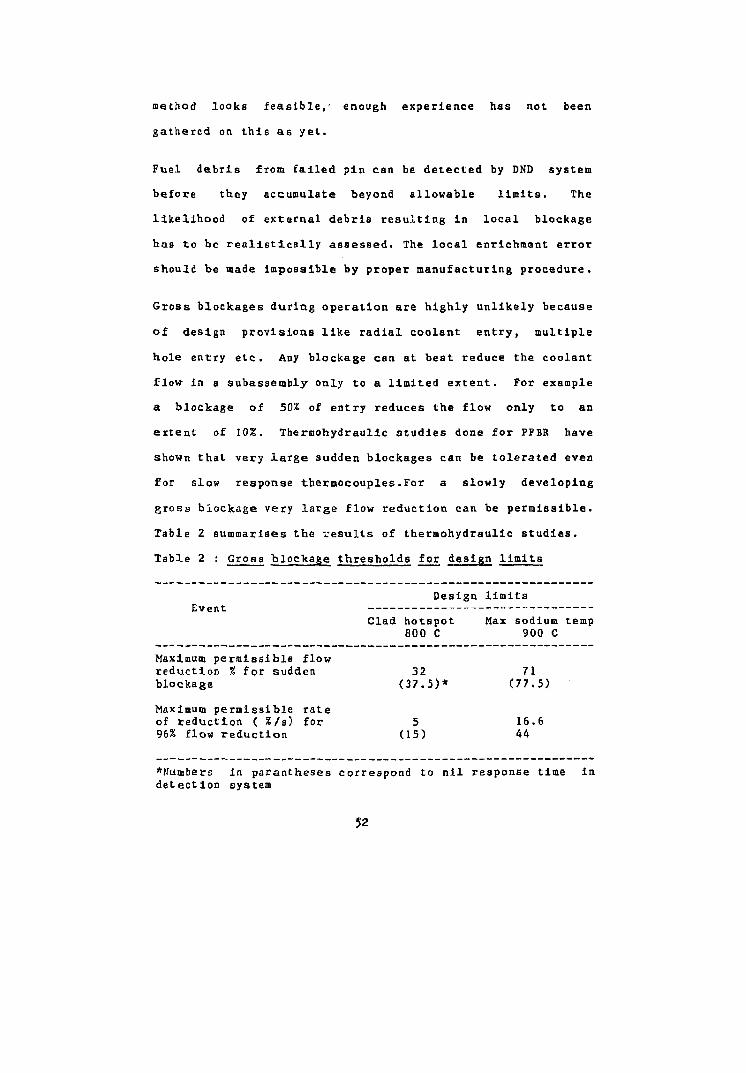
Gross blockages during operation are highly unlikely because
of design provisions like radial coolant entry, multiple
hole entry etc. Any blockage can at best reduce the coolant
flow in a subassembly only to a limited extent. For example
a blockage of 50% of entry reduces the flow only to an
extent of 10%. Thermohydraulic studies done for PFBR have
shown that very large sudden blockages can be tolerated even
for slow response thermocouples.For a slowly developing
gross blockage very large flow reduction can be permissible.
Table 2 summarises the results of thermohydraulic studies.
Table 2 : Gross blockage thresholds for design limitB
Design limits Event
Clad hotspot Max sodium temp 800 C 900 C
Maximum permissible flow reduction % for sudden 32 71 blockage (37.5)* (77.5)
Maximum pe rmis s ib l e r a t e of r educ t ion ( %/s) for 5 16.6 96% flow r e d u c t i o n (15) 44
l u m b e r s in pa ran theses correspond to n i l response time in de tec t ion system
52
It is seen from tabic- II that the advantage. In having a fast
response thermocouple is not vary significant over
conventional slow response thermocouples. Considering
improbability of large gross blockages, slow response
thermocouples are considered adequate to take care of these
events.
7. BEYOND DESIGN BASIS EVENTS
The discussion so far covered only events that have
propability of 10 or more for occurrences. It has to be
estimated whether total instantaneous blockage of a
subassembly can be completely ruled out or should be
accommodated in the design. Such an event can be detected by
einiature flow meter at the outlet of each subassembly or by
having acoustic boiling detectors. An indirect method would
be to detect the increase in outlet temperatures of adjacent
subassemblies due to inter-subassembly heat transfer. Recent
Scarabee experiments have shown that one could detect such
an event by DND also. Decision is yet to be taken en
whether to provide for TIB in the design and in such an
event what detection method should be employed to contain
damage.
8. SUMMARY
Instrumentation for supervision of core cooling in PFBR will
be as follows :
i. Subassembly monitoring will be confined to fuel region
ii. Individual subassembly outlet temperature will be
monitored by conventional chromel-alumel thermocouples.
35
iii. Local blockage due to fuel debris originating from pin
failures will be detected by DND system
iv. Global core cooling will be monitored by providing
miniature flow meters at the outlet of 4 subassemblies
in the outer fuel region in addition to the
thermocouple.
v. Acoustic boiling detectors will be provided as an
experimental measure to study the feasibility and gain
experience.
vi. Fast response thermocouples are proposed to be provided
one for each subassembly along with 2 conventional
thermocouples in order to study the efficacy of such a
system to detect local blockages or local enrichment
error.
34
»
GJ € "
SYMBOL TYPc OF SUB BSSY.
FUEL (INNER J
FUEL (CJTER)
91
90
MOSS PER RSSY.. Kg.
24S
245
CONTROL (TYPE I) 200 1128 • 72)
CONTROL (TYPE II) 200
o BLANKET 180
REFELLCrOR 78
B 4 C SHIELDING III^NERJ
STORRCE LOCATION 108 24S
o STEEL SHIELDING 869 330
B,,C SHIELDING I OUTER) 426 265
IN VESSEL TRBNSFER POSITION
FIG.1.PFBR CORE PLHN
IAEA/IWGFR
Specialists' Meeting on Instrumentation
for Supervision of Core Cooling
Kalpakkam,India,December 1989.
Development Status of Japanese Instrumentation
for Supervision of Core Cooling
Masuo Sato
Advanced Reactor Engineering Department
Isogo Engineering Center
Toshiba Corporation
37
1.Introduction [1]
For safe and reliable operation of fast breeder
reactor,the monitoring and control system should
support the operator with regard to following works.
(J) to monitor and understand the plant status
(£) to diagnose the plant status
® to perform corrective actions,if necessary
@ to confirm the recovery of the plant
Safety parameters are important relating to the
operating safety of the nuclear plant.providing the
operators with following informations on the reactor
safety status relating to the core cooling.
(D Reactivity control integrity
@ Fuel integrity
© Core cooling integrity
38
2.Supervision scheme of core cooling
[2].[3],[4],[5]
2.1 Instrumentation features of core cooling
According to classifications by installation sections,
fast breeder instrumentation for supervision of core
cooling consists of (l)fuel sub-assembly outlet
temperature sensor, (2) invessel level meter,
(3)flowmeter, (4) neutron detector,and (5) fuel failure
detection system.These instrumentations are classified
into reactor protection system,control system and
monitoring system.
In order to perform these functions,these instrument
signals are processed in a computer system for plant
control and monitoring.As these instruments dominate
plant operational performance and its safety in the
course of instrumenting various plant process values,
high accuracy,high sensitivity,high reliability and
easy maintenance are required.Furthermore,quick
response and on-line calibration ability are required,
especially for reactor protection system instruments.
39
2.2 Advanced monitoring and anomaly detection scheme
(1) Signal validation function [6]
The information provided through operator-machine
interface should be qualified and validated to avoid
mis-indication or mis-understanding caused by sensor
failure.The following techniques are applied for input
signal validation.
® 'Signal range check
© Status monitoring of signal input modules
© Signal comparison among redundant sensors
(D Signal validation by analytical redundancy
© Signal fluctuation monitoring
By proper installation of above functions according to
the importance and characteristic of each parameter,the
reliability of informations through operator-machine
interface can be much improved.
(2) On line diagnosis for anomaly detection [6],[7],[8]
A nuclear power plant contains various inherent noise
sources.Process variables.excited by these noise
sources,fluctuate through the plant response
characteristics.Hence,these fluctuations contain
information about the plant operating state.Noise
analysis techniques can extract this information in the
form of APSDs (auto-power spectral densities).coherence
functions,etc.These noise analysis results respond
sensitively to the change in plant operating state and
40
show various patterns in each state.If the relation
between the noise patterns and the plant operating
states were known,the present plant state can be
identified by comparing the newly obtained sample noise
patterns with reference noise patterns.
Among the various methods,the transit time
measurements by using the inherent temperature noise or
flow noise are considered to be most convenient
because of the direct measurements with simple
equipments.
In addition,the thermocouples are widely used sensors
in nuclear power plants and therefore the transit time
measurements by temperature noise can be applicable to
various cooling systems.
The temperature transfer function between two
measuring points can be obtained from a simple
time-dependent heat balance equation.
Fuel assemblies used in an LMFBR are exposed to
thermal-hydraulically severe environment and there is
a possibility that an anomaly in core assembly will
cause a fuel failure accident.So it is important to
detect such an anomary in its early stage.
It is known from many ex-core experiments that local
core accidents such as local blockages or local boiling
raise the amplitude of coolant temperature fluctuation
at the outlet of the assembly.lt is necessary for
highly sensitive detection to reduce the background
component independently of operating conditions.
Advanced method for reducing background component from
outlet temperature fluctuations are developed.
41
2.3 Operational guidance scheme [1],[9]
Based on the monitoring capability,we have come to the
stage to make the operation guide to recover the plant
status to the normal status in correspondance to three
different plant operational conditions,i.e.,
© Mode I : Normal operation
(2) Mode II : Operation in case disturbances happen
® Mode III : Operation after the plant trip
In the opration mode I,the main goal of the plant
operation is to continue the present normal operation,
keeping various operational limits.
In the opration mode II,the goal of the plant
operation is to prevent the disturbance propagation so
that unexpected plant trip should not ocurr.
In the opration mode III,in case the plant trips,the
mast important task of operators is to maintain the
plant not to exceed the various safety limits and bring
it back to the safe shutdown condition.
It is very important for a nuclear power plant to take
proper and quick action under abnormal condition.In
such a large scale complex system,many alarms are
usually induced from a single causal alarm.Operators
must identify the cause from among the many alarms,and
take proper and quick action.But this is one of the
most difficult jobs for operators,because it requires
much operation experience and skill.It is very
effective especially for a LMFBR plant to introduce
a plant operational guidance system to cope this
situation,because for LMFBR's sodium (Na) which has
42
large thermal inertia is used as coolant,so
we have enough time to identify- the cause of alarms and
take operation before the abnormal condition propagates
from the sodium cooling loop to the other part of the
plant.
An operational guidance system for a LMFBR plant to
improve the plant operability by using a knowledge
engineering method have been developed.
The major objective of this system is to quickly
supply operators with information concering the cause
of alarm (fast hit alarm) and with guidance indicating
proper steps to be taken when an alarm has occurred in
the LMFBR plant.The main function of the systems are
g.ven below: .
© Monitor process
® Inference diagnosis
(D Output and man-machine process
43
2.4 Advanced man-machine interface scheme for
supervision [1]
Recent advance of electronics has bring many new
products for operator-machine communication.Among many
new products of interfacing tools,the following devices
are considered as attractive candidates to augment the
operator-machine communication capability.
(1) Fullgraphic CRT
(2) Large size display
(3) Voice recognition device
(4) Voice announcement device
(5) Touch sensitive screen
44
3.Evaluation of natural circulation in Japanese
experimental reactor [10],[11]
In a nuclear power plant,an inherent safety feature
would be verified if the decay heat after reactor trip
were removed by natural circulation flow without the
need for any electric power supply.To evaluate this
natural circulation the Power Reactor and Nuclear Fuel
Development Corporation (PNC) decided to perform
verification tests using the experimental fast breeder
reactor JOYO.
These tests were intended to verify that decay heat
after reactortrip would be removed by natural
convection flow showing that the LMFBR plant has an
inherent safety feature in continuous natural
convection cooling of thecore fuel subassemblies.
45
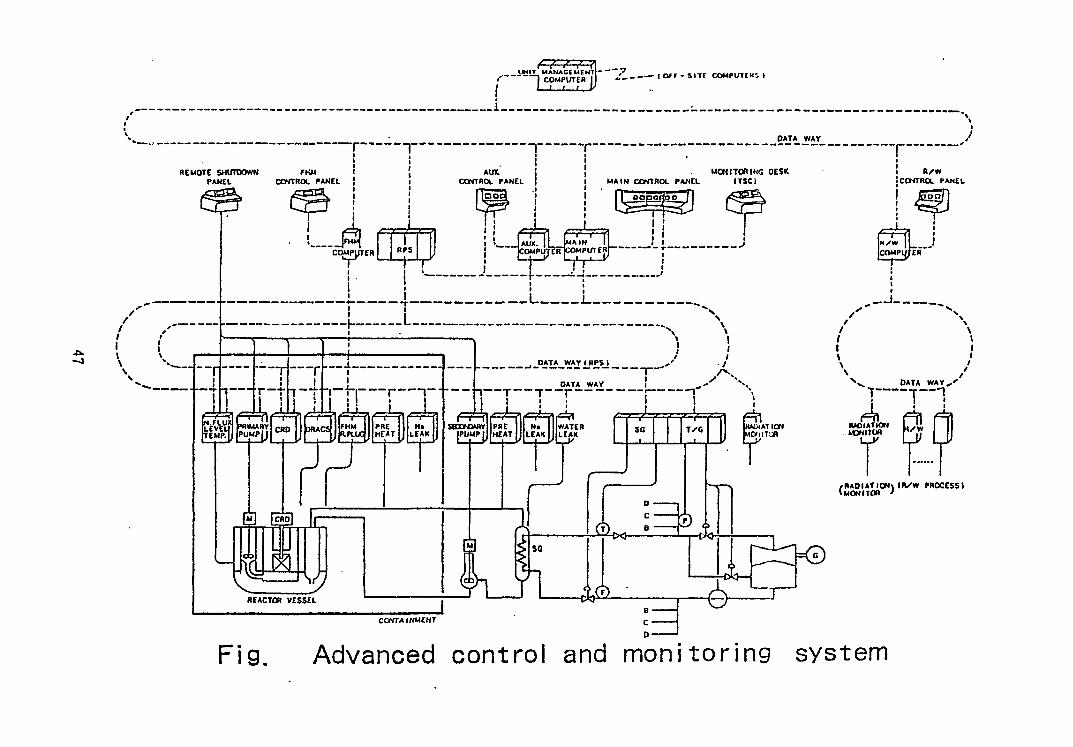
4.Conclusion [1]
For a LMFBR.new concept of the monitoring and control
technologies are proposed.The main features of this
system are as follows.
(1) Computerized and CRT based information
presentation
(2) Introduction of Safety Parameter Display
Function
(3) Introduction of Plant Operation Guidance System
(4) Advanced man-machine console with new MMIF
devices
(5)Introduction of the optical fiber links
46
1
0 C O
LEAK
FAI^I^ SBXNWIY
PUMP I
gj s/ REACTOR VESSEL
PRE HEAT
Na LEAK
WATER LEAK
SC
_1 _
-C*h
£1 txj-3)
w
fiL CONTAINMENT
t*>—
-e— a-. =0
[HyW | | I COMPUTER"
s v . DATA WA1
IX RADIATION L . ! MONITOR f " . 1
I V c
/RADIATION* IRXW PRO (MONITOR '
5.Reference
[1 ] I .Ta i ,M.Sa to ,e t . a l . :Advanced Monitoring and Control
System of Large-scale Fast Breeder Reactor,IAEA-SM-
284/31.Lyons,1S85.
[2]T.Miyazawa,M.Sato.et.al.:LMFBR Ins t rumenta t ion
Development S ta tus ,Tosh iba Review,No.128,Jul-Aug,
1980.
[ 3 ] I . T a i , e t . a l . : F B R Wide-Range Neutron Monitoring
System,Toshiba Review, No.143,Spring,1983.
[ 4 ] I . T a i , e t . a l . : N e u t r o n Detector Development,Toshiba
Review,No.132,Mar-Apr,1981,
[5]M.Sasaki,et.al:LMFBR Systems and Components for
"JOY0".Toshiba Review,No.121,May-Jun,1979.
[6]T.Tamaoki .M.Sato,e t -a l . :0n-Line Diagnosis Algorithm
Based on Noise A n a l y s i s , S p e c i a l i s t s ' Meeting
on Reactor Noise.SMORN-1,Tokyo,Oct,1981.
[7 ]T .Tamaoki , e t . a l . :L iqu id Sodium Plow Veloci ty
Est imat ion by Temperature Noise,NAIG Annual Review,
1981.
[8JT .Tamaoki .M.Sa to ,e t . a l . : Inves t iga t ion of Highly
Sens i t i ve Anomaly Detec t ion Method for LMFBR Core
Assemblies ,NAIG Annual Review,1983.
[9]T. Kaneko,M.Sato.et. a l . :Second Symposium on Expert
Systems Appl ica t ion t o Power Systems,University of
Washington,July,1989.
[10]H.Ka j iwara , e t . a l . :Ana lys i s of J0Y0 Natural
C i r cu l a t i on Test Data,NAIG Annual Review,1982.
[11IN.Handa ,e t . a l . :Eva lua t ion of Natural C i r cu l a t i on
in Fast Reactor J0Y0,Toshiba Review,No.147,Spring,
1984.
48
A Review of Work in UK
on
Instrumentation for the Supervision of Core Cooling
in IHFHR's
I D Macleod
Northern Research Laboratory
UKAKA
Risley, Warrington, Cheshire
United Kingdom
For Presentation at the IAEA/IWGFR Specialist Meeting
on
Instrumentation for the Supervision of Core Cooling in LMFER's
at Kalpakkam, INDIA
12th to 15th December 1989
49
INTRODUCTION
In the UK protection against overheating in the core is obtained from robust design backed up by thermocouple instrumentation for temperature measurement. Much work has been done to improve the performance and reliability of thermocouples and the associated instrumentation and data handling systems.
In recent designs of Fast Reactor concern to avoid thermal cycling has led to design changes in the Above Core Structure (ACS) which makes it difficult to position thermocouples to measure breeder element outlet temperatures. There has therefore been a programme of development of remote methods of measuring subassembly outlet temperatures aimed at monitoring breeder elements.
In addition to temperature measurement acoustic techniques for Boiling Noise Detection are also under development as a back up method of detecting severe overheating.
The work on these various systems is described briefly in this paper.
MEAN TEMPERATURE HRASUKSMKHT
Thermocouples
To improve the reliability of mean temperature measurement the coaxial thermocouple was developed which is described by Thompson et al[l]. This thermocouple is 1mm diameter and has a time constant of about 50 ms. It is significantly more reliable than the conventional mineral insulated thermocouple and is incapable of sustaining an undisclosed operational fault. These thermocouples can be wound into a rope around a central 3mm thermocouple to give a robust assembly for insertion in the reactor. The sensing end of the rope is protected by a perforated metal tube.
Safe operation of fast breeder reactors (FBR) requires that the outlet temperature of each subassembly be monitored accurately. In the European Fast Reactor (EFR), as in its immediate predecessors, the thermocouples are supported from the Above Core Structure so that each core assembly is associated with a thermocouple located centrally and above the core outlet level.
For hydrodynamic reasons, modern FBRs are characterised by a low baffle design of ACS. Consequently, flow exiting a core subassembly is forced to turn rapidly through 90° and thence flow radially outwards in a flat core exit jet. This behaviour places an upper limit on the distance between the core outlet and thermocouple heights. Moreover, flow at large radius is contaminated with flow from the inner core regions and it is necessary to investigate how accurately the 'apparent temperature1 (ie that measured by the thermocouple) follows the true subassembly exit temperature.
At NRL (Risley) investigation of core outlet thermocouple response (both generic and design specific) has been undertaken for a number of years. Sensitivity to changes in subassembly power output and flowrate have been investigated. Future work will address the efficacy of the EFR ACS thermocouple instrumentation by means of scaled models using air as a simulant fluid.
50
Data Processing
In the UK the signal processing system considered for fast Reactor mean outlet temperature is the Individual Sub-Assembly Temperature trip system. This is described in a specialist paper to this meeting[2], and also in [3].
The ISAT system is a failsafe microprocessor based trip system utilising low level multiplexing of the signals from fast response (50ms) coaxial thermocouples. The multiplexing reduces the amount of equipment required to monitor the large number of thermocouples on a large power reactor.
Remote Measurement
In some Fast Reactor designs it is difficult to place thermocouples in a position from which the outlet temperature of Breeder Subassemblies can be measured accurately. To overcome this we in the UK have been developing remote methods of measuring temperature using ultrasonics. This technique is described in a specialist paper to this meeting!4] and has been found to have the potential for development into an accurate fast response method of measuring temperature directly at the outlet of the subassembly so reducing errors due to the effect of cross flow. A further development to measure the temperature distribution across the core top using tomographic techniques is described in another specialist paper[5].
TEMPERATURE NOISE
Work in the UK has concentrated on the development of modelling techniques to predict the temperature noise signals from developing blockages in the subassembly over a representative range of operating conditions. Alongside the attempt to obtain analytical solutions there has been an attempt to predict real-time fluctuations to enable the evaluation of statistical techniques for decision making. This note updates the work presented at the IWGFR Specialists meeting in 1984[6]
The CDFR coaxial thermocouple clusters[l] have been tested!7] over a range of flow conditions in the BNL No 4 sodium loop. Using a temperature noise method it has been shown that the thermocouples in the clusters have time constants covering a range of 33 to 70 ms, dependent on the flow, compared to 32 ms for an individual thermocouple. This performance together with the ISAT[2] processing system enables the monitoring of a useful fraction of the temperature noise spectrum.
Work is currently in progress to assess the use of ultrasonics as a means of measuring the outlet temperatures of fuel subassemblies. Since the method is very fast, several hundred measurements per second are possible, the technique is suitable to measure rapid temperature transients and high frequency temperature noise. Recent work at BNL, reported at this meeting[4], demonstrates that fluctuations in line averaged values of temperature exist in turbulent flow and can be detected with the ultrasonic technique.
The transport equation for fluctuating temperatures has been solved in 2-dimensions by a new approach using an extension to the eddy diffusivity hypothesis[8]. The :omplete solution has been obtained for a "top-hat" teaperature profile, which represents the position at the pin bundle exit as the hot liquid from sub-channels behind a blockage mixes with cooler liquid from nearby unblocked channels. This analytical solution reproduces many of
51
the features observed experimentally. However, attempts to extend this analysis to a full 3-dimensional solution have proved unsuccessful due to the complexity of the resulting transport equation.
The multi-particle Monte Carlo code STATEN[9] has been developed and tested against data from pipe flow experiments over a wide range of Reynolds numbers and under the socially changing turbulence conditions found in a divergent Jet[10]. The axial changes are modelled by a series of linked steps in which homogeneous conditions are assumed. Dissipation processes are represented and both mean and fluctuating temperature fields are generated. Further verification of STATEN has been performed against the KfK sodium and water experiments performed in the TEPLU rig, and against the similar jet block experiment at UKAEA Risley[ll]. This has enabled the small scale grid turbulence downstream of the pin bundle to be modelled correctly.
The STATEN code has been used to predict the temperature fields generated in the outlet region of a CDFR subassembly, from the pin bundle exit to the thermocouple locationtll]. The varying turbulence structures produced by the venturi shield and orientation bar have been simulated. Different temperature profiles at the pin bundle outlet have been considered. These profiles represent normal reactor conditions by a cross-subassembly tilt of up to 50"C with cooler edge channels, and local increases due to coolant blockages within the pin bundle.
Similar modelling of the Superphenix subassembly has been performed within the collaboration!12). This has recently been extended to predict the signals from the internal blockages[13] and to evaluate the noise of line averaged values; to establish the viability of ultrasonic detection methods in a reactor.
STATEN simulated temperature signals at the sensor location have been processed to derive statistical parameters (for example skewness, kurtosis, spectral form) for use as inputs for pattern recognition processing. Data sets for progressively increasing blockages and normal conditions have been used!1A,15], to test an Adaptive Learning Network (ALN) approach. It appears possible to design a suitable network of the flow area irrespective of location in the bundle or cross-subassembly temperature tilt. This would permit the use of a single detection algorithm for all core locations. The simulated test data sets could provide a useful basis for comparing different decision making systems.
The early work has been extended to generate an improved test data set which has then been used to compare another pattern recognition method, Cluster Analysis (CA) with the ALN technique!16].
ACOUSTIC BOILING NOISE DETECTION
In fast reactors the maximum temperature of the sodium in normal operating conditions is some 300CC below the boiling point and boiling can only occur when there is severe overheating. The acoustic noise from the boiling process is therefore an indication of insufficient cooling at some point in the region monitored.
In the UK acoustic techniques for the detection of boiling noise are being developed as a candidate system for the monitoring of breeder element outlet temperatures. This work has been described!17-20]. The Acoustic Boiling Noise Detection (ABND) system has an economic advantage over thermocouple protection
52
in that a much smaller number of detectors is required however, its most probable application is to monitor conditions in breeder elements where the installation of thermocouples is difficult.
In any protection system the achievable sensitivity has to be balanced against the tolerable rate for spurious alarms. This is discussed in detail in the work of the CRP on Signal Processing for Boiling Noise Detection[21]. In a reactor the requirement for spurious trips is severe, the probability must not be more than 10"l per year. This means that there is a region of signal level between normal operation and the level at which a trip can be generated with confidence in which the acoustic signal could be an indication of an incipient fault. For this reason ABND is seen as a two level system generating a trip on large signals and functioning as a diagnostic warning device on lower signals. In this latter role ABND could well be part of a larger computerised protection system making use of signals from a range of detectors covering several parameters.
A number of techniques have been developed to aid the discrimination of the boiling signal from the background noise. The most promising methods have been a) Location Techniques and b) Pattern Recognition.
Location Techniques
Location methods are of value for two main reasons, first it is obviously of interest to the operator to know the position from which the boiling indication is coming. This enables the indication to be checked against other signals, eg thermocouples, in that area. Also this information is clearly of value after shutdown as aid to correcting the problem. Secondly if the acoustic detectors can be focused on a particular region then the background noise from elsewhere in the system is excluded. This improves the signal to noise ratio and is a valuable aid to detection.
Pulse Timing
When the signals are clear, for example a large boiling pulse, location can often be determined by a direct comparison of the signals from the detectors to determine the difference in the transmission time of the signal to each of a pair of transducers. In a two dimensional system this enables a semi-hyperbola to be drawn, with the detector which received the signal earlier as focus, on which the source must lie. A second pair of transducers allows a second semi-hyperbola to be drawn and the source will be located at an intersection of these. Additional pairs of transducers allow ambiguities to be clarified. An example of this location method from an experiment carried out in an experiment on a model of part of the PFR core is shown in Fig 1. Six transducers located above the outer corner subassemblies were used to locate the source of an electrically generated signal. This technique is appropriate when there is good signal to noise ratio. The method can be extended to three dimensions by plotting hyperboloids. A minimum of four transducers is required.
When the signal cannot be readily discriminated from the noise by inspection a correlation method is required to determine the relative delays. This is in effect the basis of beamforming techniques.
53
Delay and Sum Beamforming
In the simplest beamformer, the delay and sum beamformer, the correlation value is obtained by calculating the distance from the point of focus to each of the hydrophones. These distances are divided by the velocity of sound to give the transit times which in turn are divided by the sampling interval used in the digitising process to express the transit times as numbers of time points in the digitised records. The records can then be shifted by these amounts so that a signal emanating from the focus will appear at the same timepoint in all records. The records are then added and squared to give a measure of the acoustic power from that point. This technique has been applied to data obtained on the half scale model of the PFR core Fig 2. A plan view of the model showing the position of the hydrophones is shown in Fig 3. A transducer driven from an electrical oscillator was used as the source and the results in the form of Isometric plots are shown in Fig A. It is seen that the source is always located correctly in the central subassembly and that the sharpness of the location improves with frequency. At high frequencies the wavelength becomes less than the space between transducers and spurious locations are indicated due to aliasing. The spurious indications vary with change in frequency and so can be distinguished from the true location.
An advance on the above technique can be obtained using adaptive methods as explained by Firth[20].
Adaptive Beamforming
Adaptive array processing can significantly suppress the contribution from noise with high spatial correlation. Unpredictable physical features such as entrainments of gas or vapour within the reactor core may cause high signal attenuation at some sensors. We require the additional capability to suppress contributions from sensors with low SNR.
An adaptive array processing strategy which satisfies these requirements is the orthogonal beamforming or eigenvalue decomposition technique (see for example Owsley[22], Bienvenu and Kopp[23]). This technique is summarised below.
Define the following quantities:
a. Estimated cross spectral density matrix B. In practice there are a finite number of matrices R at discrete frequency falues f. Each matrix has dimensions n x n (where n is the number of sensors) and is positive definite. The matrix is subject to statistical variability due to the finite length of sample used to estimate it.
b. Estimated cross-spectral density matrix N for the noise (again positive definite).
c. Steering vector £. This vector contains the phase lag information corresponding to the current array focal point. It is a function of frequency.
The array output power at frequency f for a non-adaptive beam former may be expressed as
p(f,£) - p_V u>
54
where the superscript H denotes the conjugate transposed.
Generally adaptive methods replace expression (1) by
P(f) - w V (2)
vhere w is a "weight vector". The relative amplitudes and phases of w are now chosen to optimise some measure of the array performance subject to some constraint on w.
In the orthogonal beamfonning approach we require to maximise the total array output power subject to the constraint that the array response to the "noise" is unity, ie
wH N w - 1 <3)
The maximum value of P(f) may now be shown to b.; given by
where A1 is the maximum eigenvalue of the equation
H w = \ N w (5)
The optimum weight vector is the eignevector w2 corresponding to Xx.
If there is no "signal" present and furthermore K and N are estimated exactly then R = H and all of the eigenvalues of equation (5) are equal to 1. This does not happen in practice because of sampling errors and in this case the eigenvalues are clustered randomly in the neighbourhood of 1. If a single source "switches on", one eigenvalue emerges from this cluster and assumes some larger value. Thus Xj may be used in the "detection" role and some detection threshold set.
To "locate" a single source the correlation
n(r F) = ^ ^ / { ( p V1 E) (W V^)} (6)
may be tabulated or plotted over all candidate source positions r_ (NB p. depends on r_). The maximum is located in order to give an estimated source position.
An experimental result of the application of these techniques to data from the FFR model in the case where the signal to noise ratio on each of the transducers used was as stated in the table ie about -9db on average, is shown in Figs 5 and 6. The benefit of the orthogonal beamforming technique in distinguishing the new source from the normal background is clearly seen.
PATTERN RECOGNITION
This is a powerful method of distinguishing between a signal and the background noise. Essentially it consists of finding a combination of the features of the signal which is distinct from the background. The. uK work in this area is demonstrated in the CRP on Acoustic Signal Processing [X.Q • An important property of this technique is that it enables the probabilities of failure to detect boiling and spurious trip to be estimated within the
55
statistical accuracy possible with the data records available. In practise to give an assurance of a very low spurious trip rate a long examination of background data is necessary.
The current work in NRL is aimed at combining the above techniques to achieve a sensitive acoustic boiling noise detection system with a low spurious trip rate. This in turn could eventually be part of a multiparameter diagnostic system.
CONCLUSIONS
Thermocouples are a reliable method of measuring outlet temperatures of core subassemblies and instrumentation has been developed to a high degree of reliability. Ultrasonic techniques offer a promising method of measuring temperature remotely which could be valuable where it is difficult to place thermocouples. The ultrasonic method is likely to be less affected by cross flow than thermocouples.
ACKNOWLKDGBCMT
This paper has been conpiled by I D Macleod, UKAEA, Risley from contributions by:
Mr G Hughes CEGB Berkeley Laboratory Dr D Firth NRL UKAEA, Risley Mr G Spence NRL UKAEA, Risley
56
RKFBRKNCBS
[I] Thomson A and Evans R A. "High integrity thermocouples for in-pile applications". Nuclear Power Plant Control and Instrumentation, Vol 2; IAEA-SM-226/109.
[2] Wall D N. Computer Systems for Fast Reactor Core Honitoring - This Meeting.
[3] Keats A B. Failsafe Design Criteria for Computer Based Reactor Protection Systems Nuclear Energy Vol 19 No 6.
[4] Macleod et al. An Ultrasonic Technique for Remote measurement of Breeder subassembly outlet Temperature. This Meeting.
[5] Macleod ID and Olley P. The Development of Acoustic Tomography for Temperature Measurement in Fast Reactors. This Meeting.
[6] Firth D and Wey B O . "Review of Temperature Noise Studies in the UK" IWGFR Specialists Meeting on Temperature Noise, Bologna 1984.
[7] Wey B 0 and Brown C J. "CDFR coaxial thermocouple response measurements of high Reynolds Numbers". IWGFR Specialists Meeting on Temperature Noise, Bologna 1984.
[8] Firth D. "An Analytical approach to temperature noise by extending the eddy diffusivity hypothesis". Fourth Specialists Meeting on Reactor Noise, Dijon 1984.
[9] Overton R S, Wey B 0 and Hughes G. "A multiparticle Monte Carlo Simulation of Temperature Noise and Heat Transfer in Turbulent Flow". Ann. nucl. Energy, Vol 9 pp297-313, 1982.
[10] Overton R S, Wey B 0 and Hughes G. "The temperature noise code STATEN and its experimental verification". IWGFR Specialists Meeting on Temperature Noise, Bologna 1984.
[II] Hughes G, Overton R S and Wey B 0. "Modelling of subassembly outlet region flow and temperature distribution". Guernsey conference on Science and Technology of Fast Reactor Safety, p570 BNES London 1986.
[12] Girard J P, et al. "Detection of coolant temperature noise in SPX1 using intrinsic high frequency thermocouples". Paper presented at the 5th Symposium on Reactor Noise (SMORN V) Munchen, October 1985.
[13] Hughes G and Overton R S. Noise and non-linear phenomena in nuclear systems". Plenum Publishing Corporation 1989, NATO ASI Series.
[14] Hughes G, Overton R S and Wey B 0. "STATEN prediction in a CDFR subassembly and the use of simulated outlet temperatures to test decision making techniques". IWGFR Specialists Meeting on Temperature Noise, Bologna 1984.
[15] Bentley P G and Beesley M. "Pattern recognition for the interpretation of temperature noise from LMFBR fuel elements". Third Specialists Meeting on Reactor Noise, Tokyo 1981.
57
t16] Dubuisson B, et al. "The diagnostic potential of pattern recognition methods applied to temperature rioise data from simulated fast reactor fuel subassemblies". European Applied Research Reports Vol 7 No 6, 1987.
[17] Macleod I D et al. Acoustic Detection of Boiling in LMFBR's Progress in Nuclear Energy Vol 1 pp469-485.
[18] Macleod I D, Rowley R, Waites C and Blakemore M. Acoustic Techniques for the Detection of Boiling in Fast Reactors. LMBWG Meeting Grenoble 1984.
[19] Macleod I D et al. Acoustic Surveillance Systems for LMFBR's BNES Conference on Science and Technology of Fast Reactor safety Guernsey 1986.
[20] Firth D Waites C and Blakemore M. Adaptive Array Processing for Source Location in Fast Reactors. LMBWG Meeting Ispra 1986.
[21] Arkhipov et al. Signal Processing Techniques for Boiling Noise Detection, IAEA IWGFR/68 1989
[22] Owsley N L. Adaptive Data Orthogonalisation. Proc IEEE ICASP Tulsa April 1978. pp 109-112.
[23] Kopp L Bienvenu G Aiach M. New Approach to Source Detection in Passive Listening. Proc IEEE ICASP 1982 Paris pp 779-792.
58
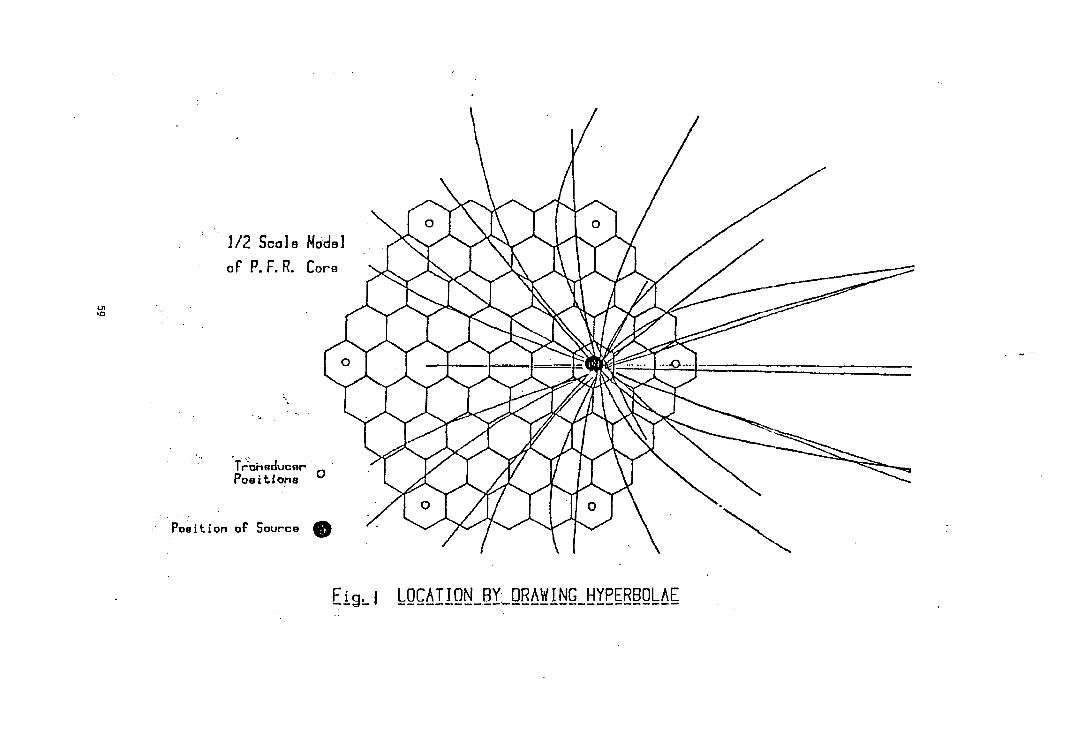
1/2 Scale Model
of P. F. R. Core
Traheducor _ Positions
Poeition of Source 4»
EigU LOCATION BY;_QRAWING HYPERBOLAE
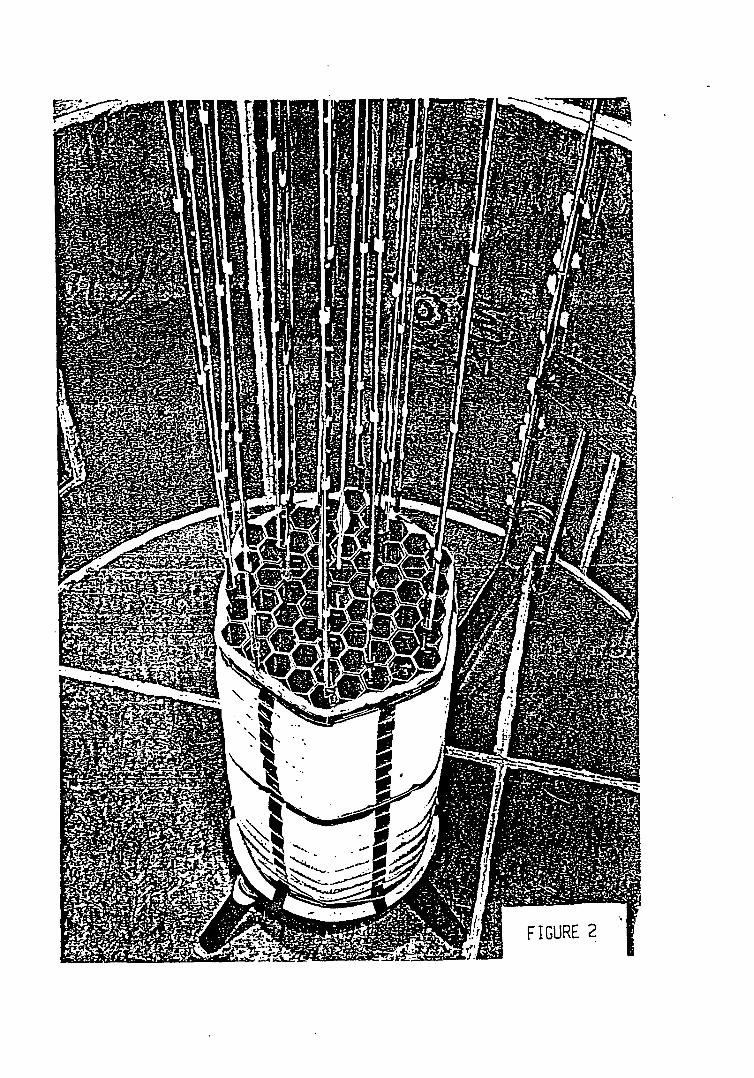
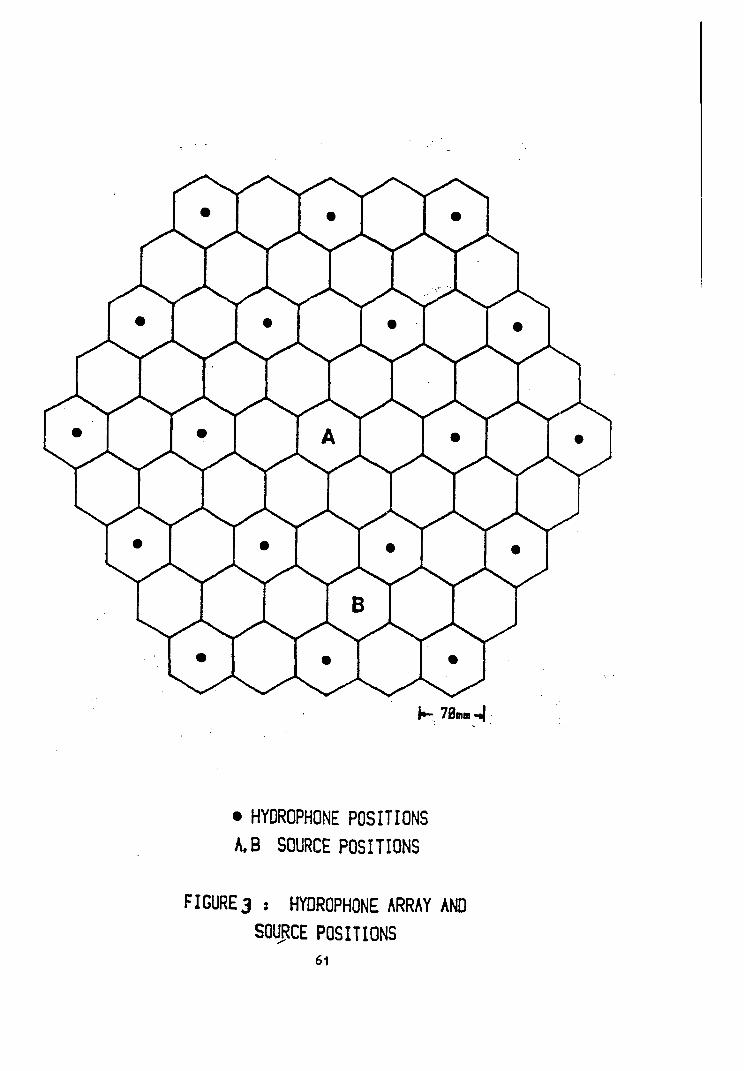
h- 70mm-i|
• HYDROPHONE POSITIONS
A.B SOURCE POSITIONS
FIGURE 3 : HYDROPHONE ARRAY AND
SOURCE POSITIONS 61
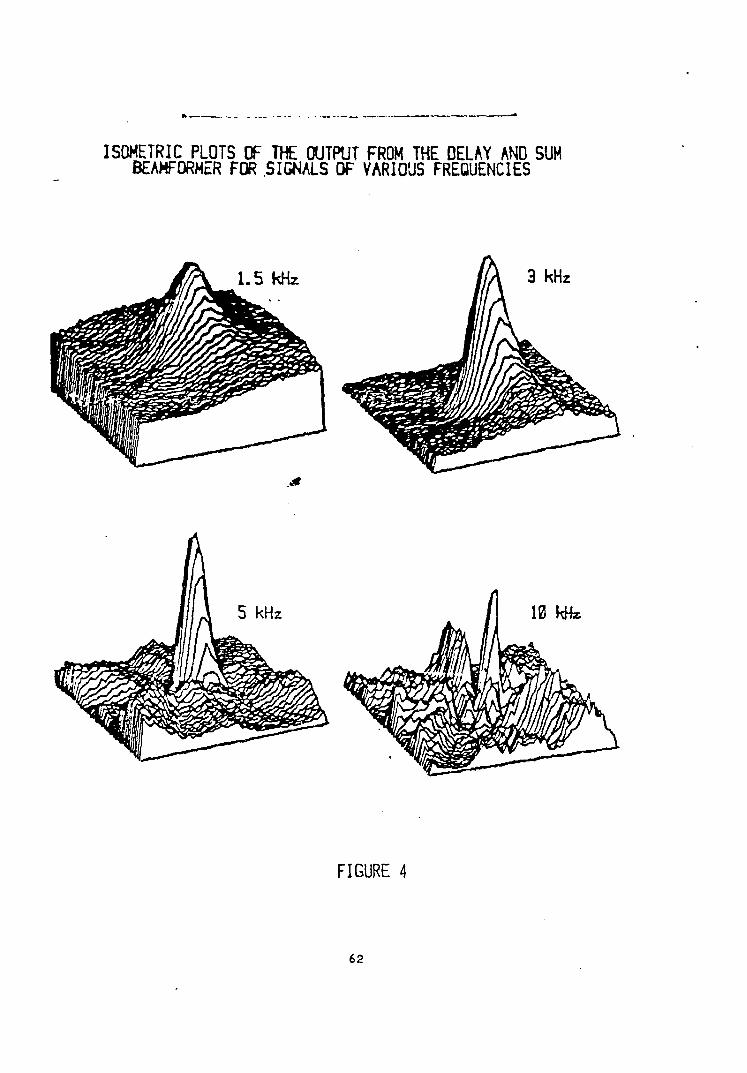
ISOMETRIC PLOTS OF THE OUTPUT FROM THE DELAY AND SUM BEAMFORMER FOR SIGNALS OF VARIOUS FREQUENCIES
10 kffe
FIGURE 4
62
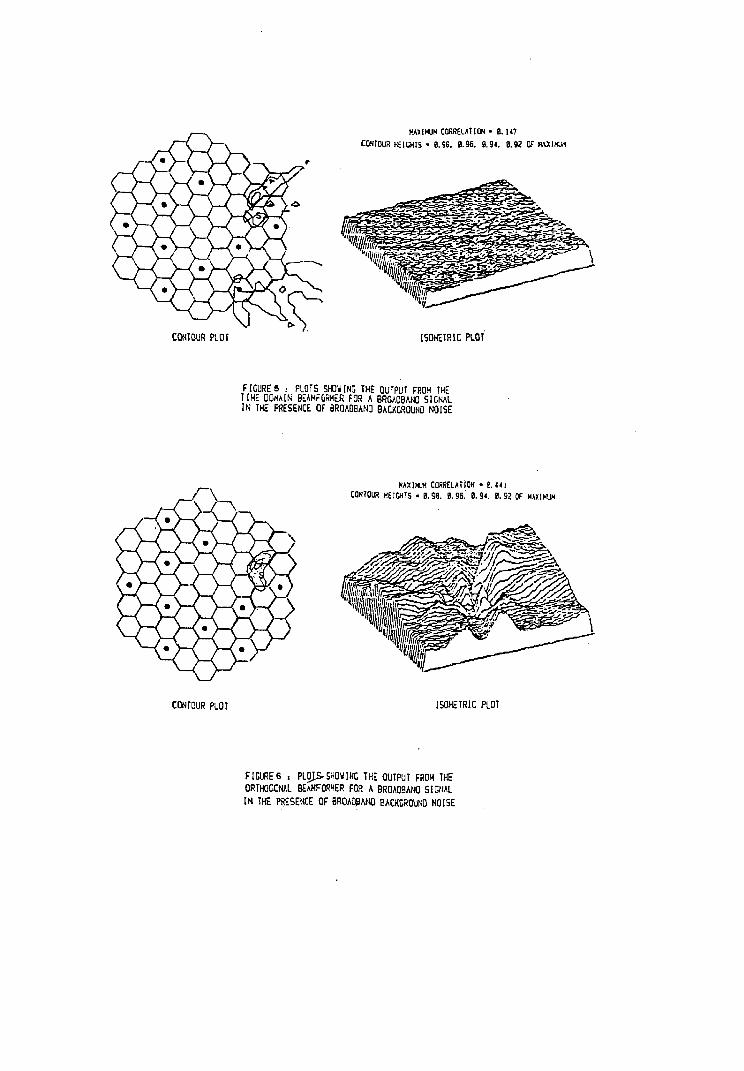
MAXIHUN CORRELATION • 8.147
cosroua H-ICHIS • e.ss. a.96. B.9<. B.92 OF HMKJH
CONTOUR PLOT ISOMETRIC PLOT
FIGURES . PLOTS SHOEING THE OUTPUT FROM THE TIHE DOMAIN BEAMFGRHER FDR A BROA0BAN0 SIGNAL I N THE PRESENCE OF BROADBAND BACKGROUND NOISE
NAXIHUH CORRELATION • M 4 1
CONTOUR HEIGHTS • B. 99. B.95. B. 94. B.92 OF MAXIMUM
.T-^TS^V
CONTOUR PLOT ISOMETRIC PLOT
FIGURE6 i PL0JS-5HOWING THE OUTPUT FRDH THE ORTHOGONAL EOHFORHER FOR A BROAOBANO SIGNAL I N THE PRESENCE OF BROAOBANO BACKGROUND HOISE
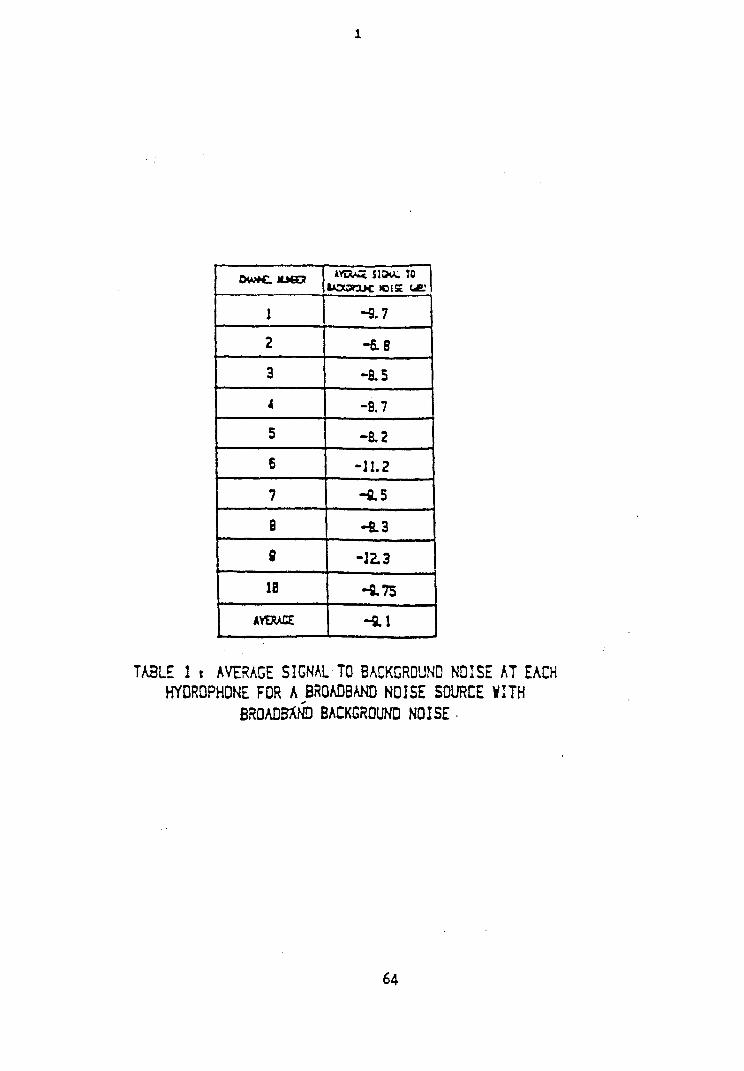
owe me?
1
2
3
4
5
6
7
8
S
18
AVERAS
»VEW* SldU. TO
-9.7
-6.8
-8.5
-8.7
-8.2
-11.2
-4.5
-fi.3
-12.3
-175
-9.1
TABLE 1 t AVERAGE SIGNAL TO BACKGROUND NOISE AT EACH HYDROPHONE FDR A BROADBAND NOISE SOURCE WITH
BROADBAND BACKGROUND NOISE •
64
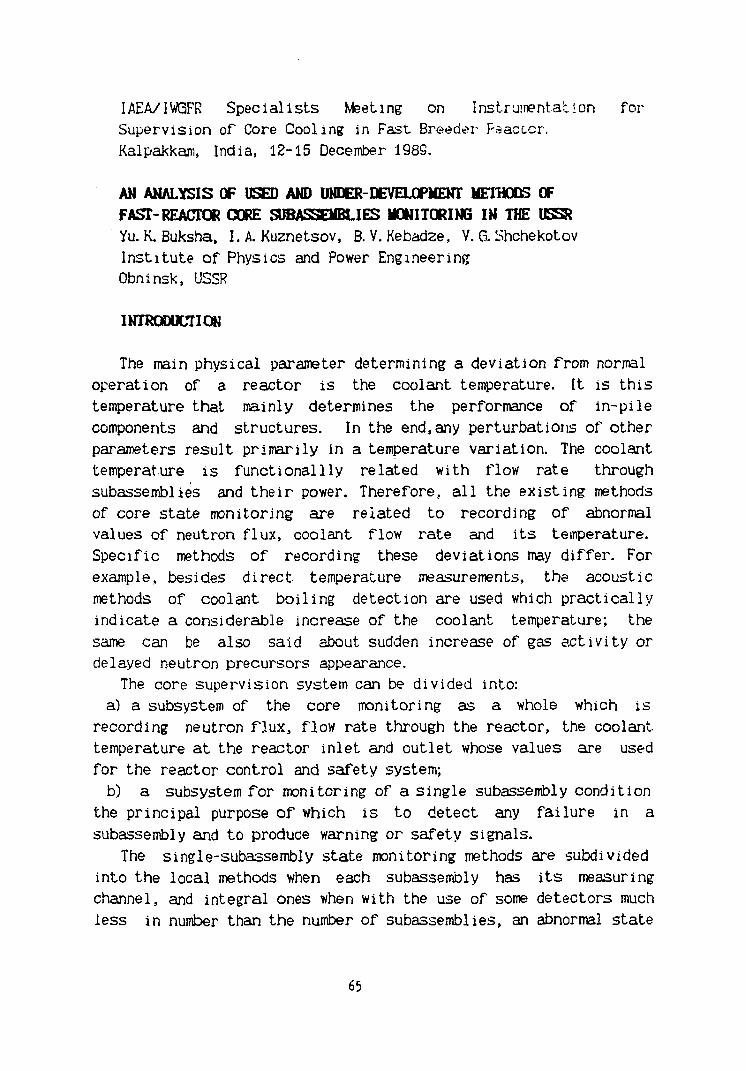
IAEA/1WGFR Specialists Meeting on Instrumentation for
Supervision of Core Cooling in Fast Breeder Peacccr.
Kalpakkam, India, 12-15 December 1989.
AN ANALYSIS OF USED AND UNDER-DEVELOPMENT METHODS OF
FAST-REACTOR CORE SUBASSEMBLIES MONITORING IN THE USSR
Yu. K. Buksha, I. A. Kuznetsov, B. V. Kebadze, V. G. Shchekotov
Institute of Physics and Power Engineering
Obninsk, USSR
INTRODUCTION
The main physical parameter determining a deviation from normal
operation of a reactor is the coolant temperature. It is this
temperature that mainly determines the performance of in-pile
components and structures. In the end,any perturbations of other
parameters result primarily in a temperature variation. The coolant
temperature is functionallly related with flow rate through
subassemblies and their power. Therefore, all the existing methods
of core state monitoring are related to recording of abnormal
values of neutron flux, coolant flow rate and its temperature.
Specific methods of recording these deviations may differ. For
example, besides direct, temperature measurements, the acoustic
methods of coolant boiling detection are used which practically
indicate a considerable increase of the coolant temperature; the
same can be also said about sudden increase of gas activity or
delayed neutron precursors appearance.
The core supervision system can be divided into:
a) a subsystem of the core monitoring as a whole which is
recording neutron flux, flow rate through the reactor, the coolant
temperature at the reactor inlet and outlet whose values are used
for the reactor control and safety system;
b) a subsystem for monitoring of a single subassembly condition
the principal purpose of which is to detect any failure in a
subassembly and to produce warning or safety signals.
The single-subassembly state monitoring methods are subdivided
into the local methods when each subassembly has its measuring
channel, and integral ones when with the use of some detectors much
less in number than the number of subassemblies, an abnormal state
65
of some subassembly is detected. The ratio between local and
integral methods in various countries ;s formed in different ways
according to design features of subassemblies and in-pile
structures. Besides, at the choice of some or other methods of
monitoring also affect such features as reliability, performance,
response time, etc. The economic problems are also of importance.
In the USSR, from the very beginning of fast reactors
introduction the subassembly design with the lateral coolant outlet,
through a number of windows has been developed.
Though the head of such a subassembly has a central hole,
nevertheless, due to mixing of the coolant passing through these
windows with the coolant from adjacent subassemblies, the medium
above a single head subassembly is already not its individual
characteristic. Therefore, the readings of any detector located
above the subassembly head will be affected by adjacent
subassemblies. Besides, as a result of using subassemblies with a
relatively small flat-to-flat size (98 mm, 94 mm) when in the core
of, e.g. , the BN-600 reactor there are more than 500 subassemblies
it is rather difficult for structural reasons to afford the
location of detectors above each subassembly and communication
channel penetrations through the upper plug that by its function is
also neutron shield. As a result, in the operating BN-350 and
BN-600 reactors and in the BN-800 reactor design the local, in the
full sense of the term, methods of single subassembly monitoring
are not used, and the integral methods are preferred. In the
BN-1600 reactor design under development now a version of a
larger-size subassembly with an open head and with monitoring the
state of each of them is considered. It should be
mentioned,however, that the advantage of the local methods of
monitoring as compared to the integral ones is not obvious, and
considerable efforts are still needed for choosing an optimum
combination of different monitoring methods.
Methods for monitoring of subassembly in operating and designed
fast reactors are considered below.
66
1. TEMPERATURE MONITORING.
BH-350
To monitor the coolant temperature inside the reactor vessel
two groups of thermocouples are used. One of them, of 4 in number,
is located in the central rotating column above the subassembly
heads, another eight - in the upper reactor plenum. The
thermocouples being enclosed in protective jackets, their time
constants are rather considerable and make up 10 sec. Of course, if
to use directly the readings from thermocouples with such time
constants in the temperature safety channel of the reactor then it
will prove to be too delayed in action. That is why a special
temperature safety device is used which processes the thermocouple
readings taking into account their transfer functions and recovers
real coolant temperature values, the safety signal being generated
by the 2/3 logic. This device has had long - term operating
experience and has shown a good performance. For the temperature
safety channel to perform efficiently it is necessary to have such
time constants of thermocouples or of a device processing their
readings that do not exceed the fuel-pin time constant that for the
BN-350 is 2 sec.
BN-600
In this reactor 20 thermocouples are placed above subassembly
heads and 8 thermocouples are in the upper plenum. The
thermocouples time constants are 20-25 sec. Their readings are also
processed by the temperature safety device providing an acceptable
response time of the safety channel.
During the years of the BN-600 operation much material on
natural noises of various parameters was obtained. Information on
natural noises is required both for an evaluation of disturbances
in the operation of safety and automatic control system and for
studying physical characteristics of the reactor, for the
development of the control and diagnostics methods.
In addition to standard thermocouples, two thermoprobes were
manufactured especially for the BN-600 which were inserted into
subassembly heads and incorporated four chrome1-alumel
thermocouples and one sodium-steel thermocouple. The tiro constants
67
of the chrome1-alumel thermocouples were 1 sec. Recording and
analysis of reactor parameters noises are carried out at 50%.rated
power in the period before the reactor reaches the medium steady
state and at rated power after the reactor goes to the medium
steady state. Experiments have shown that the highest temperature
noise is observed in the upper reactor plenum. The temperature
fluctuation band reaches 8.5JC and RMS - 1.4 °C. This hinders
high-quality operation of the temperature regulator at using in it
a signal from thermocouples located in the upper plenum. The
fluctuation band for thermocouples above the subassembly heads and
for thermoprobes is within a range of 2-5 °C and RMS of
0. 3-0. 7C With increasing of the reactor power and passing to the
medium steady-state conditions there were observed both an increase
of the fluctuation band because of increased coolant heating and a
decrease resulting from energy tuld flattening in the core. A
principal part in the temperature noise at the subassembly outlet
is played by turbulent mixing of coolant at a non-uniform
temperature distribution over the subassembly cross-section and a
less part-by a deviation of integral parameters (of power and flow
rate). All these factors should be taken into account at the
development of systems for temperature monitoring at subassembly
outlets. Particular care should be taken in the analysis of
sodium-steel thermocouple readings. For them it is important to
take particular care in providing thermostabilization of the "cold"
junction. Otherwise, taking into account its inertialessness the
fluctuation of its readings may be of a false character. In the
experiments the sodium-steel thermocouple signals dispersion
reached 2°CT. The correlation analysis of noises in this case has
revealed that dispersion of a high-frequency spectrum portion which
is determined by turbulent fluctuations of coolant velocity and by
non-uniformity of temperature distribution over subassembly
cross-section makes up ~ 70% of the total one. Thus the o t
high-frequency temperature fluctuations dispersion was 1.4 C .
This is a background noise as a result of the additional
temperature disturbance at the subassembly outlet due to . the
disturbabce in heat removal inside the fuel subassembly. Single
68
subassembly monitoring by their outlet coolant temperature can be efficient only based upon the thermocouple noise analysis because an increase of the deterministic temperature value by 15 C may be a consequence of normal technological processes or of a redistr ibution of the energy field due to the control rod movement. An increase of the temperature high-frequency natural noise dispersion in this case will not exceed 20% of the i n i t i a l one whereas the dispersion due to blockage inside the fuel subassembly causing the same increase of the mean temperature increases several times. Calculations have shown that for the BN-600 reactor conditions the minimum size of blockage in the subassembly active part centre resul t ing in increased temperature dispersion at the fuel bundle outlet up to 2'C makes up 10% of the flow area As to the requirements on processing of a signal from a thermocouple used for subassembly monitoring, then based upon the time required for fai lure detection and reactor shut-down which to our opinion should not exceed 15-20 sec, the relat ive error in the calculation of RMS of a random process during th i s tune in a frequency range of 1-20 Hz does not exceed 7% that i s quite sa t i s tac tor i ly . Of course, the best variant for measuring temperature fluctuations is the use of pract ical ly iner t ia less sodium-steel thermocouples. At using conventional thermojouples in technological jackets the processing should be carried out with the use of the thermocouple transfer function which should be obtained in advance. It should be said, however, that from the technical and procedure points of view the single subassembly s t a te monitoring with the use of thermocouples followed by a signal output into the safety system is far from introduction.
BN-800 The temperature monitoring at the core is carried out with the
use of 24 thermocouples located in the upper reactor plenum at the
coolant inlet to the intermediate heat exchanger and of 111
thermocouples combined in groups of three in separate jackets and
located in the central rotating column at a distance of 100 mm
above subassembly heads. They are arranged so that they cover the
69
whole core. The time constants of thermocouples are 5 sec. As the
design of the BN-800 fuel subassembly is similar to that of the
BN-350 and BN-600 reactors then here there are also the same
problems related to placing thermocouples above each fuel
subassembly and interpretation of their readings. The thermocouples
located above fuel subassemblies can characterize only the state of
those subassemblies above which they are located and also
temperature deviations as a whole above different throttling zones
as a result of the reactor integral parameters variation due to the
refuelling or control rod movement. The safety system over the
coolant temperature (and over other parameters as well) is realized
by 10 independent safety rods which are operated by two independent
subsystems each of which includes a device for logic processing of
discrete signals. Independence of the sets is provided by mounting
them in various rooms, by laying communication lines through
different cable routes and by connecting to independent electric
power supply sources. Emergency signals arrive at each subsystem
through three channels and are processed by 2\3 logic. The device
for logic processing of signals also consists, in its turn, of
three channels whose signals are processed by.2\3 logic. Such
arrangement of the emergency safety scheme will permit to increase
reliabilily and to minimize false trips.
BN-1600
At present it is too early to spea^ about the details of
subassembly monitoring with thermocouples but as the main variant
is considered that with an open subassembly head the flat-to-flat
size of which is 153 mm and with several thermocouples placed above
each of them. The possibilities of using the readings of all these
thermocouples for the detection of emergency situations in single
fuel subassemblies with putting out signals into the safety system
are still to be carefully studied. Here it is essential to assure
reliability both of their readings and of the system of these
readings processing, the more so that only the coolant temperature
noise analysis may be most informative.
In conclusion of this section it would be desirable to mention
70
one of" possible means of the thermocouple trouble detection. At a loss of tightness of a thermocouple sheath a leak-in of coolant inside i t and shorting of electrodes take place that create the so-called " f ic t i t ious junction" in the area of the leaking-fluid surface layer. This " f i c t i t ious junction" being agitated as a result of leaking fluid leads to a displacement of the temperature measurement point. One of the methods of detection of th is phenomenon i s the use of a three-electrode thermocouple manufactured after the USSR inventor's ce r t i f i ca te 857735. The main point of th is method i s in changing the calibration character is t ic of the thermocouple and, accordingly, of temperature indications, due t o shorting by leaking fluid of the end of the third conductor freely suspended in the region of measurement with the two working thermoelectrodes. This leads to shorting of some part of one of the working thermoelectrodes and to corresponding sharp changing of the thermal emf. From th i s change in the thermal emf the presence of the fault is determined.
2. FLOW-RATE MONITORING.
In the fast reactors in operation and being designed in the USSR at their power operation the integral monitoring of coolant flow-rate through the reactor and\or through the loops i s carried out. Monitoring of coolant flow-rate through each fuel subassembly during reactor power operation presents certain d i f f i cu l t i e s though some investigations in t h i s direction are underway. Such monitoring is carried out only on a shut-down reactor with the use of an electromagnetic flow-rate measuring device which is aimed in turn at individual subassemblies making a t ight f i t . These, measurements are aimed a t a ver i f icat ion of conformity to designs of the real hydraulic character is t ics of reactor subassemblies, operational monitoring of coolant flow-rate through fuel subassemblies, the determination of the effect of fuel-pin and subassembly-duct deformation upon the flow-rate magnitude. The flow-rate measuring device includes a number of electromagnetic sensors which not only
71
provide duplication of readings but with their use a principle of correlation measurements is realized. The correlation method allows to control the electromagnetic flow-meter readings to an accuracy of 17o. Calibration of both the correlation method and of the flowmeters themselves is carried out on special metrological rigs. Long-time operation of flowmeters have shown their high efficiency.
Let us now turn to the consideration of the integral reactor monitoring methods.
BK-350 This loop-type reactor has 6 loops. For measuring flow-rate in
each loop, two electromagnitic flowmeters are mounted on 500-600 mm
- diameter pipes at the primary pumps inlet and outlet. Due to a
considerable fluctuation in indications of the flowmeters mounted
at the pumps outlet their signals cannot be directly used in the
safety system. That is why they are subjected to processing in a
special device. Coolant flow-rate monitoring is also performed by
measuring pump revolutions. Before their mounting on the loops the
flowmeters were subjected to calibration at a special circulation
rig.
BN-6O0
In this reactor for sodium flow-rate monitoring an indirect
measurement of flow-rate is provided through a by-pass on which 6
electromagnetic flowmeters are mounted. The flowmeters were
calibrated by rig tests. Besides direct measurements a correlation
principle of flow-rate measurements was realized. With its use one
can also monitor at regular intervals the flowmeter indications.
During start-up and adjustment work, prior to bringing the reactor
to power operation a set of tests on determining the
thermohydraulic characteristics of the reactor primary circuit was
carried out that allowed to determine the correspondence of
indications of flowmeters at the by-pass loop, of sodium flow-rate
through each subassembly and the primary circuit of the reactor to
the pump rotation speed. The obtained dependence of the by-pass
loop flowmeter indications on the reactor flow-rate is of almost
72
linear character. The by-pass flowmeter indications fluctuate within a 5% band of
nominal flow-rate. An analysis has shown that the flowmeter signal noise can be approximated by a sum of two components - of a low-frequency one and a broadband non-correlated one the weight traction or which is predominant. The low-rrequency component represents the actual change of flow-rate and the broadband component is connected with the turbulent perturbations of the velocity field in the flowmeter cross-section.
BH-800 In this reactor, in addition to the measurement of flow-rate
through the by-pass loop as in the BN-600 reactor the measurement
of flow rate in loops is provided. For this purpose at the outlet
of each pump a flowmeter is placed that is similar to that used for
measuring flow-rate in single fuel subassemblies at a shutdown
reactor. Besides the direct measurement of flow-rate with the use
of magnetic sensors, in these devices it is expected to use
time-of-flight and frequency-correlation methods of monitoring.
For flowmeter calibration there are used: a circulation
metrological flowmeter rig with a measurement limit of 0-12 m3\hr
using a volume-space method with an accuracy of calibration of 0.1%
and a comparison method with an accuracy of 0.3%; a rig including a
loop providing also with the volume-space method the calibration
within 0-20 m \hr to an accuracy of 0.3%; and a circuit with
flow-rate up to 100 m3\hz containing a measuring comb with the help
of which using the comparison method the calibration to an accuracy
of not less than 1% is carried out. A rig with a flow-rate of up to
100 m \hr is being mounted and a flowmeter unit with a flow-rate up
to 1600 m* \hr is currently designed realizing a principally new
pulsed method of calibration. This rig is extremely compact for its
parameters and has small specific metal content. It will allow to
calibrate flowmeters to an accuracy of 0.5%.
75
3. MONITORING OF ACOUSTIC AND NEUTRON NOISE.
One of the systems which can provide monitoring of core
subassembly is the sodium boiling detection system. Such a system
based upon the neutron and acoustic noise measurement is now under
development for the BN-800 reactor.
A subsystem for sodium boiling monitoring by neutron noise is
being created based upon the use of ex-vessel ionization chambers
located inside common cells. In this case a noise component of
the signal is isolated and fed at the input of an instrumentation
unit being specially developed now.
The physical basis of the operation of the neutron-noise sodium
boiling monitoring subsystem is the variation of the core physical
characteristics at the appearance of sodium vapour in a single fuel
subassembly. In this case the algorithms involve the dynamics of
signal variation with the vapour quantity variation in the process
of boiling. Really, the presence of the sodium void effect of
reactivity causes corresponding response in neutron flux. Due to a
small volume of boiling, however (a case of sodium boiling in one
subassembly) the total reactivity can vary insignificantly and lie
below the noise level of measured signals. At the same time, as was
shown by experiments at the BOR-60 and BN-350 reactors, at
frequences of 0.3 Hz to 10 Hz the sodium boiling signal level
becomes higher than the background noise level and, according to
our estimates, can be well detected by measuring devices.
It should be noted that in the BN-800 reactor core there are
regions with a zero void coefficient of reactivity. This somehow
reduces the efficiency of the neutron-noise boiling detection
method. Besides, due to a small value of the void coefficient of
reactivity at the periphery of the core some doubts arise as
regards a possibility of boiling detection in this region of the
core. It is possible that some part of this zone which is on the
side of neutron chamber position can be monitored by the local
component of neutron noise caused by passing of neutron flux
through vapour space (the effect of exposure to neutrons).
To our opinion, the subsystem of boiling detection in the core
by neutron noise will permit to detect an event of boiling and, may
74
be, a trend of development of an emergency process causing boiling.
The acoustic-noise sodium boiling monitoring subsystem
incorporates specially designed waveguide acoustic detectors and a
pertinent set of equipment. For the BN-800 reactor it is envisaged
to mount 6 waveguide detectors uniformly arranged on the
circumference above the core. For this purpose the large rotating
plug is provided with special penetrations for these detectors.
The acoustic-noise coolant boiling monitoring subsystem
operates on the basis of recording acoustic signals generated by
vapour bubbles at their collapse in underheated sodium. Experiments
at BOR-60 and BN-350 have shown the sodium boiling signal to be
manifested most effectively in a frequency band of 20 kHz to 200
kHz. To determine the point of the vapour bubble collapse a well
known triangulation method is used. This method is based upon the
measurement and analysis of the time of signal arrival at
spaced-apart detectors. The use of this method allows not only to
determine the point of boiling but also to carry out practically
spatial filtration that, in its turn, increases the reliability of
boiling event detection and selectivity of the measuring system.
Soviet specialists believe that both above systems of coolant
boiling monitoring in the nuclear reactor core will allow to record
sodium boiling in the core at an early stage of abnormal situation
development, and a correlation of signals obtained from these
system will allow to increase the reliability of monitoring.
4. OTHER METHODS OF MONITORING.
Operating experience of both experimental and power reactors
has shown high efficiency of the delayed-neutron monitoring method.
The efficiency of any method is determined, first of all, by its
sensitivity and speed of response. So far in the USSR only integral
methods of delayed-neutron monitoring are used. However, they also
have proved to be highly efficient.
Sufficiently promising is a method of monitoring based upon
balance-of-reactivity calculations. Experimental sample tests at
75
various reactors have shown that this method allows to record an
anomalous reactivity variation as a result of coolant boiling in a
single subassembly or of molten fuel displacement in it.
CONCLUSION.
1. Up to now, in the USSR thermocouples have been used only for
monitoring the conditions of core subassernLiy cooling as a whole
including the distribution of a coolant temperature over the core
radius at the subassembly outlet.
An experience of using them in the system of monitoring core
subassembly conditions in the safety system has revealed that the
time constant of the thermocouples themselves or of a device for
their indications processing should be ~1 sec. An analysis of
indications noise of thermocouples located above subassembly head
pieces and in thermoprobes allows to draw a conclusion about a
possibility of isolating a signal characterizing a deviation in
subassembly operation from normal conditions. Work on development
of the BN-1600 design version with thermocouples mounted above each
fuel subassembly is conducted now.
2. The use of flowmeters at the reactor by-pass and in the
loops is an efficient means of monitoring for core cooling.
Favourable experience of their operation at the plants in operation
has been obtained. A method of monitoring coolant flow-rate through
individual subassemblies at a shut-down reactor has fully justified
itself.
3. An integral method of delayed-neutron monitoring has proved
to be a sufficiently effective method of individual subassembly
monitoring.
4. Experimental verification of neutron and acoustic-noise
monitoring methods has proven their prospects and they are
introduced at the BN-800 reactor.
5. Reliability and efficiency of single subassembly cooling
monitoring can be provided only at a combined use of various
methods. An optimum set of monitoring systems is still to be
determined. When choosing these means of monitoring one should
apparently prefer the integral methods.
76
Experimental Breeder Reactor II (EBR-II),
Instrumentation for Core Surveillance
by
L. J. Christensen Argonne National Laboratory
P.O. Box 2528 Idaho Falls, Idaho
83403-2528
Submitted for Presentation at the
International Atomic Energy Agency (IAEA) International Working Group on Fast Reactors (PWGFR)
Kalpakkam, India December 12-15, 1989
* Work supported by the U.S. Department of Energy, Office of Nuclear Energy under Contract W-31-109-Eng-38.
77
PAPER
International Atomic Energy Agency (IAEA)
International Working Group on Fast Reactors (IWGFR)
Kalpakkam, India
December 12-15,1989
Title of Conference Paper:
Experimental Breeder Reactor II (EBR-II),
Instrumentation for Core Surveillance
By L. J. Christensen
Argonne National Laboratory
Introduction
The Experimental Breeder Reactor-II (EBR-II) is a small but complete
liquid-metal-cooled reactor (LMR) power plant. It has a nameplate peak
thermal power of 62.5 MWt and a corresponding electrical output of 20 MWe; it
has been operated over a range of power including a peak of 70 MWt, as
experimental program needs have dictated, for 25 years. This facility is located
at Argonne-West site of the Idaho National Engineering Laboratory, state of
Idaho, USA.
Description of EBR-II plant
The EBR-II plant consists of a primary system and a secondary system both
using molten sodium as the coolant and a rather conventional steam system, as
shown in figure 1. The primary system is located in a large double-walled tank,
as shown in figure 2. The tank contains about 340 m^ of sodium at 371° C
under normal operating conditions. The two primary pumps take their suction
directly from the tank and deliver a combined flow to the reactor of 485 kg/s at a
78
power of 62.5 MWt. The corresponding mixed-mean temperature of the sodium
coolant leaving the reactor is 473° C.
The reactor consists of an array of hexagonal subassemblies 5.817 cm
across flats on 5.893 cm centers. The core region extends out through row 7, the
reflector region through row 10, and the blanket region out another 5-1/2 rows.
The core region may be smaller than the full seven rows. There are two safety
rods (fueled-bearing) in row 3. There are 12 control rod positions in row 5,
although only nine contain control rods (fuel-bearing) at present. The
remaining three control rod positions are available for special in-core
instrumented subassemblies, such as those used for the thermal-hydraulic (T-H)
testing. The current fuel for EBR-II (Mark II) is a uranium alloy initially
containing 5% simulated fission products, enriched to 66% in 23*>U. The fuel is
a pin 0.3302 cm in diameter in type 316 annealed stainless steel cladding,
0.4420 cm outer diameter X 0.0305 cm wall. Sodium is used as a thermal bond
between the pin and its cladding. Each such fuel element is wrapped with
0.1245 cm diameter spacewire. There are 91 elements in a regular fuel
subassembly and 61 in a control or safety subassembly.
The primary flow to the reactor splits into two streams, one entering the
high-pressure plenum that feeds the first seven rows and the other entering the
low-pressure plenum that feeds the remaining rows. About 84% of the flow goes
into the high pressure plenum and the remaining 16% goes into the low
pressure plenum. The high and low pressure sodium streams mix in the reactor
outlet plenum, go through the outlet pipe to the primary auxiliary pump (a DC
electromagnetic device), and then to the intermediate heat exchanger (IHX) in
which it transfers its heat to the secondary sodium. The primary sodium
leaving the IHX dumps directly back into the primary tank. Power to the
auxiliary pump is provided by a rectifier backed up by a battery floating on the
line. In case of a power failure, an emergency 480 volt diesel generator provides
79
power to the rectifier. If the emergency power system fails, the battery takes
over the load. Recent testing and analysis indicated that the auxiliary pump is
not needed as an engineered safety feature for operation of EBR-II.
The secondary system sodium is driven by a single electromagnetic pump at
a flowrate of 315 kg/s. The heat in the secondary system is transferred to the
steam system in seven evaporators and two superheaters, all of the Argonne
double-wall heat exchanger tube design.
The steam is used in a conventional turbine-generator to produce
electricity. At full-power (62.5 MWt) the superheaters deliver 32 kg/s of steam
at 438° C and 8.70 MPa to the turbine.
A more detailed description of the EBR-II plant is given in Reference [1].
Figure 3 shows the instrumentation associated with the primary coolant
system when the plant was built. Of the original 10 flow sensors, only three are
still in operation today. All three of these sensors are part of the reactor
shutdown system (RSS). An instrument probe has been installed through the
reactor cover into the outlet plenum region that provides an additional flow
sensor in the form of a delta pressure measurement. This sensor signal is also
part of the reactor RSS flow trip circuit. The scram contacts are arranged in a
two of four trip logic. Engineering effort is presently ongoing to qualify digital
speed sensors mounted on the primary pump motor shafts as flow trips. A
toothed nut on the shaft produces pulses in a magnetic sensor. This pulse
signal is proportional to pump speed which in turn is proportional to flowrate.
Figure 3 also shows the location of two ultrasonic flowmeters located in the
low pressure plenum inlet piping at the throttle valves. These flowmeters are
recent additions to the flow instrumentation and are in final checkout before
being placed in operation. Figure 4 is a diagram of a ultrasonic flowmeter
assembly. The system consists of a sensor assembly and an electronic control
subsystem. The sensor assembly is suspended from the valve plug of the
80
throttle valve so that the full sodium flow in the four inch pipe flows axially in
line with the sensors. The sensors are both transmitters and receivers. The
ultrasonic travel time in sodium at 371° C is about 2377 m/s. The travel time
for 35.6 cm is 150 ns with a difference of 1.0 ns difference between the up time
and the down time. To resolve the travel time to approximately ±2 ns requires
at least 100 pulse times be counted and averaged. Fast electronic circuits and a
control computer are used for this purpose.
Figure 5 shows the placement of the subassembly outlet thermocouples that
monitor the temperature of selected subassembly coolant streams. These
temperature signals provide a diverse and independent backup to the loss of
flow trips, and four of the signals are part of the RSS and trip on high
temperature from subassemblie flows.
Thermal-hydraulics testing at EBR-II
The thermal-hydraulic testing program at EBR-II, initially conducted to
support the continued safe and reliable operation of EBR-II, has evolved into an
experimental and supporting analytical program contributing to the design and
performance assessment of advanced liquid-metal-reactors, with special
emphasis on inherent safety. These eL,rts, which essentially started in 1974,
have been primarily directed towards understanding the detailed response of
EBR-II to a wide variety of upset conditions and utilizing this knowledge to
validate general purpose thermal-hydraulic-neutronic computer codes for
application to new plant designs. Initial emphasis was placed upon reactor and
primary heat transport system phenomena, and more recently, the focus of the
work has been on whole-plant dynamic behavior. The success of this program
has been immeasurably aided by the availability of fully-instrumented and
calibrated in-core fueled and non-fueled assemblies, XX07, XX08, XX09 and
XX10 [2,3,4], These assemblies give direct, real time measurements of in-core
81
•
sodium temperatures. These measurements were a prime basis for
"bootstrapping" from test to test and for use in an overtemperature scram
circuit. These assemblies, with their extensive temperature and flowrate
measure capabilities, have permitted the generation and documentation of
comprehensive data sets that have been used to validate codes modeling single
and multiple assemblies, and whole core behavior.
The in-core instrumented assemblies XX07 and XX08 have been previously
described in [3,4] while XX09 and XX10 (latest probes) were discussed in [2].
However, due to the importance of these instrumented probes to the conduct
and interpretation of the testing, XX09 and XX10 will be discussed in detail.
The fueled assembly, XX09, contains 61 elements, 59 of which are Mark-II
metal fuel and 2 serve as hollow conduits for below-core instrumentation leads.
There are 28 thermocouples measuring the three-dimensional temperature field
throughout the assembly, ranging from below core to assembly outlet; these
include thermocouples within the fueled region and in the inter-assembly
bypass flow region. Two permanent-magnet flowmeters are located in tandem
within the assembly below the core and have been calibrated over a flowrate
range covering rated conditions down to both upward and downward natural
convective flow (i.e., from -0.3 to +3.2 1/s). The normal operating conditions are
468 kW (25.6 kW/m, peak), 3.141/s, and 136° C coolant temperature rise. It is
orificed for a flow of 9340 kg/h and the mixed mean outlet temperature is 519° C
(based on an inlet temperature of 371° C).
In XX10, there are 19 elements, 18 of which are solid stainless steel (type
316) and 1 serving as a hollow conduit for below-core instrument leads. As with
XX09, there are 2 below-core permanent-magnet flowmeters calibrated over the
expected flowrate range from - 0.04 to + 0.441/s. A total of 26 thermocouples are
included providing full coverage from below-core to assembly exit regions. The
particular choice of materials and dimensions used for XX10 was based upon
0
82
standard thermal-hydraulic scaling laws so that the relative dynamic
performances of XX09 and XX10 would closely approximate that of fueled and
blanket assemblies in a large reactor [5].
Subassembly Design Considerations
The presence of an instrumented driver fuel subassembly in the core of
EBR-II played an important part in the loss of flow without scram (LOFWS)
tests and loss of heat sink without Scram (LOHSWS) tests, as it provided the
ability to measure coolant flows and temperature at different axial elevations
during each test. Thus, the accuracy, reliability, and range of operation of the
instrumentation had to meet required specifications.
However, there was another consideration, a conceptual functional
requirement in which XX09 had to represent a prototypical subassembly. That
is, XX09's T-H characteristics were designed to be similar to those of other
liquid metal cooled reactor (LMR) core designs so that the data could be
reasonably extrapolated to these reactor designs. Previous experience in EBR-II
[6] indicated the importance of determining the whole-core behavior during
natural convective transients, and the need to holistically describe the entire
core, which includes both driver and blanket subassemblies.
An analysis was performed on a conceptual design subassembly, applicable
to either a driver or blanket, and nine nondimensional parameters were
established. Of these, six were used in a steady-state comparison between two
large LMR designs and EBR-II. As a result of this comparison, two
instrumented subassemblies were designed, one a driver type (XX09) and the
other a blanket type (XX10), with significantly different T-H characteristics.
These were built for use during the Shutdown Heat Removal testing (SHRT)
program [7]. Details of the conceptual design basis, the large plant comparison,
and description of the blanket subassembly are given in [8].
83
The instrumented subassemblies XX09 and XX10 were designed to fit into
control rod positions located in the fifth row of the core. The full assembly
consists of three components: the subassembly, an extension tube, and a
terminal box. The XX09 subassembly is representative of a standard EBR-II
driver. The extension tube connects the subassembly to outside the primary
tank. It provides a protected conduit for the instrument leads and permits
movement of the subassembly during fuel handling. The terminal box provides
a junction area from which the instrument leads are connected to the DAS,
which records, processes, and stores the test data. A schematic diagram of the
XX09 assembly configuration is shown in figure 6.
The lifetime of XX09 is dependent upon the time-to-breach for the Mark-II
elements, and that generally has occurred at a burnup of about 9 at% (2 years in
the reactor).
There are two flowmeters located in the lower shield below the active core
region. Both flowmeters were calibrated; the flow inaccuracy was less than 2%
in the operating range of 390 to 9800 kg/h. The flowmeters were also calibrated
for reverse flows up to 980 kg/h.
The spacer-wire thermocouples are contained in a metal sheath of 316
stainless steel and are made of Type K chromel/alumel with magnesium oxide
insulation. The thermocouples are butt-welded to the wire wraps, and the
length adjusted so that the thermocouple junction is at the specified core
elevation when the wire wrap is spirally wound onto the elements. They have
been fabricated to the U.S. Reactor Development and Technology (RDT)
standards. The standard deviation was 0.7° C for an out-of-core calibration in
the operating range between 427° and 593° C.
There are a total of 28 thermocouples. There are two located in the
flowmeters near the inlet, five at the core midplane (MTC), thirteen near the
top-of-core (TTC), four above the core (14TC), two at the subassembly outlet
64
COTC), and two in the thimble region of the subassembly (ATC). Fig 7 gives the
specific instrument loading.
A T-H analysis was performed for XX09 on steady-state data obtained
during EBR-II run 129C (June 1984). The T-H code THI-3D [9] was used to
predict the coolant temperatures. THI-3D is a steady-state, single-phase, multi
channel code that uses the laws of mass, energy, and momentum conservation
to calculate the temperature field in both the axial and radial direction. The
turbulent interchange, radial thermal conduction, and wire-wrap forced flow
between subchannels are considered explicitly. The model consisted of a total of
149 radial nodes, with 120 nodes for the XX09 subassembly and 29 for the
surrounding annular thimble region between XX09 and the outer control-rod
hex can. There are 49 axial nodes, each 12.7 mm long, modeling the entire
Mark-II element length. The THI-3D code was used previously in thermal-
hydraulic modeling and worked very well, especially when the annular thimble
region around XX09 was included. Also, modeling of the adjacent
subassemblies was not necessary, as they have a similar power-to-fiow ratio,
and the effects of intersubassembly heat transfer are negligible. The agreement
is very good, with most of the data being within 5° C of the predicted
temperature. Temperatures at the midplane were found to be higher than
expected. However, this discrepancy can be explained by a number of factors, of
which, a wire-wrap hot-spot effect appears most plausible. Details on the XX09
subassembly and thermal-hydraulic analysis are given in [10]. The most
exciting T-H tests were the LOFWS test 45 that was conducted in April, 1986
[11], The loss-of-flow-without-scram tests involve bypassing the normal loss of
flow scram function and tripping the main coolant pumps. All of the tests
demonstrated passive power reduction caused by reactor feedback mechanisms.
Figure 8 presents pretest predictions and temperatures measured with a
representative thermocouple in XX09 near the top of the core for a LOFWS from
85
100% power. A companion test, loss-of heat-sink-without-scram (LOHSWS) test
was conducted the same day. LOHSWS involved a loss of normal means of
transferring heat from the sodium pool to the balance of plant where electricity
is generated. Figure 9 shows the tests results. The key observation from these
test is that EBR-II core can ride through two severe transients without damage.
Conclusions
EBR-II has operated for 25 years in support of several major programs.
During this time period, several of the original, non-replaceable, flow sensors,
RDT sensors and thermocouples have failed in the primary system. This has
led to the development of new sensors and the use of calculated values using
computer models of the plant. It is important for the next generation of LIAR
reactors to minimize or eliminate the use of non-replaceable sensors.
EBR-II is perhaps the best modeled reactor in the world, thanks to a
dedicated T-H analysis program. The success of this program relied on excellent
measurements of temperature and flow in subassemblies in the core. The
instrumented subassemblies of the XX series provided that measurement
capability. From this test series, EBR-II calculations showed that the core could
withstand a loss-of-flow without scram accident and a loss-of-heat sink without
scram accident from full reactor power without core damage. From this, reactor
designers can now design with confidence, inherently safe reactors.
EBR-II is an integral part of Argonne's IFR Program (Integral Fast
Reactor) and will continue the T-H program. Additional series XX in-core
instrumented subassemblies will be required.
86
References
1. L. J. Koch, W. B. Loewenstein, and H. 0. Monson, Addendum to Hazard
Summary Report, Experimental Breeder Reactor-II (EBR-II), ANL-5719
(Addendum), Argonne National Laboratory (January 7, 1964.
2. J. Poloncsik et al., The EBR-II Instrumented Subassemblies, INSAT XX09
and INSAT XX10, Proc. Conf. Fast, Thermal and Fusion Reactor
Experiments, Salt Lake City, Utah, 1 April 12-15,19082, pp. 276-287.
3. R. M. Singer and J. L. Gillete, Measurements of Subassembly Core
Temperature Distributions in an LMFBR, AIChE Symp. Series, 164, 73,
Nuclear, Solar, and Process Heat Transfer, St. Louis, 1976 (1977) 97-104.
4. J. L. Gillete et al., Experimental Study of the Transition From Forced to
Natural Circulation in EBR-II at Low Power and Flow, Trans. ASME, J.
Heat Transfer 102 (1980) 525-530.
5. P. R. Betten et al., Conceptual Design Basis and Temperature Predictions
in a Simulated Instrumented LMFBR Blanket Subassembly, Third Intl.
Meeting on Reactor Thermal Hydraulics, Newport, RI, October 15-18,1985
(submitted for publication)
6. R. M. Singer et al., Studies of Thermal-hydraulic Phenomena in EBR-II,
Nucl. Engrg. Des. 62 (1980) 219-232.
7. G. H. Golden et al., Evolution of Thermal-hydraulics Testing in EBR-II,
Nucl. Engrg. Des. 101 (1987) 3, in this issue.
87
8. P. R. Betten et al., Conceptual Design Basis and Temperature Predictions
for a Simulated Instrumented LMFBR Blanket Subassembly,
ANS/ASME/AIChE/ENS Proc. on 3rd International Meeting on Reactor
THermal Hydraulics, 2, October 1985, 17.G.1-17.G.6.
9. W. T. Sha, R. C. Schmitt, and P. R. Huebotter, Boundary-value Thermal-
hydraulic analysis of a Reactor Fuel Rod Bundle, Nucl. Sci. Engrg. 59
(1976) 140-160.
10. P. R. Betten et al., Verification of Steady-State Temperature Predictions in
an Instrumented LMFBR Driver Subassembly, ANS/ASME/AIChE/ENS
Proc. on 3rd International Meeting on Reactor Thermal Hydraulics, 2,
October 1985, 17.H.1-17.H.6.
11. H, P. Planchon, J. I. Sackett, G. H. Golden and R. H. Sevy, Implications of
the EBR-II Inherent Safety Demonstration Test. North Holland,
Amsterdam, Nuclear Engineering and Design 101 (1987) 75-90.
ee
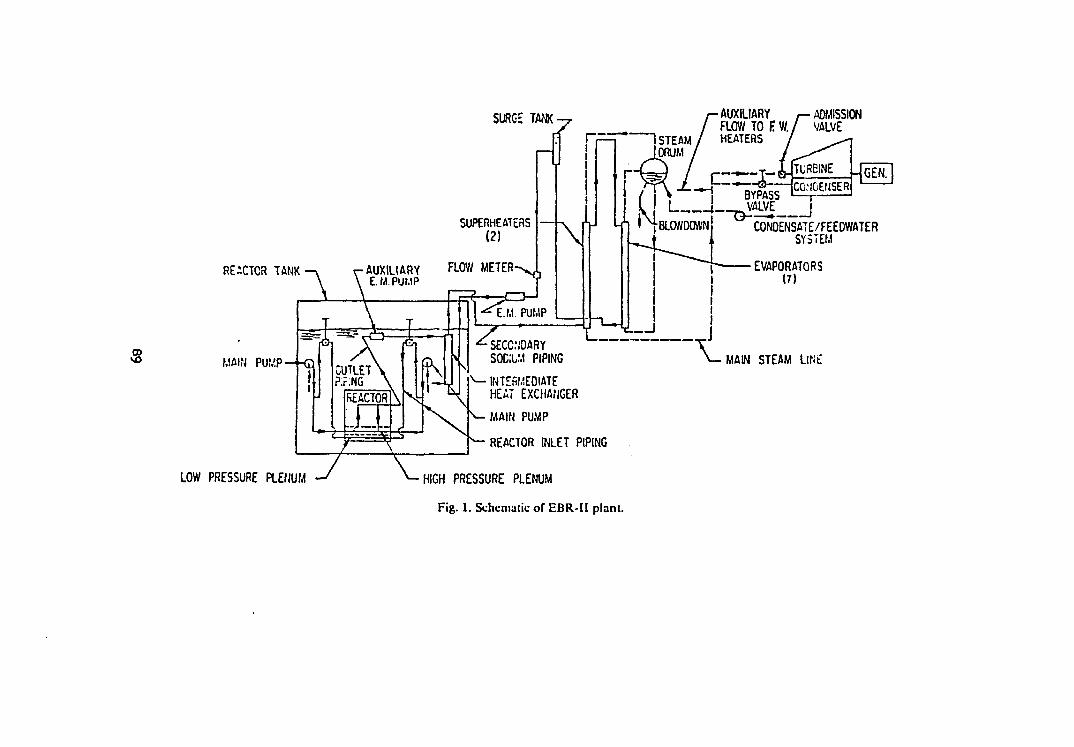
SURC- TANK •
REiCTCR TANK
a> MAIN PUWP — - Q
LOW PRESSURE PLENUM
AUXILIARY FLOW TO F W. HEATERS
•ADMISSION VALVE
MAIN PUMP
REACTOR INLET PIPING
HIGH PRESSURE PLENUM
Fig. 1. Schematic of EBR-II plant.
J • B— BYPASS
_ ^ VALVE ,
CONDENSATE/FEEDWATER SYSTEM
EVAPORATORS (7)
MAIN STEAM LINE
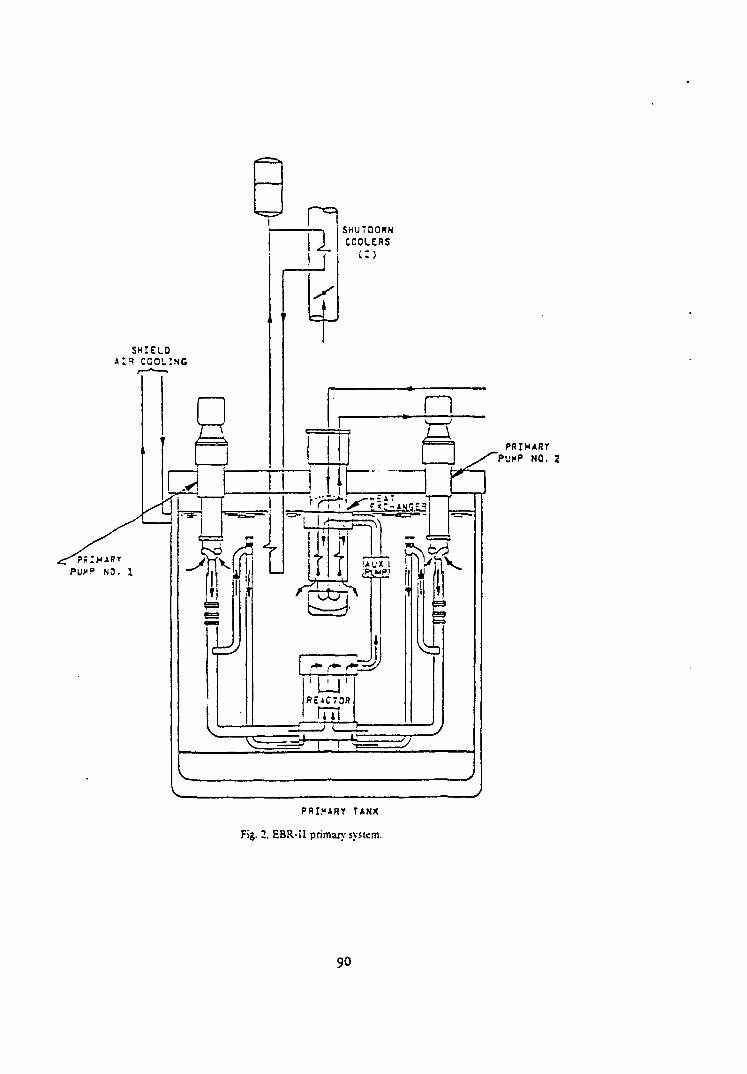
SHUTOORN COOLERS
PRIMARY PVVP NO. 2
PRIMARY TANK
Fig. 2. EBR-II primary system.
90
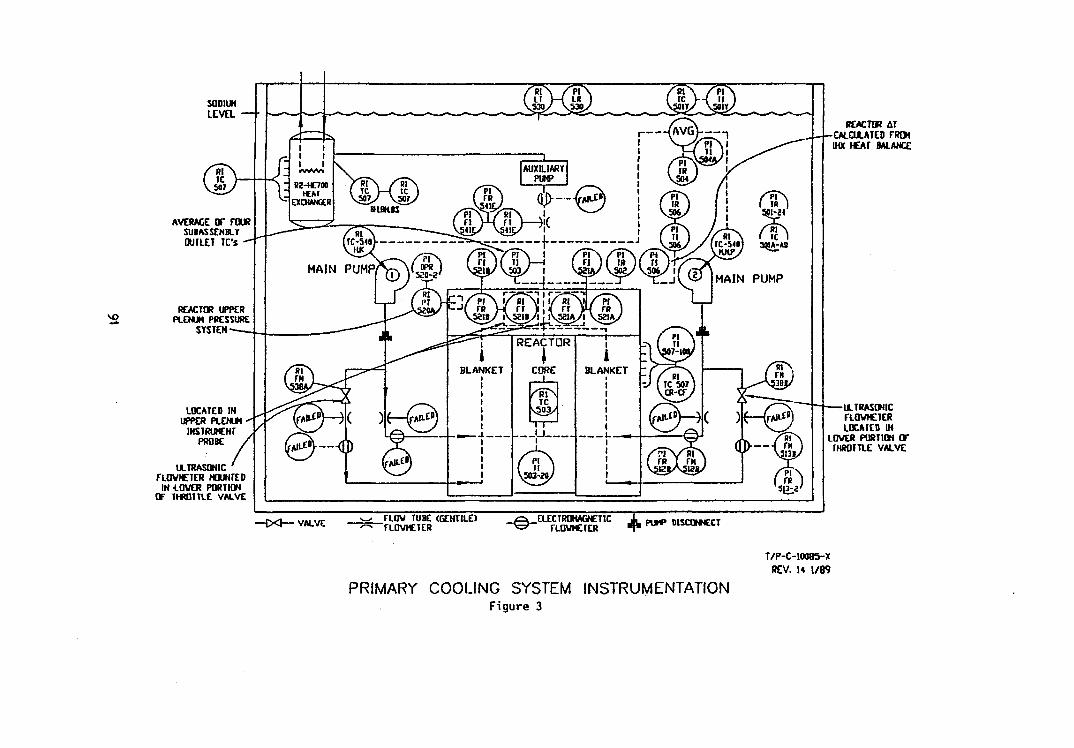
SODOM LEVEL
AVERAGE OT FOUR SUBASSEMBLY OWLET TC's
REACTOR UPPER PLENUM PRESSURE
SYSTEM
LOCATED IN UPPER PLENUM-
INSTRUMENT PROBE
ULTRASONIC FLOWMETER MOUNTED
IN LOVER PORTION OF matrix VALVE sua'
REACTOR AT -CALCULATED FROM IHX HEAT BALANCE
ULTRASONIC ELOVHETER LOCAfEO IN
LOVER PORTION OT THROTTLE VALVE
— { X I — V A L V E FLOW TUBE (GENTILE)
"FLOVHETER ELECTROMAGNETIC
FLOWMETER PUHP DISCONNECT
T /P-C- I0083-X
REV. 14 1/89
PRIMARY COOLING SYSTEM Figure 3
INSTRUMENTATION
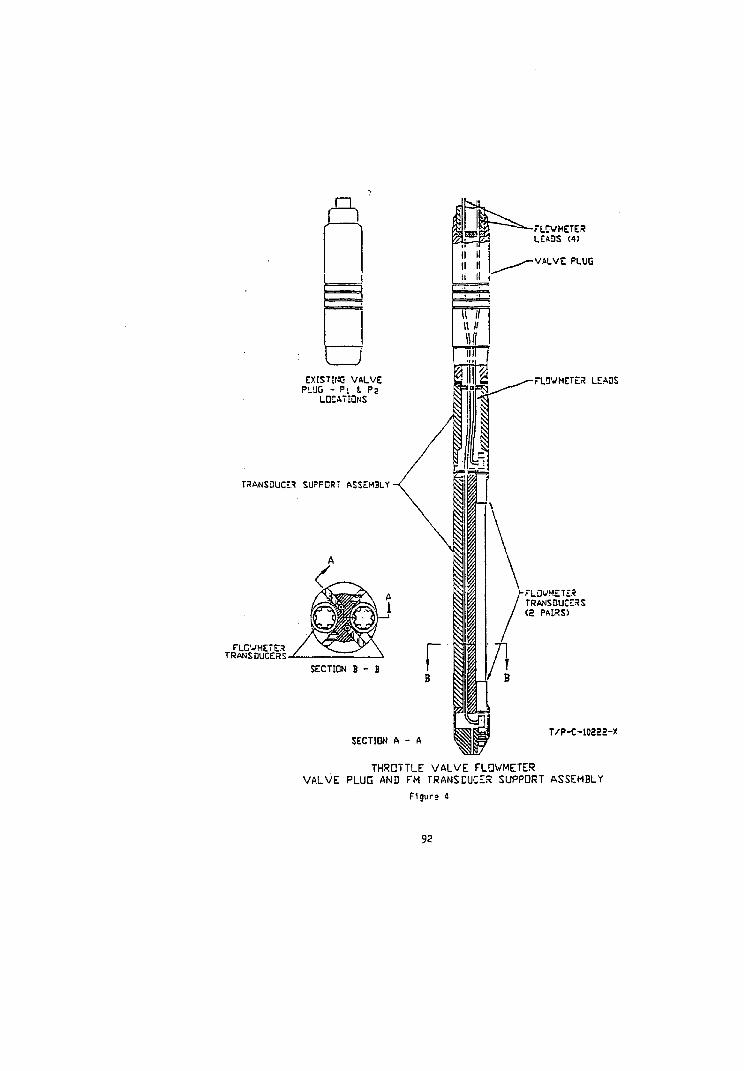
A
EXISTING VALVE PLUG - P\ I Pz
LOCATIONS
TRANSDUCE* SUPPCRT ASSEMBLY
FLOWMETER TRANSDUCERS
VALVE PLUG
FLOWMETER LEADS
fLDVMETE.? TRANSDUCERS Cg PAIRS)
SECTION A - A T /P -C-10223 -X
THROTTLE VALVE FLOWMETER VALVE PLUG AND FM TRANSDUCER SUPPORT ASSEMBLY
Flgurs &
32
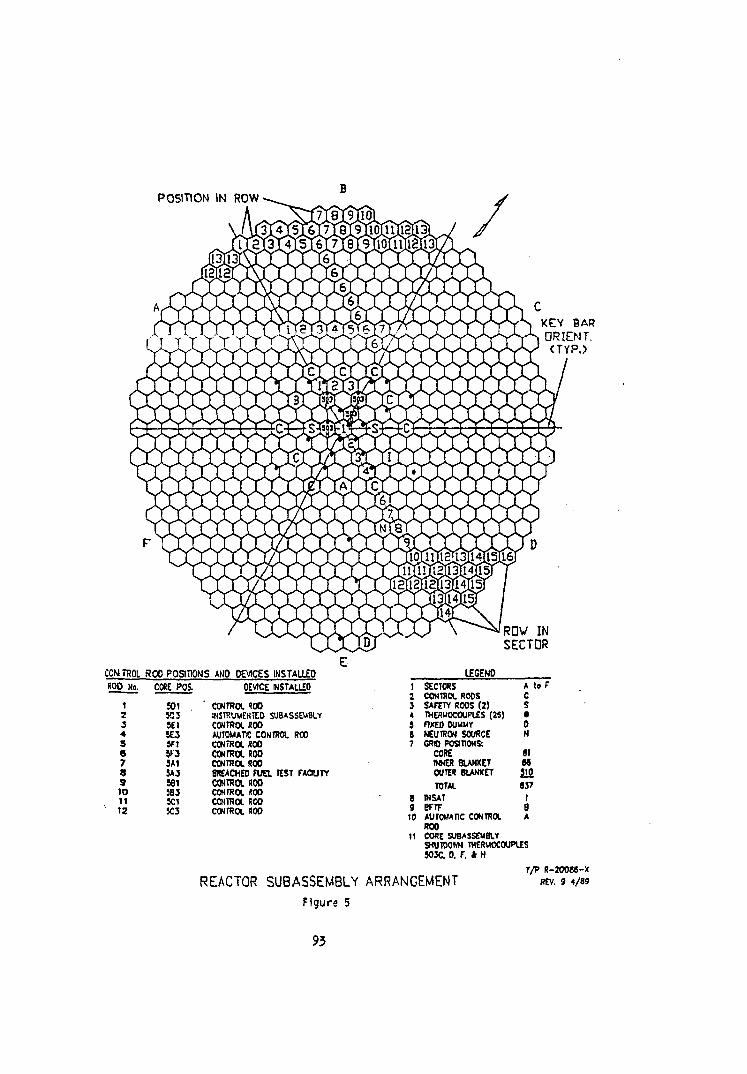
POSITION IN ROW
KEY BAR ORIENT. <TYP.>
ROW IN SECTOR
CONTROL RQQ POSITIONS AMO DEVICES INSTALLED
8 0 0 No,
1 2 3 4 S 8 7 « 9 to 11 12
CORE POS.
501 . W3 set su SF1 5>'3 3A1 JAJ 531 583 K1 JC3
OEVICE INSTALLED
CONTROL ROO INSTRUMENTED SUBASSEMBLY CONTROL SCO AUTOMATIC CONTROL RCO CONTROL ROO CONTROL ROO CONTROL ROO BREACHED FUEL TEST FACILITY CONTROL ROO CONTROL ftCO CONTROL ROO CONTROL ROO
LEGEND
1 SECTORS A to F 2 CONTROL RODS C 3 SAFETY ROOS (2 ) S * THERMOCOUPLES (26) • 5 nxED DUMMY 0 8 NEUTRON SOURCE » 7 ( M O POSITIONS:
CORE 61 INNER BLANKET M OUTER 8LANKET SJ2
TOTAL 837 B TNSAT I 9 BFTF B 10 AUTOMATIC CONTROL A
ROO 11 CORE SUBASSEMBLY
SHUTDOWN THERMOCOUPLES 50JC. 0. F. * H
REACTOR SUBASSEMBLY ARRANGEMENT
Figure 5
T/P R-200M-X REV. 9 4/89
93
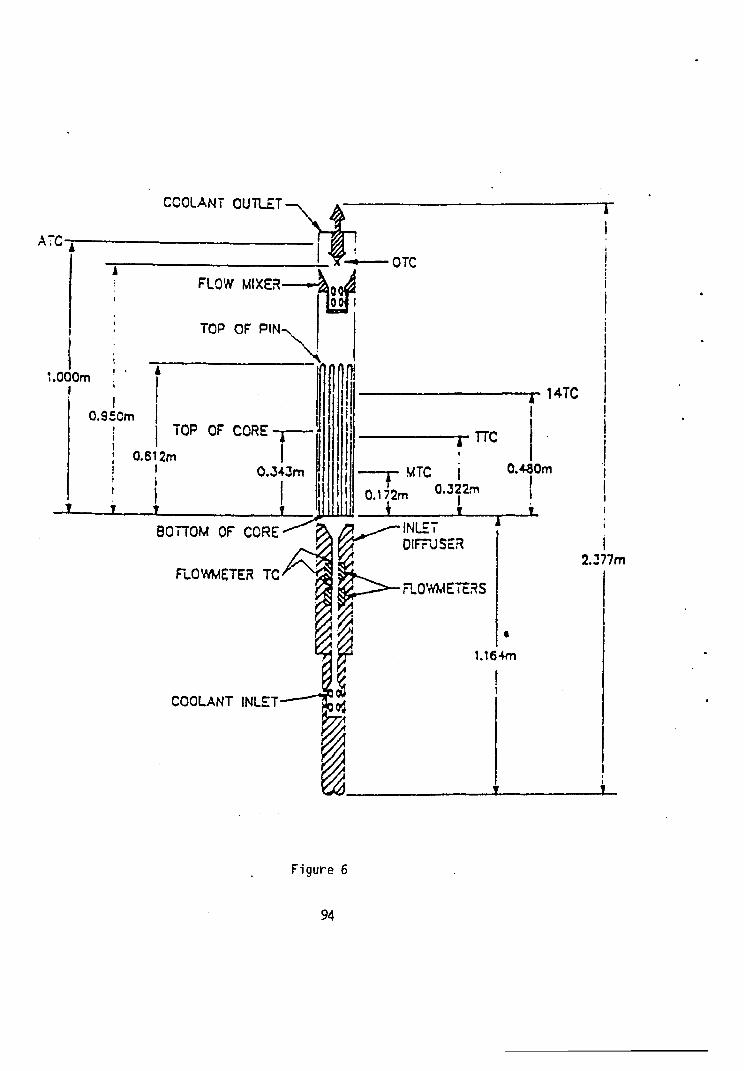
COOLANT OUTLET
A7C-
OTC
FLOW MIXER-
TOP OF PIN-
1.000m !
0.9£Cm TOP OF CORE
0.612m I i
0.343m !>
14TC
XTTC
BOTTOM OF CORE
FLOWMETER TC
/?^~,NL£T
fc< DIFFUSES
COOLANT INLET
r-MTC |
0.172m °-3l2m
0.480m
FLOWMETERS
1.164m
2.377m
Figure 6
94
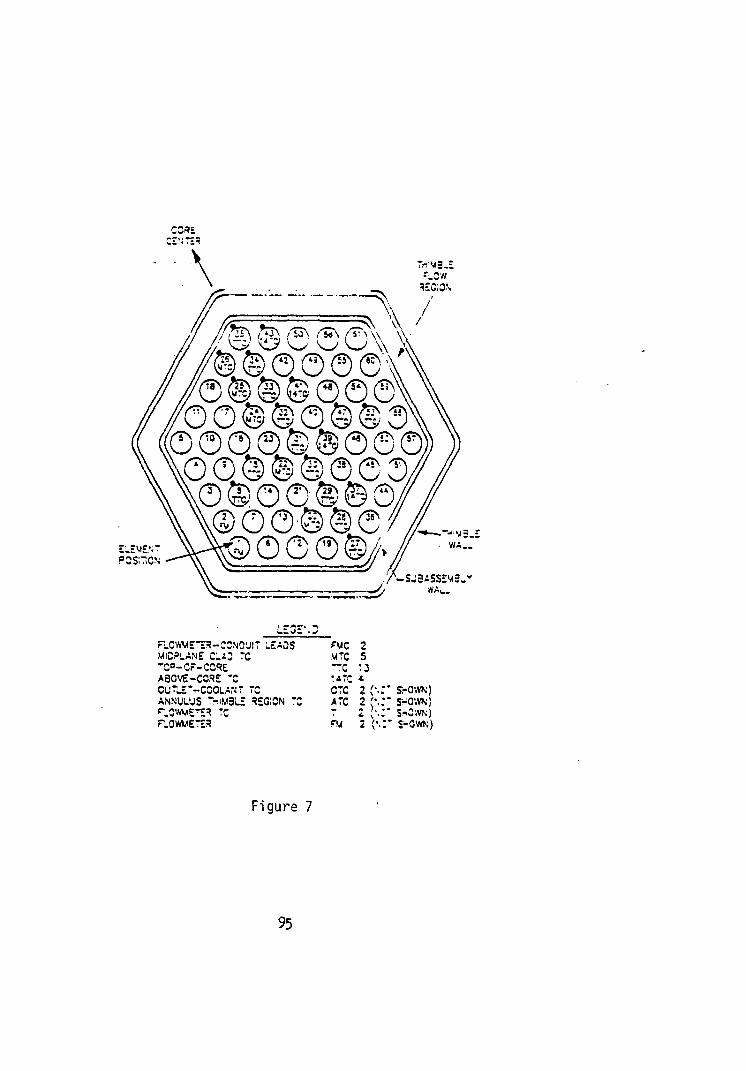
?\ ;\
P C S i n C *
mp © © ©\ \ 1) © © © © <S\
'©©©(I©©© ,/©©@©©©©©\ (©©©©©^©©©
,©©©©-©©©' ,©0©©©© ' r©Q©©©/>
r^CWVC—3-CCND'J!7 L£A0S MlCPLANE CLA3 TC ""CP-CF-CCRE A30VE-CCRE 'C Curi.£--C0OUANT 7C ANNULUS >>M31S S£G;CN -C
PMC 2 MTC 5 TC '3
crc 2 (••:* S.-0'.VN) A re 2 (•.:* s-ow\; 7 2 • ' . : * S*0'.v\) ru 2 ;••:* S-OWN)
Figure 7
95
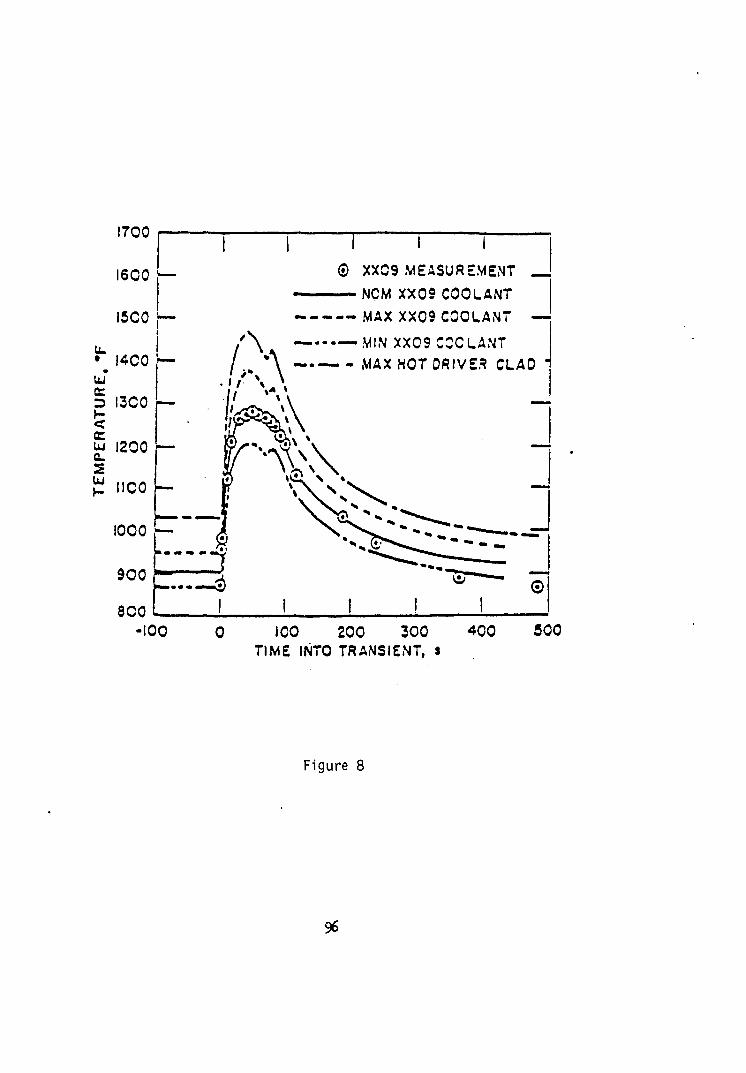
I7O0
I6C0
I5C0 r
lu I • I4C0 r
r i i 0 XXC9 MEASUREMENT __
NCM XX09 COOLANT — MAX XX09 COOLANT —
A —.- MIN XX09 COOLANT / _% * \ MAX HOT DRIVER CLAD 1
• «/' V \
IOO 200 300 TIME INTO TRANSIENT, $
500
Figure 8
96
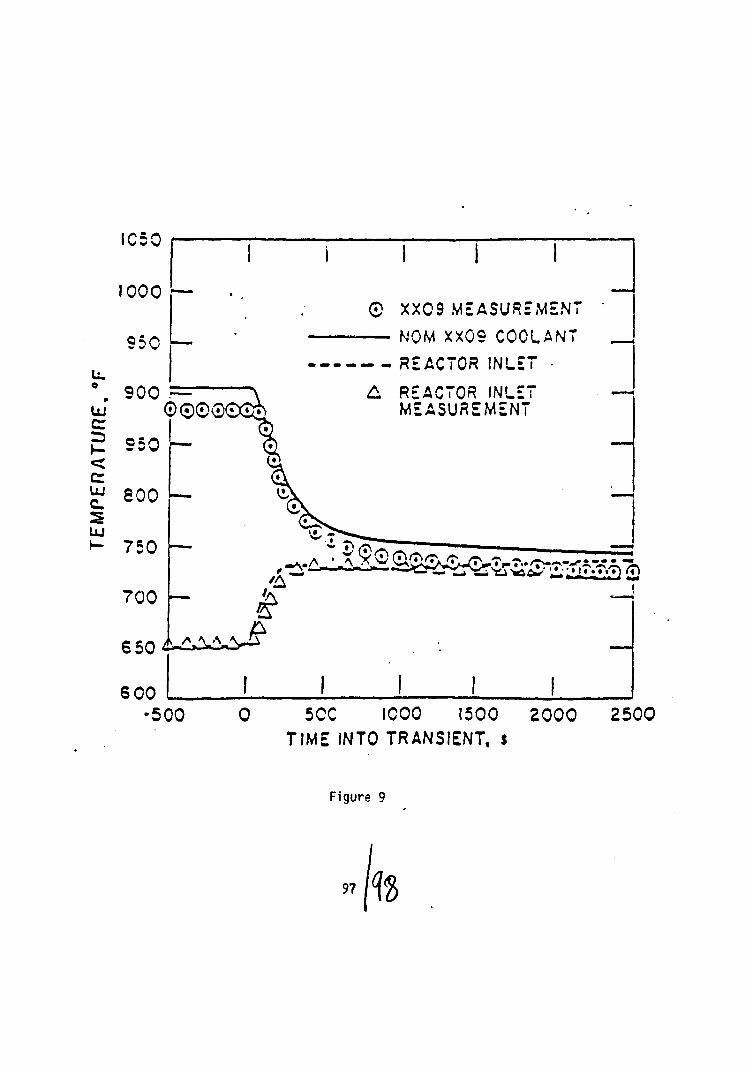
IC50
u. o
UJ
a <
UJ c s UJ
750
700 £
6 00 I I I •500 0 50C IC00 1500 2000 2500
TIME INTO TRANSIENT, $
Figure 9
97 m
INSTRUMENTATION FOR SUPERVISION OF CORE COOLING IN_ FBTR AND PFBR
Uma Seshadri, P.Swaminathan, G.Huralikrishna & K.Raghavan Power Plant & Controls Division
Reactor Group Indira Gandhi Centre for Atomic Research
Kalpakkam 603102, India
1.0 INTRODUCTION
Indian Nuclear Power programme envisages setting up a series
of Fast Br<?Prfer Reactors in the early part of the next
century. A 40 MW thermal (13 MVe) Fast Breeder Test Reactor
(FBTR) has been built with French collaboration and became
critical in Oct. 1985. We are planning to set up a 500 WWe
Prototype Fast Breeder Reactor (PFBR) at Kalpakkam and the
design for this is in an advanced stage. A detailed project
report is being finalised for obtaining approval of the
Government. In this presentation, the design features of
Instrumentation for core monitoring of FBTR is described.
Also is presented the philosophy adopted in the design of
the Instrumentation for Core Supervision of PFBR.
2.0 FBTR:
In FBTR, instrumentation for core supervision has retained
the philosophy followed in Rapsodie with modifications,
wherever felt necessary. 85 positions in the reactor core
have been provided with 2 nos. of finite time constant
thermocouples except the central one which is provided
with 3 nos. of T/Cs to measure the outlet sodium temperature
from each subassembly. Stainless steel sheathed magnesium
99
oxide insulated Chromel Alumel T/C's have been the obvious
choice because of their fairly linear EMF vs. temperature
characteristic and stability at 900 deg.C. Besides, type K
T/C's are known to withstand nuclear radiations of the order 14 2
of 10 n/cm /Sec. as will be encountered in Fast Reactors.
Ungrounded hot junction thermocouples were preferred as
failure due to thermal sht,~k is minimum for such type. The
Chromel Alumel T/C's also offer the added advantage of
higher signal strength ( >15 mV) at operating temperatures,
facilitating the use of conventional amplifiers for
processing the signal. 2 nos. of 1 mm T/Cs are assembled
on a probe called "Probe for core temperature measurement".
The probe is introduced into a thermowell tube arrangement,
so that the probe does not come in direct contact with
sodium. The probe assembly has been designed to provide good
thermal contact between the T/C's and T/W even in the
presence of possible differential expansion. The probes are
inserted through 6 T/C passage tubes in the small rotating
plug (SRP). Each tube accommodates 14 nos. of T/C probes.
The probes are provided with disconnectable lemo connectors
at the cold end, to f.acilate replacement of the T/C's. Since
temperature measurements directly relate to the safety of
the reactor, the response of these temperature sensors is
required to be fast. A time constant of 2 s e e s , wi th minimum
dispersion in the response time of any two T/C's was 1
specified. Tests in sodium were conducted, simulating the
reactor core conditions. Response time observed were of the
o r d e r of 4 to 6 sees and the maximum dispersion of 1.8 sees
100
was observed. Tests were repeated with Indium filled in the
well. Response time improved to values between 0.6 to 1 sec.
and also the dispersion between the two time constants was
found to be very small ( <0.2 sec). However, the probes have
been installed only in dry thermowells as reports indicated
interaction of Indium with the Stainless steel of the
thermowell. The response time was also found to vary with
the circumferential position of the gripper in the dry
thermowell.
These signals are scanned by the Central Data Processing
System (CDPS) which is an on-line dual computer system Each
thermocouple is scanned once in a second. The healthiness of
the thermocouple is checked by the computer by comparing the
outlet temperature of fuel sub-assembly with inlet
temperature of the core. Faulty thermocouples are deemed to
have crossed the safety limit. They do not take part in the
calculation of mean temperature. Th -> operator is informed
about the faulty thermo-couple through display and print
out.
The average outlet temperature of the fuel sub-assembly is
calculated (Urn). This will be compared against alarm, LOR
and scram limits. The global temperature rise (&c)m) is
also calculated by the computer and checked against alarm,
LOR and scram limits.
101
For every sub-assembly, the expected temperature rise is
calculated by multiplying the global temperature rise (tQ^
with a sub-assembly constant (ai). Initially, sub-assembly
constants are calculated taking into account thermal power
distribution across the reactor core. On demand, computer
can also calculate the sub-assembly constants at different
power levels. The actual temperature rise along every fuel
sub-assembly is also compared with expected temperature
rise. The difference is compared with expected temperature
rise. The difference is compared with alarm and scram
limits. Colour graphic terminal is available for the
operator to view the temperature distribution across the
reactor core. Operator can view "on-line trend" of the core
temperature signals in the colour CRT.
Plant simulator is used to check and validate the core
temperature supervision software. On-line diagnostics
programme checks the functioning of the core temperature
supervision programme and other safety related programmes.
If any safety related programme is not operational, on-line
diagnostics will order switch over to the stand by computer.
Flow reduction in individual subassemblies is possible only
due to. blocking of the flow passage. Designs adopted rule
out the possibility of a total blockage in FBTR. Even if it
were to happen the detection and safety actions are expected
to limit crossing transient hot spot clad temperature.
Besides, global incidents involving power or flow changes
are detected and safety actions initiated. For fuel failure
102
which can lead to local blockages two methods are employed
for early detection of clad rupture, one detecting delayed
neutron precursors (DND) in sodium and the other detecting
fission gases (GFPD) in the primary cover gas. The DND
system actuates the reactor protection system in the event
of a large DND signal. The GFPD alerts the operator thro' an
alarm in Control room. The DND system adopted for FBTR is
similar to Rapso<ii e with yodifi est ionz incorporated to
improve signal sensitivity. System response time is of the
order of 30 sees. The response time of the GFPD system is of
the order of 4 to 5 minutes taking into account decay of 23
He activity before detection.
3.0 PFBR:
The approach with regard to subassembly accident protection 2
to be adopted for PFBR a r e b road ly enumerated b e l o w : -
(a) Conventional Chrome! Alumel T/Cs in dry well will be
sufficient; Signals should be scanned once a second .
(b) Safety actions should be taken based on absolute mean
outlet temperature and temperature rise through the
subassembly .
(c) Fast response T/C's will be preferred if they are
replaceable. Response t ime fo r t h e s e type of T/C's
should be less than 100 ms, However, fast response T/C's
are not mandatory since credible blockages due to
e x t e r n a l debris are not expected to cause sodium
boiling.
105
(d) With fast response T/C's noise measurements for
detection of local blockage will be possible. But
considering insufficient experience to date, it would
not be feasible to take safety action based on noise
measurement.
(e) For failed fuel detection, both cover gas monitoring and
DND need to be provided.
(f) From reactor availability considerations fast
localization of failed fuel will be required.
(g) To limit consequences of BDBA events, Accoustic boiling
detectors are recommended and safety actions are to be
taken based on these measurement.
(h) Flow meters to take care of total flow blockage is
recommended.
(i) Detection system should have redundancy and voting logic
to ensure a reliability of 99.9%.
The above requirements were reviewed and instrumentation for
Supervision of Core Cooling in PFBR is planned on the
following lines.
Temperature will be measured at each of the 216
subassemblies using 2 Nos. of conventional Chromel Alumel
thermocouples and one number of zero time constant SS-Na
T/C. The conventional T/Cs will be replaceable. They will be
fixed on probes and inserted into thermowell tubes. The
intrinsic T/C's will be integral with the thermowell and
non-replaceable. Such a requirement calls for probe design
104
distinct from FBTR. Conventional T/C's will be Mgo insulated
stainless sheathed, Chromel-Alumel 1 mm sensors mounted on
t h e p r o b e f o r core t empera tu re measurement. The probes will
slide into the thermowell tube from the attic of the control
plug. Probe and tube designs will aim to have the lowest
response time possible. Preliminary studies indicate that in
o r d e r t o a v o i d i n t e r f e r e n c e s with shroud tubes some T/C
tubes may have 3 bends in different planes. A full scale
mock up i s being planned towards perfecting design of a
probe f o r core temperature housing the two types of T/C's
w i t h i n a s i n g l e we l l .
Scanning speed of 1 sec will be retained as in FBTR. The
scanning speed is decided taking into account the time
constants of detecting devices, heat propagation constants
and the hypothesis of plugging conditions. Each set of 216
T/C's will be scanned and processed by three separate
surveillance computers.
S i g n a l processing will be on similar lines as in FBTR with
added f e a t u r e s to improve accuracies through advanced
telemetry techniques. Only signals from conventional T/C's
will be used fo r s a f e t y a c t i o n s .
In order to detect gross blockage of flow through
subassemblies, flow measurements are carried out a t 4
locations on the outer periphery of the fuel subassemblies.
Power to flow ratio will be representative of the
temperature r i s e across the reactor core and will be used
as a gross flow blockage s i g n a l .
105
A combined probe type eddy current flow meter (ECFM) with 2
conventional T/C's is under development. ECFM's are good
candidates for detecting local boiling, considering their -2
fast response (better than 10 sec) and higher sensitivity 3
(approx. 17'S microvol ts/m/hr) . But for their higher cost,
they would have been ideal detection instruments for
individual 5A flow excursions. Accoustic Boiling detectors
are also planned to be provided for early detect!on of
sodium boiling which is presently under development at this
centre. However, it is not considered mandatory for the
safety of the reactor.
Detection of failed fuel pins will be by GFPD and DND in
sodium as in FBTR. Fast localisation of the failed fuel
element is planned in PFBR in addition to GFPD and global
DND. Considering the large response time (order of a few
minutes) no safety actions are envisaged from CFPD signal
and it will function only as a pre-alert signal. DND mothod
consists of sampling sodium from eight zones in the pool and
monitoring for presence of delayed neutrons in the case of a
fuel pin failure. Samples are collected by e.m. pumps and
routed to DND blocks installed on the roof top. The DND
localization method involves collection of samples from
heads of each individual subassembly with the help of three
selector valves provided for this purpose. Each selector
valve can select sample from one of the 72 subassemblies
106
with the help of a control circuit. Provision to sample one
or a group of subassembly is also available. The sample
selected is monitored in a separate DND block located on the 2
control plug. By this method a 1 cm equivalent fuel pin
rupture can be identified within a maximum period of 15
minutes. At an earlier point of time, when the evolution of
a break in a fuel element cladding was not well understood,
early removal of the failed sub-assembly from the reactor
was considered desirable. Presently, continuous operation
of the reactor without its removal is considered
permissible. This may allow some redesign to be effected
from economic considerations.
4.0 CONCLUSION:
It is recognised that monitoring of sub-assembly outlet
temperature is an important feature in Fast Breeder
Reactors. Development efforts are underway in this Centre .
for the design of probe for core temperature measurement,
eddy current flow meter and accoustic probes needed for core
monitoring. Reliable instrumentation which includes
advanced microprocessors with self-diagnostic features and
validated software is expected to be available indigenously
by the time PFBR construction is taken up.
107
REFERENCES:
1. K.Swaminathan et al, Determination of Response time of Core
Thermocouples of the Fast Breeder Test Reactor, Symposium on
Process Instrumentation and Control for Power Plants & Nuclear
Facilities, April 1983.
2. S.Covindarajan, Sub-azscmbly Accident Protection, Summary and
recommendations for PFBR, Internal Report.
108
KERNKRAFTWERK BETRIEBSGESELLSCHAFT mbH
622-I3-SP-385.46
THE KNK II INSTRUMENTATION FOR GLOBAL AND
LOCAL SUPERVISION OF THE REACTOR CORE
Werner O. Steiger Kernkrattwerk-Betriebsgesellschaft mbH (KBG)
D-7514 Eggensteln-Leopoldshafen 2 Federal Republic of Germany
IAEA/iWGFR-Speclallsts' Meeting on instrumentation for Supervision of Core-Cooling in Fast Breeder Reactors Kalpakkam, India, 12-15 December 1989.
109
ABSTRACT:
After an introduction into the KNK plant itself, their historical development and their present situation, the instrumentation of the global and local supervision of the KNK II-core as well as the main safety-related i and c-systems will be described. Special emphasis is laid on the instrumentation of the reactor protection systems and the shut down systems.
After that some practices are reported about instrumentation behavior and lessons learned from the operation and maintenance of the above mentioned systems.
At last follows a short description of the special '.nstrunen-tat:on for che detection of failed fuel subassemblies and of the plant data processing system.
TABLE OF CONTENT:
1. INTRODUCTION / SUMMARY PLANT REVIEW
2. GLOBAL SAFETY RELATED REACTOR CORE INSTRUMENTATION
3. LOCAL SAFETY RELATED REACTOR CORE INSTRUMENTATION
4. COMBINED SAFETY RELATED REACTOR CORE INSTRUMENTATION
5. PLANT PROTECTION SYSTEMS
5.1 THE KNK II REACTOR PROTECTION SYSTEM AND ITS ACTIVE SAFETY FEATURES (SAFETY SYSTEM)
5.2 THE KNK II MAIN COMPONENT PROTECTION INSTRUMENTATION
5.3 THE KNK II PLANT PROCESS SYSTEMS PROTECTION INSTRUMENTATION
6. SAFETY RELATED INSTRUMENTATION BEHAVIOR
7 . THE INSTRUMENTATION TO DETECT FAILED FUEL S/As
8. DATA PROCESSING AT TKE KNK II
9. APPENDIX
110
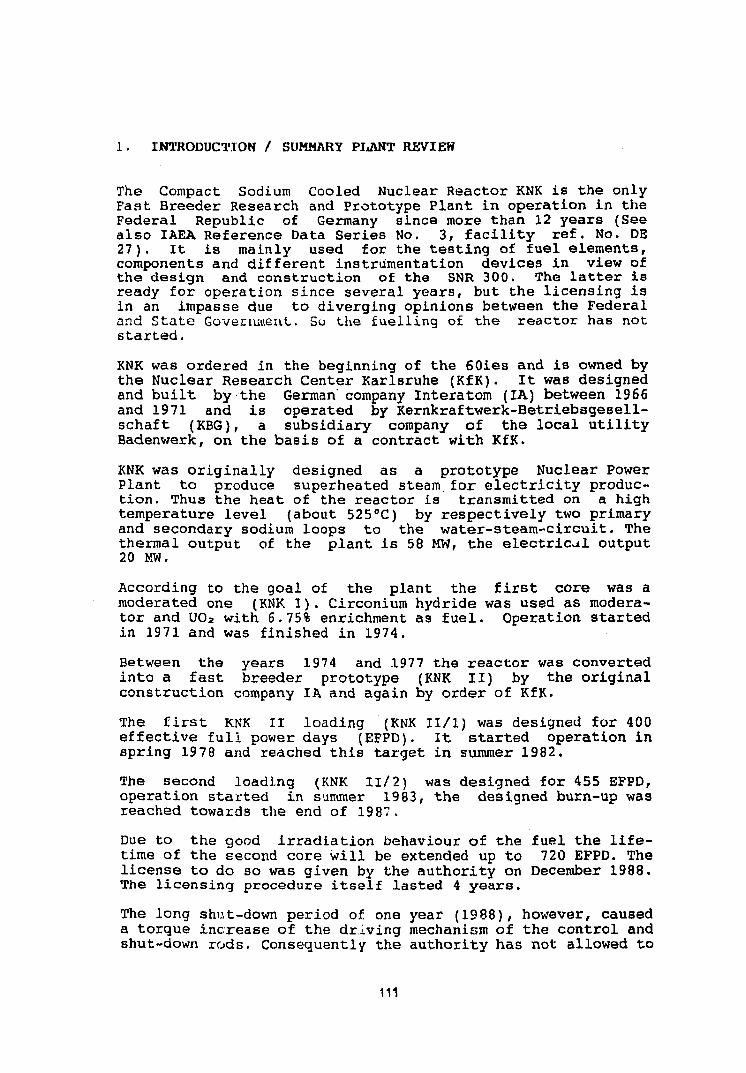
1. INTRODUCTION / SUMMARY PIJVNT REVIEW
The Compact Sodium Cooled Nuclear Reactor KNK is the only Fast Breeder Research and Prototype Plant in operation in the Federal Republic of Germany since more than 12 years (See also IAEA Reference Data Series No. 3, facility ref. No. DE 27). It is mainly used for the testing of fuel elements, components and different instrumentation devices in view of the design and construction of the SNR 300. The latter is ready for operation since several years, but the licensing is in an impasse due to diverging opinions between the Federal and State Government. So the fuelling o£ the reactor has not started.
KNK was ordered in the beginning of the 60ies and is owned by the Nuclear Research Center Karlsruhe (KfK). It was designed and built by the German company Interatom (IA) between 1966 and 1971 and is operated by Kernkraftwerk-Betriebsgesell-schaft (KBG), a subsidiary company of the local utility Badenwerk, on the basis of a contract with KfK.
KNK was originally designed as a prototype Nuclear Power Plant to produce superheated steam for electricity production. Thus the heat of the reactor is transmitted on a high temperature level (about 525°C) by respectively two primary and secondary sodium loops to the water-steam-circuit. The thermal output of the plant is 58 MW, the electrical output 20 MW.
According to the goal of the plant the first core was a moderated one (KNK I). Circonium hydride was used as moderator and U02 with 6.75% enrichment as fuel. Operation started in 1971 and was finished in 1974.
Between the years 1974 and 1977 the reactor was converted into a fast breeder prototype (KNK II) by the original construction company IA and again by order of KfK.
The first KNK II loading (KNK II/l) was designed for 400 effective full power days (EFPD). It started operation in spring 1978 and reached this target in summer 1982.
The second loading (KNK 11/2) was designed for 455 EFPD, operation started in summer 1983, the designed burn-up was reached towards the end of 1987.
Due to the good irradiation behaviour of the fuel the lifetime of the second core will be extended up to 720 EFPD. The license to do so was given by the authority on December 1988. The licensing procedure itself lasted 4 years.
The long shut-down period of one year (1988), however, caused a torque increase of the driving mechanism of the control and shut-down rods. Consequently the authority has not allowed to
111
start the plant so far.
During 1989 a cleaning procedure for the driving mechanism by wetting respectively immersion the driving mechanism into clean hot sodium (400°C) was developed in order to dissolve the oxidated sodium deposits. By this way a very useful and effective cleaning method was found.
Now the plant is ready for start-up, but once again we are waiting for the agreement of our local authority, the State Government of Baden-WUrttemberg. There should be no more obstacles because in these days the Federal Reactor Safety Comittee was in favour of our measures taken to monitor the control resp. shut-down rod driving mechanism and to prevent future oxidation of deposited sodium aerosols (Fig. 1: KNK plant photograph).
2. GLOBAL SAFETY RELATED REACTOR CORE INSTRUMENTATION
The KNK IT Core is monitored as a whole by measuring the following parameters:
- neutron flux $ - primary sodium flow rate Fp - reactor vessel sodium level L - reactor vessel sodium inlet temperature 8i« - delayed neutron emitters fcca.i - primary vessel leakage Lv - common primary sodium inlet duct leakage hs.^
All parameters are measured redundant beginning with the sensor up to the signal processing within the reactor protection system. Besides the twofold neutron flux start-up measurement all other meassurements are threefold redundant.
The electrical supply-system is just as threefold redundant as the measuring systems.
The KNK II Reactor is equipped with two redundant and diverse shut-down systems (5 respectively 3 shut-down rods) and, since the conversion from KNK I to KNK II, with two diverse protection systems. The first (older) system was built by the German company AEG, the second one by Hartmann and Braun (H+B).
The tables No. 1 through 9 in the appendix identify the different channel groups, their equipment, the trigger signals and levels, the trip signals and special features.
112
3. LOCAL SAFETY RELATED REACTOR CORE INSTRUMENTATION
The KNK II fuel subassembly (S/A) arrangement consists of two zones (see Fig. 2): the inner zone with 7 test S/A (test zone), containing mixed uranium-plutonium oxide, surrounded by 24 driver S/A (driver zone), containing enriched uranium oxide.
The coolant flow through each S/A is calibrated by a throttle nozzle in the lower grid plate according to the expected power distribution.
The main coolant flow is automaticly controlled by the reactor power output in the range of 30 through 100% rated power. Thus the temperature difference along the fuel S/A in the mentioned range is constant.
Each S/A as well of the test as of the driver zone is equipped with 3 mineral insulated thermocouples mounted above the coolant outlet within an open guide tube. Before reaching the TCs the coolant flow passes a mixer unit and an inverse trumpet-like tube (see Fig. 3). By this way the temperature difference between the three TCs is minimized and the TC response time is as fast as possible. The TC itself has an outer diameter of 1.5 mm and is 5 to 6 meters long.
12 TCs respectively are connected with one reference junction of 50°C.
The tables No. 10 through 12 in the appendix identify the different crossing details of TC circuits to form channel groups for the reactor protection system.
4. COMBINED SAFETY RELATED REACTOR CORE INSTRUMENTATION
Besides the global and the local safety related reactor core instrumentation there are two combined instrumentations, where the trip signals are derived from the ratio of two single measurements.
More details of these instrumentations are given in tables 13 and 14 in the appendix.
5. PLANT PROTECTION SYSTEMS
Reactor plants are usually protected against incidents and/or accidents by the following protection installations:
113

- the reactor protection instrumentation (system), usually threefold redundant, protects the reactor core and its associated components against damage and the environment against hazards,
- the main component protection instrumentation, usually not redundant, protects in general the main components like pumps, heat exchangers, steam generators, feed-water systems, turbine, turbine-generator etc. against damage, and
- the plant process svstem protection instrumentation, usually twofold but out of two different measurements, protects not only the reactor process systems but also the environment against hazards.
5.1 THE KNK II REACTOR PROTECTION SYSTEM AND ITS ACTIVE SAFETY FEATURES (SAFETY SYSTEM)
The aim of the reactor protection system within the plant safety system is the initiation of all measures to keep the effects of an incident or accident within predetermined limits. Thus the main purpose is the prevention of the release of radioactive substances. These substances are normally kept back by
- the cladding of the fuel pins - the primary envelope (primary sodium coolant and argon cover gas systems)
- the containment building.
In order to keep these barriers entire, the protection system
- shuts and keeps down the nuclear reaction - maintains the post heat removal - initiates the closure of the containment building.
As already mentioned the KNK II has two independant protection systems. The first system controls the whole plant, the second system controls only the reactor area i.e. the reactor core and its associated systems (the second system was fitted back during the conversion of the KNK into a fast reactor).
The logic of the first protection system is a dynamicly pulsed and self-checking solid-state system (AEG - logipuls). The logic of the second protection system is a quiescent current relay system with a superimposed automatic solid-state checking system (H+B). Thus the two systems are redundant (because threefold) and diverse.
The first shut-down system actuates 5 shim-saftey rods with a magnetic coupling device in the upper part of the rod (shut-
114

down reactivity 17 $).
The second shut-down system actuates 3 flexible (articular) safety rods with a coupling device in the lower part of the rod, i.e. under sodium. The release mechanism is mounted in the upper part of the rod (shut-down reactivity 6.1 $).
The normal absorber material in both systems is boron carbide (B„C).
The drop time of all shut-down rods is in the range of 700 ± 100 ms. The separation of the coupling device and the coupling release of the second shut-down system allows the measurement of the release time. The measured values are in the range of 40 ± 10 ms. By this way the release mechanism is checked for proper operation.
The trip signals of the global and local instrumentation to shut down the reactor are already discussed in the previous chapters (tables 1 through 14).
Besides these trip signals there exist still 4 trip signals initiated by the sodium level measurement within the two primary pumps. All these signals are 1 out of 1 due to lack in space. Two of the signals are derived from the continuous level measurement, the two other signals come from the discontinuous alarm signal:
- sodium level within the primary pumps low (2 times 1 out of 1 per pump)
Furthermore there exist 3 additional trip signals from the secondary sodium and the water-steam system. These trip signals are:
- pressure in the expansion tanks of the two secondary systems low, 3 pressure measurements, trip signals (2 times 2 out of 3, trip level p £ 4.2 bar)
- one of the four rupture disks in the two secondary loops broken (leakage detectors, 4 times 2 out of 3, trip levels L * 0)
- steam pressure low and channel deviation high (3 pressure measurements, trip signal 2 out of 3, trip levels p < 60 bar and j| A p| t 4 bar)
Besides the actuation of the shut-down rods the protection system initiates the following additional measures:
- shut-down of the primary pumps by trip signals from the channel groups 4.2, 5, 8, and 9 (primary flow rate variation, reactor vessel sodium level, primary vessel leakage and sodium inlet duct leakage).
115

- shut-down of the faulty loop (closing of valves) by trip signals
- from the channel group 4.2 (primary flow rate variation) together with a signal "sodium within the primary cell"
- from the channel group 5 (reactor vessel sodium level low) together with the same signal as before
- from the channel group 5 (reactor vessel sodium level high) together with the signal "sodium level secondary expansion tank low"
- closing of the containment building by a trip signal from the channel group 3.1 (neutron flux)
- together with alarm signals from radioactivity measurement in the containment
- tog«-Uier with the smoke monitoring system of the containment.
5.2 THE KNK II MAIN COMPONENT PROTECTION INSTRUMENTATION
As already mentioned the task of this instrumentation is to protect essential (and expensive) components against damage. This is usually done by monitoring the proper function of these components and their auxiliary systems i.e. lubrication of bearings, fluid levels in essential tanks, electrical data of the different supply systems etc.
In this case KNK is equipped like similar plants.
5.3 THE KNK II PLANT PROCESS SYSTEMS PROTECTION INSTRUMENTATION
KNK is equipped with several measuring devices indicating system failures (i.e. sodium leakage) and coincident alarm signals which initiate protective actions. These actions are:
- trip of the reactor
- trip of primary and secondary pumps
- activation of different valves to enclose the defective main component and to start the emergency core cooling by natural convection.
116
Tabel 15 in the appendix shows the initiating events for these functions in a matrix.
6. SAFETY RELATED INSTRUMENTATION BEHAVIOR
Within the past 10 years of KNK II operation - this are the years 1978 through 1987 - we recorded totally 54 "unwanted" scrams.
The time distribution is shown in Fig. 4 in the appendix.
Figure No. 4 reads as follows:
15 out of 54 trip signals were caused by negative reactivity changes due to gas bubbles travelling through the core after some fuel-element and grid-plate modifications together with the conversion of KNK into a fast reactor (KNK II). The problems could be solved by changing the grid plate throttle device. Additionally the licensing authority could be convinced to bridge this scram signal because of the redundant individual and integral temperature instrumentation of the test S/As by the coolant outlet measurement. (In the KNK Il/l core the signal was bridged from 30.04.81 through 31.01.82 and in the KNK II/2 core from 16.06.83 up today.)
15 out of 54 trip signals were "true" signals, very often caused in the first years of operation together with experiments or by the operators together with the testing of the equipment. (In the first years operators usually are not so familiar with the plant and their response to operator induced changes.)
Only 3 out of 54 trips were caused by mechanical failures of a turbine bearing resp. in the lubrication of a primary pump. The rest of 21 trip signals were caused by electrical and/or electronic equipment or component failures.
The analysis of these 21 trips shows:
- 9 trip signals were initiated by only 4 channel groups of the reactor protection system, mainly by the signal "channel deviation" and
- 12 trip signals were initiated by single alarm signals of different systems or component protection instrumentation.
The tables No. 16 through 18 in the appendix give more details of these trips.
The analysis of the different reactor trip signals allows the following statement:
117
- The availability of the KNK II reactor protection system is very high, the system itself caused no spurious scrams.
- Trip signals were very often caused by failures of the power supply respectively the speed control unit of the sodium pumps (9 failures resp. 42% of electrical failures) .
- Some trip signals were initiated by component failures of not-redundant equipment or by electrical interference problems.
Lessons learned are:
- If possible use threefold redundant measurements for the initiation of reactor trip signals i.e. level control of pumps and tanks.
- In case of equipment malfunction spend enough time for exact failure analysis and checking. (In many cases tables 16 and 17 show the same failure event repeated in a short time distance!)
- In case of replacement of defective items by new ones carry out extensive tests on the new component i.e. external temperature cycling.
7. THE INSTRUMENTATION TO DETECT FAILED FUEL S/As
Fuel S/As with cladding failures normally start with a release of a fraction of fission gas into the coolant, and subsequent into the cover gas. There the fission gases xenon and krypton are monitored. After some time the cladding failure increases and solid fission products are released into the primary coolant. This can be detected by monitoring delayed neutron emitters. This is done at the KNK as already described together with channel group 7.
The KNK has no further internal detection devices as described above. Thus the area of the failed S/A is defined by comparing the DN-signal levels of the two loops. By this way the core-half with the failed fuel S/A is defined. Later on the neutron flux of the reactor is tilted by withdrawing and insertion of single shim-rods with the reactor in operation with 15% rated power. During this procedure the DN-signal levels are observed. The magnitude of variation of the signals correlated with the temperature difference of the S/As in the neighbourhood of the moved shim-rod gives a "hit-list" for the potential defective items. At last the potential failed S/As are drawn into the fuel handling machine. There the gas flow and the pressure is lowered, the tempera-
118
ture rises and the defective item emits fission gas which can be detected by a --spectrometer. Up to now 7 failed fuel S/As were detected with this ex-core hot dry sipping method and replaced.
For the future the installation of an in-core hot wet sipping system was designed and built by INTERATOM in the framework of the R and D program of KfK and will be tested soon.
8. DATA PROCESSING AT THE KNK II
Together with the modification of KNK into a fast reactor (KNK II) a data processing system (AEG 60-50) was installed. It is a free programmable, on-line open-loop computer.
In the control room are installed:
- 1 control console - 2 record printers (plus 1 line printer and 1 record printer in the computer room)
- 2 data displays (1 monitor for alphanumeric process l n-fm~m.a+* l r»n 1 v i r i o n H i c n l a w ^ information, 1 video display)
The process computer has no safety-related function, it is only used for the information of personnel in the control room.
The CPU has a 32 k core memory, the external data storage consists of 2 magnetic drums (512 k each) and 1 magnetic tape (800 bpi).
The system generates 6 types of protocols:
SSP Malfunction and control procedure protocol. It is activated anytime and records nearly everything which gives a binary signal.
SAP Malfunction and signal sequence protocol. This program is activated by special signals or coincidences of these.
STP Hourly record of selected operating data.
MVP Program for the recording of the transient behavior of up to 15 analogous signals with 9 possible scanning modes from 1 sec to 20 min.
MRP This program allows to ask for analogous operating signals in retrospective. It also can be used as a "post mortem" protocol.
MVS This program brings up to 12 analogous signals to the screen with a scanning mode of 10 seconds each.
119

Further there are some special programs realised:
DEPRO A program surveying the steam generator behavior
BEPROR A program for surveying the temperature of core S/As.
9. APPENDIX
Figures 1 through 4
Tables 1 through 18
120
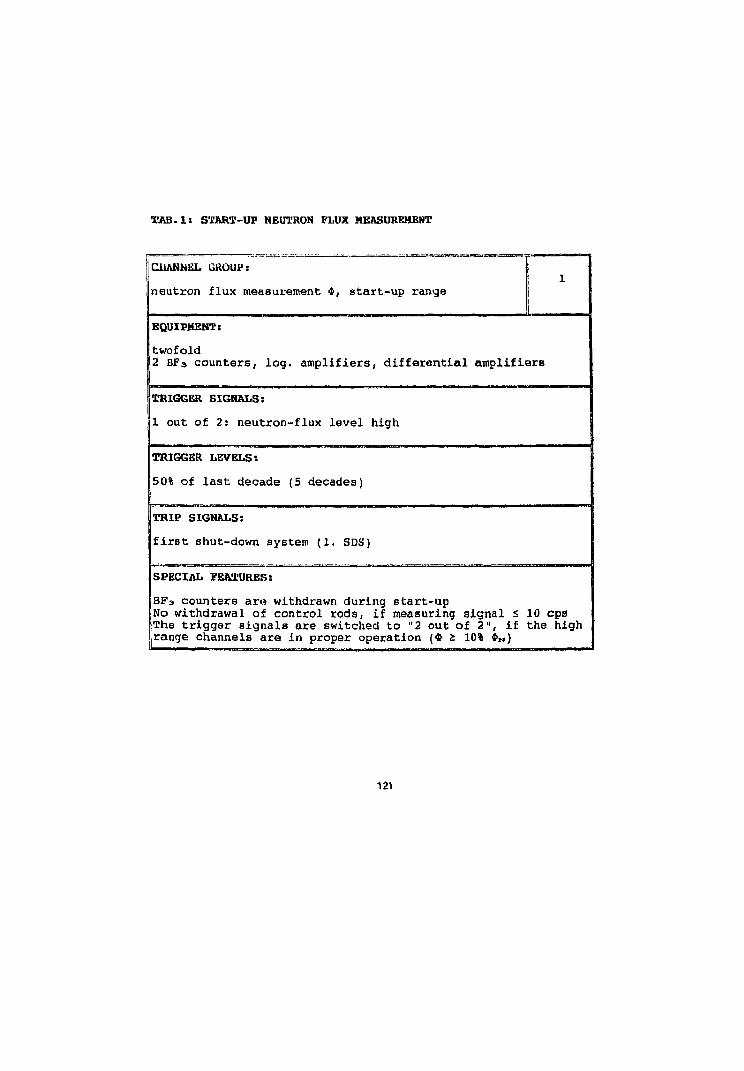
TAB.IJ START-UP NEUTRON FLUX MEASUREMENT
CHANNEL GROUP:
neutron flux measurement *, start-up range
EQUIPMENT:
twofold 2 BF3 counters, log. amplifiers, differential amplifiers
TRIGGER SIGNALS:
1 out of 2: neutron-flux level high
TRIGGER LEVELSs
50% of last decade (5 decades)
TRIP SIGNALS:
first shut-down system (1. SDS)
SPECIAL FEATURES:
BF3 counters are withdrawn during start-up No withdrawal of control rods, if measuring signal < 10 cps The trigger signals are switched to "2 out of 2", if the high range channels are in proper operation (* £ 10% **•)
121
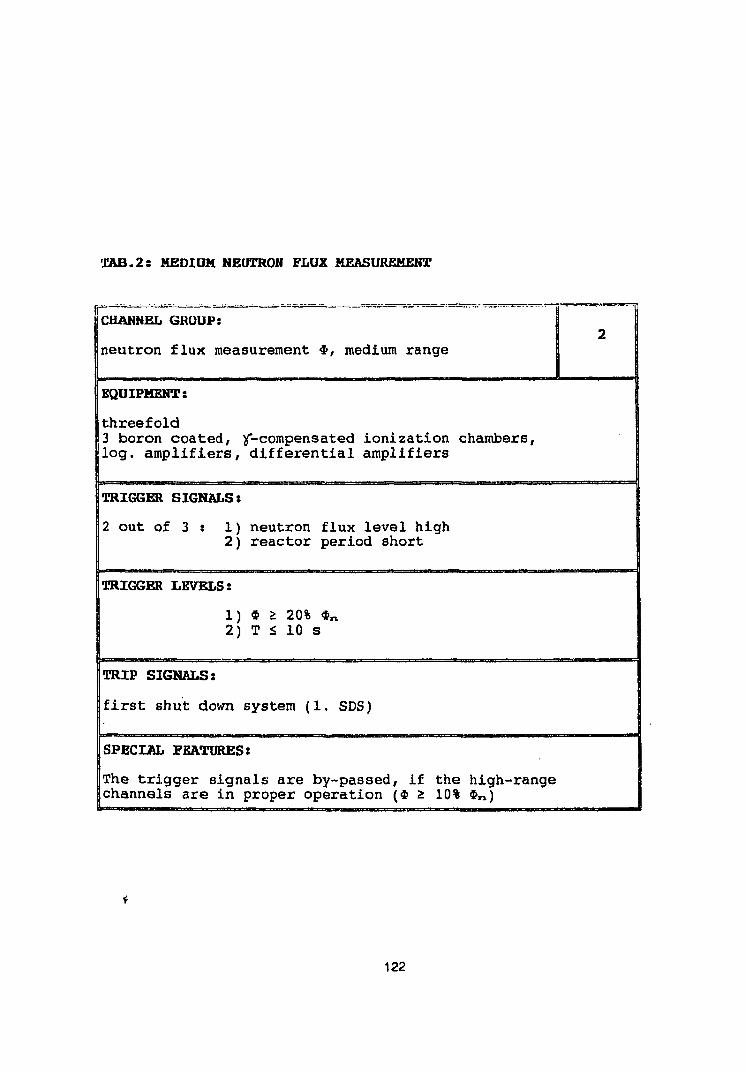
TAB.2: MEDIUM NEUTRON FLUX MEASUREMENT
CHANNEL GROUP:
neutron flux measurement *, medium range
EQUIPMENT:
threefold 3 boron coated, ^-compensated ionization chambers, log. amplifiers, differential amplifiers
TRIGGER SIGNALS: I 2 out of 3 : 1) neutron flux level high
2) reactor period short
TRIGGER LEVELS:
1) * > 20% *, 2) T ilO s
TRIP SIGNALS:
first shut down system (1. SDS)
SPECIAL FEATURES:
The trigger signals are by-passed, if the high-range channels are in proper operation (* 2 10% *„)
122
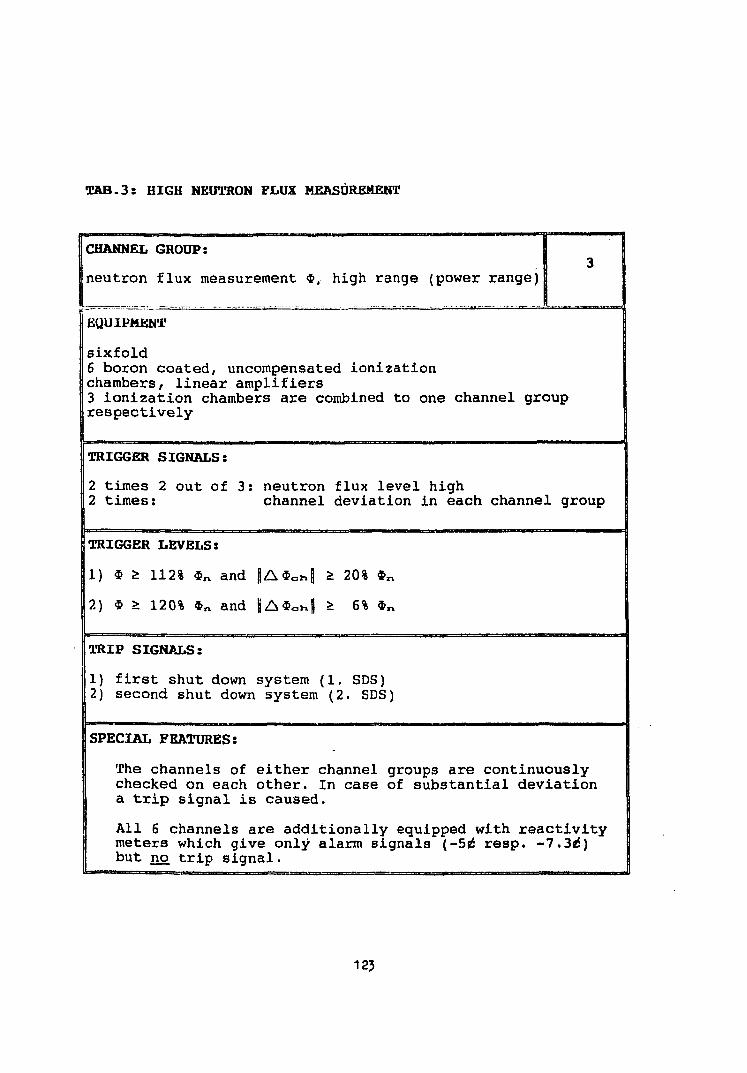
TAB.3: HIGH NEUTRON FLUX MEASUREMENT
CHANNEL GROUP:
neutron flux measurement *, high range (power range)
EQUIPMENT
sixfold 6 boron coated, uncompensated ionization chambers, linear amplifiers 3 ionization chambers are combined to one channel group respectively
TRIGGER SIGNALS:
2 times 2 out of 3: neutron flux level high 2 times: channel deviation in each channel group
TRIGGER LEVELS:
1) $ Z 112% $„ and |Aft«,h| > 20% *r
2) * > 120% $n and | A * o h | > 6% * ,
TRIP SIGNALS:
1) first shut down system (1. SDS) 2) second shut down system (2. SDS)
SPECIAL FEATURES:
The channels of either channel groups are continuously checked on each other. In case of substantial deviation a trip signal is caused.
All 6 channels are additionally equipped with reactivity meters which give only alarm signals (-5(£ resp. -7.3e5) but no trip signal.
12?
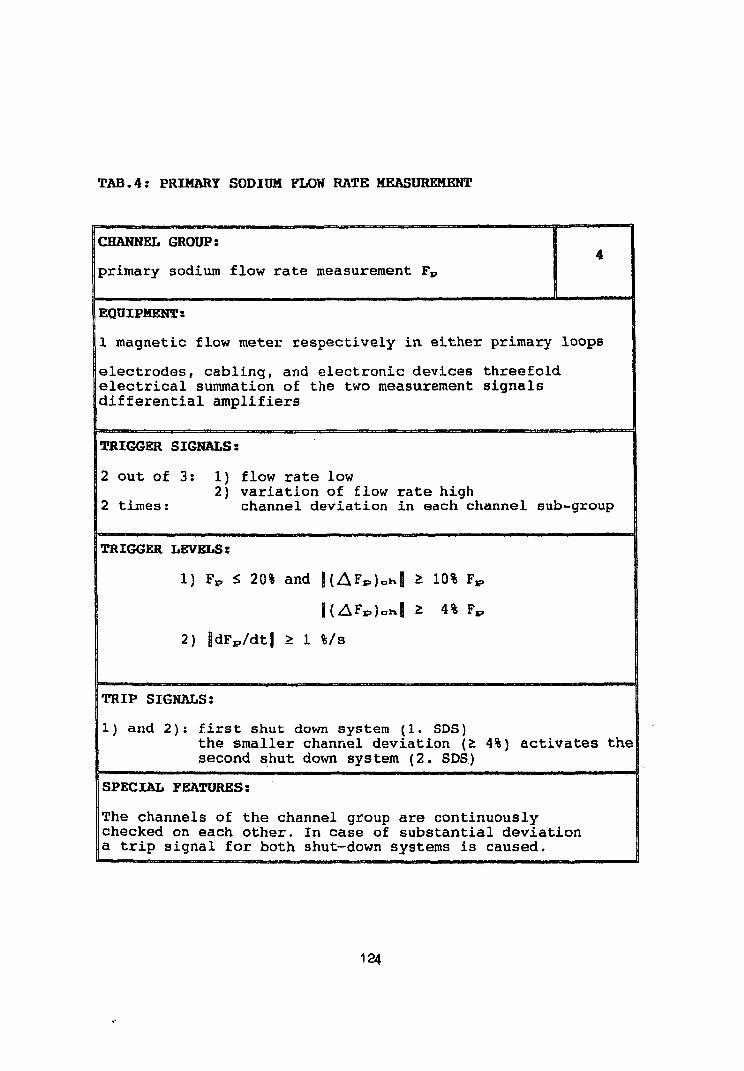
TAB.4: PRIMARY SODIUM FLOW RATE MEASUREMENT
CHANNEL GROUP:
primary sodium flow rate measurement Fp
EQUIPMENTS
1 magnetic flow meter respectively in either primary loops
electrodes, cabling, and electronic devices threefold electrical summation of the two measurement signals differential amplifiers
TRIGGER SIGNALS:
]2 out of 3: 1) flow rate low 2) variation of flow rate high
|2 times: channel deviation in each channel sub-group
TRIGGER LEVELS:
1) FP £ 20% and | ( A F P ) O H | | £ 10% F*.
2) fdFp/dtj > 1 %/s
TRIP SIGNALS:
1) and 2): first shut down system (1. SDS) the smaller channel deviation (2: 4%) activates the second shut down system (2. SDS)
SPECIAL FEATURES:
The channels of the channel group are continuously checked on each other. In case of substantial deviation a trip signal for both shut-down systems is caused.
124
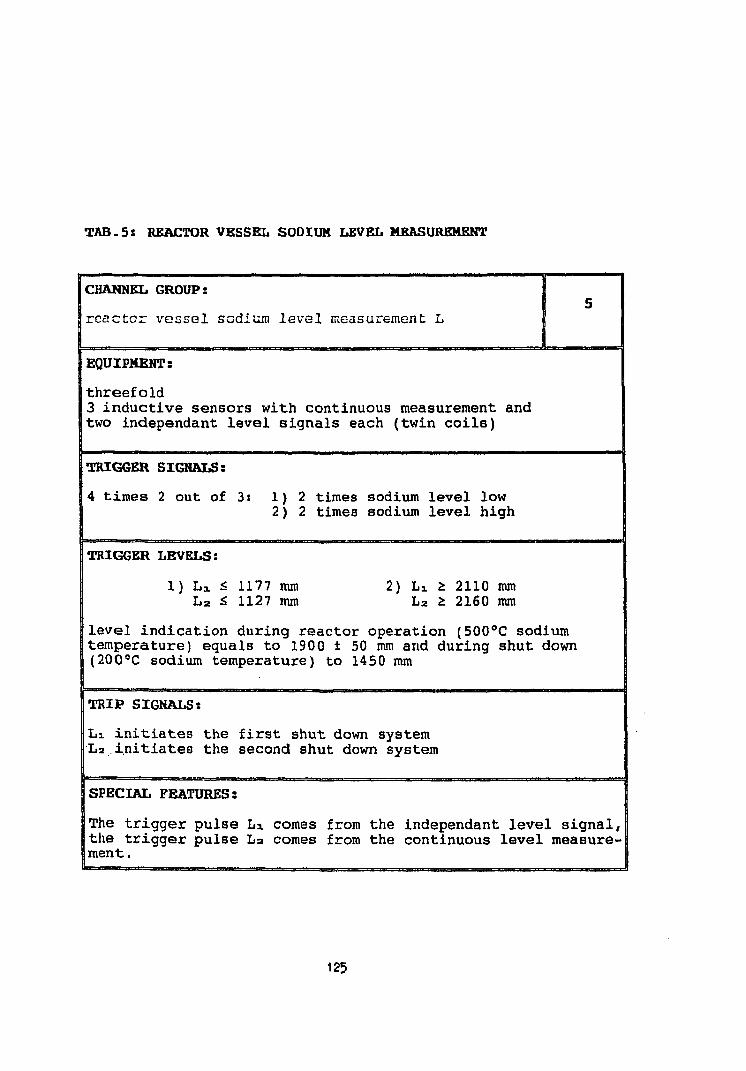
TAB.5: REACTOR VESSEL SODIUM LEVEL MEASUREMENT
|CHANNEL GROUP:
'reactor vessel sodium level measurement L
EQUIPMENT:
[threefold 3 inductive sensors with continuous measurement and I two independant level signals each (twin coils)
|TRIGGER SIGNALS:
4 times 2 out of 3s
TRIGGER LEVELS:
1)2 times sodium level low 2) 2 times sodium level high
1) Lx 5 1177 mm L2 <, 1127 mm
2) Li 2: 2110 mm L2 2. 2160 mm
level indication during reactor operation (500°C sodium temperature) equals to 1900 ± 50 mm and during shut down (200°C sodium temperature) to 1450 mm
TRIP SIGNALS:
Lx initiates the first shut down system L2 initiates the second shut down system
SPECIAL FEATURES:
The trigger pulse La. comes from the independant level signal, the trigger pulse La comes from the continuous level measurement.
125
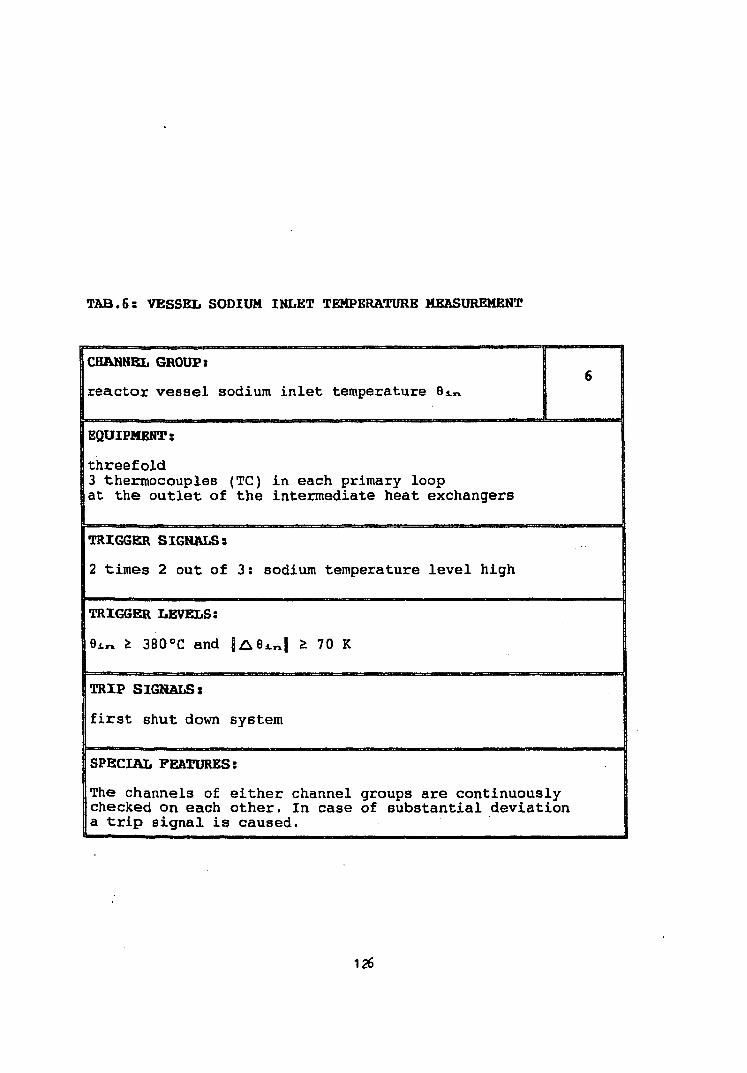
TAB.6: VESSEL SODIUM INLET TEMPERATURE MEASUREMENT
CHANNEL GROUP:
reactor vessel sodium inlet temperature 8 A
EQUIPMENT:
threefold 3 thermocouples (TC) in each primary loop at the outlet of the intermediate heat exchangers
|TRIGGER SIGNALS:
2 times 2 out of 3: sodium temperature level high
| TRIGGER LEVELS:
9j.„ * 380°C and |A6i.n| & 70 K
TRIP SIGNALS:
first shut down system
SPECIAL FEATURES:
The channels of either channel groups are continuously checked on each other. In case of substantial deviation a trip signal is caused.
126
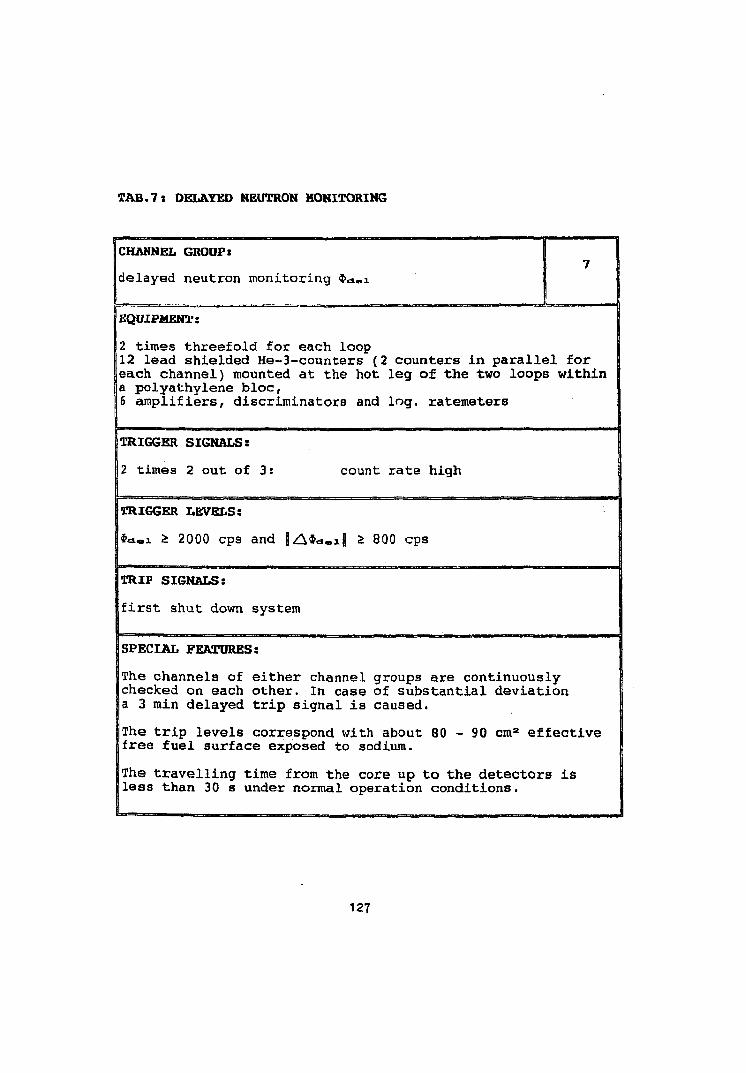
TAB.7s DELAYED NEUTRON MONITORING
CHANNEL GROUPx
delayed neutron monitoring $<a„i
EQUIPMENT:
2 times threefold for each loop 12 lead shielded He-3-counters (2 counters in parallel for each channel) mounted at the hot leg of the two loops within a polyathylene bloc, 6 amplifiers, discriminators and log. ratemeters
TRIGGER SIGNALS:
2 times 2 out of 3: count rate high
ITRIGGER LEVELS:
|*«*-i £ 2000 cps and J/iS.a.iJ i 800 cps
STRIP SIGNALS:
[first shut down system
SPECIAL FEATURES:
The channels of either channel groups are continuously checked on each other. In case of substantial deviation a 3 min delayed trip signal is caused.
The trip levels correspond with about 80 - 90 cm2 effective free fuel surface exposed to sodium.
The travelling time from the core up to the detectors is less than 30 s under normal operation conditions.
127
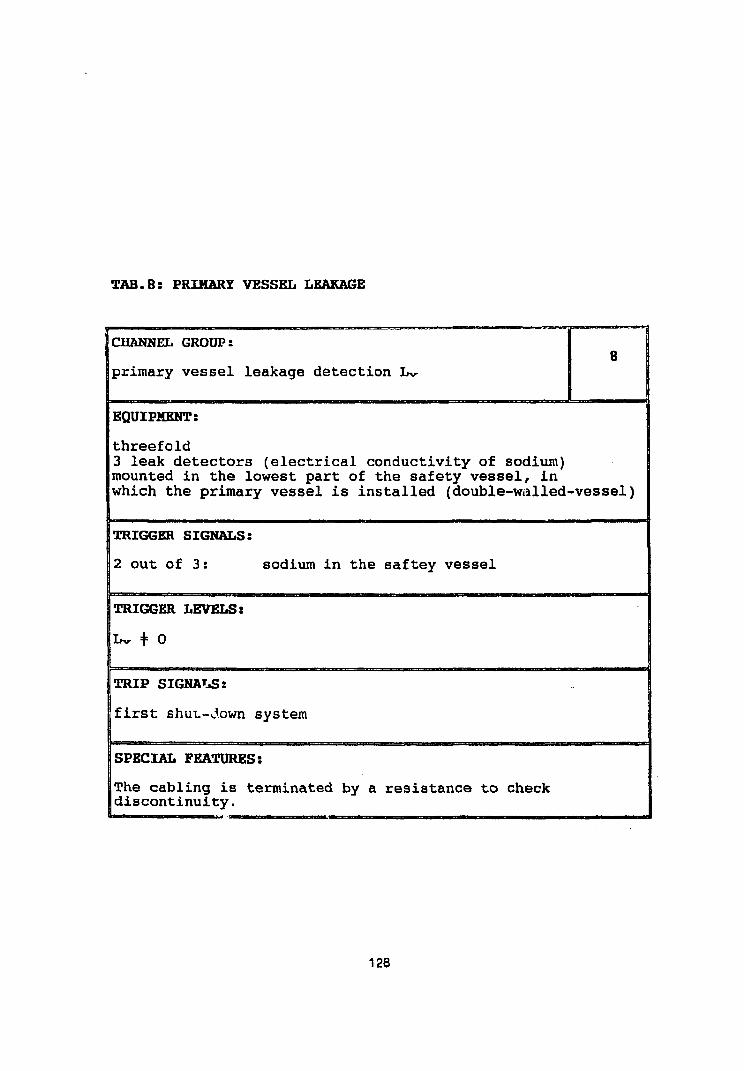
TAB.8: PRIMARY VESSEL LEAKAGE
CHANNEL GROUPr
primary vessel leakage detection I»v .
EQUIPMENT:
threefold 3 leak detectors (electrical conductivity of sodium) mounted in the lowest part of the safety vessel, in which the primary vessel is installed (double-walled-vessel)
TRIGGER SIGNALS:
2 out of 3: sodium in the saftey vessel
TRIGGER LEVELS:
Lv + 0
TRIP SIGNALS:
first shut-down system
SPECIAL FEATURES:
The cabling is terminated by a resistance to check discontinuity.
128
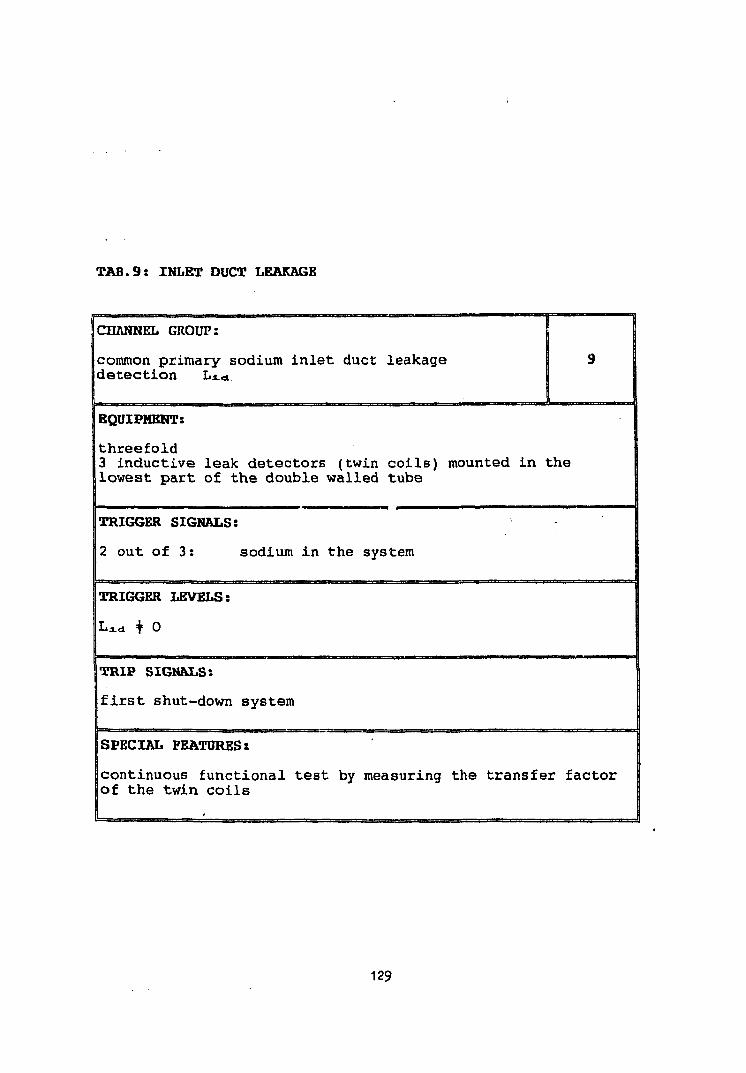
TAB.9: INLET DUCT LEAKAGE
|CHANNEL GROUP:
common primary sodium inlet duct leakage detection Lid
EQUIPMENT:
threefold
13 inductive leak detectors (twin coils) mounted in the lowest part of the double walled tube
TRIGGER SIGNALS:
2 out of 3: sodium in the system
TRIGGER LEVELS:
Lidi + 0
TRIP SIGNALS:
first shut-down system
SPECIAL FEATURES:
continuous functional test by measuring the transfer factor of the twin coils
L
129
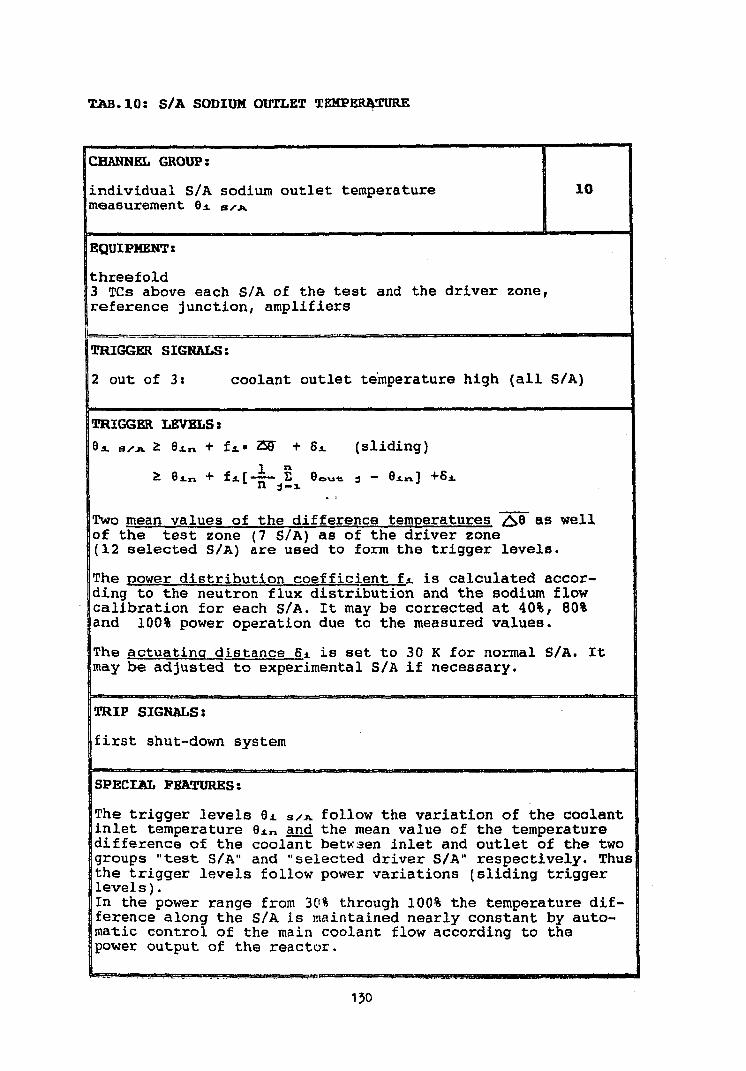
TAB. 10: S/A SODIUM OUTLET TEMPERATURE
CHANNEL GROUP:
individual S/A sodium outlet temperature measurement 6A S JV
10
EQUIPMENT:
threefold 3 TCs above each S/A of the test and the driver zone, reference junction, amplifiers
TRIGGER SIGNALS:
2 out of 3» coolant outlet temperature high (all S/A)
TRIGGER LEVELS: 9*. S/A 2: 6A„ + fA. ZS$ + Si. (sliding)
ou-b -1 ™ 6i.„] +8*
Two mean values of the difference temperatures ^8 as well of the test zone (7 S/A) as of the driver zone (12 selected S/A) are used to form the trigger levels.
The power distribution coefficient f* is calculated according to the neutron flux distribution and the sodium flow calibration for each S/A. It may be corrected at 40%, 80% and 100% power operation due to the measured values.
The actuating distance Si. is set to 30 K for normal S/A. It may be adjusted to experimental S/A if necessary.
TRIP SIGNALS:
first shut-down system
SPECIAL FEATURES:
The trigger levels 9A S/JV follow the variation of the coolant inlet temperature ein and the mean value of the temperature difference of the coolant betwaen inlet and outlet of the two groups "test S/A" and "selected driver S/A" respectively. Thus| the trigger levels follow power variations (sliding trigger levels). In the power range from 30% through 100% the temperature difference along the S/A is maintained nearly constant by automatic control of the main coolant flow according to the power output of the reactor.
150
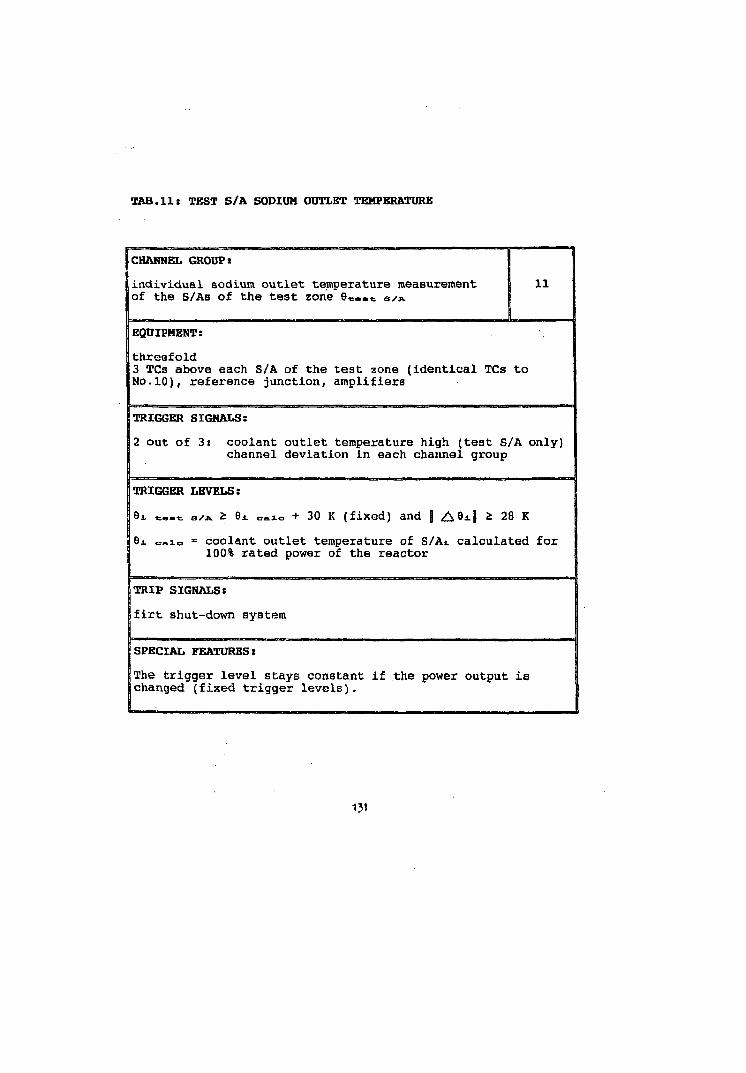
TAB.11: TEST S/A SODIUM OUTLET TEMPERATURE
CHANNEL GROUP:
individual sodium outlet temperature measurement \ 11 of the S/As of the test zone 9«..e s/A
EQUIPMENT:
threefold 3 TCs above each S/A of the test zone (identical TCs to No.10), reference junction, amplifiers
TRIGGER SIGNALS:
2 out of 3s coolant outlet temperature high (test S/A only) channel deviation in each channel group
TRIGGER LEVELS:
6i t,»t SAA 2 8i <-*!= + 30 K (fixed) and [ A9i| * 28 K
6i o»io = coolant outlet temperature of S/A* calculated for 100% rated power of the reactor
TRIP SIGNALS:
firt shut-down system
SPECIAL FEATURES:
The trigger level stays constant if the power output is changed (fixed trigger levels).
131
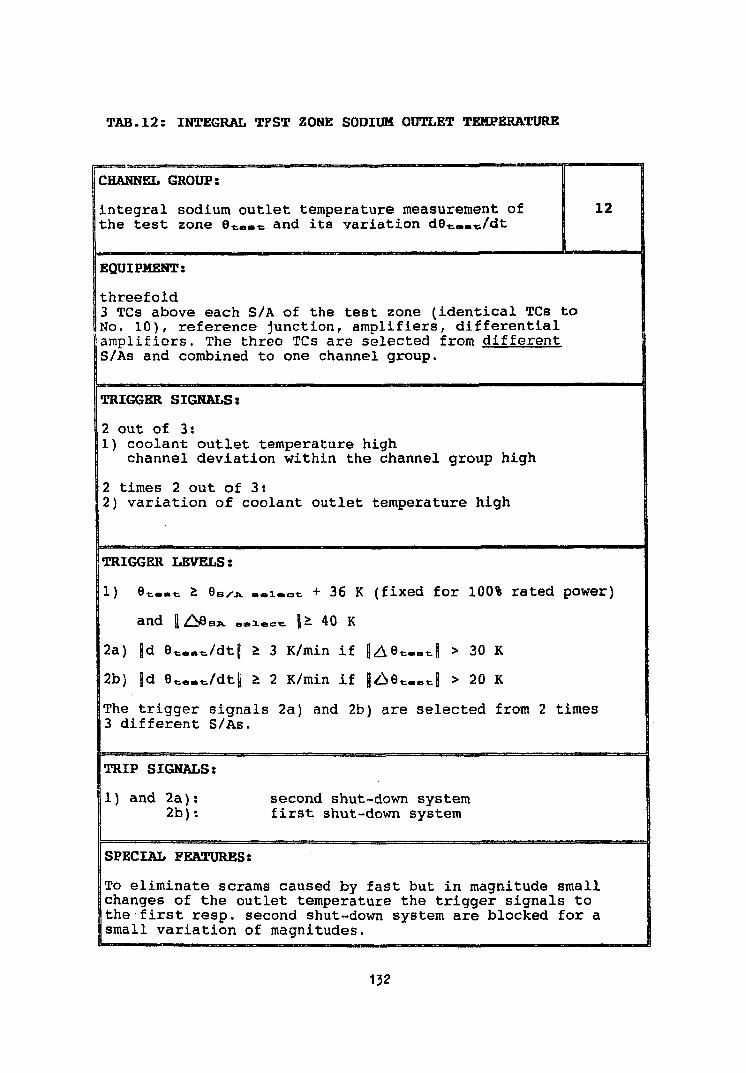
TAB.12: INTEGRAL TPST ZONE SODIUM OUTLET TEMPERATURE
CHANNEL GROUP:
integral sodium outlet temperature measurement of I 12 the test zone 9t..t and its variation dG-t. /dt
EQUIPMENT:
threefold 3 TCs above each S/A of the test zone (identical TCs to No. 10), reference junction, amplifiers, differential amplifiers. The three TCs are selected from different S/As and combined to one channel group.
TRIGGER SIGNALS:
2 out of 3: 1) coolant outlet temperature high
channel deviation within the channel group high
2 times 2 out of 3: 2) variation of coolant outlet temperature high
TRIGGER LEVELS:
1) e t — t £ eS/-jv ..i.et + 36 K (fixed for 100% rated power)
and 1Z\9 SA nalect > 40 K
2a) \d et«,»t/dt| > 3 K/min if |Ae«—«| > 30 K
2b) |d 8*..*/dt| > 2 K/min if |£e««.«| > 20 K
JThe trigger signals 2a) and 2b) are selected from 2 times 3 different S/As.
TRIP SIGNALS:
1) and 2a): second shut-down system 2b): first shut-down system
SPECIAL FEATURES:
To eliminate scrams caused by fast but in magnitude small changes of the outlet temperature the trigger signals to the first resp. second shut-down system are blocked for a small variation of magnitudes.
132
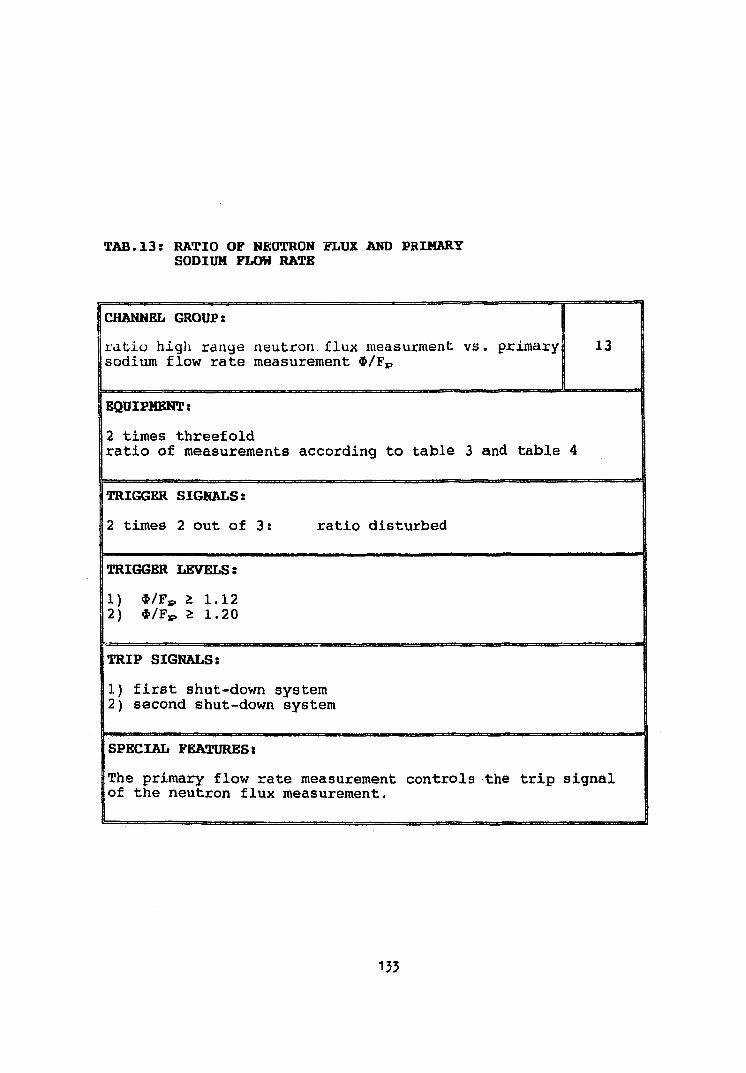
TAB. 13: RATIO OF NEUTRON FLUX AND PRIMARY SODIUM FLOW RATE
CHANNEL GROUP:
ratio high range neutron flux measurment vs sodium flow rate measurement i/~Ev
EQUIPMENT:
2 times threefold ratio of measurements according to table 3 and table 4
TRIGGER SIGNALS:
2 times 2 out of 3: ratio disturbed
TRIGGER LEVELS:
1) $/FE, i 1.12 2) */Fp i 1.20
TRIP SIGNALS:
1) first shut-down system 2) second shut-down system
SPECIAL FEATURES:
The primary flow rate measurement controls the trip signal of the neutron flux measurement.
133
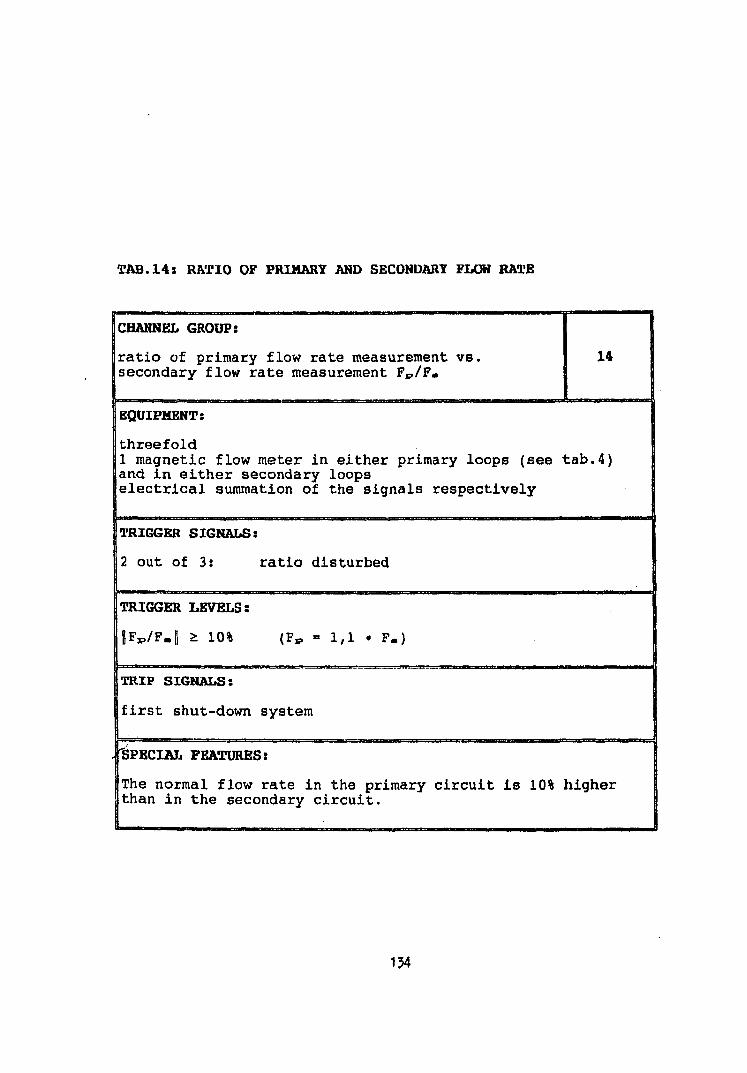
TAB.14x RATIO OF PRIMARY AND SECONDARY FLOH RATE
ICHANNEL GROUP:
ratio of primary flow rate measurement vs, secondary flow rate measurement Fp/F.
14
EQUIPMENT:
threefold 1 magnetic flow meter in either primary loops (see tab.4) and in either secondary loops electrical summation of the signals respectively
TRIGGER SIGNALS:
2 out of 3: ratio disturbed
TRIGGER LEVELS:
lFp/F.1 £ 10% (F* - 1,1 . F.)
TRIP SIGNALS:
first shut-down system
[SPECIAL FEATURES:
The normal flow rate in the primary circuit is 10% higher than in the secondary circuit.
154
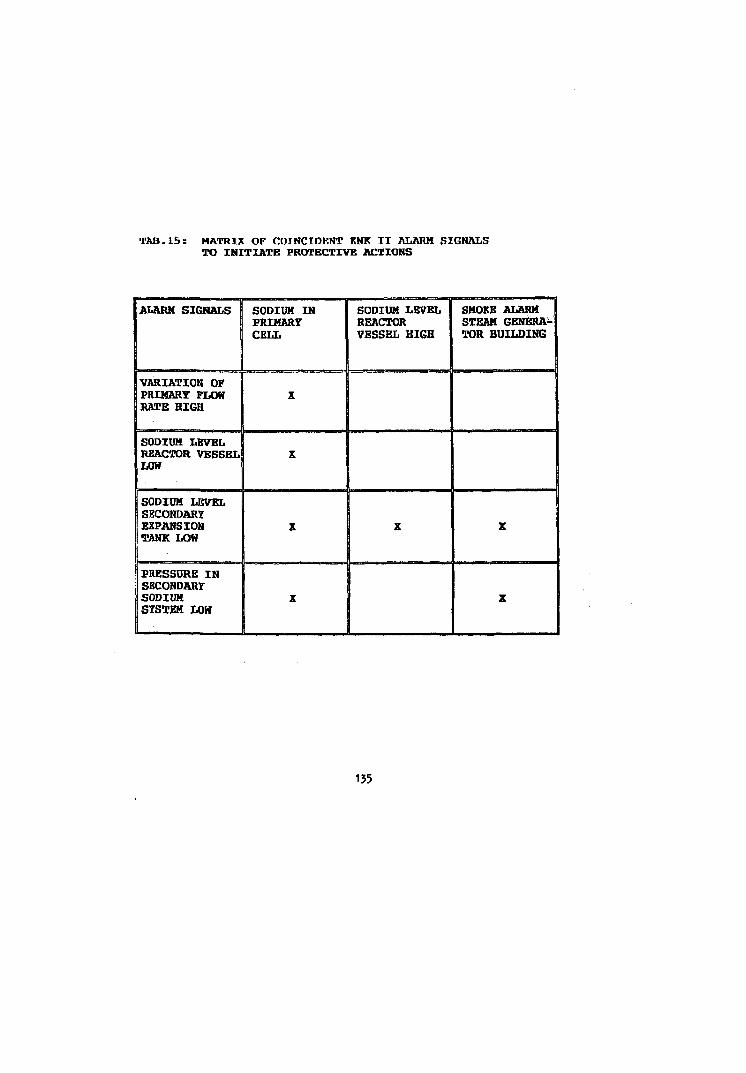
TAB. lb: MATRIX OF COINCIDBNT KNK II ALARM SIGNALS TO INITIATE PROTECTIVE ACTIONS
1 ALARM SIGNALS
VARIATION OF j PRIMARY FLOW RATE HIGH
SODIUM LEVEL REACTOR VESSEL LOW
SODIUM LEVEL SECONDARY EXPANSION TANK LOW
SODIUM IN PRIMARY CELL
X
X
SODIUM LEVEL REACTOR VESSEL HIGH
X 1 X
t PRESSORS IN I SBCONDART SODIUM X SYSTEM LOW
SMOKE ALARM STEAM GENERATOR BUILDING
X
z
135
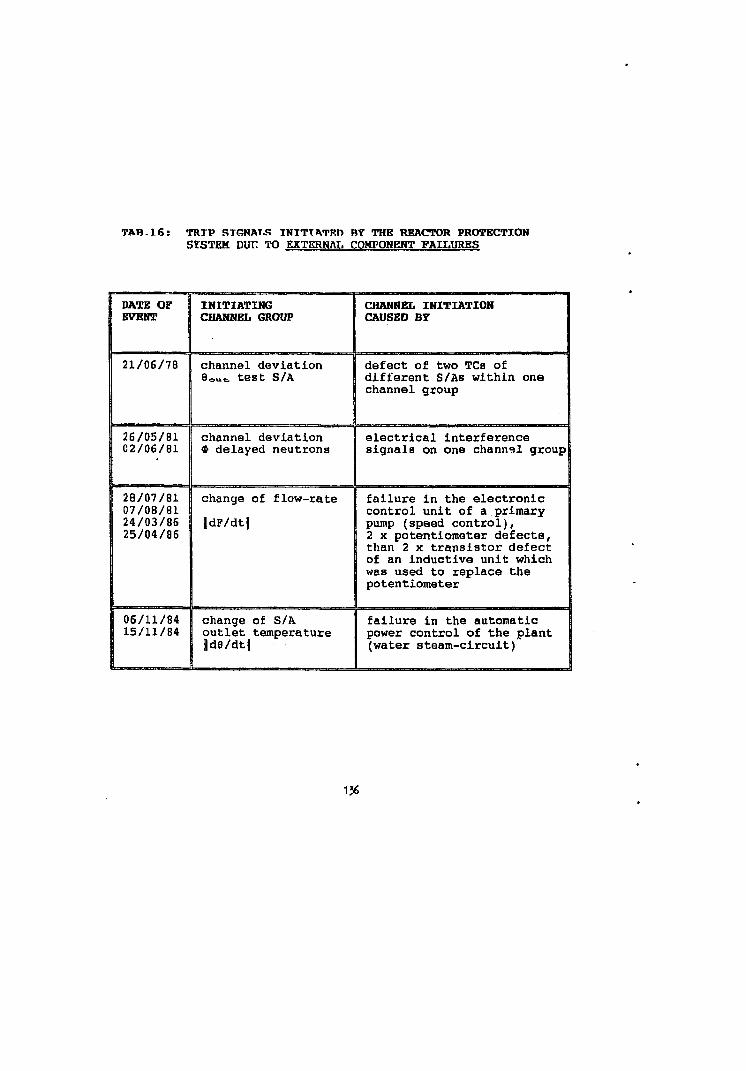
TAB. 16: TRTP STGNAT.S TNITTATRIl BY THE REACTOR PROTECTION SXSTEM. VVV. TO EXTERNAL COMPONENT FAILURES
1 DATE OF EVENT
21/06/78
26/05/81 02/06/81
28/07/81 07/08/81 24/03/86 25/04/86
06/11/84 15/11/84
INITIATING CHANNEL INITIATION CHANNEL GROUP CAUSED BY
channel deviation 8 o u t test S/A
defect of two TCs of different S/As within one channel group
channel deviation | electrical interference * delayed neutrons 1 signals on one channel group!
change of flow-rate
|dF/dt|
change of S/A outlet temperature |de/dt|
failure in the electronic control unit of a primary pump (speed control), 2 x potentiometer defects, than 2 x transistor defect of an inductive unit which was used to replace the potentiometer
failure in the automatic power control of the plant (water steam-circuit)
136
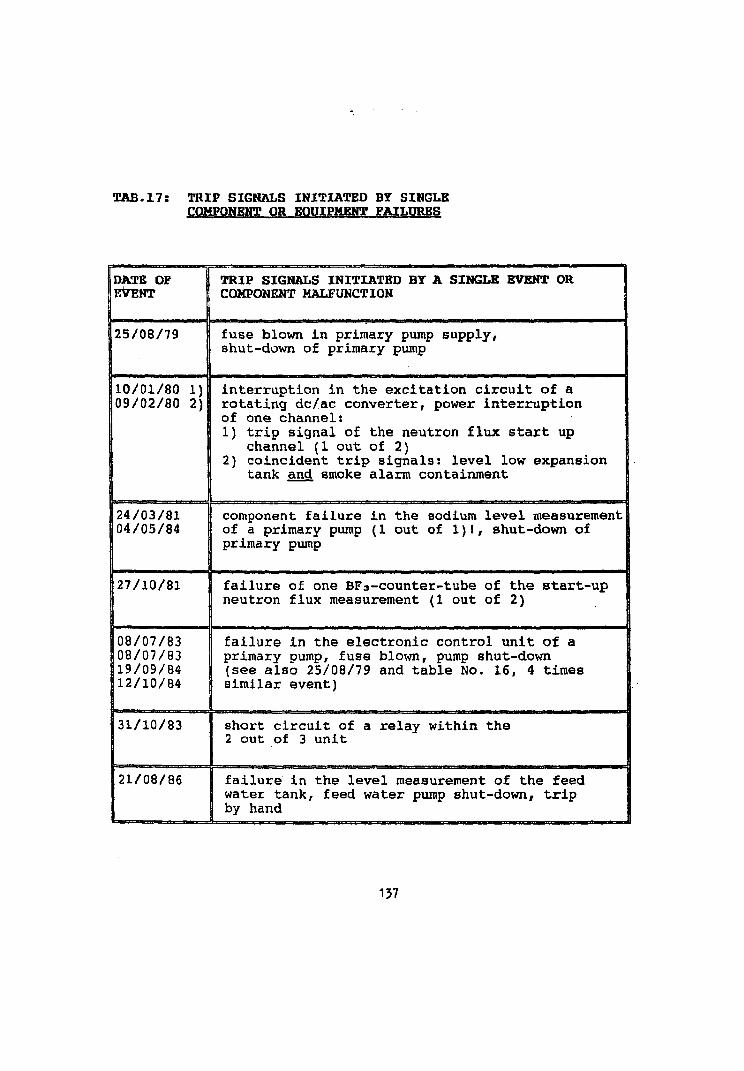
TAB.17: TRIP SIGNALS INITIATED BY SINGLE COMPONENT OR EQUIPMENT FAILURES
DATE OF EVENT
25/08/79
10/01/80 1) 09/02/80 2)
TRIP SIGNALS INITIATED BY A SINGLE EVENT OR COMPONENT MALFUNCTION
fuse blown in primary pump supply, shut-down of primary pump
interruption in the excitation circuit of a rotating dc/ac converter, power interruption of one channel: 1) trip signal of the neutron flux start up
channel (1 out of 2) 2) coincident trip signals: level low expansion
tank and smoke alarm containment
24/03/81 component failure in the sodium level measurement 104/05/84 1 of a primary pump (1 out of 1)1, shut-down of
primary pump
27/10/81 failure of one BF3-counter-tube of the start-up neutron flux measurement (1 out of 2)
08/07/83 1 failure in the electronic control unit of a 08/07/83 primary pump, fuse blown, pump shut-down 19/09/84 (see also 25/08/79 and table No. 16, 4 times 12/10/84 1 similar event)
31/10/83 3 short circuit of a relay within the 2 out of 3 unit
121/08/86 failure in the level measurement of the feed water tank, feed water pump shut-down, trip by hand
137
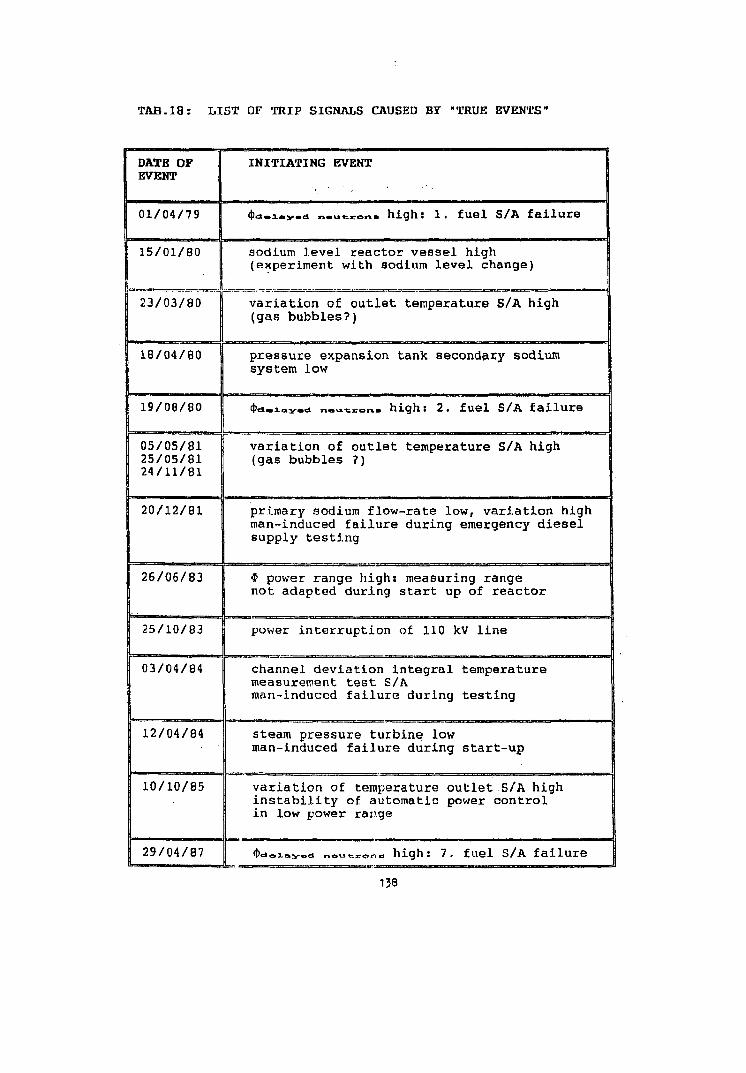
T A B . 1 8 : LIST OF TRIP SIGNALS CAUSED BY "TRUE EVENTS'
DATB OF EVENT
INITIATING EVENT
01/04/79 4 > < * . l a y a d n a u t i e o n . high: 1. fuel S/A failure
15/01/80 sodium level reactor vessel high (experiment with sodium level change)
23/03/80 variation of outlet temperature S/A high (gas bubbles?)
18/04/80 pressure expansion tank secondary sodium system low
19/08/80
05/05/81 25/05/81 24/11/81
< f c * . J-a^ad n«\a-fe2ron . high: 2. fuel S/A failure
variation of outlet temperature S/A high (gas bubbles ?)
20/12/81 1 primary sodium flow-rate low, variation high man-induced failure during emergency diesel 6upply testing
26/06/83 $ power range high: measuring range not adapted during start up of reactor
25/10/83 I power interruption of 110 kV line
03/04/84 i channel deviation integral temperature measurement test S/A man-induced failure during testing
12/04/84 steam pressure turbine low man-induced failure during start-up
10/10/85
29/04/87
variation of temperature outlet S/A high instability of automatic power control in low power range
P d a X a y e d n f t u t r o m high: 7. fuel S/A failure
138
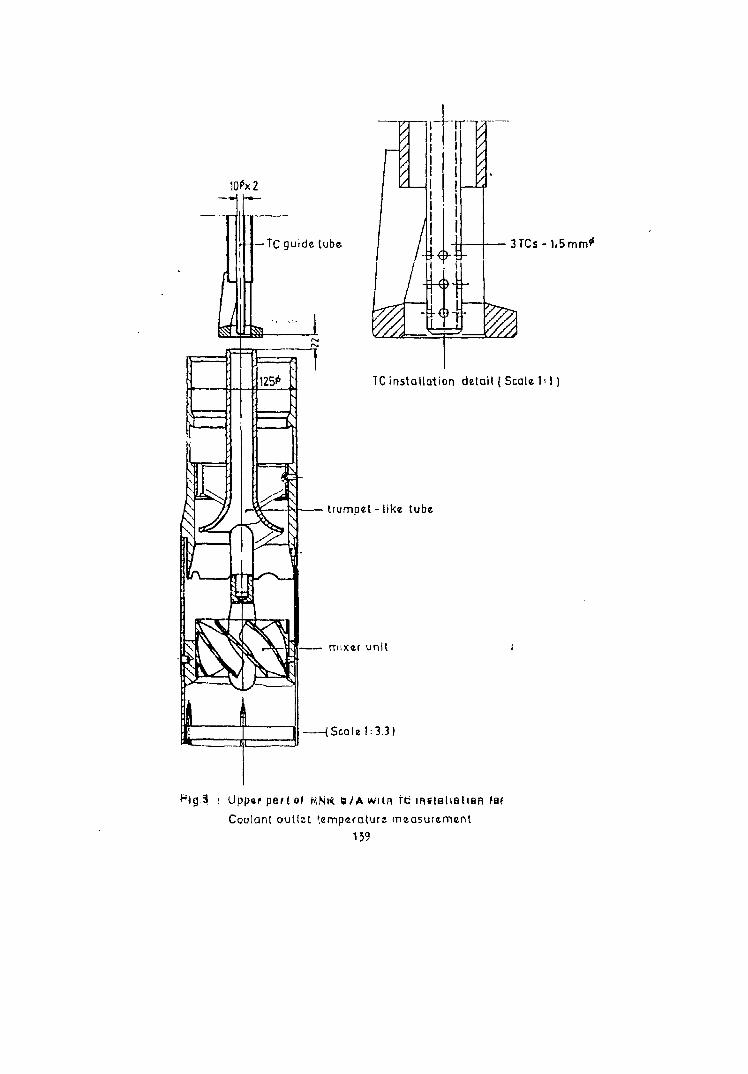
10**x2
— TC guide lube - 3TCs - ) ,5mm*
TC installation detail | Scale 1> 1)
trumpet - like tube
mixer unit
Scale 1:3.3)
Pig.3 ; Uppec pent ol KN I * 6/A WI IR fb insleliatien faf
Coolant outlet temperature measurement
139
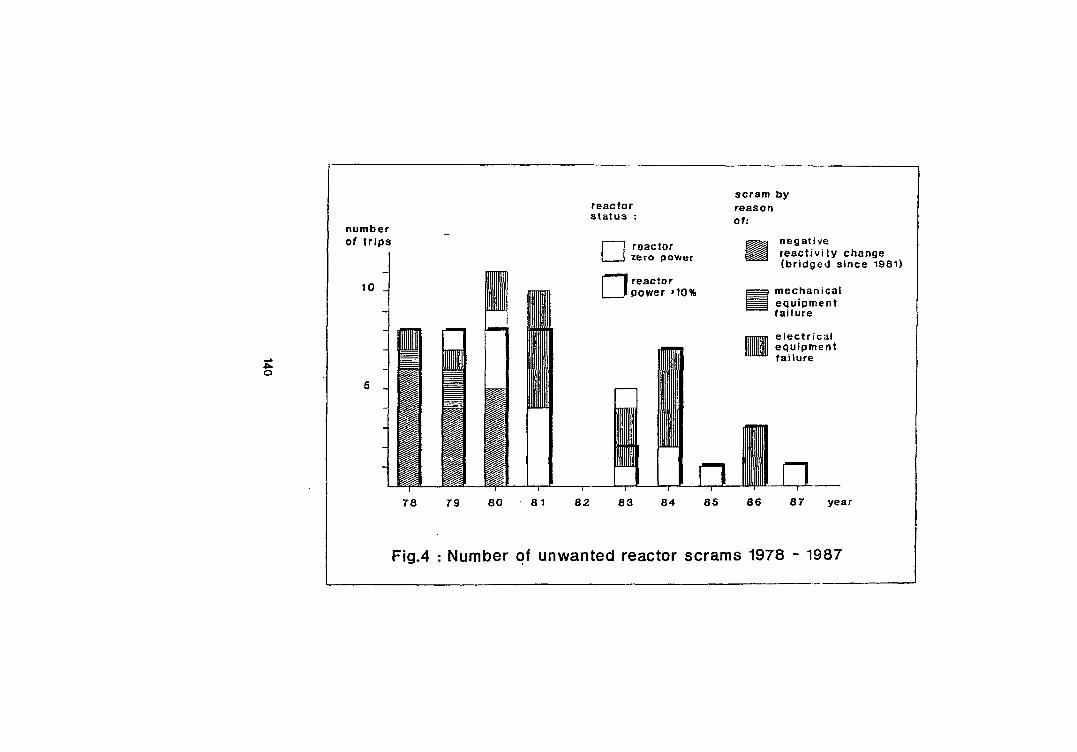
number of trips
10 _
m
7 8
^
m
79
W-
w m
80
reactor status :
scram by reason of:
• reactor zero power
reactor power >10%
^
8 2
negative reactivity change (bridged since 1981)
mechanical equipment failure
electrical equipment failure
n II n 85 87 year
Fig.4 : Number of unwanted reactor scrams 1978 - 1987
fe^? ^W^WS^W^M^WT-
• ' " ' i ' ^ - . '
• ^ ^ ^ ' " • ^ • • • ' • ' i . : : : ' : V , >
i i & v ^ - ' " • : • . • : - • • .
&^ -v- --v\:'':J.:-.-'':.;
m m W^y&i* •••• •• ' ^ • • v
fe'-5?iv1''.- v.4' frT,'- '•'';'" v f " " T - * ~
li?^^vl :-:r-V:V; ; '-.;'i•>•.•''•': '••'.•
p^i>^; ' . '^ ' -^ ' - ; ' , . ; ;.-.• '..'•'
^ * ' $ f • - ^ £ ' : •".''i.V;',r-."'.-'-,;. '•'••':-/':-^^%'?w'-tf:''':\--M::-';'':;'''-'::-; , :'-- ' • ; - • ' •••• ' • '
I ,
J
r i
£•,•:
• : : % y . - ; T ^ : ^ : : • « . • : • • • • : • • • • •
: « & ^
UplMv:
• i • fcr^i i . ^ t > i • • • t . M . A . . . - . • . . r . , , i f i t l i , , w
* t
iitti^Mipi
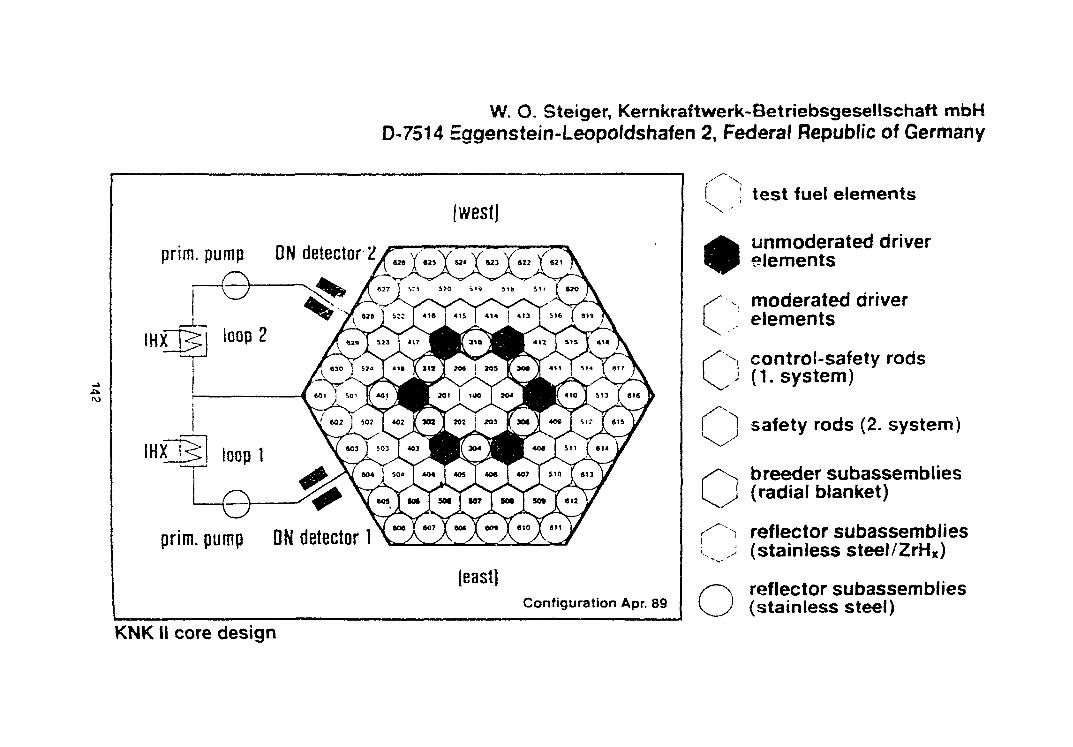
W. O. Steiger, Kernkraftwerk-Betriebsgesellschaft mbH D-7514 Eggenstein-Leopoldshafen 2, Federal Republic of Germany
(west)
prim, pump DN detector 2
IHXT5I l o o p 2
IHX loop 1
-e— prim, pump DN detector 1
(east)
Configuration Apr. 89
")
•
test fuel elements
unmoderated driver elements
moderated driver elements
control-safety rods (1. system)
safety rods (2. system)
breeder subassemblies (radial blanket)
reflector subassemblies (stainless steel/ZrHx)
reflector subassemblies (stainless steel)
KNKII core design
MEASUREMENT OP COOLANT FLOWRATE THROUGH THE FUEL
ASSEMBLIES IN BN 350 AND BN 600 REACTORS
Kamanin Y.L., Kusavkov N.G.
Experimental Machine Building Design Bureau, Gorky
IAEA/IWGPR Specialist Meeting on Instrumentation for
Supervision of Core Cooling in Past Breeder Reactors.
Xalpakham, India, 12-15 December, 1989
Abstract
Methods of the primary circuit coolant flowrate measurement in
BN 350 and BN 600 reactors are described* Flowmeter design and
parameters are outlined. Flowmeter application during reactor,
conditions and the results of measurement are presented. Details of
the modified flowmeter to be used in BN 600 reactor, that enables
its verification during reactor operation by the correlation method
have been briefly treated.
143
Coolant flow for the fuel assemblies (FAs) cooling
is one of the major parameters of the nuclear power plant.
It is evident that flow monitoring is a prerequisite of
its safe operation. Flow measurement allows to form an
additional Bignal required to provide the multilevel core
emergency protection system from the FAs overheating. In
addition there is a potential to obtain data about the
FAs hydraulic characteristics variations and the entire
primary circuit during the plant operation.
Monitoring of the bulk coolant flow to a great ex
tent depends on the primary circuit equipment arrangement.
In case of a loop layout (BN 350 reactor) it becomes mo
re convenient to measure the flowmeter by way of mounting
the flowmeter directly on the loops piping. For reactor
plants (HP) with a 300 mm piping the acceptable accuracy
of measurement can be provided by application of the conduc
tion electromagnetic flowmeters. Yet, with the reactor po
wer increase that results in the piping diameter growth,
the flowrate measurement becomes more difficult due to the
magnets weight difficulties of their calibration non-linea
rity of calibration characteristics.
1*4
During the flowmeter development for the BN350 reactor de
termination of the calibration characteristic has been experi
mentally accomplished comparing the flowmeter readings with the
measurement results obtained by a standart flowmeter. However,
the magnetic induction changes occurred during the flowmeter,
shipment and installation, differences in the velocities profi
le on the test rig and in the plant resulted in the unacceptab
le errors of the coolant flowrate measurements. Therefore, the
magnetic flowmeters readings are used to form the relative sig
nals of the emergency protection.
In the plants with the integral equipment layout (BN600 re
actor) application of the electromagnetic flowmeters in the
primary circuit faced serious problems. That is conditioned by
the difficulties of their installation and replacement and ad
verse operation. The flowrate measurement in the by-pass line
is one of the solutions that allows to determine indirectly the
primary circuit ooolant flowrate. The by-pass line connects two
circuit points that are under different pressure and can be ar
ranged beyond the reactor vessel (RV), that provided favourab
le flowmeter operation conditions, maintenance and calibration.
The measured flowrate is in a certain ratio to the primary cir
cuit bulk total flow that depends on the paths hydraulic cha
racteristics. With the integral layout the by-pass can be made
either to the core (from the hish pressure plenum to the low
pressure plenum) or the main circulation pump (from the dis
charge piping to the pump suction plenum).
The by-pass hydraulic characteristic can be obtained with
the adequate accuracy on the water test rig. If the core and
pump hydraulic characteristics are chosen rather accurately,
then it is quite possible to find out the primary circuit
145
actual flowrate and monitor it during operation.
This method is adopted in BB600 reactor. The core by-pass
line has four electromagnetic flowmeters. The flowmeters readings
are used to form the emergency protection signals in response
to the primary circuit coolant flow changes flowmeters appli
cation revealed that they can used for the reliable and effici
ent determination of the core hydraulic characteristic changes.
The major drawback of the Xlowrate measurement method adop
ted in BN-600 reactor is that the by-pass line goes beyond the
RV and is a potential source of the radioactive sodium ingress
in the rooms should the piping leak. More preferable in this res
pect is the by-pass line located in the primary circuit main
circulation pumps that is confined within the RV. Coolant
enters the by-pass line from the pump discharge piping and lea
ves it through the holes of the tube under the sodium free le
vel in the pump tank. This design decision is adopted in reac
tor BN-800.
To enhance the reactor safety it is advisable to provide
continuous coolant flow monitoring through each PA of the core.
Yet, technically such measurements are rather difficult to ac
complish especially for the FAs of BN 600 reactor which have
the head with the lateral coolant outlet.
A routine flow control effected during refuellings and main
tenance with the shutdown reactor is more practical. In this
oase there is no continuous flow monitoring through the FAs,
yet it is always possible to verify the flowrate through the
loaded PAs cross-section and its changes during operation.
A special flowmeter has been developed to carry out these
in BN-350 and BH-600 reactors. Pig. 1 shows the flowmeter design.
146
The flowmeter comprises two ma^or parts. They are flanged
tube and movable part. The flowmeter housing is a flanged tube
that functions as a guide for the movable part, a shield and al
so as a support for the movable part drive.
The movable part is a tube that has a built-in nut at the
upper end • The nut is engaged with the drive's lead screw. Ro
tation of the screw built in the support flange results in a
movable part 320 mm upward and downward movement.
The movable part has a built-in magnetic sensor and the
extension. The magnetic sensor is a streamlined rod that con
tains a permanent magnet. At the movable part downward trave
ling the extension covers the FA head until its hard-faced
edge finally touches the PA tapered part. Thus PA sealing is
effected due to which the coolant goes up the extension past
the sensor and then leaves the extension through the holes in
the plenum above the core.
The sensor's magnet is operable at temperatures up to 600 C
that provides reliable and extended long-term service at tempe
rature range 250-350 C. Next to the magnet there are two built-
in thermal couples the coolant temperature measurement at the
PA outlet. T^e thermal couples and magnet's leads pass on the
inner side of the movable part and finally are brought out thro
ugh a helical compensation device area.
When reactor is shutdown for refuelling and maintenance the
flowmeter is placed in a cell of the rotating plug. By rotating
the plugs the flowmeter may be put on any PA of the core,blan
ket or storage. I e measurements are accomplished when the pri
mary circuit pumps are operated at reduced speed. The coolant
flowrate range through the PAs measured by the flowmeter is 0.8-
-15 m /hour.
147
Taking into account that the flowmeter has a specified pres
sure loss the measured coolant flowrate through the FA with the
flowmeter on it is different from the actual one* The differen
ce depends on the ratio of the FA pressure loss and that of the
i
flowmeter. On the basis of FA and flowmeter available characte
ristics the measured flowrate has been adjusted by 1.01-1.18 de
pending on flow orif icing zones relationship between the flowrate
through the FA and the potentiometer readings has been veriti-
ed on a special sodium test rig. The sodium flowrate measurement
has been accomplished by the volumetric method. Flowmeter appli
cation at BN 350 reactor has revealed its efficiency and ability
for measuring the coolant flowrate through any type of FA. The
measurements allowed to calculate the flowrate deviation in each
flow orificing zone relative to the average value and also to
find out the bulk flowrate in the primary circuit. The sodium
flowrate deviations from the average value in the core FA have not
exceeded +2% and corresponded to the water flowrate deviations
obtained on the water test rig. More sizeable flowrate
deviations from the average value for the given flow orificing
zone have been observed in the side blanket FA* They have been
caused by the leak between the FA nozzle and the header into
the overlapped orifices. The effect of the coolant asymmetric
feeding through the loops on the flowrate through the FAs has
been also verified by the aid of the flowmeter.
All measurements have been accomplished with the pumps run
ning at 250 rev/min and sodium temperature between 200 and 280 C.
Now in BN 350 reactor the procedure of flowrate measurement
through the FAs has been included in the reactor regulations and is
accomplished not less than once in two years.
148
In BN 600 reactor the flowrate measurements through the FAs
have been accomplished during comissioning phase and repeated
ly during its operation. She measurements revealed that the cool
ant flowrate through the core FAs corresponds to the design val
ues and is characterized by a small deviation relative the ave
raged ones in the given flow orificing zone. More sizeable de
viations as well as in BE 350 reactor, has been observed in the
side blanket and storage FAs.
The possibility of experimental reactor hydraulic characte
ristic determination on the basis of available primary pumps
characteristics has become an important practical objective of
the flowmeter application. The fact that the characteristics
of two and 'three primary pumps have different slope at the point
with the operation parameters with the same pressure
difference over the core and hence, flowrate throuth the FAs has
been used in the calculations (I). Thus if on the basis of the
flowrate measurement results through the FAs the rotation speed
of two and three primary pumps can be determined with the same
flowrate through the FAs, then the point of their intersection
would represent an adequate point of the primary circuit hydrau
lic characteristic.
Having in mind, that in this method of the primary pump spe
ed determination the flowmeter e.m.f. is taken but not the ac
tual flov/rate through the FAs, the flow coefficient error is
of no significance. Moreover the primary pump rotation speed
measurement accomplished in different FAs enables to reduce
the random component of the error in the primary circuit hydra
ulic characteristic.
Flowrate measurements through the FAs in BN 600 reactor that
149
have been accomplished during its operation revealed that the
flowmeter did not always function properly. There were some cases
when the flowmeter indicatedithe reduced flow through the
FAs as compared to the actual one. That has been found out by
way of multiple flowrate measurement including the FAs repla
cement if necessary. Flowrate reduction was caused by the in
adequate flowmeter's extension sealing on the FA tapered part.
The gap between the extension and FA head allowed part of
the flow to avoid the magnetic sensors, that reduced the level
of the signal to the potentiometer.
As is known, the applied magnetic transducers apart from
the undeniable advantages such as lack of inertia and contact
with the coolant have a substantial drawback. That is related
to the problems of their metrological certification and calib
ration during operation.
The first flowmeters for BN 350 and BN 600 reactors have
not been metrologically certified. They have been only cali
brated in the sodium test rig to set the dependence between the
signal from the magnets and flowrate. The accuracy of calibra
tion was i 2.5% for a wide flow range. Only for small flowrate
values the error reached 5-8$. Yet, the sodium test rig where
calibration has been accomplished failed to meet the necessary
metrological requirements. In addition the flowmeter design pre
vented application of correlation for its calibration.
Therefore the flowmeter design has been completely revised
to improve both mechanical and measuring parts. Two magnetic
systems have been added to the measuring part, each having 6
leads used for the flowrate and correlation measurement .The sig
nal from one of the magnetic systems is accepted as the major
signal, while the other system remains redundant.
150
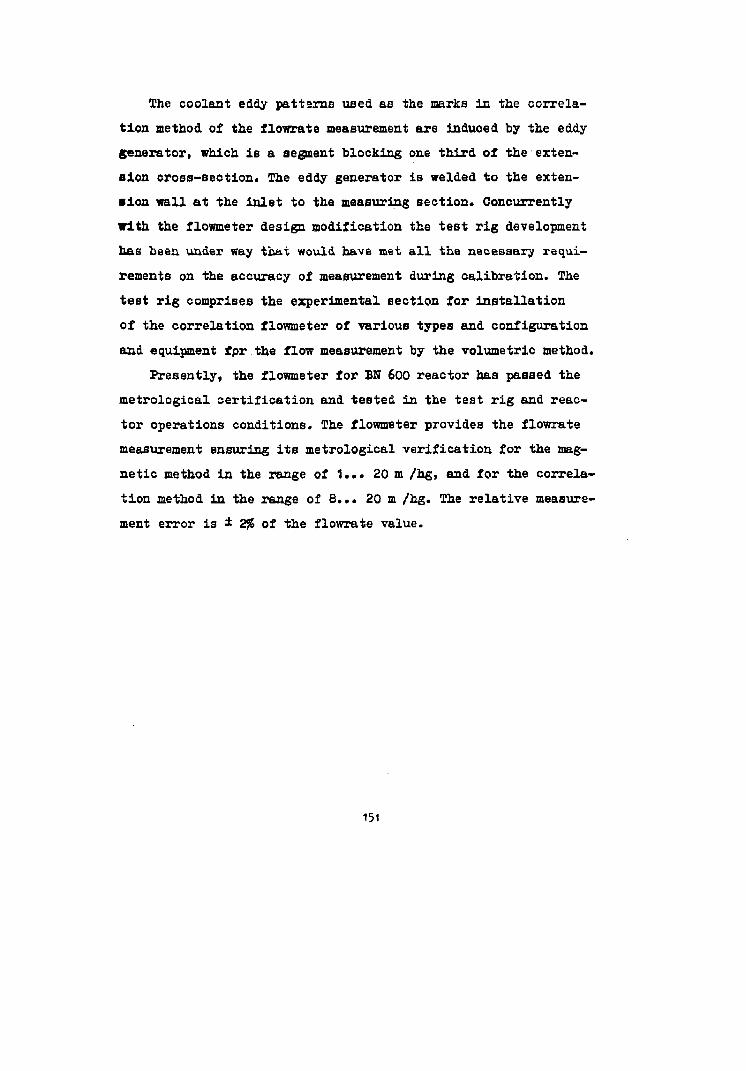
The coolant eddy pattsrns used as the marks in the correla
tion method of the flowrate measurement are induced by the eddy
generator, which is a segment blocking one third of the exten
sion cross-section. The eddy generator is welded to the exten
sion wall at the inlet to the measuring section. Concurrently
with the flowmeter design modification the test rig development
has been under way that would have met all the necessary requi
rements on the accuracy of measurement during calibration. The
test rig comprises the experimental section for installation
of the correlation flowmeter of various types and configuration
and equipment fpr.the flow measurement by the volumetric method.
Presently, the flowmeter for BN 600 reactor has passed the
metrological certification and teBted in the test rig and reac
tor operations conditions. The flowmeter provides the flowrate
measurement ensuring its metrological verification for the mag
netic method in the range of 1... 20 m /hg, and for the correla
tion method in the range of 6... 20 a /hg. The relative measure
ment error is i 2% of the flowrate value.
151

REFERENCES
I. Шейнкман А.Г., Карпенко А.И., Лыжин А.А., Сапегин СМ., Теличко М.Т., Шебалин А.С. Экспериментальное определение гидравлических характеристик первого натриевого контура установки ЕН-600 Белоярской АЭС. Теплофизика ядерных энергетических установок. Межвузовский сборник. Свердловск, изд.УВД им. СМ. Кирова, 1983г.
152
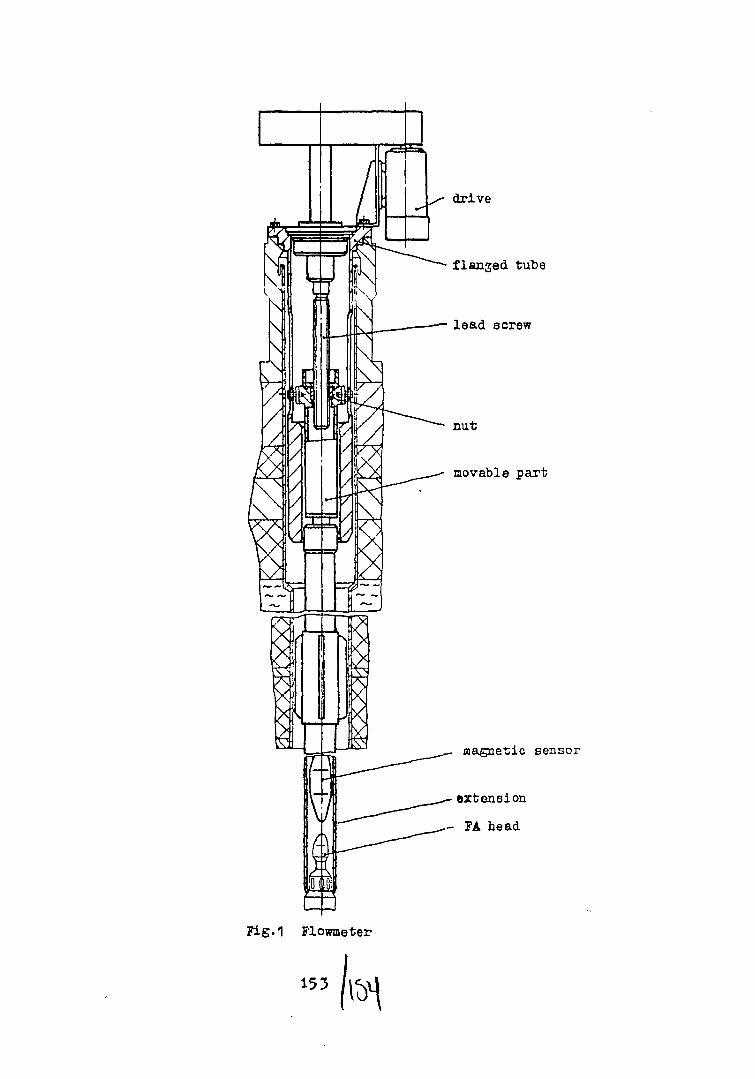
dr ive
f langed tube
l ead screw
n u t
movable p a r t
magnetic sensor
extension
FA head
Fig.1 Flowmeter
153 ( l ^
An Ultrasonic Technique for the Reaote Measurement
of
Breeder Subassembly Outlet Temperature
I D Hacleod *
G Hughes **
C H Monday ***
* Northern Research Laboratory UKAEA Risley UK ** Berkeley Nuclear Laboratory CEGB Berkeley UK *** National Nuclear Corporation Risley UK
For Presentation at the IAEA/IW6FR Specialist Meeting
on
Instrueentation for the Supervision of Core Cooling in LHFBR's
at Kalpakkam, INDIA
12th to 15th December 19B9
155
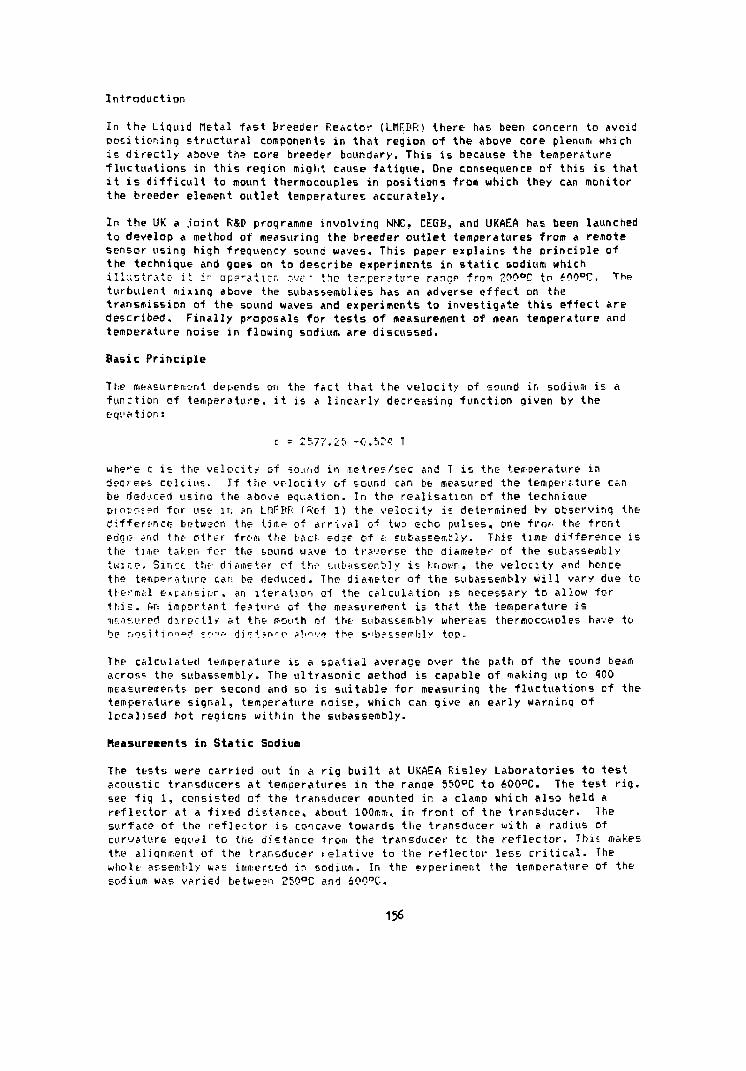
Introduction
In the Liquid tletal fast breeder Reactor (LMFBF:} there has been concern to avoid Dositioninq structural components in that region of the above core plenum which is directly above th* core breeder boundary. This is because the temperature fluctuations in this reqion might cause fatigue. One consequence of this is that it is difficult to mount thermocouples in positions from which they can monitor the breeder element outlet temperatures accurately.
In the UK a joint R&P programme involvinq NNC, CEGB, and UKAEA has been launched to develop a method of measuring the breeder outlet temperatures from a remote sensor using high frequency sound waves. This paper explains the principle of the technique and goes on to describe experiments in static sodium which illustrate it i- operation ovc;- the temperature range fron W C to tWC. The turbulent mixinq above the subassemblies has an adverse effect on the "transmission of the sound waves and experiments to investigate this effect are described. Finally proposals for tests of measurement of mean temperature and temperature noise in flowing sodium are discussed.
Basic Principle
The measure merit depends on the fact that the velocity of sound in sodium is a function of temperature, it is a linearly decreasing function given by the t-qii^td or.:
where c is the velocity of =ound in metres/sec and T is the temperature in degrees cc-ltius. If the velocity of sound can be measured the temperature can be deduced usino the above equation. In the realisation of the technique ptot-o;.?ri for use if. an LdFBF; (fte-f 1) the velocity is determined by observing the difference between the Urns of arrival of tw:/ echo pulses, one from the front ednc- and the other from the back edae of t. subassembly. This time difference is the time1 taken for the sound wave to traverse the diameter- of the subassembly twice. Sinct thf diameter cf ihc subassembly is known, the velocity and honce the temperature can be deduced. The diameter of the subassembly will vary due to thermal expansion, an iteration of the calculation is necessary to allow for this, fin important feature of the measurement is that the temperature is 'uc-i uTpr! directly at the mouth of the subassembly whereas thermocouples have to be posi 11 rmart c-r.f..,-- di ?t?nco (invi? the subassembly top.
The calculated temperature is a spatial average over the path of the sound beam across the subassembly. The ultrasonic method is capable of making up to 100 measurements per second and so is suitable for measuring the fluctuations of the temperature signal, temperature noise, which can give an early warninq of localised hot regions within the subassembly.
Measurements in Static Sodium
The ttsts were carried out in a rig built at UKAEA Risley Laboratories to test acoustic transducers at temperatures in the range 550°C to 600°C. The test rig. see fig 1, consisted of the transducer mounted in a clamp which also held a reflector at a fixed distance, about 100mm, in front of the transducer. The surface of the reflector is concave towards the transducer with a radius of curvature equal to the distance from the transducer to the reflector. This makes the aliqnment of the transducer relative to the reflector less critical. The whole assembly was immersed in sodium. In the experiment the temperature of the sodium was varied between 250°C and 600°C.
156
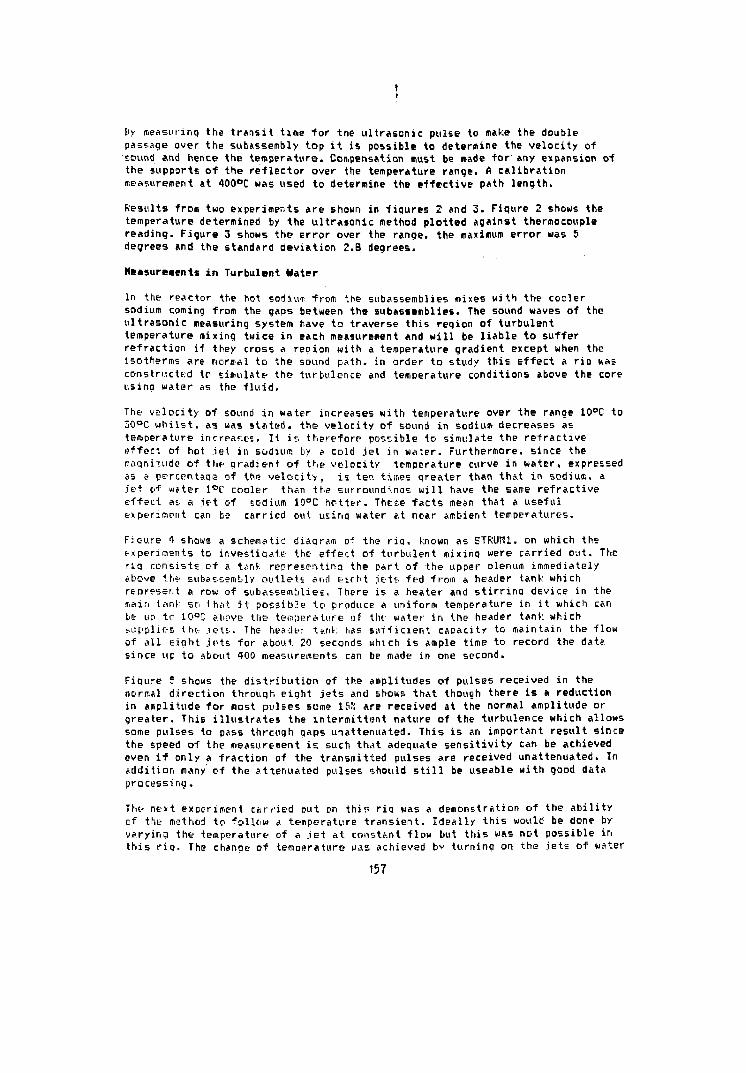
1
hy measuring the transit time -for the ultrasonic pulse to make the double passage over the subassembly top it is possible to determine the velocity of sound and hence the temperature. Compensation must be made for'any expansion of the supports of the reflector over the temperature range. A calibration measurement at 400°C was used to determine the effective path length.
Results from two experiments are shown in figures 2 and 3. Fiqure 2 shows the temperature determined by the ultrasonic method plotted against thermocouple reading. Figure 3 shows the error over the ranpe. the maximum error was 5 degrees and the standard deviation 2.8 degrees.
Measurements in Turbulent Hater
In the reactor the not sodium from the subassemblies mixes with the cooler sodium coming from the gaps between the subassemblies. The sound waves of the ultrasonic measuring system have to traverse this region of turbulent temperature mixing twice in each measurement and will be liable to suffer refraction if they cross a repion with a temperature gradient except when the isotherms are normal to the sound path, in order to study this effect a rig was constructc/d to simulate- the turbulence and temperature conditions above the core using water as the fluid.
The velocity of sound in water increases with temperature over the range 10°C to 30°C whilst, as was stated, the velocity of sound in sodium decreases as temperature increases. It is therefore possible to simulate the refractive effe:t of hot jet in sodium by a cold jet in water. Furthermore, since the magnitude of ttit- gradient of the velocity temperature curve in water, expressed as a percentage of the velocity, is ten times qreater than that in sodiurc, a jet of water 1°C cooler than the surroundinas will have the same refractive effect at. a jet of sodium 10DC hotter. There facts mean that a useful experiment can be carried out using water at near ambient temperatures.
Fieure 1 shows a schematic diagram of the rig. known as STRUM1, on which the experiments to investidate the effect of turbulent mixinq were carried out. The rig consists of a tank representing the part of the upper plenum immediately above in* subassembly outlets and eicht jets fed from a header tank which represent a row of subassemblies. There is a heater and stirrina device in the main tank so that it possible to produce a uniform temperature in it which can be up to 10°C above the temperature of the water in the header tank which supplies t ht- .lots-. The header tank, has sufficient capacity to maintain the flow of all eight jets for about. 20 seconds which is ample time to record the data since up to about 400 measurements can be made in one second.
Fiqure 5 shows the distribution of the amplitudes of pulses received in the normal direction through eight jets and shows that though there is a reduction in amplitude for most pulses some 15'i are received at the normal amplitude or greater. This illustrates the intermittent nature of the turbulence which allows some pulses to pass thrcugh gaps uiattenuated. This is an important result since the speed of the measurement is such th.it adequate sensitivity can be achieved even if only a fraction of the transmitted pulses are received unattenuated. In addition many of the attenuated pulses should still be useable with good data processing .
The- next experiment carried out on this rig was a demonstration of the ability of the method to follow a temperature transient. Ideally this would be done by varying the temperature of a jet at constant flow but this was not possible in this rip. The change of temoerature was achieved by turning on the jets of water
157
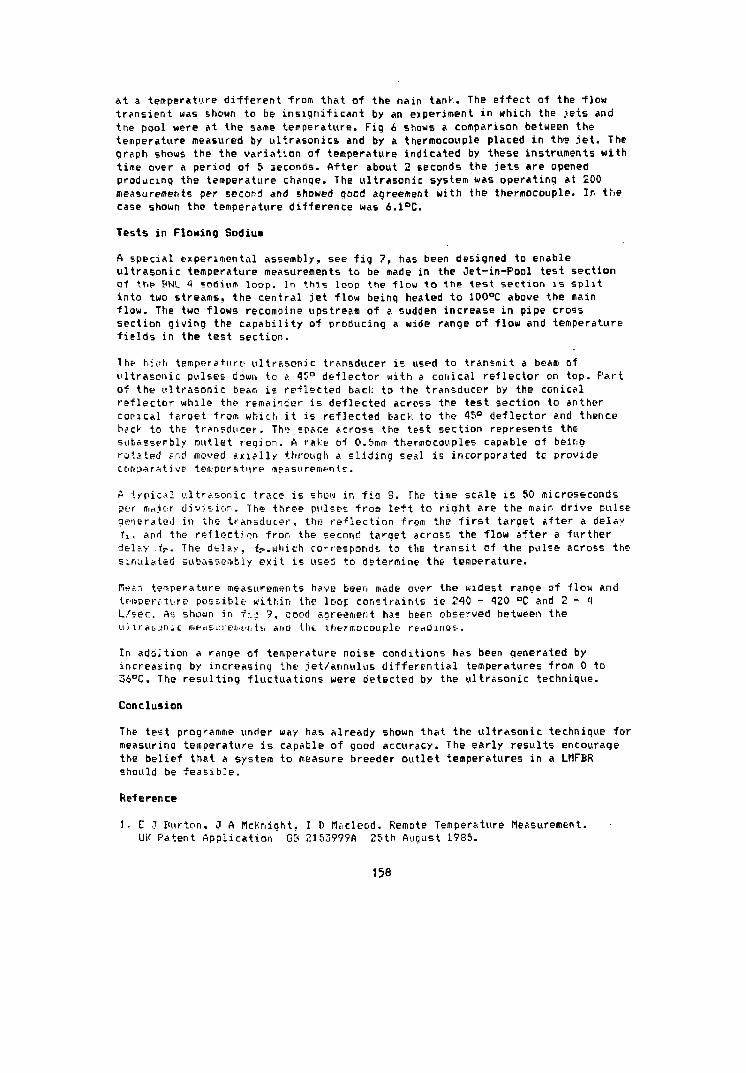
at a temperature different from that of the main tank. The effect of the flow transient was shown to be insignificant by an experiment in which the jets and the pool were at the same temperature. Fig 6 shows a comparison between the temperature measured by ultrasonics and by a thermocouple placed in the jet. The graph shows the the variation of temperature indicated by these instruments with time over a period of 5 seconds. After about 2 seconds the jets are opened producing the temperature change. The ultrasonic system was operating at 200 measurements per second and showed good agreement with the thermocouple. In the case shown the temperature difference was 6.1°C.
Tests in Flowing Sodiua
A special experimental assembly, see fig 7, has been designed to enable ultrasonic temperature measurements to be made in the Jet-in-F'ool test section of the PNL fl sodium loop. In this loop the flow to the test section is split into two streams;, the central jet flow being heated to 10O°C above the main flow. The two flows recombine upstream of a sudden increase in pipe cross section giving the capability of producing a wide range of flow and temperature fields in the test section.
The- h:tih temperature, ultrasonic transducer is used to transmit a beam of ultrasonic pulses down to a 45° deflector with a conical reflector en top. Part of the ultrasonic beam is reflected back to the transducer by the conical reflector while the remainder is deflected across the test section to anther conical target from which it is reflected back to the 45° deflector and thence hack to the transducer. Th? space across the test section represents the subassembly outlet region. A rake of O.Smrc thermocouples capable of being rotated and moved sxially through a sliding seal is incorporated tc provide comparative temperature measurements.
A typical ultrasonic trace is show in fig 3. The time scale is 50 microseconds per major division. The three pulses from left to right are the main drive pulse generated in the transducer, the reflection from the first target after a delay ?i. and the reflection frorc the second target across the flow after a further delay fr- The delay, tr.which corresponds to the transit of the pulse across the simulated subassembly exit is used to determine the temperature.
Me*.-! temperature measurements have been made over the widest range of flow and temper; ture possible within the loop constraints ie 240 - 120 °C and 2 - '1 L/sec. As shown in fi-; 9, coed agreement has been observed between the ultrasonic me«iSL:i'e«iuTitti and the thermocouple readings-.
In addition a range of temperature noise conditions has been generated by increasing by increasing the jet/annulus differential temperatures from 0 to 36°C. The resulting fluctuations were detected by the ultrasonic technique.
Conclusion
The test programme under way has already shown that the ultrasonic technique for measuring temperature is capable of good accuracy. The early results encourage the belief that a system to measure breeder outlet temperatures in a LMFBR should be feasible.
Reference
). C 1 Burton. J A McKnight, I t) Hacleod. Remote Temperature Measurement. UK Patent Application" GB 2153999A 25th August 1935.
158
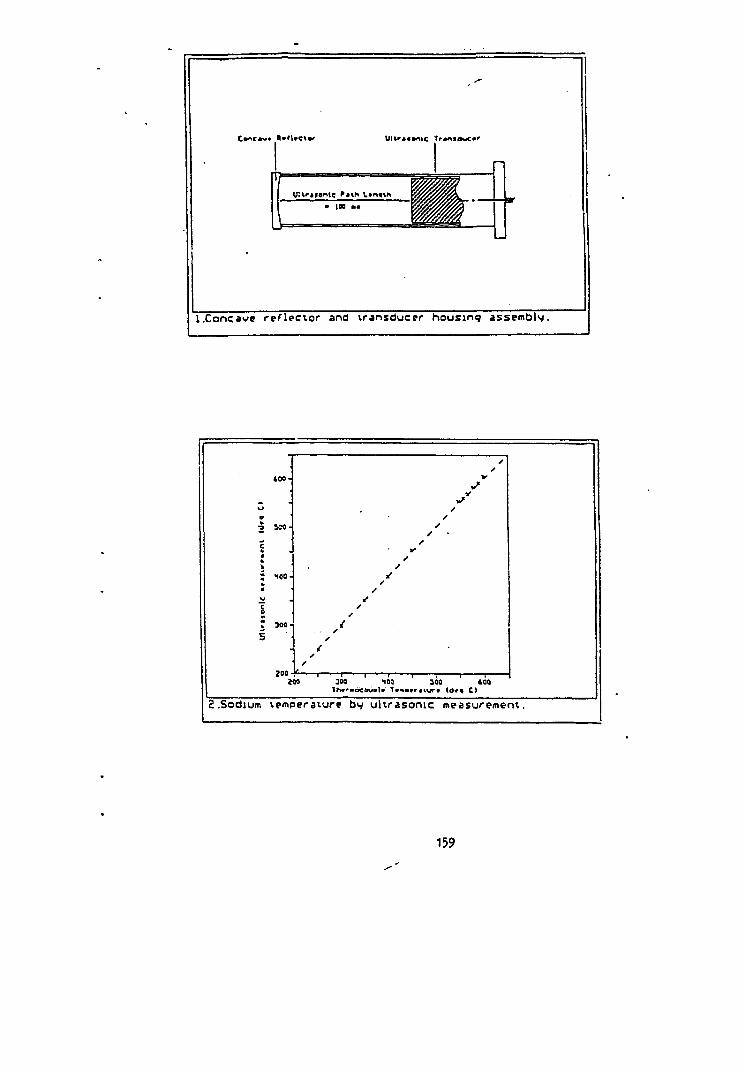
tB*C*w* RvfWClO' U l i ' t tomc TrjniawC*'
UU'«FOnie ' » l h Ltn^\h
• IBS • •
i.Coneawe re f l ec to r and transducer housing assembly^
^ KJ
* -5 ? * : X :
« c s i 9
. 400-
« 1
3C0-
H00<
.
300 -|
zoo
y s
*-^
^ *r f t
s s
•
• •
• / s
* / /
/ t
* /
i • I i • i • • • T — — T " • " 1 200 300 100 300 100
2 .Sodium temperature bw ul t rasonic measurement.
159
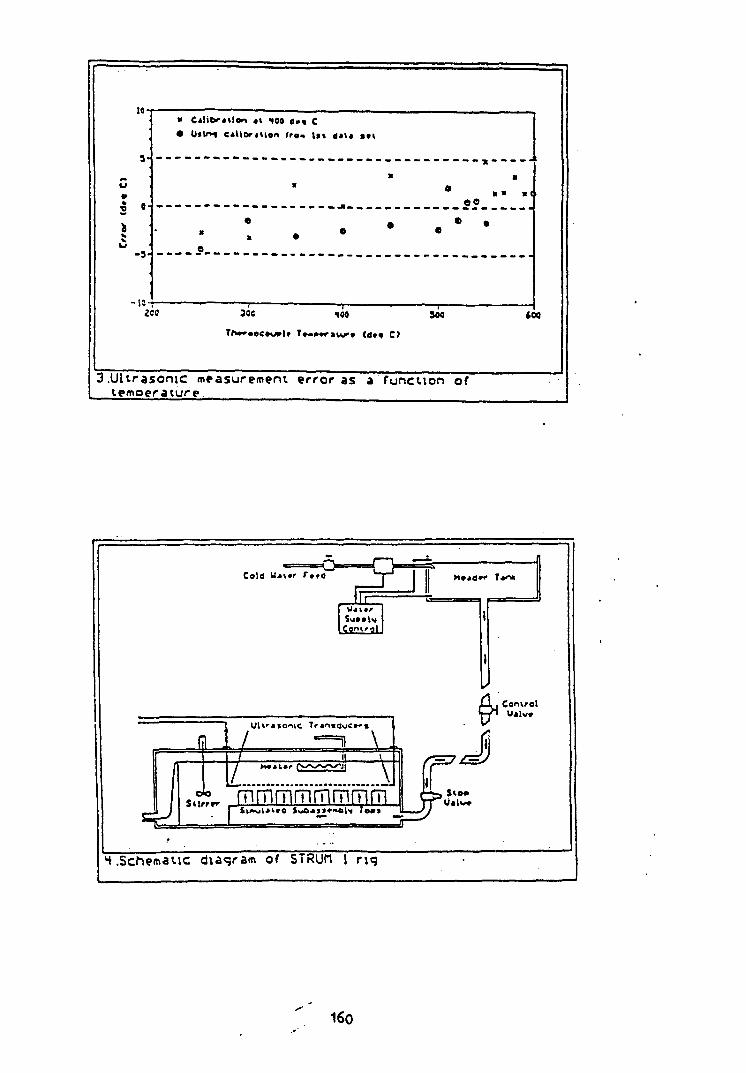
3H
u
* o
I
• Ciliex«vloo «t 100 d»* C
• U»tf*l e*UCw«Uon fro* 1st «*>« s* i
© 0
3- - - - - J *
•la-f-300 <|00
I 300 too
3.Ultrasonic measurement error as a function of temperature.
CelO U*\»r r , t o r U a c " T*«-*
Control
JR ^
Ul ir« sonic Tr *n*cjuCf-^i.
— 1 \ _, U U
Central
4 .Schematic diagram of STRUn l rig
160
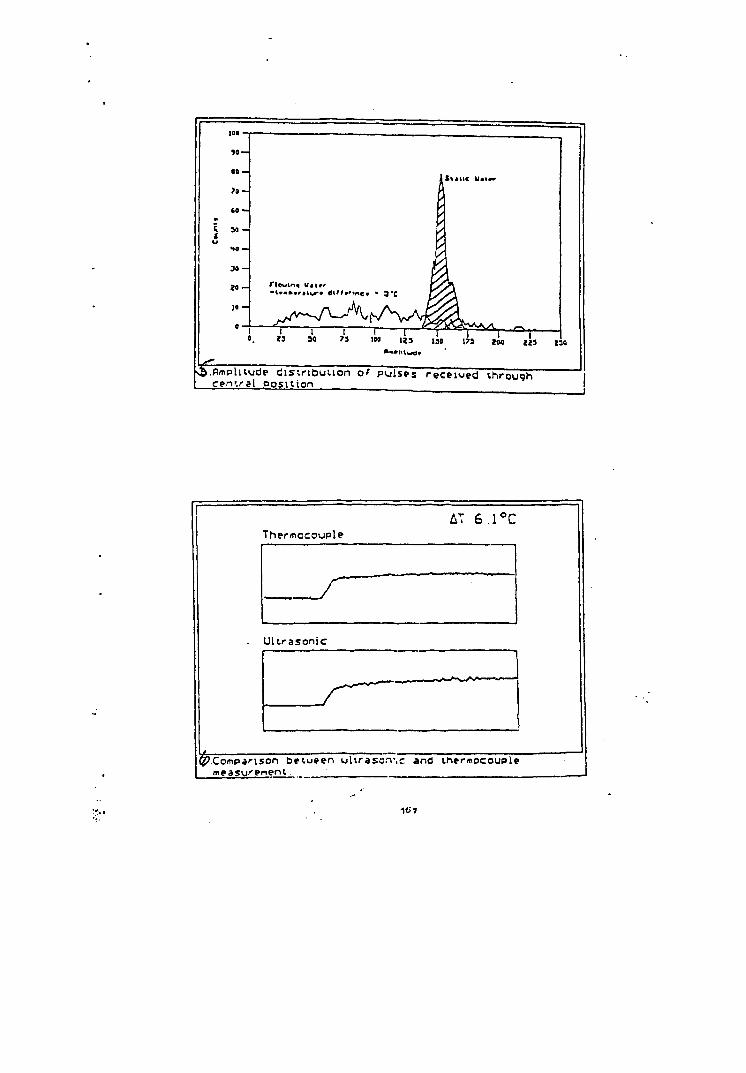
ioa
M -
• 0 -
> « -
4 0 -
3 0 -
MO —
3 a -
« o ~
j o -
•t*_»«r«l_»« dl/tr'tr^e* * 3 "C
?3
S.«UC I U I * *
<
I0« U 3 I3S 173 2M j „ _ _
s&.fimpluude d is t r ibut ion of pulsus received through cen'.ral posi t ion
AT 6.1°C Thermocouple
Ultrasonic
fc '.Comparison between u l i rascv.c and thermocouple measurement.
Mil
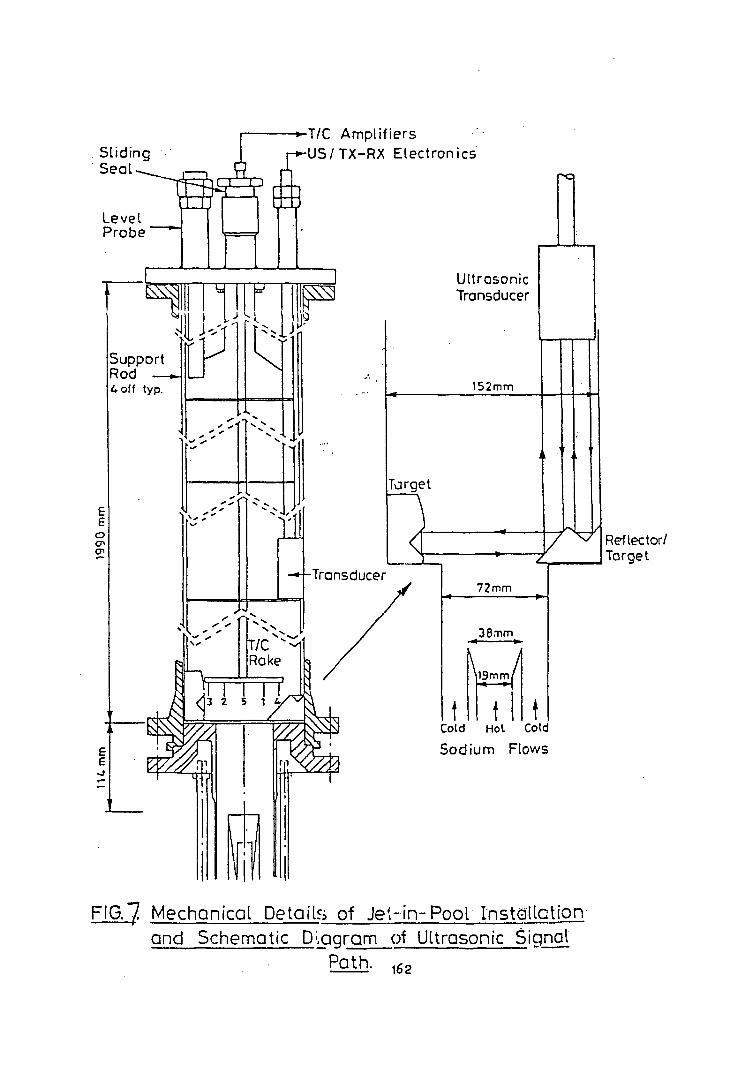
Sliding Seal
Level Probe
-»-T/C Amplifiers -US/TX-RX Electronics
Reflector/ Target
Cold Hot Cold
Sodium Flows
FIG.7 Mechanical Details of Jet-in-Pool Installation and Schematic D;,a g ram of Ultrasonic Si qnal
Path. 162
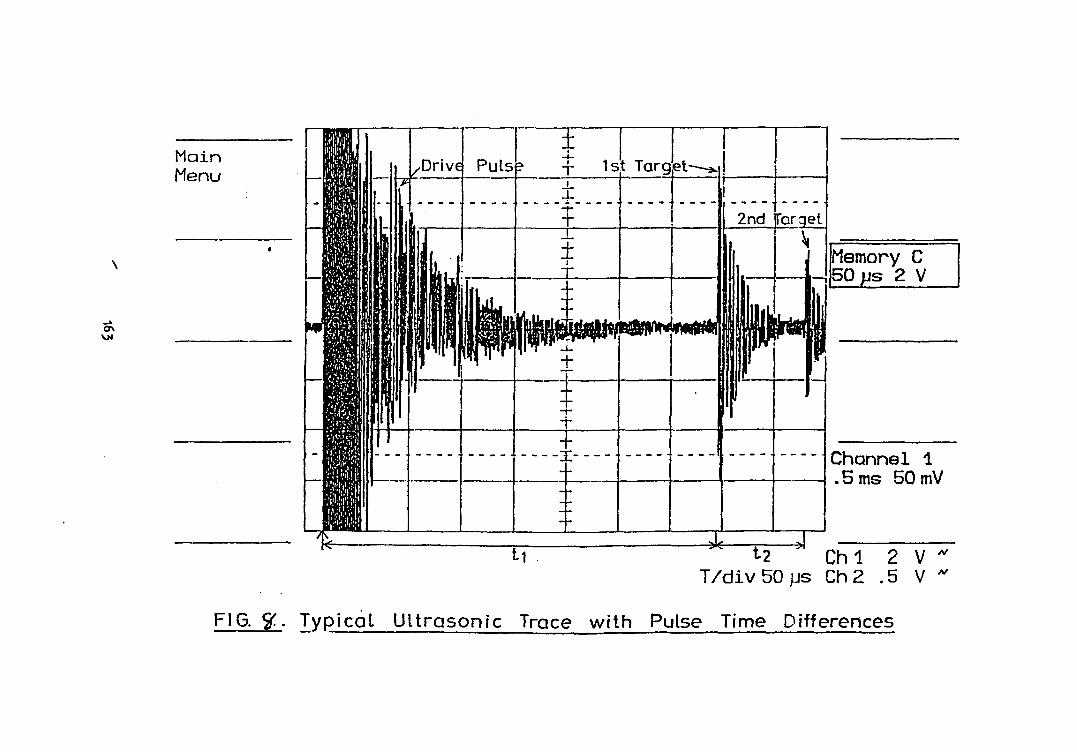
Р16. У - Тур1са1 ЦИгазогпс Тгасе УУЛЬ Ри15е "Пте Р^егепсез
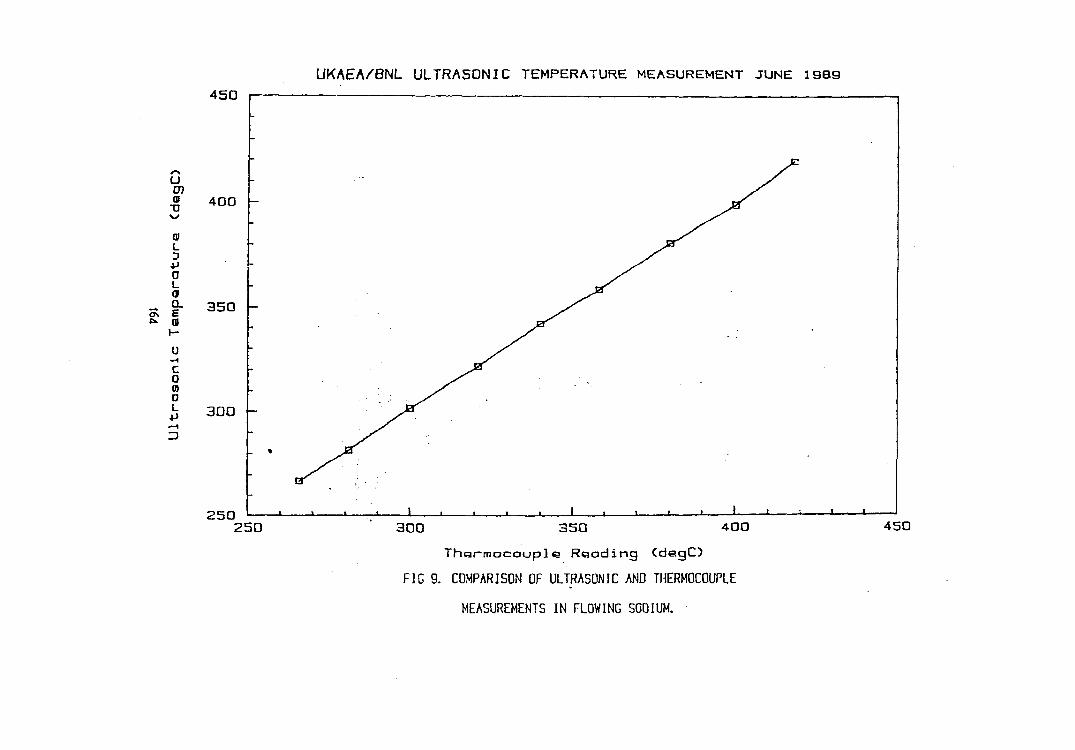
UKAEA/BNL ULTRASONIC TEMPERATURE MEASUREMENT JUNE 1983
<3\
^\ U 0> a> n
a L
• L a a. e a
t-u
•r-4 C 0 (I) o L
4 5 0
4 0 0
3 5 0 -
3 0 0 -
2 5 0 2 5 0 3 0 0 3 5 0 4 0 0
T h e r m o c o u p l e R e a d i n g CdegC)
FIG 9. COMPARISON OF ULTRASONIC AND THERMOCOUPLE
MEASUREMENTS IN FLOWING SODIUM.
4 5 0
The Development o-f Acoustic Tomography
for Te/nperature Measurement in Fast Reactors
P 01 ley
I D MaclBDd
Northern Research Laboratory
UKAEA
Risley, Warrington, Cheshire
United Kingdom
For Presentation at the IAEA/IWGFR Specialist Meeting
on
Instrumentation for the Supervision of Core Cooling in LMFBR"
at Kalpakkafl), INDIA
J.2th to 15th December 1989
165
INTRODUCTION
PRINCIPLE
DESCRIPTION OF SYSTEM FOR TOMOGRAPHICS SCANNING 3.1 Transducer Array 3.2 Theoretical
3.2.1 Requirements of path-cell ratio 3.2.2 Relating cell temperature to cell velocity 3.2.3 Relating cell velocity to transit time
EXPERIMENTAL TEST 4.1 Area of Scanning 4.2 Scanning Procedure
ILLUSTRATION OF RESULTS 5.1 Temperature Detection
CONCLUSIONS
REFERENCE
166
1 INTRODUCTION
Tomography is the name applied to the technique whereby some properties of a slice of a medium are deduced from observations of the transmission of signals through that area. The technique can be used with electromagnetic radiation eg. X-rays as well as acoustic waves. Acoustic tomography has been used to deduce temperature and flow patterns in the ocean.
A research programme is underway at NRL Risley to investigate the use of tomography for the remote measurement of the properties of a medium. The technique can be used to measure density, temperature, gas cor.tent or any other property which alters the acoustic transmission characteristics. This paper gives results which illustrate the application of the technique to the measurement of outlet temperature in an LMFBR.
2 PRINCIPLE
The region to be studied is divided into cells, the number of cells b,= ing determined by the spatial resolution reauired. In the case of a reactor the cells would correspond to subassemblies. A pulse of sound traversing the region of interest will pass through a number of cells and its velocity and the attenuation it suffers will be a combination of the velocities and attenuations in the cells through which it has passed.
The? method therefore is to transmit a sufficient number of pulses across the core in different directions so that every cell is traversed and sufficient data is obtained to allow a consistent set of simultaneous equations to be assembled from which the velocity in each cell can be determined. Since the velocity of sound in most fluids is a function of temperature this velocity measurement can be used to d *• d u c e t £-• n i p p rat u r e
3. DESCRIPTION OF SYSTEM FOR TOMOGRAPHICAL SCANNINB
Initial experiments were performed on a small easily accessible tank + •-:• d-tcTfiiirc fDc;ibj 1 i 1./ of various methods to perform a tomoaraphic scan in water, and to indicate the degree of repeatability of transit time and transmitted rms measurements. The results of these investigations were brought together in the system outlined below.
3.1 Transducer Array
An array of transducers is positioned around an area of interest. An array of eight transducers (T1-T8) on a square, side length 375mm, is considered here, as shown in Figure 1. Each transducer in turn emits a burst of sound which is detected by the other 7. As each of 8 transducers can transmit to 7 other transducers, there are 56 paths -assumed to be straight lines, along which sound transmission can be measured. However the number of distinct paths is half this, 28, as there are two directions of travel between anv given pair of transducers. In the experiment the transmitted and received signals are recorded in digital form, and the transit time along each path is measured. 28 values in all, and 2B values of received rms are calculated.
167
3.2 Theoretical
3.2.1 Requirements of Path-Cell ratio
For the solution of a set of simultaneous equations, there must be ac least as many equations as there are unknown variables. In tomography there must be at least as many distinct paths between pairs of transducers, as there are cells.
For a system using N transducers there are N/2 M(N-1) paths and it may have up to that number of cells. As there are 2B paths between B transducers trie area inside the s.rre.^/ may be split into up to 23 notional "cells". Each cell, assumed homogenous, having definite, but unknown values for attenuation and velocity of sound. The chosen cell positions are shown in Fig 1, which uses 25 cells giving a small redundancy in the number of equations available.
3.2.2 Relating cell temperature to cell velocity
The relationship between acoustic velocity and temperature depends on the transmission medium. In water, velocity and temperature are relatc-d by the approximate formula v = 1403 + 4.2 t - 0.02B t= (v is velocity in m/s and t is temperature in °C) . Fig 2 shows the plot of this function over the range 10°C to 40°C. In this range the function has no peak or trough, hence this is a feasible operating range for a tomographic scanning system.
3.2.3 Relating cell velocities to transit time
The measured timer delays are determined by the sound velocities in each of 25 calls. The time taken for the sound to travel between Tl and T2, for example, is the sum of the distance it travels through a cjj.'7-ri cell, divided bv the speed of <sound in that cell, summed for eac:h cell it parses througn. This leads to 28 equations linkino 28 ti'T.e d«le/s to 25 velocities.
4 EXPERIMENTAL TEST
4.1 (\res of Scanning
An experiment to test the possible application of Tomography to remote spatial monitoring in a realistic situation has been set up as in Figure 3. Eight transducers (Tl-TB) were placed around an area of interest in a water tank. The transducers were arranged in a horizontal square of approximately 0.4m side, 0.3m above a 1/4 scale model of the PFR reactor core. A heat source (a pipe from a large reservoir of hot water) was placed in one subassembly. The source position was below the area to be scanned.
The available manoeuverability of the transducers was limited by the design of the rig, and the position of the array relative to the subassemblies could only be measured to within 2 cm. However each source had one cell covering most of its area, with a single adjacent cell covr-ring any significant remainder as shown in figure 3.
168
4.2 Scanning Procedure
Using the computer controlled hardware, a burst of sound was transmitted from transducer 1. The signal received on all transducers was recorded in digital form and stored. Then transducer 2 was pulsed, this procedure being repeated for each transducer in turn until signals transmitted along each of the 28 paths had been stored.
The signals were processed to extract transit times or transmission signal strength along each path. These values being used in the solution routine to calculate temperature or attenuation in each cell.
5 ILLUSTRATION OF RESULTS
5.1 Temperature Detection
To illustrate the use of acoustic Tomography in a geometry similar to the core outlet region in a Fast Reactor we used the half scale model of the PFR core and the experimental arrangement described in the previous section.
The heat source, which is marked on fig 3. was positioned inside the hexagonal subassembly chiefly covered by cell 23. Thermocouples were in place at the e;:it of this subassembly, and also 0.32m above it, which is 2cm higher than the level Ecanned by the array. This additional offset was to avoid affecting transmission.
When the heat source was turned on the lower thermocouple showed temperatures of up to 40°C, while the temperature at the thermocouple at the level of the? array was 23°C, this was a rise of 7°C above the background temperature. Fluctuations in temperature caused by mi::ing cf hot and cold water were apparent on both tnermocouples.
Results
Steady Ststp (•teasureiTiertts
Figure' 4 shows a plot of temprraturc in the cells of the tomographic si-ray in which shadina is used ta indicate the temperature measured bv the tomographic technique. The results were obtained with the source turned on. The position of the source shows up clearly, giving a reading of over 20°C in the appropriate cell against a general background of 16°C. Two adjacent cells show a temperature rise of about 2°C while in all the remaining cells the change is less than 1°C.
Work on ultrasonic temperature measurement, ref 1, has shown that the sensitivity in sodium will be about a factor of 10 worse than in water. These tests suggest a sensitivity of J. to 2°C in water and therefore 10 to 20°C in sodium.
Transient tleasurem&nts
The ne::t experiment was to demonstrate the ability of the technique to fallow transient changes in temperature. To do this 128 measurements were made for each cell at a rate of one every 4.25s, the total time covered was therefore 9 minutes.
169
In Fig o the calculated temperature for each cell is plotted against time durinq the 9 minute duration of the experiment. Initially the heat source was off. After approximately 3 minutes it was switched on causing a gradual rise in temperature mainly in cell 23 (cell numbers defined in Fig 3 ) . and to a lesser e::tent in cell 22. There is a rise in 'noise' in all other cells. After a further few minutes the heat source was turned off causing an initial sharp drop in measured temperature in cell 23, followed by a steady decline to background levels.
In Fig 6 the variation in cell 23 is shown in detail along with the readinq of the thermocouple above that cell over the same oeriod. The thermocouple plot consists of 127 values, each value is the average o 7 readings taken during the acquisition of the transmission data. There is good agreement between the behaviour of the temperatures indicated by the two instruments.
Figure 7 shows a plot from a similar experiment in which the heat source was turned on for two periods of roughly 2 minutes each, with minutes off between them. Again good quantitative agreement was observed.
Figure? 8 shows a plot of cell 22, a cell covering part of the heat source and showing the next largest temperature rise. A thermocouple was positioned in the area of this cell for comparison. The thermocouple shows that the apparent, temperature rise is genuine, and is in reasonable agreement with the tomographic results.
6. CONCLUSIONS
J. The experiments have shown that tomographic ansJyfis of acoustic signals passina between transducers in an array can be used to measure temperature distribution within a plane area.
2. The results taken with other work on ultrasonic tsirpe'-ature measurement [1] indicate that the application of acoustic tomography in an LMFBR is feasible. Further te-;ts on reactor scale and in reactor conditions are however required to confirm this.
7. REFERENCE
1. I D Macleod et al. An Ultrasonic Technique for the Remote Measurement of Breeder Subassembly Outlet Temperature. This Conference.
170
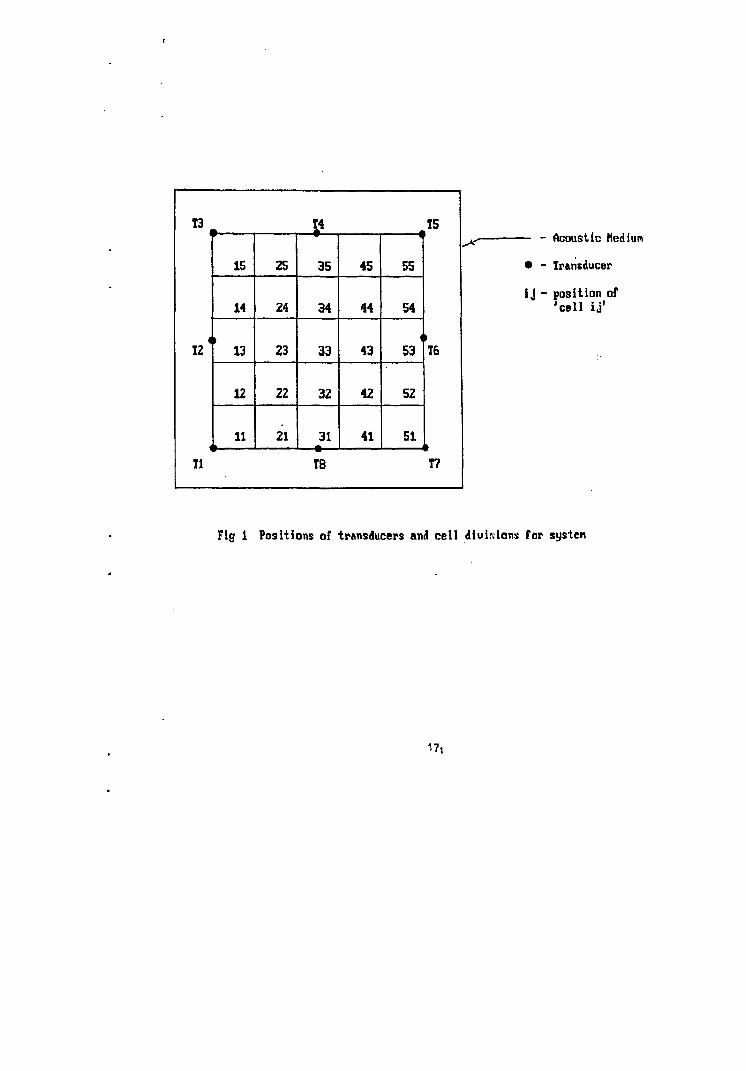
T3 i
< 12
11
15
14
13
12
11
25
24
23
22
21
T4
35
34
33
32
31
IB
45
44
43
42
41
55
54
53
52
51
15
i
T6
17
Acoustic Medium
• - Transducer
Ij - position of 'cell ij'
Fig 1 Positions of transducers and cell diuifiions for system
17,
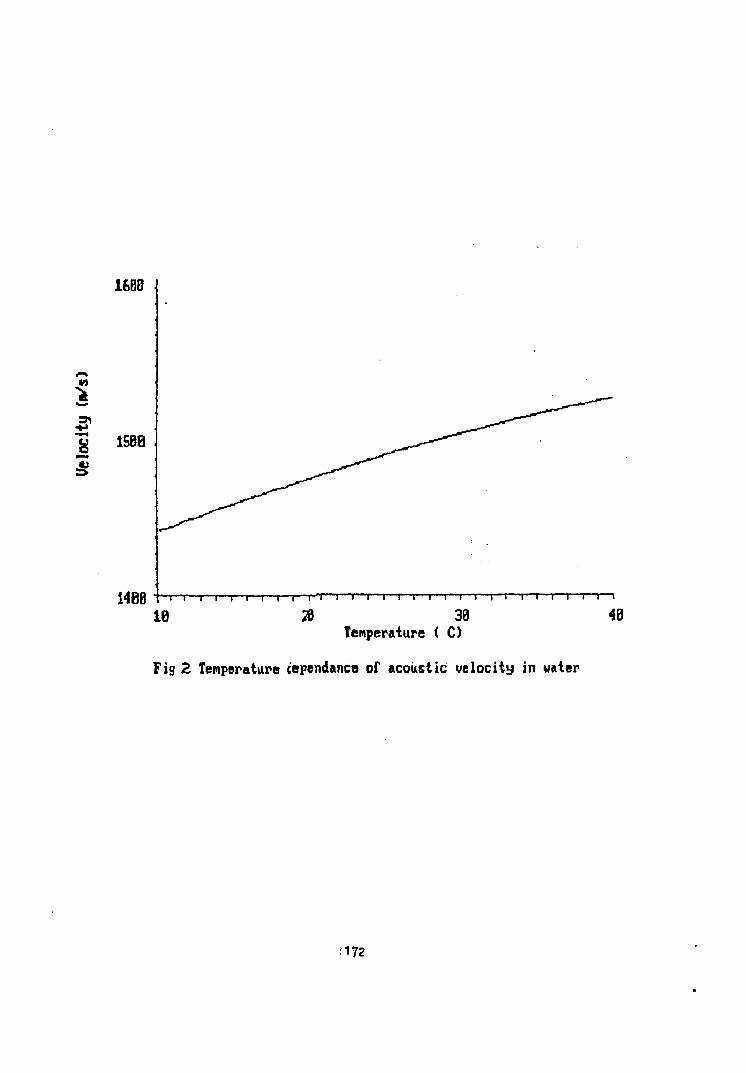
1600
3 158B
I486 r - i — i — i — I — i — i — n — n — i — i — i — i — i — i — i — i — i — i — i — i — i — i — i — i — i — i — i
IB 28 30 40 Temperature ( C)
Fig Z Tenperatupe c'ependance of acoustic velocity in water
1172
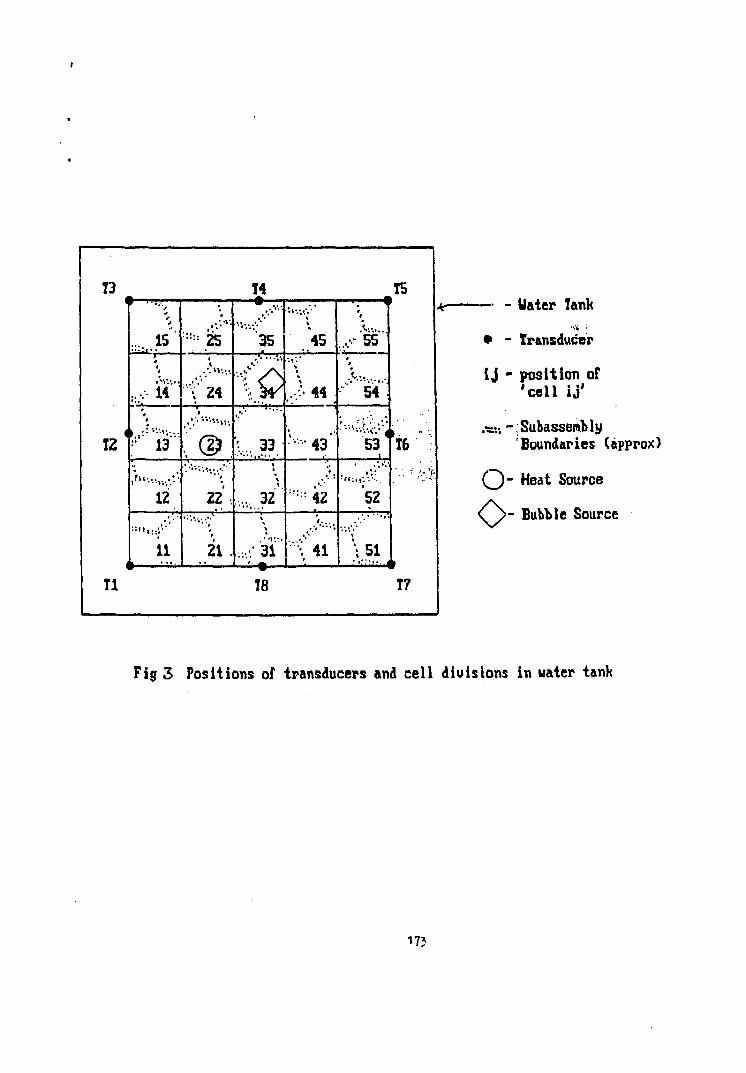
13
< 12
i
Tl
... 15 J
4 t
» . , : ' : *••••«•.•.....
" 13
12
" i i , . . • . ' • •
11
••.•*••
• i
'•'<;''24
• ®
22
21 .
T4
35
io \..J3
%
...,., 32 \
•.::•• 3 l ' "
45
.••• 44
•••••• 43 '
:,i:: 42
"••V 4 1
T8
# .'v....
.,:•- 55 t $
' ' • > : : : . . . .
•"' 54"'
53 I
! i i : > i ' . - ' ,
52
1 \51
TS
17
- Uater Tank
• - Transducer
i j - position of 'cell i j '
.-SK:-Subassembly Boundaries (approx)
O " Heat Source
\ y - Bubble Source
Fig 3 Positions of transducers and cell divisions in uater tank
17?
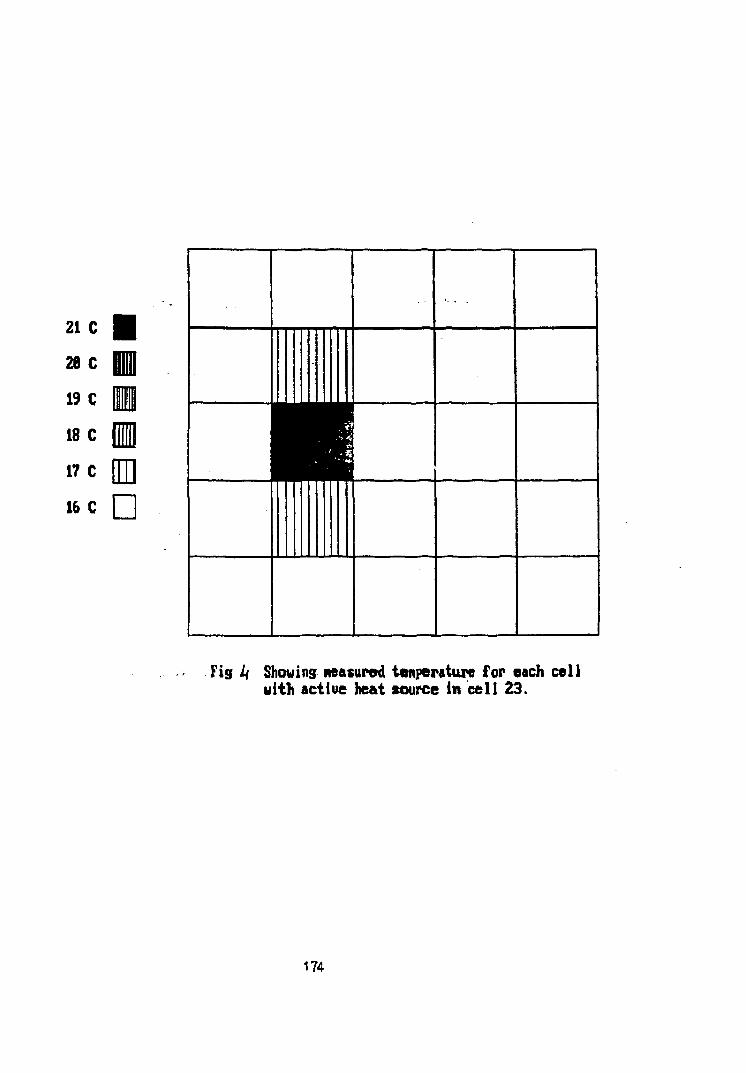
21 C
28 C
19 C
18 C
17 C
16 C
• 1 • 1 DH •
Fig k Showing Measured tenperature for each cell with actiue heat source in cell 23.
174
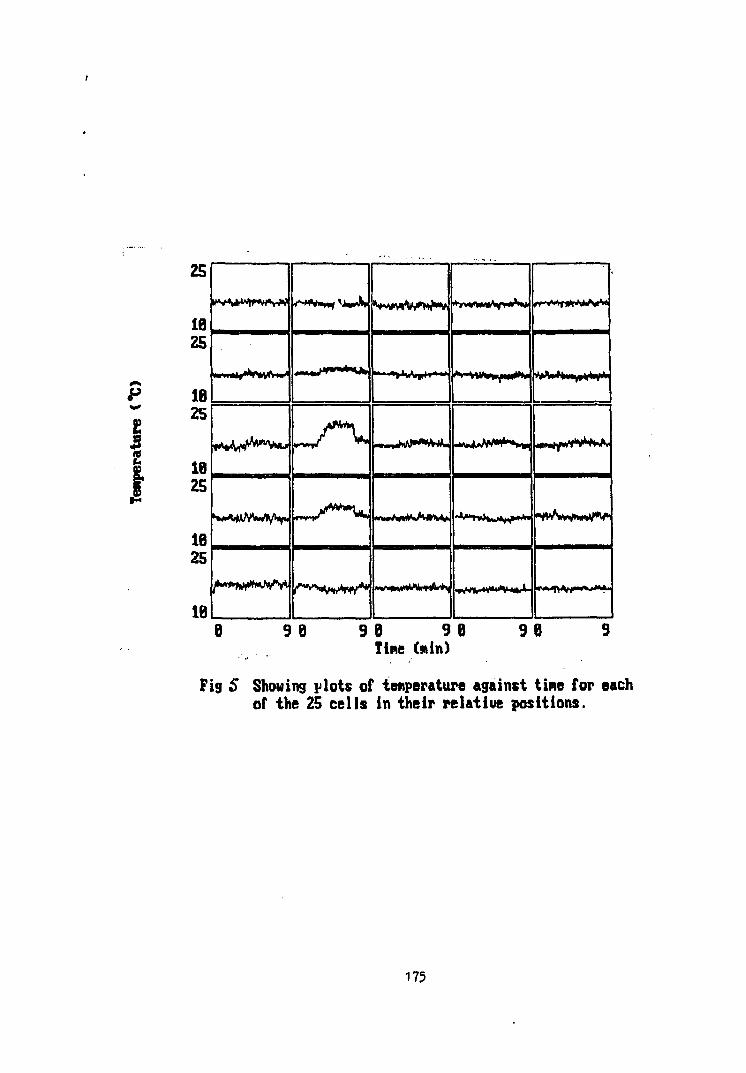
25
18 25
IB 25
18 25
IB 25
IB
i^V^f*wV^
e*r t f lMa^^TTPif f i^^
I * * W ^ " V N U
k****tfvwvv
/ - * *«*^JWA
If^V^w
^ / ^
f~*w*p>w r*********
I W H A W * ^ *y>*rt*<*y»>»,Hi*
• • t ' » V p l i * '
•^NJ^HVA.
*-*M*p^—tt>ii
-fcJuVW*****, ^wip*** * * * *
• w M - ^ t W
» r » » i * * 1 ^ ^
-VTUKV^J^WA*
»y«MfpV*NtN«
W'H>''<"^'»>1
•tv/w^wiVV*
•*«i>*rt<^»>*
9B 90 90 Tine (win)
90
Fig 5 Showing plots of tenperature against tine for each of the 25 cells in their relatiue positions.
175
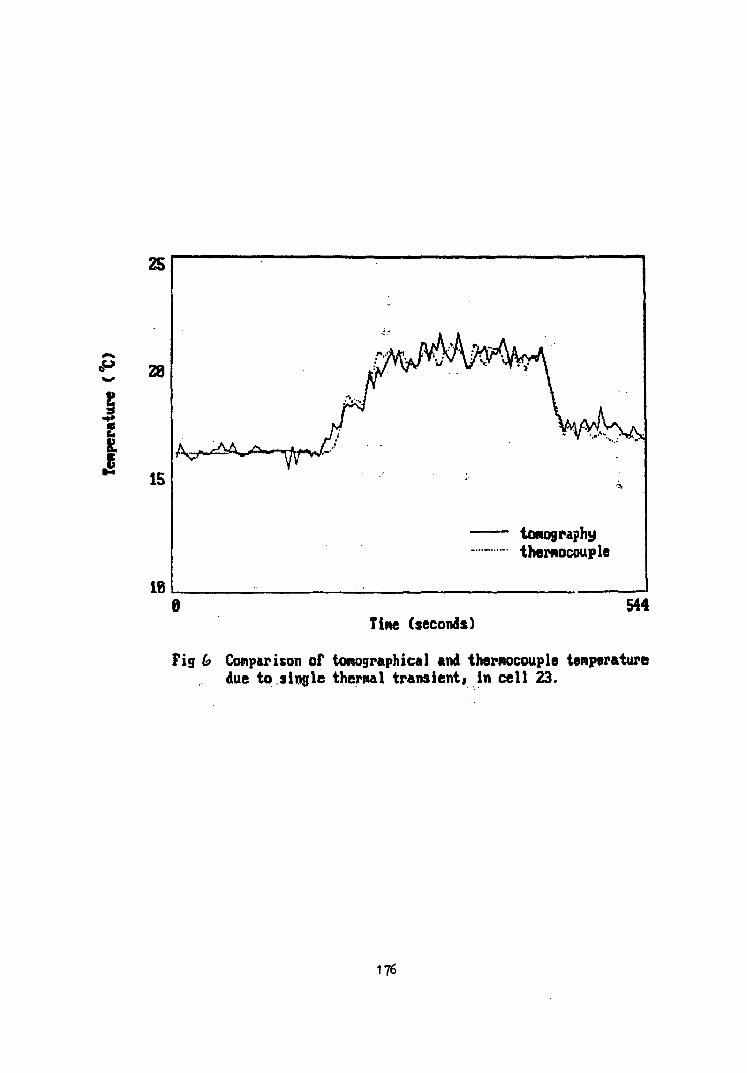
25
28
15
IB
A ^ ^ A H ^ " ffi
tonography thermocouple
e 544 Tine (seconds)
Fig (a Conpapison of tomographical and thernocouple tenperature due to single theroal transientj in cell 23.
176
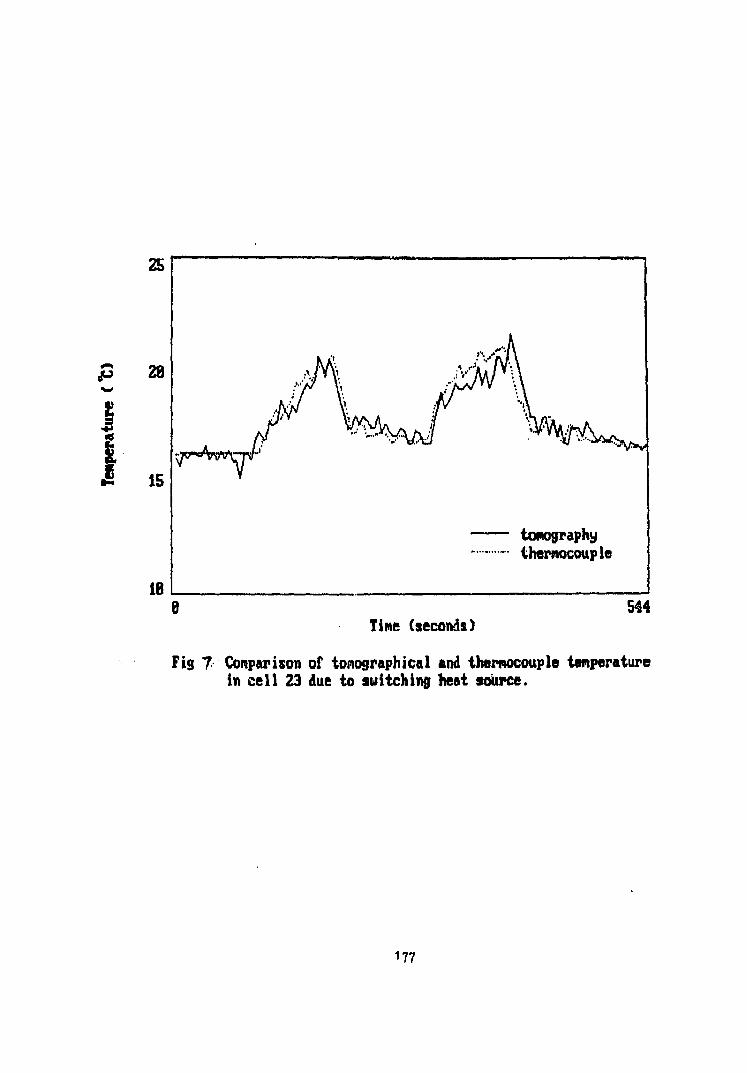
zs
28
£ IS
IB
tonography thernocouple
544 Tine (seconds)
Fig 7 Comparison of tonographical and thernocouple temperature in cell 23 due to switching heat source.
177
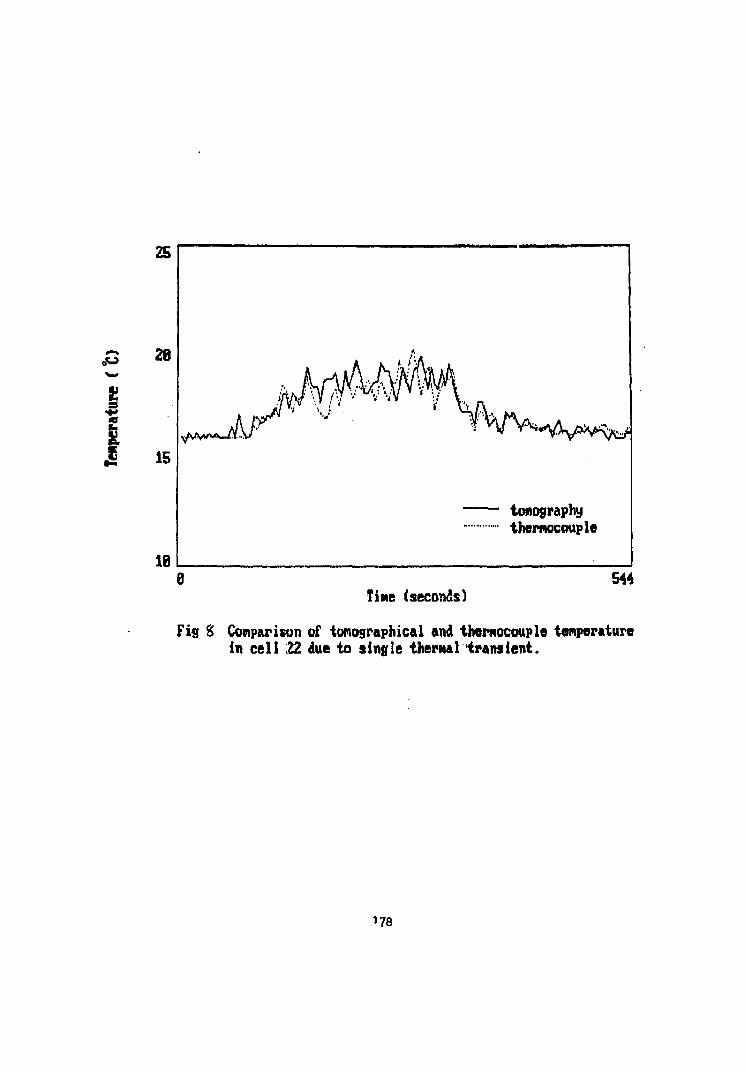
25
n 28
J 15
IB
Tine (seconds)
•YV1*^^
tonography thernocouple
544
Fig g Comparison of tonographical and thernocouple tenperature in cell 22 due to single thermal transient.
178
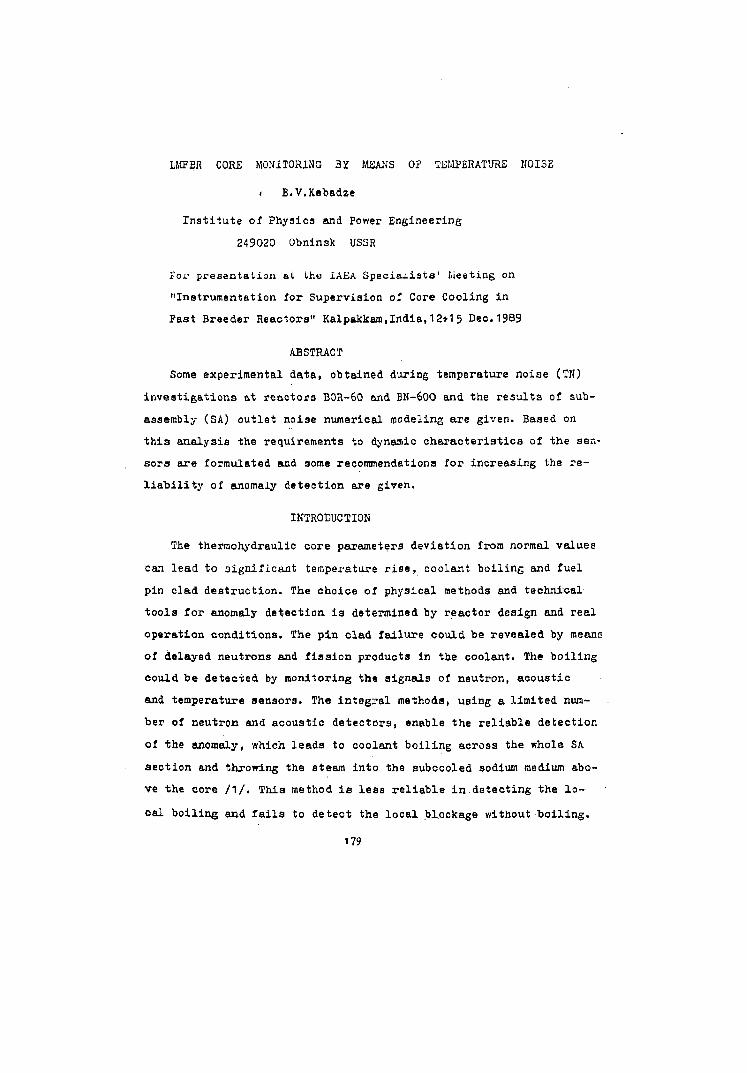
LMFBR CORE MONITORING BY MEANS OF TEMPERATURE NOISE
< B.V.Kebadze
Institute of Physics and Power Engineering
249020 Obninsk USSR
For presentation at the IAEA Speciaxists1 Meeting on
"Instrumentation for Supervision of Core Cooling in
Past Breeder Reactors" Kalpakkara,India,12*15 Dec.1989
ABSTRACT
Some experimental data, obtained during temperature noise (TN)
investigations at reactors BOR-60 and BN-600 and the results of sub
assembly (SA) outlet noise numerical modeling are given. Based on
this analysis the requirements to dynamic characteristics of the sen
sors are formulated and some recommendations for increasing the re
liability of anomaly detection are given.
INTRODUCTION
The thermohydraulic core parameters deviation from normal values
can lead to oignificant temperature rise, coolant boiling and fuel
pin clad destruction. The choice of physical methods and technical
tools for anomaly detection is determined by reactor design and real
operation conditions. The pin clad failure could be revealed by means
of delayed neutrons and fission products in the coolant. The boiling
could be detected by monitoring the signals of neutron, acoustic
and temperature sensors. The integral methods, using a limited num
ber of neutron and acoustic detectors, enable the reliable detection
of the anomaly, v/hich leads to coolant boiling across the whole SA
section and throwing the steam into the subcooled sodium medium abo
ve the core /1/. This method is less reliable in detecting the lo
cal boiling and fails to detect the local blockage v/ithout boiling.
179
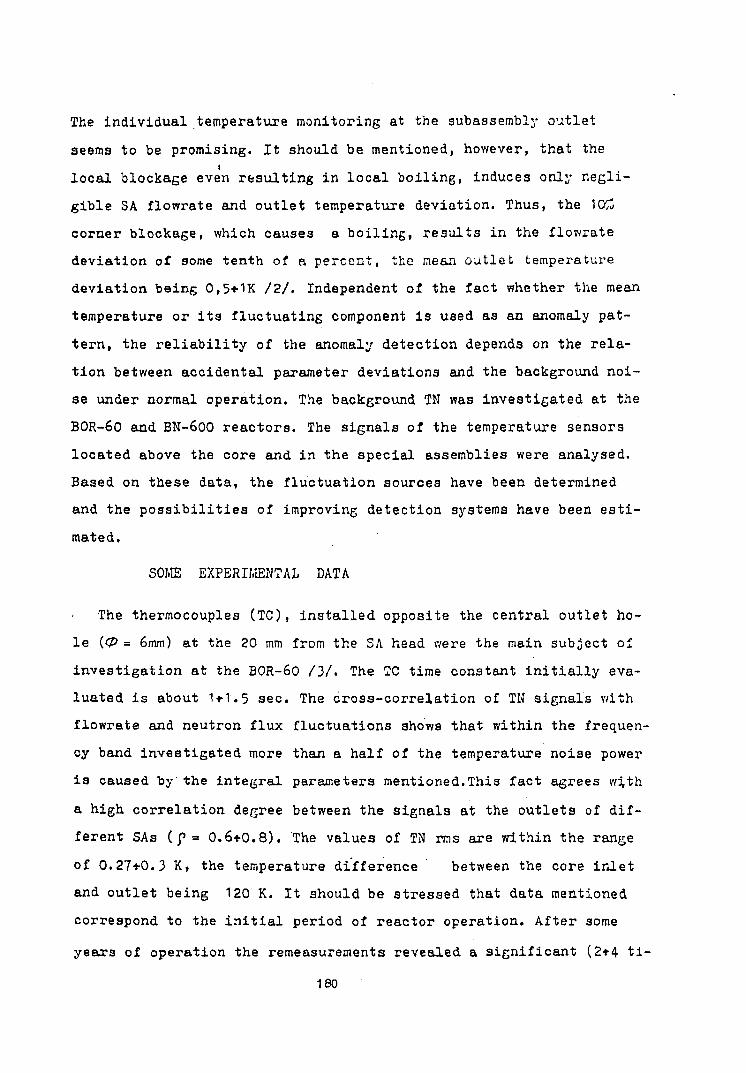
The individual temperature monitoring at the subassembly outlet
seems to be promising. It should be mentioned, however, that the
local blockage even resulting in local boiling, induces only negli
gible SA flowrate and outlet temperature deviation. Thus, the 10£
corner blockage, which causes a boiling, results in the flowrate
deviation of some tenth of a percent, the mean outlet temperature
deviation being 0,5+1K /2/. Independent of the fact whether the mean
temperature or its fluctuating component is used as an anomaly pat
tern, the reliability of the anomaly detection depends on the rela
tion between accidental parameter deviations and the background noi
se under normal operation. The background TN was investigated at the
BOR-60 and BN-600 reactors. The signals of the temperature sensors
located above the core and in the special assemblies were analysed.
Based on these data, the fluctuation sources have been determined
and the possibilities of improving detection systems have been esti
mated.
SOME EXPERIMENTAL DATA
The thermocouples (TC), installed opposite the central outlet ho
le {0 = 6mm) at the 20 mm from the SA head v/ere the main subject of
investigation at the BOR-60 /3/. The TC time constant initially eva
luated is about 1*1.5 sec. The cross-correlation of TN signals with
flowrate and neutron flux fluctuations shows that within the frequen
cy band investigated more than a half of the temperature noise power
is caused by the integral parameters mentioned.This fact agrees w^th
a high correlation degree between the signals at the outlets of dif
ferent SAs (p = 0.6*0.8). The values of TN rms are within the range
of 0.27*0.3 K, the temperature difference between the core inlet
and outlet being 120 K. It should be stressed that data mentioned
correspond to the initial period of reactor operation. After some
yeaxs of operation the remeasurements revealed a significant (2*4 ti-
180
mes) rise of fluctuation amplitude in comparison with the initial
value for the part of the TCs. This phenomenon was accompanied by a
decrease of the cross-correlation degree between abnormal TCs and in
tegral parameters signals. It could be accounted for the fact that
due to numerous reloadings and possible mechanical damages the cor
respondence between the outlet hole axis and the TC position is bro
ken. The flows from neighbouring SAs with different temperatures
reach the monitoring TC and give rise to "mixing noise" of a large
amplitude. Naturally, such noise is uncorrelated with flowrate and
neutron power fluctuations. A similar picture was observed at the
French SPX-1 reactor. The signals of TCa, located at the level of
100 mm above the core for SA monitoring, are not correlated with the
integral parameters mentioned.
Some additional data on TN were obtained at the BOR-60 using a
special instrumentated SA, equipped with a (jreat amount of TCs with
the time constant being ~ 0,1 sec. The TCs are placed in SA cross-
sections at different heights (fig. 1). Within" the frequency range
investigated the signals of TCa at different positions are strongly
correlated. Thus, the correlation degree between the signals in the
section near the 5A middle and in the SA head reaches the value P =
0.85 (fig.1b), This indicates the presence of a common fluctuation
source, most probably, a pulsation of the flowrate through the SA.
This source masks the Til generated due to the blockage.
Thermonoises at the BN-600 were investigated with temperature sen
sors installed in a special probe. The hot junctions are located in
the lower probe part, which is inserted into the SA head (fig.2).
The frequency band investigated is expanded by the use of intrinsic
(sodium-steel) thermocouples in addition to usual Cr-Al sensors /4/.
The advantage of the intrinsic TCs when monitoring dynamic processes
is evident from comparison of the readings during the BN-600 reac-
181
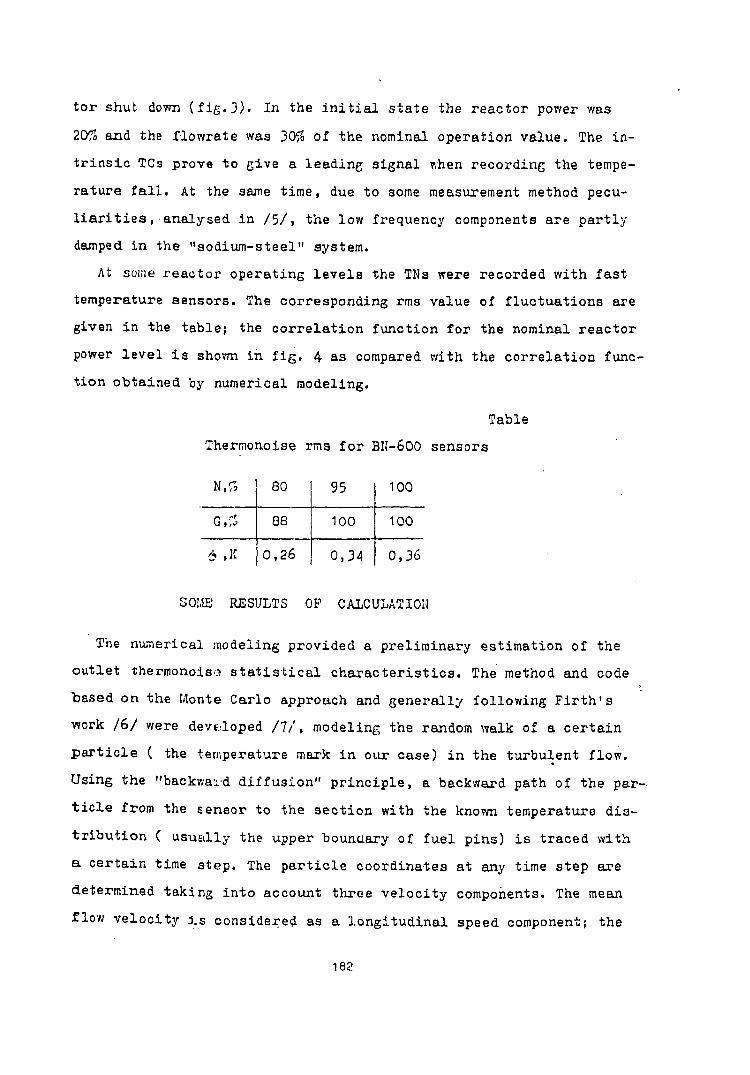
tor shut down (fig.3). In the initial state the reactor power was
207S and the flowrate was 30$ of the nominal operation value. The in
trinsic TCs prove to give & leading signal when recording the tempe
rature fall. At the same time, due to some measurement method pecu
liarities, analysed in /5/> the low frequency components are partly
damped in the "sodium-steel" system.
At some reactor operating levels the TNs were recorded with fast
temperature sensors. The corresponding rms value of fluctuations are
given in the table; the correlation function for the nominal reactor
power level is shown in fig. 4 as compared with the correlation func
tion obtained by numerical modeling.
Table
Thermonoise rms for BH-600 sensors
N.fl
G i,c
6 .K
80
88
0,26
95
100
0,34
100
100
0,36
SOME RESULTS OF CALCULATION
The numerical modeling provided a preliminary estimation of the
outlet thermonoiso statistical characteristics. The method and code
"based on the Monte Carlo approach and generally following Firth's
work /6/ were developed /!/, modeling the random walk of a certain
particle ( the temperature mark in our case) in the turbulent flow.
Using the "backward diffusion" principle, a backward path of the par
ticle from the sensor to the section with the known temperature dis
tribution ( usually the upper boundary of fuel pins) is traced with
a certain time step. The particle coordinates at any time step are
determined taking into account three velocity components. The mean
flow velocity j.s considered as a longitudinal speed component; the
182
p a r t i c l e dr i f t in the t ransverse d i r ec t ion i s charac ter ized by a con
s tant crosa-stream veloci ty v and a constant cross-stream cor re la t ion
length 1. These parameters define the apace-temporal flow cor re la t ion .
The s t o h a s t i c angle devia t ion during the cross-stream motion i s pro
duced with the random number generator . The current temperature f luc
tua t ion i s associa ted with the pos i t i on , where the present p a r t i c l e
crosses the i n i t i a l sec t ion with known temperature d i s t r i b u t i o n . The
s tohas t i c sequence obtained presents a temporal TN rea l iza t ion ,which
can be processed by various s t a t i s t i c a l methods. The number of par
t i c l e s to be traced was up to 20 thousands. The ca l cu la t ion of mean
va lues , rms, moments of the 3-d and 4-th order , normalized d i s t r i bu
t ion parameters (skewness, k u r t o s i s ) , co r r e l a t i on functions ana po
wer spec t r a l dens i t i es i s foreseen.
Computations were made for the BIJ-8O0 subassembly model. The i n
ner SA hexagonal sect ion with the f l a t - t o - f l a t dimension of 92 mm
was replaced with a c i r c l e of the same c ross-sect ion.The coolant ve
loc i ty var ied within the values of 0.5+2 m/s (Re=2.5*10* 105) . The Til
for d i f fe ren t ou t l e t temperature s ta t ionary p r o f i l e s were inves t iga
ted. The example of s t a t i s t i c a l c h a r a c t e r i s t i c a t the axisimmetrical
p ro f i l e for the temperature drop between the center and periphery
of a sec t ion being 15 K i s fjivem in f ig . 4. The ca l cu la t ions show
tha t skewness and k u r t o s i s are sens ib le to temperature p ro f i l e va r ia
t ions . For the nominal ve loci ty value (u=2m/s) the co r r e l a t i on time
?K — J P(t)c(z i s l e s s than 0 . 1 , the requirements to dynamic property
t i e s of the sensor following from t h i s f ac t . Here rms i s equal to
O.053 K. The difference betwe-an normalized experimental and calcu
l a t e d c o r r e l a t i o n funct ions can i nd i ca t e the presence of some addi
t iona l noise sources under r e a l r eac to r condi t ions .
185
C OTIC LU3 ION
1• In the experiments at fast sodium reactors the background tempe-i
rature noise under normal operation conditions has been investi
gated. Some noise sources are defined. Comparison with experi
ments at test facilities with blockages of different kind shows
/B/ that the anomaly high (one order higher than the background)
noise is observed only immediatly behind the blockage. While go
ing downstream the fluctuations attenuate and become comparable
with the background.
2. The reliability of thermohydraulic anomaly detection can be in
creased in various ways, including:
- design measures, ensuring individual SA monitoring and preven
ting the influence of the neighbouring SA flows
- compensation of the thermonoise caused by integral parameter
pulsations ( similar to the reactivity balance method /9/ )
- the noise components selection by a frequency filter
- analysis of high order moments
REFERENCE
1. Afanasiev V.A., Alexandrov K.A., Kebadze B.V. et al. BOR-60 so
dium boiling experiment. Atomnaja energia, 1978,v.45,is.5,p.330-34.
2. Basmer P., Dorr B., Kirsch D. et al. Experiments on local blockage;
In: Proc. of Meeting of liquid Metal Boiling Working Group, Ris-
ley, UK,1975, P-46
3. Adamovsky L.A., Efimov V.N., Kebadze B.V., Markin S.A. About the
sensitivity improvement of LMF3R subassembly temperature monito
ring system. Atomnaja energia, 1982, v.52,is.3,pp.164-168
4. Arnoldov M.N., Kebadze B.V. , Buksha Y.K. et al. The design and re
search of the thermoelectric transducers for temperature measure
ments in the fast breeder reactor. In: Proc. of SEV specialists'
184
meeting on "Instrumentation and diagnostic systems for fast reac
tors", Dresden, GDR, ZfK-519, pp.302-320
5.Arnoldov M.I7. , Kebadze B.V. , Komissarov Y.O. Some error sources of
sodium-steel thermoelectrical transducers. Atomnaja energia, 1986,
v.61, is. 1, pp.50-6l
6. Firth D. A Monte-Carlo approach to the theoretical prediction of
temperature noise in LI.1FBR subassemblies. Progress in Nucl.Energy,
1977, v.1, 11° 2-4, p.527
7. Kebadze B.V., Pychtina T.V., Tarasko M.S. The numerical modeling
of LI.tPBR subassembly temperature noise. Atomnaja energia, 1987,
v. 62, is.1, pp.57-59
8. Proceedings of IAEA-IY/GFR specialists' meeting on " Methods and
tools to detect thermal noise in fast reactors", Bologna, Italy,
8-10 October 1984
9. Kebadze B.V. , Efimov V.1I. , Adamovsky L.A. About the statistical
error of reactivity balance calculation. Atomna^a energia, 1977,
v.43, is. 1, p.36-37
165
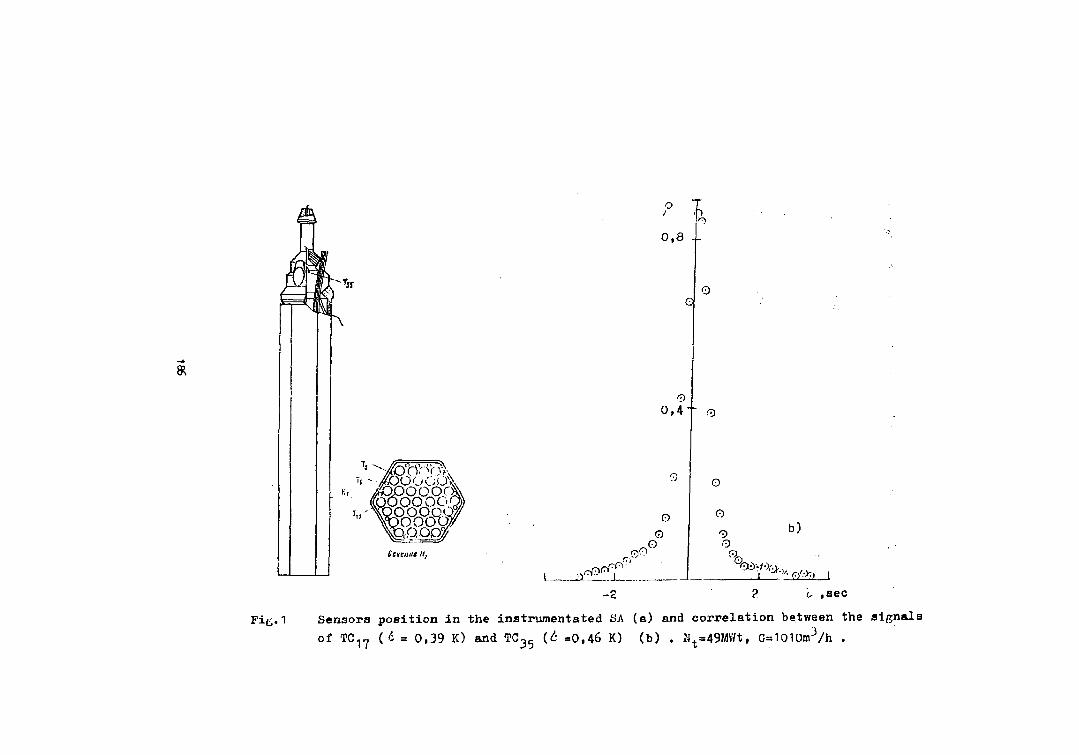
FiB.1 Sensors position in the instrumentated SA (a) and correlation between the signals
of TC1? (d = 0,39 K) and TC^ U =0,46 K) (b) . Mt-49MWt, G=1010m3/h .
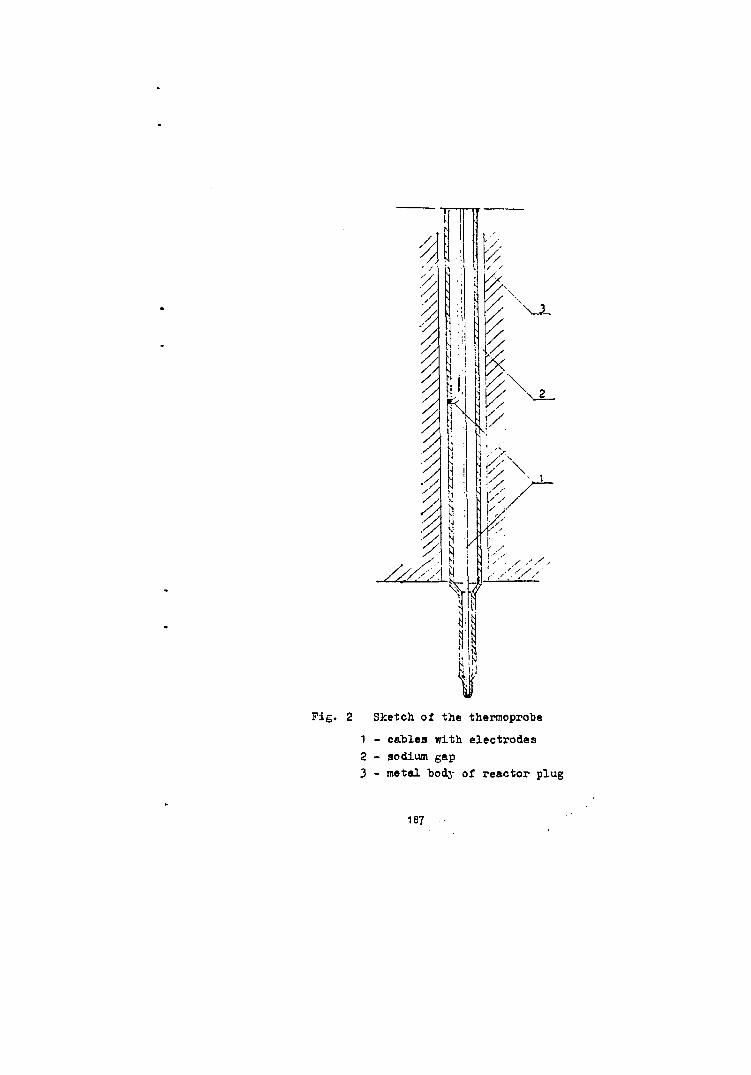
Pig. 2 Sketch of the thermoprobe
1 - cables with electrodes
2 - sodium gap
3 - metal body of reactor plug
187
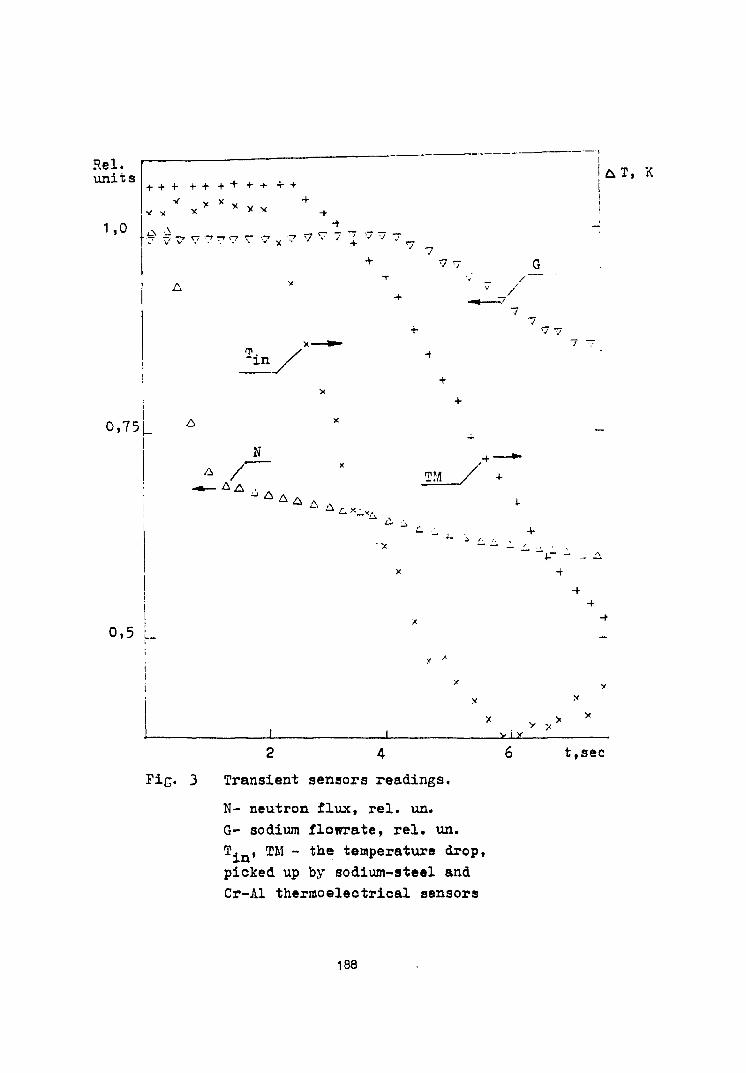
Rel. u n i t s
+ + + + + + + + • + + + & T , K
1,0 * •* "X
i_\ -i
> * x y v
f f ? ^ ^ r 7„? 7 V , ; v v - ^ V
i n
V v
/ 7
1
0.75L N
* /
^ A A ^ * _ , ,
TM
0,5 L
-f
vi / 2 4
PiG. 3 Transient sensors readings.
N- neutron flux, rel. un.
G- sodium flowrate, rel. un.
T. , TM - the temperature drop,
picked up by sodium-steel and
Cr-Al thermoelectrical sensors
t,sec
188
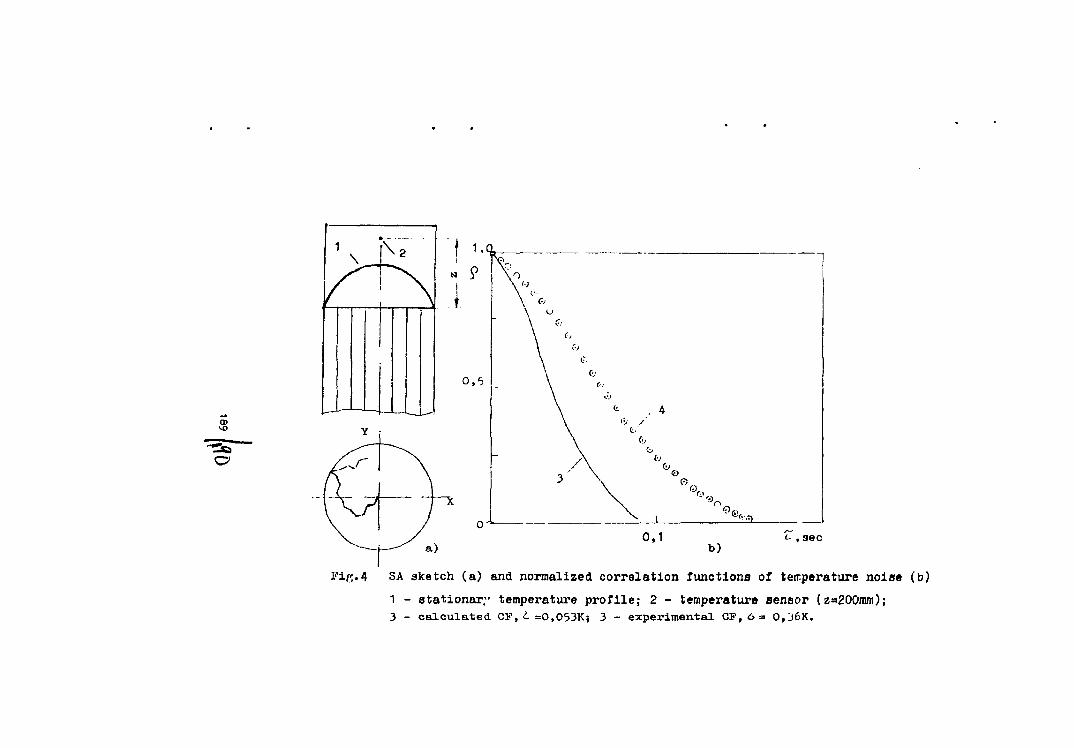
CD
o>
t- , sec
Pip.4 5A sketch (a) and normalized correlation functions of temperature noise (b.)
1 - stationary temperature profile; 2 - temperature sensor (z=200mm); 3 - calculated CV, i. =0,053Kj 3 - experimental CP,6= 0,136K.
COMPUTER BASED SYSTEMS FOR FAST REACTOR CORE TEMPERATURE MONITORING AND PROTECTION
D N HALL
Dynamics and Control Group Safety and Engineering science Division Winfrith Technology Centre
191
1 INTRODUCTION
The need for an effective system for monitoring the state of core cooling in fast reactor is regarded in the UK as being essential part of the safety system as well as providing important information to station operators. The UK has consequently spent considerable effort in developing temperature monitoring systems and incorporating them into highly reliable fail safe trip systems for reactor protection. One of the approaches that has been adopted is to make a direct measurement of the subassembly outlet temperature using specially designed coaxial thermocouples. The measured temperatures are then processed by a computer based trip system whose output goes to the guardlines for the primary shutdown system. The need for both the computer based trip system and the guardline to be fail safe, for safety, and highly reliable, for economics, has led to the use of dynamic logic to generate fail safety and redundancy to produce the required level of reliability. The resulting systems are both highly effective and have been proven in prototype form where they have successfully achieved the high data throughput and rapid response times which is particularly important for fast reactors where the time scales for many postulated accidented sequences can be very short, seconds rather than the tens of seconds of other reactor systems.
2 THE PULSE CODED LOGIC GUARDLINE
The traditional form of guardline structure used in the UK for reactor protection has been either relay based or used laddie. An alternative system that has been developed at Winfrith uses hardwired dynamic logic. The use of dynamic logic provides a continuous form of testing which is able to enhance availability as well as produce fail safety. The system can be configured many ways it has a set of M parallel guardlines, where M < 4 usually, and any number of parameters can be present on the guardlines. An oscillator at the start of each guard line generates SET and RESET signals which are propagated down the guard line via the guard line logic for each parameter. Oscillators are also used to generate a coded signal, a different one from each oscillator, these signals are passed to the instrument voters via the instrument trip contacts marked A, B and C in Figure 1. If all the instrument inputs are healthy, or satisfy the voting, then the signal from the voter to the guard line logic lets the SET RESET signals pass down the guard to the guard line logic of the next parameter and eventually to a pulse to dc converter which powers the shutdown actuators via the guard line voting and if required a power amplifier. The pattern of the coded signals passed to the instrument voter via the instrument trip contacts are arranged such that the voter outputs a pulse signal provided the system is in a safe state. The mode of operation is best illustrated by considering an actual system, for example a two out of three system that could be employed on the system illustrated in Figure l. The dynamic signals shown in Figure 2 are input to the parameter voting logic via the instrument trip contacts when all instruments are healthy this results in the uniform pulse pattern at the voter. Provided the pulse pattern is present the SET RESET
192
signals are propagated down the guard line. Should one instrument fail due to a fault on the trip state input it becomes stuck at o. The pattern at the voter for line A stuck at 0 is shown in Figure 2a, it retains its pulse like shape so the SET RESET signals still propagate and no trip is initiated but it has extra detail which uniquely defines the fault. It is usually arranged to indicate this failure at the parameter voter. Should a second instrument go to 0 then the patterns of Figure 2b result, the voter outputs a static state and the SET RESET signals are no longer propagated down the guardline, a trip is initiated depending on the state of the other guard lines and guard line voting in use. If the instrument becomes faulty such it becomes stuck at 1 then then situation of Figure lc results, the voter output is dynamic so no trip is initiated but the fault will be indicated and the pattern allows the fault to be identified.
consideration of all other cases has been made this includes the case of the failure of the pulse and coded signal generators. This situation immediately sets a guardline to the trip state and results in a stuck at 0 state on the instruments connected to that pulse generator, the system will trip on any further failure. The exhaustive investigations have shown that the system is fully fail safe and also allows faults to be quickly identified for repair or in exceptional circumstances vetoed the latter does however degrade the ability of the system to tolerate faults.
3 THE SELF TESTING TRIP SYSTEM
The trip lines that provide the input to the guardlines can also be arranged to operate in a similar manner, ie using dynamic logic to provide fail safety. However the systems incorporate computers to perform trip function analysis rather than the simple hardwired logic of the guardline. The simplest form of the system will be described as an illustration.
The plant signals are input to the multiplexer but interleaved among them in a carefully defined pattern are test signals Figure 3. These test signals are such the trip algorithm should output a fail, or trip, state if the trip computer is operating correctly. The multiplexer output passes through a polarity reverser, which switches the signal polarity on alternate sweeps of the multiplexer, through the analogue to digital converter to the trip algorithm computer where the trip calculations are performed. For example a system with four parallel trip lines might use 3 out of 4 voting. The resulting voter signals are input to a pattern recognition unit, which knows the pattern of trip and healthy states it should receive. If the pattern matches correctly the unit produces a pulse output which goes through a pulse to direct current converter and onto the guardline. If the patterns do not match, this could arise because of the plant moving to an unsafe or trip state or by failure (multiple) of the hardware then the pattern recognition unit outputs a static signal and power to the guardline contacts is lost.
The following points are noted, polarity reversal following the multiplexer can be included to check that the multiplexer is being
193
continually refreshed. The pattern of plant and test signals is carefully arranged to be unique for each set of eight inputs to the multiplexer so the multiplexer has to be fully refreshed, see Figure 4. The figure eight here arises from the use of an 8 bit pattern recognition sequence. The use of the computer to perform the trip calculation allows any plant signal and very complex trip algorithms to be employed. The vote algorithm computer is used rather than a hardwired voter such the signals from the parallel trip channels do not have to be synchronised. This marks a significant difference from the guardline structure where the codes are synchronised so hardwired voters can be used.
4 TESTING AND APPLICATION OF THE SYSTEMS
Both the pulse coded logic guardline and the self testing trip system have been tested and proved in operation under plant conditions. The pulse coded logic guardline was first tested in the laboratory then as a two parameter two out of three passive system on Bradwell (1976-1982) and a fourteen parameter two out of three passive system on Oldbury (1978-1982). The Oldbury system was then transferred to the DIDO reactor and following a three year trial operation was reworked and adopted for active service on the reactor. The system was found in both active and passive service to be extremely reliable fulfilling the reliability criteria set by the reactor operators. The systems have responded to all demand for trip action that have been made upon it and no fail danger states have been identified by analysis or have arisen in operation.
The computer based trip system has not received such extensive testing. The approach was first demonstrated in the laboratory and then a quasi commercial system was constructed and installed for testing in sodium loop at the Berkeley Nuclear Laboratories. This system contained four simple trip functions acting on subassembly outlet temperature, these were:
- absolute temperature too high;
absolute temperature too low;
- rata of change of temperature too high;
temperature difference from median of temperatures of six adjacent sub-assemblies too great.
The successful integration of the co-axial thermocouples, developed especially for fast reactor outlet temperature monitoring, and the trip system enabled it to be transferred to Dounreay and operated in passive mode on the prototype fast reactor. In operation only a small number of thermocouples have been used, dummy signals being supplied to the bulk of the inputs for convenience. The initial period of operation proved to be very disappointing as there were a large number of failures due to the very hostile environment, temperature and vibration, in which the system was placed. Following repair and relocation the system in an environment more appropriate for safety electronics has
194
achieved the prescribed reliability. Further during operation the system has functioned correctly on demand on every occasion and no fail danger statfis have arisen. Analysis of the system has similarly failed to identify any fail to danger states.
5 SYSTEM DEVELOPMENT
The major thrust of development of the pulse coded logic guardline system is to meet demands of flexibility and cost that will enable the system to be made available for use on existing and/or new plants in a cost effective manner. To this end design work is underway to produce a standard set of modules that can be put together to produce a three or four guardline structure operating on two out of three, two out of four or three out of four voting and containing any number of parameters on the guardlines. The modules are to be made up of commercially available components that can be pre-qualified and which can be assembled quickly and economically to produce any desired guardline configuration.
The more general nature of the trip system which is based upon the use of programmable computers gives rise to a much greater potential for development but does give rise to some additional work associated with the software executing the trip function. The extension of the architecture of the trip system to replace the interleaving of the test and the plant signals by introducing the test signal onto the plant input lines by using summation amplifiers as shown schematically in Figure 5. This system requires the addition of a further computer to calculate the perturbation to the plant state, this additional computer must in effect invert the forward trip calculation. This inversion procedure has been achieved for simple trip algorithms but those algorithms that contain strong temporal aspects for example the effect of damping and time delays are much more difficult to invert. Care must also be taken, especially with the trip algorithms that contain temporal features, to ensure the disturbance of the system introduced by the test signal does not produce a state that effects subsequent cycles of the trip calculation.
The extension of the trip function beyond that provided by the simple temperature functionality used on the PFR has also been investigated through the vehicle of producing channel power and linear rating trips for a PWR system. This exercise continues and work on inverting the temporal part of the algorithm is progressing quite well.
Extensive research is being undertaken into the means of producing the software for the trip computers for both simple and complex trip algorithms. The correctness or at least fail safety of this software is crucial to the successful production and licensing of the systems for use. One of the major areas of research is into the use of formal methods for the specification stage following requirements capture, the development or reification of the specification to the coding level. Formal tools are also being investigated for code production. One of the main exercises that
195
should yield information about all aspects of this process is the CEC ESPRIT II DARTS project.
6 TEMPERATURE MONITORING t
The temperature monitoring function of the self testing 'temperature trip system using thermocouples as the instrument has been described above. The UK have, however been investigating other means of sensing the temperature in the core. The first system makes use of acoustic boiling noise to monitor temperature remotely within the core. The system as such can only indicate that the temperature is above or below the saturation temperature, however this is sufficient for reactor monitoring and protection purposes. The second system, which has been developed more recently, is an ultrasonic temperature measuring system that can be used to make a line of sight temperature measurement across the subassewbly outlets at the top of the core. While both systems are not mature the results of experimentation, that has been undertaken in test loops and under test conditions in core, give a reasonable certainty that the approaches will function to detect anomalous signals. Aside from the problem of signal transmission, which also gives concern in the thermocouple based systems, there is some concern about the extensive nature of the signal processing electronics that are used in these systems. This concern takes two forms first is'how to identify any degradation or failure of the signal processing electronics, second and particularly for the acoustic boiling noise system there is some concern as to whether the signal processing system will recognise/detect boiling. The latter point is not addressed here but the concern over system availability, particularly with the extensive use of signal processing, can be resolved for both acoustic and ultrasonics by incorporating them into a self testing system. Thus rather than the instrument feeding the signal processing electronics and then the trip electronics the instrument and test signals are multiplexed before signal processing and evaluation by the trip system, see Figure 6. This architecture thus provides continuous testing of the signal processing electronics b«t the system does not test the instrument and a fail to danger of the instrument is possible. This is also true for the thermocouple based system but thermocouple failure is more likely to lead -co a fail safe rather than a fail danger state.
Test signal generation for both the acoustic and ultrasonic systems must either rely upon: use of pre-recorded signals that indicate boiling or a temperature above the trip temperature, or upon there being a test chamber in which sensors of the type used-on the plant can be subject to conditions that result in a trip state. For example an acoustic microphone could be mounted on a boiling chamber. Such an approach has the grave disadvantage compared with the use of recorded signals that the acoustic, or equivalent ultrasonic, signal may not have the same characteristic as signals from the plant.
The ultrasonic system does, however, present other possibilities as the system works by making a sound speed measurement to obtain
196
the temperature by measuring the time of an acoustic pulse over a known distance. The trip signal for testing purposes could be produced by changing the effective distance in the sound speed calculation. This approach has the great advantage over using a pre-recorded signal in that the plant signal must be present thus this approach also provides a test of the ultrasonic transmission and reception equipment.
Work is continuing to investigate the use of self testing for these alternative systems and to produce a practical system for operation on the fast reactor. The system may well employ both forms of self testing indicated in the discussion above to produce a satisfactory system.
7 CONCLUSIONS
Self testing fail safe trip systems and guardlines have been developed using dynamic logic as a basis for temperature monitoring and temperature protection in the UK. The guardline and trip system have been tested in passive operation on a number of reactors and a pulse coded logic guardline is currently in use on the DIDO test reactor.
Acoustic boiling noise and ultrasonic systems have been developed in the UK as diverse alternatives to using thermocouples for temperature monitoring and measurement. These systems have the advantage that they make remote monitoring possible but they rely on complex signal processing to achieve their output. The means of incorporating such systems within the self testing trip system architecture are explored and it is apparent that such systems, particularly that based on ultrasonics has great potential for development. There remain a number of problems requiring detailed investigation in particular the verification of the signal processing electronics and trip software. It considered that these problems while difficult are far fron. insurmountable and this work should result in the production of protection and monitoring systems suitable for deployment on the fast reactor.
197
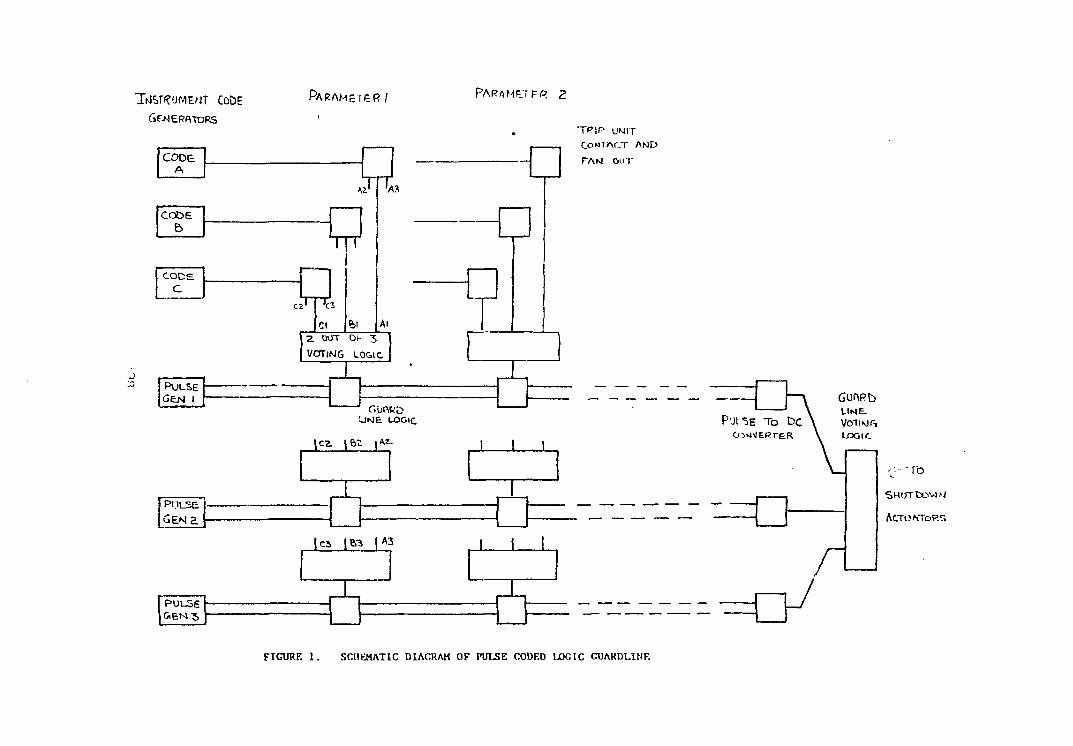
TtfSTCUMEMT CODE
GENERATORS
P U L S E GEN I
P U L S E -
PARAMETER /
CODE
cooe
CODS
c c
J
1
^
1
fct
', 1
Al
a DOT Cn- 3
VOTlMG LOGIC
F; GulttcD
| C ^ |E>3 | A3
5
PARAMF.TF(= 2
T P I P UNIT
C O N T A C T AMD
TAN DOT
PULSE
GEM a
\cz
UN E. LOGIC
1 1 1
FIGURE 1 . SCHEMATIC DIACRAM OF PULSE CODED LOGIC GUAKDLINE
P'JL-SE To DC CONVERTER
GOORb LIME. VOTIS)^
LOGIC
- ' - T O
S H U T tx) VIM
A t T O M b R K
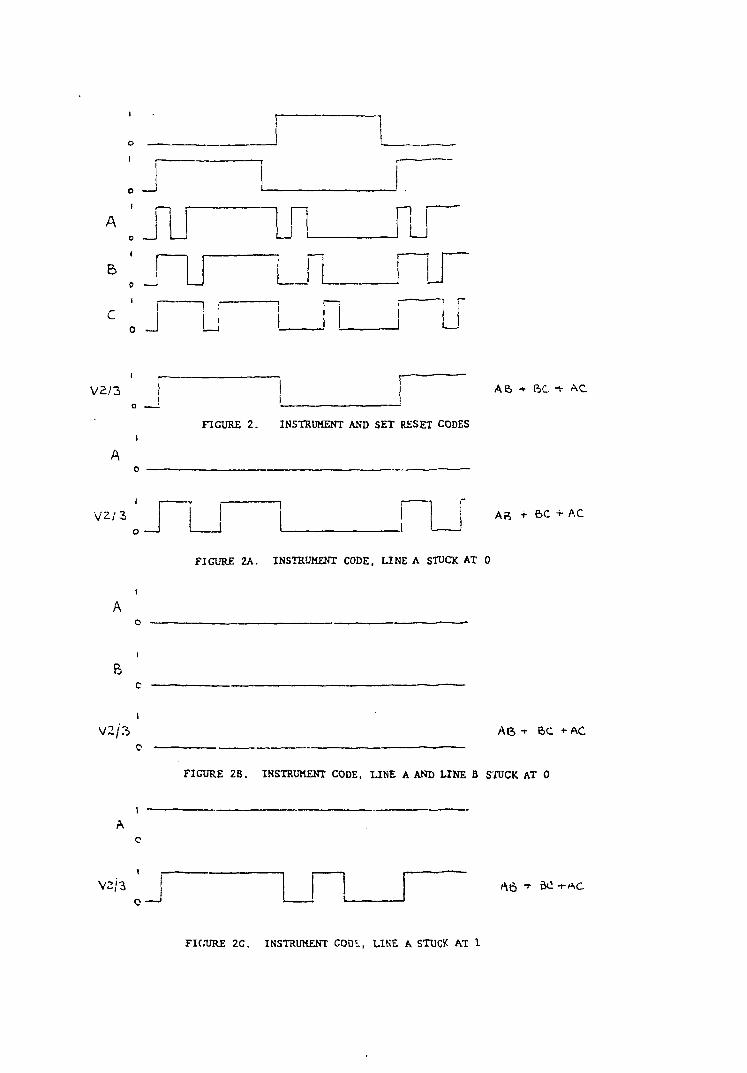
L
A n n U B
C J U -i r
U
V2/3
FIGURE 2 . INSTRUMENT AND SET RESET CODES
A 6 + ftC f AC
V 2 / 3 AR + 6C +AC
FIGURE 2A. INSTRUMENT CODE, LINE A STUCK AT 0
V 2 / 3 A 6 T BC f AC
FIGURE 2B. INSTRUMENT CODE, LINE A AND UNE B STUCK AT 0
V2/3 _J
A6 "•" ^ -rAC
FIOURE 2C. INSTRUMENT COD1.;, LINE A STUCK AT 1
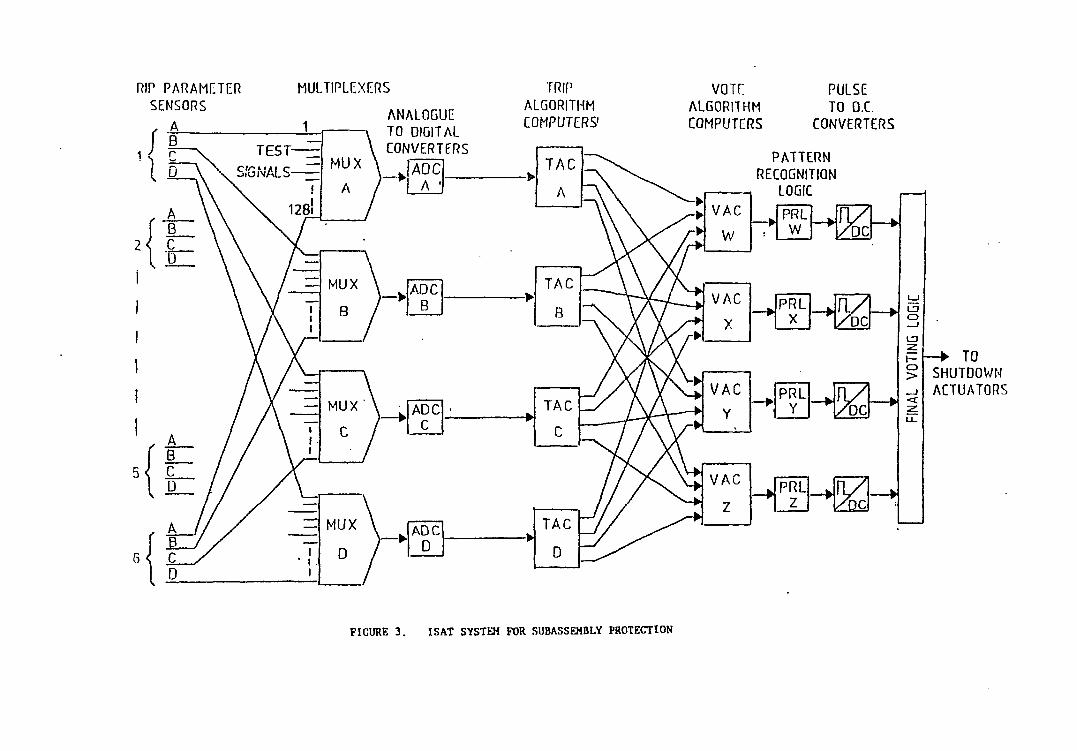
RIP PARAMETER SENSORS
A
MULTIPLEXERS
ANALOGUE TO DIGITAL CONVERTERS
TRIP ALGORITHM COMPUTERS'
VOTE ALGORITHM COMPUTERS
PULSE TO D.C.
CONVERTERS
PATTERN RECOGNITION
LOGIC
FICURE 3. ISAT SYSTEH FOR SUBASSEMBLY PROTECTION
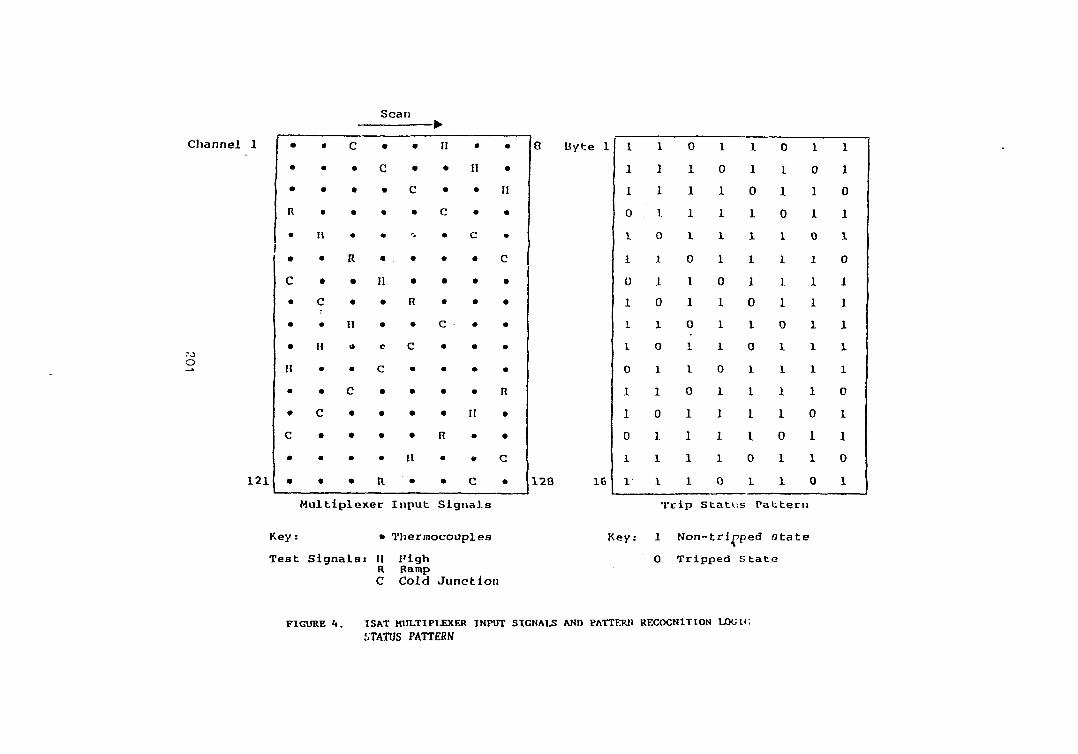
Scan
C h a n n e l 1
*o O
1 2 1
•
C
a
c
ii
c
ii
c
c
R
H
c
•
c •
•
*
•
11
•
•
e
c •
•
•
•
R
•
•
C
•
-'
•
•
R
•
C
•
•
•
•
It
•
-w
11
C
c
R
•
II
c
II
c
II
c
n
c •
8 B y t e 1
128 16
1
1
1
0
1
1
0
1
1
1
0
1
1
0
1
1
0
1
1
1
1
0
I
1
0
1
1
0
1
1
1
1
1
0
1
1
1
1
0
1
1
1
0
1
1
1
1
0
1
1
0
1
1
1
1
0
1
0
1
1
1
I
0
1
0
1
1
0
1
1
1
1
0
1
1
1
1
0
1
1
1
0
1
1
0
1
1
1
1
1
1
1
0
1
1
0
1
1
0
1
1
0
1
1
1
1
1
0
1
1
0
1
Multiplexer Input Signals Trip Status Pattern
K e y . • T h e r m o c o u p l e s
T e a t S i g n a l s ! H I ' i g h R Ramp C C o l d J u n c t i o n
K e y : 1 N o n - t r i p p e d s t a t e
0 T r i p p e d S t a t e
FIGURE 4 . ISAT MULTIPLEXER INPUT SIGNALS AND PATTERN RECOGNITION LOGIC STATUS PATTERN
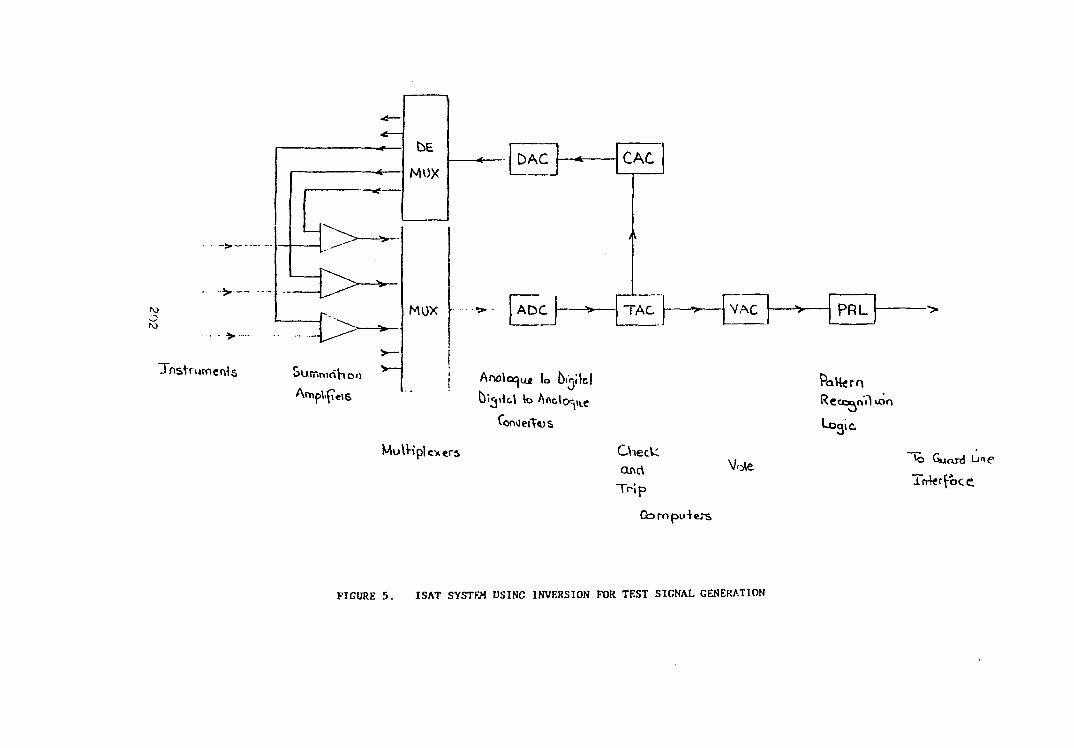
bE
MUX
> •
• > —
TnsVnimenls oUiTirndHo>)
MUX
MulKpl
DAC 1— -
ADC
Anoloeju* \o 6i»itcl
CAC
TAC
ex era
VAC
Check, anrt
Tr ip
Gornpu+ers
V.^e
J * - PRL
PaH<rn
Logic
*0 Guard Line
TrrteffoCG
FIGURE 5. ISAT SYSTEM USING INVERSION FOR TEST SIGNAL GENERATION
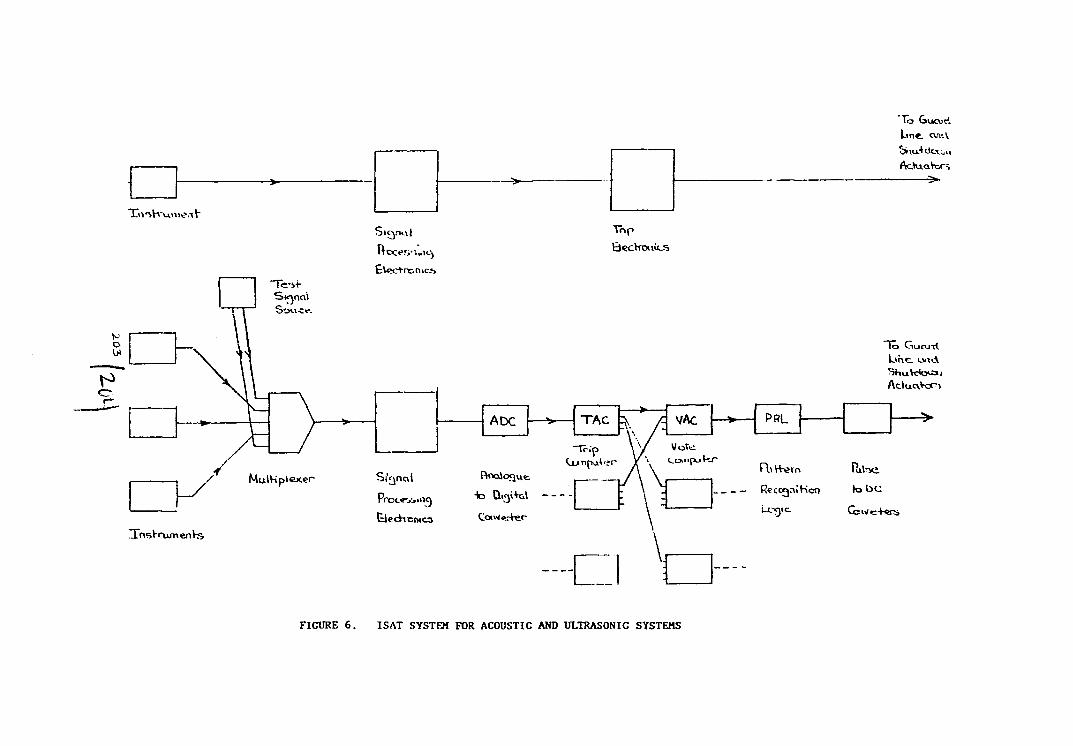
'To Gucud Lint <v«V
=*-
TLii'bVvuMW.tt'
StCyK\|
Hoo?«y-.„u^
Electronics
Trip
l o Ciuoj i l L»ne. um\ ShuVck>a>i AclucvVcr-v
R\VK>tn
RcccrjniKcrj
L)C*}<C.
Rl\-Ki
fobc
Ccwe+«r$
ITnsrrumenrs
FIGURE 6 . ISAT SYSTEM FOR ACOUSTIC AND ULTRASONIC SYSTEMS
REPORT ON IAEA-CRP ON SIGNAL PROCESSING TECHNIQUES FOR
SODIUM BOILING NOISE DETECTION*
(IGCAR, DDIAE, KFK, BNL - CONTRIBUTION) * *
Ly
Om P a l S i n g h I n d i r a Gandh i C e n t r e f o r A t o m i c R e s e a r c h
Ka lpakkam - 603 1 0 2 , T a m i l Nadu , I n d i a
* P a p e r f o r p r e s e n t a t i o n i n I A E A - I W G F R M e e t i n g o n ^ I n s t r u m e n t a t i o n f o r S u p e r v i s i o n o f C o r e C o o l i n g of FBRs ' December 1 2 - 1 5 ( 1 9 8 9 ) , IGCAR, K a l p a k k a m , T a m i l n a d u , I n d i a
IGCAR : I n d i r a G a n d h i C e n t r e f o r A t o m i c R e s e a r c h , I n d i a
DDIAE : D a r l i n g Downs I n s t i t u t e of Advanced E d u c a t i o n , A u s t r a l i a
KFK : K e r n f o r s c h u r y s z e n t r u m , K a r l s r u h u , FRG
BNL : B e r k e l e y N u c l e a r L a b o r a t o r i e s , CEGB, UK.
?^5

REPORT ON IAEA-CRP ON SIGNAL PROCESSING TECHNIQUES FOR
SODIUM BOILING NOISE DETECTION
(IGCAR, DDIAE, KFK, BNL - CONTRIBUTION)
I . INTRODUCTION
I n L i q u i d M e t a l F a s t B r e e d e r R e a c t o r s (LMFBRs), r e l i a b l e d e t e c t i o n of sod ium b o i J i n g h a s b e e n r e c o g n i s e d a s an i m p o r t a n t r e q u i r e m e n t f o r a d d i t i o n a l s a f e t y p r o t e c t i o n . The luuri^ Lut i n y of a c o u s t i c n o i s e e m i t t e d d u r i n g socaum b o i l i n g i s c o n s i d e r e d a p romis ing method. However, f o r r e l i a b l e d e t e c t i o n , i t i s n e c e s s a r y t o d i s t i n g u i s h t h e b o i l i n g n o i s e from background n o i s e . D i f f e r e n t methods a r e be ing d e v e l o p e d f o r t h i s pu rpose i n s e v e r a l c o u n t r i e s . An IWGFR S p e c i a l i s t s m e e t i n g r e c o g n i s e d t h e n e c e s s i t y for a benchmark t e s t t o make a c o m p a r a t i v e a s se s smen t of t h e e x i s t i n g s i g n a l p r o c e s s i n g t e c h n i q u e s and i d e n t i f y optimum m e t h o d s f o r a r e l i a b l e o n - l i n e sod ium b o i l i n g n o i s e d e t e c t i o n sys tem. IAEA a c c e p t e d t h e recommendation of IWGFR and sponsored t h e p r o j e c t . A u s t r a l i a , J a p a n , I n d i a , FRG, GDR a n d UK p a r t i c i p a t e d i n t h e p r o j e c t . The p r o j e c t c o n t i n u e d from 1984 t o 1987. The r e s u l t s of t h e i n v e s t i g a t i o n s a r e d o c u m e n t e d d ) i n IAEA r e p o r t no. IWGFR/68.
The d a t a f o r t h i s benchmark p r o b l e m was p r o v i d e d by IAEA from o u t of p i l e e x p e r i m e n t s (3 ) p e r f o r m e d on KNS I l o o p a t KFK - K a r l s r u h e and i n - p i l e e x p e r i m e n t s ( 4 ) performed on BOR-60 i n R u s s i a . The d e t a i l s of t h e d a t a s e t a r e p r e s e n t e d by M a c l e o d ( 2 ) a l o n g w i t h t h e h i g h l i g h t s of t h e work of RNL (UK), J a p a n and GDR. In t h i s p r e s e n t a t i o n , f i r s t t h e IGCAR work i s p r e s e n t e d . I t i s f o l l o w e d by b r i e f p r e s e n t a t i o n of BNL (UK), A u s t r a l i a and FRG work.
I I . HIGHLIGHTS OF CRP WORK
I I . l IGCAR ^ WORK
The KNS-I and BOR-60 data were analysed using known methods arid by searching new methods of signal processing. The tasks for both sets of data were to detect the onset of boiling by different methods and evaluating the quality of detection in terms of probability of spurious boiling detection (Ps) and missing the boiling detection (Pm) by choosing appropriate boiling threshold for each method. It was also checked whether the signal processing method under test can be set to achieve the spurious trip rate less than iff" per year (° 0.3 x 10 #/s) and if such a rates can be achieved what is the minimum averaging time needed in evaluating the features sensitive to boiling, what would be the probability of missing a boiling event and what is the level of discrimination between the boiling and non-boiling phases in signals.
?06
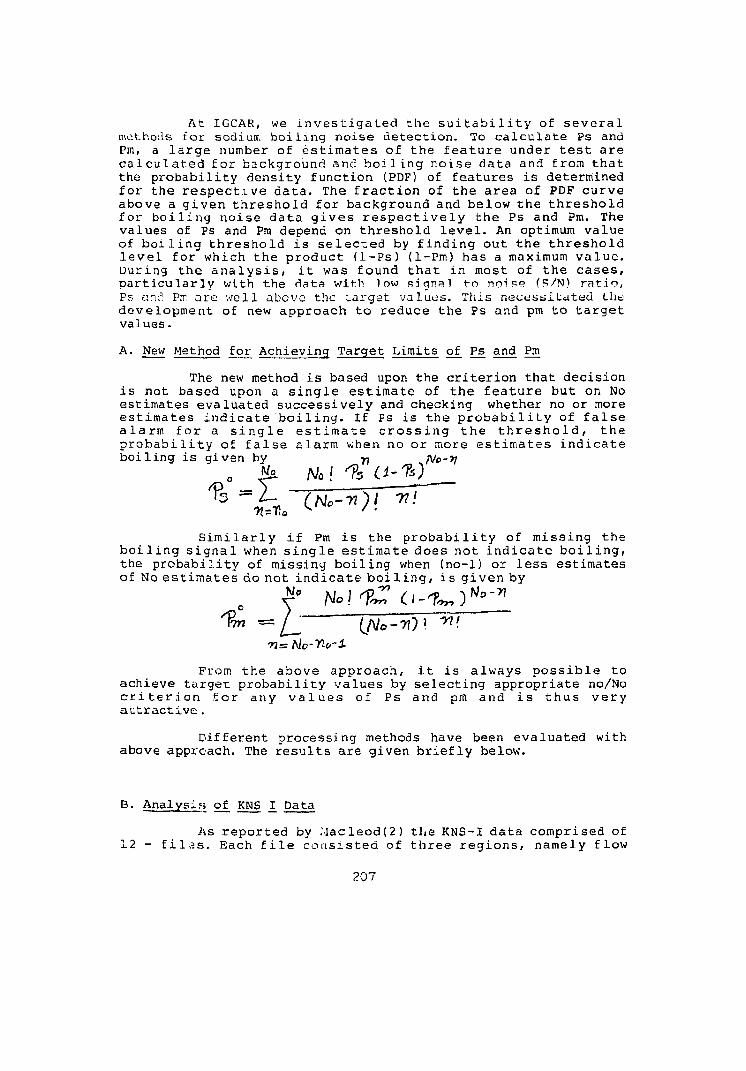
At 1GCAR, we investigated the sui tabi l i ty of several methods tor sodium boiling noise detection. To calculate Ps and Pm, a large number of estimates of the feature under test are calculated for background and boiling noise data and from that the probability density function (PDF) of features is determined for the respective data. The fraction of the area of PDF curve above a given threshold for background and below the threshold for boiling noise data gives respectively the Ps and Pm. The values of Ps and Pm depend on threshold level. An optimum value of boiling threshold is selected by finding out the threshold level for which the product (1-Ps) (1-Pm) has a maximum value. During the analysis/ i t was found that in most of the cases, particularly with the data with low signal to noi F«? (S/N) ratio, Ps and PIT: are well above the target values. This necessitated the development of new approach to reduce the Ps and pm to target values.
A. New Method for Achieving Target Limits of Ps and Pm
The new method is based upon the criterion that decision is not based upon a single estimate of the feature but on No estimates evaluated successively and checking whether no or more estimates indicate boiling. If Ps is the probability of false alarm for a single estimate crossing the threshold, the probability of false alarm when no or more estimates indicate boiling is given by 77 M>~*7
0 *k Ml % d-K)
Similarly if Pm is the probability of missing the boiling signal when single estimate does not indicate boiling, the probability of missing boiling when (no-1) or less estimates of No estimates do not indicate boiling, is given by
From the above approach, i t is always possible to achieve targer probability values by selecting appropriate no/No c r i t e r ion for any values of Ps and prti and is thus very attractive.
Different processing methods have been evaluated with above approach. The results are given briefly below.
B. Analysis of KMS I Data
As reported by Macleod(2) the KNS-1 data comprised of 12 - f i l e s . Each f i l e consisted of three regions, namely flow
207
noise, initial boiling and intense boiling noise and each file with data of different signal to noise (S/N) ratio. The first file data is with 0.0 dB S/N ratio and the twelfth file with -17.5 dB. File 2 to file 11 data is with S/N ratio decreasing successively by 2dB. The objective of the analysis is to find the onset of initial and intense boiling with required Ps and Pm using different methods.
B.l Detection of Onset of Boiling
Conventional methods
1- YiSM^i observation : As a first step, the data were scanned and examined visually on oscilloscope. Onset cfinitial bo. ling could be detected in the first 9 - tiles. However, onset of intense boiling could not be observed in visual inspection.
ii- Pulse counting : The number of pulses above a set threshold in a given time was counted and an increase in the counts was considered to be indicative of boiling signal. A pulse counter was built for this purpose. Onset of intial and intense boiling were detectedl in all the files. To evaluate Ps and Pm, the analog data were digitised with 50 microsecond sampling time. PDF was calculated for JPulse counts feature'. It was found that for file 1, there was no overlap of PDFs in background and boiling regions leading to clear cut threshold and Ps = Pm = 0. Onset of boiling could be correctly predicted. However, in the case of twelfth file, there was overlap of PDFs and no/No criterion of 11/20 satisfied the target probability of Ps=10_'° and Pm=10~s
Applying this, onset of boiling was predicted 9 s after the actual inception point.
iii. Estimation of RMS : Onset of initial and intense boiling could be predicted with RMS estimates also. PDF of RMS for background noise data was more sharply peaked than the PDF of boiling noise data. This resulted in Ps to be more sensitive to threshold level. Unlike pulse counting method, PDF of RMS for background and boiling noise data overlaped for file 1 data also. For file 1, and 12, no/No criterion of 8/20 and 21/40 provided the target values of Ps and Pm. The onset of boiling predicted for file 1 was off (delayed) by 4.9S for file 1 and 6.3 S for file 12. RMS - analysis was performed for squared data also. However, it proved of no advantage.
IV. Power Sp_ectra_l Den^i-ty IPSDJ^ : PSD - estimates for background and boiling noise data indicated that area under PSD curve increases above 35 kHz for sodium boiling. This area was treated as a feature. For file 1, onset of boiling was detected with a delay of 1.7 S and no/No criterian required was 7/13.
r>i
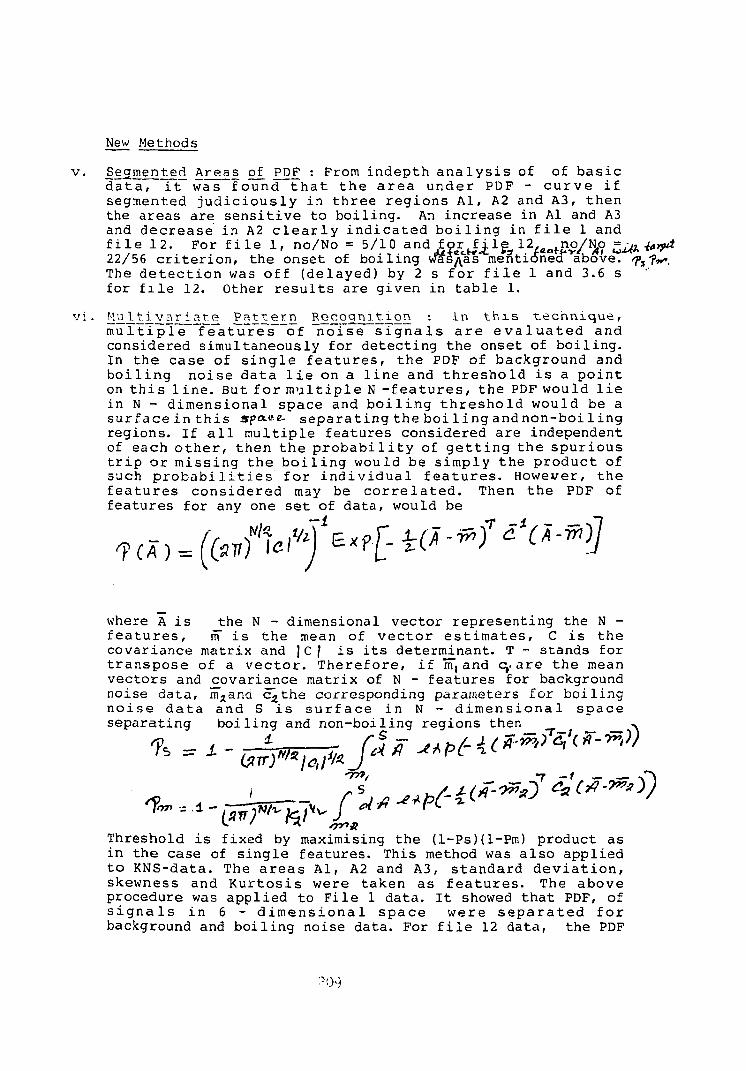
New Methods
v . Segmented Areas of j?DF : From indep th a n a l y s i s of of b a s i c d a t a , i t was found t h a t t h e a r e a u n d e r PDF - c u r v e i f segmented j u d i c i o u s l y in t h r e e r e g i o n s Al, A2 and A3, then the areas are s e n s i t i v e to b o i l i n g . An increase in Al and A3 and d e c r e a s e in A2 c l e a r l y i n d i c a t e d b o i l i n g in f i l e 1 and f i l e 12. For f i l e 1, no/No = 5/10 and f o r j j . l g 12 no/Ntf = ^ ^yd 22/56 c r i t e r i o n , the onset of b o i l i n g was^as mentioned above. 7,-jV. The d e t e c t i o n was off (de layed) by 2 s fo r f i l e 1 and 3.6 s for f i l e 12. Other r e s u l t s are given in t a b l e 1.
v i . Mni^i_var__ia_t^e P a t t e r n Rccoan^tjLon : In t h i s t e c h n i q u e , m u l t i p l e f e a t u r e s of n o i s e s i g n a l s a r e e v a l u a t e d and considered s imul taneously for de tec t ing the onset of b o i l i n g . In t he case of s i n g l e f e a t u r e s , t h e PDF of background and b o i l i n g n o i s e d a t a l i e on a l i n e and t h r e s h o l d i s a p o i n t on t h i s l i n e . But f o r m u l t i p l e N - f e a t u r e s , t he PDF would l i e in N - d imens iona l space and b o i l i n g t h r e s h o l d would be a surf ace i n t h i s spa-ee- s e p a r a t i n g t h e boi l i n g and non-boi l i n g regions. If a l l m u l t i p l e fea tures considered are independent of each o t h e r , then t h e p r o b a b i l i t y of g e t t i n g t h e s p u r i o u s t r i p or mi s s ing the b o i l i n g would be s imply t h e p r o d u c t of such p r o b a b i l i t i e s fo r i n d i v i d u a l f e a t u r e s . However, t h e f e a t u r e s cons ide r ed may be c o r r e l a t e d . Then t h e PDF of fea tures for any one s e t of da ta , would be
where A i s the N - dimensional vector represent ing the N -f e a t u r e s , m" i s t h e mean of v e c t o r e s t i m a t e s , C i s t h e covariance matrix and |Cf i s i t s determinant . T - s tands for t r a n s p o s e of a v e c t o r . T h e r e f o r e , i f m, and c . a r e t h e mean vec tors and covar iance matrix of N - fea tures for background noise data , m^and c^the corresponding parameters for b o i l i n g n o i s e d a t a and S i s s u r f a c e in N - d i m e n s i o n a l s p a c e separa t ing b o i l i n g and non-boi l ing regions then
•fi-y^S)
fi., ^pH«-^ &*•>->) Threshold i s fixed by maximising the (1-Ps)(l-Pm) product as in the case of s i n g l e f ea tu res . This method was a l s o appl ied t o KNS-data. The a r e a s Al, A2 and A3, s t a n d a r d d e v i a t i o n , skewness and K u r t o s i s were taken as f e a t u r e s . The above procedure was app l ied to F i l e 1 data . I t showed t h a t PDF, of s i g n a l s i n 6 - d i m e n s i o n a l s p a c e were s e p a r a t e d f o r background and b o i l i n g noise data . For f i l e 12 data , the PDF
?0$
overlapped and hence no/No criteria was applied to get target values of Ps and Pm. For file 1, the predicted time of onset of boiling was 27.4 S (0.4s more than the actural) and for file 12, with 15/1G criteria the onset of boiling predicted was 30.1 s (2.3s more than the actual).
vii.Adaptive Learning Network (ALN) Method : ALN-method is applied to file 1 and file 12 data with two generations. Areas Al and A3 and pulses above a set threshold, n, were used as the input features. In the first generation Al and A3 are input and y is the output. That is
V - 4-1 + ?a fit + fi **> +• fy &'+•?•< ft #*> *-& 4 J y and p u l s e c o u n t s , n a r e the i n p u t f e a t u r e s t o the second generat ion network, y' second generat ion output i s
F i l e 12 d a t a was used as t r a i n i n g s e t . C o e f f i c i e n t s in t h e equations were est imated by minimising square e r ro r function and wi th t h e ou tpu t equated t o zero in background n o i s e region and one in b o i l i n g region. Network equat ions were then a p p l i e d t o remain ing da t a in f i l e 12 and a l s o t o d a t a i n f i l e 1. F i g . l i l l u s t r a t e s the second g e n e i a t i o n o u t p u t from f i l e 1, c l e a r l y i nd i ca t i ng b o i l i n g .
Table 1 compares the time of onset of b o i l i n g detected by d i f f e r e n t methods and the required no/No c r i t e r i o n t o achieve t a r g e t p r o b a b i l i t i e s in each case. The va lues of onset of b o i l i n g t ime a r e a l s o g i v e n a t t h e bottom of t he t a b l e .
B.2 Conclusions
a. A s imp le method l i k e p u l s e coun t ing t e c h n i q u e i s q u i t e s e n s i t i v e to b o i l i n g noise .
b . A l l i n d i v i d u a l es t imates t e s t e d were found to de t e c t b o i l i n g e f f e c t i v e l y and a r e s u i t a b l e f o r m u l t i f e a t u r e p a t t e r n recogni t ion a l s o .
c . This a n a l y s i s work i d e n t i f i e d new f e a t u r e s l i k e a r e a s under the PDF curve , s e n s i t i v e to b o i l i n g noise .
d. Maximisation of the product (1-Ps)(l-PM) i s found s u i t a b l e for f ix ing b o i l i n g th re sho ld .
e . Use of b i n o m i a l d i s t r i b u t i o n approach as s u g g e s t e d makes i t p o s s i b l e t o a c h i e v e low p r o b a b i l i t i e s of f a l s e a l a rm and mising the b o i l i n g de t ec t i on .
?'0
f. Mul t iva r ia te pa t te rn recognition and ALN technique predicted onset of boi l ing very close to t rue values and appears to be su i tab le for r e l i a b l e bo i l ing detect ion.
C. Analysis of BOR-60 Data
In BOR-60 reac tor , bo i l ing was generated by gamma heating in tungs ten rod bundles in two d i f f e r e n t t e s t r i g s . Bo i l ing s i g n a l s were measured with i o n i z a t i o n chamber and s e v e r a l acoustic transducers of sodium iminersible type and wave guide *-yn«=. D e t a i l s of t h e s i g n a l s r e c o r d e d from d i f f e r e n t t r ansduce r s are given in t a b l e 1. Resu l t s of the a n a l y s i s of these data a re given below :
i . Preliminary Analysis : Al 1 the data were checked and scanned for RMS and p u l s e count ing a n a l y s i s by RMS-meter and pu l s e counter b u i l t i n -house . The i n c e p t i o n of b o i l i n g could be i d e n t i f i e d by both the methods for waveguide and p r e s su re t r a n s d u c e r s i g n a l s in f i l e 3 and 4 t h a t con ta ined both background and boi l ing s igna l s .
i i . Detailed Analysis : Detailed ana lys i s was performed for the s igna l s from pressure transducer P2 and waveguide Wl for f i l e 2 (background), f i l e 3 (background and b o i l i n g ) and f i l e 7 ( b o i l i n g ) using d i f f e r e n t methods d i scussed above for KNS-da ta a n a l y s i s . As decided in RCM, the r e s u l t s were prepared in the following form.
F i l e 2 : p robabi l i ty of fa l se alarm, Ps Vs aver .ging time
F i l e 3 : p r o b a b i l i t y t h a t b o i l i n g e x i s t s , as a funct ion of tape length
F i l e 7 : p robab i l i ty of missing bo i l i ng , Pm Vs averaging time
The r e s u l t s of t h i s ana lys i s are given in d e t a i l in Ref. 1. Table 3 l i s t s the no/No c r i t e r i o n and the detc t ion time of onset of b o i l i n g in f i l e 3 for d i f f e r e n t methods t e s t e d on wave guide data . Conclusions from ana lys i s of BOR-60 data are :
a. Instruments l i k e RMS-meter and pulse counter are able to de tec t onset of bo i l i ng .
b . Featurew l i k e a r e a s und«;r PDF-curve, RMS-value, PSD which were found s e n s i t i v e to b o i l i n g for KNS data were a l so found s e n s i t i v e to i n p i l e b o i l i n g s igna l s .
c. A p p l i c a t i o n of no/No c r i t e r i o n enabled achievement of low ta rge t p r o b a b i l i t i e s .
21 '
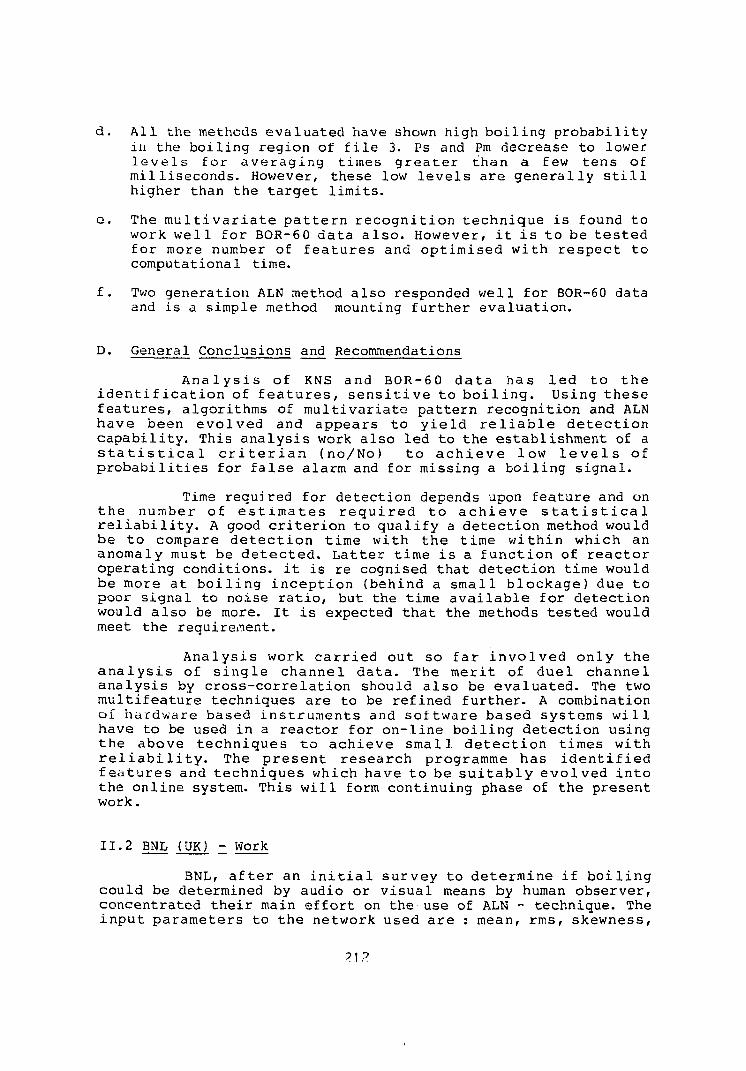
d. A l l the methods eva lua ted have shown high b o i l i n g p r o b a b i l i t y in the b o i l i n g region of f i l e 3. Ps and Pm decrease to lower l e v e l s for a v e r a g i n g t imes g r e a t e r than a few t e n s of m i l l i s e c o n d s . However, these low l e v e l s a re g e n e r a l l y s t i l l higher than the t a r g e t l i m i t s .
e . The m u l t i v a r i a t e p a t t e r n r e c o g n i t i o n t e c h n i q u e i s found t o work w e l l for BOR-60 da ta a l s o . However, i t i s t o be t e s t e d for more number of f e a t u r e s and o p t i m i s e d wi th r e s p e c t to computational time.
f. Two generat ion ALN method a l s o responded wel l for BOR-60 data and i s a simple method mounting fur ther e v a l u a t i o n .
D. General Conclusions and Recommendations
A n a l y s i s of KNS and BOR-60 d a t a h a s l e d t o t h e i d e n t i f i c a t i o n of f e a t u r e s , s e n s i t i v e t o b o i l i n g . Using t h e s e f e a t u r e s , a lgor i thms of m u l t i v a r i a t e p a t t e r n recogn i t ion and ALN have been e v o l v e d and appea r s t o y i e l d r e l i a b l e d e t e c t i o n c a p a b i l i t y . This a n a l y s i s work a l s o led to the es tab l i shment of a s t a t i s t i c a l c r i t e r i a n (no/No) t o a c h i e v e low l e v e l s of p r o b a b i l i t i e s for f a l s e alarm and for missing a b o i l i n g s i g n a l .
Time required for de tec t ion depends upon fea ture and on t h e number of e s t i m a t e s r e q u i r e d t o a c h i e v e s t a t i s t i c a l r e l i a b i l i t y . A good c r i t e r i o n to qua l i fy a de t ec t ion method would be t o compare d e t e c t i o n t ime wi th t h e t ime w i t h i n which an anomaly must be d e t e c t e d . L a t t e r t ime i s a f u n c t i o n of r e a c t o r opera t ing condi t ions , i t i s re cognised t h a t de t ec t ion time would be more a t b o i l i n g i n c e p t i o n (behind a s m a l l b lockage ) due t o poor s igna l to noise r a t i o , but the time a v a i l a b l e for de tec t ion would a l s o be more. I t i s expected t h a t the methods t e s t e d would meet the requirement.
A n a l y s i s work c a r r i e d out so f a r i n v o l v e d o n l y the a n a l y s i s of s i n g l e channe l d a t a . The m e r i t of d u e l channe l a n a l y s i s by c r o s s - c o r r e l a t i o n should a l s o be eva lua t ed . The two m u l t i f e a t u r e techniques are to be ref ined fu r the r . A combination of hardware based i n s t r u m e n t s and so f tware based systems w i l l have to be used in a r eac to r for o n - l i n e b o i l i n g de tec t ion using t h e above t e c h n i q u e s t o a c h i e v e s m a l l d e t e c t i o n t imes with r e l i a b i l i t y . The p r e s e n t r e s e a r c h programme has i d e n t i f i e d f e a t u r e s and t e c h n i q u e s which have t o be s u i t a b l y e v o l v e d i n t o the on l ine system. This w i l l form cont inuing phase of the present work.
I I . 2 BNL (UK) - Work
BNL, after an initial survey to determine if boiling could be determined by audio or visual means by human observer, concentrated their main effort on the use of ALN - technique. The input parameters to the network used are : mean, rms, skewness,
?1 P.
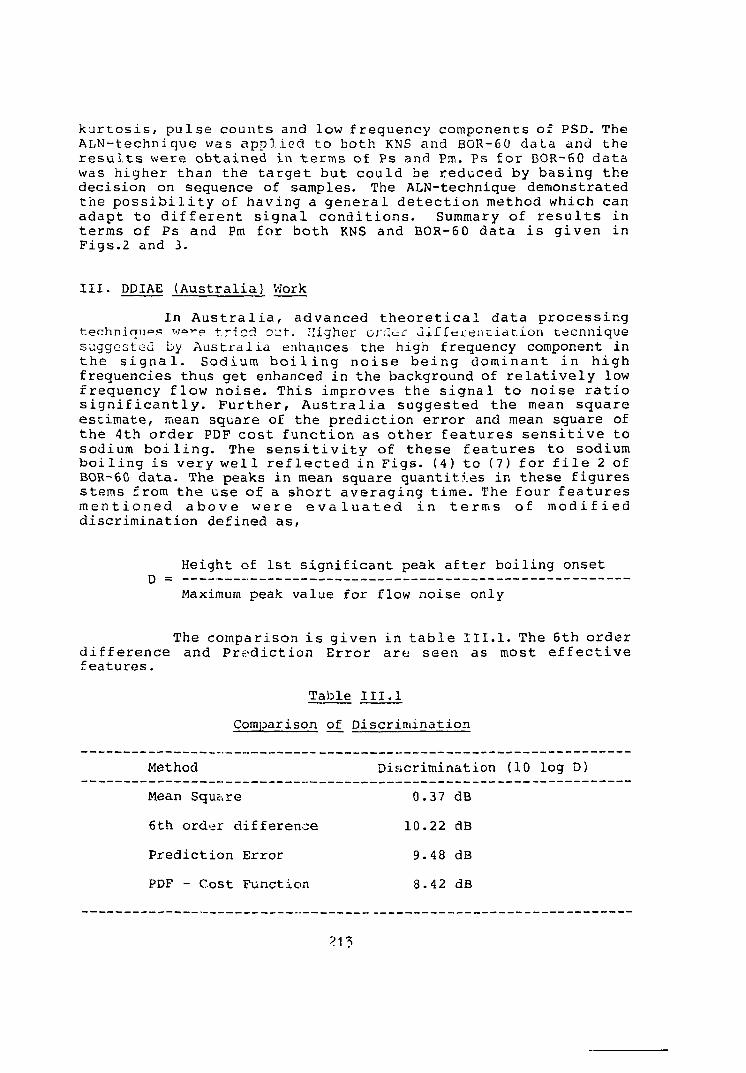
kurtosis, pulse counts and low frequency components of PSD. The ALN-technique was applied to both KNS and BOR-60 data and the results were obtained in terms of Ps and Pm. Ps for BOR-60 data was higher than the target but could be reduced by basing the decision on sequence of samples. The ALN-technique demonstrated the possibility of having a general detection method which can adapt to different signal conditions. Summary of results in terms of Ps and Pm for both KNS and BOR-60 data is given in Figs.2 and 3.
III. DDIAE (Australia) Work
In Australia, advanced theoretical data processing techniques ";ore tried out. Higher or;lc=r Jiffeientiation technique suggested by Australia enhances the high frequency component in the signal. Sodium boiling noise being dominant in high frequencies thus get enhanced in the background of relatively low frequency flow noise. This improves the signal to noise ratio significantly. Further, Australia suggested the mean square estimate, mean square of the prediction error and mean square of the 4th order PDF cost function as other features sensitive to sodium boiling. The sensitivity of these features to sodium boiling is very well reflected in Figs. (4) to (7) for file 2 of BOR-60 data. The peaks in mean square quantities in these figures stems from the use of a short averaging time. The four features mentioned above were evaluated in terms of modified discrimination defined as,
Height of 1st significant peak after boiling onset D =
Maximum peak value for flow noise only
The comparison is given in table III.l. The 6th order difference and Prediction Error are seen as most effective features.
Table III.l
Comparison of Discrimination
Method Discrimination (10 log D)
Mean Squc\re 0.37 dB
6th order difference 10.22 dB
Prediction Error 9.48 dB
PDF - Cost Function 8.42 dB
?1?
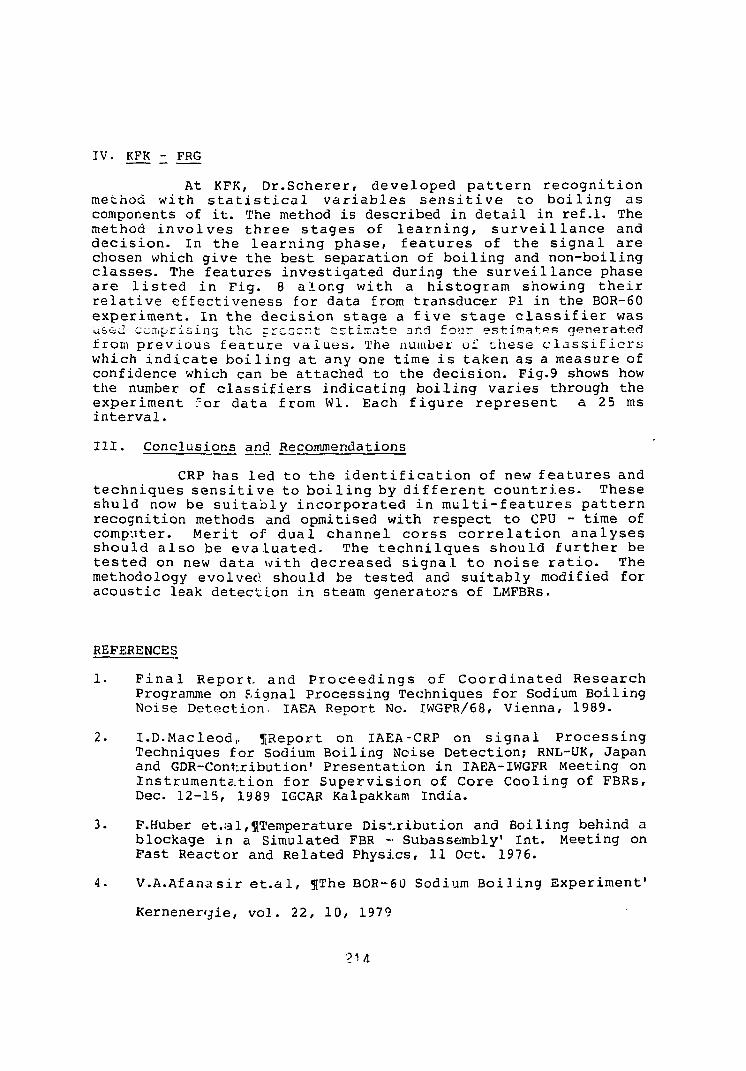
IV. KPK - FRG
At KFK, D r . S c h e r e r , d e v e l o p e d p a t t e r n r e c o g n i t i o n method w i t h s t a t i s t i c a l v a r i a b l e s s e n s i t i v e t o b o i l i n g a s components of i t . The method i s d e s c r i b e d in d e t a i l i n r e f . l . The method i n v o l v e s t h r e e s t a g e s of l e a r n i n g , s u r v e i l l a n c e and d e c i s i o n . In t h e l e a r n i n g p h a s e , f e a t u r e s of t h e s i g n a l a r e chosen which g i v e t h e b e s t s e p a r a t i o n of b o i l i n g and n o n - b o i l i n g c l a s s e s . The f e a t u r e s i n v e s t i g a t e d d u r i n g t h e s u r v e i l l a n c e phase a r e l i s t e d i n F i g . 8 a l o n g w i t h a h i s t o g r a m showing t h e i r r e l a t i v e e f f e c t i v e n e s s f o r d a t a from t r a n s d u c e r Pi i n t h e BOR-60 e x p e r i m e n t . I n t h e d e c i s i o n s t a g e a f i v e s t a g e c l a s s i f i e r was us£d compr i s ing the p r e s e n t e s t i m a t e and four e s t i m a t e s g e n e r a t e d from p r e v i o u s f e a t u r e v a l u e s . The number of t h e s e c l a s s i f i e r s which i n d i c a t e b o i l i n g a t any one t i m e i s t a k e n a s a m e a s u r e of c o n f i d e n c e which can be a t t a c h e d t o t h e d e c i s i o n . Fig .9 shows how t h e number of c l a s s i f i e r s i n d i c a t i n g b o i l i n g v a r i e s t h rough t h e e x p e r i m e n t "o r d a t a from Wl. Each f i g u r e r e p r e s e n t a 25 ms i n t e r v a l .
I I I . Conc lus ions and Recommendations
CRP h a s l e d t o t h e i d e n t i f i c a t i o n of new f e a t u r e s and t e c h n i q u e s s e n s i t i v e t o b o i l i n g by d i f f e r e n t c o u n t r i e s . T h e s e s h u l d now be s u i t a b l y i n c o r p o r a t e d i n m u l t i - f e a t u r e s p a t t e r n r e c o g n i t i o n methods and o p m i t i s e d w i t h r e s p e c t t o CPU - t ime of c o m p u t e r . M e r i t of d u a l c h a n n e l c o r s s c o r r e l a t i o n a n a l y s e s s h o u l d a l s o be e v a l u a t e d . The t e c h n i l q u e s s h o u l d f u r t h e r be t e s t e d on new d a t a w i t h d e c r e a s e d s i g n a l t o n o i s e r a t i o . The methodology e v o l v e d s h o u l d be t e s t e d and s u i t a b l y modi f ied f o r a c o u s t i c l eak d e t e c t i o n i n s team g e n e r a t o r s of LMFBRs.
REFERENCES
1. F i n a l R e p o r t , a n d P r o c e e d i n g s of C o o r d i n a t e d R e s e a r c h Programme on S i g n a l P r o c e s s i n g Techniques f o r Sodium B o i l i n g Noise Detect ion". IAEA Repor t No. IWGFR/68, Vienna , 1989.
2. I .D .Macleod , , ?[Report on IAEA-CRP on s i g n a l P r o c e s s i n g Techniques f o r Sodium B o i l i n g Noise D e t e c t i o n ; RNL-UK, Japan and GDR-Cont r ibu t ion ' P r e s e n t a t i o n i n IAEA-IWGFR Meet ing on I n s t r u m e n t a t i o n f o r S u p e r v i s i o n of Core C o o l i n g of FBRs, Dec. 12 -15 , 1989 IGCAR Kalpakkam I n d i a .
3 . F.Huber e t . a l , l [ T e m p e r a t u r e D i s t r i b u t i o n and B o i l i n g behind a b l o c k a g e i n a S i m u l a t e d FBR - Subassembly ' I n t . Meet ing on F a s t R e a c t o r and R e l a t e d P h y s i c s , 11 Oct . 1976.
4. V . A . A f a n a s i r e t . a l , flThe BOR-60 Sodium B o i l i n g E x p e r i m e n t '
K e r n e n e r ' j i e , v o l . 22 , 10 , 1979
2 U
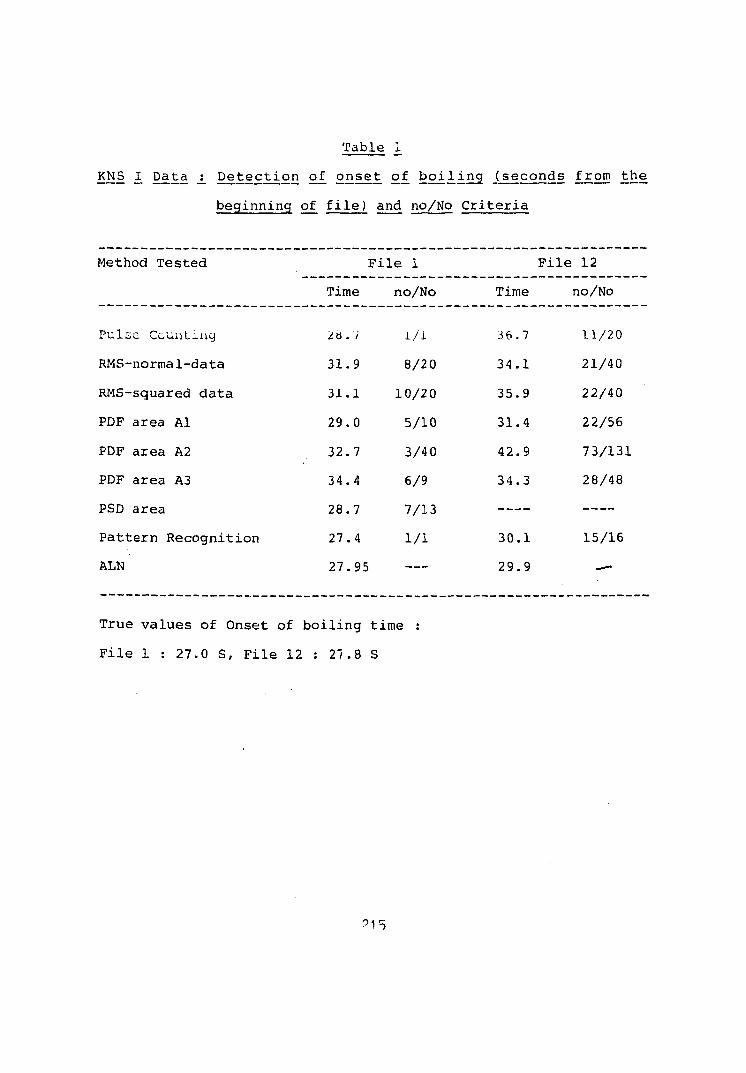
Table 1
KNS I_ Data ± 2£^££ti.°B 91. ° H ^ i 9.L boiling (seconds from the
beginning of file) and no/No Criteria
Method Tested File 1 File 12
Time no/No Time no/No
Pulse Counting
RMS-normal-data
RMS-squared data
PDF area Al
PDF area A2
PDF area A3
PSD area
Pattern Recognition
ALN
2 b . 7
31.9
31.1
29.0
32.7
34.4
28.7
27.4
27.95
1/1
8/20
10/20
5/10
3/40
6/9
7/13
1/1
36.7
34.1
35.9
31.4
42.9
34.3
30.1
29.9
11/20
21/40
22/40
22/56
73/131
28/48
15/16
^.
True values of Onset of boiling time :
File 1 : 27.0 S, File 12 : 27.8 S
?15
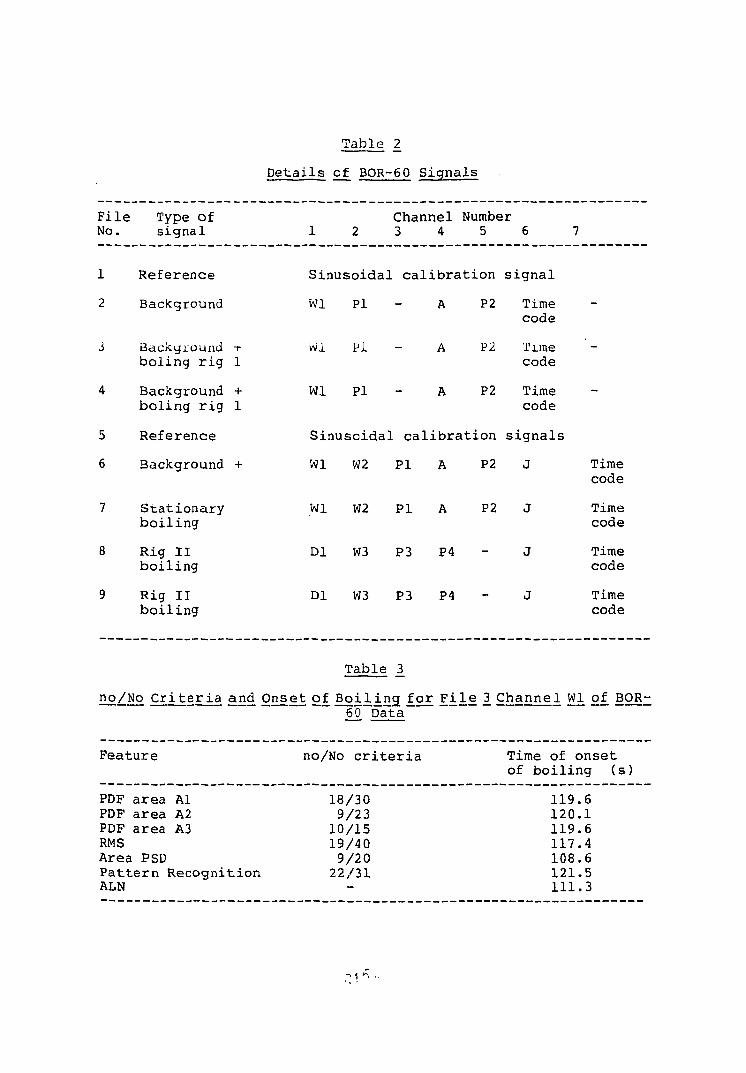
Table 2
Details of BOR-60 Signals
File Type of No. signal
Channel Number 1 2 3 4 5 6
1 Reference
2 Background
Background -r boling rig 1
Background + boling rig 1
Sinusoidal calibration signal
5
6
7
8
9
Reference
Background +
Stationary boiling
Rig 11 boiling
Rig II boiling
Wl Pi
Wl Pi
Wl PI
P2 Time code
P2 Time code
P2 Time code
Sinusoidal calibration signals
Wl W2 PI A P2 J
Wl W2 PI A P2 J
Dl W3 P3 P4 - J
Dl W3 P3 P4 - J
Time code
Time code
Time code
Time code
Table 3.
no/No Criteria and Onset o|_ Boi.ljLng; f_or F\i 1 e j3 Channel. Wl, of_ BOR-60 Data
Feature no/No criteria Time of onset of boiling (s)
PDF area Al PDF area A2 PDF area A3 RMS Area PSD Pattern Recognition ALN
18/30 9/23 10/15 19/40 9/20 22/31
-
119. 120. 119. 117. 108. 121. Ill,
pi
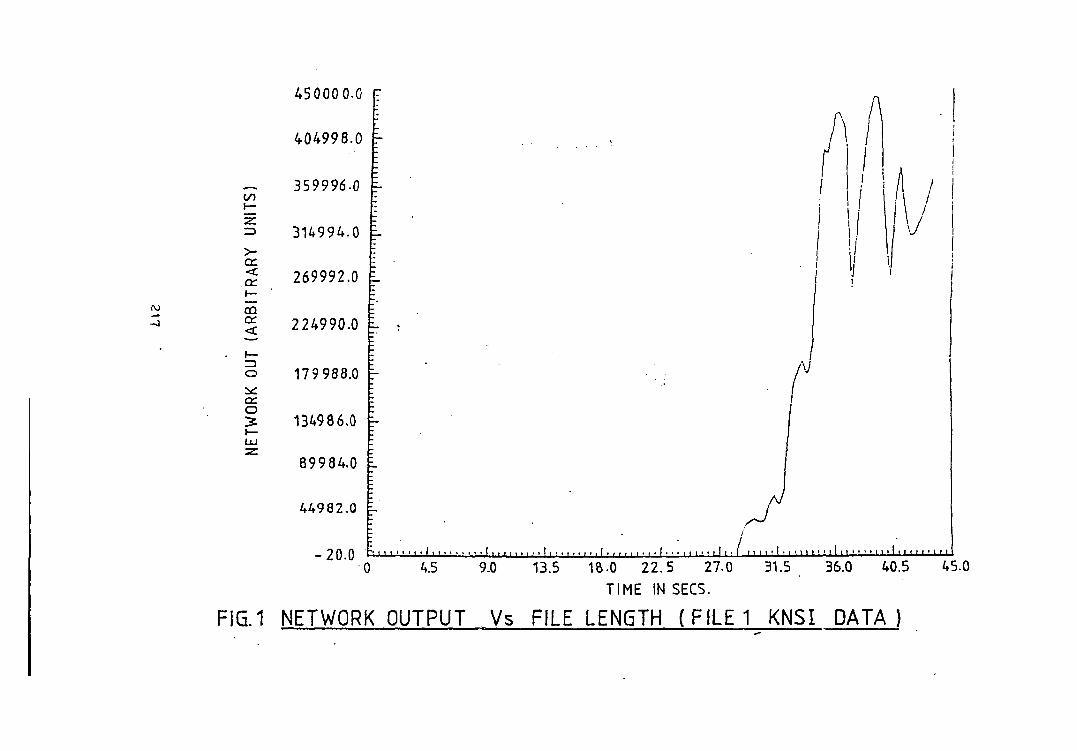
ro -a
UN
ITS
) R
AR
Y (A
RB
IT
OUT
WO
RK
450000-0
404998.0
359996-0
314994.0
269992.0
224990.0
179988.0
134986.0
89984.0
44982.0 g.
-20.0 ujb i • < 1 1 • • ' • • • • ' • ' • • . i • 1 1 • i • • > • f • • • • • • ' ' f i i i I • i i i i • i I i •. i n • ; i l i i • • • • i i i i • i i i i • i n
4.5 9.0 13.5 16.0 22.5 27-0
TIME IN SECS.
31.5 36.0 40.5 45.0
FIG.1 NETWORK OUTPUT Vs FILE LENGTH (FILE1 KNSI DATA)
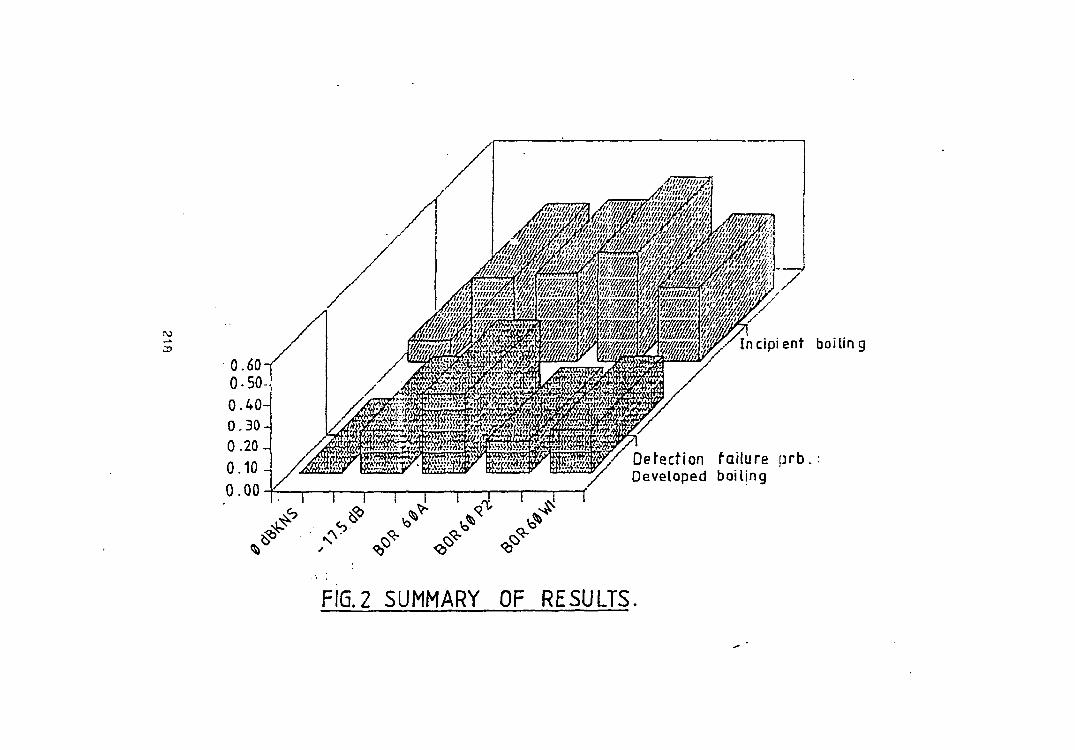
Р16.2 5ЦММАКУ ОР КЕ5ШТ5.
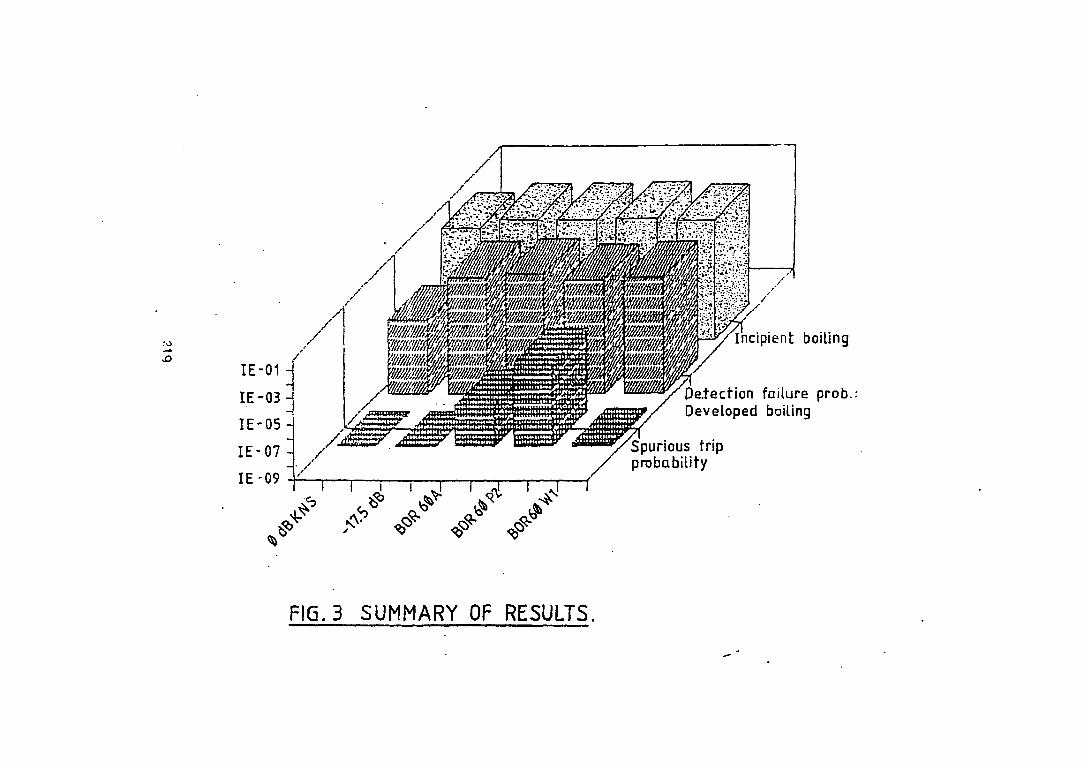
Incipient boiling
failure prob.: boiling
FIG. 3 SUMMARY OF RESULTS.
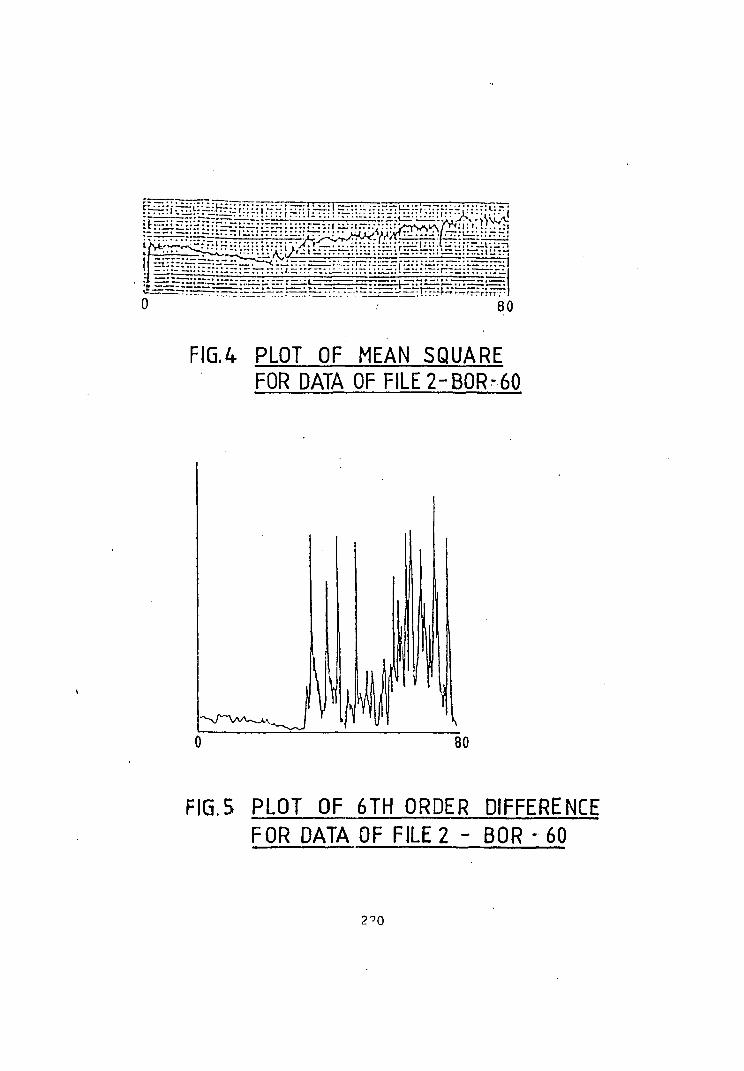
•tii:::::::y::~[--/Ti
:~r::r.-T:r:r:r.=::r
. - : : : : : . : : ! T T : : I - . ' . :
T i':: • • :-ii i rrfrlLii: iHdU i i£>rl • HI]
80
FIG.4 PLOT OF MEAN SQUARE FOR DATA OF FILE2-BOR-60
i \H
80
FIG.5 PLOT OF 6TH ORDER DIFFERENCE FOR DATA OF FILE 2 - BOR - 6 0
2">0
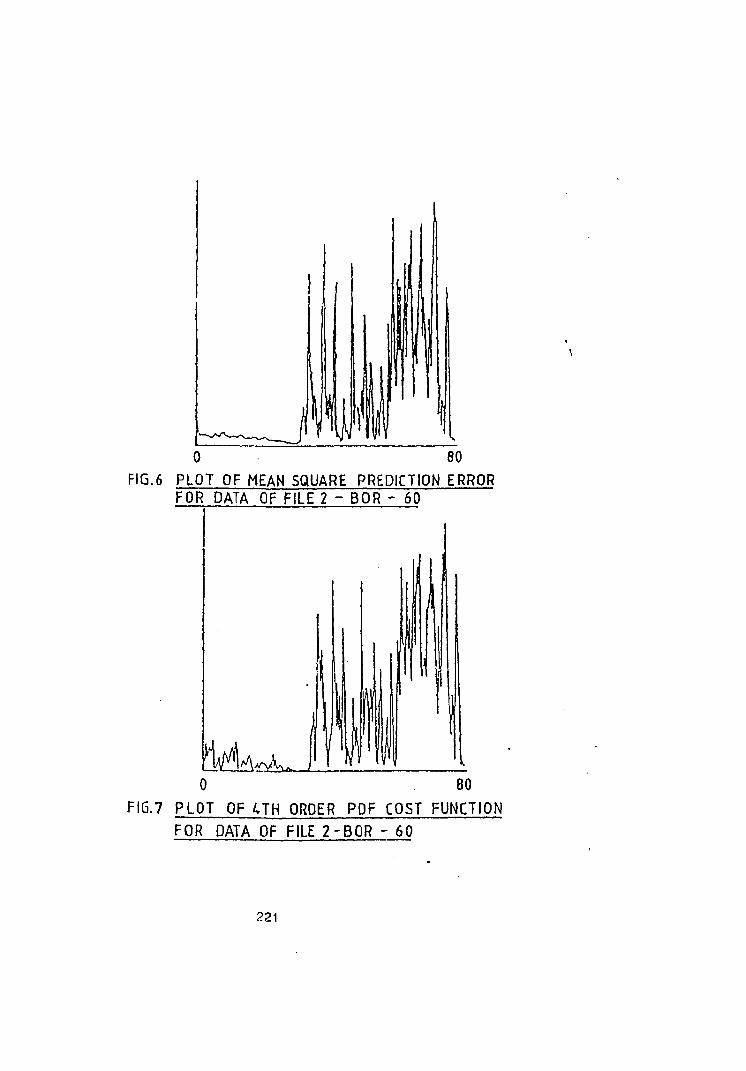
0 80
FIG.6 PLOT OF MEAN SQUARE PREDICTION ERROR FOR DATA OF FILE 2 - BOR - 60
*\A £?Au 0 80
FIG.7 PLOT OF U H ORDER PDF COST FUNCTION
FOR DATA OF FILE 2-BOR - 60
221
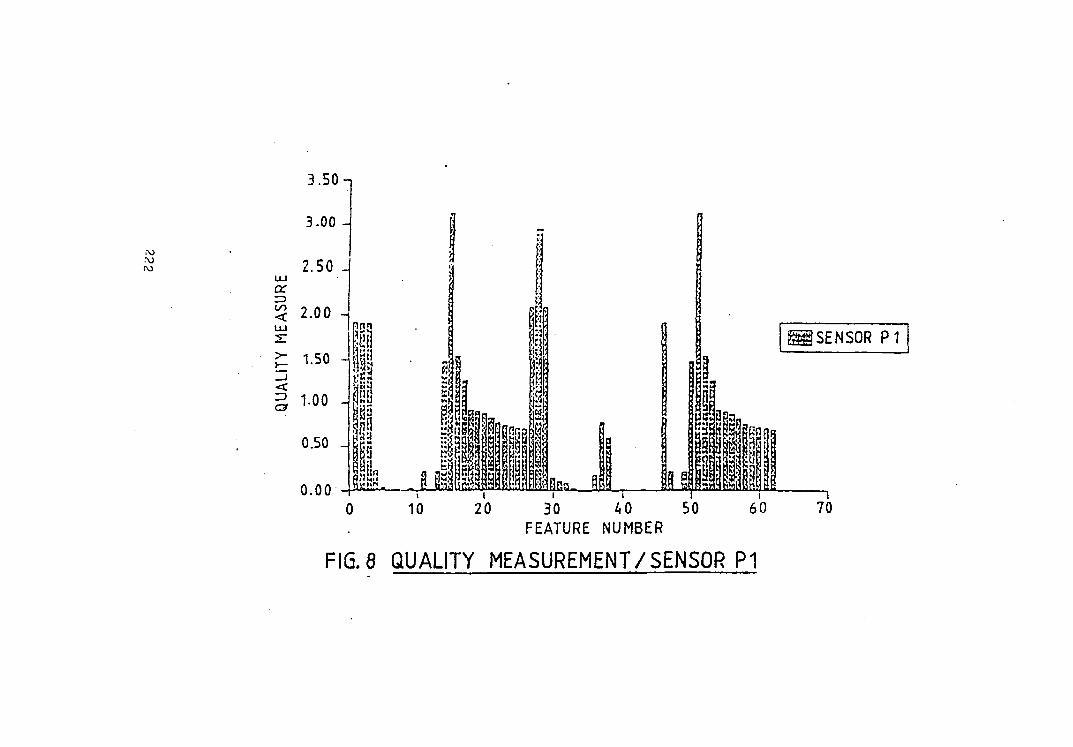
UJ
or r>
3.50-1
3.00 -
2.50 -
3 2.00 -
£: 1.50 A
I ioo -|
0.50 _|
0.00
nB0
!B5 8
i M
iS
$1? .S&sh.
10 20
aagt!SHOftt!B
30 40 FEATURE NUMBER
60
I SENSOR PI
— i 70
FIG. 8 QUALITY MEASUREMENT/SENSOR P1
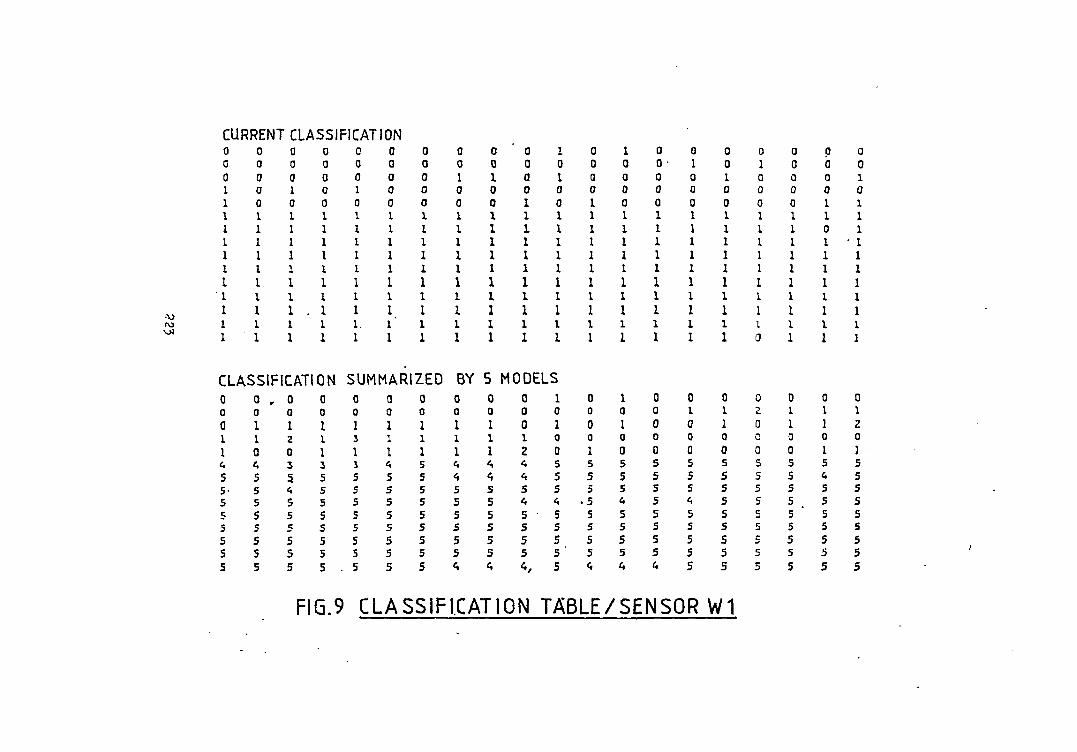
FIG.9 CLASSIFICATION TABLE/SENSOR W1