Wortprotokoll der 80. Sitzung Tagesordnung - Deutscher ...
194
Protokoll-Nr. 19/80 19. Wahlperiode Parlamentarischer Beirat für nachhaltige Entwicklung 19. Wahlperiode Seite 1 von 17 Wortprotokoll der 80. Sitzung Parlamentarischer Beirat für nachhaltige Entwicklung Berlin, den 19. Mai 2021, 18:00 Uhr Videokonferenz im Webex-Format Vorsitz: Dr. Andreas Lenz, MdB Tagesordnung - Öffentliche Anhörung Einziger Tagesordnungspunkt Seite 3 Fachgespräch zum Thema „Alternative Antriebsstoffe"
-
Upload
khangminh22 -
Category
Documents
-
view
0 -
download
0
Transcript of Wortprotokoll der 80. Sitzung Tagesordnung - Deutscher ...

Protokoll-Nr. 19/80
19. Wahlperiode
Parlamentarischer Beirat für nachhaltige Entwicklung
19. Wahlperiode Seite 1 von 17
Wortprotokoll der 80. Sitzung
Parlamentarischer Beirat für nachhaltige Entwicklung Berlin, den 19. Mai 2021, 18:00 Uhr Videokonferenz im Webex-Format
Vorsitz: Dr. Andreas Lenz, MdB
Tagesordnung - Öffentliche Anhörung
Einziger Tagesordnungspunkt Seite 3
Fachgespräch zum Thema „Alternative Antriebsstoffe"

Parlamentarischer Beirat für nachhaltige Entwicklung
19. Wahlperiode Protokoll der 80. Sitzung vom 19. Mai 2021
Seite 2 von 17
Mitglieder des Beirates
Ordentliche Mitglieder Stellvertretende Mitglieder
CDU/CSU Benning, Sybille Damerow, Astrid Lenz, Dr. Andreas Marschall, Matern von Stein (Rostock), Peter Whittaker, Kai
Beermann, Maik Färber, Hermann Kruse, Rüdiger Pilsinger, Stephan Pols, Eckhard Weiler, Albert H.
SPD Scheer, Dr. Nina Thews, Michael Westphal, Bernd
De Ridder, Dr. Daniela Klare, Arno Schäfer (Bochum), Axel
AfD Kraft, Dr. Rainer Spaniel, Dr. Dirk
Glaser, Albrecht Wiehle, Wolfgang
FDP Hoffmann, Dr. Christoph Köhler, Dr. Lukas
Bauer, Nicole Kluckert, Daniela
DIE LINKE. Vogler, Kathrin Zdebel, Hubertus
Leidig, Sabine Remmers, Ingrid
BÜNDNIS 90/DIE GRÜNEN
Hoffmann, Dr. Bettina Zickenheiner, Gerhard
Kekeritz, Uwe Strengmann-Kuhn, Dr. Wolfgang

Parlamentarischer Beirat für nachhaltige Entwicklung
19. Wahlperiode Protokoll der 80. Sitzung vom 19. Mai 2021
Seite 3 von 17
Vor Eintritt in die Tagesordnung
Vorsitzender Dr. Andreas Lenz (CDU/CSU): Es ist jetzt 18:00 Uhr, und ich würde dann auch unsere Beiratssitzung starten. Bevor wir in die Tagesord-nung übergehen, ein paar organisatorische Hin-weise: Wie Sie alle sehen, verfolgen wir die Sit-zung heute wieder mittels Videoformat. Ich bitte, Wortbeiträge bzw. Wortmeldungen über die Chat-Funktion oder per Handzeichen ersichtlich zu ma-chen, am besten natürlich über die Chat-Funktion.
Einziger Tagesordnungspunkt
Fachgespräch zum Thema „Alternative Antriebs-stoffe"
dazu Sachverständige:
Jekaterina Boening Transport & Environment's (T&E) dazu verteilt: Handout Ausschussdrucksache 19(26)117 (Anlage 1); T&E Briefing „Why e-fuels in cars make no economic or environmental sense”, April 2021 Ausschussdrucksache 19(26)117-1 (Anlage 2); BloombergNEF Studie im Auftrag von T&E „Hitting the EV Inflection Point“, Mai 2021 Aus-schussdrucksache 19(26)117-2 (Anlage 3); T&E Briefing “Was bedeutet eine Unterquote von 5 % E-Fuels im Straßenverkehr?“, April 2021 Aus-schussdrucksache 19(26)117-3 (Anlage 4)
Prof. Dr. Christopher Hebling Fraunhofer-Institut für Solare Energiesysteme ISE dazu verteilt: PowerPoint-Präsentation Ausschussdrucksache 19(26)118 (Anlage 5); Artikel „Economics & carbon dioxide avoidance cost of methanol production based on renewable hydrogen and recycled carbon dioxide – power-to-methanol“ Ausschussdrucksache 19(26)118-1 (Anlage 6); Artikel „Comparative well-to-wheel life cycle assessment of OME3–5 synfuel production via the power-to-liquid pathway†“ Ausschussdrucksache 19(26)118-2 (Anlage 7); Artikel „Energy efficiency and economic assessment of imported energy carriers based on renewable lectricity†“Ausschussdrucksache 19(26)118-3 (Anlage 8)
Vorsitzender Dr. Andreas Lenz (CDU/CSU): Wir haben heute den einzigen Tagesordnungspunkt „Öffentliches Fachgespräch zum Thema ‚Alterna-tive Antriebsstoffe‘“. Es ist ein sehr aktuelles Thema, gerade auch angesichts der CO2-Debatte. Die Mobilität ist hier ein Themenfeld, ein Sektor, der besonders herausfordernd ist auch in allen Dimensionen der nachhaltigen Entwicklung.
Ich darf unsere Gäste ganz herzlich im Namen des Beirates begrüßen; Frau Jekaterina Boening und Herr Prof. Dr. Christopher Hebling, herzlich will-kommen. Wir freuen uns auf Ihren Input und Ihre Ausführungen und natürlich auch auf die Diskus-sion im Anschluss. Begrüßen darf ich außerdem Herrn Dr. Bauernfeind vom Bundeskanzleramt und die interessierte Öffentlichkeit.
Ich bitte alle, ihr Mikro auszuschalten, wenn Sie nicht das Wort haben – aber das ist auch bei so gut wie jedem Fall. Ansonsten besteht auch noch die Möglichkeit, dass wir das hier entsprechend bewerkstelligen. Noch ein weiterer organisatori-scher Hinweis: Wir haben – Stand jetzt – etwa ab 18:45 Uhr eine namentliche Abstimmung im Deutschen Bundestag. Wir haben dann 30 Minu-ten Zeit für diese namentliche Abstimmung. Wir haben uns vorher drauf verständigt, dass wir um ca. 19:05 Uhr / 19:10 Uhr mit beiden Beiratssit-zungen fertig sein wollen, damit wir dann nicht wieder zurückkehren müssen. Insofern brauchen wir heute tatsächlich Zeitdisziplin. Wir haben uns in der Obleuterunde auf eine Fragerunde festge-legt. Sollten wir dennoch früher mit der ersten Fragerunde fertig sein, können wir durchaus noch weitere Fragen zulassen, aber das ist eigentlich das vorgesehene Zeitkorsett.
Ich stelle kurz unsere Gäste vor. Zunächst Frau Boening: Frau Boening ist Policy Manager beim europäischen Umweltdachverband „Transport & Environment“ (T&E). Sie ist Expertin für Wasser-stoff und E-Fuels und koordiniert die Aktivitäten in diesen Themenbereichen. Darüber hinaus be-fasst sich Frau Boening mit der europäischen Klimaarchitektur, darunter natürlich auch The-men wie insbesondere die CO2-Bepreisung. In der Vergangenheit war Frau Boening beim BDI (Bun-desverband der Deutschen Industrie e. V.), wo sie das Wasserstoffgremium des Verbandes leitete, so-wie beim Jacques Delors Institut und beim Ener-gieversorger E.ON. Herzlich willkommen, Frau

Parlamentarischer Beirat für nachhaltige Entwicklung
19. Wahlperiode Protokoll der 80. Sitzung vom 19. Mai 2021
Seite 4 von 17
Boening, es freut uns, dass Sie uns heute berei-chern.
Außerdem ist heute zu Gast Herr Prof. Christopher Hebling. Herr Prof. Hebling hat 1998 an der Uni-versität Konstanz im Fach „Physik“ promoviert. Er ist seit Mai 2019 “Honorary Professor” an der University of Cape Town (Department of Chemi-cal Engineering, Faculty of Engineering and the Built Environment). Seit 1992 ist Prof. Hebling beim Fraunhofer-Institut für Solare Energiesys-teme, ISE, tätig; er ist dort Bereichsleiter „Wasser-stofftechnologien“. Seit dem Jahr 2018 ist er hier zugleich Co-Direktor im Bereich „Energietechno-logien und Energiesysteme“. Auch an Sie, Herr Prof. Hebling: Ganz herzlich willkommen. Über Ihren Input und über die anschließende Diskus-sion freuen wir uns natürlich auch.
Ein paar organisatorische Hinweise: Beide Sach-verständige haben vorab Handouts übersandt, die in den entsprechenden Ausschussdrucksachen vorliegen. Wir haben uns außerdem darüber ver-ständigt, dass wir das Gespräch aufzeichnen. Es wird auf der Webseite des Deutschen Bundestages ab Freitag zu sehen sein. Wir erstellen – wie ge-habt – ein Wortprotokoll. Wir haben vorgesehen, dass die Eingangsstatements etwa zehn Minuten umfassen sollen. Sie sehen auch im Hintergrund eine entsprechende Uhr, und ich bitte Sie, auf diese Uhr zu achten und sich bei Ihren Ausfüh-rungen im Rahmen der zehn Minuten zu bewegen. Wie gesagt, um 18:50 Uhr beginnt die namentliche Abstimmung. Wir haben dann eine halbe Stunde Zeit und müssen um 19:05 Uhr die Sitzung schlie-ßen, deshalb auch keine weiteren Vorreden von mir.
Wir haben vereinbart, dass wir bei den Eingangs-statements mit Frau Boening beginnen, und ich übergebe Ihnen auch gleich das Wort. Frau Boening, wir freuen uns auf Ihre Ausführungen.
Sachverständige Jekaterina Boening (Transport & Environment's,T&E)): Vielen Dank, Herr Dr. Lenz und vielen Dank für die Einladung zur Sitzung heute.
Vorsitzender Dr. Andreas Lenz (CDU/CSU): Frau Boening, ich will Sie jetzt eigentlich gar nicht un-terbrechen, aber wir hören Sie wieder ganz leise. Wir haben Sie vorher eigentlich ganz gut gehört. Können Sie noch einmal alle entsprechenden Ein-stellungen überprüfen?
Sachverständige Jekaterina Boening (T&E): Ich höre auch, dass jemand noch das Mikro an hat, es könnte vielleicht auch daran liegen.
Vorsitzender Dr. Andreas Lenz (CDU/CSU): Ich bitte das Sekretariat, noch einmal zu schauen, ob jeder das Mikro aus hat. Ansonsten bitte ich, die-ses auszustellen.
Sachverständige Jekaterina Boening (T&E): Ge-nau. Und ich werde mein Video ausschalten, weil mir angezeigt wurde, dass die Bandbreite für den Call nicht ausreicht, deshalb wundern Sie sich nicht, dass Sie mich jetzt nicht sehen.
Vorsitzender Dr. Andreas Lenz (CDU/CSU): Wir hören Sie auf jeden Fall einwandfrei.
Sachverständige Jekaterina Boening (T&E): Sehr gut. Noch einmal vielen Dank für die Einladung. Ich werde in meinem Vortrag ausschließlich auf das Thema „E-Fuels“ eingehen, auch wenn wir natürlich andere Alternative Antriebsstoffe haben, und ich stehe für Ihre Fragen zum Thema „Biok-raftstoffe“ auch im Anschluss gerne zur Verfü-gung. Ich möchte insbesondere drei Aspekte be-leuchten:
Erstens: Wann sind die E-Fuels nachhaltig? Zwei-tens: Welche Aspekte sind zusätzlich in Bezug auf die E-Fuels Importe zu beachten? Und drittens: Wo werden die E-Fuels künftig eingesetzt?
Ich möchte gerne mit dem ersten Punkt beginnen: Wann sind E-Fuels nachhaltig? Der Herstellungs-prozess von E-Fuels sollte den meisten von Ihnen sehr gut bekannt sein. Im ersten Schritt wird im Prozess der Elektrolyse Wasser mittels Strom in Wasserstoff und Sauerstoff aufgeteilt. Danach be-nötigen wir für die Synthese zu E-Fuels auch Koh-lenstoff. Für die Gewinnung von Kohlenstoff ste-hen uns verschiedene Optionen zur Verfügung: Wir können CO2 aus der Luft abscheiden, aber wir können natürlich auch die industriellen Stromquellen nutzen. Als Endprodukt haben wir dann nach der Synthese die E-Fuels. Das ist – wie Sie hier sehen – ein komplexer Prozess mit ver-schiedenen Schritten, deshalb geht in jedem Um-wandlungsprozess natürlich auch Energie verlo-ren, weshalb wir von einem Gesamtwirkungsgrad der E-Fuels von 10 bis 35 Prozent sprechen. „Ge-samtwirkungsgrad“ bedeutet wirklich das, was wir ganz am Ende des Prozesses sehen, also bei

Parlamentarischer Beirat für nachhaltige Entwicklung
19. Wahlperiode Protokoll der 80. Sitzung vom 19. Mai 2021
Seite 5 von 17
der Verbrennung von E-Fuels, z. B. Verbrennungs-motor oder in einem Gasboiler. Das bedeutet zu-gleich, dass wir mit E-Fuels im Vergleich zur Di-rektelektrifizierung, also im Vergleich zu batterie-elektrischen Antrieben, zwei- bis vierzehn Mal so viel Strom brauchen – diese Zahlen sind vom Potsdamer Institut für Klimaforschung. Dennoch werden wir trotz dieser Komplexität E-Fuels brau-chen. Das ist auch insbesondere mit Blick auf die Klimaziele eine sehr wichtige Klimaschutzoption, und wir müssen natürlich von Anfang an die Nachhaltigkeit der E-Fuels sicherstellen. Aus-schlaggebende Faktoren sind erstens, die Strombe-zugsquelle, und zweitens, die CO2-Quelle. Bei der Strombezugsquelle ist natürlich eines klar: Wir brauchen erneuerbaren Strom, um die E-Fuels herzustellen.
Ein wichtiges Kriterium ist dennoch auch die „Zusätzlichkeit“ – zusätzliche Anlagen, die den Strom für die Herstellung von E-Fuels produzie-ren. Was bedeutet hier „zusätzlich“? Es gibt heute kein Land auf der Welt, das seine Energienach-frage zu 100 Prozent durch Erneuerbare Energien abdeckt. Das heißt, zum jeweiligen Zeitpunkt, wenn wir die Stromnachfrage haben, haben wir immer die fluktuierende Erneuerbaren Energien und die Residuallast. Die Residuallast, das sind die fossilen Kraftwerke. Wenn die Stromnachfrage steigt und der Bestandteil von Erneuerbaren Ener-gien gleich bleibt, dann steigt natürlich die Resi-duallast und dadurch erhöht sich die CO2-Intensi-tät des Strommixes. Weil wir – wie auf der vorhe-rigen Folie schon gezeigt – mit E-Fuels das Stromsystem sehr stark beanspruchen, können wir natürlich davon ausgehen, dass die E-Fuels insge-samt einen negativen Klimaeffekt für das Gesamt-system haben, wenn die „Zusätzlichkeit“ nicht eingehalten wird. Deshalb bedeutet „zusätzlich“ neue, nicht staatlich geförderte Anlagen. Das kann unter Umständen auch einen zusätzlichen Aus-baupfad im EEG bedeuten. Häufig wird dann die Frage gestellt: Warum wird dieses Kriterium nicht in Bezug auf die Elektromobilität gestellt? Die Antwort darauf liegt in dieser Grafik – etwas kom-plex –, die kommt auch vom Potsdamer Institut für Klimaforschung, sie haben erst vor wenigen Tagen ein sehr gutes Papier veröffentlicht. Sie se-hen hier auf der X-Achse die CO2-Intensität des Strommixes in verschiedenen Regionen – Deutschland ist hier in der Mitte. Auf der Y-Achseist die Berechnung für die Lebenszyklusanalyse
zu CO2-Emissionen von verschiedenen Antriebs-stoffen. Die Linien, die so horizontal verlaufen, das sind die fossilen Kraftstoffe, und die Linien in lila, das sind die E-Fuels. Wie Sie sehen: Mit dem deutschen Strommix emittieren die E-Fuels heute drei- bis viermal so viel CO2 wie fossile Kraft-stoffe. Bei Elektromobilität – das ist die gelbe Li-nie hier unten – haben wir bereits mit dem heuti-gen Strommix in Deutschland CO2-Einsparungen und deshalb auch einen positiven Klimaeffekt, weshalb auch unterschiedliche Anforderungen an E-Fuels und an Elektromobilität gestellt werden.
Zu der CO2-Quelle möchte ich gar nicht viel sa-gen. Wir haben – wie gesagt – zwei Optionen: In-dustrielle Punktquellen wie z. B. solche tollen Projekte wie „Carbon2Chem“ und die Möglichkeit mit „Direct Air Capture“ (Verfahren zur Gewin-nung von CO2 direkt aus der Umgebungsluft). Diese Möglichkeiten müssen skalieren, weil die industriellen Punktquellen natürlich die Emission nur halbieren und nicht komplett vermeiden. Des-halb müssen wir sicherstellen, dass wir von Be-ginn an auch die „Direct Air Capture“ regulato-risch verankern.
Nächster Punkt: „Importe“. Es wird sehr häufig suggeriert, dass wir E-Fuels importieren können und auch sollen. Das ist sicherlich eine Option, die wir brauchen, um die Klimaneutralität im Jahr 2050 oder 2045, wie das jetzt für Deutschland gilt, zu erreichen. Dennoch müssen wir mit Blick auf Importe auch die Nachhaltigkeit berücksichtigen, und hier gibt es auch weitere Aspekte. Erstens: Sie sehen auf dieser Folie den Energiemix von poten-ziellen Exporteuren. Marokko mit sieben Prozent Anteil Erneuerbarer Energien, Saudi-Arabien ein Prozent, Australien sechs Prozent. Der einzige wirkliche Vorreiter hier ist Chile mit 23 Prozent, hier spielt auch die Wasserkraft eine extrem wich-tige Rolle. Die Frage stellt sich natürlich: Wie wollen wir die „Zusätzlichkeit“ in Ländern sicherstellen, die heute in ihrem Energiemix über-wiegend fossil sind? Bisher gibt es keine Antwort darauf. Natürlich ist aus Sicht der Nachhaltigkeit absolut klar, dass die E-Fuel-Produktion nicht auf Kosten der Dekarbonisierung der einheimischen Energieversorgung stattfinden darf. Es kann ver-schiedene Ansätze geben. Vielleicht kann die An-forderung gestellt werden, dass z. B. ein Teil der Energieanlagen der einheimischen Energieversor-gung zur Verfügung stehen muss, aber natürlich

Parlamentarischer Beirat für nachhaltige Entwicklung
19. Wahlperiode Protokoll der 80. Sitzung vom 19. Mai 2021
Seite 6 von 17
kommen viele weitere Fragen dazu, wie die recht-lichen und die politischen Fragen: Wem gehören diese Anlagen? Es ist auf jeden Fall ein Aspekt, der weiter bedacht werden muss.
Zweitens: In Wüstenregionen haben wir den Was-serbedarf der Elektrolyse. Wir können natürlich nicht das Trinkwasser für die Elektrolyse nutzen, und die Entsalzungsanlagen, die dort betrieben werden, müssen mit erneuerbarem Strom ange-trieben werden. Wir müssen den CO2-neutralen Transport sicherstellen, und wir brauchen ein internationales Zertifizierungssystem für „Power-to-X“-Produkte (PtX). Heute haben wir keine Transparenz darüber, wo, was, wie produziert wird, und ein solches internationales Zertifizie-rungssystem ist einfach die Voraussetzung dafür, dass die Importe künftig nachhaltig werden.
Last but not least: Wir haben heute keine interna-tionalen PtX-Lieferketten und aus unserer Sicht – aus Sicht von T&E –, aber auch aus Sicht von vie-len anderen Experten, ist es einfach eine sehr ris-kante Klimaschutz- und Industriestrategie Deutschlands, aber auch Europas insgesamt, auf dieser Vision von Importen zu bauen, insbeson-dere in der kurzen Frist bis 2030.
Wo werden E-Fuels künftig eingesetzt? Trotz aller Komplexität und Schwierigkeiten bei der Sicher-stellung der Nachhaltigkeit: Wir werden E-Fuels in der Luftfahrt, in der Schifffahrt brauchen. Das wird auch eine große Herausforderung sein, weil wir natürlich hier auch über enorme Energiebe-darfe sprechen. Für die Luft- und Schifffahrt in ganz Europa werden wir über 1.000 Terrawatt-stunden (TWh) erneuerbaren Strom für die Her-stellung von E-Fuels benötigen, d. h., auch hier können die Importe eine wichtige Rolle spielen.
Die Industrie- und die Stahlbedarfe werde ich hier überspringen, um zu dem wichtigen Punkt zu kommen, dass die E-Fuels im Straßenverkehr ein-fach keine Zukunft haben. Das sage ich nicht als Vertreterin der Umweltszene, sondern das sagt der Markt. Das betrifft nicht nur den PKW-Bereich, sondern auch den LKW-Bereich. Traton, die Toch-ter von VW, hat erst vor Kurzem sehr deutlich ge-macht, dass die Zukunft dem Elektro-LKW gehört, und wir haben gesehen, wie die Börse, wie der Markt, auf die neuen Pläne von VW, massiv in Elektromobilität einzusteigen und die Ankündi-gung, 70 Milliarden Euro in Elektromobilität zu
investieren, reagiert hat: VW hat extrem an Wert gewonnen.
Wir haben immer noch das „Sorgenkind Bestands-flotte“, auch wenn wir jetzt mit der Flottenerneue-rung vorankommen. Ich möchte aber hier betonen, dass die E-Fuels auch für die Bestandsflotte keine Lösung darstellen. Diese Folie habe ich auch schon seinerzeit bei einer Anhörung gezeigt. Um fünf Prozent der Kraftstoffe mit E-Fuels im Stra-ßenverkehr in Deutschland zu ersetzen, würden wir 15 Gigawatt Elektrolysekapazität benötigen. Das ist das Dreifache von dem, was wir in Deutschland für 2030 planen. Aus heutiger Sicht ist es schwer, sich vorzustellen, dass diese Kapa-zitäten woanders auf der Welt zusätzlich zu all dem, was wir im Luftverkehr, in der Industrie und in anderen Sektoren brauchen, entstehen werden.
Ich bedanke mich für Ihre Aufmerksamkeit und freue mich auf die Diskussion. Vielen Dank.
Vorsitzender Dr. Andreas Lenz (CDU/CSU): Vielen Dank. Das war fast eine Punktlandung. Danke auch für die Darstellung der Dimension der Aufgabe, die wir vor uns haben, und ich leite gleich über zu Herrn Prof. Hebling. Herr Prof. Hebling, Sie haben das Wort.
Sachverständiger Prof. Dr. Christopher Hebling(Fraunhofer-Institut für Solare Energiesysteme, ISE): Sie hören und sehen mich? Wunderbar. Jetzt wird mir auch klarer, wie das Podium hier besetzt ist.
Ich komme aus der gleichen Zielstellung zu ande-ren Ergebnissen. Zunächst einmal: Bei Fraunhofer haben wir uns letztes Jahr in einem Strategiepro-zess die wichtigsten Themen gesellschaftlich auf-gezeichnet und sind jetzt auf sieben Forschungs-felder, die für uns von größter strategischer Be-deutung sind, gekommen – und eines davon sind die Wasserstofftechnologien, weil wir bei Fraun-hofer der Überzeugung sind, dass nur mit Wasser-stofftechnologien die Ziele der Nachhaltigkeit im Sinne auch einer vollständigen Kreislaufwirt-schaft erreicht werden können.
Wo stehen wir? Treibhausgasemissionen – die Grafik kennen Sie, denke ich: Über die letzten 20 Jahre sind die CO2-Emissionen im Transport-bereich in Deutschland mehr oder weniger kon-stant geblieben, und jetzt müssen wir in bis 2030 etwa eine Halbierung erreichen. Das zum einen

Parlamentarischer Beirat für nachhaltige Entwicklung
19. Wahlperiode Protokoll der 80. Sitzung vom 19. Mai 2021
Seite 7 von 17
aufgrund des Bundesverfassungsgerichtsurteils, aber wir müssen zudem auch schauen, wie wir die lokalen Schadstoffemissionen in erheblichem Maße reduzieren. „Euro 7“ ist im Anmarsch, aber auch die „CARB“ (California Air Resources Board – Emissionsschutzbehörde Kaliforniens), also die kalifornische Regulation von der Lokalemission. Das ist sozusagen die Aufgabe, die wir vor uns ha-ben, und die ist extrem schwer zu erreichen.
Aber was gehört noch zur Ausgangslage? Wir ha-ben inzwischen 189 Staaten, die das Pariser Ab-kommen ratifiziert haben, also nahezu 100 Pro-zent. Inzwischen sind 75 dieser Staaten auch bis 2050 der Klimaneutralität verschrieben – China bis 2060, Deutschland möglicherweise bis 2045 –, wenngleich ich nicht sicher bin, ob alle wissen, was Klimaneutralität in jetzt 25 Jahren bedeutet. Was auch interessant ist, ist, dass von inzwischen 30 Staaten im Rahmen von nationalen Strategiepa-pieren Wasserstoff als eine ganz massive Techno-logie zur Erreichung der Klimaziele formuliert wird. Wenn man alle Projekte, die unterwegs sind, aufaddiert, sind etwa 300 Milliarden Dollar für den Transport, die Verteilung und eben auch die Nutzung in den Endsektoren in der Entwicklung. Weiterhin sind in Summe im Moment 17 Gigawatt Elektrolyseure global in verschiedenen Stadien in der Entwicklung. Wir haben in unseren Szenarien Rechnungen, die wir im Fraunhofer-ISE machen die Auswirkungen der verschärften CO2-Redukti-onsziele auf minus 65% quantifiziert. Sie sehen hier „Referenz 55“, d. h., das alte Ziel bis 2030 quantifiziert. Bislang war minus 55% bis 2030 bzw. minus 95% für 2050 das alte Ziel und, Sie sehen dann hier „Referenz 65“ das verschärfte Ziel (minus 65%) bis 2030, und was das für die „Power to X“-Produkte, also die synthetischen Kraftstoffe, bedeutet. Und Sie sehen hier: Allein diese Verschärfung um zehn Prozent etwa verdop-pelt den Bedarf eben auch über 200 TWh an Syn-theseprodukten. Wir sind sicher, dass der Bedarf an grüner Energie über den reinen Stromsektor gar nicht abgedeckt werden kann.
Wir hatten den Auftrag, für den Nationalen Was-serstoffrat auch eine „Meta-Studie Wasserstoff“ zu erstellen, bei der wir alle Studien – sowohl die eu-ropäischen, hier sehen Sie die wichtigsten europä-ischen Studien, aber auch hier die nationalen Stu-dien – auswerten und ganz nüchtern einfach mal die Datenlage exzerpieren. Die meisten Kürzel
kennen Sie, denke ich: BDI (Bundesverband der Deutschen Industrie e. V.), dena (Deutsche Ener-gie-Agentur GmbH), Agora (Agora Energiewende), UBA (Umweltbundesamt), BMWi (Bundesministe-rium für Wirtschaft und Energie), ISE (Fraunhofer-Institut für Solare Energiesysteme), Jülich (For-schungszentrum Jülich GmbH) und NRW (Nord-rhein-Westfalen). Und was man da lernt, ist sehr viel. Wir haben 150 Folien, die werden nächste Woche auch durch den Nationalen Wasserstoffrat verkündet. Wir haben – wie gesagt – einfach nur die Daten exzerpiert –, und man sieht eben, bei den „Importquoten Wasserstoff“ ist die Bandbreite jetzt 2030 etwa bei 40 bis 70 Prozent. Viele gehen allerdings auch von 0 Prozent aus, d. h., dass wir bis 2030 den Wasserstoff, den wir in den Sektoren „Mobilität“ und „Industrie“ benötigen, national herstellen, und dass sich erst dann der internatio-nale Handel etablieren wird.
Wenn man die Syntheseprodukte anschaut, ist es naturgemäß umgekehrt. Die Importquoten werden jetzt lange erst mal sehr hoch sein – 90 bis 100 Prozent. Möglicherweise bleibt es auch auf hohem Niveau, weil die Synthesevorausset-zungen in anderen Ländern aufgrund des Zugangs zu sehr günstigen erneuerbaren Energie einfach deutlich besser sind. Aber auch dena sagt, „Import Wasserstoff- und Syntheseprodukte um die 20 Prozent in 2040, und es geht dann entspre-chend hoch“. Also, das ist die Studienlage.
Es wären jetzt noch sehr viele Daten anzuschauen, aber wenn man sich hier noch den Verkehrssektor anschaut: Was alle Studien sozusagen aufeinander gestapelt ergeben, ist, dass bis 2050 etwa die reine Wasserstoffnachfrage in der Größenordnung von 20 Prozent liegen wird – das sehen Sie hier rechts – bei 100 Prozent bei Treibhausgas-Minde-rungsziel und weitere etwa 20 Prozent für Syntheseprodukte. Dann kommt ein bisschen Biomasse, dann hier Strom und eben fossile Brennstoffe, die werden nicht vollständig aus dem System gedrängt sein.
Schauen wir uns noch mal die Gesamtkette an: Nachhaltige Ausgangsprodukte sind natürlich die „Grünen Elektronen“ – wo auch immer Sie herge-stellt werden – Wind und Solar und wohlmöglich eben auch die Wasserkraft. Wir brauchen die Luft, um Stickstoff quasi abzuspalten, 80 Prozent ist ja in der Luft. Wir brauchen aber auch immer den

Parlamentarischer Beirat für nachhaltige Entwicklung
19. Wahlperiode Protokoll der 80. Sitzung vom 19. Mai 2021
Seite 8 von 17
Kohlenstoff für die Syntheseschritte für kohlen-stoffbasierte Energieträger, und dann ist hier die effiziente Konversion – Methanol, Ammoniak, je nachdem, was man verwendet –, und hinten eben die nachhaltigen Produkte. Idealerweise nutzt man natürlich den Wasserstoff direkt als Energie-träger, aber für viele Anwendungen – das wurde ja eben schon benannt – brauchen wir flüssige Ener-gieträger, zum einen wegen der Transportfähig-keit, aber auch, um Schiffs- und Flugverkehr auch über nachhaltige Produkte erreichen zu können. Weiterhin brauchen wir aber auch einen Ersatz für die ganzen erdölbasierten Chemikalien. Auch Am-moniak muss ersetzt werden, der derzeit natürlich auch auf fossilen Quellen beruht. Das ist sozusa-gen das Gesamtbild, was wir in den nächsten Jahr-zehnten vor uns haben.
Was haben wir für Optionen bei Kraftstoffen? Ent-weder wir nehmen den Wasserstoff direkt – ideal-erweise in Brennstoffzellen wegen der hohen Effi-zienz, die bei etwa 50 Prozent liegt – oder eben durch eine weitere Synthese – eben „Methanol to Gasoline“ und was sie hier alles sehen. Die Oxy-methylenether-Route ist das, wo man am Ende synthetisches Diesel erzeugen kann oder „Metha-nol to Jet fuel“. Auch das ist sehr wichtig, um na-türlich auch den Flugverkehr erreichen zu kön-nen. Die Kriterien sind „gesamthaft“; also, wir brauchen die Betrachtung zur Systemeffizienz und nicht von Einzeleffizienzen in der Wandlung, sondern das Gesamtsystem.
Hier noch einmal eine Aufstellung der 30 nationa-len Wasserstoff-Roadmaps, die inzwischen ent-standen sind. Es kommen jetzt in den nächsten ein, zwei Monaten noch sechs weitere dazu, bei-spielsweise Italien. Die Antreiber für die Strategie-papiere sind recht unterschiedlich: Klar, immer sozusagen aus Klimaschutz induziert, aber sie ha-ben noch viele andere Gründe wie z. B. auch im Sinne der Sicherung des Industriestandortes, das ist insbesondere Deutschland, aber auch Japan und die USA. In anderen Regionen, wie beispiels-weise Australien und der MENA-Region, möchte man sich für den Export erneuerbarer Energieträ-ger aufstellen.
Um auch auf die Effizienzdebatte einzugehen: Wir haben Batteriefahrzeugen und Hybridfahrzeuge mit Verbrennungsmotoren verglichen. Das sind jetzt Ergebnisse, die noch nicht veröffentlicht
sind. Um es kurz zu machen: Wir haben hier ge-rechnet, dass man in der kompletten Kette, also vom Beladen der Batteriefahrzeuge bis hin zum grünen Stahl für den Motor wirklich reinen Grünstrom annimmt. Wichtig ist auch, dass man die Hybridisierung der Fahrzeuge mit berücksich-tigt, weil reine Verbrenner tatsächlich „Technolo-gie von gestern“ sind. Aber über die Hybridisie-rung, wenn man jetzt mal – was hier der Fall ist – einen Range Extender (REEV – Reichweitenver-längerer) mit einer 25-prozentigen Nutzung von E-Fuels betrachtet, ist der Unterschied zu einem BEV400 (BEV – Battery electric vehicle – Batterie-fahrzeug) etwa in der Effizienz Faktor 1,5. Noch mal: Wenn man alles auf Grünstrom basiert, was man ja in 2045 auch braucht.
Hier noch abschließend Projekte, die in der Ent-wicklung sind. Also, Shell bereitet sich in Wes-seling vor, von derzeit zehn Megawatt Elektrolyse auf 100 Megawatt hochzugehen, um synthetische Flugkraftstoffe zu erzeugen. Das „Chile-Projekt“ – denke ich – kennen Sie, das ging gut durch die Presse, dass Porsche im nächsten Jahr 130.000 Li-ter E-Fuels herstellt mit dem Ziel, zwei Jahre spä-ter 55 Millionen Liter E-Fuels herzustellen, also in Tonnen eine halbe Million Tonnen, und d. h., es wird auf Methanol basiert sein.
Auch Maersk hat sich eindeutig in Richtung Syn-thesekraftstoffe im Nachhaltigkeitsbericht aufge-stellt, da insbesondere Methanol und Ammoniak als Kraftstoffe für die Schiffe der Zukunft. Insbe-sondere da ist klar, dass man keine Zwischenlö-sungen im Sinne von LNG (Liquefied Natural Gas – Flüssiggas) mehr akzeptiert, weil das ja bekann-termaßen nicht CO2-neutral ist, sondern da gibt es eine ganz klare Priorisierung auf vollständig nach-haltige Kraftstoffe.
Abschließend: Wir müssen verstehen, dass das neue Energiesystem einen komplett anderen Cha-rakter hat. Wir haben keine Grundlast mehr, son-dern nur noch volatile Energieerzeugung. Die fos-sile Energie, aber insbesondere auch die Eigen-schaft der Speicherung selbiger, muss ersetzt wer-den. Wir brauchen wasserstoffbasierte Kraftstoffe im künftigen Mix neben Batteriefahrzeugen, ins-besondere in Form von den langkettigen Synthe-seprodukten. Wir brauchen in der Zukunft auch Verbrennungsmotoren. Die nationale Politik muss klare Pfade vorgeben. Wir müssen Well-to-Wheel – also die Gesamtketten – betrachten und in dem

Parlamentarischer Beirat für nachhaltige Entwicklung
19. Wahlperiode Protokoll der 80. Sitzung vom 19. Mai 2021
Seite 9 von 17
Sinne auch Unterquoten von grünen Kraftstoffen festlegen insb. auch für die Investitionssicherheit von Kapitalgebern festlegen. Wir brauchen gleich-ermaßen grüne Elektronen wie grüne Moleküle im Sinne der Gesamtsystemausrichtung. In dem Sinne ist klar – diese ganzen Debatten, die Sie ja auch gut kennen: Sektor-Kopplung ist ganz wich-tig, um die Sektoren Wärme, Chemie, Industrie aber auch Mobilität zu erreichen. Und schließlich, ganz wichtig, und das ist eigentlich der entschei-dende Punkt: Es geht nicht um Deutschland, es geht nicht mal nur um Europa, sondern wir brau-chen eine globale Betrachtung für den Aufbau eines globalen erneuerbaren Energiehandels. Die Welt ist gesamthaft zu betrachten und deswegen ist es so wichtig, dass 189 Länder jetzt das COP21 ratifiziert haben. Alle Länder gehen in Richtung Klimaneutralität und bereiten sich auf einen Han-del mit erneuerbaren Energieträgern vor, die in aller Regel flüssig sein werden. Ammoniak, Me-thanol und weitere langkettige Derivate, aber auch Flüssigwasserstoff werden im künftigen globalen Energiesystem und dem Energiehandel sehr wich-tig werden
Damit möchte ich mich noch mal für die Einla-dung, mit Ihnen über das Thema zu diskutieren, herzlich bedanken. Vielen Dank.
Vorsitzender Dr. Andreas Lenz (CDU/CSU): Vielen Dank auch an Sie, Herr Prof. Hebling, für den Überblick. Wir haben jetzt zwei Überblicke bekommen, die doch in der Konnotation etwas unterschiedlich waren. Umso wichtiger ist natürlich auch die entsprechende Diskussion jetzt im Anschluss. Ich schaue in die Runde. Ich bitte Sie, Herr Prof. Hebling, dass Sie vielleicht noch die Präsentation schließen. Ich würde mit Abg. Peter Stein von der CDU/CSU-Fraktion beginnen.
Abg. Peter Stein (CDU/CSU): Erst einmal ganz herzlichen Dank. Herr Prof. Hebling, ich bin Ihnen sehr dankbar, dass Sie am Schluss die globale Überschrift noch mal gefunden haben, weil ich glaube, dass es tatsächlich das ist, was auch den „Game-Changer“ darstellt, den wir jetzt in dieser aktuellen Situation haben, dass wir es durch die Erneuerbaren Energien, durch die E-Fuels, durch die Wasserstofftechnologie mit zukünftigen poten-ziellen Partnern in der Welt zu tun haben, die bis-her in der globalen Energieversorgung nicht am Tisch gesessen haben, zumindest nicht in der ers-ten Reihe. Ich glaube, das zeigt dann auch die
strategische Dimension, die dahintersteckt, wenn wir uns jetzt zu bestimmten Technologien beken-nen und auch in Investitionen gehen.
Da würde ich an einer Stelle direkt mal Frau Boening widersprechen. Ich sehe es nicht als sinnvoll an, dass wir jetzt auf die „Zusätzlichkeit“ einer Verfügbarkeit von Energie warten. Ich meine, das kann vielleicht Saudi-Arabien liefern, mit seinem wirtschaftlichen Potenzial innerhalb einer kurzen Zeit enorme Kapazitäten hochzufah-ren, um sich a) selbst zu versorgen und dann auch b) noch Exporteur zu sein, aber schon bei Chile oder Marokko wage ich mal die Behauptung: Ohne dass man es von Anfang an auch zeitgleich mit Exporten von Energieträgern zu tun hat, wird niemand investieren und die Länder werden tech-nologisch und wirtschaftlich nicht in der Lage sein, sich selbst zu versorgen, wenn nicht parallel von außen auch Investitionen in den Energiesek-tor getätigt werden. Das muss – glaube ich – auf jeden Fall zusammengedacht werden. Und wenn wir bei Investitionen sind: Da ist eigentlich etwas – glaube ich –, was wir auch national intensiver betrachten müssen. Sie haben vom „Sorgenkind Bestandsflotte“ gesprochen. Diese Bestandsflotte baut sich ja jetzt heute und auch in den nächsten Jahren noch auf. Und wenn wir jetzt das Ziel ha-ben, bis 2045 im Weitesten CO2-neutral zu wer-den, auch im Mobilitätsbereich, dann müssen wir spätestens in den nächsten vier Jahren aufhören, mit Verbrennern zu arbeiten, sondern spätestens in vier Jahren muss jedes dann gekaufte Auto, jeder Bus, jeder LKW, jedes Schiff und auch jedes Flugzeug im Grunde in der Lage sein, mit CO2-neutralen Brennstoffen gefahren zu werden. Das sind eigentlich die Herausforderungen; das ist diese Zeitschiene. Ich glaube, wir haben nicht die technologische Herausforderung, auch nicht unbe-dingt eine Willensherausforderung, wir haben tat-sächlich eine große Herausforderung in der Zeit-schiene, und da stecken wir global an dieser Stelle alle unter der gleichen Decke, also geht das nur zusammen. Da wäre meine erste Frage an Herrn Prof. Hebling: Wo sehen Sie Deutschland da? Sind wir mehr im investiven Bereich gefragt, sind wir mehr im technologischen Bereich gefragt? In der Zielstellung, dass wir selber CO2-neutral werden wollen, aber das eben nur in Partnerschaft geht: Wo würden Sie da die Schwerpunkte setzen? Wo sollte Deutschland am stärksten das Gewicht ein-bringen? Das an der Stelle.
Parlamentarischer Beirat für nachhaltige Entwicklung
19. Wahlperiode Protokoll der 80. Sitzung vom 19. Mai 2021
Seite 10 von 17
Das Zweite, was ich mir wünschen würde und was wir – glaube ich – auch als Politik brauchen: Wir brauchen Empfehlungen von Ihnen. Also nicht – ich sage einmal – ein Darstellen dessen, was alles nicht getan werden darf, und nicht ein Darstellen dessen, was alles funktioniert oder nicht funktioniert, sondern im Grunde brauchen wir dringend – ich habe von den nächsten vier Jahren gesprochen – Hilfestellung, Empfeh-lungen, worein zu investieren ist, in welcher Rei-henfolge, in welcher Priorität und wo die Schwer-punkte zu setzen sind. Ich nehme mal nur als Bei-spiel den öffentlichen Nahverkehr. Wir haben gerade bei mir im Landkreis den ersten Wasser-stoff-Testbus in Betrieb genommen. Auch dort gilt: Die Busse, die in den nächsten vier Jahren ge-kauft werden, sind danach noch 20 Jahre am Markt. Das hilft uns dann in 20 oder 25 Jahren nicht, wenn die immer noch fahren, um die Bi-lanz herunterzukriegen. Also entweder muss ich dann auch Busse haben, die dann – heute Ver-brenner – zukünftig mit E-Fuels gefahren werden können. Da bin ich ganz bei Herrn Hebling, zu sa-gen, wir brauchen E-Fuels im Markt, einfach, um mit dem Bestand umzugehen. Ich will jetzt gar nicht von Einsatzfahrzeugen – wie Feuerwehren – reden usw., die ja auch alle betrieben werden müssen.
Vorsitzender Dr. Andreas Lenz (CDU/CSU): Ich bitte, etwas auf die Zeit zu achten.
Abg. Peter Stein (CDU/CSU): Deshalb meine letzte Frage an Frau Boening noch mal: Wo würden Sie uns Empfehlungen geben, um einfach aus Ihrer Sicht in der Zeitschiene bleiben zu können?
Vorsitzender Dr. Andreas Lenz (CDU/CSU): Vielen Dank. Als Nächstes Michael Thews von der SPD-Fraktion. Wir haben Probleme – glaube ich –, dass die Frau Boening gerade aus der Leitung geflogen ist, insofern bitte ich, gleich mit den Fragen an Herrn Prof. Hebling beginnen.
Sachverständige Jekaterina Boening (T&E): Nein, ich bin schon da.
Abg. Michael Thews (SPD): Umso besser. Ich würde Frau Boening noch mal die Chance geben, über diese – ich sage es jetzt mal – „Verdrängung“ zu reden. Sie hat ja gesagt, im Grunde genommen müssen auch die Länder, aus denen wir importie-ren wollen, erst einmal selber versorgt werden. Das haben wir z. B. auch im Umweltausschuss
diskutiert als wir in Marokko waren und uns dort die Photovoltaikanlage angeschaut haben. Soweit ich weiß, wird der Strom, der da produziert wird – das ist eine riesen Anlage mit 400 / 500 MB –, erst einmal da gebraucht; er wird gar nicht expor-tiert. Da sind wir noch lange nicht. Ich kann mich auch sehr gut daran erinnern, dass Hermann Scheer, als er sein Buch geschrieben hat, darauf hingewiesen hat, dass, wenn wir regenative Ener-giemodelle entwickeln, wir auch darauf achten müssen, dass die Energie, die dann noch von Pri-märrohstoffen genutzt wird, nicht einfach nur in andere Länder verdrängt wird, weil sie dann billi-ger wird und von anderen Ländern stärker genutzt wird. Das würde in der Bilanz dem CO2 gar nichts nützen. Also insofern – glaube ich – muss man das schon beachten. Ich würde Frau Boening gerne noch mal die Chance geben, das zu erläu-tern.
Dann ist es tatsächlich so – ich habe das mal be-rechnen lassen, was das bedeutet, wenn wir auf E-Fuels gehen würden: Die sind ja von der Effektivi-tät unglaublich niedrig. Man müsste unglaublich viel Strom produzieren, um E-Fuels herzustellen. Das kann ja bestenfalls – sage ich mal – ein Pro-dukt für Antriebssysteme sein, wo man wirklich keine Alternative hat. Da frage ich mich natürlich – also beim Fliegen, okay, da weiß ich es nicht, aber bei Schiffen oder anderen Dingen –, ob wir uns dann nicht eigentlich viel stärker die An-triebstechnologien anschauen und fragen müss-ten, „Wie kriegen wir die in eine effektive Schiene?“. Effektiv ist für mich momentan Batte-rieantrieb und Wasserstofftechnologie – anstatt zu überlegen, wie wir jetzt auf Biegen und Brechen so viel Energie produzieren, dass wir E-Fuels her-stellen können. Ist das nicht eigentlich der falsche Weg? Müsste man da nicht eigentlich einen ganz anderen Weg gehen? Das wäre meine Frage. Vielen Dank erst mal.
Vorsitzender Dr. Andreas Lenz (CDU/CSU): Vielen Dank. Als Nächstes Dr. Rainer Kraft von der AfD.
Abg. Dr. Rainer Kraft (AfD): Vielen Dank. Ich würde Frau Boening kurz fragen. Es war ein recht interessanter Vortrag. Ich stimme Ihnen komplett zu, dass der Wirkungsgrad für E-Fuels bei 10 bis 35 Prozent liegt, aber in der gleichen Größenordnung liegt er für Wasserstoff. Für mich als Chemiker ist Power-to-X genau das Gleiche.

Parlamentarischer Beirat für nachhaltige Entwicklung
19. Wahlperiode Protokoll der 80. Sitzung vom 19. Mai 2021
Seite 11 von 17
Ob ich jetzt daraus einen kohlenstoffbasierten Flüssigkraftstoff herstelle oder Wasserstoff, das ist für mich „gehupft wie gesprungen“. Ich kann des-wegen Ihre Bewunderung für Wasserstoff und die Ablehnung von flüssigen Treibstoffen und Kraft-stoffen nicht ganz verstehen. Zu Recht weisen Sie darauf hin, dass PtX-Lieferketten unter Klima-schutz- und Industriestrategien riskant sind, aber das Gleiche trifft ja auch für Wasserstoff zu. Und wenn ich einmal das BMWi (Bundesministeriums für Wirtschaft und Energie) zitieren darf, das geht ja davon aus, dass wir in Zukunft 90 Prozent un-seres Wasserstoffes aus den Gegenden des Nahen und Mittleren Ostens und Afrika importieren wollen. Wenn Ihre Aussage für „Power-to-X“-Flüssigkraftstoffe – Syn-Fuels – gilt, dann gilt sie selbstverständlich auch für Wasserstoff. Es kann also in dieser Beziehung kein Argument sein, dass wir das machen. Der große Vorteil von einem syn-thetischen Kraftstoff liegt darin, dass er logistisch viel leichter handhabbar ist als der ganze Wasser-stoff. Wasserstoff hat eine extrem geringe Energie-dichte. Das stellt logistisch eine riesige Herausfor-derung dar. Es wird schwierig, überhaupt ein Schiff zu konzipieren, das Netto-Energie transpor-tieren kann, weil der Wasserstoff nämlich so eine geringe Energiedichte hat, dass ein Tanker große Probleme hat, Netto-Energie zu transportieren, wenn ich die Energie zum Transport davon ab-ziehe. Wo ist der Unterschied für Sie, dass Sie einer Syn-Fuel-Strategie – Power-to-X zu flüssigen Kraftstoffen – hier Risiken bescheinigen, während Sie gleichzeitig sagen, eine Wasserstoffproduktion aus genau den gleichen Gegenden der Welt wäre wünschenswert und würde kein Problem darstel-len? Danke.
Vorsitzender Dr. Andreas Lenz (CDU/CSU): Vielen Dank. Als Nächstes Herr Dr. Lukas Köhler von der FDP.
Abg. Dr. Lukas Köhler (FDP): Herzlichen Dank erst einmal an beide Vortragenden. Ein super spannendes Thema, eine super interessante Dis-kussion. Herr Hebling, Sie haben – finde ich – viele extrem gute, wissenschaftlich fundierte – aus der Studie ja scheinbar – Sachen gesagt, die ich extrem spannend fand. Vor allem auch diesen Effizienzvergleich, der auch so ein bisschen die Argumente von vorher ausgehebelt hat. Das fand ich also sehr, sehr spannend. Ich habe nun zwei Fragen dazu. Das eine: Sie sagten, die Studie
kommt erst noch, oder war das eine jetzt schon veröffentlichte Studie? Ich habe sie auf die Schnelle jetzt nicht gefunden, aber vielleicht war ich auch nicht schnell genug im Suchen.
Sachverständiger Prof. Dr. Christopher Hebling(Fraunhofer-Institut für Solare Energiesysteme ISE): Vielleicht darf ich gerade, weil es schnell geht, sagen: Das haben wir für den Nationalen Wasserstoffrat erstellt. Das wird diese Woche redi-giert, sowohl die 60 Seiten als auch die 150 Folien, und soll dann eigentlich nächste Woche hochgeladen werden.
Abg. Dr. Lukas Köhler (FDP): Ja, dann sage ich dazu noch nichts. Aber dann ist gut, dann freue ich mich darauf. Wenn die kommen, dann schaue ich mir das mal näher an. Super spannend.
Die zweite Frage: Sie haben den Schiffssektor er-wähnt. Ich habe das jetzt auch gehört, dass die sozusagen den Sprung gar nicht mehr über „LNG“ machen, sondern sofort in E-Fuels einsteigen. Wie sehen Sie denn die Skalenpotenziale von E-Fuels? Ich meine, dass ineffizienteste Energieprodukt, das wir jemals hatten, waren Erneuerbare. Also, Wind- und Solarenergie waren ja am Anfang un-glaublich ineffizient, bis man sie über die Skalen-effekte, über die Entwicklung, immer weiter ver-bessert hat. Die haben riesige Summen reininves-tiert. Anscheinend ist die Schiffsindustrie, so wie Sie das gerade ausgeführt haben, ja auch dazu be-reit, riesige Summen zu investieren, und das würde mich zumindest interessierten.
Frau Boening, zu Ihnen würde ich gerne auch noch kommen und drei Fragen stellen. Das Erste ist allerdings eine kurze Vorabbemerkung: Mit ih-rer Rechnung bin ich extrem überrascht, dass Transport & Environment's gegen Bahnverkehr ist, dass Sie also sagen, Bahnverkehr ist nicht sinnvoll nachhaltig nutzbar. Weil, die Rechnung – –
Sachverständige Jekaterina Boening (T&E): Ich glaube, ich habe nie etwas zum Bahnverkehr ge-sagt.
Abg. Dr. Lukas Köhler (FDP): Ja, warten Sie mal. Ich habe doch auch nicht reingelabert. Die Frage-stellung, die Sie gerade aufgemacht haben, bedeu-tet doch: Wenn ich „Zusätzlichkeit“ habe und da-für sorge, dass dann z. B. Diesel oder mehr CO2-basierte Dinge verbrannt werden, ich das dann nicht als „nachhaltig“ bezeichnen kann. Wenn ich

Parlamentarischer Beirat für nachhaltige Entwicklung
19. Wahlperiode Protokoll der 80. Sitzung vom 19. Mai 2021
Seite 12 von 17
jetzt aber den Bahnverkehr massiv erhöhen würde, würde das ja z. B. zu einer höheren Nut-zung von – aktuell – „Datteln 4“ führen, d. h. also, mehr Kohlestrom würde dafür ausgestoßen wer-den, und damit wären wir in dem gleichen Argu-mentationsmuster wie zu den E-Fuels. Genauso wie die Frage der weiteren Nutzung von dieselba-sierten Strecken. Natürlich haben Sie aktuell beim Bahnverkehr, zumindest im Bahnmix, immer noch Strecken, die Sie auf Diesel fahren müssten, und damit würde ja das auch nicht funktionieren. Ich nehme mal an, dass Sie die Gegenargumenta-tion aufmachen würden, zu sagen „Na ja, weil im Moment laut der PtX-Studie – zumindest bei dem, was beim Ausstoß hinten herauskommt – die Effi-zienz höher ist, kann man sagen, okay, aktuell kann man E-Fuels im Strommix nicht verwenden, aber E-Mobilität.“ Das ist zwar eine Ungleichbe-handlung, kann man aber noch so argumentieren. Aber zumindest im Bahnbereich müsste man ja dann sagen „Bahn ist nicht effizient“. Dass kann ich mir nicht vorstellen, dass das Ihre Argumenta-tionskette ist. Können Sie mich hier aufklären? Und ansonsten würde ich noch mal die Frage stel-len wollen, wie viele Fahrzeuge wir weltweit aktuell mit Batterieelektrik betreiben können und wie schnell wir da umsteigen können.
Vorsitzender Dr. Andreas Lenz (CDU/CSU): Vielen Dank. Viele Fragen und auch schon eine intensive Diskussion. Ich bitte – wie gesagt –, die Fragen zu stellen und dann die Antworten zu geben, und wir fahren gleich fort mit Herrn Zdebel von den LINKEN.
Abg. Hubertus Zdebel (DIE LINKE.): Ja, herzlichen Dank, Herr Vorsitzender. Herzlichen Dank auch an die beiden Vortragenden. Ich fand das, was Sie gesagt haben, auch sehr aufschlussreich und span-nend. Meine zwei Fragen gehen eigentlich an beide.
Die erste Frage, die ich hätte, wäre zur Zukunft der E-Fuels. Insbesondere Sie, Frau Boening, ha-ben ja den E-Fuels im Straßenverkehr nun eher ge-ringe Zukunftsaussichten quasi vorhergesagt oder prognostiziert. Sie haben sogar davon gesprochen, dass der Markt das ähnlich sieht. Und ich weiß, dass der Verkehrsclub Deutschland – also der VCD –, der ja Mitglied in Ihrer Organisation Transport & Environment's ist, eine deutliche Ver-lagerung des Verkehrs auf den ÖPNV (Öffentlicher
Personennahverkehr) fordert. Der ÖPNV ist ja ge-rade insbesondere von Herrn Dr. Köhler schon einmal angesprochen worden. Wie sollte Ihrer Meinung nach denn dort der künftige Antrieb aus-sehen, und welche Rahmenbedingungen sollte die Politik hier schaffen, um tatsächlich auch zu einer stärkeren Verlagerung hin zum ÖPNV zu kom-men? Das geht ein bisschen auch in dieselbe Rich-tung, wie Herr Thews und Herr Köhler gerade ge-fragt haben.
Und dann habe ich noch eine Frage an beide zur Neuzulassung von Autos mit Verbrennungsmotor. Müsste man dann nicht spätestens im Jahre 2030 vor dem Hintergrund des Ganzen zu dem Ergebnis kommen, dass Autos mit Verbrennungsmotoren dann nicht mehr zugelassen werden könnten und beendet werden müsste – auch vor dem Hinter-grund der voll-elektrischen Antriebe, die ja im Vergleich zu allen anderen Varianten in den kommen Jahren eher als effektiv zu sehen sind? Und vor dem Hintergrund auch die Frage, ob es da nicht eben auch von Seiten der Politik klarer ordnungspolitischer Maßnahmen bedarf, um diese Ziele überhaupt durchzusetzen – auch vor dem Hintergrund der ökonomisch, ökologischen, aber auch sozialen Entwicklungen in unserem Land. Herzlichen Dank.
Vorsitzender Dr. Andreas Lenz (CDU/CSU): Vielen Dank Herr Zdebel und abschließend von den GRÜNEN, Herr Abg. Zickenheiner.
Abg. Gerhard Zickenheiner (BÜNDNIS 90/DIE GRÜNEN): Ja, Danke, Herr Vorsitzender, und Danke an beide Referenten. Es war hochinteres-sant. Ich bin aber nicht Ihrer Ansicht, Herr Hebling, dass es so kontradiktiv war, was Sie beide berichtet haben; es war eher eine andere Blickrichtung. Sie haben im Wesentlichen analy-siert, was wir so alles brauchen können, und Frau Boening hat im Wesentlichen analysiert, wo es schwierig wird, das zu bekommen. Ich fand das eine ganz interessante Perspektive, und ich glaube, wir müssen das irgendwie zusammenfüh-ren, weil das eine nur mit dem anderen funktio-niert.
In dem Zusammenhang an Sie, Herr Hebling, die erste Frage. Sie haben die Karte gezeigt mit diesen 30 Wasserstoff-Roadmaps. Hat irgendjemand ein-mal diese Roadmaps zusammengezählt und ge-

Parlamentarischer Beirat für nachhaltige Entwicklung
19. Wahlperiode Protokoll der 80. Sitzung vom 19. Mai 2021
Seite 13 von 17
schaut, was wir uns weltweit denn so an Wasser-stoff wünschen, und abgeglichen, ob das mit den planetaren Grenzen machbar ist? Das wäre die Frage an Sie.
Die Frage an Frau Boening ist ein bisschen kom-plexer. Der Grundsatzentwurf der Bundesregie-rung zur Weiterentwicklung der Treibhausminde-rungsquote öffnet unserer Ansicht nach Tür und Tor, dass diese E-Fuels in irgendeiner Form kom-men, und dass man sich da eigentlich von der Vorstellung löst, man müsse auf Elektro kommen, was natürlich einfach einen ganz großen Problem-kreis mit sich bringt, in dem, was Sie analysiert haben, nämlich dass wir etwa die sechsfache Energie brauchen, um ein E-Fuel-Auto vorwärts zu bewegen wie ein elektrisches. Das dockt natür-lich auch an die Frage, die ich Herrn Hebling ge-stellt habe, an. Gibt es Berechnungen oder Überle-gungen Ihrerseits, wenn man das tatsächlich zu-lässt und Tür und Tor geöffnet wird und es in ir-gendeiner Weise verfängt, wie wir da am Schluss noch die Energiesicherheit in Deutschland ge-währleisten können? Das ist meine erste Frage.
Die zweite Frage ist: Wie gehen wir damit um? Wir haben jetzt jede Menge von diesen Zuliefe-rern, gerade MAHLE z. B., ihres Zeichens Ventil-hersteller, die sich jetzt nicht vorstellen können, wie sie die im Elektromotor unterbringen. Wie ge-hen wir damit um, dass die immer wieder nach diesen wasserstoffbasierenden E-Fuels fragen, dass da eine Technologieoffenheit eingefordert wird, obwohl doch eigentlich längst klar ist, dass das Vorgehen höchst unwirtschaftlich ist? Sollten wir den Tankstellenbesitzern und ähnlichen Leu-ten nicht tatsächlich reinen Wein einschenken und klarmachen, dass man da auf einer Abschuss-Technologie sitzt und sich frühzeitig zum Umden-ken bewegt? Ist es da nicht allerhöchste Zeit, um eben nicht in das Dilemma reinzulaufen, dass wir am Schluss einen immensen Überhang an klassi-schen Automobilen mit fossilbetriebenen Motoren rumstehen haben? Danke dafür.
Vorsitzender Dr. Andreas Lenz (CDU/CSU): Vielen Dank für die vielen spannenden Fragen. Ob wir bei den Antworten auch tatsächlich in einer übereinstimmenden Art und Weise zusammenkommen, das werden wir jetzt sehen. Ich würde jetzt Frau Boening das Wort für die erste Antwortrunde geben, und Sie bitten, dass Sie sich bei der Antwort in einem Rahmen von
höchstens sechs bis acht Minuten bewegen. Wir haben eben gesagt, dass wir um ca. 19:05 Uhr diese Runde schließen müssen. Wir müssen dann schauen, ob in Anbetracht der Zeit noch eine oder einzelne Rückfragen zulässig sind. Aber zunächst zu den Antworten, Frau Boening, Sie haben das Wort.
Sachverständige Jekaterina Boening (T&E): Vielen Dank. Ich bleibe wegen der Bandbreite bei der ausgeschalteten Kamera.
Ich möchte mit der Frage von Herrn Thews zur „Verdrängung“ beginnen, Marokko und wie wir die Transformation der Energiesysteme in Län-dern wie Marokko sehen. Das ist absolut richtig, und ich stimme Ihnen hundertprozentig zu, dass Länder wie Marokko, Saudi-Arabien, Chile und Australien natürlich die grünen Elektronen brau-chen, um ihre eigenen Energiesysteme zu dekar-bonisieren. Es gibt aber noch einen weiteren Punkt, der in der Debatte eigentlich fast immer vernachlässigt wird: Sie haben auch andere in-dustriepolitische Pläne, was sie mit diesem grü-nen Strom vorhaben. So hatte ich z. B. erst vor wenigen Monaten das Vergnügen, bei einer Veran-staltung der Konrad-Adenauer-Stiftung dabei zu sein. Dort waren Vertreter der MENA-Region gela-den, und die Vertreter der marokkanischen Regie-rung sprachen davon, dass sie den grünen Wasser-stoff für ihre eigene Stahlproduktion nutzen wollen. Sie wollen ihre eigene Stahlproduktion aufbauen und haben kein Interesse daran, den grünen Wasserstoff nach Deutschland oder nach Europa zu schiffen, und das wird einfach nicht mitgedacht. Genau das Gleiche gilt für Australien. Auch die Australier denken an die eigene Stahl-produktion, an die chemische Produktion. Das heißt, wir können als Europäer nicht davon ausge-hen, dass uns einfach die ganze Welt zur Verfü-gung steht und diese Länder darauf warten, dass wir da hingehen, um dort E-Fuels zu produzieren um diese E-Fuels dann in unseren Autos auf der Straße zu verbrennen.
Die Frage von Herrn Abg. Stein habe ich leider ein bisschen verpasst, weil ich Probleme mit der Ver-bindung hatte. Aber Sie sagten, Sie können es nicht nachvollziehen, Sie finden es nicht sinnvoll, dass der Strom „zusätzlich“ ist. Ich kann dazu nur sagen: Es geht gar nicht um sinnvoll oder nicht, sondern um die – –

Parlamentarischer Beirat für nachhaltige Entwicklung
19. Wahlperiode Protokoll der 80. Sitzung vom 19. Mai 2021
Seite 14 von 17
Vorsitzender Dr. Andreas Lenz (CDU/CSU): Frau Boening, ich bitte Sie, kurz zu stoppen, weil wir gerade eine Durchsage zum Beginn der namentli-chen Abstimmung haben. – – Alles klar, Frau Boening, Sie können gerne fortfahren; wir liegen in unserem Zeitplan.
Sachverständige Jekaterina Boening (T&E): Gerne. Vielen Dank. Herr Stein, Sie sagten, Sie finden es nicht sinn-voll, auf die „Zusätzlichkeit“ bei der Stromerzeu-gung für E-Fuels zu schauen. Es geht mir gar nicht um das Sinnvolle oder nicht Sinnvolle. Es geht mir einfach nur um diese Grafik, die ich Ihnen ge-zeigt habe, dass E-Fuels mit dem heutigen Strom-mix drei- bis viermal so viel CO2 im Vergleich zu fossilen Kraftstoffen emittieren. Wenn Sie der Meinung sind, dass es sozusagen okay ist, dass wir dann mit diesen Kraftstoffen sogar noch mehr CO2 im System haben, als wir ohne diese Kraft-stoffe hätten, dann kann man damit leben, aber das ist dann Ihre politische Entscheidung. Es geht hier nicht um das Sinnvolle oder nicht. Ich ver-stehe natürlich Ihr Dilemma: Was machen wir jetzt bis 2030?. Welche Maßnahmen können wir bis 2030 priorisieren? Hier kann ich nur sagen, das ist die Flottenerneuerung mit Unterstützung von europäischen Grenzwerten und auch eine An-passung der Dienstwagenbesteuerung und alles, was zu einer echten Mobilitätswende gehört. Wir haben von vielen heute auch das Wort „ÖPNV“ gehört, mit der Verlagerung, aber nicht nur. Dazu gehören auch bessere Mobilitätsangebote, auch ein Ausbau von Carsharing, und dass wir die Mo-bilitätswende ganzheitlich denken. Das gehört nicht nur zu den Forderungen von Umweltverbän-den, das gehört auch zu dem Programm von Agora Verkehrswende. Wir können nicht davon ausge-hen, dass wir die Verkehrswende dadurch schaf-fen, dass wir 48 Millionen Fahrzeuge, die wir heute auf der Straße haben, einfach im Jahr 2030 elektrifizieren. Das ist nicht das Ziel einer Ver-kehrswende.
Herr Köhler, auf Ihre Frage werde ich gar nicht eingehen. Ich glaube, als Abgeordneter des Deut-schen Bundestages haben Sie es gar nicht nötig, einer Sachverständigen zu sagen, dass Sie „la-bert“. Deshalb werde ich das überspringen.
Herr Kraft, Sie haben gesagt, ich hätte Wasserstoff und E-Fuels irgendwie gleich behandelt. Es kann sein, dass Sie mich missverstanden haben. Ich
habe in meinem Vortrag eigentlich nur über E-Fuels gesprochen. Bei der direkten Nutzung von Wasserstoff mit Brennstoffzelle haben Sie auf je-den Fall höhere Wirkungsgrade. Wasserstoff mit Brennstoffzelle ist im Vergleich zu E-Fuels eine effizientere Technologie. Das Problem, was wir al-lerdings heute haben, ist, dass wir keine Fahr-zeuge mit Brennstoffzellen haben. Es gibt viele verschiedene Ankündigungen. Wir wissen von Daimler, die überlegen sich, auch Brennstoffzel-len-LKWs auf den Markt zu bringen, allerdings nicht jetzt, sondern erst Ende der 2020er-Jahre. Wenn diese Fahrzeuge kommen, kann das natür-lich ein „Win-win“ auch für die Zulieferer sein, weil die Zulieferer vielleicht auch eine ganz an-dere Rolle hätten, wenn wir im Verkehrssektor auch diese Möglichkeit hätten, auch mit der Brennstoffzelle zu arbeiten. Das Problem ist: Diese Fahrzeuge kommen nicht, und deshalb ist es ris-kant darauf zu warten und darauf die Mobilitäts-strategie, die Klimapolitik im Verkehrssektor, zu bauen.
Dann die Frage zum „ÖPNV“. Welchen Antrieb sehe ich im Bereich des Öffentlichen Nahver-kehrs? Das wird wahrscheinlich ein Mix sein, weil wir bei den Bussen schon jetzt eine sehr, sehr gute Entwicklung sehen, dass es Elektrobusse sein werden. In vielen Städten – sowohl in Berlin, aber auch in anderen europäischen Städten, in Amster-dam – geht es sehr stark und gut voran, dass wir bei den Bussen auf Elektroantriebe umsteigen. Im Bahnverkehr – und dann doch noch die Frage von Herrn Köhler: Natürlich kann auch Wasserstoff für die nicht elektrifizierten Bahnstrecken eine Rolle spielen. Das muss man jetzt einfach hier so sagen, weil das eine Option ist.
Sie haben auch gefragt, welcher regulatorische Rahmen das unterstützen könnte, bis wir die Ver-lagerung haben. Wir haben das Mobilitätsgesetz, das ist auch etwas, was der VCD, unsere Mitglied-sorganisation, eng verfolgt, und das Mobilitätsge-setz kann insgesamt einfach einen sehr konstrukti-ven Beitrag dazu leisten, dass wir in einer gesamt-heitlichen Mobilitätswende vorankommen.
Es gab auch noch die Frage zum Ausstieg aus dem Verbrennungsmotor. Ich kann dazu nur sagen: Ja, wir unterstützen es, und wir unterstützen es nicht nur aus Klima- und Umweltaspekten, sondern so eine politische Entscheidung würde Investitions-sicherheit für die Industrie geben, sowohl für die

Parlamentarischer Beirat für nachhaltige Entwicklung
19. Wahlperiode Protokoll der 80. Sitzung vom 19. Mai 2021
Seite 15 von 17
Automobilhersteller, für die Ladeinfrastrukturbe-treiber als auch für die Zulieferer. Die Zulieferer stecken derzeit natürlich in einer wirklich schwie-rigen Situation. Sie verstehen, dass ihr Geschäfts-modell ausläuft, sie brauchen neue Geschäftsmo-delle, sie müssen sich wandeln, aber die E-Fuels und das Warten auf die E-Fuels aus dem Ausland, irgendwann und in irgendwelchen Mengen, wird nicht das sein, was die Arbeitsplätze in der Zulie-fererindustrie sichert. Die Zuliefererindustrien müssten jetzt schauen, wie sie in die Softwareent-wicklung investieren, wie sie vielleicht doch in die Batteriefertigung einsteigen, wie sie ins Batte-riemanagement einsteigen. Das neue Auto erfor-dert ganz andere Zulieferer. Die deutschen Zulie-ferer haben die Möglichkeit, das zu werden, aber das Warten auf die E-Fuels ist nicht die Strategie, die die Arbeitsplätze in Deutschland sichern kann.
Letzte Frage noch zu E-Fuels und der Energiesi-cherheit, sozusagen, was passieren würde, wenn wir jetzt alle Kraftstoffe auf E-Fuels umstellen würden. Ich möchte dazu keine eindeutige Aus-sage treffen, weil natürlich viel davon abhängt, welche Ausbauphase die Regierung verfolgt, wel-che Technologien ausgestoßen werden, wie schnell wir z. B. aus der Kohle aussteigen. Wenn man jetzt natürlich wieder alle Energieträger er-lauben und zulassen würde, dann könnte man vielleicht auch mit E-Fuels alles machen, aber welchen Klimaeffekt hätte das? Mit den Ausbau-pfaden, die wir haben, mit den Ausbaupfaden im novellierten EEG (Erneuerbare-Energien-Gesetz), werden wir sicherlich den deutschen Verkehrs-sektor nicht mit E-Fuels versorgen können. Es wäre dann wahrscheinlich keine gute Entschei-dung, das auf Kosten der Energiesicherheit zu machen. Ja, vielen Dank.
Vorsitzender Dr. Andreas Lenz (CDU/CSU): Vielen Dank, Frau Boening. Eine kurze Bemerkung: Es ist eine gute Debatte, eine sehr emotionale Debatte, auch eine sehr intensiv geführte Debatte. Trotzdem bitte ich natürlich alle Teilnehmerinnen und Teilnehmer, auf der Sachebene zu bleiben. Ich bin mir aber sicher, dass keine Bemerkung, die vielleicht im Eifer des Gefechts fiel, in irgendeiner Weise böse gemeint war. In dem Sinne hat jetzt Herr Prof. Hebling das Wort. Wir freuen uns auf Ihre Ausführungen.
Sachverständiger Prof. Dr. Christopher Hebling (Fraunhofer-Institut für Solare Energiesysteme ISE): Ja, vielen Dank. Zunächst einmal: Es gibt nicht „die“ eine Lösung. Die Lösung ist weder, alles mit E-Fuels, noch alles mit Batterien zu machen, sondern wir brauchen alle Lösungen, die technisch möglich sind. Wir müssen in alle Rich-tungen investieren. Ich sage deswegen vielleicht das Plädoyer „Stärker in die E-Fuels“, weil wir nach wie vor Verbrennungsfahrzeuge im Markt haben. Und noch mal: Es ist kein deutsches Prob-lem, was wir hier adressieren. Wir haben weit über anderthalb Milliarden Fahrzeuge mit Ver-brennungsmotoren global auf den Straßen, die alle mit fossilen Kraftstoffen unterwegs sind, und wir müssen den Übergang in eine nachhaltige Energie-wende auch im Bereich der Verbrennungsmotorik hinkriegen. Nicht der Verbrennungsmotor ist das Problem, sondern der fossile Kraftstoff. Ich bin mir sicher, dass wir noch das ganze Jahrhundert mit Verbrennungsmotoren unterwegs sein wer-den. Ich halte gar nichts von Verboten von irgend-einer Technologie. Das wäre so eine Art „kalte Enteignung“ von Fahrzeugen, die heute noch ge-kauft werden und die dann irgendwann einfach keinen Nachschub mehr bekommen.
Gleich zu den Fragen, also: Wo sollte Deutschland aktiv werden? Ich denke, sehr stark im Technolo-giebereich. Wir haben in Deutschland eine fantas-tische Technologiebasis, die Investitionen kom-men von anderorts. Ich war vor zwei Wochen in Dubai auf einer Investorenkonferenz für die MENA-Region, und man glaubt gar nicht, was für eine Investitionswilligkeit im Bereich „Wasser-stoff und Wasserstofftechnologien“ – alles noch mal der nächste Schritt nach den reinen PV- (Pho-tovoltaik) und Windinvestitionen – vorherrscht. Neom z. B. – in Saudi-Arabien – wird jetzt eine erste Investition von fünf Milliarden Dollar getä-tigt. Dort werden 2,2 Gigawatt Elektrolyse, kombi-niert mit 2.5 Gigawatt Photovoltaik und 1.5 Giga-watt Windkraft aufgebaut. Übrigens wird Thyssen-krupp den Zuschlag bekommen, eine deutsche Technologie, wenn man so will. Dort wird Ammo-niak hergestellt werden, ein Teil dieses Wasser-stoffs wird also in Form von Ammoniak per Schiff nach Rotterdam gebracht werden. Wir müssen eben auch sehen, dass es ein europäisches Ver-teilthema ist, was da dran hängt. Rotterdam ist jetzt schon für den Import und die Verteilung von

Parlamentarischer Beirat für nachhaltige Entwicklung
19. Wahlperiode Protokoll der 80. Sitzung vom 19. Mai 2021
Seite 16 von 17
13 Prozent aller Energieträger für Europa zustän-dig – Öl, Gas und Kohle –, und auch dort richtet man sich jetzt für nachhaltige Energieträger ein, die dann von irgendwo aus der Welt kommen werden. Vielleicht, weil es genannt wurde, „Australien“: Ich hatte hier letzte Woche eine Ver-anstaltung „Freiburg-Energie-Talk“ mit Staats-sekretär Lukas vom BMBF, mit Thorsten Herdan vom BMWI, Klaus Bonhof vom BMVI und wich-tigen Vertretern aus der Industrie und Verbänden und übrigens war auch der australische Botschaf-ter Philip Green wegen des Wasserstoff-themas zugegen. Natürlich stellt sich Australien für den Export nachhaltiger Energieträger auf. In Head-land werden 15 Gigawatt PV-Wind gerade für die Wasserstoffproduktion, für die Erzeugung von Ammoniak und Methanol, aufgebaut. Haupt-abnehmer am Markt – und wenn wir lange noch so rumkaspern, wie wir es derzeit machen –ist Japan, ist Südkorea, aber auch China. Gigantische Mengen synthetischer Energieträger werden dort sozusagen in die konventionelle Schifffahrts-infrastruktur überführt – übrigens auch das Thema „Schiffstransport von flüssigem Wasser-stoff“. Klar, Wasserstoff wird flüssig transportiert und nicht unkomprimiert oder so was. Kawasaki baut derzeit ein Schiff für 11.500 Tonnen flüssi-gen Wasserstoff. Das wird in 2025 fertiggestellt sein. Das Schiff mit einem Drittel dieser Kapazität ist jetzt schon unterwegs zwischen Kobe und Melbourn.
Also, wo soll der Deutsche aktiv werden? Techno-logieexport: Also, wir sind sicherlich mit führend, wir haben eine fantastische Forschungslandschaft, über die vier außeruniversitären Forschungsein-richtungen (Fraunhofer, Helmholtz, Max-Planck und Leibnitz) ist alles abgedeckt. Da wird gerade jetzt auch finanziell gut nachgelegt, vielen Dank übrigens auch an Sie, dass da noch weitere Mittel fließen, ich glaube, dass dies sehr gute Zukunfts-investitionen sind. Ich war auch in Katar, habe mit dem Energieminister gesprochen, dort hat man gerade ein neues Erdgasförderfeld – 150 Millionen Tonnen Erdgas-Jahresproduktion – eröffnet. Ja, und wir müssen auch Katar die Möglichkeit bieten, dieses Erdgas so zu verwenden das es klimaneutral ist – Stichwort „türkiser Wasserstoff“ –, dass der CO2-Anteil absepariert wird und als Festkörper sozusagen de-poniert wird. Auch das wird auch eine Quelle von Wasserstoff sein, und nicht nur der rein grüne
Wasserstoff über Elektrolyse in das globale Ener-giesystem kommt.
Die Lieferketten für die Syns-Fuels sind eben auch eines der großen Assets. Wir haben tausende von Schiffen, die derzeit Energieträger transportieren. Einem Schiff ist es egal, ob es grünes Methanol oder fossiles Methanol transportiert. Auch diese Assets muss man mitnehmen. Der Übergang ist nicht disruptiv, sondern incremental. Wir müssen aber jetzt die Investitionen global in diesen Über-gang – Stichwort Blend-In Fuels – eben auch schaffen, und auch das ist ein wichtiges Argument für die E-Fuels.
Zu den 30 Roadmaps: Der Wasserstoffbedarf ist sehr hoch, und er ist nicht begrenzt. Weil Wasser-stoff aus Wasser erzeugt wird und nach der Nut-zung auch wieder in Wasser übergeht ist der Kreislauf geschlossen. Das heißt nach der Nutzung in der Brennstoffzelle ist das Ergebnis lediglich feuchte Luft, was aus dem Auspuff kommt, und nicht mehr. Es wird nichts dem System entzogen oder als Ressource verbraucht, sondern das ist ja ein geschlossener Kreislauf. Wie gesagt, die Effizi-enzkette: sechsmal so viel Energie. Aus unserer Sicht ist das falsch. Wenn man die Gesamtkette sieht, wenn man richtig bilanziert, dann ist das nach unseren Berechnungen eher im Faktor zwei, aber nicht mehr, weil auch die Batterie in der Her-stellung bilanziert werden muss, der Strombedarf für die Batterieherstellung und auch der Verbren-nungsmotor, der übrigens in dem CO2-Footprint in der Herstellung des Fahrzeugs immer noch am günstigsten abschneidet.
Ansonsten noch zur Zulieferindustrie: Wenn man mal genau guckt, was Scheffler, was ElringKlinger macht: ElringKlinger hat vor zwei Jahren in Brennstoffzellen den Produktionsoutput um Fak-tor 10 erhöht, weil die Industrienachfrage in China so hoch ist. Die Zulieferindustrie in Deutschland bereitet sich sehr gut auf den globa-len Markt, der sich entwickelt, vor. Mirai, das ist das Brennstoffzellenfahrzeug von Toyota, wird schon in der zweiten Fahrzeuggeneration ab die-sem Jahr mit einer Stückzahl von 30.000 Einhei-ten produziert, Hyundai mit dem NEXO in einer ähnlichen Größenordnung. Also, Asien stellt sich wunderbar auf dem Wasserstoffmobilitätssektor auf. Deutschland ist dabei, wirklich Fehler zu machen, wenn es das nicht tut. Die E-Fuels wer-

Parlamentarischer Beirat für nachhaltige Entwicklung
19. Wahlperiode Protokoll der 80. Sitzung vom 19. Mai 2021
Seite 17 von 17
den auch noch mal im künftigen Mix an Energie-trägern in der Mobilität eine wichtige Rolle spie-len. Wir haben die technologischen Voraussetzun-gen, wir haben vor allen Dingen auch die Notwen-digkeit, weil wir bislang in der Automobilindust-rie in der gesamten Wertschöpfungskette immer vorne mit dabei waren. Bei einem Batteriefahr-zeug ist sozusagen von der Wertschöpfungstiefe – offen gesagt – nicht viel dran. Das ist in hohem Maße Softwarethemen, das stimmt, das Stichwort ist gefallen. Autonomes Fahren, Digitalisierung, sind da wichtig, aber da sind wir derzeit weit hin-ten dran, als Deutschland auch gegenüber dem, was über die USA jetzt schon vorgelegt wurde. Also, wir sollten tunlichst den Fehler vermeiden, jetzt irgendeine Technologie auszuschließen oder auf irgendwann zu verschieben. Toyota ist uns jetzt schon mit den Brennstoffzellen technologie-mäßig zehn Jahre voraus, und deswegen ist es gut, dass auch Bosch jetzt eine weitere Milliarde in Brennstoffzellen investiert, um eben diesen Sektor auch künftig bedienen zu können.
Ich sehe, jetzt ist Ihre Uhr von Grün auf Rot umge-schaltet. Ich nehme an, das gilt für uns alle jetzt hier, oder?
Vorsitzender Dr. Andreas Lenz (CDU/CSU): Ja, eigentlich schon. Wenn Sie noch einen Ab-schlusssatz hätten, dann gerne, aber wir sind
wirklich mit der Zeit leider schon vorangeschrit-ten. Es war aber eine sehr, sehr spannende Diskus-sion, das haben Sie eben auch selbst erlebt. Danke für diesen Input. Ich glaube, uns allen wurde einmal mehr die Dimension der Aufgabe klar, die wir gesellschaftlich vor uns haben. Natürlich wur-den auch die Möglichkeiten, die unterschiedli-chen Sichtweisen, entsprechend klar. Und letzten Endes muss dann natürlich auch immer die Poli-tik den Rahmen setzen, dass sich dann Innovatio-nen und neue Technologien entsprechend durch-setzen können.
Noch mal ganz herzlichen Dank an unsere Gäste. Wir haben jetzt leider nicht die Zeit für eine zweite Runde. Trotzdem wurde uns sehr viel Input gegeben, auch durch die entsprechenden Unterlagen, und wir würden uns auch vorbehal-ten, dass wir bei Ihnen dann noch mal nachfragen, sollten sich noch Fragen ergeben. Aber soweit vielen Dank für den Input, für die spannende Diskussion, für den Austausch. Auch an die Gäste, vertreten sind, die Medienvertreter, vielen Dank. Wir stellen jetzt die Nichtöffentlichkeit her und bedanken uns noch mal und wünschen Ihnen einen schönen Abend.
Schluss der Sitzung: 19:08 Uhr
Dr. Andreas Lenz, MdB Vorsitzender

Alternative Antriebsstoffe: Fokus E-Fuels
Potenziale und Risiken aus der Nachhaltigkeitsperspektive
Jekaterina Boening, Senior Policy Manager
Anlage 1
vermandelut
Ausschussstempel
vermandelut
Ausschussstempel

2
I: Wann sind E-Fuels nachhaltig?
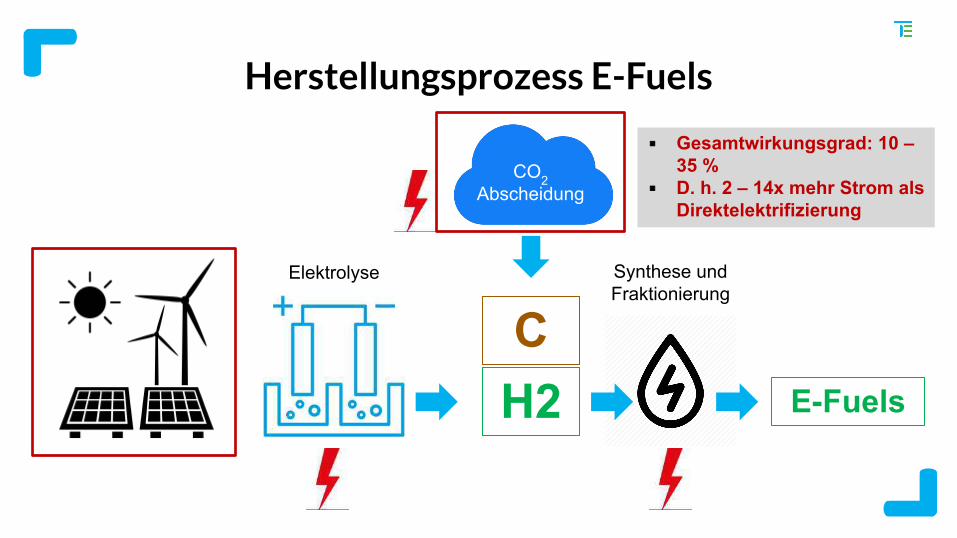
Herstellungsprozess E-Fuels
H2
CO2 Abscheidung
CE-Fuels
Synthese und Fraktionierung
Elektrolyse
▪ Gesamtwirkungsgrad: 10 – 35 %
▪ D. h. 2 – 14x mehr Strom als Direktelektrifizierung

4
Strombezugsquelle: „Zusätzliche“ erneuerbare Energieanlagen
Wenn die bereits bestehende EE-Erzeugung zugunsten der E-Fuels-Produktion umgelenkt wird, steigt die CO2-Intensität des Strommixes:
N (Stromnachfrage) = EE (fluktuierende Erneuerbare Energien) +
R (Residuallast)
Zusätzlich = neue, nicht staatlich geförderte Anlagen, zusätzlicher Ausbaupfad

5
Quelle: Ueckerdt, F. et al (2021). Potential and risks of hydrogen-based e-fuels inclimate change mitigation. In: Nature Climate Change.
▪ Um eine CO2-Minderung ggü. fossilen Kraftstoffen mit E-Fuels zu erreichen, bedarf es eines EE-Anteils von 90 – 100 %
▪ Mit heutigem Strommix Deutschlands emittieren die E-Fuels 3 - 4x mehr CO2 als fossile Kraftstoffe
▪ Durch Elektromobilität werden bereits mit aktuellem Strommix CO2-Einsparungen erzielt

6
CO2
-Quelle: Nur die CO2
-Abscheidung aus der Luft (DAC) ist mit Klimaneutralität kompatibel
Industrielle Punktquellen:- Die CO2-Emissionen werden nicht
vermieden, sondern halbiert - Aktuell günstiger als DAC. Mit steigenden
ETS-Preisen verringert sich der Kostenunterschied.
Direct Air Capture:− 15 kleine DAC-Anlagen sind heute weltweit
im Betrieb. Die erste Anlage im Industriemaßstab entsteht in den USA.
− DAC muss von Beginn an in der Produktion von E-Fuels regulatorisch verankert werden, um die industriellen Punktquellen schrittweise komplett zu ersetzen.

7
II: Wie können die SDG-Ziele eingehalten werden, wenn die Vision von PtX-Importen künftig realisiert
wird?

8
Der Energiemix von potenziellen Exporteuren ist heute überwiegend fossil
E-Fuels-/Wasserstoffproduktion für Exporte darf nicht auf Kosten der Dekarbonisierung der einheimischen Energieversorgung stattfinden (SDG 7). Für das Klima wäre dies (im besten Fall) ein Zero-Sum-Game.
Quelle: Our World in Data; Australian Energy Update 2019

9
Welche zusätzlichen Nachhaltigkeitsaspekte sind mit Blick auf PtX-Importe zu beachten?
▪ Definition der „Zusätzlichkeit“ in Ländern mit überwiegend fossilem Energiemix (z. B. bestimmter Anteil von EE-Anlagen muss der einheimischen Energieversorgung zur Verfügung stehen) (SDG 7, 13).
▪ Berücksichtigung des Wasserbedarfs der Elektrolyse in Wüstenregionen (SDG 6). Entsalzungsanlagen müssen mit EE-Strom betrieben werden.
▪ CO2-neutraler Transport (CO2-neutrale Antriebsstoffe für Schiffe, H2-Pipelines).
▪ Es bedarf eines internationalen Zertifizierungssystems für PtX-Produkte.
▪ Heute gibt es keine internationalen PtX-Lieferketten. Die Klimaschutz- und die Industriestrategie auf der Vision von Importen zu bauen birgt große Risiken.

10
III: Wo werden E-Fuels künftig eingesetzt?

11
Alternative Antriebstoffe sind zentral für die Dekarbonisierung der Luft- und Schifffahrt

12
Zur Produktion von PtX für die europäische Luft- und Schifffahrt sind 1275 TWh EE-Strom erforderlich

13
Die Verfügbarkeit von grünem Wasserstoff ist entscheidend für die Zukunftsfähigkeit der europäischen Industrie

14Im Straßenverkehr haben die E-Fuels keine Zukunft

15
VW Power Day

16
Sorgenkind Bestandsflotte
Flottenerneuerung mithilfe von ambitionierten europäischen Flottengrenzwerten sowie der Anpassung der Dienstwagenbesteuerung
Maßnahmen zum Voranbringen einer echten Mobilitätswende (u. a. Ausbau ÖPNV, Stärkung des Schienennetzes, Abbau Dienstwagenprivileg, leistungsabhängige Maut)
E-Fuels (sowie auch Biokraftstoffe) bieten nur eine Scheinlösung wie u. a. die Berechnung zu 5% E-Fuels im Straßenverkehr zeigt🗹
🗹
🗹

17
18
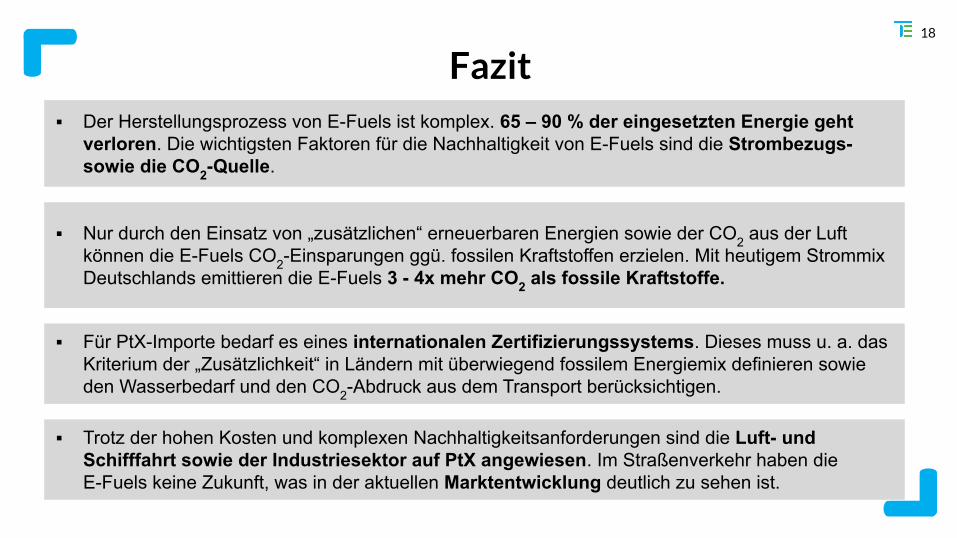
Fazit▪ Der Herstellungsprozess von E-Fuels ist komplex. 65 – 90 % der eingesetzten Energie geht
verloren. Die wichtigsten Faktoren für die Nachhaltigkeit von E-Fuels sind die Strombezugs- sowie die CO2-Quelle.
▪ Nur durch den Einsatz von „zusätzlichen“ erneuerbaren Energien sowie der CO2 aus der Luft können die E-Fuels CO2-Einsparungen ggü. fossilen Kraftstoffen erzielen. Mit heutigem Strommix Deutschlands emittieren die E-Fuels 3 - 4x mehr CO2 als fossile Kraftstoffe.
▪ Für PtX-Importe bedarf es eines internationalen Zertifizierungssystems. Dieses muss u. a. das Kriterium der „Zusätzlichkeit“ in Ländern mit überwiegend fossilem Energiemix definieren sowie den Wasserbedarf und den CO2-Abdruck aus dem Transport berücksichtigen.
▪ Trotz der hohen Kosten und komplexen Nachhaltigkeitsanforderungen sind die Luft- und Schifffahrt sowie der Industriesektor auf PtX angewiesen. Im Straßenverkehr haben die E-Fuels keine Zukunft, was in der aktuellen Marktentwicklung deutlich zu sehen ist.

19
Vielen Dank!

20
E-Fahrzeuge werden die Kostenparität mit fossilen Verbrennern 2025 – 2027 erreichen

E-fools: why e-fuels in cars makeno economic or environmental senseApril 2021
SummaryWith the review of the EU CO₂ emissions standards for cars and vans scheduled for June 2021, some,notably the oil and gas industry and automotive suppliers, are advocating adding CO₂ credits foradvanced biofuels and synthetic fuels into the vehicle standards. T&E’s new analysis shows why this isnot credible— neither from an environmental nor from an economic point of view.
Out of the Green Deal compatible technologies to decarbonise cars - sustainable batteries, greenhydrogen and renewable e-fuels - electrifying cars directly using batteries is by far the most efficientzero emissions pathway to decarbonise cars. Driving a car on e-fuels produced from renewableelectricity would require close to five times more energy than when driving a battery electric vehicle(BEV). Additional analysis in this paper now shows how both on cost and lifecycle emissions BEVsstrongly outperform e-fuel powered petrol cars.
Economic perspective: e-fuels would place a cost burden on both the economy and drivers
T&E’s Total Cost of Ownership (TCO)analysis shows that the very high costsof operating a conventional vehiclerunning on e-fuels would place a costburden on the average Europeandriver. For both new and second handcars in 2030, the TCO premium forrunning a car on e-petrol compared to aBEV is €10,000, or 43% more expensivefor an average driver. Critically, the TCOof running an existing petrol car one-fuels would still be 10% higher thanbuying a new battery electric car,making e-fuels an unaffordable andunsuitable option for the existing fleet.
E-fuels would also be the most costly CO₂ compliance route for carmakers. It would cost carmakersaround €10,000 in fuel credits for the amount of synthetic petrol needed to compensate for theemissions of an efficient petrol car placed on the market in 2030. On the other hand, the cost of a BEV
A briefing by 1
Anlage 2
https://www.transportenvironment.org/publications/why-adding-fuel-credits-vehicle-standards-bad-idea
verfoullonni
Ausschussstempel

battery could plunge down to €3,000 by 2030— or more than three times less than what carmakerswould pay for fuel credits— and with BEVs reaching cost parity with ICE in the mid 2020s, producing abattery electric vehicle rather than a petrol car will not require much additional investment. The e-fuelroute would therefore put the competitiveness of the European automotive industry at risk as it woulddivert large investments away from the transition to emobility.
The higher compliance costs from e-fuels will eventually be passed on to the wider society leading to aless cost effective trajectory for our society and our economy as a whole. T&E shows that the totaladditional cost of an e-fuel pathway would be five times higher compared to the electrificationpathway. The industry claims that producing e-fuels in Africa and importing them to the EU wouldlower the costs thanks to cheaper solar PV. In this paper, T&E assumes this most favourable case fore-fuels where these fuels would be available in 2030 and shows that the lost revenue for the EUeconomy could be around 10 times higher for the e-fuels pathway compared to domestically producedbatteries from the early 2020s).
In brief, the idea of powering cars with e-fuels does not have economic credibility— neither from thedrivers perspective, nor from the carmakers compliance angle or from the economy as a whole.Allowing e-fuels credits would thus only increase the costs of decarbonisation and delay theinevitable transformation towards affordable electric mobility.
Climate perspective: e-fuel environmental benefits are a mirage
Updated T&E lifecycle CO₂ analysis shows that the average amount of CO₂ emitted by new BEVspowered by the EU electricity grid in 2030 is around 40% lower than for a petrol car running onthe e-fuels which meet the RED II sustainability criteria.
If electricity with the same carbon intensity is used to power the BEV and to produce the e-fuel (in linewith RED II criteria), the battery car emits half as much as the comparable petrol car running on e-fuel.Conventional cars powered with e-fuels consistently emit more CO₂ than an equivalent BEV, includingin Germany where such e-fuels are high on the agenda. Using e-fuels to power conventional cars willprovide considerably less climate benefits, on top of requiring much more renewables.
Availability: e-fuels should not be diverted to cars where better alternatives exist
The limited availability of scalable sustainable fuels means that there is no scope to use renewableelectricity inefficiently for the production of e-fuels for road transport where other more efficient,cleaner and cheaper solutions are available. Promoting even a limited use of synthetic hydrocarbons inroad transport now will divert the manufacturing and supply chains from being targeted at sectors suchas aviation, maritime or the heavy industry. This makes the transition harder to accomplish and couldseriously delay the decarbonisation of the economy sectors which cannot use batteries to decarbonise.
Vehicles CO₂ regulations should not allow fuel credits
Adding e-fuels to the car CO₂ regulation would greatly weaken its effectiveness. Carmakers would beable to buy fuel credits instead of accelerating what they have direct control over: the efficiency and the
A briefing by 2

electrification of their vehicle sales. The effectiveness would also be watered down when mixingdifferent sectors (downstream transport vs. upstream fuels), already covered in effective sector-specificlegislation. From the smart regulation point of view, such a complex compensation system would likelyundermine the credibility and enforceability of the regulation.
The EU is at risk of making an untenable tactical blunder. Rewarding synthetic fuels under the cars CO₂standard regulation is a bad idea- implementing this would delay electrification in road transport,prolong life of polluting engines and postpone the economy-wide decarbonisation by misallocatinggreen electrons. With no e-fuels at scale in sight, and a surge in electric car sales, the e-fuels appear tobe a Trojan Horse to keep combustion engines and demand for hydrocarbons alive. Politicians mustnot allow the transition to zero emissions mobility to slow down.
⇒ There should be no CO₂ credits given to auto makers for either alternative or synthetic fuelsused in road vehicles under the vehicle CO₂ regulations.
A briefing by 3
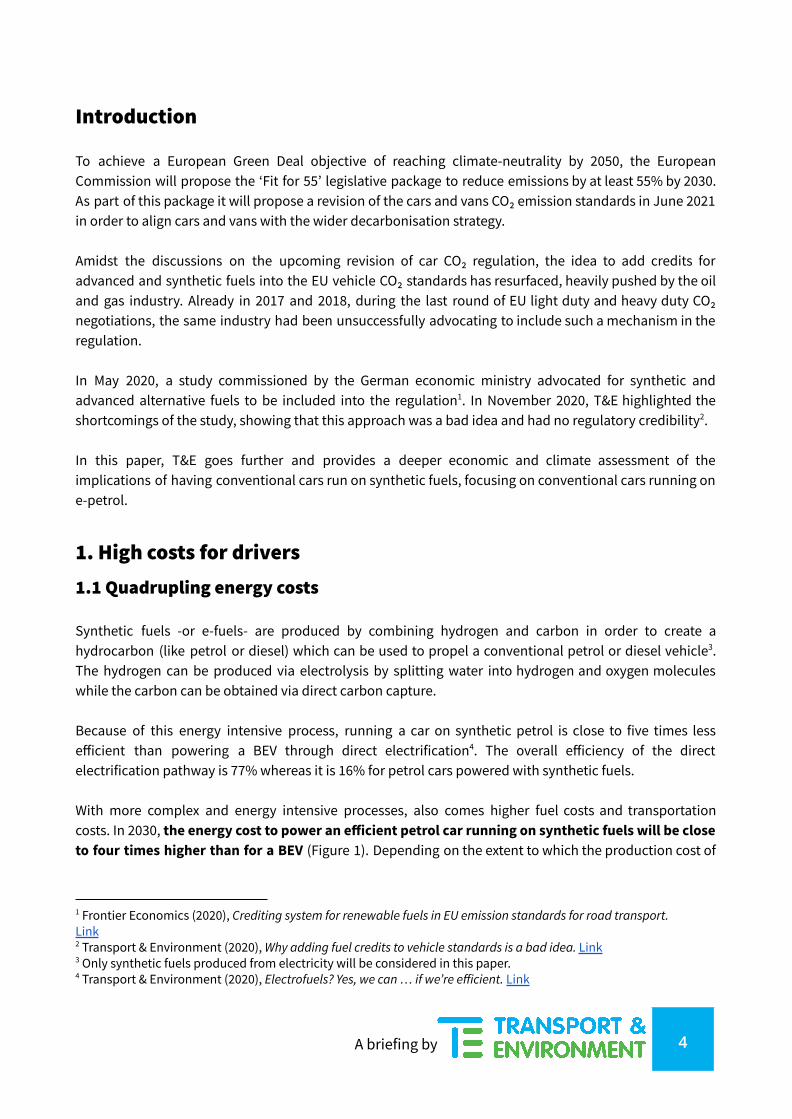
Introduction
To achieve a European Green Deal objective of reaching climate-neutrality by 2050, the EuropeanCommission will propose the ‘Fit for 55’ legislative package to reduce emissions by at least 55% by 2030.As part of this package it will propose a revision of the cars and vans CO₂ emission standards in June 2021in order to align cars and vans with the wider decarbonisation strategy.
Amidst the discussions on the upcoming revision of car CO₂ regulation, the idea to add credits foradvanced and synthetic fuels into the EU vehicle CO₂ standards has resurfaced, heavily pushed by the oiland gas industry. Already in 2017 and 2018, during the last round of EU light duty and heavy duty CO₂negotiations, the same industry had been unsuccessfully advocating to include such a mechanism in theregulation.
In May 2020, a study commissioned by the German economic ministry advocated for synthetic andadvanced alternative fuels to be included into the regulation . In November 2020, T&E highlighted the1
shortcomings of the study, showing that this approach was a bad idea and had no regulatory credibility .2
In this paper, T&E goes further and provides a deeper economic and climate assessment of theimplications of having conventional cars run on synthetic fuels, focusing on conventional cars running one-petrol.
1. High costs for drivers1.1 Quadrupling energy costs
Synthetic fuels -or e-fuels- are produced by combining hydrogen and carbon in order to create ahydrocarbon (like petrol or diesel) which can be used to propel a conventional petrol or diesel vehicle .3
The hydrogen can be produced via electrolysis by splitting water into hydrogen and oxygen moleculeswhile the carbon can be obtained via direct carbon capture.
Because of this energy intensive process, running a car on synthetic petrol is close to five times lessefficient than powering a BEV through direct electrification . The overall efficiency of the direct4
electrification pathway is 77% whereas it is 16% for petrol cars powered with synthetic fuels.
With more complex and energy intensive processes, also comes higher fuel costs and transportationcosts. In 2030, the energy cost to power an efficient petrol car running on synthetic fuels will be closeto four times higher than for a BEV (Figure 1). Depending on the extent to which the production cost of
4 Transport & Environment (2020), Electrofuels? Yes, we can … if we’re efficient. Link
3 Only synthetic fuels produced from electricity will be considered in this paper.
2 Transport & Environment (2020), Why adding fuel credits to vehicle standards is a bad idea. Link
1 Frontier Economics (2020), Crediting system for renewable fuels in EU emission standards for road transport.Link
A briefing by 4

e-fuels drops in the next decade, the energy cost would be in a range of 3.4 and 4.2 times higher (3.8based on our central scenario) with synthetic fuels.
The industry claims that producing e-fuels in Africa and importing them to the EU would lower the coststhanks to cheaper solar PV . In this paper, T&E assumes this most favourable case for e-fuels where these5
fuels would be available in 2030. However, T&E does not think it is realistic in the medium term becauseno certification, standards, infrastructure, or long-term contracts are in place yet. Furthermore, theadditional costs from the handling and the distribution of the fuel from production to the consumer pointcould add costs which are not totally reflected here. Even in this most optimistic scenario, e-fuels remainmuch more expensive for the driver. T&E does not support or endorse this option but uses it here as amost optimistic case to debunk the fact the e-fuels can be cheaper thanks to imports. The assumptionsare detailed in the info box below and in the Annex.
Figure 1: Energy cost comparison of electricity and liquid fuels for an average car(EU average)
For synthetic diesel fuel similar results are found (not shown here) with a range of energy costs beingbetween 3.3 and 4.3 times higher (3.8 under the central assumption).
5 See for example the eFuel Alliance : https://www.efuel-alliance.eu/de/efuels
A briefing by 5

Synthetic fuel cost assumptions
The Agora PtG/PtL calculator was used to calculate the levelised cost of electricity (LCOE) and the costof synthetic e-petrol and e-diesel excluding taxes & levies based on the reference scenario. The6
electricity generation and fuel production facilities are based on solar PV in North Africa (mostoptimistic assumption, not supported by T&E). The chosen weighted average cost of capital (WACC) is6% and the method of CO₂-extraction is direct air-capture (DAC). Solar PV in North Africa was set at aload factor of 2,344 full-load hours per year. High-temperature electrolysis as well as FT-synthesis wereset at 4,000 full-load hours and, thus, rely on temporary hydrogen storage.
The transport and distribution costs are based on Fasihi et al. and take into account transport viatanker vessels from North Africa (Algiers) to the Port of Hamburg and domestic distribution to therefuelling station via conventional tanker trucks.7
Overall production costs in 2030 are 1.3 €/L for e-petrol, which translates into a price of 2.3 €/L for theconsumer once taxes, levies and transport are included (same final price for e-diesel). Taxes and leviesare assumed to be the same as for fossil petrol in the EU27: 0.86€/L (2020 average).
1.2 High total costs of ownership (TCO)
Already today, the total cost of ownership (TCO) of a BEV is lower than the TCO of a comparableconventional car in more than ten European countries and their economic case will only be8
strengthened in the next few years. Indeed, BEV prices will drop and are expected to reach upfrontparity with ICEs in the mid 2020s (without subsidies) thanks to decreasing battery costs (-60%9
between 2020 and 2030 ) and improvements of manufacturing techniques, notably through10
integration and scale . On the other hand, even in the optimistic scenario, e-fuel price will remain11
higher than today’s conventional fuel price (as shown above).
New BEVs are one third cheaper than new petrol with e-fuelAs a result, the TCO of a BEV purchased in 2030 would be 30% lower than for new efficient petrol carsrunning on synthetic fuels. Both the vehicle cost and the fuel cost are expected to be lower for the
11 McKinsey (2019), Making electric vehicles profitable Link
10 BNEF, March 5 2019, A Behind the Scenes Take on Lithium-ion Battery Prices. Link
9 BNEF (2020), Electric Vehicle Outlook 2020. Link
8 Leaseplan calculates a lower TCO for BEVs in 11 countries out of 22 European countries. The 11 countries are:Austria, Belgium, Denmark, France, Germany, Italy, Luxembourg, Netherlands, Norway, Portugal and the UK.Source: LeasePlan (2021), EV Readiness Index 2021. Link
7 Fashihi et al. (2016). Techno-Economic Assessment of Power-to-Liquids (PtL) Fuels Production and Global TradingBased on Hybrid PV-Wind Power Plants. Retrieved fromhttps://www.sciencedirect.com/science/article/pii/S1876610216310761, various pages.
6 Agora Verkehrswende et al. (2018). PtG/PtL calculator. Retrieved fromhttps://www.agora-energiewende.de/en/publications/ptg-ptl-calculator/
A briefing by 6

BEV in 2030, which puts the e-petrol option in a position which would be untenable for the averagedriver. All assumptions are detailed in the Annex.
Figure 2: TCO comparison BEV vs. ICE in 2030
A�er a 5 year ownership period, a driver buying a new petrol car and driving on e-petrol would spendan additional €10,000 than with a new BEV.
It is assumed here that the petrol car drives on 100% e-fuels, which would be the most expensiveoption for the driver. In reality, it is likely that e-fuels would be blended with overall fuel mix(including conventional fuel). However, the results presented above hold true even in the situationwhere e-fuels are blended. For example with a 50% e-fuel blend the ‘e-fuel premium’ in grey in Figure2 would be cut by half and the BEV would be 26% cheaper instead of 30% cheaper.
New BEVs are still cheaper than 2nd hand petrol cars with e-fuelThe industry o�en puts forward the idea that synthetic fuels are an effective solution to decarbonisethe existing car fleet stock. While it might be true that a car running on e-fuels produced fromrenewable energy, would emit less CO₂ than if it was running on fossil fuels (but still more than aBEV, see Section 3), a second hand petrol car running on e-fuels would still be very expensive whencompared to 2nd hand BEV. Similarly to new cars, the premium for running a second hand car one-petrol compared to a second hand BEV is also around €10,000. The ownership period (5 years) and
A briefing by 7

distance driven (15,000 km per year) assumed here is the same for the first and second ownershipperiod for a like-for-like comparison. In reality, older vehicles are driven less than new vehicles. Thiswould reduce the fuel and electricity costs for both second hand vehicles in the figure.
Running a second hand petrol car is still 10% more expensive than buying a new BEV. This meansthat even buying a new BEV is still a cheaper solution for drivers than using an existing petrol carpowered by e-fuels. This result is calculated with a first hand and a second hand car running thesame distances over their ownership periods, which means the driver would have the same drivinghabit with a new or second hand car. Different mileages between the first and second hand ownercan lead to different results.
In conclusion, new T&E TCO analysis shows that the very high costs of operating a conventionalvehicle running on e-fuels would place a great burden on the average European driver effectivelymaking this economic option implausible. Mobility costs for consumers would simply be too high.
2. Effects on our economy2.1 E-fuels are the most costly compliance route for carmakers
Accounting for fuel credits under the car CO₂ emission standards would effectively allow carmakers tobuy their way into compliance. Indeed, rather than improving the vehicle tailpipe emissions and shi�ingto zero emission mobility, OEMs could buy credits from fuel suppliers for synthetic fuel that are placed onthe market. In this section, T&E shows that carmakers’ 2030 compliance costs for placing an e-fuelpowered conventional vehicle on the road are several times higher than those for BEVs.
Methodology: The cost of a synthetic fuel credit is calculated as the production cost premium of goingfrom conventional petrol fuel (excluding taxes and levies) to renewable-based synthetic petrol. In order tocompensate the emissions of a petrol car placed on the market and consider it as zero emission on paper,zero emission synthetic fuel credits equivalent to what the vehicle will consume over its whole lifetimeare considered. This is compared to the cost of a battery in a BEV.
T&E shows that in 2030 it would cost close to €10,000 in synthetic fuel credits to compensate for theemissions of an efficient petrol car placed on the market (around €11,000 in 2025). On the other hand,we can compare this with the cost of a BEV battery, which would cost around €4,400 in the early 2020sand €3,000 in 2030, or between two and three times less than the price of the fuel credits calculatedabove.
A briefing by 8

Figure 3: Comparison of e-fuel compliance route with battery price
In reality, the comparison between the cost of the efuel credits and the battery price is disingenuous, asselling or producing a BEV will not require OEMs to pay any money upfront. BEVs will reachproduction cost parity with ICEs in the mid 2020s. This implies that, all else being equal, in reality, thedrivetrain of a BEV (battery, motor(s), and electronics) would not cost more than that of an ICE (engine,exhaust treatment, transmission). In 2030 the list price of BEVs is likely to be lower than for ICEs thanks tolower battery costs, optimised BEV platforms and economies of scale, which indicates that thecompliance cost for an OEM for going for a BEV rather than a petrol could even be negative. Therefore, atthis stage, it will not cost carmakers more to produce and sell a BEV rather than an ICE.
In short, as already shown by T&E in autumn of 2020 , synthetic fuels are the least cost-effective path for12
carmakers. Complying using e-diesel and e-petrol credits raises compliance costs two-to-three-fold andthese higher expenses made by carmakers would divert investments away from the emobility transition(e.g. in new BEV dedicated platforms or battery production) into the pockets of the oil and gas industries.
2.2 Social costs
The higher compliance costs for an efuels pathway will eventually be passed on to the wider societyleading to a less cost effective decarbonisation trajectory for our society and our economy as a whole. Inthis section T&E shows that the total additional societal cost of an e-fuel pathway would be five timeshigher compared to a BEV pathway.
12 Transport & Environment (2020), Why adding fuel credits to vehicle standards is a bad idea. Link
A briefing by 9

Both pathways are based on an increase in the ambition of the 2030 car CO₂ emission standards from thecurrent 37.5% to a hypothetical 50% reduction. In the BEV scenario, the additional efforts are achieved byselling an extra 3 million BEVs in 2030 (on top of close to 4m BEV and 2m PHEV needed for the current2030 target). In the hypothetical e-fuels pathway scenario, the compliance gap is bridged by only buyingfuel credits to compensate the lifetime emissions from the fuel burnt by the same amount of petrol cars.When stacking up the vehicle sales in the 2020s, there is an additional 13 million BEVs in the vehicle stockin the BEV scenario. This comes on top of the 22 million BEVs and 15 million PHEVs on the road in 2030needed to comply under the current targets. In the e-fuels pathway an additional 13 million petrol carsrunning on e-fuels in the e-fuel pathway are placed on the roads in the 2020s.
In the e-fuels scenario, the total production cost of the e-fuels needed for those 13 million petrol cars tobe accounted as zero emission vehicles would be €230 billion up to 2030. On the other hand theadditional battery costs to produce these 13 million BEVs is under €50 billion, or around five times less.The battery costs considered here are based on BNEF’s forecast: 74 €/kWh in 2025 and 51 €/kWh in 2030 ,13
see Annex for more details.
MethodologyTo understand to what extent the money spent on batteries or efuels would be spent overseas versusinvested back into the European economy, T&E has made estimates of the share of the total spendingswhich are kept in the EU versus leaving the EU for the vehicles which are placed on the market up to 2030.As explained in Section 1.1, the most optimistic case for e-fuel costs are assumed in this paper (asadvocated by the industry) where e-fuels would be produced and imported from Africa. The timeframe ofthe analysis looks at the 2020s, and includes the full lifetime costs of the e-petrol credits needed to fuelthe petrol car. Although T&E deems it is unrealistic that e-fuels would be produced and imported fromAfrica in the 2020s, it was nonetheless assumed that small volumes of these e-fuels would be importedbefore the 2030s in order to carry out the full societal cost impact of this scenario. The e-fuel importsbefore 2030 actually only account for a limited share of the overall e-fuel imports needed to power thecars placed on the market in the 2020s over their lifetime. Indeed, the e-fuel consumed by the petrol carsbefore 2030 would account for around a quarter of the total e-fuel consumed over their lifetime, with lessthan 10% before 2027, and less than 2% before 2025.
Out of the total production cost of synthetic fuels, T&E assumes that only 30% would flow back in Europe(see Annex), thanks to the added value generated by the European fuels and hydrogen industry whenselling the technology necessary for the overseas production. On the other hand, T&E assumes thataround a third of the overall battery price does not create economic value in the EU (i.e. flows outsideEurope). Indeed battery raw materials account for around a third of the overall battery price and withrecycling and EU gigafactories, the industry will create economic value (hence jobs) in the EU.Conservatively, the economic benefits of primary supply of raw materials from European sources andrecycling are not accounted for here (this would lead to lower reliance on primary raw materials fromoutside the EU).
Results
13 Adjusted to higher battery prices in Europe compared to the global average up to 2030
A briefing by 10

Based on the above, T&E estimates that the economic value flowing outside of the EU in the BEVpathways is €16 billion while it would be close to €160 billion in the e-fuels pathway.
In brief, the total societal spendings in the BEV pathway scenario are around five times lower than in thee-fuels scenario but given a larger share of these costs would be spent on e-fuels imports, the economiccost of lost revenue for the EU would be close to 10 times higher in the e-fuels pathway.
Figure 4: Societal costs: BEV vs. efuel pathways compared
Choosing to power cars with e-fuels means that European drivers and the EU economy as a whole wouldhave to pay the big price and send billions of euros abroad, just like we do today for oil.
The conclusion is clear: the idea of powering cars with e-fuels doesn’t have any economic credibility,neither from the driver perspective, nor from the OEMs compliance angle or from the economy as awhole. Allowing e-fuels credits would thus only increase the costs of the ongoing transformation towardselectric mobility.
3. E-fuel powered cars emit much more CO₂ than battery electriccars
Synthetic fuels - which require a large amount of electricity to be produced - are only as clean as theelectricity used to produce them. In this section T&E analysis shows that even under the newsustainability criteria laid out in the Renewable Energy Directive (RED) - which requires efuels to be
A briefing by 11

produced from renewables to a very large extent- the climate impact of a petrol car running on e-fuels ismuch worse than for a BEV.
General LCA methodologyThroughout this section, the comparison is on lifecycle emissions of a new vehicle in 2030. The lifecycleanalysis for the petrol cars powered by e-fuels is broken down in two steps: first the eligible e-fuels aredetermined with the RED II sustainability criteria (more details below), which is undertaken on a WTWbasis. In other words, the RED II criteria are used to determine how much renewable electricity (countedas zero based on a WTW approach) is necessary to produce the efuel. Second, the lifecycle CO₂ emissionsfrom the fuel production which meets the WTW sustainability criteria are calculated and plugged intoT&E’s EV LCA tool. The total amount of electricity consumed by the vehicles is calculated over this lifetimeand lifecycle emissions of each electricity source is then accounted for based on respective lifecycleemissions factors from the IPCC. This lifecycle emission analysis thus provides a broader picture,including indirect emissions from the infrastructure for renewables (i.e. renewables are not zeroemission) as well as other emissions from the production of the vehicle and the EV battery for example.For more details on EV LCA methodology, please see previous T&E report .14
Methodology: GHG reduction from e-fuels under the RED IIThe RED outlines a regulatory framework to ensure the sustainability of so-called renewable fuels ofnon-biological origin (RFNBOs) by requiring at least 70% greenhouse gas savings compared to their fossilfuel equivalent . In effect, this implies that a high share of renewable electricity will be needed to meet15
this threshold. Around 90% of the electricity will have to come from renewables if a combination ofelectricity from renewables and gas is used. In the situation that grid electricity is used in 2030 to producethe e-fuel, the share of additional renewable electricity would still have to be around 70% (on top of the55% renewables included in the 2030 electricity mix ). For a combination with gas generation with CCS16
the share of additional renewables would be similar - 67%. In this analysis T&E assumes that the 70%GHG reduction criteria for e-fuels is calculated based on WTW emissions emissions from energy sources(i.e. not lifecycle emissions, which means that renewables are counted as zero - no infrastructure relatedemissions). In this methodology we assume direct air capture of CO₂ and we do not consider the differentpoint source possible (only the energy used to perform carbon capture and utilisation is accounted for).
In January 2021, T&E laid out detailed recommendations on what the minimum criteria for RFNBOsshould be under the still-to-be-defined RED II methodology in order to ensure the sustainability ofelectrofuels . Crucially it is key that the renewable electricity used needs to be produced from additional17
renewable sources: This would favour Power Purchase agreements in new and unsubsidised renewables
17 Transport & Environment (2021), Getting it right from the start: How to ensure the sustainability of electrofuels.Link
16 Source: ENSOE Ten Year Network Development Plan from 2020. For more see: Transport & Environment(2020), How clean are electric cars? Link
15 The European Commission has been tasked to adopt a delegated act by the end of 2021, on how to calculatethe greenhouse gas savings of RFNBOs. Here, T&E conservatively assumes that the 70% reduction set by theEuropean Commission is on the lifecycle emissions of the fuels produced.
14 Transport & Environment (2020), How clean are electric cars? Link
A briefing by 12
projects rather than allowing for Guarantees of Origin which are not fit for purpose (no additionality, notemporal correlation, risk of double counting etc). Furthermore, the methodology should encouragenon-fossil circular sources of carbon like direct air capture. Failing to promote atmospheric sources ofcarbon entails risks of lock-in of cheaper fossil sources of CO₂ from industrial sources.
Results: BEVs emit 38%-46% less CO₂ over their lifecycleT&E has updated its lifecycle CO₂ analysis from the 2020 report ‘How clean are electric cars?’ and18
associated tool (transenv.eu/LCA), to compare the lifecycle emissions of new BEVs with new petrol carsrunning on e-fuels in 2030.
Although the electric car has a ‘carbon debt’ when coming out of the factory gate due to the production ofthe battery, the average total lifetime amount of CO₂ emitted by new BEVs running on average EUelectricity in 2030 is around 40% lower than compared to a petrol car running on e-fuels. Over theirlifetime, average European BEVs sold in 2030 would emit 51 gCO₂/km whereas the average e-petrol car ismore than 80 gCO₂/km. If a combination of grid electricity and renewable electricity is used to produce19
the e-fuel, the lifecycle emissions of a car with e-petrol would be 82 g/km while it would be 95 g/km for acombination of electricity from natural gas and renewables. Thanks to much lower overall electricityconsumption, BEVs can perform better than e-petrol cars even when the carbon intensity of the electricityused to charge the car is higher than the one used to produce the fuel. By consuming five time moreelectricity for e-petrol even with a low lifecycle carbon intensity of the electricity used (between 66gCO₂/kWh and 80 gCO₂/kWh) results in a situation whereby the total emissions accumulated over thelifetime of the vehicles can surpass those of a BEV running on more carbon intensive grid electricity (from165 gCO₂/kWh in 2030 down to 56 gCO₂/kWh in 2040 ).20
20 ENTSO-E TYNDP 2020. For more see: Transport & Environment (2020), How clean are electric cars? Link
19 A combination of wind and solar is considered, based on the average expected mix between the two in 2030(26% solar vs. 74% wind)
18 Transport & Environment (2020), How clean are electric cars? Link
A briefing by 13

Figure 5a: Lifecycle CO₂ emissions in 2030: BEV vs. e-petrol
Why are e-petrol lifecycle emissions higher when fossil gas power generation iscombined with renewables rather than grid electricity?
Although both e-fuel production pathways here would meet the 70% RED II criteria, the differencebetween the two pathways comes from the fact that the WtW emissions from the grid electricity usedin the methodology are calculated from two years prior to 2030, which means that actual lifecycleemissions of the electricity used to produce the e-fuel in 2030 are lower than the WtW emissions usedto calculate the fuel emissions on paper. By using the 2028 figures and their higher carbon intensitydue to a lower share of renewables compared to the situation in 2030, the e-petrol lifecycle emissionswould be considered to be higher. The second reason comes from the fact that the share of renewablesused to produce the e-fuels in combination with fossil gas power generation is higher (to compensatefor higher emissions from fossil gas electricity versus average EU grid electricity). Hence the additionallifecycle emissions from renewables (when compared to zero emission renewables under the e-fuelsustainability production criteria) are more important because more of that renewables electricity isneeded to produce the e-fuel when combined with fossil gas. On the other hand the differencebetween WtW and lifecycle emissions for fossil gas electricity production is much lower than forrenewables, which means that the lifecycle emission scope brings a higher impact when the share ofrenewables is higher (for a given WtW sustainability criteria).
A briefing by 14

For comparison, in 2030, the petrol car running on conventional fuels would emit 192 gCO₂/km over itslifetime which is 2.0-2.3 times more than when running on e-fuels produced under the RED IIsustainability criteria. In other words, powering a conventional car entirely on e-fuels only reduces lifecycle CO₂ emissions by 51%-57%. In many cases the e-petrol would be blended with conventional petrol,leading to a lifecycle CO₂ emission performance which would sit somewhere between the 100% e-fuelvalues and the 100% conventional fuel value. For example, a petrol car running on a 50/50 e-fuel blendwould reduce life cycle CO₂ emissions by 25%-29% (143-137 g/km).
The lifecycle CO₂ emissions of a BEV breaks even with an e-petrol car between 50,000 km and 80,000 km,which would be reached a�er around 3-5 years for the average driver. Figure 5b below shows theevolution of lifecycle emissions for e-petrol produced from both options presented above.
Figure 5b: Lifecycle CO₂ emissions in 2030: BEV vs. e-petrol (under RED II sustainability criteria)
For Germany - where there is a strong push for e-fuels to be part of the future cars mix - BEVs emit28%-38% less CO₂ over their lifetime than e-petrol cars, while this drops to 60%-66% less for a BEVpowered with renewables (e.g. electricity from Sweden).
The comparison presented above is nonetheless still favorable to e-petrol cars: synthetic fuels areassumed to be produced via an electricity mix which is almost fully decarbonised, whereas the electricityused to charge the BEV is based on the EU27 grid average, which still relies on close to a quarter of fossilfuel powered electricity in 2030 (mainly coal and gas) and is hence more than two times more carbon
A briefing by 15

intensive. In the situation where the same electricity is used to produce the e-fuel and charge the vehicle21
, BEVs emit around half the emissions than a comparable e-petrol car (between 45% and 57%).
Even if 100% renewables electricity is used for efuels production , BEVs powered with the same mix are22
still much cleaner from the lifecycle emissions perspective, offering a 17% CO₂ reduction (33 g/km vs. 40g/km), see Figure 6 below. This is explained by the fact that the lifecycle emissions of renewableelectricity is not zero (primarily because of the production of the infrastructure), which means that byconsuming a large amount of this electricity, the e-petrol powered cars can end up having a larger impactthan the BEV even when we take into account the impact of the battery.
Figure 6a: Lifecycle CO₂ emissions in 2030: BEV vs. e-petrol (100% renewables)
Figure 6b below shows the evolution of lifecycle CO₂ emissions when both the e-petrol and theelectricity used to charge the vehicle are from renewable electricity.
22 Assuming only Wind + Solar PV, based on the 2030 split from ENTSO-E TYNDP 2020. Lifecycle carbon intensityof the electricity: 23 gCO₂/kWh
21 Lifecycle carbon intensity of the electricity: 56 gCO₂/kWh
A briefing by 16

Figure 6b: Lifecycle CO₂ emissions in 2030: BEV vs. e-petrol (100% renewables)
Even in the hypothetical situation where e-fuels would be available today and the e-petrol car would becompared to a BEV running on today’s electricity grid, the BEV would still be between 21% and 32%cleaner than the e-petrol car over the lifetime of the vehicle. This situation is however purely hypotheticalgiven that such e-fuels do not exist today. Nonetheless, the finding highlights that -even before the 2030s-e-fuels cannot be a credible solution to reduce emissions. Over the years, as more renewables areincorporated into the electricity mix, the comparative advantage of BEVs over e-petrol cars only getsstronger.
In conclusion, under the current sustainability threshold for synthetic fuels (and assuming the mostoptimistic methodology for the calculator of the threshold), conventional cars powered with e-fuelsconsistently emit more CO₂ than an equivalent BEV. This result holds true even in the situation wherethe e-petrol is produced only with renewables and compared to a BEV running on renewables as well. Theresults are clear, using e-fuels to power conventional cars cannot provide any considerable climatebenefits in the context of widespread adoption of BEVs.
4. Availability: e-fuels should not be diverted to cars where betteralternatives exist
A recent study undertaken by Ricardo and commissioned T&E (December 2020) , has found that there is23
no scope to use renewable electricity inefficiently. Enabling the use of synthetic hydrocarbons in road
23 Transport & Environment (2020), Electrofuels? Yes, we can … if we’re efficient. Link
A briefing by 17
transport, where technical alternatives such as the direct use of electricity exist, comes with a hugeenergy penalty and risks derailing the entire decarbonisation effort.
The results of the study shows that relatively small variations in the use of hydrogen and efuels can addup can add up to large differences in terms of the renewable energy that will need to be produced. Forexample, if 100% of passenger cars were battery-electric, charging them would require 417 TWh in 2050(just 15% compared to current total electricity demand). Enabling only 10% hydrogen plus 10% ofsynthetic hydrocarbons in cars would push up demand to 598 TWh or a 43% increase.
Inefficient use of e-fuels also results in a significantly higher area requirement. Delivering the energyneeded for the synthetic fuel scenario would require an area equivalent to 5.1 times the area of Denmarkif offshore wind would supply all of the additional electricity needed to decarbonise the transport sector(3.4 times in the base case). In other words, powering just a fraction of vehicles with e-fuels in 2050 wouldrequire new offshore wind-farms covering an area the size of Denmark.
With the whole economy relying on renewables, ‘efficiency first’ matters given the large impact it can haveon the renewable electricity requirement. Therefore, using less renewables is also most optimal asregards cost-effectiveness towards the energy system. Furthermore, there isn’t expected to be anyvolumes of synthetic fuels on the market until a�er 2030 , by which time plug-in cars will be by far the24
most efficient, cheap and convenient option.
The outlook is clear, promoting even a limited use of synthetic fuels in road transport now will lockthe EU’s transport decarbonisation in a pathway that will require a much greater deployment ofrenewables than necessary. This makes the transition harder to accomplish and could complicate thedecarbonisation of the long-distance transport modes like aviation and shipping (which cannot usebatteries to decarbonise).
5. Car CO₂ regulations: do not include fuel credits
On top of the strong economic, environmental, efficiency and availability arguments presented in thisbriefing, including e-fuel credits into the car CO₂ regulation cannot either be justified from the regulatoryperspective. Indeed carmakers cannot guarantee how cars are used or fueled over their lifetime.They have no direct control over the choices of drivers and the suppliers’ production processes. Thevehicle regulation should only regulate what carmakers have control over, i.e. powertrains. Fuels shouldbe regulated in appropriate EU legislation - as is the case already - such the EU Renewable EnergyDirective and the EU Fuel Quality Directive. Thus keeping both sectors separate would maintain theeffectiveness of each legislation. The effectiveness of the current design of the car CO₂ regulation hasbeen proven in 2020 as the new targets propelled the EV market from 3% in 2019 to 10.5% in 2020 .25
25 Transport & Environment (2020), CO₂ targets propel European EV sales. Link
24 Even with very strong policy support and subsidies the potential volumes of CO₂-based synthetic fuels wouldbe limited to approximately 0.15% of total EU road transport fuel demand in 2030.
A briefing by 18
The very credibility of the car CO₂ regulation could be undermined as car manufacturers could buytheir way into compliance without making any improvements. Based on the amount of credits bought, acertain number of conventional cars on the road would be considered zero emission in their eyes of theregulation. This would likely be perceived very negatively by the average European which has been askingfor zero emission cars .26
Finally including synthetic fuels in the car CO₂ regulation also opens the door to the inclusion of other socalled ‘low or zero emission fuels’ namely biofuels. These fuels are more affordable than efuels and wouldthus further reinforce the loophole and create a huge incentive to increase the use of biofuels althoughthey are currently 80% worse than diesel .27
T&E recommends : No CO₂ credits to carmakers for alternative or synthetic fuels should be28
included into the cars and vans CO₂ standards.
Further informationLucien MathieuManager, Road vehicles and emobility analysisTransport & [email protected]: +32 (0)4 83 08 48 91
28 Transport & Environment (2020), Cars CO₂ review: Europe’s chance to win the emobility race. Link
27 https://www.euractiv.com/section/agriculture-food/news/scientists-demand-end-to-crop-based-biofuels/
26 Transport & Environment (2021), Almost two in three European city dwellers want only emission-free cars aer2030. Link
A briefing by 19

6. Assumptions
General assumptions
Vehicles assumptions for a medium car (C-segment) in 2030
BEV Petrol Source/comment
Fuel consumption(real-world) - 2030
0.17 kWh/ km 6 L/100km Based on average values observed today for theBEVs. For the ICE, today’s observed values. Thevalue for petrol corresponds to today’s hybrids(optimistic)Fuel consumption
(real-world) - 20250.173kWh/km
6.5 L/100km
Vehicle cost (2030) 22,200 € 27,200€ Cost trends are derived from (unpublished) studyfrom BNEF (commissioned by T&E).The starting point is the (weighted) averagevehicle cost of top selling vehicles in 202029
Vehicle cost (2025) 28,000 € 26,100€
Lifetime mileage: 225,000 km based on the European Commission study on LCA . On average this is30
15,000 km per year over 15 years . No battery replacements are needed during the lifetime of the vehicle,31
in line with European Commission methodology and latest evidence .32
Cost assumptions
Electricity prices are based on EU average 2020 (first semester) electricity costs from Eurostat andassumed constant up to 2030: 0.21€/kWh (0.13 €/kWh excluding taxes and levies)33
Conventional fuel prices are based on 2020 EU averages from the Oil Bulletin: petrol at 1.46 €/L (0.59 €/Lwithout taxes) and diesel at 1.29 €/L (0.59 €/L without taxes). Taxes and levies account for 0.86 €/L forpetrol and 0.70€/L for diesel.
Fuel price (includingproduction, transport,distribution, taxes and levies)
Low Central High
2025 2030 2025 2030 2025 2030
33 Electricity prices for household consumers - bi-annual data (from 2007 onwards)[NRG_PC_204__custom_632753]. Band DC.
32 Transport & Environment (2020), How clean are electric cars? Link
31 In the LCA analysis and when calculating the average cost of e-fuel credits over the lifetime of a vehicle, theactivity is assumed to decrease by 3% per year.
30 Ricardo Energy & Environment (2020), Determining the environmental impacts of conventional andalternatively fuelled vehicles through LCA. Final Report for the European Commission, DG Climate Action. Link
29 2020/21 average: 34,500€ for BEVs and 25,400€ for petrol cars
A briefing by 20

E-petrol 2.3 2.0 2.5 2.3 2.7 2.5
E-diesel 2.3 2.0 2.5 2.3 2.8 2.6
Other assumptions for the TCO calculation are listed below (for more details see T&E study on the costof Uber ):34
● Ownership period 5 years● Maintenance cost: 300€ per year for the petrol cars and a reduction of 50% for the BEV.● Residual value: 40% residual value a�er 5 years.
○ For a second hand ICE car bought in 2025, it is assumed that the residual value a�er 10years (in 2035) is zero given the age of the vehicle and the strict limitation of petrol anddiesel cars in cities (Euro 7 emission standard is not likely to be enforced by 2025, whichmakes these vehicles vulnerable to air quality restriction). In 2035 buyers would likely notchoose a more expensive option which limits their ability to enter cities , thus driving35
down the residual value.○ For second hand BEVs bought in 2025, the residual value a�er ten years is assumed to be
10% of the original price.● No purchase subsidy or additional annual/circulation taxes were included in this assessment
(conservative given increasing deployment of circulation taxes for ICEs in cities).● Charging infrastructure:
○ Costs of home charger installation are factored in for the BEVs and estimated at €1,500installation costs included. The cost of the charger is paid upfront and included in the‘others’ cost category in the TCO infographic.
○ 5% of the energy is assumed to be delivered at fast public charging stations at 0.40 €/kWh.● Financing:
○ Purchase option: the TCO model includes parameters linked to the vehicle acquisitionmode (purchase, lease, or loan). The three scenarios impact the TCO only marginally; inthe report all vehicles are assumed to be purchased, as this corresponds to the mid-pricescenario. Cost effectiveness of BEVs vs. ICE can be improved by using leasing schemes,but deteriorates with loans.
○ Discount rate: 4%○ Insurance costs: 3.5% of the vehicle upfront cost (annually). The insurance cost for 2nd
hand cars was assumed the same as for 1st hand cars
Compliance pathway costs assumptions● Fuel efficiency (real world): 7L/100km in 2020/2, 6.5 L/100km in 2025 and 6L/100km in 2020 (in
line with a 1.5% annual improvement per year).● BEV battery: 60 kWh● Battery costs: 74€/kWh in 2025, 51 €/kWh in 2030 (based on BNEF battery price projection)
35 Indeed, by 2025, it is unlikely that new Euro 7 standards would be enforced which means that those vehiclescould be subject to high restrictions
34 https://www.transportenvironment.org/publications/why-uber-should-go-electric
A briefing by 21

Social cost assumptionsAssumptions for the share of revenue in e-fuel and battery production which flow back to (or staywithin) Europe (authors assumptions).
● Electricity cost of hydrogen electrolysis: 10% (allocated to RES and utility industry)● Cost of conversion of hydrogen electrolysis: 30% (allocated to hydrogen industry)● Storage cost for hydrogen: 30% (allocated to hydrogen industry)● CO₂ cost: 30% (allocated to fuels industry)● Investment cost: 30% (allocated to fuels industry)● Operating cost: 30% (allocated to fuels industry)● Battery: 65% (allocated to the battery production industry)
Lifecycle CO₂ emission analysis
In the LCA analysis of e-fuels, T&E assumes that the 70% sustainability criteria under REDII for theproduction of synthetic fuels is based on the WTW emissions from the different energy sources. If the finalmethodology adopted by the European Commission (due by the end of 2021), decides to use the widerlifecycle scope and accounts for infrastructure emissions (i.e. renewables are not counted as zero), thenlifecycle CO₂ emissions from conventional cars powered with e-fuels would be slightly lower (between12% and 25% lower depending if fossil gas or grid electricity is used in combination of renewables). Thisis explained by the fact that a higher share of renewable electricity would be needed to reach the 70%sustainability criteria and balance off the higher emissions from electricity from natural gas or gridelectricity given they are not counted as zero emissions. This option is not presented in this paper.
The well to wheel emissions for petrol and diesel fuels used as a reference for the European Commissionis of 94 gCO₂/MJ. Therefore, the maximum lifecycle CO₂ emission from e-petrol and e-diesel fuels underthe REDII 70% criteria would be 28 gCO₂/MJ.
T&E modelled different scenarios for the electricity sources that can be used in e-fuel production andtheir respective shares in the electricity used. The WTW and lifecycle carbon intensity of each electricitysupply technology is based on IPCC’s Fi�h Assessment Report .36
All other assumptions used in the LCA modelling are presented in T&E’s lifecycle CO₂ analysis report‘How clean are electric cars?’ , with the exception of the following updates:37
● The petrol car fuel consumption was set at 6 L/100km in 2030 (see above, Generalassumptions).
● The BEV energy efficiency was set at 17 kWh/km in 2030 (see above, General assumptions).● The lifecycle emissions of the electricity mix in 2020 was updated based on recent evidence
from Ember . Direct CO₂ emissions from Ember in 2020 are 226 gCO₂/kWh (EU27) while T&E38
38 Ember (2021), EU Power Sector in 2020. Link
37 Transport & Environment (2020), How clean are electric cars? Link
36 Intergovernmental Panel on Climate Change, IPCC (2014), Climate Change 2014: Mitigation of ClimateChange. Contribution of Working Group III to the Fi�h Assessment Report of the IPCC - Annex III. Link.Median values assumed
A briefing by 22

calculates life cycle CO₂ emissions at 285 gCO₂/kWh (without transmission and distributionlosses).
● Battery production in 2030: The upstream emissions from battery production (ie steps beforethe cell production and pack assembly) will decrease in the next decade thanks to the overalldecarbonisation of the world economy. T&E assumes that the carbon intensity of theupstream stage of battery production is reduced by a quarter between 2020 and 2030. This isapproximately half of the world or European improvement of the carbon intensity ofelectricity ). This effectively brings down the carbon footprint of batteries produced in the39
EU to 50 kgCO₂/kWh in 2030 (upstream accounting for 41 kgCO₂/kWh out of 50kgCO₂/kWh).
39 IEA (2020), Carbon intensity of electricity generation in selected regions in the Sustainable DevelopmentScenario, 2000-2040. Link
A briefing by 23

Hitting the EV Inflection Point
May 2021
Anlage 3
verfoullonni
Ausschussstempel
Hitting the EV Inflection Point
May 2021
© Bloomberg Finance L.P.2021
No portion of this document may be reproduced, scanned into an electronic system, distributed, publicly displayed or used as the basis of derivative works without the prior written consent of Bloomberg Finance L.P. For more information on terms of use, please contact [email protected]. Copyright and Disclaimer notice on page 58 applies throughout.
Contents
Section 1. EV price parity and phasing out combustion vehicle sales in Europe 1
Section 2. Introduction and background 4
Section 3. Analysis of Vehicle Price Parity 8
3.1. Background and context 8
3.2. Methodology 8
3.3. Battery pricing and outlook 17
3.4. Vehicle cost results 25
Section 4. Phasing Out Internal Combustion Vehicle Sales in the European Union 30
4.1. Background and context 30
4.2. Short-term methodology and forecast, 2021-2025 34
4.3. Long-term methodology and forecast, 2026-2035 38
4.4. Other considerations affecting BEV adoption 47
Appendices 52
Appendix A. ICE and BEV pre-tax retail prices for all segments 52
Appendix B. Table of tables 53
Appendix C. Table of figures 54
About us 56

Hitting the EV Inflection Point
May 2021
© Bloomberg Finance L.P.2021
No portion of this document may be reproduced, scanned into an electronic system, distributed, publicly displayed or used as the basis of derivative works without the prior written consent of Bloomberg Finance L.P. For more information on terms of use, please contact [email protected]. Copyright and Disclaimer notice on page 58 applies throughout. 1
Section 1. EV price parity and phasing out combustion vehicle sales in Europe
Electric vehicle sales are rising fast in Europe and a growing number of
governments have set targets for phasing out new internal combustion vehicle
sales. A fundamental input in deciding the feasibility of such policies is how
quickly battery electric vehicles can reach price parity with their internal
combustion counterparts. Further improvements in lithium-ion batteries will be
critical and manufacturing strategy will also play a role. This report shows
trajectories of cost developments for the production of battery electric vehicles
and internal combustion engine vehicles, and the implications for the adoption
of electric vehicles in Europe.
• Battery electric vehicles in all segments in Europe are expected to reach upfront cost price
parity with equivalent internal combustion engine vehicles within the next product cycle.
Falling battery prices and the development of optimized platforms lead the rapid decline in
BEV costs. An optimal vehicle design, produced in high volumes, can be more than a third
cheaper by 2025 compared to now. However, risks remain, primarily in achieving low enough
battery prices and managing demand uncertainty.
• Battery technology continues to improve rapidly leading to lower prices and increased
competition in Europe. New chemistries, better manufacturing methods, innovative cell and
pack design concepts and other factors contribute to average prices per kilowatt hour
declining by 58% from 2020 to 2030. There is visibility into how those declines can be
achieved up to the late-2020s. Beyond that, the technology roadmap expands with some
concepts, such as solid-state, still emerging. Uncertainties throughout the period to 2035
include raw materials prices that can become volatile and cancel some gains, and the speed
at which the supply chain can scale up rapidly and sustainably in Europe.
Figure 1: Estimated pre-tax retail prices for C segment vehicles in Europe
Source: BloombergNEF Note: includes only passenger cars; ICE is internal combustion engine
vehicle and BEV is battery electric vehicle
0
10
20
30
40
50
2020 2021 2022 2023 2024 2025 2026 2027 2028 2029 2030
2020 thousand EUR
Internalcombustion
Batteryelectric
$58/kWh Expected average battery
pack price in 2030
2025-2027 Years at which BEV prices
reach parity with internal
combustion engine vehicles
in all light vehicle segments in
Europe
51% Base case BEV share of light
duty passenger vehicles sales
in Europe in 2030

Hitting the EV Inflection Point
May 2021
© Bloomberg Finance L.P.2021
No portion of this document may be reproduced, scanned into an electronic system, distributed, publicly displayed or used as the basis of derivative works without the prior written consent of Bloomberg Finance L.P. For more information on terms of use, please contact [email protected]. Copyright and Disclaimer notice on page 58 applies throughout. 2
• Electric vehicle sales are set to rise strongly in the short term to meet the upcoming CO2
emissions target in Europe. By 2025, BNEF expects 4.3 million plug-in vehicles to be sold in
Europe, representing around 28% of all sales in that year. BEVs capture over half of those
plug-in vehicles sales, the remaining are plug-in hybrid vehicles, which are likely to become a
significant compliance tool for several automakers. Across Europe, short-term adoption is
highly uneven. Strong policy support and automakers’ market strategies mean EV adoption in
countries in the north and west of Europe far exceeds that of countries in the south or east.
• Battery electric vehicle adoption can be quick between 2025 and 2035. In an economics-
driven scenario, Europe could reach just over 50% BEV share of sales by 2030 and 85% by
2035. Countries leading in EV adoption currently, such as those in the Nordics and the
Netherlands, will remain in a leading position. Large automotive markets, such as Germany,
the U.K. and France, will follow and will contribute the highest unit sales increase across
Europe. In turn, countries starting from a low adoption position now are likely to end up
further behind those other groups, but can experience rapid growth in the late-2020s. Still,
achieving such high shares of BEV sales depends on vehicle prices coming down
considerably in the next few years, consumers continuing to receive some purchasing
support, and charging networks rolling out widely across Europe.
Figure 2: Base case and accelerated battery electric vehicle
share of new passenger car sales in Nordics+
Figure 3: Base case and accelerated battery electric vehicle
share of new passenger car sales in Western Europe
Figure 4: Base case and accelerated battery electric vehicle
share of new passenger car sales in Southern Europe
Figure 5: Base case and accelerated battery electric vehicle
share of new passenger car sales in Eastern Europe
Source: BloombergNEF. Note: includes passenger cars only; includes adoption of battery electric vehicles (BEV) only; does not
include plug-in hybrids (PHEV). Base case shows development trajectory under current technology outlook and policy measures.
Accelerated shows potential scenario under additional stimulus.
0%
20%
40%
60%
80%
100%
2015 2020 2025 2030 2035
BEV share of sales
Base case
Accelerated
0%
20%
40%
60%
80%
100%
2015 2020 2025 2030 2035
BEV share of sales
Base case
Accelerated
0%
20%
40%
60%
80%
100%
2015 2020 2025 2030 2035
BEV share of sales
Base case
Accelerated
0%
20%
40%
60%
80%
100%
2015 2020 2025 2030 2035
BEV share of sales
Base case
Accelerated

Hitting the EV Inflection Point
May 2021
© Bloomberg Finance L.P.2021
No portion of this document may be reproduced, scanned into an electronic system, distributed, publicly displayed or used as the basis of derivative works without the prior written consent of Bloomberg Finance L.P. For more information on terms of use, please contact [email protected]. Copyright and Disclaimer notice on page 58 applies throughout. 3
• Even though organic BEV adoption is high by 2035, the EU and most countries would need to
further expand their policy support frameworks to reach 100% adoption by 2035. A menu of
options could include even tighter emissions rules, carbon taxes, subsidies for ‘edge’ use
cases and extensive geographic coverage of charging networks. The accelerated scenario
highlights the importance of the early buildup of BEV production and sales volume, as that
drives cost reductions and also generates the necessary consumer buy-in for further adoption
in the future.
This report was prepared by BloombergNEF for Transport & Environment.
About BloombergNEF
BloombergNEF (BNEF) is a strategic research provider covering global commodity markets and
the disruptive technologies driving the transition to a low-carbon economy. Our expert coverage
assesses pathways for the power, transport, industry, buildings and agriculture sectors to adapt to
the energy transition. We help commodity trading, corporate strategy, finance and policy
professionals navigate change and generate opportunities.
About Transport & Environment
Transport & Environment (T&E) is Europe's leading clean transport campaign group. T&E’s vision
is a zero-emission mobility system that is affordable and has minimal impacts on our health,
climate and environment.
Since T&E was created 30 years ago, it has shaped some of Europe’s most important
environmental laws. It got the EU to set the world's most ambitious CO2 standards for cars and
trucks but also helped uncover the dieselgate scandal; campaigned successfully to end palm oil
diesel; secured a global ban on dirty shipping fuels and the creation of the world's biggest carbon
market for aviation.

Hitting the EV Inflection Point
May 2021
© Bloomberg Finance L.P.2021
No portion of this document may be reproduced, scanned into an electronic system, distributed, publicly displayed or used as the basis of derivative works without the prior written consent of Bloomberg Finance L.P. For more information on terms of use, please contact [email protected]. Copyright and Disclaimer notice on page 58 applies throughout. 4
Section 2. Introduction and background
The global EV market
Sales of electric vehicles are rising quickly, driven by supportive policy, technology improvements,
urban air quality concerns, and rising consumer awareness. Over 3 million passenger electric
vehicles were sold in 2020, up 47% from 2019, and the market is set to grow rapidly again in
2021. The Covid pandemic has roiled auto markets around the world, with total passenger vehicle
sales dropping 16% in 2020. EVs have been mostly immune to this due to additional policy
support, and a wide range of new models hitting the market.
Figure 6: Global passenger EV sales by region Figure 7: Global passenger EV sales by drivetrain
Source: BloombergNEF Note: EV are electric vehicles and include battery electrics and plug-in hybrids
China represented over 50% of global EV sales from 2017 to 2019, but that dynamic shifted in
2020 as EV sales in Europe more than doubled. Various policy mechanisms are being used to
support this growth on both the demand side and the supply side. EV sales are slower in North
America, but the Biden Administration is proposing $174 billion in investments to push the EV
market forward, which, coupled with new fuel economy targets, could help close the gap with
China and Europe. Battery electric vehicles (BEVs) form the majority of plug-in vehicles sold
globally, though sales of plug-in hybrids (PHEVs) are rising quickly in Europe.
The total number of light-duty EVs on the road globally hit 10 million at the end of 2020, up from
just 3 million in 2017. Electrification is also spreading into other segments of road transport and
there are now over 500,000 e-buses in use. Commercial EV truck sales are still small, but there
are nearly 350,000 on the road, mostly in China and Europe. Most of these are in the light
commercial segment, though there is progress of electrifying larger vehicles. At the end of 2020,
there were also around 190 million electric two-wheelers globally, including electric motorcycles,
mopeds and scooters.
EV sales in Europe
The recent surge in EV sales in the EU is being supported by the new passenger car CO2
targets, which require automakers to reduce their overall fleet emissions to 95gCO2/km in
2020/21. As a result, automakers have launched many more EV models and increased
production. More than 1 in 10 new vehicle sales in the region in 2020 had a plug. Only 95% of car
sales were included in this target in 2020, but 100% will be included in 2021, leading to higher
levels of EV adoption.
0.2 0.3 0.5 0.71.1
1.9 2.1
3.1
4.4
2013 2014 2015 2016 2017 2018 2019 2020 2021e
Million
China EuropeNorth America Japan and S.KoreaRoW
0.2 0.3 0.5 0.71.1
1.9 2.1
3.1
4.4
2013 2014 2015 2016 2017 2018 2019 2020 2021e
Million
Battery electric Plug-in hybrid
Figure 8: Global
passenger EV fleet
Source: BloombergNEF
0
2
4
6
8
10
20
12
20
13
20
14
20
15
20
16
20
17
20
18
20
19
20
20
Millions
Rest of World
Japan and S. Korea
North America
Europe
China

Hitting the EV Inflection Point
May 2021
© Bloomberg Finance L.P.2021
No portion of this document may be reproduced, scanned into an electronic system, distributed, publicly displayed or used as the basis of derivative works without the prior written consent of Bloomberg Finance L.P. For more information on terms of use, please contact [email protected]. Copyright and Disclaimer notice on page 58 applies throughout. 5
The CO2 targets are set to tighten again in 2025 and 2030. The current targets are set at a further
37.5% reduction from 2021-2030, but this is expected to be reduced further to keep the auto
sector in line with the European Commission’s Green Deal and its overall target of making Europe
climate neutral by 2050. Many national governments also have demand-side incentives and fiscal
policies in place to help stimulate EV adoption. EV sales have held up much better than
combustion vehicle sales in Europe during the Covid-19 pandemic.
Passenger EV adoption varies widely between different European countries. In 2020, Germany
was by far the largest EV market in Europe, with absolute EV sales in the country two times
higher than in the next two largest markets, France and the U.K. The highest EV adoption shares
are in the Nordics and the Netherlands, and EVs exceeded 10% of sales in a total of 12 countries
in 2020. EV adoption has generally been slower in Southern and Eastern Europe.
Electric van sales were just under 2% of the total market in 2020. The sector has suffered from
low model availability, with relatively expensive electric offerings, and a lack of widely accessible
charging solutions for small and medium-size fleets. This situation is shifting, as both startups and
established automakers are introducing new electric models with good enough range and cargo
capacity to match different use cases.
Figure 9: Europe EV share of new passenger vehicle sales Figure 10: Europe passenger vehicles sales year-on-year
change
Source: BloombergNEF, Marklines, Bloomberg Intelligence, vehicle registration agencies, EV Sales Blog, EAFO. Note: Europe data
includes EU27 countries plus Norway, Switzerland, Iceland and the U.K. EV sales include BEV and PHEV sales. ICE = internal
combustion engine.
Technology improvements
Falling prices for lithium-ion batteries are the biggest technology driver supporting the rapid rise in
EV sales. Average lithium-ion battery pack prices fell 13% in 2020 and are now down 89% from
2010-20. While there is significant variation between applications, the average lithium-ion battery
pack now costs $137/kWh and cells have already dropped to just over $100/kWh. Average
lithium-ion battery pack energy density going into EVs has also been improving at 7% annually
over the last 10 years.
Plug-in hybrid battery packs are more expensive on average, with prices of around $359/kWh
2020. In PHEVs, cells need to be balanced between power and energy. This is because packs
need to be able to carry a vehicle a reasonable distance on battery power alone, while also
0%
2%
4%
6%
8%
10%
12%
14%
16%
18%
1Q
2Q
3Q
4Q
1Q
2Q
3Q
4Q
1Q
2Q
3Q
4Q
1Q
2Q
3Q
4Q
1Q
2Q
3Q
4Q
2016 2017 2018 2019 2020
-100%
-50%
0%
50%
100%
150%
200%
250%
1Q
2Q
3Q
4Q
1Q
2Q
3Q
4Q
1Q
2Q
3Q
4Q
1Q
2Q
3Q
4Q
1Q
2Q
3Q
4Q
2016 2017 2018 2019 2020
EV
ICE

Hitting the EV Inflection Point
May 2021
© Bloomberg Finance L.P.2021
No portion of this document may be reproduced, scanned into an electronic system, distributed, publicly displayed or used as the basis of derivative works without the prior written consent of Bloomberg Finance L.P. For more information on terms of use, please contact [email protected]. Copyright and Disclaimer notice on page 58 applies throughout. 6
providing the same peak power output as a BEV, and recovering energy under high-power
situations, such as from regenerative breaking.
Battery material costs are currently rising, with prices of lithium carbonate, lithium hydroxide and
cobalt rising 72%, 47% and 58%, respectively, in the first quarter of 2021. Despite this,
BloombergNEF expects global volume-weighted average battery pack prices to cross $100/kWh
by 2024.
Other EV technology improvements being implemented include using batteries as a structural
element of the vehicle (sometimes referred to as ‘cell-to-chassis’), higher efficiency electric
motors, and better integration between EV components.
Figure 11: BloombergNEF lithium-ion battery price survey results
Source: BloombergNEF
Phasing out combustion vehicle sales
As EV sales rise and battery prices continue to fall further, a growing number of governments
have set targets for phasing out new internal combustion vehicle sales – including the biggest car
markets in Europe like France or the U.K. However, the feasibility and optimal timing of these is
still debated. The most important factor is likely to be how quickly battery electric vehicles can
reach price parity with their internal combustion counterparts. Further improvements in lithium-ion
battery performance, energy density and cost will play a large role in determining this, but other
components, vehicle manufacturing processes, and other factors will also play a role.
Automakers are also increasing their ambitions here. In 1Q 2021 alone, four automakers
announced new plans to phase out sales of combustion vehicles. Three of them are global
targets: the Jaguar brand is aiming to sell only EVs by 2025, Volvo is aiming for 2030, and GM is
aiming for 2035. Ford’s plan is regional: it will sell only EVs in Europe from 2030. VW also
announced a new target for 70% of its sales in Europe to be fully electric by 2030. Other
automakers have also committed to long-term ‘net zero’ targets including Daimler, VW, Renault,
Honda and Toyota.
Most analysis on phasing out internal combustion vehicle sales to date has focused on either a
single vehicle segment, or a single country, and has often used outdated battery price forecasts.
There is now general agreement that price parity will be reached in the 2020s, but the actual point
1,191
924
726668
592
384
295221
181 157 137
2010 2011 2012 2013 2014 2015 2016 2017 2018 2019 2020
Battery pack price (real 2020 $/kWh)
22%
21%
8%11%
35%
23%
26%18% 13% 13%

Hitting the EV Inflection Point
May 2021
© Bloomberg Finance L.P.2021
No portion of this document may be reproduced, scanned into an electronic system, distributed, publicly displayed or used as the basis of derivative works without the prior written consent of Bloomberg Finance L.P. For more information on terms of use, please contact [email protected]. Copyright and Disclaimer notice on page 58 applies throughout. 7
varies significantly by segment and geography, and most countries have very different starting
positions on EV adoption. This has big implications for policy makers, who are trying to determine
when and how ICE phase-outs might be achieved.
This report aims to address these shortcomings in the previous analysis the European context
and answer the following questions:
• In what year will BEVs reach prices parity with comparable ICE vehicles in Europe and how
does this vary by segment?
• What are the main drivers of these parity points and how sensitive are they to changes in
input assumptions?
• What is the outlook for BEV adoption in Europe, and how does this vary between regions?
• What is a potentially feasible phase-out date for new ICE vehicle sales in Europe and what
are some of the additional policy measures that would be needed to achieve this?
Methodology and approach
The analysis in this report is based on public and proprietary datasets, expert interviews, BNEF’s
in-house expertise and proprietary models. These models include BNEF’s Bottom-up Battery Cost
Model, Vehicle Economics Model and EV Adoption Model. For more details on methodology,
please refer to sections 3.2, 4.2 and 4.3.
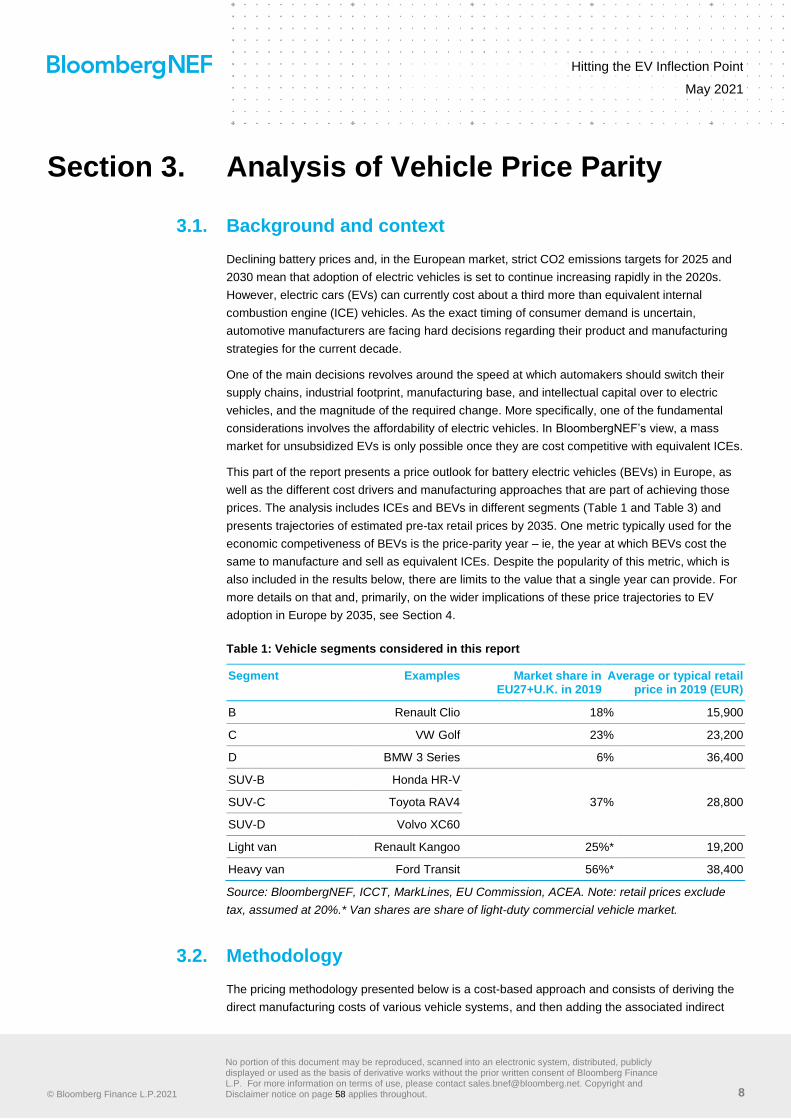
Hitting the EV Inflection Point
May 2021
© Bloomberg Finance L.P.2021
No portion of this document may be reproduced, scanned into an electronic system, distributed, publicly displayed or used as the basis of derivative works without the prior written consent of Bloomberg Finance L.P. For more information on terms of use, please contact [email protected]. Copyright and Disclaimer notice on page 58 applies throughout. 8
Section 3. Analysis of Vehicle Price Parity
3.1. Background and context
Declining battery prices and, in the European market, strict CO2 emissions targets for 2025 and
2030 mean that adoption of electric vehicles is set to continue increasing rapidly in the 2020s.
However, electric cars (EVs) can currently cost about a third more than equivalent internal
combustion engine (ICE) vehicles. As the exact timing of consumer demand is uncertain,
automotive manufacturers are facing hard decisions regarding their product and manufacturing
strategies for the current decade.
One of the main decisions revolves around the speed at which automakers should switch their
supply chains, industrial footprint, manufacturing base, and intellectual capital over to electric
vehicles, and the magnitude of the required change. More specifically, one of the fundamental
considerations involves the affordability of electric vehicles. In BloombergNEF’s view, a mass
market for unsubsidized EVs is only possible once they are cost competitive with equivalent ICEs.
This part of the report presents a price outlook for battery electric vehicles (BEVs) in Europe, as
well as the different cost drivers and manufacturing approaches that are part of achieving those
prices. The analysis includes ICEs and BEVs in different segments (Table 1 and Table 3) and
presents trajectories of estimated pre-tax retail prices by 2035. One metric typically used for the
economic competiveness of BEVs is the price-parity year – ie, the year at which BEVs cost the
same to manufacture and sell as equivalent ICEs. Despite the popularity of this metric, which is
also included in the results below, there are limits to the value that a single year can provide. For
more details on that and, primarily, on the wider implications of these price trajectories to EV
adoption in Europe by 2035, see Section 4.
Table 1: Vehicle segments considered in this report
Segment Examples Market share in EU27+U.K. in 2019
Average or typical retail price in 2019 (EUR)
B Renault Clio 18% 15,900
C VW Golf 23% 23,200
D BMW 3 Series 6% 36,400
SUV-B Honda HR-V
37% 28,800 SUV-C Toyota RAV4
SUV-D Volvo XC60
Light van Renault Kangoo 25%* 19,200
Heavy van Ford Transit 56%* 38,400
Source: BloombergNEF, ICCT, MarkLines, EU Commission, ACEA. Note: retail prices exclude
tax, assumed at 20%.* Van shares are share of light-duty commercial vehicle market.
3.2. Methodology
The pricing methodology presented below is a cost-based approach and consists of deriving the
direct manufacturing costs of various vehicle systems, and then adding the associated indirect

Hitting the EV Inflection Point
May 2021
© Bloomberg Finance L.P.2021
No portion of this document may be reproduced, scanned into an electronic system, distributed, publicly displayed or used as the basis of derivative works without the prior written consent of Bloomberg Finance L.P. For more information on terms of use, please contact [email protected]. Copyright and Disclaimer notice on page 58 applies throughout. 9
costs (Figure 12). Direct manufacturing costs (DMC) include materials, labor, energy, building and
machinery costs directly employed in the production of components. Costs such as depreciation
or capital expenditure, research and development, marketing, transportation and distribution,
warranties, profits and others are included in the production and corporate overhead costs.
Our modeling focuses on underlying production costs, while pricing can be a strategic choice
made by automakers to manage supply and demand. Price parity will theoretically be achieved
when an automaker can make and sell an EV with a comparable margin as a similar ICE model,
without subsidies.
Figure 12: Vehicle cost methodology
Source: BloombergNEF
Baseline and optimized battery electric vehicles, and central scenario
We estimate two sets of production costs for BEVs. In the baseline case, we assume that vehicles
are developed and manufactured using engineering platforms modified from existing ICE
vehicles. In the optimized case, BEVs are designed and produced based on dedicated platforms
(Table 2, and explanation box at the end of this subsection).
We combine those cost sets to derive our central pricing scenario, based on the manufacturing
strategies of major automakers in Europe. We use this scenario in the price parity analysis and
adoption forecasts. We estimate that in 2020, electric vehicle prices are heavily skewed toward
the costlier baseline case, since many BEVs currently on sale are built on modified platforms.
However, the weighting quickly shifts as several automakers develop dedicated platforms. We
expect that by 2025 most BEVs available will be built on dedicated platforms.
Baseline electric vehicles may cost 10-30% more to manufacture and sell, depending on
segment. The cost gap is primarily a result of different production volumes, mostly through lower
battery costs. The distribution of the considerable development costs to more vehicles and more
efficient inventory management are additional benefits. A second volume-related effect specific to
BEVs is that dedicated all-electric platforms can in principle be used to build vehicles in several

Hitting the EV Inflection Point
May 2021
© Bloomberg Finance L.P.2021
No portion of this document may be reproduced, scanned into an electronic system, distributed, publicly displayed or used as the basis of derivative works without the prior written consent of Bloomberg Finance L.P. For more information on terms of use, please contact [email protected]. Copyright and Disclaimer notice on page 58 applies throughout. 10
widely different segments. That is in contrast to existing ICE platforms, which can typically only
accommodate vehicles on adjacent segments.
Dedicated platforms also offer possibilities for the engineering optimization of BEVs, such as
better weight distribution and more opportunities for lightweighting, simpler assembly and
specifically re-designed components, including axles and suspensions.
The main drawback of developing a new platform is demand uncertainty. The costs, the
development timescales and the lifetime of automotive industrial assets make such decisions
challenging. On the cost side, R&D expenses may well exceed 5 billion euros for a new platform,
with additional capital expenditure needed to re-tool plants and other costs required to establish
solid supply chains. The resulting manufacturing footprint needs to be fully utilized in order to
recoup those investments, while timescales can be long. It can take three to five years to develop
from scratch a new platform, which can be used for five to seven years. It can take an additional
one to two years in strategy deliberations before taking a decision to even begin development.
So, a manufacturer that may have started thinking of new EV platforms in 2020, should be
relatively confident of sales volumes even into the early 2030s1.
In the current European automotive market, regulation offers some counterbalance for those
inherently risky decisions. Specifically, the tailpipe CO2 emissions targets for 2025 and 2030
provide demand anchors for electric vehicles, as automakers need to introduce BEVs and PHEVs
in large numbers to meet those targets. We believe that the European Commission is likely to
tighten them further in the future. Hence, we expect that in the second half of the 2020s most
manufacturers in Europe will have developed dedicated EV platforms or lease/contract these from
other suppliers. In our results, about three quarters of BEVs sold in Europe in 2025 are based on
such architectures. Manufacturers will have ever stronger incentives to base more output on
dedicated platforms, as BEV volumes rise over the next few years. By 2030, we assume that all
BEVs will come out of dedicated platforms to take full advantage of the cost advantages of high
volume manufacturing. Still, there are fundamental uncertainties in making such decisions and we
treat those as part of the price sensitivity analysis.
Vehicle platforms and production volume
A platform is the set of component designs, manufacturing equipment, production processes
and even supply-chain relationships that can be shared between different vehicles. Two of the
main benefits of a platform are the opportunity for high-volume manufacturing of individual
components and the ability to relatively quickly introduce new vehicle models and adapt to
changing consumer demand. Typically, ICE platforms can be used for vehicles in two to three
adjacent segments and they have a lifetime of about five to seven years. Initial BEV designs
used modifications of such platforms.
Dedicated BEV platforms from incumbent manufacturers have only recently appeared and, in
principle, can accommodate vehicles across more segments. As the development of a brand
new platform may require more than 5 billion dollars, building vehicles from many segments on
a single platform could provide scale benefits to manufacturers.
Some manufacturers are developing multi-energy platforms, which can support the
development and production of vehicles with several powertrain technologies, including both
1 There are indications that the development timescales of electric vehicles may be on the shorter end of
that range, while the expected accommodation of more vehicle segments on a single platform may offer
some flexibility to adapt to demand variations. However, the main thrust of the argument – that of high
upfront investments and long timescales – remains.

Hitting the EV Inflection Point
May 2021
© Bloomberg Finance L.P.2021
No portion of this document may be reproduced, scanned into an electronic system, distributed, publicly displayed or used as the basis of derivative works without the prior written consent of Bloomberg Finance L.P. For more information on terms of use, please contact [email protected]. Copyright and Disclaimer notice on page 58 applies throughout. 11
combustion engines and batteries. These purpose-built platforms may not get the entirety of
benefits of dedicated ones, but are a huge improvement over modified platforms.
The tradeoffs involved in a platform strategy are several, but the overarching consideration is
the expectation of future demand. Those companies developing dedicated BEV platforms are
more invested in an electric future, whereas those with multi-energy platforms value more the
flexibility they offer in an uncertain future vehicle market.
Table 2: Battery electric vehicle development and manufacturing strategies
Approach Examples
Current: BEV designed from the ground
up, using modified ICE platforms (eg, Bolt, iPace, EQC, Ioniq, Peugeot 2008). This is our baseline case, representing the
majority of BEV models in the market now and in the short term.
Daimler’s EQ platform
Dedicated platform: entirely new platform
and manufacturing processes designed and developed for BEV (eg, ID.3, Model Y). Currently under development by Daimler, Hyundai, GM, Ford, and others. This is our optimized case and our expectation for the market norm around the mid-2020s.
VW’s ID. platform
Ford’s approach
Next generation: tighter integration of the
battery and the vehicles – eg, Tesla’s most recent announcement. Still unproven.
Tesla’s latest announcement on ‘cell-to-chassis’ design, whereby the battery pack becomes an integral, even structural, part of the vehicle. This has the potential to save costs on materials, but could potentially make repairs more expensive. The concept has not been yet tested in a production vehicle.
Source: BloombergNEF
Battery pack improvements
Over the next decade, the introduction of more refined BEV pack architectures will continue to
drive down prices (Figure 13). However, the rate of adoption of these new architectures will vary
significantly across the industry.
Automotive companies like VW and GM are now adopting their second-generation pack designs.
These are designed specifically for EVs, they can be adapted for multiple vehicles and are
simpler to mass produce than first-generation packs. These designs are centered around
standardized modules that can use a variety of different cell formats and chemistries.
In the long run the role of the cell will become more important in BEVs and the role of the pack will
diminish. However, the timeline for this will vary by company and moving more slowly along this

Hitting the EV Inflection Point
May 2021
© Bloomberg Finance L.P.2021
No portion of this document may be reproduced, scanned into an electronic system, distributed, publicly displayed or used as the basis of derivative works without the prior written consent of Bloomberg Finance L.P. For more information on terms of use, please contact [email protected]. Copyright and Disclaimer notice on page 58 applies throughout. 12
path does not necessarily mean that a company will be at a disadvantage. A more advanced
architecture may be less reliable or harder to manufacture. There may also be limitations around
the chemistry or cell format that can be used.
Figure 13: Evolution of battery pack design
Source: Volkswagen, General Motors, BYD, Tesla
Chinese automotive companies are already adopting third-generation pack designs. BYD’s new
Han EV uses the company’s blade battery technology, which eliminates the need for modules and
uses fewer cells. The company claims this approach reduces the pack price by as much as 30%.
For the moment, this pack uses LFP batteries, which means that despite the lower cost the range
of vehicles will still be lower than EVs using second-generation packs of an equivalent kWh size
equipped with NMC (811) cells.
High-nickel chemistries are more likely to be used in these third-generation designs. BAIC already
uses NMC (532) in CATL’s cell-to-pack design, giving pack-level energy densities equal to a
second-generation pack using NMC (811). Concerns around safety and cycle life (due to changes
to the thermal management systems and BMS) explain automakers’ reluctance to integrate
higher-nickel chemistries immediately.
The fourth generation of pack design was highlighted at Tesla’s so-called Battery Day event. The
company announced it would eventually adopt a cell-to-chassis design, though the timeline for
this is not clear. Tesla suggested that the design could be in use as early as 2023, but
BloombergNEF believes 2025 is a more realistic timeline. This design would drastically alter the
pack-level costs. If the pack housing is considered part of the vehicle, the pack costs may only
include the cells, BMS, thermal management system and connections. Tesla claimed that this
approach and the accompanying changes to the cell design could cut the pack price by 56%.
Reference vehicles in each segment
Current and future reference vehicles in each segment in this report are based on prevailing
technical characteristics in the European market in 2020 and recent trends. We use the vehicle
weight as the main parameter that determines the vehicle’s physical size and segment, and the
power-to-vehicle-weight ratio as that which affects its performance. We define equivalent ICEs
and BEVs as those that have a similar ‘starting’ weight and the same power-to-vehicle-weight
ratio. For BEVs, we also set the real-world electric range and keep that constant for all years
between 2020 and 2035 (Table 3).
The starting weight of the BEV is that of an ICE in the same segment, excluding the latter’s
drivetrain – ie, consisting mostly of the weight of the body and chassis, without the engine,
transmission, fuel tank and some other components. On top of that, we add the weight of the
battery, electric motor, (potentially) e-axles and other components. We then estimate the energy
required to propel that mass and calculate the necessary battery capacity. We iterate this process
ICE/BEV architecture, 1st generation
Example: VW’s e-Golf pack
BEV architecture, 2nd generation
Example: GM’s Ultium platform
BEV architecture, 3rd generation
Example: BYD’s Blade Battery
BEV architecture, 4th generation
Example: Tesla’s cell-to-chassis platform

Hitting the EV Inflection Point
May 2021
© Bloomberg Finance L.P.2021
No portion of this document may be reproduced, scanned into an electronic system, distributed, publicly displayed or used as the basis of derivative works without the prior written consent of Bloomberg Finance L.P. For more information on terms of use, please contact [email protected]. Copyright and Disclaimer notice on page 58 applies throughout. 13
in order to take into account the improving battery energy density and electric motor power
density.
When designing a new BEV, automakers make a choice on the level of lightweighting by
considering the costs of introducing new materials to reduce weight versus those of adding
additional battery capacity to counteract heavier vehicles. The rapidly declining battery prices tip
the balance in favor of the latter approach. Some lightweighting will nevertheless continue to be
applied, but is more likely to be restricted to components, such as body panels, that may not
serve structural purposes and could be shared between several vehicles.
We find that battery electric vehicles can be between 20-40% heavier than equivalent ICEs now
(Table 3). The weight penalty declines rapidly, as the battery energy density improves around
50% between 2020 and 2030. By that time, BEVs tend to be up to 10% heavier, depending on the
segment. The weight reduction resulting from more energy dense batteries is the major
contributor to the efficiency improvements of BEVs by about 30% to 2030 (for more on battery
technology improvements, see section 3.3). By that time, battery packs can weigh about a third
less for the same capacity. For the same BEV range, batteries could weigh about half as much or
less depending on starting vehicle weight. In 2020, we estimate that the energy density of battery
packs was about 170 Wh/kg, which we expect to increase to around 250 Wh/kg by 2030.
Table 3: Reference vehicle characteristics in 2020 and 2030
Segment Type Weight (kg) Power (kW) Electric real-world driving range (km)
Battery capacity in 2020 (kWh)
Efficiency (L/100km or
Wh/km)
2020 2030
B ICE 1,000 59 - - 8.2 7.4
BEV 1,200 70 300 57 171 121
C ICE 1,200 84 - 9.9 8.4
BEV 1,600 109 400 84 188 131
D ICE 1,450 119 - - 12.5 9.9
BEV 2,000 164 500 113 203 142
SUV-B ICE 1,250 67 - - 9.2 8.1
BEV 1,450 79 300 61 182 128
SUV-C ICE 1,350 92 - - 10.8 8.9
BEV 1,750 118 400 87 195 135
SUV-D ICE 1,650 128 - - 14.0 10.6
BEV 2,200 172 500 116 208 146
Light van ICE 1,300 71 - - 9.6 8.4
BEV 1,500 84 300 62 185 131
Heavy van ICE 1,900 100 - - 15.1 12.7
BEV 2,300 122 400 93 209 155
Source: BloombergNEF, MarkLines, EU Commission, ICCT, EPA. Note: the 2020 vehicle characteristics are the same for the
baseline and optimized cases; figures are rounded. Efficiency is real world efficiency corresponding to the EPA cycle; BEV battery
capacity declines 25-35% by 2030 under equal range.
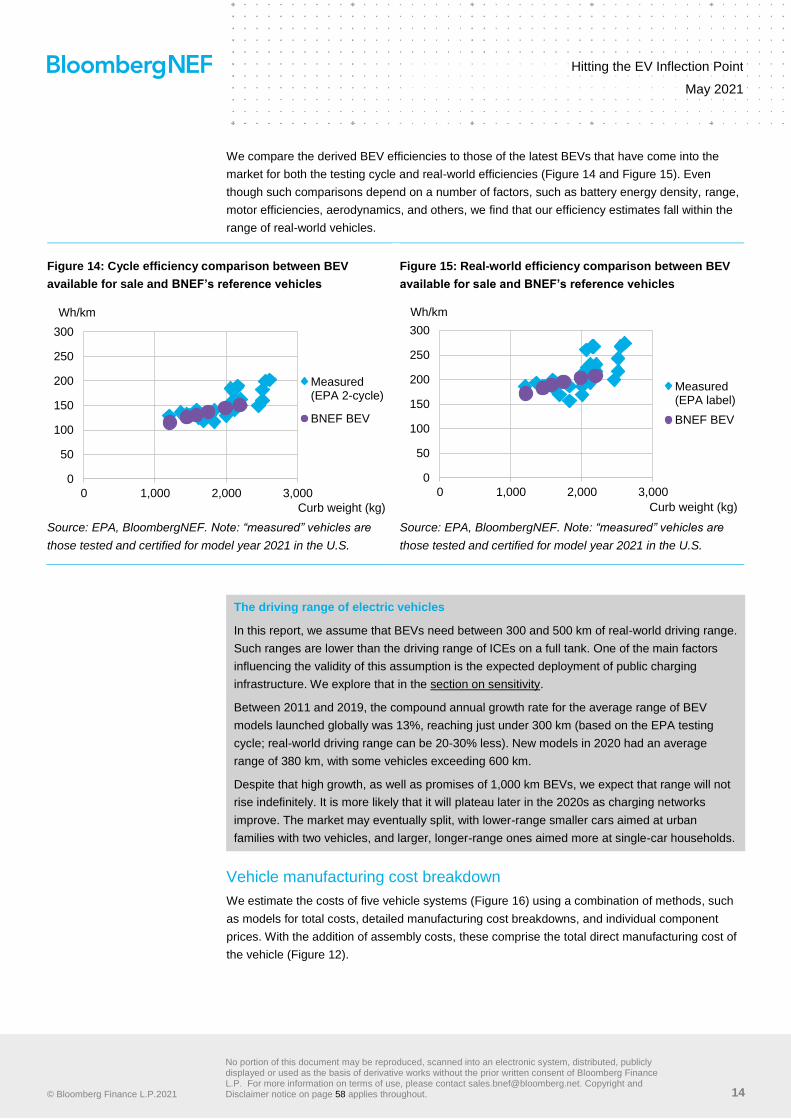
Hitting the EV Inflection Point
May 2021
© Bloomberg Finance L.P.2021
No portion of this document may be reproduced, scanned into an electronic system, distributed, publicly displayed or used as the basis of derivative works without the prior written consent of Bloomberg Finance L.P. For more information on terms of use, please contact [email protected]. Copyright and Disclaimer notice on page 58 applies throughout. 14
We compare the derived BEV efficiencies to those of the latest BEVs that have come into the
market for both the testing cycle and real-world efficiencies (Figure 14 and Figure 15). Even
though such comparisons depend on a number of factors, such as battery energy density, range,
motor efficiencies, aerodynamics, and others, we find that our efficiency estimates fall within the
range of real-world vehicles.
Figure 14: Cycle efficiency comparison between BEV
available for sale and BNEF’s reference vehicles
Figure 15: Real-world efficiency comparison between BEV
available for sale and BNEF’s reference vehicles
Source: EPA, BloombergNEF. Note: “measured” vehicles are
those tested and certified for model year 2021 in the U.S.
Source: EPA, BloombergNEF. Note: “measured” vehicles are
those tested and certified for model year 2021 in the U.S.
The driving range of electric vehicles
In this report, we assume that BEVs need between 300 and 500 km of real-world driving range.
Such ranges are lower than the driving range of ICEs on a full tank. One of the main factors
influencing the validity of this assumption is the expected deployment of public charging
infrastructure. We explore that in the section on sensitivity.
Between 2011 and 2019, the compound annual growth rate for the average range of BEV
models launched globally was 13%, reaching just under 300 km (based on the EPA testing
cycle; real-world driving range can be 20-30% less). New models in 2020 had an average
range of 380 km, with some vehicles exceeding 600 km.
Despite that high growth, as well as promises of 1,000 km BEVs, we expect that range will not
rise indefinitely. It is more likely that it will plateau later in the 2020s as charging networks
improve. The market may eventually split, with lower-range smaller cars aimed at urban
families with two vehicles, and larger, longer-range ones aimed more at single-car households.
Vehicle manufacturing cost breakdown
We estimate the costs of five vehicle systems (Figure 16) using a combination of methods, such
as models for total costs, detailed manufacturing cost breakdowns, and individual component
prices. With the addition of assembly costs, these comprise the total direct manufacturing cost of
the vehicle (Figure 12).
0
50
100
150
200
250
300
0 1,000 2,000 3,000
Curb weight (kg)
Wh/km
Measured(EPA 2-cycle)
BNEF BEV
0
50
100
150
200
250
300
0 1,000 2,000 3,000
Curb weight (kg)
Wh/km
Measured(EPA label)
BNEF BEV

Hitting the EV Inflection Point
May 2021
© Bloomberg Finance L.P.2021
No portion of this document may be reproduced, scanned into an electronic system, distributed, publicly displayed or used as the basis of derivative works without the prior written consent of Bloomberg Finance L.P. For more information on terms of use, please contact [email protected]. Copyright and Disclaimer notice on page 58 applies throughout. 15
Figure 16: Vehicle system costs by system and component
Source: BloombergNEF, ORNL, INL, ANL, McKinsey. Note: refers to C segment vehicle.
For internal combustion engines and transmissions (which can account for more than a quarter of
the ICE direct manufacturing cost, Figure 16), and for electric motors we use cost models that
mostly depend on the vehicle’s power output. Such models naturally adapt to vehicle sizes, based
on their different technical characteristics. For batteries, we use the same price for all segments
and power outputs.
Beyond the drivetrain, the main differences between ICEs and BEVs are found on the chassis
and electronics (Figure 17). Suspensions, steering and braking systems, and axles can be more
complex and 5-15% more expensive for a BEV, especially one built on a non-dedicated platform.
The additional weight of electric cars, as well as the potential integration of motors or other items
on the axles, determine the cost of such components. However, the magnitude of some of those
effects declines as electric vehicles become lighter.
On the electronics side, the high electrical power of BEVs and the lack of the thermal output of the
combustion engine affect the cost differential of control electronics, and heating and ventilation
systems2 (HVAC). The BEV-to-ICE cost difference can be between 50-100% for the whole
electronics system, in particular with the currently low manufacturing volumes and still-emerging
supply chain. However, scale effects could push lower the costs of many of those components by
2030, even though HVAC systems may still command a small premium.
2 We take into account the additional battery capacity that may be required for heating and air-conditioning
when estimating the total energy requirements of BEVs.
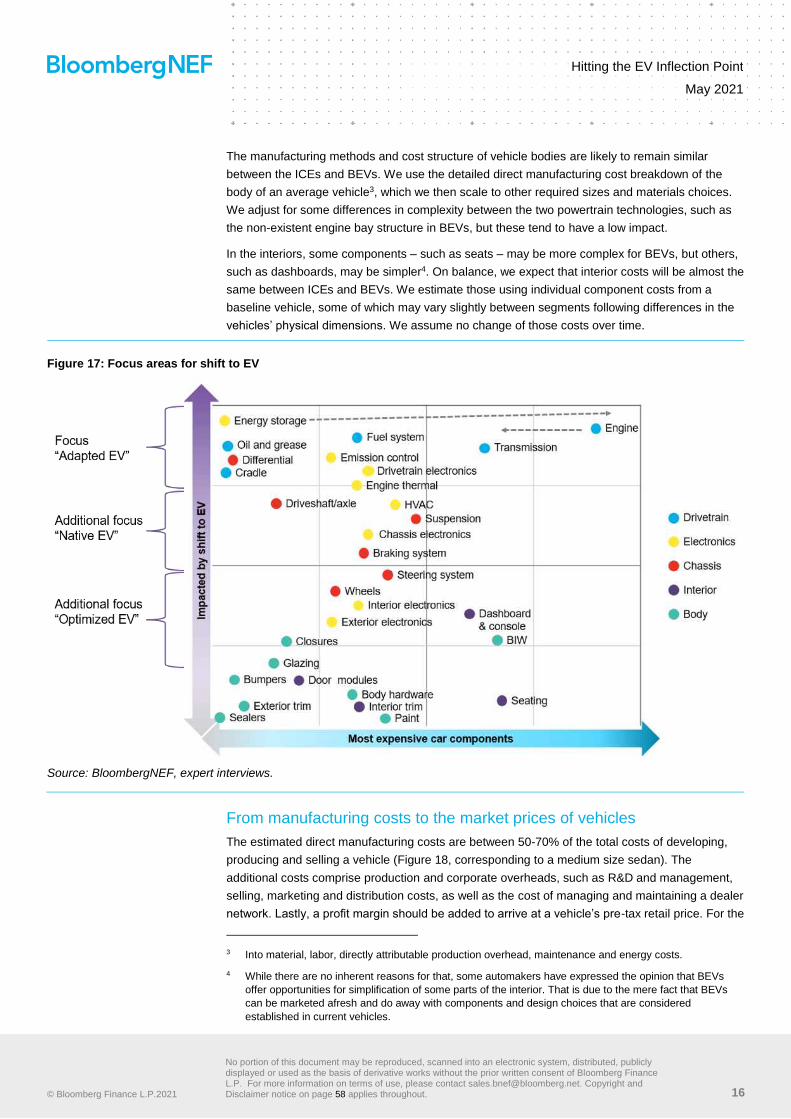
Hitting the EV Inflection Point
May 2021
© Bloomberg Finance L.P.2021
No portion of this document may be reproduced, scanned into an electronic system, distributed, publicly displayed or used as the basis of derivative works without the prior written consent of Bloomberg Finance L.P. For more information on terms of use, please contact [email protected]. Copyright and Disclaimer notice on page 58 applies throughout. 16
The manufacturing methods and cost structure of vehicle bodies are likely to remain similar
between the ICEs and BEVs. We use the detailed direct manufacturing cost breakdown of the
body of an average vehicle3, which we then scale to other required sizes and materials choices.
We adjust for some differences in complexity between the two powertrain technologies, such as
the non-existent engine bay structure in BEVs, but these tend to have a low impact.
In the interiors, some components – such as seats – may be more complex for BEVs, but others,
such as dashboards, may be simpler4. On balance, we expect that interior costs will be almost the
same between ICEs and BEVs. We estimate those using individual component costs from a
baseline vehicle, some of which may vary slightly between segments following differences in the
vehicles’ physical dimensions. We assume no change of those costs over time.
Figure 17: Focus areas for shift to EV
Source: BloombergNEF, expert interviews.
From manufacturing costs to the market prices of vehicles
The estimated direct manufacturing costs are between 50-70% of the total costs of developing,
producing and selling a vehicle (Figure 18, corresponding to a medium size sedan). The
additional costs comprise production and corporate overheads, such as R&D and management,
selling, marketing and distribution costs, as well as the cost of managing and maintaining a dealer
network. Lastly, a profit margin should be added to arrive at a vehicle’s pre-tax retail price. For the
3 Into material, labor, directly attributable production overhead, maintenance and energy costs.
4 While there are no inherent reasons for that, some automakers have expressed the opinion that BEVs
offer opportunities for simplification of some parts of the interior. That is due to the mere fact that BEVs
can be marketed afresh and do away with components and design choices that are considered
established in current vehicles.

Hitting the EV Inflection Point
May 2021
© Bloomberg Finance L.P.2021
No portion of this document may be reproduced, scanned into an electronic system, distributed, publicly displayed or used as the basis of derivative works without the prior written consent of Bloomberg Finance L.P. For more information on terms of use, please contact [email protected]. Copyright and Disclaimer notice on page 58 applies throughout. 17
analysis, we assume that the required profit margin for ICEs and BEVs is the same. We believe
that this is a necessary condition for automakers, as they attempt to maintain the overall
profitability of their businesses. Some manufacturers have stated that they expect to reach such
‘profit parity’ in the next few of years, whereas others may cross-subsidize their EVs using higher
margins in ICE vehicles until battery prices fall further.
The allocation of these indirect costs to particular vehicle models is not straightforward and
potentially is a strategic as well as an accounting choice for an automaker. For ICEs, we estimate
these additional costs as a markup on the direct manufacturing costs; the markup factors range
from 1.6 to 2.0, depending on vehicle segment. We estimate that based on different cost
structures between automakers as evidenced in their annual accounts5 and comparing with
market prices.
Following the same approach for BEVs means that these costs are directly affected by battery
manufacturing costs. However, we believe it is unlikely that many of those expenses, such as
R&D or marketing, would either be as large now or drop as fast in the future as current and future
battery costs may imply. So, we use the costs estimated for ICEs as a basis and we adjust them
mostly for different expected production volumes. The resulting markup factors range from 1.6 to
2.1 for BEVs built on modified platforms, and between 1.5 and 2.0 for those built on dedicated
platforms.
Figure 18: Vehicle retail price breakdown
Source: EPA, FEV, BloombergNEF Note: refers to a medium-size passenger car
3.3. Battery pricing and outlook
Prices today
Falling prices for lithium-ion batteries are the biggest technology driver supporting the rapid rise in
EV sales. BloombergNEF’s 2020 volume-weighted average lithium-ion battery pack price was
5 Using automakers’ quarterly and annual accounts it may possible – in some cases – to also back-
calculate aspects of the cost structure for groups of popular model lines. This is of course not entirely
precise and we use it as a check of the direction and magnitude of differences in the markup factors.
68%
63%
12%
14%
5%
3%
5%
7%
4%
9%
4%
4%
U.S.
Europe
Share of pre-tax retail price
Manufacturing
Production overhead
Corporate overhead
Selling
Dealer cost
Net income

Hitting the EV Inflection Point
May 2021
© Bloomberg Finance L.P.2021
No portion of this document may be reproduced, scanned into an electronic system, distributed, publicly displayed or used as the basis of derivative works without the prior written consent of Bloomberg Finance L.P. For more information on terms of use, please contact [email protected]. Copyright and Disclaimer notice on page 58 applies throughout. 18
$137/kWh, a fall of 13% in real terms since 2019. In EVs, the pack consists of cells, module
housing, the battery management system (BMS), wiring, pack housing and thermal management
system. Average lithium-ion battery pack prices are now down 89% from 2010.
Battery cell prices are already approaching $100/kWh. In 2020, the pack-to-cell split for across all
battery segments was 74:26 (Figure 19). This marks a change from previous years when the split
has been closer to 70:30. The split varies significantly between use cases. In e-buses and
commercial EVs in China the split is closer to 85:15, whereas in plug-in hybrid electric vehicles
(PHEVs) the split is closer to 45:55. The differences come from the variations in pack design and
requirements.
Figure 19: Pack and cell split, all sectors
Source: BloombergNEF 2020 Lithium-ion Battery Price Survey
For the past decade, the battery pack has been the single most expensive part of an electric
vehicle (EV). In 2016, the pack accounted for almost 50% of a medium-sized battery electric
vehicle (BEV) in the U.S. It is now closer to 30% and will continue to fall. There is still a wide
range of lithium-ion battery pack prices in the market. High-volume BEVs typically have lower
average battery pack prices per kWh than plug-in hybrids or commercial vehicles.
In 2020, the cheapest European batteries were competitive with some of the lowest prices
globally, but prices in Europe were more widely spread. This means the average price for battery
packs in Europe was higher than the global average, partially resulting from some lower volume
orders. As sales expectations and manufacturing strategies differ between automakers, we
expect such price differences to persist for a few more years. Our cost estimates take that
difference into account, whereby modified BEVs incur higher battery costs compared to those
built on dedicated platforms (for which we use the battery prices in Figure 20). We expect
manufacturers to gradually adopt dedicated platforms, and our vehicle cost declines also reflect
this switch to cheaper batteries by 2025.
458403
257215
155 130 110 102
210
190
127
80
6550
47 35
668
592
384
295
221181
157137
2013 2014 2015 2016 2017 2018 2019 2020
real 2020 $/kWh
Pack
Cell

Hitting the EV Inflection Point
May 2021
© Bloomberg Finance L.P.2021
No portion of this document may be reproduced, scanned into an electronic system, distributed, publicly displayed or used as the basis of derivative works without the prior written consent of Bloomberg Finance L.P. For more information on terms of use, please contact [email protected]. Copyright and Disclaimer notice on page 58 applies throughout. 19
Battery price outlook
Demand for lithium-ion batteries used in EVs and stationary storage has grown more than 264
times from 2010 to 2020. BloombergNEF has collected pricing and volume data for lithium-ion
battery packs since 2010. Based on an 18% learning rate, BloombergNEF expects lithium-ion
battery pack prices will fall below $100/kWh in 2024 and reach $58/kWh in 2030 (Figure 20).
By 2035, BloombergNEF projects that lithium-ion battery packs could achieve a volume-weighted
average price of $45/kWh. For an EV with a 100kWh battery pack, the pack price would be
$9,200 cheaper in 2035, a fall of 67% from 2020. It is not yet clear from a bottom-up perspective
how the industry can achieve these prices. It may well require material substitution and will
certainly require further technology advancements. It is equally hard to understand the full
implications of this low pricing, which could unlock new demand sectors that are currently not
addressable, and improve economics (and subsequent uptake) in sectors that have already
started to electrify.
Figure 20: Lithium-ion battery pack price and demand outlook
Source: BloombergNEF 2020 Electric Vehicle Outlook and 2020 Lithium-ion Battery Price Survey.
Despite these implied low pack prices, the annual rate of price declines is slowing. This is
consistent with the concept of a learning rate, which links the rate of price declines to the
cumulative volume of battery packs deployed on the market. The observed 18% learning rate
indicates that every time the cumulative volume of batteries deployed on the market doubles,
pack prices fall by 18%. As the market expands, more time elapses between each doubling of
cumulative battery capacity. In the five-year period between 2020 and 2025, cumulative volumes
0
250
500
750
1,000
1,250
0
5,000
10,000
15,000
20,000
25,000
2010 2015 2020 2025 2030 2035
Lithium-ion battery pack price (real 2020 $/kWh)
E-bus
Stationarystorage
Two-wheelers
Commercialvehicles
Passenger EV
Observedprices
18% learningrate
2024 implied price: $92/kWh
2030 implied price: $58/kWh
Cumulative demand for lithium-ion batteries (GWh)
2020: $137/kWh
2035 implied price: $45/kWh

Hitting the EV Inflection Point
May 2021
© Bloomberg Finance L.P.2021
No portion of this document may be reproduced, scanned into an electronic system, distributed, publicly displayed or used as the basis of derivative works without the prior written consent of Bloomberg Finance L.P. For more information on terms of use, please contact [email protected]. Copyright and Disclaimer notice on page 58 applies throughout. 20
are expected to double twice (Figure 20). A decade later, in the five years between 2030 and
2035, volumes only double once.
Price outlook: 2021-2025
The cost reductions that can be achieved over the next five years are already well understood. In
the automotive industry, cells have already been procured, with prices set, for most vehicles being
launched over this period. Outside of passenger EVs many companies still procure cells closer to
when they are required.
The biggest uncertainty for most automakers will be the cost of raw materials (see the section on
sensitivity below). Automakers may be forced to quickly pivot to different chemistries or suppliers
if key raw materials like cobalt or nickel are in short supply. This would affect pack pricing as well.
Using BNEF’s Bottom-Up Battery Cost Model, we outline one route cell manufacturers can take to
reduce manufactured cell costs to the point that they enable pack prices of less than $100/kWh (a
benchmark we expect by 2024). A 30% improvement in four key areas would reduce the
manufactured cost of a cell by 33%, to $61/kWh (Figure 21). The four areas are: decrease in
material costs, increase in energy density, increase in output and decrease in scrappage rate.
The cost trajectory in Figure 21 is a scenario, whose individual steps are already technically
feasible in isolation albeit harder to achieve simultaneously. Still, the resulting price should not be
viewed as a floor below which battery costs cannot pass. Material prices can also fall by changing
things like the chemistry composition, for example substituting cobalt for nickel or nickel for
manganese.
Figure 21: Potential battery-cell cost reductions
Source: BloombergNEF. Note: Using the manufacturing cost of NMC (622) prismatic cell in 2019
as benchmark. The material price decrease calculation only includes the prices of four major
components - cathode active material, anode active material, electrolyte and separator. Energy
density refers to cathode active material energy density, instead of battery energy density; the
figure shows a scenario of possible cost reductions, assuming a 30% change for each of the four
steps given as labels.
Additional costs such as SG&A (selling, general and administrative expense) and the
manufacturer’s margin would give a final cell price of around $70/kWh. Assuming the pack-to-cell
85.6
69.8
59.0 57.5 56.6
0
10
20
30
40
50
60
70
80
90
Benchmark Material pricedecrease
Energy densityincrease
Productionrate increase
Scrappagedecrease
$/kWh
30%change

Hitting the EV Inflection Point
May 2021
© Bloomberg Finance L.P.2021
No portion of this document may be reproduced, scanned into an electronic system, distributed, publicly displayed or used as the basis of derivative works without the prior written consent of Bloomberg Finance L.P. For more information on terms of use, please contact [email protected]. Copyright and Disclaimer notice on page 58 applies throughout. 21
price ratio of 74:26 in 2020 gives a final pack price of $94/kWh. This is in line with our expectation
for average pack prices in 2024.
Cell chemistry improvements
The adoption of new cathode materials alone can almost realize these savings. Moving from the
commonly used NMC (622) cathode material to NMC (9.5.5), which SK Innovation will use in
commercial cells from 2022, would result in a 23% increase in energy density and a 21%
decrease in raw material costs (Figure 22 and Figure 23).
Figure 22: Energy density by chemistry Figure 23: Raw material costs by chemistry
Source: BloombergNEF. Note: NMC (9.5.5)’s energy density is
estimated.
Source: BloombergNEF. Note: Based on commodity prices as of
November 30, 2020. Does not include processing costs or
losses from production.
Cell manufacturing improvements
Improvements to production and scrap rates are likely to outstrip the 30% improvements shown in
Figure 21. Over the past three years, average scrap rates have fallen from around 7.5% to 5%, a
reduction of 33%, a trend that we expect will continue.
Production rates for cell lines are also increasing dramatically. The unit production rate of
cylindrical lines increased 150% between 2010 and 2020. If improvements continue at this rate
production speeds may be 75% higher by 2025. The output of cell lines in GWh can also increase
through the adoption of new cell designs that pack in more kWh per cell. Cell formats have
become increasingly standardized in recent years. This is increasingly important for large
automakers, which may need to procure from different suppliers in different regions.
Battery manufacturing capex
BloombergNEF’s benchmark capex cost for a new-build battery manufacturing plant is around
$110 million/GWh. Since 2017, capex costs have fallen 34% and are set to fall another 28% by
2023 (Figure 24).
Reducing capex is an important way to lower cell costs. Capex savings for new-build plants will
come from a number of different areas:
• Chemistry changes: Plants can produce a set number of cells each year. Producing higher
energy density cells increases the kWh contained in each cell, lowering the $/GWh capex.
651
733800
NMC (622) NMC (811) NMC (9.5.5)
Wh/kg +23%
23.56
20.5718.69
0
5
10
15
20
25
30
NMC (622) NMC (811) NMC (9.5.5)
Manganese
Cobalt
Nickel
Lithium
$/kWh
-21%

Hitting the EV Inflection Point
May 2021
© Bloomberg Finance L.P.2021
No portion of this document may be reproduced, scanned into an electronic system, distributed, publicly displayed or used as the basis of derivative works without the prior written consent of Bloomberg Finance L.P. For more information on terms of use, please contact [email protected]. Copyright and Disclaimer notice on page 58 applies throughout. 22
• Power versus energy: PHEVs use cells that are geared toward power, while BEVs use
energy cells. As the ratio of PHEVs to BEVs sold in the market shifts in favor of the latter,
manufacturers will produce more energy cells. Energy cells have more kWh than power cells,
which means this industry trend will increase the GWh produced at factories, thereby
reducing the $/GWh capex.
• Manufacturing equipment: Companies continue to improve the factory efficiency and
utilization. This results in capex and opex savings as well as higher output volumes. CATL
and LG Chem both highlighted the role increased utilization played in increasing margins and
reducing cell costs in their 1Q 2020 reports.
• Subsidies: These have played a key role in attracting battery manufacturing to certain
regions.
• Greenfield versus brownfield: It can be cheaper to expand existing sites than open up new
ones. This is because much of the infrastructure is already in place and the land already
owned or leased. The scale of new manufacturing plants required by 2030 will limit how many
brownfield sites can be expanded.
• Location: The location of a new plant impacts the capex required. Building a factory in
Poland is less capital intensive than building in other parts of Europe (Figure 24). There are,
of course, other considerations that should be taken into account, such as the grid emissions
of the country and the availability of a skilled workforce.
Figure 24: Greenfield battery manufacturing capex
Source: BNEF, public reports. Note: it is not always clear if a facility will manufacture cells, or cells and packs.
Price Outlook 2025-2030
There are many possible pathways to realizing the price declines expected during the second half
of this decade. This could be through the adoption of new system designs, such as solid-state
cells, or improvements to existing liquid-based systems. There is tremendous overlap between
these pathways. Improvements under development for liquid-based systems, such as dry
electrode coating, could equally be adapted for solid-state cells.
LG ChemTesla/Panasonic
SK Innovation
SK Innovation
GM/ LG Chem
SK Innovation
Samsung SDI
VW/Northvolt
FarasisCATL
SaftSK Innovation
BYD
InoBat
0
20
40
60
80
100
120
140
160
180
200
2015 2016 2017 2018 2019 2020 2021 2022 2023 2024 2025 2026
$ million/GWh (real 2020)
Poland
U.S.
Hungary
Germany
China
SlovakiaCommissioning year
35GWh
10GWh
Plant size

Hitting the EV Inflection Point
May 2021
© Bloomberg Finance L.P.2021
No portion of this document may be reproduced, scanned into an electronic system, distributed, publicly displayed or used as the basis of derivative works without the prior written consent of Bloomberg Finance L.P. For more information on terms of use, please contact [email protected]. Copyright and Disclaimer notice on page 58 applies throughout. 23
Solid-state
Solid-state cells are likely to be more expensive than cells using liquid-based electrolytes when
initially introduced. Nonetheless, their costs could fall quickly. Manufacturing costs could fall since
the technology obviates the need for certain processes like formation or aging. The technology
also enables the adoption of new cathode and anode materials that may not be compatible with
the existing generation of liquid electrolytes.
BloombergNEF estimates that an optimized solid-state cell using next-generation cathode
materials and 15µm thin lithium foil anode could be manufactured for a cost of $52/kWh (Figure
25). BloombergNEF currently expects that supply chains and technology could be sufficient to
enable this by around 2030.
Figure 25: Solid-state battery (SSB) cell manufacturing cost reduction outlook, 2030
Source: BloombergNEF. Note: Conventional LiB is based on a 60Ah NMC (622) pouch cell. SSB
refers to the solid-state battery with lithium metal anode. Material savings include reduced
material costs for both active and inactive components as well as the increased cost for the
electrolyte. Manufacturing savings include saved costs across labor, manufacturing as well as
equipment and plant depreciations
This would still be around $5-10/kWh too high to realize our 2030 pack price of $58/kWh.
Improvements to manufacturing, like cell line speed and dry electrode coating, could, however,
further reduce the manufactured cost and make this target achievable.
Solid-state batteries are not the only route to further cost reductions. There are various innovative
approaches that could help liquid electrolytes maintain their dominance of the lithium-ion battery
market, including improved cell designs and new electrolytes.
Liquid electrolyte
Lithium-ion batteries have used liquid-based electrolytes for the past 30 years. Various innovative
approaches could help this technology maintain its market dominance.
Improved cell design
Cylindrical cells are the cheapest to produce on a unit basis, but they have in the past faced limits
on their maximum size. The larger they are, in diameter and height, the harder it is to control their
85.6
69.3
51.7
14.02.3
5.0
12.5
Conventional LiB Manufacturing savings Processing optimization Optimized SSB
$/kWh
Material savings Benchmark SSB Cathode improvements
Solid-state cells could
be manufactured for
$52/kWh

Hitting the EV Inflection Point
May 2021
© Bloomberg Finance L.P.2021
No portion of this document may be reproduced, scanned into an electronic system, distributed, publicly displayed or used as the basis of derivative works without the prior written consent of Bloomberg Finance L.P. For more information on terms of use, please contact [email protected]. Copyright and Disclaimer notice on page 58 applies throughout. 24
internal thermal behavior, which hinders performance. This can give pouch and prismatic cells,
that are produced at a slower unit rate but contain more kWh, an advantage over their cylindrical
counterparts. At its ‘Battery Day’ event, Tesla unveiled a new tab-less cylindrical cell design,
which enables it to overcome some of the size limitations of cylindrical cells. Using this approach,
it expects that with the current generation of liquid electrolytes, it can further reduce cylindrical cell
costs. BloombergNEF estimates that its manufactured cell cost would be close to $50/kWh. In
contrast to Tesla, VW has chosen a prismatic cell format for use in 80% of its vehicles by 2030.
New electrolytes
Innolith, a startup headquartered in Switzerland, has developed a novel inorganic liquid
electrolyte. Unlike the organic electrolytes used today, it can be used in combination with next
generation high-energy density, high-voltage cathodes. These new materials promise to both
increase energy density, which reduces manufacturing costs, and reduce material costs.
Cathode material production
Cathode materials account for an increasing proportion of cell and pack costs. We expect the
cathode will account for 43% of the pack price, an increase from 31% today, on a volume-
weighted basis. Multiple companies are working on innovative approaches to reduce the cost of
producing raw materials, precursors and cathodes.
Increased competition
Various new cell manufacturers, such as Northvolt, Freyr and Automotive Cell Company (ACC),
are all vying for a share of the growing market. These new manufacturers, alongside the
expansion of existing companies, will help Europe grow its share of installed capacity from 7% to
21% (Figure 26 and Figure 27). As these new manufacturers start volume production, there could
be increased pressure on companies’ pricing strategies as they attempt to increase or maintain
market share. Margins may well be sacrificed along the way.
Figure 26: Global manufacturing capacity, 2020 Figure 27: Global manufacturing capacity, 2025
Source: BloombergNEF Source: BloombergNEF
Price Outlook: 2030-2035
How the industry achieves costs reductions beyond 2030 is unclear as we are only just beginning
to quantify how manufacturing, materials, cell and pack designs will change over the next decade.
78%
7%
8%
5%2%0%
China
Europe
U.S.
Korea
Japan
RoW
2020:540GWh
65%
21%
6%1%
1%6%
China
Europe
U.S.
Korea
Japan
RoW
2025:2,015GWh
Some 21% of
commissioned
manufacturing capacity
will be in Europe by
2025

Hitting the EV Inflection Point
May 2021
© Bloomberg Finance L.P.2021
No portion of this document may be reproduced, scanned into an electronic system, distributed, publicly displayed or used as the basis of derivative works without the prior written consent of Bloomberg Finance L.P. For more information on terms of use, please contact [email protected]. Copyright and Disclaimer notice on page 58 applies throughout. 25
It is fair to say that continued improvements across all these areas will remain important in
realizing these prices well into the next decade.
3.4. Vehicle cost results
Main outputs
The estimated pre-tax retail prices of battery electric vehicles are set to decline rapidly by 2030,
as average battery prices fall by close to 60%. However, the vehicle price decline between 2020
and 2030 is steeper than this. BEVs in the early 2020s will mostly be built on non-dedicated
platforms with relatively low production volumes. The switch to dedicated platforms by the mid-
2020s implies that production volume-related BEV cost penalties are set to disappear (Figure 28
and Figure 29 show the price curves for all segments in Appendix A).
The cost difference between average BEVs and equivalent ICEs varies widely by segment. Light
and heavy battery electric vans are for now about 50% more expensive, as they have modest
performance requirements and medium ranges. In contrast, smaller battery vehicles in segments
A and B can cost more than twice as much compared to ICEs. Powertrain costs in these
segments tend to be low compared to total manufacturing costs at the moment, due to wide use
of smaller and cheaper gasoline engines. Even low-capacity batteries – around 55 kWh for B-
segment BEVs – may cost more than three times the total ICE drivetrain today.
Figure 28: Estimated pre-tax retail prices for C segment
vehicles
Figure 29: Estimated pre-tax retail prices for B segment
vehicles
Source: BloombergNEF Note: ICE is internal combustion engine vehicle and BEV is battery electric vehicle
0
10
20
30
40
50
2020 2022 2024 2026 2028 2030
2020 thousand EUR
ICE
BEV
0
5
10
15
20
25
30
2020 2022 2024 2026 2028 2030
2020 thousand EUR
ICE
BEV

Hitting the EV Inflection Point
May 2021
© Bloomberg Finance L.P.2021
No portion of this document may be reproduced, scanned into an electronic system, distributed, publicly displayed or used as the basis of derivative works without the prior written consent of Bloomberg Finance L.P. For more information on terms of use, please contact [email protected]. Copyright and Disclaimer notice on page 58 applies throughout. 26
Figure 30: Estimated pre-tax retail prices for SUV-C segment
vehicles
Figure 31: Estimated pre-tax retail prices for light vans
Source: BloombergNEF Note: ICE is internal combustion engine vehicle and BEV is battery electric vehicle
The BEV-to-ICE price difference gets increasingly small over the next five-to-six years in all
segments. Battery electric vehicles reach the same price as equivalent ICEs within a tight window
between 2025 and 2027 (Table 4). Vans reach price parity the earliest, B segment vehicles are
the latest, while larger sedans and SUVs are in between. This ranking of price-parity years
depends mostly on the vehicles’ technical characteristics – primarily, their assumed range – and
not directly on their average purchase price.
Table 4: Years at which BEVs reach upfront cost price parity with equivalent ICEs
Segment Year Segment Year Segment Year
B 2027 SUV-B 2026 Light vans 2025
C 2026 SUV-C 2026 Heavy vans 2026
D 2026 SUV-D 2026
Source: BloombergNEF. Note: we define price parity as the year at which a BEV becomes
cheaper than the equivalent ICE.
Vehicle cost structure
In this section we show in more detail the direct manufacturing costs of ICEs and BEVs (Figure 32
and Figure 33).
Some modest cost declines for the body and chassis of ICE vehicles are quickly outweighed by
the rising expense of improving the combustion engine. The 2025 and 2030 tailpipe CO2
emissions regulations and the Euro 7 emissions standards – which are being planned and set to
come into effect by 2025 – pose serious challenges for the cost-effective development of new
combustion drivetrains. The need for elaborate injection equipment and turbochargers, as well as
more complex exhaust systems mean that within the 2020s combustion engine costs will rise
between 1% and 2.5% annually. Cost increases will be higher for smaller segments, as gasoline
engines are also closing the efficiency gap with diesel powertrains.
0
10
20
30
40
50
2020 2022 2024 2026 2028 2030
2020 thousand EUR
ICE
BEV
0
5
10
15
20
25
30
35
2020 2022 2024 2026 2028 2030
2020 thousand EUR
ICE
BEV

Hitting the EV Inflection Point
May 2021
© Bloomberg Finance L.P.2021
No portion of this document may be reproduced, scanned into an electronic system, distributed, publicly displayed or used as the basis of derivative works without the prior written consent of Bloomberg Finance L.P. For more information on terms of use, please contact [email protected]. Copyright and Disclaimer notice on page 58 applies throughout. 27
The direct manufacturing costs of BEVs drop by at least 50% by 2030, depending on the
segment, and more than three-quarters of that is due to the battery. Additional cost declines are a
result of more power-dense electric motors and cheaper electronics.
Figure 32: Direct manufacturing costs for ICEs and BEVs,
C segment vehicle
Figure 33: Direct manufacturing costs for ICEs and BEVs,
SUV-C segment vehicle
Source: BloombergNEF. Note: “BEV mod.” refers to the conservative pricing scenario using a modified platform and “BEV ded.” to
a BEV built on a dedicated platform; the drivetrain of the ICE includes the engine, transmission, etc, whereas for the BEV it includes
the electric motor, its transmission and electronics; ICE is internal combustion engine vehicle and BEV is battery electric vehicle
Sensitivity analysis
The pre-tax retail prices for battery electric vehicles derived above depend on four main
parameters: platform choice, battery price, driving range and vehicle efficiency. Changing these
inputs (as in Table 5) provides an estimate of vehicle-price sensitivity within a wide range of the
assumptions that underlie vehicle prices.
Changes in the input parameters are not mutually exclusive, though not every combination is
equally likely. For example, in a lower-than-expected battery price environment, automakers may
well choose to increase, rather than decrease, the driving range of their vehicles. There are
several reasons for potential variations in input assumptions including consumer behavior, local
and national policies, as well as companies’ and countries’ industrial strategies.
Table 5: Battery electric vehicle price sensitivity parameters
Parameter Low value High value
Platform Dedicated Modified
Battery price -15% in 2030 vs BNEF central battery price forecast
+75% in 2030 vs BNEF central battery price forecast
Driving range -50% vs central scenario +50% vs central scenario
Vehicle efficiency +12% vs central scenario -12% vs central scenario
Source: BloombergNEF. Note: the “low” and “high” values for the platform are qualitative, rather
than quantitative, labels; the driving range and efficiency depend on vehicle segment (Table 3).
For batteries, in particular, volatile input material costs pose a considerable uncertainty for their
price outlook. In the last few years, the direction of raw material prices was supportive to battery
0
2
4
6
8
10
12
14
16
ICE BEVmod.
BEVded.
ICE BEVmod.
BEVded.
2025 2030
2020 thousand EUR
02468
1012141618
ICE BEVmod.
BEVded.
ICE BEVmod.
BEVded.
2025 2030
2020 thousand EUR

Hitting the EV Inflection Point
May 2021
© Bloomberg Finance L.P.2021
No portion of this document may be reproduced, scanned into an electronic system, distributed, publicly displayed or used as the basis of derivative works without the prior written consent of Bloomberg Finance L.P. For more information on terms of use, please contact [email protected]. Copyright and Disclaimer notice on page 58 applies throughout. 28
cost declines. However, prices for some of those materials have been edging upward recently,
while they have experienced sizeable price swings in the past. Nickel and cobalt prices have the
largest effect on the cost of an NMC (622) pack. A doubling of prices of these (from around
$26,000/metric ton and $65,000/metric ton, respectively, in February 2021) would increase
battery costs by about 9.5% and 8.1%. If material prices reduce by 40%, then the battery pack
cost would also drop by 8.8% and 7.4%. The change in the final price of a battery pack is a lot
lower than that of input material costs. Even if cobalt, lithium and nickel prices double (compared
to Feb 2021 prices), then battery pack prices would only increase by less than 25%. The high end
of our battery prices in the sensitivity analysis here is likely to result not from higher material
prices alone, but also from a combination of several factors, such as low production volumes,
slow technology improvements and other factors.
Figure 34: Impact of material price changes on pack price of a NMC (622) battery
Source: BloombergNEF. Note: Bubble size represents the change in the price of a battery pack
corresponding to the change in the price of one of the materials in the cathode; input material
prices are from February 2021
With the changes in Table 5, the pre-tax retail prices of BEVs can range from 16% lower to about
a third higher compared to our central scenario. The choice of platform strategy – which
encompasses the combined effects of production volume, efficient vehicle design and optimized
cost structure – is crucial, as by 2030 BEVs built on dedicated platforms may cost about a quarter
less to produce versus those that may still use modified ones (Figure 35).
On the individual parameters, the choice of driving range can materially change a BEV’s
affordability. A 50% change in the driving range of a BEV in the C segment, results in about 25%

Hitting the EV Inflection Point
May 2021
© Bloomberg Finance L.P.2021
No portion of this document may be reproduced, scanned into an electronic system, distributed, publicly displayed or used as the basis of derivative works without the prior written consent of Bloomberg Finance L.P. For more information on terms of use, please contact [email protected]. Copyright and Disclaimer notice on page 58 applies throughout. 29
difference in the price of the car in 2025 compared to the central case6. The effect of the battery
price change alone is lower, at around 17% by 2025. Finally, good old engineering design should
not be underestimated. Increasing a BEV’s efficiency by about 10% can result in a similar
magnitude improvement in costs versus the central case, as a result of fewer losses and lower
vehicle weight, hence smaller battery and electric motor requirements.
The price parity years could shift by up to two years as a result of the changes in Figure 35 and
range between 2025 and 2028 for the C segment vehicle, compared to 2026 for the central
scenario. The biggest effect is from the battery cost, either through the $/kWh pack price or the
vehicle’s driving range. In the unfavorable cases of Table 5, price parity is delayed by two years,
whereas it can come one year earlier with low battery prices or shorter driving ranges. Due to the
performance and price advantages, we expect manufacturers not to stay behind on dedicated
platform development by the latter half of the 2020s, outside some niche applications. We
acknowledge that the share of the market that could make use of dedicated platforms by 2025
could be lower than three quarters. In a less optimistic scenario where the market delays, and
only about half of vehicles are built on dedicated platforms, this would move the average parity
year from 2026 to 2027. Automakers who move earlier could have an advantage over those who
chose to stay on older platforms.
Figure 35: BEV price sensitivity for a C segment vehicle
Platform Battery price
Range Efficiency
Source: BloombergNEF Note: the scenario inputs are in Table 5 and more details on the central scenario in Section 3.2
6 For C segment vehicles, the central case is 400 km of real-world driving range, so this change results in
BEVs with either 200 or 600 km of range.
0
5
10
15
20
25
2025 2030
2020 thousand EUR
Dedicated
Central
Modified
ICE
0
5
10
15
20
25
2025 2030
2020 thousand EUR
Low price
Central
High price
ICE
0
5
10
15
20
25
2025 2030
2020 thousand EUR
Low range
Central
High range
ICE
0
5
10
15
20
25
2025 2030
2020 thousand EUR
Low efficiency
Central
High efficiency
ICE

Hitting the EV Inflection Point
May 2021
© Bloomberg Finance L.P.2021
No portion of this document may be reproduced, scanned into an electronic system, distributed, publicly displayed or used as the basis of derivative works without the prior written consent of Bloomberg Finance L.P. For more information on terms of use, please contact [email protected]. Copyright and Disclaimer notice on page 58 applies throughout. 30
Section 4. Phasing Out Internal Combustion Vehicle Sales in the European Union
4.1. Background and context
The number of countries planning to phase out sales of internal combustion engine vehicles (ICE)
continues to increase. Fourteen countries have now expressed long-term policy goals of phasing
out sales of ICE vehicles. Together, the national targets represented 11% of global new
passenger car sales in 2019. Additionally, 31 regional and municipal governments around the
world announced their intentions to phase out ICE vehicle sales (Figure 36).
Figure 36: Number of national, regional and municipal
governments announcing plans to phase out sales of
combustion vehicles
Figure 37: Years remaining until ICE sales phase-out targets
in select countries
Source: BloombergNEF Source: BloombergNEF. Note: U.K. target includes PHEV sales
until 2035.
European countries represent ten out of the fourteen national ICE phase-out ambition
announcements globally, and are among the countries with the most aggressive targeted dates
(Figure 37). However, such targets globally remain vague on many aspects – around the inclusion
of hybrid and plug-in hybrid vehicles and potential penalties for missing the target. There are also
questions on the enforceability of national phase-outs within EU member states. Due to these
uncertainties, the targets are not assumed to be hit in this outlook and are not included in our
short-term and long-term EV-adoption forecast discussed below.
With only nine years left for reaching many of the targets (four in the case of Norway and 19 for
France and Spain), most of the European countries with ICE phase-out plans are still some way
from reaching them. At the end of 2020, Norway was on broadly on track for its 2025 target, while
Iceland was half way toward the target set for 2030, with EV adoption in Sweden, the Netherlands
and Denmark at 32%, 25% and 16%, respectively. The progress toward ICE phase-out targets in
larger European car markets, like France or the U.K., is further behind, with the EV share of
passenger car sales just exceeding 10% at the end of 2020 in both countries (Figure 38 and
Figure 39).
8 12
23 27
31 31 2
4
7
11 14
8
14
27
34
42 45
2015 2016 2017 2018 2019 2020
Cumulative number
National
Regional andmunicipal
4
9
9
9
9
9
9
9
9
19
19
19
19
29
Norway
Denmark
Iceland
Ireland
Israel
Netherlands
Slovenia
Sweden
U.K.
Canada
France
Spain
Singapore
Costa Rica
Years

Hitting the EV Inflection Point
May 2021
© Bloomberg Finance L.P.2021
No portion of this document may be reproduced, scanned into an electronic system, distributed, publicly displayed or used as the basis of derivative works without the prior written consent of Bloomberg Finance L.P. For more information on terms of use, please contact [email protected]. Copyright and Disclaimer notice on page 58 applies throughout. 31
Figure 38: 2020 Europe passenger BEV and PHEV sales, by
country
Figure 39: 2020 Europe EV share of total passenger vehicle
sales
Source: BloombergNEF, Marklines, Bloomberg Intelligence, vehicle registration agencies, EV Sales Blog, EAFO. Note: Europe data
includes EU27 countries plus Norway, Switzerland, Iceland and the U.K. EV sales include BEV and PHEV sales.
While France’s target is still 19 years away, the U.K. will have considerably less time to scale up
to 100% adoption by 2030 – which also indicates that EV sales in the country will have to grow
very rapidly in the next five to six years in order to get there. Such targets in the larger auto
markets can also be challenging from the supply-side perspective. However, some of the major
global automakers are also increasing their ambitions in this area (Figure 40). In 1Q 2021 alone,
four automakers announced new plans to phase out sales of combustion vehicles.
Figure 40: Automakers’ drivetrain development targets
Source: BloombergNEF. Note: Ford ICE phase-out target is for Europe only.
407,900189,000
176,000108,100
93,60089,700
57,60043,80042,700
31,90027,80025,50020,100
13,6004,6004,60016,755
GermanyFrance
U.K.NorwaySweden
NetherlandsItaly
SpainBelgium
DenmarkSwitzerland
AustriaPortugalFinlandIcelandIreland
RoE
BEV
PHEV
76.4%49.1%
32.1%25.1%
16.1%14.1%14.0%13.8%
11.7%11.5%10.8%10.3%9.9%
5.1%5.1%4.2%
1%
NorwayIceland
SwedenNetherlands
DenmarkFinland
GermanyPortugal
SwitzerlandFrance
U.K.Austria
BelgiumSpain
IrelandItalyRoE

Hitting the EV Inflection Point
May 2021
© Bloomberg Finance L.P.2021
No portion of this document may be reproduced, scanned into an electronic system, distributed, publicly displayed or used as the basis of derivative works without the prior written consent of Bloomberg Finance L.P. For more information on terms of use, please contact [email protected]. Copyright and Disclaimer notice on page 58 applies throughout. 32
Country groupings
To compare EV adoption trajectories across Europe, we grouped the countries in the EU, plus the
UK and EFTA countries into four distinct regions: the initial innovators and early adopters, the
early majority, the late majority and those catching up on EV adoption (Figure 41). The main
metric for consideration is the current BEV share of vehicle sales. A number of additional metrics
include total sales, fleet size, population size and GDP per capita, as well as supporting policies,
phase-out targets and charging-infrastructure development.
Figure 41: Distribution of adoption groups and country grouping
Source: BloombergNEF. Note: Several countries might be slightly ahead of the region within
which they are grouped. Notable are Norway, the Netherlands and Portugal, which are colored
darker for this reason.
Our country groupings are as follows:
Early adoptersInnovators
Late majorityEarly majority
Catching up

Hitting the EV Inflection Point
May 2021
© Bloomberg Finance L.P.2021
No portion of this document may be reproduced, scanned into an electronic system, distributed, publicly displayed or used as the basis of derivative works without the prior written consent of Bloomberg Finance L.P. For more information on terms of use, please contact [email protected]. Copyright and Disclaimer notice on page 58 applies throughout. 33
Nordics+ includes Scandinavian countries like Norway (BEV and PHEV share of 76% of sales in
2020) and Sweden (32% share), which are leading with strong support mechanisms and high
adoption shares. The Netherlands (25% share) can be counted as one of these pioneering
countries in terms of EV adoption, policy measures and charging infrastructure development in
Europe and hence is grouped together with the Nordics. Despite boasting an average EV sales
share of 17% BEV and 12% PHEV in 2020, these are relatively small markets and only accounted
for 8% of all vehicle sales in Europe in 2019.
The major Western European markets of France and the U.K., where BEVs and PHEVs had an
11% share in 2020, and particularly Germany (14% share in 2020) show rising EV adoption,
strong policy support, and large-scale infrastructure roll-out. Smaller surrounding countries like
Austria, Switzerland and Belgium are on similar trajectories. Car sales in the region account for
61% of all units sold in Europe. The average BEV sales here jumped from 1.7% in 2019 to 5.7%
in 2020.
Southern European countries have been slightly more limited in their support for EVs, but Italy
has shown a rapid increase in EV sales in 2020 (from 0.7 to 4%) and regional infrastructure build-
out is under way. Spain is catching up to its neighbors (5% EV sales in 2020), whereas Portugal
has higher EV sales (12% BEV and PHEV share in 2020). The Southern European countries
represent 21% of all vehicle sales in Europe, yet less than 8% of EV sales in 2020.
Electric vehicle adoption is just getting started in most Eastern European countries. EVs are
picking up and have surpassed 1% of sales in many countries in this group in 2020 for the first
time. Poland is the major market in this region, responsible for half of overall sales. Most of these
markets are characterized by relatively low sales of new vehicles (10% of all new vehicles sold in
Europe) in comparison to the share of the overall European fleet of vehicles on the road (21%)
and share of the population (22%). This is due to a large second-hand market through imports
from other parts of Europe. The motorization rates are similar to most other regions in Europe, but
the average vehicle age is higher. Greece has been categorized in this group as well, mainly due
to low turnover in recent years. Several of these countries, including Estonia and Slovenia, show
slightly higher EV sales.
Table 6: Overview of country comparison metrics by region
Nordics+ Western Southern Eastern
EV share of total sales
2020
17.3% BEV,
12.3% PHEV
5.7% BEV,
5.1% PHEV
2.2% BEV,
2.5% PHEV
1.4% BEV,
1.1% PHEV
EV share of total sales
2019
10.4% BEV,
3.7% PHEV
1.7% BEV,
1.1% PHEV
0.7% BEV,
0.5% PHEV
0.5% BEV,
0.3% PHEV
Total sales 1.4M (8%) 10.5M (61%) 3.6M (21%) 1.7M (10%)
Fleet size 22M (8%) 133M (47%) 70M (25%) 59M (21%)
Population 45M (8%) 251M (48%) 118M (22%) 115M (22%)
GDP/Capita 46k EUR/year 38k EUR/year 26k EUR/year 14k EUR/year
EV policy Multi-layered support, phase-out targets
Strong support, some phase-out targets
Moderate support, some phase-out targets
Largely limited support, some phase-out targets
Charging infrastructure Large-scale roll-out underway
Large-scale roll-out underway
Low-density network Low-density network
Source: BloombergNEF, Bloomberg Economics, Marklines, OECD, IMF, World Bank. Note: Except for 2020 EV sales, other values
based on 2019 values to exclude effect of Covid-19.

Hitting the EV Inflection Point
May 2021
© Bloomberg Finance L.P.2021
No portion of this document may be reproduced, scanned into an electronic system, distributed, publicly displayed or used as the basis of derivative works without the prior written consent of Bloomberg Finance L.P. For more information on terms of use, please contact [email protected]. Copyright and Disclaimer notice on page 58 applies throughout. 34
The BEV adoption outlook in the following sections is done in two parts: a bottom-up short term
forecast covering 2021-2025, and a top-down, techno-economic consumer-adoption approach
from 2026-2035, for each of the four country groups.
4.2. Short-term methodology and forecast, 2021-2025
Short-term methodology 2021-2025
In our short-term EV sales forecast methodology we take a bottom-up approach. We begin by
updating our database of upcoming EV model releases in Europe. To compile this database we
rely on company announcements, filings and third-party data.
We then project EV sales for each market in Europe by taking into account historical EV sales
trends, model availability as well as any active relevant policies in place, including purchase
subsidies and regulatory mandates (Figure 42).
Figure 42: Short-term EV adoption forecast methodology
Source: BloombergNEF
In the model review we take into account announced upcoming EV models that are to be
introduced to the market until 2025. Considering their characteristics – drivetrain type, segment,
range and price7 – we use regression analysis to estimate their addressable market in any given
country, and their potential sales in their specific segment up to 2025. Although we do not take
concept models into consideration, we do account for various automakers’ announcements as to
their targeted sales or planned model introductions. For example, Hyundai Motor Group
announced its plans to introduce 23 battery electric vehicles globally by 2025 – in our short-term
forecast we have estimated their sales in each country, based on an assumed segment those
vehicles will address. In the policy review, we look at the availability of purchase subsidies in the
analyzed countries to understand the eligibility criteria – for example price caps, EV range etc. –
and their influence on the upfront price of an EV model. We use that knowledge to buffer model-
level sales – where we believe that generous subsidies can potentially boost a specific model’s
sales beyond what historical sales trends would indicate.
7 We use various inputs to estimate the prices of upcoming BEVs: manufacturers’ suggested prices, where
available; prices for comparable vehicles in the same segment; or manufacturers’ expectations as to the
competitive vehicles with a given BEV. For upcoming models, where less information was provided by the
manufacturer (usually models expected to come to the market towards the end of the short-term forecast
period) we incorporate our expectations of lower cost BEVs hitting the market, as more models become
available and battery prices fall further.

Hitting the EV Inflection Point
May 2021
© Bloomberg Finance L.P.2021
No portion of this document may be reproduced, scanned into an electronic system, distributed, publicly displayed or used as the basis of derivative works without the prior written consent of Bloomberg Finance L.P. For more information on terms of use, please contact [email protected]. Copyright and Disclaimer notice on page 58 applies throughout. 35
Short-term forecast 2021-2025
European EV sales continue to grow at a fast pace. Several European countries have already left
the early-adopter phase of the market. Norway finished 2020 with BEVs and PHEVs at 76% of
sales, Iceland at 49%, Sweden at 32% and the Netherlands at 25%. These are small auto
markets, but they highlight how quickly things are changing. Last year, 2020, was a breakthrough
for EV sales in some of the major markets in Europe as well, and those are now quickly catching
up.
Figure 43: Short-term EV adoption forecast for Europe
Nordics+ Western Europe
Southern Europe Eastern Europe
Source: BloombergNEF. Note: Each region on a different scale.
We expect electric vehicle sales in Europe to continue to grow in 2021 to just over 1.9 million
units. This is up 43% from the previous year. The growth in sales will continue to be driven mainly
by the CO2 regulations. More importantly, from 2021 the average emissions of all newly
registered cars from a manufacturer will have to be below the target, including the worst
performing 5%, which were exempt in 2020. This means that some of the more popular
automakers in Europe that rely on sales of SUVs – including Daimler or Audi – will need to double
down on EV sales. The addition of the 5% least efficient vehicles to the compliance pool will also
likely push PHEV sales up in the region in 2021. Automakers are responding by increasing their
sales targets – Volkswagen aims to double its electric car sales in 2021, while BMW plans to
increase EV sales by more than half, at the same time doubling its sales of pure electric vehicles
– and by adding new electric models to their offering.
0%
20%
40%
60%
80%
100%
0
200
400
600
800
1,000
2010 2015 2020 2025
Thousand vehicles
PHEV
BEV
% EV share of sales
0%
5%
10%
15%
20%
25%
30%
35%
0
500
1,000
1,500
2,000
2,500
3,000
3,500
2010 2015 2020 2025
Thousand vehicles
PHEV
BEV
% EV share of sales
0%
4%
8%
12%
16%
20%
24%
0
100
200
300
400
500
600
2010 2015 2020 2025
Thousand vehicles
PHEV
BEV
% EV share of sales
0%
1%
2%
3%
4%
5%
6%
0
20
40
60
80
100
120
2010 2015 2020 2025
Thousand vehicles
PHEV
BEV
% EV share of sales

Hitting the EV Inflection Point
May 2021
© Bloomberg Finance L.P.2021
No portion of this document may be reproduced, scanned into an electronic system, distributed, publicly displayed or used as the basis of derivative works without the prior written consent of Bloomberg Finance L.P. For more information on terms of use, please contact [email protected]. Copyright and Disclaimer notice on page 58 applies throughout. 36
Our short-term EV sales forecast brings EV sales in Europe to a little under 4.3 million units by
2025, or around 28% of all passenger vehicles sales in the region. Adoption in the four specified
groups will vary widely and not all markets will move at the same pace. While EVs reach 60%
market share in 2025 in the Nordics+ and 32% in Western Europe, the adoption still hovers under
20% in Southern European countries and barely reaches 6% in Eastern Europe (Figure 43).
Battery electric vehicles will continue to contribute over half of the expected EV sales in the
region. BEVs will be responsible for around 37% of all passenger car sales in the Nordics+, 18%
in Western Europe, just under 8% in Southern Europe and little over 3% in Eastern Europe by
2025 (Figure 44).
Figure 44: Short-term BEV adoption forecast for Europe
Nordics+ Western Europe
Southern Europe Eastern Europe
Source: BloombergNEF. Note: Each region on a different scale.
There are several reasons for the observed regional differences. First, countries in Western
Europe and the Nordics have some of the most comprehensive support for EVs in Europe, and
globally. Favorable tax discounts in Norway mean that EVs have been cheaper to buy there than
ICE vehicles for several years now. This has led to the accelerated EV adoption in the country.
The bonus-malus systems in place in Sweden or France allow for the continued offering of hefty
BEV and PHEV purchase subsidies (bonus), which are paid for by the penalizing CO2 tax levied
on the purchase of most polluting vehicles (malus). For example, in France, buyers of new BEVs
0%
10%
20%
30%
40%
50%
0
100
200
300
400
500
2010 2015 2020 2025
Thousand vehicles % BEV share of sales
0%
5%
10%
15%
20%
0
500
1,000
1,500
2,000
2010 2015 2020 2025
Thousand vehicles % BEV share of sales
0%
2%
4%
6%
8%
10%
0
50
100
150
200
250
2010 2015 2020 2025
Thousand vehicles % BEV share of sales
0%
1%
2%
3%
4%
5%
6%
7%
0
10
20
30
40
50
60
70
2010 2015 2020 2025
Thousand vehicles % BEV share of sales

Hitting the EV Inflection Point
May 2021
© Bloomberg Finance L.P.2021
No portion of this document may be reproduced, scanned into an electronic system, distributed, publicly displayed or used as the basis of derivative works without the prior written consent of Bloomberg Finance L.P. For more information on terms of use, please contact [email protected]. Copyright and Disclaimer notice on page 58 applies throughout. 37
are eligible for a purchase incentive of 7,000 euros, while buyers of vehicles emitting 219g CO2
per kilometer or more have to be prepared to pay a 30,000 euros CO2 tax on top of their
purchase price (Figure 45). Such a system effectively moves buyers of heavier vehicles toward
plug-ins.
Similarly in Germany, EV purchase subsidies – raised in 2020 to 9,000 euros as part of the Covid-
19 stimulus package – contribute more than 20% to the price of an average BEV in the country8.
And the level to which EV purchase subsidies can lower the upfront price of an EV in any given
country matters. EV purchase subsidies on offer in Spain or Italy effectively contribute only
around 10% to 12% of the average BEV price in the two countries.
Figure 45: France bonus-malus system
Source: BloombergNEF, French government.
However, purchase subsidies alone are not enough to significantly boost EV adoption. In
countries like Poland or Hungary, EV subsidies can also contribute more than 15% to the average
price of a BEV. Despite this, even in 2020, EVs made up just a fraction of total passenger car
sales in the two countries.
Countries in the Eastern Europe group (Figure 41) are predominantly second-hand car markets
and are not the focus for automakers to direct their newly released EV models. For compliance
with the CO2 targets, countries with high share of new car sales attract the majority of EV supply.
Additionally, automakers are likely not yet considering the Eastern and Southern European
consumers’ “desirability” criteria, when deciding which EVs should be released next. Therefore,
the “desirable” EV – meeting the price, segment, range criteria of an average buyer from the
groups of Southern and Eastern European countries – may not exist yet. This is changing slowly,
as brands more popular in the region, like Skoda or Dacia, begin to release new EV models – but
8 We use the Tesla Model 3 (Standard Range Plus version) as a reference vehicle. Prices of the model are
country-specific: Germany at 39,990 euros, Spain at 45,090 euros and Italy at 48,990 euros. Subsidy
value used (excluding any available scrappage bonus additions): Germany at 9,000 euro, Spain at 4,500
euro and Italy at 6,000 euro.

Hitting the EV Inflection Point
May 2021
© Bloomberg Finance L.P.2021
No portion of this document may be reproduced, scanned into an electronic system, distributed, publicly displayed or used as the basis of derivative works without the prior written consent of Bloomberg Finance L.P. For more information on terms of use, please contact [email protected]. Copyright and Disclaimer notice on page 58 applies throughout. 38
it does show that model availability and locally preferred brands should not be underestimated
when discussing the drivers for EV adoption.
Why model availability matters
1. EV models addressing popular segments can make or break a local market: A good
example of this is the Mitsubishi Outlander PHEV – the first PHEV SUV globally. It was
first introduced in Europe in late 2013. In 2014, EV sales in Europe jumped 85%
compared to 2013, with the Outlander quickly becoming the leading EV model in the
region, contributing 21% of total EV sales that year.
2. Affordable, high spec, mass market EVs can make the segments lines blurry: and
therefore significantly boost their addressable market. Tesla Model 3 is an excellent
example. Introduced in late 2017 in the U.S., its production was slowly ramping up, until
sales went up rapidly in 2018. The Tesla Model 3 contributed 39% to the total EV sales in
the U.S. that year. This is also when EV sales in the U.S. increased 80% compared to
2017. They have been relatively flat since then.
In July 2018, Tesla sold around 14,000 units of the Model 3 in the U.S. This was
remarkable since it was the highest monthly sales on record for a single EV model sold
outside of China. Moreover, it was the best-selling premium mid-sized sedan in the U.S.
that July and it outsold other leading vehicles in that segment – the BMW 3 Series, Infinity
Q50, Mercedes C-class and Audi A4, for example. A year prior, none of the ICE models in
the premium mid-sized segment in the U.S. achieved monthly sales of 14,000 or more.
Most importantly though, Tesla revealed that the top five cars that the Model 3 buyers
traded in (if they were not trading in an older Tesla model) included the Toyota Prius, the
BMW 3 Series, the Honda Accord, the Honda Civic and the Nissan Leaf – all with a lower
price tags than the Model 3. This indicates that many Tesla Model 3 buyers were trading
up, which could indicate that the Model 3 is re-defining, or at least bending, current car
segment categories.
4.3. Long-term methodology and forecast, 2026-2035
Long-term methodology 2026-2035
Our long-term forecast approach has six main steps (Figure 46 on the following page):

Hitting the EV Inflection Point
May 2021
© Bloomberg Finance L.P.2021
No portion of this document may be reproduced, scanned into an electronic system, distributed, publicly displayed or used as the basis of derivative works without the prior written consent of Bloomberg Finance L.P. For more information on terms of use, please contact [email protected]. Copyright and Disclaimer notice on page 58 applies throughout. 39
Figure 46: Simplified battery electric vehicle adoption forecast methodology
Source: BNEF. Note: Charts illustrative only.
1. Sales and Fleet: To build our adoption forecast, we develop an outlook for total vehicle
sales over time. We start with a regression of historical sales and GDP-per-capita for
each individual country in Europe. Based on country specific economic development
trajectories from the OECD and IMF, we forecast future total sales and adjust this for
population development using data from the World Bank. In the short-term we assume a
gradual post-Covid recovery. At the same time, we also calculate the development of the
fleet size, as this helps determine how quickly rising EV sales affect the electrification of
the vehicle fleet. This has knock-on effects on the speed of consumer adoption, which to
some measure impacted by what people see driving around.
2. Short-term dynamics: The short-term EV sales forecast, described in the previous
section, in combination with expected total sales provides us with a view on EV adoption

Hitting the EV Inflection Point
May 2021
© Bloomberg Finance L.P.2021
No portion of this document may be reproduced, scanned into an electronic system, distributed, publicly displayed or used as the basis of derivative works without the prior written consent of Bloomberg Finance L.P. For more information on terms of use, please contact [email protected]. Copyright and Disclaimer notice on page 58 applies throughout. 40
share in the next five years. Combined with a timeline of historic EV sales dating back to
2015, this gives us a timeline of 10 years on which we can calibrate adoption for the 10
years ahead. For some countries, like Norway, Sweden and the Netherlands, where
there is more data available dating further back, we use these to additionally inform our
adoption parameters.
3. Price parity comparison: We use our price parity work as described in Section 3 to
calculate upfront prices for ICEs and BEVs. However, while consumers might mainly
focus on the sticker price of a car, companies particularly also focus on total cost of
ownership (TCO). Taking into account factors such as fuel prices, annual kilometers
travelled, residual value and maintenance cost, we calculate TCO values for both BEV
and ICEs. As EVs reach TCO parity earlier than upfront price parity, this functions as an
additional driver.
4. Consumer price segments: We analyze the car market by looking at relationships
between prices and sales volumes in different countries and segments. Such ‘price-
volume maps’ give an indication of consumers’ spending patterns and provide the
economically potentially addressable market for a BEV at a particular price point.
5. Total addressable market: As the average price of BEVs drop, the share of consumers
for whom an EV would be a cheaper option rises. The speed at which this happens
depends on factors such as distribution of the price-volume maps by segment and
region, with larger pockets of consumers in certain price segments. Other potential
factors affecting the market dynamics that could slow down or accelerate a shift to EVs,
such as charging infrastructure availability and the role of shared mobility are discussed
in Section 4.4.
6. Adoption curve: In the long term, we think the adoption of privately owned EVs is
fundamentally a question of consumer technology diffusion and we use an adapted
Generalized Bass model to capture such effects. This is done through BloombergNEF’s
proprietary EV Adoption Model, which is calibrated on historical adoption data and
observed market dynamics. It includes consumer ‘innovation’ and ‘imitation’ factors, and
integrates price elasticity of demand effects that reflect our forecasts for both vehicle up-
front prices and total cost of ownership.
The long-term adoption forecast is demand-driven and does not assume that the currently
legislated 2030 CO2 emissions targets are met. As such, the forecast does not assume any other
regulatory support for BEVs in the time period to 2035.
Long-term forecast 2026-2035 European BEV sales reach 85% of total by 2035 under the current base case trajectory, having
already crossed 50% by 2030 (Figure 47). BEV sales growth slows slightly between 2020 and
2025, even though sales continue to increase steadily, because of the jump in 2020 to meet the
95g CO2 target. Adoption accelerates quickly from 2025 as different segments hit price parity in
quick succession and more EV models are launched.

Hitting the EV Inflection Point
May 2021
© Bloomberg Finance L.P.2021
No portion of this document may be reproduced, scanned into an electronic system, distributed, publicly displayed or used as the basis of derivative works without the prior written consent of Bloomberg Finance L.P. For more information on terms of use, please contact [email protected]. Copyright and Disclaimer notice on page 58 applies throughout. 41
Figure 47: Battery electric vehicle share of total annual passenger vehicle sales by region
in Europe: base case scenario
Source: BloombergNEF. Note: The Europe adoption curve shows the adoption for all four regions
combined according to their sales. Includes adoption of battery electric vehicles (BEV) only; does
not include plug-in hybrids (PHEV). Base case shows trajectory under current economic
development and policy measures, but does not take into account any constraints due to charging
infrastructure, raw material availability or other factors.
The Nordics+ are expected to charge ahead on BEV adoption, with Norway largely on track to
meet its 2025 ICE phase-out target. The saturation of the Norwegian market causes some
deceleration on the average adoption growth across this region. Adoption in Denmark, Sweden
and Finland rises quickly in the years ahead. Changing stimulus measures in the Netherlands
have caused the market go forward and backward several times, but overall this region reaches
very high BEV shares, hitting 39% in 2025, 82% in 2030 and 95% in 2035 (Figure 47).
Norway’s trajectory provides a playbook to understand aspects of adoption in other countries as
well. Battery electric vehicles there have been at similar prices with ICEs for a number of years.
Still, it takes time after that parity year for adoption to exceed 50% and grow further. Some of the
restrictions, such as limited model availability and patchy charging infrastructure networks, are
gradually being lifted for other countries in early stages of adoption. However, other hurdles may
remain, such as the need for additional BEV price declines to reach wide parts of the auto market
in less wealthy places, as well as an increased consumer acceptance of the new technology.
The adoption trajectory in Western Europe is also rising and is a case in point. In Germany and
France, generous subsidies and increased model offerings from domestic manufacturers provide
support and choice to consumers, and help the region gain momentum. The U.K. is also
developing well in terms of roll-out of charging infrastructure and more BEV models on sale – now
and in the near future – in the popular SUV segment. The region becomes the second highest for
BEV adoption and the biggest market for BEVs, which reach 20% of sales in 2025, 60% in 2030
and 88% in 2035 (Figure 47). The rate of growth in Western Europe after 2025 is stronger than in
the Nordics+, but not the highest in Europe after 2025.
In particular, Southern Europe and Eastern Europe grow the fastest in the 2020s, as they start
from a low base (Figure 47). In Southern Europe, signs are there to demonstrate a change in
0%
10%
20%
30%
40%
50%
60%
70%
80%
90%
100%
2015 2020 2025 2030 2035
BEV share of sales
Nordics+
Western
Europe
Southern
Eastern

Hitting the EV Inflection Point
May 2021
© Bloomberg Finance L.P.2021
No portion of this document may be reproduced, scanned into an electronic system, distributed, publicly displayed or used as the basis of derivative works without the prior written consent of Bloomberg Finance L.P. For more information on terms of use, please contact [email protected]. Copyright and Disclaimer notice on page 58 applies throughout. 42
consumer demand for EVs in general, as Portugal (in the last couple of years), and Italy and
Spain more recently experienced strong demand for electric cars. Growth rates are set to
accelerate in the region and will be even higher in the second half of the current decade than
between 2020 and 2025. During that period, all vehicle segments reach price parity, making
purchasing BEVs a simpler choice than in earlier years. BEV adoption in Southern Europe
reaches 8% in 2025, 36% in 2030 and 78% in 2035.
Despite cost competitiveness, it takes until 2030 for the Eastern Europe region to hit 18% BEV
adoption based on the current trajectory. Consumer buying patterns will not flip overnight and the
second-hand market remains larger than elsewhere in countries within that group. That limits BEV
growth for several more years, and automakers may choose to sell lower-priced mass market ICE
vehicles in these countries. However, this strategy will not hold for long. As EVs become more
ubiquitous in other parts of Europe, there is a delayed, but very rapid increase in adoption rates
closer to 2030 and beyond. In fact, between 2025 and 2030, BEV sales in Eastern Europe will
grow twice as fast as in Southern Europe and more than five times over the rate of growth of the
Nordics+ region. BEV adoption in Eastern Europe hits 76% by 2035.
Getting to 100% BEV adoption in our base case slows down slightly in the early 2030s as some segments
saturate. In the smaller vehicle segments, stripped down, low performance, low cost internal
combustion vehicles will be hard to beat on price for some time, particularly given the assumed
BEV ranges used in this analysis. This highlights an important difference between price parity in
relation to average prices in a vehicle segment and price parity with all vehicles in that segment.
Figure 48 shows that even with a BEV SUV well below the average ICE price in that segment in
2030, there are still corners of the market that remain unaddressed from a purely economic
perspective. Vehicles in adjacent segments, such as SUV-B, could fill the remaining gap in that
part of the market, as such vehicles could be cheap enough in the 2030s to do so. Market
dynamics and potential segment shifts – eg, whether consumers are willing to buy those smaller
SUVs – are likely to affect the speed and difficulty of reaching full BEV adoption in all segments.
Figure 48: Price-volume map for SUV buyers in Germany
Source: BloombergNEF. Note: the price-volume map shows the share of buyers that purchase
vehicles above a given price; for example, 40% of buyers purchase SUVs costing 30,000 euros or
more and the other 60% purchase SUVs that cost less than 30,000 euros; here we have
combined all SUV sub-segments together.
0%
10%
20%
30%
40%
50%
60%
70%
80%
90%
100%
0 20,000 40,000 60,000 80,000
Share of buyers above a price point
SUV-C BEV price in 2025
SUV-C BEV price in 2030
SUV-C BEV price in 2035

Hitting the EV Inflection Point
May 2021
© Bloomberg Finance L.P.2021
No portion of this document may be reproduced, scanned into an electronic system, distributed, publicly displayed or used as the basis of derivative works without the prior written consent of Bloomberg Finance L.P. For more information on terms of use, please contact [email protected]. Copyright and Disclaimer notice on page 58 applies throughout. 43
In order to test what reaching 100% BEV adoption would look like, we built an accelerated
scenario for each region, shown in Figure 49 to Figure 52. This scenario assumes that
governments introduce more supportive policies that push the market toward much faster BEV
adoption and, hence, does not consider additional potential constraints, such as charging
infrastructure, raw material availability for batteries and other factors. In particular, short-term BEV
volumes are higher by 2025, and the earlier sales momentum forms the basis for higher
consumer adoption in the second half of the 2020s. At the tail-end, we assume additional support
ensures a reduction in the natural slow-down that would be caused by hard-to-reach pockets and
more difficult use cases. Such a trajectory relies on more expanded policy support for consumers
and businesses, as well as on charging infrastructure. A non-exhaustive list of the potential tools
is outlined in page 45 below.
In the accelerated scenario, the Nordics+ maintain an almost linear growth trajectory in the
coming decade to hit 100% BEV sales by 2030. If Norway were to keep its current growth it could
hit 100% by late 2023. However, the last 10% of any market is challenging and likely to be hard to
fill. In addition, countries such as Sweden and the Netherlands have relied to PHEVs in the past,
but this scenario assumes that they shift exclusively to BEVs.
In Western Europe, the U.K. already has announced updated phase-out targets (100% BEV +
PHEV by 2030, 100% BEV by 2035) and is rolling out a large amount of charging network, while
Germany is also investing heavily in charging infrastructure. For this group of countries, adoption
has to come forward by only a couple of years to place them in the trajectory needed to hit 100%
of sales just after 2030. Risks in these countries include any delay in the rollout of BEVs in the
SUV segment, with buyers turning to PHEVs to meet their needs.
The accelerated adoption in Southern Europe could be similar to the 100%-trajectory of the
Western countries, but delayed by a few years. The car markets in these groups have some
similarities and as adoption increases in the region, BEVs start to become cost competitive. Still,
overall BEV sales will have to increase by more than 40x to reach a complete ICE phase-out by
2035.
Hitting 100% BEV adoption in the countries of the Eastern Europe group will the most
challenging. Due to very low adoption currently, and a limited outlook for BEV sales growth in the
short-term, the region has to experience an unprecedented sales acceleration to reach the 2035
target. BEVs at the lowest end of our estimated pre-tax retail prices will be needed to spearhead
adoption around 2025 in the region. That may require lower driving ranges or different, and
cheaper, battery technologies.

Hitting the EV Inflection Point
May 2021
© Bloomberg Finance L.P.2021
No portion of this document may be reproduced, scanned into an electronic system, distributed, publicly displayed or used as the basis of derivative works without the prior written consent of Bloomberg Finance L.P. For more information on terms of use, please contact [email protected]. Copyright and Disclaimer notice on page 58 applies throughout. 44
Figure 49: Base case and accelerated passenger battery
electric vehicle share of sales in Nordics+
Figure 50: Base case and accelerated passenger battery
electric vehicle share of sales in Western Europe
Figure 51: Base case and accelerated passenger battery
electric vehicle share of sales in Southern Europe
Figure 52: Base case and accelerated passenger battery
electric vehicle share of sales in Eastern Europe
Source: BloombergNEF. Note: Includes adoption of battery electric vehicles (BEV) only; does not include plug-in hybrids (PHEV).
Base case shows development trajectory under current technology outlook and policy measures. Accelerated shows potential
scenario under additional stimulus
0%
20%
40%
60%
80%
100%
2015 2020 2025 2030 2035
BEV share of sales
Base case
Accelerated
0%
20%
40%
60%
80%
100%
2015 2020 2025 2030 2035
BEV share of sales
Base case
Accelerated
0%
20%
40%
60%
80%
100%
2015 2020 2025 2030 2035
BEV share of sales
Base case
Accelerated
0%
20%
40%
60%
80%
100%
2015 2020 2025 2030 2035
BEV share of sales
Base case
Accelerated

Hitting the EV Inflection Point
May 2021
© Bloomberg Finance L.P.2021
No portion of this document may be reproduced, scanned into an electronic system, distributed, publicly displayed or used as the basis of derivative works without the prior written consent of Bloomberg Finance L.P. For more information on terms of use, please contact [email protected]. Copyright and Disclaimer notice on page 58 applies throughout. 45
Figure 53: Base case and accelerated passenger battery electric vehicle share of sales in
Europe
Source: BloombergNEF. Note: The Europe adoption curve shows the volume weighted average
adoption for all four regions combined. Includes adoption of battery electric vehicles (BEV) only;
does not include plug-in hybrids (PHEV). Base case shows development trajectory under current
technology outlook and policy measures. Accelerated shows potential scenario under additional
stimulus
Overall, BEV adoption in Europe follows a trajectory similar to the curve for Western Europe,
which represents the majority of the market (Figure 53). Adoption reaches 22%, 67% and 100%
of total sales by 2025, 2030 and 2035, respectively, in the accelerated case.
Additional policy options that can be considered to support the accelerated scenario
A full assessment of policy tools to achieve the accelerated scenario is beyond the scope of this
analysis. Here we highlight several approaches that could be used to support this:
• Tailpipe CO2 emissions targets that are stricter and stretch further in time than current rules.
• Support for charging infrastructure expansion to remote and otherwise under-served
locations.
• Consumer subsidies targeted to low-priced EVs to help access the full range of buyers and to
the purchase of second-hand electric vehicles.
• Mandates for the electrification of fleets, including of those of governments and transport
operators, such as mobility service providers.
• Tighter municipal regulations for vehicles entering urban areas.
0%
10%
20%
30%
40%
50%
60%
70%
80%
90%
100%
2015 2020 2025 2030 2035
BEV share of sales
Base case
Accelerated

Hitting the EV Inflection Point
May 2021
© Bloomberg Finance L.P.2021
No portion of this document may be reproduced, scanned into an electronic system, distributed, publicly displayed or used as the basis of derivative works without the prior written consent of Bloomberg Finance L.P. For more information on terms of use, please contact [email protected]. Copyright and Disclaimer notice on page 58 applies throughout. 46
Adoption of electric vans
Methodology
Total cost of ownership (TCO) is the main factor for forecasting the share of different powertrain
technologies in commercial vehicles. TCO quantifies the present value of all relevant costs in
owning and running a vehicle. It includes capital, fuel, maintenance and tires, and is normalized
over the total distance traveled throughout the vehicle’s usage period. The calculations here
exclude driver wages. We adjust the calculations to penalize electric drivetrains for low model
availability and undeveloped fueling infrastructure. However, we expect that by the mid- to late-
2020s electric vans will be easily accessible to buyers.
We then stack the TCOs of the electric, diesel and gasoline vans (for both light and heavy) and
estimate the market shares of the different technologies based on the ranked relative costs. In
this process, the sales share of a particular fuel declines rapidly the further away it is from the
cheapest option.
Forecast, 2021-2035
The total cost of ownership of light vans can already be lower than that of diesel equivalents for
some duty cycles, especially in countries with the highest diesel- or gasoline-fuel costs. The TCO
of both light and heavy vans becomes on average the lowest within the next few years. Such
economic advantage drives the adoption of these vehicles in Europe to about 84% by 2035
(Figure 54), while all four country groups reach adoption shares between 70% and 86%.
The group of Western European countries starts from a higher base and grows the quickest. Still,
the adoption of electric vans over time takes hold similarly in all country groups, more so than that
of passenger cars. Another difference is a steadier adoption trajectory. That is due to the more
economics-driven decision to purchase such vehicles. As the TCO advantage of those light-duty
commercial vehicles steadily increases, wider parts of the market choose to own and operate
electric vans.
Some hurdles that we expect to be gradually resolved are: the initially low model availability of
suitable vehicles and the currently few charging infrastructure solutions for fleets. In addition, the
predominance of smaller fleet – or even single vehicle – owners means that, until upfront cost
price parity is reached, new financing tools would be required to allow capital constrained buyers’
early access to such vehicles. In the next few years, large fleet owners and users will be the main
buyers of electric vans, as many of them also put forward decarbonization and sustainability
plans.

Hitting the EV Inflection Point
May 2021
© Bloomberg Finance L.P.2021
No portion of this document may be reproduced, scanned into an electronic system, distributed, publicly displayed or used as the basis of derivative works without the prior written consent of Bloomberg Finance L.P. For more information on terms of use, please contact [email protected]. Copyright and Disclaimer notice on page 58 applies throughout. 47
Figure 54: Base case and accelerated battery electric van share of sales in Europe
Source: BloombergNEF. Note: two vans classes are used, light and heavy vans, whose
specifications are shown in Table 1 and Table 3.
4.4. Other considerations affecting BEV adoption
The BEV outlook in the previous sections is based on our assessment of the techno-economic
factors driving adoption. There are several areas that are not considered in this analysis that
could still impact adoption. These include, but are not limited to:
• Company cars: No differentiation was made in the analysis between private and company
car sales. Company cars are a large share (more than 55% of sales in Europe in 20199) of
sales in the European market and a major driver of EV sales due to various tax incentives in
place in different countries. Additionally, total cost of ownership (TCO) and residual values
are often important factors for company car purchases. The higher focus on TCO price parity,
which generally comes 1-2 years before up-front price parity, and potential further regulation
could speed up adoption of electric vehicles in the corporate fleet. Sustainability
considerations and corporate image concerns could provide a further push for electric
company cars.
• Shared mobility: Shared cars including those deployed in car-sharing schemes, taxis and
ride-hailing services. These have not been treated separately in the analysis. The high annual
distance travelled of these vehicles – like other company cars – makes this part of the market
more sensitive to TCO. Additionally, these vehicles are mainly deployed in urban
environments, where air-quality concerns are rising and regulations are getting tighter. This
will likely push these services to electrify faster than privately owned passenger cars. These
services can also reduce private car usage, though the data here is mixed and many of the
9 Company cars include vehicles owned by corporations rather than individuals and can include cars
provided to employees, rental cars, but also cars owned through a corporate structure.
0%
10%
20%
30%
40%
50%
60%
70%
80%
90%
100%
2020 2025 2030 2035
BEV share of sales
Base case
Accelerated
Hitting the EV Inflection Point
May 2021
© Bloomberg Finance L.P.2021
No portion of this document may be reproduced, scanned into an electronic system, distributed, publicly displayed or used as the basis of derivative works without the prior written consent of Bloomberg Finance L.P. For more information on terms of use, please contact [email protected]. Copyright and Disclaimer notice on page 58 applies throughout. 48
trips they displace are from other modes like public transport. We have not included the
impact of shared vehicles and the rise of potential robotaxis in this report.
• Other drivetrains: PHEVs, fuel cell vehicles: The analysis in this report has focused on the
cost trajectory and potential adoption of BEVs. There are several reasons for this. We do not
see PHEVs as an attractive drivetrain technology in the long term, since there is no route for
them to become cheaper on an up-front price basis than BEVs. The current data on the
amount they are charged is also mixed, with newer studies showing lower rates of charging.
We expect automakers to continue to use PHEVs primarily as a compliance tool to reach
CO2 targets but it is not clear if governments and regulators will continue to treat them
favorably unless the data on charging becomes clearer.
Fuel cell vehicles (FCVs) could also play a role in the future, but with only 30,000 on the road
globally today, we do not expect any large-scale adoption in the 2020s. Even if the fuel-cell
vehicle fleet were to grow very rapidly and double every two years all the way out to 2040, it
would still only represent around 1-2% of the global vehicle fleet. Hydrogen production and
distribution costs and a lack of infrastructure are further constraints for adoption in the
passenger vehicle segment. We expect green hydrogen to be a scarce resource for the
foreseeable future, and for governments to prioritize using it in hard-to-abate sectors like
heavy industry, marine applications, and some power generation as seasonal storage in grids
with high shares of renewable generation.
• Raw material constraints. We have not factored in any raw material constraints for the
adoption analysis in this report. In practice, interest in battery materials is rising quickly, with
prices of lithium carbonate, lithium hydroxide and cobalt rising 72%, 47% and 58%,
respectively, in the first quarter of 2021. For lithium, the recent rise in prices is welcome as
prices in the last two years were not high enough to support new capacity investment. Nickel
bucked the trend and prices fell after China's Tsingshan announced in March that it will seek
to produce nickel matte from its nickel pig iron smelters in Indonesia. Matte is suitable for
refining to battery-grade nickel, and this provides another pathway to battery grade nickel
besides high-pressure acid leaching. BloombergNEF estimates that nickel needs to be
around $18,000/ton to incentive new development of battery grade capacity.
As demand for battery materials increases and prices rise, both supply and demand patterns
will change. On the supply side, more investment will flow into extraction and refining. Despite
this, bottlenecks are likely to emerge in some areas. Cobalt and Class I nickel look the most
likely to hit deficits in the near term. On the demand side, automakers and battery
manufacturers will continue to adjust battery chemistries to reflect changes in underlying
prices.
• Plant conversions and EV manufacturing capacity: The analysis in this report does not
consider any of the logistical or political challenges of switching over large amounts of
manufacturing capacity to produce EVs in a relatively short period of time. Parts of the ICE
supply chain in particular are concentrated in some regions where there may be pushback if
local jobs and economic activity are not created in newer parts of the supply chain.
Governments will need to ensure that the switch to electric drivetrains is an equitable
transition.
• Changing segment trajectories: Different sub-segments of the auto market may develop at
different speeds. Large vehicles and sports cars often are produced at lower volumes, but
with higher margins for automakers. This makes these an ideal case for automakers to push
electrification in these segments first, while building up their electric supply chain. The high
acceleration of electric vehicles can also add to the performance for this segment of vehicles.

Hitting the EV Inflection Point
May 2021
© Bloomberg Finance L.P.2021
No portion of this document may be reproduced, scanned into an electronic system, distributed, publicly displayed or used as the basis of derivative works without the prior written consent of Bloomberg Finance L.P. For more information on terms of use, please contact [email protected]. Copyright and Disclaimer notice on page 58 applies throughout. 49
On the other hand, buying certain high performance cars traditionally has been linked to the
engine technology of these automakers and at least some part of the market might be
reluctant to switch. Automakers will look for different ways to differentiate themselves in
performance and additional luxury as BEV platforms make much of the vehicle technology
more commoditized.
In the past 10 years there has been a rapid rise in sales of SUV and crossover body types in
different segments. In this outlook we have kept segment trajectories fixed based on sales in
2020 because predicting how segments will change in the years ahead is very difficult.
However, rapid development in certain popular segments could still accelerate EV adoption,
while focus on other segments could result in the opposite.
• Changing consumer demand: Rising incomes and changing demographics including aging
and urbanization can cause changes in consumer demand and spending habits. Other less
tangible factors like cultural viewpoints might also change over time, potentially resulting in
different use cases for vehicles and shifting of car trips into different modes of transport for
certain trip lengths where trains or bikes might actually be more suitable. We have kept the
shape of our consumer demand distribution similar across years in this analysis, but
acknowledge these effects might change the segments of consumers buying a car at different
price points.
Charging infrastructure
EV charging infrastructure constraints are specifically not addressed in the BEV adoption
scenarios, but it is worth understanding the current state of the market, and how this could affect
BEV adoption in the future.
The global public charging network grew 48% in 2020, compared to the previous year, to reach
1.36 million connectors. At the end of 2020 there were 810,000 connectors in China, 360,000 in
Europe and 89,000 in the U.S. (Figure 55). Annual new installations soared across China, Europe
and the U.S., despite the pandemic, as a combination of policy support and business interest
brought new momentum to the market. Europe installed112,800 connectors in 2020 (Figure 56),
over five times the 17,400 connectors installed in the U.S., but only about a third of the new
installations in China.
Figure 55: Cumulative global public charging connectors
installed
Figure 56: Annual public charging connector installations in
Europe
Source: BloombergNEF U.S. AFDC, Chargehub, China Electric Vehicle Charging Infrastructure Promotion Alliance, Various
industry data sets. Note: Includes Tesla destination and supercharger networks even though this is semi-private.
141 214 300516
810
92129
165
247
360
4960
72
89
183315
437590
918
1,361
2015 2016 2017 2018 2019 2020
Thousand connectors
RoW
Japan
U.S.
Europe
China
16,300 23,500
37,100 36,600
81,500
112,800
2015 2016 2017 2018 2019 2020
Connectors

Hitting the EV Inflection Point
May 2021
© Bloomberg Finance L.P.2021
No portion of this document may be reproduced, scanned into an electronic system, distributed, publicly displayed or used as the basis of derivative works without the prior written consent of Bloomberg Finance L.P. For more information on terms of use, please contact [email protected]. Copyright and Disclaimer notice on page 58 applies throughout. 50
Globally, the number of EVs per public connector stayed flat between 2019 and 2020, at 7.4 EVs
per connector, showing that the growth in EV sales was matched by growth in public charging
infrastructure. However, the ratio varies across countries, also in Europe. In Norway, the ratio of
EVs per connector is much higher than the global average, at 25 EVs per connector. In contrast,
the Netherlands has 3 EVs per connector. The differences between countries are due to a
number of factors, including:
• Building stock: countries with a higher share of apartments will have a lower prevalence of
home charging and are therefore more reliant on public charging.
• Public charging hardware power: countries with higher-power public infrastructure should
need less connectors to charge the same number of vehicles.
• Electric vehicle stock: markets with a high number of plug-in hybrid sales will require a
different blend of public charging infrastructure.
Further analysis shows that the ratio across leading EV markets has stayed consistent over the
last four years (Figure 57), indicating that increasing sales of EVs act as a charging infrastructure
investment signal. In the Netherlands, the ratio moved from 3.7 in 2017 to 3.0 in 2020, even
though total EV sales increased 162% in that timeframe. In Norway, the ratio increased from 23 in
2019 to 25 in 2020, even as EV’s share of total passenger car sales passed 70%. In the U.K., the
ratio rose to 11.7 in 2020 from 9.4 in 2019. This shows slower public charging growth in the
country compared to EV sales, which jumped to 11% of total sales in 2020 from 3.2% in 2019.
Figure 57: EVs per public charging connector across various regions over time
Source: BloombergNEF. Note: Bubbles indicate the size of the passenger EV fleet.
The need for charging infrastructure rollout will continue to grow. Today most EV charging takes
place at home, but a robust public charging network will be needed to get to high levels of EV
adoption across all buyer segments and housing types. Residents of high-rise multi-dwelling units
(2019)3,144,200
(2019)269,000
(2019)1,415,100
(2019)275,500
(2018)2,056,600
(2018)195,600
(2018)1,095,600
(2018)240,200
(2017)994,300
(2017)134,600
(2017)745,300
(2017)194,400
(2020), 4,367,600
(2020), 445,100
(2020), 1,739,900
(2020), 306,670
0
5
10
15
20
25
0% 2% 4% 6% 8% 10% 12% 14% 16%
EV share of total sales
(2019)319,500
(2019)207,200
(2018)243,600
(2018)140,800
(2017)171,900
(2017)113,200
(2020),427,600
(2020),296,900
0
10
20
30
0% 10% 20% 30% 40% 50% 60% 70% 80%EV share of total sales
EVs per connector
EVs per connector
Norway
China Japan Netherlands Norway U.K. U.S.
Netherlands

Hitting the EV Inflection Point
May 2021
© Bloomberg Finance L.P.2021
No portion of this document may be reproduced, scanned into an electronic system, distributed, publicly displayed or used as the basis of derivative works without the prior written consent of Bloomberg Finance L.P. For more information on terms of use, please contact [email protected]. Copyright and Disclaimer notice on page 58 applies throughout. 51
in particular are more likely to rely on the public network than those who live in single detached
homes.
We have not factored charging infrastructure spending into the BEV price parity analysis, or how
a lack of public charging infrastructure could impact the adoption curves. However,
BloombergNEF estimates that around 1.8 million public charging points will be needed across
Europe by 2035 to support the private BEV fleet in this analysis in the base case and 2 million
public charging points in the accelerated case. The total investment required for the base case
public charging infrastructure requirements will be around $13.4 billion and for the accelerated
case $14.6 billion. The European private EV fleet will be growing very rapidly by 2035, and the
number of public charging points would need to increase further to around 2.5 million between
2035 and 2040 to continue to support this growth. This analysis does not include vans, shared
vehicles or PHEVs, which may rely more heavily on public charging than private BEV vehicles.
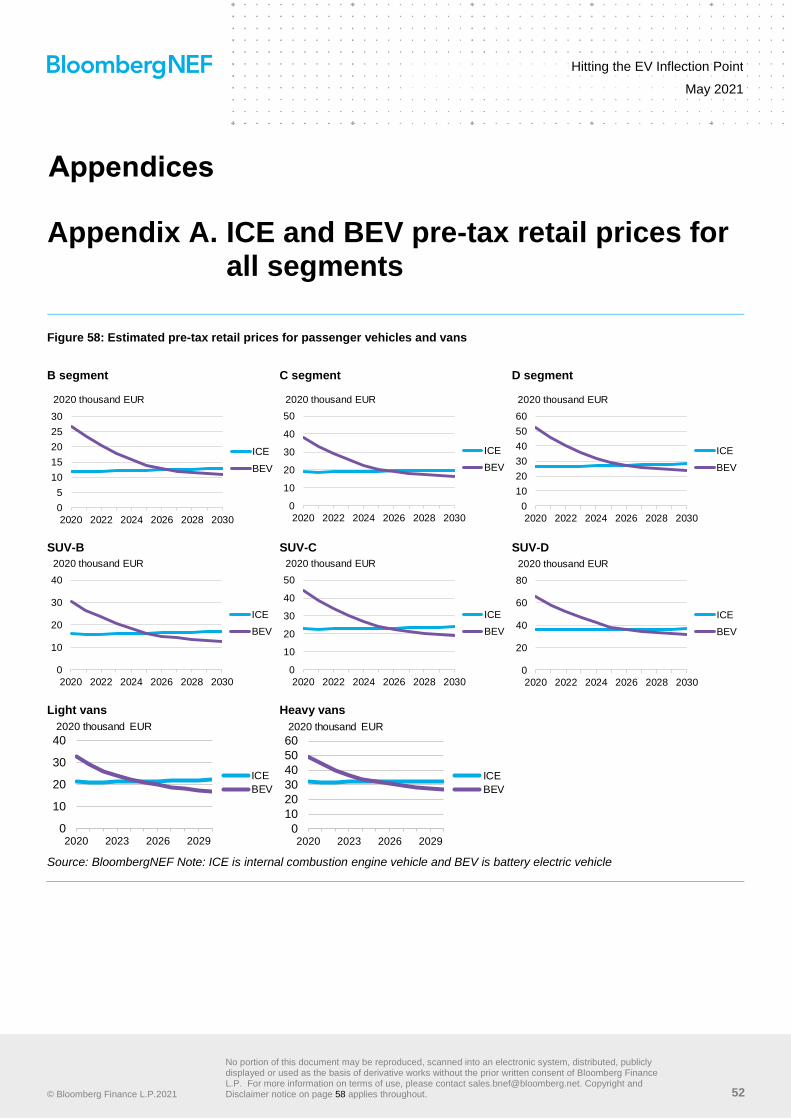
Hitting the EV Inflection Point
May 2021
© Bloomberg Finance L.P.2021
No portion of this document may be reproduced, scanned into an electronic system, distributed, publicly displayed or used as the basis of derivative works without the prior written consent of Bloomberg Finance L.P. For more information on terms of use, please contact [email protected]. Copyright and Disclaimer notice on page 58 applies throughout. 52
Appendices
Appendix A. ICE and BEV pre-tax retail prices for all segments
Figure 58: Estimated pre-tax retail prices for passenger vehicles and vans
B segment C segment D segment
SUV-B SUV-C SUV-D
Light vans Heavy vans
Source: BloombergNEF Note: ICE is internal combustion engine vehicle and BEV is battery electric vehicle
0
5
10
15
20
25
30
2020 2022 2024 2026 2028 2030
2020 thousand EUR
ICE
BEV
0
10
20
30
40
50
2020 2022 2024 2026 2028 2030
2020 thousand EUR
ICE
BEV
0
10
20
30
40
50
60
2020 2022 2024 2026 2028 2030
2020 thousand EUR
ICE
BEV
0
10
20
30
40
2020 2022 2024 2026 2028 2030
2020 thousand EUR
ICE
BEV
0
10
20
30
40
50
2020 2022 2024 2026 2028 2030
2020 thousand EUR
ICE
BEV
0
20
40
60
80
2020 2022 2024 2026 2028 2030
2020 thousand EUR
ICE
BEV
0
10
20
30
40
2020 2023 2026 2029
2020 thousand EUR
ICE
BEV
0
10
20
30
40
50
60
2020 2023 2026 2029
2020 thousand EUR
ICE
BEV

Hitting the EV Inflection Point
May 2021
© Bloomberg Finance L.P.2021
No portion of this document may be reproduced, scanned into an electronic system, distributed, publicly displayed or used as the basis of derivative works without the prior written consent of Bloomberg Finance L.P. For more information on terms of use, please contact [email protected]. Copyright and Disclaimer notice on page 58 applies throughout. 53
Appendix B. Table of tables
Table of tables
Table 1: Vehicle segments considered in this report ......................................... 8
Table 2: Battery electric vehicle development and manufacturing strategies ... 11
Table 3: Reference vehicle characteristics in 2020 and 2030 .......................... 13
Table 4: Years at which BEVs reach upfront cost price parity with equivalent ICEs ................................................................................................................ 26
Table 5: Battery electric vehicle price sensitivity parameters ........................... 27
Table 6: Overview of country comparison metrics by region ............................ 33

Hitting the EV Inflection Point
May 2021
© Bloomberg Finance L.P.2021
No portion of this document may be reproduced, scanned into an electronic system, distributed, publicly displayed or used as the basis of derivative works without the prior written consent of Bloomberg Finance L.P. For more information on terms of use, please contact [email protected]. Copyright and Disclaimer notice on page 58 applies throughout. 54
Appendix C. Table of figures
Table of figures
Figure 1: Estimated pre-tax retail prices for C segment vehicles in Europe ....... 1
Figure 2: Base case and accelerated battery electric vehicle share of new passenger car sales in Nordics+ ....................................................................... 2
Figure 3: Base case and accelerated battery electric vehicle share of new passenger car sales in Western Europe ............................................................ 2
Figure 4: Base case and accelerated battery electric vehicle share of new passenger car sales in Southern Europe ........................................................... 2
Figure 5: Base case and accelerated battery electric vehicle share of new passenger car sales in Eastern Europe ............................................................. 2
Figure 6: Global passenger EV sales by region ................................................ 4
Figure 7: Global passenger EV sales by drivetrain ........................................... 4
Figure 8: Global passenger EV fleet ................................................................ 4
Figure 9: Europe EV share of new passenger vehicle sales .............................. 5
Figure 10: Europe passenger vehicles sales year-on-year change.................... 5
Figure 11: BloombergNEF lithium-ion battery price survey results..................... 6
Figure 12: Vehicle cost methodology ................................................................. 9
Figure 13: Evolution of battery pack design ..................................................... 12
Figure 14: Cycle efficiency comparison between BEV available for sale and BNEF’s reference vehicles .............................................................................. 14
Figure 15: Real-world efficiency comparison between BEV available for sale and BNEF’s reference vehicles ....................................................................... 14
Figure 16: Vehicle system costs by system and component ............................ 15
Figure 17: Focus areas for shift to EV ............................................................. 16
Figure 18: Vehicle retail price breakdown ........................................................ 17
Figure 19: Pack and cell split, all sectors ......................................................... 18
Figure 20: Lithium-ion battery pack price and demand outlook ........................ 19
Figure 21: Potential battery-cell cost reductions .............................................. 20
Figure 22: Energy density by chemistry ........................................................... 21
Figure 23: Raw material costs by chemistry .................................................... 21
Figure 24: Greenfield battery manufacturing capex ......................................... 22
Figure 25: Solid-state battery (SSB) cell manufacturing cost reduction outlook, 2030 ................................................................................................................ 23
Figure 26: Global manufacturing capacity, 2020 .............................................. 24
Figure 27: Global manufacturing capacity, 2025 .............................................. 24
Figure 28: Estimated pre-tax retail prices for C segment vehicles ................... 25
Figure 29: Estimated pre-tax retail prices for B segment vehicles.................... 25
Figure 30: Estimated pre-tax retail prices for SUV-C segment vehicles ........... 26
Figure 31: Estimated pre-tax retail prices for light vans ................................... 26
Figure 32: Direct manufacturing costs for ICEs and BEVs, C segment vehicle ............................................................................................................. 27
Hitting the EV Inflection Point
May 2021
© Bloomberg Finance L.P.2021
No portion of this document may be reproduced, scanned into an electronic system, distributed, publicly displayed or used as the basis of derivative works without the prior written consent of Bloomberg Finance L.P. For more information on terms of use, please contact [email protected]. Copyright and Disclaimer notice on page 58 applies throughout. 55
Figure 33: Direct manufacturing costs for ICEs and BEVs, SUV-C segment vehicle ............................................................................................................. 27
Figure 34: Impact of material price changes on pack price of a NMC (622) battery ............................................................................................................. 28
Figure 35: BEV price sensitivity for a C segment vehicle ................................. 29
Figure 36: Number of national, regional and municipal governments announcing plans to phase out sales of combustion vehicles ............................................. 30
Figure 37: Years remaining until ICE sales phase-out targets in select countries ......................................................................................................... 30
Figure 38: 2020 Europe passenger BEV and PHEV sales, by country ............ 31
Figure 39: 2020 Europe EV share of total passenger vehicle sales ................. 31
Figure 40: Automakers’ drivetrain development targets ................................... 31
Figure 41: Distribution of adoption groups and country grouping ..................... 32
Figure 42: Short-term EV adoption forecast methodology ............................... 34
Figure 43: Short-term EV adoption forecast for Europe ................................... 35
Figure 44: Short-term BEV adoption forecast for Europe ................................. 36
Figure 45: France bonus-malus system .......................................................... 37
Figure 46: Simplified battery electric vehicle adoption forecast methodology .. 39
Figure 47: Battery electric vehicle share of total annual passenger vehicle sales by region in Europe: base case scenario ......................................................... 41
Figure 48: Price-volume map for SUV buyers in Germany .............................. 42
Figure 49: Base case and accelerated passenger battery electric vehicle share of sales in Nordics+ ......................................................................................... 44
Figure 50: Base case and accelerated passenger battery electric vehicle share of sales in Western Europe ............................................................................. 44
Figure 51: Base case and accelerated passenger battery electric vehicle share of sales in Southern Europe ............................................................................ 44
Figure 52: Base case and accelerated passenger battery electric vehicle share of sales in Eastern Europe .............................................................................. 44
Figure 53: Base case and accelerated passenger battery electric vehicle share of sales in Europe ........................................................................................... 45
Figure 54: Base case and accelerated battery electric van share of sales in Europe ............................................................................................................ 47
Figure 55: Cumulative global public charging connectors installed .................. 49
Figure 56: Annual public charging connector installations in Europe ............... 49
Figure 57: EVs per public charging connector across various regions over time ................................................................................................................. 50
Figure 58: Estimated pre-tax retail prices for passenger vehicles and vans ..... 52

Hitting the EV Inflection Point
May 2021
© Bloomberg Finance L.P.2021
No portion of this document may be reproduced, scanned into an electronic system, distributed, publicly displayed or used as the basis of derivative works without the prior written consent of Bloomberg Finance L.P. For more information on terms of use, please contact [email protected]. Copyright and Disclaimer notice on page 58 applies throughout. 56
About us
Contact details
Client enquiries:
Email: [email protected]
Nikolas Soulopoulos Analyst, Electrified Transport
Milo Boers Analyst, Intelligent Mobility
Ryan Fisher Analyst, Electrified Transport
Aleksandra O’Donovan Head of Electrified Transport
Colin McKerracher Head of Transport Analysis
Copyright
© Bloomberg Finance L.P. 2021. This publication is the copyright of Bloomberg Finance L.P. in connection
with BloombergNEF. No portion of this document may be photocopied, reproduced, scanned into an
electronic system or transmitted, forwarded or distributed in any way without prior consent of BloombergNEF.
Disclaimer
The BloombergNEF ("BNEF"), service/information is derived from selected public sources. Bloomberg
Finance L.P. and its affiliates, in providing the service/information, believe that the information it uses comes
from reliable sources, but do not guarantee the accuracy or completeness of this information, which is subject
to change without notice, and nothing in this document shall be construed as such a guarantee. The
statements in this service/document reflect the current judgment of the authors of the relevant articles or
features, and do not necessarily reflect the opinion of Bloomberg Finance L.P., Bloomberg L.P. or any of their
affiliates (“Bloomberg”). Bloomberg disclaims any liability arising from use of this document, its contents
and/or this service. Nothing herein shall constitute or be construed as an offering of financial instruments or as
investment advice or recommendations by Bloomberg of an investment or other strategy (e.g., whether or not
to “buy”, “sell”, or “hold” an investment). The information available through this service is not based on
consideration of a subscriber’s individual circumstances and should not be considered as information
sufficient upon which to base an investment decision. You should determine on your own whether you agree
with the content. This service should not be construed as tax or accounting advice or as a service designed to
facilitate any subscriber’s compliance with its tax, accounting or other legal obligations. Employees involved in
this service may hold positions in the companies mentioned in the services/information.
The data included in these materials are for illustrative purposes only. The BLOOMBERG TERMINAL service
and Bloomberg data products (the “Services”) are owned and distributed by Bloomberg Finance L.P. (“BFLP”)
except (i) in Argentina, Australia and certain jurisdictions in the Pacific islands, Bermuda, China, India, Japan,
Korea and New Zealand, where Bloomberg L.P. and its subsidiaries (“BLP”) distribute these products, and (ii)
in Singapore and the jurisdictions serviced by Bloomberg’s Singapore office, where a subsidiary of BFLP
distributes these products. BLP provides BFLP and its subsidiaries with global marketing and operational
support and service. Certain features, functions, products and services are available only to sophisticated
investors and only where permitted. BFLP, BLP and their affiliates do not guarantee the accuracy of prices or
other information in the Services. Nothing in the Services shall constitute or be construed as an offering of
financial instruments by BFLP, BLP or their affiliates, or as investment advice or recommendations by BFLP,
BLP or their affiliates of an investment strategy or whether or not to “buy”, “sell” or “hold” an investment.
Information available via the Services should not be considered as information sufficient upon which to base
an investment decision. The following are trademarks and service marks of BFLP, a Delaware limited
partnership, or its subsidiaries: BLOOMBERG, BLOOMBERG ANYWHERE, BLOOMBERG MARKETS,
BLOOMBERG NEWS, BLOOMBERG PROFESSIONAL, BLOOMBERG TERMINAL and BLOOMBERG.COM.
Absence of any trademark or service mark from this list does not waive Bloomberg’s intellectual property
rights in that name, mark or logo. All rights reserved. © 2021 Bloomberg.

Was bedeutet eine Unterquote von5 % E-Fuels im Straßenverkehr?Implikationen für den Ausbau von Elektrolyseurenund erneuerbaren Energieanlagen
April 2021
In einem jüngst veröffentlichten Positionspapier der CDU/CSU-Fraktion wird die Prüfung einerUnterquote für strombasierte Kra�stoffe in Höhe von 5 Prozent vorgeschlagen. Eine solcheUnterquote wurde in der Vergangenheit vom Verband der Deutschen Automobilindustrie (VDA)gefordert. Transport & Environment Deutschland hat berechnet, was eine solche Unterquote fürden Ausbau von Elektrolyseuren und erneuerbaren Energieanlagen in Deutschland bedeutenwürde.
Um 5 Prozent Kra�stoffe, die im Straßenverkehr in Deutschland abgesetzt werden (Diesel undBenzin), durch strombasierte Kra�stoffe (E-Fuels) zu ersetzen, sind rund 15 GWElektrolyse-Kapazität erforderlich. Für den Betrieb dieser Elektrolyseure mit erneuerbarerEnergie sind 60 TWh Strom notwendig. Dies entspricht einer Kapazität von 20 GW Onshore-Wind,die bis 2030 in Deutschland zusätzlich zu dem geplanten Ausbau entstehen müssten, um einenpositiven Klimaeffekt dieser Kra�stoffe zu gewährleisten.
A briefing by 1
Anlage 4
verfoullonni
Ausschussstempel

15 GW Elektrolyse ist das Dreifache, was in der Nationalen Wasserstoffstrategie bis 2030 für diedeutsche Wirtscha� insgesamt vorgesehen ist (5 GW). Zugleich sind es rund 40 Prozent des in dergesamten Europäischen Union bis 2030 geplanten Elektrolyse-Ausbaus (40 GW).
Mit diesen Zahlen möchten wir auf die technische Machbarkeit und die Implikationen für dieDekarbonisierung anderer Sektoren der aufgestellten Forderung hinweisen.
A briefing by 2

1. Grundlagen unserer Berechnung
Im Folgenden werden die Daten und Annahmen unserer Berechnungen im Detail vorgestellt:
Berechnung der zu ersetzenden Kra�stoffmenge
Kra�stoffverbrauch (Diesel und Benzin) 2019 50.162 Mtoe
Annahme zum Rückgang des Kra�stoffverbrauchs aufgrunddes Markthochlaufs der E-Mobilität im Jahr 2030
20 Prozent
Resultierende Annahme zum Kra�stoffverbrauch 2030 40.100 Mtoe
5 Prozent Quote basierend auf der 2030-Annahme 2.005 Mtoe
Wirkungsgrade und weitere technische Spezifikationen der Elektrolyse- und PtL-Anlagen
Wirkungsgrad Elektrolyse 79 Prozent
Wirkungsgrad PtL-Anlage 72 Prozent
Volllaststunden Elektrolyse 4 000 Stunden
Gesamtanteil von Diesel und Benzin an der PtL-Produktion* 68 Prozent
Annahmen zu erneuerbarer Stromerzeugung
Wind-Onshore in Deutschland
VolllaststundenLoad-Factor
28500,33
Aktuell geltende Elektrolyse-GW-Ziele
Deutschland: Nationale Wasserstoffstrategie 5 GW
EU: EU Hydrogen Strategy 40 GW in der EU
*Im Prozess der Kra�stoffherstellung in einer Raffinerie fallen verschiedene Fraktionen an (Diesel, Benzin,Kerosin, Naphtha usw.). Je nach Design der Anlage, das u. a. durch regulatorische Anreize beeinflusstwerden kann, kann der Anteil verschiedener Fraktionen an dem gesamten Output variieren, zum Beispielzugunsten eines höheren Anteils von Kerosin. Zum Zwecke der vorliegenden Berechnung wurde ein hoherAnteil von Diesel und Benzin angenommen.
A briefing by 3

2. Einordnung der Ergebnisse im Kontext der Deutschen und derEuropäischen Wasserstoffstrategien
Laut der Nationalen Wasserstoffstrategie (NWS) sollen bis zum Jahr 2030 5 GW Elektrolyse-Leistung inDeutschland entstehen. Die zur Erreichung einer 5-Prozent-E-Fuels-Unterquote erforderliche Kapazitätübersteigt dieses Ziel um das Dreifache. Sogar bei einer signifikanten Anhebung des nationalenElektrolyse-Ziels hätte eine solche Unterquote zur Folge, dass andere Branchen und Anwendungen vonder Nutzung von grünem Wasserstoff ausgeschlossen wären.
Auch die Ausbaukorridore von erneuerbaren Energieanlagen müssten entsprechend angehoben werden,um die Versorgung von Elektrolyseuren mit den hierzu notwendigen 60 TWh erneuerbaren Strom zugewährleisten. Dies entspricht einer Kapazität von 20 GW Onshore-Wind bzw. einer Anhebung desAusbauziels von Onshore-Wind von heute 71 GW (EEG-Novelle 2021) auf mindestens 91 GW im Jahr2030. Ohne diesen zusätzlichen Ausbau kann die Nachhaltigkeit von E-Fuels nicht gewährleistet werden,mehr noch würde der zusätzliche Strombedarf bei gleich bleibendem Anteil von erneuerbaren Energienzu einer insgesamt höheren CO2-Bilanz des Strommixes führen.
Die EU hat sich zum Ziel gesetzt, 40 GW Elektrolyse-Kapazität bis 2030 zu erreichen. 15 GW, die zurErfüllung einer deutschen 5-Prozent-E-Fuels-Quote erforderlich sind, machen 40 Prozent deseuropäischen Ziels aus. Dabei ist zu bedenken, dass auch andere Mitgliedstaaten ihre eigenen Ansprücheauf die Nutzung von grünem Wasserstoff zur Erreichung der ambitionierten Klimaschutzziele haben. Auchwenn in einem theoretischen Fall die Mobilisierung der europäischen Ressourcen in Höhe von 40 Prozentdes EU-Ziels für den deutschen Kra�stoffmarkt möglich wäre, würde eine solche Strategie dieInvestitionen weg von den schwer zu dekarbonisierenden Sektoren umlenken und somit dieKlimaschutzanstrengungen in diesen Sektoren unnötig verzögern. Zudem ist zu beachten, dass dasUmlenken der Klimaschutzinvestitionen in ein auslaufendes Geschä�smodell mit demVerbrennungsmotor die Transformation des Verkehrssektors stark verteuern würde.
Häufig wird suggeriert, dass E-Fuels und Wasserstoff aus den Ländern mit besseren Voraussetzungen fürdie Erzeugung von erneuerbaren Energien (z. B. MENA-Region) importiert werden können1 weshalb sie alseine Klimaschutzoption im Straßenverkehr zum Einsatz kommen sollten. Globaler Handel mit grünemWasserstoff kann sicherlich kün�ig eine Rolle bei der Erreichung der Klimaneutralität in Europa sowie derPariser Klimaziele in anderen Teilen der Welt spielen, einen bereits kurzfristig wirksamen Beitrag zumKlimaschutz bis 2030 ist dennoch nicht zu erwarten. Erstens befinden sich Projekte2, die die Entwicklungvon internationalen Wasserstofflieferketten zum Ziel haben, erst in ihrer Anlaufphase. Zweitens müssendie Rahmenbedingungen für einen solchen Handel erst geschaffen werden, vor allem der Aufbau derTransportinfrastruktur sowie die Einführung eines internationalen Zertifizierungssystems für Wasserstoffund seine Derivate.
2 Z. B. deutsch-australisches Wasserstoffprojekt „HySupply“, Pilotprojekt von Porsche und Siemens Energy inChile.
1 Z. B. Studie von Frontier Economics „Der Effizienzbegriff in der klimapolitischen Debatte zumStraßenverkehr“.
A briefing by 4

3. Fazit
Die durchgeführte Kurzanalyse zeigt, dass die Einführung einer 5-Prozent-Unterquote für E-Fuels imStraßenverkehr aufgrund der enormen Anforderungen an den Ausbau von Elektrolyse-Kapazitäten underneuerbaren Energieanlagen bis 2030 höchstwahrscheinlich nicht realisierbar ist. Eine Möglichkeit zurErreichung einer solchen Vorgabe wäre das Umlenken von 40 Prozent der in der EU bis 2030 geplantenElektrolyse-Kapazität sowie des zum Betrieb dieser Kapazität erforderlichen Ausbaus von erneuerbarenEnergieanlagen zugunsten des deutschen Kra�stoffmarktes.
Dies macht deutlich, dass eine solche Unterquote nur auf Kosten der Bedarfe anderer Sektoren (u. a. inanderen Mitgliedstaaten) und/oder auf Kosten der Nachhaltigkeit von E-Fuels implementierbar wäre.Anreize für E-Fuels im Straßenverkehr bei gleichzeitiger Nutzungskonkurrenz von grünem Wasserstoffwürde unmittelbar die Nachhaltigkeit dieser Kra�stoffe unter Druck setzen und somit den Weg für dieklimaschädlichen Herstellungsarten von Wasserstoff (“blau”, Strommix) bereiten. Eine Unterquote fürE-Fuels im Straßenverkehr wird daher von T&E kategorisch abgelehnt.
Ohne den grünen Wasserstoff und seine Derivate wird eine vollständige CO2-Minderung in schwer zudekarbonisierenden Sektoren nicht möglich sein. Deshalb ist es wichtig, in den nächsten 10 Jahren dieElektrolyse- und PtL-Anlagen zu skalieren und mit der Markteinführung dieser Energieträger in derSchwerindustrie, Lu�- und Schifffahrt zu beginnen. Die Investitionsentscheidungen der nächsten Jahrewerden darüber entscheiden, wie gut uns diese Aufgabe gelingt. Die Fehlallokation von Ressourcen kanndie Erreichung der Klimaneutralität unnötig verzögern und verteuern.
Die vorgeschlagene 5-Prozent-Quote birgt ähnlich wie andere Anreize für E-Fuels im Straßenverkehr diegroße Gefahr einer solchen Fehlallokation. Die Rettung eines auslaufenden Geschä�smodells auf Kostender CO2-Minderung in anderen Sektoren ist eine riskante Strategie für Deutschland und Europa.
KontaktJekaterina BoeningSenior Policy ManagerTransport & Environment [email protected]+49 176 64773269
Inhouse-Analyse von Transport & Environment mit Unterstützung von Suren Rangaraju und Thomas Earl.
A briefing by 5
© Fraunhofer ISEFHG-SK: ISE-INTERNAL
WASSERSTOFF UND SEINE DERIVATE FÜR EINE NACHHALTIGE MOBILITÄT
Prof. Christopher Hebling
Bereichsleiter Wasserstofftechnologien
Sprecher des Wasserstoff-Netzwerks der Fraunhofer-Gesellschaft
Mitglied im Expertenausschuss zum ZukunftsfondsAutomobilindustrie
Fraunhofer-Institut für Solare Energiesysteme, ISE
80. Sitzung des Parlamentarischen Beirates fürnachhaltige Entwicklung, Berlin, 19. May 2021
Anlage 5
verfoullonni
Ausschussstempel

© Fraunhofer ISE
2
FHG-SK: ISE-Internal
Fraunhofer Strategische Forschungsfelder
Künstliche Intelligenz
Nächste Computer
Generation
ResourcenEffizienz und
Klima-technologien
Wasserstoff-technologien
Bioökonomie Quanten Technologien
Digitale Gesundheits-
vorsorge
BezahlbaresGesundheitswesen
Energiewendevollenden
Sicherheit undresiliente
Gesellschaft
DigitalisierteWertschöpfungs-
ketten
VollständigeKreislauf-wirtschaft

© Fraunhofer ISE
3
FHG-SK: ISE-Internal
AusgangslageTreibhausgasemissionen im Mobilitätssektor in Deutschland seit 1990
Mt
CO
2-e
q
Das Bundesverfassungsgerichtsurteil zum Bundes-Klimaschutzgesetz führt zu massiver Verschärfung der benötigten Klimaschutzmaßnahmen inklusive dem Zeitpunkt deren Implementierung
Zusätzlich: Verschärfung der Lokalemissionen durch Euro 7 (2025) bzw. CARB/EPA (2024)
Weiterhin:
189 Staaten ratifizierten das Pariser Abkommen
> 75 Staaten streben Klimaneutralität 2050 an
> 30 Staaten haben nationale H2-Strategien
$ 300 Mrd. für H2-Prod., Transport, Nutzung in Entwicklung bis 2030
Aktuell 17 GW Elektrolyseure in der Planung
Source: UBA 2020

© Fraunhofer ISE
4
FHG-SK: ISE-Internal
Szenarien für die nationale und internationale Produktion von PtX-ProduktenREMOD-Energiesystemsimulationen des Fraunhofer ISE
Ambitioniertere Klimazieleerhöhen ganz erheblich den Bedarf an PtX-Produkten, um die Ziele zu erfüllen
Bedarf an GW-Erzeugung in Deutschland (windgekoppelt) und in der Welt

© Fraunhofer ISE
5
FHG-SK: ISE-Internal
Abbreviation Study
EC 2020 COMMISSION STAFF WORKING DOCUMENT - IMPACT ASSESSMENT
JRC 2020 Towards net-zero emissions in the EU energy system by 2050
EC 2019 Industrial Innovation – Pathways to deep decarbonisation of industry Part 2
EC 2018 A Clean Planet for all
Level
E U
Meta-Studie Wasserstoff für den Nationalen WasserstoffratÜberblick über EU-Studien
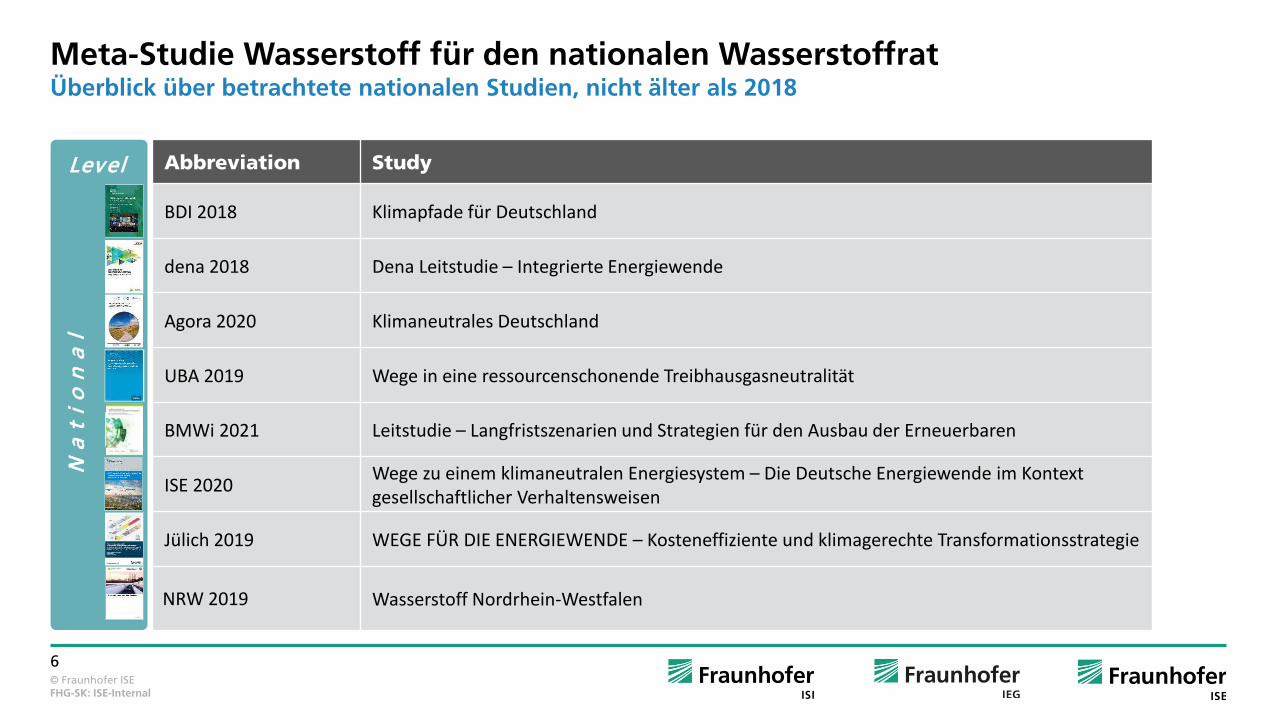
© Fraunhofer ISE
6
FHG-SK: ISE-Internal
Abbreviation Study
BDI 2018 Klimapfade für Deutschland
dena 2018 Dena Leitstudie – Integrierte Energiewende
Agora 2020 Klimaneutrales Deutschland
UBA 2019 Wege in eine ressourcenschonende Treibhausgasneutralität
BMWi 2021 Leitstudie – Langfristszenarien und Strategien für den Ausbau der Erneuerbaren
ISE 2020 Wege zu einem klimaneutralen Energiesystem – Die Deutsche Energiewende im Kontext gesellschaftlicher Verhaltensweisen
Jülich 2019 WEGE FÜR DIE ENERGIEWENDE – Kosteneffiziente und klimagerechte Transformationsstrategie
NRW 2019 Wasserstoff Nordrhein-Westfalen
?
Level
N a
t i
o n
a l
Meta-Studie Wasserstoff für den nationalen WasserstoffratÜberblick über betrachtete nationalen Studien, nicht älter als 2018
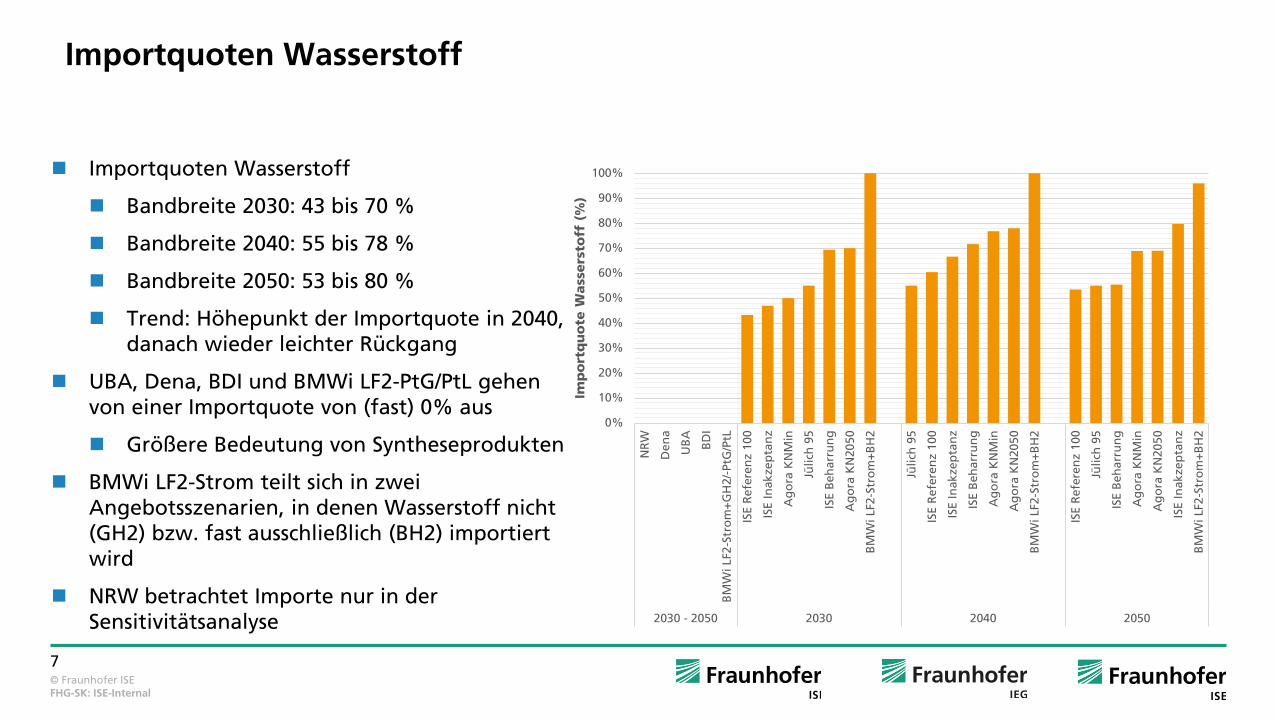
© Fraunhofer ISE
7
FHG-SK: ISE-Internal
Importquoten Wasserstoff
Importquoten Wasserstoff
Bandbreite 2030: 43 bis 70 %
Bandbreite 2040: 55 bis 78 %
Bandbreite 2050: 53 bis 80 %
Trend: Höhepunkt der Importquote in 2040, danach wieder leichter Rückgang
UBA, Dena, BDI und BMWi LF2-PtG/PtL gehen von einer Importquote von (fast) 0% aus
Größere Bedeutung von Syntheseprodukten
BMWi LF2-Strom teilt sich in zwei Angebotsszenarien, in denen Wasserstoff nicht (GH2) bzw. fast ausschließlich (BH2) importiert wird
NRW betrachtet Importe nur in der Sensitivitätsanalyse
0%
10%
20%
30%
40%
50%
60%
70%
80%
90%
100%
NR
W
Den
a
UB
A
BD
I
BM
Wi L
F2-S
tro
m+
GH
2/-P
tG/P
tL
ISE
Ref
eren
z 10
0
ISE
Inak
zep
tan
z
Ag
ora
KN
Min
Jülic
h 9
5
ISE
Beh
arru
ng
Ag
ora
KN
2050
BM
Wi L
F2-S
tro
m+
BH
2
Jülic
h 9
5
ISE
Ref
eren
z 10
0
ISE
Inak
zep
tan
z
ISE
Beh
arru
ng
Ag
ora
KN
Min
Ag
ora
KN
2050
BM
Wi L
F2-S
tro
m+
BH
2
ISE
Ref
eren
z 10
0
Jülic
h 9
5
ISE
Beh
arru
ng
Ag
ora
KN
Min
Ag
ora
KN
2050
ISE
Inak
zep
tan
z
BM
Wi L
F2-S
tro
m+
BH
2
2030 - 2050 2030 2040 2050
Imp
ort
qu
ote
Wa
sse
rsto
ff (
%)

© Fraunhofer ISE
8
FHG-SK: ISE-Internal
Importquoten Syntheseprodukte
Importquoten Syntheseprodukte
Bandbreite 2030: 90 bis 100 %
Bandbreite 2040: 93 bis 100 %
Bandbreite 2050: 79 bis 100 %
Trend: generell sehr hohe Importquoten für Syntheseprodukte, ab 2050 erschließt sich in den UBA-Szenarien z.T. auch ein Heimmarkt
Dena: Importquote Wasserstoff- und Syntheseprodukte:
2040: 22 % - 23 %
2050: 74 % (EL95) – 82 % (TM95)
BDI: Importquote Wasserstoff- und Syntheseprodukte
2050: 89%
Setzung Agora 2020: Importquote Syntheseprodukte = 100 % (2030-2050)
0%
10%
20%
30%
40%
50%
60%
70%
80%
90%
100%
BM
Wi L
F2-P
tG/P
tL
UB
A G
reen
Life
UB
A G
reen
Ee1
UB
A G
reen
Sup
rem
e
UB
A G
reen
Late
UB
A G
reen
Sup
rem
e
BM
Wi L
F2-P
tG/P
tL
UB
A G
reen
Life
UB
A G
reen
Ee1
UB
A G
reen
Late
UB
A G
reen
Sup
rem
e
UB
A G
reen
Life
UB
A G
reen
Ee1
UB
A G
reen
Late
BM
Wi L
F2-P
tG/P
tL
Jülic
h 9
5
2030 2040 2050Im
po
rtq
uo
te S
yn
the
sep
rod
uk
te (
%)

© Fraunhofer ISE
9
FHG-SK: ISE-Internal
2050: Verkehr – Wasserstoff und Syntheseprodukt spielen in der Verkehrsnachfrage eine große Rolle
Gesamte Verkehrsnachfrage zeigt große Abweichungen
Überwiegender Teil von den Szenarien enthält nur 60 % der Sektornachfrage (bzw. exkl. internationale Flüge und Schiffe)
Bei 100 % THG-Minderung:
Reine Wasserstoffnachfrage eher bei ca. 20 %
Syntheseproduktnachfrage eher um 20 % (bei Einbezug int. Flug- und Schifffahrt)
E n d e n e r g i e n a c h f r a g e i m V e r k e h r s s e k t o r E U 2 0 5 0

© Fraunhofer ISE
10
FHG-SK: ISE-Internal
PtX-Produkte für die Mobilität, den Energiesektor und die Industrie
©Fraunhofer ISE 2020

© Fraunhofer ISE
11
FHG-SK: ISE-Internal
Erneuerbare KraftstoffeWasserstoff und wasserstoffbasierte Derivate (MeOH, NH3)
Kriterien* CO2 “quasi”-Neutralität über
gesamten Lebensdauerzyklus
Nachhaltigkeit in Bezug auf unbegrenzte Verfügbarkeit
Minimaler ökologischer Fußabdruck
Ökonomische Effizienz
Bestmögliche Integration in bestehende Technologien und Infrastrukturen (drop-in)
Methanol
Wasserstoffbasierte Kraftstoffe (Methanol, FT, etc.)
DME (Dimethylether)
OME3-5
Methanol toGasoline (MtG)
Methyl formate /Dimethyl carbonate
Methanol toJet fuel
Wasserstoff
Direktnutzung von Wasserstoff
Wasserstoff-verbrennung
Brennstoffzellen
Evolutionäre und revolutionäre Technologien benötigt
Lebenszyklusanalysen verschiedener Antriebstechnologien
Globale Perspektive ist von entscheidender Wichtigkeit
NH3
• Gaukel, K. et al. (2016) 37. Internationales Wiener Motorensymposium, Conference Proceedings, 193-223.

© Fraunhofer ISE
12
FHG-SK: ISE-Internal
Mehr als 30 nationale Wasserstoff-RoadmapsAntreiber für Wasserstoff
https://de.wikipedia.org/wiki/Datei:BlankMap-World_gray.svg
MENA-Economic Growth-Export (Europe)-Social Stability
-Industry-PGM-Processing
-Prosperity, Growth-Industry-Air Quality-CO2-Reduction-Supply Security-Export
-Economy and Industry-Self Sufficiency-GHG-Reduction-Air Quality
-Industry-Export-Green Mining
-Environment(Paris Agreement)-Economy, Industry, Export-Flexible Energy System-Air Quality
-Economy and Industry
-Economic Growth-Export-Independence / SelfSufficiency-Environment-Supply Security in isolated areas
-Industriepolitik-CO2-Neutralität-THG-Reduzierung-Flexibles Energiesystem
-Economic Growth-Import (North Africa)-European Green Deal (GHG-Reduction, Climate Neutrality)-Supply Security
-Environment-Economic Growth
-Economy, Industry-Import-Independence-Air Quality-Environment
-Environment-Economy and Industry-Efficiency-Import
-Economic Growth-Export-Import-Independence-Health -CO2-Reduction-Supply Security
-Air Quality-Supply Security-GHG-Reduction-Industry
-Environment ( RED II)-Industry-Export-Economy and Industry-H2-Production-Environment

© Fraunhofer ISE
13
FHG-SK: ISE-Internal
Effizienz von Batteriefahrzeugen und Fahrzeugen mit Verbrennungsmotor
Unser Ansatz:
Strombedarf über gesamten Lebenszyklus (Herstellung, Nutzung und Entsorgung)
Herstellung: Materialien basieren auf grünem Strom (z.B. H2-basierter Stahl)
Nutzung: Kraftstoffe aus Grünstrom (e-fuel)
Vergleich für BEV und HEV:C-segment in 2025+ (Daten aus [1])
Mild hybrid electric vehicle (MHEV)
Plug-in hybrid electric vehicle (PHEV)
Range extender electric vehicle (REEV)
Battery electric vehicle (BEV)
Aktuelle Effizienzdebatte häufig verkürzt:
Batteriefahrzeug (BEV) vs. Fahrzeug mit Verbrennungsmotor (ICEV)
Hybridfahrzeug (HEV) wird zumeist nicht betrachtet
Nur Nutzungsphase wird berücksichtigt, ohne Herstellung und Recycling
𝜼𝜼𝐁𝐁𝐁𝐁𝐁𝐁𝜼𝜼𝐈𝐈𝐈𝐈𝑬𝑬𝑬𝑬
= 5−6
[1] Huss et al., JEC Tank-to-Wheel report v5: Passenger cars 2020, http://dx.doi.org/10.2760/557004

© Fraunhofer ISE
14
FHG-SK: ISE-Internal
Strombedarf für die Herstellung, Nutzung und Entsorgung der Fahrzeuge
0,0
0,2
0,4
0,6
0,8
1,0
1,2
MHEV PHEV REEV REEV 25% BEV200 BEV400
Stro
mb
edar
f in
kW
h/k
m
Produktion & Entsorgung Nutzung
Laufleistung: 200.000 kmInfrastruktur nicht berücksichtigtKein Second-Life berücksichtigt
PHEV und REEV: e-fuel-Bedarf nach WLTP REEV 25%: e-fuel wird für 25% der Fahrstrecke genutzt
MHEV: Mild hybrid electric vehiclePHEV: Plug-in hybrid electric vehicleREEV: Range extender electric vehicle
BEVXXX: Battery electric vehicle mit Reichweite in km
Kraftstoff: e-fuel Strom Strome-fuel + Strom
𝜼𝜼𝐁𝐁𝐁𝐁𝐁𝐁𝜼𝜼𝑴𝑴𝑴𝑴𝑬𝑬𝑬𝑬
= 2,6
𝜼𝜼𝐁𝐁𝐁𝐁𝐁𝐁𝜼𝜼𝑹𝑹𝑬𝑬𝑬𝑬𝑬𝑬
= 1,5
e-fuel + Strom e-fuel + Strom

© Fraunhofer ISE
15
FHG-SK: ISE-Internal
Shell: Synthetisches Kerosin – Jet FuelsQuote bei Flugkraftstoffen: 0,5% PtL-Kerosin bis 2026, 2% bis 2030
Herstellung nachhaltiger Flugkraftstoffe geplant
Bio-PtL-Anlage
PEM-Wasserstoff-Elektrolyse-Anlage
Aktuell 10 Megawatt
Zusätzlich 100 Megawatt
Kapazität 2025 zunächst 100.000 t Kerosin pro Jahr
https://www.shell.de/ueber-uns/die-marke-shell.html
https://www.shell.de/ueber-uns/projects-and-sites/shell-rheinland-refinery/aktuelles/shell-will-synthetisches-kerosin-in-rheinland-raffinerie-produzieren.html

© Fraunhofer ISE
16
FHG-SK: ISE-Internal
Porsche und Siemens EnergyE-Fuels in Chile
Weltweit erste integrierte Großanlage zur Herstellung synthetischer, klimaneutraler Kraftstoffe
2022: 130.000 Liter E-Fuels
2024: 55 Millionen Liter E-Fuels
2026: 550 Millionen Liter E-Fuels basierend auf Methanol und Methanol-to-Gasoline
https://newsroom.porsche.com/de/2020/unternehmen/porsche-siemens-energy-pilotprojekt-chile-forschung-entwicklung-synthetische-kraftstoffe-efuels-23020.html
Individualverkehr in Deutschland (Quelle: KBA)
Durchschnittliches PKW-Alter in Deutschland: 2019: 9,3 Jahre (Europa 15-17 Jahre)
PKW-Bestand in Deutschland: 2021: 48,3 Millionen
Neuzulassungen von Elektro-PkW (BEV) in Deutschland: 2020: 194.200

© Fraunhofer ISE
17
FHG-SK: ISE-Internal
Maersk: „Methanol und Ammoniak werden eine bedeutende Rolle spielen“Maersk Nachhaltigkeitsbericht 2020
Verfügbarkeit von ‚net-zero‘-Technologien
Keine Verwendung von ‚Übergangskraftstoffen‘(wie LNG), sondern direkter Übergang zu vollständigen ‚net-zero‘-Kraftstoffen
Klimaneutrales Schiff 2023 betrieben mit CO2-neutralem Methanol
Entwicklung eines Dual-Fuel Motors für Ammoniak
„Continued research on priority future fuels (biodiesel, methanol, lignin fuels and ammonia) confirming that net-zero technologies areavailable
https://www.maersk.com/news/articles/2021/02/23/maersk-backs-plan-to-build-europe-largest-green-ammonia-facility

© Fraunhofer ISE
18
FHG-SK: ISE-Internal
Der globale Handel von Erneuerbaren-Energien-Produkten basierend auf Wasserstoff beginnt jetzt
Wir werden die Energiewende im Sinne der Klimaneutralität nur dann erfolgreich umsetzen, wenn wirden grundlegend neuen Charakter des neuen Energiesystems verstehen
Fossile Energie inkl. deren inhärenten Eigenschaft der Speicherung muss in allen Sektoren vollständig ersetzt werden
Wasserstoff und wasserstoffbasierte Kraftstoffe ermöglichen neben batterieelektrischenAntrieben eine nachhaltige Mobilität in Brennstoffzellensystemen sowie in verbrennungsmotorischen Antrieben
Nationale Politik muss klare Pfade und Ziele für Klimaneutralität vorgeben und dabei Well-to-Wheel-Betrachtungen zugrunde legen (Unterquoten für nachhaltige Energieträger in allen Sektoren)
Die Bedeutung von grünen Elektronen und grünen Molekülen steigt gleichermaßen
Die Transformation ist kosteneffizient sobald CO2-Emissionen entsprechend verteuert werden
Internationale Betrachtung der Transformation ist Voraussetzung für eine schnelle Umsetzun für langfristige Handelsbeziehungen und sichere Investitionsumgebungen

© Fraunhofer ISE
19
FHG-SK: ISE-Internal
Vielen Dank für Ihre Aufmerksamkeit
Fraunhofer Institute for Solar Energy Systems ISE, www.ise.fraunhofer.de
Prof. Christopher Hebling, [email protected]
Foto
© F
rau
nh
ofe
r IS
E

SustainableEnergy & Fuels
PAPER
Publ
ishe
d on
14
Mar
ch 2
018.
Dow
nloa
ded
on 3
0/05
/201
8 06
:29:
37.
View Article OnlineView Journal | View Issue
Anlage 6
Economics & car
aFraunhofer Institute for Solar Energy S
Freiburg, Germany. E-mail: robin.white@isebKarlsruhe Institute of Technology (KIT), Eng
Germany
† Current address: University of OxfordParks Road, Oxford, OX1 3PJ, UK.
Cite this: Sustainable Energy Fuels,2018, 2, 1244
Received 18th January 2018Accepted 8th March 2018
DOI: 10.1039/c8se00032h
rsc.li/sustainable-energy
1244 | Sustainable Energy Fuels, 2018,
bon dioxide avoidance cost ofmethanol production based on renewablehydrogen and recycled carbon dioxide – power-to-methanol
Christoph Hank, ab Svenja Gelpke,a Andrea Schnabl,†a Robin J. White, *a
Johannes Full, a Nikolai Wiebe, a Tom Smolinka, a Achim Schaadt, a
Hans-Martin Henning a and Christopher Heblinga
The synthesis of sustainablemethanol based on renewable electricity generation, sustainable hydrogen (H2)
and recycled carbon dioxide (CO2) represents an interesting sustainable solution to integrated renewable
energy storage and platform chemical production. However, the business case for this electricity based
product (denoted hereafter as eMeOH) under current market conditions (e.g. vs. conventional fossil
methanol (fMeOH) production cost) and the appropriate implementation scenarios to increase platform
attractiveness and adoption have to be highlighted. The aim of the following study was to perform
a dynamic simulation and calculation of the cost of eMeOH production (where electricity is generated at
a wind park in Germany), with comparison made to grid connected scenarios. Consideration of these
scenarios is made with particular respect to the German energy market and potential for the reduction in
fees/taxes (i.e. for electrolyser systems). This evaluation and indeed the results can be viewed in light of
European Union efforts to support the implementation of such technologies. In this context, CO2 is
sourced from EU relevant sources, namely a biogas or ammonia plant, the latter profiting from the
resulting credit arising from CO2 certificate trading. Variation in electricity cost and the CO2 certificate
price (in the presented sensitivity study) demonstrate a high cost reduction potential. Under the energy
market conditions of Germany it is found that eMeOH production costs vary between V608 and 1453
per tonne based on a purely grid driven scenario, whilst a purely wind park supplied scenario results in
V1028–1067 per tonne. The reported results indicate that the eMeOH production cost in Germany is still
above the present (although variable) market price, with the economical evaluation indicating that
electrolyser and H2 storage represent the lion share of investment and operational cost. Substitution of
fMeOH results in CO2 avoidance costs between V365 and 430 per tonne of CO2eq avoided for green
methanol produced in Germany. The presented assessment indicates that the eMeOH production cost in
Germany will reach market parity in ca. 2030–2035 with the price for the avoidance of CO2eq turning
from a cost to a benefit at around the same time. Optimistically, the cost is predominantly influenced by
rapidly reducing renewable electricity costs as is already the case in South American and Arabic
countries offering the potential for methanol production at a cost of <V500 per tonne.
Introduction
With the steadily increasing contribution of renewable energy(RE) to the electrical grid, efficient and economic solutions touctuating energy supply storage are currently required. Forexample, the European Union (EU) aspires to reach
ystems ISE, Heidenhofstraße 2, 79110
.fraunhofer.de
elbert-Arnold-Straße 4, 76131 Karlsruhe,
, Department of Engineering Science,
2, 1244–1261
a contribution of renewables to primary energy supply >80% by2050.1–3 Currently storage at the TWh level is needed to avoidcurtailing of RE power output (Germany: 4.7 TWh in 2015; 3.7TWh in 2016)4 during periods of high supply from solar andwind in combination with the continuous operation of largescale fossil and nuclear power plants. Stationary storage tech-nologies need to provide large capacities whilst simultaneouslybeing efficient and economically attractive. The conversion ofelectrical into chemical energy is one solution in this contextthat can also provide a route to clean synthetic fuels, potentiallyresulting in a reduction of greenhouse gas (GHG) emissions inthe mobility sector. Future mobility, besides battery and fuel
This journal is © The Royal Society of Chemistry 2018
verfoullonni
Ausschussstempel

Fig. 1 The production of methanol based on renewable energy, water electrolysis and recycled carbon dioxide, commonly referred to as the“Power-to-Liquid” (PtL) process chain.
‡ Annex I of the EU Directive 2003/87/EC underlines that “under the EU ETS rulesfor any other transfer” than in the case of long-term geological storage “of CO2 outof the installation, no subtraction of CO2 from the installation's emissions isallowed”.
Paper Sustainable Energy & Fuels
Publ
ishe
d on
14
Mar
ch 2
018.
Dow
nloa
ded
on 3
0/05
/201
8 06
:29:
37.
View Article Online
cell electric vehicles for private transport, will also be dependenton liquid fuels with energy densities suitable for heavy roadfreight, aviation and shipping. It would be an extremelyattractive proposition if this could be achieved whilst gener-ating suitable sustainable platform chemicals for the chemicalindustry and the decoupling of energy production from energyuse.5,6 Such a scheme, if based on the conversion of CO2 willcontribute to GHG emission reduction targets establishedthrough a number of national and international agreements(e.g. COP21).7
There has been much interest in the literature and at theindustrial level regarding the interface between RE storage andchemical/fuel production schemes such as Carbon Capture &Utilisation (CCU) and Emissions-to-Liquids.8 Currently in Ger-many, this concept is generally referred to as “Power-to-X” (PtX).X equals gas (H2 or CH4 – Power-to-Gas (PtG)), chemicals andliquid energy carriers (e.g. MeOH, Fischer–Tropsch diesel –
Power-to-Liquid (PtL)). Regarding PtL, this scheme is based onthe recycling of CO2 from industrial exhaust gases or biomassplants and its hydrogenation (with H2 produced from RE pow-ered H2O electrolysis) to produce long lasting chemical mole-cules (Fig. 1). Taking MeOH as the desired liquid product, thisC1 alcohol offers numerous potential benets:9
(1) An industrially established synthesis under moderateconditions such as T < 270 �C and p < 80 bar.
(2) A relatively high energy density (at ambient conditions;16.9 MJ L�1) and suitability as a storage molecule for RE (i.e. via12.6 wt% (H2)).
(3) A highly versatile platform molecule (e.g. olens andacetic acid) for higher fuel production.6,10
(4) High volume, existing market (ca. 75 Mt a�1; 2016) anda high ratio of market price to production cost in the case ofconventional fossil production.11
However, the extremely low price of CH4 (the main basis forcurrent industrial MeOH production via reforming and syngasconversion6) makes adoption and market entry somewhatdifficult for PtL.12
This journal is © The Royal Society of Chemistry 2018
The option to recycle CO2 is attractive as it could reduceindustrial costs related to CO2-certication, whilst holisticallyelevating CO2 from a liability to a potential commercial asset.5
It is important to note that currently the capture of industrialCO2 and its utilisation (CCU) in chemical processes is notincluded in the EU Emission Trading System (EU ETS)‡ and,for this reason, does not lead to CO2 certicate savings (i.e. notas for Carbon Capture and Storage (CCS)).12,13 For the currentenergy system, the regulatory context is extremely important tosupport the economical implementation of CCU.13–15 InJanuary 2017 the European Court of Justice pronounced that inthe case of CCU the transferred CO2 is not to be seen as anemission, as it is not released into the atmosphere.16,17 Herebythe emitter (i.e. a lime producing company implementing CCUfor the production of precipitated calcium carbonate) is notobliged to purchase CO2 certicates. In this ruling, the courtannulled the second sentence of Article 49(1) of the moni-toring regulation with reference to the existence of sufficientmeans of monitoring for the avoidance of feared CO2 loop-holes. This case is foreseen as a critical legal precedent for anyCCU project which, aer careful assessment of its CO2 miti-gation potential, is found to result in reduced CO2 emissions.Therefore a comprehensive LCA is mandatory. Therefore, inthis study it is assumed that imminent legislation willconsider CCU as a part of the EU ETS market resulting ina credit due to the saving of CO2 certicates. For any large scaleimplementation of CO2 converting PtL processes it is impor-tant to shi focus towards biomass based CO2 sources. Onlythese (besides the still cost intensive direct air capturemethods) enable the recycling of CO2 from distributed emit-ters. For the following economic evaluation we consider an
Sustainable Energy Fuels, 2018, 2, 1244–1261 | 1245

Sustainable Energy & Fuels Paper
Publ
ishe
d on
14
Mar
ch 2
018.
Dow
nloa
ded
on 3
0/05
/201
8 06
:29:
37.
View Article Online
industrial/fossil and a biogenic source of CO2, namely anammonia and a biogas plant.
Regarding the synthesis of fossil based methanol (denotedhereaer as fMeOH), three key stoichiometric equations areimportant (eqn (1)–(3)). The reforming and gas cleaninginvolved in the syngas preparation give rise to high specicCO2 equivalent emissions. These range from 0.50 to 0.77t(CO2eq) t(fMeOH)�1, ref. 18 and 19 respectively, includingdirect specic CO2 emissions of 0.24 t(CO2dir) t(fMeOH)�1.20
These emissions are coupled with a very high environmentalimpact as a consequence of fossil fuel exploration and pro-cessing.21 Positively, the synthesis of electricity based meth-anol (denoted hereaer as eMeOH) based on the directhydrogenation of a pure CO2 feed is also known (eqn (1)).22,23
According to the equilibrium reaction, the production of 1metric tonne of MeOH (CH3OH) requires 1.370 kg(CO2) and188 kg(H2) are converted (producing 558 kg(H2O) as a sideproduct) (N.B. this value ignores CO2 and H2 consumption viathe Reverse Water Gas Shi reaction (eqn (3)) which becomesincreasingly favoured with rising reaction temperature). Thisequilibrium reaction occurs under exothermal reactionconditions and as a consequence is favoured at low T andbecause the volume reducing reaction requires high p. Effi-cient compression of the feed stream(s) as well as integrationof the exothermal reaction heat are important factors deter-mining the overall process efficiency.
CO2 + 3H2 #
CH3OH + H2O, DHR(298 K,50 bar) ¼ �40.9 kJ mol�1 (1)
CO + 2H2 # CH3OH, DHR(298 K,50 bar) ¼ �90.7 kJ mol�1 (2)
CO2 + H2 # CO + H2O, DHR(298 K,50 bar) ¼ +42.0 kJ mol�1 (3)
The commercial demonstration of PtL is exemplied by theGeorge Olah Renewable Methanol Plant (Carbon RecyclingInternational, Iceland), operating at 5 million litres per yearproduction. Plant operation here is based on a very low elec-tricity cost due to inexpensive renewable geothermal power andassociated low cost H2/CO2 sourcing.24
One signicant distinction and possible advantage ofdeveloping CH3OH production based on direct CO2 hydroge-nation is the avoidance of the cost intensive syngas produc-tion step (e.g. CH4 reforming at T > 700 �C). It typicallyaccounts for ca. 60% of total plant investment.22 Whilstreplacement of syngas production with CO2 and H2 sourcescan be relatively capital intensive, depending on the overallprocess conditions, investment in such a scheme can result ina “multi-benet” system: MeOH production, recycling of CO2
emissions, system services for the electrical power grid andindirect avoidance of fossil CO2 emissions. In this regard,a number of recent reports have sought to evaluate the cost-effectiveness of PtL, focusing predominantly on evaluation ofeMeOH synthesis with little consideration given to thepreceding process steps in the process chain.3,11,25–34 There-fore, it is the aim of the following work to investigate differentelectricity and CO2 purchase options, the fundamental
1246 | Sustainable Energy Fuels, 2018, 2, 1244–1261
inuence of total and partially dynamic system operation and,in turn, the impact on eMeOH production cost, H2 storagerequirements and associated investment costs. Furthermore,a complementary parametric sensitivity study is presented,highlighting the most important factors concerning eMeOHproduction cost (e.g. in a future RE system). Concerning theenvironmental impacts of PtL-schemes, the economic evalu-ation presented is concluded with the CO2 avoidance cost –i.e. an important key performance indicator when evaluatingtechnologies for CO2 emission mitigation.
Power-to-liquid – MeOH production:a brief process description
The PtL scheme for eMeOH production, denoted hereaer asPower-to-Methanol (PtM), can be divided into six primaryprocess steps (Fig. 1):
(I) Electricity as the main power source for the process isgenerated from renewables on-site or purchased from the grid.
(II) H2, the rst educt for eMeOH synthesis, is obtained viaH2O electrolysis or industrial streams providing high concen-trations of H2 (e.g. coke oven gas from steel mills). The PtMprocess is investigated with the intent to minimise CO2 emis-sions. For this purpose, H2 used in hydrogenation should not begenerated (in-)directly from fossil resources (e.g. steamreforming of CH4 and H2O electrolysis powered by the electricitygrid mix). Please note that a valuable by-product of H2O elec-trolysis is high purity O2, which will be discussed in thefollowing evaluation.
(III) CO2, the second educt for eMeOH production, iscaptured from industrial processes, biogas or even ambientair.35–38 Source dependent purication of the CO2 is necessary.
(IV) Compression of the feed H2 and CO2 and the associatedenergy demand. This will be source dependent.
(V) Temporary storage, the size of which will be related to theuctuation of the electricity production and the range of thesystems' dynamics.
(VI) Catalytic conversion of H2 and CO2 to MeOH is based onestablished technology. Recent studies focus on higher effi-ciency and dynamic operation.23,31,39,40
(VII) Synthesis is followed by a purication step based hereon distillation.
The PtM process steps that are varied within this study aremarked in orange (i.e. power supply, CO2 source, H2 storage,and MeOH synthesis; Fig. 1). The non-variable components ofthe PtM process steps are marked in blue (i.e. polymer electro-lyte membrane electrolysis (PEMEL), compression and pressurelevels, and distillation).
Technical analysis – generalframework, examined PtM scenariosand process variables
A total of six different PtM production scenarios (each with twodifferent CO2 sources) are considered (Fig. 2). In this study, twodifferent electricity sources are considered: a constant grid
This journal is © The Royal Society of Chemistry 2018

Paper Sustainable Energy & Fuels
Publ
ishe
d on
14
Mar
ch 2
018.
Dow
nloa
ded
on 3
0/05
/201
8 06
:29:
37.
View Article Online
supply (scenarios 1–4) and a local power supply (scenarios 5and 6) from a 36MWonshore wind park (which in turn providesa dynamic, uctuating electricity supply for this study). Gridconnected energy is further differentiated as a constant full loadpower supply (scenarios 1 and 2) or a price dependent powersupply (scenarios 3 and 4), (i.e. dual tariff based on electricityavailability). Wind park electricity supplies a 100% dynamicelectrolyser and a MeOH reactor differentiated into a dynamic(20% < PRL < 100%, scenario 5) and a stationary model (PRL ¼100%, scenario 6; PRL ¼ rated load). A dynamic MeOH synthesisreactor is at present not realised at the industrial scale asa consequence of the unknown effects on catalyst degradation/behaviour and the challenges of efficient heat integration (i.e.when operating under partial load). Dynamic simulation ofeach system leads to H2 storage capacities between ‘zero H2
storage’ and a ‘50 000 kg H2 storage’ reecting the synthesisability of exible operation. The investigated scenarios areadditionally differentiated regarding the application of elec-tricity fees. Finally, all six resulting scenarios are evaluatedbased on the utilisation of two different CO2 sources, namelyfrom a biogas treatment plant (biogenic CO2, indicated by ‘B’)and from an ammonia production plant (fossil CO2, indicatedby ‘A’). CO2 from biomass offers, besides air capture methods,the only possibility to close the global carbon-loop and offera long-term solution for a PtL-process independent from fossils.Regarding ammonia plant-derived CO2, a high purity isassumed and is considered an exemplary scenario for otherindustrial processes (e.g. cement, steel or bioethanol produc-tion). In the subsequent section a down-stream modular over-view of the evaluated PtM process is provided. The variousparameters identied for the generated economic evaluationare discussed and simulation results based on a combinedMatlab/Simulink-based analysis and previously reported dataare used.41,42
Fig. 2 Overview of the six different “Power-to-Methanol” (PtM) scenariofrom an ammonia-plant (A) or from a biogas upgrading plant (B).
This journal is © The Royal Society of Chemistry 2018
Electricity purchase
Purchase from the German electricity market (scenarios 1–4):these scenarios refer to the spot market (i.e. short-termpurchase, normally the next day) whereby the nal purchaseprice is dependent on the actual spotmarket price plus taxation,fees and apportionments (electricity, grid and concession fee,the EEG, ‘KWK’ and offshore apportionment and the appor-tionment according to §19 ‘StromNEV’ and §18 ‘AbLaV’).
Low spot market prices are available in times of highproduction fromRE (e.g. low or even negative residual load),43 orduring periods of low energy demand (e.g. at night). Therefore,electricity purchase during such periods can aid in the reduc-tion of the nal production cost. The stock price is, however, notthe biggest share since ca. 80% can be attributed to taxation andfees. Under certain circumstances (e.g. amount of energyconsumed/total utilisation hours/specic electricity cost inten-sity), it is commonplace in Germany, as an industrial customer,to receive a tax reduction down to 15% (EEG 2017). For thisstudy, electricity prices are calculated either with tax and fees(scenarios 1 and 3) or based on the aforementioned reduction offees and taxes (scenarios 2 and 4). The respective reduction wascalculated depending on the specic electric energy demand inthe scenarios. Furthermore the calculation model differsbetween electric energy demand of the electrolyser and the ‘rest’of the plant (i.e. compressors and eMeOH-plant). According to‘Energiewirtschasgesetz’ (EnWG, §118 (6)) and ‘Strom-steuergesetz’ (StromStG, §9a), electrolysers are found to beexempt from the grid fee and electricity tax, respectively. Theexemption from EEG apportionment for electrolysers and theenergy demand of additional components in the PtM systemtakes effect aer the rst consumed GWh of electrical energy.Aer analysing the specic tax and fee reduction potential foreach scenario, electricity prices are found to be between 3.11
s (1–6) evaluated in this study; each differed in the sourced CO2 either
Sustainable Energy Fuels, 2018, 2, 1244–1261 | 1247

Sustainable Energy & Fuels Paper
Publ
ishe
d on
14
Mar
ch 2
018.
Dow
nloa
ded
on 3
0/05
/201
8 06
:29:
37.
View Article Online
and 3.28 ctV per kWh with reduction, or 14.29–14.63 ctV perkWh without the reduction. The partial reduction of EEGapportionment (6.88 ctV per kWh full/0.18 ctV per kWhreduced), grid fees (2.26–2.77 ctV per kWh full/0.00 ctV perkWh reduced) and electricity tax (2.05 ctV per kWh full/0.00 ctVper kWh reduced) is the most signicant since they have thelargest reduction potentials.
Another possibility for electricity purchase is based onparticipation in an operating reserve market (support of gridstability), where negative reserve (increase of load/H2 produc-tion) and positive reserve (decrease of load/H2 production)could both be provided. In our study, the German operatingreserve market has been utilised as a model. Since market entryin this case is simplied (e.g. pooling is possible), there aremore and more participants in the market, resulting indecreasing revenues. The exact economic benet of participa-tion in the control energy market, whilst an important globalconsideration, is not discussed in this study. Kopp et al. hada rst evaluating insight into this topic in their work regardingthe PtG plant in Mainz, Germany.44
It is important to note that PtM scenarios using grid elec-tricity only produce eMeOH, if mainly RE is fed into the grid.The RE share will keep increasing following German/EUClimate Targets (>80% RE in 2050).44
Electricity purchase from a local onshore wind park witha rated power of 36 MW (scenarios 5 and 6): for the simulation,values at minute intervals have been applied. If insufficientwind electricity is available for H2 production (i.e. the amountrequired for eMeOH production), the difference is covered byeither the exible adaption of the eMeOH production rate(scenario 5) and/or an H2 storage (scenarios 5 and 6). A limitedexible operation of eMeOH synthesis is a novelty, and there-fore for the purposes of this study is assumed technicallyfeasible. For the wind electricity driven scenarios 5 and 6 anadditional grid connection to acquire electricity in periods oflow wind supply is not considered for the purpose of a remoterenewable scenario. The levelized cost of electricity (LCOE) fromonshore wind energy is assumed to be 4.4 ctV per kWh,45
without any additional fees or taxes since wind electricity isused for personal consumption and without grid connection (asdened by the “Renewable Energy Act” (“Erneuerbare Ener-giengesetz” EEG) of the German Government in 2014 (§61,subsection 2, sentence no. 2)).46
Table 1 PEM electrolyser: parameters for dynamic simulation
Rated load, PRL [MW] 12Efficiency, hEly [kWh per Nm3] 4.76Output pressure, PH2
[bar] 30Grid connected scenario PRL: 40% (day), 100% (night)Wind electricity driven scenario 0% < PRL < 100%
H2 production and O2 valorisation
A PEM electrolyser (PEMEL) is adopted in this study for H2
production as a consequence of its ability to operate under bothdynamic and steady state conditions with only a marginalreduction in efficiency.1,47 During dynamic operation, a PEMELis capable of following fast load changes and load-ramp curveswith high inclination (�138% PRL per min).42 Large-scalePEMELs with production capacities >10 N m3(H2) h�1 dooffer efficiencies as high as alkaline electrolysers (AELs)(PEMEL: <ca. 5.3 kWhel per Nm3(H2); AEL (pressurised): <ca.5.0 kWhel per Nm3(H2); both system-related); a positive tech-nical learning curve has been traversed over the last few years,
1248 | Sustainable Energy Fuels, 2018, 2, 1244–1261
indicating that further efficiency improvements can be expectedin the coming decade.48–50 Additionally, PEMELs operate verywell under variable loads, down to PRL ¼ 0% and an overload ofup to PRL¼ 150% (for up to 15min).51,52 The product purity fromthe PEMEL operation is high grade (i.e. H2 purity > 99.9 vol%),whilst the operating temperature is typically low (50–100 �C),facilitating a faster start-up (i.e. in comparison to an alkalineelectrolyser).52 The operating PEMEL parameters evaluated inthis study are displayed in Table 1.
Molecular O2 is produced as a high purity by-product and assuch is included in this study as a consequence of its valor-isation potential. The selling price depends on purity, with O2
purities > 99.99% (and without S or CO impurities) making ituseful for many high-tech applications (e.g. medical use inhospitals, electronics industry, and oxy-fuel processing).53 Ifpossible, O2 is utilised locally to avoid the associated energyintensive liquefaction and transport needs.3 For these reasons,the use of O2 from large electrolysers in nearby chemical/energyplants is considered the most appropriate option (e.g. inepoxide/polycarbonate production via oxidation of propyleneand CO2 addition).54
CO2 sourcing
Technical processes for the capture of CO2 include bothchemical and physical absorption processes (e.g. amine scrub-bing, Rectisol®, Selexol®, cryogenic methods, etc.) based on theuse of a variety of solvents, membranes and solid capturemedia.9,35,36,55–57 Likewise, there are various CO2 sources, whichcan be distinguished on the basis of volumetric output, CO2
concentration, presence of impurities, pressure level, CO2
origin (biogenic/fossil), impact on up-stream processes due tocarbon capture, and CO2-price (prices from negative to positivepossible).35,55 Which CO2 source is captured by which methoddepends on the operating conditions of the emitting process.Concurrently, the downstream CCU process has its ownrequirements regarding required purity, tolerable impuritiesand volumetric demand.
In this study, two different CO2 sources are considered,namely a biogas treatment plant and an ammonia plant. In thecase of biogas, CO2 is separated during a treatment processof the raw biogas. This is conventionally composed of CH4 (70–50 vol%) and CO2 (30–50 vol%), with the exact compositioninuenced by the biomass or waste being converted, which alsodictates the presence of other compounds and impurities (e.g.N2, H2S, H2O, and organosulfur compounds). Taking Germanyagain as the example, the quality requirements for the feed-in oftreated biogas to the gas grid are regulated.58,59 CO2 sourcedfrom biomass is designated as biogenic.
This journal is © The Royal Society of Chemistry 2018

Fig. 3 Operating ranges for scenario 5: ‘wind electricity driven, flex-ible’ methanol production.
Paper Sustainable Energy & Fuels
Publ
ishe
d on
14
Mar
ch 2
018.
Dow
nloa
ded
on 3
0/05
/201
8 06
:29:
37.
View Article Online
For CO2 capture from an ammonia plant, it is assumed thatCO2 is already a component of an existing ammonia productionprocess and therefore is designated as fossil-based (from steammethane reforming as a process related step in ammoniaproduction).60
H2 storage
All process scenarios examined in this study, apart from thefull-load power supply scenario, include H2 storage facilities. Inthis study, the incorporated H2 storage units consist of mediumpressure vessels operating dependent on a load capacity in therange 30 bar < PH2,storage < 200 bar. The required size and rangeof this storage has been identied, based on dynamic simula-tion via Matlab, to be in the range 100 kg(H2) < mH2,storage <50 000 kg(H2). It is important to mention that H2 storage witha 50 tonne capacity would rather be realised as an undergroundcavern facility. However, due to a strict dependence on localconditions, the possibility of an environmentally sounddisposal of the resulting brine, and socio-economic conditionsin the case of underground cavern storage, and for a bettercomparability, the installation of storage vessels is assumed forall the evaluated scenarios in the present study.
In the rst of the examined scenarios 1 and 2 (i.e. gridconnected, constant supply), no storage is necessary asa consequence of a constant H2 production. The resulting H2
mass ow of 5.47 t(H2) d�1 is directly converted to MeOH. For
the other scenarios, H2 storage requirements depend on theassumed dynamics of the MeOH synthesis reactor (Fig. 2). Inwind powered scenarios, MeOH mass ow is a function of theactual wind power, the H2 storage pressure and the possibledynamics of the MeOH synthesis reactor (Fig. 3).
Compressor
Both H2 and CO2 streams require compression since MeOHsynthesis is favoured under pressure (here designated at 40bar). The output pressure of the PEMEL is 30 bar. In the case ofdirect feed via a by-pass to the MeOH synthesis reactor, a single-stage H2 compression step is deemed technically appropriate. Ifsourced from H2 storage, a maximum pressure of 200 bar isavailable. For the compression of the PEMEL H2 product streamfor storage (i.e. 30 to 200 bar), a two-stage reciprocatingcompressor is considered. For the CO2 stream wherea compression from ambient to 40 bar pressure is necessary,a two-stage reciprocating compressor is utilised. Thecompressor specications are based on the manufacturer'soperational details (e.g. in terms of energy demand).
MeOH production and distillation
The hydrogenation of CO2 takes place under exothermal reac-tion conditions (eqn (1)–(3)). The nal theoretical MeOH yield isbased on a stationary simulation model generated using theChemCAD® soware platform. The selected reactor type isdesignated as an ideal adiabatic tube reactor with a reactionpressure of 40 bar.42 For calculation of the CO2 amount neededfor MeOH production, a per pass conversion efficiency of 90% isadopted resulting in 10% of the CO2 feed not being converted to
This journal is © The Royal Society of Chemistry 2018
MeOH. Evaluation of the simulation is based on the resultsproduced from the hydrogenation of CO2 on a lab scale MeOHproduction facility operated at Fraunhofer ISE. In this study, thetotal theoretical amount of MeOH produced varies between4000 and 10 000 tMeOH a�1.
Economic analysis – generalframework
To establish a fair economic evaluation, the frameworkconditions for the study have to be dened (Table 2). Referringto the energy needed for eMeOH production, calculationsinclude the electric energy demand. A large share of thermalenergy demand results from distillation and is mainly coveredby the exothermal MeOH synthesis. Cooling duties andadvanced heat integration are not yet considered and will beaddressed in a later report. Where possible, the economicevaluation is based on price data from manufacturers withinthe model market (i.e. Germany). Otherwise, values are takenfrom literature sources as indicated and adjusted accordinglyfor use with eqn (4).61
Co1 ¼ Co2
�C1
C2
�m
(4)
Co1: plant costs new, Co2: plant costs old, C1: plant capacitynew, C2: plant capacity old, and m: digression coefficient ¼0.67.
If not included in the component's investment cost, addi-tional costs for delivery and setup are added at a proportionateshare of the total investment cost (TIC). Maintenance costs areeither based on literature values for the specic component orcomparable processes. Not considered in this economic evalu-ation are costs associated with land, buildings or employees. Asmentioned earlier, alongside MeOH, the by-product of H2Oelectrolysis, namely O2, is also considered as a valuable productin the plant and its potential sales are also included. Credit for
Sustainable Energy Fuels, 2018, 2, 1244–1261 | 1249

Table 2 Economic assumptions: plant investment & operating expenses
Recovery period 10 years —Interest rate 2.5% p.a. Ref. 62PEMEL specic investment 800V kW�1 Ref. 48, 49, 63 and 64PEMEL grid connection 66V kW�1 Ref. 48PEMEL stack life-time 50k hours Ref. 64PEMEL stack reconditioning cost 2.0% of spec. invest. Ref. 64PEMEL maintenance & insurance 2.0% of spec. invest. Ref. 64H2 storage specic investment Depending on storage size Ref. 65H2 storage maintenance & insurance 2.0% of spec. invest. Ref. 62MeOH synthesis specic investment 810V t�1 a�1 Ref. 66MeOH synthesis maintenance & insurance 10.0% of spec. invest. Ref. 66Other installation maintenance & insurance 2.0% of spec. invest. Ref. 62Technical staff 14 h per week at 100V h�1 Own estimatePlant buildings and facilities 7.0% of spec. invest. Ref. 64Engineering, planning, delivery, and setup Inspired by internal experiences —
Sustainable Energy & Fuels Paper
Publ
ishe
d on
14
Mar
ch 2
018.
Dow
nloa
ded
on 3
0/05
/201
8 06
:29:
37.
View Article Online
O2 is considered at 50V t(O2)�1,67 which is a relatively conser-
vative value. Atsonios et al.29 and Matzen et al.30 considereda credit of ca. 75V t(O2)
�1 for their calculations (see Table 5)(NB: any possible future increase of installed electrolysiscapacity may act to decrease the impact of the O2 market value,unless a large increase in oxidation chemistry is anticipated).
The supply cost of CO2 differs for different sources. From theconsidered biogas plant source, the CO2 production cost isassumed to be 0V t(CO2,capt.)
�1, as this is essentially a wasteproduct from biogas cleaning and therefore, the cost for sepa-rating CO2 is assigned to CH4 production cost. Based onammonia production, CO2 capture costs are 3V t(CO2,capt.)
�1.36,68
Furthermore, assuming that avoided CO2 emissions will also beconsidered within the European Emission Allowances (EUA) inthe near future, a projected price of �10V t(CO2,emitt.)
�1 is ob-tained. These allowances are tradable and the resulting CO2
feedstock price is �7V t(CO2)�1 (Table 3). Biogas treatment
plants do not take part in the EUA trade, since the emitted CO2 isof biogenic origin.
The operating and full load hours of the PEMEL and theMeOH synthesis reactor differ for the different scenarios. Forpurely wind electricity driven scenarios, the PEMEL full loadhours are in the range of 3585 to 3896 h a�1 and the operatinghours (the period during which the PEMEL is operational at anyload factor) at 7044 h a�1 (Table 4). The costs for maintenanceand replacement of the PEMEL stacks do reect the specicoperating hours and a predicted stack life-time of 50 000 h.Furthermore, the yearly amortisation payments are calculatedbased on a linear depreciation over 10 years.
Table 3 Evaluated CO2 sources
Biogastreatment plant
Ammoniaplant
Capture cost [V t(CO2,capt.)�1] Excluded 3
CO2 certicate price [V t(CO2,emitt.)�1] 0 �10
CO2 feedstock price [V t(CO2)�1] 0 �7
Output pressure [bar] Atmosph. Atmosph.Environmental burden Biogenic origin Fossil origin
1250 | Sustainable Energy Fuels, 2018, 2, 1244–1261
Results and discussionInvestment cost
The TIC for every investigated scenario is found to be within themargin of 14.4–27.1 MV (Fig. 4). The TIC is strongly inuencedby the investment cost related to PEMEL use. The PEMEL isa necessary procurement, with an assumed cost of 800VkWinst
�1 without and 866V kWinst�1 with grid connection
related to installed capacity (kWinst). Considering that the mid-term (for the year 2023–2030) cost of a PEMEL on the MW-scaleranges from 750 to 1600V kWinst
�1,48,49,63,64 these values can beseen as an optimistic target value. The European Multi-AnnualImplementation Plan of the Fuel Cells and Hydrogen JointUndertaking (FCH JU) targets 720V kWinst
�1 for PEMEL systemswith production capacities <1000 kg(H2) d
�1.51 Schmidt et al.,based on interviews with experts from industry and academia,quantify PEMEL specic investment in 2030 between 850and 1650V kWinst
�1 under the assumption of no changes intechnology funding and without a production scale-up. Inten-sied R&D funding as well as a production scale-up couldlead to a further 24% reduction in specic investment.52
Saba et al. reported even lower cost estimations of 397–955VkWHHV-output
�1.50
All scenarios take a PEMEL as a basis, even though the grid-connected scenarios would be able to function reasonably usingan AEL electrolyser. As mentioned earlier, the TIC will likelydecrease in the future as a consequence of further technologydevelopment, efficiency improvements, and more widespreaduse, with a target value of 440V kW�1 considered desirable forlarge water electrolysis systems >10 MW.67 The 12 MW PEMELincluded in this investigation has a TIC of 9.6 MV (withouta grid connection) and 10.4 MV (with grid connection), repre-senting ca. 60–70% of the TIC of the overall process. Anexception to this observation is the wind-driven scenario usinga non-exible MeOH reactor (scenario 6), since a large H2
storage is included, representing a signicant expense in itself(i.e. TIC (PEMEL) ¼ 35%; TIC (PEMEL + H2 storage) ¼ 79%).Mignard et al. arrived at a similar conclusion in a previousreport where the electrolyser's share of the TIC is within 65–82%, by far the biggest share, followed by the H2 storage and
This journal is © The Royal Society of Chemistry 2018

Table 4 Operating hours and production capacities
Grid connectedconstant supply
Grid connectedelectricity price driven
Wind electricitydriven exible
Wind electricitydriven non-exible
PEM-electrolysis – production capacity [t a�1] 1906 992 791 1210PEM-electrolysis – energy demand [GWh a�1] 100.80 55.44 43.02 46.75PEM-electrolysis – operating/full load hours [h] 8400/8400 8400/4620 7044/3585 7044/3896Hydrogen storage – volume [m3] — 6 345 2840Carbon capture – capturing capacity [t a�1] 15 225 7765 6392 9780Methanol reactor – production capacity [t a�1] 10 031 5139 4188 6408
Fig. 4 Investment cost (CAPEX) of the different plant scenarios in MV.
Paper Sustainable Energy & Fuels
Publ
ishe
d on
14
Mar
ch 2
018.
Dow
nloa
ded
on 3
0/05
/201
8 06
:29:
37.
View Article Online
compression cost, with a share of 9–16%.27 The impact ofinvestment in the MeOH reactor depends on the annuallyproduced MeOH, which is assumed in this study to be 810V t�1
a�1.66 Therefore, the grid connected scenario without H2 storage(scenario 1) has the highest MeOH reactor cost (3.3 MV), sincethis scenario produces the greatest amount of product. Thepotential of additional cost for a exible reactor is not consid-ered in detail. Excluding this mentioned scenario, the MeOHsynthesis reactor's inuence is comparatively low. For futureassessments a detailed investigation of the cost incurred bya dynamic reactor design should be included. Additionally,since methanol from syngas with high CO2 content and H2
potentially offers higher purity (free of most ketones, paraffinsand other by-products) compared to methanol from syngas,a reduced demand for distillation could have a cost decreasingeffect.23,69
Operational & annual costs
Each scenario has a different operational mode with differentresulting operating costs, ranging between 4.00 and 12.93 MV
This journal is © The Royal Society of Chemistry 2018
a�1 (Fig. 5). It can be seen that the main factor is electricity cost,as long as a reduction in taxation/fees is not possible (le bar ofeach scenario). In that case, the operational cost (OPEX) is ca.2.5 times higher than in scenarios including a reduction, whichresults in a share of electricity cost of ca. 70–81% of the OPEX(with 45–59% reduction). Wind energy-based scenarios howeverindicate that the electricity cost share lies approximatelybetween 42 and 44% and therefore represents a reductionrelative to grid-connected scenarios. Due to the high electricitydemand of the PEMEL, slight changes in the electricity pricehave signicant impacts on the electricity cost. A similarobservation was made by Atsonios et al.29 Although this reportassumed a low electricity price of 2.9–5.0 ctV per kWh, elec-tricity still represents the largest share of the OPEX. The CO2
feedstock costs by comparison (e.g. for ammonia plantscenarios) are very low (i.e. 19 000–46 000 V a�1). As mentionedearlier, the trade of the EUA in the amount of recycled CO2 isassumed to be possible in the near future. Since this generatesa negative value, it may even lead to positive revenues (Table 3).However, the assumed certicate price is very low at the currenttime (ca. 10V t(CO2)
�1) and the revenue, based on currentvalues, is accordingly small. It is important to consider that theEUA value is increasing and a rise to just 30V t(CO2)
�1 wouldlower the OPEX by between 1.7 and 5.0% (or 0.17–0.3 MV a�1).
Methanol production cost
The eMeOH production cost (MPC) is calculated using eqn (5).
Cspec: ¼ Aþ Ctotal
Mtotal
(5)
Cspec.: specic production cost, A: annuity, Ctotal: annual oper-ational cost, and Mtotal: total amount of produced methanol.
Currently, the MPC of all considered scenarios (Fig. 6) isabove the actual market price (i.e. Methanex average 2017 (Janto June):70 410V t(eMeOH)�1), which has featured a low-levelupward trend of +3.20V per month over the last 2.5 years. Thescenario with the lowest MPC (scenario 2B, grid connected withconstant supply, fee reduction, without H2 storage, CO2 frombiogas, 608V t(eMeOH)�1) costs 1.5 times the possible marketrevenues, whereas the most uneconomical scenario (scenario3A, electricity price driven, without fee reduction, with H2
storage, ammonia, 1453V t(eMeOH)�1) is 254% above the 2017market price level. The electricity price has a huge impact on theMPC: where a fee reduction is not possible, MPCs are in the
Sustainable Energy Fuels, 2018, 2, 1244–1261 | 1251

Fig. 5 Operational cost (OPEX) of the evaluated scenarios in MV per year.
Sustainable Energy & Fuels Paper
Publ
ishe
d on
14
Mar
ch 2
018.
Dow
nloa
ded
on 3
0/05
/201
8 06
:29:
37.
View Article Online
range of 1284 to 1453V t(eMeOH)�1. If taxation and fees do nothave to be paid in full, the MPC will decrease to 608–782Vt(eMeOH)�1. The wind driven scenarios feature MPCs in therange of 1028–1067V t(eMeOH)�1, which are characterised bylarge H2 storage capacities and associated high investmentcosts.
In this study, a positive value of 50V t(O2)�1 for selling the
electrolyser by-product was used. Previously Atsonios et al.considered an O2 revenue of 87V t(O2)
�1 reected in a decreasein eMeOH production cost (ca. 10% reduction as a consequenceof O2 sales).29 Matzen et al. also included O2 sales in theirprocess evaluation and concluded that a price of 75V t(O2)
�1
had a positive impact on the economic feasibility of theirprocess.30 Likewise, Rivarolo et al. assumed a much highermarket value of 150V t(O2)
�1.34 Compared to the 50V t(O2)�1
used in this study, this results in a difference of 150Vt(eMeOH)�1 (1.5 t(O2) t(eMeOH)�1 produced). For furtheranalysis a detailed evaluation of the necessary process steps forpressurizing, bottling and transportation of O2 has to beincluded as well as a discussion of the development of the O2
market price in the case of increasing market penetration forelectrolyser technology.
Sensitivity study
The economic feasibility of PtM is inuenced by a number ofparameters, and it is essential to know which parameters,besides the obvious electricity price, have a high impact on theprocess economy. Therefore, a sensitivity study was performedfor the wind-powered, exible MeOH synthesis based on biogas-
1252 | Sustainable Energy Fuels, 2018, 2, 1244–1261
derived CO2 (scenario 5B). Based on a biogenic CO2 source anda local supply of wind power the chosen scenario represents themost preferable option up to now regarding the establishmentof a sustainable eMeOH production route. Only one parameterhas been varied at a time; the unchanged parameters are basedon the one set for the economic evaluation of scenario 5B (seealso Table 2). Displayed are the costs (negative slope) andbenets (positive slope); the steeper the slope the stronger theinuence of the parameter on the process economy (Fig. 7). Themost important factor is identied to be the MeOH sellingprice, since it has a direct impact on the specic prot.Increasing MeOH selling prices are consequently directly visiblein the process economics. The electrolyser investment isanother important impact factor. At 12 MW, a reduction of thespecic investment has a large impact on the TIC. A specicinvestment reduction of only �10% leads to an investmentdecrease of 1 MV (�6.2% of the TIC). If an investment targetvalue of 440V kW�1 for water electrolysis systems could bereached, the TIC would decrease by an amount of ca. 4.3 MV
(�27% of the TIC). Regarding the expected price decrease of thePEMEL, eMeOH production costs should decrease in the longterm. Thirdly, as already discussed in the context of operationalcost, the electricity price has a strong impact on the overallprocess economy. Marginal changes in electricity price aredirectly visible in the eMeOH production cost. Therefore, theavailability of green but inexpensive electricity (e.g. in periods ofexcess or over-production and regions with signicantly lowerRE generation costs) is a basic prerequisite for an economicelaboration of PtM. Although the investment in the methanolsynthesis reactor is not a key indicator for the TIC, scaling-up of
This journal is © The Royal Society of Chemistry 2018

Fig. 6 Methanol production cost (MPC) for the evaluated scenarios in V t(eMeOH)�1.
Paper Sustainable Energy & Fuels
Publ
ishe
d on
14
Mar
ch 2
018.
Dow
nloa
ded
on 3
0/05
/201
8 06
:29:
37.
View Article Online
the methanol reactor will also have a decreasing effect on thereactor specic investment cost and hence on the TIC of the PtLsystems. Hence, to improve the economic viability of PtM anddecrease the difference between the current market price leveland the production cost, the above-mentioned parameters areimportant starting points to be considered and in turnoptimised.
Evaluation
To provide an overview and classication of the results gener-ated from this study, in comparison with previously reportedstudies and data, Table 5 has been compiled. In this compar-ison, monetary values that were not given in V were calculatedbased on a time-dependent currency exchange rate (the average
Fig. 7 Sensitivity study for the wind powered, flexible synthesis based o
This journal is © The Royal Society of Chemistry 2018
exchange rate in the year of the study). For a better compara-bility of the values, eMeOH production costs were also con-verted based on the current currency exchange rate (average2017). For the calculation of production capacity, 350 days perannum were assumed if no value for working h a�1 was avail-able. All values not directly stated in the studies were calculatedon the basis of the available values (where possible).
Due to the different parameter assumptions used in thecalculation of eMeOH production costs, the results varyconsiderably from study to study. Therefore selection of systemboundaries, system components and framework conditions iscritical as they have a signicant impact on the nal results andas a consequence, different studies should be comparedcarefully.
n biogas-derived CO2 (scenario 5B).
Sustainable Energy Fuels, 2018, 2, 1244–1261 | 1253

Tab
le5
ComparisonofdifferentPtM
studies
Electricity
Electrolyser
CO2
Storag
eMethan
olreactor+distillation
Source
Source
Price[ctV
perkW
h]
Typ
e
Spec.
invest
[VkW
�1]
O2price
[Vt O
2
�1]
Source
Spec.
cost
a
[Vt C
O2
�1
a�1]
H2
CO2
Spec.
invest
b[V
t MeO
H�1]
Plan
tcapa
city
[td�1]
Pressu
relevel
[bar]
Plan
tde
preciation
time[a]
Methan
olprod
uction
cost
[Vt M
eOH�1]
Grid
3.74
–13
.43
PEM
12MW
800
50Bioga
s/am
mon
ia0/3
No
No
1514
2940
1060
8–16
15This
stud
yGrid
3.67
–14
.13
PEM
12MW
800
50Bioga
s/am
mon
ia0/3
6m
3No
2745
1540
1081
6–19
69This
stud
yWind
onsh
ore
4.4
PEM
12MW
800
50Bioga
s/am
mon
ia0/3
345m
3No
3830
1240
1010
40–1
051
This
stud
yWind
onsh
ore
4.4
PEM
12MW
800
50Bioga
s/am
mon
ia0/3
2840
m3
No
4144
1940
1095
6–96
7This
stud
yHyd
ropo
wer
1.3
——
—Flue
gas/
atmosph
ere
——
——
200
—15
258/38
719
99-
Specht
andBan
diHyd
ropo
wer
2.5
——
—CPP
/atmosph
ere
——
——
200
—15
/20
529/71
719
99-
Specht
etal.
RES
1.5–2.2
AEL10
0/50
0MW
422–14
0910
2Flue
gas
(CPP
)—
Floa
ting
head/
pressu
rised
tanks
—12
99–
2420
178–37
250
1549
8–71
1c20
03-
Mignard
etal.
429–
613d
Grid/RES
4AEL2MW
200
Sold/used
Flue
gas
(CHP)
1510
0–90
0t H
2
unde
rgroun
dga
sstorag
e
No
—89
014
4—
555
2010
-Claus
enet
al.
Grid/CPP
2.9–5
AEL14
0MW
376
87Flue
gas
(CPP
)44
Partially
——
318
6525
870–
913
2015
-Atson
ios
etal.
Wind
6.3
AEL41
MW
e44
075
Ethan
olplan
t—
Pressu
rised
storag
eLiqu
idstorage
850
9750
1032
4–78
1c20
15-
Matzen
etal.
389–
938d
CPP
9.5–12
.1—
f,g
—f
—f
Flue
gas
(CPP
)0
——
497
1320
7620
724
2015
-Pe
rez-
Fortes
etal.
—f
9.3
—f,h
—f
—f
Purchased
50Yes
fNo
1329
138
7510
980
2015
-Tremel
etal.
RES
2.6/3.3
SOEC50
MW
—Used
Flue
gas
(CPP
)20
—Buff
erstorage
1000
96/235
—20
450/48
420
15-
Varon
eet
al.
1254 | Sustainable Energy Fuels, 2018, 2, 1244–1261 This journal is © The Royal Society of Chemistry 2018
Sustainable Energy & Fuels Paper
Publ
ishe
d on
14
Mar
ch 2
018.
Dow
nloa
ded
on 3
0/05
/201
8 06
:29:
37.
View Article Online
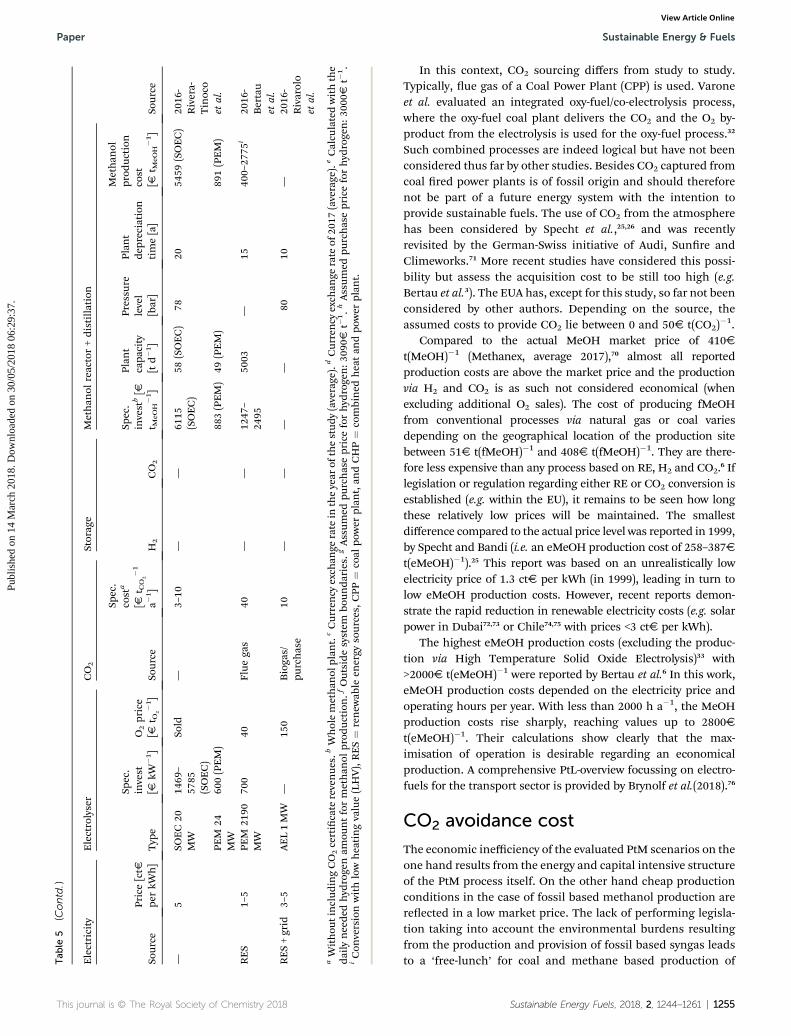
Tab
le5
(Contd.)
Electricity
Electrolyser
CO2
Storag
eMethan
olreactor+distillation
Source
Source
Price[ctV
perkW
h]
Typ
e
Spec.
invest
[VkW
�1]
O2price
[Vt O
2
�1]
Source
Spec.
cost
a
[Vt C
O2
�1
a�1]
H2
CO2
Spec.
invest
b[V
t MeO
H�1]
Plan
tcapa
city
[td�1]
Pressu
relevel
[bar]
Plan
tde
preciation
time[a]
Methan
olprod
uction
cost
[Vt M
eOH�1]
—5
SOEC20
MW
1469
–57
85(SOEC)
Sold
—3–10
——
6115
(SOEC)
58(SOEC)
7820
5459
(SOEC)
2016
-Rivera-
Tinoco
etal.
PEM
24MW
600(PEM)
883(PEM)
49(PEM)
891(PEM)
RES
1–5
PEM
2190
MW
700
40Flue
gas
40—
—12
47–
2495
5003
—15
400–
2775
i20
16-
Bertau
etal.
RES+grid
3–5
AEL1MW
—15
0Bioga
s/pu
rchase
10—
——
—80
10—
2016
-Rivarolo
etal.
aWithou
tinclud
ingCO2certicate
revenue
s.bWholemethan
olplan
t.cCurrency
exch
ange
rate
intheyear
ofthestud
y(average).
dCurrency
exch
ange
rate
of20
17(average).
eCalcu
latedwiththe
dailyneeded
hyd
rogenam
ountformethan
olprod
uction
.fOutside
system
boun
daries.g
Assum
edpu
rchasepriceforhyd
rogen:3
090V
t�1.h
Assum
edpu
rchasepriceforhyd
rogen:3
000V
t�1.
iCon
versionwithlowheatingvalue(LHV),RES¼
renew
able
energy
sources,
CPP
¼coal
power
plan
t,an
dCHP¼
combined
heatan
dpo
wer
plan
t.
This journal is © The Royal Society of Chemistry 2018
Paper Sustainable Energy & Fuels
Publ
ishe
d on
14
Mar
ch 2
018.
Dow
nloa
ded
on 3
0/05
/201
8 06
:29:
37.
View Article Online
In this context, CO2 sourcing differs from study to study.Typically, ue gas of a Coal Power Plant (CPP) is used. Varoneet al. evaluated an integrated oxy-fuel/co-electrolysis process,where the oxy-fuel coal plant delivers the CO2 and the O2 by-product from the electrolysis is used for the oxy-fuel process.32
Such combined processes are indeed logical but have not beenconsidered thus far by other studies. Besides CO2 captured fromcoal red power plants is of fossil origin and should thereforenot be part of a future energy system with the intention toprovide sustainable fuels. The use of CO2 from the atmospherehas been considered by Specht et al.,25,26 and was recentlyrevisited by the German-Swiss initiative of Audi, Sunre andClimeworks.71 More recent studies have considered this possi-bility but assess the acquisition cost to be still too high (e.g.Bertau et al.3). The EUA has, except for this study, so far not beenconsidered by other authors. Depending on the source, theassumed costs to provide CO2 lie between 0 and 50V t(CO2)
�1.Compared to the actual MeOH market price of 410V
t(MeOH)�1 (Methanex, average 2017),70 almost all reportedproduction costs are above the market price and the productionvia H2 and CO2 is as such not considered economical (whenexcluding additional O2 sales). The cost of producing fMeOHfrom conventional processes via natural gas or coal variesdepending on the geographical location of the production sitebetween 51V t(fMeOH)�1 and 408V t(fMeOH)�1. They are there-fore less expensive than any process based on RE, H2 and CO2.6 Iflegislation or regulation regarding either RE or CO2 conversion isestablished (e.g. within the EU), it remains to be seen how longthese relatively low prices will be maintained. The smallestdifference compared to the actual price level was reported in 1999,by Specht and Bandi (i.e. an eMeOH production cost of 258–387Vt(eMeOH)�1).25 This report was based on an unrealistically lowelectricity price of 1.3 ctV per kWh (in 1999), leading in turn tolow eMeOH production costs. However, recent reports demon-strate the rapid reduction in renewable electricity costs (e.g. solarpower in Dubai72,73 or Chile74,75 with prices <3 ctV per kWh).
The highest eMeOH production costs (excluding the produc-tion via High Temperature Solid Oxide Electrolysis)33 with>2000V t(eMeOH)�1 were reported by Bertau et al.6 In this work,eMeOH production costs depended on the electricity price andoperating hours per year. With less than 2000 h a�1, the MeOHproduction costs rise sharply, reaching values up to 2800Vt(eMeOH)�1. Their calculations show clearly that the max-imisation of operation is desirable regarding an economicalproduction. A comprehensive PtL-overview focussing on electro-fuels for the transport sector is provided by Brynolf et al.(2018).76
CO2 avoidance cost
The economic inefficiency of the evaluated PtM scenarios on theone hand results from the energy and capital intensive structureof the PtM process itself. On the other hand cheap productionconditions in the case of fossil based methanol production arereected in a low market price. The lack of performing legisla-tion taking into account the environmental burdens resultingfrom the production and provision of fossil based syngas leadsto a ‘free-lunch’ for coal and methane based production of
Sustainable Energy Fuels, 2018, 2, 1244–1261 | 1255
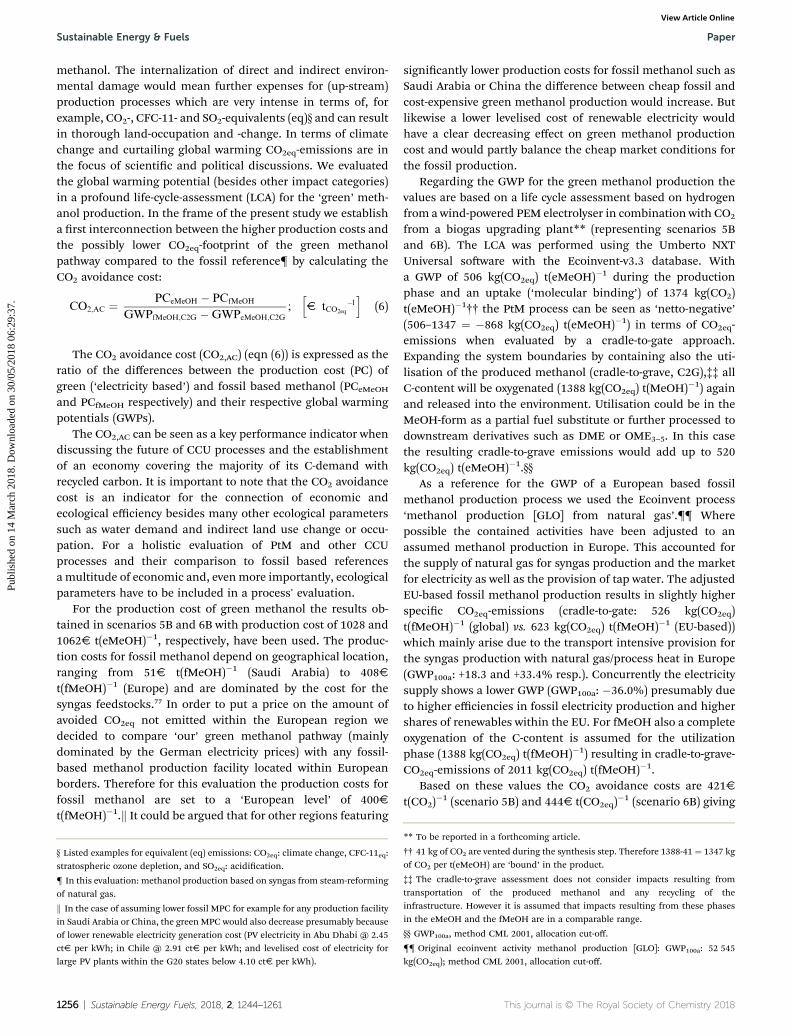
Sustainable Energy & Fuels Paper
Publ
ishe
d on
14
Mar
ch 2
018.
Dow
nloa
ded
on 3
0/05
/201
8 06
:29:
37.
View Article Online
methanol. The internalization of direct and indirect environ-mental damage would mean further expenses for (up-stream)production processes which are very intense in terms of, forexample, CO2-, CFC-11- and SO2-equivalents (eq)§ and can resultin thorough land-occupation and -change. In terms of climatechange and curtailing global warming CO2eq-emissions are inthe focus of scientic and political discussions. We evaluatedthe global warming potential (besides other impact categories)in a profound life-cycle-assessment (LCA) for the ‘green’ meth-anol production. In the frame of the present study we establisha rst interconnection between the higher production costs andthe possibly lower CO2eq-footprint of the green methanolpathway compared to the fossil reference{ by calculating theCO2 avoidance cost:
CO2;AC ¼ PCeMeOH � PCfMeOH
GWPfMeOH;C2G �GWPeMeOH;C2G
;hV tCO2eq
�1i
(6)
The CO2 avoidance cost (CO2,AC) (eqn (6)) is expressed as theratio of the differences between the production cost (PC) ofgreen (‘electricity based’) and fossil based methanol (PCeMeOH
and PCfMeOH respectively) and their respective global warmingpotentials (GWPs).
The CO2,AC can be seen as a key performance indicator whendiscussing the future of CCU processes and the establishmentof an economy covering the majority of its C-demand withrecycled carbon. It is important to note that the CO2 avoidancecost is an indicator for the connection of economic andecological efficiency besides many other ecological parameterssuch as water demand and indirect land use change or occu-pation. For a holistic evaluation of PtM and other CCUprocesses and their comparison to fossil based referencesa multitude of economic and, evenmore importantly, ecologicalparameters have to be included in a process' evaluation.
For the production cost of green methanol the results ob-tained in scenarios 5B and 6B with production cost of 1028 and1062V t(eMeOH)�1, respectively, have been used. The produc-tion costs for fossil methanol depend on geographical location,ranging from 51V t(fMeOH)�1 (Saudi Arabia) to 408Vt(fMeOH)�1 (Europe) and are dominated by the cost for thesyngas feedstocks.77 In order to put a price on the amount ofavoided CO2eq not emitted within the European region wedecided to compare ‘our’ green methanol pathway (mainlydominated by the German electricity prices) with any fossil-based methanol production facility located within Europeanborders. Therefore for this evaluation the production costs forfossil methanol are set to a ‘European level’ of 400Vt(fMeOH)�1.k It could be argued that for other regions featuring
§ Listed examples for equivalent (eq) emissions: CO2eq: climate change, CFC-11eq:stratospheric ozone depletion, and SO2eq: acidication.
{ In this evaluation: methanol production based on syngas from steam-reformingof natural gas.
k In the case of assuming lower fossil MPC for example for any production facilityin Saudi Arabia or China, the green MPC would also decrease presumably becauseof lower renewable electricity generation cost (PV electricity in Abu Dhabi @ 2.45ctV per kWh; in Chile @ 2.91 ctV per kWh; and levelised cost of electricity forlarge PV plants within the G20 states below 4.10 ctV per kWh).
1256 | Sustainable Energy Fuels, 2018, 2, 1244–1261
signicantly lower production costs for fossil methanol such asSaudi Arabia or China the difference between cheap fossil andcost-expensive green methanol production would increase. Butlikewise a lower levelised cost of renewable electricity wouldhave a clear decreasing effect on green methanol productioncost and would partly balance the cheap market conditions forthe fossil production.
Regarding the GWP for the green methanol production thevalues are based on a life cycle assessment based on hydrogenfrom a wind-powered PEM electrolyser in combination with CO2
from a biogas upgrading plant** (representing scenarios 5Band 6B). The LCA was performed using the Umberto NXTUniversal soware with the Ecoinvent-v3.3 database. Witha GWP of 506 kg(CO2eq) t(eMeOH)�1 during the productionphase and an uptake (‘molecular binding’) of 1374 kg(CO2)t(eMeOH)�1†† the PtM process can be seen as ‘netto-negative’(506–1347 ¼ �868 kg(CO2eq) t(eMeOH)�1) in terms of CO2eq-emissions when evaluated by a cradle-to-gate approach.Expanding the system boundaries by containing also the uti-lisation of the produced methanol (cradle-to-grave, C2G),‡‡ allC-content will be oxygenated (1388 kg(CO2eq) t(MeOH)�1) againand released into the environment. Utilisation could be in theMeOH-form as a partial fuel substitute or further processed todownstream derivatives such as DME or OME3–5. In this casethe resulting cradle-to-grave emissions would add up to 520kg(CO2eq) t(eMeOH)�1.§§
As a reference for the GWP of a European based fossilmethanol production process we used the Ecoinvent process‘methanol production [GLO] from natural gas’.{{ Wherepossible the contained activities have been adjusted to anassumed methanol production in Europe. This accounted forthe supply of natural gas for syngas production and the marketfor electricity as well as the provision of tap water. The adjustedEU-based fossil methanol production results in slightly higherspecic CO2eq-emissions (cradle-to-gate: 526 kg(CO2eq)t(fMeOH)�1 (global) vs. 623 kg(CO2eq) t(fMeOH)�1 (EU-based))which mainly arise due to the transport intensive provision forthe syngas production with natural gas/process heat in Europe(GWP100a: +18.3 and +33.4% resp.). Concurrently the electricitysupply shows a lower GWP (GWP100a: �36.0%) presumably dueto higher efficiencies in fossil electricity production and highershares of renewables within the EU. For fMeOH also a completeoxygenation of the C-content is assumed for the utilizationphase (1388 kg(CO2eq) t(fMeOH)�1) resulting in cradle-to-grave-CO2eq-emissions of 2011 kg(CO2eq) t(fMeOH)�1.
Based on these values the CO2 avoidance costs are 421Vt(CO2)
�1 (scenario 5B) and 444V t(CO2eq)�1 (scenario 6B) giving
** To be reported in a forthcoming article.
†† 41 kg of CO2 are vented during the synthesis step. Therefore 1388-41 ¼ 1347 kgof CO2 per t(eMeOH) are ‘bound’ in the product.
‡‡ The cradle-to-grave assessment does not consider impacts resulting fromtransportation of the produced methanol and any recycling of theinfrastructure. However it is assumed that impacts resulting from these phasesin the eMeOH and the fMeOH are in a comparable range.
§§ GWP100a, method CML 2001, allocation cut-off.
{{ Original ecoinvent activity methanol production [GLO]: GWP100a: 52 545kg(CO2eq); method CML 2001, allocation cut-off.
This journal is © The Royal Society of Chemistry 2018

Fig. 8 Estimation for the future development of green methanol production cost and CO2 avoidance cost in the case of fossil methanolsubstitution.
Paper Sustainable Energy & Fuels
Publ
ishe
d on
14
Mar
ch 2
018.
Dow
nloa
ded
on 3
0/05
/201
8 06
:29:
37.
View Article Online
emitted CO2 signicantly higher prices than the recent pricesenvisioned by the European Emission Trading Scheme (EU-ETS)with CO2-certicate prices of ca. 5V t(CO2eq)
�1 for the last 12months (Sept 16 to Aug 17).kk
Future development of methanol production cost & thecorresponding CO2 avoidance cost
For future development of the parameters until 2035 weassumed the development of some central sensitive parameters.The initial point for this assessment sets scenario 5A. Parame-ters are set considering in-house studies for the decrease oflarge-scale PEMEL specic cost (2035 @ 300V kWinst
�1),a signicant increase in CO2 certicate prices (2035 @ 80Vt(CO2)
�1),78 and a further decrease in the levelised cost ofrenewable electricity in general and PV-electricity in particular(2035 @ 1.8 ctV per kWhel).72–75 The resulting predictions ingreen methanol production costs and the corresponding CO2
avoidance costs are compared with a constant (business asusual, ‘bau’) and the exponential forward projection of themethanol market prices (‘exp’) based on the Methanex Euro-pean posted contract price for the last 15 years.70
Fig. 8 contrasts the resulting development of eMeOH with anincreasing methanol market price, demonstrating a predictionfor market parity in ca. the year 2032. At around the same timethe CO2 avoidance cost will turn negative (based on theassumptions made regarding investment and operational costs)which can be interpreted as the market offering an economicincentive to the industry for utilising their CO2 emissionsinstead of emitting them. These points of time t the publishedresults for the development of the market demand for electro-lyser technology showing a clear market launch from the year
kk EU CO2 Emission Allowances (Sept 16 to Aug 17) according to the EuropeanEnergy Exchange.
This journal is © The Royal Society of Chemistry 2018
2032.78,79 Furthermore a future increase of the GWP for fMeOHproduction could be assumed due to the necessity of a moreintensive exploration of fossil resources and longer transportdistances. This would have an additional lowering effect on CO2
avoidance cost, which was not considered here.
Conclusions
The presented evaluation shows that the economic feasibility ofa specic PtL process (i.e. for eMeOH) strongly depends onelectricity and H2 production cost, CO2 cost (also reecting anyintroduced carbon taxes), specic electrolyser cost and thepossible dynamics of the methanol reactor (having an impacton the necessity and size of H2 storage). Furthermore, indirectparameters such as carbon taxes will have an impact on thewillingness of the market to pay for eMeOH (and derivedsustainable chemicals) and as such can be considereddesirable.
Under the evaluated process conditions in this study, theproduction of eMeOH in Germany is currently not economicallycompetitive, if one presupposes the competition with fossilbased large capacity methanol production and its current lowprice. The investment and operational costs are currentlyinhibitory and therefore, the eMeOH production price exceedsthe expected revenues. Currently, conventional large scalemethanol production based on CH4 reforming has a very lowprice due to very inexpensive fossil supply (e.g. from increasedfracking in the USA and increased production of fMeOH fromcoal in China). A high degree of capacity utilisation is advan-tageous and favourable for low eMeOH production cost.Therefore maximised plant operation (e.g. in terms of hours) isalso to be highlighted as an important factor in achievingeMeOH economic feasibility.
Sustainable Energy Fuels, 2018, 2, 1244–1261 | 1257

Sustainable Energy & Fuels Paper
Publ
ishe
d on
14
Mar
ch 2
018.
Dow
nloa
ded
on 3
0/05
/201
8 06
:29:
37.
View Article Online
The presented sensitivity study demonstrates that a decreasein the specic investment costs of the PEMEL leads to a majoreconomic efficiency improvement for the described PtMprocess. Heading towards the target value for specic electro-lyser investment (target value: 440V kW�1) is in general animportant step towards the economic feasibility of PtL-systems.The low-emission eMeOH production scenario (wind energydriven) had a higher production cost due to the additionalrequirement for H2 storage (i.e. 2nd largest share of investmentcosts). A reduction in specic H2 storage size and costs wouldtherefore be benecial. The possibility of underground H2
storage in salt caverns (e.g. in northern Germany) depends onlocal conditions but offers a promising way for mitigating thestrong interlinkage between H2 storage volume and its associ-ated investment costs.64 In the long-term it will be necessary tooffer possibilities for a more dynamic operation of the synthesisstep to reduce the storage demand for H2.
To successfully introduce any PtL process, it is initiallyimportant to think of potential synergies: the methanolproduction of Carbon Recycling International is underpinnedby low-cost geothermal electricity and CO2 from a geothermalpower plant (located adjacent to the plant). Thyssenkrupp AG isaiming to signicantly cut their CO2 emissions by utilising thewaste gases from steel production (coupled with additional H2
production) to generate side streams of fuels and chemicals.80
The presented PtL scenarios are all on a small-scale comparedto fossil based plants on the Mt-scale. Future large-scale PtL-plants, coupled with existing chemical or heavy industry, wouldalso have a number of advantages: instant access to low-costgrid electricity, availability of (highly concentrated) CO2 streams(which still need purication) or unused H2 in off-gases, ifnecessary access to HT-process heat/steam and last but notleast, the vast cost-reducing effect of a PtL plant scale-up.
Regarding policy instruments to support the introduction ofeconomically viable PtL schemes, amendment of general policyframeworks and taxation systems (e.g. special grid fees forenergy storage and grid-supporting technologies, and animproved European Emission Trading System) would be bene-cial. A modied taxation system for CO2 emissions couldgenerate a CO2 certicate price and market conditions appro-priate for an industrial business case for CCU. Anotherapproach could be a tax reduction for “renewable fuels”. Thegradual reduction of fossil fuel subsidies would also aid in thelong term attractiveness of PtM schemes, particularly as theamount of the RE share in the electric grid increases. Theproposed ‘double counting’*** of 2nd generation biofuelsaccording to the revision (iLUC Directive 2015/1513/EC81) of theRE directive RED (2009/28/EC82) is a rst step when alsoincluding CO2-based fuels. Regarding fossil-based production,environmental costs and impacts are generally not internalisedand therefore factoring environmental burdens would lead to
*** Double counting of advanced/second generation biofuels: regarding theextension of the Renewable Energy Directive (RED) 2009/28/EC (28.04.2015)member States must ensure that 10% of the nal energy consumption in thetransport sector is provided by renewable sources. The share provided withadvanced/second and/or third generation biofuels is double weighted.
1258 | Sustainable Energy Fuels, 2018, 2, 1244–1261
a higher price of fMeOH. One example is the introduced foun-dation for climate protection and CO2-compensation (Founda-tion for Climate Protection and Carbon Offset (StiungKlimaschutz und CO2-Kompensation, Klik)),83 following therevision of Swiss CO2-law. It commits producers and distribu-tors of fossil fuels to provide compensation for the environ-mental impacts of their products and in turn providesinvestment in funding programs focusing on Swiss GHGemission reduction.
The presented analysis highlights that the CO2 avoidancecosts for the evaluated wind electricity based scenarios arecurrently in the range of 421–444V t(CO2eq)
�1 avoided andstrongly depend on the process and market conditions withinthe selected scenarios. The process conditions (electrolyserefficiency, synthesis pressure, source of CO2, etc.) not onlyinuence eMeOH production cost but also the results for theCO2eq footprint and thus the CO2 avoidance cost. It has beenshown that for future technological optimisation of some CCUkey components (resulting in the improvement of centraleconomic process parameters) even for cost intensive 100% REbased set-ups the green methanol production cost can bestrongly decreased (543V t(eMeOH)�1, �47%, scenario 5A)within the next two decades bringing market competitivenesswith fossil based methanol within the realms of possibility. Inthe same time frame the CO2 avoidance cost will feature a cleardrop (�124%) resulting in negative values and through thisprovide an incentive for industries to reinterpret their CO2
emissions from waste to feedstock.It is important to consider that the CO2 avoidance cost
should be used only as one key-criterion for the selection amongthe variety of possible CCU processes.84 In combination with thespecic CO2 avoidance potential of each PtL-/CCU-technology,the most cost- and eco-efficient routes should therefore beselected. In this context, a detailed Life Cycle Assessment (LCA)is mandatory to identify the specic CO2 avoidance cost andpotential. Positively, the analysed technology will be supportedby (and also support) the rapidly growing and intended expan-sion of RE (e.g. in Germany and the EU in general) over the nextfew decades. This growth will necessitate consideration oftechnologies such as PtL, further supported in terms ofeconomic readiness by the ever reducing RE price per ctV perkWh. PtX technologies will be one important pillar of the inte-grated-energy concept (‘sector-coupling’) within the Europeanmarkets of electricity, heat and mobility. Further postponementof integrating renewable energies in the mobility sector andchemical industries will further impede the climate protectionprograms.79
Our results demonstrate that off-grid wind electricity ispromising for eMeOH production, but in the case of an isolatedwind energy system and without large H2 storage it cannotensure a high degree of capacity utilisation. For realisation of anoff-grid renewable PtL process, the coupling of wind power withphotovoltaic or solar thermal electricity generation and/oradditional baseload supplies (e.g. biogas plants or combinedheat and power plants based on biomass, offering alsoa biogenic CO2 point source) would lead to higher capacityutilisation and a reduced storage demand. Thinking globally,
This journal is © The Royal Society of Chemistry 2018

Paper Sustainable Energy & Fuels
Publ
ishe
d on
14
Mar
ch 2
018.
Dow
nloa
ded
on 3
0/05
/201
8 06
:29:
37.
View Article Online
relocation to regions with higher solar irradiance (e.g. theMaghreb region, Australia or south western parts of NorthAmerica) and/or reliable wind power (e.g. Chile, Peru, SouthAfrica, or Scandinavia) offers the possibility of a low cost REsupply. Low cost RE electricity of around 2.5 ctV per kWhel
(reecting recent price bids for PV electricity72–75) and a higherdegree of capacity utilisation due to a less uctuating REpotential MPC of �500V t(eMeOH)�1 and below are in a real-istic range. Regions with a current and prospectively low REproduction cost provide opportunities for the further develop-ment of a business case for PtL (and PtX) technology within thecoming decade. Further installation of pilot plants and theassociated operational experiences, coupled with expectedeconomies of scale, will lay a path to improved PtL economics,even in countries where RE electricity costs are currentlyprohibitive.
Conflicts of interest
There are no conicts to declare.
Acknowledgements
RJW is grateful to the Fraunhofer Society and Fraunhofer ISE forproviding nancial support via the Attract programme.
References
1 Energiespeicher – Bedarf, Technologien, Integration, ed. M.Sterner and I. Stadler, Springer Berlin Heidelberg, Berlin,Heidelberg, 2014.
2 A. Palzer and H.-M. Henning, Renewable Sustainable EnergyRev., 2014, 30, 1019.
3 K. Rauchle, L. Plass, H.-J. Wernicke and M. Bertau, EnergyTechnol., 2016, 4(1), 193.
4 Bundesnetzagentur fur Elektrizitat, Gas, Telekommunikation,Post und Eisenbahnen, Monitoringbericht 2017:Monitoringbericht gemaß §63 Abs. 3 i. V. m. §35 EnWG und§48 Abs. 3 i. V. m. §53 Abs. 3 GWB, Bundesnetzagentur, 2017.
5 R. Schlogl, Top. Catal., 2016, 59(8–9), 772.6 Methanol: The Basic Chemical and Energy Feedstock of theFuture, ed. M. Bertau, H. Offermanns, L. Plass, F. Schmidtand H.-J. Wernicke, Springer Berlin Heidelberg, Berlin,Heidelberg, 2014.
7 United Nations, Paris Agreement, Paris, 2015.8 M. Z. Jacobson, Energy Environ. Sci., 2009, 2(2), 148.9 G. A. Olah, A. Goeppert and G. K. S. Prakash, Beyond Oil andGas: The Methanol Economy, Wiley-VCH, Weinheim, 2009.
10 A. Otto, Chemische, verfahrenstechnische undokonomische Bewertung von CO2 ans Rohstoff in derchemischen Industrie, Dissertation, ForschungszentrumJulich, Aachen, 2015.
11 A. Tremel, P. Wasserscheid, M. Baldauf and T. Hammer,Int. J. Hydrogen Energy, 2015, 40(35), 11457.
12 European Commission, Directive 2003/87/EC: Scheme forGreenhouse Gas Emission Allowance Trading (EU ETS), 2003.
This journal is © The Royal Society of Chemistry 2018
13 SCOT Project, EU-ETS to Incentivise CO2 Utilisation: ScotProject Brieng Paper, 2016.
14 European Commission SETIS, Carbon Capture Utilisationand Storage, Brussel, 2016.
15 Dra Report: on the Proposal for a Directive of the EuropeanParliament and of the Council Amending Directive 2003/87/EC to Enhance Cost-effective Emission Reductions and Low-carbon Investments, (COM(2015)0337 – C8-0190/2015 –2015/0148(COD)), ed. Ian Duncan, European Parliament,Brussel, 2016.
16 European Court of Justice, curia.europa.eu, 2017, http://curia.europa.eu/juris/document/document.jsf;jsessionid¼9ea7d2dc30d58212da909b459b9498e176cd9e54d9.e34KaxiLc3qMb40Rch0SaxyKbNv0?text¼&docid¼186967&pageIndex¼0&doclang¼EN&mode¼req&dir¼&occ¼rst&part¼1&cid¼679758.
17 S. Altenschmidt, Recognition of Climate Protection Measures:Success at ECJ for the Lime Industry with Luther, 2017.
18 International Maritime Organization, DNV GL, 2016, 2016.19 Ecoinvent Centre – Swiss Centre for Life Cycle Inventories,
ecoinvent LCA-database V3.3, ecoinvent, 2017.20 W. Kuckshinrich, P. Markewitz, J. Linssen, P. Zapp,
M. Peters and W. Leitner, Weltweite Innovationen bei derEntwicklungvon CCS-Technologien und Moglichkeiten derNutzung und des Recyclings von CO2: Studie im Aurag desBundesministeriums fur Wirtscha und Technologie (BMWi),Projektnummer 25/08 Endbericht Marz 2010, Julich, 2010.
21 Hugill, Overbeek and Spoelstra, a Comparison of the Eco-efficiency of Two Production Routes for Methanol, 2001.
22 F. Pontzen, W. Liebner, V. Gronemann, M. Rothaemel andB. Ahlers, Catal. Today, 2011, 171(1), 242.
23 H. Goehna and P. Koenig, CHEMTECH, 1994, 1994(24/6),36.
24 E. A. Quadrelli, G. Centi, J.-L. Duplan and S. Perathoner,ChemSusChem, 2011, 4(9), 1194.
25 M. Specht and A. Bandi, Forschungsverbund Sonnenenergie“Themen 98/99”, 1999, p. 59.
26 M. Specht, A. Bandi, M. elser and F. Staiss, Stud. Surf. Sci.Catal., 1998, 114(114), 363.
27 D. Mignard, Int. J. Hydrogen Energy, 2003, 28(4), 455.28 L. R. Clausen, N. Houbak and B. Elmegaard, Energy, 2010,
35(5), 2338.29 K. Atsonios, K. D. Panopoulos and E. Kakaras, Int. J.
Hydrogen Energy, 2016, 41(4), 2202.30 M. Matzen, M. Alhajji and Y. Demirel, Energy, 2015, 93, 343.31 M. Perez-Fortes, J. C. Schoneberger, A. Boulamanti and
E. Tzimas, Appl. Energy, 2016, 161, 718.32 A. Varone andM. Ferrari, Renewable Sustainable Energy Rev.,
2015, 45, 207.33 R. Rivera-Tinoco, M. Farran, C. Bouallou, F. Aupretre,
S. Valentin, P. Millet and J. R. Ngameni, Int. J. HydrogenEnergy, 2016, 41(8), 4546.
34 M. Rivarolo, D. Bellotti, L. Magistri and A. F. Massardo, Int.J. Hydrogen Energy, 2016, 41(4), 2105.
35 N. v. d. Assen, L. J. Muller, A. Steingrube, P. Voll andA. Bardow, Environ. Sci. Technol., 2016, 50(3), 1093.
Sustainable Energy Fuels, 2018, 2, 1244–1261 | 1259

Sustainable Energy & Fuels Paper
Publ
ishe
d on
14
Mar
ch 2
018.
Dow
nloa
ded
on 3
0/05
/201
8 06
:29:
37.
View Article Online
36 CO2: Abtrennung, Speicherung, Nutzung: GanzheitlicheBewertung im Bereich von Energiewirtscha und Industrie, ed.M. Fischedick and K. Gorner, Springer Berlin Heidelberg,Berlin, Heidelberg, 2015.
37 D. W. Keith, M. Ha-Duong and J. K. Stolaroff, Clim. Change,2006, 74(1–3), 17.
38 https://www.nature.com/news/commercial-boost-for-rms-that-suck-carbon-from-air-1.18551, last accessed March2018.
39 L. K. Rihko-Struckmann, A. Peschel, R. Hanke-Rauschenbach and K. Sundmacher, Ind. Eng. Chem. Res.,2010, 49(21), 11073.
40 B. Stefansson, Power and CO2 Emissions to Methanol, Brussel,2015.
41 S. Gelpke, Wirtschalichkeitsanalyse der Power-to-liquid-Prozesskette zur Methanolherstellung aus CO2 und H2,Bachelor-thesis, Fraunhofer Institute for Solar EnergySystems ISE, Flensburg, 2016.
42 A. Schnabl, Die Konversion von CO2 und H2 zu Methanol alsnachhaltigem chemischen Energiespeicher, Master-thesis,Fraunhofer Institute for Solar Energy Systems ISE,Munchen, 2015.
43 Bundesverband der Energie und Wasserwirtscha,Erneuerbare Energien und das EEG: Zahlen, Fakten, Graken(2013), Anlagen, installierte Leistung, Stromerzeugung, EEG-Auszahlungen, Marktintegration der Erneuerbaren Energienund regionale Verteilung der EEG-induziertenZahlungsstrome, BDEW Bundesverband der Energie- undWasserwirtscha e.V., Berlin, 2013.
44 M. Kopp, D. Coleman, C. Stiller, K. Scheffer, J. Aichingerand B. Scheppat, Int. J. Hydrogen Energy, 2017, 42(19),13311–13320.
45 C. Kost, J. Mayer, J. Thomsen, N. Hartmann, C. Senkpiel,S. Philipps, S. Nold, S. Lude and T. Schlegl,Stromgestehungskosten Erneuerbare Energien, Freiburg, 2013.
46 Bundesministerium fur Wirtscha und Energie BMWi,Gesetz fur den Ausbau erneuerbarer Energien:Erneuerbare-Energien-Gesetz – EEG 2014, 2014.
47 F. Ausfelder, C. Beilmann, M. Bertau, S. Brauninger,A. Heinzel, R. Hoer, W. Koch, F. Mahlendorf,A. Metzelthin, M. Peuckert, L. Plass, K. Rauchle,M. Reuter, G. Schaub, S. Schiebahn, E. Schwab,F. Schuth, D. Stolten, G. Teßmer, K. Wagemann andK.-F. Ziegahn, Chem. Ing. Tech., 2015, 87(1–2), 17.
48 T. Smolinka, M. Gunther and J. Garche, Stand undEntwicklungspotenzial der Wasserelektrolyse zur Herstellungvon Wasserstoff aus regenerativen Energien: Kurzfassung desAbschlussberichts, NOW-Studie, Freiburg, 2011.
49 B. V. Mathiesen, I. Ridjan and D. Connolly, Technology Datafor High Temperature Solid Oxide Electrolyser Cells, Alkali andPEM Electrolysers, Aalborg, 2013.
50 S. M. Saba, M. Muller, M. Robinius and D. Stolten, Int. J.Hydrogen Energy, 2018, 43(3), 1209.
51 Fuel Cell and Hydrogen Joint Undertaking – FCH JU, Studyon Early Business Cases for H2 in Energy and More BroadlyPower to H2 Applications: Final Report, Brussel, 2017.
1260 | Sustainable Energy Fuels, 2018, 2, 1244–1261
52 O. Schmidt, A. Gambhir, I. Staffell, A. Hawkes, J. Nelsonand S. Few, Int. J. Hydrogen Energy, 2017, 42(52), 30470.
53 T. Kato, M. Kubota, N. Kobayashi and Y. Suzuoki, Energy,2005, 30(14), 2580.
54 Q. Liu, L. Wu, R. Jackstell and M. Beller, Nat. Commun.,2015, 6, 5933.
55 D. Schuwer, K. Arnold, K. bienge and S. Bringezu, CO2
ReUse NRW: Evaluating Gas Sources, Demand and Utilizationfor CO2 and H2 within the North Rhine- Westphalia Area withRespect to Gas Qualities, Supported by Climate-kicDeutschland, Berlin, Berlin, 2015.
56 F. Ausfelder and A. Bazzanelle, Verwertung und Speicherungvon CO2: Diskussionspapier, Frankfurt/Main, 2008.
57 M. E. Boot-Handford, J. C. Abanades, E. J. Anthony,M. J. Blunt, S. Brandani, N. Mac Dowell,J. R. Fernandez, M.-C. Ferrari, R. Gross, J. P. Hallett,R. S. Haszeldine, P. Heptonstall, A. Lyngfelt, Z. Makuch,E. Mangano, R. T. J. Porter, M. Pourkashanian,G. T. Rochelle, N. Shah, J. G. Yao and P. S. Fennell,Energy Environ. Sci., 2014, 7(1), 130.
58 S. Klinski, Einspeisung von Biogas in das Erdgasnetz, Leipzig,2006.
59 DVGW Deutscher Verein des Gas- und Wasserfaches e. V,Technische Regel – Arbeitsblatt Nr. 260 (A) Zur Qualitatvon einzuspeisenden Gasen in das Erdgasnetz(260 (A)),DVGW, Bonn.
60 W. Zhou, B. Zhu, Q. Li, T. Ma, S. Hu and C. Griffy-Brown,Energy Policy, 2010, 38(7), 3701.
61 Technische Chemie, ed. A. Behr, A. Brehm, H. Hofmann,J. Gmehling, M. Baerns and U. Onken, Wiley-VCH,Weinheim, 2nd edn, 2013, ISBN: 978-3-527-33072-0.
62 K. K. Humphreys, Project and Cost Engineers' Handbook,Marcel Dekker, New York, USA, 2005.
63 T. Smolinka, N. Wiebe andM. Thomassen, Cost Break Downand Cost Reduction Strategies for PEM Water ElectrolysisSystems: Session B05: H2 from Electrolysers: Concepts &Costs, Luzern, Schweiz, 2017.
64 T. Smolinka, T. Raksha, T. Pregger, A. Friedrich andG.-S. Schneider, Studie uber die Planung einerDemonstrationsanlage zur Wasserstoff-Krastoffgewinnungdurch Elektrolyse mit Zwischenspeicherung in Salzkavernenunter Druck: Plan Delykad, Plan Delykad, Stuttgart, 2014.
65 T. Aicher, M. I. Gonzalez and M. Gotz, Betrachtung desGesamtsystems im Hinblick auf Dynamik undProzessintegration: Arbeitspaket 5, 2014.
66 ADI Analytics LLC, Natural Gas Utilization via Small-scaleMethanol Technologies, Commissioned by Ben FranklinTechnology Partners' Shale Gas Innovation &Commercialization Center, Houston, Texas, 2015.
67 O. Machhammer, A. Bode and W. Hormuth, Chem. Ing.Tech., 2015, 87(4), 409.
68 C. Hendriks and W. Graus, Global Carbon Dioxide StoragePotential and Costs, Utrecht, 2004.
69 J. Ladebeck, J. P. Wagner and T. Matsuhisa, Stud. Surf. Sci.Catal., 1997, 1997(107), 73.
70 https://www.methanex.com/our-business/pricing, last accessedDecember 2017.
This journal is © The Royal Society of Chemistry 2018
Paper Sustainable Energy & Fuels
Publ
ishe
d on
14
Mar
ch 2
018.
Dow
nloa
ded
on 3
0/05
/201
8 06
:29:
37.
View Article Online
71 Universitat Stuttgart, Verbundprojekt Sunre –Herstellung vonKrastoffen aus CO2 und H2O unter Nutzung regenerativerEnergie, Bericht Arbeitspaket D Okobilanz, 2015.
72 https://www.bloomberg.com/news/articles/2016-05-03/solar-developers-undercut-coal-with-another-record-set-in-dubai,last accessed March 2018.
73 http://fortune.com/2016/09/19/world-record-solar-price-abu-dhabi/, last accessed March 2018.
74 https://economictimes.indiatimes.com/industry/energy/power/chile-breaks-dubais-record-of-solar-power-output-at-low-cost/articleshow/53932595.cms, last accessed March 2018.
75 https://www.bloomberg.com/news/articles/2016-08-19/solar-sells-in-chile-for-cheapest-ever-at-half-the-price-of-coal, lastaccessed March 2018.
76 S. Brynolf, M. Taljegard, M. Grahn and J. Hansson,Renewable Sustainable Energy Rev., 2018, 81, 1887.
77 A. Boulamanti and J. A. Moya, Renewable Sustainable EnergyRev., 2017, 68, 1205.
This journal is © The Royal Society of Chemistry 2018
78 H.-M. Henning and A. Palzer, Was kostet die Energiewende?:Wege zur Transformation des Deutschen Energiesystems bis2050, Freiburg, 2015.
79 G. Norman, F. Sandau, B. Zimmermann, C. Pape,S. Bonger and C. Hofmann, Geschasmodell Energiewende:Eine Antwort auf das “Die-Kosten-der-Energiewende”-Argument,Kassel, 2014.
80 https://www.thyssenkrupp.com/de/carbon2chem/, last accessedMarch 2018.
81 European Commission, Directive 2015/1513/EC. Quality ofPetrol and Diesel Fuels, 2015.
82 European Commission, Directive 2009/28/EC. Promotion ofthe Use of Energy from Renewable Sources: 2009/28/EC, 2009.
83 https://www.klik.ch/, last accessed March 2018.84 A. W. Zimmermann and R. Schomacker, Energy Technol.,
2017, 5(6), 850.
Sustainable Energy Fuels, 2018, 2, 1244–1261 | 1261

SustainableEnergy & Fuels
PAPER
Publ
ishe
d on
16
Sept
embe
r 20
19. D
ownl
oade
d by
Fra
unho
fer-
Ges
ells
chaf
t - F
hG o
n 11
/3/2
019
5:49
:44
PM.
View Article OnlineView Journal | View Issue
Anlage 7
Comparative wel
aHydrogen Technologies Division, Fraunhofe
Heidenhofstraße 2, 79110 Freiburg, G
fraunhofer.debInstitut fur Nachhaltige Technische System
79110 Freiburg, GermanycInstitute for Industrial Ecology (INEC), Pfo
75175 Pforzheim, GermanydTechnical University of Berlin (TUB), StraßeeInstitute of Process and Plant Technology, Te
15, 85748 Garching, Germany
† Electronic supplementary informa10.1039/c9se00658c
‡ Current address: The Netherlands Orga(TNO), High Tech Campus 25, 5656AE Ein
Cite this: Sustainable Energy Fuels,2019, 3, 3219
Received 15th August 2019Accepted 15th September 2019
DOI: 10.1039/c9se00658c
rsc.li/sustainable-energy
This journal is © The Royal Society of C
l-to-wheel life cycle assessment ofOME3–5 synfuel production via the power-to-liquidpathway†
Christoph Hank, *ab Lukas Lazar, ac Franz Mantei, ad Mohamed Ouda,ae
Robin J. White, ‡a Tom Smolinka, a Achim Schaadt, a Christopher Heblinga
and Hans-Martin Henning a
Oxymethylene Dimethyl Ethers (OMEs) are promising diesel fuel alternatives and interesting solvents for
various industrial applications. In this report, a well-to-wheel life cycle assessment of short OME oligomers
as produced via a Power-to-Liquid (PtL) pathway has been conducted. Variations in electricity and carbon
dioxide supply as well as the hardware demand for the PtL plant components (e.g. PEM water electrolysis,
carbon capturing, and 36 kta OME plant capacity) have been considered. Conventional diesel fuel is used
as the comparative benchmark. In scenarios with a high share of renewable electricity well-to-wheel
greenhouse gas emission for OME3–5 fuel is advantageous compared to fossil diesel. For the best case,
well-to-wheel greenhouse gas emissions can be reduced by 86%, corresponding to 29 g(CO2eq) km�1
(OME3–5-fuel) compared to 209 g(CO2eq) km�1 (diesel fuel). However, these results are highly sensitive to
the applied method with regard to system multifunctionality. A sensitivity analysis indicates that input
electricity at �50 g(CO2eq) kWhel�1 enables well-to-wheel greenhouse gas emissions of <100 g(CO2eq)
km�1. For other environmental impact categories, acidification, eutrophication, respiratory effects,
photochemical ozone creation and resource depletion exceed significantly the fossil fuel reference. A high
share of these impacts can be assigned to electricity production, either through direct electricity
consumption in the PtL system or during upstream production of hardware components. The presented
results and discussion demonstrate the necessity for global defossilisation including material efficient
manufacturing of renewable energy plants which remains mandatory for synfuel production addressing
a wide range of environmental impact categories. Furthermore, PtL production concerning well-to-wheel
greenhouse gas emissions could be beneficial even in Germany if dedicated renewable energy capacities
are considered. However, operation of large-scale PtL plants will predominantly be conducted in countries
with high renewable energy potential, resulting in low levelized cost of electricity and high full load hours.
Introduction
There is tremendous pressure to limit the global temperatureincrease to 1.5 �C, which requires intensive defossilisation
r Institute for Solar Energy Systems ISE,
ermany. E-mail: christoph.hank@ise.
e (INATECH), Emmy-Noether-Straße 2,
rzheim University, Tiefenbronner Str. 65,
des 17. Juni 135, 10623 Berlin, Germany
chnical University Munich, Boltzmannstr.
tion (ESI) available. See DOI:
nisation for Applied Scientic Researchdhoven, The Netherlands.
hemistry 2019
efforts by the international community.1 In Germany especiallythe mobility sector stays way behind the sector specic targetswhich were set up in order to achieve the self-imposed nationalgreenhouse gas (GHG) reduction targets.2,3 Additionally, we facecontroversial discussions about the impact and handling ofhigh road traffic related local emissions, especially particulatematter (PM) and nitrogen oxides (NOx). Based on renewableenergy (RE), carbon dioxide (CO2) capture and its downstreamcatalytic conversion with renewable hydrogen (H2), the Power-to-Liquid (PtL) approach to chemical and fuel production cansupport defossilisation and enable integration of the energy,chemical and mobility sectors. PtL, as part of the Power-to-X(PtX) process schemes, is an important element of sector-coupling, enabling the infusion of RE into the primary energydemands of our global economies. The electrication of centralend uses such as heating and road transport will lead toa signicant rise of electricity in the nal energy consumptionfrom 19% today to 29% by 2050.4 In particular the electrication
Sustainable Energy Fuels, 2019, 3, 3219–3233 | 3219
verfoullonni
Ausschussstempel

Sustainable Energy & Fuels Paper
Publ
ishe
d on
16
Sept
embe
r 20
19. D
ownl
oade
d by
Fra
unho
fer-
Ges
ells
chaf
t - F
hG o
n 11
/3/2
019
5:49
:44
PM.
View Article Online
of mobility applications is expected to increase from <1% in2016 to 27% in 2050. With regard to urban transport theEuropean Union targets a 50% reduction in 2030 anda complete phase out of conventionally (fossil) fuelled cars.5
While battery electric vehicles are favourable for shorter drivingdistances (i.e. <300 km) long hauls or heavy road transports canin terms of life cycle GHG emissions be more sustainable whenfuelled by hydrogen fuel cells or synthetic fuels.6 The DeutscheEnergieagentur (DENA) assessed the potential of electricity-based fuels for low-emission transport in the EU. Even for2050-scenarios favouring electric powertrains, more than 49%of the total fuel demand of all mobility applications will be metby electricity based liquid fuels.7 Studies with a focus on thefuture German energy system aiming at a 95% GHG reductionquantify a total necessary electricity provision of 129 TW hel forPtL for its application in sector-coupling and future mobility8
(gross electricity generation in Germany in 2018: 649 TW hel).9
In addition to reduction of life cycle GHG emissions, localemissions of PM and NOx shi into the focus of political debateand legislation. In the context of newmobility fuels, short chainoligomeric Oxymethylene Dimethyl Ethers (denoted as OMEs;molecular formula H3CO–(CH2O)n–CH3; where n ¼ 1–5) can beproduced from CO2 and H2 typically via methanol (CH3OH).10
OME3–5 are of interest as diesel additives or substitutes as theyare non-hazardous, weakly corrosive, miscible with conven-tional diesel11,12 and their combustion is almost free of PM.13–17
Due to a high oxygen content (48 wt%)18 and cetane number,OME3–5 mixtures have been blended with conventional dieselwithout modication of the internal combustion engine.13,19,20
OMEs offer a high tolerance towards exhaust gas recirculationand hence can eliminate the PM–NOx trade-off which inevitablyoccurs in the case of conventional long-chain diesel fuel.13,21,22
Another perspective and a promising market for OMEs is theirapplication as solvents, with OME1 already established as anindustrially applied solvent.
Currently, industrial OMEn production provides capacities ofca. 30–40 kta but is characterized by low overall process effi-ciency.23 The production is based on CH3OH traditionally syn-thesised via syn-gas obtained from steam-reforming of fossilenergy carriers (e.g. methane). For the production of OME3–5
from a PtL basis, whilst economically feasible (as we have re-ported previously),24 life cycle assessment (LCA) and associatedecological impacts have yet to be examined in detail, especiallywith regard to the utilisation phase (e.g. combustion). A holisticWell-to-Wheel (WtW) LCA is thus important to determinewhether this energy carrier offers environmental advantagescompared to fossil-based equivalents. In this regard and withinthe framework of our current research24–27 this article addressesthe following questions (i.e. the goal of the performed LCA):
/ Environmental efficiency of OME3–5: what are the envi-ronmental impacts resulting from the production and uti-lisation of OME3–5 as a fuel? How does the synfuel perform incomparison to the production and utilisation of conventionalfossil diesel fuel?
/ What are the systems most impacting life cycle phasesand components in terms of environmental impactminimization?
3220 | Sustainable Energy Fuels, 2019, 3, 3219–3233
Necessity for the environmental evaluation of OME3–5
Thus far, reports in the literature regarding the LCA of OMEshave focused on either pure OME1–8 derived from forestrybiomass with Canada as the geographical reference28 or on theproduction of shorter chain OME1 based on electrolytic H2
applied in the form of OME1–diesel-blend (35 vol% OME1).21
OME1, commercially known as “Methylal”, has a high vaporpressure, relatively lower specic volumetric energy and lowash point. These are drawbacks when blended with diesel fueland when long-term storage in the current infrastructure isconsidered. Both previously reported LCAs indicated that at lowblending rates (<35 vol% OME1) soot emissions can be signi-cantly reduced. The WtW GHG emissions can be reducedconsiderably when either forestry biomass or low-carbon elec-tricity acts as the energy source for synthetic fuel production. Amore detailed description of the addressed assessments isprovided in the ESI (S1).†
Regarding testing of OME fuel in real internal combustionengines Avolio et al. conducted tests with different OME–dieselblends in different diesel engines.29 Regarding life-cycle emis-sions it was stated that a 30% OME-content leads to an 18.5%-reduction in WtW CO2-emissions ‘under the premise ofa sustainable production from renewable sources’. Furtherexplanation of the assessment background for the WtW emis-sions was not included in the report.
Therefore and to the best of our knowledge there is currentlyno publicly available LCA of OME3–5 which is required tosupport further R&D, process optimisation and indeed policydecision making.
As it is a critical consideration, when conducting theecological evaluation of sustainable fuels and chemicals,terminologies such as “CO2- or environmentally-neutral” oreven “carbon-negative” have to be handled carefully.17,30–33 It isto be emphasised that none of the proposed future mobilityoptions, if powered directly by electricity or by chemical energycarriers, will lead to CO2-neutrality. As such in a WtW approach(i.e. including upstream impacts of fuel production), there willalways be net-positive CO2(equivalent) emissions (denoted asCO2eq). Instead of discussing mobility concepts on the basis ofTank-to-Wheel system boundaries, it appears that WtWassessments should be handled as a fundamental prerequisitefor environmental evaluation. It is also important to note thatcarbon emission reduction pathways only serve as temporalCO2-storage mechanisms and aim when sourced from biogenicor atmospheric CO2 at creating a highly integrated carbon cycle.
Thus, the Methodology section below describes the assessedproduct system and scenarios, the investigated OME synthesisroute as well as the environmental indicators and the aspects ofmultifunctionality of the assessed PtL system.
Methodology for the life cycleassessment
The performed LCA was predominantly structured and con-ducted in compliance with ISO 14040:2009, ISO14044:2006,25,34,35 and recommendations of the European
This journal is © The Royal Society of Chemistry 2019

Paper Sustainable Energy & Fuels
Publ
ishe
d on
16
Sept
embe
r 20
19. D
ownl
oade
d by
Fra
unho
fer-
Ges
ells
chaf
t - F
hG o
n 11
/3/2
019
5:49
:44
PM.
View Article Online
Commission.36–38 Synthesis process data are described in the“Theoretical background for the assessed OME3–5 synthesis”section. Umberto® NXT Universal LCA soware was used formodelling and impact calculations. Background LCA data weresourced from the ecoinvent database (v.3.3), manufacturerspecications, published literature and in-house experience.For the applied ecoinvent background processes cut-off systemmodels which build on economic allocation as the defaultmethodology have been used.
Assessed product system, functional units and scenarios
The scale of the assessed PtL product system is based on theelectricity production of a 100 MWp RE park and it is designedfor an annual production capacity of 36 kta of OME3–5. Ingeneral it comprises nine main process steps (Fig. 1A): elec-trolytic H2 production by proton exchange membrane waterelectrolysis (denoted as “PEM”), CO2 capture from one of thethree assessed CO2 sources (i.e. biomethane, ammonia, anddirect air capture), methanol synthesis with subsequent ashand distillation units, anhydrous dehydrogenation of methanolto formaldehyde followed by OMEn synthesis and the necessarydistillation towards the target product OME3–5 (please see the
Fig. 1 A) Assessed PtL product system grouped into the relevant processPEM efficiency, PEM stack lifetime and thermal energy supply. CO2 is supThe resulting designation of the scenarios is indicated in square bracket
This journal is © The Royal Society of Chemistry 2019
section “Theoretical background for the assessed OME3–5
synthesis” for further details). Necessary (by-)product separa-tion, recirculation, cooling and compression are part of therelated processes of methanol- or OME3–5-synthesis. To reducethe thermal energy demand heat integration has been per-formed. The OME3–5 product is then assumed to be distributedand utilised in a mid-size diesel-car (WtW system boundaries).All of the described life cycle phases require process energies(electricity and steam), process and cooling water, parts andmaterials for plants and machinery construction, as well asmaintenance and fuel transportation. The life cycle inventoryprovides further description of the single process steps.25
Tomeet the goal of a comparative LCA study the investigatedPtL OME production and the reference system need to fulll thesame primary function. Therefore a driving distance of 1 km ischosen as the functional unit (FU) for the WtW systemboundaries.
Three main scenarios allow for variation of technologyparameters and the applied electricity (Fig. 1B). They are char-acterized by a high to low GHG intensity of the applied elec-tricity, a variation of the PEM efficiency and stack lifetime andthe supply of thermal energy for the synthesis steps.
steps. (B) The three technology scenarios varying in electricity supply,plied from three sources: biomethane, ammonia and direct air capture.s.
Sustainable Energy Fuels, 2019, 3, 3219–3233 | 3221

Sustainable Energy & Fuels Paper
Publ
ishe
d on
16
Sept
embe
r 20
19. D
ownl
oade
d by
Fra
unho
fer-
Ges
ells
chaf
t - F
hG o
n 11
/3/2
019
5:49
:44
PM.
View Article Online
The CO2 supply cases consider a biogas upgrading plantseparating mainly CO2 from biomethane [BM], an ammoniaproduction facility [AM] and a direct air capturing technology[DAC]. The designation of the resulting nine assessed combi-nations is indicated in square brackets.
Indicators for the environmental impacts
PtL (and CCU) systems are designed for the integration of thecarbon cycle and hence the mitigation of fossil CO2 emissions.This is why most discussions on PtL focus on the specicsystems' Global warming potential. However, a holistic LCAshall aspire to cover as well further impact categories to disclosefully the potential environmental benets/disadvantages. Theselected impact categories in this study are climate change,GWP 100a [kg CO2eq]; resources (minerals, fossils and renew-ables) [kg Sbeq]; freshwater and terrestrial acidication [molHeq
+]; freshwater eutrophication [kg Peq]; marine eutrophica-tion [kg Neq]; terrestrial eutrophication [mol Neq]; ozone layerdepletion [kg CFC-11eq]; respiratory effects, inorganics [kgPM2.5eq]; photochemical ozone creation [kg ethyleneeq];cumulative energy demand, total [MJeq]; and cumulative energydemand, non-renewable [MJeq]. The ILCD Handbook “Frame-work and requirements for LCIA models and indicators”provides general information on these categories.39
Solving of multifunctionality
A comprehensive denition of multifunctionality in the contextof CCU can be found in the ESI (S2)† together with references torelevant literature. A description of the avoided burden meth-odology applied in this study is also provided.
In this study system boundaries have been expanded toinclude the source of CO2 (Fig. 2A). Besides the primary FU of 1
Fig. 2 A) The assessed product systems with a CO2-supply based on bproviding an additional function (biomethane or ammonia) besides the msubtracts a respective amount of avoided conventional production fromimpact per km) can be compared to the other CO2 cases and the refereCapture [DAC] plant the sole function of the product system is a driving didiesel system. (B and C) The hereby obtained product specific results (FUreference diesel system.
3222 | Sustainable Energy Fuels, 2019, 3, 3219–3233
km driving distance, this leads to the inclusion of an additionalfunctionality – i.e. the production of either biomethane orammonia. Since the focus is on the production of OME3–5 orfossil diesel fuel and driving over 1 km, these additional func-tions are designated as “co-products”. For multifunctional CO2
supply cases, biomethane and ammonia life cycle impactresults are presented on the basis of the avoided burdenapproach, sometimes referred to as substitution. This repre-sents one solution for multifunctionality when the alternativeapproaches of subdivision and system expansion are either notapplicable or considered as insufficient for the presentation ofresults.40
Avoided burden presumes that co-product generation in thecoupled product system enables the substitution of a conven-tionally produced co-product. The respective impact of theavoided conventional production is credited (subtracted) to thecoupled product system. However, impact crediting can forsome cases even lead to negative overall results. Negative resultscan be mistaken as a reversal of impacts; i.e. if operated therespective product system is assumed to lead to an improve-ment of environmental conditions. A correct interpretation fornegative results is that the total impact of the coupled productsystem is smaller than the total impact of the avoided conven-tional production of the single co-product. This leads to a netbenet even though the coupled product system still has anenvironmental impact. The net benet is valid as long as themarket for the co-product is not saturated.36,40
It is important to note that avoided burden is valid as long asthe substitution of conventional production can be assured.The latter for example can be the case for carbon capture fromalready existing CO2 sources or if the co-production enablesa reduced production elsewhere. However, an ever increasing
iomethane [BM] or ammonia [AM] are multifunctional since they areain function (1 km driving distance). The avoided burden methodologythe expanded system. By this, the obtained product specific results (FU:nce diesel system. (B) In the case of a CO2-supply from a Direct-Air-stance of 1 km. (C) This as well applies to themonofunctional reference: impact per km) can be compared to both the CO2 case [DAC] and the
This journal is © The Royal Society of Chemistry 2019

Paper Sustainable Energy & Fuels
Publ
ishe
d on
16
Sept
embe
r 20
19. D
ownl
oade
d by
Fra
unho
fer-
Ges
ells
chaf
t - F
hG o
n 11
/3/2
019
5:49
:44
PM.
View Article Online
production of the co-product can lead to saturation of therespective market. For this case, results based on the avoidedburden approach might be misleading since the substitutioncannot be assured. As recommended by the ISO 14044 theresults for the expanded systems are included in the ESI (S7).†
For the monofunctional CO2 case [DAC] (Fig. 2B) and thediesel reference process (Fig. 2C) no avoided burden needs to becredited since these product systems are already product-specic with a FU of 1 km.
Theoretical background for the assessed OME3–5 synthesis
The LCA of OME3–5 synthesis conducted in this paper is based ona synthesis process using methanol and anhydrous formalde-hyde as described and economically assessed by Ouda et al.10,24 Inthis work the described process chain, formerly based on fossilmethanol, was extended to include the preceding synthesis ofCO2-basedmethanol, the capturing of CO2 and the electrolytic H2
production. The OME3–5 product mixture consists of 39 wt%OME3, 34 wt% OME4 and 27 wt% OME5 resulting in a heatingvalue (19.031 MJLHV per kg(OME3–5)) of 44% compared to that ofconventional diesel fuel (42.791 MJLHV per kg(diesel)).Theprocess was simulated using the simulation soware CHEM-CAD® coupled with Matlab® via a VBA script to describe theprocess reactors.24 A heat integration process has been performedusing the soware PinCH2.0.41 Here a heat exchanger networkhas been developed to maximize the process heat recovery whileconsidering occurring investment costs. Aerwards the heatexchanger network was implemented in CHEMCAD®.Combining the methanol synthesis sub-plant with the formal-dehyde and the OME sub-plants has been benecial for theoverall internal energy recovery. A detailed description of thesynthesis steps and a simplied process ow diagram areprovided in the ESI (S3).†
Inventory for the assessed OME3–5system
The order of the inventory is organised in analogy to the processscheme. A detailed tabular summary of the life cycle inventory(LCI) and complementing descriptions are included in the ESI(S5).† Since the hardware demand of the PtL components isincluded it was important to assume a technical lifetime for theoverall system as well as exchange rates for the PEM stacks andcatalysts. If not mentioned otherwise in the following descrip-tion of the LCI a lifetime of 20 years has been assumed for H2
production, CO2 sourcing and the synthesis steps, includingcompression and distillation.
Electricity
Three different scenarios have been selected (compare withFig. 1B) which combine steady-state electricity provision fromgrid mixes or hydropower with uctuating RE. A complement-ing detailed description of the derivation of the applied elec-tricity mixes is given in the ESI (S4).† The electricity provisionscenarios are described as:
This journal is © The Royal Society of Chemistry 2019
� [2018 GR + RE]. Consisting of 60% grid mix in Germany,2018, plus 40% local RE. The 40% share of RE is based on loadproles of local wind and photovoltaic (PV) plants in the southof Germany. The grid data for 2018 are based on published dataof the publicly accessible ISE energy charts.42
� [2050 GR + RE]. Consisting of 60% grid electricity fora predicted 2050 mix in Germany plus 40% local RE (asdescribed above). For an estimation of the 2050 grid electricitymix and its resulting footprint the REMod-D model developedat Fraunhofer ISE has been used.43–45
� [2018 HY + RE]. Consisting of 60% hydropower (run-of-river) and 40% local RE (as described above). The ecoinventprocess “hydro, run-of-river [DE]” is used as the backgroundprocess. When it comes to using limited forms of electricitygeneration such as the case for hydropower in Germany theargument for the PtL plants' additional electricity demand isjustied. It can be argued that in the case of a large-scale PtLplant in Germany an electricity supply from dedicated hydro-electric power plants remains unlikely. However, the [2018 HY +RE] scenario is included to provide the estimation for PtLscenarios where low-carbon electricity is supplied as is alreadythe case for anticipated pilot-projects in Scandinavia.46–48 Bynow, hydroelectricity provides the largest share of electricityfrom all RE sources within the EU member-states.
The electricity demand of the background processes such asdistribution or production processes of hardware materials isfullled by the grid electricity mix dened by the scenarios (year2018 or 2050). This is justied by the assumption that theseexternal process steps cannot be inuenced by the PtL processoperator and any decisions promoting RE.
It is indeed important for Power-to-X systems powered bya high share of PV and wind electricity (i.e. without direct CO2
emissions) to account as well for the indirect emissions duringtheir production processes. The upstream emissions of REplants can on the one hand be inuenced by the RE plant'scapacity utilization or, on the other, heavily inuenced by theapplied source of electricity for the RE plant productionprocesses. For example a PV module processed in a factorywhich in turn is powered by an electricity mix featuring highshares of fossil based energy generation will as well show higher(indirect) GHG emissions per kWhel-produced. In contrast, a PVmodule from 100% RE-powered factory potentially enableslower GHG emissions per kWhel-produced. Therefore in thesection discussing results we will analyse the source for speciclife cycle impacts and trace them to their initial “causer”.
CO2 sourcing
The three selected CO2 sources mirror the capture of atmo-spheric or fossil CO2 and cover a PtL feed demand of 227.6t(CO2) d
�1. For captured atmospheric CO2, the feedstock hasalready been part of the atmosphere before its re-emission tothe atmosphere during product utilisation. Hence for a WtWassessment it can be assumed that the same amount of CO2
removed from the atmosphere will be released to the atmo-sphere at any point of the life cycle. Indeed that does not meanthat ‘feedstock’ atmospheric CO2 can be accounted with zero
Sustainable Energy Fuels, 2019, 3, 3219–3233 | 3223
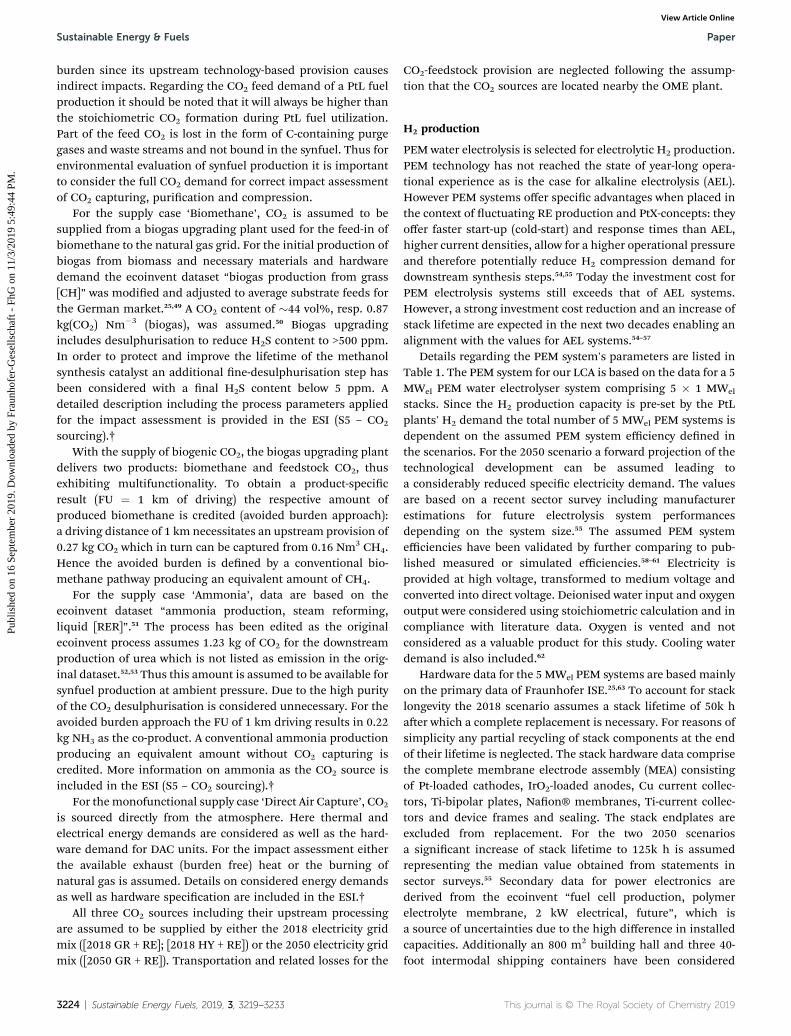
Sustainable Energy & Fuels Paper
Publ
ishe
d on
16
Sept
embe
r 20
19. D
ownl
oade
d by
Fra
unho
fer-
Ges
ells
chaf
t - F
hG o
n 11
/3/2
019
5:49
:44
PM.
View Article Online
burden since its upstream technology-based provision causesindirect impacts. Regarding the CO2 feed demand of a PtL fuelproduction it should be noted that it will always be higher thanthe stoichiometric CO2 formation during PtL fuel utilization.Part of the feed CO2 is lost in the form of C-containing purgegases and waste streams and not bound in the synfuel. Thus forenvironmental evaluation of synfuel production it is importantto consider the full CO2 demand for correct impact assessmentof CO2 capturing, purication and compression.
For the supply case ‘Biomethane’, CO2 is assumed to besupplied from a biogas upgrading plant used for the feed-in ofbiomethane to the natural gas grid. For the initial production ofbiogas from biomass and necessary materials and hardwaredemand the ecoinvent dataset “biogas production from grass[CH]” was modied and adjusted to average substrate feeds forthe German market.25,49 A CO2 content of �44 vol%, resp. 0.87kg(CO2) Nm�3 (biogas), was assumed.50 Biogas upgradingincludes desulphurisation to reduce H2S content to >500 ppm.In order to protect and improve the lifetime of the methanolsynthesis catalyst an additional ne-desulphurisation step hasbeen considered with a nal H2S content below 5 ppm. Adetailed description including the process parameters appliedfor the impact assessment is provided in the ESI (S5 – CO2
sourcing).†With the supply of biogenic CO2, the biogas upgrading plant
delivers two products: biomethane and feedstock CO2, thusexhibiting multifunctionality. To obtain a product-specicresult (FU ¼ 1 km of driving) the respective amount ofproduced biomethane is credited (avoided burden approach):a driving distance of 1 km necessitates an upstream provision of0.27 kg CO2 which in turn can be captured from 0.16 Nm3 CH4.Hence the avoided burden is dened by a conventional bio-methane pathway producing an equivalent amount of CH4.
For the supply case ‘Ammonia’, data are based on theecoinvent dataset “ammonia production, steam reforming,liquid [RER]”.51 The process has been edited as the originalecoinvent process assumes 1.23 kg of CO2 for the downstreamproduction of urea which is not listed as emission in the orig-inal dataset.52,53 Thus this amount is assumed to be available forsynfuel production at ambient pressure. Due to the high purityof the CO2 desulphurisation is considered unnecessary. For theavoided burden approach the FU of 1 km driving results in 0.22kg NH3 as the co-product. A conventional ammonia productionproducing an equivalent amount without CO2 capturing iscredited. More information on ammonia as the CO2 source isincluded in the ESI (S5 – CO2 sourcing).†
For the monofunctional supply case ‘Direct Air Capture’, CO2
is sourced directly from the atmosphere. Here thermal andelectrical energy demands are considered as well as the hard-ware demand for DAC units. For the impact assessment eitherthe available exhaust (burden free) heat or the burning ofnatural gas is assumed. Details on considered energy demandsas well as hardware specication are included in the ESI.†
All three CO2 sources including their upstream processingare assumed to be supplied by either the 2018 electricity gridmix ([2018 GR + RE]; [2018 HY + RE]) or the 2050 electricity gridmix ([2050 GR + RE]). Transportation and related losses for the
3224 | Sustainable Energy Fuels, 2019, 3, 3219–3233
CO2-feedstock provision are neglected following the assump-tion that the CO2 sources are located nearby the OME plant.
H2 production
PEM water electrolysis is selected for electrolytic H2 production.PEM technology has not reached the state of year-long opera-tional experience as is the case for alkaline electrolysis (AEL).However PEM systems offer specic advantages when placed inthe context of uctuating RE production and PtX-concepts: theyoffer faster start-up (cold-start) and response times than AEL,higher current densities, allow for a higher operational pressureand therefore potentially reduce H2 compression demand fordownstream synthesis steps.54,55 Today the investment cost forPEM electrolysis systems still exceeds that of AEL systems.However, a strong investment cost reduction and an increase ofstack lifetime are expected in the next two decades enabling analignment with the values for AEL systems.54–57
Details regarding the PEM system's parameters are listed inTable 1. The PEM system for our LCA is based on the data for a 5MWel PEM water electrolyser system comprising 5 � 1 MWel
stacks. Since the H2 production capacity is pre-set by the PtLplants' H2 demand the total number of 5 MWel PEM systems isdependent on the assumed PEM system efficiency dened inthe scenarios. For the 2050 scenario a forward projection of thetechnological development can be assumed leading toa considerably reduced specic electricity demand. The valuesare based on a recent sector survey including manufacturerestimations for future electrolysis system performancesdepending on the system size.55 The assumed PEM systemefficiencies have been validated by further comparing to pub-lished measured or simulated efficiencies.58–61 Electricity isprovided at high voltage, transformed to medium voltage andconverted into direct voltage. Deionised water input and oxygenoutput were considered using stoichiometric calculation and incompliance with literature data. Oxygen is vented and notconsidered as a valuable product for this study. Cooling waterdemand is also included.62
Hardware data for the 5 MWel PEM systems are based mainlyon the primary data of Fraunhofer ISE.25,63 To account for stacklongevity the 2018 scenario assumes a stack lifetime of 50k haer which a complete replacement is necessary. For reasons ofsimplicity any partial recycling of stack components at the endof their lifetime is neglected. The stack hardware data comprisethe complete membrane electrode assembly (MEA) consistingof Pt-loaded cathodes, IrO2-loaded anodes, Cu current collec-tors, Ti-bipolar plates, Naon® membranes, Ti-current collec-tors and device frames and sealing. The stack endplates areexcluded from replacement. For the two 2050 scenariosa signicant increase of stack lifetime to 125k h is assumedrepresenting the median value obtained from statements insector surveys.55 Secondary data for power electronics arederived from the ecoinvent “fuel cell production, polymerelectrolyte membrane, 2 kW electrical, future”, which isa source of uncertainties due to the high difference in installedcapacities. Additionally an 800 m2 building hall and three 40-foot intermodal shipping containers have been considered
This journal is © The Royal Society of Chemistry 2019

Paper Sustainable Energy & Fuels
Publ
ishe
d on
16
Sept
embe
r 20
19. D
ownl
oade
d by
Fra
unho
fer-
Ges
ells
chaf
t - F
hG o
n 11
/3/2
019
5:49
:44
PM.
View Article Online
based on presentations and publications from industry.59,64,65
Due to insufficient data availability a water–gas separator anda further H2 purication (De-Oxo) have been excluded from thehardware demand.
Methanol & OME3–5 synthesis steps
Process data of the two synthesis steps as well as relatedcompression, pumps and distillation units are based on processsimulation with CHEMCAD® and heat integration viaPinCH2.0. The synthesis plant capacity is 36 kt per a(OME3–5).Process data include the electricity for compressors and pumps,heat for the dehydrogenation of methanol to formaldehyde andsteam for the necessary 5 distillation columns. Thermal energysupply is provided by either natural gas (GRID2018 + RE) or bythe respective electricity mix (GRID2050 + RE, HYDRO2018).Material data consider catalysts, reactors, compressors andpumps. The utilities, ancillaries, and offsite infrastructuredemand are estimated by means of a standard ecoinventprocess. The ESI (S5 – Methanol synthesis and distillation)†provides detailed information on specic energy and materialdemands as well as additional information on the catalystsassumed for the assessment.
Distribution and utilisation of OME3–5
The nal OME3–5 product is assumed to be distributed to thepoint of utilisation. Since the form of distribution is verydependent on geographical and case specic assumptions,a distribution mix including comparable shares of lorry, trainand ship transportation is assumed. The necessary trans-portation distance is assumed to be 400 km. The differingenergy densities of diesel and OME3–5 result in a higher OME3–5
distribution demand.Utilisation in amedium size passenger car fuelled by OME3–5
was assumed in the utilisation phase. Due to different heatingvalues of diesel and OME3–5, the engine has a higher mass owin the case of OME fuel. Empirical data show that the injectiondemand of diesel is ca. 46% of that of OME3–5 which corre-sponds to the ratio of heating values. However, OME fuel canshow 1–3% efficiency improvement.20,66 Hence the OME3–5 fuelconsumption equals:25
mOME ¼ mdiesel
LHVdiesel
LHVOME3�5
ð1� DhÞ
Table 1 PEM electrolysis operating parameters
2018 GR
Production capacity (t(H2) d�1) 18.7
Electricity demand system (kWhel/Nm3 (H2)) 4.6
Efficiency system (%LHV, H2) 65
Efficiency rectier (%) 98Installed capacity (MWel) 40Deionised water demand (t(H2ODI) per t(H2)) 8.92Cooling water demand (t(H2Ocooling) per t(H2)) 1.62Oxygen output, vented (t(O2) per t(H2)) 7.90Lifetime PEM stacks (1000 hours) 50
This journal is © The Royal Society of Chemistry 2019
mdiesel – mass of diesel fuel [kg]. LHVdiesel – lower heating valueof diesel ¼ 42.791 MJ kg�1.67 LHVOME3�5
– lower heating value ofOME3�5 ¼ 19.031 MJ kg�1.68,69 Dh – efficiency increase for OMEvs. diesel ¼ 2%.20,66
The specic energy demand of the passenger car of 237 MJ or12.5 kg OME3–5 per 100 km is based on the EU-wide transportmodel TREMOVE of the European Union.70 This specic energydemand equals a real-world fuel consumption of 11.7 and 6.6litres of OME3–5 and diesel fuel, respectively, for amid- to upper-size passenger car. Wietschel et al. 2019 assessed a diesel fuelconsumption of 5.7 and 8.2 litres for a mid- and upper size car,respectively.71 The German federal environmental agency (UBA)quanties the average fuel consumption of cars in Germany to7.4 litres.72 The assumption we make regarding the specicenergy demand affects both fuel concepts equally. The ecoin-vent process “transport, passenger car, medium size, dieselEURO 5” has been chosen. The environmental impacts result-ing from car manufacturing are excluded since the fuelproduction and utilisation related emissions are of majorinterest in this assessment. Tire, brake and road wear emissionsare also excluded since they are assumed to be independent ofthe used fuel. The detailed compilation for the emissionsresulting from the utilisation of OME3–5 in an internalcombustion engine is provided in the ESI (S5 – OME3–5
utilization).†
Diesel reference process
The diesel reference process has been selected based onsecondary data obtained from the ecoinvent database; i.e. the“transport, passenger car, medium size, diesel, EURO 5” datasethas been selected for the impact assessment. Ecoinvent clas-sies vehicles with a gross weight of 1.6 t and an enginedisplacement of 1.4–2.0 L as “medium size” passenger cars. Thediesel fuel consumption adds up to 0.055 kg diesel per km.Upstream processes of low-sulphur diesel production, petro-leum renery operation and petroleum extraction are includedin the reference system boundaries. Electricity consumptions ofthe diesel production and the petroleum renery operationhave been adapted to the respective electricity mix of either2018 ([2018 GR + RE], [2018 HY + RE]) or 2050 ([2050 GR + RE]).However, the results for the diesel product system showed thata variation of the electricity mix only has a negligible impact on
+ RE 2018 HY + RE 2050 GR + RE
18.7 18.74.6 4.165 7498 9840 358.92 8.921.62 1.627.90 7.9050 125
Sustainable Energy Fuels, 2019, 3, 3219–3233 | 3225

Sustainable Energy & Fuels Paper
Publ
ishe
d on
16
Sept
embe
r 20
19. D
ownl
oade
d by
Fra
unho
fer-
Ges
ells
chaf
t - F
hG o
n 11
/3/2
019
5:49
:44
PM.
View Article Online
the total GHG emissions (<0.1%). For reasons of a clearpresentation the results of the OME3–5 product systems aresolely compared to the results of the diesel product systembased on the 2050 grid electricity mix. Technological improve-ments for 2050 in the case of fossil diesel production have notbeen considered. It can be assumed that these conventionalprocesses are established and mature. As for OME3–5 produc-tion, emissions from the manufacturing of the car as well astire, brake and road wear emissions have been excluded fromthe assessment.
Environmental impacts of OME3–5 assynfuel – via the avoided burdenapproach
To answer the main research questions (environmental impactsof OME3–5 production and utilisation compared to conventionalfossil diesel fuel) the life cycle impact assessment results arerst discussed for the global warming potential (GWP100).Subsequently, additional assessed impact categories will beaddressed to disclose a more complete picture of the environ-mental implications. A sensitivity analysis regarding the foot-print of supplied electricity as well as the PEM system efficiencyconcludes the section on results. The whole section on results isbased on and valid for the avoided burden approach (comparewith the section “Solving of multifunctionality”). The life cycleimpact assessment results for the expanded system areincluded in the ESI (S7 – Life cycle impact assessment results forsystem expansion).†
Global warming potential
Fig. 3 presents the product specic GWP results (expressed asGHG emissions g(CO2eq) km
�1; overall impact as green bars).The product specic FU of 1 km allows the comparison of allCO2 cases and the diesel reference. For the CO2 cases Bio-methane and Ammonia, the avoided burden approach has beenapplied and a conventional production of the co-product iscredited to the OME product system (i.e. a negative value in lightblue). For the CO2 cases Biomethane and Direct Air Capture (i.e.atmospheric CO2 sources), the nal exhaust pipe CO2 emissionsare considered without GWP (compare with the section CO2
sourcing). By contrast, the fossil CO2 case Ammonia and thereference diesel process show GWP during the utilisation pha-ses (grey bar). In the following all three CO2 sources based onthe 2018 grid and RE mix [OME2018 GR + RE] will be discussed.Subsequently the results for the additional two electricity casesare analysed.
Case [OME2018 GR + RE]. The electricity mix consisting of60% grid 2018 + 40% RE carries a GWP burden of 350 g(CO2eq)kWhel
�1, with the highest contribution from lignite and hardcoal based electricity production. The 40% share of local windand PV production accounts for only 6% of the electricity'sGWP. Regarding the WtW driving emissions, results clearlyshow that for all three CO2 sources the assessed OME3–5
production pathway is not favourable in comparison to drivingwith conventional diesel fuel. The corresponding GHG
3226 | Sustainable Energy Fuels, 2019, 3, 3219–3233
emissions per km of driving distance with OME3–5 exceed thoseof driving with conventional diesel fuel by up to 263% for theworst case [OME2018 GR + RE DAC, natural gas as heat supply].The calculated WtW emissions of 209 g(CO2eq) km
�1 for thediesel reference align with the values published by Mahbubet al. of 199 g(CO2eq) km
�1.28 The diesel exhaust pipe emissions(Tank-to-Wheel) for the present LCA account for 177 g(CO2eq)km�1. The 2020 European eet target value aims at 95 g(CO2eq)km�1 and takes manufacturer specications as a calculationbasis. For the present study the specic energy demand of thepassenger car orientates on a current mid-class vehicle underreal driving conditions (2.37 MJ km�1; 6.6 L of diesel fuel).
With regard to H2 production it should be recalled that in thecase of PtX all of the nal fuel energy content is provided by H2
or rather the upstream electricity. Due to a chain of involvedconversion efficiencies even minor shares of a carbon intensiveelectricity supplier (coal-red or natural gas power plants) aremirrored in the PtX products’ GWP footprint. The sameaccounts for the thermal heat supply for synthesis and distil-lation steps. The WtW results for the Direct-Air-Capture casesincrease by 114 g(CO2eq) km
�1 in the case of a natural gas basedprovision of necessary low-temperature heat for CO2
desorption.The steps of methanol- and OME-synthesis account for 31–
42% of the total OME3–5 life-cycle GHG emissions. Here thesynthesis steps in the case of ammonia result in a slightlyhigher GHG emission since CO2 containing purge streams areof fossil origin.
Case [OME2050 GR + RE]. The GHG footprint of the REModbased 2050 electricity grid mix results in 100 g(CO2eq)kWhel
�1. Accompanied by a 40% share of local wind and PVelectricity the applied electricity's total footprint results in 81g(CO2eq) kWhel
�1. With a less carbon-intensive electricityprovision the GHG emissions per km of driving distance canbe lowered signicantly by up to�40% and fall below the onesof the diesel reference system. The scenarios’ total specicGHG emissions of the OME3–5 product system result in 124–151 g(CO2eq) km
�1.Case [OME2018 HY + RE]. The [OME2018 HY + RE]
scenarios prot from a very low GWP for an electricity of 20g(CO2eq) kWhel
�1 (i.e. hydropower). However, when assessinglife cycle impacts of hydropower it is important to considerthat further environmental impact categories are heavilydependent on the type, capacity and location of the facility.73,74
For this low-carbon electricity provision the GHG emissionsfor OME3–5 fuel clearly fall below the emissions of driving withconventional diesel fuel by �59% to �86%. The DAC suppliedwith thermal energy from natural gas is in the range of fossildiesel fuel.
GWP of the electrolytic H2 production. When based on the2018 grid + RE electricity mix the life cycle phase of H2
production accounts for 53–68% of the PtL systems' total overallGWP. GHG emissions arising from PEM electrolysers sum up to18.3 kg(CO2eq) per kg(H2), which is signicantly higher thanthat of conventional H2 production such as steam-reforming ofnatural gas (9.0–13.0 kg(CO2eq) per kg(H2))75–77 or coal gasica-tion (11.0–12.5 kg(CO2eq) per kg(H2)).77 In the case of [OME2050
This journal is © The Royal Society of Chemistry 2019

Fig. 3 Product specific well-to-wheel life cycle impact assessment results (GWP100a [g CO2eq km�1]) for the assessed product systems. In thecase of subtraction of an avoided burden the respective negative value is indicated in light blue. The resulting total impact is plotted as a greenbar. The difference compared to the conventional diesel is specified with black arrows. For the CO2 case Direct-Air-Capture, the thermaldemand of the DAC plant is met either by exhaust heat (EH, burden-free) or natural gas (NG).
Paper Sustainable Energy & Fuels
Publ
ishe
d on
16
Sept
embe
r 20
19. D
ownl
oade
d by
Fra
unho
fer-
Ges
ells
chaf
t - F
hG o
n 11
/3/2
019
5:49
:44
PM.
View Article Online
GR + RE] the life cycle phase of H2 production results ina reduced GWP impact of 3.5 kg(CO2eq) per kg(H2). Otherpublished GWP footprints for low-carbon H2 production alsoclearly depend on the electricity source and vary between 0.6kg(CO2eq) per kg(H2),75,78 1.9 kg(CO2eq) per kg(H2)78 and 3.0kg(CO2eq) per kg(H2).79 Electrolysis hardware is, if part of therespective LCA, identied to have a minor impact. In thepresent assessment the share of GWP impact resulting from thePEM hardware varies between 0.6% (2018: 40 MWel PEM, life-time 50k h) and 1.8% (2018: 35 MWel PEM, lifetime 125k h) ofthe H2 production phase.
Thermal demand of synthesis and distillation. The synthesisand distillation steps are characterised by a high thermal energydemand (4.84 MWhth per t(OME3–5) produced). In case low-carbon-electricity is available these steps can benet fromthermal energy provided via electric energy. If natural gas isused for steam and heat production its proportional GWP sumsup to 144 g(CO2eq) km�1. A switch to an electricity basedthermal supply in the 2050 grid mix decreases the total GWP ofthe two synthesis steps by 72%. At the same time the electricitydemand of the PtL foreground system (PEM electrolyser +synthesis and distillation) is increased from 1.27 kWhel km
�1 to1.79 kWhel km
�1. The temperature level of the necessary heatsupply for methanol dehydrogenation to formaldehyde is at ca.700 �C, equal to a thermal demand of 6.93 MWth. Thusa thermal supply via excess heat at such high temperatures
This journal is © The Royal Society of Chemistry 2019
seems highly case-dependent. However, industrial processesrequiring high temperature process heat (>500 �C) such as pigiron and steel mills, stone and brick production or the glass andceramics industry are available and at the same time due tohigh direct CO2 emissions, a potential CCU case.80 If not utilisedotherwise the available high temperature excess heat can thusbe available as a “burden free” heat source to meet the thermaldemand of the PtL process. For a hypothetical scenario in 2050where the assessed OME3–5 production is supplied with hightemperature excess heat the overall GWP can be lowered to 94g(CO2eq) km�1, �55% in comparison to the reference dieselprocess' GWP. The impact related to the provision of PtL planthardware and infrastructure lies between 0.8% [OME2018 GR +RE] and 17% [OME2018 HY + RE] of the overall WtW GHGemissions.
Further environmental impacts
Fig. 4 shows the further assessed environmental impact cate-gories for the CO2 case Biomethane. The results are normalisedto the diesel reference. All results are again based on the avoi-ded burden methodology.
For the [OME2018 GR + RE] scenarios synthetic fuelproduction and utilisation performs worse than the dieselreference for all impact categories. The largest contributor formost categories is the fossil share of the electricity used. With
Sustainable Energy Fuels, 2019, 3, 3219–3233 | 3227

Fig. 4 Further evaluated impact categories by means of the CO2 case [BM]. Relative shares relate to the diesel reference (100%). The flowspresented exemplify the cause of specific impact categories. The percentage value for the specific initial causer relates to the absolute value ofthe impact category (e.g. spoil from lignite mining causes 74% of the overall freshwater eutrophication in the scenario [OME2018 GR + RE BM]).
Sustainable Energy & Fuels Paper
Publ
ishe
d on
16
Sept
embe
r 20
19. D
ownl
oade
d by
Fra
unho
fer-
Ges
ells
chaf
t - F
hG o
n 11
/3/2
019
5:49
:44
PM.
View Article Online
a reduction of fossil energy shares for the [OME2050 GR + RE]and the [OME2018 HY + RE] scenarios the impacts can bereduced signicantly for most cases. However, the categoriesaddressing impacts on ecosystems remain high even with a lowcarbon electricity provision. The following subsections focus onthe worse performing categories and analyze the respectivecause in this context.
Freshwater eutrophication. The impact category freshwatereutrophication (kg Peq) is outstanding by exceeding the dieselreference by 15 100% for the [OME2018 + RE] scenario. Here thelargest share (74%) can be attributed to lignite based electricityprovision, more precisely to the spoil and tailing wastesresulting from opencast mining.81 However, even without anydirect fossil-based electricity in the [OME2018 HY + RE]scenario, the contribution to freshwater eutrophication remainshigh (+645%). One main reason for eutrophication even for RE-based electricity is the provision of minerals and metals for themanufacturing of RE plants. Additionally the electricity for theupstream manufacturing processes of wind energy generatorsand solar modules is supplied by the manufacturing country'selectricity mix and hence include fossil energies. ForthcomingLCA studies for future scenarios should therefore account forchanges in the electricity supply of RE manufacturingprocesses. The assessed environmental footprints of RE tech-nologies will otherwise appear high and not reect any progressin future defossilisation.
Respiratory effects, inorganics. The category respiratoryeffects is represented by particulate matter (PM) formation (kgPM2.5eq). In the case of the [OME2018 GR + RE] scenario PMformation is dominated by the combustion of fossil resourcesfor the supply of electricity (49%) and syntheses' thermal energy(46%). For the low carbon scenario [OME2018 HY + RE] 82% ofPM-formation can be attributed to the electricity supply. Up to
3228 | Sustainable Energy Fuels, 2019, 3, 3219–3233
11% of the respiratory effects can be accounted to the OMEutilisation phase although direct PM formation has beenconsidered as non-existent in the case of 100% OME3–5 fuel.This is due to the formation of secondary PM equivalents suchas NOx which are part of this impact category.
Resource depletion. The depletion of resources (minerals,fossils, renewables, kg Sbeq) clearly exceeds the fossil referencefor all PtL scenarios. The major share is attributed to thedemand for minerals and metals during the manufacturing ofRE plants, more precisely to the need for molybdenum (alloy),zinc (galvanizing), copper (generators and cables), cobalt(magnets), and iron (steel constructions). These minerals andmetals represent an integral part of RE technologies and thusincrease even more for the RE dominated scenario [OME2050GR + RE]. However, future RE plants will feature increasedefficiencies and installed capacities. This in turn will lead tospecically lower amounts of incorporated minerals and metalsper energy harvested.82 Nonetheless, the very high increase upto 11 200% resource depletion represents a rising future envi-ronmental issue which has to be addressed by material effi-ciency including improved recycling ratios and as well lessextensive mining processes.
Cumulative energy demand. The total cumulative energydemand (CED total; MJeq) for the production of OME3–5 isincreased when compared to fossil-based production. Thisrelates to the concept of the “free-lunch” for fossil-based energycarrier production. Fossil fuels and energy carriers source theirenergy content from high-carbon containing fossil resources.The amount of primary energy to be considered is the amountof heating value extracted from these fossil resources. For PtLproducts all of the nal energy content is to be provided elec-trically and hence linked to multiple conversion steps andefficiencies. Hence, on the one hand, it is essential to decrease
This journal is © The Royal Society of Chemistry 2019

Paper Sustainable Energy & Fuels
Publ
ishe
d on
16
Sept
embe
r 20
19. D
ownl
oade
d by
Fra
unho
fer-
Ges
ells
chaf
t - F
hG o
n 11
/3/2
019
5:49
:44
PM.
View Article Online
the total energy demand by further technology development/efficiency improvements whilst fullling the energy demandusing a very high share of RE. This allows for a low share offossil-based energy content, mirrored in the CED non-renewable. Here the [OME2050 GR + RE BM] and the[OME2018 HY + RE BM] scenarios are clearly less fossil-intensive than the fossil diesel reference. All statements madein terms of the qualitative results are transferable to the othertwo evaluated CO2 sources.
Sensitivity of life cycle impact assessment results
Variations in supplied electricity and water electrolysis effi-ciency. The life cycle impact assessment results demonstratedthat the process energies both electric as well as thermal ener-gies signicantly inuence the overall GHG emission intensity.Similar to the case of previous power-to-hydrogen and -meth-anol studies our results show that the energy intensity of theelectrolytic H2 supply proves to be a main driver of the overallGHG intensity.79,83–85 The specic energy demand for H2 gener-ation strongly impacts on the PtL plants' total energy demand,whilst GHG emission intensity of the electricity supply alsoheavily impacts on the synfuels' GHG emissions.
Therefore it is clear that high efficiency water splittingprocesses are even more necessary in the cases of a carbon-intensive electricity supply. Fig. 5 shows the dependency of theWtW GHG emissions [g(CO2eq) km
�1] on the water electrolysissystem efficiency and the GWP intensity of the input electricity[g(CO2eq) kWhel
�1]. The CO2 case Biomethane serves as a basisfor this sensitivity evaluation. Thermal energy is assumed to besupplied electrically. The sensitivity results reveal that, depend-ing on the water electrolysis system efficiency, an electricitysupply with a GWP > 95–115 g(CO2eq) kWhel
�1 will result in
Fig. 5 Dependency of the PtL WtW GWP [g(CO2eq) km�1] on the GWP
intensity of the input electricity [g(CO2eq) kWhel�1] and the electrolysis
system efficiency. Exemplary GWP intensities of national grid elec-tricity mixes are indicatedwith redmarkers (FR: France, GER: Germany,SE: Sweden, NO: Norway, and IS: Iceland).
This journal is © The Royal Society of Chemistry 2019
emissions exceeding the WtW emissions of driving withconventional diesel fuel. Input electricity with a GWP < 50g(CO2eq) kWhel
�1 such as hydro, wind and solar offers WtW GHGemissions considerably below 100 g(CO2eq) km
�1. In the case ofa supply from national electricity grids only a few Europeancountries (i.e. Sweden, Norway or Iceland) currently offer lowGHG intensive grid electricity. Furthermore, the sensitivityanalysis shows that for low GHG intensive electricity, waterelectrolysis efficiency plays a minor role in GWP impact reduc-tion. From an economic perspective, a high water electrolysisefficiency remains, besides the utilisation rate, a key driver forlow levelized cost of H2.55,86
Further discussion regarding the dependency of the resultsbased on an expanded system with or without crediting anavoided burden is provided in the ESI (S6).† It should be notedthat the way of solving multifunctionality can inuence lifecycle impact results heavily as is the case for the present LCA:based on a preliminary study17 two common allocation proce-dures have been applied to the multifunctional system:economical and cut-off allocation (CO2 sourcing withoutimpact). The effect can be high: economical and cut-off alloca-tion show the potential to shi the above-mentioned resultswith a maximum increase of 300%.
Conclusions
The presented LCA of OME3–5 production based on a PtLapproach and different scenarios (e.g. CO2 source and electricitysource) was performed on WtW emission basis using an avoi-ded burden approach. Both 2018 and 2050 scenarios have beenincluded to allow for technology developments and anincreasing share of RE in the future grid electricity mix forGermany (Fig. 1). The results are very sensitive to the allocationprocedure used in the LCA. Solving multifunctionality by aneconomical or cut-off allocation approach shows high sensi-tivity and can even reverse the results.
The GWP results (Fig. 3), representing the WtW GHG emis-sions, show that for a high share of RE the OME3–5 fuel isadvantageous compared to fossil diesel. For the best assessedcases the WtW GHG emissions can be reduced by 86% to 59%,equating to 29–86 g(CO2eq) km�1. However, this signicantreduction can only be assured with a very high RE electricitycontribution. This is due to the fact that all of the synfuels'energy content has to be provided by electricity, chemicallystored in the form of H2. Hence, even low shares of fossil-basedelectricity, as will be the case for the current and near-futureEuropean grid mixes, will lead to a noticeable increase inrelated environmental impacts.
For conventional fossil fuels the bulk of WtW emissions(CO2, CO, NOx, PM, SO2, and HC) arise during the utilisationphase. This results in high local exhaust pipe emissions. Forfossil fuels the production phase is of comparatively minorenvironmental signicance – i.e. nature has already done thework. Conversely for synthetic fuels such as OME3–5, exhaustpipe emissions, in particular NOx, PM and SO2, can be reducedsignicantly due to their purity and combustion chemistry.29,66
Thus, the cause of WtW emissions is rather shied to the life
Sustainable Energy Fuels, 2019, 3, 3219–3233 | 3229
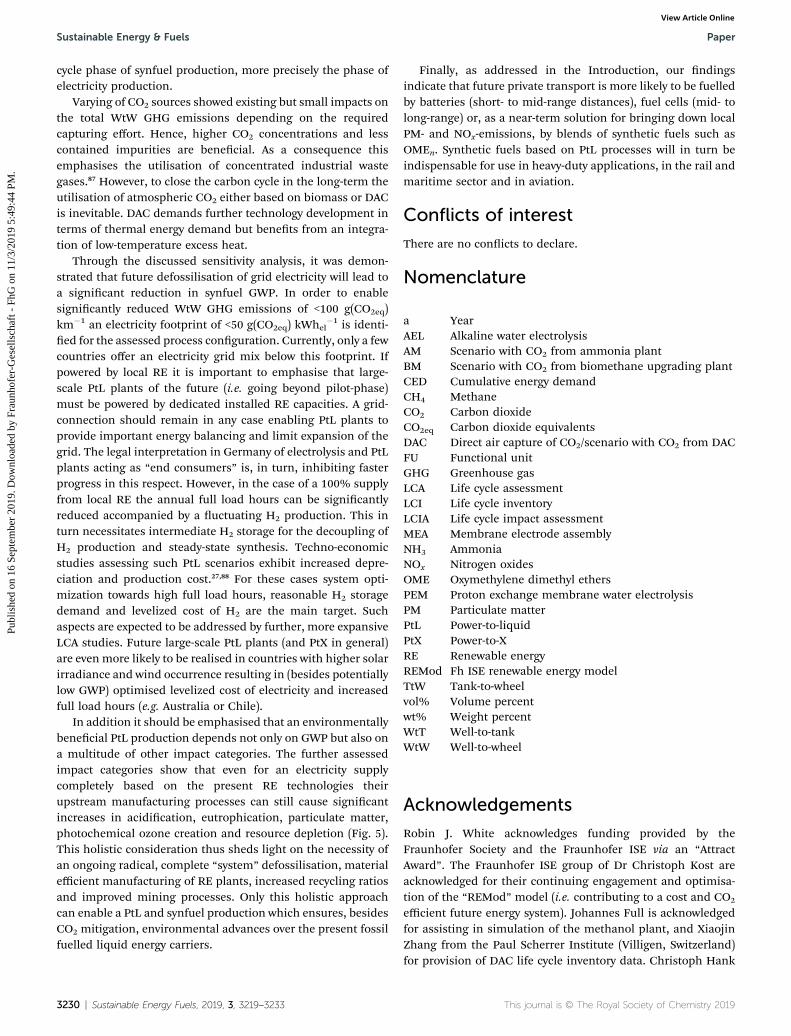
Sustainable Energy & Fuels Paper
Publ
ishe
d on
16
Sept
embe
r 20
19. D
ownl
oade
d by
Fra
unho
fer-
Ges
ells
chaf
t - F
hG o
n 11
/3/2
019
5:49
:44
PM.
View Article Online
cycle phase of synfuel production, more precisely the phase ofelectricity production.
Varying of CO2 sources showed existing but small impacts onthe total WtW GHG emissions depending on the requiredcapturing effort. Hence, higher CO2 concentrations and lesscontained impurities are benecial. As a consequence thisemphasises the utilisation of concentrated industrial wastegases.87 However, to close the carbon cycle in the long-term theutilisation of atmospheric CO2 either based on biomass or DACis inevitable. DAC demands further technology development interms of thermal energy demand but benets from an integra-tion of low-temperature excess heat.
Through the discussed sensitivity analysis, it was demon-strated that future defossilisation of grid electricity will lead toa signicant reduction in synfuel GWP. In order to enablesignicantly reduced WtW GHG emissions of <100 g(CO2eq)km�1 an electricity footprint of <50 g(CO2eq) kWhel
�1 is identi-ed for the assessed process conguration. Currently, only a fewcountries offer an electricity grid mix below this footprint. Ifpowered by local RE it is important to emphasise that large-scale PtL plants of the future (i.e. going beyond pilot-phase)must be powered by dedicated installed RE capacities. A grid-connection should remain in any case enabling PtL plants toprovide important energy balancing and limit expansion of thegrid. The legal interpretation in Germany of electrolysis and PtLplants acting as “end consumers” is, in turn, inhibiting fasterprogress in this respect. However, in the case of a 100% supplyfrom local RE the annual full load hours can be signicantlyreduced accompanied by a uctuating H2 production. This inturn necessitates intermediate H2 storage for the decoupling ofH2 production and steady-state synthesis. Techno-economicstudies assessing such PtL scenarios exhibit increased depre-ciation and production cost.27,88 For these cases system opti-mization towards high full load hours, reasonable H2 storagedemand and levelized cost of H2 are the main target. Suchaspects are expected to be addressed by further, more expansiveLCA studies. Future large-scale PtL plants (and PtX in general)are even more likely to be realised in countries with higher solarirradiance and wind occurrence resulting in (besides potentiallylow GWP) optimised levelized cost of electricity and increasedfull load hours (e.g. Australia or Chile).
In addition it should be emphasised that an environmentallybenecial PtL production depends not only on GWP but also ona multitude of other impact categories. The further assessedimpact categories show that even for an electricity supplycompletely based on the present RE technologies theirupstream manufacturing processes can still cause signicantincreases in acidication, eutrophication, particulate matter,photochemical ozone creation and resource depletion (Fig. 5).This holistic consideration thus sheds light on the necessity ofan ongoing radical, complete “system” defossilisation, materialefficient manufacturing of RE plants, increased recycling ratiosand improved mining processes. Only this holistic approachcan enable a PtL and synfuel production which ensures, besidesCO2 mitigation, environmental advances over the present fossilfuelled liquid energy carriers.
3230 | Sustainable Energy Fuels, 2019, 3, 3219–3233
Finally, as addressed in the Introduction, our ndingsindicate that future private transport is more likely to be fuelledby batteries (short- to mid-range distances), fuel cells (mid- tolong-range) or, as a near-term solution for bringing down localPM- and NOx-emissions, by blends of synthetic fuels such asOMEn. Synthetic fuels based on PtL processes will in turn beindispensable for use in heavy-duty applications, in the rail andmaritime sector and in aviation.
Conflicts of interest
There are no conicts to declare.
Nomenclature
a
Year AEL Alkaline water electrolysis AM Scenario with CO2 from ammonia plant BM Scenario with CO2 from biomethane upgrading plant CED Cumulative energy demand CH4 Methane CO2 Carbon dioxide CO2eq Carbon dioxide equivalents DAC Direct air capture of CO2/scenario with CO2 from DAC FU Functional unit GHG Greenhouse gas LCA Life cycle assessment LCI Life cycle inventory LCIA Life cycle impact assessment MEA Membrane electrode assembly NH3 Ammonia NOx Nitrogen oxides OME Oxymethylene dimethyl ethers PEM Proton exchange membrane water electrolysis PM Particulate matter PtL Power-to-liquid PtX Power-to-X RE Renewable energy REMod Fh ISE renewable energy model TtW Tank-to-wheel vol% Volume percent wt% Weight percent WtT Well-to-tank WtW Well-to-wheelAcknowledgements
Robin J. White acknowledges funding provided by theFraunhofer Society and the Fraunhofer ISE via an “AttractAward”. The Fraunhofer ISE group of Dr Christoph Kost areacknowledged for their continuing engagement and optimisa-tion of the “REMod” model (i.e. contributing to a cost and CO2
efficient future energy system). Johannes Full is acknowledgedfor assisting in simulation of the methanol plant, and XiaojinZhang from the Paul Scherrer Institute (Villigen, Switzerland)for provision of DAC life cycle inventory data. Christoph Hank
This journal is © The Royal Society of Chemistry 2019

Paper Sustainable Energy & Fuels
Publ
ishe
d on
16
Sept
embe
r 20
19. D
ownl
oade
d by
Fra
unho
fer-
Ges
ells
chaf
t - F
hG o
n 11
/3/2
019
5:49
:44
PM.
View Article Online
acknowledges funding provided by “ENsource – Zentrum furangewandte Forschung Urbane Energiesysteme und Ressour-ceneffizienz”, and Franz Kaspar Mantei would like to acknowl-edge funding through the “Deutsche Bundesstiung Umwelt”.Achim Schaadt is grateful for funding by the Fraunhofer project“Gruner Verbrennungsmotor”. Flaticon symbols were designedand provided by Vectors Market.89
References
1 J. Rogelj, D. Shindell, K. Jiang, S. Fita, P. Forster,V. Ginzburg, C. Handa, H. Kheshgi, S. Kobayashi,E. Kriegler and L. Mundaca, Mitigation PathwaysCompatible with 1.5 �C in the Context of SustainableDevelopment: Global Warming of 1.5 �C. An IPCC SpecialReport on the impacts of global warming of 1.5 �C above pre-industrial levels and related global greenhouse gas emissionpathways, in the context of strengthening the global responseto the threat of climate change, sustainable development, andefforts to eradicate poverty, Geneva, 2018.
2 M. Deutsch, M. Buck, P. Graichen and F. Vorholz, Die Kostenvon unterlassenem Klimaschutz fur den Bundeshaushalt: DieKlimaschutzverpichtungen Deutschlands bei Verkehr,Gebauden und Landwirtscha nach der EU-Effort-Sharing-Entscheidung und der EUClimate-Action-Verordnung, Studie,Berlin, 2018.
3 Umweltbundesamt, Berichterstattung unter derKlimarahmenkonvention der Vereinten Nationen und demKyoto-Protokoll 2018: Nationaler Inventarbericht zumDeutschen Treibhausgasinventar 1990–2016,Umweltbundesamt – UNFCCC-Submission, Berlin, 2018.
4 C. Tyggestad, N. Scharma, O. Rolser and B. Smeets, GlobalEnergy Perspective 2019: Reference Case: Energy Insights,Summary, New York, USA, 2019.
5 European Commission, Electrication of the TransportSystem: Studies and Reports, Brussels, 2017.
6 A. Sternberg, C. Hank and C. Hebling, Greenhouse GasEmissions for Battery Electric and Fuel Cell Electric Vehicleswith Ranges over 300 kilometers: Study Commissioned by H2
Mobility, Freiburg, 2019.7 S. Siegemund, M. Trommler, O. Kolb and V. Zinnecker, ThePotential of Electricity-Based Fuels for Low-EmissionTransport in the EU: E-Fuels Study, An Expertise by LBST andDena, Berlin, 2017.
8 Oko-Institut and Fraunhofer-Institut fur System- undInnovationsforschung ISI, Klimaschutzszenario 2050: 2.Endbericht, Studie im Aurag des Bundesministeriums fur,Berlin, Karlsruhe, 2015.
9 https://www.destatis.de/DE/Themen/Branchen-Unternehmen/Energie/Erzeugung/Tabellen/bruttostromerzeugung.html, last accessed September 2019.
10 M. Ouda, F. K. Mantei, M. Elmehlawy, R. J. White, H. Kleinand S.-E. K. Fateen, React. Chem. Eng., 2018, 3(3), 277.
11 W. Ying, L. Genbao, Z. Wei and Z. Longbao, Fuel Process.Technol., 2008, 89(12), 1272.
12 B. Lumpp, D. Rothe, C. Pastoetter, R. Laemmermann andE. Jacob, Motortech. Z., 2011, 2011(72–3), 198.
This journal is © The Royal Society of Chemistry 2019
13 M. Hartl, K. Gaukel, D. Pelerin and G. Wachtmeister,Motortech. Z., 2017, 78(02), 52.
14 M. Munz, A. Mokros, D. Topfer and C. Beidl, Motortech. Z.,2018, (03), 16.
15 E. Jacob and M. Hartl, Tagungsband des 37, InternationalenWiener Motorenymposiums, 2016.
16 M. Hartl, P. Seidenspinner, E. Jacob and G. Wachtmeister,Fuel, 2015, 153, 328.
17 W. Maus and E. Jacob, Synthetic Fuels – OME1: A PotentiallySustainable Diesel Fuel, 2014.
18 The Power to Liquid Concept: Hydrogenation of CO2 toMethanol and the Production of Oxymethylene Ethers,Catalysis – Novel Aspects in Petrochemistry and Rening, ed.M. Ouda, G. Yarce, K. Hesterwerth, M. Hadrich, R. J.White, A. Schaadt and H. Klein, 2016.
19 L. Pellegrini, M. Marchionna, R. Patrini and S. Florio, SAEInt., 2013, 2013.
20 G. Richter and H. Zellbeck, Motortech. Z., 2017, 78(12), 66.21 S. Deutz, D. Bongartz, B. Heuser, A. Katelhon, L. Schulze
Langenhorst, A. Omari, M. Walters, J. Klankermayer,W. Leitner, A. Mitsos, S. Pischinger and A. Bardow, EnergyEnviron. Sci., 2017, 55(Part B), 7296.
22 L. Lautenschutz, D. Oestreich, P. Seidenspinner, U. Arnold,E. Dinjus and J. Sauer, Fuel, 2016, 173, 129.
23 E. Jacob and W. Maus, Motortech. Z., 2017, 78(3), 54.24 M. Ouda, F. Mantei, K. Hesterwerth, E. Bargiacchi, H. Klein
and R. J. White, React. Chem. Eng., 2018, 3(5), 676.25 L. Lazar, Environmental performance of liquid energy
carriers and fuels based on renewable hydrogen andrecycled carbon dioxide (Power-to-Liquid), Master thesis,Pforzheim University, Pforzheim, 2018.
26 N. Koppel, Life Cycle Assessment of Synthetic Fuel:Environmental Performance of Oxymethylene Ethers(OME) Based on Recycled Carbon Dioxide and RenewableHydrogen, Master thesis, Technical University of Munich,Munchen, 2019.
27 C. Hank, S. Gelpke, A. Schnabl, R. J. White, J. Full, N. Wiebe,T. Smolinka, A. Schaadt, H.-M. Henning and C. Hebling,Sustainable Energy Fuels, 2018, 2(6), 1244.
28 N. Mahbub, A. O. Oyedun, A. Kumar, D. Oestreich, U. Arnoldand J. Sauer, J. Cleaner Prod., 2017, 165, 1249.
29 G. Avolio, O. Kastner, G. Rosel and R. Bruck, Motortech. Z.,2018, 79(07), 16.
30 G. A. Olah, A. Goeppert and G. K. S. Prakash, J. Org. Chem.USSR, 2009, 74(2), 487.
31 A. Feiling, M. Munz and C. Beidl, Motortech. Z., 2016,2016(02/2016), 16.
32 Umweltbundesamt, Postfossile Energieversor-gungsoptionenfur einen treibhausgasneutralen Verkehr im Jahr 2050: Eineverkehrstrager-ubergreifende Bewertung, Dessau-Roßlau, 2015.
33 Continental AG, Climate-Neutral Driving: ContinentalSuccessfully Tests the Synthetic Diesel Fuel OME,Regensburg, 2017.
34 DIN Deutsches Institut fur Normung e.V., DIN EN ISO 14040,2006th edn. 13.020.10, 2009.
35 DIN Deutsches Institut fur Normung e.V., DIN EN ISO 14044,2006th edn. 13.020.10, 2006.
Sustainable Energy Fuels, 2019, 3, 3219–3233 | 3231

Sustainable Energy & Fuels Paper
Publ
ishe
d on
16
Sept
embe
r 20
19. D
ownl
oade
d by
Fra
unho
fer-
Ges
ells
chaf
t - F
hG o
n 11
/3/2
019
5:49
:44
PM.
View Article Online
36 European Commission Joint Research Centre, ILCD-Handbook – General Guide for Life Cycle Assessment: DetailedGuidance, Luxembourg, 2010.
37 European Commission Joint Research Centre, ILCD-Handbook – Recommendations for Life Cycle ImpactAssessment in the European Context: Based on ExistingEnvironmental Impact Assessment Models and Factors,Luxembourg, 2011.
38 European Commission Joint Research Centre, ILCD-Handbook – Characterisation Factors of the ILCDRecommended Life Cycle Impact Assessment Methods:Database and Supporting Information, Luxembourg, 2012.
39 European Commission Joint Research Centre, ILCD-Handbook – Framework and Rquirements for Life CycleImpact Assessments Models and Indicators, Luxembourg,2010.
40 A. Zimmerman, J. Wunderlich, G. Buchner, L. Muller,K. Armstrong, S. Michailos, A. Marxen, H. Naims,F. Mason, G. Stokes and E. Williams, Techno-EconomicAssessment & Life-Cycle Assessment Guidelines for CO2
Utilization, Global CO2 Initiative, University of Michigan,Berlin, 2018.
41 https://pinch-analyse.ch/index.php/de/last accessed January2019.
42 https://www.energy-charts.de/index_de.htmlast accessedSeptember 2018.
43 A. Palzer, Sektorubergreifende Modellierung undOptimierung eines zukunigen deutschen Energiesystemsunter Berucksichtigung von Energieeffizienzmaßnahmenim Gebaudesektor, PhD Dissertation, Karlsruhe Institute ofTechnology KIT, Karlsruhe, 2016.
44 A. Palzer and H.-M. Henning, Renewable Sustainable EnergyRev., 2014, 30, 1019.
45 A. Palzer and H.-M. Henning, Energy Technol., 2014, 2(1), 13.46 Sunre GmbH, First commercial Plant for the production of
Blue Crude planned in Norway, Dresden, 2017.47 A. Varone, Sustainable Fuels in the Nordic Countries, Potsdam,
2015.48 J. Perner and D. Bothe, International Aspects of a Power-to-X
Roadmap: A Report Prepared for the World Energy CouncilGermany, 2018.
49 P. Adler, E. Billig and A. Brosowski, LeitfadenBiogasauereitung und -einspeisung, Gulzow-Pruzen, 2014.
50 W. Urban, K. Girod and H. Lohmann, Technologien undKosten der Biogasauereitung und Einspeisung in dasErdgasnetz: Ergebnisse der Markterhebung 2007–2008,Oberhausen, 2009.
51 https://v31.ecoquery.ecoinvent.org/Details/UPR/044d2021-1c7b-4975-b283-6744737d0f28/8b738ea0-f89e-4627-8679-433616064e82.
52 H.-J. Althaus, R. Hischier, M. Osses, A. Primas, S. Hellweg,N. Jungbluth and C. Mike, Life Cycle Inventory of Chemicals:Data v2.0, ecoinvent report no. 8, Dusseldorf, 2007.
53 T. Nemecek and T. Kagi, Live Cycle Inventory of AgriculturalProduction Systems: Ecoinvent Report No. 15, Zurich,Switzerland, Dubendorf, 2007.
3232 | Sustainable Energy Fuels, 2019, 3, 3219–3233
54 A. Buttler and H. Spliethoff, Renewable Sustainable EnergyRev., 2018, 82, 2440.
55 T. Smolinka, N. Wiebe, S. Philip, A. Palzer, F. Lehner,M. Jansen, S. Kiemel, M. Robert, S. Wahren andF. Zimmermann, Studie IndWEDe: Industrialisierung derWasserelektrolyse in Deutschland: Chancen undHerausforderungen fur nachhaltigen Wasserstoff fur Verkehr,Strom und Warme, Berlin, 2018.
56 Fuel Cell and Hydrogen Joint Undertaking – FCH JU, Studyon Early Business Cases for H2 in Energy and More BroadlyPower to H2 Applications: Final Report, Brussel, 2017.
57 O. Schmidt, A. Gambhir, I. Staffell, A. Hawkes, J. Nelson andS. Few, Int. J. Hydrogen Energy, 2017, 42(52), 30470.
58 Energiespeicher - Bedarf, Technologien, Integration, ed. M.Sterner and I. Stadler, Springer, Berlin Heidelberg, Berlin,Heidelberg, 2014.
59 T. Smolinka, T. Raksha, T. Pregger, A. Friedrich andG.-S. Schneider, Studie uber die Planung einerDemonstrationsanlage zur Wasserstoff-Krastoffgewinnungdurch Elektrolyse mit Zwischenspeicherung in Salzkavernenunter Druck: Plan Delykad, Plan Delykad, Stuttgart, 2014.
60 T. Smolinka, M. Gunther and J. Garche, Stand undEntwicklungspotenzial der Wasserelektrolyse zur Herstellungvon Wasserstoff aus regenerativen Energien: Kurzfassung desAbschlussberichts, NOW-Studie, Freiburg, 2011.
61 A. Ursua, L. M. Gandia and P. Sanchis, Proc. IEEE, 2012,100(2), 410.
62 S. Estelmann, Efficiency optimization and simulation ofPower-to-Liquid-(PtL)-Process using the example ofmethanol synthesis in consideration of heat integrationmodels, Master thesis, Technical University ofBraunschweig, Braunschweig, 2016.
63 T. Smolinka, Material data for Proton Exchange Membranestacks and related BoP-Hardware demand, EMail, personalconversation, Freiburg, 2018.
64 B. Pitschak, Power-to-X progress and developments atHydrogenics, Dusseldorf, 2016.
65 H.-J. Fell, Hydrogen from large scale alkaline electrolysis formethanol production, Copenhagen, 2017.
66 A. Omari, B. Heuser and S. Pischinger, Fuel, 2017, 209, 232.67 U. Albrecht, S. Patrick, W. Weindorf, R. Wurster and
W. Zittel, FVV, 2013, (1031/2013).68 U. Albrecht, P. Schmidt, W. Weindorf, R. Wurster and
W. Zittel, Eine Expertise fur die ForschungsvereinigungVerbrennungskramaschinen e. V. Abschlussbericht, 2013, 30,He 1031-2013.
69 F. K. Mantei, Combined Theoretical and ExperimentalApproaches to Oxymethylene Ethers Synthesis, Masterthesis, Technical University of Berlin, Berlin, 2017.
70 https://ec.europa.eu/environment/archives/air/models/tremove.htm.
71 M. Wietschel, M. Kuhnbach and R. David, Die aktuelleTreibhausgas- emissionsbilanz von Elektrofahrzeugen inDeutschland: Working Paper Sustainability and InnovationNo. S 02/2019, Karlsruhe, 2019.
72 https://www.umweltbundesamt.de/daten/verkehr/krastoffe, last accessed September 2019.
This journal is © The Royal Society of Chemistry 2019

Paper Sustainable Energy & Fuels
Publ
ishe
d on
16
Sept
embe
r 20
19. D
ownl
oade
d by
Fra
unho
fer-
Ges
ells
chaf
t - F
hG o
n 11
/3/2
019
5:49
:44
PM.
View Article Online
73 O. Edenhofer, R. P. Madruga and Y. Sokona, Renewable EnergySources and Climate Change Mitigation: Special Report of theIntergovernmental Panel on Climate Change, 2012.
74 M. M. Hand, S. Baldwin, E. DeMeo, J. M. Reilly, T. Mai,D. Arent, G. Porro, M. Meshek and D. Sandor, RenewableElectricity Futures Study (Entire Report), Golden, 2012.
75 G. Reiter and J. Lindorfer, Int. J. Life Cycle Assess., 2015, 20(4),477.
76 Shell Deutschlanbd Oil GmbH, Shell Hydrogen Study, 2017.77 R. Bhandari, C. A. Trudewind and P. Zapp, J. Cleaner Prod.,
2014, 85, 151.78 J. Burkhardt, A. Patyk, P. Tanguy and C. Retzke, Appl. Energy,
2016, 181, 54.79 K. Bareiß, C. de La Rua, M. Mockl and T. Hamacher, Appl.
Energy, 2019, 237, 862.80 Deutsche Energie-Agentur GmbH (dena), Process heat in
industry and commerce: Technology solutions for waste heatutilisation and renewable provision, Hannover, 2016.
81 G. Doka, Life Cycle Inventory of the Disposal of Lignite Spoil,Coal Spoil and Coal Tailings, Zurich, Switzerland, 2009.
This journal is © The Royal Society of Chemistry 2019
82 J. Lieberei and S. H. Gheewala, Int. J. Life Cycle Assess., 2017,22(2), 185.
83 X. Zhang, C. Bauer, C. L. Mutel and K. Volkart, Appl. Energy,2017, 190, 326.
84 V. Uusitalo, S. Vaisanen, E. Inkeri and R. Soukka, EnergyConvers. Manage., 2017, 134, 125.
85 W. Hoppe, N. Thonemann and S. Bringezu, J. Ind. Ecol.,2017, 7(3), 181.
86 T. Smolinka, N. Wiebe and M. Thomassen, Cost Break Downand Cost Reduction Strategies for PEM Water ElectrolysisSystems: Session B05: H2 from Electrolysers: Concepts &Costs, Luzern, Schweiz, 2017.
87 N. v. d. Assen, L. J. Muller, A. Steingrube, P. Voll andA. Bardow, Environ. Sci. Technol., 2016, 50(3), 1093.
88 M. Decker, F. Schorn, R. C. Samsun, R. Peters and D. Stolten,Appl. Energy, 2019, 250, 1099.
89 https://dribbble.com/vectorsmarket, last accessed March2019.
Sustainable Energy Fuels, 2019, 3, 3219–3233 | 3233

SustainableEnergy & Fuels
PAPER
Anlage 8
Energy efficiency
aHydrogen Technologies Division, Fraunhofe
Heidenhofstraße 2, 79110 Freiburg, G
fraunhofer.debInstitut fur Nachhaltige Technische System
79110 Freiburg, GermanycTechnical University of Munich, Arcisstraße
† Electronic supplementary informa10.1039/d0se00067a
Cite this: Sustainable Energy Fuels,2020, 4, 2256
Received 14th January 2020Accepted 3rd February 2020
DOI: 10.1039/d0se00067a
rsc.li/sustainable-energy
2256 | Sustainable Energy Fuels, 20
and economic assessment ofimported energy carriers based on renewableelectricity†
Christoph Hank, *ab Andre Sternberg, a Nikolas Koppel,ac Marius Holst, a
Tom Smolinka,a Achim Schaadt,a Christopher Heblinga and Hans-Martin Henning a
The production of energy carriers based on renewable electricity via the Power-to-X (PtX) approach holds
the key for a holistic transformation of our global industries from fossil fuels towards renewable energy
sources. To compete with cheap fossils, PtX products demand energy-efficient processes and low-cost
renewable electricity. Therefore, the import of PtX products from countries with high renewable energy
potentials to countries with high energy demand presents a promising pathway. However, the question
which set of PtX products qualifies as suitable for long-distance transport has not yet been answered. In
this context, this paper assesses the energy and cost efficiency of five PtX energy carriers (methane,
methanol, ammonia, liquefied hydrogen and hydrogen bound in LOHC). Furthermore, we evaluate the
influence of fluctuating renewables, availability of water and transport distance in a case study for large-
scale PtX production in Morocco. Our results show that the evaluated PtX pathway efficiencies vary
between 40–52% (base cases) and 44–58% (optimistic cases). None of the pathways assessed is
significantly affected in its overall efficiency by a ship transport over an exemplary distance of 4000 km.
However, for longer transport distances the cost difference between the assessed pathways increases.
The production cost of the PtX energy carriers (124–156 V per MWh) depends on the availability of
excess heat, energy density of the product and, if required, liquefaction efforts. In summary, the paper
reveals that the long-distance transport and import of PtX products present an interesting option for the
ongoing integration of renewable electricity into our energy system and industries. The petrochemical
and steel industries in particular, as well as heavy goods transport, shipping and aviation, will be highly
dependent on these imported synthetic energy sources.
Introduction
The global carbon cycle is out of balance due to drasticallyincreased fossil greenhouse gas (GHG) emissions to the atmo-sphere and thus exceeding the capacity of our biogeochemicalcycles.1 The result is an anthropogenic greenhouse effect withits associated environmental problems2 and extreme weatherevents – the latter having tripled since 1980.3 In order to reachthe goal of keeping the global temperature rise below 1.5 �C,a radical defossilisation of the global economies is necessary.4,5
The good news is that even the scenarios with highest energydemands for 2050 are well surpassed by the latest estimations
r Institute for Solar Energy Systems ISE,
ermany. E-mail: christoph.hank@ise.
e (INATECH), Emmy-Noether-Straße 2,
21, 80333 Munchen, Germany
tion (ESI) available. See DOI:
20, 4, 2256–2273
on the total renewable energy (RE) potential that could be har-vested by utilisation of present technologies.6 Characterised byan intense growth within the last two decades modern RE (i.e.excluding nuclear and traditional bioenergy) accounted for10.6% of total nal energy consumption in 2017 (+4.4%compared to 2016),7 but only 2% is yet covered by electricitygenerated with modern renewable technologies. Up to 80% ofthe total nal energy consumption is still covered by fossil fuels.
The integration of RE beyond direct electrication into theenergy, mobility, industry and private sectors via hydrogen (H2)based renewable energy carriers is referred to as “Power-to-X”(PtX). When powered with renewable electricity PtX can enablehighly defossilised primary energy provision. It representsa cornerstone for integrated energy systems and thus, a closingof the carbon cycle.8 However, shiing our sectors from fossil toRE based primary energy resources requires magnitudes ofalready installed RE capacities.9,10 For example, replacing fossilbased precursors in the chemical sector with PtX based chem-icals would lead to a signicant increase in the electricitydemand. In this context, Katelhon et al. 2019 substituted thefossil based precursors for the production of 20 large-volume
This journal is © The Royal Society of Chemistry 2020
verfoullonni
Ausschussstempel

Paper Sustainable Energy & Fuels
chemicals (accounting for more than 75% of the GHG emittedin the chemical industry) with RE-based PtX pathways.10 Theresult has been a demand for low-carbon electricity between18.1 and 32.0 PWhel per year – which surpasses the currentglobal electricity demand (23.0 PWhel per year in 2018).11 Foranother sector, global transports, the total energy demandcurrently sums up to �35 PWh per year.12 Enormous efforts areunderway to electrify it, either in a direct form via electricvehicles or indirectly via H2 based power trains (fuel cells andinternal combustion engines with synthetic fuels). Although,the electrication of global transport has a certain efficiencypotential, it can be assumed that the global demand forrenewable electricity will also increase signicantly for thissector.
In countries with high energy demands, the production ofsufficient renewable electricity is not always possible. Thus,energy carriers based on renewable electricity are required. Forexample, the European Union targets at a decrease of the futureprimary energy demand from 18.2 PWhel in 2017 to 17.3 PWhel
in 2020 and 15.9 PWhel in 2030.13,14 However, the total technicalrenewable electricity potential in the European Union sums upto 9–14 PWhel per year (depending on installation density andyield parameters).15 It remains questionable if this potential willbe fully tapped within the next decades under the light of a slowexpansion of national power grids and storage technologies,hesitant political frameworks and a “not-in-my-backyard”mentality in case of renewable energy projects.16–21
The future need for an import of renewable energy carriers
In their “Clean Energy for All Europeans” package22 the Euro-pean Commission recognises H2 and PtX processes as keytechnologies on the pathway towards a defossilised system butat the same time underlines that “(PtX) technologies becomeattractive in the context of abundant electricity generated fromcarbon-free sources [.]”. It is very likely that regions charac-terised by a restricted RE potential and a present net-import offossil energy carriers will as well in the future be dependent onan import of low-carbon energy carriers (e.g. via PtX). Consid-ering that the generation cost of PtX products highly dependon the price of the input electricity15,23,24 it becomes clear thatany large-scale PtX production becomes relevant in countrieswith high RE potential and full-load-hours. In the context ofa global PtX market the World Energy Council describes threecriterions for potential large-scale PtX producers: (1) low-costRE power, (2) large available areas exhibiting high solar and/or wind potentials, (3) political stability and an energy polit-ical framework.25 In this context Fasihi et al. 2018 analysed thefull load hours and levelised cost of electricity generation fromphotovoltaic and wind power plants on a global scale.26 Lev-elised cost of renewable electricity as low as 17–20V per MWhel
are described for the top sites in the world. Consideringa proximity to the coast (desalinised seawater, access to ports)LCo(E) in the range of 25–30 V per MWhel seem realistic. Thehere identied regions such as Spain, Morocco, Chile or Aus-tralia are as well listed by the World Energy Council aspotential PtX exporters.
This journal is © The Royal Society of Chemistry 2020
However, for a future export of PtX products from theseidentied countries, the aspects of social compatibility andsufficient RE availability have to be taken into account.27
Scenarios based on the stated global energy policies show thatthe global demand for fossil fuels will signicantly increasewithin the next decades mainly driven by an increasing pop-ulation (with a better standard of living).28 Additionally, many ofthese identied PtX exporters and their energy production arestill characterised by a high share of fossil energies, a privatisedenergy sector and partially depend on energy imports fromother countries. Therefore, the existing RE potential anda build-up of a sustainable energy infrastructure beyond exportshould also be used for macroeconomic and green developmentin the PtX exporting countries themselves.
Scope of the study
On the basis of the aspects discussed above it can be stated that:(1) a transformation of the global economies from fossil to REbased requires large amounts of installed RE capacities, (2) H2
based energy carriers will be an important part of this trans-formation and (3) a global trade of RE via H2 and other gaseousand liquid PtX products from regions with high RE availabilityto economic centers with high energy demand emergesunavoidable. In addition, the development of a global RE tradeshould only take place in combination with the introduction ofsocially acceptable and sustainable energy production in theRE-exporting countries themselves. This paper builds on theseconsiderations and questions:
- What is the energy efficiency of different PtX pathways forlong-distance distribution of RE via H2 based energy carriers?
- How does the energy efficiency of these PtX pathways relateto their respective economic efficiency for a specic case study?
Under the background of the dened research questions thispaper assesses ve PtX production pathways from theperspective of energy and cost efficiency. The included PtXproducts are potential options for future renewable energystorage and transport at large scales and are a frequent part inrecent scientic and politic debates: H2 distributed in liquidstate (LH2), H2 distributed with liquid organic hydrogen carriers(LOHC) as transportation medium (LOHC–H2), liquid methane(LCH4), methanol (CH3OH) and ammonia (NH3). A detailedcombined assessment of these energy carriers is currentlymissing in the scientic literature.
During its rst part, the paper is intended to offer estimationson PtX efficiencies when operated on a base-load and without anyintermediate storage demands. We do not aspire to providea pure efficiency ranking of these PtX pathways but rather high-light potential hotspots for efficiency optimisation. The efficiencyanalysis differentiates between a base and an optimistic case. Thebase case applies conversion efficiencies, electricity and heatdemands at present technology levels. In turn, the optimistic caseconsiders published near-future (�2030) target values for someof the process steps. By this we aim at giving a perspective on howoverall pathway efficiencies can change if central process stepsundergo technological advances. The selection of processparameters is outlined in the section “parameter inventory”.
Sustainable Energy Fuels, 2020, 4, 2256–2273 | 2257

Sustainable Energy & Fuels Paper
The second part of this work assesses the detailed costdistributions of the PtX pathways for an exemplary case study(Morocco) considering large-scale production and downstreamlong-distance ship transport to North-western Europe. The casestudy includes more detailed systemic and site-dependentparameters such as local availability of RE, their uctuation,availability of water and necessary storage demands.
Part I – energy efficiency analysis
Fig. 1 shows the basic scheme for the ve assessed PtX path-ways. For the basic efficiency analysis we assume renewableelectricity (1) to be available without uctuation (uctuating RErendering storage technologies necessary will be considered forthe case study in the second part of the paper). Renewableelectricity covers both electrical and thermal energy demand ofall process steps. The water supply for the electrolysis step isrealised via a seawater desalination plant (2). This enablestechnical availability of water for all arid regions with high REavailability next to the sea. Hydrogen is produced via polymerexchange membrane (PEM) electrolysis (3) and in case of LCH4,CH3OH and NH3 conditioned to synthesis pressure andtemperature and fed to the reactor for catalytic conversion (4).In case of LCH4 and LH2 the product is brought to liquid stateby cryogenic liquefaction (5). For this study, direct air capturetechnology (DAC) ((6) pathways LCH4 and CH3OH) is assumedas carbon source. Carbon capturing from industrial andbiomass point-sources represents another less energy intensiveCO2 option. However, the availability of large-scale industrialCO2 sources depends on the PtX location and CO2 trans-portation to the point of further conversion could be necessary.The energetic effort for CO2 liquefaction and transport via shipfrom quite remote areas to the PtX plant is limited and tech-nically feasible.29 From an energy point of view, atmosphericCO2 capturing can be seen as a conservative assumption for PtXscenarios but enables location-independent CO2 sourcing. DACnecessitates besides electricity, a heat source. On the one hand,the use of fossil natural gas for heat supply is not in the scope ofthis paper which focuses on fully defossilised pathways. On theother hand, utilisation of the nal product (synthetic CH4 orCH3OH) would mean an efficiency loss compared to utilising
Fig. 1 System layout Part I – energy efficiency analysis: renewable eledefossilised PtX product: H2 distributed in liquid state (LH2), H2 distributed(LOHC–H2), liquid methane (LCH4), methanol (CH3OH) and ammonia (Ntricity production are neglected in order to be able to analyse the pureaspect of renewable electricity availability including the effects on stora
2258 | Sustainable Energy Fuels, 2020, 4, 2256–2273
direct electricity. Instead, the necessary heat demand isassumed to be covered by available excess heat from theexothermal synthesis step and an electric heating module.Finally, the respective PtX product is transported by ship (7) tothe importing country (8). The functional unit of our assess-ment is 1 MJ of renewable energy carrier arrived at the nallocation. The assumed long-distance transportation covers 4000km, representative for marine transport from Northwest Africato North-western European ports (e.g. Hamburg or Rotterdam).The distance will be varied in a sensitivity analysis to cover aswell longer routes. The International Maritime Organisation's(IMO) objective to lower the GHG emissions by at least 50% by2050 (compared to 2008) and eliminate other harmful emis-sions necessitates intense defossilisation of the shippingsector.30 Therefore, we assume that the ships use their trans-ported energy carrier as fuel. The use of fossil based heavy oilcontradicts an envisioned defossilised system and is thereforenot in our scope.
Parameter inventory for the analysed PtX pathways
This chapter provides more information on the ve PtX path-ways, explains respective parameters and energy demands. Ingeneral the scale of the components orientates on an annual H2
production of 42 500 t. The specications of the seawaterdesalination and deionisation as well as the H2 productionapply to all assessed PtX pathways and will be described at thebeginning of this section. A summarising parameter table ispart of the ESI (ESI-S1†).
Sea water desalination and deionisation.Water provision viadesalination of marine sea water is assumed to be based onseawater reverse osmosis (SWRO). Voutchkov et al. 2018 ana-lysed the actual state and technological trend regarding SWROwith a focus on energy use.31 Depending on salinity andtemperature of the seawater, the applied membrane and plantcapacity the energy demand for SWRO can vary between 2.5–3.1kWhel m
�3. Considering that the actual SWRO energy demandaccounts for 65–80% of a desalination plants' total energydemand a range of 3.1–4.8 kWhel m
�3 is possible for state-of-the-art medium to large size desalination plants. The surfacesalinity of marine regions varies depending on temperature,freshwater inow from coastal regions and ocean currents.
ctricity is the sole energy source for all process steps enabling a fullywith liquid organic hydrogen carriers (LOHC) as transportationmediumH3). For the efficiency analysis (part I) fluctuations in renewable elec-electricity-to-product efficiency. Part II of the paper will address thege requirements and economic efficiency.
This journal is © The Royal Society of Chemistry 2020

Paper Sustainable Energy & Fuels
Based on satellite measurements32 a surface salinity of35 000–37 000mg L�1 can be seen as the higher range of salinityat global coastal regions in the subtropics (e.g. coast of Brazil,Argentina, parts of Australia) or the eastern Atlantic ocean (e.g.coast of Morocco).
For the hypothetical near-future small to medium scale plantof our study (�1200 m3 per day), we assumed a conservativetotal energy demand of 3.75 kWhel m
�3. Following the desali-nation it is assumed that the water will be deionised to t thedemands of the downstream water electrolysis. The process fordeionisation is based on a process from the ecoinvent v3.3database and considers an energy demand of 0.45 kWhel m
�3.33
Hydrogen production via PEM water electrolysis. For thelarge-scale water electrolysis system (�200–300 MWel), theemerging technology of proton exchange membrane (PEM)electrolysis has been considered. PEM systems offer specicadvantages when placed in the context of uctuating REproduction and PtX-concepts: they enable a shorter start-uptime (cold-start) and response time than other water electrol-ysis concepts (e.g. alkaline or high temperature sold-oxideelectrolysis), low energy consumption in standby mode,elevated operational pressures (e.g. 30 bar) and higher currentdensities (potentially reducing stack size). The inputs of theassessed PEM system are water and electricity. The assumptionsfor the PEM systems' energy demand are based on a recentsector survey on manufacturer estimations for state-of-the-artand future electrolysis systems.34 The base case assumes 4.81kWhel per Nm3(H2) and considers the range in manufacturerestimations (4.40–5.20 kWhel per Nm
3(H2)) for existing to near-future PEM systems with capacities from 1–100 MWel. Theoptimistic case calculates with 4.46 kWhel per Nm
3(H2) and isbased on the range in estimations (4.10–4.80 kWhel
per Nm3(H2)) for advanced PEM systems aer 2030. The stoi-chiometric water demand of water electrolysis amounts to 8.94kg(H2O) per kg(H2). Based on manufacturer specications fora commercial PEM system we assume a water consumption of10 kg(H2O) per kg(H2).35
H2O(l) / H2(g) + 0.5O2(g), DH0R ¼ +285.8 kJ
PtX pathway for renewable liquid hydrogen – LH2. Thepathway liquid hydrogen (LH2) comprises the smallest numberof conversion steps and is therefore promising in terms ofoverall system efficiency.
Hydrogen liquefaction. Liquefaction of H2 is based ona liquefaction plant design as described in the IDEALHYproject.36 LH2 is provided at an absolute pressure of 2 bar, 23 Kand a purity of 100%. Losses of hydrogen are assumed to be1.6%, mainly caused at the feed gas compression step. Con-cerning the energy requirements of liquefaction, several inves-tigations indicate that large-scale liqueers will most probablybe able to reach electricity consumption rates as low as 6.0kWhel per kg(LH2).37 Today's hydrogen liqueers with capacitiesup to 15 t(H2) per day show values of 10.0–12.0 kWhel perkg(LH2).38 Considering even larger conceptualised and as wellexisting liquefaction plants with capacities of several hundred
This journal is © The Royal Society of Chemistry 2020
tons per day, lower energy demands of 5.30–8.50 kWhel perkg(LH2) are in a realistic range of technological feasibility.Accordingly, the H2 liquefaction in our study differentiatesbetween a base (8.0 kWhel per kg(LH2)) and an optimistic case(6.0 kWhel per kg(LH2)).
Transport of LH2 via ship. The shipping of the liqueed H2 tothe nal destination over a distance of 4000 km is assumed tobe realised with a novel LH2 carrier as conceptualised by Kamiyaet al. 2015.39 The proposed concept describes a large-scalecarrier consisting of four vacuum panel type spherical tanks.The boil-off rate is described as 0.2% per day (or less). Since thestudy of Kamiya et al. 2015 does not include information on theships propulsion energy demand we orientate on values basedon propulsion datasheets for large conventional LNG carrierswith a total capacity of 140 000 m3 from MAN Diesel & Turbo.40
The suitable engine results in a necessary SMCR power (speci-ed maximum continuous rating) of 28 000 kW (at 20 knots/36km per hour) for the selected ship size. Assuming that thepropulsion system of the LH2 carrier concept will be based ona H2 gas motor with a rated efficiency of h ¼ 0.43 the resultingspecic LH2 consumption sums up to 0.181 kWh per tkm (“perton-kilometres”) or 54 kg(H2) per km:
W�
LH2 carrier ¼ PSMCR
capship � rLH2� vship � hH2M
withWLH2 carrier ¼ energy demand of the LH2 carrier in [kWh pertkm]PSMCR ¼ specied maximum continuous rating of selectedship class (28 000 kW)capship ¼ ship capacity (140 000 m3)rLH2
¼ volumetric density of LH2 (0.071 t per m3)vship ¼ ship speed (36 km per hour)hH2M
¼ efficiency of H2 gas motor.The boil-off rate of 0.2% per day results in a maximum
evaporation of 28 kg(LH2) per km. This enables the use of theevaporating H2 as fuel without any losses due to venting. Anylosses during port times are neglected.
PtX pathway for renewable H2 via LOHC – LOHC–H2. Theconcept of LOHC comprises a reversible chemical reactionwhere a specic chemical molecule (the “LOHC”) is loaded withgaseous H2 which can be stored in liquid form showing elevatedvolumetric energy densities. Subsequent long-distance trans-portation of the hydrogenated LOHC is thus possible withoutany boil-off losses and is manageable in an easy way. To enableutilisation of the stored H2 at the point of destination anendothermal dehydrogenation step has to be performednecessitating elevated temperatures at ambient pressure. Adirect combustion of the loaded LOHCs is due to their highmarket prices and the fossil origin (i.e. release of fossil carbon)not in the scope of the concept. The most appropriate LOHCmedium depends on a multitude of parameters such as therespective market price, the availability of waste heat at theplace of dehydrogenation or the technological maturity of theconversion and release units.41 Chemicals such as 1,2-dihydro-1,2-azaborine or N-ethylcarbazole either require additionalsolvents (reducing the storage capacity) and thus additional H2
Sustainable Energy Fuels, 2020, 4, 2256–2273 | 2259

Sustainable Energy & Fuels Paper
purication42 or show lower conversion efficiencies duringdehydrogenation.43 Within our study, we focus on dibenzylto-luene (DBT), a chemical applicable as LOHC without furthersolvents and already applied for the LOHC concept atcommercial but still comparably small scale (�4000 t(H2) peryear).43,44
Hydrogenation of LOHC. Aer its production via PEM elec-trolysis the pressurised H2 is fed to the hydrogenation unit. Thehydrogenation of DBT has to be performed at elevated pressuresand temperatures. For this study, a pressure of 25 bar is appliedtting the pressure output level of the PEM electrolysis of 30bar. Apart from start-up times, the exothermal hydrogenationreaction provides sufficient heat to realise a necessary temper-ature level of�200–250 �C.45 The LOHC loading density (wt% ofH2 in LOHC) is among other things relevant for the initialamount of LOHC medium to be purchased to realise a certainH2 supply chain. For this study a LOHC loading density of6.23 wt% H2 is assumed.45
Transport of LOHC via ship. The handling of loaded LOHC(perhydro-DBT) is assumed to be comparable to the handling ofconventional thermal oil and is assumed to be shipped ina tanker. Due to high purchase cost for DBT the assumedshipping size is smaller (73 000 t perhydro-DBT) than for theother assessed PtX pathways (compare section “Inventory of theeconomic parameters”). The tanker type and necessary enginesize is selected based on propulsion datasheets for tankers fromMAN Diesel & Turbo and results in an engine size of 12 300 kW(SMCR, at 28 km per hour) representing the “Aframax” class.46
As for every PtX pathway in this study, it is assumed that theship uses the transported PtX product as fuel. Therefore, pro-pulsion power is assumed to be realised by means of a H2 gasmotor (h ¼ 0.43; 30.8 kg(H2) per km). The heat demand fornecessary on-board dehydrogenation of perhydro-DBT (0.495t(DBT) per km) is covered by the excess heat of the gas turbine.
Dehydrogenation of LOHC at the port of destination. An endo-thermal dehydrogenation (310 �C, 1 bar) step is required torelease the stored H2 from the perhydro-DBT. The necessaryheat demand can either be supplied via oxidation of a share ofreleased H2 or, if available, via excess heat. For the efficiencyanalysis we consider a base (30 wt% of H2 is burned) and anoptimistic case (25 wt% of H2 is burned)47 and will as welldiscuss the effect if excess heat can be applied. A loss of DBTduring dehydrogenation and the DBT return transport is notpart of the efficiency analysis but will be considered within thecase study.
PtX pathway for renewable liquid methane – LCH4. Thepathway for liquid methane production is based on CH4
synthesis via Sabatier reaction with electrolytic H2 and atmo-spheric CO2 as educts commonly referred to as power-to-gas.48
Aer downstream CH4 liquefaction the LCH4 can be handledcomparable to liqueed natural gas (LNG) and is shipped viaa large-scale LNG carrier. According to the number of necessaryprocess steps the pathway for LCH4 presents the longestconversion chain from all assessed PtX pathways.
CO2 via direct air capture. CO2 is obtained via direct aircapture (DAC), a technology enabling site-independent avail-ability of carbon – relevant for regions characterised by high RE
2260 | Sustainable Energy Fuels, 2020, 4, 2256–2273
availability but low availability of CO2 containing industrialwaste gases (e.g. North Africa, Argentina, Chile, parts of Aus-tralia). Additionally, DAC represents, besides CO2 frombiomass, the only CO2 source for a possible closing of thecarbon-cycle. However, due to low atmospheric CO2 concen-trations DAC technology is characterised by a high total energydemand compared to other higher concentrated CO2 sour-ces.49,50 For this study, we assume the low-temperature solidsorbent based DAC technology as developed by the Suissecompany Climeworks.51 The capturing process is based onadsorbing CO2 molecules onto special amine supported cellu-lose bre lters. Aer full adsorption the lter is regenerated atelevated temperatures (100 �C) releasing a concentrated CO2
stream (>99.9 vol%). Running multiple units in parallel enablesa constant supply with atmospheric CO2. Besides thermal heat(1.5–2.0 kWhth per kg(CO2)) electrical energy (0.2–0.3 kWhel perkg(CO2)) is required for operation of blowers and controlunits.50,52 A base case (1.75 kWhth; 0.25 kWhel) represents thetechnological status for the capturing of 1 kg of CO2.53,54 Anoptimistic case (1.5 kWhth; 0.2 kWhel) represents a target valuefor mid-term energy demands.50 Thermal energy is partiallycovered by means of heat integration from downstreammethanation reaction. The remaining thermal energy demandis covered by an electric heater (h ¼ 0.95). A burning of the CH4
product is not reasonable from an efficiency point of view.Methanation. Sabatier reaction for methanation of pure CO2
represents a combination of the reversed water gas shi reac-tion (endothermal) and methanation of carbon monoxide(exothermal). The highly exothermal reaction is currently underresearch and takes place under moderate pressures of 6–8 barand 280 �C.55 The process concept as assessed by Muller et al.2002 serves as basis for conversion parameters and energydemands.56 The methanation reactor is operated at 8 bar and280 �C. The Sabatier reaction provides excess heat (�3.0 kWhth
per kg(CH4)) which is assumed to partially cover the thermalenergy demand of the DAC modules. This in turn signicantlyreduces the heat demand of the DAC modules by 58–68%. Forthe compression of the CO2 from ambient to synthesis pressure,an electricity demand of 0.14 kWhel per kg(CH4) is considered.The H2 as obtained from the pressurised PEM electrolysis isalready on reactor pressure.
CO2(g) + 4H2(g) / CH4(g) + 2H2O(g), DH0R ¼ �167.9 kJ
Liquefaction of CH4. Depending on its composition liqueednatural gas (LNG) demands 540–590 times less storage volumethan gaseous natural gas and is therefore already used as energycarrier for long distances. For distances >2000 km (offshore) or>4000 km (onshore) transport of LNG via ship is moreeconomical than distribution via pipelines in gaseous state.57
LNG trade has increased vefold to 250Mt per year compared to1990.58 In case of CH4 which represents the largest share of LNG(87–99%, depending on origin),59 a liquefaction step is thereforeobvious. Pospısil et al. 2019 assessed the energy demand of NGliquefaction processes based on literature and own simulations.Besides the process type, the specic liquefaction electricity
This journal is © The Royal Society of Chemistry 2020

Paper Sustainable Energy & Fuels
demand is inuenced by the size of the liquefaction plant andranges from <0.25 to 0.75 kWhel per kg(NG). Conducting anenergy optimisation by means of improved ow rates for themixed refrigerants within a liquefaction process Ali et al. 2018reduced the theoretical electricity demand from 0.46 kWhel perkg(NG) to 0.27 kWhel per kg(NG).60 Based on these consider-ations we assume for liquefaction of pure CH4 an electricitydemand of 0.5 kWhel kg
�1 for the base case and 0.25 kWhel kg�1
for the optimistic case.Transport of LCH4 via ship. A conventional LNG carrier with
a capacity of 140 000 m3 is considered for transport of the liq-ueed CH4. The carrier class and the necessary engine size areselected based on propulsion datasheets for LNG carriers fromMAN Diesel & Turbo and results in an engine size of 28 000 kW(SMCR, at 36 km per hour) representing the “small conven-tional” class.61 In our study, to avoid the use of fossil based fuel,this propulsion power shall be delivered by burning of thetransported LCH4. Therefore, we assume a dual fuel enginepossible to be operated with natural gas at a rated efficiency of h¼ 0.5.62 The resulting fuel consumption sums up to 0.026 kWhper tkm or 112 kg(CH4) per km. The boil-off during shiptransport should be prevented due to the high global warmingpotential of CH4. To minimise the slip on LNG carriers re-liquefaction systems are installed.63 Modern LNG carriersfeature boil-off rates between 0.10–0.15% per day.64 For thisstudy, an improved tank insulation system with a boil-off rate of0.10% per day as recently proposed by the Kawasaki Ship-building Corporation is assumed.65 The boil-off results in anevaporation of 68 kg(LH2) per km enabling use of evaporatingCH4 as fuel without any losses.
PtX pathway for renewable methanol – CH3OH. The CO2
based methanol production for seasonal storage of RE and theimplicit reuse of CO2 has been frequently discussed in literatureand has already been realised in pilot plants like the GeorgeOlah Renewable methanol plant.23,66,67
CO2 via direct air capture. As for synthetic CH4 production, themethanol pathway necessitates a carbon source which isassumed to be based on DAC as well. Compared to the LCH4
pathway the methanol step is less exothermal and covers onlya minor share of the DAC's thermal demand via excess heat. Theremaining thermal demand is assumed to be covered by electricheating.
Methanol step. The process concept for the methanol reactionand distillation step is based on publication of Bongartz et al.2019.68 A new kinetic model (for commercial Cu/ZnO2/Al2O3
catalysts) developed at Fraunhofer ISE and implemented in anAspen simulation (see ESI-S2†) leads to conversion parametersand energy demands. The reactor system is operated at a pres-sure of 70 bar and a temperature of 250 �C. Heat integration viapinch-analysis enables pre-heating of the educt streams CO2
and H2. The remaining excess heat (0.09 kWhth per kg(CH3OH))released below the internal heat utilisation range (<65 �C) isassumed to be available for the DAC modules' thermal energydemand. This in turn only slightly reduces the heat demand ofthe DAC modules by �4%. The compression energy demand(0.31 kWhel per kg(CH3OH)) considers single-stage H2, four-
This journal is © The Royal Society of Chemistry 2020
stage CO2 and the recycle compressors. A process owdiagram for the CH3OH step is included in the ESI.†
CO2(g) + 3H2(g) / CH3OH(l) + H2O(l), DH0R ¼ �49.2 kJ
Transport of CH3OH via ship. In contrast to the LCH4 pathway,the methanol pathway does not necessitate a separate lique-faction step to enable ship transport of a liqueed product. Theship transport orientates on a conventional tanker with a cargocapacity of 140 000 m3. Tanker class and the resultant enginesize are again based on propulsion datasheets for tankers fromMAN Diesel & Turbo resulting in a necessary engine size of15 200 kW (SMCR, at 28 km per hour, “Suezmax” class).46 Therst marine engines running on methanol are already in oper-ation. A growing number of tests demonstrate feasibility ofretrotting existing diesel two-stroke engines for use withmethanol.69,70 Besides reduced NOx emissions, engine efficiencyis reported as equal or even increased (+1–2%) when running onmethanol. Therefore, efficiency of a conventional marine dieselengine is as well assumed for the methanol engine (h ¼ 0.5).The resulting fuel consumption sums up to 0.010 kWh per tkmor 198 kg(CH3OH) per km.
PtX pathway for renewable ammonia – NH3. Ammonia is themost important feedstock for global fertiliser production. Theconventional fossil based NH3 production is largely based (77%)on syngas obtained from catalytic steam reforming of naturalgas.71 With an annual production of �150 Mt NH3 (2017), theannual global NH3 economy is expected to grow signicantly toan annual demand of 230 Mt(NH3) by the end of 2025.72,73
Additionally, NH3 is considered as one promising carrier forrenewably produced H2 since it is easier to store and transportthan gaseous H2 and offers a higher energy density.71,74 More-over, liquefaction effort is lower than in case of LH2 or LCH4.However, as for CH4 and CH3OH a carrier for the H2 moleculehas to be provided.
N2 via cryogenic air separation. Nitrogen (N2) can be providedvia cryogenic air separation units (ASU). Cryogenic distillation,a technology well proven and established at large scale, presentsthe major technology for N2 supply in case of high volume andpurity requirements.75 Electricity requirement of the ASU isbased on Althaus et al. 2007 (ref. 76) and the correspondingecoinvent process.77 The total electricity demand of an ASUlargely depends on plant size and the grade of refrigerationrecovery and varies between 0.5–0.8 kWhel per kg(N2). Thisspread is considered for the base and the optimistic case,respectively.
Ammonia production step. The Haber–Bosch process presentsthe most common method for the production of NH3.78 Theiron-based catalyst facilitates an exothermic reaction of N2 andH2 at temperatures between 400–600 �C and pressure levelsaround 200–400 bar. Conversion parameters and energyrequirements are based on own Aspen simulation (see ESI-S2†). Corresponding feed demands per kg of NH3 sum up to0.18 kg(H2) and 0.84 kg(N2) respectively. N2 obtained from theASU at �196 �C is vaporised and subsequently compressed to250 bar like H2. The exothermic ammonia formation yields the
Sustainable Energy Fuels, 2020, 4, 2256–2273 | 2261

Sustainable Energy & Fuels Paper
necessary energy to preheat the reactor feed stream. Theelectricity demand for feed compression and the recycle loopresults in 0.48 kWhel per kg(NH3). The consumption of elec-trical energy can mainly be attributed to the compression ofthe two feed gas streams. The NH3 product stream is liqueed(�33 �C) via cooling from evaporation of the N2 feed obtainedfrom the ASU.
N2(g) + 3H2(g) / 2NH3(g), DH0R ¼ �91.8 kJ
Transport of NH3 via ship. Long-distance shipping of NH3 viaocean-going vessels is realised at low but non-cryogenictemperature (�33 �C) enabling transport in liquid state. Thecarrier class and the resultant engine size are aligned toconventional LNG carriers with a cargo capacity of 140 000 m3.Similar to the LCH4 PtX pathway, the engine size representingthe “small conventional” class results in a necessary SMCRpropulsion power demand of 28 000 kW (at 36 km per hour).Due to its high energy density (5.18 kWhLHV per kg(LNH3)) andefficient production process renewable NH3 as shipping fuel isassessed in a number of research and pilot projects aiming atdemonstrational container cargo vessels.79–81 MAN EnergySolutions announced operation of its rst naval NH3 engine by2022.82 In a recent study, the Environmental Defense FundEurope identied green NH3 as one of the most promisingalternatives for future electricity based fuels.83 Advantages dis-cussed by the authors are practicability in existing combustionengines or future fuel cells, the comparably high energy densitywhen stored as liquid, the utilisation of existing logisticsinfrastructure and a safety and environmental risk prolemanageable by existing standards. We assume NH3 to be uti-lised in a combustion engine (h ¼ 0.5) due to the potentiallyhigher technology readiness level (TRL) than in case of prom-ising full cell technology.84 The fuel consumption of 0.016 kWhper tkm exceeds the boil-off rate of 0.04% per day (0.002 kWhper tkm), which is therefore included in the fuel demand.
Energy ow chart and energy efficiency for the analysed PtXpathways
Fig. 2 shows the energy ow charts and the overall efficienciesfor the assessed PtX pathways including transportation via shipover 4000 km. The overall PtX efficiencies vary between40.2–52.4% for the base and 44.1–57.9% for the optimisticcases. For all pathways, the electrolytic H2 production is themain energy-intensive process step heavily affecting overallefficiencies. Hence, any technical improvement increasingelectrolysis efficiency (e.g. reduction of internal losses, reducedcurrent densities) or the H2 conversion to nal products willclearly increase the overall pathway efficiencies.
The provision of carbon and nitrogen (CH3OH, LCH4, NH3)also requires energy. The NH3 production pathway clearlybenets from a less energy intensive provision of the hydrogencarrier N2 (0.08–0.13 MJel per MJ of product). Cryogenic airseparation presents an industrially mature process at high TRL.At the same time, the low energy demanding availability ofatmospheric N2 poses a chance for future large-scale PtX
2262 | Sustainable Energy Fuels, 2020, 4, 2256–2273
projects to be more location-independent and focus on theavailability of low-cost RE. In turn, the provision with atmo-spheric carbon for the LCH4 and CH3OH pathways via DACemerges as energy intensive process step (LCH4: 0.15–0.21 MJelper MJ of product; CH3OH: 0.52–0.44 MJel per MJ of product).One reason is the low concentration of carbon in the ambientair. The provision of thermal energy via electric heating adds upto the electricity demand for the fans of the DAC units. For thecase LCH4, the thermal demand of the DAC units can besignicantly reduced due to the integration of excess heat fromthe methanation step. The availability of unused heat sourcesposes an important efficiency enhancement in case CO2 has tobe provided via DAC. With the exception of one, all companiescurrently involved in the development of DAC technologies arefocused on regeneration temperatures # 100 �C.50 This canenable the integration of excess heat even from processes withmoderate temperature levels (e.g. food/beverage or textileindustry).85 For this study, DAC technology has been assumed toenable location-independent sourcing of carbon. Assuming, forexample, high-concentrated industrial CO2 point-sources suchas the conventional, fossil based NH3 or ethylene oxideproduction enables capturing of CO2 with signicantly reducedenergy efforts of �0.4 MJel per kg(CO2).49,86 Sourcing carbonfrom these kind of sources can lead to a signicant efficiencyincrease in case of the LCH4 (47.9–52.0%) and the CH3OH(50.2–54.0%) pathway. In this case, the efficiencies are compa-rable to the NH3 pathway.
The three synthesis steps are within a comparable range ofefficiencies. Their performances depend besides the electricitydemand for feed and recycle compression steps on theirrespective H2 conversion efficiencies. Although the methanolsynthesis inherently leads to a liquid synthesis product, itrequires more energy for CO2 sourcing and the compression offeed gases than the methane reaction via Sabatier. The Sabatierreactor operated at a moderate pressure shows a clear advan-tage over CH3OH and NH3 syntheses which need higher pres-sures. With regard to the CO2 based methanol synthesis someother published process concepts show an improved H2
conversion efficiency. However, for these cases the volume ofthe recycle stream and thus the recycle compressors' energydemand increased signicantly.87 We identied that a limita-tion of the recycle stream and the resulting reduced compres-sion demand is benecial for overall CH3OH synthesisefficiency despite the slight increase in H2 demand. A H2
recovery concept (e.g. via pressure swing adsorption) for H2
recirculation could further enhance synthesis efficiency.The energy efficiency of the cryogenic liquefaction steps for
the LH2 and LCH4 pathways clearly depends on the PtX plantscale and the possibilities for a thermal integration into theoverall process chain. Within the range of the assumed processparameters the LH2 pathway shows a higher specic energydemand (0.18–0.24 MJel per MJ(LH2)) for the cryogenic lique-faction than the LCH4 pathway (0.02–0.04 MJel per MJ(LCH4)).The latter, in turn, necessitates a carbon source.
Long-distance shipping (4000 km) does not present a notableenergy loss for the PtX pathways assessed and mostly dependson the energy-density of the product carried. Uncertainty
This journal is © The Royal Society of Chemistry 2020

Fig. 2 Energy flows (in MJ) for the assessed PtX pathways based on a functional unit of 1 MJ (LHV) of renewable energy carrier. Values for theoptimistic case are indicated in brackets for the respective process step.
Paper Sustainable Energy & Fuels
remains with regard to the efficiency of the assumed H2 andNH3 engines which are so far not realised for dynamic appli-cations and at this scale. Utilising fuel cells presents another
This journal is © The Royal Society of Chemistry 2020
option for on-board utilisation of the LH2 which potentially canoffer even elevated efficiencies > 50%LHV. The consideredLOHC, perhydro-DBT, with an H2-content of 6.23 wt% has the
Sustainable Energy Fuels, 2020, 4, 2256–2273 | 2263

Sustainable Energy & Fuels Paper
lowest volumetric energy density of all assessed PtX shippingcargos and thus demands the most propulsion energy per unitof transported energy (E�ship,LOHC–H2
: 6.8 � 10�6 kWh per kWhand km); +278% compared to CH3OH. Note that for the caseLOHC–H2 a smaller ship has been assumed than for the otherPtX products due to economic reasons. Considering a compa-rable vessel (140 000 m3) and ignoring high DBT purchase costleads to a clear decrease of E�ship,LOHC–H2
to 4.4 � 10�6 kWh perkWh and km. This results in a clear decrease, falling below thespecic energy demand for the LH2 carrier. The shippingprocesses of both, CH3OH and cryogenic LCH4, benet fromhigh volumetric energy densities and thus show the lowestpropulsion energy demand per unit of transported energy (1.8� 10�6 and 1.9 � 10�6 kWh per kWh and km respectively).
In summary, the pathway for LH2 shows the highest overallefficiency (52.4–57.9%). The NH3 pathway (47.7–52.4%) benetsfrom an energy-efficient provision of N2, the absence of energy-intensive liquefaction and a PtX product with comparably highenergy-density. The pathways for LOHC–H2 (42.6–49.2%), LCH4
(43.9–48.8%) and CH3OH (40.2–44.1%) remain withina comparable range of efficiencies. Deviations here can occurfor the amount of integrable excess heat (LCH4, CH3OH) andthe necessary thermal demand for the dehydrogenation of theLOHC–H2.
The nal utilisation of the energy carriers is not included inthe efficiency analysis due to the versatile eld of potentialapplications. Hydrogen can be used with very high efficiencies(e.g. in fuel cell cars or fuel cells for stationary applications)where, in turn, CH4 and CH3OH will offer lower efficiencies atleast in mobile applications. For the direct utilisation of NH3,further investigation on direct utilisation is required. In case ofcracking of NH3 as H2 supplier the losses could be limited byoptimised catalysts enabling cracking at reduced temperatures(see “conclusions”).
The presented efficiency analysis serves for the identicationof energy loss hot-spots and potential levers for the energyoptimisation of PtX pathways. The nal criteria by which thesuitability and realisation potential of PtX-processes is deter-mined rather depends on their techno-economic competitive-ness. Additionally, the environmental efficiency assessed bya holistic life-cycle-assessment should be included for anydecision-making. The subsequent section presents a case studyfor the assessed PtX routes including long-distance shipping toprovide an estimate of their economic efficiency.
Part II – case study for the economicassessment of the proposed PtXpathways
For a holistic assessment of PtX pathways, the total cost of therespective PtX product must also be included in the consider-ations. The following case study, located in the region Morocco/Western Sahara, adds economic conclusions to the precedingdiscussion on PtX pathway efficiencies. By this the inuence ofsite and weather conditions on plant scales, storage demands,full load hours and nally the cost of production can be taken
2264 | Sustainable Energy Fuels, 2020, 4, 2256–2273
into account. It should be noted that theWestern Sahara is on theone hand a top region for harvesting RE but on the other remainsa region whose international legal status is still not nallydetermined.88,89 For a future implementation of large RE and PtXcapacities it is therefore important to involve local stakeholdersand to respect socio-economic boundary conditions.90
Economics of imported synthetic fuels – existing studies
Fasihi et al. 2016 assessed the production and shipping cost ofsynthetic fuels (jet fuel and FT-diesel via Power-to-Liquid (PtL))from large-scale Fischer–Tropsch (FT) synthesis fed with CO2
captured from the atmosphere and renewable H2 from an alka-line electrolyser.91 The overall process efficiency (excluding the FTside product naphtha) resulted in 49.4%. The production cost forthe FT-diesel was between 64–75V per MWhFT-Diesel,LHV equalling0.59–0.69 V per liter, values comparably low for studies on PtLeconomics. This can be explained in part by the high full loadhours for the assumed hybrid PV-wind power plant (6840 hoursper year) resulting in low cost for the PtL systems' input electricityof 23 V per MWhel. Additionally, assumptions regarding lowinvestment cost of 319 V per kWel and high electrolysis efficiency(73.1%LHV) lead to low FT-diesel production cost. For anotherstudy, Fasihi et al. 2015 analysed the production of synthetic CH4
in Patagonia and shipping of the liqueed product to Japan.92 Theparameters used for the economic assessment are comparable totheir study on PtL. The nal product cost including the shippingover 17 500 km summed up to 62–73 V per MWhCH4,LHV. Fasihi'sassessments already show the importance of high RE full loadhours which indicate the price of the renewable input electricityand PtX production cost. This, in turn, leads to the presumptionthat a large-scale PtL production site should rather be selectedbased on high RE potentials than based on a close proximity tothe end consumer.
In another study, Heuser et al. 2019 avoid any downstreamcatalytic conversion of produced electrolytic H2.93 Their proposedsystem is designed to cover a prospected future Japanese annualhydrogen demand of 8.8 Mt(H2) via marine LH2 transport fromPatagonia. Their GW-scale PtG system (115 GWel) for the costassessment includes electrolytic H2 production (115 GWel) basedon wind electricity, gaseous H2-pipeline transport, cryogenic H2
storage and liquefaction and nally LH2 transport via LH2 carrierto Japan. The LH2 product cost excluding long-distance transportsum up to 99V per MWhLH2,LHV. The assumed shipping to Japanincreases the product cost to 133 V per MWhLH2,LHV. As theauthors conclude, at this price level and used in efficient fuelcells, H2 can be considered competitive with combustion enginesrunning on conventional gasoline.
Niermann et al. 2019 analysed various LOHCs for long-distance ship transport of renewable energy.41 Among thesubstances analysed DBT and methanol (including methanolcracking to H2 at the point of utilisation) performed best froman economic perspective. The authors concluded that theprovision of necessary heat for dehydrogenation/cracking is oneof the largest cost factors and that the transport by ships issignicantly cheaper than H2 transport via pipeline within theassessed distance of 5000 km.
This journal is © The Royal Society of Chemistry 2020
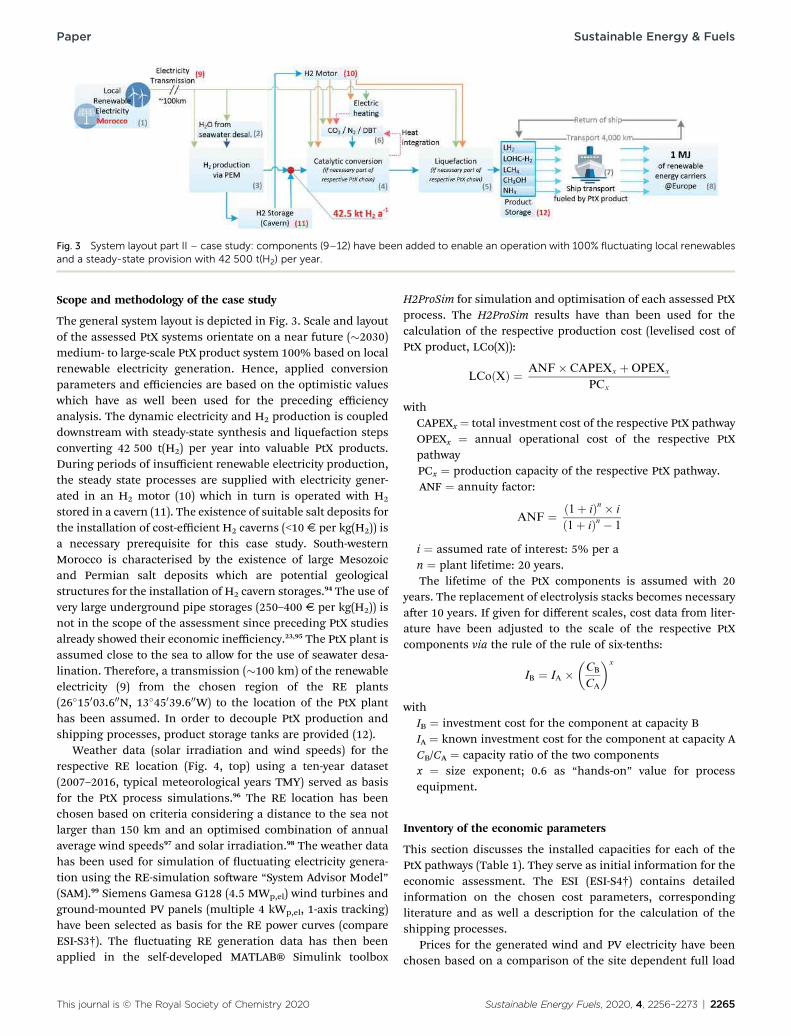
Fig. 3 System layout part II – case study: components (9–12) have been added to enable an operation with 100% fluctuating local renewablesand a steady-state provision with 42 500 t(H2) per year.
Paper Sustainable Energy & Fuels
Scope and methodology of the case study
The general system layout is depicted in Fig. 3. Scale and layoutof the assessed PtX systems orientate on a near future (�2030)medium- to large-scale PtX product system 100% based on localrenewable electricity generation. Hence, applied conversionparameters and efficiencies are based on the optimistic valueswhich have as well been used for the preceding efficiencyanalysis. The dynamic electricity and H2 production is coupleddownstream with steady-state synthesis and liquefaction stepsconverting 42 500 t(H2) per year into valuable PtX products.During periods of insufficient renewable electricity production,the steady state processes are supplied with electricity gener-ated in an H2 motor (10) which in turn is operated with H2
stored in a cavern (11). The existence of suitable salt deposits forthe installation of cost-efficient H2 caverns (<10 V per kg(H2)) isa necessary prerequisite for this case study. South-westernMorocco is characterised by the existence of large Mesozoicand Permian salt deposits which are potential geologicalstructures for the installation of H2 cavern storages.94 The use ofvery large underground pipe storages (250–400 V per kg(H2)) isnot in the scope of the assessment since preceding PtX studiesalready showed their economic inefficiency.23,95 The PtX plant isassumed close to the sea to allow for the use of seawater desa-lination. Therefore, a transmission (�100 km) of the renewableelectricity (9) from the chosen region of the RE plants(26�15003.600N, 13�45039.600W) to the location of the PtX planthas been assumed. In order to decouple PtX production andshipping processes, product storage tanks are provided (12).
Weather data (solar irradiation and wind speeds) for therespective RE location (Fig. 4, top) using a ten-year dataset(2007–2016, typical meteorological years TMY) served as basisfor the PtX process simulations.96 The RE location has beenchosen based on criteria considering a distance to the sea notlarger than 150 km and an optimised combination of annualaverage wind speeds97 and solar irradiation.98 The weather datahas been used for simulation of uctuating electricity genera-tion using the RE-simulation soware “System Advisor Model”(SAM).99 Siemens Gamesa G128 (4.5 MWp,el) wind turbines andground-mounted PV panels (multiple 4 kWp,el, 1-axis tracking)have been selected as basis for the RE power curves (compareESI-S3†). The uctuating RE generation data has then beenapplied in the self-developed MATLAB® Simulink toolbox
This journal is © The Royal Society of Chemistry 2020
H2ProSim for simulation and optimisation of each assessed PtXprocess. The H2ProSim results have than been used for thecalculation of the respective production cost (levelised cost ofPtX product, LCo(X)):
LCoðXÞ ¼ ANF� CAPEXx þOPEXx
PCx
withCAPEXx ¼ total investment cost of the respective PtX pathwayOPEXx ¼ annual operational cost of the respective PtXpathwayPCx ¼ production capacity of the respective PtX pathway.ANF ¼ annuity factor:
ANF ¼ ð1þ iÞn � i
ð1þ iÞn � 1
i ¼ assumed rate of interest: 5% per an ¼ plant lifetime: 20 years.The lifetime of the PtX components is assumed with 20
years. The replacement of electrolysis stacks becomes necessaryaer 10 years. If given for different scales, cost data from liter-ature have been adjusted to the scale of the respective PtXcomponents via the rule of the rule of six-tenths:
IB ¼ IA ��CB
CA
�x
withIB ¼ investment cost for the component at capacity BIA ¼ known investment cost for the component at capacity ACB/CA ¼ capacity ratio of the two componentsx ¼ size exponent; 0.6 as “hands-on” value for processequipment.
Inventory of the economic parameters
This section discusses the installed capacities for each of thePtX pathways (Table 1). They serve as initial information for theeconomic assessment. The ESI (ESI-S4†) contains detailedinformation on the chosen cost parameters, correspondingliterature and as well a description for the calculation of theshipping processes.
Prices for the generated wind and PV electricity have beenchosen based on a comparison of the site dependent full load
Sustainable Energy Fuels, 2020, 4, 2256–2273 | 2265

Fig. 4 Top: solar and wind potential map for south-west Morocco/Western Sahara (Global Solar and Wind Atlas 2.0 by Technical University ofDenmark DTU93,94) bottom (based on Fasihi et al. 2020): 2030 global renewable electricity generation cost for PV 1-axis tracking and wind power(considering 2005 weather data and 7% weighted average capital cost).
Sustainable Energy & Fuels Paper
hours (FLH) and global horizontal irradiation (GHI) with recentliterature. For prospected wind energy generation cost in 2030annual full load hours > 4000 h lead to cost varying between 20–40 V per MWhel.100 In case of PV in 2030 a global horizontalirradiation (GHI) of �2000 kWh per (m2 a) enables electricityproduction between 19–27 V per MWhel. This cost range hasbeen validated by a recent study of Fasihi et al. 2020, assessingthe global levelised cost of electricity for wind and PV in 2030(Fig. 4, bottom).101 Therefore, for both, wind and PV electricitycost of 25 V per MWhel have been considered for the economiccalculations. The optimum installed capacities of RE, PEMelectrolysis, H2 motor and the cavern orientate on the deter-mined production capacity of 42 500 t(H2) per year and dependon the PtX pathway and its respective process parameters. Thetotal installed capacities of wind and PV vary between 595 MWp
(LOHC–H2) and 781 MWp (CH3OH). The share of installed PVversus wind capacities varies between 28–34%, highlighting theinstallation of wind turbines over PV modules. Shares withinthis range are representative for locations with high averageannual wind speeds and have already been proposed by Fasihiet al. 2018 regarding an optimised electricity supply for remotePtX systems.26 The use of solar-thermal electricity generation toincrease full load hours could be taken into account in futurestudies.
The capacity of the PEM electrolysis varies between 453 MWp
(LOHC–H2) and 584 MWp (CH3OH) since it depends on the
2266 | Sustainable Energy Fuels, 2020, 4, 2256–2273
pathways' electricity demand which is covered by H2 duringtimes of non-sufficient uctuating RE. The LOHC–H2 pathway ischaracterised by comparably low installed capacities for PEMelectrolysis, H2 motor and cavern because of few aggregatesdemanding electricity on a base-load. In turn, the CH3OHpathway requires larger installed capacities due to a highthermal demand for the DAC units which has to be partiallycovered by electric heating. Due to production scale-up andadvancing technological maturity, a signicant reduction ofelectrolysis capital cost, especially in case of PEM electrolysis,can be assumed for the next decade placing this technology inthe focus of future large-scale PtX applications.34,102 For this casestudy, an investment of 600 V per kWel has been assumedresulting from manufacturer estimations for state-of-the-artand future electrolysis systems.34 The product storage capac-ities depend on the respective production rate, the ship'stransport capacity and its two-way travel time. A safety margin of20% for the storage capacity is assumed.
The shipping cost depend on ship type, transport capacityand the utilisation. The transport capacities are oriented tolarge conventional vessels with volumes of 140 000 m3. Theascribed ship investment depends on the respective annualutilisation of the ships. For example, in case of the LOHC–H2
pathway, the ship is utilised 44% of the year and assumed to beavailable for other transport tasks during the remaining time.For the LOHC–H2 pathway a 50% reduced ship size (70 000 m3;
This journal is © The Royal Society of Chemistry 2020

Table 1 Installed capacities for the assessed PtX pathways. The capacities orientate on a constant conversion of 42 500 t H2 per a into PtXproducts
Installed capacities NH3 LH2 LOHC–H2 LCH4 CH3OH
RenewablesWind installed capacity [MWp] 506 506 453 509 578Wind capacity factor 50% 50% 50% 50% 50%PV installed capacity [MWp] 144 172 142 153 220PV capacity factor 27% 27% 27% 27% 27%RE produced [GWhel per a] 2573 2638 2331 2606 3067
RE utilisation factor PtX systemRE cost [V per MWhel] 25 25 25 25 25
Seawater desalinationInstalled capacity [m3 per a] 425 000 425 000 425 000 425 000 425 000
PEM electrolysisInstalled capacity [MWel] 440 450 419 446 481Lifetime system [a] 20 20 20 20 20Lifetime stack [a] 10 10 10 10 10Replacement cost [% of CAPEX] 34% 34% 34% 34% 34%
H2 motorInstalled capacity [MWel] 26.2 32.6 2 29 68
H2 cavernInstalled capacity [m3] 608 410 631 980 516 430 630 240 756 230
ASU/DACInstalled capacity [t per day] 556 — — 708 873
Synthesis (NH3, CH4, CH3OH)Installed capacity [t per day] 667 — — 241 612
Liquefaction (H2, CH4)Installed capacity [t per day] — 120 — 241 —
(De-)hydrogenation setInstalled capacity [t per day] — — 120 — —
Product storageInstalled capacity [t] 114 576 11 928 87 696 71 000 132 367
ShippingAssumed vessel type LNG carrier LH2 carrier Tanker LNG carrier TankerTransport volume [m3] 140 000 140 000 70 000 140 000 140 000Transport capacity [t product] 95 480 9940 73 080 59 167 110 306Ship utilisation [% of year] 10% 17% 44% 6% 10%
Product amount at destinationTotal [GJ per a] 4 301 048 4 821 688 3 399 347 4 204 030 4 426 097
Paper Sustainable Energy & Fuels
�73 100 t perhydro-DBT) has been assumed to limit thenecessary amount of the LOHC-medium DBT. Reason is thehigh initial purchase cost of DBT ranging from 2–4 V perkg(DBT) (assumed: 2 V per kg(DBT)).47
Operating costs other than energy costs are calculated asa proportion of the respective investment costs and aredescribed in detail in the ESI (ESI-S4†).
Economics for the analysed PtX pathways
Fig. 5 shows the production cost (in V per MWhLHV) withoutand with shipping from Morocco to Germany for each PtX
This journal is © The Royal Society of Chemistry 2020
pathway. The components contain both the CAPEX deprecia-tion and OPEX (excl. electricity). The price for the fossil refer-ence product is indicated with a maximum and minimumspread based on available data (H2: steam reforming of naturalgas;103,104 NH3: conventional large-scale Haber–Bosch synthesisin Western Europe;105 CH3OH syngas based on natural gas;106
natural gas: European Union natural gas import price107). Theproduction cost including ship transport vary between 124 V
per MWhLHV (NH3) and 156 V per MWhLHV (LOHC–H2) withLCH4 showing the biggest cost difference to its fossil substitute(+705%). The PtX production cost are therefore clearly higher
Sustainable Energy Fuels, 2020, 4, 2256–2273 | 2267

Fig. 5 Production cost of PtX-products (“@GER”, incl. shipping Morocco – Germany) based on energy content (LHV). The product cost inMorocco (“@MAR”) exclude the cost for shipping, product storage and liquefaction. Levelised cost for the conventional product indicated byincluding a respective maximum/minimum price spread based on available data.
Sustainable Energy & Fuels Paper
than the fossil based reference product. That PtX products tendto be more expensive than their fossil counterparts is not a newnding of this study. The fact that, on the one hand, fossils aretoo cheap due to a missing inclusion of environmental andsocial costs and, on the other hand, general PtX production stillbeing a technology and hence capital intensive undertaking hasrecently been discussed in preceding papers.23,108–110 Assumingthat the PtX products are already utilised at the PtX location, anycost for shipping, product storage and liquefaction can beexcluded. In this case the cost for gaseous H2 are signicantlylower (90 V per MWh(H2)) than the other PtX product costs.
It becomes obvious that for all PtX pathways, the electricitydemand, mainly caused by electrolytic H2 production, repre-sents the major share of production cost (39–46%). Addition-ally, the capital and further operational cost of the PEMelectrolysis contribute with a notable cost share (20–23%). Forthe LH2 pathway the necessary liquefaction increases theproduction cost of LH2 by 10%. The on-site product storages forLH2, LCH4 and NH3, requiring a more complex constructiondue to high insulation efforts and boil-off reliquefaction, arecharacterised with higher specic investment than the tankscontaining CH3OH or LOHC. In case of the LOHC–H2 pathwayon-site storage cost are comparable to the CH3OH pathway dueto the practicable substance. However, the high initial purchasecost for the LOHC medium DBT (2 V per kg(DBT); 30% ofCAPEX) drive the overall pathway cost. Further cost increase hadbeen avoided due to the assumption of a smaller ship resultingin less DBT to be initially purchased. The consequent increasein ship utilisation and ascribed investment (a smaller ship hasto travel more frequent for the same annual amount of deliveredenergy carrier) was however offset by the savings in reducedDBT purchase. A clear reduction of the DBT market price fromcurrently �4 V per kg(DBT) to the assumed 2 V per kg(DBT)poses a clear target for future application of DBT as long-
2268 | Sustainable Energy Fuels, 2020, 4, 2256–2273
distance H2-carrier. Other discussed LOHC's such as N-ethyl-carbazole or 1,2-dihydro-1,2-azaborine have even higher marketprices.41 This case study assumes an H2 cavern as a temporarystorage facility for H2 acting as buffer between uctuating REgeneration and downstream steady-state process steps. In casethat due to geological restrictions underground H2 storage ina cavern is not possible CAPEX would be signicantly increaseddue to the high necessary investment for pressurised pipestorage systems. In such a case, the dynamic operation ofsubsequent process steps can signicantly reduce the H2
storage demand and thus limit the respective investment. Forthe steady-state syntheses a dynamic operation is by now at lowTRL and investigated at lab-scale within numerous researchprojects.111–114
For a better understanding how the production cost depend onkey economic indicators, a variation of renewable electricity cost,electrolysis investment and the interest rate has been conducted.These three parameters have been identied as the major inu-encing among all economic and technological indicators. Fig. 6shows the sensitivity for all PtX pathways. For a clear representa-tion, the paths are represented in an averaged form. This enablesa rst discussion about the impact of the key economic indicatorsof all PtX pathways assessed. Amore detailed sensitivity is includedin the ESI (ESI-S5†). An increase of the renewable electricity price to50 V per MWhLHV (+200%) results in an increase of the averagedproduction cost to an average of 187 V per MWhLHV (+39%). Lev-elised cost of renewable electricity around 50 V per MWhel arealready today representative for large parts of central Europe.101,115
However, such PtX production cost are far from the market pricedue to the cheap fossil reference products. An increased PEMelectrolysis investment of 1200 V per kWel (+200%), a value whichcan be discussed as a realistic value for present PEM systems,34,102
leads to averaged production cost of 172 V per MWhLHV (+27%).Regarding a variation of interest to 10% production cost increase
This journal is © The Royal Society of Chemistry 2020

Fig. 6 Averaged levelised cost of PtX products depending on a varia-tion of renewable electricity cost [base value ¼ 25 V per MWhel], PEMCAPEX [base value ¼ 600 V per kWel] and interest [base value ¼ 5%].
Paper Sustainable Energy & Fuels
to 157 V per MWhLHV. The feasibility of RE projects and contractprices heavily depending on interest rates has recently been dis-cussed in literature highlighting this factor as oen under-estimated.116,117 Especially when assessing future or foreign REprojects the nal estimation of project cost can be considerablyundermined by diverging real interest conditions.
Additionally, to these key economic indicators, the shiptransport distance has been varied. Fig. 7 shows the inuence ofthe shipping distance on the production cost (top) and thecargo-specic shipping fuel demand (bottom). Since the shipsuse their own cargo as fuel, the cargo-specic ship energydemand describes the amount of energy carrier “consumed” totransport one MWh of energy carrier over the respective
Fig. 7 Top: levelised cost of PtX-product depending shippingdistance. Bottom: MWh of fuel demand per MWh of product deliveredat final destination.
This journal is © The Royal Society of Chemistry 2020
distance. To give an idea on global shipping distances exem-plary routes from Morocco to the US American East Coast or toJapan are indicated. The graphs make clear that the LOHC–H2
and LH2 pathway are inuenced the most by increasing trans-port distances. In case of the LH2 pathway, reason for increasedproduct cost is on the one hand an increase of on-site LH2
storage demand for the times when the ship is on the move. Onthe other hand, the H2 consumption caused by the ship itselfdrives the LCo(LH2) since less product arrives at the naldestination. In case of the LOHC–H2 pathway, more DBT mustbe kept available as local storage medium for the times the shipis on the cruise. Even in the event that the LH2 storage costs orthe DBT market prices can be signicantly reduced, the cargo-specic shipping fuel demand represents a cost factor whoseinuence should not be underestimated. CH3OH and LCH4
prot from higher volumetric energy densities and thereforerequire a smaller share of their stored cargo as fuel.
Conclusions
With this study we provide an overview on the energy and costefficiency of ve different PtX pathways. While the rst part ofthe paper assessed the pathways respective overall efficiencydifferentiated by base and optimistic parameters, the secondpart devoted to production cost and a specic case study(Morocco/Western Sahara) considering more site and weatherdependent factors.
In general, it can be concluded that the calculated differ-ences in the pathways total efficiencies are not too signicant.For all pathways, the H2 providing water electrolysis acts as themain energy consumer. The reason for this is that the entireenergy content of the nal PtX product is provided by H2, whichis produced by water electrolysis. Hence, their electricityconsumption shall not be seen as lost power but rather asa necessary transformation of renewable energy into a storableform of sustainable energy carrier. This aspect is an importantreason why, to date, PtX pathways for energy carriers and fuelshave tended to be less energy efficient than their fossil coun-terparts. The latter prot from a “free” sourcing of fossil storedhydrocarbons with high energy densities, in turn charge theirindirect (environmental) cost in the form of massive green-house gas emissions. In order to improve PtX pathways' energyand cost efficiencies, a reduction of the electrolysis energydemand will be clearly benecial in case high full load hourscan be expected. However, R&D efforts by the electrolyserindustry are more focused on a reduction of capital cost.102
Reason is the higher share of capital cost for electrolysissystems operated with low-cost RE and at moderate full loadhours.
The LH2 pathway proved to be themost efficient of all evaluatedprocess chains (52–58% overall efficiency). Although an energyintensive liquefaction is part of the process chain, the overall effi-ciency prots from not being dependent on CO2- or N2-sourcing.Large-scale ship transport of LH2 is still in its pilot phase and has tobe demonstrated within the coming years.118 In terms of levelisedcost of product, LH2 (126 V per MWh@GER) is roughly on a parwith the low production cost of NH3 (124 V per MWh@GER) and
Sustainable Energy Fuels, 2020, 4, 2256–2273 | 2269

Sustainable Energy & Fuels Paper
CH3OH (131 V per MWh@GER). Furthermore, when focussing onpotential end-user applications, using H2 as a fuel offers highelectrical conversion efficiencies (e.g. fuel cell based combined heatand power plants with hel � 60% and hel+th � 85%).
The NH3 pathway characterised by a comparable highpathway efficiency (48–52%) and low levelised cost of product,clearly benets from a reduced energy demand for N2 provisionvia ASU. However, nal application of NH3 as energy carrier orfuel is still at an early stage. Currently, energy-intensive NH3
cracking for H2 recovery at the point of use appears to be themost realistic route. With further technological advances eitheron the side of direct NH3 application as fuel82,83 or in terms ofNH3 cracking at lower temperatures and with alternative cata-lysts119,120 this pathway can be very promising for large-scale andlong-distance energy transport and utilisation.
The overall efficiency of the CH3OH (40–44%) and LCH4
pathway (44–49%) clearly increase in case CO2 can be sourcedfrom a concentrated stream (4–10% increase in total efficiency).If CO2 shall be sourced from the atmosphere, the availability ofadditional excess or solar thermal heat to cover the necessaryDAC desorption energy demand raises the pathway efficiencies.In terms of LCH4 production cost (145 V per MWh@GER) thepathway has to deal with high capital costs for cryogenic storageand a cheap market price of the competing fossil natural gas.Furthermore, when considering the production, distributionand utilisation of synthetic CH4 at large scales, the high globalwarming potential of this gas must be critically considered.Both, LNG and methanol are already globally traded on largescales (317 and 75Mt per year, respectively121,122), with methanolproting from a less complex infrastructure for transport anddistribution.
The LOHC–H2 pathway is characterised by high initialinvestment for the LOHC medium DBT (2 V per kg(DBT)assumed) and the high thermal demand for the dehydrogena-tion step at the nal destination (25–30% of H2,LHV assumed). Incase excess heat integration for dehydrogenation is possible,the LOHC pathway signicantly increases its overall efficiency(16–18% increase in total efficiency). One idea could be theintegration of excess heat from a downstream H2 basedcombined heat and power plant. However, such integration iscase-dependent and only possible if H2 is utilised at the point ofdehydrogenation.
Besides renewable electricity, the access to water presentsa crucial aspect of large-scale PtX processes. The efficiencyanalysis (as well as the cost analysis) showed that for aridregions water provision via seawater reverse osmosis can be verypromising. The specic energy demand and attributed costs arelow. However, it should be noted that for large plants a disposalsystem for the resulting brine must be included withoutincreasing the pressure on the marine environment.123,124
When comparing our assessment to the other PtX importstudies assuming even better RE generation locations (e.g.Patagonia or South West Australia) it gets clear that PtXproduction costs can be even further reduced due to even higherfull load hours. The integration of less uctuating solar-thermalelectricity generation and small-scale battery storage couldpresent a way to reduce storage demands. This is an important
2270 | Sustainable Energy Fuels, 2020, 4, 2256–2273
aspect for PtX locations without the possibility for H2 storage incaverns.
In summary, it can be concluded that the long-distancetransport of renewable electricity in the form of PtX productsis an important step towards defossilised global societies.However, before the great hope for a defossilisation of globalsocieties is placed solely on cheap imported PtX energy sources,other strict measures should be continued in parallel. Aspectsin this context are an increased eco-sufficiency, a signicantreduction in transport, the use of regionally available REpotentials and, where reasonable, the direct electrication incombination with batteries. In any case, both the direct andindirect electrication of our currently fossil-fuelled societieswill require large amounts of renewable energy, which for manycountries cannot be fully covered by locally available RE plants.The ongoing market ramp-up of H2 technologies and steadilyincreasing technological readiness levels lead to a constantreduction in costs at all PtX levels. Imported renewable energyin the form of PtX products is not a far-off future vision. Theywill enable the urgent step towards a defossilisation of sectorssuch as the heavy-duty, marine traffic, aviation and (petro-)chemicals industry at acceptable costs.
In any case, the export of large RE and PtX capacities frompromising RE countries must also contribute to the defossili-sation of the local energy system. The local population shouldbenet from the added value and environmental regulationsshould be strictly respected. This is the only way to avoid thesignicant decits associated with the current global trade offossil fuels.
Conflicts of interest
There are no conicts to declare.
References
1 T. F. Stocker, D. Qin, G.-K. Plattner, M. Tignor, S. K. Allenand J. Boschung, Climate Change 2013: The PhysicalScience Basis, Working Group I Contribution to the FihAssesment Report of the Intergovernmental Panel onClimate Change, Cambridge, USA, 2013.
2 W. J. Ripple, C. Wolf, T. M. Newsome, P. Barnard andW. R. Moomaw, BioScience, 2019, 5, 969.
3 https://natcatservice.munichre.com/, last accessed October2019.
4 J. Rogelj, D. Shindell, K. Jiang, S. Fita, P. Forster,V. Ginzburg, C. Handa, H. Kheshgi, S. Kobayashi,E. Kriegler, L. Mundaca, Mitigation Pathways Compatiblewith 1.5�C in the Context of Sustainable Development:Global Warming of 1.5 �C. An IPCC Special Report on theImpacts of Global Warming of 1.5 �C above Pre-industrialLevels and Related Global Greenhouse Gas EmissionPathways, in the Context of Strengthening the GlobalResponse to the Threat of Climate Change, SustainableDevelopment, and Efforts to Eradicate Poverty, Geneva, 2018.
5 J. Bongaarts and B. C. O'Neill, Science, 2018, 361(6403), 650.
This journal is © The Royal Society of Chemistry 2020

Paper Sustainable Energy & Fuels
6 O. Edenhofer, R. P. Madruga and Y. Sokona, RenewableEnergy Sources and Climate Change Mitigation: SpecialReport of the Intergovernmental Panel on Climate Change,Cambridge, USA, 2012.
7 REN21, Renewables 2019 Global Status Report, Paris, 2019.8 R. Schlogl, Top. Catal., 2016, 59(8–9), 772.9 V. Quaschning, Sektorkopplung durch die Energiewende:Anforderungen an den Ausbau erneuerbarer Energien zumErreichen der Pariser Klimaschutzziele unter Berucksichtigungder Sektorkopplung, Berlin, 2016.
10 A. Katelhon, R. Meys, S. Deutz, S. Suh and A. Bardow, Proc.Natl. Acad. Sci. U. S. A., 2019, 116(23), 11187.
11 British Petroleum, BP Statistical Review of World Energy,London, United Kingdom, 68th edn, 2019.
12 C. Frei, G. Davis, A. Wilkinson, M. Ashraf and R. Kho,WorldEnergy Scenarios 2019: Exploring Innovation Pathways to2040, In Collaboration with Accenture Strategy and thePaul Scherrer Institute, London, United Kingdom, 2019.
13 https://www.eea.europa.eu/data-and-maps/indicators/primary-energy-consumption-by-fuel-6/assessment-2, lastaccessed October 2019.
14 M. Buck, A. Graf and P. Graichen, European EnergyTransition 2030: The Big Picture: Ten Priorities for the nextEuropean Commission to meet the EU's 2030 Targets andAccelerate towards 2050, Berlin, 2019.
15 S. Siegemund, M. Trommler, O. Kolb and V. Zinnecker, ThePotential of Electricity-based Fuels for Low-emission Transportin the EU: E-Fuels Study, An expertise by LBST and dena,Berlin, 2017.
16 K. Schumacher, F. Krones, R. McKenna and F. Schultmann,Energy Policy, 2019, 126, 315.
17 R. Wustenhagen, M. Wolsink and M. J. Burer, Energy Policy,2007, 35(5), 2683.
18 J. Lichter, Um die Klimaziele zu erreichen, mussen auchTabuthemen auf die Agenda, Kommentar, Handelsblatt,16 October 2019, https://www.handelsblatt.com/meinung/kommentare/kommentar-um-die-klimaziele-zu-erreichen-muessen-auch-tabuthemen-auf-die-agenda/25118732.html,last accessed October 2019.
19 K. Witsch, Das Problem mit der Windkra, ErneuerbareEnergie, Handelsblatt, 19 May 2019, https://www.handelsblatt.com/unternehmen/energie/erneuerbare-energie-das-problem-mit-der-windkra/24355964.html?ticket¼ST-39216793-aco96FEb6POcRq5RgZGN-ap3, lastaccessed October 2019.
20 https://www.iea.org/newsroom/news/2019/may/renewable-capacity-growth-worldwide-stalled-in-2018-aer-two-decades-of-strong-e.html, last accessed October 2019.
21 K. Gurtler, R. Postpischil and R. Quitzow, Energy Policy,2019, 133, 110881.
22 European Commission, A Clean Planet for All: A EuropeanStrategic Long-term Vision for a Prosperous, Modern,Competitive and Climate Neutral Economy, Communicationfrom the Commission to the European Parliamaent,Brussels, 2018.
This journal is © The Royal Society of Chemistry 2020
23 C. Hank, S. Gelpke, A. Schnabl, R. J. White, J. Full, N. Wiebe,T. Smolinka, A. Schaadt, H.-M. Henning and C. Hebling,Sustainable Energy Fuels, 2018, 2(6), 1244.
24 M. Perez-Fortes, European Commission – JRC Science forPolicy Report, 2016, 2016.
25 J. Perner and D. Bothe, International Aspects of a Power-to-XRoadmap: A Report Prepared for the World Energy CouncilGermany, 2018.
26 M. Fasihi and C. Breyer, Synthetic Fuels and Chemicals:Options and Systematic Impact, Berlin, 2018.
27 https://energiesysteme-zukun.de/de/themen/debatte/energieimporte/.
28 International Energy Agency IEA, World Energy Outlook2019, Paris, 2019.
29 International Energy Agency IEA Greenhouse Gas R&DProgramme, Ship Transport of CO2, Washington D.C., 2004.
30 http://www.imo.org/en/MediaCentre/PressBriengs/Pages/06GHGinitialstrategy.aspx, last accessed November 2019.
31 N. Voutchkov, Desalination, 2018, 431, 2.32 https://salinity.oceansciences.org/.33 Ecoinvent Centre – Swiss Centre for Life Cycle Inventories,
ecoinvent database: Process “Water Production, Deionised,from tap Water, at User [RoW]”, ecoinvent, Zurich,Switzerland, 2008.
34 T. Smolinka, N. Wiebe, S. Philip, A. Palzer, F. Lehner,M. Jansen, S. Kiemel, M. Robert, S. Wahren andF. Zimmermann, Studie IndWEDe: Industrialisierung derWasserelektrolyse in Deutschland: Chancen undHerausforderungen fur nachhaltigen Wasserstoff fur Verkehr,Strom und Warme, Berlin, 2018.
35 Siemens, Silyzer 300: Die nachste Dimension der PEM-Elektrolyse, Munchen, 2017.
36 K. Stolzenburg and R. Mubbala, idealhy: Integrated Designfor Demonstration of Efficient Liquefaction of Hydrogen(IDEALHY), Grant Agreement Number 278177, Brussel,2013.
37 U. Cardella, L. Decker, J. Sundberg and H. Klein, Int. J.Hydrogen Energy, 2017, 42(17), 12339.
38 D. Berstad, Technologies for Hydrogen Liquefaction,Gasskonferansen, Trondheim, 11 April, Trondheim, 2018.
39 S. Kamiya, M. Nishimura and E. Harada, Phys. Procedia,2015, 67, 11.
40 MAN Diesel & Turbo, Propulsion Trends in LNG Carriers:Two-stroke Engines, Copenhagen, 2013.
41 M. Niermann, S. Drunert, M. Kaltschmitt and K. Bonhoff,Energy Environ. Sci., 2019, 12(1), 290.
42 K. Muller, K. Stark, B. Muller and W. Arlt, Energy Fuels,2012, 26(6), 3691.
43 N. Bruckner, K. Obesser, A. Bosmann, D. Teichmann,W. Arlt, J. Dungs and P. Wasserscheid, ChemSusChem,2014, 7(1), 229.
44 Hydrogenious LOHC Technologies GmbH, HydrogeniousLOHC Technologies GmbH, 2019, https://www.hydrogenious.net/index.php/de/hydrogen-2/.
45 C. Paetz, Conditions and Technology Parameters using DBT asLOHC, Mail and Phone, Erlangen/Freiburg, 2019.
Sustainable Energy Fuels, 2020, 4, 2256–2273 | 2271

Sustainable Energy & Fuels Paper
46 MAN Diesel & Turbo, Propulsion Trends in Tankers,Copenhagen, 2013.
47 C. Paetz, Exchange about Hydrogenious' LOHC Technology, E-Mail, Erlangen/Freiburg, 2019.
48 M. Sterner, Bioenergy and renewable power methane inintegrated 100% renewable energy systems: limitingglobal warming by transforming energy systems, PhDthesis, University of Kassel, Kassel, 2009.
49 N. v. d. Assen, L. J. Muller, A. Steingrube, P. Voll andA. Bardow, Environ. Sci. Technol., 2016, 50(3), 1093.
50 M. Fasihi, O. Emova and C. Breyer, J. Cleaner Prod., 2019,224, 957.
51 http://www.climeworks.com/our-technology/, last accessedJuly 2018.
52 Universitat Stuttgart, Verbundprojekt Sunre – Herstellungvon Krastoffen aus CO2 und H2O unter NutzungRegenerativer Energie, Bericht Arbeitspaket D Okobilanz,2015.
53 Climeworks, Climeworks-Anlage in Hinwil: CO2 aus derUmgebungslu kurbelt Panzenwachstum an, Zurich,Switzerland, 2017.
54 L. Aleksander, C. Gebald, C. P. Brandstetter, J. P. Lindnerand S. Albrecht, Direct Air Capture of CO2, 2014.
55 Energiespeicher – Bedarf, Technologien, Integration, ed. M.Sterner and I. Stadler, Springer Berlin Heidelberg, Berlin,Heidelberg, 2014.
56 B. Muller, K. Muller, D. Teichmann and W. Arlt, Chem. Ing.Tech., 2011, 83(11), 2002.
57 J. Pospısil, P. Charvat, O. Arsenyeva, L. Klimes, M. Spilacekand J. J. Klemes, Renewable Sustainable Energy Rev., 2019,99, 1.
58 International Gas Union IGU, 2016 World LNG Report,Seoul, Republic of Korea, 2016.
59 B. B. Kanbur, L. Xiang, S. Dubey, F. H. Choo and F. Duan,Renewable Sustainable Energy Rev., 2017, 79, 1171.
60 W. Ali, M. A. Qyyum, K. Qadeer and M. Lee, Appl. Therm.Eng., 2018, 129, 782.
61 MAN Diesel & Turbo, Propulsion Trends in LNG Carriers,Copenhagen, 2013.
62 MAN Diesel & Turbo, MAN L51/60DF Propulsion: Four-strokeMarine Engines, Copenhagen, 2013.
63 J. Herdzik, New Trends in Production Engineering, 2018, 1(1),293.
64 Đ. Dobrota, B. Lalic and I. Komar, Problem of Boil-off in LNGSupply Chain, Split, Croatia, 2013.
65 K. Miyashita, K. Kobayashi, Y. Takaoka and K. Ebira, TheLarger LNG Carrier (145 000 m3) Aiming at Low OperationCost, Trondheim, 2003.
66 G. A. Olah, A. Goeppert and G. K. S. Prakash, J. Inorg. Chem.,2009, 74(2), 487.
67 Methanol: The Basic Chemical and Energy Feedstock of theFuture, ed. M. Bertau, H. Offermanns, L. Plass, F. Schmidtand H.-J. Wernicke, Springer Berlin Heidelberg, Berlin,Heidelberg, 2014.
68 D. Bongartz, J. Burre and A. Mitsos, Ind. Eng. Chem. Res.,2019, 58(12), 4881.
2272 | Sustainable Energy Fuels, 2020, 4, 2256–2273
69 MAN Diesel & Turbo, Using Methanol Fuel in the MAN B&WME-LGI Series, Copenhagen, 2014.
70 International Maritime Organization and DNV GL,Technoeconomics and Sustainability of Renewable Methanoland Ammonia Productions Using Wind Power-basedHydrogen, 2016.
71 Y. Demirel, M. Matzen and M. Alhajji, J. Adv. Chem. Eng.,2015, 5(3), 128.
72 https://www.usgs.gov/centers/nmic/nitrogen-statistics-and-information.
73 https://www.reuters.com/brandfeatures/venture-capital/article?id¼140174.
74 Y. Bennani, A. Perl and A. Patil, Power-to-Ammonia:Rethinking the Role of Ammonia – From a Value Product toa Flexible Energy Carrier: (FlexNH3), ProjectSysteemintegratie Studie, Final Report, Groningen, 2016.
75 D. Frattini, G. Cinti, G. Bidini, U. Desideri, R. Cioffi andE. Jannelli, Renewable Energy, 2016, 99, 472.
76 H.-J. Althaus, R. Hischier, M. Osses, A. Primas, S. Hellweg,N. Jungbluth and C. Mike, Life Cycle Inventory ofChemicals: Data v2.0 (2007), ecoinvent Report No. 8,Dusseldorf, 2007.
77 Ecoinvent Centre – Swiss Centre for Life Cycle Inventories,ecoinvent database: Process “Air Separation, Cryogenic[RoW]”, ecoinvent, Zurich, Switzerland, 2007.
78 M. Appl, Ammonia: Principles and Industrial Practices, Wiley-VCH, Weinheim, 1999.
79 https://www.transportenvironment.org/press/battery-hydrogen-and-ammonia-powered-ships-far-most-efficient-way-decarbonise-sector-%E2%80%93, last accessedNovember 2019.
80 https://futureproofshipping.com/, last accessed 12.11.19.81 https://www.ammoniaenergy.org/articles/pilot-project-an-
ammonia-tanker-fueled-by-its-own-cargo/.82 https://www.ammoniaenergy.org/articles/man-energy-
solutions-an-ammonia-engine-for-the-maritime-sector/,last accessed November 2019.
83 N. Ash and T. Scarbrough, Sailing on Solar: Could GreenAmmonia Decarbonise International Shipping?, London,United Kingdom, 2019.
84 https://www.seatrade-maritime.com/news/europe/ammonia-under-study-as-possible-marine-fuel/, lastaccessed November 2019.
85 Deutsche Energie-Agentur GmbH (dena), Process Heat inIndustry and Commerce: Technology Solutions for WasteHeat Utilisation and Renewable Provision, Hannover, 2016.
86 J. C. M. Farla, C. A. Hendriks and K. Blok, Clim. Change,1995, 29(4), 439.
87 L. K. Rihko-Struckmann, A. Peschel, R. Hanke-Rauschenbach and K. Sundmacher, Ind. Eng. Chem. Res.,2010, 49(21), 11073.
88 Western Sahara Resource Watch, Dirty Green March:Morocco's Controversial Renewable Energy Projects inOccupied Western Sahara, Morocco Plans to Expand itsProduction, Brussel, 2013.
89 Parliamentary Questions: Subject: International Status ofWestern Sahara under International and EC Law, ed.
This journal is © The Royal Society of Chemistry 2020

Paper Sustainable Energy & Fuels
European Parliament, European Parliament, Brussels,2017.
90 O. Radway, Western Sahara talks revive green energy hopes,resolution to the conict could provide the missing piece toMorocco's green energy jigsaw, FDi Magazine, 17 December2018, https://www.fdiintelligence.com/Sectors/Alternative-Renewable-energy/Western-Sahara-talks-revive-green-energy-hopes.
91 M. Fasihi, D. Bogdanov and C. Breyer, Energy Procedia,2016, 99, 243.
92 M. Fasihi and D. Bogdanov, Conference Paper, 31st EUPVSEC, At Hamburg, 2015, 2015.
93 P.-M. Heuser, D. S. Ryberg, T. Grube, M. Robinius andD. Stolten, Int. J. Hydrogen Energy, 2019, 44(25), 12733.
94 J. Topler and J. Lehmann, Wasserstoff und Brennstoffzelle:Technologien und Marktperspektiven, Springer Vieweg,Berlin, Heidelberg, 2017.
95 J. Michalski, U. Bunger, F. Crotogino, S. Donadei,G.-S. Schneider, T. Pregger, K.-K. Cao and D. Heide, Int. J.Hydrogen Energy, 2017, 42(19), 13427.
96 https://re.jrc.ec.europa.eu/tmy.html#cont1.97 http://gwa.stag.nazkamapps.com/.98 https://globalsolaratlas.info/map.99 National Renewable Energy Laboratory (NREL), System
Advisor Model (SAM), National Renewable EnergyLaboratory (NREL), Colorado, USA, 2018.
100 I. Tizgui, F. El Guezar, H. Bouzahir and A. Vargas, Int. J.Energy Econ. Pol., 2018, 2018(8(3)), 58.
101 M. Fasihi and C. Breyer, J. Cleaner Prod., 2020, 243, 118466.102 O. Schmidt, A. Gambhir, I. Staffell, A. Hawkes, J. Nelson
and S. Few, Int. J. Hydrogen Energy, 2017, 42(52), 30470.103 O. Machhammer, A. Bode and W. Hormuth, Chem. Ing.
Tech., 2015, 87(4), 409.104 Shell Deutschlanbd Oil GmbH, Shell Hydrogen Study, 2017,
2017.105 http://www.amis-outlook.org/amis-monitoring/.106 https://www.methanex.com/our-business/pricing, last
accessed December 2019.107 https://ycharts.com/indicators/europe_natural_gas_price.108 A. Markandya, D. Saygin, A. Miketa, D. Gielen and
N. Wagner, The True Cost of Fossil Fuels: Saving on the
This journal is © The Royal Society of Chemistry 2020
Externalities of Air Pollution and Climate Change, AbuDhabi, 2016.
109 D. Coady, I. Parry, N. Piotr and B. Shang, Global Fossil FuelSubsidies Remain Large: An Update Based on Country-LevelEstimates: IMF Working Paper, Washington D.C., 2019.
110 W. Hoppe, S. Bringezu and N. Wachter, J. CO2 Util., 2018,27, 170.
111 F. Nestler, M. Kruger, J. Full, M. J. Hadrich, R. J. White andA. Schaadt, Chem. Ing. Tech., 2018, 90(10), 1409.
112 https://www.encn.de/referenzprojekte/energiespeicher/dynamische-synthesen/.
113 B. Kreitz, J. Friedland, R. Guttel, G. D. Wehinger andT. Turek, Chem. Ing. Tech., 2019, 91(5), 576.
114 https://www.mpi-magdeburg.mpg.de/3535949/Control_of_methanol_synthesis, last accessed December2019.
115 C. Kost, S. Shammugam, V. Julch, H.-T. Nguyen andT. Schlegl, Levelized Cost of Electricity: Renewable EnergyTechnologies, Freiburg, 2018.
116 T. D. Couture, D. Jacobs and N. Appleman, A Word on LowCost Renewables: The Renewables Breakthrough: How toSecure Low Cost Renewables, Berlin, 2018.
117 T. S. Schmidt, B. Steffen, F. Egli, M. Pahle, O. Tietjen andO. Edenhofer, Nature Sustainability, 2019, 2(9), 879.
118 https://maritime-executive.com/article/world-s-rst-liqueed-hydrogen-carrier-launched.
119 K. F. Ortega, D. Rein, C. Luttmann, J. Heese, F. Ozcan,M. Heidelmann, J. Folke, K. Kahler, R. Schlogl andM. Behrens, ChemCatChem, 2017, 9(4), 659.
120 W. Zheng, T. P. Cotter, P. Kaghazchi, T. Jacob, B. Frank,K. Schlichte, W. Zhang, D. S. Su, F. Schuth andR. Schlogl, J. Am. Chem. Soc., 2013, 135(9), 3458.
121 International Gas Union IGU, 2019 World LNG Report,Seoul, Republic of Korea, 2019.
122 https://www.methanol.org/the-methanol-industry/.123 Y. Fernandez-Torquemada, J. M. Gonzalez-Correa, A. Loya,
L. M. Ferrero, M. Dıaz-Valdes and J. L. Sanchez-Lizaso,Desalin. Water Treat., 2009, 5(1–3), 137.
124 J.-P. Mericq, S. Laborie and C. Cabassud, Water Res., 2010,44(18), 5260.
Sustainable Energy Fuels, 2020, 4, 2256–2273 | 2273

1/1 Verband Deutscher Verkehrsunternehmen e. V. · Kamekestraße 37–39 · 50672 Köln · T 0221 57979-0 · F 0221 57979-8000 · [email protected] · www.vdv.de
Stellungnahme zum Öffentlichen Fachgespräch „Alternative Antriebsstoffe“
Der Verband Deutscher Verkehrsunternehmen (VDV), Branchenverband für rund 600 Unternehmen des Öffentlichen Personen- und Schienengüterverkehrs begrüßt die Beratungen im Parlamentarischen Beirat für nachhaltige Entwicklung zum Thema „Alternative Antriebsstoffe“. Denn diese und andere Initiativen tragen mit dazu bei, dass die Förderkataloge für die Umstellung der Flotten auf alternative Antriebe auch für Busse und Bahnen offen stehen. So sind dank der breiten Unterstützung von Bund und Ländern inzwi-schen 2.000 Linienbusse mit alternativen Antrieben in Betrieb. Für weitere 1.400 saubere Busse haben unsere Mitgliedsunternehmen bereits Förderanträge gestellt, die teilweise schon bewilligt sind. Aber auch im Eisenbahnverkehr gewinnen emissionsarme und -freie Antriebe zunehmend an Bedeutung; etwa in Teilbereichen die nicht elektrifziert sind oder auch bei Werks- und Hafenbahnen.
Für die Fortsetzung dieser erfolgreichen Entwicklung ist es wichtig, dass die Förderkataloge auch in Zu-kunft technologieoffen bleiben. Denn während sich etwa batterieelektrische Antriebe im Stadtverkehr als praxistauglich erweisen, eignen sich im Überlandverkehr eher Erdgas- oder Dieselhybridbusse; aber auch die Wasserstofftechnologie. Für kurzfristig messbare Effekte bei Umwelt- und Klimaschutz ist es ferner sinnvoll, auch die Beschaffung von Bussen mit moderner Dieseltechnologie und die Nutzung von synthe-tischen Kraftstoffen voranzutreiben. Mit den jüngsten Änderungen des Deutschen Bundestages (Drucksa-che 19/29196) am Gesetzentwurf „zur Umsetzung der Richtlinie (EU) 2019/1161 vom 20. Juni 2019 zur Änderung der Richtlinie 2009/33/EG über die Förderung sauberer und energieeffizienter Straßenfahr-zeuge sowie zur Änderung vergaberechtlicher Vorschriften“ wurde diesen Anforderungen Rechnung ge-tragen. Hiermit wurde unter anderem festgeschrieben, dass in Zukunft auch emissionsarme und syntheti-sche Kraftstoffe in Deutschland Verwendung finden dürfen. Demnach können zukünftig auch Dieselbusse ohne weiteres mit synthetischen und emissionsarmen Kraftstoffen betankt und betrieben werden. Kos-tenbelastungen für die andernfalls nötige Neubeschaffung von Bussen mit anderen alternativen Antriebs-technologien können so vermieden werden. Aber auch der Umgang mit zwei oder mehr verschiedenen Antriebssystemen auf einem Betriebshof ist durch diese wichtige Freigabe von synthetischen Kraftstoffen nun nicht mehr nötig.
Für die Umsetzung ist jedoch ein zweiter Schritt nötig; nämlich eine Änderung der „Zehnten Verordnung zur Durchführung des Bundes-Immissionsschutzgesetzes“ (10. BImschV). Hintergrund ist, dass die BIm-schV gegenwärtig noch keine Nutzungsmöglichkeit für synthetische Kraftstoffe im Linienbusverkehr vorsieht. So könnte mit folgender Formulierung diese Lücke in § 4 (1) geschlossen werden:
„Dieselkraftstoff darf nur dann gewerbsmäßig oder im Rahmen wirtschaftlicher Unternehmungen gegenüber dem Letztverbraucher in den Verkehr gebracht werden, wenn er den Anforderungen der DIN EN 590, Ausgabe Oktober 2017 oder der DIN EN 15940 genügt sofern dieser für den
Linienbusverkehr genutzt wird.“
Vor allem für Verkehrsunternehmen in ländlichen Räumen spielt diese Änderung und damit die Nut-zungsmöglichkeit von emissionsarmen und synthetischen Kraftstoffen eine wichtige Rolle, weil viele an-dere alternative Technologien im Überlandverkehr noch keine ausreichenden Reichweiten haben.
18. Mai 2021
VDV | GFT, KB, T3, T4
verfoullonni
Ausschussstempel