Rudorff_et_al_2012.pdf - plutao:80
15
Sustainability 2012, 4, 1074-1088; doi:10.3390/su4051074 sustainability ISSN 2071-1050 www.mdpi.com/journal/sustainability Article Remote Sensing Images to Detect Soy Plantations in the Amazon Biome—The Soy Moratorium Initiative Bernardo F. T. Rudorff 1, *, Marcos Adami 1 , Joel Risso 1 , Daniel Alves de Aguiar 1 , Bernardo Pires 2 , Daniel Amaral 2 , Leandro Fabiani 3 and Izabel Cecarelli 3 1 National Institute for Space Research, Avenida dos Astronautas, 1758, São José dos Campos, SP, 12243-750, Brazil; E-Mails: [email protected] (M.A.); [email protected] (J.R.); [email protected] (D.A.A.) 2 Brazilian Association of Vegetable Oil Industries, Av. Vereador José Diniz, 3707, 7th floor, São Paulo, SP, 04603-004, Brazil; E-Mails: [email protected] (B.P.); [email protected] (D.A.) 3 Geoambiente Consulting Engineering, Av. Shishima Hifumi, 2911, 2th floor, Parque Tecnológico UNIVAP, Urbanova, São José dos Campos, SP 12244-000, Brazil; E-Mails: [email protected] (L.F.); [email protected] (I.C.) * Author to whom correspondence should be addressed; E-Mail: [email protected] (B.R.); Tel.: +55-12-3208-6490; Fax: +55-12-3208-6488. Received: 20 February 2012; in revised form: 15 May 2012 / Accepted: 16 May 2012 / Published: 23 May 2012 Abstract: The Soy Moratorium is an initiative to reduce deforestation rates in the Amazon biome based on the hypothesis that soy is a deforestation driver. Soy planted in opened areas after July 24th, 2006 cannot be commercialized by the associated companies to the Brazilian Association of Vegetable Oil Industries (ABIOVE) and the National Association of Cereal Exporters (ANEC), which represent about 90% of the Brazilian soy market. The objective of this work is to present the evaluation of the fourth year of monitoring new soy plantations within the Soy Moratorium context. With the use of satellite images from the MODIS sensor, together with aerial survey, it was possible to identify 147 polygons with new soy plantations on 11,698 ha. This soy area represents 0.39% of the of the total deforested area during the moratorium, in the three soy producing states of the Amazon biome, and 0.6% of the cultivated soy area in the Amazon biome, indicating that soy is currently a minor deforestation driver. The quantitative geospatial information provided by an effective monitoring approach is paramount to the implementation of a governance OPEN ACCESS
-
Upload
khangminh22 -
Category
Documents
-
view
3 -
download
0
Transcript of Rudorff_et_al_2012.pdf - plutao:80

Sustainability 2012, 4, 1074-1088; doi:10.3390/su4051074
sustainability ISSN 2071-1050
www.mdpi.com/journal/sustainability
Article
Remote Sensing Images to Detect Soy Plantations in the Amazon Biome—The Soy Moratorium Initiative
Bernardo F. T. Rudorff 1,*, Marcos Adami 1, Joel Risso 1, Daniel Alves de Aguiar 1,
Bernardo Pires 2, Daniel Amaral 2, Leandro Fabiani 3 and Izabel Cecarelli 3
1 National Institute for Space Research, Avenida dos Astronautas, 1758, São José dos Campos, SP,
12243-750, Brazil; E-Mails: [email protected] (M.A.); [email protected] (J.R.);
[email protected] (D.A.A.) 2 Brazilian Association of Vegetable Oil Industries, Av. Vereador José Diniz, 3707, 7th floor,
São Paulo, SP, 04603-004, Brazil; E-Mails: [email protected] (B.P.);
[email protected] (D.A.) 3 Geoambiente Consulting Engineering, Av. Shishima Hifumi, 2911, 2th floor, Parque Tecnológico
UNIVAP, Urbanova, São José dos Campos, SP 12244-000, Brazil;
E-Mails: [email protected] (L.F.); [email protected] (I.C.)
* Author to whom correspondence should be addressed; E-Mail: [email protected] (B.R.);
Tel.: +55-12-3208-6490; Fax: +55-12-3208-6488.
Received: 20 February 2012; in revised form: 15 May 2012 / Accepted: 16 May 2012 /
Published: 23 May 2012
Abstract: The Soy Moratorium is an initiative to reduce deforestation rates in the Amazon
biome based on the hypothesis that soy is a deforestation driver. Soy planted in opened
areas after July 24th, 2006 cannot be commercialized by the associated companies to the
Brazilian Association of Vegetable Oil Industries (ABIOVE) and the National Association
of Cereal Exporters (ANEC), which represent about 90% of the Brazilian soy market.
The objective of this work is to present the evaluation of the fourth year of monitoring new
soy plantations within the Soy Moratorium context. With the use of satellite images from
the MODIS sensor, together with aerial survey, it was possible to identify 147 polygons
with new soy plantations on 11,698 ha. This soy area represents 0.39% of the of the total
deforested area during the moratorium, in the three soy producing states of the Amazon
biome, and 0.6% of the cultivated soy area in the Amazon biome, indicating that soy is
currently a minor deforestation driver. The quantitative geospatial information provided by
an effective monitoring approach is paramount to the implementation of a governance
OPEN ACCESS

Sustainability 2012, 4 1075
process required to establish an equitable balance between environmental protection and
agricultural production.
Keywords: Soy Moratorium; deforestation; Amazon forest; MODIS
1. Introduction
The process of colonizing the Brazilian Amazon started in the 1960s and was intensified in the
following decades through the creation of public policies to stimulate occupation of the region with
programs such as PIN (National Integration Program) and PROTERRA (Program for Land
Redistribution and Stimulation of Agribusiness in the North and Northeast). PIN was created to protect
the vast interior of Brazil by relocating citizens and to guarantee national sovereignty in the Amazon
region, while PROTERRA supported these actions by creating better working conditions in the field
and to foment agribusiness by providing the necessary infrastructure (roads, energy and its
distribution, expansion of telecommunication networks etc.) to integrate the region into the domestic
economy [1,2]. At the same time, the government offered tax incentives and credits for developing
agriculture and livestock farming [3–5], and the lumber industry with consequent deforestation on a
large scale [6]. With the start of an economic recession at the end of the 1980s and the beginning of the
1990s, the government reduced tax incentives which resulted in a decrease of the Amazon’s
deforestation annual rates from ~20,400 km2 in the 1980s to ~13,700 km2 between 1990 and 1994.
With the introduction of a new economic plan (Plano Real) in 1994 and the stabilization of the
Brazilian economy, offers of credits with low interest rates increased and this, together with new
government investments in infrastructure, led to an increase in deforestation, which reached 27,772 km2
in 2004 [3,5,7–10].
Several articles have dealt with the Amazon deforestation issue, showing its direct causal
relationship with the expansion of agriculture and livestock farming, especially cattle farming [5,11–13]
and soy production [14–19]. In this context, Greenpeace led a campaign for the conservation and
reduction of deforestation in the Amazon biome, entitled “Eating up the Amazon” [20]. The scope of
this campaign included publication of a report revealing that approximately one-quarter of the soy
harvested in the Amazon was used to feed chickens that were later traded by the big fast-food chains.
Due to the repercussion of this evidence in the international scenario, several fronts, especially from
the importer markets, pressured the productive soy chain sector to include in their agenda a
commitment to preserve the forests. Consequently, in July 2006, Brazilian Vegetable Oil Industries
Association (ABIOVE) and the National Grain Exporters Association (ANEC) announced the signing
of the Soy Moratorium, an agreement that committed the member companies of ABIOVE
and ANEC not to purchase soy produced in areas of the Amazon biome that were deforested after
July 2006 [21,22].
According to Lovatelli [22], soon after the declaration of the Soy Moratorium, in October 2006,
the Soy Task Force (GTS) was formed, consisting of representatives from the soy productive chain
sector (ABIOVE, ADM, ANEC, Algar Agro, Amaggi, Baldo, Bunge, Cargill, IMCOPA, Louis
Dreyfus and Óleos Menu) and from the civil society (Greenpeace, International Conservation, IPAM,
Sustainability 2012, 4 1076
The Nature Conservancy and WWF-Brasil). The GTS mission was to plan and coordinate the Soy
Moratorium’s activities. In addition to the Coordination Group, the Soy Moratorium also had the
following three subgroups:
i) EDUCATION, INFORMATION and FOREST CODE: This subgroup disseminates the adoption
of good soy production practices in the Amazon biome to ensure that the actions generated by
the Soy Moratorium reach the rural producers and the other economic, social and political
agents involved, mainly those with local relevance, and contributes to agribusiness, keeping the
proper balance between economic and social-environmental needs, thus ensuring compliance
with legislation;
ii) INSTITUTIONAL RELATIONS: This subgroup brings the GTS closer to the members of
government entities, with a view to improving sustainable development policies for the
Amazon biome and to stimulating legislative advancements to improve the region’s command
and control mechanisms;
iii) MAPPING and MONITORING: This subgroup supports the development of a system to map
and monitor the Amazon biome, defining the methods and the criteria necessary to assure
compliance with the commitment not to trade soy originating from deforested areas.
Over the last few years, Brazilian institutions such as the Ministry of the Environment, Bank of
Brazil and National Institute for Space Research (INPE) began to collaborate with the Soy
Moratorium. Starting in 2009, INPE assumed the responsibility for developing and applying a
methodology for monitoring soy plantations in deforested areas of the Amazon biome through the use
of satellite images.
It also is important to mention that since the early 2000s the Brazilian government has implemented
a comprehensive set of measures to fight illegal deforestation, highlighting the PPCDAM (Action Plan
for the Prevention and Control of Deforestation in the Legal Amazon) implemented in 2003 [23].
Other important public policies include the Ecologic-Economic Zoning (ZEE) established by the
states, a listing of degrading working conditions kept by the Ministry of Labor, a listing of embargoed
areas kept by the Ministry of the Environment, reinforcement of supervision by environmental entities
and a big advance in real-time monitoring of deforestation and forest fires using satellite images.
With the use and expansion of these new tools, the improvement in public governance over the last
five years has been very significant.
In this panorama, the objective of this work is to present the evaluation of the fourth year of
monitoring new soy plantations within the Soy Moratorium context.
2. Material and Methods
The sections of material and methods presented in this study are summarized in the flowchart
presented in Figure 1.

Sustainability 2012, 4 1077
Figure 1. Flowchart of the summary of material and methods.
2.1. Study Area
The study area is the Amazon biome, which covers nine states with 553 municipalities and an area
of 4.2 million km2, representing approximately half of Brazil’s territory. This biome is made up of the
world’s largest tropical rain forest, with a very significant biodiversity and quantity of carbon
accumulated in the form of biomass. According to Soares-Filho et al. [24], the quantity of carbon
stored in the Amazon in the form of biomass is equivalent to 15 years of anthropic emissions of carbon
dioxide (CO2) at current emission levels.
Currently, 7.5% of Brazil’s soy area is in the Amazon biome and concentrated in the states of
Mato Grosso (MT), Rondônia (RO) and Pará (PA), which comprise 99% of this area [25]. Together
these states are responsible for 78.7% of the deforestation mapped by the Amazon Deforestation
Monitoring Project (PRODES) since the beginning of the Soy Moratorium [7]. Therefore, deforested
polygons mapped by PRODES were monitored to detect soy plantations in municipalities of these
three states with a minimum soy area of 5,000 hectares (ha) each, according to the survey of the
previous crop year made by the Brazilian Geographic and Statistical Institute (IBGE).
In this way, for the year 2011, 53 municipalities (41 in MT, 6 in RO and 6 in PA) were selected,
representing 98% of the soy area in the Amazon biome (Figure 2).
Municipalitieswithin the Amazon
biome
Selectedmunicipalities
PRODES deforestation in the
Amazon biome
Selected polygonswith deforestation
≥ 25 ha
Satellite imageanalyses withEVI/MODIS
CEI image for soy orannual crop
classification
Satellite imageanalyses with Landsat
or ResourceSat
Selected for aerial survey
Removed fromanalysis
Deforested polygonsin selected
municipalities
Fusioned polygons
> 5,000 ha ofplanted soy?
PRODES deforestation in
selectecmunicipalities?
Fusion ofpolygons
Evidence ofsoy or annual
crop?
Deforestedpolygon
≥ 25ha?
CEI Method
no
no
no
yes
yes
no yes
yes
2.1. Study area
2.2. PRODES processing
2.3. Identification of annual crops
yes
2.4. Aerial survey

Sustainability 2012, 4 1078
Figure 2. (a) The Brazilian Amazon biome (yellow line); (b) The 53 municipalities
(red line) with more than 5,000 ha of soy each that represent 98% of the soy area in the
Brazilian Amazon biome.
2.2. Preprocessing of Deforested Polygons from the PRODES Project
The Amazon Deforestation Monitoring Project (PRODES), developed and carried out by INPE,
identifies on an annual basis the deforested areas in the Amazon region. The international scientific
community considers PRODES to be the world’s major tropical forest monitoring program [26].
Since 1988, INPE has monitored, mapped and estimated the annual deforestation rate for the entire
Brazilian Legal Amazon region. Starting in 2002, the analogical deforestation mapping procedure was
converted to a digital system in which Landsat images are automatically classified and later edited
through visual interpretation on the computer screen. Deforestation maps are inserted into a
georeferenced database and made available on the internet (http://www.obt.inpe.br/prodes/) [7,27,28].
Table 1 shows the data supplied by PRODES for MT, RO and PA states, related to deforested
polygons mapped in the Amazon biome during the Soy Moratorium.
Table 1. Total annual deforested area (ha) in MT, RO and PA states during the Soy Moratorium.
State Year of evaluation *
2007 2008 2009 2010 Total
MT 237,142 317,123 68,438 65,757 688,460 RO 161,100 113,600 48,200 43,500 366,400 PA 552,600 560,700 428,100 377,000 1,918,400
Total 950,842 991,423 544,738 486,257 2,973,260 * The PRODES mapping year refers to the period from August of the previous year to July of the current year. For example, deforestation of 2007 refers to the deforestation observed from August 2006 to July 2007. Source: Adapted from [7].

Sustainability 2012, 4 1079
All deforested polygons from the period between 2007 and 2010, related to MT, RO and PA states,
were selected from the PRODES database. These polygons were then intersected with the boundaries
of both the 53 municipalities with more than 5,000 ha each and the Amazon biome, to select only those
deforested polygons located within the Amazon biome, and the selected municipalities.
The GTS agreed to monitor only deforested polygons ≥25 ha due to the moderate spatial resolution
(250 m) of the satellite images from the MODIS (Moderate Resolution Imaging Spectroradiometer)
sensor [29–31] used to identify soy crop within these polygons. However, smaller areas of
deforestation that begin in specific spots are very often not isolated events that occur in a single year,
but gradually increase through deforestation of adjacent areas in following years, thus forming larger
deforested areas [4,21,32]. Therefore, annual deforested polygons of <25 ha were also monitored when
the sum of the annual and adjacent deforested polygons became ≥25 ha. For this reason, adjacent
deforested polygons with <25 ha were aggregated to form polygons ≥25 ha, according to the
methodology described by [21].
2.3. Identification of Soy Crop Within Deforested Polygons Using Satellite Images
Due to intense cloud cover in the Amazon region [33,34] the identification of soy plantations using
optical remote sensing images is not feasible with the current temporal resolution of Landsat type
images (16 days). Part of this difficulty can be solved with the use of images from high temporal
resolution sensors, thus increasing the probability of obtaining cloud-free images. In this sense, the
MODIS sensor is an alternative as it has an almost daily temporal resolution, as well as geometric [35]
and radiometric [36] qualities that produce images in 36 spectral bands, with products generated by
means of tested algorithms and the generation of validated products [37]. Allying the geometric quality
of the images, which allows the composition of time series and guaranteed pixel geolocation with the
attributes of radiometric and spectral quality of validated products, one can ensure that the MODIS
data is of good quality [35,38,39].
Although MODIS images have frequently been used to classify soy with relatively good accuracy
figures, particularly in the state of MT [40,41], these results are not accurate enough for the purpose of
the Soy Moratorium due to some classification confusion with other annual crops, such as rice and
corn. For classification of annual crops with MODIS images, an overall accuracy of 88.5% was
achieved by Galford et al. [42]. From previous Soy Moratorium work, it was observed that more
than 90% of the deforested polygons did not present any annual crop and, consequently, less than 10%
of the deforested polygons needed to be aerially surveyed to ensure the correct detection of soy
plantations among the polygons with potential presence of annual crops [21]. Therefore, the MODIS
images play a crucial role just by detecting annual crops, eliminating more than 90% of the polygons
in which soy plantation is very unlikely to be found. According to the results from the Terra Class
Project [43], more than 90% of the original tropical rain forest in the Legal Amazon mapped by
PRODES from 1988 to 2007 is now occupied by pasture, secondary forest or regenerated forest, and
only 4.6% is occupied by annual crops.
Deforested polygons with signs of presence of soy plantation or any other annual crop with similar
seasonality to soy were selected based on the Crop Enhancement Index (CEI) method, proposed by [44],
as presented by [21]. The CEI is an approach to detect the seasonality of annual crop based on the

Sustainability 2012, 4 1080
significant difference between the Enhanced Vegetation Index (EVI) [45] values, derived from
MODIS images, acquired at two specific periods: 1) prior to the beginning of the crop growing season
when EVI values are at a minimum for annual crops; and 2) at mid growing season when EVI values
are at maximum for annual crops [46,47] (Figure 3). The typical seasonality observed for annual crops
allow them to be differentiated from other targets such as regenerated forest, savanna or
pasturing (Figure 3).
Figure 3. Example of typical temporal profiles of EVI values for early and late sowing soy
according to crop calendar in MT state, regenerated forest, savanna/pasture and forest.
For the Soy Moratorium, the CEI method was adapted and the maximum EVI value used in the
CEI equation (Figure 3) was acquired during the crop greenup phase, right after the EVI values
established significant variation between minimum and maximum values, particularly to detect late
sowing soy (Figure 3). The relative early crop detection in the growing season is important to allow
enough time for the aerial survey and field work that have to be accomplished prior to the soy harvest
in late January for the early sowing soy. Furthermore, early and late sowing soy are planted in the
same region and both should be detected in a single aerial survey to avoid cost increase. From the
experience acquired in the previous crop year (2009/2010), it became evident that the soy planting
period was similar in MT and RO states, but rather different in PA state. According to the soy calendar
in MT and RO the maximum EVI values were obtained based on MODIS images (MOD09 product,
8-day composition) acquired from early December, 2010 to early January, 2011. For the crop calendar
of PA state the maximum EVI values were obtained based on MODIS images acquired from early
February to early March, 2011. Any significant seasonal change captured by the CEI approach was
enough to classify a polygon as annual crop. This strategy increases the commission error, but reduces
the possibility of not classifying a less evident soy plantation, lowering the omission error. To refine
the MODIS classification procedure, the polygons classified as annual crops were submitted to a visual
interpretation whenever recent cloud-free images acquired by either Landsat (TM or ETM+ sensors) or
Resourcesat-1 (AWIFS or LISS3 sensors) were available at the website of INPE’s Division of Image
Generation [48]. In general, only very few cloud-free images from these sensors are available during
the soy growing season, but the 2010/2011 crop season was particularly favorable in this respect.
Sustainability 2012, 4 1081
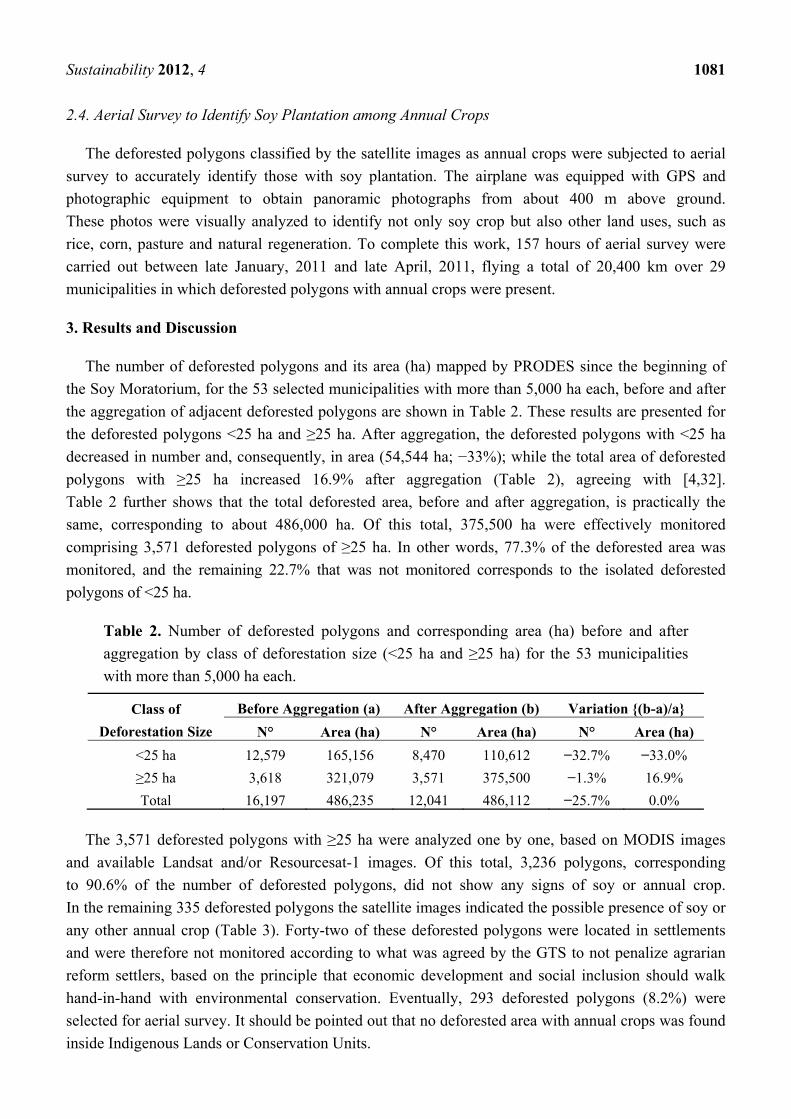
2.4. Aerial Survey to Identify Soy Plantation among Annual Crops
The deforested polygons classified by the satellite images as annual crops were subjected to aerial
survey to accurately identify those with soy plantation. The airplane was equipped with GPS and
photographic equipment to obtain panoramic photographs from about 400 m above ground.
These photos were visually analyzed to identify not only soy crop but also other land uses, such as
rice, corn, pasture and natural regeneration. To complete this work, 157 hours of aerial survey were
carried out between late January, 2011 and late April, 2011, flying a total of 20,400 km over 29
municipalities in which deforested polygons with annual crops were present.
3. Results and Discussion
The number of deforested polygons and its area (ha) mapped by PRODES since the beginning of
the Soy Moratorium, for the 53 selected municipalities with more than 5,000 ha each, before and after
the aggregation of adjacent deforested polygons are shown in Table 2. These results are presented for
the deforested polygons <25 ha and ≥25 ha. After aggregation, the deforested polygons with <25 ha
decreased in number and, consequently, in area (54,544 ha; −33%); while the total area of deforested
polygons with ≥25 ha increased 16.9% after aggregation (Table 2), agreeing with [4,32].
Table 2 further shows that the total deforested area, before and after aggregation, is practically the
same, corresponding to about 486,000 ha. Of this total, 375,500 ha were effectively monitored
comprising 3,571 deforested polygons of ≥25 ha. In other words, 77.3% of the deforested area was
monitored, and the remaining 22.7% that was not monitored corresponds to the isolated deforested
polygons of <25 ha.
Table 2. Number of deforested polygons and corresponding area (ha) before and after
aggregation by class of deforestation size (<25 ha and ≥25 ha) for the 53 municipalities
with more than 5,000 ha each.
Class of
Deforestation Size
Before Aggregation (a) After Aggregation (b) Variation {(b-a)/a}
N° Area (ha) N° Area (ha) N° Area (ha)
<25 ha 12,579 165,156 8,470 110,612 −32.7% −33.0%
≥25 ha 3,618 321,079 3,571 375,500 −1.3% 16.9%
Total 16,197 486,235 12,041 486,112 −25.7% 0.0%
The 3,571 deforested polygons with ≥25 ha were analyzed one by one, based on MODIS images
and available Landsat and/or Resourcesat-1 images. Of this total, 3,236 polygons, corresponding
to 90.6% of the number of deforested polygons, did not show any signs of soy or annual crop.
In the remaining 335 deforested polygons the satellite images indicated the possible presence of soy or
any other annual crop (Table 3). Forty-two of these deforested polygons were located in settlements
and were therefore not monitored according to what was agreed by the GTS to not penalize agrarian
reform settlers, based on the principle that economic development and social inclusion should walk
hand-in-hand with environmental conservation. Eventually, 293 deforested polygons (8.2%) were
selected for aerial survey. It should be pointed out that no deforested area with annual crops was found
inside Indigenous Lands or Conservation Units.

Sustainability 2012, 4 1082
Table 3. Number of deforested polygons with and without annual crops by state.
Deforested polygons States
MT PA RO Total (%) Without annual crops 1,929 1,133 174 3,236 (90.6%) With annual crops 214 78 1 293 (8.2%) With annual crops—within settlements * 42 0 0 42 (1.2%) Total 2,185 1,211 175 3,571 (100%)
* Not monitored.
From the aerial survey of the 293 deforested polygons, soy plantations were found in 146 polygons,
with a total area of 11,698 ha (Table 4). This indicates that the conversion of forest to soy in the
Amazon biome during the Soy Moratorium corresponds to: 0.3% of total deforestation; 0.39% of the
deforestation in the states of MT, RO and PA; 2.4% of the deforestation observed in the
53 municipalities that produce more than 5,000 ha of soy each; or 3.1% of the deforestation observed
in polygons ≥25 ha in these same municipalities.
Table 4. Number of deforested polygons and corresponding soy area (ha) by classes of
deforestation size.
Class of Deforestation size
MT PA RO Total
(ha) N° (ha) N° (ha) N° (ha) N° (ha)
25–50 40 1,149 17 418 1 29 58 1,567 50–100 23 1,340 10 445 - - 33 1,785 >100 42 5,896 13 2,421 - - 55 8,346 Total 105 8,385 40 3,284 1 29 146 11,698
In MT state, 105 deforested polygons were identified as not meeting the Soy Moratorium’s
requirements, representing 8,385 ha of soy (Table 4). This corresponds to 1.2% of the total deforested
area in MT state (688,460 ha; Table 1) during the Soy Moratorium. In PA state, 40 deforested
polygons were identified as having soy, representing 3,284 ha (Table 4). This corresponds to 0.17% of
the deforested area in PA state (1,918,400 ha; Table 1) during the Soy Moratorium. Only one
deforested area with soy was identified in RO state, representing 29 ha (Table 4) of a total deforested
area of 366,400 ha in RO (Table 1). It should be emphasized that, of the 293 selected polygons for
aerial survey (Table 2), 113 were from deforested polygons with more than 100 ha, of which 55 were
identified as having soy. The soy area of these polygons was 8,346 ha (Table 4), which corresponds to
71% of the total soy planted in deforested polygons, thus indicating that the great majority of soy
plantations occurred in deforested polygons with more than 100 ha. Further details on the selected
polygons can be found at [49].
Table 5 shows that from crop year 2009/10 to 2010/11, the monitored area increased by 24% (from
302,149 ha to 375,500 ha), but the soy area increased by 86% (from 6,295 ha to 11,698 ha).
An important factor to be considered in this 4th year of the Soy Moratorium is the longer time that had
elapsed since its beginning, due to the fact that rice crops often precede soy crops during the first two
years after deforestation [16,50]. Under this consideration the intention of planting soy in

Sustainability 2012, 4 1083
deforestations of the first two years (2007 and 2008) should appear in the 4th year. Therefore, the
increase of 5,403 ha of soy (86%; Table 5), compared to the sum of the deforestations observed in
2007 and 2008 (1,942,265 ha; Table 1), is minor.
Table 5. Comparison between crop years 2009/10 and 2010/11 of deforested polygons and
those with new soy in the 53 analyzed municipalities.
2009/10 (a) 2010/11 (b) Variation {(b − a)/a} (%)
Total area of deforested polygons (ha) 302,149 375,500 24 Total no. of deforested polygons 2,955 3,571 21 No. of deforested polygons with soy 76 146 92 New soy area in deforested polygons (ha) 6,295 11,698 86
The results of crop year 2010/11 show that soy was planted in 0.39% of the total deforested area
observed in the three soy producing states of the Amazon biome, since the inception of the
Soy Moratorium. Considering the soy area planted in the Amazon biome (1.94 million ha), the amount
of soy in deforested polygons observed during the Soy Moratorium represents 0.6% (Table 6). In view
of the results, there are strong indications that the Soy Moratorium has, for the last four years, inhibited
the advance of deforestation for the purpose of planting soy in the Amazon biome. It should be pointed
out that, in MT state, which is responsible for 88% of the Amazon biome’s soy area, the soy planted in
deforested polygons during the Soy Moratorium represent just 0.49% of the state’s soy area within the
Amazon biome (Table 6).
Table 6. Soy area (ha) in deforested polygons and in the Amazon biome; and relative
contribution of new soy in deforested polygons.
State New soy in deforested polygons (b) Soy in Amazon biome (a)* (a*100/b) (%) MT 8,385 1,704,963 0.49% PA 3,284 104,800 3.13% RO 29 132,300 0.02%
Total 11,698 1,942,063 0.60% Source: * adapted from [51].
During the four years of the Soy Moratorium (2007 to 2010) 2,973 thousand ha were deforested in
the states of MT, PA and RO (Table 1), but deforestation rates are declining and in 2010 they reached
the lowest level in a historic series of 22 years [5]. Although the results show that the land conversion
from deforestation to soy is minor, the soy planted area is continuously increasing [52], particularly in
MT. Recent works have shown that soy is mainly expanding on savanna and pasture land [53, 54].
Agriculture intensification through double cropping has also been observed in MT [42] which, coupled
to the major effort of the Brazilian government to fight illegal deforestation, should reduce the pressure
of expansion over native forest.

Sustainability 2012, 4 1084
4. Conclusions
The evaluation of the fourth year of monitoring new soy plantations within deforested polygons
during the Soy Moratorium revealed to be minor with an area of 11,698 ha in crop year 2010/2011 in
the states of Mato Grosso, Rondônia and Pará. These states are responsible for 99% of the soy planted
within the Amazon biome and, considering its total deforested area during the Soy Moratorium (2007
to 2010), the 11,698 ha of soy corresponds to 0.39%. Considering the deforestation of polygons ≥25 ha
in the 53 municipalities that altogether are responsible for 98% of the biome’s soy planted area, this
new soy area corresponds to 3.1%.
It might be premature to conclude that the Soy Moratorium is actually having an inhibitory effect
on recent deforestation in the Amazon biome but, from the figures, it is quite evident that the soy crop
was not a significant deforestation driver during the Soy Moratorium.
Monitoring soy plantations in recently deforested polygons in the Amazon biome allowed the
industries and exporters that participate in the Soy Moratorium to comply with their commitment not
to acquire soy from areas that were deforested after July 24, 2006. The present work also demonstrates
that remote sensing technology can significantly contribute to the governance process of Brazilian
natural resources.
Acknowledgments
The authors wish to thank Magog Araújo, Flávia Mendes and Fernando Yuzo Sato, of INPE’s
Laboratory of Remote Sensing in Agriculture and Forestry (LAF) for the technical support that
they provided.
Conflict of Interest
The authors declare no conflict of interest.
References
1. Mahar, D.J. Frontier Development Policy in Brazil: A Study of Amazonia; Praeger: New York,
NY, USA, 1979; p. 182.
2. Pedlowski, M.A.; Dale, V.H.; Matricardi, E.A.T.; da Silva Filho, E.P. Patterns and impacts of
deforestation in Rondônia, Brazil. Landscape Urban Plan. 1997, 38, 149–157.
3. Fearnside, P.M. Avança Brasil: Environmental and social consequences of Brazil’s planned
infrastructure in Amazonia. Environ. Manag. 2002, 30, 735–747.
4. Aguiar, A.P.D.; Câmara, G.; Escada, M.I.S. Spatial statistical analysis of land-use determinants
in the Brazilian Amazonia: Exploring intra-regional heterogeneity. Ecol. Model. 2007, 209,
169–188.
5. Fearnside, P.M. Deforestation in Brazilian Amazonia: History, Rates, and Consequences;
Blackwell Science Inc: Hoboken, NJ, USA, 2005; Volume 19, pp. 680–688.
6. Ros-Tonen, M. Novas perspectivas para a gestão sustentável da Floresta Amazônica: Explorando
novos caminhos. Ambient. Soc. 2007, 10, 11–25.

Sustainability 2012, 4 1085
7. INPE. Monitoramento da Floresta Amazônica Brasileira por Satélite—Estimativas Anuais de
desmatamento desde 1988 até 2009, 2011. Available online: http://www.obt.inpe.br/prodes/
prodes_1988_2010.htm (accessed on 15 September 2011).
8. Merry, F.; Soares, B.; Nepstad, D.; Amacher, G.; Rodrigues, H. Balancing conservation and
economic sustainability: The future of the Amazon Timber industry. Environ. Manag. 2009, 44,
395–407.
9. Nepstad, D.; Stickler, C.; Almeida, O. Globalization of the Amazon soy and beef industries:
Opportunities for conservation. Conserv. Biol. 2006, 20, 1595–1603.
10. Nepstad, D.C.; Stickler, C.M.; Soares, B.; Merry, F. Interactions among Amazon land use, forests
and climate: Prospects for a near-term forest tipping point. Philos. Trans. R. Soc. B Biol. Sci.
2008, 363, 1737–1746.
11. Mertens, B.; Poccard-Chapuis, R.; Piketty, M.G.; Lacques, A.E.; Venturieri, A. Crossing spatial
analyses and livestock economics to understand deforestation processes in the Brazilian Amazon:
The case of São Félix do Xingú in South Pará. Agric. Econ. 2002, 27, 269–294.
12. McAlpine, C.A.; Etter, A.; Fearnside, P.M.; Seabrook, L.; Laurance, W.F. Increasing world
consumption of beef as a driver of regional and global change: A call for policy action based on
evidence from Queensland (Australia), Colombia and Brazil. Glob. Environ. Change Hum.
Policy Dimens. 2009, 19, 21–33.
13. Faminow, M.D. Spatial economics of local demand for cattle products in Amazon development.
Agric. Ecosyst. Environ. 1997, 62, 1–11.
14. Fearnside, P.M.; Laurance, W.F. Comment on “Determination of Deforestation Rates of the
World’s Humid Tropical Forests”. Science 2003, 299, doi:10.1126/science.1078714.
15. Laurance, W.F. Switch to corn promotes Amazon deforestation. Science 2007, 318, 1721.
16. Morton, D.C.; DeFries, R.S.; Shimabukuro, Y.E.; Anderson, L.O.; Arai, E.; Espirito-Santo, F.D.;
Freitas, R.; Morisette, J. Cropland expansion changes deforestation dynamics in the southern
Brazilian Amazon. Proc. Natl. Acad. Sci. USA 2006, 103, 14637–14641.
17. Elferink, E.V.; Nonhebel, S.; Uiterkamp, A. Does the Amazon suffer from BSE prevention?
Agric. Ecosyst. Environ. 2007, 120, 467–469.
18. Fearnside, P.M. Soybean cultivation as a threat to the environment in Brazil. Environ. Conserv.
2001, 28, 23–38.
19. Brown, J.C.; Koeppe, M.; Coles, B.; Price, K.P. Soybean production and conversion of tropical
forest in the Brazilian Amazon: The case of Vilhena, Rondonia. Ambio 2005, 34, 462–469.
20. GREENPEACE. Eating up the Amazon; Greenpeace International: Amsterdam, The Netherlands,
2006; p. 64.
21. Rudorff, B.F.T.; Adami, M.; Aguiar, D.A.; Moreira, M.A.; Mello, M.P.; Fabiani, L.; Amaral, D.F.;
Pires, B.M. The soy moratorium in the Amazon Biome monitored by remote sensing images.
Remote Sens. 2011, 3, 185–202.
22. Lovatelli, C. Cinco anos da Moratória da Soja e sustentabilidade do Bioma Amazônia.
Polít. Externa 2011, 20, 125–137.
23. Brazilian Federal Government. Comitê Interministerial sobre Mudança do Clima; Plano Nacional
sobre Mudança do Clima (PNMC): Brasília, Brazil, 2008; p. 154.

Sustainability 2012, 4 1086
24. Soares-Filho, B.S.; Nepstad, D.C.; Curran, L.M.; Cerqueira, G.C.; Garcia, R.A.; Ramos, C.A.;
Voll, E.; McDonald, A.; Lefebvre, P.; Schlesinger, P. Modelling conservation in the Amazon
basin. Nature 2006, 440, 520–523.
25. IBGE. Sistema IBGE de Recuperação Automática, 2011. Available online:
http://www.sidra.ibge.gov.br/ (accessed on 13 October 2011).
26. Kintisch, E. Improved monitoring of rainforests helps pierce haze of deforestation. Science 2007,
316, 536–537.
27. Câmara, G.; Valeriano, D.d.M.; Soares, J.V. Metodologia para o Cálculo da Taxa Anual de
Desmatamento na Amazônia Legal; INPE: São José dos Campos, Brazil, 2006; p. 24.
Available online: http://www.obt.inpe.br/prodes/metodologia.pdf (accessed on 24 October 2011).
28. Shimabukuro, Y.E.; Batista, G.T.; Mello, E.M.K.; Moreira, J.C.; Duarte, V. Using shade fraction
image segmentation to evaluate deforestation in Landsat Thematic Mapper images of the
Amazon Region. Int. J. Remote Sens. 1998, 19, 535–541.
29. Anderson, L.O.; Shimabukuro, Y.E.; Defries, R.S.; Morton, D. Assessment of deforestation in
near real time over the Brazilian Amazon using multitemporal fraction images derived from Terra
MODIS. IEEE Geosci. Remote Sens. Lett. 2005, 2, 315–318.
30. Morton, D.C.; DeFries, R.S.; Shimabukuro, Y.E.; Anderson, L.O.; Del Bon Espírito-Santo, F.;
Hansen, M.; Carroll, M. Rapid Assessment of annual deforestation in the Brazilian Amazon using
MODIS data. Earth Interact. 2005, 9, 1–22.
31. Justice, C.O.; Vermote, E.; Townshend, J.R.G.; Defries, R.; Roy, D.P.; Hall, D.K.;
Salomonson, V.V.; Privette, J.L.; Riggs, G.; Strahler, A.; et al. The Moderate Resolution Imaging
Spectroradiometer (MODIS): Land remote sensing for global change research. IEEE Trans.
Geosci. Remote Sens. 1998, 36, 1228–1249.
32. Alves, D.S. Space-time dynamics of deforestation in Brazilian Amazônia. Int. J. Remote Sens.
2002, 23, 2903–2908.
33. Asner, G.P. Cloud cover in Landsat observations of the Brazilian Amazon. Int. J. Remote Sens.
2001, 22, 3855–3862.
34. Sano, E.E.; Ferreira, L.G.; Asner, G.P.; Steinke, E.T. Spatial and temporal probabilities of
obtaining cloud-free Landsat images over the Brazilian tropical savanna. Int. J. Remote Sens.
2007, 28, 2739–2752.
35. Wolfe, R.E.; Nishihama, M.; Fleig, A.J.; Kuyper, J.A.; Roy, D.P.; Storey, J.C.; Patt, F.S.
Achieving sub-pixel geolocation accuracy in support of MODIS land science. Remote Sens.
Environ. 2002, 83, 31–49.
36. Vermote, E.F.; El Saleous, N.Z.; Justice, C.O. Atmospheric correction of MODIS data in the
visible to middle infrared: First results. Remote Sens. Environ. 2002, 83, 97–111.
37. Friedl, M.A.; McIver, D.K.; Hodges, J.C.F.; Zhang, X.Y.; Muchoney, D.; Strahler, A.H.;
Woodcock, C.E.; Gopal, S.; Schneider, A.; Cooper, A.; et al. Global land cover mapping from
MODIS: Algorithms and early results. Remote Sens. Environ. 2002, 83, 287–302.
38. Justice, C.O.; Townshend, J.R.G.; Vermote, E.F.; Masuoka, E.; Wolfe, R.E.; Saleous, N.;
Roy, D.P.; Morisette, J.T. An overview of MODIS Land data processing and product status.
Remote Sens. Environ. 2002, 83, 3–15.

Sustainability 2012, 4 1087
39. Huete, A.; Didan, K.; Miura, T.; Rodriguez, E.P.; Gao, X.; Ferreira, L.G. Overview of the
radiometric and biophysical performance of the MODIS vegetation indices. Remote Sens. Environ.
2002, 83, 195–213.
40. Bernardes, T.; Adami, M.; Formaggio, A.R.; Moreira, M.A.; França, D.d.A.; Novaes, M.R.d.
Imagens mono e multitemporais Modis para estimativa da área com soja no estado de
Mato Grosso. Pesqui. Agropecu. Bras. 2011, 46, 1530–1537.
41. Epiphanio, R.D.V.; Formaggio, A.R.; Rudorff, B.F.T.; Maeda, E.E.; Luiz, A.J.B. Estimating
soybean crop areas using spectral-temporal surfaces derived from MODIS images in Mato Grosso,
Brazil. Pesqu. Agropec. Bras. 2010, 45, 72–80.
42. Galford, G.L.; Mustard, J.F.; Melillo, J.; Gendrin, A.; Cerri, C.C.; Cerri, C.E.P. Wavelet analysis
of MODIS time series to detect expansion and intensification of row-crop agriculture in Brazil.
Remote Sens. Environ. 2008, 112, 576–587.
43. EMBRAPA; INPE. TerraClass—Levantamento de informações de uso e cobertura da terra na
Amazônia. Sumário Executivo. 2011; p. 20. Available online: http://www.inpe.br/cra/projetos_
pesquisas/sumario_executivo_terraclass_2008.pdf (accessed on 14 May 2012).
44. Rizzi, R.; Risso, J.; Epiphanio, R.D.V.; Rudorff, B.F.T.; Formaggio, A.R.; Shimabukuro, Y.E.;
Fernandes, S.L. Estimativa da área de soja no Mato Grosso por meio de imagens MODIS.
In Proceedings of the INPE Anais XIV Simpósio Brasileiro de Sensoriamento Remoto, Natal,
Brazil, 25–30 April 2009; pp. 387–394.
45. Huete, A.R.; Liu, H.Q.; Batchily, K.; van Leeuwen, W. A comparison of vegetation indices over
a global set of TM images for EOS-MODIS. Remote Sens. Environ. 1997, 59, 440–451.
46. Arvor, D.; Jonathan, M.; Meirelles, M.S.P.; Dubreuil, V.; Durieux, L. Classification of MODIS
EVI time series for crop mapping in the state of Mato Grosso, Brazil. Int. J. Remote Sens. 2011,
32, 7847–7871.
47. Adami, M.; Rudorff, B.F.T.; Freitas, R.M.; Aguiar, D.A.; Sugawara, L.M.; Mello, M.P.
Remote sensing time series to evaluate direct land use change of recent expanded sugarcane crop
in Brazil. Sustainability 2012, 4, 574–585.
48. Divisão de Geração de Imagens. Image Catalogue. Available online: http://www.dgi.inpe.br/
siteDgi_EN/index_EN.php (accessed on 10 October 2010).
49. ABIOVE. Monitoring of the Soy Moratorium 2010/11. Available online:
http://www.abiove.com.br/english/ss_relatoriouso10_us.asp (accessed on 15 January 2012).
50. Sorrensen, C. Contributions of fire use study to land use/cover change frameworks:
Understanding landscape change in agricultural frontiers. Hum. Ecol. 2004, 32, 395–420.
51. CONAB. Acompanhamento de Safra Brasileira de Grãos—Décimo Primeiro Levantamento;
CONAB: Brasília, Brazil, 2011; p. 41.
52. CONAB. Séries históricas relativas às safras 1976/77 a 2009/2010 de área plantada,
produtividade e produção, 2011. Available online: http://www.conab.gov.br/conteudos.php
?a=1252&t= (accessed on 12 November 2011).
53. Arvor, D.; Meirelles, M.; Dubreuil, V.; Bégué, A.; Shimabukuro, Y.E. Analyzing the agricultural
transition in mato grosso, brazil, using satellite-derived indices. Appl. Geogr. 2012, 32, 702–713.
Sustainability 2012, 4 1088
54. Macedo, M.N.; DeFries, R.S.; Morton, D.C.; Stickler, C.M.; Galford, G.L.; Shimabukuro, Y.E.
Decoupling of deforestation and soy production in the southern amazon during the late 2000s.
Proc. Natl. Acad. Sci. USA 2012, 109, 1341–1346.
© 2012 by the authors; licensee MDPI, Basel, Switzerland. This article is an open access article
distributed under the terms and conditions of the Creative Commons Attribution license
(http://creativecommons.org/licenses/by/3.0/).