
80-35 Ai - DTIC
87
AD-AO85 177 DONRICH RESEARCH INC WEST PALM REACH FL F/B 5/9 DETERMINATION OF THE IMPACT OF DIGITAL DATA BROADCAST ON FL IBHT--ETC(U) FEB 80 D W RICHARDSON UNCLASSIFIED F-80-01 FAA/RD -80-35 Ai
-
Upload
khangminh22 -
Category
Documents
-
view
1 -
download
0
Transcript of 80-35 Ai - DTIC

AD-AO85 177 DONRICH RESEARCH INC WEST PALM REACH FL F/B 5/9DETERMINATION OF THE IMPACT OF DIGITAL DATA BROADCAST ON FL IBHT--ETC(U)FEB 80 D W RICHARDSON
UNCLASSIFIED F-80-01 FAA/RD -80-35 Ai

jl1.8lIl 1.25 1 -114 1111.6'*
MICROCOPY RESOLUTION TEST CHkqTNATf flJAL BUREAU Of STANDARDS-1963-?

Report No. FAA-D-80-35 . .
~V
DETERMINATION OF THE IMPACT OFit DIGITAL DATA BROADCAST ON
FLIGHT TECHNICAL ERROR
Donald W. Richardson, Ph.D
.17
DTICFEBRUARY 1980FINAL REPORT
Document is available to the U.S. public throughthe National Technical Information Service,
Springfleld, Virgnia 22161.
Prepared for
U.S. DEPARTMENT OF TRANSPORTATIONFEDERAL AVIATION ADMINISTRATION
U.. Systems Research & Development ServiceLA - Washington, D.C. 2059C
80 6 6 017'

NOTICE
This document is disseminated under the sponsorshipof the Department of Transportation in the interestof information exchange. The United States Governmentassumes no liability for its contents or use thereof.
w

I ocrncae ftspeorl UecumsttI0a IqReport No. I 7. 2. Government Accession N. 3. Recipient's Catalog No.
JA-k 6 and Subtitle ' ' S. Report DoteSETER MINATION OF THE IMPACT 0FPIG Februa 1980
BROADCAST ONJ GHT TECHNICALERROR v /6. Performing Orgenimeon Cede
7.11g . Perforating O30aizetion Report No.
/0 nald W. RihrsnPh.Di4 F.819. Performing Orgfnixtin Noae and Address 10. Work Unit Mo. (TRAIS)
D o n r i c h R e s e a r c l I n c o mp o s a e d 1_ . _ _ _ _ _ _ _rGr a n tNo .1500 Oak Drive II. ConteAt iGt No.West Palm Beach, Florida 33406 . DTFAc-,0-P-85745
113. Type of 'Ohort and Period Covered12. Sponsoring Agency Name and Address
Department of Transportation tFederal Aviation AdministrationSystems Research and Development Service " 14. Sponsoring Agency CodeWashington, D.C. 20590 ARD-311
IS. supplementry Notes. .
This report documents the data reduction and analysis of existingflight test data regarding the digital data broadcast system (DDBS)concept of automating cockpit data input procedures in an areanavigation environment. Particular attention is paid to the statisticalquantification of the impact of the DDBS concept on pilot steeringperformance, mainly flight technical error (FTE).
Results of this analysis indicate that DDBS significantly reducesboth pilot blunder rate and FTE, for both the enroute and approachphases of flight.
,,
17. Key Words 18. Distribution Statement
Flight Technical Error, Document is available to the U.S.Digital;Data, rAV, public through the National TechnicalTacan, DME Information Service, Springfield, Va.
22161
19. Security Clossif. (of Its report) 20. Security Clessi. (of this page) 21. No. of Peges 22. Price
UNCLASSIFIED UNCLASSIFIED 83
Form POT F 1700.7 (8-72) Roproduction of completed poge awthorizoed
* ... . -.... " i ,. iI 7 ". ... il. . .. .. ...... -, - -.. .. - -. .
I ~ H IIi fit ',I1
A to I
mc,4 I j
I IS 1'? 1, [81 Iiv II
I ra--
.03

TABLE OF CONTENTS
Table of Contents iList of Figures iList of Tables tii
Section
1.0 INTRODUCTION 1-1
1.1 GENERAL 1-11.2 BACKGROUND 1-11.3 OBJECTIVE 1-2
2.0 EXPERIMENTAL APPROACH 2-1
2.1 INTRODUCTION 2-12.2 DDBS CONCEPT 2-12.3 BASELINE COMPARISON CONCEPT 2-22.4 EXPERIMENT DESIGN 2-72.5 DATA REDUCTION AND ANALYSIS TECHNIQUES 2-19
3.0 FINDINGS AND RESULTS 3-1
3.1 GENERAL 3-13.2 BLUNDER ANALYSIS 3-13.3 FTE ANALYSIS 3-83.4 SUMMARY 3-13
4.0 CONCLUSIONS AND RECOMMENDATIONS 4-1
4.1 GENERAL 4-14.2 CONCLUSIONS 4-14.3 RECOMMENDATIONS i4-4
REFERENCES .:.: R-1
APPENDIX A A-1APPENDIX B B-1
. .I B-

LIST OF FIGURES
Figure Page
2.1 Controller-Modified Route Structure 2-42.2 Routes A-1 and A-2 Horizontal Profiles 2-52.3 Northeast RNAV Departures 2-102.4 Northeast RNAV Arrivals/Hotel Transition 2-112.5 Northeast RNAV Approach Plate 2-122.6 Southeast RNAV Departures 2-132.7 Southeast RNAV Arrivals/Baltic Transition 2-142.8 Southeast RNAV Approach Plate 2-152.9 Northeast RNAV Departure 2-162.10 Northwest RNAV Arrivals/Bay Transition 2-172.11 Northwest RNAV Approach Plate 2-182.12 NAFEC ONE RNAV STAR 2-202.13 Sample "Quick Look" Airborne Data Printout 2-222.14 Typical EAIR Tracking Radar Printout 2-232.15 Airborne/Radar Data Merge File 2-25
3.1 General Aviation RNAV Control Errors by Type(Baseline Experiment) 3-7
APPENDIX A - EAIR Plots A-i thru A-22
*1
ii:

LIST OF TABLES
Table Page
2.1 Flight Experience of Subject Pilots in Hours 2-7
3.1 DDB Flight Test Matrix Flown by Subject Pilot "A" 3-23.2 DDB Flight Test Matrix Flown by Subject Pilot "B" 3-33.3 DDB Flight Test Matrix Flown by Subject Pilot "C" 3-33.4 DDB Flight Test Matrix Summary of Variables/Subject
Pilot/Number of Flights 3-43.5 DDB Flight Test Pilot Blunder Analysis 3-63.6 Procedural Error Rate Per Flight 3-73.7 CDI Aggregation 3-93.8 DDBS-CDI Aggregation 3-103.9 FTE Summary (Baseline vs DDBS) 3-113.10 FTE Significance Values 3-123.11 FTE Variance Test Variables 3-12
APPENDIX B - FTE Data B-1 thru B-9
IA"ii
1.0 INTRODUCTION
1.1 GENERAL
This document is intended to serve as a basic data report,
primarily as an aid in establishing a data base regarding pilot
performance in an area navigation (RNAV) operational environment.
The two principal pilot performance measures treated in this report
are blunders and steering or flight technical error (FTE). The
quantitative data contained herein is directly correlated to, and
supplements, the more qualitative data contained in Reference 1,
Report No. FAA-RD-76-60, "Evaluation of Digital Data Broadcast for
Area Navigation". In order to effectively evaluate the results
and conclusions contained in this present document, some basic material
has been extracted from Reference 1 and included in this report for
clarity. The data presented in this report has been processed and
analyzed specifically for this contract, and has not been previously
documented.
1.2 BACKGROUND
At the present time, the dramatic expansion of avionics technology
is giving increased emphasis to the concept of area coverage navigation
systems as a companion to, if not a replacement for, the existing VOR-
based airway system. Independent of the specifics of the navigation
sensor used (VOR/DME, Loran-C, Omega/VLF, GPS/NAVSTAR), there are
serious implications regarding cockpit workload and pilot steering
performance (sometimes highly correlated with a measure called flight
technical error, or FTE) that must be considered and, if possible,
quantified as regards eventual certification of such systems for use in
the National Airspace System. The Federal Aviation Administration (FAA)
is continuously involved in an ongoing program of analytical, simulation
and flight test efforts aimed at acquiring a substantive quantitative data
base relating to the overall subject of the Interrelationship between
pilot performance factors, avionics system functional design criteria, and
overall navigation system use performance, particularly as regards avionics
certification standards, ATC operational procedures and airspace planning
guidelines.
Previous FAA activity (Contract No. DOT-FA75WA-3634) had sponsored
a hardware development program and flight test evaluation of a concept
1-1

known as the Digital Data Broadcast System (DDBS). The basis of this
concept involved the use of the existing Distance Measuring Equipment
(DME) channel as a data link medium for transmitting the location of
RNAV waypoints comprising complete Standard Instrument Departure (SID)
and Standard Terminal Arrival Route (STAR) routes. These waypoints
were automatically received in the aircraft and used by a low cost single
waypoint airborne RNAV computer as a possible means of minimizing pilot
workload and blunders in setting the series of waypoints that comprise
the SID or STAR route into this type of computer, thus potentially
improving the pilot steering performance. During the performance of the
referenced contract, the data acquired during the flight tests were
reduced as regards a quantitative comparison of blunder performance and
a subjective evaluation of pilot workload reduction. Data relating to
the quantitative evaluation of FTE was originally recorded during these
tests but was not processed or analyzed as part of the original contract.
1.3 OBJECTIVE
It is the purpose of this effort to document the additional data
reduction and analysis of the existing DDBS test data for the purpose
of statistically quantifying the impact of the DDBS cockpit data input
automation concept on pilot steering performance, namely FTE. The results
contained herein will add one more necessary element in the overall
matrix of data regarding FTE and pilot performance for area coverage
navigation systems. As a general case, the blunder/workload data should
be able to be extrapolated to other area navigation sensor systems
offering the potential for cockpit data automation, and not constrained
to the specifics of VORTAC navigation. However, the absolute impact
of DDBS on FTE performance must be carefully considered in the light of
VORTAC signal characteristics and their possible correlation with FTE
as observed in other flight test experiments (Reference 2).
In particular it must be noted that the FTE data contained in this
present report should be considered primarily in the context of a direct
comparison with previously measured FTE data taken on a "baseline" RNAV
flight test experiment as reported in Reference 3. As presented in this
report, the impact of DDBS is evaluated in terms of relative improvement
in steering performance rather than as an absolute value of FTE per se.
Further discussions in Section 3 of this report will amplify this point.
1-2
L---,7 -.-3,.,. .... . .. . . .- ,--- , -- _- :. .. . . .

2.0 EXPERIMENTAL APPROACH
2.1 INTRODUCTION
As mentioned previously in Section 1, this report will supplement
and amplify the qualitative data that was originally presented in
Reference 1. However, in order to properly interpret the quantitative
results developed in this present report, it was felt necessary to
include sufficent information to describe the basic test environment,
conditions, procedures and equipment. This is particularly true when
the comparison is ultimately drawn in Section 3 between the DDBS test
results and the FTE values obtained from the non-DDBS "baseline" flight
experiment. For this reason the following subsections are included.
Some, but not all, of the experiment description has been extracted
or reconstructed from material originally presented in Reference 1.
2.2 DDBS CONCEPT
Preliminary analysis indicated that a digital data broadcast
system (DDBS) concept could be used and applied as a potential means of
reducing cockpit workload and pilot blunders. The initial requirements
of a DDBS were derived from an operational analysis that preceded the
design of DOB engineering model hardware, and which defined an operational
concept and functional requirements for that system. The next logical
step, following the fabrication and laboratory testing of the engineering
model DDBS, was the evaluation, under actual operational flight conditions,
of quantifiable pilot performance parameters as affected by the DDBS units.
As described in Reference 4, Digital Data Broadcast is a technique
in which the DME or Tactical Air Navigation (TACAN) ground-to-air radio
link is used to carry RNAV-referenced data into the aircraft. In the
engineering model of the system that was fabricated, the data transmitted
consisted of the identification code, latitude, longitude, magnetic
variation and elevation of the transmitting station, and the RNAV distances,
RNAV bearings, sequence numbers and group (route) identifiers of the
waypoints referred to that station. These latter two items of information
are used in a concept of transmitting the entire sequence of RNAV waypoints,
which define a STAR, such that the pilot may select only a STAR designator
in order to acquire the entire STAR route. The digital information,
except for the ground station identifiers, then is decoded, stored, and
displayed to the pilot by the DDBS airborne decoder. The applicable
navigation data decoded by the DDBS airborne equipment then are fed into
2-1

the RNAV computer as required for computations of pertinent RNAV parameters.
This automatic acquisition of RNAV waypoint data accomplishes two major
goals. First, no pilot workload is involved in setting these data into
the computer, since it is done automatically. Second, no human error can
be introduced by missetting coordinates or track information.
The particular DDBS hardware fabricated for this program was
specifically designed to be interfaced with an existing single waypoint
analog course line computer, which comprises the majority of those
systems currently being used in single-pilot applications. This interface
was extremely simple and necessitated only a minor modification to the
existing RNAV computer hardware.
2.3 BASELINE COMPARISON CONCEPT
The history of the flight testing of area navigation devices spans
more than 25 years. For a variety of reasons these previous flight tests,
while providing interesting background information, were not particularly
pertinent to the problem at hand. Specifically those tests that were
run prior to 1972 did not necessarily reflect the concepts and procedures
currently postulated for our future RNAV environment. Another important
issue in the gathering of pertinent data on a particular subject involving
experimentation is the establishment of a coordinated concept of data
collection, in which the types of data and the experiments themselves are
structured on a common basis, such that data from one experiment to
another can be cross-correlated.
It has been a matter of some historical interest that data previously
obtained has been widely scattered in the type and quality thereof,
making comparisons between systems and different types of procedures
extremely difficult. It is also true that in many instances in the past,
the types of data that have been collected have been qualitative or sub-
jective in nature. Primarily, it is interpretive as far as attitudes by
both controllers and pilots is concerned. A more quantitative, systematic
type of data collection and data analysis needs to be established in order
to get meaningful results from experiments which are costly and often few
and far between.
2-2

Using lessons of the past as a guideline and the Task Force
report [51 as a forcing function, a concept of coordinated data collectionwas initiated and has been successfully applied to all of the controlled
RNAV flight tests performed since 1974. The particular approach that
was implemented was a data collection and flight evaluation program
which coordinates cockpit simulations, experimental flight tests,
operational flight tests, and real time terminal area simulations to
gather and evaluate those data considered necessary in order to reach
an intelligent set of decisions concerning RNAV.The critical issue that has been kept in mind during the planning
phase has been to maintain a strict discipline concerning commonality
in order to allow extrapolation and cross-correlation. Commonality in
this case does not always mean commonality of equipment, since different
equipments must of necessity be evaluated in order to establish
differences between performance, both accuracy and functional. The
commonality which must be maintained refers to the more ATC environment
related issues, such as commonality of routes (both ertroute and terminal
area), commonality of procedures (both pilot and controller), commonality
of tht uata acquisition concept (parameters, sampling rate, accuracy
levels, etc.) and finally, the commonality as far as the techniques of
data analysis are concerned, so that the same assumptions, ground rules,
compromises, etc., are applied whereever possible to each of the data
sources that are used to establish the overall data base.In order to realistically evaluate such interrelated and involved
elements as ATC procedures, controller phraseology, pilot/controller/
avionics functions, etc., it was decided to start from a common baseline
of routes which were practical from an airspace design point of view -
ones that were in concert with the basic guidelines set down by theTask Force. For that reason one basic route structure was selected to
be the common element in several of the later simulation and flight
experiments performed in the overall effort of which the DDBS experimental
development effort was one important element. The total route structure,
which is shown in Figure 2.1, was basically the New York design resulting
from the analytical effort of Reference 6, with principal emphasis on the
early phases of RNAV implementation when the transition from a VOR/radar
2-3
..... ... . -. ,

I OfCI1 If
J/ S. A LE.. .U T. .A L I 4 LSp
SCALE-NAULT.TA MS
10 1 20 30 40
Figure 2.1 Controller-Modified Route Structure
2-4

vector environment to an RNAV environment is of critical importance.
This route structure, with minor variations to suit the individual
circumstances, was used in the real time simulations of References 7
and 8, the cockpit simulations of Reference 2, and the baseline flight
test of Reference 3.
In the flight tests of Reference 3, referred to as the "baseline"
flight tests, the same basic flight paths which were included in the
referenced simulations were used to form a series of RNAV SIDs and STARs
which were overlaid over the NAFEC airport. A light twin engine aircraft
(Aero Commander 500) using a simple single waypoint general aviation type
analog RNAV system was flown under simulated instrument flight conditions,
over a route that approximated the same paths that would be flown in the
New York terminal area in an RNAV environment. These routes are shown
in Figure 2.2.
For the DDBS flight experiments which formed the basis of this
research study, a continuing and concerted attempt was made to maintain
maximum commonality with the baseline experiments of Reference 3. In
this way direct comparisons of pilot performance could be made. In the
DDBS experiment, the following items were either similar or identical to
the "baseline" RNAV flight tests:
Test Aircraft - Identical between each test (Aero Commander 500)
Test Location - Identical (NAFEC terminal area)
Test Routes - Identical between each test
Test Pilots - The three DOBS subject pilots were selected
from the pool of the original six subject
pilots of the "baseline" tests
RNAV Equipment- DDBS engineering model, modified an RNAV
computer identical to the "baseline" test set
Equipment The DDBS unit was located in the same placeLocation -
in the cockpit as was the RNAV unit in the
"baseline" testTest Instru- Identical between each testmentation -
Data Processing Identical between each testand Analysis -
2-5
- W- - -

Yardley
6000
..... 6000
Phi adelphia 00International
m WoawMI lyIe : 3000%
600.0 / QAFEC
Rote A- Ind_ A-2.
On Hoiona Proile
Route &2 1Sea isle
750I. , 74 030'
Figure 2.2 Routes A-i and A-2 Horizontal Profiles
2-6

I]
In this manner, a direct comparison of the two major variables
of interest to this study, namely the numerical values of blunders per
flight and the statistical measures of pilot steering performance (FTE)
can be made between the "baseline" tests of Reference 3 and the
subsequent DOBS experiment.
2.4 EXPERIMENT DESIGN
While the basic premise of this original DDBS experiment was to
evaluate the particular features of the DDBS concept as embodied by the
Engineering Model hardware, every attempt was made to maintain a maximum
of commonality with the baseline comparison experiment of Reference 3.
Three subject pilots were used in the DDBS flight test program from an
original pool of six pilots who participated in the baseline experiment.
All of the subject pilots were, therefore, familiar with RNAV operations
and the flight characteristics of the test aircraft, and were responsible
for all of the required navigation and communication tasks. All flights
were flown simulating IFR conditions by using an inflight training hood.
The safety pilot was the designated pilot in command, and would inter-
vene only for traffic avoidance when, and if, such situations arose.
Each subject pilot was briefed in the operational use of the tested DDBS
engineering airborne model including a one hour orientation flight prior
to the collection of flight test data. Pilots did not know when an
impromptu traffic flow clearance would be given. A summary of the subject
pilots' experience level is presented in Table 2.1.
Table 2.1 Flight Experience of Subject Pilots in Hours
Subject Total Instrument Multi-Engine Light RNAVPilot Twin
A 400 70 175 175 75
B 10,500 700 3,500 300 30
C 15,900 700 11,500 300 45
A basic DDBS flight test program was designed consisting of six
dedicated flight tests for which specific objects were defined as follows:
1. Waypoint Nomenclature - RNC vs DLN -- Evaluate the relative
merits of two distinct waypoint identification techniques.
From the standpoint of operational utility, should the
2-7

preferred waypoint designation technique be the route
numbering concept (RNC) in which the pilot enters a
single five character data entry into the airborne decoder
which designates the entire selected RNAV arrival or
departure route, or the discrete waypoint numbering concept
(DWN) in which the pilot enters the individual code number
of each waypoint he wishes to use?
2. Traffic Flow Transition -- Evaluate and isolate problem areas
(operational and procedural) in the terminal area by using
the DDBS concept during traffic flow (runway in use)
changes and impromptu sequences within a broadcast flow.
3. Waypoint Sequences - Auto vs Manual -- Determine from a
design requirement viewpoint whether automatic waypoint
sequencing is a desirable system feature.
4. Broadcast Flow Cycle Time -- Determine the operational
acceptable value of broadcast cycle time from a minimum
of 10 seconds to a maximum of 30 seconds.
5. Waypoint Storage -- Determine the optimum or acceptable
number of waypoint storage registers.
6. VNAV Impact -- Determine the impact of VNAV procedures on
the DDBS user, concerning such variables as workload,
blunder reduction, and changes in aircraft steering performance.
Overlaid above all of the preceding detailed objectives, which were
selected to optimize the design features of an ultimate DDBS system, was
the basic criteria of overall blunder performance, pilot steering
performance and outer loop airspace utilization.
The primary DDBS flight test program consisted of flying terminal
area SIDs and STARs. A total of three test patterns of waypoints were
transmitted over the experimental VORTAC (VOR colocated with TACAN).
Each of the test patterns contained several RNAV departures and arrivals,
but all were referenced to a specific runway in use. The three test
patterns were the following:
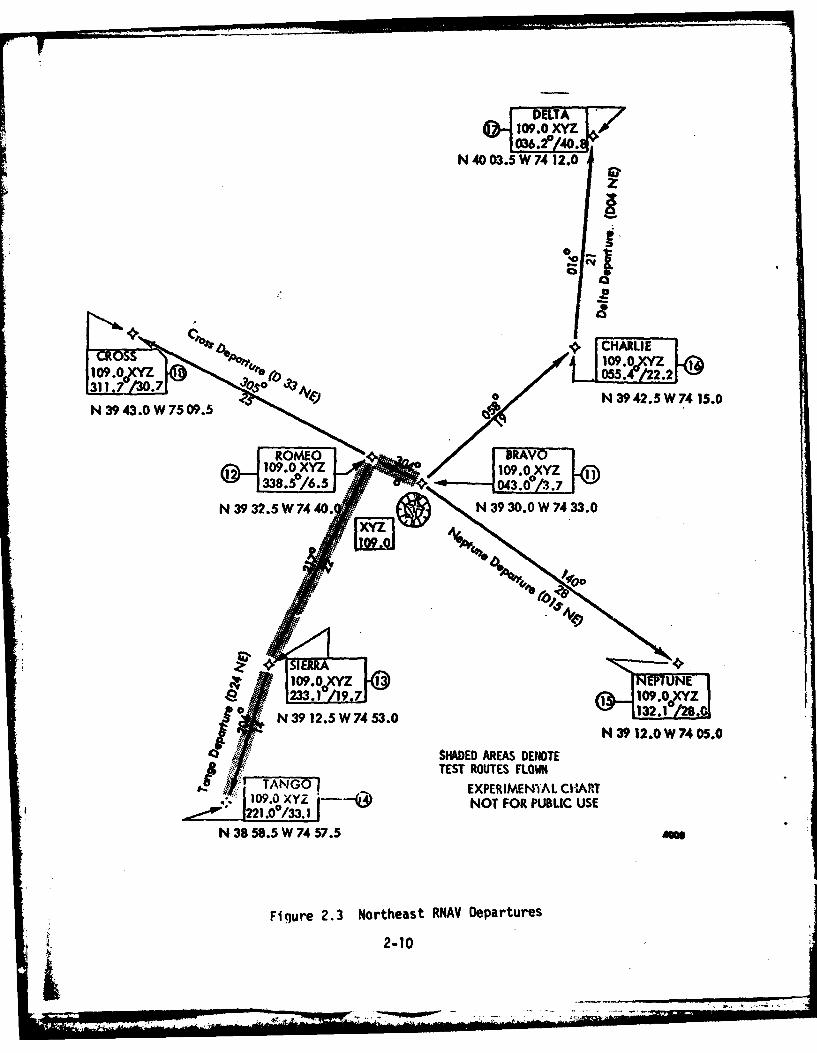
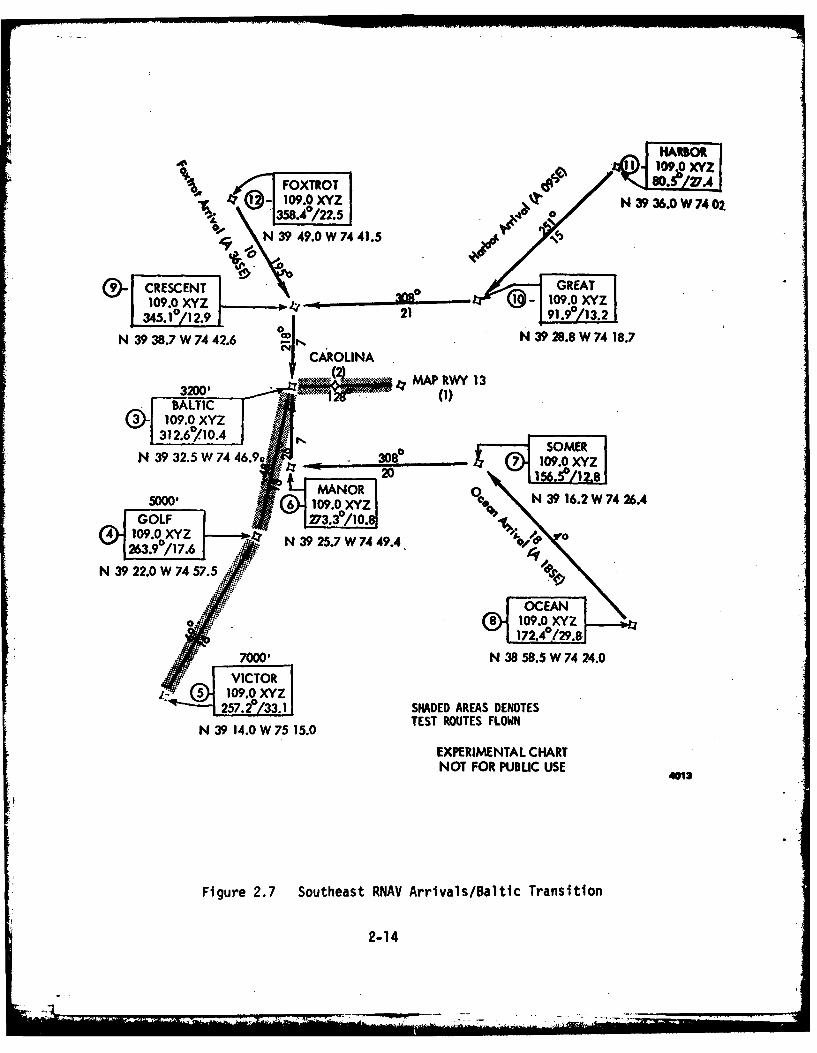
1. Northeast (runway 04) Departure/Arrival (Figures 2.3
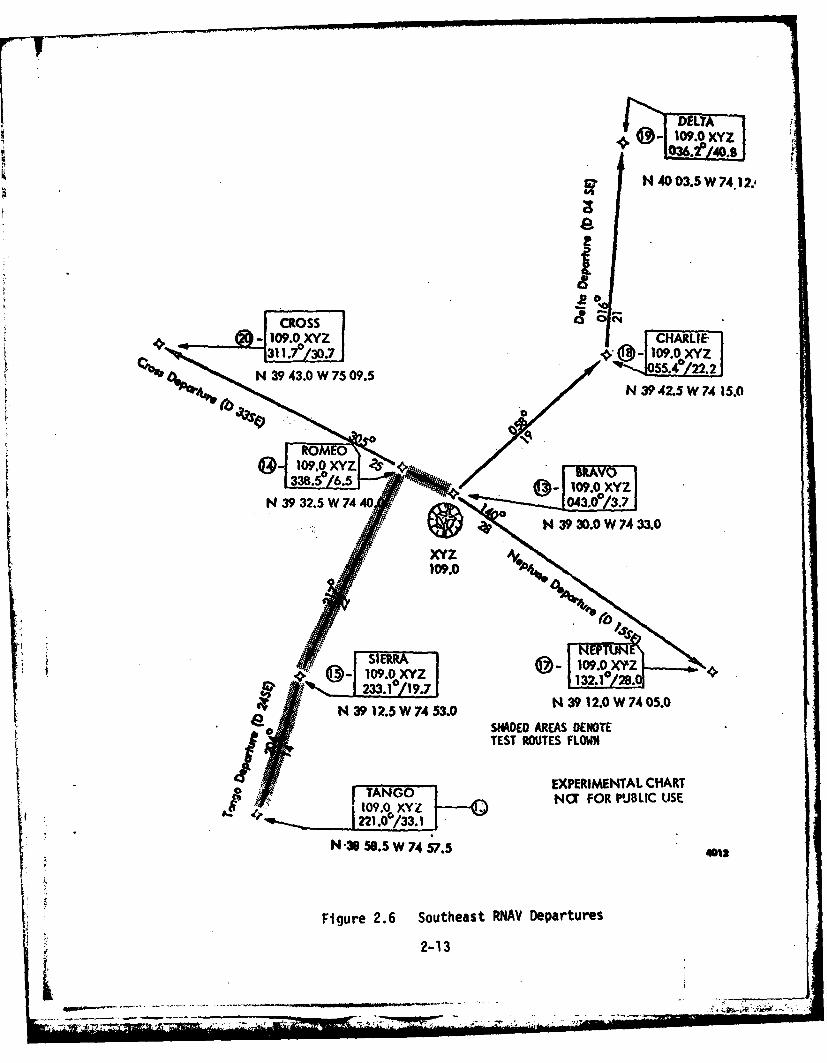
thru 2.5)2. Southeast (runway 13) Departure/Arrival (Figures 2.6
thru 2.8)
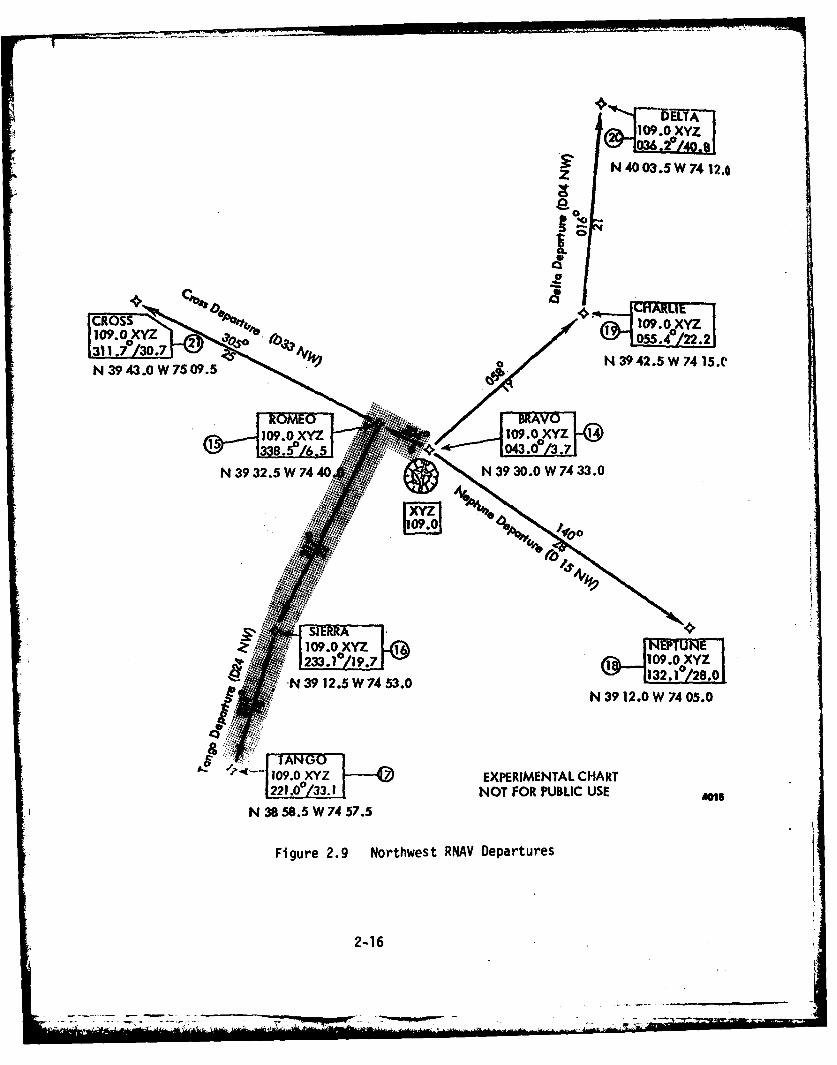
3. Northwest (runway 31) Departure/Arrival (Figures 2.9
thru 2.11)
2-8

Four different routes were flown on the three combined test patterns.
As in a normal operational situation, all arrival and departure
route patterns for one specific traffic flow (i.e., Northeast) were
broadcast at any given time. This corresponds to the fact that while
one runway is active (in use for arrivals and departures), the actual
arrivals and departures to and from any given airport can operate in
any direction. In the situation when the active runway is changed(i.e., from Northeast flow, runway 04 to Northwest flow, runway 31),
the entire broadcast pattern would be changed (from Figures 2.3 thru
2.5 to Figures 2.9 thru 2.11). The shaded route segments on each test
pattern denote the particular route flown on that specific test pattern.
1. Northeast Pattern -- (Figures 2.3 through 2.5) -- The
aircraft would be flown utilizing the Tango Departure(024NE) to a "direct-to" transition at the Tango waypoint
for the Victor arrival (A27NE) to a landing on runway 04.
Note the RNC type route designator, where D indicates
departure route, 24 indicates the center of the departure
octant through which the departure will be made, and NE
indicates the Northeast runway (04) is the current runway
flow in use.
2. Southeast Pattern -- (Figures 2.6 through 2.8) -- The
aircraft would be flown utilizing the Tango Departure(D24SE) to a "direct-to" transition at the Tango waypoint
for the Victor arrival (A27SE) to a landing on runway 13.
2. Northeast Pattern -- (Figures 2.9 through 2.11) -- This
pattern was utilized whenever an impromptu traffic flow
change was required. The aircraft was flown as in the
Northeast pattern (1) until halfway between Victor and
Gulf waypoints. At that point, the aircraft was cleared(impromptu) for the Victor arrival (A27NW), coinciding
with a traffic flow change by the broadcasting VORTAC
station from the Northeast to the Northwest test pattern.At 2.0 nautical miles "To" Gulf, one of two new clearances
were given; proceed direct to Somer or Port waypoints. If
the aircraft went by way of the Somer waypoint, a new
clearance was given just 2.0 nm short of it for a direct-to-
Day waypoint. No new clearances (impromptu) were given if
the aircraft went by way of Port waypoint. Landings on
this pattern were made to runway 31.
2-9
O?-109.XZL
N 40 03.5 W 74 12.0
04
0o- % 2/l.oY10l9.OX 055:131. A9 O17 Jj A 0o N 39 42.5 W 74 15.0
N 943.0 W 75 09.5
SROMEO ,_IBv 'g 10.0 XYZ 109.0 XYZ 1
N 39 32.5 W 744..N3300W7 33.0
0
%0
1
4I19A...Z4
N 39 142.5 W 74 .0
"e-t N 39 12.0 W 74 05.0
SHADED AREAS DENOTEi; .^TEST ROUTES FLOWN
TANGO EXPERIMEN'AL. CHART109.0 XYZ NOT 0 FOR PUBLIC USE
...,.... " .221.0°o/33. 1N 38 59.5 W 74 57.5 A3
Figure 2.3 Northeast RNAV Departures ( 1X2-10

FOXTROT 9.109.0 XYZ00.109.0 XYZ O /27.4]
358. 2 N 39 36.0 W 74 02.0
39 49.0 W74 41.5
Z BRIG109. 0 XYZ 8
MAP R.W 4N 39 28.9 W 74 23.5
(2) 109.0 XYZ 6
7.0 9N 3913.9 W 74 33.8
H 39 22.0 W 74 57 .5 E
1 .0 / 1..
N 39 17.2 W 74 41.8
25.Y1331__ N 38 58.5 W 74 24.0N 39 14.0 W 75 15.0
SHADED AREAS DENOTETEST ROUTES FLOWN
EXPERIMENTAL CHARTNOT FOR PUBLIC USE
e
Figure 2.4 Northeast RNAV Arrivals/Hotel Transition
2-11

...... . . AILANIIC CitY. N.J.Aw.NA10 1€1-a. 110.9 110b. 76, INAFEC AtRANTIC CItYIr ..:O'W ANAV Itwv 4
Loftl, Call roe G--o
N 39 $6111 04111 1" 3
N 39 300W 74 33.
EXPERIMENTAL CHART4 3 ) ?. 4 w . S -. NOT FOR PUBLIC USE
HOTEL INMA M lPXYZ 1-216.3/10.9 XYZ 1-4. 34.9 KYZ t-W7.140.3
3 X O'c I'I 1670' ', 0Io
PULL UP: C;b o I00:, goc.d to 3A~VO W/P gd hed NOIIHEAS1.eN 3 AS dWrectUd.
N 39 17 1.IN W D4G INWO 4 'FCR ULOICA U
21./a9 ' t71.m. 3AJ ItZ.11/0.I
0043~
__;_ - a-0 .lt0V18
•~~n 76$0''rl!
P L . c t 40VO I ied wa 4.0
oIRUG 1 -IN t s 40 . "
Figure 2.5 Northeast RNAV Approach Plate
2-12
. -C -3" T
..- -
N 40 03.5 W74,12.,
.20
* •-109.0 XYZCHARLIE.
0
o3109.0 XYZ
.N 3.5 W 74 o3 .7N 39 2.0 W 74 .0
109.0 9.0
:: N, 39 1.0 W 74 0.0
_ ~N 39 12.5 W 74 53.0N 92.W745.
SNADED AREAS DENOTETEST ROUTES FLOWN?
EXPERIMENTAL CHARTTANGo Nor PUBLIC USE
1 21.06i33.1
N 36 58.5 W 7457.5 4M'
Figure 2.6 Southeast RNAV Departures
2-13
- 17 1 5
,1 109.0 XYZ
9 ~FOXTROT P I109.0 -I 09.oN 39 36.0W 74 02
\ 39 49.0 W 74 41.5
®- F~N 1 .~0GREATSCENT Y-109.0 XYZ.0XY 21 91.9 13.2.112.9
N 39 38.7 W 74 42.6 (4 N 39 28.8 W 74 18.7SCAROLINA
MAP RWY 13
&BALTIC109.0 XYZ
312.6*.10.4
N 39 32.5 W 74 46.90 308 7 109.0XYZ
MANOR 20aMANOR. N 39 16.2 W 74 26.4
GOL273.3*/10.8(4'- 109.0 XYZ 0-
263 .9 / 17.6 N 39 25.7 W 74 49.4 f
39 22.0 W 74 57.5
.." 8 109.0 XYZ. ' 172"4°'/29"81 -
7000' N 38 58.5 W 74 24.0• VICTOR
2SHADED AREAS DENOTESTEST ROUTES FLOWN "
N 39 14.0 W 75 15.0
EXPERIMENTAL CHARTNOT FOR PUBLIC USE
4012
Figure 2.7 Southeast RNAV Arrivals/Baltic Transition
2-14

RlAN TIC CITY. NJ.
SALTI CAAOUNVN NAAy
12"'m~ 119 70i 12.9IStoo 28- 3
r 62'104AY 6245 4I-l
N..4 393.6W746,. 9 1. W 74 41.
''~~10 01t' z 01
401
FigureN39W. 2. Sothas RN.V Apo Pat
2-152
-~~ ~ ~ ~~~~~ 317.4 .-. . ... 4I. -___
CAOP n
ELTfA09l.0 XYz
N 40 03.5 W 74 12.0z
Cc X
1090 YZ055.4 2.2311.7/30.7 a 34.W41
N 3943.0W 7509.5N 39 2. W 74 05.C
EXPE RMAL HR1.0 3Y 10OT FOR PBI US
N 3.5 W74 5N3 3..W7 3.
2-16
. . ... . . .

~~I FOXTROT jI-- 109.0 XYZ I-J
35!e/22.51-0\ 39 49.0 W 74 41.5 5000'
~,Jo 09.XY 1109.0 XYZ 11345.10 12.9 0.I /13.7
N3938JW7442.6 N 39 28.6 W 74 17.9 COVE
1280- 109.0 XYZ I22 102.2 19.0
•N 39 26.2 W 74 12.2BAY - 5000'
S(3~ REOXYMAP RWY 31 124.9 16.3
(2) N 39 20.1 W74 16.5
5000' 109.0 XYZ 5
3109.0 XYZ o/07.6 109.0 XYZ N 39 13.8 W 74 20.7263.90?17.6
N 39 22.0 W 74 57.5 N 39 25.7 W 74 49.4 N 39 16.2 W 74 26.4
I1. SHADED AREAS DENOTETEST ROUTES FLOWN
.. "-7000' 2. DASHED LINE SHOWSV VICTR DIRECT-TO (IMPROMPTU)
N 39 14.0 W 75 1.5.0 EXPERIMENTAL CHARTNOT FOR PUBLIC USE
4016
Figure 2.10 Northwest RNAV Arrivals/Bay Thansition
2-17
-

____________________LANUC Ciff. N.J.I 4ANP( ClI.'... fj8.9 A^~ g'. 76' HAFEC ATLANTIC CITY
V"f 19W INAv 11wr 31Co.., VOGIS-C "MS W0.0 XYZ
114A 11945S 1 2 1.9 I Afw WI,. S
aW. -Y II310 I WA0411
AkN 39 37 W744' N39 SA W 417.9 A1
20., W",?. W 732.N ~ ~ ~ ~ - 11.0743. InA'/I
Ny H924 37422.2742.
so? 3-g 300 7 3.0 1W/1.34 7
N3927W73H 39 2 .4 W 74 W
A4FASECON , Y I
MAZ ftI2./63 W0Y0 R.1y.I2
12e 0 S 12 rW. I
WDZ RWY3 N6 Xo 1X 42.
SIRAGHII A BSECON RAY CCIOLN
IO It 3 .
tc 640 so *IV.. 40 464,WI
M17
Figure 2.11 Northwest RNAV Approach Plate
2-18
2.5 DATA REDUCTION AND ANALYSIS TECHNIQUES
As discussed previously, the two major issues concerning this
experimental program were the compjrison of pilot blunders and pilot
steering performance between the baseline RNAV experiments (non-DDBS)
and the DDBS experiments. Each of these issues utilized widely differing
data acquisition and analysis techniques in order to reach particular
conclusions, and therefore they are each briefly explained in the following
paragraphs.
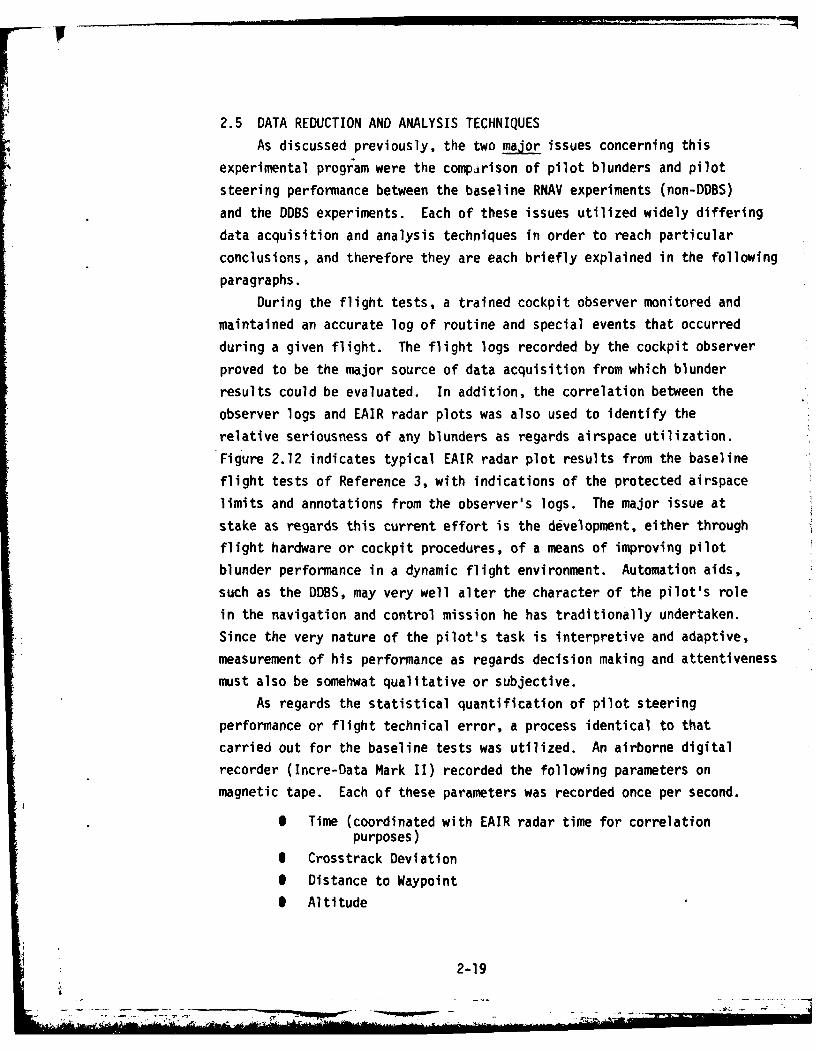
During the flight tests, a trained cockpit observer monitored and
maintained an accurate log of routine and special events that occurred
during a given flight. The flight logs recorded by the cockpit observer
proved to be the major source of data acquisition from which blunder
results could be evaluated. In addition, the correlation between the
observer logs and EAIR radar plots was also used to identify the
relative seriousness of any blunders as regards airspace utilization.
Figure 2.12 indicates typical EAIR radar plot results from the baseline
flight tests of Reference 3, with indications of the protected airspace
limits and annotations from the observer's logs. The major issue at
stake as regards this current effort is the development, either through
flight hardware or cockpit procedures, of a means of improving pilot
blunder performance in a dynamic flight environment. Automation aids,
such as the DDBS, may very well alter the character of the pilot's role
in the navigation and control mission he has traditionally undertaken.
Since the very nature of the pilot's task is interpretive and adaptive,
measurement of his performance as regards decision making and attentiveness
must also be somehwat qualitative or subjective.
As regards the statistical quantification of pilot steering
performance or flight technical error, a process identical to that
carried out for the baseline tests was utilized. An airborne digital
recorder (Incre-Data Mark II) recorded the following parameters on
magnetic tape. Each of these parameters was recorded once per second.
I Time (coordinated with EAIR radar time for correlationpurposes)
I Crosstrack Deviation
I Distance to Waypoint
I Altitude
2-19
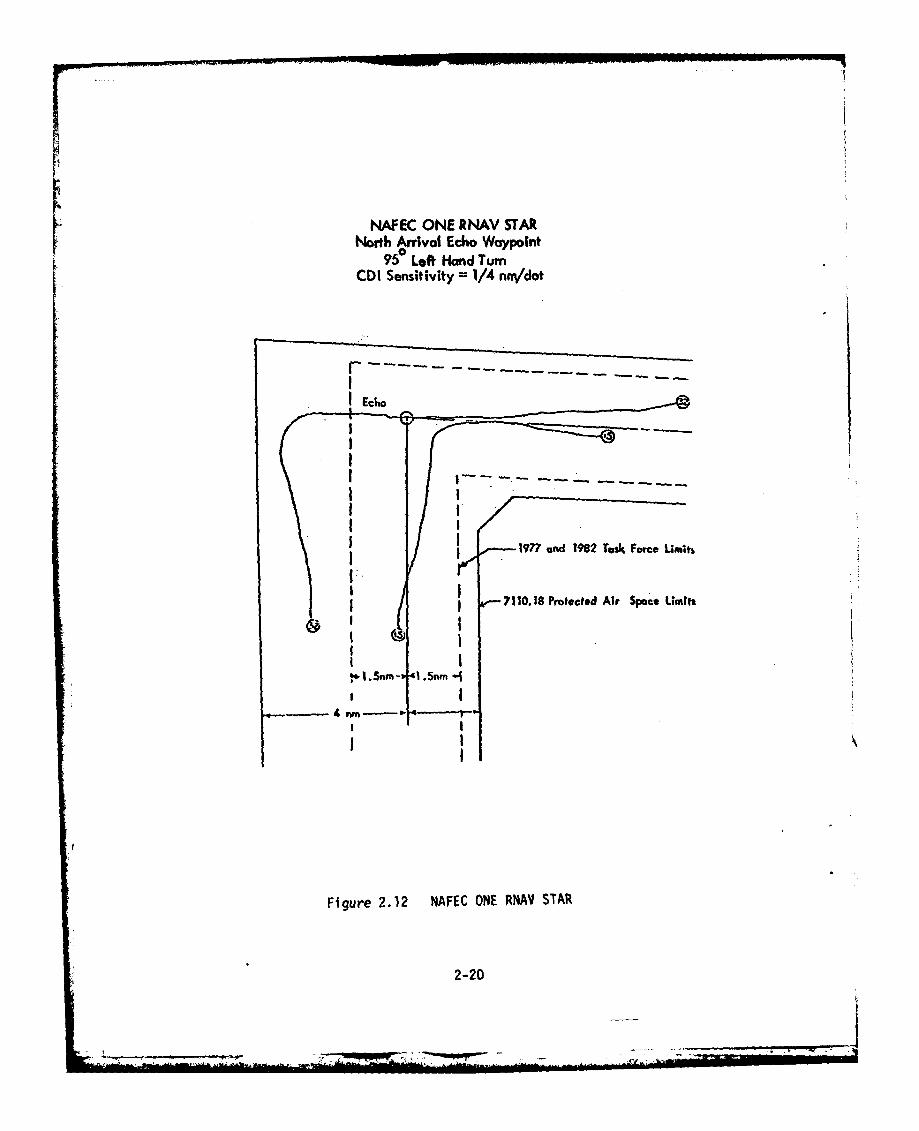
NAFEC ONE RNAV STARNorth Arrival Echo Waypoint
9?0 Left Hand TurnCDI Sensitivity 1/4 nny'dot
197? and 1982 TeAs Force Umnits
7110. 18 Protected Air Space Limift
Figure 2.12 NAFEC ONE RNAV STAR~
2-20

I Heading
I Vertical DeviationI DME Distance to Station
* VOR Bearing to Station
I Selected Track Angle
I Event Marker
Subsequent to each flight the magnetic tape was removed from theaircraft and run through a software program which converted the recordingsto engineering units (degrees, feet, miles, etc.) and provided a "quick
look" printout of the results of that flight. By visual inspection ofthis printout, a sample of which is shown in Figure 2.13, an initialdetermination of the validity and/or reasonableness of the data can be
made. In this way, if for some reason the data was not valid oracceptable, the test could be rescheduled or the deficiency correctedbefore the test program was continued.
During the flight the EAIR precision tracking radar recorded the
actual position of the aircraft on magnetic tape. The following parameterswere recorded ten times per second on tape and printed out as hard copy
immediately subsequent to each flight. Figure 2.14 illustrates a typical
EAIR tracking printout.
I Azimuth (accurate to O.Oll )
O Elevation (accurate to O.Oll )
= Range (accurate to 20 yards)
I Latitude
I Longitude
I Height
I Real Time
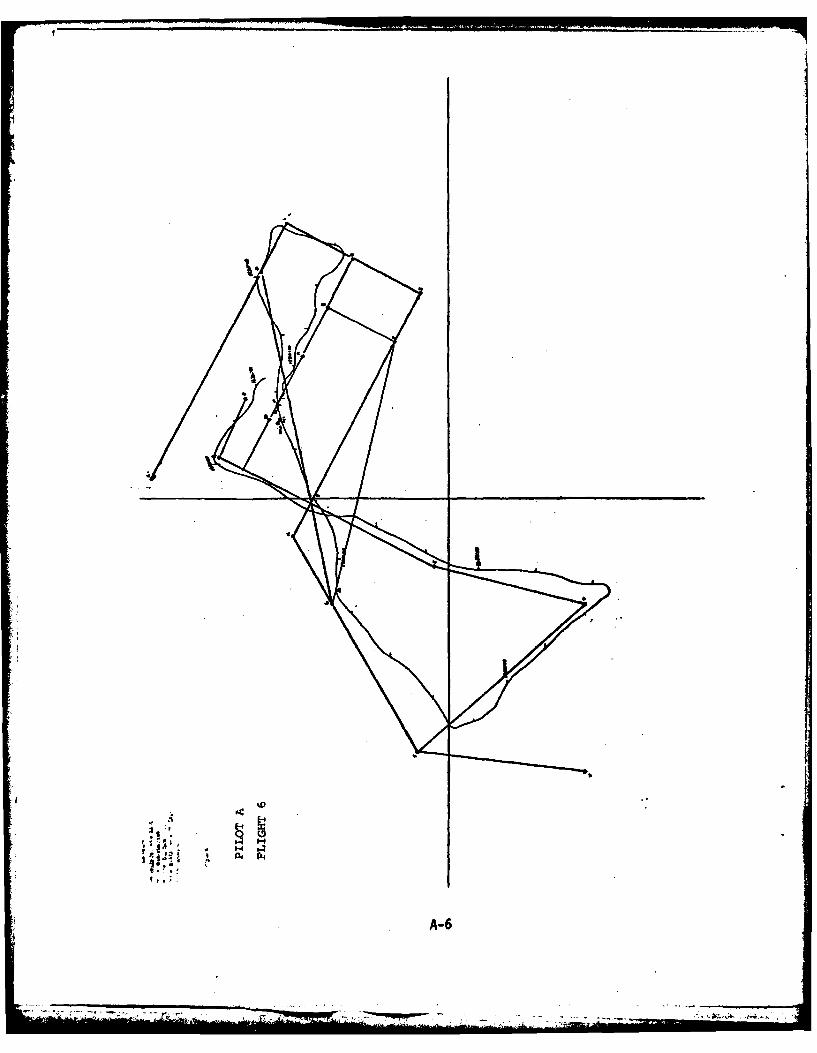
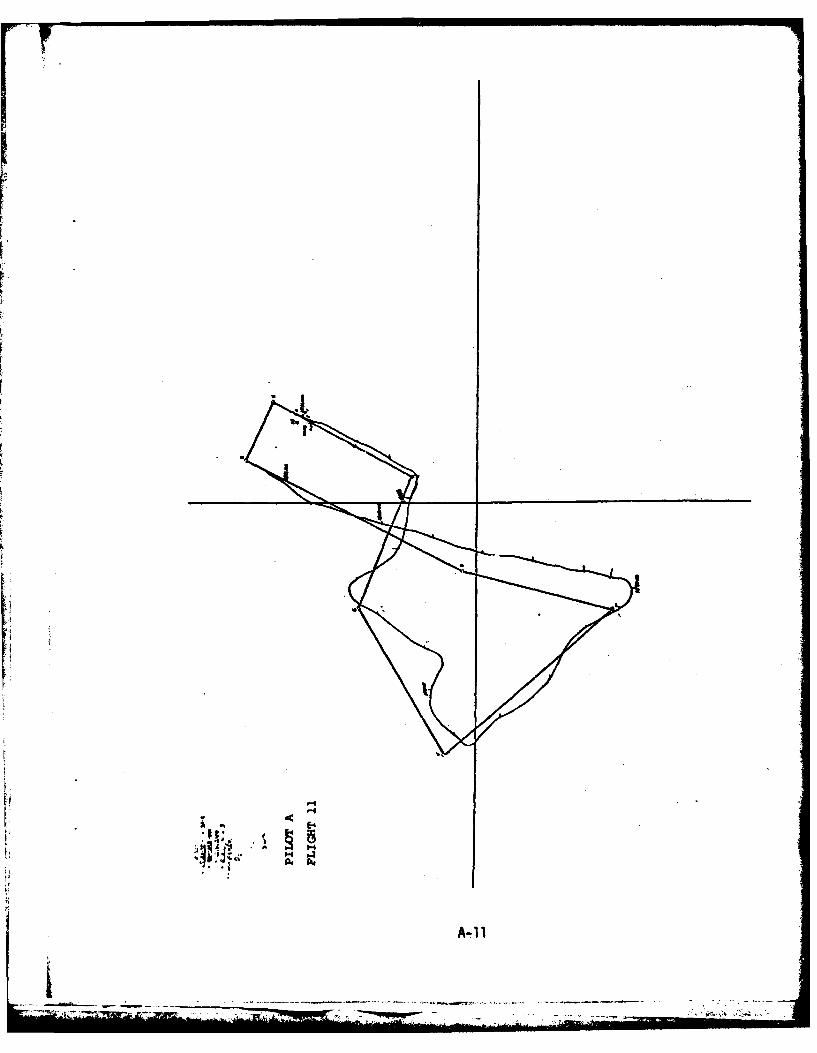
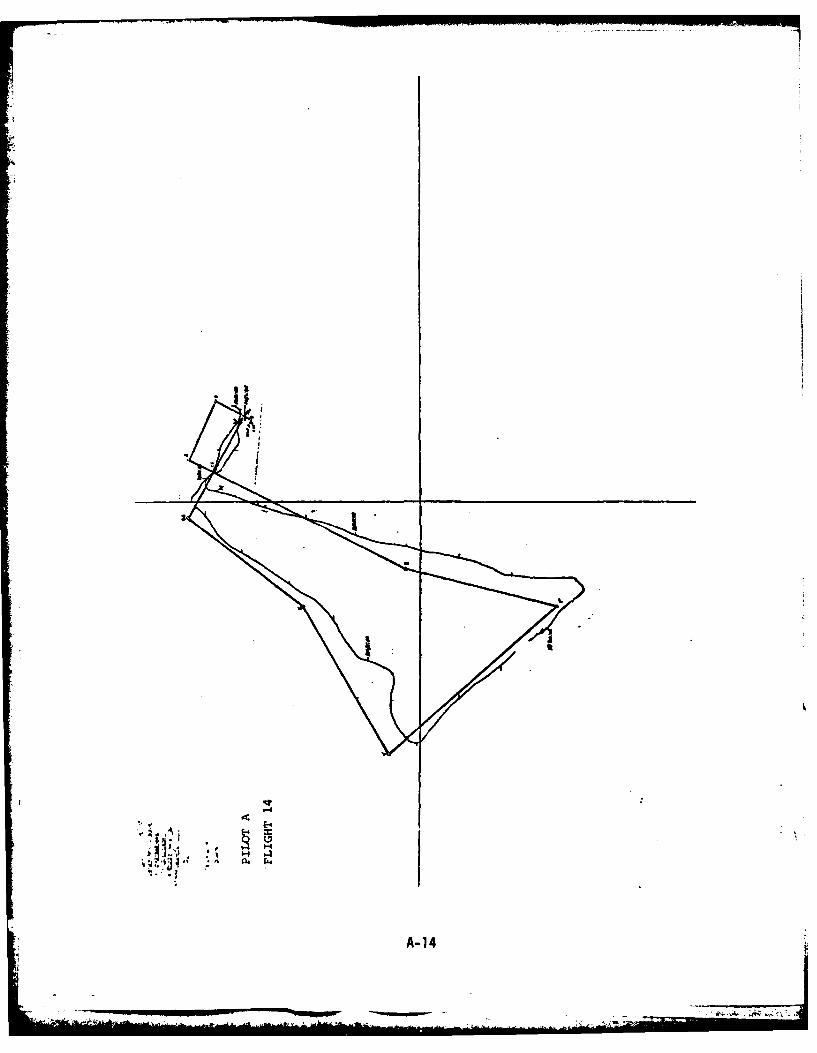
In addition to the recorded position of the aircraft, a visual
trace was made in real time. The traces for all of the valid dataflights run during this test program are contained in Appendix A.These plots also indicate the intended aircraft track per the flight
test plan for that specific flight. This trace allows a visualinspection of the flight for correlation with the observer's logs. Using
these plots, certain portions of the EAIR tracking data and/or the airborneIncre-Data data may be edited out as being invalid or not pertinent to
2-21

04 0 1D0 10.OD 0 0 I 0400f44444444444C4444444C444 'o' D D
4-)" AD 0404 044 -4 4- -4 -1 -1 4-4- - 1 0- 044 -1 0 - -400r" 004 C0O44
05 0V 040 P14"N04r, OD VM0NN0 00N0M00P 1k4 NwCg f-r--r-4 0 " 40
a 4..4.. .4 0 D0r 011maCDVQ'UMIl1 nMVt - WV% nVWM0140
-14 04 -14 -1 4 -1 0 1 -1 4f 1 -4-4 -1 -, 0 -1 -1 -4 -0 -1 -1 0 -0 .- 1 -1 1' -1 0 40 4- 4 0 SV4 -1
CL000000 0 000N~OSO~,000N 0400000 004 000000000.4400'40C
I It.~. &S~ ai l f f l
... 4 .-. 4~~~ -4 W -4 W4 -.4 %-4 -4 .4 -4 10 -4 4- .4 .4 .- .- 4in % N0000 v0In M O0 O N 0 - v V 4n n
0- C,44~S0-N00C . N-N44, I fl4NMI"-5lm- I 9 I -000044'
o l~l~454l~lflf40044000440 400044000 D 02-22--4r-

4I40 z r .D Z *0t P em ft Pftn PM"0 -M ". onen "mm4o
o -a *. . "e %-a . -ft 0 01 aJ I. ID ft I N, w.%w vtt-I f
4 -e v aaJ o wf % W n-
- . . . n .- . .4o. n
a4 Inen . , *;...a ; e P. : J::w 04
6. 14 o.nne m pr
z~ -z Z' .zz o . -0 en a lo,
an c-~ an n 36 on E n ac
4444. 0 o 40@h o o 0:e n n n e #I ea Qn n "n 1,f
10I 0L LIn[LOIVo LI0 O=Oea a 0=2 a o=3= DO00S
0~e~.d, P. 4 &- i. o-0,s)- z . -up- 0 )n.ePea 0 4 )-.. )-0 3 QO be cob b n a ob oa a1 ̂ m 0 aw o ab af
ac.a 9 a: a aaa* aaa0E
r rw I Iw II I ' " a.. ........
. P.P. . . cI o. -D. o w 0VIn $I o Pe wo- ol o0'-,
c; -1I., 14 phe4 en en en I :.9nl0cD-* 4. : z 6 fol; o an b a aoog ow -b a ab m %04 ft o
'D P. e.oP 'o r' 'orF rF
2-23.P. P . P. P . P. P . P
the particular situation. In particular, since the RNAV system does
not provide command guidance around turns, only steady state (non-
turning) data was used in the quantification of FTE. After data editing,
time correlating with the observer's data logs and establishing start/
stop of valid data, the EAIR data tape was time merged with the Incredata
tape, producing the Airborne/Radar Data Merge File shown in Figure 2.15.
For the purposes of this particular analysis, the mean and standard
deviation of the crosstrack deviation (equivalent to FTE) was calculated
from every ten second interval of data considered to be valid from the
Data Merge File, as shown in Figure 2.15. These statistical measures
were calculated for the following combinations of test paramters:
I For each individual route segment (track between any
two waypoints)
* For each flight (aggregation of all segments comprising
one complete flight)I For each pilot (aggregation of all flights flown by
each subject pilot)
I For entire test (aggregation of all flights flown by
all pilots)
These data were then compared to the results for the baseline
tests, reported in Reference 3 in an identical manner, for the final
resolution of the quantitative impact of the DDBS concept of cockpit
data input automation on pilot steering performance. Chapter 3 discusses
the results of the analysis of both the blunder data and the FTE data
resulting from this experiment.
2-24

P. C3.X 00 00 0 .90.9 0.9.0 M: 0 go *,-tSft .. It
* o 4!D 00 000 Zo 00a 0Z Z Z 0Z 0Z 4"z
a 04 0 ~ e -
me MA ZZ
vi oll4
.4. 040 04 400- 4a-0- -O 30040000o000040004; ."- 3w." .~.. 4.I
OP o00000p00 00 0001- 0 000 00 0 0 F0 0
W4 0 0 f "WVp.000Q6000b000"0 000 o to
;w 00 . W .0 e'W 0 WWob &, .VW .00*..4400 &W O-r
4 9-x-LJ
440* o4 ..... *.m..a...o...q. *..4 4 so
00 a- ; .0 44 -o -4 -% va- a- ro .. w -o - on:.. t- - - oft v- mI L*4-- W%4 10V 1"4 f 1 4 P. 944 9 m 44" 4 m~ ~ m,4 so 444P-4 60C O _ o n44 p94 449. 44.444 44 4 009f 4.9-c i 5 4 40 44 A^4 MW-44 0' 4 4 * 4
Z 0 CPO 0 00 0U c0 90 0O000 0 0 04 OP- 440 a46544 0C.- .* s'00 .09.9 .. 44 4 4 4 4 4 4 'A9-
",3 "U : 0 ;
ow.49 g C_'w o. .4
M xI =xc~w XXZexcmz wzxkz~kxzxw*zX====*sum 8or e "sua su ub u~ s . wi MA hi up wA U6 as a"* mmi "Ahmur mi aw 6*5 "o wM w
WE0 .4P.4 ---- C0 ' .... 0 f~:tt~l T l:lZ, l
IU I..............I __04 W. W .rrnn 0 .0 WWW. 444rn0W 0 4 W I 4WWW4 4 0
W-6. wD3 00000000 cm00 0 ~ ~ . U *4 - - 4 4 4 C
C~ .. P. *.9..4 44.-4 0 444 1-0.44451140 ~ 444 hia.4~ .9 444444 44 UZI
44 4 4 44 4 4 44 44z0..4 P 4 .c
0 0a 04 40 & 0444 00 & ipW0 &.o 0 W-o0.4-0u.P04
01 4 % 4 4 4 4 4 4 4 4 4 4 4 b 0 404 I !o *4106
-n 0 V%4 049 V .w -. 5-t m o 400 d . 0 441-44w ado &4 4 x ": Wn-
2-2
aa 0 00 0 00 0 0 0 00 0 00 0 0

3.0 FINDINGS AND RESULTS
3.1 GENERAL
As discussed previously in Reference 1, the flight research phase
of the DDBS test program consisted of thirty six (36) flights flown at
the FAA NAFEC facility at Atlantic City, New Jersey during the testperiod of September 15, 1975 to November 13, 1975. Of these flights,
twenty six (i6) were for data collection purposes, with the rest devoted
primarily to equipment shakedown or pilot orientation purposes.
Tables 3.1 through 3.3 show the actual DDBS flight test runs
flown by each of the three subject pilots, whose experience level has
been shown in Table 2.1. Table 3.1 illustrates that portion of the test
matrix flown by subject pilot A. Notice that the matrix is balanced
among the sixteen (16) flights as regards the primary test variables
discussed in Section 2.4 with the exception of the waypoint storage
issue. The original test matrix established in Reference 4 had defined
a 40%-60% split between the 2- and 6- waypoint test. When the original
two pilot matrix had to be perturbed, for scheduling reasons, toaccomodate an additional subject pilot (subject pilot C), this planned
distribution was not directly achievable. Tables 3.2 and 3.3 present
that portion of the test matrix which was flown by subject pilot B and
C. Table 3.4 shows an overall summary of test variables per subject
pilot per number of flights. Reference to Table 3.4 will indicate the
relative balance of the final DDBS flight test matrix as actually flown.
In each of the previously referenced Tables 3.1 through 3.3, the
arrival/departure designator code in the tables (i.e., A27SE) refers to
the DDBS nomenclature code of an arrival or departure route previouslydefined as part of a broadcast traffic flow pattern, in this case the
Southeast traffic flow for runway 13 arriving through the 2700 arrival
octant. Likewise a D24NE refers to a departure route from runway 04departing through the 2400 departure octant in a selected and broadcasttraffic flow. The remaining major headings of the tables merely refer
to the configuration of specific test variables in a given flight test.
3.2 BLUNDER ANALYSISAs discussed in Section 2, a major factor in the design of this
DDBS experiment in particular, and the continuing series of area
navigation pilot performance studies in general, was the establishment
of a maximum of commonality among experimental variables. In order to
3-1
" . " ' . T.T -- . .. . . . ... ...... ' .

.1 .u >> C3C a a C3 ca 030 n C3c00 C3 C3
mo mCC%aC%I6cn £%i " Cl %a (n ni ~C%j %l) en(% 4)
%-00
E) ( Ji~ C3)Li C) Lii
4.) ___C2_____0 __________3 CDC ___2 _
04 -
L)) 44: :
.0 V 0)
$4 IOt D4 3 0%00
00 -
U~ 080 0 0.,f 41 4 1 4
4U -4 3:~oc~a M i lAS lA3ea
ts. = CCD = c
a, 000 0 ) ,4 ' 0 -bf 0 an0 0 .U) rP.U 4.
*.-4 3c m<~ 0 c :PC C4 =c c"
c .= A s - a-c - so
cm 4 0j * _j -A _j %
V)0
04.) tnnnu u vi w w w an vi in i n im
>0 V- 4 TI- -. __ __ __ __ __ __ __
* ~ j 0mc A " W$4O~ 0- U~
$3-

0 0 0 0 0~ * ~ 0 0 0
*~*0U ~ 000=0go
1&- 0. -
4-)-
4-'-)-
__ _ __ _ __ _ 06 0a
BE 0. LL.
4J - Ce mR- .4 .0t
41)0. c0!9 L. C~ a
t00 14a 109. co
4J- cccLL.4
Q- I*...I 4-b tn tnS. t Cs0 t%50 1a >
9 e- -it c - co -S-- 0 W CM
r - __ _ _ __ _n
_ _ _41 +1 a: _

Table 3.4 DDBS Flight Test Matrix Summary of Variables/Subject Pilot/Number of Flights
Number of FlightsI TotalFlight Test ,____________ _______________ _______________
Matrix Variables Subject Subject Subject (allPilot A Pilot B Pilot C pilots)
NUMBER OF FLIGHTS 16 6 4 26
WaypointSequencing
a) Auto Mode 8 3 2 13b) Manual Mode 8 3 2 13
Waypoint Selection
a) RNC 8 4 2 14b) DWN 8 2 2 12
Approach-Descend
a) 2D RNAV 8 4 2 14b) 3D RNAV/VNAV 8 2 2 12
Waypoint Storage
a) 2 W/P 4 1 2 7b) 6 W/P 12 5 2 19
Traffic Flow Cycle Time
a) lO Seconds 8 4 2 14b) 30 Seconds 8 2 2 12
Traffic Flow Changea) Arrivdls 8 3 2 13
a) Golf-Somer-Bay (2 4 1 1 .6b) Golf-Port 4 2 1 7
3-4

assess the DDBS potential for effecting a red jction in pilot-induced
blunders, this data analysis included a direct comparison of blunder
error data between the DDBS flight test program and the "baseline"
general aviation RNAV flight test previously reported in Reference 3.
This comparison is particularly valid since the DDBS test aircraft,
cockpit configuration and basic RNAV system, and test routes were
identical or similar to a major degree to the baseline exper-ient. In
addition the total number of test flights were nearly equal (30 for
baseline vs 26 for DDBS), and most importantly the three DDBS subject
pilots were part of the original baseline subject pilot population.
Particularly in the case of blunders, where data was recorded on an
individual pilot basis, a direct comparison can be made concerning the
impact of DDBS on blunder performance for each specific pilot.
Figure 3.1, appearing in Reference 1, shows the pilot's RNAV control
errors, by type, which were observed during the previous baseline
tests. An examination of this figure indicated that thirty-one (31)
subject pilot errors were documented. This computes to an average value
of 1.03 errors per flight. In the twenty-six (26) DDBS data flights
flown by the three subject pilots, only four pilot-induced blunders were
recorded. This results in an average value of 0.15 errors per flight,
or a reduction of 86% in pilot blunders which could be attributed to the
utilization of DDBS in the RNAV environment of the terminal area.
A summary of the pilot blunder data recorded during these tests
is presented in Table 3.5. An analysis of this data indicates that
only two of the four blunders actually resulted in a violation of
protected airspace. Analysis of these data also shows that pilot A
had a blunder rate of only 0.06 errors per flight as opposed to 0.17
and 0.50 for pilots B and C, respectively. This seeming disparity
could very well be attributed to the fact that pilot A had been involved
in the preliminary analysis and design of the DDBS hardware and therefore
was much more familiar with its theory of operation than the other two
subject pilots. That fact notwithstanding, even the poorest pilot
from a blunder standpoint had an error rate of only 0.50 errors per
flight as compared to the average value of 1.03 from the baseline test.
3-5

1c
C .221
LOLLJJ
o o~ s 21C.4o C4-M-0 C Low -* :* S
S- - I c 4- (a C) d a
s o , , . ,.- , o ,, -.ri a) mo , Eu I
Si 4J,. "13 4-J 4J z raW-et .
u a. a = ja 0 -
'0 C4J EU 0; w .a 3 4-jQ)L
.T 060r- f*.- -a 0j1-
m.- -a)- 0 CL 4t-s 4 . .0 0 .U. .. 0 0 0 j 4,J L
0 04, • v " " -
aj,, -0 C 4"4A.' --i U' *
a ~asL. to c , u
EU :- c 0 0u.- :-- 4(A L 0 X'.-' Dc
E 40 1- 4- 4j x m 4 a)u'- -
snS . . jE..'L 1 1. .EO UC
0f a to cc C 4- 1 0*so~ $-04-C
S A a C '. U O 0-c 4. EU 0 S- 4, -IS- U
EUoS.. o 0i 0.." 0
3-'
0s OroC S-0 C0 i '..a
_ - Eu.'. 00 c,
o3 . C7,6 c.~ 00C0 4jAu.
4InL &- Z)J O 0 00 liJ.Eas - a U 4- . Ea U0
U' -1- 0 0. 0
1i ci :3 CO . jt0 LnE C~ 0L.S 4UOE .- -C JCI
4-3~ CL d* 41-'O 0- -D ElCj en -C - 0 C4 -. 1
LA.. 0fl 4)--0 EUOU mfLan
cu 4jwf _ A44- -W t +CE %A *7@: >r-- X "El W
G. c4 00 as0=w a 4Ct
U. C1 D . C A n44+
W0) to
mx CY 4.'
E 0 t-)0 2S.C- =l S.C
3c =m-U 4'
as as 0
4J'
u o -
03-

10
o7° (Previous Non-DOB Baseline lest%)165i Io
2
1
1 2 3 4 5 6 7 8 9Error Type
1. VORTAC Frequency 4. Waypoint Distance 7. Steering Horizontal2. CDI Sensitivity Change 5. OBS Course 8. Sttering Vertical3. Waypoint Radial 6. Waypoint Altitude Set 9. Wrow, Waypoint
(VNAV)
Figure 3.1 General Aviation RNAV Control Errors by Type (Baseline Experiment)
Another interesting evaluation of blunder data is to compare the
value of blunders per flight between the identical pilots from the
baseline tests of Reference 3 and the current DDBS tests. Table 3.6
illustrates the fact that for DOBS subject pilots P. and B, their rate
of blunders per flight was reduced markedly to values approximately
15% and 10% respectively of the baseline values. Subject pilot C had an
increase in blunder rate per flight to 125% of his original baseline
error rate. In the overall sense, pilot C's increase does not appear
to have the statistical significance of pilots A and B's drastic error
rate reduction. The average error rate for the identical three pilots
decreased to 17% of their baseline value, again a significant reduction.
Table 3.6 Procedural Error Rate Per Flight
DDBS Procedural Error Rate Per Flight
Subject Pilot Baseline DDBS
A 0.4 0.06B 1.8 0.17C 0.4 0.50
Average 0.87 0.15
3-7
*0r~--

3.3 FTE ANALYSIS
The second quantifiable measure of the impact of the DDBS concept
on pilot performance is the comparative evaluation of flight technical
error. As discussed in Section 2, since this DDBS flight test
experiment was designed to be identical to the experiment described
in Reference 3 as regards flight routes, equipment, instrumentation
and data reduction, a direct comparison of the results of the two
experiments can be made. In the blunder analysis described earlier in
this chapter, a pilot-by-pilot comparison of blunders per flight was
made. In the case of FTE, however, Reference 3 did not document FTE
on a per-pilot basis. For that reason, FTE statistics contained herein
will be compared on an overall test data basis. It will be shown that
the data sample used for this comparison is of a magnitude that the
comparisons made are statistically definitely significant.
As outlined in Section 2, the deflection of the course deviation
indicator (CDI) was used as the measure of pilot steering performance.
The pilot's primary control function was to maneuver the aircraft to
keep the CDI needle centered at all times. The deflection (if any)
of that needle was a direct measure of how far from the centerline
of the desired ground track (the line proceeding into the "To" or
active waypoint at the selected OBS bearing) the RNAV system thinks
it is. The output of crosstrack deviation from the RNAV computer
drives the CDI in a linear manner. That is to say, the deflection of
the CDI needle is directly proportional to the linear distance off track.
For the DDBS tests, a deflection of one "dot" (approximately .125 inches)
on the face of the CDI instrument normally indicated a crosstrack
deviation of 1.0 nm. During the final approach portion of the flight,
normal pilot operating procedure was to switch the scale sensitivity
of the output of the RNAV computer to 0.25 nm per dot.
The airborne instrumentation recorded, as one of its parameters,
the electrical signal of crosstrack deviation sent from the RNAV
computer to the CDI instrument. This value, seen as the CDI column
on Figures 2.13 and 2.15, was used to compute the FTE statistics presented
in this section. As discussed previously, the CDI value at every 10
seconds of merged data was originally aggregated into data sets for
each DOBS flight segment (between two waypoints), and then further
3-8

combined into groups of flight segments categorieed as "terminal"
and "approach" phases of flight for comparison with the baseline data
of Reference 3. Appendix B contains the original data sets used for
these aggregations. Note in Appendix B that the number of data samples
(column N) is shown for each segment. As stated in Section 2, some data
from each flight was selectively edited out prior to statistical
evaluation for a variety of reasons. Thus the data samples are not
identical for each flight over the same course. This same data editing
technique was applied to the baseline data of Reference 3 however, so
any-.comparisons between the two data sets can be made on the same basis.For the same basic reason, two flights flown by subject pilot B were not
included in the FTE data set. The performance of the instrumentation
was such on these two flights that the data was not considered to be
valid. Table 3.7 contains the results of the initial aggregation of
the data of Appendix B combined into FTE values of mean (x) and two sigma
presented on a per flight per pilot basis, indicating also the number (N)
of 10 second data samples for each flight.
Table 3.7 CDI Aggregation
Total Per Flight Per Pilot _
Flight No. Pilot N X 2a
1 A 209 .135 1.4422 A 200 .097 1.5723 A 192 -.015 .7584 A 196 -.066 .7085 A 238 -.141 1.2756 A 262 -.138 1.0687 A 277 .150 .8158 A 256 .203 .7129 A 246 .210 .80010 A 192 .259 .89711 A 137 .150 .74612 A 127 .075 .69413 A 161 .033 .48714 A 188 -.033 .87615 A 216 .052 .71116 A 211 -.094 .792
I B 146 -.120 .6354 B 198 -.201 .6125 B 184 .028 .5786 B 204 -.007 .6171 C 205 -.023 .9422 C 257 .045 .9553 C 199 -.086 .8254 C 232 .022 .741
3-9

Further statistical aggregation of these data results in Table
3.8, when the FTE performance of all flights flown by each pilot is
presented on a per pilot basis and then as a total FTE statistic for
the entire DDBS flight test pruyram. Two incidental comments on Table
3.8 are in order. It is interesting to note that While the blunder
analysis presented previously indicated that subject pilot A had the
lowest blunder rate per flight, this same subject pilot had the poorest
FTE performance. This could have resulted from the fact that subject
pilot A was by far the least experienced of the three subjects as far
as total flying hours was concerned, although he has the most familiarity
with the DDBS equipment per se. The other note regarding Table 3.8
is the fact that there is very little difference in the two sigma FTE
values between the three pilots. On an overall basis their performance
was quite consistent. This can also be seen from an examination of
Table 3.7.
Table 3.8 DDBS - CDI Aggregation
Total All Flights Per Pilot
(combined terminal and approach data)
Pilot N X 2a
A 3308 .054 .986B 732 -.073 .636C 893 -.006 .876
Total All 4933 .024 .927Flights
For purposes of the objective comparison of FTE between the DDBS
tests and the baseline tests of Reference 3, the test data has been
aggregated into the terminal and approach phases of flight. Table
3.9 presents the directly relatable results of these tests. As can
be scen, the sample sizes between the two tests are quite comparable
for each phase. While the mean values are somewhat different, which
does have an impact when total airspace utilization is considered,
the principal measure of comparison, the two sigma values of FTE,
are markedly improved through the use of DDBS in both phases of flight.
3-10

Table 3.9 FTE Summary
(Baseline vs DDBS)
FTE nm)
Flight Test Phase N X 2a
Baseline Terminal 5602* -.247 1.540(Ref. 3) Approach 519** -.340 1.661
DDBS Terminal 4439 .027 .950Approach 494t 1 .005 .684
*SID and STAR to Hotel or Baltic Waypoint
**Entire Final Approach Segment Hotel-India-Map
and Baltic-Carolina-MaptSID and STAR to Hotel, Baltic or Bay WaypointttEntire Final Approach Segment Hotel-India-Map,
Baltic-Carolina-Map and Bay-Map
(See Figures 2.3 through 2.11)
In the strict statistical sense, the mere observation that two
values are "markedly different" has no quantifiable meaning. For
this reason, the variance between the standard deviations of the
baseline test and the DDBS test was determined using the variance
ratio test. The variance ratio test is defined as:
greater estimate of the variance of the populationF =
lesser estimate of the variance of the population
The Null Hypothesis was used, applying Bessel's correction to
the variance to arrival at the best estimates. F distribution tables
were used [9] to determine the probability level of significance of
variation. All results of these calculations showed probability
levels of high significance, meaning that there was only a very small
chance that the results could have arisen by chance. Table 3.10
summarizes these findings. It defines the flight test data sets by
flight phase (approach or terminal). The probability level describes
the level of significance or chance that the result could have arisen
by chance, i.e., p = .05, 1 chance in 20; p = .01, 1 ; p = .005,1 7Wp = .001, Tm-" Table 3.11 shows the set of variables which
were used for the variance ratio test calculations.
3-11
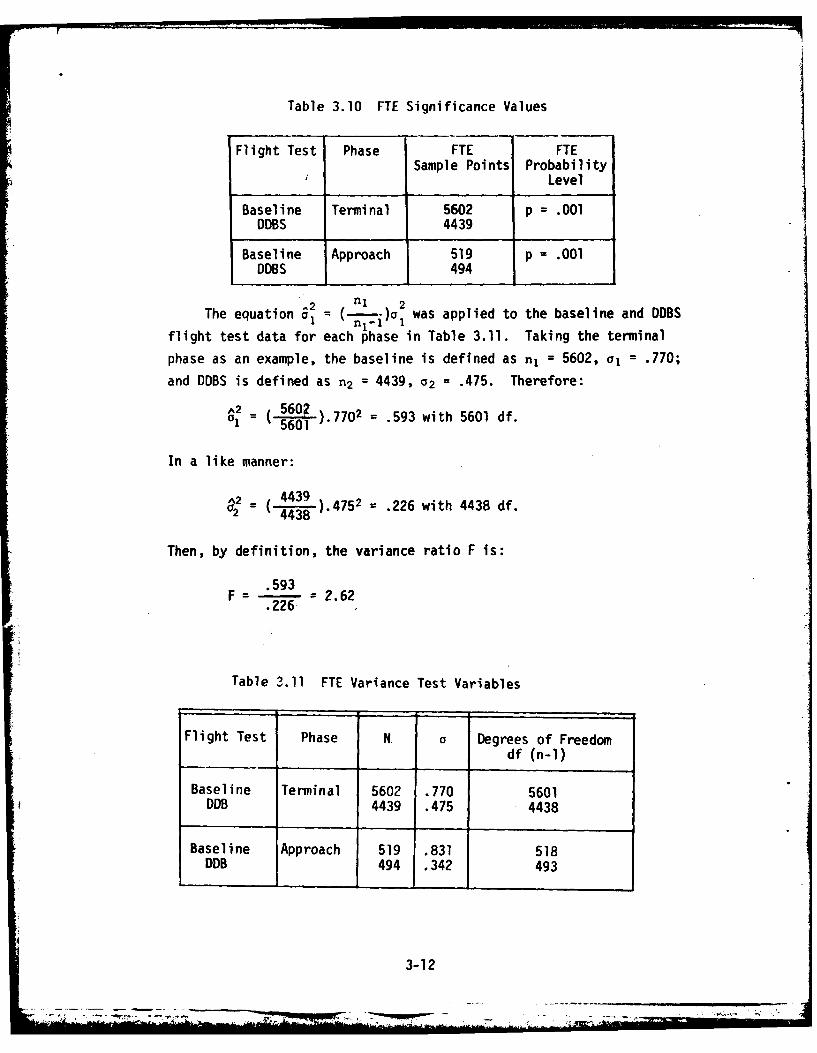
Table 3.10 FTE Significance Values
Flight Test Phase FTE FTESample Points Probability
Level
Baseline Terminal 5602 p = .001DDBS 4439
Baseline Approach 519 p = .001DDBS 494
eqaton2o n1 2The equation 1 n1(--)a I was applied to the baseline and DDBS
flight test data for each phase in Table 3.11. Taking the terminal
phase as an example, the baseline is defined as nj = 5602, a1 = .770;
and DDBS is defined as n2 = 4439, o2 = .475. Therefore:
A2 560201 N(601 ).7702 = .593 with 5601 df.
In a like manner:
A2 , 4439= 4438 ).4752 = .226 with 4438 df.
Then, by definition, the variance ratio F is:
.593F= -- = 2.62
.226
Table 3.11 FTE Variance Test Variables
Flight Test Phase N o Degrees of Freedomdf (n-l)
Baseline Terminal 5602 .770 5601DDB 4439 .475 4438
Baseline Approach 519 .831 518DDB 494 .342 493
3-12

l
The number of d~grees of freedom is 5601 for the greater variance
estimate and 4438 for the lesser variance estimate. Entering the F
distribution tables L [ ] for the variance ratio with these degrees of
freedom (in this case considered to be infinite because of the very
large values), the value of F = 2.62 is seen to be greater than the
F values for either the .005 level and the .001 level. Therefore,
the significance of variance between the standard deviations is much
less than the .001 level and is regarded as having a probability level
of p = .001, one chance in' 1,00 of the observed result arising by
chance. The significance test was similarly applied to the approach
phase data set, also yielding a probability level of p =*.001, as
summarized in Table 3.10.
3.4 SUMMARY
The results of the DDBS tests indicated a substantial improvement
in pilot blunder performance as influnced by DDBS. An analysis of
the blunder performance of three identical subject pilots showed a
reduction in blunders per flight in an identical RNAV route structure/
test aircraft environment from 0.87 blunders per flight under standard
RNAV conditions to 0.15 blunders per flight under DDBS conditions.
On an overall pilot population basis the baseline/DDBS comparison was
1.03 to 0.15 blunders per flight, respectively.
Pilot steering performance (FTE) was similarly markedly improved
through the introduction of DDBS. Baseline test results indicated mean
and two sigma FTE results of -.247 ± 1.540 nm for the terminal phase
as compared to 0.27 ± 0.950 nm for the DDBS tests. Similarly, during
the final approach phase the baseline results were -.340 ± 1.661 nm
as compared to -.005 ± .684 nm for DDBS. Both of these comparisons
were found to be significant at the p = .001 probability level,
indicating an extremely reliable quantitative reduction in steering
error due to the decreased cockpit workload afforded by the DDBS concept.
3-13
L ...................

4.0 CONCLUSIONS AND RECOMMENDATIONS
4.1 GENERAL
Ranging from the general to the specific, this report has deliberately
attempted to consider only those issues which bear directly on a
specific problem solution which is, of course, only a small contributor
to the overall solution of the ATC/air traffic growth problem. Area
navigation is a concept of air navigation and air traffic control
which has given indications through study and simulation of being able
to aid in the alleviation of the problems of traffic congestion, traffic
delays, and increased ATC system personnel staffing requirements. One
major aspect of the implementation of the area navigation concept is
the potential problem of increased cockpit workload on pilot performance
as regards blunders and steering. The possibility of automating the
area navigation cockpit data entry function as a means of reducing
cockpit workload and thus improving pilot performance has been advanced
as a potential solution to this problem.
4.2 CONCLUSIONS
The studies, simulations and experiments previously reported have
established several hypotheses or trends which resulted in three major
related areas of pilot/ATC system performance which needed substantiation
either subjectively or quantitatively. The results of this DDBS research
then, should be considered in light of the following questions:
1. Does the addition of broadcast data into the RNAV
environment substantiate the predicted reduction
in cockpit workload and pilot blunder performance?
2. Does the addition of digital broadcast data significantly
improve the previously unsatisfactory level of pilot
steering performance (FTE) for a single waypoint general
aviation RNAV system?
3. Is the DDBS concept operationally acceptable in an
RNAV terminal area, including the compatibility of
broadcast navigation information with controller-
initiated maneuvers?
4-1
V7
- ~
As regards the pilot blunders issue, a considerable amount of
research has led to the primary conclusion that any approach which
reduces the overall cockpit workload should have a positive impact on
reducing blunder rates, considered either on a blunder per flight basis
or on a blunder per operation basis. Again, considering the constraining
factor of RNAV systems and RNAV routes/procedures, several references
have verified a reduction in blunder rate as a function of increasing
waypoint storage capacity. Reference 10 observed a direct inverse
correlation of blunder rate with systems of waypoint storage of 1, 2
and 8 waypoints. Reference 11 again documented a consistent decrease
in blunders per flight with waypoint storage capacities of 1, 2, 4 and 8.
In addition, Reference 11 showed, via a side task loading experiment,
that the pilot's information processing rate, or his ability to concentrate
his attention on supplemental tasks, was worse with a two waypoint
system and best with an eight waypoint system. References 12 and 13
both concluded that blunder rate (blunders per operation) as well as
blunders per flight could be substantially reduced if the cockpit
workload situation were eased, i.e., by reducing the number of operations
per flight required.
All of these experiments indicated that some level of pilot blunders
could be reduced if the workload on the pilot was reduced. Conversely,
it was also shown[12] that the RNAV environment as it was originally
conceived requires a level of increased cockpit workload that could
adversely affect pilot blunder performance. It was for this reason[4,14)that the digital data broadcast concept was evolved in an attempt
to automate the pilot's data entry function, reduce his data input
errors and reduce his overall workload, thus potentially reducing his
overall blunder rate.
The results of the experiments reported in this document and in
Reference 3 verify that the DDBS concept resulted in a dramatic reduction
in pilot blunders. In a direct comparison of three identical subject
pilots flying the same routes in the same aircraft in the same operational
flight environment, the use of DDBS resulted in a reduction of pilot
4-2

blunders from a value of 0.87 blunders per flight for a conventional
single waypoint RNAV system to a value of 0.15 blunders per flight for
a DDBS RNAV system. When considering the total data set including all
of the subject pilot population the comparison was even more striking,
i.e., 1.03 blunders per flight for conventional RNAV as opposed to
0.15 for DDBS. Since these blunder values were obtained in a comparison
between two flight experiments that were deliberately designed to have
a maximum of commonality between controlled variables such that the
conventional RNAV vs DDBS comparison was the only difference, it is
considered that the observed blunder rate reduction can be directly
ascribed to the influence of the DDBS concept and system implementation.
The second issue, that of pilot steering performance, is of similar
importance to the overall acceptance and implementation of area
navigation into the National Airspace System. Reference 3 has stated
that the levels of flight technical error (FTE) resulting from the
baseline testing of a single waypoint area navigation system were
unacceptable for certification purposes. The data contained in Reference
3 verifies the fact that the terminal and approach phase values of FTE
obtained from the "baseline" RNAV flights tests are far above the values
set as the standard for FAA certificationElS]. As in the case of pilot
blunders, the automation of the data input function through the use of
DDBS, and its resultant decrease in pilot workload, was expected to
improve the pilot steering performance of the low cost RNAV user to
acceptable levels [4 ].
Again referring to the direct comparison between the results of the
baseline experiment of Reference 3 and the current DDBS flight experiment,
Table 3.9 has directly documented and verified the initial assumption
that D0BS can substantially reduce FTE in an RNAV flight environment.
In the case of the basic terminal phase of flight, the conventional
RNAV FTE two sigma value of ±1.540 nm was reduced to ±0.950 nm in the
case of the DDBS system. This latter value is within the nominal valueof 1.0 nm set for terminal phase FTE by AC 90-45A[15] and the RNAV TaskForceCS ]. Similarly in the final approach phase the conventional RNAV
value of ±1,661 nm was reduced to ±0.684 for DDBS. While the DDBS value
for approach is still above the nominal value of 0.5 nm[5,15], it is
considerably improved.
4-3

In considering the verification of the reduction in FTE due to
DDBS, the statistical significance of the observed quantitative values
must be considered. As has been shown in Chapter 3, the FTE improvements
in both terminal and approach phases of flight have been shown to be
significant at the p = .001 probability level, thus assuring that these
experimental results and differences can be considered to be valid.
As regards the operational acceptability of the DDBS concept as an
element of any future ATC system, this issue is extremely subjective,
and must be approached in the context of providing initial guidelines
and observations at this time rather than reaching absolute conclusions.
However, the experience gained in the DDBS operational flight test
evaluation did allow several pertinent conclusions to be drawn concerning
several pertinent issues. A primary benefit of the DDBS concept resulted
from the decrease in pilot workload involved in RNAV waypoint definition.
This critical navigation input, particularly in the final phases of the
terminal area transition, is very time-critical in conventional general
aviation RNAV systems:
4.3 RECOMMENDATIONS
Thus far, several critical issues regarding the DOBS concept of
cockpit input data automation have been resolved. The technical
feasibility of the basic concept and the tested Engineering Model hardware
has been proven. The predicted improvement in pilot blunder and steering
performance has been verified. The operational suitability of the DDBS
concept as an element of the ATC system has been demonstrated. The
applicability of the results of this research has been identified.
However, there are still two major areas of uncertainty that remain
to be clarified before a final decision can be made regarding the ultimate
incorporation of the DDBS concept into the ATC system of the future.
First, the DDBS flight test program was conducted with a single DOS$
equipped aircraft flying in a semi-controlled flight environment. It
still needs to be demonstrated that a dense terminal area traffic
environment can be operated efficiently with some mix of DDBS and non-
DDBS aircraft. It is important to define whether or not all aircraft
entering a DDBS terminal area must be DDBS equipped as a "price of
4-4

admission" or whether this equippage is a user option. As in the
simulations of References 7 and 8, the logical source of this data
would be a real time DDBS terminal area simulation run on the Digital
Simulation Facility at the FAA NAFEC facility. As in the previous
simulations, the percentage of DDBS equipped aircraft could be varied
from 0% to 100%, and such parameters as controller talk time, controller
messages, and aircraft delay time could be recorded. In this manner,
data pertinent to controller staffing studies could be accumulated
along with a further evaluation and refinement of air traffic control
procedures in a DDBS/RNAV environment could be acquired.
Second, and directly correlated to the first issue, the degree of
implementation of the DDBS concept, and indeed the decision to embark
on the program at all, is directly dependent on the economic viability
of the concept. From the FAA point of view, capital expenditures will
be required in order to convert the current DME ground stations to be
able to transmit DDBS messages. The decision as to which, or how many,
of the 950 existing ground VOR stations should be modified has not
been made. These costs must be balanced off against the potential
controller staff savings afforded by DDBS. Similarly, but more difficult
to quantify as far as benefits are concerned, the costs and benefits
to the airspace user must be quantified. Only after this interrelated
benefit/cost ratio analysis has been performed can two major questions
be answered:
1. What percentage of airspace users can be expected to equip
with DDBS/RNAV?
2. What are the benefit/cost ratios for both the FAA and the
airspace users for DDBS implementation?
Both of these efforts must be performed in conjunction with one
another before a final evaluation and recommendation regarding the
overall DDBS implementation can be made.
4-5
_1_ __ _ __ _ _

REFERENCES
1. K. Warner, M. Hughes and R. Elliott, Evaluation of Digital DataBroadcast for Area Navigation. Report No. FAA-RD-76-60Washington, D.C. Government Printing Office, April 1976
2. R.J. Adams, An Operational Evaluation of Flight Technical Error.Report No. FAA-RD-76-33. Washington, D.C. Government PrintingOffice, July 1975
3. R.J. Adams, Preliminary RNAV Avionics Standards (2D and 3D AreaNavigation Systems. Report No. FAA-RD-75-178. Washington, D.C.Government Printing Office, November 1975
4. EDMAC, Inc., TACAN/DME Digital Data Broadcast Design Plan.Report No. FAA-RD-76-161. Washington, D.C. Government PrintingOffice, September 1974
5. Federal Aviation Administration/Industry RNAV Task Force,Application of Area Navigation in the National Airspace System.Washington, D.C. Government Printing Office, February 1973
6. E.D.* McConkey, Terminal Area Design-Analysis and Validation ofRNAV Task Force Concepts. Report No. FAA-RD-76-194. Washington,D.C. Government Printing Office, October 1975
7. J. Maurer, P.J. O'Brien, et al, Preliminary Two-Dimensional AreaNavigation Terminal Simulation. Report No. FAA-RD-74-209.Washington, D.C. Government Printing Office, February 1978
8. W. Crimbring and J. Maurer, Area Navigation/Vertical AreaNavigation Terminal Simulation. Report No. FAA-RD-76-28.Washington, D.C. Government Printing Office, April 1976
9. C. Lipson and N.J. Sheth, Statistical Design and Analysis ofEngineering Experiments. New York, N.Y. McGraw-Hill BookCompany, 1973
10. R.S. Jensen and R.J. Vanderkolk, Performance of Instrument PilotsUsina Umbolic Area Navigation Displays. Report No. FAA-RD-71-31.Washington, D.C. Government Printing office, May 1971
11. R. Williges and S.N. Roscoe, Pilotage Error and Residual Attention:The Evaluation of a Performance Control System in Airborne AreaNavigation. Report No. FAA-73-1. Washington, D.C. GovernmentPrinting Office, March 1973
12. R. Van Der Kolk, R.J. Jensen, S.N. Roscoe, Pilotage Error inArea Navigation: Effects of Symbolic Display Variables. ReportNo. FAA-RD-72-29. Washington, D.C. Government Printing Office,January 1972
R-1
REFERENCES
(continued)
13. R.S. Jensen and S.N. Roscoe, Flight Tests of Pilotage Errorin Area Navigation with Vertical Guidance: Effects of NavigationProcedural Complexity. Report No. FAA-RD-74-148. Washington, D.C.Government Printing Office, August 1974
14. I. Ross and J.B. Kennedy, VORTAC Broadcast Data: System Analysisof TACAN and DME for Addition of Broadcast Digital Data. Nutley,New Jersey. ITT Avionics Division, December 1972
15. Department of Transportation, Federal Aviation Administration,Approval of Area Navigation Systems for Use in the U.S. NationalAirspace System. FAA Advisory Circular 90-45A. Washington, D.C.Government Printing Office, February 1975
R-2

APPENDIX A
EAIR PLOTS
4I
A-1

rr
A- 2

-. Lt

A-4

Ln.
A- 5
E-4
A-6

I.
A-7

f. -4
A-8

3
I)
4
£I
.1
I0i
* I I.'04 ~I4
A-9

E-4
64
A-i10
'.4
at
A-1Il

'ITS
I.I
A- 12

A-1
-4
A-i14

A-1
adimpW10it

-4
A- 16

l;IF
A-1

As 4.
IIM

p12
j A-1 9

i
\*.. -' U
*'4.*' p..' %
H~4 ~4
I j i!.A-2O
II.....,

II
2-:
;~gp.i; ~ H
.' ~4 ~.4
JA- 21
I, - ---
. ______ 4
- :4 - J-. -. J - -

I I
'I
C.)
A-22
-- T;*

APPENDIX B
FTE DATA
4-Aq - n % "j Ca0 0'c0 r%- - -C c cn ejC'
M ,.YMC 4 *r r-- C)~J-r -P . O pCo
410
4J I CJA I Zo. cmLJ&LILJ. IW CA I-LL>LCM
4A
4JC I.--rrr-- rc4 "-cm nnvccm
01~lQ~cj% cjoD~qr~n %CCJ~ r"
ie

W IWOO M L - WMn fnOO - C )~ q P r- - % (1
m . . . . . . . . . . . . .(Ot S I ~ S I I I
"I C4w oa 1.% D c q iq r O 0 IJC nL)C)rx o 1 qrr " r g% %0.J~JU CaIOLAJ)j.J -Ij c.I~n YJ &1I.UWJa%0
CU) q 90!P C
U E3
4.' 0) Ln I->:: . C )I-> Z o C W)~aE U :mS-. - I I Ifu 1 se eg:: o I coIIm 1am a1 0a e dou *x
V 'In Olt CCDcoCL =I cdo
4-b U4.4
Go 0
CL
F--

Imp "0 l OL DL
CJo O qCJal~r .O )ifC~
.4-
b.44
4%
>44) fj>a. do>
(n =wI &- W sI I I I I-:-U S-US u41 . i-o aI 0 1
4J >o. W w0 0&:I C.4
41
U)% 4.).N.r r- % *_ %P
06
0
.B-3

S.-
On) ,6 C)1d IM-r rlr 600 I l -L)
4-1
Cd),-IJ
ca
4.)mo4 l l4 C10 m 0-1 0.V - -
cn MC~o InkcoI>
IB-

OD 40O COV) W CM%0 )ifLO0 r- rLf W)fl0C%
M ~ . .c .). . .- C1~ . .. . ..
0)V) m 41 r-.caC 000-t l 1*c 4tC) 3t Goor fcl~ -C- cJrl% ~-OC ~ C f P~n- Ln P- OU MCCcm cn
C 3- . .0 .0 0 ~ .O. . . . .
t.)
La. LSL WLALS JLaLJwc JJLiLS Wu JLa j u W c
U7
4-2-
41 ~ ~ ~ ~ a L00M.t o m .ma al .*1 0l S L I Ou S S5
0)
01
p~ .
CL
U
UjC~ 0)0) 0 CV)~ () r-4 % nCj1 C)C
B-5

+31 M. LnMo N c-ID n Ln qw 7,wuwC Mto 9C !S iC!c C C C iC!C
J
C)JO O-.~ 4OJ ~ OOC.W BWU a -w u L jwu U-iv~~ LU cc -.-- OCui )OC
I I I I S
+1m G 1-0
W C
4-3
00
4.3 t) tU9-n.. En In Ln Ln Ln % 0% D% 0W% DW V - -r
E a. al.. s a s aj. u m a
I--
"PO

4.) nC 4 .~C' C~(J% C CDO (D f-4D 0.WlotWC', 4 O c c..z "! C C C Ie -C l C,!C! lr-
M,im
>5
o1 4.-) to430C Ot
I) I0 o I I a 10 10
4-A-
C 00C 4-1 C; aCS ! c
0
a-.U) 4A
toa.- ' n n v wC44r n r -
FB-

.0 %d r% .- CO d" c CAO CJ q~ cmJ~ rl m~ r 0 01COLnt r% nco-c o qtmr DCJ " ) W"C 0 oC
m -1 c c V) f) r-M ;t" 0 ;rincn n--, - I%~C JD CV
>
Ca
09
2 ~ ~ ~ ~ . C.) a ~ fI-0 C
Mu i ,Z I Is , a-4.iag Swa s
4J V) iLO u
co
0
0J
-cm mm
t-
(0
C;
B-8

g4,
to M m .C) eq coJC) C
41mP% i m%
II I
to to1
>4 %D -cr JLi cC% ) E
C:)
4.) CDO
U) 4-' t
0)
4n &
C- .,)(3uL
= -10,
4-
In
.Z.