Working with large-scale climate surveys: Reducing data complexity to gain new insights
22
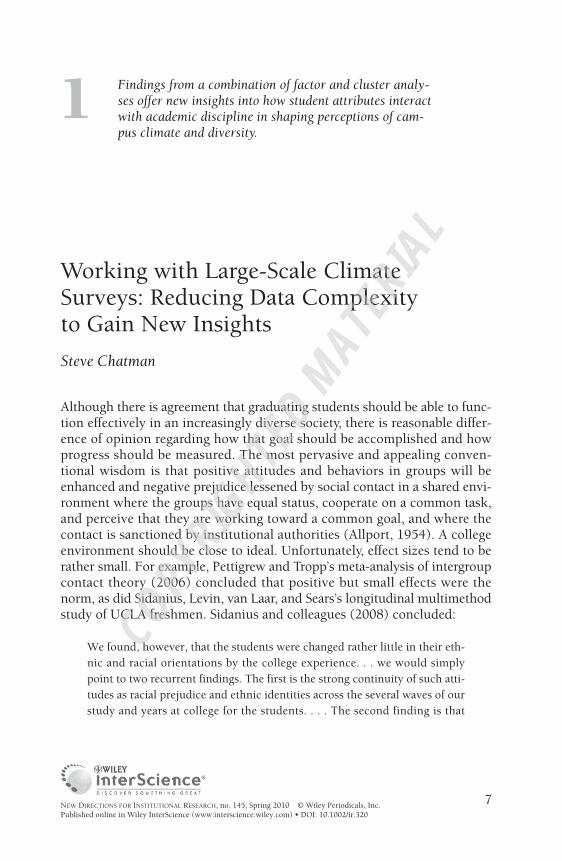
Findings from a combination of factor and cluster analy- ses offer new insights into how student attributes interact with academic discipline in shaping perceptions of cam- pus climate and diversity. Working with Large-Scale Climate Surveys: Reducing Data Complexity to Gain New Insights Steve Chatman Although there is agreement that graduating students should be able to func- tion effectively in an increasingly diverse society, there is reasonable differ- ence of opinion regarding how that goal should be accomplished and how progress should be measured. The most pervasive and appealing conven- tional wisdom is that positive attitudes and behaviors in groups will be enhanced and negative prejudice lessened by social contact in a shared envi- ronment where the groups have equal status, cooperate on a common task, and perceive that they are working toward a common goal, and where the contact is sanctioned by institutional authorities (Allport, 1954). A college environment should be close to ideal. Unfortunately, effect sizes tend to be rather small. For example, Pettigrew and Tropp’s meta-analysis of intergroup contact theory (2006) concluded that positive but small effects were the norm, as did Sidanius, Levin, van Laar, and Sears’s longitudinal multimethod study of UCLA freshmen. Sidanius and colleagues (2008) concluded: We found, however, that the students were changed rather little in their eth- nic and racial orientations by the college experience. . . we would simply point to two recurrent findings. The first is the strong continuity of such atti- tudes as racial prejudice and ethnic identities across the several waves of our study and years at college for the students. . . . The second finding is that 7 1 NEW DIRECTIONS FOR INSTITUTIONAL RESEARCH, no. 145, Spring 2010 © Wiley Periodicals, Inc. Published online in Wiley InterScience (www.interscience.wiley.com) • DOI: 10.1002/ir.320 COPYRIGHTED MATERIAL
-
Upload
independent -
Category
Documents
-
view
5 -
download
0
Transcript of Working with large-scale climate surveys: Reducing data complexity to gain new insights
Findings from a combination of factor and cluster analy-ses offer new insights into how student attributes interactwith academic discipline in shaping perceptions of cam-pus climate and diversity.
Working with Large-Scale ClimateSurveys: Reducing Data Complexity to Gain New Insights
Steve Chatman
Although there is agreement that graduating students should be able to func-tion effectively in an increasingly diverse society, there is reasonable differ-ence of opinion regarding how that goal should be accomplished and howprogress should be measured. The most pervasive and appealing conven-tional wisdom is that positive attitudes and behaviors in groups will beenhanced and negative prejudice lessened by social contact in a shared envi-ronment where the groups have equal status, cooperate on a common task,and perceive that they are working toward a common goal, and where thecontact is sanctioned by institutional authorities (Allport, 1954). A collegeenvironment should be close to ideal. Unfortunately, effect sizes tend to berather small. For example, Pettigrew and Tropp’s meta-analysis of intergroupcontact theory (2006) concluded that positive but small effects were thenorm, as did Sidanius, Levin, van Laar, and Sears’s longitudinal multimethodstudy of UCLA freshmen. Sidanius and colleagues (2008) concluded:
We found, however, that the students were changed rather little in their eth-nic and racial orientations by the college experience. . . we would simplypoint to two recurrent findings. The first is the strong continuity of such atti-tudes as racial prejudice and ethnic identities across the several waves of ourstudy and years at college for the students. . . . The second finding is that
7
1
NEW DIRECTIONS FOR INSTITUTIONAL RESEARCH, no. 145, Spring 2010 © Wiley Periodicals, Inc.Published online in Wiley InterScience (www.interscience.wiley.com) • DOI: 10.1002/ir.320
IR145-chap01.qxp 3/15/10 7:01 PM Page 7
COPYRIG
HTED M
ATERIAL
8 DIVERSITY AND EDUCATIONAL BENEFITS
NEW DIRECTIONS FOR INSTITUTIONAL RESEARCH • DOI: 10.1002/ir
diversity experiences on campus, whether in ethnic organization membershipor interethnic friends, roommates, and dating partners, have quite modesteffects [pp. 322–333].
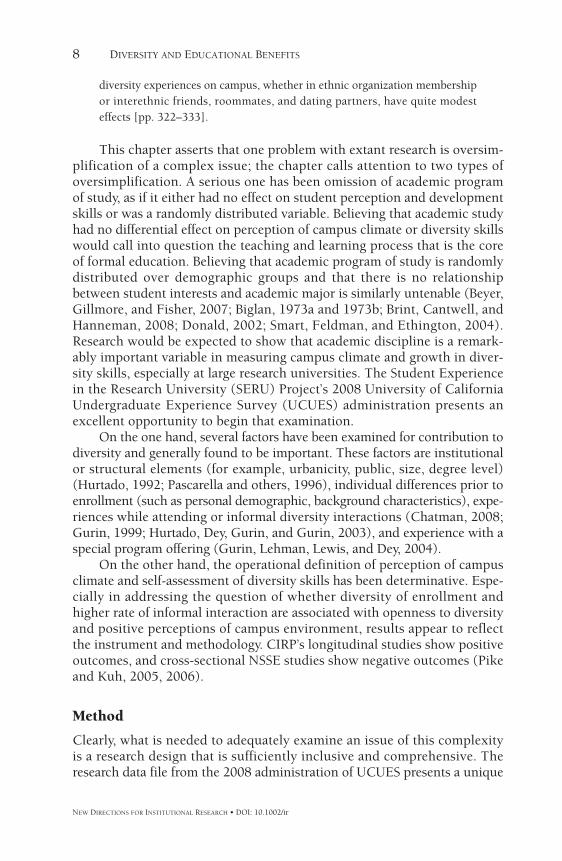
This chapter asserts that one problem with extant research is oversim-plification of a complex issue; the chapter calls attention to two types ofoversimplification. A serious one has been omission of academic programof study, as if it either had no effect on student perception and developmentskills or was a randomly distributed variable. Believing that academic studyhad no differential effect on perception of campus climate or diversity skillswould call into question the teaching and learning process that is the coreof formal education. Believing that academic program of study is randomlydistributed over demographic groups and that there is no relationshipbetween student interests and academic major is similarly untenable (Beyer,Gillmore, and Fisher, 2007; Biglan, 1973a and 1973b; Brint, Cantwell, andHanneman, 2008; Donald, 2002; Smart, Feldman, and Ethington, 2004).Research would be expected to show that academic discipline is a remark-ably important variable in measuring campus climate and growth in diver-sity skills, especially at large research universities. The Student Experiencein the Research University (SERU) Project’s 2008 University of CaliforniaUndergraduate Experience Survey (UCUES) administration presents anexcellent opportunity to begin that examination.
On the one hand, several factors have been examined for contribution todiversity and generally found to be important. These factors are institutionalor structural elements (for example, urbanicity, public, size, degree level)(Hurtado, 1992; Pascarella and others, 1996), individual differences prior toenrollment (such as personal demographic, background characteristics), expe-riences while attending or informal diversity interactions (Chatman, 2008;Gurin, 1999; Hurtado, Dey, Gurin, and Gurin, 2003), and experience with aspecial program offering (Gurin, Lehman, Lewis, and Dey, 2004).
On the other hand, the operational definition of perception of campusclimate and self-assessment of diversity skills has been determinative. Espe-cially in addressing the question of whether diversity of enrollment andhigher rate of informal interaction are associated with openness to diversityand positive perceptions of campus environment, results appear to reflectthe instrument and methodology. CIRP’s longitudinal studies show positiveoutcomes, and cross-sectional NSSE studies show negative outcomes (Pikeand Kuh, 2005, 2006).
Method
Clearly, what is needed to adequately examine an issue of this complexityis a research design that is sufficiently inclusive and comprehensive. Theresearch data file from the 2008 administration of UCUES presents a unique
IR145-chap01.qxp 3/15/10 7:01 PM Page 8
9WORKING WITH LARGE-SCALE CLIMATE SURVEYS
NEW DIRECTIONS FOR INSTITUTIONAL RESEARCH • DOI: 10.1002/ir
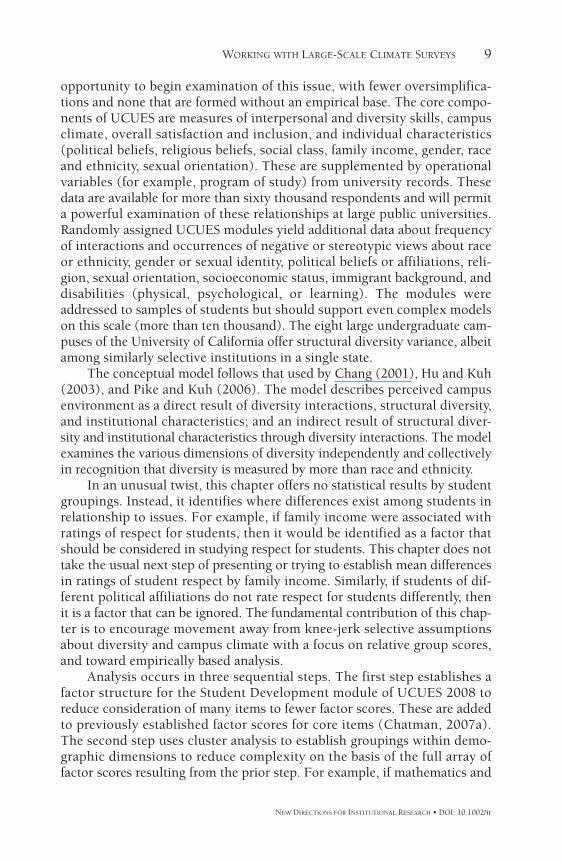
opportunity to begin examination of this issue, with fewer oversimplifica-tions and none that are formed without an empirical base. The core compo-nents of UCUES are measures of interpersonal and diversity skills, campusclimate, overall satisfaction and inclusion, and individual characteristics(political beliefs, religious beliefs, social class, family income, gender, raceand ethnicity, sexual orientation). These are supplemented by operationalvariables (for example, program of study) from university records. Thesedata are available for more than sixty thousand respondents and will permita powerful examination of these relationships at large public universities.Randomly assigned UCUES modules yield additional data about frequencyof interactions and occurrences of negative or stereotypic views about raceor ethnicity, gender or sexual identity, political beliefs or affiliations, reli-gion, sexual orientation, socioeconomic status, immigrant background, anddisabilities (physical, psychological, or learning). The modules wereaddressed to samples of students but should support even complex modelson this scale (more than ten thousand). The eight large undergraduate cam-puses of the University of California offer structural diversity variance, albeitamong similarly selective institutions in a single state.
The conceptual model follows that used by Chang (2001), Hu and Kuh(2003), and Pike and Kuh (2006). The model describes perceived campusenvironment as a direct result of diversity interactions, structural diversity,and institutional characteristics; and an indirect result of structural diver-sity and institutional characteristics through diversity interactions. The modelexamines the various dimensions of diversity independently and collectivelyin recognition that diversity is measured by more than race and ethnicity.
In an unusual twist, this chapter offers no statistical results by studentgroupings. Instead, it identifies where differences exist among students inrelationship to issues. For example, if family income were associated withratings of respect for students, then it would be identified as a factor thatshould be considered in studying respect for students. This chapter does nottake the usual next step of presenting or trying to establish mean differencesin ratings of student respect by family income. Similarly, if students of dif-ferent political affiliations do not rate respect for students differently, thenit is a factor that can be ignored. The fundamental contribution of this chap-ter is to encourage movement away from knee-jerk selective assumptionsabout diversity and campus climate with a focus on relative group scores,and toward empirically based analysis.
Analysis occurs in three sequential steps. The first step establishes afactor structure for the Student Development module of UCUES 2008 toreduce consideration of many items to fewer factor scores. These are addedto previously established factor scores for core items (Chatman, 2007a).The second step uses cluster analysis to establish groupings within demo-graphic dimensions to reduce complexity on the basis of the full array offactor scores resulting from the prior step. For example, if mathematics and
IR145-chap01.qxp 3/15/10 7:01 PM Page 9

10 DIVERSITY AND EDUCATIONAL BENEFITS
computer science students respond similarly across the twenty factorscores, then mathematics and computer science students can be combinedfor the third step. In the third step, the relationship between clusters andindividual factors is examined to determine which student characteristicsare associated with each factor score. For example, if field of study is unim-portant in examining Campus Values, then field of study can be ignoredwhen examining Campus Values. The three steps are designed to reduceitem complexity through factor analysis, shorten the student characteristicvariable set through cluster analysis, and simplify study design complexityin examining specific dimensions of campus climate and diversity. Thereductions are empirically based.
Step One: Factor Analysis of the Student Development Module. Thefactor analysis strategy followed that used to establish factors for the UCUES2006 core data elements (Chatman, 2007a). It employed varimax rotation toestablish orthogonal principal components followed by promax rotationwithin principal components to establish subfactor scores. Item placementswere guided by loadings with a rarely used 0.4 cutoff. The decision to employa 0.4 cutoff was the consensus judgment of a team of institutional researchers,faculty, and graduate students gathered for a day at the UC Riverside campusto do the factor analysis. The standard reflected the observed loadings as wellas the groups’ subjective judgment about item fit. All analyses relied onresponses by upper-division students evaluating majors who were randomlyassigned to the Student Development module. For this module, many itemscores were reversed prior to analysis to create a preferred positive scale.
The best principal component fit was a three-factor solution with reli-ability coefficients of 0.95, 0.92, and 0.85 for factors subsequently namedFaculty and Staff Expressed Prejudice (DVF1), Campus Climate and Stu-dent Expressions of Prejudice (DVF2), and Interpersonal Skills and Sensi-tivities (DVF3; Table 1.1).
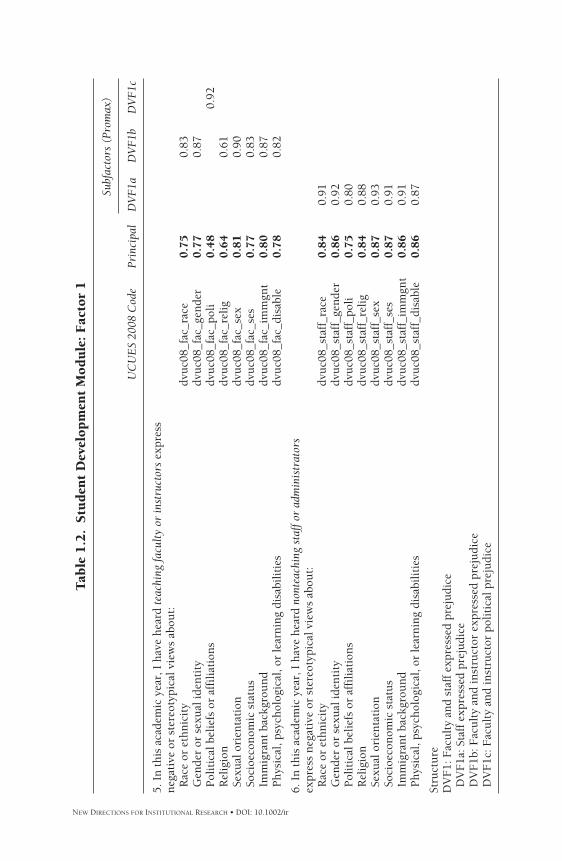
Faculty and Staff Expressed Prejudice (DVF1) comprised two item seriesasking the frequency with which the student had heard teaching faculty orinstructors and nonteaching staff or administrators express negative or stereo-typical views about any of eight characteristics: race or ethnicity; gender orsexual identity; political beliefs or affiliations; religion; sexual orientation;socioeconomic status; immigrant background; or physical, psychological, orlearning disabilities. Items about nonteaching staff or administrators were thefirst subfactor, and those about teaching faculty or instructions were the sec-ond, with one exception. Negative political or stereotypical political viewexpressions stood alone as a third factor (Table 1.2).
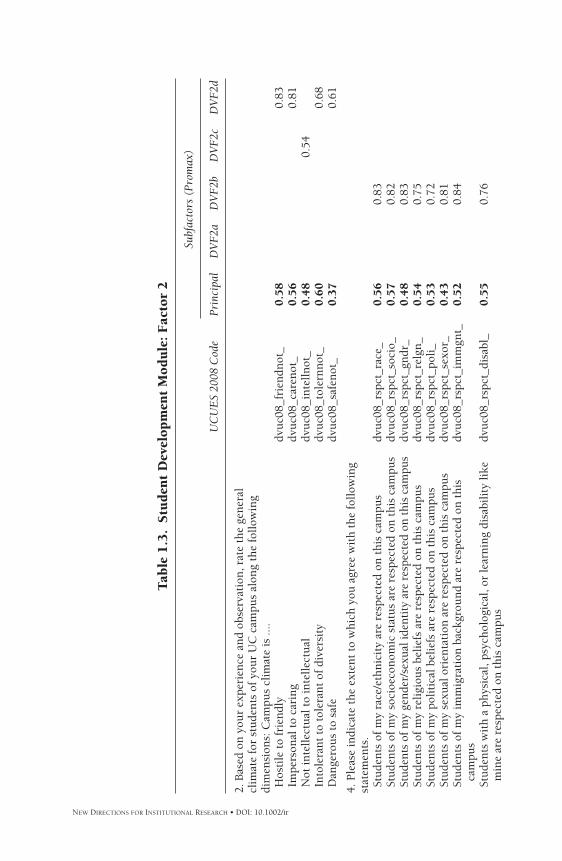
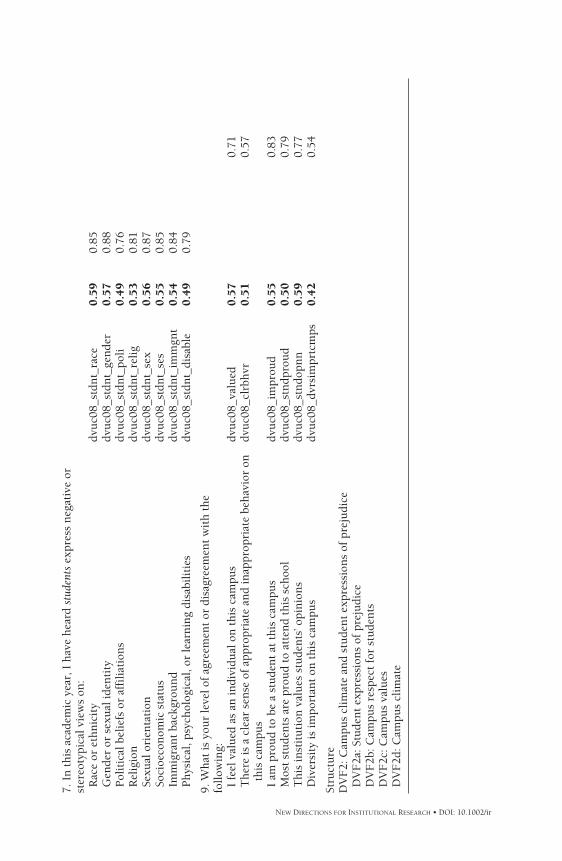
The second principal component of the Student Development Modulewas Campus Climate and Student Expressions of Prejudice. This factorcomprised frequency of student expressions of negative or stereotypicalviews, agreement with statements about students being treated with respect,campus climate ratings along a series of continuums, and general campus
NEW DIRECTIONS FOR INSTITUTIONAL RESEARCH • DOI: 10.1002/ir
IR145-chap01.qxp 3/15/10 7:01 PM Page 10
11WORKING WITH LARGE-SCALE CLIMATE SURVEYS
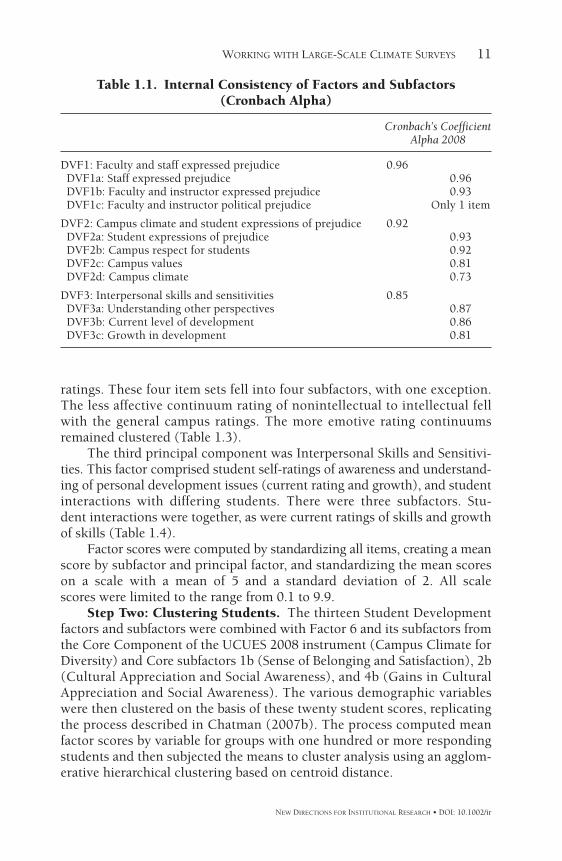
ratings. These four item sets fell into four subfactors, with one exception.The less affective continuum rating of nonintellectual to intellectual fellwith the general campus ratings. The more emotive rating continuumsremained clustered (Table 1.3).
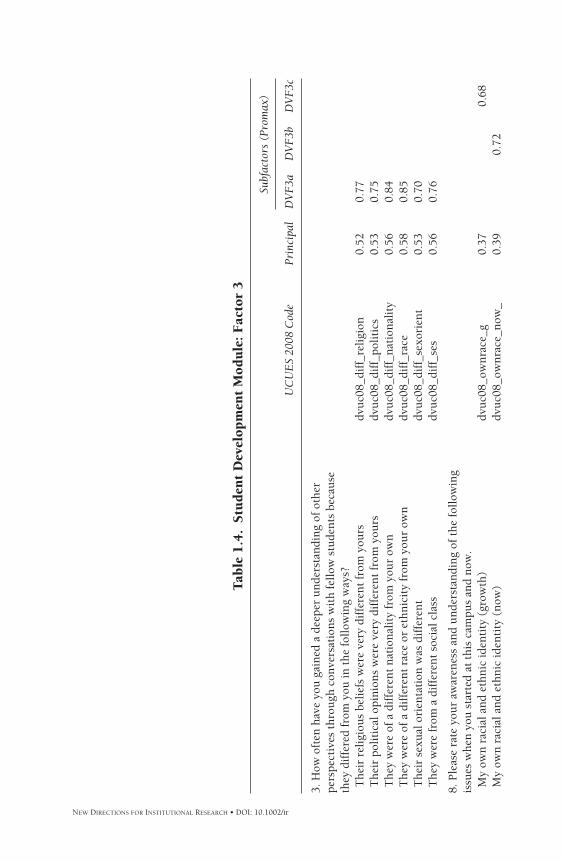
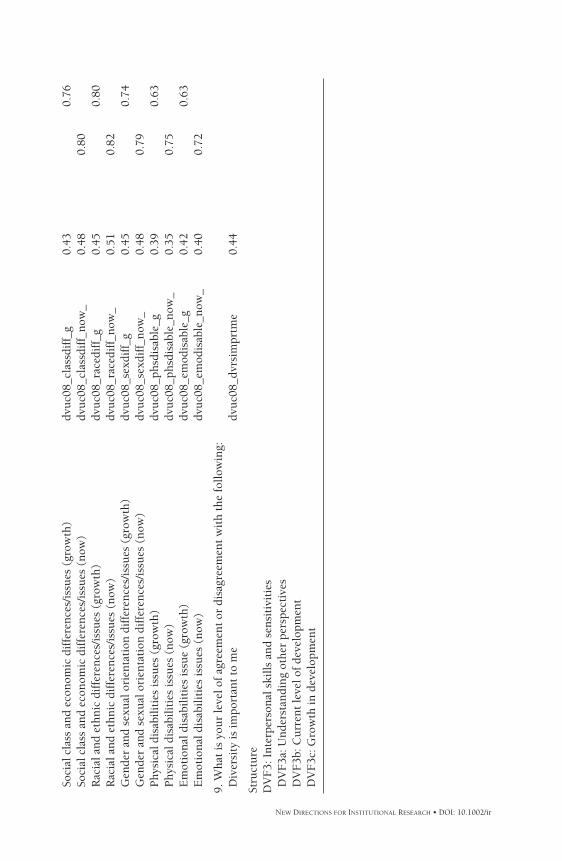
The third principal component was Interpersonal Skills and Sensitivi-ties. This factor comprised student self-ratings of awareness and understand-ing of personal development issues (current rating and growth), and studentinteractions with differing students. There were three subfactors. Stu-dent interactions were together, as were current ratings of skills and growthof skills (Table 1.4).
Factor scores were computed by standardizing all items, creating a meanscore by subfactor and principal factor, and standardizing the mean scoreson a scale with a mean of 5 and a standard deviation of 2. All scale scores were limited to the range from 0.1 to 9.9.
Step Two: Clustering Students. The thirteen Student Developmentfactors and subfactors were combined with Factor 6 and its subfactors fromthe Core Component of the UCUES 2008 instrument (Campus Climate forDiversity) and Core subfactors 1b (Sense of Belonging and Satisfaction), 2b(Cultural Appreciation and Social Awareness), and 4b (Gains in CulturalAppreciation and Social Awareness). The various demographic variableswere then clustered on the basis of these twenty student scores, replicatingthe process described in Chatman (2007b). The process computed meanfactor scores by variable for groups with one hundred or more respondingstudents and then subjected the means to cluster analysis using an agglom-erative hierarchical clustering based on centroid distance.
NEW DIRECTIONS FOR INSTITUTIONAL RESEARCH • DOI: 10.1002/ir
Table 1.1. Internal Consistency of Factors and Subfactors(Cronbach Alpha)
Cronbach’s CoefficientAlpha 2008
DVF1: Faculty and staff expressed prejudice 0.96DVF1a: Staff expressed prejudice 0.96DVF1b: Faculty and instructor expressed prejudice 0.93DVF1c: Faculty and instructor political prejudice Only 1 item
DVF2: Campus climate and student expressions of prejudice 0.92DVF2a: Student expressions of prejudice 0.93DVF2b: Campus respect for students 0.92DVF2c: Campus values 0.81DVF2d: Campus climate 0.73
DVF3: Interpersonal skills and sensitivities 0.85DVF3a: Understanding other perspectives 0.87DVF3b: Current level of development 0.86DVF3c: Growth in development 0.81
IR145-chap01.qxp 3/15/10 7:01 PM Page 11
NEW DIRECTIONS FOR INSTITUTIONAL RESEARCH • DOI: 10.1002/ir
Tab
le 1
.2.
Stu
den
t D
evel
opm
ent
Mod
ule
: F
acto
r 1
Subf
acto
rs (
Prom
ax)
UC
UE
S 20
08 C
ode
Prin
cipa
lD
VF
1a
DV
F1b
DV
F1c
5. I
n t
his
aca
dem
ic y
ear,
I h
ave
hea
rd t
each
ing
facu
lty
or in
stru
ctor
sex
pres
s n
egat
ive
or s
tere
otyp
ical
vie
ws
abou
t:R
ace
or e
thn
icit
ydv
uc0
8_fa
c_ra
ce0.7
50.
83G
ende
r or
sex
ual
iden
tity
dvu
c08_
fac_
gen
der
0.7
70.
87P
olit
ical
bel
iefs
or
affi
liat
ion
sdv
uc0
8_fa
c_po
li0.4
80.
92R
elig
ion
dvu
c08_
fac_
reli
g0.6
40.
61Se
xual
ori
enta
tion
dvu
c08_
fac_
sex
0.8
10.
90So
cioe
con
omic
sta
tus
dvu
c08_
fac_
ses
0.7
70.
83Im
mig
ran
t ba
ckgr
oun
ddv
uc0
8_fa
c_im
mgn
t0.8
00.
87P
hys
ical
, psy
chol
ogic
al, o
r le
arn
ing
disa
bili
ties
dvu
c08_
fac_
disa
ble
0.7
80.
82
6. I
n t
his
aca
dem
ic y
ear,
I h
ave
hea
rd n
onte
achi
ng s
taff
or
adm
inis
trat
ors
expr
ess
neg
ativ
e or
ste
reot
ypic
al v
iew
s ab
out:
Rac
e or
eth
nic
ity
dvu
c08_
staf
f_ra
ce0.8
40.
91G
ende
r or
sex
ual
iden
tity
dvu
c08_
staf
f_ge
nde
r0.8
60.
92P
olit
ical
bel
iefs
or
affi
liat
ion
sdv
uc0
8_st
aff_
poli
0.7
50.
80R
elig
ion
dvu
c08_
staf
f_re
lig
0.8
40.
88Se
xual
ori
enta
tion
dvu
c08_
staf
f_se
x0.8
70.
93So
cioe
con
omic
sta
tus
dvu
c08_
staf
f_se
s0.8
70.
91Im
mig
ran
t ba
ckgr
oun
ddv
uc0
8_st
aff_
imm
gnt
0.8
60.
91P
hys
ical
, psy
chol
ogic
al, o
r le
arn
ing
disa
bili
ties
dvu
c08_
staf
f_di
sabl
e0.8
60.
87
Stru
ctu
reD
VF
1: F
acu
lty
and
staf
f ex
pres
sed
prej
udi
ce
DV
F1a
: Sta
ff e
xpre
ssed
pre
judi
ce
DV
F1b
: Fac
ult
y an
d in
stru
ctor
exp
ress
ed p
reju
dice
D
VF
1c: F
acu
lty
and
inst
ruct
or p
olit
ical
pre
judi
ce
IR145-chap01.qxp 3/15/10 7:01 PM Page 12

13WORKING WITH LARGE-SCALE CLIMATE SURVEYS
Race and Ethnicity. One of the most evocative and frequently asserteddimensions along which students can be sorted is race and ethnicity (Fig-ure 1.1). When clustered by responses to these diversity and climate factors,there were four race and ethnicity groups. The most distinct cluster of onewas black or African Americans. The second comprised other underrepre-sented minorities and Filipino (Chicano or Mexican American, Latino, andFilipino). The third cluster was Asian students from ethnicities with a highproportion of recent immigrants: Chinese, Vietnamese, and Korean. Thefourth cluster was all other students: Japanese, Indian or Pakistani, Thai,white, and the “decline to state” and “other” students. (This last clustertends to confirm that students marking “decline to state” or “other” are notunderrepresented minority students.)
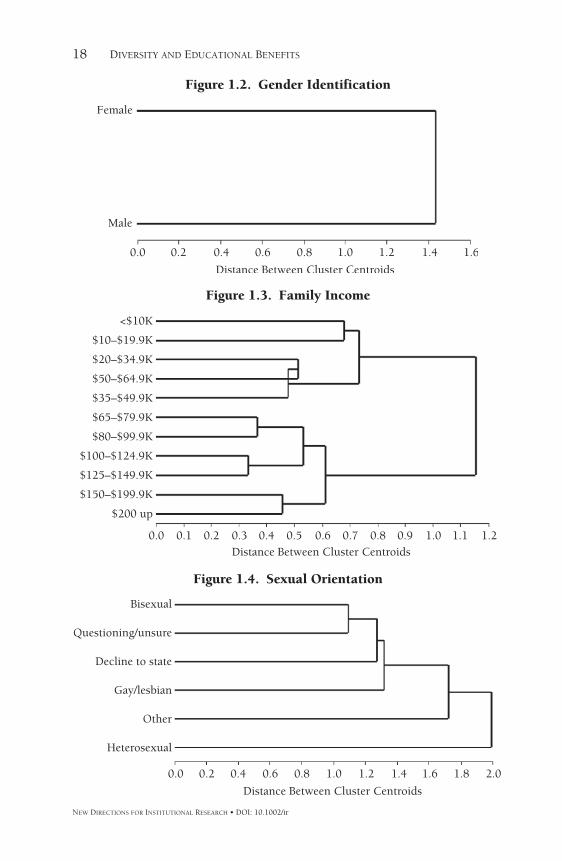
Gender. Only the male and female responses were numerically able tosupport the analysis. The two groups differed at about a 1.4 centroid dis-tance (Figure 1.2).
Family Income. The clustering of family income was especially note-worthy. First, with one minor exception, students were arrayed by familyincome from low to high. The second was the clear presence of two clustersseparated at the $65,000 income level. Those students from families withincomes of $65,000 or higher were one group, and those from families with lower incomes formed a second group (Figure 1.3).
Sexual Orientation. The clustering suggested some very interestingstructures, especially combining questioning and unsure with bisexual andplacing “decline to state” with nonheterosexuals, but the clearest distinc-tion was between heterosexual students and other groups (Figure 1.4).
NEW DIRECTIONS FOR INSTITUTIONAL RESEARCH • DOI: 10.1002/ir
Figure 1.1. Race and Ethnicity
IR145-chap01.qxp 3/15/10 7:01 PM Page 13
NEW DIRECTIONS FOR INSTITUTIONAL RESEARCH • DOI: 10.1002/ir
Tab
le 1
.3.
Stu
den
t D
evel
opm
ent
Mod
ule
: F
acto
r 2
Subf
acto
rs (
Prom
ax)
UC
UE
S 20
08 C
ode
Prin
cipa
lD
VF
2aD
VF
2bD
VF
2cD
VF
2d
2. B
ased
on
you
r ex
peri
ence
an
d ob
serv
atio
n, r
ate
the
gen
eral
cl
imat
e fo
r st
ude
nts
of
you
r U
C c
ampu
s al
ong
the
foll
owin
g di
men
sion
s: C
ampu
s cl
imat
e is
....
Hos
tile
to
frie
ndl
ydv
uc0
8_fr
ien
dnot
_0.5
80.
83Im
pers
onal
to
cari
ng
dvu
c08_
care
not
_0.5
60.
81N
ot in
tell
ectu
al t
o in
tell
ectu
aldv
uc0
8_in
tell
not
_0.4
80.
54In
tole
ran
t to
tol
eran
t of
div
ersi
tydv
uc0
8_to
lern
not
_0.6
00.
68D
ange
rou
s to
saf
edv
uc0
8_sa
fen
ot_
0.3
70.
61
4. P
leas
e in
dica
te t
he
exte
nt
to w
hic
h y
ou a
gree
wit
h t
he
foll
owin
g st
atem
ents
. St
ude
nts
of
my
race
/eth
nic
ity
are
resp
ecte
d on
th
is c
ampu
s dv
uc0
8_rs
pct_
race
_0.5
60.
83St
ude
nts
of
my
soci
oeco
nom
ic s
tatu
s ar
e re
spec
ted
on t
his
cam
pus
dvu
c08_
rspc
t_so
cio_
0.5
70.
82St
ude
nts
of m
y ge
nde
r/se
xual
iden
tity
are
res
pect
ed o
n t
his
cam
pus
dvu
c08_
rspc
t_gn
dr_
0.4
80.
83St
ude
nts
of
my
reli
giou
s be
lief
s ar
e re
spec
ted
on t
his
cam
pus
dvu
c08_
rspc
t_re
lgn
_0.5
40.
75St
ude
nts
of
my
poli
tica
l bel
iefs
are
res
pect
ed o
n t
his
cam
pus
dvu
c08_
rspc
t_po
li_
0.5
30.
72St
ude
nts
of
my
sexu
al o
rien
tati
on a
re r
espe
cted
on
th
is c
ampu
s dv
uc0
8_rs
pct_
sexo
r_0.4
30.
81St
ude
nts
of
my
imm
igra
tion
bac
kgro
un
d ar
e re
spec
ted
on t
his
dv
uc0
8_rs
pct_
imm
gnt_
0.5
20.
84ca
mpu
sSt
ude
nts
wit
h a
ph
ysic
al, p
sych
olog
ical
, or
lear
nin
g di
sabi
lity
like
dv
uc0
8_rs
pct_
disa
bl_
0.5
50.
76m
ine
are
resp
ecte
d on
th
is c
ampu
s
IR145-chap01.qxp 3/15/10 7:01 PM Page 14
NEW DIRECTIONS FOR INSTITUTIONAL RESEARCH • DOI: 10.1002/ir
7. I
n t
his
aca
dem
ic y
ear,
I h
ave
hea
rd s
tude
nts
expr
ess
neg
ativ
e or
st
ereo
typi
cal v
iew
s on
:R
ace
or e
thn
icit
y dv
uc0
8_st
dnt_
race
0.5
90.
85G
ende
r or
sex
ual
iden
tity
dv
uc0
8_st
dnt_
gen
der
0.5
70.
88P
olit
ical
bel
iefs
or
affi
liat
ion
s dv
uc0
8_st
dnt_
poli
0.4
90.
76R
elig
ion
dvu
c08_
stdn
t_re
lig
0.5
30.
81Se
xual
ori
enta
tion
dv
uc0
8_st
dnt_
sex
0.5
60.
87So
cioe
con
omic
sta
tus
dvu
c08_
stdn
t_se
s0.5
50.
85Im
mig
ran
t ba
ckgr
oun
ddv
uc0
8_st
dnt_
imm
gnt
0.5
40.
84P
hys
ical
, psy
chol
ogic
al, o
r le
arn
ing
disa
bili
ties
dvu
c08_
stdn
t_di
sabl
e0.4
90.
79
9. W
hat
is y
our
leve
l of
agre
emen
t or
dis
agre
emen
t w
ith
th
e fo
llow
ing:
I
feel
val
ued
as
an in
divi
dual
on
th
is c
ampu
sdv
uc0
8_va
lued
0.5
70.
71T
her
e is
a c
lear
sen
se o
f ap
prop
riat
e an
d in
appr
opri
ate
beh
avio
r on
dv
uc0
8_cl
rbh
vr
0.5
10.
57th
is c
ampu
s I
am p
rou
d to
be
a st
ude
nt
at t
his
cam
pus
dvu
c08_
impr
oud
0.5
50.
83M
ost
stu
den
ts a
re p
rou
d to
att
end
this
sch
ool
dvu
c08_
stn
dpro
ud
0.5
00.
79T
his
inst
itu
tion
val
ues
stu
den
ts’ o
pin
ion
s dv
uc0
8_st
ndo
pnn
0.5
90.
77D
iver
sity
is im
port
ant
on t
his
cam
pus
dvu
c08_
dvrs
impr
tcm
ps0.4
20.
54
Stru
ctu
reD
VF
2: C
ampu
s cl
imat
e an
d st
ude
nt
expr
essi
ons
of p
reju
dice
D
VF
2a: S
tude
nt
expr
essi
ons
of p
reju
dice
D
VF
2b: C
ampu
s re
spec
t fo
r st
ude
nts
D
VF
2c: C
ampu
s va
lues
D
VF
2d: C
ampu
s cl
imat
e
IR145-chap01.qxp 3/15/10 7:01 PM Page 15
NEW DIRECTIONS FOR INSTITUTIONAL RESEARCH • DOI: 10.1002/ir
Tab
le 1
.4.
Stu
den
t D
evel
opm
ent
Mod
ule
: F
acto
r 3
Subf
acto
rs (
Prom
ax)
UC
UE
S 20
08 C
ode
Prin
cipa
lD
VF
3aD
VF
3bD
VF
3c
3. H
ow o
ften
hav
e yo
u g
ain
ed a
dee
per
un
ders
tan
din
g of
oth
er
pers
pect
ives
th
rou
gh c
onve
rsat
ion
s w
ith
fel
low
stu
den
ts b
ecau
se
they
dif
fere
d fr
om y
ou in
th
e fo
llow
ing
way
s?T
hei
r re
ligi
ous
beli
efs
wer
e ve
ry d
iffe
ren
t fr
om y
ours
dvu
c08_
diff
_rel
igio
n0.
520.
77T
hei
r po
liti
cal o
pin
ion
s w
ere
very
dif
fere
nt
from
you
rs
dvu
c08_
diff
_pol
itic
s0.
530.
75T
hey
wer
e of
a d
iffe
ren
t n
atio
nal
ity
from
you
r ow
n
dvu
c08_
diff
_nat
ion
alit
y0.
560.
84T
hey
wer
e of
a d
iffe
ren
t ra
ce o
r et
hn
icit
y fr
om y
our
own
dv
uc0
8_di
ff_r
ace
0.58
0.85
Th
eir
sexu
al o
rien
tati
on w
as d
iffe
ren
t dv
uc0
8_di
ff_s
exor
ien
t0.
530.
70T
hey
wer
e fr
om a
dif
fere
nt
soci
al c
lass
dv
uc0
8_di
ff_s
es0.
560.
76
8. P
leas
e ra
te y
our
awar
enes
s an
d u
nde
rsta
ndi
ng
of t
he
foll
owin
g is
sues
wh
en y
ou s
tart
ed a
t th
is c
ampu
s an
d n
ow.
My
own
rac
ial a
nd
eth
nic
iden
tity
(gr
owth
)dv
uc0
8_ow
nra
ce_g
0.37
0.68
My
own
rac
ial a
nd
eth
nic
iden
tity
(n
ow)
dvu
c08_
own
race
_now
_0.
390.
72
IR145-chap01.qxp 3/15/10 7:01 PM Page 16
NEW DIRECTIONS FOR INSTITUTIONAL RESEARCH • DOI: 10.1002/ir
Soci
al c
lass
an
d ec
onom
ic d
iffe
ren
ces/
issu
es (
grow
th)
dvu
c08_
clas
sdif
f_g
0.43
0.76
Soci
al c
lass
an
d ec
onom
ic d
iffe
ren
ces/
issu
es (
now
)dv
uc0
8_cl
assd
iff_
now
_0.
480.
80R
acia
l an
d et
hn
ic d
iffe
ren
ces/
issu
es (
grow
th)
dvu
c08_
race
diff
_g0.
450.
80R
acia
l an
d et
hn
ic d
iffe
ren
ces/
issu
es (
now
)dv
uc0
8_ra
cedi
ff_n
ow_
0.51
0.82
Gen
der
and
sexu
al o
rien
tati
on d
iffe
ren
ces/
issu
es (
grow
th)
dvu
c08_
sexd
iff_
g0.
450.
74G
ende
r an
d se
xual
ori
enta
tion
dif
fere
nce
s/is
sues
(n
ow)
dvu
c08_
sexd
iff_
now
_0.
480.
79P
hys
ical
dis
abil
itie
s is
sues
(gr
owth
)dv
uc0
8_ph
sdis
able
_g0.
390.
63P
hys
ical
dis
abil
itie
s is
sues
(n
ow)
dvu
c08_
phsd
isab
le_n
ow_
0.35
0.75
Em
otio
nal
dis
abil
itie
s is
sue
(gro
wth
)dv
uc0
8_em
odis
able
_g0.
420.
63E
mot
ion
al d
isab
ilit
ies
issu
es (
now
)dv
uc0
8_em
odis
able
_now
_0.
400.
72
9. W
hat
is y
our
leve
l of
agre
emen
t or
dis
agre
emen
t w
ith
th
e fo
llow
ing:
Div
ersi
ty is
impo
rtan
t to
me
dvu
c08_
dvrs
impr
tme
0.44
Stru
ctu
reD
VF
3: I
nte
rper
son
al s
kill
s an
d se
nsi
tivi
ties
D
VF
3a: U
nde
rsta
ndi
ng
oth
er p
ersp
ecti
ves
DV
F3b
: Cu
rren
t le
vel o
f de
velo
pmen
t D
VF
3c: G
row
th in
dev
elop
men
t
IR145-chap01.qxp 3/15/10 7:01 PM Page 17
18 DIVERSITY AND EDUCATIONAL BENEFITS
NEW DIRECTIONS FOR INSTITUTIONAL RESEARCH • DOI: 10.1002/ir
Figure 1.2. Gender Identification
Figure 1.3. Family Income
Figure 1.4. Sexual Orientation
IR145-chap01.qxp 3/15/10 7:01 PM Page 18
19WORKING WITH LARGE-SCALE CLIMATE SURVEYS
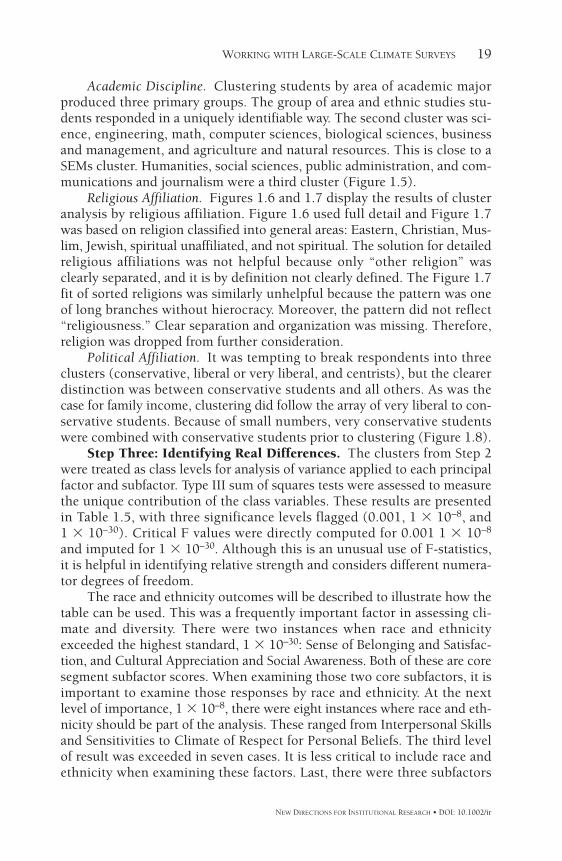
Academic Discipline. Clustering students by area of academic majorproduced three primary groups. The group of area and ethnic studies stu-dents responded in a uniquely identifiable way. The second cluster was sci-ence, engineering, math, computer sciences, biological sciences, businessand management, and agriculture and natural resources. This is close to aSEMs cluster. Humanities, social sciences, public administration, and com-munications and journalism were a third cluster (Figure 1.5).
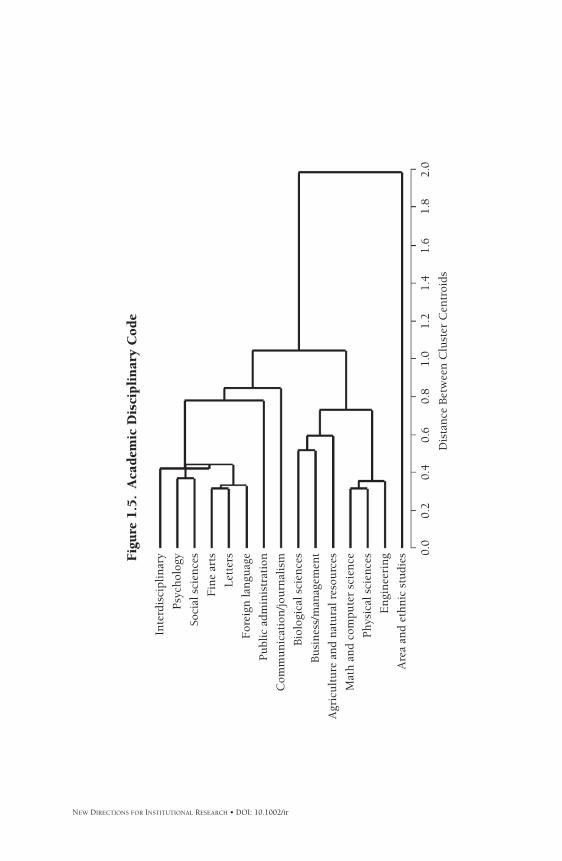
Religious Affiliation. Figures 1.6 and 1.7 display the results of clusteranalysis by religious affiliation. Figure 1.6 used full detail and Figure 1.7was based on religion classified into general areas: Eastern, Christian, Mus-lim, Jewish, spiritual unaffiliated, and not spiritual. The solution for detailedreligious affiliations was not helpful because only “other religion” wasclearly separated, and it is by definition not clearly defined. The Figure 1.7fit of sorted religions was similarly unhelpful because the pattern was oneof long branches without hierocracy. Moreover, the pattern did not reflect“religiousness.” Clear separation and organization was missing. Therefore,religion was dropped from further consideration.
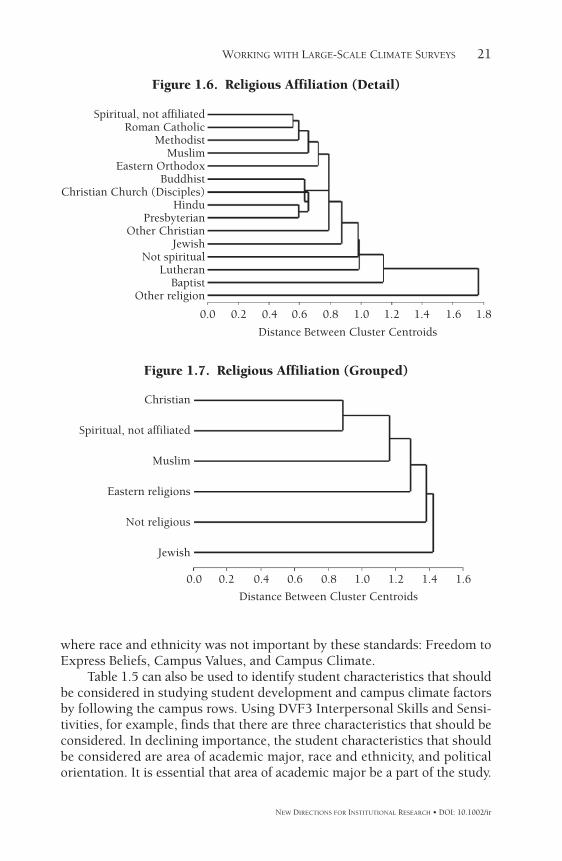
Political Affiliation. It was tempting to break respondents into threeclusters (conservative, liberal or very liberal, and centrists), but the clearerdistinction was between conservative students and all others. As was thecase for family income, clustering did follow the array of very liberal to con-servative students. Because of small numbers, very conservative studentswere combined with conservative students prior to clustering (Figure 1.8).
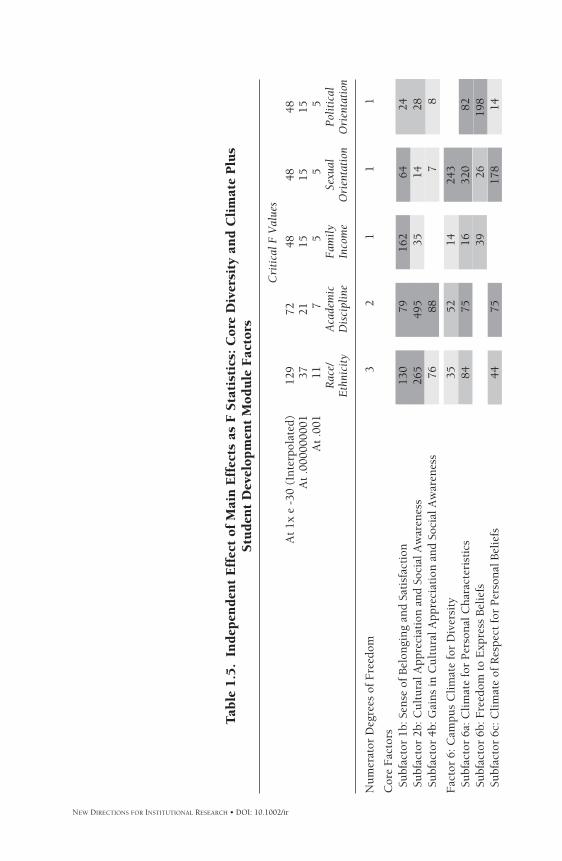
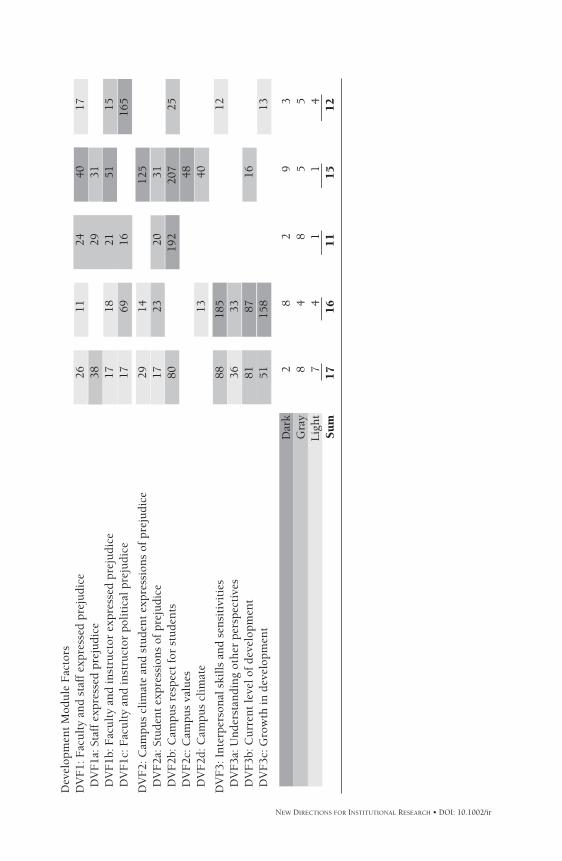
Step Three: Identifying Real Differences. The clusters from Step 2were treated as class levels for analysis of variance applied to each principalfactor and subfactor. Type III sum of squares tests were assessed to measurethe unique contribution of the class variables. These results are presentedin Table 1.5, with three significance levels flagged (0.001, 1 � 10–8, and 1 � 10–30). Critical F values were directly computed for 0.001 1 � 10–8
and imputed for 1 � 10–30. Although this is an unusual use of F-statistics,it is helpful in identifying relative strength and considers different numera-tor degrees of freedom.
The race and ethnicity outcomes will be described to illustrate how thetable can be used. This was a frequently important factor in assessing cli-mate and diversity. There were two instances when race and ethnicityexceeded the highest standard, 1 � 10–30: Sense of Belonging and Satisfac-tion, and Cultural Appreciation and Social Awareness. Both of these are coresegment subfactor scores. When examining those two core subfactors, it isimportant to examine those responses by race and ethnicity. At the nextlevel of importance, 1 � 10–8, there were eight instances where race and eth-nicity should be part of the analysis. These ranged from Interpersonal Skillsand Sensitivities to Climate of Respect for Personal Beliefs. The third levelof result was exceeded in seven cases. It is less critical to include race andethnicity when examining these factors. Last, there were three subfactors
NEW DIRECTIONS FOR INSTITUTIONAL RESEARCH • DOI: 10.1002/ir
IR145-chap01.qxp 3/15/10 7:01 PM Page 19
NEW DIRECTIONS FOR INSTITUTIONAL RESEARCH • DOI: 10.1002/ir
Fig
ure
1.5
.A
cad
emic
Dis
cip
lin
ary
Cod
e
IR145-chap01.qxp 3/15/10 7:01 PM Page 20
21WORKING WITH LARGE-SCALE CLIMATE SURVEYS
where race and ethnicity was not important by these standards: Freedom toExpress Beliefs, Campus Values, and Campus Climate.
Table 1.5 can also be used to identify student characteristics that shouldbe considered in studying student development and campus climate factorsby following the campus rows. Using DVF3 Interpersonal Skills and Sensi-tivities, for example, finds that there are three characteristics that should beconsidered. In declining importance, the student characteristics that shouldbe considered are area of academic major, race and ethnicity, and politicalorientation. It is essential that area of academic major be a part of the study.
NEW DIRECTIONS FOR INSTITUTIONAL RESEARCH • DOI: 10.1002/ir
Figure 1.6. Religious Affiliation (Detail)
Figure 1.7. Religious Affiliation (Grouped)
IR145-chap01.qxp 3/15/10 7:01 PM Page 21
22 DIVERSITY AND EDUCATIONAL BENEFITS
Discussion
The reader will note that there are no statistical facts presented by demo-graphic groupings. The results may well be obvious in some instances, butthey are left to other analysts to compute and report. For example, the mea-surement of Campus Climate and Student Expressions of Prejudice variedmost clearly by Sexual Orientation. It is reasonable to assume that hetero-sexual students observed fewer problematic instances, but it was not the pur-pose of this chapter to call attention to relative “problem areas.” The dualpurposes of this study were to dramatically reduce complexity on the onehand and call attention to measures that require greater complexity than istypically applied on the other hand. Complexity was reduced by finding fac-tor structures in the Student Development module and by reducing the num-ber of statistically distinguishable groupings within the demographicvariables. In other words, item results can be combined into a smaller num-ber of factors scores, and many individual differences within demographicvariable groups can similarly be combined into fewer distinguishable clus-ters. These reductions produce greater statistical power and should be help-ful to campus researchers. Perhaps more important than reducing variablecomplexity is the contribution of this chapter to increasing analytical com-plexity for issues that have often been oversimplified. For example, AcademicDiscipline of major was exceeded only by Sexual Orientation as a variablethat should be considered in assessing campus climate for diversity andinclusion, but academic discipline has seldom been part of campus climateevaluations (exceptions are Cole and Espinoza, 2008; and Cress and Sax,1998). (Recall that this is based on unique contribution after all other pri-mary factors were statistically considered.)
A remarkably difficult problem has not been addressed in this chapter.Measuring campus climate for diversity and inclusion is difficult becausethe outcomes reflect student perception, and perception varies. The fact thatacademic area of major was often an important factor to consider exempli-
NEW DIRECTIONS FOR INSTITUTIONAL RESEARCH • DOI: 10.1002/ir
Figure 1.8. Political Orientation
IR145-chap01.qxp 3/15/10 7:01 PM Page 22
23WORKING WITH LARGE-SCALE CLIMATE SURVEYS
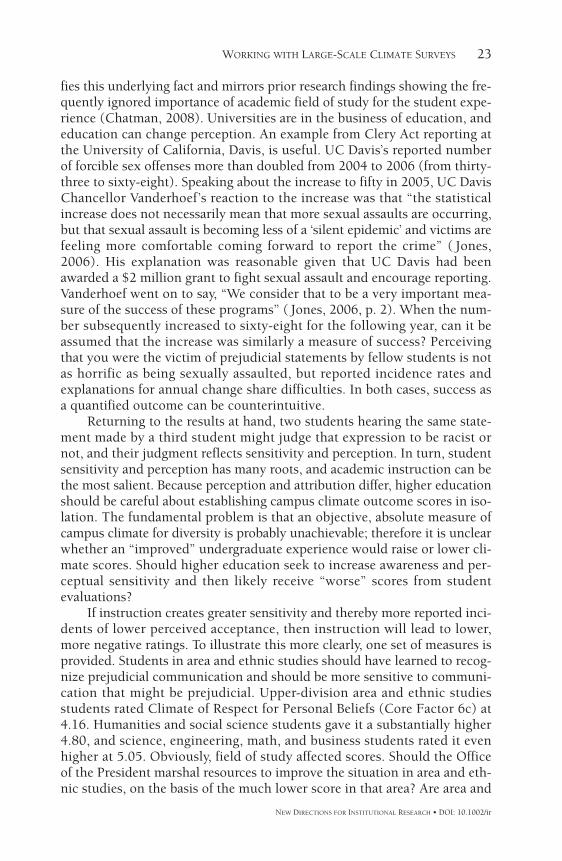
fies this underlying fact and mirrors prior research findings showing the fre-quently ignored importance of academic field of study for the student expe-rience (Chatman, 2008). Universities are in the business of education, andeducation can change perception. An example from Clery Act reporting atthe University of California, Davis, is useful. UC Davis’s reported numberof forcible sex offenses more than doubled from 2004 to 2006 (from thirty-three to sixty-eight). Speaking about the increase to fifty in 2005, UC DavisChancellor Vanderhoef’s reaction to the increase was that “the statisticalincrease does not necessarily mean that more sexual assaults are occurring,but that sexual assault is becoming less of a ‘silent epidemic’ and victims arefeeling more comfortable coming forward to report the crime” ( Jones,2006). His explanation was reasonable given that UC Davis had beenawarded a $2 million grant to fight sexual assault and encourage reporting.Vanderhoef went on to say, “We consider that to be a very important mea-sure of the success of these programs” ( Jones, 2006, p. 2). When the num-ber subsequently increased to sixty-eight for the following year, can it beassumed that the increase was similarly a measure of success? Perceivingthat you were the victim of prejudicial statements by fellow students is notas horrific as being sexually assaulted, but reported incidence rates andexplanations for annual change share difficulties. In both cases, success asa quantified outcome can be counterintuitive.
Returning to the results at hand, two students hearing the same state-ment made by a third student might judge that expression to be racist ornot, and their judgment reflects sensitivity and perception. In turn, studentsensitivity and perception has many roots, and academic instruction can bethe most salient. Because perception and attribution differ, higher educationshould be careful about establishing campus climate outcome scores in iso-lation. The fundamental problem is that an objective, absolute measure ofcampus climate for diversity is probably unachievable; therefore it is unclearwhether an “improved” undergraduate experience would raise or lower cli-mate scores. Should higher education seek to increase awareness and per-ceptual sensitivity and then likely receive “worse” scores from studentevaluations?
If instruction creates greater sensitivity and thereby more reported inci-dents of lower perceived acceptance, then instruction will lead to lower,more negative ratings. To illustrate this more clearly, one set of measures isprovided. Students in area and ethnic studies should have learned to recog-nize prejudicial communication and should be more sensitive to communi-cation that might be prejudicial. Upper-division area and ethnic studiesstudents rated Climate of Respect for Personal Beliefs (Core Factor 6c) at4.16. Humanities and social science students gave it a substantially higher4.80, and science, engineering, math, and business students rated it evenhigher at 5.05. Obviously, field of study affected scores. Should the Officeof the President marshal resources to improve the situation in area and eth-nic studies, on the basis of the much lower score in that area? Are area and
NEW DIRECTIONS FOR INSTITUTIONAL RESEARCH • DOI: 10.1002/ir
IR145-chap01.qxp 3/15/10 7:01 PM Page 23
NEW DIRECTIONS FOR INSTITUTIONAL RESEARCH • DOI: 10.1002/ir
Tab
le 1
.5.
Ind
epen
den
t E
ffec
t of
Mai
n E
ffec
ts a
s F
Sta
tist
ics:
Cor
e D
iver
sity
an
d C
lim
ate
Plu
sStu
den
t D
evel
opm
ent
Mod
ule
Fac
tors
Cri
tica
l F V
alue
s
At
1x e
-30
(In
terp
olat
ed)
129
7248
4848
At
.000
0000
0137
2115
1515
At
.001
117
55
5R
ace/
Aca
dem
icF
amil
ySe
xual
Poli
tica
lE
thni
city
Dis
cipl
ine
Inco
me
Ori
enta
tion
Ori
enta
tion
Nu
mer
ator
Deg
rees
of
Fre
edom
32
11
1
Cor
e F
acto
rsSu
bfac
tor
1b: S
ense
of
Bel
ongi
ng
and
Sati
sfac
tion
130
7916
264
24Su
bfac
tor
2b: C
ult
ura
l App
reci
atio
n a
nd
Soci
al A
war
enes
s 26
549
535
1428
Subf
acto
r 4b
: Gai
ns
in C
ult
ura
l App
reci
atio
n a
nd
Soci
al A
war
enes
s76
887
8
Fac
tor
6: C
ampu
s C
lim
ate
for
Div
ersi
ty35
5214
243
Subf
acto
r 6a
: Cli
mat
e fo
r P
erso
nal
Ch
arac
teri
stic
s 84
7516
320
82Su
bfac
tor
6b: F
reed
om t
o E
xpre
ss B
elie
fs
3926
198
Subf
acto
r 6c
: Cli
mat
e of
Res
pect
for
Per
son
al B
elie
fs44
7517
814
IR145-chap01.qxp 3/15/10 7:01 PM Page 24
NEW DIRECTIONS FOR INSTITUTIONAL RESEARCH • DOI: 10.1002/ir
Dev
elop
men
t M
odu
le F
acto
rsD
VF
1: F
acu
lty
and
staf
f ex
pres
sed
prej
udi
ce
2611
2440
17D
VF
1a: S
taff
exp
ress
ed p
reju
dice
38
2931
DV
F1b
: Fac
ult
y an
d in
stru
ctor
exp
ress
ed p
reju
dice
17
1821
5115
DV
F1c
: Fac
ult
y an
d in
stru
ctor
pol
itic
al p
reju
dice
1769
1616
5
DV
F2:
Cam
pus
clim
ate
and
stu
den
t ex
pres
sion
s of
pre
judi
ce
2914
125
DV
F2a
: Stu
den
t ex
pres
sion
s of
pre
judi
ce
1723
2031
DV
F2b
: Cam
pus
resp
ect
for
stu
den
ts
8019
220
725
DV
F2c
: Cam
pus
valu
es
48D
VF
2d: C
ampu
s cl
imat
e13
40
DV
F3:
In
terp
erso
nal
ski
lls
and
sen
siti
viti
es88
185
12D
VF
3a: U
nde
rsta
ndi
ng
oth
er p
ersp
ecti
ves
3633
DV
F3b
: Cu
rren
t le
vel o
f de
velo
pmen
t 81
8716
DV
F3c
: Gro
wth
in d
evel
opm
ent
5115
813
Dar
k2
82
93
Gra
y8
48
55
Lig
ht
74
11
4Su
m17
16
11
15
12
IR145-chap01.qxp 3/15/10 7:01 PM Page 25
26 DIVERSITY AND EDUCATIONAL BENEFITS
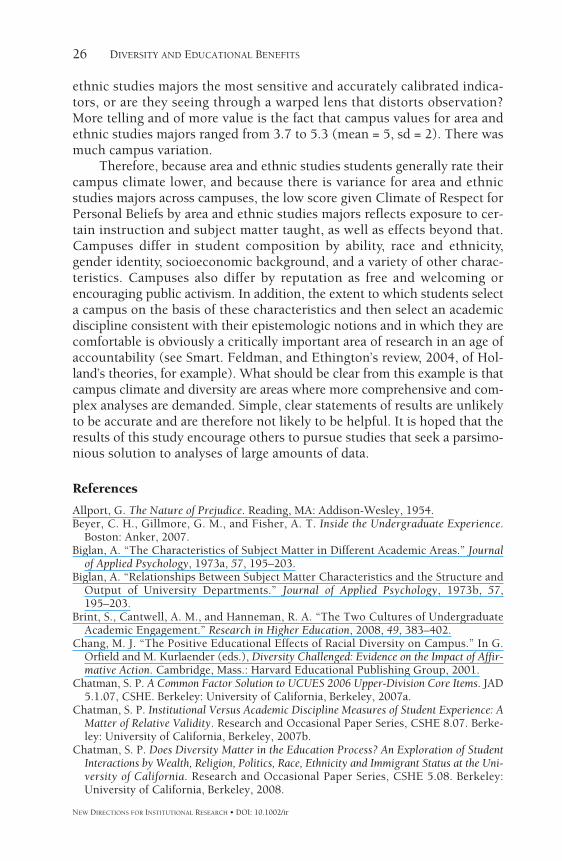
ethnic studies majors the most sensitive and accurately calibrated indica-tors, or are they seeing through a warped lens that distorts observation?More telling and of more value is the fact that campus values for area andethnic studies majors ranged from 3.7 to 5.3 (mean = 5, sd = 2). There wasmuch campus variation.
Therefore, because area and ethnic studies students generally rate theircampus climate lower, and because there is variance for area and ethnicstudies majors across campuses, the low score given Climate of Respect forPersonal Beliefs by area and ethnic studies majors reflects exposure to cer-tain instruction and subject matter taught, as well as effects beyond that.Campuses differ in student composition by ability, race and ethnicity, gender identity, socioeconomic background, and a variety of other charac-teristics. Campuses also differ by reputation as free and welcoming orencouraging public activism. In addition, the extent to which students selecta campus on the basis of these characteristics and then select an academicdiscipline consistent with their epistemologic notions and in which they arecomfortable is obviously a critically important area of research in an age ofaccountability (see Smart. Feldman, and Ethington’s review, 2004, of Hol-land’s theories, for example). What should be clear from this example is thatcampus climate and diversity are areas where more comprehensive and com-plex analyses are demanded. Simple, clear statements of results are unlikelyto be accurate and are therefore not likely to be helpful. It is hoped that theresults of this study encourage others to pursue studies that seek a parsimo-nious solution to analyses of large amounts of data.
References
Allport, G. The Nature of Prejudice. Reading, MA: Addison-Wesley, 1954.Beyer, C. H., Gillmore, G. M., and Fisher, A. T. Inside the Undergraduate Experience.
Boston: Anker, 2007.Biglan, A. “The Characteristics of Subject Matter in Different Academic Areas.” Journal
of Applied Psychology, 1973a, 57, 195–203.Biglan, A. “Relationships Between Subject Matter Characteristics and the Structure and
Output of University Departments.” Journal of Applied Psychology, 1973b, 57,195–203.
Brint, S., Cantwell, A. M., and Hanneman, R. A. “The Two Cultures of UndergraduateAcademic Engagement.” Research in Higher Education, 2008, 49, 383–402.
Chang, M. J. “The Positive Educational Effects of Racial Diversity on Campus.” In G.Orfield and M. Kurlaender (eds.), Diversity Challenged: Evidence on the Impact of Affir-mative Action. Cambridge, Mass.: Harvard Educational Publishing Group, 2001.
Chatman, S. P. A Common Factor Solution to UCUES 2006 Upper-Division Core Items. JAD5.1.07, CSHE. Berkeley: University of California, Berkeley, 2007a.
Chatman, S. P. Institutional Versus Academic Discipline Measures of Student Experience: AMatter of Relative Validity. Research and Occasional Paper Series, CSHE 8.07. Berke-ley: University of California, Berkeley, 2007b.
Chatman, S. P. Does Diversity Matter in the Education Process? An Exploration of StudentInteractions by Wealth, Religion, Politics, Race, Ethnicity and Immigrant Status at the Uni-versity of California. Research and Occasional Paper Series, CSHE 5.08. Berkeley: University of California, Berkeley, 2008.
NEW DIRECTIONS FOR INSTITUTIONAL RESEARCH • DOI: 10.1002/ir
IR145-chap01.qxp 3/15/10 7:01 PM Page 26
27WORKING WITH LARGE-SCALE CLIMATE SURVEYS
Cole, D., and Espinoza, A. “Examining the Academic Success of Latino Students in Sci-ence Technology Engineering and Mathematics (STEM) Majors.” Journal of CollegeStudent Development, 2008, 49(4), 285–300.
Cress, C. M., and Sax. L. J. “Campus Climate Issues to Consider for the Next Decade.”Campus Climate: Understanding the Critical Components of Today’s Colleges and Uni-versities. San Francisco: Jossey-Bass, 1998.
Donald, J. G. Learning to Think: Disciplinary Perspectives. San Francisco: Jossey-Bass,2002.
Gurin, P. “Expert Report of Patricia Gurin.” Gratz et al. v. Bollinger et al., No. 97–75321,Grutter et al. v. Bollinger et al., 1999.
Gurin, P., Lehman, J. S., Lewis, E., and Dey, E. L. Defending Diversity: Affirmative Actionat the University of Michigan. Ann Arbor: University of Michigan Press, 2004.
Hu, S., and Kuh, G. D. “Diversity Experiences and College Student Learning and Per-sonal Development.” Journal of College Student Development, 2003, 44, 320–334.
Hurtado, S. “The Campus Racial Climate: Contexts for Conflict.” Journal of Higher Edu-cation, 1992, 63, 539–569.
Hurtado, S., Dey, E. L., Gurin, P. Y., and Gurin, G. “College Environments, Diversity,and Student Learning.” In J. C. Smart (ed.), Higher Education: Handbook of Theory andResearch. Dordrecht, Netherlands: Kluwer, 2003.
Jones, D. “Enrollment, Diversity, Crime, Pay Highlight Talk.” Dateline UCDavis, Oct. 27,2006, 1–2.
Pascarella, E. T., and others. “Influences on Students’ Openness to Diversity and Chal-lenge in the First Year of College.” Journal of Higher Education, 1996, 67, 174–195.
Pettigrew, T. E., and Tropp, L. R. “A Meta-Analytic Test of Intergroup Contact Theory.”Journal of Personality and Social Psychology, 2006, 90(5), 751–783.
Pike, G. R., and Kuh, G. D. (2005). “A Typology of Student Engagement for AmericanColleges and Universities.” Research in Higher Education, 2005, 46, 185–210.
Pike, G. R., and Kuh, G. D. “Relationships Among Structural Diversity, Informal PeerInteractions and Perceptions of Campus Environment.” Review of Higher Education,2006, 29, 425–450.
Sidanius, J., Levin, S., van Laar, C., and Sears, D. The Diversity Challenge. New York: Rus-sell Sage Foundation, 2008.
Smart, J. C., Feldman, K. A., and Ethington, C. A. Academic Disciplines: Holland’s The-ory and the Study of College Students and Faculty. Vanderbilt University Press, 2004.
STEVE CHATMAN is SERU/UCUES project director, Center for Studies in HigherEducation, University of California, Berkeley.
NEW DIRECTIONS FOR INSTITUTIONAL RESEARCH • DOI: 10.1002/ir
IR145-chap01.qxp 3/15/10 7:01 PM Page 27

IR145-chap01.qxp 3/15/10 7:01 PM Page 28