
Profitability Performance of Supermarkets - Stockholm School ...
Upload
khangminh22Category
view
0download
0
http://iaeme.com/Home/journal/IJM 152 [email protected]
International Journal of Management (IJM) Volume 8, Issue 6, Nov Dec 2017, pp. 152 162, Article ID: IJM_08_06_016 – –Available online at http://iaeme.com/Home/issue/IJM?Volume=8&Issue=6 Journal Impact Factor (2016): 8.1920 (Calculated by GISI) www.jifactor.com ISSN Print: 0976-6502 and ISSN Online: 0976-6510 © IAEME Publication
WORKING CAPITAL MANAGEMENT AND FIRM PROFITABILITY: A STUDY OF LISTED
COMPANIES IN INDIA Arpita Naskar
Department of MBA, Student of Future Institute of Engineering and Management, Sonarpur, Kolkata, India
Prasanta Guha Department of MBA, Faculty of Future Institute of Engineering and Management,
Sonarpur, Kolkata, India
ABSTRACT Financing decision of an entity bears relation with working capital management.
It is a part of short term financing. The study of corporate finance is also linked with Working capital management. Thus, this study sought to examine the effect of working capital management on profitability of select companies listed in BSE The study used a sample of 53 companies. The study used secondary data for a period of 5 years from
2011 2015. The data have been analysed using the Pearson correlation and the –multivariate regression analysis. The study has revealed that the all components of working capital namely Receivable days( RD), Payable days(PD), Inventory holding
periods ( ID), Current ratio ( CR) and Quick ratio ( QR) have strong impact on profitability. Cash conversion cycle (CCC) is negatively related with the profitability,
Firm size is also linked with working capital. If firm size increases, the need of working capital will be more. It has been found that the firm size has also significant
impact on EBIT but insignificant impact on ROA and ROE. Finally the study has established a relation between wor king capital management and firm’s profitability.
Keyword head: Working capital management, Firm’s profitability, ROA, ROE, RD,
CCC
Cite this Article: Arpita Naskar and Prasanta Guha, Working Capital Management and Firm Profitability: A Study of Listed Companies in India. International Journal of Management, 8 (6), 2017, pp. 152 162. –
http://iaeme.com/Home/issue/IJM?Volume=8&Issue=6
1. INTRODUCTION Many research has been conducted in the area of long term financing decisions viz.
investment decisions , capital structure and business valuation etc. In comparison to that limited study has been extended in the field of working capital management. Working capital
Working Capital Management and Firm Profitability: A Study of Listed Companies in India
http://iaeme.com/Home/journal/IJM 153 [email protected]
is the fund required to meet daily expenses in a business organization. It is the amount invested in the current assets and can easily be converted into cash without changing the value of the business (Mohanty, 2013). It can be expressed technically as excess of current assets
over current liabilities. Positive working capital reflects the capacity to pay short term obligation while the negative working capital reflects the weakness of inability to pay the
same. Besides the negative working capital, excess is also not desirable. Insolvency may cause due to inadequate working capital (Singh and Asress, 2010).
Working capital management ensures the proper balancing of different components say debtors, receivable, cash balance, inventory, payables etc. The balance can be achieved by
minimizing the working capital requirement and maximizing the earning (Ganesan,2007). Such balancing draws two concepts, liquidity and profitability. Liquidity gives strength to
meet short term obligation on the other hand firm’s ability to earn profit is reflected by
profitability quotient. It acts as a measure of firm performance. Effective working capital management provides a firm to increase profitability along with the solution of optimum
liquidity (Uchenna et al., 2012).
2. LITERATURE REVIEW Researchers have concentrated in the different areas of appropriate application of working
capital management. Working capital is just a fuel to a business named car. Extra penny invested in the working capital would result to the decrease in value of the firm (Kieschnick et al, (2006) . The prime question comes to the mind of the authors about the volume of working capital. To understand the requirement of working capital , cash conversion cycle need to be
understood. This concept was first conceived by Richards and Laughlin (1980). Cash conversion cycle ( CCC) is the summation of material procurement time, raw material
conversion period , inventory holding period and receivable days reduced by payable periods. Raw materials conversion means to production time. More of production time will increase
CCC. More of finished goods holding period will cause to stretch the CCC. Similarly, receivable days or periods refers to the time of goods sold on credit to collection from
customers. More the lengthy time to receive payments from debtors , more will be the CCC. Payable days can be explained as the time to purchase the goods from suppliers to pay the dues to suppliers. The management part lies in managing the time. Shorter the time period of CCC or and increase in payable days , will require less amount of working capital. Increase in payable days may apparently benefits the organization by arranging less amount of working capital but in the long run it affects the goodwill of the organization.
Yogendrarajah and Thanabalasingam (n.d.) in their research revealed that firm’s profitability can be increased by the effective inventory management. With reference to the listed companies in Istambul , researchers found that the shareholders value can be increased
by reducing the accounts receivable period, accounts payable period and cash conversion cycle (samiloglu and Akgun,2016).The same has been supported by Deloof (2003). Mansoori and Muhammad (2012) also examined that the same fact in the context of Singapore. Using OLS method their result revealed that the cash conversion cycle is negatively associated with return on assets (ROA) where ROA is considered as a parameter of profitability.
Agha (2014) studied the same on a firm listed in Karachi stock exchange. The study revealed that a firm can increase it’s profitability by minimizing the inventory turnover,
account receivables ratio and by decreasing creditors turnover ratios but there is no significant effect of increasing or decreasing the current ration profitability. So, the results indicate that
through proper working capital management the company can increase it’s profitability. A
negative relationship has been prominent between debt and profitability of Indian firms in the
Arpita Naskar and Prasanta Guha
http://iaeme.com/Home/journal/IJM 154 [email protected]
study of Chatterjee (2012). The results derived from this research signify that A firm is able to raise it’s profits by diminishing the time period for the debtors and inventories so that the time period for payables would increase. Discussing the same Makori and Jagongo (2013) find a negative relationship between profitability and number of day’s accounts receivable and cash
conversion cycle, but a positive relationship between profitability and number of days of inventory and number of day’s payable. Moreover, the financial leverage, sales growth,
current ratio and firm size also have significant effects on the firm’s profitability. Based on the key findings from this study it has been concluded that the management of a firm can
create value for their shareholders by reducing the number of day’s accounts receivable (Makori and Jagongo,2013). Similar results have been established by Elfani and Lois (2010); Eljely (2004 ) and Jose (1996) have made the founding in their study that managers creates
value by reducing their volume of inventories and dues with the debtors and firm’s
profitability can be improved by shortening the cash conversion cycle.
The findings on the effect of working capital management and firm’s performance or profitability of the researchers mentioned in the literature are quite similar. The author is also interested to test the same varying with the companies and time span.
3. RESEARCH OBJECTIVES The research objective is to study the relationship between profitability of the firm with the working capital management. The specific objectives are as follows:
To study the impact of Working capital management of Indian firms listed in BSE To observe the effect of accounts receivables, inventories holding periods, accounts payable
and cash conversion cycle on firm’s profitability
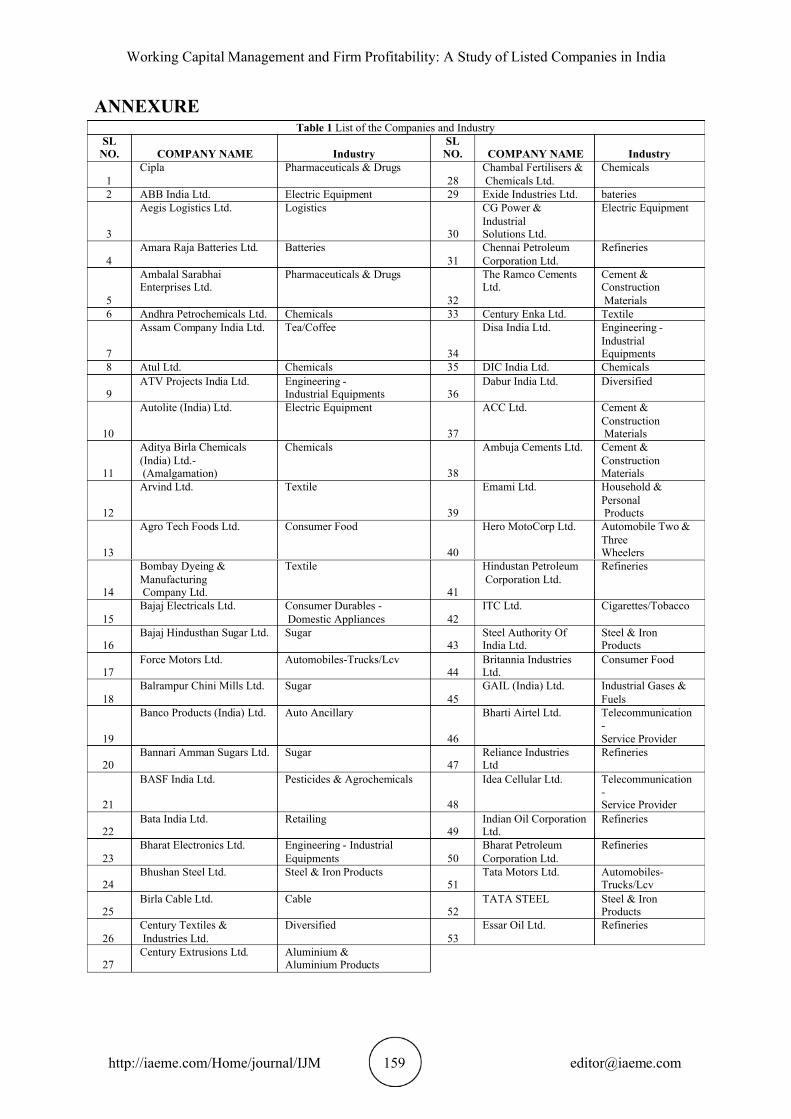
4. METHODOLOGY Data and Sample Selection The data used for the research have been obtained from the website www.arcadiastock.comand individual website of the sample companies. Financial statements and annual reports have been used for the study. The data comprising of 53 firms forty sectors listed in BSE have been considered for study( see Table 1). A time period of 5 years with the span of 2011 to 2015 has been taken for analysis. The name of the firms and sectors are given in the Table No.1.
Conceptual Framework Independent variables : An independent variable is the variable which the researcher has control over. In this study
the independent variable are Receivable days (RD),Inventory days(ID),Payable days( PD),Cash conversion cycle ( CCC) ,Current ratio (CR), Quick ratio (QR), and Firm size or LOGSALES .
Dependent variable The profitability has been linked with dependent variables. The study has considered Earnings before interest and tax (EBIT), Return on assets (ROA) and Return on equity(ROE) as profitability indicator or dependent variable. RD
Receivable days is the number of days that a customer invoice is outstanding before it is collected. The point of measurement is to determine the effectiveness of a company’s credit and collection efforts in allowing credit to reputable customers, as well as it’s ability to collect
cash from them. RD is calculated as ( Debtors+ Bills Receivable) / Net Sales x 3
Working Capital Management and Firm Profitability: A Study of Listed Companies in India
http://iaeme.com/Home/journal/IJM 155 [email protected]
ID Inventory days presents the days of holding the inventory. More and more holding of
inventory will be less of inventory turnover ratio. The inventory turnover ratio is an efficiency ratio that shows how effectively inventory is managed by comparing cost of goods sold with average inventory for a period. The inventory days are calculated as 365 / (Cost of goods sold by average inventory).
PD Accounts Payable Days is an accounting concept related to Accounts Payable. It is the length of time it takes to clear all outstanding Accounts Payable. This is useful for determining how efficient the company is at clearing whatever short-term account obligations it may have. PD has been computed as summation of Sundry Creditors and Bills payable/ net sales 365. x
CCC The cash conversion cycle (CCC) is a metric that expresses the length of time, in days, that it
takes for a company to convert resource inputs into cash flows. In other words, the cash conversion cycle calculation measures how long cash is tied up in inventory before the
inventory is sold and cash is collected from customers. CCC is computed as RD+ID-PD.
CR The current ratio is a financial ratio that measures whether or not a firm has enough resources
to pay its debts over the next 12 months. It compares a firm's current assets to its current liabilities. It is considered as liquidity ratio. CR is calculated as current
assets/current liabilities.
QR The quick ratio is a financial ratio used to gauge a company's liquidity. The quick ratio is also known as the acid test ratio. It can be calculated as current assets stock divided by current –
liabilities.
LOG SALES Size of the firm is linked with profitability. By the increase in size, rning of a firm ea
increases. The natural logarithm of sales (LOS) measures the growth of the firm. Logsales is the natural logarithm of net sales.
EBIT It is the amount of money that a company has earned after deducting the cost of goods
sold and operating expenses. This is used to see whether a company is making more than it spends or is operating at a loss. The paper has used EBIT margin as a profitability variable.
ROA Return on assets (ROA) is an indicator of how profitable a company is relative to its total assets. ROA gives an idea as to how efficient management is at using its assets to generate. It can be calculated as Net Income/Total assets .
ROE Return on equity (ROE) is the amount of net income returned as a percentage
of equity. Return on equity measures a corporation's profitability by revealing shareholder’s
Arpita Naskar and Prasanta Guha
http://iaeme.com/Home/journal/IJM 156 [email protected]
how much profit a company generates with the money shareholders have invested. ROE is calculated as Net Income of the firm /Shareholder's Equity.
The analysis has been initiated with the descriptive statistics. To understand the relation among the variables Pearson correlation statistics have been used. Further the study has been
proceeded to know the impact of independent variables on dependant variables and multivariate regression analysis has been applied.
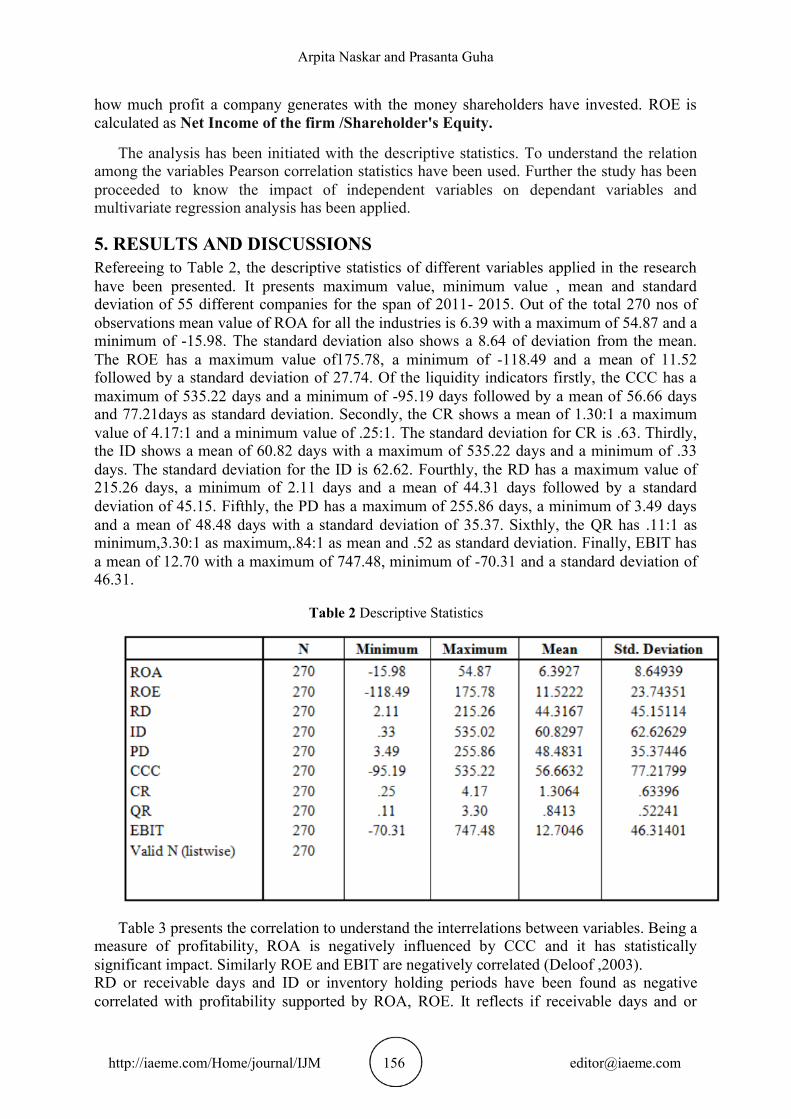
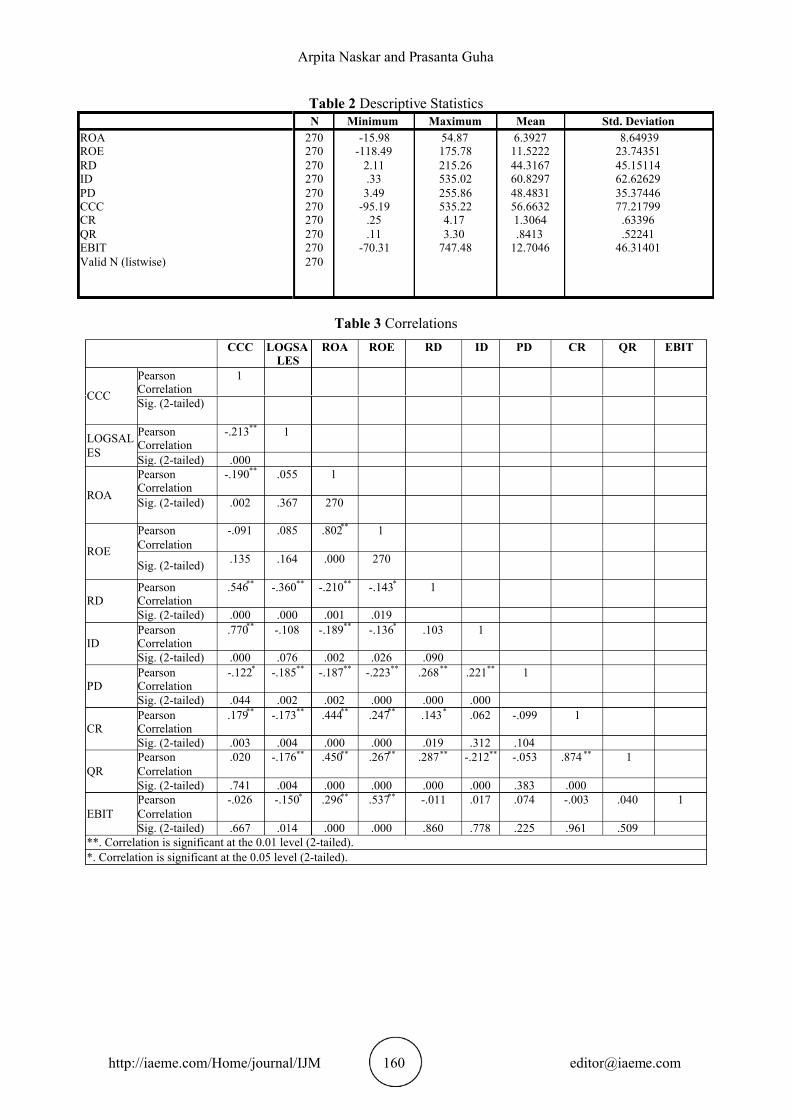
5. RESULTS AND DISCUSSIONS Refereeing to Table 2, the descriptive statistics of different variables applied in the research
have been presented. It presents maximum value, minimum value , mean and standard deviation of 55 different companies for the span of 2011- 2015. Out of the total 270 nos of observations mean value of ROA for all the industries is 6.39 with a maximum of 54.87 and a minimum of -15.98. The standard deviation also shows a 8.64 of deviation from the mean.
The ROE has a maximum value of175.78, a minimum of -118.49 and a mean of 11.52 followed by a standard deviation of 27.74. Of the liquidity indicators firstly, the CCC has a maximum of 535.22 days and a minimum of -95.19 days followed by a mean of 56.66 days and 77.21days as standard deviation. Secondly, the CR shows a mean of 1.30:1 a maximum value of 4.17:1 and a minimum value of .25:1. The standard deviation for CR is .63. Thirdly, the ID shows a mean of 60.82 days with a maximum of 535.22 days and a minimum of .33 days. The standard deviation for the ID is 62.62. Fourthly, the RD has a maximum value of
215.26 days, a minimum of 2.11 days and a mean of 44.31 days followed by a standard deviation of 45.15. Fifthly, the PD has a maximum of 255.86 days, a minimum of 3.49 days and a mean of 48.48 days with a standard deviation of 35.37. Sixthly, the QR has .11:1 as minimum,3.30:1 as maximum,.84:1 as mean and .52 as standard deviation. Finally, EBIT has a mean of 12.70 with a maximum of 747.48, minimum of -70.31 and a standard deviation of 46.31.
Table 2 Descriptive Statistics
Table 3 presents the correlation to understand the interrelations between variables. Being a measure of profitability, ROA is negatively influenced by CCC and it has statistically
significant impact. Similarly ROE and EBIT are negatively correlated (Deloof ,2003). RD or receivable days and ID or inventory holding periods have been found as negative
correlated with profitability supported by ROA, ROE. It reflects if receivable days and or
Working Capital Management and Firm Profitability: A Study of Listed Companies in India
http://iaeme.com/Home/journal/IJM 157 [email protected]
inventory holding period increases it will affect adversely to the profitability of the firm. Both RD and ID have insignificant relation EBIT with a conflict of RD is negatively related where ID is positively related. PD is negatively correlated with ROA, ROE and positively correlated with EBIT. Increase in lag in payment to creditors lead to create bad name in the industry and hence may affect profitability. The study has found that current ratio or CR and quick ratio or QR are positively correlated with profitability parameter viz. ROA and ROE whereas CR is
negatively correlated with EBIT. The study has resulted that the firm size measured as LOGSALES is positively correlated with profitability.
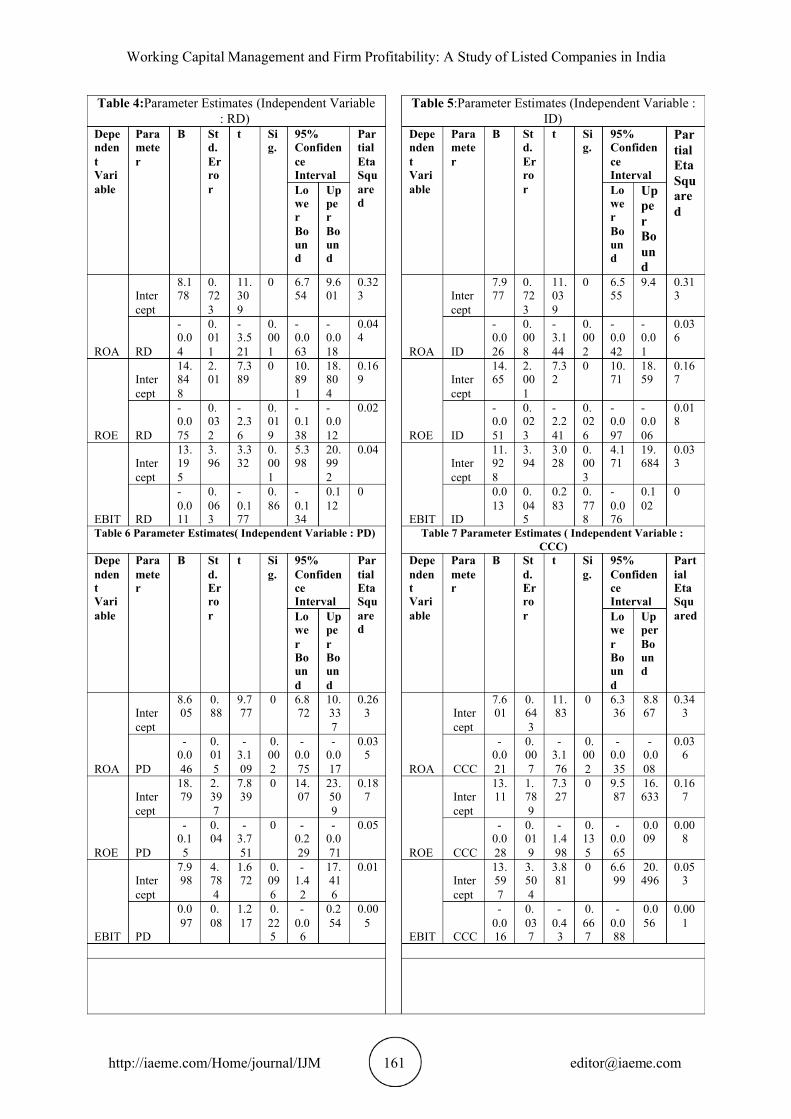
The study has forwarded towards the judgment of the measuring the effect of each independent variables on profitability representing as dependant variables. Multivariate
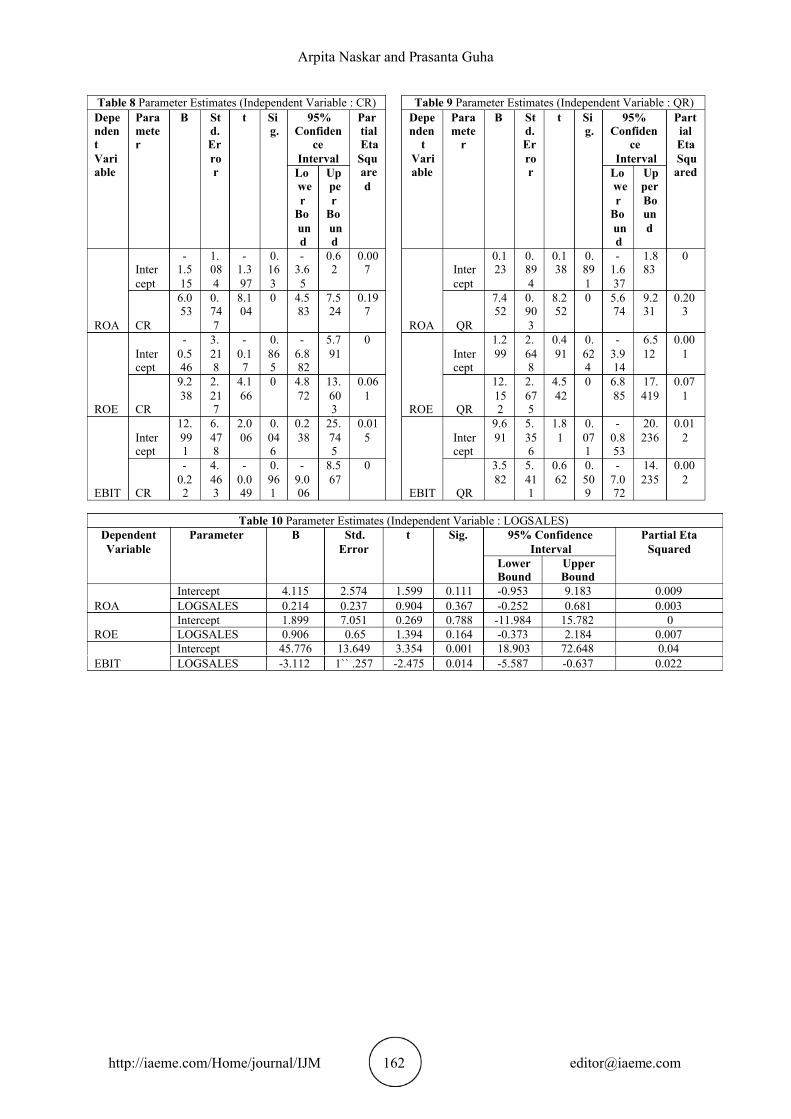
regression has been applied to derive the result. Referring to Table 4 , Table 5 and Table 6 it can be concluded that RD, ID and PD has strong impact on profitability. Referring to Table 7, CCC has significant influence on ROA. Explaining Table 8 and Table 9 , it is clear that CR and QR has significant impact on ROA and ROE as representative of profitability. Besides , the result shows that EBIT is not significantly impacted by CR and QR. Table 10 depicts the p value is less than .05 and hence it can be said that the EBIT has a strongly influenced on the firm size as measured by LOGSALES.
6. CONCLUSIONS The study made it possible to establish a relation between working capital management and firm’s profitability. With the rigorous analysis , the study has concluded that all components
of working capital namely Receivable days( RD), Payable days(PD), Inventory holding periods ( ID), Current ratio ( CR) and Quick ratio ( QR) have strong impact on profitability and the result is substantiated by the early researches. RD and ID have negative correlation
with the profitability (Mansoori & Muhammad, 2012). Cash conversion cycle (CCC) is negatively related with profitability (Uyar,2009), Firm size is also linked with working
capital. If firm size increases, the need of working capital will be more. It has been found that the firm size has also significant impact on EBIT but insignificant impact on ROA and ROE
(Wanguu1 &Kipkirui, 2015). Discussion brings the need of efficient working capital management. Researchers are in consensus that profitability of the firm is more ensured with better working capital management.
REFERENCES [1] Agha, H. ( 2014)., Impact of working capital Management on profitability, European
Scientific Journal .10, 1
[2] Arabahmadi, A. & Arabahmadi, F. (2013). The Role of Working Capital Management in Automobile Industry in Iran. International Research Journal of Applied and Basic
Sciences, 4 (9), 2491-2493
[3] Chatterjee, S.,(2012) The Impact of Working Capital on the Profitability: Evidence from the Indian Firms available at SSRN:https://ssrn.com/abstract=2125228 http://dx.doi.org/10.2139/ssrn.2125228 or
[4] Deloof, M. (2003). Does Working Capital Management Affect Profitability of Belgian Firms?. Journal of Business Finance & Accounting , 30 (3-4), 573-588.
[5] Ebrahim Mansoori , Datin Dr. Joriah Muhammad, ( 2012), The effect of working capital management on firm’s profitability: evidence from singapore, Interdisciplinary journal of contemporary research in business, 4, 5
Arpita Naskar and Prasanta Guha
http://iaeme.com/Home/journal/IJM 158 [email protected]
[6] Gill, A., Biger, N., and Mathur, N., (2010), The relationship between working capital management and profitability: Evidence from the United States , Business and Economic Journal
[7] Kieschnick, R., LaPlante, M., & Moussawi, R. (2011). Working Capital Management, Access to Financing, and Firm Value. [online] available:t
http://www.ssrn.com/abstract=1431165 .
[8] Makori, M. D and Jagongo, A. (2013) ,Working capital management and firm profitability :emperical evidence from manufacturing and construction firms listed on Nairobi
securities exchange,Kenya, , International journal of Accounting and Taxation, 1,1.
[9] Mansoori , E. & Muhammad, J. ( 2012)., The effect of working capital management on firm’s profitability: Evidence from Singapore, interdisciplinary Journal of Contemporary Research in Business, 4, 5
[10] Mohanty, S.C. (2013). An Analysis of Working Capital Management in Selected Public and Private Organizations in Mining Sector in Orissa. 3(1), 1-10
[11] Panigrahi, A. ( 2015)., Managing Working Capital A Practical Approach, International –
Journal on Textile Engineering and Processes, 1,1
[12] Sharma, A. K. and Kumar, S., (2011)., Effect of Working Capital Management on Firm Profitability: Empirical Evidence from India. Global Business Review, 12, pp. 159 173. –
[13] Shin, H.H and Soenen, L. (1998). Efficiency of Working Capital Management and Corporate Profitability, Financial Practice and Education, 8, 2, pp 37-45.
[14] Singh, K. & Asress, F. C. (2010). Determining Working Capital Solvency Level and Its Effect on Profitability in Selected Indian Manufacturing Firms. ICBI 2010 - University of Kelaniya, Sri Lanka
[15] Smith, M. Beaumont, Begemann, E. (1997). Measuring Association between Working Capital and Return on Investment, South African Journal of Business Management, 28,1.
[16] Uchenna, A. W., Okwo, I. M. & Ugwunta, D. O. (2012). Effects of Working Capital Management on Profitability: Evidence from the Top five Beer Brewery Firms in the
World. Asian Economic and Financial Review, 2(8), 966-982
[17] Uyar, A., (2009), The Relationship of Cash Conversion Cycle with Firm Size and Profitability: An Empirical Investigation in Turkey, International Research Journal of
Finance and Economics
[18] Yogendrarajah, R. & Thanabalasingam, S. (n.d.), working capital management and its impact on Financial performance: an analysis of trading firms available at
http://ssrn.com/abstract=2444311
[19] Wang, Y.J. (2002). Liquidity Management, Operating Performance, and Corporate Value: Evidence from Japan and Taiwan. . 12, Journal of Multinational Financial Managementpp. 159-169.
[20] Wanguu1, K. C. & Kipkirui, S. E., (2015), The Effect of Working Capital Management on Profitability of Cement Manufacturing Companies in Kenya, IOSR Journal of Economics and Finance, 6, 6.( III) , PP 53-61
Working Capital Management and Firm Profitability: A Study of Listed Companies in India
http://iaeme.com/Home/journal/IJM 159 [email protected]
ANNEXURE Table 1 List of the Companies and Industry
SL NO. COMPANY NAME Industry
SL NO. COMPANY NAME Industry
1 Cipla Pharmaceuticals & Drugs
28 Chambal Fertilisers & Chemicals Ltd.
Chemicals
2 ABB India Ltd. Electric Equipment 29 Exide Industries Ltd. bateries
3
Aegis Logistics Ltd. Logistics
30
CG Power & Industrial Solutions Ltd.
Electric Equipment
4 Amara Raja Batteries Ltd. Batteries
31 Chennai Petroleum Corporation Ltd.
Refineries
5
Ambalal Sarabhai Enterprises Ltd.
Pharmaceuticals & Drugs
32
The Ramco Cements Ltd.
Cement & Construction Materials
6 Andhra Petrochemicals Ltd. Chemicals 33 Century Enka Ltd. Textile
7
Assam Company India Ltd. Tea/Coffee
34
Disa India Ltd. Engineering - Industrial Equipments
8 Atul Ltd. Chemicals 35 DIC India Ltd. Chemicals
9 ATV Projects India Ltd. Engineering -
Industrial Equipments 36 Dabur India Ltd. Diversified
10
Autolite (India) Ltd. Electric Equipment
37
ACC Ltd. Cement & Construction Materials
11
Aditya Birla Chemicals (India) Ltd.- (Amalgamati on)
Chemicals
38
Ambuja Cements Ltd. Cement & Construction Materials
12
Arvind Ltd. Textile
39
Emami Ltd. Household & Personal Products
13
Agro Tech Foods Ltd. Consumer Food
40
Hero MotoCorp Ltd. Automobile Two & Three Wheelers
14
Bombay Dyeing & Manufacturing Company Ltd.
Textile
41
Hindustan Petroleum Corporation Ltd.
Refineries
15 Bajaj Electricals Ltd. Consumer Durables -
Domestic Appliances 42 ITC Ltd. Cigarettes/Tobacco
16 Bajaj Hindusthan Sugar Ltd. Sugar
43 Steel Authority Of India Ltd.
Steel & Iron Products
17 Force Motors Ltd. Automobiles-Trucks/Lcv
44 Britannia Industries Ltd.
Consumer Food
18 Balrampur Chini Mills Ltd. Sugar
45 GAIL (India) Ltd. Industrial Gases &
Fuels
19
Banco Products (India) Ltd. Auto Ancillary
46
Bharti Airtel Ltd. Telecommunication - Service Provider
20 Bannari Amman Sugars Ltd. Sugar
47 Reliance Industries Ltd
Refineries
21
BASF India Ltd. Pesticides & Agrochemicals
48
Idea Cellular Ltd. Telecommunication - Service Provider
22 Bata India Ltd. Retailing
49 Indian Oil Corporation Ltd.
Refineries
23 Bharat Electronics Ltd. Engineering - Industrial
Equipments 50 Bharat Petroleum Corporation Ltd.
Refineries
24 Bhushan Steel Ltd. Steel & Iron Products
51 Tata Motors Ltd. Automobiles-
Trucks/Lcv
25 Birla Cable Ltd. Cable
52 TATA STEEL Steel & Iron
Products
26 Century Textiles & Industries Ltd.
Diversified 53
Essar Oil Ltd. Refineries
27 Century Extrusions Ltd. Aluminium &
Aluminium Products
Arpita Naskar and Prasanta Guha
http://iaeme.com/Home/journal/IJM 160 [email protected]
Table 2 Descriptive Statistics N Minimum Maximum Mean Std. Deviation
ROA 270 -15.98 54.87 6.3927 8.64939 ROE 270 -118.49 175.78 11.5222 23.74351 RD 270 2.11 215.26 44.3167 45.15114 ID 270 .33 535.02 60.8297 62.62629 PD 270 3.49 255.86 48.4831 35.37446 CCC 270 -95.19 535.22 56.6632 77.21799 CR 270 .25 4.17 1.3064 .63396 QR 270 .11 3.30 .8413 .52241 EBIT 270 -70.31 747.48 12.7046 46.31401 Valid N (listwise) 270
Table 3 Correlations CCC LOGSA
LES ROA ROE RD ID PD CR QR EBIT
CCC
Pearson Correlation
1
Sig. (2-tailed)
LOGSALES
Pearson Correlation
-.213** 1
Sig. (2-tailed) .000
ROA
Pearson Correlation
-.190** .055 1
Sig. (2-tailed)
.002
.367
270
ROE
Pearson Correlation
-.091 .085 .802** 1
Sig. (2-tailed) .135
.164
.000
270
RD Pearson Correlation
.546** -.360** -.210** -.143* 1
Sig. (2-tailed) .000 .000 .001 .019
ID Pearson Correlation
.770** -.108 -.189** -.136* .103 1
Sig. (2-tailed) .000 .076 .002 .026 .090
PD Pearson Correlation
-.122* -.185** -.187** -.223** .268** .221** 1
Sig. (2-tailed) .044 .002 .002 .000 .000 .000
CR Pearson Correlation
.179** -.173** .444** .247** .143* .062 -.099 1
Sig. (2-tailed) .003 .004 .000 .000 .019 .312 .104
QR Pearson Correlation
.020 -.176** .450** .267** .287** -.212** -.053 .874 ** 1
Sig. (2-tailed) .741 .004 .000 .000 .000 .000 .383 .000
EBIT Pearson Correlation
-.026 -.150* .296** .537** -.011 .017 .074 -.003 .040 1
Sig. (2-tailed) .667 .014 .000 .000 .860 .778 .225 .961 .509 **. Correlation is significant at the 0.01 level (2-tailed). *. Correlation is significant at the 0.05 level (2-tailed).
Working Capital Management and Firm Profitability: A Study of Listed Companies in India
http://iaeme.com/Home/journal/IJM 161 [email protected]
Table 4:Parameter Estimates (Independent Variable : RD)
Table 5:Parameter Estimates (Independent Variable : ID)
Dependent Variable
Parameter
B Std. Error
t Sig.
95% Confidence Interval
Partial Eta Squared
Dependent Variable
Parameter
B Std. Error
t Sig.
95% Confidence Interval
Partial Eta Squared
Lower Bound
Upper Bound
Lower Bound
Upper Bound
ROA
Intercept
8.178
0.723
11.309
0 6.754
9.601
0.323
ROA
Intercept
7.977
0.723
11.039
0 6.555
9.4 0.313
RD
-0.04
0.011
-3.521
0.001
-0.063
-0.018
0.044
ID
-0.026
0.008
-3.144
0.002
-0.042
-0.01
0.036
ROE
Intercept
14.848
2.01
7.389
0 10.891
18.804
0.169
ROE
Intercept
14.65
2.001
7.32
0 10.71
18.59
0.167
RD
-0.075
0.032
-2.36
0.019
-0.138
-0.012
0.02
ID
-0.051
0.023
-2.241
0.026
-0.097
-0.006
0.018
EBIT
Intercept
13.195
3.96
3.332
0.001
5.398
20.992
0.04
EBIT
Intercept
11.928
3.94
3.028
0.003
4.171
19.684
0.033
RD
-0.011
0.063
-0.177
0.86
-0.134
0.112
0
ID
0.013
0.045
0.283
0.778
-0.076
0.102
0
Table 6 Parameter Estimates( Independent Variable : PD) Table 7 Parameter Estimates ( Independent Variable : CCC)
Dependent Variable
Parameter
B Std. Error
t Sig.
95% Confidence Interval
Partial Eta Squared
Dependent Variable
Parameter
B Std. Error
t Sig.
95% Confidence Interval
Partial Eta Squared Lo
wer Bound
Upper Bound
Lower Bound
Upper Bound
ROA
Intercept
8.605
0.88
9.777
0 6.872
10.337
0.263
ROA
Intercept
7.601
0.643
11.83
0 6.336
8.867
0.343
PD
-0.046
0.015
-3.109
0.002
-0.075
-0.017
0.035
CCC
-0.021
0.007
-3.176
0.002
-0.035
-0.008
0.036
ROE
Intercept
18.79
2.397
7.839
0 14.07
23.509
0.187
ROE
Intercept
13.11
1.789
7.327
0 9.587
16.633
0.167
PD
-0.15
0.04
-3.751
0 -0.229
-0.071
0.05
CCC
-0.028
0.019
-1.498
0.135
-0.065
0.009
0.008
EBIT
Intercept
7.998
4.784
1.672
0.096
-1.42
17.416
0.01
EBIT
Intercept
13.597
3.504
3.881
0 6.699
20.496
0.053
PD
0.097
0.08
1.217
0.225
-0.06
0.254
0.005
CCC
-0.016
0.037
-0.43
0.667
-0.088
0.056
0.001
Arpita Naskar and Prasanta Guha
http://iaeme.com/Home/journal/IJM 162 [email protected]
Table 8 Parameter Estimates (Independent Variable : CR) Table 9 Parameter Estimates (Independent Variable : QR) Dependent Variable
Parameter
B Std. Error
t Sig.
95% Confiden
ce Interval
Partial Eta Squared
Dependen
t Variable
Paramete
r
B Std. Error
t Sig.
95% Confiden
ce Interval
Partial Eta Squ
ared Lower
Bound
Upper
Bound
Lower
Bound
Upper Bound
ROA
Intercept
-1.515
1.084
-1.397
0.163
-3.65
0.62
0.007
ROA
Intercept
0.123
0.894
0.138
0.891
-1.637
1.883
0
CR
6.053
0.747
8.104
0 4.583
7.524
0.197
QR
7.452
0.903
8.252
0 5.674
9.231
0.203
ROE
Intercept
-0.546
3.218
-0.17
0.865
-6.882
5.791
0
ROE
Intercept
1.299
2.648
0.491
0.624
-3.914
6.512
0.001
CR
9.238
2.217
4.166
0 4.872
13.603
0.061
QR
12.152
2.675
4.542
0 6.885
17.419
0.071
EBIT
Intercept
12.991
6.478
2.006
0.046
0.238
25.745
0.015
EBIT
Intercept
9.691
5.356
1.81
0.071
-0.853
20.236
0.012
CR
-0.22
4.463
-0.049
0.961
-9.006
8.567
0
QR
3.582
5.411
0.662
0.509
-7.072
14.235
0.002
Table 10 Parameter Estimates (Independent Variable : LOGSALES) Dependent Variable
Parameter B Std. Error
t Sig. 95% Confidence Interval
Partial Eta Squared
Lower Bound
Upper Bound
ROA Intercept 4.115 2.574 1.599 0.111 -0.953 9.183 0.009 LOGSALES 0.214 0.237 0.904 0.367 -0.252 0.681 0.003
ROE Intercept 1.899 7.051 0.269 0.788 -11.984 15.782 0 LOGSALES 0.906 0.65 1.394 0.164 -0.373 2.184 0.007
EBIT Intercept 45.776 13.649 3.354 0.001 18.903 72.648 0.04 LOGSALES -3.112 1`` .257 -2.475 0.014 -5.587 -0.637 0.022
Copyright © 2022 FDOKUMEN