Wireless Sensor Network for Monitoring Rice Crop Growth
6
1 Wireless Sensor Network for Monitoring Rice Crop Growth Ari Ajibekti Masriwilaga 1 , Rendy Munadi 2 , Basuki Rahmat 3 Electrical Engineering Master Program Telkom University Jl. Telekomunikasi No.1, Terusan Buah Batu Bandung 40257 West java, Indonesia 1 [email protected] 2 [email protected] 3 [email protected] Abstract — For observation of rice plants continuously against climatic influences of rice plants in the vegetative stage, reproductive stage, ripening stage by measuring the pH level, temperature, soil moisture using the technology of Wireless Sensor Network (WSN). The purpose of this study to monitor climate effects on the growth of rice plants with the technology Wireless sensor network (WSN). The design and implementation of WSN based on Zigbee platform and Arduino with observation method involve monitoring the change of indicator of each sensor node, distance parameter, delay parameter on each rice growth. Testing the performance of WSN through parameter RSSI (receive signal strength indicator) between the end device and the coordinator through software applications XCTU do at every stage of rice growth. Test results at a distance of 100 meters obtained the average value of RSSI in the vegetative stage of -80.40 dBm, at the reproductive stage of -83.72 dBm, and at the ripening stage of -84.44 dBm. The WSN implementation, testing using cluster tree topology is done at a different time. The test is performed between the sensor node to the node coordinator in the topology of the cluster tree in different areas. The result of the measurement of data delivery delay is 312ms for the area of 1 hectare of rice field at 120 days of age with the node number of 7 units. Furthermore, with the node number 7 units, 376ms for the paddy field with 2 hectare area. The results of WSN implementation experiments on 2 hectares of rice farming area can provide real time information so as to contribute in agriculture when there is a change of climatic conditions or sudden pest diseases that affect the results of rice crop productivity and food security. Keywords—WSN, Zigbee Platform, Arduino, Topologi cluster tree, RSSI. I. INTRODUCTION The tropical climate to be one of the main factors to be considered in determining the timing and pattern of planting season[1]. Most rice plants are particularly vulnerable to the effects of climatic and weather conditions such as temperature, humidity, pH and pests of rice plants[2]. Classification of rice plant growth includes seedling stage, vegetation stage, reproduction stage and ripening stage[3]. Changes in climate and irregular weather conditions need to be monitored daily in the field to provide information in real time, thereby reducing the work load of farmers[4],[5]. Previous studies have designed the WSN in one stage of rice growth by using point to point topology[4],[5] and star topology[6] to monitor changes in climatic conditions. So in this study the proposed design and implementation tools WSN technology with the observation method using a cluster topology tree. Implementation is used to monitor three stages of rice plant growth on climatic factors and the influence of pests with climate indicators. Where these indicators include: temperature, pH, soil moisture, so it is useful for farmers in an effort to ensure food security. II. WIRELESS SENSOR NETWORK 2.1 WSN to monitor rice growth Wireless sensor networks have been widely used in industry, civil applications, and agricultural environments. A wireless sensor network consists of a small sensor has a transceiver that collaborate to disseminate information between the sensor nodes in an area with power consumption and lower costs. WSN architecture between the sensor network is as follows [7]: Figure 1. WSN architecture[7] A sensor mote [8] consists of four main units, namely, data acquisition unit, a memory unit and data processing, communication unit and the power unit. Block components in wireless sensor network are shown in figure 2. Figure 2. Component block WSN[8] 2.2 Zigbee ZigBee [9] is based on the IEEE 802.15.4 specification for a suite of high level communication protocols that are used to create a personal area network (PAN) to power a small radio, low power, low bandwidth requirements. Zigbee provides multihop routing and functionality for radio packet Internet & satellite Task Manager Node sink A B C D E Sensor fieId Sensor Nodes User Power Unit Processing Unit Data Acquisition unit Communication Unit Transducer ADC Microcontroller Memory Transceiver ISSN : 2355-9365 e-Proceeding of Engineering : Vol.5, No.3 Desember 2018 | Page 6479 brought to you by CORE View metadata, citation and similar papers at core.ac.uk provided by Open Library
-
Upload
khangminh22 -
Category
Documents
-
view
4 -
download
0
Transcript of Wireless Sensor Network for Monitoring Rice Crop Growth

1
Wireless Sensor Network for Monitoring Rice Crop Growth
Ari Ajibekti Masriwilaga1, Rendy Munadi
2, Basuki Rahmat
3
Electrical Engineering Master Program Telkom University
Jl. Telekomunikasi No.1, Terusan Buah Batu Bandung 40257 West java, Indonesia 1 [email protected]
Abstract — For observation of rice plants continuously against climatic influences of rice plants in the vegetative stage,
reproductive stage, ripening stage by measuring the pH level, temperature, soil moisture using the technology of Wireless
Sensor Network (WSN). The purpose of this study to monitor climate effects on the growth of rice plants with the technology
Wireless sensor network (WSN). The design and implementation of WSN based on Zigbee platform and Arduino with
observation method involve monitoring the change of indicator of each sensor node, distance parameter, delay parameter on
each rice growth. Testing the performance of WSN through parameter RSSI (receive signal strength indicator) between the end
device and the coordinator through software applications XCTU do at every stage of rice growth. Test results at a distance of
100 meters obtained the average value of RSSI in the vegetative stage of -80.40 dBm, at the reproductive stage of -83.72 dBm,
and at the ripening stage of -84.44 dBm. The WSN implementation, testing using cluster tree topology is done at a different time.
The test is performed between the sensor node to the node coordinator in the topology of the cluster tree in different areas. The
result of the measurement of data delivery delay is 312ms for the area of 1 hectare of rice field at 120 days of age with the node
number of 7 units. Furthermore, with the node number 7 units, 376ms for the paddy field with 2 hectare area. The results of
WSN implementation experiments on 2 hectares of rice farming area can provide real time information so as to contribute in
agriculture when there is a change of climatic conditions or sudden pest diseases that affect the results of rice crop productivity
and food security. Keywords—WSN, Zigbee Platform, Arduino, Topologi cluster tree, RSSI.
I. INTRODUCTION
The tropical climate to be one of the main factors to be
considered in determining the timing and pattern of planting
season[1]. Most rice plants are particularly vulnerable to the
effects of climatic and weather conditions such as temperature,
humidity, pH and pests of rice plants[2]. Classification of rice
plant growth includes seedling stage, vegetation stage,
reproduction stage and ripening stage[3]. Changes
in climate and irregular weather conditions need to be
monitored daily in the field to provide information in real time,
thereby reducing the work load of farmers[4],[5]. Previous
studies have designed the WSN in one stage of rice growth by
using point to point topology[4],[5] and star topology[6] to
monitor changes in climatic conditions. So in this study the
proposed design and implementation tools WSN technology
with the observation method using a cluster topology tree.
Implementation is used to monitor three stages of rice plant
growth on climatic factors and the influence of pests with
climate indicators. Where these indicators include:
temperature, pH, soil moisture, so it is useful for farmers in an
effort to ensure food security.
II. WIRELESS SENSOR NETWORK
2.1 WSN to monitor rice growth
Wireless sensor networks have been widely
used in industry, civil applications, and agricultural
environments. A wireless sensor network consists of a small
sensor has a transceiver that collaborate to disseminate
information between the sensor nodes in an area with power
consumption and lower costs. WSN architecture between the
sensor network is as follows [7]:
Figure 1. WSN architecture[7]
A sensor mote [8] consists of four main units, namely,
data acquisition unit, a memory unit and data processing,
communication unit and the power unit. Block components in
wireless sensor network are shown in figure 2.
Figure 2. Component block WSN[8]
2.2 Zigbee
ZigBee [9] is based on the IEEE 802.15.4 specification
for a suite of high level communication protocols that are used
to create a personal area network (PAN) to power a small
radio, low power, low bandwidth requirements. Zigbee
provides multihop routing and functionality for radio packet
Internet & satellite
Task Manager
Node
sink
A
BC
D
E
Sensor fieId Sensor
Nodes
User
Power Unit
Processing UnitData Acquisition unitCommunication Unit
Transducer ADC Microcontroller Memory Transceiver
ISSN : 2355-9365 e-Proceeding of Engineering : Vol.5, No.3 Desember 2018 | Page 6479
brought to you by COREView metadata, citation and similar papers at core.ac.uk
provided by Open Library

2
based protocols. Figure 3. Comparison of different wireless
communication standards.
Figure 3. Comparison of wireless communication standards [9]
There are several network topologies used[10],[9] such
as star, mesh and clustter tree in figure 4. In Zigbee [10]
described some concept of physical devices RFD and FFD. A
device can be a full function device (FFD) or reduced function
device (RFD). RFD can be used for simple applications where
the device does not need to transmit large amounts of data and
must communicate only with certain FFD. FFD can work in
general as PAN coordinator, router or as a simple device. It
can communicate with either another FFD or RFD.
Figure 4. Network Structure IEEE 802.15.4 / ZigBee [10]
2.3 RSSI
In this study, ranging technique RSSI (receive signal
strength indicator) used to determine the distance between the
transmitter and receiver. One of the shadowing models in
support of RSSI is in the equation 2.1[11],[12]:
…………….(2.1)
do is a reference distance of 1 meter. So to know the distance
measurement in outdoor environment can be used equation
2.2[11].
…(2.2)
Where A is the strong received signal within 1m with dBm
units.
2.3 Rice growth
In this study rice growth includes several stages [13],[14]:
a. Stage vegetative and the feasibility of planting area.
At this stage the condition of the paddy field has not been
planted. Where farmers do soil processing first. Parameter
values ideal acid at pH between (4.0-7.0) was conducted to
determine the feasibility of planting area. In lowland rice
plants have temperatures around 23 ° -27 ° C with an altitude
of 0-650 mdpl.
b. Reproduction phase
The reproductive phase or often also called the generative
phase is the phase in which the rice plants begin to appear
panicles.
c. Ripening phase
The ripening phase is the phase in which the rice crop is ready
to be harvested.
Figure 5. Rice growth phase [13]
III. DESIGN SYSTEM WSN
The design of monitoring system on rice growth in WSN
network is done before rice planting season begins until
harvest time. The survey was conducted in a land area of rice
plants cropping pattern changed. Where the rice crop research
sites located at coordinates : S 6.5149°, E 107.7783°. In
Figure 6. Is the coordinate point of the study.
Figure 6. Research location
A. Design System
To support the performance of WSN to monitor the
growth of the rice plant system design. The system model
created follows the Zigbee platform protocol[9]. The hardware
in the research consists of radio module xbee series 2,
Arduino, shield board module, DHT11 sensor, pH sensor, soil
moisture sensor and power supply with output voltage ± 5
volts. Each sensor node will send data to the router and the
router forwarding to the coordinator. Figure 7 is a model of
the proposed design system.
Teb
ar
Tan
am An
ak
an
mak
sim
al
Pem
ben
tuk
an
mala
i
Pem
bu
ng
aan
Pan
en
Fase Vegetatif
± 55 hari
Fase reproduktif
± 35 hari
Fase masak
± 30 hari
CellularWifi 802.11 a/b/g/n
Wireless USB
Zigbee 802.15.4
Bluetooth 802.15.1
VideoData
Voice
Closer Farther
Range
Slo
wer
Fas
ter
Pea
k D
ata
Ra
te
Zigbee Coordinator (FFD)
Zigbee Router (FFD)
Zigbee End Device (RFD) or (FFD)
Star
Mesh
ISSN : 2355-9365 e-Proceeding of Engineering : Vol.5, No.3 Desember 2018 | Page 6480

3
Figure 7. Proposed system model
B. Topology
1. Pair topology
The use of pair topology is done on test 1 to find the
distance between nodes[15].
2. Cluster tree topology
Topology used in this research is cluster tree topology.
This topology is used to determine the time of receipt of data
at the coordinator and the extent to which a node can reach the
area of paddy fields. In the cluster tree topology used 7 nodes
with the following explanation:
a. Node 1 is coordinator
b. Nodes 2 and 3 are routers
c. Nodes 4,5,6 dan 7 are end device
Router nodes is 100 meters from the coordinator. Node end
devices is 100 meters from the router. Node 1 is the first
device that consists of an Arduino, XBee series 2, shield board,
LCD power supply. Nodes 2 and 3 are devices 2 and 3
consisting of xbee series 2 modules and power supply. Node 4
is the device 4 consists of an Arduino, XBee series 2, shield
boards, sensor DHT11. Node 5 is a 5 device consisting of
Arduino, xbee series 2, shield board, pH sensor. Node 6 is a 6
device consisting of Arduino, xbee series 2, shield board,
DHT11 sensor and Node 7 is the device 7 consists of an
Arduino, XBee series 2, shield board, soil moisture sensor.
The cluster tree topology is used in the 2nd test because
it is sufficient for the wide coverage of 2 hectares of paddy
fields.
Figure 8. Cluster tree topology
In wireless sensor network research to monitor rice
growth using XCTU softaware. The following is explained
about the tests performed:
a. Testing 1: To obtain distance parameters Xbee network
testing between the coordinator with the end device / router
point to point first. The purpose of this test is to know the
extent to which each node can communicate with different
distances to get the value of RSSI (receive signal strength
indicator). Further testing is done[15] using a star topology
with pairing and on / off method where the coordinator and
router are connected first and then the router is brought to
some point until the router can’t communicate with the
coordinator. After that the router is connected to the end
device. Testing is planned in every growth of rice plants.
b. Testing 2: To obtain Delay parameters and monitoring
indicators used sensor node cluster topology tree. The purpose
of this test is to determine the data transmission time of each
sensor node to the recipient at the coordinator node and to
monitor several indicators of climate change include pH level,
temperature, soil moisture. The distance between Zigbee
Coordinator, Zigbee Router, Zigbee End Device about 100
meters. The area of the delay parameter measurement is
between 1 hectare and 2 hectares at 120 days of rice plant age
with the number of nodes 7 units. While the area of research
for monitoring indicators of each sensor node about 2 hectares
with the number of nodes 7 units.
IV. TEST RESULT AND ANALYSIS
4.1 Result of design
The design of the node consists of 7 units. In Figure 9. is
the result of design coordinator node that serves as the data
recipient of each node.
Figure 9. Result and design node coordinator
4.2 Test results of distance parameters
In testing the XBee network obtained RSSI value to
determine the received signal strength at different distances.
Distance measurements taken between nodes from 5 meters to
100 meters. The sampling time of the RSSI data is every 5
meters with 50 samples of observational data in 20
measurements. So we get 1000 data of RSSI observation to
different distance. In Figure 10. Shows the result of testing the
distance parameter against RSSI.
Zigbee End Device
Zigbee Router
Zigbee Coordinator
20
0 m
100 m
1
2 3
4567
Node End Device 4
Sensor 1
DHT 11 Arduino Uno
Zigbee
Node End Device 5
Sensor
pH
Arduino Uno
Xbee S2
Node End Device 6
Sensor
Soil
Moiture Arduino Uno
Xbee S2
Node End Device 7
Sensor 2
DHT11 Arduino Uno
Xbee S2
Node 2
Arduino Uno
Xbee S2
Router
Node 3
Arduino Uno
Xbee S2
Router
Node 1 Coordinator
Arduino Uno
Xbee S2
LCD
ISSN : 2355-9365 e-Proceeding of Engineering : Vol.5, No.3 Desember 2018 | Page 6481

4
Figure 10. RSSI curve to the distance at vegetative stage, reproductive stage,
ripening stage.
The relationship of measuring the distance parameter to
RSSI for the monitor of rice plants is to know the maximum
range of each node. In figure 10, the RSSI value changes as a
result of different rice growth altitudes [13] thus affecting the
value of RSSI. The measurements were taken from the
average result of RSSI at 100 meters. At the vegetative stage
the height of the rice plant averaged ± 60cm, where RSSI is -
80.40 dBm, at the reproductive stage the height of the rice
plant is approximately ± 90cm, the RSSI value becomes -
83.72 dBm, at the ripening stage the height of the rice plant
has started meeting and fruiting with a height of about ±
100cm so that the value of RSSI of -84.44 dBm. This proves
that the further the distance the node decreases the signal
strength received.
4.3 Test results parameter delay and monitoring indicators of
each sensor node.
The purpose of the delay parameter measurement is to see
how far the delay parameters affect the different area.
Measurements were made at the time of each sensor node
sends the data to the coordinator. To get the delay used the
latest delivery time difference with the previous time. During
this time the four sensor nodes transmit data simultaneously to
the coordinator node and the data received on the
coordinator are stored in the tools record in XCTU software.
The sample data taken in the measurement is every one
minute with the span of time for 10 minutes.
Figure 11. Sensors nodes test results on XCTU software
Table 1. Data stored in the xctu tools record.
In Figure 11. The data stored in the tools record in the xctu
software is still in hex form, so to see the sensor node data in
the conversion to char. In table 1. During data transmission of
each sensor node there is a delay of data reception time on the
coordinator. Data transmission by the sensor node, although
each sensor node time of data delivery has been set for 1
second. In figure 12, we get the result of delay measurement
on different area. Distance of each node between coordinator,
router, end device each 100 meters, 120 days of rice age with
an area of 1 hectare and 2 hectares with a duration of
observation 10 minutes.
Figure 12. Graph delay with an area of 1 hectare and 2 hectares
The delay relationship to the different area of the area to
know the connectivity and the delay of the data transmitted.
While the relation of delay on climate monitoring is to get real
time field information data. In addition, the information data
is also useful to anticipate the sudden onset of pest diseases
that affect rice crops. In figure 12. Shows the delay change on
a 2 hectare area of 376ms and a 1 hectare area of 312ms. On
the network side the coordinator will continue to communicate
with other node sensors even though one of the node sensors
is off. But the disadvantage is that when one of the router
nodes is dead the sensor data node is not sent. Routing the
cluster tree network in this study is different from the static
dynamic mesh topology.
Furthermore, testing the indicators of each sensor node
with different methods of monitoring at different times.
Measurement time is done from morning at 09.00-10.00 AM,
noon at 01.00-02.00 PM, afternoon at 04.00-05.00 PM.
Sample observation data taken every 5 minutes in 1 hour
during 15 days of measurements at three stages of rice growth.
Figure 13. Graph of pH at the vegetative, reproductive, ripening stage
ISSN : 2355-9365 e-Proceeding of Engineering : Vol.5, No.3 Desember 2018 | Page 6482
5
In Figure 13. Shows monitoring results at three stages of
rice plant growth. At the vegetative stage and the reproduction
stage the pH value is still stable that is between 7.0-7.06.
While at the ripening stage pH value becomes up to 7.1.
1. The results of testing the temperature and soil moisture
indicators at the vegetative stage
Figure 14. Graph of temperature of the first sensor
Figure 15. Graph of temperature of the second sensor
Figure 14. Indicates temperature changes at the vegetative
stage, where temperatures are below 33°C. Weather
conditions are sunny. Figure 15. Indicates temperature
changes at the reproductive stage, where the temperature is
below 33°C.
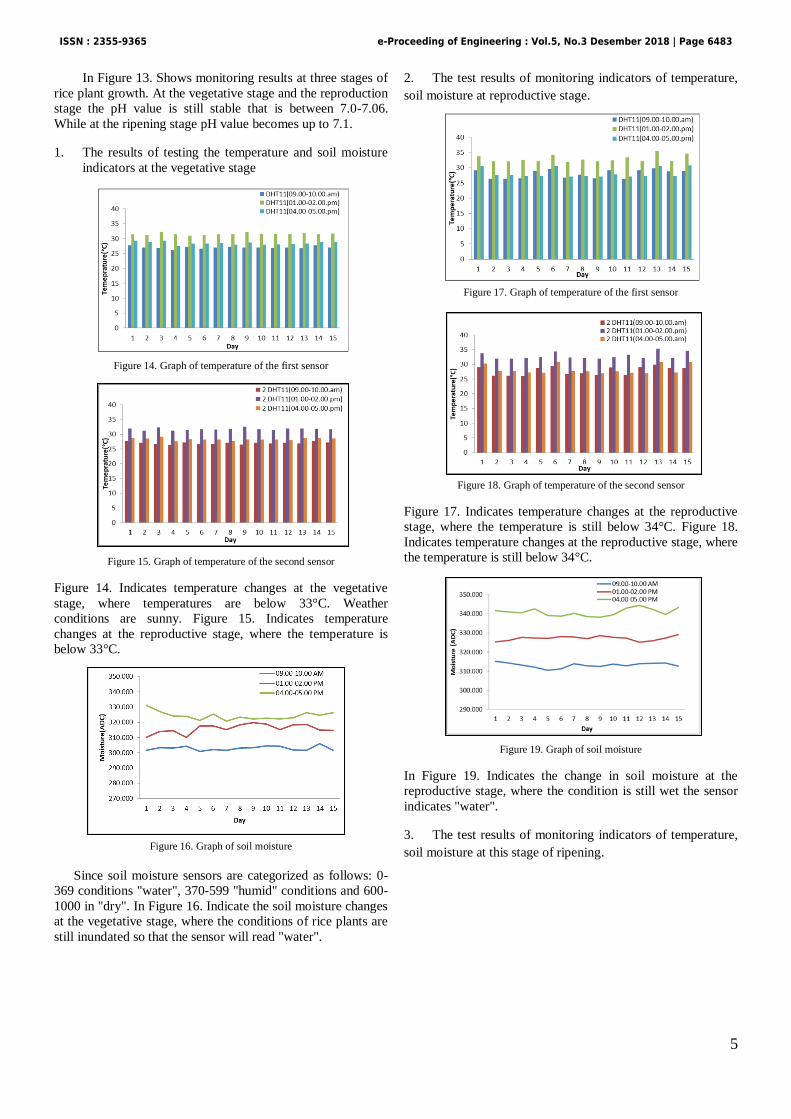
Figure 16. Graph of soil moisture
Since soil moisture sensors are categorized as follows: 0-
369 conditions "water", 370-599 "humid" conditions and 600-
1000 in "dry". In Figure 16. Indicate the soil moisture changes
at the vegetative stage, where the conditions of rice plants are
still inundated so that the sensor will read "water".
2. The test results of monitoring indicators of temperature,
soil moisture at reproductive stage.
Figure 17. Graph of temperature of the first sensor
Figure 18. Graph of temperature of the second sensor
Figure 17. Indicates temperature changes at the reproductive
stage, where the temperature is still below 34°C. Figure 18.
Indicates temperature changes at the reproductive stage, where
the temperature is still below 34°C.
Figure 19. Graph of soil moisture
In Figure 19. Indicates the change in soil moisture at the
reproductive stage, where the condition is still wet the sensor
indicates "water".
3. The test results of monitoring indicators of temperature,
soil moisture at this stage of ripening.
ISSN : 2355-9365 e-Proceeding of Engineering : Vol.5, No.3 Desember 2018 | Page 6483

6
Figure 20. Graph of temperature of the first sensor
Figure 21. Graph of temperature of the second sensor
Figure 20. Indicates temperature changes at the ripening
stage, where the temperature is below 33°C. Figure 21 shows
the temperature change at the ripening stage, where the
temperature is below 33°C.
Figure 21. Graph of soil moisture
Figure 20. Indicates the soil moisture change from humid to
dry conditions. At this stage the rice plant approaches the
harvest time, so the condition of the soil is allowed to dry.
V. CONCLUSION
From the results of WSN research to monitoring the growth
of rice plants based on Zigbee and Arduino using cluster tree
topology, the device is able to reach an area of approximately
2 hectares of rice fields. In the network also occurs data
transmission delay on a 1 hectare area of 312 ms, while on a 2
hectare area of 376 ms. The ability of nodes at a distance of
100 meters has a mean value of different RSSI due to the
influence of the height of varied rice plants. Wireless sensor
network technology with cluster tree topology can help in
anticipating the effects of climate change at an unstable
planting area, so as to reduce the workload of farmers.
REFERENSI
[1] A. Fadholi, D. Supriatin, S. Meteorologi, D. Amir, S. Meteorologi, and
F. Kaisepo, “Sistem pola tanam di wilayah priangan berdasakan
klasifikasi iklim oldeman 1,” vol. 12, pp. 56–65, 2012.
[2] H. G. Goh, H. Y. Lee, C. F. Leong, C. S. Kuek, S. Yue, And K. H.
Kwong, “Practical Implementation Of Self-Powered Wireless Sensor
Networks For Paddy Field Monitoring,”Pp. 2–7.
[3] V. Anbumozhi, E. Yamaji, and T. Tabuchi, “Rice crop growth and
yield as influenced by changes in ponding water depth , water regime
and fertigation level,” vol. 37, 1998. [7] M. A. Miskam, I. A. Rahim, O.
Sidek, and M. Q. Omar, “Deployment of Wireless Water-Quality
Monitoring System at Titi Serong Paddy Crop Field , Malaysia,” pp.
19–20, 2013.
[4] M. A. Miskam, I. A. Rahim, O. Sidek,“Deployment of Wireless Sensor
Network at Titi,” no. I4ct, pp. 30–35, 2014.
[5] M. A. Miskam, Inzarulfaisham Abd Rahim, O. Sidek, and M. Q. Omar,
“Deployment of Wireless Water-Quality Monitoring System at Titi
Serong Paddy Crop Field , Malaysia,” pp. 19–20, 2013.
[6] Santoshkumar, Udaykumar R.Y, ”Development of WSN System for
Precision Agriculture”, Department of Electrical and Electronics
Engineering National Institute of Technology Karnataka,
Surathkal,India [email protected], Department of
Electrical and Electronics Engineering National Institute of
Technology Karnataka, Surathkal, India [email protected],
IEEE Sponsored 2nd International Conference on Innovations in
Information Embedded and Communication Systems, ICIIECS 2015
[7] I.F. Akyildiz, W. Su, Y. Sankarasubramaniam, E. Cayirci,”Wireless
sensor networks: a survey, Computer Networks 38 (2002) 393–422
[8] T. Kalaivani, A. Allirani, and P. Priya, “A survey on Zigbee based
wireless sensor networks in agriculture,” TISC 2011 - Proc. 3rd Int.
Conf. Trendz Inf. Sci. Comput., no. i, pp. 85–89, 2011.
[9] Drew Gislasson, “Zigbee Wireless Sensor Networks,” pp. 1–427, 2007.
[10] S. Tadakamadla, “Indoor local positioning system for zigbee, based on
RSSI,” Mid Sweden Univ., p. 60, 2006.
[11] Zhang Jianwu, Zhang Lu, “Research On Distance Measurement Based
On RSSI Of Zigbee”, College Of Communication Hangzhou Dianzi
University Hangzhou,China, ISECS International Colloquium On
Computing, Communication, Control, And Management, 978-1-4244-
4246-/09/IEEE 2009.
[12] O. G. Adewumi, K. Djouani, and A. M. Kurien, “RSSI based indoor
and outdoor distance estimation for localization in WSN,” Proc. IEEE
Int. Conf. Ind. Technol., pp. 1534–1539, 2013.
[13] Yuli Surya Fajar,”Penelitian Irigasi Hemat Air Pada Budidaya
Tanaman Padi Dengan Metode Sri (System Of Rice Intensification) Di
Daerah Irigasi Ciramajaya, Desa Salebu, Kecamatan Mangunreja,
Kabupaten Tasikmalaya, Jawa Barat”,Skripsi IPB,2008.
[14] Heni Hariyani,”Evaluasi Status Hara Kalium Pada Tanah Sawah Di
Pulau Jawa”, Skripsi IPB tahun 2017.
[15] Koko Joni, Risanuri Hidayat, Sujoko Sumaryono, “pengujian protokol
ieee 802.15.4 /zigbee di lingkungan outdoor”.Jurusan Teknik elektro
dan Teknologi Informasi Universitas Gadjah Mada Yogyakarta,
Seminar Nasional Informatika 2012 (semnasIF 2012) ISSN: 1979-2328
UPN ”Veteran” Yogyakarta, 30 Juni 2012.
ISSN : 2355-9365 e-Proceeding of Engineering : Vol.5, No.3 Desember 2018 | Page 6484