A floating sensing system to evaluate soil and crop variability within flooded paddy rice fields
10
A floating sensing system to evaluate soil and crop variability within flooded paddy rice fields Mohammad Monirul Islam • Liesbet Cockx • Eef Meerschman • Philippe De Smedt • Fun Meeuws • Marc Van Meirvenne Published online: 29 April 2011 Ó Springer Science+Business Media, LLC 2011 Abstract Continuous paddy rice cultivation requires fields to be flooded most of the time limiting seriously the collection of detailed soil information. So far, no appropriate soil sensor technology for identifying soil variability of flooded fields has been reported. Therefore, the primary objective was the development of a sensing system that can float, acquire and process detailed geo-referenced soil information within flooded fields. An additional objective was to determine whether the collected apparent electrical conduc- tivity (EC a ) information could be used to support soil management at a within-field level. A floating sensing system (FloSSy) was built to record EC a using the electromagnetic induction sensor EM38, which does not require physical contact with the soil. Its feasibility was tested in an alluvial paddy field of 2.7 ha located in the Brahmaputra floodplain of Bangladesh. The high-resolution (1 9 1 m) EC a data were classified into three classes using the fuzzy k-means classification method. The variation among the classes could be attributed to differences in subsoil (0.15–0.30 m below soil surface) bulk density, with the smallest EC a values representing the lowest bulk density. This effect was attributed to differences in compaction of the plough pan due to differential puddling. There was also a significant difference in rice yield among the EC a classes, with the smallest EC a values representing the lowest yield. It was concluded that the floating sensing system allowed the collection of relevant soil information, opening potential for precision agriculture practices in flooded crop fields. Keywords Apparent electrical conductivity EM38 Flooded soil Paddy Bangladesh Introduction Floodplain alluvial soils are a valuable natural resource for agricultural crop production in countries like Bangladesh where they occupy almost 80% of the country’s area (Brammer M. M. Islam (&) L. Cockx E. Meerschman P. De Smedt F. Meeuws M. Van Meirvenne Research Group Soil Spatial Inventory Techniques, Department of Soil Management, Faculty of Bioscience Engineering, Ghent University, Coupure 653, 9000 Ghent, Belgium e-mail: [email protected] 123 Precision Agric (2011) 12:850–859 DOI 10.1007/s11119-011-9226-5
-
Upload
independent -
Category
Documents
-
view
0 -
download
0
Transcript of A floating sensing system to evaluate soil and crop variability within flooded paddy rice fields

A floating sensing system to evaluate soil and cropvariability within flooded paddy rice fields
Mohammad Monirul Islam • Liesbet Cockx • Eef Meerschman •
Philippe De Smedt • Fun Meeuws • Marc Van Meirvenne
Published online: 29 April 2011� Springer Science+Business Media, LLC 2011
Abstract Continuous paddy rice cultivation requires fields to be flooded most of the time
limiting seriously the collection of detailed soil information. So far, no appropriate soil
sensor technology for identifying soil variability of flooded fields has been reported.
Therefore, the primary objective was the development of a sensing system that can float,
acquire and process detailed geo-referenced soil information within flooded fields. An
additional objective was to determine whether the collected apparent electrical conduc-
tivity (ECa) information could be used to support soil management at a within-field level.
A floating sensing system (FloSSy) was built to record ECa using the electromagnetic
induction sensor EM38, which does not require physical contact with the soil. Its feasibility
was tested in an alluvial paddy field of 2.7 ha located in the Brahmaputra floodplain of
Bangladesh. The high-resolution (1 9 1 m) ECa data were classified into three classes
using the fuzzy k-means classification method. The variation among the classes could be
attributed to differences in subsoil (0.15–0.30 m below soil surface) bulk density, with the
smallest ECa values representing the lowest bulk density. This effect was attributed to
differences in compaction of the plough pan due to differential puddling. There was also a
significant difference in rice yield among the ECa classes, with the smallest ECa values
representing the lowest yield. It was concluded that the floating sensing system allowed the
collection of relevant soil information, opening potential for precision agriculture practices
in flooded crop fields.
Keywords Apparent electrical conductivity � EM38 � Flooded soil � Paddy � Bangladesh
Introduction
Floodplain alluvial soils are a valuable natural resource for agricultural crop production in
countries like Bangladesh where they occupy almost 80% of the country’s area (Brammer
M. M. Islam (&) � L. Cockx � E. Meerschman � P. De Smedt � F. Meeuws � M. Van MeirvenneResearch Group Soil Spatial Inventory Techniques, Department of Soil Management,Faculty of Bioscience Engineering, Ghent University, Coupure 653, 9000 Ghent, Belgiume-mail: [email protected]
123
Precision Agric (2011) 12:850–859DOI 10.1007/s11119-011-9226-5

1996). The most frequent land use of these soils is paddy rice cultivation whereby the fields
remain inundated for most of the year. As a consequence, direct methods for the acqui-
sition of information on soil properties are problematic as well as common indirect
methods, like air- or space-borne remote sensing. Therefore, these alluvial soils are usually
mapped as being fairly homogenous (Alam et al. 1993) and precision agriculture (PA),
which aims at adjusting soil management according to the soil variability at a within-field
scale, has not been considered. However, at present, technological advances in proximal
soil sensing allow high-resolution soil information to be obtained under flooded conditions
which can serve as a basis to investigate the possibilities of adopting PA in paddy soils.
Several proximal soil sensors have been introduced for PA under dry land conditions
(Sudduth et al. 1997). Among these, the ones based on electromagnetic induction (EMI)
are the most commonly used, even at a sub-meter resolution (Simpson et al. 2009). EMI
sensors measure the soil apparent electrical conductivity (ECa) which can be interpreted in
terms of soil properties like salinity (Triantafilis et al. 2000), texture (Saey et al. 2009),
bulk density or pore volume (Rhoades et al. 1999) and depth to a clay layer (Saey et al.
2008a). Soil ECa is also linked to the soil moisture status (Brevik et al. 2006), but this
source of variation is eliminated under water-saturated conditions. Thus, in a flooded
environment, variations in ECa reflect changes in soil properties except soil moisture. ECa
data have also been used to define management classes which could be linked to variations
in crop yield (e.g. Li et al. 2007; Vitharana et al. 2008). However, research relating ECa
and paddy rice yield is rare. One exception is Ezrin et al. (2010), but these authors used soil
resistivity measurements (requiring soil contact) under dry land conditions. Yet, they
reported a significant positive relation between ECa and paddy rice yield. Currently, no
report is available on the non-invasive use of a proximal soil sensor to analyze the within-
field spatial variability of soil properties in paddy fields under flooded conditions.
The main objective of this study was to develop, operate and evaluate a mobile prox-
imal soil sensing system capable of providing relevant information to support PA under
flooded paddy field conditions, as in Bangladesh. The within-field variability of rice yield
was used to evaluate the relevance of this system.
Materials and methods
The floating sensing system
To acquire high-resolution soil data under wet field conditions (including monsoon rains),
a floating sensing system (FloSSy) was developed.
First, the FloSSy consists of a soil sensor which was put in a waterproof housing on a
raft (Fig. 1). Preference was given to EMI as a geophysical technique because it does not
require physical contact with the soil, so the sensor can be operated floating on water. More
details on EMI are given by Corwin et al. (2008). The EM38 (Fig. 1; Geonics Limited,
Canada) was used because of its robustness, structural simplicity, light weight (about
3.5 kg) and small physical dimension (1.05 9 0.16 9 0.05 m). The inter-coil distance of
the EM38 is 1 m, resulting in a depth of influence of about 1.5 m in the vertical orientation
under conditions of a homogeneous soil. So, given the limited water depth of a paddy field
(0.10–0.25 m) there is still sufficient influence of the topsoil to be measured. More tech-
nical details on the EM38 sensor are given by McNeill (1980). The EM38 sensor can also
be operated in a horizontal orientation which receives its major influence from the
Precision Agric (2011) 12:850–859 851
123

near-surface soil (Saey et al. 2008). However, the vertical orientation to ensure a major
influence of the soil beneath the water layer was used here.
Next, a GPS (NL-422MP manufactured by NAVILOCK�, Zehlendorf, Berlin, Ger-
many) and a field laptop (Dell ATG 6400 model) with real time data processing of both the
sensor and GPS signals was adapted to be operational in a waterproof environment. A
1.8 m long PVC pipe was put vertically on the raft to enable the data communication
cables to be connected to the field computer. On top of this pipe the GPS receiver was fixed
so that its position corresponded to the centre of the EM38 sensor. A real-time path
guidance software was created to display the traversing path, otherwise it would be
impossible in a flooded field to track the previously measured path to guarantee that the
entire field was covered. The laptop was placed inside a polyethylene jacket to guard
against the splashes of field mud and rain and made visible to the vehicle driver. The raft
was sufficiently light to be trailed at some distance (1.8 m) by the usual 12 HP vehicle
operating on muddy inundated fields (called a ‘power tiller’) (Fig. 1).
The computer language G from LabVIEW (National Instruments 2003) was used to
develop software for the simultaneous acquisition and processing of signal output from the
FloSSy. Functionality of the operational system during the ECa survey was monitored from
the graphical user interface (GUI) by checking the raw and processed data from both the
EM38 and GPS. In the flooded field, the traversing path of the FloSSy could be displayed
on the computer screen in real-time to guide the distance between measured parallel lines.
Study site
A 2.7 ha experimental paddy field of the Bangladesh Agricultural University in Mymen-
singh was selected as a study area to test the operational performance of FloSSy and to
evaluate the soil spatial variability of the field. It has been under continuous paddy cul-
tivation for more than 35 years. The field (with central co-ordinates 24.72450�N and
90.42317�E) is located in the floodplain of the Brahmaputra. In general, these alluvial
deposits consist mainly of fine sand to silty material with less than 5% clay. According to
Brammer (1981), the soil in the area of the experimental field has a silt texture.
To reduce the loss of water and dissolved nutrients, paddy fields are puddled during land
preparation. During puddling, the topsoil is inundated and the subsoil is compacted by
Fig. 1 The floating soil sensingsystem (FloSSy) during fieldmeasurement of ECa. Thedifferent components areindicated as follows: i laptop, iiGPS, iii water proof sensorhousing, iv floating platform,v the power tiller
852 Precision Agric (2011) 12:850–859
123
repeated ploughing at the same depth (approximately at a depth of 0.17–0.20 m). An
additional advantage of flooding is the effective control of weeds during the growing
period.
ECa survey and data processing
The ECa survey with FloSSy was conducted in July 2009, after the usual field preparation
by puddling and before the seasonal planting of rice seedlings. At the time of measure-
ments, the water height on the field was approximately 0.18–0.20 m. The traversing speed
was approximately 3.6 km h-1 and the measurement frequency was 4 Hz. Measurement
lines were separated 1 m apart and care was taken to orient them as much as possible
parallel. The measurements were averaged to one value per square meter, so the processed
data resolution was 1 observation per m2. ECa measurements were post-corrected for
instrumental drift and standardized to a reference temperature of 25�C by the method of
Sheets and Hendrickx (1995):
ECa25¼ ECaobs
0:4470þ 1:4034:e�T=26:815� �
ð1Þ
with ECa25 , the standardized ECa values at 25�C and ECaobs , the observed ECa values at soil
temperature T (�C). During the field survey, soil temperature was recorded every hour by a
bimetal sensor pushed in the soil to a depth of 0.25 m below soil surface. It remained stable
during the survey at 30�C. In the remaining part of this article, all ECa values refer to
ECa25.
Since field measurements could not be conducted exactly on a grid basis, the soil ECa
data were interpolated to a fixed resolution using ordinary point kriging (OK) (Goovaerts
1997). This was conducted with the program Surfer (Golden Software Inc., Golden, USA)
and the final ECa map had a pixel resolution of 1 9 1 m.
The interpolated ECa data were classified using a fuzzy k-means classification proce-
dure. Therefore the FuzMe 3.0 software (Minasny and McBratney 2006), based on the
modified fuzzy k-means for predictive classification as described by de Gruijter and &
McBratney (1988), was used. The fuzziness performance index (FPI) and the modified
partition entropy (MPE) were used to guide the classification (McBratney and Moore
1985). The optimum number of classes was determined when these two measures were
minimal.
Soil and crop sampling
Within the field, 50 soil samples were collected according to a fixed spacing of 20 9 20 m.
At each sampling location, three replicate samples were taken within 1 m2 at three depths
(0.0–0.15 m, 0.15–0.30 m and 0.30–0.45 m). Given the flooded conditions of the land, a
custom-built hand-operated paddy field sampler was designed (Fig. 2). It contains a metal
tube attached to the top of the soil-sampling core which has three holes to drain water out
of the drill when the sampler is pushed into the flooded muddy soil. To avoid loss of soil
during withdrawal, pneumatic pressure was maintained inside the core with a one-way gate
valve attached to the top of the sampling core. During insertion of the sampler, opening of
the valve allowed reduction of air pressure inside the core. A pulley controlled shutter gate
was provided to open and close the bottom during insertion and removal from the soil,
respectively. The oven dried (105�C) weight of the soil samples allowed calculation of its
bulk density given the known volume of the sampler (0.75 L).
Precision Agric (2011) 12:850–859 853
123

At each of the 50 sampling locations, the paddy grain yield was determined by har-
vesting manually 1 m2. The weight of the unhusked fresh grains was measured, adjusted to
a moisture content of 18%, and expressed as t ha-1.
Results and discussion
ECa
The 30 396 ECa measurements ranged between 22 and 49 mS m-1 with a mean of
34.7 mS m-1 and a variance of 21.4 (mS m-1)2, so the coefficient of variation was 13%.
The distribution was close to Gaussian with coefficients of skewness (0.16) and kurtosis
(2.8) approaching normal values (0 and 3, respectively). The variogram was best described
by a spherical model:
c hð Þ ¼ C0 þ C1 � 1:5 h=a
� �� 0:5 h=a
� �3� �
if 0\h� a
C0 þ C1 if h [ a
8<: ð2Þ
with c(h) the variogram at lag distances h, the nugget variance C0 = 1.2 (mS m-1)2, the
sill C0 ? C1 = 14.3 (mS m-1)2 and the range a = 38 m. Thus, the ECa data were char-
acterized by a strong spatial structure with a very low noise component as indicated by a
nugget to sill ratio of 8.4%. The ECa map interpolated with OK is shown in Fig. 3a. The
ECa map shows patterns of fluctuating ECa values across the field, however, without a
systematic trend. Therefore, the field was classified in zones to delineate management
classes using the fuzzy k-means algorithm. The optimal number of ECa classes was
identified as three since the FPI and NCE were minimum at this number. Figure 3b shows a
map of these three classes: ECa class-1 grouped low ECa values around a centroid value of
29.2 mS m-1, ECa class-2 represented intermediate ECa values with a centroid value
of 35.0 mS m-1 and ECa class-3 combined the high ECa values with a centroid value of
Fig. 2 Schematic overview ofthe paddy field soil sampler:i 150 9 80 mm soil core, ii One-way gate valve, iii excess waterdraining holes, iv shutter withlever, pulley, sleeve, shaft andgate; v handle rod
854 Precision Agric (2011) 12:850–859
123
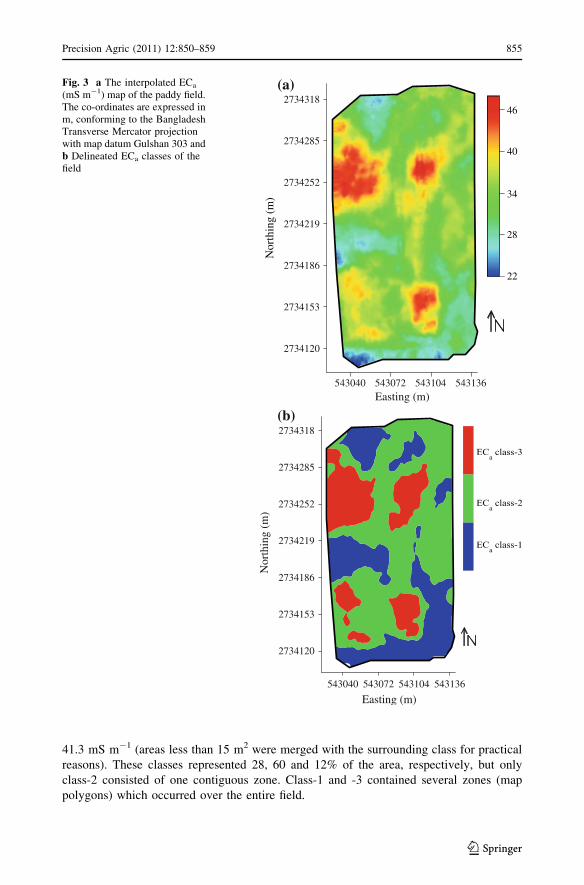
41.3 mS m-1 (areas less than 15 m2 were merged with the surrounding class for practical
reasons). These classes represented 28, 60 and 12% of the area, respectively, but only
class-2 consisted of one contiguous zone. Class-1 and -3 contained several zones (map
polygons) which occurred over the entire field.
543040 543072 543104 543136Easting (m)
2734120
2734153
2734186
(a)
(b)
2734219
2734252
2734285
2734318
543040 543072 543104 543136
Easting (m)
2734120
2734153
2734186
2734219
2734252
2734285
2734318
Nor
thin
g (m
)22
28
34
40
46
Nor
thin
g(m
)
Fig. 3 a The interpolated ECa
(mS m-1) map of the paddy field.The co-ordinates are expressed inm, conforming to the BangladeshTransverse Mercator projectionwith map datum Gulshan 303 andb Delineated ECa classes of thefield
Precision Agric (2011) 12:850–859 855
123

Bulk density
To interpret the observed variation of ECa in the flooded paddy field, it was not feasible to
turn to published information. The reconnaissance soil survey reported that these flood-
plain soils are not saline and fairly homogenous in terms of texture and drainage class
(Brammer 1981), but no information on the detailed scale of the study is available, so this
general statement should be considered with some caution. Nevertheless, as a first
approximation, the alluvial parent material, soil genesis processes and general land use
activities of the studied field were assumed to be fairly uniform resulting in a limited
variability in clay and organic matter. Therefore, bulk density as a soil property influencing
ECa was considered (Rhoades et al. 1999). Besides, bulk density is a key soil parameter for
wetland paddy cultivation. Low bulk density of the ploughed topsoil facilitates paddy root
growth whereas high bulk density of the subsoil restricts leaching of nutrients. Bulk density
values are also used to indicate the degree of ploughed soil softness and subsoil com-
paction. In light textured soils, as is the case for the studied field, a high bulk density value
indicates a well-formed plough pan.
To investigate the relationship between ECa and bulk density, the 50 observations of
bulk density at the three depth intervals were grouped according to the ECa classes.
Table 1 gives the summary statistics together with a statistical comparison of the mean
values. For all three depth intervals, the significantly smallest mean bulk density values
were found in ECa class-1, i.e. the class with the smallest ECa values. For ECa classes -2
and -3 the differences were also significant for the first two depth intervals, but not for the
0.30–0.45 m interval. So, in general, soil bulk density followed the same trend as the ECa
values, i.e. the higher the ECa, the higher the bulk density. Although the aim of this article
was not to find a cause for this relationship, it seems to indicate that the finer the saturated
soil pores are, the larger their electrical conductivity becomes.
Within each ECa class, the soil bulk density increased from 0.0–0.15 m to 0.15–0.30 m
and decreased in the deeper layer (0.30–0.45 m). Low bulk density values in the topsoil
indicated topsoil softness, while the high bulk density of the 0.15–0.30 m layer represents
compaction by puddling and the formation of a plough pan. Both topsoil softness and
Table 1 Descriptive statistics and mean comparison of soil bulk density [Mg m-3] among the ECa classes
Soil depth (m) Soil bulk density [Mg m-3]
ECa class Mean* Minimum Maximum SD
0.0–0.15 Class-1 1.26a 1.17 1.33 0.05
Class-2 1.32b 1.28 1.36 0.02
Class-3 1.37c 1.32 1.41 0.03
0.15–0.30 Class-1 1.44a 1.42 1.45 0.01
Class-2 1.63b 1.42 1.76 0.11
Class-3 1.76c 1.65 1.79 0.05
0.30–0.45 Class-1 1.43a 1.42 1.44 0.01
Class-2 1.46b 1.43 1.53 0.04
Class-3 1.46b 1.37 1.51 0.04
* Within a soil depth, means followed by the same letter do not differ significantly (P = 0.05) according toFisher’s least significant difference test; number of samples per ECa class = 16, 25 and 9 for class-1, class-2and class-3 respectively; SD = Standard deviation
856 Precision Agric (2011) 12:850–859
123

subsoil compaction are required for a high paddy rice yield. However, the large variation in
the 0.15–0.30 m layer of bulk density (between 1.42 and 1.79 Mg m-3) indicated that soil
compaction was not uniform within this field.
Paddy rice yield
Table 2 provides the summary statistics of the rice yield data. A difference of 2.0 t ha-1
was found between the lowest and highest yield, which is considerable given an average
yield of 4.9 t ha-1. To evaluate the link between ECa and rice productivity, the yield data
were also grouped according to the ECa classes and the significance of the differences
between the classes were analyzed statistically. The average rice yield was the lowest
(4.4 t ha-1) for ECa class-1, increased significantly in class-2 (5.2 t ha-1) and stabilized in
class-3 (mean = 5.4 t ha-1, not significantly different from the mean of class-2).
The general relationship between ECa and rice yield was best modeled by a second
order polynomial (the adjusted R2 of a linear model was 0.68 and of a second order
polynomial 0.80):
Yield ¼ �8:295þ 0:672 � ECað Þ � 0:00821 � ECa2
� �R2 ¼ 0:80 ð3Þ
with yield in t ha-1 at a moisture content of 18% and ECa in mS m-1 at 25�C (dashed
curve in Fig. 4).
Since the yield statistics of ECa class-1 were different from those of ECa classes -2 and
-3 (Table 2), this relationship was investigated separately within class-1 and within the
grouped classes -2 and -3. For both groups of data, a linear regression was found to be a
better fit than a second order polynomial on the basis of the adjusted R2 (full curves in
Fig. 4). For class-1 the regression was:
Yield ¼ �7:437þ 0:402 � ECað Þ R2 ¼ 0:83 ð4Þ
and for the combined class-2 and class-3 data:
Yield ¼ 3:309þ 0:052 � ECað Þ R2 ¼ 0:46 ð5ÞThe difference in slope of both regressions clearly indicate a difference in soil-yield
relationship within both ECa zones (class-1 vs. class-2 and class-3).
Since ECa class-1 had both the lowest soil bulk density values within the 0.15–0.30 m
layer and the lowest rice yield, it would be reasonable to assume that both are related. After
Table 2 Descriptive statistics and mean comparison of the paddy yield observations [t ha-1] for the wholefield and stratified per ECa class
Yield observations [t ha-1]
n Mean* Minimum Maximum SD
Whole field 50 4.9 3.6 5.6 0.5
ECa class-1 16 4.4a 3.5 5.0 0.4
ECa class-2 25 5.2b 4.6 5.6 0.2
ECa class-3 9 5.4b 4.7 5.5 0.3
* Means followed by the same letter do not differ significantly (P = 0.05) according to Fisher’s leastsignificant difference test; n = number of samples, SD = Standard deviation
Precision Agric (2011) 12:850–859 857
123

all, under flooded conditions, a less compacted subsoil will result in an increased leaching
of nutrients, although more research is needed to confirm this statement.
Conclusions
An efficient system for measuring the within-field variation of soil properties of flooded
fields is a prerequisite to introduce precision agriculture in such a type of land use. EMI
was chosen for this purpose and implemented in a FloSSy which was successfully used to
measure in detail the soil ECa of a field which is not easily accessible for soil sampling due
to the almost permanent inundation, as in the intensively cropped paddy areas of Ban-
gladesh. The ECa measurements showed a clear spatial pattern of varying values. These
data were optimally classified in three ECa classes. The differences among these classes
showed significant differences in soil bulk density in the first two depth intervals and were
the largest in the puddled subsoil (0.15–0.30 m below surface). In general, the larger the
ECa, the higher the bulk density.
The first ECa class had a significantly lower paddy rice yield compared to the yield of
the other two classes with a clearly different linear relationship between ECa and yield.
This indicated a different soil-yield relationship among the delineated ECa zones. Since the
yield was the lowest in the ECa class with lowest subsoil bulk density, it was postulated
that a poorly compacted plough pan might have facilitated the leaching of nutrients
reducing its crop yield potential.
It can be concluded that an EMI-based floating sensing system is useful in collecting
ECa data which can support the evaluation of relevant soil and crop properties allowing the
within-field management of flooded paddy rice fields.
References
Alam, M. L., Saheed, S. M., Shinagawa, A., & Miyauchi, N. (1993). Chemical properties of general soiltypes of Bangladesh. Memoirs of the Faculty of Agriculture, Kagoshima University, 29, 75–87.
Brammer, H. (1981). Reconnaissance Soil Survey of Dhaka District. Revised Edition. Dhaka: Soil ResourcesDevelopment Institute.
ECa (mS m-1)
26 28 30 32 34 36 38 40 42 44 46
Yie
ld (
t ha-1
)
3.0
3.5
4.0
4.5
5.0
5.5
6.0
ECa class-1
ECa class-2
ECa class-3
Fig. 4 Relation between ECa
and paddy yield for the field as awhole (dashed curve) and perECa zone (full curves). One ECa
zone consisted of ECa class-1,while the other zone grouped ECa
class-2 and -3. Points weresymbolized according to the ECa
class
858 Precision Agric (2011) 12:850–859
123

Brammer, H. (1996). The geography of the soils of Bangladesh. Dhaka: The University Press Limited.Brevik, E. C., Fenton, T. E., & Lazari, A. (2006). Soil electrical conductivity as a function of soil water
content and implications for soil mapping. Precision Agriculture, 7, 393–404.Corwin, D. L., Lesch, S. M., & Farahani, H. J. (2008). Theoretical insight on the measurement of soil
electrical conductivity. In B. J. Allred, J. J. Daniels, & M. R. Ehsani (Eds.), Handbook of agriculturalgeophysics (pp. 59–83). Boca Raton: CRC Press.
de Gruijter, J.J.,& McBratney, A.B. (1988). A modified fuzzy k-means method for predictive classification.In: H.H. Bock, (Ed.), Classification and related methods of data analysis (pp. 97–104). Amsterdam:Elsevier.
Ezrin, M. H., Amin, M. S. M., Anuar, A. R., & Aimrun, W. (2010). Relationship between rice yield andapparent electrical conductivity of paddy soils. American Journal of Applied Sciences, 7(1), 63–70.
Goovaerts, P. (1997). Geostatistics for natural resources evaluation. New York: Oxford University Press.Li, Y., Shi, Z., Li, F., & Li, Hong.-Yi. (2007). Delineation of site-specific management zones using fuzzy
clustering analysis in a coastal saline land. Computers and Electronics in Agriculture, 56, 174–186.McBratney, A. B., & Moore, A. W. (1985). Application of fuzzy sets to climate classification. Agricultural
and Forest Meteorology, 35, 165–185.McNeill, J. D. (1980). Electromagnetic terrain conductivity measurement at low induction numbers.
Technical Note TN-6. Missisauga: Geonics Limited.Minasny, B., & McBratney, A. B. (2006). FuzME version 3. Australian centre for precision agriculture.
Sydney: The University of Sydney.National Instruments (2003). LabVIEW: Getting Started with LabVIEW: April 2003 edition. 11500 North
Mopac Expressway Austin, Texas 78759-3504 USA.Rhoades, J. D., Chanduvi, F., & Lesch, S. M. (1999). Soil salinity assessment: methods and interpretation of
electrical conductivity measurements. (FAO irrigation and drainage paper 57). Rome: FAO.Saey, T., Simpson, D., Vermeersch, H., Cockx, L., & Van Meirvenne, M. (2008a). Comparing the EM38DD
and DUALEM-21S Sensors for Depth-to-Clay Mapping. Soil Science Society of America Journal, 73,7–12.
Saey, T., Simpson, D., Vitharana, U. W. A., Vermeersch, H., Vermang, J., & Van Meirvenne, M. (2008b).Reconstructing the paleotopography beneath the loess cover with the aid of an electromagneticinduction sensor. Catena, 74, 58–64.
Saey, T., Van Meirvenne, M., Vermeersch, H., Ameloot, N., & Cockx, L. (2009). A pedotransfer function toevaluate the soil profile textural heterogeneity using proximally sensed apparent electrical conduc-tivity. Geoderma, 150(3–4), 389–395.
Sheets, K. R., & Hendrickx, J. M. H. (1995). Non-invasive soil water content measurement using elec-tromagnetic induction. Water Resource Research, 31, 2401–2409.
Simpson, D., Lehouck, A., Verdonck, L., Vermeersch, H., Van Meirvenne, M., Bourgeois, J., et al. (2009).Comparison between electromagnetic induction and fluxgate gradiometer measurements on the buriedremains of a 17th century castle. Journal of Applied Geophysics, 68(2), 294–300.
Sudduth, K. A., Hummel, J. W., & Birrell, S. J. (1997). Sensors for site-specific management. In F. J. Pierce& E. J. Sadler (Eds.), The state of site-specific management for agriculture (pp. 183–210). Madison:ASA-CSSA-SSSA.
Triantafilis, J., Laslett, G. M., & McBratney, A. B. (2000). Calibrating an electromagnetic inductioninstrument to measure salinity in soil under irrigated cotton. Soil Science Society of America Journal,64, 1008–1017.
Vitharana, U. W. A., Van Meirvenne, M., Simpson, D., Cockx, L., & De Baerdemaeker, J. (2008). Key soiland topographic properties to delineate potential management classes for precision agriculture in theEuropean loess area. Geoderma, 143, 206–215.
Precision Agric (2011) 12:850–859 859
123