Methane budget from paddy fields in India
21
PII: S0045-6535(96)00223-~ Chemosphere. Vol. 33, No. 4. pp. 737-757, 1996 Copyright© 1996ElsevierScience Ltd Printedin Great Britain.All rightsreserved 0045-6535/96$15.00+0.00 METHANE BUDGET FROM PADDY FIELDS IN INDIA D.C. Parashar'*, A.P. Mitra', Prabhat K. Gupta', J. RaP, R.C. Sharma', N. Singh', S. Koul', H.S. Rayb, S.N. Dasb, K.M. Parida b, S.B. Raob, S.P. Kanungo b, T. Ramasami°, B.U. Naiff, M. Swamf, G. Singh d, S.K. Guptad, A.R. Singh d, B.K. Saikiae, A.K.S. Baruae, M. G. Pathal~, C.S.P. Iyerr, M. Gopalakrishnan t, P.V. Sand, S.N. Singh s, R. Banerjeet, N. Sethtmathan h, T.K. Adhyah, V.R. Raoh, P. Paliti, A.K. Salud, N.N. PurkaitJ, G.S. Clmturvedi ~, S.P. Sen ], M. Sent, B. Sarkata, A. Banild, B.H. Subbaraya m, S. Lal =, S. Venkatmmani =, G. LaP, A. Chaudhary*, and S.K. Sinha °. a. National Physical Laboratory (NPL), Dr. K.S. Krishnan Road, New Delhi-110012, India. b. Regional Research Laboratory, Bhubaneswar (RRLB), Orissa- 751013. c. Central Leather Research Institute (CLRI), Adyar, Madras- 600020, Tamil Nadu. d. Central Fuel Research Institute (CFR1), Dhanbad-828108, Bihar. e. Regional Research Laboratory, Jorhat (RRLJ), Assam-785006. f. Regional Research Laboratory, Trivandrum (RRLT), Kerala-695019. g. National Botanical Research Institute (NBR.I), Rana Pratap Marg, Lucknow-226001, U.P.h. Central Rice Research Institute (CRRD, Cuttaek-753006, Orissa. i. Central Research Institute of Jute & Allied Fibres (CRIJAF), Barrackpore-743101, West Bengal. j. Institute of Radio Physics & Electronics (IRPE), Univ. of Calcutta, 92 Acharya Pmfulla Chandm Road, Calcutta, West Bengal-700009. k. Narendra Deo Univ. of Agriculture & Technology (NDUAT), Kumarganj, Faizabad-224229, U.P. 1. Kalyani University, Kalyani-741235, West Bengal. m. Physical Research Laboratory (PRL), Ahmedabad, Gujarat-380009. n. Indian Agriculture Research Institute (IARI), New Delhi-110012. (Receivedin USA 13 January 1996;accepted30 April 1996) ABSTRACT Results of national methane campaign launched in 1991 to assess methane budget from Indian paddy fields are reported. The campaign involved a number of scientific institutions and universities with National Physical Laboratory at Delhi operating as a nodal agency and covered most of the major rice growing regions of India. Methane emission rates ranged between -0.64 and 84.1 mg m'2h "1. The methane budget from Indian paddies has been estimated to be around 4.0 TgYl with a range between 2.7 to 5.4 TgY m. Copyright © 1996 Elsevier Science Ltd 1. INTRODUCTION Increase In methane (CH4) concentration in the global troposphere is currently around 9.9 ppbv Y~ of which nearly 60 percent is attributed to human activities (Houghton et al., 1990; Steele et al., 1992; Bolin et al., 1994). Among the main anthropogenic sources, nearly 20% of the global methane budget from various sources has been attributed to the rice paddy cultivation alone (Hogan et al., 1991). Asia has about 90 percent of the total world rice harvested area out of which 60 percent falls in India and China. The estimated methane budget from Indian paddy fields is of special significance as India has an area of about 42.2 Mha's (including multiple cropping) under rice cultivation as compared to about 33.7 Mha's in China. On the basis of extrapolation of measurements done in Europe and the U.S.A., the U.S. EPA attributed 37.8 Tg CH4 y4 to Indian paddies, which is an order of magnitude more than the earlier estimates for India of 3.0 TgY a based on field measurements at 737
-
Upload
independent -
Category
Documents
-
view
3 -
download
0
Transcript of Methane budget from paddy fields in India

PII: S0045-6535(96)00223-~
Chemosphere. Vol. 33, No. 4. pp. 737-757, 1996 Copyright © 1996 Elsevier Science Ltd
Printed in Great Britain. All rights reserved 0045-6535/96 $15.00+0.00
METHANE BUDGET FROM PADDY FIELDS IN INDIA
D.C. Parashar'*, A.P. Mitra', Prabhat K. Gupta', J. RaP, R.C. Sharma', N. Singh', S. Koul', H.S. Rayb, S.N. Das b, K.M. Parida b, S.B. Rao b, S.P. Kanungo b, T. Ramasami °, B.U. Naiff, M. Swamf, G. Singh d, S.K. Gupta d, A.R. Singh d, B.K. Saikia e, A.K.S. Barua e, M. G. Pathal~, C.S.P. Iyer r, M. Gopalakrishnan t, P.V. Sand, S.N. Singh s, R. Banerjee t, N. Sethtmathan h, T.K. Adhya h, V.R. Rao h, P. Palit i, A.K. Salud, N.N. PurkaitJ, G.S. Clmturvedi ~, S.P. Sen ], M. Sen t, B. Sarkat a, A. Banild, B.H. Subbaraya m, S. Lal =, S. Venkatmmani =, G. LaP, A. Chaudhary*, and S.K. Sinha °.
a. National Physical Laboratory (NPL), Dr. K.S. Krishnan Road, New Delhi-110012, India. b. Regional Research Laboratory, Bhubaneswar (RRLB), Orissa- 751013. c. Central Leather Research Institute (CLRI), Adyar, Madras- 600020, Tamil Nadu. d. Central Fuel Research Institute (CFR1), Dhanbad-828108, Bihar. e. Regional Research Laboratory, Jorhat (RRLJ), Assam-785006. f. Regional Research Laboratory, Trivandrum (RRLT), Kerala-695019. g. National Botanical Research Institute (NBR.I), Rana Pratap Marg, Lucknow-226001, U . P . h . Central Rice Research Institute (CRRD, Cuttaek-753006, Orissa. i. Central Research Institute of Jute & Allied Fibres (CRIJAF), Barrackpore-743101, West Bengal. j. Institute of Radio Physics & Electronics (IRPE), Univ. of Calcutta, 92 Acharya Pmfulla Chandm Road, Calcutta, West Bengal-700009. k. Narendra Deo Univ. of Agriculture & Technology (NDUAT), Kumarganj, Faizabad-224229, U.P. 1. Kalyani University, Kalyani-741235, West Bengal. m. Physical Research Laboratory (PRL), Ahmedabad, Gujarat-380009. n. Indian Agriculture Research Institute (IARI), New Delhi-110012.
(Received in USA 13 January 1996; accepted 30 April 1996)
ABSTRACT
Results of national methane campaign launched in 1991 to assess methane budget from Indian paddy fields are reported. The campaign involved a number of scientific institutions and universities with National Physical Laboratory at Delhi operating as a nodal agency and covered most of the major rice growing regions of India. Methane emission rates ranged between -0.64 and 84.1 mg m'2h "1. The methane budget from Indian paddies has been estimated to be around 4.0 TgY l with a range between 2.7 to 5.4 TgY m. Copyright © 1996 Elsevier Science Ltd
1. INTRODUCTION
Increase In methane (CH4) concentration in the global troposphere is currently around 9.9 ppbv Y~ of
which nearly 60 percent is attributed to human activities (Houghton et al., 1990; Steele et al., 1992; Bolin et al.,
1994). Among the main anthropogenic sources, nearly 20% of the global methane budget from various sources
has been attributed to the rice paddy cultivation alone (Hogan et al., 1991). Asia has about 90 percent of the total
world rice harvested area out of which 60 percent falls in India and China. The estimated methane budget from
Indian paddy fields is of special significance as India has an area of about 42.2 Mha's (including multiple
cropping) under rice cultivation as compared to about 33.7 Mha's in China. On the basis of extrapolation of
measurements done in Europe and the U.S.A., the U.S. EPA attributed 37.8 Tg CH 4 y4 to Indian paddies, which
is an order of magnitude more than the earlier estimates for India of 3.0 TgY a based on field measurements at
737

738
a few rice growing regions in the country CtJ.S. EPA, 1990; Mitra, 1991; Parashar et al., 1991). Moreover, there
is significant variation in the methane emission rate depending upon soil parameters and water management
practices (Cicerone and Oremland, 1988; Sehutz et al., 1989; Saha et al., 1989; Yagi and Minami, 1990; Parashar
et al., 1991; Khalil et al., 1991; Parashar et al., 1993). In order to have a more reliable methane budget estimate
from Indian paddy fields, the 1991 methane campaign (MC91) was organised. It involved more than 15
organizations, Including various laboratories of the Council of Scientific & Industrial Research (CSIR), Institutes
of Indian Council of Agricultural Research (ICAR), and a number of universities. The measurements covered the
various rice ecosystems in the major rice-growing regions during wet season from June to November 1991.
2. METHODOLOGY AND SITE DESCRIPTION
The static box technique was used in the MC91 campaign for the measurement of methane emissions from
paddies (Mitra, 1992). This technique consists of fixing rectangular (30x50 cm 2 area) aluminium bases; mounted
with a U-shaped channel to hold water, at the measurement sites at two points within a few metres, well in
advance. The perspex box (30x50x76 cm 3 in size) with its open end rests in the channel. The water filled in the
channel isolates the air inside the perspex chamber from the outside atmosphere. Sampling kits as above were
used at all the sampling sites in the network except the deep water paddy fields where the perspex chamber was
60x40x143 em 3 with a base area of 60x40 em 2.
A battery-operated air circulation pump with a flow rate of 1.5 litres per minute, connected with polythene
tubes via a three-way stopcock, mixed the air inside the chamber and was also used to sample air (Figure 1). The
air was sucked from the top portion of the chamber by pump and pushed out near the bottom of the chamber to
ensure thorough mixing during the sampling period. Water level, paddy biomass volume, and the temperatures
inside the chamber were also measured during each sample collection for calculating the chamber air volume at
standard temperature and pressure (STP). The chamber was lifted and kept aside after 30 minutes. Air sampling
from the chamber was done at intervals of 0, 15, and 30 minutes, and ambient air was taken once a week at about
10:00 hours and 16:00 hours, giving 14 samples (8 flux data points). The chamber was tested for leakage at lower
(-5 ppmv) and higher (-50 ppmv) concentrations of CH4 maintained during simulated experiments up to 90
minutes with a 5-minute sampling time interval.
The air samples brought to the laboratory were analysed by a gas chromatograph (GC) equipped with flame
ionization detector (FID) and a column of Molecular Sieve-5A. GC calibration for CH 4 was done using secondary
standards, viz., 1.94 ppmv CH4 standard in air, 4.4 ppmv and 10.9 ppmv CH4 standards in nitrogen, prepared at
NPL. A primary standard of 1 ppmv CH4 in nitrogen from M/s Mathesons Gas Products, USA, was used for
calibrating the above secondary standards. The methane flux was calculated from the temporal increase of the
methane mixing ratios inside the box using the equation:

Oq
..< O.,
P
POLY
THEN
E TU
BE
FITT
ING
PER
SPEX
BO
X o
j \
' TH
ERM
OM
ETER
~
SO
IL
THER
MO
MET
ER
, "
~ -.i
~r
T~
A
;~"3
- W
AY V
ALVE
OCK
r"-]
~TEF
LON
_
r AMPL
ING
BAG
Expe
rimen
tal
arra
ngem
ent
for
met
hane
eff
lux
mea
sure
men
t.

740
CH+ Flux(F) (rag m-2h -1) = BVsa v × Ccn' x 16 x 1000 × 60
I0 + x22400 xAxt
where
BVsw (Box Air Volume in cc at STP) = BV x B.P. x 273 (273 +T) x760
Box air volume, BV -- [(H-h)LW - Biomass volume inside box]; H = box height; h = water level above channel;
L = box length; W = box Width in cm; B.P. = barometric pressure (ram Hg); T = box air temperature at the time
of sampling in * C; Co~ = change in CH+ concentration in ppmv from 0 minute sampling to the t minute
sampling; and A = paddy area covered by the box in m 2.
The accuracy and comparability of CI-I4 concentration values were established by calibration and
intercomparison between the National Physical Laboratory (NPL) and other network stations. The absolute
calibration comparability at the international level was established by exchanging samples with the Division of
Atmospheric Physics, CSIRO, Australia, the National Institute of Agro-Environment Sciences (NIAES), Tsukuba,
Japan, Max Plank Institute of Chemistry (MPI), Mainz, Germany, and the NPL, New Delhi.
The MC91 network (Figure 2) sites, 34 in number, were located at RRL farms Jorhat (Assam), Garagacha
Garia, Raghabpur Purulia, Charsharati Kalyani Nadia, North farms Devoke and Koirapur Barrackpore 24 Pergana
(West Bengal), Dehri-on-sone (Bihar), CRRI farms Cuttack (Orissa), Pudupakkam Chenglepet (Tamil Nadu),
Pappanamcode Trivandrum (Kemla), Andawa Allahabad and NDUAT farms Kumarganj Faizabad (Uttar Pradesh)
and IARI farms Delhi. The paddy soil characteristics for the above sites are given in Table 1.
The total areas of paddies harvested annually in India were classified (see Table 2) for CH4 emission
extrapolation and its budget estimate in four regions (east, south, north and west), for continuously flooded or
irrigated, intermittently flooded or rainfed, deep water, and upland paddy water ecosystem categories 0RRI, 1984;
Handbook on Cultivars, 1985; IRRI, 1986; Gupta and Toole, 1986; Ministry of Agriculture, 1990; OECD, 1991;
IRRI, 1993; Bolin, 1995). There are no published data available yet for the area under intermittently flooded fields
based on actual survey out of both rainfed and irrigated areas. However, some information about the intermittently
flooded areas is given for inventory purposes to estimate methane from rice paddies (Bolin, 1995). Many shallow
rainfed areas, representing about 35% of all ricelands in south and southeast Asia, have moisture sufficiency
comparable to that of irrigated lands; other rainfed shallow areas are so prone to water stress that they may be
comparable to upland areas (IRRI, 1984). These rainfed areas often experience dry and flood cycles according
to the availability of rainwater and therefore have been termed as intermittently flooded areas by IPCC (Bolin,
1995).

7 4 1
R I C E "'-" 1991 ~ethane Campaign Network
/ , C " : . ~ l . t ' " . . f aizw~aa I - . J ' ~ . . ' " -~.-':',J~.~.'.." : l - - - - - 7 . / - ~ " ~-
." - " + " ~ ' J ~ X " ~ Q ' [ ' ~ q ~ 7 " ~ - ~'~ e " ' r / ¢ C~ I " ~ " " " "-" " ' /q"-"- ~ • ~" .A'~.-" . , t " ~
t . ~ . % . _ . . . , , , , ; , . : ~ .,," .~ ..., ; ~ . ~ ~ ~ - , . . . . .
, - , . - , ~ ' - ' ~ t -~ ¢ I (~ : ' - ! .? .~ . - : . ' ~ ' : ~ : : . : y ~ r " . : .' . . . . - , -" • " - . . . . . . . . . .~ .~ / . . _ : ~-s ~ , • $ ~ " . -~:" l ' ~ . : " - . ' . " . " :.~ - . ' ~ . ~ . W
' : - - : . ' ~ * - : : ~ - - : ; ~ : :~;:_-:.:~'~-"~ 2 h / ......... x lr~. ~ ~. , " - . . . ~ . ~ , . . . . . , r :. : . . . . ~ .~ .:-~
~ .---- .-- - , - i " ~--: ::-~ ? : . ~ ".;:;-. ~ Y • . o . . . . . . ~ - g - •
d - . . ; , . , . . . . . . . . . . . ; ; - \ I ~ . " , . :'- " , ' ; ' : - " -' ~ t ' : : . ~ " " . - . , / "'." . . . . " " " . - I ~ " G a ' i a , K r v l i a , K o o d O i h a r , I
"-'- • " # 4"" X" " . ' : - " : "" '-: :
::" . t y- . . . . ( - " . . . :'..'.~ :..7-.. "" Midnapur, Barrad~ J
y . " . . . , . -'-.: I . ~" ~ t~;~i
\: :::-. C i i::..~: i ~ ~- ~i~t" ~,~,, ~-.:-... ",e.-:. -,".:.~3 ~ 4. Assam .:::" , . . . : - 7 ~ r s | ~ v ~ s. ~ t ~ a ,
7. Tamil Nadu ~ ~ ' ~ 8. Kera la
• N e t w o r k S t a t i o n s
F i g u r e 2 . M e t h a n e f l u x m e a s u r e m e n t c a m p a i g n n e t w o r k s t a t i o n s i n m a j o r r i c e g r o w i n g a r e a s o f I n d i a d u r i n g
1 9 9 1 .

Tab
le 1
. P
addy
soi
l ch
arac
teri
stic
s of
MC
91 N
etw
ork
site
s
.Ix
tO
Sr.
No.
So
il T
extu
re
Net
wor
k St
atio
n\Si
tes
1. N
PL
, N
ew D
elhi
, IA
RI
Farm
s S
andy
loa
m
2. C
FR
I, D
hanb
ad,
Bih
ar
a. A
ndaw
a, A
id.
San
dy l
oam
b.
Deh
ri-o
n-so
ne,
Bih
ar
San
dy l
oam
3. C
LR
I, T
amil
Nad
u, P
udup
akka
m,
San
dy l
oam
M
adra
s
4. N
BR
I, L
uckn
ow,
U.P
., F
aiza
bad
Silt
-cla
y
5. C
RR
I, C
utta
ck,
Ori
ssa,
CR
RI
Far
ms
San
dy-c
lay
6. R
RL
Bhu
bane
shw
ar,
CR
RI
Cut
tack
S
andy
-cla
y fa
rms
7. R
RL
, Jo
rhat
, A
ssam
, R
RL
, Jo
rhat
Far
ms
Cla
y lo
am
8. R
RL
, T
riva
ndru
m,
Ker
ala,
S
andy
cla
y P
appa
nam
code
Fie
lds
9. C
RIJ
AF
, B
arra
ckpo
re,
Wes
t B
enga
l a.
Nor
th F
arm
s C
lay
b. D
evok
e C
lay
loam
c.
Koi
rapu
r C
lay
loam
10.
Kal
yani
Uni
vers
ity,
Nad
ia,
W.B
., S
andy
loa
m
Cha
rsha
rati
11.
IRPE
, U
nivs
ity
of C
alcu
tta
a. G
arag
acha
, G
aria
b.
Rag
habp
ur,
Puru
lia
--
pH
Org
anic
C
arbo
n (%
)
8.3
0.6
7.2
0.48
5.
6 1.
56
0.8
--
8.2
0.27
6.2
0.6
7.2
0.6
4.7
1.1
6.5
1.46
7.0
0.22
6.
8 0.
32
6.8
0.32
7.7
0.66
7.8
1.12
5.
0 --
Ele
c. C
ond.
(m
mho
cm
-~)
C.E
.C.
(me/
100g
) P
erce
ntag
e
San
d Si
lt
0.49
15
.2
51.5
23
.8
0.18
10
.4
- -
0.10
20
.15
- --
3.45
-
- -
0.35
-
11.0
71
.0
1.2
18.6
51
.0
22.0
1.2
18.6
51
.0
22.0
M --
14.5
-
--
N
Cla
y
24.7
M 18
.0
27.0
27.0
--
u --

Table 2. Indian paddy cultivation area (x 10 ° ha) distribution.
743
Region/State Total Area Cont. Hooded Int. Hooded Deepwater Upland (Irrigated) (Rainf~l)
Eastern Region West Bengal 5.610 1.593 2.457 0.677 0.883 Bihar 5.330 1.892 2.235 0.672 0.531 Orissa 4.390 1.440 2.109 0.150 0.691 Assam 2.430 0.525 1.590 0.100 0.215 N.E. States 0.823 0.244 0.219 0.040 0.320
Total Area 18.583 5.694 8.610 1.639 2.640
Southern Region Andhra Pradesh 4.190 2.705 1.245 0.240 - Tamil Nadu 2.010 1.417 0.593 . . . . Kamataka 1.180 0.710 . . . . 0.470 Kerala 0.570 0.238 0.017 -- 0.315 Pondicharry 0.025 -- 0.025 . . . . Andamans 0.012 -- 0.012 - --
Total Area 7.987 5.070 1.892 0.240 O. 785
Northam Region Uttar Prardesh 5.360 0.458 3.174 0.233 0.495 Punjab 1.910 1.910 . . . . . Haryana 0.620 0.620 . . . . . . Delhi 0.003 0.003 . . . . .
J & K 0.276 Himachal Pradesh 0.093 Sikkim 0.015
Total Area 8.277 3.991 3.174 0.233
0.384
0.879
Western Region Madhya Pradesh 5.040 0.912 1
I 3.377 0.322 1.669 Maharashtra 1.520 0.280 1
Gujrat 0.600 0.390 0.210 - - Dadra N.H. 0.011 - 0.011 . . . . Rajasthan 0.160 0.160 . . . . . . Goa, Daman & Diu 0.054 - 0.054 - -
Total Area Z385 1.742 3.652 0.322 1.669
GRAND TOTAL 42.232 16.497 17.328 2.434 5.973

744
3. RESULTS AND DISCUSSION
Results of mean CH4 flux values for each network site over the entire measurement period in the cropping
season are shown in Figures 3, 4, and 5. Diurnal variations of C H 4 flux data during the cropping season for
continuously flooded and intermittently flooded sites are shown in Figure 6. The duration of the cropping period,
the CI-I4 flux measurement period, the paddy variety, and the seasonal integrated CH4 flux (SIF) for each network
site are given in Table 3. Data show that CH4 flux values range between -0.64 and 84.1 mg rn2h 1. Paddies grown
in irrigated or continuously flooded areas (Figure 3a and 3b) and deep water regime categories (Figure 5) have
a much higher CH4 flux compared to rainfed areas where continuous water flooding has not been maintained
(Figure 4a and 4b). Upland paddy areas were not studied because they are assumed to emit negligible CH4 (Hogan
and Braatz, 1990; Mitra, 1991; Bolin, 1995). The observed negative CH4 flux at some points of the cropping
season (Figure 4a) in intermittently flooded fields indicates that these fields are a sink. It may be because of
frequent drying up of the soil. The CH4 is oxidized due to change from anaerobic to aerobic soil conditions with
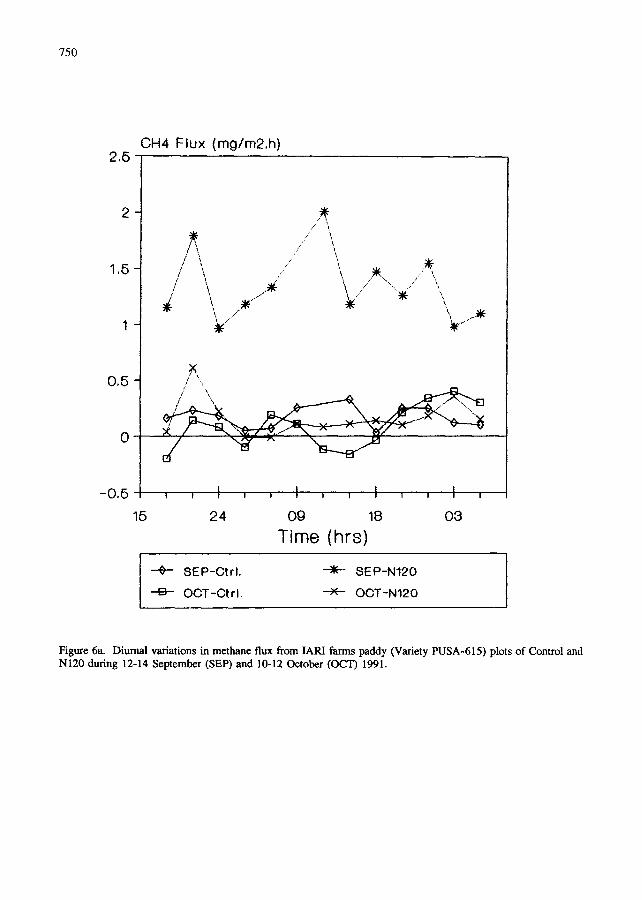
the diffusion of atmospheric oxygen into it (Keller et al., 1990). Diurnal variations in low CH4 flux Delhi sites
(Figure 6a) did not clearly show any trend as compared to the irrigated or continuously flooded site of CRRI farm
paddy fields in cuttack having higher CH4 flux, wherein (Figure 6b) it clearly indicates that emissions are greater
during the afternoon, whereas it tends to decrease from late evening to early morning. This can be attributed to
high soil temperatures in the afternoon.
The seasonal CH4 flux data at each site vary in both the channels having the same paddy variety, age and
water management practices. Therefore, the mean seasonal integrated CH4 flux (SIF) and its range were worked
out for each network site by taking the daily mean of the flux data obtained once during every week and
integrating it over the whole cropping season. Data have been extrapolated for gap periods, if any, in the cropping
season from transplantation to harvest stage, to estimate the total seasonal flux (SIF). Standard deviations from
the mean flux for one day's data every week over the cropping season are used to obtain the maximum and
minimum ranges of SIF. The SIF and its range so obtained for each network site (Table 3) were used in various
paddy cultivation ecosystems classified for estimating the CH4 budget for India (Table 4). SIF for states/union
territories not having any network station have been estimated, on the basis of assuming similar agroclimatic
conditions, by applying the mean SIF of the network stations located around that region.
The mean CH 4 SIF values obtained from five stations located at Garia, Purulia, Kalyani, North farm and
Devoke in Barrackpore were applied to the entire area in irrigated or continuously flooded category In West
Bengal (WB). The SIF from WB and Orissa stations was applied for Bihar and northern region irrigated areas of
Uttar Pradesh, Punjab, Haryana, and Delhi. The mean SIF from 3 sites in Orissa was used for paddy areas in
Orissa under this category. The SIF from the station located in Jorhat was applied to Assam and N.E. (North East)
states. The SIF for Tamil Nadu station was used for the entire southern region paddy areas of Andhra Pradesh,
Tamil Nadu, Kerala, and Kamataka. Similarly, the mean SIF of Orissa and Tamil Nadu stations was applied to
the entire western region irrigated areas of Madhya Pradesh, Maharashtra, Gujarat and Rajasthan. States, viz.,
Pondicharry, Andamans, Jammu & Kashmir, Himachal Pradesh, Sikkim, Goa Daman & Diu, and Dadar N.H., do

745
CH4 F l u x ( m g l m 2 , h ) 18
16
1,4
12
10
8
6
4
2
0
,r~
fl
I
, t
i//
L V \ t t l t't
_./ ~ ", ir', t .l~ \ ! ;l t I
z ~i \',, ~ ,,~
~ ~ , ~ . I I I I
20 40 60 80
Days Alter T r a n s p l a n l o l l o n
,o
I
0 lO0 120
:~ P u r u l l a " ( ~ N a d l a 0 D e v o k e Bkp.
A RRLB X CLRIM
Figure 3a. Seasonal methane flux from irrigated (continuously flooded) paddy water regime areas in Raghabpur Purulia (- * -) WB, Charsharati Kalyani Nadia (- [] -) WB, Devoke Barrackpore (- 0 -) WB, Cuttack RRLB (- a -) Orissa and Pudupakkam Madras (- _~ -) Tamil Nadu.

50
40
30
E]•,
i, i
20
lO
CH4 Flux (mg/m2,h) N.Farm
I !
0 20 40 120
/
; X
I \
60 80 100
Days After Transp lan tc~lon
~r G o r l a • RRLJ D N , F a r m B k p .
~- C R R I C l 0 C R R l C 2
70
60
50
40
30
20
746
0
Figure 3b. Seasonal methane flux from irrigated (continuously flooded) paddy water regime areas in Garagacha Garia (- g -) WB, RRL farms Jorhat (- * -) Assam, North farm Barrackpore (- [] -) 24 Pargana North WB, CRRI Cuttack farms plot 1 (- A -) Orissa and CRRI Cuttack farms plot 2 (- 0 -) Orissa.

747
CH4 F l u x ( m g / m 2 . h ) 1.2-r
0,8
0.6
0,4
0.2
0
-0 ,2
-0,4
..k..
0 140
[]
I I I ! I I
20 40 60 80 100 120
Days After Transplantation
A i d . 0 I A R I - C I r l . ' • I A R I - N 6 0
I A R I - N I 2 0 × I A R I - W T C
Figure 4a. Seasonal methane flux from rainfed (intermittently flooded) paddy water regime areas in Andawa Allahabad (- • -) Uttar Pradesh, IARI farms paddy plots control (- 0 -), N60 (- * -), NI20 (- I--I -) and WTC (- x -) of Delhi.

748
25
20
15
10
5
0
CH4 Flux ( m g / m 2 , h ) NBRIF
• 0 0 0 20 140
Days After
4 / ~\
! \ i i
"....
I I I I ~1
40 60 80 100 120
T r a n s p l a n t a t i o n
I 0 Dehri on Sane I RRLT ~ NBRIF J
Figure 4b. Seasonal methane flux from rainfed (intermittently flooded) paddy water regime areas in Dehri-on-sone (- 0 -) Rohtas Bihar, Pappanameode Trivandrum (- + -) Kerala and NDUAT farms Faizabab (- * -) Uttar Pradesh.

25
20
15
10
5
0 !
0 81 gO
OH4 Flux (mg/m2.h)
749
I I I I I I I I I
4 11 18 2@ 82 39 5,3 60 67
Days After Transplantation
Kolrapur Bkp. I Figure 5. Seasonal methane flux from deep water paddy regime areas in Koirapur Barrackpore (- * -) WB.
750
CH4 Flux (mgtm2.h) 2.5
1,5
_
0.5
0
-0 .5
15
/ \ / \ :
/ i ,,
..': '~ " '4 ..: \ ,.~ \~ y/ ........... .,.. ,,
, ~ . . /' ,_
, , t , , I , , I , , I ,
24 og 18 03
Time (hrs)
0 SEP-Otrl. ~ SE P - N 1 2 0
13 O O T - O t r l . X O O T - N 1 2 0
Figure 6a. Diurnal variations in methane flux from IARI farms paddy (Variety PUSA-615) plots of Control and N120 during 12-14 September (SEP) and 10-12 October (OCT) 1991.

751
20
15
10
5
0
CH4 Flux (mg/m2,h)
7
/ •
/ ~,
/ ~ / .,,,
/ \ t~ ! / ,.,.
, / \ :
o % \ ',\. /
08 11 14 17 20 23 02 05 08 11 14
T i m e ( h r s )
~ CRRI-SEP D GRRI-OCT 0 CRRI-NOV ]
Figure 6b. Diurnal variations in methane flux from CRRI Cut'tack farms paddy during 23-24 September [CRRI- SEP (- * -), Variety: Ratna], 3-4 October [CRRI-OCT(- [] -) Variety: IR-36] and 25-26 November [CRRI-NOV(- 0 -) Variety: Gayatri-CRl018] 1991.

Tab
le 3
. P
addy
crop
ping
and
CH
4 fl
ux m
easu
rem
ent
peri
ods
at M
C91
Net
wor
k St
atio
ns a
long
with
pad
dy v
arie
ty a
nd s
easo
nal
inte
grat
ed f
lux.
I'
0
Sr.
No.
C
ropp
ing
Peri
od
Mea
sure
men
t Pe
riod
Day
s Pa
ddy
Var
iety
Se
ason
al I
nteg
rate
d Fl
ux o
f C
H4
Stat
ion/
Site
s (D
ays)
D
ates
(S
IF i
n g
m -2
)
Max
imum
M
ean
Min
imum
1. R
RL
Jor
hat,
Ass
am/
106
RR
LJ
Farm
s
2. C
RR
I C
utta
ck, O
riss
a/
Cll
d
114
A12
bc
110
3. R
RI
Bhu
bane
shw
ar,
Ori
ssa/
90
C
RR
I Fa
rms
4. C
RIJ
AF
Bar
rack
pore
, W
B/
Dev
oke
110
N.
Farm
13
0 K
oira
pur
130
5. K
alya
ni U
niv.
, N
adia
WB
/ 11
0 C
hars
hara
ti
6. R
RL
Mad
ras,
Tam
il N
adu/
79
* Pu
dupa
kkam
7. R
RL
Tri
vand
rum
, K
eral
a]
73
Papp
anam
code
8. N
BR
I L
uckn
ow,
Utta
r 11
0 Pr
ades
h/
ND
UA
T,
Faiz
abad
9. C
FRI
Dha
nbad
, Bih
ar/
105
Deh
ri-o
n-So
ne
10. C
FRI-
Alla
haba
d, U
.P.
119
And
awa
20.8
to
28.1
1.91
10
1 M
ahsu
ri
62
46
32
20.8
to
19.1
0.91
61
R
atna
15
13
.2
11
20.8
to
19.1
0.91
61
A
rmad
a 10
8.
2 7
21.8
to
23.1
0.91
64
IR
-36
21
14
7
7.8
to 9
.10.
91
58
Rat
na
2.2
1.8
1 2.
8 to
11.
10.9
1 64
Pa
nkaj
80
63
47
5.
8 to
21.
10.9
1 78
D
ahar
Nag
ra
26
19
13
16.8
to
1.10
.91
53
Mas
uri
16
10.8
7
23.8
to
29.1
0.91
74
B
PT-3
402
15
11
7
7.8
to 1
8.09
.91
43
Che
ena
14
9 4
20.8
to
10.1
0.91
52
Sa
rju-
52
2.8
2 1.
3
17.9
to
24.1
1.91
69
M
ansu
ri
28
22
15
21.7
to
10.1
1.91
11
3 M
inar
0.
9 0.
52
0.15

Sr.
No.
St
atio
n/Si
tes
Cro
ppin
g Pe
riod
(D
ays)
M
easu
rem
ent
Dat
es
Peri
od D
ays
Padd
y V
arie
ty
Seas
onal
Inte
grat
ed F
lux
of C
I-I 4
(SIF
in
g m
a)
Max
imum
M
ean
Min
imum
11. N
PL-I
AR
I Del
hi/
IAR
I-C
trl.
118
IAR
I-N
60
118
IAR
I-N
I20
118
IAR
I-W
TC
11
8
12. I
RPE
, Uni
v. o
f C
alcu
tta,
Cal
cutta
, W.B
./ G
arag
acha
Gar
ia
100
Rag
habp
ur
85
18.7
to 1
.11.
91
18.7
to 1
.11.
91
18.7
to 1
.11.
91
18.7
to 1
.11.
91
8.9
to 2
4.11
.91
20.9
to 1
4.11
.91
106
Pusa
-615
0.
3 0.
16
0.08
10
6 Pu
sa-6
15
0.07
0.
06
0.05
10
6 Pu
sa-6
15
0.76
0.
58
0.45
10
6 Pu
sa-6
15
0.07
0.
06
0.05
78
Fine
40
29
18
56
Fi
ne
15
11
7
* M
easu
rem
ents
dis
cont
inue
d du
e to
cyc
loni
c de
stru
ctio
n.
t.h

Tab
le 4
. M
etha
ne B
udge
t E
stim
ates
fro
m I
ndia
n P
addy
Fie
lds
Are
as/R
egio
ns/S
tate
s
1. E
AST
ER
N R
EG
ION
a)
Wes
t B
enga
l
b) B
ihar
c)
OrL
~sa
d) A
ssam
e)
N.E
. St
ates
Padd
y C
ultiv
atio
n A
rea
(Mha
) (I
rr.
or C
ont.
Fld.
)
Inte
grat
ed S
easo
nal
CH
4 Fl
ux
(SIF
edm
2)
Max
M
ean
Min
.
Tot
al M
etha
ne E
mis
sion
fig
/Y)
Max
. M
ean
Min
.
1.59
3 30
.6
23.1
16
0.
49
0.37
0.
26
1.89
2 24
.9
18.9
13
.1
0.47
0.
36
0.25
1.
440
15.3
11
.8
8.3
0.22
0.
17
0.12
0.
525
62
46
32
0.33
0.
24
0.17
0.
244
62
46
32
0.15
0.
11
0.08
15
11
7 0.
62
0.45
15
11
7 0.
14
0.10
24.9
18
.9
13.1
1.
03
0.75
15.3
11
.6
8 0.
27
0.20
26
19
13
5.9
4.3
2.6
NIL
I I
2. S
OU
TH
ER
N R
EG
ION
a)
And
lara
Pra
desh
2.
705
1 b)
Tam
il N
adu
1.41
7 I
c) K
eral
a 0.
238
1 cO
Kam
atak
a 0.
710
1
3. N
OR
TH
ER
N R
EG
ION
a)
Utta
rpra
de,s
h 1.
458
I b)
Pun
jab
1.91
0 1
c) Har
yana
0.
620
d) Delhi
0.003
1
4. W
EST
ER
N R
EG
ION
a)
Mad
hya
Prad
esh
0.91
2 1
b) M
ahar
asht
ra
0.28
0 1
c) G
ujar
at
0.39
0 1
d) R
aja~
.han
0.160
1
TOTA
L 16.497
5. All dee
p water areas
2.434
6. All rainfed or inter-
17.328
mit
tent
ly i
rrig
ated
are
as
7.
Upl
and
area
s 5.
973
GR
AN
D T
OT
AL
42
.232
3.72
2.
83
0.63
0.
46
1.02
0.
75
5.37
[
Ref
eren
ce S
tati
ons
for
Ext
rapo
lati
ons
NIL
4.04
[
(Tab
le 2
)
Ave
. of
Gar
ia,
Puru
lia,
Kal
yani
, N
. Fa
rm,
and
Dev
oke
Ave
. of
W.B
. &
Ori
ssa
Site
s A
ve.
of R
RL
B,
CR
RIC
I, C
RR
IC2
RR
LJ
RR
LJ
2.67
0.29
C
LR
IM
0.07
C
LR
IM
0.52
A
ve.
of W
.B.
& O
riss
a St
n.
0.14
A
ve.
of O
riss
a &
CL
RIM
Sin
.
1.90
0.32
K
oira
pur
(W.B
.)
0.45
A
ve.
of D
ehri
-on-
Sone
, RR
LT
, N
BR
IF,
Aid
. &
4 s
ites
of D
elhi
IPC
C,
1992

755
not have any paddy cultivation in the irrigated category. East India receives maximum rainfall in the Indian sub-
continent, and with irrigation it leads to longer inundation periods of the paddy fields, which helps in generating
the sustainable anaerobic environment for methanogenesis and explains observed high CI-L flux. The range of SIF
in the continuously flooded or irrigated category varies between 7 to 62 gm a, and its budget estimate has a mean
of 2.83 TgY 1 with a range between 1.9 to 3.72 TgY m (Table 4). The large ranges of SIF can be due to varying
hydrological conditions from place to place not only in different sustainable flooding depth but in the flooding
duration as well, apart from low or high soil organic carbon, soil temperature, and paddy cultivar.
The Koirapore site in Barrackpore WB (Figure 5), which has a water depth of the order of 50 cm,
represents the paddy water regime category of semi-deep (30 to 50 cms)/deep water (>50 cms) (IRRI, 1994). The
SIF value of 19 gm z with a range 13 to 26 gm "z from this site was applied to all Indian deep water paddy areas.
This has led to its CI-~ budget estimate of 0.46 TgY 1 with a range between 0.32 and 0.63 TgY l for the deep and
semi-deep water regime.
The Andawa paddy field of Allahabad (Aid.) and NDUAT farms paddy fields of Faizabad (NBRIF) in UP,
Dehri-on-sone in Bihar, Pappanamcode Trivandrum (RRLT) in Kerala, and four IARI farm paddy field sites (Ctrl.,
N60, N120 and WTC) in Delhi represent intermittently flooded or rainfed areas because of non-continuous
flooding of these fields (Figure 4a and 4b). Three of the four IARI farm sites in Delhi have nitrogen fertilizer
treatment as Urea @ 0, 60 and 120 Kg Ha~(Ctd., N60 and N120), and the fourth site at Water Technology Centre
(WTC) paddy plots is without any fertilizer. CH4 fluxes were low in these four sites including negative fluxes
at some stages in the cropping season (Figure 4a). The SIF for the Bihar site was calculated by extrapolating the
CH 4 emission up to the date of transplantation (DOT) from the measurement period of 67 to 135 DAT (by
doubling the integrated emission for measured half cropping period, which includes the pre-flowering stage to the
harvest stage) and may be on the higher side. The mean SIF of all intermittently flooded stations were applied
in estimation of the CH4 budget from paddy fields under rainfed or intermittently flooded categories (Table 4).
The range of SIF under this paddy water regime is between 2.6 to 5.9 grn z, and the CH 4 budget estimate ranges
between 0.45 and 1.02 TgY -~.
Previous studies in Texas and California in USA, in Spain, and in Italy, etc., have ranges of SIF values
in continuously flooded fields within 10-50 gm "2 and are comparable to our measurements (Cicerone and Shetter,
1981; Holzapfel-Pschom and Seiler, 1986; Schutz et al., 1989; Sass et al., 1990). Uncertainities in the budget
estimates come from the lack of a sufficient database on CH4 flux from different paddy ecosystems and also from
differences in classification methodology of rice land areas. Accurate statistics on paddy cultivation area
distribution based on flooding duration and depth, which is an important parameter among the various factors
influencing methane production and emission, need to be developed.
4. CONCLUSIONS
The total CH4 budget worked out for different Indian paddy cultivation water regimes, viz., continuously
flooded (irrigated), intermittently flooded (rainfed), and deep water categories, is between 2.7 to 5.4 TgY ~ with
a mean of around 4.0 TgY ~, close to our earlier estimates of 3.0 TgY ~. This value is an order of magnitude low

756
as reported earlier by IPCC, and the consequence of these low values is that the global CI-L emissions from
paddies are probably lower than the mean value of 60 TgY ~ used in the IPCC 1992 update.
ACKNOWLEDGEMENTS
The authors are grateful to Dr. E.S.R. Gopal, Director, NPL, and Dr. K. Lal, head material characterization
division, NPL, for their keen interest in this work. The financial support from the Ministry of Environment &
Forests (MoEF), the Government of India, and technical help from the National Council of Science Museums,
Calcutta, are gratefully acknowledged. Kind help for intercomparison and calibration from Dr. P.J. Crutzen, Max
Plank institute of chemistry, Mainz, Germany, Dr. K. Minami, NIAES, Tsukuba, Japan, and Dr. P. Fraser and Dr.
P. Steele, CSIRO, Australia, is gratefully acknowledged. The benefit of discussions with Prof. M.A.K. Khalil,
Department of Physics, Portland State University, Oregon, USA, is gratefully acknowledged.
REFERENCES
Bolin, B., S.J. Houghton, and L.G.M. Filho (1994), Radiative Forcing of Climate Change: The 1994 report of the Scientific Assessment Working Group oflPCC - Summary for Policymakers, IPCC-WMO/UNEP, Geneva., p. 18.
Bolin, B. (1995), IPCC Guidelines for National Greenhouse Gas Inventories: Reference Manual, OECD Environment Directorate, Paris, France, p. 4.51-4.59.
Central Seed Committee publication (1985), Handbook on Cultivars (Dept. of Agr. Cooperation, Ministry of Agr. & Rural Development, New Delhi), p. 8-11.
Cicerone, R.J., and J.D. Shetter (1981), Sources of atmospheric methane: Measurements in rice paddies and a discussion, J. Geophys. Res., 86, 7203-7209.
Cicerone, R.J., and R.S. Oremland (1988), Biogeochemical aspects of atmospheric methane, Global Biogeochemical Cycles, 2(4), 299-327.
Environmental Protection Agency (1990), Methane Emissions and Opportunities for Control, EPA[40019-90]O07, US EPA, Washington DC.
Gupta, P.C., and J.C.O. Toole (1986), Upland Rice: A Global Perspective, IRRI, Phillipines, p. 2-5.
Hogan, K., and B. Braatz (1990), Sustainable Rice Productivity and Methane Reduction: Research Plan (EPA Was :hington D.C.), p. 12-14.
Hogan, K., J.S. Hoffman, and A.M. Thompson (1991), Methane on the Greenhouse Agenda, Nature 354, 181-182.
Holzapfel-Pschom, A., and W. Seiler (1986), Methane emission during a cultivation period from an Italian rice paddy,./. Geophys. Res., 91, 11803-11814.
Houghton, J.T., G.J. Jenkins, and J.J. Ephraums (ed.) (1990), Climate Change: The IPCC Scientific Assessment, Cambridge University Press, p. 44-56.
IRRI (1984), Terminology for Rice Growing Environments, Published by International Rice Research Institute, Los Banos, Laguna, Manila, Philippines, p. 5-16.
IRRI (1986), Progress in Rainfed Lowland Rice, published by International Rice Research Institute, Los Banos,

757
Philippines, p. 4, 28, 124, and 398.
IRRI Rice Almanac (1993), Published by International Rice Research Institute, Los Banos, Philippines, p. 55-57.
Keller, M., M.E. Mitre, and R.F. Stallard (1990), Consumption of atmospheric methane in soils of central Panama: Effects of agricultural development, Global Biogeochemical Cycles, 4, 21-27.
Khalil, M.A.K., R.A. Rasmussen, M.-X. Wang, and L. Ren (1991), Methane emissions from rice fields in China, Environ. Sci. Technol., 25(5), 979-981.
Ministry of Agriculture (1990), All India Final Estimates of Rice: 1989-1990.
Mitra, A.P. (ed.) (1991), Global Change: Greenhouse Gas Emissions in India - A Preliminary Report, No.l, PID CSIR, p. 18-21.
Mitra, A.P. (Ed.) (1992), Global Change: Greenhouse Gas Emissions in India - 1991 Methane Campaign, No.2, PID CSIR, p. 11-14.
OECD final report (1991), Estimation of Green House Gases and Sinks, p. 5-36 and 5-43.
Parashar, D.C., J. Rai, Prabhat K. Gupta, and N. Singh (1991), Parameters affecting methane emission from paddy fields, Indian J. Radio & Space Phys., 20, 12-17.
Parashar, D.C., Prabhat K. Gupta, J. Rai, R.C. Sharma, and N. Singh (1993), Effect of soil tempemaxre on methane emission from paddy fields, Chemosphere 26, 247-250.
Saha, A.K., J. Rai, V. Raman, R.C. Sharma, D.C. Parashar, S.P. Sen, and B. Sarkar (1989), Methane emission from inundated fields in a monsoon region, Indian J. Radio & Space Phys. 18, 215-217.
Sass, R.L., F.M. Fisher, P.A. Harcombe, and F.T. Turner (1990), Methane production and emission in a Texas rice field, Global Biogeochemical Cycles, 4, 47-68.
Schutz, H., A. Holzapfel-Pschorn, R. Conrad, H. Rennenberg, and W. Seiler (1989), A three year continuous record on the influence of daytime, season and fertilizer treatment on methane emission rates from an Italian rice paddy field, J. Geophys. Res., 94, 405-416.
Steele, L.P., E.J. Dlugokencky, P.M. l_ang, P.P. Tans, R.C. Martin, and K.A. Mamrie (1992), Slowing down of the global accumulation of atmospheric methane during the 1980s, Nature 358, 313-316.
Yagi, K., and K. Minarni (1990), Effect of organic matter application on methane emission from Japanese paddy fields, Soil Science Plant Nutr., 36, 599-610.