White matter integrity and cognition in chronic traumatic brain injury: a diffusion tensor imaging...
12
White matter integrity and cognition in chronic traumatic brain injury: a diffusion tensor imaging study Marilyn F. Kraus, 1,2,7 Teresa Susmaras, 2,8 Benjamin P. Caughlin, 2,8,9 Corey J. Walker, 2,8 John A. Sweeney 1,2,3,4,7 and Deborah M. Little 2,3,5,6,7,8 1 Department of Psychiatry, 2 Department of Neurology, 3 Department of Psychology, 4 Department of Bioengineering, 5 Department of Anatomy, 6 Department of Ophthalmology, 7 Center for Cognitive Medicine, 8 Center for Stroke Research, University of Illinois at Chicago Medical Center, Chicago, IL and 9 Wayne State University School of Medicine, Detroit, MI, USA Correspondence to: Dr Marilyn F. Kraus, MD, Center for Cognitive Medicine and Department of Psychiatry, University of Illinois College of Medicine, 912 South Wood Street, MC 913, USA E-mail: [email protected] Traumatic brain injury (TBI) is a serious public health problem. Even injuries classified as mild, the most common, can result in persistent neurobehavioural impairment. Diffuse axonal injury is a common finding after TBI, and is presumed to contribute to outcomes, but may not always be apparent using standard neuroimaging. Diffusion tensor imaging (DTI) is a more recent method of assessing axonal integrity in vivo . The primary objective of the current investigation was to characterize white matter integrity utilizing DTI across the spectrum of chronic TBI of all severities. A secondary objective was to examine the relationship between white matter integrity and cognition. Twenty mild, 17 moderate to severe TBI and 18 controls underwent DTI and neuropsychological testing. Fractional anisotropy, axial diffusivity and radial diffusivity were calculated from the DTI data. Fractional anisotropy was the primary measure of white matter integrity. Region of interest analysis included anterior and posterior corona radiata, cortico-spinal tracts, cingulum fibre bundles, external capsule, forceps minor and major, genu, body and splenium of the corpus callosum, inferior fronto-occipital fasciculus, superior longitudinal fasciculus and sagittal stratum. Cognitive domain scores were calculated from executive, attention and memory testing. Decreased fractional anisotropy was found in all 13 regions of interest for the moderate to severeTBI group, but only in the cortico-spinal tract, sagittal stratum and superior longitudinal fasciculus for the mild TBI group. White Matter Load (a measure of the total number of regions with reduced FA) was negatively correlated with all cognitive domains. Analysis of radial and axial diffusivity values suggested that all severities of TBI can result in a degree of axonal damage, while irreversible myelin damage was only apparent for moderate to severe TBI. The present data emphasize that white matter changes exist on a spectrum, including mild TBI. An index of global white matter neuropathology (White Matter Load) was related to cognitive function, such that greater white matter pathology predicted greater cognitive deficits. Mechanistically, mild TBI white matter changes may be primarily due to axonal damage as opposed to myelin damage. The more severe injuries impact both. DTI provides an objective means for determining the relationship of cognitive deficits to TBI, even in cases where the injury was sustained years prior to the evaluation. Keywords: traumatic brain injury; diffusion tensor imaging; white matter fibre tracts; fractional anisotropy; diffuse axonal injury; MRI Abbreviations: DTI ¼ diffusion tensor imaging; FA ¼ fractional anisotropy; TBI ¼ traumatic brain injury; MTBI ¼ mild traumatic brain injury; M/STBI ¼ moderate to severe traumatic brain injury; DAI ¼ diffuse axonal injury; k¼ axial diffusivity; ? ¼ radial diffusivity; ¼ eigenvalues; ACR ¼ anterior corona radiata; PCR ¼ posterior corona radiata; CST ¼ corticospinal tracts; Cing, cingulum fibres; fMin ¼ forceps minor; fMaj ¼ forceps major; bCC ¼ body of the corpus callosum; gCC ¼ genu of the corpus callosum; sCC ¼ splenium of the corpus callosum; IFO ¼ inferior fronto-occipital fasciculus; SLF ¼ superior long- itudinal fasciculus; ExCap ¼ external capsule; SS ¼ sagittal stratum Received June 28, 2007 . Revised August 14, 2007 . Accepted August 16, 2007 . Advance Access publication September 14, 2007 doi:10.1093/brain/awm216 Brain (2007), 130, 2508^2519 ß The Author (2007). Published by Oxford University Press on behalf of the Guarantors of Brain. All rights reserved. For Permissions, please email: [email protected] by guest on February 1, 2016 http://brain.oxfordjournals.org/ Downloaded from
-
Upload
independent -
Category
Documents
-
view
1 -
download
0
Transcript of White matter integrity and cognition in chronic traumatic brain injury: a diffusion tensor imaging...
White matter integrity and cognition in chronictraumatic brain injury: a diffusion tensor imaging studyMarilyn F. Kraus,1,2,7 Teresa Susmaras,2,8 Benjamin P.Caughlin,2,8,9 Corey J.Walker,2,8 John A. Sweeney1,2,3,4,7
and Deborah M. Little2,3,5,6,7,8
1Department of Psychiatry, 2Department of Neurology, 3Department of Psychology, 4Department of Bioengineering,5Department of Anatomy, 6Department of Ophthalmology, 7Center for Cognitive Medicine, 8Center for StrokeResearch, University of Illinois at Chicago Medical Center, Chicago, IL and 9Wayne State University School of Medicine,Detroit, MI, USA
Correspondence to: Dr Marilyn F. Kraus, MD, Center for Cognitive Medicine and Department of Psychiatry, University ofIllinois College of Medicine, 912 SouthWood Street, MC 913, USAE-mail: [email protected]
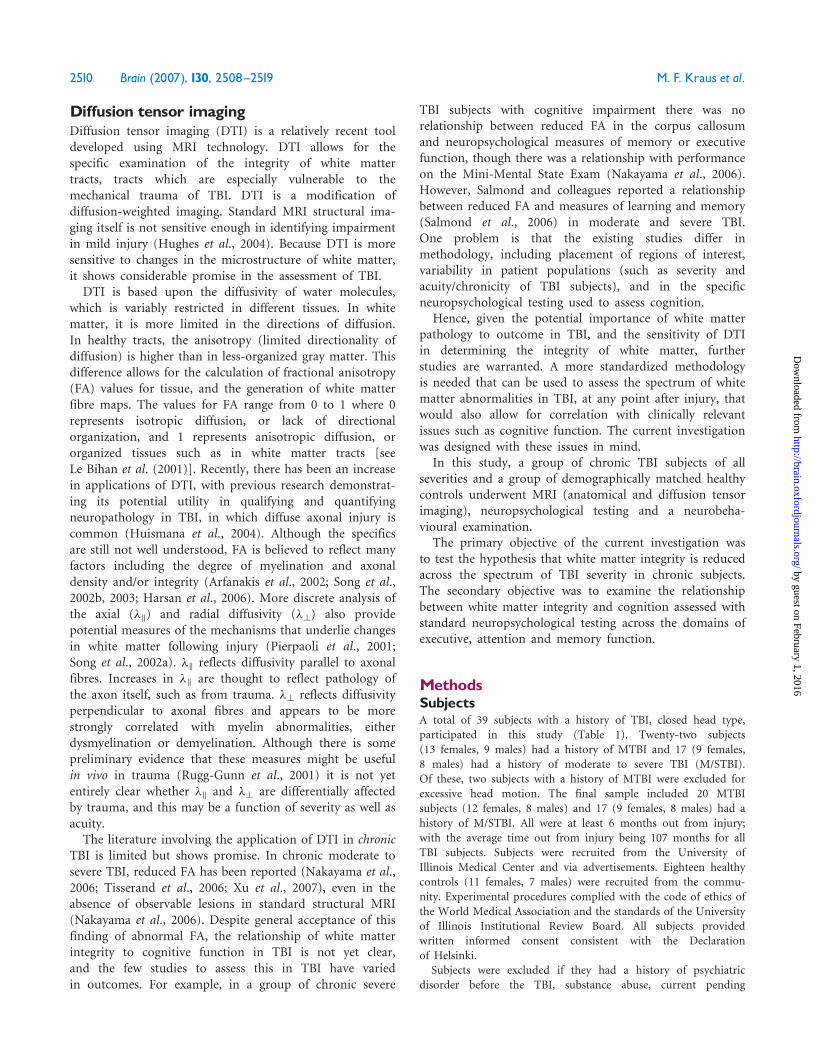
Traumatic brain injury (TBI) is a serious public health problem. Even injuries classified as mild, the mostcommon, can result in persistent neurobehavioural impairment. Diffuse axonal injury is a common findingafter TBI, and is presumed to contribute to outcomes, but may not always be apparent using standardneuroimaging. Diffusion tensor imaging (DTI) is a more recent method of assessing axonal integrity in vivo.The primary objective of the current investigation was to characterize white matter integrity utilizing DTIacross the spectrum of chronic TBI of all severities. A secondary objective was to examine the relationshipbetween white matter integrity and cognition. Twenty mild, 17 moderate to severe TBI and 18 controlsunderwent DTI and neuropsychological testing. Fractional anisotropy, axial diffusivity and radial diffusivitywere calculated from the DTI data. Fractional anisotropy was the primary measure of white matter integrity.Region of interest analysis included anterior and posterior corona radiata, cortico-spinal tracts, cingulum fibrebundles, external capsule, forceps minor and major, genu, body and splenium of the corpus callosum, inferiorfronto-occipital fasciculus, superior longitudinal fasciculus and sagittal stratum. Cognitive domain scores werecalculated from executive, attention and memory testing. Decreased fractional anisotropy was found in all13 regions of interest for the moderate to severeTBI group, but only in the cortico-spinal tract, sagittal stratumand superior longitudinal fasciculus for the mild TBI group.White Matter Load (a measure of the total numberof regions with reduced FA) was negatively correlated with all cognitive domains. Analysis of radial and axialdiffusivity values suggested that all severities of TBI can result in a degree of axonal damage, while irreversiblemyelin damage was only apparent for moderate to severeTBI.The present data emphasize that white matterchanges exist on a spectrum, includingmild TBI. An index of globalwhitematter neuropathology (White MatterLoad) was related to cognitive function, such that greater white matter pathology predicted greater cognitivedeficits. Mechanistically, mild TBI white matter changes may be primarily due to axonal damage as opposed tomyelin damage. The more severe injuries impact both. DTI provides an objective means for determiningthe relationship of cognitive deficits to TBI, even in cases where the injury was sustained years prior to theevaluation.
Keywords: traumatic brain injury; diffusion tensor imaging; white matter fibre tracts; fractional anisotropy;diffuse axonal injury; MRI
Abbreviations: DTI¼diffusion tensor imaging; FA¼ fractional anisotropy; TBI¼ traumatic brain injury; MTBI¼mildtraumatic brain injury; M/STBI¼moderate to severe traumatic brain injury; DAI¼diffuse axonal injury; �k¼ axial diffusivity;�?¼ radial diffusivity; �¼ eigenvalues; ACR¼ anterior corona radiata; PCR¼posterior corona radiata; CST¼ corticospinaltracts; Cing, cingulum fibres; fMin¼ forceps minor; fMaj¼ forceps major; bCC¼ body of the corpus callosum; gCC¼ genu ofthe corpus callosum; sCC¼ splenium of the corpus callosum; IFO¼ inferior fronto-occipital fasciculus; SLF¼ superior long-itudinal fasciculus; ExCap¼ external capsule; SS¼ sagittal stratum
Received June 28, 2007. Revised August 14, 2007. Accepted August 16, 2007. Advance Access publication September 14, 2007
doi:10.1093/brain/awm216 Brain (2007), 130, 2508^2519
� The Author (2007). Published by Oxford University Press on behalf of the Guarantors of Brain. All rights reserved. For Permissions, please email: [email protected]
by guest on February 1, 2016http://brain.oxfordjournals.org/
Dow
nloaded from

IntroductionTraumatic brain injury (TBI) of all severities is a significantpublic health problem with an incidence between 180 and500 per 100 000 population per year (Bruns and Hauser,2001, 2003; Bazarian et al., 2005). Recently the numbers ofsoldiers returning from military conflicts with TBI hascreated a clinical crisis for the United States VeteransAdministration Hospitals (Taber et al., 2006). In addition,greater public attention is finally being paid to theproblems of athletes with persistent problems secondaryto TBI (Guskiewicz et al., 2000; Pellman et al., 2004). Takentogether, the burden on healthcare systems for both civilianand military TBI is large.TBI is clinically rated as mild, moderate or severe
based on acute TBI variables that include duration of lossof consciousness (LOC), Glasgow Coma Score (GCS)and post-traumatic amnesia (PTA) (Levin et al., 1979).Mild TBI (MTBI) is the most common severity, with arecent WHO task force reporting that 70–90% of all treatedTBI fell into this category (Holm et al., 2005).Neurobehavioural deficits, especially in cognition, are
often the cause of significant disability after TBI (CDC,2003). Observed cognitive changes that follow TBI caninclude decreased mental flexibility, trouble shifting sets,impaired attention, poor planning, lack of organization,problems with sequencing, impaired judgment, deficits inverbal fluency, problems with working memory, as wellas increased impulsivity (Levin and Kraus, 1994; Miller,2000; Godefroy, 2003). Determining the extent of clinicallyrelevant neuropathology (defined as neuropathology asso-ciated with persistent neurobehavioural deficits) associatedwith TBI, particularly in the milder spectrum, is proble-matic. As such, there is a need for objective andquantifiable measures of neuropathology that can beapplied to all severities of TBI for the purpose ofdetermining the relationship between trauma and persistentdisability. This methodology would provide the foundationfor more accurate injury severity grading, prognosisand treatment planning without having to rely on oftenincomplete or inaccurate historical data that has been usedas predictors of outcomes including LOC, PTA and GCS.
Pathophysiology of TBIThere are several significant pathophysiologic sequelae ofTBI that are likely important to neurobehavioural outcome,including the location and severity of the injury, diffuseeffects and secondary mechanisms of injury. Primaryneurologic injury due to TBI can be direct and/or indirect.Contusions are common following TBI, and can directlydisrupt function in both cortical and sub-cortical regions.Certain brain regions may be more vulnerable to contusionfollowing trauma, such as the frontal and anterior temporalcortices, due to their position within the skull (Adamset al., 1980; Levin et al., 1992). Disruption of function canalso result from more diffuse damage to white matter tracts
that are particularly susceptible to the shearing forces thatoften occur with TBI (Graham et al., 2002). Such diffuseaxonal injury (DAI) can disrupt critical cortical-subcorticalpathways and lead to widespread cognitive dysfunction(Gennarelli et al., 1982; Povlishok, 1992). DAI can resultdirectly from the trauma, or secondary due to ischaemia.Brain oedema and shift can compromise blood supplyand lead to secondary infarction in the corpus callosumand deep grey matter, and elevated intracranial pressure(ICP) can cause damage to the brainstem in TBI (Grahamet al., 1987). And although the diagnosis of DAI can onlybe clearly confirmed by microscopic examination, it may beinferred from specific neuroimaging findings such ashaemorrhages in the corpus callosum or areas of rostralbrainstem (Geddes, 1997; Geddes et al., 1997).
DAI may be the only significant pathology found incertain cases of TBI, and has been identified via directpathological studies as well as neuroimaging in mildTBI (Povlishock et al., 1983; Graham et al., 1989;Blumbergs et al., 1994; Goodman, 1994; Mittl et al., 1994;Aihara et al., 1995; Blumbergs et al., 1995; Gennarelli, 1996;Inglese et al., 2005b). Changes in white matter, observed ashyperintense T2 signal, have been observed in mild TBI(Inglese et al., 2005a, b). These lesions have been reportedprimarily in the corpus callosum, internal capsule, andcentrum semiovale (Inglese et al., 2005b). Another issue isthe specificity of lesion type and the clinical relevance ofthese lesions found in mild TBI. Kurca and colleaguesreported that mild TBI subjects with defined traumaticlesions (including both gray and white matter) showedsignificantly greater impairment on neuropsychologicalevaluations and subjective reports of symptoms consistentwith postconcussion syndrome (Kurca et al., 2006).
As would be expected, as injury severity increases,the pathophysiology identified on MRI also increases.For example, chronic moderate to severe TBI has beenrelated to atrophy in the corpus callosum. The degreeof atrophy in the corpus callosum did appear to be relatedto behavioural measures of reaction time (althoughnot significantly) (Mathias et al., 2004). In chronic(at least 3 months post injury) severe TBI, increasedatrophy was reported in the corpus callosum, fornix,anterior limb of the internal capsule, superior frontalgyrus, para-hippocampal gyrus, optic radiations and opticchiasma (Tomaiulo et al., 2005). There were only modestcorrelations between atrophy of the corpus callosum andmemory function (Tomaiulo et al., 2005).
Although there is some evidence to suggest that standardT1- or T2-weighted anatomic MR imaging showspromise for quantifying pathophysiology in TBI, it maynot be as sensitive to the neuropathology of milder injuries(Hughes et al., 2004). The limitation of standard imagingis highlighted by modest relationships between cognitivefunction and standard anatomic imaging findings.Diffusion tensor imaging is a very promising methodologyin this regard.
Diffusion tensor imaging in brain injury Brain (2007), 130, 2508^2519 2509
by guest on February 1, 2016http://brain.oxfordjournals.org/
Dow
nloaded from
Diffusion tensor imagingDiffusion tensor imaging (DTI) is a relatively recent tooldeveloped using MRI technology. DTI allows for thespecific examination of the integrity of white mattertracts, tracts which are especially vulnerable to themechanical trauma of TBI. DTI is a modification ofdiffusion-weighted imaging. Standard MRI structural ima-ging itself is not sensitive enough in identifying impairmentin mild injury (Hughes et al., 2004). Because DTI is moresensitive to changes in the microstructure of white matter,it shows considerable promise in the assessment of TBI.DTI is based upon the diffusivity of water molecules,
which is variably restricted in different tissues. In whitematter, it is more limited in the directions of diffusion.In healthy tracts, the anisotropy (limited directionality ofdiffusion) is higher than in less-organized gray matter. Thisdifference allows for the calculation of fractional anisotropy(FA) values for tissue, and the generation of white matterfibre maps. The values for FA range from 0 to 1 where 0represents isotropic diffusion, or lack of directionalorganization, and 1 represents anisotropic diffusion, ororganized tissues such as in white matter tracts [seeLe Bihan et al. (2001)]. Recently, there has been an increasein applications of DTI, with previous research demonstrat-ing its potential utility in qualifying and quantifyingneuropathology in TBI, in which diffuse axonal injury iscommon (Huismana et al., 2004). Although the specificsare still not well understood, FA is believed to reflect manyfactors including the degree of myelination and axonaldensity and/or integrity (Arfanakis et al., 2002; Song et al.,2002b, 2003; Harsan et al., 2006). More discrete analysis ofthe axial (�k) and radial diffusivity (�?) also providepotential measures of the mechanisms that underlie changesin white matter following injury (Pierpaoli et al., 2001;Song et al., 2002a). �k reflects diffusivity parallel to axonalfibres. Increases in �k are thought to reflect pathology ofthe axon itself, such as from trauma. �? reflects diffusivityperpendicular to axonal fibres and appears to be morestrongly correlated with myelin abnormalities, eitherdysmyelination or demyelination. Although there is somepreliminary evidence that these measures might be usefulin vivo in trauma (Rugg-Gunn et al., 2001) it is not yetentirely clear whether �k and �? are differentially affectedby trauma, and this may be a function of severity as well asacuity.The literature involving the application of DTI in chronic
TBI is limited but shows promise. In chronic moderate tosevere TBI, reduced FA has been reported (Nakayama et al.,2006; Tisserand et al., 2006; Xu et al., 2007), even in theabsence of observable lesions in standard structural MRI(Nakayama et al., 2006). Despite general acceptance of thisfinding of abnormal FA, the relationship of white matterintegrity to cognitive function in TBI is not yet clear,and the few studies to assess this in TBI have variedin outcomes. For example, in a group of chronic severe
TBI subjects with cognitive impairment there was norelationship between reduced FA in the corpus callosumand neuropsychological measures of memory or executivefunction, though there was a relationship with performanceon the Mini-Mental State Exam (Nakayama et al., 2006).However, Salmond and colleagues reported a relationshipbetween reduced FA and measures of learning and memory(Salmond et al., 2006) in moderate and severe TBI.One problem is that the existing studies differ inmethodology, including placement of regions of interest,variability in patient populations (such as severity andacuity/chronicity of TBI subjects), and in the specificneuropsychological testing used to assess cognition.
Hence, given the potential importance of white matterpathology to outcome in TBI, and the sensitivity of DTIin determining the integrity of white matter, furtherstudies are warranted. A more standardized methodologyis needed that can be used to assess the spectrum of whitematter abnormalities in TBI, at any point after injury, thatwould also allow for correlation with clinically relevantissues such as cognitive function. The current investigationwas designed with these issues in mind.
In this study, a group of chronic TBI subjects of allseverities and a group of demographically matched healthycontrols underwent MRI (anatomical and diffusion tensorimaging), neuropsychological testing and a neurobeha-vioural examination.
The primary objective of the current investigation wasto test the hypothesis that white matter integrity is reducedacross the spectrum of TBI severity in chronic subjects.The secondary objective was to examine the relationshipbetween white matter integrity and cognition assessed withstandard neuropsychological testing across the domains ofexecutive, attention and memory function.
MethodsSubjectsA total of 39 subjects with a history of TBI, closed head type,participated in this study (Table 1). Twenty-two subjects
(13 females, 9 males) had a history of MTBI and 17 (9 females,8 males) had a history of moderate to severe TBI (M/STBI).Of these, two subjects with a history of MTBI were excluded forexcessive head motion. The final sample included 20 MTBIsubjects (12 females, 8 males) and 17 (9 females, 8 males) had a
history of M/STBI. All were at least 6 months out from injury;with the average time out from injury being 107 months for allTBI subjects. Subjects were recruited from the University ofIllinois Medical Center and via advertisements. Eighteen healthycontrols (11 females, 7 males) were recruited from the commu-
nity. Experimental procedures complied with the code of ethics ofthe World Medical Association and the standards of the Universityof Illinois Institutional Review Board. All subjects providedwritten informed consent consistent with the Declarationof Helsinki.Subjects were excluded if they had a history of psychiatric
disorder before the TBI, substance abuse, current pending
2510 Brain (2007), 130, 2508^2519 M. F. Kraus et al.
by guest on February 1, 2016http://brain.oxfordjournals.org/
Dow
nloaded from
litigation or any other neurological or medical condition that
could result in cognitive changes (e.g. severe hypertension,
diabetes). Subjects were not receiving any treatments for cognitive
deficits at the time of the study, pharmacological or otherwise.
The criteria used for defining MTBI, set forth by the American
Congress of Rehabilitation Medicine (Medicine, 1993), are as
follows: MTBI is diagnosed when at least one of the following
criteria is met (1) any period of loss of consciousness; (2) any loss
of memory for events immediately before or after the accident;
(3) any alteration in mental state at the time of the accident
(e.g. feeling dazed, disoriented or confused) and (4) focal
neurological deficit(s) that may or may not be transient
(Medicine, 1993; Cassidy et al., 2004), For this study, subjects
were categorized as moderate or greater severity TBI if the LOC
was greater than 30min and/or the GCS was less than 13
(Levin et al., 1992; Medicine, 1993; Cassidy et al., 2004; Tagliaferri
et al., 2006). These criteria allowed the separation of MTBI from
moderate to severe TBI for the purposes of the present study.
For the MTBI group, the average reported LOC was 0.1 h
(range¼ 0–0.50 h), for the M/STBI group average LOC was
213.5 h (range¼ 0.25–1440 h). Data on acute TBI variables such
as LOC were collected by medical record when available and by
subject and family report. For the MTBI cases, all except one (who
met criteria for mild TBI by history with positive LOC but did not
seek immediate attention) were seen and diagnosed acutely at an
ER or outpatient setting.In terms of clinical details concerning the index traumatic
event, for many of the cases the TBI was the primary diagnosis at
the time of their injury. Five MTBI and five M/STBI cases
had associated injuries (traumatic injuries other than the TBI).
Of these, most were fractures of the clavicle or an extremity.
The most common mechanisms of injury were motor vehicle
accidents (17 subjects). The remainder included bicycle accidents,
blunt head trauma and falls. On the neurological exam (exclusive
of cognitive testing) done at the time of evaluation, only eight
TBI subjects (two MTBI, six M/STBI) showed abnormalities,
which were primarily soft signs such as mildy unsteady tandem
gait. Of the MTBI group, all but two were employed or in school
at the time of evaluation; all but three of the M/STBI group were
either employed or in school at the time of evaluation.Healthy controls were excluded if they had any history of
psychiatric illness or TBI, substance abuse/dependency or a history
of significant medical or neurological illness that would be
associated with significant changes in the brain, such as diabetes,seizures or stroke. The healthy control group was not significantlydifferent from the TBI groups in age or years of education(Table 1). The controls and MTBI groups were not significantlydifferent in estimates of premorbid IQ (Table 1). The M/STBIdid differ from the controls in terms of premorbid IQ estimates.The M/STBI group did not differ from MTBI in age at the timeof injury.
DTI data acquisitionStudies were acquired on a 3.0-Tesla whole body scanner(Signa VHi, General Electric Medical Systems, Waukesha, WI)using a customized DTI pulse sequence with a quadrature headcoil. The sequence is based on a single-shot EPI pulse sequencewith the capability of compensating eddy currents induced bythe diffusion gradients via dynamically modifying the imaginggradient waveforms. The diffusion-weighting orientations aredesigned based on the electrostatic repulsion model proposedby Jones et al. (1999) (TR¼ 5200ms, TE¼minimum (81ms),b-values¼ 0, 750 s/mm2, diffusion gradient directions¼ 27,FOV¼ 22 cm, Matrix¼ 132� 132 (reconstructed to 256� 256,slice thickness¼ 5mm, gap¼ 1.5mm, ramp-sampling¼ on,NEX¼ 2, total acquisition time¼ 5:46).An additional 3D high-resolution anatomical scan was also
acquired to allow coregistration with the DTI data and normal-ization to the Montreal Neurological Institute template (MNI)(3D inversion recovery fast spoiled gradient recalled (3DIRfSPGR), plane¼ axial, TR¼ 9ms, TE¼ 2.0ms, flip angle¼ 25�,NEX¼ 1, bandwidth¼ 15.6 kHz, acquisition matrix¼ 256� 256,FOV¼ 22� 16.5 cm2, slice thickness/gap¼ 1.5/0mm/mm,slices¼ 124).
Neuropsychological assessmentSubjects completed a test battery that was assembled to assessexecutive function, attention and memory. Since TBI commonlyaffects frontal lobe function, the battery was weighed more heavilyon executive measures to heighten sensitivity to deficits in thisarea of cognition. Tests included the Tower of London (Shallice,1982; Culbertson and Zilmer, 2001), Stroop Colour–Word Test(Stroop, 1935; Jensen and Rohwer, 1966; Golden and Freshwater,2002), Paced Auditory Serial Addition Test (PASAT) (Gronwalland Sampson, 1974; Gronwall, 1977), Trail Making Test
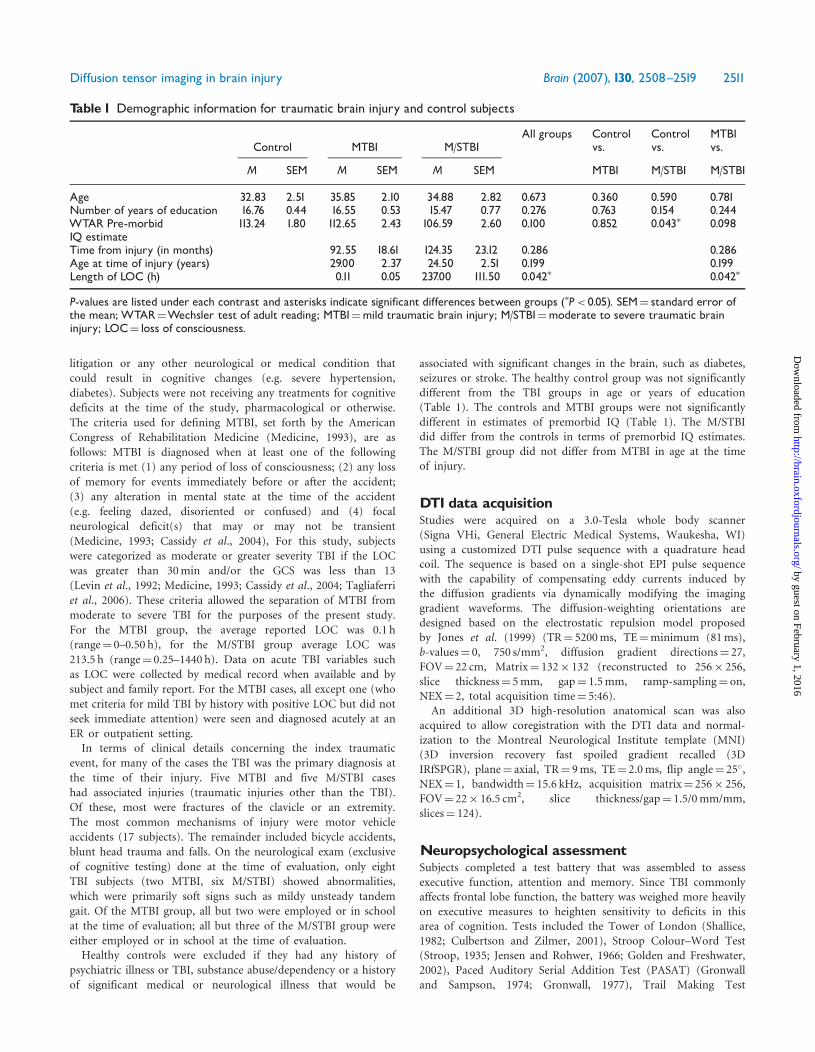
Table 1 Demographic information for traumatic brain injury and control subjects
All groups Control Control MTBIControl MTBI M/STBI vs. vs. vs.
M SEM M SEM M SEM MTBI M/STBI M/STBI
Age 32.83 2.51 35.85 2.10 34.88 2.82 0.673 0.360 0.590 0.781Number of years of education 16.76 0.44 16.55 0.53 15.47 0.77 0.276 0.763 0.154 0.244WTAR Pre-morbid 113.24 1.80 112.65 2.43 106.59 2.60 0.100 0.852 0.043� 0.098IQ estimateTime from injury (in months) 92.55 18.61 124.35 23.12 0.286 0.286Age at time of injury (years) 29.00 2.37 24.50 2.51 0.199 0.199Length of LOC (h) 0.11 0.05 237.00 111.50 0.042� 0.042�
P-values are listed under each contrast and asterisks indicate significant differences between groups (�P< 0.05). SEM¼ standard error ofthe mean; WTAR¼Wechsler test of adult reading; MTBI¼mild traumatic brain injury; M/STBI¼moderate to severe traumatic braininjury; LOC¼ loss of consciousness.
Diffusion tensor imaging in brain injury Brain (2007), 130, 2508^2519 2511
by guest on February 1, 2016http://brain.oxfordjournals.org/
Dow
nloaded from
(Reitan, 1958), Conners’ Continuous Performance Test (Conners
and Staff, 2000), Controlled Oral Word Association Test(COWAT) (Benton and Hamsher, 1976; Benton and Hamsher,
1989), Ruff Figural Fluency Test (Ruff, 1988), Wechsler Test of
Adult Reading (WTAR) (Psychological, 2001), California VerbalLearning Test – Second Edition (CVLT-II) (Delis et al., 2000),
Brief Visual Spatial Memory Test – Revised (BVMT-R) (Benedict,
1997), Digit Span and Spatial Span from the Wechsler MemoryScales – Third Edition (Wechsler, 1997) and the Grooved
Pegboard (Klove, 1964; Matthews and Klove, 1964). In addition,subjects had to pass tests for malingering and effort, including the
Test of Memory Malingering (TOMM) and Dot Counting to
ensure that only subjects who performed testing effortfully wereincluded (Rey, 1941; Tombaugh, 1996, 1997).Z-scores were calculated for all subjects, with the mean and SD
of data from healthy subjects used to define z-scores for all subject
groups. Negative scores indicate performance below the mean ofhealthy subjects. Domain scores for measures of executive
function, attention and memory were generated by averaging the
standardized data from tests assessing these cognitive domains aspresented in Table 2.
DTI data analysisThe 28 diffusion directions, along with the B0 image, were usedto calculate FA as the primary indicator of white matter integrity.
The images were reconstructed and FA, �1, �2 and �3 were
calculated using the program from Johns Hopkins, DTI Studio
(Wakana et al., 2004). The 28 diffusion-weighted image sets wereexamined for image quality and head movement. Head movementwas required to be within one voxel across the image acquisition.
Because noise can introduce bias in estimates of the eigenvaluesand because noise decreases the signal-to-noise ratio we applied abackground noise level to all subjects prior to calculation of pixel-
wise FA and the eigenvalues (�1, �2, �3) (backgroundnoise¼ 125). It is important to note that the application of thiscriterion and the noise itself can influence calculation of
anisotropy. However, because the analyses focus on differencesbetween groups the bias introduced by this noise floor should notinfluence group differences. The FA, �1, �2 and �3 were then
converted to ANALYSE format and read into StatisticalParametric Mapping software for analysis (SPM2, WellcomeDepartment of Imaging Neuroscience, London, UK). DTI data
from each subject was co-registered with their correspondingT1-weighted anatomic image set (after skull stripping) using anormalized mutual information cost function and trilinear
interpolation. Normalization parameters were determined basedupon the high-resolution T1 image relative to the MontrealNeurological Institute (MNI) template. These normalizationparameters were then applied to the FA and eigenvalue images.
Each image was visually checked for accuracy after both the co-registration and normalization steps. From these eigenvalue maps,axial (�k ¼ �1) and radial [�?¼ (�2 + �3)/2] diffusivity were
calculated. Although no additional smoothing was applied to
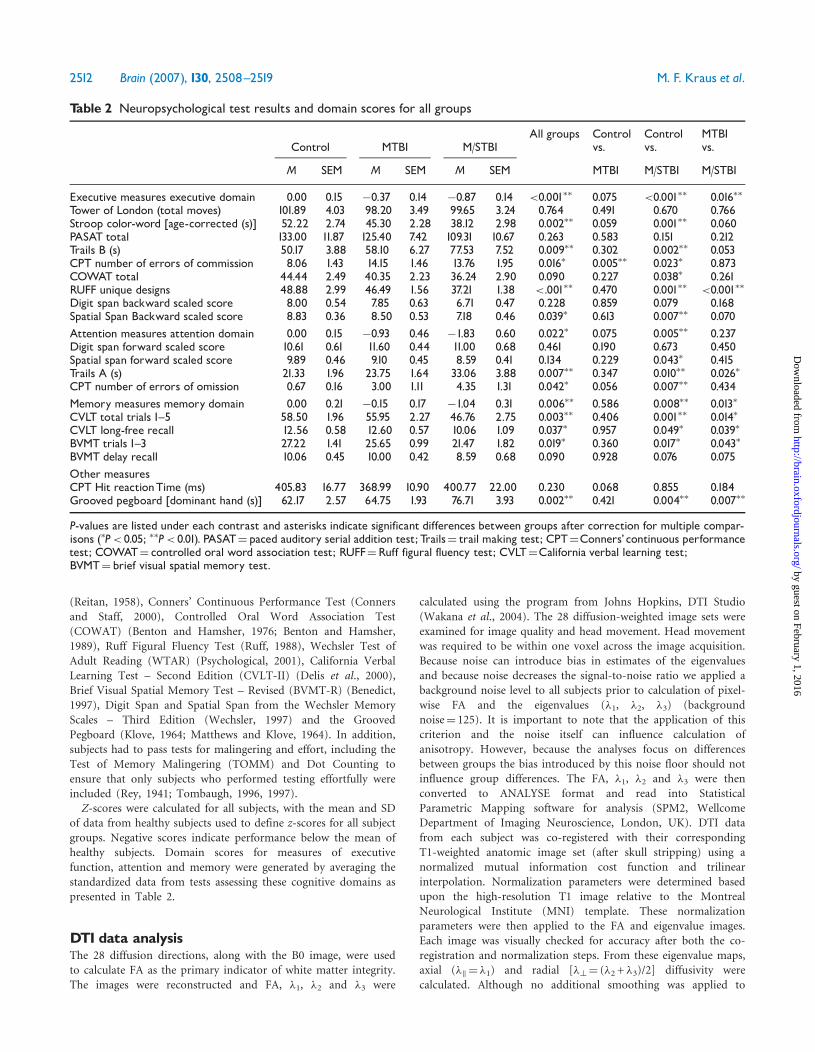
Table 2 Neuropsychological test results and domain scores for all groups
All groups Control Control MTBIControl MTBI M/STBI vs. vs. vs.
M SEM M SEM M SEM MTBI M/STBI M/STBI
Executive measures executive domain 0.00 0.15 �0.37 0.14 �0.87 0.14 <0.001�� 0.075 <0.001�� 0.016��
Tower of London (total moves) 101.89 4.03 98.20 3.49 99.65 3.24 0.764 0.491 0.670 0.766Stroop color-word [age-corrected (s)] 52.22 2.74 45.30 2.28 38.12 2.98 0.002�� 0.059 0.001�� 0.060PASAT total 133.00 11.87 125.40 7.42 109.31 10.67 0.263 0.583 0.151 0.212Trails B (s) 50.17 3.88 58.10 6.27 77.53 7.52 0.009�� 0.302 0.002�� 0.053CPT number of errors of commission 8.06 1.43 14.15 1.46 13.76 1.95 0.016� 0.005�� 0.023� 0.873COWAT total 44.44 2.49 40.35 2.23 36.24 2.90 0.090 0.227 0.038� 0.261RUFF unique designs 48.88 2.99 46.49 1.56 37.21 1.38 <.001�� 0.470 0.001�� <0.001��
Digit span backward scaled score 8.00 0.54 7.85 0.63 6.71 0.47 0.228 0.859 0.079 0.168Spatial Span Backward scaled score 8.83 0.36 8.50 0.53 7.18 0.46 0.039� 0.613 0.007�� 0.070Attention measures attention domain 0.00 0.15 �0.93 0.46 �1.83 0.60 0.022� 0.075 0.005�� 0.237Digit span forward scaled score 10.61 0.61 11.60 0.44 11.00 0.68 0.461 0.190 0.673 0.450Spatial span forward scaled score 9.89 0.46 9.10 0.45 8.59 0.41 0.134 0.229 0.043� 0.415Trails A (s) 21.33 1.96 23.75 1.64 33.06 3.88 0.007�� 0.347 0.010�� 0.026�
CPT number of errors of omission 0.67 0.16 3.00 1.11 4.35 1.31 0.042� 0.056 0.007�� 0.434Memory measures memory domain 0.00 0.21 �0.15 0.17 �1.04 0.31 0.006�� 0.586 0.008�� 0.013�
CVLT total trials 1^5 58.50 1.96 55.95 2.27 46.76 2.75 0.003�� 0.406 0.001�� 0.014�
CVLT long-free recall 12.56 0.58 12.60 0.57 10.06 1.09 0.037� 0.957 0.049� 0.039�
BVMT trials 1^3 27.22 1.41 25.65 0.99 21.47 1.82 0.019� 0.360 0.017� 0.043�
BVMT delay recall 10.06 0.45 10.00 0.42 8.59 0.68 0.090 0.928 0.076 0.075Other measuresCPT Hit reactionTime (ms) 405.83 16.77 368.99 10.90 400.77 22.00 0.230 0.068 0.855 0.184Grooved pegboard [dominant hand (s)] 62.17 2.57 64.75 1.93 76.71 3.93 0.002�� 0.421 0.004�� 0.007��
P-values are listed under each contrast and asterisks indicate significant differences between groups after correction for multiple compar-isons (�P< 0.05; ��P< 0.01). PASAT¼ paced auditory serial addition test; Trails¼ trail making test; CPT¼Conners’ continuous performancetest; COWAT¼ controlled oral word association test; RUFF¼Ruff figural fluency test; CVLT¼California verbal learning test;BVMT¼ brief visual spatial memory test.
2512 Brain (2007), 130, 2508^2519 M. F. Kraus et al.
by guest on February 1, 2016http://brain.oxfordjournals.org/
Dow
nloaded from

the data the magnitude of spatial filtering which occurs duringnormalization to standardized space can potentially affect the DTIdata (see Jones et al., 2005; Smith et al., 2006). In some cases,large smoothing kernels can potentially reduce group differences(Jones et al., 2005).
Region-of-interest analysisAll ROI analyses were carried out on data from each individualsubject and hand-drawn in standardized space. ROIs were drawnindividually on the FA maps with respect to the T2 FSE andcolour-coded FA maps.The specific ROIs included: anterior and posterior corona
radiata (respectively, ACR and PCR), cortico-spinal tracts (CST)which included parts of the cortico-pontine tract and parts of thesuperior thalamic radiation, cingulum (CG) fibres, forceps minor(fMin), forceps major (fMaj), the body, genu and splenium of thecorpus callosum (bCC, gCC and sCC), the inferior fronto-occipital (IFO) fasciculus, the superior longitudinal fasciculus(SLF), external capsule (ExCap) and the sagittal stratum includingthe optic radiations (SS). A description of the identification ofthese ROIs follows. A representative subject’s FA map withsuperimposed ROIs is presented in Fig. 1.The cingulum was defined firstly as the long association fibre
that is located internal to the cingulate gyrus and running alongits entire length continuing into the parahippocampal gyrus.It was defined dorsally by the corpus callosum continuing into thetemporal lobe along the ventral/medial wall of the hippocampal
gyri. Some of the cingulum fibres intersect with fibres of the
superior longitudinal fasciculus, inferior longitudinal fasciculus,superior fronto-occipital fasciculus, inferior fronto-occipital fasci-culus and uncinate fasciculus. The anterior and posterior corona
radiata are the fibres which run throughout the internal capsule.The anterior corona radiata was defined as those fibres which runthrough limb of the internal capsule and contain nerve tracts
running to and from the anterior areas of the cortex. Theposterior corona radiata was defined by the posterior limb of theinternal capsule. However, the cortico-spinal tract is a large part of
the corona radiata. However, because we wanted to examine thecortico-spinal tract individually we have excluded these fibresfrom our definitions of anterior and posterior corona radiata.
The external capsule contains cortico–cortico association fibres.The superior longitudinal fasciculus (fibres running from frontalto parietal to occipital and vice versa), inferior fronto-occipital
fasciculus and the uncinate fasciculus (fibres running from ventralfrontal lobe to pole of temporal lobe) run through the externalcapsule. The external capsule was defined as the white matter
tracts located lateral to the lentiform nucleus, most specifically theputamen of the basal ganglia, and lateral to the extreme capsule isthe claustrum. The external capsule, claustrum and extremecapsule are very closely associated. We are unable to discriminate
between these tracts. In order to examine the external capsuleseparately from the SLF and IFO we excluded any fibre definedas external capsule from the SLF or IFO. The IFO runs from
the frontal lobe to the occipital and temporal lobes ipsilaterally.
Fig. 1 Example region of interest masks for a single representative subject: (A) forceps minor (green), cortico-spinal tract (purple), inferiorfrontal-occipital fasciculus (red), external capsule (yellow), sagittal stratum (blue); (B) anterior corona radiata (green), superior longitudinalfasciculus (red), posterior corona radiata (blue); (C) cingulum (red), corpus callosum body (blue), splenium (yellow), and genu (green) andforceps major (purple).
Diffusion tensor imaging in brain injury Brain (2007), 130, 2508^2519 2513
by guest on February 1, 2016http://brain.oxfordjournals.org/
Dow
nloaded from

It is deep within the cerebral hemisphere and runs laterally to thecaudate nucleus. The SLF connects the anterior part of the frontallobe to the occipital and temporal lobes. This tract has extensivebranching in the frontal, parietal and temporal lobes. We excludedfibres associated with the IFO from these masks. Although thecorpus callosum contains fibres which run anterior to posterior wewanted to investigate differential loss of the genu, splenium, andbody of the corpus callosum as well as in forceps major andminor. The corpus callosum was first defined as a whole and thensubdivided. The forceps minor were characterized as those fibreslocated inferior to the IFO and medially to the anterior portion ofthe corona radiata. Forceps major was defined as those fibresposterior to the posterior corona radiata and medial to the sagittalstratum. The corticospinal tract was identified by following thefibre bundle from the brainstem into the cortex. We refer hereinto the corticospinal tract but also include the cortico-bulbar andcortico-pontine tract in this ROI. Although we define theseregions there is considerable overlap between many of these tracts.Because of this we inspected each ROI relative to every other ROIto ensure that the same voxel was not included in more than oneROI. To ensure that FA was only calculated from white mattertissue, a threshold of 0.20 was applied prior to extraction ofindividual subjects’ FA maps.
White matter loadThis was used as an index of global white matter integrity. It wasdefined as the number of ROIs that showed significantly decreasedFA values compared to controls. This measure was used as it maybe more sensitive to white matter abnormalities by looking at theactual number of affected areas across the brain independent ofindividual variability in the specific location of these white matterabnormalities. To measure the White Matter Load, z-scores werecalculated for the FA within each ROI. The control group meanand SD were treated as zero. We then calculated the number ofROIs which showed decreased FA for each subject. We used aconservative criterion of 1 SD below the control mean to definedecreased integrity. White Matter Load was then calculated as thetotal number of regions which showed impaired white matterrelative to values from controls. The value for White Matter Loadcan range from 0 to 13 (13 ROIs).
Statistical analysesNeuropsychological test scores were analysed using a one-wayANOVA with group membership (controls, MTBI, M/STBI) andwere corrected for multiple comparisons using the least significantdifference post-hoc tests. The primary measures of interest werethree scores which were each a composite of those individual testresults which loaded preferentially on executive, memory andattention domains, respectively. Because these three domain scoresare more stable than individual tests scores they were also used toassess relationships between measures of white matter integrityand cognition using bivariate Pearson correlations.The primary analyses carried out on the dependent measures
extracted from the DTI data was a two-way mixed design ANOVAwith cerebral hemisphere (right, left) as the within subjectscomparison and group membership (controls, MTBI and M/STBI)as the between subjects comparison. For those regions where areasin both hemispheres were assessed together (corpus callosum andcerebral peduncles) the analysis was a one-way between subjectsANOVA with group membership (controls, MTBI and M/STBI) asthe between-subjects comparison. The primary dependent measure
was FA. Data were confirmed to have a normal distribution usingthe Kolmogorov–Smirnov test.
ResultsNeuropsychological testingGroup means are presented for the each neuropsychologicaltest in Table 2. Of note, the only individual measurewhich differed significantly between the controls and MTBIwas the number of commissions on the CPT [F(1,37)¼8.86, P¼ 0.005], which is a measure associated stronglywith prefrontal function (Miranda et al., in press). Meancognitive domain scores are also presented in Fig. 2.M/STBI differed from the controls on almost all measures.The trend in means for the individual tests indicate thatthe controls have the highest performance, followed byMTBI, with M/STI showing the most severe and globalimpairment. The MTBI group did not differ significantlyfrom controls in any domain scores when compared tothe controls (P> 0.050). The M/STBI group performedsignificantly worse than both the controls and MTBI in theexecutive [M/STBI versus Controls: F(1,34)¼ 18.08,P< 0.001; versus MTBI: F(1,35)¼ 6.39, P¼ 0.016] andmemory domains [M/STBI versus Controls:F(1,34)¼ 7.83, P¼ 0.008; versus MTBI: F(1,35)¼ 6.79,P¼ 0.013]. M/STBI performed considerably worse thanthe controls on the attention domain [F(1,34)¼ 9.14,P¼ 0.005] but did not differ from MTBI [F(1,34)¼ 3.194,P¼ 0.083].
Fig. 2 Mean domain scores (normalized z-scores) for theMTBI (white) and M/STBI (dark gray). Note that the light gray boxaround zero indicates 1 SEM around the control mean.
2514 Brain (2007), 130, 2508^2519 M. F. Kraus et al.
by guest on February 1, 2016http://brain.oxfordjournals.org/
Dow
nloaded from

Fractional anisotropy: symmetryAlthough there was a main effect of symmetry across theCST (P¼ 0.038) and ACR (P¼ 0.043) with FA in the righthemisphere being higher than the left there were nodifferential symmetry effects across the three groups. Assuch, the remaining analyses are presented collapsed acrosshemispheres.
Fractional anisotropyOverall, there was a main effect of group membership onwhole brain FA [F(2,54)¼ 4.52, P¼ 0.015] relative tocontrols. Post-hoc testing demonstrated that the M/STBIhad reduced FA relative to both controls [F(1,34)¼ 6.47,P¼ 0.016] and MTBI [F(1,36)¼ 5.36, P¼ 0.027]. In theROI analyses, with the exception of fMin [F(2,54)¼ 2.71,P¼ 0.076] and ExCap [F(2,54)¼ 3.06, P¼ 0.055], signifi-cant main effects of group membership were observed forall other ROIs. As the primary contrast of interest wascomparison between controls and both TBI subject groups,z-scores were calculated with the controls set to zero. Ascan be seen in Fig. 3, MTBI showed reduced FA along theCST [F(1,37)¼ 4.99, P¼ 0.032], SLF [F(1,37)¼ 9.08,P¼ 0.005] and SS [F(1,37)¼ 6.84, P¼ 0.013]. FA valuesfor all ROIs in the M/STBI group were decreased comparedto controls (P< 0.05; see Table 3).Comparisons between MTBI and M/STBI showed that
the M/STBI had reduced FA in the corpus callosum [gCC:F(1,36)¼ 8.42, P¼ 0.006; bCC: F(1,36)¼ 15.63, P< 0.001;sCC: F(1,36)¼ 18.76, P< 0.001], Cing [F(1,36)¼ 12.84,P< 0.001], fMaj [F(1,36)¼ 18.34, P< 0.001], CST[F(1,36)¼ 5.27, P¼ 0.028], IFO [F(1,36)¼ 4.48,P¼ 0.042], PCR [F(1,36)¼ 4.80, P¼ 0.035] and in the SS[F(1,36)¼ 5.23, P¼ 0.028].
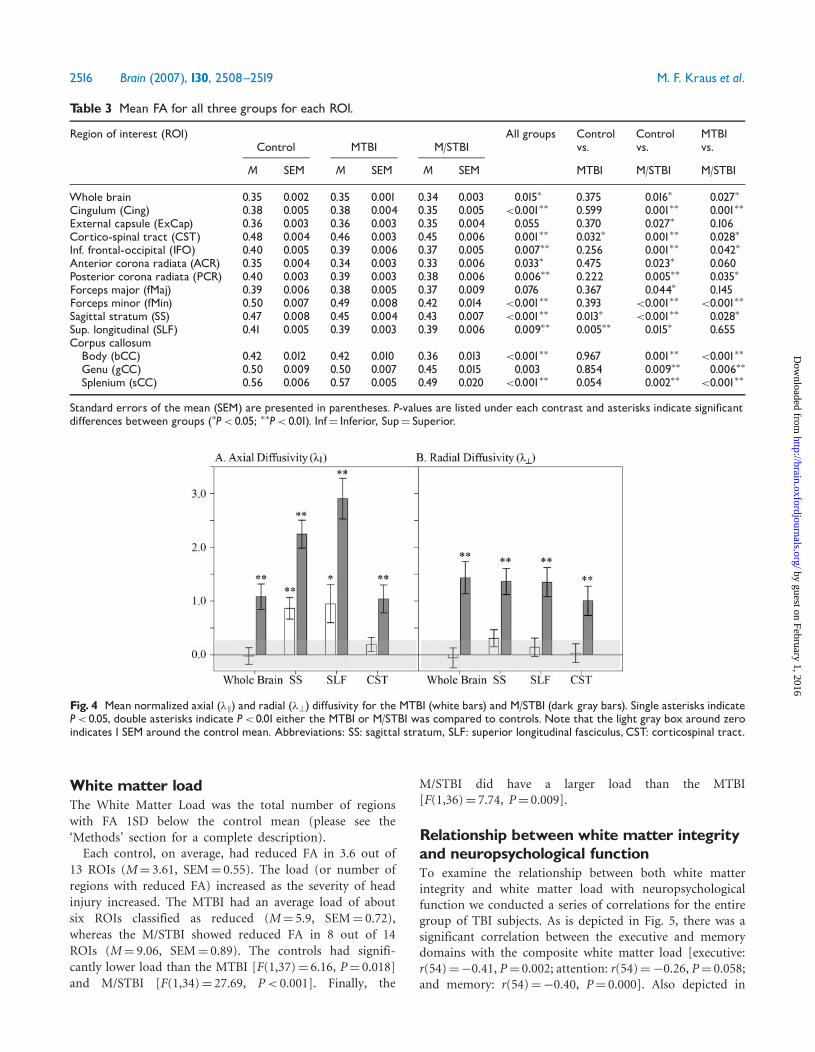
Axial and radial diffusivityTo investigate potential mechanisms for changes in whitematter integrity in chronic TBI, both axial and radialdiffusivity were extracted from a whole brain white mattermask as well as from the ROIs which showed sensitivityto all severities of head injury (SS, SLF, CST). As withthe earlier FA analysis, these values were transformed toz-scores based upon the control group mean. There was anoverall main effect of group for both axial (�k) and radial(�?) diffusivity in the whole brain (P< 0.004 for allcomparisons). However, these results were primarily drivenby increased diffusivity in M/STBI. As can be seen in Fig. 4,M/STBI, relative to controls, showed increased �k and �? inall regions [whole brain �k: F(1,34)¼ 10.40, P¼ 0.003;whole brain �?: F(1,34)¼ 14.30, P¼ 0.001; SS �k:F(1,34)¼ 40.96, P< 0.001; SS �?: F(1,34)¼ 14.12,P4 0.001; SLF �k: F(1,34)¼ 43.56, P< 0.001; SLF �?:F(1,34)¼ 14.29, P¼ 0.001; CST �k: F(1,34)¼ 8.83,P¼ 0.005; CST �?: F(1,34)¼ 7.79, P¼ 0.009). The MTBIshowed increased �k relative to controls in the SS
[F(1,34)¼ 4.78, P¼ 0.008] and SLF [F(1,34)¼ 4.78,P¼ 0.035] but not in the whole brain or CST. The MTBIshowed no significant increases in radial diffusivity inany region.
Fig. 3 Mean normalized FA for each ROI for the MTBI (green) andM/STBI (blue). Single asterisks indicate P< 0.05, double asterisksindicate P< 0.001 for the control group compared to either MTBI(M) or M/STBI (MS). Note that the light gray box around zeroindicates 1SEM around the control mean. Abbreviations: ACR,PCR: anterior and posterior corona radiata, CST: corticospinaltracts, Cing: cingulum, fMin, fMaj: forceps minor and major, bCC,sCC, gCC: body, genu and splenium of the corpus callosum,IFO: inferior fronto-occipital fasciculus, SLF: superior longitudinalfasciculus, SS: sagittal stratum, ExtCap: external capsule.Note thatwhite boxes on the colour-coded direction map indicate the targetfibres but do not indicate the entire region of interest.
Diffusion tensor imaging in brain injury Brain (2007), 130, 2508^2519 2515
by guest on February 1, 2016http://brain.oxfordjournals.org/
Dow
nloaded from
White matter loadThe White Matter Load was the total number of regionswith FA 1SD below the control mean (please see the‘Methods’ section for a complete description).Each control, on average, had reduced FA in 3.6 out of
13 ROIs (M¼ 3.61, SEM¼ 0.55). The load (or number ofregions with reduced FA) increased as the severity of headinjury increased. The MTBI had an average load of aboutsix ROIs classified as reduced (M¼ 5.9, SEM¼ 0.72),whereas the M/STBI showed reduced FA in 8 out of 14ROIs (M¼ 9.06, SEM¼ 0.89). The controls had signifi-cantly lower load than the MTBI [F(1,37)¼ 6.16, P¼ 0.018]and M/STBI [F(1,34)¼ 27.69, P< 0.001]. Finally, the
M/STBI did have a larger load than the MTBI[F(1,36)¼ 7.74, P¼ 0.009].
Relationship between white matter integrityand neuropsychological functionTo examine the relationship between both white matterintegrity and white matter load with neuropsychologicalfunction we conducted a series of correlations for the entiregroup of TBI subjects. As is depicted in Fig. 5, there was asignificant correlation between the executive and memorydomains with the composite white matter load [executive:r(54)¼�0.41, P¼ 0.002; attention: r(54)¼�0.26, P¼ 0.058;and memory: r(54)¼�0.40, P¼ 0.000]. Also depicted in
Table 3 Mean FA for all three groups for each ROI.
Region of interest (ROI) All groups Control Control MTBIControl MTBI M/STBI vs. vs. vs.
M SEM M SEM M SEM MTBI M/STBI M/STBI
Whole brain 0.35 0.002 0.35 0.001 0.34 0.003 0.015� 0.375 0.016� 0.027�
Cingulum (Cing) 0.38 0.005 0.38 0.004 0.35 0.005 <0.001�� 0.599 0.001�� 0.001��
External capsule (ExCap) 0.36 0.003 0.36 0.003 0.35 0.004 0.055 0.370 0.027� 0.106Cortico-spinal tract (CST) 0.48 0.004 0.46 0.003 0.45 0.006 0.001�� 0.032� 0.001�� 0.028�
Inf. frontal-occipital (IFO) 0.40 0.005 0.39 0.006 0.37 0.005 0.007�� 0.256 0.001�� 0.042�
Anterior corona radiata (ACR) 0.35 0.004 0.34 0.003 0.33 0.006 0.033� 0.475 0.023� 0.060Posterior corona radiata (PCR) 0.40 0.003 0.39 0.003 0.38 0.006 0.006�� 0.222 0.005�� 0.035�
Forceps major (fMaj) 0.39 0.006 0.38 0.005 0.37 0.009 0.076 0.367 0.044� 0.145Forceps minor (fMin) 0.50 0.007 0.49 0.008 0.42 0.014 <0.001�� 0.393 <0.001�� <0.001��
Sagittal stratum (SS) 0.47 0.008 0.45 0.004 0.43 0.007 <0.001�� 0.013� <0.001�� 0.028�
Sup. longitudinal (SLF) 0.41 0.005 0.39 0.003 0.39 0.006 0.009�� 0.005�� 0.015� 0.655Corpus callosumBody (bCC) 0.42 0.012 0.42 0.010 0.36 0.013 <0.001�� 0.967 0.001�� <0.001��
Genu (gCC) 0.50 0.009 0.50 0.007 0.45 0.015 0.003 0.854 0.009�� 0.006��
Splenium (sCC) 0.56 0.006 0.57 0.005 0.49 0.020 <0.001�� 0.054 0.002�� <0.001��
Standard errors of the mean (SEM) are presented in parentheses. P-values are listed under each contrast and asterisks indicate significantdifferences between groups (�P< 0.05; ��P< 0.01). Inf¼ Inferior, Sup¼ Superior.
Fig. 4 Mean normalized axial (�k) and radial (�?) diffusivity for the MTBI (white bars) and M/STBI (dark gray bars). Single asterisks indicateP< 0.05, double asterisks indicate P< 0.01 either the MTBI or M/STBI was compared to controls. Note that the light gray box around zeroindicates 1 SEM around the control mean. Abbreviations: SS: sagittal stratum, SLF: superior longitudinal fasciculus, CST: corticospinal tract.
2516 Brain (2007), 130, 2508^2519 M. F. Kraus et al.
by guest on February 1, 2016http://brain.oxfordjournals.org/
Dow
nloaded from

Fig. 5 is the overlapping distribution of load and neuropsy-chological function amongst all the three groups.In terms of correlations between FA in specific ROIs
with these domain scores there were significantcorrelations between executive function and bCC(r¼�0.368, P¼ 0.006), sCC (r¼�0.348, P¼ 0.009), CST(r¼�0.390, P¼ 0.003), ExCap (r¼�0.265, P¼ 0.050),fMaj (r¼ 0.563, P< 0.001), fMin (r¼ .281, P¼ 0.038),IFO (r¼�0.346, P¼ 0.009), ACR (r¼�0.383, P¼ 0.004),PCR (r¼�0.407, P¼ 0.002), SLF (r¼�0.305, P¼ 0.023),SS (r¼�0.495, P< 0.001) and Cing (r¼�0.277,P¼ 0.041). Only the fMaj (r¼�0.310, P¼ 0.022) andPCR x(r¼ 0.271, P¼ 0.046) correlated with the attentiondomain. The bCC (r¼�0.030, P¼ 0.026), sCC(r¼�0.328, P¼ 0.015), fMaj (r¼�0.432, P¼ 0.001),fMin (r¼�0.269, P¼ 0.047), IFO (r¼�0.314, P¼ 0.019),PCR (r¼�0.330, P¼ 0.014), SS (r¼�0.316, P¼ 0.019)and Cing (r¼�0.311, P¼ 0.021) all corrected with thememory domain. Although we do not have the statisticalpower to examine these correlations within each subjectgroup the trend is such that these patterns appearconsistent within both the MTBI and M/STBI.
ConclusionsIn this study, the moderate to severe TBI subjectsdemonstrated reduced white matter integrity, relative tocontrols, in all 13 regions of interest. The MTBI showedreduced white matter integrity in the superior longitudinalfasciculus, sagittal stratum and corticospinal tract (Fig. 3).The total number of regions with reduced white matterintegrity (White Matter Load) was greatest in the moderateto severe group, and least in the controls (Fig. 5). TheMTBI subjects fell between these two groups, beingsignificantly different than controls (Fig. 5).In M/STBI increased radial and axial diffusivity is
observed both in the whole brain and in specific regionsof interest (Fig. 4). This finding likely reflects damage to
both myelin and to axons. In MTBI, relatively normalradial diffusivity and increased axial diffusivity suggests thatirreversible damage to myelin is less common in MTBI ascompared to M/STBI but that axonal damage is presenteven 6 months following injury. It could be that the injuryin the MTBI group had less of an effect on myelin due totrauma acutely or that the less severe injury allowed somedegree of myelin damage that was reversible. Only threeROIs were assessed in this analysis, and further research iswarranted.
M/STBI differed from the controls on almost allmeasures of cognitive function, being more impaired ineach domain than controls or the MTBI group. Althoughthere was a trend in executive and attention function to bemore impaired, the MTBI group did not differ significantlyfrom controls in any domain scores.
The moderate to severe TBI subjects showed reducedfunction across all domains. There was a modest negativecorrelation between FA in individual regions of interestwith cognitive function. However, the relationship betweenoverall white matter load was more strongly related to thedomains of executive and memory function than FA inindividual ROIs. This suggests that a global measure such aswhite matter load is a useful index, as it appears to relatemore clearly to declines in cognitive functions which relyon widespread cortical and subcortical networks.
While it is not surprising that moderate and severeinjuries tend to show evidence of white matter changes andcognitive impairment, acquiring data on all severities in onestudy allows for the milder injuries to be assessed in thecontext of a spectrum of injury, from the healthy controlsto the more severe injuries. Importantly, the controls werefairly well matched to the TBI groups in terms of age andyears of education. None of the subjects were activelyinvolved in litigation. These findings are consistent withTBI existing on a spectrum of neuropathologic severity andresulting disability, placing subjects with a history of mildTBI between controls and more severe injuries. In addition
Fig. 5 Plotsindicating therelationshipbetweeneachnormalizeddomain score (left: executive,middle: attention, right:memory) as a functionof thenumberofROIswith FA<1SD from the controlmean.Controls are indicatedby white dots,MTBI (graydots), andM/STBI (blackdots).
Diffusion tensor imaging in brain injury Brain (2007), 130, 2508^2519 2517
by guest on February 1, 2016http://brain.oxfordjournals.org/
Dow
nloaded from
to demonstrating that TBI, regardless of severity, results inchronic changes to the white matter microstructure, thepresent findings suggest that injury severity may differen-tially impact axons and myelin. This finding begins toaddress the issue of mechanism in the differential effects ofmild versus more severe TBI on white matter.In terms of white matter changes, there is some overlap
between amount of pathology and the different clinicalclassifications of TBI severity. This is important in under-standing variation in recovery. Certain injuries classifiedacutely as mild based on acute TBI variables such as loss ofconsciousness may actually be closer to moderate in thedegree of pathology. Conversely, certain individuals withmoderate or severe TBI may show more intact white matterthan expected based on accepted means of clinicalclassification of injury severity. The data presented heredemonstrate that DTI allows for a more sensitive delinea-tion of severity and mechanism of white matter pathology,and may help to explain apparent discrepancies betweenclinically diagnosed injury severity and cognitive outcomesacross the spectrum of TBI.
AcknowledgementsThis work was supported by National Institute of Health[K23 MH068787]. The contents of this paper are solely theresponsibility of the authors and do not necessarilyrepresent the official views of either the NationalInstitute of Mental Health or the University of Illinois atChicago.
ReferencesAdams HJ, Graham DI, Scott G, Parker LS, Doyle D. Brain damage in fatal
non-missile head injury. J Clin Pathol 1980; 33: 1132–45.
Aihara N, Hall J, Pitts L, Fukuda K, Noble L. Altered immunoexpression
of microglia and macrophages after mild head injury. J Neurotrauma
1995; 12: 53–63.
American Congress of Rehabilitation Medicine. Definition of mild
traumatic brain injury. J Head Trauma Rehabil 1993; 8: 86–7.
Arfanakis K, Haughton VM, Carew JD, Rogers BP, Dempsey RJ,
Meyerand ME. Diffusion tensor MR imaging in diffuse axonal injury.
Am J Neuroradiol 2002; 23: 794–802.
Bazarian J, McClung J, Shah M, Cheng Y, Flesher W, Kraus J. Mild
traumatic brain injury in the United States, 1998–2000. Brain Injury
2005; 19: 85–91.
Benedict R. Brief visuospatial memory test – revised: professional manual.
Odessa, FL: Psychological Assessment Resources Inc.; 1997.
Benton A, Hamsher K. Multilingual aphasia examination. Iowa City:
University of Iowa; 1976.
Benton A, Hamsher K. edn. Multilingual aphasia examination. 2nd edn.
Iowa City: AJA Associates; 1989.
Blumbergs PC, Scott G, Manavis J, Wainwright H, Simpson DA,
McLean AJ. Topography of axonal injury as defined by amyloid
precursor protein and the sector scoring method in mild and severe
closed head injury. J Neurotrauma 1995; 12: 565–72.
Blumbergs PC, Scott G, Manavis J, et al. Staining of amyloid precursor
protein to study axonal damage in mild head injury. Lancet 1994; 344:
1055–6.
Bruns JJ, Hauser AW. The epidemiology of traumatic brain injury: a
review. Epilepsia (Copenhagen) 2003; 44: 2–10.
Cassidy J, Carroll L, Peloso P, Borg J, Holst Hv, Holm L, et al. WHO
collaborating centre task force on mild traumatic brain injury.
Incidence, risk factors and prevention of mild traumatic brain
injury: results of the WHO collaborating centre task force on mild
traumatic brain injury. J Rehabil Med 2004; 43 (Suppl): 28–60.
CDC.Traumatic brain injury in the United States: a report to Congress.
Atlanta, GA: Centers for Disease Control; 2001.
CDC.Report to Congress on mild traumatic brain injury in the United
States: steps to prevent a serious public health problem. Centers for
Disease Control: Atlanta, GA; 2003.
Conners D, Staff M. Conners’Continuous Performance Test II (CPT II).
North Tonawada, NY: Multi-Health Systems Inc.; 2000.
Culbertson W, Zilmer E. The Tower of London – Drexel University
(TOLDX): technical manual. North Tonawanda, NY: Multi-Health
Systems Inc.; 2001.
Delis D, Kramer J, Kaplan E, Ober B. California Verbal Learning Test –
second edition. Adult version. Manual. San Antonio, TX: Psychological
Corporation; 2000.
Geddes J. What’s new in the diagnosis of head injury? J Clin Pathol
1997; 50.
Geddes J, Vowles G, Beer T, Ellison D. The diagnosis of diffuse axonal
injury: implications for forensic practice. Neuropathol Appl Neurobiol
1997; 23.
Gennarelli T. The spectrum of traumatic axonal injury. Neuropathol Appl
Neurobiol 1996; 22: 509–13.
Gennarelli TA, Thibault LE, Adams JH, Graham DI, Thompson CJ,
Marcincin RP. Diffuse axonal injury and traumatic coma in the primate.
Ann Neurol 1982; 12: 564–74.
Godefroy O. Frontal syndrome and disorders of executive functions.
J Neurol 2003; 250: 1–6.
Golden C, Freshwater S. The Stroop Color and Word Test: a manual for
clinical and experimental uses. Wood Dale, IL: Stoelting Co; 2002.
Goodman J. Pathologic changes in mild head injury. Semin Neurol 1994;
14: 19–24.
Graham DI. Pathology of mild head injury. In: Hoff JT, Anderson T,
Cole TM, editors. Mild to moderate head injury. Boston: Blackwell
Scientific; 1989. pp. 63–75.
Graham D, Gennarelli T, McIntosh T. Trauma. In: Graham D, Lantos P,
editors. Greenfield’s Neurpathology. Vol. 2. London: Arnold, Hodder
Headline Group; 2002.
Graham D, Lawrence A, Adams J, Doyle D, McLellan D. Brain damage in
non-missile head injury secondary to high intracranial pressure.
Neuropathol Appl Neurobiol 1987; 13: 209–17.
Gronwall D. Paced Auditory Serial-Addition Task: a measure of recovery
from concussion. Percept Mot Skills 1977; 44: 367–73.
Gronwall D, Sampson H. The psychological effects of concussion.
Auckland: Auckland University Press; 1974.
Guskiewicz K, Weaver N, Padua D, Garrett W. Epidemiology of
concussion in collegiate and high school football players. Am J Sports
Med 2000; 28: 643–50.
Harsan L, Poulet P, Guignard B, Steibel J, Parizel N, de Sousa P, et al.
Brain dysmyelination and recovery assessment by noninvasive in vivo
diffusion tensor magnetic resonance imaging. J Neurosci Res 2006; 83:
392–402.
Holm L, Cassidy JD, Carroll LJ, Borg J. Neurotrauma task force on mild
traumatic brain injury of the WHO Collaborating Centre. Summary of
the WHO Collaborating Centre for Neurotrauma Task Force on Mild
Traumatic Brain Injury. J Rehabil Med 2005; 37: 137–41.
Hughes D, Jackson A, Mason D, Berry E, Hollis S, Yates D. Abnormalities
on magnetic resonance imaging seen acutely following mild traumatic
brain injury: correlation with neuropsychological tests and delayed
recovery. Neuroradiology 2004; 46: 550–8.
Huismana TAGM, Schwammb LH, Schaeferc PW, Koroshetzb WJ, Shetty-
Alvaa N, Ozsunar Y, et al. Diffusion tensor imaging as a potential
biomarker of white matter injury in diffuse axonal injury. Am J
Neuroradiol 2004; 25: 370–6.
2518 Brain (2007), 130, 2508^2519 M. F. Kraus et al.
by guest on February 1, 2016http://brain.oxfordjournals.org/
Dow
nloaded from
Inglese M, Bomsztyk E, Gonen O, Mannon LJ, Grossman RI, Rusinek H.
Dilated perivascular spaces: hallmarks of mild traumatic brain injury.
Am J Neuroradiol 2005a; 26: 719–24.
Inglese M, Makani S, Johnson G, Cohen BA, Silver JA, Gonen O, et al.
Diffuse axonal injury in mild traumatic brain injury: a diffusion tensor
imaging study. J Neurosurg 2005b; 103: 298–303.
Jensen A, Rohwer W. The Stroop color-word test: a review. Acta
Psychologica 1966; 24: 398–408.
Jones D, Symms M, Ciercignani M, Joward R. The effect of filter size on
VBM analyses of DT-MRI data. NeuroImage 2005; 26: 546–54.
Klove H. Clinical neuropsychology. New York: Saunders; 1964.
Kurca E, Sivak S, Kucera P. Impaired cognitive functions in mild
traumatic brain injury patients with normal and pathologic magnetic
resonance imaging. Neuroradiology 2006; 48.
Le Bihan D, Mangin J, Poupon C, Clark C, Pappata S, Molko N, et al.
Diffusion tensor imaging: concepts and applications. J Magn Resonanace
Imaging 2001; 13: 534–46.
Levin HS, Kraus MF. The frontal lobes and traumatic brain injury.
J Neuropsychiatry Clin Neurosci 1994; 6: 443–54.
Levin HS, O’Donnell VM, Grossman RG. The Galveston Orientation
and Amnesia Test: a practical scale to assess cognition after head injury.
J Nervous Mental Dis 1979; 167: 675–84.
Levin HS, Williams DH, Eisenberg HM, High WM Jr, Guinto FC Jr. Serial
magnetic resonance imaging and neurobehavioral findings after mild to
moderate closed head injury. J Neurol Neurosurg Psychiatry 1992; 55:
255–62.
Mathias JL, Bigler ED, Jones NR, Bowden SC, Barrett-Woodbridge M,
Brown GC. Neuropsychological and Informational processing perfor-
mance and its relationship to white matter changes following moderate
and severe traumatic brain injury: a preliminary study. Appl
Neuropsychol 2004; 11: 134–52.
Matthews C, Klove H. Instruction manual for the Adult
Neuropsychological Test Battery. Madison: University of Wisconsin
Medical School; 1964.
Miller E. The prefrontal cortex and cognitive control. Nat Neurosci Rev
2000; 1: 59–65.
Miranda M, Sinnes E, Pompeia S, Bueno O. A comparative study of
performance in the Conners’ Continuous Performance Test between
Brazilian and North American Children. J Atten Disord (in press).
Mittl RL, Grossman RI, Hiehle JF, Hurst RW, Kauder DR, Gennarelli TA,
et al. Prevalence of MR evidence of diffuse axonal injury in patients with
mild head injury and normal head CT findings. Am J Neuroradiol 1994;
15: 1583–9.
Nakayama N, Okamura A, Shinoda J, Yasokawa Y-T, Miwa K,
Yoshimura S-I, et al. Evidence for white matter disruption in traumatic
brain injury without macroscopic lesions. J Neurol Neurosurg Psychiatry
2006; 77: 850–5.
Pellman E, Powell J, Viano D, Casson I, Tucker A, Feuer H, et al.
Concussion in professional football: epidemiological features of game
injuries and review of the literature—part 3. Neurosurgery 2004; 54:
81–94.
Pierpaoli C, Barnett A, Pajevic S, Chen R, Penix L, Virta A, et al. Water
diffusion changes in wallerian degeneration and their dependence on
white matter architecture. NeuroImage 2001; 13: 1174–85.
Povlishock J, Becker D, Cheng C, Vaughan G. Axonal change in minor
head injury. J Neuropathol Exper Neurol 1983; 42.
Povlishok JT. Traumatically induced axonal injury: pathogenesis and
pathobiological implications. Brain Pathol 1992; 2: 1–12.
Psychological C. Wechsler Test of Adult Reading: Manual. San Antonio,
TX: Harcourt Assessment Company; 2001.
Reitan R. The validity of the Trail Making Test as an indicator of organic
brain damage. Percept Motor Skills 1958; 8: 271–6.
Rey A. L’examen psychologique dans les cas d’encephalopathie trauma-
tique [The psychological examination of traumatic encephalopathy].
Archives de Psychologie 1941; 28: 286–340.
Ruff R. Ruff Figural Fluency Test (RFFT): professional manual. Lutz, FL:
Psychological Assessment Resources; 1988.
Rugg-Gunn F, Symms M, Barker G, Greenwood R, Duncan J. Diffusion
imaging shows abnormalities after blunt head trauma when conven-
tional magnetic resonance imaging is normal. J Neurol Neurosurg
Psychiatry 2001; 70: 530–3.
Salmond C, Menon D, Chatfield D, Williams G, Pena A, Sahakian B, et al.
Diffusion tensor imaging in chronic head injury survivors:
correlations with learning and memory indices. Neuroimage 2006; 29:
117–24.
Shallice T. Specific impairments of planning. Phil Trans R Soc Lond B
1982; 298: 199–209.
Smith S, Jenkinson M, Johansen-Berg H, Rueckert D, Nichols T,
Mackay C, et al. Tract-based spatial statistics: voxelwise analysis of
multi-subject diffusion data. NeuroImage 2006; 31: 1487–505.
Song S-K, Sun S-W, Ramsbottom M, Chang C, Russell J, Cross A.
Dysmyelination revealed through MRI as increased radial
(but unchanged axial) diffusion of water. NeuroImage 2002a; 17:
1429–36.
Song S, Sun S, Ju W, Lin S, Cross A, Neufeld A. Diffusion tensor
imaging detects and differentiates axon and myelin degeneration
in mouse optic nerve after retinal ischemia. Neuroimage 2003; 20:
1714–22.
Song S, Sun S, Ramsbottom M, Chang C, Russell J, Cross A.
Dysmyelination revealed through MRI as increased radial
(but unchanged axial) diffusion of water. Neuroimage 2002b; 17:
1429–36.
Stroop J. Studies of interference in serial verbal reactions. J Exp Psychol
1935; 18: 643–62.
Taber KH, Warden DL, Hurley RA. Blast-related traumatic
brain injury: what is known? J Neuropsychiatry Clin Neurosci 2006;
18: 141–5.
Tagliaferri F, Compagnone C, Korsic M, Servadei F, Kraus J. A systematic
review of brain injury epidemiology in Europe. Acta Neurochirurgica
2006; 148: 255–68.
Tisserand D, Staanisz G, Lobaugh N, Gibson E, Li T, Black S. Diffusion
tensor imaging for the evaluation of white matter pathology in
traumatic brian injury. Brain Cogn 2006; 60: 216–7.
Tomaiulo F, Worsely KJ, Lerch J, DiPaola M, Carlesimo GA, Bonanni R,
et al. Changes in white matter in long term survivors of severe non-
missile traumatic brain injury: a computational analysis of magnetic
resonance imaging. J Neurotrauma 2005; 22: 76–82.
Tombaugh T. Test of Memory Malingering (TOMM). Toronto, Canada:
Multi-Health Systems, Inc.; 1996.
Tombaugh T. Test of Memory Malingering (TOMM) manual. Tonawanda,
NY: Multi-Health Systems, Inc.; 1997.
Wakana S, Jiang H, Nagae-Poetscher L, van Zijl P, Mori S. Fiber tract-
based atlas of human white matter anatomy. Radiology 2004; 230:
77–87.
Wechsler D. WMS-III Administration and scoring manual. San Antonio,
TX: Psychological Corporation; 1997.
Xu J, Rasmussen I-A, Lagopoulos J, Haberg A. Diffuse axonal injury in
severe traumatic brain injury visualized using high-resolution diffusion
tensor imaging. J Neurotrauma 2007; 24: 753–65.
Diffusion tensor imaging in brain injury Brain (2007), 130, 2508^2519 2519
by guest on February 1, 2016http://brain.oxfordjournals.org/
Dow
nloaded from