Information Age Technology, Industrial Age Laws - CUA Law ...
Upload
independentCategory
view
4download
0
CCGGEEHH WWoorrkkiinngg PPaappeerr SSeerriieess
“When the heart is baked, don’t try to knead it”
Marriage age and spousal age gap as a measure of female ‘agency’
Sarah Carmichael, Utrecht University
Tine De Moor, Utrecht University
Jan Luiten van Zanden, Utrecht University
November 2011
Working paper no. 19
http://www.cgeh.nl/working-paper-series/
© 2011 by Authors. All rights reserved. Short sections of text, not to exceed two paragraphs, may be quoted without explicit permission provided that full credit, including © notice, is given to the source.

“When the heart is baked, don’t try to knead it”
Marriage age and spousal age gap as a measure of female ‘agency’
Sarah Carmichael, Utrecht University
Tine De Moor, Utrecht University
Jan Luiten van Zanden, Utrecht University
Abstract
The study of the ages women marry and the age gap between husband and wife is well accepted by social-economic historians and demographers as it is highly associated with the growth of a population. There is however another reason for studying marriage patterns, that of female agency. Young girls who marry men many years their senior are likely left with very little say as to the terms of the union and later decisions made within the household. This is a hypothesis that has been explored by a number of authors recently as marriage patterns data is available on a large scale over a long time period. But how good a measure are ages at marriage of women and spousal age gaps. Rather than explore the mechanisms underlying this relationship this paper seeks to test marriage patterns as a measure of female empowerment by comparing a global set of marriage patterns data against three measures currently in use in the international development community, the Gender –related Development Index, the Global Gender Gap Index and the Gender Inequality Index. We use a new index of marriage ages (the Girlpower-Index) constructed by subtracting spousal age gap from marriage age and find that female SMAM and the Girlpower-Index both correlate strongly with the modern gender empowerment indices. This lends support to the use of marriage patterns as a historical measure of gender empowerment.
Keywords: Marriage Patterns, Gender, Female agency, Female SMAM, spousal age gap, Gender empowerment indices
JEL Codes: J12, J16, 015
Corresponding author: [email protected]
Acknowledgements: We would like to thank Theo Engelen, Onno Boonstra and Angélique Janssens for their feedback on an earlier Dutch language draft of this paper.

1
Introduction Social-economic historians and demographers have good reason to study marital behaviour, both of present and past societies. Following in the footsteps of Hajnal historical demographers discovered that the timing of the decision to marry – at least in Western Europe – is a significant determinant of the growth of the population. A substantial share of historical demography since has been devoted to the study of the crucial role of marital behaviour in the “homeostatic” demographic system of the Western European region. For social-economic historians marriage is the moment – again principally in Western Europe – when new households, and therefore new economic entities, are formed (neolocality). However there is possibly a more fundamental reason for the careful study of marriage behaviour. The decision to marry may well be the most crucial moment of the life-cycle and therefore the most important decision of many people’s lives. In this article we put forward the idea that who takes this decision and the timing of the decision to marry are a reflection of the relationship between the sexes and between generations that are typical for certain societies. Whether, while a girl (or boy) is still of a young age, decisions are already being made about the marriage or whether she (or he) has the chance to decide for herself at a later age is possibly the most fundamental difference in marriage patterns. Societies in which arranged marriage is the norm are, for all sorts of reasons, fundamentally different from societies in which the younger generation gets to choose his or her own partner. The transition from the one system to the other is one of the most fascinating and important changes in our history. This transition is now underway in large parts of the world where it is accompanied by, and this will have escaped no one, significant tension (think of the issues surrounding ‘honour killings’). In Western Europe this transition occurred very early on, in some areas it was already underway in the Middle Ages. Why this was the case and what consequences it has had for societal relationships and economic development is, in our view, one of the big questions of European history.1 In this article we do not concentrate on the underlying reasons which account for the creation of these situations of transition, nor on the manner in which consensus-marriage evolved and contributed to the delay of marriage.2 The central issue in this article is the age at marriage of women (at their first marriage) and the spousal age gap. A typically Western European situation is one in which men and women marry relatively late (often older than 24). Normally marriages would not be arranged, but it was presumed that individuals would seek their own partners, and this took time. In addition it was only possible to begin this search at a certain age. It is noticeable that the spousal age gap between husband and wife was minimal: the “search process” on the marriage market was targeted at more or less equal partners.
1 In De Moor, T. and van Zanden, J.L. (2006) Vrouwen en de geboorte van het kapitalisme (Boom: Amsterdam), De Moor and van Zanden make a first attempt to explain these differences. 2 See Noonan, J.T. (1973) ‘The power to choose', Viator, 4, pp.414-434 and the chapter by Michael Sheehan, ‘Choice of marriage partner in the Middle ages: development and mode of application of a theory of marriage’, in Sheehan, M. and Farge, J,.K. (1996) Marriage, Family, and Law in Medieval Europe : Collected Studies, pp. 91-117.
2
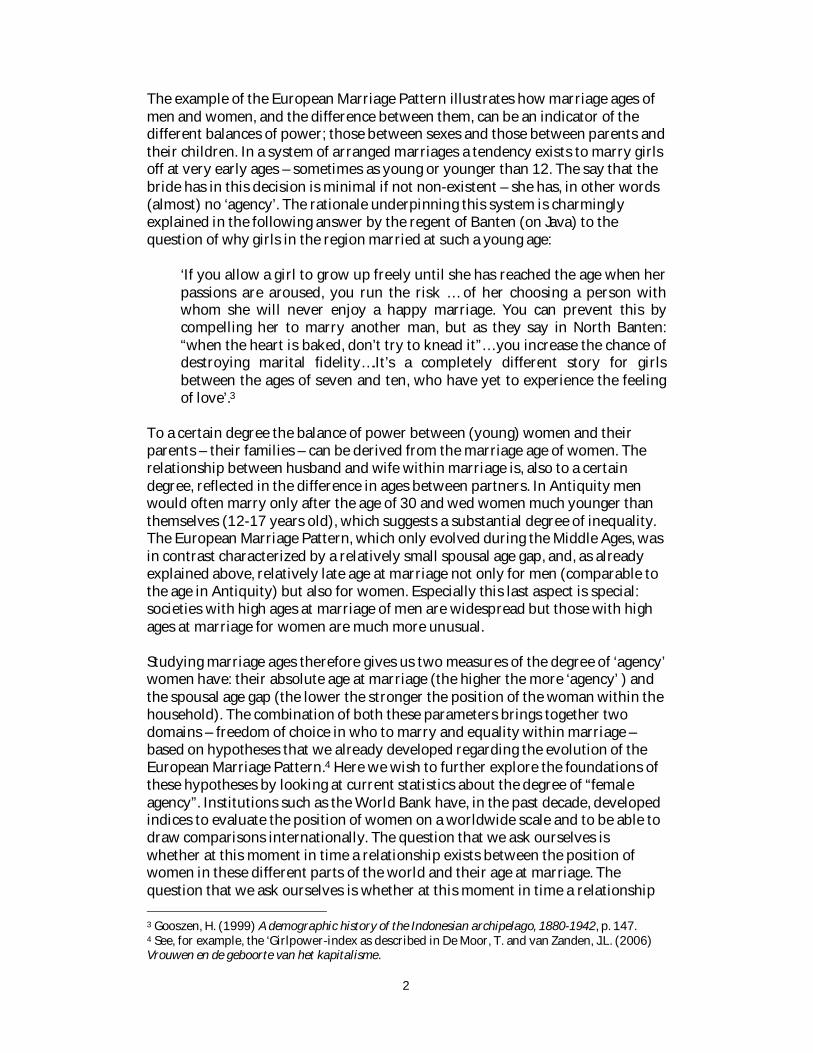
The example of the European Marriage Pattern illustrates how marriage ages of men and women, and the difference between them, can be an indicator of the different balances of power; those between sexes and those between parents and their children. In a system of arranged marriages a tendency exists to marry girls off at very early ages – sometimes as young or younger than 12. The say that the bride has in this decision is minimal if not non-existent – she has, in other words (almost) no ‘agency’. The rationale underpinning this system is charmingly explained in the following answer by the regent of Banten (on Java) to the question of why girls in the region married at such a young age:
‘If you allow a girl to grow up freely until she has reached the age when her passions are aroused, you run the risk … of her choosing a person with whom she will never enjoy a happy marriage. You can prevent this by compelling her to marry another man, but as they say in North Banten: “when the heart is baked, don’t try to knead it”… you increase the chance of destroying marital fidelity….It’s a completely different story for girls between the ages of seven and ten, who have yet to experience the feeling of love’.3
To a certain degree the balance of power between (young) women and their parents – their families – can be derived from the marriage age of women. The relationship between husband and wife within marriage is, also to a certain degree, reflected in the difference in ages between partners. In Antiquity men would often marry only after the age of 30 and wed women much younger than themselves (12-17 years old), which suggests a substantial degree of inequality. The European Marriage Pattern, which only evolved during the Middle Ages, was in contrast characterized by a relatively small spousal age gap, and, as already explained above, relatively late age at marriage not only for men (comparable to the age in Antiquity) but also for women. Especially this last aspect is special: societies with high ages at marriage of men are widespread but those with high ages at marriage for women are much more unusual. Studying marriage ages therefore gives us two measures of the degree of ‘agency’ women have: their absolute age at marriage (the higher the more ‘agency’ ) and the spousal age gap (the lower the stronger the position of the woman within the household). The combination of both these parameters brings together two domains – freedom of choice in who to marry and equality within marriage – based on hypotheses that we already developed regarding the evolution of the European Marriage Pattern.4 Here we wish to further explore the foundations of these hypotheses by looking at current statistics about the degree of “female agency”. Institutions such as the World Bank have, in the past decade, developed indices to evaluate the position of women on a worldwide scale and to be able to draw comparisons internationally. The question that we ask ourselves is whether at this moment in time a relationship exists between the position of women in these different parts of the world and their age at marriage. The question that we ask ourselves is whether at this moment in time a relationship 3 Gooszen, H. (1999) A demographic history of the Indonesian archipelago, 1880-1942, p. 147. 4 See, for example, the ‘Girlpower-index as described in De Moor, T. and van Zanden, J.L. (2006) Vrouwen en de geboorte van het kapitalisme.

3
exists between the position of women in these different parts of the world and their age at marriage. Our analysis in this article should help us to find out whether this relationship can be used as a basis for better understanding the position of women in the past – can we suggest a similar sort of relationship for societies of the past. Can we, in other words, using data on marriage age in the past get insight into the “agency” of women? The contemporary measures of agency we use for our analysis comprise two sorts of indices. The first is the Global Gender Gap (GGG) developed by the World Economic Forum (known for the conferences in Davos). A second index, the Gender-related Development Index (GDI), was created by the UN, in the same spirit as the Human Development Index. A second measure developed by the UN to replace the GDI is also used, the Gender Inequality Index. The GDI covers 136 countries while the GGG covers 110 and the GGI has data available for 127 countries. We examined these indices over the period 2006 until 2008, and compared them to the data we have on marriage age as well as the Girlpower-Index developed by van Zanden and De Moor. The Girlpower-Index is defined as the average age at first marriage of women minus the spousal age gap. It hereby unites two dimensions of agency in one index. We hope that this will lead to a stronger correlation between the Girlpower-Index and the variable we are comparing it to. All the data we compare are averages per country. All variables exhibit a certain spread; the average age of marriage varies from 17 to 34 years, the age difference from 0 to 8 years. Countries where women marry remarkably early are, for example, Niger, Mali and Afghanistan where women marry on average before their 18th birthday. At the other extreme are countries such as Sweden, Norway, France and Ireland where women on average marry at an age of 31 or above.5 The spousal age gap is greatest in Afghanistan, Niger and Mauritania with an average of around 7.5 years. In countries such as Australia there is barely a difference in the ages of spouses. For the entire database the average age of marriage of women is 24.19 years and the average spousal age gap is 3.47 years.6 The Gender-related Development Index In the framework of developing an integral measurement of development, the result of which was the Human Development Index, the United Nations have done additional research to also bring gender inequality into the picture.7 The Gender-related Development Index (GDI) is very similar to the Human Development Index, and was one of the first gender empowerment indices to be developed. The GDI is an indicator of the standard of living in a country and is one of the 5 indicators that have returned each year in the Human Development 5 Jamaica also belongs to this group, but is a noticeable outlier in most of the results presented below. 6 Average age of marriage is measured using a method developed by Hajnal, the Singulate Mean Age at Marriage (SMAM). The data comes from a variety of sources, for example from UN overviews but also from World Bank or census data. It is possible that measurement methods differ per organization. 7 The first Human Development Report introduced a new way of measuring development by combining indicators of life expectancy, educational level and income into one composite ‘human development index’, the HDI.

4
Report (until 2010 when the GDI was replaced by the GII). The GDI is meant to identify the inequalities between men and woman in a number of domains: long and healthy life, knowledge and a reasonable standard of living. The GDI is the unweighted average of the following three indices: Equally distributed life expectancy index8, Equally distributed education index, and Equally distributed income index. The index runs from 0 (total inequality) to 1 (absolute equality). Figure 1: Female SMAM and GDI
Figure 2: Girlpower-Index and GDI
8 The UN uses a different life expectancy standard for women than for men, on the basis of the principle that women on average live 5 years longer than men.

5
The correlations between marriage ages, spousal age gap and GDI, and between the Girlpower-Index and GDI are, as is to be expected relatively strong (R2 of 0.5365 for age at marriage and 0.5984 for Girlpower-Index). The correlation between spousal age gap and thee GDI is somewhat lower, with a R2 of 0.4729. In countries with a high GDI score and therefore with a more equal position of men and women, women marry later and there is only a small spousal age gap. This is shown in Figure 1 and 2: As can be observed in Figure 2 there are a number of obvious outliers. The most noticeable is the point at the top of the figure with a very high age at marriage but a fairly average GDI score. This is Jamaica where women marry remarkably late (33.6 years of age) and a very small spousal age gap is normal. This outlier is also to be observed in Figure 1. Burundi, as a country where women on average get married at the age of 23.7 and there is an average spousal age gap of 2.4 years, is also an outlier. Burundi has a GDI score of 0.409, which lies between that of Ethiopia and Ivory Coast, whereas with a Girlpower-score of 21.3 Burundi looks more like Uruguay or Saudi Arabia which have a GDI of 0.849 and 0.783 respectively. Other outliers are Guyana, Mauritius, Rwanda, Swaziland and Namibia. Guyana and Mauritius have lower Girlpower-scores than would be expected on the basis of their GDI, while Namibia, Rwanda and Swaziland, like Burundi and Jamaica have a higher Girlpower-score than would have been predicted by looking at their GDI. However overall the picture painted by the graphs is one of a close relationship between marriage ages of women and the GDI with the Girlpower-index demonstrating an even stronger relationship than purely the marriage age data. The Global Gender Gap Since 2005 the World Economic Forum has been publishing data on the ‘global gender gap’ which measures the relative position of women along four dimensions:
1. Economic participation and opportunity: this includes parameters such as wage levels, labour market participation, and access to highly skilled employment. The indices with which this dimension is measured have been given the names: participation gap, remuneration gap, and advancement gap.
2. Educational attainment: this dimension looks at access to both primary and further education. This is measured using the ratios of men to women in primary, secondary and tertiary education and the ratio of literate women to literate men
3. Political empowerment: for this dimension the representation of women in decision structures is examined. This is done using measures of the ratio of women to men in ministerial positions and, if relevant, parliamentary roles. In addition the ratio of women to men in terms of the number of years spent in executive office in the past 50 years is looked at. The difference in participation between men and women at the local and regional government level are not included in this measure.
4. Health and Survival: includes differences between men and women in terms of life expectancy, measured by the number of years that women

6
and men can expect to live in good health (whereby the number of years lost to violence, sickness, malnutrition etc. are included in the calculation). Also the sex ratios at birth are included here, which is particular importance in societies with a strong preference for sons and to take into account the subsequent phenomenon of “missing women”.
These dimensions are weighted and brought together in one index, the Global Gender Gap. Just like the GDI this index runs from 0, indicating a situation of absolute inequality and 1, a situation of absolute equality. Below in Figures 3 and 4 the Global Gender Gap is compared to female SMAM and the Girlpower-Index. Figure 3: Correlation Female SMAM and Global Gender Gap
Figure 4: Correlation Girlpower-Index and Global Gender Gap

7
Again we find a relatively high correlation between this measure of inequality and the marriage age of women and the Girlpower-Index. This can be seen clearly by looking at the example of Sweden, Norway and Finland that are the top three scoring countries in the Gender Gap rankings and – if Jamaica is momentarily not considered – also the top three in terms of marriage ages. The correlation between spousal age gap and the GGG index, which is not presented here, is 0.2514. For five countries the regression line of female SMAM correlated with the GGG does not fit well, represented by their standardized residuals being greater than an absolute value of two. These are Algeria (-2.08), Pakistan (-2.12), the Philippines (2.07), Saudi Arabia (-2.67) and Yemen (-3.66). A negative value means that the marriage age of women is higher than one would expect given the country’s GGG score. For example we see that Algeria has a Gender Gap Index value of 0.60 which is just above that of India whereas women in Algeria marry on average at an age of 29.6, just higher than the average age of marriage in Japan. This indicates a significant variation between the two measures. Algeria may be an outlier due to high levels of youth unemployment, which delay marriage until a later age when economic security has been attained. The Philippines have a lower age at marriage than would be expected for a country that comes in in the top ten of the GGG rankings. The Philippines is ranked between Germany and New Zealand in the ranking of the GGG but women marry on average at the age of 23, much earlier in Germany where they marry at 31. The Philippines are the highest ranked Asian country in the GGG-tables. In 2006 until 2008 they were at number 6 in the total rankings and since 2009 they have been at number 9. In terms of education and health gaps the Philippines comes in 1st, while for economic participation it is ranked at 13th in the list. When looking at the Girlpower-Index the Philippines disappears as an outlier. The outliers for the Girlpower-Index are presented in the table below: Table 1: Outliers in the correlation between GGG and the Girlpower-Index Country Standardised Residual Bangladesh -2.021 France 2.263 Jamaica 2.134 Tanzania -2.202 Bangladesh has a very low Girlpower-Index, with an average age of marriage of 18.7 and a spousal age gap of 6.63, giving a Girlpower-Index of 12.04. Along with Mali, Chad, and Burkina Faso, Bangladesh belongs to a small group of countries included in the GGG which have a Girlpower-Index of below 13. Bangladesh does not show up in the other two correlations as an outlier because both the GDI and the GII attribute a high degree of inequality to the country giving it a very low
8
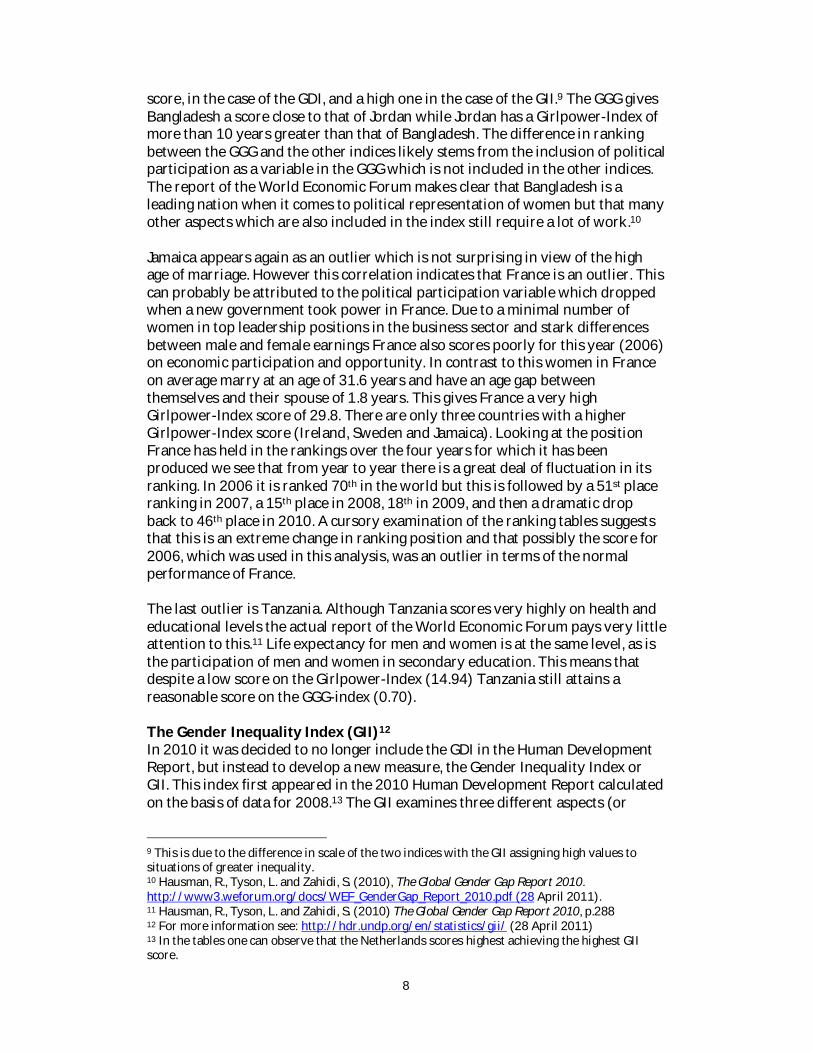
score, in the case of the GDI, and a high one in the case of the GII.9 The GGG gives Bangladesh a score close to that of Jordan while Jordan has a Girlpower-Index of more than 10 years greater than that of Bangladesh. The difference in ranking between the GGG and the other indices likely stems from the inclusion of political participation as a variable in the GGG which is not included in the other indices. The report of the World Economic Forum makes clear that Bangladesh is a leading nation when it comes to political representation of women but that many other aspects which are also included in the index still require a lot of work.10 Jamaica appears again as an outlier which is not surprising in view of the high age of marriage. However this correlation indicates that France is an outlier. This can probably be attributed to the political participation variable which dropped when a new government took power in France. Due to a minimal number of women in top leadership positions in the business sector and stark differences between male and female earnings France also scores poorly for this year (2006) on economic participation and opportunity. In contrast to this women in France on average marry at an age of 31.6 years and have an age gap between themselves and their spouse of 1.8 years. This gives France a very high Girlpower-Index score of 29.8. There are only three countries with a higher Girlpower-Index score (Ireland, Sweden and Jamaica). Looking at the position France has held in the rankings over the four years for which it has been produced we see that from year to year there is a great deal of fluctuation in its ranking. In 2006 it is ranked 70th in the world but this is followed by a 51st place ranking in 2007, a 15th place in 2008, 18th in 2009, and then a dramatic drop back to 46th place in 2010. A cursory examination of the ranking tables suggests that this is an extreme change in ranking position and that possibly the score for 2006, which was used in this analysis, was an outlier in terms of the normal performance of France. The last outlier is Tanzania. Although Tanzania scores very highly on health and educational levels the actual report of the World Economic Forum pays very little attention to this.11 Life expectancy for men and women is at the same level, as is the participation of men and women in secondary education. This means that despite a low score on the Girlpower-Index (14.94) Tanzania still attains a reasonable score on the GGG-index (0.70). The Gender Inequality Index (GII)12 In 2010 it was decided to no longer include the GDI in the Human Development Report, but instead to develop a new measure, the Gender Inequality Index or GII. This index first appeared in the 2010 Human Development Report calculated on the basis of data for 2008.13 The GII examines three different aspects (or
9 This is due to the difference in scale of the two indices with the GII assigning high values to situations of greater inequality. 10 Hausman, R., Tyson, L. and Zahidi, S. (2010), The Global Gender Gap Report 2010. http://www3.weforum.org/docs/WEF_GenderGap_Report_2010.pdf (28 April 2011). 11 Hausman, R., Tyson, L. and Zahidi, S. (2010) The Global Gender Gap Report 2010, p.288 12 For more information see: http://hdr.undp.org/en/statistics/gii/ (28 April 2011) 13 In the tables one can observe that the Netherlands scores highest achieving the highest GII score.

9
dimensions) of gender inequality: participation on the labour market, ‘empowerment’, and reproductive health (see the diagram below). Figure 5: Theoretical Framework underlying the construction of the GII
Source: Technical Notes, Human Development Report 2010 (http://hdr.undp.org/en/media/HDR_2010_EN_TechNotes_reprint.pdf) The index gives an indication of the level of development as a result of inequality between men and women, measured along the 3 specified dimensions. This index varies from 0 to 1, but unlike the other indices in this case 0 means no inequality between men and women and 1 means total inequality. The GII report of 2010 demonstrates that the gender aspect with the greatest impact on human development is reproductive health, as measured by maternal mortality during child-birth and the adolescent fertility rate. The GII is calculated using a ‘association-sensitive inequality measure’ as developed by Seth.14 As the diagram above demonstrates the GII is based on averages of different levels: the first aggregation is done using a geometric mean over the different dimensions. The variables that are used in this calculation are: maternal death during childbirth, adolescent fertility rate and parliamentary representation. Below are the graphs showing the correlation between the GII and female SMAM and the GII and the Girlpower-Index. 14 Seth, S. (2010) ‘A Class of Association Sensitive Multidimensional Welfare Indices’, Oxford Poverty and Human Development Initiative. Working Paper No. 27 http://www.ophi.org.uk/wp-content/uploads/OPHI-wp27.pdf (28 April 2011).

10
Figure 6: Correlation Female SMAM GII
Figure 7: Correlation Girlpower-Index and GII
The correlations between the GII and female SMAM and the Girlpower-Index and the GII are both remarkably high, even though the marriage age is not a part of the construction of this measure and therefore cannot be an explanation for the high level of correlation. Just as with the other measures the correlation between the GII and the spousal age gap is markedly lower, at 0.3456.

11
An analysis of the outliers for the correlation between female SMAM and the GII indicates that the following seven countries have a standardized residual with an absolute value greater than 2: Table 2: Outliers in the correlation between female SMAM and the GII
Country15 Standardised Residual
Algeria 2,31 Botswana 2,03 Jamaica 4,03 Malta -2,08 Morocco 2,05 Namibia 2,03 South Africa 2,10
Algeria has a higher female SMAM than would be expected on the basis of its GII score. This is the same result as was found above for the correlation with the Global Gender Gap. The most extreme outlier is a familiar face, Jamaica. Jamaica is ranked 89th in the world when using the GII ranking but first in the world when looking at female SMAM. The high average marriage age of Jamaican women is difficult to explain. It could be related to the phenomenon of ‘consensual unions’, a practice common in Jamaica. In a system of consensual unions couples live in an unwedded state until they have achieved economic stability after which they marry. Keith F. Otterbein, in an article on Caribbean family organization, describes the dominant role of women. Men in the Caribbean system have, according to a number of authors, a low economic position which means they have to delay marriage and often do not play a significant role in the raising of children.16 Namibia is an outlier due to the fact that despite its low GII score (0.615) it has one of the highest ages of marriage for women in Africa (28.3). Namibia’s low GII score is due to a high level of adolescent fertility (74.4 per thousand women between 15 and 19), a low percentage of women holding seats in parliament and female labour force participation of only 53.5 percent. When looking at the correlation between the GII and the Girlpower-Index Algeria, Jamaica and Namibia are all still outliers but the rest no longer are. However Guyana and Mauritius join the list of outliers, both of which have a very high spousal age gap (more than 6 years). In combination with a low age at
15 There are a few countries which fall just inside the ‘cutoff’-range of -2; +2, including Cyprus (-1.955789) and Yemen (1.993066). All other outliers have a standardized residual of less than 1.8. 16 Clarke, E. (1957) My Mother who fathered me: a study of the family in three selected communities in Jamaica (Jamaica: University of the West Indies), Smith, R.T. ‘The family in the Caribbean’ in Vera Rubin, Ed. (1957)Caribbean studies: a symposium (Jamaica: University College of the West Indies), Otterbein, K.F. (1965) ‘Caribbean Family Organisation: A Comparative Analysis’, American Anthropologist, 67:1, pp.66-79, and Burnard, T. (1994) ‘A Failed Settler Society: Marriage and Demographic Failure in Early Jamaica’, Journal of Social History, 28:1, pp.63-82.
12
marriage this means that their Girlpower-Index score is lower than would be expected from looking at the GII. Of the 138 countries analysed by the GII Guyana is ranked at 92nd while it belongs to a group of only 8 countries in the world with a Girlpower-Index of lower than 13.17 Conclusion In this article we tried to test the idea that the relative (power) position of women can be indicated by the age at which she marries, and the difference in age between herself and her husband. By using three recent measures of the position of women we have been able to check if this theory is correct. It seems, from our analysis, that this is indeed the case, although some variation in the strength of the relationship can be observed. The age at first marriage of women correlated ever more strongly with the modern indicators of agency of women, presented in chronological order of development; the relationship between spousal age gap and the various indices was weaker. The best results were observed when both types of marriage data were combined into the Girlpower-Index. It seems that the Girlpower-Index is therefore a suitable index for measuring the power position of women in a society – in the first place it is a measure of her power within marriage and the family, but probably also in broader sense because the measures of female agency examined here reflect a wide spectrum of gender inequality. The tests conducted in this article are important because the Girlpower-Index can be relatively easily calculated using historical sources as opposed to the far more elaborate indices which are used today for which the relevant historical data is likely not available. The current indices go no further back than 1995; to develop a complete picture of the development of female empowerment we have to find other measures. To this end female SMAM corrected by spousal age gap – ‘our’ Girlpower-Index – offers a very interesting opportunity.
17 The rest of the group are Niger, Afghanistan, Mali, Bangladesh, Chad, Guinea and Burkina Faso
Copyright © 2022 FDOKUMEN