PENGARUH HORMON TIROKSIN TERHADAP KECEPATAN METAMORFOSIS KATAK (Bufo sp)
Upload
independentCategory
view
4download
0
Weber and Noise Adaptation in the
Retina of the Toad Bufo marinus
KRISTIAN DONNER, DAVID R. COPENHAGEN, and TOM REUTER
From the Department of Zoology, University of Helsinki, SF-00100 Helsinki, Finland; and the Departments of Ophthalmology and Physiology, University of California School of Med- icine, San Francisco, California 94143-0730
A B S T R A C T Responses to flashes and steps of light were recorded intracellularly from rods and horizontal cells, and extracellularly from ganglion cells, in toad eye- cups which were either dark adapted or exposed to various levels of background light. The average background intensities needed to depress the dark-adapted flash sensitivity by half in the three cell types, determined under identical condi- tions, were 0.9 Rh*s -1 (rods), 0.8 Rh*s -I (horizontal cells), and 0.17 Rh*s -1 (gan- glion cells), where Rh* denotes one isomerization per rod. Thus, there is a range (-0.7 log units) of weak backgrounds where the sensitivity (response amplitude/ Rh*) of rods is not significantly affected, but where that of ganglion cells (1/ threshold) is substantially reduced, which implies that the gain of the transmission from rods to the ganglion cell output is decreased. In this range, the ganglion cell threshold rises approximately as the square root of background intensity (i.e., in proportion to the quantai noise from the background), while the maintained rate of discharge stays constant. The threshold response of the cell will then signal light deviations (from a mean level) of constant statistical significance. We propose that this type of ganglion cell desensitization under dim backgrounds is due to a post- receptoral gain control driven by quantal fluctuations, and term it noise adapta- tion in contrast to the Weber adaptation (desensitization proportional to the mean background intensity) of rods, horizontal cells, and ganglion cells at higher back- ground intensities.
I N T R O D U C T I O N
In this study we first describe how the responses of single rods, horizontal cells, and ganglion cells in the dark-adapted toad retina are affected by weak background illu- mination. Here, our objective was to obtain a quantitative picture of how the sen- sitivities o f the different cell types are changed in a preparat ion that is as "physio- logical" as possible. All three cell types were studied in the eyecup under identical conditions, and often two were studied in the same eye. The importance of studying all cell types in the same kind of preparat ion is exemplified by our finding that the background adaptation of toad rods in eyecups is significantly different f rom that found by recording the photocurrent of single rods with suction pipettes (Baylor et
Address reprint requests to Dr. Kristian Donner, Department of Zoology, University of Helsinki, Arkadiankatu 7, SF-00100 Helsinki, Finland.
j. G~:N. PHYSIOL. �9 The Rockefeller University Press �9 0022-1295/90/04/0733/21 $2.00 Volume 95 April 1990 733-753
733

734 THE JOURNAL OF GENERAL PHYSIOLOGY �9 VOLUME 95 �9 1990
al., 1980; Lamb et al., 1981). I f we had re l ied on da ta f rom rods d rawn into pi- pet tes , we would have ove res t ima ted the d i f ferences be tween the adap ta t i on o f rods and that o f m o r e p rox imal neurons .
O u r second objec t ive was to e luc ida te the ro le o f gangl ion cells as units d isplaying l ight adap t a t i on i n d e p e n d e n t o f r e c e p t o r adap ta t ion . In the skate, cat, and rat, it has been shown that gangl ion cells a re desens i t ized by b a c k g r o u n d lights d i m m e r than those that desensi t ize rods (Sakmann and Fil ion, 1972; G r e e n et al., 1975; G r e e n and Powers, 1982). W e f ind in the toad re t ina , too, a range o f low b a c k g r o u n d intensi t ies that desensi t ize gangl ion cells, bu t no t rods. W e p r o p o s e that the differ- ence is re la ted to how the d i f fe ren t cell types reac t to the quanta l f luctuat ions imposed by the backg round . At b a c k g r o u n d levels where individual rods do no t yet receive e n o u g h quan ta to desensi t ize, the desens i t iza t ion o f gangl ion cells cou ld act to p ro t ec t the re t inal o u t p u t f rom be ing conges ted by spike responses to r a n d o m quanta l f luctuat ions. The gangl ion cell o p e r a t i n g range would thus be rese rved for light changes exceed ing a c r i t e r ion statistical s ignificance (signal-to-noise ratio).
M E T H O D S
Preparation, Stimulation, and Recording
The preparation of the eyecup, light stimulation, estimation of isomerization rates, and meth- ods for extracellular recording have been described by Copenhagen et al. (1987). The meth- ods for intraceilular recording from rods and horizontal cells and cell identification are described in Copenhagen et al. (1990). The temperature was kept at 20~ in all experi- ments.
All backgrounds were presented as large fields. Stimulus spots were large enough to cover the entire central summation area of any cell under study (except where separately noted). Observing this, they were still kept as small as possible especially for ganglion cells, to avoid excessive stimulation of the inhibitory surround. For rods and horizontal cells, the usual test spot diameter was 520 #m, while for ganglion cells it varied somewhat depending on the size of the receptive field center (typically 300-600 #m in diameter). The stimuli were delivered as brief flashes (13.5 or 67 ms) or oN steps (actually 4-s pulses) of light.
Sensitivity
By the symbol Rh* we denote one photoisomerization per rod. Accordingly, background intensity is given as Rh*s -~. We define the flash sensitivities of rods and horizontal cells as the amplitudes of flash-evoked responses per Rh* (in millivolts per Rh*) and the flash sensitivity of a ganglion cell as the reciprocal of the flash intensity needed for a threshold response (1/Rh*), in all cases referring to stimuli that cover the whole central summation area (recep- tive field center) of the cell type under study. The ganglion cell threshold was taken as the lowest intensity at which one or more spikes occurred within a fixed 2-s time window (starting at 0.5 and ending at 2.5 s) after stimulus onset in at least half of the trials. It is worth empha- sizing that the threshold thus defined does not depend on the detectability (signal-to-noise ratio) of the response (see below). Thus, our definitions of sensitivity are equivalent to the gain of Shapley and Enroth-Cugell (1984).
The sensitivity to step stimuli is defined as response amplitude per Rh*s -1, or, for ganglion cells, the reciprocal of threshold intensity [1/(Rh*s-I)].

DONNER ET AL. Adaptation in Toad Retimz 735
Integration Time
The time span within which isomerization signals interact is defined by the integration time
tl = (1/a,,~O f f (t) dt (1)
where f ( t ) is the amplitude of the response at time t and am~, its peak amplitude (Baylor and Hodgkin, 1973; Baylor et al., 1974). From this, two different ways of experimentally deter- mining t~ follow. Firstly, if Ss (in millivolts per Rh* s -1) is the step sensitivity and St (in milli- volts per Rh*) is the flash sensitivity (for flash durations much shorter than ti), then
ti = Ss/Sf (2)
Secondly, if the response time course is well defined, the flash response may be graphically integrated (the area under the response measured). If A(mVs) is the value of that integral, then
t i = a / a ~ x (3)
Summation Area
The spatial summation of a cell is expressed as a representative circular summation area As (mm z) within which all isomerization signals are linearly summed with equal weight ("top-hat" approximation). Alternatively, it can be expressed as the number of red rods within As (= As • 15,000 mm -~ for the toad retina). For a fuller account of these measures, the reader is referred to Donner and Gr6nholm (1984), Copenhagen et al. (1987, 1990) and Donner (1987).
The Signal-to-No~w Ratio
We consider not only response thresholds and criterion amplitudes of responses, but also their statistical significance, i.e., signal-to-noise ratios. We have found it particularly useful to consider in each case the maximally obtainable signal-to-noise ratio. We assume that it is lim- ited by three kinds of statistically independent quantal fluctuations: (a) in the numbers of photoisomerizations induced by the stimulus, (b) in the numbers of photoisomerizations induced by the background light, and (c) in the numbers of isomerization-like "dark" events spontaneously occurr ing in the rods (see Hecht et ai., 1942; Rose, 1942, 1948; de Vries, 1943; Barlow, 1956, 1964; Baylor et al., 1980; Reuter et al., 1986; Aho et al., 1987; Copen- hagen et al., 1987, 1990; Donner, 1989). When a stimulus is given, the cell will sum isomeri- zation events from all three sources: stimulus, background, and "dark" events. Let the mean numbers (summed over As and tO be Es, E~ (EB = 0 in darkness), and ED, respectively. Then the ratio of the mean number of stimulus events, Es, to the (Poisson) standard deviation of the total number of events, (Es + EB + E,) ~ is a measure of the signal-to-noise ratio at the input to the visual system (here denoted SNRi,). This sets an upper limit to the signal-to-noise ratio of any physiological response to the stimulus Es:
SNRi. = Es/(Es + EB + ED) ~ (4)
The corresponding intensities Is, Is, and lo of a large-field step stimulus, the background light, and the dark light, respectively, are obtained by dividing the appropriate event numbers by Ast~, yielding the alternative formulation
SNRin = (Astl) ~ • &( I s + 1~ + ID) ~ (5)
Eq. 5 reduces to the well-known square root or Rose-deVries law Is ~ 1 ~ provided that three

736 THE JOURNAL OF GENERAL PHYSIOLOGY �9 VOLUME 95 �9 1990
conditions prevail: (a) threshold responses have a constant signal-to-noise ratio that is equal to (or a fixed fraction of) SNRI,, (b) the background intensity is high enough, so that quantal fluctuations from IB are the dominant noise source, and (c) spatio-temporal summation (AsTi) is constant.
Adaptation, Desensitization, and Change in Signal-to-Noise Ratio
It is clear from Eqs. 4 and 5 that a background light that is not significantly weaker than the "dark light" always degrades the detectability of a fixed stimulus: in the presence of the back- ground, a stronger stimulus than before is needed for detection of constant reliability. When we record from a single visual cell, the decreased detectability of the stimulus is in principle always evident as a decreased signal-to-noise ratio of the physiological response, but this need not necessarily be associated with a decrease in the amplitude of the response (a desensitiza- tion). Instead, there may just be an increase in noise amplitude. When the term adaptation is used in this article, we are always referring to true desensitization, never to the fact that a larger response and hence a stronger stimulus than before is required to ensure a constant signal-to-noise ratio when the noise has increased. Particularly, by the novel term noise adap- tation we refer to a physiological process whereby noise reduces the sensitivity of a cell, so that a stronger stimulus than before is needed to produce a response of criterion ampli- tude.
R E S U L T S
Desensitization of Rod and Horizontal Cell Responses by Dim Backgrounds
The b a c k g r o u n d intensi ty n e e d e d to decrease the sensitivity o f a cell by 50% is a conven ien t index o f its suscept ibi l i ty to desensi t izat ion. We d e t e r m i n e d this in 11 rods and 7 hor izon ta l cells by f ind ing the b a c k g r o u n d that halved the ampl i tude o f the responses , to dim flashes o f f ixed intensity. The d a r k - a d a p t e d eyecup was e x p o s e d to 13.5-ms flashes at 22-s intervals. The test intensi ty was ad jus t ed to elicit 1 .5 -2 mV responses , and as soon as the r e sponse ampl i tudes were stable, a 500-nm b a c k g r o u n d field was t u r n e d on for a b o u t 110 s (Fig. 1). This was r e p e a t e d several t imes with slightly d i f fe ren t b a c k g r o u n d intensit ies. The prec ise ampl i tude-ha lv ing intensi ty was o b t a i n e d by in te rpola t ion .
The sensitivity o f ho r i zon ta l cells to large-f ie ld st imuli was 4 - 1 0 t imes h ighe r than that o f rods (see Table I). Thus the test flashes used for hor izon ta l cells cou ld be co r r e spond ing ly weaker (in Fig. 1 :0 .31 Rh* for the hor izon ta l cell vs. 1.52 Rh* for the rod). The ampl i tude-ha lv ing b a c k g r o u n d intensit ies, however , were approx i - mately the same for bo th cell types. F o r example , in Fig. 1 the r o d and the hor izon- tal cell a re e x p o s e d to the same b a c k g r o u n d (0.58 Rh*s-~), and in bo th cases the flash responses are app rox ima te ly halved. Still, because o f the much h igher flash sensitivity o f the hor izon ta l cell, the amp l i t ude o f the b a c k g r o u n d - i n d u c e d h y p e r p o - lar iza t ion is abou t f ou r t imes larger. The halving o f r e sponse ampl i tude was typically associa ted with a 1 -1 .5 -mV steady hype rpo la r i za t ion in rods (cf. Fig. 3, below) and a 6-mV hype rpo la r i za t ion in hor izon ta l cells.
The mean ampl i tude-ha lv ing b a c k g r o u n d intensi ty was 1.3 Rh*s -1 for rods and 0.8 Rh*s -~ for hor izon ta l cells (Table I; the r o d and hor izonta l cell p r e s e n t e d in Fig. 1 are nos. 4 and 6, respectively, in this table). W h e n the results are s ta ted in terms o f sensit ivity-halving backgrounds , even this m o d e r a t e d i f ference virtually d isappears .

DONNER ET AL. Adaptation in Toad Retina 737
While the horizontal cell recordings could be carr ied ou t within a fully linear par t o f the intensity-response [R(log I)] curve, the 1.5-mV cri terion is slightly outside the linear range o f dark-adapted rods (cf. the R( log I ) funct ions in Fig. 3 o f Copenha- gen et al., 1990). The halving o f response ampli tude in rods therefore implied a sensitivity reduct ion o f almost 60%. Taking this nonlinearity into account , the mean sensitivity-halving background for the rods in Table I becomes 0.9 Rh*s -1, no t sig- nificantly different f rom that o f the horizontal cells.
In four rods we investigated the effect o f these weak backgrounds on the com- plete R(log I ) function. In full agreement with the results o f Fain (1976) and Hem- il~i (1977) we found a very slight (<10%) reduct ion o f the maximum amplitude. It is thus clear that the halving o f rod sensitivity is due almost exclusively to a displace-
rod
hoaz0nt~ ee~l
J background 0.58 Rh*s "-1 1
FIGURE 1. Recordings from a rod (top; No. 4 in Table I) and a horizontal cell (bottom; No. 6 in Table 1) in darkness and during a 110-s exposure to a weak background light (0.58 Rh*s -~, as indicated below the recordings). Both cells were stimulated at 22-s intervals with test flashes of constant intensities: 1.52 Rh* for the rod and 0.31 Rh* for the horizontal cell. The flashes were preceded by 2-mV calibration pulses seen as upward "spikes." The horizon- tal cell was nine times more sensitive than the rod, while its integration time was shorter by balf. Because of that, the background produced a four to five times larger maintained hyper- polarization in the horizontal cell. Observe that the background caused both a decrease in response amplitude and an increase in random membrane fluctuations.
ment o f the R (log I) funct ion to the right on the log intensity axis, not to a compres- sion o f the voltage response range.
Decrease in the Integration Times of Rods and Horizontal Cells due to Dim Backgrounds
Adapt ing background lights can change not only the sensitivities o f cells, but also their summat ion properties. The summat ion o f stimulus and background pho tons is critical for the signal-to-noise ratio o f responses (see Eq. 5). Whereas the summat ion areas As o f retinal cells appear to be little affected by very low levels o f background illumination, this is not the case for integrat ion times (cf. Donner , 1987).
The integrat ion times tl o f rods and horizontal cells were first de te rmined in dark-

738 THE JOURNAL OF GENERAL PHYSIOLOGY-VOLUME 9 5 . 1990
hess by the two d i f f e r e n t m e t h o d s e x p r e s s e d in Eqs. 2 a n d 3. T h e resul ts f o r the
ind iv idua l cells a r e g iven in Tab l e I. T h e g r a n d m e a n o f t he two sets o f va lues was
1.9 s f o r b o t h rods a n d h o r i z o n t a l cells at this t e m p e r a t u r e . W e t h e n s tud ied , in the
s a m e s a m p l e o f cells, h o w m u c h t~ ( a c c o r d i n g to Eq. 3) was r e d u c e d by a sensit ivity-
ha lv ing b a c k g r o u n d . T h e d e t e r m i n a t i o n was ba sed o n e x p e r i m e n t s o f t he type
s h o w n in Fig. 1. O n ave rage , ti d e c r e a s e d by 22% (range , 6 - 2 8 ) in rods a n d by 27%
(range , 1 1 - 4 1 ) in h o r i z o n t a l cells. T h e d i f f e r e n c e b e t w e e n r o d s a n d h o r i z o n t a l cells
is n o t stat ist ically s ignif icant .
T A B L E I
Response Characteristics of Red Rods and Rod-driven Horizontal Cells
Rods
Background Integration time Dark-adapted intensity halving
Cell sensitivity response amplitude Method A Method B Mean of A and B
mV/Rh* Rh*s t s s s 1 0.67 1.47 1.65 1.89 1.77 2 0.68 1.63 0.65 1.75 1.20 3 0.97 1.67 1.56 1.94 1.75 4 1.05 0.42 2.86 2.54 2.70 5 1.04 2.41 2.11 2.01 2.06 6 0.79 1.66 1.68 1.71 1.70 7 0.65 1.05 1.60 2.22 1.91 8 1.02 0.70 1.40 1.84 1.62 9 0.91 1.31 1.89 1.83 1.86
10 1.10 1.15 1.21 2.68 1.95 11 1.13 1.25 2.00 2.53 2.27
Mean 0.91 1.34 (0.91 1.69 2.09 1.89 after correction)
Horizontal cells 1 4.12 1.34 1.34 2.14 1.74 2 5.39 1.26 0.83 1.95 1.39 3 8.19 0.25 3.30 2.33 2.82 4 9.94 0.34 2.53 2.42 2.48 5 6.14 0.82 1.94 1.57 1.76 6 9.25 0.85 1.16 1.42 1.29 7 2.25 0.87 1.93 1.74 1.84
Mean 6.47 0.82 1.86 1.94 1.90
Rod No. 4 and horizontal cell No. 4 were from the same preparation, as well as rod No. 11 and horizontal cell No. 7.
Bui ldup and Decay of the Background Effect in Rods
An analysis o f 22 r o d r e c o r d i n g s o f t he type s h o w n in Fig. 1 i n d i c a t e d tha t t he
r e s p o n s e a m p l i t u d e s to the s a m e test in tens i ty r e m a i n e d re la t ively c o n s t a n t d u r i n g
the t i m e o f the b a c k g r o u n d e x p o s u r e . M o r e o v e r , the first r e s p o n s e a f t e r the t e rmi -
n a t i o n o f t he b a c k g r o u n d a l r eady r e g a i n e d the full d a r k - a d a p t e d a m p l i t u d e . T h u s
the b a c k g r o u n d - i n d u c e d desens i t i z a t i on in r o d s bu i lds u p a n d decays wi th in 15 s (cf. Hemil 'S, 1977; G r e e n b l a t t , 1983). I n fact , it a p p e a r s tha t t he b u i l d u p phase is fin-

DONNER ET AL. Adaptation in Toad Retina 739
ished within just a couple of seconds, as is shown by the experiment illustrated in Fig. 2.
In Fig. 2, a sensitive rod (No. 8 in Table I) was exposed to 12-s periods of weak background light (0.73 Rh*s -]) alternating with 23-s periods of darkness. 3.5 s before each background period the retina was exposed to a 1.30-Rh* flash, and the same flash was repeated with varying delays after the background had been turned on. (In Fig. 2, the delays are 5 s in the top recording, 2 and 8 s in the bot tom recording). It is seen that the response to a flash with 2 s delay was no larger than those obtained after longer delays. In the same series of recordings, the amplitudes of four responses to flashes with 3-s delays averaged 44% (range, 31-54) of the dark-adapted amplitude, and did not significantly differ f rom responses with longer delays. Thus, desensitization is nearly complete in 3 s.
It is interesting to note that, at the time the responses to flashes having 3-s delays peaked, the rods had received on average no more than three photoisomerizations
I I I I I I I I I s ,
FIGURE 2. Recordings from a sensi- tive rod (No. 8 in Table I) exposed to 12-s periods of weak background light (0.73 Rh*s -1) alternating with 23-s periods of darkness, as indicated under the recordings. Also indicated are stimulus flashes (1.30 Rh*) pre- sented 3.5 s before the background was turned on, and with varying delays after the background had been turned on (5 s delay in the top record, 2 and 8 s in the bottom rec- ord). Tile flashes were preceded by 2-mV calibration pulses seen as upward "spikes" in the recordings. The lowermost scale marks 10-s intervals.
f rom the background light. This implies that the desensitizing effect o f a single pho- toisomerization must spread rapidly over a significant part of a dark-adapted rod (cf. Donner and Hemil~, 1978).
Rod Desensitization Bears No Strict Relation to Hyperpolarization
Inter-rod coupling allows extensive electrotonic spread of signals between rods at least in turtle and toad retinas (Schwartz, 1973; Fain, 1975; Copenhagen and Owen, 1976; Leeper et al., 1978). Conceivably, desensitization could also be conducted between rods via the network of interconnections. However, thorough studies in the turtle retina have indicated that a possible spread of desensitization must, at any rate, be much more limited than that of the light-induced signals (Copenhagen and Green, 1985).
We examined the possibility of inter-rod spread of desensitization in the toad retina by comparing the actions of three different background patterns centered on

740 T H E J O U R N A L OF G E N E R A L P H Y S I O L O G Y �9 V O L U M E 9 5 . 1 9 9 0
the impaled rod: (a) a small-spot background (27/~m diam, only somewhat larger than the test spot); (b) an annular background (inner diam, 60/~m; outer diam, 110 #m); (c) a full-field background. Against each of these, a small (13/lm) stimulus spot was flashed on the impaled rod to test sensitivity.
Fig. 3 shows, for the full-field background, the type of data underlying the com- parison. Relative sensitivities (ordinate) were plotted against the background- induced hyperpolarizations (abscissa) at several background intensities. (The inten- sity variable is thus eliminated f rom the plot.) The steady hyperpolarizations associated with a halving of response amplitude can be read directly f rom the plot (at log relative sensitivity = -0 .3 ) . The mean hyperpolarizations thus obtained for the different background configurations were (a) (small spot) 0.8 mV, (b) (annulus)
-0.1
uJ u) -0.2 , < LU r'lr" ,o, o -0.3
_>
z ~?.4 u.I
..A IJA
~ -0.5 q
-0.6
1 2 3 I
I I I
0 1 2 3
ROD HYPERPOLARIZATION (mV)
FIGURE 3. The log sensitivity decreases in rods induced by full- field backgrounds of different inten- sities, plotted as functions of the membrane hyperpolarization observed at each background intensity. Each symbol type refers to data from one rod. Log dark-adapted sensitivity is scaled to zero and corresponds to zero background-induced hyperpo- larization for all cells (upper left-hand corner); 50% sensitivity depression is indicated by the log relative sensitiv- ity -0.3. The saturating response in these rods was a hyperpolarization of 15-20 mV.
2.0 mV, and (c) (full-field) 1.3 mV. The conclusion is that there is no clear relation between desensitization and hyperpolarization. In fact, in view of the similarity to results from turtle retina (see above), it seems quite probable that the desensitiza- tion caused by the annular background was entirely due to light scattered onto the central rods.
Background-induced Noise and the Signal-to-Noise Ratio
Experiments of the type shown in Figs. 1 and 2 clearly demonstrate that background illumination reduces the signal-to-noise ratio of rod and horizontal cell responses in two ways: (a) the signal, i.e., the mean response amplitude, is reduced through desensitization; (b) the noise, i.e., the amplitude of random membrane potential

DONNER ET AL. Adaptation in Toad Retina 741
fluctuations in a low-frequency band ( -0 .1 -1 Hz) is increased. A response-halving background typically increased the peak-to-peak low-frequency fluctuations in rods to 1-2 mV from 0.3-0.4 mV in darkness. Thus, a background that reduces the amplitude of the response to a given test flash by exactly 50% reduces the signal- to-noise ratio of that response by much more than 50%.
The fluctuations can be analyzed by Fourier techniques, as illustrated in Fig. 4 for one horizontal cell (No. 3 in Table I). (cf. also Reuter et al., 1986; Donner, 1989; for rods in the same species, see Baylor et al., 1980). A shows sample records, the top one taken in darkness and the bot tom one in the presence of a dim steady back- ground light (0.21 Rh*s-1), each including four flash responses. It is immediately evident that although the background reduces the amplitude of the responses by less than 50%, it makes them much more difficult to detect.
C shows the power spectra obtained by Fourier-transforming periods of "dark" and "background" records that did not include flash responses, and D (plusses) shows the difference spectrum of "background" minus "dark." The difference spectrum isolates the noise component added by the background light. In D, this added component is compared with two other spectra: (squares) the power spectrum of background records including flash responses (such as the lower sample in A), thus essentially catching the power of the flash responses; (continuous line) the spec- tral composition of a model flash response fitting responses recorded in the pres- ence of the background (as shown in B). The good agreement of the difference spectrum with the two spectra that reflect the waveform of dim-flash responses indi- cates that the background-induced noise is built up of events having that waveform, i.e., of photoisomerization events.
It is possible to go fur ther and calculate quantitatively the rate of such events needed to account for the power of the low-frequency voltage noise. Let the mean number of events that occur within the summation area within one integration time be X (the mean rate is then X/As/tl). The standard deviation of these Poisson-distrib- uted numbers is x]X. I f S is the sensitivity of the cell in terms of signal amplitude per isomerization within the receptive field (in millivolts per isomerization) and ~ is the standard deviation (in millivolts) of the observed voltage fluctuations in the relevant frequency band, then
S r ~ = a (6)
The variance of the low-frequency noise (below 0.8 Hz) in the "background" spec- t rum of Fig. 4 C is a 2 = 0.034 mV 2, giving the standard deviation a = 0.184 mV. The sensitivity of the cell in Fig. 4 under background illumination was 4.70 mV/Rh*, which, with a receptive field encompassing ~300 rods (cf. Copenhagen et al., 1990), corresponds to S = 0.0157 mV per isomerization in the receptive field. Eq. 6 then gives X = 137 isomerizations. On the other hand, since the background intensity was 0.21 Rh*s -1 and the integration time tl ~ 2.1 s in the presence of this back- ground, a direct calculation indicates that the cell receives 132 isomerizations/Asti f rom the background. Thus we know, firstly, that a mean of 137 isomerizations will suffice to account for the electrical low-frequency noise, and secondly, that the background light in fact delivers a mean of 132 isomerizations. The conclusion then must be that the voltage noise is almost wholly due to the quantal fluctuations in the

lO-a
"1-
~'~ 10-3
o
10 4
A i i
C TIME (s)
o
o o Background
o +
+ o
o
Dark + o +
+ + 1:i
%
B
1 0 ~
"r"
10 ~
o
+ 10'
I 1 1 1 I I I I 0 1 2 3 4 5 6 7 8 9 10
D IB
TIME (s)
10-1
10-2 "1-
> E
10 -3 O~
[]
1 0 5 1 I I I I I I I I J l l l l I I I I I I I H I 1 0 - ~ I I 1 1 1 I I I I I I I . I L _ I I I 1 1 1 1
O1 1 10 0.1 1 10
F REOUENCY (Hz) FREQUENCY ( Hz )
FIGURE 4. The membrane potential of a horizontal cell (No. 3 in Table I) in darkness and during background illumination. (A) Flashes of light (0.20 Rh*, 13.5 ms, 0.56 mm diam spot on the retina) were presented once every 22 s in darkness (top) and during background illu- mination (0.21 Rh*s -t, 1.5 mm diam; bottom). Vertical scale bar, 1 mV. The resting membrane potential and flash sensitivity in darkness were -40 .5 mV and 8.19 mV/Rh*, respectively. The background light hyperpolarized the membrane by - 4 . 2 mV and depressed sensitivity to 4.70 mV/Rh*. (B) Averaged light responses. Flash responses to 0.20 Rh* were averaged in darkness (10 responses, top) and during background (6 responses, bottom). Vertical scale bar, 1 inV. The smooth line superimposed on the bottom record is a model flash response, calcu- lated according to the Poisson model of Baylor et al. (1974) (four stages, time constant = 361 ms). (C) Power spectra of membrane potential in darkness (plusses) and during background (squares). 1- or 2-min segments of membrane potential during continuous darkness and back- ground (no flashes) were digitized (14.6 ms intervals), filtered (_<10 Hz), and Fourier analyzed by a 1024 FFT algorithm. The averages of six dark spectra and four background spectra are shown. Five point smoothing was applied to points above 1.2 Hz. The variances of the low- frequency component (calculated as the area under the power spectrum for frequencies _<0.8 Hz) were a '~ (background) = 0.034 mV 2 and a2(dark) = 0.017 mV 2. (/9) The plusses show the difference spectrum (background-dark) of the spectra in C; the left ordinate refers to these data. The squares show the power spectrum of 15-s segments of recordings taken during background illumination and including flash responses (such as the lower record in A). The scale for this spectrum is shown on the right. The continuous line is the spectrum of a model response fitted to the average flash response during background illumination as shown in B.

DONNER ET AL. Adaptation in Toad Retina 743
background light. A similar calculation for the "dark" noise in this cell points to a mean rate of dark isomerizations = 0.027 Rh*s -~. This is in good agreement with the rate of spontaneous rod events obtained by Baylor et al. (1980) at the same temperature, 0.021 Rh*s -1 as recorded f rom three-fourths of the length of the rod outer segment.
In summary, Fourier analysis of noise in rods (Baylor et al., 1980) and horizontal cells in toad suggests that the low-frequency noise, which degrades the detectability of dim-flash responses under weak background illumination, is mainly due to quan- tal fluctuations (cf. Reuter et al., 1986; Donner, 1989). Then Eq. 4 or 5 for SNRi, will give a fair description of how the signal-to-noise ratio of physiological responses is degraded by a background light. With very weak backgrounds (<< 0.8 Rh*s-l), the cells do not desensitize, and then the voltage noise will grow in direct proport ion to the quantal fluctuations in the light.
Desensitization and Noise in Ganglion Cell Spike Discharges under Dim Backgrounds
Desensitization. The responses and maintained discharge of ganglion cells were studied extracellularly in eyecup preparations identical to those used for the intra- cellular rod and horizontal cell recordings described above. In a separate article we have given the absolute sensitivities, summation characteristics, and threshold-dou- bling background intensities of six thoroughly investigated, sensitive ganglion cells (cells Nos. 1-5 and No. 7 in Table I of Copenhagen et al., 1987). With stimulus spots covering the whole summation area of the receptive field center, the mean dark-adapted flash threshold of these six cells was 0.025 Rh* (range, 0 .008-0.038 Rh*). The mean integration time of the threshold response was 1.76 s (range, 0 .85- 2.77 s), which is not significantly different f rom that of rods and horizontal cells. However, the mean background intensity needed to depress sensitivity by half (dou- ble threshold intensity) was only 0.17 Rh*s -~ (range, 0 .06-0.38 Rh*s-~), no more than 20% of the sensitivity-halving background of rods and horizontal cells. Thus Kanglion cells are truly desensitized by backgrounds that do not affect the response amplitude of rods or horizontal cells.
No persistent noise increase. In rods and horizontal cells, the quantal noise of weak background lights was seen to be directly reflected as increased random fluc- tuations of the membrane potential, i.e., as "ou tpu t" noise. The output noise of a ganglion cell lies in the randomness of its spiking. The very low rate of maintained activity in toad (often < 1 spike/min) makes its randomness difficult to test rigor- ously. However, there is no evident regularity in the maintained discharge of healthy ganglion cells, except for the fact that spikes often occur in bursts of two to three within one second. Here we equate such a burst with a single spike and refer to both as one "event ." The mean rate of such events can then be used as at least a semi- quantitative measure of noise in the ganglion cell output (see Aho et al., 1987 on frog cells).
The maintained activity of ganglion cells was monitored in eight cells over dif- ferent periods after the turning ON or OFF of dim backgrounds of various intensities. In seven of these cells, the discharge gradually stabilized at a constant low level, regardless of the intensity of the (dim) background. Only one of the cells was an

744 THE JOURNAL OF GENERAL PHYSIOLOGY �9 VOLUME 95 �9 1 9 9 0
except ion, in that the main ta ined discharge remained on an elevated level for the whole per iod o f background illumination.
However , it took the cells a few minutes to regain the constant level o f mainta ined discharge. This is i l lustrated in Fig. 5. When the background was tu rned on, the main ta ined firing rate transiently rose; correspondingly , it d r o p p e d transiently when the background was decreased. In e i ther case, it r e tu rned to the original level over a per iod o f 5 - 1 0 rain. Sensitivity requi red a similar t ime to stabilize at a new level, while it will be recalled that rods reached their final sensitivity within a few sec- onds.
Thus, d im backgrounds that do not desensitize rods or horizontal cells, but only increase their m e m b r a n e noise, have quite a different effect on ganglion cells. They are really desensitized, while their mainta ined rate o f discharge remains constant instead. This suggests that the gain o f the rod- to-gangl ion cell t ransmission is reduced so as to keep the r a n d o m spiking (output noise) constant in the face o f
,,>,
F I G U R E 5 . T h e m a i n t a i n e d
9~- a a ! I L 1 ~ ~ _ ~ . dischargeground of ganglion cells in darkness (DL, denoting dark light, left), after a dim back-
~------'x~r c - '~ '~ has been turned on 0 I ; , i i i (DL + 0.02 Rh*s-', middle),
1 2 3 4 5 6 1 2 3 4 5 6 7 0 rain and after the intensity of the ,I '"[ background has been de-
creased (DL + 0.002 Rh*s -~, DL OL + 0.02 Rh*s -1 DL + 0.002 Rh*s -1 r/ght). Each point gives the
number of "events" (either one spike or a burst of two to three spikes, see text) during 1 min; mean values of recordings from two cells. (Left) Counts during each of 5 min preceding back- ground onset. (Middle) Counts during each of 6 min starting 15 s after background onset, when the ON response had ceased. The 0.02 Rh*s-~ background was on for a total of 15 min. (Right) Counts during each of 8 min starting 15 s after a I-log-unit dimming of the previous background, when the OFF response had ceased.
increased r a n d o m light f luctuations (input noise). I f so, the desensitization must be p ropor t iona l to the qu in ta l fluctuations, i.e., to the square roo t o f background intensity (Eq. 5). The increment threshold exper iments descr ibed below conf i rm that this is the case.
Increment Threshold Functions of Rods, Horizontal Cells, and Ganglion Cells
I n c r e m e n t threshold funct ions were r eco rded in four rods, two horizontal cells, and five ganglion cells over 6 log unit ranges o f background intensity. For the rods and horizontal ceils, this implied finding, against each background , the stimulus intensity that would p roduce a response o f cri ter ion ampl i tude (2.8 mV). Each background was ON for 2 -2 .5 min, allowing four to five stimulus presenta t ions at 30-s intervals. Even with s t ronger backgrounds it was clear that these per iods were quite sufficient to ensure a steady state o f adaptat ion. Background intensity was increased in 0.5- o r I-log-unit steps, and when the s t rongest one had been presented , the measu remen t s against some o f the backgrounds were repea ted in reverse order . Af ter the re tu rn to

DONNER ET AL. Adaptation in Toad Retina 745
a moderate background intensity, we could assess how much the cell's response to a fixed stimulus had decayed. Typically, the amplitude fell by half over a whole sequence of backgrounds lasting - 2 5 min. The recorded amplitudes were corrected for this decay by linear interpolation, and the exact intensity eliciting the (corrected) criterion amplitude 2.8 mV was determined by interpolation f rom the R( logI ) curve. In the ganglion cells, the threshold intensity against each background was determined by 10-20 presentations of stimuli a round threshold intensity. The inter- stimulus interval was 30 s and each background was ON for periods varying between 6 and 20 min.
Typical increment " threshold" curves f rom the three cell types are compared in Fig. 6. The intensities needed to produce a criterion response in the rod and hori- zontal cell are indicated by open circles and open squares, respectively. The thresh-
(.9 - 2 o,
- ]__
- O - -
-3
4
" 3 #.
>" 2 t,,-
Z cu 1 I.- z a
w- u ) u.i - 1
I~ I I I I i i i i --2 -1 0 1 2 3 4 5
LOG BACKGROUND INTENSITY (Rh*s-1)
FIGURE 6. I n c r e m e n t thresh- olds of a ganglion cell (filled circles), a rod (open circles), and a horizontal cell (squares) as functions of log background intensity. For the two latter, "threshold" intensities were the intensities needed to pro- duce a 2.8-mV criterion response. Step stimuli, full- field backgrounds. The abscissa (log background inten- sity) is common to all the cells. The ordinate, giving log threshold intensity, refers only to the ganglion cell. The rod data have been shifted down-
wards by 1.75 log units and the horizontal cell data by 0.8 log units to facilitate comparison between the three increment "threshold" curves by making the Weber ranges coincide. (Thus, in darkness the horizontal cell was in fact four times more sensitive than the rod.) The full-drawn curve is composed of straight segments with slopes 0, 0.5, and 1, illustrating back- ground independence, square-root adaptation, and Weber adaptation, respectively.
old intensities of the ganglion cells are indicated by filled circles. The abscissa, com- mon to all the cells, gives log background intensity (Rh*s-~). The ordinate gives threshold intensity for the ganglion cell. The rod and horizontal cell data have been vertically positioned for best coincidence with the ganglion cell data in the high- intensity range. Tiffs is done to facilitate comparison; it is permissible, because there is no a priori correspondence between ganglion cell thresholds and the amplitude criterion applied to the rod and horizontal cell.
Two main conclusions emerge f rom Fig. 6 and the other increment-threshold experiments. First, at high background intensities ganglion cells and rods, as well as horizontal cells, desensitize roughly in concert, approximating the Weber relation (slope 1). Secondly, in the range of very low background intensities that depress the sensitivity of ganglion cells, but not that of rods or horizontal cells, the former

746 THE JOURNAL OF GENERAL PHYSIOLOGY �9 VOLUME 9 5 . 1 9 9 0
desensitize along a slope of roughly 0.5, i.e., proportionally to the quantal fluctua- tions in the background.
In these experiments, we used ON-step stimulation. The purpose was to ensure that stimulus and background photons should be as equivalent as possible f rom the viewpoint of signal detection. (With a flash, all the stimulus photons are coincident in time, which may enhance their detectability.) The mean sensitivity-halving back- grounds in these experiments were 1.1 Rh*s -~ for the rods, 0.9 Rh*s -~ for the hor- izontal cells, and 0.06 Rh*s -1 for the ganglion cells. Thus, the detection of step stimuli by the ganglion cell was indeed affected by even dimmer backgrounds than the detection of flash stimuli.
D I S C U S S I O N
Background Adaptation in Rods
We find that rods start desensitizing at background intensities between 0.1 and 1 Rh*s -~, the average sensitivity-halving intensity being 0.9 Rh*s -1. From a functional viewpoint, it appears natural that a desensitizing mechanism should become opera- tive only when each individual rod starts receiving isomerizations at a rate close to one per integration time (i.e., ~0.5 Rh*s-~). Dimmer backgrounds would leave the operat ing range of phototransduction essentially intact and pose no need for pro- tecting it through desensitization. Nor could desensitization at lower background intensities serve to improve the signal-to-noise ratio at the rod output, because the background-induced membrane fluctuations and the light responses would be sub- ject to the same amplitude reduction.
The background adaptation of rods in intact retinas and suction pipettes. The flash sensitivity of dark-adapted toad rods is approximately the same for microelectrode- penetrated rods in eyecups and single rods drawn into recording pipettes (1 Rh* evokes - 3 - 5 % of the maximum response; Fain, 1975; Baylor et al., 1979a, b; Copenhagen et al., 1990). Yet there is a considerable discrepancy between the two preparations as regards the desensitization by weak backgrounds. In our eyecup preparation, sensitivity was halved by a background intensity of 0.9 Rh*s -~. Corre- sponding values for the photocurrent of isolated rods have been given as 7.7 Rh*s -~ (Baylor et al., 1980) and 4 -30 Rh*s -~, depending on the buffer used (Lamb et al., ! 981). Earlier studies of rods in intact retinas of other species have yielded values that are even lower than ours: "0.2 Rh*s -~ in the eyecup of the snapping turtle (Copenhagen and Green, 1985) and 0.3-0.5 Rh*s -1 in the perfused frog retina (Hemilfi, 1977; Hemilfi and Reuter, 1981).
It might be thought that the crucial difference between the preparations is the extent to which lateral interactions remain patent. However, experiments on the lateral spread of adaptation (see Results and Copenhagen and Green, 1985) gave no support to the idea that hyperpolarization, or some other rod-rod interaction, would be important for spreading desensitization. It must then be assumed that the experimental procedures for single-rod current recording change either (a) the magnitude of the desensitizing effect per photon absorbed, (b) its longitudinal spread within one rod outer segment, or (c) its rate of decay. Factor c cannot be crucial, since it fails to explain the dramatic effect of the very few isomerizations

DONNER E'r AL, Adaptation m Toad Retina 747
collected during the first seconds of dim background illumination. The present evi- dence does not, however, allow a more precise identification of the decisive fac- tor.
Distal and Proximal Adaptation in the Vertebrate Retina
Ganglion cells were found to be more susceptible than rods to desensitization by background light. This is in qualitative agreement with results from other species. In both the skate (Green et al., 1975) and the rat (Green and Powers, 1982) the differ- ence in the background intensities that produce l-log-unit desensitizations at the two levels was 2-2.5 log units. For rods and ganglion cells in the cat retina, the difference seems to be 2-4 log units (Steinberg, 1971; Sakmann and Filion, 1972; Shapley and Enroth-Cugell, 1984). Human a- vs. b-wave data (Faber, 1969) and a comparison of single macaque rods with human psychophysics (Baylor, 1987) sug- gest a difference of 3 log units in man.
All these differences are considerably larger than the mean difference we found with sensitivity-halving backgrounds in toad (0.7 log units with flash stimuli, 1 log unit with step stimuli). There is an interesting correlation between the number of rods per ganglion cell receptive field and the difference in rod and ganglion cell background adaptation. The rods in skate and mammals are much thinner than in toad, hence the receptive field of a large ganglion cell may comprise up to 200,000 rods in the cat (Leach et al., 1961; Enroth-Cugell and Shapley, 1973) compared with 4,000 in the toad. Thus, in the cat there is a wider gap than in the toad between the intensities where a ganglion cell receptive field and an individual rod, respec- tively, start collecting isomerizations at a significant rate.
Weber and Noise Adaptation
A compelling reason for retinal cells to adapt is the necessity to escape saturation, i.e., retain high differential sensitivity in the presence of sustained illumination (cf. Byzov and Kusnezova, 1971; Werblin, 1974). At higher background levels, toad rods, horizontal cells, and ganglion cells were all seen to desensitize in direct pro- portion to mean background intensity. Functionally, this realizes the Weber- Fechner law: the cells give constant responses to fixed contrast ratios over a wide range of illumination levels. At the same time it provides sufficient protection against saturation in DC-coupled cells like photoreceptors, which respond tonically to steady illumination.
At the lowest background intensities, toad ganglion cells did not show Weber adaptation, but desensitized approximately as the square root of background inten- sity. In a situation where the quantal fluctuations in the background constitute the dominant source of variability, a constant criterion response (e.g., one spike) will then signal light deviations (from the prevailing mean illumination level) of constant statistical significance. This is an essential aspect of what we shall refer to as "noise adaptation." It is noteworthy that, simultaneously, this type of desensitization will provide just sufficient protection against saturation (from background fluctuations) in AC-coupled cells, which respond to changes in illumination, but set up no tonic response proportional to the mean light level. This includes the most common types of anuran ganglion cells (Maturana et al., 1960; Ewert and Hock, 1972; B~ickstr6m

748 THE JOURNAL OF GENERAL PHYSIOLOGY. VOLUME 9 5 . 1990
and Reuter, 1975; Donner and Gr6nholm, 1984), and differentiation of the signal may be a ubiquitous feature of the transmission from receptors to ganglion cells in vertebrates (cf. Baylor and Fettiplace, 1977).
Possibly, all reported cases of "proximal" adaptation at low background intensi- ties can be regarded as noise adaptation. From Eq. 5 it is seen that such adaptation would follow the precise slope 0.5 only when spatio-temporal summation (AstO stays constant. In fact, it does not. In frog ganglion cells, integration time (ti) falls as the power 0.17 of background intensity (Donner, ]987). In human psychophysics, spa- tio-temporal summation (Asti) decreases as the power 0.25 of background intensity (Barlow, 1958). The decrease in ti alone would, according to Eq. 5, give a limiting slope (0.17 • 0.5) + 0.5 ~- 0.59 for noise adaptation measured with step stimuli. Dowling and Ripps (1977), using 1-s stimuli (steps, in effect), report limiting slopes of 0.5-0.7 for the adaptation of ganglion cells, b-wave, and the proximal negative response in the skate. Extended increment threshold slopes of 0.5-0.7 are found with step stimuli in cat ganglion cells as well. Barlow and Levick (1976) report a mean slope of 0.59 for 0.29 ~ 1 s (i.e., small-spot step) stimuli in ON-center cells. Sakmann and Creutzfeld (1969) obtained the mean slope 0.68 in cat ganglion cells, but they averaged results with spot sizes ranging from 0.2 ~ to 1 ~ and it is possible that their largest spots had activated surround antagonism.
The Mechanism of Noise Adaptation
The site of adaptation. The adaptation of horizontal cells faithfully followed that of the rods, as also found in skate by Green et al. (1975). In bipolar cells of the dogfish retina, Ashmore and Falk (1982) found that the root-mean-square mem- brane fluctuations in the frequency band of photoresponses grew as the square root of tile intensity of weak backgrounds (i.e., in proportion with the quantal fluctua- tions). If the mechanism for noise adaptation resided in the distal retina, it should be evident in these second-order ceils: (a) they should desensitize at lower back- ground intensities than rods, and (b) their membrane noise should increase less than proportionally to the quantal fluctuations (because the response to quantal fluctua- tions would be subject to decreasing amplification). Thus, these results indicate that the mechanism for noise adaptation resides in the proximal retina, conceivably involving interactions between bipolar, amacrine, and ganglion cells in the inner plexiform layer (cf. Dowling, 1967; Dowling and Ripps, 1977). Teleologically, it would appear purposeful to place the gain reduction close to the retinal output, where it can act on the entire retinal noise.
The adapting signal. The above-mentioned result of Ashmore and Falk (1982) also implies that, at least in dogfish, fluctuations proportional to the quantal noise do actually constitute a sustained input to third-order neurons. There is thus the intriguing possibility that the desensitizing mechanism responsible for noise adapta- tion is driven by the fluctuations themselves rather than through some accurate computation (as expressed by Eq. 5) from a DC signal proportional to the mean level of illumination.
The time course of adaptation. The idea that the gain of the proximal desensitiz- ing mechanism could be set by the variation (standard deviation) rather than the mean of the background-induced signal is consistent with the slow time course of

DOYNER ~T AL. Adaptation in Toad Retina 749
ganglion cell adapta t ion to dim backgrounds. I f it is assumed, for example, that a "s teady" adaptat ion level requires that the adapt ing signal be known within + 10% with 95% confidence, a mean event n u m b e r 500 (typical for a sensitivity-halving background summed over Asti in a toad ganglion cell; see Copenhagen et al., 1987) will be known accurately enough f rom one single sample. Since a sample in this case is the count within one integrat ion time (mean, 1.76 s), the ganglion cell would need no more than 1 o r 2 s for this. In contrast , knowing the s tandard deviation with the same accuracy requires 100 -200 samples. With the mean integrat ion time 1.76 s, this cor responds to 3 - 6 min.
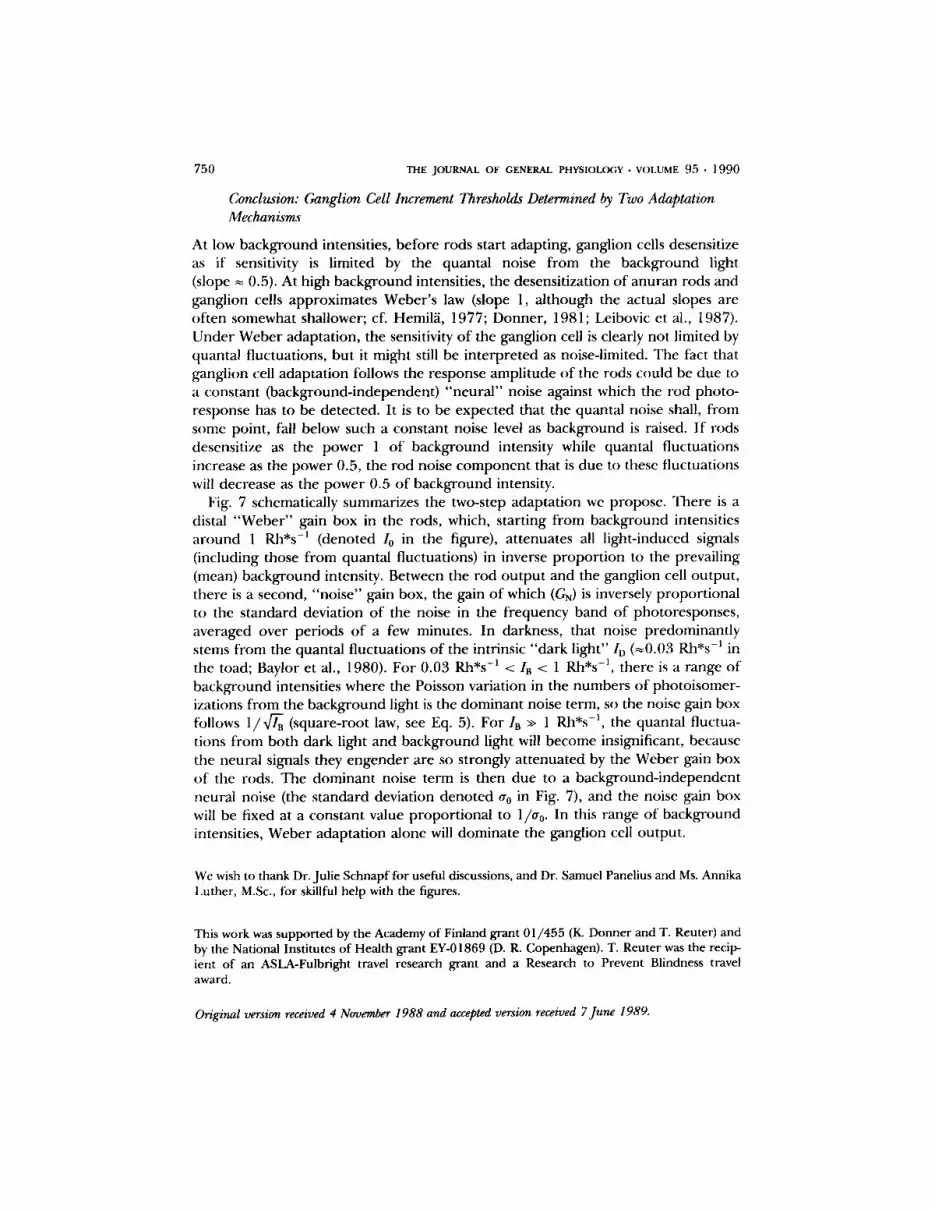
input rods proximal retina ganglion cell output
. . . . . . I
noise . . . . ~ - . . . . . . ~ _ L
G, = G w ~ c o n s t a n t
s i g n a l ~ [ �9
als l R =Gw(als) I N R =G"Gw(als)
Weber gain box Noise gain box
Gw = k~ G = k2 k~ N 2 2
1+~-- - s 4Gwa(lB+lo)+<ro '.~" ) <r ~ a
FIGURE 7. Schematic picture of the proposed two-level light adaptation involving a "Weber" gain box in the rods, and a "noise" gain box in the proximal retina. The passage of signal (continuous arrows) and that of noise (broken arrows) through the retina are drawn sepa- rately only for visual clarity; it should be noted that the arrows do not represent separate "channels"! (Symbols) Variables: Gw, gain of Weber box; GN, gain of noise box; Is, stimulus intensity; Is, background intensity, crx, standard deviation of the noise component due to quantal fluctuations; R, response amplitude at each respective level in the retina. Constants: In, "dark" rate of isomerization-like events (~-0.03 Rh*s-I); I0, sensitivity-halving background for rods (~ 1 Rh*s-~); a0, standard deviation of neural noise in the frequency band of photo- responses; k~ and k2, proportionality constants, a stands for the spatio-temporal summation of the ganglion cell (a = AsQ and may here be thought of as a constant, although strictly speak- ing it is not (see Text). The gain of the Weber box Gw is constant (=k0 for very. dim back- grounds, but falls as k~/Is when IB >> I0. The ga_in, of the noise box GN is set by the total retinal noise, measured by the standard deviation ~ + or0 ~. For dim backgrounds, GN is essentially determined by k~/~r, = ks/,]-~B. For bright backgrounds, however, Gw and consequently ~ become very small; then GN approaches the constant value k2/ao and the ganglion cell's response R= GNGw(als) will be governed by the Weber gain G w alone.
Indeed, in the present experiments, rod adaptat ion to a new background was complete within a couple o f seconds (Fig. 2). The ganglion cells, on the o ther hand, reached a stable level only several minutes after a change in background intensity (Fig. 5). A comparatively slow time course seems to be a general feature o f proximal adaptat ion (frog ganglion cells: Byzov and Kusnezova, 1971; skate ganglion cells, b-wave and proximal negative response: Green et al., 1975; Dowling and Ripps, 1977).
750 THE JOURNAL OF GENERAL PHYSIOLOGY �9 VOLUME 9 5 �9 1 9 9 0
Conclusion: Ganglion Cell Increment Thresholds Determined by Two Adaptation Mechanisms
At low background intensities, before rods start adapting, ganglion cells desensitize as if sensitivity is limited by the quantal noise from the background light (slope ~ 0.5). At high background intensities, the desensitization of anuran rods and ganglion cells approximates Weber 's law (slope 1, although the actual slopes are often somewhat shallower; cf. Hemil/i, 1977; Donner, 1981; Leibovic et al., 1987). Under Weber adaptation, the sensitivity of the ganglion cell is clearly not limited by quantal fluctuations, but it might still be interpreted as noise-limited. The fact that ganglion cell adaptation follows the response amplitude of the rods could be due to a constant (background-independent) "neural" noise against which the rod photo- response has to be detected. It is to be expected that the quantal noise shall, f rom some point, fall below such a constant noise level as background is raised. I f rods desensitize as the power 1 of background intensity while quantal fluctuations increase as the power 0.5, the rod noise component that is due to these fluctuations will decrease as the power 0.5 of background intensity.
Fig. 7 schematically summarizes the two-step adaptation we propose. There is a distal "Weber" gain box in the rods, which, starting f rom background intensities around 1 Rh*s -1 (denoted Io in the figure), attenuates all light-induced signals (including those f rom quantal fluctuations) in inverse proport ion to the prevailing (mean) background intensity. Between the rod output and the ganglion cell output, there is a second, "noise" gain box, the gain of which (GN) is inversely proport ional to the standard deviation of the noise in the frequency band of photoresponses, averaged over periods of a few minutes. In darkness, that noise predominantly steins f rom the quantal fluctuations of the intrinsic "dark light" ID (~-0.03 Rh*s -I in the toad; Baylor et al., 1980). For 0.03 Rh*s -1 < IB < 1 Rh*s -1, there is a range of background intensities where the Poisson variation in the numbers of photoisomer- izations f rom the background light is the dominant noise term, so the noise gain box follows 1/x]-~a (square-root law, see Eq. 5). For IB >> 1 Rh*s -l, the quantal fluctua- tions from both dark light and background light will become insignificant, because the neural signals they engender are so strongly at tenuated by the Weber gain box of the rods. The dominant noise term is then due to a background-independent neural noise (the standard deviation denoted a0 in Fig. 7), and the noise gain box will be fixed at a constant value proportional to 1/ao. In this range of background intensities, Weber adaptation alone will dominate the ganglion cell output.
We wish to thank Dr. Julie Schnapf for useful discussions, and Dr. Samuel Panelius and Ms. Annika Luther, M.Sc., for skillful help with the figures.
This work was supported by the Academy of Finland grant 01/455 (K. Donner and T. Reuter) and by the National Institutes of Health grant EY-01869 (D. R. Copenhagen). T. Reuter was the recip- ient of an ASLA-Fulbright travel research grant and a Research to Prevent Blindness travel award.
Original version received 4 November 1988 and accepted version received 7 June 1989.

DONNER El" AL. Adaptation in Toad Retina 751
R E F E R E N C E S
Aho, A.-C., K. Donner, C. Hyd6n, T. Reuter, and O. Y. Orlov. 1987. Retinal noise, the perfor- mance of retinal ganglion cells, and visual sensitivity in the dark-adapted frog. Journal of the Optical Society of America A. 4:2321-2329.
Ashmore, J. F., and G. Falk. 1982. An analysis of voltage noise in rod bipolar cells of the dogfish
retina. Journal of Physiology. 332:273-297. BSckstr6m, A.-C., and T. Reuter. 1975. Receptive field organization of ganglion cells in the frog
retina: contributions from cones, green rods and red rods. Journal of Physiology. 246:79-107. Barlow, H. B. 1956. Retinal noise and absolute threshold.Journal of the Optical Society of America.
46:634-639. Barlow, H. B. 1958. Temporal and spatial summation in human vision at different background
intensities. Journal of Physiology. 141:337-350. Badow, H. B. 1964. The physical limits of visual discrimination. In Photophysiology. Vol. 2. A.C.
Giese, editor. Academic Press, New York. 163-202. Barlow, H. B., and W. R. Levick. 1976. Threshold setting by the surround of cat retinal ganglion
cells. Journal of Physiology. 259:737-757. Baylor, D. A. 1987. Photoreceptor signals and vision. Investigative Ophthalmology and V~ual Science.
28:34-49. Baylor, D. A., and R. Fettiplace. 1977. Kinetics of synaptic transfer from receptors to ganglion
cells in turtle retina.Journal of Physiology. 271:425--448. Baylor, D. A., and A. L. Hodgkin. 1973. Detection and resolution of visual stimuli by turtle photo-
receptors. Journal of Physiology. 234:163-198. Baylor, D. A., A. L. Hodgkin, and T. D. Lamb. 1974. The electrical response of turtle cones to
flashes and steps of light. Journal of Physiology. 242:685-727. Baylor, D. A., T. D. Lamb, and K.-W. Yau. 1979a. The membrane current of single rod outer
segments. Journal of Physiology, 288:589-611. Baylor, D. A., T. D. Lamb, and K.-W. Yau. 1979b. Responses of retinal rods to single photons.
Journal of Physiology. 288:613-634. Baylor, D. A., G. Matthews, and K.-W. Yau. 1980. Two components of electrical dark noise in toad
retinal rod outer segments.Journal of Physiology. 309:591-621. Byzov, A. L., and L. P. Kusnezova. 1971. On the mechanisms of visual adaptation. Vision Research.
Suppl. 3:51-63.
Copenhagen, D. R., K. Donner, and T. Reuter. 1987, Ganglion cell performance at absolute threshold in toad retina: effects of dark events in rods. Journal of Physiology. 393:667-680.
Copenhagen, D. R., and D. G. Green. 1985. The absence of spread of adaptation between photo- receptors in turtle retina.Journal of Physiology. 369:161-181.
Copenhagen, D. R., S. HemiHi, and T. Reuter. 1990. Signal transmission through the dark-adapted
retina of the toad Bufo marinus: gain, convergence, and signal/noise. Journal of General Physiol- ogy. 95:717-732.
Copenhagen, D. R., and W. G. Owen. 1976. Functional characteristics of lateral interactions between rods in the retina of the snapping turtle. Journal of Physiology. 259:251-282.
de Vries, H. 1943. The quantum character of light and its bearing on the threshold of vision, the differential sensitivity and visual acuity of the eye. Physica. 10:553-564.
Donner, K. 1981. Receptive fields of frog retinal ganglion cells: response formation and light-dark adaptation. Journal of Physiology. 319:131 - 142.
Donner, K. 1987. Adaptation-related changes in the spatial and temporal summation of frog reti- nal ganglion cells. Acta Physiologica Scandinavica. 131:479-487.

752 THE JOURNAL OF GENERAL PHYSIOLOGY. VOLUME 9 5 . 1 9 9 0
Donner, K. 1989. The absolute sensitivity of vision: can a frog become a perfect detector of light-
induced and dark rod events? Physica Scripta. 39:133-140. Donner, K., and M.-L. Gr6nholm. 1984. Center and surround excitation in the receptive fields of
frog retinal ganglion cells. Vision Research. 24:1807-1819. Donner, K. O., and S. Hemil/i. 1978. Excitation and adaptation in the vertebrate rod photore-
ceptor. Medical Biology. 56:52-63. Dowling, J. E. 1967. The site of visual adaptation. Science. 155:273-279. Dowling, J. E., and H. Ripps. 1977. The proximal negative response and visual adaptation in the
skate retina.Journal of General Physiology. 69:57-74. Enroth-Cugell, C., and R. M. Shapley. 1973. Adaptation and dynamics of cat retinal ganglion cells.
Journal of Physiology. 233:271-309. Ewert, J.-P., and F. Hock. 1972. Movement-sensitive neurons in the toad's retina. Experimental
Brain Research. 16:41-59. Faber, D. S. 1969. Analysis of the slow transretinal potentials in response to light. Ph.D. Thesis.
State University of New York at Buffalo, New York. Fain, G. L. 1975. Quantum sensitivity of rods in the toad retina. Science. 187:838-841. Fain, G. L. 1976. Sensitivity of toad rods: dependence on wavelength and background illumina-
tion. Journal of Physiology. 261 : 71 - 101. Green, D. G., J. E. Dowling, I.M. Siegel, and H. Ripps. 1975. Retinal mechanisms of visual adap-
tation in the skate. Journal of General Physiology. 65:483-502. Green, D. G., and M. K. Powers. 1982. Mechanisms of light adaptation in rat retina. Vision
Research. 22:209-216. Greenblatt, R. E. 1983. Adapting lights and lowered extracellular free calcium desensitize toad
photoreceptors by differing mechanisms, Journal of Physiology. 336:579-605. Hecht, S., S. Shlaer, and M. H. Pirenne. 1942. Energy, quanta, and vision.Journal of General Phys-
iology. 25:819-840. Hemil~i, S. 1977. Background adaptation in the rods of the frog's retina. Journal of Physiology.
265:721-742. Hemilii, S., and T. Reuter. 1981. Longitudinal spread of adaptation in the rods of the frog's retina.
Journal of Physiology. 310:501-528. Lamb, T. D., P. A. McNaughton, and K.-W. Yau. 1981. Spatial spread of activation and back-
ground desensitization in toad rod outer segments. Journal of Physiology. 319:463-496. Leach, E. H., F. H. C. Marriott, and V. B. Morris. 196l. The distances between rods in the cat's
retina. Journal of Physiology. 157:17P. Leeper, H. F., R. A. Normann, and D. R. Copenhagen. 1978. Evidence for passive electrotonic
interactions in red rods of toad retina. Nature. 275:234-236. Leibovic, K. N., J. E. Dowling, and Y. Y. Kim. 1987. Background and bleaching equivalence in
steady-state adaptation of vertebrate rods.Journal of Neuroscience. 7:1056-1063. Maturana, H. R., J. Y. Lettvin, W. S. McCulloch, and W. H. Pitts. 1960. Anatomy and physiology
of vision in the frog (Rana pipiens). Journal of General Physiology. 43:129-175. Reuter, T., K. Donner, and D. R, Copenhagen. 1986. Does the random distribution of discrete
photoreceptor events limit the sensitivity of the retina? Neuroscience Research. 4:S163-S180. Rose, A. 1942. The relative sensitivities of television pick-up tubes, photographic film, and the
human eye. Proceedings of the Institute of Radio Engineers. 30:293-300. Rose, A. 1948. The sensitivity performance of the human eye on an absolute scale. Journal of the
Optical Society of Amerwa. 38:196-208. Sakmann, B., and O.D. Creutzfeld. 1969. Scotopic and mescopic light adaptation in the cat's
retina. Pfli~gers Archiv. 313:168-185.

DONNER El" AL. Adaptation in Toad Retina 753
Sakmann, B., and M. Filion. 1972. Light adaptation of the late receptor potential in the cat retina. In The Visual System. Neurophysiology, Biophysics, and Their Clinical Applications. G.B. Arden, editor. Plenum Publishing Co., New York. 87-93.
Shapley, R., and C. Enroth-Cugell. 1984. Visual adaptation and retinal gain controls. In Progress in Retinal Research. Vol. 3. N. Osborne and G. Chader, editors. Pergamon Press, Oxford. 263- 346.
Schwartz, E. A. 1973. Responses of single rods in the retina of the turtle. Journal of Physiology. 232:503-514.
Steinberg, R. H. 1971. Incremental responses to light recorded from pigment epithelial cells and horizontal cells of the cat retina.Journal of Physiology. 217:93-110.
Werblin, F. S. 1974. Control of retinal sensitivity. II. Lateral interactions at the outer plexiform layer. Journal of General Physiology. 63:62-87.
Copyright © 2022 FDOKUMEN