Bufo melanostictus SEBAGAI SPESIES INDIKATOR TERHADAP KUALITAS LINGKUNGAN HUTAN PENDIDIKAN WANAGAMA

This article was published in the above mentioned Springer issue.The material, including all portions thereof, is protected by copyright;all rights are held exclusively by Springer Science + Business Media.
The material is for personal use only;commercial use is not permitted.
Unauthorized reproduction, transfer and/or usemay be a violation of criminal as well as civil law.
ISSN 1566-0621, Volume 11, Number 1

RESEARCH ARTICLE
Genetic structure in peripheral populations of the natterjack toad,Bufo calamita, as revealed by AFLP
Bjorn Rogell • Hanna Thorngren • Stefan Palm •
Anssi Laurila • Jacob Hoglund
Received: 10 July 2009 / Accepted: 2 December 2009 / Published online: 24 December 2009
� Springer Science+Business Media B.V. 2009
Abstract Decreased fitness due to loss of genetic varia-
tion is a well recognised issue in conservation biology.
Along the Swedish west coast, the endangered natterjack
toad (Bufo calamita) occurs on, for the species, highly
unusual habitat of rocky islands. Although the toads inhabit
a restricted geographical area (maximum distance between
the populations is 71 km), the fragmented nature of the
landscape makes the genetic properties of the populations
of conservation interest. However, lack of genetic variation
found using conventional methods (microsatellites) has
impeded genetic studies within these peripheral popula-
tions so far. In this study we assess population structure and
genetic variation among seven of these fringe populations
using 105 polymorphic Amplified Fragment Length Poly-
morphism (AFLP) loci. We found a well-defined popula-
tion structure without evidence for isolation by distance,
implying restricted gene flow between populations. Addi-
tionally, the populations differed in their amount of genetic
variation, emphasizing the need to monitor genetically
impoverished populations for possible declines mediated
by inbreeding depression and reduced adaptive potential.
Conservation implications for these unique populations are
discussed in the light of our results.
Keywords AFLP � Genetic structure �Peripheral populations � Genetic diversity � Amphibians
Introduction
Small and isolated populations are expected to lose genetic
variation due to stronger genetic drift than in large popula-
tions and may thus suffer from decreased fitness due to
increased expression of deleterious alleles, i.e. inbreeding
depression, and loss of adaptive potential (Frankham et al.
2002; Hoglund 2009). Issues regarding fragmented habitat
are emphasised in organisms characterized by poor dispersal
abilities (Thomas 2000), such as amphibians (Beebee 2005).
Indeed, previous studies have found inbreeding depression
in the natterjack toad (Rowe and Beebee 2003) and in
two European Rana species (Ficetola et al. 2007; Johansson
et al. 2007).
In Sweden, the natterjack toad (Bufo calamita) lives at
the northern margin of its distribution (Beebee 1983).
During the last century it has decreased throughout its
northern range and the species is red-listed in many
countries including Sweden (Beebee 1983; Gardenfors
2005; Allentoft et al. 2009). The natterjack toad has two
separate distribution areas in Sweden: one in the south-
ernmost part of the country and the other one on approxi-
mately 30 small offshore islands in the Bohuslan
archipelago on the western coast (henceforth named
Bohuslan, Andren and Nilson 1985). During the late 20th
century, the species has disappeared from many previously
known localities both in the southern Sweden and
Bohuslan, although the decline seems to have been stronger
in the south (Andren and Nilson 1985). The Bohuslan
population is likely to exhibit spatial genetic structure since
open sea can be expected to be a solid barrier for
B. Rogell (&) � H. Thorngren � S. Palm � A. Laurila �J. Hoglund
Population Biology and Conservation Biology/Department of
Ecology and Evolution, Evolutionary Biology Centre, Uppsala
University, Norbyvagen 18D, 75236 Uppsala, Sweden
e-mail: [email protected]
H. Thorngren
Animal Ecology/Department of Ecology and Evolution,
Evolutionary Biology Centre, Uppsala University,
Norbyvagen 18D, 75236 Uppsala, Sweden
123
Conserv Genet (2010) 11:173–181
DOI 10.1007/s10592-009-0021-z Author's personal copy

amphibian dispersal (Rowe et al. 2000b; Rudh et al. 2007).
Since a well defined population structure may yield iso-
lated populations with low amount of genetic variation that
may be in need of genetic rescue in terms of migration, the
genetic structure of these populations is of interest for
putative conservation efforts.
The natterjack toad shows a negative correlation
between genetic variation and distance from its glacial
refuges, and the Swedish populations harbour little genetic
variation as compared to continental populations (Rowe
et al. 2006). This is a frequently encountered pattern in
northern hemisphere taxa (Merila et al. 1996; Zeisset and
Beebee 2001; Rowe et al. 2006). Thus, the geographical
pattern in genetic variation not only depends on recent
isolation but also on historical colonisation patterns, where
gradual dispersal combined with selection in novel envi-
ronments seems to have decreased the level of genetic
variation (Hewitt 1999).
From a conservation viewpoint, it is important to dis-
tinguish between loss of genetic variation due to recent
fragmentation or bottlenecks, and loss of genetic variation
due to historic colonisation patterns. For example, in their
study of the Italian agile frog Rana latastei, Ficetola et al.
(2007) found that while loss of genetic variation due to
recent fragmentation was associated with loss of fitness,
loss of genetic variation due to postglacial colonisation was
not. One possible explanation for this pattern may be that
purging of deleterious alleles is more likely to occur when
loss of genetic variation occurs during slow colonisation,
whereas purging is less likely during the short time frame
of recent fragmentation or local founder effects (Swindell
and Bouzat 2006). However, it seems likely that effects of
recent fragmentation may be more severe close to range
margins, since, due to the less frequent occurrence of
suitable habitats, many species are less abundant and
already occur as more fragmented populations in areas
close to their physiological limit (Hoffmann and Blows
1994). Thus, conservation issues regarding population
subdivision may become increasingly important as range
margins are approached.
When assessing population structure and levels of
genetic variation it is important to choose a genetic marker
system that works on an appropriate spatial and temporal
scale. In general, studies where populations have been
isolated for shorter periods of time require more poly-
morphic markers than do studies of populations fragmented
over long time periods. For example mitochondrial DNA
may be an appropriate choice when assessing broad-scale,
phylogeographic patterns across species distributions (e.g.
Avise 2000), while more polymorphic loci such as micro-
satellites can be a better choice when assessing population
structure at a fine-scale. Quantifications of fine-scaled
genetic structure are often limited by lack of statistical
power (Pemberton 2004), and the possibilities of assessing
population-wide levels of genetic variation within and
among peripheral populations, characterized by low levels
of genetic variation, may be particularly restricted (Zeisset
and Beebee 2001). Indeed, our previous attempts to
quantify genetic variation within and among the Bohuslan
natterjack populations using microsatellite markers were
impeded by lack of genetic variation yielding low statis-
tical power (Table 1), emphasising the need to develop
another methodology suitable for assessing genetic varia-
tion in these genetically impoverished populations.
Here we have examined the genetic population structure
and molecular genetic variation in a subset of the Bohuslan
natterjack toad populations using Amplified Fragment
Length Polymorphism (AFLP). Although dominant geno-
typic data is generated, a large number of polymorphic
markers can be derived with this methodology. Compared
to co-dominant marker systems such as microsatellites,
which typically are studied using fewer but more infor-
mative loci, AFLP may often provide equally robust esti-
mates of genetic variation when migration rates are low
(Mariette et al. 2002). In fact, this technique has proven to
have enough statistical power to pick up even fine-scale
differentiation (Bensch and Akesson 2005), and inferences
of population structure derived from co-dominant and
Table 1 Average levels of observed microsatellite-heterozygosity
(Ho) in Swedish (Rogell 2005) and continental natterjack toad
populations
Locus Ho Bohuslan pop. Ho Continental pop.
Bcall1 0.10 0.48A
Bcall2 0 0.31A
Bcall3 0.38 0.43A
Bcall4 0.37 0.46A
Bcall6 0 0.04A
Bcall7 0.05 0.29A
Bcall8 0.07 0.38A
Bcall9a – 0.81B
Bcall10 0.27 0.80B
Bcall11 0 0.70B
Buca1 0 0.63C
Buca 2 0 0.38C
Buca 3 0.21 0.63C
Buca 5 0 0.38C
All loci (without Bcall9a) 0.11 0.45
Ho for the Bohuslan populations is calculated on a total of 40
individualsA Rowe et al. (1997)B Rowe et al. (2000a)C Rogell (2005), Rogell et al. (2005)a The locus did not amplify well enough for objective scoring of
alleles
174 Conserv Genet (2010) 11:173–181
123
Author's personal copy

dominant markers have generally been found to be con-
gruent (reviewed in Nybom 2004). The aims of this study
were to asses the population structure and relative amounts
of genetic variation at a subpopulation scale in the
Bohuslan natterjack toad. Due to the nature of the habitat
these populations inhabit, we expected to find a distinct
population structure over relatively small spatial scale.
Materials and methods
In May 2006 tissue samples were taken from 30 adult
natterjack toads from each of six small islands (Fig. 1);
Altarholmen (henceforth AL, 58�10N, 11�260E), Buskar
(BU, 58�210N, 11�110E), Fagelskar (FA, 58�60N, 11�200E),
Hyppeln (HY, 57�450N, 11�360E), Oxskar (OX, 58�70N,
11�220E) and Pater Noster (PA, 57�530N, 11�270E). A
biopsy sample was collected from the adults by removing a
small piece of skin from the swim web with a dermal
punch. Approximately 3 9 2 mm piece of skin was taken
and stored in 70% of EtOH for later analyses. The adult
animals were released immediately after sampling. In
addition, 20 individuals were collected as embryos (one per
full sib family) at the island Maseskar (MA, 58�50N,
11�190E) and stored in 70% EtOH. The pair-wise distances
between the sampled islands range between 1 and 71 km.
AFLP-screening
DNA was extracted using standard high salt purification
(Rudh et al. 2007; slightly modified from Miller et al.
1988). We used the AFLP protocol of Bensch et al. (2002),
modified from Vos et al. (1995), with some further modi-
fications: 10 ll of the extracted DNA was cut in the fol-
lowing mix: 6.9 ll of ddH2O, 2 ll of TA buffer 109
(100 mM Tris–acidic pH 7.9, 100 mM MgAc, 500 mM
KaC, 10 mM DTT), 1 ll of BSA (1 lg/ll), 0.05 ll of
EcoRI (50 U/ll) and 0.05 ll of Tru1 (50 U/ll). The
restriction mix was incubated for 1 h at 37�C. To ligate
adaptors, 5 ll of a mix containing 4.15 ll of ddH2O, 0.5 ll
of T4 ligase buffer 109, 0.025 ll of E-adaptor (100 lM),
0.25 ll of M-adaptor (100 lM) and 0.1 ll of T4 ligase
(5 U/ll) was added to the cut DNA and incubated for
additional 3 h at 37�C. The E-adaptor and the M-adaptor
was build of the primers 50-CTCGTAGACTGCGTACC-30,50-AATTGGTACGCAGTC-30 and 50-GACGATGAGTCC
TGAG-30, 50-TACTCAGGACTCAT-30.To improve the ligation capability of the adaptors these
were denatured in 94�C for 3 min and then cooled down in
room temperature before being added the to the ligation
mixture. After completed ligation, samples were diluted ten
times with ddH2O and amplified in a non-selective PCR. In
the PCR, 10 ll of the diluted, cut and ligated DNA was
amplified with the mix of 1 ll of ddH2O, 2 ll of MgCl2(25 mM), 2 ll of Fermentas Taq buffer (109), 4 ll of
dNTP (1 mM), 0.06 ll of E-primer (100 lM), 0.06 ll of
M-primer (100 lM), 0.08 ll of Fermentas Taq polymerase
and 0.8 ll of BSA (1 lg/ll). The reactions were incubated
with the following temperature profile: (94�C 2 min); (94�C
30 s, 56�C 30 s, 72�C 60 s) 9 20 cycles; (72�C 10 min).
E-primer and M-primer were 50-GACTGCGTACCAAT
TCN-30and 50-GATGAGTCCTGAGTAAN-30, where N is
an arbitrary chosen base.
After completion of the PCR reactions, the products were
diluted 10 times with ddH2O. The non-selective amplifica-
tion was followed by a selective amplification where 7.5 ll
of the diluted product was mixed with 2.9 ll of ddH2O, 1 ll
of MgCl2 (25 mM), 1 ll of Fermentas Taq buffer (109),
2 ll of dNTP (1 mM), 0.06 ll of E-primer (100 lM),
0.06 ll of M-primer (100 lM), 0.08 ll of Fermentas Taq
polymerase and 0.4 ll of BSA (1 lg/ll). The mix was run in
a touchdown PCR-reaction with the following temperature
profile: (94�C 2 min); [94�C 30 s, (65–0.7�C/cycle) 30 s,
72�C 60 s] 9 12 cycles; (94�C 30 s, 56�C 30 s, 72�C
60 s) 9 23 cycles; (72�C 10 min). E-primer and M-primer
were 50-GACTGCGTACCAATTCNNN-30and 50-GATGA
GTCCTGAGTAANNN-30, where N are arbitrary chosen
bases, the first N the same as in the non-selective
amplification.
Eleven selective primer combinations were used based
on the E-primers: -TGC, -TAG, -TCT and M-primers:
-CAC, -CGT, -CTA, -CAG. Finally 1 ll of the PCR product
was mixed with 9.75 ll ddH2O and 0.25 ll of MegaBACE
ET400-R size standard. The mix was run in MegaBACE
1000 (Amersham Biosciences) and the results were analysedFig. 1 Map of the study area. Study populations: 1, BU; 2, OX; 3,
FA; 4, MA; 5, AL; 6, PA; 7, HY
Conserv Genet (2010) 11:173–181 175
123
Author's personal copy
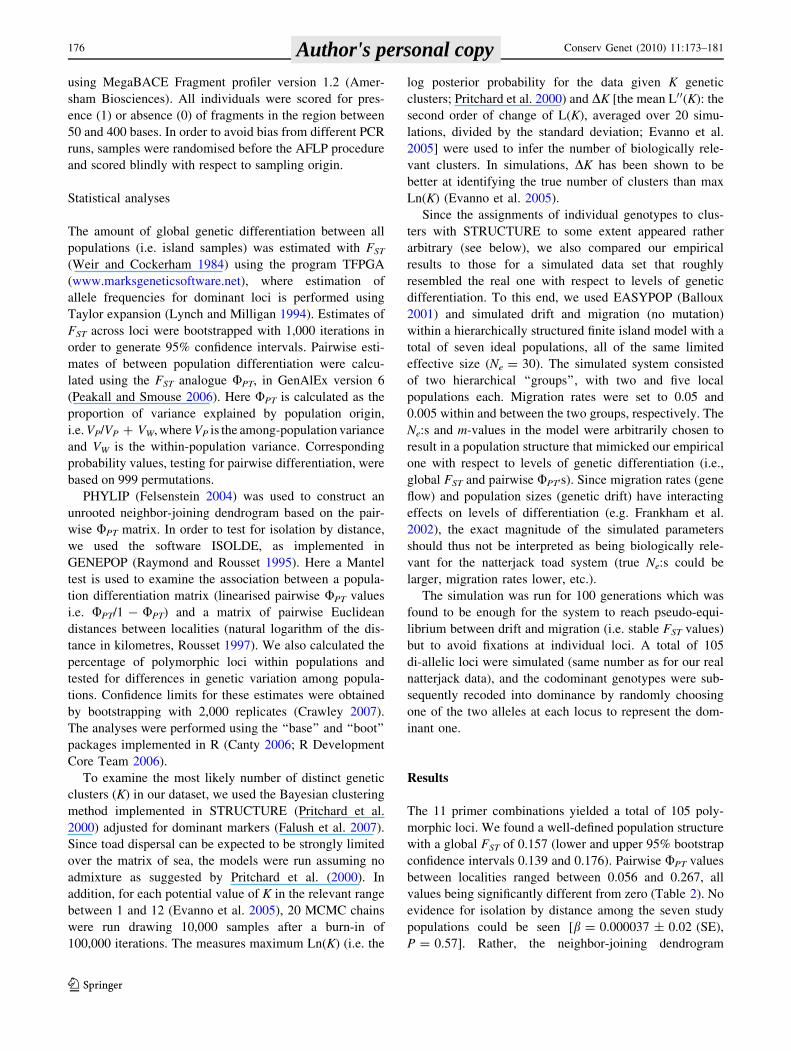
using MegaBACE Fragment profiler version 1.2 (Amer-
sham Biosciences). All individuals were scored for pres-
ence (1) or absence (0) of fragments in the region between
50 and 400 bases. In order to avoid bias from different PCR
runs, samples were randomised before the AFLP procedure
and scored blindly with respect to sampling origin.
Statistical analyses
The amount of global genetic differentiation between all
populations (i.e. island samples) was estimated with FST
(Weir and Cockerham 1984) using the program TFPGA
(www.marksgeneticsoftware.net), where estimation of
allele frequencies for dominant loci is performed using
Taylor expansion (Lynch and Milligan 1994). Estimates of
FST across loci were bootstrapped with 1,000 iterations in
order to generate 95% confidence intervals. Pairwise esti-
mates of between population differentiation were calcu-
lated using the FST analogue UPT, in GenAlEx version 6
(Peakall and Smouse 2006). Here UPT is calculated as the
proportion of variance explained by population origin,
i.e. VP/VP ? VW, where VP is the among-population variance
and VW is the within-population variance. Corresponding
probability values, testing for pairwise differentiation, were
based on 999 permutations.
PHYLIP (Felsenstein 2004) was used to construct an
unrooted neighbor-joining dendrogram based on the pair-
wise UPT matrix. In order to test for isolation by distance,
we used the software ISOLDE, as implemented in
GENEPOP (Raymond and Rousset 1995). Here a Mantel
test is used to examine the association between a popula-
tion differentiation matrix (linearised pairwise UPT values
i.e. UPT/1 - UPT) and a matrix of pairwise Euclidean
distances between localities (natural logarithm of the dis-
tance in kilometres, Rousset 1997). We also calculated the
percentage of polymorphic loci within populations and
tested for differences in genetic variation among popula-
tions. Confidence limits for these estimates were obtained
by bootstrapping with 2,000 replicates (Crawley 2007).
The analyses were performed using the ‘‘base’’ and ‘‘boot’’
packages implemented in R (Canty 2006; R Development
Core Team 2006).
To examine the most likely number of distinct genetic
clusters (K) in our dataset, we used the Bayesian clustering
method implemented in STRUCTURE (Pritchard et al.
2000) adjusted for dominant markers (Falush et al. 2007).
Since toad dispersal can be expected to be strongly limited
over the matrix of sea, the models were run assuming no
admixture as suggested by Pritchard et al. (2000). In
addition, for each potential value of K in the relevant range
between 1 and 12 (Evanno et al. 2005), 20 MCMC chains
were run drawing 10,000 samples after a burn-in of
100,000 iterations. The measures maximum Ln(K) (i.e. the
log posterior probability for the data given K genetic
clusters; Pritchard et al. 2000) and DK [the mean L00(K): the
second order of change of L(K), averaged over 20 simu-
lations, divided by the standard deviation; Evanno et al.
2005] were used to infer the number of biologically rele-
vant clusters. In simulations, DK has been shown to be
better at identifying the true number of clusters than max
Ln(K) (Evanno et al. 2005).
Since the assignments of individual genotypes to clus-
ters with STRUCTURE to some extent appeared rather
arbitrary (see below), we also compared our empirical
results to those for a simulated data set that roughly
resembled the real one with respect to levels of genetic
differentiation. To this end, we used EASYPOP (Balloux
2001) and simulated drift and migration (no mutation)
within a hierarchically structured finite island model with a
total of seven ideal populations, all of the same limited
effective size (Ne = 30). The simulated system consisted
of two hierarchical ‘‘groups’’, with two and five local
populations each. Migration rates were set to 0.05 and
0.005 within and between the two groups, respectively. The
Ne:s and m-values in the model were arbitrarily chosen to
result in a population structure that mimicked our empirical
one with respect to levels of genetic differentiation (i.e.,
global FST and pairwise UPT0s). Since migration rates (gene
flow) and population sizes (genetic drift) have interacting
effects on levels of differentiation (e.g. Frankham et al.
2002), the exact magnitude of the simulated parameters
should thus not be interpreted as being biologically rele-
vant for the natterjack toad system (true Ne:s could be
larger, migration rates lower, etc.).
The simulation was run for 100 generations which was
found to be enough for the system to reach pseudo-equi-
librium between drift and migration (i.e. stable FST values)
but to avoid fixations at individual loci. A total of 105
di-allelic loci were simulated (same number as for our real
natterjack data), and the codominant genotypes were sub-
sequently recoded into dominance by randomly choosing
one of the two alleles at each locus to represent the dom-
inant one.
Results
The 11 primer combinations yielded a total of 105 poly-
morphic loci. We found a well-defined population structure
with a global FST of 0.157 (lower and upper 95% bootstrap
confidence intervals 0.139 and 0.176). Pairwise UPT values
between localities ranged between 0.056 and 0.267, all
values being significantly different from zero (Table 2). No
evidence for isolation by distance among the seven study
populations could be seen [b = 0.000037 ± 0.02 (SE),
P = 0.57]. Rather, the neighbor-joining dendrogram
176 Conserv Genet (2010) 11:173–181
123
Author's personal copy

indicated presence of a hierarchical population structure,
with the two neighbouring populations MA and FA (cf.
Fig. 1) being somewhat more genetically similar than
compared to the other populations (Fig. 2).
The populations differed significantly in the amount of
genetic variation with percentages of polymorphic AFLP
bands varying between 91.4 and 42.8% with largely non-
overlapping confidence intervals (Table 2). AL and OX
had highest genetic variation, while HY and MA displayed
the lowest. Additionally, the genetic diversity found in the
two genetically least variable populations represented a
subset of the genetic variation found in the more variable
populations, as they did not have any private alleles.
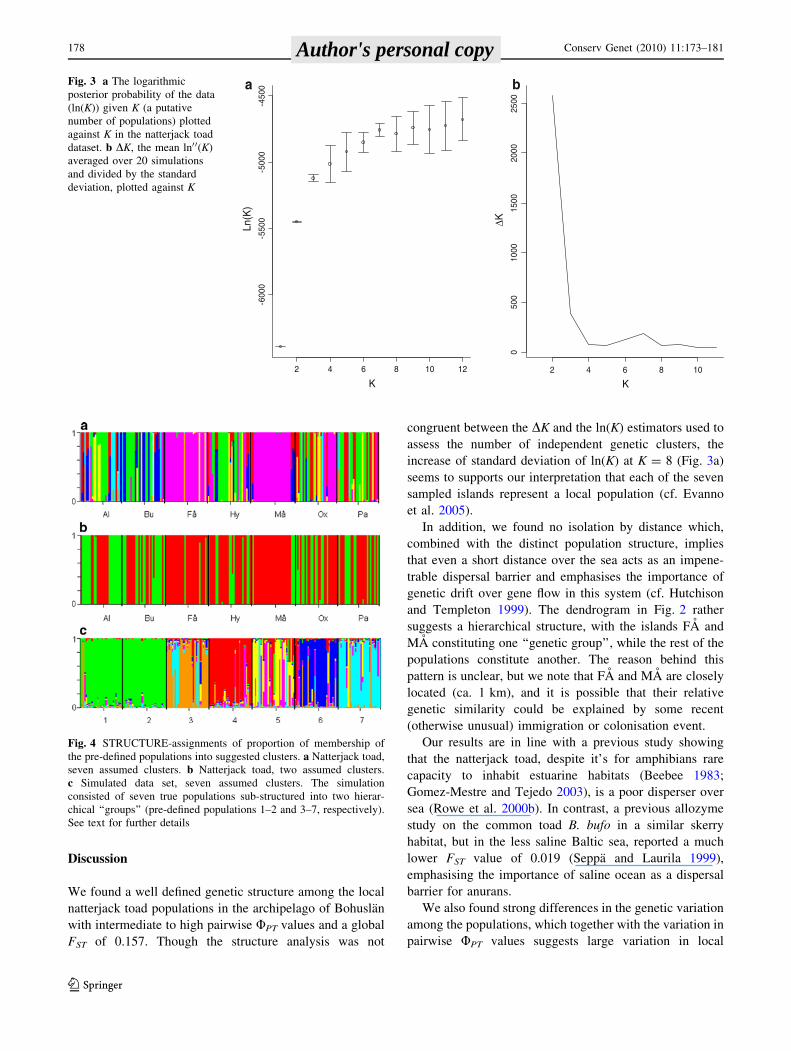
The clustering method implemented in STRUCTURE
yielded the highest Ln(K) for twelve genetic clusters
(Fig. 3a), whereas DK gave most support for two clusters
(DK = 2579, Fig. 3b). However, the curve for DK also
indicated another local optimum located at K = 7
(DK = 187, Fig. 3b) being equal to the number of sampled
localities. When STRUCTURE assigned the proportion of
membership of individual genotypes in the pre-defined
populations into seven clusters, two populations (FA and
MA) were assigned with high probabilities to the same
genetic cluster, whereas the individuals from the other five
pre-defined populations seemed to be assigned largely
randomly to the remaining clusters (Fig. 4a).
Under a model with K = 2, the individuals from FA and
MA were rather strongly assigned to the same cluster (on
average with a 0.90 and 0.87 probability, respectively;
Fig. 4b), and for K = 7 the assigned probabilities remained
almost as high (0.89 and 0.87 to the same cluster, respec-
tively; Fig. 4a). In contrast, the individuals from the other
five pre-defined populations were assigned to the remaining
clusters with lower probabilities; at K = 2 the maximum
assignment proportion for those individuals varied in the
range 0.67–0.55, indicating that the members of the pop-
ulations were scattered more or less randomly over the two
clusters (Fig. 4b). For K = 7 their maximum assignment
proportions were even lower, varying between 0.43 and
0.26 and only with a weak association to the pre-defined
populations (Fig. 4a).
The assignment results based on our simulated data set
(true K = 7) were rather congruent with those for the
natterjack toad (Fig. 4c), indicating that for the present
population structure and number of AFLPs, the ability of
STRUCTURE to correctly assign individuals to popula-
tions appears rather limited. In accordance with the real
data, populations 1 and 2 belonging to the smaller hierar-
chical subset (i.e. the simulated populations with highest
average FST against the other populations: 0.15 and 0.19 vs.
0.11–0.13; Weir and Cockerham 1984) were assigned to
the same cluster (to be compared with the two real popu-
lations MA and FA in Fig. 4a). In comparison, the
remaining individuals were assigned much more randomly
in relation to their pre-defined (true) populations, though
not as pronounced as for the real dataset (cf. Fig. 4a, c).
Table 2 Proportions of polymorphic AFLP loci per population with
95% confidence intervals (first column) and pairwise UPT values
among the seven sampled natterjack toad localities (below the
diagonal) with associated Bonferroni corrected probability values
based on 999 permutations (above the diagonal)
%P AL BU FA HY MA OX PA
AL 91.4 (82.9; 95.2)% 0.021 0.021 0.021 0.021 0.021 0.021
BU 71.4 (61.0; 78.1)% 0.065 0.021 0.021 0.021 0.042 0.021
FA 57.1 (46.7; 65.7)% 0.153 0.224 0.021 0.021 0.021 0.021
HY 49.5 (39.1; 58.1)% 0.063 0.094 0.165 0.021 0.021 0.021
MA 42.9 (32.4; 51.4)% 0.170 0.297 0.122 0.160 0.021 0.021
OX 77.1 (66.7; 83.8)% 0.056 0.088 0.150 0.071 0.193 0.021
PA 53.3 (42.3; 61.2)% 0.096 0.180 0.267 0.106 0.206 0.108
0.02
HY
BU
PA
OX
AL
FA
MA
Fig. 2 Unrooted neighbor-joining dendrogram based on pairwise
UPT values in Table 2
Conserv Genet (2010) 11:173–181 177
123
Author's personal copy
Discussion
We found a well defined genetic structure among the local
natterjack toad populations in the archipelago of Bohuslan
with intermediate to high pairwise UPT values and a global
FST of 0.157. Though the structure analysis was not
congruent between the DK and the ln(K) estimators used to
assess the number of independent genetic clusters, the
increase of standard deviation of ln(K) at K = 8 (Fig. 3a)
seems to supports our interpretation that each of the seven
sampled islands represent a local population (cf. Evanno
et al. 2005).
In addition, we found no isolation by distance which,
combined with the distinct population structure, implies
that even a short distance over the sea acts as an impene-
trable dispersal barrier and emphasises the importance of
genetic drift over gene flow in this system (cf. Hutchison
and Templeton 1999). The dendrogram in Fig. 2 rather
suggests a hierarchical structure, with the islands FA and
MA constituting one ‘‘genetic group’’, while the rest of the
populations constitute another. The reason behind this
pattern is unclear, but we note that FA and MA are closely
located (ca. 1 km), and it is possible that their relative
genetic similarity could be explained by some recent
(otherwise unusual) immigration or colonisation event.
Our results are in line with a previous study showing
that the natterjack toad, despite it’s for amphibians rare
capacity to inhabit estuarine habitats (Beebee 1983;
Gomez-Mestre and Tejedo 2003), is a poor disperser over
sea (Rowe et al. 2000b). In contrast, a previous allozyme
study on the common toad B. bufo in a similar skerry
habitat, but in the less saline Baltic sea, reported a much
lower FST value of 0.019 (Seppa and Laurila 1999),
emphasising the importance of saline ocean as a dispersal
barrier for anurans.
We also found strong differences in the genetic variation
among the populations, which together with the variation in
pairwise UPT values suggests large variation in local
2 4 6 8 10 12
-600
0-5
500
-500
0-4
500
K
Ln(K
)
a
2 4 6 8 10
050
010
0015
0020
0025
00
K
∆K
bFig. 3 a The logarithmic
posterior probability of the data
(ln(K)) given K (a putative
number of populations) plotted
against K in the natterjack toad
dataset. b DK, the mean ln0 0(K)
averaged over 20 simulations
and divided by the standard
deviation, plotted against K
Fig. 4 STRUCTURE-assignments of proportion of membership of
the pre-defined populations into suggested clusters. a Natterjack toad,
seven assumed clusters. b Natterjack toad, two assumed clusters.
c Simulated data set, seven assumed clusters. The simulation
consisted of seven true populations sub-structured into two hierar-
chical ‘‘groups’’ (pre-defined populations 1–2 and 3–7, respectively).
See text for further details
178 Conserv Genet (2010) 11:173–181
123
Author's personal copy

effective population sizes and (or) different demographic
histories such as founder effects during colonisation. Lack
of historical demographic records and estimates of current
effective sizes makes it difficult to settle between these
alternatives. The cumulative effect of genetic drift is
dependent on two factors—time and effective population
size. Though we do not have any direct estimates of pop-
ulation sizes in Bohuslan, the present total sizes of the
study populations must be considered to be ‘‘large’’, as it is
possible to encounter hundreds of adult individuals on each
island (B. Rogell, personal observations). The effective
population sizes are expected to be much smaller, however.
For example, Scribner et al. (1997) studied populations of
common toad around ponds in the UK and estimated the
effective number of breeders per year (Nb) to be 55–230
times smaller than the corresponding estimates of total
population size.
Implications for conservation
The fact that some of the populations had considerable
lower genetic variation than the others raises concerns for
the future and conservation of the Bohuslan natterjack
toads. Loss of fitness due to inbreeding depression is a well
documented threat to the persistence of genetically
impoverished populations (Frankham et al. 2002), that may
apply to some of the Bohuslan populations. This is further
emphasized by previous studies showing inbreeding
depression in other natterjack toad populations (Rowe and
Beebee 2003). In addition to the immediate problem of
inbreeding depression, loss of genetic variation may also
affect the adaptive potential of populations (Lande 1995).
Though not as well examined as inbreeding depression in
natural populations, this may be a specific concern to the
Bohuslan populations since they inhabit a highly specific
habitat where selection pressures are likely to differ from
those in other northern populations (Beebee 1983; Andren
and Nilson 1985). Indeed, larval life history traits in the
Bohuslan natterjack toads are locally adapted to the high
desiccation risk of their specific habitat (Rogell et al. 2009).
Congruent with our present results, other studies
examining population structure of peripheral natterjack
toad populations have found more well defined population
structures (Rowe et al. 2000a, b; Allentoft et al. 2009) as
when compared to the studies of more centrally located
populations (Gomez-Mestre and Tejedo 2004). This may
be either an auto-correlative pattern since genetic variation
decreases in a similar manner (Rowe et al. 2006) and may
statistically affect differentiation indexes, or a result of
increasing population divergence due to increasing popu-
lation fragmentation and isolation towards the edge of the
species range (Hoffmann and Blows 1994; Petit et al.
2001). Since natterjack toad populations are known to be
more isolated in peripheral regions of the distribution area
(Beebee 1983), the latter alternative (increased population
isolation) seems likely to explain the observed patterns.
From a conservation point of view, this suggests that
peripheral populations of the natterjack toad could be
particularly vulnerable to declines mediated by processes
occurring within isolated subpopulations.
It is widely accepted that low genetic variation has
negative effects on the viability of a population and is
expected to limit its adaptability (Lande 1995; Frankham
et al. 2002). Hence, differences in genetic variation should
be taken into account when planning conservation strate-
gies for the Swedish natterjack toad populations. For
example, support releases could be considered if geneti-
cally impoverished populations decline in size (Madsen
et al. 1999). A possible problem with support releases
may be the presence of local adaptations amongst popu-
lations that may decrease fitness if expressed in the wrong
environment (i.e. outbreeding depression, Tallmon et al.
2004). Though the Bohuslan natterjack toads are locally
adapted to their specific insular habitat in larval life his-
tory traits (Rogell et al. 2009), the same traits show low
variation amongst populations within the archipelago,
suggesting uniform selection patterns (Rogell 2009). Thus,
in the case of Bohuslan natterjacks, local populations with
high levels of genetic variation within the same archi-
pelago would be the most immediate choice for source
populations.
Additionally, since extinction risk may increase due to
interactions between inbreeding depression and environ-
mental stress (Liao and Reed 2009), a more complete
assessment of threats to the Bohuslan natterjack popula-
tions is needed, including both genetic and ecological
information. For example, complementary studies focusing
on estimation of current local effective population sizes
from genetic and demographic data would be informative
for the future conservation of these populations (e.g. Jorde
and Ryman 1995). Finally, conventional population genetic
markers such as microsatellites may be impeded by low
statistical power when assessing genetic structure and
variation in systems of populations characterised by gen-
erally low genetic variation. Although AFLP is a method
with certain limitations (yielding dominant, not locus
specific data that, for example, may perform poorly in
assignment tests), our results show that the use of AFLP
may nevertheless facilitate population genetic studies of
peripheral populations.
Acknowledgements We thank Sara Bergek and Andreas Rudh for
comments on earlier versions of this manuscript, and Maarten
Hofman and Jonas Andersson for help with the map. The project was
funded by Formas (to J. Hoglund) and Zoologiska stiftelsen
(B. Rogell). The study was conducted under permissions from the
Conserv Genet (2010) 11:173–181 179
123
Author's personal copy

Ethical Committee for Animal Experiments in Uppsala County and
the county board in Vastra Gotaland.
References
Allentoft M, Siegismund H, Briggs L et al (2009) Microsatellite
analysis of the natterjack toad (Bufo calamita) in Denmark:
populations are islands in a fragmented landscape. Conserv
Genet 10:15–28
Andren C, Nilson G (1985) Habitat and other environmental
characteristics of the natterjack toad (Bufo calamita Laur) in
Sweden. Br J Herpetol 6:419–424
Avise JC (2000) Phylogeography: the history and formation of
species. Harvard University Press, Cambridge
Balloux (2001) EASYPOP (version 1.7): a computer program for
population genetics simulations. J Hered 92:301–302
Beebee TJC (1983) The natterjack toad. Oxford university press,
Oxford
Beebee TJC (2005) Conservation genetics of amphibians. Heredity
95:423–427
Bensch S, Akesson M (2005) Ten years of AFLP in ecology and
evolution: why so few animals? Mol Ecol 14:2899–2914
Bensch S, Helbig AJ, Salomon M et al (2002) Amplified fragment
length polymorphism analysis identifies hybrids between two
subspecies of warblers. Mol Ecol 11:473–481
Canty A (2006) boot: Bootstrap R (S-Plus) functions. R Foundation for
Statistical Computing, Vienna, Austria. ISBN 3-900051-07-0.
http://www.R-project.org
Crawley M (2007) The R book. Wiley, Chichester
Evanno G, Regnaut S, Goudet J (2005) Detecting the number of
clusters of individuals using the software STRUCTURE: a
simulation study. Mol Ecol 14:2611–2620
Falush D, Stephens M, Pritchard JK (2007) Inference of population
structure using multilocus genotype data: dominant markers and
null alleles. Mol Ecol Notes 7:574–578
Felsenstein J (2004) PHYLIP (Phylogeny Inference Package) version
3.6. Distributed by the author. Department of Genome Sciences,
University of Washington, Seattle
Ficetola GF, Garner TWJ, De Bernardi F (2007) Genetic diversity,
but not hatching success, is jointly affected by postglacial
colonization and isolation in the threatened frog, Rana latastei.Mol Ecol 16:1787–1797
Frankham R, Ballou JD, Briscoe DA (2002) Introduction to conser-
vation genetics. Cambridge University Press, Cambridge
Gardenfors U (2005) Rodlistade arter i Sverige. SLU Publikations-
service, Uppsala
Gomez-Mestre I, Tejedo M (2003) Local adaptation of an anuran
amphibian to osmotically stressful environments. Evolution
57:1889–1899
Gomez-Mestre I, Tejedo M (2004) Contrasting patterns of quantita-
tive and neutral genetic variation in locally adapted populations
of natterjack toad, Bufo calamita. Evolution 58:2343–2352
Hewitt GM (1999) Post-glacial re-colonization of European biota.
Biol J Linn Soc 68:87–112
Hoffmann AA, Blows MW (1994) Species borders—ecological and
evolutionary perspectives. Trends Ecol Evol 9:223–227
Hoglund J (2009) Evolutionary conservation genetics. Oxford Uni-
versity Press, Oxford
Hutchison DW, Templeton AR (1999) Correlation of pairwise genetic
and geographic distance measures: inferring the relative influ-
ences of gene flow and drift on the distribution of genetic
variability. Evolution 53:1898–1914
Johansson M, Primmer CR, Merila J (2007) Does habitat fragmen-
tation reduce fitness and adaptability? A case study of the
common frog (Rana temporaria). Mol Ecol 16:2693–2700
Jorde PE, Ryman N (1995) Temporal allele frequency change and
estimation of efficient population size in populations with
overlapping generations. Genetics 139:1077–1090
Lande R (1995) Mutation and conservation. Conserv Biol 9:782–791
Liao W, Reed DH (2009) Inbreeding-environment interactions
increase extinction risk. Anim Conserv 12:54–61
Lynch M, Milligan BG (1994) Analysis of population genetic-
structure with RAPD markers. Mol Ecol 3:91–99
Madsen T, Shine R, Olsson M et al (1999) Conservation biology—
restoration of an inbred adder population. Nature 402:34–35
Mariette S, Le Corre V, Austerlitz F et al (2002) Sampling within the
genome for measuring within-population diversity: trade-offs
between markers. Mol Ecol 11:1145–1156
Merila J, Bjorklund M, Baker AJ (1996) Genetic population structure
and gradual northward decline of genetic variability in the
greenfinch (Carduelis chloris). Evolution 50:2548–2557
Miller SA, Dykes DD, Polesky HF (1988) A simple salting out
procedure for extracting DNA from human nucleated cells.
Nucleic Acids Res 16:1215
Nybom H (2004) Comparison of different nuclear DNA markers for
estimating intraspecific genetic diversity in plants. Mol Ecol
13:1143–1155
Peakall R, Smouse PE (2006) GENALEX 6: genetic analysis in
Excel. Population genetic software for teaching and research.
Mol Ecol Notes 6:288–295
Pemberton J (2004) Measuring inbreeding depression in the wild: the
old ways are the best. Trends Ecol Evol 19:613–615
Petit R, Freville H, Mignot A et al (2001) Gene flow and local
adaptation in two endemic plant species. Biol Conserv 100:
21–34
Pritchard JK, Stephens M, Donnelly P (2000) Inference of popula-
tion structure using multilocus genotype data. Genetics 155:
945–959
R Development Core Team (2006) R: a language and environment for
statistical computing. R Foundation for Statistical Computing,
Vienna, Austria. ISBN 3-900051-07-0. http://www.R-project.org
Raymond M, Rousset F (1995) Genepop (version-1.2) population-
genetics software for exact tests and ecumenicism. J Hered
86:248–249
Rogell B (2005) Microsatellite variation in the natterjack toad on the
Swedish west coast. Master thesis, Uppsala University
Rogell B (2009) Genetic variation and local adaptation in peripheral
populations of toads. Doctoral thesis, Uppsala University
Rogell B, Gyllenstrand N, Hoglund J (2005) Six polymorphic
microsatellite loci in the natterjack toad, Bufo calamita. Mol
Ecol Notes 5:639–640
Rogell B, Hofman M, Eklund M et al (2009) The interaction of
multiple environmental stressors affects adaptation to a novel
habitat in the natterjack toad Bufo calamita. J Evol Biol
22:2267–2277
Rousset F (1997) Genetic differentiation and estimation of gene flow
from F-statistics under isolation by distance. Genetics 145:1219–
1228
Rowe G, Beebee TJC (2003) Population on the verge of a mutational
meltdown? Fitness costs of genetic load for an amphibian in the
wild. Evolution 57:177–181
Rowe G, Beebee TCJ, Burke T (1997) PCR primers for polymorphic
microsatellite loci in the anuran amphibian Bufo calamita. Mol
Ecol 6:401–402
Rowe G, Beebee TCJ, Burke T (2000a) A further four polymorphic
microsatellite loci in the natterjack toad Bufo calamita. Conserv
Genet 1:371–372
180 Conserv Genet (2010) 11:173–181
123
Author's personal copy

Rowe G, Beebee TJC, Burke T (2000b) A microsatellite analysis of
natterjack toad, Bufo calamita, metapopulations. Oikos 88:
641–651
Rowe G, Harris DJ, Beebee TJC (2006) Lusitania revisited: a
phylogeographic analysis of the natterjack toad Bufo calamitaacross its entire biogeographical range. Mol Phylogenet Evol
39:335–346
Rudh A, Rogell B, Hoglund J (2007) Non-gradual variation in colour
morphs of the strawberry poison frog Dendrobates pumilio:
genetic and geographical isolation suggest a role for selection in
maintaining polymorphism. Mol Ecol 16:4284–4294
Scribner KT, Arntzen JW, Burke T (1997) Effective number of
breeding adults Bufo bufo estimated from age specific variation
at microsatellite loci. Mol Ecol 6:701–712
Seppa P, Laurila A (1999) Genetic structure of island populations
of the anurans Rana temporaria and Bufo bufo. Heredity 82:
309–317
Swindell WR, Bouzat JL (2006) Ancestral inbreeding reduces the
magnitude of inbreeding depression in Drosophila melanogaster.
Evolution 60:762–767
Tallmon DA, Luikart G, Waples RS (2004) The alluring simplicity
and complex reality of genetic rescue. Trends Ecol Evol 19:
489–496
Thomas CD (2000) Dispersal and extinction in fragmented land-
scapes. Proc R Soc Lond B 267:139–145
Vos P, Hogers R, Bleeker M et al (1995) AFLP—a new technique for
DNA-fingerprinting. Nucleic Acids Res 23:4407–4414
Weir BS, Cockerham CC (1984) Estimating F-statistics for the
analysis of population-structure. Evolution 38:1358–1370
Zeisset I, Beebee TJC (2001) Determination of biogeographical
range: an application of molecular phylogeography to the
European pool frog Rana lessonae. Proc R Soc Lond B 268:
933–938
Conserv Genet (2010) 11:173–181 181
123
Author's personal copy
Copyright © 2022 FDOKUMEN