Water and Fertilizer Nitrogen Management to Minimize Nitrate Pollution from a Cropped Soil in...
18
WATER AND FERTILIZER NITROGEN MANAGEMENT TO MINIMIZE NITRATE POLLUTION FROM A CROPPED SOIL IN SOUTHWESTERN QUEBEC, CANADA ABDIRASHID A. ELMI 1∗ , C. MADRAMOOTOO 2 , MOHAMUD EGEH 2 and C. HAMEL 1 1 Department of Natural Resource Sciences Macdonald Campus of McGill University, Quebec, Canada; 2 Department of Agricultural and Biosystems Engineering, Macdonald Campus of McGill University, Quebec, Canada ( ∗ author for correspondence, e-mail: [email protected], Fax: (514) 398 7767) (Received 18 November 2002; accepted 10 July 2003) Abstract. Nitrate-N (NO − 3 -N) pollution of water resources is a widely recognized problem. Water and nitrogen fertilizer are the two most important factors affecting NO − 3 -N movement to surface and groundwater. Field trials were conducted from 1998 to 2000 growing seasons to investigate the com- bined impacts of water table management (WTM) and N fertilization rate on NO − 3 -N concentration in the soil profile and in drain discharge. There were two water table treatments: free drainage (FD) with open drains at a 1.0 m depth from the soil surface and subirrigation (SI) with a target water table depth of 0.6 m below the soil surface, and two N fertilizer rates: 120 kg N ha −1 (N 120 ) and 200 kg N ha −1 (N 200 ) in a split-plot design. Compared to FD, SI reduced NO − 3 -N concentration in the soil by up to 50% averaged over the two N rates. Concentrations of NO − 3 -N in drainage water from SI plots were lower than those from FD by 55 to 73%. These findings suggest that SI can be used as a means of reducing soil NO − 3 -N pollution and drainage water NO − 3 -N concentrations. Keywords: drainage, nitrate, nitrogen, pollution, water quality 1. Introduction Water and nitrogen (N) fertilizer are the two factors that have the greatest impact on NO − 3 -N movement to surface and groundwater. Leaching of NO − 3 -N is primar- ily associated with conditions that allow NO − 3 -N accumulation in the soil profile. Strategies to reduce NO − 3 -N pollution should therefore seek to prevent accumula- tion of NO − 3 -N in the soil profile. When NO − 3 -N is translocated to a lower depth of soil profile, it becomes unavailable for plant uptake and a danger to the quality of the underlying water systems (Hatfield et al., 1999). The realization that our environment, water quality in particular, is something that needs to be protected is a concept which is spreading very quickly at all social levels. Heightened public awareness in recent years has led to the perception that NO − 3 -N contamination of surface waters and shallow groundwater is closely linked to the extensive use of N fertilizer in agricultural crop production systems. This perception is supported by numerous research reports that established an obvious Water, Air, and Soil Pollution 151: 117–134, 2004. © 2004 Kluwer Academic Publishers. Printed in the Netherlands.
-
Upload
independent -
Category
Documents
-
view
0 -
download
0
Transcript of Water and Fertilizer Nitrogen Management to Minimize Nitrate Pollution from a Cropped Soil in...
WATER AND FERTILIZER NITROGEN MANAGEMENT TO MINIMIZENITRATE POLLUTION FROM A CROPPED SOIL IN SOUTHWESTERN
QUEBEC, CANADA
ABDIRASHID A. ELMI1∗, C. MADRAMOOTOO2, MOHAMUD EGEH2 andC. HAMEL1
1 Department of Natural Resource Sciences Macdonald Campus of McGill University, Quebec,Canada; 2 Department of Agricultural and Biosystems Engineering, Macdonald Campus of McGill
University, Quebec, Canada(∗ author for correspondence, e-mail: [email protected], Fax: (514) 398 7767)
(Received 18 November 2002; accepted 10 July 2003)
Abstract. Nitrate-N (NO−3 -N) pollution of water resources is a widely recognized problem. Water
and nitrogen fertilizer are the two most important factors affecting NO−3 -N movement to surface and
groundwater. Field trials were conducted from 1998 to 2000 growing seasons to investigate the com-bined impacts of water table management (WTM) and N fertilization rate on NO−
3 -N concentrationin the soil profile and in drain discharge. There were two water table treatments: free drainage (FD)with open drains at a 1.0 m depth from the soil surface and subirrigation (SI) with a target water tabledepth of 0.6 m below the soil surface, and two N fertilizer rates: 120 kg N ha−1 (N120) and 200 kgN ha−1 (N200) in a split-plot design. Compared to FD, SI reduced NO−
3 -N concentration in the soil
by up to 50% averaged over the two N rates. Concentrations of NO−3 -N in drainage water from SI
plots were lower than those from FD by 55 to 73%. These findings suggest that SI can be used as ameans of reducing soil NO−
3 -N pollution and drainage water NO−3 -N concentrations.
Keywords: drainage, nitrate, nitrogen, pollution, water quality
1. Introduction
Water and nitrogen (N) fertilizer are the two factors that have the greatest impacton NO−
3 -N movement to surface and groundwater. Leaching of NO−3 -N is primar-
ily associated with conditions that allow NO−3 -N accumulation in the soil profile.
Strategies to reduce NO−3 -N pollution should therefore seek to prevent accumula-
tion of NO−3 -N in the soil profile. When NO−
3 -N is translocated to a lower depthof soil profile, it becomes unavailable for plant uptake and a danger to the qualityof the underlying water systems (Hatfield et al., 1999). The realization that ourenvironment, water quality in particular, is something that needs to be protected isa concept which is spreading very quickly at all social levels.
Heightened public awareness in recent years has led to the perception thatNO−
3 -N contamination of surface waters and shallow groundwater is closely linkedto the extensive use of N fertilizer in agricultural crop production systems. Thisperception is supported by numerous research reports that established an obvious
Water, Air, and Soil Pollution 151: 117–134, 2004.© 2004 Kluwer Academic Publishers. Printed in the Netherlands.
118 A. A. ELMI ET AL.
connection between N fertilizer use and NO−3 -N concentrations in water (Randall
and Mulla, 2001; Hatfield et al., 1999; Patni et al., 1998; Smith et al., 1987).High levels of NO−
3 -N in drinking water have long been regarded as dangerousfor infants under 6 months of age. Methemoglobinemia (also known as Blue babysyndrome), for example, was first linked to NO−
3 -N contamination of drinkingwater in Iowa in the 1940s (Comly, 1945).
In addition, discharge of N into surface waters via subsurface drains can lead toexcessive growth of algal blooms and eutrophication in aquatic ecosystems. Certainalgae species produce toxins, which can be dangerous to health, impairing the useof water resources for human consumption, irrigation, and recreational purposes(Pitois et al., 2001). David et al. (1997) indicated that NO−
3 -N contaminated drain-age water from subsurface drainage systems in agricultural regions is a primarysource of NO−
3 -N loadings to surface waters. Hatfield et al. (1999) estimated thatmost of NO−
3 -N passing through the root zone is intercepted by the tile drains andmoved eventually as discharge into surface waters. Therefore, NO−
3 -N contamin-ation of water resources is increasingly becoming a critical ecological and publichealth issue. Society is seeking ways to diminish the adverse impacts of agriculturalactivities on the environment.
Water table management (WTM) is an agronomic practice that has been shownto offer better water quality while enhancing or maintaining crop performance(Kalita and Kanwar, 1993; Drury et al., 1997; Cooper et al., 1999). Water tablemanagement consists of two main alternatives: controlled drainage (CD) and sub-irrigation (SI). Under CD, water is prevented from leaving the drain outlet bymeans of raising the drainage outlet. No supplemental water, other than rainfall,is added to the system. Subirrigation is similar to the CD system, except thatsupplemental water is pumped into the system to maintain the water table at adesigned level during drought periods. Controlled drainage-subirrigation (CD-SI)reduces NO−
3 -N pollution problems either by restricting the volume of drain dis-charge (Gilliam and Skaggs, 1986; Kliewer and Gilliam, 1995; Wright et al., 1992)and/or by creating anaerobic conditions which enhance denitrification (Elmi et al.,2000; Jacinthe et al., 2000).
There is a general lack of information regarding interactive effects of N andwater table management on environmental quality. In this context, the effects ofthe interactions between N application rate and water table depth (WTD) on NO−
3 -N accumulation in the soil profile and NO−
3 -N losses to subsurface drainage needto be examined in order to develop environmentally sustainable farming systems.Specific objectives of this study were to (1) evaluate water table management ef-fectiveness in lowering NO−
3 -N in the soil profile, and (2) examine drainage waterquality.
NITRATE POLLUTION OF WATER RESOURCES 119
2. Materials and Methods
2.1. FIELD HISTORY AND MANAGEMENT
The research was conducted on a 4.2 ha privately-owned field located at St-Emma-nuel near Côteau-du-Lac, Quebec (74◦11′15′′ = lat., 45◦21′0′′ = long.), about 30 kmsouthwest of the Macdonald Campus of McGill University. Site design and instru-mentation is detailed in Tait et al. (1995). The soil, a Soulanges fine sandy loam(fine silty, mixed, non-acid, frigid Humaquept, Gleysol, according to the FAO clas-sification system), was of sedimentary origin. Surface topography was generallyflat with an average slope of less than 0.5%. The fine sandy loam soil (0–0.25 m)was underlain by layers of sandy clay loam (0.25–0.55 m) and clay (0.55–1.0 m),and the clay layer impeded the natural drainage. Experimental plots were under aconventional tillage system (i.e., moldboard-plowed to 0.20 m in fall and disked inspring performed by the farm owner as part of his normal production practice), thecommon practice in the region. The site had been a pasture prior to 1992, when itwas converted to corn production.
2.2. EXPERIMENTAL DESIGN
Field layout and treatment arrangements were detailed in Elmi et al., 2000. Briefly,there were two water table management treatments: FD with open drains 1 m indepth from the soil surface and SI with a design water table 0.6 m below the soilsurface, and two fertilizer rates: 120 kg N ha−1 (N120) and 200 kg N ha−1 (N200).Nitrogen fertilizer was applied in a split dose: 23 kg N ha−1 banded as diammoniumphosphate (18-46-0) at planting, and 97 kg N ha−1 or 177 kg N ha−1 broadcastas ammonium nitrate (34-0-0) one month after planting (8 June 1998, 10 June1999, and 20 June 2000), resulting in rates of 120 kg N ha−1 (N120) and 200 kg Nha−1 (N200), respectively. In addition, prior to the initiation of this study the farmerapplied manure (cattle slurry) on the field in spring 1998 at a rate of approximately20 Mg ha−1 (wet wt).
Treatments were laid out in a split-plot design with water table depth as mainplot and N fertilization as subplot. The water table treatments were established in30 m wide and 75 m long plots, and each main plot was split into two 15 × 75 msubplots. The water table treatments were replicated in 3 blocks, and fertilizer treat-ments were assigned randomly to the subplots. In the middle of each plot, 75 mmdiameter subsurface drain pipes were installed, at 1.0 m depth, with a slope of0.3%. Blocks were separated by a 30 m wide strip of undrained land. To minimizeseepage and chemical flow between plots, a 6-mil (0.6 mm) polyethylene sheetingwas installed to a depth of 1.5 m between plots (Tait et al., 1995). In addition,adjacent to each WTM treatment were buffer plots with the same water treatment.All buffer plots received 120 kg N ha−1.
The field was seeded on 8 May in 1998, 4 May in 1999, and 23 May in 2000 withgrain corn (Pioneer hybrid 3905) at a planting density of 75 000 plants ha−1 with
120 A. A. ELMI ET AL.
0.75 m spacings. Potassium (muriate of potash, 0-0-60) was side-dressed at a rateof 90 kg K2O ha−1 roughly one week before planting. Subirrigation treatment wasimposed 2 weeks after planting and maintained until crop maturity in late Septem-ber. Well water with no detectable nitrates was continuously pumped into the fieldto balance crop use and evaporative losses. The plots received no surface irrigation.Due to deep seepage it was difficult to maintain water tables at the desired depth.Following heavy rainfall events, pumping was stopped in SI plots and excess waterdrained until a 0.6 m water table depth was achieved in the field. To monitor watertable fluctuations, three observation wells, a perforated 12 mm diameter polyethyl-ene pipes wrapped with geotextile sleeves (Zodiac, London, ON), were installeddiagonally in each treatment or buffer plot to a depth of about 1.4 m, and watertable depth averaged for each plot. Water table depths were measured once or twicea week during the growing season by inserting a sonic water sensor mounted on agraduated rod. Drains were opened 28 September in 1998, 17 September in 1999,and 25 September in 2000 to facilitate trafficability for harvesting. Rainfall andair temperature data were obtained from an Environment Canada weather stationsituated 500 m from the experimental site.
2.3. SOIL SAMPLING AND ANALYSIS
Soil samples (three samples per plot) for NO−3 -N analysis were taken prior to
planting in the spring (April or early May), during summer (July), and shortlyafter harvest in fall (October) from 0–0.25 m, 0.25–0.50 m, and 0.50–0.75 m depthincrements using hand-held auger sampling probe. Each sample was placed ina prelabeled soil sample bag and transported to the laboratory. All soil sampleswere promptly frozen (at –4◦C) after collection and kept for 1–3 weeks prior toanalysis. Samples were then thoroughly mixed and moist subsamples of 10 g wereshaken with 100 mL of 1 M KCl for 60 min. The soil suspensions were filteredthrough Whatman #5 filter papers. Nitrate-N was quantified using Lachat flowinjection autoanalyzer (Lachat Quickchem, Milwaukee, WI) according to Keeneyand Nelson (1982). The detection limit was 0.05 mg L−1.
2.4. COLLECTION OF DRAINAGE WATER SAMPLES AND ANALYSIS
Tipping buckets, housed in the two buildings, were located at the outlet of each sub-surface drain to measure samples of drain discharge. Water sampling was done ac-cording to a flow weighted composite strategy, i.e., the frequency of water samplingwas set according to accumulated volume of drain flow. Water samples were ob-tained from plastic containers (20 L) connected to each pipe using a water samplingvalve located just before the tipping buckets, and brought to the laboratory twicea week or once in every two weeks, depending on tile flow rate, and frozen un-til analysis. Composite samples accumulated in the 20 L plastic containers, fromwhich 20 mL sub-samples were taken and analyzed for NO−
3 -N in triplicates us-ing a Lachat flow injection Autoanalyzer (Lachat Quickchem, Milwaukee, WI)

NITRATE POLLUTION OF WATER RESOURCES 121
according to Keeney and Nelson (1982). Nitrate-N mass loss in tiles was calcu-lated by multiplying the computed volumes of subsurface outflow with measuredconcentrations of NO−
3 -N in the drain outflow.
2.5. STATISTICAL ANALYSIS
Analysis of variance (ANOVA) was performed on NO−3 -N concentrations in the
soil profile and drain water. Data were analysed as a split plot with water tablebeing the main plot and fertilizer N treatments as sub-plot. When a main ploteffect was significant without any interaction, Fisher’s F test statistic was usedto determine statistical significance within each main plot treatments. Since theinteraction between the water table and N fertilizer treatments was significant in1999 and 2000 seasons with respect to NO−
3 -N concentration in drain water, in-teractions rather than the main treatment effects are discussed. Unless otherwisenoted, statistical significance is reported at the 5% probability level (alpha < 0.05).All statistical analyses were conducted using the General Linear Model (GLM)procedure of the Statistical Analysis System (SAS Institute, 1996).
3. Results and Discussion
3.1. SEASONAL WATER TABLE, DRAIN OUTFLOW AND PRECIPITATIONS
Water table levels, and drainage outflows fluctuated throughout the growing sea-sons, responding primarily to rainfall events (Figures 1–3). Total seasonal (May–October) rainfall in 1998 was 29% above normal. About 34% of the total seasonalrainfall in 1998 occurred in June. June 1998 was the wettest in 70 yr and the secondwettest on record (NOAA, 1998). July 1998 was also much wetter than the normal,accounting for about 20% of the seasonal total rainfalls. Rainfall in these twomonths together accounted for nearly 60% of the seasonal (May–October) total.These two months of high rainfall (Figure 1c) resulted in periods of shallowestwater table depths, especially in the SI treatment (Figure 2), and produced thegreatest volume of drainage outflows, especially in FD plots, during the entiregrowing season (Figure 1b). In June and July 1998, drain outflow was significantly(P ≤ 0.01) lower (48 and 15%, respectively) in SI than FD. This is likely to be dueto WTD under FD remaining well above the drains (1.0 m depth) from mid June tothe end of July because of the excessive rainfall.
It is worth noting that the August 25 rainfall event, the second highest in 1998(Figure 1c), raised the water table in the SI treatment to as shallow as 0.1 m belowthe soil surface (Figure 1a), but did not cause a significant increase in drain dis-charge (Figure 1b). A plausible explanation for this observation was that a heavyrainfall event preceded by dry conditions may not cause significant water percol-ation to the subsurface drains. Another notable observation is the increase in thedrain outflow from SI plots at the end of September. This increase coincided with

122 A. A. ELMI ET AL.
Figure 1. Measured (a) water table depth (m), (b) mean daily drainage outflow (L) under controlleddrainage-subirrigation (SI) and free drainage (FD), and (c) daily precipitation in 1998.
NITRATE POLLUTION OF WATER RESOURCES 123
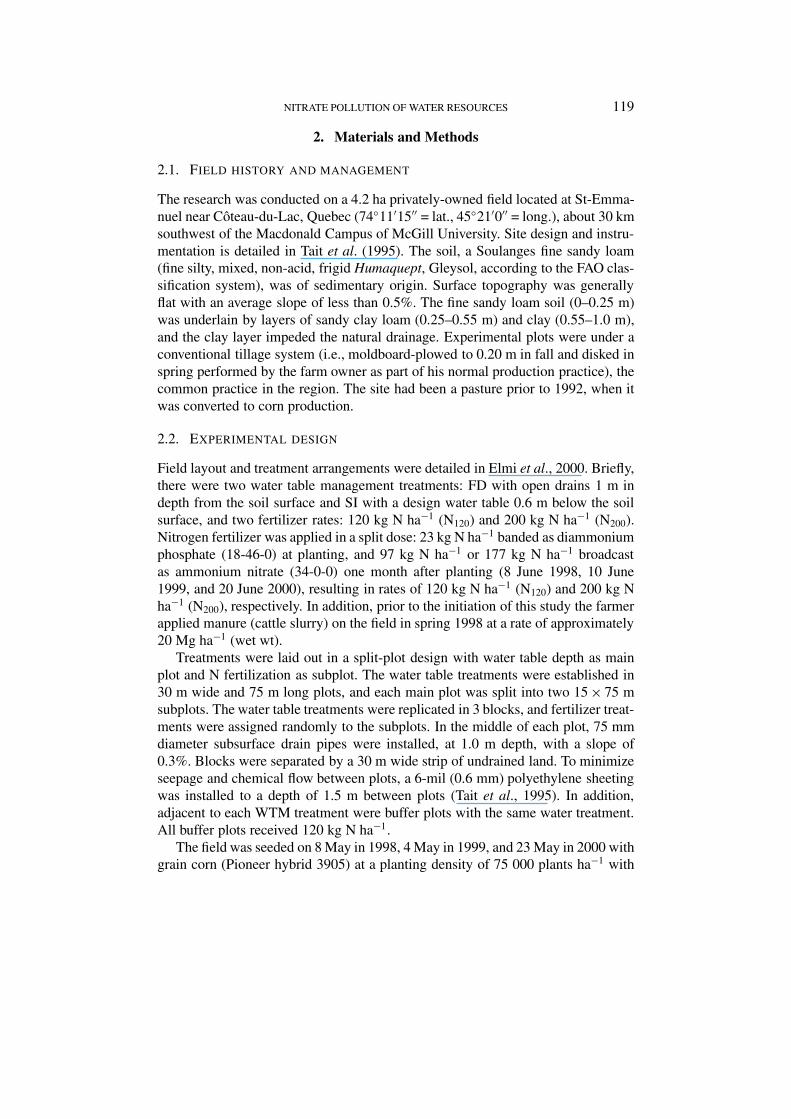
Figure 2. Measured (a) water table depth (m), (b) mean daily drainage outflow (L) under controlleddrainage-subirrigation (SI) and free drainage (FD), and (c) daily precipitation in 1999.

124 A. A. ELMI ET AL.
Figure 3. Measured (a) water table depth (m), (b) mean daily drainage outflow (L) under controlleddrainage-subirrigation (SI) and free drainage (FD), and (c) daily precipitation in 2000.
NITRATE POLLUTION OF WATER RESOURCES 125
the opening of drains (i.e., SI switched to FD mode), suggesting that water storedin the SI plots started to drain out in October. September and October rainfallswere 7% and 9% below normal, respectively, providing further evidence that theincreased drainage outflow in the SI plots (Figure 1b) was from water stored in thesoil profile due to subirrigation, rather than rainfall.
The 1999 cropping season was characterized by a dry summer (Figure 2c).While total seasonal (May-October) rainfall was 13% higher than the normal, Mayand August were 23 and 35% lower than the normal, respectively. The first weekof July, just three weeks after the N application, received frequent precipitationresulting in a flush of drain outflow from SI plots (Figure 2b) and the shallowestwater depth (Figure 2a) of the growing season. For much of 1999, water tablein FD plots remained deeper than 1.0 m, whereas in SI plots, water table wereon average 0.8 m below the soil surface. A single rainfall event on September 16provided 29% of the total growing season rainfall (Figure 2c), and occurred just oneday before SI system was switched into drainage mode, resulting in a significantincrease in drain outflow from formerly subirrigated plots (Figure 2b) and a watertable shallower than the design depth (0.6 m). Rainfall during the 1999 croppingseason totaled 589.2 mm, with nearly half (276 mm) falling in September andOctober (Figure 1b).
During the 2000 growing season, total rainfall (Figure 3c) was about 12% higherthan the normal. May was the wettest month, accounting for 25% of seasonalrainfall with October being the driest month, accounting for less than 5% of totalrainfall. The subirrigation system was not functional in May, and there was a largedrainage outflow both from conventionally drained and formerly subirrigated plots(Figure 3b). The shallowest WTD under SI (Figure 3a) corresponded to a rainfallevent that delivered 39 mm on August 7 (Figure 3c) and resulted in a large drainageoutflow on 9 August (Figure 3b). This suggest that drainage outflow can be greaterin SI than FD when the SI system is opened to drain excess water.
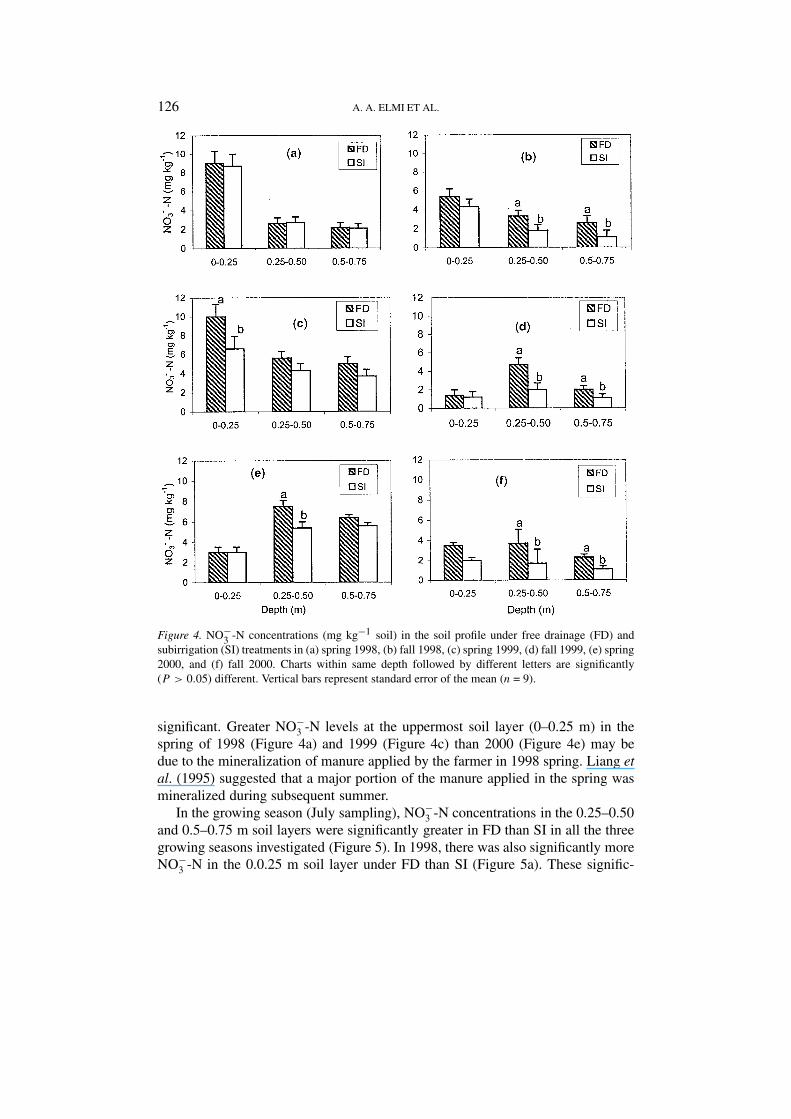
3.2. WATER TABLE EFFECTS ON NO−3 -N LEVELS IN THE SOIL PROFILE
Nitrate-N concentrations in the soil profile for the spring and fall are shown inFigure 4. No significant difference between freely drained plots and plots formerlysubjected to subirrigation was observed in spring 1998 at any depth (Figure 4a),whereas in the fall, FD plots showed a significantly greater NO−
3 -N levels at thedeeper depths of the soil profile (Figure 4b). Similar trends were observed in 1999and 2000 except that the difference between FD and SI was significant at the up-permost layer in the spring 1999 (Figure 4c), and at the intermediate depth in thespring of 2000 (Figure 4e). These findings suggest that the effects of water tabletreatments were more pronounced in the fall than spring. This may be becausesampling in the spring was done long (7 months) after SI was switched into FD,and the carry-over effect of SI treatment was minimal. Whereas in the fall, sampleswere collected immediately after SI was put into FD mode and the SI effect was
126 A. A. ELMI ET AL.
Figure 4. NO−3 -N concentrations (mg kg−1 soil) in the soil profile under free drainage (FD) and
subirrigation (SI) treatments in (a) spring 1998, (b) fall 1998, (c) spring 1999, (d) fall 1999, (e) spring2000, and (f) fall 2000. Charts within same depth followed by different letters are significantly(P > 0.05) different. Vertical bars represent standard error of the mean (n = 9).
significant. Greater NO−3 -N levels at the uppermost soil layer (0–0.25 m) in the
spring of 1998 (Figure 4a) and 1999 (Figure 4c) than 2000 (Figure 4e) may bedue to the mineralization of manure applied by the farmer in 1998 spring. Liang etal. (1995) suggested that a major portion of the manure applied in the spring wasmineralized during subsequent summer.
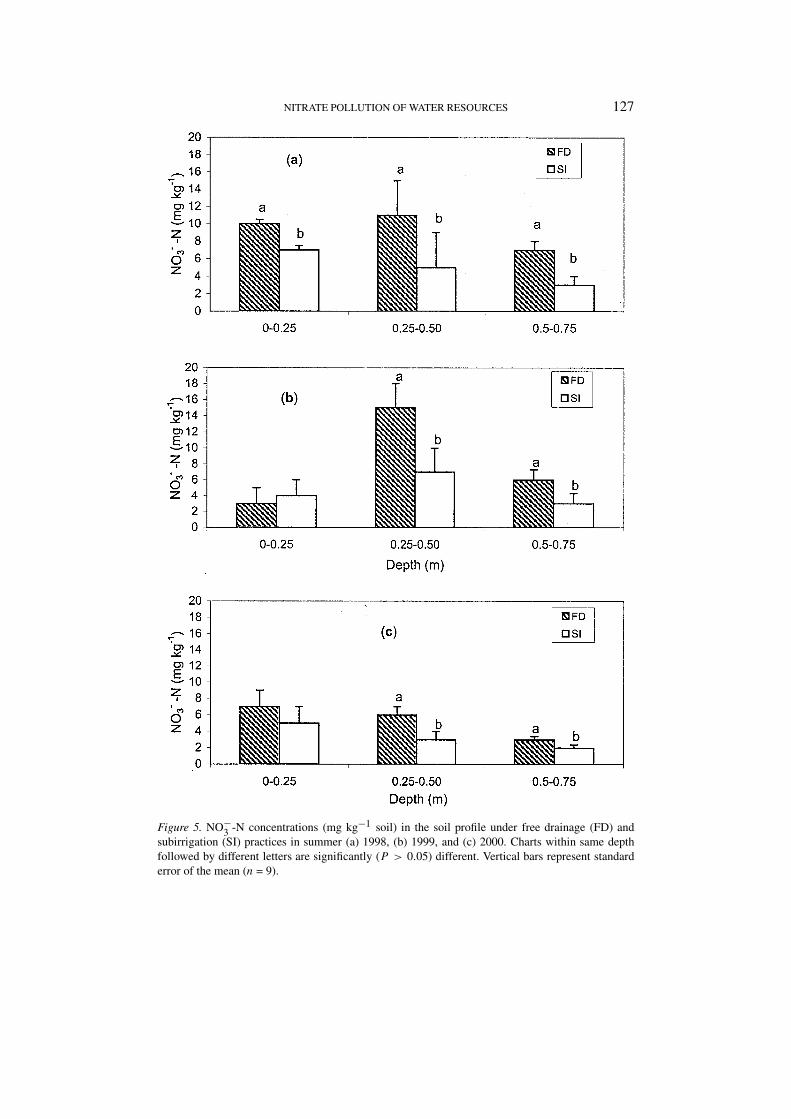
In the growing season (July sampling), NO−3 -N concentrations in the 0.25–0.50
and 0.5–0.75 m soil layers were significantly greater in FD than SI in all the threegrowing seasons investigated (Figure 5). In 1998, there was also significantly moreNO−
3 -N in the 0.0.25 m soil layer under FD than SI (Figure 5a). These signific-
NITRATE POLLUTION OF WATER RESOURCES 127
Figure 5. NO−3 -N concentrations (mg kg−1 soil) in the soil profile under free drainage (FD) and
subirrigation (SI) practices in summer (a) 1998, (b) 1999, and (c) 2000. Charts within same depthfollowed by different letters are significantly (P > 0.05) different. Vertical bars represent standarderror of the mean (n = 9).
128 A. A. ELMI ET AL.
ant effects of water table depth on NO−3 -N can be explained by the fact that SI
was functional during summer months (May–September). The significant decreasein soil NO−
3 -N associated with SI may be due to enhanced denitrification. Soilmoisture content (data not presented here) was significantly greater under SI thanFD plots during the 1998 to 2000 growing seasons, which might have createdsufficiently anaerobic conditions to promote NO−
3 -N loss through denitrification.Denitrification has long been recognized as an important mechanism for reducingNO−
3 -N loading in the saturated zone of the soil profile (Yeomans et al., 1992).In general, there was a trend for NO−
3 -N concentrations in the soil to decreasewith depth under both water table treatments. A notable exception was spring 2000(Figure 4e). An increase in NO−
3 -N with soil depth would be expected if leachinghad occurred. As pointed out earlier, heavy rains in the fall of 1999 producing thelargest amount of drain discharge (Figure 2b) might have caused NO−
3 -N leachingwith percolation water. In coarse-textured soils such as the study site, NO−
3 -N canbe leached easily below the crop rooting zone and, consequently, discharged intowater bodies during heavy rainfall events or excessive irrigation, particularly afterharvest. This may explain the sharp increase of soil NO−
3 -N concentrations withdepth in the spring 2000 (Figure 4e), following the excessively wet fall of 1999.Hatfield et al. (1999) suggested that approximately 95% of NO−
3 -N passing throughthe root zone is intercepted and moved eventually as discharge into surface waters.In spring, when evapotranspiration is low and precipitation and snow melt exceedthe water holding capacity of the soil, residual NO−
3 -N can leach beyond the croproot zone and, consequently, contaminate surface water resources via subsurfacedrains or groundwater with percolating water. Patni et al. (1998) estimated thatapproximately 70% of NO−
3 -N leaching occurs from fall to spring (October throughApril). Keeney and DeLuca (1993) found that NO−
3 -N concentrations in the DesMoines river in Iowa, U.S.A., were above 10 mg L−1 for about 14 days per year,mainly in the spring. Drury et al. (1996) reported that up to 88 to 95% of theNO−
3 -N loss to subsurface drainage occurred during the noncrop period (Novemberthrough April). All these observations indicate that NO−
3 -N leaching in early springappears to account for the majority of NO−
3 -N loading losses to the subsurfacedrains which subsequently discharged into surface waters.
Averaged across all depths, seasonal reduction of total soil NO−3 -N under SI
compared to FD ranged from 2 to 29% in the spring, 38 to 46% in the summer, and36 to 50% in the fall. Nitrate-N reductions of 30 to 60%, resulting from controlleddrainage/subirrigation have been reported in several studies. For example, Fogieland Belcher (1991) found that controlled drainage-subirrigation reduced NO−
3 -Nloading through drainage by 25 to 59% over a two year period compared withconventional drainage. Gilliam and Skaggs (1986) predicted a 32% decrease inNO−
3 losses due to controlled drainage relative to conventional drainage systems.Jacinthe et al. (1999) reported 24 to 43% reduction in NO−
3 leaching using WTMtechniques. Further reductions could be achieved if controlled drainage is keptoperational during the early spring, when NO−
3 -N losses is most severe (Patni et

NITRATE POLLUTION OF WATER RESOURCES 129
al., 1998) and drainage is not needed to optimize crop production. Operation ofcontrolled drains might enhance denitrification and reduce excess NO−
3 -N in thesoil-water system in early spring, if temperatures are warm enough. This practice,however, may interfere with tillage operations in early spring.
3.3. IMPACTS OF N FERTILIZER RATE ON NO−3 -N IN THE SOIL PROFILE
Nitrogen fertilizer rate (120 kg N ha−1 (N120) vs 200 kg N ha−1 (N200)) had noclear effect on soil NO−
3 -N concentrations (data not shown). This general lack ofsignificant treatment (N120 vs N200) effects or even consistent trends suggests thatlimiting N fertilization alone might not be a sufficient strategy to overcome theproblem of NO−
3 -N loading in the soil-water system. The first evidence of NO−3 -N
movement below the root zone for cultivated soils receiving no mineral N fertil-izer or manure was presented many decades ago (Buckman, 1910). More recently,Sainju et al. (1998) reported that even with no fertilization, significant concentra-tions of residual NO−
3 -N accumulated beyond the root zone because of continuedmineralization from soil and crop residues retained on the soil surface. It is possiblethat the manure applied by the farmer across the whole farm, including our experi-mental plots, in the spring 1998 might have obscured any significant differences tobe detected. No information was available about how much N was available fromthe cattle manure. Similar to our findings, Cambardella et al. (1999) found littlerelationship between N fertilizer rate and NO−
3 -N removal in tile drainage. Theyconcluded that although NO−
3 -N loss in drain discharge tended to increase with Nfertilization rate, N mineralized from soil organic matter accounted for a significantportion of the N leached from soil or used by crops.
3.4. SUBSURFACE TILE DRAINAGE WATER QUALITY
Since there was a significant interaction between water table (main plot) and Nfertilizer (sub-plot) in most sampling dates of the 1999 and 2000 seasons withrespect to NO−
3 -N levels in drainage water, interactions rather than the main treat-ment effects are discussed. During all three cropping seasons, drainage water fromplots receiving 200 kg N ha−1 under FD (FD200) contained the greatest concen-tration of NO−
3 -N (Figure 6). Leaching losses, in terms of NO−3 -N concentrations
in drainage water, were often significantly less from SI plots receiving 200 kg Nha−1 fertilizer (SI200) than FD plots receiving 120 kg N ha−1 fertilizer (FD120).Although N fertilizer treatment had a significant effect on NO−
3 -N concentrationsin drainage effluents in the FD system, no significant effect was observed in the SIsystem. These observations clearly indicate that NO−
3 -N concentrations in drainagewater were greatly reduced by the implementation of subirrigation, both during thecropping season and the fall months.
Controlled drainage-subirrigation reduces nitrate loading to drainage waterprimarily by retaining water and nitrate in the soil profile rather than allowing themto be drained away to surface waters. According to our findings, total outflow from

130 A. A. ELMI ET AL.
Figure 6. Mean monthly NO−3 -N concentration (mh L−1) in subsurface drainage water under con-
trolled drainage-subirrigation (SI) and free drainage (FD) (a) 1998, (b) 1999, and (c) 2000. Verticalbars represent standard error of the mean (n = 3).

NITRATE POLLUTION OF WATER RESOURCES 131
SI were greater than from FD in 1999 (Figure 2b) and 2000 (Figure 3b), but therewas no significant difference in 1998 (Figure 1b). Our results indicate that despitedrain outflows from SI being mostly higher than FD, NO−
3 -N concentrations werestill lower under SI plots. For example, September and October 1998 and 1999(Figures 1b and 2b, respectively), drain outflow was significantly greater under SIthan FD but the reverse trend was observed for NO−
3 -N level in the drainage effluent(Figures 6a and b, respectively). The effects of CD-SI on drainage outflow variesseasonally. Zero drain outflow frequently observed in 2000 resulted in zero NO−
3 -Noutflow in these periods (Figure 6c). Evans et al. (1995) have shown that duringa dry period or season, CD reduces drainage outflow rates, sometimes completelyeliminating outflow for some storm events. Further, they demonstrated that duringwetter periods or seasons, CD may have little effect or in some cases may evenincrease peak outflow.
Averaged across N treatments, SI reduced seasonal mean NO−3 -N concentra-
tions in drainage effluent by 74% in 1998, 55% in 1999, and 64% in 2000, com-pared to FD. Gilliam et al. (1979) reported that the reduction in NO−
3 -N losses wasdue to reduced drain flows, rather than to reduced concentration in drainage water.Evans et al. (1995) reported a significant decrease in drainage water NO−
3 -N con-centrations with CD system; however, the main reduction was of NO−
3 -N losses dueto CD was achieved through the reduction in drainage volume. Contrary to thesefinding, Mejia and Madramootoo (1998) reported that despite greater drainage inthe SI plots (0.5 and 0.75 m below the soil surface), NO−
3 -N levels from SI plotswere still lower than from FD plots. Their findings suggest that the decrease inNO−
3 -N associated with SI was due to enhanced denitrification.The lower drainage water NO−
3 -N concentrations under SI plots in the presentstudy is consistent with the conclusion that SI offers drainage water quality benefitsby promoting denitrifying activity in the soil. In a previous study on this experi-mental site, Elmi et al. (2000) noted significantly greater denitrification rates inSI than in FD. In a lysimeter study, Kalita and Kanwar (1993) found that shallowwater table depths of 0.3 to 0.6 m reduced NO−
3 -N concentrations in groundwaterto levels below 10 mg NO−
3 -N L−1. They postulated that these lower NO−3 -N levels
were due to enhanced denitrification resulting from saturated conditions in uppersoil layers (0–0.15 m) where organic matter is greatest. Denitrification has beenwidely recognized as being an important removal mechanism of NO−
3 -N fromthe soil-water solution and controlling migration and entry of NO−
3 -N into surfacewater and groundwater resources (Elmi et al., 2000; Jacinthe et al., 2000; Kliewerand Gilliam, 1995).
Mean NO−3 -N concentration values obtained with this study, particularly 1998
(Figure 6a) and 1999 (Figure 6b) seasons, were markedly lower than what is com-monly reported in the literature. Jaynes et al. (2001), for example, using N ratessimilar to ours (203 kg N ha−1) reported NO−
3 -N concentrations in the tile drain-age consistently exceeding the 10 mg L−1. Randall and Igavarapu (1995) reportedsimilar results for 200 kg N ha−1 applied to continuous corn. In New Brunswick,

132 A. A. ELMI ET AL.
Canada, Milburn et al. (1997) showed tile effluent with flow-weighted averageNO−
3 -N concentrations between 2 and 5 mg L−1 but the field received only 80–105 kg N ha−1 in fertilizer and manure. A summary of selected studies on NO−
3 -Nleaching associated with corn production in various humid and temperate regionsof North America compiled by Milburn and Richards (1994) showed mean annualNO−
3 -N concentrations of drainage discharge ranging from 4 to 43 mg NO−3 -N L
−1. Our results fall within the low end of this range (Figure 6).Significant (P < 0.006) differences in mass loss of NO−
3 -N (kg ha−1) betweenSI and FD plots occurred only in 1998 because of the heavy rains of June andJuly. In 1998, NO−
3 -N losses were 7.2 kg ha−1 under FD and 1.5 kg ha−1 underSI. In 1999, total seasonal loss from FD was 3 kg ha−1 and 1.4 kg ha−1 from SI.In 2000, NO−
3 -N losses were 2.6 kg ha−1 under FD and 1.5 kg ha−1 under SI. Insouthwestern Ontario, Patni et al. (1996) reported 13 to 30 kg ha−1 loss of NO−
3 -Nthrough subsurface tile drains in fields cropped to corn. The level at which NO−
3 -Nconstitutes a problem is a function of water use. The losses obtained in this studymay not be economically important, but may be significant in terms of NO−
3 -Neffects on aquatic ecosystems.
Water quality concerns are usually expressed in terms of drinking water qualityguidelines of 10 mg NO−
3 -N L−1. It is, however, important to highlight that waterquality deterioration caused by eutrophication may occur at considerably lowerconcentrations of NO−
3 -N than drinking water standards (Thomas et al., 1991;Evans et al., 1995). Burkholder et al. (1992) reported a depressed eelgrass (Zosteramarina) survival when NO−
3 -N exceeded values as low as 0.1 mg L−1. From theseobservations, it is evident that NO−
3 -N concentrations well-below drinking waterquality guidelines may degrade surface water quality. Developing drain effluentquality guidelines for NO−
3 -N concentration offers a great challenge. The difficultyis that it will be hard to define N input levels since various sources can contributeand leaching NO−
3 -N greatly varies with climatic conditions which are not underfarmer’s control (Randal and Mulla, 2001).
4. Conclusions
In view of growing public concerns over NO−3 -N losses to water bodies, there is jus-
tification for identifying best management practices which minimize water qualityproblems. Integrating water table management and N input strategies can minimizethe risk of NO−
3 -N contamination of water resources. Averaged across all depthsand N treatments, reduction of total soil NO−
3 -N under SI compared to FD rangedfrom 55 to 74% throughout the study periods. These findings support the idea thatthe adoption of water table management practices may offer water quality benefitsby enhancing NO−
3 -N removal from soil-water system through denitrification and,therefore, control migration and entry of NO−
3 -N into surface- and groundwaterresources.

NITRATE POLLUTION OF WATER RESOURCES 133
References
Buckman, H. O.: 1910, ‘Moisture and nitrate relationships in dry-land agriculture’, Proc. Am. Soc.Agron. 2, 121–138.
Burkholder, K. M., Mason, J. M. and Glasgow Jr., H. B.: 1992, ‘Water-Column nitrate enrichmentpromotes decline of eelgrass Zostera marina: Evidence from seasonal mesocosm experiment’,Marine Ecol. Progress Ser. 81, 163–178.
Cambardella, C. A., Moorman, T. B., Jaynes, D. B., Hatfield, J. L., Parkin, T. B., Simpkins, W. W.and Karlen, D. L.: 1999, ‘Water quality in walnut creek watershed: Nitrate-nitrogen in soils,subsurface drainage water, and shallow groundwater’, J. Environ. Qual. 28, 25–34.
Comly, H. H.: 1945, ‘Cyanosis in infants caused by nitrates in well water’, J. Am. Med. Assoc. 29,112.
Cooper, R. L., Fausey, N. R. and Johnson, J. W.: 1999, ‘Yield response of corn to a subirriga-tion/drainage management system in northern Ohio’, J. Prod. Agric. 12, 74–77.
David, M. B., Gentry, L. E., Kovacic, D. A. and Smith, K. M.: 1997, ‘Nitrogen balance in and exportfrom an agricultural watershed’, J. Environ. Qual. 26, 1038–1048.
Drury, C. F., Tan, C. S., Gaynor, J. D., Oloyo, T. O. and Welacky, T. W.: 1996, ‘Influence of controlleddrainage-subirrigation on surface and tile drainage nitrate loss’, J. Environ. Qual. 25, 317–324.
Elmi, A. A., Madramootoo, C. A. and Hamel, C.: 2000, ‘Influence of water table and nitrogenmanagement on residual soil NO−
3 and denitirification rate in under corn production in sandyloam soil in Quebec’, Agric. Ecosyst. Environ. 79, 187–197.
Evans, R. O., Skaggs, R. W. and Gilliam, J. W.: 1995, ‘Controlled vs. conventional drainage effectson water quality’, J. Irrig. Drain. Eng. 21, 271–276.
Fogiel, A. C. and Belcher, H. W.: 1991, ‘Water Quality Impacts of Water Table ManagementSystems’ ASAE paper No. 91-2596, ASAE, St. Joseph, MI.
Gilliam, J. W. and Skaggs, R. W.: 1986, ‘Controlled agricultural drainage to maintain water quality’,J. Irrig. Drainage Eng. 112, 254–263.
Gilliam, J. W., Skaggs, R. W. and Weed, S. B.: 1979, ‘Drainage control to reduce nitrate loss fromagricultural fields’, J. Environ. Qual. 8, 137–142.
Hatfield, J. L., Jaynes, D. B., Burkart, M. R., Cambardella, C. A., Morman, T. B., Brueger, J. H. andSmith, M. A.: 1999, ‘Water quality in Walnus Creek watershed: Setting and farming practices’,J. Environ. Qual. 28, 11–24.
Jacinthe, P. A., Dick, W. A. and Brown, L. C.: 2000, ‘Bioremediation of nitrate-contaminated shallowsoils using water table management techniques: Production and evolution of nitrous oxide’, SoilBiol. Biochem. 32, 371–382.
Jacinthe, P. A., Dick, W. A. and Brown, L. C.: 1999, ‘Bioremediation of nitrate-contaminated shallowsoils using water table management techniques: Nitrate removal efficiency’, Trans. ASAE. 42,1251–1259.
Jaynes, D. B., Colvin, T. S., Cambardella, C. A. and Meek, D. W.: 2001, ‘Nitrate loss in subsurfacedrainage as affected by nitrogen fertilizer rate’, J. Environ. Qual. 30, 1305–1314.
Kalita, P. K. and Kanwar, R. S.: 1993, ‘Effect of water table management practices on the transportof nitrate-N to shallow groundwater’, Trans. ASAE. 36, 413–421.
Keeney, D. R. and Nelson, D. W.: 1982, ‘Nitrogen: Inorganic Forms’, in A. L. Page et al. (eds),Methods of Soil Analysis: Part 2. Chemical and Microbiological Properties, 2nd ed., Madison,Wisc., ASA and SSSA, pp. 643–709.
Keeney, D. R. and DeLuca, T. H.: 1993, ‘Des Moines river nitrate in relation to watershed agriculturalpractices: 1945 versus 1980s’, J. Environ. Qual. 22, 267–272.
Kliewer, B. A. and Gilliam, J. W.: 1995, ‘Water management effects on denitrification and nitrousoxide evolution’, Soil Sci. Soc. Am. J. 59, 1694–1701.

134 A. A. ELMI ET AL.
Liang, B. C., Gregorich, E. G. and Schintzer, M.: 1995, ‘Mineral nitrogen accumulation in soils asaffected by water-soluble organic carbon extracted from composted diary manure’, Commun.Soil Sci. Plant Anal. 26, 2711–2723.
Mejia, M. and Madramootoo, C.: 1998, ‘Improved water quality through water table management ineastern Canada’, J. Irri. Drain. Eng. 124, 116–122.
Milburn, P., Macleod, J. and Sanderson, B.: 1997, ‘Control of fall nitrate leaching from earlyharversted potatoes on Prince Edward Island’, Can. Agric. Eng. 39, 263–271.
Milburn, P. and Richards, J. E.: 1994, ‘Nitrate concentration of subsurface drainage water from acorn field in southern New Brunswick’, Can. Agric. Eng. 36, 69–78.
National Oceanic and Atmospheric Administration (NOAA): 1998, ‘Climate Research’, MonthlyReports [Online]. Available at www.ncdc.noaa.gov/ol/climate (accessed 15 September 2001).
Patni, N. K., Masse, L. and Jui, P. Y.: 1998, ‘Groundwater quality under conventional and no-tillage:I. Nitrate, electrical conductivity, and pH’, J. Environ. Qual. 27, 869–877.
Patni, N. K., Masse, L. and Jui, P. Y.: 1996, ‘Tile effluent quality and chemical losses underconventional and no tillage – Part 1: Flow and nitrate’, Am. Soc. Agric. Eng. 39, 1665–1672.
Pitois, S., Jackson, M. H. and Wood, B. T. B.: 2001, ‘Sources of the eutrophication problemsassociated with toxic algae: An overview’, J. Environ. Health 64, 25–32.
Randall, G. W. and Mulla, D. J.: 2001, ‘Nitrate nitrogen in surface waters as influenced by climaticconditions and agricultural practices’, J. Environ. Qual. 30, 337–344.
Randall, G. W. and Iragavarapu, T. K.: 1995, ‘Impact of long-term tillage systems for continuouscorn on nitrate leaching to tile drainage’, J. Environ. Qual. 24, 360–366.
Sainju, U. M., Singh, B. P. and Whitehead, W. F.: 1998, ‘Crop root distribution and its effects on soilnitrogen cycling’, Agron. J. 90, 511–518.
Smith, R. A., Alexander, R. B. and Wolman, M. G.: 1987, ‘Water quality trends in the nation’s rivers’,Science 235, 1607–1615.
Tait, R., Madramootoo, C. A. and Enright, P.: 1995, ‘An instrumented, field scale research facilityfor drainage and water quality studies’, Computer Electronics Agric. 12, 131–145.
Thomas, D. L., Shirmohammad, A., Lowrence, R. R. and Smith, M. C.: 1991, ‘Drainage-subirrigation effects on water quality in Georgia Flatwoods’, J. Irrig. Drain. Eng. 117, 123–137.
Wright, J. A., Shirmohammadi, A., Magette, W. L., Fous, J. L., Bentson, R. L. and Parsons, J. E.:1992, ‘Water table management practice effects on water quality’, Trans. ASAE. 35, 823–831.
Yeomans, J. C., Bremner, J. M. and McCarty, G. W.: 1992, ‘Denitrification capacity and denitrifica-tion potential of subsurface soils’, Commun. Soil Sci. Plant Anal. 23, 919–927.