Promoting Teachers' Collaborative Reuse of Educational Materials
Upload
khangminh22Category
view
5download
0
IMPERIAL COLLEGE LONDON
Waste tyre pyrolysis:
Sustainable recovery and
reuse of a valuable resource by
Eliana Athanassiades
A thesis submitted in fulfilment of the requirements for the degree of Doctor of Philosophy
Department of Civil and Environmental Engineering
Imperial College London
2013
2
I, Eliana Athanassiades, confirm that the work presented in this PhD thesis is my own
original work.
Signature: Eliana Athanassiades
Date: 19th March 2013
Supervisor:
Dr G. D. Fowler
Department of Civil & Environmental Engineering
Imperial College London
South Kensington
SW7 2AZ
3
ABSTRACT
End-of-life car passenger tyres represent a major waste management problem, with more than
450,000 tonnes of used tyres being generated each year in the UK alone (approximately
55,000,000 tyres). Recent legislation has made 100% material or value recovery from waste
tyres an imperative.
There are many different waste tyre management options available. The most commonly used
processes include: retreading, use as fuel in incinerators and cement kilns and reprocessing to
produce rubber crumb which has further applications in asphalt mixtures, carpet underlay and
playgrounds.
The theme of the research presented is a fundamental study and development of tyre
pyrolysis. Pyrolysis is an attractive method to sustainably recover valuable components of the
tyre rubber through the generated carbonaceous solid, oil and gas. Both conventional and
microwave-induced pyrolysis have been investigated. Microwave pyrolysis offers an exciting
alternative to traditional pyrolysis because of the potentially significant energy efficiency
advantage offered.
In the first instance an investigation of the optimisation of the pyrolysis conditions by
statistical design using conventional means to produce a carbonaceous solid char has been
undertaken. This was followed by the investigation of microwave-induced pyrolysis using
modified commercially available microwave equipment as well as a bespoke and novel 2450
MHz, 2 kW rotary microwave furnace developed for the purposes of this project by Cobham
Microwave Ltd. Carbonaceous solids produced by varying different experimental parameters,
such as power levels and pyrolysis duration are reported and analysed. In addition, the main
constituents of the oils generated have been identified and comparisons made with traditional
thermal pyrolysis oil.
Reuse of the solid residue is an important activity which has been researched. This char is
often described as carbon black, but given that it contains all the solid, inorganic components
present in the tyre, as well as carbon black, it is better described as “char filler”. The
suitability of this waste tyre-derived char for reuse in the rubber industry as a filler substitute
has been evaluated and is presented. The results show that the char has similar properties to a
semi-reinforcing filler with potential for improvement.

4
ACKNOWLEDGEMENTS
This research project was funded by Technology Strategy Board and this financial support is
gratefully acknowledged. I would also like to thank the collaborators of this project, ABB
Robotics, ARTIS, Cobham Microwave, Hughes Pumps and Symphony Energy especially
Rob Wilkins, Martin Bennett, Paul Marchant and Ken Jones.
I would like to thank my supervisor Dr Geoff Fowler for giving me the opportunity to do this
PhD and for all his support throughout its duration.
I would like to thank Carol Edwards for all your help and support in the lab. I am grateful to
Steven James Goodman for all the helpful discussions and suggestions in solving problems
encountered in lab and teaching me how most of the equipment works along with the Q-man!
Also Mr Muscles, I would not have been able to do without you and the big guns in the lab.
I am grateful and lucky to have met you and start this journey together with you from the
MSc year. Fei, Cuthbert and Quentonium thank you so much for everything.
I also want to thank Carsten, Karl and Suzan, and the amazing 307A office especially Paj,
Anna, Feyi, Pam, Hara, Nikos, Abdel, Shane and Owen.
A special mention to all my besties, Eleni, Despina, Popo, Tonia, Marlen, Myrelia & Sarah
not only for being there throughout the years, but especially for the support during the last
part of my PhD. Eleni, thank you so much for your home visits when I had to still be in
England – I know they made a difference.
I am grateful to my family with a different surname especially my sista Theo and ‘nonas’
kiria Athinoulla! Also a huge thank you to my auntie Yiota and my bro Abhi!
To my family, my parents and sister – a simple thank you is not enough! Thank you for
always being there for me. Mum and Dad, thank you for all your encouragement, support and
sacrifices for making my and my sister’s education your first priority.
To my ‘particularly specially special friend’ and one of the best outcomes of this PhD, that I
am lucky to now call my hubbie (must thank our supervisors for that), you know how I feel,
so simply thank you.
Mum, thank you again and sorry for not finishing this earlier.

5
To my mum, R.I.P

6
Table of Contents
ABSTRACT ............................................................................................................................................ 3
ACKNOWLEDGEMENTS .................................................................................................................... 4
Table of Contents .................................................................................................................................... 6
List of Tables .......................................................................................................................................... 9
List of Figures ....................................................................................................................................... 11
List of abbreviations ............................................................................................................................. 15
1 Introduction and Literature Review .............................................................................................. 17
1.1 General Overview ................................................................................................................. 17
1.2 Introduction to tyres .............................................................................................................. 17
1.2.1 Fillers ............................................................................................................................ 22
1.3 The management of waste tyres ............................................................................................ 25
1.3.1 Introduction to waste management ............................................................................... 25
1.3.2 Relevant legislation ....................................................................................................... 26
1.3.3 Problematic waste ......................................................................................................... 28
1.3.4 End-of-life tyre management methods .......................................................................... 29
1.3.5 Concluding remarks ...................................................................................................... 40
1.4 Microwaves ........................................................................................................................... 42
1.4.1 Introduction to microwaves .......................................................................................... 42
1.4.2 Microwave interactions with materials ......................................................................... 42
1.4.3 Microwave equipment components .............................................................................. 46
1.4.4 Advantages and disadvantages of using microwaves ................................................... 48
1.5 Summary ............................................................................................................................... 49
2 Research Aim and Objectives ....................................................................................................... 50
3 Characterisation of tyre rubber crumb .......................................................................................... 51
3.1 Introduction ........................................................................................................................... 51
3.2 Characterisation .................................................................................................................... 52
3.2.1 Thermal Analysis .......................................................................................................... 52

7
3.2.2 Carbon Hydrogen Nitrogen Sulfur Analysis ................................................................. 53
3.2.3 Bomb Calorimetry......................................................................................................... 54
3.3 Results and discussion .......................................................................................................... 54
3.4 Conclusions ........................................................................................................................... 64
4 Conventional Thermal Pyrolysis ................................................................................................... 66
4.1 Introduction ........................................................................................................................... 66
4.2 Statistical Background .......................................................................................................... 67
4.2.1 Multiple linear regression ............................................................................................. 67
4.2.2 Testing model significance ........................................................................................... 69
4.3 Part I – Screening test ........................................................................................................... 72
4.3.1 Experimental procedure ................................................................................................ 72
4.3.2 Characterisation ............................................................................................................ 76
4.3.3 Results and discussion .................................................................................................. 81
4.3.4 Conclusions ................................................................................................................... 96
4.4 Part II – Fitting a quadratic model ........................................................................................ 97
4.4.1 Introduction ................................................................................................................... 97
4.4.2 Experimental procedure ................................................................................................ 97
4.4.3 Results and discussion ................................................................................................ 100
4.4.4 Conclusions ................................................................................................................. 109
5 Microwave-induced tyre pyrolysis .............................................................................................. 110
5.1 Introduction ......................................................................................................................... 110
5.2 Experimental apparatus for microwave pyrolysis ............................................................... 110
5.2.1 Modified domestic microwave oven I......................................................................... 111
5.2.2 Modified domestic microwave oven II ....................................................................... 111
5.2.3 RotoSYNTH ............................................................................................................... 112
5.2.4 Cobham Microwave .................................................................................................... 113
5.3 Characterisation .................................................................................................................. 115
5.3.1 Apparent density ......................................................................................................... 116
5.3.2 Dielectric measurements ............................................................................................. 117
8
5.3.3 IR Spectroscopy .......................................................................................................... 119
5.3.4 Gas Chromatography/Mass Spectroscopy .................................................................. 119
5.4 Results and Discussion ....................................................................................................... 120
5.5 Conclusions ......................................................................................................................... 150
6 Recovery of value from pyrolysed chars .................................................................................... 151
6.1 Introduction ......................................................................................................................... 151
6.2 Fillers from waste ............................................................................................................... 155
6.3 Experimental procedure ...................................................................................................... 156
6.3.1 Formation of rubber compounds ................................................................................. 159
6.3.2 Assessment of rubber compounds ............................................................................... 161
6.4 Results and discussion ........................................................................................................ 164
6.5 Conclusions ......................................................................................................................... 175
7 Conclusions and recommendations for further research ............................................................. 177
7.1 Concluding discussion ........................................................................................................ 177
7.2 Contribution to knowledge.................................................................................................. 181
7.3 Further work ........................................................................................................................ 181
References ........................................................................................................................................... 184
Appendix I .......................................................................................................................................... 203
Appendix II ......................................................................................................................................... 205
Appendix III ........................................................................................................................................ 209
Presentations ....................................................................................................................................... 211
9
List of Tables
Table 1.1. Typical composition of a car passenger tyre (Adapted from Shulman, 2004) ....... 18
Table 1.2. Tyre pyrolysis product yields under different conditions ....................................... 34
Table 1.3. Properties of the oil derived from the AMAT process compared to kerosene
(Environment Agency, 2004) ................................................................................................... 39
Table 3.1. Tyre rubber crumb samples record ......................................................................... 51
Table 3.2. Peak temperatures of samples A – F ....................................................................... 61
Table 3.3. Compositions of the rubbers using TGA ................................................................ 63
Table 3.4. CHNS analysis and calorific values of tyre rubber samples ................................... 64
Table 4.1. ANOVA .................................................................................................................. 70
Table 4.2. Plus and minus signs used for the Plackett-Burman Designs ................................. 73
Table 4.3. Plackett-Burman Design for N=12 ......................................................................... 73
Table 4.4. Experimental conditions for Part I pyrolysis by conventional means .................... 75
Table 4.5. Assigned coding of parameters ............................................................................... 76
Table 4.6. Yield results of Part I experiments (conventional pyrolysis) ................................. 82
Table 4.7. Char characterisation results of Part I experiments (conventional pyrolysis) ........ 83
Table 4.8. ANOVA results for C-content ................................................................................ 88
Table 4.9. ANOVA results for surface area ............................................................................. 90
Table 4.10. ANOVA results for pH-value ............................................................................... 93
Table 4.11. Box-Behnken design for 3 parameters .................................................................. 98
Table 4.12. Part II design parameters ...................................................................................... 99
Table 4.13. Char characterisation results of Part II experiments (conventional pyrolysis) ... 103
Table 4.14. CPII,E13–15 and CPII,D16 chars composition ...................................................... 103
Table 4.15. ANOVA results for carbon content value ........................................................... 105
Table 4.16. ANOVA results for surface area ......................................................................... 107
Table 4.17. ANOVA results for pH-value ............................................................................. 108
Table 5.1. Domestic Microwave I, II and RotoSYNTH experimental conditions ................ 113
Table 5.2. Cobham Microwave experimental conditions ...................................................... 115
Table 5.3. Cobham Microwave Part II Yields (Sample F) .................................................... 121
Table 5.4. Dielectric Properties ............................................................................................. 135
Table 5.5. Empirical relationships between power vs. time and power vs. heating rate ....... 139
Table 5.6. Cobham Microwave (Part I) experimental conditions and results ....................... 140
10
Table 5.7. End temperatures for conventional thermal pyrolysis .......................................... 140
Table 5.8. CHNS analysis and calorific value of tyre oil (600°C end temperature) .............. 142
Table 5.9. FTIR spectrum peak assignment........................................................................... 143
Table 5.10. GC/MS spectrum peak assignment ..................................................................... 145
Table 5.11. Major tyre pyrolysis oil components from different research ............................ 149
Table 6.1. Summary of the conditions used in some of the studies investigating the
replacement of fillers by waste products ............................................................................... 157
Table 6.2. Rubber formulation ............................................................................................... 159
Table 6.3. Summary of properties of the rubber compounds and their respective filler ....... 164
Table 6.4. Mechanical properties of the rubber compounds .................................................. 170
Table 6.5. Dynamic properties of the rubber compounds ...................................................... 173

11
List of Figures
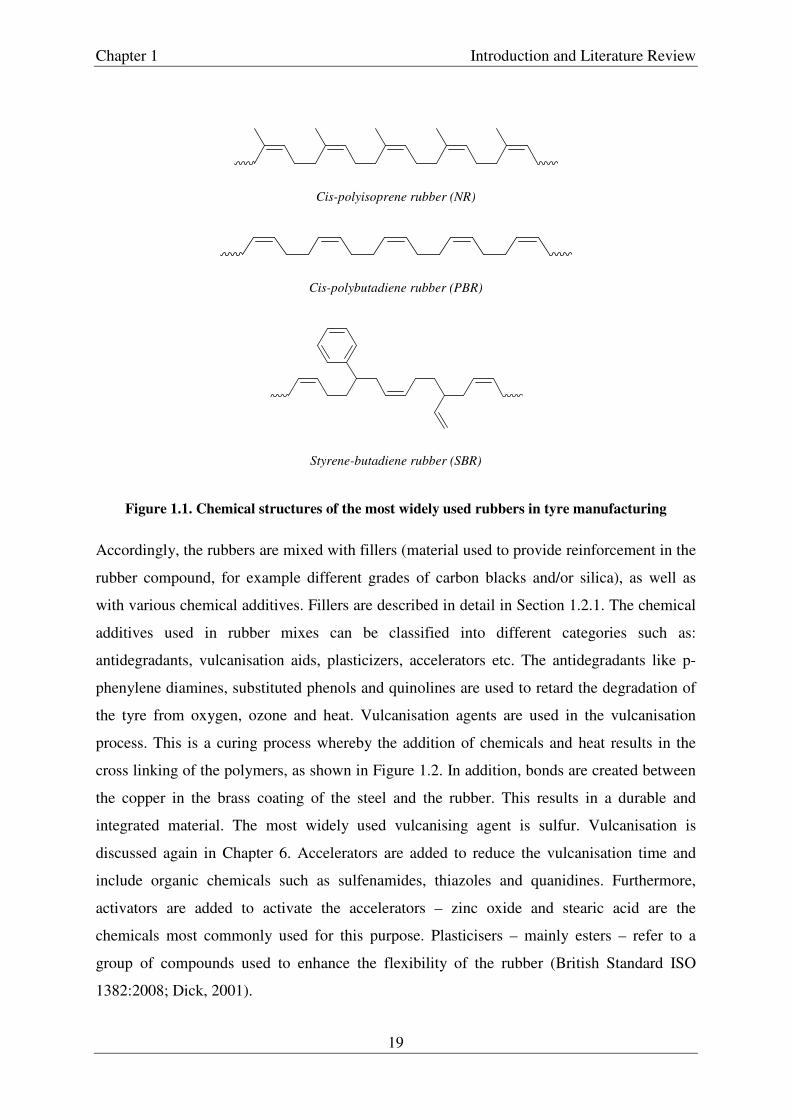
Figure 1.1. Chemical structures of the most widely used rubbers in tyre manufacturing ....... 19
Figure 1.2. Representation of the crosslinking during vulcanisation ....................................... 20
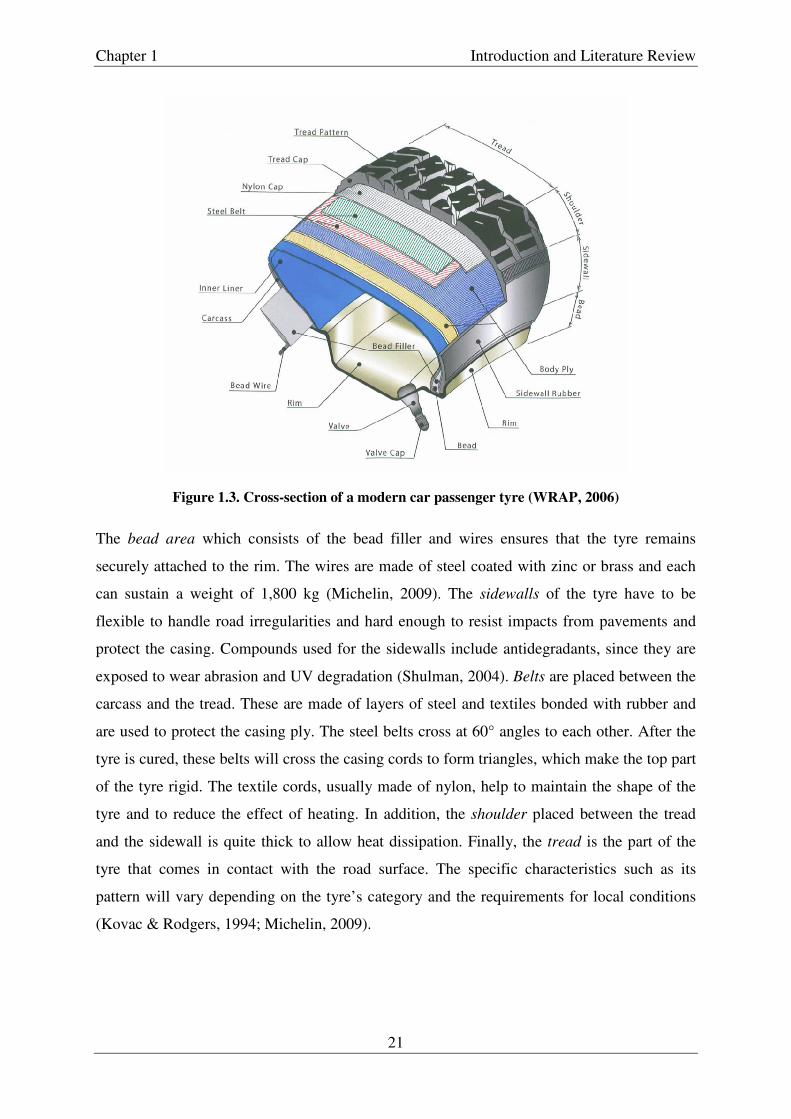
Figure 1.3. Cross-section of a modern car passenger tyre (WRAP, 2006) .............................. 21
Figure 1.4. Carbon black structure (Wang et al., 2000) ........................................................... 23
Figure 1.5. Waste hierarchy ..................................................................................................... 25
Figure 1.6. Used Tyre Statistics of 2010 (Environment Agency, 2012).................................. 30
Figure 1.7. Electric Dipole ....................................................................................................... 43
Figure 1.8. Dipolar polarisation mechanism (Adapted from Lidström et al., 2001) ............... 44
Figure 1.9. Conduction mechanism (Adapted from Lidström et al., 2001) ............................. 46
Figure 1.10. a) Illustration of magnetron and b) Typical microwave oven diagram ............... 47
Figure 3.1. UHPW system at Imperial College: a) the placement of the whole passenger tyre
onto a robotic arm, b) the steel remaining after the process, and c) the crumb generated ....... 52
Figure 3.2. TG and DTG plots of sample C at 5°C/min heating rate in N2 ............................. 55
Figure 3.3. TG plot of natural rubber and SBR at 5°C/min heating rate in N2 ........................ 56
Figure 3.4. DTG plot of natural rubber and SBR at 5°C/min heating rate in N2 ..................... 56
Figure 3.5. TG plots of sample A at different heating rates in N2 ........................................... 57
Figure 3.6. DTG plot of sample A at different heating rates in N2 .......................................... 58
Figure 3.7. Sanglar et al.’s (2010) proposed cross-linked structures from 1,4-polybutadiene
degradation ............................................................................................................................... 59
Figure 3.8. TG plot of different rubbers at 5°C/min heating rate in N2 ................................... 60
Figure 3.9. DTG plot of different rubbers at 5°C/min heating rate in N2 ................................ 61
Figure 3.10. Proximate thermal analysis plot of sample C ...................................................... 62
Figure 4.1. Normal probability plot of the residuals ................................................................ 72
Figure 4.2. Carbolite HTR/ 11/150 rotary furnace .................................................................. 74
Figure 4.3. Types of physisorption isotherms (Bansal & Goyal, 2005) .................................. 80
Figure 4.4. Illustration of oil condensation on the a) front arm and b) backend of the vessel 82
Figure 4.5. SEM Images of CPI,C4 a) without distribution b) showing Si distribution c)
showing Zn distribution and d) showing Fe distribution. ........................................................ 84
Figure 4.6. FTIR spectrum of CPI,C4 ....................................................................................... 85
Figure 4.7. Adsorption/Desorption isotherms of CPI,C3, CPI,C4 and CPI,C6 ............................ 87
Figure 4.8. Graphical representation of the main effects influencing the carbon content ....... 89

12
Figure 4.9. Graphical representation of the main effects influencing surface area ................. 91
Figure 4.10. Graphical representation of surface area interaction effects: (a)
temperature*heating rate and (b) heating rate*nitrogen flow .................................................. 92
Figure 4.11. Graphical representation of the main effects influencing pH-value .................... 94
Figure 4.12. Figueiredo’s summary of decomposition temperatures of carbon surface groups
by TPD studies ......................................................................................................................... 95
Figure 4.13. Graphical representation of the Box-Behnken design ......................................... 98
Figure 4.14. Thermocouple measurement configuration ....................................................... 100
Figure 4.15. Furnace and thermocouple temperature measurements .................................... 101
Figure 4.16. Comparison of thermocouple measurements for different samples at 6°C/min 102
Figure 4.17. Surface area response ........................................................................................ 106
Figure 4.18. Graphical representation of pH-value response ................................................ 109
Figure 5.1. Modified domestic microwave oven I ................................................................. 111
Figure 5.2. Modified domestic microwave system II ............................................................ 112
Figure 5.3. Modified RotoSYNTH ........................................................................................ 113
Figure 5.4. Cobham Microwave ............................................................................................ 114
Figure 5.5. Apparatus for measuring apparent density .......................................................... 117
Figure 5.6. Dielectric measurements set-up ........................................................................... 118
Figure 5.7. Representation of the two-port network system .................................................. 118
Figure 5.8. Model representation of the sample at the centre and the side of the waveguide119
Figure 5.9. Domestic Microwave I char yields at 850 W ...................................................... 121
Figure 5.10. Plots of Cobham Microwave Part II yields ....................................................... 122
Figure 5.11. First two attempts for efficient condensation system ........................................ 123
Figure 5.12. Condensation system using liquid nitrogen traps .............................................. 123
Figure 5.13. IR sensor in Cobham Microwave ...................................................................... 124
Figure 5.14. Thermocouple measurement of the SiC mix ..................................................... 125
Figure 5.15. SiC mix temperature measurements a) time range 0 – 200 minutes and b) time
range 70 – 120 minutes .......................................................................................................... 126
Figure 5.16. Domestic microwave II average thermal profiles at different powers .............. 127
Figure 5.17. Domestic microwave II thermal profiles at 440 W ........................................... 127
Figure 5.18. RotoSYNTH thermal profiles a) for 50g and b) 100g ....................................... 128
Figure 5.19. Cobham microwave average thermal profiles at different powers .................... 129
Figure 5.20. Illustration of hot spots and its effects on the glassware ................................... 131

13
Figure 5.21. RotoSYNTH reactor after pyrolysis .................................................................. 131
Figure 5.22. Plasma and arching during microwave pyrolysis .............................................. 133
Figure 5.23. Relationship of power and temperature measurements with weight change at
1000 W ................................................................................................................................... 134
Figure 5.24. Typical plots obtained by the network analyser showing the amplitude and phase
of Return and Insertion Loss. Here shown for rubber F placed in the centre of the waveguide
................................................................................................................................................ 136
Figure 5.25. Cobham Microwave system power absorption and time relationship............... 138
Figure 5.26. Cobham Microwave system power and heating rate relationship ..................... 139
Figure 5.27. Weight change and density of chars produced using conventional and microwave
pyrolysis at 1000 W and 1500 W (Sample F) ........................................................................ 141
Figure 5.28. FTIR spectrum of oil generated at 1500 W ....................................................... 143
Figure 5.29. GC/MS spectrum of oil generated at 2000 W ................................................... 144
Figure 5.30. Resonance of radicals formed by β scission of natural rubber .......................... 146
Figure 5.31. Monomer Formation .......................................................................................... 146
Figure 5.32. Limonene formation mechanism by a) intramolecular cyclisation followed by
scission b) Diels-Alder reaction ............................................................................................. 146
Figure 5.33. Ethene formation from natural rubber ............................................................... 147
Figure 5.34. SBR β-chain scission possibilities (red - with respect to 2 bonds, blue - with
respect to 1 bond) and the main products from SBR degradation (Adapted from Choi, 2002)
................................................................................................................................................ 148
Figure 5.35. Possible mechanisms of xylene formation from SBR degradation ................... 148
Figure 6.1. Illustration of the filler polymer interactions (Adapted from Sosson et al., 2010)
................................................................................................................................................ 153
Figure 6.2. Payne effect illustration (Adapted from Meon et al., 2004) ................................ 154
Figure 6.3. Experimental process for rubber compounding formation and testing ............... 158
Figure 6.4. Typical MDR plots (BS ISO 3417:2008) ............................................................ 161
Figure 6.5. Sulfurating agent ................................................................................................. 165
Figure 6.6. Zn2+ interaction with the sulfurating precursor, where ISy- is an ionised form of
linear sulphur (Coran, 2005) .................................................................................................. 166
Figure 6.7. MDR plots of CPII,E1 and CPII,E2 ........................................................................ 167
Figure 6.8. TEM images of CMD1500_41a (left) and N772 (right) at x 300 (unit = 5 μm), x
4000 (unit = 0.5 μm), and x 20000 (unit = 100 nm) .............................................................. 168

14
Figure 6.9. Optical microscopy of rubber compounds containing a) N772, b) CMD1500_41a
and c) CMD800_210 .............................................................................................................. 171
Figure 6.10. Elastic modulus plots against double strain amplitude of the various compounds
containing different types of fillers ........................................................................................ 172
Figure 6.11. tanδ plots against double strain amplitude of the various compounds containing
different types of fillers .......................................................................................................... 172

15
List of abbreviations
AMAT Advance Molecular Agitation Technology
ANOVA ANalysis Of Variance
ASTM American Society for Testing and Materials
BET Brunauer-Emmett-Teller
BS British Standard
CHNS Carbon Hydrogen Nitrogen Sulfur
DEFRA Department for Environment, Food and Rural Affairs
df degrees of freedom
DMA Dynamic Mechanical Analysis
DSA Double Strain Amplitude
DTG Derivative ThermoGravimetry
DUKES Digest of UK Energy Statistics
Eb Elongation at break
EDX Energy Dispersive X-ray
ETRMA European Tyre and Rubber Manufacturers Association
EU European Union
FTIR Fourier Transform Infrared
GC/MS Gas Chromatography/Mass Spectroscopy
ICBA International Carbon Black Association
ICES International Committee on Electromagnetic Safety
IEC International Electrotechnical Commission
IEEE Institute of Electrical and Electronics Engineers
IR InfraRed
ISM Industrial, Scientific and Medical
ISO International Organisation for Standardization
IUPAC International Union of Pure and Applied Chemistry
LOF Lack of Fit
M100 Modulus at 100% elongation
M300 Modulus at 300% elongation
MATLAB MATrix LABoratory
MDR Moving Die Rheometer

16
MS Mean Square
NMR Nuclear Magnetic Resonance
NR natural rubber
OAN Oil Absorption Number
PAH Polycyclic Aromatic Hydrocarbons
PBR polybutadiene rubber
PE Pure Error
phr parts per hundred rubber
PTFE polytetrafluoroethylene
R2 Coefficient of determination
RMA Rubber Manufacturers Association
rpm revolutions per minute
RSM Response Surface Methodology
RµPERT Rµbber Product Enhanced Recovery Technology
SBR styrene butadiene rubber
SEM Scanning Electron Microscopy
SS Sum of squares
SSE Sum of squares of errors
SSR Sum of squares of regression
SST Total sum of squares
stdev standard deviation
TEM Transmission Electron Microscopy
TG ThermoGravimetry
TGA ThermoGravimetry Analysis
TPD Temperature-programmed desorption
TS Tensile Strength
UHPW Ultra High Pressure Water
UNECE United Nations Economic Commission for Europe
WRAP Waste and Resources Action Programme
Chapter 1 Introduction and Literature Review
17
1 Introduction and Literature Review
1.1 General Overview
The work presented in this thesis is part of a project supported by the Technology Strategy
Board (TSB): an agency established by the UK government to stimulate innovation. The
major objective of the project was the development of an integrated tyre recycling system and
involved the participation of six partners: ARTIS, ABB Robotics, Cobham Microwave,
Hughes Pumps, Symphony Energy and Imperial College London. This project was titled the
RµPERT (Rµbber Product Enhanced Recovery Technology) project.
The project was divided into two parts: (i) the disassembly of tyres by Ultra High Pressure
Water (UHPW) to produce crumb, steel and fibres and (ii) the pyrolysis of the tyre crumb i.e.
the thermal degradation of the material in the absence of oxygen. The UHPW aspect of the
work does not form part of this Thesis. Pyrolysis is an attractive method to sustainably
recover valuable components of the tyre rubber through the generated carbonaceous solid, oil
and gas. This research has investigated both traditional and microwave induced pyrolysis.
This chapter presents a brief literature review on tyres, the current methods for handling end-
of-life tyres which have been discarded and the relevant controlling legislation. In addition,
the theory behind microwaves and rubber fillers is introduced.
1.2 Introduction to tyres
Tyres are known as one of the best engineered products, and their manufacture is a well
established process which involves tight quality controls. They are designed to perform a
number of functions, such as providing mobility, safety and comfort to the passengers of a
vehicle even under extreme conditions.
Tyres consist of a complex mixture of more than 200 component parts. The specific
composition of a tyre will depend on a number of factors including but not limited to the
following:
� The tyre manufacturer

Chapter 1 Introduction and Literature Review
18
� The vehicle category (passenger car, trucks, van and light utility vehicles, airplanes
etc.)
� The type of car (family, sports etc.)
� The weather conditions (cold, wet, summer conditions etc.)
� The intended use (driving) terrain: on-road, off-road or both
All tyres, however, contain the same groups of materials (Shulman, 2004; Feraldi et al.,
2012) in varying design percentages, rubber being the main component. A typical
composition of a passenger car tyre is given in Table 1.1 below.
Rubber, the main ingredient of tyres, is an elastic hydrocarbon polymer. The most frequently
employed rubbers in tyre manufacture are natural rubber (NR), polybutadiene rubber (PBR)
and styrene butadiene rubber (SBR). Their structures are presented in Figure 1.1.
Table 1.1. Typical composition of a car passenger tyre (Adapted from Shulman, 2004)
Material wt. %
Rubber (Natural and/or synthetic) 43 Fillers (Carbon black, silica) 27 Reinforcing Materials 16 • Metals 11
• Textiles 5
Chemicals additives1 14
• Vulcanisation aids 3
• Other additives 3
• Aromatic oils 8 1 Chemical additives include strearic acid, zinc oxide, sulfur etc.
Different types of rubbers are used in the various components of the tyre depending on their
function within the tyre. For example, SBR is extensively used in tyre treads, as it provides
wet skid and traction properties, as well as good abrasion resistance; PBR is used in treads
and sidewalls as it can provide good abrasion resistance, tread wear performance and
enhanced cut propagation resistance (Rodgers & Waddell, 2005).
Chapter 1 Introduction and Literature Review
19
Cis-polyisoprene rubber (NR)
Cis-polybutadiene rubber (PBR)
Styrene-butadiene rubber (SBR)
Figure 1.1. Chemical structures of the most widely used rubbers in tyre manufacturing
Accordingly, the rubbers are mixed with fillers (material used to provide reinforcement in the
rubber compound, for example different grades of carbon blacks and/or silica), as well as
with various chemical additives. Fillers are described in detail in Section 1.2.1. The chemical
additives used in rubber mixes can be classified into different categories such as:
antidegradants, vulcanisation aids, plasticizers, accelerators etc. The antidegradants like p-
phenylene diamines, substituted phenols and quinolines are used to retard the degradation of
the tyre from oxygen, ozone and heat. Vulcanisation agents are used in the vulcanisation
process. This is a curing process whereby the addition of chemicals and heat results in the
cross linking of the polymers, as shown in Figure 1.2. In addition, bonds are created between
the copper in the brass coating of the steel and the rubber. This results in a durable and
integrated material. The most widely used vulcanising agent is sulfur. Vulcanisation is
discussed again in Chapter 6. Accelerators are added to reduce the vulcanisation time and
include organic chemicals such as sulfenamides, thiazoles and quanidines. Furthermore,
activators are added to activate the accelerators – zinc oxide and stearic acid are the
chemicals most commonly used for this purpose. Plasticisers – mainly esters – refer to a
group of compounds used to enhance the flexibility of the rubber (British Standard ISO
1382:2008; Dick, 2001).

Chapter 1 Introduction and Literature Review
20
CH3
CH3
Sx
CH3
CH3
Figure 1.2. Representation of the crosslinking during vulcanisation
The ingredients are mixed beforehand and shaped into rubber sheet layers. The specific
formulations are chosen from each manufacturer after a series of tests. These tests are
conducted to find the optimum balance of the ingredients’ properties. For example, use of an
increased amount of carbon black leads to a higher modulus compound. However, the
hysteresis and heat build up from deformational cycling also increases, thus compromises are
required to achieve the best compounding (Dick, 2001). Furthermore, cost plays a major role
in choosing the formulation materials. Figure 1.3 illustrates a constructional cross-section of a
modern passenger car tyre.
The first layer is the inner liner which consists of an airtight material, usually butyl rubber or
its halogenated derivatives. This layer is impermeable to gases, ensuring that the air between
the tyre and the rim does not escape. The casing ply, also known as the carcass, consists of
fine textiles arranged in straight lines and sandwiched in rubber. It extends from bead to bead
and constitutes the main framework of the tyre. The casing ply provides the primary
reinforcement responsible for supporting the air pressure, vertical load and absorption of
shocks. In fact, in each ply of a tyre, there are around 1,400 cords, each one of which can
resist a weight of 15 kg (Michelin, 2009).
Chapter 1 Introduction and Literature Review
21
Figure 1.3. Cross-section of a modern car passenger tyre (WRAP, 2006)
The bead area which consists of the bead filler and wires ensures that the tyre remains
securely attached to the rim. The wires are made of steel coated with zinc or brass and each
can sustain a weight of 1,800 kg (Michelin, 2009). The sidewalls of the tyre have to be
flexible to handle road irregularities and hard enough to resist impacts from pavements and
protect the casing. Compounds used for the sidewalls include antidegradants, since they are
exposed to wear abrasion and UV degradation (Shulman, 2004). Belts are placed between the
carcass and the tread. These are made of layers of steel and textiles bonded with rubber and
are used to protect the casing ply. The steel belts cross at 60° angles to each other. After the
tyre is cured, these belts will cross the casing cords to form triangles, which make the top part
of the tyre rigid. The textile cords, usually made of nylon, help to maintain the shape of the
tyre and to reduce the effect of heating. In addition, the shoulder placed between the tread
and the sidewall is quite thick to allow heat dissipation. Finally, the tread is the part of the
tyre that comes in contact with the road surface. The specific characteristics such as its
pattern will vary depending on the tyre’s category and the requirements for local conditions
(Kovac & Rodgers, 1994; Michelin, 2009).
Chapter 1 Introduction and Literature Review
22
Overall, it can be seen that a tyre is a complex engineered product the design of which
reflects its purpose; an object which must operate under extreme conditions whilst not
displaying signs of weakness.
The following sub-section is an introduction to fillers, the focus of the experimental
investigation presented in the later part of this thesis (Chapter 6).
1.2.1 Fillers
Carbon black is the most commonly used reinforcement filler in rubber. It is usually
manufactured by the incomplete combustion of heavy hydrocarbons, which has a
considerable carbon footprint; 2.4 tonnes of CO2 are estimated to be emitted per tonne of
carbon black – this compares to 0.8 tonnes of CO2 per tonne of cement for cement
manufacture (Cabot Corporation, 2010; IEA, 2007). Current global production of carbon
black is estimated to be 8.1 million tonnes per year (ICBA, 2006), of which 70% is used in
the tyre rubber industry, 20% in other rubber applications while the rest is used for other
purposes such as a pigment for printing inks, coatings and plastics (Kühner & Voll, 1993;
ICBA, 2006).
Over 95% of carbon black is manufactured by the incomplete combustion of hydrocarbons, in
a well-defined and controlled process that ensures the production of carbon black with
specific and consistent properties. Carbon black should not be confused with soot which is an
impure by-product of thermal decomposition of hydrocarbons, full of inorganic contaminants
and extractable organic residues (Wang et al., 2000).
The raw materials primarily used for its manufacture include natural gas or oils that are
preferentially rich in 3- or 4-membered aromatic rings but can be vaporised under the
reaction conditions, since carbon blacks are formed in the gas phase (Kühner & Voll, 1993).
Fuel such as natural gas is burned with preheated process air at the first part of the reactor.
The feedstock is then added and under turbulent flow the oxidative decomposition occurs.
Frequently, alkali metal salt additives are used to control the structure of carbon black. Water
is used to quench the reaction and cool the carbon black formed in the gas phase and the off-
gases. These undergo further processing to achieve separation, purification, pelletisation,
densification and packaging of the carbon black as a finished product. Carbon black can also

Chapter 1 Introduction and Literature Review
23
be formed by thermal decomposition in the absence of oxygen (Kühner & Voll, 1993;
Medalia & Kraus, 1994).
Carbon black is composed of aggregates which consist of spheres fused together, known as
“nodules”. These nodules are in turn composed of many tiny graphite-like stacks or
crystallites. Figure 1.4 below from Carbon Black by Wang et al. in Kirk-Othmer
Encyclopaedia of Chemical Technology (2000) provides a good representation of carbon
black structure. Specifically “... carbon black consists of well-developed graphite platelets
stacked roughly parallel to one another but random in orientation with respect to adjacent
layers...” (Wang et al., 2000). Just like graphite, carbon black forms large sheets of
condensed aromatic ring systems with the same interatomic spacing within the sheet as in the
graphite structure. However, the interplanar distances are larger (0.350 – 0.365 nm) than the
ones found in graphite (0.335 nm) (Wang et al., 2000).
Figure 1.4. Carbon black structure (Wang et al., 2000)
Carbon blacks consist of more than 97% elemental carbon. Other elements present include
hydrogen, oxygen, sulfur, and nitrogen, which are incorporated in the carbon structure
depending on the feedstock and manufacturing process (Wampler et al., 2004).
Various grades of carbon black exist, and there is a classification system consisting of 4
characters made up of one letter followed by 3 digits. The letter denotes the curing rate of a

Chapter 1 Introduction and Literature Review
24
typical compound containing the carbon black, which is either a normal curing rate (N-) or a
slow curing rate (S-) (Wampler et al., 2004). The first digit, immediately following the letter,
denotes the range of average specific surface area grouped from 0 to 9, while the other two
digits are arbitrary numbers. N300 series for example denote fillers which result in normal
curing rate of the host rubber compound and specific surface area between 70 and 99 m2/g.
The complete classification of carbon blacks is presented in Appendix I (Table A).
Their aggregate dimensions can range from tens to a few hundreds of nanometres (Wang et
al., 2000). Larger particles are used in the inner part of the tyre, whereas smaller particles are
employed in the casing and tread. The addition of carbon black to tyres reinforces the rubber
by increasing its tear and tensile strength, abrasion resistance as well as the modulus of
elasticity (Medalia & Kraus, 1994).
Another filler used increasingly in the rubber industry and, in particular, for the manufacture
of “green tyres” is silica, as it helps reduce the rolling resistance (Michelin, 2009). Silica has
been used in rubber compounds as a simple filler for years – it did not qualify as a reinforcing
filler due to its poor dispersion in rubber. It was not until the introduction of specific
precipitated silica and coupling agents that resulted in homogeneously and finely dispersed
silica particles, a prerequisite for high reinforcement, that silica became a serious candidate
for tyre filler (Meon et al., 2004).
Precipitated silicas, most commonly used in the rubber industry, are formed by the alkaline
fusion of pure sand and an alkaline salt to form a silica glass, which is then solubilised in
water at high temperature and acid precipitated. During this process primary particles are
formed which link together via siloxane bonds to form aggregates. The aggregates are held
together by hydrogen bonding or van der Waals interactions to form agglomerates (Meon et
al., 2004). The silica suspension is sequentially filtered, washed and dried (Donnet &
Custodero, 2005).
Precipitated silica is hydrophilic by nature, due to the presence of silanols, Si–OH on its
surface (Donnet & Custodero, 2005). Mixing silica with rubber, which is a hydrophobic
material, was not ideal until bifunctional organosilanes were added in conjunction with the
silica, that act as coupling agents by reacting with both silica’s surface and rubber (Meon et
al., 2004).

Chapter 1
Currently, most of the European
filler material.
1.3 The management of waste tyres
This section discusses the management of waste tyres, and begins with an introduction to
waste management and relevant legislation in waste tyre management as a suitable backdrop
to a review of current practices and
problematic waste stream.
1.3.1 Introduction to waste
Waste, as defined by the latest European Union (EU) Directive 2008/98/EC on waste, (2008)
is “... any substance or object which the holder discards
The waste strategy conveyed in the various UK Regulations and European Directives has, as
its primary objective, the prevention of waste. Prevention of waste is the best option
according to the waste hierarchy which
reiterated in the Directive 2008/98/EC on waste. The waste hierarchy is illustrated in Figure
1.5 and can be summarised as follows
Directive 2008/98/EC on waste
� Prevention: Taking the necessary measures before a product becomes waste that will
reduce the amount of waste generated, prolong its life, reduce the negative
environmental effects and risks to human health and li
substances in the products.
� Preparing for re-use:
original purpose they were intended.
Prevention
Preparing for re
Introduction and Literature
25
Currently, most of the European-made tyres incorporate more silica than carbon black as
The management of waste tyres
This section discusses the management of waste tyres, and begins with an introduction to
waste management and relevant legislation in waste tyre management as a suitable backdrop
to a review of current practices and issues in the management of this significant and
aste management
Waste, as defined by the latest European Union (EU) Directive 2008/98/EC on waste, (2008)
any substance or object which the holder discards or intends or is required to discard
The waste strategy conveyed in the various UK Regulations and European Directives has, as
its primary objective, the prevention of waste. Prevention of waste is the best option
according to the waste hierarchy which has been adopted in all the recent waste strategies and
reiterated in the Directive 2008/98/EC on waste. The waste hierarchy is illustrated in Figure
1.5 and can be summarised as follows (The Waste (England and Wales) Regulations 2011;
C on waste):
Figure 1.5. Waste hierarchy
Taking the necessary measures before a product becomes waste that will
reduce the amount of waste generated, prolong its life, reduce the negative
environmental effects and risks to human health and limit the use of harmful
substances in the products.
use: Any operation that enables the reuse of materials for the
original purpose they were intended.
Prevention
Preparing for re-use
Recycling
Other recovery
Disposal
Introduction and Literature Review
made tyres incorporate more silica than carbon black as
This section discusses the management of waste tyres, and begins with an introduction to
waste management and relevant legislation in waste tyre management as a suitable backdrop
issues in the management of this significant and
Waste, as defined by the latest European Union (EU) Directive 2008/98/EC on waste, (2008)
or intends or is required to discard”.
The waste strategy conveyed in the various UK Regulations and European Directives has, as
its primary objective, the prevention of waste. Prevention of waste is the best option
has been adopted in all the recent waste strategies and
reiterated in the Directive 2008/98/EC on waste. The waste hierarchy is illustrated in Figure
es) Regulations 2011;
Taking the necessary measures before a product becomes waste that will
reduce the amount of waste generated, prolong its life, reduce the negative
mit the use of harmful
Any operation that enables the reuse of materials for the

Chapter 1 Introduction and Literature Review
26
� Recycling: Any recovery operation that involves the reprocessing of waste to form
materials that will be useful either by restoring them to their original form or as a
replacement of other raw materials. This does not include energy recovery.
� Other recovery: Energy recovery including gasification and pyrolysis.
� Disposal: Any operation which is not recovery, such as landfill.
Deviations from this hierarchy can be accepted if justified by life-cycle thinking on the
overall impacts of the generation and management of specific wastes (Directive 2008/98/EC).
Life cycle approach involves the investigation of the environmental impacts of a material or
system over its whole life cycle (that is raw material acquisition, manufacture, use and end of
life (which includes its final disposal or recycle/reuse), as well as transport during all these
stages). This is collectively known as cradle-to-grave (ISO 14040:2006). All the energy
consumed during the above processes and generally all the emissions generated into all
environmental compartments (air, water and soil) are taken into consideration.
1.3.2 Relevant legislation
Used tyres can be considered a high-volume waste. Worldwide, used tyre generation is
estimated to be 1 billion units per year; the UK alone produces more than 55 million waste
tyres a year (Environment Agency, 2012; Shulman, 2004). The European Commission
identified waste tyres as one of the ‘priority waste streams’ from the mid-1990s below
(DEFRA, 2007) and has since introduced legislation regulating their disposal.
1.3.2.1 Council Directive 1999/31/EC on the landfill of waste
The Council Directive 1999/31/EC on the landfill of waste (1999) was composed with the
objective of setting operational and technical requirements to ensure the prevention or
reduction of the negative environmental effects caused by the disposal of waste in landfills.
Three categories of landfills were defined by this Directive, according to the type of waste
each can accept: (i) hazardous, (ii) non-hazardous, and (iii) inert. Targets were also set for
reducing the quantity of wastes disposed in landfills. As conveyed in England’s waste
strategy 2007, this required a reduction in the amount of biodegradable municipal waste
going to landfill. Using the 1995 data on the total amount of the biodegradable municipal
waste produced, this would reduce to 75% by 2010, 50% by 2013 and 35% by 2020.
Chapter 1 Introduction and Literature Review
27
In addition, the Directive listed the conditions necessary to obtain a permit to operate a
landfill site, defined waste acceptance procedures and described measures for the control and
monitoring of the landfill during its operation as well as during the after-closure phase.
Of significance to the current work, the Directive banned certain wastes, particularly tyres,
from landfill disposal. Specifically, the disposal of whole tyres in landfills from 2003 and
shredded tyres from 2006 was outlawed. Bicycle tyres and tyres with an outside diameter
above 1400 mm are excluded from this restriction. Tyres will only be allowed in landfills if
they are used for engineering purposes, such as their employment as leachate drainage layer.
1.3.2.2 Directive 2000/53/EC on end-of-life vehicles
The 2000/53/EC Directive on end-of-life vehicles (2000) aims primarily to prevent waste
arising from vehicle disposal and at the reuse, recycling and recovery of the vehicles and their
components. Thus, it encourages manufacturers of vehicles and their components to develop
new designs which would take into consideration the need for prevention of waste, facilitate
reuse and recovery and limit the amount of hazardous substances used.
The Directive set up the following targets for all the end-of-life vehicles:
� The reuse and recovery will be increased to at least 85%, while the reuse and
recycling will be increased to a minimum of 80% by an average weight per vehicle
and year, from 1 January 2006. Lower targets of 75% and 70% respectively, will
apply to vehicles produced before 1 January 1980.
� The reuse and recovery will be increased to at least 95%, while the reuse and
recycling will be increased to a minimum of 85% by an average weight per vehicle
and year, no later than 1 January 2015.
The reuse and recovery of waste tyres can make a significant contribution to the achievement
of these targets as the relevant infrastructure already exists.
1.3.2.3 Directive 2000/76/EC on the incineration of waste
The Directive 2000/76/EC on the incineration of waste (2000) aims to prevent or limit the
negative environmental effects and the resulting risks to human health from the incineration
and the co-incineration of waste.

Chapter 1 Introduction and Literature Review
28
The Directive describes the necessary requirements to obtain a permit to operate an
incineration plant, defines the operating conditions and sets up various parameters and
emission limit values for the control and monitoring of the process.
The Directive defines incineration plants as plants that thermally treat waste by oxidizing it,
with or without the recovery of the combustion heat generated. It also includes other thermal
treatment processes such as pyrolysis, gasification or plasma processes as long as the
substances obtained by these treatments are subsequently incinerated.
Co-incineration plants include plants intended for the generation of energy or to produce
material products such as cement kiln plants, but additionally use a waste stream as fuel or
with the intention of its disposal.
The importance of this Directive will be further discussed in Section 1.3.4.5.2.
1.3.2.4 Directive 2008/98/EC on waste and repealing certain Directives
Article 6 of the Directive 2008/98/EC on waste sets up conditions where waste ceases to be a
waste when it has undergone a recovery operation and fulfils the following criteria:
� “the substance or object is commonly used for specific purposes
� a market or demand exists for such a substance or object
� the substance or object fulfils the technical requirements for the specific purposes and
meets the existing legislation, and
� the use of the substance or object will not lead to overall adverse environmental or
human health impacts”
The article dictates specific waste streams that the end-of-waste criteria should be applied to,
among which are tyres.
1.3.3 Problematic waste
End-of-life tyres are considered a problematic waste, and the reasons for this are summarised
as follows:
� Large quantities of tyres are generated every year
� Tyres, by design, are not easily degradable
Chapter 1 Introduction and Literature Review
29
� Harmful gases are generated when tyres are burnt
� Tyres have been banned from landfill disposal by Directive 1999/31/EC
� Tyres are subject to fly-tipping – requiring unnecessary and costly clean up operations
by local authorities
� There are problems associated with collection of data and inaccuracies on the
handling of tyres when they enter the waste stream
� Tyres do not have a consistent formulation – they are composed of so many different
ingredients and proportions that it is difficult to produce something that will give a
consistent output. New developments are ongoing and drastic changes are expected as
a result of the recent directives which require the limitation of harmful substances and
encourage the manufacturers to design new ‘greener’ products
1.3.4 End-of-life tyre management methods
There are currently various methods employed in the management of waste tyres. The
favoured method is to retread the tyre; however there is a limit to the number of times this
can be done. Another approach is to utilise crumb produced from waste tyres. These crumbs
are used for various purposes including road applications, carpet underlays, playgrounds etc.
Furthermore, the high calorific value of waste tyres makes them an attractive substitute solid
fuel in incineration plants and cements kilns for energy recovery. However, the
implementation of the 2000/76/EC Waste Incineration Directive (2000) has imposed stricter
emission limits, which affect the number of waste tyres that can be used in these plants.
Figure 1.6 presents the 2010 UK statistics of used tyres allocation (Environment Agency,
2012). As shown in the Figure, the most popular waste tyre management route in the UK was
the generation of crumbs. The management of waste tyres within the context of waste
hierarchy is described in the following subsections.

Chapter 1
Figure 1.6. Used Tyre Statistics of 2010 (Environment Agency, 2012)
1.3.4.1 Prevention
There is ongoing development by all major tyre manufacturing companies to provide a
material with extended lifetime. Also, the amount of tyres requiring disposal every year can
be minimised by simple good driving practices and maintenance of the tyres by vehicles
owners.
1.3.4.2 Reuse and Recycling (of whole tyres)
Part worn tyres are reused for their original purpose usually by exporting them to countries
with fewer restrictions on the thickness of the tread
whole tyres can be used directl
They provide low cost structures and help in the implementation of the 2002/49/EC Directive
on environmental noise (2002). Furthermore, whole tyres find applications in the marine
sector. For example, their use as artificial reefs offer habitat to corals and algae. They are also
popular in marine barriers and embankments (Fenner & Clarke, 2003). Their arrangement
into bales provides a lightweight and long
construction (Dufton, 2001; Shulman, 2004). Published research also report material,
environmental and financial benefits from the reuse of waste tyres.
Crumb >30%
Introduction and Literature
30
Figure 1.6. Used Tyre Statistics of 2010 (Environment Agency, 2012)
ongoing development by all major tyre manufacturing companies to provide a
material with extended lifetime. Also, the amount of tyres requiring disposal every year can
be minimised by simple good driving practices and maintenance of the tyres by vehicles
Reuse and Recycling (of whole tyres)
Part worn tyres are reused for their original purpose usually by exporting them to countries
with fewer restrictions on the thickness of the tread (Environment Agency, 2004).
whole tyres can be used directly for civil engineering applications such as for noise barriers.
They provide low cost structures and help in the implementation of the 2002/49/EC Directive
on environmental noise (2002). Furthermore, whole tyres find applications in the marine
example, their use as artificial reefs offer habitat to corals and algae. They are also
popular in marine barriers and embankments (Fenner & Clarke, 2003). Their arrangement
into bales provides a lightweight and long-life alternative to cement and gravel
construction (Dufton, 2001; Shulman, 2004). Published research also report material,
environmental and financial benefits from the reuse of waste tyres. Curry et al. (2011)
Energy
Recovery
18%
Retreading
11%
Other
5%
Introduction and Literature Review
Figure 1.6. Used Tyre Statistics of 2010 (Environment Agency, 2012)
ongoing development by all major tyre manufacturing companies to provide a
material with extended lifetime. Also, the amount of tyres requiring disposal every year can
be minimised by simple good driving practices and maintenance of the tyres by vehicles
Part worn tyres are reused for their original purpose usually by exporting them to countries
(Environment Agency, 2004). Also,
y for civil engineering applications such as for noise barriers.
They provide low cost structures and help in the implementation of the 2002/49/EC Directive
on environmental noise (2002). Furthermore, whole tyres find applications in the marine
example, their use as artificial reefs offer habitat to corals and algae. They are also
popular in marine barriers and embankments (Fenner & Clarke, 2003). Their arrangement
life alternative to cement and gravel for use in
construction (Dufton, 2001; Shulman, 2004). Published research also report material,
Curry et al. (2011), for
Reuse (in the
UK or abroad)
20%
Landfill
Engineering
16%

Chapter 1 Introduction and Literature Review
31
example, reported raw material savings of 1.53 – 4.42 tonnes and CO2 emissions savings of
0.19 – 0.55 tonnes per bale when aggregate gabions are replaced by car tyre bales, as well as
cost savings of between £10 and £57.
1.3.4.3 Retreading for Reuse
Retreading involves the removal of the worn tread from the tyre casing and its replacement
with a new one. This process is performed under strict regulations to ensure that the
performance and safety of the retreaded tyre is comparable to or even better than the
performance and the safety of many new tyres. This strict regulation implies that not all tyres
will qualify for retreading. Statistical evidence of this is presented in a report by Dufton
(2001) stating that only 15% of car tyres and 50 – 70% of truck tyres qualified for retreading
in 2001. Of this figure, only 9% of the used passenger car tyres and 24% of the truck tyres
were actually retreaded. This was attributed to the severe competition the retreading industry
faces from low budget tyres and the reduced profitability from selling these tyres compared to
others. In addition, retreading suffers from unfavourable public perception. This is
completely unjustified given that all processes used in the retreading industry are governed
by stringent legislation (Lawton, 2001). Specifically, they must comply with the United
Nations European Commission for Europe (UNECE) Regulations 108 and 109 for retreaded
tyres (UNECE, 1998a, b). Accordingly, passenger car tyres that have been retreaded
previously or that have a casing more than 7 years old are rejected even before the initial
inspection. Then each of them is thoroughly examined both internally and externally to
ensure that the tyre does not have any damage that will compromise its performance, such as
extensive cracking extending through to the carcass, appreciable oil or chemical attack, non-
repairable deterioration or damage to the inner liner etc.
After the worn tread is removed (buffing), the tyre is re-examined before the attachment of
new material through the application of heat, pressure and time. The integrity of the final
product is inspected and is subject to the same standards applied for new tyres. Curry et al.
(2011) report that life cycle analysis of retreading car tyres in comparison to the manufacture
of new car tyres results in raw materials savings of between 0.01 and 0.09 tonnes per tyre,
CO2 emissions savings of between 0.02 and 0.04 tonnes per tyre and cost savings of between
£33 and £88 per tyre.

Chapter 1 Introduction and Literature Review
32
1.3.4.4 Material Recovery (Recycling)
Whole tyres or pre-treated tyres can be reduced to rubber crumb by mechanical or cryogenic
means. Pre-treatment involves bead removal, tread/sidewall removal, bailing and/or
compression. Mechanical means involve the use of knives to produce rubber crumb.
Shredding of tyres produces a material of particle size 50 – 300 mm. Chipping of tyres
further reduces the material to a size of 10 – 50 mm. Shreds and chips are ground and metals
are magnetically separated. The rest of the material passes through the granulators and
screens for further processing. Textiles are removed using air separators (Shulman, 2004).
Cryogenic grinding involves the cooling of the shredded material using liquid nitrogen to
temperatures of -80 to -120°C. At these temperatures the material becomes brittle and is
easily reduced in size by use of a hammer mill (Rouse, 2005; Shulman, 2004).
In general, ambient tyre rubber granulate (1 – 10 mm) and powder (less than 1 mm) produce
irregularly shaped surfaces in contrast to cryogenic grinding that generates crumb with
smooth regular surfaces. Crumb production is an energy intensive process, especially when
finer particles are produced (Feraldi et al., 2012). Heat is generated during the procedure that
can alter the properties of the crumb; for example it may initiate a chain of radical reactions
or damage equipment (Jones, 2001).
Another technology for the production of crumb has been developed at Imperial College
London in association with ABB Robotics, ARTIS, Hughes Pumps and Symphony Energy.
Crumb generated from this technology was employed in the current work, which uses an ultra
high pressure water cutting system to separate the tyre into its constituents (Section 3.1).
Shreds are employed in landfill engineering for construction cells, daily covers and as
drainage layers. In fact, in 2005 almost 60,000 tonnes of tyres were used for this application
and usage has grown strongly through 2006 (DEFRA, 2007). Curry et al. (2011) compared
the use of tyre shreds in landfill engineering in place of primary aggregates and found that
2.67 tonnes of raw materials per tonne and 159 tonnes of CO2 emissions per tonne are saved
by this replacement. The analysis, however, also indicated a per tonne cost increase of £17.
Nevertheless, as the 1999/31/EC Directive targets for waste diversion from landfills are
fulfilled, the number of landfills will reduce and thus the market for this application for
reusing tyres will decline.
Chapter 1 Introduction and Literature Review
33
Rubber crumb finds use in civil engineering applications, in asphalt and in carpet underlays.
It is also used to provide drainage in layers below road surfaces, helping the water percolate
through the soil (Shulman, 2004). Other applications include its use as a material for thermal
and vibration insulation and as a lightweight fill in road constructions, sports surfaces and
playgrounds. Granulate rubber in sports surfaces acts as a shock absorbing material.
Powder from tyres can be used as a feedstock for rubber reclaim. This process involves the
partial devulcanisation of the rubber, which is usually achieved with the addition of various
chemicals and the application of heat and pressure to form a material in plastic state (Rouse,
2005). This material can ultimately be incorporated with new rubber compounds and
revulcanised for the production of new tyres, although the high quality control and complex
nature of tyre compounding reduces this potential use (Jones, 2001).
Material recovery from waste tyres through crumb production has shown an increasing trend
according to the latest statistics published by both the Rubber Manufacturers Association
(RMA) of the United States and the European Tyre and Rubber Manufacturers Association
(ETRMA). The RMA (2011) reported a 9% increase based on a comparison of 2007 and
2009 figures for the USA and the ETRMA (2012) reported a similar increase of 10% based
on a comparison of 2009 and 2010 figures for Europe. The ETRMA further identifies
material recovery as the main recovery route in Europe. In the UK, the Environment Agency
(2012) reports that over 30% of the waste tyre arisings are managed through this route (see
Figure 1.6).
1.3.4.5 Other recovery
1.3.4.5.1 Pyrolysis of tyres
Pyrolysis refers to the thermal decomposition of a material in the absence of oxygen.
Pyrolysis of tyre rubber results in the production of char, oil and gases, all of which have the
potential to be reused. Various types of reactors have been employed for the pyrolysis of
tyres including rotary kilns, fluidised bed reactors, conical spout reactors and static batch
reactors. The process is governed by various parameters including temperature, retention
time, pressure, composition of atmosphere and type of reactor. Table 1.2 highlights the
product yields in relation to the different pyrolysis conditions as reported by various authors.

Chapter 1 Introduction and Literature Review
34
Table 1.2. Tyre pyrolysis product yields under different conditions
Reference Type of
reactor Experimental Conditions
Yields (wt. %) Notes
Particle
size
(mm)
Temp
(°C)
Dwell
Time
(hr)
Heating
rate
(°C/min)
Atmosphere Flow rate
(mL/min)
Pressure
(kPa)
Solid
Residue Oil Gas Steel Water
Roy &
Unsworth,
1989
Bench scale
6.35 - 12.70
250
– N/A Vacuum – < 3
91.1 7.2 Traces – 1.7 Fibres
included
310 79.4 17.7 0.3
2.6
335 68.8 27.2 1.7
2.3
363 45.6 48.3 2.9
3.2
415 36.6 56.6 2.2
4.6
500 35.5 56.2 4.3
4.0
150-400 420 34.8 58.4 2.1
4.7
Cunliffe &
Williams,
1998b
Static bed batch
30 x 15 x [500-1500]
450
1.5 5 Nitrogen N/A –
37.4 58.1 4.5 –
Steel and
fibres included
475 37.3 58.2 4.5
500 38.3 56.2 5.5
525 37.8 56.9 5.2
560 38.1 55.4 6.5
600 38.0 53.1 8.9
San Miguel et
al., 1998
Rotary kiln reactor
< 0.42 500 – 5 Nitrogen 500 – 42.0 53.0 5.0 –
Roy et al.,
1999 Continuous 20 x 30 550 – –
Vacuum – 10 33 56 10 – 1 Car tyre
Batch
100 x 120
520 until no
more 10 7 36 45 6 10 3 Car tyre

Chapter 1 Introduction and Literature Review
35
Reference Type of
reactor Experimental Conditions
Yields (wt. %) Notes
Particle
size
(mm)
Temp
(°C)
Dwell
Time
(hr)
Heating
rate
(°C/min)
Atmosphere Flow rate
(mL/min)
Pressure
(kPa)
Solid
Residue Oil Gas Steel Water
Batch
Whole tyre
500
gaseous products
10 7 37 47 5 10 1
Car tyre with silica filler
Batch
100 x 120
520 10 7 39 43 5 10 3 Truck tyre
Gonzalez et
al., 2001 0.20-1.6 400
0.5 –
Nitrogen 75 –
81.5 18.1 0.4
Metal included
350 55.1 42.9 2
450 40.3 55.2 4.5
500 38.6 55.4 6
550 37.6 55.6 6.8
575 37.4 54.6 8.1
600 37 52.2 10.8
700 36.7 36.6 26.7
600
–
5 40.9 55 4.1
10 40.3 55.2 4.5
15 39.1 55.4 5.6
20 38.7 54.7 6.6
Williams &
Brindle, 2003 Fixed Bed 1-1.4 570 1 5 Nitrogen 1500 – 38.7 57.1 4.3
Barbooti et
al., 2004
Fixed Bed batch
10 430 N/A – Nitrogen 5833 – 32.6 51.2 16.2
Laresgoiti et
al., 2004 20 x 30 300
0.5 15 Nitrogen 1000 –
87.6 ± 7.8 4.8 ± 3.9 7.6 ± 3.9
400 55.9 ± 5.5 24.8 ± 6.0 19.3 ± 2.2
500 44.8 ± 0.6 38 ± 1.8 17.2 ± 1.8
600 44.2 ± 0.6 38.2 ± 0.5 17.6 ± 0.8
700 43.7 ± 0.4 38.5 ± 1.2 17.8 ± 1.2
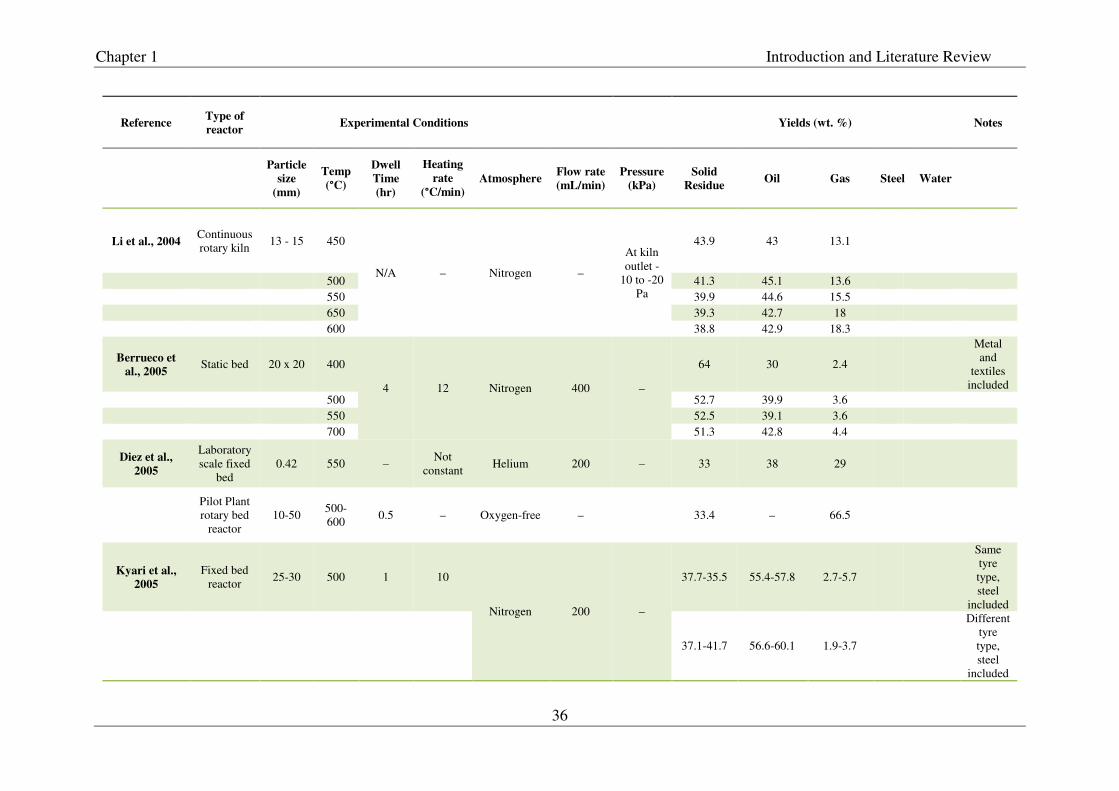
Chapter 1 Introduction and Literature Review
36
Reference Type of
reactor Experimental Conditions
Yields (wt. %) Notes
Particle
size
(mm)
Temp
(°C)
Dwell
Time
(hr)
Heating
rate
(°C/min)
Atmosphere Flow rate
(mL/min)
Pressure
(kPa)
Solid
Residue Oil Gas Steel Water
Li et al., 2004 Continuous rotary kiln
13 - 15 450
N/A – Nitrogen –
At kiln outlet -
10 to -20 Pa
43.9 43 13.1
500 41.3 45.1 13.6
550 39.9 44.6 15.5
650 39.3 42.7 18
600 38.8 42.9 18.3
Berrueco et
al., 2005 Static bed 20 x 20 400
4 12 Nitrogen 400 –
64 30 2.4
Metal and
textiles included
500 52.7 39.9 3.6
550 52.5 39.1 3.6
700 51.3 42.8 4.4
Diez et al.,
2005
Laboratory scale fixed
bed 0.42 550 –
Not constant
Helium 200 – 33 38 29
Pilot Plant rotary bed
reactor 10-50
500- 600
0.5 – Oxygen-free –
33.4 – 66.5
Kyari et al.,
2005
Fixed bed reactor
25-30 500 1 10
Nitrogen 200 –
37.7-35.5 55.4-57.8 2.7-5.7
Same tyre type, steel
included
37.1-41.7 56.6-60.1 1.9-3.7
Different tyre type, steel
included

Chapter 1 Introduction and Literature Review
37
Reference Type of
reactor Experimental Conditions
Yields (wt. %) Notes
Particle
size
(mm)
Temp
(°C)
Dwell
Time
(hr)
Heating
rate
(°C/min)
Atmosphere Flow rate
(mL/min)
Pressure
(kPa)
Solid
Residue Oil Gas Steel Water
Ucar et al.,
2005
Fixed bed reactor
1.5-2 550
1 7 Nitrogen 25
42.0 ± 2.5 47.4 ± 1.8 7.4 ± 2.5
3.2 ± 0.9
650
41.7 ± 2.7 48.4 ± 1.9 7.6 ± 2.7
2.3 ± 0.5
800
41.5 ± 2.3 47.2 ± 1.9 7.8 ± 2.3
3.5 ± 0.4
Aylon et al.,
2007 Fixed bed 2 600 – 50 Nitrogen 10 – 37.9 54.6 7.5
Arabiourrutia
et al., 2007
Conical Spouted
Bed Reactor
1 500 – – Nitrogen 6500 – 33.7 63.2 3.1
Mui et al.,
2010
Muffle Furnace
1-2 500
Nitrogen 500
37.15
600
35.43
700
34.93
800
33.71
900
32.34

Chapter 1 Introduction and Literature Review
38
Pyrolysis conditions can be varied depending on the desired output. For example, if the
formation of oils is the primary aim of the experiment, high heating rates and rapid removal
of the products from the reaction zone are required. The latter minimises the extent of
secondary reactions that result in carbonaceous residue formation and increases in char yield
(Williams et al., 1993).
The gas generated from tyre pyrolysis consists mainly of hydrogen, CO, CO2 and light
hydrocarbons (Roy & Unsworth, 1989). Its calorific value is approximately 32 MJ/kg
(Laresgoiti et al., 2000). The gas can be used to power the pyrolysis plant and, if there is an
excess, for electricity or heat generation (Environment Agency, 2004).
The oil generated from tyre pyrolysis has a high content of valuable hydrocarbons such as
limonene, toluene, xylene and styrene (Cunliffe & Williams, 1998a). Limonene has
significant applications as it is widely used as a constituent in cleaning agents, resins and
adhesives (Pakdel et al., 1991). It has been suggested that pyrolytic oil can be used as number
4 ASTM bunker oil, light petroleum oil and feedstock. Its calorific value ranges between 40 –
43 MJ/kg (Roy & Unsworth, 1989; Cunliffe & Williams, 1998a).
The pyrolytic char consists mainly of carbon black, carbonised rubber polymer and ash from
the inorganic ingredients of rubber. The char, depending on the experimental conditions
which influence its qualities, can be reused in tyres, bitumen, dye works wastewater
decolourization and as smokeless fuel (Gross Calorific Value ~ 28 – 30 MJ/kg) (Roy &
Unsworth, 1989; Cunliffe & Williams, 1998b). Studies have investigated the potential use of
chars as activated carbon after physical activation; even though the surface area can be
comparable to activated carbons, their use in water treatment plants is prohibited due to
leaching of metals (San Miguel, 1999). Suggestions for the use of char as carbon black
substitute are restrained by the high ash content. To enable its use as carbon black upgrading
is required (Cypres & Bettens, 1989). Nevertheless, the technology is yet to be proven on a
commercial scale. This is attributed to the low value of the end products compared to the
costs of operating the plant (Roy & Unsworth, 1989).
In a review of the management of waste tyres, Sienkiewicz et al. (2012) stated that industrial-
scale pyrolysis of tyres is rarely used due to high capital costs (installation and servicing
costs) and uncompetitive product prices. Nevertheless, according to Sienkiewicz et al.,
considerable potential of this management method is evidenced by ongoing research in this
field along with increasing costs of energy and petroleum products.

Chapter 1 Introduction and Literature Review
39
Microwave-driven pyrolysis has been identified as an energy-efficient alternative to the
current heating technologies employed for the treatment of problematic waste such as used
tyres (Appleton et al., 2005). A number of patents exist on proposed equipment (Pringle,
2006; Kim, 2005; Holland, 1992); however there is limited information on actual experiments
performed using microwave technology to pyrolyse tyres.
A study conducted by Pang (2007) proved the feasibility of tyre microwave pyrolysis. A
domestic microwave oven was used to generate 45% char, 21% gas and 33% oil by mass.
Pyrolysis was completed after 5 minutes using 40% of the power level and 4 minutes using
60% of the power level. In addition, it was shown that devulcanisation of the rubber was
completed after one minute of microwave radiation exposure.
Industrially, Advance Molecular Agitation Technology (AMAT) used microwave technology
to pyrolyse whole tyres. It was reported that the oil generated had similar calorific value to
commercial diesel (Environment Agency, 2004). A comparison of the oil produced from the
process with kerosene is shown in Table 1.3. The char was claimed to be of a higher quality
than that produced by conventional thermal pyrolysis with a wider variety of higher-value
applications. However, the AMAT tyre processing facility ceased to operate due to
insufficient funding.
Table 1.3. Properties of the oil derived from the AMAT process compared to kerosene
(Environment Agency, 2004)
Property Kerosene Tyre-derived Oil Carbon (%) 86.40 83.60 Hydrogen (%) 13.48 12.30 Oxygen (%) 0.00 3.68 Sulfur (%) 0.09 0.40 PAH 0.03 0.02 Specific gravity 0.7245 0.74 Calorific Value (MJ/kg) 42 40.68 Average Mol Weight 106.51 108.78
The limited information regarding the behaviour of rubber under microwave-induced
pyrolysis is a driver for this research project. Microwave theory is introduced in detail in
Section 1.4.
Chapter 1 Introduction and Literature Review
40
1.3.4.5.2 Energy recovery
Tyres have a high calorific value in the range of 31 – 33 MJ/kg (Sharma et al., 2000;
Laresgoiti et al., 2000). This enables them to be used as an alternative to fossil fuel in energy
generation (steam and electricity). They are commonly used in incinerators, cement kilns and
pulp and paper mills either as whole or shredded tyres (Feraldi et al., 2012). According to
recent statistics, energy recovery accounts for 38% (based on 2010 statistics) of end-of-life
tyres in Europe (ETRMA, 2012) and 40.3% (based on 2009 statistics) in USA (RMA, 2011).
However, both ETRMA and RMA reported a decrease of the trend from previous years (-3%
and -12.5% respectively). In the UK, energy recovery consumes only approximately 18% of
waste tyres based on 2010 statistics (Figure 1.6) (Environment Agency, 2012).
Tyres used in incineration plants provide for the generation of steam for the production of
electricity; for example 32,000 tonnes of tyres would generate 10 MW of electricity
(Shulman, 2004).
Cement manufacture is an energy intensive process; energy accounts for 30 – 40% of the
total cost (Davies & Worthington, 2001). The presence of iron in the whole tyre is beneficial,
though care must be taken not to create blockage in the feeding system (Kääntec et al., 2001).
The presence of sulfur in tyres also provides an advantage by altering the melting behaviour
of the mixture.
The implementation, however, of recent directives such as the 2000/76/EC Incineration
Directive (2000), which sets stringent regulations on the gas emissions released in the
atmosphere, requires extended and costly procedures to obtain a permit to use tyres for
energy recovery. External testing is necessary to measure the presence of substances such as
Polycyclic Aromatic Hydrocarbons (PAH), benzene, styrene, chloromethane and HBr with
high associated costs (Davies & Worthington, 2001). In addition, this application of tyres
faces competition from other waste streams.
1.3.5 Concluding remarks
A brief overview of the current management options for handling end-of-life tyres has been
presented in the above section. Even though the management options are typically considered
according to the waste hierarchy, it must be emphasised again that deviations are accepted if
justified by life-cycle thinking. In fact recent life cycle assessment of nine recovery methods
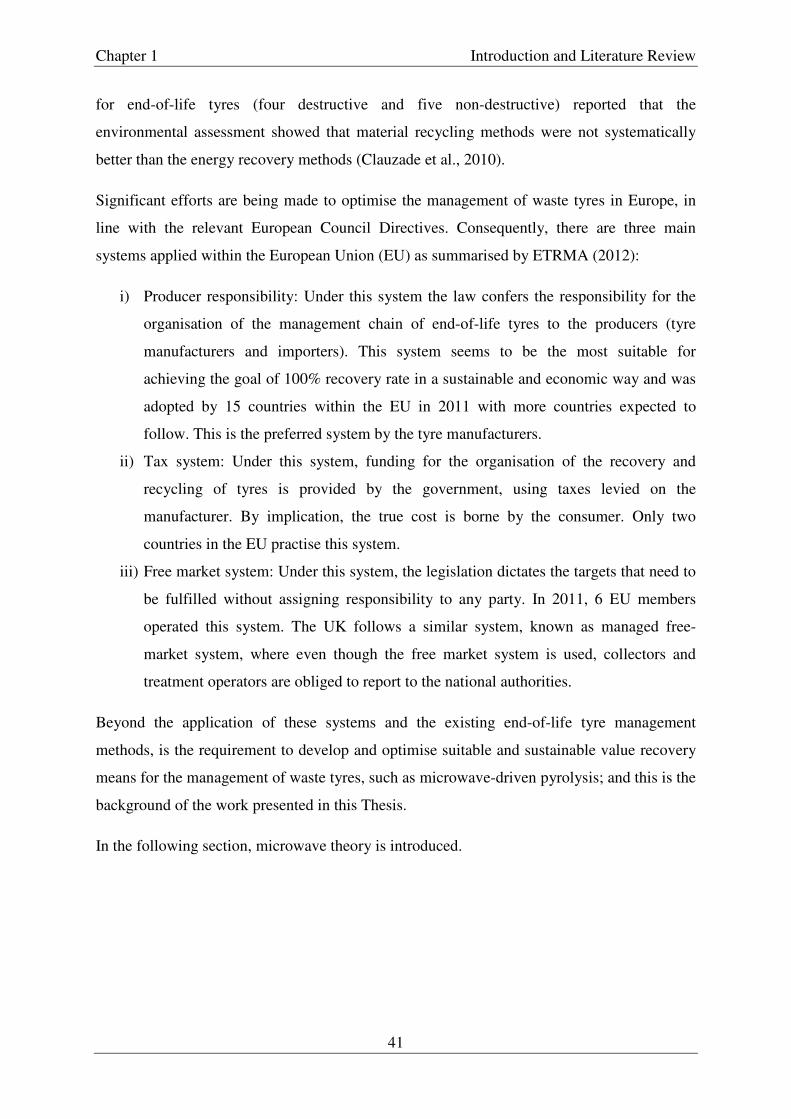
Chapter 1 Introduction and Literature Review
41
for end-of-life tyres (four destructive and five non-destructive) reported that the
environmental assessment showed that material recycling methods were not systematically
better than the energy recovery methods (Clauzade et al., 2010).
Significant efforts are being made to optimise the management of waste tyres in Europe, in
line with the relevant European Council Directives. Consequently, there are three main
systems applied within the European Union (EU) as summarised by ETRMA (2012):
i) Producer responsibility: Under this system the law confers the responsibility for the
organisation of the management chain of end-of-life tyres to the producers (tyre
manufacturers and importers). This system seems to be the most suitable for
achieving the goal of 100% recovery rate in a sustainable and economic way and was
adopted by 15 countries within the EU in 2011 with more countries expected to
follow. This is the preferred system by the tyre manufacturers.
ii) Tax system: Under this system, funding for the organisation of the recovery and
recycling of tyres is provided by the government, using taxes levied on the
manufacturer. By implication, the true cost is borne by the consumer. Only two
countries in the EU practise this system.
iii) Free market system: Under this system, the legislation dictates the targets that need to
be fulfilled without assigning responsibility to any party. In 2011, 6 EU members
operated this system. The UK follows a similar system, known as managed free-
market system, where even though the free market system is used, collectors and
treatment operators are obliged to report to the national authorities.
Beyond the application of these systems and the existing end-of-life tyre management
methods, is the requirement to develop and optimise suitable and sustainable value recovery
means for the management of waste tyres, such as microwave-driven pyrolysis; and this is the
background of the work presented in this Thesis.
In the following section, microwave theory is introduced.

Chapter 1 Introduction and Literature Review
42
1.4 Microwaves
1.4.1 Introduction to microwaves
Electromagnetic radiation is energy carried in the form of electromagnetic waves.
Electromagnetic waves are transverse waves travelling with the speed of light in vacuum, and
consist of electric and magnetic fields oscillating in phases perpendicular to each other.
Their wavelength and frequency are related by:
� � � . � (Eq. 1.1)
Where: � = the speed of light (2.998 x 10⁸ m/s in vacuum)
� = the wavelength (m)
� = the frequency (Hz)
Microwaves are electromagnetic waves that range in frequencies from 300 MHz to 300 GHz.
These frequencies correspond to wavelengths between 1 mm and 1 m and are mainly used for
communication services. In addition, some frequencies are designated for non-
communication purposes which include ‘industrial, scientific and medical’ (ISM)
applications such as heating. Microwave heating is achieved primarily at either 915 MHz
(896 MHz in the UK) or 2450 MHz (Meredith, 1998; Chan & Reader, 2000). The former
frequency is used predominantly in industry whereas all domestic microwave ovens operate
at 2450 MHz (λ = 12.2 cm) (Will et al., 2004).
1.4.2 Microwave interactions with materials
Materials respond to microwave energy differently depending on their properties. Some are
transparent to the microwave radiation, thus the electromagnetic waves pass through the
material without causing any effect. Such materials include quartz and
polytetrafluoroethylene (PTFE). Other materials reflect the electromagnetic waves. This
category includes conductors such as stainless steel. Conductors have electric charges that
move freely through the material. On the other hand, a group of materials known as insulators
or dielectrics, absorb microwaves. Dielectrics have charges that are attached to specific atoms
or molecules and can only move a bit within the atoms or molecules (Griffiths, 1998).

Chapter 1 Introduction and Literature Review
43
Microwave heating is achieved from the interaction of the electric field component of the
electromagnetic wave with charged particles in the material via two mechanisms; the dipolar
polarization mechanism and the conduction mechanism.
1.4.2.1 Dielectrics and polarisation
When a dielectric is placed in an electric field the material will become polarised.
Polarization involves the short-range displacement of charge through the formation and
rotation of electric dipoles (or magnetic dipoles if present) (Clark & Sutton, 1996). An
electric dipole is illustrated in Figure 1.7 and it refers to a positive and a negative charge
separated by a certain distance. A dipole in a molecule can be permanent, due to uneven
distribution of charge, or it can be induced when a material is under the influence of an
electric field (Bolton, 1992). Regardless of the dipole’s origin, on application of an electric
field these tend to align with the field direction.
Figure 1.7. Electric Dipole
Total polarization is the sum of a number of components depending on their mechanisms:
electronic polarization, ionic polarization, dipolar polarization and interfacial polarization.
Electronic polarization is caused by the displacement of electron charges in relation to their
nuclei, resulting in the distortion of the distribution of the electron cloud. Atomic polarisation
results from the relative displacement of atomic nuclei due to unequal distribution of charge
in molecule formation. Molecular or dipole polarisation occurs in molecules with permanent
dipoles. In the presence of an electromagnetic field these dipoles align themselves with the
electric field. Interfacial polarization, also known as the Maxwell-Wagner effect, occurs due
to imperfect arrangements of the atoms, ions or molecules in a material, inhomogeneity and
presence of impurities or a few free electrons. On the application of an external electric field,
these can move through a material to its surface (Bolton, 1992; Metaxas & Meredith, 1983;
Von Hippel, 1954).
When the dielectric is placed in an electric field, the induced dipoles try to align themselves
with the changing electric field. At very low frequencies, the dipoles follow precisely the
+ -
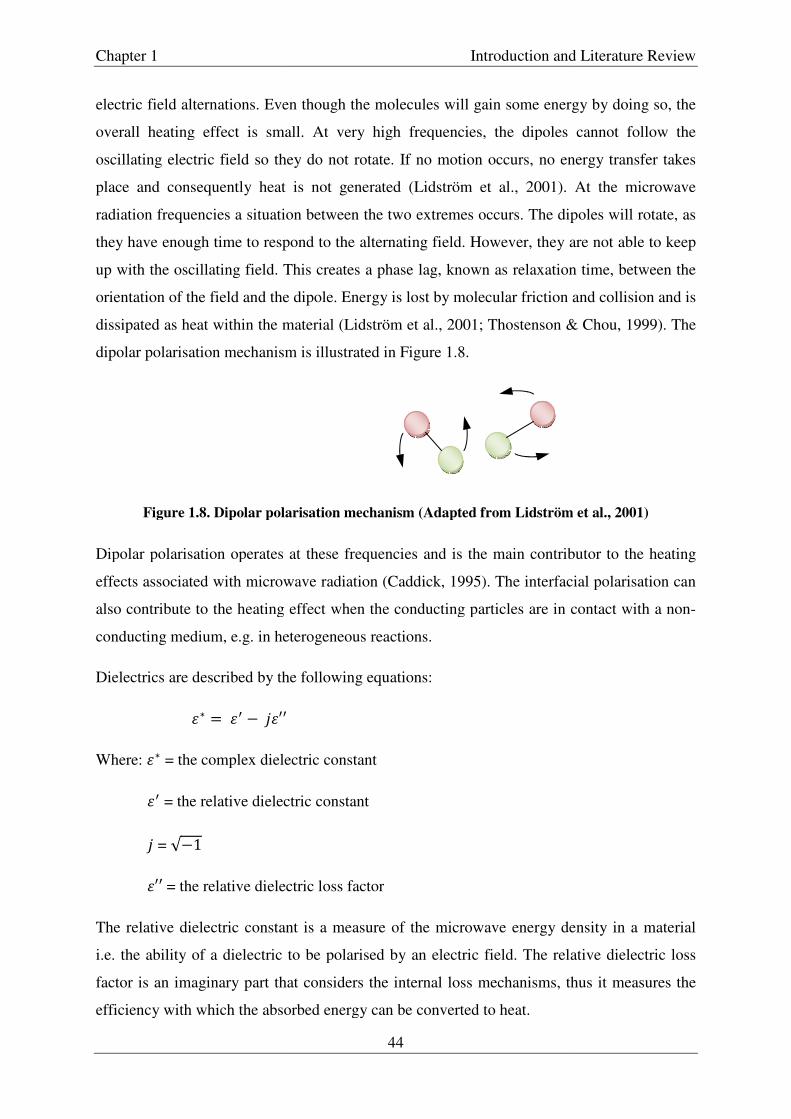
Chapter 1
electric field alternations. Even though the molecules will gain some energy by doing so, the
overall heating effect is small
oscillating electric field so they
place and consequently heat is not generated (
radiation frequencies a situation between the two extremes occurs. T
they have enough time to respond to
up with the oscillating field. This creates a
orientation of the field and the dipole. Ener
dissipated as heat within the material
dipolar polarisation mechanism is illustrated in Figure 1.8.
Figure 1.8. Dipolar polarisation mechanism (Adapted from
Dipolar polarisation operates at these frequencies and
effects associated with microwave radiation (Caddick
also contribute to the heating effect when the conducting particles are in contact with a non
conducting medium, e.g. in hete
Dielectrics are described by the following equations:
�� � � ����Where: �� = the complex dielectric constant
� = the relative dielectric constant
� = √1
��� = the relative dielectric loss factor
The relative dielectric constant is a measure of the microwave energy density in a material
i.e. the ability of a dielectric to be polarised by an electric field. T
factor is an imaginary part that considers the internal loss mechanisms, thus it measur
efficiency with which the absorbed energy can be converted to heat.
Introduction and Literature Review
44
electric field alternations. Even though the molecules will gain some energy by doing so, the
overall heating effect is small. At very high frequencies, the dipoles cannot follow the
they do not rotate. If no motion occurs, no energy transfer takes
heat is not generated (Lidström et al., 2001).
radiation frequencies a situation between the two extremes occurs. The dipoles
they have enough time to respond to the alternating field. However, they are not able to
with the oscillating field. This creates a phase lag, known as relaxation time, between the
orientation of the field and the dipole. Energy is lost by molecular friction and collision and is
dissipated as heat within the material (Lidström et al., 2001; Thostenson & Chou, 1999
dipolar polarisation mechanism is illustrated in Figure 1.8.
Figure 1.8. Dipolar polarisation mechanism (Adapted from Lidström
Dipolar polarisation operates at these frequencies and is the main contributor
h microwave radiation (Caddick, 1995). The interfacial polarisation can
also contribute to the heating effect when the conducting particles are in contact with a non
conducting medium, e.g. in heterogeneous reactions.
Dielectrics are described by the following equations:
�� = the complex dielectric constant
dielectric constant
dielectric loss factor
constant is a measure of the microwave energy density in a material
i.e. the ability of a dielectric to be polarised by an electric field. The relative
is an imaginary part that considers the internal loss mechanisms, thus it measur
efficiency with which the absorbed energy can be converted to heat.
Introduction and Literature Review
electric field alternations. Even though the molecules will gain some energy by doing so, the
. At very high frequencies, the dipoles cannot follow the
nergy transfer takes
, 2001). At the microwave
poles will rotate, as
are not able to keep
, known as relaxation time, between the
gy is lost by molecular friction and collision and is
et al., 2001; Thostenson & Chou, 1999). The
Lidström et al., 2001)
the main contributor to the heating
). The interfacial polarisation can
also contribute to the heating effect when the conducting particles are in contact with a non-
constant is a measure of the microwave energy density in a material
he relative dielectric loss
is an imaginary part that considers the internal loss mechanisms, thus it measures the

Chapter 1 Introduction and Literature Review
45
The ratio of the relative dielectric constant and the dielectric loss factor is given by Equation
1.3.
���� � ���/ �� (Eq. 1.3)
Where: ���� = the loss tangent.
The loss tangent, also known as the dissipation factor, is a measure of the penetration of the
electric field in a material and the ability of the material to convert electromagnetic energy
into heat energy, at a given frequency and temperature (Caddick, 1995; Lidström et al.,
2001). Both �� and ���� depend on frequency and sample temperature (Chen et al., 1993).
Higher values of ���� indicate better coupling with microwave radiation.
Microwave heating originates from dielectric power absorption as described by Equation 1.4.
� � 2����� (Eq. 1.4)
Where: � = the power dissipation (W/m3)
� = the applied frequency (Hz)
� = the electric field strength (V/m)
The electric field is assumed to be uniform throughout the volume of the material. However,
as energy is absorbed within the material, the electric field decreases as a function of the
distance from the surface of the material; so that Equation 1.4 is valid only for thin materials
(Thostenson & Chou, 1999). An important parameter is the penetration depth, which is
defined as the distance from the sample surface where the absorbed power is 1/e of the
absorbed power at the surface. Beyond this depth, volumetric heating due to microwave
energy is negligible (Thostenson & Chou, 1999). Penetration depth, �, is given by Equation
1.5.
� � ���/2�� (Eq. 1.5)
Where: �� = dielectric constant of free space
If the penetration depth of the microwave is much less than the thickness of the material, non-
uniformities in the temperature occur and only the surface is heated. The rest of the sample is
heated through heat transfer (Metaxas & Meredith, 1983; Thostenson & Chou, 1999).
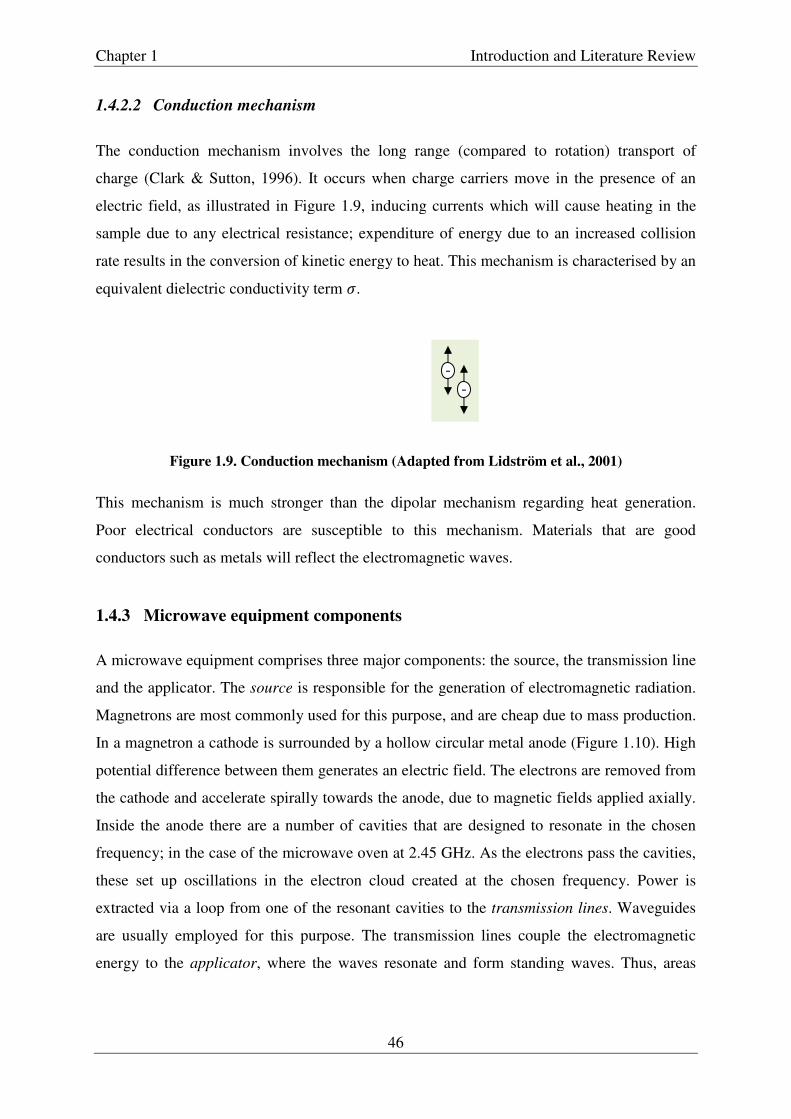
Chapter 1
1.4.2.2 Conduction mechanism
The conduction mechanism involves the long range (compared to rotation) transport of
charge (Clark & Sutton, 1996
electric field, as illustrated in Figure 1.9, inducing currents which will cause heating in the
sample due to any electrical resistance; expenditure of energy due to an increased collisi
rate results in the conversion of kinetic energy to heat. This mechanism is characterised by an
equivalent dielectric conductivity term
Figure 1.9. Conduction mechani
This mechanism is much stronger than the dipolar mechanism regarding heat generation.
Poor electrical conductors are susceptible to this mechanism. Materials that are good
conductors such as metals will reflect the electromagnetic waves.
1.4.3 Microwave equipment components
A microwave equipment comprises three major components: the source, the transmission line
and the applicator. The source
Magnetrons are most commonly used for this purpose, and are cheap due to mass production.
In a magnetron a cathode is surrounded by a hollow circular metal anode (Figure 1.10). High
potential difference between them generates an electric field. The electrons are rem
the cathode and accelerate spirally towards the anode, due to magnetic fields applied axially.
Inside the anode there are a number of cavities that are designed to resonate in the chosen
frequency; in the case of the microwave oven at 2.45 GHz. A
these set up oscillations in the electron cloud created at the chosen frequency. Power is
extracted via a loop from one of the resonant cavities to the
are usually employed for this purpose.
energy to the applicator, where the waves resonate and form standing waves. Thus, areas
Introduction and Literature Review
46
Conduction mechanism
The conduction mechanism involves the long range (compared to rotation) transport of
1996). It occurs when charge carriers move in the presence of an
electric field, as illustrated in Figure 1.9, inducing currents which will cause heating in the
sample due to any electrical resistance; expenditure of energy due to an increased collisi
rate results in the conversion of kinetic energy to heat. This mechanism is characterised by an
equivalent dielectric conductivity term �.
Figure 1.9. Conduction mechanism (Adapted from Lidström et al., 2001)
This mechanism is much stronger than the dipolar mechanism regarding heat generation.
Poor electrical conductors are susceptible to this mechanism. Materials that are good
conductors such as metals will reflect the electromagnetic waves.
Microwave equipment components
A microwave equipment comprises three major components: the source, the transmission line
source is responsible for the generation of electromagnetic radiation.
are most commonly used for this purpose, and are cheap due to mass production.
In a magnetron a cathode is surrounded by a hollow circular metal anode (Figure 1.10). High
potential difference between them generates an electric field. The electrons are rem
the cathode and accelerate spirally towards the anode, due to magnetic fields applied axially.
Inside the anode there are a number of cavities that are designed to resonate in the chosen
frequency; in the case of the microwave oven at 2.45 GHz. As the electrons pass the cavities,
these set up oscillations in the electron cloud created at the chosen frequency. Power is
extracted via a loop from one of the resonant cavities to the transmission lines
are usually employed for this purpose. The transmission lines couple the electromagnetic
, where the waves resonate and form standing waves. Thus, areas
- -
Introduction and Literature Review
The conduction mechanism involves the long range (compared to rotation) transport of
). It occurs when charge carriers move in the presence of an
electric field, as illustrated in Figure 1.9, inducing currents which will cause heating in the
sample due to any electrical resistance; expenditure of energy due to an increased collision
rate results in the conversion of kinetic energy to heat. This mechanism is characterised by an
et al., 2001)
This mechanism is much stronger than the dipolar mechanism regarding heat generation.
Poor electrical conductors are susceptible to this mechanism. Materials that are good
A microwave equipment comprises three major components: the source, the transmission line
electromagnetic radiation.
are most commonly used for this purpose, and are cheap due to mass production.
In a magnetron a cathode is surrounded by a hollow circular metal anode (Figure 1.10). High
potential difference between them generates an electric field. The electrons are removed from
the cathode and accelerate spirally towards the anode, due to magnetic fields applied axially.
Inside the anode there are a number of cavities that are designed to resonate in the chosen
s the electrons pass the cavities,
these set up oscillations in the electron cloud created at the chosen frequency. Power is
transmission lines. Waveguides
The transmission lines couple the electromagnetic
, where the waves resonate and form standing waves. Thus, areas

Chapter 1 Introduction and Literature Review
47
with nodes and antinodes are created, i.e. areas where the electromagnetic field is at a
minimum and areas where it is at a maximum.
a) b)
Figure 1.10. a) Illustration of magnetron and b) Typical microwave oven diagram
Applicators include single mode and multimode resonant cavities (Thostenson & Chou,
1999). A single mode cavity is one that can sustain one mode, so there is only one area where
the electromagnetic field is at a maximum, whereas a multimode cavity has a number of
nodes and antinodes.
An important aspect of a microwave equipment design is to make provisions for safety from
exposure to microwave radiation. Usually this is achieved by cavity seals. There are emission
limits of 1 and 5 mW/cm2 for new and used ovens measured at a distance of 5 cm from the
external surfaces of the oven, as defined by international organisations such as the
International Electrotechnical Commission (IEC), the International Committee on
Electromagnetic Safety (ICES) of the Institute of Electrical and Electronics Engineers (IEEE)
and the European Committee for Electrotechnical Standardization (Chan & Reader, 2000;
WHO, 2005). Also, a sealing system is required to ensure there is no interference from
cellular phones and bluetooth operations.
If the microwaves are not absorbed by the material they may be reflected back down the
waveguide and damage the magnetron; thus it is essential to have a microwave active
“dummy load” which will absorb excess microwaves and avoid such damage (Caddick,
1995). For this purpose, a three-port circulator is often employed in microwave equipment.
One of the ports is connected to the microwave source, the other to the applicator and the last
to the dummy load. The generated microwaves are only transmitted in one direction, so that
Stirrer
Waveguide
Magnetron
Power Supply
Turntable
Anode
Cathode
Coupling loop
Resonant
Cavities

Chapter 1 Introduction and Literature Review
48
any reflected power will be diverted and absorbed by the dummy load (Thostenson & Chou,
1999).
1.4.4 Advantages and disadvantages of using microwaves
Microwave energy is delivered directly through interaction with the electromagnetic field,
which results in volumetric heating – unlike conventional heating where the energy is
transferred through convection, conduction and radiation (Thostenson & Chou, 1999). In
conventional pyrolysis the heat is transferred via conduction, thus the exterior of the sample
is hotter than the interior. The volatiles released from the centre of the sample will pass
through a high temperature surface region, where undesired secondary reactions can occur
that will produce low molecular weight species which will deposit. In microwave heating the
centre will probably be heated first (the exterior will act as an insulator). Volatile gases
released will pass through low temperature regions and undesired secondary reactions are
reduced, producing a cleaner structure (Miura et al., 2004).
Overall, the potential advantages of using microwaves are numerous and include (Jones et al.,
2002): (i) efficient heating, (ii) rapid reaction times, (iii) energy savings, (iv) selective heating
and material property dependence that ensures no energy is lost in bulk heating, and (vi)
potentially better quality outputs.
There are, however, disadvantages to microwaves. One of the major disadvantages of
microwave processing involves the difficulty of accurate temperature measurements and
control of experimental conditions (Zong et al., 2003). Simple instruments such as
thermocouples and thermistors cannot be used due to their interaction with microwaves.
In addition, hot spots can be created due to thermal runaway. This occurs when the power
dissipation in an area of the sample exceeds the rate of heat transmission to its surroundings,
thus it heats faster, with increasing temperature due to the abrupt increase of the dielectric
constant. This effect is more pronounced in multimode cavities, where the sample
experiences different intensities of electromagnetic field depending on its position in the
cavity, which leads to its non-uniform heating.
The design of the furnace is crucial to achieve uniform electromagnetic field within the
cavity, which will ensure uniform heating. In domestic microwave ovens this is solved by
stirring the sample or using a stirring modem – a fan – that bounces the electromagnetic

Chapter 1 Introduction and Literature Review
49
waves to different directions within the cavity. In addition, further difficulties in the design of
a microwave cavity arise from the change in dielectric properties of a sample during
microwave processing – which makes it even harder to control and monitor.
The inability to accurately monitor, or at least give reasonable explanations to microwave-
driven phenomena gave rise to the term “microwave effects”. Microwave effects have been a
controversial issue amongst scientists, as there are different opinions whether unexpected
results from microwave processing such as the enhancement in the rates of activated
processes, differences in reaction pathways and reaction products are due to poor temperature
measurements and localised temperature variations or effects due to different mechanisms
occurring (Clark & Sutton, 1996).
1.5 Summary
The UK produces more than 450,000 tonnes of used tyres each year and combined with their
otherwise desired property to resist degradation, their disposal presents a significant waste
management problem. The 99/31/EC directive on the landfill of waste banned their disposal
from landfill, effectively enforcing 100% recovery.
The most sustainable method for handling waste tyres is retreading. However, a car passenger
tyre can only be retreaded once, thus limiting the options for tyre recycling. Reprocessing of
tyres to produce rubber crumb for use in asphalt mixtures, carpet underlays, playgrounds and
other applications are options currently employed. In addition, the use of tyres as fuel in
incineration plants and cement kilns is heavily regulated. Furthermore, waste tyres are
frequently subject to fly-tipping causing local authorities significant costs and waste of
resources for the clean-up. Pyrolysis provides an alternative means for recovery of value from
waste tyres, and this is investigated in the current work.
The following chapter presents the aim and objectives of this work.

Chapter 2 Research Aim and Objectives
50
2 Research Aim and Objectives
The aim of this research was to investigate end-of-life tyre pyrolysis using conventional and
microwave heating with a view to recovering value from this high volume waste in the form
of reusable products.
The objectives of this research were the following:
i) To review the current practices in end-of-life tyre management, including value
recovery from this waste and relevant legislation
ii) To characterise samples of rubber crumb obtained from different sources using
various techniques
iii) To pyrolyse these crumb samples by both conventional and microwave heating,
and to evaluate the characteristics of the char obtained
iv) To investigate the potential of using this char as a alternative to current filler
material in rubber compounds
Following the review presented in Chapter 1, the remainder of this Thesis contains the
outcome of the work that was carried out as follows:
In Chapter 3, tyre crumb samples from various sources were characterised using selected
analytical techniques and the results discussed. Chapters 4 and 5 describe the pyrolysis
investigations while Chapter 6 presents the investigation of filler replacement in rubber
formulations. The conclusions reached in this work and the recommendations for future work
are summarized in Chapter 7.
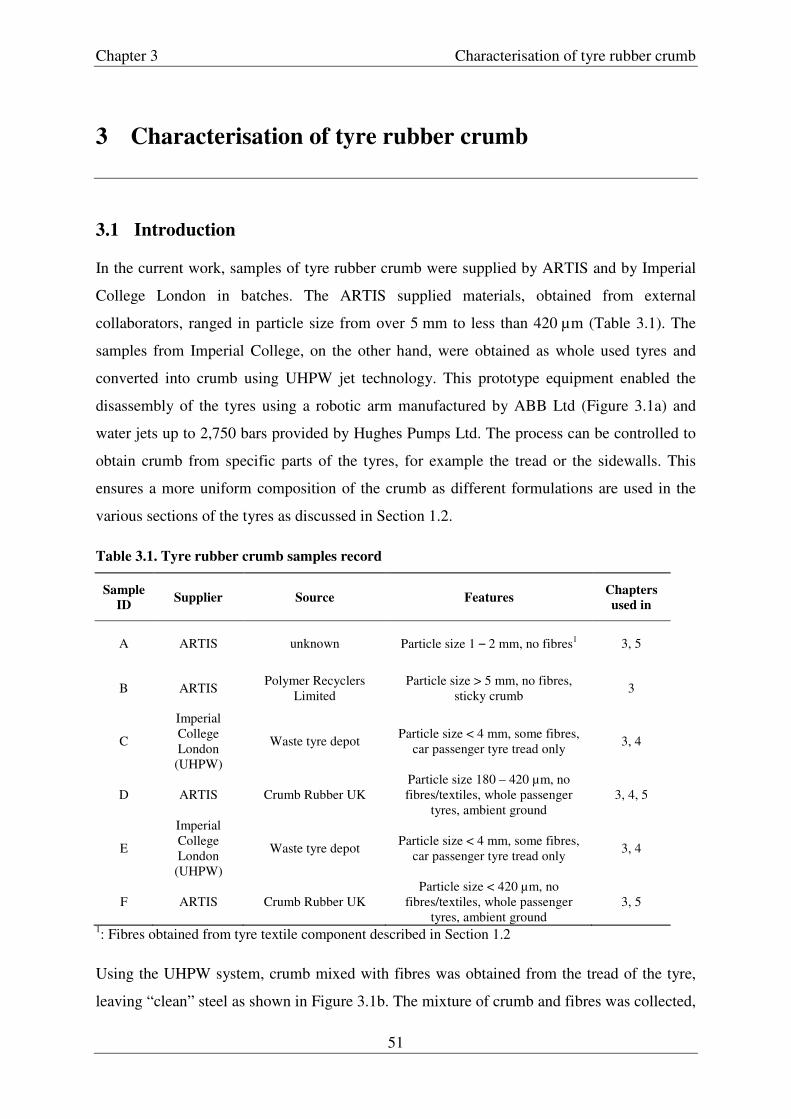
Chapter 3 Characterisation of tyre rubber crumb
51
3 Characterisation of tyre rubber crumb
3.1 Introduction
In the current work, samples of tyre rubber crumb were supplied by ARTIS and by Imperial
College London in batches. The ARTIS supplied materials, obtained from external
collaborators, ranged in particle size from over 5 mm to less than 420 µm (Table 3.1). The
samples from Imperial College, on the other hand, were obtained as whole used tyres and
converted into crumb using UHPW jet technology. This prototype equipment enabled the
disassembly of the tyres using a robotic arm manufactured by ABB Ltd (Figure 3.1a) and
water jets up to 2,750 bars provided by Hughes Pumps Ltd. The process can be controlled to
obtain crumb from specific parts of the tyres, for example the tread or the sidewalls. This
ensures a more uniform composition of the crumb as different formulations are used in the
various sections of the tyres as discussed in Section 1.2.
Table 3.1. Tyre rubber crumb samples record
Sample
ID Supplier Source Features
Chapters
used in
A ARTIS unknown Particle size 1 – 2 mm, no fibres1 3, 5
B ARTIS Polymer Recyclers
Limited Particle size > 5 mm, no fibres,
sticky crumb 3
C
Imperial College London
(UHPW)
Waste tyre depot Particle size < 4 mm, some fibres,
car passenger tyre tread only 3, 4
D ARTIS Crumb Rubber UK Particle size 180 – 420 µm, no fibres/textiles, whole passenger
tyres, ambient ground 3, 4, 5
E
Imperial College London
(UHPW)
Waste tyre depot Particle size < 4 mm, some fibres,
car passenger tyre tread only 3, 4
F ARTIS Crumb Rubber UK Particle size < 420 µm, no
fibres/textiles, whole passenger tyres, ambient ground
3, 5
1: Fibres obtained from tyre textile component described in Section 1.2
Using the UHPW system, crumb mixed with fibres was obtained from the tread of the tyre,
leaving “clean” steel as shown in Figure 3.1b. The mixture of crumb and fibres was collected,
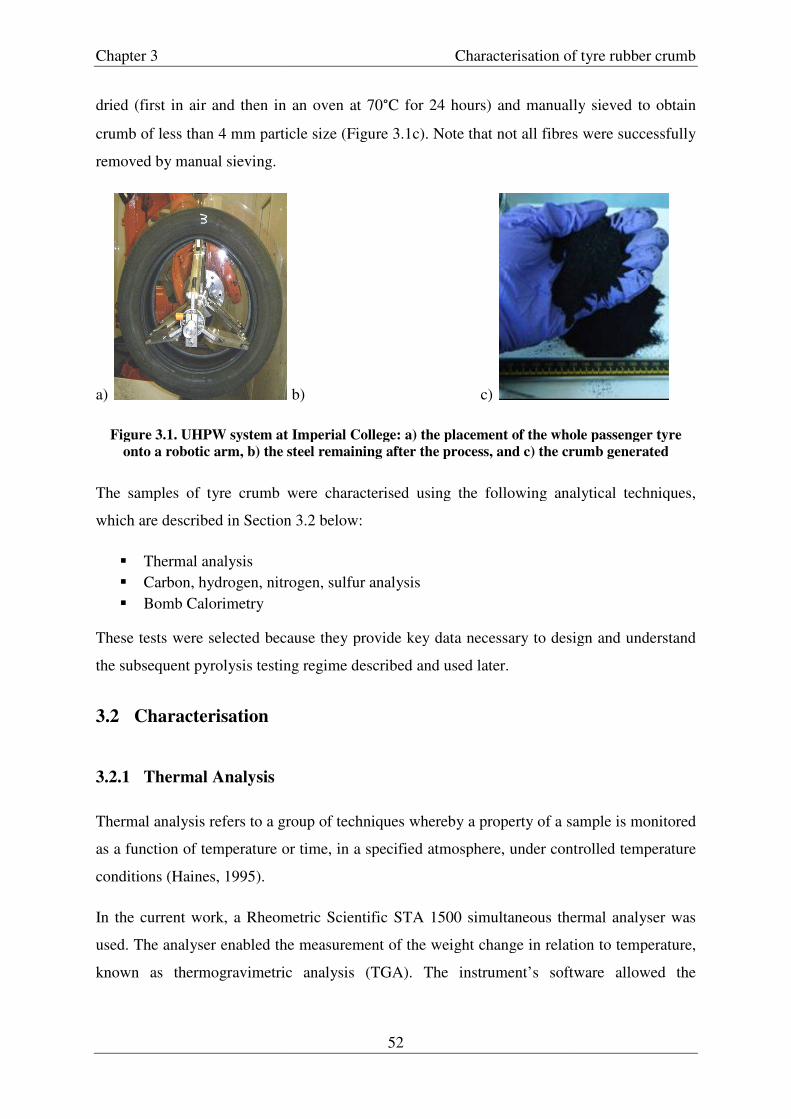
Chapter 3
dried (first in air and then in
crumb of less than 4 mm particle size (Figure 3.1c). Note that not all fibres were successfully
removed by manual sieving.
a)
Figure 3.1. UHPW system at Imperial College: a) the placement of the whole passenger tyre
onto a robotic arm, b) the steel remaining after the process, and c) the crumb generated
The samples of tyre crumb were characterised using the following analytical techniques,
which are described in Section 3.2 below:
� Thermal analysis � Carbon, hydrogen, nitrogen, su� Bomb Calorimetry
These tests were selected because they provide key data necessary to design and understand
the subsequent pyrolysis testing regime described and used later.
3.2 Characterisation
3.2.1 Thermal Analysis
Thermal analysis refers to a group
as a function of temperature or time, in a specified atmosphere, under controlled temperature
conditions (Haines, 1995).
In the current work, a Rheometric Sc
used. The analyser enabled the measurement of the weight change in relation to temperature,
known as thermogravimetric analysis (TGA).
Characterisation of tyre rubber crumb
52
dried (first in air and then in an oven at 70°C for 24 hours) and manually
crumb of less than 4 mm particle size (Figure 3.1c). Note that not all fibres were successfully
b) c)
Figure 3.1. UHPW system at Imperial College: a) the placement of the whole passenger tyre
otic arm, b) the steel remaining after the process, and c) the crumb generated
The samples of tyre crumb were characterised using the following analytical techniques,
which are described in Section 3.2 below:
Carbon, hydrogen, nitrogen, sulfur analysis
These tests were selected because they provide key data necessary to design and understand
the subsequent pyrolysis testing regime described and used later.
Thermal analysis refers to a group of techniques whereby a property of a sample is monitored
as a function of temperature or time, in a specified atmosphere, under controlled temperature
a Rheometric Scientific STA 1500 simultaneous thermal
used. The analyser enabled the measurement of the weight change in relation to temperature,
known as thermogravimetric analysis (TGA). The instrument’s software allowed the
Characterisation of tyre rubber crumb
and manually sieved to obtain
crumb of less than 4 mm particle size (Figure 3.1c). Note that not all fibres were successfully
Figure 3.1. UHPW system at Imperial College: a) the placement of the whole passenger tyre
otic arm, b) the steel remaining after the process, and c) the crumb generated
The samples of tyre crumb were characterised using the following analytical techniques,
These tests were selected because they provide key data necessary to design and understand
of techniques whereby a property of a sample is monitored
as a function of temperature or time, in a specified atmosphere, under controlled temperature
hermal analyser was
used. The analyser enabled the measurement of the weight change in relation to temperature,
The instrument’s software allowed the

Chapter 3 Characterisation of tyre rubber crumb
53
calculation of the rate of mass loss using the TG data collected, providing derivative
thermogravimetric (DTG) results.
For each analysis 12 ± 1 mg of sample were weighed in an alumina crucible and placed on
the hang-down of the thermobalance. The samples were subjected to either a continuous flow
of nitrogen or a combination of air and nitrogen all at 50 ml/min. One data point was
recorded per 1°C temperature increase.
3.2.1.1 Under Nitrogen atmosphere
Thermal analyses of the samples listed in Table 3.1 were carried out using a 5°C/min heating
rate and temperatures up to 800°C. Samples of natural rubber and SBR provided by ARTIS
were also tested under the same conditions. Further, sample A was also heated under nitrogen
atmosphere at the additional heating rates of 2.5°C/min, 10°C/min, 20°C/min and 40°C/min.
3.2.1.2 Under Nitrogen/Air atmosphere (Proximate analysis)
British Standard method BS ISO 9924-1:2000 for rubber and rubber products was employed
to provide a proximate estimation of the composition of the different crumb samples.
Accordingly, samples were heated to 300°C at a rate of 10°C/min and maintained at this
temperature for 10 minutes. The temperature was then raised to 550°C, at a rate of 20°C/min,
where the samples remained for 15 minutes. The temperature was further raised to 650°C at
40°C/min and maintained until the mass change remained negligible. The temperature was
allowed to cool down to 300°C and the nitrogen atmosphere was switched to air. The gas
flow was adjusted to correct for changes in buoyancy that would have an effect on the
apparent weight of the sample. The furnace temperature was raised again to 650°C as rapidly
as the instrument allows (40°C/min) and maintained for 15 minutes. Finally the heater was
switched off, and the air stream was replaced with nitrogen while the samples cooled down.
3.2.2 Carbon Hydrogen Nitrogen Sulfur Analysis
Carbon hydrogen nitrogen and sulfur (CHNS) analysis was carried out by combustion
analysis by MEDAC Ltd, Surrey, UK. Combustion analysis involves the burning of a sample
in excess of oxygen in the presence of a catalyst. The products of this combustion are then
separated by gas chromatography and the components measured. Carbon is oxidised to

Chapter 3 Characterisation of tyre rubber crumb
54
carbon dioxide, hydrogen to water and sulfur to sulfur dioxide. The technique had accuracy
of 0.30% and detection limit < 0.1%.
3.2.3 Bomb Calorimetry
Calorific values, as measured by bomb calorimeters, represent the heat released by a sample
when combusted with oxygen in an enclosure of constant volume (Parr Instrument Company,
2007). Calorific values were measured using a Parr 6100 Calorimeter.
When the sample, placed in a metal pressure vessel or bomb that is surrounded by water in a
container located inside a calorimeter jacket is ignited, heat is liberated. The resulting
temperature rise of the bomb and the surrounding water container is recorded. The calorific
value of the sample per unit weight is then obtained by multiplying the temperature change
with the heat capacity of the calorimeter and dividing by the sample’s weight.
In this study, the equipment was first calibrated with benzoic acid to determine the heat
capacity of the calorimeter. Then approximately 0.15 g of the crumb samples in Table 3.1
were tested in triplicate, taking into consideration their sulfur content as determined by the
CHNS analysis. The sulfur under these experimental conditions oxidises to trioxide which
reacts with the water present to form sulfuric acid.
3.3 Results and discussion
The TG and DTG plots obtained from thermal analysis of weighted portions of sample C
from Table 3.1 (the first UHPW batch produced crumb) are presented in Figure 3.2.
Three regions are identified, as annotated in Figure 3.2:
� Region I, between approximately 150°C to 300°C, associated with volatilisation of the
various chemical additives present in tyres such as processing oils and plasticisers
(Brazier & Nickel, 1975)
� Region II, from approximately 300°C to 400°C with a peak in the DTG curve at
368°C, representing weight loss associated with rubber degradation, and
� Region III, between 400°C and 480°C with a peak at 427°C also representing weight
loss associated with rubber degradation.

Chapter 3 Characterisation of tyre rubber crumb
55
Figure 3.2. TG and DTG plots of sample C at 5°C/min heating rate in N2
After 500°C, pyrolysis is essentially completed and further weight loss is attributed to char
rearrangement and thermal cracking and volatilisation of large molecular hydrocarbons
formed during the pyrolysis (San Miguel, 1999).
Williams & Besler (1995) stated that tyre rubber degradation could be related to the specific
elastomers present in each tyre’s formulation. As stated in Section 1.2, the main elastomers
used in tyre production are natural rubber, SBR and PBR. In the current work, samples of
natural rubber and SBR were also analysed and the TG and DTG plots obtained are presented
in Figures 3.3 and 3.4 respectively.
From the results of the analysis, both natural rubber and SBR left minimal residue following
decomposition, 0.08% and 0.82% at 800°C respectively (Figure 3.3), though natural rubber
fully degraded at a lower temperature (~460°C) than SBR (~488°C).
The DTG plot for natural rubber presents a peak at ~372°C and a shoulder at higher
temperatures. Using the same heating rate (5°C/min), Williams & Besler (1995) also
observed a peak at 375°C and Seidelt et al. (2006) observed a peak at 378°C using a
10°C/min heating rate.
-0.07
-0.06
-0.05
-0.04
-0.03
-0.02
-0.01
0
0.01
0
20
40
60
80
100
120
0 100 200 300 400 500 600 700 800
d(W
eig
ht)
/d(T
em
pera
ture
)
Weig
ht
ch
an
ge (
%)
Temperature (°C)
TGA DTG
I
II III
368 °C 427 °C

Chapter 3 Characterisation of tyre rubber crumb
56
Figure 3.3. TG plot of natural rubber and SBR at 5°C/min heating rate in N2
Figure 3.4. DTG plot of natural rubber and SBR at 5°C/min heating rate in N2
In addition, as observed in Figure 3.4, SBR shows a two-step mass loss. The first step
presented as a small broad peak at around 150 – 300°C is attributed to the volatilisation of
processing oils required in the manufacture of synthetic rubber. The second step which
presents a shoulder and then a major peak at 450°C is due to the thermal decomposition of the
0
10
20
30
40
50
60
70
80
90
100
0 100 200 300 400 500 600 700 800
Weig
ht
ch
an
ge (
%)
Temperature (°C)
Natural Rubber SBR
-0.3
-0.25
-0.2
-0.15
-0.1
-0.05
0
0.05
0 100 200 300 400 500 600 700 800
d(W
eig
ht)
/d(T
em
pera
ture
)
Temperature (°C)
Natural Rubber SBR
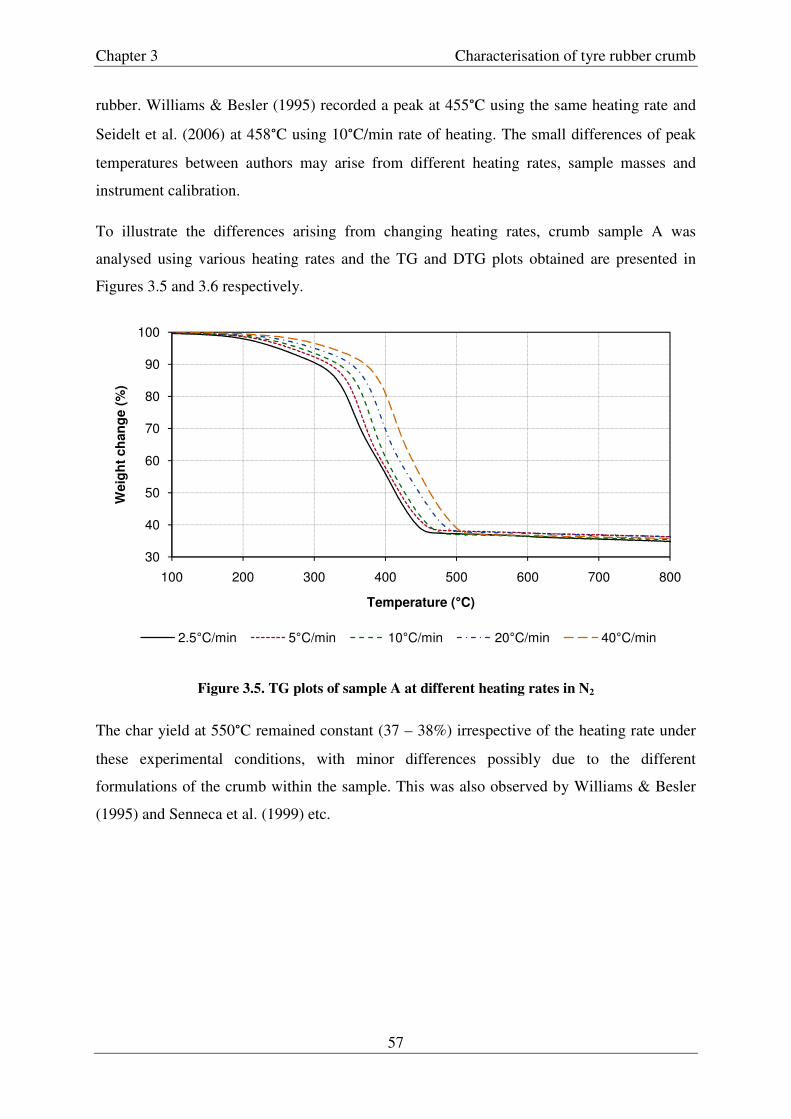
Chapter 3 Characterisation of tyre rubber crumb
57
rubber. Williams & Besler (1995) recorded a peak at 455°C using the same heating rate and
Seidelt et al. (2006) at 458°C using 10°C/min rate of heating. The small differences of peak
temperatures between authors may arise from different heating rates, sample masses and
instrument calibration.
To illustrate the differences arising from changing heating rates, crumb sample A was
analysed using various heating rates and the TG and DTG plots obtained are presented in
Figures 3.5 and 3.6 respectively.
Figure 3.5. TG plots of sample A at different heating rates in N2
The char yield at 550°C remained constant (37 – 38%) irrespective of the heating rate under
these experimental conditions, with minor differences possibly due to the different
formulations of the crumb within the sample. This was also observed by Williams & Besler
(1995) and Senneca et al. (1999) etc.
30
40
50
60
70
80
90
100
100 200 300 400 500 600 700 800
Weig
ht
ch
an
ge (
%)
Temperature (°C)
2.5°C/min 5°C/min 10°C/min 20°C/min 40°C/min

Chapter 3 Characterisation of tyre rubber crumb
58
Figure 3.6. DTG plot of sample A at different heating rates in N2
On increasing the heating rate a shift of the peaks to higher temperatures is observed.
Williams & Besler (1995) attributes this to a combined effect of heat transfer and kinetics of
decomposition. The former occurs because the transfer of heat from the furnace to the sample
is not instantaneous but rather depends on the conduction, convection and radiation within the
apparatus. A thermal lag is thus created between the different parts of the instrument. This
effect is more pronounced when higher heating rates are used (Haines, 1995). In addition, at
lower heating rates better resolution of changes occurring at close temperatures is achieved.
Indeed, using 2.5°C/min heating rate, the two main peaks of the DTG are clearly identified.
On increasing the rate, the two peaks merge and shift to higher temperatures, as observed by
other authors (Williams & Besler, 1995; Gonzáles et al., 2001; Lah et al., 2013).
In the case of SBR, different peak temperatures reported can be due to different styrene ratios
present in the samples. In fact, Seidelt et al. (2006) recorded DTG curves of SBR samples
with differing oil content and styrene-butadiene ratio of the copolymer. Similar styrene ratio
samples showed identical peaks in the rubber degradation region (between 360°C – 520°C
using 10°C/min heating rate), whereas a higher styrene ratio sample had a more pronounced
shoulder at the beginning of the rubber degradation. This is because the release of styrene
starts at ~360°C while that of 4-ethenylcyclohexene, the main decomposition product of
-0.1
-0.08
-0.06
-0.04
-0.02
0
0.02
100 200 300 400 500 600 700 800
d(W
eig
ht)
/d(T
em
pera
ture
)
Temperature (°C)
2.5°C/min 5°C/min 10°C/min 20°C/min 40°C/min

Chapter 3 Characterisation of tyre rubber crumb
59
butadiene, starts after ~420°C. Increased content of processing oils increased the intensity of
the minor peak at around 150 – 300°C.
The other possible main constituent of tyre rubber, polybutadiene rubber (which has not been
examined in the present work) shows one major weight loss in its DTG plot, observed at
461°C by Brazier & Nickel (1975) and 468°C by Seidelt et al. (2006). In addition, a minor
peak is observed at 385°C (Seidelt et al., 2006) and 372°C of height 4 – 10 % of that at 461°C
(Brazier & Nickel, 1975), using 10°C/min heating rate.
The two stage degradation of polybutadiene containing rubbers involves first a main scission
of the polymer to generate radicals. These can undergo further depolymerisation or react to
form cyclised and cross-linked products. Sanglar et al. (2010) investigated the thermal
degradation of 1,4-PBR using 13C Nuclear Magnetic Resonance (NMR) and identified two
compounds possibly formed by crosslinking, according to the mechanism shown in Figure
3.7. In addition, Golub & Gargiulo (1972) attributed the infrared spectroscopy and NMR
results of the thermally degraded cis 1,4-PBR to the formation of a polymeric residue which
is nearly fully cyclised. It is to these cyclised and cross-linked products, which possibly
require higher temperatures to degrade, that the observed second peak is attributed (Brazier &
Schwartz, 1978). In the case of natural rubber, cyclised polyisoprene is not as thermally
stable as polybutadiene and degrades just above the depolymerisation temperature; thus the
one major peak observed in DTG curves (Brazier & Schwartz, 1978).
Figure 3.7. Sanglar et al.’s (2010) proposed cross-linked structures from 1,4-polybutadiene
degradation

Chapter 3 Characterisation of tyre rubber crumb
60
Williams & Besler (1995) suggested the use of TGA analysis to give a rough indication of the
elastomers present in each tyre sample. Lower temperature decomposition is related to
natural rubber, as its major weight loss peak temperature has ~ 80 – 100°C difference from
SBR/PBR’s main peak (Lee et al., 2007). The higher decomposition temperature is related to
SBR/PBR and cannot be distinguished between the two by this method, as their major peak
temperatures have less than 20°C difference.
Furthermore, Seidelt et al. (2006) showed that the three most commonly used tyre additives –
zinc oxide, sulfur and carbon black – had no significant influence on the DTG curves of
natural rubber and SBR, justifying further the use of DTG curves as an identification method
for rubber mixtures due to their characteristic peak temperature.
The TG and DTG plots obtained from thermal analyses of the tyre rubber crumb samples in
Table 3.1 are presented in Figures 3.8 and 3.9, respectively. All samples generated char yield
between 34 – 37%, irrespective of their composition. The remaining residue is a mixture of
the carbon black and the inorganic materials present in tyres, as well as carbonisation residue
from the pyrolysis process (Kim et al., 1995).
Figure 3.8. TG plot of different rubbers at 5°C/min heating rate in N2
30
40
50
60
70
80
90
100
0 100 200 300 400 500 600 700 800
Weig
ht
ch
an
ge (
%)
Temperature (°C)
A B C D E F

Chapter 3 Characterisation of tyre rubber crumb
61
Figure 3.9. DTG plot of different rubbers at 5°C/min heating rate in N2
The DTG plots obtained indicated comparable proportions of natural rubber and SBR/PBR in
samples C (obtained from IC UHPW), and D and F (both from Crumb Rubber UK) with
similar peak temperatures observed at 368°C, 363°C, 367°C and second peak temperature at
427°C, 423°C and 428°C respectively. Senneca et al. (1999) recorded similar peak
temperatures of 360°C and 420°C when pyrolysing scrap tyre samples of 1 mm size at
5°C/min heating rate. A summary of all the peak temperatures is presented in Table 3.2.
Table 3.2. Peak temperatures of samples A – F
A B C D E F
Peak 1 Temp (°C) 367 270 368 363 366 367 Peak 2 Temp (°C) 405 443 427 423 438 428
Sample E, originating from a second batch from the UHPW jet system had SBR/PBR blend
as the main constituent probably due to different types of tyres being used in the process.
Whereas the first peak at 367°C is similar to the samples C, D and F, the second peak is
higher at 438°C. Sample A showed a major peak at 367°C in the region where natural rubber
degrades. This is usually expected from crumb originating from truck tyres, where natural
rubber is the main rubber constituent used. There was a second peak presented at 405°C, a
lower temperature than the ones recorded from the other samples examined.
-0.1
-0.08
-0.06
-0.04
-0.02
0
0.02
0 100 200 300 400 500 600 700 800
d(W
eig
ht)
/d(T
em
pera
ture
)
Temperature (°C)
A B C D E F

Chapter 3 Characterisation of tyre rubber crumb
62
As stated previously, cyclised products from natural rubber degradation are not stable and
decompose just above the main degradation temperature, which would explain the
consistency of the first peak in the DTG plots of samples A, C, D, E and F at around 367°C.
The second peak is influenced by the specific formulations of the SBR/PBR blend that can
promote secondary reactions and shift the second peak temperature. Nevertheless, tyre
pyrolysis is a complex process associated with a number of reactions occurring both in
parallel and in series. Peaks observed on the DTG plots are composites of one or more
degrading components (Williams & Besler, 1995; Brazier & Nickel, 1975).
Sample B showed unusual behaviour, for tyre rubber. It presented a broad hump in the region
between 125°C and 350°C with a maximum dip at 270°C and a major peak at 443°C. Using
the proximate analysis (BS ISO 9924-1:2000) the compositions of the tyre crumb samples
were estimated. Figure 3.10 presents typical results obtained from the analysis (in this
example for sample C).
Figure 3.10. Proximate thermal analysis plot of sample C
The compositions shown in Table 3.3 were derived by assuming that the weight loss up to
300°C will give an approximation of the content of the oils. The weight loss from 300°C to
550°C is from the polymers. Changing the atmosphere to air means the weight loss from
0
100
200
300
400
500
600
700
0
20
40
60
80
100
120
0 20 40 60 80 100 120
Tem
pera
ture
(°C
)
Weig
ht change (
%)
Time (min)
Weight change (%) Temperature
N2 Atmosphere Air
~ Polymers
~ Ash content
~ Carbon Black
~ Oils
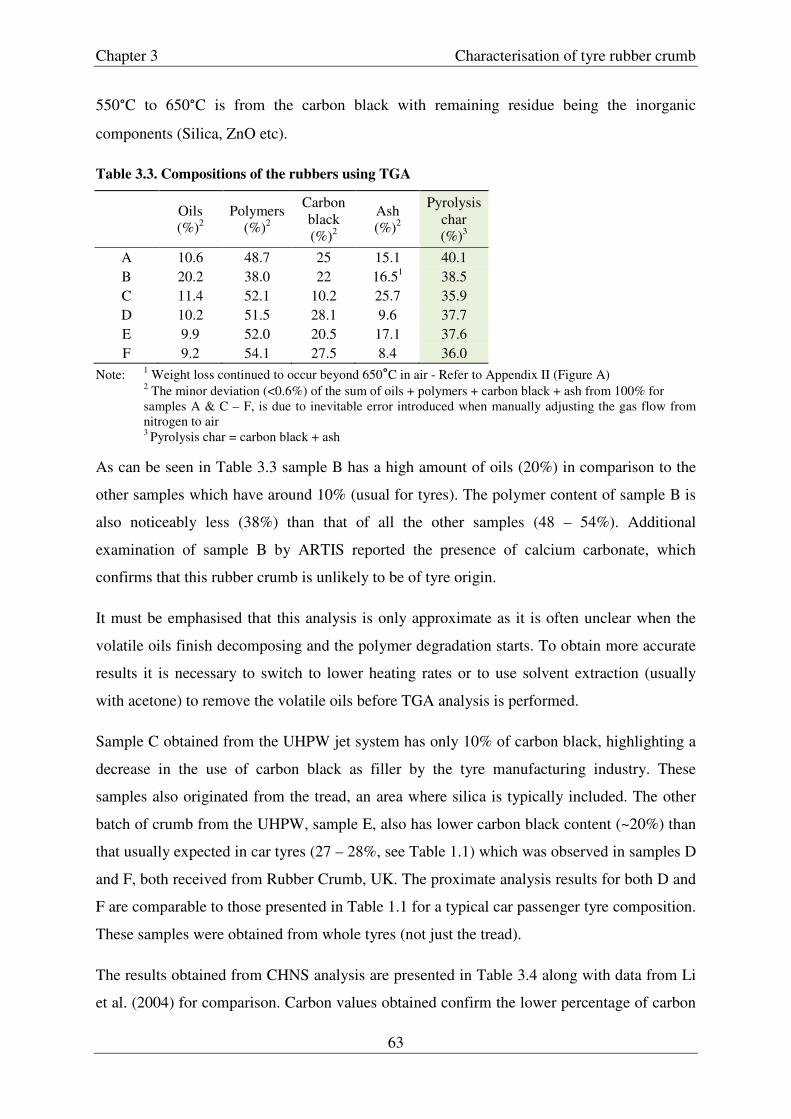
Chapter 3 Characterisation of tyre rubber crumb
63
550°C to 650°C is from the carbon black with remaining residue being the inorganic
components (Silica, ZnO etc).
Table 3.3. Compositions of the rubbers using TGA
Oils (%)2
Polymers (%)2
Carbon black (%)2
Ash (%)2
Pyrolysis char (%)3
A 10.6 48.7 25 15.1 40.1 B 20.2 38.0 22 16.51 38.5 C 11.4 52.1 10.2 25.7 35.9 D 10.2 51.5 28.1 9.6 37.7 E 9.9 52.0 20.5 17.1 37.6 F 9.2 54.1 27.5 8.4 36.0
Note: 1 Weight loss continued to occur beyond 650°C in air - Refer to Appendix II (Figure A) 2 The minor deviation (<0.6%) of the sum of oils + polymers + carbon black + ash from 100% for samples A & C – F, is due to inevitable error introduced when manually adjusting the gas flow from nitrogen to air 3 Pyrolysis char = carbon black + ash
As can be seen in Table 3.3 sample B has a high amount of oils (20%) in comparison to the
other samples which have around 10% (usual for tyres). The polymer content of sample B is
also noticeably less (38%) than that of all the other samples (48 – 54%). Additional
examination of sample B by ARTIS reported the presence of calcium carbonate, which
confirms that this rubber crumb is unlikely to be of tyre origin.
It must be emphasised that this analysis is only approximate as it is often unclear when the
volatile oils finish decomposing and the polymer degradation starts. To obtain more accurate
results it is necessary to switch to lower heating rates or to use solvent extraction (usually
with acetone) to remove the volatile oils before TGA analysis is performed.
Sample C obtained from the UHPW jet system has only 10% of carbon black, highlighting a
decrease in the use of carbon black as filler by the tyre manufacturing industry. These
samples also originated from the tread, an area where silica is typically included. The other
batch of crumb from the UHPW, sample E, also has lower carbon black content (~20%) than
that usually expected in car tyres (27 – 28%, see Table 1.1) which was observed in samples D
and F, both received from Rubber Crumb, UK. The proximate analysis results for both D and
F are comparable to those presented in Table 1.1 for a typical car passenger tyre composition.
These samples were obtained from whole tyres (not just the tread).
The results obtained from CHNS analysis are presented in Table 3.4 along with data from Li
et al. (2004) for comparison. Carbon values obtained confirm the lower percentage of carbon

Chapter 3 Characterisation of tyre rubber crumb
64
black in sample C, and E to a lesser extent, as the carbon values reflect the carbon black
levels – the polymer content is approximately the same. Hydrogen levels are between 6.60
and 6.99% for all the samples with the exception of sample B. Nitrogen is present in all
samples at less than 1% and originates from chemicals such as p-phenylamine used as
antidegradant in tyre formulations. All samples also contain sulfur, the most commonly used
vulcanising agent in rubber industry, as observed by Kaminsky & Mennerich, 2001 (1.4%),
Senneca et al., 1999 (1.9%) and so on.
Table 3.4. CHNS analysis and calorific values of tyre rubber samples
C (%) H (%) N (%) S (%)
Calorific Values
(MJ/kg) A 85.65 6.76 0.80 1.15
36.4
B 83.63 7.44 0.25 0.60
36.3 C 60.59 6.74 0.45 2.13
32.1
D 80.20 6.69 0.56 1.79
36.5 E 69.50 6.79 0.44 2.25
32.6
F 78.96 6.99 0.58 1.73
36.4 Li et al., 2004 84. 08 6.71 0.49 1.51
34.9
Table 3.4 also presents the calorific values of the samples which are similar to those observed
by other authors (36.8 MJ/kg by Roy & Unsworth (1989), 31.8 MJ/kg by Senneca et al.
(1999) and so on). The high calorific value, which is comparable to that of anthracite and dry
steam coal (34.6 MJ/kg), confirms why tyres are considered a valuable candidate for fuel
recovery from waste (Digest of UK energy statistics (DUKES, 2013). The calorific value of
tyres is significantly higher than that observed from other renewable sources such as
municipal solid waste (9.5 MJ/kg), wood pellets (17.2 MJ/kg), meat and bone (20.0 MJ/kg)
etc, with the exception of that of biodiesel (38.7 MJ/kg) (DUKES, 2013).
3.4 Conclusions
The various tyre rubber crumb samples from different sources were characterised using
CHNS analysis, calorific value measurements and thermal analysis.
The results obtained indicated that samples C and E, both from the UHPW jet system, had
lower carbon content (60.6 – 69.5%) in comparison to the other crumb samples (79.0 –
85.7%). This is attributed to the increasing usage of silica as filler material in the tread in tyre
manufacture. All samples had high calorific value (32.1 – 36.4 MJ/kg).

Chapter 3 Characterisation of tyre rubber crumb
65
TG analysis showed that the main rubber degradation occurred at temperatures between
300°C and 480°C using 5°C/min heating rate. The DTG plots presented two peaks associated
with the degradation of natural and synthetic rubber. Sample B showed different thermal
degradation patterns than the rest of the samples. On this basis, samples A, C, D, E and F
were chosen for further examination as presented in the following chapters of this thesis.
Chapter 4 Conventional Thermal Pyrolysis
66
4 Conventional Thermal Pyrolysis
4.1 Introduction
As discussed in Section 1.3.4.5.1, the process of tyre pyrolysis is influenced by various
parameters including temperature, retention time, pressure, type of reactor etc. The
relationship of these parameters with the outcomes of pyrolysis experiments such as the
surface area of the char generated are of great interest, especially if the process is to be
optimised to achieve high-value end-products.
There are various ways to investigate how the different parameters of a process relate to the
outcome. The most extensively used methodology is the ‘one-factor-at-a-time’ approach,
whereby each factor under investigation is varied over a range, while the others are kept
constant at a predefined baseline (Montgomery, 2005). This approach, however, does not take
into consideration the possibility of interactions between the different parameters. The effect
of one parameter using a certain baseline for the rest of the parameters kept constant, might
not be the same at a different baseline. To overcome this, it is best to employ statistical
designed experiments where factors are varied together (Montgomery, 2005). The “collection
of statistical and mathematical techniques useful for developing, improving and optimizing
processes” (Myers et al., 2009) is known as Response Surface Methodology (RSM).
In RSM, the relationship between the measured outcome of an experiment, known as the
response, and the independent variables is modelled and examined using multiple linear
regression as described below.
In this chapter the statistical background of RSM is first introduced and then used to
investigate the influence of seven parameters on the characteristics of char generated from
tyre pyrolysis (Part I). By elimination these parameters are reduced to three and investigated
further (Part II). The experimental procedure and characterization techniques are described,
followed by a discussion of the results.
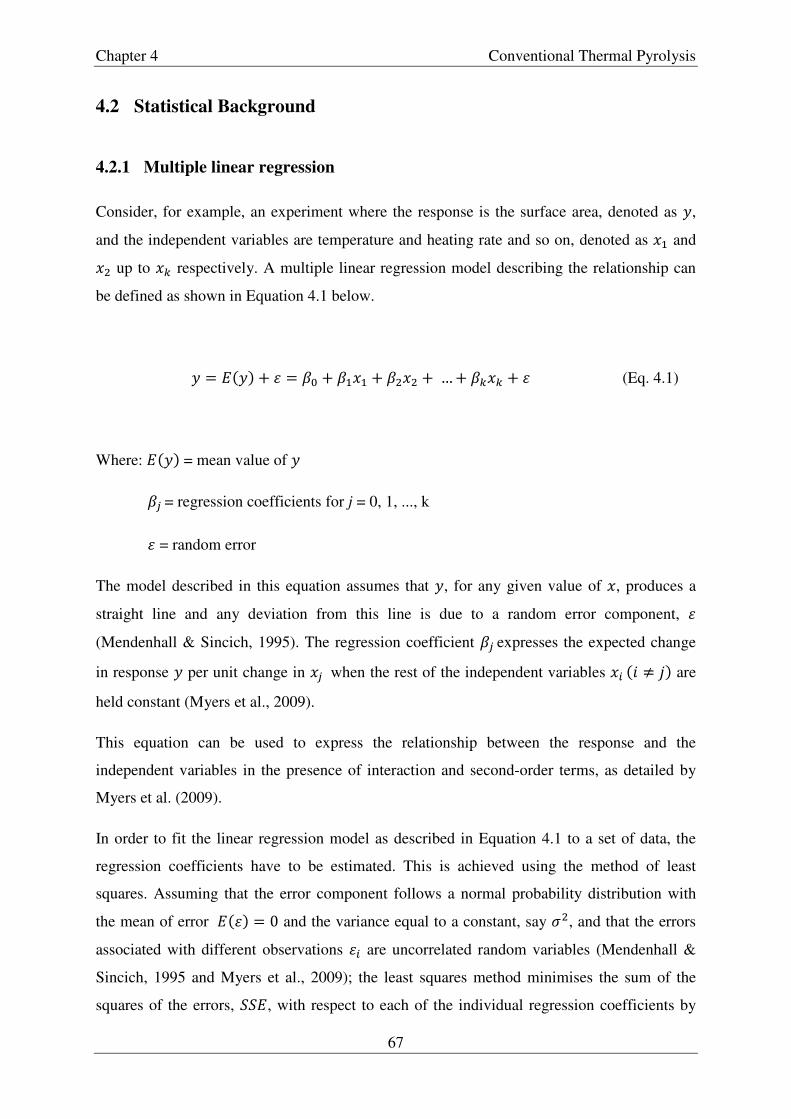
Chapter 4 Conventional Thermal Pyrolysis
67
4.2 Statistical Background
4.2.1 Multiple linear regression
Consider, for example, an experiment where the response is the surface area, denoted as �,
and the independent variables are temperature and heating rate and so on, denoted as �� and �� up to �� respectively. A multiple linear regression model describing the relationship can
be defined as shown in Equation 4.1 below.
� � � �! " � � #� " #��� " #��� " … " #��� " � (Eq. 4.1)
Where: � �! = mean value of �
#% = regression coefficients for j = 0, 1, ..., k
� = random error
The model described in this equation assumes that �, for any given value of �, produces a
straight line and any deviation from this line is due to a random error component, �
(Mendenhall & Sincich, 1995). The regression coefficient #% expresses the expected change
in response � per unit change in �% when the rest of the independent variables �& ' ( �! are
held constant (Myers et al., 2009).
This equation can be used to express the relationship between the response and the
independent variables in the presence of interaction and second-order terms, as detailed by
Myers et al. (2009).
In order to fit the linear regression model as described in Equation 4.1 to a set of data, the
regression coefficients have to be estimated. This is achieved using the method of least
squares. Assuming that the error component follows a normal probability distribution with
the mean of error � �! � 0 and the variance equal to a constant, say ��, and that the errors
associated with different observations �& are uncorrelated random variables (Mendenhall &
Sincich, 1995 and Myers et al., 2009); the least squares method minimises the sum of the
squares of the errors, **�, with respect to each of the individual regression coefficients by

Chapter 4 Conventional Thermal Pyrolysis
68
setting the derivatives +,--.,/0 120,24,…,25 and +,--.,/6 720,24,…,25to zero, where 8�, 8�, … , 8� are the
corresponding least square estimators.
This creates a set of 9 " 1, simultaneous equations, called least squares normal equations
which are easier to be solved when rearranged into a matrix notation, described in Equation
4.2.
� � :# " � (Eq. 4.2)
Where: � � ;����<�=> , X � ;1 ��� ��� … ���1 ��� ��� … ���< < < < <1 �=� �=� … �=�
> , β � ;#�#�<#�> , ��� � � ;���<��
>
The least square estimator 8 is then calculated using Equation 4.3:
8 � ::!A�:� (Eq. 4.3)
MATLAB®, which is a numerical programming language (MATrix LABoratory), can be
used to provide a solution. To avoid errors occurring from rounding off numbers during the
matrix solution of the equations, coding of the independent variables is recommended
(Mendenhall & Sincich, 1995). There are various ways to do this, one of which is by setting
the maximum value to 1 and the minimum to -1.
The fitted regression model generated is presented in Equation 4.4.
�B& � 8� " ∑ 8%�%D� �&% (Eq. 4.4)
Where �B& is the estimate of the response �& The difference between �& and �B& is defined as residual E& � �& �B&, and is one of the
parameters used to test the fitted model’s accuracy in tests described in Section 4.2.2 below.
Chapter 4 Conventional Thermal Pyrolysis
69
4.2.2 Testing model significance
There are certain statistical hypothesis tests that have to be performed to evaluate the fitted
regression model, either to assess its significance in giving a good approximation of the
responses or to verify the validity of the assumptions used in developing the model. The tests
and parameters considered in this thesis to evaluate the model adequacy are: ANalysis Of
Variance (ANOVA), coefficient of multiple determination F� and FGH%� , individual regression
coefficients testing, and residual analysis. These are discussed below.
4.2.2.1 Analysis of variance
Analysing the variance of the least squares fit provides information on the usefulness of the
overall model. The appropriate test examines the null hypothesis which considers that all
regression coefficients are equal to each other and equal to zero (I�: #� � #� � K � #� � 0)
against the alternative hypothesis that at least one of the regression coefficients is not equal to
zero (IG: �� LE�M� N�E N� #�, #�, … , #� ( 0!. If at least one of the regression coefficients #
is non-zero, then there is evidence of a linear relationship between the response and one or
more of the independent variables, thus the constructed regression model is considered to be
useful.
If the null hypothesis is rejected, when in fact it is true, it gives rise to what is known in
statistics as a Type I error. The probability of making a Type I error is known as the
significance level O, and hypothesis testing is usually conducted at a predefined significance
level O.
To test this hypothesis the ANOVA table is constructed as shown in Table 4.1. The total sum
of squares (**P) is the sum of squares of the difference between the response �&% and the
overall mean �Q, calculated over all the distinct levels of the variables, ' � 1,2, . . R, and
replicates at the same level, � � 1,2, . . �&. The total sum of squares is divided into two
components: the sum of squares due to the regression (**S) and the sum of squares due to the
residual or error (**.). The former (**S! is the sum of squares of the differences between the
predicted values �B& and the average of the response variable �Q&, and the latter (**.! is the sum
of squares of residuals between the experimental responses �&% and the predicted values �B& from the model.

Chapter 4 Conventional Thermal Pyrolysis
70
Table 4.1. ANOVA
Source of variation Sum of Squares Degrees of Freedom ��!
Mean Square
F0 p-value
Regression **S � T T �B �Q!�=U%D�
V&D� k MSR MSR/MSE Model significant <α
Error
of residual
**. � T TW�&% �BX�=U%D�
V&D� n-k-1 MSE
Lack of Fit **YZ[ � T T �Q& �B& !�=U%D�
V&D� m-k-1 MSLOF MSLOF/MSPE Model significant >α
Pure Error **\. � T TW�&% �Q&X�=U%D�
V&D� n-m MSPE
Total **P � T TW�&% �QX�=U%D�
V&D� n-1
* � = number of observations, 9 = number of regression coefficients, m = number of distinct levels of the variable x, � � ∑ �&V&D� and ]E�� *^_�`E � -aV bc deaGfgdhgifggd bc [fggHbV
If j � k-lk-m n jo,pl,pm, then the null hypothesis is rejected. Every F-value has a corresponding
observed significance level, known as a p-value. For a significant model, the observed p-
value must be less than the predefined O. Reporting p-values allows individual readers to
decide the maximum level of O they would tolerate and draw their own conclusions
(Mendenhall & Sincich, 1995).
From Table 4.1 we note that the Error of residual has two components, Lack of Fit (LOF) and
Pure Error (PE). Testing for lack of fit is essential for the determination of the models
appropriateness. This involves having more than one observation at the same setting of
variables, to check on the variability of the process. For the overall model to be significant, it
has to be proved that the variation of the predicted values is large with respect to the relative
error, otherwise the model has been fitted to the errors only (Myers et al., 2009).
If j � k-qrsk-tm n jo,pqrs,ptm and the corresponding p-value is low, then the null hypothesis that
the model is adequate is rejected; there is evidence of lack of fit and thus the model is not
suitable.

Chapter 4 Conventional Thermal Pyrolysis
71
Further, the ratio of --l--u from the ANOVA table is known as the coefficient of determination
F�. This provides a measure of the amount of reduction in the variability of � gained by the
use of the regression variables ��, ��, … , �� in the model (Myers et al., 2009) i.e. gives an
indication of how well the least squares equation fits the data.
For example, if a model has F� � 0.95, this means that the least squares line relating � with
the �% can explain 95% of the variation present in the sample of � values (Mendenhall &
Sincich, 1995).
Care must be taken when interpreting the value of F�, as it increases with increasing number
of variables, irrespective of whether the added variables are significant or not. In fact, it is
better, if used in conjunction with FGH%� , which is an adjusted version of F�, that takes into
consideration the sample size and number of variables in the model (Eq. 4.5).
FGH%� � 1 --m =Ax!--u =A�! � 1 =A�=Ax 1 F�! (Eq. 4.5)
A noticeable difference between F� and FGH%� highlights the presence of non-significant terms
in the model.
4.2.2.2 Individual regression coefficients
Testing individual regression coefficients is important, even if the overall model has been
found significant. This can give information on which of the ��, ��, … , �� variables are the
most important, or whether insignificant parameters are included in the model.
The appropriate test statistic to investigate the null Hypothesis I�: #% � 0 against the
alternative IG: #% ( 0 is given below (Eq. 4.6):
�� � 26yz{|}66 (Eq. 4.6)
Where ~%% is the diagonal element of ::!A� corresponding to 8%

Chapter 4 Conventional Thermal Pyrolysis
72
I� is rejected if |��| n �o �� ,=A�A�. If the null Hypothesis is rejected, there is evidence that #% ( 0, so �% contributes information for the prediction of �.
4.2.2.3 Residual analysis
One of the assumptions in creating the least square model is that the error component is
described by a normal distribution. This can be checked graphically by plotting the residuals E& � �& �B& on a normal probability graph in which the ordinate (y-axis) is scaled using the
cumulative normal distribution (Magrab et al., 2005). If the data are normal, this would give a
linear plot. A typical graph, as produced using MATLAB®, is illustrated in Figure 4.1.
Figure 4.1. Normal probability plot of the residuals
4.3 Part I – Screening test
4.3.1 Experimental procedure
4.3.1.1 Plackett and Burman design
In order to identify the more influential parameters in the current study a screening test was
used based on the Plackett and Burman design. Plackett-Burman designs are two-level
fractional factorial designs for 9 � � 1, where � is a multiple of 4 (Montgomery, 2005).
They are constructed using the appropriate plus and minus signs depending on � from Table
4.2.
-0.3 -0.2 -0.1 0 0.1 0.2 0.3
0.05
0.10
0.25
0.50
0.75
0.90
0.95
Data
Pro
babilit
y
Normal Probability Plot

Chapter 4 Conventional Thermal Pyrolysis
73
Table 4.2. Plus and minus signs used for the Plackett-Burman Designs
k = 11, N = 12 + + - + + + - - - + - k = 19, N = 20 + + - - + + + + - + - + - - - - + + - k = 23, N = 24 + + + + + - + - + + - - + + - - + - + - - - - k = 35, N = 36 - + - + + + - - - + + + + + - + + + - - + - - - - + - + - + + - - + -
This is written as the first row or column of the design as shown in Table 4.3 for N = 12, k =
11. The second row or column is obtained by moving the elements of the column (or row)
down (or to the right) one position and transferring the last element in the first position. This
process continues until column (or row) k is produced. The design is completed by adding a
row of minus signs (Plackett & Burman, 1946).
Table 4.3. Plackett-Burman Design for N=12
Run A B C D E F G H I J K
1 + - + - - - + + + - + 2 + + - + - - - + + + - 3 - + + - + - - - + + + 4 + - + + - + - - - + + 5 + + - + + - + - - - + 6 + + + - + + - + - - - 7 - + + + - + + - + - - 8 - - + + + - + + - + - 9 - - - + + + - + + - +
10 + - - - + + + - + + - 11 - + - - - + + + - + + 12 - - - - - - - - - - -
In the current study seven parameters were chosen to be tested. These are the temperature, the
dwell time, the heating rate, the nitrogen flow, the rotation of the vessel, the particle size and
the sample load. Therefore an adjusted Plackett-Burman 11 factor design was used, by
removing columns from the right.
4.3.1.2 Experimental set-up
The experimental set-up was as follows:
Rubber crumb sample C (Table 3.1) was pyrolysed by conventional means using a Carbolite
HTR 11/150 (Hope Valley, UK) laboratory scale rotary furnace (Figure 4.2). This furnace
consists of a quartz reaction vessel that has up to 1 kg capacity, suspended by air-tight rotary

Chapter 4 Conventional Thermal Pyrolysis
74
fixtures inside an electrically heated box-furnace. The temperature is controlled by a thermal
programmer which is connected to a thermocouple located inside the box-furnace. Nitrogen
gas is introduced to the reaction vessel via gas inlet ports at a controlled flow rate (San
Miguel, 1999). The reaction vessel is connected to a glass trap where the condensed oils are
collected. Volatile gases are vented to the fume cupboard.
Figure 4.2. Carbolite HTR/ 11/150 rotary furnace
For each experiment, the char and oil yields were recorded by weighing the reactor and the
oil trap before and after pyrolysis, while the gas yields were calculated by difference.
4.3.1.3 Experimental conditions
For each parameter a specific range was chosen.
� The temperature range under investigation was between 500 and 700°C. The lower
limit of 500°C is based on tyre pyrolysis investigations by San Miguel (1999) using
the same furnace, in which he concluded that pyrolysis was complete at 500°C, using
a heating rate of 5°C/min and 200 g sample weight and is in agreement with the TGA
results presented in Chapter 3 (Figures 3.8 & 3.9).
� The furnace was heated at a constant rate at values between 2 and 10°C/min. The
lower limit of 2°C/min was selected as a compromise of having a slow rate while
being able to run an experiment over a reasonable duration. Furthermore, a higher
heating rate than 10°C/min would have been preferred, but that exceeded the
capabilities of the furnace.
Oil trap
Gases
N2 gas
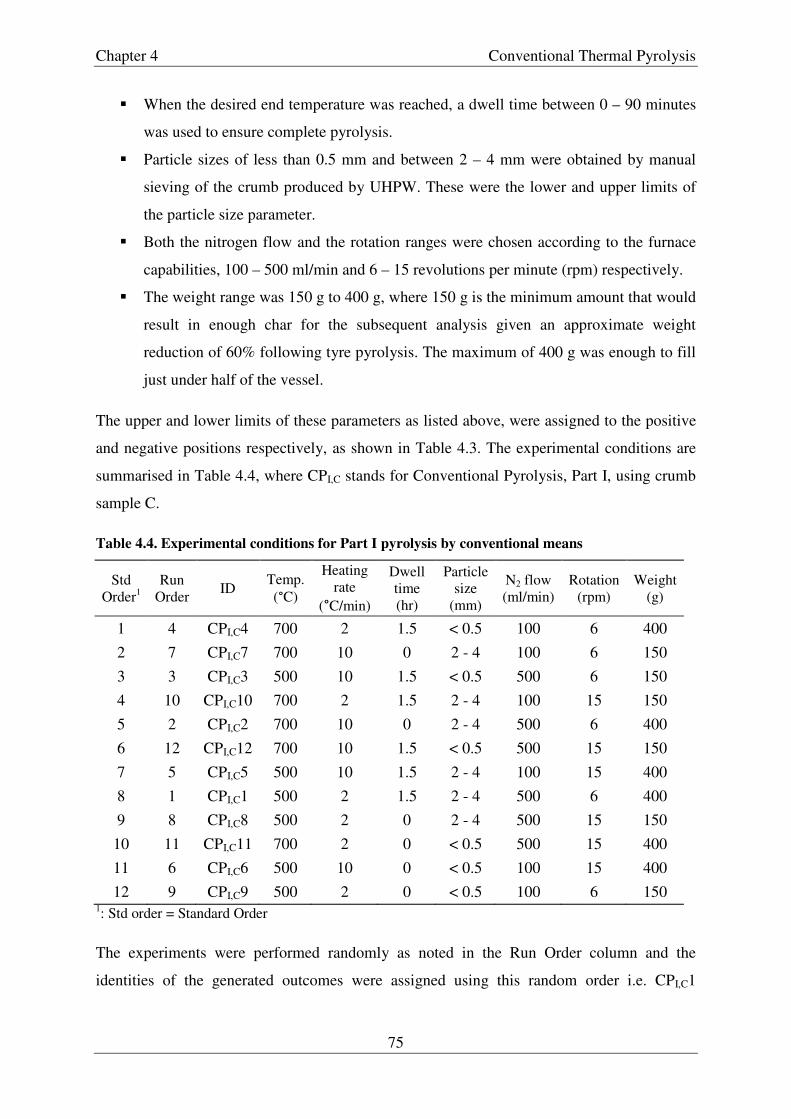
Chapter 4 Conventional Thermal Pyrolysis
75
� When the desired end temperature was reached, a dwell time between 0 – 90 minutes
was used to ensure complete pyrolysis.
� Particle sizes of less than 0.5 mm and between 2 – 4 mm were obtained by manual
sieving of the crumb produced by UHPW. These were the lower and upper limits of
the particle size parameter.
� Both the nitrogen flow and the rotation ranges were chosen according to the furnace
capabilities, 100 – 500 ml/min and 6 – 15 revolutions per minute (rpm) respectively.
� The weight range was 150 g to 400 g, where 150 g is the minimum amount that would
result in enough char for the subsequent analysis given an approximate weight
reduction of 60% following tyre pyrolysis. The maximum of 400 g was enough to fill
just under half of the vessel.
The upper and lower limits of these parameters as listed above, were assigned to the positive
and negative positions respectively, as shown in Table 4.3. The experimental conditions are
summarised in Table 4.4, where CPI,C stands for Conventional Pyrolysis, Part I, using crumb
sample C.
Table 4.4. Experimental conditions for Part I pyrolysis by conventional means
Std Order1
Run Order ID Temp.
(°C)
Heating rate
(°C/min)
Dwell time (hr)
Particle size
(mm)
N2 flow (ml/min)
Rotation (rpm)
Weight (g)
1 4 CPI,C4 700 2 1.5 < 0.5 100 6 400
2 7 CPI,C7 700 10 0 2 - 4 100 6 150
3 3 CPI,C3 500 10 1.5 < 0.5 500 6 150
4 10 CPI,C10 700 2 1.5 2 - 4 100 15 150
5 2 CPI,C2 700 10 0 2 - 4 500 6 400
6 12 CPI,C12 700 10 1.5 < 0.5 500 15 150
7 5 CPI,C5 500 10 1.5 2 - 4 100 15 400
8 1 CPI,C1 500 2 1.5 2 - 4 500 6 400
9 8 CPI,C8 500 2 0 2 - 4 500 15 150
10 11 CPI,C11 700 2 0 < 0.5 500 15 400
11 6 CPI,C6 500 10 0 < 0.5 100 15 400
12 9 CPI,C9 500 2 0 < 0.5 100 6 150 1: Std order = Standard Order
The experiments were performed randomly as noted in the Run Order column and the
identities of the generated outcomes were assigned using this random order i.e. CPI,C1

Chapter 4 Conventional Thermal Pyrolysis
76
identifies the experiment with the conditions listed in standard order 8. The parameters were
assigned a coding name as shown in Table 4.5 to facilitate the modelling in MATLAB®.
Table 4.5. Assigned coding of parameters
Parameter Code in
MATLAB®
Temperature (°C) x1 Heating rate (°C/min) x2 Dwell time (hr) x3 Particle size (mm) x4 N2 flow (ml/min) x5 Rotation (rpm) x6 Weight of sample (g) x7
The modelling involved a sequential process, where all seven parameters were tested in the
model and, depending on the individual regression coefficients, some parameters were
eliminated until a significant model (p < α) was achieved. The significance level α was
chosen to be 0.05. All normal probability plots of the residuals are shown in Appendix II
(Figure B).
4.3.2 Characterisation
The chars generated were powdered in a Tema® mill until a maximum particle size of < 150
µm was obtained prior to analysis, unless otherwise stated. For this operation approximately
25 grams was milled each time for a period of 1 minute and then passed through a 150 µm
wire mesh screen. Any oversized material was re-milled.
The chars were then tested for the following properties:
� pH-value � CHN analysis � Ash content � Transmittance of toluene extract � Infrared Spectroscopy � Scanning Electron Microscope-Energy Dispersive X-ray Analysis � Surface Area
The methodology of the above tests is described below.

Chapter 4 Conventional Thermal Pyrolysis
77
4.3.2.1 pH-value
The pH of the char produced was determined using a modified method derived from Bagreev
et al. (2001). After drying for 1 hour at 125°C, 0.4 g of the sample was added to 20 ml of
deionised water. The mixture was mechanically agitated for 24 hrs (at 150 rpm) and after the
removal of the char by filtration with a Whatman No.1 filter paper, the pH of the recovered
solution was measured. The equipment (Fisherbrand HYDRUS 300 pH-meter with a VWR
662-1761 electrode) was calibrated prior to use at pH = 4, 7 and 10 and measurements were
done in duplicate. This is not a standard method, but the measurements were carried out
simply for comparison between the samples under investigation.
4.3.2.2 CHN Analysis
The method for CHN analysis was described previously in Section 3.2.2. Samples of chars
obtained were sent to MEDAC, UK for this analysis.
4.3.2.3 Ash Content
Ash tests were conducted according to American Society for Testing and Materials (ASTM)
method 1506 – 99. The chars were first dried in the oven at a temperature of 125°C for 1 hour
and allowed to cool to room temperature. Two grams of each of the dried samples were then
placed in a porcelain crucible, and heated at 550°C ± 25°C for 16 hours. The change in
weight was recorded. Experiments were performed in duplicate.
4.3.2.4 Transmittance of toluene extract
This test was performed to investigate the presence of organic (toluene soluble) residuals in
the char. This test, adopted from the ASTM D1618 – 99, measured the transmittance at
425 nm (using a spectrophotometer) of the filtrate obtained from the toluene mixed with the
char produced (2 g ± 0.01 g), in comparison to the transmittance of pure toluene. Duplicate
measurements were performed.
4.3.2.5 Infrared Spectroscopy
In infrared spectroscopy the absorption of electromagnetic radiation in the infrared region by
a sample is measured. The absorption in mid-infrared region (4000 cm-1 – 400 cm-1) is related

Chapter 4 Conventional Thermal Pyrolysis
78
to the vibration of specific sets of chemical bonds from within a molecule (Coates, 2000) and
therefore this method enables deductions to be made on the likely functional groups within
the sample under observation.
In this study, a Nicolet Magna-IR 560 spectrometer using Fourier Transform (FT) was
employed. To perform the analysis the sample (dried at 125°C for an hour) was mixed with
potassium bromide in a 1 to 200 ratio and pressed at 10 tonne load to form a disc. This disc is
then mounted in the light path of the machine and infrared radiation passing through the
sample detected and an absorption spectra generated.
4.3.2.6 Scanning Electron Microscope-Energy Dispersive X-ray Analysis
Scanning Electron Microscopy (SEM) is a technique for studying the microstructural
characteristics of materials. In SEM, a beam of high energy electron scans the surface of a
sample. From this interaction secondary electrons are emitted and the signal generated is
collected and processed to generate a high resolution image of the surface’s features
(Brandon & Kaplan, 2008).
Certain electron energy losses from the interaction of the electron beam and the sample lead
to the emission of characteristic X-rays (Brandon & Kaplan, 2008). When SEM is used in
conjunction with an energy dispersive X-ray (EDX) analyser, information on the composition
of the sample can be determined.
SEM-EDX analysis of a selected char was carried out by ARTIS, UK using a JEOL T100
SEM with Princeton Gamma Tech ‘Imagemaster’ and Princeton Gamma Tech ‘Spirit’ EDX
analyser.
4.3.2.7 Surface area
Nitrogen gas adsorption at 77 K was carried out using a Coulter Omnisorp® 100 automatic
adsorption analyser to measure the char’s total surface and external surface area. The sample
(approximately 0.25 g) was weighed accurately in an analysis tube to be degassed at 75°C
until the pressure in the tube dropped to less than 10-5 Torr. This ensured that any
physisorbed material present in the char was removed.
The degassed sample was then transferred under vacuum to the analysis side of the
instrument, where it was immersed in liquid nitrogen. The sample in the tube was exposed to

Chapter 4 Conventional Thermal Pyrolysis
79
a continuous flow of nitrogen gas using a slow flow rate to establish equilibrium conditions
between the adsorbed nitrogen and the nitrogen remaining in the atmosphere around the
sample. The instrument is fully automated so once the parameters are entered and the
experiment is completed, full adsorption/desorption data are obtained.
Adsorption refers to the enrichment of one or more components in an interfacial layer of a
solid (IUPAC, 1985). Adsorption can be either physical (physisorption) or chemical
(chemisorption). In physical adsorption, the substance attached to the surface (adsorbate) is
held to the surface of the adsorbent by relatively weak Van der Waals forces. In
chemisorption, on the other hand, a bond is formed between the adsorbent and the adsorbate
by exchange or sharing of electrons (Bansal & Goyal, 2005). The adsorptive capabilities are
provided by the porous structure of the adsorbents. There are three classes of pores in
physisorption (i) micropores – pores of less than 2 nm width (ii) mesopores – pores between
2 nm and 50 nm and (iii) macropores – widths exceeding 50 nm (IUPAC, 1985).
Adsorption isotherm is a graphical representation of the amount of gas adsorbed by a solid at
different gas pressure, �, at constant temperature. The amount of gas adsorbed is usually
plotted preferentially against the relative pressure, xx0, instead of � itself, where �� is the
saturation pressure of the gas (Bansal & Goyal, 2005). Adsorption isotherms give an
indication of the porosity of a material. Thus, different materials with different porosities give
different types of isotherms. The possible isotherms can be grouped in 5 types and are shown
in Figure 4.3 (Bansal & Goyal, 2005). The most common ones are (i) Type I isotherms,
obtained by microporous solids with small external surfaces, (ii) Type II, obtained by non-
porous or macroporous adsorbents, and (iii) Type IV, obtained by mesoporous adsorbents.
All isotherms, irrespective of their type, tend to be linear at low pressures, in accordance with
Henry’s Law (IUPAC, 1985).
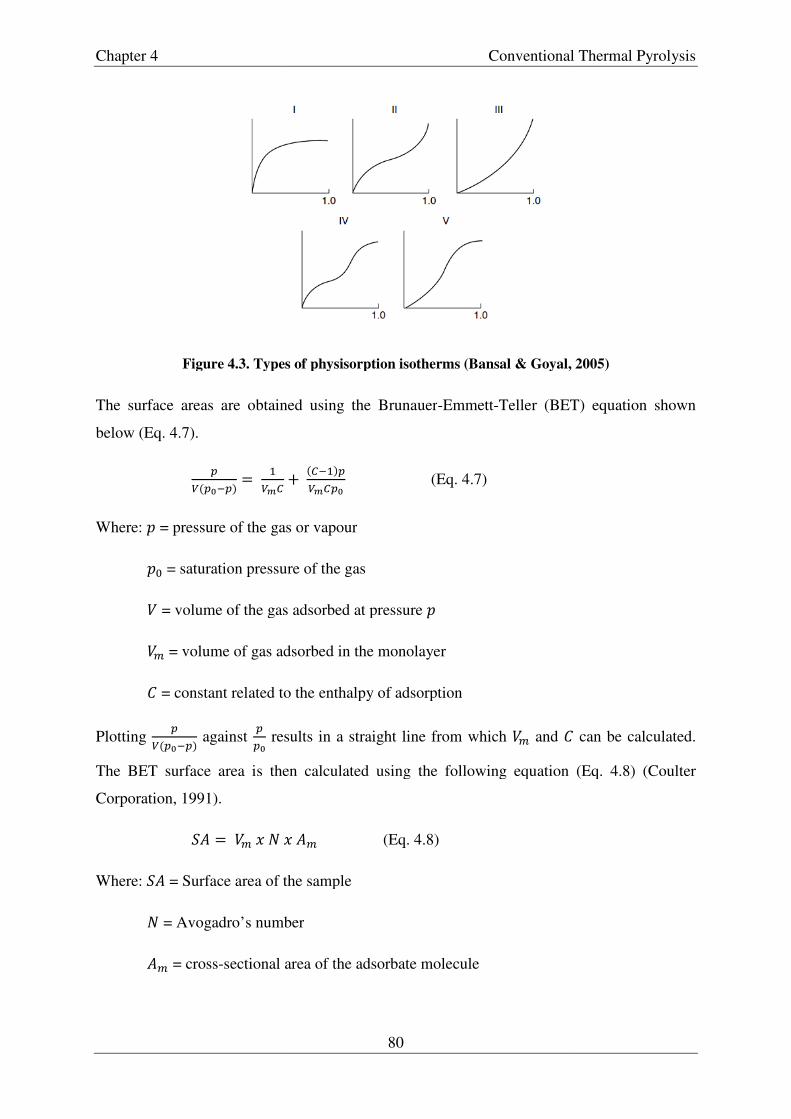
Chapter 4
Figure 4.3. Types of physisorption isotherms (Bansal & Goyal, 2005)
The surface areas are obtained using the Brunauer
below (Eq. 4.7).
x� x0Ax! � ���}
Where: � = pressure of the gas or vapour
�� = saturation pressure of the gas
� = volume of the gas adsorbed at pressure
�V = volume of gas adsorbed in the monolayer
~ = constant related to the enthalpy of adsorption
Plotting x� x0Ax! against
xx0 results in a straight line from which
The BET surface area is then calculated using the following equation (Eq. 4.8) (Coulter
Corporation, 1991).
*� � �V � � �Where: *� = Surface area of the sample
� = Avogadro’s number
�V = cross-sectional area of the adsorbate molecule
Conventional Thermal Pyrolysis
80
Figure 4.3. Types of physisorption isotherms (Bansal & Goyal, 2005)
The surface areas are obtained using the Brunauer-Emmett-Teller (BET) equation shown
" }A�!x��}x0 (Eq. 4.7)
= pressure of the gas or vapour
= saturation pressure of the gas
= volume of the gas adsorbed at pressure �
= volume of gas adsorbed in the monolayer
= constant related to the enthalpy of adsorption
results in a straight line from which �V and ~The BET surface area is then calculated using the following equation (Eq. 4.8) (Coulter
� �V (Eq. 4.8)
of the sample
= Avogadro’s number
sectional area of the adsorbate molecule
Conventional Thermal Pyrolysis
Figure 4.3. Types of physisorption isotherms (Bansal & Goyal, 2005)
Teller (BET) equation shown
~ can be calculated.
The BET surface area is then calculated using the following equation (Eq. 4.8) (Coulter

Chapter 4 Conventional Thermal Pyrolysis
81
BET surface area calculates the total surface area. To obtain the external surface area, which
includes the area provided from the meso and macropores, but not the micropores, t-plot
analysis was used. T-plot analysis involves plotting the adsorption isotherm in terms of the
volume of the gas adsorbed versus the statistical film thickness. The latter is the thickness of
the adsorbed gas on the walls of the pores and is calculated using the following equation
(Coulter, 1991).
� � ������ � � (Eq. 4.9)
Where: � = average thickness of adsorbate layer
� = average thickness of a single layer of nitrogen molecules (3.54 Å)
�GHd = volume of nitrogen gas adsorbed by the sample
�V = volume of gas adsorbed in the monolayer
The slope of the plot of the volume of the gas adsorbed against the statistical thickness gives
the external surface area.
4.3.3 Results and discussion
4.3.3.1 General overview
To obtain the yields, the weight of the vessel was recorded before and after the experiment. A
second weight reading was also obtained following the cleaning of the arms to remove the oil
residues. As this oil inevitably contains some of the char, both weights were considered to
represent the weight range for the oil and char yields. The yields recorded are presented in
Table 4.6. The char yields from the pyrolysis experiments range between 38.2 – 43.1 wt.%
which is comparable to the yields observed by other authors (Table 1.2) apart from CPI,C6
which had a yield of 47.6 – 49.1 wt.%. The char from CPI,C6 was produced at a combination
of low nominal end temperature (500°C), high heating rate (10°C/min), large sample size
(400 g) and no dwell time, which resulted in incomplete pyrolysis of the tyre. This
incomplete pyrolysis is evident in the other results as will be discussed below. The char yield
range is slightly higher than the thermal analysis results for the same rubber (36 wt.%, Table
3.3). This is because unlike the conditions of the thermal analysis, the conditions of the
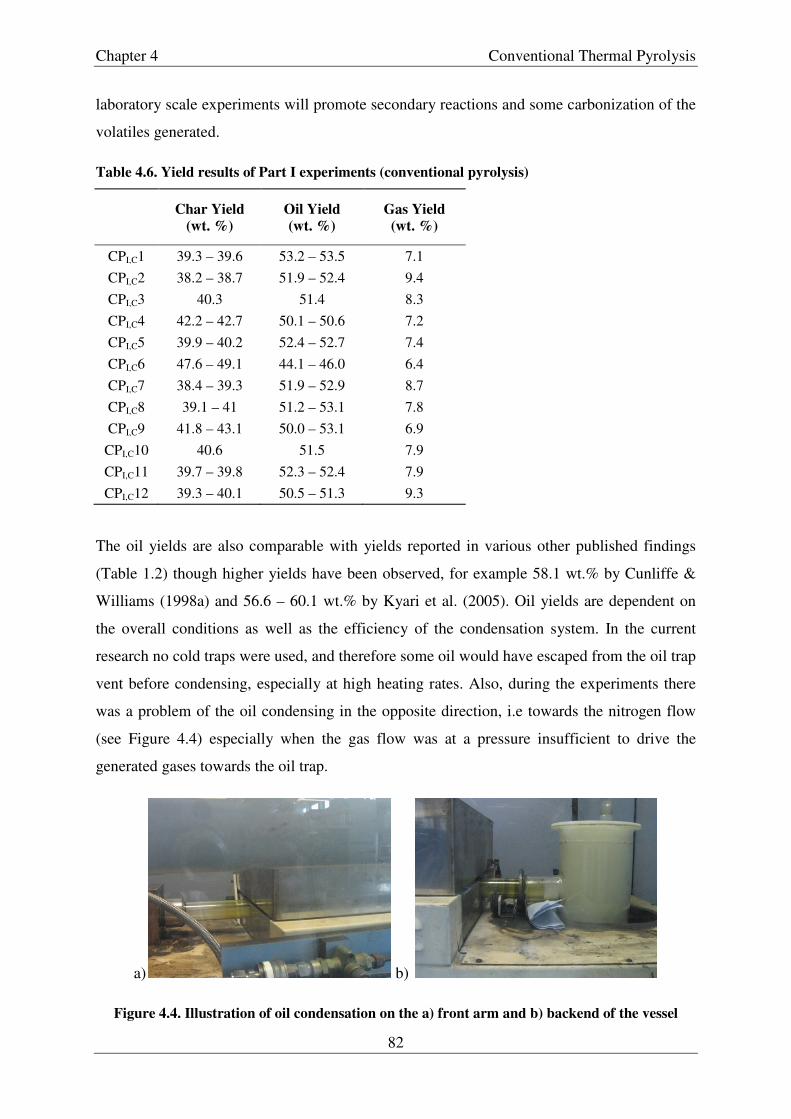
Chapter 4 Conventional Thermal Pyrolysis
82
laboratory scale experiments will promote secondary reactions and some carbonization of the
volatiles generated.
Table 4.6. Yield results of Part I experiments (conventional pyrolysis)
Char Yield
(wt. %) Oil Yield (wt. %)
Gas Yield
(wt. %)
CPI,C1 39.3 – 39.6 53.2 – 53.5 7.1 CPI,C2 38.2 – 38.7 51.9 – 52.4 9.4 CPI,C3 40.3 51.4 8.3 CPI,C4 42.2 – 42.7 50.1 – 50.6 7.2 CPI,C5 39.9 – 40.2 52.4 – 52.7 7.4 CPI,C6 47.6 – 49.1 44.1 – 46.0 6.4 CPI,C7 38.4 – 39.3 51.9 – 52.9 8.7 CPI,C8 39.1 – 41 51.2 – 53.1 7.8 CPI,C9 41.8 – 43.1 50.0 – 53.1 6.9
CPI,C10 40.6 51.5 7.9 CPI,C11 39.7 – 39.8 52.3 – 52.4 7.9 CPI,C12 39.3 – 40.1 50.5 – 51.3 9.3
The oil yields are also comparable with yields reported in various other published findings
(Table 1.2) though higher yields have been observed, for example 58.1 wt.% by Cunliffe &
Williams (1998a) and 56.6 – 60.1 wt.% by Kyari et al. (2005). Oil yields are dependent on
the overall conditions as well as the efficiency of the condensation system. In the current
research no cold traps were used, and therefore some oil would have escaped from the oil trap
vent before condensing, especially at high heating rates. Also, during the experiments there
was a problem of the oil condensing in the opposite direction, i.e towards the nitrogen flow
(see Figure 4.4) especially when the gas flow was at a pressure insufficient to drive the
generated gases towards the oil trap.
a) b)
Figure 4.4. Illustration of oil condensation on the a) front arm and b) backend of the vessel

Chapter 4 Conventional Thermal Pyrolysis
83
This flow anomaly introduced an error on the yields as the oil had to be cleaned before the
char came out of the vessel. The furnace was tilted towards the oil trap to counteract this flow
anomaly and the resulting error, but this proved to be ineffective. Further, losses (char or oil)
were more pronounced for lower sample weights, while a lower weight in combination with
smaller particle size, high nitrogen flow and possibly increased rotation speed increased the
chances of generated char to gravitate towards the oil trap due to greater likelihood of the fine
particles generated to be swept into the arm of the vessel.
The results obtained from the characterisation of the chars are shown is Table 4.7.
Table 4.7. Char characterisation results of Part I experiments (conventional pyrolysis)
Ash
Content
(%)
Transmittance
of Toluene
Extracts (%)
C
(%) H
(%) N
(%)
Surface Area (m2/g)
pH-
value BET Meso & Macropore
CPI,C1 56.0 98.7 40.1 1.0 0.1 124.6 100.03 7.75
CPI,C2 57.4 95.8 39.1 0.1 0.1 116.3 98.72 7.90
CPI,C3 53.6 97.8 42.4 0.9 0.1 128.6 111.13 7.75
CPI,C4 52.6 99.1 44.3 1.0 0.2 101.1 85.20 8.64
CPI,C5 58.9 93.4 36.7 1.0 0.1 122.0 103.14 7.81
CPI,C6 45.6 0.0 49.6 1.9 0.1 43.4 42.01 7.64
CPI,C7 57.8 99.5 40.2 1.0 0.1 112.9 96.12 7.99
CPI,C8 57.0 78.7 39.5 1.0 0.1 119.0 108.58 7.71
CPI,C9 52.6 31.8 45.0 1.2 0.2 107.4 97.90 7.67
CPI,C10 56.9 98.9 40.9 0.1 0.1 106.0 89.96 9.15
CPI,C11 54.7 99.9 42.6 0.1 0.1 115.0 94.79 8.39
CPI,C12 57.5 98.6 42.1 0.1 0.1 110.9 99.52 8.68
The percentage of transmittance of toluene extracts for most chars was above 90%, indicating
that most of the organic residues had been removed from the char. The exception was CPI,C6;
the 0% transmission of the toluene extracts along with the low ash content and high carbon
and hydrogen content indicate that part of the rubber had not been completely pyrolysed.
CPI,C8 and CPI,C9 chars which also presented low toluene transmittance percentage at 78.7%
and 31.8% respectively, were produced at 500°C and no dwell time. This prompted an
investigation of the thermal lag of the thermocouple temperature inside the furnace box and
the actual temperature inside the vessel (Section 4.4.2.2).

Chapter 4
The ash results were very high compared to other studies on tyre pyrolysis
12.96% by Mui et al. (2010), 11.78
San Miguel (1999) and 14.3
work, Ucar et al. (2005) had observed a relatively high amount of
passenger car tyres. Sample C, as stated in Chapter 3 was produced using the in
UHPW equipment; most of the tyres disassembled in this batch were Michelin, known for
using a high amount of silica as filler, which would explai
carbon black grades have very low ash content that range from about <0.1 to 2% (Hess &
Herd, 1993).
In the current work, further examination of the ash content of one of the samples,
using SEM-EDX confirmed the pr
ZnO. The coloured areas of the images below (Figure 4.5) highlight the dense distribution of
Si, the sparse to moderate distribution of Zn and the sparse distribution of Fe.
a)
c)
Figure 4.5. SEM Images of CP
Zn distribution and d) showing Fe distribution.
The presence of SiO2 was also verified by the FTIR spectroscopy. Figure 4.6 presents the
FTIR spectrum of CPI,C4. Even though the transmittance was low due to the dominance of the
Conventional Thermal Pyrolysis
84
The ash results were very high compared to other studies on tyre pyrolysis
12.96% by Mui et al. (2010), 11.78 – 15.33% by Galvagno et al., (2002),
San Miguel (1999) and 14.3 – 16.3% by González et al. (2001). However, like the current
work, Ucar et al. (2005) had observed a relatively high amount of ash (40.3
Sample C, as stated in Chapter 3 was produced using the in
UHPW equipment; most of the tyres disassembled in this batch were Michelin, known for
using a high amount of silica as filler, which would explain the high ash content. Commercial
carbon black grades have very low ash content that range from about <0.1 to 2% (Hess &
In the current work, further examination of the ash content of one of the samples,
EDX confirmed the presence in high quantities of SiO2 (over 90%) as well as
ZnO. The coloured areas of the images below (Figure 4.5) highlight the dense distribution of
Si, the sparse to moderate distribution of Zn and the sparse distribution of Fe.
b)
d)
CPI,C4 a) without distribution b) showing Si distribution c) showing
Zn distribution and d) showing Fe distribution.
was also verified by the FTIR spectroscopy. Figure 4.6 presents the
Even though the transmittance was low due to the dominance of the
Conventional Thermal Pyrolysis
The ash results were very high compared to other studies on tyre pyrolysis such as 6.82 –
15.33% by Galvagno et al., (2002), 10.2 – 10.6% by
lez et al. (2001). However, like the current
ash (40.3 – 40.8%) from
Sample C, as stated in Chapter 3 was produced using the in-house
UHPW equipment; most of the tyres disassembled in this batch were Michelin, known for
n the high ash content. Commercial
carbon black grades have very low ash content that range from about <0.1 to 2% (Hess &
In the current work, further examination of the ash content of one of the samples, CPI,C4,
(over 90%) as well as
ZnO. The coloured areas of the images below (Figure 4.5) highlight the dense distribution of
Si, the sparse to moderate distribution of Zn and the sparse distribution of Fe.
4 a) without distribution b) showing Si distribution c) showing
was also verified by the FTIR spectroscopy. Figure 4.6 presents the
Even though the transmittance was low due to the dominance of the

Chapter 4 Conventional Thermal Pyrolysis
85
carbon (which permitted low amount of light to go through the sample disk), a main band
with peak at ~1110 cm-1 was identified and can be attributed to the asymmetrical stretching
vibrations of silicon-oxygen covalent bonds Si–O–Si and Si–O–R (Al-Oweini & El-Rassy,
2009; Gendron-Badou et al., 2003). The peak at ~470 cm-1 can be due to the bending modes
of silicon-oxygen covalent bonds. The small peak at around 810 cm-1 is possibly due to Si–
O–Si symmetric stretching vibration. There is no strong band in the range of 910 – 830 cm-1,
expected from the Si–O stretching for Si–OH (Stuart, 1996) or it is overlapped by the main
band at 1100 cm-1. The weak band at around 1620 cm-1 could be due to H-OH bending
vibration of H2O molecules adsorbed on KBr or on the char if there are available surface
silanol groups (Al-Oweini & El-Rassy, 2009; Gendron-Badou et al., 2003). The very minor
broad band that peaks at 3450 cm-1 can be due to the presence of an –OH group either of
hydrogen-bonded water molecules or surface silanols hydrogen-bonded to molecular water
(Al-Oweini & El-Rassy, 2009). Most silanol groups in silica materials are removed when
they are exposed to temperatures above 400 – 450°C; above 750°C only free, unpaired SiOH
groups are present in minor concentrations and are nearly all removed at around 1000°C (Iler,
1979).
Figure 4.6. FTIR spectrum of CPI,C4
The presence of a large amount of inorganic material in the char is expected considering the
low carbon content of sample C (60.1%, Table 3.4). Carbon content is inversely proportional
to ash content (Correlation = -0.94). Hydrogen content has been reduced to less than 1%
(apart from CPI,C6 and CPI,C9) signifying the increase in aromaticity of the carbon as the
crumb is pyrolysed. Nitrogen is present in less than 0.2%.
5
10
15
20
25
30
35
40
2000 4000
Wavenumbers (cm-1)
Tra
nsm
itta
nce
(%
)
1110
470 1620
3450
810

Chapter 4 Conventional Thermal Pyrolysis
86
pH-values of carbon blacks are usually recorded by measuring the pH of the slurry of carbon
black and water. A different method was employed in this research as described in Section
4.3.2.1. Fabish & Schleifer (1984) measured the pH values of the slurries and their clear
supernatent liquid obtained after centrifuging the slurry and found their values equal. The pH-
value was recorded immediately after filtration as the readings are expected to drift over a
long interval due to dissolution of atmospheric carbon dioxide.
The pH-values of the chars ranged between 7.71 and 9.15. Alkaline pH values are also
observed for furnace carbon black grades with low concentration of oxygen complexes and
very small amount of water soluble salts (Cabot Corporation, 2012).
The pH-values give an indication of the chemical activity of the carbons. The chemical
activity of carbons is mainly a consequence of the heteroatoms present in the surface of the
carbons, the most important being oxygen (Boehm, 1994). Several different types of surface
oxides can be present in carbons, giving them acidic or basic properties. These include
carboxyls, carboxylic anhydrides, carboxylic acids, lactones, phenols, hydroquinones,
quinines, and neutral groups containing one or two oxygens (acidic properties) and γ-pyrone-
like structures (basic properties) (Wang et al., 2000; Boehm, 1994; Leon y Leon et al., 1992).
In the case of the chars generated in this study the pH is also likely to be affected by the high
ash presence.
The BET surface areas of the chars ranged between 101.1 – 128.6 m2/g apart from CPI,C6
whose surface area was only 43.4 m2/g. These results were obtained by applying the BET
equation in the region p/p0 = 0.05 – 0.24 where linear sections with r2 = 1 were obtained.
The isotherm plots of CPI,C3 (128.6 m2/g), CPI,C4 (101.1 m2/g) and CPI,C6 are presented in
Figure 4.7.

Chapter 4 Conventional Thermal Pyrolysis
87
Figure 4.7. Adsorption/Desorption isotherms of CPI,C3, CPI,C4 and CPI,C6
All nitrogen adsorption/desorption isotherms were similar to each other, though CPI,C6
showed much lower adsorption capacities. This has been observed by San Miguel et al.
(1998) from transition samples (incomplete rubber degradation). The plots show a type IV
isotherm. Type IV isotherm has a characteristic hysteric loop. Hysteresis occurs when
desorption takes a different path than the adsorption and it is associated with capillary
condensation in mesopores (IUPAC, 1985).
Bradley et al. (1995) obtained similar adsorption/desorption isotherms for commercial carbon
black grades N330 and N100. The external surface areas obtained show correlation with the
total surface areas (r = 0.96). Commercially available carbon blacks with similar surface area
are of the N100 and N200 series (Wang et al., 2000) which offer high abrasion resistance and
are easy to process. However, as it will be discussed in Chapter 6, the chars generated
resemble lower grade carbon blacks, such as N772 (surface area = 32 m2/g), when applied in
rubber formulations.
4.3.3.2 Influence of parameters
The influence of the process parameters were investigated with regard to the carbon content,
surface area and pH value for all samples with the exception of CPI,C6 (as this sample had not
been completely pyrolysed), hence it was excluded from the model application. As this was
0
50
100
150
200
250
300
350
400
0 0.2 0.4 0.6 0.8 1
Vo
lum
e A
dso
rbed
(cm
3/g
)
p/p0
CPI,C3 CPI,C4 CPI,C6
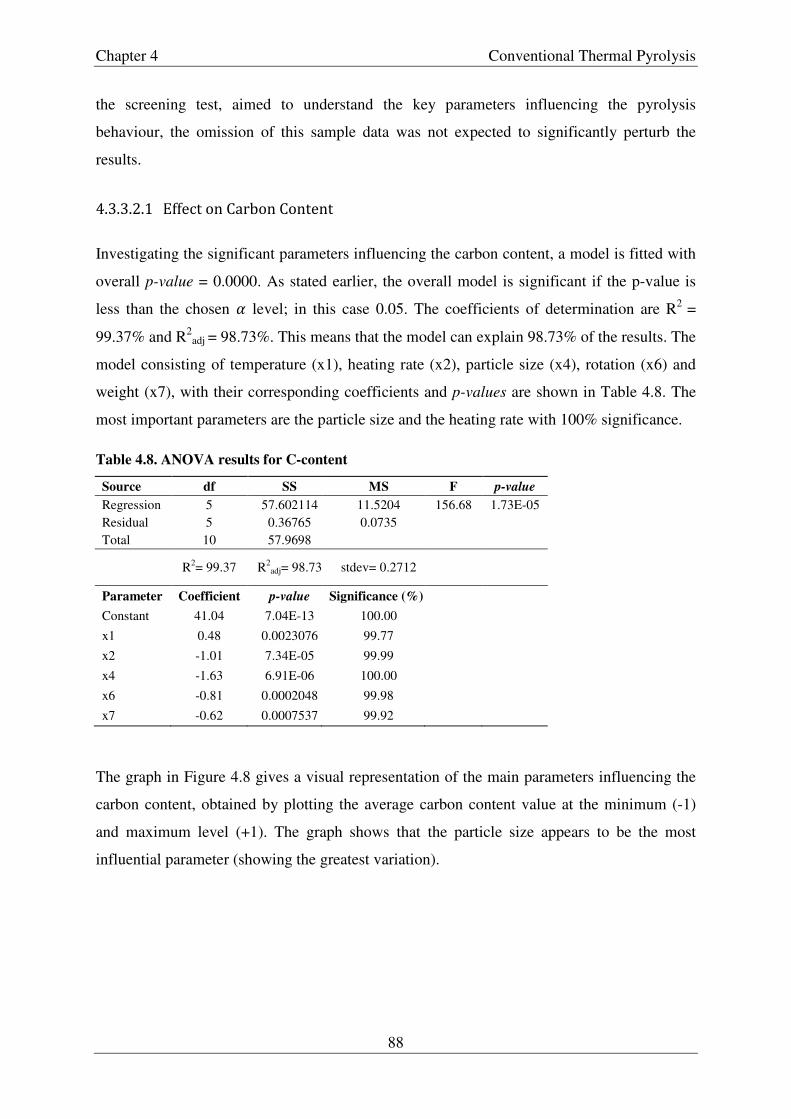
Chapter 4 Conventional Thermal Pyrolysis
88
the screening test, aimed to understand the key parameters influencing the pyrolysis
behaviour, the omission of this sample data was not expected to significantly perturb the
results.
4.3.3.2.1 Effect on Carbon Content
Investigating the significant parameters influencing the carbon content, a model is fitted with
overall p-value = 0.0000. As stated earlier, the overall model is significant if the p-value is
less than the chosen O level; in this case 0.05. The coefficients of determination are R2 =
99.37% and R2adj = 98.73%. This means that the model can explain 98.73% of the results. The
model consisting of temperature (x1), heating rate (x2), particle size (x4), rotation (x6) and
weight (x7), with their corresponding coefficients and p-values are shown in Table 4.8. The
most important parameters are the particle size and the heating rate with 100% significance.
Table 4.8. ANOVA results for C-content
Source df SS MS F p-value
Regression 5 57.602114 11.5204 156.68 1.73E-05 Residual 5 0.36765 0.0735
Total 10 57.9698
R2= 99.37 R2adj= 98.73 stdev= 0.2712
Parameter Coefficient p-value Significance (%) Constant 41.04 7.04E-13 100.00
x1 0.48 0.0023076 99.77
x2 -1.01 7.34E-05 99.99
x4 -1.63 6.91E-06 100.00
x6 -0.81 0.0002048 99.98
x7 -0.62 0.0007537 99.92
The graph in Figure 4.8 gives a visual representation of the main parameters influencing the
carbon content, obtained by plotting the average carbon content value at the minimum (-1)
and maximum level (+1). The graph shows that the particle size appears to be the most
influential parameter (showing the greatest variation).

Chapter 4 Conventional Thermal Pyrolysis
89
Figure 4.8. Graphical representation of the main effects influencing the carbon content
The influence of particle size in pyrolysis processes has been a subject of investigation by
various authors especially for its role in the transport effects with respect to pyrolysis rate.
Galan & Smith (1985), Encinar et al. (2000) and Gonzales et al. (2001) summarized these
transport effects for pyrolysis on a fixed reactor to (i) intraparticle transport, which depends
on particle size, (ii) particle to fluid transport – which is affected by particle size and nitrogen
flow, and (iii) interparticle transport which is influenced by the sample masses, i.e. the
number of layers of particles. In the current study, the last two effects would also be affected
by the rotational speed of the vessel.
For particle sizes between 0.2 mm and 1.6 mm, Gonzales et al. (2001) did not observe any
influence on the process rate, though the increase in particle size was expected to cause
greater temperature gradients inside the particle resulting in more secondary reactions which
would lead to higher carbon content. In the present case, the opposite is observed. This is in
agreement with the findings of Mui et al. (2010) who also observed that the carbon content in
chars from finer particle precursors was higher. Mui et al. attributed this “... to the tortuous
diffusion path between finer particles, which increased the residence time of the volatiles
involved in secondary reactions”. This would favour formation of carbon deposits over the
surface and increase the carbon content. Senneca et al. (1999) further pointed out that “...
carbon black in tyre rubber is likely to act as a nuclei source around which coherent solid
carbon grows by cyclisation and/or cross-linking and affects the yields of char”.
39
39.5
40
40.5
41
41.5
42
42.5
43
43.5
-1 -0.5 0 0.5 1
Carb
on
co
nte
nt
(%)
Coded Values
Temperature
Heating Rate
Particle size
Rotation
Weight

Chapter 4 Conventional Thermal Pyrolysis
90
Gavalas (1982) who investigated coal pyrolysis pointed out that care must be taken when
interpreting results concerning the influence of particle size as there is a chance there is a
difference in compositions between different ranges. With the possible variation in rubber
formulation between makers, similar effects could be observed for tyres.
Another important parameter is the heating rate. The higher the heating rate, the lower the
carbon content observed. As shown in Table 4.7 higher carbon content is observed at the
conditions where secondary reactions are favoured – in this case the slow heating rate (Miura
et al., 2004).
4.3.3.2.2 Effect on Surface area
Statistical analysis of the BET results was carried out. A model consisting of temperature
(x1), heating rate (x2) and nitrogen flow (x5), as well as the interactions of temperature with
heating rate (x1*x2) and heating rate with nitrogen flow (x2*x5) as parameters gave a good
overall model (p-value = 0.0089) with R2 and R2adj of 92.02% and 84.04% respectively. This
means that the model can explain 84.04% of the results. The most significant parameters are
summarised in Table 4.9.
Table 4.9. ANOVA results for surface area
Source df SS MS F p-value
Regression 5 639.299 127.8598 11.533 8.90E-03 Residual 5 55.4332 11.0866
Total 10 694.7322
R2= 92.02 R2
adj= 84.04 stdev= 3.3297
Parameter Coefficient p-value Significance (%) Constant 115.62 1.05E-09 100.00
x1 -4.44 0.0084312 99.16
x2 3.43 2.05E-02 97.95
x5 4.03 0.01 98.76
x1*x2 -1.80 1.50E-01 85.05*
x2*x5 -2.42 0.07 93.00*
* Lower than 95% significance was accepted due to the overall model’s and the other individual parameters’ high significance
The main effects are illustrated in Figure 4.9. The interaction effects are illustrated by
plotting for example the average surface area versus the heating rate at -1 and +1 levels, for
each temperature setting (-1 and +1) and connecting these points for the low and high
temperature settings to give the two lines as shown in Figure 4.10 (Myers et al., 2009).

Chapter 4 Conventional Thermal Pyrolysis
91
Figure 4.9. Graphical representation of the main effects influencing surface area
The most significant parameter was temperature with 100% significance. Mui et al. (2010)
pointed out that temperature is essential to the breakdown of the linkage between polymeric
components to the formation of the new pores through rearrangement of carbon atoms. This
rearrangement leads to porosity development.
It can be observed from Figure 4.9 that the temperature effect is negative, indicating that for
the range studied, higher temperatures give lower BET surface areas. However, Williams et
al. (1990) observed that surface areas increased with both the increase in temperature and
heating rates for chars generated at 420°C, 600°C and 720°C end temperatures using 5°C/min,
20°C/min, 40°C/min and 80°C/min heating rates. In these experiments chars were held at the
end temperature for a minimum of 2 hours or until no further significant release of gas was
observed. This means the surface areas could have been affected by this irregular but
unaccounted dwell time. Mui et al. (2010), conversely, observed a decrease in surface area at
end temperature 500°C (156 m2/g) to 700°C (96 m2/g) which was attributed to the opening
and widening of more pores, transforming micropores to mesopores, as a result of the
continuous release of volatiles and the collapse of pore walls.
104
109
114
119
124
-1 -0.5 0 0.5 1
Su
rface A
rea (
m2/g
)
Coded Values
Temperature
Heating Rate
Nitrogen Flow
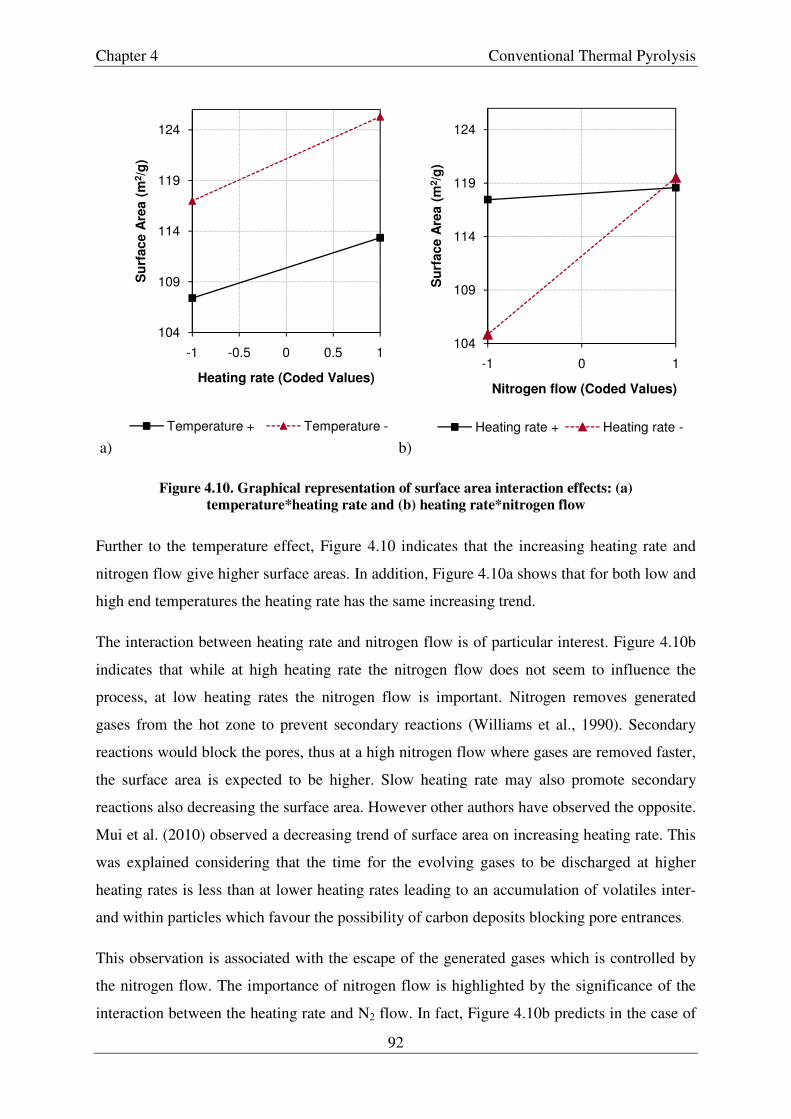
Chapter 4 Conventional Thermal Pyrolysis
92
a) b)
Figure 4.10. Graphical representation of surface area interaction effects: (a)
temperature*heating rate and (b) heating rate*nitrogen flow
Further to the temperature effect, Figure 4.10 indicates that the increasing heating rate and
nitrogen flow give higher surface areas. In addition, Figure 4.10a shows that for both low and
high end temperatures the heating rate has the same increasing trend.
The interaction between heating rate and nitrogen flow is of particular interest. Figure 4.10b
indicates that while at high heating rate the nitrogen flow does not seem to influence the
process, at low heating rates the nitrogen flow is important. Nitrogen removes generated
gases from the hot zone to prevent secondary reactions (Williams et al., 1990). Secondary
reactions would block the pores, thus at a high nitrogen flow where gases are removed faster,
the surface area is expected to be higher. Slow heating rate may also promote secondary
reactions also decreasing the surface area. However other authors have observed the opposite.
Mui et al. (2010) observed a decreasing trend of surface area on increasing heating rate. This
was explained considering that the time for the evolving gases to be discharged at higher
heating rates is less than at lower heating rates leading to an accumulation of volatiles inter-
and within particles which favour the possibility of carbon deposits blocking pore entrances.
This observation is associated with the escape of the generated gases which is controlled by
the nitrogen flow. The importance of nitrogen flow is highlighted by the significance of the
interaction between the heating rate and N2 flow. In fact, Figure 4.10b predicts in the case of
104
109
114
119
124
-1 -0.5 0 0.5 1
Su
rface A
rea (
m2/g
)
Heating rate (Coded Values)
Temperature + Temperature -
104
109
114
119
124
-1 0 1
Su
rface A
rea (
m2/g
)
Nitrogen flow (Coded Values)
Heating rate + Heating rate -

Chapter 4 Conventional Thermal Pyrolysis
93
high nitrogen flow that low heating rate does marginally produce chars with higher surface
area as observed by Mui et al. (2010). However, the reverse occurs when low nitrogen flow is
used – this highlights the importance of experiments designed with the factors varied
together. The differences in observations between authors may be a result of the different
reactor shapes and characteristics, which can influence heat transfer, volatile losses and gas
flows.
San Miguel (1998) also examined pyrolysis using three different particle sizes (i) powdered
sample < 0.42 mm, (ii) granular sample < 2 mm and (iii) cut sample < 9.5 mm. Surface area
analysis showed similar adsorption/desorption isotherms but the powdered sample had
greater adsorption capacities at p/p0 < 0.90, implying that the smaller the precursor the larger
the surface area. In the current study the particle size did not show up as one of the three
important parameters – possibly because of the lower range of particle sizes used. However
in San Miguel’s study, sample (i) and (ii) came from a different supplier than sample (iii) and
for the first two samples there is no information if they were shredded from the same
feedstock; the differences in surface area could be because of differences in composition.
4.3.3.2.3 Effect on pH-value
Statistical analysis on the effect of the process variables on the pH-value was carried out.
Important factors composing a model with overall p-value = 0.0003, R2 = 98.11% and R2adj =
96.21% were temperature (x1), heating rate (x2), dwell time (x3), rotation (x6) and weight of
sample (x7). The most important factor with the most pronounced effect as shown in Figure
4.11 is temperature.
Table 4.10. ANOVA results for pH-value
Source df SS MS F p-value
Regression 5 2.4745 0.4949 51.811 3.00E-04 Residual 5 0.0478 0.0096
Total 10 2.5223
R2= 98.11 R2
adj= 96.21 stdev= 0.0977
Parameter Coefficient p-value Significance
(%) Constant 8.06 1.47E-11 100.00
x1 0.40 4.66E-05 100.00
x2 -0.16 3.45E-03 99.65
x3 0.24 5.63E-04 99.94
x6 0.11 0.0155355 98.45
x7 -0.10 0.0230549 97.69

Chapter 4 Conventional Thermal Pyrolysis
94
Roy et al. (1995) also observed an increase in the pH-values of aqueous suspensions of tyre
pyrolysis chars on increasing the temperature. Studebaker (1957) and Bradley et al. (1995)
had measured pH-values of commercial carbon blacks and correlated it to the surface oxygen
level – with increasing surface oxygen the pH-values decrease.
Figure 4.11. Graphical representation of the main effects influencing pH-value
The surface oxygen groups decompose under pyrolysis conditions (heating in inert
atmosphere) by releasing CO or CO2 at different temperatures depending on their stability
(Burg & Cagniant, 2008). Temperature–programmed desorption (TPD) methods have been
employed to monitor the amount of CO or CO2 desorbed and assigned to the respective
surface oxides. A summary by Figueiredo et al. (1999) is shown in Figure 4.12.
7.7
7.8
7.9
8
8.1
8.2
8.3
8.4
8.5
-1 -0.5 0 0.5 1
pH
-valu
e
Coded Values
Temperature
Heating Rate
Dwell Time
Rotation
Weight

Chapter 4 Conventional Thermal Pyrolysis
95
~�`8N��L'� ���� F ~��I P\h ������� ~�� �100 400°~� ����N�E ���� n ~ � �� n � P\h ������� ~�� �190 627°~� ��E�NL ���� F �I P\h ������� ~� �600 980°~�
�_'�N�E ���� n ~ � � P\h ������� ~� �600 980°~� n ~ � � �
�����`'�E ���� � � n ~ � � P\h ������� ~� " ~�� �350 627°~� ���E` ���� F ~ � ~ F P\h ������� ~� �700°~�
Figure 4.12. Figueiredo’s summary of decomposition temperatures of carbon surface groups by
TPD studies
Thus once the oxygen is removed, the alkalinity observed is attributed to the Lewis base
character of the aromatic π-electrons of the basal planes of the carbon (Boehm, 1994). Lewis
bases are electron pair donors and are likely to absorb hydronium ions in water so that the
excess of hydroxyl ions remaining would give a basic pH (Studebaker, 1957) according to
Equation 4.10 (Fabish & Schleifer, 1984).
2I�� � I��� " �IA }��� ~��I���� " �IA (Eq. 4.10)
� was defined by Fabish & Schleifer (1983) “... as the idealized graphitized surface platelet
having maximum itinerate π-electrons”. Oxygen chemisorbed on the carbons surface results
in localisation of the mobile π-electrons towards the periphery of the basal planes, decreasing
Lewis basicity.
The other parameters found important could be linked to the temperature factor and their
influence on how the heat is transferred. Fast rotation, for example, lowers the heating rate
because it reduces the contact time.

Chapter 4 Conventional Thermal Pyrolysis
96
4.3.4 Conclusions
Car passenger tyre crumb was pyrolysed in experiments using the Plackett-Burman design to
formulate the experiments used to generate chars (38.2 – 49.1 wt.%), oils (44.1 – 53.5 wt.%)
and gas (6.4 – 9.4 wt.%) at yields similar to those observed by other authors. Under the
conditions used, one char (CPI,C6) was significantly under-pyrolysed (transmittance of
toluene extracts = 0%) and was excluded from the model. The chars were alkaline with pH-
values of 7.75 – 9.15, had high ash content of between 52.6 and 59.9% (CPI,C6 had 45.6%)
and surface areas ranging from 101.1 – 128.6 m2/g (CPI,C6: 43.4 m2/g).
The parameters that had the most influence upon the char properties examined further –
carbon content, surface area and pH-value – at the selected minimum and maximum ranges
were the temperature and the heating rate. These parameters were therefore selected to be
used in further experiments described in Part II (Section 4.4) of this chapter along with dwell
time (to ensure that compete pyrolysis was achieved).
The Plackett-Burman design used was found to be very suitable for identifying the most
important variables in a screening test with a reduced number of experiments. However, it
must be emphasised, that this design has its disadvantages, especially compared to the
general fractional factorial design which would have resulted in this case in 16 experiments,
as they are known to produce ‘messy aliases’ (Montgomery, 2005). Furthermore, the removal
of one point due to the incomplete pyrolysis of CPI,C6, introduced further uncertainty in the
model, but was necessary as its inclusion created a significant distortion of the data.

Chapter 4 Conventional Thermal Pyrolysis
97
4.4 Part II – Fitting a quadratic model
4.4.1 Introduction
The screening test resulted in linear model relationships, identifying temperature and heating
rate as the most influential parameters on the characteristics of the char obtained. In this
section the possibility of fitting the process parameters into a quadratic model was
investigated. To exclude the possibility of having incomplete pyrolysis occurring again, along
with temperature and heating rate, a third parameter, dwell time was added to the model.
There is limited literature reporting the use of response surface methodology in studies on
waste tyre pyrolysis. Barbooti et al. (2004) studied the influence of pyrolysis temperature
(400 – 460°C), nitrogen flow rate (0.2 – 0.5 m3/hour and particle size (2 – 20 mm) to find the
optimum conditions for the production of the maximum yields of pyrolytic carbon and oil.
Miranda et al. (2010) examined the influence of temperature, reaction time and pressure on a
mixture of tyres (30% w/w) and plastics (70% w/w) to optimise the oil yield. The current
work is interested in the quality of the products rather than the yields.
4.4.2 Experimental procedure
4.4.2.1 Box-Behnken design
To fit a second order model in the potential relationship between the variables and the
responses, at least three levels of each design variable is necessary. Ideally to account for all
possible combinations, a full three level factorial design would be required. For 3 variables,
this implies 3¡ experiments, i.e 27 experiments. There are several designs used in RSM that
allow the investigation of 3 variables but with fewer experiments. One of them is the Box-
Behnken design. This design, based on the three-level incomplete factorial, can be described
by a cube having a centre point, to account for curvature, and the points in the middle of the
edges (Figure 4.13) (Ferreira et al., 2007).
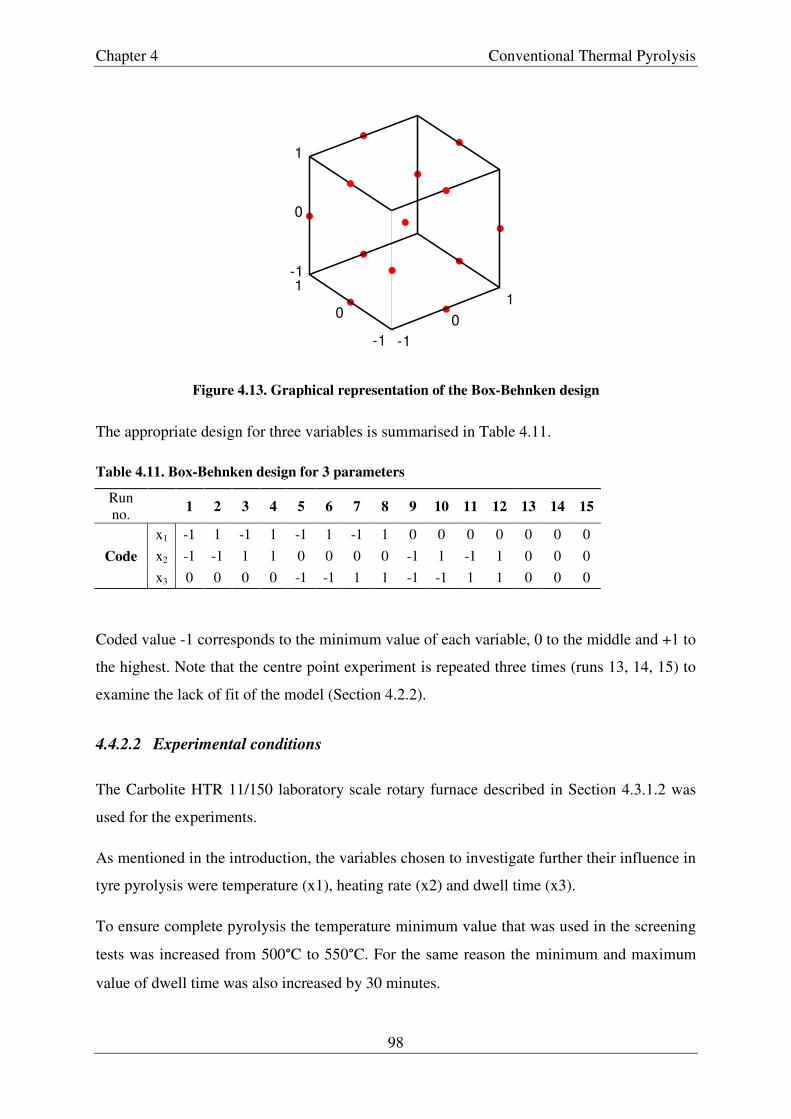
Chapter 4 Conventional Thermal Pyrolysis
98
Figure 4.13. Graphical representation of the Box-Behnken design
The appropriate design for three variables is summarised in Table 4.11.
Table 4.11. Box-Behnken design for 3 parameters
Run no.
1 2 3 4 5 6 7 8 9 10 11 12 13 14 15
Code
x1 -1 1 -1 1 -1 1 -1 1 0 0 0 0 0 0 0 x2 -1 -1 1 1 0 0 0 0 -1 1 -1 1 0 0 0 x3 0 0 0 0 -1 -1 1 1 -1 -1 1 1 0 0 0
Coded value -1 corresponds to the minimum value of each variable, 0 to the middle and +1 to
the highest. Note that the centre point experiment is repeated three times (runs 13, 14, 15) to
examine the lack of fit of the model (Section 4.2.2).
4.4.2.2 Experimental conditions
The Carbolite HTR 11/150 laboratory scale rotary furnace described in Section 4.3.1.2 was
used for the experiments.
As mentioned in the introduction, the variables chosen to investigate further their influence in
tyre pyrolysis were temperature (x1), heating rate (x2) and dwell time (x3).
To ensure complete pyrolysis the temperature minimum value that was used in the screening
tests was increased from 500°C to 550°C. For the same reason the minimum and maximum
value of dwell time was also increased by 30 minutes.
-1
0
1
-1
0
1-1
0
1

Chapter 4 Conventional Thermal Pyrolysis
99
The complete conditions of the three variables, temperature, heating rate and dwell time, are
summarised in Table 4.12. Significant effects of the factors and their interaction effects were
tested at 95% confidence interval.
300 g of sample E of particle size between 1 – 2 mm was used for all the experiments. The
reaction vessel was set to rotate at 10 rpm, as adopted from the work of San Miguel (1999).
The system was purged with nitrogen gas at a constant flow of 500 ml/min, from 20 minutes
prior to the start of the experiment until its end and the furnace had cooled down.
In addition, crumb from sample D and commercial carbon black grade N772 were pyrolysed
at the centre point. The experiments were performed randomly as noted in the Run Order
column but the IDs of the generated outcomes were assigned using the standard order i.e.
CPII,E1 identifies the experiment with the conditions listed in standard order 1. CPII,E stands
for Conventional Pyrolysis, part II, using crumb sample E.
Table 4.12. Part II design parameters
Std
order Run
order ID
Temp.
(°C)
Heating
rate
(°C/min)
Dwell
time
(min)
1 7 CPII,E1 550 2 75
2 3 CPII,E2 700 2 75
3 8 CPII,E3 550 10 75
4 9 CPII,E4 700 10 75
5 2 CPII,E5 550 6 30
6 11 CPII,E6 700 6 30
7 10 CPII,E7 550 6 120
8 5 CPII,E8 700 6 120
9 6 CPII,E9 625 2 30
10 1 CPII,E10 625 10 30
11 13 CPII,E11 625 2 120
12 4 CPII,E12 625 10 120
13 14 CPII,E13 625 6 75
14 12 CPII,E14 625 6 75
15 15 CPII,E15 625 6 75
16 16 CPII,D16 625 6 75
17 17 CPII,N77217 625 6 75
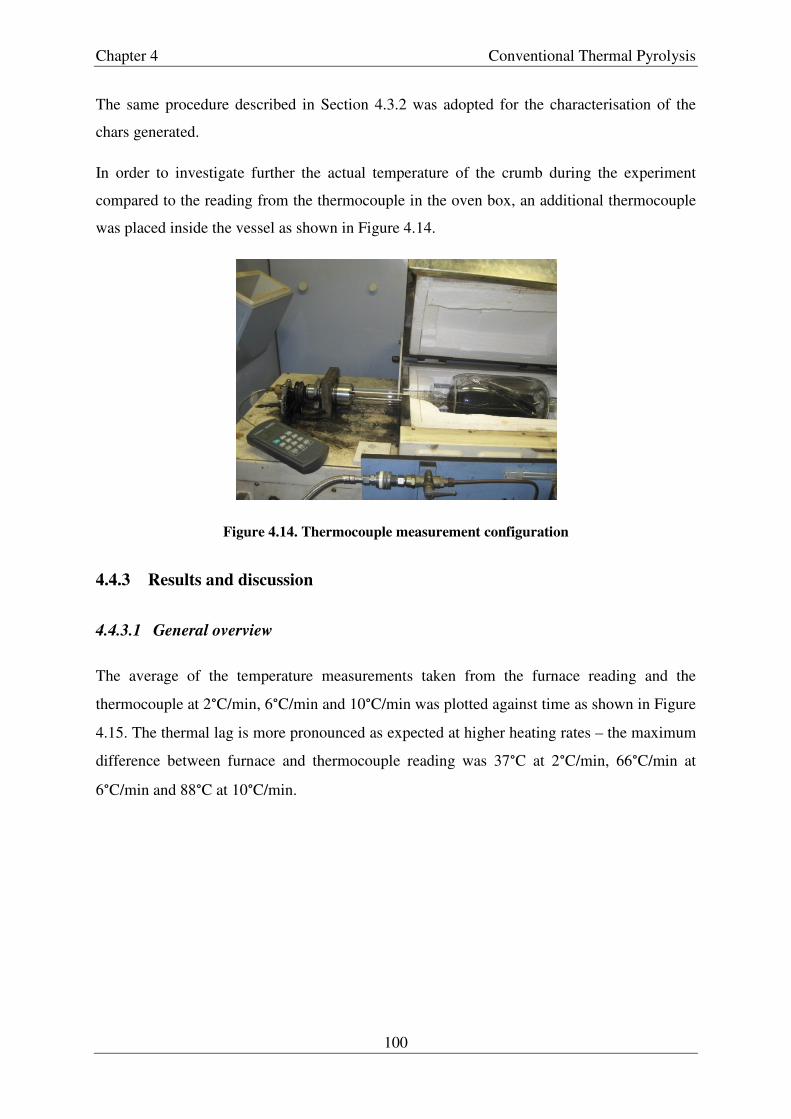
Chapter 4 Conventional Thermal Pyrolysis
100
The same procedure described in Section 4.3.2 was adopted for the characterisation of the
chars generated.
In order to investigate further the actual temperature of the crumb during the experiment
compared to the reading from the thermocouple in the oven box, an additional thermocouple
was placed inside the vessel as shown in Figure 4.14.
Figure 4.14. Thermocouple measurement configuration
4.4.3 Results and discussion
4.4.3.1 General overview
The average of the temperature measurements taken from the furnace reading and the
thermocouple at 2°C/min, 6°C/min and 10°C/min was plotted against time as shown in Figure
4.15. The thermal lag is more pronounced as expected at higher heating rates – the maximum
difference between furnace and thermocouple reading was 37°C at 2°C/min, 66°C/min at
6°C/min and 88°C at 10°C/min.
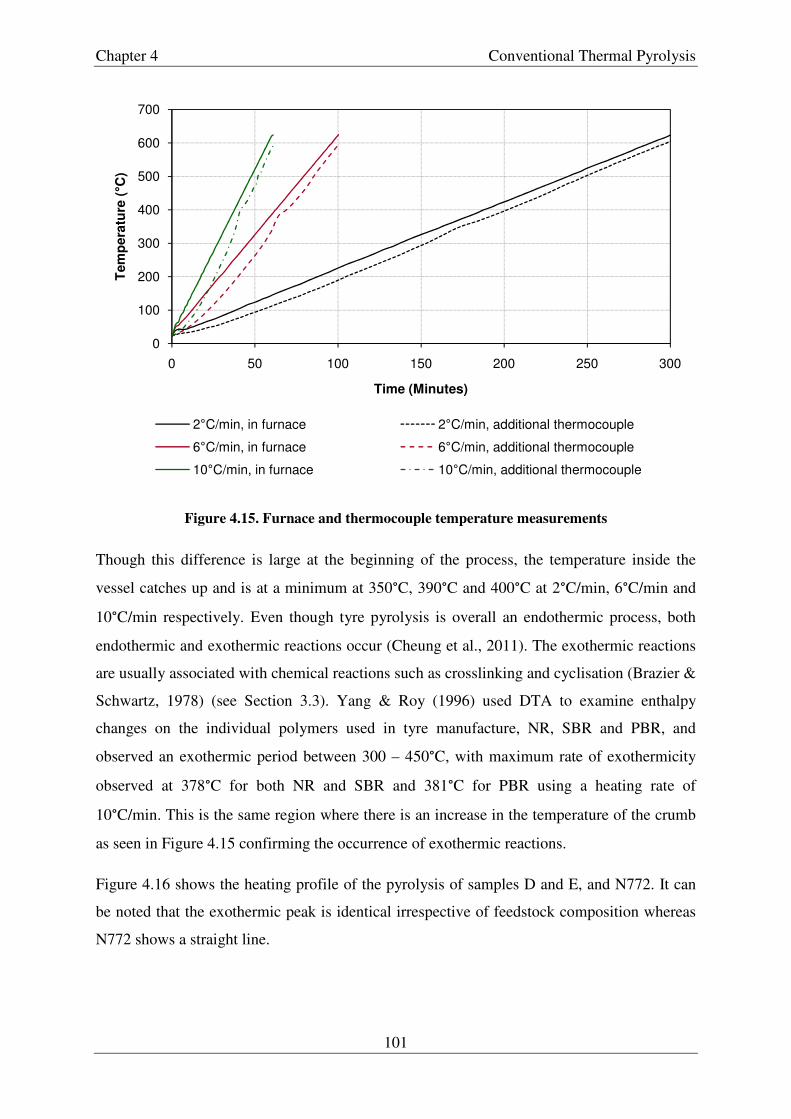
Chapter 4 Conventional Thermal Pyrolysis
101
Figure 4.15. Furnace and thermocouple temperature measurements
Though this difference is large at the beginning of the process, the temperature inside the
vessel catches up and is at a minimum at 350°C, 390°C and 400°C at 2°C/min, 6°C/min and
10°C/min respectively. Even though tyre pyrolysis is overall an endothermic process, both
endothermic and exothermic reactions occur (Cheung et al., 2011). The exothermic reactions
are usually associated with chemical reactions such as crosslinking and cyclisation (Brazier &
Schwartz, 1978) (see Section 3.3). Yang & Roy (1996) used DTA to examine enthalpy
changes on the individual polymers used in tyre manufacture, NR, SBR and PBR, and
observed an exothermic period between 300 – 450°C, with maximum rate of exothermicity
observed at 378°C for both NR and SBR and 381°C for PBR using a heating rate of
10°C/min. This is the same region where there is an increase in the temperature of the crumb
as seen in Figure 4.15 confirming the occurrence of exothermic reactions.
Figure 4.16 shows the heating profile of the pyrolysis of samples D and E, and N772. It can
be noted that the exothermic peak is identical irrespective of feedstock composition whereas
N772 shows a straight line.
0
100
200
300
400
500
600
700
0 50 100 150 200 250 300
Tem
pera
ture
(°C
)
Time (Minutes)
2°C/min, in furnace 2°C/min, additional thermocouple
6°C/min, in furnace 6°C/min, additional thermocouple
10°C/min, in furnace 10°C/min, additional thermocouple

Chapter 4 Conventional Thermal Pyrolysis
102
Figure 4.16. Comparison of thermocouple measurements for different samples at 6°C/min
All chars had yields of 40.3 ± 0.6% as complete pyrolysis was ensured. CHN, ash content and
toluene extractable transmission results are summarised in Table 4.13. Only one char, CPII,E3,
that was generated at 550°C, 10°C/min and 75 min dwell time had some oils still present
(93.3%).
0
100
200
300
400
500
600
700
0 20 40 60 80 100
Tem
pera
ture
(°C
)
Time (Minutes)
Furnace Thermocouple Sample D Sample E N772

Chapter 4 Conventional Thermal Pyrolysis
103
Table 4.13. Char characterisation results of Part II experiments (conventional pyrolysis)
Ash
Content
(%)
Transmission
of Toluene
Extracts (%)
C
(%) H
(%) N
(%)
Surface Area (m2/g)
pH-
value BET Meso & Macropore
CPII,E1 44.11 99.8 51.77 <0.1 <0.1 112.5 91.0 7.80
CPII,E2 43.89 99.4 52.99 <0.1 <0.1 94.2 79.3 8.40
CPII,E3 43.45 93.3 52.61 <0.1 <0.1 105.9 91.9 7.84
CPII,E4 43.90 99.7 53.61 <0.1 <0.1 97.8 84.1 8.31
CPII,E5 44.79 98.6 50.79 <0.1 <0.1 113.3 94.1 7.81
CPII,E6 47.01 99.5 50.21 <0.1 <0.1 102.6 88.0 8.60
CPII,E7 44.00 99.6 51.86 <0.1 <0.1 113.3 92.6 7.81
CPII,E8 44.00 99.7 52.93 <0.1 <0.1 98.9 86.1 8.55
CPII,E9 45.74 99.5 51.14 <0.1 <0.1 109.8 87.7 7.92
CPII,E10 44.03 98.3 53.12 <0.1 <0.1 105.7 90.8 7.90
CPII,E11 45.45 99.2 51.39 <0.1 <0.1 106.7 87.2 8.27
CPII,E12 44.77 99.0 52.35 <0.1 <0.1 103.9 88.5 8.07
CPII,E13 46.31 99.4 50.88 <0.1 <0.1 102.5 84.9 8.13
CPII,E14 43.45 99.5 53.56 <0.1 <0.1 100.3 84.9 8.16
CPII,E15 45.88 99.4 55.87 <0.1 <0.1 105.7 89.1 8.07
CPII,D16 19.54 98.2 – – – 82.3 70.3 9.10
CPII,N77217 0.75 99.6 – – – 35.2 33.2 b
N772 0.33 73.3 – – – 32a 31a b
a Wang et al. (2000), b See explanation below
The pH-values of the chars were again in the alkaline region, specifically between 7.73 and
8.60 (Table 4.13). The pH-value of CPII,D16 was 9.10 compared to the 8.12 (average of
CPII,E13–15). Table 4.14 shows their differences in composition derived from EDX
measurements.
Table 4.14. CPII,E13–15 and CPII,D16 chars composition
C Ash O Mg Al Si K Ca Fe Zn SiO2 Fe2O3 ZnO
CPII,E13-15 54.8 45.2 22.8 0.2 0.3 19.5 0.0 0.1 0.0 2.0 41.8 0.0 2.6
CPII,D16 80.5 19.5 8.3 0.0 0.2 6.6 0.1 0.5 0.1 3.1 14.2 0.1 3.8
Though CPII,E13-15 has more oxygen, this is probably bound with the other elements present
to form oxides such as SiO2 and ZnO. Alkali elements that can contribute to the alkalinity are
not present in significant amounts, so the difference in pH-values of CPII,D16 and CPII,E13–15
might be because CPII,D16 has a larger carbon percentage, so with the removal of the oxygen

Chapter 4 Conventional Thermal Pyrolysis
104
from its surface upon heating, there are more sites that can act as Lewis bases. In addition the
SiO2, present in CPII,E13–15 (41.8%), might absorb the freed OH- (Eq. 4.11).
*'�� M! " �IA ¢ *'� �I!�A " I�� (Eq. 4.11)
Commercial carbon black N772 and CPII,N77217 were also tested under the same conditions.
The values recorded changed within minutes to acidic ones and duplicate measurements gave
ranges of values between 8.46 and 6.72. Also the filtrate volume was much less than that
recovered from the chars, indicating the hydrophilicity of these carbons. This implied that
these carbons are more prone to oxygen chemisorptions.
The surface area of the char from sample D was 82.3 m2/g compared to the average of runs
13 – 15 of 102.8 m2/g, highlighting again the significance of the composition of rubber to the
surface area formation. The presence of inorganics might have a contribution– the surface
area of Ultrasil® VN3, a form of precipitated silica used as reinforcement filler in the rubber
industry is 180 m2/g (Evonik Industries, 2012). The surface area of CPII,N77217 is expected to
increase as volatile content (1.2%) was removed by the pyrolysis process, that could hinder
the pores. The removal is evident from the transmission of toluene extracts which increased
from 73.3% to 99.6% post-pyrolysis.
4.4.3.2 Influence of parameters
4.4.3.2.1 Effect on Carbon content
An attempt to fit a quadratic model to the carbon content values was unsuccessful, as the
model showed no evidence of regression (p-value = 0.8356 > 0.05) (Table 4.15). This might
be because by changing the conditions – increasing the end temperature and dwell time
minimum – therefore achieving complete pyrolysis, carbon content values become similar
provided the feedstock is the same.

Chapter 4 Conventional Thermal Pyrolysis
105
Table 4.15. ANOVA results for carbon content value
ANOVA for quadratic model Source df SS MS F p-value
Regression 9 13.5402 1.5045 0.4871 0.8356 Residual 5 15.4428 3.0886
LOF 3 2.9699 0.99 0.1587 0.9157
PE 2 12.4729 6.2364
Total 14 0.8288
R2= 46.72 R2adj= -0.4919 stdev= 1.7574
Parameter Coefficient p-value Significance
(%) Constant 53.44 0.0000 100.00
x1 0.34 0.6091 39.09
x2 0.55 0.4166 58.34
x3 0.41 0.5397 46.03
x1*x2 -0.06 0.9525 4.75
x1*x3 0.41 0.6585 34.15
x2*x3 -0.255 0.7833 21.67
x1*x1 -0.622083 0.5266 47.34
x2*x2 -0.069583 0.9423 5.77
x3*x3 -1.367083 0.1952 80.48
4.4.3.2.2 Effect on Surface area
The quadratic fit produced a model with p = 0.0044 and no evidence of lack of fit. Individual
parameters with high significance were temperature (x1), temperature with heating rate
(x1*x2) and the dwell time with dwell time (x3*x3) with coefficients all under α = 0.05. The
difference of R2 = 96.32 and R2adj= 89.68 prompt the investigation for the removal of the non-
significant terms and the re-evaluation of the model. The best fit for the overall model (p =
0.0000) was obtained using as parameters the temperature (α = 0), heating rate (α = 0.05),
dwell time (α = 0.08), temperature with heating rate (α = 0.009) and the dwell time with
dwell time (α = 0.0006). The coefficients of determination were R2 = 95.36 and R2adj = 92.78,
which means that the model can explain 92.78% of the results (Table 4.16).
Figure 4.17 shows the response of the model.
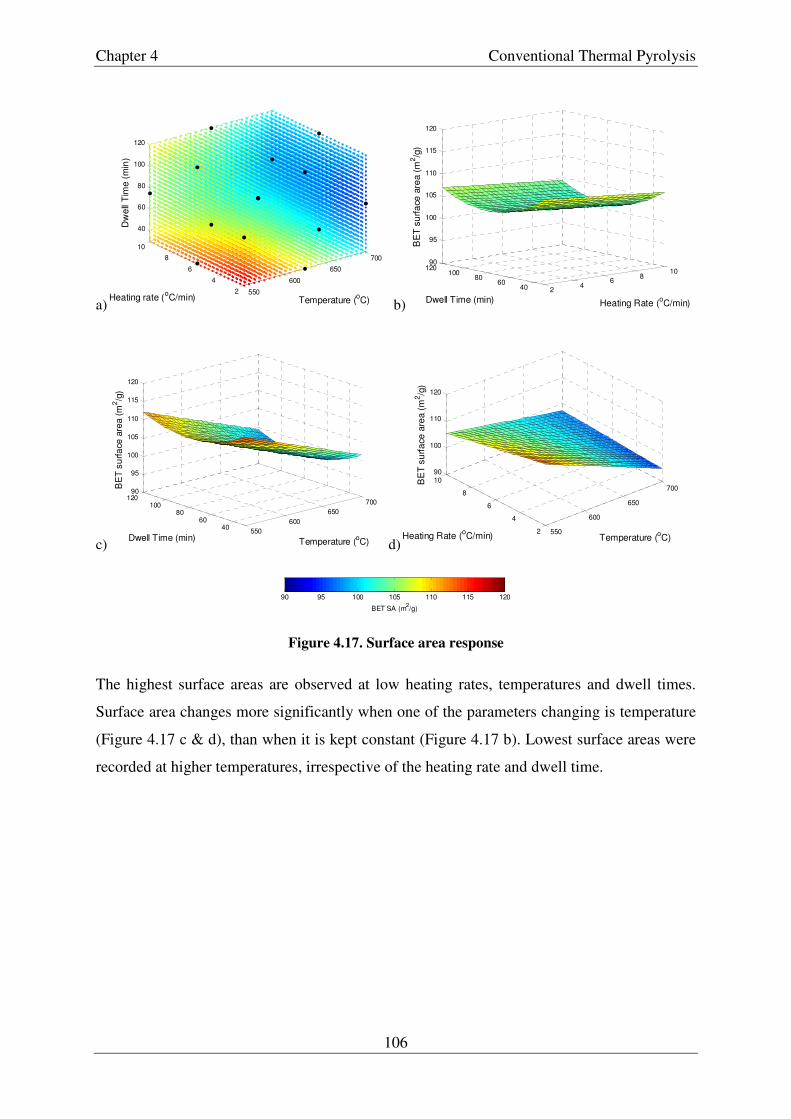
Chapter 4 Conventional Thermal Pyrolysis
106
a) b)
c) d)
Figure 4.17. Surface area response
The highest surface areas are observed at low heating rates, temperatures and dwell times.
Surface area changes more significantly when one of the parameters changing is temperature
(Figure 4.17 c & d), than when it is kept constant (Figure 4.17 b). Lowest surface areas were
recorded at higher temperatures, irrespective of the heating rate and dwell time.
550
600
650
700
2
4
6
8
10
40
60
80
100
120
Temperature (oC)Heating rate (
oC/min)
Dw
ell
Tim
e (
min
)
24
68
10
4060
80100
12090
95
100
105
110
115
120
Heating Rate (oC/min)Dwell Time (min)
BE
T s
urf
ace
are
a (
m2/g
)
550
600
650
700
4060
80100
12090
95
100
105
110
115
120
Temperature (oC)Dwell Time (min)
BE
T s
urf
ace
are
a (
m2/g
)
550
600
650
700
2
4
6
8
1090
100
110
120
Temperature (oC)Heating Rate (
oC/min)
BE
T s
urf
ace
are
a (
m2/g
)
BET SA (m2/g)
90 95 100 105 110 115 120

Chapter 4 Conventional Thermal Pyrolysis
107
Table 4.16. ANOVA results for surface area
ANOVA for quadratic model Source df SS MS F p-value
Regression 9 445.4702 49.4967 14.524 0.0044 Residual 5 17.0392 3.4078
LOF 3 2.2925 0.7642 0.1036 0.9506 PE 2 14.7467 7.3733
Total 14 462.5093
R2= 96.32
R2adj=
89.68 stdev= 1.8460
Parameter Coefficient p-value Significance
(%) Constant 102.83 0.0000 100.00
x1 -6.44 0.0002 99.98
x2 -1.24 0.1165 88.35
x3 -1.08 0.1605 83.95
x1*x2 2.55 0.0397 96.03
x1*x3 -0.92 0.3623 63.77
x2*x3 0.325 0.7391 26.09
x1*x1 0.1333333 0.8950 10.50
x2*x2 -0.366667 0.7184 28.16
x3*x3 4.0583333 0.0083 99.17
ANOVA Adjusted Source df SS MS F p-value
Regression 5 441.0318 88.2064 36.962 0.0000 Residual 9 21.4775 2.3864
LOF 7 6.7308 0.9615 0.1304 0.9828 PE 2 14.7467 7.3733
Total 14 462.5093
R2= 95.36 R2
adj= 92.78 stdev= 1.5448
Parameter Coefficient p-value Significance
(%) Constant 102.70 3.16E-17 100.00
x1 -6.44 8.97E-07 100.00
x2 -1.24 4.97E-02 95.03
x3 -1.08 8.06E-02 91.94
x1*x2 2.55 0.0092092 99.08
x3*x3 4.075 0.0006479 99.94
4.4.3.2.3 Effect on pH-value
The quadratic fit produced a model with p = 0.02 and no evidence of lack of fit at a
significance level of α = 0.05. The individual parameter with high significance was only
temperature α = 0.0007. The difference of R2 = 92.65 and R2adj = 79.42 prompted the

Chapter 4 Conventional Thermal Pyrolysis
108
investigation of the removal of the non-significant terms and the re-evaluation of the model
(Table 4.17).
Table 4.17. ANOVA results for pH-value
ANOVA for quadratic model Source df SS MS F p-value
Regression 9 0.9438 0.1049 7.0029 0.0226 Residual 5 0.0749 0.015
LOF 3 0.0707 0.0236 11.218 0.0829 PE 2 0.0042 0.0021
Total 14 1.0187
R2= 92.65 R2adj= 79.42 stdev= 0.1224
Parameter Coefficient p-value Significance
(%) Constant 8.12 0.0000 100.00
x1 0.33 0.0007 99.93
x2 -0.03 0.4706 52.94
x3 0.06 0.2326 76.74
x1*x2 -0.03 0.6180 38.20
x1*x3 -0.01 0.8462 15.38
x2*x3 -0.045 0.4951 50.49 x1*x1 0.06 0.3894 61.06 x2*x2 -0.0925 0.2061 79.39 x3*x3 0.0125 0.8521 14.79 ANOVA Adjusted Source df SS MS F p-value
Regression 2 0.8806 0.4403 38.268 0.0000 Residual 12 0.1381 0.0115
LOF 10 0.1339 0.0134 6.3749 0.1431 PE 2 0.0042 0.0021
Total 14 1.0187
R2= 86.45 R2
adj= 84.19 stdev= 0.1073
Parameter Coefficient p-value Significance
(%) Constant 8.16 1.52E-22 100.00
x1 0.33 1.85E-06 100.00
x2*x2 -0.10 1.04E-01 89.61
The best fit for the overall model (p = 0.0000) was obtained using as parameter the
temperature (α = 0). In addition, heating rate*heating rate (α = 0.10) was also added to the
model to give coefficients of determination of R2 = 86.45 and R2adj = 84.19, which means that
the model can explain 84.19% of the results.
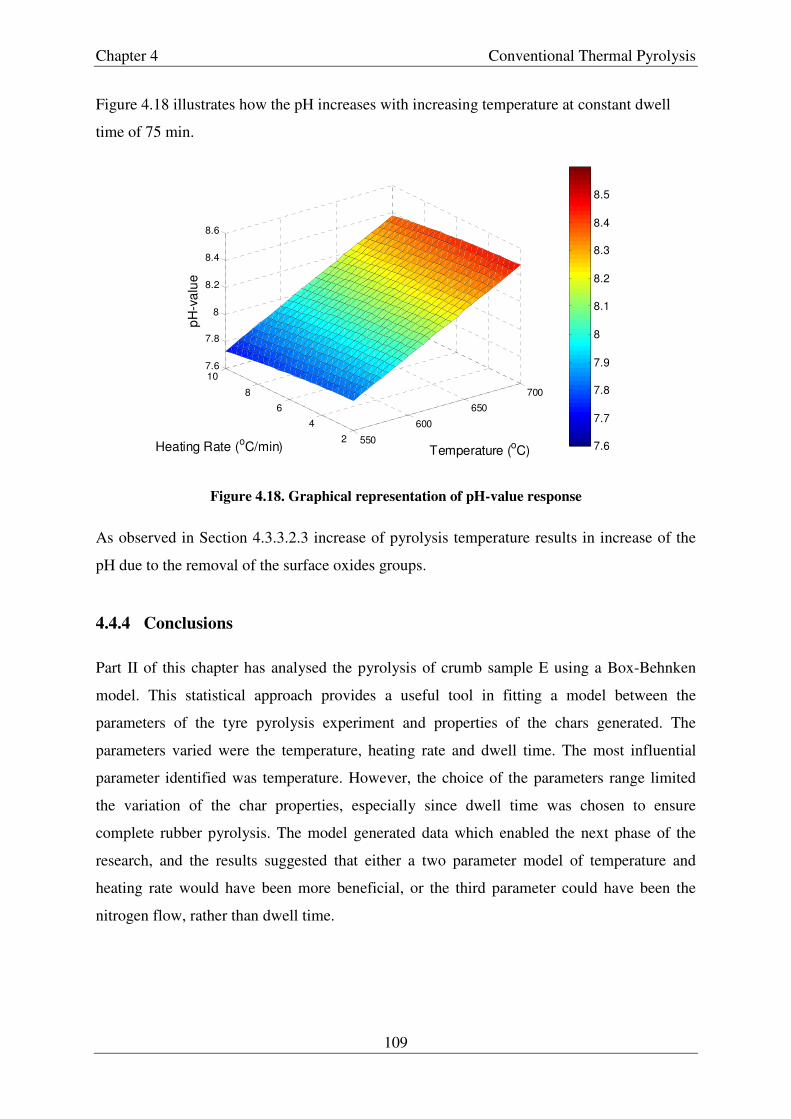
Chapter 4 Conventional Thermal Pyrolysis
109
Figure 4.18 illustrates how the pH increases with increasing temperature at constant dwell
time of 75 min.
Figure 4.18. Graphical representation of pH-value response
As observed in Section 4.3.3.2.3 increase of pyrolysis temperature results in increase of the
pH due to the removal of the surface oxides groups.
4.4.4 Conclusions
Part II of this chapter has analysed the pyrolysis of crumb sample E using a Box-Behnken
model. This statistical approach provides a useful tool in fitting a model between the
parameters of the tyre pyrolysis experiment and properties of the chars generated. The
parameters varied were the temperature, heating rate and dwell time. The most influential
parameter identified was temperature. However, the choice of the parameters range limited
the variation of the char properties, especially since dwell time was chosen to ensure
complete rubber pyrolysis. The model generated data which enabled the next phase of the
research, and the results suggested that either a two parameter model of temperature and
heating rate would have been more beneficial, or the third parameter could have been the
nitrogen flow, rather than dwell time.
550
600
650
700
2
4
6
8
107.6
7.8
8
8.2
8.4
8.6
Temperature (oC)Heating Rate (
oC/min)
pH
-va
lue
7.6
7.7
7.8
7.9
8
8.1
8.2
8.3
8.4
8.5
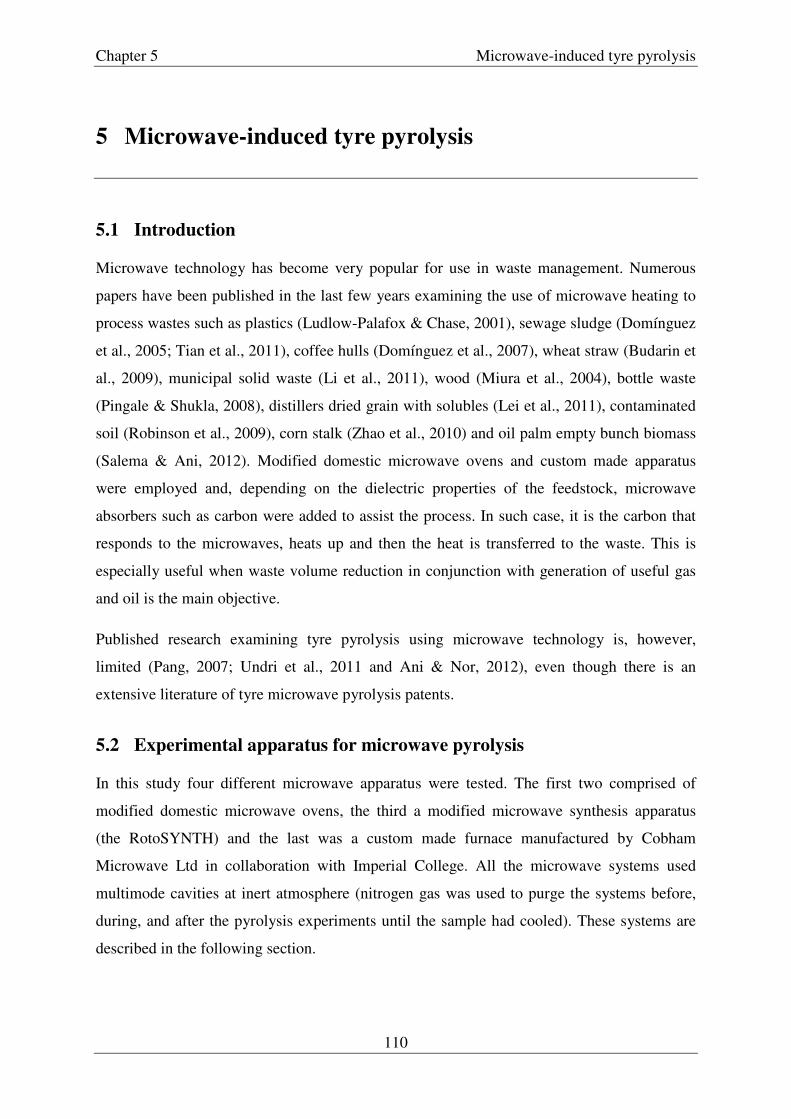
Chapter 5 Microwave-induced tyre pyrolysis
110
5 Microwave-induced tyre pyrolysis
5.1 Introduction
Microwave technology has become very popular for use in waste management. Numerous
papers have been published in the last few years examining the use of microwave heating to
process wastes such as plastics (Ludlow-Palafox & Chase, 2001), sewage sludge (Domínguez
et al., 2005; Tian et al., 2011), coffee hulls (Domínguez et al., 2007), wheat straw (Budarin et
al., 2009), municipal solid waste (Li et al., 2011), wood (Miura et al., 2004), bottle waste
(Pingale & Shukla, 2008), distillers dried grain with solubles (Lei et al., 2011), contaminated
soil (Robinson et al., 2009), corn stalk (Zhao et al., 2010) and oil palm empty bunch biomass
(Salema & Ani, 2012). Modified domestic microwave ovens and custom made apparatus
were employed and, depending on the dielectric properties of the feedstock, microwave
absorbers such as carbon were added to assist the process. In such case, it is the carbon that
responds to the microwaves, heats up and then the heat is transferred to the waste. This is
especially useful when waste volume reduction in conjunction with generation of useful gas
and oil is the main objective.
Published research examining tyre pyrolysis using microwave technology is, however,
limited (Pang, 2007; Undri et al., 2011 and Ani & Nor, 2012), even though there is an
extensive literature of tyre microwave pyrolysis patents.
5.2 Experimental apparatus for microwave pyrolysis
In this study four different microwave apparatus were tested. The first two comprised of
modified domestic microwave ovens, the third a modified microwave synthesis apparatus
(the RotoSYNTH) and the last was a custom made furnace manufactured by Cobham
Microwave Ltd in collaboration with Imperial College. All the microwave systems used
multimode cavities at inert atmosphere (nitrogen gas was used to purge the systems before,
during, and after the pyrolysis experiments until the sample had cooled). These systems are
described in the following section.

Chapter 5
5.2.1 Modified domestic microwave oven I
Preliminary laboratory microwave pyrolysis experiments were conducted in a modified
domestic oven (Panasonic model No. NN
microwave energy using inverter technology. Two holes were drilled in the oven cavity
at the back of the oven for the supply of nitrogen gas (N
side of the oven to allow the discharge of gases generated during the pyr
tubing (microwave transparent) as shown in Figure 5.1.
Figure 5.1. Modified domestic microwave oven I
Five grams of sample A were placed in a quartz round bottom flask with a borosilicate
drechel head and placed in the microwave oven. Th
flow rate of 0.6 L/min from 15 min prior to microwave pyrolysis until after the sample had
cooled down (post pyrolysis). For the initial trial tests, full power of 850
varying periods of time. The co
and 4 minutes were run in triplicate.
5.2.2 Modified domestic microwave oven II
The set-up used in the domestic microwave oven I experiments was modified by Fowler &
Goodman (2009) to include an infra
quartz as shown in Figure 5.2. The IR sensor was used to monitor the temperature of the
sample. As the quartz vessel is not infra
such a way that it would ‘view’ the surface of the sample directly. It was placed on the top of
Microwave-induced tyre pyrolysis
111
Modified domestic microwave oven I
Preliminary laboratory microwave pyrolysis experiments were conducted in a modified
domestic oven (Panasonic model No. NN-SD277S) capable of delivering continuous
owave energy using inverter technology. Two holes were drilled in the oven cavity
at the back of the oven for the supply of nitrogen gas (N2) to the system and the other at the
side of the oven to allow the discharge of gases generated during the pyr
tubing (microwave transparent) as shown in Figure 5.1.
Figure 5.1. Modified domestic microwave oven I
Five grams of sample A were placed in a quartz round bottom flask with a borosilicate
drechel head and placed in the microwave oven. The system was then purged with N
L/min from 15 min prior to microwave pyrolysis until after the sample had
cooled down (post pyrolysis). For the initial trial tests, full power of 850 W was employed for
varying periods of time. The conditions are summarised in Table 5.1. Experiments at 1, 2, 3
and 4 minutes were run in triplicate.
Modified domestic microwave oven II
up used in the domestic microwave oven I experiments was modified by Fowler &
Goodman (2009) to include an infra-red (IR) sensor and to substitute all glassware with
quartz as shown in Figure 5.2. The IR sensor was used to monitor the temperature of the
sample. As the quartz vessel is not infra-red transparent, the IR-sensor had to be placed in
ld ‘view’ the surface of the sample directly. It was placed on the top of
induced tyre pyrolysis
Preliminary laboratory microwave pyrolysis experiments were conducted in a modified
SD277S) capable of delivering continuous
owave energy using inverter technology. Two holes were drilled in the oven cavity – one
) to the system and the other at the
side of the oven to allow the discharge of gases generated during the pyrolysis via PTFE
Five grams of sample A were placed in a quartz round bottom flask with a borosilicate
e system was then purged with N2 at a
L/min from 15 min prior to microwave pyrolysis until after the sample had
W was employed for
nditions are summarised in Table 5.1. Experiments at 1, 2, 3
up used in the domestic microwave oven I experiments was modified by Fowler &
red (IR) sensor and to substitute all glassware with
quartz as shown in Figure 5.2. The IR sensor was used to monitor the temperature of the
sensor had to be placed in
ld ‘view’ the surface of the sample directly. It was placed on the top of

Chapter 5
the microwave furnace at a distance dictated by the focal point of the sensor. Nitrogen gas
was also introduced from the top, at a flow rate of 1 L/min. A joining collar and a custom
drechel head, all made from quartz, were used to connect the system with the round bottom
flask. The gases generated escaped the cavity again from the side of the furnace. An ether
condenser, which was kept at
glycol), was used to aid the condensation of the oil produced. Experiments were run using
20 grams of crumb sample A, 20 minute heating duration and varying power levels as
summarised in Table 5.1. Experiments at 250 W were run in duplicate
and 850 W in quadruplicate.
Figure 5.2. Modified domestic microwave system II
5.2.3 RotoSYNTH
The RotoSYNTH, which is an equipment used for synthesis experiments, was modified for
pyrolysis experiments. Specifically
placed in the middle to provide
experiment (Figure 5.3). The vessel was tilted to 45
nitrogen gas flow rate was 1
levels (Table 5.1). Temperature was monitored by an IR sensor located on the lower side of
the equipment, and the maximum temperature
Microwave-induced tyre pyrolysis
112
the microwave furnace at a distance dictated by the focal point of the sensor. Nitrogen gas
was also introduced from the top, at a flow rate of 1 L/min. A joining collar and a custom
drechel head, all made from quartz, were used to connect the system with the round bottom
flask. The gases generated escaped the cavity again from the side of the furnace. An ether
condenser, which was kept at –10°C (using a grant chiller RC2718 fille
glycol), was used to aid the condensation of the oil produced. Experiments were run using
grams of crumb sample A, 20 minute heating duration and varying power levels as
summarised in Table 5.1. Experiments at 250 W were run in duplicate, then at 440 W, 650 W
Figure 5.2. Modified domestic microwave system II
The RotoSYNTH, which is an equipment used for synthesis experiments, was modified for
pyrolysis experiments. Specifically a quartz reactor was custom made and a quartz
placed in the middle to provide a discharge route for the gas generated during the pyrolysis
experiment (Figure 5.3). The vessel was tilted to 45° and set in constant rotation, and the
L/min. Crumb from sample D was pyrolysed at varying power
Temperature was monitored by an IR sensor located on the lower side of
maximum temperature alarm was adjusted to 1000°
induced tyre pyrolysis
the microwave furnace at a distance dictated by the focal point of the sensor. Nitrogen gas
was also introduced from the top, at a flow rate of 1 L/min. A joining collar and a customised
drechel head, all made from quartz, were used to connect the system with the round bottom
flask. The gases generated escaped the cavity again from the side of the furnace. An ether
C (using a grant chiller RC2718 filled with ethylene
glycol), was used to aid the condensation of the oil produced. Experiments were run using
grams of crumb sample A, 20 minute heating duration and varying power levels as
, then at 440 W, 650 W
The RotoSYNTH, which is an equipment used for synthesis experiments, was modified for
custom made and a quartz tube was
during the pyrolysis
and set in constant rotation, and the
rumb from sample D was pyrolysed at varying power
Temperature was monitored by an IR sensor located on the lower side of
°C.

Chapter 5 Microwave-induced tyre pyrolysis
113
Figure 5.3. Modified RotoSYNTH
Table 5.1 below is a summary of the experimental conditions in the first three microwave set-
ups.
Table 5.1. Domestic Microwave I, II and RotoSYNTH experimental conditions
Domestic
microwave I Domestic
microwave II RotoSYNTH
Crumb Sample A
Crumb Sample A
Crumb Sample D
Power (W)
Time (min)
Mass (g)
Power (W)
Time (min)
Mass (g)
Power (W)
Time (min)
Mass (g)
850
0.5
5
250 20
20
300 180
50
1
440 20
600 60 1.5
600 20
750 50
2
850 20
750 50 3
1000 50
4
1200 30 5
300 120
100 6
750 50
1000 60
1200 30
5.2.4 Cobham Microwave
A new furnace was developed in collaboration with Cobham Microwave Ltd. This equipment
(Figure 5.4) featured a rotary system, similar to the Carbolite rotary furnace previously

Chapter 5 Microwave-induced tyre pyrolysis
114
described in Section 4.3.1.2. The laboratory unit had maximum power of 2 kW. One of its
features was to provide measurement and recording of forward and reverse (reflected) power.
In addition an IR sensor was used to provide temperature measurements of the quartz vessel.
The quartz vessel was surrounded by microwave-transparent ceramic fibre insulation.
The system was designed taking into consideration the safety of the instrument in compliance
with health and safety regulations, for example BS EN 55011:1998 (Industrial, scientific and
medical (ISM) radio-frequency equipment - Radio disturbance characteristics - Limits and
methods of measurement). For this purpose, choke flanges surrounded the cavity in order to
attenuate the microwave radiation which would otherwise be released.
Figure 5.4. Cobham Microwave
Chiller units were used to cool the magnetron and the IR sensor, and an alarm device was
used to prevent their overheating. This was set at 80°C. Air was used to prevent the formation
of mist on the IR eye. During tyre pyrolysis the equipment was tilted to avoid condensation
of oils in the front arm of the vessel.
Using 400 g of sample, a nitrogen flow rate of 2 L/min and a rotation of 10 rpm, two main
sets of experiments were performed. The first set (Part I) included 21 experiments using
crumb from sample D, different power levels ranging from 650 to 2000 W, and durations of
Quartz vessel
Magnetron
IR sensor
Chillers
Chapter 5 Microwave-induced tyre pyrolysis
115
27 – 265 minutes. This produced completely pyrolysed chars that were then characterised.
The second set of experiments (Part II) used crumb from sample F, power levels of 1000 W
and 1500 W, and different duration times, to examine the weight loss until pyrolysis is
achieved. The experimental conditions are summarised in Table 5.2. The generated outcomes
were assigned IDs using the initials CM for Cobham Microwave followed by the crumb
sample name, the nominal power used and the duration of the experiment in minutes e.g.
CMD2000_27 identifies with the experiment performed in the Cobham apparatus using
crumb from sample D, pyrolysed at 2000 W for 27 minutes.
Table 5.2. Cobham Microwave experimental conditions
Cobham Microwave - 400 g
Part I Crumb Sample D
Part II Crumb Sample F
Power (W)
Time (min)
ID Power (W)
Time (min)
ID
2000 27 CMD2000_27
1000
33 CMD2000_33 31 CMF1000_31 40 CMD2000_40 35 CMF1000_35
1500
40 CMD1500_40 38 CMF1000_38 41 CMD1500_41a 41 CMF1000_41 41 CMD1500_41b 47 CMF1000_47 41 CMD1500_41c 50 CMF1000_50 53 CMD1500_53 70 CMF1000_70 60 CMD1500_60 88 CMF1000_88
1200
66 CMD1200_66 138 CMF1000_138 70 CMD1200_70
1500
90 CMD1200_90 17 CMF1500_17
119 CMD1200_119 18 CMF1500_18
1000 90 CMD1000_90 20 CMF1500_20
120 CMD1000_120 24 CMF1500_24 180 CMD1000_180 26 CMF1500_26
800 97 CMD800_97 32 CMF1500_32
160 CMD800_160 44 CMF1500_44 210 CMD800_210 54 CMF1500_54
750 142 CMD750_142
600 265 CMD600_265
5.3 Characterisation
Selected outputs obtained from the microwave pyrolysis were characterised using the
following procedures:

Chapter 5 Microwave-induced tyre pyrolysis
116
� pH-value (Chars)
� Ash content (Chars)
� Transmittance of toluene extract (Chars)
� Surface Area (Chars)
� Apparent density (Chars)
� Dielectric Measurements (Chars)
� CHNS analysis (Oils)
� Infrared Spectroscopy (Oils)
� Bomb Calorimetry (Oils)
� Gas Chromatography/ Mass Spectroscopy (Oils)
Only procedures which have not been previously described are introduced in the following
sub-sections.
5.3.1 Apparent density
The apparent density of selected chars generated from Part II of the Cobham Microwave
experiments, was obtained using a modified ASTM method (ASTM D2854-96). In the
experiment, a vibrating feeder was used to fill a graduated cylinder at a uniform rate of
between 0.75 and 1.0 ml/s by free fall with the chars to a pre-determined level. This ensured
uniform distribution of the chars in the cylinder. The mass of this known volume of chars was
then measured, and used to calculate the density. The chars were used as-produced (no
preparation, e.g. grinding) and the experimental set-up is shown in Figure 5.5. Equation 5.1
was used to calculate the apparent density.
����`E�� �E�M'�� £ i¤V¥¦ � VGdd bc ¤§Gf¤§Gf ¨b©aVg (Eq. 5.1)

Chapter 5 Microwave-induced tyre pyrolysis
117
Figure 5.5. Apparatus for measuring apparent density
5.3.2 Dielectric measurements
The dielectric properties of selected chars generated from Part II of the Cobham Microwave
experiments, were examined using a vector network analyser (Rohde-Schwarz model ZVB4).
This analyser includes a microwave generator that can be swept in output frequency over a
predefined range and enables the measurement of the phase and amplitude of a reflected and
transmitted wave relative to the forward wave from the generator (Meredith, 1998). The
frequency range used in this study was between 2.17 GHz and 3.3 GHz. The network
analyser generates only low power (tens of milliwatts), which ensures negligible heating and
is therefore safe to use. The experimental set up is shown in Figure 5.6, and a detailed
description is presented below.
As shown in Figure 5.7, the network analyser is comprised of the signal input (with incident
and reflected waves) and the signal output (with transmitted and load reflected waves). These
are identified as port 1 and port 2 respectively. The sample or material under investigation is
placed in a waveguide which is connected at one end to port 1 and at the other end to port 2.
This connection is by coaxial cables through which the signal is delivered. For the dielectric
measurements, each sample was placed in a quartz vessel in the centre of the waveguide. To
ensure accuracy of the measurements, readings were taken for two positions in the centre of
the waveguide: (i) in the geometric middle, and (ii) at the side of the middle of the
waveguide, and each measurement was done in duplicate.

Chapter 5 Microwave-induced tyre pyrolysis
118
Figure 5.6. Dielectric measurements set-up
Depending on the dielectric properties of the material under investigation, when the signal is
delivered, some of it will be reflected, some transmitted, and some absorbed by the material.
The analyser measures the voltage of the travelling waves and generates plots representing
the amplitude and phase of the Scattering (S) parameters of the system. The S parameters for
a 2-port network can be described using equations 5.2 and 5.3, where �� and �� are the waves
entering and 8� and 8� are the waves leaving the two-port network system (Bryant, 1993) as
shown in the schematic in Figure 5.7:
8� � ��*�� " ��*�� (Eq. 5.2)
8� � ��*�� " ��*�� (Eq. 5.3)
Figure 5.7. Representation of the two-port network system
For a network system where �� is zero, known as having a matched load (Bryant, 1993), the
equations for *�� and *�� are linear ratios as follows:
2-port
��
8�
��
8� 1 2

Chapter 5 Microwave-induced tyre pyrolysis
119
*�� � 24G4 (Eq. 5.4)
*�� � 2|G4 (Eq. 5.5)
*�� is the response reflected back to port 1 and is known as Return Loss and its
corresponding phase Return Phase. *�� is the response at port 2 due to a signal at port 1 and
is known as Insertion Loss and its corresponding phase is the Through Phase. These are the
two S parameters that are plotted by the analyser.
To ensure accurate measurement of *�� and *��, the ports were calibrated initially, using
three standards with known reflection coefficients.
Ansoft HFSS (High Frequency Structural Simulator) software was used to build an identical
system to the one used and find the best match for the recorded signals by changing the
permittivity, ���� and conductivity (Figure 5.8).
Figure 5.8. Model representation of the sample at the centre and the side of the waveguide
5.3.3 IR Spectroscopy
IR spectroscopy was previously described in Section 4.3.2.5. However, for the analysis of
liquids the test sample is analysed directly rather than forming a disk, using a Thermo
Scientific Nicolet iS10 spectrometer.
5.3.4 Gas Chromatography/Mass Spectroscopy
Gas Chromatography/Mass Spectroscopy (GC/MS) is an analytical technique that combines
gas liquid chromatography and mass spectroscopy to separate, detect and identify the
components of a mixture of compounds. In GC/MS the sample is injected through a column

Chapter 5 Microwave-induced tyre pyrolysis
120
with a stationary phase. Depending on the chemical properties of the components, they will
interact differently with the column so that different components will elute from the column
at different times. As these molecules leave the column, they are transferred to the mass
spectrometer’s ionization source, which results in the formation of charged particles. The
mass spectrometer then focuses these ions through a magnetic mass analyser, and collects and
measures the amount of each selected ion in a detector (McMaster, 2008). The resulting
spectra are then compared with libraries to find the best match.
In the current study, a Clarus 500GC and a Clarus 560MS (Ei+ quadrupole mass
spectrometer) (Perkin Elmer, NJ, USA) was used, fitted with a Supelco Petrocol DH (100 m
x 0.25 mm ID, 0.5 µm film (non-polar bonded methyl silicone)). Helium was used as carried
gas. The analysis program comprised the following steps: a GC initial oven temperature of
40°C was held for 10 minutes, then increased to 300°C at 0.5°C/min where it was held for a
further 180 minutes. The chromatograms generated were analysed using Perkin Elmer
Turbomass Ver. 5.3.0 software, in which peaks were automatically identified and integrated.
Mass spectra were then automatically compared against the ‘NIST Mass Spectral Data
Library 2005’. Peaks were then identified tentatively with the best spectral match.
5.4 Results and Discussion
The following section contains observations from the microwave experiments covering the
interaction of the samples with the microwaves in terms of yield, duration, power and
temperature as well as challenges faced. Results from the characterisation experiments are
also reported.
The yields of completely pyrolysed chars ranged between 48 – 50 wt.% (domestic microwave
I), 45.5 – 46.3 wt.% (domestic microwave II), 43.5 – 46.5 wt.% (RotoSYNTH) and 39.8 –
41.6 wt.% and 40.6 – 41.4 wt.% (Cobham, samples D and F respectively) for all the power
levels. As was presented in Chapter 4, the yields for completely pyrolysed chars ranged
between 38.2 and 43.1 wt.% (Part I) and 40.3 ± 0.6 wt.% (Part II). The higher yields observed
in the domestic microwave set-ups are probably due to the experimental arrangements
promoting secondary reactions. A summary of all the yields obtained is presented in
Appendix I (Table B). Figure 5.9 shows the char yields obtained by domestic microwave
oven I over different durations.
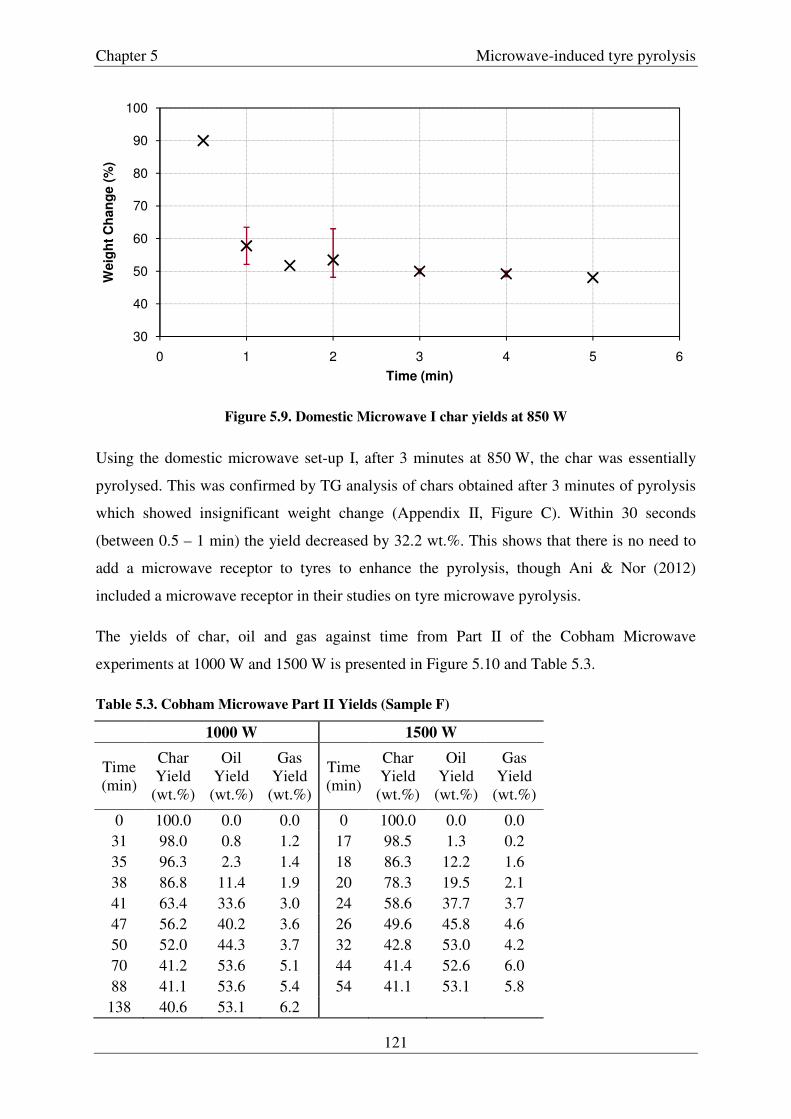
Chapter 5 Microwave-induced tyre pyrolysis
121
Figure 5.9. Domestic Microwave I char yields at 850 W
Using the domestic microwave set-up I, after 3 minutes at 850 W, the char was essentially
pyrolysed. This was confirmed by TG analysis of chars obtained after 3 minutes of pyrolysis
which showed insignificant weight change (Appendix II, Figure C). Within 30 seconds
(between 0.5 – 1 min) the yield decreased by 32.2 wt.%. This shows that there is no need to
add a microwave receptor to tyres to enhance the pyrolysis, though Ani & Nor (2012)
included a microwave receptor in their studies on tyre microwave pyrolysis.
The yields of char, oil and gas against time from Part II of the Cobham Microwave
experiments at 1000 W and 1500 W is presented in Figure 5.10 and Table 5.3.
Table 5.3. Cobham Microwave Part II Yields (Sample F)
1000 W 1500 W
Time (min)
Char Yield
(wt.%)
Oil Yield
(wt.%)
Gas Yield
(wt.%)
Time (min)
Char Yield
(wt.%)
Oil Yield
(wt.%)
Gas Yield
(wt.%)
0 100.0 0.0 0.0 0 100.0 0.0 0.0 31 98.0 0.8 1.2 17 98.5 1.3 0.2 35 96.3 2.3 1.4 18 86.3 12.2 1.6 38 86.8 11.4 1.9 20 78.3 19.5 2.1 41 63.4 33.6 3.0 24 58.6 37.7 3.7 47 56.2 40.2 3.6 26 49.6 45.8 4.6 50 52.0 44.3 3.7 32 42.8 53.0 4.2 70 41.2 53.6 5.1 44 41.4 52.6 6.0 88 41.1 53.6 5.4 54 41.1 53.1 5.8
138 40.6 53.1 6.2
30
40
50
60
70
80
90
100
0 1 2 3 4 5 6
Weig
ht
Ch
an
ge (
%)
Time (min)

Chapter 5 Microwave-induced tyre pyrolysis
122
Whereas Undri et al. (2011) successfully pyrolysed 400 g of chopped tyres in 13 minutes
using 6 kW of power, and in 39 minutes using 3 kW, their attempt to completely pyrolyse
their crumb using 1.5 kW power in 100 minutes was unsuccessful. Their reactor was a static
bed reactor and comprised a microwave oven, heat exchanging pipes and collecting flasks. In
the current work using the Cobham Microwave (Figure 5.4), however, the complete pyrolysis
of the same quantity of tyre crumb was achieved using 1.5 kW of power in 44 minutes, and
1.0 kW in 70 minutes. As shown later in this chapter, complete pyrolysis was also achieved
after 27 minutes using 2.0 kW power. This shows that with better design and optimisation of
the apparatus much higher efficiency can be achieved.
Figure 5.10. Plots of Cobham Microwave Part II yields
Oil yields from the set of experiments using sample D ranged between 52 – 55 wt.% for all
powers and 53 wt.% for the experiments with sample F (Appendix I, Table B). Similar oil
yields were obtained as with the pyrolysis using conventional means. Undri et al. (2011)
measured yields between 37 – 40 wt.% under optimal conditions and gas yields between 12 –
23 wt.%, perhaps because the condensation system was not adequate to handle the rapid
generation of gas. For the Cobham system in the current work, a lot of modifications had to
be made to achieve optimal condensation and accurate measurement of the oil yields. For this
0 10 20 30 40 50 60
0
10
20
30
40
50
60
70
80
90
100
0
10
20
30
40
50
60
70
80
90
100
0 20 40 60 80 100 120 140
Time (Minutes) - 1500 W
Yie
lds (
%)
-1500 W
Yie
lds (%
) -
1000 W
Time (Minutes) - 1000 W
Char Yield - 1000 W Oil Yield - 1000 W Gas Yield - 1000 W
Char Yield - 1500 W Oil Yield - 1500 W Gas Yield - 1500 W
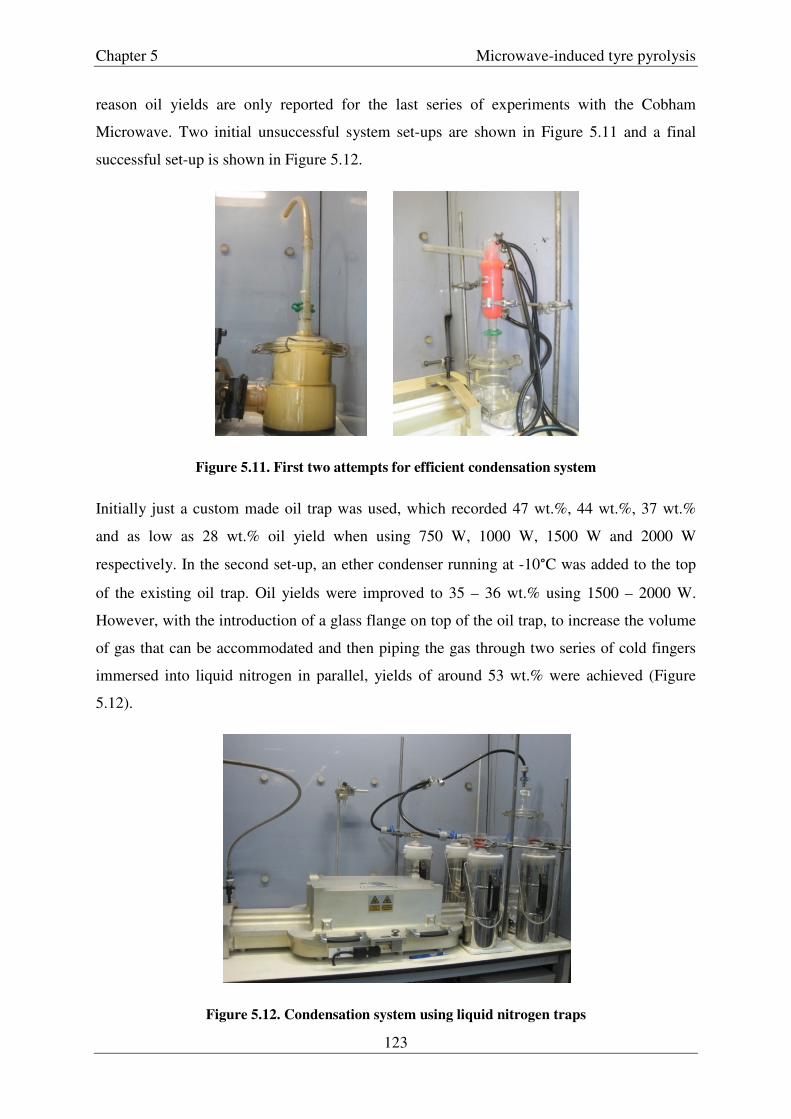
Chapter 5 Microwave-induced tyre pyrolysis
123
reason oil yields are only reported for the last series of experiments with the Cobham
Microwave. Two initial unsuccessful system set-ups are shown in Figure 5.11 and a final
successful set-up is shown in Figure 5.12.
Figure 5.11. First two attempts for efficient condensation system
Initially just a custom made oil trap was used, which recorded 47 wt.%, 44 wt.%, 37 wt.%
and as low as 28 wt.% oil yield when using 750 W, 1000 W, 1500 W and 2000 W
respectively. In the second set-up, an ether condenser running at -10°C was added to the top
of the existing oil trap. Oil yields were improved to 35 – 36 wt.% using 1500 – 2000 W.
However, with the introduction of a glass flange on top of the oil trap, to increase the volume
of gas that can be accommodated and then piping the gas through two series of cold fingers
immersed into liquid nitrogen in parallel, yields of around 53 wt.% were achieved (Figure
5.12).
Figure 5.12. Condensation system using liquid nitrogen traps
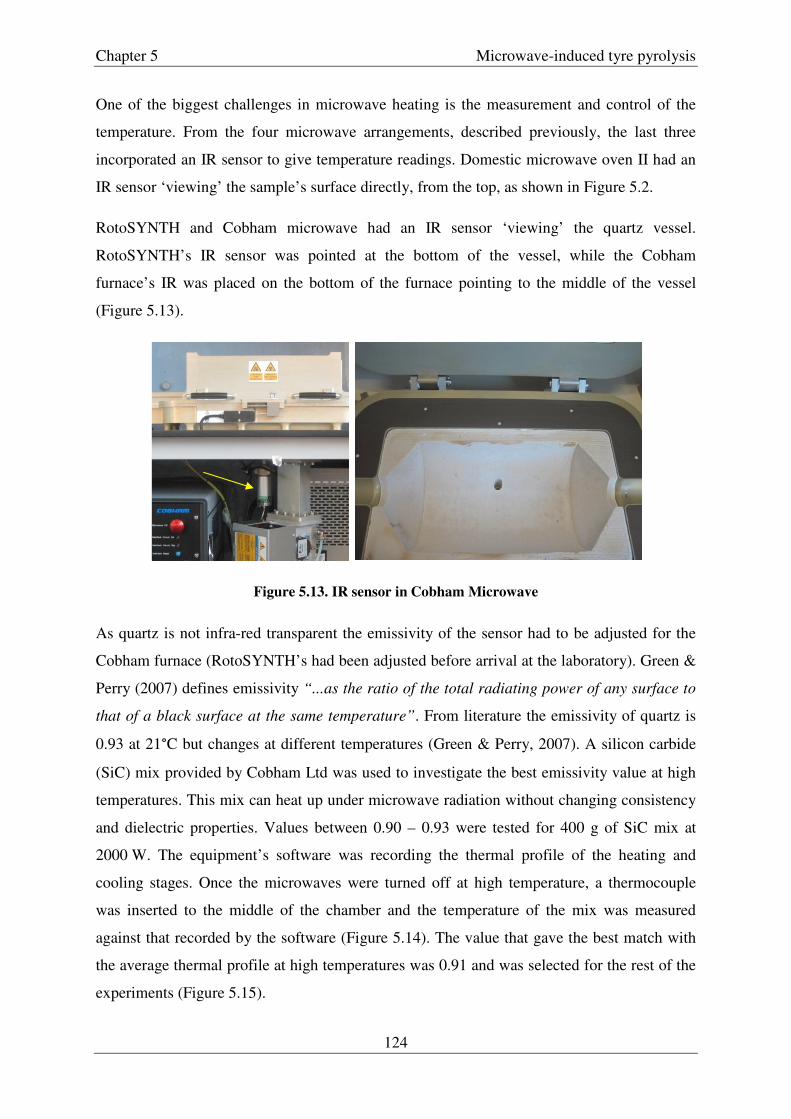
Chapter 5 Microwave-induced tyre pyrolysis
124
One of the biggest challenges in microwave heating is the measurement and control of the
temperature. From the four microwave arrangements, described previously, the last three
incorporated an IR sensor to give temperature readings. Domestic microwave oven II had an
IR sensor ‘viewing’ the sample’s surface directly, from the top, as shown in Figure 5.2.
RotoSYNTH and Cobham microwave had an IR sensor ‘viewing’ the quartz vessel.
RotoSYNTH’s IR sensor was pointed at the bottom of the vessel, while the Cobham
furnace’s IR was placed on the bottom of the furnace pointing to the middle of the vessel
(Figure 5.13).
Figure 5.13. IR sensor in Cobham Microwave
As quartz is not infra-red transparent the emissivity of the sensor had to be adjusted for the
Cobham furnace (RotoSYNTH’s had been adjusted before arrival at the laboratory). Green &
Perry (2007) defines emissivity “...as the ratio of the total radiating power of any surface to
that of a black surface at the same temperature”. From literature the emissivity of quartz is
0.93 at 21°C but changes at different temperatures (Green & Perry, 2007). A silicon carbide
(SiC) mix provided by Cobham Ltd was used to investigate the best emissivity value at high
temperatures. This mix can heat up under microwave radiation without changing consistency
and dielectric properties. Values between 0.90 – 0.93 were tested for 400 g of SiC mix at
2000 W. The equipment’s software was recording the thermal profile of the heating and
cooling stages. Once the microwaves were turned off at high temperature, a thermocouple
was inserted to the middle of the chamber and the temperature of the mix was measured
against that recorded by the software (Figure 5.14). The value that gave the best match with
the average thermal profile at high temperatures was 0.91 and was selected for the rest of the
experiments (Figure 5.15).

Chapter 5 Microwave-induced tyre pyrolysis
125
As can be observed from Figure 5.15, the thermal profile fluctuates with time – this is
because the focal point of the IR changes due to the veins of the reactor (clearly visible in
Figure 5.14). For the rest of the experiments the average over a period of 10 was taken.
Figure 5.14. Thermocouple measurement of the SiC mix
It should be noted that the IR reading was calibrated for the quartz surface temperature, not
the material’s temperature. The material’s temperature is transferred to the vessel mainly by
convection so there will be some thermal lag between the recorded temperature and the
instantaneous temperature inside the vessel. However, given the nature of microwaves, the
use of an IR sensor to give an indication of the thermal profiles was the only option. Other
methods of temperature measurement such as thermocouples or fibre optics are not suitable.
As Will et al. (2004) point out, thermocouples cannot be used in an electromagnetic field
(EMF) without shielding and grounding as they would cause interactions with the field or
even be destroyed. Even with these precautions taken, interactions of the thermocouple with
the electric field can never be completely excluded (Will et al. 2004). In fact when Pert et al.
(2001) placed a K-type thermocouple in a microwave cavity and applied 150 W for 10
minutes they recorded a thermocouple measurement of 100°C while the ambient temperature
was only 26°C. This supports the view that the thermocouple can be directly heated by
microwaves. Furthermore, when Pert et al. (2001) heated zinc oxide samples with and
without a thermocouple using identical conditions and monitored the temperature using a
pyrometer, it was observed that the surface temperature of the sample was twice as much in
the presence of the thermocouple than without. However, thermocouples are still used in
microwave pyrolysis (for example Ani & Nor, 2012). Commercially available fibre optic
Reactor
veins

Chapter 5 Microwave-induced tyre pyrolysis
126
thermometers are restricted by a maximum temperature limit of 400°C, and cannot therefore
be used in this research (Undri et al., 2011).
a)
b)
Figure 5.15. SiC mix temperature measurements a) time range 0 – 200 minutes and b) time
range 70 – 120 minutes
0
100
200
300
400
500
600
700
800
900
0 50 100 150 200
Tem
pera
ture
(°C
)
Time (minutes)
Software temp. (°C) Average Software temp. (°C)
Thermocouple Measurement (°C)
300
400
500
600
700
800
900
70 80 90 100 110 120
Tem
pera
ture
(°C
)
Time (minutes)
Software temp. (°C) Average Software temp. (°C)
Thermocouple Measurement (°C)
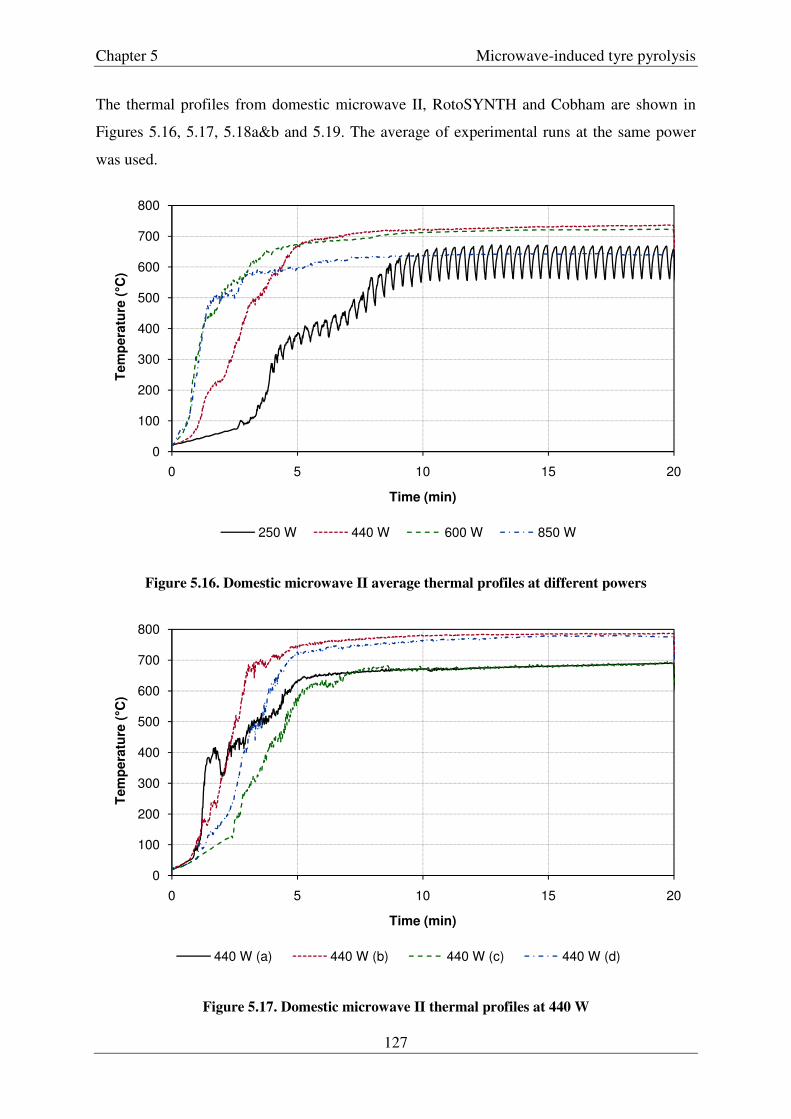
Chapter 5 Microwave-induced tyre pyrolysis
127
The thermal profiles from domestic microwave II, RotoSYNTH and Cobham are shown in
Figures 5.16, 5.17, 5.18a&b and 5.19. The average of experimental runs at the same power
was used.
Figure 5.16. Domestic microwave II average thermal profiles at different powers
Figure 5.17. Domestic microwave II thermal profiles at 440 W
0
100
200
300
400
500
600
700
800
0 5 10 15 20
Tem
pera
ture
(°C
)
Time (min)
250 W 440 W 600 W 850 W
0
100
200
300
400
500
600
700
800
0 5 10 15 20
Tem
pera
ture
(°C
)
Time (min)
440 W (a) 440 W (b) 440 W (c) 440 W (d)

Chapter 5 Microwave-induced tyre pyrolysis
128
a)
b)
Figure 5.18. RotoSYNTH thermal profiles a) for 50g and b) 100g
0
100
200
300
400
500
600
0 5 10 15 20 25 30
Tem
pera
ture
(°C
)
Time (min)
300 W 600 W 750 W 750 W 1000 W 1200 W
0
100
200
300
400
500
600
0 5 10 15 20 25 30
Tem
pera
ture
(°C
)
Time (min)
300 W 750 W 1000 W 1200 W

Chapter 5 Microwave-induced tyre pyrolysis
129
Figure 5.19. Cobham microwave average thermal profiles at different powers
All thermal profiles demonstrate a similar pattern. There are three regions better identified by
the RotoSYNTH and Cobham microwave experiments. First there is an initial warm up
where release of some volatiles was observed followed by a steeper slope where violent
generation of gases occurred and then a slower increase of temperature that, depending on the
power and duration of the experiment, reached or did not reach a plateau.
The profile of the domestic microwave II shows a pulse-shaped curve at 250 W. This is as a
result of how the oven operates and varies its power. At higher power levels there is a
continuous supply of voltage to the magnetron, and therefore the sample under investigation
is exposed to a continuous microwave field for the entire duration of the experiment.
Different power levels are achieved by varying the amount of voltage. At 250 W and below,
it is the magnetron that is turned on and off, instead, creating this pulse effect.
The thermal profiles of the domestic microwave II showed differences during repeated runs,
especially during the first minutes. This is illustrated in Figure 5.17 for 440 W. Differences in
repeated measurements at short durations is supported by the high standard deviation (8%)
calculated on the char yields from the domestic microwave I arrangement (Figure 5.9 and
Appendix I, Table B). Furthermore, all the thermal profiles obtained for the domestic
microwave II show that a plateau was reached at approximately 5 minutes. At this point,
0
100
200
300
400
500
600
700
800
0 50 100 150 200
Tem
pera
ture
(°C
)
Time (min)
600 W 750 W 800 W 1000 W
1200 W 1500 W 2000 W

Chapter 5 Microwave-induced tyre pyrolysis
130
where the temperature stopped increasing, all the volatiles had been released and the heat
applied is equal to the heat being lost to the surroundings. However, there are differences in
the final temperature reached which varied by up to 150°C (Figure 5.17).
In addition, the generation of gas during the experiments, which signified the start of the
rubber degradation, was observed at surface temperatures lower than expected for rubber
degradation, i.e. from 300°C onwards. In fact, it was observed at temperatures ranging from
100 – 125°C. This can be due to inaccurate measurements of the temperature. Also the
system was static and hot spots observed, so even though the IR-sensor was viewing a surface
of lower temperature, a different area within the sample might have been experiencing higher
temperatures.
All these differences can be attributed to specific effects; differences between the position of
the glassware within the cavity and the use of different, yet almost identical glassware sets
between runs. This causes the sample to experience a slightly different electromagnetic field.
The inconsistencies observed at shorter durations can also be due to the rapid generation of a
large amount of gas that prohibited the direct measurement of the surface temperature.
Problems associated with the lack of controllability and reproducibility have been identified
in the use of domestic microwaves in organic synthesis and have been reported by Lidström
et al. (2001). In the current work, these problems can be due to a number of factors as
described below.
In multimode cavities, the sample does not experience a uniform electromagnetic field but
rather nodes and antinodes of the electromagnetic waves, and, parameters such as different
positions of the glassware (equipment orientation) between each run or the heterogeneity of
the sample can make a significant difference. In addition, the non-uniformity of the EMF
makes the system prone to the creation of hot spots, which were observed during the
experiment. As explained in Section 1.4.7 this occurs when there is variation in temperature
within the sample. Provided that the permittivity of the sample increases with temperature
increase, the temperature of the specific region of the sample increases rapidly and reaches a
critical temperature that makes it much hotter than the rest of the sample. Further,
carbonaceous residues left in the flask between runs worsen this problem, since they have
high dielectric constant and selectively couple with the EMF.

Chapter 5 Microwave-induced tyre pyrolysis
131
Figure 5.20 shows the divitrification of the round bottom flask from a domestic microwave I
experiment at a hot spot area. The temperature reached during this experiment must have
exceeded the softening temperature of the borosilicate glassware, as the borosilicate dreschel
head was deformed. This occurs at temperatures between 750 and 800°C (Shelby, 2005). It
was suggested that the introduction of a rotary system would reduce the formation of hot
spots, and this theory was subsequently tested.
Figure 5.20. Illustration of hot spots and its effects on the glassware
The RotoSYNTH set-up, incorporating a rotary system, generated thermal profiles with
pronounced temperature fluctuations, especially at high powers and in the middle area where
the rubber degradation occurs. Irrespective of the rotation, hot spots were still observed
during the experiment. These were not localised however and evidence of non uniform
heating was obtained by the visual examination of the char produced post-pyrolysis (Figure
5.21).
Figure 5.21. RotoSYNTH reactor after pyrolysis
The char presented big lumps on the top and fine particles on the bottom of the reactor. The
big lumps might have formed during the onset of devulcanisation. In addition the temperature

Chapter 5 Microwave-induced tyre pyrolysis
132
readings recorded are likely to differ from the actual temperature of the sample. All the chars,
with the exception of those produced at 300 W, were fully pyrolysed, as confirmed by
insignificant weight losses observed in TG analysis. This means that whereas some of the
RotoSYNTH thermal profiles show maximum temperature of less than 400°C, the samples
must have experienced temperature minimums of between 480 – 500°C (Figure 5.18).
Differences were expected between the readings and the samples’ real temperature as the IR-
sensor records the vessel’s surface temperature. The sample’s heat is transferred to the vessel
mainly by convection, however the reactor is not insulated and the cavity has a forced-air
cooling flow, so some of the heat will be lost to the surroundings. Furthermore, the rotation of
the vessel may have been too fast, resulting in insufficient continuous contact between the
sample and the surface of the vessel. In addition, sticky, incompletely pyrolysed rubber had
been deposited on the surface of the vessel along with oil residues, which might have
increased the inaccuracy of the sample temperature measurements, by providing an insulating
layer.
The rubber heated under 300 W power was not completely pyrolysed; 100 g of tyre crumb
were reduced to 52.9% (47.1% loss) of their initial weight after 2 hours, whereas 50 g were
reduced to 96.4% (3.6% loss) after 3 hours.
The Cobham microwave generated fewer fluctuations in the thermal profiles. The thermal
profiles presented in Figure 5.19 are the averages of at least three runs apart from 600 W and
750 W. Identical conditions generated similar profiles, given that microwaves are sensitive to
small differences in composition, even from extensive usage of the equipment. Khraisheh et
al. (1997) pointed out that microwave apparatus are subject to magnetron aging. In addition,
operation of the magnetron for long periods of time may cause the heating of the magnets and
consequently the reduction of the magnetic field. This in turn leads to the reduction of the
operating voltage, thereby causing the power output to reduce (Khraisheh et al., 1997).
Higher power profiles had higher temperature standard deviations, especially in the middle
section where the degradation occurs. The graphs obtained show that the three sections are
recorded at different temperatures depending on the power. This is expected as the heating
rate changes with power, so a similar effect to the TGA change of heating rate is expected
(see Section 3.3).
In both domestic microwave systems and the RotoSYNTH (all the configurations that
allowed viewing of the chamber), sparks were observed sometimes for a few seconds and
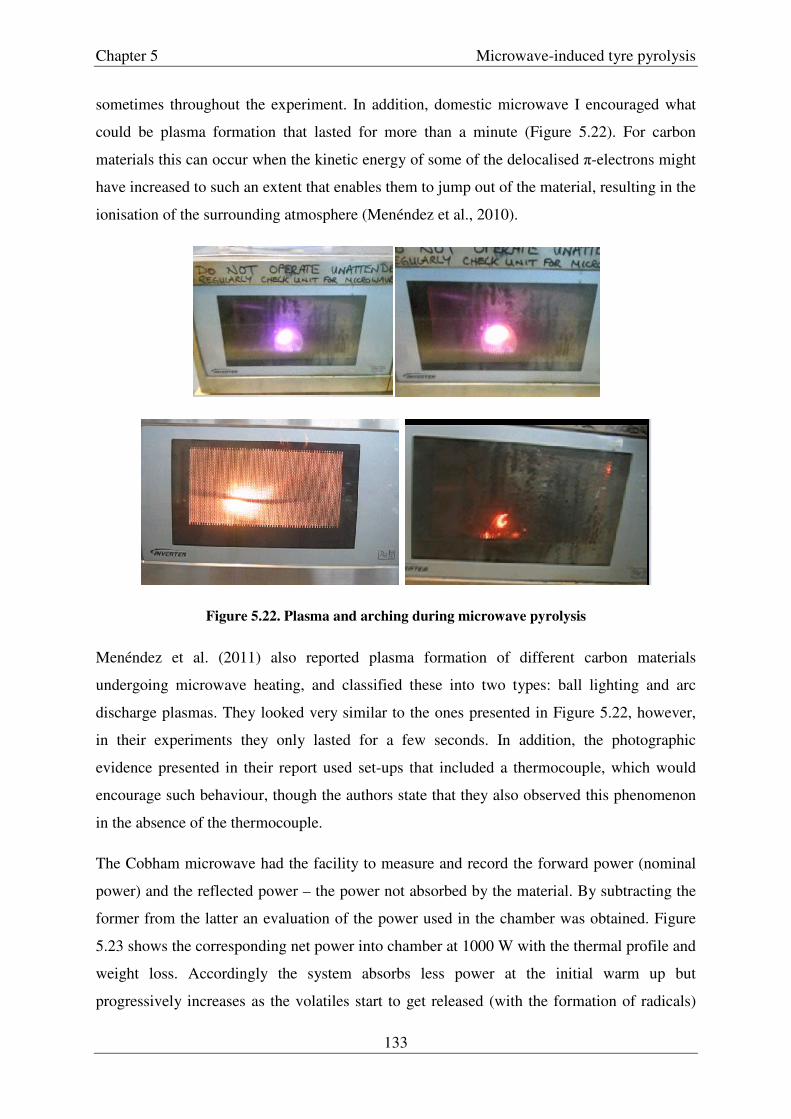
Chapter 5 Microwave-induced tyre pyrolysis
133
sometimes throughout the experiment. In addition, domestic microwave I encouraged what
could be plasma formation that lasted for more than a minute (Figure 5.22). For carbon
materials this can occur when the kinetic energy of some of the delocalised π-electrons might
have increased to such an extent that enables them to jump out of the material, resulting in the
ionisation of the surrounding atmosphere (Menéndez et al., 2010).
Figure 5.22. Plasma and arching during microwave pyrolysis
Menéndez et al. (2011) also reported plasma formation of different carbon materials
undergoing microwave heating, and classified these into two types: ball lighting and arc
discharge plasmas. They looked very similar to the ones presented in Figure 5.22, however,
in their experiments they only lasted for a few seconds. In addition, the photographic
evidence presented in their report used set-ups that included a thermocouple, which would
encourage such behaviour, though the authors state that they also observed this phenomenon
in the absence of the thermocouple.
The Cobham microwave had the facility to measure and record the forward power (nominal
power) and the reflected power – the power not absorbed by the material. By subtracting the
former from the latter an evaluation of the power used in the chamber was obtained. Figure
5.23 shows the corresponding net power into chamber at 1000 W with the thermal profile and
weight loss. Accordingly the system absorbs less power at the initial warm up but
progressively increases as the volatiles start to get released (with the formation of radicals)
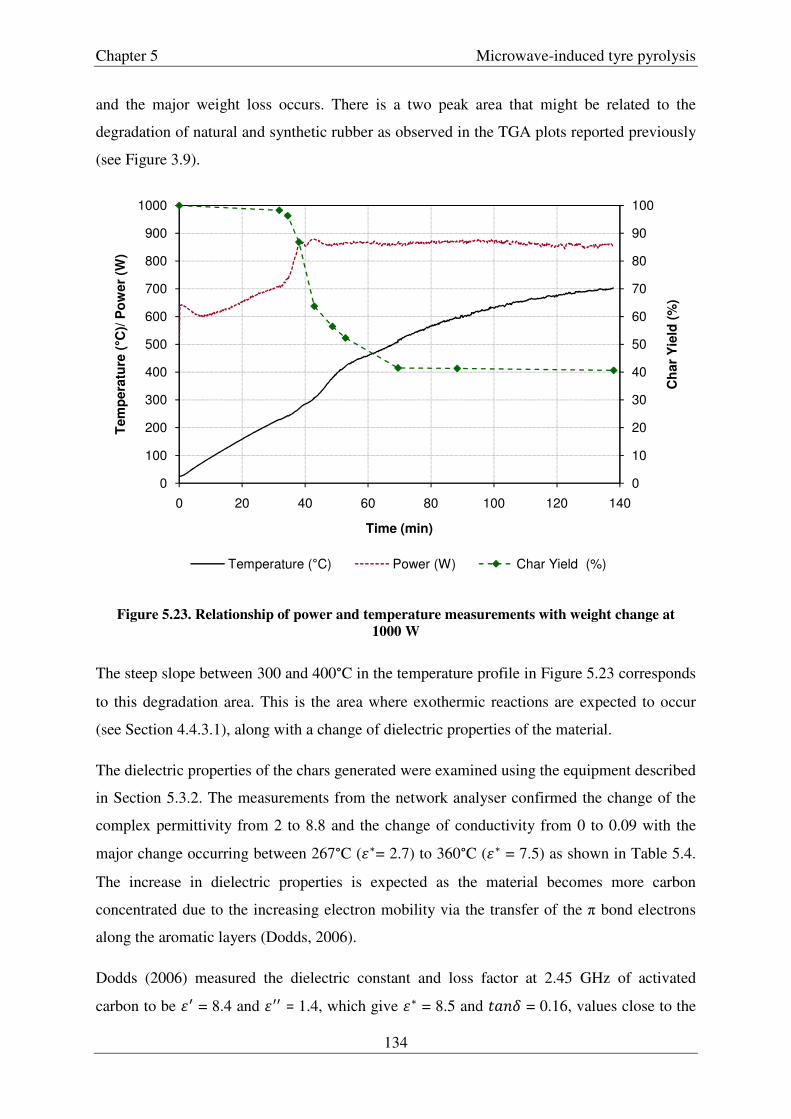
Chapter 5 Microwave-induced tyre pyrolysis
134
and the major weight loss occurs. There is a two peak area that might be related to the
degradation of natural and synthetic rubber as observed in the TGA plots reported previously
(see Figure 3.9).
Figure 5.23. Relationship of power and temperature measurements with weight change at
1000 W
The steep slope between 300 and 400°C in the temperature profile in Figure 5.23 corresponds
to this degradation area. This is the area where exothermic reactions are expected to occur
(see Section 4.4.3.1), along with a change of dielectric properties of the material.
The dielectric properties of the chars generated were examined using the equipment described
in Section 5.3.2. The measurements from the network analyser confirmed the change of the
complex permittivity from 2 to 8.8 and the change of conductivity from 0 to 0.09 with the
major change occurring between 267°C (��= 2.7) to 360°C (�� = 7.5) as shown in Table 5.4.
The increase in dielectric properties is expected as the material becomes more carbon
concentrated due to the increasing electron mobility via the transfer of the π bond electrons
along the aromatic layers (Dodds, 2006).
Dodds (2006) measured the dielectric constant and loss factor at 2.45 GHz of activated
carbon to be � = 8.4 and � = 1.4, which give �� = 8.5 and ���� = 0.16, values close to the
0
10
20
30
40
50
60
70
80
90
100
0
100
200
300
400
500
600
700
800
900
1000
0 20 40 60 80 100 120 140
Ch
ar
Yie
ld (
%)
Tem
pera
ture
(°C
)/ P
ow
er
(W)
Time (min)
Temperature (°C) Power (W) Char Yield (%)

Chapter 5 Microwave-induced tyre pyrolysis
135
ones observed from the chars generated at high temperatures where carbon is the
predominant element. In addition, in a review by Menéndez et al. (2010) the ���� values of
charcoal, carbon black and activated carbon were stated as between 0.11 – 0.83 at room
temperature. These values are comparable to or higher than the ���� value of water (0.1),
which is commonly known as a good microwave absorber (Lam & Chase, 2012). The ����
values calculated from the dielectric measurement experiments in this work are in the lower
range as stated by Menéndez et al. (2010) possibly because of trapped air (the chars were not
ground to ensure dense packing).
Table 5.4. Dielectric Properties
�� ���� � End
Temperature (IR-sensor)
Sample F 2 0.03 0 0 CMF,1000_31 2 0.03 0 247.6 CMF,1000_35 2 0.03 0 258.3 CMF,1000_38 2.7 0.06 0.01 267.6 CMF,1000_41 5.2 0.08 0.03 304.8 CMF,1000_47 7.5 0.08 0.03 360.3 CMF,1000_50 7.5 0.08 0.03 395.7 CMF,1000_70 8.4 0.10 0.02 495.0 CMF,1000_88 8.4 0.10 0.02 602.0
CMF,1000_138 8.8 0.13 0.09 702.6
It should be noted that these values are approximate as it was very difficult to achieve an
exact match from the simulations and especially the relationship between �� and �. This is
because these two parameters are connected with each other in a way that a combination of a
higher tan� and lower � would give a similar result to a lower ���� and a higher value of �
(Balanis, 1989). In addition, for the simulations it was assumed that the parameters do not
change in the range of frequencies used, even though they would change slightly as shown in
the plots generated from the network analyser for the materials under investigation. Figure
5.24, for rubber F placed in the centre of the waveguide, is a typical example.

Chapter 5
Figure 5.24. Typical plots obtained by the network
Return and Insertion Loss. Here shown for rubber F placed in the centre of the waveguide
Combining the observations from Figure 5.23 and Table 5.4, even though the material
becomes more microwave-responsive the h
to thermal energy losses occurring in the surroundings (due to conduction, convection and
radiation of heat from the crumb to the quartz vessel, insulation, casing etc.).
aluminium casing of the reactor reached a temperature of 100
indicating these losses to the surroundings.
It must be highlighted that all values used in the dielectric measurement
room temperature, and it is possible that at t
dielectric values will vary (Meredith, 1998).
In addition to the sample F and chars generated from it, the dielectric parameters of samples
D and E were also measured. Sample
showed the same responses (�
Microwave-induced tyre pyrolysis
136
Figure 5.24. Typical plots obtained by the network analyser showing the amplitude and phase of
Return and Insertion Loss. Here shown for rubber F placed in the centre of the waveguide
Combining the observations from Figure 5.23 and Table 5.4, even though the material
responsive the heating rate starts to decline. This is probably due
to thermal energy losses occurring in the surroundings (due to conduction, convection and
radiation of heat from the crumb to the quartz vessel, insulation, casing etc.).
the reactor reached a temperature of 100°C at high internal temperatures
indicating these losses to the surroundings.
It must be highlighted that all values used in the dielectric measurement
room temperature, and it is possible that at the high temperatures of the experiments the
will vary (Meredith, 1998).
In addition to the sample F and chars generated from it, the dielectric parameters of samples
D and E were also measured. Samples D and F, both originated from whole passenger tyres �� = 2, ���� = 0.03 and � = 0). Vulcanized rubber measured at
induced tyre pyrolysis
analyser showing the amplitude and phase of
Return and Insertion Loss. Here shown for rubber F placed in the centre of the waveguide
Combining the observations from Figure 5.23 and Table 5.4, even though the material
eating rate starts to decline. This is probably due
to thermal energy losses occurring in the surroundings (due to conduction, convection and
radiation of heat from the crumb to the quartz vessel, insulation, casing etc.). The external
C at high internal temperatures
It must be highlighted that all values used in the dielectric measurements were recorded at
he high temperatures of the experiments the
In addition to the sample F and chars generated from it, the dielectric parameters of samples
D and F, both originated from whole passenger tyres
. Vulcanized rubber measured at

Chapter 5 Microwave-induced tyre pyrolysis
137
40°C and 2.45 GHz had �� = 2.6 (Komarov, 2012). Sample E was less responsive with �� =
1.5, ���� = 0.02 and � = 0. Sample E was crumb from the tread of car passenger tyres that
were contaminated with fibres like nylon which are expected to be less microwave-
responsive.
In the current work, a statistical model was going to be formed to examine the relationship
between the independent variables, in this case time and power, with the dependent variables,
such as char characteristics, as in Chapter 4. To achieve this, the independent variables of the
process would be assigned values so that the correlation between them would be zero.
However, the very nature of microwaves made this impossible for this setting. For example,
in reference to Table 4.3, consider a power setting of minimum 600 W and maximum 2000
W and time range of minimum 27 minutes and maximum 265 minutes. The combination of
600 W, 265 minutes (-1, +1) and 2000 W and 27 minutes (+1, -1) is achievable. A
combination of 600 W, 27 minutes (-1, -1), however, would result in non-pyrolysed rubber
whereas 2000 W and 265 minutes (+1, +1) would probably not be achieved as the cavity will
be heated up to a level high enough to trigger the high temperature alarm. This comes as a
result of the non-linear relation and dependence of the change of dielectrics during the
process.
Other authors have tried to use response surface methodology on microwave pyrolysis; Lei et
al. (2011) used power, time and temperature as independent variables and Ren et al. (2012)
used power and temperature to find a relationship between these variables and the oil, char
and syngas pyrolysis yields of distillers dried grain with soluble and Douglas fir sawdust
pellets respectively. Relationships were achieved with regression coefficients ranging
between 83 and 95% for the former and 99 and 100% for the latter. However and as noted in
the papers the duration value was recorded after the ideal temperature was achieved, which
by definition makes this variable dependent.
The three sections from the thermal profiles for the Part I set of 21 experiments were
manually divided to (i) the initial warm up – the first linear section (ii) the main volatile
release section and (iii) up to 600°C. The average power absorbed by the sample was then
calculated for each section. Figure 5.25 shows the relationship between the power and the
time. All sections form power relations with the equations given in Table 5.5.

Chapter 5 Microwave-induced tyre pyrolysis
138
Figure 5.25. Cobham Microwave system power absorption and time relationship
The power has a linear relationship with the heating rate (Figure 5.26). Huang et al. (2008)
determined a linear relationship between the power and the heating rate (dT/dt) from a series
of experiments using a single mode microwave to pyrolyse rice straw using powers between
50 W – 500 W. As the thermocouple can interfere with the electromagnetic radiation, it was
placed at the bottom of the sample holder to give an indication of the nearby thermal effects
and the heating rate was calculated from the slope of the linear regression of temperatures
from the 1st till the 4th minute. Huang et al. (2008) noted that to initiate a rise in temperature
sufficient power input is needed. Similarly, from the equations below, for a heating rate equal
to zero there is a certain amount of power required for each section. For section 3, it was not
possible to achieve 600°C as a final temperature using nominal powers of 600 W and 750 W,
as they only provided average power to the chamber of 492 W and 588 W. These values were
below the y value of 616.31 W, derived from equation in Table 5.5. Figure 5.19 shows this
effect.
Note that for section 2, the dielectric properties change drastically (Table 5.4) therefore a
lower R2 is obtained as shown in Table 5.5.
0
200
400
600
800
1000
1200
1400
1600
1800
2000
0 50 100 150 200
Po
wer
ab
so
rbed
(W
)
Time (min)
Section 1 Section 2 Section 3
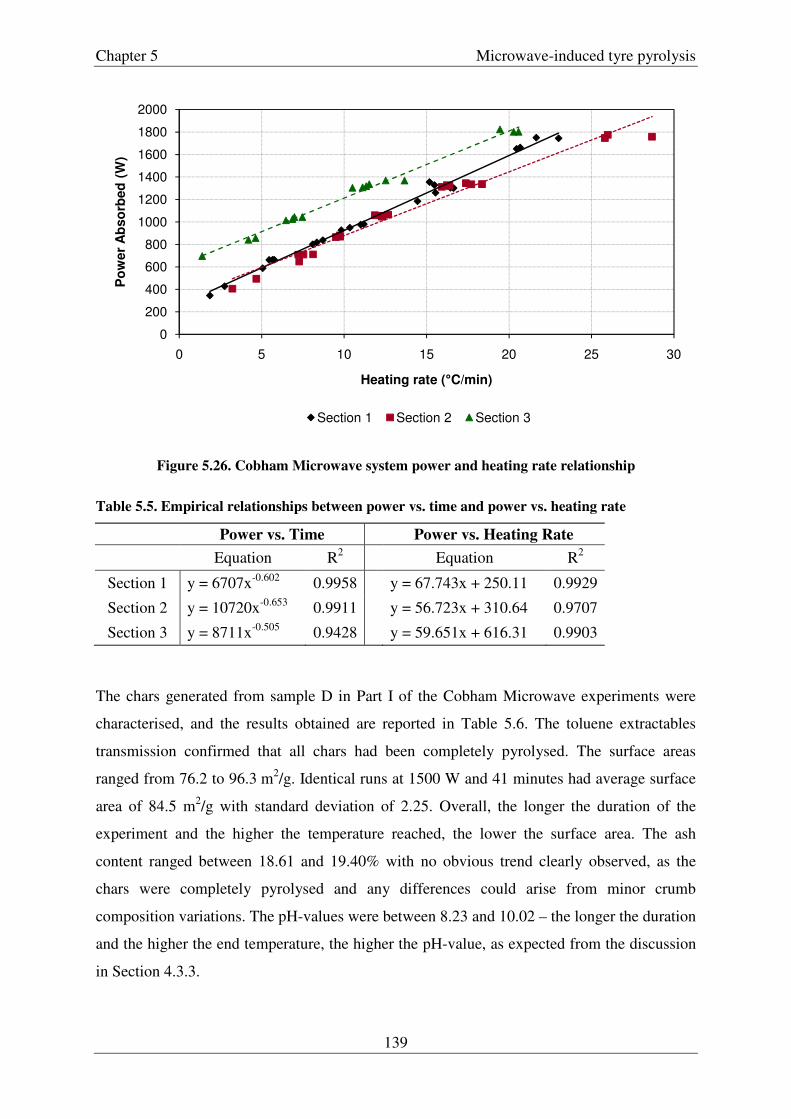
Chapter 5 Microwave-induced tyre pyrolysis
139
Figure 5.26. Cobham Microwave system power and heating rate relationship
Table 5.5. Empirical relationships between power vs. time and power vs. heating rate
Power vs. Time Power vs. Heating Rate
Equation R2
Equation R2
Section 1 y = 6707x-0.602 0.9958
y = 67.743x + 250.11 0.9929
Section 2 y = 10720x-0.653 0.9911
y = 56.723x + 310.64 0.9707
Section 3 y = 8711x-0.505 0.9428
y = 59.651x + 616.31 0.9903
The chars generated from sample D in Part I of the Cobham Microwave experiments were
characterised, and the results obtained are reported in Table 5.6. The toluene extractables
transmission confirmed that all chars had been completely pyrolysed. The surface areas
ranged from 76.2 to 96.3 m2/g. Identical runs at 1500 W and 41 minutes had average surface
area of 84.5 m2/g with standard deviation of 2.25. Overall, the longer the duration of the
experiment and the higher the temperature reached, the lower the surface area. The ash
content ranged between 18.61 and 19.40% with no obvious trend clearly observed, as the
chars were completely pyrolysed and any differences could arise from minor crumb
composition variations. The pH-values were between 8.23 and 10.02 – the longer the duration
and the higher the end temperature, the higher the pH-value, as expected from the discussion
in Section 4.3.3.
0
200
400
600
800
1000
1200
1400
1600
1800
2000
0 5 10 15 20 25 30
Po
wer
Ab
so
rbed
(W
)
Heating rate (°C/min)
Section 1 Section 2 Section 3
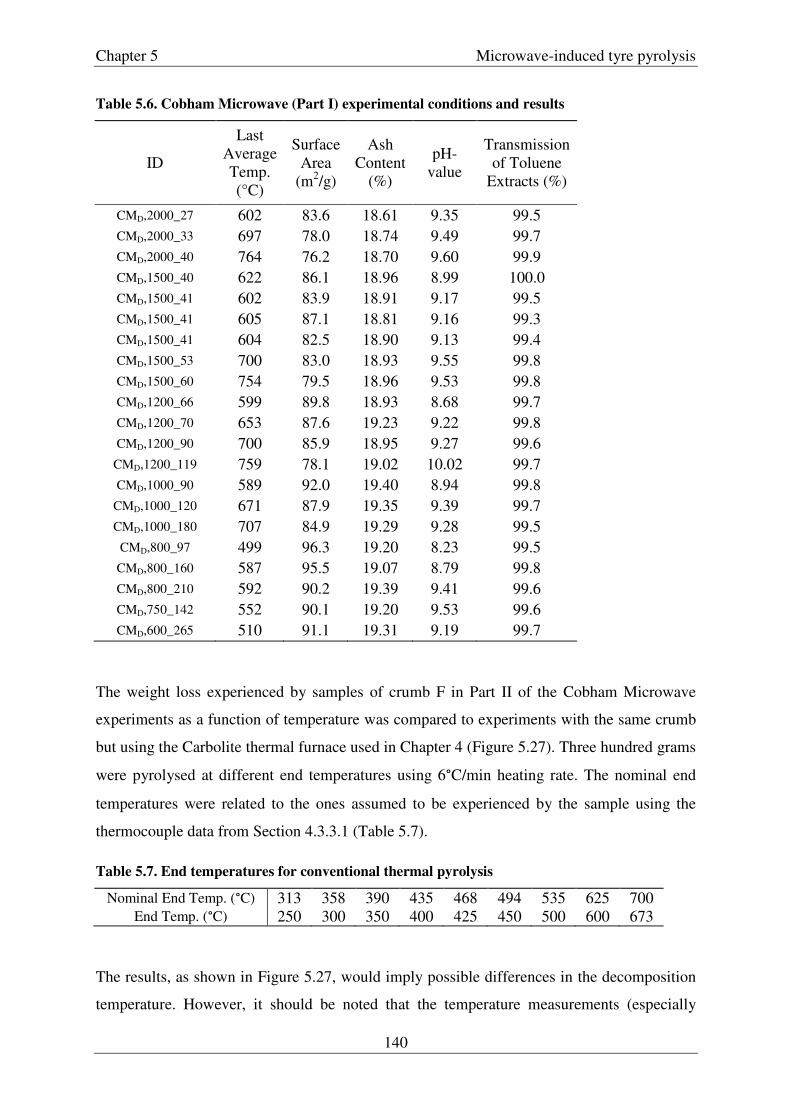
Chapter 5 Microwave-induced tyre pyrolysis
140
Table 5.6. Cobham Microwave (Part I) experimental conditions and results
ID
Last Average Temp. (°C)
Surface Area
(m2/g)
Ash Content
(%)
pH-value
Transmission of Toluene
Extracts (%)
CMD,2000_27 602 83.6 18.61 9.35 99.5 CMD,2000_33 697 78.0 18.74 9.49 99.7 CMD,2000_40 764 76.2 18.70 9.60 99.9 CMD,1500_40 622 86.1 18.96 8.99 100.0 CMD,1500_41 602 83.9 18.91 9.17 99.5 CMD,1500_41 605 87.1 18.81 9.16 99.3 CMD,1500_41 604 82.5 18.90 9.13 99.4 CMD,1500_53 700 83.0 18.93 9.55 99.8 CMD,1500_60 754 79.5 18.96 9.53 99.8 CMD,1200_66 599 89.8 18.93 8.68 99.7 CMD,1200_70 653 87.6 19.23 9.22 99.8 CMD,1200_90 700 85.9 18.95 9.27 99.6
CMD,1200_119 759 78.1 19.02 10.02 99.7 CMD,1000_90 589 92.0 19.40 8.94 99.8
CMD,1000_120 671 87.9 19.35 9.39 99.7 CMD,1000_180 707 84.9 19.29 9.28 99.5
CMD,800_97 499 96.3 19.20 8.23 99.5 CMD,800_160 587 95.5 19.07 8.79 99.8 CMD,800_210 592 90.2 19.39 9.41 99.6 CMD,750_142 552 90.1 19.20 9.53 99.6 CMD,600_265 510 91.1 19.31 9.19 99.7
The weight loss experienced by samples of crumb F in Part II of the Cobham Microwave
experiments as a function of temperature was compared to experiments with the same crumb
but using the Carbolite thermal furnace used in Chapter 4 (Figure 5.27). Three hundred grams
were pyrolysed at different end temperatures using 6°C/min heating rate. The nominal end
temperatures were related to the ones assumed to be experienced by the sample using the
thermocouple data from Section 4.3.3.1 (Table 5.7).
Table 5.7. End temperatures for conventional thermal pyrolysis
Nominal End Temp. (°C) 313 358 390 435 468 494 535 625 700 End Temp. (°C) 250 300 350 400 425 450 500 600 673
The results, as shown in Figure 5.27, would imply possible differences in the decomposition
temperature. However, it should be noted that the temperature measurements (especially

Chapter 5 Microwave-induced tyre pyrolysis
141
using the IR sensor) would show lower values than the real ones, for the reasons highlighted
previously, as well as that emissivity changes with temperature. In this case, the IR sensor
was calibrated to high temperatures – at lower temperatures the recorded value may be even
less than the actual value, and this is why the profiles possibly do not match. Similarity
between the char characteristics show that the same results are obtained by both forms of
heating.
Figure 5.27. Weight change and density of chars produced using conventional and microwave
pyrolysis at 1000 W and 1500 W (Sample F)
However the differences in the density of the material is notable as the carbonaceous residue
formed from conventional means has much higher density at the point where most volatiles
are removed compared to the ones from microwaves. This could support the volumetric
heating mechanism by microwaves, which heat from the inside out as opposed to thermal
heating from the outside to inside by convection. In any case, care should be taken when
direct comparisons are made as even though the design is similar, the volumes of the reactors
are different, and different sample masses were used. The question is posed as to whether this
effect is really a microwave effect or if it is down to the design and the conditions of the
experiment.
0.0
0.2
0.4
0.6
0.8
1.0
1.2
1.4
0
10
20
30
40
50
60
70
80
90
100
0 100 200 300 400 500 600 700
Den
sit
y (
kg
/m3)
Weig
ht
ch
an
ge (
%)
Temperature (°C)
Weight Change - Conventional Weight Change - 1000 W
Weight Change - 1500 W Density - Conventional
Density - 1000 W Density - 1500 W

Chapter 5 Microwave-induced tyre pyrolysis
142
Selected oils obtained from the earlier mentioned Cobham Microwave Part I experiments
were also characterised using CHNS analysis, calorific value measurements, FTIR and
GC/MS. Oils derived from tyre pyrolysis are very complex, reflecting the presence of the
various polymers and chemical additives associated with different degradation temperatures,
leading to a number of reactions occurring in parallel and in series (Williams & Besler,
1995). Thus, the highly heterogeneous nature of oil makes it difficult to analyse (Galvagno,
2002).
All spectra obtained using FTIR and GC/MS were very similar, irrespective of the different
conditions. Significant differences between the oils would have been expected if the
experiments had been done at end temperatures lower than the complete pyrolysis; however
all oils examined were produced at temperatures higher than 500°C.
The oils were dark brown coloured with intense odour. Sulfur is present in tyre oils (Table
5.8) mostly in theophene derivative compounds and contributes significantly in the oils’
malodour (Pakdel et al., 2001). The CHNS analysis gave results almost the same as the ones
observed by Laresgoiti et al. (2004) and Cunliffe & Williams (1998a), though the content of
nitrogen was lower. The high calorific value was confirmed (42.3 MJ/kg).
Table 5.8. CHNS analysis and calorific value of tyre oil (600°C end temperature)
Reference C (%) H (%) N (%) S (%) Calorific
Value (MJ/kg)
In current work 87 11 < 0.1 1.6 42.3 Laresgoiti et al., (2004) 86.2 ± 1.0 10.2 ± 0.1 0.4 ± 0.03 1.2 ± 0.1 42
Cunliffe & Williams (1998a) 87.9 10.1 0.5 1.3 41.2
The oil is a mixture of both aliphatic and aromatic chemicals. FTIR spectroscopy (Figure
5.28) confirmed the presence of alkanes by the intense peaks at 2960 – 2850 cm-1, 1470 –
1450 cm-1 and 1370 – 1350 cm-1. The presence of alkanes and aromatics groups is indicated
by the peaks between 675 – 900 cm-1 and around 1600 cm-1. Table 5.9 gives a summary of
the peaks possible assignments.

Chapter 5 Microwave-induced tyre pyrolysis
143
Figure 5.28. FTIR spectrum of oil generated at 1500 W
Table 5.9. FTIR spectrum peak assignment
Peak
absorption
(cm-1
)
Possible Group
Assignment Band
(cm-1
)* Comments
> 3000 ›C=C‹H /Aryl-H 3040-3010
C-H stretching (alkene and aromatic C-H) - often obscured by the stronger bands
of saturated C-H below 3000 cm-1
2953 ›CH2 & ‐CH3 2960-2850 ΞC-H stretching (Saturated C-H) 2923
2854
2346 O=C=O 2349 Appears in spectra due to inequalities in path length
1643 ›C=C‹, Dienes, trienes 1680-1620, ~1650 Alkenes
1602 Aromatic Rings/dienes ~1600 Aromatic Compounds/alkenes
1452 ›CH2 & ‐CH3 1470-1430 ΞC-H deformation (Saturated C-H)
1376 ‐CH3 1390-1370 ‐CH3 symmetrical deformation (Saturated C-H)
65
70
75
80
85
90
95
100
105
400900140019002400290034003900
Tra
nsm
itta
nce (
%)
Wavenumber (cm-1)
2923.2
2953.82854.7
2361.62345.9
16
43
.41
60
2.6
1452.2
1375.8
698.01
74
4.2
81
5.2
88
7.5
96
4.2

Chapter 5 Microwave-induced tyre pyrolysis
144
Peak
absorption
(cm-1
)
Possible Group
Assignment Band
(cm-1
)* Comments
964 875 815 744 698
, ,
, ,
, Aryl-H
970-675 C-H out of plane deformation (alkene and aromatic C-H)/ aryl-H vibration
* Band frequencies from Williams & Fleming (1995)
The complexity of the oil composition was verified by GC/MS analysis, which presented a
large number of different peaks (more than 800), most of them with very small peak areas
(Figure 5.29).
Figure 5.29. GC/MS spectrum of oil generated at 2000 W
Table 5.10 presents the possible assignments of the peaks with percentage area more than
1%. The most abundant peak was identified as C10H16, possibly in the form of limonene (both
55.01 155.01 255.01 355.01 455.01 555.01 655.01Time0
100
%
27 mix oiltrap and cold finger Scan EI+ TIC
1.85e1013.80
118.36
14.41
42.03
72.75
95.74412.98
121.15
362.47230.27214.33
151.32 193.73
341.15
294.39253.85 406.68
528.24502.29
421.63556.38 573.99
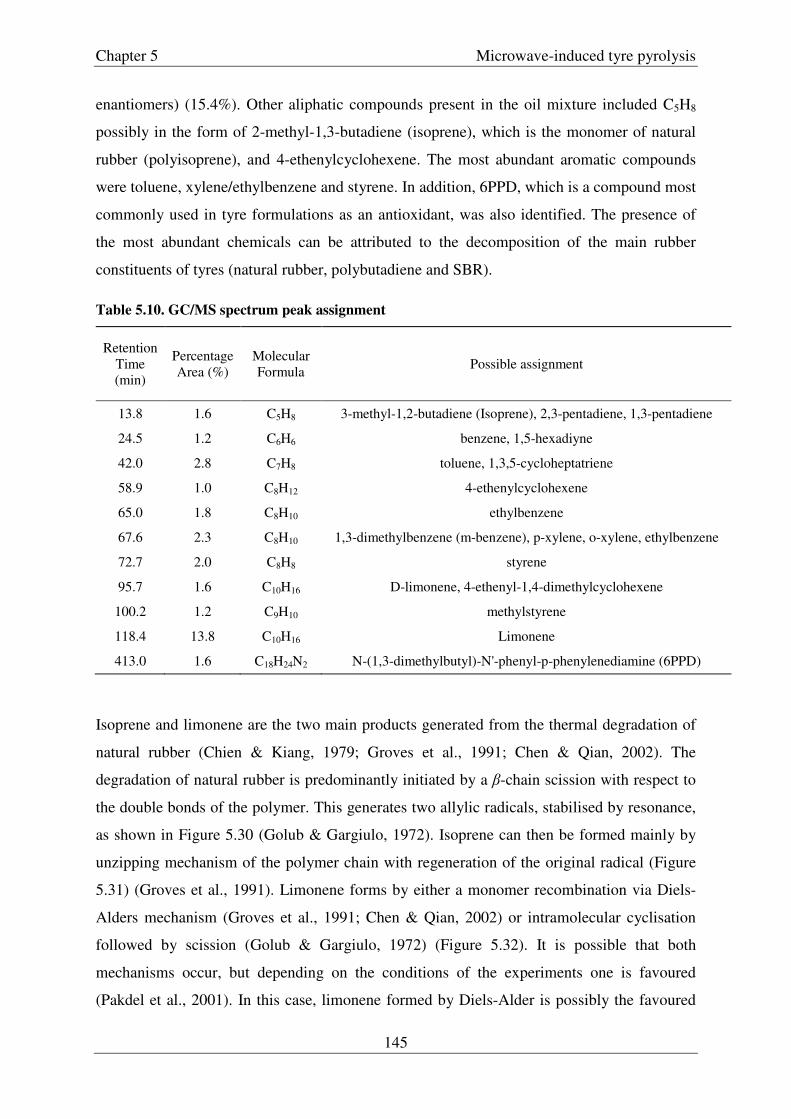
Chapter 5 Microwave-induced tyre pyrolysis
145
enantiomers) (15.4%). Other aliphatic compounds present in the oil mixture included C5H8
possibly in the form of 2-methyl-1,3-butadiene (isoprene), which is the monomer of natural
rubber (polyisoprene), and 4-ethenylcyclohexene. The most abundant aromatic compounds
were toluene, xylene/ethylbenzene and styrene. In addition, 6PPD, which is a compound most
commonly used in tyre formulations as an antioxidant, was also identified. The presence of
the most abundant chemicals can be attributed to the decomposition of the main rubber
constituents of tyres (natural rubber, polybutadiene and SBR).
Table 5.10. GC/MS spectrum peak assignment
Retention Time (min)
Percentage Area (%)
Molecular Formula
Possible assignment
13.8 1.6 C5H8 3-methyl-1,2-butadiene (Isoprene), 2,3-pentadiene, 1,3-pentadiene
24.5 1.2 C6H6 benzene, 1,5-hexadiyne
42.0 2.8 C7H8 toluene, 1,3,5-cycloheptatriene
58.9 1.0 C8H12 4-ethenylcyclohexene
65.0 1.8 C8H10 ethylbenzene
67.6 2.3 C8H10 1,3-dimethylbenzene (m-benzene), p-xylene, o-xylene, ethylbenzene
72.7 2.0 C8H8 styrene
95.7 1.6 C10H16 D-limonene, 4-ethenyl-1,4-dimethylcyclohexene
100.2 1.2 C9H10 methylstyrene
118.4 13.8 C10H16 Limonene
413.0 1.6 C18H24N2 N-(1,3-dimethylbutyl)-N'-phenyl-p-phenylenediamine (6PPD)
Isoprene and limonene are the two main products generated from the thermal degradation of
natural rubber (Chien & Kiang, 1979; Groves et al., 1991; Chen & Qian, 2002). The
degradation of natural rubber is predominantly initiated by a β-chain scission with respect to
the double bonds of the polymer. This generates two allylic radicals, stabilised by resonance,
as shown in Figure 5.30 (Golub & Gargiulo, 1972). Isoprene can then be formed mainly by
unzipping mechanism of the polymer chain with regeneration of the original radical (Figure
5.31) (Groves et al., 1991). Limonene forms by either a monomer recombination via Diels-
Alders mechanism (Groves et al., 1991; Chen & Qian, 2002) or intramolecular cyclisation
followed by scission (Golub & Gargiulo, 1972) (Figure 5.32). It is possible that both
mechanisms occur, but depending on the conditions of the experiments one is favoured
(Pakdel et al., 2001). In this case, limonene formed by Diels-Alder is possibly the favoured

Chapter 5 Microwave-induced tyre pyrolysis
146
mechanism as it results in reduction of the amount of isoprene, explaining the difference in
abundance of the two chemicals present in the oil. Limonene is considered an important
chemical as it finds wide industrial applications. In fact, it is the main ingredient of household
cleaning agents and industrial hand cleaners (Pakdel et al., 1991).
Figure 5.30. Resonance of radicals formed by β scission of natural rubber
Figure 5.31. Monomer Formation
a) b)
Figure 5.32. Limonene formation mechanism by a) intramolecular cyclisation followed by
scission b) Diels-Alder reaction
Other products can be attributed to carbon-carbon scissions followed by intramolecular
hydrogen or group transfer, or radicals formed from α-scission and second carbon-carbon
bond cleavage, which leads to a stable product, for example formation of ethene (Figure 5.33)
(Chien & Kiang, 1979).
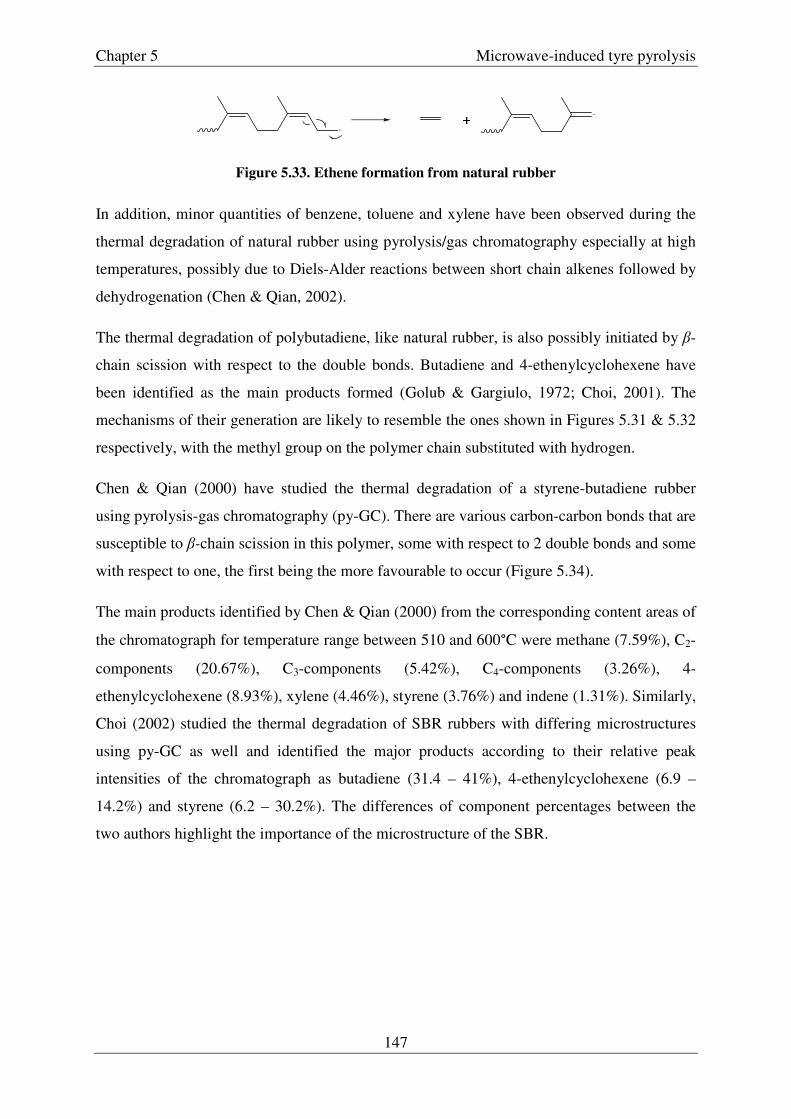
Chapter 5 Microwave-induced tyre pyrolysis
147
Figure 5.33. Ethene formation from natural rubber
In addition, minor quantities of benzene, toluene and xylene have been observed during the
thermal degradation of natural rubber using pyrolysis/gas chromatography especially at high
temperatures, possibly due to Diels-Alder reactions between short chain alkenes followed by
dehydrogenation (Chen & Qian, 2002).
The thermal degradation of polybutadiene, like natural rubber, is also possibly initiated by β-
chain scission with respect to the double bonds. Butadiene and 4-ethenylcyclohexene have
been identified as the main products formed (Golub & Gargiulo, 1972; Choi, 2001). The
mechanisms of their generation are likely to resemble the ones shown in Figures 5.31 & 5.32
respectively, with the methyl group on the polymer chain substituted with hydrogen.
Chen & Qian (2000) have studied the thermal degradation of a styrene-butadiene rubber
using pyrolysis-gas chromatography (py-GC). There are various carbon-carbon bonds that are
susceptible to β-chain scission in this polymer, some with respect to 2 double bonds and some
with respect to one, the first being the more favourable to occur (Figure 5.34).
The main products identified by Chen & Qian (2000) from the corresponding content areas of
the chromatograph for temperature range between 510 and 600°C were methane (7.59%), C2-
components (20.67%), C3-components (5.42%), C4-components (3.26%), 4-
ethenylcyclohexene (8.93%), xylene (4.46%), styrene (3.76%) and indene (1.31%). Similarly,
Choi (2002) studied the thermal degradation of SBR rubbers with differing microstructures
using py-GC as well and identified the major products according to their relative peak
intensities of the chromatograph as butadiene (31.4 – 41%), 4-ethenylcyclohexene (6.9 –
14.2%) and styrene (6.2 – 30.2%). The differences of component percentages between the
two authors highlight the importance of the microstructure of the SBR.

Chapter 5 Microwave-induced tyre pyrolysis
148
Figure 5.34. SBR β-chain scission possibilities (red - with respect to 2 bonds, blue - with respect
to 1 bond) and the main products from SBR degradation (Adapted from Choi, 2002)
The styrene was produced mainly by the styrene unit of the polymer. This was confirmed by
Choi (2002), who observed increased styrene presence from the polymers with higher styrene
content. In addition, other aromatics like toluene can be formed by direct bond scission from
SBR (Kwon & Castaldi, 2009). However, the presence of aromatics is not just because of the
aromatic nature of the polymer. Like in the case of natural rubber and polybutadiene,
aromatic compounds can be generated by the dehydrogenation of cyclised molecules, formed
possibly by Diels-Alder mechanisms. Styrene, for example, can also be formed by
dehydrogenation of 4-ethenylcyclohexene (Figure 5.35) (Chen & Qian, 2000). In fact,
hydrogen is one of the main gases identified from tyre pyrolysis (21.7 vol% by Kyari et al.,
2005).
Figure 5.35. Possible mechanisms of xylene formation from SBR degradation
Thus, in the case of tyre pyrolysis, products from the individual polymers are expected to be
generated as seen from the GC/MS results. The major compounds identified from the oil

Chapter 5 Microwave-induced tyre pyrolysis
149
derived from microwave pyrolysis are compared to the ones identified by other authors using
conventional tyre pyrolysis as well as to the major components of oil generated from the
CPII,D16 experiment (Chapter 4).
Table 5.11. Major tyre pyrolysis oil components from different research
Current work
Arabiourrutia et al. (2007)
Kyari et al.
(2005)
Laresgoiti et al. (2004)
Rotary Furnace
(Microwave)
Rotary Furnace (Conv.)
Conical spouted reactor
Fixed Bed
Reactor Autoclave
End Temperature (°C)
600 600 500 500 500 600
Dwell Time (hr) - - - 1 0.5 0.5
Compounds % area % area % area % area % area % area
toluene 2.8 1.7 0.8 3.5 4.4 2.81 ethylbenzene/xylene 4.1 3.4 1.8 4.1 6.3 3.93
styrene 2.0 <1 2.2 2.2 2.5 1.94 Limonene 15.4 16.2 26.8 13.8 5.1 3.19
6PPD 1.6 1.3 0.3 na na na
The major component is, as expected, limonene (though Laresgoiti et al. (2004) observed it in
much less quantities). The quantities of the main compounds identified from the microwave
generated oil are very similar to the ones identified by Kyari et al. (2005). Differences in the
percentage compositions in comparison with the other authors are probably due to different
experimental conditions, such as the reactor’s design, that may or may not promote the
secondary reactions and cracking of the oils, and possibly the composition of the tyre rubber,
that may or may not contain more natural rubber, SBR or PBR, rather than the form of
heating.
Whereas the properties of the chars and oils obtained by both conventional and microwave-
induced pyrolysis are similar, microwave heating should offer an advantage in the area of
energy efficiency through volumetric heating. As the energy is transferred
electromagnetically and not as heat flux (as occurs in conventional pyrolysis), there are no
longer limitations related to the thermal diffusivity and surface temperature (Meredith, 1998).
This implies a significant reduction in heating times, using an optimal design chamber with
no losses to the surrounding environment; Meredith (1998) states a possible reduction to less
than 1% compared to conventional heating. In addition, the power conversion (electrical to
microwave) is more efficient in microwave heating. Using a 2450 MHz generator this

Chapter 5 Microwave-induced tyre pyrolysis
150
efficiency is between 50 – 70%, whereas for a 915 MHz generator this reaches more than
80% (personal communication with experts in the microwave industry). At an industrial
scale, using 915 MHz would be more beneficial due to this conversion efficiency. Meredith
(1998) also states that the magnetron life is 8000 – 12000 hours at 915 MHz compared to
4000 – 6000 hours at 2540 MHz. The latter frequency is commonly used in small scale
applications such as in the current work, being widely available and cheaper because of its
use in domestic microwaves.
5.5 Conclusions
In this chapter it has been shown that microwave technology can be used for the microwave-
induced pyrolysis of tyres. Issues related to the temperature measurements inside a
microwave cavity were highlighted and the importance of the system design has been
emphasised using four different apparatus configurations, including a prototype custom-made
rotary furnace. The behaviour of tyre rubber under microwaves was related to the change of
its dielectric properties. The latter were measured for chars produced at increasing
temperatures using a network analyser at room temperature, and it was found that the
complex permittivity, tanδ and σ, were increased from 2, 0.03 and 0 (raw tyre rubber) to 8.8,
0.13 and 0.09 (char generated at an end temperature as recorded by the IR sensor of 703°C)
respectively. Similarities between properties of the chars (surface area, ash-content, pH-
values) and oils (CHNS, individual components as identified by GC/MS) generated from
microwave and conventional heating have been observed. Overall, microwave heating would
have an advantage in this type of application through a careful cavity design that would
ensure uniform heating (to minimise hot-spot formations) and be optimised to achieve
maximum energy efficiency.

Chapter 6 Recovery of value from pyrolysed chars
151
6 Recovery of value from pyrolysed chars
6.1 Introduction
In this Chapter the recovery of value from pyrolysed tyre chars is investigated by examining
the use of selected chars produced in Chapters 4 and 5 as reinforcement filler replacement in
rubber compound formulation.
Tyre rubber compound formulation was discussed in Chapter 1, as well as the use of carbon
black as reinforcement filler in the rubber formulation. Published research in the use of waste
as filler replacement report varying levels of success – due primarily to comparability issues;
there are different grades of fillers and therefore different reinforcement performance
expectations. The wastes that have been investigated include rice husk ash (da Costa et al.,
2000) and pyrolysed chars (Cataldo, 2005), discussed in Section 6.2 below.
Reinforcement can be defined in general as the enhancement of specific and measurable
physical performance properties to exceed typical expectations for the material in its intended
application. For example, glass fibre reinforced composites and steel-reinforced concrete. In
polymer reinforcement, these properties include tensile strength, tear resistance, abrasion
resistance, modulus of elasticity (Fröhlich et al., 2005; Boonstra, 1979), etc. Reinforcement in
elastomers is considered for specific applications, such as increasing the service life of a tyre
by using carbon black as reinforcement filler to improve the abrasion resistance. Typically,
there are trade-offs in the overall characteristics of the resulting material, as the use of a
reinforcement to improve a particular property, e.g. modulus of elasticity, may have a
corresponding negative effect on a different property. For example, an increase in hardness
results in a decrease in deformation at break. Donnet & Custodero (2005) refer to this as “a
fascinating paradox that explains the ability of reinforced elastomers to provide unique
material properties and applications”.
The reinforcement of rubber by filler is a complex phenomenon influenced by a number of
factors such as the polymers properties, the filler properties and the processing of the rubber
compound. Fröhlich et al. (2005) summarised the main factors related to the filler properties
as follows:

Chapter 6 Recovery of value from pyrolysed chars
152
i) the primary particle size or specific surface area – this relates to the effective
contact area between the filler and polymer matrix,
ii) the structure of the filler – this influences the degree of restrictive motion of
elastomer chains under strain, and
iii) the surface activity – this determines the filler-filler and filler-polymer interaction.
Wolff & Wang (1993) state that all these properties contribute to the reinforcement of the
rubber through mechanisms such as interfacial interaction between the rubber molecules and
the filler particles, filling up of the voids present in the filler aggregates by polymer, and
further aggregation or clustering of the filler aggregates in the polymer matrix. These
mechanisms cause the rubber compound to display properties expected of a compound into
which a higher volume of filler has been added to it, than is currently the case, based solely
on the filler density and loading.
The effective filler volume can be influenced by interfacial interactions between the rubber
and the filler, which lead to the adsorption of the polymer molecules on the surface of the
filler. This adsorption causes a restriction in molecular mobility of the polymer chains in the
vicinity of the filler (Donnet & Custodero, 2005; Wolff & Wang, 1993; Boonstra, 1979). This
surface interaction, which depends on the surface area and surface activity of the filler, can be
measured by bound rubber measurements. These measurements involve the determination of
the portions of the rubber that are insoluble in good rubber solvents (Donnet & Custodero,
2005).
In addition, the filling up of the voids in the filler aggregates, known as occlusion of rubber,
causes that rubber to behave more like filler than as a rubber matrix, by resisting deformation.
Occluded rubber is a function of the structure of the filler (Wang, 1998).
Furthermore, the aggregates of the filler tend to form agglomerates (filler-filler interactions)
which lead to the formation of a filler network or secondary structure. Within these structures
rubber is trapped which also contributes to the effective volume of the filler. All the above
are illustrated in Figure 6.1.
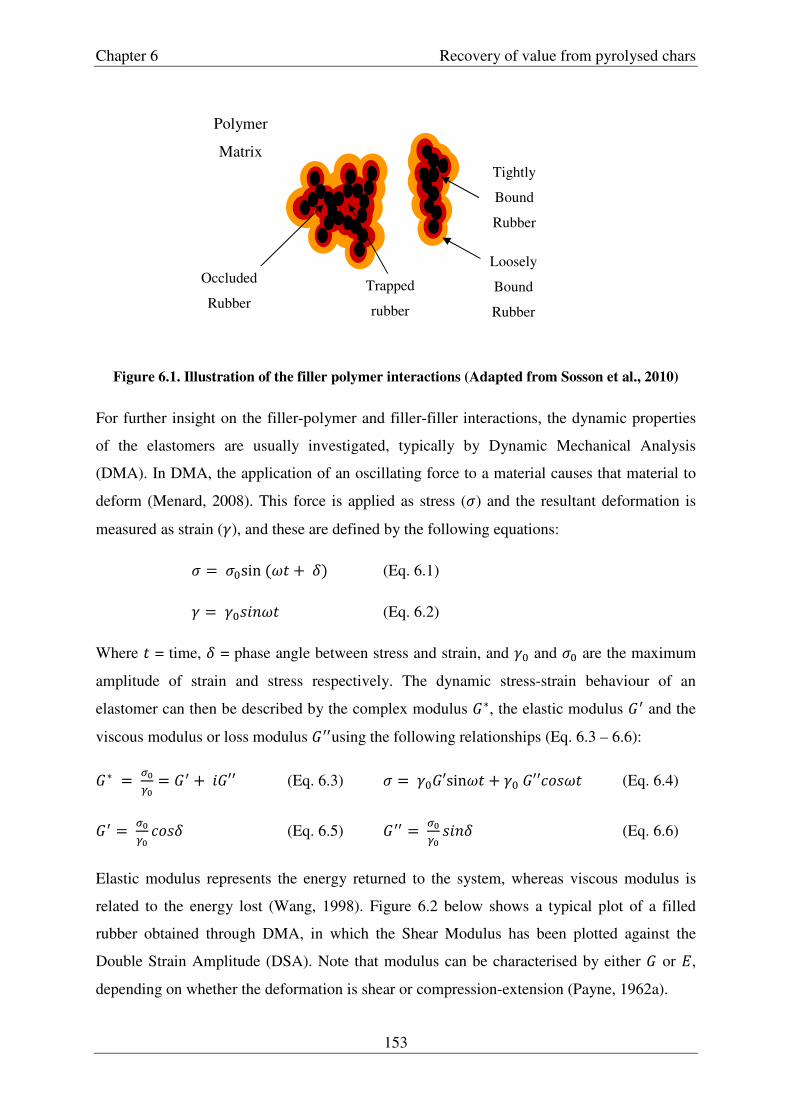
Chapter 6 Recovery of value from pyrolysed chars
153
Figure 6.1. Illustration of the filler polymer interactions (Adapted from Sosson et al., 2010)
For further insight on the filler-polymer and filler-filler interactions, the dynamic properties
of the elastomers are usually investigated, typically by Dynamic Mechanical Analysis
(DMA). In DMA, the application of an oscillating force to a material causes that material to
deform (Menard, 2008). This force is applied as stress (�) and the resultant deformation is
measured as strain («), and these are defined by the following equations:
� � ��sin ¯� " �! (Eq. 6.1)
« � «�M'�¯� (Eq. 6.2)
Where � = time, � = phase angle between stress and strain, and «� and �� are the maximum
amplitude of strain and stress respectively. The dynamic stress-strain behaviour of an
elastomer can then be described by the complex modulus °�, the elastic modulus ° and the
viscous modulus or loss modulus °using the following relationships (Eq. 6.3 – 6.6):
°� � z0±0 � ° " '°�� (Eq. 6.3) � � «�°�sin¯� " «� °���NM¯� (Eq. 6.4)
° � z0±0 �NM� (Eq. 6.5) ° � z0±0 M'�� (Eq. 6.6)
Elastic modulus represents the energy returned to the system, whereas viscous modulus is
related to the energy lost (Wang, 1998). Figure 6.2 below shows a typical plot of a filled
rubber obtained through DMA, in which the Shear Modulus has been plotted against the
Double Strain Amplitude (DSA). Note that modulus can be characterised by either ° or �,
depending on whether the deformation is shear or compression-extension (Payne, 1962a).
Polymer
Matrix Tightly
Bound
Rubber
Loosely
Bound
Rubber
Occluded
Rubber Trapped
rubber

Chapter 6 Recovery of value from pyrolysed chars
154
Figure 6.2. Payne effect illustration (Adapted from Meon et al., 2004)
As shown in Figure 6.2 there are two parts that contribute to the modulus, a strain dependent
and a strain independent part. The strain independent part of the modulus is a function of the
following elements as summarised by Fröhlich et al., (2005), Meon et al., (2004) and Payne
(1962b):
i) the polymer network (depends on the crosslinked density and the nature of the
polymer)
ii) the hydrodynamic effect (caused by the addition of a non deformable filler to the
viscoelastic rubber matrix – dependent on the shape of the filler)
iii) the in-rubber structure (related to the likelihood of the filler preventing the
deformation of the rubber)
In the strain dependent part, the modulus decreases with strain increase. This effect, known
as Payne effect, defined as the difference between modulus values measured at low and high
strains (²°�), is attributed to interaggregate interaction (Meon et al., 2004; Wolff & Wang,
1993). With increased strain this filler-filler network breaks down, releasing trapped rubber,
thus reducing the apparent filler volume.
The following section discusses some previous research in the use of material derived from
waste, as an alternative to commercial fillers in rubber formulation.
In-Rubber Structure
Polymer Network
Hydrodynamic Effects
Filler-Filler Interactions
Double Strain Amplitude (%)
Shear
Modulus

Chapter 6 Recovery of value from pyrolysed chars
155
6.2 Fillers from waste
Similar to the current work, chars were generated by Cataldo (2005) from pyrolysis of
crumbs derived from tyre tread. Using a heating rate of 50°C/min, the crumbs were heated up
to 700°C under inert conditions (nitrogen atmosphere) and held at this temperature for 10
minutes. The char obtained was evaluated as a filler replacement in a natural rubber/SBR
compound formulation without any treatment, by replacing partially or completely carbon
black grade N339. This grade of carbon black was chosen due to its surface area proximity
(90 m2/g) to the surface area of the generated char (81 m2/g). The mechanical properties of
the compounds containing the pyrolytic char, however, showed inferior reinforcing effect
compared to the control compound.
More recently, Ivanov & Mihaylov (2011) also examined the possibility of replacing the filler
in rubber compounds using a material obtained from the pyrolysis-cum-water vapor of
‘green’ tyre tread. Ivanov & Mihaylov report that the material was found to contain mainly
silicon dioxide (65%) and carbon (30%) following characterisation. The material, identified
as SiO2D, (75 parts per hundred rubber, phr) was mixed in an SBR/BR blend and other
additives and tested for its curing characteristics, mechanical and dynamic properties. The
results were compared to two controls: one containing silica (50 phr) and the other containing
silica (50 phr) and carbon black N330 (25 phr). The SiO2D filled compound showed similar
mechanical and dynamic properties as the compound filled with the blend of silica/N330,
though the former had a much shorter optimum curing time.
Furthermore, the potential for replacing commercial filler with rice-husk ash generated from
the incineration of rice husk waste has been investigated in various rubber blends by Sae-Oui
et al. (2002), Ismail et al. (1997) and da Costa et al. (2000 & 2003). Rice husks can be
separated to white husk ash (95% SiO2) and black husk ash (55% SiO2, 45% carbon)
depending on the conditions they are generated (Klingensmith & Rodgers, 2004). The white
rice husk ash used by da Costa et al. (2000) was either simply milled or milled and then
chemically treated in rubber compounds at various loadings (0 – 50 phr), and compared to
N774 (20 phr) and precipitated silica (20 phr). Under some conditions comparable results
were obtained, for example the tensile strength of a compound containing 20 phr of treated
rice husk ash was 26.0 MPa compared to 22.0 MPa of a compound containing N774.
However, for most properties examined the overall results obtained were slightly inferior to
the results obtained from the controls.

Chapter 6 Recovery of value from pyrolysed chars
156
Nabil et al. (2012) investigated the effect of partial replacement of commercial fillers by
recycled Poly(ethylene terephthalate) (PET). Physical properties such as tensile strength and
modulus showed inferior results when compared with the compounds containing carbon
black N550 and silica.
Other wastes examined for their potential as fillers in rubber compounds include palm ash
(Ismail & Haw, 2008), recycled newspaper (Ismail et al., 2008) and cocoa pod husks and
rubber-seed shells (Okieimen & Imanah, 2005). Physical characteristics examined by these
authors suggest that the filler has semi to non-reinforcing properties. Table 6.1 below is a
summary of some previous investigations on the use of materials derived from waste as an
alternative to commercial fillers in rubber compound formulation.
In addition to the summary above, RockTron (http://rktron.com/) has developed a technology
that enables the use of fly ash from coal power stations as filler in various applications
including in polymers and elastomers. This application however is not presented in publicly
available literature in sufficient detail, but is claimed (on RockTron’s website) to be the first
and only commercial solution to recovering value from fly ash waste by its transformation
into an eco-mineral filler.
6.3 Experimental procedure
In the current work, selected ground chars (< 150 µm) were examined for their performance
as filler replacements in rubber compounds. The selected chars included four chars generated
using conventional pyrolysis; CPII,E1 and CPII,E2, (generated using the same heating rate and
dwell time but different end temperature, 550 and 700°C respectively) and CPII,E15 and
CPII,D16 (identical conditions but different source of feedstock). In addition, two chars
obtained by microwave-induced pyrolysis: one using relatively low power and long duration
(CMD800_210) and one obtained using relatively high power and short duration
(CMD1500_41a) were also selected.
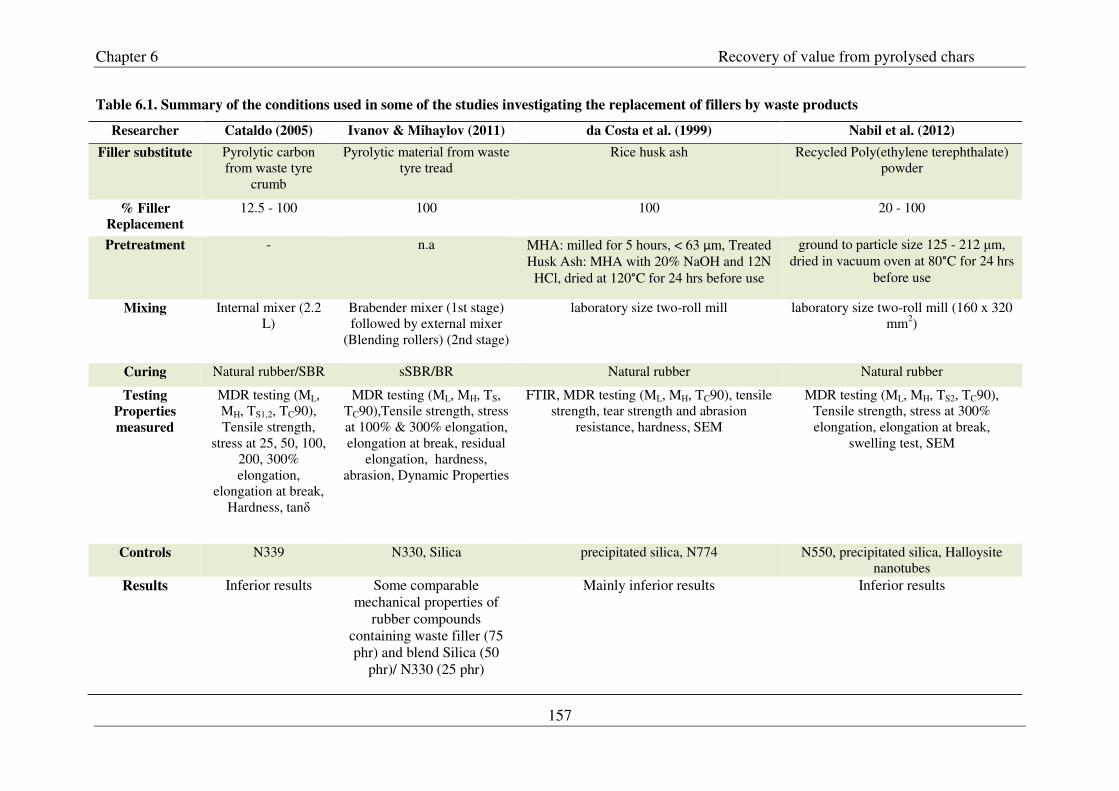
Chapter 6 Recovery of value from pyrolysed chars
157
Table 6.1. Summary of the conditions used in some of the studies investigating the replacement of fillers by waste products
Researcher Cataldo (2005) Ivanov & Mihaylov (2011) da Costa et al. (1999) Nabil et al. (2012)
Filler substitute Pyrolytic carbon from waste tyre
crumb
Pyrolytic material from waste tyre tread
Rice husk ash Recycled Poly(ethylene terephthalate) powder
% Filler
Replacement
12.5 - 100 100 100 20 - 100
Pretreatment - n.a MHA: milled for 5 hours, < 63 μm, Treated Husk Ash: MHA with 20% NaOH and 12N HCl, dried at 120°C for 24 hrs before use
ground to particle size 125 - 212 µm, dried in vacuum oven at 80°C for 24 hrs
before use
Mixing Internal mixer (2.2 L)
Brabender mixer (1st stage) followed by external mixer
(Blending rollers) (2nd stage)
laboratory size two-roll mill laboratory size two-roll mill (160 x 320 mm2)
Curing Natural rubber/SBR sSBR/BR Natural rubber Natural rubber
Testing
Properties
measured
MDR testing (ML, MH, TS1,2, TC90), Tensile strength,
stress at 25, 50, 100, 200, 300% elongation,
elongation at break, Hardness, tanδ
MDR testing (ML, MH, TS, TC90),Tensile strength, stress at 100% & 300% elongation, elongation at break, residual
elongation, hardness, abrasion, Dynamic Properties
FTIR, MDR testing (ML, MH, TC90), tensile strength, tear strength and abrasion
resistance, hardness, SEM
MDR testing (ML, MH, TS2, TC90), Tensile strength, stress at 300% elongation, elongation at break,
swelling test, SEM
Controls N339 N330, Silica precipitated silica, N774 N550, precipitated silica, Halloysite nanotubes
Results Inferior results Some comparable mechanical properties of
rubber compounds containing waste filler (75 phr) and blend Silica (50
phr)/ N330 (25 phr)
Mainly inferior results Inferior results
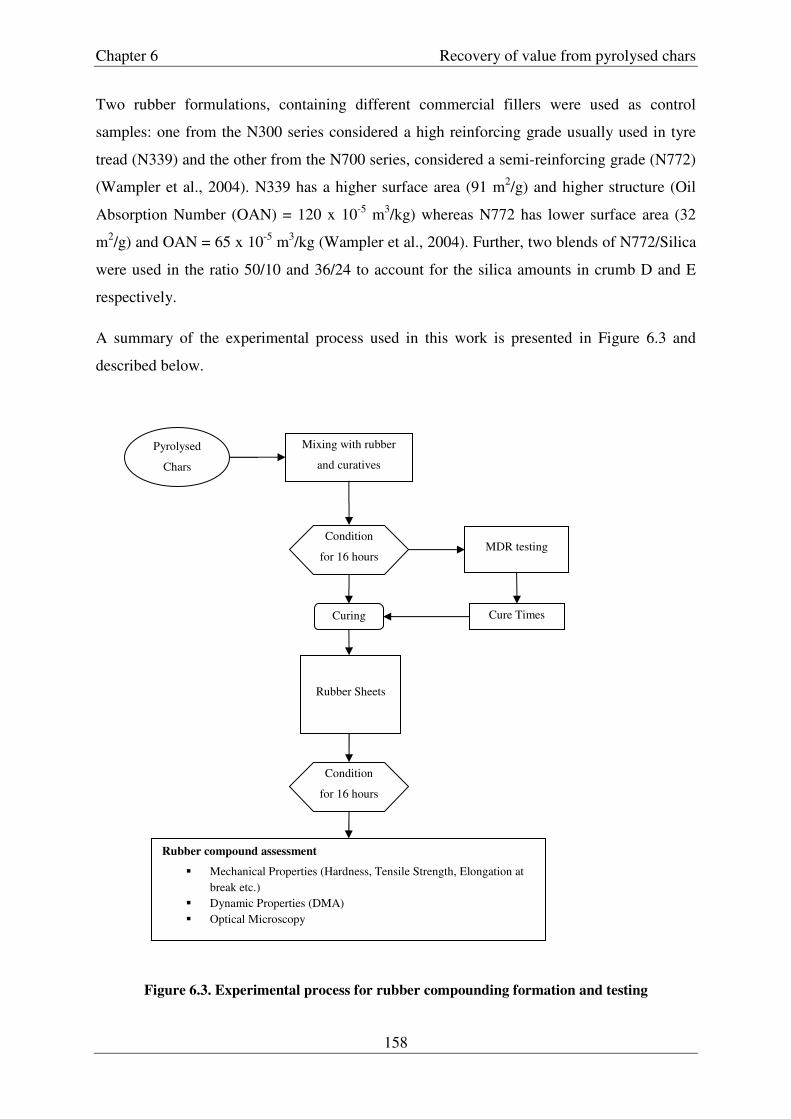
Chapter 6 Recovery of value from pyrolysed chars
158
Two rubber formulations, containing different commercial fillers were used as control
samples: one from the N300 series considered a high reinforcing grade usually used in tyre
tread (N339) and the other from the N700 series, considered a semi-reinforcing grade (N772)
(Wampler et al., 2004). N339 has a higher surface area (91 m2/g) and higher structure (Oil
Absorption Number (OAN) = 120 x 10-5 m3/kg) whereas N772 has lower surface area (32
m2/g) and OAN = 65 x 10-5 m3/kg (Wampler et al., 2004). Further, two blends of N772/Silica
were used in the ratio 50/10 and 36/24 to account for the silica amounts in crumb D and E
respectively.
A summary of the experimental process used in this work is presented in Figure 6.3 and
described below.
Figure 6.3. Experimental process for rubber compounding formation and testing
Pyrolysed
Chars
Mixing with rubber
and curatives
Condition
for 16 hours
Curing
MDR testing
Cure Times
Rubber compound assessment
� Mechanical Properties (Hardness, Tensile Strength, Elongation at break etc.)
� Dynamic Properties (DMA) � Optical Microscopy
Condition
for 16 hours
Rubber Sheets

Chapter 6 Recovery of value from pyrolysed chars
159
6.3.1 Formation of rubber compounds
The formation of the rubber compound sheets involved the mixing of the compounds and the
curing assessment. The chars were mixed with compounding ingredients as described in
Section 6.3.1.1 and allowed to rest for a minimum of 16 hours before undergoing a curing
assessment (Moving Die Rheometer test) described in Section 6.3.1.2. From this test,
information on the cure times for each char was obtained, which was then used to mould test
sheets. The moulded samples were then conditioned for a minimum of 16 hours at 23°C prior
to being assessed.
6.3.1.1 Mixing
A Brabender Plasticorder mixing machine with a small chamber of 50 ml volume was used
due to the limited sample size of char available (40 g). The ingredients, comprising the
rubber, filler, vulcanising agent, accelerators and antioxidants, shown in Table 6.2 as parts
per hundred rubber (phr), were accurately weighed to 2 decimal places accordingly to fill
94% of the chamber volume.
Table 6.2. Rubber formulation
Ingredients phr Rubber (SBR) 100 Process Oil 10 ZnO 5 Stearic acid 2 Anti-oxidant (6PPD) 1.5 Accelerator (TBBS) 1.5 Sulfur + mineral oil 1.5 Filler 60
Excluding the rubber, all the ingredients were blended to form an add-mixture. The following
mixing sequence was used at 55 rpm rotor speed: At 0 minutes, the polymer was added,
followed by the add-mixture, the ram was then lowered. After 1 minute the ram was raised to
brush down the feed throat area and lower the ram again. After 2 minutes the mixer was
stopped.
The material was then removed from the mixing chamber and placed into a steel bowl. The
batches were then blended immediately on the ARTIS 13” 2-roll mill to take the heat out and
Chapter 6 Recovery of value from pyrolysed chars
160
prevent scorching (premature activation of the cure reactions which prevent flow in the
mould if this happens) using a nip setting of 5. Any remaining loose powders were added to
the nip and the batch was passed through the nip 6 times to ensure dispersion of any powder.
Material was then removed from the mill using a nip setting of 10, to give a sheet thickness
of around 4 mm for subsequent moulding operations.
In addition, the formulation and mixing process was modified for the formation of 2 rubber
compounds to investigate the effect of using a coupling agent. These rubbers were formed
using char generated from the Cobham Microwave furnace at 1500W for 41 minutes and
crumb from sample E (< 500 µm). More details are presented in Appendix III.
6.3.1.2 Curing and Moving Die Rheometer testing
A rubber test piece is examined for its vulcanisation characteristics using a Moving Die
Rheometer (MDR) test according to BS ISO 3417:2008. This testing was conducted by
ARTIS using an MDR 2000 by Alpha Technologies. A fixed volume of sample of the
mixture (4.5 cm3) is placed between polyester films on a biconical disc in a temperature-
controlled die cavity. The disc is oscillated through ± 0.5° amplitude, exerting shear strain to
the sample. On the upper die the torque required to oscillate the disc is measured and
recorded as a function of time. The torque value depends on the stiffness of the sample (BS
ISO 3417:2008). Typical graphs produced in an MDR test are shown in Figure 6.4, where:
]Y = Minimum torque (N.m)
]³ = Highest torque (N.m)
�d� = time to an increase of one unit of torque above ]Y (minutes)
�¤ 90! = cure time to 90% of maximum torque developed during the test (minutes)
As seen in the graph there is an initial area known as the scorch time that covers the shaping
and processing operations of rubber. This is the time required at a specified temperature for
the pre-crosslink insertion chemistry to take place (Dick, 2001), defined as the time until one
torque unit rise above the minimum is achieved (�d�). After this, the torque increases as
permanent crosslinks are formed as part of the vulcanisation process; thus increasing the
resistance to deformation. �¤ 90! is the time where 90% of the cure measured is achieved,
and this is used to approximate the curing time of the rubber mixture and identifies the point
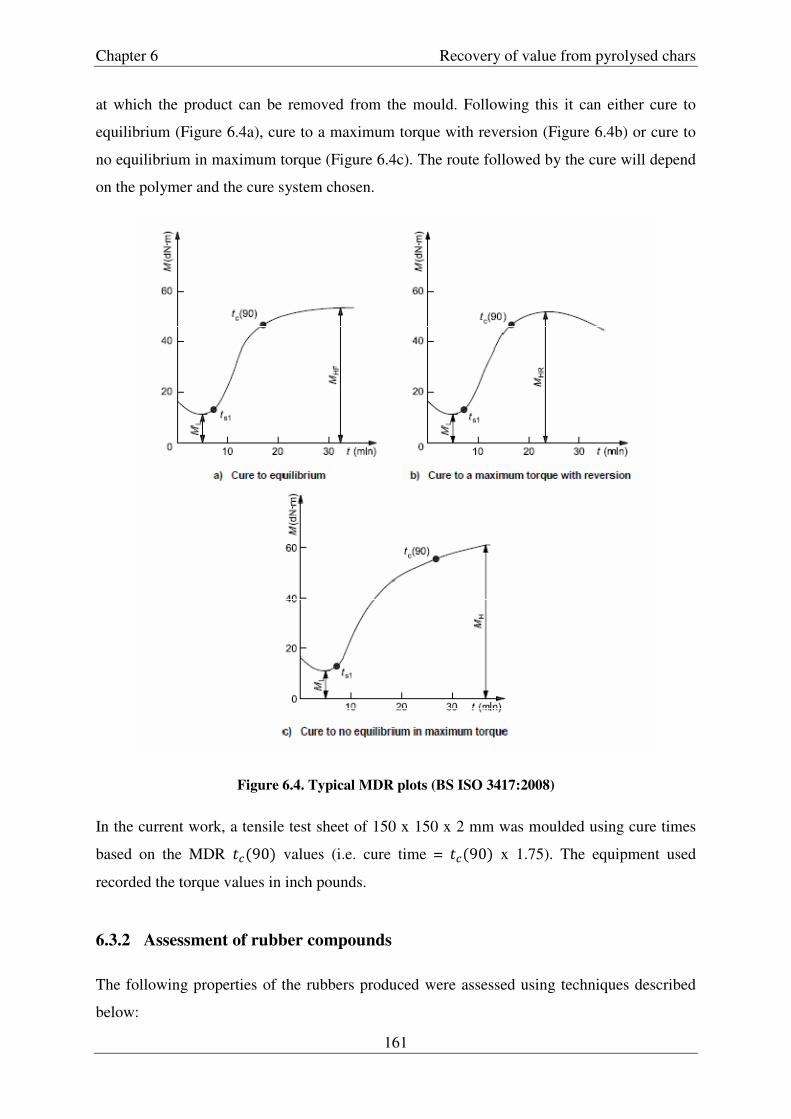
Chapter 6 Recovery of value from pyrolysed chars
161
at which the product can be removed from the mould. Following this it can either cure to
equilibrium (Figure 6.4a), cure to a maximum torque with reversion (Figure 6.4b) or cure to
no equilibrium in maximum torque (Figure 6.4c). The route followed by the cure will depend
on the polymer and the cure system chosen.
Figure 6.4. Typical MDR plots (BS ISO 3417:2008)
In the current work, a tensile test sheet of 150 x 150 x 2 mm was moulded using cure times
based on the MDR �¤ 90! values (i.e. cure time = �¤ 90! x 1.75). The equipment used
recorded the torque values in inch pounds.
6.3.2 Assessment of rubber compounds
The following properties of the rubbers produced were assessed using techniques described
below:

Chapter 6 Recovery of value from pyrolysed chars
162
� Dynamic mechanical analysis isothermal strain sweep at 40°C
� Hardness
� Tensile properties (M100, M300, Elongation at break and tensile strength)
� Optical Microscopy
A selected char was also characterised using Transmission Electron Microscopy.
6.3.2.1 Dynamic Mechanical Analysis
The dynamic properties of the samples were measured by performing strain sweeps at
constant frequency and temperature. The double strain amplitude varied between 0.05 to 4%
at 40°C in tensile mode using frequency of 10 Hz. These experiments were performed by
ARTIS and plots were obtained for modulus against DSA.
6.3.2.2 Hardness
The hardness of the cured rubber compounds was measured according to the British Standard
for Determination of indentation hardness, Part 1: Durometer method (Shore Hardness), BS
ISO 7619-1:2010. In this method the hardness of the test sample is measured by applying a
load on the surface using an indentor for a given period of time. This measurement was
carried out by ARTIS, using a type A durometer with the indentor applied for 3 seconds. The
hardness is obtained by the following relationship:
j � 550 " 75I´ (Eq. 6.7)
where j is force applied in millinewton and I´ is the hardness reading taken from the type A
durometer. As performed by ARTIS, five readings were taken at different positions on the
test sample and the median value was determined.
6.3.2.3 Tensile properties
The tensile stress-strain properties were determined according to BS ISO 37:2005. The
following properties were determined as defined by the Standard: Tensile strength (the
maximum tensile stress recorded in extending the test piece to a breaking point), Elongation
at break (the tensile strain in the test length at breaking point), and stress at a given elongation
(stress required to produce an elongation, in this instance an elongation of 100% and 300%).
Chapter 6 Recovery of value from pyrolysed chars
163
In these experiments, carried out by ARTIS, the test pieces were cut to a dumb-bell shape,
stretched in a tensile-testing machine at a constant rate and readings of force and elongation
taken as required. The different properties are calculated using the equations below.
µE�M'LE M�`E�¶��, µ* � [�·¸ ]��! (Eq. 6.8)
�LN�¶��'N� �� 8`E�9, �2 � ��� Y¹AY0! Y0 %! (Eq. 6.9)
*�`EMM �� ¶'»E� ELN�¶��'N�, ]g � [¼·¸ ]��! (Eq. 6.10)
Where jV = maximum force recorded (N)
½ = width of the narrow portion of the die (mm)
� = thickness of the test length (mm)
�� = initial test length (mm)
�2 = test length at break (mm)
jg = the force recorded at a given strain (N)
The median of three runs was determined. A laser extensometer was used to measure the
strain in the gauge length of the sample.
6.3.2.4 Optical Microscopy
Optical Microscopy was used to assess the dispersion of the filler in rubber compound. This
is a morphological analysis technique in which visible light in conjunction with a system of
lenses is used to magnify samples (Brandon & Kaplan, 2008). The analysis was performed by
ARTIS using a Leica MZ6 microscope with Leica DFC 280 camera at x 40 magnification.
6.3.2.5 Transmission Electron Microscopy
Transmission Electron Microscopy (TEM) is a similar technique for microstructural analysis
like SEM (Section 4.3.2.6) but in TEM the electron beam is transmitted through the material
under investigation (Brandon & Kaplan, 2008). Using TEM, images are obtained at much
higher resolutions than SEM. Images of selected chars in ethanol were obtained using a JEOL

Chapter 6 Recovery of value from pyrolysed chars
164
2010 TEM in the Materials department at Imperial College London, using x 300, x 4000 and
x 20000 magnification.
6.4 Results and discussion
Using MDR testing, plots were generated for torque against time for rubber compounds
containing selected chars obtained in the previous chapters. Values were obtained for �d�, �¤ 90!, ]Y and ]³, as shown in Table 6.3. Also shown in Table 6.3 are values for surface
area, pH-value and ash content obtained for the respective chars from the characterisation
section in Chapters 4 and 5, as well as values from MDR testing for compounds containing
the commercial fillers.
Table 6.3. Summary of properties of the rubber compounds and their respective filler
�d�
(sec) �¤ 90!
(sec) ]Y
(lb.ic) ]³
(lb.ic) Surface Area
(m2/g) pH-
value
Ash Content
(%) CPII,E1 65 231 1.88 11.76 112.5 7.80 44.0
CPII,E2 53 191 1.79 12.60 94.2 8.40 44.0
CPII,E15 58 196 1.89 11.94 105.7 8.07 45.9 CPII,D16 53 177 1.6 10.66 82.3 9.10 19.5
CMD800_210 52 207 1.36 10.07 90.2 9.41 19.4 CMD1500_41a 57 191 1.57 12.13 83.9 9.16 18.9
N339 73 254 2.45 15.5 91a
N772 80 221 0.98 12.64 32a
N772/Silica (50/10) 80 228 1.06 11.22 32/180b
N772/Silica (36/24) 122 287 1.89 7.97 32/180b
a Wampler et al. (2004), b Evonik Technology (2012)
MDR testing gives an indication of the vulcanisation characteristics of a rubber compound.
As stated in Section 1.2, vulcanisation is the process where crosslinks are inserted between
polymer chains. This results in a compound with increased elasticity that is essentially
insoluble in any solvent and cannot be processed further using techniques that require it to
flow (Coran, 2005).
The most widely used system is the accelerated-sulfur vulcanisation. Even though there are
still differences between researchers as to the exact mechanism of the vulcanisation, there is a
general agreement on the basic steps involved (Ghosh et al., 2003). These include the
following as summarised by Ghosh et al. (2003):
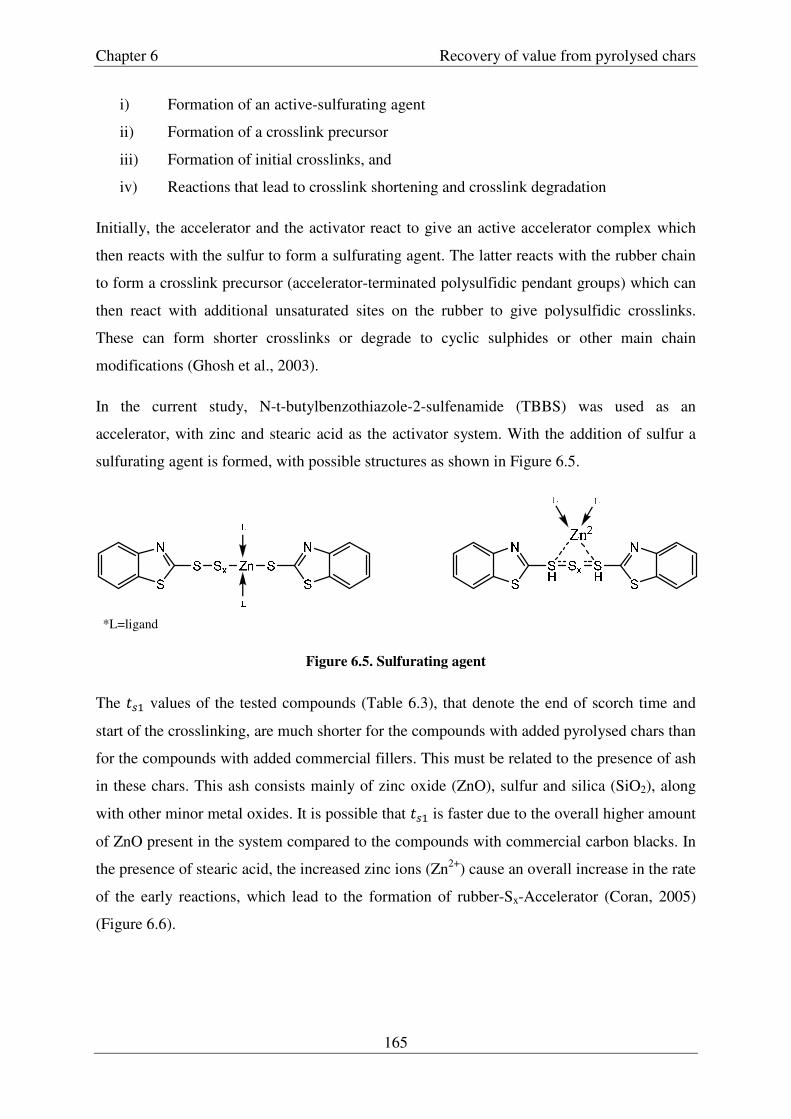
Chapter 6 Recovery of value from pyrolysed chars
165
i) Formation of an active-sulfurating agent
ii) Formation of a crosslink precursor
iii) Formation of initial crosslinks, and
iv) Reactions that lead to crosslink shortening and crosslink degradation
Initially, the accelerator and the activator react to give an active accelerator complex which
then reacts with the sulfur to form a sulfurating agent. The latter reacts with the rubber chain
to form a crosslink precursor (accelerator-terminated polysulfidic pendant groups) which can
then react with additional unsaturated sites on the rubber to give polysulfidic crosslinks.
These can form shorter crosslinks or degrade to cyclic sulphides or other main chain
modifications (Ghosh et al., 2003).
In the current study, N-t-butylbenzothiazole-2-sulfenamide (TBBS) was used as an
accelerator, with zinc and stearic acid as the activator system. With the addition of sulfur a
sulfurating agent is formed, with possible structures as shown in Figure 6.5.
Figure 6.5. Sulfurating agent
The �d� values of the tested compounds (Table 6.3), that denote the end of scorch time and
start of the crosslinking, are much shorter for the compounds with added pyrolysed chars than
for the compounds with added commercial fillers. This must be related to the presence of ash
in these chars. This ash consists mainly of zinc oxide (ZnO), sulfur and silica (SiO2), along
with other minor metal oxides. It is possible that �d� is faster due to the overall higher amount
of ZnO present in the system compared to the compounds with commercial carbon blacks. In
the presence of stearic acid, the increased zinc ions (Zn2+) cause an overall increase in the rate
of the early reactions, which lead to the formation of rubber-Sx-Accelerator (Coran, 2005)
(Figure 6.6).
*L=ligand
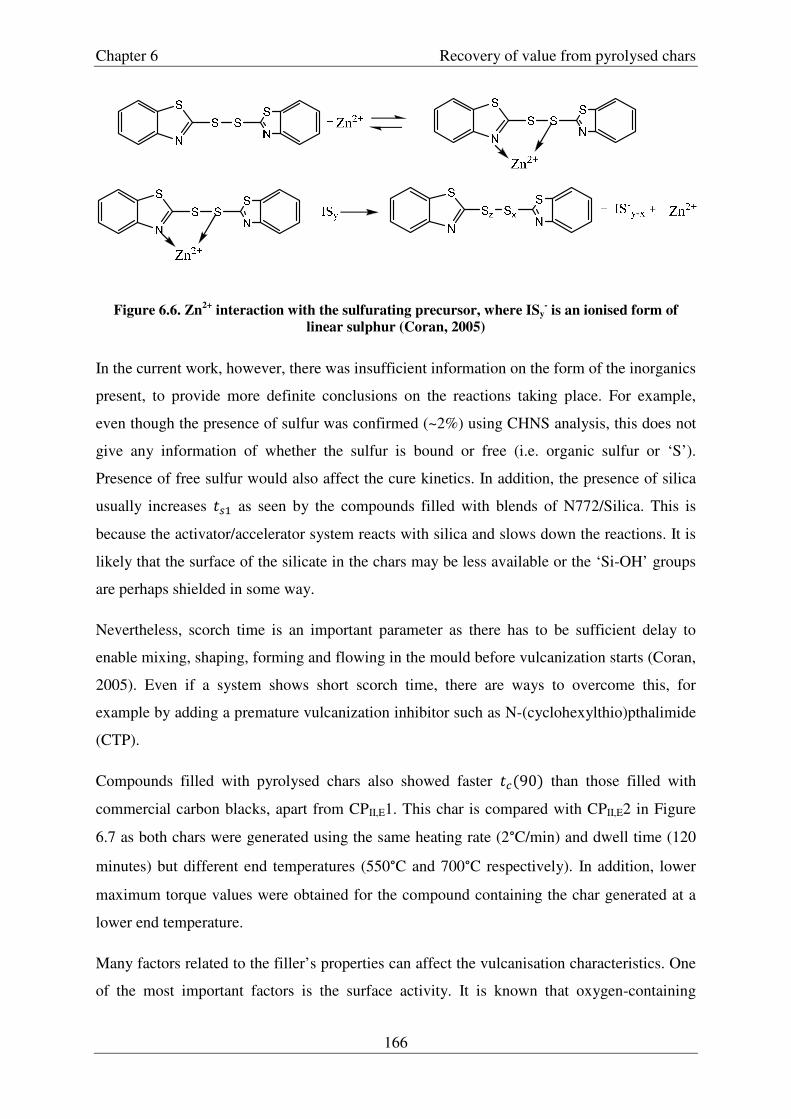
Chapter 6 Recovery of value from pyrolysed chars
166
Figure 6.6. Zn2+
interaction with the sulfurating precursor, where ISy- is an ionised form of
linear sulphur (Coran, 2005)
In the current work, however, there was insufficient information on the form of the inorganics
present, to provide more definite conclusions on the reactions taking place. For example,
even though the presence of sulfur was confirmed (~2%) using CHNS analysis, this does not
give any information of whether the sulfur is bound or free (i.e. organic sulfur or ‘S’).
Presence of free sulfur would also affect the cure kinetics. In addition, the presence of silica
usually increases �d� as seen by the compounds filled with blends of N772/Silica. This is
because the activator/accelerator system reacts with silica and slows down the reactions. It is
likely that the surface of the silicate in the chars may be less available or the ‘Si-OH’ groups
are perhaps shielded in some way.
Nevertheless, scorch time is an important parameter as there has to be sufficient delay to
enable mixing, shaping, forming and flowing in the mould before vulcanization starts (Coran,
2005). Even if a system shows short scorch time, there are ways to overcome this, for
example by adding a premature vulcanization inhibitor such as N-(cyclohexylthio)pthalimide
(CTP).
Compounds filled with pyrolysed chars also showed faster �¤ 90! than those filled with
commercial carbon blacks, apart from CPII,E1. This char is compared with CPII,E2 in Figure
6.7 as both chars were generated using the same heating rate (2°C/min) and dwell time (120
minutes) but different end temperatures (550°C and 700°C respectively). In addition, lower
maximum torque values were obtained for the compound containing the char generated at a
lower end temperature.
Many factors related to the filler’s properties can affect the vulcanisation characteristics. One
of the most important factors is the surface activity. It is known that oxygen-containing

Chapter 6 Recovery of value from pyrolysed chars
167
groups and increased acid concentration on the carbon’s surface has a retarding effect on the
rate of vulcanisation (Wiegand, 1937; Parkinson, 1951; Cotten, 1972). As shown in Chapter
4, increase in pyrolysis temperature increased the pH value of the char (used to give an
indication of surface activity), which would explain the faster cure characteristics of CPII,E2
compared to CPII,E1.
Figure 6.7. MDR plots of CPII,E1 and CPII,E2
The minimum torque values (]Y) depend on the stiffness and viscosity of the unvulcanized
compound at a low shear rate (BS, 2008). Compounds filled with the high reinforcing grade,
N339 are expected to have high viscosity. Its high surface and structure compared to N772
encourage more rubber to become trapped within its aggregates or bound on its surface as
described in Section 6.1, which will increase its viscosity. The values of the compounds with
added chars are in between the ones observed for the compounds with N772 fillers and those
with N339 fillers. These chars have surface area values similar or higher to the N339 surface
area. However, the presence of ash has a detrimental effect on their properties, as it can not
only affect the surface area by reducing the availability for interaction with the polymer, but
can also affect its surface activity. This is evident when comparing the two chars generated
under identical conditions, but using different feedstock, CPII,E15 and CPII,D16.
TEM analyses of CMD1500_41a and N772 at different magnifications are shown in Figure
6.8.
0
2
4
6
8
10
12
14
0 1 2 3 4 5 6
To
rqu
e (
lb. in
)
Time (min)
CPII,E1 CPII,E2
MH
ML
ts1
tc(90)

Chapter 6 Recovery of value from pyrolysed chars
168
Figure 6.8. TEM images of CMD1500_41a (left) and N772 (right) at x 300 (unit = 5 μm), x 4000
(unit = 0.5 μm), and x 20000 (unit = 100 nm)

Chapter 6 Recovery of value from pyrolysed chars
169
At lower magnifications, the char and filler appear very similar, with grape like clusters
observed in both samples. However, the char shows a larger variety of particles size
distribution, with the smaller ones (probably due to the inorganic components) trapped within
the larger particles making it effectively one big chunk and reducing the availability of space
where the rubber would normally get trapped.
The increase of torque during MDR testing is proportional to the number of crosslinks
formed per unit volume of rubber (Coran, 2005). As expected from a high reinforcing filler,
N339 shows a high value of maximum torque (]³) and a higher difference between the
maximum and minimum torque values (]³ ]Y!, as this implies better reduction of
mobility of the macromolecular rubber chains, thus greater interaction between the filler and
the rubber matrix (Table 6.3). N772 filled compounds have slightly higher ]³ ]Y values
and similar ]³ values to the ones obtained from the pyrolysed char filled compounds which
imply that the mechanical properties of the last two may be similar.
As seen in Table 6.4 the physical properties of the compounds with pyrolysed chars are close
to that with N772 control. Hardness results (these give an indication of the elastic modulus of
a vulcanisate) ranged between 56 and 61 for the compounds filled with pyrolysed chars. The
hardness of N772 filled compounds was within this range (58), whereas N339 filled
compound had a higher value of 68. Tensile strength (TS) and elongation at break values for
the compounds with pyrolysed chars ranged between 16.3 – 18.6 MPa and 605 – 702%
respectively, also close to the N772 filled compound (18.9 MPa and 625%). In higher
modulus vulcanisates, there are relatively short chain lengths between crosslinks and filler
particles, so they reach their limit of extensibility at lower strains. This is why the vulcanisate
filled with the highly reinforcing carbon black grade N339, as presented in Table 6.4, had the
highest tensile strength (24.5 MPa) and the lowest elongation at break (493%).
The rubber compound containing CMD1500_41a had a higher modulus at 100% elongation
(2.02 MPa) than that with N772 (1.74 MPa) but a slightly lower modulus at 300% elongation
(7.43 MPa compared to 7.89 MPa). Also in Table 6.4, the rubber compound filled with
CPII,D16 char had higher modulus than that with CPII,E15 (both produced under the same
conditions but different feedstock). This is possibly due to the presence of less inorganic
components (lower ash content, Table 6.3) which would imply less occlusion of active sites.

Chapter 6 Recovery of value from pyrolysed chars
170
Table 6.4. Mechanical properties of the rubber compounds
Hardness
TS (MPa)
M100 (MPa)
M300 (MPa)
Eb %
CPII,E1 58 18.6 1.78 6.37 673 CPII,E2 59 17.4 1.86 7.00 624
CPII,E15 60 18.2 1.72 6.21 676 CPII,D16 57 17.7 1.93 7.65 605
CMD,800_210 56 16.3 1.49 5.69 702 CMD,1500_41a 61 16.6 2.02 7.43 635
N339 68 24.5 2.99 14.9 493 N772 58 18.9 1.74 7.89 625
N772 /Silica (50/10) 58 20.4 1.56 6.10 721 N772/Silica (36/24) 52 20.2 1.24 3.79 845
The compound with the lowest reinforcing properties was CMD800_210, generated at low
power and long duration. This might be because the low power resulted in slow heating rate,
which would promote secondary reactions of the generated volatiles. This would cause “the
formation of hard-to-break agglomerated particles...” which lower the quality of the char and
reduce its reinforcing capabilities (Roy et al., 1995). In addition, the long exposure of the
crumb to heat (210 minutes) would eliminate most surface functional groups. Furthermore,
this compound showed significant deviations on repeated measurements. Low mechanical
properties might be related to poor dispersion in the polymer matrix.
To investigate the dispersion issue, optical microscopy was employed at x 40 magnification.
This confirmed the uneven dispersion of all the chars examined indicating that the filler-
rubber interactions are not ideal. Figure 6.9 presents the optical microscopy results for
vulcanisates filled chars CMD800_210 and CMD1500_41a compared to one filled with N772.
Commercial carbon blacks are normally pelletized during the manufacture process and these
pellets disintegrate during the rubber formulation mixing process. In the current work, the
pyrolysed chars, however, do not completely disintegrate during formulation mixing, giving
rise to the uneven dispersion of the char filler on the formed rubber compound. This is an
aspect that can be investigated further.

Chapter 6
a)
c)
Figure 6.9. Optical microscopy of rubber compounds containing a) N772, b) CM
Nonetheless, even with a non
similar properties with the one filled with N772. The DMA studies also confirm this
similarity in the properties of the vulcanisates. Figures 6.10 and 6.11 show the
modulus and ���� plots against the double strain
Table 6.5 presents the percentage increase in the following dynamic properties: (i) the elastic
modulus, from the initial value (
from the initial value �&! to the maximum value (
value ����&) to the maximum value recorded (
Recovery of value from pyrolysed chars
171
b)
Figure 6.9. Optical microscopy of rubber compounds containing a) N772, b) CM
c) CMD800_210
Nonetheless, even with a non-ideal dispersion, the compounds generated with the chars had
similar properties with the one filled with N772. The DMA studies also confirm this
similarity in the properties of the vulcanisates. Figures 6.10 and 6.11 show the
plots against the double strain amplitude for selected vulcanis
Table 6.5 presents the percentage increase in the following dynamic properties: (i) the elastic
modulus, from the initial value (�&! to the last value measured (�©!, (ii) the viscous modulus,
to the maximum value (�VG¾ !, and (iii) the ���) to the maximum value recorded (����VG¾).
Recovery of value from pyrolysed chars
Figure 6.9. Optical microscopy of rubber compounds containing a) N772, b) CMD1500_41a and
ideal dispersion, the compounds generated with the chars had
similar properties with the one filled with N772. The DMA studies also confirm this
similarity in the properties of the vulcanisates. Figures 6.10 and 6.11 show the elastic
amplitude for selected vulcanisates and
Table 6.5 presents the percentage increase in the following dynamic properties: (i) the elastic
(ii) the viscous modulus, ���� , from the initial

Chapter 6 Recovery of value from pyrolysed chars
172
Figure 6.10. Elastic modulus plots against double strain amplitude of the various compounds
containing different types of fillers
Figure 6.11. tanδ plots against double strain amplitude of the various compounds containing
different types of fillers
0
5
10
15
20
25
0.05 0.50
Ela
sti
c M
od
ulu
s, E
' (M
Pa)
Dynamic Strain Amplitude (%)
N339 N772 N772/Silica (10/50)
N772/Silica (36/24) CPII,E15 CPII,D16
0.000
0.050
0.100
0.150
0.200
0.250
0.300
0.05 0.50
tanδ
Dynamic Strain Amplitude (%)
N339 N772 N772/Silica (10/50)
N772/Silica (36/24) CPII,E15 CPII,D16

Chapter 6 Recovery of value from pyrolysed chars
173
The vulcanisate filled with N339 is expected to show the highest Payne effect
(% ����¶E N� �& � 50.2! compared to the one filled with N772 % ����¶E N� �& � 22.5!
as it has higher surface area and structure. Higher surface area leads to shorter inter-aggregate
distance, and subsequently to a more developed filler network. In addition, stronger filler-
polymer interaction is expected with increasing surface area, so more rubber becomes
immobilised compared to lower surface area carbons and larger particles. These factors make
the effective volume of the filler higher, thus the effect on increasing strain amplitude will be
larger (Wang, 1998). In addition, the higher structure of N339 might contribute in the larger
Payne effect observed. Wang (1998) explains that the effect of structure on the dynamic
properties of the rubber is complex, as two opposing effects occur: (i) filler with higher
structure implies shorter distances between aggregates due to higher effective volume (ii) the
larger effective size of aggregates, however, reduces the diffusion rate of the filler in the
polymer matrix – this does not enhance filler networking.
The viscous modulus, unlike the elastic modulus, increases with increase of DSA until it
reaches a maximum and then drops. Viscous modulus is related to the energy loss of the
rubber and is a function of the breakdown and reformation of the filler network (Wang,
1998). A stronger filler network will reach a higher value of � before it is broken, as seen
by the high percentage of viscous modulus change of the compound with N339. In addition, ����, which is the ratio of viscous and elastic modulus, also shows a maximum value for the
vulcanizate filled with N339.
Table 6.5. Dynamic properties of the rubber compounds
% change of � % change of � % change of ����
CPII,E1 30.7 4.7 29.6
CPII,E2 31.2 4.6 30.5
CPII,E15 31.2 5.0 31.4
CPII,D16 20.6 3.0 18.1
CMD,800_210 16.4 2.1 13.5
CMD,1500_41a 19.1 2.5 16.3
N339 50.2 21.5 91.1 N772 22.5 8.4 26.8
N772/Silica (50/10) 25.9 8.1 29.0 N772/Silica (36/24) 37.3 6.0 35.2
Chapter 6 Recovery of value from pyrolysed chars
174
The compounds filled with chars generated from sample E have closer values, as the range of
conditions used was narrower than the conditions used in generating the chars from sample D
(using microwave and conventional heating). Chars CPII,E15 and CPII,D16 which were
generated using identical conditions, but different feedstock, display considerable differences.
Similarly, differences are also observed between the compounds filled with only N772 and
those with blends of N772 and silica. On increasing the silica content, the compounds with
blends of N772 and silica show an increasing Payne effect. This is because silica forms a
stronger filler network than carbon black, due to its being less compatible with rubber and it
can also form hydrogen bonds (Fröhlich et al., 2005). Further, compounds with CPII,E15 and
the other fillers obtained from sample E, which had a high amount of silica and higher
surface area, showed a larger Payne effect, as expected from a stronger filler-filler network.
This implies that there might be some active Si–OH groups available in the char. As
mentioned in Section 4.3.3.1 in reference to Figure 4.6, even though under the conditions the
chars are generated, most –OH groups should have been removed through dehydration, some
–OH groups in silica materials remain until heated to temperatures around 1000°C (Iler,
1979). Further, the heterogeneity between feedstock compositions is an issue that can affect
the possibility of reusing chars in rubber formulations. In the current study, sample D was
sourced externally from ground whole passenger car tyres and sample E was produced
internally by combining a small amount of crumb from the UHPW system that originated
from a small number of tyre treads to make a homogeneous sample. This resulted in
significantly different compositions. It is envisaged that in an industrial scale operation,
homogeneity of the compositions will be achieved from continuous mixing of sufficiently
larger quantities of feedstock crumbs.
What is fascinating about rubber compounding is that the properties of a rubber compound
can be altered through modifications. For example, samples from char CME1500_41 were
used in a formulation with and without a coupling agent, TESPT (bis[3-
(triethoxysilyl)propyl]tetrasulfide), commonly used in conjunction with silica. Even though
the dispersion was not significantly improved, or the tensile strength (15.6 MPa to 15.5 MPa),
the modulus at 100% and 300% increased from 1.62 to 2.32 MPa and from 5.67 to 8.48 MPa,
respectively. This could again imply that there are some ‘unshielded’ silanol groups, Si-OH
active in the chars. Carbon black could also react with the coupling agent, depending on the
functional groups present in its surface. More investigation is needed to identify the active
Chapter 6 Recovery of value from pyrolysed chars
175
surface groups on the chars to enable further modifications either to the chars themselves or
of the formulation, to increase their reinforcing capabilities.
Ismail & Haw (2008) also observed an increase of the modulus at 100% and 300% when
incorporating a coupling agent (maleated natural rubber) in their vulcanisates, using palm ash
as a filler. Other examples of modifications of non-conventional fillers to improve their
quality can be found in published research. Meon et al. (2004), for example, reports that
montmorillonite modified with quaternary ammonium salts resulted in a more organophilic
clay; this improved tensile strength and reduced hysteresis loss. Goodyear has replaced 10%
of a conventional filler by an extracted and modified form of corn starch (Meon et al., 2004).
In addition, even the way the char is reduced in size can make a difference. One of the
collaborators in the RμPERT consortium, who is involved in rubber industry, is positive that
an appropriate method to grind the char, such as jet milling, can make its performance in
rubber compounds even better.
Further, the mixing process and the sequence of adding ingredients can change the behaviour
of a compound (Dick, 2001). Due to the limited amount of char in the current work, a small
volume mixer was used; a higher volume mixer could promote better mixing and dispersion
of the char.
6.5 Conclusions
End-of-life tyres are considered a problematic waste and the feasibility of recovering value
through the use of chars obtained from the pyrolysis of waste tyres in rubber formulations has
been investigated and demonstrated in this chapter.
Rubber compounds were prepared using chars generated from conventional and microwave-
induced pyrolysis of tyre rubber as described in Chapters 4 and 5. The rubber compounds
prepared were assessed for relevant physical and mechanical properties and found to be
comparable to rubber compounds containing N772 as well as compounds with N772 and
silica. The char filled compounds had hardness values of 56 – 61, tensile strength in the range
of 16.3 – 18.6 MPa, modulus at 100% and 300% elongation between 1.49 – 2.02 MPa and
5.69 – 7.43 MPa respectively and elongation at break of between 605 and 702%. These
compared to the values of the N772-filled compound which had Hardness = 58, TS = 18.9

Chapter 6 Recovery of value from pyrolysed chars
176
MPa, M100 = 1.74 MPa, M300 = 7.89 MPa and Elongation at break = 625%. This places the
optimum chars in the category of semi-reinforcing fillers.
It has also been suggested in this work that modifications to the rubber formulation and
process conditions can result in better reinforcing properties. Promising results were obtained
from char-filled rubber compounds formed with added coupling agent where the modulus at
100% and 300% increased from 1.62 to 2.32 MPa and from 5.67 to 8.48 MPa, respectively.
Overall, through a combination of pyrolysis optimisation and rubber compounding
adjustment, the potential for reusing the tyre char in new tyres is evident.
Chapter 7 Conclusions and recommendations for further research
177
7 Conclusions and recommendations for further research
7.1 Concluding discussion
End-of-life tyres are considered to be a significant problematic waste. The UK alone
produces more than 450,000 tonnes of used tyres each year. By design, tyres are very robust
and hence hard to degrade. Legislation banning landfill disposal of tyres (whole or shred)
means that there must be 100% recovery of material from this substantial waste stream.
Various waste management options are currently applied to the handling of waste tyres.
Latest UK statistics show that the generation of crumb is the most popular reuse route,
accounting for more than 30% of waste tyres (EA, 2010). This crumb is subsequently used in
numerous civil engineering applications including asphalt mixtures, carpet underlay etc.
Other management options include the reuse of whole tyres both in the UK and abroad,
which accounts for 20% of the amount of waste tyres generated. In the UK reuse can be in
the form of noise barriers, while abroad a second life as a tyre in countries with less strict
restrictions on the thickness of the tread occurs. In addition, tyres can be used for energy
generation as a substitute fuel in incineration plants and cement kilns due to the inherently
high calorific value. This route accounts for approximately 18% of waste tyres in the UK,
38% of waste tyres in Europe (ETRMA, 2012) and 40% of waste tyres in USA (RMA, 2011).
The continued development of additional management options, however, is driven by issues
such as the increasingly high volume of waste tyres generated, the need to exploit the
potential economic value of end-of-life tyre and need for more sustainable material
management practices wherever possible. Pyrolysis of waste tyres, which is the heating of the
rubber in the absence of oxygen to generate a carbonaceous solid, oil and gas, is a technology
which provides a means for sustainable value recovery from waste tyres.
The primary aim of this research was to investigate end-of-life tyre pyrolysis using
conventional and microwave-induced heating with a view to recovering value in the form of
reusable residue for inclusion in rubber. The objectives of this research were to (i) review the
management of waste tyres (ii) characterise samples of waste tyre crumb obtained from
different sources and techniques (iii) investigate the pyrolysis of the crumb by thermal and

Chapter 7 Conclusions and recommendations for further research
178
microwave methods and evaluate the residues, and (iv) investigate the feasibility of using the
solid residue in rubber formulations.
A detailed review of the management practices and legislation for waste tyres was carried out
and presented in Chapter 1, along with an introduction to tyres and microwave theory.
Following this review, the characterisation of samples of waste tyres in the form of granules
was presented in Chapter 3. This characterisation was by CHNS analysis, calorific
measurements and thermal analysis. Thermal analysis using 5°C/min heating rate showed that
the main rubber degradation occurs between approximately 300 and 480°C, with DTG plots
presenting two peaks associated with the degradation of natural and synthetic rubber
respectively. The carbon content ranged from 60.59 to 85.65% and the calorific values from
32.1 to 36.4 MJ/kg. The results obtained confirmed compositions reported in the literature on
the mix design of tyres and highlighted the significantly increased use of silica in tyre tread.
In Chapter 4, tyre crumb was pyrolysed by conventional means to examine the influential
parameters on selected properties of the chars generated. These properties included the
carbon content, the surface area and the pH. A Carbolite HTR 11/150 laboratory scale rotary
furnace was used and the experiments were conducted under a nitrogen atmosphere. In the
first set of experiments a Plackett-Burman screening test was employed to test the influence
of seven parameters: temperature, heating rate, dwell time, particle size, nitrogen flow,
rotation of the vessel and sample weight. The experiments generated chars with pH-values of
7.75 – 9.15, carbon content of 36.7 – 45.0% (outlier char CPI,C6 with a carbon content of
49.6% was excluded from the model as it was significantly under-pyrolysed) and surface
areas ranging from 101.1 to 128.6 m2/g (CPI,C6 was 43.4 m2/g). These experiments identified
the most important parameters to be temperature and heating rate.
In the second set of experiments reported in Chapter 4, a Box-Blehnken design was used to
investigate the possibility of fitting a quadratic model of the responses with temperature,
heating rate and dwell time as parameters. The dwell time was added to ensure that complete
pyrolysis of the samples was achieved. The chars generated had pH-values of 7.80 – 8.60,
carbon content of 50.21 – 53.61% and surface areas of 94.2 – 113.3 m2/g. The key parameter
was found to be temperature. In addition, experiments performed under the same conditions
but using different crumb samples highlighted again the difference in the chars properties; the
pH-value, ash content and surface area of char originating from whole passenger tyre crumb

Chapter 7 Conclusions and recommendations for further research
179
was 9.10, 19.54% and 82.3 m2/g respectively, compared to 8.07, 45.88% and 105.7 m2/g of
char originating from tyre tread.
The investigation of microwave-induced pyrolysis was conducted and discussed in Chapter 5.
Microwaves offer an attractive alternative to conventional heating, because whereas in
conventional heating energy is transferred through convection, conduction and radiation, in
microwave heating, energy is delivered directly to the material through interaction with the
electromagnetic field. This interaction results in the volumetric heating of the material
potentially causing a more efficient heating, faster reaction time and energy savings.
Though microwave technology is established in various applications, such as the food
industry, there is limited research on its use for pyrolysis purposes. For this work, four
different apparatus configurations were used. These were two modified domestic microwave
ovens, a modified microwave synthesis apparatus (RotoSYNTH) and a custom-made rotary
furnace manufactured by Cobham Microwave Ltd. in collaboration with Imperial College
designed specifically for this project.
The use of the domestic microwave ovens highlighted the difficulty to control the creation of
hot spots and uneven heating in static systems as the chamber experienced nodes and
antinodes of the electromagnetic field. With RotoSYNTH, which is a rotary system, hot spots
were also observed and the nature of microwaves means that the design of the reactor is
important for efficient heating and prevention of hot spots.
One of the biggest challenges was the temperature measurement, as the use of thermocouples
was prohibited inside the chamber. As a compromise, measurement by infrared sensor of the
quartz vessel in contact with the tyre crumb was used for the monitoring of the pyrolysis
process in the Cobham microwave configuration. The behaviour of tyre rubber under
microwaves was related to the change of its dielectric properties with increasing temperature.
This results in a more carbon concentrated material with increasing electron mobility via the
transfer of the π bond electrons along the aromatic layers (Dodds, 2006).
Properties of completely pyrolysed chars (surface area, ash-content, pH-values) and oils
(CHNS, individual components as identified by GC/MS) generated using Cobham
microwave had similarities with chars and oils obtained from conventional pyrolysis.
Chars obtained from studies reported in Chapters 4 and 5 were successfully reused as
replacements for semi-reinforcing fillers in rubber formulations. These rubber compounds

Chapter 7 Conclusions and recommendations for further research
180
were assessed for relevant physical and mechanical properties and were found to be
comparable to rubber compounds containing N772 as well as compounds with N772 and
silica, and the detailed results presented in Chapter 6. Further, it was proposed that better
reinforcing properties could be obtained through modifications to the formulations to
accommodate the differences between the recovered char and traditional fillers.
Whereas the concept of pyrolysis is not new, the application of pyrolysis in the management
of waste has yet to be applied in a commercially successful system. This is influenced by
several factors including the economics of the system, feedstock availability and product
quality. In terms of waste tyres, the feedstock is significant – pyrolysis can be of whole tyres,
however microwave-induced pyrolysis is of shredded tyres. The shredding of tyres was
considered energy intensive, and may still be, even with the introduction of robotic
technologies like the UHPW system. The true energy intensity still needs to be investigated
and quantified. However, microwave pyrolysis could potentially offer energy savings due to
more efficient heating mechanisms compared to conventional heating systems. The key
parameter is to optimize the design of the reactor so that uniform heating is achieved with
minimal losses to the surroundings.
It may also be perceived that restrictions on the source (in terms of distance travelled) of the
waste tyres for pyrolysis is a hindrance to the commercialisation of the process. This was
premised on a consideration that the transportation of the tyres only adds more burdens to the
system and that close proximity between the waste and the plant is of economic and
environmental benefit. Current developments in environmental assessment using life cycle
methodology have shown that the impacts from transportation are minimal in comparison to
raw material and process impacts. It would be commercially advantageous to locate the
pyrolysis plant close to power stations for the dual reasons of energy supply for pyrolysis and
the collection and transfer of resulting syngas from pyrolysis to the power station for energy
generation. The economics of the latter is further embedded in the fact there is therefore no
requirement for gas treatment onsite, along with the relevant infrastructure – this is a facility
that will be available at the power station.
In addition, one other determining factor in the economics is the quality of the pyrolysis
outputs. The implementation of quality control mechanisms and purpose-driven research and
development is imperative. The quality control requirement reflects the importance of
ensuring the production of better quality, fit for purpose, carbonaceous material, which will

Chapter 7 Conclusions and recommendations for further research
181
consequently have a better market value. A fuller understanding of the char properties will
also enable modification of the rubber formulation to achieve the desired filler replacement.
The successful use of the char as a filler replacement represents a significant step in
sustainable management of waste tyres through closed loop recycling.
7.2 Contribution to knowledge
The contributions to knowledge derived from the current work have been many and varied
given the holistic approach used in this research, and are as follows:
� This is the first combined comparative study of the products and potential reuse
opportunities of conventional thermal and microwave generated tyre pyrolysis chars;
� An in-depth study and demonstration of the key influential parameters for the
pyrolysis of tyre crumb by conventional means has been completed;
� A similarly comprehensive study of the feasibility of using microwave technology for
tyre crumb pyrolysis, using a new and bespoke microwave furnace design, has been
undertaken. This has highlighted the key challenges and issues to be considered for
further development of this application;
� The work has provided evidence that the characteristics of the outputs of tyre
pyrolysis using both conventional and microwave heating exhibit similarities. This
implies that potential differences arise mainly due to the reactor configuration and
experimental conditions rather than from the different forms of heating;
� Confirmation that the solid residue from tyre crumb pyrolysis can be used as a semi-
reinforcing filler in rubber compounds and demonstration that further modifications of
the formulation recipe can increase its reinforcing ability.
7.3 Further work
The work presented in this thesis has shown that the recovery of value from waste tyres can
be achieved by using the solid residue obtained from both conventional and microwave-
induced pyrolysis as a replacement for semi-reinforcing fillers in rubber compounds. The
benefits from using microwave technology over conventional heating need to be harnessed.
From the results obtained in this work the following opportunities for future work have been
identified:
Chapter 7 Conclusions and recommendations for further research
182
(i) Microwave Pyrolysis: Numerous advances have been made in microwave
technology especially in the food industry, but its application in waste
management is still limited. Most of the current published work has been from
work using modified domestic microwaves. There is a need to develop suitably
optimised microwave designs. The custom made microwave (Cobham system)
used in this thesis was a prototype and it exhibited particular operational
characteristics which indicate that further optimisation is recommended through
microwave design for the following:
a. Real-time temperature measurements to enable better control of the reactions
in the cavity, ideally in multiple locations within the chamber
b. Uniform heating of the material during pyrolysis. This can be achieved by
rotation of the sample, though the design is crucial to prevent hot spot
creation. As shown with the RotoSYNTH experiments, even this rotation
needs to be optimised
c. Pyrolysis of high volumes of material which means using cavities which are
well matched to the absorption properties of the feedstock, thus reducing
losses to the surrounding
d. The current work involved the use of low heating rates (less than 30°C/min).
The effect of higher heating rates on the properties and characteristics of the
chars and the oils obtained from pyrolysis needs to be investigated further.
e. Design and optimisation of a continuous system instead of a batch system for
large scale pyrolysis
(ii) Char application in rubber compounds: The characteristics of the chars have to be
further investigated, for example the influence of the inorganic components and
surface activity. This will help understand what modifications are needed to either
the char or the formulation recipe, or both, to improve the char interactions with
the rubber. Different formulations should be examined to accommodate the
differences between the waste tyre-derived char and the traditional fillers. More
testing parameters, in addition to those used in this work, should be included to
assess the char’s performance (weathering effects, abrasion etc.).
(iii) Environmental and economic evaluation: In line with true sustainability in
practice, the conversion of waste tyres into a filler replacement, using microwave
pyrolysis as a management method for the waste stream, needs to be assessed in

Chapter 7 Conclusions and recommendations for further research
183
terms of the environmental implications and the economics. Life cycle assessment
methodology is recommended as a suitable approach for this. It can be used to
evaluate both energy and resource requirements of any system alongside the
environmental impacts in defined categories.

References
184
References
Al-Oweini R. & El-Rassy H. (2009) Synthesis and characterization by FTIR spectroscopy of
silica aerogels prepared using several Si(OR)4 and R´´Si(OR´)3 precursors. Journal of
Molecular Structure, 919, 140 – 145.
Ani F. N. & Nor N. S. M. (2012) Microwave induced fast pyrolysis of scrap rubber tires. AIP
conference proceedings, 1440, 834 – 841.
Appleton T. J., Colder R. I., Kingman S. W., Lowndes I. S. & Read A. G. (2005) Microwave
technology for energy-efficient processing of waste. Applied Energy, 81, 85 – 113.
Arabiourrutia M., Lopez G., Elordi G., Olazar M., Aguardo R. & Bilbao J. (2007)
Characterization of the liquid obtained in tyre pyrolysis in a conical spouted bed reactor.
International Journal of Chemical Reactor Engineering, 5.
ASTM D1506 – 99 (2007) Standard Test Methods for Carbon Black – Ash Content. West
Conshohocken, ASTM International.
ASTM D1618 – 99 (2004) Standard Test Methods for Carbon Black Extractables–
Transmittance of Toluene Extract. West Conshohocken, ASTM International.
ASTM D2854 – 96 (1996) Standard test method for apparent density of activated carbon.
Washington D.C., ASTM International.
Aylón E., Murillo R., Fernández-Colino A., Aranda A., García T., Callén M. S. & Mastral A.
M. (2007) Emissions from the combustion of gas-phase products at tyre pyrolysis. Journal of
Analytical and Applied Pyrolysis, 79, 210 – 214.
Bagreev A., Locke D. C. & Bandosz T. J. (2001) H2S adsorption/oxidation on adsorbents
obtained from pyrolysis of sewage-sludge-derived fertilizer using Zinc Chloride activation.
Industrial & Engineering Chemistry Research, 40, 3502 – 3510.
Balanis C. A. (1989) Advanced engineering electromagnetics. John Wiley & Sons.
Bansal R. C. & Goyal M. (2005) Activated carbon adsorption. CRC Press, Taylor and
Francis Group, Boca Raton.
References
185
Barbooti M. M., Mohamed T .J., Hussain A. A. & Abas F. O. (2004) Optimization of
pyrolysis conditions of scrap tires under inert gas atmosphere. Journal of Analytical and
Applied Pyrolysis, 72, (1), 165 – 170.
Berrueco C., Esperanza E., Mastral F. J., Ceamanos J. & Garcia-Bacaicoa P. (2005) Pyrolysis
of waste tyres in an atmospheric static-bed batch reactor: Analysis of the gases obtained.
Journal of Analytical and Applied Pyrolysis, 74, 245 – 253.
Boehm H. P. (1994) Some aspects of the surface chemistry of carbon blacks and other
carbons. Carbon, 32, (5), 759 – 769.
Bolton W. (1992) Electrical and magnetic properties of materials, Longman Scientific &
Technical, Essex.
Boonstra (1979) Role of particulate fillers in elastomer reinforcement: a review. Polymer, 20,
(6), 691 – 704.
Bradley R. H., Sutherland I. & Sheng E. (1995) Relationship between carbon black surface
chemistry and energy. Journal of the Chemical Society, Faraday Transactions, 91, (18), 3201
– 3207.
Brandon D. & Kaplan W. D. (2008) Microstructural characterisation of materials. 2nd
edition. John Wiley & Sons Ltd., England. Online version available at:
http://www.dawsonera.com/depp/reader/protected/external/AbstractView/S9780470727126
[Accessed on 20th November 2012]
Brazier D. W. & Nickel G. H. (1975) Thermoanalytical methods in vulcanizate analysis II.
Derivative thermogravimetric analysis. Rubber Chemistry and Technology, 48, 661 – 677.
Brazier D. W. & Schwartz N. V. (1978) The effect of heating rate on the thermal degradation
of polybutadiene. Journal of Applied Polymer Science, 22, 113 – 124.
British Standards Institution (2010) BS ISO 7619:2010. Rubber, vulcanized or thermoplastic
– Determination of indentation hardness, Part 1: Durometer method (Shore hardness).
London, BSI.
British Standards Institution (2008a) BS ISO 1382:2008. Rubber – Vocabulary. London, BSI.
References
186
British Standards Institution (2008b) BS ISO 3417:2008, Rubber – Measurement of
vulcanization characteristics with the oscillating disc curemeter. London, BSI.
British Standards Institution (2005) BS ISO 37:2005. Rubber, vulcanized or thermoplastic –
Determination of tensile stress-strain properties. London, BSI.
British Standards Institution (2000) BS ISO 9924-1:2000. Rubber and rubber products.
Determination of the composition of vulcanizates and uncured compounds by
thermogravimetry. Butadiene, ethylene-propylene copolymer and terpolymer, isobutene-
isoprene, isoprene and styrene-butadiene rubbers. London, BSI.
British Standards Institution (1998) BS EN 55011:1998. Industrial, scientific and medical
(ISM) radio-frequency equipment - Radio disturbance characteristics - Limits and methods of
measurement. London, BSI.
Bryant G. H. (1993) Principles of Microwave Measurements. Revised Edition. Peter
Peregrinus Ltd. on behalf of the Institution of Eletrical Engineers, London.
Burg P. & Cagniant D. (2008) Characterisation of carbon surface chemistry. In: Radovic L.
R. (ed.) Chemistry and Physics of Carbon, Taylor & Francis Group, LLC, pp. 129 – 175.
Butarin V. L., Clark J. H., Lanigan B. A., Shuttleworth P., Breeden S. W., Wilson A. J.,
Macquarrie D. J., Milkowski K., Jones J., Bridgeman T. & Ross A. (2009) The preparation of
high-grade oils through the controlled, low temperature microwave activation of wheat straw.
Bioresource Technology, 100, 6064 – 6068.
Cabot Corporation (2012) What is the pH of carbon black. [Online] Available from:
http://www.cabot-corp.com/Specialty-Carbon-Blacks/KBase?recOffset=100 [Accessed 13th
April 2012].
Cabot Corporation (2010) Greenhouse Gases. [Online] Available from: http://www.cabot-
corp.com/Safety-Health-and-Environment/Environmental-
Performance/GN200810310938AM1924 [Accessed 8th March 2010].
Caddick S. (1995) Microwave assisted organic reactions, Tetrahedron, 51, 10404 – 10432.
Cataldo F. (2005) Preparation of pyrolytic carbon black from scrap tire rubber crumb and
evaluation in new rubber compounds. Macromolecular Materials and Engineering, 290, 463
– 467.

References
187
Chan T. V. C. T. & Reader H. C. (2000) Understanding microwave heating cavities, Artech
House Inc., Norwood.
Chen F. & Qian J. (2002) Studies on the thermal degradation of cis-1,4-polyisoprene. Fuel,
81, 2071 – 2077.
Chen F. & Qian J. (2000) Studies on the thermal degradation of poly(styrene-butadiene)
Energy Sources, 22, (9), 837 – 843.
Chen M., Siochi E. J., Ward T. C. & Mcgrath J. E. (1993) Basic ideas of microwave
processing of polymers, Polymer Engineering and Science, 33, (17), 1092 – 1109.
Cheung K.-Y., Lee K.-L., Lam K.-L., Lee C.-W. & Hui C.-W. (2011) Integrated kinetics and
heat flow modelling to optimise waste tyre pyrolysis at different heating rates. Fuel
Processing Technology, 92, 856 – 863.
Chien J. C. W. & Kiang J. K. Y. (1979) Polymer Reactions – X, Thermal pyrolysis of
poly(isoprene). European Polymer Journal, 15, 1059 – 1065.
Choi S. S. (2002) Characteristics of the pyrolysis patterns of styrene-butadiene rubbers with
differing microstructures. Journal of Analytical and Applied Pyrolysis, 62, 319 – 300.
Choi S. S. (2001) Characteristics of the pyrolysis patterns of polybutadienes with different
microstructures. Journal of Analytical and Applied Pyrolysis, 57, 249 – 259.
Clark D. E. & Sutton W. H. (1996) Microwave processing of materials. Annual Review of
Materials Science, 26, 299 – 331.
Clauzade C., Osset P., Hugrel C., Chappert A., Durande M. & Palluau M. (2010) Life cycle
assessment of nine recovery methods for end-of-life tyres. The International Journal of Life
Cycle Assessment, 15, 883 – 892.
Coates (2000) Interpretation of infrared spectra, A practical approach. In: Meyers R. A.:
Encyclopedia of analytical chemistry, John Wiley & Sons Ltd, Chichester.
Coran A. Y. (2005) Vulcanization. In: Mark J. E., Erman B. & Eirich F. R. (ed.) Science and
Technology of Rubber. 3rd Edition, Elsevier Academic Press, pp. 321 – 366.
Cotten G. R. (1972) The effect of carbon black surface properties and structure on rheometer
cure behaviour. Rubber chemistry and technology, 45, (1), 129 – 144.

References
188
Coulter Corporation (1991) Reference Manual – Coulter Omnisorp 100/360 Series, Luton,
England.
Council Directive 1999/31/EC of 26 April 1999 on the landfill of waste. (1999) Brussels.
Cunliffe A. M. & Williams P. T. (1998a) Composition of oils derived from the batch
pyrolysis of tyres. Journal of Analytical and Applied Pyrolysis, 44, 131 – 152.
Cunliffe A. M. & Williams P. T. (1998b) Properties of chars and activated carbons derived
from the pyrolysis of used tyres. Environmental Technology, 19, 1177 – 1190.
Curry R., Powell J., Gribble N. & Waite S. (2011) A streamlined life-cycle assessment and
decision tool for used tyres recycling. Waste and Resource Management, 164, WR4, 227 –
237.
Cypres R. & Bettens B. (1989) Pyrolysis and Gasification. In: Ferrero, G. L., Maniatis, K.,
Buckens, A. and Bridgewater, A. V. (ed.) Pyrolysis and Gasification. London, Elsevier
Applied Science, London.
Davies R. W. & Worthington G. S. (2001) Use of scrap tyre as an alternative fuel in the
cement manufacturing process. In: Dhir R. K., Limbachiya M. C., Paine K. A. (ed.) Recycling
and reuse of used tyres. London, Thomas Telford Ltd, pp. 93 – 106.
da Costa H. M., Visconte L. L. Y., Nunes R. C. R. & Furtado R. C. R. (2000) The effect of
coupling agent and chemical treatment on rice husk ash-filled natural rubber composites.
Journal of Applied Polymer Science, 76, 1019 – 1027.
da Costa H. M., Visconte L. L. Y., Nunes R. C. R. & Furtado R. C. R. (2003) Rice hush ash
filler natural rubber. I. Overall rate constant determination for the vulcanization process from
rheometric data. Journal of Applied Polymer Science, 87, 1194 – 1203.
Department for Environment, Food and Rural Affairs (DEFRA) (2007) Annex C12: Tyres for
Waste Strategy for England [Online] Available from:
http://archive.defra.gov.uk/environment/waste/strategy/strategy07/documents/waste07-
annexes-all.pdf [Accessed 12th December 2008].
Dick J. S. (2001) Rubber compounding: Introduction, definitions, and available resources. In:
Dick J. S. (ed.) Rubber technology, compounding and testing for performance. 1st Edition.
Cincinnati, Hanser Gardner Publications, pp. 1 – 16.

References
189
Diez C., Sanchez M. E., Haxaire P., Martinez O. & Moran A. (2005) Pyrolysis of tyres: A
comparison of the results from a fixed-bed laboratory reactor and a pilot plant (rotatory
reactor). Journal of Analytical and Applied Pyrolysis, 74, (1-2), 254 – 258.
Digest of UK energy statistics (DUKES) (2013) Statistical data set DUKES 2012: Calorific
values. [Online] Available from: https://www.gov.uk/government/statistical-data-sets/dukes-
2012-calorific-values [Accessed 7th March 2013].
Directive 2008/98/EC of the European parliament and of the council of 19 November 2008
on waste and repealing certain Directives. (2008) Brussels.
Directive 2002/49/EC of the European parliament and of the council of 25 June 2002
relating to the assessment and management of environmental noise. (2002) Brussels.
Directive 2000/53/EC of the European parliament and of the council of 18 September 2000
on end-of life vehicles. (2000) Brussels.
Directive 2000/76/EC of the European parliament and of the council of 4 December 2000 on
the incineration of waste. (2000) Brussels.
Dodds C. J. (2006) Microwave treatment of carbonaceous materials. PhD Thesis. University
of Nottingham.
Domínguez A., Menéndez J. A., Inguanzo M. & Pis J. J. (2005) Investigations into the
characteristics of oils produced from microwave pyrolysis of sewage sludge. Fuel Processing
Technology, 86, 1007 – 1020.
Domínguez A., Menéndez J. A., Fernández Y., Pis J. J., Valente Nabais J. M., Carrott P. J.
M. & Ribeiro Carrot M. M. L. (2007) Conventional and microwave induced pyrolysis of
coffee hulls for the production of hydrogen rich fuel gas. Journal of Analytical and Applied
Pyrolysis, 79, 128 – 135.
Donnet J.-B & Custodero E. (2005) Reinforcement of Elastomers by Particulate Fillers. In:
Mark J. E., Erman B. & Eirich F. R. (ed.) Science and Technology of Rubber. 3rd Edition,
Elsevier Academic Press, pp. 367 – 400.
Dufton P. W. (2001) End of Life Tyres – Exploiting their value. Shawbury, Rapra Technology
Limited.
References
190
Encinar J. M., González J. F. & González J. (2000) Fixed-bed pyrolysis of Cynara
cardunculus L. Product yields and compositions. Fuel Processing Technology, 68, 209 – 222.
Environment Agency (2012) Waste Tyres. [Online] Available from: http://www.environment-
agency.gov.uk/homeandleisure/waste/138215.aspx [Accessed 6th November 2012].
Environment Agency (2004) Life Cycle Assessment of the Management Options for Waste
Tyres. Environment Agency R&D Report Ref. No. P1 437/TR, Environment Agency, Bristol.
European Tyre and Rubber Manufacturers Association (ETRMA) (2012) End of life tyres – A
valuable resource with growing potential, 2011 Edition. [Online] Available from:
http://www.etrma.org/uploads/Modules/Documentsmanager/brochure-elt-2011-final.pdf
[Accessed 10th January 2013].
Evonik Industries (2012) Product Information ULTRASIL®
VN3. [Online] Available from:
http://ultrasil.evonik.com/sites/dc/Downloadcenter/Evonik/Product/ULTRASIL/Produktinfor
mationen/ultrasil-vn-3_2328_15032012101337.pdf.pdf [Accessed 11th December 2012].
Fabish T. J. & Schleifer D. E. (1984) Surface chemistry and the carbon black work function.
Carbon, 22, (1), 19 – 38.
Fenner R. A. & Clarke K. (2003) Environmental and structural implications for the re-use of
tyres in fluvial and marine-construction projects. Water and Environment Journal, 17, (2), 99
– 105.
Feraldi R., Cashman S., Huff M. & Raahauge L. (2012) Comparative LCA of treatment
options for US scrap tires material recycling and tire-derived fuel combustion. The
International Journal of Life Cycle Assessment, 1 – 13.
Ferreira S. L. C., Bruns R. E., Ferreira H. S., Matos G. D., David J. M., Brandão G. C., da
Silva E. G. P., Portugal L. A., dos Reis P. S., Souza A. S. & dos Santos W. N. L. (2007) Box-
Behnken design: An alternative for the optimization of analytical methods. Analytica
Chimica Acta, 597, 179 – 186.
Figueiredo J. L., Pereira M. F. R., Freitas M. M. A. & Órfão J. J. M. (1999) Modification of
the surface chemistry of activated carbons. Carbon, 37, 1379 – 1389.
Fröhlich J., Niedermeier W. & Luginsland H.-D. (2005) The effect of filler-filler and filler-
elastomer interaction on rubber reinforcement. Composites: Part A, 36, 449 – 460.
References
191
Fowler G. D. & Goodman S. J. (2009) Personal Communication.
Galan M. A. & Smith J. M. (1985) Pyrolysis of oil shale: Experimental study of transport
effects. American Institute of Chemical Engineers Journal, 29, (4), 604 – 610.
Galvagno S., Casu S., Casabianca T., Calabrese A. & Cornacchia G. (2002) Pyrolysis process
for the treatment of scrap tyres: preliminary experiment results. Waste Management, 22, 917
– 923.
Gavalas G. R. (1982) Coal pyrolysis. In: Anderson L. L. Coal science and Technology 4,
Elsevier Scientific Publishing Company, Amsterdam.
Gendron-Badou A., Coradin T., Maquet J., Fröhlich F. & Livage J. (2003) Spectroscopic
characterisation of biogenic silica. Journal of non-crystalline solids, 36, 331 – 337.
Ghosh P., Katare S., Patkar P., Caruthers J. M., Venkatasubramanian V. & Walker K. A.
(2003) Sulfur vulcanization of natural rubber for benzothiazole accelerated formulations:
From reaction mechanisms to a rational kinetic model. Rubber chemistry and technology, 76,
592 – 693.
Golub M. A. & Gargiulo R. J. (1972) Thermal degradation of 1,4-polyisoprene and 1,4-
polybutadiene. Polymer Letters, 10, 41 – 49.
González J. F., Encinar J. M., Canito J. L. & Rodriguez J. J. (2001) Pyrolysis of automobile
tyre waste. Influence of operating variables and kinetics study. Journal of Analytical and
Applied Pyrolysis, 58 – 59, 667 – 683.
Green D. W. & Perry R. H. (2007) Perry’s chemical engineers’ handbook. 8th Edition.
McGraw-Hill Professional.
Griffiths D. J. (1998) Introduction to electrodynamics. Prentice-Hall International Inc., New
Jersey.
Groves S. A., Lehrle R. S., Blazsó M. & Székely T. (1991) Natural rubber pyrolysis: study of
temperature and thickness-dependence indicates dimer mechanism. Journal of Analytical and
Applied Pyrolysis, 19, 301 – 309.
Haines P. J. (1995) Thermal methods of analysis. Principles, applications and problems.
Glasgow, Blackie Academic and Professional.
References
192
Hess W. H. & Herd C. R. (1993) Microstructure, morphology and general physical
properties. In: Donnet J.; Bansal R. C. & Wang M. (ed.) Carbon Black, Science and
technology, Second Edition, Revised and Expanded. Taylor and Francis, New York, pp. 89 –
174.
Holland K. M. (1992) Process of destructive distillation of organic material. US005084141A
(Patent).
Huang Y. F., Kuan W. H., Lo S. L. & Lin C. F. (2008) Total recovery of resources and
energy from rice straw using microwave-induced pyrolysis. Bioresource Technology, 99,
(17), 8252 – 8258.
Iler R. K. (1979) The Chemistry of Silica. New York, Wiley.
International Carbon Black Association (ICBA) (2006) What is Carbon Black. [Online]
Available from: http://www.carbon-black.org/what_is.html [Accessed 16th January 2009].
International Energy Agency (IEA) (2007) Tracking Industrial Energy Efficiency and CO2
Emissions. [Online] Available from:
http://www.iea.org/publications/freepublications/publication/tracking_emissions.pdf
[Accessed 18th March 2010].
International Organisation for Standardization (ISO) (2006) ISO 14040:2006 Environmental
management – Life cycle assessment – Principles and framework. Trans. Technical
Committee ISO/TC 207 "Environmental management" in collaboration with CMC. Second
edition.
International Union of Pure and Applied Chemistry (IUPAC) (1985) Reporting physisorption
data for gas/solid systems with special reference to the determination of surface area and
porocity. Pure & Applied Chemisty, 57, (4), 603 – 619.
Ismail H. & Haw F. S. (2008) Effects of palm ash loading and maleated natural rubber as a
coupling agent on the properties of palm-ash-filled natural rubber composites. Journal of
Applied Polymer Science, 110, 2867 – 2876.
Ismail H., Osman H. & Jaafar M. (2008) Hybrid-filler filled polypropylene/(Natural Rubber)
composites: Effects of natural weathering on mechanical and thermal properties and
morphology. Journal of Vinyl and Additive Technology, 14, (3), 142 – 151.

References
193
Ismail H., Ishiaku U. S., Arinab A. R. & Mohd Ishak Z. A. (1997) The effect of rice husk ash
as a filler for epoxidized natural rubber compounds. International Journal of Polymeric
Materials, 36, (1-2), 39 – 51.
Ivanov M. & Mihaylov M. (2011) Silica obtained via pyrolysis of waste ‘green’ tyres – A
filler for tyre tread rubber blends. Journal of elastomers and plastics, 43, 303 – 316.
Jones K. P. (2001). Back to the trees. In: Dhir R. K., Limbachiya M. C., Paine K. A. (ed.)
Recycling and reuse of used tyres. London, Thomas Telford Ltd, pp. 39 – 50.
Jones D. A., Lelyveld T. P., Mavrofidis S. D., Kingman S. W. & Miles N. J. (2002)
Microwave heating applications in environmental engineering – a review. Resources,
Conservation and Recycling, 34, 2, 75 – 90.
Kääntec U., Zevenhoven R., Backman R. & Hupa M. (2001) Process modelling of cement
manufacturing using alternative fuels. In: Dhir R. K., Limbachiya M. C. & Paine K. A. (ed.)
Recycling and reuse of used tyres, London, Thomas Telford Ltd, pp. 81 – 92.
Kaminsky W. & Mennerich C. (2001) Pyrolysis of synthetic tire rubber in a fluidised-bed
reactor to yield 1,3-butadiene, styrene and carbon black. Journal of Analytical and Applied
Pyrolysis, 58 – 59, 803 – 811.
Khraisheh M. A. M., Cooper T. J. R. & Magee T. R. A. (1997) Microwave and air drying I.
Fundamental considerations and assumptions for the simplified thermal calculations of
volumetric power absorption. Journal of Food Engineering, 33, 207 – 219.
Kim T. J. (2005) The waste rubber or waste tire resolution method and system by avail of
microwave. WO 2005/073344 A1 (Patent).
Kim S., Park J. K. & Chun H. (1995) Pyrolysis kinetics of scrap tire rubbers. I: Using DTG
and TGA. Journal of Environmental Engineering, 121, 507 – 514.
Klingensmith W. & Rodgers B. (2004) Natural rubber and recycled materials. In: Rodgers B.
(ed.) Rubber Compounding, Chemistry and Applications, Marcel Dekker.
Komarov V. V. (2012) Handbook of dielectric and thermal properties of materials at
microwave frequencies. Artech House.

References
194
Kovac F. J. & Rodgers M. B. (1994) Tire Engineering. In: Mark J. E., Erman B. & Eirich F.
R. (ed.) Science and Technology of Rubber. 2nd Edition, Academic Press, New York, pp. 675
– 718.
Kühner G. & Voll M. (1993) Manufacture of carbon black. In: Donnet J., Bansal R. C. &
Wang M. (ed.) Carbon Black, Science and technology, Second Edition, Revised and
Expanded, pp. 1 – 66.
Kyari M., Cunliffe A. & Williams P. T. (2005) Characterization of oils, gases, and char in
relation to the pyrolysis of different brands of scrap automotive tyres. Energy & Fuels, 19,
(3), 1165 – 1173.
Kwon E. & Castaldi M. J. (2009) Fundamental understanding of the degradation mechanisms
of waste tires and their air pollutant generation in a N2 atmosphere. Environmental Science
and Technology, 43, 5996 – 6002.
Lah B., Klinar D. & Likozar B. (2013) Pyrolysis of natural, butadiene, styrene-butadiene
rubber and tyre components: Modelling kinetics and transport phenomena at different heating
rates and formulations. Chemical Engineering Science, 87, 1 – 13.
Lam S. S. & Chase H. A. (2012) A review on waste to energy processes using microwave
pyrolysis. Energies, 5, (10), 4209 – 4232.
Laresgoiti M. F., Caballero B. M., de Marco I., Torres A., Cabrero M. A. & Chomón M. J.
(2004) Characterization of the liquid products obtained in tyre pyrolysis. Journal of
Analytical and Applied Pyrolysis, 71, 917 – 934.
Laresgoiti M. F., de Marco I., Torres A., Caballero B., Cabrero M. A. & Chomón M. J.
(2000) Chromatographic analysis of the gases obtained in tyre pyrolysis. Journal of
Analytical and Applied Pyrolysis, 55, 43 – 54.
Lawton B. (2001) Retreading – Dispelling the myths. In: Dhir R. K., Limbachiya M. C. &
Paine K. A. (ed.) Recycling and reuse of used tyres. London, Thomas Telford Ltd, pp. 51 –
56.
Lee Y. S., Lee W., Cho S., Kim I. & Ha C. (2007) Quantitative analysis of unknown
compositions in ternary polymer blends: A model study on NR/SBR/BR system. Journal of
Analytical and Applied Pyrolysis, 78, 85 – 94.

References
195
Lei H., Ren S., Wang L., Bu Q., Julson J., Holladay J. & Ruan R. (2011) Microwave
pyrolysis of distillers dried grain with soluble (DDGS) for fuel production. Bioresource
Technology, 102, 6208 – 6213.
Leon y Leon C. A., Solar J. M., Calemma V. & Radovic L. R. (1992) Evidence for the
protonation of basal plane sites of carbon. Carbon, 30, (5), 797 – 811.
Li X.-y., Yan J., Yang H., Peng T. (2011) Study on processing technology for microwave
pyrolysis of municipal solid waste. International conference on materials for renewable
energy & environment (ICMREE), 1, 336 – 340.
Li S.-Q., Yao, Q., Chi, Y., Yan, J.-H. & Cen K.-F. (2004) Pilot-scale pyrolysis of scrap tyres
in a continuous rotary kiln reactor. Industrial & Engineering Chemistry Research, 43, (17),
5133 – 5145.
Lidström P., Tierney J., Wathey B. & Westman J. (2001) Microwave assisted organic
synthesis – a review. Tetrahedron, 57, 9225 – 9283.
Ludlow-Palafox C. & Chase H. A. (2001) Microwave-induced pyrolysis of plastic wastes.
Industrial & Engineering Chemical Research, 40, (22), 4749 – 4756.
Magrab E. B., Azarm S., Balachandran B., Duncan J. H., Herold K. E. & Walsh G. C. (2005)
An engineer’s guide to MATLAB®
with applications from mechanical, aerospace, electrical
and civil engineering. Upper Saddle River, Pearson Education Inc.
McMaster M. C. (2008) GC/MS A practical user’s guide. Second Edition. John Wiley &
Sons. Inc., New Jersey.
Medalia A. I. & Kraus G. (1994) Reinforcement of elastomers by particulate fillers. In: Mark
J. E., Erman B. & Eirich F. R. (ed.) Science and Technology of Rubber. 2nd Edition,
Academic Press, pp. 387 – 418.
Menard K. P. (2008) Dynamic mechanical analysis, a practical introduction. Second Edition,
CRC Press.
Mendenhall W. & Sincich T. (1995) Statistics for Engineering and the Sciences. 4th Edition.
New Jersey, Prentice-Hall Inc.
References
196
Menéndez J. A., Arenillas A., Fidalgo B., Fernández Y., Zubizarreta L., Calvo E. G. &
Bermúdez J. M. (2010) Microwave heating processes involving carbon materials. Fuel
Processing Technology, 91, 1 – 8.
Menéndez J. A., Juárez-Pérez E. J., Ruisánchez E., Bermúdez J. M. & Arenillas A. (2011)
Ball lightning plasma and plasma arc formation during the microwave heating of carbons.
Carbon, 49, 339 – 351.
Meon W., Blume A., Luginsland H.-D. & Uhrlandt S. (2004) Silica and Silanes. In: Rodgers
B. (ed) Rubber Compounding, Chemistry and Applications, Marcel Dekker, 285 – 364.
Meredith R. (1998) Engineers handbook of industrial microwave heating. London, The
institution of electrical engineers.
Metaxas A. C. & Meredith R. J. (1983) Industrial microwave heating. Peter Peregrinus,
Institution of Electrical Engineers, Exeter.
Michelin (2009) What is a tyre? [Online] Available from:
http://www.michelin.co.uk/michelinuk/en/car-4x4-van/what-tyre/20070301111326.html
[Accessed 13th May 2008].
Miranda M., Pinto F., Gulyurtlu I., Cabrita I., Nogueira C. A. & Matos A. (2010) Response
surface methodology optimization applied to rubber tyre and plastic wastes thermal
conversion. Fuel, 89, (9), 2217 – 2229.
Miura M., Kaga H., Sakurai A., Kakuchi T. & Takahashi K. (2004) Rapid pyrolysis of wood
block by microwave heating. Journal of Analytical and Applied Pyrolysis, 71, 187 – 199.
Montgomery D. C. (2005) Design and Analysis of Experiment. 6th Edition. John Wiley &
Sons Inc.
Mui E. L. K., Cheung W. H. & McKay G. (2010) Tyre char preparation from waste tyre
rubber for dye removal from effluents. Journal of Hazardous Materials, 175, 151 – 158.
Myers R. H., Montgomery D. C. & Anderson-Cook C. M. (2009) Response Surface
Methodology – Process and product optimization using designed experiments. 3rd Edition.
New Jersey, John Wiley & Sons.
References
197
Nabil H., Ismail H. & Rashod A. A. (2012) Effects of partial replacement of commercial
fillers by recycled poly(ethylene terephthalate) powder on the properties on natural rubber
composites. Journal of Vinyl & Additive Technology, 139 – 146.
Okieimen F. E. & Imanah J. E. (2005) Studies in utilization of agricultural waste products as
filler in natural rubber compounds. Journal of Applied Polymer Science, 100, 2561 – 2564.
Pakdel H., Pantea H. M. & Roy C. (2001) Production of dl-limonene by vacuum pyrolysis of
used tires. Journal of Analytical and Applied Pyrolysis, 57, 91 – 107.
Pakdel H., Roy C., Aubin H., Jean G. & Coulombe S. (1991) Formation of limonene in used
tyre vacuum pyrolysis oils. Environmental Science & Technology, 25, 1646 – 1649.
Pang S. (2007) Microwave pyrolysis of waste tyres. Master Thesis. University of London,
Imperial College of Science, Technology and Medicine.
Parkinson D. (1951) The reinforcement of rubber by carbon black. British Journal of Applied
Physics, 2, 273 – 280.
Parr Instrument Company (2007) Introduction to bomb calorimetry (No. 484M) [Online]
Available from: http://www.parrinst.com/support/downloads/manuals/ [Accessed 13th
November 2012].
Payne A. R. (1962a) The dynamic properties of carbon black-loaded natural rubber
vulcanizates. Part I. Journal of Applied Polymer Science, 6, (19), 57 – 63.
Payne A. R. (1962b) The dynamic properties of carbon black-loaded natural rubber
vulcanizates. Part II. Journal of Applied Polymer Science, 6, (21), 368 – 372.
Pert E., Carmel Y., Birnboim A., Olorunyolemi T., Gershon D., Calame J., Lloyd I. K. &
Wilson Jr. O. C. (2001) Temperature measurements during microwave processing: The
significance of thermocouple effects. Journal of Americal Ceramic Society, 84, (9), 1981 –
1986.
Pingale N. D. & Shukla S. R. (2008) Microwave assisted ecofriendly recycling of
poly(ethylene terephthalate) bottle waste. European Polymer Journal, 44, 4151 – 4156.
References
198
Plackett R. L. & Burman J. P. (1946) The design of optimum multifactorial experiment.
Biometrika, 33, (4), 305 – 325, Published by: Biometrika Trust, Article Stable URL:
http://www.jstor.org/stable/2332195
Pringle J. A. (2006) Microwave pyrolysis apparatus for waste tires. US 7,101,464 B1
(Patent).
Ren S., Hanwu L., Wang L., Bu Q., Chen S., Wu J., Julson J. & Ruan R. (2012) Biofuel
production and kinetic analysis for microwave pyrolysis of Douglas fir sawdust pellet.
Journal of Analytical and Applied Pyrolysis, 94, 163 – 169.
Robinson J. P., Kingman S. W., Snape C. E., Shang H., Barranco R. & Saeid A. (2009)
Separation of polyaromatic hydrocarbons from contaminated soils using microwave heating.
Separation and Purification Technology, 69, 246 – 245.
Rodgers B. & Waddell W. (2005) The science of rubber compounding. In: Mark J. E., Erman
B. & Eirich F. R. (ed.) Science and Technology of Rubber. 3rd Edition, Elsevier Academic
Press, Burlington, pp. 401 – 454.
Rouse M. W. (2005) Manufacturing practices for the development of crumb rubber materials
from whole tyres. In: De S. K., Isayev A. I. & Khait K. (ed.) Rubber Recycling. 1st Edition.
Taylor and Francis Group, Boca Raton, pp. 1 – 100.
Roy C., Rastegar A., Kaliaguine S., Darmstadt H. & Tochev V. (1995) Physicochemical
properties of carbon blacks from vacuum pyrolysis of used tires. Plastics, Rubber and
Composites processing and applications, 23, (1), 21 – 30.
Roy C., Chaala A. & Darmstadt H. (1999) The vacuum pyrolysis of used tyres: End-uses for
oil and carbon black products. Journal of Analytical and Applied Pyrolysis, 51 (1-2), 201 –
221.
Roy C. & Unsworth J. (1989) Pilot plant demonstration of used tyres vacuum pyrolysis. In:
Ferrero G. L., Maniatis K., Buckens A. & Bridgewater A. V. (ed.) Pyrolysis and Gasification.
London, Elsevier Applied Science, pp. 180 – 189.
Rubber Manufacturers Association (RMA) (2011) US Scrap Tire Markets 2009 Summary.
[Online] Available from:

References
199
http://www.rma.org/publications/scrap_tires/index.cfm?PublicationID=11517 [Accessed 10th
January 2013].
Sae-Oui P., Rakdee C. & Thanmathorn P. (2002) Use of rice ash as filler in natural rubber
vulcanizates: In comparison with other commercial fillers. Journal of Applied Polymer
Science, 83, 2485 – 2493.
Salema A. A. & Ani F. N. (2012) Pyrolysis of oil palm empty fruit bunch biomass pellets
using multimode microwave irradiation. Bioresource Technology, 125, 102 – 107.
San Miguel G. (1999) Activated carbon produced by pyrolysis and physical activation of
waste tyres. PhD Thesis. University of London. Imperial College of Science, Technology and
Medicine.
San Miguel G., Fowler G. D. & Sollars C. J. (1998) Pyrolysis of tire rubber: Porosity and
adsorption characteristics of the pyrolytic chars. Industrial & Engineering Chemistry
Research, 37, (6), 2430 – 2435.
Sanglar C., Nguyen Quoc H. & Grenier-Loustalot M. F. (2010) Studies on thermal
degradation of 1-4 and 1-2 polybutadienes in inert atmospheres. Polymer Degradation and
Stability, 95, 1870 – 1876.
Seidelt S., Müller-Hagedorn M. & Bockhorn H. (2006) Description of tire pyrolysis by
thermal degradation behaviour of main components. Journal of Analytical and Applied
Pyrolysis, 75, 11 – 18.
Senneca O., Salatino P. & Chirone R. (1999) A fast heating-rate thermogravimetric study of
the pyrolysis of scrap tyres. Fuel, 78, 1575 – 1581.
Sharma V. K., Fortuna F., Mincarini M., Berillo M. & Cornacchia G. (2000) Disposal of
waste tyres for energy recovery and safe environment. Applied Energy, 65, 381 – 394.
Shelby J. E. (2005) Introduction to glass science and technology. 2nd edition. The Royal
Society of Chemistry.
Shulman V. L. (2004) Tyre Recycling. Rapra Review Reports, Rapra Technology Limited,
Shawbury.

References
200
Sienkiewicz M., Kucinska-Lipka J., Janik H., & Balas A. (2012) Progress in used tyres
management in the European Union: A review. Waste Management, 32, (10), 1742 – 1751.
Sosson F., Belec L., Chailan J.-F., Carriere P. and Crespy A. (2010) Highlight of a
compensation effect between filler morphology and loading on dynamic properties of filled
rubbers. Journal of Applied Polymer Science, 117, 2715 – 2723.
Stuart B. (1996) Modern infrared spectroscopy. John Wiley & Sons, Chichister.
Studebaker M. L. (1957) The chemistry of carbon black and reinforcement. Rubber
Chemistry and Technology, 30, (5), 1400 – 1483.
The Waste (England and Wales) Regulations 2011. (2011) No. 998. London, TSO (The
Stationery Office).
Thostenson E. T. & Chou T. W. (1999) Microwave processing: fundamentals and
applications. Composites: Part A, 30, 1055 – 1071.
Tian Y., Zuo W., Ren Z. & Chen D. (2011) Estimation of a novel method to produce bio-oil
from sewage sludge by microwave pyrolysis with the consideration of efficiency and safety.
Bioresource Technology, 102, 2053 – 2061.
Ucar S., Karagoz S., Ozkan A. R. & Yanik J. (2005) Evaluation of different scrap tires as
hydrocarbon source by pyrolysis. Fuel, 84, 1884 – 1892.
United Nations Economic Commission for Europe UNECE (1998a) Regulation 108 -
Retreaded pneumatic tyres for motor vehicles [Online] Available from:
http://www.unece.org/trans/main/wp29/wp29regs/r108e.pdf [Accessed 30th May 2009].
United Nations Economic Commission for Europe UNECE (1998b) Regulation 109 -
Retreaded pneumatic tyres for commercial vehicles [Online] Available from:
http://www.unece.org/trans/main/wp29/wp29regs/r108e.pdf [Accessed 30th May 2009].
Undri A., Rosi L., Frediani M. & Frediani P. (2011) Microwave pyrolysis of polymeric
materials In: Chandra U. (Ed.), Microwave Heating, InTech, pp. 207 – 232. [Online]
Available from: http://www.intechopen.com/books/microwave-heating/microwave-pyrolysis-
of-polymeric-materials [Accessed 10th September 2012]
Von Hippel A. R. (1954) Dielectrics and waves. John Wiley & Sons Inc., New York.

References
201
Wampler W. A., Carlson T. F. & Jones W. R. (2004) Carbon Black. In: Rodgers B. (ed)
Rubber Compounding, Chemistry and Applications, Marcel Dekker, 239 – 284.
Wang M. J. (1998) Effect of polymer-filler and filler-filler interactions on dynamic properties
of filled vulcanizates. Rubber Chemistry and Technology, 71, (3), 520 – 589.
Wang M. J., Gray C. A., Reznek S. A., Mahmud K. & Kutsovsky Y. (2000) Carbon Black.
In: Kirk-Othmer Encyclopedia of Chemical Technology. 5th Edition, John Wiley & Sons Inc.,
Hoboken, pp. 761 – 803.
WHO (2005) Electromagnetic fields & public health:
Microwave ovens. [Online] Available from: http://www.who.int/peh-
emf/publications/facts/info_microwaves/en/ [Accessed 15th March 2010].
Wiegand W. B. (1937) pH properties of colloidal carbon. Industrial and Engineering
Chemistry, 29, (8), 953 – 956.
Will H., Scholz P. & Ondruschka B. (2004) Review microwave-assisted heterogeneous gas-
phase catalysis. Chemical Engineering & Technology, 27, (2), 113 – 122.
Williams D. H. & Fleming I. (1995) Spectroscopic methods in organic chemistry. Fifth
Edition. McGraw-Hill Book Company, London.
Williams P. T. & Besler S. (1995) Pyrolysis-thermogravimetric analysis of tyres and tyre
components. Fuel, 74 (9), 1277 – 1283.
Williams P. T., Besler S. & Taylor D. T. (1993) The batch pyrolysis of tyre waste – fuel
properties of the derived pyrolytic oil and overall plant economics. Proceedings of the
Institution of Mechanical Engineers. Part A: Journal of Power and Energy, 207, (1), 55 – 63.
Williams P. T., Besler S. & Taylor D. T. (1990) The pyrolysis of scrap automotive tyres. The
influence of temperature and heating rate on product composition. Fuel, 69, 1474 – 1482.
Williams P. T. & Brindle A. J. (2003) Temperature selective condensation of tyre pyrolysis
oils to maximise the recovery of single ring aromatic compounds. Fuel, 82, (9), 1023 – 1031.
Wolff S. & Wang M.-J. (1993) Carbon Black reinforcement of elastomers. In : Donnet J.-B,
Bansal R. C. & Wang M. (ed.) Carbon Black, Science and technology, Second Edition,
Revised and Expanded. Taylor and Francis, New York, pp. 289 – 356.
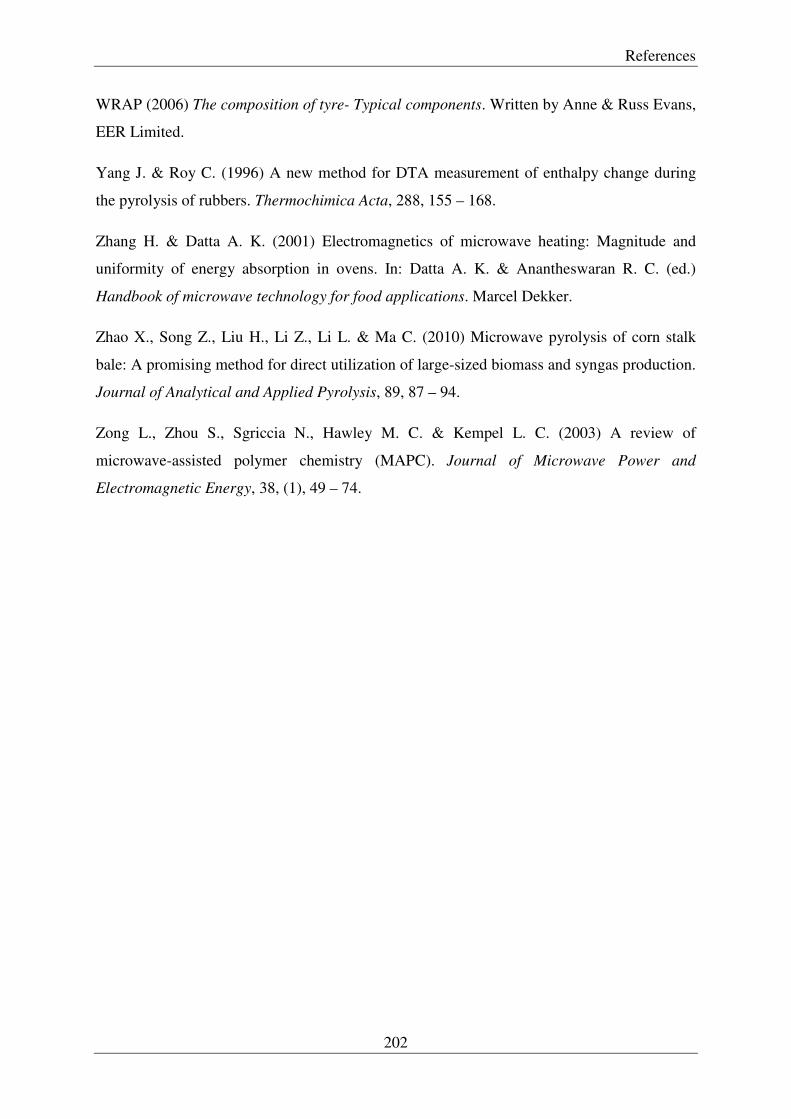
References
202
WRAP (2006) The composition of tyre- Typical components. Written by Anne & Russ Evans,
EER Limited.
Yang J. & Roy C. (1996) A new method for DTA measurement of enthalpy change during
the pyrolysis of rubbers. Thermochimica Acta, 288, 155 – 168.
Zhang H. & Datta A. K. (2001) Electromagnetics of microwave heating: Magnitude and
uniformity of energy absorption in ovens. In: Datta A. K. & Anantheswaran R. C. (ed.)
Handbook of microwave technology for food applications. Marcel Dekker.
Zhao X., Song Z., Liu H., Li Z., Li L. & Ma C. (2010) Microwave pyrolysis of corn stalk
bale: A promising method for direct utilization of large-sized biomass and syngas production.
Journal of Analytical and Applied Pyrolysis, 89, 87 – 94.
Zong L., Zhou S., Sgriccia N., Hawley M. C. & Kempel L. C. (2003) A review of
microwave-assisted polymer chemistry (MAPC). Journal of Microwave Power and
Electromagnetic Energy, 38, (1), 49 – 74.

Appendix I
203
Appendix I
Table A. Classification of carbon blacks (Wang et al., 2000)
Group No.
Average N2 surface area (m2/g)
0 > 150 1 121 - 150 2 100 - 120 3 70 - 99 4 50 - 69 5 40 - 49 6 33 - 39 7 21 - 32 8 11 - 20 9 0 - 10
Table B. Microwave pyrolysis yields from Chapter 5
i) Domestic microwave I yields
Time (min)
Char Yield (wt. %)
Standard Deviation
0.5 90.0
1.0 57.8 8.0 1.5 51.8
2.0 53.4 8.3 3.0 50.0 0.0 4.0 49.2 1.1 5.0 48.1
ii) Domestic microwave II yields
Power (W)
Char Yield (wt. %)
Standard Deviation
250 45.5 0.6 440 45.6 0.4 600 46.0 0.6 850 46.3 0.2

Appendix I
204
iii) RotoSYNTH yields
50 g Duration
(min) Char Yield
(wt. %) 100 g
Duration (min)
Char Yield (wt. %)
300 W 180 96.4
300 W 120 52.9 600 W 60 45.5
750 W 50 44.0
750 W 50 44.7
1000 W 60 43.5 750 W 50 44.2
1200 W 30 44.1
1000 W 50 46.5
1200 W 30 45.2
iv) Cobham Microwave Part I yields
Char Yield
(wt. %) Oil Yield (wt. %)
Gas Yield (wt. %)
CMD2000_40 41.2 47.5* 11.3* CMD2000_33 41.4 52.3 6.3 CMD2000_27 41.6 52.7 5.7 CMD1500_60 41.5 52.3 6.2 CMD1500_53 40.9 52.4 6.7 CMD1500_41a 41.5 52.0 6.5 CMD1500_41b 41.1 53.1 5.8 CMD1500_41c 41.2 52.3 6.4 CMD1500_40 41.3 52.7 6.0
CMD1200_119 40.7 53.3 6.0 CMD1200_90 40.4 51.5 8.1 CMD1200_70 40.7 52.7 6.6
CMD1200_66.5 40.9 54.4 4.7 CMD1000_180 40.1 52.5 7.4 CMD1000_120 40.5 53.1 6.4 CMD1000_90 40.3 52.2 7.4 CMD800_210 39.8 54.6 5.6 CMD800_160 40.3 54.7 5.0 CMD800_97 40.5 53.7 5.9 CMD750_142 40.3 53.8 5.9 CMD600_265 39.9 53.6 6.5
* Oil leak experienced in the first experiment

Appendix II
205
Appendix II
Figure A. Proximate analysis plot of sample B (Chapter 3)
Figure B. Normal probability residuals plots (Chapter 4)
Part I
� Effect on Carbon Content
0
100
200
300
400
500
600
700
0
20
40
60
80
100
120
0 20 40 60 80 100 120
Tem
pera
ture
(°C
)
Weig
ht change (
%)
Time (min)
Weight Change (%) Temperature
N2 Atmosphere Air
~ Polymers
~ Ash content
~ Carbon Black
~ Oils
-0.3 -0.2 -0.1 0 0.1 0.2 0.3
0.05
0.10
0.25
0.50
0.75
0.90
0.95
Data
Pro
babilit
y
Normal Probability Plot

Appendix II
206
� Effect on Surface area
� Effect on pH-value
Part II
� Effect on Carbon content
-3 -2 -1 0 1 2 3
0.05
0.10
0.25
0.50
0.75
0.90
0.95
Data
Pro
babilit
y
Normal Probability Plot
-0.1 -0.05 0 0.05 0.1
0.05
0.10
0.25
0.50
0.75
0.90
0.95
Data
Pro
babilit
y
Normal Probability Plot
-2 -1 0 1 20.02
0.05
0.10
0.25
0.50
0.75
0.90
0.95
0.98
Data
Pro
babilit
y
Normal Probability Plot

Appendix II
207
� Effect on Surface area
� Effect on pH-value
-2 -1 0 1 2 30.02
0.05
0.10
0.25
0.50
0.75
0.90
0.95
0.98
Data
Pro
babilit
y
Normal Probability Plot
-0.15 -0.1 -0.05 0 0.05 0.1 0.15 0.20.02
0.05
0.10
0.25
0.50
0.75
0.90
0.95
0.98
Data
Pro
babilit
y
Normal Probability Plot
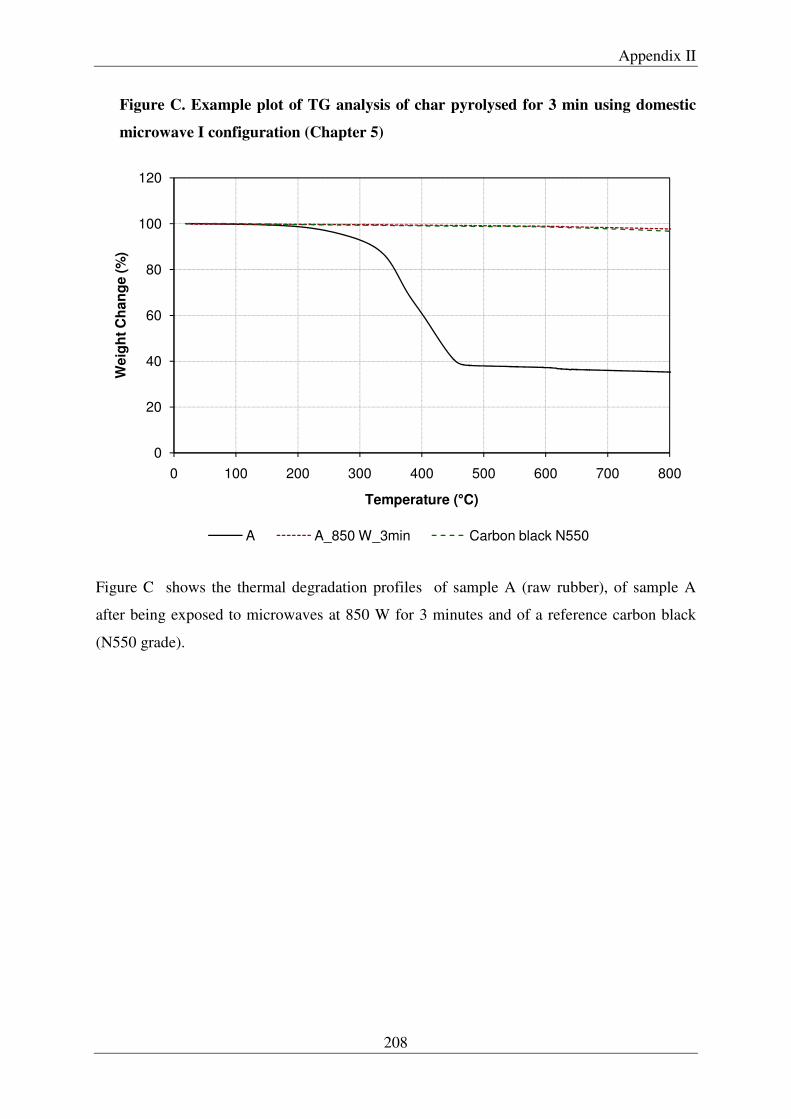
Appendix II
208
Figure C. Example plot of TG analysis of char pyrolysed for 3 min using domestic
microwave I configuration (Chapter 5)
Figure C shows the thermal degradation profiles of sample A (raw rubber), of sample A
after being exposed to microwaves at 850 W for 3 minutes and of a reference carbon black
(N550 grade).
0
20
40
60
80
100
120
0 100 200 300 400 500 600 700 800
We
igh
t C
ha
ng
e (
%)
Temperature (°C)
A A_850 W_3min Carbon black N550

Appendix III
209
Appendix III
A. Mixing Process for compounds with and without coupling agent
The mixing process was completed in three stages. At the first stage the Brabender mixer was
heated to 80°C and set at 60 rpm rotor speed counter mixing.
The following mixing sequence was used:
� 0 minutes: the polymer was added, followed by the char add-mix shown in the Table I below
� 1 min: ram raised ram lowered � 2 min: ram raised, ram lowered. Speed reduced to 40rpm � 3 min: ram raised, ram lowered � 4 min: ram raised, ram lowered � 5 min: ram raised, ram lowered
Table I. Rubber mixing formulation Ingredients A (phr) B (phr) Rubber (SBR) 100 100 Filler 60 60 Process Oil 10 10 ZnO 3.4 3.4 Stearic acid 2 2 Anti-oxidant (6PPD) 1.5 1.5 Coupling agent (TESPT) - 8
The material was then removed and blended immediately on the ARTIS 13” 2-roll mill using
a nip setting of 0.5. It was then allowed to rest for a minimum of 16 hours before conducting
the second mixing stage. At the second stage the Brabender mixer was heated to 80°C and set
at 60 rpm rotor speed counter mixing.
The following mixing sequence was used:
� 0 mins: Master batch added in strip format, ram lowered � 1 min: ram raised, ram lowered. Speed then reduced to 40RPM � 2 min: ram raised, ram lowered � 3 min: ram raised, ram lowered � 4 min: ram raised, ram lowered
On removal from the mixing chamber the first batches of compound were transferred to the
ARTIS 13” 2-roll mill and passed through the nip once on a nip setting of 0.5. The second
batch of each compound, once mixed was then added to the mill along with the first batch
and the material passed through the nip of the mill 6 times. The nip was then increased to 1.0

Appendix III
210
and a sheet produced, this was then allowed to rest for a minimum of 16 hours before
conducting the conversion mixing stage. The total batch weight of the two batches of each
compound was then added to the nip of the ARTIS 13” 2-roll mill using a nip setting of 0.2,
mill rolls were cooled to 18°C. The correct weight of each curative was then slowly added to
the nip of the mill. The formulation details is shown in Table II below.
Table II. Rubber mixing formulation Ingredients A (phr) B (phr) Accelerator (TBBS) 1.5 1.5 Sulfur + mineral oil 1.37 1.37

Presentations
211
Presentations
Oral Presentations
Reclaiming rubber fillers by microwave devulcanization of tyres. Presented at the 10th
International Conference on Materials Chemistry (MC10), 4 – 7 July 2011, University of
Manchester, UK
The RµPERT Project: Demonstration and application of a novel, state-of-the-art rotary
microwave furnace for tyre devulcanization. Presented at the Microwave and Flow Chemistry
Conference, 28 February – 2 March 2012, Lanzarote
Poster Presentations
Car Tyres: Where fools fear to retread? Producing the sustainable tyre. Presented at the SET
for BRITAIN Exhibition in the Engineering Section held at the House of Commons on
Monday 14th March 2011.
Back to Black: Closing the tyre recycling loop. Presented at the Department of Civil and
Environmental Engineering Research Poster Presentation Day, Imperial College London on
Wednesday 29th June 2011. Awarded Highly Commented.
Back to Black: Closing the tyre recycling loop. Presented at the Graduate Schools Poster
competition on Friday 22nd July 2011. Awarded best poster title.
Recycling Carbon Fillers from Tyres by Microwave Pyrolysis. Presented at the conference
“Medical Devices and Carbon Materials: Current Issues in Health and the Environment” on
22nd September 2011.
Copyright © 2022 FDOKUMEN