RaM - Recycle and Mathematics: the art of tiling for eco-design
Upload
khangminh22Category
view
0download
0
University of Denver University of Denver
Digital Commons @ DU Digital Commons @ DU
Electronic Theses and Dissertations Graduate Studies
1-1-2012
Reduce, Reuse, Recycle? An Examination of Factors Influencing Reduce, Reuse, Recycle? An Examination of Factors Influencing
Environmental Behavior in Denver, Colorado Environmental Behavior in Denver, Colorado
Dan J. Kasper University of Denver
Follow this and additional works at: https://digitalcommons.du.edu/etd
Part of the Environmental Health Commons, Environmental Studies Commons, and the Psychology
Commons
Recommended Citation Recommended Citation Kasper, Dan J., "Reduce, Reuse, Recycle? An Examination of Factors Influencing Environmental Behavior in Denver, Colorado" (2012). Electronic Theses and Dissertations. 840. https://digitalcommons.du.edu/etd/840
This Thesis is brought to you for free and open access by the Graduate Studies at Digital Commons @ DU. It has been accepted for inclusion in Electronic Theses and Dissertations by an authorized administrator of Digital Commons @ DU. For more information, please contact [email protected],[email protected].

REDUCE, REUSE, RECYCLE? AN EXAMINATION OF FACTORS INFLUENCING
ENVIRONMENTAL BEHAVIOR IN DENVER, COLORADO
________________
A Thesis
Presented to
the Faculty of Natural Sciences and Mathematics
University of Denver
_________________
In Partial Fulfillment
of the Requirements for the Degree
Master of Arts
________________
by
Daniel J. Kasper
May 2012
Advisor: Dr. Matthew Taylor

ii
Author: Daniel J. Kasper
Title: REDUCE, REUSE, RECYCLE? AN INVESTIGATION OF FACTORS
INFLUENCING ENVIRONMENTAL BEHAVIOR IN DENVER, COLORADO
Advisor: Dr. Matthew Taylor
Degree Date: May 2012
ABSTRACT
Non-recycling and non-composting of municipal solid waste have important natural
resource management implications, in that they both reduce energy, water, and raw
natural resource use. Responsible waste management also likely has positive climate
impacts by virtue of reducing greenhouse gas emissions. Recycling and composting are
pro-environmental behaviors that have been shown to be influenced by numerous socio-
demographic and psychological factors. This study analyzes the correlation of a number
of variables with frequency of recycling and composting in select census tracts in Denver,
CO, USA, with the goals of informing waste management policy and contributing to the
overall pro-environmental behavior literature. The results show that habit strength as
quantified by the Self-Reported Habit Index has the strongest correlation with both
recycling and composting behavior. Overall, waste management policy should focus on
influencing habit formation, using literature to dissuade residents from placing plastic
bags into recycling bins, and consider charging a minimal fee for recycling.

iii
Acknowledgments
I am grateful to the University of Denver Geography Department, specifically Dr. Mike
Keables, for providing me with a research grant to undertake this research. I would also
like to thank my thesis committee: Drs. Andrew Goetz, Don Sullivan, and Chip
Reichardt, and especially my thesis advisor Dr. Matthew Taylor. The students, faculty
and staff of the University of Denver Geography Department have always been
supportive and constructively critical when necessary, and for that, I am grateful. Karen
Escobar was instrumental throughout my career at the University, and couldn’t have been
more helpful. Most of all, I am blessed to have such an understanding and supportive
partner that has endured this journey with me. Thank you Nicole.

iv
TABLE OF CONTENTS
ABSTRACT ........................................................................................................................ ii
Acknowledgments.............................................................................................................. iii
List of Tables ..................................................................................................................... vi
List of Figures .................................................................................................................. viii
Chapter 1 Introduction ........................................................................................................ 1
Chapter 2 Review of Relevant Literature ........................................................................... 8 2.1 Environmental Values .......................................................................................... 8
2.2 Demographic Variables ...................................................................................... 11 2.3 Concrete and Abstract Knowledge ..................................................................... 13
2.4 Willingness to Pay Studies ................................................................................. 14 2.5 Social Context and Barriers to Action Studies ................................................... 15
2.5.1 Integrating Behavioral Factors and the Theory of Reasoned Action .......... 17
2.6 Habits ................................................................................................................. 20 2.6.1 Quantifying Habits: The Self-Reported Habit Index ................................. 23
2.7 Modeling Behavior ............................................................................................. 25
Chapter 3 Description of Study Area ................................................................................ 27
3.1 Geographic Setting ............................................................................................. 27
3.2 Waste Management Services in Denver, CO ..................................................... 28 3.3 Neighborhoods Surveyed ................................................................................... 30
Chapter 4 Methods and Research Questions .................................................................... 33 4.1 Research Design...................................................................................................... 33
4.1.1 Behavioral Model............................................................................................. 33 4.2 Methods................................................................................................................... 37
4.2.1 Data Collection Method ................................................................................... 37 4.2.2 The Survey Instrument ..................................................................................... 44
4.3 Research Questions and Data Analysis................................................................... 49 4.3.1 A Note on Statistical Methods and Research Goals ........................................ 49
4.3.2 Descriptive Statistics ........................................................................................ 50 4.3.3 Multivariate Inferential Statistics ..................................................................... 51 4.3.4 Creating the Behavioral Model ........................................................................ 52
4.3.5 Research Questions .......................................................................................... 54 4.3.6 Survey Administration and Data Analysis ....................................................... 56

v
Chapter 5 Results and Analysis ........................................................................................ 58
5.1 Survey Responses ................................................................................................... 58 5.2 Descriptive Statistics ............................................................................................... 59
5.2.1 Demographics of the Sample ........................................................................... 59
5.2.2 Waste Management Behavior .......................................................................... 61 5.2.3 NEP and SRHI Responses ............................................................................... 63 5.2.4 Responses to Questions Directly Addressing Waste Management Policy in
Denver ....................................................................................................................... 67 5.3 Multivariate Inferential Statistics ............................................................................ 74
5.3.1 Factor Analyses ................................................................................................ 74 5.3.2 Regression Analysis ......................................................................................... 90 5.3.3 Cluster Analysis ............................................................................................... 95
Chapter 6 Discussion ...................................................................................................... 105 6.1 Sampling and Study Design .................................................................................. 105
6.2 Descriptive Waste Management Behavior............................................................ 106 6.3 The Behavioral Model .......................................................................................... 112
6.3.1 Variable Groupings in the Factor Analysis .................................................... 112 6.3.2 Regression Analysis and the Behavioral Models........................................... 115 6.3.3 Comparison to Exeter Study .......................................................................... 122
6.3.4 Characteristics of (Ir)responsible Waste Managers ....................................... 127 6.3.5 Neighborhood Comparison ............................................................................ 128
Chapter 7 Conclusion ...................................................................................................... 134
Bibliography ................................................................................................................... 141
Appendices ...................................................................................................................... 148

vi
List of Tables
Table 2.1 The Self-Reported Habit Index ......................................................................... 24
Table 5.1 Response Rates, Total and by Neighborhood ................................................... 59
Table 5.2 Demographic Characteristics of the Sample ..................................................... 60
Table 5.3 Mean Score on Self-Reported Behavioral Frequency Items ............................ 62
Table 5.4 Summary Answers to “What, if anything, prevents you from composting
regularly?”......................................................................................................................... 69
Table 5.5 Aggregated Answers to the Survey Question "What, if anything, prevents you
from recycling regularly?" ................................................................................................ 73
Table 5.6 Aggregate Answers to the Survey Question "What, if anything, prevents you,
or whoever mows the lawn, from (grass-cycling)?" ......................................................... 74
Table 5.7 Factor Analysis Eigenvalues and Explanatory Power of Waste Management
Behavior Variables............................................................................................................ 75
Table 5.8 Factor Loadings for Recycling/Composting Behavior ..................................... 76
Table 5.9 Waste Management Behavior Factors as Determined by Factor Analysis ....... 77
Table 5.10 Principal Component Eigenvalues and Explanatory Power of NEP Variables
........................................................................................................................................... 79
Table 5.11 Factor Loadings for NEP Items ...................................................................... 80
Table 5.12 Mean Scores for NEP Item Questions ............................................................ 81
Table 5.13 NEP Factors as Determined by Factor Analysis ............................................. 81

vii
Table 5.14 Principal Component Eigenvalues and Explanatory Power of Recycling
Psychological Variables .................................................................................................... 82
Table 5.15 Principal Component Eigenvalues and Explanatory Power of Composting
Psychological Variables .................................................................................................... 82
Table 5.16 Factor Loadings for Recycling Psychological Variables ................................ 84
Table 5.17 Factor Loadings for Composting Psychological Variables ........................... 86
Table 5.18 Recycling and Composting Psychological Variable Factors .......................... 87
Table 5.19 Regression Analysis Results for Recycling Behavior .................................... 91
Table 5.20 Beta Weights of the Explanatory Variables in the Waste Management
Behavioral Models ............................................................................................................ 94
Table 5.21 Clustering History for Recycling and Composting Behavioral Analysis ....... 98
Table 5.22 Recycling and Composting Behavioral Levels of Respondent Clusters ........ 99
Table 5.23 Demographic Characteristics of Waste Management Clusters ..................... 101
Table 6.1 Stepwise Model of Behavioral Change Toward a Pro-Environmental Habit . 121
Table 6.2 Mean NEP Item Scores in Exeter and Denver Samples ................................. 123
Table 6.3 NEP Factor Loadings in Exeter and Denver ................................................... 125
Table 6.4 Recycling Beta Weights for Exeter and Denver Studies ................................ 126
Table 6.5 Comparison of Key Cluster Variables and Neighborhood Demographics .... 132
viii
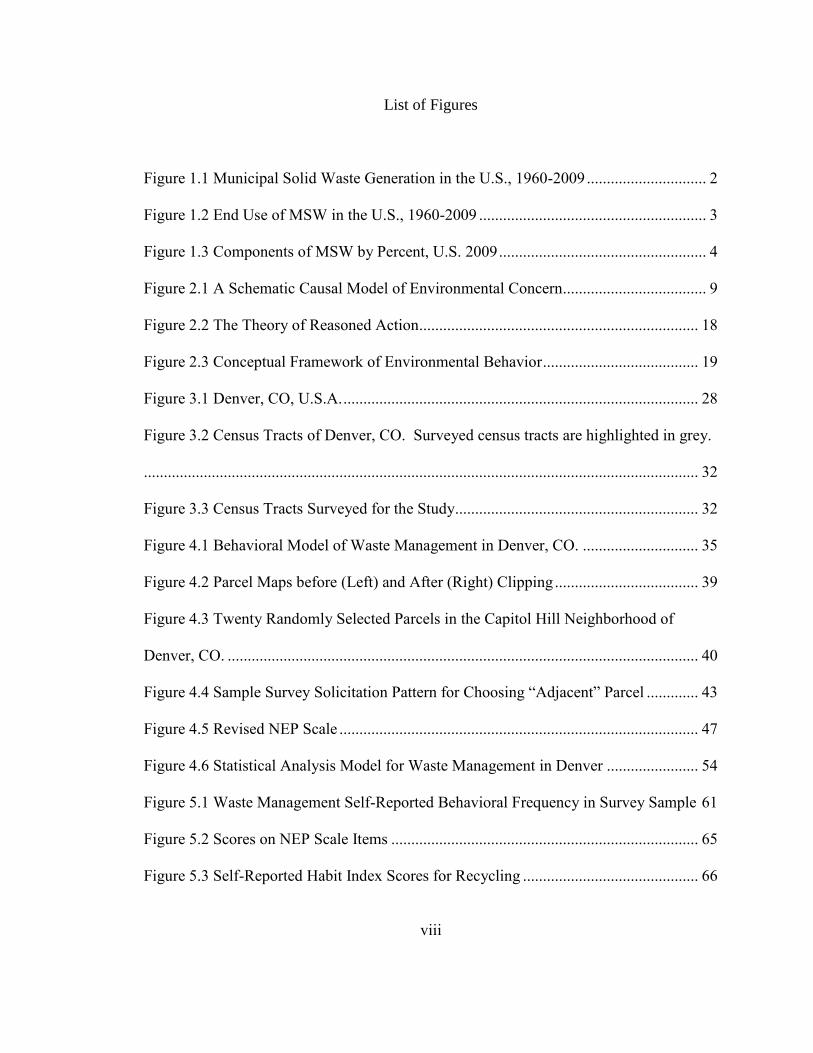
List of Figures
Figure 1.1 Municipal Solid Waste Generation in the U.S., 1960-2009 .............................. 2
Figure 1.2 End Use of MSW in the U.S., 1960-2009 ......................................................... 3
Figure 1.3 Components of MSW by Percent, U.S. 2009 .................................................... 4
Figure 2.1 A Schematic Causal Model of Environmental Concern.................................... 9
Figure 2.2 The Theory of Reasoned Action...................................................................... 18
Figure 2.3 Conceptual Framework of Environmental Behavior ....................................... 19
Figure 3.1 Denver, CO, U.S.A. ......................................................................................... 28
Figure 3.2 Census Tracts of Denver, CO. Surveyed census tracts are highlighted in grey.
........................................................................................................................................... 32
Figure 3.3 Census Tracts Surveyed for the Study............................................................. 32
Figure 4.1 Behavioral Model of Waste Management in Denver, CO. ............................. 35
Figure 4.2 Parcel Maps before (Left) and After (Right) Clipping .................................... 39
Figure 4.3 Twenty Randomly Selected Parcels in the Capitol Hill Neighborhood of
Denver, CO. ...................................................................................................................... 40
Figure 4.4 Sample Survey Solicitation Pattern for Choosing “Adjacent” Parcel ............. 43
Figure 4.5 Revised NEP Scale .......................................................................................... 47
Figure 4.6 Statistical Analysis Model for Waste Management in Denver ....................... 54
Figure 5.1 Waste Management Self-Reported Behavioral Frequency in Survey Sample 61
Figure 5.2 Scores on NEP Scale Items ............................................................................. 65
Figure 5.3 Self-Reported Habit Index Scores for Recycling ............................................ 66

ix
Figure 5.4 Self-Reported Habit Index Questions .............................................................. 66
Figure 5.5 Self-Reported Habit Index Scores for Composting ........................................ 67
Figure 5.6 Desire for Free Compost Service in Denver.................................................... 67
Figure 5.7 Willingness to Pay for Composting Service .................................................... 68
Figure 5.8 Willingness to Pay for Recycling and Trash Services..................................... 68
Figure 5.9 Support for Waste Management as it Applies to Climate Change .................. 70
Figure 5.10 Support for Waste Management as it Applies to Job Creation .................... 70
Figure 5.11 Support for Waste Management as it Applies to the County Budget ........... 71
Figure 5.12 Support for Waste Management as it Applies to Personal Finance ............. 71
Figure 5.13 Recycling Frequency as a Result of Large Bins ............................................ 72
Figure 5.14 Reasons for Increased Recycling with Large Bins ........................................ 73
Figure 5.15 Recycling Methods used by Residents who are not Eligible for Home
Recycling .......................................................................................................................... 73
Figure 5.16 Linear Regression Line and Data Points for Recycling Behavior Regression
Model ................................................................................................................................ 92
Figure 5.17 Recycling Behavioral Model ......................................................................... 95
Figure 5.18 Composting Behavioral Model...................................................................... 95
Figure 5.19 Cluster Analysis Dendrograms and Scree Plots for Recycling and
Composting Behavior ....................................................................................................... 98
Figure 6.1 Recycling Behavioral Model ......................................................................... 117
Figure 6.2 Composting Behavioral Model...................................................................... 117
Figure 6.3 Age Distribution of Denver Neighborhoods and Clusters ............................ 129

x
Figure 6.5 Housing Type Distribution of Denver Neighborhoods and Clusters ............ 129
Figure 6.6 Political Persuasion Distribution of Denver Neighborhoods and Clusters ... 130
Figure 6.7 Educational Attainment Distribution of Denver Neighborhoods and Clusters
......................................................................................................................................... 130
Figure 6.8 Homeownership Status Distribution of Denver Neighborhoods and Clusters
......................................................................................................................................... 131
1
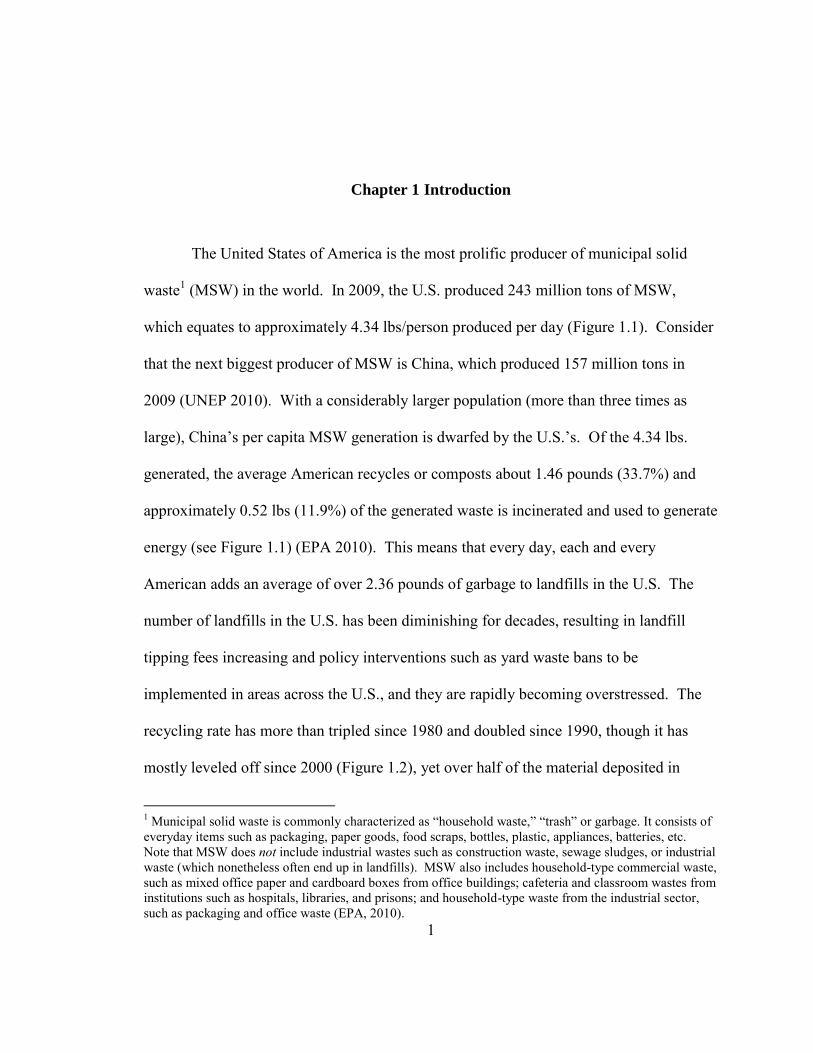
Chapter 1 Introduction
The United States of America is the most prolific producer of municipal solid
waste1 (MSW) in the world. In 2009, the U.S. produced 243 million tons of MSW,
which equates to approximately 4.34 lbs/person produced per day (Figure 1.1). Consider
that the next biggest producer of MSW is China, which produced 157 million tons in
2009 (UNEP 2010). With a considerably larger population (more than three times as
large), China’s per capita MSW generation is dwarfed by the U.S.’s. Of the 4.34 lbs.
generated, the average American recycles or composts about 1.46 pounds (33.7%) and
approximately 0.52 lbs (11.9%) of the generated waste is incinerated and used to generate
energy (see Figure 1.1) (EPA 2010). This means that every day, each and every
American adds an average of over 2.36 pounds of garbage to landfills in the U.S. The
number of landfills in the U.S. has been diminishing for decades, resulting in landfill
tipping fees increasing and policy interventions such as yard waste bans to be
implemented in areas across the U.S., and they are rapidly becoming overstressed. The
recycling rate has more than tripled since 1980 and doubled since 1990, though it has
mostly leveled off since 2000 (Figure 1.2), yet over half of the material deposited in
1 Municipal solid waste is commonly characterized as “household waste,” “trash” or garbage. It consists of
everyday items such as packaging, paper goods, food scraps, bottles, plastic, appliances, batteries, etc.
Note that MSW does not include industrial wastes such as construction waste, sewage sludges, or industrial
waste (which nonetheless often end up in landfills). MSW also includes household-type commercial waste,
such as mixed office paper and cardboard boxes from office buildings; cafeteria and classroom wastes from
institutions such as hospitals, libraries, and prisons; and household-type waste from the industrial sector,
such as packaging and office waste (EPA, 2010).

2
landfills is recyclable (EPA 2006). The result of these factors is staggering: 243 million
tons of MSW were produced by Americans in 2009, with nearly 132 million tons ending
up in landfills (EPA 2010).
Figure 1.1 Municipal Solid Waste Generation in the U.S., 1960-2009
Source: US EPA, 2010, p. 3
88.1 104.4
121.1 127.8 151.6
166.3
208.3 217.9
242.5
252.4
255 243
2.68 2.96
3.25 3.25 3.66
3.83
4.57 4.52 4.72 4.67
4.63
4.34
0
1
2
3
4
5
6
0
50
100
150
200
250
300
350
400
ton
s/cap/yr m
illio
n t
on
s
Total MSW Generation (million tons) MSW Generation Rate (lbs./capita/yr)

3
Figure 1.2 End Use of MSW in the U.S., 1960-2009
Source: EPA 2010, p. 3
This massive amount of discarded recyclable and compostable material represents
an enormous mismanagement of natural resources. Recycling and composting (MSW
recovery) save significant amounts of energy, water, and of course, raw natural resources.
For example, each ton of recycled aluminum saves more than the equivalent of 36 barrels
of oil or 1,655 gallons of gasoline (EPA 2006); recycling one ton of paper prevents 60 lbs
of air pollution (Center for Ecological Technology 2007); recycling paper results in 35%
less water pollution than making it from virgin materials, and for recycling glass the
pollution reduction is 50% (Blatt 2005); and 1 ton of recycled aluminum saves 4 tons of
aluminum ore from being mined (Blatt 2005). These are but a few of the positive natural
resource and energy effects that are realized by recycling materials2. In addition to all of
this, mining raw materials such as iron (used to make steel) and aluminum, and
2For a more comprehensive list of the positive effects of waste recovery, see Appendix A
0
50
100
150
200
250
mill
ion
to
ns
Recovery for Recycling Combustion with Energy Recovery Discarded

4
unsustainable tree-cutting often used to garner raw materials for paper production, have
deleterious environmental and social effects. As Figure 1.3 shows, a significant portion
of the 243 tons of material in the MSW stream in 2009 in the U.S. is recoverable. Of
this, as noted above, only 33.7% was recovered through recycling and composting, and
another 11.9% was incinerated and used to produce energy (EPA 2010). Waste
incineration and energy production is in some ways preferable to landfilling, but it is
important to note that MSW contains a large portion of plastics (and other materials that
contain toxins), and when incinerated release toxic chemicals such as dioxins, despite
modern pollution control systems. This type of pollution does not occur when MSW is
recycled or composted, which is the primary reason why “recovery” (recycling and
composting) is preferable to incineration.
Figure 1.3 Components of MSW by Percent, U.S. 2009
Source: EPA 2010, p. 6
Food scraps (14.1%)
Other (3.5%)
Paper & paperboard
(28.2%)
Yard trimmings (13.7%)
Wood (6.5%)
Rubber, leather, &
textiles (8.3%)
Plastics (12.3%)
Metals (8.6%) Glass (4.8%)
5
Increasing MSW recovery rates will also help mitigate the onset of global climate
change. The anaerobic decomposition of organic material in landfills is the largest
producer of anthropogenic methane emissions in the United States (Blatt 2005), and
methane is over twenty times as potent a “greenhouse gas” (GHG) as carbon dioxide.
The EPA (2010) reported that the 82 million tons of MSW that was recycled in 2009
prevented 178 million metric tons of carbon dioxide equivalents from being emitted into
the atmosphere, which had the same effect of removing nearly 33 million passenger
vehicles from the road. Carbon dioxide is viewed as the most important GHG because 1)
it is the most abundantly emitted GHG in the world, and 2) it has a very long residence
time in the atmosphere – it can exist for upwards of 200 years. This means that the CO2
emitted from today’s landfills will likely still cause increased global temperatures in the
year 2200.
It is thus clear that household waste management behavior is an important issue in
the United States, and simply put, the higher percentage of the waste stream that is
recycled, the better. But the question remains: What can be done to increase the MSW
recovery rate? One of the major difficulties in attempting to improve recycling and
composting rates is that these activities are personal behaviors, which are notoriously
difficult to explain or influence, due to the complex nature of the human decision making
process. Myriad studies have been performed that have analyzed determinants and
correlates of recycling behavior (e.g. Vining and Ebreo 1990, Jenkins et al. 2003, Barr
and Gilg 2005, Seacat and Northrup 2010), while fewer have researched composting
behaviors (e.g. Taylor and Todd 1995, Barr and Gilg 2005, Edgerton, McKechnie &

6
Dunleavy 2009). The results of these studies have been equivocal. Many theories have
been posited in an attempt to delineate what factors dictate behavior (see review of
relevant literature in the following chapter), but no single theory has proven able to
explain behavioral variance. It is generally understood that because of the complex
nature of behavioral motivations, studies of environmental behaviors should be
performed on a location-by-location basis when attempting to determine motivations of
specific populations (Vining and Ebreo 1990).
Recycling was chosen for this study because, in addition to resource management
issues detailed above, it is a service readily available to most residents of Denver, and
thus the potential for gathering data on recycling-specific behaviors is high. Also,
recycling is largely seen as normative behavior (Barr and Gilg 2005), yet the recycling
rate in the United States remains below 35% (EPA 2009), which is a curious pair of
circumstances – something is preventing people in the U.S from recycling. The benefits
of recycling are many, so it is important to attempt to explain what those “somethings”
are.
As composting is a similar behavior (household waste management), and has
similarly important resource, energy, and emissions impacts, but has not been
emphasized nearly to the extent of recycling in policy nationally or locally, it is relevant
to study in combination with recycling. The purpose of this study is to determine at least
some of the factors that influence3 recycling and composting behavior in the City and
3 Note that I am careful not to aver that these factors are “determinants” of behavior – human behavior is
simply too complex to assume that anything determines behavior. Potentially infinite factors lead to
behavioral outcomes, and they may reside deep within temporal or psychological recesses. It is not

7
County of Denver and ultimately to ascertain ways to positively influence these
behaviors. Various demographic, socio-economic, and behavioral factors have been
considered in this study, and their impacts on behavior analyzed. In addition, a
descriptive analysis of between-neighborhood differences was undertaken to lend
spatially-specific weight to the research. City policymakers may benefit greatly if
correlations can be made between the various factors and behavioral outcomes. Studies
of this nature are commonly undertaken in an attempt to inform waste management
policy decisions (e.g. Barr 2002; Edgerton, McKechnie & Dunleavy, 2010; Seacat and
Northrup 2010); the Denver City government could use the results of this study to modify
its policies, for example by targeting promotional efforts in an attempt to influence
factors that are correlated with increased recycling and composting. Also, questions were
asked of respondents that provide direct answers that can inform waste management
policy. No study to date has specifically addressed recycling or composting behavior in
Denver, analyzed the impact of the habit-measurement metric4 used in this study on
recycling behavior, or studied the impact of habit strength on composting. Thus this is a
groundbreaking study that can be used to inform current understanding of waste
management behavior, as well as lend itself to future research that may further enhance
the understanding of factors that influence these important behaviors.
reasonable to believe that a set of factors outlined in one study can be the full determinants of behavior, but
the use of regression analysis does indicate causal possibility, albeit with caveats. 4 The Self-Reported Habit Index (Verplanken and Orbell, 2003) was used. See Chapter 2 for details.

8
Chapter 2 Review of Relevant Literature
2.1 Environmental Values
The modern environmental movement is a relatively new phenomenon in
American history. Its inception is generally understood to correspond to the publication
of Silent Spring in 19625, and to a large extent was recognized as a bona fide (and
organized) movement when the first Earth Day celebration was held in 1970. The period
from the late 1960s to mid- to late-1970s saw a flurry of environmental legislation passed
in the United States, as well as the establishment of the U.S. Environmental Protection
Agency (EPA), and general environmental awareness and activism was on the rise.
Events such as the oil shocks in 1973 and 1979, as well as the Love Canal disaster in the
late 1970’s helped solidify the movement. In the 1960s and 1970s, it seemed as though
the general environmental attitude was shifting from what Pirages and Ehrlich (1974)
termed the Dominant Social Paradigm (characterized by a technocentric and
anthropocentric worldview) of Western Society to the New Environmental Paradigm
(NEP) (Dunlap and Van Liere 1978), a more ecocentric worldview. Dunlap and Van
Liere felt that it was important to quantify this movement in order to better measure the
paradigm shift that they sensed may be occurring. In an attempt to do so, they devised a
12 question survey with the intent of measuring adherence to the NEP, and found that the
5 It could be said that a more contemporary environmental movement is currently ongoing, though it is
different in nature than the one that began in the 1960’s. The movement that began in the 1950’s and
1960’s was largely based on deep ecology principles, and the modern movement can be characterized as
more eco-managerial in nature.
9
scale could validly measure ecological worldview (1978). This was the first time that the
ecological worldview was measured in a study (Dunlap et al. 2000), and many
subsequent researchers set out to test the validity and predictive validity of the NEP scale.
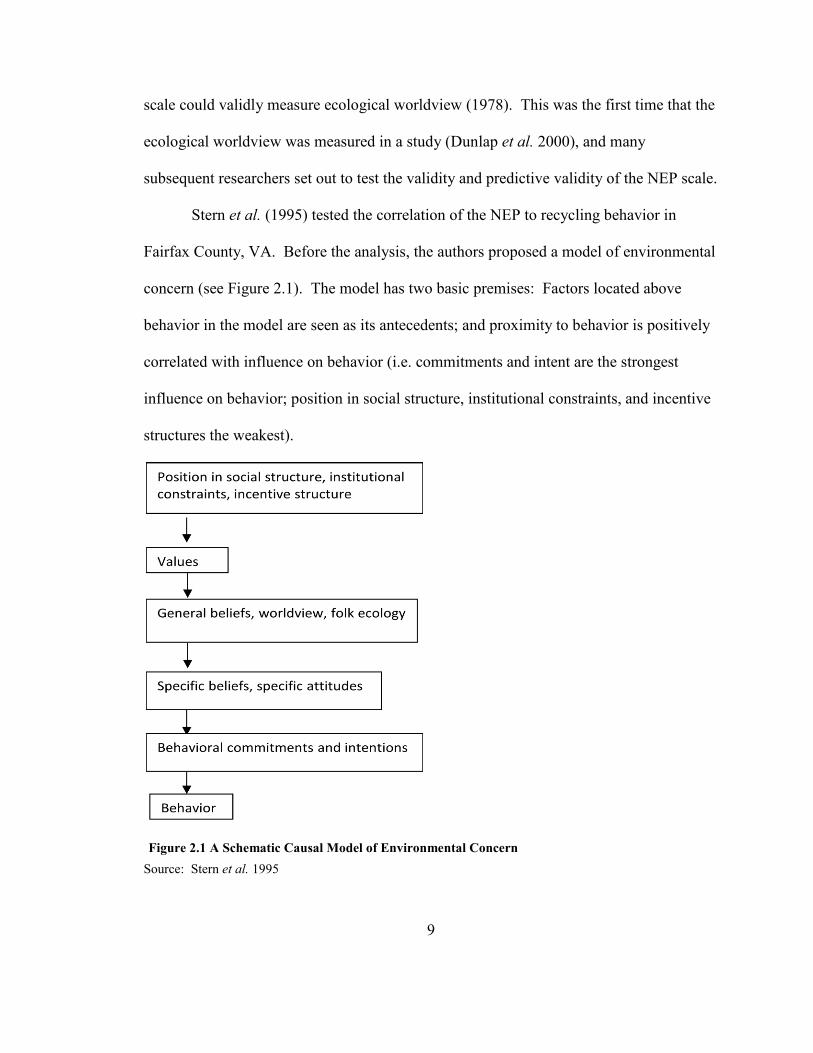
Stern et al. (1995) tested the correlation of the NEP to recycling behavior in
Fairfax County, VA. Before the analysis, the authors proposed a model of environmental
concern (see Figure 2.1). The model has two basic premises: Factors located above
behavior in the model are seen as its antecedents; and proximity to behavior is positively
correlated with influence on behavior (i.e. commitments and intent are the strongest
influence on behavior; position in social structure, institutional constraints, and incentive
structures the weakest).
Source: Stern et al. 1995
Figure 2.1 A Schematic Causal Model of Environmental Concern
10
Stern et al. determined that the NEP was a valid measure of generalized positive
environmental beliefs, and that adherence to the NEP was positively correlated to intent
to engage in recycling behavior. However, they surmised that NEP beliefs were located
somewhere between (and including) values and specific beliefs on the scale. Therefore,
although the beliefs engendered a propensity to engage in pro-environmental behaviors
(PEBs), extrinsic factors could intervene, thereby preventing the behavior from
occurring. The authors ultimately decided that although environmental beliefs likely
have an effect on environmental behaviors, the interaction between values, beliefs,
attitudes, and behavior are complex to the point that beliefs do not entirely predict
behavior.
The authors of the original NEP revised the scale in 2000 (Dunlap, Van Liere,
Mertig & Jones) in an effort to contemporize the vernacular and make improvements
based on criticisms of the dimensionality and predictive validity of the original scale.
The new scale was deemed the New Ecological Paradigm (NEP, the original scale will
henceforth be designated as the “original NEP”), and it contained 15 items, 3 more than
the original 12 items. The authors tested this improved scale in 2000. The NEP was
found to correlate with both support for environmental policies and self-reported PEB. In
2003, Cordano et al. tested the predictive validity of both the NEP and the original NEP,
as well as some abbreviated versions of the scale. Overall, they found that all of the
scales were positively correlated with intent to engage in PEB. They recommended that
the choice of which NEP scale to use should be made on a study-by-study basis. Overall,

11
they posit that adherence to the NEP is an important antecedent of PEB, but warn that the
relationship between intent and behavior is not always a causal one.
Nooney et al. (2003) tested the relationship between the NEP worldview,
demographic variables, and unspecified PEBs. The authors found that the NEP
worldview did not contribute substantially to behavior. They purported that, due to
extrinsic influences, people do not necessarily behave according to abstract beliefs, but
that an ecological worldview does predispose one to act in an ecologically sound manner.
They point to the Theory of Reasoned Action (TRA) and the Theory of Planned Behavior
(TPB) for an explanation of the belief-behavior gap. These theories argue that, “factual
knowledge, social values, and barriers to behavior performance work along with
individual attitudes to condition the performance of environmentally protective
behaviors” (ibid, 766).
These studies all provide empirically based arguments for the correlation of
various environmental value scales with engagement in, and intent to engage in, PEBs.
However, they also indicate that there are many other factors that influence behavior.
2.2 Demographic Variables
Crafting environmental policies and streamlining pro-environmental advertising
would be rendered eminently less difficult if researchers could pinpoint demographic
variables that had a demonstrative effect on propensity to engage in PEB. To this end,
many studies have tried to prove just that, with limited success. For example, Schahn and
Holzer (1990) found that women were more apt to engage in household-related PEB
(buying environmentally safe products, recycling, and conserving water). Also more

12
inclined to act in an environmentally friendly manner were people who were more
educated, older, and of liberal political affiliation. The authors warn that despite these
correlations, external factors likely contribute to behaviors.
Steel (1995) found that women were more likely to engage in PEB (recycling,
environmental politics, purchasing environmentally friendly appliances) than men, as
were those with more education, less political apathy, and those purporting to be
politically liberal. Extrinsic factors also had an effect, which will be discussed later.
Ebreo et al. (1999) found no strong correlations between demographic variables and
behavior. Barr et al. (2005) found that people who were least likely to engage in PEBs
(recycling, composting, energy conservation, water conservation) were generally young,
male, minimally educated, politically apathetic, and did not own their own home.
Conversely, the most committed environmentalists were most likely to be older, female,
politically active, and homeowners.
In a meta-analysis of 128 previous studies, Hines et al. (1987) found that overall,
income and educational levels were significantly related to PEB, while gender and age
were not. In 1995, Shultz et al. summarized the theretofore studies of demographic
effects on recycling behavior and found that women were more likely to recycle than
men, and that income had a positive relationship with recycling behavior. The results
gathered regarding age, education level, and ethnicity were deemed inconclusive.
Overall, most studies to date support the idea that women are more
environmentally responsible than men, and that degree of adherence to a politically
liberal philosophy and income level are generally positively correlated to self-reported

13
PEB. However, similar to the NEP research performed, none of these studies claim that
demographics are the sole determinants of behavior. No sociologist or social
psychologists claim that behavior is dictated by only one, or even a few, factors.
2.3 Concrete and Abstract Knowledge
Two types of knowledge are generally understood to be relevant when studying
environmental behavior, which Schahn and Holzer (1990) termed abstract knowledge
(AK) and concrete knowledge (CK). Abstract knowledge refers to general awareness of
macro-environmental issues, such as greenhouse gas emissions, deforestation, resource
depletion, biodiversity loss, etc. Concrete knowledge refers to one’s familiarity with
local issues and services, such as what can be recycled, where to deposit compost, and
local water use restrictions. Schahn and Holzer found that AK had no effect on PEB, but
that CK exhibited a positive correlation with recycling rates. Vining and Ebreo (1990)
found a strong correlation between knowledge of local recycling practices and self-
reported recycling behavior, as did Barr et al. (2005). In their review of previously
published literature, Schultz et al. (1995) showed that overall, CK had shown a positive
relationship with recycling behavior.
These findings are intuitive – one is conceivably more likely to perform behaviors
that are familiar to them. It is important to note that CK not only renders a behavior less
taxing, but also enhances the perception that the behavior is easier to perform (Barr and
Gilg 2005, Palatnik et al. 2005, Vining and Ebreo 1990). Abstract knowledge often has
no bearing on behavior because it is not usually the only impetus for behavior. Many
researchers have noted this disconnect between abstract beliefs and behavior (e.g. Ebreo

14
et al. 1999, Nooney et al. 2003, Schahn and Holzer 1990). Thus, CK is generally
understood to be the only relevant type of knowledge in terms of PEB.
2.4 Willingness to Pay Studies
As is the case for any public service, waste removal costs money. In addition,
many environmentally friendly behaviors (e.g. buying organic foods, buying natural
cleaners, purchasing alternative energy sources) come at a higher cost than their
environmentally “unfriendly” counterparts. Consequently, money has often been found
to play a role in rates of PEB. For example, Palatnik et al. (2005) found that most survey
participants exhibited a willingness to recycle, even if they would have to pay a small
amount of money to do so. However, the higher the proposed cost, the less people were
willing to recycle. Also, as perceived effort to recycle increased the acceptable recycling
fee decreased. Overall, price was shown to have a mildly preventative effect on
willingness to recycle.
Batley et al. (2000) found a similar relationship between willingness to pay
(WTP) and PEB. Their study population was nearly unanimous in their support for the
purchase of renewable energy, as long as the cost was no greater than non-renewable
energy. Only 34% of the respondents declared their WTP if their cost was to increase,
even when controlling for anthropocentric worldview and demographics. In 2005, Blaine
et al. designed a study to determine if proposed method of payment (payment card or
referendum) had any effect on the amount people would be willing to pay for waste
removal services (the service was free at the time of the study). They found that residents
were willing to pay more when considering the referendum, and that a significant

15
majority of respondents were willing to pay at least $1.50/month for services, even when
given the option of paying less or nothing. A mere $1/month from every Denver
household eligible for free recycling (approximately 160,000) would cover the entire
2007 recycling operating budget of $1.5 million (Pitt 2007).
2.5 Social Context and Barriers to Action Studies
It is generally understood that extrinsic influences have an effect on behavior, and
they have often been determined as the most important influence. The presence of
perceived or real inconvenience has been shown to be an important factor leading to
PEB. Derkson and Gatrell (1993) determined that people who avow concern for the
environment recycled at a higher rate than the unconcerned, but only if recycling was
convenient (curbside recycling available). There was no difference in recycling when
respondents did not have curbside recycling available. The lack of convenience was seen
as a “contextual barrier to action” (p. 435) that could not be overcome. The authors
contended that reducing barriers based on inconvenience was the most efficient way to
increase recycling rates, and increase PEB rates in general. Vining and Ebreo (1990)
arrived at a similar conclusion – specifically, that perception of the inconvenience of
recycling was enough to override the ecologically sound intentions of survey
respondents. In fact, recyclers and non-recyclers were found to have nearly identical
levels of environmental concern. The only difference between the groups was perceived
inconvenience of recycling, and CK (as noted above). The authors recommended that the
best way to convince people to recycle is to increase their knowledge regarding what and
how to recycle, to decrease the difficulty of engaging in recycling behavior, and to

16
convince them of the long-term benefits of recycling. Berger (1997) found that
inconvenience was consistently a significant barrier to recycling, as did Jenkins et al.
(2003). As previously mentioned, Palatnik et al (2005) found that WTP and willingness
to participate in composting and recycling decreased significantly with decreased
convenience. They also found that the positive impact of ecological worldview on
behavior decreased with increasing perception of inconvenience. Shultz et al. (1995)
cited three separate studies that determined that recycling rates were inversely
proportional to distance to the nearest recycling receptacle (assumed to be a measure of
convenience). Steel (1996) determined that situational variables, such as accessibility
and ease of behavior, were the most important determinants of PEB (donating money to
environmental organizations, signing petitions, recycling, using alternative transportation,
and a host of other behaviors). Lack of opportunity, which was interpreted by the author
to mean presence of inconvenience, was cited by survey respondents as the main barrier
to engaging in all PEBs studied.
Corraliza and Berenguer (2000) also found that barriers to action had significant
effects on PEB. They found that when one’s personal disposition favored a behavior in
question and the situation (social context) is seen as facilitory, the behavior was nearly
always performed. If the disposition was unfavorable, and the social context seen as
inhibitory, the behavior was rarely performed. These results are not surprising.
However, they also found that the behavioral result of a positive disposition combined
with an inhibitory context and a negative disposition with a facilitory context was the
same. Social context, it seemed, was a primary driver of behavior. Vining and Ebreo
17
(1999) found that recycling rates did not correlate well with other PEBs, and they also
posit that this was a result of contextual barriers. More specifically, they believed that
recycling was seen as a social norm, while environmentally responsible consumerism was
not. The normative aspect of recycling behavior was also proposed by Barr et al. (2005)
and Nooney et al. (2003).
It has thus often been found that social context and barriers to action have a
significant effect on PEB rates. Most researchers agree that convenience, both real and
perceived, plays a prominent role in propensity to engage in PEB. This may be due to a
dearth of leisure time, laziness, or a general state of apathy among a given populace. In
any case, these barriers to action are difficult to overcome.
2.5.1 Integrating Behavioral Factors and the Theory of Reasoned Action
Studies by Barr (2002) and Barr and Gilg (2005) effectively synthesized most of
the concepts discussed in the aforementioned articles. Barr proposed a new model of the
conceptualization of the determinants of PEB. The model is an expansion of the Theory
of Reasoned Action (Fishbein and Ajzen 1975), which is a highly respected and oft-used
general model of behavior. The Theory of Reasoned Action posits that behavior is
determined by behavioral intention, which is predicated on attitude towards the behavior
and subjective norms. Attitude is dependent on anticipated consequences of the behavior
in question and the evaluation of those consequences, while subjective norms are
comprised of the recognition of the norms to act, and the acceptance of these norms
(Figure 2.2).

18
Figure 2.2 The Theory of Reasoned Action
Soiurc: (Fishbein and Ajzen 1975) from Barr and Gilg (2005)
Barr expanded this model considerably, and adapt it specifically to study PEB
(Figure 2.3). In his model, behavior is affected by “situational variables” (SV),
“behavioral intention” (BI), and “psychological variables” (PV) (2005, 231). Behavioral
intention is influenced by SV, PV, and environmental values (ecocentricity or
anthropocentricity). The situational variables are behavioral context, socioeconomic
variables, knowledge (AK and CK), and personal experience. Psychological variables
are: Altruistic influences, intrinsic motivation, extrinsic motivation, perception of
problem, perception of environmental threat, response efficacy (the awareness of the
consequences of behavior), subjective norms, perceived difficulty of behavior, and
environmental citizenship (the feeling of being part of society and the natural
environment). Note that some of these variables were based on the Theory of Planned
Behavior (Ajzen, 1991) (from Barr, 2002), which added “perceived behavioral control”
to the TRA. Perceived behavioral control relates to the belief that a behavior is
convenient and under one’s control (de Bruijn, 2011).

19
Figure 2.3 Conceptual Framework of Environmental Behavior
Source: Barr and Gilg (2005)
The authors used this model to analyze self-reported behavior, and willingness to
engage in PEB, with a focus on recycling (though other PEBs were considered). They
found that perceived convenience was the most important factor in reported behavior,
while knowledge of local waste policies (CK) and access to a curbside recycling bin
(convenience) were significant to a lesser degree. It is important and perhaps surprising
to note that the expressed willingness to recycle and self-reported recycling behavior
were significantly different. Only ten percent of those surveyed were “very unwilling” to
recycle, but thirty percent said that they “never recycled” most items, which
demonstrated a significant value-action gap (p. 237). Willingness to recycle was
predicted mainly by environmental concern, norm acceptance, logistical issues, perceived
convenience, and concrete knowledge; whereas actual behavior was only affected by
concrete knowledge, perceived convenience, and actual convenience.

20
The authors also determined that other waste prevention behaviors6 were
undertaken to a significantly lower degree than recycling. They proposed that this was
likely due to recycling being a normative behavior, and waste prevention not being
normative in nature. The authors concluded that recycling is not the result of ecological
worldview, a true commitment to recycling, or the normative nature of recycling
behavior; and that factors facilitating recycling are different than those that determine
other PEBs. They recommend that the most effective way to increase recycling rates are
to increase actual convenience (more curbside availability), perceived convenience
(perhaps a “recycling is easy” campaign), and clarifying knowledge of where and when
to recycle. These recommendations are based on the results of the analysis of all the
behavioral influences in the model (Figure 2.3). The model is very holistic, taking into
consideration most perceivable factors that may influence PEB. As will be seen below,
the research structure in this report is largely based on this model created by Barr (2002).
2.6 Habits
Habits are most commonly associated with recurrent behavioral, as in “a habitual
liar,” or “a habitual flirt.” Most commonly, these statements imply frequency of
behavior. However, in a sociological or psychological context habits have a deeper
connotation, as adequately summarized by Verplanken and Aarts (1999). They state that
habits are “learned sequences of acts that have become automatic responses to specific
cues, and are functional in obtaining certain goals or end-states” (p. 104). They are
mostly subconscious, automated decision-making tools that have been proven to achieve
6 Other behaviors studied included composting, reusing items, bringing a reusable bag to the grocery store,
and fixing an item instead of buying a new one.

21
certain goals, and are performed in reaction to environmental cues. Humans’ lives are
rife with habitual behavior – looking both ways before crossing the street, brushing one’s
teeth before bed, exercising, smoking – all of these behaviors are performed in response
to specific environmental or internal cues. The role of habits in explaining behavior has
traditionally received less attention than more conscious processes, as demonstrated by
the predominant behavioral theories of the past few decades, such as the Norm Activation
Model (Schwartz 1977), the Theory of Reasoned Action (Ajzen and Fishbein 1980), and
the Theory of Planned Behavior (Ajzen 1991). There are many possible explanations of
habit formation, such as freeing the mind for more complex tasks, and simplifying the
enormous amount of information people receive on a daily basis (Biel 2003, Verplanken
and Orbitt 2003). Whatever the reason, habits have been shown to have powerful
influence over behavior and behavioral intention.
Bamberg and Schmidt (2003) studied the role of habits and other behavioral
correlates (subjective norms, intention, attitude, perceived behavioral control) in making
transportation choices. They found that the strongest predictor of actual behavior was
habit. The role of habit was even stronger than behavioral intention, which is largely
seen as having the most direct influence over behavior (e.g. Ajzen and Fishbein 1980,
Ajzen 1991, Taylor and Todd 1997). Similar results were obtained by Verplanken
(2005), Verbecke and Vackier (2005), and Honkanen et al. (2005), albeit in studies of
eating habits. All of these studies determined that habits have a very strong influence
over behavior.

22
Dahlstrand and Biel (1997) studied the implications of varying habit strengths of
PEB in the form of purchasing environmentally-friendly cleaning products. Based on
survey responses, they divided their subjects into three groups, each with different overall
level of habit strength, and examined common characteristics of members of each group.
Each group differed from the others in terms of many different characteristics, including
belief in effectiveness of products, environmental, sensitivity to price, perceived
difficulty of behavior, and others. Discerning these groups’ psychological characteristics
has important policy implications – it shows that people may respond to distinct types of
information depending on their habit strength (this finding is corroborated by many
studies – e.g. Oullette and Wood 1998, and Biel 2003). If a correlation can be made
between habit and behavior, and correlates of these habits can be delineated, it provides
another set of possibilities to increase incidence of desired behavior. Also, a strong
correlation between habit and behavior would open the door to habit-modification as a
viable method of changing behavior (Biel 2003).
A few more recent studies have attempted to shed some light on the influence that
habit has on waste management behavior, focusing on recycling. Knussen and Yule
(2008) analyzed surveys they administered to individuals near Glasgow, Scotland. After
controlling for demographic and TPB-related characteristics, the authors found that (lack
of) recycling habit played a significant role in intention to recycle. Self-reported habit
was found to mediate the attitude-intention relationship, diminishing the influence that
attitudes had on intention. Klöckner and Oppedal (2011), in a study of Norwegian
college students, found that recycling habit exhibited a stronger influence on self-reported

23
recycling behavior than both intention and perceived behavioral control. Notably, neither
personal norms, social norms, nor attitude were found to significantly influence recycling
behavior.
2.6.1 Quantifying Habits: The Self-Reported Habit Index
The results of these studies indicate that a measurement of habit should be
included in any examination of psychological factors that influence behavior. Of course,
to determine habit strength, one must utilize a reliable metric. Traditionally, most studies
have used researcher-derived scales that measure frequency of past behavior (see
Dahlstrand and Biel 1997, Oulette and Wood 1998, Biel 2003, Verplanken and Orbell
2003, and Knussen and Yule 2008). However, as explained above, habit is not entirely
analogous to behavioral frequency, though recurrence of behavior may lead to habit
formation (Verplanken and Orbell 2003). Habits are psychological constructs with a
number of facets, and therefore cannot be explained entirely by behavioral frequency.
Verplanken and Orbell (2003) set out to determine a reliable habit measuring tool
based on extensive research of published studies of the elements of habitual behavior.
The key elements they derived for this metric are: difficulty of controlling the behavior,
lack of awareness of performing the behavior, and perceived efficiency of the behavior
(these are seen as the “automaticity” element of habits); history of repetition of the
behavior; and the “identity element” (p. 1317). These constructs are intuitive, with
perhaps the exceptions of identity, which the researchers proposed because “habits are
part of how we organize everyday life and thus might reflect a sense of identity or
personal style” (p. 1317); and efficiency, which the authors stated would be particularly

24
apparent under “conditions of heavy load, such as exhaustion, time pressure, distraction,
or information overload” (p. 1317). As mentioned previously, habits are perhaps formed
to cope with various daily stressors. They hold that the identity construct should be
relevant to many, but not all, behaviors. They termed this scale the Self-Report Habit
Index (SRHI), which is made of twelve items (see Table 2.1). The authors subsequently
tested the SRHI on four separate studies, which assessed a variety of behaviors, including
transportation choices, eating habits, and television watching habits. They found the
scale to be psychometrically reliable, valid, and unidimensional. The SRHI has been
successfully used by other researchers, including Honkanen et al. (2005) and Klöckner
and Oppedal (2011) (the latter used a modified version). To date, only Klöckner and
Oppedal have used the SHRI to analyze recycling behavior, but none have utilized it in
research relating to composting behavior.
Table 2.1 The Self-Reported Habit Index
Behavior X is something…
I do frequently
I do automatically
I do without having to consciously remember
that makes me feel weird if I do not do it
I do without thinking
that would require effort not to do
that belongs to my daily routine
I start doing before I realize I’m doing it
I would find hard not to do
I have no need to think about doing
that’s typically “me”
I have been doing for a long time
Source: Verplanken & Orbell (2003)

25
2.7 Modeling Behavior
Human behavior is extremely complex – despite the best efforts of experts in
relevant fields of study over decades, behavior cannot be predicted. However, the
literature demonstrates that statistically significant correlations can be made between
antecedent variables and behavioral outcomes, and these relationships can be useful to
policymakers and those who wish to better understand behavioral influences. A review
of the relevant literature provided a comprehensive list of potential variables and
behavioral models that this study could be based on. I took into account all of the
research and derived a questionnaire and model that incorporates nearly all of the
variables in the research described above. The resulting survey instrument is described
in Chapter 4.
2.8 A Note on Geographical Context
Stewart Barr notes that environmental action7 is “quintessentially a geographic
topic” (2006, p. 44), though research regarding environmental action has been
traditionally limited to social psychology. Barr gives no further explanation for this
assertion, but Richard Peet provides insight when he states that “Geography is the study
of relations between society and the natural environment” in his seminal work Modern
Geographical Thought (1998, p. 1). The implication of these two statements is that -
arguments against a human-nature dichotomy aside – investigation of environmental
behavior is geographic ipso facto because it involves the relationship between spatially
distinct elements. Namely, the self on one hand, and “nature” on the other. This is also
7 Recycling and composting, having significant environmental impacts, are environmental actions.
26
expressed by Amadeo and Golledge (2003) when they describe Environmental
Perception and Behavioral Geography (EPBG), a Geography sub-discipline, as the study
of the relationship between the self and the environment. They refer more specifically to
environmental perception and its impact on actions, which is addressed in this research
via the use of environmental values (see above), but also to the general belief that “all
environments, essentially by their presence, constitute external sources of information for
human beings” (ibid, p. 135).
Thus, this research is geographic in the sense that it is an analysis of human-
environment interaction in the form of the pro-environmental behaviors recycling and
composting. In addition, in order to address the more common perception of Geography
as a study of place and/or space, spatial elements are considered as well. First, as noted
in the Introduction, I performed a between-neighborhood descriptive analysis. Second, I
make a comparison to results of this study and similar study undertaken in Exeter,
England by Barr (2002). I could not locate any other piece of research that is analytically
analogous to my research other than the study by Barr. Both of these elements strengthen
the spatial component of the analysis, and thus render it more explicitly geographical in
the common perception of the discipline.

27
Chapter 3 Description of Study Area
3.1 Geographic Setting
The study was undertaken in Denver, Colorado, United States (see figure 1),
which had an approximate population of 554,636 as of 2007, according the United States
Census Bureau (U.S. Census Bureau 2007). Denver’s populace is a mix of various socio-
economic and demographic backgrounds, and possesses members of all age groups,
education classes, household types and sizes (The City and County of Denver, 2007).
The variable nature and size of Denver’s population makes it an ideal setting to research
effects of different demographic and social correlates of behavior. Regardless of how
suitable the population is for a study such as this, it is recommended that motivations for
recycling behaviors should be undertaken on a place-by-place basis (Vining and Ebreo
1990, Blaine et al. 2005), thus if one is interested in waste management analysis in
Denver, it is best if data from Denver are used. Further, as pointed out by Amadeo and
Golledge, at the core of Geography is the notion that “activities and experiences must be
(understood) in terms of the environmental contexts in which they occur” (2003, p. 135).
This notion is corroborated by Hargreaves (2011), who stresses the context-dependant
nature of pro-environmental behavior research. The spatial context for this study is the
areas of the City and County of Denver that were selected for study.

28
Figure 3.1 Denver, CO, U.S.A.
3.2 Waste Management Services in Denver, CO
“Denver Recycles” (DR) is a sub-department of the Denver Solid Waste
Authority, and oversees recycling services in the city. Recycling services are free to all
Denver residents of single-family dwellings and multi-family dwellings that have seven
units or less, while trash removal is free and available to all residents. Residents that live
in buildings with more than seven units have access to public recycling facilities, as there
are many community recycling bins located throughout the city8. Fee-based recycling
services are also available through a number of private companies. Signing up for free
recycling service can be accomplished by registering at the DR website (City of Denver,
2011). Until June of 2005, DR accepted six materials in curbside recycling bins, and
seven additional materials were added as of June 2005 (see Appendices B and C). The
materials do not need to be separated – this method is called “single stream recycling.”
In other words, all recyclable materials can be put together in one bin without being
separated. This is obviously a much more convenient means of recycling than being
8 Public recycling facility details, including location and accepted materials, can be found on the DR
website. See
http://www.denvergov.com/trashrecycling/TrashandRecycling/Recycling/RecyclingDirectoryDropoffLocat
ions/tabid/440907/Default.aspx for details.

29
required to separate materials. At the time data were gathered for this study, DR had
recently phased out the use of small individual recycling bins and replaced them with
much larger wheeled carts in an effort to make recycling more convenient. The new carts
were completely phased in by January of 2007 (Pitt 2007), though some residents at the
time this research was undertaken were still using the smaller bins.
At the time this research was undertaken, the city did not offer curbside
composting service, though household composting was supported by a number of indirect
means. Denver Recycles made household composting information readily available on
their website, and offered free composting classes throughout the year. This information
and training was made available in an attempt to increase home composting. “Grass-
cycling,” a form of home composting, was also encouraged by DR on their website.
Grass-cycling is achieved by leaving grass clippings created by mowing in place on the
lawn. Not only does this reduce the burden on landfills and prevent GHG emissions9, but
it also increases nutrient and water retention on lawns, reduces lawn maintenance costs,
and minimizes the amount of time spent on lawn maintenance (City of Denver, 2011b).
Finally, leaf drop off sites were made available in the fall, and limited yard waste pickup
was available to residents. The latter two services do not promote home composting per
se, but they are yard waste management services that ultimately result in reuse of organic
materials through mulching.
As of the spring of 2011, the leaf drop off and limited yard waste pickup policies
remain in place, composting and grasscycling information are still available on the DR
9 See details regarding anaerobic digestion in Chapter one for GHG implications of organic material in
landfills.

30
website, and composting classes are still offered throughout the year10
. However, one
aspect of composting policy has changed significantly, especially in regards to this
research. Namely, the city now offers curbside composting services to limited areas of
the city. A successful curbside composting pilot study resulted in fee-based composting
service being available to city residents in select areas11
. This is a significant step toward
responsible management of the organic component of MSW, and has implications for
future research, as can be seen in the Discussion section.
3.3 Neighborhoods Surveyed
Given unlimited resources, I would have attempted to procure a representative
sample of the entire City and County of Denver, and thus (assuming the proper level of
participation) would be able to make statistical inferences that would consider the
residents of Denver as the population. However, given the temporal12
, financial13
and
human resource14
constraints in the data gathering, I reduced the survey area
considerably. This lack of resources was an important consideration in choosing the
survey area. The second condition that limited the survey area was also practical in
nature: as will be seen in the following section, the study instrument chosen in this
analysis was a 17-page survey that was physically handed to participants, then collected
10
There are currently 28 classes available throughout the year. See
http://www.denvergov.org/trashrecycling/TrashandRecycling/CompostingOrganics/CompostingClasses/tab
id/438333/Default.aspx for class schedule as of May 2011. 11
See
http://www.denvergov.com/trashrecycling/TrashandRecycling/CompostingOrganics/CompostCollectionPil
otProgram/tabid/438328/Default.aspx for complete details of pilot program availability. 12
I had approximately 2 months to gather the data. 13
This research was self-funded, aside from a generous $300 research grant given by the Department of
Geography at the University of Denver. This grant was sufficient to cover most of the printing costs. 14
Given the financial constraints, I administered and gathered all of the surveys, which as will be seen in
the following section required a considerable time commitment. It is hoped that a large group of assistants
will be available if future research of this nature is undertaken.

31
by hand. This type of data gathering limited the survey area precisely because I had to be
physically present in the areas being studied. Simply put, there are some areas of the city
that I was not comfortable walking around and knocking on doors unannounced. This
limited the representativeness of the samples in at least one regard. Namely, that this
resulted in surveying relatively affluent neighborhoods. This is not to say that more low-
income neighborhoods were more dangerous, but that I was not familiar with them, and
did not “feel” comfortable knocking on doors unannounced. This says as much about my
personal psychology as much as it does the neighborhoods in question, if not more.
Regardless, it reduced the representativeness of the sample.
Taking all of these factors into consideration, I chose to survey nine U.S. Census
Tracts: Speer, Washington Park West, Capitol Hill, Cheesman Park, Congress Park, City
Park, Corey-Merrill, City Park West, and Whittier (see Figure 3.2 and Figure 3.3). These
census tracts were not chosen scientifically, per se – they were chosen because I felt that
1) they could be surveyed in the given time frame and with the given resources and 2) I
felt safe walking alone in them and knocking on doors unannounced. This compromises
the representativeness of the sample, but was pragmatic in nature.

32
Figure 3.2 Census Tracts of Denver, CO. Surveyed census tracts are highlighted in grey.
Figure 3.3 Census Tracts Surveyed for the Study

33
Chapter 4 Methods and Research Questions
4.1 Research Design
4.1.1 Behavioral Model
The inherent complexity of behavior allows researchers to choose any number of
variables to study, as can be demonstrated by the studies detailed in the literature review.
After performing the literature review, I found that Barr’s 2002 and Barr and Gilg’s 2005
study of waste management behavior analyzed the most comprehensive list of variables,
and thus provided the most robust behavioral model.
I chose to largely base this study on their waste management model (see Figure
2.3), with two important exceptions: First, though intent to engage in a behavior is
widely viewed as the most direct antecedent of behavior itself (Barr, 2002), I chose not to
quantify intent to recycle and compost in this study. This was partly a pragmatic
decision, in that adding intention-based questions increased the length (two additional
pages) of the already lengthy survey (17 pages), and that respondents to test surveys that
contained intention items noted that the intention questions seemed redundant and
unnecessarily increased the length of the survey. In addition, the literature is rife with
studies that do not measure intent to engage in behavior, but measure behavior directly,
thus it is apparent that viable research can be undertaken without measuring intent.
Intent can be viewed as both an independent and dependent variable, as Barr (2002) and
Barr and Gilg (2005) demonstrate. Behavior is the focus of this research, for it is waste

34
management behavior (not intent) that most directly result in the impacts discussed in
Chapter 1, thus it is not an important dependent variable. Excluding intent does
potentially compromise the explanatory capacity of this research, insofar as intent is a
variable that leads to behavior, but the results are still useful in their absence as many
other studies indicate. Given the limited resources I had to complete this research, a high
response rate was imperative in order to obtain a statistically significant sample, thus I
removed the intention items.
The second way the behavioral model in this study differs is that it includes habit
strength as an independent variable. Inclusion of habit is important for a number of
reasons. First of all, habits have been shown to be correlated with corresponding
behaviors (e.g. Verplanken & Orbell 2003), including recycling (Knussen and Yule 2008,
Klöckner and Oppedal 2011), so the inclusion of habit adds to the explanatory capacity
of the model. In short, measuring habit formation strengthens the model. Secondly, habit
quantification can have important implications for waste management policy in Denver.
If habit strength is shown to have a strong correlation with recycling and/or composting
behavior, the city can pursue ways to influence habit formation among city residents.
Thus it may provide another way to increase responsible waste management behavior in
the city. Finally, the addition of habit to Barr and Barr and Gilg’s model adds an
additional element of separation between their research and the research undertaken for
this study. As explained previously, it has been noted that implications of PEB research
are mostly relevant to the geographic area in which the research was performed (Vining
and Ebreo 1990), so this research is unique. However, the addition of habit strength to

35
the mix of variables further separates this research from others done in the past. In fact,
of the published research to date, only Klöckner and Oppedal (2011) have analyzed the
impact of both SRHI-measured habit strength and a mixture of situational and
psychological variables on waste management behavior or other PEB, though this study
distinguishes itself from Klöckner and Oppedal in a number of ways15
. Since the time
the data were gathered for this research, de Bruijn (2010) has undertaken research that
combines the use of the SHRI with other constructs used in this research, but de Bruijn
studied exercising behavior. Thus, this study is unique in that it is the first to analyze
influences of waste management behavior in Denver and is the first to analyze the impact
of the set of variables I have chosen for this research.
15
Important differences between this study and Klöckner and Oppedal’s are: they did not analyze
demographic characteristics, they did not perform factor analysis to verify their variable groupings (see
Methods section below), and their sample was derived solely from undergraduate students in Norway.
Figure 4.1 Behavioral Model of Waste Management in Denver, CO.

36
Figure 4.1shows the behavioral model that I have derived for this study. Note the
similarities between this model and Barr’s and Barr and Gilg’s (Figure 2.3), but with the
addition of a habit variable. This model proposes, broadly speaking, four categories of
variables in the analysis of waste management behavior. First, environmental values,
which will be measured by responses to the modified NEP scale proposed by Barr (2002)
and Barr and Gilg (2005) (see below for description of this scale). Second, psychological
motivators and barriers are included, including attitude, subjective norms, self-efficacy,
perceived convenience, and response-efficacy. The third category of variables is
“situational,” which includes socio-demographics, actual convenience, and concrete
knowledge. Finally, habits were included and measured by responses to the SRHI
questionnaire. Note that the dotted lines connecting habit to the situational and
psychological variables indicate that habits fit into both of these categories. Habits,
simply put, are automated responses (hence, psychological) to external stimuli (hence,
situational).
It is important to note that the individual sub-categories (e.g. attitude, self-efficacy,
actual convenience) are proposed variables, and may not come to pass when the analysis
is undertaken. As will be seen in the next section describing the questionnaire, specific
questions are designed to ascertain the influence of each category and sub-category of
variable. However, whether or not each of these (sub-)categories is incorporated into the
final regression-based model depends on the results of factor analysis. These results
cannot be dictated a priori – the factor analysis separates (“loads”) individual variables
into groups/categories based on statistical similarity, which do not always coincide with

37
preconceived categories. Thus, questions are grouped into categories and sub-categories
that may or may not align with those I intended. These groups can be seen in the Results
section.
4.2 Methods
4.2.1 Data Collection Method
As noted in the previous chapter, the study area was chosen in part by the nature of
the survey instrument and administration method. For this study, the data were survey-
based and gathered via a “call and collect” method, which is modeled after the technique
used by Barr (2002). The first step in data collection was to select the households to be
sampled. I chose to utilize a hand-administered hard copy survey, for the reasons
described in the next section, and used stratified random sampling to determine the
sample. A stratified random sample “divides the population into separate groups, called
strata, and then selects a simple random sample from each stratum” (Agresti & Finlay
1997, p. 26). In this study, the nine census tracts were the strata, and 40 samples
(residences) were randomly chosen from each census tract. Stratified random sampling
was used instead of simple random16
because I wanted to garner sufficient responses
from each neighborhood to perform parametric tests on each neighborhood’s responses in
addition to performing them on the sample as a whole. A sample size (“N”) of
approximately 30 is generally accepted as the minimum sample size to assume a normal
distribution. If a 75% response rate could be achieved, this benchmark could be reached
if 40 surveys were administered to each neighborhood. Also, after consulting with an
16
A simple random sample would require random selections be made from all of the household in all the
census tracts, not a given number from each census tract.

38
expert in statistical analysis, the other response goal was to have at least 200 usable
surveys in order to be able to perform many of the analyses, which would only require a
55.5% response rate.
The data points were chosen through the use of ArcMap©, a software created and
maintained by Environmental Systems Research Institute (ESRI 2007). ArcMap is a
mapping and data/spatial analysis program, and was used to both generate the stratified
random samples and to create maps that were used as navigational tools to administer the
surveys. ArcMap enables the user to add map “layers” that contain spatial and/or tabular
data. For this analysis, I first loaded layers containing shape and location information for
all of the parcels, streets and census tracts in the City and County of Denver. This
created a huge and cumbersome data set/map, so I “clipped” this aggregate data
according to the borders of the census tracts that were designated for analysis. Clipping
data eliminates all of the spatial data that are outside the boundaries of designated areas –
in this case, all data that were not within the boundaries of the nine census tracts of
interest were eliminated17
(Figure 4.2). Upon clipping I was left with 15,837 parcels,
which was reduced from 165,424 parcels in Denver as a whole.
17
Note that if one desired to obtain a representative sample from the entire city of Denver, clipping would
not be necessary.

39
The stratified random sample was obtained as follows: First, I created individual
maps of each neighborhood. Each map contains discrete polygons for every municipal
parcel of land that resides within the tract, and each polygon has tabular data associated
with it that contains at minimum a unique (integer) identifier (the “FID” field) that
differentiates it from all of the other polygons in the file. The parcels represented one of
three things: residential housing, businesses or parks. I was able to eliminate the parks
according to a “parks” layer. The parcels were chosen randomly through the use of the
FID field. Using a random number generator18
, I chose the given number of parcels (40
in each neighborhood) by generating 40 random numbers from the set of FID integers
associated with the parcels in the map. For example, if there were 1200 parcels in the
map (e.g. the Capitol Hill Neighborhood), I asked the generator to produce 40 integers
(non-duplicative) from the set of numbers 1 through 1200. I then selected these parcels
on the map, highlighted them, and printed the map out to use as a navigation guide.
Figure 4.3 shows an example of twenty randomly selected parcels in the Capitol Hill
18
Available at http://www.random.org/integers/, a website maintained by Trinity College in Dublin.
Figure 4.2 Parcel Maps before (Left) and After (Right) Clipping

40
neighborhood. Note that this was a test map, and the parcels were not selected to
participate in the study – providing a map of locations surveyed would compromise the
anonymity of the respondents. A map with 40 randomly selected parcels for each
neighborhood was generated, and used as a guide to administer the surveys.
Figure 4.3 Twenty Randomly Selected Parcels in the Capitol Hill Neighborhood of Denver, CO.
After randomly choosing the household/parcel to be surveyed, I visited each
selected household19
. Note that businesses were not eligible for the study, so if a
business parcel was selected, I moved to the adjacent residential parcel, according to the
19
If the randomly selected parcel was an apartment building, I randomly selected an apartment to solicit,
and contacted the residents through the “call” button, if one was available. If no call button was available, I
waited until someone entered the apartment building, and asked them to participate. If either of these
methods were not successful, I went to the adjacent parcel.

41
procedure explained below. If someone answered the door, I briefly explained the
purpose of the research and asked the resident if they would be willing to fill out the
questionnaire. As an enticement, I informed them that I would randomly select three
survey participants after all of the surveys were collected, who would each receive a $50
cash prize. In order to be considered a qualified survey participant, the resident had to fit
two criteria: First, they must be at least 18 years of age, as required by the University of
Denver Internal Review Board. It is clearly outlined on the survey instrument that the
person who fills out the survey must be at least 18 years of age. If the person who
answers the door appears to be under the age of 18, I asked if there is someone at least 18
years of age who could be spoken to, and they are asked to fill out the survey. The
second qualification is that the person surveyed must be a resident of the selected
household. This is important because I hoped to gather representative samples from each
neighborhood, thus I wanted to be sure the person surveyed resided in the given
neighborhood. I chose to respect all requests (via signage or otherwise) to not solicit, as
it was important that I was respectful of all individuals, whether or not they were
involved in the study.
If no one answered the door, refused to take the survey, or was not a qualified
person, I went to the adjacent house and attempted to administer the survey again, using
the same survey administration procedure. The adjacent house was chosen according to
the following procedure. I went to the closest dwelling in the northern direction20
on the
20
If the street was not oriented exactly north-south, I went in the northernmost direction that would allow
me to stay on the same side of the street. For example, if the street was oriented NW-SE, I went to the
residence on the same side of the street, walking northwest; if it was NE-SW, I walked to the northeast,
staying on the same side of the street.

42
same side of the street, until I could no longer travel in a northern direction and remain in
the same census tract. If I could no longer travel in a northern direction in the tract, I
went to the next residential unit to the west, then as soon as I could move in a southern
direction, I did so, staying on the same side of the street. I continued south until I could
no longer do so and remain in the tract, at which point I would go west again, then north
as soon as I could. The pattern was then repeated until a survey was successfully
administered. I repeated this process until a qualified respondent agreed to participate in
the survey. Figure 4.4 shows a hypothetical pattern that would be undertaken in order to
administer a single survey. The purple-colored shapes are parcels in the desired census
tract, and the white lines between the parcels are streets. The circled polygon indicates
the randomly selected parcel, and the numbered arrows show the paths that would be
taken (in order) to administer the survey.

43
Figure 4.4 Sample Survey Solicitation Pattern for Choosing “Adjacent” Parcel
If the resident agreed to participate, I informed them that I could return later the
same day to pick up the completed survey, but would otherwise return the following day
to pick it up, and that they had the option of returning the survey in person or leaving it in
a safe and accessible location on the premises. As will be seen in the results section,
many respondents returned the survey the same day it was administered. Upon return to
the household, if the survey was not visible, I personally asked if the completed survey
was available. If the resident answered the door, but had not completed the survey, I
informed them that I would return the following day. If the survey was not left in a
visible location and no one answered the door, I left a note explaining that I would return
the following day. On the third visit to the household, if the survey was not available and
no one answered the door, I left another note explaining that I would return the next day.

44
If the survey was not collected on the fourth visit, I left a final note explaining that they
could contact me to return the survey if they still wished to participate in the research. If
I was able to speak with them in person, I explained that they were still eligible to
participate, but that they would need to contact me in order to do so. I did not return after
the fourth day unless explicitly invited to do so.
4.2.2 The Survey Instrument
I chose to provide the survey in person via hard copy as a result of multiple
considerations. The first consideration was borne of cost combined with the desire to
retrieve a large enough sample to perform a robust and statistically significant analysis.
The goal of the survey procedure was to garner enough valid responses to assume a
normally distributed sample size in each neighborhood, which would require a minimum
of 30 responses from each neighborhood. Given the cost and time restrictions, it was
infeasible to administer the surveys by mail. Mail-in surveys require at least two
postages – one to send the letter and one for the return. Ebreo et al. (1999) note that a
nearly 54% response rate is “within the range that is normally acceptable for mail surveys
(117). If my study achieved a 50% response rate, the minimum cost for postage alone
would be $44.40 per neighborhood21
, and this does not include the cost of the printing,
envelopes or reminder mailings. Such a budget would easily have surpassed $500-
$100022
, which was beyond the means available at the time. Even a 100% response rate
– an extremely unlikely outcome - would cost a minimum of $300 to $400 given the
desired sample size. Secondly, a hard copy delivered by hand should result in a relatively
21
At the time the study was conducted, a first class stamp cost $0.37. Each survey would thus cost $0.74,
and to receive a minimum of 30 surveys, 60 would need to be sent out, for a total cost of $44.40. 22
Printing costs for the project were approximately $350.
45
high response rate. Barr and Gilg (2005) attributed their high response rate (69%) to the
personal interaction that resulted from hand-administration of the surveys. Unlisted
phone numbers and the preponderance of cell phone use eliminate a large pool of
potential subjects if phone surveys are used. Also, phone numbers as identifiers are
difficult to apportion according to neighborhood, as they are not spatially-based. Thus I
did not use a phone survey, though it would have been quite inexpensive. I considered
using an internet-based survey, but could not solicit entries according to neighborhood
with this method either.
The survey instrument consisted of 17 pages (see Appendix D). It included a cover
page explaining the purpose of the survey23
, who it was administered by, notification of
the availability of the cash prize, and my contact information. Directions for filling out
the survey were also supplied. The bulk of the document (twelve pages) contained the
questionnaire, which consisted of 78 numbered questions, with 25 subquestions24
that
were designed to a) address items in the conceptual framework and b) ascertain
information that may help DR improve or otherwise modify waste management services.
Note that I created eight versions of the survey, which varied in three ways: 1) Half of
the surveys asked if they would be willing to pay $3/month for a) composting services
and b) garbage and recycling pickup, and the other half asked if they would be willing to
pay $1/month; 2) half of the surveys listed composting-based questions first, half asked
recycling-based questions first; and 3) half of the surveys had behavioral frequency as the
23
As recommended by Barr (2002) following recommendations by Dillman (1978), no mention was made
of the purpose of the research being for a Master’s thesis, 24
Recycling and composting behavior was considered one question, though there are 17 sub-questions that
address the frequency with which individual items are recycled or composted. Similarly, the NEP scale
was considered one question, though it contains 8 items.

46
first question, and half had it as the third question, after asking if recycling and
composting were important. This was done in an attempt to limit the ordering bias of the
questions. The question description and goals are as follows25
.
Section one (questions 1-67) contained questions pertaining to recycling and
composting, and section two (questions 68-78) had demographic-related questions. Note
that answers to Likert-scale questions were recoded when necessary so that when I
performed the data analyses, a higher score meant more frequent behavioral occurrence
and a stronger positive view of the value in question. Question one contained 17 sub-
questions that asked the frequency with which the respondent recycled or composted
specific items. Five Likert-style options were given, in a scale that ranged from “never”
to “always.” Note that items were included that DR allows (see Appendices C and D)
and disallows (e.g. plastic tubs and plastic bags) for recycling. Non-recyclable items
were included to ascertain to what extent residents are putting items in the recycling bin
that should not be there. This could have implications for DR’s publicity efforts26
. A
sub-question regarding grass-cycling was included as well.
25
The descriptions are of a survey that had a) composting questions before recycling questions and b)
behavioral items first. 26
For example, if residents report high rates of plastic bag recycling, DR should consider undertaking a
publicity campaign reminding people that plastic bags are not to be placed in the recycling bins.

47
Questions 2 and 3 address the “attitude” construct in the framework model
(acceptance of the importance of recycling/composting). Questions 4 – 11 were designed
to glean information that could potentially be useful to DR, including willingness to pay
(WTP) for services and what positive impacts of recycling/composting would motivate
them to recycle (global climate change, job creation, as well as personal and county-
based economic benefits). Questions 2-11 utilized 5-item Likert scales, ranging from
“unimportant” to “very important.” Questions 12, 14 and 15 addressed concrete
knowledge (what can be recycled, how often it is picked up, and need to separate
recyclables). Questions 13 and 16-21 were designed to provide information to DR,
including where residents get information about recycling/composting (website, TV,
radio ads, etc.) and what prevents them from recycling/composting/grasscycling.
Questions 22 and 23 asked if the respondent has a garden, and if so, whether or not they
use their compost in the garden. Having or not having a garden will be used for a
descriptive statistic (do gardeners compost more than non-gardeners?), and may also be a
situational variable. Question 24 has 8 sub-questions with the NEP scale items (see
Figure 4.5). This is a modified scale that was utilized by Barr (2002) and used a 5-item
Likert scale ranging from “strongly disagree” to “strongly agree.” The test survey used
the 12-item NEP scale derived by Dunlap et al (2000), but feedback from test
The environment is forgotten too often when decisions are made
If we over-use our natural resources, human development may be harmed in the future (reverse coded
Nature and the environment have as much value as human beings
Humans should not develop any more resources or land, in order to protect the natural environment
Nature isn’t harmed by human changes
Human welfare should be our primary concern in the future
The environment is of little concern to me
Getting through daily life and surviving is what concerns me the most, not the environment
Figure 4.5 Revised NEP Scale

48
respondents indicated that some of the questions on the scale were “odd” and somewhat
confusing. The modified 8-question NEP scale used by Barr (2002) was found to be
more acceptable to test respondents, thus it was used. There are a number of NEP scales
available that have been used in various studies with varying degrees of success, and
Cordano et al. (2003) recommend that the choice of NEP scale should be made on a
study-by-study basis.
Questions 25, 26, 29, 30, 35 and 36 address the subjective norm of
composting/recycling (awareness of norm and acceptance of the norm), while questions
27, 28, 33 and 34 address perceived convenience and /or personal efficacy
(recycling/composting is easy and/or too time consuming to worry about). Questions 31
and 32 were meant to address response-efficacy (recycling/composting is not justified
due to small amount created), and questions 37 and 38 addressed self-efficacy
(recycling/composting on a daily basis is possible). Question 39 is meant to provide DR
with information regarding whether or not residents are aware that DR will provide them
with a bin for free. Questions 40 – 63 contain the 12 question SRHI for recycling and
composting (12 for each behavior). Questions 64 – 66 were to be answered by
respondents that use the large, wheeled cart, and were meant to ascertain 1) if they
recycled more or less than they did when they had the smaller bins and 2) why they
recycled more or less. This information can be potentially be used by DR, as it delineates
explicitly why the bigger bins are effective or not. Question 67 was only to be answered
by respondents who lived in apartment complexes larger than seven units, and
ascertained whether or not they recycled, and if so, where they recycled. This

49
information could also be useful to DR. Note that questions 25 – 63 had 5-item Likert-
scale answers ranging from “strongly disagree” to “strongly agree.”
The final section consisted of questions 68 – 78, which were designed to gather
demographic information. These questions addressed age, gender, education level,
income, whether the home is rented or owned, type of residence, political affiliation, who
is responsible for recycling, race/ethnicity, and language spoken at home. These data are
“situational variables,” and will be integrated into the final behavioral model. One final
note – Spanish and English versions of the survey were available, in case Spanish was the
primary language spoken at home. The Spanish version was administered once, but the
survey was not returned.
4.3 Research Questions and Data Analysis
4.3.1 A Note on Statistical Methods and Research Goals
After all of the questionnaires were collected, the data from the surveys had to be
compiled before the analysis was to take place. The dataset that resulted from
aggregation of the answers to the questionnaire is large – 199 completed surveys and 101
questions per survey - and would be very difficult to interpret without aggregating the
data. For this report, statistics were used to summarize data most relevant to the research.
A dataset with so many variables can be used for a multitude of low- and higher-level
statistical analyses. As described in the Introduction, the overarching goal of this
research is to inform waste management policy in Denver as it relates to recycling and
composting. The data analysis focused on variables that are most pertinent to this goal,
which are correlates of waste management behavior as well as data that are directly

50
related that behavior. Data that are not pertinent to the research goal were not analyzed
in this report. In short, there are many other analyses that could possibly be performed
using the data gathered for this study in addition to the analyses contained within this
report. Given the focus of this piece of research, these other analyses may be performed
at a future date and/or provided to the City and County of Denver in an effort to assist
them in waste management policy. Not all of the data will be used in this analysis, but
may be used in future research undertakings.
4.3.2 Descriptive Statistics
The first portion of this analysis utilizes descriptive statistics, which, simply put,
are ways to “summarize and describe data, to make the information easier to assimilate”
(Agresti & Finlay, 1997, p. 35). Descriptive statistics describe the sample only, and do
not make any claim to describe the population27
as a whole. In this study, descriptive
statistics describe characteristics of the respondents, and claim no implications for the
population of the neighborhoods, or Denver as a whole. Perhaps the most common
descriptive statistics are the calculation of means, medians, modes and standard
deviations. I used descriptive statistics to provide the reader with 1) a general idea of
waste management behavior among the survey respondents (e.g. frequency with which
each material is recycled), 2) a description of the survey respondents (demographic
descriptions) and 3) summaries of responses to the NEP and SRHI constructs. A mixture
27
In statistics lingo, “population” refers to the “total set of subjects of interest in the study” (Agresti &
Finlay, 1997, p.4). In this study, the residents of the nine census tracts are the population. If the sample
was drawn randomly from the City of Denver as a whole (i.e. each resident of Denver had an equal chance
at being chosen), then the population would have been the residents of Denver. A “sample” refers to the
subset of the population for which data were collected. In this study, they survey respondents are the
sample.

51
of graphical and tabular descriptions of data is used to summarize the data. Graphs and
tables are very efficient way to display large, aggregated data sets, and are commonly
used in research of this nature.
4.3.3 Multivariate Inferential Statistics
Inferential statistics provide predictions (inferences) about the population being
studied based on the sample statistics (Agresti & Finlay, 1997). Inferential statistics are
powerful tools, as they enable the researcher to describe the population being studied
while limiting the data that need to be gathered. In this study, the sample size of 199 (the
number of completed surveys) will be used to describe the population (approximately
15,000 households in nine census tracts). However, the strength of this type of analysis –
being able to describe the population with a subset (sample) – can also be a weakness
because inferences must be made. It is often much easier to gather data for a sample than
from a population, but inferential statistics have probabilistic limitations. The probability
that a sample statistics is indicative of a population parameter is denoted by a “probability
level.” A probability level is expressed as a decimal, usually in the form of “p < n.” The
variable “n” is a decimal that indicates the level of confidence that the null hypothesis
can be rejected. For example, a confidence interval of p < 0.05 indicates that the
researcher can be confident that the same result would occur 5% of the time or less if the
null hypothesis were true. In other words, there is a 5% or less chance that the researcher
incorrectly refuted the null hypothesis. A p < 0.01 indicates a 99% chance that the null
hypothesis is correctly rejected. A 95% confidence interval is the most commonly

52
accepted level of confidence in statistical analyses, and is the benchmark confidence
interval used in this study.
4.3.4 Creating the Behavioral Model
. Multivariate statistics, as the name implies, involve the analysis of more than two
variables. The two multivariate statistical analyses employed in this research are factor
analysis and multiple regression analysis. Factor analysis is very beneficial for an
analysis such as this one, in that it reduces the burden and potential confusion of
assessing the impact and/or explanatory power of many variables on an individual basis
by creating groups of variables with similar characteristics. Factor analysis assesses the
intercorrelation of multiple variables and provides statistical evidence of this correlation
(Agresti & Finlay 2003). This has multiple benefits. First of all, it can simplify an
analysis by reducing the number of variables. Variables can be grouped into “factors”
that are highly correlated, as dictated by the results of factor analysis, and these factors
can thenceforth be treated as variables. For example, Whitmarsh and O’Neill (2010)
analyzed 24 behavioral antecedents to engaging in PEB (purchasing carbon offsets) using
a factor analysis and were able to reduce these 24 variables into 8 factors, and thus
reduced the number of variables they needed to analyze by 66%. This is a common
procedure in research that involves many variables, including ones that assess PEB (e.g.
Nooney et al. 2003; Barr and Gilg 2005). Factor analysis is also explanatory in nature, in
that it can organize variables into groups that are statistically similar, but may not adhere
to preconceived grouping. In this way, factor analysis explains the relationship between
variables.

53
For this research, factor analysis was used for both of the reasons listed above.
First, it was used to group independent and dependent variables into factors, thus
reducing the number of variables. This made modeling simpler and more intuitive. It
was also used to explain the relationship between variables, which helped confirm or
deny the variable groupings I proposed.
Regression analysis is a statistical method that determines the influence of one or
more independent variables on a dependent variable. The result of a regression analysis
is an equation that incorporates independent variables that are shown to have a significant
impact on the dependent variable. When the values of independent variables for a data
point are known, this equation predicts the value of the dependent variable within a given
level of confidence (Agresti & Finlay 2003; McDonald 2009). Two types of regression
were used in this study. “Stepwise regression” takes any number of variables and
assesses their impact on the dependent variable by integrating them into the regression
equation, and eliminates variables that do not have a significant impact on the dependent
variable. This reduces unnecessary complexity of the regression equation and simplifies
the explanation that needs to be offered by the analyst. “Standard least squares
regression” was used after stepwise regression. Standard least squares regression enters
the variables retained by the stepwise regression into the regression equation, resulting in
an equation that describes a line that best fits the data points. The regression coefficients
and their correlates were used to populate the behavioral model described previously.
Figure 4.6 shows the directional model of statistical analysis that was used in this study.
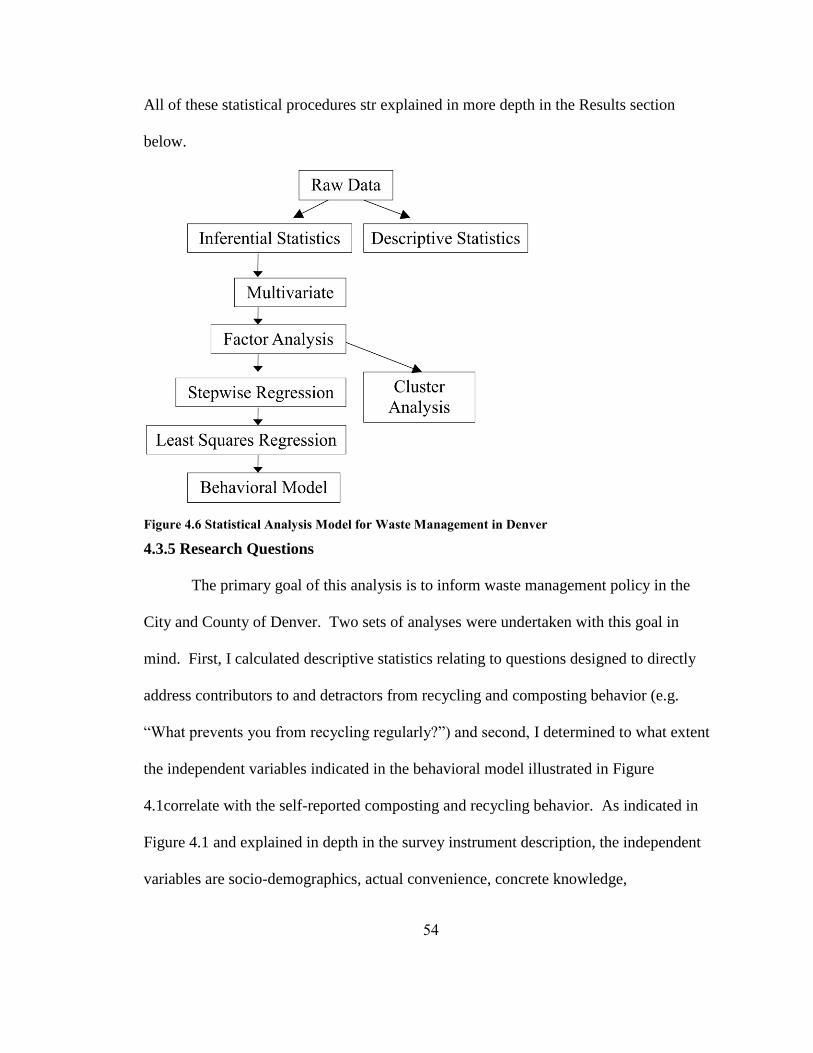
54
All of these statistical procedures str explained in more depth in the Results section
below.
Figure 4.6 Statistical Analysis Model for Waste Management in Denver
4.3.5 Research Questions
The primary goal of this analysis is to inform waste management policy in the
City and County of Denver. Two sets of analyses were undertaken with this goal in
mind. First, I calculated descriptive statistics relating to questions designed to directly
address contributors to and detractors from recycling and composting behavior (e.g.
“What prevents you from recycling regularly?”) and second, I determined to what extent
the independent variables indicated in the behavioral model illustrated in Figure
4.1correlate with the self-reported composting and recycling behavior. As indicated in
Figure 4.1 and explained in depth in the survey instrument description, the independent
variables are socio-demographics, actual convenience, concrete knowledge,

55
environmental values, attitude, subjective norms, self-efficacy, perceived convenience,
response efficacy and habit strength. Of special interest is the determination of the
strength of the correlation between habit strength and PEB relative to the other variables
in the model. Note that as explained in Section 4.1.1 Behavioral Model, these variables
may not all be incorporated into the final model. The survey questions were designed to
address the full suite of variables groupings, but the actual groupings were dictated by the
results of the factor analysis.
Most of the other research questions are related to the primary goal. For example,
I hoped to ascertain the characteristics of a “typical” recycler and composter in the
surveyed neighborhoods. The demographic variables were used in this regard, including
gender, education level, household type, rent/own, political persuasion and age. Another
related research questions is to determine how strongly environmental values are
correlated with self-reported PEB. The literature is ambivalent in terms of the
relationship between NEP scores and PEB, and this study was intended to contribute to
the body of research. Conversely, there is near universal agreement that actual and
perceived convenience is strongly correlated with recycling behavior. I anticipated that
this will also be the case for the sample in this report. I felt it would also be interesting to
see if perceived convenience also has a significant impact on composting, or if other
factors are stronger.
A research outcome that is not related to the behavioral model is finding out to
what extent residents are willing to pay for recycling/garbage and/or composting services.
Will people be significantly more willing to pay $1/month than $3/month for services?

56
Another unrelated research question is whether or not residents are putting non-
recyclable materials (plastic tubs, packaging, and plastic bags) in recycling bins, and to
determine which materials are being recycled at the highest rate. Also, descriptive
statistics are used to provide DR with pertinent information about waste management
services, including what prevents residents from recycling and/or composting, what
motivates residents to recycling and/or compost, why people do/do not grass-cycle,
where residents get recycling information, if residents like the large bins and why (not),
and how frequently apartment dwellers recycle, and if so, what service they use. Finally,
a descriptive analysis of neighborhood waste management behaviors and other variables
is undertaken, as is a comparison of results between Barr’s 2002 Exeter study and this
study. Both of these are done in an effort to analyze spatially distinct places and possibly
propose geographical differences between locations.
4.3.6 Survey Administration and Data Analysis
The neighborhoods were surveyed during the summer of 2007. The first survey
was administered on June 6th
, 2007 and the last survey was collected on July 27th
, 2007.
In order to maximize the likelihood that residents would be at home, I administered
during non-working hours only – I began after 5:30 pm on weekdays and stopped at or
before nightfall, and surveyed throughout the day on weekends. I personally
administered and collected all of the surveys. As noted above, the survey respondents
were visited a maximum of four times in order to collect a survey that was to be filled
out. Respondents were not required to fill out the entire survey in order to be eligible for

57
the prize drawing, but did have to participate to some degree to be eligible. Response
rates can be seen in the next section.
After all surveys were collected, I personally compiled and coded the survey
results. The data were first entered into a Microsoft Excel© spreadsheet. All surveys
responses were entered into the worksheet, but if a respondent did not provide answers to
all of the questions that were to be used in the inferential statistical analyses28
, the survey
was not included in the final analysis. Excel was used for the initial coding because it is
a powerful data calculation tool and graphs and tables can readily be made for descriptive
statistical analysis and display. Excel is also useful because it is compatible with the
statistical analysis software chosen for this study, JMP© (SAS Inc., 2008). JMP© is a
powerful software that can perform numerous statistical analyses with tabular data. All
of the non-descriptive analyses were performed with this program.
28
Failure to answer questions that were meant to garner information for descriptive analysis only did not
disqualify a survey from the inferential statistical analyses. For example, question 17 asks “Have you ever
consulted Denver’s recycling website for waste management information?” This question is intended to
inform DR to what extent respondents are consulting the website, and will not be used for anything but a
descriptive analysis. If this question was not answered, it did not compromise the primary analysis of this
report, the behavioral model, and thus a non-answer to question 17 did not disqualify a survey from
analysis.

58
Chapter 5 Results and Analysis
5.1 Survey Responses
Table 5.1shows the response rates for the all administered surveys. The overall
response rate of 75% is considered high in survey-based research, and in light of the
considerable length of the survey (17 pages and 101 questions), this is a very impressive
result. Less impressive is the response rate of usable surveys, which was only 56.5%.
Unfortunately, I did not achieve my goal of 30 usable surveys from each neighborhood,
and histograms of results (e.g. recycling and composting behavior by neighborhood) are
not normally distributed, so only non-parametric tests could be used for analyses that
compare neighborhoods. The Kruskall-Wallis test, which uses rank scores for nominal
variables with more than two groups, could possibly be used, but this test is not
descriptive enough to be useful in this analysis (McDonald, 2009). However, having 199
fully-completed surveys comes very close to achieving the goal of 200 surveys outlined
in the Methods section. Most of the desired statistical analyses could thus be performed.

59
Table 5.1 Response Rates, Total and by Neighborhood
Neighborhood Surveyed Returned Completed Response Rate Usable Rate
Congress Park 40 27 20 67.5% 50.0%
Capitol Hill 40 21 19 52.5% 47.5%
Cheesman 40 39 32 97.5% 80.0%
Corey-Merril 3229
25 18 78.1% 56.3%
City Park West 40 29 18 72.5% 45.0%
City Park 40 33 23 82.5% 57.5%
Speer 40 26 23 65.0% 57.5%
Whittier 40 29 19 72.5% 47.5%
Washington Park West 40 35 27 87.5% 67.5%
Total 352 264 199 75.0% 56.5%
5.2 Descriptive Statistics
5.2.1 Demographics of the Sample
Table 5.2 provides a summary of the demographic characteristics of individuals
whose survey answers were used for inferential statistics. Note that filling out all of the
demographic questions was not a prerequisite for being considered a “usable” survey.
Only those questions that contained answers that were used in inferential statistical
analyses were necessary to fill out. It is also important to point out that though the
sample size was 199, some of the descriptive statistical questions allowed for more than
one answer, thus more than 199 answers are possible for some questions.
The sample was approximately half female (55.8%) and almost entirely (80%)
white, and was relatively evenly distributed among the age groups, though skewed
slightly young, with over 60% being under 40 years old. A very high proportion have
earned at least a bachelor’s degree, with nearly 30% having a graduate degree. The
29
Only 32 surveys were administered to the Cory-Merril neighborhood due to time constraints.

60
income groups were almost exactly evenly divided, with no group comprising less than
11% or more than 14% of the total sample. Small family sizes abounded, with only 20%
having three or more people in the household. There were slightly more renters than
homeowners, and the majority lived in single family detached homes (55.3%) and nearly
all of the rest living in either apartments (21%) or duplexes (16%). The sample was
overwhelmingly Democrat (58%) and had more Independents (34) than the rest of the
political persuasions combined (33, not counting those who do not know).
Table 5.2 Demographic Characteristics of the Sample
Gender
Male (88) Female (111)
Race/Ethinicity
White (159) Black/Af. American (13) Hispanic (12) American Indian (3) Asian (3) Mixed (9)
Age Group
18-29 (66) 30-39 (54) 40-49 (38) 50-59 (30) 60-69 (10) 70+ (1)
Educational Level
No High School Diploma or Equivalent (3) High School Diploma or Equivalent (7) Some College (24)
Asssociate’s Degree (12) Bachelor’s Degree (94) Graduate Degree (59)
Income
<$20,000 (22) $20,000-$35,000 (27) $35,001-$50,000 (26) $50,001-$75,000 (27) $75,001-
$100,000 (27)
Household Size
1 (43) 2 (90) 3 (26) 4 (26) 5+ (14)
Rent or Own
Rent (87) Own (112)
Type of Residence
Single Family Detached (110) Apartment (42) Duplex (32) Town Home (8) Other (6)
Political Persuasion
Democrat (116) Republican (20) Independent (34) Green (3) Libertarian (5) None (4) Other (1)
Don’t Know (6)
Primary Language Spoken at Home
English (196) English & Spanish (2) English & Mandarin Chinese (1) Turkish (1) Ibibio (1)

61
5.2.2 Waste Management Behavior
As noted above, descriptive statistics summarize all of the data gathered from the
sample, but do not make any inferences about the population. The following statistics are
provided to give the reader a feel for who filled out the surveys (demographics), what
they are recycling, to what extent they adhere to the NEP, and how strong their recycling
and composting habits are. The mean score for the self-reported behavioral question
items is indicative of the relative frequency with which each behavior is undertaken. All
of the behavioral items were coded such that a higher score indicates a higher frequency.
Each respondent was asked how often each of these items was recycled or composted, or
how often grass-cycling was done (see Appendix D). These items utilized a 5-item
Likert scale, and given the choices of “never” (coded as 1 point), “rarely” (2 points),
“sometimes” (3 points), “usually” (4 points) and “always” (5 points). The results can be
seen in Figure 5.1 and Table 5.3.
Figure 5.1 Waste Management Self-Reported Behavioral Frequency in Survey Sample
N = 199 for all materials except grass-cycling, which as an N of 168
*Grass-cycling has an N of 168 because 31 respondents indicated that they do not have a lawn. This does
not affect average score or percent each answer was given.
0.000.501.001.502.002.503.003.504.004.505.00
0%10%20%30%40%50%60%70%80%90%
100%always
usually
sometimes
rarely
never
mean score

62
Table 5.3 Mean Score on Self-Reported Behavioral Frequency Items
Item Mean
Score
Available Prior to June 2005
glass bottles 3.69
newspaper 3.72
plastic bottles 3.69
aluminum cans 3.86
steel cans 3.44
aerosol cans 2.19
Available During/After June 2005
corrugated cardboard 3.30
paper board 3.31
mixed office paper 3.16
magazines and catalogs 3.31
phone books 3.62
Not Recyclable
plastic bags at home 3.01
plastic packaging 1.85
plastic tubs 2.22
Organic Material
kitchen waste 1.67
yard waste 1.82
grass-cycling 3.12
These results indicate that recycling can be considered normal behavior for the
sample. As can be seen in Figure 5.1and Table 5.3, all of the recyclable items except for
aerosol cans were recycled, on average, between “sometimes” and “usually.” This
indicates that the average respondent reported recycling these items more often than not.
Aluminum cans were recycled at the highest rate, followed closely by glass bottles,
plastic bottles, newspaper, phone books. Trailing slightly behind in average rate are steel

63
cans, corrugated cardboard, paperboard, mixed office paper, and magazines and catalogs.
The non-recyclable items were generally put in the recycling bin at a lower rate, though
plastic bags had nearly as high a recycling score as the recyclable items. This is perhaps
a cause for concern, and will be addressed in the Results and Discussion sections. Two
other phenomena are worth mentioning. First, it appears that aerosol cans are recycled at
a lower rate than the rest of the items. This may have a policy implication, and will be
addressed at the end of the report. Second, composting is clearly undertaken at a lower
rate than recycling items, as reported by the sample. In fact, composting is undertaken at
a lower rate than any of the non-recyclable items are recycled. This is not a surprising
result, as recycling is a much more prominent issue than composting in Denver, as
evidenced by the fact that home-composting services are available on a limited basis, yet
recycling is widely available (and free). Finally, grass-cycling had a middling score, but
it appears that people that do have lawns are likely to grass-cycle, as the sample consisted
of only 110 detached single family homes, and in fact consisted of 42 apartments. Since
apartment dwellers are very unlikely to be responsible for lawns, the average grass-
cycling score underestimates the true rate, that is the rate that those with lawns grass-
cycle.
5.2.3 NEP and SRHI Responses
The answers to the NEP question items were also on a five-item Likert scale, but
the answers indicated the level of agreement with the statements listed in Figure 5.2,
ranging from “strongly disagree” to “strongly agree,” with a higher score indicating a
higher level of agreement with the statement. Higher adherence to a pro-environmental
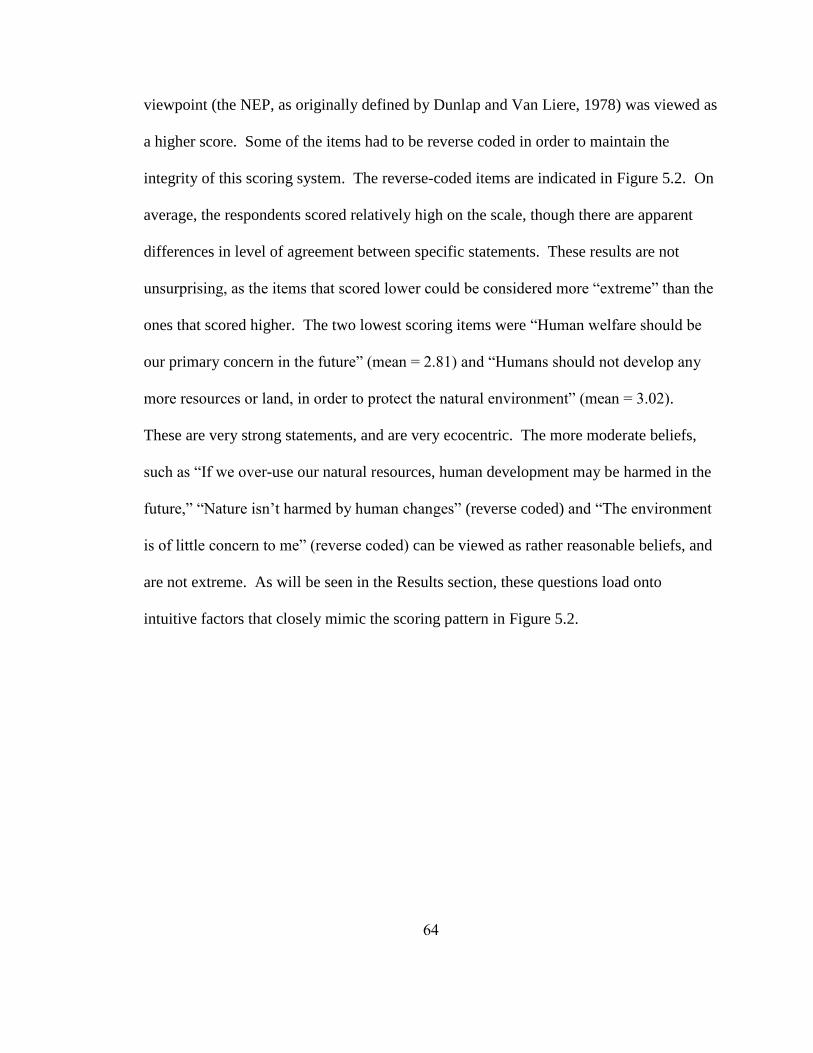
64
viewpoint (the NEP, as originally defined by Dunlap and Van Liere, 1978) was viewed as
a higher score. Some of the items had to be reverse coded in order to maintain the
integrity of this scoring system. The reverse-coded items are indicated in Figure 5.2. On
average, the respondents scored relatively high on the scale, though there are apparent
differences in level of agreement between specific statements. These results are not
unsurprising, as the items that scored lower could be considered more “extreme” than the
ones that scored higher. The two lowest scoring items were “Human welfare should be
our primary concern in the future” (mean = 2.81) and “Humans should not develop any
more resources or land, in order to protect the natural environment” (mean = 3.02).
These are very strong statements, and are very ecocentric. The more moderate beliefs,
such as “If we over-use our natural resources, human development may be harmed in the
future,” “Nature isn’t harmed by human changes” (reverse coded) and “The environment
is of little concern to me” (reverse coded) can be viewed as rather reasonable beliefs, and
are not extreme. As will be seen in the Results section, these questions load onto
intuitive factors that closely mimic the scoring pattern in Figure 5.2.

65
Figure 5.2 Scores on NEP Scale Items
Finally, the SRHI scores for recycling and composting can be seen in Figure
5.3and Figure 5.5. Like the NEP items, the SRHI items are scored on a 5-point Likert
scale ranging from “strongly disagree” to “strongly agree,” with a higher magnitude
indicating a higher level of agreement with the statements in the scale. It is quite clear
upon inspection of these results that composting habit strength is much weaker among the
sample than recycling habit strength. This lends weight to the results in Table 5.3, and
indicates strongly that composting is not “normal” behavior for the respondents of this
survey. Overall, recycling habits appear to be strong, with all 12 items scoring above
average (“agree”). All of the composting items, with the exception of “I have no need to
4.21
4.56
4.09
3.02
4.60
2.81
4.61
3.86
0.00
0.50
1.00
1.50
2.00
2.50
3.00
3.50
4.00
4.50
5.00
0%
10%
20%
30%
40%
50%
60%
70%
80%
90%
100%
NEP 1 NEP 2 NEP 3 NEP 4 NEP 5 NEP 6 NEP 7 NEP 8
strongly agree
agree
undecided
disagree
strongly disagree
mean score
NEP 1 The environment is forgotten too often when decisions are made (mean = 4.21)
NEP 2 If we over-use our natural resources, human development may be harmed in the future (4.56)
NEP 3 Nature and the environment have as much value as human beings (4.09)
NEP 4 Humans should not develop any more resources or land, in order to protect the natural
environment (3.02)
NEP 5 Nature isn’t harmed by human changes (reverse coded) (4.60)
NEP 6 Human welfare should be our primary concern in the future (reverse coded) (2.81)
NEP 7 The environment is of little concern to me (reverse coded) (4.61)
NEP 8 Getting through daily life and surviving is what concerns me the most, not the environment
(reverse coded) (3.86)

66
think about (composting)” and “(composting is) typically me,” scored an average of
below 2 points. It is odd that these two items scored higher. The highest score being the
“no need to think about” item makes sense, in that respondents may misconstrue the
intended meaning of this answer to be that they don’t have to think about it because they
rarely engage in the activity. I cannot conceive of an explanation why item 11 scored
higher, however.
Figure 5.3 Self-Reported Habit Index Scores for Recycling
3.88 3.76 3.66 3.64 3.56
3.18
3.78 3.46 3.59
3.01
3.64 3.71
0.00
0.50
1.00
1.50
2.00
2.50
3.00
3.50
4.00
4.50
5.00
0%
10%
20%
30%
40%
50%
60%
70%
80%
90%
100%
Item1
Item2
Item3
Item4
Item5
Item6
Item7
Item8
Item9
Item10
Item11
Item12
strongly agree
agree
undecided
disagree
strongly disagree
mean score
Composting/Recycling is something…
Item 1: I do frequently
Item 2: I do automatically
Item 3: I do without having to consciously remember
Item 4: that makes me feel weird if I do not do it
Item 5: I do without thinking
Item 6: that would require effort not to do
Item 7: that belongs to my daily routine
Item 8: I start doing before I realize I’m doing it
Item 9: I would find hard not to do
Item 10: I have no need to think about doing
Item 11: that’s typically “me”
Item 12: I have been doing for a long time
Figure 5.4 Self-Reported Habit Index Questions
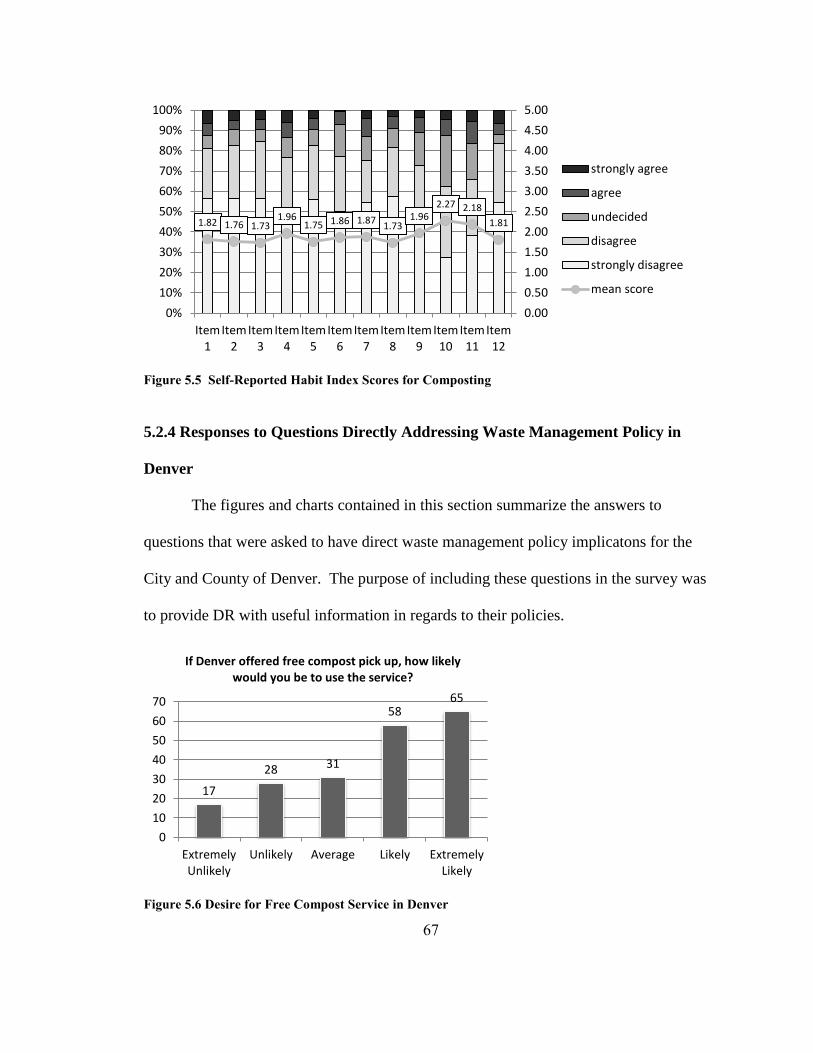
67
Figure 5.5 Self-Reported Habit Index Scores for Composting
5.2.4 Responses to Questions Directly Addressing Waste Management Policy in
Denver
The figures and charts contained in this section summarize the answers to
questions that were asked to have direct waste management policy implicatons for the
City and County of Denver. The purpose of including these questions in the survey was
to provide DR with useful information in regards to their policies.
Figure 5.6 Desire for Free Compost Service in Denver
1.82 1.76 1.73 1.96
1.75 1.86 1.87 1.73
1.96 2.27 2.18
1.81
0.00
0.50
1.00
1.50
2.00
2.50
3.00
3.50
4.00
4.50
5.00
0%
10%
20%
30%
40%
50%
60%
70%
80%
90%
100%
Item1
Item2
Item3
Item4
Item5
Item6
Item7
Item8
Item9
Item10
Item11
Item12
strongly agree
agree
undecided
disagree
strongly disagree
mean score
17
28 31
58 65
0
10
20
30
40
50
60
70
ExtremelyUnlikely
Unlikely Average Likely ExtremelyLikely
If Denver offered free compost pick up, how likely would you be to use the service?
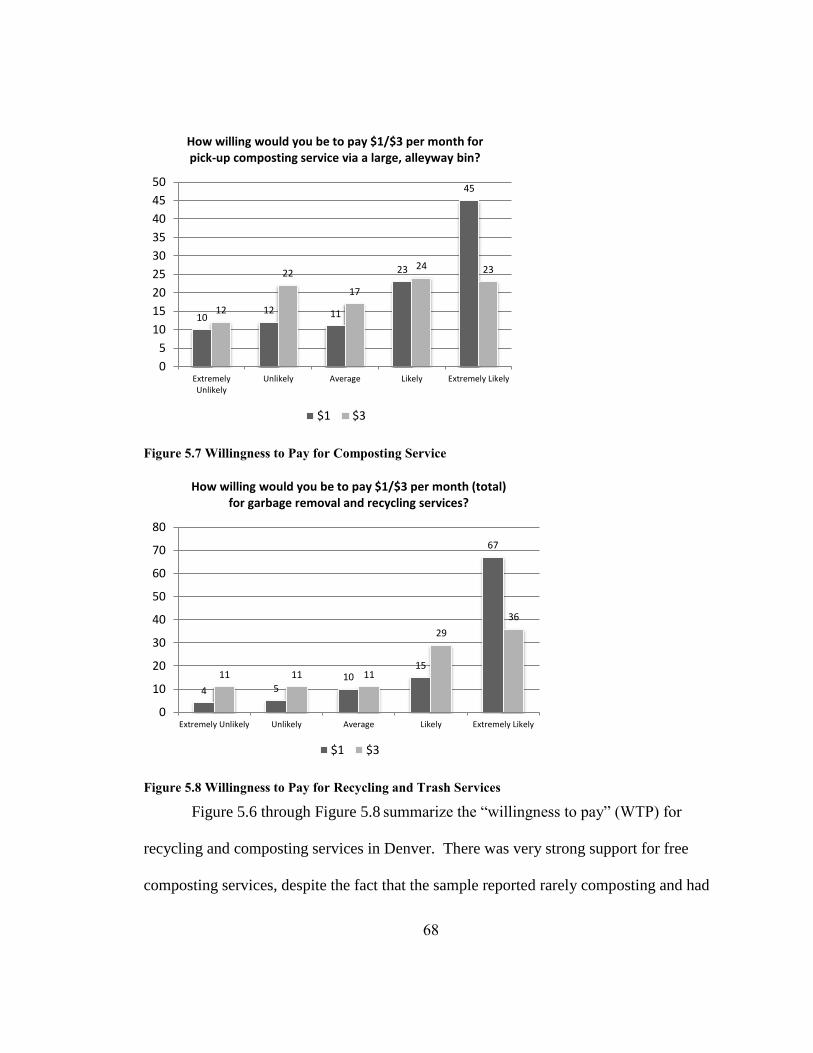
68
Figure 5.7 Willingness to Pay for Composting Service
Figure 5.8 Willingness to Pay for Recycling and Trash Services
Figure 5.6 through Figure 5.8 summarize the “willingness to pay” (WTP) for
recycling and composting services in Denver. There was very strong support for free
composting services, despite the fact that the sample reported rarely composting and had
10 12 11
23
45
12
22
17
24 23
0
5
10
15
20
25
30
35
40
45
50
ExtremelyUnlikely
Unlikely Average Likely Extremely Likely
How willing would you be to pay $1/$3 per month for pick-up composting service via a large, alleyway bin?
$1 $3
4 5 10
15
67
11 11 11
29
36
0
10
20
30
40
50
60
70
80
Extremely Unlikely Unlikely Average Likely Extremely Likely
How willing would you be to pay $1/$3 per month (total) for garbage removal and recycling services?
$1 $3

69
very weak composting habits. Not surprisingly, as proposed composting cost rose, desire
to participate dropped, though an interesting (and perhaps counterintuitive result) is that
65 people were extremely likely to use free service, but 68 people combined were willing
to pay at least $1 for service. However, WTP was relatively strong overall, though even
the highest monthly charge in this study ($3) is less than one third the cost of the optional
recycling service being offered by DR currently ($29/quarter) (City of Denver 2011a).
Table 5.4 Summary Answers to “What, if anything, prevents you from composting regularly?”
69 Do not want to store kitchen wastes at home
64 I do not know how to compost
37 I never thought about it
21 I have no use for it
21 Nothing - I compost regularly
8 My contribution to the landfill is so small that it's unimportant
5 I thought about it, but it's not important
21 Other
3 No Answer
Figure 5.9 through Figure 5.12 summarize the support that composting and
recycling receive relative to three important contemporary issues: climate change, job
creation, the municipal budget and personal fiduciary concerns. It is somewhat surprising
that climate change appears to be more important than the other three issues, as 125
respondents believed that recycling and composting would be “very important” if it had
an impact on global warming/climate change, yet less than 100 indicated that the other
three issues were “very important.” However, it is very important to point out that when
this survey was taken, the global financial crisis had not yet occurred, and in fact the City
and County of Denver was still in the midst of the housing bubble that (as it turned out)

70
artificially inflated the financial self-confidence of the general population, and Denver in
particular. Combined with the fact that the respondents were moderately well-off and
had a high level of environmental concern, it can be argued that this result makes sense.
It is also possible that a bias occurred in this regard, in that the study is obviously related
to PEB, and thus the respondents may (subconsciously or otherwise) fell obliged to over-
represent their environmental concern.
Figure 5.9 Support for Waste Management as it Applies to Climate Change
Figure 5.10 Support for Waste Management as it Applies to Job Creation
4 4 13
51
125
0
20
40
60
80
100
120
140
If recycling and composting had an impact on global warming/climate change, how important would it be to you?
Unimportant
Of Little Importance
Moderately Important
Important
Very Important
4 8
31
57
99
0
20
40
60
80
100
120
If recycling and composting helped create jobs, would they be important issues?
Unimportant
Of Little Importance
Moderately Important
Important
Very Important

71
Figure 5.11 Support for Waste Management as it Applies to the County Budget
Figure 5.12 Support for Waste Management as it Applies to Personal Finance
Figure 5.13 and Figure 5.14 reveal two important things about the sample. First,
over half of the respondents who had a large recycling bin and answered the question in
Figure 5.13 noted that they recycled “much more” with the new, larger bin than they did
with the old, smaller bin. This lends support to the use of larger bins. Second, Figure
5.14 shows that respondents reported with overwhelming frequency that the convenience
2
14
39
59
85
0
10
20
30
40
50
60
70
80
90
If recycling and composting contributed large amounts of money to the county budget, would they be important issues?
Unimportant
Of Little Importance
Moderately Important
Important
Very Important
1 8
33
60
97
0
20
40
60
80
100
120
If recycling and composting saved or earned you money, would they be important issues?
Unimportant
Of Little Importance
Moderately Important
Important
Very Important

72
of the larger bins is why they increase the recycling rate. This is further supported by the
answers described in Table 5.5, which indicate that 65% of respondents who indicated
that they are prevented from recycling in some way cite lack of convenience as a reason
why, as indicated by the number that answered that either “recycling is not available,”
there is a “lack of space to store recyclables” or “it is inconvenient.” These reasons are
all indicative of a lack of convenience. Note that the second-most cited reason for the
larger bins being conducive to recycling is the fact that a recycling information packet is
included with the bin. This lends support to concrete knowledge being an important
factor leading to PEB.
Figure 5.13 Recycling Frequency as a Result of Large Bins
1 0
26 32
64
50
26
0
10
20
30
40
50
60
70
If you have a large bin now, how much do you recycle now, compared to when you had the smaller bins?
Much less
A little less
About the same
A little more
Much more
NA
No Answer

73
Figure 5.14 Reasons for Increased Recycling with Large Bins
Figure 5.15 Recycling Methods used by Residents who are not Eligible for Home Recycling
Table 5.5 Aggregated Answers to the Survey Question "What, if anything, prevents you from
recycling regularly?"
126 Nothing - I do it regularly
28 It is not available at my residence
24 Lack of space to store recyclables
16 I've never thought about it
12 It is inconvenient
7 It's too far to travel to the bin
6 Do not want to separate materials
4 My contribution to the landfill is so small that it's unimportant
3 Takes too much time (cleaning containers, etc.)
2 I've thought about it, but it's not important
13 other
2 No Answer
95
19
43
12
0
20
40
60
80
100
If you recycle more with the larger bin, why?
Convenience of larger bins
The bin is easier to see
Information aboutrecyclables came with bin
Other
1
10
2 4
0
5
10
15
If you live in an apartment with more than seven units and you recycle regularly, what service do you use?
Private Company
Community bin onstreet/alley
Community bins atgrocery stores
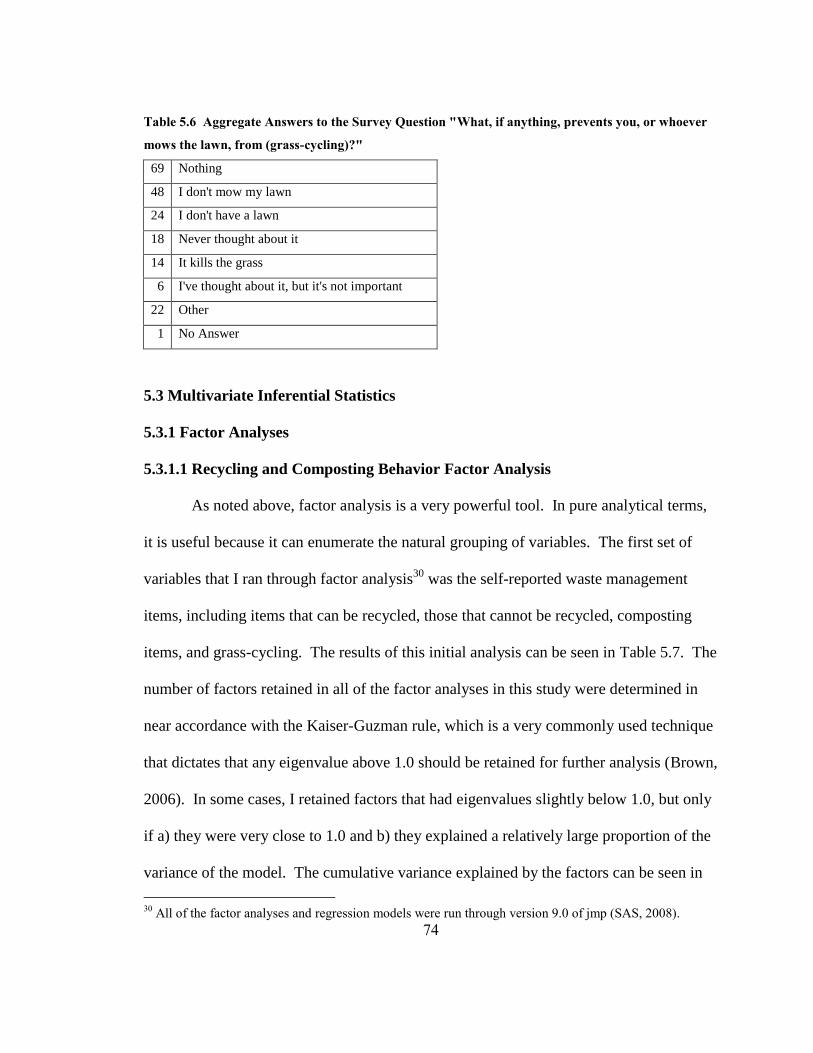
74
Table 5.6 Aggregate Answers to the Survey Question "What, if anything, prevents you, or whoever
mows the lawn, from (grass-cycling)?"
69 Nothing
48 I don't mow my lawn
24 I don't have a lawn
18 Never thought about it
14 It kills the grass
6 I've thought about it, but it's not important
22 Other
1 No Answer
5.3 Multivariate Inferential Statistics
5.3.1 Factor Analyses
5.3.1.1 Recycling and Composting Behavior Factor Analysis
As noted above, factor analysis is a very powerful tool. In pure analytical terms,
it is useful because it can enumerate the natural grouping of variables. The first set of
variables that I ran through factor analysis30
was the self-reported waste management
items, including items that can be recycled, those that cannot be recycled, composting
items, and grass-cycling. The results of this initial analysis can be seen in Table 5.7. The
number of factors retained in all of the factor analyses in this study were determined in
near accordance with the Kaiser-Guzman rule, which is a very commonly used technique
that dictates that any eigenvalue above 1.0 should be retained for further analysis (Brown,
2006). In some cases, I retained factors that had eigenvalues slightly below 1.0, but only
if a) they were very close to 1.0 and b) they explained a relatively large proportion of the
variance of the model. The cumulative variance explained by the factors can be seen in
30
All of the factor analyses and regression models were run through version 9.0 of jmp (SAS, 2008).

75
the “Cum Percent” column of the eigenvalue tables. Note that combined, the factors
explain 100% of the variance of the set.
Table 5.7 Factor Analysis Eigenvalues and Explanatory Power of Waste Management Behavior
Variables
Number Eigenvalue Percent Cum Percent
1 9.3632 55.078 55.078
2 1.6933 9.960 65.038
3 1.5052 8.854 73.892
4 1.0305 6.062 79.954
5 0.6648 3.910 83.864
6 0.5463 3.214 87.078
7 0.4432 2.607 89.685
8 0.4175 2.456 92.141
9 0.2732 1.607 93.749
10 0.2517 1.481 95.229
11 0.2284 1.344 96.573
12 0.1529 0.899 97.473
13 0.1270 0.747 98.220
14 0.1099 0.647 98.866
15 0.0936 0.550 99.417
16 0.0580 0.341 99.758
17 0.0411 0.242 100.000
As Table 5.7 indicates, four factors were retained for the next step in the factor
analysis, which is to determine the “factor loading” of the variables. After the number of
factors is determined in the first step, the variables are “loaded” onto the designated
number of factors, such that each factor has zero correlation to all of the other factors
(Agresti & Finlay, 2003). The magnitude of the factor loadings delineate how well each
variable correlates (the “loading” is in fact the correlation coefficient [Barr 2002]) to the
factor. The higher the number, the better correlated the variable is to the given factor.

76
The coefficients range from zero to one, with a value of one indicating perfect
correlation. Variables are grouped into factors that they are most highly correlated with.
One final note: factors are often “rotated” to make more meaningful factors with simpler
structures (Agresti & Finlay 2003). Rotation usually results in more distinct factor
loadings, and thus can clarify which variables to include on which factor. All of the
factors in this analysis were rotated using the “varimax” rotation, which resulted in more
distinct factors. The results of the factor loading analysis regarding waste management
behavior can be seen in Table 5.8.
Table 5.8 Factor Loadings for Recycling/Composting Behavior
Item Factor 1 Factor 2 Factor 3 Factor 4
glass 0.9241401 0.18621 0.0827405 0.0979965
newspaper 0.9046115 0.1476946 0.0975286 0.1024271
plastic 0.868284 0.2491003 0.0522841 0.115852
aluminum 0.8788669 0.1856921 0.0846722 0.0866336
steel 0.9193965 0.1395712 0.1139237 -0.010703
aerosol 0.539952 0.3221652 0.3064227 -0.122813
cardboard 0.9046223 0.1447545 0.1321799 0.002601
paper board 0.9231305 0.1393414 0.1059004 0.0004518
mixed office 0.8808159 0.1669987 0.1211275 -0.022931
magazines & catalogs 0.9117584 0.1389966 0.085333 -0.022863
phone books 0.8077693 0.1371269 0.012198 -0.017191
plastic bags at home 0.0674065 0.7673417 0.051901 0.3341462
packaging 0.2959037 0.7631579 0.0454336 -0.169291
plastic tubs 0.2621159 0.7609873 0.0357056 -0.139657
kitchen waste 0.188942 0.0793141 0.9161866 -0.044577
yard waste 0.0725964 0.0217792 0.9119898 0.1841447
grass-cycle 0.10124 -0.041737 0.104383 0.9207302
Cronbach’s Alpha 0.9732 0.7011 0.8521 n/a
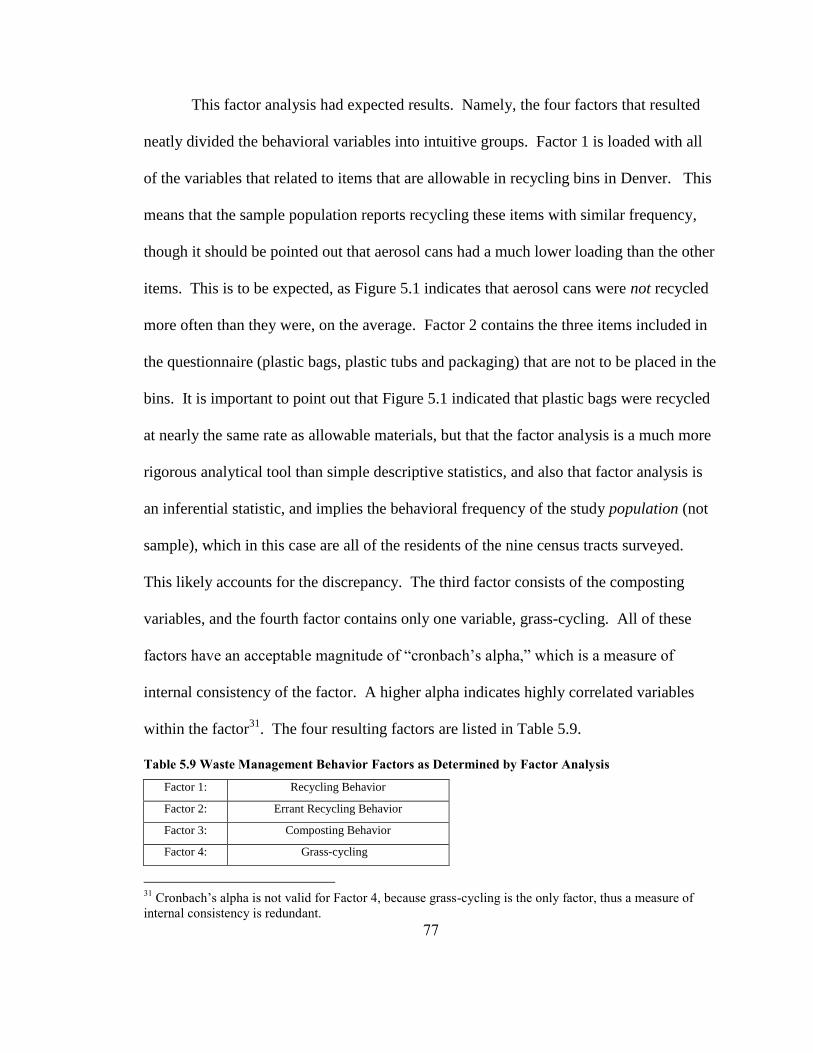
77
This factor analysis had expected results. Namely, the four factors that resulted
neatly divided the behavioral variables into intuitive groups. Factor 1 is loaded with all
of the variables that related to items that are allowable in recycling bins in Denver. This
means that the sample population reports recycling these items with similar frequency,
though it should be pointed out that aerosol cans had a much lower loading than the other
items. This is to be expected, as Figure 5.1 indicates that aerosol cans were not recycled
more often than they were, on the average. Factor 2 contains the three items included in
the questionnaire (plastic bags, plastic tubs and packaging) that are not to be placed in the
bins. It is important to point out that Figure 5.1 indicated that plastic bags were recycled
at nearly the same rate as allowable materials, but that the factor analysis is a much more
rigorous analytical tool than simple descriptive statistics, and also that factor analysis is
an inferential statistic, and implies the behavioral frequency of the study population (not
sample), which in this case are all of the residents of the nine census tracts surveyed.
This likely accounts for the discrepancy. The third factor consists of the composting
variables, and the fourth factor contains only one variable, grass-cycling. All of these
factors have an acceptable magnitude of “cronbach’s alpha,” which is a measure of
internal consistency of the factor. A higher alpha indicates highly correlated variables
within the factor31
. The four resulting factors are listed in Table 5.9.
Table 5.9 Waste Management Behavior Factors as Determined by Factor Analysis
Factor 1: Recycling Behavior
Factor 2: Errant Recycling Behavior
Factor 3: Composting Behavior
Factor 4: Grass-cycling
31
Cronbach’s alpha is not valid for Factor 4, because grass-cycling is the only factor, thus a measure of
internal consistency is redundant.

78
The results of this factor analysis will be used to determine the structure of the
dependent variables in the behavioral model. Only factors 1 and 3 were considered in
this analysis, as they are the two most impactful waste management behaviors and have
been the focus of the research from the outset. It would perhaps be instructive to
determine the correlates of errant recycling behavior, but it is a less important construct
than proper recycling behavior. Likewise for grass-cycling. As noted previously, there
are many possible analytical uses for the data gathered for this study, but the research
scope must be limited to a reasonable extent. Regardless, this analysis demonstrates the
usefulness and power of factor analysis. First of all, it greatly simplified the behavioral
model by reducing the dependent variables from thirteen to two. Granted, these thirteen
variables could have been combined into two groups/factors intuitively. The fact that
factor analysis objectively placed the variables into these groups significantly strengthens
the rationale for the groupings, thus lending more legitimacy (i.e. reducing caveats) to the
analysis, which is another benefit of factor analysis.
5.3.1.2 NEP Factor Analysis
The eight questions that consisted of the modified NEP scale used by Barr (2002)
and Barr and Gilg (2005) were also subjected to factor analysis in order to determine
their dimensionality. The literature contains many examples of NEP scales being
unidimensional (e.g. Dunlap & Van Liere 1978; Dunlap et al. 2000) and
multidimensional (e.g Albrecht et al. 1982). Though the NEP scale is designed so that all
of the items are correlated, the diversity of results of previous studies indicates the need
to examine the scale to determine if it should be divided among factors. Table 5.10

79
shows the results of the factor analysis. I chose to retain three factors instead of the two
that would be dictated by the Kaiser-Guzman rule for two reasons. First, the third factor
had a value very close to 1 (0.917). Secondly, by adding the third factor, over 11% of
additional variance was explained and only 55% of the variance was explained by the
first two factors. This indicates that this third factor has relatively high explanatory
capabilities. Taking these factors into consideration, I ran a varimax rotation with three
factors, the results of which can be seen in Table 5.11.
Table 5.10 Principal Component Eigenvalues and Explanatory Power of NEP Variables
Number Eigenvalue Percent Cum Percent
1 3.1626 39.532 39.532
2 1.2381 15.477 55.009
3 0.9107 11.383 66.392
4 0.7078 8.848 75.240
5 0.6456 8.069 83.310
6 0.5616 7.020 90.330
7 0.4196 5.245 95.575
8 0.3540 4.425 100.000
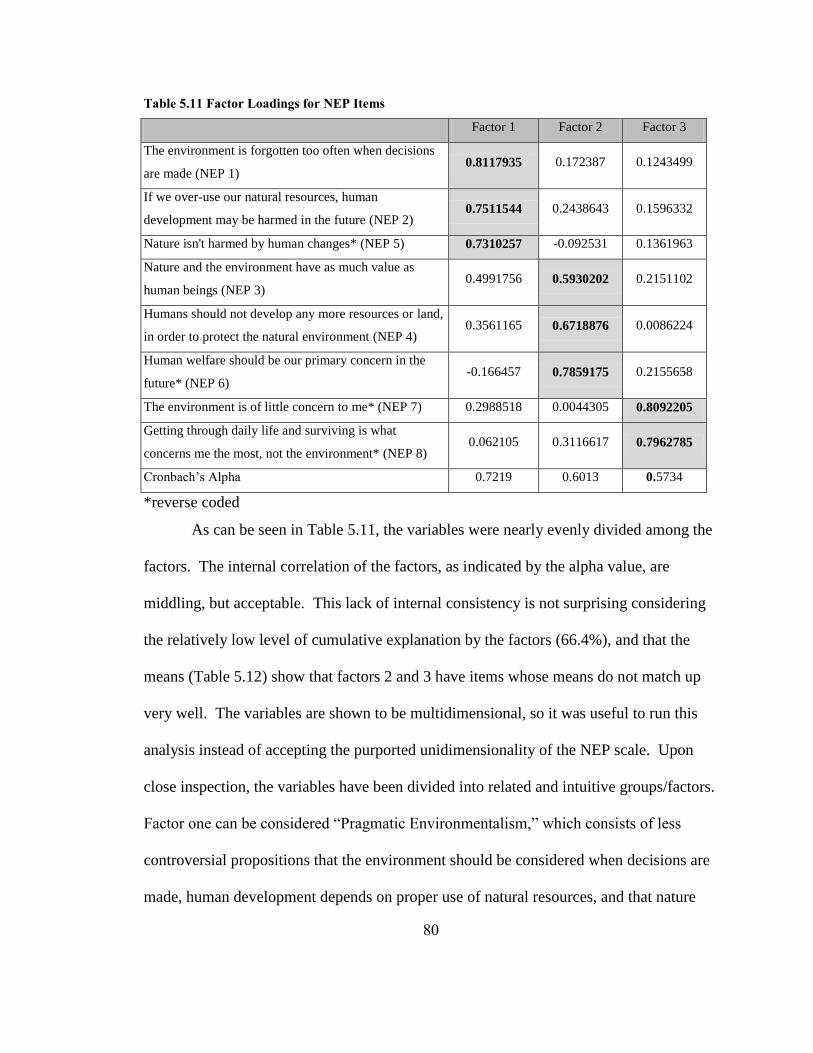
80
Table 5.11 Factor Loadings for NEP Items
Factor 1 Factor 2 Factor 3
The environment is forgotten too often when decisions
are made (NEP 1) 0.8117935 0.172387 0.1243499
If we over-use our natural resources, human
development may be harmed in the future (NEP 2) 0.7511544 0.2438643 0.1596332
Nature isn't harmed by human changes* (NEP 5) 0.7310257 -0.092531 0.1361963
Nature and the environment have as much value as
human beings (NEP 3) 0.4991756 0.5930202 0.2151102
Humans should not develop any more resources or land,
in order to protect the natural environment (NEP 4) 0.3561165 0.6718876 0.0086224
Human welfare should be our primary concern in the
future* (NEP 6) -0.166457 0.7859175 0.2155658
The environment is of little concern to me* (NEP 7) 0.2988518 0.0044305 0.8092205
Getting through daily life and surviving is what
concerns me the most, not the environment* (NEP 8) 0.062105 0.3116617 0.7962785
Cronbach’s Alpha 0.7219 0.6013 0.5734
*reverse coded
As can be seen in Table 5.11, the variables were nearly evenly divided among the
factors. The internal correlation of the factors, as indicated by the alpha value, are
middling, but acceptable. This lack of internal consistency is not surprising considering
the relatively low level of cumulative explanation by the factors (66.4%), and that the
means (Table 5.12) show that factors 2 and 3 have items whose means do not match up
very well. The variables are shown to be multidimensional, so it was useful to run this
analysis instead of accepting the purported unidimensionality of the NEP scale. Upon
close inspection, the variables have been divided into related and intuitive groups/factors.
Factor one can be considered “Pragmatic Environmentalism,” which consists of less
controversial propositions that the environment should be considered when decisions are
made, human development depends on proper use of natural resources, and that nature

81
can be harmed by human changes. The second factor can be termed “Deep Ecology”
because it contains constructs that are border on valuing nature more than humans.
Finally, Factor 3 is termed “Enviro-centrism” because it contains two items that center on
(not) holding the environment as a central personal concern. The NEP factors are listed in
Table 5.13.
Table 5.12 Mean Scores for NEP Item Questions
Item Mean Score
NEP 1 4.21
NEP 2 4.56
NEP 3 4.09
NEP 4 3.02
NEP 5 4.60
NEP 6 2.81
NEP 7 4.61
NEP 8 3.86
Table 5.13 NEP Factors as Determined by Factor Analysis
Factor 1: Pragmatic Environmentalism
Factor 2: Deep Ecology
Factor 3: Enviro-centrism
5.3.1.3 Psychological Variable Factor Analysis
The final two factor analyses were undertaken to analyze the relationship between
the psychological variables concerning recycling on the one hand, and composting on the
other. Variables related to habit strength, attitude, awareness of norm, acceptance of
norm, personal efficacy and response efficacy were entered into each factor analysis.
Table 5.14 and Table 5.15 show the eigenvalues for the recycling and composting
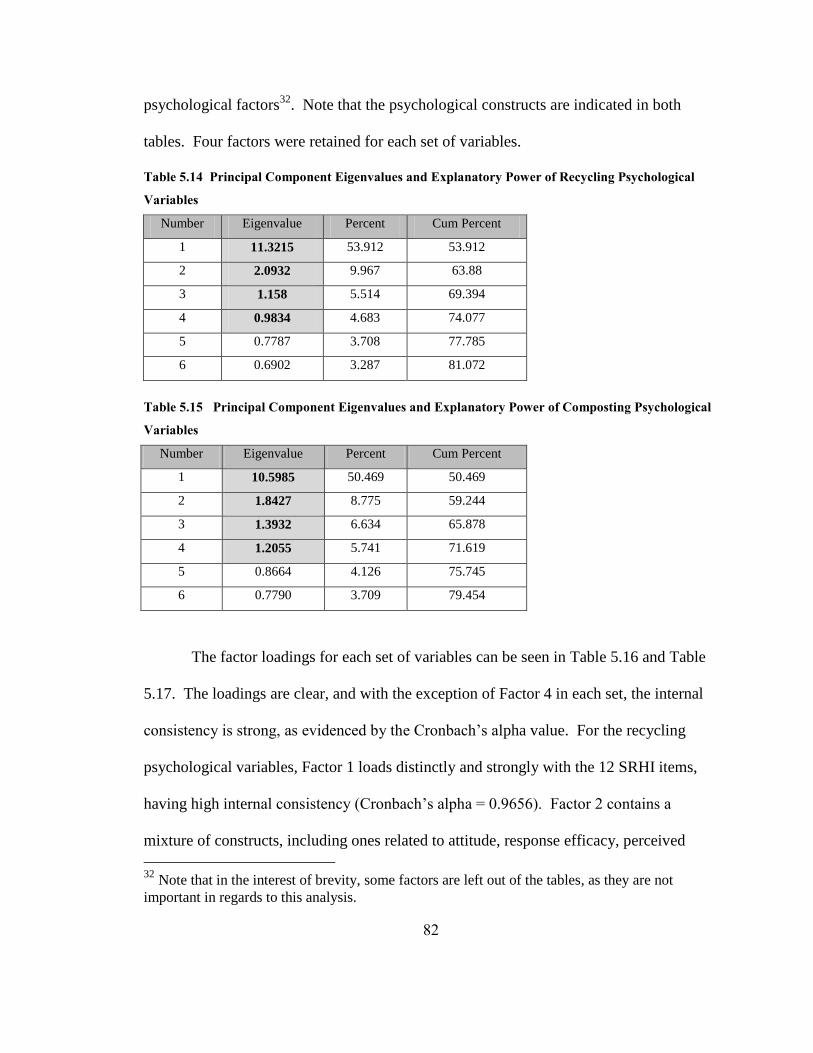
82
psychological factors32
. Note that the psychological constructs are indicated in both
tables. Four factors were retained for each set of variables.
Table 5.14 Principal Component Eigenvalues and Explanatory Power of Recycling Psychological
Variables
Number Eigenvalue Percent Cum Percent
1 11.3215 53.912 53.912
2 2.0932 9.967 63.88
3 1.158 5.514 69.394
4 0.9834 4.683 74.077
5 0.7787 3.708 77.785
6 0.6902 3.287 81.072
Table 5.15 Principal Component Eigenvalues and Explanatory Power of Composting Psychological
Variables
Number Eigenvalue Percent Cum Percent
1 10.5985 50.469 50.469
2 1.8427 8.775 59.244
3 1.3932 6.634 65.878
4 1.2055 5.741 71.619
5 0.8664 4.126 75.745
6 0.7790 3.709 79.454
The factor loadings for each set of variables can be seen in Table 5.16 and Table
5.17. The loadings are clear, and with the exception of Factor 4 in each set, the internal
consistency is strong, as evidenced by the Cronbach’s alpha value. For the recycling
psychological variables, Factor 1 loads distinctly and strongly with the 12 SRHI items,
having high internal consistency (Cronbach’s alpha = 0.9656). Factor 2 contains a
mixture of constructs, including ones related to attitude, response efficacy, perceived
32
Note that in the interest of brevity, some factors are left out of the tables, as they are not
important in regards to this analysis.

83
convenience, attitude, and personal efficacy. It is not clear why these constructs all
loaded onto one factor, as other studies (e.g. Barr 2002; Chen & Tung 2010) found that
these psychological variables were statistically distinct in terms of factor loading. It is
possible that the limited number of questions addressing each construct influenced their
correlation. Regardless, the factor has high internal consistency (Cronbach’s alpha =
0.8498), and will be used. Factors 3 and 4 each contains the two variables related to
norm acceptance and norm awareness, respectively. Factor 3 has very strong internal
consistency (Cronbach’s alpha = 0.9202), but Factor 4’s is quite low (0.4887). The latter
finding is curious, because the questions used to address norm acceptance are very
similar and should load consistently. Regardless, all four factors were kept for the
regression analysis.

84
Table 5.16 Factor Loadings for Recycling Psychological Variables
Factor 1 Factor 2 Factor 3 Factor 4
RH – I do frequently (HABIT) 0.671956 0.452379 -0.04945 0.349855
RH – I do automatically (HABIT) 0.745673 0.380275 -0.03205 0.39205
RH – I do without having to consciously remember
(HABIT) 0.76804 0.376845 -0.02415 0.356891
RH – that makes me feel weird if I do not do it (HABIT) 0.664535 0.464668 0.042786 0.139477
RH – I do without thinking (HABIT) 0.821375 0.363767 0.001754 0.202669
RH – that would require effort not to do it (HABIT) 0.772614 0.296614 0.019482 -0.05372
RH – that belongs to my daily routine (HABIT) 0.713469 0.535168 0.019064 0.221131
RH – I start before I realize I’m doing it (HABIT) 0.835107 0.277003 -0.03369 0.131993
RH – I would find hard not to do (HABIT) 0.748071 0.416692 0.061452 0.086631
RH – I have no need to think about doing (HABIT) 0.786283 -0.04983 -0.02722 -0.12588
RH – That’s typically "me" (HABIT) 0.767307 0.37635 0.070908 0.158923
RH – I have been doing a long time (HABIT) 0.777166 0.332507 -0.01614 0.277614
Is recycling an important issue to you? (ATTITUDE) 0.491789 0.666233 0.019626 0.113151
Recycling is easy (PERCEIVED CONVENIENCE) 0.477296 0.549176 -0.02451 0.230533
I do not create enough waste to justify recycling
(RESPONSE EFFICACY) 0.201551 0.732479 0.192617 0.064317
Recycling is too time-consuming to worry about
(PERCEIVED CONVENIENCE, ATTITUDE) 0.336052 0.783839 0.076532 0.106853
Recycling on a daily basis is possible for me
(PERSONAL EFFICACY) 0.278438 0.684299 -0.05799 0.204046
Generally speaking, it is important that my
friends/family approve of what I do (NORM
ACCEPTANCE)
-0.06255 0.04846 0.941501 0.106648
Generally speaking, it is important that those who are
important to me approve of what I do (NORM
ACCEPTANCE)
0.038563 0.079882 0.948206 0.123071
Most of my friend/family recycle (NORM
AWARENESS) 0.146985 0.221103 0.029723 0.754448
Most people who are important to me think that I should
recycle (NORM AWARENESS) 0.097183 0.063705 0.227356 0.710807
Cronbach’s Alpha 0.9656 0.8498 0.9202 0.4887
Table 5.17 shows the factor loading for the composting psychological constructs.
The factors are strikingly similar to those found in the recycling analysis. Factor 1

85
contains the composting-related SRHI questions and the perceived convenience variable.
Factor 2 for composting contains the same items as Factor 2 in recycling, with the
exception of one of the convenience items being loaded with the habit constructs.
Composting Factor 2 will also be termed “efficacy, attitude and convenience.” Factors 3
and 4 for composting are the same as they are for recycling, namely “acceptance of
norms” and “norm awareness,” respectively. Factors 1 and 2 have very high internal
consistency (greater than 0.9 Cronbach’s apha), while Factors 2 and 4 are less reliable,
having Cronbach’s alpha values of 0.6709 and 0.5845, respectively. All of these factors
(four factors each for recycling and composting) were retained for regression analysis,
and are listed in Table 5.18.

86
Table 5.17 Factor Loadings for Composting Psychological Variables
Factor 1 Factor 2 Factor 3 Factor 4
CH – I do frequently (HABIT) 0.8865864 0.2413836 -0.059466 0.1234226
CH – I do automatically (HABIT) 0.9321222 0.1813804 -0.078378 0.0972677
CH – I do without having to consciously remember
(HABIT) 0.9226214 0.1916714 -0.064644 0.1007789
CH – that makes me feel weird if I do not do it
(HABIT) 0.7902375 0.3270518 -0.006588 0.0115627
CH – I do without thinking (HABIT) 0.9367738 0.1698252 -0.058109 0.0724625
CH – that would require effort not to do it (HABIT) 0.6210664 0.1324116 -0.144755 -0.017558
CH – that belongs to my daily routine (HABIT) 0.857031 0.2502645 -0.059979 0.0950409
CH – I start before I realize I’m doing it (HABIT) 0.882751 0.1394271 -0.06455 0.0538262
CH – I would find hard not to do (HABIT) 0.8006587 0.259664 -0.141009 -0.022004
CH – I have no need to think about doing (HABIT) 0.6433407 -0.19532 -0.097642 -0.021675
CH – That’s typically "me" (HABIT) 0.7438303 0.3420552 -0.122803 0.0018286
CH – I have been doing a long time (HABIT) 0.8817799 0.1990851 -0.132584 0.100724
Composting is easy (PERCEIVED CONVENIENCE) 0.5864121 0.4066541 -0.138174 0.0436069
Composting on a daily basis is possible for me
(PERSONAL EFFICACY) 0.3822822 0.5070212 -0.180061 0.0641885
I do not create enough waste to justify composting
(RESPONSE EFFICACY) 0.0104235 0.7196268 0.0667493 0.0496373
Is composting an important issue to you?
(ATTITUDE) 0.5202613 0.5265932 -0.006959 0.0609108
Composting is too time-consuming to worry about
(PERCEIVED CONVENIENCE, ATTITUDE) 0.3880645 0.6883754 -0.055847 0.0699395
Generally speaking, it is important that my
friends/family approve of what I do (NORM
ACCEPTANCE)
-0.137992 -0.039891 0.9464576 0.0367334
Generally speaking, it is important that those who are
important to me approve of what I do (NORM
ACCEPTANCE)
-0.149113 -0.018729 0.9438113 0.0184062
Most people who are important to me think that I
should compost (NORM AWARENESS) 0.017118 0.1851204 0.0285498 0.8228005
Most of my friend/family compost (NORM
AWARENESS) 0.1231133 -0.036733 0.0197846 0.8423652
Cronbach’s Alpha 0.9648 0.6709 0.9202 0.5845

87
Table 5.18 Recycling and Composting Psychological Variable Factors
Recycling Composting
Factor 1: Recycling Habit Composting Habit
Factor 2: Efficacy, Convenience and
Attitude
Efficacy, Convenience and
Attitude
Factor 3: Acceptance of Norms Acceptance of Norms
Factor 4: Recycling Norm Awareness Composting Norm Awareness
5.3.1.4 Summary of Factor Analyses
After the factor analyses, each behavioral outcome (self-reported recycling and
composting behavior) has seven variables that are to be tested for their impact and
integrated into the behavioral model. The NEP variables, which have been found to load
onto three factors, will each be entered into the regression for both recycling and
composting. Each behavior also has the same four psychological variables each that will
be analyzed, though note that the variables within the first two factors (Habit and
Efficacy, Convenience and Attitude) vary slightly between the composting and recycling
factors. The seven factors are as follows:
Factor 1: Pragmatic Environmentalism
Factor 2: Deep Ecology
Factor 3: Enviro-centrism
Factor 4: Composting/Recycling Habit
Factor 5: Efficacy, Convenience and Attitude
Factor 6: Acceptance of Norms
Factor 7: Composting/Recycling Norm Awareness

88
Other variables will be tested for their impact on self-reported behavior, as noted
previously – namely, demographics, actual convenience and concrete knowledge (CK)
for recycling; and demographics and home gardening status for composting. These
variables are situational variables, and thus were not included in the psychological
variable factor analysis. The logic behind this is that situational variables are not
impacted by each other or by psychological variables, nor are dependent on perception of
the individual. The latter is most important, because all of the psychological variables are
based on perception. Some demographic variables can be dictated by the individual (e.g.
education level), but once achieved, they are not changed according to how one “thinks
about it,” as psychological variables are. Concrete knowledge is also obviously within
the control of the individual, but again, it is not dependent upon perception. The
additional variables that will be entered into the model are as follows:
Socio-demographics (gender, age group, education level, housing type,
homeownership)
Concrete knowledge (recycling only)
Actual convenience (having a curbside bin or not; for recyclers only)
Having a home garden or not (for composting only)
Of these variables, gender, housing type, rent/own and having a curbside bin are nominal
variable; and age group and education level are ordinal. To prepare these variables for
regression analysis, “dummy variables” were created. Dummy variables act as continuous
proxies to nominal or ordinal data, and thus can be analyzed in regression analyses33
33
Note that if dummy variables are not created by the analyst, they will automatically be created by jmp,
which is the software used in this analysis.

89
(Stockburger n.d.; McDonald 2009). I created dummy variables that had values of zero
or one, as follows:
Gender: female = 1, male = 0
Age Group: age 40 or older = 1, under the age of 40 = 0
Education Level: bachelor’s degree or higher = 1, other = 0
Housing Type: single family detached = 1, other = 0
Homeownership: homeowner = 1, renter = 0
Actual Convenience: has large recycling bin with wheels = 1, other = 0
Having a Home Garden: has a garden = 1, no garden = 0
Income level: more than $50,000 = 1, $50,000 or less = 0
Note that gender, housing type, convenience, homeownership and home gardening are
categorical, i.e. they do not imply valuation. However, age group and education level are
ordinal, thus a higher number indicates “more” of each variable.
Concrete knowledge was derived based on the answers to three questions on the
survey. Question 12 asked how often curbside recycling got picked up. Question 15
asked if materials needed to be separated when put in the recycling bin. For both of
these, a correct answer was worth one point. Question 14 listed 14 items and asked
which of the items could be recycled. Nine of the items are recyclable, and 5 are not (“I
don’t know” was also an allowable response). In order to weight this question equally
with the other two CK questions, an intra-question score was generated – each correct

90
answer was worth one point, each incorrect answer worth negative one point34
. The best
possible score was nine points, so the intra-questions score was divided by nine to
generate the overall question score. An answer of “I don’t know” was worth zero points.
Thus, all three CK questions were worth one point each. The totals were summed, and
normalized to a 1-point interval scale by dividing by 3.
5.3.2 Regression Analysis
The final step in deriving the behavioral models is to integrate all of the
independent and dependent variables into a regression model. A regression model is a
very useful tool for social (and physical) scientists, because as noted above it has the
ability to take a large number of independent variables and measure their impact on a
dependent variable. For this study, I chose to utilize a stepwise regression tool. Stepwise
regression adds one variable at a time and quantifies the impact it has on the dependent
and the independent variables. It continuously adds variables, each time measuring the
impact on all of the variables. After numerous iterations, a stepwise regression retains
only those variables that have a (user-defined) significant impact on the outcome (Agresti
& Finlay 2003; McDonald 2009). The stepwise regression removes unnecessary
variables, which in this study I defined as those variables not having a statistically
significant (p < 0.05) influence on the dependent variable(s). The simplified results of
the recycling behavior stepwise regression can be seen in Table 5.19.
34
It is -1 instead of 0 because it prevented a respondent from getting a perfect score by checking all the
boxes.

91
Table 5.19 Regression Analysis Results for Recycling Behavior
Retained Parameter F Ratio p-value
X Intercept 0 1
X Total CK score 22.786 3.56E-06
X Large bin 8.835 0.00333
NEP 1 - pragmatic environmentalism 0.251 0.61679
NEP 2 - deep ecology 1.03 0.31132
NEP 3 - enviro-centrism 1.818 0.17913
Acceptance of norm factor 1.232 0.26837
Knowledge of recycling norm 0.081 0.77691
X Recycling efficacy, attitude and convenience 21.275 7.21E-06
X Recycling habit 65.082 7.30E-14
40 years or older? 0.04 0.84084
Gender 0.863 0.35416
Bachelor's or higher 0.01 0.92155
Income above $50,000 0.323 0.57034
Rent/own 0.227 0.63397
Detached house? 2.152 0.14401
As noted above, I chose to keep only those variables that had a p < 0.05. The column
labeled “Retained” indicates which variables are to be kept for the next analytical step.
After the stepwise regression determines which variables to retain, the final step
in ascertaining the impact of the variables on the measurement variable is to run a simpler
“multiple regression” (Barr 2002). The most common linear regression technique is
“least square.” The goal of linear regression is to integrate the predictor variables into an
equation that best matches the actual data points if they were plotted on a graph. Figure
5.16 shows the regression line (the straight red line) and data points for the four variables
that were retained for analysis on recycling behavior. It should be apparent that the
regression line is drawn in such a way as to closely mimic the pattern of the data points.

92
This is a result of the least squares regression. Least squares calculates the equation and
line that best fits the data points by calculating the squared distance between the points
and the regression line. The greater the aggregate distance between the points and the
line, the worse the regression equation fits the data points. By minimizing the sum of
squares, least squares regression derives the best-fitting linear equation, and thus
maximizes the explanatory power of the equation (McDonald 2009).
Figure 5.16 Linear Regression Line and Data Points for Recycling Behavior Regression Model
Figure 5.16 also shows an important statistic – the r-squared (r2) value (it appears
as “RSq” in the figure). The r2 value quantifies the percent of the variance of the
dependent variable that results from integration of the independent variables into the
regression equation. In essence, it shows how much of the outcome (in this case,
recycling behavior) can be predicted by the independent variables. This model has an r2
of 0.82, which means that approximately 82% of the variance in recycling behavior can
be predicted if the value of the four explanatory variables is known. It is clear from the
scatterplot that the line is a relatively good fit, and the residuals appear to be low. Note
also that the regression equation has an extremely high confidence level, p < 0.0001.

93
The final component of the behavioral model can be seen in Table 5.20. This
statistic is called the “beta weight.” The beta weight is a number between 0 and 1, and
represents the magnitude of standard deviation that the dependent variable would change
if the dependent variable were to increase by one standard deviation (Barr, 2002). For
example, if the Concrete Knowledge score for a given respondent would increase by one
standard deviation (3.7, the mean is 6.3 on a scale of 1-10), it would be expected that the
recycling score would increase by 0.241225 standard deviations. The recycling score
standard deviation is 15.73, so an increase in one standard deviation of the CK score
should result in an increase of approximately 3.79 in the recycling score. Of course, this
is only an approximation – it is the expected value, but as Figure 5.16 clearly shows, this
will not always be accurate. Table 5.20 shows the beta weights for all of the independent
variables in the recycling and composting behavioral models. Note that composting
behavior is not explained as well by its independent variables as recycling is, though at
over 62% explanatory power, the regression is nonetheless rather powerful. Also note
the “error term,” which quantifies the explanatory strength of all variables not included in
the behavioral model. It can be thought of as the beta weight of the aggregate of all
unseen variables, both those included in the original analysis and not considered in the
analysis.

94
Table 5.20 Beta Weights of the Explanatory Variables in the Waste Management Behavioral Models
Independent Variables Recycling
Behavior
Composting
Behavior
Concrete Knowledge Score 0.241225
Having a Large Recycling Bin 0.138471
Efficacy, Convenience and Attitude (Recycling) 0.235291
Recycling Habit 0.426505
Has a Garden
0.176537
NEP 2 - Deep Ecology
-0.09281
Efficacy, Convenience and Attitude (Composting)
0.149573
Composting Habit
0.671693
Age, >40 Years Old
-0.14601
R2 Value (% variance explained) 0.813376 0.621534
F (significance, all < 0.0001) 216.7389 66.0329
Error Term 0.432 0.615
The benefit of using beta values for the behavioral models instead of the
regression coefficients is that beta values are normalized to a 0 – 1 scale, whereas
regression coefficients reflect the magnitude of the scales that the variables were
measured in. For example, in the recycling model, Concrete Knowledge scores ranged
from 0 – 10, whereas a respondent could score anywhere from 5 to 25 on the Efficacy,
Convenience and Attitude (ECA) score35
. As a result, even though the beta weights of
these two variables are approximately equal (~0.24)36
, the regression coefficients are 1.02
and 1.08 (6% difference) for CK score and ECA score, respectively. Beta weights
rescale the explanatory variables so that the magnitude of the numbers can be compared
simply and intuitively. The beta weights for recycling and composting have been
35
Note that the scores were summed, not averaged. The Efficacy, Convenience and Attitude score was the
sum of 5 items with each item having a scale of 1 – 5, hence the total score could be anywhere from 5 to
25. 36
These are rounded scores. The actual beta weights are 2.5% different.

95
integrated into separate recycling and composting behavioral models (Figure 5.17 and
Figure 5.18). In order to make the model easier to interpret, arrow and line weights
reflect the relative explanatory power of the variable (thicker line means a higher beta
value) and negative correlations are indicated by a dotted line (Barr 2002). The error
term is indicated by the “e” symbol.
Figure 5.17 Recycling Behavioral Model
Figure 5.18 Composting Behavioral Model
5.3.3 Cluster Analysis
Finally, a cluster analysis, which is another multivariate inferential statistic, was
run with the intention of further explaining the correlates of recycling and composting

96
behavior. Cluster analysis is a statistical procedure that takes large groups of data points
and groups them together based on similar values of measured variables (Barr, Gilg and
Ford 2005). This feature is available on jmp© as well. The software combines data
points one at a time, grouping them into clusters sharing similar values for given
variables, then combining clusters that are closest in value, until all data points are in one
cluster. The number of clusters thus progress from n to 1, and it is up to the researcher to
decide at what point (usually before all points are combined) to accept the number of the
groups. The groups can then be analyzed to determine if the groupings make sense and
are statistically significant. For this research, the data points are individual
surveys/respondents and a cluster analysis can group them based on any number of
variables. The result of the cluster analysis detailed below is groupings of survey
respondents that share similar scores on the self-reported behavior constructs, with the
goal being to describe to the statistically significant extent possible the demographic
characteristics of “typical” (non) recycler and/or (non) composter.
The diagrams and plots in Figure 5.19 show the results of the cluster analysis.
The variables that were clustered were the eleven recyclable material options and the two
composting items. Thus, the data points are grouped together based on similar scores for
these thirteen behaviors. The large charts are called “dendrograms”, and they allow the
user to visualize the iterative combining of the individual points. Notice that the number
of horizontal lines (representing points and ultimately clusters) decrease going from left
to right – this visually demonstrates the combining of points, then clusters until one
cluster results. The dendrogram on the right shows the three color-coded clusters that

97
resulted from this analysis. The number of clusters was chosen based on the information
provided in Table 5.21, which is the “clustering history.” This table shows in a numeric
manner the progressive combining of clusters. Note that the “scree plot” (beneath the
dendrograms in Figure 5.19) is a graphical representation of the cluster history. It is
generally recommended to choose a number of clusters at a point where the scree plot
slope increases abruptly, as evidenced by a rapid increase in the “distance” value in the
cluster history. Recall that cluster analysis combines data based on similarity of scores
on designated variables. “Distance” refers to the difference in these scores, thus the
greater the distance, the lower the level of similarity, and the less reliable the clusters are
likely to be. This is the reason that clusters are “cut off” when the distance begins to
increase abruptly – it indicates increasing dissimilarity in the variables. Based on this, I
chose to retain three clusters.
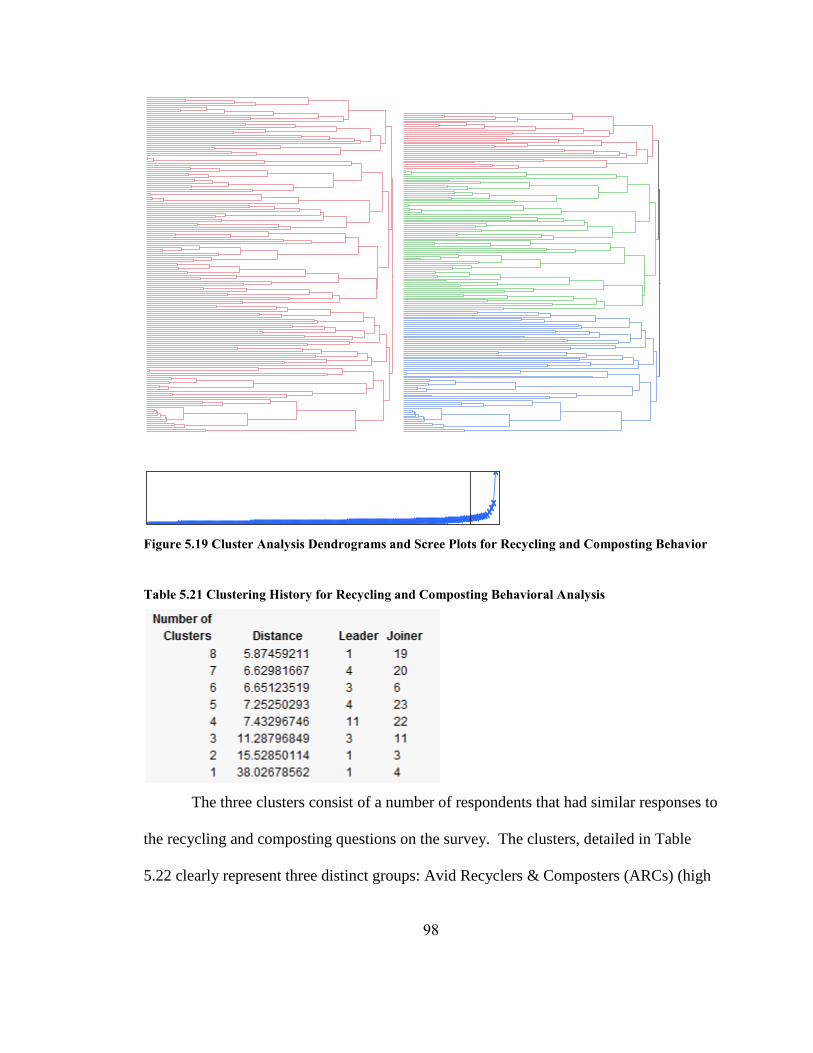
98
Figure 5.19 Cluster Analysis Dendrograms and Scree Plots for Recycling and Composting Behavior
Table 5.21 Clustering History for Recycling and Composting Behavioral Analysis
The three clusters consist of a number of respondents that had similar responses to
the recycling and composting questions on the survey. The clusters, detailed in Table
5.22 clearly represent three distinct groups: Avid Recyclers & Composters (ARCs) (high

99
recycling and composting scores), Avid Recyclers (ARs) (high recycling score, low
composting score) and Poor Waste Managers (PWMs) (low scores for recycling and
composting. These groups can easily be distinguished by the differing mean scores on
the recycling and composting questions.
Table 5.22 Recycling and Composting Behavioral Levels of Respondent Clusters
Cluster N37
Recycling
Mean Score
Composting
Mean Score
Generalized
Recycling
Score
Generalized
Compost
Score
Group
Designation
1 32 4.73 3.78 High High Avid Recyclers
and Composters
2 102 4.34 1.31 High Low Avid Recyclers
3 64 1.55 1.41 Low Low Poor Waste
Managers
Dividing the individuals into clusters as such is potentially useful, because the
general characteristics of each of these groups can now be summarized and statistically
analyzed to see if each group shares identifiable characteristics, which can potentially be
used to inform waste management policy. In essence, this creates a generalized
demographic profile of individuals in the population who are likely to engage in the
generalized levels of recycling and composting detailed in Table 5.22. The summary
demographic characteristics and their level of statistical significance can be seen in Table
5.23.
The demographic statistics were tested for significance through a “chi-square”
analysis. A chi-square analysis can be used in a number of ways, but for this portion of
the analysis, it was used to determine if the proportion of individuals from each cluster
37
One data point was thrown out because it did not have a composting value.

100
differed significantly for the given demographic characteristics. For example, the
proportion of respondents of each cluster falling into each of the three age groups differs.
Cluster 3 (PWM) has a high proportion of 18-29 year-olds (48.4%), while Clusters 1
(ARC) and 2 (AR) are mostly comprised of 30-49 year-olds (62.5% and 49.0%,
respectively). This is descriptive, but without the chi-square test, nothing can be inferred
regarding the population. The chi-square test, however, determined that the proportion of
respondents falling into each age group differed significantly, with a p-value of 0.0127,
meaning that there is a less than 2% chance that the proportions are in fact equal. There
is thus high confidence that the groups are made up of proportionately different age
groups.
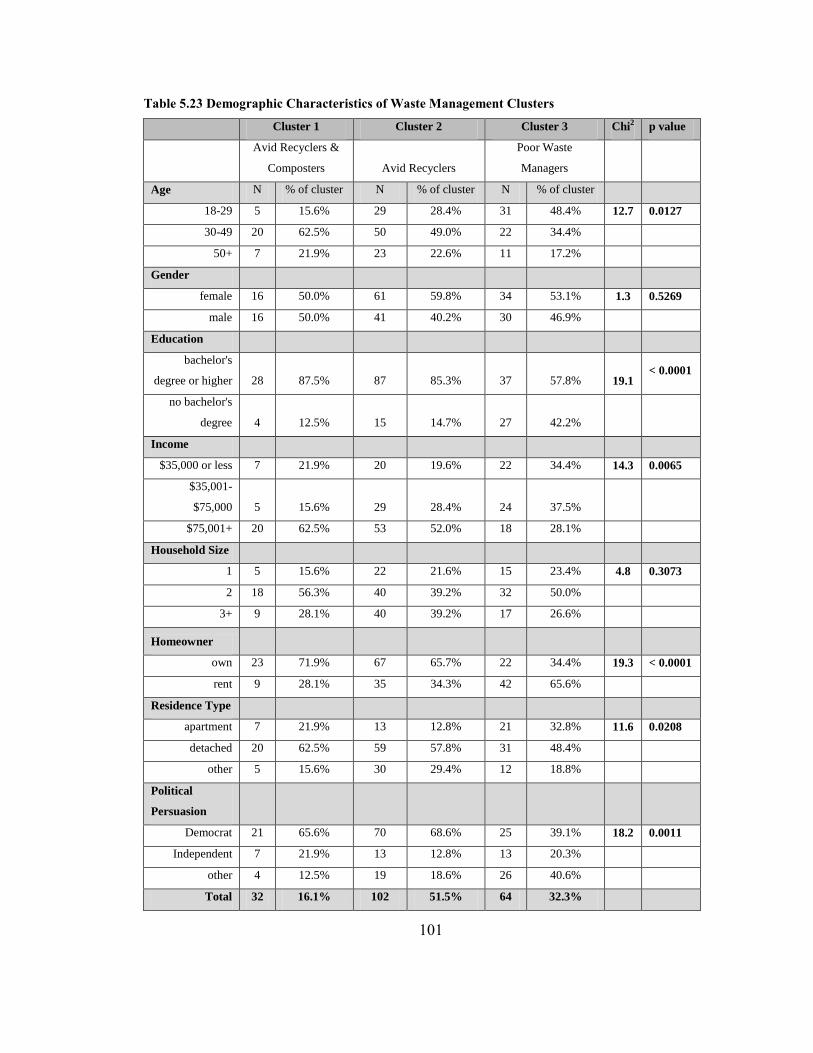
101
Table 5.23 Demographic Characteristics of Waste Management Clusters
Cluster 1 Cluster 2 Cluster 3 Chi2 p value
Avid Recyclers &
Composters Avid Recyclers
Poor Waste
Managers
Age N % of cluster N % of cluster N % of cluster
18-29 5 15.6% 29 28.4% 31 48.4% 12.7 0.0127
30-49 20 62.5% 50 49.0% 22 34.4%
50+ 7 21.9% 23 22.6% 11 17.2%
Gender
female 16 50.0% 61 59.8% 34 53.1% 1.3 0.5269
male 16 50.0% 41 40.2% 30 46.9%
Education
bachelor's
degree or higher 28 87.5% 87 85.3% 37 57.8% 19.1 < 0.0001
no bachelor's
degree 4 12.5% 15 14.7% 27 42.2%
Income
$35,000 or less 7 21.9% 20 19.6% 22 34.4% 14.3 0.0065
$35,001-
$75,000 5 15.6% 29 28.4% 24 37.5%
$75,001+ 20 62.5% 53 52.0% 18 28.1%
Household Size
1 5 15.6% 22 21.6% 15 23.4% 4.8 0.3073
2 18 56.3% 40 39.2% 32 50.0%
3+ 9 28.1% 40 39.2% 17 26.6%
Homeowner
own 23 71.9% 67 65.7% 22 34.4% 19.3 < 0.0001
rent 9 28.1% 35 34.3% 42 65.6%
Residence Type
apartment 7 21.9% 13 12.8% 21 32.8% 11.6 0.0208
detached 20 62.5% 59 57.8% 31 48.4%
other 5 15.6% 30 29.4% 12 18.8%
Political
Persuasion
Democrat 21 65.6% 70 68.6% 25 39.1% 18.2 0.0011
Independent 7 21.9% 13 12.8% 13 20.3%
other 4 12.5% 19 18.6% 26 40.6%
Total 32 16.1% 102 51.5% 64 32.3%

102
Chi-square is a non-parametric test, so does not require a normal distribution or a
specific pattern of variance between or among groups. However, if sample sizes are too
small, false rejections of null hypotheses can result (McDonald 2009). As noted by
Agresti and Finlay (2003) (and the Help Menu on jmp©), it is recommended that there
are at least 5 samples in each cell of the chi-square matrix. In regards to this analysis,
that means that there should be at least 5 people in each cluster with each characteristic38
.
This condition was not met based on the data resolution of the survey instrument. The
data in the age group, income level, education, residence type, and political persuasion
categories had to be recombined to meet this criterion. However, I was able to retain
logical categories while recoding, as can be seen in Table 5.23.
The cluster analysis resulted in some significant findings, but not for all of the
variables. The proportion of respondents in the gender and household size categories
were not significantly different, as evidenced by having a p-value greater than 0.05. The
other six demographic variables were found to be significantly different between groups,
with all but age and residence type having at least a 0.001 p-value. Some inferences can
be drawn from these data. First, there appears to be a somewhat positive relationship
between responsible waste management behavior and age. The ARC and AR groups had
relatively equal proportion of 50+ year-olds, and the ARC group had the highest
proportion of 30-49 year-olds (62.5%). A further indication of the relationship between
age and responsible behavior is that the PWM cluster had the highest proportion of 18-29
year-olds. Overall, the 30-49 year-old age group most strongly defines good waste
38
E.g. five or more 18-29-year olds in each cluster; five or more 30-49-year olds in each cluster; five or
more Democrats, etc.

103
management behavior, and 18-29 year-olds behavior. Education level exhibited a similar
trend – ARCs and ARs had a much higher proportion of people with a minimum of a
bachelor’s degree (greater than 85% each), while the PWM cluster had nearly 42% of its
population with no bachelor’s degree. Income also appears to be positively correlated
with responsible waste management behavior. The ARC group had the highest
percentage of top earners (62.5%), followed by the ARs and PWMs. The PWM group
had the highest proportion of the lowest income bracket, which was less than $35,000 per
year, and the middle income bracket ($35,001 - $75,000). The Homeownership variable
exhibited the same pattern as income level, with homeowners making up the highest
proportion of the ARC group, followed by the AR and PWM groups. Over 65% of the
PWM cluster was comprised of renters. Those living in detached homes were more
likely to be in the ARC and AR cluster than those living in other types of dwellings,
though they also comprised nearly half of the PWM cluster. Finally, Democrats
dominated the ARC and AR groups, while “other” (Republican, Libertarian, Green,
unaffiliated, and “don’t know”) comprised 40.6% of the PWC group.
Overall, the cluster analysis revealed that Avid Recyclers and Composters were
likely to be middle-aged, educated, relatively high income, own their own (single family
detached) home, and identify as Democrats. Avid Recyclers were likely to be middle-
aged, educated, middle-to-high income, own their own home which is likely a single-
family detached home, and identify themselves as Democrats. Finally, Poor Waste
Managers were likely to be young, less-educated than the other groups, low-to-middle

104
income, live in rental housing, and not identify as Democrats. The implications of these
results will be discussed in the next section.

105
Chapter 6 Discussion
6.1 Sampling and Study Design
The sampling method I employed (“call and collect”) was a success, and
has a number of benefits relative to other sampling methods. I was able to create a
random sample of as many households as desired in as many census tracts as I desired to
sample, with publicly available data. This process is largely automated, and could be
used in any geographical area for which spatial data are available. The sampling
procedure is extremely flexible, does not require the cumbersome process of searching
voting registries, and avoids the problem unlisted numbers and cellular telephones
present to phone surveys. Another benefit is that it leads directly to the creation of maps
that can then be used to navigate to the selected locations. The primary drawback is that
survey administration is very time-consuming – surveys were administered and/or
collected for a few hours a day nearly every day for one month, and only 352 surveys
were collected. The 75% overall response rate is very high for any survey-based
research, but especially given the lengthy survey instrument that was used. However, the
56.5% usable response rate was lower than hoped. Most of the non-usable surveys were
only missing a few items. Future research could address this problem either through the
use of imputation methods (e.g. Shrive, Stuart, Quan & Ghali 2006), revisiting the
households with missing data, or simply administering more surveys.

106
One important caveat to the randomness of the data is that apartments were
undersampled. This research was meant to randomly select households, not buildings.
Each apartment building had an equal chance to be selected as an individual household,
yet there are multiple households within a single apartment building. Thus, individuals
who live in apartments were less likely to be selected for the study than those living in
single family homes, townhomes, or duplexes.
6.2 Descriptive Waste Management Behavior
The descriptive waste management behavior results offer a glimpse of the degree
to which recycling and composting are undertaken in the sample, and preface the results
of other analyses in the study. As expected, materials that are recyclable are reportedly
recycled at a higher rate than non-recyclable materials and composting. Many studies
have found that convenience plays an essential role in promoting PEB (e.g. Derkson &
Gatrell 1993; Berger 1997; Jenkins et al. 2003), and having a curbside bin is much more
convenient than storing and making one’s own compost. The relatively low frequencies
with which non-recyclable items were put into recycling bins is positive, but these
materials are apparently still placed in the bins at a higher than desirable rate.
It is encouraging that the mean recycling factor (the average of the average
recycling scores39
) was 3.51 on a 5.0 scale, though the mean overall composting score
was only 1.75. It is important to point out that such a high recycling rate may be
misleading, because of response bias. There are three primary (and unavoidable in this
context) problems with the method that was used to determine behavior. First, it was
39
Under most circumstances, averaging a set of averages is an invalid way to summarize data, but it is
valid in this case because the average numbers that were averaged resulted from analysis of an identical
number of numbers, thus each final average is proportional to the others.
107
made clear to the respondents from the outset that the survey was done in an attempt to
ascertain waste management behavior in Denver. Recycling is largely seen as normative
behavior (Barr & Gilg 2005), and this combined with knowing that the purpose of the
research was to find out about recycling behavior could have influenced respondents to
overstate their recycling rates. Secondly, self-selection bias could have played a role, in
that people who do recycle may be more likely to respond to a survey asking about
recycling behavior. The prize offering was meant to reduce the occurrence of this type of
bias, but there is no way to know if it was effective or not. Only eight people who
initially accepted the survey refused to take it after they read it, and fifty-six never
returned the survey. Further, many people refused to take the survey after it was initially
introduced. Unfortunately, data were not kept in terms of outright refusal rate. Finally,
as Barr (2002) notes, self-reported behavior can be an unreliable metric. Answers can be
exaggerated or underplayed (purposefully or otherwise), and aggregate estimation
methods can be mistaken by the individual filling out the survey. For example,
assessment of the difference between “sometimes” and “usually” engaging in a behavior
is necessarily subjective. I used 5-item Likert scales in an effort to reduce the incidence
of this problem, as they are less nuanced than 7-item scales, though this results in the loss
of some data resolution. Overall, the most accurate way to measure behavior is to
observe it first hand, but this was obviously impossible to do for this study.
Caveats aside, the recycling rate results are encouraging and speak to the
potentially normative stature of recycling in the study area. However, the behavioral
frequency results indicate that two of the items should be addressed by the city. First,
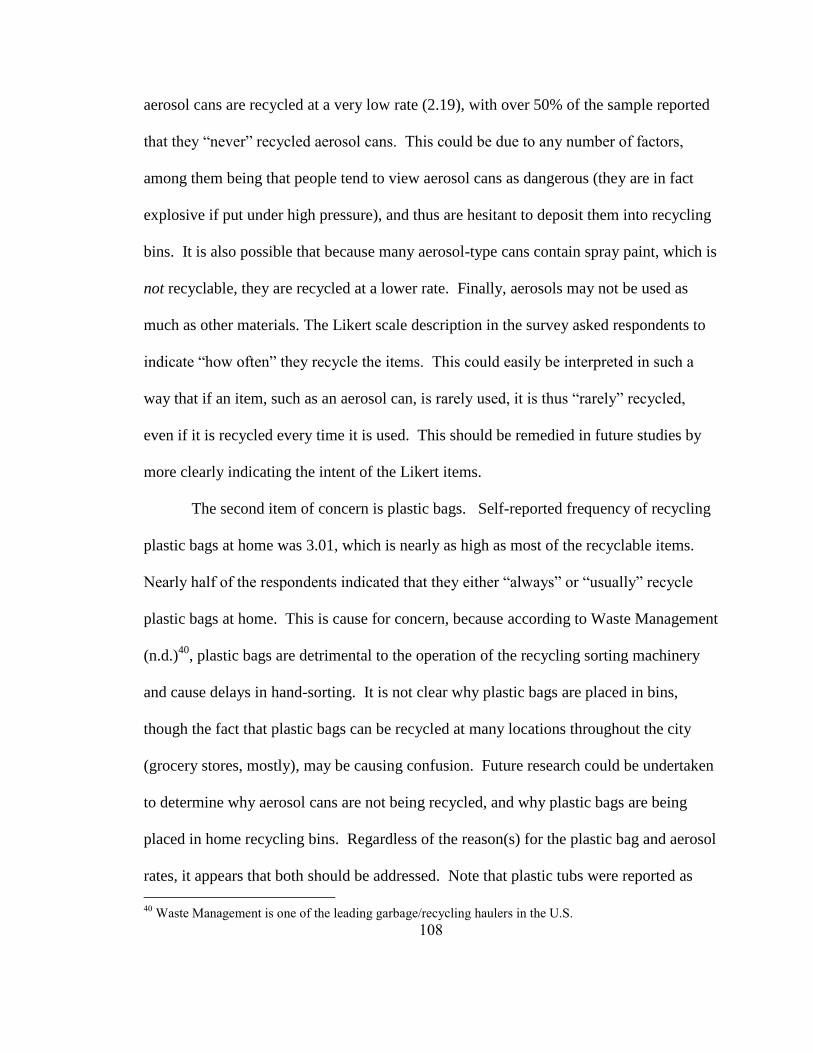
108
aerosol cans are recycled at a very low rate (2.19), with over 50% of the sample reported
that they “never” recycled aerosol cans. This could be due to any number of factors,
among them being that people tend to view aerosol cans as dangerous (they are in fact
explosive if put under high pressure), and thus are hesitant to deposit them into recycling
bins. It is also possible that because many aerosol-type cans contain spray paint, which is
not recyclable, they are recycled at a lower rate. Finally, aerosols may not be used as
much as other materials. The Likert scale description in the survey asked respondents to
indicate “how often” they recycle the items. This could easily be interpreted in such a
way that if an item, such as an aerosol can, is rarely used, it is thus “rarely” recycled,
even if it is recycled every time it is used. This should be remedied in future studies by
more clearly indicating the intent of the Likert items.
The second item of concern is plastic bags. Self-reported frequency of recycling
plastic bags at home was 3.01, which is nearly as high as most of the recyclable items.
Nearly half of the respondents indicated that they either “always” or “usually” recycle
plastic bags at home. This is cause for concern, because according to Waste Management
(n.d.)40
, plastic bags are detrimental to the operation of the recycling sorting machinery
and cause delays in hand-sorting. It is not clear why plastic bags are placed in bins,
though the fact that plastic bags can be recycled at many locations throughout the city
(grocery stores, mostly), may be causing confusion. Future research could be undertaken
to determine why aerosol cans are not being recycled, and why plastic bags are being
placed in home recycling bins. Regardless of the reason(s) for the plastic bag and aerosol
rates, it appears that both should be addressed. Note that plastic tubs were reported as
40
Waste Management is one of the leading garbage/recycling haulers in the U.S.

109
being recycled at a somewhat elevated rate (2.22), but this is no longer of concern
because the city now accepts them in the single-stream bins.
In terms of grass-cycling, the average score (3.12), which was slightly higher
among those not living in apartments (3.17), and was nearly as high as the recycling
score. The level of grass-cycling is encouraging because DR features it on their website
along with other responsible waste management materials. It is not clear through the
survey results why the rate of grass-cycling is relatively high, as the only other question
asked regarding grass-cycling was designed to find out what prevents residents from
grass-cycling. Thirty percent of the respondents that did not grass-cycle indicated that
the reason they did not do it was because they had never heard of it, and 23% noted that
they thought it would kill the grass, while 10% said they did not think that is was
important. The policy implications that can be gleaned from this information are that
general awareness of the practice may be the most effective policy if DR desires to
increase the incidence of grass-cycling in the city. Further, if this publicity can be
combined with information disabusing people of the idea that it will kill the grass and it is
not important, over 60% of the volume of reasons given for not grass-cycling could be
addressed. Note that over half of the respondents reported getting their recycling
information from the booklet that came with the large bin, so it may be advisable to
include information regarding grass-cycling and composting with booklets that are
provided with bins. For residents who already have booklets, a few alternative policies
could be undertaken. First, a booklet could delivered to homes that already have
recycling. However, this may not be very effective, because as the data show, not only

110
are respondents recycling at a relatively high rate, but the average recycling habit is quite
strong, as measured by the SRHI. Recall that many of the constructs of the SRHI are
related to the automaticity of the behavior, so providing recycling information regarding
materials that are already strongly habitual may not be effective because people already
know, largely without thinking, what materials and how to recycle. However, there are
two possible remedies to this situation: First, if a new material or materials become
allowable recyclables in the future, the booklet could be provided with this new
information. Secondly, as the new composting program ramps up, information regarding
grass-cycling should be included with the compost bin.
Overall, the sample indicated a strong willingness to pay for recycling and waste
management services, as 84% of those asked if they would pay $1/month indicated they
would be “likely” (15%) or “extremely likely” (68%41
) to do so, and 66% of those asked
if they would pay $3 were “likely” (30%) or “extremely likely” (37%) to do so. The
relative frequencies of these results are not surprising, as it is expected that as proposed
costs increase, WTP will decrease, echoing results by Batley et al. (2000) and Palatnik et
al. (2005). This is an encouraging result, especially in terms of recycling and trash
removal. Charging only $1/month to everyone eligible for both trash and recycling
services would result in the generation of over $2 million in revenue, which would be
enough to cover the entire DR budget as of 2007 (Pitt 2007).
There was a strong interest in free and fee-based composting services in Denver.
Sixty-two percent reported being either “likely” or “extremely likely” to use a free
composting service and 67% and 48% would be willing to pay $1/month and $3/month,
41
Some of the percentages provided may not add up properly due to rounding errors.

111
respectively, for home composting service. This is somewhat surprising in light of the
fact that the sample reported rarely engaging in composting behavior and had very weak
composting habits. The average overall score on the composting SRHI was only 1.89,
compared to 3.57 on the recycling SRHI. In other words, recycling habit was nearly
twice as strong as composting habit. These seemingly contradictory results show that
people have the desire to compost, but may not believe they have the means or
knowledge to do so. This is exactly what is indicated by the aggregated answers to the
question that asked what prevents respondents from composting. In fact, the most
frequent answers to this question were that people did not want to store kitchen wastes at
home and that they do not know how to compost. The bins would solve both of these
problems. Not surprisingly, as proposed composting cost rose, desire to participate
dropped. However, WTP was relatively strong, though even the highest monthly charge
in this study ($3) is less than one third the cost of the optional recycling service being
offered by DR currently ($29/quarter) (City of Denver 2011a). The success of the
composting pilot program in Denver appears to confirm these results. It would be very
interesting to see if composting habits and behavior have increased in the city as a result
of the new composting program. One would assume that the increasing visibility of the
composting program would increase the general awareness of, and perhaps concrete
knowledge regarding home composting.

112
6.3 The Behavioral Model
6.3.1 Variable Groupings in the Factor Analysis
The results of the factor analyses were instructive, and for the most part, expected.
First of all, the behavioral items loaded exactly as would be expected. The varimax-
rotated factors were loaded with descriptive, logically consistent groups. The eleven
recyclable items grouped into the “Recycling Behavior” factor, the three non-recyclable
items made up the “Errant Recycling” factor, the two composting items loaded into the
“Composting Behavior” factor, and Grass-cycling comprised its own factor. The
individual variables demonstrated very high internal consistency – with the exception of
aerosol cans in the Recycling Behavior factor, which has a correlation coefficient of 0.54,
all variables had at least a 0.76 factor loading within their respective components, and all
Cronbach’s alpha values were above 0.7. These are important results, because they allow
for a high level of confidence in the legitimacy of grouping the behavioral items into
these factors. Illegitimate results can occur if a researcher groups variables without
performing a factor analysis or if the factor analysis is done improperly.
Past studies have shown the NEP to be multidimensional (e.g. Barr 2002; Nooney
et al. 2003), so it is not surprising prima facie that the NEP factor analysis resulted in
three factors. Upon closer inspection, the factor loading was logical. Factor one can be
considered “Pragmatic Environmentalism,” which consists of less controversial
propositions that 1) the environment should be considered when decisions are made, 2)
human development depends on proper use of natural resources, and 3) that nature can be
harmed by human changes. Many of these assertions could conceivably be held by even

113
non-environmentalists, as they are practical. Evidence abounds for the negative impacts
humans can have on nature, the need for natural resources, and environmental
degradation caused by human decision-making. The second factor is termed “Deep
Ecology” because it contains constructs that are border on valuing nature more than
humans. Deep Ecology is a belief that nature has as much (if not more) inherent value
than humans. The three items in Factor 2 indicate a relatively extreme42
view of the
value of nature, such as proposing to halt all land development and that nature is just as
valuable as human beings. Finally, Factor 3 is termed “Enviro-centrism” because it
contains two items that center on (not) holding the environment as a central personal
concern. The internal consistency of the factors was acceptable. It would be interesting
to see if these results could be duplicated in further research in Denver or elsewhere, and
to determine whether or not they are correlated with other forms of PEB.
The psychological variable factor analyses resulted in both predictable and
surprising outcomes. It is important to note that only the psychological variables related
to each behavior were factored together. For example, recycling SRHI and recycling
convenience were not subjected to factor analysis with the composting variables. This
stated, the same norm-related variables were used in both analyses. It is clear that
recycling habit (RH) is unidimensional, and appears to be a reliable measure of RH. The
Cronbach’s alpha was over 0.96 and only the 12 items of the SRHI scale loaded into the
factor, so the construct has a very high internal consistency. This agrees with the
findings of Verplanken & Orbell (2003), and the correlative strength indicates that the
42
This characterization of an “extreme” view should not be misconstrued as me having a negative
view of deep ecological thought, only that this viewpoint is extreme relative to what can be
considered more mainstream thought.

114
SRHI is a reliable measure of habit strength. The same can be said for the composting
habit (CH), though one of the Perceived Convenience variables (“composting is easy”)
loaded onto the SRHI factor. It is somewhat surprising that the ease of composting was
found to load onto the same factor with all of the SRHI items, but upon further thought, it
is logical. As noted by the creators of the SRHI (Verplanken & Orbell 2003) and others
(e.g. Dahlstrand & Biel 1997), the main characteristic of a strong habit is the (near)
automatic response to an external stimulus. Multiple items in the SRHI scale reflect this.
If one has a well-established composting habit, it is implied that they are able to compost,
and do so frequently (this is also addressed by the SRHI). If composting behavior is done
frequently and almost without thinking, it would likely not be perceived as a difficult
behavior, as doing something automatically implies that it is done with little effort. Note
also that perceived ease of recycling loaded fairly heavily on the same factor as recycling
habit, but it was more correlated with the Efficacy and Convenience factor. It appears
that perceived convenience may be correlated with habit, and may be a useful subject for
future research.
The norm acceptance and norm awareness variables each loaded together as
expected for both recycling and composting, which is to be expected. However, all of the
other psychological variables loaded into one factor for recycling and composting. This
is a surprising result, because variables within this factor were designed to measure
attitude, response efficacy, perceived convenience, and personal efficacy. This is a good
example of why factor analysis is a useful statistical method, as it shows that these
seemingly unrelated variables are in fact highly correlated. It is not clear why these

115
factors were so well correlated, as they followed similar question constructs used in
studies that found them to load on separate factors (e.g. Barr 2002). It is possible that
those that engage in specific levels of recycling and composting behavior share many of
the same beliefs, attitudes, feelings of efficacy, and notions of convenience about the
behaviors. It is also possible that the limited number of variables that I used to ascertain
these constructs compromised the model’s ability to derive multiple factors. It would be
instructive to undertake future research and see if similar results occur.
6.3.2 Regression Analysis and the Behavioral Models
The factor analysis reduced the number of input variables into each of the
behavioral models from 35 to 14 for recycling and 34 to 13 for composting. Figure
6.1and Figure 6.2 show the results (via a path diagram) that occurred after each set was
run through the regression models with their respective behavior (recycling or
composting) scores as the outcome. As noted in Chapter 5, the coefficients in these
diagrams are called “beta weights,” otherwise known as normalized regression
coefficients. They demonstrate the predictive power of the independent variables on the
dependent variable. The purpose of performing a regression analysis is to attempt to
demonstrate causality. But it is important to note that the complexity of human behavior
is such that it is nearly impossible to say that any single factor or set of factors caused a
behavior to occur. There are inevitably factors that have not been considered by the
researcher, as evidenced by the error terms in each of the models. The relatively small
error term in each of the models indicates that I can say with moderate confidence that
the independent variables in the model are valid causal predictors of the behaviors. That

116
stated, the error term indicates that there are a number of intervening variables that are
not present in the model, which render the model less than perfect. In general, increased
predictor variables reduces the error term. Future research should include more variables
if possible. The strongest implication of the models is the relative predictive strength of
each variable. In other words, the path coefficients demonstrate which variables are more
likely to lead to the given behavioral outcome, with higher coefficients being stronger
predictors than lower ones43
.
These two behavioral models have many implications. First, it is readily apparent
that many of the variables were not found to be significant influences on behavior. For
the recycling model, none of the demographic variables were found to be statistically
significant. This is a somewhat surprising result, as Barr et al. (2005) found age to be
positively correlated with recycling behavior, though the beta value was only 0.07, so did
not have a strong impact on recycling behavior. Other studies researched for this report
found that demographics were correlated with recycling behavior (e.g. Steel 1995;
Swami, Chamorro-Premuzic, Snelgar, & Furnham 2011), but others found no correlation
(e.g. Ebreo et al. 1999). Age was the only demographic variable that had a significant
impact on composting. Being over 40 years old was shown to be negatively correlated
with composting behavior. This seemed to be a curious result, as I assumed that older
people would be more likely to have a garden, but the sample data show that those under
40 (55% had a home garden) were more likely to have a garden than those older than 40
(35% had a home garden). This makes intuitive sense, as a person would seemingly be
43
Negative correlation coefficients are predictors that the behavior will not occur – more negative means
less likely that the behavior will occur.
117
more likely to compost if they had a use for the compost. As it turns out, this also makes
statistical sense, because having a home garden was the second biggest influence on
composting behavior next to habit formation.
Figure 6.1 Recycling Behavioral Model
Figure 6.2 Composting Behavioral Model
None of the NEP factors were found to be significant in the recycling model,
which is a slightly unexpected result. Many studies have found that NEP is positively
correlated with PEB in general (e.g. Steel 1996; Cordano et al. 2003) and recycling in
particular (e.g. Barr & Gilg 2005). It is intuitive that possessing and environmental
worldview would lead to PEB in general, including recycling. This result has a few
possible implications. It is possible that environmental values are the norm for the

118
population studied. The descriptive results do indicate that this is likely the case for most
of the NEP constructs, as the average answer to all of the NEP questions (with the
exception of the two deep ecology questions) was at or above “agree,” (i.e. near or above
a mean value of 4.0). If adherence to the NEP is normative, then level of agreement with
NEP items would not be expected to differ among behavioral groups. Further research
should be undertaken to ascertain the general level of environmental awareness in
Denver, and if it is correlated with recycling and composting behavior. If similar results
are borne, the policy implication would be that addressing larger environmental issues is
not an effective way to increase waste management diversion rates.
An even more surprising result is that of the NEP factors, only Deep Ecology
demonstrated a significant impact on composting, but it was negatively correlated with
composting behavior. This is an exceedingly odd result, as it is clear that composting is
not normative behavior for the population being studied. This is apparent from the low
average recycling behavioral and habit scores. Yet, apparently those who express an
extreme level of environmental belief are actually less likely to engage in composting
behavior. It is likely that there are other mediating circumstances that prevent this group
from composting, but one of the benefits of running a regression analysis is that it
analyzes variables on their own merit, while holding other variables constant, which
minimizes the chance of this occurring. However, the error term in the composting
behavioral model is relatively high (0.62), so there is likely a variable or set of variables
that mediate(s) the relationship between the Deep Ecology NEP and composting
behavior. In addition, as Figure 5.2 indicates, scores on NEP item 3 – “Nature and the

119
environment have as much value as human beings” – was surprisingly high (4.09) given
its extreme implication. This statement is the epitome of Deep Ecology, a viewpoint that
is not held by mainstream American society. This item is included in the Deep Ecology
NEP factor. Perhaps the item was misunderstood and over-reported, thus leading to the
odd result relative to composting behavior. Future research may be needed to address
this, and perhaps the item should be reworded in future studies.
The Efficacy, Convenience and Attitude factor demonstrated a moderate impact
on both recycling and composting behavior, which is to be expected. These concepts
have been shown to be correlated with recycling behavior (e.g. Barr & Gilg 2005) and
composting behavior (e.g. Taylor & Todd 1995). Actual Convenience (having a large
bin) and Concrete Knowledge were found to be positively correlated with recycling
behavior, which is an expected result. Convenience and CK are almost universally
recognized as important influences on PEB in general and recycling in particular. Having
a garden can be viewed as a proxy for actual convenience in relation to composting, so it
is not surprising that having a garden is positively correlated with composting.
In both models, habit is shown to have a very powerful predictive impact on
behavior. In the recycling model, it is equally as powerful as the error term, and is only
slightly smaller than the error term in the composting model. In both models, it was the
strongest predictor of all discrete independent variables. This corroborates the results of
studies of recycling (e.g. Knussen & Yule 2008) and PEB (e.g. Dahlstrand & Biel 1997).
No studies to date have measured the impact of habit on composting. These findings
have important implications for waste management policy in Denver. It appears that the
120
most effective way to increase behavior is to somehow attempt to influence the formation
of habits. Dahlstrand and Biel (1997) propose a seven-step model of habit formation, and
purport that many actions can be taken to exogenously cultivate desired habits buy
intervening in any number of these steps. The seven steps can be seen in Table 6.1
This is a logically-structured model, and offers many opportunities for DR to
attempt to positively influence recycling and composting habit, and hence behavior.
Though this study has shown that they are not direct influences on behavior, pro-
environmental beliefs may serve to “prime” the formation of PEB habit. At any rate, it is
very difficult for DR to greatly influence general environmental values, as in the modern
information age, there are so many other environmental influences as to render any
campaigns by DR lost in the environmental awareness “noise,” so to speak. Part of the
Activation step is normative influence, which was found to be insignificant in terms of
driving PEB in this study, but it could also possibly act as a priming step that may
ultimately lead to habit formation and hence, behavior. However, it may be difficult to
impact normative influences, though campaigns that tell people how much (more) their
neighbors are recycling and/or composting may be effective. Steps three through six can
readily be addressed by DR. Making alternatives evident and providing clear procedural
instructions can be accomplished through awareness campaigns regarding the availability
of recycling and composting and providing information on how to do it. This is
corroborated by the respondents’ answers to the descriptive questions. Two of the top
three reasons given for not composting at home are “I do not know how to compost” and
“I never thought about it.” Both of these can be addressed through information and

121
awareness campaigns. The fourth most-frequently cited reason was “I have no use for
it,” which could also possibly be addressed through information campaigns. Providing
bins can overcome step 5 (testing the new behavior), and providing information regarding
how many pounds of CO2 or methane were saved, or other resources saved or money
saved, may help residents get past step six, after which the habit should be formed.
Table 6.1 Stepwise Model of Behavioral Change Toward a Pro-Environmental Habit
Impeding Factors Substeps toward PEB habit Promoting factors
Strongly established, old habits
Priming of pro-environmental values
1) Activation Perceptions of others' PEB
2) Attending present behavior
Specific information about present
behavior and negative environmental
consequences
Negative beliefs about alternative 3) Consider alternative solution Evident, existing alternatives
Lack of specific knowledge 4) Planning new behavior Clear procedural instructions
Physical obstructions 5) Testing the new behavior
Unexpected negative
consequences
6) Evaluation of the new
behavior Positive feedback
7) Establishment of the new habit
Source: Dahlstrand and Biel (1997), p. 590
One final point regarding habit formation – as noted by Dahlstrand and Biel
(1997) and Verplanken and Orbell (2003), habit is not necessarily characterized by
frequency of behavior as traditionally thought. It is actually a (near) automatic response
to a cue. For example, when approaching a road that must be crossed in the U.S., most
people automatically look left, then right before the road is crossed. Most likely this is
done without thinking, but is actually an automated response to the external stimulus of

122
crossing the street. Thus a habitual behavior is largely the result of an association with
another factor. This relationship can be taken advantage of through structured
information campaigns that attempt to associate a desired behavioral outcome with a
given environmental cue. For example, leaflets could be given or emails sent to residents
with simple pictures and words that convey the message “Making a fresh pot of coffee?
Put the old grounds in your compost bin!” or other similar exhortations.
6.3.3 Comparison to Exeter Study
I could find no comprehensive contemporary study of waste management
behavior in the literature, with the exception of the study by Stewart Barr (2002), which
serves as the model for this research44
. Ideally, the results contained within this report
should be compared with results from similar studies in other cities, preferably in the
United States, in order to make regional comparisons. This would lend a strong spatial
component and would contribute to the literature in Regional Geography in addition to
the current focus on Environmental Perception and Behavioral Geography45
. This is an
important suggestion for future research. Note that Barr gathered his data in 1999, and
administered 983 surveys to randomly selected households using the “call and collect”
method, receiving 673 completed surveys in return (a 69% response rate). The survey
was 10 pages long, with self-reported behavior as the dependent variables. Barr does not
indicate the number of questions that were on the survey instrument.
44
Recall that this study was similar in most ways to Barr’s study, including the use of the behavioral
models, with the major exception that a) my study took place in a very different geographical context and
b) I integrated the habit construct in addition to the NEP, situational variables and psychological variables. 45
As I note in chapter 2, this study is inherently geographic in nature, but most specifically addresses issues
pertinent to Environmental Perception and Behavioral Geography.

123
A full comparison may be undertaken at a future date, but due to the limited scope
of this research, a few key components of the research will be compared. First, a
comparison of the NEP average scores and factor loadings can be seen in Table 6.2 and
Table 6.3, respectively. Recall that one of the primary goals of this research was to
contribute to the overall body of research regarding NEP, including dimensionality.
Table 6.2 Mean NEP Item Scores in Exeter and Denver Samples
NEP Scale Item Exeter46
Denver Difference
The environment is forgotten too often when decisions
are made (NEP 1) 3.88 4.21 7.8%
If we over-use our natural resources, human
development may be harmed in the future (NEP 2) 4.04 4.56 11.4%
Nature and the environment have as much value as
human beings (NEP 3) 3.8 4.09 7.1%
Humans should not develop any more resources or land,
in order to protect the natural environment (NEP 4) 3.21 3.02 -6.3%
Nature isn't harmed by human changes* (NEP 5) 4.14 4.6 10.0%
Human welfare should be our primary concern in the
future* (NEP 6) 2.92 2.81 -3.9%
The environment is of little concern to me* (NEP 7) 4.12 4.61 10.6%
Getting through daily life and surviving is what concerns
me the most, not the environment* (NEP 8) 3.45 3.86 10.6%
N 673 199
*Reverse coded
There are a few results outlined in Table 6.2 worth noting. First, it is clear that
the mean scores of the NEP items are relatively similar between the two samples, with no
single answer differing more than 11.4%. However, with the exception of items 4 and 6,
the Denver sample had higher average scores than the Exeter sample. This indicates that
the sample (not the population47
) in Denver had more robust environmental values, at
least according to the NEP construct used in these studies. It would be instructive to
research why these differences exist, and more importantly, attempt to make inferences to
46
Source: Barr 2002, p. 99 47
These are descriptive statistics, so no inferences can be made to the population.

124
the populations in both studies to determine if statistically significant environmental
value differences exist between the two cities. Second, it appears that these values are
largely normative behavior in the samples, as all scores were above average with the
exception of item number 6, though item 4 had just above average scores. These results
are not very surprising, given the nature of the questions. NEP 4 asks the level of
agreement with the notion that no more land or resources should be developed in order to
protect the environment. This is a relatively extreme viewpoint that even strong
environmentalists are likely to disagree with to an extent. Resources and land can be
developed with minimal environmental damage, so disagreeing with this statement does
not render one “anti-environment.” NEP 6 (reverse coded) states that “human welfare
should be our primary concern in the future.” This is less extreme than NEP 4, but
agreeing with this statement can be seen as morally correct, albeit in an anthropocentric
sense.
Finally, it is worth noting that the Deep Ecology item (NEP 3) that had what I
thought was a surprisingly high score (4.09) in Denver given its relatively extreme nature
(“Nature and the environment have as much value as human beings”), had a similarly
high score (3.80) in Exeter. This is a surprising result. An interesting topic for future
research is to look more in-depth into this construct to see if the population(s) at large has
an ecocentric worldview, as indicated by these descriptive results.

125
Table 6.3 NEP Factor Loadings in Exeter and Denver
Denver Exeter48
Factor
1
Factor
2
Factor
3
Factor
1
Factor
2
The environment is forgotten too often when decisions
are made (NEP 1) 0.812 0.172 0.124 0.643 0.388
If we over-use our natural resources, human
development may be harmed in the future (NEP 2) 0.751 0.244 0.160 0.690 0.329
Nature isn't harmed by human changes* (NEP 5) 0.731 -0.093 0.136 0.821 0.037
Nature and the environment have as much value as
human beings (NEP 3) 0.499 0.593 0.215 0.57 0.508
Humans should not develop any more resources or
land, in order to protect the natural environment (NEP
4) 0.356 0.672 0.009 0.062 0.842
Human welfare should be our primary concern in the
future* (NEP 6) -0.166 0.786 0.216 0.196 0.762
The environment is of little concern to me* (NEP 7) 0.299 0.004 0.809 0.835 0.129
Getting through daily life and surviving is what
concerns me the most, not the environment* (NEP 8) 0.062 0.312 0.796 0.464 0.553
Table 6.3 shows a comparison of the factor loadings for the NEP items in the two
studies. Interestingly, Factors 1 and 2 are nearly identical in both studies. The only
difference in Factor 1, which I termed “Pragmatic Environmentalism” is that in the
Exeter study, NEP 7 (“The environment is of little concern to me”) loads strongly onto
the factor. Factor 2 only differs in the Exeter study by virtue of NEP 3 not loading onto
it, whereas it does load weakly onto Factor 2 in Denver. It could be argued that due to
the relatively weak loading of NEP 3 in the Denver study, the Factor 2s are identical in
both studies. These are significant results, and they add power to the notion that certain
NEP items (NEP 1, 2, and 5; NEP 4 and 6) are likely unidimensional. Conversely, the
fact that Barr’s study found two factors and my study found three factors, as well as the
48
Source: Barr 2002, p. 114

126
slight differences in similar factors, indicates the importance of running a factor analysis
when utilizing NEP items in research. It would be instructive to do a wider-scale survey
of just the NEP items in both cities to see if similar results occurred, and if any
implications can be made about each city’s environmental value systems.
Barr also derived a behavioral model of recycling (but not composting) using regression
analysis and ultimately beta weights. It is clear from Table 6.4 that the Exeter study found
significantly more independent variables that impacted recycling behavior. It is important to note
that four of these variables were not found to have direct impacts on recycling behavior, but
predicted intention to act, which was a strong predictor of behavior. Barr calculated the indirect
effect of these variables, as indicated by the asterisk in Table 6.4.Table 6.4 Recycling Beta Weights
for Exeter and Denver Studies
Beta Weight
Independent Variable Exeter49
Denver
Willingness/intent 0.33
Has a curbside bin 0.28
Convenience/effort 0.27
Local waste knowledge (concrete knowledge) 0.19
Awareness of norm 0.1
Active concern* 0.07
Age 0.07
House type* 0.04
Knowledge sources* 0.03
Importance of nature 0.03
Acceptance of norm to recycle 0.009
Static recycling provision* -0.03
Habit 0.43
Concrete knowledge 0.24
Efficacy, convenience and attitude 0.24
Actual convenience (having a large bin) 0.14
Error term
0.46 0.43
R2
0.79 0.82
*Indirect effect, mediated by intention to recycle
This comparison has a few important implications. First, though Barr integrated
three times as many variables into his regression equation, his variables explained less of
the variance than in the Denver model. These r2
values are similar enough to be
essentially the same, and it is surprising that the model with significantly fewer
49
Source: Barr 2002, p. 122

127
independent variables was as powerful. This is likely due to the very high beta weight
for the habit construct. A very important result is that actual convenience (having a
curbside bin in Exeter and a large bin in Denver) was a strong predictor in both models.
Concrete knowledge is a strong predictor in both models as well. Convenience has been
cited in numerous studies (e.g. Berger 1997; Jenkins et al. 2003) as having a positive
correlation with recycling behavior. This is an intuitive result. Concrete knowledge, in
this case operationalized as knowledge of local waste rules, is also a logical predictor of
recycling behavior. It is clear that knowledge of how to recycle will be associated with
behavior, though the causal relationship is questionable.
6.3.4 Characteristics of (Ir)responsible Waste Managers
The cluster analysis revealed some details regarding generalized characteristics of
individuals who engaged in relative levels of waste management activity that cannot be
found elsewhere in this study. The cluster analysis resulted in three groups (“clusters”)
of respondents with summarized demographic characteristic, and so I am able to provide
a general portrait of what an Avid Recycler and Composter (ARC) (high self-reported
recycling and composting), an Avid Recycler (AR) (low level of composting) and a Poor
Waste Manager (PWM) (low levels of both behaviors) is. Generally speaking, an ARC is
likely to be middle-aged, educated, have a relatively high income, own their own single
family detached home, and identify themselves as a Democrat. An AR is likely to be
middle-aged, educated, middle-to-high income, own their own home which is likely a
single-family detached home, and identify themselves as a Democrat. Note that the only
significant difference between the first two groups is that the ARC is slightly more likely

128
to be middle-aged, less likely to be female, and likely to have a slightly higher income.
The PWM were likely to be young, less-educated than the other groups, low-to-middle
income, live in rental housing, and not identify as Democrats.
These findings have policy implications. As pointed out by Barr (2005), the most
highly committed PEB groups cannot improve their behavior much more, and thus waste
managers are not best served by focusing on changing this group’s behavior. Barr
believes that PWMs are probably not likely to change their behavior, so it is probably not
worth the time and effort to try to influence them. I agree with the first belief – the ARCs
have a high level of commitment to recycling and composting behavior, and are likely to
continue to do so. Also, they are the smallest group, so there is less to be gained. The
primary focus of composting campaigns should be the AR group, as they are likely the
most amenable to a PEB-based change such as composting, but also are the largest group,
comprising over 50% of the sample. Recycling campaigns should be focused on the third
group, since they are the only ones with low recycling rates. Policymakers can take into
account the results of the cluster and regression analyses to guide action. For example, it
may be beneficial to solicit relatively well-to-do home owners (not renters) during
composting campaigns. The campaign could utilize suggestions from the previous
section, such as providing specific information regarding composting procedures and/or
fostering associations between specific situations and desired behavior.
6.3.5 Neighborhood Comparison
The following six figures provide a graphical description of the demographic
variables that were found to be statistically significant in the cluster analysis.

129
Figure 6.3 Age Distribution of Denver Neighborhoods and Clusters
Figure 6.4 Income Distribution of Denver Neighborhoods and Clusters
Figure 6.5 Housing Type Distribution of Denver Neighborhoods and Clusters
0.0
1.0
2.0
3.0
4.0
5.0
0%10%20%30%40%50%60%70%80%90%
100%
50+
30-49
18-29
recycling score
composting score
0.0
1.0
2.0
3.0
4.0
5.0
0%10%20%30%40%50%60%70%80%90%
100%
over $75,000
$35,001 - $75,000
$35,000 or less
recycling score
composting score
0.0
1.0
2.0
3.0
4.0
5.0
0%10%20%30%40%50%60%70%80%90%
100%
other
detached
apartment
recycling score
composting score

130
Figure 6.6 Political Persuasion Distribution of Denver Neighborhoods and Clusters
Figure 6.7 Educational Attainment Distribution of Denver Neighborhoods and Clusters
0.0
1.0
2.0
3.0
4.0
5.0
0%10%20%30%40%50%60%70%80%90%
100%
other
Independent
Democrat
recycling score
composting score
0.0
1.0
2.0
3.0
4.0
5.0
0%10%20%30%40%50%60%70%80%90%
100%
Bachelor's+
no Bachelor's
recycling score
composting score

131
Figure 6.8 Homeownership Status Distribution of Denver Neighborhoods and Clusters
There are a couple of interesting implications of these results. First, it is clear that
there is not a great amount of variation in self-reported recycling and composting rates
between the neighborhoods, although the samples from Capitol Hill, City Park West,
Cory-Merril, and Whittier appear to recycle at a slightly lower rate than the others
sampled50
. For these four neighborhoods, mean recycling scores were approximately 3.0,
which means that items were overall “sometimes” recycled. This number is somewhat
deceiving, because as indicated in Figure 5.1, aerosol cans were recycled at such a low
rate (overall mean of 2.19) that recycling score means are artificially low. The mean
composting scores were even less variable than the recycling scores, and were all below
2.0 with the exception of City Park and Whittier.
These figures also demonstrate that the Avid Recyclers and Composters and Poor
Waste Managers (PWM) appear to be outlier groups, and may not be descriptive of any
of the neighborhoods. None of the neighborhoods appear to have similar recycling and
composting scores to either of these two clusters, but further analysis helps to clarify this.
50
Note that these are descriptive statistics, and make no inferences to the larger populations.
0.0
1.0
2.0
3.0
4.0
5.0
0%10%20%30%40%50%60%70%80%90%
100%
renter
homeowner
recycling score
composting score

132
Close inspection of the cluster analysis results (Table 5.23), in conjunction with close
inspection of Tables 6.3 – 6.8 help to assess the predictive capability of the cluster
analysis. It is clear that education level, homeownership status, and political persuasion
are the most egregiously different characteristics of the PWM relative to the other two
clusters51
. Table 6.5 offers a comparison of the frequency of these variables in the
neighborhoods and the clusters.
Table 6.5 Comparison of Key Cluster Variables and Neighborhood Demographics
Education Homeowner Political Persuasion Behavior
N
Bach.
Degree+
No
Bach.
Degree
Own Rent Dem Ind. Other Rec
Mean
Comp
.Mean
Neighborhoods
Congress
Park 20 85% 15% 75% 25% 70% 20% 10% 4.01 2.0
Capitol Hill 19 63% 37% 37% 63% 47% 21% 32% 2.95 1.6
Cheesman
Park 32 84% 16% 59% 41% 63% 9% 28% 3.74 1.7
Cory-Merril 18 89% 11% 67% 33% 56% 11% 33% 3.04 1.8
City Park
West 18 78% 22% 50% 50% 56% 11% 33% 2.97 1.3
City Park 23 78% 22% 48% 52% 35% 30% 35% 3.79 2.2
Speer 23 70% 30% 52% 48% 65% 13% 22% 3.50 1.7
Whittier 19 53% 47% 68% 32% 63% 16% 21% 3.11 2.1
Washington
Park West 27 85% 15% 52% 48% 67% 22% 11% 3.97 1.6
Clusters
Avid
Recyclers
and
Composters 32 88% 13% 72% 28% 66% 22% 13% 4.73 3.8
Avid
Recyclers 102 85% 15% 66% 34% 69% 13% 19% 4.34 1.3
Poor Waste
Managers 64 58% 42% 34% 66% 39% 20% 41% 1.55 1.4
This table is somewhat supportive of the predictive capability of the cluster
analysis. The highlighted cells in the “Neighborhoods” section indicate if a
51
The Avid Recyclers and Composters, and the Avid Recyclers are in fact very similar demographically.

133
neighborhood has a similar demographic characteristic as the PWM cluster. Given the
recycling and composting score comparisons between the clusters, one would expect that
the neighborhoods that match up most closely to the PWM would have a relatively low
recycling score, because a low recycling score is the only thing that truly distinguishes
the PWM from the other clusters. The results are mixed. The neighborhood that is most
demographically similar to the PWM is Capitol Hill, and Capitol Hill has the lowest
recycling score. However, City Park is similar to PWM, yet is tied for second-highest
recycling score. Further, City Park West has a very low recycling score, yet is
demographically quite different than PWM. These results indicate the need for further
research, and ideally a larger sample size within each neighborhood, but indicate that the
cluster analysis does have some merit.

134
Chapter 7 Conclusion
Waste management behavior has important energy, environmental, economic and
equity impacts. In the United States alone, nearly 132 million tons of municipal solid
waste were deposited in landfills in 2009, much of which was recoverable material (EPA
2010). Landfilling at such a high rate (over 55%) costs money, unnecessarily creates
greenhouse gas pollution, and represents a severe waste of valuable and increasingly
limited natural resources. Much of this waste can be diverted at the household level
through recycling and composting, but this diversion method requires buy-in from
individuals. In other words, household waste management is a behavioral process. This
presents a number of difficulties for those (policymakers, etc.) who wish to increase the
incidence of waste diversion at the household level, for the causes of specific human
behaviors can be influenced by many variables on multiple temporal, geographical, and
even psychological (id to superego) scales. Models and behavioral correlates are
frequently used in attempts to determine factors that lead to certain behaviors, which are
then used as the basis for interventions that are meant to engender desired behavioral
outcomes.
This research was undertaken in an attempt to describe recycling and composting
behavior in select areas of the City and County of Denver and determine predictors of
these behaviors, with the overarching goals of informing waste management policy and
contributing to the overall body of research in this field. The results of this study have
135
achieved all of these goals to varying degrees. In terms of the first overarching goal, the
following are general policy recommendations based on the results of this study:
Aerosol cans were recycled at a very low rate, and plastic bags were reportedly
frequently placed in home recycling bins. It appears that though overall recycling
rates are high, DR would be well-served to remind recyclers that aerosol cans are
recyclable, and plastic bags not. Plastic bags are particularly important to manage
because they can clog sorting machinery and slow down hand-sorting
Grass-cycling was common among the sample, but the top two reasons for not
grass-cycling are that respondents thought it would kill the grass and that is was
not “important.” Grass-cycling information campaigns should prominently
highlight that not only will it not kill the grass, but it will help it grow. This
information is on the DR website, but perhaps it could be more prominent.
Information campaigns should continue to focus on the importance, from personal
to global scales, of grass-cycling
Booklets that came with bins were the primary means of gathering recycling
information. It is recommended that booklets that detail composting and grass-
cycling should be provided when possible.
DR should entertain the possibility of charging for recycling and waste removal
services. Nearly all respondents would be willing to pay $12/year for waste
management services, which would provide upwards of $2 million in revenue,
minus the additional overhead of administering the payment system
136
Habit strength was the most important predictor of recycling and composting
behavior, so DR would be well-served to focus on ways to influence recycling
and composting habit formation. Dahlstrand and Biel’s (1997) habit formation
model would be very useful in this regard. As noted by Verplanken and Orbell
(2003) and others, habit is an automatic response to an external stimulus. Perhaps
a campaign promoting cueing would be helpful, for example by distributing
marketing materials or advertisements stating, “Making a pot of coffee? Put the
grounds and filter in the compost bin!”
It appears that holding environmental values does not influence behavior, but
climate change was cited as the most important motivation for responsible waste
management. Climate change was cited with greater frequency than job creation
and budgetary concerns. Perhaps stressing the climate-related benefits would be
useful, though it is important to note that this survey took place in 2007 prior to
the recession, thus new data should be gathered before informational campaigns
are undertaken.
Having a garden was a relatively strong predictor of composting behavior, thus
DR may be well-served to encourage gardening, perhaps teaming up with Denver
Urban Gardens to promote home and community gardening by residents.
Two of the top three reasons given for not composting at home are “I do not know
how to compost” and “I never thought about it.” Both of these can be addressed
through information and awareness campaigns.

137
The sampling method was very effective. Anyone with a cursory knowledge of
Geographic Information Systems could use the method described in Chapter 4 to select a
random sample of any size using any geographic constraints, whether a stratified random
sample of neighborhoods or other sections of the city, or a random sample of the whole
city. In addition, the sampling method results in the production of a map that can then be
used to administer surveys. The data used were free and publicly available, thus this
method could be used in any geographic area in the world if data layers are available.
This study also contributes to the wider body of research on correlates of waste
management behavior. It is the first piece of research to analyze the impact of habit
strength on domestic composting. Habit was found to be the strongest influence on self-
reported composting, and was more important than any of the other variables, which is a
significant outcome. Those studying composing behavior have ignored this line of
research – it is recommended that it be pursued further. Having a garden, perceived
convenience, attitude, and response and personal efficacy were all important predictors of
composting behavior as well. Similar to composting, recycling habit strength was found
to be the most impactful variable relative to recycling behavior, followed by concrete
knowledge; then perceived convenience, attitude, and response and personal efficacy; and
actual convenience. These results are similar to the ones realized by Barr (2002) in a
very similar study done in Exeter, England, which lend weight to the assertion that these
variables are important predictors of recycling and composting. Note that Barr did not
include habit in his models, which renders this study unique by virtue of its use of
variables.

138
The results regarding the dimensionality of the modified New Ecological
Paradigm scale were instructive, because the NEP was found to be made of three
constructs, all three of which were intuitive (Pragmatic Environmentalism, Deep
Ecology, and Enviro-centrism). These results contradict Barr (2002), who used the same
NEP scale and found only two factors. The NEP variables loaded similarly in both
studies, but not the same. This indicates that 1) future research is needed to study the
dimensionality and loading of this NEP scale, 2) it is important to undertake factor
analysis when using the NEP, and 3) perhaps NEP dimensionality vary according to
geographic location.
Many possible avenues of future research can be undertaken based on the results
of this study.
This analysis can be viewed as a “snapshot in time” of self-reported recycling and
composting behaviors in the neighborhoods studied. It would be instructive to
perform a similar analysis in the same neighborhoods currently, in an attempt to
discern if propensity to recycle has changed, and if so, why. Such a study may be
instructive in many other ways, for example, to determine if environmental
worldview has changed, if peer influence over recycling has changed, and if any
of the studied variables have changed, and/or if their impact on behavior has
changed.
It would also be instructive to see if the optional curbside composting program
currently being offered in Denver has altered self-reported composting rates, and
made composting a more normative behavior. It is presumed that making such a

139
service is available would result in the composting rates increasing and the
awareness of compost increasing, but perhaps only among certain segments of the
population.
Habit was found to be a strong influence on composting behavior. This is the first
piece of research to study the impact of habit on composting, and the strong
results indicate that this relationship should be further investigated, particularly in
terms of habit intervention.
The NEP item that expresses a Deep Ecology essential construct (“Nature and the
environment have as much value as human beings”) had a very high average
score in this study (4.09 out of 5), and Barr’s 2002 study (3.8). This is a
relatively extreme viewpoint. I am curious if this belief is indeed held by most
people, either in general or in these neighborhoods, or if the question is confusing
or otherwise being misinterpreted, and should be reworded.
The same or similar study should be undertaken in other cities in the United States
and elsewhere. The only published study to date that is similar is Barr’s 2002
study referred to above. Researching other cities would allow for regional
comparison, and would (hopefully) strengthen the results.
In a similar vein, if robust inter-neighborhood comparisons within Denver are to
be made, more samples need to be taken. This could provide insight into ways to
cater messaging and policies by neighborhood.
Finally, this study could be used as a model for research to include more of, if not
the entire City and County of Denver. Such research could be catered to the goals
140
and resources of whoever undertakes the study. If DR leads the research, they
could use this study as a model, and choose which variables they would like to
include based on their goals.
It is hoped that this research will be found useful by the City and County of Denver
in regards to its waste management policies. In the least, it provides a snapshot of many
factors related to recycling and composting in certain areas of the city, and can be used to
inform policy and assist in the formation of future avenues of policy research. This is the
first study of its kind in Denver - it will hopefully contribute to increasingly responsible
waste management in the city and beyond.
141
Bibliography
Agresti, A., and Finlay, B. (1997). Statistical methods for the social sciences, 3rd
Edition. Upper Saddle River, NJ: Prentice Hall.
Ajzen, I. (1991). The Theory of Planned Behavior. Organizational Behavior and
Human Decision Processes, 50, 179-211.
Albrecht, D., Bultena, G., Hoiberg, E., and Nowak, P. (1982). The New Environmental
Paradigm Scale. Journal of Environmental Education, 13, 39-43.
Bamberg, S., and Schmidt, P. (2003). Incentives, Morality, or Habit? Predicting
Students’ Car Use for University Routes with the Models of Ajzen, Schwartz, and
Triandis. Environment and Behavior, 35, 2, 264-285.
Barr, S. (2002). Household Waste in a Social Perspective: Values, Attitudes, Situation
and Behaviour. Hampshire, England: Ashgate.
Barr, S. (2006). Environmental action in the home: Investigating the ‘value-action’ gap.
Geography, 91(1), 43 – 54.
Barr, S., and Gilg, A.W. (2005). Conceptualizing and analyzing household attitudes and
actions to a growing environmental problem: Development and application of a
framework to guide local waste policy. Applied Geography, 25, 226-247.
Barr, S., Gilg, A., and Ford, N. (2005). Defining the multi-dimensional aspects of
household waste management: A study of reported behavior in Devon.
Resources Conservation and Recycling, 45, 172-192.
Batley, S.L., Colbourne, D., Fleming, P.D., and Urwin, P. (2000). Citizen versus
consumer: Challenges in the UK green power market. Energy Policy, 29, 479-
487.
Berger, I. (1997). The demographics of recycling and the structure of environmental
behavior. Environment and Behavior, 29, 4, 515-531.

142
Biel, A. (2003). Environmental Behaviour: Changing Habits in a Social Context. In A.
Biel, B. Hansson, and M. Martensson (Eds.). Individual and Structural
Determinants of Environmental Practice (pp. 11-25). Hants, England: Ashgate
Publishing Ltd.
Blaine, T.W., Lichtoppler, F.R., Jones, K.R., and Zondag, R.H. (2005). An assessment of
household willingness to pay for curbside recycling: A comparison of payment
card and referendum approaches. Journal of Environmental Management, 76, 15-
22.
Blatt, H. (2005). America’s Environmental Report Card. Cambridge and London: The
MIT Press.
Brown, T. A. (2006). Confirmatory factor analysis for applied research. New York:
Guilford Press.
Chen, M-F,, and Tung, P-J. (2010). The moderating effect of perceived lack of facilities
on consumers’ recycling intentions. Environment and Behavior, 42(6), 824-844.
City of Denver. (2011a). Trash and Recycling. Available at
www.denvergov.org/trashrecycling
City of Denver. (2011b). Trash and Recycling: Grass Trimmings/Grass Clippings.
Available at
http://www.denvergov.org/trashrecycling/TrashandRecycling/CompostingOrganic
s/GrassandYardWaste/tabid/438330/Default.aspx
Cordano, M., Welcomer, S.A., and Scherer, R.F. (2003). An analysis of the predictive
validity of the new ecological paradigm scale. The Journal of Environmental
Education, 34, 3, 22-28.
Corraliza, J.A., and Berenguer, J. (2000). Environmental values, beliefs, and actions.
Environment and Behavior, 32, 6, 832-848.
Dahlstrand, U. and Biel, A. (1997). Pro-Environmental Habits: Propensity Levels in
Behavioral Change. Journal of Applied Social Psychology, 27, 7, 588-601.
Denver Recycles. 2007. Retrieved 20 May 2007 at www.denvergov.org/recycle.
Derkson, L., and Gartrell, J. (1993). The social context of recycling. American
Sociological Review, 58, 3, 434-442.

143
Dillman, R.A. (1978). Mail and telephone surveys. New York: Wiley.
Dunlap, R. E., and Van Liere, K. D. (1978). The new environmental paradigm: A
proposed measuring instrument. The Journal of Environmental Education, 9, 10-
19.
Dunlap, R. E., Van Liere, K. D., Mertig, A. G., and Jones, R. E. (2000). Measuring
endorsement of the New Ecological Paradgm: A revised scale. Journal of Social
Issues, 56(3), 425-442.
Easterling, D., Miller, S., and Weingberger, N. (1995). Environmental consumerism – A
process of children’s socialization and families resocialization. Psychology and
Marketing, 12, 6, 531-550.
Ebreo, A., Hershey, J., and Vining, J. (1999). Reducing solid waste: Linking recycling
to environmentally responsible consumerism. Environment and Behavior, 31, 1,
107-135.
Edgardton, E., MkKechnie, J, & Dunleavy, K. (2009). Behavioral Determinants of
Household Participation in a Home Composting Scheme. Environment and
Behavior, 4(2), 151-169.
ESRI (Environmental Systems Resource Institute). (2007). ArcMap (Version 9.2.)
[computer software]. Redlands, CA: ESRI
Fang, M. F. and Tung, P.J. (2010). The Moderating Effect of Perceived Lack of
Facilities on Consumers’ Recycling Intentions
Fishbein, M., and Ajzen, I. (1975). Belief, attitude, intention and behavior: An
introduction to theory and research. Reading, MA: Addison-Wesley.
Hargreaves, T. (2011). Questioning the virtues of pro-environmental behavior research:
Towards a phronetic approach. Geoforum, 43(2012), 315 – 324.
Hines, J.M., Hungerford, H.R., and Tomera, A.N. (1987). Analysis and synthesis of
research on responsible environmental behavior: a meta analysis. Journal of
Environmental Education, 18, 1-8.
Honkanen, P., Olsen S. O., and Verplanken, B. (2005). Intention to consume seafood –
the importance of habit. Appetite, 45, 161-168.

144
Jenkins, R.R., Martinez, S.A., Palmer, K., and Podolsky, M.J. (2003). The determinants
of household recycling: a material-specific analysis of recycling program features
and unit pricing. Journal of Environmental Economics and Management, 45,
294-318.
Klöckner, C. A., and Oppendal, I. O. (2011). General vs. domain specific recycling
behavior – Applying a multilevel comprehensive action determination model to
recycling in Norwegian student homes. Resources, Conservation and Recycling,
55, 463-471.
Knussen, C., and Yule, F. (2008). “I’m not in the habit of recycling:” The role of
habitual behavior in the disposal of household waste. Environment and
Behavior, 40(5), 683-702.
McDonald, J. H. (2009). Handbook of biological statistics. Retrieved from
http://udel.edu/~mcdonald/statintro.html.
Nooney, J.G., Woodrum, E., Hoban, T.J., and Clifford, W.B. (2003). Environmental
worldview and behavior: Consequences of dimensionality in a survey of North
Carolinians. Environment and Behavior, 35, 6, 763-783.
O’Riordan, T. (1985). Future directions in environmental policy. Environment and
Planning A, 17, 11, 1431-1446.
Palatnik, R., Ayalon, O., and Shechter, M. (2005). Household demand for waste
recycling services. Environmental Management, 35, 2, 121-129.
Pearce, D., Markandya, A. and Barbier, E. (1989). Blueprint for a Green Economy.
London: Earthscan.
Peet, R. (1998). Modern geographical thought. Oxford: Blackwell Publishers Ltd.
Pirages, D.C., and P.R. Ehrlich. Ark II: Social Response to Environmental Imperatives.
San Francisco, CA: W.H. Freeman, 1974.
Pitt, Charlotte. Conversation, 13 May 2007.
SAS Institute, Inc. (2008). JMP (Version 9). [computer software]. Cary, NC: SAS
Institute, Inc.

145
Schahn, J., and Holzer, E. (1990). Studies of individual environmental concern: The role
of knowledge, gender, and background variables. Environment and Behavior, 22,
6, 767-786.
Seacat, J. D. and Northrup, D. (2010). An Information-Motivation-Behavioral Skills
Assessment of Curbside Recycling Behavior. Journal of Environmental
Psychology, 30, 393-401.
Shrive, F. M., Stuart, H., Quan, H., and Ghali, W. A. (2006). Dealing with missing data
in a multi-question depression scale: a comparison of imputation methods. BMC
Medical Research Methodology, 2006, 6:57. doi:10.1186/1471-2288-6-57.
Shultz, P.W., Oskamp, S., and Manieri, T. (1995). Who recycles and when? A review of
personal and situational variables. Journal of Environmental Psychology, 15,
105-121.
Steel, B. (1996). Thinking globally and acting locally? Environmental attitudes,
behavior and activism. Journal of Environmental Management, 47, 27-36.
Stern, P.C., Dietz, T., and Guagnano, G.A. (1995). The new ecological paradigm in
social-psychological context. Environment and Behavior, 27, 6¸ 723-743.
Stockburger, D.W. (n.d.). Multiple regression with categorical variables. Retrieved
from online academic statistics guide:
http://www.psychstat.missouristate.edu/multibook/mlt08m.html.
Swami, V., Chamorro-Premuzic, T., Snelgar, R, and Furnham, A. (2011). Personality,
individual difference, and demographic antecedents of self-reported household
waste management behaviors. Journal of Environmental Psychology,, 31(1), 21-
26.
Taylor, S., and Todd, P. (1995). An Integrated Model of Waste Management Behavior.
A Test of Household Recycling and Composting Intentions. Environment and
Behavior, 27, 5, 603-630.
Thompson, S.C.G. and Barton, M.A. (1994). Ecocentric and anthropocentric attitudes
toward the environment. Journal of Environmental Psychology, 14, 149-157.

146
United States Census Bureau (U.S. Census Bureau). (n.d.). Denver County, Colorado:
2005-2009 American Community Survey 5-year estimates. Accessed 11 May
2011 at
http://factfinder.census.gov/servlet/ACSSAFFFacts?_event=Search&_lang=en&_
sse=on&geo_id=0500 0US08031&_county=Denver+County.
United States Environmental Protection Agency (EPA). “Municipal Solid Waste in the
United States: 2005 Facts and Figures.” October 2006. Accessed 20 March
2007 at http://www.epa.gov/epaoswer/non-hw/muncpl/pubs/mswchar05.pdf
Verbeke, W., and Vackier, I. (2005). Individual determinants of fish consumption:
Application of the theory of planned behaviour. Appetite, 44, 67-82.
Verplanken, B. (2005). Habits and implementation intenions. In J. Kerr, R. Weitkunat,
and M. Moretti (Eds.). The ABC of behavioural change (pp. 99-109). Oxford:
Elsevier Science.
Verplanken, B., and Orbell, S. (2003). Reflections on Past Behaviour: A Self-Report
Index of Habit Strength. Journal of Applied Social Psychology, 33, 6, 1313-1330.
Vining, J., and Ebreo, A. (1990). What makes a Recycler? A comparison of recyclers
and non-recyclers. Environment and Behavior, 22, 1, 55-73.
Waste Management. (n.d.). Plastics recycling. Accessed 15 May 2011 at
http://www.wmnorthwest.com/guidelines/plasticrecycling.htm.
Whitmarsh, L., and O’Neill, S. (2010). Green identity, green living? The role of pro-
environmental self-identity in determining consistency across diverse pro-
environmental behaviors. Journal of Environmental Psychology,
30(2010), 305-314.
The United Nations Environmental Programme (UNEP). (2010). Environmental
indicators: Waste. Retreived from
http://unstats.un.org/unsd/environment/wastetreatment.htm
United States Environmental Protection Agency (EPA). (2006). Municipal solid waste
generation, recycling, and disposal in the United States: Facts and figures for
2006. Retrieved from http://cues.rutgers.edu/bioreactorlandfill/pdfs/19-
USEPA_MSW%20Facts_2006.pdf

147
United States Environmental Protection Agency (EPA). (2010). Municipal solid waste
in the United States: 2009 facts and figures. Retrieved from
www.epa.gov/osw/nonhaz/municipal/pubs/msw2009rpt.pdf

148
Appendices
Appendix A
Select Natural Resource Management Benefits of Recycling
Water Savings
Recycling one ton of paper saves 7000 gallons of water (a 58% savings), and
creates 35% less water pollution (EPA)
The recycling of Aluminum creates 97% less water pollution (Blatt 2005)
Steel recycling uses 40% less water and produces 50% less water pollution (Blatt
2005)
Glass recycling uses 50% less water (Blatt 2005)
Reusing any of these products (as opposed to recycling or disposing) saves nearly
100% water and water pollution
Energy Savings
Recycling aluminum uses 95% less energy; recycling one aluminum can saves the
equivalent of 6oz. of gas (Blatt 2005)
Each ton of recycled aluminum saves approximately 1 ton of petroleum products
(Blatt 2005) – this equates to over 2 million tons of petroleum products thrown
out in 2005 (EPA)
Recycled glass saves 50% energy; recycling of one glass container saves enough
energy to light a 100-watt light bulb for 4 hours; therefore, the equivalent of 32
million hours of light were thrown away last year (EPA)
Recycling paper saves 23 – 74% energy; the paper industry is the largest single
user of fuel oil in the country (Blatt 2005)

149
Raw Material and Aesthetics
Recycling 1 ton of paper saves approximately 17 adult trees – the equivalent of
over 71 million trees were thrown out in 2005 (EPA)
Each ton of recycled paper saves 60 lbs of air pollution (~ 1.25 million tons of air
pollution in 2005) (Center for Ecological Technology 2007); recycling paper
results in 35% less water pollution (Blatt 2005)
1 ton of recycled aluminum saves 4 tons of aluminum ore; recycling aluminum
causes 95% less air pollution and 97% less water pollution (Blatt 2005)
Nearly one ton of resources are saved by recycling 1 ton of glass – over 1300
pounds of sand, 433 pounds of limestone, 151 pounds of feldspar; recycled glass
produces 80% less mining wastes and 20% less air pollution (Blatt 2005)
Appendix B
Acceptable materials for curbside collection in Denver prior to June 2005
newspapers (including inserts and ads)
plastic bottles
glass bottles and jars
aluminum and steel cans
aluminum foil and pie tins
empty aerosol cans
Appendix C
Additional material accepted as of June 2005
mixed office paper
junk mail
magazines and catalogs
paperboard (cereal boxes, tissue
boxes, etc)
phone books
brown paper bags,
corrugated cardboard

150
Appendix D
Questionnaire given to all respondents
The following survey is being performed to obtain information about recycling
and composting behavior in Denver. Participation is voluntary, and you may
refuse to answer any question that you do not feel comfortable answering. You
must be at least 18 years of age to participate.
The City and County of Denver did not provide any names or addresses for this
study. It is being performed by an independent researcher.
However, information from this study may potentially be used by the City to
improve, add, or otherwise alter these services. Please answer all questions
honestly.
As you will see below, completing a survey will enter you into a drawing to
win a $50 cash prize. The survey will take about 10 - 15 minutes to complete.
Please answer as honestly as possible. It is not necessary to fill out all answers to
be entered into the drawing.
All answers are anonymous, and will not be shared with anyone. No information,
aside from the information you provide, is being used.
Thank you very much for your participation!

151
If you have any questions or concerns about this study, or you
would like to see the results, please contact me (Dan Kasper) at
[email protected] or (303)756-0386 (email preferred).
You may also contact my supervisor, Matthew Taylor, PhD, at the
University of Denver at [email protected], or (303)871-2656
Thank you again for participating in the survey!!
This study was approved by the University of Denver’s
Institutional Review Board for the Protection of Human Subjects
in Research on June 4, 2007. If you have any concerns or
complaints about how you were treated during this study, please
contact Dennis Witmer, Chair, Institutional Review Board for the
Protection of Human Subjects (303)871-2431, or Sylk Sotto-
Santiago, Office of Sponsored Programs (303)871-4052.
You may keep this page for your records

152
To thank you for participating in this survey, I will draw 3 random
surveys, and the winners will each receive a $50.
I will need contact information in the event your entry is drawn.
The information will only be used to contact you if your entry is
drawn. All information is strictly confidential, and will not be
used for any other purpose. If you do not win, your contact
information will be discarded. Good luck!
Please enter me in the drawing.
Name (first name will suffice) _________________
Phone number, email address, or mailing address
_________________
_________________
I do not wish to be entered into the drawing.
Thank you!

153
Please have the person/persons who most often takes care of the household waste
disposal answer the following questions. This person must be over 18 years of
age. Some of the questions may appear to be similar, but they do address
somewhat different issues. Please read each question carefully by circling the
number on the 5-point scale that corresponds to your answer.
For example, if it asks how often you throw away old furniture, and you always
do, you would circle 5:
: 1 : 2 : 3 : 4 : 5 :
never rarely sometimes usually always
However, if you almost never throw it away, you would circle 2:
: 1 : 2 : 3 : 4 : 5 :
never rarely sometimes usually always
If you throw it away only about half of the time, you would circle 3:
: 1 : 2 : 3 : 4 : 5 :
never rarely sometimes usually always
When filling in answers, please remember:
- circle only one answer per question
- answer all questions
This survey should take less than 20 minutes to fill out. Please answer as honestly
as you can. Thank you again for participating!
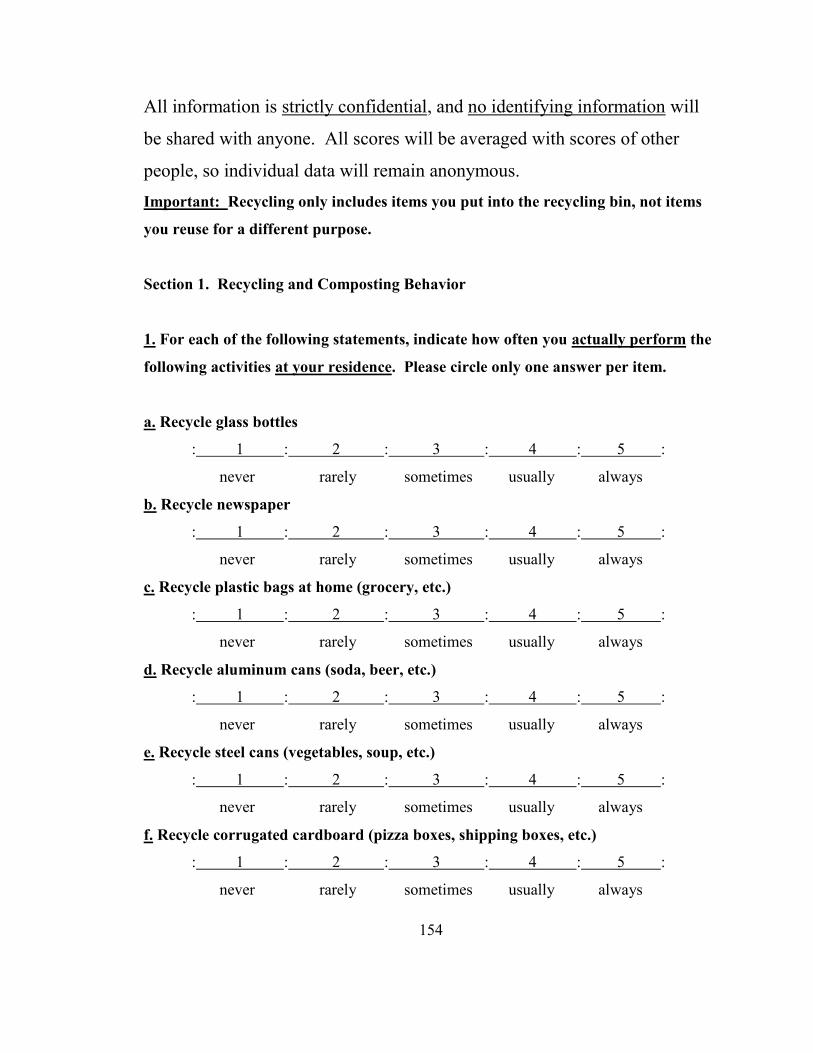
154
All information is strictly confidential, and no identifying information will
be shared with anyone. All scores will be averaged with scores of other
people, so individual data will remain anonymous.
Important: Recycling only includes items you put into the recycling bin, not items
you reuse for a different purpose.
Section 1. Recycling and Composting Behavior
1. For each of the following statements, indicate how often you actually perform the
following activities at your residence. Please circle only one answer per item.
a. Recycle glass bottles
: 1 : 2 : 3 : 4 : 5 :
never rarely sometimes usually always
b. Recycle newspaper
: 1 : 2 : 3 : 4 : 5 :
never rarely sometimes usually always
c. Recycle plastic bags at home (grocery, etc.)
: 1 : 2 : 3 : 4 : 5 :
never rarely sometimes usually always
d. Recycle aluminum cans (soda, beer, etc.)
: 1 : 2 : 3 : 4 : 5 :
never rarely sometimes usually always
e. Recycle steel cans (vegetables, soup, etc.)
: 1 : 2 : 3 : 4 : 5 :
never rarely sometimes usually always
f. Recycle corrugated cardboard (pizza boxes, shipping boxes, etc.)
: 1 : 2 : 3 : 4 : 5 :
never rarely sometimes usually always

155
g. Recycle paper board (cereal boxes, cracker boxes, etc.)
: 1 : 2 : 3 : 4 : 5 :
never rarely sometimes usually always
h. Recycle mixed office paper (junk mail, paper, etc.)
: 1 : 2 : 3 : 4 : 5 :
never rarely sometimes usually always
i. Recycle magazines and catalogs
: 1 : 2 : 3 : 4 : 5 :
never rarely sometimes usually always
j. Recycle phone books
: 1 : 2 : 3 : 4 : 5 :
never rarely sometimes usually always
k. Recycle aerosol cans
: 1 : 2 : 3 : 4 : 5 :
never rarely sometimes usually always
l. Recycle plastic bottles (soda, water, etc.)
: 1 : 2 : 3 : 4 : 5 :
never rarely sometimes usually always
m. Recycle plastic packaging (pretzel or chip bags, food packaging, etc.)
: 1 : 2 : 3 : 4 : 5 :
never rarely sometimes usually always
n. Recycle plastic tubs (yogurt, butter tubs, etc.)
: 1 : 2 : 3 : 4 : 5 :
never rarely sometimes usually always
o. Compost kitchen waste
: 1 : 2 : 3 : 4 : 5 :
never rarely sometimes usually always

156
p. Compost yard waste
: 1 : 2 : 3 : 4 : 5 :
never rarely sometimes usually always
q. Leave grass clippings in yard by not using a bagging mower (allowing clippings to
be spread over lawn by the mower)
: 1 : 2 : 3 : 4 : 5 : 6 :
never rarely sometimes usually always I don’t have
a lawn
2. Is composting an important issue to you?
: 1 : 2 : 3 : 4 : 5 :
unimportant of little moderately important very
importance important important
3. Is recycling an important issue to you?
: 1 : 2 : 3 : 4 : 5 :
unimportant of little moderately important very
importance important important
4. If Denver offered free compost pick up, how likely would you be to use the
service?
: 1 : 2 : 3 : 4 : 5 :
extremely somewhat average somewhat extremely
unlikely unlikely likely likely
5. If recycling service was free, but you paid more the more trash you threw away,
how likely would you be to recycle?
: 1 : 2 : 3 : 4 : 5 :
extremely somewhat average somewhat extremely
unlikely unlikely likely likely

157
6. How willing would you be to pay $1/month for pick-up composting service via a
large, alleyway bin?
: 1 : 2 : 3 : 4 : 5 :
extremely somewhat average somewhat extremely
unwilling unwilling willing willing
7. How willing would you be to pay $1/month (total) for garbage removal and
recycling services?
: 1 : 2 : 3 : 4 : 5 :
extremely somewhat average somewhat extremely
unlikely unlikely likely likely
8. If recycling and composting had an impact on global warming/climate change,
would they be important issues?
: 1 : 2 : 3 : 4 : 5 :
unimportant of little moderately important very
importance important important
9. If recycling and composting helped create jobs, would they be important issues?
: 1 : 2 : 3 : 4 : 5 :
unimportant of little moderately important very
importance important important
10. If recycling and composting contributed large amounts of money to the county
budget, would they be important issues?
: 1 : 2 : 3 : 4 : 5 :
unimportant of little moderately important very
importance important important
11. If recycling and composting saved or earned you money, would they be
important issues?
: 1 : 2 : 3 : 4 : 5 :
unimportant of little moderately important very
importance important important

158
12. How often does the curbside recycling get picked up, if available?
twice a week once a week every two weeks once a month don’t know
13. About how often do you put out the recycling bin for collection?
twice a week once a week every two weeks once a month
about every other month I don’t recycle
14. Which of the following items can you place in the curbside recycling bins (check
all that apply)?
newspaper glass bottles glass jars plastic bottles plastic grocery bags
plastic tubs (yogurt, butter containers, etc.) cardboard aluminum cans
plastic packaging (pretzel and chip bags, food wrappers, etc.) junk mail
loose paper glass cups tin cans food scraps don’t know
15. Do you need to separate your recyclables when placing them in the bin (for
example, put all glass in one bin, plastic in another, etc.)?
yes no don’t know
16. Where have you gotten information about Denver’s recycling program (check all
that apply)?
newspaper internet radio TV school work
booklet that comes with bin other (please list)__________________
17. Have you ever consulted Denver’s recycling website for waste management
information?
I wasn’t aware there was a recycling website
yes no I don’t use the internet

159
18. What recycling method do you have available at home?
small personal curbside bin (no wheels) large personal curbside bin (with wheels)
large community bin(s) pay for private company don’t recycle
other (please list)________
19. What, if anything, prevents you from composting regularly (mark all that
apply)?
composting service is unavailable do not want to store kitchen wastes in home
I’ve thought about it, but it’s not important never thought about it
my contribution to landfill is so small as to be unimportant
I have no use for it nothing - I compost regularly
I do not know how to compost other (please specify)________________
20. What, if anything, prevents you from recycling regularly (mark all that apply)?
it is not available at my residence lack of space to store recyclables
it is inconvenient my contribution to the landfill is so small that it’s unimportant
I’ve never thought about it I’ve thought about it, but it’s not important
takes too much time (cleaning containers, etc) do not want to separate materials
it’s too far to travel to the bin nothing - I recycle regularly
other (please list)____________
21. What, if anything, prevents you, or whoever mows the lawn, from leaving grass
clippings in yard by not using a bagging mower (mark all that apply)?
it kills the grass never thought about it thought about it, but it’s not important
I don’t have a lawn I don’t mow my lawn other (please list)_________
22. Do you have a home garden?
vegetable garden flower garden no garden

160
23. If yes, do you use your compost in your garden?
vegetable garden flower garden N/A (no garden)
24. To what extent do you agree with the following statements? Please circle the
appropriate number.
a. The environment is forgotten too often when decisions are made
: 1 : 2 : 3 : 4 : 5 :
strongly disagree undecided agree strongly
disagree agree
b. If we over-use our natural resources, human development may be harmed in the
future
: 1 : 2 : 3 : 4 : 5 :
strongly disagree undecided agree strongly
disagree agree
c. Nature and the environment have as much value as human beings
: 1 : 2 : 3 : 4 : 5 :
strongly disagree undecided agree strongly
disagree agree
d. Humans should not develop any more resources or land, in order to protect the
natural environment
: 1 : 2 : 3 : 4 : 5 :
strongly disagree undecided agree strongly
disagree agree
e. Nature isn’t harmed by human changes
: 1 : 2 : 3 : 4 : 5 :
strongly disagree undecided agree strongly
disagree agree
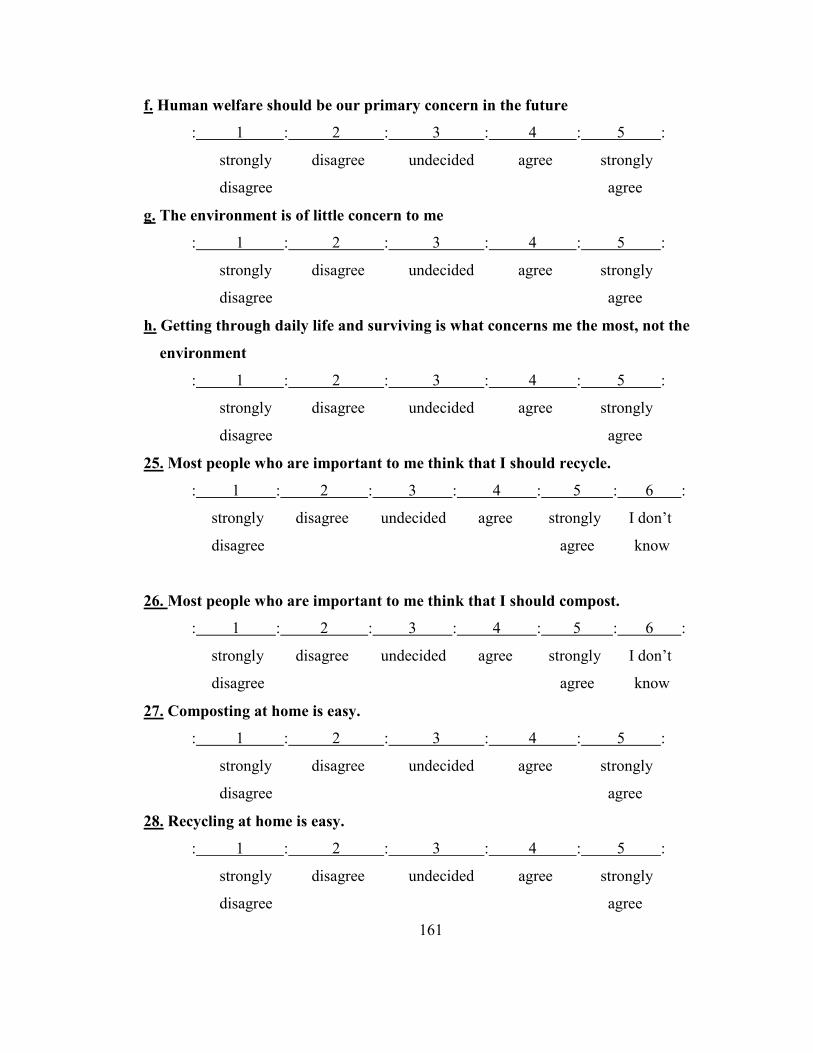
161
f. Human welfare should be our primary concern in the future
: 1 : 2 : 3 : 4 : 5 :
strongly disagree undecided agree strongly
disagree agree
g. The environment is of little concern to me
: 1 : 2 : 3 : 4 : 5 :
strongly disagree undecided agree strongly
disagree agree
h. Getting through daily life and surviving is what concerns me the most, not the
environment
: 1 : 2 : 3 : 4 : 5 :
strongly disagree undecided agree strongly
disagree agree
25. Most people who are important to me think that I should recycle.
: 1 : 2 : 3 : 4 : 5 : 6 :
strongly disagree undecided agree strongly I don’t
disagree agree know
26. Most people who are important to me think that I should compost.
: 1 : 2 : 3 : 4 : 5 : 6 :
strongly disagree undecided agree strongly I don’t
disagree agree know
27. Composting at home is easy.
: 1 : 2 : 3 : 4 : 5 :
strongly disagree undecided agree strongly
disagree agree
28. Recycling at home is easy.
: 1 : 2 : 3 : 4 : 5 :
strongly disagree undecided agree strongly
disagree agree

162
29. Most of my friends/family compost.
: 1 : 2 : 3 : 4 : 5 : 6 :
strongly disagree undecided agree strongly I don’t
disagree agree know
30. Most of my friends/family recycle.
: 1 : 2 : 3 : 4 : 5 : 6 :
strongly disagree undecided agree strongly I don’t
disagree agree know
31. I do not create enough waste to justify composting.
: 1 : 2 : 3 : 4 : 5 :
strongly disagree undecided agree strongly
disagree agree
32. I do not create enough waste to justify recycling.
: 1 : 2 : 3 : 4 : 5 :
strongly disagree undecided agree strongly
disagree agree
33. Composting is too time-consuming to worry about.
: 1 : 2 : 3 : 4 : 5 :
strongly disagree undecided agree strongly
disagree agree
34. Recycling is too time-consuming to worry about.
: 1 : 2 : 3 : 4 : 5 :
strongly disagree undecided agree strongly
disagree agree
35. Generally speaking, it is important that my friends/family approve of what I do
: 1 : 2 : 3 : 4 : 5 :
strongly disagree undecided agree strongly
disagree agree

163
36. Generally speaking, it is important that those who are important to me approve
of what I do
: 1 : 2 : 3 : 4 : 5 :
strongly disagree undecided agree strongly
disagree agree
37. Composting on a daily basis is possible for me.
: 1 : 2 : 3 : 4 : 5 :
strongly disagree undecided agree strongly
disagree agree
38. Recycling on a daily basis is possible for me.
: 1 : 2 : 3 : 4 : 5 :
strongly disagree undecided agree strongly
disagree agree
39. If I wanted a recycling bin, the City of Denver would give me one for free.
: 1 : 2 : 3 : 4 : 5 : 6 :
strongly disagree undecided agree strongly I don’t
disagree agree know
Composting is something…
40. I do frequently
: 1 : 2 : 3 : 4 : 5 :
strongly disagree undecided agree strongly
disagree agree
41. I do automatically
: 1 : 2 : 3 : 4 : 5 :
strongly disagree undecided agree strongly
disagree agree

164
42. I do without having to consciously remember
: 1 : 2 : 3 : 4 : 5 :
strongly disagree undecided agree strongly
disagree agree
43. that makes me feel weird if I do not do it
: 1 : 2 : 3 : 4 : 5 :
strongly disagree undecided agree strongly
disagree agree
44. I do without thinking
: 1 : 2 : 3 : 4 : 5 :
strongly disagree undecided agree strongly
disagree agree
45. that would require effort not to do it
: 1 : 2 : 3 : 4 : 5 :
strongly disagree undecided agree strongly
disagree agree
46. that belongs to my daily routine
: 1 : 2 : 3 : 4 : 5 :
strongly disagree undecided agree strongly
disagree agree
47. I start doing before I realize I’m doing it
: 1 : 2 : 3 : 4 : 5 :
strongly disagree undecided agree strongly
disagree agree
Composting is something…
48. I would find hard not to do
: 1 : 2 : 3 : 4 : 5 :
strongly disagree undecided agree strongly
disagree agree
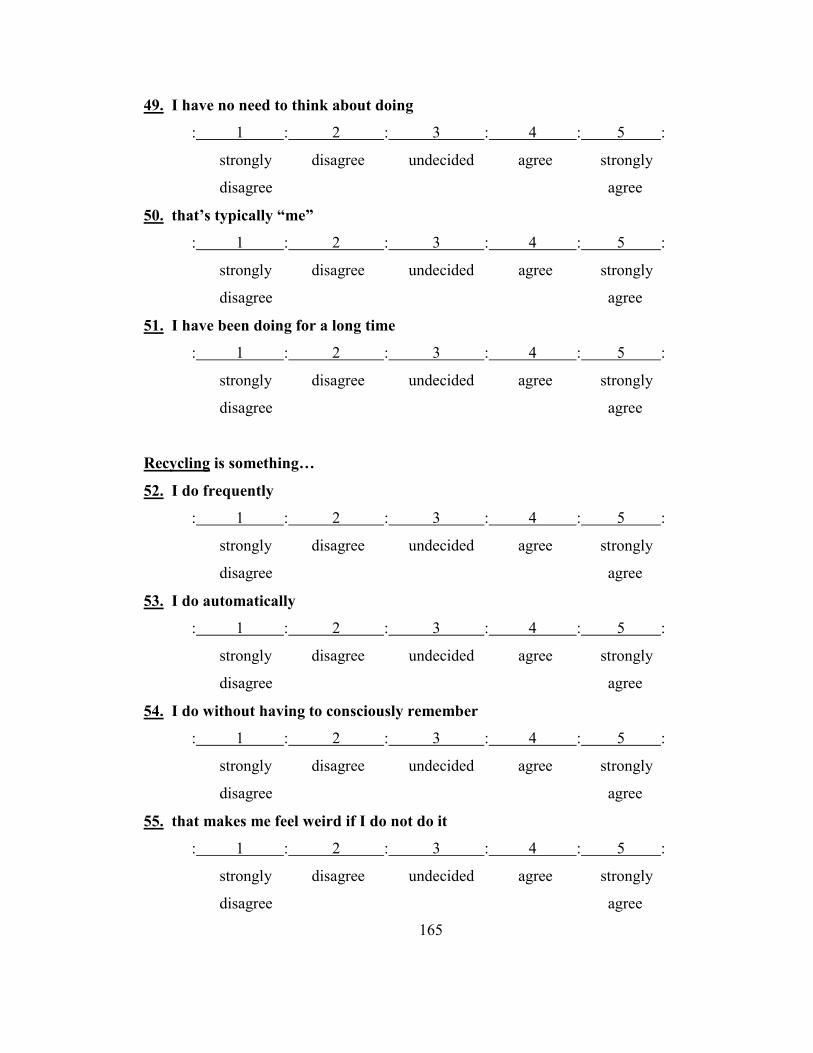
165
49. I have no need to think about doing
: 1 : 2 : 3 : 4 : 5 :
strongly disagree undecided agree strongly
disagree agree
50. that’s typically “me”
: 1 : 2 : 3 : 4 : 5 :
strongly disagree undecided agree strongly
disagree agree
51. I have been doing for a long time
: 1 : 2 : 3 : 4 : 5 :
strongly disagree undecided agree strongly
disagree agree
Recycling is something…
52. I do frequently
: 1 : 2 : 3 : 4 : 5 :
strongly disagree undecided agree strongly
disagree agree
53. I do automatically
: 1 : 2 : 3 : 4 : 5 :
strongly disagree undecided agree strongly
disagree agree
54. I do without having to consciously remember
: 1 : 2 : 3 : 4 : 5 :
strongly disagree undecided agree strongly
disagree agree
55. that makes me feel weird if I do not do it
: 1 : 2 : 3 : 4 : 5 :
strongly disagree undecided agree strongly
disagree agree

166
Recycling is something…
56. I do without thinking
: 1 : 2 : 3 : 4 : 5 :
strongly disagree undecided agree strongly
disagree agree
57. that would require effort not to do it
: 1 : 2 : 3 : 4 : 5 :
strongly disagree undecided agree strongly
disagree agree
58. that belongs to my daily routine
: 1 : 2 : 3 : 4 : 5 :
strongly disagree undecided agree strongly
disagree agree
59. I start doing before I realize I’m doing it
: 1 : 2 : 3 : 4 : 5 :
strongly disagree undecided agree strongly
disagree agree
60. I would find hard not to do
: 1 : 2 : 3 : 4 : 5 :
strongly disagree undecided agree strongly
disagree agree
61. I have no need to think about doing
: 1 : 2 : 3 : 4 : 5 :
strongly disagree undecided agree strongly
disagree agree
62. that’s typically “me”
: 1 : 2 : 3 : 4 : 5 :
strongly disagree undecided agree strongly
disagree agree
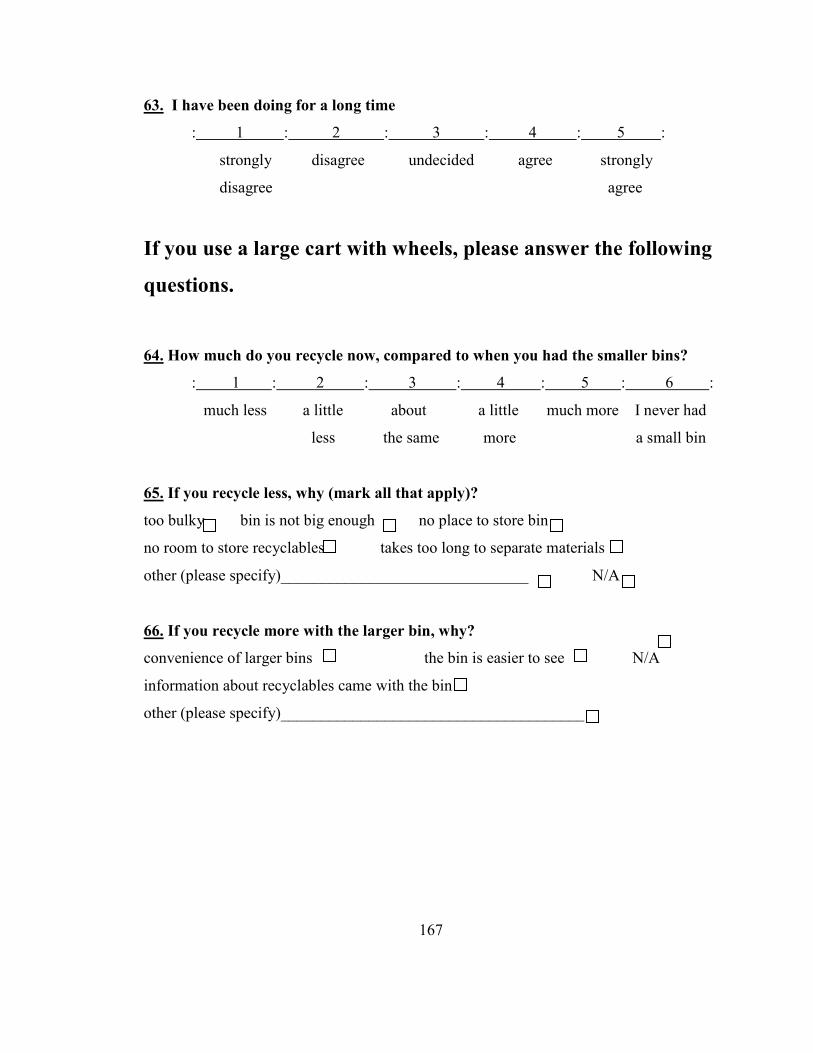
167
63. I have been doing for a long time
: 1 : 2 : 3 : 4 : 5 :
strongly disagree undecided agree strongly
disagree agree
If you use a large cart with wheels, please answer the following
questions.
64. How much do you recycle now, compared to when you had the smaller bins?
: 1 : 2 : 3 : 4 : 5 : 6 :
much less a little about a little much more I never had
less the same more a small bin
65. If you recycle less, why (mark all that apply)?
too bulky bin is not big enough no place to store bin
no room to store recyclables takes too long to separate materials
other (please specify)_______________________________ N/A
66. If you recycle more with the larger bin, why?
convenience of larger bins the bin is easier to see N/A
information about recyclables came with the bin
other (please specify)______________________________________

168
If you live in an apartment building with more than 7 apartments in it,
please answer the following question.
67. If you do recycle regularly, what service do you use?
private recycling company community bins on street/alley
community bins at grocery stores
other (please specify)________________________________________________

169
Section 2. Demographic Data. All information is strictly confidential, and will be
anonymous.
68. What age category do you belong to?
18-29 30-39 40-49 50-59 60-69 70+
69. What is your gender?
male female
70. How many years of formal education have you had?
12th
grade or less, no diploma high school or equivalent degree
some college, no degree Associate’s degree Bachelor’s degree
Graduate or professional degree
71. What is your approximate combined yearly household income?
less than 20,000 20,000-35,000 35,001-50,000
50,001-75,000 75,001-100,000 100,000+
72. How many people live in your residence, including yourself?
1 2 3 4 5 6 7 8+
73. Do you rent or own your home?
rent own
74. What type of residence do you live in?
detached house apartment duplex town home other_______
75. Which political affiliation do you most identify with?
Democrat liberal Democrat conservative Democrat liberal Republican
Republican conservative Republican don’t know Independent
Green Libertarian Other (please identify) ___________

170
76. Who takes out the recycling most often (check all correct answers)?
adult male adult female one certain child different children
all share duty equally
77. What race/ethnicity do you identify with most strongly?
White Black or African American Hispanic/Latino (of any race)
American Indian/Alaskan Asian Native Hawaiian or other Pacific Islander
Other (specify)__________ More than one race/ethnicity (list)____________
78. What language is most often spoken at your residence?
English Spanish Other (please list)____________
171
Please use the space below to write any comments about the survey, any
extra input you would like to provide, including how to improve recycling or
add composting services in Denver. If possible, please provide reasons why
you do or do not recycle and/or compost.
You have completed the survey. Thank you very much for
participating!
Remember to fill in your phone number or email address if
you’d like to enter in the drawing for the $50 prize!
Copyright © 2022 FDOKUMEN