Vorticity organization in the outer layer of turbulent channels with disturbed walls
10
J. Fluid Mech. (2007), vol. 591, pp. 145–154. c 2007 Cambridge University Press doi:10.1017/S0022112007008506 Printed in the United Kingdom 145 Vorticity organization in the outer layer of turbulent channels with disturbed walls OSCAR FLORES 1 , JAVIER JIM ´ ENEZ 1,2 AND JUAN C. DEL ´ ALAMO 3 1 School of Aeronautics, Universidad Polit´ ecnica de Madrid, 28040 Madrid, Spain 2 Center for Turbulence Research, Stanford University, Stanford, CA 94305, USA 3 MAE Department, University of California San Diego, La Jolla, CA 92093, USA (Received 13 June 2007 and in revised form 24 August 2007) The vortex clusters in the turbulent outer region of rough- and smooth-walled channels, and their associated velocity structures, are compared using data from numerical experiments at friction Reynolds numbers Re τ 674. The results indicate that the roughness of the wall does not affect their properties, particularly the existence of wall-detached and wall-attached populations, and the self-similar size distribution of the latter. The average flow field conditioned to the attached clusters reveals similar conical structures of low streamwise velocity for the rough- and smooth- walled cases, which eventually grow into the global modes previously identified from spectral analysis. We conclude that the vortex clusters of the turbulent outer region either originate away from the wall, or quickly forget their origin, in agreement with Townsend’s similarity hypothesis. 1. Introduction Turbulent wall flows are a challenging research subject with applications ranging from drag reduction to atmospheric dispersion. The analysis of how their outer layers may be influenced by the structures of the near-wall region is particularly useful, because the latter are altered by the hydraulically rough surfaces often found in engineering and geophysical flows, and because flow control strategies are usually implemented through actuators located at the wall. It has long been proposed that the inner–outer interactions are due to vortex loops connecting the two layers (see the review by Robinson 1991a ). The best-known theoretical models are variations of the vortex hierarchies proposed by Perry & Chong (1982) and Perry, Henbest & Chong 1986, loosely based on Townsend’s (1976, pp. 150– 162) attached-eddy hypothesis. Although those models were initially constructed from abstract eddies, with larger elements emerging from smaller ones through unspecified processes, they eventually evolved into collections of lambda-vortices growing from the wall. Such objects have been observed in low-Reynolds-number numerical simulations (Robinson 1991b ; Blackburn, Mansour & Cantwell 1996; Chong et al. 1998), and in experiments with relatively coarse resolutions (Adrian, Meinhart & Tomkins 2000; Ganapathisubramani, Longmire & Marusic 2003). The resulting picture is of packets of hairpin vortices growing from the wall into the outer region through self-induction, regeneration and mergers, generating long ramps of low streamwise velocity. A less organized model was proposed by del ´ Alamo et al. (2006) (hereafter AJZM06) after analysing vortex clusters in numerical channels at friction Reynolds numbers
-
Upload
independent -
Category
Documents
-
view
1 -
download
0
Transcript of Vorticity organization in the outer layer of turbulent channels with disturbed walls
J. Fluid Mech. (2007), vol. 591, pp. 145–154. c© 2007 Cambridge University Press
doi:10.1017/S0022112007008506 Printed in the United Kingdom
145
Vorticity organization in the outer layer ofturbulent channels with disturbed walls
OSCAR FLORES1, JAVIER JIMENEZ 1,2
AND JUAN C. DEL ALAMO3
1School of Aeronautics, Universidad Politecnica de Madrid, 28040 Madrid, Spain2Center for Turbulence Research, Stanford University, Stanford, CA 94305, USA
3MAE Department, University of California San Diego, La Jolla, CA 92093, USA
(Received 13 June 2007 and in revised form 24 August 2007)
The vortex clusters in the turbulent outer region of rough- and smooth-walledchannels, and their associated velocity structures, are compared using data fromnumerical experiments at friction Reynolds numbers Reτ 674. The results indicatethat the roughness of the wall does not affect their properties, particularly the existenceof wall-detached and wall-attached populations, and the self-similar size distributionof the latter. The average flow field conditioned to the attached clusters revealssimilar conical structures of low streamwise velocity for the rough- and smooth-walled cases, which eventually grow into the global modes previously identified fromspectral analysis. We conclude that the vortex clusters of the turbulent outer regioneither originate away from the wall, or quickly forget their origin, in agreement withTownsend’s similarity hypothesis.
1. IntroductionTurbulent wall flows are a challenging research subject with applications ranging
from drag reduction to atmospheric dispersion. The analysis of how their outer layersmay be influenced by the structures of the near-wall region is particularly useful,because the latter are altered by the hydraulically rough surfaces often found inengineering and geophysical flows, and because flow control strategies are usuallyimplemented through actuators located at the wall.
It has long been proposed that the inner–outer interactions are due to vortexloops connecting the two layers (see the review by Robinson 1991a). The best-knowntheoretical models are variations of the vortex hierarchies proposed by Perry & Chong(1982) and Perry, Henbest & Chong 1986, loosely based on Townsend’s (1976, pp. 150–162) attached-eddy hypothesis. Although those models were initially constructed fromabstract eddies, with larger elements emerging from smaller ones through unspecifiedprocesses, they eventually evolved into collections of lambda-vortices growing from thewall. Such objects have been observed in low-Reynolds-number numerical simulations(Robinson 1991b; Blackburn, Mansour & Cantwell 1996; Chong et al. 1998), and inexperiments with relatively coarse resolutions (Adrian, Meinhart & Tomkins 2000;Ganapathisubramani, Longmire & Marusic 2003). The resulting picture is of packetsof hairpin vortices growing from the wall into the outer region through self-induction,regeneration and mergers, generating long ramps of low streamwise velocity.
A less organized model was proposed by del Alamo et al. (2006) (hereafter AJZM06)after analysing vortex clusters in numerical channels at friction Reynolds numbers
146 O. Flores, J. Jimenez and J. C. del Alamo
Reτ 1900. Those clusters share many of the properties of the large-scale eddiesof the theoretical models of vortex forests, but they are ‘bags’ of vortices in whichindividual hairpins are difficult to identify. The clusters separate naturally into wall-attached and wall-detached families, and the attached ones have sizes and dimensionssimilar to the hairpin packets in Ganapathisubramani et al. (2003) and Tomkins &Adrian (2003). The average velocity field conditioned to an attached cluster containsa lambda-vortex with a wall-normal velocity ejection between its legs. Tanahashi et al.(2004) also observed that the large scales in a channel at Reτ = 800 were formed byvortex tangles, although they noted that the dominant vortex orientation is consistentwith hairpin legs (but with fewer heads) even far from the wall.
The origin and evolution of the vortex packets, whether organized or not, remainselusive, specially regarding how they move away from the wall. Zhou et al. (1999)described how a hairpin packet could be created from an initial lambda-vortex ina laminar channel with a turbulent mean profile, but neglected the backgroundfluctuations of real turbulent flows, which might alter significantly the process byshortening the lifetimes and lowering the intensities of the vortices. Moreover, theirhairpins moved only moderately far from the wall. AJZM06, showed that the lifetimesof the attached clusters are too short to have grown from the wall to their observedheights, and suggested that they originate at all heights, sizes and wall distances.
The origin of the vortex packets of the outer layer has implications for flows overrough walls. The classical theory states that the outer region is independent of the wallroughness and of the fluid viscosity ν, as long as the Reynolds number is high enough,and the roughness height, k, is much smaller than the flow thickness h (Townsend1976, pp. 139–143). This approximation has been the subject of controversy in recentdecades (see the review by Jimenez 2004) but the evidence is now in its favour. Recentexperiments and numerical simulations of rough-walled turbulent boundary layersand channels with k/h 0.04 and Reτ ∈ [400–5000] agree well with smooth-wall data(Keirsbulck et al. 2002; Ashafarian, Andersson & Manhart 2004; Flack, Schultz, &Shapiro 2005; Bakken et al. 2005; Flores & Jimenez 2006).
This evidence is hard to reconcile with a model in which the important flowstructures are born near the wall. One would then expect that the organization ofthe outer layer would be altered by the roughness. It favours AJZM06’s view thatvortex clusters/packets are born at different wall-normal positions, or that clustersform at the wall, but quickly forget their origin and reach some local equilibrium withthe outer layer. Either way, the importance of the wall is diminished. In this paper,we present new evidence for wall independence by comparing the vortex clusters innumerically simulated turbulent channels with smooth and rough walls.
2. Numerical experiments and cluster identificationWe use data from direct numerical simulations of plane turbulent channels at
Reτ = uτh/ν ≈ 600, where uτ is the friction velocity, and h is the channel half-width.The experiments are summarized in table 1, and documented comprehensively by delAlamo et al. (2004) and Flores & Jimenez (2006). We denote variables in wall unitswith a + superscript. The streamwise, wall-normal and spanwise coordinates are x, y
and z, and the corresponding velocity components are u, v and w. The case labelledS has smooth walls, while the cases labelled R have harmonic velocity disturbancesprescribed at the walls, which successfully mimic the effect of wall roughness bydestroying the near-wall energy cycle (Flores & Jimenez 2006). The wall disturbancesin R1 only have streamwise and wall-normal components, whereas those in R2
Vorticity organization over disturbed walls 147
Case Reτ Lx/h Lz/h x+ z+ y+ k+s h+
R αc NC Natt
S 547 8π 4π 13.4 6.7 6.7 – – 0.0024 1.9 × 10⁶ 1.4 × 10⁵
R1 632 8π 4π 11.6 5.8 8.0 129 93 0.0046 2.3 × 10⁶ 1.7 × 10⁵
R2 674 4π 2π 12.4 6.2 8.6 207 146 0.0034 1.0 × 10⁶ 0.8 × 10⁵
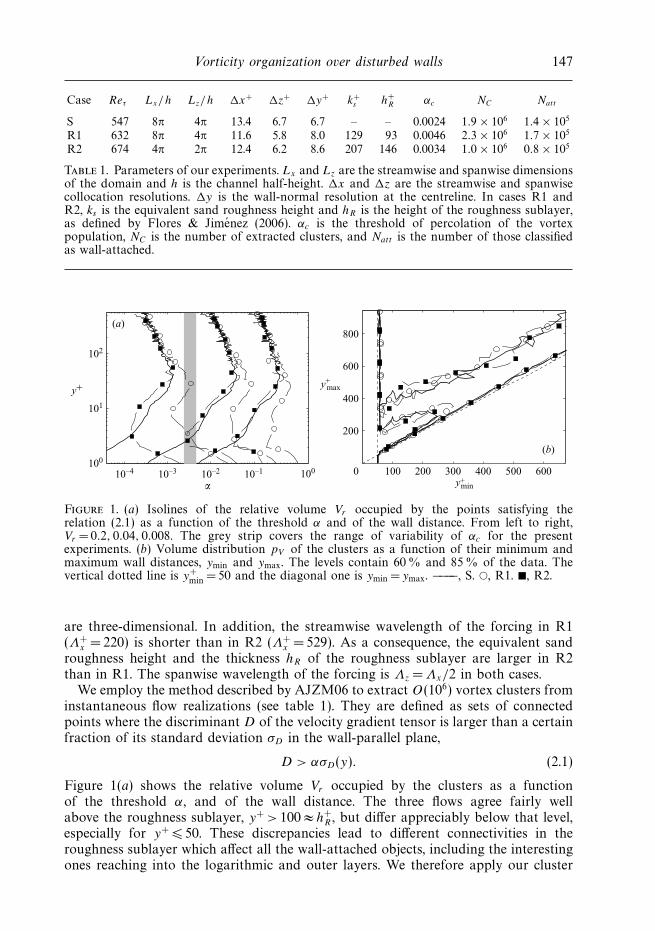
Table 1. Parameters of our experiments. Lx and Lz are the streamwise and spanwise dimensionsof the domain and h is the channel half-height. x and z are the streamwise and spanwisecollocation resolutions. y is the wall-normal resolution at the centreline. In cases R1 andR2, ks is the equivalent sand roughness height and hR is the height of the roughness sublayer,as defined by Flores & Jimenez (2006). αc is the threshold of percolation of the vortexpopulation, NC is the number of extracted clusters, and Natt is the number of those classifiedas wall-attached.
102
101
100
10–4 10–3 10–2 10–1 100
α
y+
0 100 200 300 400 500 600
200
400
600
800
y+min
y+max
(a)
(b)
Figure 1. (a) Isolines of the relative volume Vr occupied by the points satisfying therelation (2.1) as a function of the threshold α and of the wall distance. From left to right,Vr = 0.2, 0.04, 0.008. The grey strip covers the range of variability of αc for the presentexperiments. (b) Volume distribution pV of the clusters as a function of their minimum andmaximum wall distances, ymin and ymax. The levels contain 60 % and 85 % of the data. Thevertical dotted line is y+
min = 50 and the diagonal one is ymin = ymax. −−−−, S. , R1. , R2.
are three-dimensional. In addition, the streamwise wavelength of the forcing in R1(Λ+
x = 220) is shorter than in R2 (Λ+x = 529). As a consequence, the equivalent sand
roughness height and the thickness hR of the roughness sublayer are larger in R2than in R1. The spanwise wavelength of the forcing is Λz = Λx/2 in both cases.
We employ the method described by AJZM06 to extract O(106) vortex clusters frominstantaneous flow realizations (see table 1). They are defined as sets of connectedpoints where the discriminant D of the velocity gradient tensor is larger than a certainfraction of its standard deviation σD in the wall-parallel plane,
D > ασD(y). (2.1)
Figure 1(a) shows the relative volume Vr occupied by the clusters as a functionof the threshold α, and of the wall distance. The three flows agree fairly wellabove the roughness sublayer, y+ > 100 ≈ h+
R , but differ appreciably below that level,especially for y+ 50. These discrepancies lead to different connectivities in theroughness sublayer which affect all the wall-attached objects, including the interestingones reaching into the logarithmic and outer layers. We therefore apply our cluster
148 O. Flores, J. Jimenez and J. C. del Alamo
identification algorithm to the truncated domain 50 < y+ < 2Reτ − 50 for the threeflows in table 1, which allows us to compare consistently the clusters from the rough-and the smooth-walled cases. The results obtained from full channels, and fromchannels truncated at other wall distances, agree qualitatively with those presentedbelow.
In our analysis, we use α = 0.0055 ≈ αc, where αc is the critical threshold below whicha cluster percolates throughout the truncated channel (see table 1). The percolationthresholds from cases S, R1 and R2 differ little from one another, taking into accountthat α multiplies a sixth power of the vorticity. This is emphasized by the narrownessof the grey bar representing the range of variability of αc in figure 1(a). Our valueof α is closer to the percolation threshold than those used by AJZM06, because onlywhen α ≈ αc does the vortex distribution become independent of Reτ in the outerregion. This allows us to compare the results from S, R1 and R2 despite their differentReynolds numbers. The results for other values of α are very similar (Flores 2007).
Figure 1(b) shows isocontours of the distribution of volume occupied by theclusters as a function of the minimum and maximum wall distances of these objects,pV (ymin, ymax). Similar to the smooth-wall cases reported by AJZM06, the shapeof pV suggests that the population of clusters in rough-walled channels may bedivided into wall-detached and wall-attached families. The wall-detached family is thewide inclined strip where the volume distribution is approximately homogeneous,pV ≈ pV (ymax − ymin), and is formed by clusters that reside away from the wall. Thewall-attached family is the thin vertical strip formed by clusters whose minimum walldistance coincides with the boundary of the truncated-height channel, y+
min = 50.Because our definition of an attached cluster is slightly different from that in
AJZM06 (y+min < 20), we classify as attached some objects that they would have
classified as detached. However, the differences are small, especially for large clustersreaching the outer region. The analysis of pV (ymin, ymax) in full channels (plotted inAJZM06) shows that 25 % of the clusters in S with y+
max = 100, and 10 % of those withy+
max = 200, switch families between the two definitions. These figures only represent6% of the total cluster population. Similar results are obtained for cases R1 and R2.
In the rest of this paper, we analyse the wall-attached clusters to evaluate thepossibility of inner–outer interactions caused by vortex loops emanating from thebuffer layer. We focus on them because they are important for the dynamics of theouter region (AJZM06), and because they could be argued to depend on the details ofthe wall, due to their wall-attached nature. The detached clusters are just dissipativeeddies and, as expected, are not affected by the wall (for more details see AJZM06and Flores 2007).
3. The geometry and distribution of the attached clustersFigure 2(a) shows joint p.d.f.s of the streamwise and wall-normal sizes of the
attached clusters (∆x , ∆y), defined as those of the Cartesian boxes that circumscribethem. In AJZM06, the attached clusters had y+
min < 20, and ∆y = ymax − ymin andymax were roughly equal. In our case, the minimum wall distance of the attachedclusters very likely lies below the truncation level, y+
min = 50. Since this cutoff can bean appreciable fraction of the cluster height, ymax seems a better measure of thatheight than ∆y . However, we use ∆y in figure 2(a) because the length of the cluster∆x is only measured above y+
min = 50.In the preparation of the figure, clusters with vortex volumes smaller than 303 wall
units have not been considered because their sizes are of the order of the simulation
Vorticity organization over disturbed walls 149
102
101
102 103
∆+x
–2 –1 0 1 2
–0.5
0
0.5
1.0
rx
ry
(a) (b)
∆+y
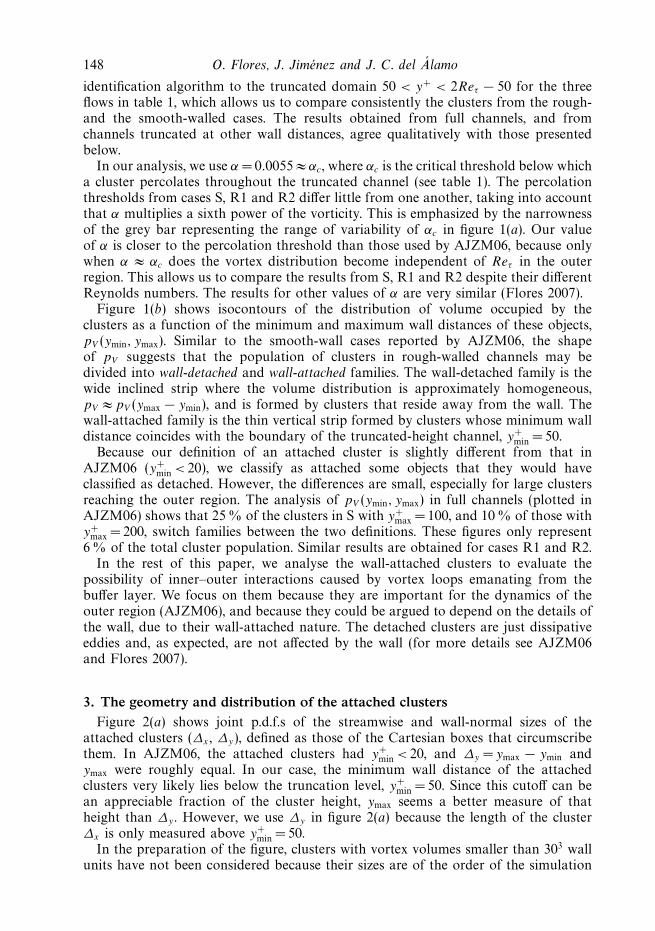
Figure 2. (a) Isolines of the joint p.d.f.s of the logarithms of the length and the height of theattached clusters p(∆+
x ,∆+y ), containing 40 % and 94 % of the data. The shaded patches are
contours of the premultiplied spectral density φvv(λx, y − ymin) of v2 from case S, while thedashed lines correspond φvv from case R1. We have plotted the levels 1/4 and 1/2 times themaximum of φvv , using the correspondence λ ∼ ∆. The straight solid line is (3.1). (b) P.d.f. ofthe relative positions of the vortex cores in the circumscribing boxes of the attached clusterswith y+
max > 100. The contours contain 20 %, 50 % and 80 % of the data. −−−−, S. , R1. ,R2.
grid. The results show that the distributions of sizes of the attached clusters do notdepend on the wall forcing, with the exception of the clusters that are fully containedin the roughness sublayer of channels R1 and R2 (∆+
y 50). Even in that case, thesize of the clusters is not set by the wavelength of the forcing. Similar results areobtained for p(∆+
z , ∆+y ) and p(∆+
x , ∆+z ), not shown here. In all of these distributions,
the clusters from our three flows show the self-similar scalings reported by AJZM06,
∆x ≈ 3∆y, ∆x ≈ 2∆z. (3.1)
Figure 2(a) also includes the spectral energy densities of v for S (shaded) and R1(dashed lines), as functions of y − ymin, showing the good agreement between therough- and the smooth-walled cases. Furthermore, the most energetic scales coincidereasonably well with the cluster sizes, consistent with the idea that the attachedclusters are markers for wall-normal velocity structures. Notice that this conclusion isnot invalidated by the imperfect agreement in figure 2(a), because the correspondencebetween wall distance and cluster height is only approximate, and because sizes areproportional but not equal to spectral wavelengths (Jimenez, del Alamo & Flores2004).
The average shape of the tall attached clusters is shown in figure 2(b), which presentsp.d.f.s of the coordinates of the points belonging to each cluster, with respect to thecentre, xc, zc, and yc = ymax/2, of its circumscribing box. The scaled position vectorin that reference frame is defined as r = (x − xc)/yc. The results show that the p.d.f.sof (rx, ry) depend little on the nature of the wall. The slight discrepancy observedfor the outer contour at |rx | ≈ 1 shows that the attached clusters are slightly moreelongated in the smooth- than in the rough-walled channel. The observed differencesdisappear when larger clusters are considered, or when the channel is truncated aty+
min = 100, which suggests that these differences are caused by the lower mean shearnear the rough walls, rather than by the direct effect of the wall disturbances. This isconfirmed because the transverse p.d.f.s of (rx, rz) and (rz, ry), which are not affectedby the shear, agree perfectly for the smooth- and rough-walled cases (not shown).
150 O. Flores, J. Jimenez and J. C. del Alamo
ry
ry
5
(a)
–10 0 5 10 15 20
0
2
rx
–10 5 0 5 10 15 20
0
2 (b)
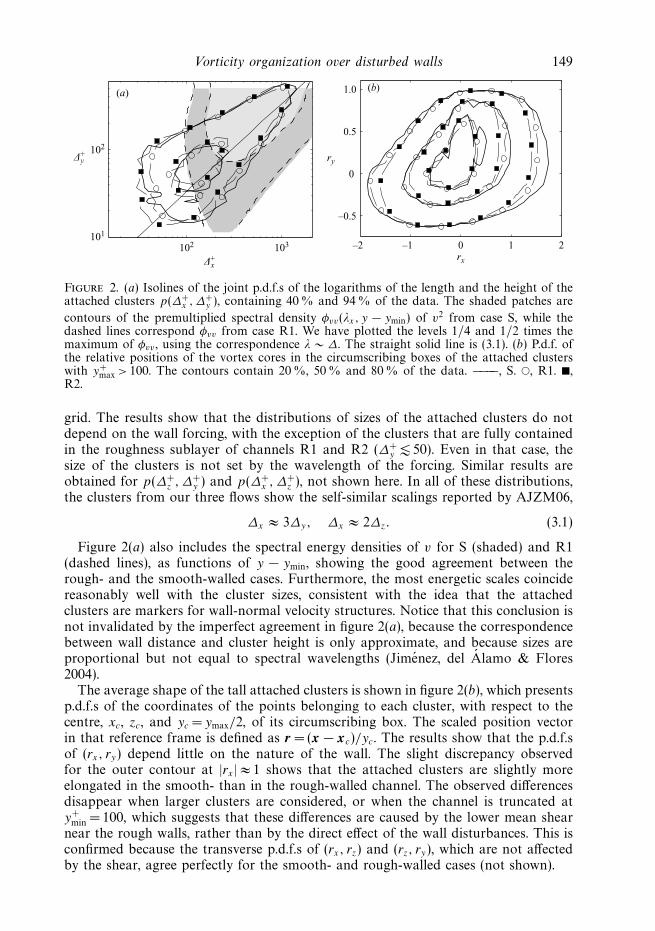
Figure 3. Quiver plot of the average fluctuating velocity field (〈u′〉, 〈v′〉) conditioned to thepresence of tall attached clusters (y+
max > 200). The data are taken at the plane rz = 0. Thecontour lines are 〈u′〉+ = −0.05, −0.1. The shaded contours contain 33 % and 66 % of thep.d.f. of the positions of points inside the conditioning clusters. The dashed lines have a slopeof 8. (a) S, longest arrow 0.93uτ . (b) R1, longest arrow 0.81uτ .
The results presented in figure 2 indicate that the sizes and shapes of the attachedclusters are not affected by the nature of the wall. Flores (2007) shows that this is alsotrue for other cluster properties, such as the fraction of Reynolds stresses containedin their circumscribing boxes, or their volume density per unit wall distance. Theseresults suggest that the attached clusters are either generated away from the wall, orthat they forget their origin soon after they are born. Note that the two possibilitiesdo not exclude each other: the lifetimes of the wall-normal velocity reported byAJZM06 support the first, while the analysis by Flores & Jimenez (2007) of the linearevolution of concentrated perturbations in a logarithmic layer supports the second.
4. The average velocity field conditioned to the tall attached clustersWe mentioned in the introduction that the conditionally averaged flow field in the
neighbourhood of the attached clusters contains a lambda-vortex and a v-ejection.AJZM06 showed that, in smooth channels, it also anchors a conical low-u structurethat was too long to be contained within their averaging box, but that was at least 10times longer than the conditioning cluster. In this section, we analyse the effect of wallroughness on those structures. We have excluded data from R2, whose box length ismarginally too short for that purpose, even though its conditionally averaged fieldsare in qualitative agreement with those below.
We define the average velocity fluctuations conditioned to a cluster set as
〈u′〉(r) =
N∑i
u′(xc,i + yc,i r)y3c,i
/ N∑i
y3c,i , (4.1)
where the prime denotes fluctuations with respect to the mean velocity profile, andthe subindex i refers of the ith cluster of the set. As in AJZM06, the weight factor y3
c,i
ensures that (4.1) is an unbiased ensemble average, since the probability of samplinga given structure is proportional to its volume. Figure 3 shows 〈u′〉(rz =0) for tallattached clusters, defined here as those with y+
max > 200. The results from the two casesare nearly identical, and similar to the conical wakes obtained by AJZM06 at higherReynolds numbers. The main difference is that the upstream (left) part of the wakeis shorter for R1, probably due to the lower mean shear of this flow below y+ ≈ 100.
Vorticity organization over disturbed walls 151
(a)
(b)
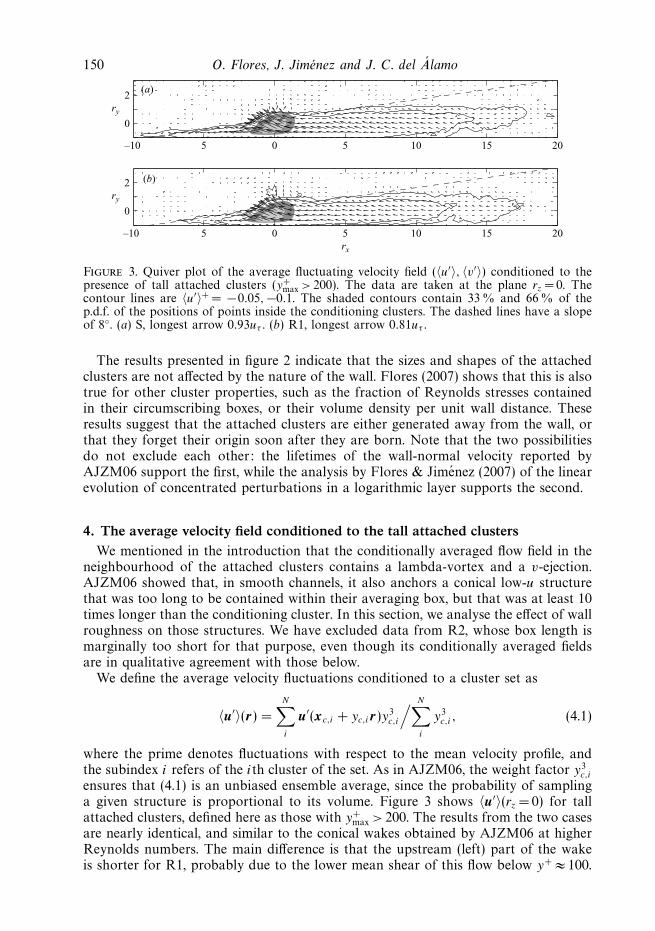
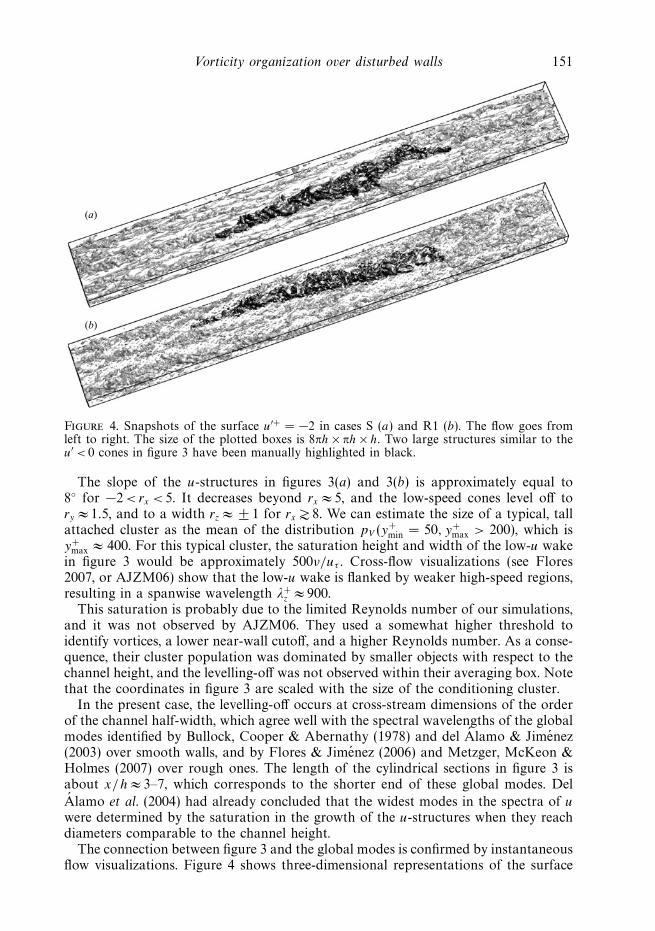
Figure 4. Snapshots of the surface u′+ = −2 in cases S (a) and R1 (b). The flow goes fromleft to right. The size of the plotted boxes is 8πh × πh × h. Two large structures similar to theu′ < 0 cones in figure 3 have been manually highlighted in black.
The slope of the u-structures in figures 3(a) and 3(b) is approximately equal to8 for −2 < rx < 5. It decreases beyond rx ≈ 5, and the low-speed cones level off tory ≈ 1.5, and to a width rz ≈ ± 1 for rx 8. We can estimate the size of a typical, tallattached cluster as the mean of the distribution pV (y+
min = 50, y+max > 200), which is
y+max ≈ 400. For this typical cluster, the saturation height and width of the low-u wake
in figure 3 would be approximately 500ν/uτ . Cross-flow visualizations (see Flores2007, or AJZM06) show that the low-u wake is flanked by weaker high-speed regions,resulting in a spanwise wavelength λ+
z ≈ 900.This saturation is probably due to the limited Reynolds number of our simulations,
and it was not observed by AJZM06. They used a somewhat higher threshold toidentify vortices, a lower near-wall cutoff, and a higher Reynolds number. As a conse-quence, their cluster population was dominated by smaller objects with respect to thechannel height, and the levelling-off was not observed within their averaging box. Notethat the coordinates in figure 3 are scaled with the size of the conditioning cluster.
In the present case, the levelling-off occurs at cross-stream dimensions of the orderof the channel half-width, which agree well with the spectral wavelengths of the globalmodes identified by Bullock, Cooper & Abernathy (1978) and del Alamo & Jimenez(2003) over smooth walls, and by Flores & Jimenez (2006) and Metzger, McKeon &Holmes (2007) over rough ones. The length of the cylindrical sections in figure 3 isabout x/h ≈ 3–7, which corresponds to the shorter end of these global modes. Del
Alamo et al. (2004) had already concluded that the widest modes in the spectra of u
were determined by the saturation in the growth of the u-structures when they reachdiameters comparable to the channel height.
The connection between figure 3 and the global modes is confirmed by instantaneousflow visualizations. Figure 4 shows three-dimensional representations of the surface

152 O. Flores, J. Jimenez and J. C. del Alamo
–5 0 5 10 15 200
5
10
15
20
rx
–Uw
/Vw
–5 0 5 10 15
(a) (b)
200
0.1
0.2
0.3
0.4
rx
–U+ w
, V+ w
Figure 5. Mean velocity fluctuations inside the cone, Uw and Vw (see (4.2)), for attachedclusters with y+
max > 200. (a) Velocities in wall units, solid lines correspond to −U+w and dashed
lines to V +w . (b) Ratio −Uw/Vw , the horizontal line is −Uw/Vw = 6. −−−−, S. , R1.
u′+ = −2 in sub-domains of S and R1. A large conical structure, reminiscent of theaveraged velocity fields in figure 3, has been highlighted near the centre of each plot.Although the details of the highlighting are arbitrary in that both structures couldbe continued into much longer roughly cylindrical streaks, the identification of theinitial conical part is in each case essentially unambiguous. The longer downstreamstructures attached to these regions have lengths of the same order as the simulationbox, and recall the very long u-structures identified over smooth (Kim & Adrian 1999;del Alamo et al. 2004; Hutchins & Marusic 2007) and rough (Flores & Jimenez 2006)walls. Note that the near-wall streaks are clearly visible in case S, but in R1 theyhave been substituted by a regular array of spots generated by the wall disturbances.Similar structures are found in all the instantaneous realizations that were inspected.The only manipulation in the figure has been to centre them in the display box.
It was shown by Flores & Jimenez (2006) that the global modes are very efficientin generating Reynolds stresses, because their wall-normal and spanwise velocitycomponents are highly correlated. The same happens with the saturated part of thecones shown in figure 3. We define the mean velocity fluctuations inside the cones as
Uw(rx) = A−1Ω
∫Ω(rx )
〈u′〉 dA, Vw(rx) = A−1Ω
∫Ω(rx )
〈v′〉 dA, (4.2)
where Ω(rx) is the region where 〈u′〉+ < − 0.05 at each streamwise location. Thesevelocities are shown in figure 5(a) for clusters with y+
max > 200. Both U+w and V +
w
peak at the centre of the cluster but the mean fluctuating velocities from case R1 aresomewhat weaker than those from case S. This agrees with Flores & Jimenez (2006),who found that the global modes were slightly stronger over smooth than over roughwalls, and attributed that difference to the lower centreline velocity of the latter.
Figure 5(b) shows that the ratio Uw/Vw , which is a measure of the efficiency of v increating u-perturbations from the mean velocity profile, is reasonably constant in therange 5 <rx < 15. The level of the plateau is higher than the overall ratio of the r.m.s.turbulent intensity in the outer layer (u′2)/(v′2) ≈ 1.5–2 (the overline denotes time andwall-parallel averaging). The level in figure 5(b) is of the same order as the structureparameter for the Reynolds stresses −(u′2)1/2/(u′v′)1/2 ≈ 4.5–5, which measures onlythe part of v correlated with u. It is also of the order of the ratio between the energyspectrum of the streamwise velocity and the Reynolds-stress cospectrum, which is
Vorticity organization over disturbed walls 153
−φuu/φuv ≈ 3–7 for wavelengths of the order of 5h × h, outside the buffer layer. Thesefigures are consistent with the interpretation of the saturated parts of the structuresin figure 3 as global modes. Other values of the threshold in the definition of Ω(rx),and any reasonable range of sizes for the attached clusters with y+
max > 100, lead tothe same plateau as in figure 5(b).
5. ConclusionsWe have investigated the vortex clusters found in turbulent channels with rough
walls at moderate Reynolds numbers. As in the smooth-walled case, they separate intowall-attached and wall-detached families. We have payed special attention to thoseattached clusters that reach above the roughness sublayer and into the outer regionof the flow. They play an important role in the dynamics of the turbulent outer layer(AJZM06), and have many characteristics in common with the constitutive elementsof a number of models that represent that part of the flow by hierarchies of vortexloops emanating from the wall (Perry & Chong 1982; Perry & Marusic 1995).
Our results indicate that the geometry and spatial distribution of the attachedclusters are independent of the details of the wall. These clusters are associated withcones of negative streamwise velocity fluctuations both over smooth and over roughwalls. The only appreciable effects of the wall details are restricted to the roughnesssublayer, where the lower mean shear of the rough-walled flows leads to shorter cones.
These observations, together with the lifetimes obtained by AJZM06 for thestructures in channels at higher Reτ , suggest that either the clusters are generatedat all heights, or that they quickly become self-similar and forget their origin. Thepresent results help to reconcile the attached-eddy models with Townsend’s hypothesisthat the outer layer is independent of the wall details, which is receiving increasedsupport (Keirsbulck et al. 2002; Flack et al. 2005; Bakken et al. 2005; Flores &Jimenez 2006).
Finally, we have shown that the cones level off when their widths and heightsbecome of the order of the channel half-height. These parts of the structures are theglobal modes identified by del Alamo et al. (2004), and the analysis of their meanstreamwise and wall-normal velocity fluctuations shows that their wall-normal andstreamwise velocity components are highly correlated, in agreement with del Alamo &Jimenez (2003) and Flores & Jimenez (2006).
This work was supported in part by the Spanish CICYT under grant TRA2006-08226. The computational resources have been provided by the CIEMAT in Madrid,and by the CEPBA and the BSC in Barcelona. The Spanish MEC has supported O. F.with a FPI scholarship and J. C. A. with consecutive FPU and Fulbright scholarships.
REFERENCES
Adrian, R. J., Meinhart, C. D. & Tomkins, C. D. 2000 Vortex organization in the outer region ofthe turbulent boundary layer. J. Fluid Mech. 422, 1–53.
del Alamo, J. C. & Jimenez, J. 2003 Spectra of the very large anisotropic scales in turbulentchannels. Phys. Fluids 15, L41–L44.
del Alamo, J. C., Jimenez, J., Zandonade, P. & Moser, R. D. 2004 Scaling of the energy spectraof turbulent channels. J. Fluid Mech. 500, 135–144.
del Alamo, J. C., Jimenez, J., Zandonade, P. & Moser, R. D. 2006 Self-similar vortex clusters inthe logarithmic region. J. Fluid Mech. 561, 329–358.
154 O. Flores, J. Jimenez and J. C. del Alamo
Ashafarian, A., Andersson, H. I. & Manhart, M. 2004 DNS of turbulent flow in a rod-roughenedchannel. Intl J. Fluid Flow 25, 373–383.
Bakken, O. M., Krogstad, P. A., Ashfarian, A. & Andersson, H. I. 2005 Reynolds number effectsin the outer layer of the turbulent flow in a channel with rough walls. Phys. Fluids 17, 065101.
Blackburn, H. M., Mansour, N. N. & Cantwell, B. J. 1996 Topology of fine-scale motions inturbulent channel flow. J. Fluid Mech. 310, 269–292.
Bullock, K. J., Cooper, R. E. & Abernathy, F. H. 1978 Structural similarity in radial correlationsand spectra of longitudinal velocity fluctuations in pipe flow. J. Fluid Mech. 88, 585–608.
Chong, M. S., Soria, J., Perry, A. E., Chacin, J., Cantwell, B. J. & Na, Y. 1998 Turbulencestructures of wall-bounded flows using DNS data. J. Fluid Mech. 357, 225–247.
Flack, K. A., Schultz, M. P. & Shapiro, T. A. 2005 Experimental support for Townsend’s Reynoldsnumber similarity hypothesis on rough walls. Phys. Fluids 17, 035102.
Flores, O. 2007 The dynamics of the outer region of wall-bounded turbulence. PhD thesis,Universidad Politecnica de Madrid, in preparation.
Flores, O. & Jimenez, J. 2006 Effect of wall-boundary disturbances on turbulent channel flows.J. Fluid Mech. 566, 357–376.
Flores, O. & Jimenez, J. 2007 Linear dynamics of self-similar structures in the turbulent logarithmicregion. J. Fluid Mech. (submitted).
Ganapathisubramani, B., Longmire, E. K. & Marusic, I. 2003 Characteristics of vortex packetsin turbulent boundary layers. J. Fluid Mech. 478, 35–46.
Hutchins, N. & Marusic, I. 2007 Evidence of very long meandering features in the logarithmicregion of turbulent boundary layers. J. Fluid Mech. 579, 1–28.
Jimenez, J. 2004 Turbulent flows over rough walls. Annu. Rev. Fluid Mech. 36, 173–196.
Jimenez, J., del Alamo, J. C. & Flores, O. 2004 The large-scale dynamics of near-wall turbulence.J. Fluid Mech. 505, 179–199.
Keirsbulck, L., Labraga, L., Mazouz, A. & Tournier, C. 2002 Surface roughness effects onturbulent boundary layer structures. Trans. ASME: J. Fluids Engng 124, 127–135.
Kim, K. & Adrian, R. J. 1999 Very large-scale motion in the outer layer. Phys. Fluids 11, 417–422.
Metzger, M., McKeon, B. J. & Holmes, H. 2007 The near-neutral atmospheric surface layer:turbulence and non-stationarity. Phil. Trans. R. Soc. Lond. A 365, 859–876.
Perry, A. E. & Chong, M. S. 1982 On the mechanism of wall turbulence. J. Fluid Mech. 119,173–217.
Perry, A. E., Henbest, S. & Chong, M. S. 1986 A theoretical and experimental study of wallturbulence. J. Fluid Mech. 119, 163–199.
Perry, A. E. & Marusic, I. 1995 A wall-wake model for the turbulence structure of boundarylayers. 1. Extension of the attached eddy hypothesis. J. Fluid Mech. 298, 361–388.
Robinson, S. K. 1991a Coherent motions in the turbulent boundary layer. Annu. Rev. Fluid Mech.23, 601–639.
Robinson, S. K. 1991b The kinematics of turbulent boundary layer structure. PhD thesis, NASAAmes Research Center.
Tanahashi, M., Kang, S.-J., Miyamoto, T., Shiokawa, S. & Miyauchi, T. 2004 Scaling of fine scaleeddies in turbulent channel flows up to Reτ = 800. Intl J. Heat Fluid Flow 25, 331–340.
Tomkins, C. D. & Adrian, R. J. 2003 Spanwise structure and scale growth in turbulent boundarylayers. J. Fluid Mech. 490, 37–74.
Townsend, A. A. 1976 The Structure of Turbulent Shear Flows , 2nd edn. Cambridge UniversityPress.
Zhou, J., Adrian, R. J., Balachandar, S. & Kendall, T. M. 1999 Mechanisms for generatingcoherent packets of hairpin vortices in channel flow. J. Fluid Mech. 387, 353–396.