Microbiome composition of disturbed soils from sandy-gravel ...
28
One Ecosystem 7: e83756 doi: 10.3897/oneeco.7.e83756 Research Article Microbiome composition of disturbed soils from sandy-gravel mining complexes with different reclamation approaches Anastasiia Kirillovna Kimeklis , Grigory V Gladkov , Rustam H Tembotov , Arina A Kichko , Alexander G Pinaev , Sergey L Hosid , Evgeny E Andronov , Evgeny V Abakumov ‡ Department of Applied Ecology, St. Petersburg State University, Saint-Petersburg, Russia § Laboratory of Microbiological Monitoring and Bioremediation of Soils, All-Russian Research Institute for Agricultural Microbiology, Pushkin, Russia | Tembotov Institute of Ecology of Mountain Territories, Russian Academy Sciences, Nalchik, Russia ¶ Department of Genetics and Biotechnology, St. Petersburg State University, Saint-Petersburg, Russia # V.V. Dokuchaev Soil Science Institute, Moscow, Russia Corresponding author: Anastasiia Kirillovna Kimeklis ([email protected] ) Academic editor: Joachim Maes Received: 14 Mar 2022 | Accepted: 07 Jun 2022 | Published: 21 Jun 2022 Citation: Kimeklis AK, Gladkov GV, Tembotov RH, Kichko AA, Pinaev AG, Hosid SL, Andronov EE, Abakumov EV (2022) Microbiome composition of disturbed soils from sandy-gravel mining complexes with different reclamation approaches. One Ecosystem 7: e83756. https://doi.org/10.3897/oneeco.7.e83756 Abstract Activities connected to mineral mining disrupt the soil layer and bring parent rock material to the surface. It leads to altering the environmental conditions and leaves behind vast areas of disturbed lands. Returning these lands to natural ecosystems is an important contemporary challenge, which can be acquired by reclamation practices. Soil microbiome composition reflects changes happening to disturbed lands; thus, its analysis is a powerful tool for evaluating the disturbance degree and estimating the effect of the implementation of reclamation techniques. Additionally, factors connected to the characteristics of a particular geographical region have a certain impact on the microbiome and should be taken into account. Thereby, studies of soil microbiomes of disturbed soils of different origins are essential in understanding the dynamics of soil restoration. Here, we focus on soil microbiomes from two sandy-gravel mining complexes in mountainous areas with a moderate continental climate of the Central Caucasus. These quarries share the same parent rock material, but differ in benchmark soil type and reclamation approach - one was ‡,§ ‡,§ | § § § §,¶,# ‡,§ © Kimeklis A et al. This is an open access article distributed under the terms of the Creative Commons Attribution License (CC BY 4.0), which permits unrestricted use, distribution, and reproduction in any medium, provided the original author and source are credited.
-
Upload
khangminh22 -
Category
Documents
-
view
0 -
download
0
Transcript of Microbiome composition of disturbed soils from sandy-gravel ...

One Ecosystem 7: e83756
doi: 10.3897/oneeco.7.e83756
Research Article
Microbiome composition of disturbed soils from
sandy-gravel mining complexes with different
reclamation approaches
Anastasiia Kirillovna Kimeklis , Grigory V Gladkov , Rustam H Tembotov , Arina A Kichko ,
Alexander G Pinaev , Sergey L Hosid , Evgeny E Andronov , Evgeny V Abakumov
‡ Department of Applied Ecology, St. Petersburg State University, Saint-Petersburg, Russia
§ Laboratory of Microbiological Monitoring and Bioremediation of Soils, All-Russian Research Institute for Agricultural
Microbiology, Pushkin, Russia
| Tembotov Institute of Ecology of Mountain Territories, Russian Academy Sciences, Nalchik, Russia
¶ Department of Genetics and Biotechnology, St. Petersburg State University, Saint-Petersburg, Russia
# V.V. Dokuchaev Soil Science Institute, Moscow, Russia
Corresponding author: Anastasiia Kirillovna Kimeklis ([email protected])
Academic editor: Joachim Maes
Received: 14 Mar 2022 | Accepted: 07 Jun 2022 | Published: 21 Jun 2022
Citation: Kimeklis AK, Gladkov GV, Tembotov RH, Kichko AA, Pinaev AG, Hosid SL, Andronov EE, Abakumov
EV (2022) Microbiome composition of disturbed soils from sandy-gravel mining complexes with different
reclamation approaches. One Ecosystem 7: e83756. https://doi.org/10.3897/oneeco.7.e83756
Abstract
Activities connected to mineral mining disrupt the soil layer and bring parent rock material
to the surface. It leads to altering the environmental conditions and leaves behind vast
areas of disturbed lands. Returning these lands to natural ecosystems is an important
contemporary challenge, which can be acquired by reclamation practices. Soil microbiome
composition reflects changes happening to disturbed lands; thus, its analysis is a powerful
tool for evaluating the disturbance degree and estimating the effect of the implementation
of reclamation techniques. Additionally, factors connected to the characteristics of a
particular geographical region have a certain impact on the microbiome and should be
taken into account. Thereby, studies of soil microbiomes of disturbed soils of different
origins are essential in understanding the dynamics of soil restoration. Here, we focus on
soil microbiomes from two sandy-gravel mining complexes in mountainous areas with a
moderate continental climate of the Central Caucasus. These quarries share the same
parent rock material, but differ in benchmark soil type and reclamation approach - one was
‡,§ ‡,§ | §
§ § §,¶,# ‡,§
© Kimeklis A et al. This is an open access article distributed under the terms of the Creative Commons Attribution License (CC BY4.0), which permits unrestricted use, distribution, and reproduction in any medium, provided the original author and source arecredited.
left for passive recovery and the other was technically reclaimed with overburden material.
Comparative analysis of microbiome composition, based on sequencing of 16S rRNA gene
libraries, showed that region and disturbance are the key factors explaining microbiome
variation, which surpass the influence of local factors. However, the application of
reclamation techniques greatly reduces the dissimilarity of soil microbiomes caused by
disturbance. Linking of soil chemical parameters to microbiome composition showed that
the disturbance factor correlates with a lack of organic carbon. Other chemical parameters,
like pH, ammonium, nitrates and total carbon explain microbiome variability on a smaller
scale between sampling sites. Thus, while regional and disturbance factors reflected
differentiation of soil microbiomes, soil chemical parameters explained local variation of
certain groups of microorganisms.
Keywords
16S rRNA, amplicon library sequencing, disturbance factor, open-pit mining, quarry,
reclamation techniques, soil microbiome
Introduction
One of the global ecology and soil science problems is land degradation (Jie et al. 2002,
Gregory et al. 2015, Prăvălie 2021). As the world's population grows, so does the demand
for natural resources, such as minerals, raw materials and rock, leading to overexploitation
of ecosystems by industry (Thakur et al. 2022). Minerals are extracted by mining, including
surface and underground methods (Hartman and Mutmansky 2002). Open-pit (quarry)
extraction is the cheapest method of surface mining and therefore prevails (Abakumov and
Gagarina 2006). Open-pit mining causes the greatest damage to the landforms (Chen et
al. 2015). For example, open-pit mining in forested areas is associated with cutting down
trees, draining ponds and rivers and streams being diverted beyond the deposits. Negative
changes occur, not only at the extraction sites, but also in adjacent territories. The areas
affected by open-pit mining are much larger than the quarry area (Bekarevich et al. 1969,
Melnikov 1977, Monjezi et al. 2008). Open-pit mining results in the formation of dumps
which can serve as an example of a negative human impact on the ecosystem (Burlakovs
et al. 2017, Puell Ortiz 2017). This negative impact can be eliminated by the
implementation of mine reclamation techniques. These include diverse practices –
restoration, rehabilitation or replacement - aimed at returning disturbed lands to the natural
ecosystem by restoring or giving them new functions (Bradshaw 1984, Favas et al. 2018).
The choice of reclamation approach depends on the available resources and tasks. In the
case of open pit mining, the important task is to remove dumps and restore the surface
level. It can be achieved by backfilling the quarry pit with dumps and overburden material
(Jurek 2014, Legwaila et al. 2015). In cases when no techniques are applied to abandoned
mines due to economical or other difficulties, they can undergo passive recovery with
consequent spontaneous vegetation (Holl 2002, Prach et al. 2013).
2 Kimeklis A et al
The effect of degraded land transformations can be assessed by analysis of chemical and
biological soil properties (Gavrilenko et al. 2011, Murugan et al. 2014, Gorobtsova et al.
2016, Kazeev et al. 2020). Studies of soil microbial biomass and microbe enzyme activity
have shown that soil microbiota are the first to respond to changes in the soil (Józefowska
et al. 2016). Nowadays, high-throughput sequencing of 16S rRNA gene libraries becomes
a fast and effective tool for gathering huge amounts of genetic information, which becomes
more effective in characterising changes in soil microbial communities. Although there are
many studies connecting the effects of different types of agricultural practices on soil
microbe communities (Coller et al. 2019, Chen et al. 2020, Liu et al. 2021), such studies of
soils disturbed by mining are scarce (Epelde et al. 2014, Sun et al. 2019). Comparative
analysis of soil microbiome composition can reveal relationships amongst its composition,
soil disturbance and chemical parameters (Liddicoat et al. 2019). For example, it was
shown that microbiomes of technically reclaimed coal mines differ by bacterial abundance
and diversity from natural soil, but with time, their diversity evens out (Hou et al. 2018).
Furthermore, some of the top bacterial taxa can be linked to chemical and functional
changes, which appear in a disturbed land. Thus, there are a lot of factors, including the
presence of disturbance and reclamation, soil type, vegetation, climate and chemical
parameters, all of which, to a different extent, affect the microbiota of degraded soils. Here,
we aimed to evaluate the degree of influence of these factors on the soil microbiome
composition.
There are huge areas of degraded soil in the Central Caucasus regions. As specified in the
government statement (Abramchenko et al. 2019), the degraded soil area in Stavropol Krai
is 3400 ha and 1007 ha in the Kabardino-Balkarian Republic. The dominating activity that
leads to land disturbance in the region is the extraction of common minerals, such as
boulder-sand-gravel mixes, construction sand, building stone, clays etc. We found two
boulder-sand-gravel mining complexes in both regions, in one of which quarry soils were
technically reclaimed, in the other left for self-restoration. Thus, we aimed to compare
microbiomes of benchmark and quarry soils from these complexes, which share
disturbance type and climate, but differ in soil type and reclamation practices and to link
microbiome composition with these factors.
Materials and Methods
Sampling sites were located in the foothills of the Central Caucasus in two regions – Urvan
(Kabardino-Balkarian Republic, Russia) and Progress (Stavropol Krai, Russia) (Fig. 1a).
The terrain of both study areas can be characterised as hilly plains. According to the
classification (Sokolov and Tembotov 1989), they belong to the belt of meadow steppes
(400-800 m above sea level) of the Elbrus variant of the zonation (Progress) and the
steppe zone (200-400 m above sea level) of the Terek variant zonation (Urvan) of the
Central Caucasus. In the studied territories, the climate is moderately continental, with a
long frost-free period, hot summers and little snow, with frequent thaws in winter. In the
zone of meadow steppes (Progress), the average annual precipitation is 579 mm/year, the
average annual air temperature is 10.45°C and the total evaporation is 864 mm/year
Microbiome composition of disturbed soils from sandy-gravel mining complexes ... 3
(Razumov et al. 2003). In the steppe zone (Urvan), the average annual precipitation is 522
mm/year, the average annual air temperature is 11°C, the total evaporation is 818 mm/year
(Ashabokov et al. 2005). Two regions have different soil types and water regimes:
Phaeozems in Progress were formed under the influence of only atmospheric moisture,
with a periodic leaching regime, while Umbric Gleyic soils in Urvan are characterised by
increased surface watering and additional film-capillary moisture, the source of which is
shallow (1.5-3 m) located groundwater. The bluish-grey inhomogeneous colouration of the
lower horizons of meadow soils is a weakly pronounced sign of hydromorphism
(Duchaufour 1982).
In each region, we found an abandoned territory of a quarry, located on a deposit of sand
and gravel mixture. Both territories consist of multiple differently-aged pits and rock dumps.
The first mining complex was found in the Urvan District of Kabardino-Balkaria near the
terrace of the eponymous river, which flows between two quarry pits. The deposits in this
area have been developed since 1958. The benchmark soil type for this area is Umbric
a b
c
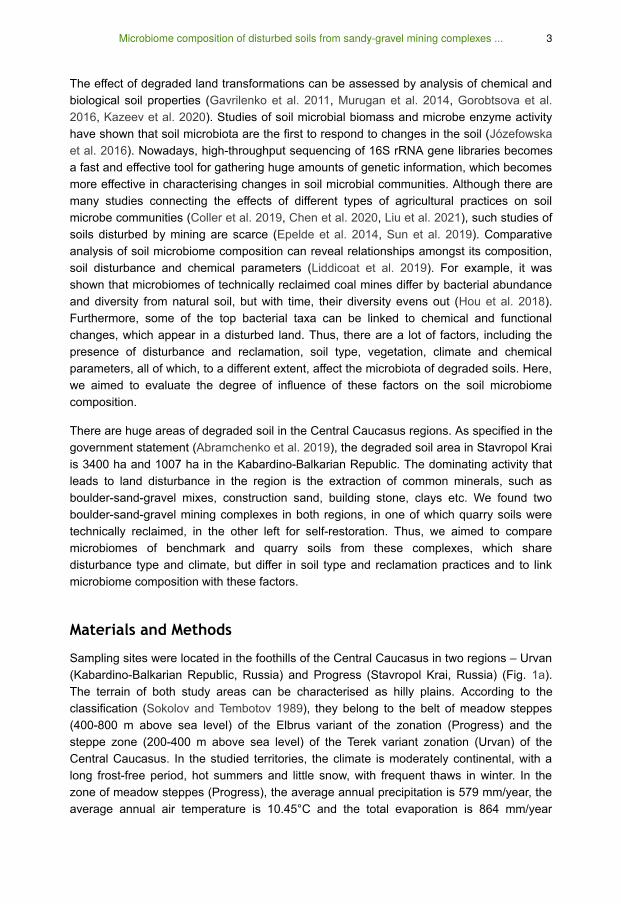
Figure 1.
Sampling sites. Maps based on Google Earth (Google, USA).
a: Relative position of Kabardino-Balkarian Republic (KBR) and Stavropol Krai (SK) regions.
b: Urvan in KBR: UB - benchmark site, UQ1 and UQ2 - quarry sites
c: Progress in SK: PB - benchmark site, PQ1, PQ2 and PQ3 - quarry sites
4 Kimeklis A et al
Gleyic, which remains undisturbed near the riverbanks. Abandoned quarry pits showed
signs of passive recovery with spontaneous overgrowth by Populus, Hippophae and reed.
The second mining complex was found in the Kirovsky District of Stavropol Krai near the
Malka River. The field has been developed since the 2000s. The flat lands surrounding the
quarry complex belong to the Phaeozem soil type and are completely converted for
farming purposes. Thus, the nearest benchmark soil for this territory is Agrisol. Of course,
Agrisol itself is a disturbed soil (Conacher 2009, Lupatini et al. 2017, Wipf et al. 2021), but
in this case, we treat it as a benchmark soil, due to the lack of native soil nearby. Technical
reclamation, consisting of backfilling the bottoms of the abandoned pits with a mixture of
overburden Phaeozem, sand and gravel, was implemented in this area. Vegetation in the
quarry pits varied from Ambrosia to Acacia thickets.
For the analysis we did not consider the time of the last extraction of minerals on the sites
or the expansion of the extraction zone, just the fact of mining, which by itself had a
negative impact on the soil, being a factor of disturbance. A similar assumption was applied
to the reclamation factor; we considered reclamation practices as present in the Progress
region and absent in the Urvan region. As disturbed soil no longer shares the same type as
benchmark soil from the same region, we considered the regional factor instead of the soil
type factor as determining the difference between Progress and Urvan soils. To estimate
differences connected to local variation of vegetation and chemical parameters factors, we
took biological replicates within one site from as diverse ecotopes as possible (e.g.
different plant cover).
Profiles of weakly developed soils of quarries usually consist of two horizons: W -
accumulated humic material and C - parent rock underneath, usually the overburden
material (Abakumov 2008). In our previous studies, we compared microbiomes of these
horizons within and between sampling sites and it turned out that the microbiome of parent
material is a reflection of the topsoil horizon and that their microbiomes shift simultaneously
between sites (Kimeklis et al. 2021). Taking this into consideration, in this study, we limited
ourselves to the top horizon of each site.
Sampling was conducted in August 2020. In the Urvan region, we collected samples at the
three sites: UQ1 and UQ2 - two neighbouring quarry pits: one fully abandoned at the time
of collecting, the other partly functional and UB - benchmark soil near the river (Fig. 1b). In
the Progress region, we collected samples at the four sites: PQ1 - newly excavated and
freshly overgrown two-year mining pit, PQ2 and PQ3 - in the old overgrown quarry pit
currently used for pasture and PB - Agrisol from the nearest field, where the crops (corn)
have already been harvested (Fig. 1c). For each site, we made two to four soil cuts,
depending on the variability of the ecological microniches. More detailed information is
presented in Table S1 (Suppl. material 2). Temperature was measured in the top 2-5 cm
layer using a digital thermometer. From the same top layer, soil samples were collected in
50 ml plastic tubes with same-day freezing at -20°C for subsequent molecular analysis and
into plastic 1 litre bags with subsequent air drying for chemical analysis.
For all dried soil samples, chemical analysis was performed, including measuring of pH,
organic carbon (OC), ammonium (NH ), nitrate (NO -), mobile phosphorus (P O ) and4+
3 2 5
Microbiome composition of disturbed soils from sandy-gravel mining complexes ... 5

potassium (K O), as previously described in Gladkov et al. 2019. Total carbon content (TC)
was determined by direct combustion on the elemental analyser Euro-EA3028-HT
(Evrovector, Italy) at the St. Petersburg University Research Park. To detect the effect of
region and disturbance factors, ANOVA with Tukey HSD test, t-test group comparisons and
correlation coefficients of the results were calculated in Statistica 13 (TIBCO Software Inc.,
USA).
From each sample of the frozen soil, total DNA was extracted in quadruplicate and
consequently used for the construction and sequencing of the 16S rRNA amplicon libraries
using Illumina MiSeq (Illumina, Inc., USA) as described in Gladkov et al. 2019 at the
Centre for Genomic Technologies, Proteomics and Cell Biology (ARRIAM, Russia).
Obtained data was processed and visualised as described in Kimeklis et al. 2021 in R (R
Core Team 2021) and QIIME2 (Bolyen et al. 2019) software environments using the
following tools: dada2 (Nearing et al. 2018), phyloseq (McMurdie and Holmes 2013),
DESeq2 (Love et al. 2014), vegan 2.5-7 (Oksanen et al. 2020), ggpubr 0.4.0 (Kassambara
2019), picante (Kembel et al. 2010), ggforce 0.3.3 (Pedersen 2019), tidyverse (Wickham et
al. 2019), ggtree (Yu et al. 2018), ampvis2 (Andersen et al. 2018) in RStudio (RStudio
Team 2020) and SEPP package (Janssen et al. 2018). Taxonomy was assessed by RDP
Classifier with 50% confidence threshold (Wang et al. 2007), using SILVA SSU database
138 (Quast et al. 2013). Alpha diversity was accessed by four indexes - Observed, Faith's
phylogenetic diversity (PD) (Faith 1992), Shannon (Shannon and Weaver 1949) and
inverted Simpson (Simpson 1949). Significance of mean differences between alpha-
diversity indexes was calculated by the Mann-Whitney test (Mann and Whitney 1947). Beta
diversity was calculated using Bray-Curtis distance matrix (Bray and Curtis 1957) and
visualised by NMDS (Kruskal 1964). Differences of beta-diversity between sites were
accessed by PERMANOVA (Anderson 2017) performed with adonis2 test (McArdle and
Anderson 2001). Differences between biological replicates of beta-diversity within one site
were accessed by analysis of multivariate homogeneity of group dispersions (Anderson
2005, Anderson et al. 2006). Canonical Correlation Analysis (CCA) (ter Braak 1986,
Palmer 1993, McCune 1997) was used to link beta-diversity of microbiomes with soil
chemical properties. Multicollinearity between soil parameters was checked by the
Variance inflation factors (VIF) test (Fox and Monette 1992, Fox 1997). Analysis of
compositional microbiota data (balances) was performed by PhILR transformation
(Silverman et al. 2017). The code is available in the supplement (Suppl. material 3).
Results
Soil chemical parameters
Two mining complexes from Urvan and Progress were based on different soil types -
Phaeozem and Umbric Gleyic, which determined variation in some soil chemical
parameters, which we attribute to the region factor. Differences between disturbed and
benchmark soils, which we classify as disturbance factor, are also reflected in some
chemical parameters (Table 1). ANOVA with post-hoc Tukey HSD test showed that the
region factor significantly affects soil temperature, pH, TC, potassium, ammonium and
2
6 Kimeklis A et al
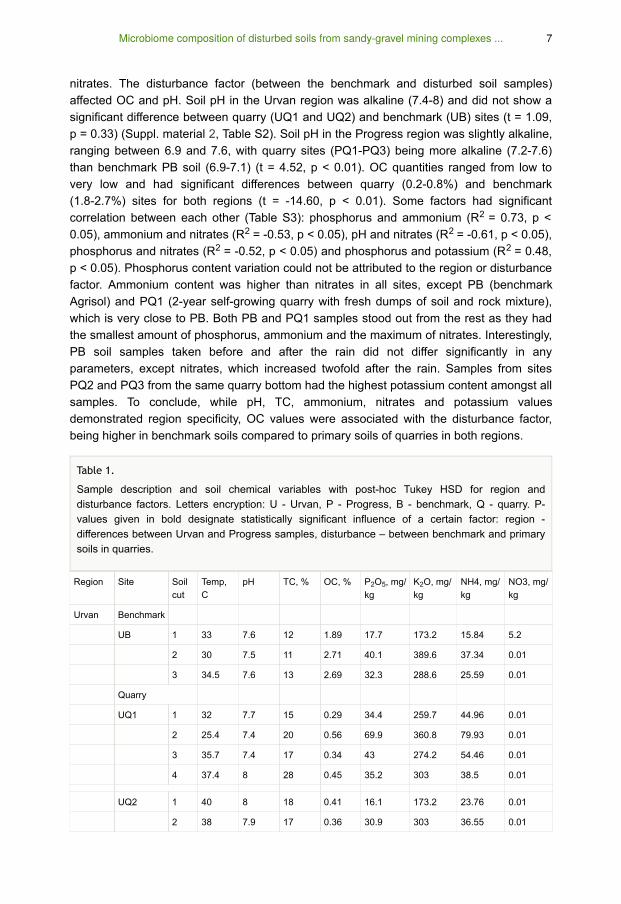
nitrates. The disturbance factor (between the benchmark and disturbed soil samples)
affected OC and pH. Soil pH in the Urvan region was alkaline (7.4-8) and did not show a
significant difference between quarry (UQ1 and UQ2) and benchmark (UB) sites (t = 1.09,
p = 0.33) (Suppl. material 2, Table S2). Soil pH in the Progress region was slightly alkaline,
ranging between 6.9 and 7.6, with quarry sites (PQ1-PQ3) being more alkaline (7.2-7.6)
than benchmark PB soil (6.9-7.1) (t = 4.52, p < 0.01). OC quantities ranged from low to
very low and had significant differences between quarry (0.2-0.8%) and benchmark
(1.8-2.7%) sites for both regions (t = -14.60, p < 0.01). Some factors had significant
correlation between each other (Table S3): phosphorus and ammonium (R = 0.73, p <
0.05), ammonium and nitrates (R = -0.53, p < 0.05), pH and nitrates (R = -0.61, p < 0.05),
phosphorus and nitrates (R = -0.52, p < 0.05) and phosphorus and potassium (R = 0.48,
p < 0.05). Phosphorus content variation could not be attributed to the region or disturbance
factor. Ammonium content was higher than nitrates in all sites, except PB (benchmark
Agrisol) and PQ1 (2-year self-growing quarry with fresh dumps of soil and rock mixture),
which is very close to PB. Both PB and PQ1 samples stood out from the rest as they had
the smallest amount of phosphorus, ammonium and the maximum of nitrates. Interestingly,
PB soil samples taken before and after the rain did not differ significantly in any
parameters, except nitrates, which increased twofold after the rain. Samples from sites
PQ2 and PQ3 from the same quarry bottom had the highest potassium content amongst all
samples. To conclude, while pH, TC, ammonium, nitrates and potassium values
demonstrated region specificity, OC values were associated with the disturbance factor,
being higher in benchmark soils compared to primary soils of quarries in both regions.
Region Site Soil
cut
Temp,
C
pH TC, % OC, % P O , mg/
kg
K O, mg/
kg
NH4, mg/
kg
NO3, mg/
kg
Urvan Benchmark
UB 1 33 7.6 12 1.89 17.7 173.2 15.84 5.2
2 30 7.5 11 2.71 40.1 389.6 37.34 0.01
3 34.5 7.6 13 2.69 32.3 288.6 25.59 0.01
Quarry
UQ1 1 32 7.7 15 0.29 34.4 259.7 44.96 0.01
2 25.4 7.4 20 0.56 69.9 360.8 79.93 0.01
3 35.7 7.4 17 0.34 43 274.2 54.46 0.01
4 37.4 8 28 0.45 35.2 303 38.5 0.01
UQ2 1 40 8 18 0.41 16.1 173.2 23.76 0.01
2 38 7.9 17 0.36 30.9 303 36.55 0.01
2
2 2
2 2
2 5 2
Table 1.
Sample description and soil chemical variables with post-hoc Tukey HSD for region and
disturbance factors. Letters encryption: U - Urvan, P - Progress, B - benchmark, Q - quarry. P-
values given in bold designate statistically significant influence of a certain factor: region -
differences between Urvan and Progress samples, disturbance – between benchmark and primary
soils in quarries.
Microbiome composition of disturbed soils from sandy-gravel mining complexes ... 7
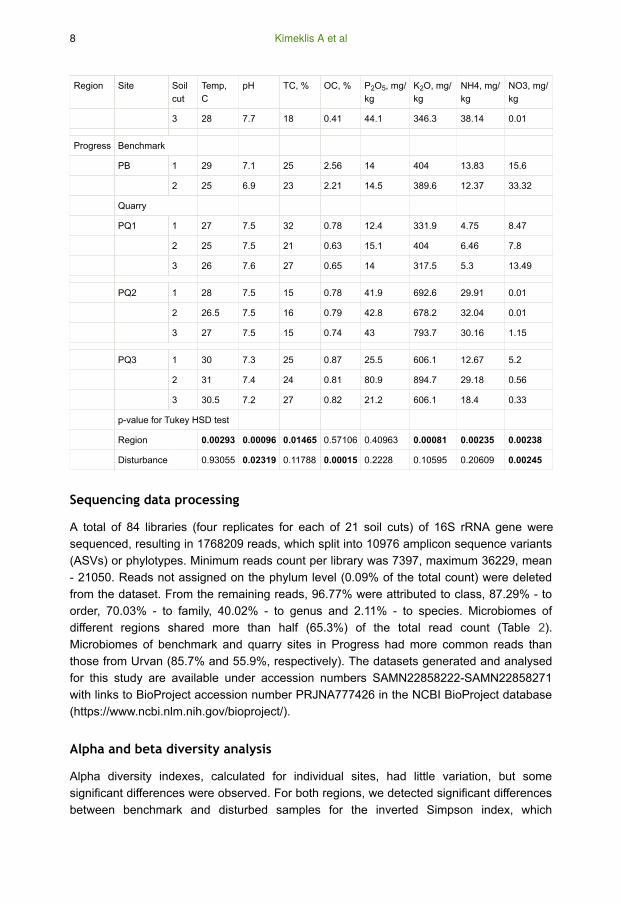
Region Site Soil
cut
Temp,
C
pH TC, % OC, % P O , mg/
kg
K O, mg/
kg
NH4, mg/
kg
NO3, mg/
kg
3 28 7.7 18 0.41 44.1 346.3 38.14 0.01
Progress Benchmark
PB 1 29 7.1 25 2.56 14 404 13.83 15.6
2 25 6.9 23 2.21 14.5 389.6 12.37 33.32
Quarry
PQ1 1 27 7.5 32 0.78 12.4 331.9 4.75 8.47
2 25 7.5 21 0.63 15.1 404 6.46 7.8
3 26 7.6 27 0.65 14 317.5 5.3 13.49
PQ2 1 28 7.5 15 0.78 41.9 692.6 29.91 0.01
2 26.5 7.5 16 0.79 42.8 678.2 32.04 0.01
3 27 7.5 15 0.74 43 793.7 30.16 1.15
PQ3 1 30 7.3 25 0.87 25.5 606.1 12.67 5.2
2 31 7.4 24 0.81 80.9 894.7 29.18 0.56
3 30.5 7.2 27 0.82 21.2 606.1 18.4 0.33
p-value for Tukey HSD test
Region 0.00293 0.00096 0.01465 0.57106 0.40963 0.00081 0.00235 0.00238
Disturbance 0.93055 0.02319 0.11788 0.00015 0.2228 0.10595 0.20609 0.00245
Sequencing data processing
A total of 84 libraries (four replicates for each of 21 soil cuts) of 16S rRNA gene were
sequenced, resulting in 1768209 reads, which split into 10976 amplicon sequence variants
(ASVs) or phylotypes. Minimum reads count per library was 7397, maximum 36229, mean
- 21050. Reads not assigned on the phylum level (0.09% of the total count) were deleted
from the dataset. From the remaining reads, 96.77% were attributed to class, 87.29% - to
order, 70.03% - to family, 40.02% - to genus and 2.11% - to species. Microbiomes of
different regions shared more than half (65.3%) of the total read count (Table 2).
Microbiomes of benchmark and quarry sites in Progress had more common reads than
those from Urvan (85.7% and 55.9%, respectively). The datasets generated and analysed
for this study are available under accession numbers SAMN22858222-SAMN22858271
with links to BioProject accession number PRJNA777426 in the NCBI BioProject database
(https://www.ncbi.nlm.nih.gov/bioproject/).
Alpha and beta diversity analysis
Alpha diversity indexes, calculated for individual sites, had little variation, but some
significant differences were observed. For both regions, we detected significant differences
between benchmark and disturbed samples for the inverted Simpson index, which
2 5 2
8 Kimeklis A et al

represents the probability that two randomly-selected sequences belong to different
phylotypes (Fig. 2). In both cases, it was higher for quarry sites than for the benchmark. In
Urvan, all indexes for separate samples from all sites differed significantly between each
other with no relation to disturbance factor, with UQ2 site being the most diverse and UQ1
– the least (Suppl. material 1, Fig. S3). Apart from that, the dispersion of most alpha
indexes of samples from Urvan was higher than in Progress. Indexes of alpha diversity
allow us to estimate microbiome variation within samples and, in our case, we can assume
that microbiome variation from Progress is more consistent across different sites and
biological replicates, while from Urvan, it is more diversified.
Total Urvan Progress
Urvan Common Progress Benchmark Common Quarry Benchmark Common Quarry
ASV Count 6113 1625 3238 1917 711 5110 534 1064 3265
% of total reads 20.7 65.3 14 17.4 55.9 26.7 2.9 85.7 11.3
a
b
Table 2.
Distribution of phylotypes (expressed in number of ASVs) between soil samples.
Figure 2.
Alpha diversity in four indexes – Observed, Faith (PD), Shannon, Inverted Simpson for quarry/
benchmark sites in different regions.
a: Progress region
b: Urvan region
Microbiome composition of disturbed soils from sandy-gravel mining complexes ... 9

Unlike alpha-diversity, beta-diversity revealed differences between samples in a more
defined manner. PERMANOVA showed that microbiomes of quarry and benchmark
samples differ significantly for both regions - with R = 0.26 (p-value = 0.001) for Urvan and
R = 0.11 (p-value = 0.002) for Progress. Its values also show that disturbance is a greater
factor of explained variability in microbiomes for the soils in Urvan than in Progress. Data
visualised by NMDS matches with PERMANOVA, as we can see three distinct groups:
1. Urvan quarry samples UQ1 and UQ2,
2. Urvan benchmark UB and
3. All Progress samples PB, PQ1-PQ3 (Fig. 3).
For the Urvan region, samples from both quarry pits group closer together, while
benchmark samples are separated from them. On the other hand, for the Progress region,
separation of microbiomes of benchmark and disturbed soils is less apparent.
Apart from differences between sites, we also investigated differences between biological
replicates within one site. Analysis of multivariate homogeneity of group dispersions
showed significantly higher distance to centroids values between replicates at Urvan sites
(ANOVA p-value < 0.001) than for Progress sites (Suppl. material 1, Fig. S4). Thus, despite
similar levels of differences in ecological microniches (variance in vegetation, climate and
insolation), dispersion between biological replicates in Urvan was higher than in Progress.
2
2
Figure 3.
Beta-diversity of soil sites. Biological and technical replicates of each site are surrounded by
ellipses. Urvan: UQ1 and UQ2 – Quarry, UB – Benchmark. Progress: PQ1, PQ2 and PQ3 –
Quarry, PB – Benchmark.
10 Kimeklis A et al

Phylogeny composition
The most abundant phyla across all samples were typical of soil microbiomes -
Actinobacteriota, Acidobacteriota, Alpha- and Gamma- proteobacteria, Bacteroidota,
Crenarchaeota, Firmicutes, Verrucomicrobiota, Planctomycetota, Chloroflexi, Myxococcota
and Gemmatimonadota (Fig. 4). According to the heatmap, the relative abundance of phyla
reflects differences between samples like beta-diversity: benchmark (UB) and quarry (UQ1,
UQ2) samples from Urvan site demonstrate the difference in quantities of the phyla
Bacteroidota, Crenarchaeota, Firmicutes, RCP2-54, Patescibacteria and
Entotheonellaeota, while for Progress samples, there is no evident difference in major
phyla composition between benchmark (PB) and quarry samples (PQ1-PQ3). As for
location-specific phyla, Acidobacteriota, Planctomycetota and Chloroflexi show higher
relative abundance in Urvan, while Verrucomicrobiota - in Progress.
On the family level, we still see that major groups are present in all samples, but their
abundance differs between samples (Suppl. material 1, Fig. S5). Top taxa are
Nitrososphaeraceae and Planococcaceae (higher values at benchmark sites),
Chitinophagaceae (higher values at quarry sites), Pyrinomonadaceae,
Sphingomonadaceae and Chthoniobacteraceae. Apart from these, Urvan sites have
variation in the content of the following families between benchmark and quarry samples:
Pseudonocardiaceae, Micromonosporaceae, Beijerinckiaceae, Bryobacteraceae and
Figure 4.
Heat map of the phyla relative abundance across soil sites. Orange stands for the highest and
blue - for the lowest values. Urvan: UQ1, UQ2 – Quarry, UB – Benchmark. Progress: PQ1-
PQ3 – Quarry, PB – Benchmark.
Microbiome composition of disturbed soils from sandy-gravel mining complexes ... 11
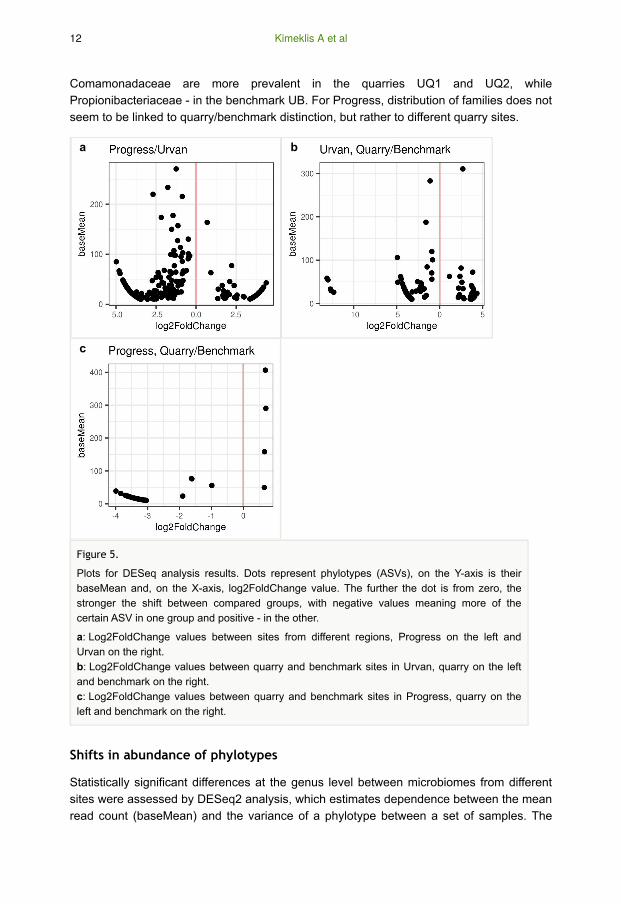
Comamonadaceae are more prevalent in the quarries UQ1 and UQ2, while
Propionibacteriaceae - in the benchmark UB. For Progress, distribution of families does not
seem to be linked to quarry/benchmark distinction, but rather to different quarry sites.
Shifts in abundance of phylotypes
Statistically significant differences at the genus level between microbiomes from different
sites were assessed by DESeq2 analysis, which estimates dependence between the mean
read count (baseMean) and the variance of a phylotype between a set of samples. The
a b
c
Figure 5.
Plots for DESeq analysis results. Dots represent phylotypes (ASVs), on the Y-axis is their
baseMean and, on the X-axis, log2FoldChange value. The further the dot is from zero, the
stronger the shift between compared groups, with negative values meaning more of the
certain ASV in one group and positive - in the other.
a: Log2FoldChange values between sites from different regions, Progress on the left and
Urvan on the right.
b: Log2FoldChange values between quarry and benchmark sites in Urvan, quarry on the left
and benchmark on the right.
c: Log2FoldChange values between quarry and benchmark sites in Progress, quarry on the
left and benchmark on the right.
12 Kimeklis A et al

outcome is expressed in a log2FoldChange value, which indicates how much the phylotype
abundance has shifted between the compared samples. The higher the modulo value of
log2FoldChange, the higher is the shift. Positive or negative values of log2FoldChange
indicate the direction in which the shift occurs. We applied DESeq2 to detect shifts
between regions (Fig. 5a), quarry and benchmark in Urvan (Fig. 5b), quarry and
benchmark in Progress (Fig. 5c).
Only phylotypes with baseMean equal to 10 reads or more were left in the analysis, with
log2FoldChange adjusted p-value < 0.05. With this cutoff region, comparisons revealed
that there are 45 phylotypes, which are more abundant in Urvan and 164 - in Progress
(Fig. 5a, Suppl. material 2, Table S4). The highest modulo values of log2FoldChange are
detected for the phylotypes with baseMean < 100 reads, meaning that the highest
differences are detected in minor phylotypes. On the contrary, phylotypes with baseMean
values exceeding 100 reads have lower log2FoldChange values, meaning they are present
in both regions, but most of them are prevalent in Progress. No apparent phylum tends to
be more characteristic of any region. Both regions have different prevalent phylotypes from
Acidobacteriota, Actinobacteriota, Bacteroidota, Crenarchaeota, Gemmatimonadota,
Proteobacteria and others.
Comparisons between benchmark/quarry samples show different phylotype distributions in
the two regions. In Urvan, there are 37 phylotypes which are more prevalent in the
benchmark samples and 106 - in the quarry (Fig. 5b, Suppl. material 2, Table S5). The
most abundant phylotypes in the Urvan benchmark site belong to Acidobacteriota (5),
Actinobacteriota (6), Firmicutes (11) and Crenarchaeota (7). Phylotypes from quarry
belonged to Acidobacteriota (24), Actinobacteriota (31), Bacteroidota (13), Proteobacteria
(19) and Crenarchaeota (6). In Progress, four phylotypes were more abundant in
benchmark soil microbiomes, all of which belong to Crenarchaeota; while 33 phylotypes
were detected as more abundant in the quarry microbiomes, most of them belonging to
Acidobacteriota (3), Actinobacteriota (10), Bacteroidota (8) and Proteobacteria (7) (Fig. 5c,
Suppl. material 2, Table S6).
Several trends could be highlighted from the DESeq2 analysis data. Shifts of phylotypes
quantities are the most contrasting between regions. Within regions, contrast between
quarry and benchmark is more pronounced in Urvan than in Progress. Quarry microbiomes
of both Urvan and Progress regions have a larger proportion of minor phylotypes in
comparison to benchmark microbiomes. In all comparisons, phylotypes with higher
baseMean values had lower modulo values of log2FoldChange, while phylotypes with low
baseMeans have higher modulo values of log2FoldChange.
Links between taxonomic composition and soil chemical properties
Canonical Correlation Analysis (CCA) was used to link beta-diversity of microbiomes from
all sites with soil chemical properties. Biological replicates of microbiomes from different
sites allowed us to build a significant model (ANOVA p-value = 0.002). For this analysis,
temperature data were scaled to the deviation from the day’s mean to level the differences
between sampling days. The most significant factors were pH (p-value = 0.003), OC (p-
Microbiome composition of disturbed soils from sandy-gravel mining complexes ... 13
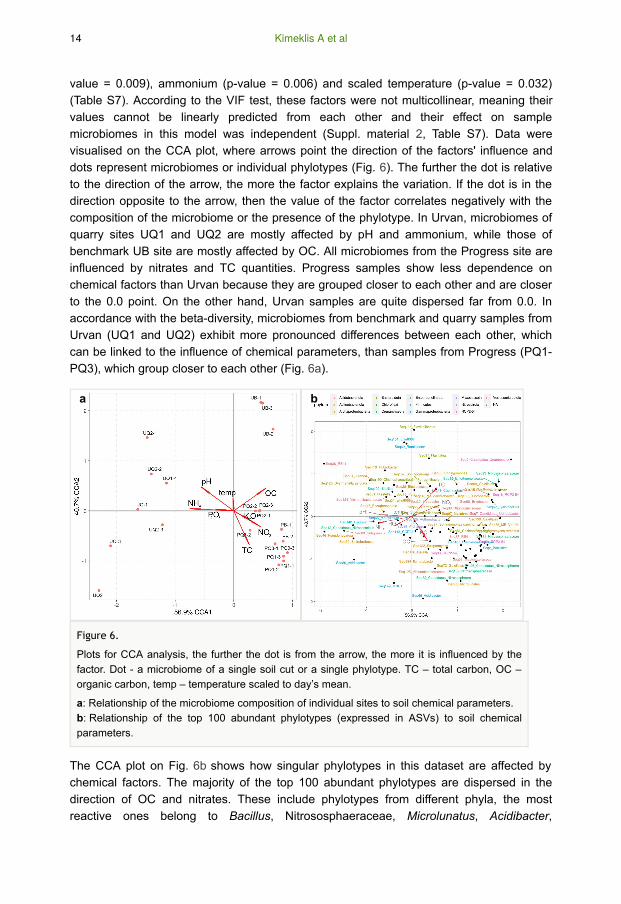
value = 0.009), ammonium (p-value = 0.006) and scaled temperature (p-value = 0.032)
(Table S7). According to the VIF test, these factors were not multicollinear, meaning their
values cannot be linearly predicted from each other and their effect on sample
microbiomes in this model was independent (Suppl. material 2, Table S7). Data were
visualised on the CCA plot, where arrows point the direction of the factors' influence and
dots represent microbiomes or individual phylotypes (Fig. 6). The further the dot is relative
to the direction of the arrow, the more the factor explains the variation. If the dot is in the
direction opposite to the arrow, then the value of the factor correlates negatively with the
composition of the microbiome or the presence of the phylotype. In Urvan, microbiomes of
quarry sites UQ1 and UQ2 are mostly affected by pH and ammonium, while those of
benchmark UB site are mostly affected by OC. All microbiomes from the Progress site are
influenced by nitrates and TC quantities. Progress samples show less dependence on
chemical factors than Urvan because they are grouped closer to each other and are closer
to the 0.0 point. On the other hand, Urvan samples are quite dispersed far from 0.0. In
accordance with the beta-diversity, microbiomes from benchmark and quarry samples from
Urvan (UQ1 and UQ2) exhibit more pronounced differences between each other, which
can be linked to the influence of chemical parameters, than samples from Progress (PQ1-
PQ3), which group closer to each other (Fig. 6a).
The CCA plot on Fig. 6b shows how singular phylotypes in this dataset are affected by
chemical factors. The majority of the top 100 abundant phylotypes are dispersed in the
direction of OC and nitrates. These include phylotypes from different phyla, the most
reactive ones belong to Bacillus, Nitrososphaeraceae, Microlunatus, Acidibacter,
a b
Figure 6.
Plots for CCA analysis, the further the dot is from the arrow, the more it is influenced by the
factor. Dot - a microbiome of a single soil cut or a single phylotype. TC – total carbon, OC –
organic carbon, temp – temperature scaled to day’s mean.
a: Relationship of the microbiome composition of individual sites to soil chemical parameters.
b: Relationship of the top 100 abundant phylotypes (expressed in ASVs) to soil chemical
parameters.
14 Kimeklis A et al
Xiphinematobacter, Nitrospira and Gaiellales. Some of these phylotypes match those
which are statistically more prevalent in benchmark sites (Suppl. material 2, Table S5 and
S6). In the opposite direction of OC, there are phylotypes, associated with the lack of OC.
These are RB41, Ramlibacter, Flavisolibacter, Asanoa, Puia, Niastella and Briobacter.
Some of these phylotypes are also detected as characteristic of quarry microbiomes by
Log2FoldChange analysis. Other factors influence microbiome composition, which could
be linked to some other differences between samples, not linked to disturbance or region
factors. Such factors include ammonium and nitrates: they influence the microbiome
composition in opposite directions, so that phylotypes reacting to the presence on
ammonium (Pseudonocardia, Solirubrobacter, Acidibacter) and nitrates (Udaeobacter,
Nitrososphaeraceae, Gaiellales) could be distinguished.
We also used CCA to show the connection between microscale (chemical parameters) and
macroscale (region, disturbance) factors and their influence on microbiome composition. If
we put on the CCA plot only phylotypes, significantly changing between regions (detected
by DESeq, Suppl. material 2, Table S4), we see that phylotypes split into two groups: the
ones from Urvan are on the side of ammonium and pH influence, while on the opposite
side, there are phylotypes from the Progress region, which are more influenced by TC and
nitrates. Both regions have characteristic phylotypes from Acidobacteriota,
Actinobacteriota, Proteobacteria, Crenarchaeota and other phyla.
Fig. S6b (Suppl. material 1) demonstrates the CCA plot with phylotypes that were revealed
as statistically different between quarry and benchmark samples for each region by DESeq
analysis. Here, phylotypes are located on opposite sides of OC, which is consistent with
the fact of correlation between OC quantities and soil disturbance. These phylotypes are
mostly from Acidobacteriota, Proteobacteria and Actinobacteriota. Groups corresponding to
the presence of OC (Crenarchaeota, Firmicutes) are divided into two: one between OC and
ammonium, corresponding to phylotypes from the Urvan benchmark and the other
between OC and nitrates, corresponding to the Progress benchmark. Notable, phylotypes
with the same taxonomy (Nitrososphaeraceae, Vicinamibacteraceae,
Gemmatimonadaceae) can be seen in the groups correlating with both the presence and
the absence of OC.
Phylogenic compositional analysis
Analysis of 16S rRNA gene libraries is often based on the negative binomial distribution,
which has some limitations. These methods make a Type I error in assessing changes in
the microbial community at high taxonomic levels (Lin and Peddada 2020, Nearing et al.
2022). The PhILR transformation offers an approach to overcome statistical artifacts of
relative abundance of microbiota and analyse compositional data. It reveals “balances”
which allows further investigation into the relating of phylogenetically close microorganisms
to different factors. We applied this approach to detect changes in microbiota associated
with the disturbance factor from each region. Nine significant balances for Urvan and
seven significant balances for Progress were identified. It was shown that, for Progress,
significant differences between benchmark and disturbed soils appear at low taxonomic
Microbiome composition of disturbed soils from sandy-gravel mining complexes ... 15
levels (differences in individual phylotypes within genus or family) (Suppl. material 1, Fig.
S7A). In contrast, for Urvan, several balances (n210, n733, n788) show differences at the
phylum-class levels (Suppl. material 2, Fig. S7B). The response is especially diverse at
different taxonomic levels within the Acidobacteriota phylum. Differences in the phylotype
content within the phyla Firmicutes, Chloroflexi, and Verrucomicrobiota is also shown in the
quarry sites. These results support previous observations: microbiomes of disturbed, but
reclaimed quarry soils in Progress are much more similar to benchmark soil than
microbiomes of unreclaimed quarry soils in Urvan.
Discussion
Linking to previous studies
This work is a continuation of the research on the microbiomes of soils from different
climate zones, recovering from anthropological damage, primarily mining of parent rock
material (Gladkov et al. 2019, Ivanova et al. 2020, Pershina et al. 2020, Zverev et al. 2020,
Abakumov et al. 2021, Kimeklis et al. 2021). Here, we explore the area with a moderate
continental climate, located in the northern foothills of the Caucasus mountains. The
specificity of this study is that we collected samples from the same type of sandy-gravel
quarries in close regions (approximately 50 km) with different benchmark soil types. The
key difference between sampling sites was that quarry pits at one region (Progress) were
reclaimed by backfilling using soil heaps from the overburden Agrisol, while the others
(Urvan) were left to passively recover with spontaneous vegetation overgrowth on parent
rock material. Thus, we were able to analyse different patterns of microbiome restoration
on similar parent rock material in one climatic zone, but with different benchmark soil types
and applied reclamation practices.
In our previous studies from the quarries of northern regions, we observed that primary
soils of quarries are colonised by photosynthetic bacteria – Cyanobacteria and Chloroflexi
(Gladkov et al. 2019, Kimeklis et al. 2021). These microorganisms form biofilms or soil
crusts and can successfully colonise substrates deprived of organic carbon resources
(Malard and Pearce 2018), but in this work, presence of these groups of microorganisms
was minuscule. Perhaps, it can be explained by the overall lower humidity of the southern
region and warm arid conditions during the period of sample collecting.
Factors influencing microbiome composition
Factors that influence microbiome composition can be put into hierarchical categories,
based on their complexity and scale of effect (Deakin et al. 2018). Large-scale differences,
like regions, distance or type of agricultural practice, usually are considered the main
factors of microbiome variation (O'Brien et al. 2016, Deakin et al. 2018, Shi et al. 2018). On
the other hand, local overgrown vegetation, which is one of the bases of humic layer
accumulation (Abakumov et al. 2020), usually creates spatial variations, which translate
into microscale differences in microbiomes (Schreiter et al. 2014, Mitter et al. 2017). The
same goes for comparisons between seasons and distance - while seasons create
16 Kimeklis A et al

variation due to fast-changing factors, geographical differences explain more of microbial
variation (Zhang et al. 2020, Wang et al. 2021). In our study, we detected differences
between biological replications caused by microscale factors, like vegetation, insolation or
water regime, but they did not overcome diversity created by large-scale factors - region
and disturbance. There is evidence that the application of soil reclamation techniques
shortens the recovery period and stabilises the microbial community (Hou et al. 2018).
Here, we detected the same effect: application of backfilling in the quarries of the Progress
region led to a significant reduction in microbiome dispersion and the difference between
disturbed and benchmark sites. On the other hand, quarry microbiomes of the Urvan
region demonstrated higher distinction from benchmark samples and higher dispersion of
biological replicates. This effect can be explained by the fact that, in poor unreclaimed
gravel heaps, microbiota has higher sensitivity to microscale spatial variation of nutrients
introduced by plants than in primary soils mixed with Agrisol (Naylor et al. 2020,
Ayangbenro and Babalola 2021).
Another effect that happens with soil disturbance is the adaptation of microorganisms to
the new conditions. It was shown that, in treated soils, relevance of abundant
microorganisms (bacteria and fungi) is reduced and the relevance of low-abundance
microorganisms is increased (Bossolani et al. 2021), which can happen since conditions
have become less favourable for major microbiota and more favourable for the growth of
minor microbiota. We observed this effect in both regions: in comparison to benchmark
soils, in disturbed soils, major phylotypes decrease their abundance, while higher
quantities of minor phylotypes emerge. In Progress, microbiomes of disturbed soils still
carried the same major phylotypes from Firmicutes and Crenarchaeota as in benchmark
Agrisol, but their quantities were relatively lower. At the same time, disturbed soils carried
many minor phylotypes, some of which from cellulose decomposing Chitinophagaceae and
Cellulomonas. The presence of these taxa can be linked to the increased content of plant
residues, which accumulate in quarry soils due to lack of crop harvesting (Kolton et al.
2013).
Soil chemical parameters and the microbiome
The content of the most measured chemical parameters, including OC, phosphorus and
nitrates was low across all sampling sites, which is typical for the local soils (Gorobtsova et
al. 2017, Gorobtsova et al. 2021). The acidity of the benchmark and quarry soils
corresponds to their genetic features, which is explained by the chemical composition of
the mineral waste (Gorobtsova et al. 2016, Gorobtsova et al. 2017, Gorobtsova et al.
2021). In Urvan region, the main difference between benchmark and quarry soils was
reflected in carbon content: benchmark soil retained higher percentages of organic carbon,
while primary soils of quarries showed high quantities of total carbon, enhanced by parent
rock material. Soil cover in Progress reacts differently to the introduction of parent
materials: initial Agrisol already has high quantities of carbon, it rises in the freshly
reclaimed quarry bottom, but is reduced in older quarry bottoms. Organic matter content
reduction in disturbed lands with reclamation was reported earlier (Liu et al. 2017).
Microbiome composition of disturbed soils from sandy-gravel mining complexes ... 17

Benchmark soil in Progress - Agrisol - was the only soil showing the prevalence of nitrates
over ammonium, which is typical for agricultural soils (Cui and Song 2007). This feature is
preserved in the mining pit neighbouring the field, which showed signs of recent
reclamation with the mixture of rock dumps and soil heaps. In the soil of the older quarry,
the balance of nitrates and ammonium shifts back to ammonium prevalence. It could be
linked to soil acidic status, nitrate leaching or an introduction of plant residues since crops
were no longer being harvested (Dejoux et al. 2000, Miller and Cramer 2005).
Using several biological replicates with varying chemical parameters allowed us to create a
reliable model of factors influencing the microbial community. The key factor defining soil
disturbance in both regions was OC, which revealed the same phylotypes from the two
regions reacting to its content - Nitrososphaeraceae in benchmark soil and
Nitrososphaeraceae, Azospirillaceae, Cellulomonadaceae, Vicinamibacteraceae,
Nocardioidaceae and Chitinophagaceae in quarries. Members of Azospirillaceae were
reported to be associated with plants and to be involved in carbon and nitrogen cycles (
Sun et al. 2020). Vicinamibacteraceae from Acidobacteriota were reported to be flexible in
their preferred carbon source (Navarrete et al. 2015). Cellulomonadaceae can degrade not
only plant residues, but other carbon sources, like DNA and chitin (Stackebrandt and
Schumann 2014). Nocardioidaceae are considered mostly chemoorganotrophs (Tóth and
Borsodi 2014). Thus, with the lack of easy organic carbon in disturbed soil, microbiomes
are becoming enriched by microbiota, flexible to available energy resources.
Traditionally, microorganisms are divided by their life-history strategy into fast-growing
copiotrophs (or r-strategs) and slow-growing oligotrophs (K-strategs) (de Vries and Shade
2013). Based on their growth rates, usually gram-minus soil bacteria, like Proteobacteria,
Bacteroidota and Gemmatimonadota are treated as copiotrophs, while gram-plus bacteria
(Firmicutes, Actinobacteriota) as oligotrophs (Fierer et al. 2007, Zhang et al. 2020).
However, this division is quite arbitrary and does not always follow taxonomic division (
Ernebjerg and Kishony 2012, Ho et al. 2017, Song et al. 2017). For example, archaea from
Nitrososphaera are reported to correlate with nitrate composition in soil (Zhalnina et al.
2014), but in our dataset, we found different Nitrososphaera phylotypes correlating with
contents of nitrates, ammonia and organic carbon. Moreover, Ramlibacter representatives
were described from poor nutrient desert environments (Heulin et al. 2003) and alongside
this fact, we found phylotypes from Gammaproteobacteria - Ramlibacter and Ellin6067 -
associated with the lack of OC. However, there were also other phylotypes attributed to
Ramlibacter and Acidibacter, associated with the presence of OC. The same trend was
detected in Acidobacteriota - phylotypes from Vicinamibacteraceae and Blastocatellaceae
were detected in OC-rich soil samples and Vicinamibacteraceae, Bryobacter and RB41 in
OC-deprived soils. Thus, while the prevalence of a certain phylum in the dataset can be
linked to some microbiome-forming factors, our analysis showed once again that phyla are
formed by phenotypically paradox lower taxons.
18 Kimeklis A et al

Conclusions
Here, we described factors influencing the microbiome composition of disturbed soils. The
disturbance factor acts on the macroscale level and shapes the microbiome of unreclaimed
soil in almost the same way as the soil type factor. Vegetation brings diversity on the
microscale level and has a higher impact on the unreclaimed soils. Applying reclamation
techniques reduces the effect of disturbance and vegetation on the microbiome, but does
not eliminate it. Soil chemical parameters help to explain variation for some groups of
microorganisms, regardless of macroscale factors. In the Central Caucasus region, soil
disturbance can be linked to the loss of organic carbon, which reduces the presence of
major representatives of Firmicutes and facilitates the growth of minor representatives from
Acidobacteriota, Actinobacteriota, Bacteroidota and Proteobacteria.
Acknowledgements
We are grateful to Olga Hosid for proofreading of the manuscript.
Funding program
This work was supported by the Ministry of Science and Higher Education of the Russian
Federation in accordance with agreement № 075-15-2022-322 date 22.04.2022 on
providing a grant in the form of subsidies from the Federal budget of the Russian
Federation. The grant was provided for state support for the creation and development of a
World-class Scientific Center “Agrotechnologies for the Future”.
Author contributions
A.K.K. - sampling, DNA isolation, soil chemical data analysis, manuscript preparation,
G.V.G. - sampling, microbiome sequencing data analysis, manuscript preparation, R.H.T. –
choice of study objects, sampling, A.A.K. - construction and sequencing of the 16S rRNA
amplicon libraries, A.G.P. - construction and sequencing of the 16S rRNA amplicon
libraries, S.L.H. – manuscript proofreading, E.E.A. – project conceptualisation, manuscript
proofreading, E.V.A. – project conceptualisation, manuscript proofreading, funding
acquisition. All authors have read and agreed to the published version of the manuscript.
Conflicts of interest
The authors declare that the research was conducted in the absence of any commercial or
financial relationships that could be construed as a potential conflict of interest.
Microbiome composition of disturbed soils from sandy-gravel mining complexes ... 19

References
• Abakumov E, Gagarina E (2006) Soil Formation in Post-man-affected Quarry
Ecosystems in the Northwest Russian Plain. St. Petersburg University Press.
[In Russian].
• Abakumov E, Zverev A, Suleymanov A, Suleymanov R (2020) Microbiome of
posttechnogenic soils of quarries in the Republic of Bashkortostan (Russia). Open
Agriculture 5 (1): 529‑538. https://doi.org/10.1515/opag-2020-0053
• Abakumov E, Zverev A, Kichko A, Kimeklis A, Andronov E (2021) Soil microbiome of
different-aged stages of self-restoration of ecosystems on the mining heaps of
limestone quarry (Elizavetino, Leningrad region). Open Agriculture 6 (1): 57‑66. https://
doi.org/10.1515/opag-2020-0207
• Abakumov EV (2008) Accumulation and transformation of organic matter in
differentaged dumps from sand quarries. Eurasian Soil Science 41 (8): 844‑851. https://
doi.org/10.1134/s1064229308080061
• Abramchenko VV, Elizarova GY, Samoilova NS, Smirnov MS, Spirenkov VA, Dmitriev
YE, Konokotin MN, Kornilovich NV, Kunitsyna YV, Lilina LS, Tukhtasunov PK, Kharitov
MD, Shipkov YN (2019) State (National) report on the state and use of land in the
Russian Federation in 2018. Rosreestr, Moscow. [In Russian].
• Andersen K, Kirkegaard R, Karst S, Albertsen M (2018) ampvis2: an R package to
analyse and visualise 16S rRNA amplicon data. bioRxiv https://doi.org/10.1101/299537
• Anderson M (2005) Distance-Based Tests for Homogeneity of Multivariate Dispersions.
Biometrics 62 (1): 245‑253. https://doi.org/10.1111/j.1541-0420.2005.00440.x
• Anderson M, Ellingsen K, McArdle B (2006) Multivariate dispersion as a measure of
beta diversity. Ecology Letters 9 (6): 683‑693. https://doi.org/10.1111/j.1461-
0248.2006.00926.x
• Anderson M (2017) Permutational Multivariate Analysis of Variance (PERMANOVA).
Wiley StatsRef: Statistics Reference Online 1‑15. https://doi.org/10.1002/
9781118445112.stat07841
• Ashabokov BA, Fedchenko LM, Kalov K, Bischokov RM, Bogachenko EM (2005)
Analysis and forecast of climate change in the Kabardino-Balkarian Republic.
Publishing house of KBGAU, Nalchik. [In Russian].
• Ayangbenro AS, Babalola OO (2021) Reclamation of arid and semi-arid soils: The role
of plant growth-promoting archaea and bacteria. Current Plant Biology 25: 100173.
https://doi.org/10.1016/j.cpb.2020.100173
• Bekarevich NE, Masyuk NT, Uzbek M (1969) Recommendations for biological land
restoration in Dnipropetrovsk Oblast. Promin' Publ, Dnepropetrovsk. [In Russian].
• Bolyen E, Rideout JR, Dillon M, Bokulich N, Abnet C, Al-Ghalith G, Alexander H, Alm E,
Arumugam M, Asnicar F, Bai Y, Bisanz J, Bittinger K, Brejnrod A, Brislawn C, Brown CT,
Callahan B, Caraballo-Rodríguez AM, Chase J, Cope E, Da Silva R, Diener C,
Dorrestein P, Douglas G, Durall D, Duvallet C, Edwardson C, Ernst M, Estaki M,
Fouquier J, Gauglitz J, Gibbons S, Gibson D, Gonzalez A, Gorlick K, Guo J, Hillmann B,
Holmes S, Holste H, Huttenhower C, Huttley G, Janssen S, Jarmusch A, Jiang L,
Kaehler B, Kang KB, Keefe C, Keim P, Kelley S, Knights D, Koester I, Kosciolek T,
Kreps J, Langille MI, Lee J, Ley R, Liu Y, Loftfield E, Lozupone C, Maher M, Marotz C,
Martin B, McDonald D, McIver L, Melnik A, Metcalf J, Morgan S, Morton J, Naimey AT,
20 Kimeklis A et al

Navas-Molina J, Nothias LF, Orchanian S, Pearson T, Peoples S, Petras D, Preuss ML,
Pruesse E, Rasmussen LB, Rivers A, Robeson M, Rosenthal P, Segata N, Shaffer M,
Shiffer A, Sinha R, Song SJ, Spear J, Swafford A, Thompson L, Torres P, Trinh P,
Tripathi A, Turnbaugh P, Ul-Hasan S, van der Hooft JJ, Vargas F, Vázquez-Baeza Y,
Vogtmann E, von Hippel M, Walters W, Wan Y, Wang M, Warren J, Weber K, Williamson
CD, Willis A, Xu ZZ, Zaneveld J, Zhang Y, Zhu Q, Knight R, Caporaso JG (2019)
Reproducible, interactive, scalable and extensible microbiome data science using
QIIME 2. Nature Biotechnology 37 (8): 852‑857. https://doi.org/10.1038/
s41587-019-0209-9
• Bossolani J, Crusciol CC, Leite MA, Merloti L, Moretti L, Pascoaloto I, Kuramae E
(2021) Modulation of the soil microbiome by long-term Ca-based soil amendments
boosts soil organic carbon and physicochemical quality in a tropical no-till crop rotation
system. Soil Biology and Biochemistry 156: 108188. https://doi.org/10.1016/j.soilbio.
2021.108188
• Bradshaw AD (1984) Ecological principles and land reclamation practice. Landscape
Planning 11 (1): 35‑48. https://doi.org/10.1016/0304-3924(84)90016-9
• Bray JR, Curtis JT (1957) An Ordination of the Upland Forest Communities of Southern
Wisconsin. Ecological Monographs 27 (4): 325‑349. https://doi.org/10.2307/1942268
• Burlakovs J, Kriipsalu M, Klavins M, Bhatnagar A, Vincevica-Gaile Z, Stenis J, Jani Y,
Mykhaylenko V, Denafas G, Turkadze T, Hogland M, Rudovica V, Kaczala F, Rosendal
RM, Hogland W (2017) Paradigms on landfill mining: From dump site scavenging to
ecosystem services revitalization. Resources, Conservation and Recycling 123: 73‑84.
https://doi.org/10.1016/j.resconrec.2016.07.007
• Chen J, Li K, Chang K, Sofia G, Tarolli P (2015) Open-pit mining geomorphic feature
characterisation. International Journal of Applied Earth Observation and Geoinformation
42: 76‑86. https://doi.org/10.1016/j.jag.2015.05.001
• Chen L, Li D, Shao Y, Adni J, Wang H, Liu Y, Zhang Y (2020) Comparative Analysis of
Soil Microbiome Profiles in the Companion Planting of White Clover and Orchard Grass
Using 16S rRNA Gene Sequencing Data. Frontiers in Plant Science 11: 538311. https://
doi.org/10.3389/fpls.2020.538311
• Coller E, Cestaro A, Zanzotti R, Bertoldi D, Pindo M, Larger S, Albanese D, Mescalchin
E, Donati C (2019) Microbiome of vineyard soils is shaped by geography and
management. Microbiome 7 (1): 140. https://doi.org/10.1186/s40168-019-0758-7
• Conacher A (2009) Land degradation: A global perspective. New Zealand Geographer
65 (2): 91‑94. https://doi.org/10.1111/j.1745-7939.2009.01151.x
• Cui X, Song J (2007) Soil NH4+/NO3− nitrogen characteristics in primary forests and
the adaptability of some coniferous species. Frontiers of Forestry in China 2 (1): 1‑10.
https://doi.org/10.1007/s11461-007-0001-8
• Deakin G, Tilston E, Bennett J, Passey T, Harrison N, Fernández-Fernández F, Xu X
(2018) Spatial structuring of soil microbial communities in commercial apple orchards.
Applied Soil Ecology 130: 1‑12. https://doi.org/10.1016/j.apsoil.2018.05.015
• Dejoux J, Recous S, Meynard J, Trinsoutrot I, Leterme P (2000) The fate of nitrogen
from winter-frozen rapeseed leaves: mineralization, fluxes to the environment and
uptake by rapeseed crop in spring. Plant and Soil 218: 257‑272. https://doi.org/10.1023/
a:1014934924819
• de Vries F, Shade A (2013) Controls on soil microbial community stability under climate
change. Frontiers in Microbiology 4: 265. https://doi.org/10.3389/fmicb.2013.00265
Microbiome composition of disturbed soils from sandy-gravel mining complexes ... 21

• Duchaufour P (1982) Hydromorphic soils. In: Duchaufour P (Ed.) Pedology. Springer,
Dordrecht, 335-372 pp. https://doi.org/10.1007/978-94-011-6003-2_12
• Epelde L, Lanzén A, Blanco F, Urich T, Garbisu C (2014) Adaptation of soil microbial
community structure and function to chronic metal contamination at an abandoned Pb-
Zn mine. FEMS Microbiology Ecology 91 (1): 1‑11. https://doi.org/10.1093/femsec/
fiu007
• Ernebjerg M, Kishony R (2012) Distinct Growth Strategies of Soil Bacteria as Revealed
by Large-Scale Colony Tracking. Applied and Environmental Microbiology 78 (5):
1345‑135. https://doi.org/10.1128/aem.06585-11
• Faith D (1992) Conservation evaluation and phylogenetic diversity. Biological
Conservation 61 (1): 1‑10. https://doi.org/10.1016/0006-3207(92)91201-3
• Favas PJ, Martino LE, Prasad MN (2018) Bio-Geotechnologies for Mine Site
Rehabilitation. Elsevier, Amsterdam. https://doi.org/10.1016/c2016-0-04139-6
• Fierer N, Bradford M, Jackson R (2007) Toward an ecological classification of soil
bacteria. Ecology 88 (6): 1354‑1364. https://doi.org/10.1890/05-1839
• Fox J, Monette G (1992) Generalized Collinearity Diagnostics. Journal of the American
Statistical Association 87 (417): 178‑183. https://doi.org/10.1080/0162
1459.1992.10475190
• Fox J (1997) Applied regression, linear models, and related methods. Sage
Publications, Inc., Thousand Oaks.
• Gavrilenko EG, Susyan EA, Anan’eva ND, Makarov OA (2011) Spatial variability in the
carbon of microbial biomass and microbial respiration in soils of the south of Moscow
oblast. Eurasian Soil Science 44 (10): 1125‑1138. https://doi.org/10.1134/
s106422931110005x
• Gladkov G, Kimeklis A, Zverev A, Pershina E, Ivanova E, Kichko A, Andronov E,
Abakumov E (2019) Soil microbiome of the postmining areas in polar ecosystems in
surroundings of Nadym, Western Siberia, Russia. Open Agriculture 4 (1): 684‑696.
https://doi.org/10.1515/opag-2019-0070
• Gorobtsova ON, Gedgafova FV, Uligova TS, Tembotov RK (2016) A comparative
assessment of the biological properties of soils in the cultural and native cenoses of the
Central Caucasus (using the example of the Terskii variant of altitudinal zonality in
Kabardino-Balkaria). Eurasian Soil Science 49 (1): 89‑94. https://doi.org/10.1134/
s1064229316010063
• Gorobtsova ON, Uligova TS, Tembotov RK, Khakunova EM (2017) Assessment of
Biological Activity in Agrogenic and Natural Chernozems of Kabardino-Balkaria.
Eurasian Soil Science 5: 589‑596. [In Russian]. https://doi.org/10.7868/
s0032180x17030042
• Gorobtsova ON, Uligova TS, Gedgafova FV, Tembotov RH, Khakunova EM (2021)
Biological Activity of Soils in the Broad Leaved Forests of the Central Caucasus. Forest
Science 1: 78‑92. [In Russian]. https://doi.org/10.31857/s0024114821010046
• Gregory AS, Ritz K, McGrath SP, Quinton JN, Goulding KW, Jones RJ, Harris JA, Bol R,
Wallace P, Pilgrim ES, Whitmore AP (2015) A review of the impacts of degradation
threats on soil properties in the UK. Soil Use and Management 31: 1‑15. https://doi.org/
10.1111/sum.12212
• Hartman HL, Mutmansky YM (2002) Introduction to mining. Introductory Mining
Engineering. 2nd edition. 592 pp. [ISBN 978-0-471-34851-1].
22 Kimeklis A et al

• Heulin T, Barakat M, Christen R, Lesourd M, Sutra L, De Luca G, Achouak W (2003)
Ramlibacter tataouinensis gen. nov., sp. nov., and Ramlibacter henchirensis sp. nov.,
cyst-producing bacteria isolated from subdesert soil in Tunisia. International Journal of
Systematic and Evolutionary Microbiology 53 (2): 589‑594. https://doi.org/10.1099/ijs.
0.02482-0
• Ho A, Lonardo DP, Bodelier PE (2017) Revisiting life strategy concepts in environmental
microbial ecology. FEMS Microbiology Ecology 93 (3): fix006. https://doi.org/10.1093/
femsec/fix006
• Holl K (2002) Long-term vegetation recovery on reclaimed coal surface mines in the
eastern USA. Journal of Applied Ecology 39 (6): 960‑970. https://doi.org/10.1046/j.
1365-2664.2002.00767.x
• Hou H, Wang C, Ding Z, Zhang S, Yang Y, Ma J, Chen F, Li J (2018) Variation in the
Soil Microbial Community of Reclaimed Land over Different Reclamation Periods.
Sustainability 10 (7): 2286. https://doi.org/10.3390/su10072286
• Ivanova E, Pershina E, Shapkin V, Kichko A, Aksenova T, Kimeklis A, Gladkov G,
Zverev A, Vasilyeva N, Andronov E, Abakumov E (2020) Shifting prokaryotic
communities along a soil formation chronosequence and across soil horizons in a South
Taiga ecosystem. Pedobiologia 81-82: 150650. https://doi.org/10.1016/j.pedobi.
2020.150650
• Janssen S, McDonald D, Gonzalez A, Navas-Molina J, Jiang L, Xu ZZ, Winker K, Kado
D, Orwoll E, Manary M, Mirarab S, Knight R (2018) Phylogenetic Placement of Exact
Amplicon Sequences Improves Associations with Clinical Information. mSystems 3 (3):
e00021-18. https://doi.org/10.1128/msystems.00021-18
• Jie C, Jing-zhang C, Man-zhi T, Zi-tong G (2002) Soil degradation: a global problem
endangering sustainable development. Journal of Geographical Sciences 12 (2):
243‑252. https://doi.org/10.1007/bf02837480
• Józefowska A, Woś B, Pietrzykowski M (2016) Tree species and soil substrate effects
on soil biota during early soil forming stages at afforested mine sites. Applied Soil
Ecology 102: 70‑79. https://doi.org/10.1016/j.apsoil.2016.02.012
• Jurek V (2014) Wildlife return at the quarry “Břidla”: possibilities of natural habitat
restoration. Quarry Life Award Project, Czech Republic.
• Kassambara A (2019) ggpubr: `ggplot2' Based Publication Ready Plots. R
packageversion 0.4.02022-1-10. https://cran.r-project.org/web/packages/ggpubr/
index.html. Accessed on: 2022-1-10.
• Kazeev KS, Odabashyan MY, Trushkov AV, Kolesnikov SI (2020) Assessment of the
Influence of Different Pyrogenic Factors on the Biological Properties of Chernozems.
Eurasian Soil Science 11: 1372‑1382. [In Russian]. https://doi.org/10.31857/
s0032180x20110064
• Kembel SW, Cowan PD, Helmus MR, Cornwell WK, Morlon H, Ackerly DD, Blomberg
SP, Webb CO (2010) Picante: R tools for integrating phylogenies and ecology.
Bioinformatics 26 (11): 1463‑1464. https://doi.org/10.1093/bioinformatics/btq166
• Kimeklis A, Gladkov G, Zverev A, Kichko A, Andronov E, Ergina E, Kostenko I,
Abakumov E (2021) Microbiomes of different ages in Rendzic Leptosols in the Crimean
Peninsula. PeerJ 9: 10871. https://doi.org/10.7717/peerj.10871
• Kolton M, Sela N, Elad Y, Cytryn E (2013) Comparative Genomic Analysis Indicates that
Niche Adaptation of Terrestrial Flavobacteria Is Strongly Linked to Plant Glycan
Metabolism. PLoS ONE 8 (9): 76704. https://doi.org/10.1371/journal.pone.0076704
Microbiome composition of disturbed soils from sandy-gravel mining complexes ... 23
• Kruskal JB (1964) Multidimensional scaling by optimizing goodness of fit to a nonmetric
hypothesis. Psychometrika 29 (1): 1‑27. https://doi.org/10.1007/bf02289565
• Legwaila I, Lange E, Cripps J (2015) Quarry reclamation in England: a review of
techniques. Journal American Society of Mining and Reclamation 4 (2): 55‑79. https://
doi.org/10.21000/jasmr15020055
• Liddicoat C, Weinstein P, Bissett A, Gellie NC, Mills J, Waycott M, Breed M (2019) Can
bacterial indicators of a grassy woodland restoration inform ecosystem assessment and
microbiota-mediated human health? Environment International 129: 105‑117. https://
doi.org/10.1016/j.envint.2019.05.011
• Lin H, Peddada SD (2020) Analysis of microbial compositions: a review of normalization
and differential abundance analysis. npj Biofilms and Microbiomes 6 (1): 60. https://
doi.org/10.1038/s41522-020-00160-w
• Liu Q, Zhang Q, Jarvie S, Yan Y, Han P, Liu T, Guo K, Ren L, Yue K, Wu H, Du J, Niu J,
Svenning J (2021) Ecosystem restoration through aerial seeding: Interacting plant-soil
microbiome effects on soil multifunctionality. Land Degradation & Development 32 (18):
5334‑5347. https://doi.org/10.1002/ldr.4112
• Liu X, Bai Z, Zhou W, Cao Y, Zhang G (2017) Changes in soil properties in the soil
profile after mining and reclamation in an opencast coal mine on the Loess Plateau,
China. Ecological Engineering 98: 228‑239. https://doi.org/10.1016/j.ecoleng.
2016.10.078
• Love MI, Huber W, Anders S (2014) Moderated estimation of fold change and
dispersion for RNA-seq data with DESeq2. Genome Biology 15 (12): 550. https://
doi.org/10.1186/s13059-014-0550-8
• Lupatini M, Korthals G, Hollander M, Janssens TS, Kuramae E (2017) Soil Microbiome
Is More Heterogeneous in Organic Than in Conventional Farming System. Frontiers in
Microbiology 7: 2064. https://doi.org/10.3389/fmicb.2016.02064
• Malard L, Pearce D (2018) Microbial diversity and biogeography in Arctic soils.
Environmental Microbiology Reports 10 (6): 611‑625. https://doi.org/
10.1111/1758-2229.12680
• Mann HB, Whitney DR (1947) On a Test of Whether one of Two Random Variables is
Stochastically Larger than the Other. The Annals of Mathematical Statistics 18 (1):
50‑60. https://doi.org/10.1214/aoms/1177730491
• McArdle BH, Anderson MJ (2001) Fitting multivariate models to community data: A
comment on distance-based redundancy analysis. Ecology 82: 290‑297. https://doi.org/
10.2307/2680104
• McCune B (1997) Influence of noisy environmental data on canonical correspondence
analysis. Ecology 78 (8): 2617‑2623. https://doi.org/
10.1890/0012-9658(1997)078[2617:ionedo]2.0.co;2
• McMurdie P, Holmes S (2013) phyloseq: An R Package for Reproducible Interactive
Analysis and Graphics of Microbiome Census Data. PLoS ONE 8 (4): 61217. https://
doi.org/10.1371/journal.pone.0061217
• Melnikov NV (1977) Extraction of minerals in the USSR and the problems of
reclamation of lands disturbed by mining operations. In: Melnikov NV (Ed.) Scientific
and technical problems of reclamation of lands disturbed during mining in the USSR.
VINITI, Moscow. [In Russian].
• Miller AJ, Cramer MD (2005) Root Nitrogen Acquisition and Assimilation. Plant and Soil
274: 1‑36. https://doi.org/10.1007/s11104-004-0965-1
24 Kimeklis A et al

• Mitter E, de Freitas JR, Germida J (2017) Bacterial Root Microbiome of Plants Growing
in Oil Sands Reclamation Covers. Frontiers in Microbiology 8: 849. https://doi.org/
10.3389/fmicb.2017.00849
• Monjezi M, Shahriar K, Dehghani H, Samimi Namin F (2008) Environmental impact
assessment of open pit mining in Iran. Environmental Geology 58 (1): 205‑216. https://
doi.org/10.1007/s00254-008-1509-4
• Murugan R, Loges R, Taube F, Sradnick A, Joergensen RG (2014) Changes in Soil
Microbial Biomass and Residual Indices as Ecological Indicators of Land Use Change
in Temperate Permanent Grassland. Microbial Ecology 67 (4): 907‑918. https://doi.org/
10.1007/s00248-014-0383-8
• Navarrete AA, Venturini AM, Meyer KM, Klein AM, Tiedje JM, Bohannan BJ, Nüsslein K,
Tsai SM, Rodrigues JL (2015) Differential Response of Acidobacteria Subgroups to
Forest-to-Pasture Conversion and Their Biogeographic Patterns in the Western
Brazilian Amazon. Frontiers in Microbiology 6: 1443. https://doi.org/10.3389/fmicb.
2015.01443
• Naylor D, Fansler S, Brislawn C, Nelson W, Hofmockel K, Jansson J, McClure R (2020)
Deconstructing the Soil Microbiome into Reduced-Complexity Functional Modules.
mBio 11 (4): e01349-20. https://doi.org/10.1128/mbio.01349-20
• Nearing J, Douglas G, Comeau A, Langille MI (2018) Denoising the Denoisers: an
independent evaluation of microbiome sequence error-correction approaches. PeerJ 6:
e5364. https://doi.org/10.7717/peerj.5364
• Nearing J, Douglas G, Hayes M, MacDonald J, Desai D, Allward N, Jones CA, Wright
R, Dhanani A, Comeau A, Langille MI (2022) Microbiome differential abundance
methods produce different results across 38 datasets. Nature Communications 13 (1):
342. https://doi.org/10.1038/s41467-022-28034-z
• O'Brien S, Gibbons S, Owens S, Hampton-Marcell J, Johnston E, Jastrow J, Gilbert J,
Meyer F, Antonopoulos D (2016) Spatial scale drives patterns in soil bacterial diversity.
Environmental Microbiology 18 (6): 2039‑2051. https://doi.org/10.1111/1462-2920.13231
• Oksanen J, Blanchet FG, Friendly M, Kindt R, Legendre P, McGlinn D, Minchin PR,
O'Hara RB, Simpson GL, Solymos P, Stevens MH, Szoecs E, Wagner H (2020) vegan:
Community Ecology Package. R package version 2.5-7. https://CRAN.Rproject.org/
package=vegan. Accessed on: 2022-1-25.
• Palmer MW (1993) Putting things in even better order: The advantages of canonical
correspondence analysis. Ecology 74: 2215‑2230. https://doi.org/10.2307/1939575
• Pedersen TL (2019) ggforce: Accelerating `ggplot2'. R package version 0.3.3. https://
cran.r-project.org/package=ggforce. Accessed on: 2022-1-10.
• Pershina E, Ivanova E, Kimeklis A, Zverev A, Kichko A, Aksenova T, Andronov E,
Abakumov E (2020) Soil microbiomes of reclaimed and abandoned mines of the Yamal
region. Polish Polar Research 41 (1): 95‑114. https://doi.org/10.24425/ppr.2020.132571
• Prach K, Lencová K, Řehounková K, Dvořáková H, Jírová A, Konvalinková P, Mudrák
O, Novák J, Trnková R (2013) Spontaneous vegetation succession at different central
European mining sites: a comparison across seres. Environmental Science and
Pollution Research 20 (11): 7680‑7685. https://doi.org/10.1007/s11356-013-1563-7
• Prăvălie R (2021) Exploring the multiple land degradation pathways across the planet.
Earth-Science Reviews 220: 103689. https://doi.org/10.1016/j.earscirev.2021.103689
Microbiome composition of disturbed soils from sandy-gravel mining complexes ... 25

• Puell Ortiz J (2017) Methodology for a dump design optimization in large-scale open pit
mines. Cogent Engineering 4 (1): 1387955. https://doi.org/
10.1080/23311916.2017.1387955
• Quast C, Pruesse E, Yilmaz P, Gerken J, Schweer T, Yarza P, Peplies J, Glöckner FO
(2013) The SILVA ribosomal RNA gene database project: improved data processing and
web-based tools. Nucleic Acids Research 41: d590‑d596. https://doi.org/10.1093/nar/
gks1219
• Razumov VV, Kurdanov KA, Razumova LA, Krokhmal AG, Batyrbekova LM (2003)
Ecosystems of the Central Caucasus mountains and human health. Ileksa,
Stavropolservice School, Moscow-Stavropol. [In Russian].
• R Core Team (2021) R: A language and environment for statistical computing.
RFoundation for Statistical Computing, Vienna, Austria. https://www.R-project.org/.
Accessed on: 2022-1-10.
• RStudio Team (2020) (2020) RStudio: Integrated Development for R. RStudio, PBC,
Boston,MA. http://www.rstudio.com/. Accessed on: 2022-1-10.
• Schreiter S, Ding G, Heuer H, Neumann G, Sandmann M, Grosch R, Kropf S, Smalla K
(2014) Effect of the soil type on the microbiome in the rhizosphere of field-grown
lettuce. Frontiers in Microbiology 5: 144. https://doi.org/10.3389/fmicb.2014.00144
• Shannon CE, Weaver W (1949) The mathematical theory of communication. University
of Illinois Press, Urbana.
• Shi Y, Li Y, Xiang X, Sun R, Yang T, He D, Zhang K, Ni Y, Zhu Y, Adams J, Chu H (2018)
Spatial scale affects the relative role of stochasticity versus determinism in soil bacterial
communities in wheat fields across the North China Plain. Microbiome 6 (1): 27. https://
doi.org/10.1186/s40168-018-0409-4
• Silverman JD, Washburne AD, Mukherjee S, David LA (2017) A phylogenetic transform
enhances analysis of compositional microbiota data. eLife 6: e21887. https://doi.org/
10.7554/elife.21887
• Simpson EH (1949) Measurement of Diversity. Nature 163 (4148): 688. https://doi.org/
10.1038/163688a0
• Sokolov VE, Tembotov AK (1989) Vertebrates of the Caucasus. Mammals. Insectivores.
Nauka, Moscow. [In Russian].
• Song H, Song W, Kim M, Tripathi B, Kim H, Jablonski P, Adams J (2017) Bacterial
strategies along nutrient and time gradients, revealed by metagenomic analysis of
laboratory microcosms. FEMS Microbiology Ecology 93 (10): fix114. https://doi.org/
10.1093/femsec/fix114
• Stackebrandt E, Schumann P (2014) The Family Cellulomonadaceae. In: Rosenberg E,
DeLong EF, Lory S, Stackebrandt E, Thompson F (Eds) The Prokaryotes. Springer,
Berlin, Heidelberg. https://doi.org/10.1007/978-3-642-30138-4_223
• Sun R, Song C, Sun Y, Wang Q, Liu H, Wang J (2020) Agricultural Soil Organic Matters
and Microbiome Are Shaped by Management and Hedgerows. Agronomy 10 (9): 131.
https://doi.org/10.3390/agronomy10091316
• Sun S, Sun H, Zhang D, Zhang J, Cai Z, Qin G, Song Y (2019) Response of Soil
Microbes to Vegetation Restoration in Coal Mining Subsidence Areas at Huaibei Coal
Mine, China. International Journal of Environmental Research and Public Health 16
(10): 1757. https://doi.org/10.3390/ijerph16101757
26 Kimeklis A et al

• ter Braak CF (1986) Canonical Correspondence Analysis: A New Eigenvector
Technique for Multivariate Direct Gradient Analysis. Ecology 67 (5): 1167‑1179. https://
doi.org/10.2307/1938672
• Thakur TK, Dutta J, Upadhyay P, Patel DK, Thakur A, Kumar M, Kumar A (2022)
Assessment of land degradation and restoration in coal mines of central India: A time
series analysis. Ecological engineering 175: 106493. https://doi.org/10.1016/j.ecoleng.
2021.106493
• Tóth EM, Borsodi AK (2014) The Family Nocardioidaceae. In: Rosenberg E, DeLong
EF, Lory S, Stackebrandt E, Thompson F (Eds) The Prokaryotes. Springer, Berlin,
Heidelberg. https://doi.org/10.1007/978-3-642-30138-4_193
• Wang Q, Garrity G, Tiedje J, Cole J (2007) Naive Bayesian Classifier for Rapid
Assignment of rRNA Sequences into the New Bacterial Taxonomy. Applied and
Environmental Microbiology 73 (16): 5261‑5267. https://doi.org/10.1128/aem.00062-07
• Wang R, Wang M, Wang J, Lin Y (2021) Habitats Are More Important Than Seasons in
Shaping Soil Bacterial Communities on the Qinghai-Tibetan Plateau. Microorganisms 9
(8): 1595. https://doi.org/10.3390/microorganisms9081595
• Wickham H, Averick M, Bryan J, Chang W, McGowan L, François R, Grolemund G,
Hayes A, Henry L, Hester J, Kuhn M, Pedersen T, Miller E, Bache S, Müller K, Ooms J,
Robinson D, Seidel D, Spinu V, Takahashi K, Vaughan D, Wilke C, Woo K, Yutani H
(2019) Welcome to the Tidyverse. Journal of Open Source Software 4 (43): 1686.
https://doi.org/10.21105/joss.01686
• Wipf HL, Xu L, Gao C, Spinner H, Taylor J, Lemaux P, Mitchell J, Coleman-Derr D
(2021) Agricultural Soil Management Practices Differentially Shape the Bacterial and
Fungal Microbiomes of Sorghum bicolor. Applied and Environmental Microbiology 87
(5). https://doi.org/10.1128/aem.02345-20
• Yu G, Lam TT, Zhu H, Guan Y (2018) Two Methods for Mapping and Visualizing
Associated Data on Phylogeny Using Ggtree. Molecular Biology and Evolution 35 (12):
3041‑3043. https://doi.org/10.1093/molbev/msy194
• Zhalnina K, Dias R, Leonard M, Quadros P, Camargo FO, Drew J, Farmerie W, Daroub
S, Triplett E (2014) Genome Sequence of Candidatus Nitrososphaera evergladensis
from Group I.1b Enriched from Everglades Soil Reveals Novel Genomic Features of the
Ammonia-Oxidizing Archaea. PLoS ONE 9 (7): 101648. https://doi.org/10.1371/
journal.pone.0101648
• Zhang K, Delgado-Baquerizo M, Zhu Y, Chu H (2020) Space Is More Important than
Season when Shaping Soil Microbial Communities at a Large Spatial Scale. mSystems
5 (3): e00783-19. https://doi.org/10.1128/msystems.00783-19
• Zverev A, Petrov A, Kimeklis A, Kichko A, Andronov E, Petrov A, Abakumov E (2020)
Microbiomes of the initial soils of mining areas of Yakutsk City (Eastern Siberia, Russia).
Czech Polar Reports 10 (1): 69‑82. https://doi.org/10.5817/cpr2020-1-7
Microbiome composition of disturbed soils from sandy-gravel mining complexes ... 27

Supplementary materials
Suppl. material 1: Supplementary figures
Authors: Kimeklis AK, Gladkov GV
Data type: images
Download file (2.34 MB)
Suppl. material 2: Supplementary tables
Authors: Kimeklis AK, Gladkov GV
Data type: tables
Download file (95.48 kb)
Suppl. material 3: Supplementary code
Authors: Gladkov GV
Data type: code
Brief description: Code used for data processing and analysis
Download file (3.81 MB)
28 Kimeklis A et al