Distribution of methanotrophs in managed and highly disturbed watersheds
13
Distribution of methanotrophs in managed and highly disturbed watersheds Andrew Ogram * , Hector Castro, Elizabeth Stanley, Weiwei Chen, Joseph Prenger Soil and Water Science Department, University of Florida, P.O. Box 110290, Gainesville, FL 32611-0290, USA Received 21 January 2005; received in revised form 6 May 2005; accepted 24 May 2005 Abstract Potential impacts of mechanized infantry training activities on the distribution of methanotrophs were investigated in two watersheds on Fort Benning, a US Army installation in southwest Georgia, USA. The Bonham Creek watershed shows significant impacts from intensive training exercises, including severe erosion and deposition of sediments in bottomlands. The Sally Branch watershed is a managed watershed with only limited exposure to mechanized training activity and much less erosion. A clone library of the gene encoding particulate methane monooxygenase, pmoA, was constructed from DNA extracted from Sally Branch bottomland and upland samples. Libraries were constructed from only one watershed in the interest of decreasing the amount of sequencing, and Sally Branch was chosen for construction of these libraries because relatively undisturbed environments generally exhibit higher levels of diversity. The Sally Branch pmoA libraries were dominated by a deeply rooted lineage related to Type I methanotrophs (the ‘‘Benning soil cluster g,’’ BSCg). Sequences clustering with known Type II methanotrophs were restricted to samples taken from the Sally Branch bottomland sample. Terminal restriction fragment length polymorphism (T-RFLP) analysis of pmoA was applied to samples taken from transects located in upland and bottomland sites within the two watersheds. Observed T-RFs matched well with T-RFs predicted from sequences obtained from the clone library, with few exceptions. Principal components analysis revealed that in both watersheds most T-RFLPs from upland samples clustered separately from bottomland samples. Upland and bottomland T-RFLPs clustered separately in the Sally Branch transect; however, some Bonham Creek bottomland T-RFLPs clustered within the upland cluster, suggesting mixing of upland with bottomland soils in this watershed. Assemblages were, in general, similar between the eroded and managed watersheds, although erosional soil movement likely resulted in mixing of upland assemblages with bottomland assemblages in the Bonham Creek watershed. # 2005 Elsevier Ltd. All rights reserved. Keywords: Methanotrophs; T-RFLP; Habitat disturbance 1. Introduction The impact of land use practices on the structure and function of microbial communities is currently of great interest, particularly with regard to potential This article is also available online at: www.elsevier.com/locate/ecolind Ecological Indicators 6 (2006) 631–643 * Corresponding author. Tel.: +1 352 392 1951x211. E-mail address: [email protected]fl.edu (A. Ogram). 1470-160X/$ – see front matter # 2005 Elsevier Ltd. All rights reserved. doi:10.1016/j.ecolind.2005.05.002
-
Upload
independent -
Category
Documents
-
view
5 -
download
0
Transcript of Distribution of methanotrophs in managed and highly disturbed watersheds
Distribution of methanotrophs in managed
and highly disturbed watersheds
Andrew Ogram *, Hector Castro, Elizabeth Stanley, Weiwei Chen, Joseph Prenger
Soil and Water Science Department, University of Florida, P.O. Box 110290, Gainesville, FL 32611-0290, USA
Received 21 January 2005; received in revised form 6 May 2005; accepted 24 May 2005
Abstract
Potential impacts of mechanized infantry training activities on the distribution of methanotrophs were investigated in two
watersheds on Fort Benning, a US Army installation in southwest Georgia, USA. The Bonham Creek watershed shows
significant impacts from intensive training exercises, including severe erosion and deposition of sediments in bottomlands. The
Sally Branch watershed is a managed watershed with only limited exposure to mechanized training activity and much less
erosion. A clone library of the gene encoding particulate methane monooxygenase, pmoA, was constructed from DNA extracted
from Sally Branch bottomland and upland samples. Libraries were constructed from only one watershed in the interest of
decreasing the amount of sequencing, and Sally Branch was chosen for construction of these libraries because relatively
undisturbed environments generally exhibit higher levels of diversity. The Sally Branch pmoA libraries were dominated by a
deeply rooted lineage related to Type I methanotrophs (the ‘‘Benning soil cluster g,’’ BSCg). Sequences clustering with known
Type II methanotrophs were restricted to samples taken from the Sally Branch bottomland sample. Terminal restriction fragment
length polymorphism (T-RFLP) analysis of pmoAwas applied to samples taken from transects located in upland and bottomland
sites within the two watersheds. Observed T-RFs matched well with T-RFs predicted from sequences obtained from the clone
library, with few exceptions. Principal components analysis revealed that in both watersheds most T-RFLPs from upland samples
clustered separately from bottomland samples. Upland and bottomland T-RFLPs clustered separately in the Sally Branch
transect; however, some Bonham Creek bottomland T-RFLPs clustered within the upland cluster, suggesting mixing of upland
with bottomland soils in this watershed. Assemblages were, in general, similar between the eroded and managed watersheds,
although erosional soil movement likely resulted in mixing of upland assemblages with bottomland assemblages in the Bonham
Creek watershed.
# 2005 Elsevier Ltd. All rights reserved.
Keywords: Methanotrophs; T-RFLP; Habitat disturbance
This article is also available online at:www.elsevier.com/locate/ecolind
Ecological Indicators 6 (2006) 631–643
* Corresponding author. Tel.: +1 352 392 1951x211.
E-mail address: [email protected] (A. Ogram).
1470-160X/$ – see front matter # 2005 Elsevier Ltd. All rights reserved
doi:10.1016/j.ecolind.2005.05.002
1. Introduction
The impact of land use practices on the structure
and function of microbial communities is currently of
great interest, particularly with regard to potential
.
A. Ogram et al. / Ecological Indicators 6 (2006) 631–643632
effects on nutrient cycling and ecosystem functioning.
Due to their responsiveness to environmental condi-
tions, various aspects of microbial communities have
been used as indicators of environmental quality (Rice
et al., 1996; Paerl et al., 2003; Ellis et al., 2002) and
ecosystem integrity (Peacock et al., 2001a). Much of
this research has focused on use of general microbial
indicators such as biomass or on gross structure of
microbial communities through analysis of biomar-
kers such as phospholipid fatty acids (PLFA; Peacock
et al., 2001a,b). Analysis of the response of individual
groups of microorganisms to environmental perturba-
tions may provide greater sensitivity to environmental
changes than gross microbial measurements (Castro
et al., 2002, 2004, 2005; Stephen et al., 2001), and
provide greater insight into the effects of these
perturbations on microbially mediated processes.
Among those microbial groups that have been
suggested as indicators of ecosystem function and
quality are methanotrophs, methane-oxidizing bac-
teria that are widespread in most soils. Methanotrophs
are important sinks for approximately 700 Tg of
methane emitted annually from various sources
(Reeburgh et al., 1993), and are an important part
of the carbon cycle in many soils.
Most methanotrophs can be divided into two broad
physiological and phylogenetic groups, the Types I
and II methanotrophs. Type I methanotrophs belong to
the g-proteobacteria and Type II are members of the a-
proteobacteria (Hanson and Hanson, 1996). Both
types coexist in many environments, although Type I
methanotrophs typically dominate in high oxygen, low
methane environments (Henckel et al., 2000b) and
Type II methanotrophs tend to dominate under high
methane conditions. Both types have been found in
forests, although Type I methanotrophs have been
reported to be more active than Type II strains in some
forests (Knief et al., 2003). With few exceptions
(Dunfield et al., 2003), both types harbor characteristic
forms of the particulate methane monooxygenase gene
( pmoA), and most Type II species typically also
encode a soluble methane monooxygenase. These
genes are sufficiently conserved between representa-
tive strains to be of use in constructing phylogenies
that compare well with 16S rRNA phylogenies
(Auman et al., 2000; Costello and Lidstrom, 1999).
The availability of conserved genes such as those
encoding the particulate and soluble methane mono-
oxygenases make them attractive targets for non-
culture based studies of the distribution and activities
of methanotrophs in soils. Distribution of these
genotypes has been studied in a variety of environ-
ments, including forests (Bourne et al., 2001; Henckel
et al., 2000a; Knief et al., 2003), peat bogs
(Kravchenko, 2002; Morris et al., 2002), aquifers
(Newby et al., 2004) and rice paddies (Henckel et al.,
1999). The relatively high diversity of methanotrophs,
the availability of conserved genetic sequences and
their importance in ecosystem functioning make
methanotrophs strong candidates for indicator organ-
isms in studies on the effects of land use on ecosystem
properties.
Ecosystem stability is of great concern at military
training facilities, particularly those involved in
intensive training where the natural landforms are
highly susceptible to soil loss. Movement of tracked
vehicles across hillsides removes natural vegetation
cover, and accelerates processes such as erosion.
Decreased vegetation and increased erosion would
significantly change rhizosphere nutrient dynamics
and soil porosity, may impact rates of methanogenesis,
and subsequently affect activities and compositions of
assemblages of methanotrophs.
Ft. Benning, a 72,000 ha US Army installation in
southwestern Georgia, USA, is the Army’s primary
infantry training facility. In addition, it supports a
brigade of mechanized infantry of the regular army,
which trains with tanks and other tracked armored
vehicles. The entire area has been subjected to farming
and disturbance since the early 19th century, but
within the base are many less-impacted areas that are
recovering, and therefore relatively undisturbed.
These relatively undisturbed areas of the base are
often adjacent to areas that have been highly impacted
by training exercises (Bhat et al., submitted for
publication; Perkins et al., submitted for publication).
Highly disturbed areas are characterized by high levels
of erosion (Perkins et al., submitted for publication)
and relatively low numbers of plant species and
surface coverage by plants (Dale et al., 2002). A
previous study on the distribution of PLFA profiles
utilized artificial neural networks to correlate micro-
bial community composition with degree with degree
of traffic impact at Ft. Benning, indicating the
response of the microbial community in general to
training practices (Peacock et al., 2001a). Analysis of
A. Ogram et al. / Ecological Indicators 6 (2006) 631–643 633
PLFA provides a very good overview of microbial
groups present in a sample; however, this approach
lacks the resolution of approaches intended to
characterize the variability within specific genetic
elements, such as pmoA.
In this study, we investigated relationships between
the degree of recent impact and the distribution of
methanotrophs in a low impact and high impact
watershed pair. The Sally Branch watershed has not
been subjected to extensive training, and many upland
areas are managed as pine plantations. Bonham Creek
watershed is highly impacted, with a high degree of
erosion observed in upland sites with concomitant
high sedimentation in bottomland sites. A non-culture
based approach, terminal restriction fragment length
polymorphism (T-RFLP) analysis of the pmoA gene,
was used to screen samples taken from two transects
(upland and bottomland) in each watershed for
comparison of potential effects of military training
on methanotrophic assemblages. This study was
intended to investigate the potential application of
pmoA genotypes as an indicator of disturbance at this
training facility.
2. Materials and methods
2.1. Site description and sampling
The study area is within the Ft. Benning military
reservation in west-central Georgia, in the Carolina
and Georgia sand hills major land resource area
(USDA, 2000). Upland soils in the area are primarily
well to excessively drained Ultisols and Entisols,
supporting forests of slash (Pinus elliotii), long
leaf (P. palustris) and loblolly (P. taeda) pines.
Excessively drained Lakeland soils (Entisol) of
sandhill communities are associated with long leaf
pine, turkey oaks (Quercus laevis), blackjack oaks
(Q. marilandica) and post oaks (Q. stellata) near
ridgetops in the central and northern portion of the
reservation. Wetlands and hydric soils are generally
restricted to bottomlands along streams and creeks.
Military related impacts result from the direct
removal of or damage to vegetation, earthmoving
activities and ground disturbance from vehicles. The
mechanized forces in particular use tracked and
wheeled vehicles that cause soil disturbance and
movement that may result in soil erosion and stream
sedimentation. This study focused on two watersheds
characterized by different land uses.
High and low impact regions were identified by
land use, degree of disturbance and characteristic
vegetation. The Bonham Creek watershed had
supported extensive tank warfare training and was
considered to be highly impacted. The Sally Branch
watershed had not experienced intensive mechanized
training and was considered to be minimally
impacted. One upland transect and one bottomland
transect were selected within each watershed
(Table 1). Upland transects were 400 m long and
soil samples were collected every 20 m. Bottomland
transects were 25 m long and samples were collected
every 5 m perpendicular to the creek. High and low
impact bottomland transects were located downslope
from the high and low impact upland transects,
respectively. Five 20-cm deep cores were taken from
each upland sampling site and manually homoge-
nized to create one composite sample per site.
Similarly, five replicate 10-cm deep cores were taken
at each bottomland site. A total of 70 samples
were collected and individual samples manually
homogenized by mixing on bench top, sub-sampled
from composite samples and stored at �80 8C.
Soil characteristics were provided by the Wetland
Biogeochemistry Lab at University of Florida.
2.2. DNA extraction from soil
DNA was directly extracted and purified from
250 mg soil samples using an UltraClean Soil DNA kit
(MoBio Laboratories, Solana Beach, CA) according to
manufacturer’s instructions. The mass of DNA within
5 ml of extracted DNA was estimated by electrophor-
esis through a 0.7% agarose gel stained in ethidium
bromide. DNA was aliquoted and stored at �20 8C.
2.3. PCR amplification of pmoA
PCRs were conducted using the primer sets A189
(Holmes et al., 1995) combined with A650 (Bourne
et al., 2001) or mb661 (Costello and Lidstrom, 1999).
PCR reactions of 20 ml were set up containing
approximately 1 ml of soil DNA, 0.4 mM of
each primer, 7.4 ml of distilled water and 10 ml �HotStarTaq Master Mix (Qiagen, Valencia, CA). PCR
A. Ogram et al. / Ecological Indicators 6 (2006) 631–643634
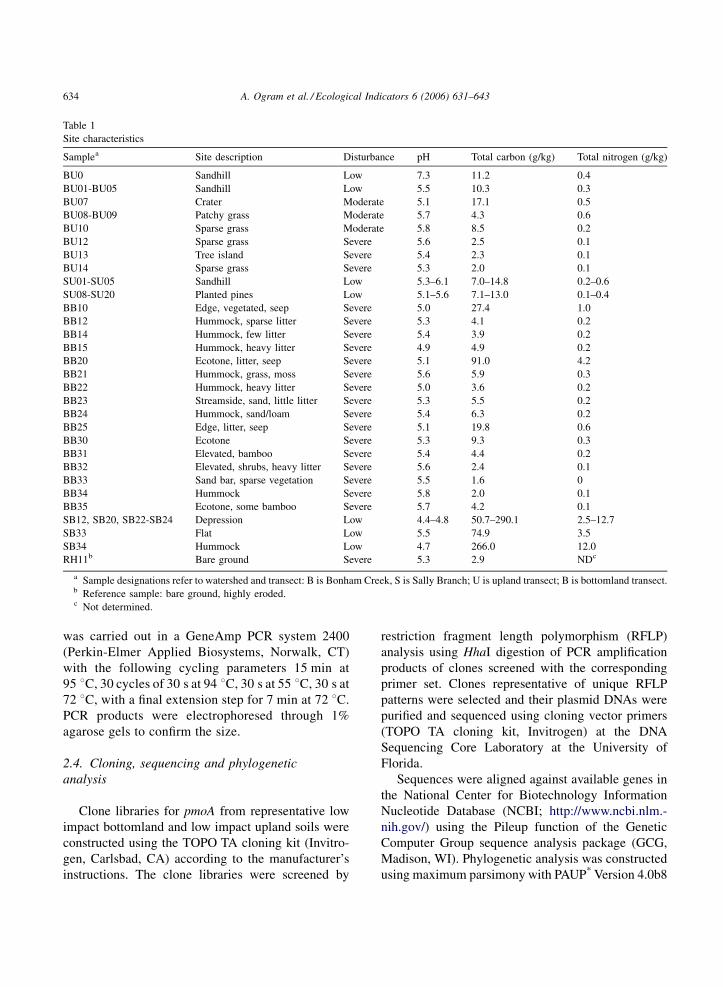
Table 1
Site characteristics
Samplea Site description Disturbance pH Total carbon (g/kg) Total nitrogen (g/kg)
BU0 Sandhill Low 7.3 11.2 0.4
BU01-BU05 Sandhill Low 5.5 10.3 0.3
BU07 Crater Moderate 5.1 17.1 0.5
BU08-BU09 Patchy grass Moderate 5.7 4.3 0.6
BU10 Sparse grass Moderate 5.8 8.5 0.2
BU12 Sparse grass Severe 5.6 2.5 0.1
BU13 Tree island Severe 5.4 2.3 0.1
BU14 Sparse grass Severe 5.3 2.0 0.1
SU01-SU05 Sandhill Low 5.3–6.1 7.0–14.8 0.2–0.6
SU08-SU20 Planted pines Low 5.1–5.6 7.1–13.0 0.1–0.4
BB10 Edge, vegetated, seep Severe 5.0 27.4 1.0
BB12 Hummock, sparse litter Severe 5.3 4.1 0.2
BB14 Hummock, few litter Severe 5.4 3.9 0.2
BB15 Hummock, heavy litter Severe 4.9 4.9 0.2
BB20 Ecotone, litter, seep Severe 5.1 91.0 4.2
BB21 Hummock, grass, moss Severe 5.6 5.9 0.3
BB22 Hummock, heavy litter Severe 5.0 3.6 0.2
BB23 Streamside, sand, little litter Severe 5.3 5.5 0.2
BB24 Hummock, sand/loam Severe 5.4 6.3 0.2
BB25 Edge, litter, seep Severe 5.1 19.8 0.6
BB30 Ecotone Severe 5.3 9.3 0.3
BB31 Elevated, bamboo Severe 5.4 4.4 0.2
BB32 Elevated, shrubs, heavy litter Severe 5.6 2.4 0.1
BB33 Sand bar, sparse vegetation Severe 5.5 1.6 0
BB34 Hummock Severe 5.8 2.0 0.1
BB35 Ecotone, some bamboo Severe 5.7 4.2 0.1
SB12, SB20, SB22-SB24 Depression Low 4.4–4.8 50.7–290.1 2.5–12.7
SB33 Flat Low 5.5 74.9 3.5
SB34 Hummock Low 4.7 266.0 12.0
RH11b Bare ground Severe 5.3 2.9 NDc
a Sample designations refer to watershed and transect: B is Bonham Creek, S is Sally Branch; U is upland transect; B is bottomland transect.b Reference sample: bare ground, highly eroded.c Not determined.
was carried out in a GeneAmp PCR system 2400
(Perkin-Elmer Applied Biosystems, Norwalk, CT)
with the following cycling parameters 15 min at
95 8C, 30 cycles of 30 s at 94 8C, 30 s at 55 8C, 30 s at
72 8C, with a final extension step for 7 min at 72 8C.
PCR products were electrophoresed through 1%
agarose gels to confirm the size.
2.4. Cloning, sequencing and phylogenetic
analysis
Clone libraries for pmoA from representative low
impact bottomland and low impact upland soils were
constructed using the TOPO TA cloning kit (Invitro-
gen, Carlsbad, CA) according to the manufacturer’s
instructions. The clone libraries were screened by
restriction fragment length polymorphism (RFLP)
analysis using HhaI digestion of PCR amplification
products of clones screened with the corresponding
primer set. Clones representative of unique RFLP
patterns were selected and their plasmid DNAs were
purified and sequenced using cloning vector primers
(TOPO TA cloning kit, Invitrogen) at the DNA
Sequencing Core Laboratory at the University of
Florida.
Sequences were aligned against available genes in
the National Center for Biotechnology Information
Nucleotide Database (NCBI; http://www.ncbi.nlm.-
nih.gov/) using the Pileup function of the Genetic
Computer Group sequence analysis package (GCG,
Madison, WI). Phylogenetic analysis was constructed
using maximum parsimony with PAUP* Version 4.0b8
A. Ogram et al. / Ecological Indicators 6 (2006) 631–643 635
(D. L. Swofford, Sinauer Associates, Sunderland,
MA) and neighbor joining using the Jukes and Cantor
algorithms (Van de Peer and de Wachter, 1994).
Bootstrap analyses were conducted with 100 resam-
plings. Only branches with bootstrap values higher
than 50% are shown. pmoA sequences for Sally
Branch upland clones are listed under the GenBank
accession numbers AY662347–AY662367, and
sequences for Sally Branch bottomland clones are
listed under accession numbers AY662368–
AY662389. The sequences were later used in selection
of restriction enzymes for T-RFLP.
2.5. T-RFLP analysis
PCRs were performed on 20 ml reactions in
triplicate using A189 and fluorescently labeled
A650 with 6-FAM (6 carboxyfluorescein) in the 50
position (Invitrogen). PCRs were carried out using the
following cycling parameters: 15 min at 95 8C, 30
cycles of 30 s at 94 8C, 30 s at 49 8C, 30 s at 72 8C,
with a final extension step for 7 min at 72 8C. The
triplicate PCR reactions were pooled and the pooled
reactions were cleaned and concentrated using
QIAquick PCR purification kit (Qiagen) to a final
volume of 30 ml following the manufacturer’s
instructions. Restriction enzymes were selected in
silico based on manually aligned sequences using
CloneMap Version 2.11 (CGC Scientific Inc., Ballwin,
MO) on each sequence and the enzyme producing the
greatest discrimination between sequences was
selected for use in T-RFLP (the restriction enzyme
with greater degree of discrimination for pmoA was
HhaI). Approximately 50 ng of PCR product was
added to the mixture with approximately 3 U (0.3 ml)
of restriction enzyme (Promega, Madison WI), 1 ml
restriction buffer, 1 mg bovine serum albumin and
deionized water to make a final volume of 10 ml.
Enzymatic digestions were carried out at 37 8Covernight.
One microliter of digestion product was used in
terminal restriction fragment (t-RF) detection by the
DNA Sequencing Core Laboratory (University of
Florida). Briefly, 1 ml of digested DNA was mixed
with 2.5 ml deionized formamide, 0.5 ml ROX-labeled
GenScan 500-bp internal size standard (Applied
Biosystems, Perkin-Elmer Corporation, Norwalk,
CT) and 0.5 ml of loading buffer (50 mM EDTA,
50 mg/ml blue dextran). The samples were denatured
by heating at 95 8C for 3 min and immediately
transferred to ice. One microliter of denatured digests
were electrophoresed in a 36 cm, 5% polyacrylamide
gel containing 7 M urea for 3 h at 3000 V on an ABI
377 Genetic Analyzer (Applied Biosystems) with
filter set A and a well-to-read length of 36 cm. T-RFLP
profiles were analyzed using GeneScan Version 2.1
software (Applied Biosystems). The sizes in base pairs
(bp) of terminal restriction fragments were estimated
by reference to internal standard by using local
southern method included in GeneScan Version 2.1
(Applied Biosystems). T-RFLP results, including peak
size, peak fluorescence height and area and scan size
were exported to Excel (Microsoft Corporation,
Redmond, WA) for data analysis.
2.6. T-RFLP data analysis
Principal components analysis (PCA) was per-
formed using the relative abundance of individual
peaks normalized by the total area of all T-RFs with
the Multivariate Statistical Package (MSVP Version
3.12d, Kovach Computing Services, Wales, UK). All
T-RFs observed were included in this analysis.
Relationships between the frequency of individual
T-RFs and various site characteristics were statisti-
cally analyzed and plotted by PC SAS (SAS Inst.,
2003). GLM analysis for the significant differences of
means was performed. Significant differences were
observed at the 0.05 level. Population normality was
tested for each variable before using parametric
statistics for comparisons and testing.
3. Results and discussion
3.1. pmoA clone libraries
pmoA clone libraries were constructed from
samples representative of the Sally Branch upland
and bottomland transects (Fig. 1). Sally Branch soils
were chosen for library construction due to their low
level of disturbance. Low disturbance sites are
generally characterized by higher biological diversity
than are high disturbance sites (Atlas and Bartha,
1993), and was predicted that most genotypes
observed in Sally Branch samples are present in the
A. Ogram et al. / Ecological Indicators 6 (2006) 631–643636
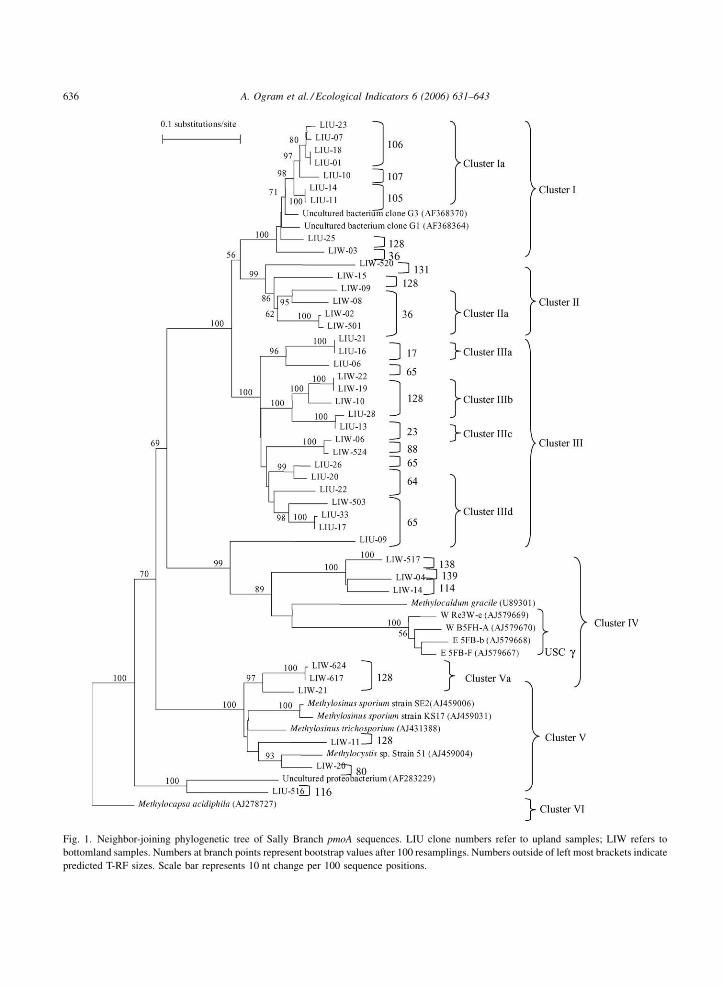
Fig. 1. Neighbor-joining phylogenetic tree of Sally Branch pmoA sequences. LIU clone numbers refer to upland samples; LIW refers to
bottomland samples. Numbers at branch points represent bootstrap values after 100 resamplings. Numbers outside of left most brackets indicate
predicted T-RF sizes. Scale bar represents 10 nt change per 100 sequence positions.
A. Ogram et al. / Ecological Indicators 6 (2006) 631–643 637
Bonham Creek samples. The assumption that Bonham
Creek shared most sequences with Sally Branch was
confirmed via T-RFLP analysis, presented below in
Section 3.2.
The great majority (31 out of 41) of sequenced
clones were grouped in Clusters I–III and were not
associated with cultured representatives (Fig. 1). The
closest cultured relative for these sequences is
Methylocaldum gracile, a Type I methanotroph in
Cluster IV that branches outside of the major branch
for Clusters I–III. The deep branch isolating Clusters
I–III from Cluster IV is supported by strong bootstrap
values and indicates a major lineage within the Type I
methanotrophs. These clusters, collectively termed
the ‘‘Benning soil cluster g’’ (BSCg), branch outside
the recently reported ‘‘upland soil cluster g’’
(USCg)(Knief et al., 2003), which falls in Cluster
IV of our tree (Fig. 1). Representatives of this cluster
have been reported previously (Auman et al., 2000;
Bourne et al., 2001), but this is the first report of a
library dominated by these sequences.
Representatives of upland and bottomland libraries
were segregated in most major branches, e.g., Cluster
Ia is comprised exclusively of upland clones and
Cluster IIa is dominated by bottomland sequences.
Type I methanotrophs have been reported to out-
compete Type II methanotrophs under conditions of
high oxygen and low methane concentrations
(Henckel et al., 2000b), as might be expected from
upland soils.
Five out of 41 clones sequenced grouped within
Cluster V, defined by the Type II methanotrophic
genera Methylosinus and Methylocystis. This group is
not closely related to the previously described ‘‘forest
sequence cluster,’’ a significant group of uncultured
Type II methanotrophs identified in European soils
(Bourne et al., 2001; Henckel et al., 2000a). Cluster V
is exclusively comprised of bottomland clones; Type
II methanotrophs typically dominate Type I methano-
trophs in areas with higher methane concentrations, as
might be expected for bottomlands (Hanson and
Hanson, 1996). One upland clone (LIU-516; Cluster
VI) branched outside of Types I and II clusters and was
not associated with previously cultivated strains.
Most previous forest soil pmoA libraries have been
constructed from European soils (Holmes et al., 1999;
Henckel et al., 2000b) that contained much greater
organic carbon contents than did the soils of this study
(Table 1). Organic carbon content of soil is roughly
correlated with methanogenesis rates, and it is likely
that methane produced in this soil is low relative to
most previous studies. Sandy, well drained, low
organic carbon soils such as those of the Ft. Benning
watersheds are likely to be characterized by low
CH4:O2 concentration ratios relative to finer textured
soils reported in other studies (Holmes et al., 1999;
Henckel et al., 2000b), which may select for
methanotrophs with high affinities for methane.
Bender and Conrad (1992) hypothesized that,
although low affinity methanotrophs (micromolar
Km) dominate culture collections, high affinity
methanotrophs (nanomolar Km) may be largely
responsible for much of the methane oxidation that
occurs in soils. A number of studies have demon-
strated that Type I methanotrophs are active under low
CH4:O2 concentration ratios (Henckel et al., 2000b;
Knief et al., 2003). It is possible that BSCg
methanotrophs are particularly well adapted to the
low methane concentrations likely to be present in the
very well drained, low organic carbon forest soils of
the southeastern United States. Without culturable
relatives, it is not possible to make inferences
regarding possible ecological roles for these groups
beyond general inferences for Type I methanotrophs.
3.2. T-RFLP analysis
T-RFLP is a useful approach to screening
distributions of genotypes in large numbers of samples
(Horz et al., 2000; Liu et al., 1997; Marsh, 1999).
While subject to limitations (Dunbar et al., 2001;
Osborn et al., 2000), T-RFLP analysis can provide
information on complex assemblages of functional
genotypes. Sequences of pmoA clones presented in
Fig. 1 were used to design and evaluate a T-RFLP
system for screening samples from the Sally Branch
and Bonham Creek watersheds. Predicted T-RF
lengths for individual clones are presented in Fig. 1
immediately to the right of the clones, and groupings
within major clusters (e.g., Clusters Ia, IIa, IIIa, etc.)
represent clones predicted to yield similar T-RFs
(�2 bp). Predicted T-RFs were consistent with major
phylogenetic groupings, although some overlap was
observed between individual clones and broader
groups: Clone LIW-03 (Cluster I) shares a predicted
T-RF of 36 bp with Cluster IIa; Clone LIW-11 (Cluster
A. Ogram et al. / Ecological Indicators 6 (2006) 631–643638
V) shares T-RF 128 bp with Cluster Va; Clone LIU-09
(Cluster III) shares T-RF 138 and 139 bp with Clone
LIW-517 (Cluster IV) and Clone LIW-11 (Cluster V)
shares T-RF 128 bp with Cluster Va. In general,
however, this T-RFLP system provides good resolu-
tion between major subgroups observed in the library.
T-RFLP analyses were conducted on a total of 70
soil samples plus one reference sample (Table 1), from
the Bonham Creek watershed, 13 samples were
analyzed from the upland transect, and 16 from the
bottomland transect. For Sally Branch watershed, 18
samples were analyzed from the upland transect and
23 from the bottomland transect and one highly eroded
reference site from Bonham Creek (RH11). A total of
21 T-RFs from all samples were observed, with
numbers of T-RFs ranging from 5 to 13 for individual
samples. Most T-RFs predicted from the library were
observed, although 5 primarily minor predicted groups
were not observed: T-RFs 78, 114, 127, 128 and 131.
The absence of these predicted T-RFs from observed
T-RFLPs was likely due to the greater sensitivity of
clone libraries than of T-RFLP analysis. These strains
were undoubtedly present in the samples because they
were present in the clone libraries, but T-RFLP is not
sufficiently sensitive to detect low abundance groups.
Conversely, five T-RFs not predicted from the clone
libraries were observed in T-RFLPs (Table 2).
Lowered species diversity is frequently cited as an
indication of stress (Atlas, 1993), such that it was
predicted that samples taken from Sally Branch would
harbor greater richness of pmoA genotypes than
similar samples taken from Bonham Creek. This
prediction was not supported from the T-RFLP data, in
which an average of between 8 and 10 T-RFs with no
significant differences observed between the samples
from the four transects (data not shown).
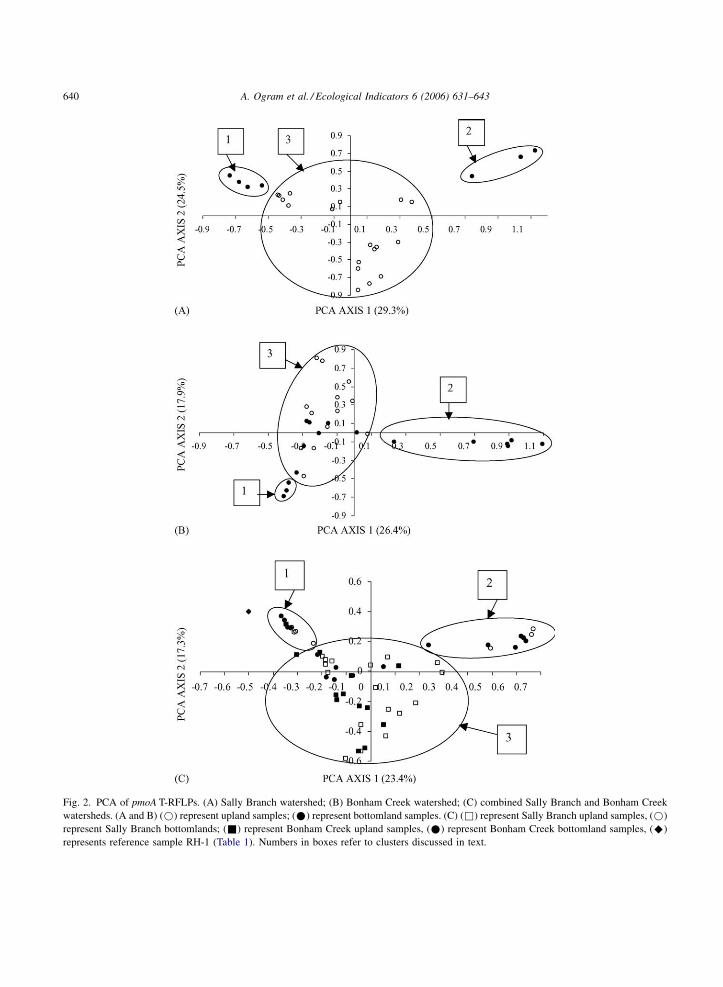
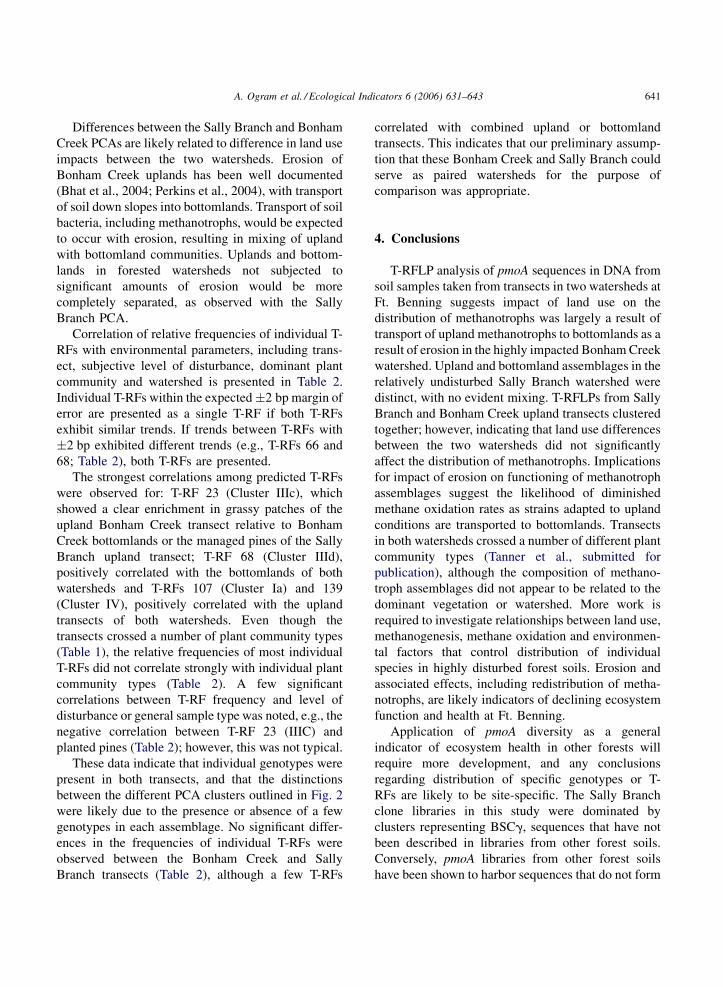
Principal components analysis was applied to T-
RFLP data from the two watersheds and significant
differences between PCAs of methanotrophic assem-
blages within a given watershed were observed
(Fig. 2). Groupings of points were identified as
individual clusters in these figures. The clusters
ascribed are somewhat subjective and it is certainly
possible to imagine other schemes for grouping these
points. Upland samples were completely separated
from bottomland samples in the Sally Branch
watershed (Fig. 2A), although the bottomland samples
formed two distinct clusters (1 and 2) that were largely
independent of vegetation type, but no mixing of
bottomland and upland samples was observed. This is
contrasted with the Bonham Creek watershed, where
significant overlap between bottomland and upland T-
RFLPs was observed (Fig. 2B). Two separate clusters
comprised exclusively of several bottomland samples
were observed (Clusters 1 and 2), but several
bottomland samples also grouped among upland
samples (Cluster 3).
These general trends are supported when all data
are combined (Fig. 2C), all bottomland samples
cluster in two separate groups (Clusters 1 and 2), with
some mixing of Bonham Creek bottomland samples
within the diffuse upland cluster (Cluster 3). The
separation of T-RFLPs into bottomland and upland
clusters, independent of watershed, indicates that land
management effects on the distribution of methano-
trophs were not as strong as landscape position at these
sites. These data suggest that methanotrophs in these
watersheds are relatively stable, and that the eroded
conditions do not differ from the less disturbed areas
significantly enough to select for different groups of
methanotrophs. Species presence does not imply
activities (Knief et al., 2003); however, it is quite
possible that different groups are responsible for
oxidation of methane in the different watersheds.
It is not known at this time why the bottomland
assemblages of both watersheds split into two
divergent clusters. Cluster 1 of the Bonham Creek
watershed (Fig. 2B) was comprised of adjacent
samples taken between ecotones (BB30–BB35;
Table 1) and Cluster 2 (BB14, BB20 and BB21)
were also adjacent samples, although not from similar
vegetation. The Sally Branch bottomland Cluster 1
was composed of samples taken from adjacent sites
(SB12, SB20, SB22 and SB24) within a depression,
and Cluster 2 (SB23, SB34 and SB33) included
samples from contiguous ecotones, although SB23
appears to be an outlier from adjacent samples that
grouped in Cluster 1.
The robustness of these groupings is not clear at
this time. Even though groupings assigned to these
PCAs were subjective, it is clear that considerable
overlap exists between the Bonham Creek bottomland
and upland points at the center of Fig. 2B and C, and
that mixing is not observed in Sally Branch.
Additional data from Sally Branch bottomlands would
be of great value in testing these groupings.
A.
Og
ram
eta
l./Eco
log
ical
Ind
icato
rs6
(20
06
)6
31
–6
43
63
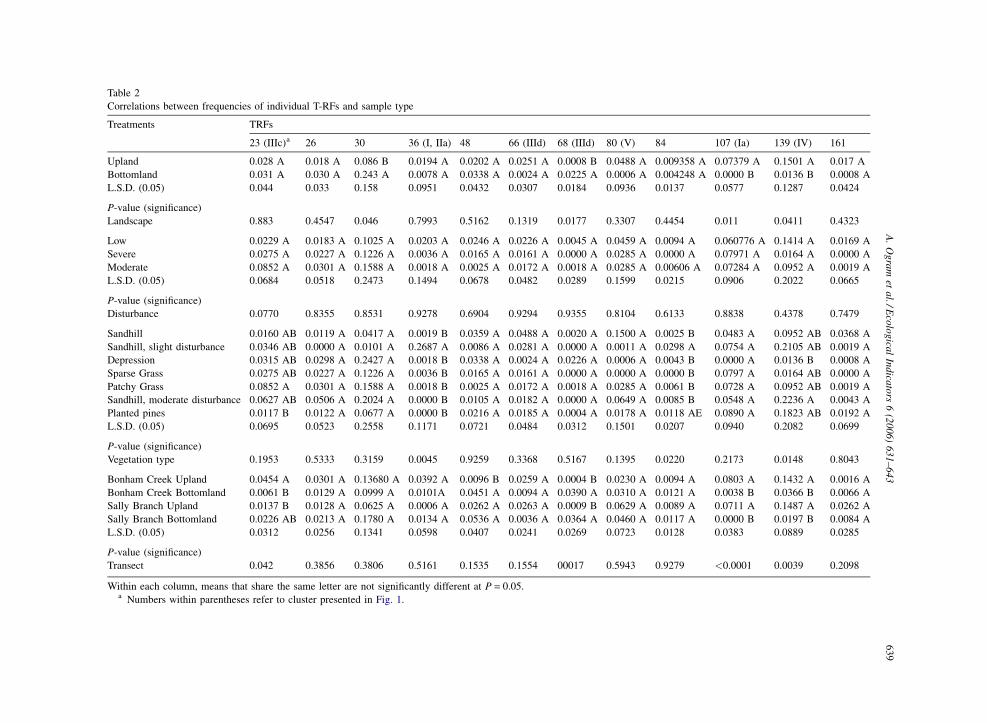
9Table 2
Correlations between frequencies of individual T-RFs and sample type
Treatments TRFs
23 (IIIc)a 26 30 36 (I, IIa) 48 66 (IIId) 68 (IIId) 80 (V) 84 107 (Ia) 139 (IV) 161
Upland 0.028 A 0.018 A 0.086 B 0.0194 A 0.0202 A 0.0251 A 0.0008 B 0.0488 A 0.009358 A 0.07379 A 0.1501 A 0.017 A
Bottomland 0.031 A 0.030 A 0.243 A 0.0078 A 0.0338 A 0.0024 A 0.0225 A 0.0006 A 0.004248 A 0.0000 B 0.0136 B 0.0008 A
L.S.D. (0.05) 0.044 0.033 0.158 0.0951 0.0432 0.0307 0.0184 0.0936 0.0137 0.0577 0.1287 0.0424
P-value (significance)
Landscape 0.883 0.4547 0.046 0.7993 0.5162 0.1319 0.0177 0.3307 0.4454 0.011 0.0411 0.4323
Low 0.0229 A 0.0183 A 0.1025 A 0.0203 A 0.0246 A 0.0226 A 0.0045 A 0.0459 A 0.0094 A 0.060776 A 0.1414 A 0.0169 A
Severe 0.0275 A 0.0227 A 0.1226 A 0.0036 A 0.0165 A 0.0161 A 0.0000 A 0.0285 A 0.0000 A 0.07971 A 0.0164 A 0.0000 A
Moderate 0.0852 A 0.0301 A 0.1588 A 0.0018 A 0.0025 A 0.0172 A 0.0018 A 0.0285 A 0.00606 A 0.07284 A 0.0952 A 0.0019 A
L.S.D. (0.05) 0.0684 0.0518 0.2473 0.1494 0.0678 0.0482 0.0289 0.1599 0.0215 0.0906 0.2022 0.0665
P-value (significance)
Disturbance 0.0770 0.8355 0.8531 0.9278 0.6904 0.9294 0.9355 0.8104 0.6133 0.8838 0.4378 0.7479
Sandhill 0.0160 AB 0.0119 A 0.0417 A 0.0019 B 0.0359 A 0.0488 A 0.0020 A 0.1500 A 0.0025 B 0.0483 A 0.0952 AB 0.0368 A
Sandhill, slight disturbance 0.0346 AB 0.0000 A 0.0101 A 0.2687 A 0.0086 A 0.0281 A 0.0000 A 0.0011 A 0.0298 A 0.0754 A 0.2105 AB 0.0019 A
Depression 0.0315 AB 0.0298 A 0.2427 A 0.0018 B 0.0338 A 0.0024 A 0.0226 A 0.0006 A 0.0043 B 0.0000 A 0.0136 B 0.0008 A
Sparse Grass 0.0275 AB 0.0227 A 0.1226 A 0.0036 B 0.0165 A 0.0161 A 0.0000 A 0.0000 A 0.0000 B 0.0797 A 0.0164 AB 0.0000 A
Patchy Grass 0.0852 A 0.0301 A 0.1588 A 0.0018 B 0.0025 A 0.0172 A 0.0018 A 0.0285 A 0.0061 B 0.0728 A 0.0952 AB 0.0019 A
Sandhill, moderate disturbance 0.0627 AB 0.0506 A 0.2024 A 0.0000 B 0.0105 A 0.0182 A 0.0000 A 0.0649 A 0.0085 B 0.0548 A 0.2236 A 0.0043 A
Planted pines 0.0117 B 0.0122 A 0.0677 A 0.0000 B 0.0216 A 0.0185 A 0.0004 A 0.0178 A 0.0118 AE 0.0890 A 0.1823 AB 0.0192 A
L.S.D. (0.05) 0.0695 0.0523 0.2558 0.1171 0.0721 0.0484 0.0312 0.1501 0.0207 0.0940 0.2082 0.0699
P-value (significance)
Vegetation type 0.1953 0.5333 0.3159 0.0045 0.9259 0.3368 0.5167 0.1395 0.0220 0.2173 0.0148 0.8043
Bonham Creek Upland 0.0454 A 0.0301 A 0.13680 A 0.0392 A 0.0096 B 0.0259 A 0.0004 B 0.0230 A 0.0094 A 0.0803 A 0.1432 A 0.0016 A
Bonham Creek Bottomland 0.0061 B 0.0129 A 0.0999 A 0.0101A 0.0451 A 0.0094 A 0.0390 A 0.0310 A 0.0121 A 0.0038 B 0.0366 B 0.0066 A
Sally Branch Upland 0.0137 B 0.0128 A 0.0625 A 0.0006 A 0.0262 A 0.0263 A 0.0009 B 0.0629 A 0.0089 A 0.0711 A 0.1487 A 0.0262 A
Sally Branch Bottomland 0.0226 AB 0.0213 A 0.1780 A 0.0134 A 0.0536 A 0.0036 A 0.0364 A 0.0460 A 0.0117 A 0.0000 B 0.0197 B 0.0084 A
L.S.D. (0.05) 0.0312 0.0256 0.1341 0.0598 0.0407 0.0241 0.0269 0.0723 0.0128 0.0383 0.0889 0.0285
P-value (significance)
Transect 0.042 0.3856 0.3806 0.5161 0.1535 0.1554 00017 0.5943 0.9279 <0.0001 0.0039 0.2098
Within each column, means that share the same letter are not significantly different at P = 0.05.a Numbers within parentheses refer to cluster presented in Fig. 1.
A. Ogram et al. / Ecological Indicators 6 (2006) 631–643640
Fig. 2. PCA of pmoA T-RFLPs. (A) Sally Branch watershed; (B) Bonham Creek watershed; (C) combined Sally Branch and Bonham Creek
watersheds. (A and B) (*) represent upland samples; (*) represent bottomland samples. (C) (&) represent Sally Branch upland samples, (*)
represent Sally Branch bottomlands; (&) represent Bonham Creek upland samples, (*) represent Bonham Creek bottomland samples, (^)
represents reference sample RH-1 (Table 1). Numbers in boxes refer to clusters discussed in text.
A. Ogram et al. / Ecological Indicators 6 (2006) 631–643 641
Differences between the Sally Branch and Bonham
Creek PCAs are likely related to difference in land use
impacts between the two watersheds. Erosion of
Bonham Creek uplands has been well documented
(Bhat et al., 2004; Perkins et al., 2004), with transport
of soil down slopes into bottomlands. Transport of soil
bacteria, including methanotrophs, would be expected
to occur with erosion, resulting in mixing of upland
with bottomland communities. Uplands and bottom-
lands in forested watersheds not subjected to
significant amounts of erosion would be more
completely separated, as observed with the Sally
Branch PCA.
Correlation of relative frequencies of individual T-
RFs with environmental parameters, including trans-
ect, subjective level of disturbance, dominant plant
community and watershed is presented in Table 2.
Individual T-RFs within the expected�2 bp margin of
error are presented as a single T-RF if both T-RFs
exhibit similar trends. If trends between T-RFs with
�2 bp exhibited different trends (e.g., T-RFs 66 and
68; Table 2), both T-RFs are presented.
The strongest correlations among predicted T-RFs
were observed for: T-RF 23 (Cluster IIIc), which
showed a clear enrichment in grassy patches of the
upland Bonham Creek transect relative to Bonham
Creek bottomlands or the managed pines of the Sally
Branch upland transect; T-RF 68 (Cluster IIId),
positively correlated with the bottomlands of both
watersheds and T-RFs 107 (Cluster Ia) and 139
(Cluster IV), positively correlated with the upland
transects of both watersheds. Even though the
transects crossed a number of plant community types
(Table 1), the relative frequencies of most individual
T-RFs did not correlate strongly with individual plant
community types (Table 2). A few significant
correlations between T-RF frequency and level of
disturbance or general sample type was noted, e.g., the
negative correlation between T-RF 23 (IIIC) and
planted pines (Table 2); however, this was not typical.
These data indicate that individual genotypes were
present in both transects, and that the distinctions
between the different PCA clusters outlined in Fig. 2
were likely due to the presence or absence of a few
genotypes in each assemblage. No significant differ-
ences in the frequencies of individual T-RFs were
observed between the Bonham Creek and Sally
Branch transects (Table 2), although a few T-RFs
correlated with combined upland or bottomland
transects. This indicates that our preliminary assump-
tion that these Bonham Creek and Sally Branch could
serve as paired watersheds for the purpose of
comparison was appropriate.
4. Conclusions
T-RFLP analysis of pmoA sequences in DNA from
soil samples taken from transects in two watersheds at
Ft. Benning suggests impact of land use on the
distribution of methanotrophs was largely a result of
transport of upland methanotrophs to bottomlands as a
result of erosion in the highly impacted Bonham Creek
watershed. Upland and bottomland assemblages in the
relatively undisturbed Sally Branch watershed were
distinct, with no evident mixing. T-RFLPs from Sally
Branch and Bonham Creek upland transects clustered
together; however, indicating that land use differences
between the two watersheds did not significantly
affect the distribution of methanotrophs. Implications
for impact of erosion on functioning of methanotroph
assemblages suggest the likelihood of diminished
methane oxidation rates as strains adapted to upland
conditions are transported to bottomlands. Transects
in both watersheds crossed a number of different plant
community types (Tanner et al., submitted for
publication), although the composition of methano-
troph assemblages did not appear to be related to the
dominant vegetation or watershed. More work is
required to investigate relationships between land use,
methanogenesis, methane oxidation and environmen-
tal factors that control distribution of individual
species in highly disturbed forest soils. Erosion and
associated effects, including redistribution of metha-
notrophs, are likely indicators of declining ecosystem
function and health at Ft. Benning.
Application of pmoA diversity as a general
indicator of ecosystem health in other forests will
require more development, and any conclusions
regarding distribution of specific genotypes or T-
RFs are likely to be site-specific. The Sally Branch
clone libraries in this study were dominated by
clusters representing BSCg, sequences that have not
been described in libraries from other forest soils.
Conversely, pmoA libraries from other forest soils
have been shown to harbor sequences that do not form

A. Ogram et al. / Ecological Indicators 6 (2006) 631–643642
significant fractions of the libraries constructed in this
study. No pmoA genotype or T-RF in this study was
specifically associated with impact, but rather with
translocation of upland sequences into bottomland
environments. Studies in a variety of environments,
including those without significant slopes and clearly
distinct communities as reported here, are required to
establish pmoA genotype distribution as a general
indicator of ecological impact.
It is likely that the most sensitive molecular
microbial indicator of a particular stress or ecosystem
health will be dependent on the stressor and the
specific environment. For example, Castro et al.
(2005) recently demonstrated that distribution of
specific genes associated with sulfate reducing
bacteria and methanogens provided sensitive indica-
tors of nutrient impact in a wetland soil. A
fundamental knowledge of the general ecology of
the site and the microbial process most likely affected
by the impact would aid in identification of potential
molecular microbial indicators.
Acknowledgements
We thank Abid Al-Ageley for statistical analysis of
data and Ping Duan for construction of clone libraries.
This work was supported by the DOD-DOE-EPA
Strategic Environmental Research and Development
Program (SERDP), and was funded a SERDP
Ecosystem Management Project CS-1114A, adminis-
tered through contract DACA88-99-C-0009 from the
US Army ERDC.
References
Atlas, R.M., Bartha, R., 1993. Microbial Ecology: Fundamentals
and Applications, third ed. Benjamin Cummings, New York.
Auman, A.J., Stolyar, S., Costello, A.M., Lidstom, M.E., 2000.
Molecular characterization of methanotrophic isolates from
freshwater lake sediment. Appl. Environ. Microbiol. 66,
5259–5266.
Bender, M., Conrad, R., 1992. Kinetics of CH4 oxidation in oxic
soils exposed to ambient air or high CH4 mixing rations. FEMS
Microbiol. Ecol. 101, 261–270.
Bhat, S., Jacobs, J.M., Hatfield, K., Prenger, J. Ecological indicators
in forested watersheds: relationships between watershed char-
acteristics and stream water quality in Fort Benning, GA,
submitted for publication.
Bourne, D.G., McDonald, I.R., Murrell, J.C., 2001. Comparison of
pmoA PCR primer sets as tools for investigating methanotroph
diversity in three Danish soils. Appl. Environ. Microbiol. 67,
3802–3809.
Castro, H.F., Newman, S., Reddy, K.R., Ogram, A.V., 2005. Dis-
tribution and stability of sulfate reducing prokaryotic and hydro-
genotrophic methanogenic assemblages in nutrient-impacted
regions of the Florida Everglades. Appl. Environ. Microbiol.
71, 2695–2704.
Castro, H., Reddy, K.R., Ogram, A., 2002. Composition and func-
tion of sulfate-reducing prokaryotes in eutrophic and pristine
areas of the Everglades. Appl. Environ. Microbiol. 68, 6129–
6137.
Castro, H., Reddy, K.R., Ogram, A.V., 2004. Phylogenetic char-
acterization of methanogenic assemblages in eutrophic and
oligotrophic areas of the Florida Everglades. Appl. Environ.
Microbiol. 70, 6559–6568.
Costello, A.M., Lidstrom, M.E., 1999. Molecular characterization of
functional and phylogenetic genes from natural populations of
methanotrophs in lake sediments. FEMS Microbiol. Ecol. 65,
5066–5074.
Dale, V.H., Beyeler, S.C., Jackson, B., 2002. Understory vegetation
indicators of anthropogenic disturbance in longleaf pine forests
at Fort Benning, Georgia, USA. Ecological Indicators 1, 155–
170.
Dunbar, J., Ticknor, L.O., Kuske, C.R., 2001. Phylogenetic spe-
cificity and reproducibility and new method for analysis of
terminal restriction fragment profiles of 16S rRNA genes from
bacterial communities. Appl. Environ. Microbiol. 67, 190–
197.
Dunfield, P.F., Khmelenina, V.N., Suzina, N.E., Trotsenko, Y.A.,
Dedysh, S.N., 2003. Methylocella silvestris sp. nov., a novel
methanotroph isolated from an acidic forest cambisol. Int. J.
Syst. Evol. Microbiol. 53, 1231–1239.
Ellis, R.J., Best, J.G., Fry, J.C., Morgan, P., Neish, B., Trett, M.W.,
Weightman, A.J., 2002. Similarity of microbial and meiofaunal
community analyses for mapping ecological effects of heavy-
metal contamination in soil. FEMS Microbiol. Ecol. 20, 113–
122.
Hanson, R.S., Hanson, T.E., 1996. Methanotrophic bacteria. Micro-
biol. Rev. 60, 439–471.
Henckel, T., Friedrich, M., Conrad, R., 1999. Molecular analyses of
the methane oxidizing microbial community in rice field soil by
targeting the genes of the 16S rRNA, particulate methane
monooxygenase, and methanol dehydrogenase. Appl. Environ.
Microbiol. 65, 1980–1990.
Henckel, T., Jackel, Schnell, U., Conrad, R., 2000a. Molecular
analyses of novel methanotrophic communities in forest soil
that oxidize atmospheric methane. Appl. Environ. Microbiol. 66,
1801–1808.
Henckel, T., Roslev, P., Conrad, R., 2000b. Effects of O2 and CH4 on
presence and activity of the indigenous methanotrophic com-
munity in rice field soil. Environ. Microbiol. 2, 666–679.
Holmes, A.J., Costello, A.M., Lidstrom, M.E., Murrell, J.C., 1995.
Evidence that particulate methane monooxygenase and ammo-
A. Ogram et al. / Ecological Indicators 6 (2006) 631–643 643
nia monooxygenase may be evolutionarily related. FEMS
Microbiol. Lett. 132, 203–208.
Holmes, A.J., Roslev, P., McDonald, I.R., Iversen, N., Henriksen, K.,
Murrell, J.C., 1999. Characterization of methanotrophic bacter-
ial populations in soils showing atmospheric methane uptake.
Appl. Environ. Microbiol. 65, 3312–3318.
Horz, H.P., Rotthauwe, J.H., Lukow, T., Liesack, W., 2000. Identi-
fication of major subgroups of ammonia-oxidizing bacteria in
environmental samples by T-RFLP analysis of amoA PCR
products. J. Microbiol. Meth. 39, 197–204.
Knief, C., Lipski, A., Dunfield, P.F., 2003. Diversity and activity of
methanotrophic bacteria in different upland soils. Appl. Environ.
Microbiol. 69, 6703–6714.
Kravchenko, I.K., 2002. Methane oxidation in boreal peat soils
treated with various nitrogen compounds. Plant Soil 242, 157–
162.
Liu, W.T., Marsh, T.L., Cheng, H., Forney, L.J., 1997. Character-
ization of microbial diversity by determining terminal restriction
fragment length polymorphisms of genes encoding 16S rRNA.
Appl. Environ. Microbiol. 63, 4516–4522.
Marsh, T.L., 1999. Terminal restriction fragment length polymorph-
ism T-RFLP an emerging method for characterizing diversity
among homologous populations of amplification products. Curr.
Opin. Microbiol. 2, 323–327.
Morris, S.A., Radajewski, S., Willison, T.W., Murrell, J.C., 2002.
Identification of the functionally active methanotroph popula-
tion in a peat soil microcosm by stable-isotope probing. Appl.
Environ. Microbiol. 68, 1446–1453.
Newby, D.T., Reed, D.W., Petzke, L.M., Igoe, A.L., Delwiche, M.E.,
Roberto, F.F., McKinley, J.P., Whiticar, M.J., Colwell, F.S.,
2004. Diversity of methanotroph communities in a basalt aqui-
fer. FEMS Microbiol. Ecol. 48, 333–344.
Osborn, A.M., Moore, E.R.B., Timmis, K.N., 2000. An evaluation of
terminal-restriction fragment length polymorphism (T-RFLP)
analysis for the study of microbial community structure and
dynamics. Environ. Microbiol. 2, 39–50.
Paerl, H.W., Dyble, J., Moisander, P.H., Noble, R.T., Piehler, M.F.,
Pinckney, J.L., Steppe, T.F., Twomey, L., Valdes, L.M., 2003.
Microbial indicators of aquatic ecosystem change: current
applications to eutrophic studies. FEMS Microbiol. Ecol. 46,
233–246.
Peacock, A.D., Macnaughton, S.J., Cantu, J.M., Dale, V.H., White,
D.C., 2001a. Soil microbial biomass and community composi-
tion along an anthropogenic disturbance gradient within a long-
leaf pine habitat. Ecological Indicators 1, 113–121.
Peacock, A.D., Mullen, M.D., Ringelberg, D.B., Tyler, D.D.,
Hedrick, D.B., Gale, P.M., White, D.C., 2001b. Soil microbial
community responses to dairy manure or ammonium nitrate
applications. Soil. Biol. Biochem. 33, 1011–1019.
Perkins, D., Haws, N., Das, B.S., Rao, P.S.C. Soil hydraulic proper-
ties as indicators of land quality for upland soils in forested
watersheds with military training impacts, submitted for pub-
lication.
Reeburgh, W.S., Whalen, S.C., Alperin, M.J., 1993. The role of
methylotrophy in the global methane budget. In: Murrell, J.C.,
Kelly, D.P. (Eds.), Microbial Growth on C1 Compounds. Inter-
cept, Andover, UK, pp. 1–14.
Rice, C.W., Moorman, T.B., Beare, M., 1996. Role of microbial
biomass carbon and nitrogen in soil quality. In: Doran, J.W.,
Jones, A.J. (Eds.), Methods for Assessing Soil Quality. Special
Publication No. 49, SSSA, Madison, WI, USA, pp. 203–215.
Stephen, J.R., Chang, Y.J., Gan, Y.D., Peacock, A.D., Pfiffner, S.M.,
Barcelona, M.J., White, D.C., Macnaughton, S.J., 2001. Micro-
bial characterization of a JP-4 fuel-contaminated site using a
combined lipid biomarker/polymerase chain reaction-denatur-
ing gel gradient electrophoresis (PCR-DGGE)-based approach.
Environ. Microbiol. 1, 231–241.
Tanner, G.W., D.L. Miller, J. Archer. Vegetative indicators of
disturbance in a chronically disturbed ecosystem: Ft. Benning
Military Reservation, Georgia. Ecological Restoration, sub-
mitted for publication.
USDA, 2000. Natural Resources Conservation Service Major Land
Resource Area Boundaries, http://www.nrcs.usda.gov/technical/
land/mlra/.
Van de Peer, Y., de Wachter, Y., 1994. TREECON for Windows: a
software package for the construction and drawing of evolu-
tionary trees for the Microsoft Windows environment. Comput.
Appl. Biosci. 10, 569–570.