
Rainfall simulations on a fire disturbed mediterranean area
16
Rainfall simulations on a fire disturbed mediterranean area Maria Cristina Rulli * , Silvia Bozzi, Matteo Spada, Daniele Bocchiola, Renzo Rosso Department of Hydraulic, Environmental, Road and Surveying Engineering, Hydraulics, Fantoli Lab Building, Politecnico di Milano, Piazza Leonardo da Vinci, 32 I-20133 Milano, Italy Received 20 October 2005; received in revised form 2 November 2005; accepted 17 November 2005 Summary Rainfall simulator experiments were carried out in the Liguria region, Italy, imme- diately after a forest fire in early August, 2003, to evaluate the effects of forest fire on soil hydraulic properties, runoff and erosion. Two adjacent 30 m 2 plots were set up with common physiographic features, and the same fire history, except for the fire of August 2003, which burned only one of them. Since both plots were previously subject to the passage of fire in March 1997, one compares the hydrologic and sedimentologic response of an area burned in year 2003 (B03) with that of an area burnt 6 years before (B97). Each rainfall simulation consisted of a single 60 min application of rainfall with constant intensity of about 76 mm h 1 . The results show runoff ratio, evaluated for different pre-event soil moisture conditions, ranging from 0% to 2% for B97 plot, and from 21% to 41% for B03. Runoff ratio for the recently burned plot was 60 times higher than for the plot burned six years before, under wet conditions, and 20 times higher, under very wet conditions. A large increase in sediment production also was measured in B03 plot, as compared with that in B97 plot. Suspended sediment yield from B03 plot was more than two orders of magnitude higher than that from B97 plot in all the simulated events. The high soil losses measured immediately after burning indicate that effective post-fire rehabilitation programs must be carried out to reduce soil erosion in recently burned areas. However, the results for the plot burned six year prior show that recovery of the hydrological properties of the soil occurs after the transient post-fire modification. ª 2005 Elsevier B.V. All rights reserved. KEYWORDS Rainfall simulation; Fire; Erosion; Runoff; Mediterranean environment; Water repellency 0022-1694/$ - see front matter ª 2005 Elsevier B.V. All rights reserved. doi:10.1016/j.jhydrol.2005.11.037 * Corresponding author. Tel.: +39 02 23996292; fax: +39 02 23996207. E-mail addresses: [email protected] (M.C. Rulli), [email protected] (S. Bozzi), [email protected] (M. Spada), daniele. [email protected] (D. Bocchiola), [email protected] (R. Rosso). Journal of Hydrology (2006) 327, 323– 338 available at www.sciencedirect.com journal homepage: www.elsevier.com/locate/jhydrol
-
Upload
independent -
Category
Documents
-
view
0 -
download
0
Transcript of Rainfall simulations on a fire disturbed mediterranean area

Journal of Hydrology (2006) 327, 323–338
ava i lab le a t www.sc iencedi rec t . com
journal homepage: www.elsevier .com/ locate / jhydrol
Rainfall simulations on a firedisturbed mediterranean area
Maria Cristina Rulli *, Silvia Bozzi, Matteo Spada,Daniele Bocchiola, Renzo Rosso
Department of Hydraulic, Environmental, Road and Surveying Engineering, Hydraulics, Fantoli Lab Building,Politecnico di Milano, Piazza Leonardo da Vinci, 32 I-20133 Milano, Italy
Received 20 October 2005; received in revised form 2 November 2005; accepted 17 November 2005
Summary Rainfall simulator experiments were carried out in the Liguria region, Italy, imme-diately after a forest fire in early August, 2003, to evaluate the effects of forest fire on soilhydraulic properties, runoff and erosion.
Two adjacent 30 m2 plots were set up with common physiographic features, and the samefire history, except for the fire of August 2003, which burned only one of them. Since both plotswere previously subject to the passage of fire in March 1997, one compares the hydrologic andsedimentologic response of an area burned in year 2003 (B03) with that of an area burnt 6 yearsbefore (B97). Each rainfall simulation consisted of a single 60 min application of rainfall withconstant intensity of about 76 mm h�1. The results show runoff ratio, evaluated for differentpre-event soil moisture conditions, ranging from 0% to 2% for B97 plot, and from 21% to 41%for B03. Runoff ratio for the recently burned plot was 60 times higher than for the plot burnedsix years before, under wet conditions, and 20 times higher, under very wet conditions. A largeincrease in sediment production also was measured in B03 plot, as compared with that in B97plot. Suspended sediment yield from B03 plot was more than two orders of magnitude higherthan that from B97 plot in all the simulated events. The high soil losses measured immediatelyafter burning indicate that effective post-fire rehabilitation programs must be carried out toreduce soil erosion in recently burned areas. However, the results for the plot burned six yearprior show that recovery of the hydrological properties of the soil occurs after the transientpost-fire modification.ª 2005 Elsevier B.V. All rights reserved.
KEYWORDSRainfall simulation;Fire;Erosion;Runoff;Mediterraneanenvironment;Water repellency
0d
b
022-1694/$ - see front matter ª 2005 Elsevier B.V. All rights reserved.oi:10.1016/j.jhydrol.2005.11.037
* Corresponding author. Tel.: +39 02 23996292; fax: +39 02 23996207.E-mail addresses: [email protected] (M.C. Rulli), [email protected] (S. Bozzi), [email protected] (M. Spada), daniele.
[email protected] (D. Bocchiola), [email protected] (R. Rosso).
324 M.C. Rulli et al.
Introduction
Every year the higher and higher number of wildfires, dev-astating the forests all over the world, attracts attentionto this underestimated problem. Fire effects are not onlylimited to the disappearing of vegetation, but they alsoalter soil hydrological response, reducing resistance toerosion and increasing overland flow production, duringrainstorms.
The watershed response to rainfall events, after a fire, isgoverned by many factors interacting with each other, suchas fire intensity, vegetation cover, soil properties, soil mois-ture content, rainfall intensity and time interval betweenthe burning and the meteoric event. In addition, it mustbe considered that fire can change soil properties, inducingthe formation of a water repellent layer at or near the soilsurface, reducing soil infiltration capacity, increasing over-land flow and accelerating surface erosion (Letey, 2001).During a forest fire the organic compounds in the litterand vegetation vaporize and penetrate into the soil untilthey reach a lower temperature soil layer where they con-dense (DeBano, 1981). At that depth these substances forma hydrophobic coating on soil particles, i.e. a water repel-lent layer whose strength and persistency are consideredto depend on a variety of factors (Huffman et al., 2001).These are: fire severity, often considered the primary factor(Giovannini and Lucchesi, 1997; DeBano, 2000), amount andtype of vegetation (DeBano, 1981; Doerr et al., 1998; Ime-son et al., 1992), soil texture (Meeuwig, 1971; DeBano,1981), soil moisture (Dekker and Ritsema, 1994; Doerr andThomas, 2000) and time since burning (DeBano, 1981). Fireintensity controls the combustion of the litter and humusand thus the vaporization of the hydrophobic organic sub-stances which they contain. Soil texture influences thestrength of the hydrophobic layer because soils with a lowerspecific area suffer a higher coating on the soil particles bythe hydrophobic compounds. Vegetation also contributes todetermine soil hydrophobicity since the amount and thetype of hydrophobic compounds in the plant litter dependon the plant species and on the age of the forest, which,in turn, is affected by the period since the last fire.
Given the large number of factors influencing post-firerunoff and erosion processes, it is necessary (to correctlyevaluate the possible mitigation efforts) to understand themechanisms and the geomorphologic processes controllingthe erosional and hydrological response in post-fire condi-tion. Several recent studies attempted to highlight the mainfactors affecting overland flow and sediment productionafter fire (e.g. Prosser and Williams, 1998; Wilson, 1999;Johansen et al., 2001; Rulli and Rosso, 2005). Some authorssuggested that spoiling of the vegetation cover and the con-sequent soil surface exposition to raindrop impact play themain role in increasing overland flow and in accelerating soilerosion (Cerda, 1998; Inbar et al., 1998; Marcos et al., 2000).Other authors argue that the factor responsible for the dis-tinct hydrologic behaviour after fire is the change in soilproperties mostly due to the fire-induced formation of thewater repellent layer (Imeson et al., 1992; Giovannini, 1997).
The Mediterranean area presents many characteristicswhich make it particularly open to fires and its effects.These include the relevant number of residential areas sur-
rounded by forest, scrubland and pastureland, the lack ofpre-suppression policies, the typical Mediterranean climatewith a long arid summer followed by intense autumn storms,and the characteristics of the Mediterranean plant commu-nities which are mostly highly inflammable. As a conse-quence of this vulnerability, the average annual amount offorest fires throughout the Mediterranean countries is nowclose to 50,000, i.e. twice as many as during the 1970s, withan annual cumulated burnt area of 600,000 ha (Alexandrianet al., 1999).
The increasing number of wildfires in the Mediterraneanbasin has awaken the scientific community to the risk ofpost-fire flooding and severe erosion. Some studies werecarried out to investigate post-fire effects. Cerda (1998)showed the quick recovery of vegetation after fire and itsinfluence on runoff in a scrubland in Spain, Thomas et al.(1999) measured the nutrient losses in eroded sedimentsafter a forest fire in the Agueda Basin, northern Portugal,under natural rainfall events. Kutiel et al. (1995) investi-gated the seasonal trend of runoff and sediment productionin burned and unburned plots following a forest fire in Haifa,Israel.
In Italy an increasing number of forest fires has been ob-served from the 1970s to the present day (from 3400 to10,500), with a consequent increase in the annual cumu-lated burned area from 43,000 to 118,000 ha (Alexandrianet al., 1999). In spite of this dramatic situation, only afew studies have been carried out to investigate fire effectson physio-chemical soil properties (Giovannini and Lucchesi,1997), on soil losses during natural rainfall events (Giovan-nini, 1997) and on Mediterranean plant dynamics (De Lillisand Testi, 1990; Mazzoleni and Pizzolongo, 1990). Appar-ently, up to now, no effort has been devoted to quantita-tively assess post-fire hydrologic and sedimentologicprocesses under simulated rainfall conditions.
Given this background, the aim of this study is to assessthe impact of forest fire on hydrological response and on soilerosion processes in an Italian region, typical of the Medi-terranean environment. Some experiments were conductedto quantify runoff and erosion rates in two areas with differ-ent fire histories, using controlled rainfall conditions, whichreduce bias induced by a non-uniform spatial and temporaldistribution of rain and enable to know the initial conditionsaccurately.
A rainfall simulator was employed in a set of experimentson two approximately 30 m2 plots, in different antecedentsoil moisture conditions. The plots were placed in two sitesfeaturing homogenous morphology and soil properties butsubjected to different treatments: one site burned in 1997and in 2003, one month before the experiments, while theother burned in 1997 only. Moreover, we studied the princi-pal soil properties (i.e. hydrological properties, by means ofinfiltrometer tests, and geopedological characterization, bymeans of geological surveys), the possible presence of afire-induced water repellent layer and the characteristicsof the vegetation, before and after the burning (by carryingout field surveys).
Thanks to the use of large hillslope scale plots and con-trolled storm events the results of this study provide alsoa new set of data which can be useful in physically basedrunoff and erosion models.

Rainfall simulations on a fire disturbed mediterranean area 325
Study area
The study plots were located in the Branega catchment,4.8 km2, 14 km from Genoa, in the Liguria region (NorthWest Italy). The 9th August 2003 a fire event occurred inthat area affecting a large portion of the Branega catch-ment (Fig. 1). Liguria region was chosen among the otherItalian regions because it holds the sad record of the highestvulnerability to wildfires amounting, on average, to 1500per year. It has the highest percentage of woodland, cover-ing more than 65% of its territory. Further, among the otheritalian regions, it has one of the highest population density.As a result, many towns are closely surrounded by forest, sobeing subjected to the effects of forest fire.
The Liguria region has a typical Mediterranean ecosys-tem: the vegetation is distinctly Mediterranean up to aheight of 500 m, with evergreen scrubs and vast woods ofPinus pinaster and Pinus halepensis and the climate istypically Mediterranean with wet cool winters and dry warmsummers.
During the last 30 years the Branega catchment has beensubjected to a large number of fires of different intensitiesand severity that has caused relevant alterations to plantcommunity dynamics and soil properties, exposing someareas to potential desertification. Since 1978 the catchmentarea has been subjected to 85 fires, causing in many casesserious hazard for the population. Now it is classified as ahigh-risk zone by the ‘‘Regional Plan for the Protectionand Conservation of Woodland Areas’’.
The fire of August 2003 occurred after an extraordinarydry and hot summer. The four months preceding the fireexperienced a total rainfall amount of only 105 mm. Accord-ing to the fire department, which conducted the fire extin-guishing operations, the area suffered a high severity burnt:the surface litter and the low vegetation were fully con-sumed and the flames reached the tree crowns up to aheight of 11 m.
The Branega catchment area is characterized by a typicalMediterranean climate influenced by its proximity to thesea. Average annual rainfall is about 1400 mm and it fallsmostly during autumn, from October to December, and dur-ing spring, from March to May. Intensity–duration–fre-quency curves for this area show that hourly rainfall, withintensity of 100 mm h�1, has a return period of 20 years.
Figure 1 Location of the Branega catc
Mean annual temperature is around 12 �C. Catchment eleva-tion ranges from 0 to 881 m a.s.l., with an average elevationof 288 m a.s.l. The mean slope of the catchment is 38%,with an easterly and south-easterly aspect.
The vegetation of the Branega catchment shows a typicalmatorral cover, characterized by the presence of pinewoodforests and evergreen shrubs including Erica arborea L.,Erica scoparia L., Arbutus unedo L., Myrtus communis L.and Cistus salvifolious L. Because of the recurrent fires,the pine forests, which are the result of the reafforestationcampaigns that took place during the 1930s, are now domi-nated by the P. pinaster, which is one of the most fire-dependent and fire-promoting species of the Mediterraneanvegetation. By comparing an aerial view of the Branega ba-sin taken in 1944 with recent photographs, one can observethat the pine forest has been replaced by acidophil matorralvegetation in the areas subjected to the frequent passage offire. Field surveys reveal that in such zones there has been areduction in the number of plant species (with a prevalenceof the most resilient ones) and a decrease in plant density.In these sites, the existing ecosystem can be classified asgarrigue (a degradated Mediterranean habitat) whichevolves in acid soils with low nutrient concentrations. Onthe contrary, those areas that did not suffer the passageof the fires or that were only subjected to low-intensityevents present a more varied and dense vegetation and itis possible to notice the presence of broadleaf trees.
The geology of the study area is characterized by thepresence of Voltri Group soils mainly consisting of ultra-mafic and basic rocks including serpentinities, calcschists,micaschists, quartzschists and metabasalts. The bedrocksare principally serpentinities and serpentine-schists,belonging to the ‘‘Membro delle Serpentiniti delle Capannedi Marcarolo’’.
Plot characteristics
Experiments were carried out on two 30 m2 plots, approxi-mately 4 m by 8 m, 200 m away from each other. Unfortu-nately, given the difficulty to move and allocate therainfall simulator in such steep areas, it was not possibleto replicate the experiments on other plots. Neverthelessextensive field surveys were carried out to select the studysites so as to minimize the interplot variability of soil
hment and the experimental plots.

326 M.C. Rulli et al.
properties and surface characteristics, that could affect theresults. Moreover, the plot size was chosen to be large en-ough to investigate the erosional and hydrological processesat the hillslope scale (Johansen et al., 2001). In fact, thespatial variability of vegetation and soil properties existingat that scale was integrated, while avoiding inaccuracyderiving from the use of small plots (Emmerich and Cox,1992). The experimental plots show different fire histories:one was established in an area burned during the 2003 forestfire and the other was located in a different area that wasnot subject to that fire. However, both plots were previ-ously burned in March 1997. Therefore, this study comparesan area recently burned for the second time (hereafterknown as B03 site), with one unburned for the last six years(hereafter known as B97 site). The plots were located onsimilar soil series, slope and vegetation cover (the B97 plotpresented the vegetation type that was present in the B03area before the fire occurred) as from surveys carried outby a pedologist and a botanic expert (Table 1). Soil samplescollected near the experimental plots revealed that the soilcan be characterized by two horizons: a sandy loam horizon(61% sand, 32% silt, and 7% clay) with a high stone coveroverlying a loam horizon (53% sand, 36% silt, and 11% clay).
The morphology of the B03 plot was characterized by astraight slope in the upper part and by an impluvium inthe lower part, with a SE aspect, while the B97 plot had astraight slope over the whole length, with a SE aspect. Aver-age plot slope was calculated from measures of the localslope, taken with a clinometer, resulting in 24% for theB03 plot and 32% for the B97 one.
In each plot the percentage of canopy cover, groundcover (shrub and grass) and bare soil was visually estimated.The 2003 forest fire completely removed the shrubs and the
Table 1 Characteristics of the plots
Plot Event Area (m2) Slope (%) Aspect Surface soil t
Burned 03 1 13 21 SE Sandy loam2 3 26 24 SE Sandy loam
Burned 97 1 2 3 32 32 SE Sandy loam
Figure 2 Experi
grass from the hillslopes, leaving only the strongest and big-gest pine trees. The B03 plot had over 90% bare soil, com-pared with less than 20% in the B97 site, and theremaining part was occupied by burned roots and stones.The B97 plot was established on a slope that presented agarrigue vegetation grown after the 1997 fire and thatnow reached a plant cover around 80% (herbaceous andarboreous). The vegetation inside this plot was character-ized by E. arborea and E. scoparia in the upper part andby small pine trees (P. pinaster) in the lower part, as canbe seen from Fig. 2. On these hillslopes the shrubs reachedan average height of 1 m while the young pines reached anaverage height of 1.5 m. In the recently burnt site, the veg-etation started to regenerate seven months after the fire atthe beginning of the spring season. At that period, a re-growth of E. arborea and A. unedo was observed, regener-ated by sprouting from the underground plant parts whichremained after the forest fire. Therefore, at both sites a ra-pid post-fire recovery of the matorral cover was observed,consistent with the findings of many authors about the rees-tablishment of the Mediterranean plant communities afterfire events (Naveh, 1975; Trabaud and Lepart, 1980; Mazzo-leni and Pizzolongo, 1990).
Methods
Experimental design
The experimental procedure employed a rainfall simulatorbuilt by the Italian National Research Council, CNR-IRPI/ISE (Panini et al., 1993). The basic unit of the instrumentconsists of a metallic square frame on which either four or
exture Bare soil (%) Canopy cover (%) Vegetation type
>90 0 –>90 0 –
�20 �50 Pinus pinasterErica arboreaErica scoparia
mental plots.

Figure 3 Rainfall simulator installed on the B03 plot.
Figure 4 Typical spatial distribution of the rainfall intensityon the B03 plot and pluviometer locations (P). Contours arerainfall intensities expressed in mm h�1.
Rainfall simulations on a fire disturbed mediterranean area 327
nine nozzles can be stuck, depending on the desired rainfallintensity: four nozzles generate a 38 mm h�1 rainfall, whilenine nozzles generate a 76 mm h�1 rainfall. Each square ishoisted at a height of 6 m over four poles and it is securedwith ropes and stakes, as shown in Fig. 3. For our experi-ments, two basic units were used to maximize plot sizesas large as possible, and nine nozzles were applied for eachsquare in order to obtain a rainfall intensity approximatelyequal to the one of a 1 h storm event with a 10 year returnperiod.
The plots were bordered by 20 cm wide sheet metal in-serted vertically 5 cm into the soil and the inside edges weresealed and waterproofed. Drains were also dug along theboundaries of the plots to avoid infiltration from the out-side. A covered trough was placed at the base of each plotto convey surface runoff and eroded sediments through anoutlet hose where they were collected manually in2000 ml bottles at 2 or 3 min time intervals throughoutthe entire rainfall simulation. Runoff samples were weighedand filtered to determine runoff hydrographs and sedimentyields. The soil organic matter content and the particle sizedistribution curve were determined for the cumulative sed-iment yield of every simulation. At the end of each experi-ment any sediment remaining in the trough was collected,dried and weighed and it was considered as bed load sedi-ment. The timing of runoff start and stop was also recorded.
Rainfall simulations
Rainfall simulations were carried out six weeks after the2003 forest fire. During the time period between the fireand the start of the experiments the study site received onlyfew millimetres of natural rainfall.
A rainfall simulation experiment consisted of a single60 min rainfall application at a constant intensity. Therainfall intensity was about 76 mm h�1, according to theequipment design. The actual rainfall intensity, and its spa-tial distribution, was assessed by means of 10 rain gaugesplaced in and around the plot. The volume of water accumu-lated in each rain gauge was converted to a rainfall intensityover the whole period of the simulation experiment (Fig. 4).
Despite considerable spatial variations in rainfall intensityare usually obtained in field plots larger than a few squaremeters, during all the performed experiments a consider-able uniformity in the spatial distribution of rainfall wasattained. On average, the Christiansen’s uniformity coeffi-cient (Christiansen, 1941) was equal to 81% and in justone simulation was less than 80% (i.e. 76%).
The experiments were designed to analyse hydrologicaland sedimentological responses under three different ante-cedent soil moisture conditions. Each plot underwent threerainfall events: Event 1 (dry) was carried out under existingsoil moisture conditions, Event 2 (wet) was conducted a fewdays after Event 1 and Event 3 (very wet) was carried outabout 2 h after Event 2.
Before the experiments four soil samples were collectedin each plot with steel cylinders of 5 cm diameter and 5 cmlength. Two samples were taken at the surface (0–5 cm forthe B97 plot and 1–6 cm for the B03 plot, because the ashlayer was removed) and two at depths of 5–10 cm and6–11 cm, for the B97 and the B03 site, respectively. Thenthe samples were weighed and dried to determine anteced-ent soil moisture conditions (Table 2).
Soil properties and hydrophobicity
In each experimental area, saturated hydraulic conductiv-ity was measured at different locations using a Guelphpermeameter (Reynolds et al., 1984). Water flux into thesoil was measured until a saturated bulb was formed andthe out-flow of water from the storage cylinder reacheda constant value. Then the saturated hydraulic conductiv-ity was calculated following the constant head permeame-ter method, which is based on the Reynolds et al. (1985)solution of Richards equation for steady flow out of a well.

393393Table 2 Mean soil moisture, by weight, before the simu-lations, measured at two different depths
Depth (cm) Soil moisture (%)
Burned 03 plotEvent 1 1–6 5
6–11 13
Event 2 1–6 236–11 17
Event 3 1–6 286–11 22
Burned 97 plotEvent 1 0–5 21
5–10 17
Event 2 0–5 275–10 19
Event 3 0–5 365–10 25
328 M.C. Rulli et al.
Since the Guelph permeameter method yields essentially apoint measurement, three measurements were made insideeach plot and two more outside to provide a representa-tive value of the hydraulic conductivity of the two studiedsites.
Several Water Drop Penetration Time (WDPT) tests werecarried out on the hillslope where the B03 plot was placed,six months after the rainfall simulations, to investigate thewater repellency of the soil and any presence of fire-in-duced hydrophobic layer under the soil surface.
WDPT test, as described by several authors (e.g. DeBano,1981), consists in placing three drops of distilled water witha standard dropper (6 mm of diameter) on the soil surface atdifferent depths, recording the time required for theirabsorption. The median value is considered as the drop pen-etration time at the analysed depth and the soil is consid-ered hydrophobic if the WDPT is greater than 5 s (DeBano,1981). The measurements were taken at the soil surfaceand at 5 cm intervals to a depth of 20 cm.
Results
Hydraulic conductivity and WDPT test
Table 3 presents the mean hydraulic conductivity of thestudy sites, measured between a depth of 5 and 15 cm.Comparing Ks values measured inside the plots, a lower
Table 3 Saturated hydraulic conductivity at the B03 andB97 plot
Inside the plot Outsidethe plot
1 2 3 1 2
Ks B03 (mm h�1) 26 44 102 19 140Ks B97 (mm h�1) 79 90 290 70 380
hydraulic conductivity in the recently burnt area was no-ticed: the geometric means were 49 mm h�1 at the B03 plotand 127 mm h�1 at the B97 plot. Considering all the mea-surements, the geometric averages Ks were 50 mm h�1 atthe recently burned site and 141 mm h�1 at the site burnedin 1997.
The WDPT tests showed that there was not a water repel-lent layer up to a depth of 20 cm. This seems to indicatethat the 2003 fire did not induce the formation of a waterrepellent soil layer or that this layer weakened or disap-peared at the time of the WDPT measurements. However,since the longevity of fire-induced water hydrophobic layeris usually around two years (Robichaud, 2000), although it isdeeply variable depending on regions (Huffman et al.,2001), we believe that the time elapsed from the fire tothe WDPT measurements was not enough to restore thesoil’s pre-burn conditions.
Runoff
While considering the summary of the rainfall simulations,two problems were encountered during the experiments.First, the dry experiment on the B03 plot took place in asmaller area than the other experiments on the same plot.This was due to problems encountered with the electricpump, which, because of the complex topography, couldnot provide enough head to supply the right flow rate toeach nozzle. Thus, the nozzles of the upslope square ofthe rainfall simulator were not used for this simulationand two sequential pumps were used in the following ones.In spite of this change, during the second event, the rainfallintensity was again a bit low, about 68 mm h�1, and theright value of rainfall intensity, 76 mm h�1, was definitelyreached only during the third experiment after somearrangements on the hydraulic circuit to reduce head losses.To allow for a better understanding of results, we presentedthem, whenever it was convenient, in non-dimensional formwith respect to the area of the plots, to the amount of rain-fall and to rainfall duration. The second problem arose dur-ing the fourth simulated event, that is, the first simulationon the B97 plot: in particular the plot did not produce runoffafter 40 min of simulated rainfall. At first the absence ofrunoff at the plot outlet was ascribed to likely flow lossesalong the plot edges or along the collecting trough and sothe simulation was interrupted. Then, a tracer was usedto check the flow paths and to detect eventual water losses.No runoff losses were discovered. The experiment was thusconsidered valid and was taken into account for final re-marks. The extraordinary low flow rates of the followingtwo experiments on the B97 plot also confirmed the resultsof the first simulation on this plot. In spite of these prob-lems, the results, presented in Table 4, were fully consis-tent and in agreement with the ones obtained in otherstudies (e.g. Robichaud and Waldrop, 1994; Benavides-Solo-rio and MacDonald, 2001; Johansen et al., 2001).
The runoff ratio (i.e. the fraction of the precipitationconverted to runoff) of the B03 plot ranged from 21% to41%, whereas in the B97 plot, it ranged from 0% to 2%. Whencomparing the results from simulated events with similarantecedent soil moisture conditions, the runoff ratio fromthe B03 plot was 60 times higher than from the B97 onefor the wet experiment, and 20 times higher for the very
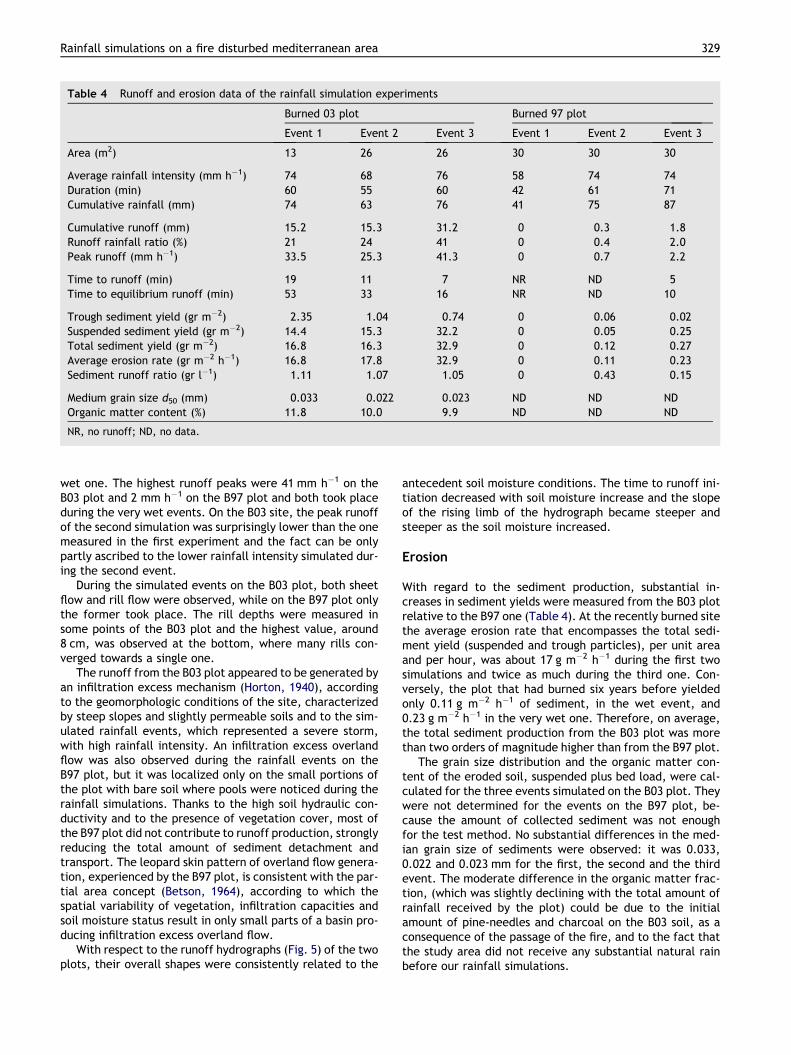
Table 4 Runoff and erosion data of the rainfall simulation experiments
Burned 03 plot Burned 97 plot
Event 1 Event 2 Event 3 Event 1 Event 2 Event 3
Area (m2) 13 26 26 30 30 30
Average rainfall intensity (mm h�1) 74 68 76 58 74 74Duration (min) 60 55 60 42 61 71Cumulative rainfall (mm) 74 63 76 41 75 87
Cumulative runoff (mm) 15.2 15.3 31.2 0 0.3 1.8Runoff rainfall ratio (%) 21 24 41 0 0.4 2.0Peak runoff (mm h�1) 33.5 25.3 41.3 0 0.7 2.2
Time to runoff (min) 19 11 7 NR ND 5Time to equilibrium runoff (min) 53 33 16 NR ND 10
Trough sediment yield (gr m�2) 2.35 1.04 0.74 0 0.06 0.02Suspended sediment yield (gr m�2) 14.4 15.3 32.2 0 0.05 0.25Total sediment yield (gr m�2) 16.8 16.3 32.9 0 0.12 0.27Average erosion rate (gr m�2 h�1) 16.8 17.8 32.9 0 0.11 0.23Sediment runoff ratio (gr l�1) 1.11 1.07 1.05 0 0.43 0.15
Medium grain size d50 (mm) 0.033 0.022 0.023 ND ND NDOrganic matter content (%) 11.8 10.0 9.9 ND ND ND
NR, no runoff; ND, no data.
Rainfall simulations on a fire disturbed mediterranean area 329
wet one. The highest runoff peaks were 41 mm h�1 on theB03 plot and 2 mm h�1 on the B97 plot and both took placeduring the very wet events. On the B03 site, the peak runoffof the second simulation was surprisingly lower than the onemeasured in the first experiment and the fact can be onlypartly ascribed to the lower rainfall intensity simulated dur-ing the second event.
During the simulated events on the B03 plot, both sheetflow and rill flow were observed, while on the B97 plot onlythe former took place. The rill depths were measured insome points of the B03 plot and the highest value, around8 cm, was observed at the bottom, where many rills con-verged towards a single one.
The runoff from the B03 plot appeared to be generated byan infiltration excess mechanism (Horton, 1940), accordingto the geomorphologic conditions of the site, characterizedby steep slopes and slightly permeable soils and to the sim-ulated rainfall events, which represented a severe storm,with high rainfall intensity. An infiltration excess overlandflow was also observed during the rainfall events on theB97 plot, but it was localized only on the small portions ofthe plot with bare soil where pools were noticed during therainfall simulations. Thanks to the high soil hydraulic con-ductivity and to the presence of vegetation cover, most ofthe B97 plot did not contribute to runoff production, stronglyreducing the total amount of sediment detachment andtransport. The leopard skin pattern of overland flow genera-tion, experienced by the B97 plot, is consistent with the par-tial area concept (Betson, 1964), according to which thespatial variability of vegetation, infiltration capacities andsoil moisture status result in only small parts of a basin pro-ducing infiltration excess overland flow.
With respect to the runoff hydrographs (Fig. 5) of the twoplots, their overall shapes were consistently related to the
antecedent soil moisture conditions. The time to runoff ini-tiation decreased with soil moisture increase and the slopeof the rising limb of the hydrograph became steeper andsteeper as the soil moisture increased.
Erosion
With regard to the sediment production, substantial in-creases in sediment yields were measured from the B03 plotrelative to the B97 one (Table 4). At the recently burned sitethe average erosion rate that encompasses the total sedi-ment yield (suspended and trough particles), per unit areaand per hour, was about 17 g m�2 h�1 during the first twosimulations and twice as much during the third one. Con-versely, the plot that had burned six years before yieldedonly 0.11 g m�2 h�1 of sediment, in the wet event, and0.23 g m�2 h�1 in the very wet one. Therefore, on average,the total sediment production from the B03 plot was morethan two orders of magnitude higher than from the B97 plot.
The grain size distribution and the organic matter con-tent of the eroded soil, suspended plus bed load, were cal-culated for the three events simulated on the B03 plot. Theywere not determined for the events on the B97 plot, be-cause the amount of collected sediment was not enoughfor the test method. No substantial differences in the med-ian grain size of sediments were observed: it was 0.033,0.022 and 0.023 mm for the first, the second and the thirdevent. The moderate difference in the organic matter frac-tion, (which was slightly declining with the total amount ofrainfall received by the plot) could be due to the initialamount of pine-needles and charcoal on the B03 soil, as aconsequence of the passage of the fire, and to the fact thatthe study area did not receive any substantial natural rainbefore our rainfall simulations.

Burned 03 plot- Event 1
0
10
20
30
40
50
0 10 20 30 40 50 60 70Time (min)
Run
off
(mm
h -1
)
Burned 03 plot- Event 2
0
10
20
30
40
50
0 10 20 30 40 50 60 70Time (min)
Run
off
(mm
h -1
)
Burned 03 plot- Event 3
0
10
20
30
40
50
0 10 20 30 40 50 60 70
Time (min)
Run
off
(mm
h-1
)
Burned 97 plot- Event 2
0
1
2
3
4
5
0 10 20 30 40 50 60 7
Time (min)R
unof
f (m
mh -1
)
0
Burned 97 plot - Event 3
0
1
2
3
4
5
0 10 20 30 40 50 60 70
Time (min)
Run
off
(mm
h-1
)
Figure 5 Runoff hydrographs of the B03 and B97 plot. Note the order of magnitude difference between the ordinate axis of the B03and B97 plot.
330 M.C. Rulli et al.
The amount of eroded material, deposited in the run-off trough showed less marked differences between thetwo sites, than the suspended sediments. The trough sed-iment yield was 17 times higher, after the wet event onthe B03 plot, and 34 higher considering the very wetevent. It is interesting to notice that for each plot thisquantity (the trough sediment concentrations) tended todecline as the number of events simulated on that plot in-creased. On the B03 plot, it was 2.35 g m�2 for the firstevent and less than a half for the others, while on theB97 plot it was around 0.06 g m�2 for the second eventand 0.02 g m�2 for the third one. The temporal patternsof the sediment yield also were analyzed, based oninstantaneous erosion rates (Fig. 6). On the B03 plot, dur-ing the first event, the erosion rate fluctuated, but thenbecame steady when runoff reached the maximum ob-served value whereas during the second event, it variedthroughout the whole simulation period without reachinga steady state condition. The sedigraph of the very wetevent on the B03 plot was the most consistent: it fea-tured an initial peak, followed by a flat or slightly declin-ing trend.
Discussion
The results of this study document that high runoff and ero-sion rates occur on a high severity burnt Mediterranean hills-lope, dominated by matorral vegetation and by a wood of P.pinaster. Whereas, on an area recovering from a fire of sixyears before runoff was minimal. The overland flow rates,following the high intensity rainfall events simulated onthe recently burnt hillslope, were more than one order ofmagnitude higher than those observed on the long unburntsite. The apparent infiltration rates, calculated as a firstapproximation, as the difference between rainfall intensityand instantaneous runoff rate (Imeson et al., 1992; Piersonet al., 2001), showed a strong reduction in infiltrationcapacities of the recently burnt soil (Fig. 7). On the B97plot, the steady state infiltration rate, reached in saturatedsoil conditions, was around 73 mm h�1, very close to theaverage rainfall intensity, whereas on the recently burnedsite, it was about 40 mm h�1, i.e. 45% less. These resultsare consistent with the measured values of saturatedhydraulic conductivity at the two study sites. On the re-cently burnt hillslope, a marked decrease of saturated

Burned 03 plot- Event 1
0
10
20
30
40
0 10 20 30 40 50 60 70
Time (min)
Sed
imen
ts (
mg
s-1m
-2)
Burned 03 plot- Event 2
0
10
20
30
40
0 10 20 30 40 50 60 70
Time (min)
Sedi
men
ts (
mg
s-1m
-2)
Burned 03 plot- Event 3
0
10
20
30
40
0 10 20 30 40 50 60 70
Time (min)
Sedi
men
ts (
mg
s-1m
-2)
Burned 97 plot - Event 2
0.0
0.1
0.2
0.3
0.4
0 10 20 30 40 50 60 70
Time (min)
Sedi
men
ts (
mg
s-1m
-2)
Burned 97 plot -Event 3
0.0
0.1
0.2
0.3
0.4
0 10 20 30 40 50 60 70
Time (min)
Sedi
men
ts (
mg
s-1m
-2)
Figure 6 Sedigraphs of the B03 and B97 plot. Note the two orders of magnitude difference between the ordinate axis of the B03and B97 plot.
Rainfall simulations on a fire disturbed mediterranean area 331
hydraulic conductivity was noticed with respect to the longunburnt site. On average, the geometric mean of thehydraulic conductivity of the B03 plot was 61% less thanthe one measured on the B97 plot. These results may bedue to inherent site variability but, given the magnitudeof the differences and the similar soil and vegetationcharacteristics of the two sites, we believe that they area result of the high severity fire, which affected the B03site. Furthermore, this reduction in soil hydraulic conductiv-ity and infiltration capacities after intense fires has beenalso observed by other authors who argued that it is dueto ground cover reduction, formation of a water repellentlayer and sealing of soil pores by ash particles or fine sedi-ment mobilized by raindrop splash (Imeson et al., 1992;Marcos et al., 2000; Martin and Moody, 2001). In particular,Robichaud (2000) found a reduction of hydraulic conductiv-ity from pre to post fire conditions of about 40% and sug-gested that it was caused by the development of a fire-induced water repellent layer. Immediately after fire Sha-
kesby et al. (1993) measured significantly lower infiltrationcapacities than either 4 years or 9 years after fire, not re-lated to soil hydrophobicity. Finally Cerda (1998) observedan increase in steady state infiltration capacities duringthe six years following a fire, owed to the quick recoveryof the vegetation.
In this study, no clear relation between the saturatedhydraulic conductivity and the soil hydrophobicity was ob-served. In fact, theWDPT test on the recently burnt forest siteshowed no evidence of water repellency at any depth. Never-theless, field and laboratory tests indicate that water repel-lency disappears when the soil exceeds a certain moisturecontent (Dekker and Ritsema, 1994) and that, as a conse-quence, soil hydrophobicity follows a seasonal trend: it canbe very severe during dry seasons, disappear after long wetperiod and re-appear when soil become dry again (Shakesbyet al., 2000). Therefore, the fact that a water repellent layerwas not noted after the forest fire of August 2003 can be due tothe high soil moisture content at the time of the WDPT tests.

0
10
20
30
40
50
60
70
80
0 10 20 30 40 50 60 70Time (min)
Infi
ltrat
ion
(mm
h-1
)
80
B03-Dry B03-Wet B03-Very Wet
B97-Wet B97-Very Wet
Figure 7 Apparent infiltration rates over time for all rainfall events.
332 M.C. Rulli et al.
Some authors (Shahlaee et al., 1991; Hester et al.,1997; Robichaud, 2000) recognized an effect of soil hydro-phobicity on the shape of hydrographs, obtained by rain-fall simulation experiments. They found hydrographsshowing an initial high runoff rate followed by a decreaseto a lower constant rate as a result of the destruction ofthe water repellent layer by the infiltrated water. Therunoff hydrographs, resulting from our rainfall simulations,did not present these characteristics. Nevertheless, this isnot enough to retain that a water repellency layer was notpresent since other studies report moderate fire-inducedwater repellency but no evident hydrophobic trend ofthe runoff hydrographs (e.g. Benavides-Solorio and Mac-Donald, 2001).
Additional field work on severely burned areas is neededto achieve a better understanding of the relation betweenWDPT test, saturated hydraulic conductivity and runoffhydrographs.
Sediment yields, observed during the rainfall simula-tions, remarkably differed depending on the plot treat-ment. After the forest fire the soil erosion per unit areaand per mm of rainfall ranged from 0.23 to 0.43 g m�2
mm�1, while on the site burned six years before, it rangedfrom 0 to 0.003 g m�2 mm�1. Thus the ratio between soillosses on the B03 and the B97 plots was 162 for the wetevent and 143 for the very wet one. These ratios are largerthan those between overland flow on the B03 and B97plots, which were 60 and 20 during the wet and very wetevents, respectively. This difference has been also ob-served by other authors (Benavides-Solorio and MacDonald,2001; Johansen et al., 2001; Pardini et al., 2004) and ithighlights the importance of considering that soil erosionmight increase after intense fires, much more than surfacerunoff. This is due to the fact that the erosion processes,including detachment, transport and deposition of sedi-ments, are controlled by a variety of factors relating tosoil, vegetation, morphology and rainfall and are not onlya simple function of the magnitude of overland flow. Spe-cifically, on a recently burnt area, soil detachment by rain-
drop impact, overland flow and rill flow is enhanced by theremoval of the litter and vegetation cover and by the fire-induced degradation of soil structure. The latter is due tothe burning of the organic matter, which has a key role insoil structure and aggregate stability, and so, when it iscombusted, causes a decrease of the cohesive strengthof the soil (Giovannini and Lucchesi, 1997). Once the soillooses its structure, the shear forces exerted on the sur-face soil by raindrop impact and by overland flow, maymore easily exceed the critical soil shear stress and detacha higher amount of sediments. Moreover, the decreasedcohesiveness of surface soil aggregates favours rillinitiation, increasing flow depth and velocity and thereforethe sediment transport capacity of overland flow (Wells,1987). Our data are consistent with these observations:no recognisable rills were observed on the B97 plot,during the three rainfall simulations whereas, on the re-cently burned plot, preferential flow paths started todevelop during the first event and, at the end of thelast rainfall simulation, a rill network was clearlyrecognizable.
These results highlight the need of using large scale plotsin post fire erosion assessment because they allow one tointegrate rill erosion that would not occur on a small scaleplot where only erosion processes from rain splash and sheeterosion can take place. This is particularly important if thedata collected by field experiments have to be used in pro-cess-based runoff erosion models in which rill processes arecritical components.
The average sediment/runoff ratio, calculated by divid-ing cumulative sediment yield by cumulative runoff was sur-prisingly identical for all the events at the recently burnedsite, around 1 g l�1, despite the cumulative runoff was twiceas much during the third simulation than during the others.On the B97 plot sediment concentrations in the runoff weretwo or three times less than on the B03 plot and they werealmost three times higher for the wet run than for the fol-lowing event, in spite of the overland flow was 5 timeshigher.

Rainfall simulations on a fire disturbed mediterranean area 333
Absolute values of soil losses from the recently burnedhillslope, on average 22.5 g m�2 h�1, were lower than thosemeasured by other authors after intense fires in differentforest ecosystems, but the magnitude of increase in soil ero-sion of the recently burnt site with respect to the long un-burnt one, on average 120 times, was higher than thosereported by other studies. For example, Johansen et al.(2001) found a sediment production of 75 g m�2 h�1 afterthe Cerro Grande fire (New Mexico) in ponderosa pine forestbut a ratio between soil losses in burned and unburned plotof 25; in a Tasmanian eucalyptus forest, Wilson (1999) ob-served that post-fire soil erosion was around 80 g m�2 h�1,but the severely burned area yielded only 5 times more sed-iments than the unburned one; in three different fires, inponderosa and lodgepole pine forests of the Colorado FrontRange, Benavides-Solorio and MacDonald (2001) measured asediment production from high-severity burnt areas rangingfrom 32 to 50 g m�2 h�1, and it was from 10 to 17 timesmore than in unburned areas.
Numerous studies have been carried out in the Mediter-ranean area to quantify post-fire erosion and runoff ratesand to investigate the recovery period of burned areas. Asynthesis of these works is reported in Tables 5 and 6 toprovide a comparison between the present study and theones conducted to date in the same Mediterranean envi-ronment. Table 5 presents post-fire rainfall simulationstudies and Table 6 reports post-fire runoff and erosionrates from studies under natural rainfall conditions onburned and unburned areas. As can be noticed from Table5, very few studies have investigated hydrologic and ero-sional fire impacts on a Mediterranean area by means ofrainfall simulations and, in those cases, plot sizes wereof the order of magnitude of few square meters. All theserainfall simulation studies report an increase in surfaceerosion after fire between 2.4 (Kutiel et al., 1995) and423 times (De Luis et al., 2003) with respect to pre-firevalues. In Spain, in areas with similar climate and vegeta-tion communities to the ones of this study, Cerda (1998),Marcos et al. (2000) and De Luis et al. (2003) found thatthe amount of litter and vegetation cover plays a decisiverole in reducing post-fire runoff and erosion and in acceler-ating the recovery time of burned soils. This result, in con-junction with the ones found by other authors (Inbar et al.,1998; Vega et al., 2005) suggests that the period necessaryfor soil erosion to return to background levels can be re-lated to the type of species existing prior to fire; eachone has a specific recovery capacity and speed dependingon its regeneration strategy. In our case, the matorral veg-etation had a rapid post-fire recovery: seven months afterthe forest fire, there was a re-growth of E. arborea and A.unedo on the B03 plot and six years after the fire event thevegetation reached a plant cover of around 80% on the B97site.
Studies of the evolution of post-fire erosion in Mediter-ranean climate and environment (Table 6), show that soillosses are similar to those of long unburnt sites after aperiod of between 2 (Cerda and Lasanta, 2005) and 10years (Inbar et al., 1998), similar to that documented inother environments (Robichaud, 2000) and that the high-est soil losses per unit area can occur at different timefrom fire. For example, Soto et al. (1995) and Andreuet al. (2001) measured the peak erosion 4 months after
burning, Vega et al. (2005) observed the maximum erosion8 months after fire and Cerda and Lasanta (2005) mea-sured the highest soil losses of two burned plots, one yearand two year after burning. Apart for the latter research-er, in all the other studies the post-fire erosion was re-lated to rainfall intensity and so it occurred in thefollowing rainy season.
Several studies of those reported in Table 6 also moni-tored the changes in physicochemical characteristics of thesoil over a period of time after fire. Soto et al. (1995) andPardini et al. (2004) measured an increase of availablenutrients in the first months after fire and the formerfound a decrease to pre-fire values within nine monthswhile the latter measured values higher than prior to fire,after 6 months after the burning. Andreu et al. (2001)showed that fire-induced deterioration of soil structurecauses an increase of soil compaction and bulk densityand a decrease in soil cohesiveness and that soils withsoutherly aspect present a greater structure degradationby fire than north-oriented soils. Cerda et al. (1995) alsofound a close relation between fire and aspect and,particularly, that 10 years after the fire, south facingslopes, characterized by slower post-fire revegetationrates, have lower aggregate stability and more erodiblesoils than north facing ones. Rubio et al. (1997) high-lighted the decisive role of soil profile and texture inthe erosion response to fire on burned Mediterraneanpine forests and, the strong influence of the naturaland fire-induced surface heterogeneity on runoff and soillosses.
Conclusions
In the present study the hydrological and erosional re-sponses of a recently burnt slope and a long unburnt slopewere investigated by means of rainfall simulation experi-ments in order to assess the effect of fire on runoff and ero-sion. The overland flow and sediment production were,respectively, one and two orders of magnitude higher inthe recently burnt site than in the long unburnt site. Imme-diately after fire, the runoff ratio ranged from 21% to 41%,while, six years after, it ranged from 0% to 2%. Soil erosionwas also strongly accelerated by the passage of fire: the ra-tio between soil losses in B03 and in B97 plot was 162, forthe wet event, and 143 for the very wet one. These resultssuggest that an intense rainfall event can affect more thesedimentologic than the hydrologic response of a severelyburnt catchment, being a potentially triggering cause of adesertification process.
Infiltrometer tests with a Guelph permeameter showed adecrease in hydraulic conductivity on the B03 plot with re-spect to the B97 one. The presence of fire-induced soilhydrophobicity was investigated with WDPT measurementsand no water repellent layer was found at the recently burntsite, six months after the fire event. Anyway it must be ta-ken into account that the WDPT tests were carried out dur-ing the wet season and so, at that period, the waterrepellency could have disappeared because of the high soilmoisture content.
The low runoff and erosion rates observed on the siteburned six year before indicated that fire did not lead to apermanent degradation of the Mediterranean ecosystem.

Table 5 Runoff and erosion data from rainfall simulation studies on Mediterranean burned and unburned areas (sorted by date)
Reference Location Plotsize(m2)
Slope (%)[aspect]
Vegetation Soil texture Rainfallintensity[duration]
Plot treatment[fire severity]
Timesincefire
Runoff/rainfallratio (%)
Averageerosion(kg ha�1 mm�1)
Cerda et al. (1995) La CosteraDistrict,E Spain
<1 25 [N] Pinus halepensisand matorralshrubs
Sandy loam 55 [60] Burned 2 years 38 37.631 [N] Burned 10 years 8 0.6624 [S] Burned 10 years 17 1.88
Kutiel et al. (1995) Haifa,NW Israel
1 15–22 [N–S] Pinus halepensis,Quercuscalliprinos andmatorral shrubs
Clay 30 [120] Unburned withoutvegetation
– 2a 2.25
Burned [moderate] Immediatelyafter
7a 5.33
Burned [high] 2 weeks 8a 6.791 year 8a 6.54
Cerda (1998) La CosteraDistrict,E Spain
<1 Pinus halepensisand matorralshrubs
Sandy loam 55 [60] Burned 6 months 45 –1.5 years 28 –2.4 years 14 –5.3 years 6 –
Marcos et al. (2000) Leon,Spain
1 10 Matorral shrubs Loamy sand 180 [5] Unburned – 9 2.30Burned [low] 1.5 years 34 0.6–13.3
De Luis et al. (2003) Onil,SE Spain
4 26 Gorse shrubs Loam 156 [105] Unburned – – 0.16Burned [moderate] 2 months – 2.12Burned [high] 2 months – 30.8
Our study (2005) Liguria,NW Italy
32 32 [SE] Pinus pinaster andmatorral shrubs
Sandy loam 58–76 [42–71] Burned 6 years 1 0.0226 24 [SE] Burned [high] 6 weeks 29 3.07
a Final runoff rate.
334M.C.Rulli
etal.

Table 6 Runoff and erosion data from studies under natural rainfall conditions on Mediterranean burned and unburned areas (sorted by date)
Reference Location Plotsize(m2)
Slope (%)[aspect]
Vegetation Soil texture Plot treatment[fire severity]
Monitoring periodafter fire 0 = fireevent
Runoff/rainfallratio (%)
Averageerosion(kgha�1
mm�1)
Shakesby et al. (1993) Agueda, NorthcentralPortugal
16 20 Eucalyptus globulusand Pinus pinaster
Sandy loam Burned 1–2 years 5.3 0.14Burned 3–4 years 7.7 0.004Burned 9–10 years 1.8 0.004
Soto et al. (1995) Galicia, NWSpain
80 30 Gorse shrubs Sandy loam Unburned 0–9 months 2.8 0.86Slashed andburned
5.7 31.4
Rubio et al. (1997) SierraCalderona, ESpain
34 35 [E–SE] Pine and kermes oak Sandy loam Burned[moderate]
0–8 months 1.9 0.44
25 30 [NE] Pine and kermes oak Loam Burned [high] 4.3 0.3926 35 [S] Pine and kermes oak Loam Burned [low] 1.8 0.1423 35 [NE] Pine and cork tree Loam Burned [high] 18.3 10.411 25 [S–SW] Pine and abandoned
fieldSandy loam Burned
[moderate]25.5 5.05
25 20 [N–NW] Pine, kermes oak andholm oak
Sandy loam Burned [low] 32.2 5.36
Giovannini (1997) Tuscany,Cenfral Italy
68 27 Matorral shrubs – Unburned 0–1 year – 0.39Burned [low] – 0.10Burned [high] – 0.68
– 8.80
Inbar et al. (1998) Haifa, NWIsrael
200 20–30 Pinus halepensis,Quercus calliprinosand matorral shrubs
Fine-grainedtexture
Unburned 0–3 years – 0.001Burned [high] 4.87
Andreu et al. (2001) SierraCalderona, ESpain
25 30 [NE] Pine, kermes oak andshrubs
Sandy loam Burned [high] 0–3 years 0.3 0.2735 [S] Burned [high] 0.2 0.30
Pardini et al. (2004) Cap de CreusPeninsula, NESpain
36 27 [N–S] Cork trees Sandy loam Unburned �7 to 0 months – 0.01Burned[moderate]
0–5 months 0.07
28 [N–S] Olive Trees Sandy loam Unburned �7 to 0 months – 0.09Burned[moderate]
0–5 months 0.23
30 [N–S] Shrubs Loamy sand Unburned �7 to 0 months – 0.01Burned[moderate]
0–5 months 0.17
(continued on next page)
Rain
fallsim
ulatio
nsonafire
distu
rbedmedite
rranean
area
335

Table 6 (continued)
Reference Location Plotsize(m2)
Slope (%)[aspect]
Vegetation Soil texture Plot treatment[fire severity]
Monitoring periodafter fire 0 = fireevent
Runoff/rainfallratio (%)
Averageerosion(kg ha�1
mm�1)
29 [N–S] Shrubs Sandy loam Unburned �7 to 0 months – 0.004Burned[moderate]
0–5 months 0.13
20 [N–S] Vineyard Sandy loam Unburned �7 to 0 months – 0.07Burned[moderate]
0–5 months 0.16
Vega et al. (2005) Galicia, NWSpain
80 30 Coarse shrubs Sandy loam Unburned 0–12 months 6.3 0.40
Burned [low] 4.2 0.16Burned [high] 2.5 0.07
Cerda and Lasanta (2005) Pyrenees, NESpain
30 – Shrubs Clay loam Unburned 0.5–8 years 4.2 0.08
Burned[moderate]
0.5–8 years 7.0 0.13
Burned[moderate]
0–7 years 8.5 0.50
336M.C.Rulli
etal.
Rainfall simulations on a fire disturbed mediterranean area 337
However, the relatively high values, measured on the re-cently burned hillslope, showed that soil erosion and runoffrates can largely increase immediately after fire. This con-sideration indicates that post-fire rehabilitation programsshould be undertaken in the degradated soils of the Mediter-ranean environment which are often exposed to torrentialrainfall events to prevent the temporary increment of soilerosion consequent to high intensity forest fires. Additionalresearch is needed to assess runoff and erosion rates overtime and to detect the recovery period of burned areas inthe Mediterranean climate and environment of North WestItaly.
In this study, the use of large plots allowed us to takeinto account some of the natural spatial variability of soilproperties and vegetation and to reduce the effect of spa-tial scale on the results. We do not know of any previousexperiments quantifying post fire runoff and erosion in aMediterranean country by carrying out rainfall simulationson hillslope scale plots. Therefore, although not replicated,our data give an insight of the fire-induced changes in run-off, erosion, soil and vegetation and provide new quantita-tive information, in an area where literature is lacking, todevelop and test physically-based runoff and erosionmodels.
Acknowledgements
Many people have to be kindly thanked for having made theexperiments possible. Dr. D. Torri and Dr. P. Sanchez gaveinvaluable help in setting up the rainfall simulator and sup-ported us with their precious experience in erosion issues.Special thanks to Dr. R. Castello, Liguria Region, for provid-ing precious assistance during our experimental works. Wekindly thank Dr. M Brancucci for geological investigations,Dr. R. Tranquilli for vegetation surveys, Dr. S. Pini and Dr.R. D’Imporzano for laboratory analysis. We are also verygrateful to Mr. Bozzano, who allowed us to carry out theexperiments on his properties. The anonymous reviewer iswarmly acknowledged for his accurate revision.
Funding for the project was provided by INRM throughthe project ‘‘Analysis of hydrological and sedimentologicalresponse in burned areas’’, by the Liguria Region throughINTERREG 3B DESERNET Project and by GNDCI-National Re-search Council (Contract No. 00.00545PF42).
References
Alexandrian, D., Esnault, F., Calabri, G., 1999. Forest fires in theMediterranean area. Unasylva 50 (197).
Andreu, V., Imeson, A.C., Rubio, J.L., 2001. Temporal changes insoil aggregates and water erosion after a wildfire in a Mediter-ranean pine forest. Catena 44, 69–84.
Benavides-Solorio, J., MacDonald, L.H., 2001. Post–fire runoff anderosion from simulated rainfall on small plot, Colorado FrontRange. Hydrological Processes 15, 2931–2952.
Betson, R.P., 1964. What is watershed runoff? Journal of Geophys-ical Research 69, 1541–1552.
Cerda, A., Imeson, A.C., Calvo, A., 1995. Fire and aspect induceddifferences on the erodibility and hydrology of soils at LaCostera, Valencia, southeast Spain. Catena 24, 289–304.
Cerda, A., 1998. Changes in overland flow and infiltration after arangeland fire in Mediterranean scrubland. Hydrological Pro-cesses 12, 1031–1042.
Cerda, A., Lasanta, T., 2005. Long-term erosional responses afterfire in the Central Spanish Pyrenees 1. Water and sediment yield.Catena 60, 59–80.
Christiansen, J.E., 1941. The uniformity of application of water bysprinkler system. Agricultural Engineering 22, 89–92.
DeBano, L.F., 1981. Water repellent soils: a state of the art. Gen.Tech. Rep., PSW-46, Pacific Southwest Forest and RangeExperiment Station, US Dept. Agriculture, Berkeley, CA.
DeBano, L.F., 2000. The role of fire and soil heating on waterrepellency in wildland environments: a review. Journal ofHydrology 231–232 (May 29), 195–206.
Dekker, L.W., Ritsema, C.J., 1994. How water moves in a waterrepellent sandy soil 1. Potential and actual water repellency.Water Resources Research 30 (9), 2507–2517.
De Lillis, M., Testi, A., 1990. Post-fire dynamics in a disturbedMediterranean community in central Italy. In: Goldammer, J.G.,Jenkins, M.J. (Eds.), Fire in Ecosystem Dynamics. SPB AcademicPublishing, The Hague, pp. 53–62.
De Luis, M., Gonzalez-Hidalgo, J.C., Raventos, J., 2003. Effectsof fire and torrential rainfall on erosion in a Mediterraneangorse community. Land Degradation and Development 14,203–213.
Doerr, S.H., Shakesby, R.A., Walsh, R.P.D., 1998. Spatial variabilityof soil hydrophobicity in fire-prone eucalyptus and pine forests,Portugal. Soil Science 163, 313–324.
Doerr, S.H., Thomas, A.D., 2000. The role of soil moisture incontrolling water repellency: new evidence from forest soils inPortugal. Journal of Hydrology 231–232, 134–147.
Emmerich, W.E., Cox, J.R., 1992. Hydrologic characteristicsimmediately after seasonal burning on introduced andnative grasslands. Journal of Range Management 45, 476–479.
Giovannini, G., 1997. Forest fires and soil erosion. In: Proceedingsof the IX Italian Geologist Congress, Roma, April 17–20, pp.236–242 (in Italian).
Giovannini, G., Lucchesi, S., 1997. Modifications induced in the soilphysio-chemical parameters by experimental fires at differentintensities. Soil Science 162, 479–486.
Hester, J.W., Thurow, T.L., Taylor Jr., C.A., 1997. Hydrologiccharacteristics of vegetation types as affected by prescribedburning. Journal of Range Management 50, 199–204.
Horton, R.E., 1940. An approach toward a physical interpretation ofinfiltration capacity. Proceedings of Soil Science Society ofAmerica 5, 399–417.
Huffman, E.L., MacDonald, L.H., Stednick, J.D., 2001. Strength andpersistence of fire-induced soil hydrophobicity under ponderosaand lodgepole pine, Colorado Front Range. Hydrological Pro-cesses 15, 2877–2892.
Imeson, A.C., Verstraten, J.M., Van Mulligen, E.J., Sevink, J., 1992.The effects of fire and water repellency on infiltration andrunoff under Mediterranean type forest. Catena 19, 345–361.
Inbar, M., Tamir, M., Wittenberg, L., 1998. Runoff and erosionprocesses after a forest fire in Mount Carmel, a Mediterraneanarea. Geomorphology 24, 17–33.
Johansen, P.J., Hakonson, T.E., Breshears, D.D., 2001. Post firerunoff and erosion from rainfall simulation: contrasting forestswith shrublands and grasslands. Hydrological Processes 15,2953–2965.
Kutiel, P., Lavee, H., Segev, M., Benyamini, Y., 1995. The effect offire-induced surface heterogeneity on rainfall-runoff-erosionrelationships in an eastern Mediterranean ecosystem, Israel.Catena 25, 77–87.
Letey, J., 2001. Causes and consequences of fire-induced soil waterrepellency. Hydrological Processes 15, 2867–2875.

338 M.C. Rulli et al.
Marcos, E., Tarrega, R., Luis-Calabuig, E., 2000. Comparativeanalysis of runoff and sediment yield with a rainfall simulatorafter experimental fire. Arid Soil Research and Rehabilitation 14,293–307.
Martin, D.A., Moody, J.A., 2001. Comparison of soil infiltration ratesin burned and unburned mountainous watersheds. HydrologicalProcesses 15, 2893–2903.
Mazzoleni, S., Pizzolongo, P., 1990. Post-fire regenerationpatterns of Mediterranean shrubs in the Campania region,southern Italy. In: Goldammer, J.G., Jenkins, M.J. (Eds.),Fire in Ecosystem Dynamics. SPB Academic Publishing, TheHague, pp. 43–51.
Meeuwig, R.O., 1971. Infiltration and water repellency in graniticsoils. United States Department of Agriculture Forestry ServiceResearch Paper INT-111, Ogden, UT, 20 pp.
Naveh, Z., 1975. The evolutionary significance of fire in theMediterranean region. Vegetatio 29, 199–208.
Panini, T., Salvador Sanchis, M.P., Torri, D., 1993. A portable rainsimulator for rough and smooth morphologies. Quaderni discienza del suolo 5.
Pardini, G., Gispert, M., Dunjo, G., 2004. Relative influence ofwildfire on soil properties and erosion processes in differentMediterranean environments in NE Spain. Science of the TotalEnvironment 328, 237–246.
Pierson, F.B., Robichaud, P.R., Spaeth, K.E., 2001. Spatial andtemporal effects of wildfire on the hydrology of a steeprangeland watershed. Hydrological Processes 15, 2905–2916.
Prosser, I., Williams, L., 1998. The impact of wildfire on runoff anderosion in native Eucalyptus forest. Hydrological Processes 12,251–265.
Reynolds, W.D., Elrick, D.E., Baumgartner, N., Clothier, B.E., 1984.The ‘‘Guelph Permeameter’’ for measuring the field-saturatedhydraulic conductivity above the water table: 2. The apparatus.In: Proceedings of Canadian Hydrology Symposium 1984, QuebecCity, Quebec.
Reynolds, W.D., Elrick, D.E., Clothier, B.E., 1985. The constanthead well permeameter: effect of unsaturated flow. Soil Science139, 172–180.
Robichaud, P.R., Waldrop, T.A., 1994. A comparison of surfacerunoff and sediment yields from low- and high-severity sitepreparation burns. Water Resources Bulletin 30, 27–34.
Robichaud, P.R., 2000. Fire Effects on infiltration rates prescribedfire in Northern Rocky Mountain forests, USA. Journal ofHydrology 231–232, 220–229.
Rubio, J.L., Forteza, J., Andreu, V., Cerni, R., 1997. Soil profilecharacteristics influencing runoff and soil erosion after forestfire: a case study (Valencia, Spain). Soil Technology 11, 67–78.
Rulli, M.C., Rosso, R., 2005. Modeling catchment erosion afterwildfires in the Saint Gabriel Mountains of southern California.Geophysical Research Letters 32, L19401, doi:10.1029/2005GL023635.
Shahlaee, A.K., Nutter, W.L., Burroughs Jr., E.R., Morris, L.A, 1991.Runoff and sediment production from burned forest sites in theGeorgia Piedmont. Water Resources Bulletin 27, 485–493.
Shakesby, R.A., Coelho, C.de O.A., Ferreira, A.D., Terry, J.P.,Walsh, R.P.D., 1993. Wildfire impacts on soil erosion andhydrology in wet Mediterranean forest, Portugal. InternationalJournal of Wildland Fire 3, 95–110.
Shakesby, R.A., Doerr, S.H., Walsh, R.P.D., 2000. The erosionalimpact of soil hydrophobicity: current problems and futureresearch directions. Journal of Hydrology 231–232, 178–191.
Soto, B., Basanta, R., Perez, R., Diaz-Fierros, F., 1995. Anexperimental study of the influence of traditional slash andburn practices on soil erosion. Catena 24, 13–23.
Thomas, A.D., Walsh, R.P.D., Shakesby, R.A., 1999. Nutrient lossesin eroded sediment after fire in eucalyptus and pine forests inthe wet Mediterranean environment of northern Portugal.Catena 36, 283–302.
Trabaud, L., Lepart, J., 1980. Diversity and stability in garrigueecosystems after fire. Vegetatio 43, 49–57.
Vega, J.A., Fernandez, C., Fonturbel, T., 2005. Throughfall, runoffand soil erosion after prescribed burning in gorse shrubland inGalicia (NW Spain). Land Degradation and Development 16, 37–51.
Wells II, W.G., 1987. The effects of fire on the generation of debrisflows in southern California. Reviews in Engineering Geology 7,105–114.
Wilson, C.J., 1999. Effects of logging and fire on runoff and erosionon highly erodible granitic soils in Tasmania. Water ResourcesResearch 35 (11), 3531–3546.