The degree of prevalence of similarity between outer tropical ...
15
1 SCIENTIFIC REPORTS | (2018) 8:8247 | DOI:10.1038/s41598-018-26553-8 www.nature.com/scientificreports The degree of prevalence of similarity between outer tropical cyclone rainbands and squall lines Cheng-Ku Yu, Che-Yu Lin, Lin-Wen Cheng, Jhang-Shuo Luo, Chun-Chieh Wu & Ying Chen Tropical cyclone rainbands (TCRs) are not only one of the most striking and persistent features of tropical cyclones (TCs) but also one of the major causes for extreme floods as TCs approach or encounter the land area. TCRs have been traditionally considered as manifestations of atmospheric waves initiated near the eyewall or close to the TC center. However, the limited evidence from recent studies showed the possibility for TCRs to develop squall-line-like characteristics in the outer region of TCs. In this study, the degree of the prevalence for this similarity is explored by radar and surface observations from a large set of 50 outer TCRs associated with 22 TCs as they approached Taiwan. The results indicate that around 58% of outer TCRs are similar to squall lines. These outer TCRs are generally characterized by convective precipitation, an obvious convergence zone between the band-relative rear-to-front flow and front-to-rear flow at low levels, either frontward or rearward tilting updrafts, and a surface cold pool signature. The frequent similarity between the outer TCRs and squall lines documented provides important insights into the formation of organized, heavy precipitation associated with TCs. In addition to the eye and eyewall, tropical cyclone rainbands (TCRs) are the most striking and persistent fea- ture of tropical cyclones (TCs) 1–8 . Outside the eyewall region, TCRs are a primary, concentrated region of the heaviest precipitation within TCs and play prominent roles in influencing the intensification or weakening of the storms 9–16 . TCR landfalls and the interactions between the topography and the TCs as they approach and move over landmasses are major causes of heavy rainfalls and/or severe floods in many different geographical locations 17–25 . In the past few decades, significant efforts have been made by a large number of tropical cyclone studies to identify the possible origins of TCRs. e most well-known concept in both observational and theoretical studies is that the appearance of TCRs is considered to be a manifestation of atmospheric waves initiated near the eyewall or close to the TC center 26–38 . Despite the diversity of wave types proposed previously, these wave arguments, to a certain extent, have reasonably explained the formation, spiral nature, and propagation characteristics of TCRs. Having said so, different interpretations of TCR origins and propagation continue to emerge in the literature 5,39–43 , and a consensus has not yet been reached. In contrast to TCR wave theories, there is still a vast gap in our knowledge regarding the physical processes conducive to the triggering and maintenance of the moist convection associated with TCRs. is is mostly due to the incomplete documentation of the complexity of convective processes inside the TC environment. One of the intriguing questions is whether the convective initiation and development of TCRs are similar to those of ordinary convective rainbands such as squall lines. Squall lines, according to the AMS Glossary of Meteorology, are usually referred to as a line of active deep moist convection and are a frequent and the most well-documented mode of precipitation organization within mesoscale convective systems 44 . e presence of pronounced cold pools at low levels is one of the most striking thermodynamic signatures associated with squall lines and many organized convective systems and represent a crucial convective forcing in the initiation and development of moist convection 45–48 . Considerable aircraſt observations have revealed some unique mesoscale structures of TCRs, which are tied to the inner-core vortex dynamics and are essentially different from those of squall lines 4,11,12,49–57 . e temperature deficit produced by precipitation evaporation within these documented TCRs was typically weaker than that of ordinary convective systems 11,12,48 . However, most of these previous case studies of TCRs dealt with the so-called “principal band”, a well-known rainband type that is typically located near the boundary between the inner core Department of Atmospheric Sciences, National Taiwan University, Taipei, Taiwan. Correspondence and requests for materials should be addressed to C.-K.Y. (email: [email protected]) Received: 21 November 2017 Accepted: 15 May 2018 Published online: 29 May 2018 OPEN Corrected: Publisher Correction
-
Upload
khangminh22 -
Category
Documents
-
view
4 -
download
0
Transcript of The degree of prevalence of similarity between outer tropical ...
1SCieNTifiC REPORTS | (2018) 8:8247 | DOI:10.1038/s41598-018-26553-8
www.nature.com/scientificreports
The degree of prevalence of similarity between outer tropical cyclone rainbands and squall linesCheng-Ku Yu, Che-Yu Lin, Lin-Wen Cheng, Jhang-Shuo Luo, Chun-Chieh Wu & Ying Chen
Tropical cyclone rainbands (TCRs) are not only one of the most striking and persistent features of tropical cyclones (TCs) but also one of the major causes for extreme floods as TCs approach or encounter the land area. TCRs have been traditionally considered as manifestations of atmospheric waves initiated near the eyewall or close to the TC center. However, the limited evidence from recent studies showed the possibility for TCRs to develop squall-line-like characteristics in the outer region of TCs. In this study, the degree of the prevalence for this similarity is explored by radar and surface observations from a large set of 50 outer TCRs associated with 22 TCs as they approached Taiwan. The results indicate that around 58% of outer TCRs are similar to squall lines. These outer TCRs are generally characterized by convective precipitation, an obvious convergence zone between the band-relative rear-to-front flow and front-to-rear flow at low levels, either frontward or rearward tilting updrafts, and a surface cold pool signature. The frequent similarity between the outer TCRs and squall lines documented provides important insights into the formation of organized, heavy precipitation associated with TCs.
In addition to the eye and eyewall, tropical cyclone rainbands (TCRs) are the most striking and persistent fea-ture of tropical cyclones (TCs)1–8. Outside the eyewall region, TCRs are a primary, concentrated region of the heaviest precipitation within TCs and play prominent roles in influencing the intensification or weakening of the storms9–16. TCR landfalls and the interactions between the topography and the TCs as they approach and move over landmasses are major causes of heavy rainfalls and/or severe floods in many different geographical locations17–25.
In the past few decades, significant efforts have been made by a large number of tropical cyclone studies to identify the possible origins of TCRs. The most well-known concept in both observational and theoretical studies is that the appearance of TCRs is considered to be a manifestation of atmospheric waves initiated near the eyewall or close to the TC center26–38. Despite the diversity of wave types proposed previously, these wave arguments, to a certain extent, have reasonably explained the formation, spiral nature, and propagation characteristics of TCRs. Having said so, different interpretations of TCR origins and propagation continue to emerge in the literature5,39–43, and a consensus has not yet been reached.
In contrast to TCR wave theories, there is still a vast gap in our knowledge regarding the physical processes conducive to the triggering and maintenance of the moist convection associated with TCRs. This is mostly due to the incomplete documentation of the complexity of convective processes inside the TC environment. One of the intriguing questions is whether the convective initiation and development of TCRs are similar to those of ordinary convective rainbands such as squall lines. Squall lines, according to the AMS Glossary of Meteorology, are usually referred to as a line of active deep moist convection and are a frequent and the most well-documented mode of precipitation organization within mesoscale convective systems44. The presence of pronounced cold pools at low levels is one of the most striking thermodynamic signatures associated with squall lines and many organized convective systems and represent a crucial convective forcing in the initiation and development of moist convection45–48.
Considerable aircraft observations have revealed some unique mesoscale structures of TCRs, which are tied to the inner-core vortex dynamics and are essentially different from those of squall lines4,11,12,49–57. The temperature deficit produced by precipitation evaporation within these documented TCRs was typically weaker than that of ordinary convective systems11,12,48. However, most of these previous case studies of TCRs dealt with the so-called “principal band”, a well-known rainband type that is typically located near the boundary between the inner core
Department of Atmospheric Sciences, National Taiwan University, Taipei, Taiwan. Correspondence and requests for materials should be addressed to C.-K.Y. (email: [email protected])
Received: 21 November 2017
Accepted: 15 May 2018
Published online: 29 May 2018
OPENCorrected: Publisher Correction

www.nature.com/scientificreports/
2SCieNTifiC REPORTS | (2018) 8:8247 | DOI:10.1038/s41598-018-26553-8
and outer region in TCs5,7,8. It is clear that these aircraft investigations are largely confined to the inner-core vicin-ity and thus provide a rather incomplete depiction of the entire spectrum of TCRs.
Because the convective behavior within TCs is fundamentally determined by the degree to which they are influenced by the inner-core vortex, TCRs may be conceptually classified into inner and outer rainbands. Theoretically, the inner TCRs are recently recognized to be more probably related to vortex Rossby waves32,37. However, the outer TCRs are traditionally considered as inertia-gravity waves27–29,58, although the outward prop-agation of the observed outer TCRs (several meters per second) seems much slower than the typical outward speed of inertia-gravity waves (several tens of meters per second)38,42. The frequent occurrence of inertia-gravity waves within TCs has also been reported in some recent published works59,60. The gravity-wave-like disturbances can propagate outward into the outer region of TCs, in distinct contrast to the vortex Rossby waves that exhibit the stagnation radius [~3 times the radius of the maximum wind (RMW)] in their radial propagation. However, the degree to which the outer TCRs resemble the inertia-gravity waves remains largely unclarified due to the lack of detailed observations38. The moist convection of the inner TCRs is strongly constrained by the inner-core vortex, generally moves with ambient rotational flow, and is rapidly filamented3,61. In contrast, the precipitation of the outer TCRs usually exhibit higher asymmetry as opposed to the quasi-circular geometry of the inner TCRs3,5,8. In addition, the outer areas of TCs usually possess larger convective available potential energy (CAPE) and lower humidity than the inner-core environment62–66, both of which would facilitate intense convection, the effect of precipitation evaporation, and the occurrence of potentially threatening and severe weather conditions. Consistent with this point of view, limited research evidence from studies of TCs indicates the likelihood for outer TCRs to develop squall-line-like airflow structures and a low-level cold-pool signature66–72. However, the degree of the prevalence for the appealing similarity between outer TCRs and squall lines has not been identified at this stage because only very few outer TCRs have been thoroughly studied and reported in the literature.
The primary objective of this study is to use long-term radar observations (2003~2015) to investigate a consid-erable number of outer TCRs from different TCs as they approach Taiwan, in an attempt to advance our general understanding of the outer TCRs and their possible similarities to squall lines. Taiwan is a well-known target for TCs originating over the northwestern Pacific Ocean and has established an excellent whole-island Doppler radar observing network in the 2000s. Both the above aspects make this geographical location unique for the investiga-tion of the outer TCRs. The particular focus of the present study is to perform dual-Doppler radar analyses for a comprehensive TCR dataset to understand to what extent the squall-line-like convective structures are prevalent in the outer regions of TCs.
Data, Methodology and RainbandsRadar measurements. The primary datasets used in this study were provided by eight ground-based Doppler radars (see the locations in Fig. 1) available in Taiwan, including four S-band (10 cm) operational Doppler radars of the Central Weather Bureau (CWB) at Wu-Fen-San (WFS), Chi-Gu (CG), Ken-Ting (KT), and Hua-Lien (HL); one C-band (5 cm) operational Doppler radar of the Civil Aeronautics Administration (CAA) at
Figure 1. Radar and surface observations used in this study. The locations of the Doppler radars at Wu-Fen-San (WFS), Hua-Lien (HL), Chi-Gu (CG), Ken-Ting (KT), Civil Aeronautics Administration (CAA), Green Island (GI), Ma-Gong (MG), and Ching-Chuan-Kang (CCK) are denoted by triangles. The locations of the selected surface and island stations are denoted by the hollow circles. The seven inset boxes (D1~D7) surrounding the Taiwan Island indicate the dual-Doppler synthesis domains. The number of the outer TCRs available for dual-Doppler analysis within each of the synthesis domains is also indicated. The outer curve denotes the approximate data coverage for these radars. This map is generated by the NCAR Command Language (Version 6.4.0) [Software]. (2017). Boulder, Colorado: UCAR/NCAR/CISL/TDD. https://doi.org/10.5065/D6WD3XH5.
www.nature.com/scientificreports/
3SCieNTifiC REPORTS | (2018) 8:8247 | DOI:10.1038/s41598-018-26553-8
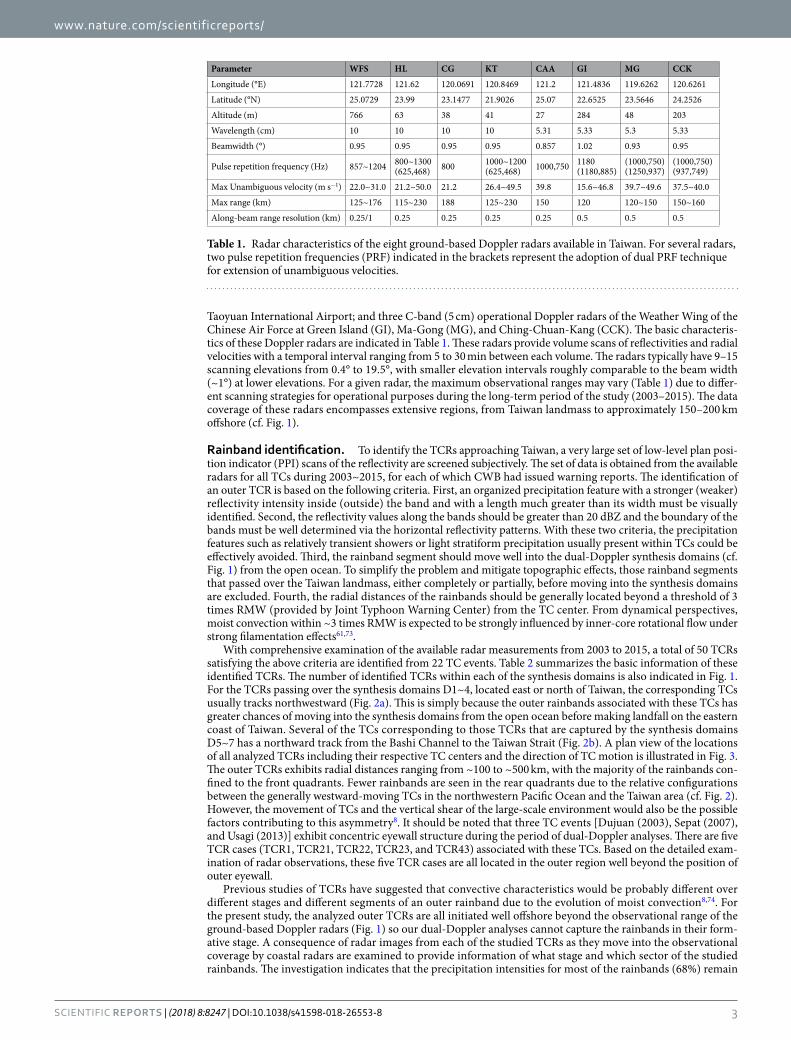
Taoyuan International Airport; and three C-band (5 cm) operational Doppler radars of the Weather Wing of the Chinese Air Force at Green Island (GI), Ma-Gong (MG), and Ching-Chuan-Kang (CCK). The basic characteris-tics of these Doppler radars are indicated in Table 1. These radars provide volume scans of reflectivities and radial velocities with a temporal interval ranging from 5 to 30 min between each volume. The radars typically have 9–15 scanning elevations from 0.4° to 19.5°, with smaller elevation intervals roughly comparable to the beam width (~1°) at lower elevations. For a given radar, the maximum observational ranges may vary (Table 1) due to differ-ent scanning strategies for operational purposes during the long-term period of the study (2003–2015). The data coverage of these radars encompasses extensive regions, from Taiwan landmass to approximately 150–200 km offshore (cf. Fig. 1).
Rainband identification. To identify the TCRs approaching Taiwan, a very large set of low-level plan posi-tion indicator (PPI) scans of the reflectivity are screened subjectively. The set of data is obtained from the available radars for all TCs during 2003~2015, for each of which CWB had issued warning reports. The identification of an outer TCR is based on the following criteria. First, an organized precipitation feature with a stronger (weaker) reflectivity intensity inside (outside) the band and with a length much greater than its width must be visually identified. Second, the reflectivity values along the bands should be greater than 20 dBZ and the boundary of the bands must be well determined via the horizontal reflectivity patterns. With these two criteria, the precipitation features such as relatively transient showers or light stratiform precipitation usually present within TCs could be effectively avoided. Third, the rainband segment should move well into the dual-Doppler synthesis domains (cf. Fig. 1) from the open ocean. To simplify the problem and mitigate topographic effects, those rainband segments that passed over the Taiwan landmass, either completely or partially, before moving into the synthesis domains are excluded. Fourth, the radial distances of the rainbands should be generally located beyond a threshold of 3 times RMW (provided by Joint Typhoon Warning Center) from the TC center. From dynamical perspectives, moist convection within ~3 times RMW is expected to be strongly influenced by inner-core rotational flow under strong filamentation effects61,73.
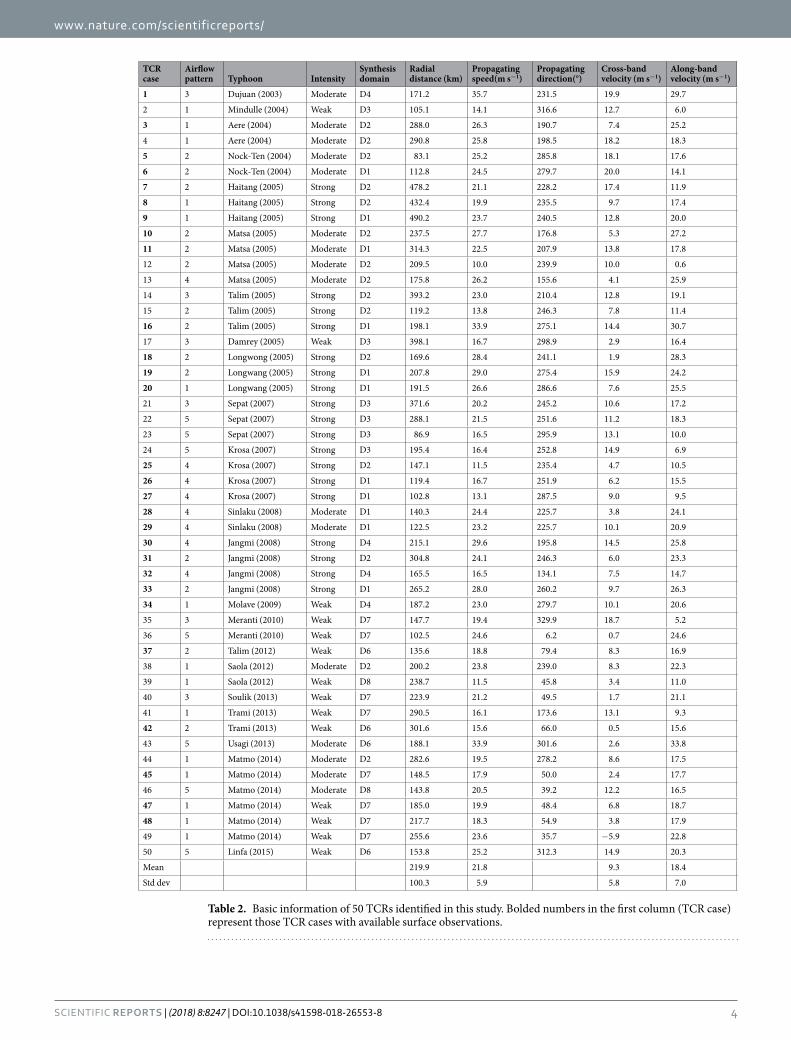
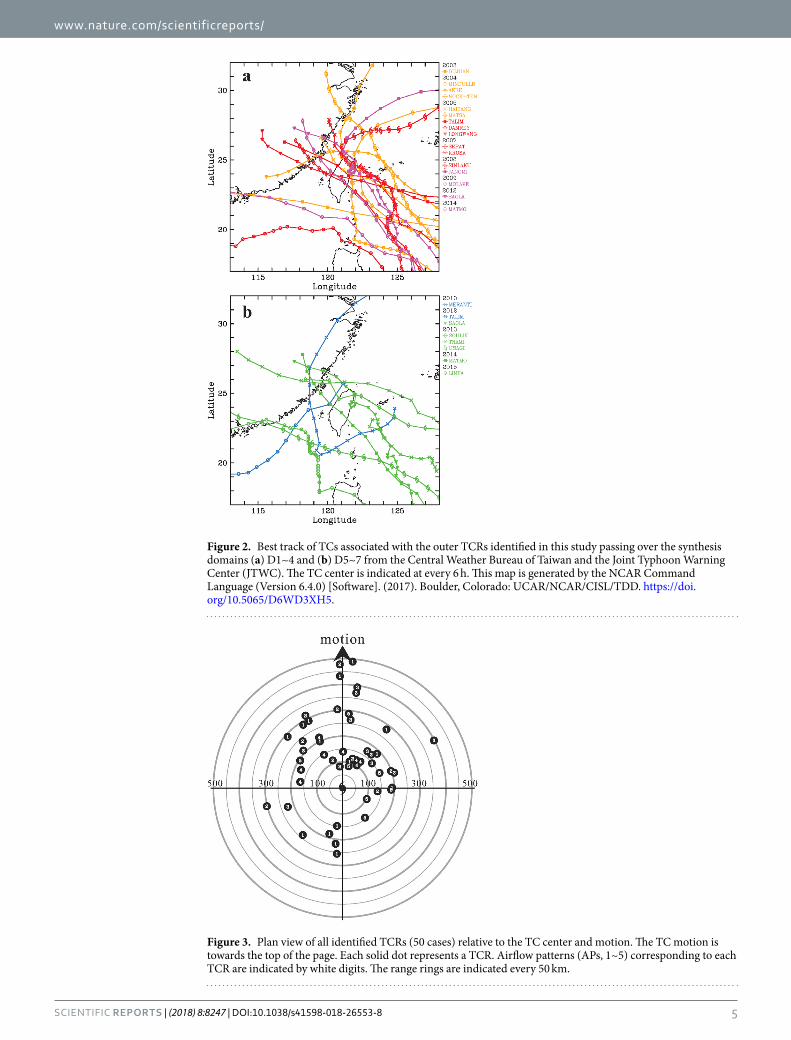
With comprehensive examination of the available radar measurements from 2003 to 2015, a total of 50 TCRs satisfying the above criteria are identified from 22 TC events. Table 2 summarizes the basic information of these identified TCRs. The number of identified TCRs within each of the synthesis domains is also indicated in Fig. 1. For the TCRs passing over the synthesis domains D1~4, located east or north of Taiwan, the corresponding TCs usually tracks northwestward (Fig. 2a). This is simply because the outer rainbands associated with these TCs has greater chances of moving into the synthesis domains from the open ocean before making landfall on the eastern coast of Taiwan. Several of the TCs corresponding to those TCRs that are captured by the synthesis domains D5~7 has a northward track from the Bashi Channel to the Taiwan Strait (Fig. 2b). A plan view of the locations of all analyzed TCRs including their respective TC centers and the direction of TC motion is illustrated in Fig. 3. The outer TCRs exhibits radial distances ranging from ~100 to ~500 km, with the majority of the rainbands con-fined to the front quadrants. Fewer rainbands are seen in the rear quadrants due to the relative configurations between the generally westward-moving TCs in the northwestern Pacific Ocean and the Taiwan area (cf. Fig. 2). However, the movement of TCs and the vertical shear of the large-scale environment would also be the possible factors contributing to this asymmetry8. It should be noted that three TC events [Dujuan (2003), Sepat (2007), and Usagi (2013)] exhibit concentric eyewall structure during the period of dual-Doppler analyses. There are five TCR cases (TCR1, TCR21, TCR22, TCR23, and TCR43) associated with these TCs. Based on the detailed exam-ination of radar observations, these five TCR cases are all located in the outer region well beyond the position of outer eyewall.
Previous studies of TCRs have suggested that convective characteristics would be probably different over different stages and different segments of an outer rainband due to the evolution of moist convection8,74. For the present study, the analyzed outer TCRs are all initiated well offshore beyond the observational range of the ground-based Doppler radars (Fig. 1) so our dual-Doppler analyses cannot capture the rainbands in their form-ative stage. A consequence of radar images from each of the studied TCRs as they move into the observational coverage by coastal radars are examined to provide information of what stage and which sector of the studied rainbands. The investigation indicates that the precipitation intensities for most of the rainbands (68%) remain
Parameter WFS HL CG KT CAA GI MG CCK
Longitude (°E) 121.7728 121.62 120.0691 120.8469 121.2 121.4836 119.6262 120.6261
Latitude (°N) 25.0729 23.99 23.1477 21.9026 25.07 22.6525 23.5646 24.2526
Altitude (m) 766 63 38 41 27 284 48 203
Wavelength (cm) 10 10 10 10 5.31 5.33 5.3 5.33
Beamwidth (°) 0.95 0.95 0.95 0.95 0.857 1.02 0.93 0.95
Pulse repetition frequency (Hz) 857~1204 800~1300(625,468) 800 1000~1200
(625,468) 1000,750 1180(1180,885)
(1000,750)(1250,937)
(1000,750)(937,749)
Max Unambiguous velocity (m s−1) 22.0~31.0 21.2~50.0 21.2 26.4~49.5 39.8 15.6~46.8 39.7~49.6 37.5~40.0
Max range (km) 125~176 115~230 188 125~230 150 120 120~150 150~160
Along-beam range resolution (km) 0.25/1 0.25 0.25 0.25 0.25 0.5 0.5 0.5
Table 1. Radar characteristics of the eight ground-based Doppler radars available in Taiwan. For several radars, two pulse repetition frequencies (PRF) indicated in the brackets represent the adoption of dual PRF technique for extension of unambiguous velocities.
www.nature.com/scientificreports/
4SCieNTifiC REPORTS | (2018) 8:8247 | DOI:10.1038/s41598-018-26553-8
TCR case
Airflow pattern Typhoon Intensity
Synthesis domain
Radial distance (km)
Propagating speed(m s−1)
Propagating direction(°)
Cross-band velocity (m s−1)
Along-band velocity (m s−1)
1 3 Dujuan (2003) Moderate D4 171.2 35.7 231.5 19.9 29.7
2 1 Mindulle (2004) Weak D3 105.1 14.1 316.6 12.7 6.0
3 1 Aere (2004) Moderate D2 288.0 26.3 190.7 7.4 25.2
4 1 Aere (2004) Moderate D2 290.8 25.8 198.5 18.2 18.3
5 2 Nock-Ten (2004) Moderate D2 83.1 25.2 285.8 18.1 17.6
6 2 Nock-Ten (2004) Moderate D1 112.8 24.5 279.7 20.0 14.1
7 2 Haitang (2005) Strong D2 478.2 21.1 228.2 17.4 11.9
8 1 Haitang (2005) Strong D2 432.4 19.9 235.5 9.7 17.4
9 1 Haitang (2005) Strong D1 490.2 23.7 240.5 12.8 20.0
10 2 Matsa (2005) Moderate D2 237.5 27.7 176.8 5.3 27.2
11 2 Matsa (2005) Moderate D1 314.3 22.5 207.9 13.8 17.8
12 2 Matsa (2005) Moderate D2 209.5 10.0 239.9 10.0 0.6
13 4 Matsa (2005) Moderate D2 175.8 26.2 155.6 4.1 25.9
14 3 Talim (2005) Strong D2 393.2 23.0 210.4 12.8 19.1
15 2 Talim (2005) Strong D2 119.2 13.8 246.3 7.8 11.4
16 2 Talim (2005) Strong D1 198.1 33.9 275.1 14.4 30.7
17 3 Damrey (2005) Weak D3 398.1 16.7 298.9 2.9 16.4
18 2 Longwong (2005) Strong D2 169.6 28.4 241.1 1.9 28.3
19 2 Longwang (2005) Strong D1 207.8 29.0 275.4 15.9 24.2
20 1 Longwang (2005) Strong D1 191.5 26.6 286.6 7.6 25.5
21 3 Sepat (2007) Strong D3 371.6 20.2 245.2 10.6 17.2
22 5 Sepat (2007) Strong D3 288.1 21.5 251.6 11.2 18.3
23 5 Sepat (2007) Strong D3 86.9 16.5 295.9 13.1 10.0
24 5 Krosa (2007) Strong D3 195.4 16.4 252.8 14.9 6.9
25 4 Krosa (2007) Strong D2 147.1 11.5 235.4 4.7 10.5
26 4 Krosa (2007) Strong D1 119.4 16.7 251.9 6.2 15.5
27 4 Krosa (2007) Strong D1 102.8 13.1 287.5 9.0 9.5
28 4 Sinlaku (2008) Moderate D1 140.3 24.4 225.7 3.8 24.1
29 4 Sinlaku (2008) Moderate D1 122.5 23.2 225.7 10.1 20.9
30 4 Jangmi (2008) Strong D4 215.1 29.6 195.8 14.5 25.8
31 2 Jangmi (2008) Strong D2 304.8 24.1 246.3 6.0 23.3
32 4 Jangmi (2008) Strong D4 165.5 16.5 134.1 7.5 14.7
33 2 Jangmi (2008) Strong D1 265.2 28.0 260.2 9.7 26.3
34 1 Molave (2009) Weak D4 187.2 23.0 279.7 10.1 20.6
35 3 Meranti (2010) Weak D7 147.7 19.4 329.9 18.7 5.2
36 5 Meranti (2010) Weak D7 102.5 24.6 6.2 0.7 24.6
37 2 Talim (2012) Weak D6 135.6 18.8 79.4 8.3 16.9
38 1 Saola (2012) Moderate D2 200.2 23.8 239.0 8.3 22.3
39 1 Saola (2012) Weak D8 238.7 11.5 45.8 3.4 11.0
40 3 Soulik (2013) Weak D7 223.9 21.2 49.5 1.7 21.1
41 1 Trami (2013) Weak D7 290.5 16.1 173.6 13.1 9.3
42 2 Trami (2013) Weak D6 301.6 15.6 66.0 0.5 15.6
43 5 Usagi (2013) Moderate D6 188.1 33.9 301.6 2.6 33.8
44 1 Matmo (2014) Moderate D2 282.6 19.5 278.2 8.6 17.5
45 1 Matmo (2014) Moderate D7 148.5 17.9 50.0 2.4 17.7
46 5 Matmo (2014) Moderate D8 143.8 20.5 39.2 12.2 16.5
47 1 Matmo (2014) Weak D7 185.0 19.9 48.4 6.8 18.7
48 1 Matmo (2014) Weak D7 217.7 18.3 54.9 3.8 17.9
49 1 Matmo (2014) Weak D7 255.6 23.6 35.7 −5.9 22.8
50 5 Linfa (2015) Weak D6 153.8 25.2 312.3 14.9 20.3
Mean 219.9 21.8 9.3 18.4
Std dev 100.3 5.9 5.8 7.0
Table 2. Basic information of 50 TCRs identified in this study. Bolded numbers in the first column (TCR case) represent those TCR cases with available surface observations.
www.nature.com/scientificreports/
5SCieNTifiC REPORTS | (2018) 8:8247 | DOI:10.1038/s41598-018-26553-8
Figure 2. Best track of TCs associated with the outer TCRs identified in this study passing over the synthesis domains (a) D1~4 and (b) D5~7 from the Central Weather Bureau of Taiwan and the Joint Typhoon Warning Center (JTWC). The TC center is indicated at every 6 h. This map is generated by the NCAR Command Language (Version 6.4.0) [Software]. (2017). Boulder, Colorado: UCAR/NCAR/CISL/TDD. https://doi.org/10.5065/D6WD3XH5.
Figure 3. Plan view of all identified TCRs (50 cases) relative to the TC center and motion. The TC motion is towards the top of the page. Each solid dot represents a TCR. Airflow patterns (APs, 1~5) corresponding to each TCR are indicated by white digits. The range rings are indicated every 50 km.
www.nature.com/scientificreports/
6SCieNTifiC REPORTS | (2018) 8:8247 | DOI:10.1038/s41598-018-26553-8
similar whereas relatively fewer rainbands (28%) are observed to intensify. The smallest percentage of the rain-bands (4%) is in the weakening stage. Therefore, the convective structures presented in this study are most relevant to mature or developing TCRs instead of their formative or decaying stages. In addition, roughly 60% (40%) of the studied TCRs are captured by the dual-Doppler analysis in their downwind (upwind) segment. It is also found that although ~25% of the studied TCRs tend to have more convective (stratiform) precipitation features in the upwind (downwind) segment, there are no obvious differences in convective characteristics (i.e., convective vs. stratiform) between the upwind and downwind sides for most of the studied TCRs (~70%). This implies that the results from the present study would not influenced significantly by the along-band variations in the convective nature.
The movement of each of the studied TCRs for the given period of synthesis is obtained by tracking the leading edge of their 35 dBZ contour using a sequence of low-level PPI scans of radar reflectivity. The propagating speeds of the studied rainbands are observed to vary case by case (~10–30 m s−1), with very few cases above 30 m s−1. The rain-bands are embedded within the large-scale cyclonic TC circulation so they exhibit an obvious propagating motion not only in the cross-band direction but also in the along-band direction (Table 2). In the present study, the TC centers are frequently located well offshore in a longer distance to radars, as the studied outer TCRs pass over coastal synthesis domains (cf. Fig. 1). Making an accurate estimate for the rainband’s motion relative to the TC motion is usually not practical because of difficulties in determining TC center locations from radar observations. Along-band variations in the radial distance due to the spiral nature of the outer TCRs represent another complexity to this velocity estimate. Despite these uncertainties, a crude estimate for the relative distance of the studied TCRs to the TC center is possible if both the rainband and TC eye could be visually tracked via radar-observed precipitation patterns over a considerable period of time. It is found that more than a half of the studied rainbands tend to move away from the TC center (i.e., outward propagation) while only a small portion of the rainbands (~18%) are observed to be approximately stationary relative to the TC center. The outward propagating or stationary characteristic is similar to that of previously documented outer TCRs and principal band5,11,38.
Dual-Doppler analysis. In this study, the dual-Doppler synthesis of the multiple-view reflectivity and radial velocity data75 is performed to retrieve the three-dimensional precipitation and wind information of the TCRs. Based on the consideration of synthesized geometries, the seven domains located offshore, surrounding the Taiwan island, are determined for dual-Doppler synthesis, as indicated by the inset boxes (D1~D7) in Fig. 1. The cross-beam angles of each pair of synthesized radar within the domains are between 30° and 150° so they could produce relatively smaller uncertainties and errors in the dual-Doppler-derived winds76. Distances of radar sites to the studied rainbands are typically between 30 and 90 km so as to provide better sampling of winds at lower and upper levels. If we take the lower bound of radar beams, earth curvature, and the heights of radar sites into account, the average altitude of the lowest PPI scan near the rainband’s location is calculated to be ~0.6 km (MSL), which is comparable to the typical lowest level of available data (0.5~1 km) from previous dual-Doppler analysis works of TCRs and squall lines54,77,78.
For the procedure of the dual-Doppler synthesis, the National Center for Atmospheric Research (NCAR) SOLO software79 is first used to unfold the radial velocities and to remove incorrect or obviously suspicious val-ues of radar reflectivity and radial velocity. Consequently, the NCAR REORDER software80 is used to interpolate reflectivities and radial velocities from the raw PPI scans to Cartesian coordinates with a horizontal grid spacing of 1 km and a vertical grid spacing of 0.5 km, with the lowest (highest) analysis level located at 0.5 (10) km (MSL). Given the horizontal data spacing (~1.5 km) at the range of 90 km and the average vertical data spacing (~1 km), the horizontal (vertical) grid spacing chosen herein is roughly comparable to the horizontal (vertical) data spac-ing divided by 2.5 (i.e., ∆/2.5)81. In the interpolation procedure, the advection adjustment due to the rainband’s movement is also considered66,82. The NCAR software program Cartesian Space Editing, Synthesis, and Display of Radar Fields under Interactive Control (CEDRIC83) is used for the synthesis of the gridded radial velocities into horizontal wind fields. The vertical air motions are obtained through the variational adjustment of the anelastic continuity equation with boundary conditions of zero vertical motions at the surface and the echo’s top.
Accuracy of dual-Doppler-derived winds is influenced by various sources of errors due to incomplete sampling, boundary conditions, and integration procedures76. Following Ray et al.75 and Kessinger et al.84, the error character-istics of synthesized winds may be evaluated for each studied rainband based on synthesis geometry and grid spacing adopted herein. To better elaborate representative errors in regions encompassing the studied TCRs, the mean var-iances of wind errors averaged for all rainbands are calculated and illustrated as a function of altitudes, as shown in Fig. 4. In this analysis, the variances of radial velocity and terminal velocity are assumed to be 1 m2 s−2. The boundary condition for the vertical velocity variance (1 m2 s−2) is applied at the top of the synthesis domain and downward integration is performed. The error variances of horizontal wind components (i.e., u and v) are small (1~1.5 m2 s−2) and remain constant with height. The horizontal velocity errors can be considered negligible when compared to strong horizontal winds (typically around 20 m s−1) associated with TC circulations. The error variances of vertical velocities (w) are slightly larger and range from 1 to 2.7 m2 s−2. These expected values of w errors (1~1.6 m s−1) are smaller than the typical strength of updrafts (on the order of 5 m s−1 or more) observed within outer TCRs38,66.
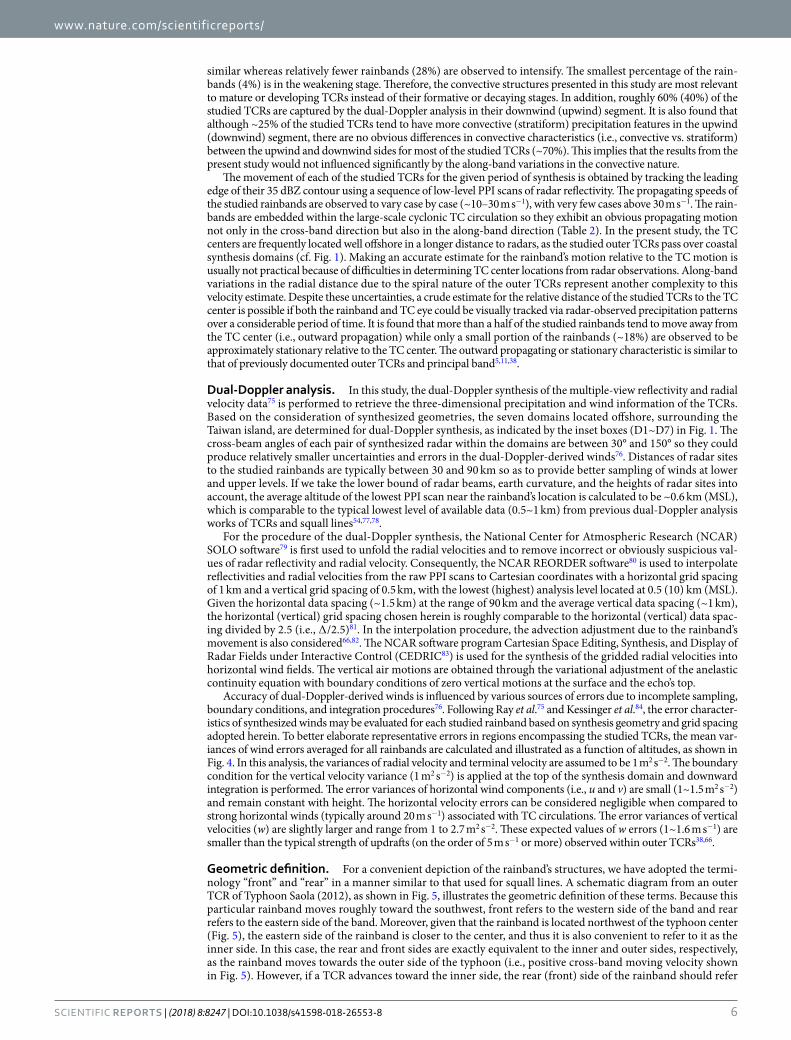
Geometric definition. For a convenient depiction of the rainband’s structures, we have adopted the termi-nology “front” and “rear” in a manner similar to that used for squall lines. A schematic diagram from an outer TCR of Typhoon Saola (2012), as shown in Fig. 5, illustrates the geometric definition of these terms. Because this particular rainband moves roughly toward the southwest, front refers to the western side of the band and rear refers to the eastern side of the band. Moreover, given that the rainband is located northwest of the typhoon center (Fig. 5), the eastern side of the rainband is closer to the center, and thus it is also convenient to refer to it as the inner side. In this case, the rear and front sides are exactly equivalent to the inner and outer sides, respectively, as the rainband moves towards the outer side of the typhoon (i.e., positive cross-band moving velocity shown in Fig. 5). However, if a TCR advances toward the inner side, the rear (front) side of the rainband should refer

www.nature.com/scientificreports/
7SCieNTifiC REPORTS | (2018) 8:8247 | DOI:10.1038/s41598-018-26553-8
to outer (inner) side. As indicated in Table 2, the studied TCRs usually moved towards the outer side, except for the one rainbands (case 49) that possess a negative cross-band moving velocity. Therefore, the geometric config-uration of Saola’s TCR, shown in Fig. 5, is the dominant condition for the studied rainbands. In our discussions below, we have considered the rear (front) side as the inner (outer) side for convenience of presentation.
Other data. In addition to the radar measurements and dual-Doppler synthesis as described above, 1-min temporal resolution surface observations available within the coastal area of Taiwan are used to retrieve detailed surface characteristics associated with the studied TCRs. It should be noted that some spatial and temporal vari-ations in the thermodynamics along the different portions of the rainbands are possible69. To mitigate this uncer-tainty, data from a number of particular coastal and island stations (location in Fig. 1) subject to the passage of some of our studied TCRs and also nearest to the synthesis domains are chosen for analysis. More than a half of our studied TCRs (28 cases, bolded in Table 2) are available for this investigation and these surface observa-tions provide valuable thermodynamic information to complement the dual-Doppler-derived kinematics. The National Centers for Environmental Prediction (NCEP) Final Operational Global Analysis data (1° × 1°) are also used to analyze the large-scale environmental conditions associated with the studied TCRs.
ResultsStructural classification. To understand the common airflow and precipitation structures of TCRs, we undertook a comprehensive examination of the dual-Doppler-synthesized fields for all of the studied TCRs. In reality, some temporal and spatial variations in the details of the rainband structure, presumably due to convec-tive-scale motions, are expected. These rapidly evolving smaller-scale variabilities are inherently complicated but are not the focus of the present study. The primary attempt herein is to seek the rainband-scale, more-robust structural characteristics by looking into a large set of the band-normal vertical cross sections of the airflow and precipitation for all analyzed TCR cases. These analyses enable us to get a sense of the representative airflow and precipitation patterns for each of the different rainbands. With this approach, it was found that the structural characteristics of the outer TCRs could be fundamentally classified into five distinct band-relative airflow patterns (APs). These APs and their associated precipitation features are illustrated in Fig. 6. The specific APs correspond-ing to each of the studied rainbands are also indicated in the second column of Table 2.
AP1 exhibits a rearward tilting updraft rooted in the prominent low-level convergence between the rear-to-front flow (hereafter RTF) and front-to-rear flow (hereafter FTR). AP2 is similarly characterized by an obvious low-level convergence between the RTF and FTR. However, an overturning updraft (i.e., frontward tilting updraft aloft) is evident. AP3 has an overturning updraft feature but is dominated by the FTR at low levels, which decelerates as it passes through the region of the heaviest precipitation. In contrast to the generally convective nature of the precipitation with prominent vertical extents, horizontal gradients and intense radar reflectivity for AP1~3, the precipitation associated with AP4 (AP5) is less convective, with weaker vertical motions and a deep layer of RTF (FTR) throughout the rainband’s area. Although each of these APs is distributed over diverse regions and without obvious preference in its location relative to the TC center (Fig. 3), most of the rainbands with AP4 and AP5 are located within 200 km of the radial distance. It is likely that the inner-core circulation of TCs may have some impacts on the structural characteristics of these two APs.
Composite structure. To better demonstrate these observed APs, a spatial composite of the band-normal vertical cross sections of the dual-Doppler-derived airflow and precipitation from the different TCR cases for each AP is performed at locations of the heaviest precipitation within the rainband. The composite enables presentation
Figure 4. Vertical profiles of the mean variances of u, v, and w errors averaged for all studied rainbands based on the synthesis geometry and grid spacing adopted in this study.
www.nature.com/scientificreports/
8SCieNTifiC REPORTS | (2018) 8:8247 | DOI:10.1038/s41598-018-26553-8
of a reasonable number of figures to illustrate the key aspects of different APs seen from dual-Doppler observa-tions. The composite band-relative structures shown in Fig. 7 reveal important signatures of airflow and precipita-tion. It should be noted that there are three different methods that can be applied to generate the composite field. The first method is to choose a representative cross section for each of different TCR cases and then to calculate the mean for these sections for a given AP. The second method is simply to take the mean of all individual vertical cross sections from different rainband cases for a given AP. The third method is to obtain an averaged vertical cross section first by averaging individual cross sections for each TCR case, and then we take the mean of these averaged cross sections for a given AP. No matter what method we use for the averaging, we found that the com-posite results are very similar and consistent. In view of this, only the composite results using the first method (i.e., Fig. 7) are presented.
The FTR observed for AP1 tends to meet with the RTF near the outer edge of the rainband to form an obvious convergence zone, convective precipitation, and a rearward tilting updraft (Fig. 7a). The mean magnitudes of maximum convergence below 3 km (MSL) averaged along the rainbands range from 1 × 10⁻³ to 3 × 10⁻³ s−1. The FTR is present throughout the troposphere ahead of the band; however, the layer of the RTF is relatively shallow and confined to below ~3.5 km (MSL) on the inner side. These kinematic patterns are highly similar to those of the convective regions of mature squall lines documented previously with dual-Doppler observations44,77,85–87.
Figure 5. (a) Low-level composite radar reflectivity (dBZ) from the CWB radars at 0236 UTC 10 Aug associated with a TCR identified from Typhoon Saola (2012). The inset box shows the zoomed-in area in (b). (b) The geometric definition of the rear and front side for the TCR. Radar reflectivities greater than 35 and 40 dBZ are indicated by contour and shading, respectively. In this case, the rear (front) side is exactly equivalent to the inner (outer) side as the rainband moves towards the outer side of the typhoon. The definition of the cross-band and along-band velocities are also highlighted, with positive values away from the typhoon center and in the direction of the cyclonic typhoon circulation, respectively. This map is generated by the NCAR Command Language (Version 6.4.0) [Software]. (2017). Boulder, Colorado: UCAR/NCAR/CISL/TDD. http://dx.doi.org/10.5065/D6WD3XH5.

www.nature.com/scientificreports/
9SCieNTifiC REPORTS | (2018) 8:8247 | DOI:10.1038/s41598-018-26553-8
For AP2, the FTR on the outer side is shallower [below ~2 km (MSL)], and it meets with the RTF to lift the air upward and to form an overturning-updraft-like feature (Fig. 7b). The intensities of low-level convergence are generally comparable to those of AP1. Although the frontward slant of the vertical motions, forced by the flow collision between the RTF and FTR, as revealed in Fig. 7b, is relatively less common for a mature squall line, it has been frequently documented within linear convective systems and/or during the early development of squall lines due to the presence of stronger ambient vertical shear, which is favorable for convective updrafts to lean downshear47,88,89.
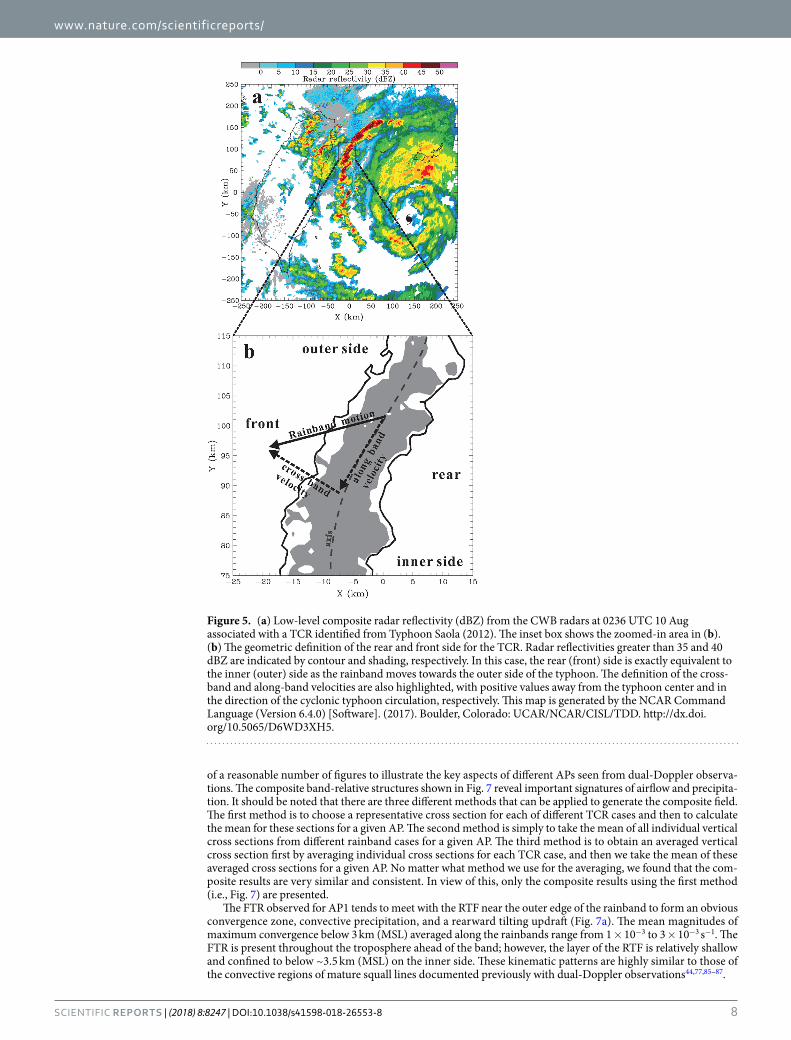
Consistent with the scenario above, the mean vertical profiles of the band-normal winds from the selected NCEP analysis gridded data that were located over the regions ahead of the rainbands (i.e., the front side) indicate more pronounced frontward ambient shears (i.e., band-normal winds increase with height) in the lower tropo-sphere for AP2 (Fig. 8a). The mean cross-band vertical wind shear calculated below 3 and 5 km (MSL) is equal to ~3.4 and ~2.0 m s−1 km−1, respectively. The shear magnitude is comparable to that of tropical squall lines90. The rainband’s environment of AP1 is characterized by relatively gentle vertical variations of the band-normal winds (i.e., weaker vertical shear, ~1.4 m s−1 km−1) at low levels. Despite the potential influence of convectively generated cold pools, the environmental flow with larger shear vectors toward the front side for AP2 is consistent with its overall downshear tilt of updrafts (cf. Fig. 7b). Note that AP2 exhibits stronger band-normal winds (~8–11 m s−1) in the mid-to-upper troposphere (Fig. 8a), which would favor occurrence of the upper-level rear-to-front flow (i.e., overturning updrafts aloft) as seen in Fig. 7b. The mean vertical cross sections of radial winds associated with TCs constructed from the NCEP analysis data (not shown) reveal weaker (stronger) intensities of upper-level cyclone-scale outflow for AP1 (AP2), consistent with their relative strength of environmental band-normal winds shown in Fig. 8a. It is thus reasonable to suspect that the upper-level TC outflow characteristics could also be a factor contributing to the observed difference in the rainband’s structures between AP1 and AP2.
In the cases of AP1 and AP2, the intensities of the band-parallel winds are obviously stronger than those of the band-normal winds and decrease with height in the mid-to-upper troposphere (Fig. 8b), both of which reflect typical kinematic features of TC circulations. However, the along-band vertical shear is quite small in the lower troposphere. Note that much weaker along-band vertical shear than the cross-band vertical shear evident at low levels is also the characteristic of the environmental conditions associated with tropical and midlatitude squall lines90–92. It is noteworthy that the mean vertical profiles of environmental thermodynamics associated with AP1 and AP2 calculated from the NCEP data (not shown) reveal similar characteristics, with relative humidity of ~85–94% and obvious convective instability [i.e., decrease in equivalent potential temperature (θe) with height] in the lower troposphere. The differences in θe between AP1 and AP2 are minor (<3 K) at the same levels and the minimum in θe occurs at ~4–5 km (MSL) for both APs. These two APs account for the majority of our analyzed TCRs (29 cases; ~58%) (cf. Fig. 6). Consistent with this statistic, previous observational studies have shown that the outer TCRs tend to exhibit kinematic structures similar to either AP1 or AP266,82.
Figure 7c–e basically reflect what we have already described for AP3–5, shown in the schematic diagram of Fig. 6. The less intense precipitation of AP4 and AP5, is associated with a broader zone of weaker upward motions (<~2 m s−1). Convergence associated with the deceleration of either FTR or RTF at low levels is also evident, with magnitudes of 0.5 × 10⁻³~1.5 × 10⁻³ s−1 that are generally weaker than those of AP1 and AP2. Bright-band signatures near the 0 °C level (i.e., between 5 and 6 km MSL) in the radar reflectivity are sometimes present as seen from individual vertical cross sections of these rainbands (not shown). The causal relationship between the low-level convergence and the rainband’s precipitation is somewhat uncertain in this analysis because the stratiform precipitation in the outer region of the TCs would probably also result from the melting process of the upper-level ice particles within the inner-core convection50. In this context, the movement and formation of AP4 and AP5 would be influenced by the characteristics of storm-scale radial and tangential flow of TCs.
Each of these three APs (AP3–5) accounts for only 12~16% of our analyzed TCRs (cf. Fig. 6), implying that these APs would not prevail for the outer TCRs. It should be noted that AP3 (cf. Fig. 7c) resembles the common
Figure 6. Schematic band-normal vertical cross sections qualitatively illustrating the band-relative kinematic structures and their associated precipitation for five different APs identified from the studied TCRs. Heavy solid arrows indicate salient airflow features observed from the dual-Doppler analyses, and color shading denotes the generalized precipitation pattern associated with the studied TCRs. The number of the TCR cases and frequencies of occurrence for each AP are also indicated.

www.nature.com/scientificreports/
1 0SCieNTifiC REPORTS | (2018) 8:8247 | DOI:10.1038/s41598-018-26553-8
airflow pattern of the previously documented TCRs located closer to the inner core of TCs, such as the principal bands11,51,54. Band-normal circulations of the principal band usually exhibit no obvious RTF and are dominated by the low-level inflow from the outer to inner side, with a prominent feature of an overturning updraft aloft. To some extent, AP3 reflects a typical secondary circulation associated with TCs with storm inflow at low levels and an outflow layer in the mid-to-upper troposphere.
It should be noted that examination of individual vertical cross sections of the studied TCRs indicates evi-dence of convective downdrafts that typically have higher spatial and temporal variabilities. The averaging
Figure 7. The spatial composite of the band-normal vertical cross sections of the dual-Doppler-derived airflows (indicated by wind vectors) and radar reflectivities (dBZ, color shading) for each AP of the studied TCRs. (a) AP1, (b) AP2, (c) AP3, (d) AP4, (e) AP5.
www.nature.com/scientificreports/
1 1SCieNTifiC REPORTS | (2018) 8:8247 | DOI:10.1038/s41598-018-26553-8
procedure in the composite analysis as shown in Fig. 7 somewhat smoothes out signatures of downward motions but retains more robust and persistent features of convective motions associated with the rainbands. Mean inten-sities of downdrafts for AP1-2 are observed to be stronger and have a wider range from −0.5 to −2.5 m s−1, in contrast to generally weaker downward motions (<−1.5 m s−1) for AP3-5. It is thus likely that if convectively generated downdrafts can feed into low-level flow, they may have a potential role in favoring the intensification of RTF observed in AP1-2.
Cold pool characteristics. According to the kinematic structures discussed above, one intriguing question is whether the outer TCRs, with squall-line-like APs (i.e., AP1 and AP2), exhibit obvious cold pools, in a manner simi-lar to squall lines45,47,48. The surface observations during the passage of these TCRs are analyzed to provide important clues about this likelihood. Practically, the strength of the convectively generated cold pool may be approximated by the temperature deficit that is defined as the difference between the minimum value found within the rainband and the mean value measured immediately before the arrival of the band (i.e., the pre-rainband environment)93–95. As described in the earlier section, 28 TCR cases are available for thermodynamic analysis, and the calculated tem-perature deficits for each of the squall-line-like APs (20 cases) and other APs (8 cases) are shown in Fig. 9a. The equivalent potential temperature (θe) deficits are also calculated and shown in Fig. 9b for reference.
The temperature deficits for the squall-line-like APs are characterized by a wider range of values, mostly between 1 to 5 °C (Fig. 9a). More than a half of these APs have prominent temperature deficits greater than 2 °C.
Figure 8. The mean vertical profiles of environmental winds from the NCEP analysis gridded data calculated over the regions ahead of the rainband for the TCR cases with AP1 (solid line) and AP2 (dashed line). (a) Band-normal winds, with positive values toward the front (outer) side of the rainbands (b) Band-parallel winds, with positive values in the direction of the cyclonic circulation.

www.nature.com/scientificreports/
1 2SCieNTifiC REPORTS | (2018) 8:8247 | DOI:10.1038/s41598-018-26553-8
These observed temperature deficits are comparable to the intensities of the cold pools reported in the previous studies of the outer TCRs (~2–4 °C)66,69 and tropical precipitation96. Relatively smaller temperature deficits (around or less than ~1 °C) are also observed in a few squall-line-like APs, such as the TCR cases 5, 6, 10, 31, and 34 (Fig. 9a). Most of these outer TCRs possess frontward tilting updrafts (i.e., AP2; Table 2) with cellular transient and/or strat-iform precipitation present ahead of the rainband, as revealed by the radar-observed precipitation distributions (not shown). The near-surface temperature may be modified by the pre-rainband precipitation, which complicates the representation of the calculated temperature deficits as the strength of the cold pools for these particular cases. The temperature deficits for nearly all of the non-squall-line APs are quite minor and generally less than 1 °C. The mean temperature deficit for the squall-line-like and non-squall-line APs are equal to 2.2 °C and 0.5 °C, respectively.
A separation of the calculated θe deficits of the squall-line-like APs from those of the non-squall-line APs is also evident (cf. Fig. 9b). A dominant portion of the θe deficits for the squall-line-like APs could reach 5–20 K, in contrast to much lower θe deficits (<4 K) associated with the non-squall-line APs. The insignificant θe deficit for non-squall-line APs would be partly related to weaker downward transport of lower-θe air aloft due to weaker convective downdrafts observed within these rainbands as described earlier97. Consistent with stronger cold pools observed in the squall-line-like APs, more pronounced changes in kinematics during the passage of these rain-bands are also evident, with the average wind shift and deceleration in cross-band flow equal to ~40° and ~8 m s−1, respectively. Combination of these surface analyses and dual-Doppler observations presented earlier supports a fundamental similarity between the squall-line-like APs and squall lines.
Figure 9. (a) Temperature deficits (°C) calculated from the surface observations for the squall-line-like APs (SL-APs, 20 TCR cases) and non-squall-line APs (NSL-APs, 8 TCR cases). Each solid black circle with a white digit (case number in Table 2) represents a TCR case. (b) Same as in (a), but showing the equivalent potential temperature deficit (θe, K). The mean deficits for the SL-APs and NSL-APs are also calculated and indicated in (a and b). Note that the θe for the case 31 did not appear in (b) because of unavailability of moisture data for this particular TCR.
www.nature.com/scientificreports/
13SCieNTifiC REPORTS | (2018) 8:8247 | DOI:10.1038/s41598-018-26553-8
Summary and ImplicationsBy performing the dual-Doppler radar analyses from a large set of 50 outer tropical cyclone rainbands (TCRs) associated with 22 tropical cyclones (TCs) that approached the Taiwan area, this study attempts to understand the degree of the prevalence of similarities between the outer TCRs and squall lines. Five distinct airflow pat-terns (APs) are identified from the studied TCRs, including squall-line-like APs and non-squall-line APs. The outer TCRs with squall-line-like APs (AP1-2) are found to be common (~58%) and are generally characterized by convective precipitation and an obvious convergence zone between the band-relative rear-to-front flow and front-to-rear flow at low levels, with either frontward or rearward tilting updrafts. In contrast, the majority of the non-squall-line APs (i.e., AP4-5) is characterized by less convective precipitation and exhibits a deep layer of either front-to-rear flow or rear-to-front flow within the rainband. Around 12% of the studied TCRs (i.e., AP3) resembles the kinematic characteristics of the previously documented inner TCRs and/or principal bands. Analysis of the surface observations during the passage of the studied TCRs further indicates stronger intensities of the convectively generated cold pools associated with the squall-line-like APs. Combination of dual-Doppler and surface observations supports a fundamental similarity between the squall-line-like APs and squall lines.
This study documents a frequent similarity between outer TCRs and squall lines, which provides important implications. First of all, the effect of cold pools on the initiation and development of moist convection can be expected to be generally prominent in the outer region of TCs, consistent with the previous findings from limited case studies of outer TCRs66,69. It has been long recognized that atmospheric cold pools bear high resem-blance to the laboratory density current, in terms of their associated airflow patterns and propagation speed95,98,99. Nevertheless, the density-current dynamics is commonly treated as a two-dimensional problem, namely, con-sidering the plane of the vertical and the propagation direction. Our knowledge for the behavior of cold pools under strong ambient winds and highly rotational background like the vortex environment of TCs remains very poor. To advance a general understanding of convective forcings for TCRs, future investigations should pay more attention to the dynamics of cold pools and their origin in the TC environment.
In addition, the appearance of TCRs has been traditionally considered as a manifestation of atmospheric waves such as vortex Rossby waves and inertia-gravity waves27–29,32,37,58. In particular, these waves usually initiate in the vicinity of the inner-core region and propagate outward radially. Given these wave properties, together with the findings from the present study, one can reasonably anticipate that a dynamic transformation from wave-dominant convection to squall-line-like rainbands is very likely to occur in certain time periods as TCRs propagate outward from inner to outer regions of TCs. As evident in this study, the variability in structural char-acteristics of the studied TCRs, including both squall-line-like APs and non-squall-line APs, would reflect differ-ent stages or different scenarios of such transformation. Carefully tracking the history of evolving and structural details of a given TCR is quite challenging, especially from the observational perspective, but represents a critical, future task to explore the likelihood and understanding of these transformation processes.
Data AvailabilityThe datasets generated during and/or analysed during the current study are available from the corresponding author on reasonable request.
References 1. Wexler, H. Structure of hurricanes as determined by radar. Ann. N.Y. Acad. Sci. 48, 821–844 (1947). 2. Senn, H. V. & Hiser, H. W. On the origin of hurricane spiral rain bands. J. Meteor. 16, 419–426 (1959). 3. Anthes, R. A. Tropical cyclones: Their evolution, structure, and effects. Vol. 19 (Amer. Meteor. Soc., 1982). 4. Jorgensen, D. P. Mesoscale and convective-scale characteristics of mature hurricanes. Part I: General observations by research
aircraft. J. Atmos. Sci. 41, 1268–1285 (1984). 5. Willoughby, H. E., Marks, F. D. Jr. & Feinberg, R. J. Stationary and moving convective bands in hurricanes. J. Atmos. Sci. 41,
3189–3211 (1984). 6. Cecil, D. J., Zipser, E. J. & Nesbitt, S. W. Reflectivity, ice scattering, and lightning characteristics of hurricane eyewalls and rainbands.
Part I: Quantitative description. Mon. Wea. Rev. 130, 769–784 (2002). 7. Marks, F. D. Jr. State of the science: Radar view of tropical cyclones. Vol. 30 (Amer. Meteor. Soc., 2003). 8. Houze, R. A. Jr. Clouds in tropical cyclones. Mon. Wea. Rev. 138, 293–344 (2010). 9. Shapiro, L. J. & Willoughby, H. E. The response of balanced hurricanes to local sources of heat and momentum. J. Atmos. Sci 39,
378–394 (1982). 10. Willoughby, H. E., Clos, J. A. & Shoreibah, M. G. Concentric eye walls, secondary wind maxima, and the evolution of the hurricane
vortex. J. Atmos. Sci. 39, 395–411 (1982). 11. Barnes, G. M., Zipser, E. J., Jorgensen, D. P. & Marks, F. D. Mesoscale and convective structure of a hurricane rainband. J. Atmos. Sci.
40, 2125–2137 (1983). 12. Powell, M. D. Boundary layer structure and dynamics in outer hurricane rainbands. Part II: Downdraft modification and mixed
layer recovery. Mon. Wea. Rev. 118, 918–938 (1990). 13. Willoughby, H. E. Temporal changes of the primary circulation in tropical cyclones. J. Atmos. Sci. 47, 242–264 (1990). 14. May, P. T. & Holland, G. J. The role of potential vorticity generation in tropical cyclone rainbands. J. Atmos. Sci. 56, 1224–1228 (1999). 15. Houze, R. A. Jr et al. The hurricane rainband and intensity change experiment: Observations and modeling of Hurricanes Katrina,
Ophelia, and Rita. Bull. Amer. Meteor. Soc. 87, 1503–1521 (2006). 16. Riemer, M., Montgomery, M. T. & Nicholls, M. E. A new paradigm for intensity modification of tropical cyclones: thermodynamic
impact of vertical wind shear on the inflow layer. Atmos. Chem. Phys. 10, 3163–3188 (2010). 17. Hamuro, M. et al. Precipitation bands of Typhoon Vera in 1959 (Part I). J. Meteor. Soc. Japan 47, 298–309 (1969). 18. Parrish, J. R., Burpee, R. W., Marks, F. D. Jr & Grebe, R. Rainfall patterns observed by digitized radar during the landfall of Hurricane
Frederic (1979). Mon. Wea. Rev. 110, 1933–1944 (1982). 19. Geerts, B. et al. Hurricane Georges’s landfall in the Dominican Republic: Detailed airborne Doppler radar imagery. Bull. Amer.
Meteor. Soc. 81, 999–1018 (2000). 20. Yu, C.-K. & Cheng, L.-W. Radar observations of intense orographic precipitation associated with Typhoon Xangsane (2000). Mon.
Wea. Rev. 136, 497–521 (2008). 21. Smith, R. B., Schafer, P., Kirshbaum, D. & Regina, E. Orographic enhancement of precipitation inside Hurricane Dean. J.
Hydrometeor. 10, 820–831 (2009).
www.nature.com/scientificreports/
1 4SCieNTifiC REPORTS | (2018) 8:8247 | DOI:10.1038/s41598-018-26553-8
22. Huang, J.-C. et al. Linking typhoon tracks and spatial rainfall patterns for improving flood lead time predictions over a mesoscale mountainous watershed. Water Resour. Res. 48, W09540, https://doi.org/10.1029/2011wr011508 (2012).
23. Wu, C.-C. Typhoon Morakot: Key findings from the journal TAO for improving prediction of extreme rains at landfall. Bull. Amer. Meteor. Soc. 94, 155–160 (2013).
24. Yu, C.-K. & Cheng, L.-W. Distribution and mechanisms of orographic precipitation associated with Typhoon Morakot (2009). J. Atmos. Sci. 70, 2894–2915 (2013).
25. Yu, C.-K. & Cheng, L.-W. Dual-Doppler-derived profiles of the southwesterly flow associated with southwest and ordinary typhoons off the southwestern coast of Taiwan. J. Atmos. Sci. 71, 3202–3222 (2014).
26. Macdonald, N. J. The evidence for the existence of Rossby-like waves in the hurricane vortex. Tellus 20A, 138–150 (1968). 27. Diercks, J. W. & Anthes, R. A. Diagnostic studies of spiral rainbands in a nonlinear hurricane model. J. Atmos. Sci. 33, 959–975 (1976). 28. Kurihara, Y. On the development of spiral bands in a tropical cyclone. J. Atmos. Sci. 33, 940–958 (1976). 29. Willoughby, H. E. Inertia-buoyancy waves in hurricanes. J. Atmos. Sci. 34, 1028–1039 (1977). 30. Willoughby, H. E. A possible mechanism for the formation of hurricane rainbands. J. Atmos. Sci. 35, 838–848 (1978). 31. Guinn, T. A. & Schubert, W. H. Hurricane spiral bands. J. Atmos. Sci. 50, 3380–3403 (1993). 32. Montgomery, M. T. & Kallenbach, R. J. A theory for vortex Rossby waves and its application to spiral bands and intensity changes in
hurricanes. Quart. J. Roy. Meteor. Soc. 123, 435–465 (1997). 33. Gall, R., Tuttle, J. & Hildebrand, P. Small-scale spiral bands observed in Hurricanes Andrew, Hugo, and Erin. Mon. Wea. Rev. 126,
1749–1766 (1998). 34. Chen, Y. & Yau, M. K. Spiral bands in a simulated hurricane. Part I: Vortex Rossby wave verification. J. Atmos. Sci. 58, 2128–2145 (2001). 35. Wang, Y. Vortex Rossby waves in a numerically simulated tropical cyclone. Part I: Overall structure, potential vorticity, and kinetic
energy budgets. J. Atmos. Sci. 59, 1213–1238 (2002). 36. Wang, Y. Vortex Rossby waves in a numerically simulated tropical cyclone. Part II: The role in tropical cyclone structure and
intensity changes. J. Atmos. Sci. 59, 1239–1262 (2002). 37. Corbosiero, K. L., Molinari, J., Aiyyer, A. R. & Black, M. L. The structure and evolution of Hurricane Elena (1985). Part II: Convective
asymmetries and evidence for vortex Rossby waves. Mon. Wea. Rev. 134, 3073–3091 (2006). 38. Yu, C.-K. & Tsai, C.-L. Surface pressure features of landfalling typhoon rainbands and their possible causes. J. Atmos. Sci. 67,
2893–2911 (2010). 39. Fung, I. Y.-S. The organization of spiral rain bands in a hurricane Ph.D. thesis, Massachusetts Institute of Technology (1977). 40. Yamasaki, M. A further study of the tropical cyclone without parameterizing the effects of cumulus convection. Pap. Meteor.
Geophys. 34, 221–260 (1983). 41. Yamasaki, M. A study of the mesoscale structure of Typhoon Flo (T9019): A case of COMPARE model intercomparison. J. Meteor.
Soc. Japan 83, 1057–1084 (2005). 42. Sawada, M. & Iwasaki, T. Impacts of evaporation from raindrops on tropical cyclones. Part II: Features of rainbands and asymmetric
structure. J. Atmos. Sci. 67, 71–81 (2010). 43. Moon, Y. & Nolan, D. S. Spiral rainbands in a numerical simulation of Hurricane Bill (2009). Part II: Propagation of inner rainbands.
J. Atmos. Sci. 72, 191–215 (2015). 44. Houze, R. A. Jr. Mesoscale convective systems. Rev. Geophys. 42, Rg4003, https://doi.org/10.1029/2004rg000150 (2004). 45. Houze, R. A. Jr. Structure and dynamics of a tropical squall-line system. Mon. Wea. Rev. 105, 1540–1567 (1977). 46. Zipser, E. J. Mesoscale and convective-scale downdrafts as distinct components of squall-line circulation. Mon. Wea. Rev. 105,
1568–1589 (1977). 47. Rotunno, R., Klemp, J. B. & Weisman, M. L. A theory for strong, long-lived squall lines. J. Atmos. Sci. 45, 463–485 (1988). 48. Engerer, N. A., Stensrud, D. J. & Coniglio, M. C. Surface characteristics of observed cold pools. Mon. Wea. Rev. 136, 4839–4849 (2008). 49. Barnes, G. M. & Stossmeister, G. J. The structure and decay of a rainband in Hurricane Irene (1981). Mon. Wea. Rev. 114, 2590–2601 (1986). 50. Marks, F. D. Jr. & Houze, R. A. Jr. Inner core structure of hurricane Alicia from airborne Doppler radar observations. J. Atmos. Sci.
44, 1296–1317 (1987). 51. Powell, M. D. Boundary layer structure and dynamics in outer hurricane rainbands. Part I: Mesoscale rainfall and kinematic
structure. Mon. Wea. Rev. 118, 891–917 (1990). 52. Ryan, B. F., Barnes, G. M. & Zipser, E. J. A wide rainband in a developing tropical cyclone. Mon. Wea. Rev. 120, 431–447 (1992). 53. Samsury, C. E. & Zipser, E. J. Secondary wind maxima in hurricanes: Airflow and relationship to rainbands. Mon. Wea. Rev. 123,
3502–3517 (1995). 54. Hence, D. A. & Houze, R. A. Jr. Kinematic structure of convective-scale elements in the rainbands of Hurricanes Katrina and Rita
(2005). J. Geophys. Res. 113, D15108, https://doi.org/10.1029/2007jd009429 (2008). 55. Didlake, A. C. & Houze, R. A. Jr. Convective-scale downdrafts in the principal rainband of Hurricane Katrina (2005). Mon. Wea. Rev.
137, 3269–3293 (2009). 56. Didlake, A. C. & Houze, R. A. Jr. Convective-scale variations in the inner-core rainbands of a tropical cyclone. J. Atmos. Sci. 70,
504–523 (2013). 57. Didlake, A. C. & Houze, R. A. Jr. Dynamics of the stratiform sector of a tropical cyclone rainband. J. Atmos. Sci. 70, 1891–1911 (2013). 58. Chow, K. C., Chan, K. L. & Lau, A. K. H. Generation of moving spiral bands in tropical cyclones. J. Atmos. Sci. 59, 2930–2950 (2002). 59. Schecter, D. A. & Montgomery, M. T. Conditions that inhibit the spontaneous radiation of spiral inertia–gravity waves from an
intense mesoscale cyclone. J. Atmos. Sci. 63, 435–456 (2006). 60. Kumar, K. N., Rao, C. K., Sandeep, A. & Rao, T. N. SODAR observations of inertia-gravity waves in the atmospheric boundary layer
during the passage of tropical cyclone. Atmos. Sci. Let. 15, 120–126, https://doi.org/10.1002/asl2.478 (2014). 61. Rozoff, C. M., Schubert, W. H., McNoldy, B. D. & Kossin, J. P. Rapid filamentation zones in intense tropical cyclones. J. Atmos. Sci.
63, 325–340 (2006). 62. Frank, W. M. The Structure and energetics of the tropical cyclone. Part I: Storm structure. Mon. Wea. Rev. 105, 1119–1135 (1977). 63. Bogner, P. B., Barnes, G. M. & Franklin, J. L. Conditional instability and shear for six hurricanes over the Atlantic Ocean. Wea.
Forecasting 15, 192–207 (2000). 64. Yu, C.-K. & Chen, Y. Surface fluctuations associated with tropical cyclone rainbands observed near Taiwan during 2000–08. J. Atmos.
Sci. 68, 1568–1585 (2011). 65. Molinari, J., Romps, D. M., Vollaro, D. & Nguyen, L. CAPE in tropical cyclones. J. Atmos. Sci. 69, 2452–2463 (2012). 66. Yu, C.-K. & Tsai, C.-L. Structural and surface features of arc-shaped radar echoes along an outer tropical cyclone rainband. J. Atmos.
Sci. 70, 56–72 (2013). 67. Barnes, G. M., Gamache, J. F., LeMone, M. A. & Stossmeister, G. J. A convective cell in a hurricane rainbands. Mon. Wea. Rev. 119,
776–794 (1991). 68. Robe, F. R. & Emanuel, K. A. The effect of vertical wind shear on radiative-convective equilibrium states. J. Atmos. Sci. 58, 1427–1445
(2001). 69. Eastin, M. D., Gardner, T. L., Link, M. C. & Smith, K. C. Surface cold pools in the outer rainbands of Tropical Storm Hanna (2008)
near landfall. Mon. Wea. Rev. 140, 471–491 (2012). 70. Li, Q. & Wang, Y. A comparison of inner and outer spiral rainbands in a numerically simulated tropical cyclone. Mon. Wea. Rev. 140,
2782–2805 (2012).
www.nature.com/scientificreports/
1 5SCieNTifiC REPORTS | (2018) 8:8247 | DOI:10.1038/s41598-018-26553-8
71. Li, Q. & Wang, Y. Formation and quasi-periodic behavior of outer spiral rainbands in a numerically simulated tropical cyclone. J. Atmos. Sci. 69, 997–1020, https://doi.org/10.1175/2011jas3690.1 (2012).
72. Moon, Y. & Nolan, D. S. Spiral rainbands in a numerical simulation of Hurricane Bill (2009). Part I: Structures and comparisons to observations. J. Atmos. Sci. 72, 164–190 (2015).
73. Wang, Y. Rapid filamentation zone in a numerically simulated tropical cyclone. J. Atmos. Sci. 65, 1158–1181 (2008). 74. Li, Q., Wang, Y. & Duan, Y. A numerical study of outer rainband formation in a sheared tropical cyclone. J. Atmos. Sci. 74, 203–227,
https://doi.org/10.1175/jas-d-16-0123.1 (2017). 75. Ray, P. S., Ziegler, C. L., Bumgarner, W. & Serafin, R. J. Single- and multiple-Doppler radar observations of tornadic storms. Mon.
Wea. Rev. 108, 1607–1625 (1980). 76. Doviak, R. J. & Zrnic, D. S. Doppler Radar and Weather Observations. 2 edn, (Academic Press, 1993). 77. Roux, F. The West African squall line observed on 23 June 1981 during COPT 81: Kinematics and thermodynamics of the convective
region. J. Atmos. Sci. 45, 406–426 (1988). 78. Houze, R. A. Jr, Lee, W.-C. & Bell, M. M. Convective contribution to the genesis of HurricaneOphelia. Mon. Wea. Rev. 137,
2778–2800 (2009). 79. Nettleton, L. et al. In 26th Int. Conf. on Radar Meteorology, 338–339 (Amer. Meteor. Soc., Norman, OK 1993). 80. Oye, R., Mueller, C. & Smith, S. In 27th Conf. on Radar Meteorology, 359–361 (Amer. Meteor. Soc., Vail, CO 1995). 81. Koch, S. E., DesJardins, M. & Kocin, P. J. An interactive Barnes objective map analysis scheme for use with satellite and conventional
data. J. Climate Appl. Meteor. 22, 1487–1503 (1983). 82. Yu, C.-K. & Tsai, C.-L. Structural changes of an outer tropical cyclone rain band encountering the topography of northern Taiwan.
Quart. J. Roy. Meteor. Soc. 143, 1107–1122 (2017). 83. Mohr, C. G. & Miller, L. J. In 21st Conf. on Radar Meteorology, 569–574 (Amer. Meteor. Soc., Edmonton, AB, Canada 1983). 84. Kessinger, C. J., Ray, P. S. & Hane, C. E. The Oklahoma squall line of 19 May 1977. Part I: A multiple Doppler analysis of convective
and stratiform structure. J. Atmos. Sci. 44, 2840–2864 (1987). 85. Chong, M., Amayenc, P., Scialom, G. & Testud, J. A tropical squall line observed during the COPT 81 experiment in West Africa.
Part 1: Kinematic structure inferred from dual-Doppler radar data. Mon. Wea. Rev. 115, 670–694 (1987). 86. Smull, B. F. & Houze, R. A. Jr. Dual-Doppler radar analysis of a midlatitude squall line with a trailing region of stratiform rain. J.
Atmos. Sci. 44, 2128–2148 (1987). 87. Jorgensen, D. P., LeMone, M. A. & Trier, S. B. Structure and evolution of the 22 February 1993 TOGA COARE squall line: Aircraft
observations of precipitation, circulation, and surface energy fluxes. J. Atmos. Sci. 54, 1961–1985 (1997). 88. Weisman, M. L., Klemp, J. B. & Rotunno, R. Structure and evolution of numerically simulated squall lines. J. Atmos. Sci. 45,
1990–2013 (1988). 89. Parker, M. D. & Johnson, R. H. Simulated convective lines with leading precipitation. Part I: Governing dynamics. J. Atmos. Sci. 61,
1637–1655 (2004). 90. Barnes, G. M. & Sieckman, K. The environment of fast- and slow-moving tropical mesoscale convective cloud lines. Mon. Wea. Rev.
112, 1782–1794 (1984). 91. Bluestein, H. B., Marx, G. T. & Jain, M. H. Formation of mesoscale lines of precipitation: Nonsevere squall lines in Oklahoma during
the spring. Mon. Wea. Rev. 115, 2719–2727 (1987). 92. LeMone, M. A., Zipser, E. J. & Trier, S. B. The role of environmental shear and thermodynamic conditions in determining the
structure and evolution of mesoscale convective systems during TOGA COARE. J. Atmos. Sci. 55, 3493–3517 (1998). 93. Charba, J. Application of gravity current model to analysis of squall-line gust front. Mon. Wea. Rev. 102, 140–156 (1974). 94. Goff, R. C. Vertical structure of thunderstorm outflows. Mon. Wea. Rev. 104, 1429–1440 (1976). 95. Wakimoto, R. M. The life cycle of thunderstorm gust fronts as viewed with Doppler radar and rawinsonde data. Mon. Wea. Rev. 110,
1060–1082 (1982). 96. Barnes, G. M. & Garstang, M. Subcloud layer energetics of precipitating convection. Mon. Wea. Rev. 110, 102–117 (1982). 97. Tompkins, A. M. Organization of tropical convection in low vertical wind shears: The role of cold pools. J. Atmos. Sci. 58, 1650–1672
(2001). 98. Simpson, J. E. A comparison between atmospheric and laboratory density currents. Quart. J. Roy. Meteor. Soc. 95, 758–765 (1969). 99. Simpson, J. E. & Britter, R. E. A laboratory model of an atmospheric mesofront. Quart. J. Roy. Meteor. Soc. 106, 485–500 (1980).
AcknowledgementsThe Doppler radar data used in this study were provided by the Taiwan Central Weather Bureau, Civil Aeronautics Administration, and the Weather Wing of the Chinese Air Force. Surface observations were provided by the Taiwan Central Weather Bureau and the Japan Meteorological Agency, and RMW information was provided by the Joint Typhoon Warning Center. This study was supported by the Ministry of Science and Technology of Taiwan under Research Grants MOST106-2111-M-002-002-MY3 and 106-2111-M-002 -013-MY3.
Author ContributionsC.K. Yu. led the study and wrote the manuscript, C.Y. Lin, L.W. Cheng, J.S. Luo and Y. Chen performed data analysis, and C.C. Wu provided comments and helped the rewording of the text.
Additional InformationCompeting Interests: The authors declare no competing interests.Publisher's note: Springer Nature remains neutral with regard to jurisdictional claims in published maps and institutional affiliations.
Open Access This article is licensed under a Creative Commons Attribution 4.0 International License, which permits use, sharing, adaptation, distribution and reproduction in any medium or
format, as long as you give appropriate credit to the original author(s) and the source, provide a link to the Cre-ative Commons license, and indicate if changes were made. The images or other third party material in this article are included in the article’s Creative Commons license, unless indicated otherwise in a credit line to the material. If material is not included in the article’s Creative Commons license and your intended use is not per-mitted by statutory regulation or exceeds the permitted use, you will need to obtain permission directly from the copyright holder. To view a copy of this license, visit http://creativecommons.org/licenses/by/4.0/. © The Author(s) 2018