
Outer pages - SAIMM
124
VOLUME 118 NO. 11 NOVEMBER 2018
-
Upload
khangminh22 -
Category
Documents
-
view
0 -
download
0
Transcript of Outer pages - SAIMM

VOLUME 118 NO. 11 NOVEMBER 2018


The Southern African Institute of Mining and Metallurgy
Mxolisi MgojoPresident, Minerals Council South Africa
Gwede MantasheMinister of Mineral Resources, South Africa
Rob DaviesMinister of Trade and Industry, South Africa
Mmamoloko Kubayi-NgubaneMinister of Science and Technology, South Africa
A.S. Macfarlane
M.I. Mthenjane
Z. Botha
V.G. Duke
I.J. Geldenhuys
S. Ndlovu
R.T. Jones
V.G. Duke
I.J. Geldenhuys S.M RupprechtC.C. Holtzhausen N. SinghW.C. Joughin A.G. SmithG.R. Lane M.H. SolomonE. Matinde D. TudorH. Musiyarira A.T. van ZylG. Njowa E.J. Walls
N.A. Barcza J.L. PorterR.D. Beck S.J. RamokgopaJ.R. Dixon M.H. RogersM. Dworzanowski D.A.J. Ross-WattH.E. James G.L. SmithR.T. Jones W.H. van NiekerkG.V.R. Landman R.P.H. WillisC. Musingwini
G.R. Lane–TPC Mining ChairpersonZ. Botha–TPC Metallurgy Chairperson
K.M. Letsoalo–YPC ChairpersonG. Dabula–YPC Vice Chairperson
Botswana VacantDRC S. MalebaJohannesburg J.A. LuckmannNamibia N.M. NamateNorthern Cape F.C. NieuwenhuysPretoria R.J. MostertWestern Cape L.S. BbosaZambia D. MumaZimbabwe C. SadombaZululand C.W. Mienie
*Deceased
* W. Bettel (1894–1895)* A.F. Crosse (1895–1896)* W.R. Feldtmann (1896–1897)* C. Butters (1897–1898)* J. Loevy (1898–1899)* J.R. Williams (1899–1903)* S.H. Pearce (1903–1904)* W.A. Caldecott (1904–1905)* W. Cullen (1905–1906)* E.H. Johnson (1906–1907)* J. Yates (1907–1908)* R.G. Bevington (1908–1909)* A. McA. Johnston (1909–1910)* J. Moir (1910–1911)* C.B. Saner (1911–1912)* W.R. Dowling (1912–1913)* A. Richardson (1913–1914)* G.H. Stanley (1914–1915)* J.E. Thomas (1915–1916)* J.A. Wilkinson (1916–1917)* G. Hildick-Smith (1917–1918)* H.S. Meyer (1918–1919)* J. Gray (1919–1920)* J. Chilton (1920–1921)* F. Wartenweiler (1921–1922)* G.A. Watermeyer (1922–1923)* F.W. Watson (1923–1924)* C.J. Gray (1924–1925)* H.A. White (1925–1926)* H.R. Adam (1926–1927)* Sir Robert Kotze (1927–1928)* J.A. Woodburn (1928–1929)* H. Pirow (1929–1930)* J. Henderson (1930–1931)* A. King (1931–1932)* V. Nimmo-Dewar (1932–1933)* P.N. Lategan (1933–1934)* E.C. Ranson (1934–1935)* R.A. Flugge-De-Smidt
(1935–1936)* T.K. Prentice (1936–1937)* R.S.G. Stokes (1937–1938)* P.E. Hall (1938–1939)* E.H.A. Joseph (1939–1940)* J.H. Dobson (1940–1941)* Theo Meyer (1941–1942)* John V. Muller (1942–1943)* C. Biccard Jeppe (1943–1944)* P.J. Louis Bok (1944–1945)* J.T. McIntyre (1945–1946)* M. Falcon (1946–1947)* A. Clemens (1947–1948)* F.G. Hill (1948–1949)* O.A.E. Jackson (1949–1950)* W.E. Gooday (1950–1951)* C.J. Irving (1951–1952)* D.D. Stitt (1952–1953)* M.C.G. Meyer (1953–1954)* L.A. Bushell (1954–1955)* H. Britten (1955–1956)* Wm. Bleloch (1956–1957)
* H. Simon (1957–1958)* M. Barcza (1958–1959)* R.J. Adamson (1959–1960)* W.S. Findlay (1960–1961)* D.G. Maxwell (1961–1962)* J. de V. Lambrechts (1962–1963)* J.F. Reid (1963–1964)* D.M. Jamieson (1964–1965)* H.E. Cross (1965–1966)* D. Gordon Jones (1966–1967)* P. Lambooy (1967–1968)* R.C.J. Goode (1968–1969)* J.K.E. Douglas (1969–1970)* V.C. Robinson (1970–1971)* D.D. Howat (1971–1972)* J.P. Hugo (1972–1973)* P.W.J. van Rensburg
(1973–1974)* R.P. Plewman (1974–1975)* R.E. Robinson (1975–1976)* M.D.G. Salamon (1976–1977)* P.A. Von Wielligh (1977–1978)* M.G. Atmore (1978–1979)* D.A. Viljoen (1979–1980)* P.R. Jochens (1980–1981)
G.Y. Nisbet (1981–1982)A.N. Brown (1982–1983)
* R.P. King (1983–1984)J.D. Austin (1984–1985)H.E. James (1985–1986)H. Wagner (1986–1987)
* B.C. Alberts (1987–1988)* C.E. Fivaz (1988–1989)* O.K.H. Steffen (1989–1990)* H.G. Mosenthal (1990–1991)
R.D. Beck (1991–1992)* J.P. Hoffman (1992–1993)* H. Scott-Russell (1993–1994)
J.A. Cruise (1994–1995)D.A.J. Ross-Watt (1995–1996)N.A. Barcza (1996–1997)
* R.P. Mohring (1997–1998)J.R. Dixon (1998–1999)M.H. Rogers (1999–2000)L.A. Cramer (2000–2001)
* A.A.B. Douglas (2001–2002)S.J. Ramokgopa (2002-2003)T.R. Stacey (2003–2004)F.M.G. Egerton (2004–2005)W.H. van Niekerk (2005–2006)R.P.H. Willis (2006–2007)R.G.B. Pickering (2007–2008)A.M. Garbers-Craig (2008–2009)J.C. Ngoma (2009–2010)G.V.R. Landman (2010–2011)J.N. van der Merwe (2011–2012)G.L. Smith (2012–2013)M. Dworzanowski (2013–2014)J.L. Porter (2014–2015)R.T. Jones (2015–2016)C. Musingwini (2016–2017)S. Ndlovu (2017–2018)
Scop Incorporated
Genesis Chartered Accountants
The Southern African Institute of Mining and Metallurgy
Fifth Floor, Minerals Council South Africa Building
5 Hollard Street, Johannesburg 2001 • P.O. Box 61127, Marshalltown 2107
Telephone (011) 834-1273/7 • Fax (011) 838-5923 or (011) 833-8156
E-mail: [email protected]

�
ii
ContentsJournal Comment: Copper Cobalt Africa 10–12 July 2018by K.C. Sole. . . . . . . . . . . . . . . . . . . . . . . . . . . . . . . . . . . . . . . . . . . . . . . . . . . . . . . . . . . . . . . . . . . . ivPresident’s Corner: A new dawn for the mining industy?by A.S. Macfarlane . . . . . . . . . . . . . . . . . . . . . . . . . . . . . . . . . . . . . . . . . . . . . . . . . . . . . . . . . . . . . . v–vi
The giant Kamoa–Kakula project in the Democratic Republic of Congo by S. Amos, V. Nkuna, and B. Matsetela........................................................................................... 1121The Kamoa-Kakula copper project—a joint venture between Ivanhoe Mines, Zijin Mining Group, and the government of the Democratic Republic of Congo—has been independently ranked as the world's largest undeveloped high-grade copper discovery. A phased approach is envisaged which involves the initial development of a 6 Mt/a underground mine and surface processing complex at the Kakula deposit followed by an integrated 12 Mt/a two-stage development and asubsequent, separate underground mining operation at the nearby Kansoko mine.Sonic injection in sulphide bath smelting: an updateby J.P.T. Kapusta............................................................................................................................... 1131Sonic injection can be applied to any submerged tuyere bath process, including smelting, converting, fire refining, slag cleaning, and slag fuming. This update reviews the application and design of sonic tuyeres as a retrofit option to existing vessels to reduce energy usage and to address SO2 abatement issues to comply with environmental regulations.Copper electrowinning circuit design: optimized costing as a function of cell arrangement, productivity, rectiformer size, and throughputby E.L. Forner, J. Scheepers, A.J. du Toit, and G.M. Miller................................................................. 1141A model was compiled which contained a range of cellhouse layouts in terms of number of cathodes per cell, crane productivity, stripping machine productivity, and rectifier–transformer(rectiformer) sizing using data tables for sensitivity analysis. The model provides an optimum band of operation for cellhouse productivity and project capital cost for a typical range of production throughputs. The data was validated and compared with existing copper electrowinning cellhouses around the world.Methodology for assessing the benefits of grind control using particle size tracking technology for true on-line particle size measurementby R. Maron, C. O’Keefe, and J. Sepulveda ........................................................................................ 1149An innovative technology for real-time particle size measurement on individual hydrocyclones has been developed and proven in commercial installations, demonstrating near 100% availability with minimal maintenance, thus overcoming the limitations of previous technologies. As an extension of previous work, this paper presents the key operating criteria to optimize theproduction of valuable metal and increase mill throughput by identifying the optimal grind size.Relationship between ore mineralogy and copper recovery across different processing circuits at Kansanshi mineby L. Little, Q. Mclennan, A. Prinsloo, K. Muchima, B. Kaputula, and C. Siame ................................ 1155The Kansanshi concentrator has three different flotation circuits for sulphide, oxide, and mixed ores. Quantifying the variability of copper mineralization is essential to be able to monitor and optimize the performance of the concentrator. This paper describes the relationship between mineralogy and plant performance at Kansanshi, and discusses some of the advantages and challenges of on-site process mineralogy.
R. Dimitrakopoulos, McGill University, CanadaD. Dreisinger, University of British Columbia, CanadaE. Esterhuizen, NIOSH Research Organization, USAH. Mitri, McGill University, CanadaM.J. Nicol, Murdoch University, AustraliaE. Topal, Curtin University, AustraliaD. Vogt, University of Exeter, United Kingdom
VOLUME 118 NO. 11 NOVEMBER 2018
R.D. BeckP. den Hoed
M. DworzanowskiB. Genc
R.T. JonesW.C. JoughinH. Lodewijks
J.A. LuckmannC. Musingwini
S. NdlovuJ.H. PotgieterN. Rampersad
T.R. StaceyM. Tlala
D. Tudor
The Southern African Institute ofMining and MetallurgyP.O. Box 61127Marshalltown 2107Telephone (011) 834-1273/7Fax (011) 838-5923E-mail: [email protected]
Camera Press, Johannesburg
Barbara SpenceAvenue AdvertisingTelephone (011) 463-7940E-mail: [email protected]
ISSN 2225-6253 (print)ISSN 2411-9717 (online)
THE INSTITUTE, AS A BODY, ISNOT RESPONSIBLE FOR THESTATEMENTS AND OPINIONSADVANCED IN ANY OF ITSPUBLICATIONS.Copyright© 2018 by The Southern AfricanInstitute of Mining and Metallurgy. All rightsreserved. Multiple copying of the contents ofthis publication or parts thereof withoutpermission is in breach of copyright, butpermission is hereby given for the copying oftitles and abstracts of papers and names ofauthors. Permission to copy illustrations andshort extracts from the text of individualcontributions is usually given upon writtenapplication to the Institute, provided that thesource (and where appropriate, the copyright)is acknowledged. Apart from any fair dealingfor the purposes of review or criticism under
,of the Republic of South Africa, a single copy ofan article may be supplied by a library for thepurposes of research or private study. No partof this publication may be reproduced, stored ina retrieval system, or transmitted in any form orby any means without the prior permission ofthe publishers.
U.S. Copyright Law applicable to users In theU.S.A.The appearance of the statement of copyrightat the bottom of the first page of an articleappearing in this journal indicates that thecopyright holder consents to the making ofcopies of the article for personal or internaluse. This consent is given on condition that thecopier pays the stated fee for each copy of apaper beyond that permitted by Section 107 or108 of the U.S. Copyright Law. The fee is to bepaid through the Copyright Clearance Center,Inc., Operations Center, P.O. Box 765,Schenectady, New York 12301, U.S.A. Thisconsent does not extend to other kinds ofcopying, such as copying for generaldistribution, for advertising or promotionalpurposes, for creating new collective works, orfor resale.
COPPER COBALT AFRICA
VOLUME 118 NO. 11 NOVEMBER 2018

�iii
Structural characteristics of strata overlying of a fully mechanized longwall face: a case studyby J. Wang, J. Ning, L. Jiang, J-Q. Jiang, and T. Bu ............................................................................................................................... 1195An increase in the cutting height of the shearer in longwall faces in coal mining in China has presented new challenges such as determination of a suitable working resistance for the shield and control of the roof. Through field observation and theoretical analysis, a three- stage structural model was developed and a suitable method identified for calculating the working resistance of the shield support for single-cut mining height s of 6 m and greater.Silicomanganese production at Mogale Alloysby N.A. Sithole, N. Rambuda, J.D. Steenkamp, D.A. Hayman, and C. Hockaday................................................................................... 1205This paper describes the silicomanganese process that is specific to Mogale Alloys, which operates two 20 MVA submerged arc furnaces that produce 55 000 t of SiMn per annum.Technical and economic assessment of subsurface rock mass deformation and pore pressure monitoring using a network of wireless devicesby C. Holck, O. Fredes, E. Widzyk-Capehart, J. Yarmuch, J. Read, and R. Castro .................................................................................. 1217The design and evaluation of monitoring campaigns to measure subsurface deformation and groundwater pore pressure in open pit mines is presented. The monitoring programmes were applied to a theoretical case of an open pit mine designed using DeepMine software. Mine plans were developed with monitoring programmes considered for four types of instrumentation. Technical and economic appraisals of the monitoring programmes and sensitivity analysis of the developed mine plans showed that Enhanced Networked Smart Markers (ENSMs) spaced every 4 m had the lowest cost per unit of gathered data.An investigation of the behaviour of double oxide film defects in aluminium-magnesium cast alloysby M.A. El-Sayed.................................................................................................................................................................................. 1225Two different experiments were performed to study the behaviour of double oxide film defects in Al alloys. The results of this research could provide a better understanding of the behaviour of double oxide film defects, and may lead to the development of new techniques to eliminate, or at least deactivate, these defects in light alloy castings.
Innovative process design for copper-cobalt oxide ores in the Democratic Republic of Congoby D. Alexander, C. van der Merwe, R. Lumbule, and J. Kgomo ........................................................................................................... 1163The physical characteristics of the oxide ores provide the process design engineer with an opportunity to critically examine the principles on which equipment selection is based and to design processes better suited to these ores. A number of innovative changes to the conventional process design were included in the modified Luita hydrometallurgical flow sheet, the most novel of which is an alternative approach to mitigate the impact of colloidal silica on the operation of the solvent extraction plant.The Mutoshi Project – Part I: Metallurgical test work, process design, and project deliveryby P. Ilunga, D. Samal, M. Nicolle, M. Lampi, K. Valkama, J. Edwards, and N. Tatalias........................................................................ 1171This paper outlines the metallurgical and process development of the Mutoshi copper–cobalt project in the Democratic Republic of Congo. The metallurgical test work, process design, and project delivery approach are presented, along with the decisions that were taken to minimize risk and maximize upside to the project.Empirical model of recovery response of copper sulphide circuit at Kansanshi Mineby M. Lusambo and F.K. Mulenga ........................................................................................................................................................ 1179The development of a predictive model for the flotation recovery at the Kansanshi concentrator in Zambia as a function of key operational parameters is presented. Data was recorded and collected over a period of one year of production from diverse sensors measuring semi-autogenous milling and flotation parameters. Statistical analysis was used to identify the parameters that contribute the most to the predictive power of the proposed empirical model.Techno-economic evaluation of BASF’s new high-temperature solvent extraction reagentby J.J. Taute and S.J. Archer.................................................................................................................................................................. 1185The techno-economic benefits of using the new high-temperature extractant as an alternative to the standard extractant in a high-temperature application were investigated. The results showed a reduction in the extractant addition requirements as well as lower acid and limestone consumptions, leading to a reduction in valuable metal losses and a significant cost saving compared with the standard extractant.
Contents (continued)
VOLUME 118 NO. 11 NOVEMBER 2018
PAPERS OF GENERAL INTEREST
COPPER COBALT AFRICA

�
iv
The second Copper Cobalt Africa conference was held in the Mosi-oa-Tunya (Victoria Falls) NationalPark, Zambia. Recent strong rises in the prices of copper and particularly of cobalt, coupled withincreasing international interest in developments in the African Copperbelt, attracted over 300
delegates, representing 22 countries. Among the highlights were the outstanding keynote speakers. Sokwani Chilembo, CEO of the
Zambian Chamber of Mines, discussed the future of Zambian mining that would not only focus oncopper, but also include other strategic metals. Caspar Rawles, of Benchmark Mineral Intelligence,presented a fascinating analysis of the role of cobalt in the rapidly emerging electric vehicle batterymarket. Matt Pascal, COO of First Quantum Minerals, gave a provocative and thoughtful analysis of
the challenges of mining in Africa. ‘Who moved my cobalt stocks?’ was the title of an insightful presentation by Lara Smith,founder of Core Consulting. Steve Amos of Ivanhoe Mines presented a very interesting update of the giant Kamoa–Kakulaproject in the Democratic Republic of Congo (DRC), the largest and highest-grade undeveloped copper deposit in the world,and Bernadette Currie of Ausenco provided an update of the state-of-the-art with respect to urban mining, particularly asconcerns recycling of battery materials.
The technical programme comprised 58 papers that showcased advances in exploration, mining, and processingtechnologies. With the DRC producing more than two-thirds of the world’s cobalt, many presentations described cobaltprojects that are in development, ramping up, or recently commissioned. The best papers, presented in this issue of theJournal, reflect the quality and diversity of the conference proceedings.
Tremendous support for this event was received from sponsors, with demand for sponsorship and exhibitionopportunities outstripping availability. Networking opportunities were also plentiful in the relaxed environments afforded bya sunset cruise on the Zambezi River and a traditional Zambian-style boma dinner.
Following the undisputed success of the second in this conference series, the SAIMM has great pleasure in announcingthat the third Copper Cobalt Africa conference will take place in July 2021.
Some of the dignitaries present at Copper Cobalt Africa 2018
L-R: Mooya Lumamba (Director of Mines and Minerals, Zambia), Jackson Sikamo (Chairperson and Country Manager atChibuluma Mines Plc, Zambia), Sehliselo Ndlovu (then President: SAIMM), Paul Chanda (Permanent Secretary: ZambiaMinistry of Mines and Mineral Development), Sokwani Chilembo (CEO Zambian Chamber of Mines), Darius Muma (ZambianBranch Chair: SAIMM), Kathy Sole (Conference Chair: Copper Cobalt Africa 2018).
Kathryn C. Sole (PrEng, PhD, FSAIMM)Chair of the Organizing Committee: Copper Cobalt Africa
Journal
Comment
Copper Cobalt Africa 10–12 July 2018

�v
As I sit here writing this President’s Corner, today’s dawn has brought with it the first real rainsof the summer. I am reminded that the rain represents a blessing showered down upon us, andour country. Is this a blessing for our industry?Much has changed for the mining industry over the last few months, or has it? First, after the inauguration of the new President of South Africa, the promise of a ‘new dawn’
for South Africa and its peoples created a sense of euphoria, popularly described as ‘Ramaphoria’.Exactly what the new dawn will bring for us is not altogether clear, however. Sello Lediga, writing inthe Daily Maverick on 7 May 2018, points to the following as four pillars that could assist thePresident in clarifying the concept, these being:
� Establishing clean governance and an intensified anti-corruption drive. Given the events and announcements of thelast month and the revelations from the State Capture inquiry, this resonates even louder.
� Rebuilding a broken economy. Many sectors of the economy are broken, but is mining broken beyond repair, or justdamaged, and in need of some care and attention?
� Rebuilding our education and training systems. � Thuma Mina, which is a spirit epitomized in the music of Hugh Masekela,who wrote: ‘I wanna be there when the people
start to turn it around/When they triumph over poverty/I wanna be there when the people win the battle against AIDS/Iwanna lend a hand/ I wanna be there for the alcoholic/ I wanna be there for the drug addict/ I wanna be there for thevictims of violence and abuse/ I wanna lend a hand/Send me.’ These pillars reflect the objectives of the National Development Plan, as described in my Presidential Address.Turning more specifically to the mining industry, we have seen the replacement of the previous Minister of Mineral
Resources with Minister Mantashe, and this has been widely supported as heralding the dawn of a new era within theDepartment of Mineral Resources, headed up by a man who knows the industry well. This creates the opportunity for openand transparent dialogue; but, of course, the engagements will be robust. This was clearly illustrated at the Joburg Indabaand the launch of the Mandela Mining Precinct, where the Honourable Minister emphasised the need for all parties to worktogether for the future of the industry.
First and foremost on the agenda for the new Minister has been the resolution of outstanding issues in the MiningCharter, so as to create, through engagement, a version of the Charter that has broad support. Notwithstanding this broadsupport, there are still issues to be resolved, and definitions and intent to be more clearly defined. However, at leastcertainty has been established on a number of issues, some of which are of importance to the SAIMM. In particular, theneed for increased research and development capability and capacity, and the focus on increased localization of the supplychain to the mining industry present opportunities for job creation and skills development.
The recent gazetting of the Department of Science and Technology White Paper on Science, Technology and Innovationestablished a vision of ‘Science, Technology and Innovation (STI) enabling sustainable and inclusive South Africandevelopment in a changing world’, which has the following objectives:� Improved National System of Innovation (NSI) partnerships, coherence, and coordination � Strengthened and transformed NSI institutions;� Increased human capabilities � Expanded research enterprise � Enhanced enabling environment for innovation � Improved financing for the NSI funding regime.
The White Paper stresses the need for R&D to be inclusive and interdepartmental at government level, and to be pan-African, with a strong emphasis on skills development and the embracing of Industrial Revolution 4.0 in South Africangrowth and competitiveness. This approach also provides opportunity for the SAIMM to support and develop the R&Dinitiatives for the mining industry through dissemination of information and knowledge, and to allow for dialogue andengagement between interested stakeholders, beyond the traditional or historical norm.
Not only the Charter, but also the White Paper emphasises the need for the development of circular and lateraleconomies around mining areas, involving the development of local industrialization, agri-businesses, and alternativeenergy sources, so as to ensure the sustainability of mining communities after the mining has ceased.
Of course, if there is a new dawn for mining, there must be mineral resources within the country that can continue tobe exploited. This requires a new approach to exploration, a topic that is partially addressed by the Charter, but whichrequires further debate to encourage investment in this vital activity.
All of these announcements, initiatives, and activities create a context for the SAIMM, in terms of its forward-lookingstrategy.
The Council of the SAIMM, through Office Bearers, has used this context to develop a new strategic plan for theInstitute. Previous strategic plans have tended to be more operational than strategic, so a longer term vision and contextwas used to develop this plan, which takes at least a five-year view of the future.
President’s
Corner
A new dawn for the mining industry?

�
vi
The plan has established a new vision for the Institute, which is ‘To be an independent and globally recognizedplatform for the development of the African minerals industry of the future.’
This vision articulates that the Institute, in order to remain current and valuable to its members, needs to explore newmeans of establishing dialogues between multiple stakeholders, while preserving its professional, independent, andapolitical status.
The strategic plan contains six focus areas, which are as follows.� Redefining who we are. This involves issues such as:
• How to better engage with our members using modern technology• How to better market our products and services in a modern way• How to embrace state-of-the-art digital technology• How to send out a modern message to members and prospective members• How to further engage and collaborate with our key partners.
� Modernizing and extending our reach. This covers:• Reassessing and modernizing current offerings and services in line with individual and company needs, i.e. a
review of what ‘the industry’ needs and expects• Aggressive marketing of the Institute• Initiating stakeholder mapping and nurturing current and new relationships• Adapting to an Industrial Revolution 4.0 world, where there may be new partners• Holding general meetings (local and regional) to eke out what members want from the SAIMM• Developing a strategy to engage new professions for modern mining• Engaging with emerging/junior miners to develop a strategy with them (value proposition) and others in this space• Supporting localization and local supply chain development• Extending into ‘green mining’ for sustainable communities.
� Keeping in touch.This involves using Council meetings to inform members of developing issues, and the landscape as it changes. Thismeans adopting a more dynamic and open approach, and using these discussions to form TPC initiatives for ‘platform’issues.
� Strengthening and extending our geographic reach.• Instituting a project for improving geographic reach (linked to the digitalization strategy via a focused approach).
This involves being able to share meetings, presentations etc. remotely on a live basis • Creating mechanisms to link old/new ideas• Developing an SAIMM app for members to interact with the Institute• Increasing our geographical reach through engagement with MIASA (Mining Industry Associations of Southern
Africa)• Strengthening existing branches and links.
� Creating platforms.• Harnessing a portal for ‘independent platform’ issues and strategy• Being the conduit for digitalization, new technology, and the Mine of the Future• Making the TPC Digitalization in Mining strategy work for all• Creating a regularized calendar of breakfast events• Identifying burning platform issues where we can add value through facilitation and dialogue• Supporting, collaborating in, and creating the Mine of the Future• Green mining (work with Minerals to Metals and MineCare)• Establishing a knowledge hub• Establishing an emerging miners hub, working with financiers, MCSA, WIM etc.• Supply chain development and localization• Creating an industry-wide independent ‘hackathon’-type annual platform• Establishing a serious role for the YPC.
� Strengthening our professionalism.• Setting out SAIMM conditions of professionalism (ethics/code of conduct)• Reaffirming our ethics to our members• Constantly re-emphasising the importance of membership to the industry• Engagement with MCSA and other organizations• Strengthening our ties with ECSA, SACNASP, and other statutory organizations• Continuing to punch above our weight on SAMREC, SAMVAL, and IMVAL• Continuing and strengthening our position in the Global Mining Guidelines Group• Engaging actively in Global Mining Professional Associations, activities by representing Africa.
All of these strategic issues are now being turned into action plans, and members will be regularly updated on progressand alignment of the Institute to its vision, the African Mining Vision, and the National Development Plan.
A.S. MacfarlanePresident, SAIMM
A new dawn for the mining industry? (continued)

The Kamoa–Kakula project comprises a newlydiscovered, very large stratiform copperdeposit with adjacent prospective explorationareas, located within the Central AfricanCopperbelt in Lualaba Province, DemocraticRepublic of Congo (DRC). The Kamoa–Kakulaproject lies approximately 25 km west of thetown of Kolwezi and about 270 km west ofLubumbashi. Ivanhoe owns a 49.5% shareinterest in Kamoa Holding, an Ivanhoesubsidiary that currently owns 80% of theproject. Zijin Mining owns a 49.5% shareinterest in Kamoa Holding, which it acquiredfrom Ivanhoe in December 2015 for anaggregate cash consideration of US$412million. The remaining 1% interest in KamoaHolding is held by privately-owned CrystalRiver.
The Kamoa–Kakula project consists of theKamoa exploitation licences (exploitationpermits 12873, 13025, and 13026, whichcover an area of 397.4 km2) and oneexploration licence (exploration permit 703covering an area of 12.74 km2). The Kamoaexploitation licences, approved 20 August2012, grant Kamoa Copper the right to explore
for, develop, and exploit copper and otherminerals, for an initial 30-year term, expiringon 19 August 2042. The permits can then beextended for 15-year periods until the end ofthe mine’s life.
The Kamoa–Kakula project area is sparselyinhabited. The company is preparing aresettlement plan that will identify anytraditional owners within the project area, butno major resettlement is expected.Compensation related to land access for theexploration programmes completed to date hasbeen successfully negotiated and has notamounted to a material cost to the company.
Pursuant to the DRC Mining Code, thegrant of the Kamoa exploitation licencestriggered an obligation on the part of Ivanhoeto transfer to a DRC state-owned nominee, forno consideration, a non-dilutable 5% interestin Kamoa Copper within 30 working days. On11 September 2012, the company satisfied thisobligation by transferring 5% of the sharecapital of Kamoa Copper to the DRC state. Inaddition, during the application process for thegrant of the Kamoa exploitation licences,Ivanhoe engaged in discussions with the DRCgovernment regarding the nature of the DRC’sparticipation in the project. These discussionsculminated in Ivanhoe offering to transfer afurther 15% interest in Kamoa Copper to theDRC on terms to be negotiated betweenIvanhoe and the DRC government. On 11November 2016, an additional 15% interest inKamoa Copper was transferred to the DRC byKamoa Holding. Ivanhoe and Zijin Mininghave also indicated their willingness toparticipate, in conjunction with the DRCgovernment, DRC state-owned utilities, othermining companies, and interested parties in
The giant Kamoa—Kakula project in the Democratic Republic of Congo by S. Amos*, V. Nkuna†, and B. Matsetela†
The Kamoa-Kakula copper project—a joint venture between Ivanhoe Mines,Zijin Mining Group Co. Ltd, and the government of the Democratic Republicof Congo—has been independently ranked as the world's largestundeveloped high-grade copper discovery by international miningconsultant Wood Mackenzie. It is a very large, near-surface stratiformcopper deposit with adjacent prospective exploration areas within theCentral African Copperbelt, approximately 25 km west of the town ofKolwezi and about 270 km west of the provincial capital of Lubumbashi. Aphased development approach is currently envisaged. The first phase of theproject involves the development of a 6 Mt/a underground mine and surfaceprocessing complex (dual stream concentrator) at the Kakula deposit, adiscovery announced in early 2016. The second phase involves an integrated12 Mt/a two-stage development, beginning with initial production from theKakula mine, to be followed by a subsequent, separate underground miningoperation at the nearby Kansoko mine, along with the construction of asmelter.
copper, Democratic Republic of Congo, mineral resources, economicevaluation, staged development.
* Kamoa Copper SA, South Africa.† Ivanhoe Mines, South Africa.© The Southern African Institute of Mining and
Metallurgy, 2018. ISSN 2225-6253. This paperwas first presented at the Copper Cobalt Africa,incorporating the 9th Southern African BaseMetals Conference, 9–12 July 2018, AvaniVictoria Falls Resort, Livingstone, Zambia.
1121 �
http://dx.doi.org/10.17159/2411-9717/2018/v118n11a1

The giant Kamoa—Kakula project in the Democratic Republic of Congo
the region in the enhancement of rail and powerinfrastructure in Lualaba and adjacent provinces.
The Kamoa–Kakula project represents the first discovery of amajor copper deposit or district in Lualaba Province since theearly 1900s, and indicates the prospectivity of the Katangansection of the Central African Copperbelt for discovery ofadditional copper deposits. During the period 1971–1975, theTenke Fungurume Consortium, operating as the SocietéInternationale Des Mines du Zaïre, undertook grassrootsexploration over an area that extended southwest fromKolwezi towards the Zambian border. A helicopter-supportedregional stream sediment sampling programme wascompleted in 1971. No sample location information isavailable for any sampling that may have been done withinthe Kamoa–Kakula project area during this period.
In 2003, Ivanhoe acquired a significant groundholding,including the permit areas that now comprise the Kamoa–Kakula project. Work completed to date includes datacompilation; acquisition of satellite imagery; geologicalmapping; stream sediment and soil geochemical sampling; anairborne geophysical survey that comprised total fieldmagnetic intensity, horizontal and longitudinal magneticgradient, multi-channel radiometric, linear and barometric,and altimetric and positional data; acquisition of whole-rockmajor and trace element data from selected intervals of themineralized zone and footwall sandstone in dril-lholeDKMC_DD019; and aircore, reverse circulation (RC), and core(DDC) drilling.
An initial Mineral Resource Estimate was prepared byAMEC for the project in 2009. The estimate was updated in2010, 2011, 2012, 2014, 2016, 2017, and 2018.
The metallogenic province of the Central African Copperbelt ishosted in metasedimentary rocks of the NeoproterozoicKatanga Basin. The lowermost sequences were deposited in aseries of restricted rift basins that were then overlain bylaterally extensive, organic-rich marine siltstones and shales.These units contain the bulk of the ore deposits within theCentral African Copperbelt (Kamoa–Kakula is, however, anexception to this). This is in turn overlain by an extensivesequence of mixed carbonate and clastic rocks of the UpperRoan Group. The Roan Group now forms a northerly-directed, thin-skinned thrust-and-fold orogenic system, theLufilian Arc, which resulted from the convergence of theCongo and Kalahari cratons. The metallogenic province isdivided into two distinct districts: the Zambian and Congoleseor Katangan copperbelts.
The Katangan Basin overlies a composite basement madeup of older, multiply deformed and metamorphosedintrusions that are mostly of granitic affinity and supracrustalmetavolcanic–sedimentary sequences. In Zambia, thisbasement is mainly Paleoproterozoic in age (2100–1900 Ma),whereas in the Kamoa–Kakula region, only Mesoproterozoicbasement (ca. 1100–1300 Ma) is known.
The majority of the Kamoa–Kakula project area lies on abroad, gentle plateau between two major north−northeast-trending structures. To the east, and identified primarily by
airborne magnetics, is the Kansoko Trend, which is theinterpreted boundary with the External Fold and Thrust Belt.The geology of the Kansoko Trend is currently poorlydefined. To the west is a prominent escarpment and magneticfeature named the West Scarp Fault.
The Kamoa–Kakula project is located in a broadly foldedterrane centred on the Kamoa and Makalu domes betweenthe West Scarp Fault and Kansoko Trend. The domes formerosional windows exposing the redox boundary between theunderlying haematitic (oxidized) Roan sandstones and theoverlying carbonaceous and sulphidic (reduced) GrandConglomerate diamictite (host to the mineralization). Unlikethe tectonically dismembered deposits of the KatanganCopperbelt and the External Fold and Thrust Belt, the hostrocks at Kamoa–Kakula are intact and relatively undisturbed.
Mineralization at the Kamoa–Kakula Project has beendefined over an irregularly shaped area of 27 km × 15 km.Mineralization is typically stratiform and vertically zonedfrom the base upwards with chalcocite (Cu2S), bornite(Cu5FeS4), and chalcopyrite (CuFeS2). There is significantpyrite mineralization above the mineralized horizon thatcould possibly be exploited to produce pyrite concentrates forsulphuric acid production (needed at oxide copper mines inthe DRC).
The dip of the mineralized body ranges from 0º to 10ºnear–surface above the Kamoa dome to 15º to 20º on theflanks of the dome. Mineralization thicknesses at a 1.0% Cucut–off grade range from 2.3 m to 15.8 m (for IndicatedMineral Resources). The deposit has been tested locally frombelow surface to depths of more than 1560 m, and remainsopen to the east and south.
Mineralization in the majority of the Katangan Copperbeltorebodies, such as at those located at Kolwezi and Tenke–Fungurume, is oxide in nature and is hosted in the MinesSubgroup (R2). The mineralization at Kamoa–Kakula differsfrom these deposits in that it is primarily sulphidemineralization located in the Grand Conglomerate unit(Ki1.1) at the base of the Lower Kundelungu Group.
Kamoa–Kakula Mineral Resources (Table I), as defined forthe Prefeasibility Study (PFS) and Preliminary EconomicAssessment (PEA), are effective 16 May 2017 and are basedon drilling up to 5 May 2014 for Kamoa and 18 April 2017for Kakula.
The new estimate boosts the total tonnage of Kakula’sIndicated Mineral Resources by 50%, at a 3% Cu cut-off,compared with the previous Kakula resource estimate issuedin May 2017 that covered a strike length of 7.7 km. The May2017 resource was used in the 2017 PEA and PFS studies.Kakula’s new Indicated Mineral Resources at a 3% cut-offgrade have increased by 58 Mt and currently total 174 Mt ata grade of 5.62% Cu. This compares with the May 2017estimate of 116 Mt at 6.09% Cu, at the same cut-off grade.Estimated Inferred Mineral Resources now total an additional9 Mt at a grade of 3.66% Cu, at a 3% cut-off. At a 1% Cu cut-off, Kakula’s Indicated Mineral Resources have increased by58%, now totalling 585 Mt at 2.92% Cu.
�
1122

The expanded Kamoa–Kakula project Mineral Resourcesare shown in Table II, and the resource map is shown inFigure 1.
The PFS and PEA were based on the May 2017 MineralResource Estimate. The Kakula Mineral Resource hassubsequently been significantly expanded and includes theKakula West extension as summarized above. In November2017, Ivanhoe issued the results of the Kamoa 2017 PFS andthe Kakula 2017 PEA that reflected the updated developmentscenarios for the Kamoa-Kakula project. The three potentialdevelopment scenarios examined include:
1. Initial mine development scenario. The Kakula 2017PEA evaluates the development of a 6 Mt/aunderground mine and surface processing complex at
the Kakula deposit (a discovery announced in early2016) as the project’s first phase of development.
2. Expanded two-mine development scenario. TheKakula 2017 PEA also includes an option for anintegrated 12 Mt/a two-stage development, beginningwith initial production from the Kakula mine, to befollowed by a separate underground mining operationat the nearby Kansoko mine, along with theconstruction of a smelter.
3. Kamoa 2017 PFS. The Kamoa 2017 PFS evaluates thedevelopment of the Kansoko mine as a standalone 6Mt/a underground mine and surface processingcomplex that would be supplied with ore from theKansoko Sud and Kansoko Centrale areas of theKamoa deposit, which were discovered in 2008. ThePFS refines the findings of the March 2016 KamoaPFS, which envisaged a production rate of 3 Mt/a.
The giant Kamoa—Kakula project in the Democratic Republic of Congo
1123 �
Table I
Indicated 1101 60.3 6.3 2.85 31 391 69.2Inferred 244 19.8 4.3 2.12 5 178 11.5
Table II
Indicated 1340 70.1 6.9 2.72 36 600 80.7Inferred 315 24.9 4.6 1.87 5 890 13.0

The study assessed the potential development of the Kakuladeposit as a 6 Mt/a mining and processing complex. TheKakula mill would be constructed in two smaller phases of 3Mt/a each as the mining operations ramped up to fullproduction of 6 Mt/a. The 24-year life-of-mine productionscenario provides for 108.4 Mt to be mined at an averagegrade of 5.48% Cu, producing 9.4 Mt of high-gradeconcentrate, containing approximately 11.4 billion pounds ofCu.
The average annual production rate for the first five yearsof operation would be 246 000 t Cu at a mine site cash costof US$0.45 per pound Cu and total cash cost of US$1.08 perpound Cu, with annual production reaching up to 385 000 tCu by year four.
The estimated initial capital cost, including contingency,is US$1.2 billion. The capital expenditure for off-site power,which is included in the initial capital cost, includes a US$1 million advance payment to the DRC state-ownedelectricity company, SNEL, to upgrade two hydropower plants(Koni and Mwadingusha) to provide the Kamoa–Kakulaproject with access to clean electricity for its plannedoperations. Mwadingusha is being upgraded first. The workis being led by Stucky Ltd., of Switzerland; the advancepayment will be recovered through a reduction in the powertariff.
The economic analysis uses a long-term price assumptionof US$3.00 per pound Cu and returns an after-tax net presentvalue (NPV) at an 8% discount rate of US$4.2 billion. It hasan after-tax internal rate of return (IRR) of 36.2% and apayback period of 3.1 years.
The Kakula 2017 PEA envisages a three-yeardevelopment period, with development of twin undergrounddeclines already well underway. The Kakula 2017 PEA’sreturns for the 6 Mt/a initial development scenario are set outin Table III for long-term copper prices of $3.00 and $3.50per pound. Table IV sets out the mining, processing,production, and operating and capital cost estimates.
The Kakula 2017 PEA also assessed the potentialdevelopment of the Kakula and Kamoa deposits as anintegrated 12 Mt/a mining and processing complex, built intwo stages. This scenario envisages the construction andoperation of two separate facilities: an initial miningoperation on the Kakula deposit, followed by a, separatemining operation at the Kansoko Sud and Kansoko Centraleareas of the Kamoa deposit.
As this two-stage development scenario was based ondelineated resources at the time (announced May 2017), itdoes not incorporate the mining of any resources that weredelineated at the Kakula West discovery and announced inFebruary 2018 or resources that may result from the ongoingdrilling of high-priority targets located in the untested partsof the Kamoa–Kakula project area.
Each mining operation is expected to constitute aseparate underground mine with a shared processing facilityand surface infrastructure. Included in this scenario is theconstruction of a direct-to-blister flash (DBF) copper smelterwith a capacity of 690 000 t of copper concentrate perannum. As the resources at the Kakula and Kansoko minesare mined out, production would begin at Kamoa North tomaintain a throughput of 12 Mt/a to the then-existingconcentrator and smelter complex.
The giant Kamoa—Kakula project in the Democratic Republic of Congo
�
1124
Table III
Net present value (8% discount rate, $ million) 4 243 5 764Internal rate of return (%) 36.2 42.8Project payback (years) 3.1
Table IV
Plant feed milled (kt) 108 422 4 518Copper feed grade (%) 5.48Copper recovery (%) 86.9Concentrate produced (kt) 9400 392Copper concentrate grade (%) 54.9Contained copper in concentrate (kt) 5164 215Contained copper in concentrate (million lb) 11 385 210
Mine site cash costs 0.60Total cash costs 1.23
Peak funding ($ million) 1135Initial capital cost ($ million) 1231Expansion capital cost ($ million) 318Sustaining capital cost ($ million) 1443

The giant Kamoa—Kakula project in the Democratic Republic of Congo
1125 �
The 44-year life-of-mine production scenario provides for444.3 Mt to be mined at an average grade of 3.79% Cu,producing 34.2 Mt of concentrate, of which 24.5 Mt issmelted internally and 9.7 Mt is sold to external smelters.This produces approximately 30.0 billion pounds of coppercathode and 10.6 billion pounds of copper in concentrate.
The average annual production rate would be 370 000 tCu at a mine site cash cost of US$0.63 per pound copper andtotal cash cost of US$1.02 per pound, after sulphuric acidcredits, for the first ten years of operations, with recoveredcopper annual production of up to 542 000 t by year nine.Given that the first phase is the same as the Kakula 6 Mt/ainitial scenario, estimated initial capital cost, includingcontingency, is approximately the same, at US$1.2 billion.Expansion capital is then funded by using internal cashflows. The economic analysis uses a long-term priceassumption of US$3.00 per pound of copper and returns anafter-tax NPV at an 8% discount rate of US$7.2 billion. It hasan after-tax IRR of 33.0% and a payback period of 3.1 years.
The Kakula 2017 PEA’s returns, for the expanded 12Mt/a scenario, are shown in Table V for long-term copperprices of $3.00 and $ 3.50 per pound. Table VI sets out themining, processing, production, and operating and capitalcost estimates.
In addition to the PEA, a PFS was completed for thedevelopment of a 6 Mt/a Kansoko mine at the Kamoadeposit. This refined the findings of the Kamoa March 2016PFS, which envisaged a production rate of 3 Mt/a.
The PFS is based entirely on the Kamoa 2017 PFSMineral Reserve, details of which are shown in a sectionbelow. The PFS re-assessed the development of the Kamoadeposit as a standalone 6 Mt/a mining and processing
complex. The 26-year life-of-mine production scenarioschedules 125.2 Mt to be mined at an average grade of3.81% Cu, producing 11.4 Mt of high-grade copperconcentrate containing approximately 9.2 billion pounds Cu.
The average annual production rate would be 178 000 tCu at a mine site cash cost of US$0.57 per pound Cu andtotal cash cost of US$ 1.44 per pound Cu for the first tenyears of operation, with an annual production of up to 245000 t Cu by year seven. The estimated initial capital cost,including contingency, is US$1.0 billion.
The economic analysis used a long-term price assumptionof US$3.00 per pound Cu and returns an after-tax NPV at an8% discount rate of US$2.1 billion, which is an increase of110% compared with the after-tax NPV8% of US$986 millionthat was projected in the Kamoa 2016 PFS. It has an after-tax IRR of 24.2% and a payback period of 5.0 years. Theestimated initial capital cost, including contingency, isUS$1.0 billion.
The Kamoa 2017 PFS returns, at a production rate of 6Mt/a, are shown in Table VII for long-term copper prices of$3.00 and $ 3.50 per pound. Table VIII summarizes themining, processing, production, and operating and capitalcost estimates.
Table V
Net present value (8% discount rate, $ million) 7 179 9 808Internal rate of return (%) 33.0 39.6Project payback (years) 4.7
Table VI
Plant feed milled (kt) 444 276 10 079Copper feed grade (%) 3.79Copper recovery (%) 86.0Concentrate produced (kt) 34 206 777Concentrate smelted (kt) 24 461 556Concentrate sold (kt) 9744 221Copper concentrate grade (%) 42.3Contained copper in blister (kt) 9505 216Contained copper in blister (million lb) 20 955 476Contained copper in concentrate (kt) 4820 110Contained copper in concentrate (million lb) 10 627 242
Mine site cash costs 0.78Total cash costs (after credits) 1.20
Peak funding ($ million) 1 139Initial capital cost ($ million) 1 235Expansion capital cost ($ million) 3 647Sustaining capital cost ($ million) 5 133

The giant Kamoa—Kakula project in the Democratic Republic of Congo
�
1126
The Kamoa 2017 PFS includes a Probable Mineral Reserve ofapproximately 125.2 Mt grading at 3.81% Cu, which hasbeen defined in multiple mining zones to support a 6 Mt/aproduction rate over a 26-year mine life. The PFS targets theKansoko Sud and Kamoa Centrale areas of the Kamoaresource. These ore zones occur at depths ranging fromapproximately 60 m to 1235 m. Access to the mine will bevia twin declines. Mining will be by the room and pillar(R&P) method for areas between 60 m and 150 m andcontrolled convergence R&P (CCR&P) for mineralized zonesbelow 150 m. The methods were modified from previousstudies.
Based on the positive results of the CCR&P validationstudy completed in 2016 by KGHM Cuprum Ltd., KamoaCopper engaged KGHM Cuprum to provide CCR&P designcriteria, schedule inputs, panel sequencing, and technicalcontributors for the PFS.
The production development of the R&P method will bein a grid-like fashion, using 7.0 m wide drifts. The roomdevelopment will run parallel to the strike of the panel fordips less than 20°, with belt drives running at an acute angleto the room drifts. Where the dip is greater than 20°, therooms will be developed slightly off strike to accommodate
the acute angle between the room development and the beltdrives. The R&P areas, designed to prevent subsidence, willbe accessible if maintained and ventilated.
CCR&P mining will be used in the mineralization zonesbelow 150 m. An initial panel will be taken as a trial tofurther define the design criteria, operational procedures, andgeotechnical monitoring programmes. The productionschedule is based on mining 70% of the trial panel prior tocommencing additional CCR&P panels.
CCR&P mining is based on the strength and strainparameters of the rock that makes up the mining panelsupporting pillar or technological pillars, and includes thefollowing parameters:
� Ore zone below 150 m � Strength of the immediate roof (i.e., roofbolting and
handling of the rockburst threat)� Strength and strain parameters of the rocks within the
roof of the extraction panel (i.e., the slow bendingabove the extraction space and in the workings)
� Technological pillars (pillars between rooms) designedto work in post-destruction strength state to maximizeore extraction.
The development schedule focuses on the establishmentof necessary mine services and support infrastructure to set
Table VII
Net present value (8% discount rate, $ million) 2 063 3 126Internal rate of return (%) 24.2 30.5Project payback (years) 5.0
Table VIII
Plant feed milled (kt) 125 182 4815Copper feed grade (%) 3.81Copper recovery (%) 87.5Concentrate produced (kt) 11 405 439Copper concentrate grade (%) 36.6Contained copper in concentrate (kt) 9211 354Contained copper in concentrate (million lb) 4178 161
Mine site cash costs 0.64Total cash costs 1.51
Peak funding ($ million) 1 070Initial capital costs ($ million) 1 004Expansion capital costs ($ million) 348Sustaining capital costs ($ million) 1 334

up the initial production mining areas and ramp up to 6 Mt/aore production and associated development waste. Thedevelopment schedule is broken down into the followingthree main phases:
� Phase 1: development of the declines to the main orebins
� Phase 2: R&P mining and CCR&P pillar trial panel � Phase 3: development of Centrale and Sud mining
areas.
The production schedule is based on the followingcriteria:
� Proximity to the main access and early development� High grade and thickness� Mining direction� Panel sequencing follows a declining copper grade
profile.
The production will ramp up over a five-year period,achieving full production by year six. The schedule maintainsfull production for 17 years with an overall mine life of 26years. The schedule is developed to mine a portion of the oretonnage from Kansoko Sud while the majority of the oreproduction is from Centrale mining area.
Kamoa Copper prepared a mining method selection study forthe thicker portions of the Kakula deposit that analysed theresource geometry, grade distribution, ore thickness, andpreliminary geotechnical information to determine the mostappropriate mining methods. The study also included keycriteria such as extraction percentage, design flexibility,productivities, and safety in the evaluation to ensure theselection process was all-encompassing. The results of thestudy indicate that drift-and-fill with paste fill (D&F) is thepreferable method for the high-grade portion of the Kakularesource greater than 6 m thick. This method meets allevaluation objectives. The D&F method has a greater amountof flexibility related to challenges that will be encountered,such as steeply dipping portions of the deposit andgroundwater.
In parallel with the mining method selection study for thethicker area, Kamoa engaged KGHM Cuprum to investigatethe areas of the resource ranging between 3 m and 6 m inthickness and with dips from 12° to 25° for possibleapplication of CCR&P mining methods. The CCR&P validationstudy included geotechnical drilling and test work thatcompared the rock properties and geotechnical parametersbetween Kakula and the KGHM orebody in Poland. Theresults of the study were positive, indicating that the methodcan be applied to Kakula.
The two mining methods selected for the 2017 KakulaPEA were D&F and CCR&P. There is further work requiredduring the ongoing 2018 PFS to further refine the miningmethod design criteria and associated inputs to confirm theassumptions used in the PEA. The mine layout is shown inFigure 2.
Between 2010 and 2015, a series of metallurgical test workprogrammes was completed on drill-core samples of Kamoamineralization. These investigations focused on metallurgicalcharacterization and flow sheet development for theprocessing of hypogene and supergene copper mineralization.
In 2016, further bench-scale metallurgical flotation testwork was carried out at XPS Consulting and TestworkServices laboratories in Falconbridge, Ontario, Canada. Thiswork was conducted on composite samples of drill core fromthe Kansoko Sud and Kansoko Centrale areas in the southernpart of the Kamoa Mineral Resource area. The flow sheetdeveloped was suited for the fine-grained nature of thematerial and yielded positive results. Test work on acomposite grading 3.61% Cu produced a copper recovery of85.4% at a concentrate grade of 37.0% Cu. The secondcomposite, grading 3.20% Cu, produced a copper recovery of89.2% at a concentrate grade of 35.0% Cu using the sameflow sheet.
Additional bench-scale metallurgical flotation test workwas carried out in 2016 on two chalcocite-rich compositesfrom the Kakula deposit at a Zijin Mining laboratory inXiamen, China and by XPS Consulting and Testwork
The giant Kamoa—Kakula project in the Democratic Republic of Congo
1127 �

The giant Kamoa—Kakula project in the Democratic Republic of Congo
Services. The initial composite, grading 4.1% Cu, produced acopper recovery of 86% at a concentrate grade of 53% Cu atthe Zijin Mining laboratory in July 2016. The secondcomposite, grading 8.1% Cu, produced a recovery of 87% atan extremely high concentrate grade of 56% Cu. The flotationtests were conducted using the circuit developed during the2016 Kamoa PFS.
Average arsenic levels in the concentrate were measuredas approximately 0.02%, which is significantly lower than thelimit of 0.5% imposed by Chinese smelters. Extremely lowarsenic levels in concentrate are expected to attract apremium from copper concentrate traders.
The concentrator design (Figure 3) incorporates a run-of-mine stockpile followed by primary and secondary crushingon surface. The crushed material, with a design sizedistribution of 80% passing (or P80) 9 mm, is fed into a two-stage ball-milling circuit for further size reduction to a targetgrind size P80 of 53 μm. The milled slurry will be passedthrough a rougher and scavenger flotation circuit. The high-grade, or fast-floating, rougher concentrate and medium-grade, or slow-floating, scavenger concentrate will becollected separately. The rougher concentrate is upgraded intwo stages to produce a high-grade concentrate. Themedium-grade scavenger concentrate and tailings from thetwo rougher cleaning stages, representing approximately 25%of the feed mass, will be combined and re-ground to a P80 of10 μm before being cleaned in two stages. The cleanedscavenger concentrate will then be combined with the cleanedrougher concentrate to form the final concentrate. The finalconcentrate will be thickened before being pumped to theconcentrate filter where the filter cake will be bagged forshipment to market.
Under the 12 Mt/a scenario examined in the Kakula 2017PEA, the construction of a DBF smelter is envisaged, subject
to further studies on feasibility, scale, and timing. Flashsmelting is typically advantageous compared with othertechnologies because the energy costs are relatively low.
The smelter is designed with a capacity of 690 000 t ofconcentrate, and would operate at full capacity fed by Kamoa–Kakula copper concentrates until the end of the mine life.Concentrate would be first dried and sent to the DBF, where itis smelted in the reaction shaft with oxygen-enriched air toproduce blister copper, molten slag containing oxide minerals,and SO2-rich off-gas. The oxidation reactions providesufficient heat required to melt the charge, although a smallamount of external fuel is used for process control purposes.Molten slag and blister copper collect in the DBF furnacesettler and are intermittently tapped via dedicated tap-holes.The slag is reduced in two electric slag-cleaning furnacesoperating in series to recover copper in the form of blister andalloy, respectively. The SO2-rich off-gas is de-dusted, dried,and sent to a double-contact double-adsorption acid plant forproduction of high-strength sulphuric acid that is sold to thelocal market.
An on-site smelter offers numerous cost savings,including on treatment charges, certain royalties, andtransportation costs, particularly for the lower-grade copperconcentrates from the Kansoko and Kamoa North mines. Thesale of the sulphuric acid by-product would generateadditional revenue. Sulphuric acid is in short supply in theDRC and is imported for use in processing ore from oxidecopper deposits.
Because the Kamoa–Kakula project is a greenfield project, itwill require the development of new infrastructure to conductmining and processing operations. In addition to minedevelopment and processing infrastructure, Kamoa Coppercontemplates developing power, transportation, water,housing, and other ancillary infrastructure.
�
1128

Kamoa Holding is in the process of securing sources ofpower through a joint development with SNEL. In June 2011,a Memorandum of Understanding (MOU) with SNEL wasexecuted, by which the parties agreed to rehabilitate twoexisting hydroelectric plants, Mwadingusha and Koni, thathave an aggregate generation capacity of 113 MW. The costof the rehabilitation will be financed by Kamoa Holdingthrough a loan to SNEL, although the projects will be jointlydeveloped. The loan will be repaid by SNEL through adeduction from the monthly power bills incurred over the lifeof the loan. The MOU contemplates that, following such anupgrade, Kamoa Holding would have an entitlement of up to100 MW from these facilities, which the company believes tobe sufficient for the infrastructure contemplated in the mineplan for the initial concentrate phase. The MOU led to thesigning of a pre-financing agreement with SNEL in June 2012for rehabilitation works on the Mwadingusha power plant.This pre-financing agreement stipulates the exclusive right toconduct full rehabilitation on both the Mwadingusha andKoni plants.
In April 2013, a further MOU with SNEL was signed toupgrade a third hydroelectric power plant, Nzilo 1, to itsdesign capacity of 111 MW. Similar to the June 2011 MOU,Kamoa Holding would finance the refurbishment of Nzilo 1through a repayable loan to SNEL and SNEL would grantKamoa Holding a priority entitlement to power from thepower grid. Nzilo 1, Mwadingusha, and Koni could produce acombined total of up to 200 MW, which is believed to besufficient for the infrastructure contemplated in thesubsequent, expansion phase.
In March 2014, the company signed a financingagreement with SNEL governing the terms of therehabilitation of three power plants and associated nearbytransmission lines and substations. Transmission lines thatrun within 10 km of the Kamoa–Kakula Project have nowbeen extended to the project.
In January 2018, the company announced that thecompletion of rehabilitation of three of the six generators atMwadingusha had increased interim power output to 32 MW(45% of the plant’s designed capacity of 71 MW), with theremaining three generators due to be upgraded and fullyoperational by the end of 2019.
A phased logistics solution is proposed in the Kakula2017 PEA. Initially, the corridor between southern DRC andDurban in South Africa is viewed as the most attractive andreliable export route. As soon as the railway between Kolweziand Dilolo, a town near the DRC–Angola border, is upgraded,the Kamoa–Kakula project’s production is expected to betransported by rail to the Atlantic port of Lobito in Angola. Inaddition, there is the potential to negotiate offtakearrangements with smelters in Zambia.
Water is abundant in the area and Kamoa Copperanticipates that it will be able to secure a nearby water sourcefor its operations as part of further mine developmentplanning. Preliminary water studies have identified bothunderground and surface water sources, specifically theaquifer developed within the sandstone forming the Kamoaand Makalu domes and the footwall to the mining operations,and the Mutaka Dam, approximately 13 km to the east of theproposed plant site.
Kamoa Holding contemplates constructing office andadministrative facilities, an employee village with housing,recreation, and other amenities, including a medical facilityand other associated infrastructure.
To date, Kamoa Copper has not advanced contract andmarket studies, apart from an initial analysis of potential saleof concentrate to Zambian and international smelters. KamoaCopper continues to maintain a dialogue with numeroussmelters in the region.
The company conducted an environmental baseline studythat analysed environmental, biological, social, and culturalheritage issues. As the Kamoa–Kakula project is in a sparselyinhabited area, to date no significant environmental, social,or community risks have been identified.
Numerous community projects have been completed todate, including:
� The construction of three schools, including equipping� A community water project� Farming and agricultural projects� The construction of a community centre� Construction of two poultry projects� Training and job creation.
Following the publication of the Kakula 2017 PEA, a PFS fora 6 Mt/a operation is underway, with completion targeted forthe second half of 2018. In addition, following thepublication of an expanded Mineral Resource for Kakula,including Kakula West, on 26 February 2018, work isunderway to update the Kamoa–Kakula development plan toinclude these new resources in the mine plan.
Underground development work on the twin declines atKakula is progressing according to plan. Each decline hasbeen advanced more than 250 m, approximately 15% of theprojected total distance. The Kakula boxcut was successfullycompleted on 26 October 2017 and the first blast for the twindeclines took place on 16 November 2017. The Kakuladecline development work is being undertaken by JMMC, aDRC subsidiary of JCHX Mining Management of Beijing,China. Depending on ground conditions, the 3600 m declinedevelopment contract is scheduled for completion around theend of 2018. In addition to the declines, other projectdevelopment works planned for 2018 include terracing, theconstruction of a mine access road from Kolwezi airport, andother surface infrastructure at the Kakula camp.
NI 43-101 Technical Report, Kamoa–Kakula 2017 Development Plan, January
2018. https://www.ivanhoemines.com/site/assets/files/3634/kamoa-
kakula_2017_development_plan_-_january_2018.pdf
NI 43-101 Technical Report, Kamoa-Kakula 2018 Resource Update, March
2018. https://www.ivanhoemines.com/site/assets/files/3736/kamoa-
kakula-2018-resource-update-march-2018.pdf �
The giant Kamoa—Kakula project in the Democratic Republic of Congo
1129 �

7th Sulphur andSulphuric Acid 2019
Conference11–12 March 2019 Conference13 March 2019 Technical Visit
Swakopmund Hotel Swakopmund,Namibia
For further information contact:Camielah Jardine: Head of Conferencing, SAIMM
P O Box 61127, Marshalltown 2107Tel: (011) 834-1273/7, Fax: (011) 833-8156 or (011)
838-5923E-mail: [email protected]
Website: http://www.saimm.co.za
BACKGROUNDThe production of SO2 and sulphuric acid remains a pertinent topic in the Southern African mining andmetallurgical industry, especially in view of the strongdemand for, and increasing prices of, vital base metalssuch as cobalt and copper.
The electric car revolution is well underway anddemand for cobalt is rocketing.New sulphuric acid plants are being built, com-prising both smelters and sulphur burners, as the demand for metals increases. However, these projects take time to plan and construct, and in the interim sulphuric acid is being sourced from far afield, some-times more than 2000 km away from the place that itis required.
The need for sulphuric acid ‘sinks’ such as phosphate fertilizer plants is also becoming apparent. All of the above factors create both opportunities andissues and supply chain challenges. To ensure that you stay abreast of developments in the industry, the Southern African Institute of Mining and Metallurgy invites you to participate in a conference on the production, utilization, and conversion of sulphur, sulphuric acid, and SO2
abatement in metallurgical and other processes, to beheld in March 2019 in Namibia.

In the last decade, developments in the coppersmelting industry have been driven by two keyconcepts: (1) increasing cleaner smeltingcapacity to meet the world’s growing copperdemand, as illustrated in Figure 1, and (2)increasing process off-gas capture to complywith more stringent environmental regulationsand abide by a corporate social responsibilityethic of a clean work environment (for smelteremployees) and clean air (for families livingaround smelters). The copper smeltingindustry has also faced some major challengesin the last few decades, including (1) lowtreatment and refining charges (TC/RC orprocessing fees) impacting custom smelters,(2) lower concentrate quality and grades withhigher levels of impurities (e.g. As and Hg),(3) higher processing and transportation costsdue to the rising cost of energy, (4)restrictions in process intensification (tonnageoxygen usage) due to furnace integrity limits,and (5) scarcity of educated and trained
personnel due to fewer metallurgistsgraduating from pyrometallurgical schoolprogrammes combined with a high retirementrate of skilled workers.
In a nutshell, the challenge is tantamountto producing more with lower-qualityconcentrates and less-skilled workers whilelowering the smelter environmental footprintby reducing the energy usage and increasingoff-gas capture at times when profit marginsare low (set by fluctuating TC/RC). Theobvious approach would be to increasesmelting intensity with higher oxygen usage toproduce more copper while reducing processoff-gas generation, ‘removing the dead-handsof nitrogen’ as per the famous words of PaulQueneau Sr. (1977), and therefore reducingthe off-gas treatment costs and lowering thesmelter’s fugitive emissions. This ‘obvious’approach has been in the minds of smeltermen and women ever since tonnage oxygenbecame available at an affordable price. Atestimony to this fact is the development ofoxygen bath and flash smelting to replace low-intensity processes, such as the reverberatoryfurnace, as far back as the 1950s.
The more recent trend in copper processingin the last two or three decades has been forcopper smelters to select flash smelting and/orconverting or top-submerged lancing (TSL)technologies, rather than the bath smeltingfurnaces of the 1970s such as the NorandaReactor and Teniente Converter. For the 2003copper smelter survey, 53 smelters respondedto the questionnaire, representing about 73%of the 2003 world copper smelter production of12.4 Mt (Kapusta, 2004). Notably, the surveyshowed that flash smelting reigned supreme atthe time, accounting for 48.7% of the copper
Sonic injection in sulphide bathsmelting: an updateby J.P.T. Kapusta*
The copper smelting industry faces increasingly stringent environmentalregulations and must continue driving innovation to reduce energy usage inits production chain. With the coming of age of ‘bottom-blowing’ coppertechnologies in China over the last decade, much renewed attention hasbeen brought to tuyere bath smelting for clean copper-making. Sincebottom-blowing sonic injection was originally developed and implemented insteelmaking in the 1970s and lead smelting in the 1990s, the time seemsappropriate to revisit the sonic injection concepts and dispel some myths.After reviewing the trends in the copper industry and providing a briefhistorical context of research and development related to sonic injection, theauthor presents a comparison of the main submerged tuyere bath smeltingtechnologies, namely the Noranda Reactor (NR), the Teniente Converter(TC), and the Chinese Bottom-Blowing Smelting Furnace (SKS/BBS) forcopper, and the Queneau-Schuhmann-Lurgi Reactor (QSL) for lead. The coreof this article, however, consists of a brief description of the fundamentaltheories for sonic injection (jetting regime) and ‘sonic flow mapping’ toillustrate the relationship between the minimum tuyere back-pressurerequired to achieve sonic flow and the tuyere internal diameter. The articlealso offers a comparison between side- and bottom-blowing in jetting regimebefore concluding with the author’s vision of the new trend in submergedtuyere bath smelting.
sulphide smelting, bottom blowing, sonic injection.
* BBA Inc., Canada.© The Southern African Institute of Mining and
Metallurgy, 2018. ISSN 2225-6253. This paperwas first presented at the Copper Cobalt Africa,incorporating the 9th Southern African BaseMetals Conference, 9–12 July 2018, AvaniVictoria Falls Resort, Livingstone, Zambia.
1131 �
http://dx.doi.org/10.17159/2411-9717/2018/v118n11a2

Sonic injection in sulphide bath smelting: an update
produced by the respondents, while all bath smeltingtechnologies combined represented 36.7% of that samecopper production. Bath smelting with side-blowingsubmerged tuyeres represented a mere 20%.
Fifteen years have passed since the 2003 survey and thetrend seems to have been shifted by the Chinese towardswhat they call ‘modern bath smelting technology’ as a dozenor more smelters in China have been built using their so-called ‘bottom-blowing smelting’ furnaces. Not only have theChinese repositioned copper bath smelting with horizontalcylindrical vessels, but they have also positioned theirprocess in the lower quartiles of the cash cost curvespublished by various institutions. Their ability to do so stemsfrom the adoption of ultra-high oxygen-shrouded injectors inthe reactors, transforming them into high-intensity smeltingunits. My goal is to provide readers with a few pointers tounderstand how this was accomplished against all odds.
Mackey and Brimacombe (1992) reported that Guy Savardand Robert Lee of Canadian Liquid Air transformed themetallurgical landscape in 1966 with their invention of thehigh-oxygen-shrouded injector, commonly known as theSavard–Lee tuyere (Savard and Lee, 1966). That inventionbecame the enabling oxygen injection technology for theadvent of the oxygen bottom-blowing metallurgy – or OBMprocess – which revolutionized the steel industry in the1970s.
If Savard and Lee were the first, over a 20-year period inthe 1950s and 1960s, to test and develop sonic injectiontechnologies and then implement their concentric tuyere insteelmaking, I consider that Noranda, at its research centre inMontreal, pioneered the fundamental research to understandthe dynamics of submerged gas injection in nonferrouspyrometallurgy (Themelis, Tarassoff, and Szekely, 1969).The true breakthrough, however, came from the Brimacomberesearch group at the University of British Columbia, whichidentified and characterized for the first time two distinctinjection regimes: bubbling and jetting (Oryall andBrimacombe, 1976; Hoefele and Brimacombe, 1979), asillustrated in Figure 2.
Following the pioneering work of Savard and Lee,Noranda, and the University of British Columbia, much
attention and research around the world were devoted to thedynamics of submerged gas injection into molten metals. Awealth of knowledge on gas injection phenomena wasproduced in the golden decades of the 1970s and 1980swhen gas injection dynamics research, both in the laboratoryand during plant trials, was conducted to elucidate the criticalaspects of submerged gas injection, including thecharacterization of steady jetting conditions or thequantification of gas penetration into molten baths. Thisbroad know-how, in large part generated in Canada, hasserved as the basis for my own understanding of gasinjection phenomena and for the development of sonicinjection technologies. Although I have previously publisheda detailed review of the development of the Savard–Leetuyere and its subsequent adoption and adaptation tononferrous smelting and converting (Kapusta, 2013; Kapustaand Lee, 2013), I will use this article to further share some ofmy insights into sonic injection.
For the sake of brevity, I will discuss, in this paper, only thecopper bath smelting technologies using horizontal cylindricalvessels; namely, the Noranda Reactor (NR), the TenienteConverter (TC), the Queneau–Schuhmann–Lurgi Reactor
�
1132

(QSL), and the Bottom-Blowing Smelting Furnace (SKS/BBS).A similar analysis would also be valid for the bath convertingvessels (Peirce–Smith, Hoboken, and bottom-blowingconverters). The NR and TC use conventional side-blowinglow-pressure tuyeres while the QSL and SKS/BBS usebottom-blowing high-oxygen-shrouded injectors. The NR andTC are known to operate in bubbling regime and the QSL injetting regime, but the actual mode of operation of theSKS/BBS, bubbling or jetting regime, is still unclear. In thissection, I will attempt to shed some light by providing a briefgas dynamics analysis and some explanations about thedifferences between conventional low-pressure and sonicinjection.
In a short course on gas injection phenomena that I havebeen offering for over 15 years, and presented in part at aconference (Kapusta and Richards, 2009), I review thedynamics of submerged gas injection and illustrate theconcepts with images and videos from laboratory researchand plant trials. One key conclusion is that conventional low-pressure, single-pipe tuyere injection is characterized by fourmain phenomena.
� Although injected continuously, the gas discharges aslarge discrete bubbles in the molten bath – hence theterm bubbling regime – with a frequency of 8 to 12bubbles per second and a bubble diameter in the rangeof 40 to 70 cm.
� The large discrete bubbles do not penetrate forwardinto the molten bath but rise vertically above the tuyeretip, causing the oxidation reactions to occur at therefractory wall and resulting in severe tuyere-linedamage.
� The collapsing of large bubbles at the bath surfacegenerates bath slopping and splashing conditions,resulting in accretion formation on the convertermouth, production downtime to clean the mouth, andincreased damage to the refractory bricks around themouth.
� After each bubble detachment, i.e., 8 to 12 times persecond, molten metal penetrates and solidifies insidethe tuyeres, forming a plug that hinders the flow of gasand requires mechanical punching to be dislodged,further increasing tuyere-line damage.
In addition to tuyere blockage, gas flow rate fluctuations,tuyere punching, and refractory damage, conventional tuyereinjection under bubbling regime is also characterized by alower vessel intensity due to limited oxygen enrichmentlevels and to gas leaks and losses of up to 15% through thetuyere body during punching, as well as an increasedpredisposition to fugitive emissions due to higher off-gasvolumes at lower SO2 strength. In fact, all bath smelting,converting, and refining vessels using side-blowing,including the NR and TC, Peirce–Smith and Hobokenconverters, and anode furnaces, were developed for and stilloperate under low-pressure bubbling conditions with all thelimitations and hindrances listed above. Over time, ratherthan addressing the cause of the problems – the unfavourablegas dynamics of the bubbling regime – the nonferrousindustry focused instead on mitigating the consequences withnew technological developments. Great examples of such
mitigating technologies were the invention of the automaticpunching machines to reopen the blocked tuyeres and thedevelopment and implementation of secondary and tertiaryhoods to capture the large off-gas volumes and associatedfugitive emissions produced under low-intensity bubblingregime.
A step back in history will show that when the NR and TCwere developed in the 1970s, the quality of copperconcentrates was high (35–40% Cu), which imposed someconstraints in processing, even at a time when tonnageoxygen was becoming more affordable and common incopper smelters. In their paper on new and emergingtechnologies in sulphide smelting, Mackey and Tarassoff(1983) provided the elements to understand how coppersmelters in the early 1980s were evolving to improve theirenergy footprint while increasing throughput. With onediagram, reproduced in Figure 3, Mackey and Tarassoffillustrated the fundamental concept that autogenous smeltingof a chalcopyrite concentrate in a flash or bath smeltingfurnace had an upper limit of oxygen enrichment. This limit,when producing a 75% matte grade, was about 48–50% O2for a wet concentrate (7% moisture), as marked on the figureby the blue arrow added to the original graph, dropping toabout 37–38% O2 for a dry concentrate (0.1% moisture),demonstrating the strong impact of concentrate moisture inautogenous copper smelting.
Although no proven gas injection technology for mattesmelting capable of enrichment levels of 48% and above insubmerged tuyeres was available at the time (early 1980s),the need for such an injection technology was not evenwarranted. Operators of the new bath NR and TC smeltingvessels were still learning the practice of using largeramounts of oxygen in smelting and the enrichment levelsachieved, 30–32% O2, were still far from the abovementionedupper limits of 37–38% and 48–50% for dry and wetconcentrates, respectively. Nevertheless, fully autogenousoperation was not even the goal as the supplemental use ofcoal or coke was seen in both Canada and Chile as beneficialto the process chemistry. At their apogee in the early 1990s,more than a dozen NRs and TCs were in operation and bothNoranda and Codelco were promoting their matte smeltingvessels as ‘technologies of choice for emerging economies of
Sonic injection in sulphide bath smelting: an update
1133 �

the 21st century’ due to their low capital cost, flexibility inprocessing various feeds, and ease of retrofit into existingconverter aisles.
Fast-forward to 2018 and only two NRs (the Horne andAltonorte smelters) and six TCs (Caletones, Chuquicamata,Hernan Videla Lira, La Caridad, Las Ventanas, and Potrerillossmelters) remain in commercial operation as the flashfurnace has continued to rule supreme and the other bathsmelting technologies, the top submerged lancing (TSL)furnaces (Isasmelt and Ausmelt) and the SKS/BBS furnace,gained momentum.
The original concept of the QS reactor for copper smeltingwas developed two years after the Savard–Lee concentrictuyere was commercially implemented in steelmaking.Queneau and Schuhmann were impressed with the concentrictuyere and believed its use in copper smelting would providethe smelting intensity they were envisioning while limitingthe off-gas volumes (Queneau and Schuhmann, 1974).History will remember that the copper industry rejected theirconcept while a visionary from Europe, Werner Schwartz ofLurgi, saw its potential for the lead industry. The new reactordeveloped with Lurgi, hence the acronym QSL for Queneau–Schuhmann–Lurgi, became the first bottom-blowing smeltingreactor in the nonferrous industry. Kapusta and Lee (2013)provided details of the QSL process developments, frombench and pilot scale to demonstration and commercialplants.
The design of the concentric oxygen injector also evolvedgreatly during the development of the QSL process. Tested ina demonstration plant, the gear-type design, as opposed tothe earlier simple pipe-in-a-pipe design, was adopted forcommercial operation to reduce the gas momentum bydividing the gas streams into many small conduits, asillustrated on Figure 4. If the gas momentum was indeedlowered, the required pressure to achieve sonic velocity wasdrastically increased to the range 1 200 to 1 600 kPagaccording to the research archives from Air Liquide andLurgi. I will elaborate later in the paper on the reasons whysuch high pressures were needed.
By the early 1990s, four commercial QSL reactors hadbeen designed, built, and commissioned at Cominco, Trail,
BC, Canada, in 1990 (120 000 t/a original design capacity,no longer in operation), Berzelius, Stolberg, Germany, in1990 (80 000 t/a original design capacity, currently 155 000t/a), CNIEC, Baiyin, China, in 1990 (52 000 t/a originaldesign capacity, no longer in operation), and Korea Zinc,Onsan, South Korea, in 1991 (60 000 t/a original designcapacity, currently above 130 000 t/a).
The SKS/BBS furnace developed by the Chinese bearssuch a marked resemblance to the QSL vessel that eminentmetallurgists in the western world questioned its chances ofsuccess in copper smelting, even dismissing its claim to be anew invention. Kapusta and Lee (2013) suggested insteadthat the SKS/BBS furnace was an adoption of the QSLconcept with bottom-blowing shrouded injectors that wasadapted to copper smelting, since only the oxidizing sectionof the QSL reactor was retained for the design of theSKS/BBS furnace. This, if not an invention in itself, iscertainly a notable innovation as it took a copper smeltingprocess concept – the Cu–QS process as described byQueneau and Schuhmann (1974) – which was rejected by theglobal copper industry in its time, and developed it into oneof the most important matte smelting technologies in China.
I have always assumed that the goal of the ChineseSKS/BBS innovators was to develop a high-intensity smeltingprocess that could treat wet feed with ultra-high oxygeninjection and produce low volumes of off-gases at higher SO2strength. A study with my colleagues at BBA (Kapusta,Larouche, and Palumbo, 2015) showed that in spite of muchdisbelief from the western copper industry experts, thisassumed goal was actually achieved: the SKS/BBS furnacesexamined were more intense than the NR/TC reactors, evenat lower feed grades of 22% Cu (versus 37% for the NR and27% for the TC in the study).
The SKS/BBS injector design, at least as presented inpublications from China ENFI Engineering and DongyingFangyuan, also has some strong resemblance to the QSLinjectors based on the Savard–Lee tuyere, as illustrated inFigure 5. The key difference, however, is the reported lowpressure of operation of the SKS/BBS injectors, at 400 to 600 kPag, apparently as a means to limit the energy cost ofthe process.
The question that comes to mind is why did the QSLinventors recommend the use of a very high pressure (up to1 600 kPag) if the much lower pressure (below 600 kPag)
Sonic injection in sulphide bath smelting: an update
�
1134

Sonic injection in sulphide bath smelting: an update
1135 �
used in China is sufficient? The true question is actuallywhether the gases flowing through a multitude of smallorifices of a gear-type Savard–Lee shrouded injector couldreach sonic velocity (jetting regime) with pressures in therange of 400 to 600 kPag? In the next section, I will brieflyexplain the principle of injection in jetting regime, attemptingto dispel some of the myths about sonic injection, and willprovide a bubbling-jetting map of inlet or back-pressurerequirements for various orifice/tuyere diameters at twodifferent submergences. This map should provide readerswith a quick diagnosis tool to evaluate whether or not aprocess is operated in jetting regime, based on the single-pipetuyere or shrouded injector design and the claimed operatingpressure range.
Following the pioneering work of Savard and Lee, whichtriggered a transformation of the metallurgical landscape,much attention was devoted to the dynamics of submergedgas injection into molten metals. The wealth of knowledge onsubmerged gas injection phenomena produced in the 1970sand 1980s is well documented in the seminal paper ofBrimacombe et al. (1990). I personally gained furthertheoretical knowledge and new practical experience fromplant trials conducted by Air Liquide in the 1990s at UnionMinière’s Hoboken smelter in Belgium – now Umicore(Bustos, Cardoen, and Janssens, 1995) – and atFalconbridge’s Sudbury smelter in Canada – now GlencoreNickel (Bustos et al., 1999). This newly acquired know-howallowed me to successfully contribute to the subsequentcommercial implementation of shrouded injection in the SlagMake Converter (SMC) at the Falconbridge smelter (Bustosand Kapusta, 2000; Kapusta, Stickling, and Tai, 2005) and inthe Hoboken converters at the Thai Copper Industries smelterin Thailand (Kapusta, Wachgama, and Pagador, 2007;Pagador et al., 2009). More recently, I acquired someadditional insights with BBA during plant trials of single-pipe sonic tuyeres in a Peirce–Smith converter at the LonminPlatinum smelter in South Africa (Kapusta et al., 2012).Based on this acquired theoretical knowledge and practicalexperience, I offer in my short course on gas injectionphenomena the following main characteristics andadvantages of sonic injection.
� Achieving sonic velocity (jetting regime) requireshigher pressures than conventional bubbling regime,typically above 250 kPag depending on tuyere diameterand submergence.
� The injected gases discharge as a continuous jet in themolten bath – hence the term jetting regime –characterized by a swarm of smaller bubbles.
� Sonic tuyeres or injectors do not require punching (notuyere blockage) as the bath does not come in contactwith or penetrate the sonic tuyeres or injectors, andtherefore gas leaks and losses at the back of thetuyeres are greatly reduced or eliminated.
� Properly designed and operated sonic tuyeres andinjectors reduce slopping and splashing.
� Sonic injection is characterized by a stable gas flowrate throughout the blowing period, and therefore acontrolled amount of oxygen is delivered to the bath,which translates into better metallurgical control.
� Sonic injection also allows higher levels of oxygenenrichment, typically in the range of 25–45% withsingle-pipe sonic tuyeres, and above 35% with sonicshrouded injectors.
In addition to punchless operation and stable gas flowrate, sonic injection under jetting regime is also characterizedby higher vessel intensity due to higher permissible oxygenenrichment levels. This higher oxygen intensity allows ahigher reverts and cold charge reprocessing rate whilegenerating lower off-gas volumes, which therefore reducesthe propensity for fugitive emissions.
Adoption and implementation of sonic injection in basemetals occurred much later and at a much slower pace thanin the steel industry, partly due to some misconceptions andmisunderstandings of the technology, and also due to theslower pace of process intensification and tonnage oxygenusage in nonferrous metallurgy compared with steelmaking.One of the biggest myths about sonic injection within thebase metals industry is that ‘very high pressures’ arerequired and that the benefits of operating in jetting regimeare cancelled out by the cost of delivering the gases at theseperceived ‘very high pressures’. Jetting regime certainly doesrequire higher pressures than conventional bubbling regime,but let us evaluate this myth quantitatively before we dispelit. Another myth is that bottom-blowing is ‘obviously’ betterthan side-blowing as it provides a longer residence time forthe injected gases, and therefore results in better oxygenefficiency. I will also evaluate and challenge this belief.
The basic principle in sonic injection is to consider the gases

Sonic injection in sulphide bath smelting: an update
�
1136
flowing through a tuyere or injector to be compressible andadiabatic with wall friction effects through ducts of constantcross-sectional area (inner pipe and annulus for a shroudedinjector). This type of flow is commonly known as Fannoflow. From the compressible fluid flow literature (for exampleOosthuizen and Carscallen, 1997; Saad, 1985), deriving theFanno flow equations and integrating over the length of thetuyere or injector while setting the value of the Mach numberat the tip to unity (Moutlet = 1) – since the fundamental designcriteria of a sonic tuyere or injector is that both gas streamsare to exit at sonic velocity – the following expressions forFanno flow are obtained:
[1]
[2]
where f, L, and Dh are the friction factor, the length, and thehydraulic diameter of the duct, respectively, k is the Cp/Cvratio of the gas, Minlet is the Mach number at the inlet of theduct, and Pinlet and Poutlet are the inlet and outlet pressures ofthe gas stream.
Based on my experience, sonic flow conditions (Mach 1)are indeed necessary but not necessarily sufficient formaintaining stable jetting. The necessary and sufficientcondition for sonic tuyere and injector design, whether formatte smelting, converting, or refining, is that the fullyexpanded Mach number, Mexp, attains a critical value largerthan unity. This critical value is determined by applying thePrandtl–Meyer theory of expansion wave to sonic gas flow,as suggested by Ozawa and Mori (1983a, 1983b), whospeculated that an underexpanded gas jet attaining sonicflow at the tuyere exit would discharge as a supersonic jetinto molten metal in the immediate vicinity of the tuyere.They derived the formulation to characterize the initialexpansion angle and the fully expanded Mach number of thesupersonic jet as follows:
[3]
[4]
where c is the initial expansion angle (or jet cone angle),Mexp is the fully expanded Mach number of the supersonic
jet, Pexit is the gas pressure at the tuyere exit and Pmetal is themetallostatic pressure of the bath above the tuyere exit.Figure 6 provides a graphical representation of the initialexpansion angle to help understand its significance. In theirresearch work, Oryall and Brimacombe (1976) determinedthat the initial expansion angle for submerged gas injectionunder bubbling regime is in the range 150° to 155° (bubblegrowth prior to detachment). Farmer et al. (1989) conducteda study with small tuyeres with diameters in the range 1.4 to2.0 mm. Based on their results, they proposed the criterionthat stable jetting regime is attained at a value of Mexp above1.25, corresponding to an initial expansion angle larger than10°. Although providing an interesting comparison betweenbubbling and jetting in terms of initial expansion angle, theapplicability of their criterion is, however, limited to therange of tuyere diameters they used in their study (1.4 to 2.0 mm). A complete review of the Prandtl-Meyer theory andre-derivation of the mathematical expressions was recentlypublished by Kapusta (2017).
Although Mexp is mathematically independent of thetuyere or injector diameter or the liquid-to-gas density ratio,based on my experience in sonic injection in both copper andnickel converting, the minimum or critical value of Mexp, andcorrespondingly c, required for stable jetting is impacted bythe physical characteristics of the gas–molten bath system,particularly the gas flow rate and momentum, and thereforeindirectly to the tuyere or injector diameter.
Let us now revisit the myth that ‘very high pressures’ areneeded to achieve sonic flow or jetting regime by exploringthe pressure and flow rate requirements for jetting as afunction of tuyere or injector diameter and submergence. Forillustration purposes, I have performed a series ofcalculations using Equations [1] to [4] to determine theminimum tuyere back-pressure required to achieve sonicflow as a function of tuyere diameter for a tuyeresubmergence of 0.75 m and 1.10 m, with a bath densityabove the tuyere of 4 500 kg/m3 and 4 700 kg/m3,respectively. The portion of bath above the tuyere being amixture of white metal and slag, I simply assumed a higherdensity at the 1.10 m submergence to account for a largerproportion of white metal than slag at a higher bath depth.Finally, I considered a 1.00 m long tuyere in all calculations.The results are depicted in the graph in Figure 7, whichcorresponds to what I call a ‘sonic flow mapping’ for thespecific conditions of the case study.
The curves for the two submergence cases correspond tothe boundaries for the transition between the end of thebubbling regime at a Mach number close to but lower than

unity and the beginning of the stable jetting regime at a fullyexpanded Mach number, also close to but greater than unity.These curves, obtained by calculating the minimum tuyereback-pressure required to achieve sonic flow as a function oftuyere diameter, actually represent the incipient jettingboundaries.
The areas of the graph below and above the boundariescorrespond to the bubbling and jetting regions, respectively.For example, a 50 mm inner diameter single-pipe tuyereinjecting compressed air and oxygen at a back-pressure of100 kPag is operating in the bubbling regime – point A in thebubbling region of the graph. If the injection back-pressure israised above 300 kPag (above the incipient jetting curves forthe two submergence cases at an inner diameter of 50 mm, to350 kPag for instance – Point B in the jetting region of thegraph) the tuyere will operate in the jetting regime. Arthur,Siegmund, and Schmidt (1992) indicated that a QSL reactorfor lead sulphide smelting needed to operate within thetuyere back-pressure range of 1 000 to 1 500 kPag using aSavard–Lee-type concentric tuyere with a structure as shownon Figure 8, while Ashman (1998) indicated back-pressuresas high as 1 900 kPag. Such high gas pressures arenecessary due to the very small flow areas of the 1.0 mm by 1.6 mm orifices (1.43 mm equivalent diameter) for theshrouding gas mixture of nitrogen, atomized water, and ahydrocarbon gas, and the 3.0 mm by 4.5 mm orifices (4.15 mm equivalent diameter) for the reactive oxygen-enriched air. The box in the top left corner of the graph
represents the QSL reactor injection back-pressure rangefrom Arthur, Siegmund, and Schmidt (1992). The texturedbox in the bottom right corner corresponds to the operatingrange of conventional low-pressure injection of the NR, TC,and Peirce–Smith converter (PSC) with tuyere diametersbetween 40 and 60 mm and back-pressures of about 100 to140 kPag.
I recently published a study of submerged gas jet penetrationinto molten metal and compared the bubbling versus jettingregime and side versus bottom blowing (Kapusta, 2017). Forthis study, I used the mathematical formulation of a gas jettrajectory and penetration into a liquid that was developedalmost 50 years ago by Themelis, Tarassoff, and Szekely(1969). Their formulation was based on continuity andmomentum balances to calculate an idealized gas jet axistrajectory based on parameters such as tuyere diameter andinclination angle, jet cone angle or initial expansion angle,modified Froude number, and bath and gas densities. Figure 9 represents a scaled diagram of a smelting vesselwith a 4.0 m internal diameter, a 1.0 m height of white metal,and an average slag height of 1.70 m.
The diagram offers a comparison of the gas jettrajectories for a side-blowing tuyere positioned at a 49°angle from the vertical and inclined downward from thehorizontal by 18° and a bottom-blowing tuyere positioned ata 22° angle from the vertical and installed radially. Thetrajectory curves on Figure 9 represent the calculated‘idealized’ gas jet axis trajectories using an initial expansionangle value of 20° (Kapusta, 2017). The actual gas jetboundaries widen as the gas penetrates into the bath andaway from the tuyere tip. The width of the gas jet depends ona number of parameters, including the initial expansionangle, the gas and bath densities, as well as the tuyere orificediameter, inclination angle, and submergence.
Sonic injection in sulphide bath smelting: an update
1137 �

Sonic injection in sulphide bath smelting: an update
One surprising result was that the calculated length of thetrajectories for side and bottom blowing under the conditionsused in Figure 9 were about the same, at 156 and 159 cm forside and bottom blowing, respectively. This result seems toindicate that bottom blowing does not necessarily provide alonger gas jet trajectory than side blowing with an optimumtuyere inclination angle; in fact, the residence time for thereactive gas to create conditions for oxygen efficiencies isvery similar. In practice, however, the more significantdifference, in my opinion, resides in the matte and slagrecirculation flow patterns generated by side blowingcompared with bottom blowing. The key for success for bothside and bottom blowing in jetting regime is that the injectorsmust be designed and operated to maintain sonic flow whileensuring the degree of underexpansion is sufficient, yet nottoo large, so that the gas jet exiting at sonic velocity at the tipof the tuyere becomes supersonic immediately after exitingthe tuyere (Prandtl-Meyer flow).
The nonferrous metals industry has been reluctant toimplement sonic injection and is still very slow in deploying itcommercially in spite of its great advantages. I believe thatthere are three main reasons for this slow adoption andimplementation. The first is the aversion to risk and changethat characterizes the copper industry, in great contrast to thesteel industry. The second is more historical thantechnological. One has to remember that the Savard–Leeconcentric tuyere was invented for the steel industry at atime, in the 1960s and 1970s, when capturing and treatingprocess off-gases in copper and nickel processing was notlegislated and when ‘superstacks’ spewing and dispersingSO2-laden fumes were the pride of the smelters and townswhere they were standing tall. Acid plants were stilluncommon and a distant staple of a copper or nickel smelter.With no legislation to ‘encourage’ mining companies toreduce their SO2 and dust emissions, the cost ofimplementing sonic injection with compressors rather thanblowers was too high, with no means to amortize theinvestment. The third reason has a human dimension and isrelated to the reluctance of smelter managers, engineers, and
operators to believe that sonic injection was, and is,punchless. Peirce–Smith converters, for example, haveoperated for more than a hundred years with punching of thetuyeres, first manually, then mechanically, with a dedicatedcrew of operators or automatically in the best cases.
The nonferrous industry has certainly matured as the useof tonnage oxygen has become a prevalent reality to boostprocess intensity. Legislation to protect the environment andpopulations around smelters has also matured and somemining companies have transformed the obligation to complywith new environmental and work hygiene legislation intoopportunities to improve the competitiveness of theiroperations. Their corporate social responsibility – combinedwith a spirit of technological innovation – has allowed theirsmelters to sit comfortably in the lower quartile of the cashcost curve of worldwide smelters. Some of these lower costsmelters have made high- or ultra-high-oxygen injection anessential part of their technological development plan, leadingthem to adopt and implement variations of the Savard–Leeconcentric tuyere.
I am convinced that the nonferrous industry has finallyseen the dawn of sonic injection with its growing adoption inChina and that sonic injection in bath smelting, converting,and refining will become a mainstream technology within thenext ten years. The wealth of knowledge in submerged gasinjection phenomena and the practical and operationalexperience acquired by the few companies that have operatedhigh-intensity reactors equipped with sonic tuyeres orinjectors will be put to use to further improve the design andlifespan of sonic tuyeres and injectors. Examples ofcompanies with experience in high-intensity sonic injectioninclude Berzelius in Germany and Korea Zinc in South Koreawith their QSL reactors for lead processing, Glencore Nickel inCanada with their original Slag Make Converter (now replacedby two hybrid vessels capable of both converting and slagcleaning using high-oxygen-shrouded injectors), andnumerous lead and copper smelters in China using SKS/BBSfurnaces.
Back in 1998 during his short course on Peirce–Smithconverting at the TMS Annual Meeting, Tony Eltringham toldAlejandro Bustos – my mentor at the time at Air LiquideCanada – that ‘Air Liquide was 20 years ahead of theindustry with its Air Liquide Shrouded Injection (ALSI)Technology’. Twenty years later and no longer a junior in thefield, I am delighted to be witnessing the current evolution ofthe copper and nickel industry with its renewed interest inhigh-oxygen sonic injection, an evolution that is fully in syncwith my work findings and with Tony Eltringham’s foresight.I truly look forward to taking part in this new transformationof the metallurgical landscape of the nonferrous industry andto contributing in any way I can in the deployment andoptimization of sonic injection.
I wish to acknowledge and thank the management of BBA forencouraging me and giving me the opportunity to spend timeto prepare this manuscript and allowing me to present it atCu-Co 2018 in Zambia and to publish it in the SAIMMJournal. Without sharing, knowledge and experience get lostand so does the chance for individuals to help our industrymove forward another step.
�
1138

ARTHUR, P., SIEGMUND, A., and SCHMIDT, M. 1992. Operating experience with QSLsubmerged bath smelting for production of lead bullion. Proceedings of theSavard/Lee International Symposium on Bath Smelting. Brimacombe, J.K.,Mackey, P.J., Kor, G.J.W., Bickert, C., and Ranade, M.G. (eds). TheMinerals, Metals and Materials Society of AIME, Warrendale, PA. pp. 127–145.
ASHMAN, D. 1998. Lead pyrometallurgy. Lead and zinc processing short courseat the 1998 Conference of Metallurgists, Calgary, Alberta, 15–16 August1998. The Metallurgical Society of CIM, Montreal, QC.
BRIMACOMBE, J.K., NAKANISHI, K., ANAGBO, P.E., and RICHARDS, G.G. 1990. Processdynamics: gas-liquid. Proceedings of the Elliott Symposium on ChemicalProcess Metallurgy. Koros, P.J. and St. Pierre, G.R. (eds). The Iron andSteel Society of AIME (ISS), Warrendale, PA. pp. 343–412.
BUSTOS, A.A., CARDOEN, M., and JANSSENS, B. 1995. High oxygen enrichment atUM-Hoboken converters. Proceedings of Copper 95 – Cobre 95, Vol. IV –Pyrometallurgy of Copper. Chen, W.J., Diaz, C., Luraschi, A., and Mackey,P.J. (eds). The Metallurgical Society of CIM, Montreal, QC. pp. 255–269.
BUSTOS, A.A., KAPUSTA, J.P., MACNAMARA, B.R., and COFFIN, M.R. 1999. Highoxygen shrouded injection at Falconbridge. Proceedings of Copper 99 –Cobre 99 International Conference, Vol. VI – Smelting, TechnologyDevelopment, Process Modeling and Fundamentals. Diaz, C., Landolt, C.,and Utigard, T. (eds). The Minerals, Metals and Materials Society ofAIME, Warrendale, PA. pp. 93–107.
BUSTOS, A.A. and KAPUSTA, J.P. 2000. High oxygen shrouded injection in copperand nickel converters. Proceedings of the Brimacombe MemorialSymposium. Irons, G.A. and Cramb, A.W. (eds). The Metallurgical Societyof CIM, Montreal, QC. pp. 107–124.
CHINA ENFI ENGINEERING CORPORATION. 2013. Oxygen bottom blowing coppersmelting technology (SKS). http://wenku.baidu.com/view/4a6be5990029bd64783e2cf1.html [accessed 11 March 2018].
FARMER, L., LACH, D., LANYI, M., and WINCHESTER, D. 1989. Gas injection tuyeredesign and experience. Proceedings of the 72nd Steelmaking Conference.The Iron and Steel Society of AIME (ISS), Warrendale, PA. pp. 487–495.
HAO, X., LU, Z., WEI, K., ZHANG, Z., HU, L., LI, B., WEN, Z., SU, F., and YU, Y.2013. Development and application of oxygen bottom-blowing Cusmelting technology. Proceedings of the Copper 2013 International CopperConference, Vol. III (Book 2)—The Nickolas Themelis Symposium onPyrometallurgy and Process Engineering. Bassa, R., Parra, R., Luraschi,A., and Demetrio, S. (eds). Instituto de Ingenieros de Minas de Chile,Santiago. pp. 451–459.
HOEFELE, E.O. and BRIMACOMBE, J.K. 1979. Flow regimes in submerged gasinjection. Metallurgical Transactions B, vol. 10B, no. 4. pp. 631–648.
International Copper Study Group. 2017. The World Copper Factbook 2017.Lisbon.
KAPUSTA, J.P. 2004. JOM World Nonferrous Smelters Survey, Part I: Copper.JOM, July. pp. 21–27.
KAPUSTA, J.P. 2013. Sonic injection in bath smelting and converting: myths,facts and dreams. Proceedings of the Ralph Harris Memorial Symposium.Harris, C., Kashani-Nejad, S., and Kreuh, M. (eds). The MetallurgicalSociety of CIM, Montreal, QC. pp. 267–317.
KAPUSTA, J.P. 2017. Submerged gas jet penetration: a study of bubbling versusjetting and side versus bottom blowing in copper bath smelting. JOM,June. pp. 970–979.
KAPUSTA, J.P.T., DAVIS, J., BEZUIDENHOUT, G.A., LEFUME, S., and CHIBWE, D.K.2012. Industrial evaluation of sonic injection in a Peirce-Smith converterat the Lonmin Platinum Smelter. Proceedings of the 51st Conference ofMetallurgists – Towards Clean Metallurgical Processing for Profit, Socialand Environmental Stewardship Symposium. Schonewille, R.H., Rioux, D.,Kashani-Nejad, S., Kreuh, M., and Muinonen, M.E.S. (eds). TheMetallurgical Society of CIM, Montreal, QC. pp. 43–58.
KAPUSTA, J.P.T., LAROUCHE, F., and PALUMBO, E. 2015. Adoption of high oxygenbottom blowing in copper matte smelting: why is it taking so long?
Proceedings of the Torstein Utigard Memorial Symposium. Muinonen, M.,Marin, T., and Stubina, N. (eds). The Materials and Metallurgical Societyof CIM, Montreal, QC, Canada. Paper no. 9078.
KAPUSTA, J.P.T. AND LEE, R.G.H. 2013. The Savard-Lee shrouded injector: areview of its adoption and adaptation from ferrous to non-ferrouspyrometallurgy. Proceedings of the Copper 2013 International Conference,Volume III (Book 2) – The Nickolas Themelis Symposium onPyrometallurgy and Process Engineering. Bassa, R., Parra, R., Luraschi,A., and Demetrio, S. (eds). Instituto de Ingenieros de Minas de Chile,Santiago. pp. 523-558.
KAPUSTA, J. and RICHARDS, G. 2009. Injection phenomena in the PS converter –the teachings of J. Keith Brimacombe and his UBC research team.International Peirce-Smith Converting Centennial Symposium ShortCourse. 138th Annual Meeting & Exhibition of TMS, San Francisco.
KAPUSTA, J.P., STICKLING, H., and TAI, W. 2005. High oxygen shrouded injectionat Falconbridge: five years of operation. Proceedings of Converter and FireRefining Practices. Ross, A., Warner, T., and Scholey, K. (eds). TheMinerals, Metals and Materials Society of AIME, Warrendale, PA. pp. 47–60.
KAPUSTA, J.P.T., WACHGAMA, N., and PAGADOR, R.U. 2007. Implementation of theAir Liquide shrouded injector (ALSI) technology at the Thai CopperIndustries smelter. Proceedings of the Copper 2007 – Cobre 2007International Conference, Vol. III (Book 1) – The Carlos Diaz Symposiumon Pyrometallurgy. Warner, A.E.M., Newman, C.J., Vahed, A., George,D.B., Mackey, P.J., and Warczok, A. (eds). The Metallurgical Society ofCIM, Montreal, QC. pp. 483–500.
MACKEY, P.J. and BRIMACOMBE, J.K. 1992. Savard and Lee – transforming themetallurgical landscape. Proceedings of the Savard/Lee InternationalSymposium on Bath Smelting. Brimacombe, J.K., Mackey, P.J., Kor, G.J.W.,Bickert, C., and Ranade, M.G. (eds). The Minerals, Metals and MaterialsSociety of AIME, Warrendale, PA. pp. 3–28.
MACKEY, P.J. and TARASSOFF, P. 1983. New and emerging technologies insulphide smelting. Proceedings of Advances in Sulfide SmeltingSymposium, Vol. 2. Technology and Practice. Sohn, H.Y., George, D.B.,and Zunkel, A.D. (eds). The Metallurgical Society of AIME, New York, NY.pp. 399–426.
OOSTHUIZEN, P.H. and CARSCALLEN, W.E. 1997. Compressible Fluid Flow.McGraw-Hill, New York.
ORYALL, G.N. and BRIMACOMBE, J.K. 1976. The physical behavior of a gas jetinjected horizontally into liquid metal. Metallurgical Transactions B, vol. 7B, no. 3. pp. 391–403.
OZAWA, Y. and MORI, K. 1983a. Behavior of gas jets injected into a two-dimensional liquid metal bath. Transactions of the ISIJ, vol. 23. pp. 759–763.
OZAWA, Y. and MORI, K. 1983b. Characteristics of jetting observed in gasinjection into liquid. Transactions of the ISIJ, vol. 23. pp. 764–768.
PAGADOR, R., WACHGAMA, N., KHUANKLA, C., and KAPUSTA, J.P. 2009. Operation ofthe Air Liquide shrouded injector (ALSI) technology in a Hoboken siphonconverter. Proceedings of the International Peirce-Smith ConvertingCentennial Symposium. Kapusta, J.P.T. and Warner, A.E.M. (eds). TheMinerals, Metals and Materials Society of AIME, Warrendale, PA. pp. 367–381.
QUENEAU, P.E. 1977. Oxygen technology and conservation. MetallurgicalTransactions B, vol. 8B, September. pp. 357–369.
QUENEAU, P.E. and SCHUHMANN, R. 1974. The Q-S oxygen process. Journal ofMetals, August. pp. 2–4.
SAAD, M.A. 1985. Compressible Fluid Flow. Prentice-Hall., Englewood Cliffs, NJ.
SAVARD, G. and LEE, R. 1966. Air Liquide. Improvements in metallurgicalprocess. French patent 1450718.
THEMELIS, N.J., TARASSOFF, P., and SZEKELY, J. 1969. Gas-liquid momentumtransfer in a copper converter. Transactions of the Metallurgical Society ofAIME, vol. 245. pp. 2425–2433. �
Sonic injection in sulphide bath smelting: an update
1139 �

Glenhove Conference Centre
Melrose Estate, Johannesburg
BACKGROUND
Previous SAIMM Mine Planning forumshave clearly highlighted deficiencies inmine planning skills. The 2012, 2014,and 2017 colloquia all illustrated devel-oping skill-sets with a variety of mineplanning tools in a context of multiplemining methods. Newer tools and newerskills for the future of mining will featurein 2019.
FOR FURTHER INFORMATION CONTACT:Camielah Jardine • Head of Conferencing
SAIMM • Tel: +27 11 834-1273/7Fax: +27 11 833-8156
E-mail:[email protected]: http://www.saimm.co.za
OBJECTIVES
Using a backdrop of a generic description ofthe multidisciplinary mine planning process,the forum provides a platform for the mineplanning fraternity to share mining business-relevant experiences amongst peers. Whiledifferent mining environments have their specific information requirements, all requirethe integration of inputs from different tech-nical experts, each with their own toolsets.
The forum’s presentations will highlightcontributions from a series of technical experts on current best practice, and will beaugmented by displays of state-of-the-artmine planning tools in order to create a learning experience for increased planning competencies.
WorleyParsons provides innovative solutions for each step of the mining value chain. We combine world-leading, concept-to-completion expertise with design and major project delivery capabilities for the minerals and metals sector, from bulk commodities to rare earths, with complete mine-to-market solutions from inception to rehabilitation. Our Global Centre of Excellence for Mining and Minerals in South Africa has niche expertise in hard rock and precious minerals and metals, and we have achieved particular recognition for the delivery of complex processing plants and deep shaft mines.
Environment & Approvals
Non-Process Infrastructure
Mine Planning
Mining & Mine Development
MaterialsHandling
Resource Evaluation
Mineral Processing
Tailings & Waste Management
Smelting & Refining
Transport to Market
Realising possibilities from mine to market.

The sizing, designing, and costing of copperelectrowinning (EW) circuits require an in-depth understanding of the fundamentalparameters as well as the practicalrequirements to optimize cellhouseproductivity and capital cost. Although asignificant amount of work has been donedesigning new copper electrowinning circuits,an in-depth evaluation of world operating datareveals that the number of cathodes per cell,which affects cellhouse layout andproductivity, is not consistent for a specificproduction rate (Anderson et al., 2009;Robinson et al., 2003, 2013). Based on thispremise, Kafumbila (2017) suggested thatthere are unanswered questions, such as ‘whyare the numbers of cathodes per cell differentfor copper production rates of 20 kt/a and 40kt/a?’
In this paper, data tables are employed tomap the operating limits and costs of key CuEW equipment. An overall Cu EW project costmap is then compiled by collating optimumcellhouse layout (number of cathodes per cell),optimum crane productivity, optimum
stripping machine productivity, and associatedcosts. Fundamentally, Excel data tables allowone to perform sensitivity analysis byexploring many scenarios within a specificformula/model, for up to two variables. Thevariables evaluated for Cu EW include:
1. Production tonnage2. Number of cathodes per cell.
Major costed mechanical equipmentincluded the following items:
� Anodes and cathodes� Cathode washing, stripping, and
handling system � Polymer concrete cells � Rectifiers and transformers (including
shorting frame, trunk, and apron busbarsystem)
� Cellhouse overhead cranes.
Faraday’s Law is applied as the basis forsizing each Cu EW circuit for a specificproduction rate (Equation [1]).
[1]
where n is the number of transferred electrons.F is Faraday’s constant (C/gmol). MM is themolecular mass of Cu (g/mol). t is time (s); Pis production rate (kg h/Cu). area is platingarea (m2). CD is current density (A/m2). andn is the current efficiency (%).
The technical design parameters arespecified in Table I. Once the number ofcathodes per cell is specified then otherparameters like the number of anodes, rectifier
Copper electrowinning circuit design:optimized costing as a function of cellarrangement, productivity, rectiformersize, and throughputby E.L. Forner*, J. Scheepers*, A.J. du Toit*, and G.M. Miller†
The sizing, designing, and costing of copper electrowinning circuits requiresan in-depth understanding of the fundamental relationships between circuitparameters and the practical operation requirements. The aim of thisinvestigation was to optimize total copper electrowinning project cost bymapping the operating limits of key mechanical equipment. The model wascompiled by mapping various cellhouse layouts in terms of number ofcathodes per cell, crane productivity, stripping machine productivity, andrectifier–transformer (rectiformer) sizing using data tables for sensitivityanalysis. These parameters were then collated and evaluated on a cost bysize basis. The model provides an optimum band of operation for cellhouseproductivity and project capital cost for a typical range of productionthroughputs, from 10 kt/a to 200 kt/a cathode copper. The information maybe used as a high-level selection guide to assist with identifying a cost-effective copper electrowinning circuit design for a specific production rate.The data was validated and compared with existing copper electrowinningcellhouses around the world that typically install no more than 84 cathodesper cell.
copper electrowinning, circuit design, production rate, cost optimization.
* DRA Projects, South Africa.† Miller Metallurgical International (MMI),
Australia.© The Southern African Institute of Mining and
Metallurgy, 2018. ISSN 2225-6253. This paperwas first presented at the Copper Cobalt Africa,incorporating the 9th Southern African BaseMetals Conference, 9–12 July 2018, AvaniVictoria Falls Resort, Livingstone, Zambia.
1141 �
http://dx.doi.org/10.17159/2411-9717/2018//v118n11a3

Copper electrowinning circuit design
amperage, number of cells, and transformer voltage can bedetermined. Each piece of major EW equipment is discussedin the sub-sections to follow, regarding optimization ofproductivity and cost
Typical configurations of key Cu EW cellhouse equipment arepresented in Figure 1. The primary parameters used in
determining the crane productivity are the harvest cycle andharvest time (crane travel time). For the purposes of thispaper, it is assumed that all cathodes in the cellhouse areharvested over a period of 7 days with every third cathodebeing harvested per cell. Typically, about 50 harvests percrane per day are possible if it is assumed that there areroughly five harvests per hour and a 10-hour harvesting timeper day.
�
1142 VOLUME 118
Table I
Production
Annual tonnage (design) kt/a Cu VariableProduction hours h 7884Faraday’s Law
t s 3600n (no. of e– transferred) - 2F (Faraday’s constant) C/gmol 96485m (mol of metal plated) mole 1Molar mass of Cu g/mol 63.55Ampere-hour/kg A.h/kg 843.5
Cu tenor in advance electrolyte g/L Cu 50Cu tenor in spent electrolyte g/L Cu 35Cellhouse bite g/L Cu 15Cell bite (scavenger and commercial cells) g/L Cu 3Recirculation ratio % 400%Cathode specifications
No. of cathodes per cell Cathodes/cell VariablePlating area (design) m2 2.2Cathode materials of construction (MOC) - LDX2101Height/length (deposition plating – cathode only) m 1.215Width (deposition plating – cathode only) m 0.950Height/length (whole cathode length) m 1.390Width (cathode + edge strips) m 0.998Edge strips size (W) (sides) mm 24Cathode thickness mm 3Anode specifications
Anode type - Pb-Sn-CaAnode thickness mm 6Height/length m 0.99Width m 0.92Rectiformer sizing and electrical
Current density (design) A/m2 320Current efficiency % 85Cell voltage (design) V 2.3Cell voltage (nominal/operating) V 2.1Crane productivity
Harvest cycle days 7Hours per day for harvesting h/d 10 - 12Harvests per hour harvests/h 4 - 5Harvest time min 12 – 15No. harvests per day per crane (max.) harvests/day/crane ±50Stripping machine productivity
Semi-automatic stripping machine (standard) Plates per hour (max) 120Stripping machine (large) Plates per hour (max) 450Cell specifications and dimensions
MOC of cells - Polymer concreteAnode/cathode spacing (L) (anode centre to centre = 100 mm) mm 45.50Cathode centre to centre (L) mm 100Cell side spacing (W) (cathode edge strip to cell wall) mm 77Cell wall thickness (W, top) mm 70Cell bottom spacing (H) ( sloped with a minimum of 400) mm 400Cell bottom thickness (H) mm 100Cell top spacing (H) (above electrolyte deposition line) mm 175Feed area allowance (L) mm 300Overflow area allowance (L) mm 100Overflow box (L) mm 300Building Size
Cell centres (across cell width) m 1.4Platform width – left side, middle, and right side m 2

The crane productivity is shown in Table II. Worldoperating data shows that Cu EW cellhouses do not typicallyhave more than 84 cathodes per cell (depicted by the boldblack line across all throughputs in Table II) (Robinson et al.,2013). Black horizontal bars denote the limit for craneutilization in terms of number of cathodes per cell for eachthroughput. Once the crane productivity limit is determined,it follows that the limits of four main parameters in the EWcellhouse design are specified, namely:
1. Maximum building length (maximum number of cellsper row): 60 cells per row in the cellhouse (120 totalcells) is the absolute maximum limit set by craneproductivity. Total voltage is calculated from the totalnumber of cells and cell potential.
2. Minimum number of cranes required for cathodeharvesting for a specific production rate (assumingthat most cellhouses install less than 84 cathodes percell):
� It is possible to harvest cathodes for productionrates less than 55 kt/a Cu with only one crane
� 60 kt/a Cu to 110 kt/a Cu requires two cranes� 115 kt/a Cu to 165 kt/a Cu requires three cranes� Greater than 170 kt/a Cu requires at least four
cranes. 3. Minimum number of cathodes per cell: By limiting the
number of cells to a maximum of 60 per row, the
minimum number of cathodes per cell is limited foreach production tonnage.
4. Minimum rectifier amperage possible in operation:Because the rectifier amperage is determined bynumber of cathodes per cell and Faraday’s Law, theminimum possible operating rectifier amperage is thendetermined. Rectiformer sizing for all the productiontonnages aims to minimize rectifier amperage, whichthen minimizes cost (number of cathodes per cell,which gives approximately 116 cells per bay, i.e., tworows of approximately 58 cells).
Referring to points 1 to 4 and the bold black horizontalbar in Table II, for a throughput of 45 kt/a it is possible toharvest the required number of cathodes using one crane ifthere are 69 cathodes per cell or more. This results in aminimum rectifier amperage of 57 kA. Theoretically, it wouldbe possible to harvest up to 65 kt/a with only one crane with102, or more, cathodes per cell.
Other cellhouse arrangement considerations include thefollowing (Miller, 2018):
� One cannot have more than one crane operating in asingle bay due to the risk of collision
� One can, however, have two cranes operating in twoseparate bays feeding the same stripping machine butat the cost of anti-collision instrumentation andcontrols
Copper electrowinning circuit design
1143 �
Table II

� The biggest improvement to crane productivity isobtained by using auto-positioning for both lift andreplacement activities: laser sight on cell and cathodepositions, and the use of positive alignment systemslike Rhino Horn anode insulators.
The cathode stripping machine productivity is represented inTable III and determines the number and size of strippingmachines required for each production rate.
Table III shows that the number of cathode platesstripped is independent of number of cathodes per cell and isonly dependent on production rate (total number ofcathodes). A ‘standard’ stripping machine can accommodatean absolute maximum of 120 plates per hour, while one’large’ stripping machine can strip an absolute maximum of450 plates per hour. It is assumed that, for production ratesless than 15 to 18 kt/a Cu, cathode handling and washing isperformed by a machine while stripping is performedmanually (Garbutt, 2018).
Rectiformers (rectifier–transformer pairs) are sized based onthe nominal production tonnage at design current densities of320 A/m2. No extra margin is included in the productiontonnage. The design margin is accounted for in the rectifieramperage capability to operate at higher current density(Miller, 2018). Depending on rectiformer supply and sizing,the cell design can be modified to suit. In terms of theelectrical arrangement, it is not recommended to have, forexample, one rectiformer with two operating cranes. Theelectrical circuits need to be partitioned accordingly.
Another variable to consider is the relative cost of thebuilding to house the cells. Building utilization is shown inTable IV. Each column is formatted per column (perproduction rate).
� Building utilization (%) = Cell area/Total area � Total area = Cell area + Platform area:
Copper electrowinning circuit design
�
1144 VOLUME 118
Table III
Table IV

Copper electrowinning circuit design
1145 �
– Cell area: The cell area is determined by multiplyingthe number of cells by cell centre-to-centre width.
– Platform area: A minimum walkway of 2 m eitherside of the two rows of cells and down the middle isrequired to prevent a dropped electrode shortingbetween the building steel and the last anode in thecell, or across the centre aisle from first anode tolast anode.
Referring to Table IV, it is clear that building utilization isrelatively constant across different production tonnages butincreases percentage-wise as the number of cathodes per cellincreases. The rectifier amperage is constant for a specificnumber of cathodes per cell and increases proportionally withincreasing number of cathodes per cell.
Analysis was conducted on a bare-bones basis, in real terms,and excludes the effects of taxes, interest, or financing terms.The costs should be regarded as budget values with ±30%estimation accuracy.
� Overhead cranes—The cost of one crane was multipliedby the number of cranes required for each productionrate, determined from Table II.
� Stripping machines—The cost of one standard/largestripping machine was multiplied by the number ofstripping machines required for each production rate,determined from Table III. The minimum cost wastaken when there was an option of multiple ‘standard’stripping machines or fewer ‘large’ stripping machines.It was assumed that cathodes are stripped manually forproductions rates less than 15 kt/a Cu; however, thereis still an associated cost applied for cathode handlingand washing.
� Rectiformers—Each rectiformer and busbar system wascosted from budget quotations from ABB (Oberholzer,2018). The range costed included: 20 kA, 30 kA, 40 kA, and 60 kA. One rectifier and two transformers(12-pulse configuration) totalling 250 V can cater for116 to 120 cells per bay.
� Building utilization—Theoretically, the building costincreases with a longer narrower building having alower percentage of the floor space used for cellplacement. Initially, the intention was to adjust thecapital cost (CAPEX) estimate with a cost per area ofEW floor space (US dollars per m2). This would allowfor increased cost as the number of cathodes per celldecreased; however, when the final Cu EW project costswere examined, it was found that the buildingutilization cost contributed less than 1% of the totalCAPEX estimate. Consequently, building utilizationwas not included as a variable in the overall EW projectcost but rather factored in the same manner asstructural steel, platework, etc.
The following assumptions were made in compiling the totalcopper EW cost.
� The CAPEX estimates were based on the use of typicalEW design parameters for compiling calculations,
which were then used to size major equipment. Majormechanical equipment included anodes and cathodes,cathode washing and stripping system (includingancillaries), EW polymer concrete cells, rectifiers andtransformers (including shorting frame, trunk, andapron busbar system), and cellhouse overhead cranes.
� A breakdown of the cost contribution of each piece ofmajor equipment is provided in Figure 2. Anodes,cathodes, and rectiformers are the largest costcontributors to the total mechanical supply cost. It hasbeen seen from recent studies that anode cost cancontribute as much as 50% to mechanical supply cost,depending on the lead price at the time.
� Mechanical equipment cost and rectiformer costs weredetermined from recent studies, DRA’s internaldatabase, and selected vendor quotes (Garbutt, 2018;Oberholzer, 2018).
� Internal DRA factors were applied to the mechanicalsupply costs (including rectiformers) for civils,structural (supply and erection), platework (supply anderection), mechanical erection, piping (supply andinstallation), electrical, control and instrumentation(supply and installation), transport, project services,and preliminary and general costs. Owners’ costs wereexcluded.
Sensitivity analysis was performed using the data tables tomap ranges of costs based on two main variables: namely,production tonnage and number of cathodes per cell.Mechanical supply costs, excluding rectiformer costestimates, are summarized in Table V. Rectiformer costs areshown in Table VI.
All data tables in this section are formatted per column(per production rate). This means that ‘low costs’ for twodifferent production rates are not necessarily the same, i.e.,the formatting shows a relative low/intermediate/high costfor a specific column (production rate) and should not becompared with another column. Black horizontal bars depictthe limit of crane productivity, in terms of number ofcathodes per cell, for a specific production rate.
A number of observations can be made from the data inTables V and VI.
� Table V shows that as the number of cathodes per cellincreases, the mechanical supply cost decreases. The

Copper electrowinning circuit design
�
1146 VOLUME 118
‘low cost’ range starts at: US$4.2 million for 10 kt/aCu; US$14 million for 45 kt/a Cu; US$35 million for110 kt/a Cu; US$50 million for 165 kt/a Cu; and US63million for 200 kt/a Cu.
� Because the total number of cathodes and anodesrequired remains constant for a specific productionrate, regardless of number of cathodes per cell, higherproduction rates (total number of cathodes) becomemore economical due to the base cost of the cell mould.The stripping machine and overhead cranes costs alsobecome more economical when these pieces ofequipment operate at high utilization.
Table VI shows that rectiformer cost increases with thenumber of cathodes per cell and number of rectiformersrequired per cellhouse. This can be attributed to the directly
proportional relationship between number of cathodes percell and rectifier amperage. The ‘low cost’ range starts at:US$1.5 million for 10 kt/a Cu; US$2.4 million for 45 kt/a Cu;US$5.8 million for 110 kt/a Cu; US$9.5 million for 165 kt/aCu; and US$13.3 million for 200 kt/a Cu.
Table VII shows a combination of mechanical supply costand rectiformer cost factored for total Cu EW project cost. Thebold black lines indicate the limit of crane productivity(approximately 116 to 120 cells). Costs range from US$18.8million for 10 kt/a to US$249 million for 200 kt/a in the low-cost ranges.
Figure 3 represents the economy of scale achieved athigher production rates within a specific band ofthroughputs. The absolute minimum cost per ton of copperacross all columns (production rate of 165 kt/a Cu) wasdetermined and then subtracted from the minimum cost perton of copper for each column. The percentage increase above165 kt/a was then graphed.
Table V
Table VI

Economy of scale is reduced at the beginning of a band,for example, the highest cost peaks are seen at productiontonnages of 10, 60, 115, and 180 kt/a Cu. These peaks resultfrom the jump from n number of cranes to n+1 number ofcranes, as the utilization/productivity limit is reached andproduction rate increases. Intermediate cost peaks are seen atproduction tonnages of 20, 50, 95, 145, and 170 kt/a Cu asstripping machine capacity is reached. Because the stripping
machine cost contributes a larger proportion to mechanicalsupply than crane cost, minimum costs are seen before thejump from n stripping machines to n+1 stripping machines.
A production tonnage of 165 kt/a copper has the besteconomy of scale because one ‘large’ stripping machine ismore cost-effective than four ‘standard’ stripping machines.
In a scenario where a large production capacity isrequired, for example 180 kt/a, and capital is limited in thebeginning of a project, the cost map suggests that the bestproject cost would be achieved if modules/cellhouses of 45kt/a are added progressively.
The world operating data for Cu EW is summarized in TableVIII (Anderson et al., 2009; Robinson et al., 2003, 2013).Ranges of number of cathodes per cell are listed for eachnameplate production rate.
Table IX shows the number of cathodes per cell foroptimum productivity and lowest total EW project cost withthe world operating data superimposed (indicated by bluecircles). Theoretical evaluation shows lower cost potentialsfor higher throughputs before including another cellhouseset.
Copper electrowinning circuit design
1147 �
Table VII
Table VIII
(Anderson et al., 2009) No. of cathodes per cell 30–36 – 45 – 60–66(Robinson et al., 2003) 30–48 21–64 33–60 33–60 66–68 57–66 60–66 63 – 60(Robinson et al., 2013) 21–48 – 48–84 45–84 30–63 30–60 51–62 28–61 60–84 50
(Anderson et al., 2009) No. of cathodes per cell 60–66(Robinson et al., 2003) – 60 60–65 60 66 60–66(Robinson et al., 2013) 48–89 48–72 60–69 60–69 48–66 60–66

Copper electrowinning circuit design
It can be noted from Table IX that existing Cu EWinstallations often fall within the recommended ranges fornumber of cathodes per cell; however, they are not always atthe optimum value for cellhouse productivity and lowest CuEW project cost.
Green arrows indicate areas where the model matchesexisting world operating data. Throughputs of 45 to 55 kt/aCu are particularly interesting because the world operatingdata shows that these plants were designed to operate with30 to 66 cathodes per cell. On the contrary, the cost mapsuggests that the project capital costs could have beenminimized by increasing the number of cathodes per cell to66 or more. In the same manner, lower project costs couldhave resulted from installing more than 69 cathodes per cellfor production rates of 90 to 110 kt/a Cu, 140 to 165 kt/a Cu,and 185 to 200 kt/a Cu.
The aim of this paper was to optimize total Cu EW project costby mapping productivity and arrangement of major Cu EWcellhouse equipment. A number of findings emerged.
� 58 to 60 cells per row of cells is the absolute maximumlimit of crane productivity with each cellhouse bayhaving two rows of cells.
� One crane can be utilized for production tonnages up to55 kt/a, assuming a minimum of 84 cathodes per cell(typical of world operating data).
� A ’standard’ stripping machine can accommodate anabsolute maximum of 120 plates per hour.
� Anodes contribute the highest proportion to Cu EWmechanical equipment cost.
� EW cellhouse floor area utilization is insignificant interms of total project cost, although further work isrecommended for projects in cold climates.
� Economy of scale is evident in dollars per ton Cu asproduction rate increases.
� A production tonnage of 165 kt/a copper has the besteconomy of scale, in terms of total project cost, for therange 10 to 200 kt/a Cu.
� Large nameplate production rates would achieve thelowest project capital cost when built in 45 kt/a Cumodules, should capital be constrained.
Data tables were used as a sensitivity analysis tool todetermine the optimum Cu EW cellhouse arrangement andcost, by changing the variables: number of cathodes per celland Cu cathode production rate. The optimum number ofcathodes per cell, in terms of total project cost, for eachproduction rate was determined and validated againstexisting world operating tankhouse data.
Our thanks to ABB and Glencore Technology: to ABB fortheir comprehensive rectiformer costing, and to GlencoreTechnology for stripping machine costing.
ANDERSON, C.G., GIRALICO, M.A., POST, T.A., ROBINSON, T.G., and TINKLER, O.S.2009. An update: selection equipment sizing and flowsheet applications incopper solvent extraction. Recent Advances in Mineral Processing PlantDesign. Malholtra, D., Taylor, P., Spiller, E., and LeVier, M. (eds). Societyof Mining Engineers, Littleton, CO.
GARBUTT, P.J. 2018. Budget quote for 120 plate per hour, 450 plate per hourcathode stripping systems and cathodes. Africa Co-ordinator, GlencoreTechnology, Brisbane, Australia.
KAFUMBILA, J. 2017. Design of copper electrowinning circuit using conventionalcells https://www.911metallurgist.com/blog/wp-content/uploads/2015/11/Design-Copper-Electrowinning-Circuit.pdf[accessed 25 January 2018].
OBERHOLZER, K. 2018. Budget estimates for rectifier-transformer pairs forvarious copper electrowinning production tonnages. BusinessDevelopment Manager – Rectifiers, ABB, Modderfontein, South Africa.
ROBINSON, T., DAVENPORT, W.G., JENKINS, J., KING, M., and RASMUSSEN, S. 2003.Electrolytic copper electrowinning – 2003 world tankhouse operating data.Global Cu EW Survey spreadsheet. Proceedings of Copper 2003: Vol. V,Copper Electrorefining and Electrowinning. Dutriza, J.E. and Clements,C.G. (eds). Canadian Institute of Mining, Metallurgy and Petroleum,Montreal. pp. 3–66.
ROBINSON, T.G., SOLE, K.C., SANDOVAL, S., MOATS, M.S., SIEGMUND, A., andDAVENPORT, W.G. 2013. Copper electrowinning – 2013 world tankhouseoperating data. Global Cu EW survey spreadsheet. Proceedings of Copper-Cobre Conference 2013: Vol. 1. Gecamin, Santiago, Chile. pp. 3–14. �
�
1148 VOLUME 118
Table IX

Owners and operators of mineral concentratorsconstantly search for the most economicallyattractive way to increase the output ofvaluable metal. A logical approach is toidentify a key parameter that has the greatestimpact on the performance of multiple stagesof the process and then use a holistic analysismethodology to determine how this keyparameter can be controlled to optimize thefinal output.
Particle size is widely recognized as such akey parameter; however, very fewconcentrators today use real-time particle sizemeasurements for automatic control of thefinal product size due, to a large extent, to the
inherent limitations of existing technologies.‘Near-line’ particle size measurementinstrumentation, which has been used fordecades, typically suffers from low availabilitybecause the fundamental measurementtechnologies were developed for other, lessdemanding industries and then adapted to theharsh environment of the typical mineralconcentration process. An outline of the keydifferences among the available technologiesused for particle size measurement incomminution circuits has been completed inprevious work, and plant data has proven thebenefits of measurements on individualcyclones – something that, until now, has notbeen possible (Cirulis, 2017).
The patented CYCLONEtrac™ PST particlesize tracking (PST) technology was expresslydesigned for true on-line measurement of theproduct size on the overflow of individualhydrocyclones, almost continuously, avoidingthe always cumbersome technique of takingrepresentative slurry samples, thusovercoming several limitations of legacytechnologies. Its simple acoustic-impacttechnology, rugged design, and absence ofmoving parts has solved the problem of lowavailability, thereby making real-timemeasurement and automatic control of groundproduct size a practical reality.
To assess the potential economic benefit ofimplementing this PST-based measurementand control system, the authors previouslydeveloped a methodology (Maron, O’Keefe,and Sepulveda, 2017) for determining theoptimum final ground product size that resultsin the maximum net metal production (NMP),
Methodology for assessing the benefitsof grind control using particle sizetracking technology for true on-lineparticle size measurementby R. Maron*, C. O’Keefe*, and J. Sepulveda†
Despite the recognized influence of product fineness on line capacity anddownstream process performance, few mineral concentrators today useparticle size measurement of the final product in automatic controlapplications for particle size. ‘Near-line’ particle size instrumentation hasexisted for decades and is utilized in modern concentrators, but lowavailability and measurement frequency, due to problems with slurrysampling and transport systems, make these technologies unreliable for usein automatic control. An innovative technology for real-time particle sizemeasurement on individual hydrocyclones, named CYCLONEtrac™ PST(particle size tracking), has been developed by CiDRA Minerals Processing,and proven in commercial installations, demonstrating near 100%availability with minimal maintenance requirements, thus overcoming thelimitations of previous technologies. Potential stakeholders requireconvincing, reliable information regarding the economic value delivered byautomatic grind control projects. In this paper we present a methodology forestimating such value with the CYCLONEtrac™ PST technology, anddemonstrate unique opportunities to improve process stability andperformance. Based on actual plant data accumulated over time, theevaluation approach assesses and highlights the significant potentialprocess improvement that can be expected with the particle size trackingtechnology. As an extension of previous work, in this paper we present thekey operating criteria for optimizing the production of valuable metals andincrease mill throughput by identifying the optimal grind size. As thisrequires operating closer to the process boundaries, accurate real-timeparticle size measurements, such as those provided by the CYCLONEtrac™PST system, become essential for achieving the maximum potential valuefrom every operation. For further illustration, data from three differentcopper plants is compared.
grind control, particle size, real-time measurement.
* CiDRA Minerals Processing, Wallington,Connecticut, USA.
† Consultants Ltd., Santiago, Chile.© The Southern African Institute of Mining and
Metallurgy, 2018. ISSN 2225-6253. This paperwas first presented at the Copper Cobalt Africa,incorporating the 9th Southern African BaseMetals Conference, 9–12 July 2018, AvaniVictoria Falls Resort, Livingstone, Zambia.
1149 �
http://dx.doi.org/10.17159/2411-9717/2018//v118n11a4

Methodology for assessing the benefits of grind control using particle size tracking technology
defined as the amount of valuable net metal produced perunit time. The method uses historical daily or hourly plantdata for a minimum period of one year, ideally longer. Sincethat initial work, data-sets from two additional plants havebeen analysed. In all three cases, the analyses have shownthat although there are significant potential gains to berealized from only reducing the variability in product size,there are additional and larger potential gains obtained fromcoarsening the product size, which enables the throughput ofthe plant to be increased, therefore proportionally increasingthe NMP. However, this must be done in a stable andcontrolled manner to avoid downstream problems withmaterial handling and to prevent roping conditions onindividual hydrocyclones. This PST system provides thenecessary information, not previously available, to moreclosely approach these process barriers in a safe operationalway.
In this paper, we briefly review the technology, thenexamine three specific paths available to increase processperformance, i.e., to maximize NMP, showing the key role ofreliable ground product size measurements. We then brieflypresent the methodology used to determine the product sizethat maximizes NMP. Finally, we discuss three different real-world examples of applications of this methodology.
This approach to increasing NMP focuses on thesecondary grinding or ball milling stage, for a good reason. Inthe 1980s and 1990s, the typical bottleneck in grindingcircuits was the semi-autogenous (SAG) mill. However,significant improvements to SAG mills over the last twodecades have now shifted the bottleneck to the ball mills.Thus, the ball mill classification circuit is the unit operationwhere the greatest potential NMP improvement can beobtained, with significant economic benefits.
Acoustic impact-based PST is a unique method for measuringand controlling a reference product mesh size in cycloneoverflow streams. The implementation of this technology iscentred upon a sensor probe that is inserted into the overflowslurry stream via a two-inch (50 mm) hole in the overflowpipe. Particles in the slurry stream impact the surface of the
probe, generating travelling stress waves within the probe. Asensor converts these travelling stress waves into anelectrical signal, and proprietary signal processing techniquesconvert these signals into a particle size measurement that isoutput every four seconds. The sensor is constantly incontact with many particles in the slurry stream, thusobtaining information from orders-of-magnitude moreparticles than traditional sample-based technologies. Also,because of the location of the sensor downstream of thehydrocyclone and the presence of an air core at that point, thesensor produces no change in the back-pressure seen by thehydrocyclone and thus does not affect hydrocycloneperformance. The probe has a useful life of approximately 18months due to the abrasive wear caused by the direct slurryimpact. The probe life is related to the particle hardness andsize, which is obviously finer in the overflow stream than inthe feed stream, thus enabling an acceptable probe life.Currently, the software provides a single reference mesh sizeto be incorporated into a process control strategy. Figure 1shows the main components of the PST system.
The value analysis methodology, presented later, shows thatto achieve the maximum increase in NMP, which is directlylinked to net cash flow from the operation, we shouldincrease throughput and coarsen the final product size,despite a possible decrease in recovery. The throughputequals the ratio of power to specific energy. The well-knownBond’s Law relates the specific energy consumption used insize reduction to the feed and product sizes by a factorknown as the Bond Work Index (Wi), which is a property ofthe ore (Bond, 1985). These two relationships can becombined, as shown in Equation [1], to show three parallelpaths to increase throughput using the existing circuit, whereWi is replaced by the ‘operational work index’ (Wio), whichis the actual energy per ton as measured in the plant. Ideally,Wio should be less than Wi for an efficient grindingoperation. A detailed explanation of these paths is wellknown and has been presented on various occasions,including by the current authors (Sepulveda, 2017), and issummarized in the following three subsections of this paper.
�
1150

[1]
The first path to increase throughput, as shown by Equation[1], is by increasing the power (P) drawn by the ball mill.The well-known relationship shown in Figure 2 indicateshow this can be accomplished. It follows that one shouldincrease the mill charge level (J) and/or the mill speed (Nc)whenever possible.
The second path to increase throughput, as shown inEquation [1], involves the operational work index (Wio),which is affected by the response of the classifiers in theirclosed-circuit interaction with the ball mill. The Wio appearsas a reciprocal in Equation [1], thus representing the‘effectiveness’ of the classification, i.e., how the classifierscontribute to reducing the tons processed per unit of energyconsumed. A more effective operation is that in which theWio is reduced to its minimum possible value. This meansthat for optimal energy efficiency and throughput in aneffective grinding process, the content of fine particles in themill charge should be as low as possible for a given grindingtask, thus reducing Wio. This may be achieved by operatingthe circuit under the following three conditions, which aresometimes referred to as the ‘Fourth Law’ criterion:
� Minimum % solids overflow, only limited by the totalwater availability
� Maximum % solids underflow, only limited by theundesirable ‘roping’ condition
� Maximum circulating load, only limited by the capacityof both the pump(s) and the mill itself to transport therequired volume of slurry.
The collective goal of these three operating conditions isfor the hydrocyclones to remove fine particles from the circuitas soon as they are reduced to the target size. In this way,the energy of the mill is directed to grinding the coarseparticles that have not yet reached the final target grind size,rather than being used to overgrind particles that havealready reached the final target size and should not bepresent in the mill.
The third and most effective way to increase throughput (T)is to relax the grinding task, which in Equation [1] isrepresented by the denominator that contains the feed size(F80) to the ball mill section and the product size (P80)discharged through the cyclone overflow. Equation [1] showsthat bringing the F80 and P80 closer together, i.e., making thefeed size smaller and/or making the product size coarser, willresult in increased throughput (T). A graphicalrepresentation of the grinding task and the empiricalrelationship known as Bond’s Law is shown in Figure 3(left), where Wio represents the effective hardness of the ore.In the NMP optimization methodology, we focus oncoarsening the P80, which has a greater effect on increasingthroughput than reducing the F80 size, as shown in Figure 3(right).
As the P80 and throughput are increased, a reliable real-time measurement of product size, like the one provided byPST, becomes extremely valuable for implementing thismethod while avoiding problems as downstream processlimits are approached. A typical process limit is whenhydrocyclones enter a so-called roping condition as theirunderflow discharge capacity is exceeded. Figure 4 showssuch an example of a ball mill classification circuit beingpushed to a higher throughput and greater particle size – asmeasured by PST – until the point at which a hydrocycloneexceeds its operating limit and enters a roping condition. The
Methodology for assessing the benefits of grind control using particle size tracking technology
1151 �

detrimental effect on the stability and performance of all theother cyclones in the battery is clearly seen, as the batterysends a large volume of coarse material to downstreamflotation. The data was obtained after the installation of areal-time PST system but before it was used for control. Themost relevant learning from this experience is that ‘onewrong cyclone corrupts the whole battery of cyclones’.
The objective of this methodology is to quantify the value ofincorporating this on-line particle size measurement into theautomatic process control system for a grinding/classificationcircuit using normally available historical plant data. The
methodology uses daily data over a long enough time (ideallymore than one year) to obtain a high-level assessment of thegeneral plant operating performance, focusing mainly onthroughput (T) and recovery (R), which are used to calculatethe net production of valuable metal (NMP) – the primarygenerator of cash flow – giving the final objective function forprocess optimization purposes, as determined by the simpleexpression:
NMP = hTR [2]
where h represents the head grade of valuable metal beingrecovered.
Inherent in this methodology is the usual observationthat throughput (T) and recovery (R) are a strong functionof product size, thus product size is chosen as theindependent variable. Therefore, NMP is also a strongfunction of product size, thus there should exist an optimalproduct size that maximizes NMP and cash flow. Therefore,accurate measurement and control of product size is herehighlighted as a necessity for effective process control.Correlations of throughput and recovery to other variablessuch as feed grade and ore hardness must also be examinedin every case, whenever the proper information is available.Finally, operational plant constraints (like maximum tonnageor flow rates, product coarseness limitations for slurrytransport, etc.) should also be taken into consideration asthey may limit the maximum NMP values that can beconsistently obtained.
The minimum input data-set consists of the following fourparameters, sampled at least once daily for a minimum of oneyear: mass per cent passing a target grind size (e.g., P80 orpercentage exceeding target mesh size), throughput per unittime, feed grade, and percentage net metal recovery. Once the
Methodology for assessing the benefits of grind control using particle size tracking technology
�
1152

Methodology for assessing the benefits of grind control using particle size tracking technology
1153 �
data-set is cleaned by filtering or data pre-processing, thethroughput (T) and recovery (R) are plotted against targetgrind size, as shown in Figure 5 (left). These plots typicallyexhibit centrally weighted data clouds that make trenddetection very unreliable. Both visual examination of suchdata clouds and regression fits are heavily influenced by acentral grouping of data points, which are typically locatedaround the plant operating points. To increase the influenceof data points located further away from the normaloperating points, data pre-processing can be used to reducethe number of points and allow for a clearer visualrepresentation of the underlying trends. In our experience,this also increases the accuracy of the regression fits,particularly for low-order fit functions when the regressionresults are compared with other empirical data and first-principles models. The pre-processing used here, databinning, either through equal intervals or equal frequency,does allow for an increase in the influence of data outside themajority group of data points. Data binning partitions thehorizontal axis and the data within these partitions iscombined into a single number or category, which in thiscase was the mean of the data. In these particular data-sets,equal interval data binning was used, resulting in an increasein the influence of the data from the lower percentages of thetarget mesh size. The resulting equal interval means are
shown in the throughput and recovery plots in Figure 5 (right).The filtered throughput and recovery are then verified;
i.e., throughput should show an increasing tendency withincreasing particle size, and recovery should show a peak ata unique particle size, both as predicted by basiccomminution and flotation practice. NMP can now becalculated, and its maximum identified as shown in Figure 5(right).
In general, an important conclusion that can be drawnfrom the data, as shown in Figure 5, is that the maximumNMP is normally achieved by increasing throughput bycoarsening the product size, usually at the expense ofsacrificing some recovery. From this conclusion comes achallenge: how to measure grind size in a continuous,reliable way so that these measurements can be incorporatedin the automatic control strategy, and thus prevent violationof the downstream process limitations imposed by particlesize and/or material handling capabilities. Figure 6 (left)shows the actual particle size distribution without real-timeparticle size control, and the expected reduced variability andincreased product size achievable by using real-time particlesize control such as PST. Figure 6 (right) shows the potentialincremental NMP improvements obtained by only reducingsize variability at the current product size, and thencoarsening the product size to a higher target size.

Methodology for assessing the benefits of grind control using particle size tracking technology
�
1154
In addition to the data-set analysed above, data-sets fromtwo additional SAG and ball mill (SABC) circuits wereanalysed. To compare and benchmark the performance ofplants without real-time product size control, normalizedhistograms of the product size distributions for the threeplants are shown together in Figure 7 (left). For bettercomparison, the x-axis was normalized to the averageproduct size and the y-axis normalized to the percentage oftotal number of readings. The data was plotted withoutfiltering or data binning to reveal more of the data structure.It is interesting to observe that the natural process variabilityappears similar in all cases, considering that these are alllarge porphyry copper operations with similar grinding andclassification circuits that do not include particle sized-basedcontrol strategies. It is to be expected that with particle sizecontrol strategies, the variability would be significantlyreduced.
Figure 7 (right) shows the normalized NMP improvementfor the plants, indicating that the current product size isnormally in the range of 80–90% of the optimum size toachieve maximum NMP, and the expected NMPimprovements are 3–6% if the current average product size isincreased to the optimum size.
Final ground particle size determines plant throughput andrecovery, and thus the production of valuable metal thatdrives cash flow. The absence of a reliable real-time particlesize measurement has for decades limited theimplementation of automatic particle size control strategiesthat can enable mineral concentrator plants to maximize theproduction of valuable metal. The new, highly reliable real-time particle size measurement technology now enablesplants to implement control strategies that permit them togrind coarser, increase throughput, and optimize metal
production, thus more closely approaching process limitswhile monitoring and controlling product size to avoiddownstream problems. We have presented the fundamentaloperational strategies that should be implemented tomaximize valuable metal production, and a simplemethodology to estimate the resulting economic benefits.Data from three plants showed a typical variation in productsize in processes without automatic control based on real-time particle size measurement. The data also showed thatsignificant increases in valuable metal production of severalpercentage points are possible. This methodology can berepeated on any mineral concentrator with a similarrelationship between grind size, throughput, and recovery.
BAZIN, C., GRANT, R., COOPER, M., and TESSIER, R. 1994. A method to predictmetallurgical performances as a function of fineness of grind. CanadianMineral Processors Annual Conference, CMP Proceedings 1964-1998.http://www.sciencedirect.com/science/article/pii/0892687594901155
BOND, F.C. 1985. Testing and calculations. SME Mineral Processing Handbook.Weiss, N.L. (ed.), Section 3A: General Aspects of Comminution. Society ofMining Engineers of the American Institute of Mining, Metallurgical, andPetroleum Engineers pp. 16–27.
CIRULIS, D., DUNFORD, S., SNYDER, J., BARTSCH, E., ROTHMAN, P., MARON, R.,NEWTON, D., O’KEEFE, C., and MERCURI, J. 2015. Process optimization usingreal team tracking of coarse material in individual cyclone overflowstreams. Proceedings of Metplant 2015 Conference, Perth, WesternAustralia, 7–8 September. Australasian Institute of Mining andMetallurgy, Melbourne.
CIRULIS, D. 2017. Particle size tracking system vs. traditional measurementtechniques. Engineering and Mining Journal, March. pp. 58–59.
EDWARDS, R., VIEN, A., and DESBIENS, A. (eds.). 1999. Application of a model-based size-recovery methodology. Canadian Institute of Mining,Metallurgy and Petroleum, Montreal.
MARON, R., O’KEEFE, C., and SEPULVEDA, J. 2017. Assessing the benefits ofautomatic grinding control using PST technology for true on-line particlesize measurement. PROCEMIN-GEOMET 2017, Proceedings of the 13thInternational Mineral Processing Conference and 4th InternationalSeminar on Geometallurgy. Gecamin, Santiago.
SEPULVEDA, J.E. 2017. Operational guidelines for an energy efficientgrinding/classification circuit. Pre-Seminar at PROCEMIN 2017, sponsoredby the Coalition for Energy Efficient Comminution (CEEC), Santiago,Chile, 4 October 2017. �
SUBSCRIBEof the SAIMM Journal
TO 12 ISSUESJanuary to December 2018
ORR2157.10LOCAL
US$551.20OVERSEAS
per annum per subscription
For more information please contact: Tshepiso Letsogo
The Journal Subscription Department
Tel: 27-11-834-1273/7 • e-mail: [email protected] or [email protected]: http://www.saimm.co.za
� Less 15% discount to agents only
� PRE-PAYMENT is required
� The Journal is printed monthly
� Surface mail postage included
� ISSN 2225-6253
� with cutting-edge research � new knowledge on old subjects � in-depth analysis

Kansanshi is a copper and gold mine located inthe Northwestern Province of Zambia, with anannual production in the region of 250 000 tof copper and 160 000 ounces of gold. Oremined from the epigenetic vein-hosted depositis classified into three ore types based on theextent of oxidation and supergene enrichment.Sulphide, oxide, and mixed ore are fed toseparate mineral processing circuits tailoredfor recovery of the dominant copper mineralsin each. After comminution to a target grindsize of 80% passing 150 μm, each ore type issubjected to flotation to recover the coppersulphide minerals (chalcopyrite, bornite,chalcocite, covellite). The oxide float tails anda large proportion of the mixed float tails arethen treated by atmospheric leaching to extractcopper from the remaining copper-hostingminerals, which include cuprite, malachite,chrysocolla, and delafossite. Some nativecopper is recovered by flotation and some of itis recovered by leaching. A small portion of thecombined concentrate from all circuits issubjected to high-pressure leaching and therest is sent to the smelter. Sulphuric acidproduced during smelting is used for theatmospheric leach.
With assistance from Dr Will Goodall andcolleagues from MinAssist and iMinSolutions,Kansanshi set up an on-site mineralogicalsection within its processing department in2015 to provide applied mineralogy servicesfor continuous plant performanceimprovement. Most features of the set-up thatGoodall outlined in 2015 have beenmaintained to date, with the Zeiss MinSCANbeing used for automated mineralogicalanalysis of weekly composite samples of thekey streams for each circuit. In this work,sulphide, mixed, and oxide flotation areconsidered as three separate circuits, and theatmospheric leach that processes oxide andmixed flotation tails is considered as a fourthcircuit. Detailed weekly mineralogy reports foreach circuit have helped to explain variation inperformance, and have underpinned a numberof successful recovery and grade improvementprojects. Kalichini et al., (2017) describedsome of the key successes of the Kansanshimineralogy programme, focusing on the valuedelivered by the programme in the sulphidecircuit.
Work involving Kansanshi ore mineralogythat has been reported to date has typicallyfocused on mineralogy or processingassociated with a particular circuit atKansanshi (Corin et al., 2017; Kalichini et al.,2017; Jacobs, 2016; Pacquot and Ngulube,2015; Kalichini, 2015; Pérez-Barnuevo, Pirard,and Castroviejo, 2013). The objective of thispaper is to provide a broader perspective,analysing variation in mineralogy across thefour circuits and relating this to the operatingstrategies and performance of each.
Relationship between ore mineralogyand copper recovery across differentprocessing circuits at Kansanshi mineby L. Little, Q. Mclennan, A. Prinsloo, K. Muchima, B. Kaputula, and C. Siame
The variability of copper mineralization at Kansanshi mine significantlyaffects the efficiencies of the processes used to recover copper. Quantifyingthis variability is therefore essential for monitoring and optimizing theperformance of the concentrator, which comprises three different flotationcircuits (sulphide, mixed, and oxide) and an atmospheric leach circuit. On-site automated scanning electron microscopy with energy-dispersive X-rayspectrometry (Auto-SEM-EDS) is used to analyse routine weekly compositesamples for each circuit, providing detailed analyses of bulk mineralogy,copper deportment to different minerals, mineral liberation, andassociations. Weekly mineralogical trends are used to assess changes inprocess performance, and characterization of the copper losses has inspireda number of projects to target the specific particle types responsible for themain losses. In this paper we describe the relationship between mineralogyand plant performance at Kansanshi, and discuss some of the advantagesand challenges of on-site process mineralogy.
process mineralogy, automated SEM, copper deportment, flotation recovery.
* First Quantum Minerals Limited, Kansanshi Mine,Solwezi, Zambia.
© The Southern African Institute of Mining andMetallurgy, 2018. ISSN 2225-6253. This paperwas first presented at the Copper Cobalt Africa,incorporating the 9th Southern African BaseMetals Conference, 9–12 July 2018, AvaniVictoria Falls Resort, Livingstone, Zambia.
1155 �
http://dx.doi.org/10.17159/2411-9717/2018/v118n11a5

Relationship between ore mineralogy and copper recovery across different processing circuits
The data presented in this paper is from routine weeklymineralogical analysis performed on-site using the ZeissMinSCAN (Hill, 2014). Automated sample cutters on thecyclone overflows, final tails, and final concentrate streamsare used to collect two-hourly samples for chemical analysis.From these samples, daily composites are prepared, whichare in turn combined to form weekly composites. The plantsampling equipment and sample preparation procedures arecontinually being improved with the aim of ensuring fullrepresentativeness. This is a work in progress.
After being wet-screened into four fractions, the weeklycomposite samples (four fractions from three streams in eachof the four circuits), are further split using a micro-riffler,mixed with graphite, and mounted in resin. After setting,these blocks are polished and carbon-coated for scanningelectron microscopy (SEM) analysis with the MinSCAN. Theblocks are analysed using a random grid pattern of fields thatare mapped with a 2–14 μm energy-dispersive spectroscopy(EDS) point spacing, depending on the size fraction. Mineralclassification, performed using the Mineralogic software, isbased on a mineral list that was developed by iMin Solutions.Optical microscopy is used intermittently for corroboration ofSEM mineral identification (Figure 1), and this has helped toidentify and resolve occasional issues with SEM mineralclassification.
Calculations for copper distribution by-mineral-by-sizeincorporate total copper assays from the Kansanshi chemicallaboratory for weighting of the copper deportment to eachsize fraction. This reduces the errors associated with particlesegregation during block preparation. In November 2017, theanalysis method for tails samples was changed from X-raymapping to a bright-phase search to increase the number ofcopper mineral particles analysed and thus reduce theuncertainty associated with losses of sulphide minerals,native copper, malachite, and cuprite.
Data from the period December 2017 to May 2018 (22weeks) was selected for description of the bulk mineralogy,copper deportment, copper mineral recovery, and mineralassociations across the four circuits. This was due to slightmodifications in the mineral list clustering and improvementsin the analysis set-up that were implemented in November2017. However, data for 2016 and 2017 describes similarmineral behaviour across the four circuits as the selectedperiod data.
Figure 2 shows the bulk mineralogy of the ore fed to thethree flotation circuits, as well as that of the flotationconcentrates obtained. The major non-sulphide gangueminerals are quartz, feldspar (albite), mica (biotite,
�
1156

muscovite), and calcite, which together comprise over 80mass% of the ore fed to the three circuits. Dolomite, clay(kaolinite), iron oxides (magnetite, haematite, and goethite),and others (rutile, ilmenite, and zircon) comprise another 10–20 mass%. Note that graphite is not shown in Figure 2 as itis not directly quantifiable by EDS, but minor quantities areexpected to be present, and at times ‘carbonaceous material’does cause problems in the flotation circuits. Additionally,the mica cluster currently includes amphibole and chloriteminerals, which are present in minor amounts. Pyrite,pyrrhotite, and other sulphides (mostly galena) are all minorcomponents of the feeds, with pyrite having the biggestimpact on concentrate quality, accounting for 10–20% of thefinal concentrate mass.
The bulk mineralogy by size for each circuit shows clearvariation in the breakage rates and grain sizes between themajor gangue minerals, with quartz and calcite preferentiallydeporting to the coarse fractions. A substantial proportion ofthe copper and gold mineralization at Kansanshi is hostedwithin the network of quartz and calcite veins that crisscrossthe deposit. The chalcopyrite mineralization within theseveins is mostly coarse, so it is easily liberated andpreferentially recirculated within the grinding circuits, andtherefore it does not follow the same distribution by size as
the quartz and calcite. Across the three flotation circuits, theproportions of the acid-consuming gangue minerals (calciteand dolomite) decrease from sulphide to mixed to oxide ore.The relative abundance of these minerals and variationthereof is of key interest for the leach circuit and has at timesbeen used as a means of controlling the acid balance betweenthe smelter and the leach circuit.
The variation in extent of oxidation and weatheringacross the three flotation circuits is apparent in the ratio ofsulphide to oxide minerals in the feeds, with increasingproportions of iron oxides, secondary copper sulphideminerals such as bornite, chalcocite, and covellite, andchrysocolla. The main differences between the concentratesacross the three circuits is apparent in the copper sulphideminerals, where supergene enrichment has led to replacementof chalcopyrite with secondary copper sulphides in the mixedand oxide ores (Figure 1). Djurleite and digenite have alsobeen identified (Jacobs, 2016), but these have been clusteredwith chalcocite. The similarity in bulk mineralogy of themixed and oxide concentrates does not fully reflect thedifferences in copper mineralogy between these two oresbecause the flotation recovery of chrysocolla is negligible.The difference in chrysocolla content is more clearlydemonstrated in the following sections.
Relationship between ore mineralogy and copper recovery across different processing circuits
1157 �
Table I
Chalcopyrite 94 78 57 37 34Bornite 84 86 70 43 40Chalcocite 69 89 75 69 65Covellite 71 76 62 33 24Native copper 40 63 37 67 63Copper oxides and carbonates 43 55 14 93 94Delafossite and Cu-Fe oxides 50 32 10 75 76Chrysocolla 7 6 1 94 94

Relationship between ore mineralogy and copper recovery across different processing circuits
�
1158

Relationship between ore mineralogy and copper recovery across different processing circuits
1159 �
The distribution of copper between different mineral hostswas originally identified as one of the key mineralogicalvariables to track at Kansanshi, and this has been the mostuseful mineralogical measurement for explaining variation ingrade and recovery over time. Figure 3 shows how the copperin the feed to each circuit is recovered to the flotationconcentrate or lost to the flotation tails, depending on thecopper deportment to different minerals. Figure 3 alsodescribes the leaching of copper from various minerals in thetwo leach trains through comparison of the copperdistribution in the leach feed to that in the solid residuesdischarged from the two leach trains. It is predominantly thecopper sulphide minerals that are recovered to theconcentrates, and chrysocolla and copper oxides andcarbonates that are leached.
Of the three flotation circuits, the sulphide circuit has thehighest recovery (>90%) due to the simple coppermineralization, with approximately 90% of the copperoccurring in chalcopyrite. In the mixed ore, chalcopyrite hostsapproximately 35% of the copper in the feed, and in the oxideore this proportion is normally less than 20%. In the oxidecircuit, the flotation recovery is less than 50%, asapproximately 50% of the copper is contained in chrysocolla,cuprite, and malachite, which report to the oxide tails.Fortunately, these minerals leach well, so it is the loss ofchalcopyrite that is most detrimental to the combined floatand leach recoveries in the oxide and mixed circuits. In themixed circuit, controlled potential sulphidization (CPS) withaddition of sodium hydrogen sulphide (NaHS) is used toimprove flotation recovery of the secondary copper sulphide,copper oxide, and copper carbonate minerals. NaHS is alsoadded to the oxide circuit and occasionally to the sulphidecircuit for a similar purpose, but dosages are not currentlycontrolled by CPS. Projects supported by mineralogy areunder way to optimize NaHS dosages using CPS for both theoxide and the sulphide circuit.
Historically, little or none of the mixed float tails was sentto the leach circuit, so more effort was made to recover thecopper oxide and carbonate minerals by flotation in themixed circuit, with multiple CPS stages and regular trials ofnew reagents designed to improve recovery of these minerals(Pacquot and Ngulube, 2015; Corin et al., 2017). Recently,due to the abundance of acid available from the smelter andquantitative mineralogy describing the losses in the mixedflotation tails, the leach circuit has been reconfigured to
increase capacity and allow for processing of up to 100% ofthe mixed flotation tails.
The mineralization that leads to difficulty in achievinghigh flotation recoveries in the mixed and oxide circuits has apositive effect on concentrate grade. For the sulphide circuit,to achieve a target grade of 24% total copper the concentratehas to contain 70% chalcopyrite by mass as chalcopyrite hasa relatively low copper content (34.8%). On the other hand,chalcocite has a copper content of approximately 80%, so forthe mixed and oxide concentrates it is possible to achievegrades of over 40%. For this reason, the operating strategyfor the sulphide circuit places greater emphasis on pyrite andnon-sulphide gangue rejection than the other circuits, with achalcopyrite-selective collector and Jameson cells used forcleaning the final concentrate (wash water reducesentrainment). The effects are evident in the bulk mineralogyof the concentrate (Figure 2), which shows more copperminerals and less pyrite in the sulphide concentrate than inthe mixed and oxide concentrates, while the copper grades ofthe three concentrates are 22%, 28%, and 30%, respectively(average for the year to date).
The ability to calculate recoveries of individual copperminerals within a circuit provides a valuable tool forassessing operating factors influencing both flotation andleach performance, as well as for understanding how orevariability affects performance. The recoveries and leachefficiencies of the major copper-hosting minerals arepresented in Table I, and the copper mineral recoveries bysize fraction are presented in Figure 4. It is apparent that it isnot only the distribution of copper to different minerals in thethree circuits that influences recovery, but the recovery ofeach mineral also varies across the different circuits. Therecovery of chalcopyrite is highest in the sulphide circuit(94%), moderate in the mixed circuit (78%), and poor in theoxide circuit (57%). This variation is likely a result ofdifferences in the surface chemistry of the chalcopyritegrains, which may be influenced by multiple variables. Keyfactors identified that could influence the chalcopyrite grainsurfaces include the stream’s bulk mineralogy (affecting ironand copper species in solution), the grinding environment(different quality steel media used), and the pulp potential(modified by addition of NaHS) (Heyes and Trahar, 1979;Bruckard, Sparrow, and Woodcock, 2011; Chen, Peng, andBradshaw, 2014; Greet et al., 2004; Whiteman. Lotter, andAmos, 2016; Lotter, Bradshaw, and Barnes, 2016).

Of the secondary copper sulphides, bornite has thehighest recoveries in the sulphide circuit with similarbehaviour to chalcopyrite, whereas chalcocite has the highestrecoveries in the mixed and oxide circuits. This is consistentwith observations in the literature that the Eh ranges foroptimal flotation of chalcopyrite and chalcocite differ due tothe difference in semiconductor types, with chalcocite floatingbetter at more negative Eh (Lotter, Bradshaw, and Barnes,2016). Additional CPS stages are likely responsible for higherrecoveries of chalcocite, native copper, and copper oxides andcarbonates in the mixed circuit (Pacquot and Ngulube, 2015),
and this reasoning has motivated CPS projects for the oxideand sulphide circuit to further improve flotation recoveries.Variation in the different Cu mineral head grades across thethree circuits could also account for some of the variation inmineral recoveries, with the sulphide ore having the highestchalcopyrite head grade and very low head grades for theother copper minerals. The year-to-date chalcocite headgrades for the sulphide, mixed, and oxide circuits are 0.01%,0.28%, and 0.33%, which perhaps accounts for the differencein chalcocite recovery between sulphide and mixed, but notbetween mixed and oxide.
Relationship between ore mineralogy and copper recovery across different processing circuits
�
1160

Relationship between ore mineralogy and copper recovery across different processing circuits
1161 �
The effects of particle size on flotation performance havebeen well documented (Feng and Aldrich, 1999), and thetraditional ‘optimal particle size range for flotation’ with aP80 of 150 μm has been targeted since the plant wascommissioned. The size-by-size recovery data (Figure 4)seems to justify this approach, with flotation recoveries ofthe sulphide minerals higher for the −150+75 μm and−75+38 μm fractions than for the +150 μm and −38 μmfractions. However, in Figure 5 it is evident that losses in the−38 μm fraction are typically greater than those in the othersize fractions, indicating that perhaps a coarser and steeperparticle size distribution would be preferable.
Many projects have been implemented to reduce the fineslosses. In the sulphide circuit, Jameson cells (GlencoreTechnology, 2017) were installed in August 2017, andProFlote (paramagnetism to agglomerate fines) is currentlybeing trialled (FLSmidth, 2018). To reduce fines generationin the mixed circuit, the discharge mechanism of the ball millwas converted from grate to overflow in mid-2017, which ledto a substantial increase in recovery. High-shear stators havealso been trialled for improving fines recovery.
Apart from mineral abundance and copper distribution,understanding the liberation and associations of keyminerals is important for explaining mineral behaviour inprocessing and identifying opportunities for improvements(Evans and Morrison, 2016; Fandrich et al., 2007; Albijanicet al., 2014; Whiteman, Lotter, and Amos, 2016). Acommonly occurring association texture, that of rimming ofchalcopyrite with chalcocite, is shown in Figure 6 (Pérez-Barnuevo, Pirard, and Castroviejo, 2013; Jacobs, 2016). Theassociations of chalcopyrite, chalcocite, pyrite, and quartzwith other minerals in the feed and flotation concentratestreams of each circuit are quantified in Figure 7. In eachgraph, the colour of the selected mineral is used to indicatethe associations of that mineral with ‘background’, which isan indication of the extent of liberation. By this measure, of
the four minerals, chalcopyrite and quartz have the greatestextent of liberation. As expected, in all of the feed streamsliberation increases with decreasing particle size.
Figure 7 shows that chalcopyrite and pyrite havesignificant associations with quartz, mica, and feldspar in thecoarse fractions of the feeds, and it is clear that theseassociations have a negative impact on recovery as theconcentrates indicate much lower associations with thesenon-sulphide gangue minerals. Chalcocite has negligibleassociations with gangue minerals and is almost entirelyassociated with other copper minerals, predominantlycovellite, bornite, and chalcopyrite. In the sulphide circuit,chalcocite associated with bornite and chalcopyrite is morelikely to be recovered than liberated chalcocite, whileliberated chalcocite appears to have the highest recoveries inthe mixed and oxide circuits. Associations of chalcocite withcovellite, chrysocolla, cuprite, and malachite (Cu ox & carb)seem to adversely affect chalcocite recovery.
A large proportion of pyrite recovered to the concentratesis liberated, and the remainder is associated with pyrrhotite,chalcopyrite, or mica. Similarly, a large proportion of thequartz recovered is either liberated or associated with othernon-sulphide gangue minerals, which implies recovery byentrainment. Nevertheless, association of quartz with copperminerals and pyrite does account for a significant proportionof the quartz recovered in the coarse size fractions.
Across the three circuits, the main differences observedare in the association of chalcopyrite and quartz withsecondary copper sulphides, which is due to weathering andsupergene enrichment. It was noted in the previous sectionthat chalcopyrite has lower recoveries in the oxide and mixedcircuits than in the sulphide circuit. Figure 7 suggests that inthe oxide and mixed circuits, chalcopyrite is slightly poorerliberated and is more often associated with other mineralsthan in the sulphide circuit, which likely contributes to thelower chalcopyrite recovery, but does not fully explain thedifference observed.

Relationship between ore mineralogy and copper recovery across different processing circuits
The average recoveries of each copper mineral for the year2016 were used to calculate predicted recoveries for eachcircuit based on variation in feed copper deportment for 2017.These mineralogy-predicted recoveries are compared tomeasured recoveries in Figure 8, which shows actualrecovery versus mineralogy-predicted recovery for the fourcircuits in 2017. This graph (going forward) provides auseful tool to identify periods of high and low recovery thatcan be explained by variations in feed mineralogy, thusimproving interpretation of the impacts of operational andcircuit changes. Figure 8 also illustrates that the variability offeed mineralogy is much greater for the mixed and oxide oresthan it is for the hypogene sulphide ore, and this in turnleads to high variability in flotation recovery as compared tothe sulphide circuit.
The relative abundance of copper minerals in the ores fed toeach of the processing circuits at Kansanshi has a strongimpact on process performance. The fresh, hypogene sulphideore, with approximately 90% of the contained copper hostedin chalcopyrite, has consistently high flotation recoveries withminimal variation in flotation performance. In the oxide andmixed circuits, the copper mineralogy is much more variabledepending on the extent of oxidation and supergeneenrichment, which causes large fluctuations in both copperrecovery and flotation concentrate grade.
Quantitative mineralogy using automated SEM providesan understanding of the relationship between processperformance and mineralogy. At Kansanshi, it has deliveredsignificant value by highlighting opportunities for grade andrecovery improvement projects, which have included reagentsuite optimization and circuit modifications. Key circuitmodifications guided by process mineralogy have includedthe change of the mixed circuit ball mill dischargemechanism, the installation of Jameson cells, and CPS for thesulphide circuit (still in progress).
The authors would like to thank First Quantum Minerals andKansanshi Mining plc management for funding andsupporting mineralogical studies at Kansanshi, and forallowing the publication of this work. Edward Paul, MonicaKalichini, and Busiku Hamilemba have all been responsiblefor developing and maintaining the programme over certainperiods, and the mineralogy sample-preparation team playsan essential role in consistently producing high-qualitysamples for analysis. We appreciate the contributions of WillGoodall, James Strongman, and colleagues from MinAssistand iMinSolutions for technical support since the inception ofthe Kansanshi mineralogy programme. The Carl Zeiss serviceteam has also worked hard to help us keep the MinSCAN andancilliary equipment running full-time.
ALBIJANIC, B., SUBASINGHE, N., BRADSHAW, D.J., and NGUYEN, A.V. 2014. Influenceof liberation on bubble–particle attachment time in flotation. MineralsEngineering, vol. 74. pp. 156–162.
BRUCKARD, W.J., SPARROW, G.J., and WOODCOCK, J.T. 2011. A review of the effectsof the grinding environment on the flotation of copper sulphides.International Journal of Mineral Processing, vol. 100, no. 1–2. pp. 1–13.
CHEN, X., PENG, Y., and BRADSHAW, D. 2014. The effect of particle breakagemechanisms during regrinding on the subsequent cleaner flotation.Minerals Engineering, vol. 66–68. pp. 157–164.
CORIN, K.C., KALICHINI, M., CONNOR, C.T.O., and SIMUKANGA, S. 2017. The recoveryof oxide copper minerals from a complex copper ore by sulphidisation.Minerals Engineering, vol. 102. pp. 15–17.
EVANS, C.L. and MORRISON, R.D. 2016. Mineral liberation. Process Mineralogy,Becker, M., Wightman, E.M., and Evans, C. (eds). Julius KruttschnittMineral Research Centre, Indooroopilly, Queensland, Australia.
FANDRICH, R., BEARMAN, R.G., BOLAND, J., and LIM, W. 2007. Modern SEM-basedmineral liberation analysis. International Journal of Mineral Processing,vol. 84, no. 1–4. pp. 310–320.
FENG, D. and ALDRICH, C. 1999. Effect of particle size on flotation performance ofcomplex sulphide ores. Minerals Engineering, vol. 12, no. 7. pp. 721–731.
FLSMIDTH. 2018. ProFlote flotation. http://www.flsmidth.com/en-US/Industries/Categories/Products/Flotation/ProFloteFlotation/ProFloteFlotation [accessed 16 March2018].
GLENCORE TECHNOLOGY. 2017. Jameson cell.:http://www.jamesoncell.com/en/Pages/home.aspx
GREET, C., SMALL, G.L., STEINIER, P., and GRANO, S.R. 2004. The Magotteaux mill:investigating the effect of grinding media on pulp chemistry and flotationperformance. Minerals Engineering, vol. 17, no. 7–8. pp. 891–896.
HEYES, G.W. and TRAHAR, W.J. 1979. Oxidation-reduction effects in the flotationof chalcocite and cuprite. International Journal of Mineral Processing, vol.6. pp. 229–252.
HILL, E. 2014. Zeiss mineralogic mining - ore process optimization. WhitePaper. Carl Zeiss, Jena, Germany.
JACOBS, T.T. 2016. Process mineralogical characterisation of the Kansanshicopper ore, NW Zambia. MSc thesis, Department of Chemical Engineering,University of Cape Town. https://open.uct.ac.za/handle/11427/20490
KALICHINI, M.S. 2015. A study of the flotation characteristics of a complexcopper ore. MSc thesis, Department of Chemical Engineering, University ofCape Town. http://hdl.handle.net/11427/16196
KALICHINI, M.S., GOODALL, W.R., PAUL, E.M., PRINSLOO, A., and CHONGO, C. 2017.Applied mineralogy at Kansanshi mine – proof of the concept of on-siteroutine process mineralogy for continuous improvement of plantoperations. Proceedings of Process Mineralogy ’17, Cape Town. MineralsEngineering International, Falmouth, UK. pp. 1–10.
KOTTGEN, A. and BASTIN, D. 2009. Mineralogical analysis of the “Red Ore”flotation circuit - Kansanshi. University of Liège.https://orbi.uliege.be/handle/2268/155492
LOTTER, N.O., BRADSHAW, D.J., and BARNES, A.R. 2016. Classification of themajor copper sulphides into semiconductor types, and associated flotationcharacteristics. Minerals Engineering, vol. 96–97. pp. 177–184.
PACQUOT, F. and NGULUBE, C. 2015. Development and optimization of mixedsulphide/ oxide copper ore treatment at Kansanshi. Journal of theSoutheren African Institute of Mining and Metallurgy, vol. 115. pp. 1253–1258.
PÉREZ-BARNUEVO, L., PIRARD, E., and CASTROVIEJO, R. 2013. Automatedcharacterisation of intergrowth textures in mineral particles. A case study.Minerals Engineering, vol. 52. pp. 136–142.
WHITEMAN, E., LOTTER, N.O., and AMOS, S.R. 2016. Process mineralogy as apredictive tool for flowsheet design to advance the Kamoa project.Minerals Engineering, vol. 96–97. pp. 185–193. �
�
1162

ERG Africa operates the Luitahydrometallurgical facility located at Kakandain the Democratic Republic of Congo (DRC),treating malachite and heterogenite mineralsto recover copper as electrowon cathode andcobalt as a hydroxide precipitate. The processwas originally conceived as a heap leachoperation followed by direct electrowinning ofcopper, with solvent extraction (SX) andelectrowinning (EW) of cobalt. In preparing thesized ore for the heap leach operations, theundersized ore fraction at a P80 of 625 μm wasdischarged to a fines storage facility for laterprocessing. This fraction carried with itapproximately 30% of the copper contained inthe run-of-mine (ROM) ore feed, and anequivalent proportion of cobalt.
In a subsequent development, the cobaltSX section was converted to a copper SXfacility, the leached cobalt being recoveredfrom a bleed stream from the copper heapleach circuit. The operating cost for the processas then installed placed this facility well in thefourth quartile of the industry cost curve.
The initial Luita operation was establishedin 2010 at a time when metal prices were
above long-term averages (copper aboveUS$3.00 per pound; cobalt above US$20.00per pound), and the drop in prices in2015/2016 presented a major challenge. TheLondon Metal Exchange (LME) copper pricedropped below US$2.00 per pound, with cobaltdropping below US$10.00 per pound in Q12016. This set in motion a range ofimprovement initiatives for the Luitaoperation. Central to this was the installationof a tank leach circuit to process the discardedfines and a modified SX circuit to managecolloidal silica. The revised Luita circuitreached design capacity in November 2017and has proven to be well suited to processingof the oxide ore feed. This process designchallenges the boundaries of conventionalthinking in the areas of leaching, solid/liquidseparation, solution management, impuritymanagement, and metal recovery, and is thesubject of this paper.
The Luita plant block flow diagram as it was in2015 is illustrated in Figure 1. ROM ore wasprocessed through two crushing and washingplants to produce a sized ore (−50 mm +625μm) for the heap leach operation. Theundersized ore (−625 μm ‘fines’) was removedfrom the feed in order to allow for a maximumheap irrigation rate of 90 L/m2/h. The selectedirrigation rate took advantage of the rapidleaching kinetics of malachite.
The pregnant leach solution (PLS)recovered from the heaps was clarified andthen processed through SX and EW circuits toproduce the copper cathode product. The cobaltwas recovered from a raffinate bleed stream byiron and copper precipitation processes,
Innovative process design for copper-cobalt oxide ores in the DemocraticRepublic of Congoby D. Alexander*, C. van der Merwe†, R. Lumbule†, and J. Kgomo†
The mining industry in the Democratic Republic of Congo has seen asignificant expansion in copper and cobalt production in recent years. Thegreater proportion of this expansion has arisen through processing of oxideores. The design of metallurgical processes for these oxide ores is based onthe conventional equipment and layout for processing of sulphide ores, andcomprises milling followed by leaching, solvent extraction, andelectrowinning. The physical characteristics of the oxide ores, however,provide the process design engineer with an opportunity to examinecritically the principles on which equipment selection is based and to designprocesses better suited to these ores. In 2015, ERG Africa began a project toexpand the leaching capacity of the Luita hydrometallurgical facility. Anumber of innovative changes to the conventional process design wereincluded in the modified flow sheet, which were validated when the projectreached design throughput in November 2017. Of these changes, the mostnovel presented an alternative approach to mitigate the impact of colloidalsilica on the operation of the solvent extraction plant.
copper, cobalt, process design, oxide ores, solvent extraction, colloidal silicamanagement.
* ERG Africa, South Africa.† Boss Mining, Democratic Republic of Congo.© The Southern African Institute of Mining and
Metallurgy, 2018. ISSN 2225-6253. This paperwas first presented at the Copper Cobalt Africa,incorporating the 9th Southern African BaseMetals Conference, 9–12 July 2018, AvaniVictoria Falls Resort, Livingstone, Zambia.
1163 �
http://dx.doi.org/10.17159/2411-9717/2018/v118n11a6

Innovative process design for copper-cobalt oxide ores in the Democratic Republic of Congo
followed by precipitation of a basic cobalt hydroxide sulphateby-product utilizing soda ash as a precipitant.
In developing the process design for the uprated Luita circuit,the following areas were assessed.
(i) Overall solution management: Conventional processdesigns will seek to limit addition of water to theprocess through equipment and technologyselection, and provide for a neutralization process tomanage excess solution build-up. Little use is madeof natural water removal processes such asevaporation.
(ii) Optimum particle size for leaching: A reduction inparticle top size is often required to liberate thetargeted minerals for effective leaching. Majoroperations in the DRC specify a P80 from 75 μm to200 μm for the leach feed, and milling becomes thedefault technology selection. For the copper oxideores, effective liberation may be achieved at a muchcoarser particle top size, bringing into questiontechnologies selected for the size reduction duty.
(iii) Silica management: Colloidal silica in the PLSpresents processing challenges for the operation ofmany SX circuits. Much attention has been placedon flocculation/coagulation measures appliedupstream as a means of containing, rather thancontrolling, the effects of colloidal silica formation.The management of colloidal silica within the SXcircuit itself has not been extensively explored.
(iv) Layout of the copper tankhouse: With no successfulstrategy defined for management of silica,tankhouses are being designed such that the richelectrolyte from the SX plant, passes first through abank of electrolytic cells (referred to as scavengercells) to capture the organic phase entrained in theelectrolyte. Copper cathodes produced from thesecells are typically downgraded on quality grounds.
Taking into consideration these processing issues, analternative process design was developed around a tank leachoperation for processing the fines then being discarded. Keyprocess design changes and the impact on the overall processare described in the following sections.
In the Luita heap leach operation, the working solutioninventory is between 90 000 m3 and 100 000 m3, andprovision was made in the original design for a spillageinventory capacity of a further 100 000 m3. However, this didnot take into account the 200 000 m3 of rainfall per seasonon the heap leach footprint. This resulted in 100 000 m3 ofexcess solution being processed through the neutralizationcircuit each season to prevent process ponds fromoverflowing. The impact of rainfall addition on the totalinventory movement through 2015, 2016, and into 2017 isillustrated in Figure 2.
Data past June 2017 has been excluded. Thecommissioning of the tank leach circuit introduced an
�
1164

additional water supply into the process, requiring a changeto the solution management philosophy to manage theadditional volume. The increase in Q1 2017 over 2016reflects the impact of the tank leach.
In a typical annual cycle, the inventory will peak inFebruary/March and reach a minimum in November. Takinginto consideration water deficiency at the height of the dryseason (September to October), the decision was taken toexpand the solution storage capacity of the Luita spillagecircuit by a further 150 000 m3 to capture rainfall during thewet season and to optimize evaporation profiles through thebalance of the year through the heap spray irrigation system.The direct impact of the revised inventory managementphilosophy was a reduction in consumption of neutralizingreagents and a more effective utilization of sulphuric acid inthe process. Further optimization of process conditions(dropping the free acid background in the raffinate leachsolution to below 30 g/L) has reduced acid consumption byhalf over the period 2015 to 2017, as illustrated in Figure 3.
The oxide ROM ores are composed of dolomite, dolomiticshales, and argillites. The primary ore minerals present aremalachite [CuCO3.Cu(OH)2] and heterogenite [CoO(OH)]. Thechief components of the orebodies impacting on processdesign are silica, talc, and dolomite.
For comparative purposes, images of malachite andchalcopyrite samples from the Kakanda ore complexes areincluded in Figure 4, illustrating key differences inmineralization. Malachite has a massive mode of occurrence,while chalcopyrite is crystalline and disseminated in the hostrock.
In a fundamental change in thinking around processdesign, when opting to process the undersize ore from thecrushing circuit, the decision was taken to exclude furthersize reduction technologies (milling) from the process; ineffect, to leach the crusher fines through a tank leach facilityat a P80 of 625 μm (well above the industry norm). Keyconsiderations in arriving at this decision were the massive
nature of the malachite (Figure 4) and the risk of elevatedgangue acid consumption when gangue constituents(specifically dolomite) are ground to finer product sizes.Metallurgical test work indicated a potential saving in gangueacid consumption of over 20 kg/t ore when leaching at a P80of 625 μm as opposed to leaching at a P80 of 150 μm. Nobenefit in copper leaching was evident in leaching at the finerparticle size. The tank leach was then designed for a three-hour residence time, focusing primarily on copper recovery –lower cobalt recoveries were indicated in early test work;however, particle size distribution was identified as only oneof a number of variables affecting leach efficiency, along withresidence time and iron concentration in solution. From theeconomic assessments carried out, it was determined that thereduced operating costs associated with the acid savingsoutweighed the potential loss in revenue from lower cobaltrecoveries. Since commissioning, the success achieved inoptimizing the cobalt leach efficiency to values above thatindicated in the bench-scale test work has justified thedecision to design the leach circuit for processing of thecrusher fines.
The leach efficiencies subsequently achieved through thetank leach operation are summarized in Table I. The averageleach efficiencies for the four months May to August 2018represent the tank leach circuit having reached nameplatecapacity.
Innovative process design for copper-cobalt oxide ores in the Democratic Republic of Congo
1165 �
Table I
Average: May – Aug 2018 88.5 70.5Peak 93.7 87.0

Processing of ores with particle top sizes greater than 200 μm brings into question the selection and design ofequipment typically found in a base metal hydrometallurgicalcircuit. Dewatering cyclones prove to be ineffective on broadparticle size distributions, and thickener designs typicallycater for slow-settling solids milled finer than 400 μm.Taking such factors into consideration, the design philosophyadopted for the Luita circuit was to focus on movement of thecoarser size fraction through the tank leach section. Theleach tanks were designed as overflow tanks with fullhomogenous suspension of particles at a P100 of 1000 μm,with sufficient power installed to re-suspend the loadfollowing a dead stop (for example, following a power trip).In conventional circuit design, continuous withdrawal ofslurry from the bottom of each leach tank at a volumetricflow rate equivalent to up to 20% of the feed flow rate isincluded in order to move forward heavier particles that donot readily suspend. Such a cropping system was excludedfrom the Luita tank leach design; an alternative proprietarysystem was installed to bleed forward a smaller volume ofslurry on a batch basis, only when an increase in the slurrydensity at the bottom of the tank is detected. In this way, a‘true’ overflow leach train is installed (as opposed to the‘dual transfer’ system when making use of cropping pumps).
Given the free-settling nature of the coarser particles,horizontal vacuum belt filters were selected for solid-liquidseparation, as opposed to countercurrent decantation (CCD).This offered the opportunity to reduce wash water volumes(lower the wash ratio) for fast-settling solids and to size asmaller processing circuit for metals recovery from the low-grade filter cake wash solution.
One of the biggest challenges facing hydrometallurgicaloperations in the DRC lies in managing silica leached fromsiliceous minerals such as chrysocolla [Cu2H2Si2O5(OH)4].As per conventional design, the Luita facility includes a bleedstream to remove impurities from the circulating PLS; cobaltis then recovered from the bleed stream as a hydroxideprecipitate. Referring to the solution inventory profilesillustrated in Figure 2, background impurity concentrationsin the solution inventory are at their lowest in the firstquarter of the year, when dilution from rainwater ingressreaches a maximum. Through the year (April to October), thesolution inventory is then managed down and this results ina corresponding increase in the concentration of impuritiesreporting to the bleed stream and exiting the process. Thisimpurity management system is effective for all impuritiesother than silica,.
As the solution inventory reduces through the year(primarily through evaporation) the increasing silicaconcentration reaches a series of tipping points wheremassive colloidal silica formation in the Luita processsolutions occurs almost overnight. The consequence of this ismassive aqueous and organic entrainment through the SXcircuit into the EW tankhouse. This is driven by colloidalsilica crud formation, as the silica finds an alternative exitfrom the circulating process solutions in the leach circuit. Inthe tankhouse, the silica and organic phases disengage,‘silica sand’ being collected from the floors of the EW cellsand the organic phase floated off the surface of the
electrolyte. The consequence of this silica deportmentmechanism is organic staining on the copper cathodes andconsequent downgrading of the product. Typically, thisoccurs every two to three months through the dry season andpresents a significant disruption to the SX/EW processes.
The effects of the colloidal silica formation are illustratedin Figure 5. Pipe blockages and fouling of in-line instrumentsboth in the leach circuits and in the tankhouse are common,and silica precipitation on the anodes in the tankhouse hasbeen associated with marked reductions in current efficiency.During such excursions, current efficiencies as low as 50%have been reported.
Work carried out on the use of coagulants to control silicain leach process solutions raises concern over the effect onthe downstream SX operation, with at least one operation inthe DRC in the recent past experiencing significant processdisruptions following a trial run utilizing coagulants.
In reviewing the operation of the Luita facility, a keyobservation during silica excursions was that the crudformed in the SX was of a low density and non-compacting.The crud sat at the interface in the extract settlers, reportingwith the organic phase to the strip circuit and then with theaqueous phase into the tankhouse. Recognizing the potentialto manage the silica deportment by forcing the formation of ahigher density, compacting crud, a novel approach to thedesign of the SX circuit was adopted, providing for a diluentwash section at the front of the process. The layout of theLuita SX circuit is illustrated in Figure 6, highlighting thepositioning of the diluent wash section.
In operation, an unclarified PLS is contacted with thediluent containing no extractant in the diluent wash section.The function of the diluent wash is to form a compactingcrud that will encapsulate the low-density silica crud, thusrendering it more manageable through crud removalprocesses and subsequent tricanter centrifuge operation. The‘clean’ PLS is then fed forward to the first extraction stage ofthe conventional SX circuit.
The proposed SX circuit was piloted to highlight the processissues being encountered in managing silica, and to developoperating parameters for the commercial installation. Theissues pertaining to colloidal silica formation are illustratedin Figure 7, where the colloidal silica is seen to stabilize theemulsion exiting the picket fence in the diluent wash settlerand in the E1 extract settler.
The nature of the crud formed from the colloidal silica isillustrated in Figure 8.
Innovative process design for copper-cobalt oxide ores in the Democratic Republic of Congo
�
1166

Innovative process design for copper-cobalt oxide ores in the Democratic Republic of Congo
1167 �
The darker crud phase, closer to the picket fence in Figure8, shows the formation of the more compact, higher densitycrud being targeted. Aqueous entrainment in the non-compacting low-density crud phase is highlighted.
In the past Luita operation, ‘phase flipping’ at organicflow rates lower than 1.5 times the aqueous flow rates(internal O:A ratio lower than 1.5) was a common occurrenceand the SX circuit was operated at O:A ratios greater than 2.0to force organic continuity through all stages of theoperation. When operating under aqueous-continuousconditions (O:A less than 1.0), settling times extendedbeyond 10 minutes (compared with 2 minutes in organic-continuous mode) and entrainment increased significantly.The effect of operating in aqueous continuity on phasedisengagement times is illustrated in Figure 9 in the pilotsettler unit and a laboratory flask (photograph taken after 10minutes’ settling time). Formation of the stable emulsion isevident.
The new Luita SX installation was commissioned in July2017 with commercially available diluent and extractantproducts. Within two weeks, the circuit was operating at
design transfer capacity. As is common practice, the circuitstart-up was with diluent and the value of the noveloperating philosophy was immediately apparent. In additionto the diluent wash, crud formation in the strip settlershighlighted the ‘dirty’ nature of the EW electrolyte,contaminated by entrainment from the operation of the older,decommissioned, SX circuit. The crud formation in thediluent wash and strip settlers during commissioning isillustrated in Figure 10.
In the new SX circuit, no clarification of the PLS is carriedout, the solids loading assisting with the crud managementin the diluent wash. The diluent wash itself serves as aneffective clarification unit with the solids concentration in thePLS entering the first extract stage being reduced to below 20 mg/L.
An unanticipated benefit of the diluent wash lies in thefact that the diluent is transparent. This makes it simpler tomanage the crud formation in the diluent wash circuit asopposed to the extraction and stripping sections, where themixing of extractant into the diluent generates an opaqueorganic phase (refer to Figures 7 and 11).

Innovative process design for copper-cobalt oxide ores in the Democratic Republic of Congo
�
1168
Colloidal silica in solution is notably difficult to analysebecause of the propensity to form under varying conditionsof pH and total silica concentration. While the benefit that thediluent wash section brings to the Luita circuit has beendifficult to quantify solely through analytical measurementsof silica in solution (reported silica assays typically rangingbetween 500 mg/L and 1000 mg/L), improvements notedinclude the following.
(i) Whereas the older SX could not operate in aqueous-continuous mode, the new installation is operated atthe desired continuity for any particular extractionor stripping stage. The E1 stage is now operatedsuccessfully in aqueous-continuity mode (O:A ratioless than 1.0).
(ii) Both extractant and diluent consumption havereduced. The full extent of the reduction is stillbeing evaluated, but to date, reductions of 75% and65%, respectively, are indicated.
(iii) In line with the reduction in organic consumption,aqueous entrainment to the tankhouse has reducedsignificantly and this is discussed in followingsections.
The overall improvement in the Luita operation may best be characterized by comparison of the crud removalmechanism used in the old SX circuit and the nature of the crud now being generated from the new installation(Figure 11).
In the old SX circuit, crud removal proved to be asignificant challenge with much of the crud draining throughthe makeshift sieves ‘manufactured’ for this purpose.Following commissioning of the diluent wash circuit, crud isremoved effectively through a modern vacuum system, and acompact crud is discharged from the tricanter units.
The following mechanism explains the deportment of silica tothe EW tankhouse (Parris, 2009). Colloidal silica combineswith the organic phase in the SX circuit to form a stable low-density crud that contains a high proportion of the aqueousphase within its structure. This crud tracks with the lowerdensity organic phase through SX, through the strip stageand into the rich electrolyte. In the more acidic richelectrolyte, the colloidal silica separates from the organicphase, and this is evidenced by organic floating on thesurface of the electrolyte in the EW cells, staining the coppercathodes, and siliceous mud recovered from the base of theEW cells during the cleaning cycles. Parris describes furtherthe ongoing, unordered coalescing of the colloidal silica inthe low pH environment, in the extreme case generating thesilica gel illustrated in Figure 5 on the anodes and thesiliceous mud removed from the floor of the EW cells.Examples of organic staining from a South Americanoperation and siliceous mud collected form the Luita EW cellsare illustrated in Figure 12.
In response to the process issues relating to formation ofcolloidal silica and aqueous entrainment into the tankhouse,current tankhouse designs provide for a ‘scavenger section’at the front end of the tankhouse. The operating philosophyfor the scavenger cells is to allow for the disengagement ofthe entrained organic phase contained in the ‘dirty’ richelectrolyte, and for the disengaged organic phase to be ‘burnt
off’ (evaporated). The ‘clean’ rich electrolyte may then besent forward to the commercial section of the tankhouse,where the primary copper cathode product is plated. It isnoted that the disengagement, or ‘dehydration’, process inthe scavenger cells (and subsequent evaporation of theorganic phase) has a strong time-dependency, influencingthe number of cells assigned to the ‘scavenger’ duty
Key shortcomings in this process design concept are:(i) There is no direct control over the disengagement of
the entrained organic and organic ‘burning off’process. In practice, where there may be some lossof the diluent fraction through evaporation theentrained organic disengaged from the richelectrolyte (primarily the extractant) is physicallyremoved from the cells along with the coppercathodes (organic staining).
(ii) The downgrading of the copper cathode productplated in the scavenger cells. In current designs thismay be anything from 10% to 30% of the overallcopper production.
(iii) Holding an organic phase on the electrolyte surfaceof operating electrowinning cells presents asignificant hazard. Studies into the ignition of firesin solvent extraction plants have identified twocontributing factors, namely:
a. Formation of a vapour phaseb. Potential for a spark source
Both of these factors are present in the design concept forthe scavenger cells.The success of the Luita SX circuit design and diluent
wash in addressing the organic entrainment issue hasresulted in a significant improvement in the quality of therich electrolyte reporting to the copper tankhouse and, as adirect consequence of this, the chemical and physicalqualities of the copper cathodes produced. As a result, thedesign of the Luita EW tankhouse was modified to removescavenger cells from the layout; this change in EW circuitdesign is illustrated in Figure 13.

The benefits attributed to the novel design conceptsintroduced into the Luita plant operation are best illustratedby the improvements in two key aspects of the copperelectrowinning operation:
� Cell cleaning: reduction in the mass of silica mudrecovered from the EW cells
� Copper cathode quality: reduction in impurities (Fe, S,and Pb).
Prior to the introduction of the new SX circuit and diluentwash, the EW cells in the Luita tankhouse were cleaned on a25-day cycle; this required cleaning of 12 cells per day. Foreach cell to be cleaned, the rectifier amperage is reduced toallow for short-circuiting bars to be installed, and followingcleaning the rectifier amperage is reduced again to removethe shorting bars and bring the cleaned cell back on line. Themass of siliceous mud removed through the cleaning cycleaveraged 252 kg per day (see Table II).
Following commissioning of the diluent wash circuit, thecell cleaning cycle has been extended to 75 days (four cellscleaned per day), with the mass of siliceous mud removedreduced to an average of 7 kg per day. The cell cleaningschedule is still below the industry norm of 120 to 180 days,but this represents an area for further improvement.
In the Boss Luita tankhouse operation, key impurities trackedare iron, sulphur, and lead. Trends in these analyses,following commissioning of the tank leach circuit and diluentwash in July 2017 are illustrated in Figure 14.
Immediately prior to the commissioning of the new SXcircuit a silica excursion (massive colloidal silica formation)was experienced, and this is highlighted as Silica Excursion(1) in Figure 14. The spike in sulphur assay at this time isalso evident. A further excursion occurred three months later.The impact of this excursion (Silica Excursion (2) in Figure14) was less severe with the diluent wash in circuit andprovided Boss with an opportunity to refine the operatingparameters for the diluent wash. Since then the operation hasseen a steady improvement in both the physical and chemicalquality of the copper cathode product. The improvement in issummarized in Table III and illustrated in Figure 15.
Innovative process design for copper-cobalt oxide ores in the Democratic Republic of Congo
1169 �
Table II
Old circuit 12 252New circuit 4 7
Table III
2016–2017: pre-commissioning 21 52 302017: post-commissioning 19 38 162018: to date 18 30 5

Innovative process design for copper-cobalt oxide ores in the Democratic Republic of Congo
The Luita plant process flow as it is in 2018 is illustrated inFigure 16.
Further process design changes have seen the copperprecipitation process in the cobalt recovery (COB) circuitreplaced by a SX circuit, improving the chemical quality of thecobalt COB product.
In 2015, ERG Africa initiated a project at the Boss MiningLuita process plant to provide for tank leaching of a crusherfines discard product and to uprate the SX plant capacity. Thenovelty in these two initiatives lay in the proposals to leachthe crusher fines at a coarse particle size distribution (P80 of625 μm), and to provide for a diluent wash section at thefront end of the SX circuit to manage the impact of colloidalsilica formation on the downstream EW process. The projectreached nameplate capacity in November 2017, and thenovelty introduced into the process design has contributed tosignificant reductions in consumption of key reagentsincluding sulphuric acid, diluent, and extractant, withminimal loss in leaching efficiency for copper and cobalt.Introduction of the diluent wash into the SX circuit hasprovided a means to manage the deportment of silica throughthe process, specifically to the copper tankhouse, and this hasresulted in a marked improvement in the chemical andphysical characteristics of the copper cathode produced.
Following a retrospective review of this and other projectsin the DRC, further opportunities have been identified aimedat improving the overall efficiency in future process designsfor processing of DRC oxide ores.
Acknowledgement is given to ERG Management, not only forpermission to present this paper, but also for creating an
environment where innovation and exploitation of consideredrisk opportunities is supported.
The involvement of specific vendors and reagent suppliersin bench and piloting test work before and after projectinitiation, and in critically assessing the proposed designconcepts, is also acknowledged.
� BASF: SX pilot plant� Solvay: SX pilot plant� Outotec: solid suspension and abrasion test work; Sand
Sense/Sand Gate technology for density control in theleach tanks
� Roytec: filtration and flocculation test work (horizontalbelt filters)
� Kemira: flocculation test work (horizontal belt filters)� ProProcess: CRUD FORX for crud removal from SX
settlers.
AUCHTERLONIE, A. and LYDALL, M.I. 2011. The Democratic Republic of Congo andZambia: A growing global ‘hotspot’ for copper cobalt mineral investmentand exploitation. Proceedings of the 6th Southern Africa Base MetalsConference 2011, Phalaborwa, 18–21 July. Southern African Institute ofMining and Metallurgy. Johannesburg. pp. 25–38.
ROBINSON, T.G., SOLE, K.C., SANDOVAL, S., MOATS, M.S., SIEGMUND, A., andDAVENPORT, W.G. 2013. Copper electrowinning: 2013 world tankhouseoperating data. Proceedings of Copper-Cobre 2013, Santiago, Chile. Vol. V.Gecamin. Santiago. pp. 3–14.
FISHER, K.G. 2011. Cobalt processing developments. Proceedings of the 6thSouthern Africa Base Metals Conference 2011, Phalaborwa, 18–21 July.Southern African Institute of Mining and Metallurgy. Johannesburg. pp. 237–258.
GOEL, N., LUZANGA, A., SANDOVAL, S., and TSHIFUNGAT, O. 2015. Improvements incopper electrowinning at Tenke Fungurume Mining Company. Proceedingsof the Copper Cobalt Africa Conference, Victoria Falls, Livingstone,Zambia, 6-8 July. Southern African Institute of Mining and MetallurgyJohannesburg. pp. 497–502.
PARRIS, D. 2009. Silica in acid leaching. Parris Consulting Limited, Parkville,Victoria, Australia. �
�
1170

Chemaf (Chemicals of Africa), a miningcompany located in Katanga province of theDemocratic Republic of Congo (DRC), has beenoperating since 2001 with two major copper–cobalt processing facilities: the Usoke andEtoile plants. In 2016, Chemaf acquired theMutoshi mine, which belonged to Gécaminesand had been explored by Anvil Mining since2004 under a joint venture with Gécamines.Chemaf appointed African Mining ConsultantsLtd (AMC) to undertake a preliminaryeconomical assessment, then develop a JORC-compliant Mineral Resource estimate andfinally a full life-of mine feasibility study. Botha Mineral Reserve and Mineral Resource weredeveloped and the final life-of-mine feasibilitystudy is to be published shortly. Ametallurgical test work programme wasinitiated and carried out by Chemaf’s researchand development laboratory with assistancefrom the Chemaf process team. Aftercompletion of the initial test work, Chemafdeveloped a process design criteria documentfor a 20 kt/a copper cathode and 8 kt/a cobaltin hydroxide production plant, followed by aflow sheet and supporting METSIM massbalance. As the drilling progressed, the plantdesign capacity was revised to 16 kt/a cobalt
production. The life of the mine at thisproduction rate is over 40 years.
In 2017, Chemaf approached Outotec andMetallurgical Engineering Technology andConstruction(METC) for the detailedengineering and equipment supply for theMutoshi project. The main objective was todesign a project with minimal risk andmaximized upside potential using thesignificant experience of both Outotec andMETC engineers in metallurgical plant designand Chemaf’s long experience in copper andcobalt plant operation and optimization.Metallurgical test work, process design, andthe project delivery approach, as well as thedecisions taken to achieve the aboveobjectives, are discussed in this paper.
A substantial amount of test work has beencarried out using 2016 drill core samples fromdifferent areas within the Mutoshi complexand orebody with the purpose of (a) assessingthe suitability of the ore to be processedthrough a hydrometallurgical route for bothcopper and cobalt recovery and (b) generatingdata to confirm specific plant operatingparameters.
Chemaf has a well-equipped research anddevelopment complex with state-of-the-artfacilities in Lubumbashi. The facility contains
The Mutoshi Project — Part I:Metallurgical test work, process design,and project deliveryby P. Ilunga*, D. Samal†, M. Nicolle‡, M. Lampi§, K. Valkama§, J. Edwards#, and N. Tatalias#
Developing a greenfield mining project is a complex exercise: doing so in anincreasingly volatile, uncertain, and ambiguous global economy addssignificantly to this complexity. In the context of an elevated cobalt price,this paper outlines the metallurgical and process development of theMutoshi copper–cobalt project for copper cathode and cobalt hydroxideproduction in the Democratic Republic of Congo. Chemaf has a longproduction history on the Copperbelt, a region widely perceived to be toughto operate in. This history stretches back to 2001, during which time thecompany has developed two copper–cobalt processing facilities. Theexperience gained in the development and operation of these two facilitieshas been used extensively in the Mutoshi copper–cobalt project. Themetallurgical test work, process design, and project delivery approach arepresented. Additionally, the decisions taken to minimize risk and maximizeupside to the project are discussed.
copper-cobalt, greenfield project, test work, process design, project delivery.
* Consulting Metallurgist, Democratic Republic ofCongo.
† Chemicals of Africa SARL (CHEMAF), DemocraticRepublic of Congo.
‡ Outotec South Africa (Pty) Limited, South Africa.§ Outotec Finland (Pty) Limited, Finland.# METC, Africa.© The Southern African Institute of Mining and
Metallurgy, 2018. ISSN 2225-6253. This paperwas first presented at the Copper Cobalt Africa,incorporating the 9th Southern African BaseMetals Conference, 9–12 July 2018, AvaniVictoria Falls Resort, Livingstone, Zambia.
1171 �
http://dx.doi.org/10.17159/2411-9717/2018/v118n11a7

The Mutoshi Project — Part I: Metallurgical test work, process design, and project delivery
laboratory and pilot-scale crushers and ball mills, a workindex ball mill, laboratory and pilot-scale ore beneficiationfacilities (flotation and gravity separation), laboratory andpilot-scale batch and cascade leaching and precipitationfacilities, laboratory and pilot-scale solvent extraction andelectrowinning units, and a laboratory-scale ion exchangecolumn. In addition, Chemaf has five large analyticallaboratories located at three different sites: Usoke, Etoile, andMutoshi, each equipped with ICP–OES (inductively coupledplasma optical emission spectrometry) and AAS (atomicabsorption spectrophotometry). All of the above facilitieswere used for the metallurgical test work related to theMutoshi project.
The Mutoshi complex comprises several different ore sourcesand orebodies, namely the Kulumaziba tails (fine tails fromthe previous Anvil Mining heavy medium separation (HMS)operation), stockpiles (from the previous Gécamines miningoperation), the Kumwehulu orebody, and the Mutoshi Northand Mutoshi Central orebodies (AMC, 2016, 2017).Metallurgical test work was conducted on each ore source asthe drilling progressed. All drill cores used for the test workwere selected and sampled under the supervision andguidance of AMC. The core samples used for SAG millcomminution (SMC) test work were selected usingcompetency criteria. The samples were grouped into four lots:lot-1, lot-2, lot-3, and lot-4, representing respectivecomposites of competent cores in the hangingwall of theorebody, the cobalt orebody (below the hangingwall), thecopper orebody (below the cobalt orebody) in the footwall(below the copper orebody).
The samples used for other test work were selected basedon their representativeness of the anticipated feed to theplant for the first five years of production. The stockpileswere initially sampled using a grid of 50 m spacing. The gridwas laid out using a GPS and each sampling point wasidentified using three coordinates. Sample was collected oneach identified point by digging to 20 cm depth.Subsequently, a systematic drilling campaign was conductedon all the stockpiles under the supervision of AMC andfollowing JORC procedure. All the stockpile ores wereobserved to be sticky in nature.
The comminution test work was conducted in two campaigns:the Bond ball work index test work and the SMC andabrasion test work. The Bond ball work index tests wereconducted internally at Usoke R&D Laboratory on coresamples selected based on their representativeness of the
orebody, and the SMC and abrasion test work were conductedat external accredited laboratories (GEMET, 2017; ROCKLAB,2017) in South Africa on core samples selected based ontheir competency. The work index determination wasconducted following the procedure proposed by Bond (1960),as described by Gupta and Yan (2006). The SMC tests wereconducted following the standard method developed byMorrell (2004).
As primary ore comminution was to be performed using ahigh-steel milling process, most operating problems wouldrelate to inadequate breakage of larger particles as the addedsteel balls would assist with primary ore breakage. As such,ore competency tests specifically focused on the morecompetent components of the ore and also whether anyproblems would be encountered due to foot- and hangingwallinclusion in plant feed material.
Figures 1 and 2 show the map of the Mutoshi permit andphotographs of some core samples respectively. Figure 3shows that there is quite a variation in the work index results
�
1172

from one orebody to another, which confirms the largevariation in the characteristics of the Mutoshi ore. Even inthe same orebody the work index varies up to 30% from onearea to another. The results of SMC test work are presentedin Table I. From the results, the estimates of parameters A, b,and ta required for the comminution circuit design andmodelling were derived as shown in Table II.
The estimates of parameters derived from SMC testworkvaried from 20% to 40% from one location to another withinthe same orebody. The variability in ore characteristicspresented a challenge in the design of the comminutioncircuit. Although the samples were of more competent ores, itdoes confirm that the Mutoshi ores have harder and morepower-intensive characteristics compared with other typicalDRC copper orebodies, and this must be taken into account inthe mill design. It highlights the need for good blending ofthe feed to the plant to maintain stable mill operation.
The leaching and post-leach settling test work aimed toassess the response of different Mutoshi orebodies toleaching and settling and generate data required for the
design and engineering of the leach and post-leach solid–liquid separation circuits for the Mutoshi project.
The test work methodology adopted is outlined below:
� Leach and settling parameters were optimized on theMutoshi North orebody samples
� Single tests were conducted on each of the rest of theMutoshi ore sources (Mutoshi Central, Kulumazibatails, Mutoshi stockpile, and Kimwehulu) under theabove optimized conditions to assess their variability inbehaviour compared with that of the Mutoshi Northorebody.
The elemental compositions of the Mutoshi ores arepresented in Table III.
The leaching optimization strategy focused on thefollowing parameters: solids particle size distribution, pH,ORP (oxidation–reduction potential), residence time, solidsconcentration in feed slurry, and temperature. Sulphuric acidwas used as the lixiviant at controlled pH and sodiummetabisulphite was used as reducing agent for the reductionof cobaltic (Co3+) to cobaltous (Co2+) at controlled ORP.
The results obtained from particle size distribution andresidence time are presented in Figures 4 and 5, respectively.
Figure 4 shows that the leaching efficiency for bothcopper and cobalt increased as the size distribution becamefiner. This is due to the increase in leaching kinetics, which islinked with the liberation of valuable minerals; however,below a P80 of 106 m, the increase in both copper and cobaltleaching efficiency was very marginal while the dissolution ofimpurities increased significantly, with a consequent increasein reagent consumption. The optimum grind size for theMutoshi North orebody is considered to be a P80 of 106 m.
Figure 5 shows that 4 hours of batch residence time isrequired to reach the maximum cobalt leaching efficiencywhereas 2 hours is enough for maximum copper leaching.Four hours was therefore selected as the optimum residencetime because it gives the maximum cobalt and copper
The Mutoshi Project — Part I: Metallurgical test work, process design, and project delivery
1173 �Table II
Lot 01 87.5 0.44 0.41Lot 02 71.8 0.64 0.50Lot 03 65.1 0.71 0.50Lot 04 64.8 0.61 0.41
Table I
Lot 01 6.28 45 20.8 15.1 7.8 2.41Lot 02 5.20 31 18.0 12.6 6.5 2.39Lot 03 5.14 30 17.8 12.5 6.4 2.39Lot 04 6.29 45 19.9 14.6 7.5 2.51
DWi – drop weight index. Mia, Mih, Mic: comminution indexes respectivelyfor tube mills, high-pressure grinding mills, and crushers
Table III
Mutoshi North 1.80 1.73 0.50 0.45 1.99 0.16 0.69 1.40 0.01 0.88 0.01Kulumaziba 2.31 2.22 0.10 0.09 2.85 0.08 0.24 1.18 0.01 0.79 0.01Kimwehulu 1.16 1.10 0.02 0.02 2.99 0.05 0.21 1.34 0.01 1.87 0.01Stockpiles 1.16 1.11 0.08 0.07 2.48 0.16 1.02 2.44 0.04 1.28 0.01
*AS - Acid soluble

recoveries. Based on past experience and other copper–cobaltplants in the region, Chemaf has always operated the leachplant at 30% (by mass) solids concentration and below tominimize sands settling in the leach tanks. It was planned todesign the Mutoshi leach section for similar conditions.
After a review of all leaching test work results forMutoshi by Outotec, a recommendation was made to explorethe possibility of operating the leach at higher solidsconcentration, with the objective of increasing metal tenors insolution and reducing the solution volumes to be handleddownstream. Smaller solution volumes enable smallerequipment to be used in areas such as leaching, solventextraction, ponds, and low-grade raffinate precipitation. Therisks of sanding in reactors would be addressed by theOutotec OKTOP® agitation design. Therefore, the effect ofsolids concentration in the slurry was studied at optimizedleach conditions.
From the results obtained and presented in Figure 6, itwas observed that both copper and cobalt leachingefficiencies start dropping when the slurry solidsconcentration exceeds 35% by mass. This was chosen as theoptimum solids concentration of the slurry. Thus, a reductionin leach solution volume of approximately 7% was achieved(1 − 65/70 = 7.1%).
The temperature optimization investigation indicated thatthere was no further improvement in copper and cobaltleaching efficiency above 45°C. No external heating will berequired to attain this temperature. In fact, experience withseveral copper-cobalt plants in the DRC has shown that theheat generated by acid addition to closed leach reactors canmaintain temperature within 45–50°C. Figure 7 indicates theeffect of temperature on leaching efficiencies.
Table IV shows the optimized leaching conditions andresults obtained from test work and used for the Mutoshileach circuit design.
The post-leach settling test work was conducted on leachslurry starting from flocculant screening, flocculant dosage,and slurry dilution optimization up to batch thickening todefine the design settling flux. Different countercurrentwashing scenarios were simulated using METSIM and HSCChemistry software to arrive at the optimum operatingconditions. The key objective for optimization was cobaltrecovery, given the pricing environment. The optimizedsolid–liquid separation parameters are shown in Table V.
Based on results obtained from leaching and post-leach testwork, METSIM and HSC simulations were developed to derivethe pregnant leach solution (PLS) chemistries. From the PLScopper grades, the ideal extractant concentration in organicwas calculated following the BASF procedure (Cognis Group,2007). Then Isocalc simulations were developed and theresults were reviewed and validated by BASF. Finally,laboratory tests, including McCabe-Thiele plots and
The Mutoshi Project — Part I: Metallurgical test work, process design, and project delivery
�
1174
Table IV
Leach feed particle size distribution ( P80) μm 106Residence time (batch) h 4pH - 1.5ORP (Eh) mV 350Leach feed solids concentration % (m/m) 35Temperature °C 45Copper leach efficiency % 92Cobalt leach efficiency % 85Iron leach efficiency % 11Manganese leach efficiency % 89Silica in leach discharge liquor mg/L ~500Total acid consumption kg/t ore 57Gangue acid consumption (GAC)* kg/t ore 37Specific acid consumption** t/t Cu+Co 3.8Sodium metabisulphite consumption (as sulphur) t/t Co 0.7
*GAC (gangue acid consumption) is the acid consumed by all minerals inthe ore excluding the valuable minerals (copper and cobalt minerals). It isgenerally calculated as the difference between the total acid consumedand the acid consumed by valuables minerals.
**Specific acid consumption is simply the total acid consumption butexpressed as tons of acid per ton of valuable metals contained in theore.

The Mutoshi Project — Part I: Metallurgical test work, process design, and project delivery
1175 �
countercurrent extraction and stripping simulations, wereconducted to confirm the Isocalc parameters. Solventextraction parameters derived from the above evaluation andused for design are given in Table VI.
The cobalt recovery test work included impurity (iron andmanganese) removal followed by cobalt precipitation andcobalt effluent treatment by magnesium precipitation. Thetest work was conducted on raffinate solution (copper-barrensolution) generated from copper solvent extraction tests.Summarized optimized test work results are presented inTable VII.
The Mutoshi process was developed with the objective ofminimizing risks and maximizing upside to the project. Themajor constraints considered in the overall design arediscussed in the following sections.
Phase I of the Mutoshi project is designed for 20 kt/a and 16 kt/a copper and cobalt production, respectively. The plantis planned to be expanded in Phase II to achieve a finalnameplate capacity of 100 kt/a copper. To this end, Phase Iwas designed for easy and cost-effective expansion.
� Overall plant throughput relates to an ore processing
capability of 3.07 Mt/a at 0.85% acid-soluble Cu and0.4% acid-soluble Co, increasing to 15.3 Mt/a with thethroughput increase.
� The ore receiving and milling plant design wasoptimized such that future throughput would beachieved using two parallel two-stage grinding circuits,each having their own dedicated single-stage crushingfacility. For initial plant operations, only one millingmodule with a single closed-circuit SAG mill is to bebuilt with a design that allows easy expansion.
� The sticky ore precludes the use of conventionalcrushers and screens and intermediate storage, so atooth-roll crusher with direct feed conveyance to themill was chosen.
� Initial plant operations will mill a nominal 390 t/hthrough a single-stage SAG mill, with the futuresecond mill (SAB) taking throughput up to 975 t/h,which is half of the two-module 1 950 t/h throughputcapacity. Figure 8 illustrates the phased approach tocomminution.
� The specific expansion requirements of the millrequired a mill discharge sump and cyclone cluster tobe designed for the final two-mill circuit tonnagerequirements. The mill feed conveyor, front-end bins,and crusher were also designed for future full-moduletonnage throughput.
� The significant tonnage throughput change with the
Table V
Flocculant type - Senfloc 5310 or equivalent (Rheomax DR 1050 suggested)Flocculant strength % (m/v) 0.025Flocculant dosage g/t 60–80Settling flux t/h/m2 0.351Underflow solids concentration % (m/m) 55Countercurrent decantation (CCD) circuit configuration - Post-leach thickener + CCDsNumber of CCD units - 7Wash ratio (volume of solution to mass of solids) - 2.0Copper wash efficiency % 99.8Cobalt wash efficiency % 99.7
Table VI
Circuit configuration - Split circuit (series–parallel) – high grade (HG) – low grade (LG)Copper in HG PLS g/L 4.0Copper in LG PLS g/L 1.7Acid in HG PLS g/L 3.1Acid in LG PLS g/L 2.0Advance O/A* ratio in HG extraction - 1.5Advance O/A ratio in LG extraction - 1.0Extractant - LIX 984N-CExtractant concentration % (v/v) 17Overall copper extraction efficiency % 95.0Net copper transfer g/L/% (v/v) 0.24Maximum loading of extractant % 77
*Organic-to-aqueous flow rate ratio

The Mutoshi Project — Part I: Metallurgical test work, process design, and project delivery
�
1176
second mill installation will necessitate a change-out ofcyclone feed pump and associated pipeline at this time.
� Both cyclone feed boxes and mill discharge tanks willbe designed with additional nozzles to accommodateadditional piping and pumping during the Phase IIexpansion and with minimum downtime.
Metallurgical test work showed that the ore sources andorebodies exhibit more or less similar behaviour in leaching.There is, however, wide variability in the grindability andpost-leach settling characteristics. This introduced a majorchallenge in the design of the comminution and post-leachsolid–liquid separation circuits.
To minimize the risk of significant overdesign of thecomminution and post-leach solid–liquid separationequipment, a strategy of defining an optimum blending ofdifferent ore sources, taking into account their totalrespective resources as well as the overall Mutoshi life-of-
mine plan, was adopted. This optimum blending was used asbasis for the design for the comminution and post-leachsolid–liquid separation circuits.
In addition, due to the high proportion of fines in orefrom the Mutoshi stockpiles and the sticky nature of theseores, a mineral sizer was selected as the best option forcrushing and the crushed ore bin (surge between crusher andmill) initially planned in the design was eliminated. In itsplace, 6 hours’ slurry surge storage capacity was providedbetween leaching and milling to enable the leach circuit tokeep running in cases when the mill is down, and 36 hoursof PLS storage capacity to keep the back end (copper solventextraction and electrowinning and cobalt plant) runningwhen the front end is down.
As silica is known to have adverse impacts on solventextraction and electrowinning operations (Readett and Miller,1995), PLS diluent wash stages are to be incorporated as partof the solvent extraction circuit, with the aim of removingsilica and total suspended solids from both the LG and HGPLS before they enter the extraction stages.
As the copper and cobalt grades in the feed are low,maximizing the metals recoveries, particularly cobalt, wasanother challenge. An opportunity for metals recoveryimprovement was identified at the countercurrent decantation(CCD) circuit. The process was initially designed with fourCCD thickeners. Outotec later undertook an optimizationstudy using simulations with HSC, and the results indicatedthat seven thickeners in the CCD circuit were required toachieve optimum recovery of both copper and cobalt whenconsidering the cost and revenue benefits. Recovery of cobaltwas more challenging than of copper because the specificwash waters used, although low in copper, still contain
Table VII
Iron–manganese removal:pH – 3.5ORP (Eh) mV >700Residence time h 6.0Neutralizing reagent - Limestone slurryOxidizing agent for iron and manganese - Air–SO2 mixtureSO2–air ratio % (v/v) 1.0Temperature °C 55 (live steam injection)Limestone consumption kg/m3 raffinate 20.9Iron precipitation efficiency % 95.6Manganese precipitation efficiency % 35.5Cobalt co-precipitation % 2.1Cobalt precipitation: -pH - 8.2Residence time h 6.0Precipitation reagent – MgOTemperature °C 25–35 (no heating)Magnesia consumption t/t Co 1.4Cobalt precipitation efficiency % 97.5Cobalt hydroxide purity % 29.5Magnesium precipitation: -pH - 11Residence time h 0.5 (batch)Precipitation reagent - Milk of limeLime consumption kg/m3 of solution 27.8

significant cobalt. An additional 451 t/a cobalt and 92 t/acopper are expected to be recovered by increasing the numberof CCDs from four to seven, which would result in a totalannual income of US$29 million (calculations based oncopper and cobalt sale prices of US$7000 per ton and US$63 000 per ton, respectively). Table VIII summarizes theexpected benefits of seven CCDs.
Optimizing plant design also entails tight control of operatingcost, which will maximize profitability. For the Mutoshiprocess design, particular attention was placed on (a)minimizing acid consumption, which is the top operatingcost-driver reagent and (b) achieving a negative waterbalance, which is a key to driving down metals losses due toneutralization of excess process solutions, driving down bothacid and neutralizing reagent consumption.
As part of water balance optimization, and based onexperience at other plants, including Etoile (Miller andKendal, 2013), milling in raffinate was selected as the bestmethod of minimizing the water introduced from post-millingsolid–liquid separation. For similar reasons, the selection ofthe Kulumaziba tails re-mining (reclamation) method was achallenge. To this end, mechanical reclamation using anexcavator followed by repulping in copper solvent extractionraffinate was considered the best option, instead of hydraulicmining using process water followed by solid–liquidseparation. The milling and tailings reclamation withraffinate was integrated with a Split CircuitTM solventextraction design, based on experience at other plants,including Etoile (Miller and Nisbett, 2007), for maximizationof acid recycle from raffinate to the leach, subsequentlyminimizing the limestone requirement for acid neutralizationfrom the raffinate bled to cobalt recovery.
The block flow diagram for the Mutoshi project is shownas Figure 9.
To achieve timeous delivery of the project and minimizedesign risks, the project delivery responsibilities have beendivided between Outotec, METC, and Chemaf’s process andconstruction team. Chemaf signed a fixed-price EPCS(Engineering, Procurement and Construction Supervision)contract with Outotec and METC, which was completelydifferent from a traditional EPCM (Engineering, Procurementand Construction Management) contract. In this way, theproject delivery time has significantly improved to date.
Chemaf’s process team has taken responsibility formetallurgical test work, with the assistance of METC in cases
of specific test work that was outsourced to externallaboratories. In addition, developing and updating the processmass balance and process design criteria, as well asreviewing all the projects deliveries from Outotec and METC,was part of Chemaf’s responsibilities.
The responsibilities of METC relate to all detailedengineering deliveries: process flow diagrams, piping andinstrumentation diagrams, plant layout design, and civil,mechanical, and electrical designs. Outotec’s scope is thedelivery of a core engineering package that mainly focusedon reviewing Chemaf’s test work results and process designcriteria to ensure they comply with the process requirements.Additionally, Outotec has a small detailed engineeringsupervision role, as well as a significant scope of delivery forthe main process equipment and technology to the project.This includes, among other equipment, the LDX mill,OKTOP® reactors with agitators, thickeners, Vertical SmoothFlow (VSF®X) modular solvent extraction equipment,containerized crud treatment plant, filters, electrowinning,process control system (Proscon), and three modularsulphur-burning acid plants. The expected benefits of themodular pre-engineered plants that will be supplied byOutotec are lower total investment, shorter project lead time,lower project financing cost, less work at the constructionsite, less risk due to shorter project time at site, and residualvalue due to reusability of modules (Weatherseed et al.,2015).
By simplifying the project interfaces and scope for each party,and their respective expertise and experience, Chemaf,Outotec, and METC have developed a robust process designand project implementation plan for the Mutoshi project. Theplant design has ensured low operating cost, optimized waterbalance, high metal recovery, and an optimized capital cost,while the innovative project implementation plan significantlyaccelerates the project execution timeframe in comparisonwith traditional models employed on the DRC Copperbelt. Theproject is currently under construction and expected to becommissioned in the third quarter of 2019.
The authors would like to thank Mr Shiraz Virji, Chairman ofChemicals of Africa, and the management team of thecompany for their permission to publish this paper.
AFRICAN MINING AND CONSULTANTS LTD. 2016. Preliminary economic assessmentof Mutoshi.
The Mutoshi Project — Part I: Metallurgical test work, process design, and project delivery
1177 �
Table VIII
Four 0 0 579 0 0 0Seven 451 28.4 102 92 0.6 29.0

The Mutoshi Project — Part I: Metallurgical test work, process design, and project delivery
AFRICAN MINING AND CONSULTANTS LTD. 2017. Mutoshi life of mine feasibilitystudy.
CHEMAF RESEARCH AND DEVELOPMENT LABORATORY. 2017. Mutoshi metallurgicaltestwork report.
COGNIS CORPORATION. 2007. LIX reagents redbook. Tucson, AZ.GEMET. 2017. SMC test report for Mutoshi.GUPTA, A. and YAN, D.S. 2006. Mineral Processing Design and Operation: An
Introduction. Elsevier.MILLER, G. and NISBETT, A. 2007. Use of split circuit SX plants for high copper
recovery and low operating costs. Proceedings of the ALTANickel/Copper/Cobalt Conference. ALTA Metallurgical Services, Melbourne.
MILLER, G. and KENDAL, K. 2013. Milling in acid-copper raffinate at the MUMIoperation in DRC. Proceedings of the ALTA Nickel/Copper/CobaltConference. ALTA Metallurgical Services, Melbourne, pp. 247–258.
MORELL, S. 2004. Predicting the specific energy of autogenous and semiautogenous mills from small diameter drill core samples. MineralsEngineering, vol. 17, no. 3. pp. 447–451.
READETT, D.J. and MILLER, G. 1995. The impact of silica in solvent extraction:Girilambone Copper Company, case study. Proceedings of Copper 95 -Cobre 95, Vina del Mar, Santiago, Chile. Vol 3; Electrorefining andHydrometallurgy of Copper. Canadian Institute of Mining, Metallurgy andPetroleum, Montreal. pp. 679–690.
ROCKLAB. 2017. Rock properties tests for Mutoshi.WEATHERSEED, M., MATINHEIKKI, J., SAARIO, R., and FREDRIKSSON, H. 2015.
Modular mixer-settlers for SX plant sustainability. Proceedings of Copper Cobalt Africa, the 8th Southern African Base Metals Conference.Southern African Institute of Mining and Metallurgy, Johannesburg. pp. 335–345. �
�
1178

Kansanshi is the largest copper mine in Africaand the world’s eighth largest copper producer,with a total of 253 272 t of copper produced in2016 (Newall, 2017). It is locatedapproximately 10 km north of Solwezi, thecapital and administrative headquarters of theNorth Western Province, Republic of Zambia.The ore deposit consists predominantly ofchalcopyrite and malachite with variableamounts of chalcocite, bornite, chrysocolla,and azurite. Because of the varyingproportions of sulphide and oxide copperminerals, the ore is classified into threedistinct categories: sulphide, mixed, and oxideores. As such, three separate processingcircuits are used to mill the ore down to astandard targeted grind size of 80% passing150 μm before froth flotation and leaching.
A lot of research and development hasbeen done to improve the performance of thesulphide ore circuit at Kansanshi. Despite theresearch efforts and subsequent operation, thesulphide ore circuit did not attain the targetrecovery and grade for 2016, primarilybecause of the complexity of the orebody.
The constant drive to achieve the setproduction target of recovery andconcentration grade after froth flotation
motivated the development of a tool for theprediction of recovery. The anticipated benefitis not only to enable the plant to applycorrective actions when needed, but also tomake a tool available for the quick assessmentof the plant performance of the. For thatpurpose, data spanning June 2016 to May2017 was analysed, cleaned up and curve-fitted to an empirical model. In doing so, keyparameters were determined and calibrated torepresent the behaviour of the plant.
The Kansanshi process comprises threeseparate circuits for three distinct run-of-mineore feeds: sulphide ore, mixed ores, and oxideores. The three circuits run in parallel, witheach consisting of a dedicated crushing,milling, and flotation circuit. The presentresearch work focuses on the sulphide orecircuit.
The sulphide ore circuit at the Kansanshimine processed an average of 35 000 dry tonsper day between 1 June 2016 and 31 May2017. The run-of-mine sulphide ore undergoesa two-stage primary and secondary crushingin open circuit. The material is then sent to aclassic semi-autogenous / Ball mill / Crushercircuit, also known as an SABC design. From aThe product from the comminution sectionundergoes two stages of flotation roughing in6 × 300 m3 cells, and cleaning in 8 × 30 m3
cells. Relevant specifications of thecomminution equipment are listed in Table I.
Empirical model of recovery response ofcopper sulphide circuit at KansanshiMineby M. Lusambo*† and F.K. Mulenga‡
Geometallurgical models are a strategic tool used primarily in planning,diagnosis, and process optimisation. This paper discusses the developmentof a predictive model for flotation recovery at Kansanshi concentrator inZambia as a function of key operational parameters. Daily data for millingand flotation from the circuit processing the copper sulphide ore wasanalysed. This data, recorded over a period of one year of production, wascollected from diverse sensors measuring semi-autogenous milling andflotation parameters. Statistical analysis showed that copper head grade,acid-insoluble, and acid-soluble copper, SAG mill throughput, ball mill load,and tonnage of feed material to the SAG mill in the -125 +63 mm sizefraction contributed to the prediction power of the proposed empirical modelby as much as 90%. Finally, a proposal was made for the development of asimulation model under MODSIM®, a flexible tool for mineral processingapplications. This was to test the limitations of the empirical model forfuture refinement.
sulphide flotation, empirical model, recovery response.
* Kansanshi Mining Plc., First Quantum MineralsLimited, Zambia.
† Department of Civil and Chemical Engineering,University of South Africa, South Africa.
‡ Department of Electrical and Mining Engineering,University of South Africa, South Africa.
© The Southern African Institute of Mining andMetallurgy, 2018. ISSN 2225-6253. This paperwas first presented at the Copper Cobalt Africa,incorporating the 9th Southern African BaseMetals Conference, 9–12 July 2018, AvaniVictoria Falls Resort, Livingstone, Zambia.
1179 �
http://dx.doi.org/10.17159/2411-9717/2018/v118n11a8

Empirical model of recovery response of copper sulphide circuit at Kansanshi Mine
The primary objective of a processing plant is to producegood quality concentrates at the highest levels of recoveryand throughput and at the lowest operation costs. Theattainment of this objective depends on the quality of the orefeed, the geometry, configuration and operating conditions ofall the processing units involved and, most importantly, anaccurate knowledge and understanding of the circuitbehaviour.
Concentrators generally yield a variable metallurgicalrecovery, to the extent that it has become common practice tomodel the behaviour of the concentrator as a function of keyoperating parameters. To do that, in-house databases can beused with the data comprising for example, historicaloperational performance data of the plant, planned surveys,geometallurgical data, and ore characteristics. The work byCompan, Pizarro, and Videla (2015) exemplifies this with aregression model proposed for the Chuquicamata plant whichtreats a copper sulphide ore by milling and flotation.
An attempt was made to produce an empirical model ofthe Kansanshi plant similar to that of the Chuquicamataplant. To this end, key input parameters were identifiedbefore the structure of the model was proposed. The data waspre-processed to enable curve-fitting by nonlinear regression.This was to determine the values of the parameters of themodel and calibrate them to the Kansanshi operation.
The Kanshanshi plant is fitted with a wide array of sensors
for monitoring its general performance. For example, acamera-based system is used to measure the particle sizedistribution of the feed to the SAG mill, and weightometersare installed on the belt conveyors of all major units to supplymass flow data. Flow meters, densitometers, pressurereaders, and level sensors are also used in the flotationsection. On-stream analysers and laboratory analyses provideassays of key plant process streams for process control andmetallurgical accounting purposes respectively. Figure 1illustrates a typical signal from a weightometer measuring theSAG mill load.
Overall, 29 signals are collected from the SABC sectionand 49 signals comes from the flotation section. It becameclear that, to produce a useful and flexible model of the plant,the number of input parameters should be cut down to areasonable minimum.
King (2012) described in a comprehensive manner themost important phenomenological models that can be used inthe description of a wide variety of mineral processing units.These units include SAG mills, ball mills, hydrocyclones andflotation, which are all relevant to Kansanshi. A criticalreview of the models applicable to each unit reveals that, ofthe 78 signals streamed from the Kansanshi sulphide orecircuit, 13 may be used to model the performance of the plantwith reasonable accuracy. These 13 parameters are listed inTable II.
By consulting King (2012), the choice of the keyparameters above was also supported by the followingreferences: Austin et al. (1984), Compan et al. (2015), Hu(2014), Klimpel (1995), Napier-Munn et al. (1996); Pease etal. (2006) and Yahyaei et al. (2014).
The work by Compan, Pizarro, and Videla (2015) wasselected to serve as the basis for the development of aregression model for use in determining the copper recoveryof the Kansanshi sulphide ore circuit, since the Chuquicamataplant recovers sulphide copper minerals such as chalcocite
�
1180
Table I
Primary Crusher Gyratory crusherModel: Metso 54 – 75Available power: 450 kWOpen side setting: 125–200 mmClosed side setting: 90–120 mm
Secondary crusher Nordberg MP800Available power: 600 kWClosed side setting: 40–55 mm
Pebble crusher Terex Cedarapids MVP 450Available power: 315 kWClosed side setting: 12 mm
Semi-autogenous mill Internal diameter: 9.75 mInternal belly length: 6.10 mCentre line length: 8.9 mAvailable power: 11.6 MWGrate discharge designSpeed: 75% of critical (VSD)Ball filling: 19%Top-up ball size: 125 mm80% passing feed size: 75 mm
Ball mill Internal diameter: 6.10 mInternal belly length: 9.30 mCentre line length: 10.5 mAvailable power: 5.8 MWOverflow discharge designSpeed: 75% of criticalBall filling: 28%Top-up ball size: 50 mmAverage Bond Work index: 9.2 kWh/t

and chalcopyrite, which are also found in the Kansanshisulphide ore type. The following model was proposed for theChuquicamata (Compan, Pizarro, and Videla 2015):
[1]
where RCu is the final copper recovery after flotation; Cu isthe copper feed grade; Fe and CuS are, respectively, the ironand copper sulphide feed grades to the plant; Mo, Cp, and Dg,are the molybdenite, chalcopyrite, and digenite grades in theore feed; and Wi and P80 are the work index and product sizeof the ore after milling.
A look at Equation [1] shows that the majority of theinput parameters in the Chuquicamata response function aregrades of mineral species in the ore feed. The otherparameters, including the work index Wi and product sizeP80, are all physical properties of the ore. No parameterrelating to operating conditions of milling and flotation isincluded, although the model should take into considerationthese two processes. This can probably be ascribed to the factthat the parameters in Equation [1] are among thosemonitored on the plant.
The general problem with empirical models is that theyare developed based on available information. This, in asense, tempts one to overlook critical parameters in buildingthe model; hence the limitationof these models. Theadvantages, however, of this type of model offers areprimarily their simple structure, flexibility, and quickmanipulation when estimates are needed, among others.
This brings us to discuss the structure of the empiricalmodel of recovery response proposed for the Kansanshicopper sulphide ore circuit. The following equation wasproposed for testing on the Kansanshi data at our disposal:
[2]
where C0 to C9 are the model coefficients that needed to bedetermined by the nonlinear regression of the Kansanshi datacollected between June 2016 and May 2017. Thirty percent ofthis data was used in the calculation of the modelcoefficients, while the remaining 70% served to assess thepredictive ability of the model proposed in Equation [2]. Theoutcome of this endeavour is presented in the next section.
The results of the regression analysis are presented in thissection. The adequacy of the model and that of the regressedcoefficients are also discussed. A proposal is made for asimplified model based on the contribution of eachparameter.
As a starting point, Equation [2] was curve-fitted againstthe copper recovery data in the least squares sense. Initialguesses were allocated to the coefficients C0 to C9 then thesum of squared differences between the theoretical and actualcopper recovery values was calculated. A computer algorithmwas finally involved to iteratively adjust the values of thecoefficients until the sum of squared differences converged toa global minimum. Table III summarizes this result, witheach coefficient value allocated its 95% confidence interval.
Figure 2 illustrates the results of the curve-fittingperformed on the recovery data spanning June 2016 toSeptember 2016. The theoretical and actual time-seriescurves are superimposed for the time duration. Thecoefficient of determination R2 of Equation [2] wascalculated. This statistic was found to be R2 = 0.557,meaning that 55.7 % of the data considered can be explainedby Equation [2].
Based on the regressed coefficient values in Table III aswell as their respective confidence intervals at a 95%significance level, it was decided to set the coefficients C2, C3,C5 and C6 at to zero. The decision to eliminate thesecoefficients was based primarily on their poor level ofaccuracy with respect to their average regressed values. Bydoing so, Equation [2] was simplified to the following form:
[3]
Empirical model of recovery response of copper sulphide circuit at Kansanshi Mine
1181 �
Table II
SAG mill throughput Weightometer Q (t/h)−22 mm feed size fraction Camera W1 (t)−63 +22 mm feed size fraction Camera W2 (t)−125 +63 mm feed size fraction Camera W3 (t]Ball mill load Set point J (t)Flotation feed flowrate Flowmeter F (m3/h)Flotation feed density Densitometer Cw (% solids)Flotation feed grade – total copper On-stream analyser TCu (% TCu)Flotation feed grade – acid soluble copper Analytical Laboratory AsCu (% AsCu)Flotation feed grade – acid insoluble copper Analytical Laboratory AiCu (% AiCu)Bubble velocity Camera v (mm/s)Air flowrate Flow meter a (m3/h)Froth level Level sensor f (mm)

It should be noted in Equation [2] that input parameterCw (flotation field density) is now absorbed into coefficientC7. This is because this particular parameter representing(see Table II) did not vary significantly over the year forwhich operation data was collected. Furthermore, for the sakeof simplicity, the lower the number of input parameters, thebetter for the model. This, of course, needs to be balancedwith an acceptable level of accuracy within the capabilities ofthe various measuring and monitoring instruments used atthe plant. That is why a new exponent parameter k wasintroduced around parameter W3 to add flexibility to thecurve-fitting procedure.
With a simplified definition of the empirical model ofrecovery response of the Kansanshi copper sulphide circuit, anew regression analysis was initiated. This time, sevencoefficients were regressed and their uncertainties stillcalculated at a significance level of 95%. The outputs fromthe curve-fitting algorithm are reported in Table IV.
It will be noted that the parameters in Table IV are moreaccurately predicted than those in Table III based their errorsat 95% significance level. In addition to this, when validated
again the data from 1 October 2016 to 31 May 2017, astriking similarity is evident, as shown in Figure 3. Toconfirm this observation, the coefficient of determination R2
of Equation [3] was calculated. This statistic was found to beR2 = 0.694, indicating that 69.4% of the data considered canbe explained by Equation [3]. Compared with Equation [2](coefficient of determination R2 = 0.557) it is clear thatEquation [3] is preferable, especially considering its simpleformat.
It is clear that some long negative peaks are not wellreproduced by the model; however, the general trend,including the slight cyclical nature of the actual copperrecovery data, is followed to an acceptable extent. The otherconcern is that the coefficient of determination may requirefurther improvement. For that to be done, relevant operatingparameters perhaps not yet available or not shortlisted inTable II should be explored for inclusion into the model.
To further improve on the predictive ability, the inclusionof the percentage acid-soluble copper (AsCu), the ratio ofacid-insoluble copper to total copper (AiCu/TCu), and thedifference between total copper (TCu) and total copper meanfor the data-set (TCu) into the empirical model was explored.In doing so, Equation [3] was modified to the following form:
Empirical model of recovery response of copper sulphide circuit at Kansanshi Mine
�
1182
Table III
C0 70.4 ± 12.1C1 328 × 10−8 ± 14 × 10−8
C2 −223 × 10−4 ± 87 × 10−4
C3 141 × 10−5 ± 74 × 10−5
C4 0.13 ± 0.02C5 −0.056 ± 0.032C6 157 × 10−12 ± 61 × 10−12
C7 12.6 ± 0.2C8 0.78 ± 0.09C8 0.25 ± 0.03
Table IV
C0 76.1 ± 8.6C1 106 × 10−7 ± 9 × 10⁻⁷
C4 0.911 ± 12C7 21.213 ± 0.007C8 0.076 ± 0.005C9 0.36 ± 0.03k 0.5323 ± 0.0034

Empirical model of recovery response of copper sulphide circuit at Kansanshi Mine
1183 �
[4]
A new regression analysis was performed based onEquation [4]. This time, 10 coefficients were regressed andtheir uncertainties still calculated at a significance level of95%. The outputs from the curve-fitting algorithm arereported in Table V.
The result of this analysis was also validated against thedata between 1 June 2016 and 31 May 2017. Here, acoefficient of determination R2 = 0.904 was noted forEquation [4]. In addition, when validated again the databetween 1 June 2016 and 31 May 2017, a striking similarityis evident, as shown in Figure 4. The improved coefficient ofdetermination R2 = 0.904 simply means that Equation [4]describes 90.4% of the data well with the remaining 9.6%being attributed to uncertainties inherent to the plant datacollected as well as the structure of the model. However, animprovement is noted from R2 = 0.694 for Equation [3] witha more complex structure for Equation [4].
Finally, empirical models are generally useful and simpleto use while their format is based on the experience of theresearchers involved. One shortcoming, though, is that theyneed constant refinement and calibration. Therefore, theyshould be used with caution outside the average operatingconditions under which they were developed. More realisticmodels are needed for application in wider operating ranges.Phenomenological models built around the populationbalance model (Austin, Klimpel, and Luckie, 1984; King,2012) are good examples of realistic models of mineralprocessing operations. Further work is necessary to producesuch type of a model for the Kansanshi copper sulphide orecircuit. A simplified version of the anticipated model maythen serve the purpose better than Equations [3] and [4] in awider operating range. The drawback may be the complexformat of this type of model and the need to define anincreased number of input parameters. For as long as thephenomenological model or its simplified version are notavailable, the proposed empirical model should be used.
The objective of this research was to develop a predictivemodel for copper recovery in the Kansanshi copper sulphideore circuit. All available data collected online from theoperation was reviewed to shortlist important inputparameters to the model, and the literature was studied todetermine an initial form of the empirical model.
The model building ensued once only 13 operatingparameters of the circuit were retained; the information fromthe signals corresponding to each parameter was thenextracted for the period from 1 June 2016 to 31 May 2017.This time-series data was curve-fitted using the empiricalmodel initially proposed and the relevant statistics wereproduced in the process. From the statistics, it was clear thatsome regressed fitting coefficients added little to the accuracyof the model. These were eliminated and, consequently, theempirical model took a simplified format that included onlyten fitting coefficients and seven input parameters. The inputparameters are the copper head grade (TCu), percentage acid-soluble copper (AsCu), acid-insoluble copper (AiCu) at theflotation section, the SAG mill throughput, the ball mill load,and the tonnage of feed material to the SAG mill in the sizefraction −125 +63 mm. The regression analysis revealed thatthe simplified empirical model accounts for approximately90% of the copper recovery data. The significantimprovement in model prediction ability with the inclusion ofacid soluble copper provides strong evidence of the influenceof mineralogy on flotation recovery. The influence of acid-soluble copper grade on model predictive ability was expectedbecause soluble copper minerals do not float under sulphideflotation conditions. This indicated that there is room forimprovement in the model; this may be achieved by theinclusion of parameters not currently measured or those thatwere not shortlisted in the development of the initial model.Despite some limitations, the model has the potential to servethe purpose of quickly estimating the expected recoveryunder given operating conditions. This timely informationmay help make sense of the actual recovery and identifyavenues for corrective action guided by production targets.
Work is currently underway aimed at developing a modelof the behaviour of the Kansanshi copper sulphide ore circuit.This computer model will be based on a more theoreticaldescription of unit processes using MODSIM®, a specialized
Table V
C0 27.4C1 1.301 × 10⁻⁵
C4 3.550C7 1.883C8 1.521C9 0.11C10 62.87C11 45.1C12 6.526k 0.2896

Empirical model of recovery response of copper sulphide circuit at Kansanshi Mine
�
1184
module simulator for mineral processing operations. This willbecome an additional, yet more comprehensive, tool to assistthe process engineers in efficient operation of the plant.
The authors are indebted to the management of KansanshiMining PLC, First Quantum Limited, for permission topublish this paper. The University of South Africa (UNISA) isalso acknowledged for encouraging the collaborative workand providing an environment conducive to research.
AUSTIN, L.G., KLIMPEL, R.R., and LUCKIE, P.T. 1984. Process engineering of sizereduction: Ball milling. Society of Mining Engineers of the AIME, NewYork.
COMPAN, G., PIZARRO, E., and VIDELA, A. 2015. Geometallurgical model of acopper sulphide mine for long-term planning. Journal of the SouthernAfrican Institute of Mining and Metallurgy, vol. 115, no. 6. pp. 549–556.
HU, W. 2014. Flotation circuit optimization and design. PhD thesis, ImperialCollege London, UK.
KING, R.P. 2012. Modeling and Simulation of Mineral Processing Systems. 2ndedn. Schneider, C.L., and King, E.A. (eds.). Society for Mining,Metallurgy, and Exploration, Littleton, CO.
KLIMPEL, R.R. 1995. The influence of frother structure on industrial coalflotation. High Efficiency Coal Preparation, Kawatra, S. (ed.). Society forMining, Metallurgy, and Exploration, Littleton, CO. pp. 141–151.
NAPIER-MUNN, T.J., MORRELL, S., MORRISON, R.D., and KOJOVIC, T. 1996. Mineralcomminution circuits – Their operation and optimization. JKMRCMonograph Series, University of Queensland.
NEWALL, C. 2017. First Quantum Minerals announces its 2016 production andsales. http://www.first-quantum.com/Media-Centre/Press-Releases/Press-Release-Details/2017/First-Quantum-Minerals-Announces-Its-2016-Production-and-Sales/default.aspx [accessed 9 April 2018].
PEASE, J.D., CURRY, D.C., and YOUNG, M.F. 2006. Designing flotation circuits forhigh fines recovery. Minerals Engineering, vol. 19, no.s 6–8. pp. 831–840.
YAHYAEI, M., VOS, F., POWELL, M.S., SILIEZAR, J., and PERKINS, P. 2014. Challengesin developing integrated process models based on industrial survey data.Proceedings of the 12th AusIMM Mill Operators Conference. AustralasianInstitute of Mining and Metallurgy, Carlton, Victoria. pp. 437–446. �
About the SAIMM 5 Star Incentive Programme:
The SAIMM are proud to welcome you to our Incentive programme where we have negotiated to provide you withmore benefits. These benefits include: 1. Top 5 Proposers for the current financial year are to be given a free ticket to the SAIMM Annual Banquet with
mention at the Annual General Meeting.2. Top 5 Referees for the financial year are to be given a free ticket to the SAIMM Annual Banquet with mention at
the Annual General Meeting.3. Access to discounts offered by Service providers that have negotiated discounted rates and special offers for you
our valued member. 4. Conference attendance within a 2 year period and applies to events that are paid for. If you attend 3 events you
get the next conference that you register for at no cost.5. The author with the most number of papers published in the SAIMM Journal in the previous financial year
would be recognised at the Annual General Meeting and will receive a free ticket to the SAIMM Annual Banquet.
How it works:
1. Collect your membership card from the SAIMM2. Visit the SAIMM Website partner page to view all the deals available3. Present it to the selected providers on the page behind this to qualify for the discount or offer.
5 StarIncentive Programme

Current solvent extraction (SX) reagentsemployed for the extraction of copper fromtypical pregnant leach solutions (PLS) atambient conditions function well with minimallong-term effects on the extractant’sperformance (Taute et al., 2015). Thisperformance, however, deteriorates at elevatedtemperatures due to the degradation of thereagent’s hydroxyoximes. The degradationmechanism, acid-catalysed hydrolysis of theoxime, is accelerated by high temperature.This has a knock-on effect where the increasein degradation products increases the organicviscosity, leading to increased entrainment,crud formation, and ultimately to an increasein SX reagent consumption (Bender,Emmerich, and Nisbett, 2013).
SX reagents also show an increase in theco-extraction of iron as the ferric concentrationin the PLS increases. Co-extracted iron istransferred to electrowinning (EW) duringstripping of the loaded organic and canadversely affect EW current efficiency. Iron inthe EW circuit is typically managed by
bleeding the electrolyte; however, this can leadto excessive consumption of EW reagents suchas acid, cobalt, and mist-eliminatingsurfactants. The electrolyte bleed can alsoaffect upstream consumption of reagents, suchas lime, due to the high acid concentrationrecycled to leach.
High PLS temperatures and ironconcentrations are typically encountered whenprocessing sulphide ores. Numeroustechnologies have been developed for theleaching of primary sulphide ores (Dreisinger,2016). Table I is an adapted list fromDreisinger (2016). It is evident that whilethere are as many conditions as there areprocesses, the high temperature of theresulting PLS is ever-present.
BASF has developed a new generation ofSX reagents that have a much greater stabilitythan currently available reagents at highertemperatures. During extensive laboratoryinvestigations and various customer pilot-plant trials, the new high-temperature (HT)extractant exhibited higher copper-to-ironselectivity andwas nitration-proof. As the HTextractant is still in the research anddevelopment phase, a full-scale plant trial willbe conducted in 2018. To evaluate thedifference in operating costs when using astandard SX reagent compared with BASF’snew HT extractant, a desktop study wasconducted and is presented in this paper.
BASF’s new-generation HT extractant hasvarious properties that exhibit significantadvantages over the existing range of
Techno-economic evaluation of BASF’snew high-temperature solventextraction reagentby J.J. Taute* and S.J. Archer†
BASF Mining Solutions has developed a new-generation copper solventextraction reagent that offers significant benefits over standard extractantscurrently available to the industry. As the name suggests, the new high-temperature (HT) extractant can be used at a higher operating temperature,but also exhibits significantly lower degradation rates, greater copper-to-iron selectivity, and is totally nitration-proof compared with the standardextractants. Pilot-plant trials have also shown that lower aqueous-in-organic entrainment can be achieved. This paper investigates the techno-economic benefit of using the HT extractant as an alternative to thestandard extractant in a high-temperature application. The results of thetechnical evaluation showed that the use of the HT extractant reduces theextractant addition requirements and bleed volume from copperelectrowinning; this smaller bleed requirement further reduces acid andlimestone consumption, leading to a reduction in valuable metal losses. Theresults of the economic evaluation showed that the use of the HT extractantrepresents significant cost savings over that of the standard extractant.
copper solvent extraction, reagents, high temperature, selectivity,entrainment
* BASF Corporation, Tucson, Arizona.† SENET (Pty) Ltd, Johannesburg, South Africa.© The Southern African Institute of Mining and
Metallurgy, 2018. ISSN 2225-6253. This paperwas first presented at the Copper Cobalt Africa,incorporating the 9th Southern African BaseMetals Conference, 9–12 July 2018, AvaniVictoria Falls Resort, Livingstone, Zambia.
1185 �
http://dx.doi.org/10.17159/2411-9717/2018//v118n11a9

Techno-economic evaluation of BASF’s new high-temperature solvent extraction reagent
hydroxyoximes extractants (standard reagents/extractants)available to the market:
� Increased resistance to degradation� Nitration-proof� High copper-to-iron selectivity� Comparable kinetics� Lower entrainment, thereby reducing impurity transfer
in copper SX circuits.
Accelerated degradation testing was performed by batchwisecontacting of the organic solution containing the extractantwith a synthetic strip electrolyte. For comparison purposes,the stripping conditions used were more aggressive thanthese typically employed. Thus, they are not representative ofthe actual degradation in SX circuits.
Figure 1 shows the results of tests that were individually
performed to illustrate the degradation rate of non-modified,modified, and HT extractants. As expected, the aldoximeswere more susceptible to degradation, followed by theketoxime. All the extractants, except for the HT extractants,exhibited similar degradation behaviour, with an initial highloss of extractant followed by a decrease in loss over time.The shape of these extractant curves suggests that as theconcentration of degradation products increases with time,these products start to interact with the oximes and thusreduce the degradation rate.
It is evident from Figure 1 that the degradation rates ofthe HT extractants (RGT-1 and RGT-2) are substantiallylower than those of the standard extractants. The RGT-2extractant even stopped degrading once an initial loss of 7%was reached after 100 days. The RGT-1 extractantdegradation also appeared to have stopped after a loss ofbetween 20% and 25%.
�
1186
Table I
Activox Pilot plant 90–110 10–12Albion Pilot plant 85 1.0Anglo American – UBC Pilot plant 150 10–12Mintek bioleach Pilot plant 35 1.0BIOCOP Commercial 65–80 1.0CESL Demo plant 140–150 10–12Dynatec Pilot plant 150 10–12Mt Gordon Commercial 90 8.0Platsol Pilot plant 220–230 30–40Sepon Commercial 80 1.0Total pressure oxidation (TPOX) Commercial 200–230 30–40Medium-temperature pressure oxidation (MTPOX) Commercial 160 22High-temperature lite (HT-LITE) Commercial 195 22Cobre Las Cruces Commercial 90 1.0Galvanox Pilot plant 80 1.0Rapid oxidative leach (ROL) Pilot plant 80 1.0

High temperatures not only increase the rate ofdegradation of standard extractants but also increase theorganic viscosity, due to the increase in concentration of thedegradation products. This increase in viscosity would lead toan increase in entrainment, crud formation, and ultimately anincrease in SX reagent consumption (Bender et al., 2013).
The degradation by nitration of the oxime molecule ofstandard SX extractants is given by Equations [1] and [2].The nitronium molecule, a highly reactive species, will forceelectrophilic substitution (a), followed by loss of a proton (b),and results in the nitrated species (c).
Catalytic formation of the nitronium ion:
[1]
The nitration mechanism of oximes is expressed asfollows:
[2]
Nitration results in various degradation products:
� Nitrated oximes� Nitrated nonylphenol� Nitrated aldehydes and/or ketones.
Nitrated organic species also cause higher organicviscosities, which can adversely affect organic behaviour,leading to poor phase separation and higher entrainmentlosses. Nitrated oximes also extract copper although theloaded copper cannot be stripped. To counter this destructivemechanism nonylphenol, which is preferentially nitrated, isadded to the organic, thereby protecting the oxime. Allcurrent aromatic hydroxyoximes can undergo this form ofattack, with the nitration rate depending on the substituentgroups (Virnig et al., 2003).
The HT extractants do not have a chemically favourablesite for nitration, therefore, the nitronium ion cannot nitratethe new-generation reagents, making them completelynitration-proof (Bender Emmerich, and Nisbett, 2014).
Extractant selectivity for copper over iron is very important incircuits with high PLS iron concentrations, for reasonsalready mentioned. Blended and unblended HT extractantshave a high copper-to-iron selectivity compared withstandard non-modified aldoxime/ketoxime blends, as shownin Figure 2 (pilot-plant trial).
Table II provides the PLS composition and averagecopper-to-iron selectivity achieved over the trial periodshown in Figure 2. The copper-to-iron selectivity was two tothree times higher for the HT extractant than it was for thestandard, non-modified aldoxime-ketoxime blend.
Extraction and stripping kinetics at 25°C were investigatedfor various blends of HT extractants (RGT-1 and RGT-2) andcompared with the standard extractant LIX® 984N (seeFigure 3). The BASF quality-control test for LIX® reagents(BASF, 2018) was used to generate the kinetic data. Figure 3shows that the extraction kinetics for the HT blendedextractants were comparable with LIX® 984N because theytoo have relatively high copper extractive strength (Bender etal., 2013).
Techno-economic evaluation of BASF’s new high-temperature solvent extraction reagent
1187 �
Table II
PLS properties:Cu (g/L) g/L 4.10Fe (g/L) g/L 4.30pH – 1.5
Temperature °C 35Selectivity (Cu:Fe):HT extractant – 443Standard extractant – 176

Aqueous-in-organic entrainments for both the HT extractantand a standard modified aldoxime reagent were determinedduring a week-long pilot-plant campaign. Entrainment wasdetermined by measuring the manganese concentration inthe spent wash liquor and is given in Figure 4. Manganese is
not extracted and can only transfer via aqueous entrainmentof PLS to the loaded organic. In the wash stage, the loadedorganic is contacted with a wash liquor and most of theentrained aqueous, which contains manganese, reports to thespent wash liquor. Entrainment of manganese in the HTextractant was approximately 20% to 30% less than in thestandard modified aldoxime reagent (Bender et al., 2014).
Techno-economic evaluation of BASF’s new high-temperature solvent extraction reagent
�
1188

Techno-economic evaluation of BASF’s new high-temperature solvent extraction reagent
1189 �
The transfer of impurities such as iron, chloride, nitrate, andmanganese from the PLS to the electrolyte occurs by meansof two mechanisms: physical and chemical transfer. Physicaltransfer occurs in the following ways:
� Aqueous entrainment of the PLS in the loaded organic� Micro-emulsions (tend to form when the organic phase
contains surfactants and modifiers along with thecopper extractant)
� Crud (which contains leach solution) moving with E1loaded organic to the strip circuit
� Misdirected flow of the E1 aqueous into the E1 organicweir.
In many cases, the physical transfer of impurities into theEW circuit via the entrainment of E1 aqueous in loadedorganic is far greater than the chemical transfer.
In terms of chemical transfer, there is no clear evidencethat oxime-based copper extractants transfer chloride,nitrate, or manganese by chemical loading; however, this isthe case for Fe(III). Unless the organic has beencontaminated with a cationic functionality (such as anamine), transfer of chloride by chemical loading is very low.Although Fe(III) is co-extracted, it occurs to a lesser extentbecause the oxime-based extractants have a high selectivityfor copper over iron. Kinetic experiments have shown rapidiron extraction and that freshly loaded iron strips faster andmore efficiently than loaded iron that has been through thestripping circuit numerous times. This phenomenon is termed‘iron-staining’.
It is well known that copper will crowd iron from thetypical oxime copper extractants; however, the rate ofcrowding is slower than the rate of iron loading. Thisnecessitates a longer E1 mixer residence time for moreefficient crowding. In general, the chemical loading of iron
from copper leach solutions by oxime copper extractants isgoverned by the following:
� The pH of the leach liquor: higher pH favours ironextraction
� Copper loading on the organic: a high copper loadingwill crowd iron from the organic
� Addition of a modifier, particularly with an aldoxime:esters and BASF’s low-viscosity modifiers reduce ironloading
� Impurities in the organic phase: certain species that aresoluble in the organic phase (sulfonates or organicacids), may enhance iron loading. Clay treatmentremoves some of these species and, therefore,enhances copper-to-iron selectivity (Dudley et al.,2006).
In some copper SX plants there will be excessive transferof impurities to the electrolyte, even if the plant is welldesigned and operated, and even when using an organichaving good physical properties. Typical examples are leachsolutions derived from:
� Leaching copper oxide ores with seawater or salinewater
� Leaching ores with a high manganese content
� Leaching certain copper oxide ores in northern Chilewhere the soil has a high nitrate content
� Bioleaching of copper sulphide ores that have a highpyrite content
� Leaching of primary sulphides or roaster calcinescontaining high iron levels
� Plants where certain organic contaminants are presentin the process water used in the plant.
In the abovementioned cases, the best solution is to

Techno-economic evaluation of BASF’s new high-temperature solvent extraction reagent
�
1190
install a scrub or wash stage for processing the loadedorganic. The scrub or wash stage will:
� Remove entrained iron, nitrate, chloride, or manganeseby a displacement wash using a dilute acid solution
� Reduce chemical iron transfer by approximately 50% to60%. If the pH of the wash aqueous is lower than thatof the E1 aqueous and the copper content is higherthan the E1 aqueous, both Fe stripping by acid andcrowding by copper will occur.
The new HT extractant is currently not availablecommercially, therefore it was decided to conduct a desktopcase study to compare its operating costs with those of astandard non-modified extractant.
The desktop case study used data and information gatheredfrom a recent copper–cobalt project in the DemocraticRepublic of Congo. The project processes a sulphide ore,which is concentrated by flotation and then roasted in asulphating roast before being leached. SX is employed toselectively extract the copper from the resulting PLS, which isthen stripped and electrowon to produce London MetalExchange (LME) Grade A copper, as shown in Figure 5.
The comparison of the HT extractant with the standard, non-modified extractant required a process design basis to becompiled for the circuit described in Figure 5. It should be
noted that this comparison considered only the differentials;areas such as comminution, flotation, and roasting wereexcluded. Capital cost (CAPEX) differentials were assumed tobe negligible as the same unit operations were employed forboth reagents, with a few unit operations differing onlymarginally in size. A more detailed flow sheet (see Figure 6)was used for this comparison, highlighting the operating cost(OPEX) differentials that could be expected, such as:
� Reducing PLS and electrolyte heat-transferrequirements
� Minimizing organic reagent top-up
� Reducing the electrolyte bleed requirement, therebyreducing the neutralization in leach as well as reducingvaluable metal losses.
Table III provides a summary of the key designparameters used to compile the mass balance for both the HTand standard extractant. The following assumptions wereused as the basis for the comparative evaluation.
� The excess acid in the leach circuit that is notneutralized by the oxide float concentrate is furtherneutralized with limestone. Calcined material has noneutralizing potential due to the upfront sulphatingroast.
� The PLS has a ferric-to-ferrous ratio of 1.
� The copper-to-iron selectivity ratio for the HTextractant is 2.5 times higher than that of the standardnon-modified reagent.
� Aqueous-in-organic entrainment for the HT extractantis 20% less than for the standard non-modifiedreagent.

Techno-economic evaluation of BASF’s new high-temperature solvent extraction reagent
1191 �
Table III
Copper recovery
Leach recovery % 97Cu SX 1 Cu recovery % 81Cu SX 2 Cu recovery % 99Overall plant Cu recovery % 95Annual copper production kt/a 35
Leach
Leach feed Sulphide Oxide
Leach feed composition % (m/m) 68 32Feed rate t/h 17 18
Typical feed head grade (solids)Cu % (m/m) 26 13Fe % (m/m) 3 1
Leach circuit operating parameters
Leach discharge pH – 1.5Leach operating temperature (max) °C 80Reducing agent (sodium metabisulphite) kg /t feed 16.9Neutralization reagent (limestone) kg/t feed 52.3
Leach performance
Cu leach efficiency % 97Leach configuration – Acid leach, neutralization, reductive leach
Copper solvent extraction
PLS
PLS flow rate m3/h 112.8Cu g/L 39.0Co g/ 20.5LFerric g/L 5.0
Extractant concentration HT extractant Standard extractant
Concentration % (v/v) 35 35Extractant degradation kg/t Cu 1.8 0.7Extractant entrainment loss kg/t Cu 2 2Total consumption (SX 1 and SX 2) kg/t Cu 3.8 2.6Cu:Fe selectivity – 700 1 700
Diluent Shellsol 2325Consumption kg/t Cu 7.0
Extraction circuit SX 1 (primary) SX 2 (secondary)
Number of stages - 3 2Advanced O:A – 2.5 1.2Cu extraction overall efficiency % 81 99
Wash circuit HT extractant Standard extractant
Cu:Fe selectivity (pre-wash) – 1 700 700Wash efficiency % 50Advance O:A 81Cu:Fe selectivity (post-wash) – 3 549 2 642Aqueous-in-organic entrainment – 804 1 022
Stripping circuit
Delta Cu g/L 15Number of stages – 2
� Organic-in-aqueous entrainment for both reagents is50 mg/L with no reagent recovery from the raffinateponds.
� A high wash-stage advance organic:aqueous (O:A)ratio was used to ensure a minimal effect on theoverall water balance.
� The reagent degradation rate for the HT extractant is2.7 times lower than for the standard non-modifiedreagent.
� A total of 3% of the copper and cobalt recycled to leachvia the electrolyte bleed is lost during solid–liquidseparation.

Techno-economic evaluation of BASF’s new high-temperature solvent extraction reagent
The provisional costs used for this case study assumed thatthe HT extractant is 40% more expensive than the standardnon-modified reagent. The major reagents and metal pricesused for the evaluation are provided in Table IV. Reagentprices include delivery to site. It should be noted that thecopper and cobalt prices have increased significantly fromthose used for this evaluation.
The SX circuit was modelled using BASF’s Isocalc® softwareand the mass balance was calculated using SysCAD. Theelectrolyte bleed for each reagent was determined bymaintaining the spent electrolyte’s iron concentration at
1.5 g/L since the bleed is affected by both the chemical andphysical transfer of iron from the washed organic into theelectrolyte. Table V illustrates the calculated chemical andphysical iron transfer to electrolyte based on the properties ofthe SX reagents used. The total iron transfer for the HTextractant was 35% less than for the standard extractant.This relates to a 35% lower electrolyte bleed rate, as shownin Table VI.
Table VI shows that the electrolyte bleed flow rate for thestandard extractant is greater than that for the HT extractant,resulting in higher reagent consumptions and metal losses,and consequently greater annual bleed costs. The organiccosts were calculated based on consumption resulting fromdegradation, entrainment to raffinate, and diluent make-up.The net annual cost resulting from bleeding electrolyte andtopping up organic is significantly lower for the HTextractant; however, the once-off first-fill cost (extractantand diluent cost on start-up) for the HT extractant is higherthan the standard non-modified extractant.
To illustrate the long-term OPEX savings when using the HTextractant instead of the standard extractant, a five-yearreagent cost calculation was done. Table VII shows thecomparative cost and differential cost (saving) of the bleed,organic, and overall cost, including the first-fill cost over afive-year period. The total OPEX saving over five years is justover US$ 1.2 million.
Various sensitivity analyses have been conducted on thecalculations to determine the impact of the various reagentcosts on the total saving. The saving of US$329 082(calculated in Table VI) is roughly 14% per annum. Thefollowing prices and factors will have the largest impact onthe overall savings:
� HT extractant price
� Acid price
� Copper-to-iron selectivity
� Aqueous-in-organic entrainment (physical irontransfer)
�
1192
Table IV
ReagentsAcid US$/t 253Limestone US$/t 90Diluent US$/m3 1 200FC1100 US$/t 22 040MetalCopper US$/t 6 000Cobalt US$/t 46 284
Table V
Chemical iron transfer (kg/d) 34.7 25.9Physical iron transfer (kg/d) 13.8 5.7Total iron transfer (kg/d) 48.5 31.6
Table VI
EW bleed (m3/h) 1.35 0.88 −0.47Bleed cost (US$/a) –
Acid 538 559 350 533Limestone 244 380 159 060
Cobalt recycled 5 603 3 647FC 1100 782 509
Copper recycled 74 463 48 466Total bleed cost (US$/a) 863 785 562 214 −301 572Organic reagent cost (US$/a) 1 449 699 1 422 188 −27 511Net cost (US$/a) 2 313 484 1 984 402 −329 082First fill: extractant + diluent (US$) 1 438 276 1 878 178 439 902

� Cobalt price (except in the DRC).
Should the price difference between the HT extractant andthe standard extractant be lower than the estimated 40%,then the annual saving would increase proportionally (3%annual saving for every 10% decrease in HT extractantprice). Similarly, if the acid price increases, the saving onusing the HT extractant would be higher: roughly 1% morefor every US$50 increase in acid price. A change in thecopper-to-iron selectivity could have a positive or negativeimpact on the annual saving. An increased copper-to-ironselectivity ratio would mean less iron is chemicallytransferred, thus reducing the electrolyte bleed rate andincreasing the annual saving. The opposite would be true ifthe copper-to-iron selectivity ratio is lower. Should theaverage aqueous-in-organic entrainment increase, physicaltransfer of iron will increase, resulting in a higher electrolytebleed rate. This will reduce the annual saving by roughly 3%for every 100 mg/L of additional aqueous entrained.
The HT extractant offers a viable alternative to the standardoxime-based extractants, for the following reasons.
� The HT extractant degradation rate is significantlylower than that of the standard oxime extractant. Alower degradation rate means a lower extractantconsumption rate.
� The HT extractant cannot be nitrated, which would be asubstantial benefit for certain plants that operate withhigh nitrates in the PLS. This would also result in asignificant drop in extractant consumption.
� The HT extractant offers a step-change improvement incopper-to-iron selectivity, which results in lesschemical transfer of iron to electrowinning.
� Pilot-plant trials showed that aqueous-in-organicentrainment is significantly lower when using the HTextractant, which results in less physical transfer ofiron to electrowinning.
� The case study showed that the electrolyte bleed ratecan be reduced by 35% when using the HT extractant,which results in an OPEX saving of approximately 14%(> US$300 000 per annum). This saving would resultin first-fill extractant cost payback of less than 18months on the higher priced HT extractant. The casestudy also showed that a loaded organic wash stage is
necessary to minimize physical and chemical irontransfer, even when using the HT extractant. Thiswould require additional CAPEX, but the paybackperiod is less than 12 months.
It should be noted that the HT extractant is still in theresearch and development phase. A commercial plant trial isscheduled for Q3 2018.
The authors would like to acknowledge and thank JacoScheepers for the SysCAD mass balances done as part of thiswork.
BASF. 2018. Quality control test of LIX® reagents (TI-D/EVH 017 e). TechnicalInformation Global Mining Solutions.http://www.basf.com/miningsolutions
BENDER, J., EMMERICH, N., and NISBETT, A. 2013. Development of a newgeneration of copper solvent extraction reagents. Proceedings of Copper2013: Vol. IV. Hydrometallurgy. Ugarte, G. (ed.). Instituto de Ingenierosde Minas de Chile, Santiago. pp. 381–391.
BENDER, J., EMMERICH, N., and NISBETT, A. 2014. Evaluation of the nextgeneration of copper solvent extraction reagents. Proceedings of ALTA2104 Nickel-Copper-Cobalt Conference. ALTA Metallurgical Services,Melbourne. pp. 292–304.
DREISINGER, D. 2016. Hydrometallurgical treatment of high grade copper oresand concentrates. Proceedings of Copper 2016: Vol. 5 (3)Hydrometallurgy. Mining and Materials Processing Institute of Japan(MMIJ) and Japan Mining Industry Association (JMIA), Kobe. pp. 1655–1666.
DUDLEY, K., VIRNIG, M., CRANE, P., and HEIN, H. 2006. Clay treatment for coppersolvent extraction circuits. Proceedings of ALTA 2006 Copper Conference.ALTA Metallurgical Services, Melbourne.
TAUTE, J.J., BWANDO, P., CHISAKUTA, G., MITSHABU, G., and NISBETT, A. 2015.Improved copper/iron selectivity in solvent extraction. Proceedings ofCopper Cobalt Africa, incorporating the 8th Southern African Base MetalsConference. Southern African Institute of Mining and Metallurgy,Johannesburg. pp. 281–290.
VIRNIG, M.J., EYZAGUIRRE, D., JO, M., and CALDERON, J. 2003. Effects of nitrate oncopper SX circuits: a case study. Proceedings of Copper 2003: Vol VI (2)Hydrometallurgy of Copper. Canadian Institute of Mining, Metallurgy andPetroleum, Montreal. pp. 795–810. �
Techno-economic evaluation of BASF’s new high-temperature solvent extraction reagent
1193 �
Table VII
Bleed cost (US$) 4 318 927 2 811 070 −1 507 858Organic cost (extractant + diluent) (US$) 7 248 495 7 110 942 −137 553Bleed + organic cost (US$) 11 567 422 9 922 012 −1 645 410First fill + bleed + organic cost (US$) 13 005 698 11 800 191 −1 205 508

NINTH INTERNATIONAL CONFERENCE ONDEEP AND HIGH STRESS MINING 2019
24–25 JUNE 2019 - CONFERENCE26 JUNE 2019 - SARES 2019
27 JUNE 2019 - TECHNICAL VISITMISTY HILLS CONFERENCE CENTRE, MULDERSDRIFT
JOHANNESBURG, SOUTH AFRICA
For further information contact:
Camielah Jardine, Head of Conferencing, SAIMMTel: +27 11 834-1273/7, Fax: +27 11 833-8156 or +27 11 838-5923E-mail: [email protected], Website: http://www.saimm.co.za
BACKGROUND
The Ninth International Conference on Deep and High StressMining (Deep Mining 2019) will be held at the Misty HillsConference Centre, Muldersdrift, Johannesburg on 24 and25 June 2019. Conferences in this series have previouslybeen hosted in Australia, South Africa, Canada, and Chile.Around the world, mines are getting deeper and the chal-lenges of stress damage, squeezing ground, and rockburstsare ever-present and increasing. Mining methods and sup-port systems have evolved slowly to improve the manage-ment of excavation damage and safety of personnel, butdamage still occurs and personnel are injured. Techniquesfor modelling and monitoring have been adapted and en-hanced to help us understand rock mass behaviour underhigh stress. Many efficacious dynamic support products havebeen developed, but our understanding of the demand andcapacity of support systems remains uncertain.
OBJECTIVE
To create an international forum for discussing the chal-lenges associated with deep and high stress mining and topresent advances in technology.
WHO SHOULD ATTEND
� Rock engineering practitioners� Mining engineers� Researchers� Academics� Geotechnical engineers� Hydraulic fracturing engineers� High stress mining engineers� Waste repository engineers� Rock engineers� Petroleum engineers� Tunnelling engineers

The coal seams in the Shendong coalfield,located in the northwest of China, arecharacterized by low dips and largethicknesses and are thus suited for fullthickness extraction. Since the mid-1990s, theShendong coalfield has been developed intoone of the largest in the world (Ning, Liu, andTan. 2014; Ning et al., 2017). Recentdevelopments in mining equipment have madeit possible extract entire seams up to 5.0 mthick in a single cut. This method, termed the‘super-great mining height longwall face’(SGMHLW) method, has been widely adoptedin the Shendong coalfield (Table I) (Ju and Xu,2013; Peng, Li, and Zhou 2015; Zhang, Fan,and Ma 2011). According to some studies,sudden support-closure incidents often occurwhen using the SGMHLW method. The key tosolving this engineering issue is to have aclear understanding of the structuralcharacteristics and movement laws of theoverlying strata. For instance, the load on thesupports is related to the movement of the roofstratum as a response to the mining activities.
To date, extensive studies have beenconducted to obtain a clear understanding of
the mining-induced cave-in response of thestrata (e.g. roof movement and failureresponses). These studies have used differentmethods, such as numerical simulations,theoretical analyses, physical modelling, andon-site investigations (Ghose and Dutta, 1987;Yasitli and Unver 2005; Trueman, Lyman, andCocker 2009; Shabanimashcool, Jing, and Li2014; Tan, Li, and Ning 2017; Jiang, Sainoki,and Mitri 2017). Based on field observations,Peng and Chiang (1984) suggested that thefirst cave-in event involves shear fracture ofthe main roof before that of the face, while thesubsequent and periodic cave-in eventsinvolve cantilever instead of Voussoir beamcollapse. Song (1988) proposed that the rockblocks in the main roof stratum rotate andinterlock with each other to form a jointedVoussoir beam when the stratum deflectsdownwards. Sofianos (1996) developed amodel of Voussoir beams in the hard roofthrough numerical simulations. These studiesindicated that roof cave-in is a dynamicprocess involving rock fracturing,disintegration, and movement. However, allthese studies were conducted with a miningheight of less than 6.0 m, i.e. under normalmining height extraction conditions.
In recent years, considerable attention hasbeen given to the strata failure and movementpattern induced by the mining of thick coalseams, for example, the longwall top coalcaving (LTCC) and SGMHLW methods (Gongand Jin 2008; Yu, Zhao, and Kuang 2015; Yu,Zhao, and Xiao 2017). Owing to the highoutput and high efficiency of the SGMHLWmethod compared with the LTCC method atpresent, it is popular for mining thick coal
Structural characteristics of strataoverlying of a fully mechanized longwallface: a case studyby J. Wang, J. Ning, L. Jiang, J-Q. Jiang, and T. Bu
In coal mining in China, the cutting height of the shearer in longwall facesis increasing. Owing to the increase of extraction height, the caved roofstrata area is enlarged, and new issues are being encountered, such asdetermination of a suitable working resistance for the shield and control ofthe roof. Through field observation and theoretical analysis of the firstlongwall face with a height of 6.0 m in the Bayangaole mine, a three-stagestructural model was developed. Stage I is defined as the period in whichthe lower immediate roof (LIR) caves into the goaf and is broken intoirregular shapes of various sizes. Stage II is defined as the period in whichthe upper immediate roof (UIR) breaks and impacts the LIR. In stage III,the main roof breaks into blocks and then impacts the UIR. With respect tothese three stages, a suitable method was identified for calculating theworking resistance of the shield support for a super-great mining heightlongwall face (SGMHLW).
Strata behaviour, strata movement, working resistance, super-greatmining height longwall face.
* State Key Laboratory of Mining DisasterPrevention and Control Co-founded by ShandongProvince and the Ministry of Science andTechnology, Shandong University of Science andTechnology, China.
© The Southern African Institute of Mining andMetallurgy, 2018. ISSN 2225-6253. Paper receivedJul. 2017; revised paper received May 2018.
1195 �
http://dx.doi.org/10.17159/2411-9717/2018/v118n11a10

Structural characteristics of strata overlying a fully mechanized longwall face: a case study
seams in China. Recently, a significant number of studieshave been performed under SGMHLW extraction conditions.Literature reviews show that with the increase in extractionheight, the mining-induced strata failure area is enlarged andthe strata behaviour differs from that with a normalextraction height (Unver and Yasitli, 2009; Singh and Singh,1999; Alehossein and Poulsen, 2010). Owing to complexgeological conditions, roof fracturing, induced movements,and roof management are still unclear, in particular when themining height is greater than 6.0 m.
Determination of the shield capacity has been a researchobjective in many countries, resulting in a number ofmethods for its calculation (Coulthard, 1999; Verma and Deb,2013; Lawson et al., 2017; Batchle,r 2017; Prusek, Płonka,and Walentek, 2017). As early as the 1980s, mostresearchers suggested that external loading on supports wasrelated to the weight of the roof strata (Henderson, 1980).Currently, the determination of external loading on the shieldsupports is still a critical issue for roof management. Thereare four main methods for determining shield capacity: thedetached roof block method, shield-leg pressuremeasurement method, design of powered support selectionmodel, and yielding foundation model (Smart and Redfern,1986; Gilbride, Richardson, and Agapito 1998; Trueman,Lyman, and Cocker, 2009; Islavath, Deb, and Kumar, 2016).All these methods have been commonly used by supportmanufacturers and coal operators. In summary, thesetheories and methods are used for calculating loads on shieldsupports based on the strata movement and failure responsesinduced by mining in a longwall face with a mining heightless than 6.0 m. The determination of shield support capacityis still challenging because of the limited understanding ofthe behaviour of the roof strata and of the mechanismsresponsible for external support loading when the miningheight is greater than 6.0 m.
Owing to the limited studies, some issues, such as themovement of the overlying rock strata induced through theSGMHLW mining method and the unique formulae fordetermining external loadings on the supports, require morein-depth investigation and understanding. The presentanalysis is based on the mining conditions of panel 311101in the Bayangaole Colliery, China. In this study, first, thetime-weighted average resistance (TWAR) of the shieldsupport was measured to understand the roof behaviour.Secondly, field observation was used to simulate the mining-
induced overburden failures with the advance of the longwallface. Finally, a simplified theoretical model was established todescribe the structural characteristics and movement of theroof. From these studies, a mathematical formula wasdeveloped to estimate the shield working resistance.
The Bayangaole Colliery is located in the Shendong coalfield,Ordos City, Inner Mongolia Autonomous Region, China. Thecoal-bearing geological sequence has an average thickness of730 m and contains eight coal seams, five of which can bemined with a total thickness of 24 m. The mine is currentlyextracting seam No. 3 and all the panels in this mine areusing the retreat longwall extraction method.
Panel 311101, at an average depth of 614 m, was used asthe target panel for this case study. As the first longwall facein the mining area of coal seam no. 3, Panel 311101 adoptsthe SGMHLW method. Its designed cutting height is 6.0 m.The roof of the longwall face is supported by ZZ15000/16/25standing-shield hydraulic supports with a rated workingresistance of 15 000 kN (Figure 1). A total of 150 shieldsupports were used in this panel, and were numbered from 1to 150. Seam no. 3 has a mean thickness of 6.0 m and amean dip angle of 1.5°, ranging from 0° to 3°. The panel isapproximately 260 m along the dip, and 2 550 m along thestrike. The simplified stratigraphic column of this panel,obtained by core logging, is shown in Figure 2. The roof
�
1196
Table I
Bayangaole mine 311101 6.0 Medium hard 12 782 This studyBulianta mine 22303 7.0 Soft and weak 17 612 Ju et al. (2013)Bulianta mine 32301 6.1 Soft and weak 10 022 Peng et al. (2015)Halagou mine 22401-2 5.6 Soft and weak 7 587 Peng et al. (2015)Shangwan mine 51201 5.3 Medium hard 11 856 Zhang et al. (2011)Shangwan mine 12206 6.8 Soft and weak 14 652 Peng et al. (2015)Nalinmiaoer mine 62105 6.2 Soft and weak 11 207 Peng et al. (2015)Daliuta mine 22614 5 Soft and weak 9 176 Peng et al. (2015)
Note: Mean roof load was the shield support load at the onset of roof weighting

strata are composed mainly of sandy mudstone, finesandstone, and siltstone; these have a mean uniaxialcompressive strength (UCS) of over 30 MPa. The floor ismainly sandy mudstone, with a mean UCS of 45 MPa. Theoverburden rocks are designated as medium-strong type.
To measure the shield leg pressures from shield to shield andcycle to cycle, a real-time shield-leg pressure monitoringsystem (SLPMS) was utilized, as shown in Figure 3. This
SLPMS was produced by UROICAC Ltd., China. It consists ofa host, control computer, data line, power supply equipment,and substation, among other components. The analysissoftware was installed on the control computer software toautomatically calculate the TWAR of the shield supports andrecord the shield-leg pressures at one-minute intervals.
To simplify the analysis, this paper illustrates one case(shield leg pressures of the shield support no. 100) todescribe the change rule of shield leg pressures. Figure 4shows the recorded shield leg pressures of the shield supportno. 100 when the longwall face advanced 20 and 60 m. Asshown in Figure 4, when the longwall face advanced 20 m(the nonweighting period), the shield leg load wasapproximately 7 500 kN. However, when the longwall faceadvanced 60 m (weighting period begins), the shield leg loadreached the early warning value of 12 000 kN. It can bededuced that the load on the shield support increasedconsiderably because of the beginning of the weightingperiod. In the figure, the early warning value was setaccording to engineering experience (in Table I). During theperiod marked ‘overhaul’ the longwall face did not advancebecause of faulty equipment.
[1]
where Pt is the average support resistance during period ti,and Tt is the time that a mining (supporting) cycle takes.
Figure 5 shows a typical support leg resistance variationin a mining cycle. In an earlier study by Peng (2015),Equation [1] was used to calculate the TWAR. Figure 6shows the TWAR for a face advance distance of 500 m. As
Structural characteristics of strata overlying a fully mechanized longwall face: a case study
1197 �
Main station
Power Substation 1#Substation 2#
Substation 100#Substation 149#Substation 150#
Substation 1# Substation 149#
Hydraulic support
Communicationsubstation
Power SupplyEquipment
Underground Control computer
Report form
Ground surfaceData cable
(a) Field layout of SLPMS
(b) Full profile of SLPMS
Host
Hydraulic support Hydraulic support
Substation 150#

the longwall face advances, three stages are observed,distinguished by changes in the slope of the curves. Thesestages correspond to stages in the movement of the roofstrata. In the following text, these three stages are named A,B, and C. At stage A, along curves ab, a'b', and a''b'', theTWAR increases slowly, and its maximum value is 3 000–3500 kN. At stage B, along the curves bc, b'c', and b''c'', theTWAR increases rapidly, and its maximum value is 4 000–5
000 kN. Interestingly, at stage C, along the curves cd, c'd',and c''d'' the TWAR shows the greatest increase: theincrement is 7 000–9 000 kN and is at least twice as large asthat in the other stages. The in situ measurementsdemonstrated that the dynamic load coefficient (DLF: theratio of shield-leg pressure during the nonweighting periodto the shield leg pressure during the weighting period (Ju andXu, 2013) presented a periodic alternation betweenshort/gentle and long/strong, and stage C was accompaniedby a large DLF, up to 2.5, which indicated a violentmovement of the overburden.
A deep hole multiposition extensometer (DMPX), producedby UROICAC Ltd., China, was used to identify the longwallmining-induced strata movement. The DMPX is a speciallyconstructed instrument that measures the differentmovements of selected overburdened strata layers in aborehole relative to a fixed point. In addition, a digitalpanoramic imaging device (DPID; UROICAC Ltd, China) wasused to determine the longwall mining-induced strata failure.The DPID is a specially constructed instrument used forinspecting roof strata conditions, such as mining-inducedmacro-fractures, inside a borehole. These monitoring deviceswere also used by Ning et al. (2017) to investigate mining-induced overburden failures.
The DMPX was applied at a borehole, and four anchorswere installed to monitor the overburden movement. Figure 7shows the locations of the anchors. The displacementmeasured at the borehole with the advance of panel 311101is shown in Figure 8. Hi (i = 1, 2, 3, 4) is defined as thedisplacement of the rock strata at anchor i. The horizontaldistances from panel 20107 to the boreholes is denoted as D,which is taken as negative when the working face does notadvance across the location of boreholes and positive when
Structural characteristics of strata overlying a fully mechanized longwall face: a case study
�
1198

the working face advances across the location of boreholes.As shown in Figure 8, when D = 0 m < D < 20 m, theoverlying strata were observed to move. When D = 38.2 m,H1 rapidly increased to 986 mm, which was approximatelyone-sixth of the thickness of coal seam no. 3. This suggeststhat the strata monitored by anchor no. 1 moved as one unit.When D = 40 < D < 50 m, H2, H3, and H4 began to similarlyincrease. When D was approximately 60 m, H2, H3, and H4increased rapidly and reached a maximum of approximately696, 713, and 709 mm, respectively. This suggests that thestrata monitored by anchors no. 2, 3, and 4 moved as oneunit when the longwall face was approximately 40–60 mfrom the borehole.
The above analysis was validated through the monitoringof mining-induced macro-fractures (the DPID was used tomeasure the magnitudes of fractures, voids, and dislocationsin the borehole wall). Figure 9a shows the fractures in theborehole wall recorded 7–8 m above the top of the coal seamfor D = 40 m. It could be deduced that when panel 311101advanced 38.5 m, the strata monitored by anchor no. 1 (fine
sandstone) fractured. At this time, the working surfacehydraulic support pressure increased, leading to roofweighting. This implies that the fracturing of fine sandstonesled to roof weighting. Similarly, when D = 60 m, fractureswere observed in the borehole wall 15–41 m above the top ofthe coal seam (Figures 9b–d), indicating that the stratamonitored by anchors no. 2, 3, and 4 were fractured as oneunit. At this time, roof weighting also occurred.
In brief, the field monitoring provided valuable and reliabledata, indicating that the strata behaviour induced bySGMHLW is very violent and the dynamic load is much largerthan when mining thinner seams. Owing to the considerableextraction height, the mining-induced strata failure area isenlarged and the progressive failure can be divided intodifferent stages. This is described in the following sections.
To understand the progressive failure of the overlying roofinduced by the SGMHLW operation, a simplified theoreticalmodel was developed based on the field measurements andcantilever beams (Diederichs and Kaiser, 1999). Hereafter,model A represents the first occurrence of roof weighting andmodel B the subsequent periodic roof weighting.
Based on the field measurements and theoretical research,the progressive failure of overlying strata in model A isdivided into three stages:
� Stage I: In this stage, the lower immediate roof (LIR)caves into the goaf and is broken into irregular shapesof various sizes. LIR refers to the weak overlying layerwhich is located above the coal seam and has a similarthickness as the seam. As the longwall face advancesfrom the set-up entry, the LIR bends and sags. Whenthe face moves beyond the critical span of the LIR, it
Structural characteristics of strata overlying a fully mechanized longwall face: a case study
1199 �

Structural characteristics of strata overlying a fully mechanized longwall face: a case study
breaks into fragments of different sizes and then cavesinto the goaf, as shown in Figure 10.
� Stage II: In this stage, the upper immediate roof (UIR)is broken and impacts the LIR. As the face continues toadvance, the UIR sags downward. Once the longwallface moves beyond its critical span, the UIR is fracturedand split into two rock beams (A and B), as shown inFigure 11. These two rock beams rotate with respect toeach other to form a Voussoir beam above the mined-out void. Owing to the large mining height, the panelvoid cannot be completely filled by the caved-inmaterials. The Voussoir beam continues to deflectdownwards, ultimately resulting in a buckling failure.At that moment, rock beam B impacts the shieldsupport via the LIR while rock beam A falls directly intothe caved zone. The cave-in of the UIR involves similarprocesses to those in the conventional immediate roofthat directly caved into the gob; however, it alsoinvolves instability before the balance of the Voussoirbeam is broken. Owing to this special property, thedynamic impacts of the UIR cave-in event are harmfulto the stability of the longwall shield supports.
� Stage III: In this stage, the main roof is broken intoblocks and then impacts the UIR. Once theadvancement of the working face has reached thecritical span of the main roof (Figure 12), the firstcave-in occurs as the main roof is broken into two rockbeams owing to the occurrence of tensile fractures at itsmid-span. When the main roof fractures, the brokenroof beam quickly sags, generating dynamic impactsbecause of the large bed separation between the mainroof and UIR. At this stage, owing to the impact forceinduced by the sudden sagging of the main roof, thelongwall support load immediately increases, increasingthe dynamic load coefficient. The caved height in theroof is the highest in the middle of the caved zone,where the panel void is fully filled by the caved-inmaterials.
Field experience shows that after the first roof weighting, thelongwall face enters into the second phase of overburdenmovement. In this phase, the main roof breaks periodically
behind the face after every critical advance so that a periodicweighting is placed on the longwall shields. The periodiccave-in is a progressive process which starts when theexcavation reaches a critical length. During each occurrenceof model B, the overburden movement can also be dividedinto three stages. During stage I, the LIR caves immediatelybehind the longwall supports. During stage II, the UIR hangsin the form of cantilever beams and is periodically broken atcertain intervals. In stage III, shear fracture occurs in themain roof ahead of the face, and dynamic impacts aregenerated (Figure 13).
At the beginning of stage I, both the LIR and main roofdeform gently, and thus maintain stability. Then, the LIRcaves into the goaf following the advance of the shieldsupports. Therefore, the LIR cannot maintain its self-supporting stability. In this case, at least half of the LIRweight needs to be supported by the shield canopy (Ning etal., 2014). Consequently, the equation for calculatingworking resistance for stage I can be expressed as follows:
[2]
where mz and Lz are the thickness and critical span of the LIR(m), respectively, z is the unit weight of the LIR (kN.m-3), Lkis the shield canopy length (m), and P1 is the calculatedworking resistance of the shield support for stage I.
At this stage, the main roof continues to deform gently andits movement has little influence on the UIR movement.Consequently, the force acting between the main roof and LIRcan be ignored. Therefore, the roof load applied to the shieldsupport is composed of two parts: the acting force on thesupport induced by the LIR, Q1, and the impact load inducedby the movement of the UIR, Q2. As suggested by Song(1988), Q1 can be expressed as follows:
�
1200

[3]
where Ls is the rear overhang of the LIR (m).To identify the impact force induced by the movement of
the UIR, Q2, the yield foundation model was introduced. Inthis simplified model, the shield support is regarded as aspring (as shown in Figure 14). In Figure 14a, o1 is regardedas the centre of gravity of beam B. GB and GA are regarded asthe weight of beams B and A, respectively. Here, status Arepresents the beginning of the sagging of the UIR. Status Brepresents the occurrence of instability in the Voussoir beam.Moreover, once status B occurs, the LIR is suddenly impactedand the impact load is transferred to the longwall supportsvia the Voussoir beam. Status C represents the end of impactin the LIR. Accordingly, in this study, we assumed that (i) atthe time of statuses B and C, the velocity of the UIR tended tobe zero; (ii) the UIR is regarded as a rigid body with verticalmotion, and it transmits impact force to the shield support;(iii) the shield is regarded as a linear spring; and (iv) there isno energy dissipation during the UIR movement.
At statuses B and C, the UIR velocity is zero. Thus, thekinetic energy variation is also zero. The potential energychange of rock beam B Esp, UIR Exp, and shield supportEv, can be expressed as follows:
[4]
where GB is the weight of the rock beam B (kN), h0 is theaverage displacement of the LIR covered by the shield canopy(m), x1 is the horizontal distance from the UIR beam end-fracturing to the longwall face, Lz is the first critical span ofthe UIR (m), and Fsd is the impact force induced by the UIRmovement (kN).
At this stage, the potential energy of gravity istransformed into the elastic potential energy of the shieldsupport. According to the energy conservation law (David,Robert, and Jearl, 2014), the relationship is written asfollows:
[5]
Based on Equations [4] and [5], the impact force inducedby the UIR movement can be established as follows:
[6]
The impact force transmitted to the shield support by theLIR can be expressed as follows:
[7]
where mz' is the UIR thickness (m), z' is the unit weightof the UIR (kN.m-3), and is the load transmitted coefficient,which can be obtained from Ning, Liu, and Tan (2014).
At this stage, when the LIR rotation reaches themaximum allowable sagging, the movement of the UIRinduces the impact force, namely:
[8]
where KA is the bulk factor of the LIR.At this stage, the shield support external load can be
expressed as follows:
[9]
At this stage, the working resistance P3 should be calculatedfrom three factors: The first factor is the weight of the LIR,that is, Q1; the second is load force induced by the UIRmovement, that is, Q3. The third is the impact force inducedby the movement of the main roof, that is, Q4. In this case,the weight of the LIR, Q1, can be calculated using Equation[3]. The load force Q3 induced by the movement of the UIRshould be determined from two factors: one being the weightof the UIR over the shield canopy area, and the other theweight of the UIR overhangs. As suggested by Song (1988),Q3 can be expressed as follows:
[10]
where Ls' is the rear overhang of the UIR (m).To obtain the impact force Q4 induced by the movement
of the UIR, a simplified model was also developed (Figure15). In this model, the broken main beam impacts the lowerstrata (the UIR and LIR are regarded as rigid bodies withvertical motion) rotating around point ‘o’. In Figure 15, o2 isregarded as the centre of gravity of the broken beam. InFigure 15, state D represents the downward-deflected mainroof and state E represents the occurrence of impact. State Frepresents the end of the main roof movement. At states Dand E, the velocities of the LIR, UIR, and main roof are zero.Therefore, at those states, the corresponding kinetic energy iszero.
After the main roof is broken at mid-span, thedisplacement of the roof over the shield canopy areaincreases by h1. Here, the potential energy change of themain roof ( Ejp), UIR ( Esp), LIR( Exp), and shield support ( Ev) can be expressed as follows:
[11]
Structural characteristics of strata overlying a fully mechanized longwall face: a case study
1201 �

Structural characteristics of strata overlying a fully mechanized longwall face: a case study
where G1 is the weight of the main roof (kN), h1 is the bedseparation between the main roof and UIR (m), L0 is the firstcritical span of the main roof (m), and h1 is thedisplacement of the roof over the shield canopy area (m).
According to the energy conservation law (David, Robert,and Jearl 2014), the impact force induced by the suddenmovement of the main roof can be obtained by
[12]
where Fjd is the impact load induced by the suddenmovement of the main roof (kN).
The impact load transmitted to the shield support by theLIR can be expressed as follows:
[13]
where mE is the thickness of the main roof (m) and E is theunit weight of the UIR (kN.m−3).
At this stage, the shield support external load can beexpressed as follows:
[14]
In model B, the overburden movement is also divided intothree stages.
At stage I, the shield support external load P4 is composed oftwo parts: the weight of the LIR over the shield canopy areaand the weight of the LIR overhangs. It can be calculatedusing Equation [3].
At this stage, the shield support external load is composed oftwo parts: the weight of the LIR (Q1) and the impact load(Q5), induced by the periodic break of the UIR. To obtain theimpact force (Q5) induced by the periodic movement of theUIR, a simplified model was developed (shown in Figure 16).In Figure 16, o3 is the weight centre. Before the UIR isbroken, the bed separation between the UIR and LIR is h2. Atthe end of the UIR movement, the displacement of the roof
over the shield canopy area increases by h0. At this stage,the potential energy change of the UIR ( Ejp), LIR ( Esp), andshield support ( Ev) can be expressed as follows:
[15]
where G2 is the LIR weight in model B (kN), Lz is the periodicbroken length of the LIR (m), and Fsd is the impact forceinduced by movement of the UIR (kN).
After the movement of the UIR, the change in potentialenergies of the UIR and LIR is transformed into elasticpotential energy of the shield support. According to theenergy conservation law (David, Robert, and Jearl. 2014), theimpact force Fsd induced by the sudden movement of theUIR can be obtained by:
[16]
The impact force Q5 transmitted to the shield support canbe expressed as:
[17]
At this stage, the shield support external load P5 can beexpressed as:
[18]
At this stage, the shield support external load P6 is composedof three parts: the weight of the LIR, Q1; the load forceinduced by the movement of the UIR, Q3; and the impactforce induced by the movement of the main roof, Q6. Theweight of the LIR, Q1, and the load force induced by themovement of the UIR, Q3, can be calculated using Equations[3] and [4], respectively.
To obtain the impact force (Q6) induced by the periodicmovement of the UIR, a simplified model was developed(Figure 17). In Figure 17, o4 is regarded as the broken mainroof. The change in potential energy of the main roof ( Ejp),UIR ( Esp), LIR ( xp), and shield support ( v) can beexpressed as:
[19]
�
1202

where G3 is the weight of the LIR in model B (kN), h1 is thebed separation between the UIR and main roof in model B(m), L1 is the periodic broken length of the main roof (m),h1 is the displacement of main roof in model B (m), x2 is
the horizontal distance from the main roof beam end-fracturing to the longwall face in model B (m), and F jd is theimpact force induced by the movement of the main roof inmodel B.
According to the energy conservation law (David, Robert,and Jearl. 2014), the impact force F jd induced by themovement of the main roof in model B can be expressed as:
[20]
The impact force Q5 transmitted to the shield support canbe expressed as:
[21]
At this stage, the shield support external load P6 can beexpressed as:
[22]
In conclusion, the abovementioned two models should beconsidered when calculating the shield support external loadwhen using the SGMHLW method. Therefore, the workingresistance of the shield support can be expressed as:
[23]
Based on the stratigraphy of panel 311101, the workingresistance of the shield supports can be calculated. As shownin Figure 1, the LIR of panel 311101 is sandy mudstone witha height of 4.0 m, which will cave and fall into the goaffollowing the advance of the coal extraction and shieldsupport. The UIR of this panel is siltstone less than 7.0 mthick. The main roof is composed mainly of fine sandstoneand sandy mudstone, and its thickness is 30.5 m. Based onexperience in mining engineering, the LIR unit weight is 22.5 kN/m3 and its bulk factor KA is 1.2. The UIR and mainroof unit weights are 22.8 and 23.8 kN/m3, respectively.
Field experience shows that cave-in events occur so thata roof weighting is placed on the longwall shields. Thevariations in response of the longwall shields can be used topredict the critical spans or breaking length of overlyingstrata. According to the analysis of the shield support TWAR(as shown in Figure 5), the increasing rate of resistance canbe divided into three main types which could refer to thebreaking of the LIR, UIR, and main roof. Therefore, thecritical spans of the LIR (Lz), UIR (Lz), and main roof (L0) inmodel A are 23.5, 38.2, and 60.0 m, respectively. The criticalspans of the UIR (Lz) and main roof (L1) in model B are 16.2and 34.7 m, respectively. A laser measuring instrument wasinstalled at the end of the support of the working face tomeasure the rear overhang of the LIR (Ls), which wasdetermined to be approximately 2.0 m. According to thesupport parameters, the shield canopy length isapproximately 5.0–6.4 m. Field investigations show that inmodel A, h1 and h1 are 0.35 and 0.20 m, respectively. Inmodel B, h0 and h1 are 0.25 and 0.65 m, respectively. Amultiposition borehole extensometer was installed in panel311101. For each extensometer, three anchors were installedin the LIR, UIR, and main roof to measure the displacements.The field measurements showed that h1 = 0.2 m and h1 =0.1 m.
According to the three types of structures that exist inpanel 311101 and the equations presented in the previoussections, the working resistance for each of the three stageswas calculated, and the results are reported in Table II. Atstage II of models A and B, the working resistances of theshield support are 4 720 and 4 517 kN, and thecorresponding dynamic load coefficients are 2.2 and 2.4,respectively. At stage III of models A and B, i.e. when themain roof undergoes violent movement, the workingresistances of the shield support are 12 782 and 10 398 kN,and the corresponding dynamic load coefficients are 2.7 and2.3, respectively. Therefore, the working resistance of theshield support with the advance of the longwall face is 1.141 MPa (12 782 kN), according to Equation [23].
Table III lists the estimated working resistance of theshield support using the equations provided by Song (1988)and Qian et al. (2010). As shown in Table III, the measuredworking resistance of panel 311101 is approximately 12 084 kN, while the working resistances estimated by usingthe equations provided by Song (1988) and Qian et al.(2010) were 7 294.1 and 8 500.4 kN, respectively, which aremuch lower than those obtained from the measurements inthis study. However, the working resistance estimated usingEquation [23] is 12 782 kN, which is very close to themeasured value. Obviously, the methods that Song (1988)and Qian et al. (2010) provide cannot be used for a SGMHLWoperation. Thus, the 6.0 m height chock shields with workingresistance of 13 000 kN were used in the next panel, that is,panel 311102 of the Gaojialiang coal mine.
In China, the SGMHLW mining method has been successfullypracticed in the Ordos coalfield. To understand the stratabehaviour induced using the SGMHLW method, an in situinvestigation and theoretical research were conducted onpanel 311101 of the Gaojialiang mine. The results presentedin this paper are summarized as follows.
1. With the advance of the longwall face, the SLPMS of
Structural characteristics of strata overlying a fully mechanized longwall face: a case study
1203 �

Structural characteristics of strata overlying a fully mechanized longwall face: a case study
the shield support progressed in three stages: slow,rapid, and high-speed growth. In addition, the shieldsuffered from two impact loadings induced by theoverburden movement. The numerical simulation alsoconfirmed that the progressive failure of the stratacould be divided in three stages.
2. Based on the data obtained from the in situinvestigation and numerical simulation, a simplifiedtheoretical model was built to describe the structuralcharacteristics of the overlying strata. In this model,the progressive failure of the overlying strata wasdivided into three stages. In addition, the workingresistance of the shield was determined at every stage,and then a reasonable working resistance wasidentified for the shield support under SGMHLWconditions. The reasonable working resistance isdefined as P = max (P1, P2, P3, P4, P5, P6,). Theappropriate working resistance for the 6.0 m heightchock shields of the longwall face of panel 311101 in the Bayangaole coal mine was determined at 12 782 kN.
This study was supported by National Key R&D Program ofChina 2018YFC0604703), the National Natural ScienceFoundation of China (No. 51574154, 51274133, 51474137,51574155), the Shandong Province Science and TechnologyDevelopment Plan, item (2014GSF120002), and the Tai’shanScholar Engineering Construction Fund of the ShandongProvince of China.
ALEHOSSEIN, H. and POULSEN, B.A. 2010. Stress analysis of longwall top coalcaving. International Journal of Rock Mechanics and Mining Sciences, vol. 47, no. 1. pp. 30–41.
DAVID, H., ROBERT, R., and JEARL, W. 2014. Principles of Physics. 10th edn.Wiley, New York.
BATCHLER, T. 2017. Analysis of the design and performance characteristics ofpumpable roof supports. International Journal of Mining Science andTechnology, vol. 27, no. 1. pp. 91–99.
COULTHARD, M.A. 1999. Applications of numerical modelling in underground
mining and construction. Geotechnical and Geological Engineering, vol. 17, no. 3. pp. 373–385.
GONG, P.L. and JIN, Z.M. 2008. Mechanical model study on roof control for fully-mechanized coal face with large mining height. Chinese Journal of RockMechanics and Engineering, vol. 27, no. 1. pp. 193–198 [in Chinese].
GHOSE, A.K. and DUTTA, D. 1987. A rock mass classification model for cavingroofs. Geotechnical and Geological Engineering, vol. 5, no. 3. pp. 257–271.
GILBRIDE, L.J., RICHARDSON A.M., and AGAPITO J.F.T. 1998. Use of block modelsfor longwall shield capacity determinations. International Journal of RockMechanics and Mining Sciences, vol. 35, no. 4–5. pp. 425–426.
HENDERSON, P.G. 1980. Experience in longwall mining at Coalbrook Collieries.Journal of the South African Institute of Mining and Metallurgy, vol. 80,no. 1. pp. 22–33.
ISLAVATH, S.R, DEB, D., and KUMAR, H. 2016. Numerical analysis of a longwallmining cycle and development of a composite longwall index.International Journal of Rock Mechanics and Mining Sciences, vol. 89. pp. 43–54.
JU, J.F. and XU, J.L. 2013. Structural characteristics of key strata and stratabehaviour of a fully mechanized longwall face with 7.0 m height chocks.International Journal of Rock Mechanics and Mining Sciences, vol. 58, no. 1. pp. 46–54.
JIANG, L.S., SAINOKI, A., and MITRI, H.S. 2016, Influence of fracture-inducedweakening on coal mine gateroad stability. International Journal of Rock Mechanics and Mining Sciences, vol. 88. pp. 307–317. doi: 10.1016/j.ijrmms.2016.04.017
LAWSON, H.E., DOUGLAS, T., LARSON, M.K., and HABTE, A. 2017, Effects ofoverburden characteristics on dynamic failure in underground coalmining. International Journal of Mining Science and Technology, vol. 27,no. 1. pp. 121–129.
NING, J.G., LIU, X.S., TAN, Y.L., ZHANG M., and ZHANG L.S. 2014, Fracturestructure model of weakly cemented roof in shallow seam. Journal ofMining and Safety Engineering, vol. 31, no. 4. pp. 569–574 [in Chinese].
NING, J.G, WANG, J., TAN, Y.L., ZHANG L.S., and BU T.T. 2017, In situinvestigations into mining-induced overburden failures in close multiple-seam longwall mining: A case study. Geomechanics and Engineering, vol. 12, no. 4. pp. 814–820.
PENG, S.S., LI, H.M., and ZHOU, Y. 2015. Ground Control in the Ordos Coal Field.China Science Press, Beijing.
PENG, S.S. and CHIANG H.S. 1984. Longwall Mining. Wiley, New York.PRUSEK, S., PŁONKA, M., and WALENTEK, A. 2016. Applying the ground reaction
curve concept to the assessment of shield support performance in longwallfaces. Arabian Journal of Geosciences, vol. 9, no. 3. pp. 1–15.
SMART, B.G.D. and REDFERN, A. 1986. The evaluation of powered support fromgeological and mining practice specifications information. Proceedings ofthe 27th US Symposium on Rock Mechanics (USRMS),Tuscaloosa,Alabama, 23-25 June 1986. American Rock Mechanics Association,Alexandria, VA. pp. 367–377.
SONG, Z.Q. 1988. Practical ground pressure control. China University of Miningand Technology Press, Xuzhou.
SOFIANOS, A.I. 1996. Analysis and design of an underground hard rock voussoirbeam roof. International Journal of Rock Mechanics and Mining Sciences,vol. 32, no. 2. pp. 153–166.
SINGH, R., and SINGH, T.N. 1999. Investigation into the behaviour of a supportsystem and roof strata during sublevel caving of a thick coal seam.Geotechnical and Geological Engineering, vol. 17, no. 1. pp. 21–35.
SHABANIMASHCOOL, M., JING, L., and LI, C.C. 2014. Discontinuous modelling ofstratum cave-in in a longwall coal mine in the arctic area. Geotechnicaland Geological Engineering, vol. 32, no. 5. pp. 1239–1252.
TRUEMAN, R., LYMAN, G., and COCKER, A. 2009. Longwall roof control through afundamental understanding of shield–strata interaction. InternationalJournal of Rock Mechanics and Mining Sciences, vol. 46, no. 2. pp. 371–380.
TAN, Y.L., LIU X.S. NING, J.G., and LU Y.W. 2017. In situ investigations onfailure evolution of overlying strata induced by mining multiple coalseams. Geotechnical Testing Journal, vol. 40, no. 2. pp. 244–257.
VERMA, A.K. and DEB, D. 2013. Numerical analysis of an interaction betweenhydraulic-powered support and surrounding rock strata. InternationalJournal of Geomechanics, vol. 13, no. 2. pp. 181–192.
YASITLI, N.E. and UNVER, B. 2005. 3D numerical modeling of longwall miningwith top-coal caving. International Journal of Rock Mechanics and MiningSciences, vol. 42, no. 2. pp. 219–235.
YU, B., ZHAO, J., and KUANG, T.J. 2015. In situ investigations into overburdenfailures of a super-thick coal seam for longwall top coal caving.International Journal of Rock Mechanics and Mining Sciences, vol. 4, no. 78. pp. 155–162.
YU, B., ZHAO, J., and XIAO, H.T. 2017. Case study on overburden fracturingduring longwall top coal caving using microseismic monitoring. RockMechanics and Rock Engineering, vol. 50, no. 2. pp. 507–511.
UNVER, B. and YASITLI, N.E. 2006. Modelling of strata movement with a specialreference to caving mechanism in thick seam coal mining. InternationalJournal of Coal Geology, vol. 66, no. 4. pp. 227–252.
ZHANG D.S., FAN G.W., and MA L.Q. 2011. Aquifer protection during longwallmining of shallow coal seams: a case study in the Shendong Coalfield of China. International Journal of Coal Geology, vol. 86, no. 2. pp. 190–196. �
�
1204
Table II
Stage I 2 153 1 875Stage II 4 720 4 517Stage III 12 782 10 398
Table III
Working resistance (kN) 12 084 12 782 7294.1 8 500.4Difference (%) - 5.8 –39.6 –29.7
Note: Difference with regard to working resistance measured fromSLPMS

Mogale Alloys is situated in Krugersdorp in theWest Rand District Municipality in SouthAfrica’s Gauteng Province. The Krugersdorpfacilities were initiated by Palmiet ChromeCorporation in February 1963 to producecharge chrome (Basson, Curr, and Gericke,2007). Mogale Alloys bought the PalmietChrome facilities in 2005 from SamancorChrome. The Afarak Group currently owns90% of Mogale Alloys.
SiMn is produced in two 20 MVAsubmerged arc furnaces (SAFs), which wereoriginally built for chromite processing, andferrochromium (FeCr) in two DC open bathfurnaces rated at 40 MVA and 10 MVA. Whenthis paper was compiled, the 10 MVA furnacewas not operational due to the high cost ofproduction, and one of the 20 MVA SAFs wasrecently converted to produce FeCr due tomarket constraints. Mogale Alloys has 290permanent employees with four contractingcompanies on site. The paper presented herefocuses on the production of SiMn at MogaleAlloys.
The high-level process flow at MogaleAlloys is summarized in Figure 1, whichdetails the raw material input and the productsproduced by the two 20 MVA furnaces. SiMnis produced by carbothermic reduction ofmanganese-bearing raw materials from fourdifferent sources, namely Wessels, Mamatwan,and UMK ores, and BHP sinter feed. The
carbon sources are bituminous coal fromForzando and Msobo, local suppliers inMpumalanga.
Figure 2 depicts the location of rawmaterial suppliers relative to Mogale Alloys.
Quartz is sourced from South Africanproducers located in Marble Hall in Limpopo.
The SiMn is primarily produced for theexport market. Slag is disposed of off-site. Off-gas is vented to the atmosphere after cleaning.
The chemical composition of the SiMnproduced at Mogale Alloys is typical of ASTMgrade B (ASTM Standards A483/A483M - 10,2010) shown in Table I. The product sizeranges, in comparison with the ASTMspecifications, are summarized in Table II.Three product sizes are produced, the twolarger size fractions being sold and the smallerfraction used to line the casting beds.
Silicomanganese production at MogaleAlloysby N.A. Sithole*, N. Rambuda†, J.D. Steenkamp*, D.A. Hayman*, and C. Hockaday*
Mogale Alloys operates two alternating current (AC) submerged arcfurnaces (SAFs), and two direct current (DC) open bath furnaces. Thesefurnaces are capable of producing two products, silicomanganese (SiMn)and ferrochrome (FeCr), with a total production capacity of 110 000 t/a.This paper focuses on the silicomanganese process specific to MogaleAlloys, with a two-furnace operation facility that produces 55 000 t ofSiMn per annum.
silicomanganese, submerged arc furnace, Mogale Alloys.
* Mintek, Johannesburg, South Africa.† Mogale Alloys, Krugersdorp, South Africa© The Southern African Institute of Mining and
Metallurgy, 2018. ISSN 2225-6253. Paper receivedMay 2017; revised paper received July 2018.
1205 �
http://dx.doi.org/10.17159/2411-9717/2018/v118n11a11

Silicomanganese production at Mogale Alloys
A basic schematic of the operations at Mogale Alloys isprovided in Figure 3.
The feed to the furnaces comprises a blend of the variousores and quartz as listed in Table III. The compositions ofthese raw materials have a large influence on the product
composition. Therefore, the recipe is adjusted to produceSiMn containing 65% Mn, 17% Si, 14% Fe, and a maximumof 2% C with an 80% metal recovery. The quartz providessilicon to the metal and also fluxes the slag system.
Most of the manganese ores (Wessels, Mamatwan, UMK,and BHP sinter) are sourced from the Hotazel area in theNorthern Cape Province (Figure 2). The selection of thedifferent types of ore is governed by the manganese content,ratio of manganese to iron (Mn/Fe), reducibility, price, andcarbonate content. To manage the risk of non- or delayeddelivery, different suppliers are used to allow for a constantsupply of raw materials. The various factors are optimized toreduce production costs and meet product specifications.From Table III it can be seen that the manganese contents ofthe ores and sinter are fairly similar, but that the iron contentvaries significantly, as indicated by the Mn/Fe ratios.Another variable is the carbonate content of the ore. Theproblem with carbonate-rich ores, seen in Table III with lowmanganese-to-carbonate ratios, is that they consume largeamounts of fixed carbon, and increase the partial pressure ofcarbon monoxide (PCO) in the system because of theBoudouard reaction, shown in Equation [1] (Olsen,Tangstad, and Lindstad, 2007). This reaction typicallyproceeds at temperatures exceeding 800°C.
�
1206
Table I
Mogale Alloys 65.7 17.2 1.73 0.066 0.014ASTM Grade A 65.0–68.0 18.5–21.0 1.5 0.20 0.04ASTM Grade B 65.0–68.0 16.0–18.5 2.0 0.20 0.04ASTM Grade C 65.0–68.0 12.5–16.0 3.0 0.20 0.04
Table II
200–100 40 kg lump, max. 10% max. passing 100 mm sieve -200–50 40 kg lump, max. 10% max. passing 50 mm sieve -100–25 10% max. retained on 100 mm sieve 10% max. passing 25 mm sieve -80+5050–5 10% max. retained on 50 mm sieve 10% max. passing 5 mm sieve -50+5< 50 10% max. retained on 50 mm sieve 15% max. passing 5 mm sieve -5

[1]
Therefore, the Mamatwan and UMK ores are maintained atless than 65% of the feed ore. Wessels ore contains lesscarbonate material than the other two ores, but is the highestcontributor towards the iron content in the process. Wesselsore is more cost-effective than the BHP sinter and Mamatwanore. Although both the manganese-bearing ores and thereductants contain silicon, the primary source of silicon in theblend is quartz, with the typical composition indicated inTable III. The addition of quartz is required for the siliconcontent in SiMn, but the system is fluxed by the SiO2. The
slag basicity B3 is adjusted by the quartz according toEquation [2] (Olsen, Tangstad, and Lindstad, 2007).
[2]
The carbon required for the reduction of manganese andsilicon is provided by bituminous coal. Bituminous coal isless costly than anthracite, and more readily available inSouth Africa (Wellbeloved and Kemink, 1995). However,technical difficulties arise as a result of the high volatilematter content, which causes a phenol build-up in theeffluent from the wet scrubbers (Wellbeloved and Kemink,1995).
Silicomanganese production at Mogale Alloys
1207 �
Table III
Mn 43.2 38 37.0 45. -Fe 15.9 4.4 5.8 5. -MgO 0.69 3.6 3.3 4.5 0.2Al2O3 0.74 0.33 0.34 0.61 0.5SiO2 5.5 4.6 5.8 6.6 98CaO 5.3 14. 15 17 0.5Mn/Fe ratio 2.9 8.6 6.5 8.4 -Mn/Carbonate 7.2 2.1 2 - -Particle size (mm) 50 - 80 6 - 75 6 - 75 5 - 60 30 - 70

Manganese-containing feed material is a combination ofraw ore, sinter, and recycled by-products of the process suchas alloy fines and metal-rich slag. The alloy fines have thesame composition as the tapped metal product (Table I). Thecomposition of the metal-rich slag is not analysed.
The flow of raw materials, from delivery by truck to feedinginto the furnace, is summarized schematically in Figure 4.
The raw materials are delivered by suppliers and areplaced in stockpiles in the receiving yard. The material fromthe stockpiles is transported by trucks and discharged intohoppers that store the raw material in day bins. From the daybins, the raw materials are released into weighing hopperswhere the feed is mixed. The conveyor system then
Silicomanganese production at Mogale Alloys
�
1208
Table IV
MgO 0.6 0.1Al2O3 2.3 3.9SiO2 4.1 6.1CaO 4.0 0.2Cfixed 51 52Ash 17 16Total 79 78Particle size (mm) 30 - 60 25 - 60

transports the mixed feed into the primary bins. Two separateprimary bins are used for furnaces P2 and P3. Feeding isdone manually using the two vehicles shown in Figure 5.
The contents of the primary bin are poured into thecharge car and the feed material is discharged inside thefurnace through the opening. The rabbling cars then come inand push the material closer to the electrodes.
Figure 6 depicts a schematic flow diagram of one of thefurnaces. The feed rates of the input and output material arepresented Table V. The data is for furnace 3, based on asingle 3100 kg batch of feed material. The furnaces areoperated at the same capacity and are controlled to yield the
Silicomanganese production at Mogale Alloys
1209 �
Table V
Operating power (MW) 13.75 13.75Mn ore (kg per batch) 1600 1600Reductant (kg per batch) 657 657Flux(quartz) (kg per batch) 524 524Slag (kg per batch) 869 869Metal (kg per batch) 828 828Off-gas (kg per batch) 1406 1406Recycle (kg per batch) 320 320Electricity usage (MWh/t metal) 3.5-4 3.5-4

Silicomanganese production at Mogale Alloys
same amount of metal with minimal amounts of slag in theoutput. This will result in an average slag-to-metal ratio of1.05 for furnace 3.
The 20 MVA furnaces at Mogale Alloys are capable ofswitching between SiMn and FeCr production (Basson, Curr,and Gericke, 2007). FeCr processes require highertemperatures than SiMn, around 1800°C, and higherresistances to reach these temperatures. Coke is used for FeCrproduction and the slag to metal ratio is higher. Thesefurnaces are semi-open SAFs operated with three Söderbergelectrodes positioned in equilateral arrangement. Variousmodifications have been made to the furnaces over the yearsas ownership changed. The furnaces are identical indimensions, and both furnace facilities were modified in2010 to change the electrode diameter from 1 m to 1.2 mbefore the Afarak group bought the facilities.
From a theoretical perspective, an increase in electrodediameter at the same conductivity increases its currentcarrying capacity (Dougall and Gasik, 2013). Figure 7 andTable VI present the dimensions of the current furnacelayout.
Table VI lists the design power rating (PR), operatingpower (OP), electrode diameter (ED), electrode pitch circlediameter (PCD), PCD power intensity (PITPCD), outer diameterof steel shell (ODS), internal diameter of hearth refractory(IDH), and hearth power intensity (PIThearth). The electrodePCD power intensity is related to the operating power and thePCD, according to Equation [3].
[3]
The hearth power intensity (PIThearth) is related to theoperating power (OP) and the internal diameter of hearthrefractory (IDH), according to Equation [4].
[4]
The layout in Figure 7 and parameters tabulated in TableVI all work together to transform electrical energy to meet theenergy requirements of the reactions and heating of products.In order to produce SiMn, heat transfer is required to facilitatethe temperature-dependent reactions. The furnace burdenheight H is significantly higher than the electrode tip wherethe arc forms, hence the furnace burden covers the electrodesand the arc, which is why the furnaces are termed‘submerged-arc’. However, the bulk of the energy transferredis through ohmic (resistance) heating due to the short arc(Saevarsdottir and Gasik, 2013). Ohmic heating requires the
current to flow through a medium that resists (electricalresistance) current flow in order to produce heat. In the SiMnfurnace the slag is the resistant medium where the heat isgenerated (Saevarsdottir and Gasik, 2013). The transformerpower rating is related to the production capacity – enoughpower must be available to meet the company’s yearlyproduction targets (Saevarsdottir and Gasik, 2013). Thispower value is estimated the from mass and energy balanceof the process (Saevarsdottir and Gasik, 2013). Parameters ofthe furnace bath are then considered along with the requiredelectrode resistance and current (Saevarsdottir and Gasik,2013), because the electrodes are the means of transferringpower from the transformer to the process materials. Thefurnace freeboard is the gap between the furnace roof K andthe top of the burden H. It is designed according to theamount of gas and dust generated by the process. Therefore ahigh gas volume generation will require a large combustionchamber.
The purpose of an electrode is to deliver the current to theslag. Multiple calculations are carried out to deriveparameters such as the electrode current, voltage, anddiameter (Gasik, 2013). The electrodes are selected to meetcurrent demands using their maximum current-carryingcapacity, which is determined by the electrode material anddiameter. The maximum current-carrying capacity of anelectrode is the upper limit of the furnace operating current,which should be greater than the full load current. Anoptimal selection of current density also minimizes arcing.Arcing is an indication of an unbaked electrode at thepressure ring and contact pads, since the steel casing canonly handle a 25 kA current. The PCD is used to distributethe heat evenly across the furnace hearth, since theelectrodes create hotspots. A smaller PCD causes the electrodehotspots to be in close proximity, which increases the processtemperature at the centre of the furnace. At Mogale Alloys theSiMn furnaces are designed such that one electrode is in linewith the tap-hole in order to minimize metal freezing duringtapping.
Söderberg self-baking electrodes require careful control toensure that the operation runs as expected. This due to thesoftening and baking that electrode paste undergoes before itcan adequately carry current to the correct location in thefurnace. Softening and baking are dictated by thetemperature profile in the electrode column (Nelson andPrins, 2004). Self-baking electrodes are prepared by weldingcylindrical casings and inserting the electrode paste cylindersas shown in Figure 8a. During normal operation, theelectrode cylinder paste melts in the casing at the top and
�
1210
Table VI
2 20 13.75 1.2 3.1 1.822 9.8 8.292 0.25463 20 13.75 1.2 3.1 1.822 9.8 8.292 0.2546

starts baking at temperatures around 450–500°C furtherdown the shaft. Above these temperatures, even furtherdown the shaft, the electrode solidifies, forming graphite, andbecomes electrically conductive. The steel casings (Figure 8b)then melt and are incorporated into the charge mix. Self-baking electrodes are preferred since they are cheaper, andrequire less preparation than prebaked electrodes, despite thefact prebaked electrodes have a superior current-carryingcapacity (Jones, 2014). This is due to the size limitation onprebaked electrodes; once they exceed 700 mm in diameterthey become very costly and difficult to source (Reynolds andJones, 2005).
For effecting control, various factors need to be taken intoaccount, such as the electrode submerged length, electrodepaste additions, baking zone, hard and soft paste levels,slipping rate, and temperature profile (Nelson and Prins,2004). The estimated length of the electrode submerged intothe burden is obtained manually, by allowing the furnace tomelt out for a period of 8 hours, with no feeding, until theelectrode tips are uncovered. A rope is then dropped from thetop of the electrode, just under the pressure ring, until itreaches the electrode tip. The measurements are then takenand used to determine the slip length. Electrode slipping isdone hourly, and monitoring of the electrode is done by theforeman on every shift, which lasts for 8 hours. Operatingthe furnace with short electrodes will result in an increasedcoal demand in the charge, while operating with longelectrodes will require less coal in the feed charge. Both
scenarios will cause the alloy grade to be poor, hence goodelectrode management is required.
Figure 9 is a schematic drawing of the Söderbergelectrode set-up in a submerged arc furnace. The top andbottom pressure rings are used to hold the electrode in place,and the bottom ring contains the contact shoe, through whichthe current is supplied to the electrode. The jacks can beeither pneumatic or hydraulic, and are used for electrodeclamping and slipping. The solid and liquid levelmeasurements are used to determine the number of electrodepaste cylinders to be added to maintain the liquid level in theappropriate range. Electrode paste additions are used tocalculate electrode consumption ratios. Figure 10 shows aschematic drawing of the electrode casings that have beenwelded together, the solid cylinder, and molten paste.
The solid level is measured by dropping a tape, which hasa metal weight at the end, inside the steel casing so that ittouches the top part of the unmelted cylindrical electrode. Theliquid level is then measured by dropping the tape into thegap between the fins of the casing and solid electrodecylinder to obtain the distance between the molten paste andthe top of the steel casing. High or low liquid levels will cause
Silicomanganese production at Mogale Alloys
1211 �

Silicomanganese production at Mogale Alloys
the electrode to break, hence monitoring is important toreduce the downtime associated with electrode breakage.‘Green break’ is the term used to describe what happenswhen liquid starts to leak from the casing due to over-slipping and the electrodes are not allowed to bake properly.To prevent green breaking, the liquid paste levelmeasurements, together with the furnace control system, are used to ensure proper baking and slipping in furnaces P2 and P3.
Furnace control is achieved using the FurnStar Minstralsubmerged-arc furnace control system, which employs aresistance algorithm patented by Mintek (Mintek, 2011). Insummary, the system uses resistance values to achieve itscontrol objectives. Resistance values can be set to between0.9 and 1.2 mΩ, with the transformer size determining thepower intensity of the furnace. There are two controlvariables that are used, current and resistance (Mulholland,Brereton-Stiles, and Hockaday, 2009). Current-based controlis simple, familiar, and yields the same results as resistance-based control when furnace conditions are stable(Mulholland, Brereton-Stiles, and Hockaday, 2009).However, resistance-based control is deemed better inunsteady furnaces, because it decouples the electrodes anddoes not move unaffected electrodes due to resultantinteractions (Mulholland, Brereton-Stiles, and Hockaday,2009).
At Mogale Alloys the primary current is used as areference controlling parameter since it can limit the powerinput, unlike transformer capacity or electrode diameter(Barker, 1980).
The mass balance data in Table V was used to calculatevarious efficiencies (given in Table VII). The carbonefficiencies were calculated using the mass percentage offixed carbon (Table IV) multiplied by the mass of reductant(Table V). Table VIII lists the compositions of the tappedmetal and slag obtained by the efficiencies shown in TableVII.
The aim of production is to meet the metal productspecifications and the required capacity while keepingproduction costs low. This can be seen by the low slag-to-metal ratio that is close to unity in Table VII and the lowstandard deviation values in Table VIII.
The slag-to-metal ratio is low enough to meet productspecifications without energy being wasted on extra wastematerial. The average MnO content in Table VIII is within theexpected 10–20% loss for the discard slag process (Gasik,2013). There are no excessive losses of MnO to the slag thatcharacterize a system with too much slag (Olsen andTangstad, 2004). The availability of the both furnaces ishigh, and production is carried out year-round with minimaldowntime. The standard deviation for most of theconstituents is low, except for MnO and CaO in the slag. Dueto the nature of the operations, there is a time delay betweenreceiving production information and changing the feedmaterial. For a cost-efficient process, MnO in the slag mustbe kept low, but the deviations arise when the recipechanges, which causes the furnace to receive more MnO thancan be reduced by the available reductant.
The furnaces are tapped every 2 hours. Each furnace istapped from a single, single-level tap-hole, with the metaland slag both being tapped from the same tap-hole. Tap-holes are drilled open, using drill-and-mud-gun technology.Tap-holes are lanced open only when difficulties with drillingare experienced, i.e. when the metal/slag is frozen in thetapping channel. The metal and slag flow along a 1 m longlaunder into a refractory-lined ladle, seen in Figure 11a. Dueits higher density, the metal settles at the bottom of the ladle,and slag overflows into a slag pot (see Figure 11a). The slagthat remains on top of the metal is skimmed off into themetal-rich slag bay, by letting the slag trickle out of the ladle(see Figure 11b). Lastly, the metal is poured onto a launderthat skims more slag while guiding the metal into the castingpit (see Figure 11c).
�
1212
Table VII
Slag /metal ratio 1.05 1.05Ore efficiency (ore /alloy) 1.9 1.9Carbon efficiency (C/ore) 0.41 0.41Quartz efficiency (quartz /ore) 0.33 0.33Availability (%) 98 98
Table VIII
Mn 65.7 0.29 MnO 16 2.5C 1.73 0.17 SiO2 46.4 0.75Si 17.2 0.47 MgO 5.04 0.42Fe 14.7 0.33 CaO 26.6 2.2Total 99.3 - FeO 0.42 0.39
Al2O3 4.60 0.54Total 99.1 -B/A 0.68 0.06

The SAFs at Mogale Alloys are semi-open to the atmosphere,with half of the open area covered using three furnace coversplaced in an equilateral formation (Figure 12). The furnaceroof is completely separated from the furnace shell by a 1.5 mgap and the gaps between the furnace covers are utilized forcharging, rabbling, and also for visual inspection of theburden (Figure 12). The burden level must at all times be justabove the furnace seal and level throughout. To ensure this,the burden is rabbled conducted on a regular basis to achievetwo main objectives: levelling of the burden, and improvingburden permeability. Levelling is needed to minimize heatlosses, as well as losses of Mn and SiO vapour and fines.Ensuring burden permeability is important to avoid furnaceblowouts, which occur primarily as a result of the flow ofgases through the burden being hindered.
Other causes of furnaces blowout include high slag levels
in the furnace, electrode position, a large amount of fines,and poor slag basicity control resulting in a viscous slag.
The metal is cast onto casting beds lined with SiMn fines, asindicated in Figure 13b. The SiMn fines are also used as anembankment around the casting pits to contain the liquidalloy. Alloy from both furnace ladles is cast in one castingbed. It is then allowed to cool and solidify (Figure 13a) beforebeing excavated and moved by front-end loader to thecrushing plant, while the next casting bed is used. As a layerof alloy is allowed to solidify before the next layer is castonto it, the layers remain separate. As a result, when thematerial is removed, the alloy breaks easily into pieces. Thefront-end loader moves the alloy from the casting bed to thealloy stockpile (Figure 13c).
Silicomanganese production at Mogale Alloys
1213 �

Silicomanganese production at Mogale Alloys
The stockpiled material is fed to the alloy processingplant, where it is crushed and screened into different productsizes. The process flow sheet for the alloy processing plant isgiven in Figure 14. The stockpiled alloy from the casting bedsis fed into the primary jaw crusher and then to a grizzlyscreen. The +80 mm oversized fraction is reduced in thesecondary jaw crusher and returned to the grizzly screen. The–80 mm undersized fraction is fed to a multi-deck screen,which produces –80+50 mm, –50+5 mm, and –5 mm
fractions. The 80+50 mm and –50+5 mm products are storedin bunkers. The –5 mm fines, which are not saleable, arestockpiled for use on the casting beds and for remelting.
After tapping the product, the ladle is taken to the slag area,where the slag is skimmed off. The slag is cooled using wateras indicated in Figure 15.
Around 20% of the metal is entrained in the slag. This is
�
1214

a significant amount, and recovery of the metal is required.Metal recovery is done off-site by a contractor. Figure 16details the material flow diagram of the slag handling plant.
The stockpiled slag is transported from Mogale Alloys bytruck to the slag processing plant. The material is fed into ajaw crusher where it is reduced to –18 mm, then the metalliclumps are hand-picked. The metal is taken to the metalproduct stockpile. Once the remaining slag has accumulatedto 60 t it is fed into a vibrating screen where the metallicproduct is recovered into the +8 mm fraction, which goes tothe product stockpile. The –8 mm product is fed into a jig,which recovers a further10–15% of the metallic product.
Each furnace has three off-gas removal ducts, one aboveeach electrode, which lead into a single duct. The ducts fromthe two furnaces join before the off-gas is treated (see Figure17). The off-gas bypasses the raw-gas stack and goes intotrombone coolers where heat is exchanged with theatmosphere. Large particles are removed using pre-collectorcyclones. The smaller particles flow to the bag filter plantthrough the action of a reverse flow fan. The dust recoveredfrom the baghouse is stored in a silo for collection by a wastemanagement company and disposal off-site.
Silicomanganese production at Mogale Alloys
1215 �

Silicomanganese production at Mogale Alloys
As one of only two producers of SiMn in South Africa,Mogale Alloys has been producing silicomanganese since2005. Due to market constraints, SiMn production wasreduced by 50% in 2016, by converting one of the two 20MVA SAFs at Mogale Alloys to FeCr production.
As plans are underway to convert the second SAF to FeCrproduction, the information presented here captures usefuldetails of SiMn production at Mogale Alloys.
This paper is published with the permission of Mintek andMogale Alloys.
ASTM STANDARDS A483 / A483M - 10, 2010. Standard Specification forSilicomanganese. ASTM International, West Conshohocken, PA.
BARKER, I.J. 1980. An electrode controller for submerged arc furnaces. IFACProceedings. vol. 13, no. 7. pp. 611–621.
BASSON, J., CURR, T.R., and GERICKE, W.A., 2007. South Africa’s ferro alloysindustry - present status and future outlook. Innovations in Ferro AlloyIndustry. Proceedings of INFACON XI, New Delhi, India, 18-21 February2007. Indian Ferro Alloy Producers Association. pp. 3–24.
DOUGALL, I.M. and GASIK, M. 2013. Ferroalloys processing equipment.Handbook of Ferroalloys. Elsevier. pp. 83–138.
GASIK, M. 2013. Handbook of Ferroalloys: Theory and Technology.Butterworth-Heinemann, UK.
JONES, R.T. 2014. DC arc furnaces – past, present, and future. Celebrating theMegascale: Proceedings of the Extraction and Processing Division.Symposium on Pyrometallurgy in Honor of David G.C. Robertson. MackeyP.J., Grimsey E.J., Jones R.T., and Brooks G.A. (eds.). The Minerals, Metals& Materials Society, Warrendale, PA. pp. 129–139.
MINTEK. 2011. Measurement and control solutions.http://www.mintek.co.za/technical-divisions/measurement-and-control-solutions-mac/control-solutions/furnstar/ [accessed 7 June 2018].
MULHOLLAND, A., BRERETON-STILES, P., and HOCKADAY, C. 2009. The effectivenessof current control of submerged arc furnace electrode penetration inselected scenarios. Journal of the Southern African Institute of Mining andMetallurgy, vol. 109. pp. 601–607.
NELSON, L.R. and PRINS, F.X. 2004. Insights into the influences of pasteadditions and levels on Söderberg electrode management. Proceedings ofINFACON X: Transformation through Technology, Cape Town, SouthAfrica, 1-4 February 2004. Southern African Institute of Mining andMetallurgy, Johannesburg. pp. 418–431.https://www.pyrometallurgy.co.za/InfaconX/045.pdf
OLSEN E, TANGSTAD, M., and LINDSTAD, T. 2007. Production of manganeseferroalloys. Tapir Academic Press, Trondheim, Norway.
OLSEN, S.E. and TANGSTAD, M. 2004. Silicomanganese production – processunderstanding. Proceedings of INFACON X: Transformation throughTechnology, Cape Town, South Africa. Southern African Institute ofMining and Metallurgy, Johannesburg. pp. 231–238.
REYNOLDS, Q.G. and JONES, R.T. 2006. Twin-electrode DC smelting furnaces –Theory and photographic testwork. Minerals Engineering, vol. 19, no. 3.pp. 325–333.
SAEVARSDOTTIR, G. and GASIK, M. 2013. Electric and thermal operations offurnaces for ferroalloys production. Handbook of Ferroalloys. Elsevier. pp. 139–175.
WELLBELOVED, D.B. and KEMINK, M., 1995. The economic and technicalimplications of the use of coal rather than coke as a reductant atMetalloys. Proceedings of the 7th International Ferroalloys Congress(INFACON VII), Trondheim, Norway. Tveit, H., Tuset, J.K., and Page, I.G.(eds). Norwegian Ferroalloy Producers Research Organization (FFF). pp. 191–199.
WIKIMEDIA FOUNDATION, INC. Not dated. Provinces of South Africa.https://en.wikipedia.org/wiki/Provinces_of_South_Africa#/media/File:Map_of_South_Africa_with_provincial_borders.svg [accessed 7 June 2018]. �
�
1216

Several open pit mines have already exceededtheir design life and, as they become deeperand reach depths over 1000 m, they facehigher rock stress levels and tensiledeformations (Stacey and Xianbin, 2004;Stacey et al., 2003). The more complex theconditions in modern open pit mines, the moredifficult it is to achieve long-lasting, stable pitslopes and to meet the mine’s economic needs:maximize financial returns, minimize risks tooperational safety, achieve optimal orerecovery, and minimize waste extraction(Stacey, 2009). Steepening of slopes providesthe means to reduce waste extraction andincrease ore recovery (Stacey, 2009; Calderonand Tapia, 2006; Bye and Bell, 2001; Jefferies,Lorig, and Alvarez, 2008); however, it mayadversely affect operational safety, as steeperslopes are less stable than shallow slopes(Steffen et al., 2008; Mphathiwa and Cawood,2014).
To manage the risk inherent in steeperslopes, the implementation of a slopemonitoring program is recommended, as thisprovides data to assess the actual performanceof the rock mass and of the slopes affected byopen pit mining. In particular, slopemonitoring is an essential activity with respectto safety, as it is difficult to assess rock massbehaviour through other means. Moreover, ithas been shown (Dunnicliff, Marr, andStanding, 2012) that, during the constructionof geotechnical projects, monitoring campaignsimprove the project’s competitiveness.However, the implementation of monitoringcampaigns at the early stages in the project lifehas not been fully incorporated in the miningindustry yet; the majority of reported casesaddress geotechnical monitoring either forspecific instrumentation or for monitoringprogrammes in civil engineering applications,both of which might have differentcharacteristics from those required for amonitoring campaign in open pit mines(Mphathiwa and Cawood, 2014; Marr, 2013;Cawood and Stacey, 2006).
In open pit slope monitoring, the effortfocuses on two main variables: slopedeformation and groundwater pore pressure.Nowadays, surface displacement monitoringinstruments are sophisticated devices,including automated wireline extensometers,universal EDM total stations, 3D digitalphotogrammetry and laser scanning, andground-based and satellite-based radar.Together, they can provide a real-time 3Drecord of any surface movements that may betaking place behind the walls of the pit.
Technical and economic assessment ofsubsurface rock mass deformation andpore pressure monitoring using anetwork of wireless devicesby C. Holck*, O. Fredes*, E. Widzyk-Capehart*, J. Yarmuch†,J. Read‡, and R. Castro†
Steepening of slopes provides the means to reduce waste extraction andincrease ore recovery in open pit mines; however, it may also adverselyaffect safety by posing a higher risk of slope failure. The implementationof slope monitoring programmes is recommended to manage this riskinherent in steeper slopes. In this paper, the design and evaluation ofmonitoring campaigns to measure subsurface deformation andgroundwater pore pressure in open pit mines is presented. The monitoringprogrammes were applied to a theoretical case of an open pit minedesigned using DeepMine software (BOAMine SpA, 2015). Mine planswere developed based on the initial base case scenario with monitoringprogrammes considered for four types of monitoring instrumentation: twoestablished technologies, in-place inclinometers (IPIs) and vibrating wirepiezometers (VWPs); one emerging technology, the ShapeAccelArray(SAA); and a novel technology under development, the EnhancedNetworked Smart Markers (ENSMs). Technical and economic appraisals ofthe monitoring programmes and sensitivity analysis of the developed mineplans showed that using ENSMs spaced every 4 m had the lowest cost perunit of data gathered.
open pit optimization, slope stability, subsurface deformation monitoring,pore pressure, ENSM technology.
* Advanced Mining Technology Center, Universityof Chile, Chile.
† Department of Mining Engineering, University ofChile, Chile.
‡ CSIRO Chile International Centre of Excellence,Chile.
© The Southern African Institute of Mining andMetallurgy, 2018. ISSN 2225-6253. Paper receivedAug. 2017; revised paper received Jul. 2018.
1217 �
http://dx.doi.org/10.17159/2411-9717/2018/v118n11a12

Technical and economic assessment of subsurface rock mass deformation
On the other hand, in-ground displacement monitoringinstruments are less sophisticated, yet they can potentiallyserve as a predictive tool of slope failures with weeks ofadvance notice by registering ground movement before itpropagates to the surface (Lynch and Malovinchko, 2006;Little, 2006; Hawley et al., 2009.
The pore water pressure can also adversely affect slopestability; nonetheless, it is the only geotechnical parameterthat can be managed with relative ease. Proper watermanagement that successfully couples pore pressuremonitoring (commonly using vibrating wire piezometers)with dewatering campaigns has been proven to be anefficient measure to maintain stable conditions of the pit’swalls as slope angles are increased (Beale et al., 2013; Readet al., 2013; Dunnicliff, 2012; Preene, 2012; Sperling et al.,1992; Dunnicliff, 1998; Brawner, 1982).
In this paper, a design of monitoring campaigns ispresented to measure, from the beginning of mineconstruction, subsurface deformation and groundwater porepressure in a theoretical open pit mine. The mine wasdesigned using DeepMine software (BOAMine SpA, 2015)and, based on the initial scenario (base case), different mineplans incorporating two established technologies: in-placeinclinometers (IPIs) and vibrating wire piezometers (VWPs),an emerging technology, the ShapeAccelArray (SAA), and anovel technology under development, the EnhancedNetworked Smart Markers (ENSM), were developed. Thetechnical and economic appraisals of the monitoringprogrammes and the sensitivity analysis of the developedmine plans were undertaken based on the usage of theselected instrumentation to determine the best possiblemonitoring alternative.
A general overview of the most widely appliedinstrumentation techniques in geotechnical monitoring isshown in Figure 1.
The technologies considered in the evaluation wereselected based on their characteristics.
� The in-place inclinometer (IPI) is designed to measurelateral displacement within a borehole. Mostcommonly, multiple IPIs are installed at varying depths.In this manner, the profile of the displacement can bemonitored. The IPI itself consists of one or two(uniaxial or biaxial) MEMS tilt sensors mounted in astainless steel housing. Each sensor incorporates anonboard microprocessor which performs an automatictemperature compensation of the tilt data. The sensorsare powered and the data is read by a logger such asthe Campbell Scientific CR1000. Argus software can beused to produce a near real-time profile of displacementthat is constantly updated (Machan and Bennett; 2008;Eberhardt and Stead, 2011; Chaulya and Prasad,2016).
� The vibrating wire piezometer (VWP) is designed to beembedded in soil, rock, fills, and concrete to measuregroundwater elevations and water pore pressure wheninstalled in the ground, embankments, concretestructures, pipelines, wells, and other similar
structures. VWPs are capable of measuring pore waterand fluid pressures in fully or partially saturated soils.More information about VWP technology and itsapplication can be found in a number of works(Applied Geomechanics, 2008; Soil Instruments, 2015;Brawner, 1982; Read et al., 2013; Gillespie, East, andCobb, 2004; Preene, 2012).
� ShapeAccelArray (SAA) is a sensor that can be placedin a borehole or embedded within a structure tomonitor deformation. It consists of a continuum ofcable-like segments with embedded triaxial micro-electromechanical system (MEMS) accelerometers. Eachsegment has a known length. By sensing the gravityfield at each segment, the bend angles between eachsegment can be calculated. Using the calculated bendangles and known segment lengths, the shape of anSAA can be determined. SAAs can be used todetermine 3D shape when installed vertically and 2Dshape when installed horizontally. 3D shape can bedetermined when the SAA is installed up to 60 degreesfrom the zenith. SAAs have a maximum length of 100m, but several arrays can be installed in a singleborehole to cover greater depths. Some drawbacks ofthis device are that each particular array has a differentaccuracy due to the nature of the calibration process,gathered data can exhibit significant drift (due toincorrect voltage supply) and, when installed ininclined boreholes, a SAA cannot distinguish torsionfrom tilting of the array, which can lead tomeasurement of displacements that do not exist(Swarbrick and Clarke, 2015; Bradley and Prado, 2014;Lipscombe et al., 2014; Dasenbrock, Levesque, andDanisch, 2012).
The Enhanced Networked Smart Markers (ENSMs)
�
1218

monitoring system is a novel sensing technology beingdeveloped specifically to monitor subsurface rock massdeformation and, simultaneously, groundwater pore pressurein open pit mines. The ENSM monitoring system is composedof three main parts: the sensors, an antenna, and the readerstation (Figure 2). This technology has the capability oftransmitting the data wirelessly between the individualsensors, which has been proven in sensor installations in thefield (Widzyk-Capehart et al., 2015).
The ENSM has the potential to overcome some limitationsof the currently available technologies: savings related to theinstallation procedure due to the possibility of installingdifferent sensing devices in the same borehole and at thesame location (installation point), the elimination of cablesand the risk of them being damaged by ground movement,more data from a single hole, and diverse data collocatedspatially and temporally in a single hole (Widzyk-Capehart etal., 2016).
This system can be deployed behind a slope wall and canuse its wireless communication capabilities to monitor theslope’s performance remotely and in near real-time, thusproviding mine designers and operators with valuable datatowards improving mine operation safety and slope design(Widzyk-Capehart et al., 2016, 2015).
The mine plan for a theoretical copper ore deposit was createdusing the DeepMine software.
The mine plan was developed under the assumption that theopen pit mine was constructed in a region with two differentrock types. The slope angles in the high-quality (high-strength) rock mass would be steeper than in the poor quality(lower strength) rock mass (Table I).
It was assumed that the final pit would have an overallslope angle of 50° in the good quality rock mass area and anangle of 40° in the low quality rock mass (Figure 3). Thisinitial configuration was assumed to be stable along theentire pit perimeter (from a geomechanical perspective).
In addition, the following assumptions were made: � The rock mass was initially fully saturated, meaning
that the water table was located at surface level� Optimized slope designs include a dewatering
campaign� A single instrumentation borehole could house devices
to measure both deformation and pore pressure at thesame time and, if required, at the same position
� Detailed mine design was not the main focus of thisresearch: ramps, berms, and other structures inside thepit were not included in the design and the analyseswere made considering the outline of the pit only.
The model was built taking into account economic conditionsin the copper ore market as of August 2015 and thepredictions made by the Central Bank of Chile for the year2016 (Central Bank of Chile, 2015). A discount rate of 8%was considered for the evaluation and all economicparameters were considered deterministic and invariable forthe duration of the mine life.
The mine’s maximum annual extraction capacity was setat 40 Mt/a. Five different destinations for the extractedmaterial were defined to allow the DeepMine software to
Technical and economic assessment of subsurface rock mass deformation
1219 �
Table I
Good quality rock mass 0° 50°Good quality rock mass 90° 50°Poor quality rock mass 180° 40°Poor quality rock mass 270° 40°

perform coherent mine plan calculations: a concentratorplant, a leaching plant, a sulphide ore stockpile, an oxide andoxide/sulphide transition ore stockpile, and a waste dump.
Taking into consideration the mine's extraction rate andprocessing capacities of both plants, the software simulated a300 m deep pit with 16 years life-of-mine (LOM), 12 phases(named V1 to V12), and a US$210.51 million net presentvalue (NPV) open pit mining project. The mine planconsidered the extraction of 355.03 Mt of material (Figure 4),processing 88.16 Mt of sulphide ore and 95.31 Mt of oxideand oxide/sulphide transition ores. This simulation wasdefined as the initial scenario (base case) for furthersensitivity analysis.
The base case design was optimized by steepening the pitslope to increase the project's NPV. However, an increase inslope angle also increased the risk to operations and theprobability of slope failure. Therefore, to mitigate theincrease in risk and probability of failure, the mine plan incorporated a slope monitoring campaign as a mean toassess slope performance and future slope stability.
The borehole layout was assumed to be the same for theimplementation of each selected technology. However, theinclination of the boreholes varied due to special installationrequirements for some of these technologies, which led totwo different campaign types (subsurface and groundwaterpore pressure campaigns) being required for comparisonpurposes. The borehole characteristics for each type ofcampaign and technology are listed in Table II.
With the steepening of the pit slopes, it was necessary todetermine in which areas of the open pit slopes stabilitycould have been compromised as a result of the moreaggressive design. These areas would be selected formonitoring from the point of view of both safety andprofitability. Based on this analysis, the following decisionswere made.
� To assess the initial rock mass conditions, it wasdecided to instrument the southwestern part of phaseV1 (Figure 5a), as phase V1 exposed the first slopes ofthe mine and enabled the understanding of the initialconditions of the lowest quality rock mass in terms ofdeformation and ground water presence.
Technical and economic assessment of subsurface rock mass deformation
�
1220
Table II
Shallow angle boreholes campaign � � Boreholes follow the pit wall inclination.Steep angle boreholes campaign � � � Boreholes dipping at approx. 60° and move
farther from the pit wall as depth increases.2 m spacing configuration � � - -4 m spacing configuration � - -Phase V1 � SAA, IPI, and VWP cannot withstand nearby blasting.Phase V4 � -Phase V8 � � � -Phase V9 � � � -Installation depth ≥100 m ≥100 m* ≥100 m *Only the lowermost 100 m of the borehole can be
instrumented.

� The southern part of phase V4 (Figure 5b) was to bemonitored, as this sector corresponded to one of theshallowest slopes in the pit. Thus, the data acquiredfrom this sector could influence steepening ofneighboring phases developed after the extraction ofphase V4, such as, phases V5, V6, V9, and/or V10.
� To assess long-term slope stability, phases V8, V9,V10, and V11 should be instrumented and theirbehaviour monitored, since these phases unveiled thefinal pit wall. From those alternatives, the northern sideof phase V8 was selected as a critical sector (Figure 5c),as it was the first phase to unveil the final pit wall andthis portion of the final wall was the longest standingone: nine years from the moment it started to beunveiled and four years from the time it was totallyexposed until mine closure (year 2030). Phase V8 alsounveiled the steepest side of the pit’s final wall, whichmade it a less conservatively designed pit slope thanother areas of the pit.
� Pit walls uncovered by the extraction of phase V4 andphase V9 presented complex convex pit wallgeometries, including bullnoses, which are geometriescharacterized by a stress relaxation due to a lack ofconfinement and which might create slope stabilityproblems. Thus, to avoid potentially hazardousconditions, both sectors were selected as critical.However, only surface monitoring was advised for theinspection of the bullnoses in phase V4, as theyremained in service for less than one year and did notcover the entire depth of the pit at this stage.Conversely, the bullnoses in phase V9 - eastern wall(Figure 5d) remained in service until the end ofoperations (more than three years) along the entiredepth of the final pit. Thus, subsurface deformationmonitoring was advised for this critical sector.
The costs associated with each instrumentation campaignstudied in this paper were incorporated into the NPVcalculations for all variations in the slope angle. For each
alternative (campaign), the cost of: drilling the boreholes, theinstruments, and their installation were incorporated in theNPV calculations as variable costs, distributed over time toincorporate the effect of temporality and scheduling for everymonitoring campaign installation (Table III).
The shallow angle boreholes campaign considered twoalternative technologies: (1) IPI and VWP and (2) ENSM,while the steep angle boreholes campaign considered threeinstrumentation alternatives: (1) IPI and VWP, (2) SAAcoupled with VWP, and (3) ENSM.
From Table III, it can be seen that the IPI plus VWPcampaign and SAA plus VWP campaign were the leastexpensive: US$5.30 million in the shallow angle boreholescampaign; US$4.60 million and US$6.09 million in the steepangle boreholes campaign. However, these two campaignshad to be deployed after the slope to be monitored wascompletely developed (due to technical limitations of thesetechnologies). Therefore, there were no potential economicbenefits rendered by a reduction in waste extraction or anincrease in ore recovery when applying those campaigns,since these technologies could only be used to monitor finalpit walls.
Economic assessments of subsurface monitoringcampaigns due to slope angle increases are summarized inTable IV and Figures 6 and 7.
Five subsurface deformation monitoring campaigns weredesigned with the aim of achieving the highest possiblerevenue by steepening of slopes while considering subsurfacedeformation monitoring and the surface monitoringcampaigns commonly deployed in the major open pits in theworld. These campaigns were designed as an integral part ofthe mine planning and slope design process. This allowed focusing on the monitoring effort in the most relevant zonesfor a particular open pit project.
The results obtained clearly show that the proposedcampaigns were technically feasible, with ENSMs installationbeing the most technically advantageous. Moreover, aneconomical evaluation was undertaken considering the effectof steepening the slope angle by 1° at a time on theinstrumented mine project’s NPV. This assessment
Technical and economic assessment of subsurface rock mass deformation
1221 �

incorporated the potential benefit of a lower waste strippingratio, which showed the economic viability of all studiedalternatives. The campaigns using ENSMs were the mostadvantageous, in particular, the campaign that considered theinstallation of one ENSM every 4 m, which presented thelowest cost per unit of gathered data.
A new geotechnical monitoring technology, the EnhancedNetworked Smart Markers (ENSM), promises to overcomesome drawbacks of the existing technologies by enablingthrough-the-rock wireless data transmission. The technical
feasibility of this wireless data transmission was proven afterfield testing of these devices in two mine-scale trials forsixteen months.
The authors would like to acknowledge the financial supportof AMTC through the Chilean Government Conicyt projectFB0809 and the Fundaciòn CSIRO Chile, under the auspicesof CORFO.
APPLIED GEOMECHANICS. 2008. User’s manual. Vibrating wire piezometers.http://www.ampere.com.mx/pdf/Manual_Usuario_Bigboy_VWP.pdf
BANK CENTRAL OF CHILE. 2015. Monetary Policy Report. http://www.bcentral.clBEALE, G., DE SOUZA, J., SMITH, R., and ST LOUIS, B. 2013. Implementation of
slope depressurisation systems. Guidelines for Evaluating Water in PitSlope Stability. Beale, G. and Read, J. (eds.). CSIRO Publishing,Collingwood, Victoria. pp. 19–64.
BRADLEY, B. and PRADO, R. 2014. The use of Shape Accel Array for monitoringutilities during urban tunnel drives. Technical Paper, ICE Publishing.
BRAWNER, C.O. 1982. Control of groundwater in surface mining. InternationalJournal of Mine Water, vol. 1, no. 1. pp. 1–16.
BYE, A.R. and BELL, F.G. 2001. Stability assessment and slope design atSandsloot open pit. South Africa. International Journal of Rock Mechanicsand Mining Sciences, vol. 38, no. 3. pp. 449–466.
CALDERON, A.R. and TAPIA, A.D. 2006. Slope-steepening decision using aquantified risk assessment: the Chuquicamata case. Proceedings of the41st US Symposium on Rock Mechanics (USRMS), Golden Rocks,Colorado. Yale, D., Holtz, S., Breeds, C., and Ozbay, U. (eds.). AmericanRock Mechanics Association, Alexandria, VA.
Technical and economic assessment of subsurface rock mass deformation
�
1222
Table IV
0° steepening 2.89% NPV decrease 0.87% NPV decrease for 2.25% NPV decrease for 0.76% NPV decrease for (base case) for the 2 m spacing IPI plus VWP the 2 m spacing IPI plus VWP
2.66% NPV decrease 2.06% NPV decrease 1.02% NPV decrease
for the 4 m spacing for the 4 m spacing for SAA & VWP1° steepening 1.02% NPV decrease 1.00% NPV increase for 0.38% NPV decrease for 1.12% NPV increase for
for the 2 m spacing IPI plus VWP the 2 m spacing IPI plus VWP0.80% NPV decrease 0.20% NPV decrease for 0.86% NPV increase for
for the 4 m spacing the 4 m spacing SAA plus VWP2° steepening 3.16% NPV increase - 3.80% NPV increase for -
for the 2 m spacing the 2 m spacing3.39% NPV increase 3.98% NPV increase for for the 4 m spacing the 4 m spacing
Table III
2014 1.71 1.59 0.00 1.29 1.20 0.00 0.002017 1.56 1.45 0.00 1.12 1.04 0.00 0.002021 3.46 3.17 0.00 3.01 2.76 0.00 0.002022 2.08 1.90 0.00 1.49 1.37 0.00 0.002027 0.00 0.00 3.21 0.00 0.00 2.90 4.062029 0.00 0.00 2.09 0.00 0.00 1.70 2.03Sum 8.81 8.11 5.30 6.91 6.37 4.60 6.09

Technical and economic assessment of subsurface rock mass deformation
1223 �
CAWWOD, F.T. and STACEY, T.T. 2006. Survey and geotechnical slope monitoringconsiderations. Journal of the South African Institute of Mining andMetallurgy, vol. 106. pp. 495–502.
CHAULYA, S.K. and PRASAD, G.M. 2016. Sensing and Monitoring Technologiesfor Mines and Hazardous Areas. Monitoring and Prediction technologies,Elsevier.
DASENBROCK, D.D., LEVESQUE, C.L., and DANISCH, L. 2012. Long-term behaviormonitoring using automated MEMS-based sensing arrays in an urbanenvironment. Landslides and Engineered Slopes: Protecting Societythrough Improved Understanding. Proceedings of the 11th Internationaland 2nd North American Symposium on Landslides, Banff, Alberta, June3–8, 2012. Vol. 2. Eberhardt, E.B. (ed.). CRC Press. pp. 1393–1398.
DEEPMINE. 2015. http://www.boamine.com [accessed January 2015].DUNNICLIF, J. 1998. Geotechnical Instrumentation for Monitoring Field
Performance. Wiley, New York.DUNNICLIFF, J. 2012. Types of geotechnical instrumentation and their usage. ICE
Manual of Geotechnical Engineering, Vol. II. Burland, J., Chapman, T.,Skinner, H., and Brown, M. (eds.). Chapter 95: pp. 1379–1403.
DUNNICLIFF, J., MARR, W.A., and STANDING, J. 2012. Principles of geotechnicalmonitoring. ICE Manual of Geotechnical Engineering, Volume II. Burland,J., Chapman, T., Skinner, H., and Brown, M. (eds,). Chapter 94. pp. 1363–1377.
EBERHARDT, E. and STEAD, D. 2011. Geotechnical instrumentation. SME MiningEngineering Handbook. Darling, P. (ed.), Society for Mining, Metallurgy,and Exploration, Inc., Littleton, CO. Chapter 8.5. pp. 551–571.
GILLESPIE, C.D., EAST, D.R., and COBB, C.F. 2004. Tailing impoundmentpermitting, design, construction, and operation in an artic environment.Proceedings of Tailing and Mine Waste 04. Taylor & Francis. London. pp. 27-38.
HAWLEY, M., MARISETT, S., BEALE, G., and STACEY, P. 2009. Performanceassessment and monitoring. Guidelines for Open Pit Slope Design. Read, J.and Stacey, P. (eds.). CSIRO Publishing, Collingwood, Victoria. Chapter12. pp. 327–380.
JEFFERIES, M., LORIG, L., and ALVAREZ, C. 2008. Influence of rock-strength spatialvariability on slope stability. Proceedings of the First InternationalFLAC/DEM Symposium on Numerical Modeling. Hart, R., Detournay, C.,and Cundall, P. (eds.). Itasca Consulting Group. Minneapolis, MN. pp. 24–26.
LIPSCOMBE, R., CARTER, C., PERKINS, O., THURLOW, P., and GUERRERO, S. 2014. Theuse of Shape Accel Arrays (SAA) for measuring retaining wall deflection.Technical Paper, ICE Publishing.
LITTLE, M. 2006. Slope monitoring strategy at Pprust open pit operation.Proceedings of the International Symposium on Stability of Rock Slopes inOpen Pit Mining and Civil Engineering. Southern African Institute ofMining and Metallurgy, Johannesburg. pp. 211–230.
LYNCH, R.A., and MALOVINCHKO, D.A. 2006. Seismology and slope stability inopen pit mines. Proceedings of the International Symposium on SlopeStability in Open Pit Mining and Civil Engineering. Southern AfricanInstitute of Mining and Metallurgy, Johannesburg. pp. 375–390.
MACHAN, G. and BENNETT, G.V. 2008. Use of inclinometers for geotechnicalinstrumentation on transportation projects – State of the practice.Transportation Research Circular, no. E-C129.
MARR, W.A. 2013. Instrumentation and monitoring of slope stability.Proceedings of Geo-Congress 2013: Stability and Performance of Slopesand Embankments III. Pando, M.A., Pradel, D., Meehan, C., and Labuz,J.F. (eds.). pp. 2231–2252.
MPHATHIWA, N. and CAWOOD, F.T. 2014. Design principles for optimizing anestablished survey slope monitoring system. Journal of the SouthernAfrican Institute of Mining and Metallurgy, vol. 114, no. 6. pp. 463–470.
PREENE, M. 2012. Groundwater control. ICE Manual of GeotechnicalEngineering, vol. II. Burland, J., Chapman, T., Skinner, H., and Brown, M.(eds.). ICE Publishing. pp. 1173–1190.
READ, J., BEALE, G., RUEST, M., and ROBOTHAM, M. 2013. Guidelines forEvaluating Water in Pit Slope Stability. Beale, G.and. Read, J. (eds.).CSIRO Publishing, Collingwood, Victoria. pp. 1–18.
SOIL INSTRUMENTs. 2015. Standard vibrating wire piezometer. user manual.http://www.itmsoilsupport.com/manuals/Man106_Standard_Vibrating_Wire_Piezometer.pdf
SPERLING, T., FREEZE, R.A., MASSMANN, J., SMITH, L., and JAMES, B. 1992.Hydrogeological Decision Analysis: 3. Application to Design of aGround-Water Control System at an Open Pit Mine. Ground Water, vol. 30, no. 3. pp. 376–389.
STACEY, P. 2009. Fundamentals of slope design. Guidelines for Open Pit SlopeDesign. Read, J. and Stacey, P. (eds.). CSIRO Publishing, Collingwood,Victoria. pp. 1-14.
STACEY, T.R. and XIANBIN, Y. 2004. "Extension" in large open pit slopes andpossible consequences. Proceedings of the 4th International Conferenceand Exhibition on Mass Mining, Santiago Chile 22–25 August 2004.Alfaro, M.A. and Karzulovic, A. (eds). Mineria Chilena, pp. 280–285.
STACEY, T.R., XIANBIN, Y., ARMSTRONG, R., and KEYTER, G.J. 2003. New slopestability considerations for deep open pit mines. Journal of the SouthAfrican Institute of Mining and Metallurgy, vol. 103, no. 6. pp. 373–389.
STEFFEN, O.K.H., CONTRERAS, L.F., TERBRUGGE, P.J., and VENTER, J. 2008. A riskevaluation approach for pit slope design. Proceedings of the 42nd USSymposium on Rock Mechanics (USRMS). American Rock MechanicsAssociation, Alexandria, VA. https://pdfs.semanticscholar.org/a8ed/44d00bde85797911064ab8fa3fce99350748.pdf
SWARBRICK, G.E. and CLARKE, S.J. 2015. Shape Accel Arrays - Comparativeperformance in a mining application. Proceedings of the NinthInternational Symposium on Field Measurements in Geomechanics.Australian Centre for Geomechanics, Perth. pp. 195–206.
WIDZYK-CAPEHART, E., HÖLCK, C., FREDES, O., PEDEMONTE, I., and STEFFEN, S. 2015.Implementation of novel subsurface deformation sensing device for openpit slope stability monitoring – The Networked Smart Markers System.Proceedings of the 23rd International Symposium on Mine Planning andEquipment Selection (MPES 2015). Southern African Institute of Miningand Metallurgy, Johannesburg. pp. 203–214.
WIDZYK-CAPEHART, E., HÖLCK, C., FREDES, O., RIVERO, V., SNACHEZ, E., PEDEMONTE,I., GONZALEZ, N., and STEFFEN, S. 2016. Understanding rock massbehaviour through the development of an intergrated sensing platform.Proceedings of the Seventh International Conference and Exhibition onMass Mining, Sydney. Australasian Institute of Mining and Metallurgy,Melbourne. pp. 275–284. �

Copyright © 2018 Weir Minerals Australia Ltd. All rights reserved. WARMAN, CAVEX, ISOGATE, LINATEX, ENDURON and WEIR LOGO are trade marks and/or registered trade marks of The Weir Group PLC and/or its
subsidiaries. Certain features of the technology featured in this publication may be protected by pending and granted patents and designs in the name of The Weir Group PLC and/or its subsidiaries.
Mineralswww.minerals.weirwww.weirafricastore.com
Think about your entire circuit; we have.
Consider an end-to-end solution from Weir Minerals. Our product range covers everything you need. With best-in-class products from Cavex®, Enduron®, Isogate®, Linatex®, Trio® and Warman®, your circuit will work in perfect harmony. Whether it’s a pump or an entire circuit, every Weir product comes with a lifetime of support from Weir Minerals’ extensive global service network. That’s what makes our market leading product range, market leading, from end-to-end.
For more information contact us on +27 (0)11 9292600.
To get more from your mine, visit www.minerals.weir today.

One of the major structural defects affectingthe reproducibility of mechanical properties ofaluminium castings is the double oxide filmdefect (El-Sayed and Essa, 2017; El-Sayed andGhazy, 2017). This type of defect is usuallycreated as a result of poor filling systemdesign. Owing to the very high reactivity ofliquid Al-Mg alloy with oxygen in the air, thesurface of the liquid metal can be considered tobe permanently coated with an oxide film(Weigel and Fromm, 1990). As a consequenceof surface turbulence, the oxidized metalsurface can become folded over onto itself, butnot fused, and then submerged into the bulkliquid, with a portion of the mould atmospherebeing entrapped within it (Campbell, 2003; Al-Sayed, 2016; El-Sayed, Hassanin, and Essa,2016).
Oxidation refers to the combination ofoxygen (O) with a metal (M), forming ametallic oxide, according to the followinggeneral formula:
[1]
This reaction is reversible, and thedirection that it takes depends upon theconcentration of oxygen. When the oxygenconcentration (or pressure) exceeds a certainvalue, the direction is to the right, with freemetal and oxygen combining to form theoxide, and to the left at lower oxygenconcentrations (Pilling and Bedsworth, 1923).Impey, Stephenson, and Nicholls (1990)studied the oxidation kinetics of purealuminium and Al alloys with Mg contents ofup to 5% in dry air at 750°C. They reportedthat the addition of magnesium (from 1–5 wt%) increased the rate of oxidation of thealuminium alloy. The authors suggested thatfor magnesium contents above 1.5 wt%, themost stable oxide is MgO, since it is inequilibrium with the lowest oxygen pressure.For magnesium contents in the range 0.02–1.5wt%, the most stable oxide is MgAl2O4, andbelow this range, Al2O3.
A bifilm has no bonding between its innerfaces and typically would form a crack in thesolidified casting. Such cracks could be openedfurther during solidification, either under thenegative pressure arising from the contractionof the solidifying metal or by the diffusion ofhydrogen to fill the gap between the two layersof the bifilm, which has been held responsiblefor the formation of hydrogen porosity in Alcasting (El-Sayed, Hassanin, and Essa, 2016).Submerged oxide films were also recognizedas acting as nucleation sites for Fe-richintermetallics (Campbell, 2006; El-Sayed andGriffiths, 2014). Therefore, the presence ofthis defect was reported to increase the scatterof the tensile and fatigue properties of thecastings produced (Basuny et al., 2016).
An investigation of the behaviour ofdouble oxide film defects in aluminium-magnesium cast alloysby M.A. El-Sayed
Double oxide films (bifilms) are significant defects in light alloy castingsthat occur when, during melt handling, the oxidized surface of the melt isfolded over onto itself and then entrained into the liquid metal,encapsulating a portion of the local atmosphere. These defects createcrevices in the final castings and have been shown to decrease tensile andfatigue properties, and also to increase their scatter, making castingproperties unreproducible and unreliable. This paper reports on twodifferent experiments performed to study the behaviour of such defects inAl alloys. In the first experiment and as a proxy for a bifilm, air bubbleswere held in an Al-5Mg alloy melt for varying periods of time before themelt was allowed to solidify. The composition of the gas content of thebubbles was subsequently analysed using mass spectrometry to ascertainhow it changed with time. In the other experiment the influence of the ageof bifilms on the mechanical properties of Al-5Mg castings was assessedby holding castings in the liquid state for different times beforesolidification, followed by mechanical property testing and SEM and EDXstudies of the fracture surfaces of tensile test bars. This research couldprovide a better understanding of the behaviour of double oxide filmdefects, and may lead to the development of new techniques by whichthese defects could be eliminated, or at least deactivated, in light alloycastings.
aluminium alloys, oxide films, entrainment, mechanical properties.
* Department of Industrial and ManagementEngineering, Arab Academy for Science andTechnology and Maritime Transport, Egypt..
© The Southern African Institute of Mining andMetallurgy, 2018. ISSN 2225-6253. Paper receivedNov. 2017; revised paper received Jul. 2018.
1225 �
http://dx.doi.org/10.17159/2411-9717/2018/v118n11a13
��

An investigation of the behaviour of double oxide film defects in aluminium-magnesium
It was suggested in a previous investigation (Nyahumwa,Green, and Campbell, 1998) that in pure Al melts, thetransformation of the alumina constituting the bifilm from -alumina to -alumina would take about 5 hours. Theassociated volume change might initiate cracks in the film,forming a pathway by which the liquid aluminium can comeinto contact with, and react with, the gas inside the oxide filmdefect. This could result in the consumption of theatmosphere inside the bifilm and possibly contribute to itsdeactivation, which may minimize the detrimental effect onthe mechanical properties of the castings.
Raiszadeh and Griffiths (2006) carried out an experimentin which a bubble of air, acting as an analogue for a doubleoxide film defect, was held in a melt of commercial purity Alfor several hours, and real-time X-ray radiography was usedto monitor the change in the bubble volume with time. Theirresults showed that the oxygen in the trapped air should beinitially consumed to form Al2O3, then the nitrogen wouldreact to form AlN. These reactions, as suggested, occurred asthe skin of the air bubble was ruptured and resealed, ratherthan by diffusion of the interior gases through the oxide skinof the bubble. In addition, hydrogen dissolved in the meltmight pass into the air bubble, increasing its volume, whichsupported the idea that double oxide film defects could play arole in the initiation of hydrogen porosity in Al cast alloys.
It should be noted that the amount of Mg in the Al alloyhas a considerable effect on the type of the oxide formed.Silva and Talbot (1989) reported that at 725°C for an Al meltcontaining above 1.5 wt% magnesium, the most stable oxideis MgO, whereas in Al alloys with Mg contents in the range0.02–1.5 wt% the most stable oxide is MgAl2O4. Below 0.02 wt% Mg, alumina is expected to form. The oxygen andnitrogen reactions with the surrounding melt for different Alalloys are described by the following four equations eactions(Raiszadeh and Griffiths, 2006; Aryafar, Raiszadeh, andShalbafzadeh, 2010; Yang et al., 1996; Griffiths, El-Sayed,and El-Sayed, 2016):
[2]
[3]
[4]
[5]
During casting of aluminium alloys, hydrogen is formedby the reaction of the melt with water vapour (Talbot, 1975).It is believed that hydrogen is the only gas that is soluble inaluminium and its alloys (Davis, 1993). Hydrogen moleculesdissociate into the monatomic form and then are transportedinto the bulk liquid by diffusion. The ambient atmosphere isthe main source of water vapour. However, fluxes, crucibles,refractories, and charge materials can also contain somemoisture which can add hydrogen to the melt (El-Sayed,Shyha, and Basuny, 2018; El-Sayed, 2018.
The aim of this work was to study the change in the gascontent with time of a bifilm defect held in an Al-5Mg alloymelt for different periods before solidification, and thecorresponding influence on the mechanical properties of thecastings. The consumption rates of the gases inside airbubbles held in a liquid Al alloy were studied, using mass
spectroscopy, as an analogy for the behaviour of doubleoxide film defects. The reaction rates of oxygen and nitrogenin the bubble with the adjacent liquid metal, and the rate ofhydrogen diffusion from the melt into the bubbles, weremeasured. Moreover, the tensile properties of castingscomprising oxide films of different ages were evaluated andthe fracture surfaces on tensile test bars were characterizedusing SEM and EDX analysis. The main objective of thisstudy was to learn whether oxide film defects could beeliminated, or at least their deleterious effects reduced.
In order to characterize the development in the compositionof an air bubble with time, as an analogue for a bifilm, abubble was trapped inside an Al-5Mg alloy melt bysubmerging a steel bar containing a blind hole 6 mm indiameter and 5 mm in depth into the liquid metal. The steelbar was connected to a stirrer and was rotated at 540 r/min(equivalent to 1.4 m/s at the position of the hole). The steelbar was left within the melt, subjected to stirring, for variousperiods ranging from 2 to 24 minutes. This would allow theair inside the hole in the bar to be in direct contact with theAl melt, enabling the air to react with the adjacent melt andhydrogen dissolved in the liquid metal to pass into thebubble. More details about the experimental procedure aredescribed elsewhere (Griffiths, Caden, and El-Sayed, 2014,2013; El-Sayed et al., 2013).
After the completion of the given holding time, thestirring was paused and the melt rapidly solidified (inapproximately 30 seconds), trapping the air bubble with itscontents. Afterwards, a cubic sample with an edge length of15 mm was machined out of the solidified casting comprisingthe bubble trapped inside the hole in the steel bar. Thegaseous content of the bubble was subsequently analysedusing a pore gas analyser (PGA), (constructed by Hyden Ltd.,Warrington, UK) containing a mass spectrometer, to measurethe quantities of H, O, N, and Ar in the bubble. After the gasin the bubble had been analysed, the surface of the solidifiedsample from the bubble’s interior was removed and examinedusing SEM in order to verify the existence of differentreaction products on the surface of the solidified Al alloyentrapped within the hole in the steel rod.
A reference air bubble, containing ambient atmosphere,was formed by sealing the bottom of a blind hole made froma Cu tube of the same dimensions. It was analysed in thepore gas analyser in order to determine the preciseness ofthis technique. A comparison of the results from the referencebubble with the nominal percentages of different gases in theambient atmosphere suggested a variability in the results ofthe PGA of less than 2%.
Another set of experiments was performed to assess theinfluence of the time spent by the Al melt in the liquid statebefore solidification, during which the interior atmosphere ofthe entrained bifilms was allowed to react with thesurrounding melt and hydrogen dissolved in the melt couldbe diffused into the bifilms, on the mechanical properties ofthe castings produced. In these experiments, an investmentcasting technique was employed to produce Al-5Mg alloycastings that contained oxide films with different nominalages; 0, 10 and 20 minutes. Three experiments were carriedout in each about 10 kg of the alloy was melted and held at a
�
1226
�
�
�
�

temperature of about 1073K (800°C), under a vacuum ofabout 8 kPa for 60 minutes. Such a process was anticipatedto eliminate most of bifilms from the melt (Raiszadeh andGriffiths, 2010).
After the holding period under vacuum, the surface oxidelayer was removed and the melt was poured from a height ofabout 1 m into preheated investment shell moulds. Thesurface turbulence associated with pouring from such aheight was enough to cause entrainment of the oxidizedsurface of the melt during filling and hence introduce freshbifilms into the melt. More details about the experimental set-up can be found elsewhere (El-Sayed et al., 2011).
After pouring, one mould was left to freeze directly, whilethe two others were placed in a resistance-heated furnace at atemperature of about 800°C (1073K) to prevent solidification.These moulds were subsequently removed after differentholding periods of 10 and 20 minutes, and allowed tosolidify. The hydrogen content of the melt was evaluatedduring holding, using a Severn Science Hyscan H-measuringdevice.
Fifteen tensile test bars were obtained from each mouldand tested using a Zwick 1484 tensile testing machine(Zwick GmbH & Co. KG, Ulm, Germany) at a strain rate of 1 mm min-1. Tensile results were evaluated using a Weibullstatistical analysis approach to assess the influence of theholding treatment on the mechanical properties of thecastings. The fracture surfaces of the failed test bars wereexamined using a scanning electron microscope (SEM) fittedwith an Oxford Inca energy-dispersive X-ray (EDX) analyserfor microanalysis, which was used to confirm the presence ofoxide film defects on the fracture surfaces.
Experiments were carried out to investigate the influence ofholding an Al-5Mg alloy melt in the liquid state for a giventime before solidification on the behaviour of its entrainedbifilm defects. As a proxy for a bifilm defect, an air bubblewas trapped in liquid Al-5Mg alloy for various periods of timeand subjected to stirring, and the change the gaseous contentwas studied. These results can be interpreted to helpunderstand the change in the composition of the atmosphereof a bifilm defect floating within an Al melt. Additionally, thechange in the morphology of the bifilms with time, and thecorresponding impact on the mechanical properties of thecastings, were investigated in detail.
Figure 1 shows a typical output from the pore gas analyser,presenting the results of analysis of the gas composition inan air bubble that had been held for 2 minutes and subjectedto stirring at 540 r/min (1.4 m s-1 angular velocity) inside anAl-5Mg alloy melt. The largest peak was associated withnitrogen, as anticipated, followed by oxygen, hydrogen, andargon, with traces of water vapour.
Figure 2a shows the change in the gaseous content withtime for an air bubble kept inside an Al-5Mg alloy melt at993K (720°C) and subjected to stirring. The correspondingchange in the volume of the bubble with time is shown inFigure 2b. As shown in Figure 2a, most of the oxygencontent in the air bubble was lost within the first fourminutes of holding, at a rate of about 9 × 10⁻⁸ mol min-1.
There was an accompanying slower consumption of nitrogenat a rate of 5.7 × 10⁻⁸ mol min-1, and a further slowerdiffusion of hydrogen into the bubble at an approximate rateof 2.8 × 10⁻⁸ mol min-1. There was a noticeable increase inthe rate of hydrogen diffusion into the bubble after theoxygen inside the bubble had been consumed (which tookabout 4 minutes). After 24 minutes’ holding, the compositionof the bubble principally comprised nitrogen and hydrogen.At this time, the bubble had reached about 46% of its initialvolume (Figure 2b).
Nyahumwa, Green, and Campbell (1998) and Raiszadehand Griffiths (2006) suggested that the internal atmosphereof oxygen and nitrogen in a bifilm could be consumed byreaction with the adjoining molten metal. By the same token,soluble hydrogen in the melt may diffuse into the bifilm gap(Griffiths and Raiszadeh, 2009). As the Gibbs free energies
An investigation of the behaviour of double oxide film defects in aluminium-magnesium
1227 �

of formation (for the reaction of one mole of O2 at 1000K(727°C)) to form MgO and Al2O3, are –986 and –940 kJ mol-1respectively, whereas that for AlN is –423.6 kJ mol-1 N2 at1000K (727°C) (Chase, 1985; Brandes and Brook, 1999), theliquid alloy would first consume all of the oxygen in theatmosphere of a bifilm, producing MgO, and then nitrogenmight begin to react to form AlN. The Gibbs free energy forthe reaction of one mole of N2 at 1000K (727°C) to formMg3N2 is 0150206.61 kJ mol-1 N2 (Chase, 1985), indicatingthat for Al-5Mg alloy, AlN is the nitride more likely to form,rather than Mg3N2.
In the current experiments, it was shown that bothoxygen and nitrogen were consumed with time (with oxygenbeing consumed first). On the other hand, as the meltremained longer in the liquid state, the hydrogen content ofthe bubbles increased, which was in accordance withprevious results (Raiszadeh and Griffiths, 2006; El-Sayed etal., 2013). Notably, as the oxygen content of the bubbleatmosphere reached about 2%, the nitrogen content of thebubble started to diminish. In other words, the beginning ofnitrogen consumption was independent of the completeconsumption of oxygen; this corroborates the work ofRaiszadeh and Griffiths (2006), who hypothesised thatnitrogen in a static air bubble held within an Al melt startsreacting with the surrounding liquid metal once the oxygenconcentration in the bubble reaches around 5% by volume.
It should be also noted that no change was detected inthe quantities of either argon or water vapour in bubbles ofdifferent ages, as shown in Figure 2a, these values beingconstant at about 5.2 × 10⁻⁸ and 2.8 × 10⁻⁸ moles,representing about 1.3% and 0.7% respectively of the bubble
volume. Therefore, only the changes in the amounts ofnitrogen, oxygen, and hydrogen were considered in thisstudy.
Figure 3a shows a SEM micrograph of the surface of asample from inside a bubble that was held within an Al-5Mgmelt for 24 minutes before solidification. EDX spectra atlocations X1 and X2, presented in Figures 3b and 3c,indicated the existence of AlN and MgO respectively. Thissuggests that the oxygen and nitrogen within the trapped airbubble were consumed by reactions with the surroundingmelt, producing MgO and AlN, respectively. The existence ofsuch species on the sample surfaces was confirmed by thecorresponding EDX spectra. The oxygen peak noticed atlocation X1 (Figure 3b) indicates the presence of anunderlying MgO layer. This further confirms the suggestionsthat oxygen was consumed first to create a magnesia film,and nitrogen would have then seeped through the cracks inthe film to react with the melt forming an AlN layer on theMgO film.
According to Weigel and Fromm (1990), liquidaluminium is likely to be always covered with a layer ofoxide because of its extreme reactivity. If broken, this layer isexpected to re-form almost immediately. Any discontinuitiesin the oxide film could allow O2 from the atmosphere todiffuse across the film into the melt, allowing oxidation tocontinue (Sleppy, 1961).
The magnesia layer is expected to be porous andpermeable, since the Pilling-Bedworth ratio (PBR) of MgO isabout 0.84 (Pilling and Bedworth, 1923). Such permeabilitywould create leakage paths for oxygen (and subsequentlynitrogen) to flow outwards through the initially formed oxide
An investigation of the behaviour of double oxide film defects in aluminium-magnesium
�
1228

layer and react with the adjacent melt, leading to thecomplete depletion of the former. Accordingly, most of theoxygen inside the air bubble was depleted in only about 4minutes. The AlN layer, on the contrary, is anticipated toconstitute a continuous protective layer with a PBR of 1.26(Pilling and Bedworth, 1923). However, a significantpressure on the oxide and nitride layers (between the meltand the bubble) would be induced by the spinning action ofthe air bubble in the melt (which simulated the movement ofa bifilm within a flowing liquid metal). This may lead to thetearing of the oxide and nitride layers. Such cracks would actas leakage paths, enabling the nitrogen (and remainingoxygen) to react with the molten metal.
As suggested in previous research to be more appropriatethan a normal fit, the two-parameter Weibull distribution wasused of in order to analyse the tensile properties of the Al-5Mg alloy castings (Green and Campbell, 1993). The slope ofthe line fitted to the log-log Weibull cumulative distributiondata (known as the Weibull modulus) is indicative of thespread of properties; a higher Weibull modulus implies anarrower spread of properties.
Figures 4a and 4b illustrate the Weibull plots of the UTSand percentage elongation, respectively, of the test bars cutfrom castings that were held in the furnace for 0, 10, and 20minutes before solidification. The R2 values of approximately0.95 show that these values were obtained from relationshipsthat were a good linear fit to the data obtained (Tiryakioglu,Hudak, and Okten, 2009). The castings maintained at 1073K(800°C) for 10 minutes prior to cooling obviouslyexperienced enhanced Weibull moduli of their UTS andpercentage elongation, as indicated by the steeper slopes ofthe trend lines compared to the castings solidifiedimmediately or held in the liquid state for 20 minutes beforesolidification.
Figure 5a depicts plots of the Weibull moduli of both theUTS and the percentage elongation of the Al-5Mg alloycastings against the holding time before solidification. TheWeibull modulus of the UTS has a value of 22 for samplesallowed to solidify without holding, rising to 31 after holdingfor 10 minutes and dropping again to 24 after 20 minutes’
holding. The percentage elongation data shows the samebehaviour, with a Weibull modulus of 9.7 at zero minutes,13.8 at 10 minutes, and 8.4 at 20 minutes.The moduli, inother words, were a maximum at 10 minutes’ holding timeprior to cooling. Figure 5b depicts a plot of the amount ofhydrogen in solution in the liquid metal versus holding time;a steady rise in the hydrogen content of the alloy withholding time is evident.
Figure 6a shows a SEM micrograph, with thecorresponding EDX analysis, of an oxide layer found on thefracture surface of a specimen from the casting solidifiedimmediately after pouring. Another SEM image of a pore onthe fracture surface of a specimen from an Al-5Mg alloycasting that was held in the liquid state for 20 minutes priorto solidification is shown in Figure 6b, in which a number ofoxide fragments were found located over the dendrites insidethe pore. The EDX analyses suggest that the oxide layers areMgO.
Almost all of the magnesia films found on the fracturesurfaces (not inside the pores) of the test bars wereassociated with castings that had solidified immediately afterpouring. Castings held in the liquid state for 10 or 20 minutesprior to cooling were devoid of any bifilms on the fracturesurfaces of the test bars. Many MgO fragments, nevertheless,were detected inside pores on the fracture surfaces of thesecastings. This suggests that the holding treatment maymodify the morphology of bifilms in Al castings and causethem to form pores. This could be indicative of the effect ofthe holding treatment on the removal of oxide films, or atleast changing their morphologies to form hydrogen porosityin light metal alloy castings.
An investigation of the behaviour of double oxide film defects in aluminium-magnesium
1229 �
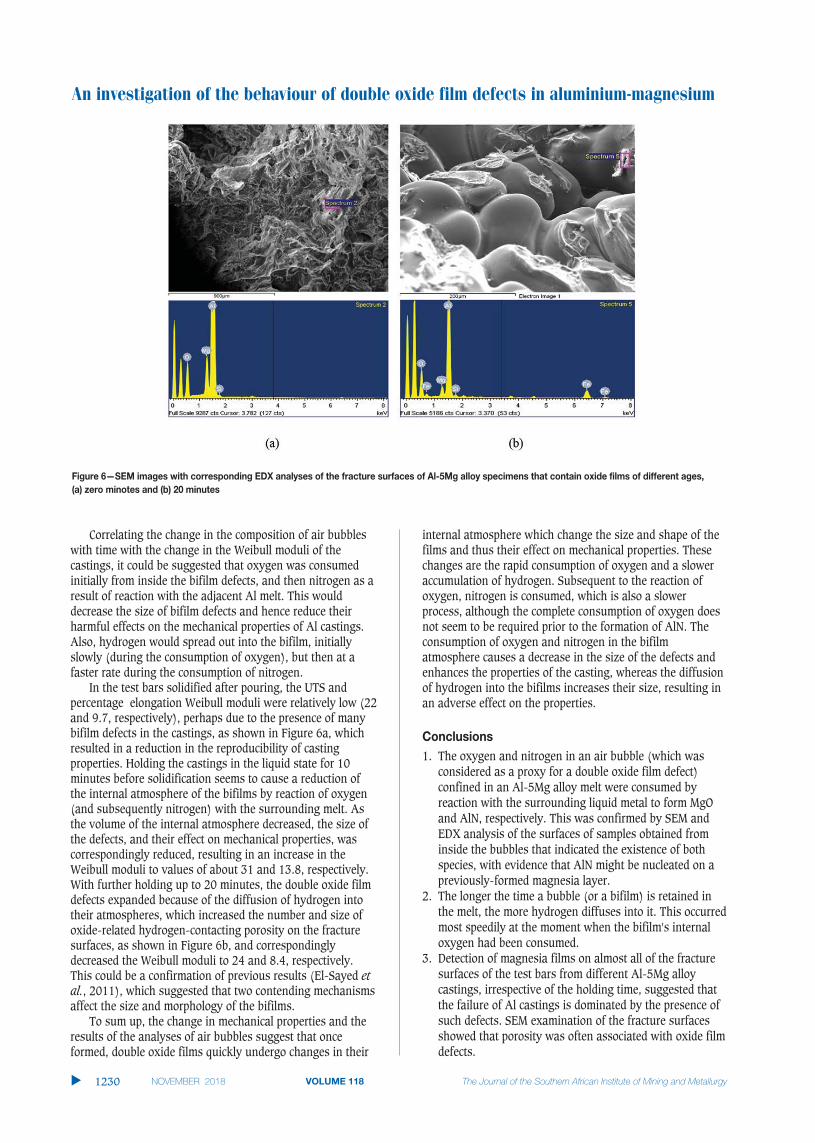
An investigation of the behaviour of double oxide film defects in aluminium-magnesium
Correlating the change in the composition of air bubbleswith time with the change in the Weibull moduli of thecastings, it could be suggested that oxygen was consumedinitially from inside the bifilm defects, and then nitrogen as aresult of reaction with the adjacent Al melt. This woulddecrease the size of bifilm defects and hence reduce theirharmful effects on the mechanical properties of Al castings.Also, hydrogen would spread out into the bifilm, initiallyslowly (during the consumption of oxygen), but then at afaster rate during the consumption of nitrogen.
In the test bars solidified after pouring, the UTS andpercentage elongation Weibull moduli were relatively low (22and 9.7, respectively), perhaps due to the presence of manybifilm defects in the castings, as shown in Figure 6a, whichresulted in a reduction in the reproducibility of castingproperties. Holding the castings in the liquid state for 10minutes before solidification seems to cause a reduction ofthe internal atmosphere of the bifilms by reaction of oxygen(and subsequently nitrogen) with the surrounding melt. Asthe volume of the internal atmosphere decreased, the size ofthe defects, and their effect on mechanical properties, wascorrespondingly reduced, resulting in an increase in theWeibull moduli to values of about 31 and 13.8, respectively.With further holding up to 20 minutes, the double oxide filmdefects expanded because of the diffusion of hydrogen intotheir atmospheres, which increased the number and size ofoxide-related hydrogen-contacting porosity on the fracturesurfaces, as shown in Figure 6b, and correspondinglydecreased the Weibull moduli to 24 and 8.4, respectively.This could be a confirmation of previous results (El-Sayed etal., 2011), which suggested that two contending mechanismsaffect the size and morphology of the bifilms.
To sum up, the change in mechanical properties and theresults of the analyses of air bubbles suggest that onceformed, double oxide films quickly undergo changes in their
internal atmosphere which change the size and shape of thefilms and thus their effect on mechanical properties. Thesechanges are the rapid consumption of oxygen and a sloweraccumulation of hydrogen. Subsequent to the reaction ofoxygen, nitrogen is consumed, which is also a slowerprocess, although the complete consumption of oxygen doesnot seem to be required prior to the formation of AlN. Theconsumption of oxygen and nitrogen in the bifilmatmosphere causes a decrease in the size of the defects andenhances the properties of the casting, whereas the diffusionof hydrogen into the bifilms increases their size, resulting inan adverse effect on the properties.
1. The oxygen and nitrogen in an air bubble (which wasconsidered as a proxy for a double oxide film defect)confined in an Al-5Mg alloy melt were consumed byreaction with the surrounding liquid metal to form MgOand AlN, respectively. This was confirmed by SEM andEDX analysis of the surfaces of samples obtained frominside the bubbles that indicated the existence of bothspecies, with evidence that AlN might be nucleated on apreviously-formed magnesia layer.
2. The longer the time a bubble (or a bifilm) is retained inthe melt, the more hydrogen diffuses into it. This occurredmost speedily at the moment when the bifilm's internaloxygen had been consumed.
3. Detection of magnesia films on almost all of the fracturesurfaces of the test bars from different Al-5Mg alloycastings, irrespective of the holding time, suggested thatthe failure of Al castings is dominated by the presence ofsuch defects. SEM examination of the fracture surfacesshowed that porosity was often associated with oxide filmdefects.
�
1230

4. Holding of an Al-5Mg alloy casting at 1073K (800°C) for10 minutes before solidification enhanced the Weibullmoduli of the UTS and percentage elongation of thecastings by approximately 41% and 42% respectively.This is suggested to be caused by the gaseous content ofoxide film defects becoming exhausted, which decreasesthe size of the films and accordingly their influence onmechanical properties.
5. The amount of hydrogen diffused into bifilms is suggestedto increase by extending the holding period to 20 minutes,perhaps resulting in the formation of oxide-relatedhydrogen-containing porosity. This caused a reduction inthe Weibull moduli of the UTS and percentage elongationby about 23% and 39% respectively.
The author would like to thank of Mr. Adrian Caden of theUniversity of Birmingham for his technical assistance. Theauthor also gratefully acknowledges the excellentsupervision, guidance, motivation, and sincere support of DrBill Griffiths of the University of Birmingham during thepreparation of this work.
ARYAFAR, M., RAISZADEH, R., and SHALBAFZADEH, A. 2010. Healing of doubleoxide film defects in A356 aluminium melt. Journal of Materials Science,vol. 45, no. 11. pp. 3041–3051.
BASUNY, F.H., GHAZY, M.. KANDEIL, A.-R.Y., and EL-SAYED, M.A. 2016. Effect ofcasting conditions on the fracture strength of Al-5 Mg alloy castings.Advances in Materials Science and Engineering, vol. 2016.doi:10.1155/2016/6496348
BRANDES, E.A. and BROOK, G.B. 1999. Smithells Metals Reference Book. 7th edn.Butterworth-Heinemann, Oxford.
CAMPBELL, J. 2003. Castings. 2nd. edn. Butterworth-Heinemann.
CAMPBELL, J. 2006. Entrainment defects. Materials Science and Technology, vol. 22, no. 2. pp. 127–145. doi:10.1179/174328406x74248
CHASE, M.W. 1985. JANAF Thermochemical tables. Journal of Physical andChemical Reference Data, vol. 14. American Chemical Society/AmericanInstitute of Physics for the National Bureau of Standards, Ann Arbor,Michigan.
DAVIS, J.R. 1993. Aluminum and Aluminum Alloys. 1st edn. ASM SpecialtyHandbook. ASM International, Materials Park, Ohio:
EL-SAYED, M. and GHAZY, M. 2017. Entrained defects in light metal cast alloys.Journal of the Southern African Institute of Mining and Metallurgy, vol. 117, no. 7. pp. 656–662.
EL-SAYED, M., HASSANIN, H., and ESSA, K. 2016. Effect of casting practice on thereliability of Al cast alloys. International Journal of Cast Metals Research,vol. 29, no. 6. pp. 350–354.
EL-SAYED, M., SALEM, H.G., KANDEIL, A.-R., and GRIFFITHS, W.D. 2013. A study ofthe behaviour of double oxide films in Al alloy melts. Materials ScienceForum, vol. 765. pp. 260–265.
El-Sayed, M.A. 2016. The behaviour of bifilm defects in cast Al-7Si-Mg alloy.PloS One, vol. 11, no. 8. pp. e0160633.
EL-SAYED, M.A. 2018. Influence of mould design and hydrogen content on thetensile properties of Al-Mg cast alloys. Journal of Engineering Technology,vol. 6, no. 1. pp. 584–594.
EL-SAYED, M.A. and ESSA, K. 2017. Effect of mould type and solidification timeon bifilm defects and mechanical properties of Al–7Si–0.3Mg alloycastings. International Journal of Computational Methods andExperimental Measurements, vol. 6, no. 4. pp. 647–655.
EL-SAYED, M.A. and GRIFFITHS, W.D. 2014. Hydrogen, bifilms and mechanical
properties of Al castings. International Journal of Cast Metals Research,vol. 27, no. 5. pp. 282–287. doi:10.1179/1743133614Y.0000000113
EL-SAYED, M.A., HASSANIN, H., and ESSA, K. 2016. Bifilm defects and porosity inAl cast alloys. International Journal of Advanced ManufacturingTechnology, vol. 86, no. 5. pp. 1173–1179. doi:10.1007/s00170-015-8240-6
EL-SAYED, M.A., SALEM, H.A.G., KANDEIL, A.Y., and GRIFFITHS, W.D. 2011. Effectof holding time before solidification on double-oxide film defects andmechanical properties of aluminum alloys. Metallurgical and MaterialsTransactions B: Process Metallurgy and Materials Processing Science, vol. 42, no. 6. pp. 1104–1109. doi:10.1007/s11663-011-9571-9
EL-SAYED, M.A., SHYHA, I., and BASUNY, F.H. 2018. Effect of hydrogen contenton the double oxide film defects and properties of aluminium castings: Areview. Journal of Engineering Technology, vol. 6. pp. 225–244.
GREEN, N.R. and CAMPBELL, J. 1993. Statistical distributions of fracture strengthsof cast Al-7Si-Mg alloy. Materials Science and Engineering A, vol. 173,no.1-2. pp. 261–266. doi:10.1016/0921-5093(93)90226-5
GRIFFITHS, W., CADEN, A., AND EL-SAYED, M. 2013. The behaviour of entrainmentdefects in aluminium alloy castings. Proceedings of the 2013International Symposium on Liquid Metal Processing & Casting. Springer.doi:10.1002/9781118830857.ch28
GRIFFITHS, W.D., CADEN, A., and EL-SAYED, M. 2014. An investigation intodouble oxide film defects in aluminium alloys. Materials Science Forum,vol. 783-786. pp. 142–147.
GRIFFITHS, W.D., EL-SAYED, A., and EL-SAYED, M.A. 2016. Whisker formation inporosity in Al alloys. Metallurgical and Materials Transactions B, vol. 47,no. 6. pp. 3459–3468.
GRIFFITHS, W.D. and RAISZADEH, R. 2009. Hydrogen, porosity and oxide filmdefects in liquid Al. Journal of Materials Science, vol. 44, no. 13. pp. 3402–3407.
IMPEY, S., STEPHENSON, D., and NICHOLLS, J.R. 1990. A study of the effect ofmagnesium additions on the oxide growth morphologies on liquidaluminium alloys. Proceedings of the International Conference on theMicroscopy of Oxidation, Cambridge University. Institute of Metals.
NYAHUMWA, C., GREEN, N.R., and CAMPBELL, J. 1998. Effect of mold-fillingturbulence on fatigue properties of cast aluminum alloys. AFSTransactions, vol. 106. pp. 215–223.
PILLING, N.B. and BEDSWORTH, R.E. 1923. The oxidation of metals at hightemperatures. Journal of the Institute of Metals, vol. 29. pp. 529–591.
RAISZADEH, R. and GRIFFITHS, W.D. 2006. A method to study the history of adouble oxide film defect in liquid aluminum alloys. Metallurgical andMaterials Transactions B, vol. 37, no. 6. pp. 865–871.
RAISZADEH, R. and GRIFFITHS, W.D. 2010. The behaviour of double oxide filmdefects in liquid Al alloys under atmospheric and reduced pressures.Journal of Alloys and Compounds, vol. 491, no. 1–2. pp. 575–580.doi:10.1016/j.jallcom.2009.10.271
SILVA, M.P. and TALBOT, D.E.J. 1989. Oxidation of liquid aluminum-magnesiumalloys. Proceedings of the 118th Annual Meeting. Las Vegas, Nevada.Technical Sessions, TMS Light Metals Committee.
SLEPPY, W.C. 1961. Oxidation of molten high-purity aluminum in dry oxygen.Journal of the Electrochemical Society, vol. 108, no. 12. pp. 1097–1102.
TALBOT, D.E.J. 1975. Effects of hydrogen in aluminium, magnesium, copper,and their alloys. International Materials Reviews, vol. 20, no. pp. 166–184.
TIRYAKIOGLU, M., HUDAK, D., and OKTEN, G. 2009. On evaluating Weibull fits tomechanical testing data. Materials Science and Engineering A, vol. 527,no. 1–2. pp. 397–399.
WEIGEL, J. and FROMM, E. 1990. Determination of hydrogen absorption anddesorption processes in aluminum melts by continuous hydrogen activitymeasurements. Metallurgical and Materials Transactions B, vol. 21, no. 5.pp. 855–860. doi:10.1007/bf02657810
YANG, L., ZHU, D., XU, C., ZHANG, J., and ZHANG, J. 1996. On the role ofmagnesium and silicon in the formation of alumina from aluminum alloysby means of DIMOX processing. Metallurgical and Materials TransactionsA, vol. 27, no. 8. pp. 2094–2099. doi:10.1007/bf02651863 �
An investigation of the behaviour of double oxide film defects in aluminium-magnesium
1231 �

The Southern African Institute of Mining and Metallurgy
in collaboration with The Zululand Branch are organising
The Eleventh International
HEAVY MINERALS CONFERENCE‘Renewed focus on Process and Optimization’
5–6 August 2019—ConferenceThe Vineyard, Cape Town, South Africa
Academics Business development managers Concentrator managers Consultants Engineers Exploration managers Geologists Hydrogeologists Innovation managers Mechanical engineers Metallurgical managers Metallurgical consultants Metallurgists Mine managers Mining engineers New business development managers Planning managers Process engineers Product developers Production managers Project managers Pyrometallurgists Researchers Scientists
This series of heavy minerals conferences has traditionally focused on the industries associated withilmenite, rutile and zircon. There are many other economic minerals which have specific gravities suchthat they may also be classed as ‘heavy minerals’. The physical and chemical properties of these otherminerals result in them being processed by similar technologies and sharing similar markets with themore traditional heavy minerals. In this conference we focus on optimization of mining, processing, andrecovery.
CONFERENCE OBJECTIVE
This series of conferences was started in 1997 and has run since that date. The Conference alternatesbetween South Africa and other heavy mineral producing countries. It provides a forum for anexchange of knowledge in all aspects of heavy minerals, from exploration through processing andproduct applications.
This is a strictly technical conference, and efforts by the Organizing Committee are aimed atpreserving its technical nature. The benefit of this focus is that it allows the operators of businesseswithin this sector to discuss topics not normally covered in such forums. The focus on heavy mineralsincludes the more obvious minerals such as ilmenite, rutile and zircon; and also other heavy mineralssuch as garnet, andalusite, and sillimanite.
WHO SHOULD ATTEND
CONFERENCE THEME
Contact: Yolanda Ndimande, Conference Co-ordinator · Tel: +27 11 834-1273/7
Fax: +27 11 833-8156 or +27 11 838-5923 · E-mail: [email protected] · Website: http://www.saimm.co.za
Conference Announcement
2019The Southern African Institute of Mining and Metallurgy
in collaboration with the Zululand Branch is organising
The Eleventh International
HEAVY MINERALS CONFERENCE‘Renewed focus on Process and Optimization’
5–6 August 2019—ConferenceThe Vineyard, Cape Town, South Africa
The Vineyard is nestled on an eco-award-winning riverside estate, overlooking the eastern slopes ofTable Mountain and conveniently located on the edge of the city. A short distance from the hotel inany direction allows you to easily explore some of the world’s top tourist destinations.
August and September in the Western Cape is flower season. Explore the Cape’s unique ‘fynbos’floral kingdom at the world-famous Kirstenbosch Botanical Gardens, where one of the manyattractions is the staggering aerial tree-canopy walkway.
A short distance from the hotel is the Constantia Winelands, which affords guests the opportunityto discover classic vintages and Cape Dutch homesteads, and within a five-minute walk is the well-known retail centre, the upmarket shopping precinct of Cavendish, with exclusive local and globaloutlets, travel agencies, foreign exchange outlets, and more.
ABOUT THE VENUE

�vii
201911–13 March 2019— 7th Sulphur and Sulphuric Acid2019 ConferenceSwakopmund Hotel, Swakopmund, NamibiaContact: Camielah JardineTel: +27 11 834-1273/7Fax: +27 11 838-5923/833-8156 E-mail: [email protected]: http://www.saimm.co.za
22–23 May 2019—Mine Planning Colloquium 2019Glenhove Conference Centre, Melrose Estate,Johannesburg
Contact: Camielah JardineTel: +27 11 834-1273/7Fax: +27 11 838-5923/833-8156 E-mail: [email protected]: http://www.saimm.co.za
24–27 June 2019— Ninth International Conferenceon Deep and High Stress Mining 2019ConferenceMisty Hills Conference Centre, Muldersdrift,JohannesburgContact: Camielah JardineTel: +27 11 834-1273/7Fax: +27 11 838-5923/833-8156 E-mail: [email protected]: http://www.saimm.co.za
5–7 August 2019 — The Southern African Instituteof Mining and Metallurgy in collaboration with theZululand Branch is organising The EleventhInternational Heavy Minerals Conference‘Renewed focus on Process and Optimization’The Vineyard, Cape Town, South AfricaContact: Yolanda NdimandeTel: +27 11 834-1273/7Fax: +27 11 838-5923/833-8156 E-mail: [email protected]: http://www.saimm.co.za
1–3 October 2019—The SAMREC/SAMVALCompanion Volume ConferenceAn Industry Standard for Mining Professionals inSouth AfricaEmperors Palace, JohannesburgContact: Camielah JardineTel: +27 11 834-1273/7Fax: +27 11 838-5923/833-8156 E-mail: [email protected]: http://www.saimm.co.za
17–18 October 2019— Tailing Storage Conference2019‘Investing in a Sustainable Future’JohannesburgContact: Camielah JardineTel: +27 11 834-1273/7Fax: +27 11 838-5923/833-8156 E-mail: [email protected]: http://www.saimm.co.za
13–15 November 2019 — XIX International CoalPreparation Congress & Expo 2019New Delhi, IndiaContact: Coal Preparation Society of IndiaTel/Fax: +91-11-26136416, 4166 1820E-mail: cpsidelhi. [email protected], [email protected]@gmail.com,[email protected]
NATIONAL & INTERNATIONAL ACTIVITIES

�
viii
Company AffiliatesThe following organizations have been admitted to the Institute as Company Affiliates
3M South Africa (Pty) Limited
AECOM SA (Pty) Ltd
AEL Mining Services Limited
Air Liquide (Pty) Ltd
Alexander Proudfoot Africa (Pty) Ltd
AMEC Foster Wheeler
AMIRA International Africa (Pty) Ltd
ANDRITZ Delkor(Pty) Ltd
Anglo Operations Proprietary Limited
Anglogold Ashanti Ltd
Arcus Gibb (Pty) Ltd
Atlas Copco Holdings South Africa (Pty) Limited
Aurecon South Africa (Pty) Ltd
Aveng Engineering
Aveng Mining Shafts and Underground
Axis House Pty Ltd
Bafokeng Rasimone Platinum Mine
Barloworld Equipment -Mining
BASF Holdings SA (Pty) Ltd
BCL Limited
Becker Mining (Pty) Ltd
BedRock Mining Support Pty Ltd
BHP Billiton Energy Coal SA Ltd
Blue Cube Systems (Pty) Ltd
Bluhm Burton Engineering Pty Ltd
Bouygues Travaux Publics
CDM Group
CGG Services SA
Coalmin Process Technologies CC
Concor Opencast Mining
Concor Technicrete
Council for Geoscience Library
CRONIMET Mining Processing SA Pty Ltd
CSIR Natural Resources and theEnvironment (NRE)
Data Mine SA
Department of Water Affairs and Forestry
Digby Wells and Associates
DMS Powders
DRA Mineral Projects (Pty) Ltd
DTP Mining - Bouygues Construction
Duraset
Elbroc Mining Products (Pty) Ltd
eThekwini Municipality
Expectra 2004 (Pty) Ltd
Exxaro Coal (Pty) Ltd
Exxaro Resources Limited
Filtaquip (Pty) Ltd
FLSmidth Minerals (Pty) Ltd
Fluor Daniel SA ( Pty) Ltd
Franki Africa (Pty) Ltd-JHB
Fraser Alexander (Pty) Ltd
G H H Mining Machines (Pty) Ltd
Geobrugg Southern Africa (Pty) Ltd
Glencore
Hall Core Drilling (Pty) Ltd
Hatch (Pty) Ltd
Herrenknecht AG
HPE Hydro Power Equipment (Pty) Ltd
Immersive Technologies
IMS Engineering (Pty) Ltd
Ivanhoe Mines SA
Joy Global Inc.(Africa)
Kudumane Manganese Resources
Leco Africa (Pty) Limited
Longyear South Africa (Pty) Ltd
Lonmin Plc
Lull Storm Trading (Pty) Ltd
Maccaferri SA (Pty) Ltd
Magnetech (Pty) Ltd
MAGOTTEAUX (Pty) LTD
Maptek (Pty) Ltd
MBE Minerals SA Pty Ltd
MCC Contracts (Pty) Ltd
MD Mineral Technologies SA (Pty) Ltd
MDM Technical Africa (Pty) Ltd
Metalock Engineering RSA (Pty)Ltd
Metorex Limited
Metso Minerals (South Africa) Pty Ltd
Minerals Council of South Africa
Minerals Operations Executive (Pty) Ltd
MineRP Holding (Pty) Ltd
Mintek
MIP Process Technologies (Pty) Limited
Modular Mining Systems Africa (Pty) Ltd
MSA Group (Pty) Ltd
Multotec (Pty) Ltd
Murray and Roberts Cementation
Nalco Africa (Pty) Ltd
Namakwa Sands(Pty) Ltd
Ncamiso Trading (Pty) Ltd
New Concept Mining (Pty) Limited
Northam Platinum Ltd - Zondereinde
OPTRON (Pty) Ltd
PANalytical (Pty) Ltd
Paterson & Cooke Consulting Engineers (Pty) Ltd
Perkinelmer
Polysius A Division Of ThyssenkruppIndustrial Sol
Precious Metals Refiners
Rand Refinery Limited
Redpath Mining (South Africa) (Pty) Ltd
Rocbolt Technologies
Rosond (Pty) Ltd
Royal Bafokeng Platinum
Roytec Global (Pty) Ltd
RungePincockMinarco Limited
Rustenburg Platinum Mines Limited
Salene Mining (Pty) Ltd
Sandvik Mining and Construction Delmas (Pty) Ltd
Sandvik Mining and ConstructionRSA(Pty) Ltd
SANIRE
Schauenburg (Pty) Ltd
Sebilo Resources (Pty) Ltd
SENET (Pty) Ltd
Senmin International (Pty) Ltd
Smec South Africa
Sound Mining Solution (Pty) Ltd
SRK Consulting SA (Pty) Ltd
Technology Innovation Agency
Time Mining and Processing (Pty) Ltd
Timrite Pty Ltd
Tomra (Pty) Ltd
Ukwazi Mining Solutions (Pty) Ltd
Umgeni Water
Webber Wentzel
Weir Minerals Africa
Worley Parsons RSA (Pty) Ltd

Visit us today [email protected] | www.axishouse.co.za | +27 11 463 4888
SEPARATION CAN BE TOUGH, BUT IT DOESN’T HAVE TO BECOME AN
ORE-DEAL
Axis House are leading Reagent Technology Management
you covered with cutting edge mineral processing reagents.
• FULLY EQUIPPED LABORATORY
• ACCURATE BENCHMARKING OF ALTERNATE REAGENT SUITES
• GLOBAL FOOTPRINT
Don’t let your minerals get caught up in the wrong gangue.
29
CuCopper63.546
30
ZnZinc65.38
27
CoCobalt58.933
79
AuGold96.97

Felix Project Management and Consulting Services cc
As a trusted partner to the world’s largest mining and minerals processing companies around the world, CiDRA professionals collaborate with their customers to apply highly
to new heights.
-
CiDRA.
Minerals Processing
From Data... to Knowledge... to Action...
We’ve Got Your Back