Electropermeabilization of inner and outer cell membranes ...
242
HAL Id: tel-01687535 https://tel.archives-ouvertes.fr/tel-01687535 Submitted on 18 Jan 2018 HAL is a multi-disciplinary open access archive for the deposit and dissemination of sci- entific research documents, whether they are pub- lished or not. The documents may come from teaching and research institutions in France or abroad, or from public or private research centers. L’archive ouverte pluridisciplinaire HAL, est destinée au dépôt et à la diffusion de documents scientifiques de niveau recherche, publiés ou non, émanant des établissements d’enseignement et de recherche français ou étrangers, des laboratoires publics ou privés. Electropermeabilization of inner and outer cell membranes with microsecond pulsed electric fields : effective new tool to control mesenchymal stem cells spontaneous Ca2+ oscillations Hanna Hanna To cite this version: Hanna Hanna. Electropermeabilization of inner and outer cell membranes with microsecond pulsed electric fields : effective new tool to control mesenchymal stem cells spontaneous Ca2+ oscillations. Cellular Biology. Université Paris Saclay (COmUE), 2016. English. NNT : 2016SACLS493. tel- 01687535
-
Upload
khangminh22 -
Category
Documents
-
view
0 -
download
0
Transcript of Electropermeabilization of inner and outer cell membranes ...

HAL Id: tel-01687535https://tel.archives-ouvertes.fr/tel-01687535
Submitted on 18 Jan 2018
HAL is a multi-disciplinary open accessarchive for the deposit and dissemination of sci-entific research documents, whether they are pub-lished or not. The documents may come fromteaching and research institutions in France orabroad, or from public or private research centers.
L’archive ouverte pluridisciplinaire HAL, estdestinée au dépôt et à la diffusion de documentsscientifiques de niveau recherche, publiés ou non,émanant des établissements d’enseignement et derecherche français ou étrangers, des laboratoirespublics ou privés.
Electropermeabilization of inner and outer cellmembranes with microsecond pulsed electric fields :effective new tool to control mesenchymal stem cells
spontaneous Ca2+ oscillationsHanna Hanna
To cite this version:Hanna Hanna. Electropermeabilization of inner and outer cell membranes with microsecond pulsedelectric fields : effective new tool to control mesenchymal stem cells spontaneous Ca2+ oscillations.Cellular Biology. Université Paris Saclay (COmUE), 2016. English. �NNT : 2016SACLS493�. �tel-01687535�

NNT : 2016SACLS493
THÈSE DE DOCTORAT
DE
L’UNIVERSITÉ PARIS-SACLAY
PRÉPARÉE À
L’UNIVERSITÉ PARIS-SUD 11
ÉCOLE DOCTORALE N˚ 569
Innovation Thérapeutique : du Fondamental à l’Appliqué
Spécialité : Pharmacotechnie et Biopharmacie
Par
Mr. Hanna Hanna
Electropermeabilization of inner and outer cell membranes with microsecond
pulsed electric fields: effective new tool to control mesenchymal stem cells
spontaneous calcium oscillations
Thèse présentée et soutenue à Villejuif, le 13 Décembre 2016
Composition du Jury :
M. Combettes Laurent Directeur de recherche, INSERM Président du jury
M. O’Connor Rodney Professeur, Ecole des Mines de Saint Etienne Rapporteur
M. Satkauskas Saulius Professeur, Vytautas Magnus University Rapporteur
Mme Fromigué Olivia Chargé de recherche, INSERM Examinatrice
M. Percherancier Yann Chargé de recherche, CNRS Examinateur
M. Mir Lluis M. Directeur de recherche, CNRS Directeur de thèse
M. André Franck M. Chargé de recherche, CNRS Co-encadrant de thèse


1
Table of contents
Abbreviations ____________________________________________________ 5
Preface _________________________________________________________ 9
I. State of the art _______________________________________________ 13
1 The Biomembranes _____________________________________________________ 15
1.1 The plasma membrane ____________________________________________________ 15 1.1.1 Historical view __________________________________________________________________ 15
1.1.1.1 The Fluid-Mosaic Model ______________________________________________________ 16 1.1.2 Plasma membrane composition ____________________________________________________ 17
1.1.2.1 Lipids _____________________________________________________________________ 17 1.1.2.1.1 Phospholipids ___________________________________________________________ 17 1.1.2.1.2 Glycolipids ______________________________________________________________ 19 1.1.2.1.3 Sterols _________________________________________________________________ 20 1.1.2.1.4 Lipid phases in plasma membrane ___________________________________________ 20
1.1.2.2 Proteins ___________________________________________________________________ 22 1.1.2.3 Carbohydrates _____________________________________________________________ 23 1.1.2.4 Lipid rafts _________________________________________________________________ 24 1.1.2.5 The asymmetry of the plasma membrane _______________________________________ 25
1.1.3 The dynamic nature of the plasma membrane ________________________________________ 26 1.1.4 The plasma membrane functions ___________________________________________________ 28
1.1.4.1 Lipids functions _____________________________________________________________ 28 1.1.4.1.1 Compartmentalization ____________________________________________________ 28 1.1.4.1.2 A selectively permeable barrier _____________________________________________ 28 1.1.4.1.3 Signal Transduction in response to external stimuli _____________________________ 29
1.1.4.2 Proteins functions __________________________________________________________ 29 1.1.4.2.1 Selective permeability: transport proteins _____________________________________ 29 1.1.4.2.2 Signal transduction: receptor proteins ________________________________________ 31 1.1.4.2.3 Other functions __________________________________________________________ 33
1.1.5 Resting membrane potential ______________________________________________________ 33
1.2 The organelles membranes _________________________________________________ 35 1.2.1 Eukaryotic cell compartmentalization _______________________________________________ 35 1.2.2 Organelles membranes composition ________________________________________________ 36 1.2.3 The endoplasmic reticulum ________________________________________________________ 38
1.2.3.1 The largest membranes network of the cell ______________________________________ 38 1.2.3.2 A highly permeable membrane? _______________________________________________ 39 1.2.3.3 The largest calcium store of the cell ____________________________________________ 40 1.2.3.4 The KDEL sequence _________________________________________________________ 41
1.3 The continuity of the cellular membranes _____________________________________ 42 1.3.1 Vesicular transport ______________________________________________________________ 42
2 Calcium regulation in the cell _____________________________________________ 45
2.1 The importance of the calcium in the organisms and the cell physiology _____________ 45
2.2 Calcium-signaling system __________________________________________________ 45 2.2.1 Principal components of the calcium increase step _____________________________________ 46
2.2.1.1 Voltage-operated calcium channels ____________________________________________ 47

2
2.2.1.2 Receptor-operated calcium channels ___________________________________________ 48 2.2.1.3 Inositol-1,4,5-triphosphate receptor ____________________________________________ 49 2.2.1.4 Ryanodine receptor _________________________________________________________ 50 2.2.1.5 Two-pore calcium channels ___________________________________________________ 50 2.2.1.6 Store-operated calcium channels ______________________________________________ 51 2.2.1.7 Calcium-induced calcium release (CICR) _________________________________________ 52
2.2.2 Principle components of the calcium decrease step ____________________________________ 52 2.2.2.1 Plasma membrane Ca2+-ATPase ________________________________________________ 53 2.2.2.2 Sarco/endoplasmic reticulum Ca2+-ATPase _______________________________________ 53 2.2.2.3 Plasma membrane NA+/Ca2+ exchanger _________________________________________ 54 2.2.2.4 Mitochondrial voltage-dependent anion channel _________________________________ 54 2.2.2.5 Mitochondrial calcium uniporter _______________________________________________ 55
2.2.3 Calcium buffers and effectors ______________________________________________________ 55 2.2.4 How the calcium spatial and temporal signaling is decoded by the cell? ____________________ 56
2.2.4.1 Calcium sparks, oscillations and waves __________________________________________ 56 2.2.4.2 Calcium-sensitive enzymes and transcription-factors ______________________________ 58
2.3 Different calcium-related mechanisms in the cell________________________________ 59 2.3.1 Mitochondria-associated membranes and apoptosis ___________________________________ 59 2.3.2 Other mechanisms and functions ___________________________________________________ 60
2.4 Studying calcium signaling: the calcium markers ________________________________ 61 2.4.1 Fluorescent Ca2+-sensitive dyes ____________________________________________________ 61 2.4.2 Genetically encoded Ca2+ indicators _________________________________________________ 63
3 Mesenchymal stem cells and differentiation _________________________________ 65
3.1 Mesenchymal stem cells ___________________________________________________ 65 3.1.1 Human adipose Mesenchymal stem cells ____________________________________________ 66 3.1.2 Calcium oscillations in MSCs _______________________________________________________ 68 3.1.3 Calcium oscillations between MSCs and differentiated cells _____________________________ 69
3.2 Mesenchymal stem cells differentiation _______________________________________ 70 3.2.1 Differentiation into osteoblasts ____________________________________________________ 71
3.2.1.1 Osteogenic-induction factors __________________________________________________ 72 3.2.1.2 The importance of the extracellular matrix in osteogenic differentiation _______________ 73 3.2.1.3 Osteodifferentiation markers _________________________________________________ 73
3.2.2 Differentiation into adipocytes _____________________________________________________ 74 3.2.2.1 Adipogenic-induction factors __________________________________________________ 74 3.2.2.2 Adipogenic markers _________________________________________________________ 75
3.2.3 Differentiation into neuronal cells __________________________________________________ 75 3.2.3.1 Neurogenic-induction factors _________________________________________________ 76 3.2.3.2 Neurogenic markers _________________________________________________________ 76
3.3 Effects of physical stimuli on the MSCs differentiation ___________________________ 77 3.3.1 Effect of mechanical stimulation ___________________________________________________ 77 3.3.2 Effect of the electric, electromagnetic fields and the membrane potential __________________ 78
4 Membranes electroporation ______________________________________________ 81
4.1 A brief historical view _____________________________________________________ 81
4.2 The electroporation principle _______________________________________________ 82 4.2.1 The induced transmembrane potential ______________________________________________ 83 4.2.2 The permeabilization threshold ____________________________________________________ 85

3
4.3 Some factors that influence the permeabilization threshold and impact the
electropermeabilization outcomes _________________________________________________ 86 4.3.1 The impact of the electric field amplitude ____________________________________________ 86 4.3.2 The impact of the pulse duration ___________________________________________________ 88 4.3.3 The impact of the number of the pulses _____________________________________________ 88 4.3.4 The impact of the pulses frequency _________________________________________________ 88 4.3.5 The impact of the cell shape and diameter ___________________________________________ 89 4.3.6 The impact of the plasma membrane properties and lipid composition ____________________ 90 4.3.7 The impact of the medium composition [conductivity]__________________________________ 91 4.3.8 The impact of the cell confluence or density __________________________________________ 92 4.3.9 The impact of the temperature ____________________________________________________ 92
4.4 Electroporation vs electropermeabilization ____________________________________ 93 4.4.1 Electroporation: the direct effect of the pulse _________________________________________ 93 4.4.2 Electropermeabilization: the long-lasting effect of the pulse _____________________________ 93
4.5 Indices of membrane permeabilization _______________________________________ 94 4.5.1 The permeabilization markers _____________________________________________________ 94 4.5.2 The membrane conductivity _______________________________________________________ 95
4.6 The different kinds of pulses used in electroporation ____________________________ 95 4.6.1 The millisecond pulsed electric fields ________________________________________________ 95 4.6.2 The microsecond pulsed electric fields ______________________________________________ 96 4.6.3 The nanosecond pulsed electric fields _______________________________________________ 97
4.7 Some applications of the membrane electropermeabilization ______________________ 98 4.7.1 Electrochemotherapy ____________________________________________________________ 98 4.7.2 Electrogenetransfer ______________________________________________________________ 99 4.7.3 Electrofusion ___________________________________________________________________ 99
II. Research hypotheses and objectives ___________________________ 101
III. Results ___________________________________________________ 105
1 Electropermeabilization of Inner and Outer Cell Membranes with Microsecond Pulsed
Electric Fields: Quantitative Study with Calcium Ions (article n˚1) ___________________ 107
2 Electrical Control of Calcium Oscillations in Mesenchymal Stem Cells Using Microsecond
Pulsed Electric Fields (article n˚2) _____________________________________________ 135
3 In vitro Osteoblastic differentiation of mesenchymal stem cells generates cell layers
with distinct properties (article n˚3) __________________________________________ 153
4 Supplementary data ____________________________________________________ 175
4.1 Effect of a one 100 µs pulse applied once a day on the osteodifferentiation of human-adipose
mesenchymal stem cells __________________________________________________________ 176
4.2 Examples of electro-induced calcium spikes and spontaneous calcium oscillations _______ 187
IV. Discussion and Perspectives__________________________________ 193
V. Discussion en langue française _______________________________ 199
VI. References__________________________________________________ 207

4

5
ABBREVIATIONS AM: acetoxymethyl
AGPR: asialoglycoprotein receptor
2-APB: 2-Aminoethoxydiphenyl borate
Asc: ascorbic acid
ATP: adenosine triphosphate
BAPTA: 1,2-bis(o-aminophenoxy)ethane-N,N,N',N'-tetraacetic acid
BHA: butylated hydroxyanisole
βME: β-mercaptoethanol
BSP: bone sialoprotein
CaM: calmodulin
CAM : cell adherence molecule
CaMKII: calmodulin-dependent protein kinase II
cAMP: cyclic adenosine monophosphate
CCV: clathrin-coated vesicle
CD: cluster of differentiation
C/EBP: CCAAT/enhancer binding proteins
cGMP: cyclic gunosine monophosphate
CHO: Chinese Hamster Ovary (cells)
CICR: calcium-induced calcium release
CL: cardiolipin
CNGC: cyclic-nucleotide-gated channel
Col1: collagen type 1
CREB: cAMP response element-binding protein
CSFD: Ca2+-sensitive fluorescent dye
DAG: diacylglycerol
Dex: dexamethasone
DMSO: dimethyl sulfoxide
ECM: extracellular matrix
ECT: electrochemotherapy
EGT: electrogenetransfer
EGTA: ethylene glycol tetraacetic acid
EP: equilibrium potential
ER: endoplasmic reticulum
ERK: extracellular signal-regulated kinases
ESC: embryonic stem cell
FAK: focal adhesion kinase
FABP4: fatty-acid biding protein 4
FRAP: fluorescence recovery after photobleaching
FRET: Förster resonance energy transfer
GalCer: galactosylceramide
GDP: guanosine di-phosphate

6
GFP: green fluorescent protein
GlcCer: glucosylceramide
G2P: glycerol 2-phosphate
GPCR: G protein-coupled receptor
GPI: glycosylphosphatidylinositol
GPL: glycerophospholipid
GqPCRs: Gq protein-coupled receptors
GRP: glucose-regulated protein
GSL: glycosphingolipid
GTP: guanosine tri-phosphate
GUV: giant unilamellar vesicle
haMSC: human adipose mesenchymal stem cell
hbMSC: human bone marrow mesenchymal stem cell
ICR: Ion channel receptor
ICRAC: Ca2+ release-activated Ca2+ current
Ig : immunoglobulin
IL : interleukin
IMM: inner mitochondrial membrane
IP3: inositol triphosphate
IP3R: inositol triphosphate receptor
iPS: induced pluripotent stem cell
LDL: low density lipoprotein
LGC: ligand-gated channels
LOX: lipoxygenase
MAM: mitochondria-associated membrane
MAPK: mitogen-activated protein kinase
MCU: mitochondrial calcium uniporter
MD: molecular dynamic
MIX: 1-methyl-3-isobutylxanthine
MP: membrane potential
MSC: mesenchymal stem cell
NAADP: nicotinic acid adenine dinucleotide phosphate
NCX: NA+/Ca2+ exchanger
NFAT: nuclear factor of activated T cells
NF-κB: nuclear factor-kappa B
NGF: nerve growth factor
NMDAr: N-methyl-D-aspartate receptor
NP: Nernst potential
NT: neurotransmitter
OMM: outer mitochondrial membrane
PAF: platelet activating factor
PDGF: platelet-derived growth factor
PEF: pulsed electric field
PhA: phosphatidic acid
PhC: phosphatidylcholine

7
PhE: phosphatidylethanolamine
PhG: phosphatidylglycerol
PhI: phosphatidylinositol
PhS: phosphatidylserine
PI: propidium iodide
PIP2: phosphatidylinositol 4,5-biphosphate
PKA: protein kinase A
PKC: protein kinase C
PLB: phospholamban
PLC: phospholipase C
PM: plasma membrane
PMCA: plasma membrane calcium ATPase
PPARγ: peroxisome proliferator-activated receptor γ
PR : purinergic receptor
PrSN: presynaptic neuron
PSN: postsynaptic neuron
RER: rough endoplasmic reticulum
RhoA: Ras homolog gene family, member A
RME: receptor-mediated endocytosis
RNA: ribonucleic acid
ROCC: receptor-operated calcium channel
RTKs: receptor tyrosine kinases
Runx2: Runt-related transcription factor 2
RyR: ryanodine receptor
SACC: Stretch-activated calcium channel
SAM : substrate adhesion molecule
SDS: Sodium dodecyl sulfate
SDS-PAGE: SDS polyacrylamide-gel electrophoresis
SER: smooth endoplasmic reticulum
SERCA: sarcoplasmic/endoplasmic reticulum calcium ATPase
SH2: Src Homology 2 domain
SM: sphingomyelin
SMOC: second messenger-operated channel
STIM: Stromal interaction molecule
SOCC: store-operated calcium channel
SOCE: store-operated calcium entry
SR: sarcoplasmic reticulum
TGF-β: transforming growth factor beta
TRPC: transient receptor potential cation channel
TPC: two-pore channel
VA: valproic acid
VDAC: voltage-dependent anion channel
VGC: voltage-gated channels
VOCC: voltage-operated calcium channel

8

9
PREFACE

10

11
The calcium is a universal second messenger that controls, either directly or indirectly, many basic
cellular functions, such as proliferation, differentiation, apoptosis and vesicular trafficking. Hence, the
control of cytosolic calcium concentrations may be a useful tool to study and control such processes
in physiological and pathological conditions. The electroporation is a widely used technique in
research, medicine, food industry and many biotechnological processes, in order to permeabilize the
plasma or/and the organelles membranes to normally non-permeant molecules such as genetic
materials, drugs or ions such as calcium. Therefore, this research work deals with 1) the generation of
electro-induced calcium spikes in the cells using 100 µs electric pulses (by the electropermeabilization
of the plasma membrane alone or together with the endoplasmic reticulum membranes), 2) the use
of theses pulses to control the spontaneous calcium oscillations in mesenchymal stem cells.
The first chapter of this manuscript is dedicated to the description of the state of the art, giving
the reader the key elements necessary for a deep understanding of this research work, whose
objectives are then addressed in the second chapter. The concepts specifically presented are: cell and
organelles membranes, calcium regulation in the cell, the mesenchymal stem cells calcium oscillations
and the cell electroporation. The guiding principle was the understanding of the mechanisms
underlying the electropermeabilization of internal membranes by microsecond pulsed electric fields,
and also studying the control of spontaneous calcium oscillations by these pulses.
In the third chapter the results are described. First, the electropermeabilization of inner and outer
cell membranes with a single 100 µs pulse is demonstrated by using the calcium as a permeabilization
marker. Then, the fine control of calcium oscillations in mesenchymal stem cells using microsecond
pulsed electric fields is evaluated. In addition, a further investigation of the mesenchymal stem cells
differentiation into osteogenic, adipogenic and neurogenic lineages was also assessed. These results
are presented as three research articles. Finally, a global synthesis of the results is presented in the
discussion sections (in English as well as in French) where perspectives and future works are also
addressed.

12

13
I. STATE OF THE ART

14

15
1 THE BIOMEMBRANES
1.1 THE PLASMA MEMBRANE
The plasma membrane (PM) is a common structure to all living organisms, whether animal,
plants, unicellular or multicellular. However, its composition is not the same for all the orgsanisms.
The plasma membrane is the boundary between the cell and its environment, and it makes only 5 to
10 nm wide (Karp 2010). It regulates what enters and exits the cell. Cells must maintain an appropriate
amount of molecules to function inside them (Uzman 2003), thus, each cell has to exchange molecules
with its environment (selective nutrient absorption, secretion of molecules in the cellular
environment). The plasma membrane defines the rules of these exchanges between the cell and its
environment.
1.1.1 Historical view
The lipid nature of the cell membrane was first correctly intuited by Quincke in 1888, who
noted that a cell generally forms a spherical shape in water and, when broken in half, forms two smaller
spheres. The only other known material to exhibit this behavior was oil. He also noted that a thin film
of oil behaves as a semi-permeable membrane, precisely as predicted (Loeb 1904). Based on these
observations, Quincke asserted that the cell membrane comprised a fluid layer of fat less than 100 nm
thick (Hertwig et al. 1895). Later on, Ernest Overton made the hypothesis that to pass the cell
membrane a molecule must be at least sparingly soluble in oil, hence lipophilic and/or amphiphilic
(Overton 1895).
In 1935, Hugh Davson and James Danielli proposed a model of the cell membrane in which a
phospholipid bilayer lay between two layers of globular proteins (Danielli & Davson 1935). The
phospholipid bilayer had already been proposed for the first time by Gorter and Grendel in 1925
(Gorter & Grendel 1925), but the flanking proteinaceous layers of the Davson-Danielli’s model were
novel and intended to explain Danielli's observations on the surface tension of lipid bilayers. In 1957,
David Robertson, based on electron microscopy studies, establishes the “Unit Membrane Hypothesis”.
This, states that all membranes in the cell, i.e. plasma and organelle membranes, have the same
structure: a bilayer of phospholipids with monolayers of proteins at both sides of it (Robertson 1959,
1960) .
The Davson-Danielli model predominated until Singer and Nicolson proposed the fluid mosaic
model in 1972 (Singer & Nicolson 1972). This model included the transmembrane proteins, and
eliminated the flanking protein layers that were not well-supported by experimental evidence. It is
now known that the phospholipid head groups are sufficient to explain the measured surface tension
observed by Danielli.

16
Figure 1: two generations of membrane models, (a) original Davson-Danielli trilayer model, (b) current fluid-mosaic model
(adapted from http://www.uic.edu/classes/bios/bios100/lectures/membranes.htm).
1.1.1.1 The Fluid-Mosaic Model
In 1972 the Fluid-Mosaic Membrane Model was proposed (Singer & Nicolson 1972). According
to this model, the two leaflets of biological membranes are asymmetric and divided into subdomains
composed of specific proteins or lipids, allowing spatial segregation of biological processes associated
with membranes. The previous models, presenting proteins as sheets neighboring a lipid layer, rather
than incorporated into the phospholipid bilayer, were not well supported by microscopy, and did not
permit to explain the dynamic membrane properties as well as the changes in structure and behavior
of cell membranes under different temperatures (Nicolson 2014).
The nature of the membrane proteins was studied by Unwin and Henderson (1984). They
found that the portion of the protein that spans the lipid bilayer is hydrophobic in nature (similar to
the lipids forming the bilayer) and arranged in a three-dimensional shape, often in the form of an alpha
helix (Unwin & Henderson 1984).
Figure 2: a current representation of the plasma membrane showing the same basic fluid- mosaic model organization as
that proposed by Singer and Nicolson (Karp 2010).

17
1.1.2 Plasma membrane composition
The PM is composed of lipids and proteins and contains carbohydrates which are attached to
them (Figure 2). The phospholipid bilayer forms a stable barrier between two aqueous compartments:
the inside and the outside of the cell. The proteins embedded within the PM carry out specific functions
such as selective transport of molecules and cell-cell recognition. The ratio of lipid to protein in a
membrane depends on the type of cellular membrane (plasma vs. endoplasmic reticulum vs. Golgi),
the type of organism (bacterium vs. plant vs. animal), and the type of cell (liver vs. muscle vs. bone)
(Karp 2010).
1.1.2.1 Lipids
Lipids are water-insoluble biomolecules that are highly soluble in organic solvents such as
chloroform. Membranes contain a wide diversity of lipids, all of which are amphipathic; that is, they
contain both hydrophilic and hydrophobic regions. Lipids constitute approximately 50% of the PM
mass (Cooper 2000a).
1.1.2.1.1 Phospholipids
Most membrane lipids contain a phosphate group, which makes them phospholipids. Because
most membrane phospholipids are built on a glycerol backbone (Figure 3), they are called
phosphoglycerides or glycerophospholipids and they represent the major structural lipids in eukaryotic
membranes. Their hydrophobic portion is a diacylglycerol (DAG), which contains two saturated or cis-
unsaturated fatty acyl chains of various lengths. The fatty acyl chains are unbranched hydrocarbons
approximately 14 to 24 carbons in length. A membrane fatty acid may be fully saturated,
monounsaturated, or polyunsaturated. Phosphoglycerides often contain one unsaturated and one
saturated fatty acyl chain (Alberts et al. 2002a). The insaturations create an angle in the aliphatic chain
and play an important role in the membrane fluidity.
Two of the hydroxyl groups of the glycerol are esterified to fatty acids; the third is esterified to
a hydrophilic phosphate group. Membrane phosphoglycerides have an additional group linked to the
phosphate, most commonly either choline (forming phosphatidylcholine, PhC), ethanolamine (forming
phosphatidylethanolamine, PhE), serine (forming phosphatidylserine, PhS), or inositol (forming
phosphatidylinositol, PhI) (Figure 4). These groups, together with phosphate, form at one end of the
phospholipid the highly hydrophilic head group (Figure 3).

18
Figure 3: phospolipid bilayer (cross section) and the structure of a phospholipid (Campbell and Reece, 2007).
PhC accounts for >50% of the phospholipids in most eukaryotic membranes and has a
cylindrical molecular geometry. Most PhC molecules have one cis-unsaturated fatty acyl chain, which
renders them fluid at room temperature. PhE assumes a conical molecular geometry because of the
relatively small size of its polar headgroup (van Meer et al. 2008). The inclusion of PhE in PhC bilayers
imposes a curvature stress onto the membrane, which is used for budding, fission and fusion (Marsh
2007). At physiologic pH, the head groups of PhS and PhI have an overall negative charge (anionic head
group), whereas those of PhC and PhE are neutral (zwitterionic head group).
Lipids with a small area ratio of polar head to acyl chain (creating a cone shape) induce negative
curvature, lipids with an equal head to chain area ratio (creating a cylinder shape) are neutral, and
those with a much larger head compared with the acyl chain area (creating an inverted cone shape)
induce a positive curvature (Holthuis and Menon, 2014). Non-bilayer lipids are those who induce a
curvature in the PM, like PhE and cardiolipin (CL). They may be used to accommodate membrane
proteins and modulate their activities (Vance & Vance 2008). An additional factor that contributes to
curvature stress in biomembranes is the asymmetric distribution of various lipids between the two
bilayer leaflets (van den Brink-van der Laan et al. 2004) (cf. 1.1.2.5).
Another class of membrane phospholipids, called sphingolipids, are derivatives of sphingosine,
an amino alcohol that contains a long hydrocarbon chain (Figure 4). Sphingolipids consist of
sphingosine linked to a fatty acid (R of Figure 4) by its amino group to form a ceramide. The various

19
sphingosine-based lipids have additional groups esterified to the terminal alcohol of the sphingosine
moiety (Karp 2010). If the substitution is PhC, the molecule is sphingomyelin (SM), which is the only
phospholipid of the membrane that is not built with a glycerol backbone and is one of the major
sphingolipids in mammalian cells.
Figure 4: (a) The structures of phosphoglycerides, (b) The structures of sphingolipids. Sphingomyelin is a phospholipid;
cerebrosides and gangliosides are glycolipids (Karp, 2010).
1.1.2.1.2 Glycolipids
Another class of sphingolipids are the glycolipids or glycosphingolipids (GSLs), that contain
mono-, di- or oligosaccharides based on glucosylceramide (GlcCer) and sometimes galactosylceramide
(GalCer) (Meer & Lisman 2002). Such glycolipid with a simple carbohydrate are called cerebroside
(Figure 4.b). Gangliosides are GSLs with an oligosaccharide and a terminal sialic acids. Glycolipids play
crucial role in cell function. They are particularly enriched in the nervous system. The GalCer comprise
nearly 30% of lipids in myelin sheaths of oligodendrocytes and Schwann cells, in which they are thought
to participate in axon insulation and saltatory conduction of the action potential (Norton & Cammer

20
1984). The fungal toxins, called fumonisins, which inhibits the synthesis of glycolipids, disturb cell
growth, cell death, cell-cell interactions and communication from the outside of the cell to the interior
(Riley et al. 2001). Sphingolipids have saturated (or trans-unsaturated) tails so they are able to form
taller, narrower cylinders than PC lipids of the same chain length and they pack more tightly, adopting
the solid 'gel' or so phase (cf. 1.1.2.1.4); they are fluidized by sterols (van Meer et al. 2008).
1.1.2.1.3 Sterols
Sterols are the major non-polar lipids of cell membrane: cholesterol predominates in animal
cells whereas ergosterol predominates in yeast cells (van Meer et al. 2008). Cholesterol may
constitute up to 50 percent of the lipid molecules in the animal cells PM and it is absent from the
PM of most plant and all bacterial cells. Cholesterol is smaller than the other lipids of the
membrane and less amphipathic (Karp 2010).
Figure 5 : (a) structural formula of the cholesterol, (b) Schematic drawing, (c) a cholesterol molecule interacting with two
phospholipid molecules in one monolayer of a lipid bilayer (Alberts et al., 2002).
The backbone of cholesterol consists of a rigid, fused four-ring system (Figure 5). A single
hydroxyl group forms the polar headgroup that faces the aqueous milieu while the hydrocarbon tail is
positioned towards the bilayer interior. The small headgroup of cholesterol is insufficient to shield the
hydrophobic ring system from water molecules, so the neighbouring lipids fulfil this role. This may
favour interactions of cholesterol with other lipids that have larger headgroups. This is known as the
umbrella model (Ikonen 2008).
Cholesterol determines the permeability, fluidity, and mechanical properties of the
membranes (Ohvo-Rekilä et al. 2002). It increases the order of fluid-phase phospholipid acyl chains,
giving rise to the formation of the liquid-ordered (lo) phase (Almeida 2009) (cf.1.1.2.1.4). Through this
process, it is also involved in the formation of highly ordered nano-scale membrane domains called
lipid rafts (Niemelä et al. 2007) which play an important role in numerous cellular functions (cf. 1.1.2.4).
1.1.2.1.4 Lipid phases in plasma membrane
The PM lipids can exist in multiple possible phase states that determine the fluidity of this
latter. This fluidity depends on the temperature and the PM composition.

21
At lower temperatures, membrane lipid bilayers undergo a reversible change of state from a fluid
(disordered) LD to a nonfluid (ordered) SO array of the fatty acyl chains (Figure 6). The temperature at
the midpoint of this transition is called the transition temperature. The change of state accompanying
a temperature increase is called the order-disorder transition (Mansilla et al. 2004). The transition
temperature is a function of many factors such as the membrane lipid composition, the saturation
degree and the length of the fatty acid chain in addition of the presence of cholesterol. Phospholipids
with saturated chains pack together more tightly than those containing unsaturated chains. The
greater the degree of unsaturation of the fatty acids of the bilayer, the lower the temperature before
the bilayer gels. The introduction of one double bond in a molecule of stearic acid for example can
lower the melting temperature from 70˚C to 13˚C (Karp 2010).
Figure 6: lipid phases in plasma membrane. S: the order parameter of a segment of acyl chain, DT: the translational
diffusion coefficient (van Meer et al. 2008).
The presence of cholesterol tends to abolish sharp transition temperatures and decreases the
permeability of the PM (Cooper 1978). At relatively higher temperatures (e.g. 37˚C), cholesterol makes
the membrane less fluid by restraining phospholipid movement. However, because cholesterol also
hinders the close packing of phospholipids, it lowers the temperature required for the membrane to
solidify. Thus, cholesterol plays a role of a "temperature buffer” for the membrane, resisting changes
in membrane fluidity that can be caused by changes in temperature (Campbell n.d. et al., 2008).
The membrane fluidity plays a key role in membrane assembly (from preexisting membranes
and many cellular processes, including cell movement, cell growth, cell division, formation of
intercellular junctions and vesicular trafficking. An example of the importance of the membrane fluidity
in the life cycle is the adaptation of plants that tolerate extreme cold, such as winter wheat. In these
plants, the percentage of unsaturated phospholipids increases in autumn, increasing the fluidity of PM,
which keeps the membranes from solidifying during winter.

22
1.1.2.2 Proteins
There are much less proteins molecules than lipids molecules in the PM (about 50 lipids
molecules for each protein), but given they are much larger, they constitute about 50% of PM mass.
Approximately, 30% of all active genes encode membrane proteins of which approximately one-third
are G-protein coupled receptors (GPCRs) (von Heijne 2007).
The primary structure of a protein is the amino-acids sequence. Alpha helices and beta-sheets
are the two types of stable secondary structures, they are located at the core of the protein, whereas
random coils, loops or turns are in its outer regions. Tertiary structure describes the packing of alpha-
helices, beta-sheets and random coils with respect to each other on the level of one whole polypeptide
chain. Then quaternary structure describes the spatial organization of many chains present in a
complex protein.
The maturation of membrane proteins is directed by an initial specific glycosylation in the
endoplasmic reticulum (ER). Correct glycosylation is guarantead by the lectin chaperones calnexin and
calreticulin before vesicular transport to the Golgi apparatus and later transfer to the PM (Trombetta
& Parodi 2003).
The membrane proteins are associated in different ways with the lipid bilayer (Figure 7), and
they are amphipatic like lipids; their quaternary structrure displays hydrophilic parts and lypophylic
parts, in particular at the level of the transmembrane domain. Membrane proteins can span a
membrane once in a single pass such as guanylate cyclase (an enzyme of the G protein signaling
cascade that synthesizes cGMP from GTP) or up to 19 times such as voltage-dependent Ca2+ channels
(Remm & Sonnhammer 2000). The most frequent are proteins with a single transmembrane spanning
segment followed by those with two to seven such segments. The great majority of the membrane-
spanning segments of polypeptide chains form an alpha helix when they traverse the bilayer (Alberts
et al. 2002b). The first evolution of the original fluid-mosaic model presented by Singer and Nicolson
was the integration of proteins in the lipid bilayer which the hydrophobe part was an alpha helix as
suggested first by Unwin and Henderson (cf. 1.1.1.1, Figure 1. b and Figure 2).
Figure 7 : Various ways of membrane proteins association with the lipid bilayer (Alberts et al. 2002b).

23
Membrane proteins can be grouped into three distinct classes:
a. Integral proteins : penetrate the lipid bilayer
Called also transmembrane proteins, integral proteins have some parts in the ouside of the lipid bilayer
and some others integrated in the lipid bilayer by multiple ways : a single α helix, multiple α helices, or
a rolled-up β sheet (a β barrel) (Figure 7: 1, 2 and 3 respectively). Some of these “single-pass” and
“multipass” proteins have a covalently attached fatty acid chain inserted in the cytosolic lipid
monolayer.
b. Lipid-anchored proteins: exposed at only one side of the membrane.
Some of these proteins are anchored to the cytosolic surface by an amphipathic α helix that partitions
into the cytosolic monolayer of the lipid bilayer through the hydrophobic face of the helix (Figure 7: 4).
Others are attached to the bilayer solely by a covalently attached lipid chain—either a fatty acid chain
or a prenyl group—in the cytosolic monolayer (Figure 7: 5), or via an oligosaccharide linked to a
molecule of phosphatidylinositol in the noncytosolic monolayer (Figure 7: 6).
c. Peripheral proteins : located entirely outside of the lipid bilayer
Many proteins are attached to the membrane only by noncovalent interactions with other membrane
proteins (Figure 7: 7 and 8).
1.1.2.3 Carbohydrates
A carbohydrate is a biological molecule consisting of carbon, hydrogen and oxygen atoms,
usually with a hydrogen:oxygen atom ratio of 2:1, and with an empirical formula Cm(H2O)n.
The PM of eukaryotic cells contain carbohydrates that are covalently linked to both lipids and proteins.
More than 90 percent of the membrane’s carbohydrates are covalently bonded to proteins to form
glycoproteins; the remaining proportion is covalently linked to lipids to form glycolipids. Membrane
carbohydrates are short, branched chains of fewer than 15 sugar units (Campbell & Reece 2007).
Depending on the species and cell type, the carbohydrate content of the PM ranges between 2 and 10
percent by weight (Karp 2010).
The carbohydrate projections play a role in mediating the interactions of a cell with another
cell and with its environment. Infection by pathogenic microorganisms is often initiated by their
adhesion to appropriate target cell via a carbohydrate. Enteric bacteria Escherichia coli binds to D-
mannose of the urinary and gastrointestinal tracts epithelial cells via their lectins (Sharon 1987).
Oligosaccharides may be attached to several different amino acids by two major types of
linkages seen on Figure 8: the N-glycosidic linkage and the O-glycosidic linkage. The carbohydrates of
the glycolipids of the red blood cell PM determine whether a person’s blood type is A, B, AB, or O.

24
Figure 8 : Two types of linkages that join sugars to a polypeptide chain. (a) The N-glycosidic and (b) the O-glycosidic linkage
(Karp 2010).
1.1.2.4 Lipid rafts
Lipid rafts are specialized membrane domains that contain high concentrations of cholesterol,
glycosphingolipids, sphingomyelin, gangliosides and saturated phospholipids. Bulk PM containing
these components in a smaller concentration together with unsaturated glycerophospholipids (GPL),
is more fluid than lipid rafts. The rafts are liquid-ordered regions that are resistant to extraction with
cold nonionic detergents such as Triton X-100. They are small in size, but may constitute a relatively
large fraction of the PM.
Lipid rafts are involved in the regulation of signal transduction; a variety of proteins involved
in cell signaling have been shown to partition into lipid rafts (Pike 2003). Lipid rafts contain many fatty
acylated proteins that play key roles in regulating cellular structure and function. The two most
common forms of protein fatty acylation are modification with myristate, a 14-carbon saturated fatty
acid, and palmitate, a 16-carbon saturated fatty acid (Resh 1999).
Lipid rafts play important role in membrane trafficking (Simons & Ikonen 1997). Sphingolipid-
cholesterol rafts are involved in transporting protein in the endocytic pathways (Danielsen 1995).
Caveolae, small PM invaginations are a subset of lipid rafts. Glycosylphosphatidylinositol (GPI)-linked
proteins are members of lipid rafts and are often used as markers for these domains (Schnitzer et al.
1995). Analysis of the rate of lateral diffusion of GPI-linked proteins as well as gangliosides, suggested
that the domains are 200 nm to 300 nm in diameter (Jacobson et al. 1995).

25
Figure 9 : the lipid raft composition. GPI: glycosylphosphatidylinositol, GPL: glycerophospholipid, GSL : glycosphyngolipid,
TM protein: transmembrane protein, SM : sphyngomyelin. (Zhong 2011).
1.1.2.5 The asymmetry of the plasma membrane
Membranes are structurally and functionally asymmetric. The outer and inner surfaces of all
known biological membranes have different components and different enzymatic activities. This
asymmetry is referred to as membrane “sidedness.”
Membrane proteins have a unique orientation because they are synthesized and inserted into
the membrane in an asymmetric manner. This asymmetry is preserved because membrane proteins
do not rotate from one side of the membrane to the other (Berg et al. 2002a). Lipids, too, are
asymmetrically distributed as a consequence of their mode of biosynthesis. The asymmetric
distribution of glycolipids in the bilayer results from the addition of sugar groups to the lipid molecules
in the lumen of the Golgi apparatus, which is topologically equivalent to the exterior of the cell (Alberts
et al. 2014). The phospholipid asymmetry is generated in the endoplasmic reticulum (ER), where most
of the membranes in a eucaryotic cell, including the plasma membrane, are synthesized. The
asymmetric distribution of cholesterol and the various glycerophospholipids contribute to the lipid
curvature needed to maintain cell structure and to sustain the noncrystalline state by limiting the
ability to phase shift to a more rigid structure (Maxfield & Tabas 2005).
The lipid asymmetry is functionally important. The enzyme protein kinase C, for example,
requires the negatively charged PS to act; when it is activated by an extracellular signal, it binds to the
cytoplasmic face of the PM, where the PS is concentrated (Alberts et al. 2002a). On the other hand,
the appearance of PS on the outer surface of aging lymphocytes marks the cells for destruction by
macrophages, whereas its appearance on the outer surface of platelets leads to blood coagulation
(Karp 2010). Another example is that of PI; these minor phospholipids concentrated in the inner leaflet
are cleaved into two fragments by specific enzymes that are activated by extracellular signals. Both
fragments act as diffusible mediators to relay the signal into the cell interior.

26
Figure 10: the asymetric distribution of phospho and glycolipids in the plasma membrane (Alberts et al. 2002a).
1.1.3 The dynamic nature of the plasma membrane
The lipids and proteins represented in the fluid mosaic model of Singer and Nicolson are not
fixed in their position. They move within the PM. Phospholipids and glycolipids can rotate freely around
their axes and diffuse laterally within the membrane leaflet (Figure 11). Because such movements are
lateral or rotational, the fatty acyl chains remain in the hydrophobic interior of the membrane. A typical
lipid molecule exchanges places with its neighbors in a leaflet about 106 times per second and diffuses
several micrometers per second at 37 °C. The third movement of phospholipids is the migration, or
flip-flop, from one leaflet to another, and this movement is catalyzed by specific membrane proteins
called flippases, which help maintain asymmetric gradient in the PM (Daleke 2007). However, this
movement is restricted, because the transport of the polar head of a phospholipid through the
hydrophobic interior of the membrane consumes a lot of energy.
Figure 11 : The possible movements of phospholipids in a membrane and the approximate time scales over which they occur
(Karp 2010).
Like lipids, membrane proteins are able to move laterally within the PM (lateral diffusion) and
they can rotate about an axis perpendicular to the plane of the bilayer (rotational diffusion) but they
do not tumble (flip-flop) across the lipid bilayer (Alberts et al. 2002b).

27
One of the first experiments to demonstrate that membrane proteins could move within the
membrane was that of Larry Frye and Michael Edidin in 1970 (Frye & Edidin 1970). Cells from
established tissue culture lines of mouse and human origin were marked by different fluorescent
antibodies against membrane proteins and then fused together with Sendai virus (Figure 12). The
heterokaryons bearing both mouse and human surface antigens were then followed by the indirect
fluorescent antibody method. At the beginning the rhodamine labeled antibodies (against human
membrane) were localized at one part of the heterokaryons and the fluorescin labeled antibodies
(against mouse membrane) at the other part. Within 40 min following fusion, total mixing of both
parental antigens occurred in over 90% of the heterokaryons (Frye & Edidin 1970).
Because they are bigger, the proteins move more slowly than the phospholipids. Protein-rich
regions of the PM, about 1 μm in diameter, separate lipid-rich regions. Phospholipids are free to diffuse
within such a region but not from one lipid-rich region to an adjacent one. The lateral diffusion rate of
a mobile protein in an intact membrane is 10 -30 times lower than that of the same protein embedded
in synthetic liposomes. This suggests that the mobility of integral proteins in intact membranes is
restricted by interactions with the rigid submembrane cytoskeleton. (Lodish et al. 2000a).
Figure 12 : An experiment demonstrating the mixing of PM proteins on mouse-human hybrid cells (Alberts et al. 2002b).

28
1.1.4 The plasma membrane functions
1.1.4.1 Lipids functions
1.1.4.1.1 Compartmentalization
The PM constitutes a scaffold that encloses the contents of the cell and allows specialized
activities to proceed without external interference. At the same time, membranes provide the means
of communication between the extracellular and intracellular compartments. This
compartmentalization is the basic role of the PM that enables segregation of specific chemical
reactions.
Due to its fluid structure, the PM is able to conserve its architecture even when the external
conditions, such as temperature and pH, change. In addition to the barrier function, lipids provide
membranes with the potential for budding, tubulation, fission and fusion, characteristics that are
essential for cell division, biological reproduction and intracellular membrane trafficking via
endocytosis and exocytosis (cf. 1.3.1). Lipids also allow particular proteins in membranes to aggregate,
and others to disperse (van Meer et al. 2008). To do their job, the cells need to be able to change shape
and this ability impose changes and plasticity in the PM. For example, some immune cells, such as
neutrophils, engulf bacteria and viruses, so they need to change their shape to ‘swallow’ them by
phagocytosis (Nordenfelt & Tapper 2011).
1.1.4.1.2 A selectively permeable barrier
The lipids are amphipatic: they have hydrophobic moieties that tend to self-associate, and
hydrophilic moieties that tend to interact with aqueous environments and with each other. This
property enables the cells to segregate their internal constituents from the external environment. The
PM controls what enters and what exits the cell, and allows some substances to cross it more easily
than others, phenomenon called the selective permeability.
The selective permeability of biological membranes to small molecules allows the cell to
control and maintain its internal composition. Only small uncharged molecules can diffuse freely
through phospholipid bilayers (Figure 13). Small nonpolar molecules, such as O2 and CO2, are soluble
in the lipid bilayer and therefore can readily cross the PM. Small uncharged polar molecules, such as
H2O, also can diffuse through membranes, but larger uncharged polar molecules, such as glucose,
cannot (Cooper 2000a). Non polar hydrophobic molecules such as steroid hormones can diffuse
through the PM. However, charged molecules, such as ions, are unable to diffuse through a
phospholipid bilayer regardless of size; even H+ ions cannot cross a lipid bilayer by free diffusion. The
ions pass across the membrane via specific transmembrane proteins which act as transporters
(discussed in section 1.1.4.2.1) that determine, with the lipid bilayer, the selective permeability of the
PM.

29
Figure 13 : permeability of phospholipids bilayer (Cooper 2000a).
1.1.4.1.3 Signal Transduction in response to external stimuli
The PM plays a critical role in the response of a cell to external stimuli, and in the propagation
of stimuli by signal transduction. Lipids can act as first and second messengers in this signal
transduction. For example, the phospholipase C (PLC) is a cytosolic enzyme translocated to the PM
when activated by the Gq protein-coupled receptors (GqPCRs). This enzyme catalysis the reaction of
PIP2 (phosphatidylinositol 4,5-biphosphate) hydrolysis into inositol triphosphate (IP3) and
Diacylglycerol (DAG), two important second messengers in the cell leading to calcium (Ca2+) release
and protein kinase C (PKC) activation (Falkenburger et al. 2013). Additional examples of biologically
active lipids are arachidonic and docosahexaenoic acids ω-6, present mostly in PhE, PhC, and PhI, which
can be liberated by activated phospholipases A2 (Serhan et al. 1996). When oxidized, these fatty acids
produce the prostaglandins and leukotrienes families of compounds, most of which activate members
of the G protein-coupled receptor (GPCR) family, and key effectors in the process of inflammation and
many other cellular processes.
1.1.4.2 Proteins functions
1.1.4.2.1 Selective permeability: transport proteins
PM proteins can serve as transporters whose functions include creating and/or maintaining
concentration gradients of electrolytes, water, nutrients, metabolic cofactors, and other essential
molecules; extruding toxic substances; and recapturing neurotransmitters and many other substances
(MÜLLER et al. 2008). The two main types of transport are the passive and the active transport.
a- Passive transport : channel and carrier proteins
The diffusion of a substance across the PM is called passive transport because it does not need
an energy depense from the cell. The concentration gradient itself represents potential energy and
drives diffusion. Many polar molecules and ions impeded by the lipid bilayer of the membrane diffuse

30
passively with the help of transport proteins. This phenomenon is called facilitated diffusion. The
tendency of an electrolyte to diffuse between two compartments depends on two gradients: a
chemical gradient, determined by the concentration difference of the substance between the two
compartments, and the electric potential gradient, determined by the difference in charge. Together
these differences are combined to form an electrochemical gradient (Karp 2010). At the
electrochemical equilibrium the chemical and electrical gradients are equal in magnitude.
An exemple of a nonelectrolyte is the water molecules that are small enough to cross through
the phospholipid bilayer, however the rate of water movement by this route is relatively slow because
of its polarity. The passage of water occurs via channel proteins known as aquaporins. Each aquaporin
allows entry of up to 3 billion water molecules per second (Campbell & Reece 2007). The aquaporins
are considered channel proteins that function by having a hydrophilic channel that certain molecules
or atomic ions use as a tunnel through the PM (Figure 14). The channel proteins are one of two general
classes of membrane transport proteins and they group aquaporins and ions channels. Many ions
channels function as gated channels, which open or close in response to a chemical or electrical
stimulus and allow the passage of inorganic ions such as sodium (Na+), potassium (K+), calcium (Ca2+),
and chlore (Cl-) across the PM (Cooper 2000b). For example, stimulation of a nerve cell by certain
neurotransmitter molecules open gated channels that allow sodium ions to enter the cell (chemical
stimulation). Later on, an electrical stimulus activates the ion channel protein that rush out potassium
ions from the cell (Friedman 2008).
The other classe of transport proteins are the carrier proteins. These proteins do not form
open channels but act like enzymes to facilitate the passage of specific molecules across the PM. These
proteins are specific for the substance they translocate and their shape changes are triggered by the
binding and release of the transported molecule. For example, the glucose enters the red blood cells
rapidly via specific carrier protein: the glucose transporter, so selective that it even rejects fructose, a
structural isomer of glucose.
Figure 14 : passive and active transport. Chan : channel protein, Carr : carrier protein. (Campbell n.d. et al., 2008).

31
b- Active transport: carrier proteins
Some transport proteins can move solutes against their concentration gradients. This process
is called active transport and it is coupled to ATP (adenosine triphosphate) hydrolysis as a source of
energy. All the proteins implicated in this transport are carrier proteins rather than channel proteins.
Active transport enables a cell to maintain internal concentrations of small solutes that differ from
concentrations in its environment. For example, compared with its surroundings, an animal cell has a
much higher concentration of K+ ions and a much lower concentration of Na+ ions (Campbell & Reece
2007). The PM helps maintaining these steep gradients by pumping sodium out of the cell and
potassium into the cell. One way ATP can power active transport is by transferring its terminal
phosphate group directly to the pump protein. This can induce the protein to change its shape in a
manner that translocates a solute bound to the protein across the membrane. One of the very
important transport system that works this way is the sodium-potassium pump, which exchange 3 Na+
for 2 K+ across the PM (Morth et al. 2011). This pump plays an important role in the establishment of
a membrane potential (discussed in 1.1.5).
1.1.4.2.2 Signal transduction: receptor proteins
Membrane proteins can function as receptors for extracellular ligands (signaling molecules) A
membrane receptor may have a binding site with a specific shape that fits the shape of a chemical
messenger, such as a hormone. The external messenger causes a shape change in the protein that
relays the message to the inside of the cell. The three largest protein families in this category are: G
protein-coupled receptors (GPCR), receptor tyrosine kinases (RTK) and ion channel receptors.
a- G protein-coupled receptors
A GPCR is a PM receptor that has seven α helix spanning the membrane, containing a signaling
molecule binding site and a segment that interacts with G-proteins. Many ligands (sensory stimuli,
neurotransmitters, chemokines and hormones) use GPCRs. The binding of the ligand to the GPCR
activates a specific G protein located on the cytoplasm side. A G protein is made up of three subunit:
α, β and γ (Dupré et al. 2012) (Figure 15). There are four main families of G proteins: Gs, Gq, Gi/o and
G12/13 (Ellis 2004) that are expressed by different genes and differ in the α subunit composition, the
effector, the cellular effets, and the receptor that are coupled with.
In its inactive form, the G protein is bound to a guanosine di-phosphate (GDP) by its α subunit.
When a signaling molecule binds to the extracellular side of the GPCR, this latter is activated; its
structure changes and its cytoplasmic side binds to an inactive G protein, causing a guanosine tri-
phosphate (GTP) to displace the GDP. This activates the G protein and leads to the dissociation of GTP-
bound α subunit from βγ subunit and their dissociation from the receptor. The GTP-bound α subunit
diffuses along the membrane and binds to a membrane bound enzyme called the effector, and
activates it. Among effectors, there is the adenylyl cyclase (it generates the cyclic adenosine
monophosphate (cAMP) that activate the protein kinase A (PKA)), PLC (generates IP3 and DAG), many
ions channels and voltage operated calcium channels (VOCC) (Figure 15). The free Gβγ complex act also
as a signaling molecule, and activates other second messengers like phosphatidyl inositol 3 kinase, and
ion channels like L-type calcium channels (cf. 2.2.1.1), and G protein-regulated inwardly rectifying

32
potassium channels (GIRK) (Mark & Herlitze 2000). G protein functions as a GTPase enzyme, then
hydrolises GTP to GDP, leaves the effector and returns to its original state.
Figure 15 : binding of ligand to GPCR causes conformational change in the G coupled protein and leads to activate (or
inhibit) many effectors. For example αs and αi will stimulate and inhibit adenylyl cyclase, respectively; αq will activate PLC (all
the terms of the figure are explained in the text) (Vassart & Costagliola 2011).
b- Receptor tyrosine kinases
The RTKs are metabotropic receptors (like GPCRs) but they differ from the GPCRs by their
enzymatic (kinase) activity and the ability of a single ligand-binding event to trigger many pathways.
Different RTKs recruit different collections of intracellular signaling proteins, producing different
effects; however, certain components seem to be used by most RTKs. These include, for example, the
PLCγ (that functions in the same way as the PLCβ activated by GPCRs) and Ras (a small GTP-binding
protein, bound by a lipid tail to the cytoplasmic face of the PM). All RTKs activate Ras; some examples
are the platelet-derived growth factor (PDGF) receptors which mediate cell proliferation in wound
healing (Andrae et al. 2008), and nerve growth factor (NGF) receptors which prevent certain neurons
from dying in the developing nervous system (Marshall 1995).
c- Ion channel receptors
Ion channel receptors (ICR) or ionotropic receptors are transmembrane molecules that can
open or close a hydrophilic channel that would allow smaller particles to get in and out of the cell. They
act as a gate when the receptor shape changes. When a signaling molecule binds to an extracellular
specific site of the receptor, the gate opens or closes, allowing or blocking the flow of specific ions,
such as Na+, Ca2+, K+ or Cl-. When the ligand dissocates from the receptor, the gate closes and ions no
longer move. The two major categories of gated channels are:
Voltage-gated channels (VGC): whose conformational state depends on the difference in ionic
charge on the two sides of the PM. They open transiently in response to a change in the
membrane potential (cf. 1.1.5). The Ca2+ VGC in the axon terminal of a presynaptic neuron

33
(PrSN) allow Ca2+ entry and fusion of neurotransmitters (NT) vesicles with PrSN membrane and
release of NT in the synaptic space.
Ligand-gated channels (LGC): whose conformational state depends on the binding of a ligand
which is usually not the solute that passes through the channel (Karp 2010). Like the VGC, they
are very important in the nervous system. Many NT receptors are LGC.
Ionotropic receptors (ICR) act quickly. As soon as a ligand binds to them, they change shape
and allow ions to flow in. They remain open for few milliseconds (Marieb & Hoehn 2006). On the other
hand, metabotropic receptors (GPCR and RTK), take a longer time, depending on the number of steps
(secondary messengers) required, to produce a response. They remain open from seconds to minutes
(Kandel et al. 2000).
Figure 16 : examples of voltage and ligand-gated channels (Purves et al. 2001).
1.1.4.2.3 Other functions
In addition to transport and signal transduction, PM proteins exhibit a lot of other functions.
They serve as structural molecules that maintain the size and the polarity of the cells. (MÜLLER et al.
2008). They bind, noncovalently, to the microfilaments or other elements of the cytoskeleton which
help maintaining cell shape (Campbell n.d. et al., 2008). Membrane proteins act as adhesion molecules
that allow attachment of adjacent cells to each other. In addition, they play a role in cell-cell
recognition as they serve as identification tags recognized specifically by the PM proteins of other cells.
They allow cells to communicate and to detect changes in their environment. And finally, the PM
proteins could exhibit enzymatic activity, and carry out sequential steps of metabolic pathways.
1.1.5 Resting membrane potential
The free-energy change when an uncharged solute (a nonelectrolyte) diffuses across a
membrane depends on the magnitude of the concentration gradient and it is given by

34
∆𝐺 = 𝑅𝑇 ln[𝐶𝑖]
[𝐶𝑜]
Where ∆𝐺 is the free-energy change, R is the gas constant, T is the absolute temperature, and [Ci]/[Co]
is the ratio of the concentration of the solute on the inside (i) and outside (o) surfaces of the
membrane.
The free-energy change for the diffusion of an electrolyte into the cell is
∆𝐺 = 𝑅𝑇 ln[𝐶𝑖]
[𝐶𝑜]+ 𝑧𝐹∆𝐸𝑚
where 𝑅𝑇 ln[𝐶𝑖]
[𝐶𝑜] is the chemical gradient (∆GChemical) and 𝑧𝐹∆𝐸𝑚 is the electrical gradient (∆GElectrical). z
is the charge of the solute, F is the Faraday constant, and ∆𝐸𝑚 is the potential difference (in volts)
between the two compartments.
At equilibrium ∆GElectrical and ∆GChemical are equal, hence:
𝑅𝑇 ln[𝐶𝑖]
[𝐶𝑜]= 𝑧𝐹∆𝐸𝑚eq.
Solving the ∆𝐸𝑚eq , we get: ∆𝐸𝑚eq. = 𝑅𝑇
𝑧𝐹ln
[𝐶𝑖]
[𝐶𝑜]
The last equation is known as the Nernst equation. The Nernst equation allows us to calculate
the potential that will be established across the membrane based on the valence and concentration
gradient of an ion (provided that only this ion channels are present). This potential is also referred to
as the Nernst potential (NP). The NP for any given ionic species is the membrane potential at which
the ionic species is in equilibrium (Vidal-Iglesias et al. 2012). Therefore, the NP for an ion is referred to
as the equilibrium potential for that ion.
The practical case of plasma membrane include several ions on either side, not only one. The
Goldman-Hodgkin-Katz equation is used to calculate the equilibrium potential (EP) in the case of many
ions surrounding the membrane (Engelking 2002). The EP of a membrane surrounded by a solution
containing sodium (Na+), potassium (K+), and chlore (Cl-) is:
∆𝐸𝑚eq. =𝑅𝑇
𝐹 𝑙𝑛 (CNa+ [Na+]o + CK+ [K+]o + CCl- [Cl-]i / CNa+ [Na+]i + CK+ [K+]i + CCl- [Cl-]o)
Where C is the ion conductance (or permeability coefficient). Note that the terms i (for inside) and o
(for outside) are reversed for Cl- compared with K+ and Na+ because it has a valence of -1. The
equilibrium potential for K+ ions is -90 mV, -70 mV for Cl- and +60 mV for Na+.
All cells have electrical potential energy across their plasma membranes. The cytoplasm is
negative in charge relative to the extracellular medium because of an unequal distribution of anions
and cations on opposite sides of the PM. The voltage across a membrane, called a membrane potential
(MP), ranges from about – 4.5 (Veech et al. 1995) to - 200 millivolts (mV) (Campbell n.d. et al., 2008)
indicating that the inside of the cell is negative relative to the outside. This is why the MP favors the
passive transport of cations into the cell and anions out of the cell. For neurons, typical values of the

35
resting potential range from –70 to –80 millivolts. Some membrane proteins that actively transport
ions against their electrochemical gradient contribute to the membrane potential. An example is the
Na+/K+ pump seen in section 1.1.4.2.1 b, which pumps three sodium ions out of the cell for every two
potassium ions it pumps into the cell. This process makes a net transfer of one positive charge from
the cytoplasm to the extracellular medium and stores energy as voltage. Such transport protein that
generates voltage across a membrane is called an electrogenic pump. The sodium-potassium pump is
the major electrogenic pump of animal cells. The main electrogenic pump of plants, fungi, and bacteria
is a proton pump, which actively transports hydrogen ions (protons) out of the cell (Sperelakis 2012).
1.2 THE ORGANELLES MEMBRANES
1.2.1 Eukaryotic cell compartmentalization
The eukaryotic cell organelles are specialized structures that have characteristic shapes, and
provide different local environments that facilitate perform specific metabolic functions needed for
growth, maintenance, and reproduction of the cell. The Figure 17 summarizes the different organelles
of a eukaryotic cell, their relative structures and functions. Not mentioned in this figure are the
endosomes, specialized vesicules in sorting of endocytosed material.
On the average, the membrane-enclosed organelles together occupy nearly half the volume of
a eucaryotic cell. In terms of its area and mass, the plasma membrane is only a minor fraction of the
membranes in most eucaryotic cells. It is possible to separate one type of organelle from another by
differential centrifugation. The cytoskeleton plays an important role in the characteristic distributions
of the organelles. The localization of the Golgi apparatus close to the nucleus and of the ER throughout
the entire cytosol is due to interactions with intact microtubules. If the microtubules are
experimentally depolymerized with a drug, the Golgi apparatus fragments and disperse throughout
the cell, and the ER network collapses toward the cell centre (Alberts et al. 2002a).

36
Figure 17 : the different eukaryotic cell organelles – their structure and function (Campbell n.d. et al., 2008).
1.2.2 Organelles membranes composition
The basic structure and composition of PM and organelles membranes are similar. Each
membrane is held together via noncovalent interaction of hydrophobic fatty acid tails. However, each

37
organelle has a unique composition of membrane lipids and proteins suited to that membrane’s
specific functions. For example, enzymes embedded in the membranes of mitochondria function in
cell respiration. In the endoplasmic reticulum (ER), there is a relative abundance of certain
glycerophospholipids on the cytoplasmic face of the membrane with sphingolipids being
predominantly located on the luminal surface (MÜLLER et al. 2008). All the other lipids are
symmetrically distributed between the two leaflets of the ER membrane (Devaux & Morris 2004).
Most of the enzymes involved in phospholipids synthesis are membrane associated. In
mammalian cells, the smooth ER synthetises nearly all the major classes of lipids including cholesterol
and ceramid. This is why the phospholipid asymmetry of the PM is generated in the ER (Csala et al.
2006b). The asymmetric distribution of glycolipids in the bilayer results from the addition of sugar
groups to the lipid molecules in the lumen of the Golgi apparatus, which is topologically equivalent to
the exterior of the cell (Alberts et al. 2014).
Like the outer leaflet of the PM, the luminal surface of internal organelles is enriched in
choline-based lipids such as phosphatidylcholine (PC) and sphingomyelin. However, there is less
cholesterol in the organelles membranes and the amount differs between organelles. It is higher in the
endosomes and golgi apparatus than in the ER and mitochondria (van Meer et al. 2008). The table 2
shows the approximate lipid composition by weight of different membranes.
The difference in membrane composition is correlated to lipid synthesis and function of each organelle.
For example, the ER is the major site of PC synthesis and its membrane can contain until 60% of PC.
Another example is that of mitochondria; phospholipids specifically required for mitochondrial
function such as cardiolipin and PE are synthesized in mitochondrial membrane (Zinser et al., 1991).
Therefore mitochondrial membrane presents a large amount of cardiolipin, specialy the inner
mitochondrial membrane (IMM). It is important to mention that 75% of IMM as well as chlororoplasts
membranes are proteins involved in ATP production (Alberts et al. 2002b).
Table 1 : Approximate Lipid Compositions of Different Cell Membranes (Alberts et al. 2002a).
The Golgi and endosomal membranes display an asymmetric lipid distribution, with SM and
GSL on the luminal side, and with PS and PE enriched on the cytosolic side (Devaux & Morris 2004).
There is an exchange of phospholipids between the different organelles. Newly synthesized
phospholipids can move between membranes by routes that are independent of the vesicular traffic
that carries membrane proteins. This routes include zones of apposition and contact between donor

38
membranes, source of specific phospholipids, and acceptor membranes unable to synthesize the
necessary lipids (Voelker 2005). For example, the PS synthetized in the ER is exchanged with
mitochondria via mitochondria-associated ER membrane (Gaigg et al. 1995). In mitochondria, the PS
is transformed to PE via PS decarboxylase. The Golgi uses also this enzyme to synthetise the PE (Voelker
2005), and it is also specialized in sphingolipids and GSL synthesis (Futerman & Riezman 2005).
1.2.3 The endoplasmic reticulum
1.2.3.1 The largest membranes network of the cell
The ER is the most extensive membrane system in a eucaryotic cell (Figure 18) and accounts
more than half the total membrane in many eukaryotic cells (Campbell n.d. et al., 2008). In a typical
mammalian cell, the area of the ER membrane is 20–30 times greater than that of the PM (Alberts et
al. 2009).
The ER is a network of flattened sacs and branching tubules that extend throughout the
cytoplasm. There are two distinct, though connected, regions of the ER that differ in structure and
function: the smooth ER (SER) and the rough ER (RER) also called ergastoplasm. Rough ER has
ribosomes on the outer surface of the membrane and thus appears rough through the electron
microscope. Smooth ER lacks ribosomes on its outer surface. The RER lies immediately adjacent to the
nucleus, and its membrane is continuous with the outer membrane of the nuclear envelope. The SER
consists of tubules network extended throughout the entire cytosol and found, in some regions of the
cell, in near proximity of the PM (Hay 2012). An interesting aspect of tubule formation is that the high
membrane curvature of a tubule occurs along only two dimensions (Shibata et al. 2006).
The sacs and tubules are all interconnected by a single continuous membrane so that the
organelle has only one large, highly convoluted and complexly arranged lumen (internal space). Many
FRAP and FLIP (fluorescence loss in photobleaching) experiments have provided evidence that the
membranes and luminal spaces of the ER are continuous throughout the cell, and that RER and SER
form an interconnected membrane system (Subramanian & Meyer 1997, Dayel et al. 1999, Nehls et al.
2000). The lumen of the ER (cisternal space) often takes up more than 10 percent of the total volume
of a cell (Csala et al. 2006a). In plant cells, the ER forms one continuum throughout the plant, via
plasmodesma (Denecke 2001).
Cells specialising in the production of proteins will tend to have a larger amount of RER whilst
cells producing lipids and steroid hormones will have a greater amount of SER. Larger and more
homogeneous forms of the smooth ER are found in the adrenal and testes cells that secrete large
amounts of steroids, in muscle cells where the sarcoplasmic reticulum that modulates Ca2+ levels
control muscle contraction, and in liver cells that make large amounts of enzymes for detoxification
(Shibata et al. 2006). It was shown that expression of a single ER protein at high levels can induce the
formation of an ordered ER domain in which this protein becomes highly enriched. For example, the
expression of IP3 receptor (IP3R) at very high levels causes the formation of ER cisternal stacks in COS
cells (Takei et al. 1994), and overexpression of ryanodine receptor (RyR) results in the formation of
closely apposed flat ER cisternea in CHO cells (Takekura et al. 1995).

39
The ER lumen is a highly viscous environment compared to the cytoplasm; the diffusion of
green fluorescent protein (GFP) in the continuous ER lumen was found to be 9 to 18 fold slower than
its diffusion in water and 3 to 6 fold slower than GFP diffusion in the cytoplasm (Dayel et al. 1999). The
gel-like consistency of the ER lumen is due to the very high concentrations of resident proteins of the
ER (chaperones including disulfide isomerase, binding immunoglobulin protein (BiP), calreticulin,
calnexin) (Koch 1987). The ER is the starting point of the secretory pathway. It serves as an entry point
for proteins destined for other organelles, as well as for the ER itself.
Figure 18 : immunofluorescence micrograph of ER being labeled with a monoclonal antibody against chicken fibroblast ER
calcium ATPase (http://www.bio.davidson.edu/courses/genomics/method/IMF.html).
1.2.3.2 A highly permeable membrane?
Although the plasma and lysosomal membranes are considered to be highly impermeable, the
situation with the ER membrane is not the same. The lipid composition of the ER membranes is
different to that of other cell compartments. It has a large abundance of phosphatidylcholine and a
very low concentration of cholesterol. It is also very fluid and discorded due to its large proportion of
unsaturated fatty acids (Csala et al. 2006b). The lipid composition of the RER and SER membranes is
the same, but the RER has also abundant translocon pores (Denecke 2001). The translocon is a complex
of several protein that transports newly formed polypeptides into the lumen of the ER. It forms a
translocation channel in the hydrophobic lipid bilayer of the ER. The transiently open translocon may
allow non-selective fluxes (Roy & Wonderlin 2003). In addition, there is no difference in pH between
the ER lumen and the cytosol, in contrast to the other compartments in the secretory pathway, which
are more acidic (Wu et al. 2000).
Despite an extensive exchange of material by membrane trafficking, the ER membrane and PM
are remarkably different (Figure 19). The ER membrane is thinner than the PM due to the nearly
absence of cholesterol and the shorter length of acyl chain, and presents major packing defects due to
the high amount of unsaturated acyl chains and small head groups comparing to the PM. The surface

40
charge is determined by the presence of anionic lipids such as PS and PI; the PM and ER membrane
have respectively a negative and a neutral cytoplasmic surface charge adapted for the barrier function
of the first and the biogenic function of the second. The lengh and geometry of transmembrane
domains (TMD) of the ER and PM proteins are also different. The transition from a thin and loosely
packed membrane (ER) into a thick and rigid one (PM) occurs in the trans-Golgi where sterol supply
and sphingolipid production are held (Holthuis et al. 2001).
Figure 19: differences between plasma membrane (PM) and endoplasmic reticulum (ER) membrane. TMD: transmembrane
domain (Holthuis & Menon 2014).
Low cholesterol and high protein content (enzymes, translocons, receptors) of ER membrane
might increase leakiness by making the membrane structure less ordered (Papahadjopoulos et al.
1972). Due to this and to its high fluidity, the ER membrane is permeable to small molecules less than
5 kDa (Le Gall et al. 2004). However, it remains poorly permeable to Ca2+ ions which stops them from
leaking back into the cytosol, due to powerful sarcoplasmic/endoplasmic reticulum Ca2+ ATPase pump
(SERCA), and to the Ca2+-binding proteins within the ER lumen (Meldolesi & Pozzan 1998). This shows
that high-capacity active processes surpass the velocity of passive transmembrane fluxes of Ca2+.
1.2.3.3 The largest calcium store of the cell
The ER is the largest store of releasable Ca2+ in the cell (Ashby & Tepikin 2001). The SER
sequesters almost all of the Ca2+ from the cytosol (Karp 2010). This is achieved via the SERCA, and the
Ca2+-binding proteins within the ER lumen. The concentration of free ER Ca2+ ions is much lower than
the total (Le Gall et al. 2004). Ca2+ ion release and reuptake occurs in response to extracellular signals
(Csala et al. 2006b). Some cells have SER further specialized; this is the example of the sarcoplasmic
reticulum (SR), found in muscle cells. When a muscle cell is stimulated by a nerve impulse, Ca2+ ions
are released into the cytosol and trigger contraction of the cell. The terminal cisternae of the SR are
juxtaposed to the cell surface T tubules to form the triad in skeletal muscle (Franzini-Armstrong &
Jorgensen 1994).
A study of Subramanian and Meyer (Subramanian & Meyer 1997) using GFP-tagged luminal
markers, shows that the structural continuity of the ER was preserved during short Ca2+ transients or
Ca2+ store depletion. In contrast, the structural continuity of ER Ca2+ stores was disrupted by persistent
Ca2+ increases (using 1 µM of ionomycine, a Ca2+ ionophore) that lasted longer than 10 minutes. A
similar disruption in ER structure has been shown to occur transiently during fertilization of mouse

41
(Mehlmann et al. 1995), starfish oocytes (Jaffe & Terasaki 1994) and sea urchin eggs (Terasaki et al.
1996).
The mean concentration of the Ca2+ in the cytosol varies between 100 and 400 nM (Schantz
1985, Ratto et al. 1988), whereas it varies almost between 50 μM and 1 mM in the RE (Hofer & Machen
1993, Chatton et al. 1995). In plants, the vacuoles represent the major Ca2+ store within the cell (Canut
et al. 1993).
1.2.3.4 The KDEL sequence
The synthesis of the proteins in the cell begins on the ribosomes in the cytosol. The exceptions
are the few mitochondrial and chloroplast proteins that are synthesized on ribosomes inside these
organelles (Harris et al. 1994, O’Brien 2003). The fate of any protein molecule synthesized in the
cytosol depends on its amino acid sequence, which can contain a sorting signal that directs the protein
to the organelle in which it is required. Proteins that lack such signals remain as permanent residents
in the cytosol. This has been shown by experiments in which the sequence is either deleted or
transferred from one protein to another by genetic engineering techniques. Deleting a signal sequence
from an ER protein, for example, converts it into a cytosolic protein, while placing an ER signal
sequence at the beginning of a cytosolic protein redirects the protein to the ER (Alberts et al. 2009).
Some proteins made in the ER are destined to function there. They are retained in the ER (and
are returned to the ER when they escape to the Golgi apparatus) by a C-terminal sequence of four
amino acids called an ER retention signal or KDEL sequence in mammals and HDEL sequence in yeasts
(Munro & Pelham 1987); K for lysine, D for aspartic acid, E for glutamic acid, L for Leucine and H for
histidine. This retention signal is recognized by a membrane-bound receptor protein in the ER and
Golgi apparatus.
ER luminal proteins, especially those present at high levels can be passively incorporated into
COPII vesicles and transported to the Golgi (Figure 20). Many such proteins bear a C-terminal KDEL
(Lys-Asp-Glu-Leu) sequence that allows them to be retrieved. The KDEL receptor, located mainly in the
cis-Golgi network and in both COPII and COPI vesicles, binds proteins bearing the KDEL sorting signal
and returns them to the ER. This retrieval system prevents depletion of ER luminal proteins such as
those needed for proper folding of newly made secretory proteins. The binding affinity of the KDEL
receptor is very sensitive to pH (Lodish et al. 2007). The small difference in the pH of the ER and Golgi
favors binding of KDEL-bearing proteins to the receptor in Golgi-derived vesicles and their release in
the ER.

42
Figure 20 : Role of the KDEL receptor in retrieval of ER-resident luminal proteins from the Golgi. KDEL sequence is colored in
red (Lodish et al. 2007).
1.3 THE CONTINUITY OF THE CELLULAR MEMBRANES
Many of the different membranes of the eukaryotic cell are part of the endomembrane system.
The membranes of this system are related either through direct physical continuity or by the transfer
of membrane segments as small vesicles. The luminal continuity between PM and ER for example are
essential features of membrane flow and normal cell function (Hay 2012). There is also a continuity
between RER and SER membranes and nuclear envelop. The Golgi apparatus is closely associated with
the ER and recent observations suggest that parts of the two organelles are so close, that some
chemical products probably pass directly between them without vesicles.
The smooth ER is where vesicle budding and fusion take place, as well as zones of contact with
other organelles membranes, possibly for the purpose of delivering lipids to them (Shibata et al. 2006).
For example, couplings between ER and the PM can be observed as seen before in skeletal muscle but
also in nonmuscle cells with a highly differentiated ER network such as squid giant axon (Metuzals et
al. 1997) or cerebellar Purkinje cells (Takei et al. 1994). Moreover, ER membranes may form contacts
with the OMM, for the transport of certain lipids into the mitochondrion (Perkins et al. 1997).
1.3.1 Vesicular transport
The interior of the ER, Golgi apparatus, endosomes and lysosomes, communicate extensively
with one another and with the outside of the cell by means of small vesicles. This phenomenon permits
the membrane transport between cellular organelles in the secretory and endocytic pathway.
Secretory and endocytic organelles are connected by bidirectional vesicular transport as shown in
Figure 21. Vesicles bud from one membrane and fuse with another, carrying membrane components
and soluble proteins between cell compartments.

43
Figure 21 : vesicular trafficking between the endomembrane system and the plasma membrane. In Pink: secretory
pathways, in green: endocytic pathways and in blue: retrieval pathways (Alberts et al. 2009).
Each transport vesicle have a distinctive protein coat and are therefore called coated vesicles.
Some examples of coated vesicles are:
- Clathrin-coated vesicles (CCV) are involved in material transport from the trans-Golgi or the
PM to the endosomes.
- COPI vesicles are involved in transporting molecules from the cis-Golgi to the ER (Figure 20).
- COPII vesicles are involved in transporting molecules from ER to the cis-Golgi (Figure 20) and
from one part of the Golgi apparatus to another.
After budding from a cellular compartment, the vesicle sheds its coat to be able to interact with
the target membrane. The vesicle is transported by motor proteins that move along cytoskeletal fibers
such as kinesin and dynein. The kinesin move toward the exterior whereas dynein move toward the
interior of the cell by using ATP (Garrett & Grisham 2000 p. 537).

44

45
2 CALCIUM REGULATION IN THE CELL
2.1 THE IMPORTANCE OF THE CALCIUM IN THE ORGANISMS AND THE CELL
PHYSIOLOGY
Calcium (Ca2+) is essential for all living organisms. It forms part of cell walls and is an essential
constituent of leaves, and a major material used in mineralization of bones, teeth, and exoskeleton. In
many animals, it is the most abundant ion by mass. Hence, it is an important component of healthy
diet.
Ca2+ is a primordial element and a key regulator of many physiological processes occuring in
many organisms. It is important for blood clotting, muscle contraction, egg fertilization, cell
proliferation, learning, memory and neuronal transmission. On the cellular scale, it constitutes one of
the most important second messengers in the cell. It regulates many important cellular processes such
as metabolism, ATP synthesis, apoptosis, vesicle trafficking, exo and endocytosis, cellular motility,
membrane excitability, cellular growth, proliferation and differenciation, control of gene expression
and many other functions.
2.2 CALCIUM-SIGNALING SYSTEM
Because of its extremely importance, the cells have developed a sophisticated machinery
responsible for Ca2+ regulation and to maintain the intracellular cytoplasmic calcium concentration
stable, taking into account that any uncontrolled excess of this concentration could be highly toxic for
the cell, resulting in cell death. Each cell has its unique set of Ca2+ signaling system components, in a
way to create calcium transients with specific spatial and temporal properties. Figure 22 shows the
principles channels and receptors implicated in the generation of Ca2+ pulses in the cell, and the
different physiological effects of calcium transients.

46
Figure 22 : Exapmles of some components of the “on” and “off” reactions governing the calcium signaling systems. Red
circles = Ca2+, IP3R: inositol-1,4,5-triphosphate receptor, NCX: NA+/Ca2+ exchanger, PMCA: plasma membrane Ca2+-ATPase,
RyR: ryanodine receptor, SERCA: Sarco/endoplasmic reticulum Ca2+-ATPase, Red circles: calcium. The buffers are the proteins
that attach to cytosolic Ca++, leaving a very small percentage of free Ca2+ (Berridge et al. 2003).
2.2.1 Principal components of the calcium increase step
The first step of a Ca2+ transient is an increase of cytosolic the Ca2+ concentration. The Ca2+ may
enter from the extracellular medium in response to a variety of stimuli or may be released from the
internal stores, mostly the endoplasmic (ER) or sarcoplasmic (SR) reticulum. The entry of Ca2+ from the
external medium could be enhanced by extracellular agonists, membrane depolarization, mechanical
stretch or depletion in the internal Ca2+ stores. Many channels types are implicated in the external Ca2+
entry like the voltage-operated Ca2+ channels (VOCC), the receptor-operated Ca2+ channels (ROCC), the
store-operated Ca2+ channels (SOCC) and the second-messenger-operated Ca2+ channels (SMOCC). The
calcium release from the ER/SR is mainly due to the inositol-1,4,5-triphosphate receptor (IP3R) and the
ryanodine receptor (RyR). Stimuli that induce the entry of extracellular Ca2+ lead to the formation of
second messengers that release internal Ca2+ from the ER/SR. One of the most important second
messengers is the IP3. Finally, Ca2+ can also be released by two-pore [calcium] channels (TPC) located
on lysosomes and endosomes.

47
2.2.1.1 Voltage-operated calcium channels
VOCC are activated by membrane depolarization and lead to calcium entry form the outside
due to the change in membrane potential. These channels are mainly present in the excitable cells, but
can also be present, at low levels, in other cells not considered excitable such as the immune system
cells (Cahalan et al. 2001). The rapid Ca2+ fluxes across the VOCCs initiate diverse physiological fast
cellular processes; in endocrine cells for example, it mediates hormones secretion (Yang & Berggren
2006). In cardiac, skeletal and smooth muscle cells, it mediates contraction, either directly through the
cytosolic increase of Ca2+ concentration or indirectly by calcium-induced calcium release (see section
2.2.1.7) (Bers 2002). In neurons, it mediates synaptic transmission (Catterall & Few 2008). The Ca2+
entering the cytosol via the VOCC regulates also slow cellular processes such as many biochemical
processes, enzymatic functions, and gene expression (Flavell & Greenberg 2008).
The VOCC are heteromultimers composed of 4 subunits: α1, α2-δ, β, and γ (Hille 2001). The
main subunit is the α1 . According to their pharmacological and biophysical properties, the VOCC can
be divided into five types: L type (long-lasting), P/Q (Purkinje), N (Neural/Non-L), R (residual), T
(transient). All of them are medium to high-voltage-activated except the T type which is low-voltage
activated (Snutch et al. 2013). Table 3 gives the α1 subunits that can form each channel type, their
principles physiological functions and blockers, and inherited diseases caused by their abnoraml
functions.
The L-type channels are the most understood pharmacologically. They can be inhibited by the
dihydropyridines (nifedipin, nicardipin, nisoldipin), the phenylalkylamines (verapamil) or
benzothiazepines (diltiazem). They require strong depolarization to be activated, have large
conductance and are slowly inactivated. The N, P, Q and R-type can be selectively blocked by snail or
spider toxins. They have medium conductance, and intermediate inactivation kinetics (Hille 2001). The
T-type have low-conductance and they are called transient because they are rapidly inactivated (Perez-
Reyes & Lory 2006). They can be blocked by mibefradil, which is also a blocker of other VOCC (Viana
et al. 1997). The VOCC blockers are used to cure many diseases such as hypertension (Felizola et al.
2014) and traumatic brain injury (Krieglstein et al. 1996).

48
Table 2 : different types of VOCC. DHP, dihydropyridine; ω-CTx-GVIA, ω-conotoxin GVIA from the cone snail Conus
geographus; SNX-482, a synthetic version of a peptide toxin from the tarantula Hysterocrates gigas (Catterall 2011).
2.2.1.2 Receptor-operated calcium channels
The transport of Ca2+ through ROCC depends on the binding of a ligand which is usually not the
solute that passes through the channel, but causes conformational changes in the channel in a way
that allows the passage of the Ca2+ (alone or with other cations) to the cell. In the nervous system for
example, the N-methyl-D-aspartate receptor (NMDAr) is a non-selective ionotropic channel that allows
positively charged ions to cross the PM. When activated by glutamate, aspartate or glycine, it allows
the passage of Ca2+ and Na+ into the cell and the flow of K+ outside the cell. The NMDAr is 10 times
more permeable to the Ca2+ than Na+ (Dityatev & El-Husseini 2006). The Ca2+ flux through this receptor
is crucial for many nervous functions such as learning, memory and synaptic plasticity (Tsien et al.
1996).
The P2X purinergic receptors are another type of ionotropic ROCC. They open in response to
external ATP binding and allow the entry of Ca2+ and Na+ into the cell and the activation of various Ca2+-
sensitive intracellular processes. The cations entry cause membrane depolarization and facilitate
voltage-sensitive Ca2+ entry in excitable cells through the activation of VOCCs (Koshimizu et al. 2000).
The P2X can be found in many tissues and they have a lot of physiological roles. They modulate synaptic
transmission and neural-glial interactions in the nervous system. They participate in the contraction
initiation of the heart, skeletal and smooth muscle including that of the urinary bladder and the vas
deferens (Burnstock 2006).

49
2.2.1.3 Inositol-1,4,5-triphosphate receptor
The IP3R is a ER glycoprotein complex activated by the second messenger IP3 and acting as a
Ca2+ channel that releases the Ca2+ from the ER, the Golgi and the endolysosomal vesicles (Kew &
Davies 2010), and from the mitochondria (Decuypere et al. 2011). In Golgi, the IP3Rs are 2-3 fold less
than in the ER (Pinton et al. 1998), which explains the reduced amount of Ca2+ release from it.
A very wide range of external stimuli, such as hormones and neurotransmitters, activating
GPCRs (G-protein coupled receptors) or RTKs (receptors tyrosine kinase), lead to the activation of
phospholipase C (PLC β and γ respectively) and the formation of IP3. Other forms of PLC are activated
by an increase in cytosolic Ca2+ concentration (PLCδ) or through Ras signaling (PLCε) (Berridge et al.
2003). The IP3R plays a very important role in the transduction of the external stimuli to specific
intracellular Ca2+ signals. These signals are characterized by complex patterns of spatial and temporal
properties that are expressed by Ca2+ waves and oscillations specific for each cell type. The dynamics
of IP3 production depends on the receptor type being activated, the G protein it is coupled to and the
type of PLC activated further (Wal et al. 2001). For example, histamine, thrombin and lysophosphatidic
acid receptors give small, slow and long Ca2+ transients, whereas Neurokinin A and bradykinin
receptors give large and rapid Ca2+ transients.
Figure 23 : an example of steps leading to Ca2+ release from IP3R (the first step is the attachment of a ligand to a GPCR)
(Campbell & Reece 2007).
In nonexcitable cells, Ca2+ signaling is typically initiated by receptor-triggered production of IP3
and the subsequent Ca2+ release from the ER (Liou et al. 2005). During mammalian egg fertilization for
example, the IP3 is responsible for triggering the Ca2+ oscillations necessary to activate the egg after
activation of PLCζ (zeta) (Saunders et al. 2002). The IP3R is blocked by the Aminoethoxydiphenyl borate
(2-APB) (Xiao et al. 2010).

50
2.2.1.4 Ryanodine receptor
The RyRs are Ca2+ release channels found on the ER/SR. They are named after the plant alkaloid
ryanodine, to which they show a high affinity. They are found in different tissues but their highest
density is in striatic (cardiac and skeletal) muscles (Fill & Copello 2002). In mammals, there are 3 RyR
isoforms (RyR 1, 2 and 3). The RyRs are activated by calcium (Ca2+ -induced Ca2+ release) and by the
second messenger Cyclic ADP-ribose (cADPR) which also contributes to Ca2+ -induced Ca2+ release
(CICR). The cADPR functions either directly by binding to the RYR or indirectly through accessory
proteins such as the FK506-binding protein 12.6 (FKBP12.6) (Figure 24), a subunit associated to the
RyR (Noguchi et al. 1997). The calmodulin (CaM) is another accessory protein needed in cADPR-
induced Ca2+ release, either directly (Lee et al. 1994) via a calmodulin binding domain (Rodney et al.
2005), or indirectly through phosphorylation of RyR via the CaM kinase II (Takasawa et al. 1995). cADPR
constitutes a physiological agonist of RyR. Other agonists such as caffeine and pentifylline activate the
RyR by potentiating sensitivity to Ca2+. cADPR sensitizes the receptor to Ca2+ in a manner similar to
caffeine but with much higher potency (Lee 1993). The RyR can be blocked by dantrolene (Zhao et al.
2001) or ryanodine (Ostrovskaya et al. 2007).
Figure 24 : RyR activation via cADPR (Deshpande et al. 2005).
2.2.1.5 Two-pore calcium channels
They are called TPCs because of their unusual structure combining 2 pores in tandem. These
channels are mainly present in the endolysosomal system which constitutes an acidic Ca2+ store playing
an important role in Ca2+ regulation in parallel to the ER stores. Three subtypes of TPCs have been
characterized in the endolysosomal system : TPC1 and TPC3 present on endosomes, and TPC2 present
on lysosomes (Zhu et al. 2010). All the TPCs are nicotinic acid adenine dinucleotide phosphate
(NAADP)-gated, because they are activated by the NAADP. The release of Ca2+ from TPCs cause a
further release of Ca2+ from the IP3R and the RyR by CICR (cf. 2.2.1.7).
ER
Cytosol

51
2.2.1.6 Store-operated calcium channels
The major Ca2+ entry pathway from the outside, in electrically nonexcitable cells, is the store-
operated calcium entry (SOCE), in which the emptying of the intracellular Ca2+ stores leads to Ca2+ influx
across the SOCC (Parekh & Putney 2005).
Many PM receptors are coupled to a G protein (GPCR) including some ROCC. The receptor can
be coupled to a Gq protein (that activates PLC) or a Gs protein (that activates adenylyl cyclase) as
shown in Figure 25. Also the receptors tyrosine kinase activates PLC. The PLC generates the IP3 that
cause the release of Ca2+ from the ER via the IP3R. When the ER stores are filled of calcium, this latter
inhibits the action of a calcium sensor called Stromal interaction molecule 1 (STIM1), a single
transmembrane ER protein (Liou et al. 2005) that can be found also with a lesser percentage (10%) on
the PM (Saitoh et al. 2011). The release of Ca2+ from the ER results in its dissociation from STIM1, which
in turn activates the SOCCs of the PM. STIM1 can also activate the adenylyl cyclase (Lefkimmiatis et al.
2009). Another form of STIM protein is the STIM2, that is a weaker activator of Orai channels (see
below) than STIM1 (Bird et al. 2009) but a more sensitive sensor of ER luminal Ca2+ (Brandman et al.
2007).
The Orai proteins (3 members: Orai 1, 2 and 3) form the pore of the SOCC, and contain the site
of interaction with STIM1. Ca2+ signaling through the SOCC plays an important role in the activation
and proliferation of the T lymphocytes after an antigen recognition. If a mutation occurred in STIM1 or
Orai1 protein, it leads to the absence of Ca2+ influx and subsequent severe combined
immunodeficiency (SCID) (Qu et al. 2011).
Figure 25 : steps leading to SOCC activation. Ag : agonist, R : receptor, (Putney 2009).
SOCCs play an important role in maintaining Ca2+ oscillations (see also 2.2.4 and 3.1.2) (a series
of repetitive spikes of Ca2+ that occur in many types of cells and constitute a physiological response for
many stimuli (Berridge 1990)) by refilling the ER Ca2+ following store depletion (Parekh & Putney 2005).
The inflowing calcium current that results from the Ca2+ flow through the SOCCs is called Ca2+ release-
activated Ca2+ current (ICRAC). The activity of SOCC could be modulated by 2-APB; at low
concentrations, the 2-APB activates the SOCC whereas at high concentrations it causes transient
increase activity followed by a total inhibition (Prakriya & Lewis 2001). The 2-APB prevents also the

52
STIM from moving toward PM by clustering it in the cell (Zeng et al. 2012). Other inhibitors can also be
used to block the SOCCs such as lanthanum (La3+), gadolinium (Gd3+), cadmium (Cd2+), zinc (Zn2+) (Gore
et al. 2004) and diethylstilbesterol (Zakharov et al. 2004).
2.2.1.7 Calcium-induced calcium release (CICR)
One of the key controllers of Ca2+ signaling in the cell is the Ca2+ itself; a cytosolic increase in
Ca2+ concentration leads to further Ca2+ release from the ER/SR via the IP3R and RyR, thus establishing
a positive feedback. This phenomenon is called Ca2+-induced Ca2+ release. The IP3R and RyR have a
Ca2+ “sensor” which is a site for cytosolic Ca2+ binding: a small amount of Ca2+ near the receptor will
cause it to release more Ca2+. Two examples of CICR are mentioned in Figure 26. The first one is the
CICR from IP3R and RYR after the activation of TPC of the acidic Ca2+ stores (the endolysosomal system)
by the NAADP (see also 2.2.1.5). The second one is the activation of RyR after a Ca2+ entry through
VOCCs. This latter is crucial for excitation-contraction coupling in cardiac and skeletal muscle (Capes
et al. 2011). Note that the larger spacing between Ca2+ release sites, the lower efficacy of CICR
(FOSKETT et al. 2007).
Figure 26 : two examples of CICR. a : after TPC activation by NAADP, b : after Ca2+ entry from VOCC (Patel & Docampo
2010).
2.2.2 Principle components of the calcium decrease step
Any uncontrolled excess of the cytosolic calcium concentration could be toxic for the cell.
However, there is a very large transmembrane electrochemical gradient of Ca2+ between cytosol and
the external medium or between cytosol and the ER/SR, that favors the entry of the Ca2+ from the
exterior, or the release of Ca2+ from the inner Ca2+ stores, to the cytosol. Therefore, the cell, to keep
low concentrations of Ca2+ for proper cell signalling, has developed a specific machinery to pump the
excess of Ca2+ to the external medium or to the ER/SR and mitochondria via specific pumps and
exchangers. There is also the Ca2+ buffers, proteins that remove the excess Ca2+ by binding it to specific
sites on them.
a b
Ca2+
Ca2+

53
2.2.2.1 Plasma membrane Ca2+-ATPase
The PMCA serves to pump the Ca2+ from the cytosol to the external medium. As it is an ATPase,
it drives the Ca2+ against its electrochemical gradient. Its function is vital for keeping a suitable Ca2+
concentration in the cell necessary for homeostasis. And because it pumps the Ca2+ to the extracellular
medium, it participates to the regulation of Ca2+ concentration outside the cell. The PMCA is a PM
transport protein that belongs to the family of P-type primary ion transport ATPases. These proteins
are ions pumps responsible for active transport of cations and capable to auto-phosphorylate a highly
conserved aspartate (Asp) residue of their pumps by using the ATP as a source of energy. They have at
least 2 different conformations called E1 (in presence of saturating concentrations of Ca2+) and E2 (Ca2+
free).
The PMCA is present in all the human tissues in 4 different isoforms (PMCA 1, 2, 3 and 4). It
plays important role in regulating synaptic transmission (Jensen et al. 2007). However, the PMCA
activity is not always advantageous ; in breast cancer, the PMCA2 lowers the cytosolic Ca2+
concentration and hence decreases the calcium-induced apoptosis (c.f 2.3.1) in malignant cells
(VanHouten et al. 2010). As all P-type pumps, PMCA is inhibited by lanthanum La3+ and vanadate. Other
more specific inhibitors are usually used such as thapsigargine, carboxyeosin and caloxin peptides
(Szewczyk et al. 2008).
2.2.2.2 Sarco/endoplasmic reticulum Ca2+-ATPase
Like the PMCA, the SERCA belongs also to the family of P-type primary ion transport ATPases.
It has the same structure as the PMCA but it is situated in the ER/SR membrane. It oscillates also
between 2 conformational structures E1 and E2. As PMCA, it uses ATP as a source of energy to pump
Ca2+ from cytosol to the ER lumen (against its concentration gradient) : the mean concentration of Ca2+
in the cytosol being between 100 and 400 nM (Schantz 1985, Ratto et al. 1988), whereas it varies
between 50 μM and 1 mM in the RE (Hofer & Machen 1993, Chatton et al. 1995).
There are 3 paralogs of SERCA (SERCA 1, 2 and 3) encoded respectively by the genes ATP2A1,
2 and 3 and expressed at various levels in different cell types. SERCA1 is the most studied one with an
available detailed 3D structure (Toyoshima et al. 2000). SERCA1 is a fast switch pump expressed
essentially in skeletal muscle (Odermatt et al. 1996). The slow-switch SERCA2a is mainly expressed in
heart and smooth muscle (SERCA2b is found in muscle and non-muscle cells) (Foundation 2003).
SERCA3 is expressed in non-muscle tissues such as blood platelets, lymphocytes, mastocytes, epithelial
and endothelial cells (Wuytack et al. 1995). SERCA genes are absent from yeast and some other fungi
genomes (Wuytack et al. 2002).
Together with PMCA, SERCA plays a crucial role to restore the relaxation state of muscle cells
after contraction, by eliminating the Ca2+ excess from the cytosol (MacLennan et al. 1997). Mutations
in SERCA1 lead to delayed muscle relaxation and brody disease characterized by stiffness, cramps and
impairment of skeletal muscle relaxation (Odermatt et al. 2000). Mutations in SERCA3 results in the
impairment of endothelial cells Ca2+ signaling and defective endothelium-dependent relaxation of
vascular smooth muscle (Liu et al. 1997). SERCA is inhibited by thapsigargine, cyclopiazonic acid (CPA),

54
tetrabromobisphenol A (TBBPA) or vandanate (Michelangeli & East 2011) and it is activated by
istaroxime (Khan et al. 2009), CDN1134 and CDN1163 (Gruber et al. 2014).
2.2.2.3 Plasma membrane NA+/Ca2+ exchanger
NA+/Ca2+ exchanger (NCX) has a very important role in removing Ca2+ from the cytoplasm. It
does not have the high affinity of Ca2+ ATPases such as PMCA but on the other hand, it does have a
high capacity and rapidity to remove Ca2+ (until five thousand Ca2+ ions per second), while the PMCA
has a low transport capacity for Ca2+ (Carafoli et al. 2001). Hence, the essential role of PMCA is to
maintain the cytosolic Ca2+ (by binding even low augmentation of Ca2+) and of NCX is to countercact
large cytosolic Ca2+ variations especially in excitable cells (by pumping rapidly a large increase of Ca2+)
(Brini & Carafoli 2011). Note that the PMCA and the PM NCX are the main regulators of the long-term
resting intracellular Ca2+ concentrations (Strehler & Zacharias 2001).
NCX is an antiporter that uses the electrochemical gradient of Na+ to transport 3 Na+ ions into
the cell in exchange to one Ca2+ ion. The NCX is found on PM, ER and mitochondria (Sisalli et al. 2014).
There are three subtypes of NCX (NCX1, 2 and 3) particularly abundant in excitable tissues and all of
them exist in the brain (Shenoda 2015). The NCX1 was the first to be purified in canine cardiac cells
(Philipson et al. 1988), and the 2 other subtypes were later found in rat hippocampus cultures
(Thurneysen et al. 2002).
PM NCX plays important roles in neuronal signalling, cardiac excitation-contraction coupling,
and Ca2+ reabsorption in the kidney (Lytton 2007). In heart, NCX plays an important role in cardiac cell
relaxation, and its expression is remarkably higher in the first postnatal developmental stages of
neonatal animals (Artman et al. 1995, Huang et al. 2005) before the SR (sarcoplasmic reticulum)
reaches its functional maturity. Its dysfunction leads to many heart problems such as diastolic
dysfunctions, cardiac arrhythmias, ischemia, and hypertrophy (Menick et al. 2007). Hence, NCX
inhibitors such as dronedarone, amiodarone, bepridil may have cardioprotective effects (Iwamoto et
al. 2007). NCX is a promising target for drugs to treat ischemia in neural, cardiac and renal tissues
(Yamashita et al. 2003).
2.2.2.4 Mitochondrial voltage-dependent anion channel
The Mitochondrial voltage-dependent anion channel (VDAC) known also as mitochondrial
porin is a β barrel protein with 19 transmembrane beta-strands found in the outer mitochondrial
membrane (OMM). It represents the most abundant protein of the OMM. As it name refers, it is
voltage-dependent: it has a partially closed state when the membrane potential (MP) is between -30
and +30 mV, and has a conductance of 2 nS. When it is opened it has a conductance of 4 ns (Hiller et
al. 2010).
Ca2+ flux across the OMM occurs mainly via VDAC. It was shown that there is a physical link
between VDAC and IP3R on the ER via the chaperone glucose-regulated protein 75 (GRP75) (Szabadkai
et al. 2006). This neighboring enhances mitochondrial Ca2+ uptake from ER (Figure 28). The VDAC is not
only an important regulator of Ca2+ transport across the OMM but is also involved in the transport of

55
ATP, ADP, many ions such as K+ and Na+ and many metabolites such malate and pyruvate of the Krebs
cycle (that generates ATP). Ca2+ is a cofactor for many Krebs cycle enzymes such as isocitrate
dehydrogenase and pyruvate dehydrogenase. VDAC, by regulating Ca2+ permeability, controls ATP
production and regulates Ca2+ homeostasis and apoptosis (Shoshan-Barmatz & Gincel 2003).
2.2.2.5 Mitochondrial calcium uniporter
The mitochondrial calcium uniporter (MCU) is a Ca2+ channel located in the inner mitochondrial
membrane IMM (Figure 28). The Ca2+ itself is a regulator of the MCU; it activates the channel indirectly
via the Calmodulin-dependent Protein Kinase II (CaMK II) and this activation occurs with a time
constant of 6 seconds. Then, on the other hand, the increase in Ca2+ concentration inhibits
Ca2+ transport with a time constant of 17 seconds (Rizzuto et al. 2009). The MCU has low-affinity at
micromolar Ca2+ cytosolic concentrations but high affinity mitochondrial Ca2+ uptake can occur at
nanomolar concentrations (Santo-Domingo & Demaurex 2010). This biphasic dependence on cytosolic
Ca2+ concentration allows mitochondrial Ca2+ oscillations, and prevents further Ca2+ uptake and
accumulation in mitochondria when cytosolic Ca2+ elevation is prolonged (Moreau et al. 2006). The
mitochondrial Ca2+ oscillations are important to control many mitochondrial metabolic processes such
as ATP production, NADPH elevation and stimulation of mitochondrial enzymes such as
deshydrogenases (Robb-Gaspers et al. 1998)
MCU is activated by spermine (Litsky & Pfeiffer 1997) and plant flavonoids especially the
kaempferol (Montero et al. 2004). Its activity can be modulated, in a concentration-dependent
manner, by adenine nucleotides, in the order of effectiveness ATP>ADP>AMP (Litsky & Pfeiffer 1997)
and it is inhibited by Rhutenium red (Bae et al. 2003).
2.2.3 Calcium buffers and effectors
The Ca2+ constitutes a highly versatile signal for the cell and the information carried within its
variable spatial and temporal signaling needs to be suitably decoded. The cells have specific classes of
proteins that act as Ca2+ sensors that decode the information embedded in Ca2+ signal before passing
it on to targets. This decoding processus is based on specific conformational changes in the sensor
proteins (Carafoli et al. 2001). After an increase of cytosolic Ca2+ concentration, most of the Ca2+ binds
to Ca2+-binding proteins that function as Ca2+ buffers or Ca2+ effectors, and a very few amount of Ca2+
remains free in the cytosol. These proteins can control both the amplitude and the recovery time of
Ca2+ transients (Berridge et al. 2003).
Examples of cytosolic buffers are calretinin, calbindin D-28 and parvalbumin. There is also the
ER/SR buffers and chaperones such as calreticulin (the predominant one), calnexin, calsequestrin,
glucose-regulated protein 78 and 94 (GRP 78 and GRP 94). The ER Ca2+ buffers reduce ER free Ca2+
concentration and helps SERCA in its pumping function by reducing the concentration gradient
between the ER and the cytoplasm. The Ca2+ binding of these proteins is characterized by its affinity
and capacity (kinetic). For example, calretinin, calbindin D-28 and calreticulin are low-affinity but high-
capacity binding protein whereas parvalbumin has higher affinity but slower binding-kinetics for Ca2+.

56
Golgi Ca2+ buffers are Cab45, P54/NEFA, and CALNUC (nucleobindin). In mitochondria, Ca2+ is not
bound to buffering proteins but precipitated as insoluble salt CaPO4 (Prins & Michalak 2011).
The buffering capacity of a cell is measured by Ca2+-binding ratio KS. Cells with low buffering
capacity such as adrenal chromaffin cells and motoneurons (KS=40) generate rapid Ca2+ dynamics
comparing with high buffering capacity cells such as hippocampal or cerebellar Purkinje neurones
(KS=2000). Low endogenous Ca2+ buffering may cause pathophysiological conditions such as excitotoxic
stress and motoneuron disease (Palecek et al. 1999).
Ca2+ effectors are Ca2+-binding protein that control many cellular functions depending on the
binding or not of Ca2+. Hence, the calcium, through the interaction with these proteins, regulates a
wide variety of cellular processes such contractile processes, intracellular transport and trafficking,
secretary functions, intracellular communication, glycolysis and mitosis (Petersen et al. 2005). Some
examples of Ca2+ effectors are calmodulin (CaM), troponin C, synaptotagmin, annexin, neuronal Ca2+
sensor family (NCS-1), visinin-like proteins (VILIP), hippocalcin, recoverin and guanylate-cyclase-
activating proteins (Berridge et al. 2003).
2.2.4 How the calcium spatial and temporal signaling is decoded by the cell?
Every cell sets the suitable combination of Ca2+ channels and pumps subtypes in order to
respond to its own requirements in Ca2+ signaling and to control effectively its physiological specific
functions. For example, cells such cardiomyocytes, myocytes and stereocelia, which recover very
rapidly after a Ca2+ spark have the fastest isoforms of PMCA (PMCA 3f and 2a), whereas Jurkat cells
that takes more time to recover (up to one minute) have the slow PMCA 4b (Caride et al. 2001). Even
the distribution of Ca2+ channels and pumps different isoforms is specific, especially in polarized cells.
For example, in pancreatic acini, SERCA2a is expressed in the luminal pole, whereas SERCA2b is
expressed in the basal pole. Whereas in salivary gland acinar and duct cells, SERCA3 is found in the
basal pole and SERCA2b in the luminal one (Lee et al. 1997).
2.2.4.1 Calcium sparks, oscillations and waves
The regulation of intracellular Ca2+ concentrations is a complex phenomenon using several
mechanisms and a wide number of Ca2+ channels and pumps essentially in the PM, the ER/SR and a
possible contribution of mitochondria, Golgi and the endolysosomal system. This complexity is
manifested in spatial and temporal domains by Ca2+ sparks, oscillations (repetitive spikes) or waves.
An example of Ca2+ spark and wave is shown on Figure 27. Ca2+ sparks are generated by low
and intermediate IP3 concentrations, whereas Ca2+ wave is generated by a high concentration of IP3
resulting from a high concentration of extracellular agonists. In detail, at low IP3 concentration,
individual IP3R of the ER are opened and localized spatiotemporally elevations in cytosolic Ca2+
concentration called Ca2+ “sparks” or “blips” occur at discrete release sites (Parker et al. 1996) (Figure
27). These sites are spaced at intervals of several microns and represent clusterings of IP3R (FOSKETT
et al. 2007). At intermediate concentrations of IP3, many IP3R within a cluster are activated generating

57
Ca2+ “puffs”. The released Ca2+ stimulates other IP3R within the cluster by CICR. And at higher levels of
IP3 concentration, Ca2+ released at one cluster site can trigger Ca2+ release at other adjacent sites by
CICR, and the localised Ca2+ signal propagates from an IP3R cluster to another as a Ca2+ wave (Bootman
& Berridge 1996, Callamaras et al. 1998). Generated Ca2+ waves are the spatial and temporal
summation of individual Ca2+ sparks (Cheng et al. 1996), that can propagate in a continuous (without
deformation) or a saltatory (burst-like) manner (Dawson et al. 1999). The Ca2+ wave propagates at a
velocity of a few tens of microns per second by successive cycles of Ca2+ release, diffusion, and CICR
(Berridge 1997a). The Ca2+ signal can either propagate to the entire cell (Rooney & Thomas 1993), or
remain localised in specific subcellular regions (Allbritton & Meyer 1993).
Figure 27 : genetration of Ca2+ wave by increased IP3 concentration and CICR. In green : open receptor (FOSKETT et al.
2007).
Spontaneous Ca2+ waves have been observed in both excitable and nonexcitable cells (Lipp &
Niggli 1996). In cardiac tissue, Ca2+ waves propagated in and between cardiac myocytes but their
functions remains unclear. These waves result from spontaneous localized Ca2+ sparks and are not
dependent from membrane depolarization. However, they can cause membrane depolarization and
under some circumstances induce an action potential (Stuyvers et al. 2000). In all cases¸ spontaneous
Ca2+ releases in a cardiomyocyte are regarded as potential arrhythmogenic process in the heart (Fedida
et al. 1987). In cardiac trabeculae, Ca2+ waves propagate at low velocity (≈30 μm/s) and over a limited
distance throughout the muscle (Wier et al. 1997). Kaneko et al. demonstrated three distinct types of
Ca2+ waves in Langendorff-perfused rat heart, depending on localized Ca2+ concentration. Under
quiescence, the waves occurred sporadically (3.8 waves/min/cell), with a velocity of 84 μm/s. In
regions with higher basal levels of Ca2+, Ca2+ waves occurred more frequently (28 waves/min/cell) and
propagated at a higher velocity (116 μm/s) with occasional intercellular propagation. In regions with
much higher basal Ca2+ concentration, waves occurred with a high incidence (133 waves/min/cell)
(Kaneko et al. 2000).
Ca2+ waves exist also in the intestine where they control specific behavioral motor patterns
governed by neural activities timing. For example, the defecation motor program in Caenorhabditis
elegans consists of three stereotyped motor steps with precise timing, which start by a periodic
Low [IP3]
Intermediate [IP3]
High [IP3]

58
calcium spike in a pacemaker cell. The IP3R is necessary for this periodic behavior and its inhibition
blocks the second and third motor steps (Teramoto & Iwasaki 2006). Gap junctions are also crucial for
the intercellular Ca2+ wave propagation. The absence of pannexin gap junctions in mutant animals
affects the reliability of the pacemaker cell and the wave propagation (Peters et al. 2007)
2.2.4.2 Calcium-sensitive enzymes and transcription-factors
The necessity of a decoding system for the different Ca2+ behaviors (Ca2+ sparks, oscillations or
waves) is of a primodial importance for the cell to ensure an adequate control of the physiological Ca2+
dependant processes. For example, mesenchymal stem cells (MSC) present spontaneous Ca2+
oscillations (discussed in details in section 3.1) at different frequencies depending on wether they are
pluripotent or on the route of differentiation (Pullar 2011). In these cells for example, the Ca2+ code is
embedded within the spontaneous Ca2+ oscillations frequency and the cell should have the suitable
translating system for decoding the Ca2+ message in order to control oscillations frequency-dependent
cell responses such as gene expression, proliferation and differentiation.
Many Ca2+-sensitive enzymes are responsible of the decoding of Ca2+ signals, such as
calmodulin-dependent protein kinases (CaMK), PKC, adenylyl cyclase, calcineurin, Ca2+-activated
proteases (calpain I and II), myosin light chain kinase (MLCK), phosphorylase kinase, IP3-kinase, cyclic
AMP phosphodiesterase, endothelial and neuronal nitric oxide synthase (NOS) (Berridge et al. 2003).
The CaM Kinase II (CaMKII) for example can decode the frequency of Ca2+ oscillations into
distinct amounts of kinase activity. The frequency response of CaMKII is also modulated by the
individual Ca2+ spikes duration and amplitude (De Koninck & Schulman 1998). These CaMKII features
may present an important role in the control of MSC pluripotency and differentiation, due to the Ca2+
oscillations frequency differences between the pluripotent MSC and MSC on the routes of
differentiation to many cellular lineages (cf. section 3 for details). As seen in section 2.2.2.5, the CaMKII
responds to cytosolic Ca2++ concentration changes by activating the MCU. The mutation in CaMKII was
correlated with the lack of Ca2+ wave propagation and coordination of the muscle contraction in
Caenorhabditis elegans intestine (Teramoto & Iwasaki 2006).
In addition to Ca2+-sensitive enzymes, there is the Ca2+-sensitive transcription factors that
participate also in the decoding of Ca2+ signals, such as nuclear factor of activated T cells (NF-AT),
nuclear factor-kappa B (NF-κB), Oct/OAP, cyclic AMP response element-binding protein (CREB) and
CREB-binding protein (CBP).
For example, NF-AT is expressed in many cells such as MSC (Figure 34) and T lymphocytes, both
of them presenting Ca2+ oscillations. These oscillations depend on, between others, IP3R Ca2+ release
and Ca2+ entry from SOCC (MSC Ca2+ oscillations are discussed in details in section 3.1.2). In MSC, Ca2+
oscillations are important in controlling the proliferation and differentiation of the cells (Pullar 2011),
and in T lymphocytes, they play crucial role in activating these latter after antigen binding to T-cell
receptor (TCR) (Lewis 2003). It was shown that the Ca2+ oscillations act as a frequency encoding system
rather than amplitude encoding because it is the frequency that varies most often with stimulus
strength. For example, the interleukin-2 (IL-2) and IL-8 gene expression is sensitive to oscillations
frequency that activate either NF-AT or NF-κB. Rapid Ca2+ oscillations stimulate the expression of the

59
three transcription factors NFAT, NF-κB and Oct/OAP, whereas less frequent oscillations activate only
the NF-κB (Dolmetsch et al. 1998).
2.3 DIFFERENT CALCIUM-RELATED MECHANISMS IN THE CELL
2.3.1 Mitochondria-associated membranes and apoptosis
The regions of tightly apposition of ER/SR and mitochondria are called mitochondria-
associated membranes (MAM) (Patergnani et al. 2011). Figure 28 shows an example of Ca+ trafficking
between ER and mitochondria. Upon to an agonist (the IP3) stimulation, the ER IP3R are activated and
release Ca2+. And as several mitochondria are within 20-100 nm of the ER, the released Ca2+ is
transmitted to these adjacent mitochondria via MCU and VDAC (in connection with IP3R via GRP75).
Hence, mitochondrium acts as a Ca2+ buffer that shapes cellular Ca2+ signals. In pancreatic acinar cells
for example, Ca2+ waves are always generated in the apical pole. These waves must be very robust in
order to reach the basolateral pole due to mitochondria clustering between apical and basal poles of
the cell, and because this mitochondrial clustering can retain any Ca2+ excess (see also section 2.2.4).
Figure 28: mitochondria–ER contact sites and Ca2+ handling showing the connection between IP3R and VDAC, and further
implication of MCU and NCLX (Rizzuto et al. 2009). Ca2+ concentrations in AMM and cytosol are taken from Santo-Domingo
and Demaurex, 2010.
Among many regulatory functions such as autophagy regulation, Ca2+ control the ATP
production rate in mitochondria by activating Ca2+-sensitive mitochondrial dehydrogenases (pyruvate-
, α-ketoglutarate- and isocitrate-dehydrogenases) of the Kreb cycle (McCormack et al. 1990). On the
other side, mitochondrial Ca2+ overload caused by agonist hyperstimulation results in bioenergetic
catastrophe and cell death (Celsi et al. 2009). Therefore, mitochondria responds to Ca2+ elevations
either by increasing the cell energy supply or by triggering the cell death program of apoptosis.
Nevertheless, even slow and steady cytosolic Ca2+ concentrations can be sensed by the mitochondria
that tune high affinity mode of Ca2+ uptake on (cf. section 2.2.2.5). This latter transforms small cytosolic
Ca2+ concentrations increase into sustained increases in mitochondrial Ca2+ concentrations which
initiate the signalling cascade of apoptosis (Santo-Domingo & Demaurex 2010).
[Ca2+
]cyt
100 nM
[Ca2+
]AMM
10 μM

60
The RyR generates Ca2+ sparks and participate also with the IP3R to Ca2+ release from ER, that
controls ATP synthesis in many cell types such as cardiomyocytes (Bround et al. 2013) and pancreatic
β cells (Tsuboi et al. 2003). In these latter, ATP production potentiates glucose-stimulated insulin
release.
2.3.2 Other mechanisms and functions
In addition to enzymatic function regulation, mitochondrial respiration and metabolics, cell
bioenergetics (ATP production), survival, apoptosis and autophagy control, Ca2+ regulates a very wide
band of cellular proteins and mechanisms. Ca2+ regulates gap junctions opening: an increase in
cytosolic Ca2+ concentrations in apoptotic cells close the gap channels, which is an effective way to
isolate these cells and to avoid tranferring the apoptotic signal to adjacent cells. This mechanism is not
effective in cancerous cells, and the failure to disrupt cell coupling is a way to propagate cell death via
Ca2+ signals (Krutovskikh et al. 2002).
Ca2+ is important for cell interactions with its environment. Many cell-adhesion molecules
(CAM) (for cell-cell interaction) and substrate-adhesion molecules (SAM) (for cell-ECM interaction) are
Ca2+ dependent, such as immunoglobulins (Ig), cadherins (responsible of the contact inhibition
processus) (Hirano et al. 1987), selectins (implicated in Leukocyte extravasation), integrins (links
between cytoskeleton and the proteins of the basal lamina such as fibronectin, laminin and collagen).
The CAM and SAM are present in tight junctions, gap junctions, cell-cell, and cell-matrix junctions. In
all cell-adhesion junctions, the transmembrane CAMs are linked to the cytoskeleton via various
adapter proteins in cytoplasmic plaques (Lodish et al. 2000b). The cadherins and other CAMs play also
important role in survival and differentiation of pluripotent stem cells and of human trophoblast
(Coutifaris et al. 1991, Li et al. 2012).
Ca2+ exerts an effect on cytoskeleton ; it has cytoskeletal receptor on actin filament and
controls actin polymerisation (Europe-Finner & Newell 1986). A raise in cytosolic calcium causes
increased polymerization of the actin microfilaments (Dushek et al. 2008). It exerts an effect on the
structure and activity of myosin and tubulin (microtubules) cytoskeletons (Hepler 2016). A
concentration of 10 µm of Ca2+, in presence of CaM, inhibits microtubule assembly in vitro (Marcum et
al. 1978). In muscle, calcium binds to troponin C which cause tropomyosin to be displaced along the
actin filament, exposing myosin-binding sites and permitting contraction to occur. Ca2+, by controlling
cytoskeleton remodeling, controls cell shape changes, cell division, and cell movements and motility
including phagocytosis, secretion and locomotion (Bennett & Weeds 1986).
Ca2+ is a crucial factor for membrane repair and resealing by lysosome exocytosis. Reddy et al.
showed that an elevation in intracellular Ca2+ concentrations triggers fusion of lysosomes with the PM,
and that this process is regulated by the lysosomal synaptotagmin isoform Syt VII. The inhibition of Syt
VII by specific antibodies or the use of recombinant Syt VII prohibited lysosomal exocytosis and
membrane resealing (Reddy et al. 2001).
Ca2+ modulates the activity of many PM channels such as Ca2+-activated K+ channels (BK
channels) and Ca2+-activated Cl- channels (CaCC). In arterial smooth muscle cells for example,
intracellular Ca2+ controls both contraction and relaxation. While the contraction phenomenon has
been already discussed, the relaxation is mediated by local Ca2+ sparks from the SR that activate BK
channels (Brenner et al. 2000). CaCCs play important roles in epithelial secretion of electrolytes and

61
water, regulation of neuronal and cardiac excitability, regulation of vascular tone and sensory
transduction (Hartzell et al. 2005).
All the examples cited above are ones from countless events and processes controlled by Ca2+.
Ca2+ is a universal and the most versatile intracellular messenger implicated in cell growth,
development and death, and it is not false to think that in every cellular process there is a certain
implication of Ca2+ wether directly or indirectly.
2.4 STUDYING CALCIUM SIGNALING: THE CALCIUM MARKERS
Whole-cell configuration of the patch clamp technique (Neher & Sakmann 1976) can measure
ionic currents flowing through single protein channels of the PM. It is an indirect technique to monitor
membrane Ca2+ currents by using ion-sensitive microelectrodes. However, this technique only
measures Ca2+ concentration underneath the PM and not the bulk Ca2+ concentration (Lipp & Niggli
1996). The recent development of fluorescent Ca2+-indicators is a more sensitive and reliable technique
to measure Ca2+ concentration variations in living cells, and subsequent cellular and subcellular aspects
of Ca2+ regulation.
The first experiments that visualized intracellular Ca2+ changes (Ridgway & Ashley 1967) used a
Ca2+-sensitive bioluminescent protein called aequorin, extracted from the luminescent hydromedusan,
Aequorea victoria (Shimomura et al. 1962). Actually, a very large palette of fluorescent Ca2+ indicators
is available, and allow the measure of a broad spectrum of Ca2+ concentrations ranging from < 50 nM
to > 50 μM (Paredes et al. 2008). Ca2+ indicators are either intensiometric (single wavelength) or
ratiometric (2 excitation or 2 emission wavelengths) dyes. The ratiometric indicators are less sensitive
to images artifacts, photobleaching, leakage or uneven dye loading, and their use is advantageous over
the intensiometric markers because they give quantitative informations on the Ca2+ concentrations.
These indicators excite and emit at different wavelengths depending on whether they are Ca2+-free or
Ca2+-bound states.
The choice of a Ca2+ indicator depends on the Ca2+ signal to be measured and the type of the
experiment. Intensiometric markers are more sensitive to even a modest Ca2+ changes (their intensity
change is easily detectable) but give only qualitative data. The difference in intensities between Ca2+-
free and Ca2+-bound indicator is smaller with ratiometric markers but these latters are more useful for
quantitave analysis (and can be used for qualitative analysis).
2.4.1 Fluorescent Ca2+-sensitive dyes
The Ca2+-sensitive fluorescent dyes (CSFDs) are chemical indicators based on BAPTA, a non-
fluorescent Ca2+ chelator derived from EGTA (ethylene glycol tetraacetic acid) with high selectivity for
Ca2+ over Mg2+ ions (Tsien 1980), associated with a fluorescent chromophore. Actually, a wide variety
of Ca2+ indicators is available, with differences in Ca2+ affinity, and cell permeability in addition to a
large excitation and emission spectra ranging from ultraviolet to the infrared. The fluorescence
intensity of a CSFD depends on the Ca2+ concentration. Ca2+ signalling can be studied by loading the

62
cell with a CSFD such as fura-2, fluo-3, fluo-4, indo-1, quin-2 or calcium Green-1. Each of them has its
strong and weak points. For example, among the cited indicators, fura-2 and indo-1 give quantitative
Ca2+ measurements because they are ratiometric markers (Figure 29), the others being intensiometric.
Fluo-3 has a higher affinity to Ca2+ than Calcium green-1, but this latter is about 5-fold brighter than
fluo-3 at saturating Ca2+ levels (Eberhard & Erne 1991). The Table 3 shows the properties of some
CSFDs.
Table 3 : some examples of Ca2+ indicaters and their properties. Kd :dissociation constant - the concentration of Ca2+ at
which half the indicator molecules are bound with Ca2+ at equilibrium (Paredes et al. 2008).
Figure 29 : Ratiometric measurement of cytosolic Ca2+ concentration using indo-1 (Takahashi et al. 1999).
All the Ca2+ indicator dyes cited above are hydrophilic by their nature, and do not cross the PM.
So, they are oftenly coupled to a lipophilic ester group, called acetoxymethyl (AM) group, to facilitate
their diffusion across the PM. The AM ester masks the chelator carboxyl group of the dye. Once inside
the cells, the AM esters are cleaved from the dye by specific esterases called acetylesterases. The
cleavage of the AM group liberates the chelator part of the dye, allowing it to bind free Ca2+, and traps
the dye in the cytosol; the dye, without its lipophilic ester group, comes back to its hydrophilic nature

63
and can not therefore leak from the cell. Markers with AM groups are dissolved in dimethylsulfoxide
(DMSO) before being used, after the corresponding dilution, in the extracellular medium of the cells.
Pluronic-F127 can also be used to facilitate the dispersion of the dye in the medium (Kao et al. 2010).
2.4.2 Genetically encoded Ca2+ indicators
Protein-based genetically encoded Ca2+ indicators (GECIs) are engineered fluorescent protein
chimeras that change in function of Ca2+ concentrations fluctuations. These powerful tools were
developed first in the laboratory of Roger Tsien, the same person who contributed to the development
of the green fluorescent protein (GFP) (Tsien 1998), already reported by Shimomura et al. in the
jellyfish Aequorea victoria (Shimomura et al. 1962). The GECIs are not loaded to the cell like CSFDs, but
transfected as encoding plasmids. Roger Tsien Lab deposited such plasmids at Addgene for distribution
to the research community (https://www.addgene.org/Roger_Tsien/). Some examples of such
plasmids are the pcDNA-D1ER and the pcDNA-4mtD3cpv (the D1ER and 4mtD3cpv are second
generation cameleon Ca2+ sensors targeted to ER and mitochondria respectively) (Palmer et al. 2004,
2006). The pcDNA-D1ER for example, codes for a Ca2+ marker protein containing a KDEL sequence in
its C-terminal side and this sequence targets the marker to the ER (cf. 1.2.3.4).
Figure 30 : example of A. a single fluorescent protein Ca2+ indicator (GCaMP), and B.two fluorescent protein Ca2+ indicator
(cameleon, FRET: fluorescence resonance energy transfer (Lindenburg & Merkx 2014).
The fluorescent GECIs are based essentially on GFP or one of its color variants, yellow (YFP),
red (RFP) or cyan fluorescent protein (CFP), which are suitable for Förster resonance energy transfer
(FRET), and a Ca2+ buffer (the CaM) (Miyawaki et al. 1997), with its binding peptide M13 derived from
myosin light chain kinase (Porumb et al. 1994). Two important classes of GECIS are the single
fluorescent protein type, such as GCaMP (Nakai et al. 2001), pericams (Nagai et al. 2001), GECOs (Zhao
et al. 2011) and Camgaroos (Baird et al. 1999), that are dim in the absence of Ca2+ and bright when
bound to Ca2+, and the two fluorescent protein (FRET) type such as cameleons (Miyawaki et al. 1997)
and TN-XL (Mank et al. 2006), that have FRET signal increased upon Ca2+ binding.

64
Another category of GECIs are the bioluminescent ones ; they use a donor chemiluminescent
protein, such as aequorin or a luciferase that does not require an external light excitation and instead
of FRET, used the BRET (bioluminescent resonance energy transfer) to excite a GFP (or one of its
derivatives) upon the binding of Ca2+. The GFP can be linked directly to aequorin such as in GFP-
aequorin and upon the binding of Ca2+ to aequorin, the BRET occurs, just like it exists naturally in the
jellyfish Aequorea victoria. In the BRAC indicator and Nano-lantern (Ca2+), there is a CaM and its binding
peptide M13 between the aequorin and the yellow fluorescent protein (Venus) or the monomeric red
fluorescent protein (mRFP1) (Curie et al., 2007).
Figure 31 : bioluminescent Ca2+ indicators (Pérez Koldenkova & Nagai 2013).
The GFP-aequorin and Nano-lantern directly depend on Ca2+ binding in an intensiometric way :
the signal intensity of aequorin and therefore the BRET depends on the Ca2+ concentration (Saito et al.
2012), whereas BRAC can be used as a ratiometric probe because the binding of Ca2+ modulates the
BRET ratio by changing the distance between the donor and acceptor proteins (Saito et al. 2010).

65
3 MESENCHYMAL STEM CELLS AND DIFFERENTIATION
3.1 MESENCHYMAL STEM CELLS
Mesenchymal stem cells (MSCs) are multipotent stromal cells (Dominici et al. 2006) originated
from the embryonic mesoderm (mesenchyme) and present in many adult tissue such as bone marrow
(bMSC), adipose tisue (aMSC), muscle, dermis, umbilical cord and around blood vessels (as pericytes)
(Caplan & Bruder 2001, Lee et al. 2004, Malgieri et al. 2010). These cells have the ability to self-renew
and to differentiate into a wide variety of cells including mesodermal (osteoblasts, fibroblasts,
chondrocytes, adipocytes, muscle, tendocytes, ligaments), ectodermal (neurons, epithelial cells) and
endodermal (endothelial, pancreatic and liver cells) lineages (Friedenstein et al., 1974; Kopen et al.,
1999; Krause et al., 2001; Marappagounder et al., 2013; Pittenger et al., 1999; Woodbury et al., 2002).
The MSCs have the capacity to form cell types from alternative layers of their embryogenesis origin
(both endodermal and ectodermal tissue), a process termed ‘transdifferentiation’.
Figure 32 : The multipotency of MSCs. Solid arrows: differentiation into mesenchymal lineages, dashed arrows :
differentiation into cells from unrelated germline lineages (transdifferentiation) (Uccelli et al. 2008).
The non-hematopoietic MSCs of bone marrow were discovered by Friedenstein, who called
them stromal cells (Friedenstein et al. 1968, 1970, 1974). He described clonal, plastic adherent cells
capable of differentiating into osteoblasts, chondrocytes and adipocytes. The first experiments using
MSCs, called them fibroblast (because they are fibroblast-like cells) or marrow (because extracted from

66
the bone marrow) stromal cells (Piersma et al. 1985). The term « mesenchymal stem cell » was
popularized by Caplan in the early 1990s (Caplan 1991), and later on, the Mesenchymal and Tissue
Stem Cell Committee of the International Society for Cellular Therapy (ISCT), state that, to define MSCs,
they should have minimal criteria: be plastic adherent when maintained in standard culture conditions,
express certain specific cellular markers and lack others (see below) and must differentiate to
osteoblasts, chondroblasts and adipocytes in vitro (Dominici et al. 2006).
As they are adult stem cells, MSCs have lower differentiation potency than embryonic stem cells
(ESC) (Thomson et al. 1998) and induced pluripotent stem cells (iPS) (Cyranoski 2008), but they are
advantageous over the two because of the ethical issues correlated with the use of ESC and the
production cost issues of the iPS. The use of MSCs seeded in biomaterial scaffolds have been used in
order to heal organs and tissues defects. They have been used also for cell delivery (without a scaffold)
(Marion & Mao 2006). MSCs have Immuosuppression effects, they can inhibit T lymphocytes
proliferation or induce their tolerance in vivo, and regulate many immune cells functions such as
neutrophils activation and dendritic cells antigen presentation. They can also release anti-apoptotic
and anti-inflammatory molecules (Uccelli et al. 2008), hence being tissue protective. All these
properties make the MSCs excellent candidates for regenerative medicine.
Depending on the species and the tissue source, MSCs express different levels of clusters of
differentiation (CD) markers such as CD13, CD29 (Integrin beta-1), CD44, CD90, CD71 (transferrin
receptor), CD73 (ecto-5'-nucleotidase) CD105 (endoglin), and CD271 (low-affinity nerve growth factor
receptor). They lack the immune cells co-stimulatory molecules CD40, CD80 and CD86, and the
haematopoietic markers CD14, CD34 and CD45 and HLA (human leucocyte antigen)-DR (Lindroos et al.
2011, Ullah et al. 2015)
3.1.1 Human adipose Mesenchymal stem cells
Human aMSC (haMSC) are derived from the adipose tissue. They are more available than other
MSC like the human bMSC (HbMC) because they are easily accessible in higher number and without
painful procedures of extraction. In addition, they have phenotypes, surface markers (Gronthos et al.
2001) and gene expression profile similar to those of the HbMSC. They are also easier to maintain and
proliferate than HbMSC (Lee et al. 2004), and capable to differentiate into, at least, osteogenic,
chondrogenic, adipogenic, myogenic and neurogenic lineages in vitro (Gimble et al. 2007). Other
studies showed also the haMSC capacity of differentiation into cardiomyocytes (van Dijk et al. 2008)
hepatocytes (Seo et al. 2005), endothelial (Miranville et al. 2004, De Francesco et al. 2009) and
pancreatic (Timper et al. 2006) cells. All these characteristics make the haMSC one of the ideal MSC to
use (Lindroos et al. 2011) for experimental testings, cell therapy and regenerative medicine. In vitro,
haMSC display a cell doubling time of 2 to 4 days (shorter doubling time than HbMSCs), depending on
the culture medium and the passage number, and they express ESC markers, Sox-2, Oct-4, and Rex-1
for at least 10 passages (Izadpanah et al. 2006).

67
Figure 33 : shematic view of components of adipose tissue (Lindroos et al. 2011) and isolation steps of haMSC (Gimble et al.
2007).
After isolation, haMSCs are characterized by their immunophenotype (Table 4) and their
differentiation potential towards adipogenic, chondrogenic and osteogenic lineages in presence of
lineage-specific induction factors (Lindroos et al. 2011).
Table 4 : immunophenotype of haMSCs (Gimble et al. 2007).

68
3.1.2 Calcium oscillations in MSCs
Ca2+ oscillations are a universal mode of Ca2+ signaling. They exist in excitable (Tsien 1983, Parri
et al. 2001) and non-excitable cells (Fewtrell 1993). As seen in section 2, in electrically excitable cells,
the major pathway of Ca2+ entry are the VOCCs, which play important role in proliferation and
differentiation. In nonexcitable cells, Ca2+ oscillations are typically initiated by receptor-triggered
production of IP3 (after an agonist attachement to the receptor) (Nash et al. 2001) and the subsequent
Ca2+ release from the ER (Liou et al. 2005) which stimulates the store-operated calcium entry (SOCE)
via the SOCC (Parekh & Putney 2005). The Ca2+ oscillations were tought, for a long time, to exist only
in excitable cells. Woods et al. were the first to show that Ca2+ oscillations can occur in nonexcitable
cells by demonstrating that hormone-stimulated hepatocytes present repetitive transient rises in
cytoplasmic free calcium (Woods et al. 1986). In the same year, Yada et al. showed that cultured
epithelial cells present synchronous oscillations of the cytoplasmic Ca2+ concentration (Yada et al.
1986). These studies changed the ideas that were prevalent on the fact that Ca2+ signals in nonexcitable
cells are only amplitude encoded, to show that there is also a frequency encoded system.
The MSCs, which are nonexcitable cells, present spontaneous Ca2+ oscillations. As their name
refers, these oscillations are spontaneous which means that they occur without agonists stimulation.
The precise mechanism on how they are generated and sustained are not well understood. The major
source of these oscillations is the largest intracellular Ca2+ store, the ER. However, Ca2+ entry from
extracellular medium is necessary to refill the ER of Ca2+ and sustain Ca2+ oscillations. This explains why,
in a Ca2+ free solution, the oscillations can not be sustained (Kawano et al. 2003a). Ca2+ release is
mediated by the IP3R of the ER with no contribution of the RyRs, and Ca2+ influx across PM is mainly
mediated by SOCCs (activated by Ca2+ release from ER) but also a little contribution of VOCCs (Kawano
et al. 2002). The practically no contribution of RyRs to these oscillations is consistent with the fact that
generally, RyRs are the main pathway of Ca2+ release from ER in excitable cells, and IP3Rs are the main
one in nonexcitable cells (Berridge 1997b). The Ca2+ oscillations are inhibited by the application of La3+
suggesting a probable Ca2+ entry through non-selective cation channels (Kawano et al. 2003b).
After the increase of intracellular Ca2+ concentration (the first step of a Ca2+ oscillation), Ca2+ is
extruded via the PMCA and PM NCX to the extracellular medium, and pumped via SERCA to the ER
(Kawano et al. 2003a). Kawano et al. showed also that autocrine/paracrine ATP, via the activation of
the purinergic receptor P2Y1, contributes to the MSC spontaneous Ca2+ oscillations. ATP is secreted via
an hemi-gap junction channel, and the stimulation of P2Y1R activates PLC-β that produces IP3 (Figure
34). The Ca2+ oscillations modulate the activity of Ca2+-activated K+ channels (so-called BK channels),
and a Ca2+ activated outward K+ current could be recorded: hence, Ca2+ oscillations induce
hyperpolarization of the membrane (Kawano et al. 2006).

69
Figure 34 : mechanisms of Ca2+ oscillations induced by ATP autocrine/paracrine signaling (Kawano et al. 2006).
As it can be seen in Figure 34, Ca2+ oscillations activate the transcription factor NFAT which will
be translocated to the nucleus. NFAT is dephosphorylated by Ca2+/CaM-dependent phosphatase
calcineurin. As seen before, the Ca2+ oscillations act as a frequency encoding system. The Ca2+ code
embedded within the spontaneous Ca2+ oscillations frequency should be suitablly translated by the cell
in order to control gene expression, proliferation and differentiation (Berridge et al. 2000, 2003). NFAT
is one of the Ca2+-sensitive enzymes of the decoding system and its activation plays a very important
role in the proliferation or the differentiation of MSC. NFAT plays a role in the process of adipocyte
differentiation for example by binding to and transactivating the promoter of the adipocyte-specific
gene aP2 upon fat cell differentiation (Ho et al. 1998).
The observation of the MSCs in vitro shows that not all the cells present Ca2+ oscillations at the
same time. Some of them do not have oscillations. This difference can be related to the fact that MSCs
display Ca2+ oscillations at the G1-S phases transition of the cellular cycle, and not all the cells in the
visualisation area of an experiment are in the same phase of the cell cycle. Ca2+ oscillations increase
levels of cell cycle regulators such as cyclins A and E and probably control cell cycle progression and
proliferation, via the regulation of cyclin levels (amongst other mechanisms) (Resende et al. 2010). In
addition, the MSCs presenting Ca2+ oscillations do not do it at the same rhythm and frequency. First
the oscillations are asynchronous, and at a specific time, each cell is in a different phase of a Ca2+
oscillation. Secondly, the oscillations frequencies display wide variations from cell to cell. Kawano et
al. observed a mean interval of 2.8 ± 1.9 minutes between an oscillation and another (Kawano et al.
2003a).
3.1.3 Calcium oscillations between MSCs and differentiated cells
The Ca2+ oscillations frequency is different between undifferentiated MSC and MSC on routes of
differentiation and it differs between the different outcomes of differentiation (the various

70
differentiated cell types). While the MSCs have ordered Ca2+ oscillations, MSCs undergoing neuronal
differentiation display disordered oscillations. The primary myoblasts present different patterns from
the two, and MSC undergoing osteodifferentiation show a decrease in spontaneous Ca2+ oscillations
frequency (Titushkin et al. 2010, Pullar 2011). This shows that each cell type (between undifferentiated
MSC and differentiated cells) has its own pattern of Ca2+ oscillations frequency and form.
According to Titushkin et al., the MSCs Ca2+ oscillations are suppressed after addition of
neuroinductive factors, but reappear in less than 7 days after neurodifferentiation (Titushkin et al.
2010). Friel reported that sympathetic neurons displayed Ca2+ oscillations that do not depend on
VOCCs or IP3R but on RyR (Friel 1995). Sun and colleagues observed that multipotent MSCs present
8.06 ± 2.64 Ca2+ spikes per 30 min of observation, and that this number decreases to 3.66 ± 2.42 after
28 days of incubation with osteoinductive factors (Sun et al. 2007). The adipocytes don’t present
spontaneous Ca2+ oscillations but different agonists such as acetylcholine can engage distinct
subsystems of Ca2+ signaling, each of them generating oscillations with a specific temporal pattern
(Turovsky et al. 2012).
Figure 35 : different profiles of Ca2+ oscillations. From top to bottom: undifferentiated MSCs, MSCs undergoing
osteodifferention (3rd week), primary myocyte, MSCs undergoing neurodifferention (day 5) (Titushkin et al. 2010).
As discussed before, the Ca2+ oscillations contain a code for the cell, and the frequency of
oscillations should be suitably translated, because it controls many cell functions. The substrate rigidity
for example plays crucial role in MSCs differentiation by altering the Ca2+ oscillations (discussed in
3.3.1) demonstrating that many stimuli (chemical and physical) on MSCs will converge to impact the
Ca2+ signaling, and hence the control of gene expression and differentiation.
3.2 MESENCHYMAL STEM CELLS DIFFERENTIATION
As seen above, multipotent MSC can differentiate into wide variety of cellular lineages.
Izadpanah et al. studied some properties of human and rhesus macaque (R) MSCs from bone marrow
and adipose tissue. They found that the MSCs have similar multilineage differentiation capability at
early passages. However, RbMSCs and haMSCs retain greater differentiation efficiency at higher
passages. They found also that MSCs from all sources maintained their mean telomere length over

71
extended culture time (Izadpanah et al. 2006). Pittenger et al. observed a normal telomerase activity
even at passage 12 (Pittenger et al. 1999).
Aksu et al. showed that the MSCs donor gender has an impact on osteogenic capacity of haMSCs;
male haMSCs differentiate more rapidly and more effectively than female haMSCs in vitro (Aksu et al.
2008). Zhu and co-workers studied the effect of age on osteogenic and adipogenic capacity; they
showed that the adipogenic potential is unchanged irrespective of the donor age but the osteogenic
one decreased with increasing age (Zhu et al. 2009). These differences can be due to the difference in
steroid types and functions between males and females and the variations in hormone levels with age.
These differences must be taken into account when designing clinical treatments for patients (Lindroos
et al. 2011).
Every MSCs differentiation has its own characteristics, markers, duration and a specific cocktail
of chemicals to be added in order to obtain the specific cellular outcome. Table 5 shows examples of
inductive chemical factors used in some differentiation pathways.
Table 5 : examples of chemical inductive factors in order to obtain different cell lineage from MSC (Gimble et al. 2007).
MSCs produce autocrine and paracrine signals that are very important for lineage specific
progression (Pittenger et al. 1999). This is why the culture medium should not be changed before 3-4
days of contact with the cells, in order to allow communication and signaling between the MSCs.
3.2.1 Differentiation into osteoblasts
MSCs osteogenic differentiation was the first differentiation to be identified by Friedenstein
and co-workers in the late 1960s – early 1970s (Friedenstein et al. 1968, 1970). As the MSCs (known
then as marrow stromal cells) were extracted from the bone marrow, it was not surprising that they
could give rise to osteoblasts. Bruder et al. showed that the process of cryopreserving and thawing the
cells had no effect on either their growth or osteogenic differentiation (Bruder et al. 1997), Aksu et al.
showed that male haMSCs differentiate more rapidly and more effectively than female haMSCs in vitro
72
(Aksu et al. 2008), and Zhu et al. showed that osteogenic capacity of haMSCs appeared to decrease
with increasing age of the donor (Zhu et al. 2009).
3.2.1.1 Osteogenic-induction factors
The most common factors used to mediate MSCs osteodifferentiation are dexamethasone
(Dex), ascorbic acid (Asc) and β-glycerophosphate also known as glycerol 2-phosphate (G2P). The cells
are first plated at a density of 10 to 15 000 cells/cm2. A high cell confluence (100%) is recommended,
before starting to add the osteoinductive factors, because it promotes the osteogenic differentiation.
The day 1 of differentiation is the day of the first addition of the osteoinductive factors to the cells.
The cells are cultured between 21 and 28 days in order to obtain osteoblasts and medium should be
changed twice per week. The classical concentrations used are 10 nM for Dex, about 200 μM of Asc
and 10 to 100 mM G2P (Jaiswal et al. 1997, Pittenger et al. 1999, Lindroos et al. 2011).
Dexamethasone is a glucocorticoid steroid. Hence, it diffuses freely across the PM and has
intracellular receptors. Dex contributes to osteogenic differentiation by increasing and activating
(indirectly) the Runt-related transcription factor 2 (Runx2), a key transcription factor that induces
osteoblast differentiation and bone formation.
Ascorbic acid enters the cells through the glucose transporters GLUT1 (Montel-Hagen et al.
2008). The Asc enhances the osteogenic differentiation by increasing the secretion of collagen type I
(coI1) to the extracellular matrix (ECM) and the (indirect) activation of Runx2. Asc is highly required as
a cofactor for enzymes that hydroxylate proline and lysine in pro-collagen (Vater et al. 2011b) and its
secretion into the ECM. Ultrastructural observations indicated that the ECM produced by Asc-treated
cells is highly organized and contains well-banded collagen fibrils (Franceschi & Iyer 1992). The
secretion of col1 leads to increased binding of ECM with α2β1 integrins of the cell and the further
resulting signaling of the Ras pathway, the phosphorylation of Extracellular related kinase ERK1/2, and
the subsequent translocation of P-ERK1/2 to the nucleus where it activates Runx2.
Glycerol 2-phosphate: G2P enhances the mineralization of the ECM, and is critical to stimulate
calcified matrix formation (already developed under the effect of Asc) (Franceschi & Iyer 1992). It is
the source of phosphate needed to the formation of hydroxyapatite (Ca10(PO4)6(OH)2). The alkaline
phosphatase (an early osteogenic marker) plays an important role in bone ECM mineralization by
removing the phosphate group from G2P. Then, the free phosphate will bind to Ca2+ to form the
hydroxyapatite deposits. Extracellular inorganic phosphate (Pi) plays also a key role in promoting
osteoblastic differentiation by regulating the expression of many osteogenic genes such as BMP2 (Tada
et al. 2011) and osteopontin (Fatherazi et al. 2009).
Other osteogenic factors such as the bone morphogenetic proteins (BMPs), 1,25-
Dihydroxyvitamin D3 (1,25(OH)2D3) and transforming growth factor TGF-β1 can also be used to
promote osteogenic differentiation.
MSCs osteogenic differentiation was also demonstrated to occur just by cultivating MSCs with
osteocytes and osteoblasts without chemical factors. Osteocytes and osteoblasts cells had synergistic

73
effects and produced biochemical signals to stimulate the osteogenic differentiation of MSCs
(Birmingham et al. 2012).
3.2.1.2 The importance of the extracellular matrix in osteogenic differentiation
Osteogenic matrix is an essential element for the osteogenic differentiation. This matrix is
secreted by the osteoblasts and, in addition to BMPs, contains growth factors, collagenous and
noncollagenous proteins such as fibronectin, vitronectin, laminin, osteopontin and osteonectin (El-
Amin et al. 2003). Osteoblasts must be in contact with a collagen-containing matrix before they can
differentiate. This highlights the very important role of ascorbic acid in osteoblast differentiation, via
the induction of collagen synthesis. The binding of osteoblasts with ECM is assured via the col1- α2β1
integrins interaction, which leads to MAPK signaling and Runx2 phosphorylation. This step is crucial for
activating osteoblast marker genes such as osteocalcin and bone sialoprotein (BSP). ECM formation is
a marker of MSC differentiation to osteoblast, and it accumulates maximally after one week of culture,
as collagen biosynthesis begins to diminish. After 2 weeks of culture, mineralization of ECM begins
which marks the final phase of osteoblast phenotypic development (Quarles et al. 1992).
3.2.1.3 Osteodifferentiation markers
Expression of osteoblast markers follow a temporal sequence. The earliest effects of ascorbic
acid for example is to stimulate type I procollagen mRNA and collagen synthesis, followed by induction
of alkaline phosphatase and later on osteocalcin (Franceschi & Iyer 1992). Quarles and colleagues
showed that, by the day 9 of osteodifferentiation, the cells attain confluence and stop proliferation.
Downregulation of replication is associated with expression of osteoblast markers such as ALP,
processing of procollagens to collagens, and progressive deposition of a collagenous ECM (Quarles et
al. 1992). Later on, other bone markers can be detected (see below). The cell proliferation before
mineralization is a critical process for increasing bone mass, and many physical stimuli were shown to
enhance osteodifferentiation by (amongst others) increasing MSCs (on the route of osteoblasts)
proliferation (Li et al. 2004, Kim et al. 2009a).
Alkaline phosphatase, found in cytoplasm and as a membrane-bound enzyme, is an early
osteoblast marker (within the early stage of differentiation, from days 5 to 14 (Aubin 2001)). It is the
most used marker to prove early osteogenesis in addition to col 1 (onto which the hydroxyapatite is
deposited) (Rodan & Noda 1991). The Asc is essential for ALP expression and activity (Quarles et al.
1992). ALP induction is inhibited by the use of collagen formation inhibitors (Franceschi et al. 1994).
The ALP can be measured quantitatively by biochemical tests relying on colorimetric enzymatic assays,
or histologically by using the BCIP substrate (bromochlorylindolophosphate), a naphtol-based chemical
stain (Aubin 1998, Malaval et al. 1999). Note that ALP presents a peak of expression after 2 weeks of
differentiation, after which its level starts to decline (Quarles et al. 1992) while other genes are
upregulated. After 3 weeks of culture, 100 nM of Dex suppresses ALP activity (Yin et al. 2006). In the
study of George and colleagues (George et al. 2006), MSCs were cultured in honeycomb collagen
scaffold without Dex, and the level of ALP keeped increasing even after the day 14.

74
After 2 weeks of osteogenic differentiation (the final stage of differentiation from days 14 to
28), the late osteogenic markers (Huang et al. 2007) such as osteocalcin, osteopontin, BSPs, and
osteonectin can be measured by RT-PCR (Reverse transcription polymerase chain reaction) or ELISA
(enzyme-linked immunosorbent assay) (Marion & Mao 2006). Osteocalcin is an excellent marker of
mature osteoblast because its expression is highly restricted in these cells (Frendo et al. 1998). Around
day 16, mineralization of ECM begins. The hydroxyapatite deposits mark the final phase of osteoblast
phenotypic development (Quarles et al. 1992). The mineralization in confluent monolayers can be
histologically verified by Alizarin Red S or Von Kossa (silver nitrate) staining (Marion & Mao 2006).
3.2.2 Differentiation into adipocytes
The understanding and manipulation of this process may present a hope for the diminution of
severity of many diseases such as obesity, diabetes and soft tissue resorption or atrophy after burns,
accidents and some medications. Human immunodeficiency virus patients for example receive
antiretroviral medications that may cause facial lipodystrophy, which can be socially embarrassing.
Such patients would highly benefit from a tissue engineering approach that reconstruct their
inadequate adipose compartment (Scott et al. 2011). Note that the adipogenic capacity of MSCs
decrease with the age of the donor (Hauner et al. 1989).
3.2.2.1 Adipogenic-induction factors
Adipogenic differentiation can be induced in MSCs monolayer cultures by adding an hormonal
cocktail containing dexamethasone (Dex), 1-methyl-3-isobutylxanthine (MIX), indomethacin (Ind) and
insulin. There is vast inconsistency between the different recipes: between 100 and 1000 nM of Dex,
0.5 and 500 μM of IBMX, 50 – 200 μM of Ind, and 5 to 400 nM of insulin (Marion & Mao 2006, Styner
et al. 2010, Scott et al. 2011). While a low concentration (100 nM) of Dex is used also to stimulate
osteogenic differentiation, it is advised to use higher concentrations for adipogenic differentiation
because higher Dex concentrations promote adipogenic differentiation and inhibit osteogenic one
(Bruder et al. 1997). The treatment with the four factors mentioned above is cyclic, followed by
treatment with insulin only (Maltman et al. 2011).
1-methyl-3-isobutylxanthine stimulates adipogenesis via the increase of cAMP. In details, MIX
is a phosphodiesterase inhibitor that blocks the conversion of cAMP to 5′AMP, which permits the cAMP
to perform its functions. cAMP decreases cell proliferation and activates the hormone sensitive lipase
(HSL) which converts triacylglycerides to glycerol and free fatty acids (Gregory et al. 2005). MIX has
been shown to increase the levels of the CCAAT/enhancer binding proteins (C/EBP), an essential
adipogenic regulator (Cao et al. 1991).
Indomethacin is a non nonsteroidal anti-inflammatory drug (NSAID) that promotes
adipogenesis by increasing both C/EBP and peroxisome proliferator-activated receptor γ (PPARγ)
(Rosen & Spiegelman 2000, Styner et al. 2010). The Ind is a ligand for PPAR γ, an early adipogenic key
transcription factor that suppresses the canonical wingless (Wnt) signaling (Sekiya et al. 2004). The

75
inhibition of canonical Wnt signaling is primordial for the progression of adipogenesis (Gregory et al.
2005).
Insulin stimulates prenylation (addition of hydrophobic molecules) of the Ras family GTPases,
which phosphorylate and activate CREB (c-AMP response element-binding protein) that, in turn,
triggers the intrinsic cascade of adipogenesis (Klemm et al. 2001).
Dexamethasone exerts its effect on adipogenic differentiation by regulation of the expression
of PPARγ and CEBPα (Zilberfarb et al. 2001). While a low concentration (100 nM) of Dex is used also to
stimulate osteogenic differentiation, it is advised to use higher concentrations for adipogenic
differentiation because higher Dex concentrations promote adipogenic differentiation and inhibit
osteogenic one (Bruder et al. 1997).
Other factors can be used to induce adipogenesis either in addition to the standard cocktail of
chemicals or alone such as PARP agonists or BMP. Others can replace classical factors such as
hydrocortisone (instead Dex) or thiazolidinedione (instead Ind) or forskolin (instead MIX) (Tang et al.
1999, Scott et al. 2011).
3.2.2.2 Adipogenic markers
MSCs undergoing adipogenesis undergo growth arrest at preadipocyte level before
subsequent terminal differentiation into adipocytes (Gregoire et al. 1998). Early adipocytes have a
spherical shape, whereas mature adipocytes are round with large perilipin-coated lipid droplets that
displace nuclei to the cell periphery (Zhang et al. 2012). After one week of induction in adipogenic
medium, the adipogenic markers could be detected. The key molecules and markers of early
adipocytes are: accumulation of lipid vacuoles, adipogenic mRNAs and proteins production such as
PPARγ, C/EBPβ, adipocyte determination and differentiation factor (ADD1), lipoprotein lipase (LPL),
leptin, adiponectin and acylCoA synthetase. The markers of mature adipocytes are PPARγ, C/EBPα,
adiponectin, adipsin and adipocyte fatty-acid biding protein 4 (FABP4) known also as aP2 (adipocyte
protein 2) (Gregoire et al. 1998, Sekiya et al. 2004). Lipid vacuoles can be detected histologically by Oil
Red O, Nile red (Aldridge et al. 2013) or boron-dipyrromethene (Bodipy) staining (Nagayama et al.
2007). Free glycerol is another indicator of triacylglycerides degradation and fatty acids synthesis by
the hormone sensitive lipase, and it can be quantified by lysing the cells and using a glycerol kit (Pairault
& Green 1979). The other adipogenesis markers can be detected either by immunocytochemistry or
by RT-PCR.
3.2.3 Differentiation into neuronal cells
The MSCs differentiation to neuronal cells is a transdifferenciation because the embryogenic
origin of the MSCs (the mesoderm) is different from the neuronal cells origin (the exoderm). An
extensive data exists today on the MSCs neuronal differentiation ability in vitro, and many groups
demonstrated that MSCs display neuronal forms and markers in a few days after culture in suitable

76
medium with the suitable chemical factors (Woodbury et al. 2002, Ortiz-Gonzalez et al. 2004, Jori et
al. 2005).
3.2.3.1 Neurogenic-induction factors
There is a wide variety of cocktails used to induce MSCs neurogenic differentiation. These
cocktails may contain one or many neuronal induction factors such as retinoic acid (RA), β-
mercaptoetanol (βME), dimethyl sulfoxid (DMSO), valproic acid, butylated hydroxyanisole (BHA),
forskolin, K252a, growth factors (brain-derived neurotrophic factor, epidermal growth factor, neural
growth factor), noggin factor or 5-Azacytidine (Jori et al. 2005, Mareschi et al. 2006, Liu et al. 2015).
The cells are maintained in a pre-induction medium for 12-24 hours and then in an induction medium
for 5-6 days. In vitro, MSCs differentiate into early neuronal cells progenitors under conditions that
increase the intracellular level of cAMP (Deng et al. 2001). The co-culture of MSCs with neural cells can
result also in MSCs neuronal differentiation, due to cell-cell interactions and effects of secreted soluble
factors. The co-culture of MSCs with cerebellar granule neurons for example gives arise to MSC-derived
neuron-like cells presenting single-action potentials and respond to several neurotransmitters such as
GABA, glycine and glutamate (Wislet-Gendebien et al. 2005).
3.2.3.2 Neurogenic markers
The nestin is one of the first and very important markers for the responsive character of MSCs
to extrinsic signals, and its expression in MSCs is essential for the integration of these signals (Wislet-
Gendebien et al. 2005). It is essential and characteristic of neuronal precursor stem cells (after some
hours of differentiation), but undetectable after 6 days of differentiation. In contrast, expression of
other markers such as the Tropomyosin receptor kinase A (TrkA), also known as high affinity nerve
growth factor receptor, persisted from 5 hr throughout the 6 days of differentiation (Woodbury et al.
2000). Other important neurogenic markers are the neuron-specific enolase (NSE), neuron-specific
nuclear protein (NeuN), neurofilament-M (NF-M), tubule-associated unit (tau), microtubule-associated
protein 2 (MAP-2) and glial fibrillary acidic protein (GFAP). With an optimal differentiation protocol,
different studies showed that almost 80% of the cells express NSE and NF-M (Woodbury et al. 2000)
or become immunoreactive for NeuN, nestin, and GFAP (Mareschi et al. 2006). Deng et. al showed that
undifferentiated cultures of MSCs express some markers characteristic of neural cells such as
microtubule-associated protein 1B (MAP1B), TuJ-1, NSE and vimentin. After treatment with an
adequate neural induction medium, the MSCs differentiated into neuronal cells showed increased
levels of both NSE and vimentin (Deng et al. 2001), and expressed tau protein in their cell body (Black
& Woodbury 2001).

77
3.3 EFFECTS OF PHYSICAL STIMULI ON THE MSCS DIFFERENTIATION
The cell density, the optimal combination and concentration of growth factors, cytokines, basal
nutrients and serum supplements have important impacts in controlling MSCs differentiation process
and cell fate. Recent studies have tested also the effect of mechanical forces and electromagnetic fields
on the differentiation outcomes.
3.3.1 Effect of mechanical stimulation
The substrate rigidity plays crucial role in stem cell differentiation (Engler et al. 2006) and
influences Ca2+ signaling. It was shown that substrate rigidity regulates Ca2+ oscillations via Ras
homolog gene family member A (RhoA) and its downstream effector the molecule Rho-associated
protein kinase (ROCK)(Kim et al. 2009b). MSCs cultured on gels with low elastic moduli displayed low
RhoA activities. Lowering the substrate stiffness to 1 kPa significantly inhibited both the magnitudes
and frequencies of Ca2+ oscillations in comparison to stiffer or more rigid substrates (Kim et al. 2009b).
Altman et al. showed that the application of a cyclic mechanical stimulation (translational and
rotational strain) to undifferentiated MSCs embedded in a collagen gel, over a period of 21 days
resulted in ligament cell lineage differentiation even without differentiation factors. The differentiated
ligament cells expressed ligament markers such as oriented collagen fibers I and III and tenascin-C.
They did not express bone or cartilage-specific cell markers which demonstrate the specificity of the
differentiation (Altman et al. 2002). Ward and colleagues studied the effect of the application of a 3-
5% tensile strain to a collagen I substrate and saw that it stimulates osteogenesis of attached human
MSCs (hMSCs). This mechanical strain increased osteogenic markers expression and matrix
mineralization while simultaneously reduced the expression levels of other lineage markers
(chondrogenic, adipogenic, and neurogenic). They showed that mechanical strains enhanced
osteogenic differentiation through the ERK MAP kinase pathway (Ward et al. 2007). Another study of
Datta et al. underlined the synergetic effect of the combination of a mechanical stimulation and ECM
and dexamethasone. They showed that rat MSCs cultured on titanum fiber mesh discs exhibit high
levels of osteogenic markers when they are cultured in the presence of fluid shear stresses, ECM and
dexamethasone (Datta et al. 2006). The oscillatory fluid flow was studied by another group that
showed also the positive effect of such a shear stress on MSC osteodifferentiation. They showed that
the mechanotransduction involved intracellular Ca2+ mobilization, demonstrating the role of Ca2+
signaling in the differentiation process (Li et al. 2004). Many other studies mentioned the effects of
shear stress (Zhao et al. 2007, Kreke et al. 2008, Sharp et al. 2009) and mechanical stretch i.e. uniaxial
cyclic tensile strain (Yoshikawa et al. 1997, Sumanasinghe et al. 2006), equibiaxial cyclic strain
(Simmons et al. 2003), on MSCs osteodifferentiation.
Ca2+ oscillations play an important role in the mechanotransduction of a mechanical signal in
the cells. A study of Jing et al. showed that tissue strain and shear stress on mouse tibia is transduced
by repetitive Ca2+ spikes in the osteocytes. The spikes frequency and amplitude depend on the
mechanical magnitude. The oscillations were inhibited by the ER depletion or the inhibition of PLC and
P2 purinergic receptors (P2R). This study demonstrated that osteocytes respond to mechanical
stimulation, in situ, by Ca2+ oscillations dependent on P2R/PLC/IP3 pathway (Jing et al. 2014).

78
Low intensity ultrasounds (LIUS) are another form of mechanical stress, and has been shown
to enhance the chondrogenic differentiation. When human MSCs cultured in pellets were treated with
transforming growth factor beta (TGF-β) and exposed to LIUS for 20 min every day, they displayed
enhaced chondrocyte differentiation (Ebisawa et al. 2004). However when LIUS are compared to TGF-
β, the LIUS were more effective in enhancing chondrogenesis, especially when the MSCs were
cultivated in a fibrin-hyaluronic acid hydrogel (Choi et al. 2013).
Haudenschild et al. reported that hMSCs have distinct gene expression patterns according to
the nature of mechanical stress, whether it was dynamic tensile or compressive loading. This ability to
distinguish between these forms of stress is due to the different conformational changes caused in cell
shape and volume. Dynamic tension regulates both fibroblastic and osteogenic associated genes
whereas dynamic compression up-regulated genes associated with chondrogenesis (Haudenschild et
al. 2009).
Figure 36 : A schematic view of the potential effects of physical stimuli on the MSCs differentiation (an example of
osteodifferentiation). The inductive factors diffuse across the cell membrane (or enter by specific receptors) to produce their
effects. Physical stimuli (mechanical or electrical) can modulate the Ca2+ dynamics by modulating Ca2+ channels openings, or
GPCR-activated molecules (PLC) or integrin-mediated focal adhesion (Titushkin et al. 2010).
3.3.2 Effect of the electric, electromagnetic fields and the membrane
potential
In the bibliography there are less studies that use the electric and electromagnetic fields to
enhance MSCs differentiation than the ones using a mechanical stimulation. Sun et al. demonstrated
that 0.1 V/cm electrical stimulation applied for 30 min per day for 10 days, on attached MSCs cultured
with osteoinductive factors, enhance their osteodifferentiation; the levels of osteogenic markers were
significantly higher than when the osteoinductive factors were applied alone. This electrical
stimulation was shown to act, between others, on the frequency of the Ca2+ oscillations. The incubation
of MSCs with osteinductive factors results in the diminution of their Ca2+ oscillations frequency.
Application of a non invasive electrical stimulation resulted in further reduction of Ca2+ oscillations
frequency to a level similar to that found in differentiated osteoblasts (Sun et al. 2007). However the
Physical stimuli
Inductive factors

79
application of an electrical stimulation alone failed to differentiate the MSCs, which demonstrates the
synergistic effects between the soluble osteoinductive factors and the electrical stimulation. Another
study showed that the exposition of hMSCs to a static biphasic electric current (BEC) promotes
osteogenic differentiation. The hMSCs were exposed to a 100 Hz electrical stimulation with a
magnitude of 1.5 to 15 μA/cm2 for 250 to 25 μs respectively. The cells presented increased proliferation
under the electric stimulation (ES) for 5 days (the importance of cells proliferation before bone
mineralization was already discussed in 3.2.1.3), and enhanced calcium deposition after 7 days (after
the electric stimulation). The osteogenic differentiation was enhanced by the mitogenic effect of BEC
and the activation of VOCCs and MAPK (Erk and p38) pathway (Kim et al. 2009a). The common
mechanism between the two studies cited above is the activation of the MAPK pathway by the electric
stimulation, which is known to be involved in cell differentiation (Luttrell 2002, Burdon et al. 2002).
However, the activation of VOCCs was not observed in the two studies: in the study of Kim et al., the
ES was sufficient to activate VOCCs, whereas the 0.1 V/cm used by Sun et al. did not alter the
membrane potential because the electric field was too low.
Other studies using electrical stimulation of bone cells showed also the implication of Ca2+ in
the effects of the ES. They suggested an increase of intracellular Ca2+ concentration either by the
activation of VOCCs and the Ca2+ - CaM pathway inducing a proliferative response in the cells (Lorich
et al. 1998, Brighton et al. 2001), or by the stimulation of PLC-coupled cell surface receptors, IP3-
dependent intracellular processes and activation of SOCCs (Khatib et al. 2004). Electrical stimulation
also induces integrin activation, redistribution, clustering and assembly of some FA proteins such as
paxillin, vinculin, FAK and src (Cho 2002, Wozniak et al. 2004). Such assembly could induce the MAPK
activation (Miranti & Brugge 2002) and hence cell differentiation.
Electromagnetic fields (EMF) can also promote MSCs differentiation to osteoblasts through
Ca2+-related mechanisms. The exposition of MSCs to pulsed EMF for 10 min every day at the same time
resulted in the enhancement of the early stages of osteogenesis (first 2 weeks) through the activation
of VOCCs and the increase of intracellular Ca2+ concentrations (Petecchia et al. 2015). Many other
studies showed also that the effects of EMF, whether beneficial or not, are mediated by VOCCs (Pall
2013).
Many reports mention the relationship between membrane depolarization and control of
proliferation and differentiation. They show that proliferative and relatively immature cells exhibit
depolarized membrane potentials, while terminally differentiated quiescent cells exhibit
hyperpolarized membrane potentials (Cone, Jr. 1970, Cone & Tongier 1971, Binggeli & Weinstein 1986,
Olivotto et al. 1996, Wonderlin & Strobl 1996, Levin 2007). A study of Sundelacruz and colleagues
showed that the transmembrane potential is an essential determinant of differentiation, and that it
can control the adipogenic and osteogenic differentiation of MSCs (Sundelacruz et al. 2008). They
observed that the process of MSCs differentiation was accompanied by a hyperpolarization in
membrane potential, and that differentiated osteoblasts and adipocytes have a hyperpolarized
membrane whereas the undifferentiated MSCs have a depolarized membrane. They demonstrated
that membrane depolarization, either by the addition of high concentrations of extracellular K+ or the
addition of ouabain (a Na+/ K+ ATPase blocker), suppresses the osteogenic and adipogenic
differentiation. However, hyperpolarization by ATP-senstive K+ channel openers pinacidil and
diazoxide, during osteogenic differentiation causes upregulation of osteogenic markers (Sundelacruz
et al. 2008).

80
81
4 MEMBRANES ELECTROPORATION
The plasma membrane (PM) is the physical barrier that shields the cell interior from the external
medium. It preserves the integrity of the cells and controls all the exchanges between the interior and
the exterior via its very wide collection of channels and receptors. Nevertheless, it would be important
to cause a temporary rupture in the PM structure in order to let interesting non permeant molecules
to reach the cell. Such molecules can be drugs, genetic material or chemicals compounds. The rupture
of PM does not cause only the entry of certain compounds but also the leakage of internal material.
The passage of ions or molecules always occurs according to the concentration gradient.
The fact of breaking the PM integrity is called membrane permeabilisation, because it will make
the PM permeable to usually non permeant compounds. In its quiescent state, the cell controls what
goes in and what comes out via the PM. When permeabilised, the PM loses this control but
temporarily, because every uncontroled PM permeabilization, either in space or in time may cause
drastical outcomes leading to cell death. This is why, the factors that are used to cause PM
permeabilization should be controlled and set carefully in order to give the desired outcomes without
causing cell mortality, unless the purpose of the permeabilization is to break irreversibly the integrity
of the PM.
Many chemical and physical factors can be used to permeabilize the PM. Molecules such
polyethylene glycol are used for cell transfection, transformation (Bibb et al. 1978, Chang & Cohen
1979) or even to cover nanoparticles carrying drugs or DNA to the cells (Brigger et al. 2002, Cha et al.
2013). The PEG is not toxic and protects nanoparticles from the immune system (Jokerst et al. 2011).
Another chemical that can permeabilize the PM is the DMSO. The DMSO is known to be a cryoprotector
agent of the cells when they are frozen, but can also cause membrane permeabilization (Hempling &
White 1984, Ménorval et al. 2012). The sonoporation is a physical way to permeabilise the PM by using
ultrasounds. The use of microbubbles greatly enhances the outcomes of this technique. The
sonoporation causes the formation of short-lived pores in the PM lasting for a few seconds, and up to
100 nm in effective diameter (Newman & Bettinger 2007). Sonoporation has been successfully used to
enhance gene transfer in vitro as well as in vivo (Lan et al. 2003, Guo et al. 2004). Another physical way
lays on the use of an electric field to achieve PM permeabilization and is called electroporation. It is a
simple, easily applicable, very efficient and non invasive technique used in vitro and in vivo for many
purposes such as cell transfection and electrochemoterapy.
4.1 A BRIEF HISTORICAL VIEW
The first works on electroporation (called also electropermeabilisation) started in the 60s with
Sale and Hamilton. While studying many cell types in culture, they demonstrated that unpermeant
molecules to the PM in physiological conditions can cross it after the application of an intense electric
field pulse (Sale & Hamilton 1968). They observed that the degree of lysis of a cell suspension
population depends on the electric field strength. In 1972, Neumann and Rosenheck showed that
electric pulses of 20 kilovolts/centimeter (kV/cm) cause transient permeability changes in the
membranes of vesicles storing biogenic amines. They monitored the PM permeabilisation by the

82
measurement of the amount of catecholamines released by these vesicles (Neumann & Rosenheck
1972). A few years later, Kinosita and Tsong published an important study showing that the exposure
of an isotonic suspension of erythrocytes to an electric field (EF) of 2.2 kV/cm, makes the erythrocytes
PM becomes leaky to normally impermeant ions or molecules. They demonstrated that the passage of
molecules across the PM is due to the formation of pores in this latter. The size of these pores can be
varied in a controlled manner and they can be resealed (Kinosita & Tsong 1977). In 1982, Neumann et
al. drive gene transfer into mouse lyoma cells by using electric pulses and found that this technique
greatly enhances the DNA transfer into the cells. After six years, Mir and colleagues achieved the
electropermeabilization of 90% of cultured NIH 3T3 cells by using 8 successive square pulses of 100 s
and 1500 V/cm (Mir et al. 1988). From then on, the applications using electroporation growed
considerably in biology, medicine, research and food industry.
4.2 THE ELECTROPORATION PRINCIPLE
The electroporation (or electropermeabilization) occurs when the cells are subjected to an
electric field sufficiently high. The cells are placed between two electrodes where an electric field is
applied (Figure 37). The zones of the cells that are more subjected to the electric field, and hence more
permeabilized, are the two poles facing the electrodes. According to the electric pulse parameters
(electric field amplitude, pulse duration, frequency of repetition), to the cell type and to the properties
of the external medium, the PM permeabilization could be reversible, as cells recover after the pulse,
or irreversible, thus leading to cell death. The reversible electroporation is used to make molecules of
interest enter the cell, such as therapeutic molecules, drugs or genetic material (Hofmann et al. 1999,
Widera et al. 2000, Lucas & Heller 2003, Mir et al. 2005) and can be used to achieve cell fusion (Claude
& Justin 1983). The irreversible electroporation is used to kill harmful cells such as cancerous cells in
vivo (tumor ablation) (Al-Sakere et al. 2007), bacterial decontamination and food processings
(Schoenbach et al. 2000, Schultheiss et al. 2002) or even to increase the efficiency of juice extraction
from fruits (Bouzrara & Vorobiev 2000).
Figure 37 : the electroporation principle and applications (Subhra et al. 2013).

83
4.2.1 The induced transmembrane potential
In its quiescent state, the cell has a resting transmembrane potential (TMP) insured by the
function of the Na+/K+ ATPase (cf. section 1.1.5). The resting TMP 0 ranges from about - 4.5 (Veech
et al. 1995) to - 200 millivolts (mV) (Campbell n.d. et al., 2008) depending on the species and the cell
type. When a cell is subjected to an electric field, an induced TMP i is added to the resting 0. The
i is mainly due to the movements of mobile charges caused by the electrophoretic force of the
electric field. This displacement of electric charges (mostly ions) causes further charging of the PM and
hence the i.
The charging time m of a membrane is the time required to charge the surface of this
membrane. The m of the PM depends on the electrical parameters of the cell and the medium in which
it is suspended and it is given by the equation (Cole 1937):
m = rCm (c + 0/2) (1)
where Cm is the membrane capacitance (considering that the PM acts as a dielectric layer with no
leakage currents), r is the cell radius, ρc is the resistivity of the cytoplasm, and ρ0 is the resistivity of the
extracellular medium. This equation is mainly applied to spherical cells in suspension (Deng et al. 2003).
Figure 38 : representation of 0 and i on a cell of a radius r exposed to an electric field. The sign (+) represents the
anodic side and the (-) is the cathode, (Escoffre & Rols 2012).
The charging time of the PM is approximately 100 ns for mammalian cells (Ashton Acton 2012).
By using electric pulses with longer duration than the charging time of the PM, this latter has the time
to be charged, and if the electric field is high enough, to be permeabilised. Shorter pulse durations are
thought to have more effects on the cell interior, and if high enough, to permeabilize the organelles
membranes. However, recent studies show that, it is not obligatory that the pulse has a sufficient
duration to cause membrane charging, because such observations were done with ultrashort electric
pulses (Frey et al. 2006, Pakhomov et al. 2007). The i is given by Laplace equation (Pauly & Schwan
1959):
i = f E r cos (1 - 𝑒−𝑡/m ) (2)
where E is the electric field amplitude, r is the cell radius, is the angle between the electric field
direction and the normal to the surface at a specific membrane position, t is the duration of the

84
exposure to the electric field and m is the charging time of the membrane. f is a function depending
on the electrical and dimensional properties of the cell and the surrounding medium, and is given by
the equation (Kotnik et al. 1997):
f = 3𝜆0 [3𝑑𝑟2 𝜆𝑖+(3𝑑2𝑟−𝑑3)(𝜆𝑚− 𝜆𝑖)]
2𝑟3 (𝜆𝑚+ 2𝜆0) (𝜆𝑚+ 1
2 𝜆𝑖)−2 (𝑟−𝑑)3 (𝜆0− 𝜆𝑚) (𝜆𝑖− 𝜆𝑚)
(3)
where d is the PM thickness, Cm is its capacitance, λ0, λi and λm are the conductivities of the extracellular
medium, the cytoplasm and the PM respectively.
Two simplifications can be done on equation (1): first, if the PM is considered as a perfect
insulator, hence its conductivity is considered as zero, and f will be approximately 3/2. Second, it is
often assumed that m is much smaller than t, and in this case 𝑒−𝑡/m will be zero, and equation (2) is
simplified to become the Schwan equation (Schwan 1957):
i = 3
2 E r cos (4)
As a consequence of this equation, the cells that have a large radius require a lower electric field to
get their membrane permeabilized than cells having a small radius.
As it can be seen on Figure 38, i is added to 0 at the anodic side of the cell, whereas it is
against it on the cathodic side. Because the total TMP m is the addition of i + 0 , hence the
pore formation process begins on the anodic side of the electrically stressed membrane (Hu et al. 2005,
Frey et al. 2006). The charges accumulation is the highest on the 2 poles of the cell facing the 2
electrodes (Figure 39), which makes them the regions where the permeabilization occurs. On the
anodic side, the PM is hyperpolarized, whereas on the cathodic one, it is depolarized. In these two
regions, the total TMP m is higher than the other parts of the cell. According to Schwan equation,
the 2 positions of the cell that make an angle of 0˚ or 180˚ with the electric field direction, are the
positions where the total TMP m is the highest, and these positions are indeed in the 2 poles of the
cell facing the 2 electrodes. According to the same equation, the 2 positions of the cell that are
perpendicular to the electric field direction, are the positions where the total TMP m is the lowest
and it is equal to zero.
Figure 39 : left: field lines and charges distribution on the 2 poles of the cells facing the anode and the cathode, right: the
total TMP (Vm) at different angles relative to the electric field direction (Burgain-Chain & Scherm 2013, Vlahovska 2015).

85
These theoretical predictions were confirmed by many experimental studies as demonstrated
by Kinosita et al. (Kinosita et al. 1988) and later on by Kotnik et al. (Kotnik et al. 2010). By using the
voltage sensitive dye di-8-ANEPPS to determine total TMP m, and the propidium iodide (PI) to
monitor the transmembrane transport, Kotnik et al. demonstrated that the highest absolute values of
m are found in the regions of the PM that face the two electrodes, and that the PI transport is mainly
confined to these regions. Another important demonstration of their study was that the theoretical
model is not only applicable to spherical or regular cell shapes, but also to cells with irregular shapes
as can be seen in Figure 40. According to this study, the cell region facing the anode is the most
permeabilized.
Figure 40 : local variations of the TMP of an irregular shaped Chinese Hamster Ovary (CHO) cell. A: changes in fluorescence
of di-8-ANEPPS caused by a nonporating 50 ms, 100 V/cm pulse. B: PI transport caused by a porating 200 µs, 1000 V/cm
pulse, visualized in the same cell after 200 ms of exposure. The bar is 5 µm. C: the dashed line represents the m predicted
by numerical computation, and the solid line represents the m measured along the path shown in A (Kotnik et al. 2010).
4.2.2 The permeabilization threshold
The permeabilisation threshold is the level that i + 0 should reach to cause changes in
membrane properties and its permeabilisation. This concept was first introduced by Neumann and
Rosenheck in 1972 (Neumann & Rosenheck 1972). The permeabilisation threshold is not a fixed value;
it depends, between others, on the cell type, the original TMP of a cell 0, and the size and
conformation of the permeabilization marker. Sale and Hamilton calculated the potential difference
across the PM of spherical cells in suspension exposed to an electric field, and noticed that lysis
occurred when the potential difference reached about 1 V in average (Sale & Hamilton 1968). The
same result was obtained by 2 independent studies leaded by Coster and Simmermann in 1975 and by
Kinosita and Tsong in 1977; Coster and Simmermann worked on Valonia utricularis (a genus of green

86
algae), and demonstrated that the critical breakdown potential is 1V at 4˚C. Interestingly, this potential
was strongly dependent on the temperature, and decreased to 640 mV at 30˚C (Coster & Simmermann
1975). Kinosita and Tsong found that the EF necessary to permeabilize erythrocytes in suspension
corresponds to a TMP of approximately 1 V (Kinosita & Tsong 1977). Later on, Hibino et al.
demonstrated that the permeabilization threshold of sea urchin eggs is 1V (Hibino et al. 1993).
However, other studies showed that the permeabilisation threshold may be under 1V. Teissié
and Rols calculated a TMP, needed to permeabilise the protoplasts (cells that have their wall removed)
of bacteria and plant, between 100 and 250 mV only. They demonstrated also that CHO cells are
permeabilized when their TMP reaches 250 mV (Teissié & Rols 1993), a value near to the
permeabilization threshold of 100 nm lipidic vesicles, that was found to be between 200 and 300 mV
by Teissié and Tsong (Teissie & Tsong 1981). By using the whole cell patch-clamp technique on
protoplasts derived from the tobacco culture cell line "Bright yellow-2", Wegner et al. demonstrated
that an electropermeabilisation occurred when the PM was either hyperpolarized or depolarized
beyond threshold values of around -250 to -300 mV and +200 to +250 mV, respectively (Wegner et al.
2011). They demonstrated also that a TMP of 800 mV is required to permeabilise a protoplast of green
marine algue. As a conclusion of the studies cited above and many others in the bibliography, the
permeabilisation threshold of the PM ranges from 100 to 1000 mV (1V).
4.3 SOME FACTORS THAT INFLUENCE THE PERMEABILIZATION THRESHOLD AND
IMPACT THE ELECTROPERMEABILIZATION OUTCOMES
When the total TMP m (i + 0) reaches the permeabilisation threshold, the PM loses its
insulating character and becomes permeabilised. The electropermeabilisation can be quantified by the
internalization of impermeant dyes or the leakage of cytoplasmic components such as ATP (Rols &
Teissié 1990). In the case of a reversible electroporation, the permeabilized state of the PM lasts from
some minutes (Pakhomov et al. 2007) to some tens of minutes, after which the PM returns to its
original state (Wilhelm et al. 1993). The permeabilization threshold, the pore formation, extension and
lifetime depend on the electric pulse parameters, the cell geometry, the PM and the medium
composition.
4.3.1 The impact of the electric field amplitude
One of the most important factors of an electric pulse, which determines the permeabilisation
threshold and the PM breakdown is the electric field (E) amplitude. The E amplitude determines the
I that favors the development of the pores (Abidor et al. 1979). Rols and Teissié demonstrated that
the fact of reaching the permeabilisation threshold is directly dependent of the electric field amplitude.
When the electric field amplitude increases, the permeabilized area of the permeabilized zone
increases (Rols & Teissié 1990), and larger molecules can cross the PM. If higher electric field
amplitudes are applied, the percentage of permeabilized cells increases until reaching a plateau. Above

87
a certain value of the electric field, a mortality of the cells starts to be observed. This value is dependent
on the cell type, the extracellular medium and many other factors.
Many models attempted to explain how the PM breakdown occurred after the application of
an electric field. According to the bilayer lipid membrane (BLM) model (known also as bimolecular or
black lipid membrane) of Crowley (Figure 41), the membrane is modeled as a homogeneous isotropic
and viscoelastic layer that has insulating electrical properties. When the membrane is subjected to an
electric field, a compressive electric force tends to cruch it. If the compressive force exceeds a critical
value, in a way that the viscoelastic force of the elastic layer could not compensate it, hence the
membrane is ruptured (Crowley 1973). It should be noted that the restoring elastic force of a stretched
membrane is inversely proportional to its length; the more the membrane is long, the more its
restoring elastic force is small. Another model interpretation of the breakdown phenomenon is based
upon the concept of structural defects in the PM, whose development is favoured by the electric field
(Abidor et al. 1979). The membrane breakdown is a multistep phenomenon that can be divided into
three stages: (i) growth of the membrane surface fluctuations, (ii) molecular rearrangements leading
to membrane discontinuities, and (iii) expansion of the pores, resulting in the mechanical breakdown
of the membrane (Dimitrov 1984). However, these models did not predict neither the effect of an
electric field increase above the permeabilization threshold, nor the effect of the duration or the
number of the pulses. The pore creation time has been shown to decrease as the electric field
amplitude initiating it increases (Ziegler & Vernier 2008).
Figure 41: electrical breakdown of the membrane. A. Membrane is modeled as an electrically insulating elastic layer
surrounded by a conducting liquid. B. An applied electric field squeezes the membrane, and ruptures it. a: the original semi-
thickness of the membrane, L: the new semi-thickness after electric compression, ∆ = L – a, V: the voltage applied, ε: the
permittivity of the membrane, E: young’s modulus, a property of the membrane dependent on its capacitance and thickness
(Crowley 1973).

88
4.3.2 The impact of the pulse duration
Another major determinant of the electropermeabilization is the electric field duration. Frey
et al. demonstrated that the pore size depends on the duration of the electric pulse (Frey et al. 2006).
The microseconds to milliseconds pulses (with an EF amplitude high enough) generate relatively large
pores in the PM, sufficient for the passage of large molecules such as bleomycin, siRNA and DNA
plasmids. The pulses with a duration of nanoseconds are thought to create small pores in the PM that
allow ions but not large molecules to pass through (Chen et al. 2004, Hu et al. 2005). Moreover, the
membrane stability depends on the duration of the electric field (Tien & Diana 1967). This could be
explained by the fact that the creation of an electropore is completely stochastic, hence when the
pulse duration increases, the probability for a pore formation increases also. Rols and Teissié
demonstrated that the permeabilisation threshold depends on the electric field amplitude, and the
molecules flow across the permeabilized PM depends on the pulse duration [and the number of pulses]
(Rols & Teissié 1990). The microscopic observations of individual living cells demonstrated different
effects between electric pulses of different duration. A 100 µs pulse for example induces cellular
swelling and a median PM permeabilization duration of 5 minutes, whereas after a 60 ns pulse, the
membrane permeability is delayed to a median of 17 minutes with no cellular swelling.
4.3.3 The impact of the number of the pulses
Mauroy et al. found that increased number of pulses caused lipid loss and a decrease in size of
giant unilamellar vesicles (GUVs) (Mauroy et al. 2012). As seen above, the molecules flow intensity
across the permeabilized PM depends on the pulse duration and the number of pulses (Rols & Teissié
1990). In a recent work of Silve et al., it was demonstrated that a large number of pulses resulted in a
large number of pores or defects in the PM. The authors showed that, with an external concentration
of 3 μM, one single 10 ns pulse of 40 kV/cm is sufficient to allow the uptake of bleomycin in 20% of
cells. The same levels of cytotoxicity can be reached even with a 100 fold reduction in the external
bleomycin concentration, if the number of pulses is increased 25 times (Silve et al. 2012). The authors
found that, due to the very short half life of a nanopore (Levine & Vernier 2010), the fact of increasing
the number of pulses may have the same result than the addition of the effects of each separate pulse.
This means that the higher number of pulses cause additional defects (additional pores) in the PM
rather than stabilizing initial ones or increasing their size. This is also demonstrated by the inverse
relationship between the external concentration of bleomycin, and the number of pulses needed to
cause cell death, in another words, the entry of at least 500 bleomycin molecules. A recent study of
Pakhomov et al. showed also that increasing the pulse number resulted in increasing the pores
number, not the size of pre-existing pores (Pakhomov et al. 2015).
4.3.4 The impact of the pulses frequency
Several studies demonstrated that electric pulses delivered at low repetition rates are more
efficient in inducing electropermeabilization. Silve et al. showed that, for pulses of 100 µs, a saturation
was observed below a frequency of 0.1 Hz, and that the pulses delivered at such frequencies were

89
more efficient than those delivered at higher ones, from 1 Hz to 7 kHz (Silve et al. 2014). This study
was conducted on potato cells but other studies showed also the same tendencies on other plant
tissues such as onion (Asavasanti et al. 2011) and apple (Lebovka et al. 2001), where lower frequencies
(< 1 Hz) caused more damage to tissue integrity than higher ones (1 Hz to 5 kHz). Other in vivo studies
are in agreement with the previous ones. Sersa et al. demonstrated that the electrochemotherapy (cf.
4.7.1) of mouse sarcoma tumors was more effective when using electric pulses trains at 1 Hz compared
to 5 kHz. They explained this effect by the fact of prolonged exposition of electroporated tumors to
the chemotherapeutic drugs and a greater electroporative effect (Sersa et al. 2010). The use of shorter
pulses (in the nanosecond range) gave the same outcomes; a greater permeabilization is observed
when pulses are delivered at very low repetition rate (Silve et al. 2014).
Figure 42 : Pulse repetition rate impact during the exposure to A: 300 pulses of 10 ns pulse and 40 kV/cm and B: 4 pulses of
100 μs and 300 V/cm, NID: normalized impedance drop (Silve et al. 2014).
4.3.5 The impact of the cell shape and diameter
The Schwan equation implies that the cell size affects the electroporation outcomes. The
permeabilisation threshold is inversely proportional to the diameter of the object wanted to be
permeabilized. Larger GUVs for example are more affected at lower electric field strengths than the
smaller ones (Mauroy et al. 2012). The restoring elastic force of a stretched membrane exposed to an
electric field is inversely proportional to its length; this means that the more the size of a cell or a
vesicle is large, the more the elastic force of their membranes, compensating the compressive
electrical force, is small, hence they are more easily permeabilized (Crowley 1973). This is why cells in
suspension need higher electric field amplitudes to be permeabilized than when they are attached and
spread. This has been demonstrated in Rols and Teissié’s study in 1990: the same CHO cells are not
permeabilised with the same electric field amplitudes when they are in suspension or attached. A 700
V/cm pulse (of 100 µs) was needed to observe a trypan blue entry in the cells in suspension, whereas
300 V/cm was sufficient to obtain the same effect when the cells were attached and spread (Rols &
Teissié 1990).
Kotnik and colleagues performed many simulation studies that showed how the geometry and
the orientation of the cells relative to the orientation of the electric field impact the induced
transmembrane potential on different points of the cells (Kotnik & Miklavcic 2000, Kotnik et al. 2010).

90
An example in Figure 43 shows a cell with 2 different radius R1 and R2, and demonstrates how the cell
with the highest R2 compared to R1 presented the highest maximum values of induced TMP, and how
the shape of the curves depend on the cell geometry.
Figure 43: Left: the induced transmembrane voltage (ΔΦ) in units of ER1 as a function of the polar angle φ for three
spheroidal cells with equal R1 and R2 = 1/5 R1 (solid line), R2 = R1 (dashed line), and R2 = 5 R1 (dotted line) (Kotnik & Miklavcic
2000).
4.3.6 The impact of the plasma membrane properties and lipid composition
The process of electropermeabilization was demonstrated experimentally in vitro on different
kinds of cells and in vivo. However, the simplest model to study the process remains the GUV which is
a purely lipidic structure assembled in vitro. The GUV is being the simplest model to study membrane
electroporation, because this phenomenon occurs normally in lipids-rich zones of the PM. The
composition of the GUV can involve one single lipid or a combination of two or more lipids. These lipids
can be either synthetic or natural. The complexity of the GUV could be monitored by adding or not the
cholesterol which makes the GUV nearer in properties to the physiological PM. The rupture voltage is
dependent upon the nature, the lipid composition and the physico-chemical properties of the
membrane. The presence of cholesterol for example, makes higher the voltage needed to permeabilize
a membrane. The measured breakdown voltage of a membrane made from cholesterol for example,
is three times higher than if it was made of phosphatidylcholine (Crowley 1973). Furthermore, the
electroporation threshold changes with the nature of lipids tails (whether these tails are acyl chains or
methyl branched chains) and the type of linkages (whether these are ether or ester linkages). This is
what showed a molecular dynamics (MD) simulation of Polak et al. in 2013. They used three different
lipids in their study: the dipalmitoyl-phosphatidylcholine (DPPC), the diphytanoyl-phosphocholine-
ester (DPhPC-ester) and the diphytanoyl-phosphocholine-ether (DPhPC-ether) (Figure 44). The
electroporation of the lipid bilayers occurred at 2.3, 3 and 3.7 V for DPPC, DPhPC-ester and DPhPC-
ether respectively (Polak et al. 2013). This shows that the addition of methyl groups in the hydrophobic
tails stabilizes the lipid bilayer. Also, the ether linkage stabilizes even more the bilayer. The more the

91
lipid bilayer is stabilized, the more the electroporation threshold is higher. This can explain why, for
example, the archea membranes are more stable than the eukaryotes or bacteria membrane; the
archaeal lipids have ether linkages that replace the ester linkages in their membranes. The archaeal
lipids resist hydrolysis and oxidation and this helps these organisms to withstand the extreme
conditions in which they live (Berg et al. 2002b).
Figure 44 : Left, structures of the lipids in the study of Polak et al., Right, atoms are color-labeled in MD models (O: red, C:
cyan, H: gray, P: brown), the DPhPC-ether is not shown due to similarity to the DPhPC-ester (Polak et al. 2013).
The breakdown voltage does not depend only on the composition of the PM but depends also
on other properties such as, between others, the thickness of the membrane, which can be given by
the equation (Michael & O’Neill 1970):
U > (𝜎 ℎ
𝜀0)
12⁄
where h is the membrane thickness, 𝜎 is the surface tension and 𝜀0 is the dielectric constant of
vacuum. The surface tension is produced by the surface charges (under the forces of the electric field)
that cause the coalescence of water droplets on the water interfacial surface of the membrane
(Michael & O’Neill 1970). Ziegler and Vernier also demonstrated, by molecular dynamics simulations,
such a correlation between the bilayer thickness and the breakdown voltage. They showed that, the
larger the phospholipid hydrocarbon tail length of a bilayer, the higher the magnitude of the field
required for poration (Ziegler & Vernier 2008).
4.3.7 The impact of the medium composition [conductivity]
The medium conductivity is determined by the amount of ions present in this medium. Rosen
and Sutton demonstrated, on lecithin bimolecular membranes, that the compressive electric force on
the membrane bilayer is affected by the composition of the surrounding medium, especially the
electrolyte concentration, and that the capacitance of the membrane depends on this concentration
(Rosen & Sutton 1968). The rupture voltage of a membrane is dependent upon the composition and

92
the concentration of the electrolytes of the medium (Abidor et al. 1979). Silve et al. has demonstrated
recently that the lower the conductivity of the medium, the more efficient the reversible
permeabilization, whether with micro or nanosecond pulses (Silve et al. 2016). However, this effect of
medium conductivity is only detected under saturation conditions, giving that the results were the
same (between low and high-conductivity medium) when extreme conditions were used.
4.3.8 The impact of the cell confluence or density
Using the same electrical parameters on the same cells will give different outcomes if the cell
confluence (if attached) or density (if in suspension) differs. Numerical computational studies have
shown that cell density and organization impact the induced transmembrane potential (TMP) (Susil et
al. 1998, Pavlin et al. 2002). High cell density resulted in an altered distribution of the TMP and a
reduction of the area of the permeabilised regions. This was also shown experimentally by Pucihar et
al. who demonstrated that, to achieve the same fraction of cells permeabilization of a suspension of
10 x 106 and 400 x 106 cells/ml, a higher electric field amplitude should be applied in the second case.
Furthermore, they showed that the PI fluorescence in the cells is lower when the cell density increases,
and explained this phenomenon by the fact of a reduced extracellular dye availability to the
permeabilized regions of the membrane (already reduced), and the hindered diffusion into the cells
(Pucihar et al. 2007).
4.3.9 The impact of the temperature
The effect of the temperature is somekind controversial: an increasing temperature will make
the membrane more fluid, hence decreasing the electric field needed to permeabilize it, but in the
same time the resealing of the electroporated membrane is faster. At lower temperature, the
membrane is less fluid, hence its electroporation is harder but the permeabilized status remains longer
due to the slower resealing of the pores. For example, while increasing the temperature from 5 to 37°C
decreases the necessary voltage for electropermeabilization of Madin-Darby canine kidney epithelial
cells by a factor of 2 (Díaz & Rubinsky 2004), a temperature of 4°C yielded a better protein extraction
from bacterial cells (Meglič et al. 2016). For the electrotransfection, optimal conditions of pre and post-
incubation temperatures should be respected: Rols et al. showed that a preincubation of CHO cells for
10 minutes on ice limits DNA degradation by extracellular nucleases, and a post-incubation at 37°C for
10 minutes increases the survival and transfection rate. Lowering the temperature after the pulse will
stabilize the permeable pores but appeared not necessary because the DNA should be only present
during the electropulsation (Rols et al. 1994).

93
4.4 ELECTROPORATION VS ELECTROPERMEABILIZATION
4.4.1 Electroporation: the direct effect of the pulse
The PM behaves as a leaky dielectric, and when the voltage across it reaches the
permeabilisation treshold, transient aqueous pores are formed in the lipid bilayer resulting in
electroporation (Weaver & Chizmadzhev 1996, Neumann et al. 1999). However, even though the
electroporation is a widely used technique in biomedical sciences and food industry, the exact
mechanisms underlying membrane permeabilization, and the exact nature of the permeabilised area,
remain poorly understood (Escoffre et al. 2009, Miklavčič et al. 2014). Abidor et al. mentioned that the
membrane defects are through-going macroscopic pores (which they named holes), that are originated
from the evolution of micropores arisen in the membrane under the influence of the electric field
(Abidor et al. 1979). The holes or pores theory of Abidor was echoed by many teams in the following
years (Sugar & Neumann 1984, Freeman et al. 1994) and developed to assume that aqueous pores are
created in the membranes (Weaver & Chizmadzhev 1996). However, no experimental study has shown
what these claimed pores may look like in reality. The development of the molecular dynamics works
revealed these virtual pores in silico. Tielman showed such pores in his computational study published
in 2004. He explained that the pore formation is due to the local voltage gradient at the interface
between water and lipids. The water molecules can move in this voltage gradient, which increases the
probability of observing a water molecule across the plasma membrane. This passage of a water
molecule causes an increase of the local field which accelerates the process and allows the
enlargement of the water column formed until the formation of a completely hydrophilic pore
(Tieleman 2004). These observations were later confirmed by other studies such as those of Tarek and
Tokman. Tarek showed that defects in the interfacial water are formed on both sides of the membrane
and eventually joining to form a hydrophilic channel (Tarek 2005). Tokman et al. demonstrated that
pore formation is driven by the reorganization of the interfacial water molecules and that the process
of poration is the same with or without lipid bilayer; it is always driven by field-induced reorganization
of water dipoles at the water-lipid or water-vacuum interfaces (Tokman et al. 2013). The electro-
induced pores are stabilised by the phospholipids polar heads. The lipids may also move from one
leaflet to another along the hydrophilic pores. An example of this movement is the externalization of
phosphatidylserine (Tekle et al. 2008).
4.4.2 Electropermeabilization: the long-lasting effect of the pulse
The short-lasting electro-induced pores have been shown to be associated with chemical
modifications of lipids which make the membrane permeable up to several hours after the application
of the electric pulses (Abidor et al. 1979). The electropermeabilization of the membrane can persist
for times much longer than the pulses (Gowrishankar & Weaver 2006) and their lifetime depends on
the electric field parameters (Rols & Teissié 1990). It is dependent on pulse duration and number but
not on electric field amplitude which creates the electropermeabilization. Different studies have
shown that the electropermeabilisation, that follows the creation (electroporation) and resealing of
the electropores, is due to reactive oxygen species (ROS) and the oxidation reactions of the lipids. Our
team has recently showed a new model reconcilating the electroporation and electropermeabilization

94
at the molecular level. It shows that the oxidation of the unsaturated lipids, which are the main
constituent of the cell membranes, changes its physico-chemical properties and explains how the
membrane stays permeable for a long time after the pulse (Breton et al. 2016). It was shown before,
by MD simulations and experiments with living cells, that the oxidation of the PM lipids with oxidative
agents increases the membrane susceptibility to electropermeabilization (Vernier et al. 2009). The long
permeabilisation of the membrane due to lipids oxidation can be explained by the reparation time of
these oxidations. It is the exocytosis phenomenon that permits to replace the oxidized lipids with new
synthetized ones.
4.5 INDICES OF MEMBRANE PERMEABILIZATION
4.5.1 The permeabilization markers
According to all the factors cited in the section 4.3, and depending on the combination of many
of them, the electroporation could be reversible or irreversible. In general, one to eight electric pulses
of a duration of 100 s and an electric field ranging from tens of volts to 2 kV/cm cause reversible
electroporation. Higher values of these parameters may cause irreversible electroporation, depending
also on the cell type and the medium properties. However, there is also an important factor, often
forgotten, which is the size of the permeabilization marker. The membrane permeabilization can not
be referred as a general phenomenon for all molecules but as a relative phenomenon depending on
the permeabilization factors and the molecules used to measure it. For example, a set of electrical
parameters may not show an internalization of yo-pro iodide to the cells, but may lead to the entry of
Ca2+ . In this case the membrane is not permeabilized for the yo-pro but it is for the Ca2+ which is
smaller. Hence, it is more suitable to talk about membrane permeabilization for a specific molecule
but not in general. Table 6 shows some ions, molecules and fluorescent dyes that have been used to
show the degree of membrane permeabilization. It shoud be noted that not only the entry of
permeabilization markers can demonstrate an electropermeabilization, but also the release of some
cell components such as ATP, K+ ions or lactate dehydrogenase (Hojman et al. 2008).
Ion/molecule Weight (Dalton) Direction
Water 18 Entry
Potassium 39 Release
Calcium 40 Entry
Thallium 204 Entry
Yo-pro 1 iodide 375 Entry
Lucifer Yellow 443 Entry
ATP 507 Release
Propidium iodide 541 Entry
Calcein 623 Entry
Trypan blue 965 Entry

95
Bleomycin 1 500 Entry
siRNA 14 000 Entry
Lactate dehydrogenase 35 000 Release
DNA plasmid 3 000 000 Entry
Table 6: some frequently used permeabilization markers, respecting ascending order in weight from up to down.
4.5.2 The membrane conductivity
The PM is poorly conductive by its own. After an exposition to an electric field, the
permeabilised regions of the PM are those where the TMV induced by the electric pulse exceed the
permeabilisation treshold. These regions present an increased membrane conductance, related to a
loss of 0.01-0.1% of the membrane area and the formation of stable conductance pores. After the
pulse, the conductance decreases to lower level in less than a millisecond, leaving a moderately
electroporated cell (Kinosita et al. 1988). Benz and Zimmermann showed conductance changes within
few nanoseconds after the application of an electric pulse (Benz & Zimmermann 1980). The electrically
conductive pores prevent permanent damage of the membrane by shunting current and limiting
further TMP rise (DeBruin & Krassowska 1999). Hence, the PM conductance is an indirect method to
monitor the electropermeabilisation and the passage of ions through this membrane. It has been
suggested that the local defects that cause the membrane breakdown (discussed above in the model
of Abidor et al. (Abidor et al. 1979)) are assimilated to ions channels, thus they have higher [ionic]
conductivity (Parsegian 1975). Wegner et al. found that a transition from a low-conductance (~0.1
nS/pF) to a high-conductance state (~5 nS/pF) was observed when the PM of protoplasts derived from
tobacco culture was electropermeabilized (Wegner et al. 2011). Moreover, the membrane rupture is
preceeded by an increase in the level of conductivity fluctuations (Tien & Diana 1967).
4.6 THE DIFFERENT KINDS OF PULSES USED IN ELECTROPORATION
4.6.1 The millisecond pulsed electric fields
This type of pulses is used for the aims of PM permeabilization but also to enhance DNA
movements in vitro and in vivo. As mentioned before, a combination of the pulse parameters impact
the outcomes of the electroporation, and as the duration of this type of pulse is relatively long, the
electric field should be low to permit a reversible electroporation, otherwise an irreversible
electroporation occurs. For example, a set of ten electric pulses of 0.5 to 5 ms and 800 V/cm can be
used to reversibly permeabilize the PM of CHO cells (Golzio et al. 2002). However, increasing the
number of pulses to 15 with an electric field to 3 kV/cm causes irreversible electroporation and protein
extraction from microalguea with a duration of 2 ms for each pulse (Coustets et al. 2013). A study of
Mauroy et al. showed that the millisecond pulsed electric fields (msPEF) induce loss of lipids and
membrane deformations of GUVs facing the electrodes. The permeabilization threshold depended on
the vesicles size (Schwan equation). Millisecond pulses were used for carotenoid extraction from

96
microalguea such as Chlorella Vulgaris; 20 pulses of 20 ms and 5 kV/cm caused electroporation of 90%
of the cells (Luengo et al. 2015).
This type of pulses revealed a specific importance in cell transfection with nucleic acids. They
can generate an electrophoretic force that guides the charged molecules movement such as DNA and
plasmids in vitro and in vivo. The combination of these pulses with microsecond pulses yields a higher
transfection rate especially in vivo (discussed in the next section).
4.6.2 The microsecond pulsed electric fields
The microsecond pulsed electric fields (µsPEF) are more used than the msPEF for the different
applications of electroporation (cf. section 4.7). The main purpose of their use is the plasma membrane
permeabilization. Due to their short duration, the heating effect resulted from such pulses is neglected
(Davalos et al. 2005). They are called also high voltage (HV) pulses because the electric field used in
combination with such pulses is higher than the msPEF called low voltage (LV). The µsPEF are widely
used in vitro and in vivo for the internalization of many molecules, drugs and nucleic acids. The use of
one to eight 100 µs pulse (the classical number and duration used frequently) with 0.5 to 1.5 kV/cm
allowed PM permeabilization to many molecules such as bleomycin (Poddevin et al. 1991), lucifer
yellow (Mir et al. 1988) or propidium iodide (Mohr et al. 2006). However, for DNA internalization, a
combination of microsecond and millisecond PEF is required to obtain optimal results in vivo. As
mentioned before, the msPEF create an electrophoretic force guiding the DNA toward or across the
permeabilized cell membrane but also across the exracellular matrix [in vivo], and the µsPEF cause the
membrane permeabilization to the DNA molecule allowing its entry to the cell. Such combination is
called HV+LV and has been widely used in vitro and in vivo. Satkauskas et al. showed that a combination
of one HV of 100 µs and 800 V/cm followed by one LV of 100 ms and 80 V/cm (separated by 100s)
resulted in a large increase in DNA transfer. The lags between pulses can be increased to 3000 s if the
HV is followed by 4 LV (Satkauskas et al. 2002). Hojman et al. demonstrated that the combination of
one HV and one LV is less toxic and caused less disturbance of cell function comparing to 8
permeabilizing HV, which is important for efficient transgene expression (Hojman et al. 2008). André
et al. studied in depth the combination of HV + LV in many rodent tissues such as liver, muscle, skin
and tumor and confirmed the importance of this pulses combination. They found that a lag time of 1s
was optimal for gene transfer and that the electrical parameters were dependent on the tissue
organization and the cell size (André et al. 2008a).
The mechanisms of permeabilization induced by the microsecond and millisecond pulses is
nearly the same. Due to their “relatively long duration” (larger than the plasma membrane charging
time), the majority of their effects are induced on the level of the PM. The TMP induced by these pulses
is mainly due to the charging of the membrane resulting from ions movements, which have the
necessary time to charge the membrane.
The µsPEFs have been widely used in research, medicine, biotechnology and food industry for
the applications related to the plasma membrane permeabilization. However, recent simulation
studies done by the team of James Weaver (M.I.T, Boston USA) showed that the µsPEF could also
permeabilize the organelles membranes. Due to their duration higher than the charging time of the
PM, these pulses give sufficient time to small electrolytes such as ions to charge this latter. Once the

97
PM is permeabilized, the extracellular electric field will enter to the interior of the cell and create
intracellular fields sufficient to cause an induced transmembrane voltage at the organelles
membranes, to gate organelles channels and to cause organelle membranes poration (Esser et al.
2010, Weaver et al. 2012). In their simulation study, Weaver et al. used one pulse of 40 µs and an
electric field ranging from 1 to 7 kV. They showed that, the higher the electric field amplitude, the
larger the affected regions of the PM, and the more the organelles membranes are porated.
4.6.3 The nanosecond pulsed electric fields
When the applied electric field have an ultrashort duration, less than the charging time of the
PM, the field will pass through the membrane into the cytoplasm and affect the internal structures.
The principle is the same as the PM permeabilization: the applied electric field should be high enough
to cause the TMP across intracellular membranes to reach the permeabilisation threshold value. In this
case, electroporation of these membranes occurs (Schoenbach et al. 2001a). However, the charging
mechanism for intracellular membranes is not yet completely understood. Due to the very short
duration of this kind of pulses, energical effects in terms of heating (thermal effects) are negligible.
Chen et al. studied the effects of electrical pulses of 60 and 10 ns duration and an EF strength
up to 65 kV/cm on the PM and nucleus of HL-60 cells and found that the more the pulse duration is
shortened, the more its effects on PM are delayed and become smaller, and its intracellular effects
increase. They found no effect of these pulses on cell viability and no thermal effect was observed even
though very high pulsed electric fields were applied, because of the ultrashort pulse duration (Chen et
al. 2004). By using the ANNINE-6, a fast voltage-sensitive dye, Frey et al. measured the voltage across
the membrane of Jurkat cells exposed to 60 ns pulses of 100 kV/cm. They found that this voltage
reached 1.6 V after 15 ns at the anodic pole of the cell, whereas it did not surpass 0.6 V in the same
time period at the cathodic pole. This drop in voltage across the PM corresponds nearly to the entire
electric field applied, which demonstrates that this electric field penetrates into the interior of the cell
and organelles (Frey et al. 2006).
The nsPEFs cause, between others, the release of intracellular Ca2+ (Vernier et al. 2003, White
et al. 2004), a transient externalization of phosphatidylserine (Vernier et al. 2004), breaching of
intracellular granule membranes (Schoenbach et al. 2004), cell and nuclear shrinkage (Schoenbach et
al. 2001b), enhanced expression of genes and the induction of apoptosis or necrosis at higher electric
fields (Beebe et al. 2002, 2003). The Ca2+ release from internal stores activates the Ca2+ influx from PM
SOCCs or capacitative Ca2+ entry.
In contrary to what has been thought for a long time, the nsPEF do not only affect the interior
of the cells, but can also cause similar effects on the PM like longer pulses, even if their duration is
under the charging time of the PM (Gowrishankar & Weaver 2006). Pakhomov et al. demonstrated
that mammalian cells exposed to nsPEF of 60 ns and 12 kV/cm presented an increased PM conductivity
which was due to the opening of stable conductance pores that were permeable to small ions such as
Cl− and alkali metal cations (Pakhomov et al. 2007). The increase in PM conductivity is one of the results
and signs of electropermeabilization observed with microsecond and millisecond pulsed electric fields.
Frey et al. showed also a change in the PM potential after using 100 ns pulses (Frey et al. 2006). The
PM pores created by nsPEF may be large enough to let relatively large molecules such as yo-pro-1

98
iodide (Vernier et al. 2006) and bleomycin to cross the membrane. Silve et al. demonstrated that one
single 10 ns pulse was sufficient to mediate transport of bleomycin across the membrane (Silve et al.
2012).
4.7 SOME APPLICATIONS OF THE MEMBRANE ELECTROPERMEABILIZATION
4.7.1 Electrochemotherapy
The electrochemotherapy (ECT) is a non-thermal technique used for the treatment of many
types of cutaneous and subcutaneous tumor nodules. It consists on the application of an electric field
combined with non- or low-permeant drugs. The ECT is now applied in over 140 clinical centers in
Europe. The ESOPE study (European Standard Operating Procedures of Electrochemotherapy)
performed in 2004-2005 allowed to define the standard procedures for treatment efficacy and patients
safety using the standard electrical parameters consisting of 8 square-wave pulses of 100 µs and 1-1.3
kV/cm delivered at a frequency of 1 Hz or 5 kHz (Mir et al. 2006). The most popular drugs used in ECT
are bleomycin and Cisplatin. The bleomycin is a non-permeant drug that generates single and double-
stranded DNA breaks. When combined with electric pulses, its cytotoxicity increases 700-fold
(Orlowski et al. 1988); this can be explained by the fact that some hundreds molecules of bleomycin
are enough to kill the cell (Poddevin et al. 1991). The Cisplatin is a low-permeant drug efficient by itself
as an anti-cancer treatment, and its cytotoxicity is only 10-fold higher when combined with the pulses
(Gehl et al. 1998). This is why the bleomycin was more often used in the in- vivo and clinical studies
(Belehradek et al. 1991, Mir et al. 1991). As the bleomycin kills the cells by a mitotic mechanism, it will
be only harmful for dividing cells and not for the quiescent ones and this is one of the most interesting
features and advantages of the ECT, its ability to selectively kill the dividing cancerous cells and spare
the quiescent ones. Another advantage of the ECT is the vasoconstriction and reduction in tumor blood
flow in the treated zone. This ECT-associated phenomenon is called vascular lock and it permits the
retaining of the drug in the treated area. This is why the ECT is a very interesting approach to treat
bleeding tumors. Another vascular effect of the ECT is the destruction of the tumor endothelial cells,
preventing tumor resupply in nutriments and oxygen (Cemazar et al. 2001).
The electrodes used for ECT are generally plate or needle electrode. However, in the last ten
years, and due to the success of this technique, there have been many developments of new types of
electrodes suitable to treat a large number of superficial and internal tumors. For example, expandable
electrodes were developed to treat brain cancer, endoscopes for intraluminal tumors and finger
electrodes for oral and anal cavities tumors (Breton & Mir 2012). The operation is done under local or
general anesthesia.
Our team has recently shown that ECT with bleomycin induces hallmark of immunogenic cell
death, promoting the possible generation of a systemic anticancer immune response (Calvet et al.
2014a). The important role of the immune system in the ECT treatments was also demonstrated by
other studies: Mir et al. demonstrated that the rate of cured animals by ECT is increased by an injection
of IL-2 (Mir et al. 1992), Roux et al. found that the expression of Toll-like receptor 9 (TLR9) expression
is highly increased after the ECT and that combination with CpG oligonucleotides resulted in systemic

99
antitumor effects (Roux et al. 2008). The combination of ECT and immunotherapy was tested on
several tumors and showed a higher efficiency in tumor treatment.
4.7.2 Electrogenetransfer
Gene electrotransfer (EGT) is a very promising and efficient technique for nonviral gene
transfer in vitro as well as in vivo. The electric pulses used for EGT are the micropulses (HV), millipulses
(LV) or their combination (HV+LV). In vitro, the HV pulses can be used alone for an efficient EGT,
whereas in vivo, and as mentioned before, a combination of LV + HV pulses is recommended: the LV
are needed to move the nucleic acids electrophoretically in the tissue to be transfected, and the HV
are needed to permeabilize the tissue cells to these nucleic acids. The DNA transfer into muscle for
example is dramatically enhanced and leads to highly efficient long-term gene expression (André et al.
2008a). It was tested in many animals such as rabbit, mouse, rat and monkey. Mir et al. showed that
the plasmid DNA should be present in the tissue when the pulses are applied, and demonstrated a
gene expression stability in muscle for at least 9 months (Mir et al. 1999).
The EGT is used in research and in medicine for many applications such as transfection of
reporter genes, gene therapy, DNA vaccination and generation of iPS. The most common reporter
genes are the ones coding for GFP (fluorescent protein), luciferase (generating bioluminescence in
presence of ATP and luciferin) and β-galactosidase (generating a coloured product from the galactose
glycoside X-gal). These genes are attached (or not) to another gene of interest and serve to quantify
the percentage of cells and the expression level of the wanted protein. The optimal electrical
parameters should set to assure the highest transfection efficiency while preserving the cell viability
or the tissue integrity. Another important application of EGT is the DNA vaccination. That consists of
injecting a DNA sequence coding for a pathogenic cell epitope (such as cancerous cell), which will lead
to the activation of the immune system against the cells exposing that epitope. A recent study done in
our team by Calvet et al. used a plasmid that encodes a modified form of the human telomerase
reverse transcriptase gene (hTERT) and its intradermal electrotransfection in mice. The transgene
expression was 100-fold higher when combined to EGT than when the DNA was injected alone. After
optimization of the electrical parameters including the best electrodes, the best HV pulse intensity and
the best combination of HV-LV, the telomerase antigen will be used as a cancer DNA vaccine called
INVAC-1 (Calvet et al. 2014b).
4.7.3 Electrofusion
If two cells are in close contact to each other, the electric field can cause their irreversible
membrane fusion, a phenomenon called cell electrofusion. The electrofusion has several advantages
over other fusion means such as polyethylene glycol and Sendai virus; it is more efficient, synchronous,
without any added products that affect the cell viability and gives possibility to create giant polynuclear
cells. This phenomenon was first observed by the team of U. Zimmermann in 1980, who realized that
adhered red blood cells in an hypotonic suspension displayed membrane fusion after the application
of an electric field of 830 V/cm (Scheurich et al. 1980). The next year, the same team published more
papers reporting the electrofusion on many cellular models. For example, with a pulse of 50 µs and

100
250 V/cm they observed the electrofusion of many plant protoplasts (Scheurich et al. 1981). In all their
studies, U. Zimmermann team used the same conditions of hypotonic and low-conductive medium and
applied first an external, alternating, non uniform field to cause cells to adhere. Once the cells adhered
to each others, they form like a pearl chain between the electrodes and an additional external electric
field of low duration and high intensity (supposed to cause membrane breakdown) was applied. Teissié
and Rols showed that the electropermeabilization is required for cell electrofusion and that the cells
can be brought to contact even after their permeabilization (for cells in suspension); they applied first
5 electric pulses of 100 µs and 0.7 to 2 kV/cm and then they centrifuged the CHO cells after about 5
minutes. They demonstrated that the 2 phenomena were not simultaneous because the
electropermeabilization occurs before the electrofusion (Teissie & Rols 1986).
The first study to demonstrate the electrofusion in vivo was that of Mekid and Mir on B16
murine melanoma tissue. They confirmed the observations already done in vitro consisting that the
cells, to undergo electrofusion, they should have been electropermeabilized; when they used 8 electric
pulses of 100 µs and 500 V/cm (electric field that electropermeabilizes a low percentage of cells), they
observed four times less nuclei in giant cells than when they used 1350 V/cm. Furthermore, they
confirmed another observation which is the required contact between the cells; the electrofusion was
observed in melanoma tumor but not in liver or fibrosarcoma even with a higher permeabilizing field
amplitude (2000 V/cm), because the cells in these latters are separated by a dense extracellular matrix
(ECM). This ECM is degraded by the secreted proteases in the melanoma tissue (Mekid & Mir 2000).
Most of the studies done on electrofusion used microsecond pulses in the range of 100 to several
hundreds V/cm. A recent study of Rems et al. used the nsPEF to achieve cell electrofusion between
cells of equal or different size (Rems et al. 2013). Interestingly, they showed by numerical calculations
that, with nanosecond pulses, contact areas between cells are selectively electroporated. This was
explained by the fact that the contact areas are surrounded by highly conductive cytoplasm (0.25 S/m)
from both sides comparing to the rest of the membrane surrounded by the fusion medium of low
conductance (0.01 S/m).
Cell electrofusion was used in many important biological applications such as the production
of monoclonal antibodies and the antitumoral immunotherapy. The monoclonal antibodies are
producted by hybridoma cells formed by the fusion of B lymphocytes (that produce antibodies) and
myeloma tumour cells (immortalized cells). The fused cells have the properties of the two fused
original cells: immortalization and production of antibodies. The electrofusion has been proved to be
a very efficient technique (over chemicals) in inducing hybridoma formation (Lo & Tsong 1989). The
generation of dendritic cell – tumor cell hybrids is another important application consisting in fusing
pre-irradiated cancerous cells with dentritic cells in order to develop a vaccine (Trevor et al. 2004). The
dendritic cells are antigen presenting cells that will stimulate the immune system against the cancerous
cells by presenting the tumor antigen at their surfaces.

101
II. RESEARCH HYPOTHESES
AND OBJECTIVES

102

103
Our attention was focused on the generation, control and consequences of electro-induced
calcium (Ca2+) spikes in the cells using one single 100 µs pulse.
Ca2+ is a universal intracellular messenger playing a role in plenty of cellular processes either
directly or indirectly (Berridge et al. 2000). The control of the cytosolic concentration of Ca2+ could
present a promising tool to control cell proliferation, differentiation, senescence, apoptosis and other
cellular key functions. Electroporation has emerged some 50 years ago with Sale and Hamilton (Sale &
Hamilton 1968). This technique showed an interesting approach to permeabilize the cells to non-
permeant molecules (such as Ca2+, bleomycin, genetic material). Hence, its applications concerns a lot
of aspects in biotechnology, medicine, research, food and environment industry (Neumann et al. 1982,
Gehl et al. 1998, Schoenbach et al. 2000, Mir et al. 2005, Potter & Heller 2011). The application of a
temporary electric field results in the cellular uptake of normally non-permeant molecules to the cells.
By changing the electric field intensity, the duration of the pulse, the number of pulses and their
repetition frequency, the outcomes of electroporation can largely differ. The three types of pulses used
frequently are the millisecond (msPEFs), microsecond (µsPEFs) and nanosecond (nsPEFs) pulsed
electric fields. The µsPEFs are often used to permeabilize the plasma membrane (PM) of the cells (Mir
et al. 1988, Poddevin et al. 1991). The msPEFs are used to permeabilize the PM and to assure an
electrophoretic force for the uptake of large charged molecules e.g. for DNA electrotransfer (André et
al. 2008b). The nsPEF have emerged recently compared to the two other types of pulses and they are
applied to make a transitory permeabilization of cell organelles or to cause cell apoptosis (Beebe et al.
2002, Vernier et al. 2003). Depending on the pulse parameters, the electroporation can be reversible
or irreversible.
Not all the laboratories possess the nsPEFs technology due to its high price and complexity of
use. The µsPEFs technology is more available since it can be found frequently in the laboratories and
is more practical to use. As said before, all the observations done with the µsPEF showed their
interaction with the PM and the nsPEFs are essentially used to permeabilize the inner membranes of
the cells, even though it has been also shown that these pulses can cause the formation of small pores
in the PM (Gowrishankar & Weaver 2006). A couple of simulation studies done by J. Weaver and
colleagues showed that it was possible, in silico, to permeabilize the organelles membrane with
µsPEFs, that is using the so-called conventional electroporation (Esser et al. 2010, Weaver et al. 2012).
In the first part of this thesis, we aimed to verify experimentally the theoretical work of J. Weaver and
colleagues. We decided to use only one single 100 µs pulse. This choice was based on several reasons:
first because we wanted to study the effect of a classical µsPEFs duration on the PM and on the
organelles, and secondly because the application of one pulse would relieve us from the study of the
effect of the frequency if several pulses were applied. We decided to use the Ca2+ as a permeabilization
marker because it is present in the extracellular medium and in many cell organelles, mainly the
endoplasmic reticulum (ER) which is the larger Ca2+ store in the cell. The use of two different media,
with and without Ca2+ would allow us to know the origin of an electro-induced Ca2+ spike (whether it
was originated from the Ca2+ of the extracellular medium or/and from the Ca2+ of the inner stores,
mostly the ER).
After the assessment of the effect of one 100 µs pulse on two different kind of cells (the DC-
3F cells and the human-adipose mesenchymal stem cells (haMSC)) and evaluate its effect on cell PM
and ER membranes depending on electric field amplitude, this pulse was applied to control the Ca2+
oscillations in haMSCs. The MSCs are pluripotent cells originated from embryonic mesoderm and

104
present in many adult tissues (Dominici et al. 2006). These cells present a high potential to differentiate
into many cell types including osteoblasts, chondrocytes and neuronal cells (Pittenger et al. 1999).
Therefore, they are very interesting candidates for the regenerative medicine. These cells present
spontaneous Ca2+ oscillations related to their differentiation state and pathway. For example, a
diminution in the Ca2+ oscillations frequency was observed when the MSC undergo
osteodifferentiation (Pullar 2011). Our second objective was to study the effect of one 100 µs pulse on
the Ca2+ oscillations in MSC extracted from adipose tissue (haMSCs). We chose the haMSC because
they are easily accessible in large number and without painful procedures of extraction (Gronthos et
al. 2001). The mechanical stimulation of MSC has shown to induce their differentiation and the Ca2+
oscillations present an important mechanotransduction signal (Jing et al. 2014). Hence, our aim was to
assess whereas one 100 µs pulse could modulate the Ca2+ oscillations by imposing electrically-induced
Ca2+ spikes to the cell.
The third objective of this thesis was to apply one 100 µs pulse, already used to induce cytosolic
Ca2+ spikes from different origins (ER, extracellular medium), on haMSC undergoing
osteodifferentiation. The purpose was to assess the effect of the pulse on the duration of the period
necessary to achieve mature osteoblasts. Under normal conditions (MSC incubated with osteogenic
chemical factors), four weeks are needed to obtain mature osteoblasts. If the second part of the thesis
would give us positive results on the control of the Ca2+ oscillations in MSC by one 100 µs pulse, such
pulse or train of pulses could be used to control the differentiation outcomes and rapidity, since the
Ca2+ oscillations are a major regulating factor of the differentiation. The differentiation of MSC to
osteoblast is known to occur in an extensive collagen I extracellular matrix (Owen et al. 1990). Hence,
we sought to develop a new protocol to dissociate the cells in this extensive matrix in order to study
Ca2+ oscillations in the different layers separately, and analyse if there is a difference between the
layers in terms of these oscillations, and in terms of pluripotent stem cells markers.

105
III. RESULTS

106

107
1 ELECTROPERMEABILIZATION OF INNER AND OUTER CELL MEMBRANES
WITH MICROSECOND PULSED ELECTRIC FIELDS: QUANTITATIVE STUDY
WITH CALCIUM IONS (ARTICLE N˚1)
Many laboratories already possess the microsecond pulsed electric fields (µsPEFs) technology that
is used for many routine applications such as gene delivery, cell transfection and
electropermeabilization of the plasma membrane. On the contrary, few laboratories possess the more
sophisticated nanosecond pulsed electric fields (nsPEFs) generators. This latter technology is used to
manipulate cell organelles permeability and it is more expensive than the µsPEFs technology. James
Weaver and his team showed, theoretically, that it is possible to permeabilize the cell inner
membranes with the classical µsPEFs, but no experimental study had shown this yet. Therefore, in the
first part of this thesis, we decided to bring an experimental evidence to the theoretical work of J.
Weaver and colleagues (Esser et al. 2010, Weaver et al. 2012). We used one single 100 µs pulse to
study its effect on two different cell lines and we used the Ca2+ as a permeabilization marker in order
to create electro-induced Ca2+ spikes in the cells cytosol. Since Ca2+ is one of the most important second
messengers in the cells, the use of the available µsPEFs technique to control the Ca2+ in the cell and to
study its consequences is of a high importance. We decided to study the effect of one single 100 µs
pulse because we had to choose electrical parameters to be used in the following parts of the thesis.
One pulse is simpler than many pulses since there is no need to study the impact of the frequency if
many pulses were applied. One hundred microseconds is a classical duration already used for many
electroporation applications. The study of the interaction of one single 100 µs pulse with the PM and
the ER was primordial in this first part of the thesis to give us the necessary information in order to use
this kind of pulse for further applications in the following parts. These results have been submitted to
“Scientific Reports” in August 2016.

108
Electropermeabilization of Inner and Outer Cell Membranes with
Microsecond Pulsed Electric Fields: Quantitative Study with Calcium Ions
Hanna Hanna 1, Franck M. Andre 1, Agnese Denzi 2, Micaela Liberti 2 and Lluis M. Mir 1*
1 Vectorology and Anticancer Therapies, UMR 8203, CNRS, Univ. Paris-Sud, Gustave Roussy, Université
Paris-Saclay, 94 805 Villejuif, France. 2 Department of Information Engineering, Electronics and Telecommunication (DIET), University of
Rome “La Sapienza,” Rome, 00184, Italy
* To whom correspondence should be addressed.
E-mail address: [email protected]
Tel. : +33 1 42 11 47 92
Laboratoire de Vectorologie et Thérapeutiques Anticancéreuses
UMR 8203 CNRS Univ Paris-Sud
Gustave Roussy
114 rue Edouard Vaillant
94805 VILLEJUIF Cédex France
Abstract
Microsecond pulsed electric fields (μsPEF) permeabilize the plasma membrane and are widely used in
research, medicine and biotechnology. For internal membranes permeabilization, nanosecond pulsed
electric fields (nsPEF) are applied but this technology is not simple to use. The endoplasmic reticulum
(ER) membrane electropermeabilization to Ca2+ ions by one 100 µs pulse is reported here in Chinese
hamster lung fibroblast (DC-3F) and human adipose mesenchymal stem cells. This
electropermeabilization was achieved while cell viability was preserved. One single µsPEF of low field
amplitude is also sufficient to permeabilize the plasma membrane to Ca2+ ions. This study compares
the electropermeabilization of the plasma membrane and the ER membrane, which are highly
dependent on the cell type. The importance of the ER size, distribution and architecture in the field
amplitude needed to permeabilize its membrane was revealed. This study demonstrates that µsPEF, a
simple to use technology already available in the research laboratories, can permeabilize internal
membranes with the interest that µsPEF application is easier to control than the nsPEF technology. In
particular, μsPEF, through their interaction with either the plasma or ER membranes, can be an
efficient tool to modulate cytosolic calcium concentration and study Ca2+ roles in cell physiology.

109
Introduction
Cell electroporation involves the application of electric pulses in order to increase the plasma
membrane (PM) permeability. This concept emerged in the mid-60s with the work of Sale and
Hamilton (1968) 1. Molecules that cannot cross the PM in normal conditions can reach the cell cytosol
due to the delivery of one or several electric pulses 2. Furthermore, in 1982, Neumann et al. showed
that gene transfer into a cell was possible by the application of electric pulses 3.
In the quiescent state of the cell, PM behaves as an insulator. However, certain ions, such as Na+ and
K+ ions are pumped by the Na+-K+ ATPase which causes ion imbalance on either side of the membrane.
This imbalance creates the resting transmembrane potential difference (resting ∆TMP). When cells are
subjected to an electric field, the mobile charges (mainly ions) will move under the action of the
electrophoretic force generated by the electric field, which will result in a further charging of the
membrane: the so-called induced ∆TMP, superposing to the resting ∆TMP. When the net ∆TMP
reaches a critical value, called permeabilization threshold, the properties of the membrane change:
electroporation occurs, the membrane is electropermeabilized and it loses its insulating character.
Depending on the amplitude of the field and the duration of the pulses, the electropermeabilization
can be reversible or irreversible. In the case of the reversible electroporation, the increased
permeability of the PM persists for a few minutes and afterwards the membrane returns to its original
impermeable state.
Electric pulses of a typical duration of 100 microseconds and an electric field amplitude of the order of
1000 V/cm (μsPEF), have been widely used in many biotechnological or medical applications, notably
for antitumor electrochemotherapy 4,5, tumor ablation 6,7, cell transfection in vitro 8 and even gene
transfer in vivo 3,9. μsPEF have been used to permeabilize many cell types and allow internalization of
non-permeant molecules such as 51Cr-EDTA 10, bleomycin 11, or plasmid DNA 12 either in vitro and in
vivo. Such pulses may also be used to achieve the fusion of adjacent cells brought in contact to each
other 13 or even to break the integrity of the cell membrane and cause cell death in the case of the
achievement of irreversible electroporation 6,14.
Since the early 2000s, electric pulses of a few nanoseconds to several hundreds of nanoseconds and a
field strength up to 300 kV/cm are used in biology: the so-called nanosecond pulsed electric fields
(nsPEF). As the pulse duration in this type of pulses is below the PM charging time, effects at the PM
level decrease and effects on intracellular membranes become detectable 15,16. Unlike the μsPEF, these
ultrashort pulses have already been shown to permeabilize both the PM and the organelles
membranes 17.
Small ions such as calcium Ca2+ can be used to visualize the PM or the inner stores permeabilization
through the use of fluorescent markers like Fluo-4, or Fura-2. The difference of Ca2+ concentration
between the cytoplasm and the extracellular medium (respectively about 100 nM and 1.2-1.8 mM)
and between the cytoplasm and the endoplasmic reticulum ER (respectively 100 nM and 0.05 to 1 mM)
are very different: therefore, when permeabilization of the PM or ER membranes occurs, a large
number of molecules will enter the cytosol with gradient-driven very fast kinetics.
In the study here reported, Ca2+ was used as a marker of internal or external membrane
electropermeabilization in two very different types of cells exposed to one single 100 μsPEF. Response
curves of Chinese hamster lung fibroblast cells (DC-3F) and human adipose mesenchymal stem cells
(haMSC) to different electric field amplitudes were achieved. Characterization of the response
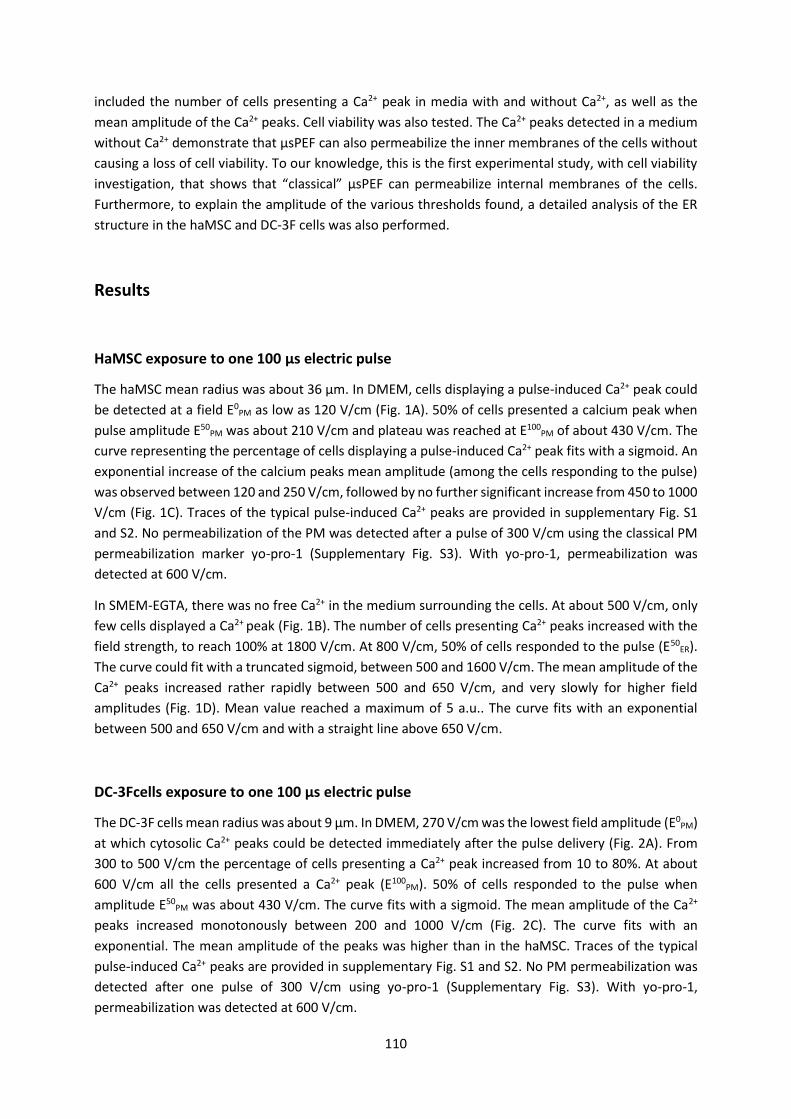
110
included the number of cells presenting a Ca2+ peak in media with and without Ca2+, as well as the
mean amplitude of the Ca2+ peaks. Cell viability was also tested. The Ca2+ peaks detected in a medium
without Ca2+ demonstrate that µsPEF can also permeabilize the inner membranes of the cells without
causing a loss of cell viability. To our knowledge, this is the first experimental study, with cell viability
investigation, that shows that “classical” μsPEF can permeabilize internal membranes of the cells.
Furthermore, to explain the amplitude of the various thresholds found, a detailed analysis of the ER
structure in the haMSC and DC-3F cells was also performed.
Results
HaMSC exposure to one 100 µs electric pulse
The haMSC mean radius was about 36 μm. In DMEM, cells displaying a pulse-induced Ca2+ peak could
be detected at a field E0PM as low as 120 V/cm (Fig. 1A). 50% of cells presented a calcium peak when
pulse amplitude E50PM was about 210 V/cm and plateau was reached at E100
PM of about 430 V/cm. The
curve representing the percentage of cells displaying a pulse-induced Ca2+ peak fits with a sigmoid. An
exponential increase of the calcium peaks mean amplitude (among the cells responding to the pulse)
was observed between 120 and 250 V/cm, followed by no further significant increase from 450 to 1000
V/cm (Fig. 1C). Traces of the typical pulse-induced Ca2+ peaks are provided in supplementary Fig. S1
and S2. No permeabilization of the PM was detected after a pulse of 300 V/cm using the classical PM
permeabilization marker yo-pro-1 (Supplementary Fig. S3). With yo-pro-1, permeabilization was
detected at 600 V/cm.
In SMEM-EGTA, there was no free Ca2+ in the medium surrounding the cells. At about 500 V/cm, only
few cells displayed a Ca2+ peak (Fig. 1B). The number of cells presenting Ca2+ peaks increased with the
field strength, to reach 100% at 1800 V/cm. At 800 V/cm, 50% of cells responded to the pulse (E50ER).
The curve could fit with a truncated sigmoid, between 500 and 1600 V/cm. The mean amplitude of the
Ca2+ peaks increased rather rapidly between 500 and 650 V/cm, and very slowly for higher field
amplitudes (Fig. 1D). Mean value reached a maximum of 5 a.u.. The curve fits with an exponential
between 500 and 650 V/cm and with a straight line above 650 V/cm.
DC-3Fcells exposure to one 100 µs electric pulse
The DC-3F cells mean radius was about 9 μm. In DMEM, 270 V/cm was the lowest field amplitude (E0PM)
at which cytosolic Ca2+ peaks could be detected immediately after the pulse delivery (Fig. 2A). From
300 to 500 V/cm the percentage of cells presenting a Ca2+ peak increased from 10 to 80%. At about
600 V/cm all the cells presented a Ca2+ peak (E100PM). 50% of cells responded to the pulse when
amplitude E50PM was about 430 V/cm. The curve fits with a sigmoid. The mean amplitude of the Ca2+
peaks increased monotonously between 200 and 1000 V/cm (Fig. 2C). The curve fits with an
exponential. The mean amplitude of the peaks was higher than in the haMSC. Traces of the typical
pulse-induced Ca2+ peaks are provided in supplementary Fig. S1 and S2. No PM permeabilization was
detected after one pulse of 300 V/cm using yo-pro-1 (Supplementary Fig. S3). With yo-pro-1,
permeabilization was detected at 600 V/cm.

111
In SMEM-EGTA, a high field strength (2500 V/cm) was needed to observe Ca2+ peaks in 20% DC-3F cells
(Fig. 2B). The percentage of cells presenting a Ca2+ peak increased to 38% at 2750 V/cm and then
decreased to 27% at 3000 V/cm. The curve between 2000 and 2750 V/cm could be fitted by an
exponential. The curve presenting the mean amplitude of Ca2+ peaks (Fig. 2D) increased from 2 to 8
a.u. between 2500 to 2750 V/cm, and then decreased to 4 a.u. at 3000 V/cm.
Inhibition of the Voltage-Operated Calcium Channels (VOCCs)
HaMSC cells were exposed to one single 100 µs electric pulse in DMEM with or without verapamil and
mibefradil, inhibitors respectively of L-type and T-type VOCCs 18,19. Even at the lowest electric field
amplitude (150 V/cm, resulting in about 10% of cells displaying an electro-induced Ca2+ peak), the use
of VOCCs blockers did not affect the pulse-induced Ca2+ peaks (p = 0.4, Mann Whitney test) (Fig. 3 and
supplementary Fig. S4).
Inhibition of Sarco/Endoplasmic Reticulum Calcium ATPase (SERCA)
After the addition of 2 µM of thapsigargin (a SERCA inhibitor) 20 to haMSC in SMEM-EGTA medium, an
increase of Ca2+ concentration was observed (Fig. 4), corresponding to the depletion of the ER Ca2+
store 21. When a 2000 V/cm electric pulse (100 µs) was applied after thapsigargin application, no
electro-induced Ca2+ peak was observed. On the contrary, the electric pulse caused a little decrease in
fluo-4 fluorescence. When the same pulse (2000 V/cm) was applied without a prior addition of
thapsigargin, it provoked an electro-induced Ca2+ peak.
Inhibition of the inositol triphosphate and ryanodine receptors
HaMSC cells were incubated with or without 2-aminoethoxydiphenyl borate (2-APB), dantrolene
sodium salt, and flecainide acetate salt, inhibitors respectively of inositol trisphosphate receptor
(IP3R), ryanodine receptor (RyR) 1, 2 and RyR 3 22–24. In all the cases, Ca2+ peaks mean amplitude
increased proportionally with the field strength (Fig. 5 and supplementary Fig. S5). No differences in
the mean amplitude were observed between cells with or without inhibitors (p = 0.1384, 2-way ANOVA
test), while there was a significant effect of the field strength applied according to the same test (p =
0.0035).
Comparison of the endoplasmic reticulum of the two cell types
The ER was decorated by the D1ER protein. In attached haMSC, nuclei were located at the center of
the cells and completely surrounded the nuclei, occupying a large volume in the cell. The ER 3D
reconstruction allowed getting precise ER dimensions. The maximal diameter of the ER was
approximately 75 % of the haMSC diameter. In the attached DC-3F cells, nucleus was located in general
at one side of the cell and the ER extended mainly in the other side of the cell. Maximal ER diameter
did not surpass 45% of DC-3F cells diameter (Fig. 6).

112
Cell viability after one 100 µs electric pulse
Up to 2000 V/cm there was no significant difference in cell mortality between haMSC unexposed (ctrl)
or exposed to one pulse (Fig. 7A). haMSC viability was almost the same in the two media, with and
without calcium.
In DMEM, one pulse of 1000 V/cm did not impact DC-3F cells viability (Fig. 7B). A little decrease in the
apparent DC-3F cells viability, from 100 to about 87%, was observed between 1400 and 2000 V/cm.
Above 2000 V/cm the number of colonies decreased with the field amplitude, with 60% of cells still
making colonies at 2750 V/cm, and 40% at 3000 V/cm.
In SMEM-EGTA, a decrease of DC-3F cells viability to 60-65% was observed even at 1000 V/cm and
until 1800 V/cm. At 2000 V/cm, only 50% of cells made colonies. This percentage decreased at 2200
V/cm to reach 30%, and no further decrease was found at higher field amplitudes.
Discussion
μsPEF are an effective tool used in many domains such as research, medicine and biotechnology, for
antitumor electrochemotherapy, tumor ablation, cell transfection, etc. Due to their duration, which is
long enough to cause transmembrane potential changes, μsPEF were normally supposed to solely
interact with the PM and change its permeability properties if the field amplitude reached a certain
value. If the investigators desire to permeabilize internal membranes, nsPEF (pulses of a few
nanoseconds duration) are applied 25,26. Indeed, using nsPEF, internal membranes such as
mitochondrial 27 or endosomal 28 membranes were shown to be permeabilized. Thus, in the case of the
μsPEF (classical duration: 100 µs), it is widely accepted that only the external membrane is affected by
the electric pulses.
Only a couple of theoretical studies simulated the effect of the μsPEF on organelles 29,30, and so far, no
experimental study showed such an effect. Our quantitative study demonstrates for the first time that
internal membranes can be permeabilized with a single 100 μs pulse, while preserving cell viability.
The amplitude of the pulse strength is highly dependent on the cell type.
haMSC and DC-3F cells and two media, with and without calcium, were used here to study calcium
peaks generation in cells exposed to one 100 μs pulse of field amplitudes ranging from 120 to 3000
V/cm. The DC-3F cells are a hamster cell line whereas the haMSC are human primary cells. Moreover,
the DC-3F cells are small cells whereas the haMSC are large ones. The origin and size difference was
important for us in order to have two models of cells and to study the interaction of the electric field
with their PM and ER. One single electric pulse was delivered because we recently showed that pulses
repetition frequency impacts the efficacy of the PM permeabilization when several pulses are
delivered 31. Thus, the real impact of electric pulses on different cells and/or organelles is easier to
evaluate if a single pulse is delivered. In ulterior studies, it will be necessary to analyze the impact of
pulses repetition frequency on organelles electropermeabilization. To distinguish between PM
permeabilization and internal organelles permeabilization, we used a medium with classical Ca2+
concentration (DMEM; 1.8 mM CaCl2) and a medium completely deprived of Ca2+ (SMEM-EGTA; not
only the SMEM is prepared without Ca2+ ions, but moreover we added EGTA to complex any remaining
trace of Ca2+ ions). In DMEM, a Ca2+ peak (detected by the increase in the cytosolic Fluo-4 Ca2+ marker
fluorescence) is mainly the result of Ca2+ influx from the external medium, across the PM, but a

113
contribution of Ca2+ release from inner stores cannot be excluded. On the contrary, in the SMEM-EGTA,
any observed cytosolic Ca2+ peak must be due to Ca2+ released from the Ca2+ inner stores.
Plasma membrane permeabilization
The comparison of the two curves achieved in the presence or absence of Ca2+ (Fig. 1 and 2 panels A
and B) demonstrates that, up to certain field amplitude, only extracellular Ca2+ contributes to the peak
in a medium with Ca2+. Indeed, in haMSC and DC-3F cells, 100% of cells in DMEM displayed a Ca2+ peak
respectively at 450 and 700 V/cm (Fig. 1 and 2 panels A), electric field amplitudes at which no Ca2+ peak
was detected in SMEM-EGTA (Fig. 1 and 2 panels B).
This influx of extracellular calcium induced by the electric pulse could be the result of the
electropermeabilization of the cell membrane or/and the activation of VOCCs. In the literature
electropermeabilization is usually reported for transmembrane potential across the plasma membrane
of at least 200 mV 32. But these values are based on the penetration of large fluorescent dyes such as
propidium iodide which are much larger than a calcium ion. For small ions like calcium,
electropermeabilization probably occurs for lower transmembrane potentials. However, activation of
VOCCs occurs for even lower membrane depolarization (30-50 mV) 33. Moreover, it has been reported
that nsPEF can trigger calcium influx via VOCCs 34. We have thus exposed MSCs to the electric pulse in
presence of L-type and T-type VOCCs inhibitors. Even at the lowest electric field amplitude, the use of
VOCCs blockers did not affect the pulse-induced Ca2+ peaks (Fig. 3 and supplementary Fig. S4). Thus,
VOCCs do not participate in the calcium peaks induced by the electric pulses, which is coherent with
the fact that only 10–15% of MSCs express VOCCs 35,36. For DC3F, since the electric field necessary to
induce calcium peaks is much higher, VOCCs are probably not involved either. Therefore, in our
experiments the external calcium is most likely entering the cytoplasm through the
electropermeabilized membrane. Indeed, penetration of Ca2+ from the outside of the cell due to PM
permeabilization using trains of eight 100 µs electric pulses was already known. Tumor treatment by
penetration of large Ca2+ amounts after electroporation is even tested at the clinical level 37.
Endoplasmic reticulum permeabilization
The calcium peaks reported in haMSC and DC-3F cells in SMEM-EGTA (Fig. 1 and 2 panels B)
demonstrate that one single 100 µs pulse can mobilize Ca2+ from internal vesicles. Indeed, the total
absence of Ca2+ in the external medium implies that the electro-induced Ca2+ peaks can only arise from
the flow of Ca2+ from the internal stores to the cell cytosol. Since the ER is known to be the largest
store of releasable Ca2+ in the cell 38, these electro-induced Ca2+ peaks are probably due to the release
of Ca2+ from the ER. To test this hypothesis, we depleted the ER calcium store by inhibiting the SERCA
(that pumps the Ca2+ from the cytosol to the ER) by thapsigargin (Fig. 4). When the thapsigargin was
added to haMSC in SMEM-EGTA, an electric pulse of 2000 V/cm did not provoke an electro-induced
Ca2+ peak. However, when the same electric pulse was applied without a prior addition of thapsigargin,
all the cells presented a Ca2+ peak. This demonstrate that the ER depletion by thapsigargin prohibited
the appearance of the electro-induced Ca2+ peaks. Therefore, the major source of electro-induced Ca2+
spike in SMEM-EGTA is the ER. This is coherent with the mathematical cell model of Esser et al. 29who
showed that a single 40 µs electric pulse can cause transient electric perturbations of all organelle

114
transmembrane voltages, preferably on larger organelles such as the ER compared to smaller
organelles such as the mitochondria. This is also identical to what has been reported with nsPEF where
the ER was also the only appreciable source of intracellular calcium increase in response to nsPEF
stimulation in a calcium free buffer 39.
To assess if the Ca2+ peaks observed in SMEM-EGTA were the result of the ER membrane
electropermeabilization or a release of Ca2+ through the IP3R and RyR due to cellular signaling,
experiments with inhibitors of these channels were performed at three field strengths. The IP3R and
RyR are the two channels from which Ca2+ is released from the ER: the IP3R plays an important role in
the transduction of the external stimuli to specific intracellular Ca2+ signals 40. Both RyR and IP3R are
activated by a cytosolic increase in Ca2+concentration 41. Even in the simultaneous presence of the
three inhibitors, Ca2+ peaks always appeared in SMEM-EGTA (Fig. 5 and supplementary Fig. S5). This
concentration of inhibitors was sufficient to block the natural calcium oscillation of the haMSC in
presence of external calcium, and even a 4-time increase of the inhibitors concentration did not affect
the pulse induced Ca2+ peaks observed without external calcium (data not shown). This demonstrate
that these Ca2+ peaks are due to the release of calcium through the ER electropermeabilized
membrane.
Therefore, we bring the experimental evidence to the theoretical work of J. Weaver and colleagues 29,30 who postulated that µsPEF can permeabilize cell organelles even though organelles radius is lower
than cell radius and even if internal vesicles are shielded by the PM before the pulses delivery.
Electroporation threshold for PM and ER in haMSC and DC3F cells
Electroporation threshold for PM
The curves reporting the percentage of cells presenting a Ca2+ peak after one µsPEF in DMEM as a
function of the field amplitude are sigmoids, with a shift to higher values of the field amplitude in the
case of the DC-3F cells (approximately two times higher) (Fig. 1 and 2 panel A).
This shift could be due to the difference in cell size, the haMSC mean radius being 4 times larger than
the DC-3F cells one (respectively 36 and 9 μm). Indeed, H. Schwan 42 and others later on 43 analyzed
the influence of the particle radius in the ∆TMP generated by an external field showing the reciprocal
influence of the radius and the field strength. However, according to the Schwan equation ΔΨ = 3/2
E.R cos θ 42 (where E: applied field strength; R: cell radius; θ: angle between field lines and a normal to
the cell surface at the point of interest; ΔΨ: value of the electrically induced ∆TMP at this point of the
cell surface), the electric field amplitudes between the two cell types should have differed by a factor
of four, while they only differed by a factor of two. However, the Schwan equation is strictly valid for
spherical cells in suspension. For attached cells the contribution of the cell size may not be linear.
Moreover, other differences between the haMSC and DC-3F cells could contribute to the variation in
the permeabilization threshold such as cell shape, cell orientation and cell organization 44 (see
supplementary Fig. S6).
All our data here were achieved using Ca2+ which is not a classical permeabilization marker. Therefore,
a classical one, like the yo-pro-1 iodide 17,45, was used to compare the PM permeabilization thresholds
between the two markers (Supplementary Fig. S3). The results showed no cell permeabilization to yo-
pro-1 at a field lower than 600 V/cm, whereas electropermeabilization to Ca2+ (in Ca2+-containing

115
medium) was partly detectable at 120 and 270 V/cm for haMSC and DC-3F cells respectively. These
results confirm that the electric field threshold needed to detect cell permeabilization is lower for a
small molecule (like Ca2+) than for a large one.
Electroporation threshold for ER
For the two cell types, higher electric field amplitudes were needed for the ER permeabilization than
for the PM permeabilization (Fig. 1 and 2 panel B versus A) . For example, in haMSC, an about 4 times
higher electric field amplitude was needed to observe the beginning of the permeabilization of the
Ca2+ internal stores membranes (480 vs 120 V/cm). In the case of nsPEF, the electric field threshold
reported for ER permeabilization was also greater than the threshold for PM permeabilization 39. This
could be explained by the fact that the PM needs to be permeabilized first for the field lines to be able
to penetrate inside the cell and permeabilize the cell organelles. Moreover, according to Schwan 42 and
others 29,46, higher field amplitudes are needed to permeabilize the organelles membranes due to the
organelles smaller size.
Permeabilization of the ER is detectable as soon as 480 V/cm for MSCs (4 times higher than for their
PM permeabilization) and above 2000 V/cm for DC-3F cells (7.4 times higher than for their PM
permeabilization). The difference in ER size and distribution between the two cell types could
contribute to this discrepancy. Indeed, while haMSC ER distributes in a large fraction of the cell and
completely surrounds the nucleus (Fig. 4), DC-3F cells ER was found to be localized in a rather small
part of the cell at one side of the nucleus. Moreover, the link between the organelle size and the change
in their transmembrane voltage induced by the electric pulse has been reported by Esser et al. 29.Using
a mathematical cell model, they showed that a single 40 µs electric pulse causes a larger change in the
organelle transmembrane voltage for larger organelles.
The percentage of DC-3F cells presenting a calcium peak in a medium without Ca2+ reached a maximum
of around 40% at 2750 V/cm then decreased at 3000 V/cm. This decrease might be attributed to the
leak of fluo-4 through the plasma membrane. Indeed, the very high field strength applied (3000 V/cm)
could create large pores which would lead to the fluorophore leakage and to the fluorescence
decrease.
Mean amplitude of the cytosolic calcium peaks: comparison between the 2 media and the
2 cell types
The mean amplitude of the calcium peaks in the 2 cell types was higher in a medium with Ca2+ than in
a medium without Ca2+. The flux of external Ca2+ across the membrane is thus higher than the Ca2+
release from the ER. The mean concentration of the Ca2+ in the cytosol varies between 100 and 400
nM 47,48. The Ca2+ concentration in DMEM is 1.8 mM, near the one found in the body extracellular
medium (around 2mM 49,50), (the free Ca2+ concentration in serum is between 1.2 and 1.5 mM (4.8 and
5.9 mg/dl) 51) whereas it varies between 50 μM and 1 mM in the RE 52,53. Considering these
concentrations and the fact that the Ca2+ reservoir in the DMEM (the extracellular medium) is larger

116
than the of Ca2+ reservoir in the vesicles, the different amplitude of the Ca2+ peaks can be easily
understood.
Furthermore, the PM is more exposed to the fields than the ER membranes, which are encaged inside
the cell. The electric field lines have to interact first with the PM, thus creating pores, and then, enter
the cell inside and interact with the ER membrane. Hence the PM permeabilized areas PM should be
greater in number or larger in size than those created in the ER. However the shape of the curves was
the same in the two media: an exponential increase for the DC-3F cells and an exponential increase
followed by a straight line for the haMSC. The second part of the haMSC response was not due to a
limited access of Ca2+ ions but to a limitation in the fluo-4 as demonstrated by using higher external
concentrations of fluo-4-AM (supplementary Fig. S6). A three times increase in fluo-4AM concentration
did not modify the percentage of cells displaying a Ca2+ peak but caused a significant increase in the
peaks mean amplitude. Furthermore, calcein-AM fluorescence in DC-3F cells was higher than in haMSC
demonstrating that DC-3F have a larger capacity to load the fluophores than haMSC (the calcein-AM
uses the same strategy as fluo-4-AM to enter the cell - that is the presence of the acetoxymethyl
hydrophobic group - but once in the cell, its fluorescence depends (between others) on the
acetylesterases activity – the enzymes that cut the AM group - and not on the Ca2+ presence).
Cell Viability under the pulse conditions
Since massive Ca2+ entry into cell cytoplasm can cause apoptosis 54, it was expected that cell viability
would be lower when cells were pulsed in the presence of Ca2+ or eventually that the viability would
be the same in the 2 media. Actually, the results with DC-3F cells were the opposite since at all the
field amplitudes, their viability in SMEM-EGTA was apparently lower than in DMEM. haMSC viability
was not significantly affected after the delivery of one 100 µs pulse in the presence or absence of
calcium. Even at 2000 V/cm (where the internal Ca2+ stores were permeabilized in all the haMSC cells),
the percentage of haMSC viability was about 85%.
To understand these results, microscopic observations of the DC-3F cells were performed for 20 min
directly after the pulses. In SMEM-EGTA, the videos showed rapid movements of the cells and
polykaryons began to be observed at short times (even 5 minutes) after the pulse delivery
(supplementary Fig. S7). When cells were pulsed in DMEM, no cell fusion was observed within the first
20 minutes. The generation of polykaryons in SMEM-EGTA could explain, in part, the decrease in the
number of colonies (that is the number of cells able to still replicate for several generations), and thus
the apparent loss of viability, which was actually due to the cells electrofusion. The role of Ca2+ in the
cell fusion procedure is controversial. Whereas some studies evocate a positive role in enhancing cell
fusion 55, another shows an inhibiting one 56. Actually, fusion is a cell type dependent event, maybe
related to differences in the extracellular matrix of the cells 57: the fusogeneicity of the DC-3F cells in
SMEM-EGTA was not found with the haMSC.
Conclusion
The present study shows, for the first time, the electropermeabilization of the ER membrane by μsPEF,
experimentally, and with cell viability assessments. It also demonstrates that one single micropulse
with a low field amplitude is sufficient to permeabilize the cells PM to Ca2+ ions, a small size

117
permeability marker. The importance of the ER size, distribution and architecture in the field amplitude
needed to permeabilize the ER was revealed. This study brings the experimental evidence to previous
simulation studies on the interaction of μsPEF with the internal membranes and establishes thresholds
of permeabilization between PM and ER membrane, which are highly dependent on the cell type. It is
also possible to conclude that the use of μsPEF is an efficient tool to modulate calcium concentration,
through the interaction with the cell or the ER membranes. Since the Ca2+ signalization in the cell
always implicate the ER, and since the Ca2+ is implicated in key cellular functions, the ER
permeabilization could be an effective tool to study the role of Ca2+ in such functions and cellular
physiology without a chemical stimulation and in a receptor-independent manner. This study
demonstrates that, in some cases, µsPEF can be used to permeabilize internal membranes instead of
nsPEF, with the interest that the µsPEF generation is cheaper, easier to control and more accessible to
a large number of teams than the nsPEF technology.
Materials and methods
Cells and cell culture conditions
haMSC (Human adipose-derived mesenchymal stem cells), isolated from lipoaspirates (a plastic
surgery waste) of individuals that volunteered and gave informed and written consent for the use of
the lipoaspirates, were grown in DMEM (Dulbecco’s Modified Eagle Medium). DC-3F cells (Chinese
hamster lung fibroblast cells) were grown in MEM (Minimum Essential Medium). Both media were
supplemented with 10% fetal bovine serum, 100 U/mL penicillin and 100 mg/mL streptomycin. The
cell culture chemicals were purchased from Fischer Scientific (Parc d’innovation Illkirch, France). Cells
were propagated at 37°C in a humidified 5% CO2 atmosphere.
haMSC were passed every 3-4 days (one passage corresponding to one doubling time of the
population). The multipotency capabilities of the cells were assessed by submitting them to
differentiation conditions as previously reported by our group in André et al. 12. DC-3F were routinely
passed every 2 days.
During the experiments, two different media were used: DMEM and SMEM (Suspension Minimal
Essential Medium) supplemented with 2mM (final concentration) of EGTA (ethylene glycol tetraacetic
acid – a calcium chelator). DMEM contained 1.8 mM CaCl2 whereas SMEM did not contain CaCl2.
Cell staining
Cells were seeded in 24 well plates at a density of 5.104 cells/cm2 (DC-3F cells) or 20.103 cells/cm2
(haMSC) one day before the experiments. In order to visualize the effect of the μsPEF on living cells,
the cells were incubated with 5 μM of Fluo-4 AM (Fischer Scientific), a fluorescent Ca2+ marker, for 30
min in a humidified 5% CO2 atmosphere at 37 °C in complete DMEM (haMSC) or MEM (DC-3F). To
easily localize the cells, the incubation buffer also contained 375 nM of the nuclear fluorescent dye
Hoechst 33342 (Fischer Scientific). After incubation, the wells were washed three times with PBS
(Phosphate Buffered Saline) and then 500 μl of either DMEM or SMEM-EGTA were added.

118
Inhibition of calcium channels and receptors
In order to inhibit the Voltage-Operated Calcium Channels (VOCCs), 10 µM verapamil (L-type VOCC
inhibitor) and 5 µM of mibefradil (T-type VOCC inhibitor) were added to a final volume of 500 μl of
DMEM (in addition to Fluo-4 AM and Hoechst 33342) and incubated with the cells for 30 min. Then,
the incubation medium was removed, the cells were washed 3 times with PBS and a fresh DMEM
medium containing the same concentration of the inhibitors was added to the cells.
In experiments devoted to inhibit the inositol trisphosphate receptors (IP3R) and ryanodine receptors
(RyR), 50 μM of 2-aminoethoxydiphenyl borate (2-APB – an IP3R inhibitor), 50 μM of dantrolene
sodium salt (a RyR1 and 3 inhibitor) and 25 μM flecainide acetate salt (a RyR2 inhibitor) were added to
a final volume of 500 μl of SMEM-EGTA (in addition to Fluo-4 AM and Hoechst 33342) and incubated
with the cells for 30 minutes. Then, the incubation medium was removed, the cells were washed 3
times with PBS and a fresh SMEM-EGTA medium containing the same concentration of the inhibitors
was added to the cells.
In order to empty the endoplasmic reticulum from calcium, 2 µM (final concentration) of thapsigargin,
an inhibitor of the sarco/endoplasmic reticulum calcium ATPase (SERCA) were added to the cells. All
drugs were purchased from Sigma Aldrich (St Quentin Fallavier, France).
Microsecond pulse generator and electrodes
μsPEF were generated by a CliniporatorTM (Igea, Carpi, Italy). For the treatment of the cells under the
microscope, the pulse generator was connected to two parallel stainless steel rods of 1.2 mm diameter
used as electrodes. They were shaped to enter a 24 plate well and touch the bottom of the dish. The
distance between the electrodes was always 5 mm, except when very high fields (> 2000 V/cm) were
applied. In this latter case the distance was 2 mm between the electrodes. The whole system was set
under a Zeiss Axiovert S100 epifluorescence inverted microscope. One single micropulse of 100 μs was
delivered in all the experiments.
For cell viability assessment, we designed a new model of electrodes. In this system, a thick cover of
10 cm2 was designed to fit in a Petri dish of the same dimensions. This cover contained 2 slots in which
2 plate electrodes of 2 mm thickness and 2 cm length could fit in: the electrodes were slipped into the
slots until they touched the bottom of the Petri dish.
Image analysis
Images of the cells were taken every 10 s for 10 to 20 min with a Zeiss AxioCam Hrc camera controlled
by the Axio Vision 4.6 software (Carl Zeiss, Germany). The pulses were always delivered after at least
2 minutes of recording and 2 seconds before the next image. The excitation and emission wavelengths
used for Fluo-4 were 496 nm and 515 nm respectively. The nuclear dye Hoechst 33342 (λex = 350 nm,
λem = 461 nm) was used to track the cells during the videomicroscopy recording. There was no
interference between Fluo-4 and Hoechst 33342 fluorescence because their emission wavelengths are
separated enough. In this way, nuclei were recognized and the individual cells tracked using the Cell
Profiler (version 2.0) software (Broad Institute, Cambridge, USA), allowing the automatic measurement
of the fluorescence intensity signal of each cell on every image. Curves were plotted with a MATLAB
program (version 7.8.0). All the observations were done at room temperature. The minimum opening

119
time of the shutter for the fluorescent light was about 500 ms. To decrease the light energy applied on
the cells, a 90% density Filter NE110B (Thorlabs, Maisons-Lafitte, France) was used.
Transfection of the cells with the pcDNA-D1ER and endoplasmic reticulum imaging
pcDNA-D1ER was a gift from Amy Palmer & Roger Tsien (Addgene plasmid # 36325). This plasmid is
coding for an endoplasmic reticulum (ER) marker fluorescing in green (535 nm) 58. Cells were
transfected with pcDNA-D1ER using 8 electric pulses of 100 μs and 1500 V/cm or 1200 V/cm (for the
haMSC and DC-3F cells respectively) delivered at a repetition frequency of 1 Hz by the CliniporatorTM
(Igea, Carpi, Italy). We used 50 μg or 20 μg plasmid (for the haMSC and DC-3F cells respectively) in 100
μl, for 5.105 cells in a cuvette of 1mm distance between the electrodes. D1ER is retained in the ER
lumen through its C-terminal KDEL (lysine, aspartic acid, glutamic acid, leucine) sequence 59.
A confocal microscope Leica TCS SPE with an objective HC PL APO CS2 63x, 1.30 NA oil and the LAS AF
software version 3.3 (Leica, Germany) was used to visualize the endoplasmic reticulum, labelled by the
ER marker. Excitation of the marker was done at 480 nm and emission captured at 535 nm. Cells nuclei
were marked with Hoechst 33342 (excitation and emission at 405 and 486 nm respectively). The
images were taken without electronic zooming for the haMSC and using a ×2 zoom for the DC-3F cells.
The area of ER has been identified and reconstructed on the basis of the green fluorescence by using
a custom semi-automated MATLABTM routine, obtained adapting the procedure of Joensuu et al. 60.
For each cell the algorithm elaborates together all the images taken, considering only the green
channel. The preliminary choice of which pixel is reticulum was taken on the basis of a threshold set
by means of the specific procedure. In particular, the green value attributable to the background noise
was chosen, by taking the 99.9% value of the distribution of the areas without cells, and subtracted to
the images. Successively the final threshold, interpreted as the green value attributable to the
presence of the cells, was identified by taking the 95 % value of the areas with not transfected cells
(called for simplicity negative cells). After the threshold identification, a clusterization of the images
was carried out. Finally, on this binary matrix, extraction of the edges was performed resulting in the
identification of the ER boundaries in the images.
Microscopic observations of the DC-3F cells
In experiments devoted to detect cell fusion events in the electric pulse treated DC-3F cells, the Petri
dish was transferred after the pulse delivery in a chamber set on the microscope stage to maintain the
cells at 37˚ C and 5% CO2, and a video of the cells was recorded for 20 min, with an image taken every
15 s.
Cell viability assessment
Cells were seeded in 10 cm2 Petri dishes containing one 12×32 mm cover slide, at a density of 105
cells/cm2 (DC-3F) or 20.103 cells/cm2 (haMSC) one day prior to the experiments. After one day, medium
was removed, cells were washed with PBS, and 1 ml of treatment medium (SMEM-EGTA, without Ca2+,
or DMEM, with Ca2+) was added to the cells. The Petri dish cover with slots and the electrodes were
placed and the pulse was delivered. After the pulse, the Petri dish was transferred into the incubator

120
for 10 (DC-3F) or 20 minutes (haMSC). The placement of the electrodes causes the loss of cells beneath
the electrodes. Interestingly, this allows recognizing the area covered by the pulsed cells after the
removal of the electrodes. Then, the non- pulsed cells on the cover slides were scratched under the
sterile hood, and the cover slide with the pulsed cells only was transferred to a fresh medium and put
in the incubator for 10 min (DC-3F) or 2 hours (haMSC). The use of short incubation times (two times
10 min) in the case of the DC-3F cells was mandatory to prevent difficulty in cell trypsinization.
The DC-3F cells were counted in one or two trypsinized non-pulsed controls. The other controls and
treated (pulsed) samples were then trypsinized and diluted in complete medium (according to the
number of cells in the controls) in order to obtain a final number of 1000 cells/8ml, later on distributed
in 3 wells of a 6 wells plate (250 cells or 2ml/plate). The surviving cells formed colonies which were
counted after 5 days.
Because haMSC do not form colonies, the assessment of haMSC viability could not be performed using
the precise clonogenic assay test like in the case of the DC-3F cells. Therefore, pulsed haMSC cells were
trypsinized, centrifuged, resuspended in 300μl of fresh medium, and distributed in 2 wells of an
opaque-walled 96 multiwell plate. After 24 hours in the incubator, 150 μl of Cell-Titer Glo Reagent
(Promega) were added to each well according to manufacturer’s protocol. This caused cell lysis and
generation of a luminescence signal proportional to the amount of ATP. The amount of ATP was
directly proportional to the number of cells present in culture 61. The luminescence was read on a
GloMax luminometer (Promega).
Calculation of the mean diameter of the cells and the endoplasmic reticulum
50 cells from each cell type were chosen randomly in photos taken under the Zeiss Axiovert
microscope. The larger diameter and a perpendicular diameter to it were measured, then the mean
diameter of the two were calculated for each cell. The mean diameter for a cell type was calculated as
the mean of the mean diameter of 50 cells. The ER mean diameter of each cell type was measured in
the same manner.
Statistical analysis
All the experiments were done at least 3 times. Data are presented as means and standard deviations
(except where indicated). To compare the effect of the VOCCs inhibitors, Mann-Whitney test was used.
For the experiments using haMSC in a medium without calcium and with inhibitors of calcium channels,
two-way ANOVA followed by Turkey multiple comparisons test was used. To compare the results of
DC-3F viability, Kruskal-Wallis test was used.
References
1. Sale, A. J. & Hamilton, W. A. Effects of high electric fields on micro-organisms. 3. Lysis of
erythrocytes and protoplasts. Biochim. Biophys. Acta 163, 37–43 (1968).
2. Mir, L. M., Banoun, H. & Paoletti, C. Introduction of definite amounts of nonpermeant
molecules into living cells after electropermeabilization: direct access to the cytosol. Exp. Cell
Res. 175, 15–25 (1988).

121
3. Neumann, E., Schaefer-Ridder, M., Wang, Y. & Hofschneider, P. H. Gene transfer into mouse
lyoma cells by electroporation in high electric fields. EMBO J. 1, 841–845 (1982).
4. Belehradek, M. et al. Electrochemotherapy, a new antitumor treatment. First clinical phase I-
II trial. Cancer 72, 3694–3700 (1993).
5. Sersa, G., Kranjc, S., Scancar, J., Krzan, M. & Cemazar, M. Electrochemotherapy of mouse
sarcoma tumors using electric pulse trains with repetition frequencies of 1 Hz and 5 kHz. J.
Membr. Biol. 236, 155–162 (2010).
6. Al-Sakere, B. et al. Tumor ablation with irreversible electroporation. PloS One 2, e1135 (2007).
7. Scheffer, H. J. et al. Irreversible electroporation for nonthermal tumor ablation in the clinical
setting: a systematic review of safety and efficacy. J. Vasc. Interv. Radiol. JVIR 25, 997–1011;
quiz 1011 (2014).
8. Potter, H. & Heller, R. Transfection by electroporation. Curr. Protoc. Cell Biol. Editor. Board
Juan Bonifacino Al Chapter 20, Unit20.5 (2011).
9. Mir, L. M., Moller, P. H., André, F. & Gehl, J. Electric pulse-mediated gene delivery to various
animal tissues. Adv. Genet. 54, 83–114 (2005).
10. Satkauskas, S. et al. Mechanisms of in vivo DNA electrotransfer: respective contributions of
cell electropermeabilization and DNA electrophoresis. Mol. Ther. J. Am. Soc. Gene Ther. 5, 133–
140 (2002).
11. Poddevin, B., Orlowski, S., Belehradek, J. & Mir, L. M. Very high cytotoxicity of bleomycin
introduced into the cytosol of cells in culture. Biochem. Pharmacol. 42 Suppl, S67-75 (1991).
12. Liew, A. et al. Robust, efficient, and practical electrogene transfer method for human
mesenchymal stem cells using square electric pulses. Hum. Gene Ther. Methods 24, 289–297
(2013).
13. Finaz, C., Lefevre, A. & Teissié, J. Electrofusion. A new, highly efficient technique for generating
somatic cell hybrids. Exp. Cell Res. 150, 477–482 (1984).
14. Davalos, R. V., Mir, I. L. M. & Rubinsky, B. Tissue ablation with irreversible electroporation.
Ann. Biomed. Eng. 33, 223–231 (2005).
15. Beebe, S. J. et al. Diverse effects of nanosecond pulsed electric fields on cells and tissues. DNA
Cell Biol. 22, 785–796 (2003).
16. Vernier, P. T. et al. Calcium bursts induced by nanosecond electric pulses. Biochem. Biophys.
Res. Commun. 310, 286–295 (2003).
17. Vernier, P. T., Sun, Y. & Gundersen, M. A. Nanoelectropulse-driven membrane perturbation
and small molecule permeabilization. BMC Cell Biol. 7, 37 (2006).
18. Hockerman, G. H., Peterson, B. Z., Johnson, B. D. & Catterall, W. A. Molecular determinants of
drug binding and action on L-type calcium channels. Annu. Rev. Pharmacol. Toxicol. 37, 361–
396 (1997).
19. Martin, R. L., Lee, J. H., Cribbs, L. L., Perez-Reyes, E. & Hanck, D. A. Mibefradil block of cloned
T-type calcium channels. J. Pharmacol. Exp. Ther. 295, 302–308 (2000).
20. Lytton, J., Westlin, M. & Hanley, M. R. Thapsigargin inhibits the sarcoplasmic or endoplasmic
reticulum Ca-ATPase family of calcium pumps. J. Biol. Chem. 266, 17067–17071 (1991).
21. Thastrup, O., Cullen, P. J., Drøbak, B. K., Hanley, M. R. & Dawson, A. P. Thapsigargin, a tumor
promoter, discharges intracellular Ca2+ stores by specific inhibition of the endoplasmic
reticulum Ca2(+)-ATPase. Proc. Natl. Acad. Sci. U. S. A. 87, 2466–2470 (1990).

122
22. Bootman, M. D. et al. 2-Aminoethoxydiphenyl borate (2-APB) is a reliable blocker of store-
operated Ca2+ entry but an inconsistent inhibitor of InsP3-induced Ca2+ release. FASEB J. 16,
1145–1150 (2002).
23. Zhao, F., Li, P., Chen, S. R., Louis, C. F. & Fruen, B. R. Dantrolene inhibition of ryanodine receptor
Ca2+ release channels. Molecular mechanism and isoform selectivity. J. Biol. Chem. 276,
13810–13816 (2001).
24. Hilliard, F. A. et al. Flecainide inhibits arrhythmogenic Ca2+ waves by open state block of
ryanodine receptor Ca2+ release channels and reduction of Ca2+ spark mass. J. Mol. Cell.
Cardiol. 48, 293–301 (2010).
25. Schoenbach, K. H., Beebe, S. J. & Buescher, E. S. Intracellular effect of ultrashort electrical
pulses. Bioelectromagnetics 22, 440–448 (2001).
26. Tekle, E. et al. Selective field effects on intracellular vacuoles and vesicle membranes with
nanosecond electric pulses. Biophys. J. 89, 274–284 (2005).
27. Batista Napotnik, T., Wu, Y.-H., Gundersen, M. A., Miklavčič, D. & Vernier, P. T. Nanosecond
electric pulses cause mitochondrial membrane permeabilization in Jurkat cells.
Bioelectromagnetics 33, 257–264 (2012).
28. Salomone, F. et al. High-yield nontoxic gene transfer through conjugation of the CM₁₈-Tat₁₁
chimeric peptide with nanosecond electric pulses. Mol. Pharm. 11, 2466–2474 (2014).
29. Esser, A. T., Smith, K. C., Gowrishankar, T. R., Vasilkoski, Z. & Weaver, J. C. Mechanisms for the
intracellular manipulation of organelles by conventional electroporation. Biophys. J. 98, 2506–
2514 (2010).
30. Weaver, J. C., Smith, K. C., Esser, A. T., Son, R. S. & Gowrishankar, T. R. A brief overview of
electroporation pulse strength-duration space: a region where additional intracellular effects
are expected. Bioelectrochemistry Amst. Neth. 87, 236–243 (2012).
31. Silve, A., Guimerà Brunet, A., Al-Sakere, B., Ivorra, A. & Mir, L. M. Comparison of the effects of
the repetition rate between microsecond and nanosecond pulses: electropermeabilization-
induced electro-desensitization? Biochim. Biophys. Acta 1840, 2139–2151 (2014).
32. Teissié, J. & Rols, M. P. An experimental evaluation of the critical potential difference inducing
cell membrane electropermeabilization. Biophys. J. 65, 409–413 (1993).
33. Fox, A. P., Nowycky, M. C. & Tsien, R. W. Kinetic and pharmacological properties distinguishing
three types of calcium currents in chick sensory neurones. J. Physiol. 394, 149–172 (1987).
34. Craviso, G. L., Choe, S., Chatterjee, P., Chatterjee, I. & Vernier, P. T. Nanosecond electric pulses:
a novel stimulus for triggering Ca2+ influx into chromaffin cells via voltage-gated Ca2+
channels. Cell. Mol. Neurobiol. 30, 1259–1265 (2010).
35. Heubach, J. F. et al. Electrophysiological properties of human mesenchymal stem cells. J.
Physiol. 554, 659–672 (2004).
36. Zahanich, I. et al. Molecular and functional expression of voltage-operated calcium channels
during osteogenic differentiation of human mesenchymal stem cells. J. Bone Miner. Res. Off.
J. Am. Soc. Bone Miner. Res. 20, 1637–1646 (2005).
37. Frandsen, S. K. et al. Direct therapeutic applications of calcium electroporation to effectively
induce tumor necrosis. Cancer Res. 72, 1336–1341 (2012).
38. Ashby, M. C. & Tepikin, A. V. ER calcium and the functions of intracellular organelles. Semin.
Cell Dev. Biol. 12, 11–17 (2001).
39. Semenov, I., Xiao, S. & Pakhomov, A. G. Primary pathways of intracellular Ca(2+) mobilization
by nanosecond pulsed electric field. Biochim. Biophys. Acta 1828, 981–989 (2013).

123
40. Berridge, M. J., Bootman, M. D. & Roderick, H. L. Calcium: Calcium signalling: dynamics,
homeostasis and remodelling. Nat. Rev. Mol. Cell Biol. 4, 517–529 (2003).
41. Patel, S. & Docampo, R. Acidic calcium stores open for business: expanding the potential for
intracellular Ca2+ signaling. Trends Cell Biol. 20, 277–286 (2010).
42. Schwan, H. P. Electrical properties of tissue and cell suspensions. Adv. Biol. Med. Phys. 5, 147–
209 (1957).
43. Kotnik, T. & Miklavcic, D. Analytical description of transmembrane voltage induced by electric
fields on spheroidal cells. Biophys. J. 79, 670–679 (2000).
44. Kotnik, T., Pucihar, G. & Miklavcic, D. Induced transmembrane voltage and its correlation with
electroporation-mediated molecular transport. J. Membr. Biol. 236, 3–13 (2010).
45. Chen, M.-T., Jiang, C., Vernier, P. T., Wu, Y.-H. & Gundersen, M. A. Two-dimensional
nanosecond electric field mapping based on cell electropermeabilization. PMC Biophys. 2, 9
(2009).
46. Gowrishankar, T. R. & Weaver, J. C. Electrical behavior and pore accumulation in a multicellular
model for conventional and supra-electroporation. Biochem. Biophys. Res. Commun. 349, 643–
653 (2006).
47. Schantz, A. R. Cytosolic free calcium-ion concentration in cleaving embryonic cells of Oryzias
latipes measured with calcium-selective microelectrodes. J. Cell Biol. 100, 947–954 (1985).
48. Ratto, G. M., Payne, R., Owen, W. G. & Tsien, R. Y. The concentration of cytosolic free calcium
in vertebrate rod outer segments measured with fura-2. J. Neurosci. Off. J. Soc. Neurosci. 8,
3240–3246 (1988).
49. Larsson, L. & Ohman, S. Serum ionized calcium and corrected total calcium in borderline
hyperparathyroidism. Clin. Chem. 24, 1962–1965 (1978).
50. Goldstein, D. A. in Clinical Methods: The History, Physical, and Laboratory Examinations (eds.
Walker, H. K., Hall, W. D. & Hurst, J. W.) (Butterworths, 1990).
51. Sofronescu, A. G. Serum Calcium: Reference Range, Interpretation, Collection and Panels.
(2016).
52. Hofer, A. M. & Machen, T. E. Technique for in situ measurement of calcium in intracellular
inositol 1,4,5-trisphosphate-sensitive stores using the fluorescent indicator mag-fura-2. Proc.
Natl. Acad. Sci. U. S. A. 90, 2598–2602 (1993).
53. Chatton, J. Y., Liu, H. & Stucki, J. W. Simultaneous measurements of Ca2+ in the intracellular
stores and the cytosol of hepatocytes during hormone-induced Ca2+ oscillations. FEBS Lett.
368, 165–168 (1995).
54. Orrenius, S., Zhivotovsky, B. & Nicotera, P. Regulation of cell death: the calcium-apoptosis link.
Nat. Rev. Mol. Cell Biol. 4, 552–565 (2003).
55. Suo, L. et al. Optimal concentration of calcium and electric field levels improve tetraploid
embryo production by electrofusion in mice. J. Reprod. Dev. 55, 383–385 (2009).
56. Zheng, Q. & Zhao, N. M. Electrofusion of IBRS2 cells and the study of their fusion process. Sci.
China B 32, 303–313 (1989).
57. Salomskaitė-Davalgienė, S., Čepurnienė, K., Satkauskas, S., Venslauskas, M. S. & Mir, L. M.
Extent of Cell Electrofusion In Vitro and In Vivo Is Cell Line Dependent. Anticancer Res. 29,
3125–3130 (2009).
58. Palmer, A. E., Jin, C., Reed, J. C. & Tsien, R. Y. Bcl-2-mediated alterations in endoplasmic
reticulum Ca2+ analyzed with an improved genetically encoded fluorescent sensor. Proc. Natl.
Acad. Sci. U. S. A. 101, 17404–17409 (2004).

124
59. Munro, S. & Pelham, H. R. A C-terminal signal prevents secretion of luminal ER proteins. Cell
48, 899–907 (1987).
60. Joensuu, M. et al. ER sheet persistence is coupled to myosin 1c-regulated dynamic actin
filament arrays. Mol. Biol. Cell 25, 1111–1126 (2014).
61. Crouch, S. P., Kozlowski, R., Slater, K. J. & Fletcher, J. The use of ATP bioluminescence as a
measure of cell proliferation and cytotoxicity. J. Immunol. Methods 160, 81–88 (1993).
Acknowledgements
This work has been supported by CNRS, Gustave Roussy and Université Paris XI. The research was also
conducted in the scope of the EBAM European Associated Laboratory (LEA) and of the COST action BM
1309 EMF-MED. This project received support within the framework of the Joint IIT-Sapienza LAB on
Life-NanoScience Project (81/13 16-04-2013).Authors want to thank Sophie Salome from the PFIC of
Gustave Roussy for her precious help in acquiring the ER photos, Paola Camilleri and Mattia Corradini
for their contribution to the setup of the ER images extraction procedure and Francesca Apollonio and
Thierry Ragot for scientific discussions.
Author contributions
H.H, F.M.A and L.M.M.: Conception and design of the study, H.H: performance of biological
experiments, A.D and M.L: performance of numerical research, H.H, A.D, M.L, F.M.A and L.M.M.: data
analysis and interpretation, writing and final approval of manuscript.
Competing Financial Interests Statement
The authors declare no competing financial interests.

125
Figures
Figure 1. Response of the haMSC exposed to one pulse of 100 μs in DMEM (panels A and C) or in
SMEM-EGTA (panels B and D). (A and B): Percentage of cells displaying calcium peaks. (C and D): Mean
amplitude of the calcium peaks. E0, E50, and E100 are the values of the electric field amplitudes needed
to respectively start to permeabilize the cells, and for the permeabilization of 50% and 100% of the
cells.
Figure 2. Response of the DC-3F cells exposed to one pulse of 100 μs in DMEM (panels A and C) or in
SMEM-EGTA (panels b and d). (A and B): Percentage of cells displaying calcium peaks. (C and D):
Mean amplitude of the calcium peaks. For E0, E50, and E100, refer to Fig. 1.

126
Figure 3. Response of haMSC in DMEM in the presence of VOCCs inhibitors. (A) Percentage of cells
presenting a Ca2+ peak (n=4 experiments), the line represents the mean, P = 0.4. (B) Mean amplitude
of Ca2+ peaks (n=39 cells for 150 and 49 cells for 150+inhib), boxes and whiskers representing 5-95
percentile are shown, P = 0.828. 150: one pulse of 150 V/cm (100 µs), inhib: in the presence of 10 µM
verapamil and 5 µM mibefradil.
Figure 4. Application of 2000 V/cm in haMSC in SMEM-EGTA with or without thapsigargin. First arrow:
(A) 2 µM thapsigargin, (B) control. Second arrow: 2000 V/cm (A and B).
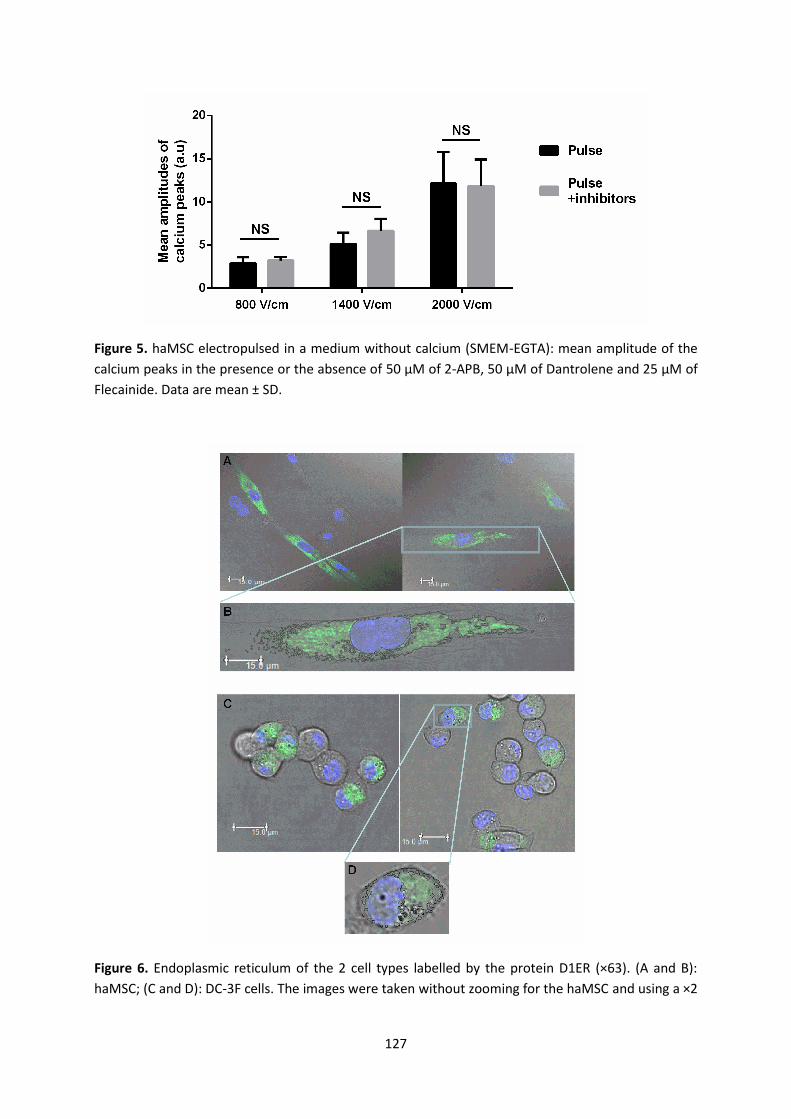
127
Figure 5. haMSC electropulsed in a medium without calcium (SMEM-EGTA): mean amplitude of the
calcium peaks in the presence or the absence of 50 µM of 2-APB, 50 µM of Dantrolene and 25 µM of
Flecainide. Data are mean ± SD.
Figure 6. Endoplasmic reticulum of the 2 cell types labelled by the protein D1ER (×63). (A and B):
haMSC; (C and D): DC-3F cells. The images were taken without zooming for the haMSC and using a ×2

128
zoom for the DC-3F cells (Nuclei were labelled with by Hoechst 33342). (A and C): confocal pictures. (B
and D): examples of ER identification and reconstruction.
Figure 7. Cells viability after exposure to one 100 μs pulse in a medium with calcium (DMEM) or without
calcium (SMEM-EGTA). (A) haMSC. (B) DC-3F cells. Data are means ± SD. +++ and *** p < 0.001
compared respectively to the DMEM and SMEM-EGTA controls (Ctrl).

129
Supplementary figures:
Figure S1. Typical traces of Ca2+ peaks for the haMSC and the DC-3F cells in a medium with (DMEM) or
without Ca2+ (SMEM-AGTA). The rigid line represents the average. The optimal scale plotted by Matlab
was shown.
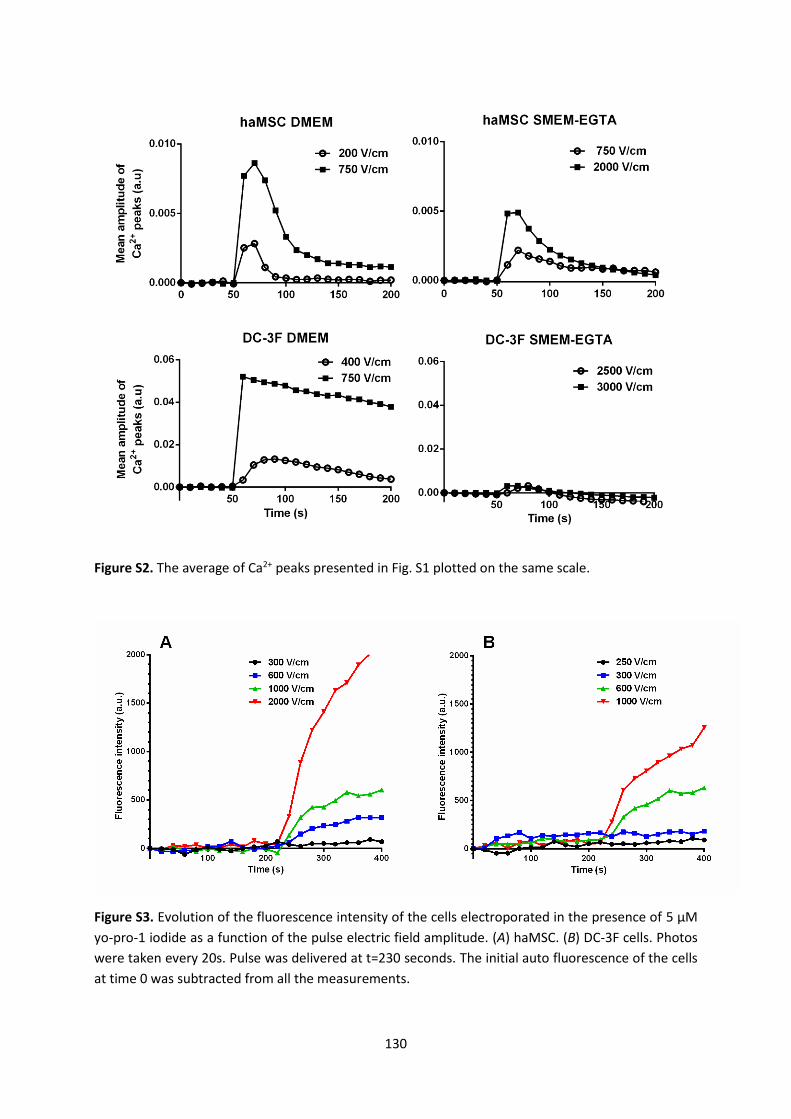
130
Figure S2. The average of Ca2+ peaks presented in Fig. S1 plotted on the same scale.
Figure S3. Evolution of the fluorescence intensity of the cells electroporated in the presence of 5 μM
yo-pro-1 iodide as a function of the pulse electric field amplitude. (A) haMSC. (B) DC-3F cells. Photos
were taken every 20s. Pulse was delivered at t=230 seconds. The initial auto fluorescence of the cells
at time 0 was subtracted from all the measurements.

131
Figure S4. Typical traces of Ca2+ peaks for the haMSC in DMEM with or without VOCCs inhibitors.

132
Figure S5. typical traces of Ca2+ peaks for the haMSC in SMEM-EGTA with or without IP3R and RyR
inhibitors.

133
Figure S6. (A) Mean amplitude of the calcium peaks in haMSC after previous incubation of the cells in
5 or 15 µM fluo-4 AM; (B and C): loading of respectively haMSC and DC-3F cells incubated in the
presence of 5 µM calcein AM for 30 minutes at 37˚C.\
Figure S7. DC-3F cells electrofusion after one pulse in SMEM-EGTA. (A) control, (B) 20 min after a pulse
of 2000 V/cm.

134

135
2 ELECTRICAL CONTROL OF CALCIUM OSCILLATIONS IN MESENCHYMAL
STEM CELLS USING MICROSECOND PULSED ELECTRIC FIELDS (ARTICLE
N˚2)
The mesenchymal stem cells (MSCs) are promising candidates for the regenerative medicine and
the cell therapy. These multipotent stem cells can differentiate into many cell types such as
osteoblasts, chondrocytes, myoblasts and neuronal cells. These cells present spontaneous Ca2+
oscillations related to their differentiated state. Many studies demonstrated that the frequency of
these oscillations differ according to the stemenss or differentiated state of the MSCs. The team of
Shan Sun (Sun et al. 2007) showed that the MSCs undergoing an osteoblastic differentiation for
example have their Ca2+ oscillations frequency decreased, and that this frequency reached its minimal
value in the finally differentiated osteoblasts. The team of Igor Titushkin (Titushkin et al. 2010) showed
that the Ca2+ oscillations frequency differed between MSCs undergoing neurodifferentiation and MSCs
undergoing osteo or myodifferentiation.
The first part of this thesis reports that one 100 µs pulse is able to induce cytosolic Ca2+ spikes
originated from the extracellular medium or both the extracellular medium and the ER, depending on
the electric field amplitude. Hence, we decided to use 100 µs pulse to create electro-induced Ca2+
spikes in the human adipose mesenchymal stem cells (haMSCs), to assess the effect of this pulse on
the Ca2+ oscillations in the haMSCs. Our aim was to manipulate these oscillations by one or several 100
µs pulse. The results obtained in this second part of the thesis will help us to know how one 100 µs
pulse can control the Ca2+ oscillations in MSCs. Since the Ca2+ oscillations are implicated in MSCs
proliferation and differentiation, the control of these oscillations by an electric pulse could have an
impact on MSCs differentiation. If one 100 µs pulse would give us positive results, we will use it later
with haMSCs undergoing an osteogenic differentiation in order to evaluate its effect on this
differentiation. These results have been submitted to “Stem Cell Research and Therapy” in September
2016.

136
Electrical control of calcium oscillations in mesenchymal stem cells
using microsecond pulsed electric fields
Authors and affiliations Hanna Hanna 1, Franck M. Andre 1, Lluis M. Mir 1,*
1 Vectorology and Anticancer Therapies, UMR 8203, CNRS, Univ. Paris-Sud, Gustave Roussy,
Université Paris-Saclay, 94 805 Villejuif, France.
* Correspondence should be addressed to Dr. Lluis M. Mir
E-mail address: [email protected]
Tel. : +33 1 42 11 47 92
UMR 8203 CNRS
Gustave Roussy, PR2
114 rue Edouard Vaillant
94805 VILLEJUIF Cédex
FRANCE
Abstract
Background
Human mesenchymal stem cells are promising tools for regenerative medicine due to their ability to
differentiate into many cellular types such as osteocytes, chondrocytes and adipocytes amongst many
other cell types. These cells present spontaneous calcium oscillations implicating calcium channels and
pumps of the plasma membrane and the endoplasmic reticulum. These oscillations regulate many
basic functions in the cell such as proliferation and differentiation. Therefore, the possibility to mimic
or regulate these oscillations might be useful to regulate mesenchymal stem cells biological functions.
Methods
One or several electric pulses of 100 µs were used to induce Ca2+ spikes caused by the penetration of
Ca2+ from the extracellular medium, through the transiently electropermeabilized plasma membrane,
in human adipose mesenchymal stem cells from several donors. Attached cells were preloaded with

137
Fluo-4 AM and exposed to the electric pulse(s) under the fluorescence microscope. Viability was also
checked.
Results
According to the pulse(s) electric field amplitude, it is possible to generate a supplementary calcium
spike with properties close to those of calcium spontaneous oscillations, or, on the contrary, to inhibit
the spontaneous calcium oscillations for a very long time compared to the pulses duration. Through
that inhibition of the oscillations, Ca2+ oscillations of desired amplitude and frequency could then be
imposed to the cells using subsequent electric pulses. None of the pulses used here, even those with
the highest amplitude, caused a loss of cell viability.
Conclusions
An easy way to control Ca2+ oscillations in mesenchymal stem cells, through their cancellation or the
addition of supplementary Ca2+ spikes, is reported here. Indeed, the direct link between the
microsecond electric pulse(s) delivery and the occurrence/cancellation of cytosolic Ca2+ spikes allowed
us to mimic and regulate the Ca2+ oscillations in these cells. Since microsecond electric pulses delivery
constitutes a simple technology available in many laboratories, this new tool might be useful to
investigate deeply the role of Ca2+ in human mesenchymal stem cells biological processes such as
proliferation and differentiation.
Keywords
Mesenchymal stem cells - Calcium oscillations - Calcium spikes – Electroporation - Electric pulses –
Electropermeabilization – Electropulsation
Background
Mesenchymal stem cells (MSCs) are multipotent stromal cells [1] originated from the
embryonic mesoderm (mesenchyme) and present in many adult tissues such as bone marrow (bMSC),
adipose tissue (aMSC), muscle, dermis, umbilical cord… [2,3]. These cells gained a lot of momentum in
the last decade due to their ability to differentiate into a wide variety of cells including osteoblasts,
myoblasts, fibroblasts and chondrocytes. They also express key markers of cardiomyocytes, neuronal
and endothelial cells [4]. This ability makes them a very promising candidate for cell therapy and
regenerative medicine in order to heal damaged tissues and organs. However, MSCs from different
tissues are not the same. They have different differentiation capacities and transcriptomic signatures
[5].
Human-adipose MSCs (haMSCs) that derived from the adipose tissue, are amongst the most
easily accessible MSCs, in high quantities and without aggressive extraction procedures.They are more
available than other MSCs as, for example, the human bMSCs (hbMSCs). In addition, they have a
phenotype, surface markers [6] and gene expression profile similar to those of the hbMSC, and they
are easier to maintain and proliferate [3], which make them ideal MSCs to use [7].
These cells present spontaneous Ca2+ oscillations implicating Ca2+ channels and pumps of the plasma
membrane (PM) and the endoplasmic reticulum (ER) [8]. These oscillations seem to start by an ATP

138
autocrine/paracrine signaling [9] followed by Inositol triphosphate (IP3)-induced Ca2+ release from the
ER and further amplification from plasma membrane store-operated Ca2+ channels (SOCCs). Afterward,
the excess of Ca2+ is removed from the cytosol by the sarco/endoplasmic reticulum Ca2+ ATPase
(SERCA), the plasma membrane Ca2+ ATPase (PMCA) and the Na+/ Ca2+ exchanger (NCX) [10]. Ca2+ is
the most important second messenger in the cell, and it regulates many important cellular processes
such as ATP synthesis, apoptosis, cellular motility, growth, proliferation and gene expression. Hence,
Ca2+ oscillations contain embedded information that have to be decoded by the cell, and Ca2+ signaling
pathways play a key role in controlling cell behavior and differentiation processes of MSCs.
It was shown that the Ca2+ oscillations frequency is different between undifferentiated MSCs
and MSCs on route of differentiation and it differs between the various outcomes of the differentiation
process (the level of differentiation and the differentiated cell type). While the MSCs exhibit regularly
repeated Ca2+ oscillations, MSCs undergoing osteodifferentiation display a decrease in the frequency
of their spontaneous Ca2+ oscillations while primary myoblasts present still another pattern of
oscillations [11]. This shows that each cell type possesses its own pattern of Ca2+ oscillations frequency
and shape, but the exact correlation between Ca2+ oscillations and MSC differentiation is still unclear.
Presently, pulsed electric fields (PEF) are widely used in research as a non-invasive physical
means to permeabilise cellular membranes. Using one or several pulses of ultrashort duration cause
changes in the cell membrane structure that permits the access to the cell cytosol to molecules that
cannot cross the plasma membrane under normal conditions [12]. Normally, Ca2+ is an ion that only
crosses the plasma and ER membranes through channel proteins. Applying a PEF to cells in a medium
containing Ca2+ (amongst other compounds) allows Ca2+ entry from the cell outside, and, if the electric
field amplitude and pulse duration are high enough , Ca2+ is released from the cell inner stores [13].
The electromagnetic fields (EMF) have been already applied hbMSCs to test their effect on the
differentiation of these latters. Those EMF were either direct current of very low electric field
amplitude (0.1 V/cm) and a long time exposition (30 min) [14] or biphasic electric current (1.5 µA/cm2
for 250 µs) [15]. These fields either activate VOCCs if their amplitude is large enough or do not alter
the membrane potential if the electric field is too low. None of the electromagnetic fields used was
permeabilizing the cell PM.
The novelty of our study is the use of PEFs of a high field amplitude that are capable to
permeabilize the cells PM or both the PM and the ER. Our objectives was to test the effect of these
pulses on the Ca2+ oscillations of the cells. Attached haMSC presenting normal spontaneous Ca2+
oscillations were exposed to one single pulse of a duration of 100 μs and different electric field
amplitudes. At low and moderate electric field amplitudes, the Ca2+ spike induced by such a PEF can be
very similar to a spontaneous oscillation. At high electric field amplitudes, the electrically induced Ca2+
spikes inhibit the spontaneous oscillations occurrence for some time after which oscillations reappear.
This inhibition allowed us to impose to the cells experimentally induced Ca2+ spikes at a desired
frequency. Hence, we show here that it is possible to control haMSC spontaneous Ca2+ oscillations by
microsecond pulsed electric field (μsPEF) with a complete preservation of the cell viability. The delivery
of μsPEFs constitute an easy way to control Ca2+ oscillations in mesenchymal stem cells, through their
cancellation or the addition of supplementary Ca2+ spikes. Indeed, unlike chemical factors which cause
continuous effects, the direct link between the microsecond electric pulse(s) delivery and the ulterior
occurrence/cancellation of the cytosolic Ca2+ spikes allowed us to mimic and regulate the Ca2+
oscillations in these cells. Since microsecond electric pulses delivery constitutes a simple technology

139
available in many laboratories, the electrical control of Ca2+ oscillations could be in the future a
promising tool to further investigate the role of Ca2+ in MSC physiology and to better understand the
correlation between the Ca2+ oscillations MSC biological processes such as proliferation and
differentiation.
Methods
Cells and cell culture conditions
HaMSCs were isolated from surgical waste of individuals undergoing elective lipoaspiration. Samples
were obtained after written informed consent from all the donors, in accordance with France and
European legislations. The lipoaspirates were surgical waste and as such the French legislation (Art.L.
1245-2 du Code de la Santé Publique) establishes that the authorization from an ethics committee is
not required. Every experiment was done on cells before passage 8 from, at least two donors (seven
different donors in total). All haMSCs reacted similarly to the electric pulses, whatever the donor. The
cells were grown in Dulbecco’s Modified Eagle Medium (DMEM) with Glutamax and supplemented
with 10% fetal bovine serum, 100 U/mL penicillin and 100 mg/mL streptomycin and were cultured at
37°C in a humidified incubator with 5% CO2. Cells were passed twice a week (every passage
corresponds to one doubling time of the population). The multipotency capabilities of the cells were
assessed by submitting them to differentiation conditions as previously reported in André et al. [16].
Cells from all the donors have thus been differentiated in osteoblasts, adipocytes and chondrocytes.
The cell culture chemicals were purchased from Fischer Scientific (Parc d’innovation Illkirch, France).
Cell staining
One day prior to the experiments, cells were seeded in 24 well plates at a density of 20x103 cells/cm2.
After one day, the cells were incubated for 30 min with 5 μM of Fluo-4 AM (Fischer Scientific), a
fluorescent Ca2+ marker, in a humidified 5% CO2 atmosphere at 37°C in complete DMEM. The
incubation buffer also contained 375 nM of the nuclear fluorescent dye Hoechst 33342. After
incubation, the attached cells were rinsed three times with PBS (Phosphate Buffered Saline) and 500
μl of complete DMEM were added to the cells.
Microsecond pulse generator and electrodes
One single micropulse of 100 μs was delivered in all the experiments. A CliniporatorTM (Igea, Carpi,
Italy) was used for the generation of the microsecond pulsed electric fields (μsPEFs). In order to treat
the cells under the microscope, the pulse generator was connected to two parallel stainless steel rods
of 1.2 mm diameter used as electrodes. The distance between them was 5 mm, and they were shaped
to enter a 24 plate well and to reach the bottom of the dish. The whole system was set under a Zeiss
Axiovert S100 epifluorescence inverted microscope.
In order to test the cell viability, another model of electrodes was designed. In this system, a thick
cover of 10 cm2 containing 2 slots was designed to fit in a Petri dish of the same dimensions. Two plate
electrodes of 2 mm thickness and 2 cm length were slipped into the slots until they touched the bottom

140
of the Petri dish. This system does not permit to observe the cells under a microscope, it was used
because it allows covering a larger surface (in order to have enough cells) than the system described
above.
Images acquisition and analyses
Images of the cells were taken every 10 s for 10 to 20 min with a Zeiss AxioCam Hrc camera
controlled by the Axio Vision 4.6 software (Carl Zeiss, Germany). The electric pulse was delivered after
at least 2 minutes of recording, and 2 seconds before the next image. The excitation and emission
wavelengths used for Fluo-4 were 496 nm and 515 nm respectively. The nuclear dye Hoechst 33342
(λex = 350 nm, λem = 461 nm) was used to recognize the nuclei and to track the cells using the Cell
Profiler (version 2.0) software (Broad Institute, Cambridge, USA). The software allowed the automatic
measurement of the fluorescence intensity signal of each cell on every image. Curves were plotted
using a Matlab program (version 7.8.0). All the observations were done at room temperature. The
minimum opening time of the shutter for the fluorescent light was about 500 ms. To decrease the light
energy applied on the cells, a 90% density Filter NE110B (Thorlabs, Maisons-Lafitte, France) was used.
Cell viability assessment
One day prior to the experiments, cells were seeded at a density of 20x103 cells/cm2 in 10 cm2
Petri dishes containing a 12×32 mm cover slide. After 24 hours, medium was removed, cells were
washed with PBS, and 1 ml of fresh medium was added. The electrodes were placed on the cover slide
using the Petri dish cover containing two slots and a 100 μs pulse was delivered to the attached cells.
After the pulse, the Petri dish was put in the incubator for 20 minutes. Then, the non- pulsed cells on
the cover slides were scratched under a sterile hood. The area covered by the pulsed cells was
recognised due to the loss of cells beneath the electrodes after the removal of these latter. The cover
slide with the pulsed cells only was transferred to a Petri dish with fresh medium and placed for 2
hours in the incubator. Then medium was removed and the cells were trypsinised, centrifuged and
resuspended in 300μl of a fresh medium. This volume was distributed in 2 wells of an opaque-walled
96 multiwell plate and put in the incubator for 24 hours. After 24 hours, cells were visualized on an
epifluorescnece microscope to compare their shape and level of confluence, and 150μl of Cell-Titer
Glo Reagent (Promega) were added to each well according to manufacturer’s protocol. The reagent
caused cell lysis and the generation of a luminescent signal proportional to the amount of the ATP
present in the medium. A GloMax luminometer (Promega) was used to read the luminescence. The
ATP amount and therefore the luminescence intensity reflected the number of cells present in the
culture [17].
Statistical analysis
All the experiments were done at least 3 times. Data are presented as means and standard
deviations. The Spearman correlation was used to analyse data of Fig. 3 and Fig. 6.

141
Results
Spontaneous Ca2+ oscillations in haMSC in normal conditions and after one 100 µs electric
pulse
Undifferentiated haMSC present asynchronous Ca2+ oscillations as seen in Fig. 1 (left column). The
oscillations frequencies differed from cell to cell and not all of the cells displayed spontaneous Ca2+
oscillations (dire combien?). When one electric pulse of 100 μs was applied on haMSC, different
situations could be observed. As shown in Fig. 1 (middle column), an electric pulse of 300 V/cm induced
a Ca2+ spike in all the cells whatever the stage of their Ca2+ oscillation at the time the pulse was applied.
After the pulse, the spontaneous Ca2+ oscillations returned to their original cell-dependent frequency
and continued normally. When the electric pulse applied was 900 V/cm (Fig. 1, right), all the cells
presented a Ca2+ spike with higher amplitude with respect to 300 V/cm. However, even 750 s after the
pulse, the cells still presented a high cytosolic Ca2+ concentration (as shown by the persistent fluo-4
high fluorescence level) and the spontaneous Ca2+ oscillations did not yet resume.
Ca2+ spikes in response to different electric field amplitudes
The shapes of the electrically-induced Ca2+ spikes in response to a 100 μs duration pulse of different
electric field amplitudes are represented in Fig. 2. At a very low electric field amplitude (100 V/cm), no
Ca2+ spike was observed. At 150 V/cm, the Ca2+ spikes had a lower amplitude than the spontaneous
oscillations and presented a relatively small slope. At moderate electric field amplitudes (200 to 450
V/cm), each electric pulse induced a Ca2+ spike. The Ca2+ spike displayed a higher slope than at 150
V/cm, then reached its maximal amplitude and came back to the normal Ca2+ amplitude as before the
pulse. The electro-induced Ca2+ spikes had nearly the same shape and amplitude as the spontaneous
oscillations at 200 and 300 V/cm. At 450 V/cm, their amplitudes were higher than the spontaneous
ones, but they came back to the original baseline. When high electric field amplitudes were applied
(600 to 900 V/cm), the electrically induced Ca2+ spike presented larger slopes (with different degree of
sharpness depending on the electric field strength) and displayed a higher amplitude than the
spontaneous oscillations; after the Ca2+ spike, the Ca2+ amplitude remained relatively high compared
to the initial amplitude, and it took a longer time (several minutes) to come back to the normal
depending also on the amplitude of the applied electric field.
According to Fig. 3, only 10% of the cells presented a Ca2+ spike in response to the electric pulse at 150
V/cm. This percentage increased proportionally to the electric field amplitude, mainly between 150
and 300 V/cm. 100% of the cells responded to the pulse at 450 V/cm. According to Spearman
correlation analysis, there was a perfect correlation between the electric field amplitude and the
percentage of cells displaying a Ca2+ spike (r = 0.96).
Different outcomes on Ca2+ oscillations according to the electric field amplitude
According to the electric field amplitude, the pulse-induced Ca2+ spike had different effects on Ca2+
oscillations. At a relatively low electric field amplitude (300 V/cm), the pulse-induced Ca2+ spike

142
displayed a very similar shape to the spontaneous Ca2+ oscillations (Fig. 4A), and it could be generated
between two oscillations or during an oscillation. After the 100 µs pulse-induced Ca2+ spike, the
spontaneous oscillations continued normally at their proper initial rhythm with no significant
modification of the amplitude or duration of the oscillations. At relatively high electric field amplitude
such as 600 V/cm, the pulse-induced Ca2+ spike displayed higher amplitude than the spontaneous
oscillations and three different outcomes could be observed after the electro-induced spike. The
oscillations could continue normally, with a minor change of the oscillation shape (Fig. 4B, upper trace).
Or, secondly, a short inhibition of the spontaneous oscillations could be observed for some minutes,
after which the oscillations reappeared (Fig. 4B, lower trace). The first oscillations that appeared after
such an inhibition period did not displayed the same shape as the original ones. The third possible
outcome was a longer inhibition of the Ca2+ oscillations, for a duration longer than 10 minutes (Fig.
4C). The application of higher electric field amplitude (750 and 900 V/cm) resulted in the inhibition of
the spontaneous Ca2+ oscillations for longer times (depending on the amplitude of the electric field,
even 45 to 60 minutes post pulses only some cells had recovered their oscillations). After 24 hours all
cells recovered their oscillations whatever the electric field applied (data not shown).
The percentage of cells with no spontaneous oscillation for at least 10 minutes after the electric pulse
delivery increased as a function of the electric field amplitude (Fig. 5). While no inhibition of the
spontaneous oscillations was observed at 300 V/cm, 25% of the cells had their Ca2+ oscillations
inhibited at 450 V/cm. Nearly all the cells had their Ca2+ oscillations inhibited after one electric pulse
at 750 V/cm. 24 hours post pulses, the cells remained viable under all the conditions tested, even for
the highest electric field amplitude (Fig. 6). Photos taken before the Cell-Titer Glo assay showed no
difference in the shape and level of confluence of the cells between the pulsed and the control wells
(data not shown). The Spearman correlation showed no effect of the electric field amplitude on the
cell viability (r = 0.43).
Electrically-mediated Ca2+ spikes manipulation after the 900 V/cm inhibition
To test whether the cells were in a “refractory” state after the inhibition of their Ca2+ oscillations, or if
they were still able to respond to the electric pulses, pulses of different field amplitudes were applied
after a pulse of 900 V/cm (which provokes the absence of further spontaneous oscillations in 100% of
the cells). For example (Fig. 7), a sequence of 3 pulses with descending electric field amplitudes (750
followed by 600 and 450 V/cm) were applied successively: the cells responded to the electric pulses as
if each pulse would have been applied alone, or independently. The amplitude of the electrically-
induced Ca2+ spike was again proportional to the electric field amplitude like in Fig. 2. Thus calibrated
electric pulses allow to restore Ca2+ spikes at the time and with the amplitude chosen by the
investigators.
Discussion
Mesenchymal stem cells (MSCs) are multipotent stromal cells that have the ability to self-
renew and to differentiate into a wide variety of cells of the mesodermal, ectodermal, and endodermal
lineages [18]. This is why they represent an important tool for cell therapy and regenerative medicine.
However, the differentiation procedures may be long and not able to respond to the demand. The

143
improvement and optimization of these procedures is of a crucial importance to ensure the
differentiated cells in a reasonable time. Many studies have tested the effects of physical stimuli on
the differentiation outcomes. Altman et al. showed that the application of a cyclic mechanical
stimulation (translational and rotational strain) to undifferentiated MSCs (embedded in a collagen gel)
over a period of 21 days resulted in ligament cell lineage differentiation even without differentiation
factors [19]. Ward and colleagues studied the effect of the application of a 3-5% tensile strain to a
collagen I substrate and concluded that it stimulated osteogenesis of attached hMSCs [20]. Low
intensity ultrasounds, another form of mechanical stress, have been shown to enhance the
chondrogenic differentiation [21]. Sun et al. demonstrated that 0.1 V/cm electrical stimulation applied
for 30 min per day for 10 days, on attached MSCs cultured with osteoinductive factors, accelerated
their osteodifferentiation [14].
Ca2+ oscillations play an important role in the transduction of many physical stimuli in the cells.
For example, tissue strain and shear stress on mouse tibia are transduced by repetitive Ca2+ spikes in
the osteocytes. The spikes frequency and amplitude depend on the mechanical magnitude [22].
Electromagnetic fields (EMF) can also promote MSCs differentiation to osteoblasts through Ca2+-
related mechanisms. The exposition of MSCs to pulsed EMF for 10 min every day results in the
enhancement of osteogenesis early stages [23].
Ca2+ oscillations are a universal mode of Ca2+ signalling in both excitable [24,25], and non-
excitable cells [26]. In non-excitable cells such as hMSC, Ca2+ oscillations are typically initiated by a
receptor-triggered production of IP3 (after the binding of an agonist to the receptor) [27] and the
subsequent Ca2+ release from the ER [28] which stimulates the store-operated calcium entry (SOCE)
via the SOCC [29]. It was shown that the Ca2+ oscillations frequency is different between
undifferentiated MSC and MSC on routes of differentiation and it differs between the various
differentiated cell types [11]. According to Titushkin et al., the MSCs Ca2+ oscillations are suppressed
after the addition of neuroinductive factors, but reappear in less than 7 days after neurodifferentiation
[11]. Sun and colleagues observed that multipotent MSCs present 8.06 ± 2.64 Ca2+ spikes per 30 min of
observation, and that this number decreases to 3.66 ± 2.42 after 28 days of incubation with
osteoinductive factors [14].
In our study, we decided to analyse the effect of a type of short electric pulses termed
microsecond pulsed electric fields (μsPEF) on the spontaneous Ca2+ oscillations of haMSC because
many of the physical stimuli are transduced by cytosolic Ca2+ concentration rapid changes (oscillations)
in the cells. The ultrashort pulses (one thousandth to one ten thousandth shorter than the pulses of
100 µs used in our study) called nanopulses or nanosecond pulsed electric fields (nsPEF) have been
used already to induce Ca2+ bursts in the cell, which resulted from the electropermeabilisation of the
ER, the plasma membrane or both [13,30]. However, contrary to the 100 µs electric pulses, the
technology to deliver nanopulses is not yet spread in the laboratories and is not simple to use.
The haMSCs loaded with the fluorescent marker Fluo-4 asynchronously displayed periodic
changes in their cytosolic Ca2+ concentration detected by the periodic increase of their fluorescence.
The videos of the haMSCs showed that not all the cells presented Ca2+ oscillations at a specific time.
Some of the cells never displayed oscillations during the recording time (20 minutes). This observation
can be related to the fact that MSCs display Ca2+ oscillations only during the phases G1 and S of the cell
cycle, and not all the cells in the visualisation area of an experiment were in those phases of the cell
cycle. Ca2+ oscillations increase the levels of cell cycle regulators such as cyclins A and E and probably

144
control cell cycle progression and cell proliferation, via the regulation of cyclin levels (amongst other
mechanisms) [31]. In addition, the haMSCs presenting Ca2+ oscillations displayed them at different
rhythms and frequencies: the oscillations were asynchronous, and at a given time, each cell was in a
different phase of a Ca2+ oscillation and the oscillations frequencies displayed wide variations between
cells. The average duration of an oscillation was around two minutes.
Electric pulses of 100 μs duration are already applied in many biotechnological and medical
applications, notably in anticancer electrochemotherapy [32], tumour ablation [33], and cell
transfection [34]: by permeabilizing the plasma membrane temporally they allow the internalization
of non-permeant molecules of interest like drugs or nucleic acids. Classically, 8 successive pulses of
100 µs are used in biomedical sciences. The technology is spread in many laboratories and is very
simple to use. In our study, we applied a single electric pulse because, when several pulses are
delivered, pulses repetition frequency may impact the efficacy of cell membrane permeabilisation as
we have recently shown in our group [35]. When an electric pulse of 100 μs was applied to the cells,
an electrically-induced Ca2+ spike was observed synchronously in a given percentage of the cells (as a
function of the electric field amplitude). Moreover, the electric field amplitude should be enough to
cause the transmembrane voltage to reach a permeabilization threshold. This threshold depends on
the size of the molecule to be internalised. This is why, at 100 V/cm, which is a very low electric field
amplitude, no Ca2+ spike was observed because there was no permeabilization and hence no Ca2+
entry. 120 V/cm was the lowest electric field amplitude at which some cells presented Ca2+ spikes. This
threshold is very low compared to other ones previously reported, because the Ca2+ has a small size
compared to other classical markers such as yo-pro-1 iodide, propidium iodide or bleomycin that are
those frequently used (Hanna et al., submitted). At 450 V/cm, 100% of the cells responded to the
electric pulse. The origin of the Ca2+ causing the Ca2+ spike was not always the same: it could be the
result of Ca2+ entry from the external medium only, or the combination of Ca2+ entry from cell outside
and Ca2+ release from the ER. Our group demonstrated recently that the μsPEF could permeabilize not
only the cell membrane (as usually observed and stated) but also the internal organelles membranes
(Hanna et al., submitted). The origin of the Ca2+ spike depends on the electric field amplitude. If this
latter is below 500 V/cm, the pulse permeabilizes only the plasma membrane (Hanna et al., submitted),
and the Ca2+ spike is primarily the result of Ca2+ entry through the plasma membrane followed by an
amplification due to Ca2+ entry from the voltage-operated Ca2+ channels (VOCC), activated by the
membrane depolarization [36]. However, above 500 V/cm, the electric pulses will also affect the ER
membranes, permeabilize them and cause Ca2+ release from the ER (Hanna et al., submitted). Hence,
the Ca2+ spike at high electric field amplitudes, resulted primarily of a massive Ca2+ entry through the
plasma membrane (due to the generation of larger pores at the higher field amplitudes) also followed
by the external Ca2+ entry through the VOCCs, the Ca2+ release from the ER and the subsequent
stimulation of the store-operated Ca2+ channels (SOCC) [37]. This explains, why the Ca2+ spike induced
by electric fields below 500 V/cm had a very similar shape to the spontaneous Ca2+ oscillations with a
gradual increase and same amplitude, whereas the Ca2+ spike induced by electric fields above 500 V/cm
had higher amplitude than the spontaneous oscillations, and presented a sharper rise (due to the
abrupt penetration of Ca2+ through the permeabilized membranes). At 600 V/cm, three different
outcomes were observed, mainly due to three factors: first the distribution of the electric field which
results in field amplitude small differences in the area between the two electrodes; second, the cells
are heterogeneous in size and according to Schwan equation [38], the electric field impact will be
different between the smallest and the largest cells; third, the orientation of the cell with respect to

145
the electric field lines which has an impact on the induced transmembrane potential that will lead to
the cell membrane permeabilization [39]; fourth, the position of the cells are in the cell cycle that could
lead to different responses to the pulses. However, at 750 V/cm, it seems that the electric field has
exceeded a certain threshold above which no more heterogeneity was observed and nearly all the cells
had their Ca2+ oscillations inhibited.
The Ca2+ spikes obtained looked like the Ca2+ spikes induced by even shorter electric pulses
(the so-called nanopulses, of a duration of e.g. 10 ns, that can directly affect the cell internal
membranes such as those of the endoplasmic reticulum [30]). In our study, an electrically induced Ca2+
spike with properties very near to the oscillations did not inhibit these latter, could be applied at any
time of an oscillation without interfering with this latter, and after the pulse, the oscillations continued
normally at their own rhythm, and with their normal shape. Nevertheless, a high amplitude Ca2+ spike
inhibited the Ca2+ oscillations. The percentage of cells that were unable to display further Ca2+
oscillations increased proportionally with the electric field amplitude of the inhibitory electric pulse.
The Ca2+ oscillations inhibition could last some minutes or be longer, to reach tens of minutes, also
depending on the electric field amplitude of the inhibitory electric pulse.
The inhibition of the Ca2+ oscillations for some time allowed us to study the state of the cell
during this period, to determine whether the cell was in a “refractory state” or if it was still able to
respond to an electric pulse. The application of several pulses after a 900 V/cm pulse inhibition showed
that the cells could still react to the pulse and present Ca2+ spikes with different amplitudes depending
on the applied electric field amplitude.
The electrically induced Ca2+ spikes can have wide effects on the Ca2+ oscillations frequency,
amplitude and duration. Whereas the nanosecond pulses allowed only to add a Ca2+ spike to the
oscillations [30], the microsecond pulses display more complex effects. The electric field amplitude
allowed us either to induce a Ca2+ spike without affecting the oscillations, or to inhibit the Ca2+
oscillations and impose to the cell Ca2+ oscillations at a desired frequency and amplitude. It is worthy
to note that the microsecond technology is cheaper than the nanosecond one, it is more available in
the laboratories, and simple generators can deliver it. These considerations add further value to the
observations reported here. Taking into account that each type of differentiated cell from MSC has its
own Ca2+ oscillations characteristics, and that these oscillations may play an important role in the
decision of MSC fate, the μsPEF constitutes a novel useful tool to control the oscillations and the
differentiation of MSCs.
Conclusions
The hMSC present a big promise for the regenerative medicine. As a function of the pulse(s)
electric field amplitude, we report here that it is possible to generate a supplementary calcium spike
with properties close to those of calcium spontaneous oscillations, or, on the contrary, to inhibit the
spontaneous calcium oscillations for a very long time compared to the pulses duration. Through that
inhibition of the oscillations, Ca2+ oscillations of desired amplitude and frequency could then be
imposed to the cells using subsequent electric pulses. The delivery of short PEF of 100 µs, a robust
technology easy to apply, could be therefore a promising way to investigate the role of the Ca2+ in MSC
physiology and biological processes such as proliferation and differentiation.

146
Abbreviations aMSC: adipose tissue mesenchymal stem cells bMSC: bone marrow mesenchymal stem cells
DMEM: Dulbecco’s Modified Eagle Medium EMF: Electromagnetic fields
ER: endoplasmic reticulum haMSC: human aMSC hbMSC: human bMSC
IP3: inositol triphosphate MSC: mesenchymal stem cells NCX: Na+/ Ca2+ exchanger
PBS: Phosphate Buffered Saline PEF: pulsed electric fields PM: plasma membrane
PMCA: plasma membrane Ca2+ ATPase SERCA: sarco/endoplasmic reticulum Ca2+ ATPase
SOCCs: store-operated Ca2+ channels VOCC: voltage-operated Ca2+ channels
μsPEF: microsecond pulsed electric field
Declarations
Acknowledgements
Authors would like to thank Dr. Bassim Al Sakere for the lipoaspirates.
Funding
This work was supported by CNRS, Gustave Roussy, Université Paris-Sud, the ITMO Cancer in the frame
of the Plan Cancer 2015-2019 (project PC201517) and the Fondation EDF. The research was also
conducted in the scope of the EBAM European Associated Laboratory (LEA) and of the COST action BM
1309 EMF-MED.
Author’s contributions:
HH, FMA and LMM designed the study, contributed to data interpretation, analysed the data and
drafted the manuscript. HH performed the experiments. All authors edited/approved the manuscript.
Competing interests
The authors indicate that they have no competing interests.
Consent for publication
All the authors have read and approved the manuscript for publication.
Ethics approval and consent to participate
HaMSCs were isolated from surgical waste of individuals undergoing elective lipoaspiration. Samples
were obtained after written informed consent from all the donors, in accordance with France and

147
European legislations. The lipoaspirates were surgical waste and as such the French legislation (Art.L.
1245-2 du Code de la Santé Publique) establishes that the authorization from an ethics committee is
not required.
References
1. Dominici M, Le Blanc K, Mueller I, Slaper-Cortenbach I, Marini F, Krause D, et al. Minimal criteria for
defining multipotent mesenchymal stromal cells. The International Society for Cellular Therapy
position statement. Cytotherapy. 2006;8:315–7.
2. Malgieri A, Kantzari E, Patrizi MP, Gambardella S. Bone marrow and umbilical cord blood human
mesenchymal stem cells: state of the art. Int. J. Clin. Exp. Med. 2010;3:248–69.
3. Lee RH, Kim B, Choi I, Kim H, Choi HS, Suh K, et al. Characterization and expression analysis of
mesenchymal stem cells from human bone marrow and adipose tissue. Cell. Physiol. Biochem.
Int. J. Exp. Cell. Physiol. Biochem. Pharmacol. 2004;14:311–24.
4. Marion NW, Mao JJ. Mesenchymal stem cells and tissue engineering. Methods Enzymol.
2006;420:339–61.
5. Sacchetti B, Funari A, Remoli C, Giannicola G, Kogler G, Liedtke S, et al. No Identical “Mesenchymal
Stem Cells” at Different Times and Sites: Human Committed Progenitors of Distinct Origin and
Differentiation Potential Are Incorporated as Adventitial Cells in Microvessels. Stem Cell Rep.
2016;6:897–913.
6. Gronthos S, Franklin DM, Leddy HA, Robey PG, Storms RW, Gimble JM. Surface protein
characterization of human adipose tissue-derived stromal cells. J. Cell. Physiol. 2001;189:54–
63.
7. Lindroos B, Suuronen R, Miettinen S. The potential of adipose stem cells in regenerative medicine.
Stem Cell Rev. 2011;7:269–91.
8. Kawano S, Shoji S, Ichinose S, Yamagata K, Tagami M, Hiraoka M. Characterization of Ca(2+) signaling
pathways in human mesenchymal stem cells. Cell Calcium. 2002;32:165–74.
9. Kawano S, Otsu K, Kuruma A, Shoji S, Yanagida E, Muto Y, et al. ATP autocrine/paracrine signaling
induces calcium oscillations and NFAT activation in human mesenchymal stem cells. Cell
Calcium. 2006;39:313–24.
10. Kawano S, Otsu K, Shoji S, Yamagata K, Hiraoka M. Ca(2+) oscillations regulated by Na(+)-Ca(2+)
exchanger and plasma membrane Ca(2+) pump induce fluctuations of membrane currents and
potentials in human mesenchymal stem cells. Cell Calcium. 2003;34:145–56.
11. Titushkin I, Sun S, Shin J, Cho M. Physicochemical Control of Adult Stem Cell Differentiation:
Shedding Light on Potential Molecular Mechanisms. BioMed Res. Int. 2010;2010:e743476.
12. Mir LM, Banoun H, Paoletti C. Introduction of definite amounts of nonpermeant molecules into
living cells after electropermeabilization: direct access to the cytosol. Exp. Cell Res.
1988;175:15–25.
13. Vernier PT, Sun Y, Marcu L, Salemi S, Craft CM, Gundersen MA. Calcium bursts induced by
nanosecond electric pulses. Biochem. Biophys. Res. Commun. 2003;310:286–95.
14. Sun S, Liu Y, Lipsky S, Cho M. Physical manipulation of calcium oscillations facilitates
osteodifferentiation of human mesenchymal stem cells. FASEB J. Off. Publ. Fed. Am. Soc. Exp.
Biol. 2007;21:1472–80.

148
15. Kim IS, Song JK, Song YM, Cho TH, Lee TH, Lim SS, et al. Novel effect of biphasic electric current on
in vitro osteogenesis and cytokine production in human mesenchymal stromal cells. Tissue
Eng. Part A. 2009;15:2411–22.
16. Liew A, André FM, Lesueur LL, De Ménorval M-A, O’Brien T, Mir LM. Robust, efficient, and practical
electrogene transfer method for human mesenchymal stem cells using square electric pulses.
Hum. Gene Ther. Methods. 2013;24:289–97.
17. Crouch SP, Kozlowski R, Slater KJ, Fletcher J. The use of ATP bioluminescence as a measure of cell
proliferation and cytotoxicity. J. Immunol. Methods. 1993;160:81–8.
18. Woodbury D, Reynolds K, Black IB. Adult bone marrow stromal stem cells express germline,
ectodermal, endodermal, and mesodermal genes prior to neurogenesis. J. Neurosci. Res.
2002;69:908–17.
19. Altman GH, Horan RL, Martin I, Farhadi J, Stark PRH, Volloch V, et al. Cell differentiation by
mechanical stress. FASEB J. Off. Publ. Fed. Am. Soc. Exp. Biol. 2002;16:270–2.
20. Ward DF, Salasznyk RM, Klees RF, Backiel J, Agius P, Bennett K, et al. Mechanical strain enhances
extracellular matrix-induced gene focusing and promotes osteogenic differentiation of human
mesenchymal stem cells through an extracellular-related kinase-dependent pathway. Stem
Cells Dev. 2007;16:467–80.
21. Ebisawa K, Hata K-I, Okada K, Kimata K, Ueda M, Torii S, et al. Ultrasound enhances transforming
growth factor beta-mediated chondrocyte differentiation of human mesenchymal stem cells.
Tissue Eng. 2004;10:921–9.
22. Jing D, Baik AD, Lu XL, Zhou B, Lai X, Wang L, et al. In situ intracellular calcium oscillations in
osteocytes in intact mouse long bones under dynamic mechanical loading. FASEB J.
2014;28:1582–92.
23. Petecchia L, Sbrana F, Utzeri R, Vercellino M, Usai C, Visai L, et al. Electro-magnetic field promotes
osteogenic differentiation of BM-hMSCs through a selective action on Ca2+-related
mechanisms. Sci. Rep. 2015; 5; 13856
24. Parri HR, Gould TM, Crunelli V. Spontaneous astrocytic Ca2+ oscillations in situ drive NMDAR-
mediated neuronal excitation. Nat. Neurosci. 2001;4:803–12.
25. Tsien RW. Calcium Channels in Excitable Cell Membranes. Annu. Rev. Physiol. 1983;45:341–58.
26. Fewtrell C. Ca2+ Oscillations in Non-Excitable Cells. Annu. Rev. Physiol. 1993;55:427–54.
27. Nash MS, Young KW, John Challiss RA, Nahorski SR. Intracellular signalling: Receptor-specific
messenger oscillations. Nature. 2001;413:381–2.
28. Liou J, Kim ML, Heo WD, Jones JT, Myers JW, Ferrell JE, et al. STIM is a Ca2+ sensor essential for
Ca2+-store-depletion-triggered Ca2+ influx. Curr. Biol. CB. 2005;15:1235–41.
29. Parekh AB, Putney JW. Store-operated calcium channels. Physiol. Rev. 2005;85:757–810.
30. de Menorval M-A, Andre FM, Silve A, Dalmay C, Français O, Le Pioufle B, et al. Electric pulses: a
flexible tool to manipulate cytosolic calcium concentrations and generate spontaneous-like
calcium oscillations in mesenchymal stem cells. Sci. Rep. 2016;6:32331.
31. Resende RR, Adhikari A, da Costa JL, Lorençon E, Ladeira MS, Guatimosim S, et al. Influence of
spontaneous calcium events on cell-cycle progression in embryonal carcinoma and adult stem
cells. Biochim. Biophys. Acta. 2010;1803:246–60.
32. Belehradek M, Domenge C, Luboinski B, Orlowski S, Belehradek J, Mir LM. Electrochemotherapy, a
new antitumor treatment. First clinical phase I-II trial. Cancer. 1993;72:3694–700.
33. Al-Sakere B, André F, Bernat C, Connault E, Opolon P, Davalos RV, et al. Tumor ablation with
irreversible electroporation. PloS One. 2007;2:e1135.

149
34. Potter H, Heller R. Transfection by electroporation. Curr. Protoc. Cell Biol. 2011;52:20.5.1-20.5.10.
35. Silve A, Guimerà Brunet A, Al-Sakere B, Ivorra A, Mir LM. Comparison of the effects of the repetition
rate between microsecond and nanosecond pulses: electropermeabilization-induced electro-
desensitization? Biochim. Biophys. Acta. 2014;1840:2139–51.
36. Catterall WA. Voltage-Gated Calcium Channels. Cold Spring Harb. Perspect. Biol. 2011;3:a003947.
37. Smyth JT, Hwang S-Y, Tomita T, DeHaven WI, Mercer JC, Putney JW. Activation and regulation of
store-operated calcium entry. J. Cell. Mol. Med. 2010;14:2337–49.
38. Schwan HP. Electrical properties of tissue and cell suspensions. Adv. Biol. Med. Phys. 1957;5:147–
209.
39. Kotnik T, Pucihar G, Miklavcic D. Induced transmembrane voltage and its correlation with
electroporation-mediated molecular transport. J. Membr. Biol. 2010;236:3–13.
Figures:
Figure 1. Time lapse follow-up of calcium oscillations and spikes in haMSC. Left: spontaneous calcium
oscillations. Middle: spontaneous calcium oscillations before and after a 100 µs pulse of 300 V/cm (the
pulse was applied at 630 s and a calcium spike in all the cells follows the pulse delivery at e.g. 650 s).
Right: spontaneous calcium oscillations before a 100 µs pulse of 900 V/cm (applied at t = 630 s)
followed by a non-oscillating increased calcium signal.

150
Figure 2. Calcium spikes in response to different electric field amplitudes. For each panel, two separate
adherent cells, displaying the typical behavior of the cells after the delivery of one 100 µs electric pulse,
were chosen to illustrate that behavior. In all the cases, the pulse was applied at time = 390 s (black
arrows).
Figure 3. Percentage of cells presenting a calcium spike in response to one 100 µs electric pulse as a
function of the field amplitude. r = 0.96 according to Spearman correlation.

151
Nor
mal
ized
flu
ores
cenc
e in
tens
ity
0 300 600 900 1200Time (s)EP
0 300 600 900 1200Time (s)EP
Nor
mal
ized
flu
ores
cenc
e in
tens
ity
0 300 600 900 1200Time (s)EP
Nor
mal
ized
flu
ores
cenc
e in
tens
ity
0 300 600 900 1200Time (s)EP
Nor
mal
ized
flu
ores
cenc
e in
tens
ity
Figure 4. Examples of changes in the pattern of Ca2+ oscillations caused by the delivery of one 100 µs
electric pulse of different field amplitudes, a: 300 V/cm, b and c: 600 V/cm, d: 900 V/cm.
Figure 5. Percentage of cells displaying no Ca2+ oscillation within a period of at least 10 minutes after
the delivery of one 100 µs electric pulse of different field amplitudes.

152
Figure 6. haMSC cell viability after the delivery of one 100 µs electric pulse of different field
amplitudes, r = 0.43 according to Spearman correlation.
T im e (s )
Flu
ore
sc
en
ce
in
ten
sit
y (
a.u
.)
0 2 0 0 4 0 0 6 0 0 8 0 0 1 0 0 0
0 .0 0
0 .0 5
0 .1 0
0 .1 5
0 .2 0
0 .2 5
T im e (s )
Flu
ore
sc
en
ce
in
ten
sit
y (
a.u
.)
0 2 0 0 4 0 0 6 0 0 8 0 0 1 0 0 0
0 .0 0
0 .0 5
0 .1 0
0 .1 5
0 .2 0
0 .2 5
9 0 0
V /c m
7 5 0
V /c m
6 0 0
V /c m
4 5 0
V /c m
9 0 0
V /c m
7 5 0
V /c m
6 0 0
V /c m
4 5 0
V /c m
Figure 7. Two examples of calcium spikes manipulation in haMSC. After the delivery of one 100 µs
electric pulse at 900 V/cm (that abolishes the spontaneous Ca2+ oscillations), pulses of various field
amplitudes were delivered to mimic Ca2+ oscillations at experimentally controlled times.

153
3 IN VITRO OSTEOBLASTIC DIFFERENTIATION OF MESENCHYMAL STEM
CELLS GENERATES CELL LAYERS WITH DISTINCT PROPERTIES (ARTICLE
N˚3)
The mesenchymal stem cells undergoing an osteogenic differentiation form an extensive
extracellular matrix connecting the cells. When we tried to trypsinise the cells in differentiation in
order to study their Ca2+ oscillations, we found that these latter were not well dissociated. We decided
to use the collagenase I to dissociate the cells since the ECM is mainly composed of collagen I. We
found, after the use of the collagenase I, that an attached layer of cells remained at the bottom of the
dish. This layer was not sensitive to the collagenase I but to the trypsin. This part of the thesis presents
the observations done for the first time on the different layers of cells undergoing osteogenic
differentiation. A characterization of the two different layers types was done. The comparison with an
adipogenic and neurogenic differentiation was also assessed in order to compare the evolution of the
cell monolayer during each differentiation. This work is related to a new observation that has been
done on the osteogenic differentiation. This observation could be helpful for new applications and for
obtaining osteoblasts in a shorter time in an electroporation-independent manner. In the next section
of the thesis, the combination of an osteogenic differentiation with electroporation will be further
evaluated. These results have been submitted to “FASEB Journal” in December 2016.
154
In vitro osteoblastic differentiation of mesenchymal stem cells
generates cell layers with distinct properties
Short title:
Cell layers in MSC differentiation
Authors and affiliations Hanna Hanna1, Lluis M. Mir 1, Franck M. Andre 1,*
1Vectorology and Anticancer Therapies, UMR 8203, CNRS, Univ. Paris-Sud, Gustave Roussy,
Université Paris-Saclay, 94 805 Villejuif, France.
* Correspondance should be addressed to Franck M. Andre
E-mail address: [email protected]
Tel. : +33 1 42 11 54 07
UMR 8203 CNRS
Gustave Roussy, PR2
114 rue Edouard Vaillant
94805 VILLEJUIF Cédex France

155
List of abbreviations:
ALP: alkaline phosphatase
CD: cluster of differentiation
DMEM: Dulbecco’s Modified Eagle Medium
ECM: extracellular matrix
FABP4: fatty acid binding protein 4
haMSCs: human adipose mesenchymal stem cells
MAP2: microtubule-associated protein 2
MSCs: mesenchymal stem cells
pNPP: p-nitrophenyl phosphate
pNP: p-nitrophenol

156
Abstract
The differentiation of mesenchymal stem cells to osteoblasts is widely performed in research
laboratories. Classical tests to prove this differentiation employ procedures such as cell fixation, cell
lysis or cell scraping. Gentle dissociation of mesenchymal stem cells undergoing an osteodifferentiation
is reported in very few studies. It reveals the presence of several cell layers in the culture dish. Through
the sequential detachment of the cells, we confirm the presence of several layers of differentiated
cells and we show that they have distinct properties. The upper layers, maintained by a collagen I
extracellular matrix, can be dissociated using collagenase I, while the remaining lowest layer, attached
to the bottom of the dish, is sensitive only to trypsin-versene. The action of collagenase I is more
efficient before the mineralization of the extracellular matrix. The collagenase sensitive and trypsin
sensitive layers differ in their cluster of differentiation expression. The dissociation of the cells on day
15 reveals that cells can resume their growth, while differentiating in osteoblasts in 2 weeks (instead
of 4). Cells from the upper layers displayed a higher mineralization. This could allow the investigators
to use upper layers to rapidly produce differentiated osteoblasts and the lowest layer to continue
growth and differentiation until an ulterior dissociation.
Key Words: collagenase I, trypsin, extracellular matrix, multilayers, cluster of differentiations, calcium
oscillations
Introduction
MSCs osteogenic differentiation was the first differentiation to be identified by Friedenstein
and co-workers in the late 1960s – early 1970s (1, 2). As the MSCs (known then as marrow stromal
cells) were extracted from the bone marrow, it was not surprising that they could give rise to
osteoblasts. In vitro, osteogenic differentiation occurs on a period of one month and produces
differentiated osteoblasts. Downregulation of DNA replication by the second week of differentiation
is associated with expression of osteoblast markers (such as alkaline phosphatase, ALP), processing of
type I procollagen to collagen I under the effect of ascorbic acid, and progressive deposition of a
collagenous extracellular matrix (ECM) (3). Later on, other bone markers can be detected, such as
osteocalcin, osteopontin, bone sialoprotein and osteonectin. Hydroxyapatite deposits mark the final
phase of osteoblast phenotypic development (3). The ECM is an essential element for the osteogenic
differentiation; it is secreted by the MSCs undergoing an osteogenic differentiation and contains
growth factors and many proteins such as fibronectin, vitronectin, laminin, osteopontin and
osteonectin (4). Osteoblasts must be in contact with a collagen I matrix before they can differentiate
(5). ECM formation is a marker of MSC differentiation to osteoblast, and it accumulates maximally after
one week of culture. After 2 weeks of culture, mineralization of ECM begins, which marks the final
phase of the osteoblast phenotypic development (3). Cell proliferation before mineralization is a
critical process for increasing bone mass. Because the cells are exposed to the differentiating agents
when they form a more or less confluent monolayer in the culture dishes, the differentiated cells in 2D
cultures are sometimes referred as « monolayers » (6), « confluent monolayers » (7) or « cells in
monolayer » (8). The term « multilayer » was barely used (9). Zhu et al. showed that a weak
osteogenesis is characterized by the formation of an ALP positive cell monolayer while a strong

157
osteogenesis is characterized by the presence of multilayered ALP positive nodular structures (10). To
assess the differentiation potential, the investigators used many classical tests that label the cells or
measure the osteogenic markers. In all of these methods there was no dissociation of the cells from
the different layers. Indeed, the first step is often the fixation of the cells, for example to stain the cells
with alizarin red that labels the deposits of calcium phosphate (hydroxyapatite Ca5(PO4)3(OH)) (11, 12).
Other tests such as immunofluorescent labelling (13, 14), ECM protein production (4), external ALP
measurement (12, 15) are performed without dissociation of the cells, just after their fixation. In other
methods, the supernatant of the cells is taken, to measure osteocalcin (6, 16), type I procollagen (16),
bone sialoprotein or different specific cytokines production (17, 18) by ELISA or other techniques.
Finally, other methods starts by the scraping or the lysis of the cells using trichloroacetic acid and SDS
(9), sonication (16), trizol (19), RIPA buffer (17) or many cycles of freeze-thaw (15) in order to perform
DNA and calcium assays (16, 20, 21), to measure internal ALP by colorimetric assays (13, 15, 17, 20, 22)
or to detect specific proteins by western blot or mRNA by RT-PCR (6, 8, 9, 12). All these techniques do
not dissociate the living cells. Some studies (13, 23) used the trypsin alone (until day 14 of
osteodifferentiation, before the mineralization occurred) or the trypsin-EDTA (24, 25) to harvest all the
layers in 2D cultures.
In our study, we used human adipose mesenchymal stem cells (haMSCs) to perform
osteogenic, adipogenic and neurogenic differentiations to assess the multipotency of the haMSCs and
to compare the evolution of the cells in one or several layers during the differentiation. Confocal
microscopy observations were performed in order to assess the evolution of the cells in one or many
layers in the three differentiations. Furthermore, differential dissociation by collagenase I and trypsin
was performed on the layers in osteogenic differentiation. The different layers were then characterized
by their cluster of differentiation markers and their Ca2+ oscillations in order to evaluate if they were
identical or not. The different cell populations resulting from differential dissociation at day 15 were
also cultivated separately to evaluate their osteogenic potential. This study presents new observations
on the cell layers in an in vitro osteogenic differentiation and proposes a new method to dissociate the
cells which could expand their use and facilitate applications.
Materials and methods
Cell culture and differentiation
haMSCs (human adipose-derived mesenchymal stem cells) were isolated from lipoaspirates of
individuals that gave informed and written consent for the use of the lipoaspirates. The cells were
grown in Dulbecco’s Modified Eagle Medium (DMEM) supplemented with 10% foetal bovine serum,
100 U/mL penicillin and 100 mg/mL streptomycin and were cultured at 37°C in a humidified incubator
with 5% CO2. Cells were passed twice a week (every passage corresponded to one doubling time of the
population). The multipotency capabilities of the cells were assessed by submitting them to
differentiation conditions as previously reported in André et al. (26). The cell culture chemicals were
purchased from Fischer Scientific (Parc d’innovation Illkirch, France). Prior to every differentiation, cells
were seeded at a density of 15000 cells/cm2 and let in culture for 2-3 days to attain confluence, after
which the normal medium was removed and differentiation medium was added. This medium change
corresponded to differentiation day 1. The osteogenic medium was composed of complete alpha MEM
supplemented with 100 nM of dexamethasone, 200 µM of ascorbic acid and 10 mM of glycerol 2-

158
phosphate. Medium was changed twice a week. For the adipogenic differentiation, two media were
consecutively used: an induction medium composed of complete DMEM supplemented with 1 µM
dexamethasone, 200 µM indomethacin, 500 µM 3-isobutyl-1-methylxantine and 10 µg/ml insulin for
2-3 days, and a maintenance medium composed of complete DMEM supplemented with 10 µg/ml
insulin renewed every 24 hours. For the neurogenic differentiation, a ready-to-use neurogenic
induction medium was used from Promocell (C-28015), and was changed every 48 hours. The controls
were haMSCs cultivated without passage in their normal medium, which was changed twice a week.
Cells dissociation and counting
For controls, adipogenic differentiation and neurogenic differentiation cells were simply trypsinised
and counted 3 times at every time point. As described in this article, several layers of cells could be
distinguished in osteogenic differentiation. To dissociate the upper layers before the calcium deposits
begun to appear, 2mg/ml collagenase I (Fisher Scientific, Illkirch, France) diluted in PBS was added to
the cells for 30 minutes. After collagenase I action, the cell cultures were pipetted gently to remove all
the cells of the upper layers. The remaining layer was trypsinised. When the mineralization occurred,
i.e. when Ca2+ deposits became apparent, the calcium deposits were removed using 20 to 40 mM of
EDTA in PBS for 20 to 40 minutes, depending on the density of these deposits. Then the cells of the
upper layers were detached using a higher concentration of collagenase (4 mg/ml) and the cells of the
lowest layer using trypsin. The cells from all the layers were gathered together in one tube and counted
3 times at every time point.
Alkaline phosphatase assay and Alizarin Red staining
In order to test the ALP activity (osteogenic differentiation), cells were harvested by using collagenase
I and trypsin, centrifuged at 1500 rpm for 5 min, resuspended in 1 ml of cold PBS (4˚C) and counted. A
volume corresponding to 300 000 cells was taken, centrifuged and suspended in 600 µl of assay buffer
(Abcam), and centrifuged at 13200 rpm for 5 minutes at 4˚C. The supernatant was transferred to a new
tube. 200 µl of the supernatant were distributed in 4 wells of a 96 well plate (50 µl/well). One of them
served to determine the background through the simultaneous addition of 80 µl p-nitrophenyl
phosphate (pNPP) 1 mM and 20 µl of stop solution. For the 3 remaining wells, 80 µl of pNPP were
added. After 60 minutes, 20 µl of stop solution (Abcam) was added to the wells and the plate was read
in a spectrophotometer (BioTek, Colmar, France) to measure the optical density at 405 nm. The
quantity of p-nitrophenol (pNP) in each well was determined using a standard curve established using
pNPP and purified ALP enzyme. 350 µl of the remaining supernatant were incubated with 750 nM of
Hoechst 33342 for 30 min and distributed in triplicate in an opaque 96 well plate to read the
fluorescence at 365 nm excitation. Prior to AR staining, cells were washed in PBS and fixed in 95%
methanol for 10 min. 2% Alizarin Red S solution was added for 5 min, then rinsed with water, and
imaged under an epifluorescence microscope to visualize the Ca2+ deposits.
FABP4 and bodipy staining
To assess adipogenic differentiation, the attached cells were washed after medium removal, fixed in
10% formalin for 20 min and washed 3 times in PBS + 1% BSA. Then cells were permeabilized and

159
blocked with PBS containing 0.3% Triton X-100, 1% BSA and 10% universal blocking reagent. After
blocking, the cells were incubated overnight at 4˚C with an antibody (PA5-30591, Fisher scientific,
Illkirch, France) against the fatty acid binding protein 4 (FABP4). Then the cells were washed 3 times in
PBS + 1% BSA, incubated for 60 min in the dark with a secondary antibody coupled to alexa fluor 488
(A-11008, Fisher Scientific), washed 3 times in PBS + 1% BSA and visualized under an epifluorescence
microscope (Zeiss Axiovert S100).
In order to stain the cells with Bodipy, the cell medium was removed and the cells were incubated for
one hour with a fresh medium containing 100 µg/ml of Bodipy (Molecular Probes, Fisher Scientific),
washed and imaged under the epifluorescence microscope.
MAP2 and cresyl violet staining
To assess neurogenic differentiation, cells were fixed and incubated with microtubule-associated
protein 2 (MAP2) antibody (ref 4542, Cell signaling, Saint Quentin, France) following the same protocol
as for the FABP4 antibody (see above).
In order to stain Nissl bodies, cells were washed and fixed with 10% formalin for 20 min. Then a 0.5%
cresyl violet staining solution (Sigma Aldrich) was added to cells and incubated for 30 min at room
temperature. Then the cells were washed 3 times in PBS and imaged under an epifluorescence
microscope.
Living cells imaging
MSCs were seeded, prior to the differentiation, on a glass bottom µ-slide 4 well (ref 80447, Ibidi GMBH,
Planegg, Germany). Prior to confocal imaging, cells were incubated for 30 min with 375 nM Hoechst
33342 (nuclei marker; λexc 480 nm; λem 535 nm) and 5 µM of fluorescein diacetate (FDA) (cytoplasm
marker; λexc 405 nm; λem 486 nm). A confocal microscope Leica TCS SPE with an objective HC PL APO
CS2 20x, and the LAS AF software version 3.3 (Leica, Germany) were used to visualize the
mono/multilayers in osteogenic, adipogenic or neurogenic differentiation.
Calcium oscillations visualization and analysis
The upper layers in osteogenic differentiation were dissociated by collagenase I as described
before, the lowest layer was trypsinized and the cells from each layer type were seeded apart
at a density of 15 000 cells/cm2 for 24 hours in an osteogenic differentiation medium. After
24 hours, medium was removed and the cells were incubated for 30 min with 5 μM of Fluo-4
AM (Fischer Scientific), a fluorescent Ca2+ marker, in a humidified 5% CO2 atmosphere at 37°C
in osteogenic medium. The incubation buffer also contained 375 nM of the nuclear fluorescent
dye Hoechst 33342. After incubation, the attached cells were rinsed three times with PBS and
500 μl of fresh medium were added to the cells.

160
Immunofluorescent staining
Upper layers in osteogenic differentiation were dissociated with 2 mg/ml of collagenase I. The
remaining layer was trypsinized. On day 22, the differentiating cell cultures were treated first by 20
mM EDTA in PBS before the collagenase addition. Cells were counted and centrifuged at 825 rpm for
10 min after which the supernatant was aspirated and the cells suspended in a buffer made of PBS,
0.5% BSA and 2mM EDTA (100 μl/100 000 cells). 10 μl of anti-CD44 APC, CD90 PE and CD105 FITC were
added per 100 μl of cells. The cells were incubated with the antibodies for 10 minutes at 4˚C in the
dark. Then cells were washed with 1 ml of buffer and centrifuged. The pellet was resuspended in 300
μl of buffer for analysis by flow cytometry (Accuri C6 cytometer, BD Life Sciences, Le Pont de
Claix, France). The antibodies were purchased from Miltenyi Biotec, Paris, France.
Statistical analysis
To compare the difference in immunofluorescent staining between the upper and lowest layers,
unpaired t test was used. To analyse the influence of the layers and the number of days of
differentiation on Ca2+ oscillations, two-way Anova with Tukey’s multiple comparisons test was used.
To compare the control to the other conditions, we used one-way Anova with Dunnett's multiple
comparisons test. All the results are expressed as the mean and standard deviation from three
different differentiations.
Results
Cells characterization
Characterization of osteodifferentiation was performed by the measure of ALP activity and the staining
of the Ca2+ deposits using Alizarin Red. The control MSC (Fig. 1A) displayed no alizarin red labeling and
no ALP activity. In osteogenic differentiation the Ca2+ deposits started to accumulate at the end of the
second weak and became more and more dense (Fig. 1B). These deposits were colored in red by the
alizarin red staining (Fig. 2A). The ALP activity slightly increased at day 8 of osteodifferentiation and
reached a peak on day 15 (Fig. 2B).
The adipodifferentiation was characterized by the FABP4 staining and the lipidic vacuoles formation.
The lipidic vacuoles shown in Fig. 1 C are stained in green by bodipy staining in fig. 2 D. The adipose
cells fluoresced in green after FABP4 labeling (fig. 2 C). The controls displayed no bodipy staining or
FABP4 antibody labeling. The cresyl violet that stains the Nissl bodies specific of the neuronal cells
labeled the haMSCs undergoing neurodifferentiation but not the controls (Fig. 2E). The MAP2 antibody
interacted with neuronal cells but not with control, and this was revealed by the green fluorescence
displayed by the neuronal cells (Fig. 2F).
Evolution of the cell number in the different differentiation pathways
When the cells were exposed to the neurodifferentiation medium, they showed no proliferation at all:
the cell number remained nearly the same during all the differentiation process (Fig. 3). In adipogenic

161
differentiation, cell proliferation was maintained, only slightly reduced with respect to the proliferation
in the controls (Fig. 3). On the contrary, in osteogenic differentiation there was a real stimulation of
the cell proliferation: cells proliferated extensively between day 1 and 15 and faster than the control
MSCs (Fig. 3). At days 8 and 15, there were nearly 4 and 6 times more cells than at day 1. After day 15,
no further increase of the cell number was observed.
In osteogenic differentiation, due to the initial very rapid cell proliferation, cells started to accumulate
in several layers in the first week of osteodifferentiation (Fig. 4). The number of layers stabilized at the
end of the second week when the cells stopped proliferation. Four different layers of cells could be
seen on day 22 of osteodifferentiation, every layer hiding the previous one. The layers were well
separated, and almost no cell could be observed in between. In adipogenic differentiation (Fig. 5),
above a first continuous layer, a discontinuous second layer of cells could also be observed in some
parts of the dish. In neurogenic differentiation, even at day 22, cells remained always in one single
layer in agreement with the total absence of cell proliferation. Furthermore, the cells shrank with time
when they transformed from the mesenchymal fibroblastic shape to the neuronal one.
Characterization of the different cell layers in osteogenic differentiation
When 2mg/ml collagenase I were applied to the cells undergoing an osteogenic differentiation (before
the Ca2+ deposits started to appear), only the cells of the upper cells layers dissociated. After the action
of collagenase I, an attached cell layer remained intact at the bottom of the culture dishes (Fig. 6 A).
This lowest layer was not sensitive to the collagenase. It could only be detached by trypsin.
When the mineralization occurred, collagenase I had no effect at all, even on the upper layers. The
Ca2+ deposits had to be removed first. Prior EDTA treatment (20 to 40 mM for 20 to 40 minutes) was
used to remove these deposits and collagenase concentration had to be increased from 2 to 4 mg/ml
(Fig. 6 B).
The upper (collagenase sensitive) and lowest (trypsin sensitive) layers were labeled using MSC markers
at days 1, 8, 15 and 22 (Fig. 7). As expected, the cells significantly lost the MSC markers (CD105, CD90
and CD44) when they progressed in the differentiation (****, p < 0.0001, two-way ANOVA).
Unexpectedly, this immunostaining showed different evolutions between the upper and the lowest
layers. The CD105 expression was the most rapidly lost among the three. At day 8, 60% of the cells had
already significantly lost it (****, p < 0.0001, two-way ANOVA with Tukey's multiple comparisons test).
At day 22, only 15 to 20% of the cells were still positive to the CD105 labeling. No significant differences
between the upper and lowest layers was observed in terms of CD105 labeling (p = 0.7081, 0.8878 and
0.7531, at days 8, 15 and 22, two-way ANOVA with Tukey's multiple comparisons test). The loss of the
CD90 and CD44 positive labeling was slower and more progressive (Fig. 7). Moreover, a different
evolution was found in the cells from the upper and lowest layers. Decrease was significantly faster in
the trypsin-treated cells (lowest layer) than in the collagen-treated ones (upper layers) (p < 0.05 to p <
0.001, two-way ANOVA with Tukey's multiple comparisons test), except for day 8 for the CD44 (p =
0.8376, two-way ANOVA with Tukey's multiple comparisons test). The cells in the controls expressed
their markers at high levels all the time.
The different layers were also compared in terms of Ca2+ oscillations. These oscillations significantly
decreased when the haMSCs were put in the osteodifferentiation medium (p < 0.0001, one-way Anova
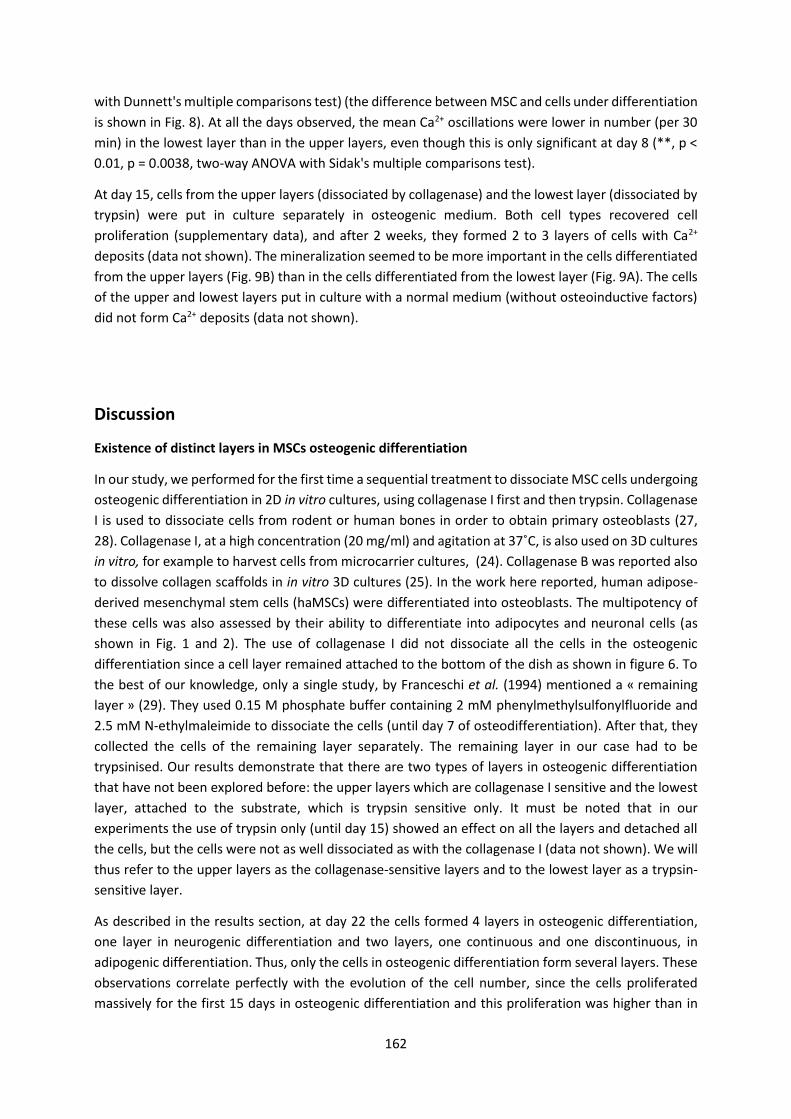
162
with Dunnett's multiple comparisons test) (the difference between MSC and cells under differentiation
is shown in Fig. 8). At all the days observed, the mean Ca2+ oscillations were lower in number (per 30
min) in the lowest layer than in the upper layers, even though this is only significant at day 8 (**, p <
0.01, p = 0.0038, two-way ANOVA with Sidak's multiple comparisons test).
At day 15, cells from the upper layers (dissociated by collagenase) and the lowest layer (dissociated by
trypsin) were put in culture separately in osteogenic medium. Both cell types recovered cell
proliferation (supplementary data), and after 2 weeks, they formed 2 to 3 layers of cells with Ca2+
deposits (data not shown). The mineralization seemed to be more important in the cells differentiated
from the upper layers (Fig. 9B) than in the cells differentiated from the lowest layer (Fig. 9A). The cells
of the upper and lowest layers put in culture with a normal medium (without osteoinductive factors)
did not form Ca2+ deposits (data not shown).
Discussion
Existence of distinct layers in MSCs osteogenic differentiation
In our study, we performed for the first time a sequential treatment to dissociate MSC cells undergoing
osteogenic differentiation in 2D in vitro cultures, using collagenase I first and then trypsin. Collagenase
I is used to dissociate cells from rodent or human bones in order to obtain primary osteoblasts (27,
28). Collagenase I, at a high concentration (20 mg/ml) and agitation at 37˚C, is also used on 3D cultures
in vitro, for example to harvest cells from microcarrier cultures, (24). Collagenase B was reported also
to dissolve collagen scaffolds in in vitro 3D cultures (25). In the work here reported, human adipose-
derived mesenchymal stem cells (haMSCs) were differentiated into osteoblasts. The multipotency of
these cells was also assessed by their ability to differentiate into adipocytes and neuronal cells (as
shown in Fig. 1 and 2). The use of collagenase I did not dissociate all the cells in the osteogenic
differentiation since a cell layer remained attached to the bottom of the dish as shown in figure 6. To
the best of our knowledge, only a single study, by Franceschi et al. (1994) mentioned a « remaining
layer » (29). They used 0.15 M phosphate buffer containing 2 mM phenylmethylsulfonylfluoride and
2.5 mM N-ethylmaleimide to dissociate the cells (until day 7 of osteodifferentiation). After that, they
collected the cells of the remaining layer separately. The remaining layer in our case had to be
trypsinised. Our results demonstrate that there are two types of layers in osteogenic differentiation
that have not been explored before: the upper layers which are collagenase I sensitive and the lowest
layer, attached to the substrate, which is trypsin sensitive only. It must be noted that in our
experiments the use of trypsin only (until day 15) showed an effect on all the layers and detached all
the cells, but the cells were not as well dissociated as with the collagenase I (data not shown). We will
thus refer to the upper layers as the collagenase-sensitive layers and to the lowest layer as a trypsin-
sensitive layer.
As described in the results section, at day 22 the cells formed 4 layers in osteogenic differentiation,
one layer in neurogenic differentiation and two layers, one continuous and one discontinuous, in
adipogenic differentiation. Thus, only the cells in osteogenic differentiation form several layers. These
observations correlate perfectly with the evolution of the cell number, since the cells proliferated
massively for the first 15 days in osteogenic differentiation and this proliferation was higher than in

163
the adipogenic and neurogenic differentiations. After day 15, we observed no further proliferation of
the cells as well as the beginning of the mineralization. The evolution of the cell number in osteogenic
differentiation corroborates the observations in other studies showing also that cell proliferation stops
by the second week of the osteogenic differentiation (3). Cells have to proliferate before mineralization
in order to increase bone mass.
After mineralization started, the action of collagenase I was more difficult. This is why we treated first
the cells with 20 mM EDTA to remove the Ca2+ deposits. EDTA is classically used during the osteoblasts
isolation from rodent and human bones (27). EDTA is also used in vitro on fixed cells in order to remove
Ca2+ deposits (9) or combined to trypsin for harvesting cells in osteogenic differentiation (24, 25).
However, the EDTA concentrations used in vitro on fixed cells (about 350 mM) were 9 to 17 times
higher than the concentrations that we used here on viable cells (9). The dissociation of the upper and
lowest layers on day 29 required a higher EDTA concentration (40 mM) and a longer treatment time
(40 minutes). After this intense EDTA treatment, collagenase I dissociated and detached all the cells
from the dish, probably because EDTA weakened the bonds between the lowest layer and the bottom
of the dish due to the chelation of the Ca2+ necessary to keep the cells attached to the culture substrate.
Differences between upper and lowest layers
The upper and lowest layers were characterized by cluster of differentiation (CD) expression and by
Ca2+ oscillations. The MSCs express the CD105, CD90 and CD44 when they are multipotent (30, 31). As
the cells progress in the differentiation process, they lose the multipotency markers compared to the
control cells. The two types of layers showed no difference in losing the CD105 expression but showed
a difference in the CD90 and CD44 evolution. This observation reveals that the cells in the two layers
are not identical. Since decrease was probably faster in the cells of the upper layer, these latter could
be considered as more differentiated than the cells of the lowest layer. The determination of the
number of spontaneous Ca2+ oscillations during a given period of time confirmed previous results
showing that the frequency of Ca2+ oscillations decreases progressively when MSCs undergo the
osteogenic differentiation (32). It also revealed, again, that cells of the two layers behave differently.
On day 8 of osteodifferentiation, the Ca2+ oscillations frequency was lower in the lowest layer than the
upper layers which could indicate that the cells of the lowest layer could differentiate faster than the
cells of the upper layer. However, no significant difference was observed on days 15 and 22.
To further investigate the osteogenic potential of the two layer types, cells from the upper layers and
cells from the lowest one were taken at day 15 and separately put again in the osteogenic medium at
the same confluency as at day 1 of osteodifferentiation. Cell growth resumed and after 2 weeks, cells
had formed again multilayers as well as Ca2+ deposits. The Ca2+ deposits were more extensive in the
cells from the upper layers. Moreover, cells originated from lowest layer proliferated more extensively
than the cells originated from the upper layers. Three conclusions can be drawn from this experiment:
the first one is that the cells, even on day 15, could proliferate again provide they are separated and
cultured again. It is true that they did not form 4 layers as in the first two weeks of osteodifferentiation
but they still formed 2 to 3 layers of cells, repetitively. On the contrary, if the layers had remained
together, they would have stopped proliferation at day 15 (Fig. 3). The second conclusion is that this
experiment confirmed our previous observations showing that the two cell layer types are different. It
seems that the upper layers are slightly more differentiated than the lowest one. Indeed, the former

164
cells proliferated less than the cells originated from the lowest layer and they produced more Ca2+
deposits after two more weeks. Finally, the very important role of the osteogenic extracellular matrix
is confirmed. As mentioned before, osteoblasts must be in contact with such a matrix to differentiate
(4, 13, 33). When cells were dissociated and separated from the extracellular matrix as in our case, the
cells presented again an ability to proliferate.
In conclusion, we show that MSC undergoing osteogenic differentiation form several layers.
Collagenase I was used to dissociate the cells of the upper layers which gives access to a lowest
attached layer sensitive to trypsin. The collagenase-sensitive upper layers and the trypsin-sensitive
lowest layer showed differences in the expression of the MSC CDs. The characterization of these two
types of layers that are not identical constitutes a new observation in osteogenic differentiation which
offers new possibilities in the control of the number, the quality and the time to produce terminally
differentiated osteoblasts. We can suggest that the investigators could indeed, on the one hand,
dissociate the upper layers by collagenase I on day 15, expand them and use them rapidly (in 15 days)
as terminally differentiated osteoblasts, and on the other hand, treat by trypsin the lowest layer, put
the cells again in culture to keep them in proliferation, to dissociate them later, to continue the cycle
of the production of differentiated osteoblast in only two weeks (instead of four) from a pool of rapidly
growing cells in the middle of the differentiation process. This cycle should favor both the production
of differentiated osteoblasts and the maintenance of a stock of cells undergoing the differentiation
facilitating the application of these cells and spreading their uses.
References
1. Friedenstein, A. J., Petrakova, K. V., Kurolesova, A. I., and Frolova, G. P. (1968) Heterotopic of
bone marrow. Analysis of precursor cells for osteogenic and hematopoietic tissues.
Transplantation 6, 230–247
2. Friedenstein, A. J., Chailakhjan, R. K., and Lalykina, K. S. (1970) The development of fibroblast
colonies in monolayer cultures of guinea-pig bone marrow and spleen cells. Cell Tissue Kinet.
3, 393–403
3. Quarles, L. D., Yohay, D. A., Lever, L. W., Caton, R., and Wenstrup, R. J. (1992) Distinct
proliferative and differentiated stages of murine MC3T3-E1 cells in culture: an in vitro model
of osteoblast development. J. Bone Miner. Res. Off. J. Am. Soc. Bone Miner. Res. 7, 683–692
4. El-Amin, S. F., Lu, H. H., Khan, Y., Burems, J., Mitchell, J., Tuan, R. S., and Laurencin, C. T. (2003)
Extracellular matrix production by human osteoblasts cultured on biodegradable polymers
applicable for tissue engineering. Biomaterials 24, 1213–1221
5. Vater, C., Kasten, P., and Stiehler, M. (2011) Culture media for the differentiation of
mesenchymal stromal cells. Acta Biomater. 7, 463–477
6. Aksu, A. E., Rubin, J. P., Dudas, J. R., and Marra, K. G. (2008) Role of gender and anatomical
region on induction of osteogenic differentiation of human adipose-derived stem cells. Ann.
Plast. Surg. 60, 306–322

165
7. Langenbach, F. and Handschel, J. (2013) Effects of dexamethasone, ascorbic acid and β-
glycerophosphate on the osteogenic differentiation of stem cells in vitro. Stem Cell Res. Ther.
4, 117
8. Granéli, C., Thorfve, A., Ruetschi, U., Brisby, H., Thomsen, P., Lindahl, A., and Karlsson, C. (2014)
Novel markers of osteogenic and adipogenic differentiation of human bone marrow stromal
cells identified using a quantitative proteomics approach. Stem Cell Res. 12, 153–165
9. Owen, T. A., Aronow, M., Shalhoub, V., Barone, L. M., Wilming, L., Tassinari, M. S., Kennedy,
M. B., Pockwinse, S., Lian, J. B., and Stein, G. S. (1990) Progressive development of the rat
osteoblast phenotype in vitro: reciprocal relationships in expression of genes associated with
osteoblast proliferation and differentiation during formation of the bone extracellular matrix.
J. Cell. Physiol. 143, 420–430
10. Zhu, M., Kohan, E., Bradley, J., Hedrick, M., Benhaim, P., and Zuk, P. (2009) The effect of age
on osteogenic, adipogenic and proliferative potential of female adipose-derived stem cells. J.
Tissue Eng. Regen. Med. 3, 290–301
11. Friedman, M. S., Long, M. W., and Hankenson, K. D. (2006) Osteogenic differentiation of
human mesenchymal stem cells is regulated by bone morphogenetic protein-6. J. Cell.
Biochem. 98, 538–554
12. Song, I.-H., Caplan, A. I., and Dennis, J. E. (2009) In vitro dexamethasone pretreatment
enhances bone formation of human mesenchymal stem cells in vivo. J. Orthop. Res. Off. Publ.
Orthop. Res. Soc. 27, 916–921
13. Kundu, A. K., Khatiwala, C. B., and Putnam, A. J. (2009) Extracellular matrix remodeling, integrin
expression, and downstream signaling pathways influence the osteogenic differentiation of
mesenchymal stem cells on poly(lactide-co-glycolide) substrates. Tissue Eng. Part A 15, 273–
283
14. Jaiswal, N., Haynesworth, S. E., Caplan, A. I., and Bruder, S. P. (1997) Osteogenic differentiation
of purified, culture-expanded human mesenchymal stem cells in vitro. J. Cell. Biochem. 64,
295–312
15. Birmingham, E., Niebur, G. L., McHugh, P. E., Shaw, G., Barry, F. P., and McNamara, L. M. (2012)
Osteogenic differentiation of mesenchymal stem cells is regulated by osteocyte and osteoblast
cells in a simplified bone niche. Eur. Cell. Mater. 23, 13–27
16. Fromigué, O., Marie, P. J., and Lomri, A. (1997) Differential effects of transforming growth
factor beta2, dexamethasone and 1,25-dihydroxyvitamin D on human bone marrow stromal
cells. Cytokine 9, 613–623
17. Kim, I. S., Song, J. K., Song, Y. M., Cho, T. H., Lee, T. H., Lim, S. S., Kim, S. J., and Hwang, S. J.
(2009) Novel effect of biphasic electric current on in vitro osteogenesis and cytokine
production in human mesenchymal stromal cells. Tissue Eng. Part A 15, 2411–2422
18. Tada, H., Nemoto, E., Foster, B. L., Somerman, M. J., and Shimauchi, H. (2011) Phosphate
increases bone morphogenetic protein-2 expression through cAMP-dependent protein kinase
and ERK1/2 pathways in human dental pulp cells. Bone 48, 1409–1416
19. Huang, Z., Nelson, E. R., Smith, R. L., and Goodman, S. B. (2007) The sequential expression
profiles of growth factors from osteoprogenitors [correction of osteroprogenitors] to
osteoblasts in vitro. Tissue Eng. 13, 2311–2320
20. Li, Y. J., Batra, N. N., You, L., Meier, S. C., Coe, I. A., Yellowley, C. E., and Jacobs, C. R. (2004)
Oscillatory fluid flow affects human marrow stromal cell proliferation and differentiation. J.
Orthop. Res. Off. Publ. Orthop. Res. Soc. 22, 1283–1289

166
21. Bruder, S. P., Jaiswal, N., and Haynesworth, S. E. (1997) Growth kinetics, self-renewal, and the
osteogenic potential of purified human mesenchymal stem cells during extensive
subcultivation and following cryopreservation. J. Cell. Biochem. 64, 278–294
22. George, J., Kuboki, Y., and Miyata, T. (2006) Differentiation of mesenchymal stem cells into
osteoblasts on honeycomb collagen scaffolds. Biotechnol. Bioeng. 95, 404–411
23. Rickard, D. J., Sullivan, T. A., Shenker, B. J., Leboy, P. S., and Kazhdan, I. (1994) Induction of
rapid osteoblast differentiation in rat bone marrow stromal cell cultures by dexamethasone
and BMP-2. Dev. Biol. 161, 218–228
24. Goh, T. K.-P., Zhang, Z.-Y., Chen, A. K.-L., Reuveny, S., Choolani, M., Chan, J. K. Y., and Oh, S. K.-
W. (2013) Microcarrier culture for efficient expansion and osteogenic differentiation of human
fetal mesenchymal stem cells. BioResearch Open Access 2, 84–97
25. Castrén, E., Sillat, T., Oja, S., Noro, A., Laitinen, A., Konttinen, Y. T., Lehenkari, P., Hukkanen,
M., and Korhonen, M. (2015) Osteogenic differentiation of mesenchymal stromal cells in two-
dimensional and three-dimensional cultures without animal serum. Stem Cell Res. Ther. 6, 167
26. Liew, A., André, F. M., Lesueur, L. L., De Ménorval, M.-A., O’Brien, T., and Mir, L. M. (2013)
Robust, efficient, and practical electrogene transfer method for human mesenchymal stem
cells using square electric pulses. Hum. Gene Ther. Methods 24, 289–297
27. Bakker, A. D. and Klein-Nulend, J. (2012) Osteoblast isolation from murine calvaria and long
bones. Methods Mol. Biol. Clifton NJ 816, 19–29
28. Taylor, S. E. B., Shah, M., and Orriss, I. R. (2014) Generation of rodent and human osteoblasts.
BoneKEy Rep. 3
29. Franceschi, R. T., Iyer, B. S., and Cui, Y. (1994) Effects of ascorbic acid on collagen matrix
formation and osteoblast differentiation in murine MC3T3-E1 cells. J. Bone Miner. Res. Off. J.
Am. Soc. Bone Miner. Res. 9, 843–854
30. Lindroos, B., Suuronen, R., and Miettinen, S. (2011) The potential of adipose stem cells in
regenerative medicine. Stem Cell Rev. 7, 269–291
31. Ullah, I., Subbarao, R. B., and Rho, G. J. (2015) Human mesenchymal stem cells - current trends
and future prospective. Biosci. Rep. 35
32. Titushkin, I., Sun, S., Shin, J., and Cho, M. (2010) Physicochemical Control of Adult Stem Cell
Differentiation: Shedding Light on Potential Molecular Mechanisms. BioMed Res. Int. 2010,
e743476
33. Xiao, J., Liang, D., Zhao, H., Liu, Y., Zhang, H., Lu, X., Liu, Y., Li, J., Peng, L., and Chen, Y.-H. (2010)
2-Aminoethoxydiphenyl borate, a inositol 1,4,5-triphosphate receptor inhibitor, prevents
atrial fibrillation. Exp. Biol. Med. Maywood NJ 235, 862–868
Author contributions:
Hanna Hanna, Franck M. Andre and Lluis M. Mir designed research, analysed data and wrote the paper;
Hanna Hanna: performed research.

167
Acknowledgements
This work has been supported by CNRS, Gustave Roussy, Université Paris XI, Paris-Saclay, the ITMO
Cancer and INSERM in the frame of the Plan Cancer 2015-2019 (project PC201517) and the Fondation
EDF. The research was also conducted in the scope of the EBAM European Associated Laboratory (LEA)
and of the COST action BM 1309 EMF-MED. Authors would like to thank Dr. Bassim Al Sakere for the
lipoaspirates, and Sophie Salomé, from the PFIC of Gustave Roussy, for her precious help in acquiring
the multilayers stacks under the confocal microscope.
Figures:
Figure 1. Morphological aspects of the cells. A: control haMSCs after three days of culture, B, C and D:
haMSCs undergoing respectively osteogenic (day 29), adipogenic (day 15) and neurogenic (day 5)
differentiation. The calibration bars correspond to 100 µm.

168
Figure 2. Characterization of the differentiated cells. A and B: osteogenic differentiation, C and D:
adipogenic differentiation, E and F: neurogenic differentiation. A: alizarin red staining, B: alkaline
phosphatase activity, C: labeling with FABP4 antibody, D: bodipy staining, E: cresyl violet staining, F:
labeling with MAP2 antibody and Hoechst. In all pairs of photos, the right one is the control
(undifferentiated) MSC. The calibration bars correspond to 100 µm.
Figure 3. Evolution of the cell number between day 1 and day 29 in the different groups of cells.

169
Figure 4. The different layers of an osteogenic differentiation day 22, stained with Hoechst and
fluorescein diacetate. A: first layer (the layer in contact with the coverslide), B, C and D: second, third
and fourth layer respectively. The grids to the right and below every photo represent the Z axis. The
calibration bars correspond to 50 µm.

170
Figure 5. The different layers of an adipogenic (A and B) and neurogenic (C) differentiation day 22,
stained with Hoechst and fluorescein diacetate. A: first layer (the layer in contact with the microslide),
B: second layer. The grids to the right and below every photo represent the Z axis. The calibration bars
correspond to 50 µm.
Figure 6. The action of collagenase I and EDTA on the osteogenic layers. A: the observation of the cells
before (left) and after (right) the action of the collagenase I (2 mg/ml) on day 15 of osteodifferentiation.
B: The Ca2+ deposits before (left) and after (right) the action of 40 mM of EDTA on day 29 of
osteodifferentiation. The calibration bars correspond to 100 µm.

171
Figure 7. Immunostaining of the upper and lowest layers in an osteogenic differentiation. Coll: the
upper layers dissociated with collagenase I; tryps: the lowest layer trypsinisated.

172
Nu
mb
er o
f C
a2
+ o
sc
illa
tio
ns
pe
r 3
0 m
in
M S C s D a y 8 D a y 1 5 D a y 2 2
0
1 0
2 0
3 0
4 0U p p e r la y e rs (c o lla g e n a s e I t re a te d )
L o w e s t la y e r ( try p s in tre a te d )
C o n tro l
* * * *
* *
O s te o d if fe r e n tia t io n
Figure 8. Comparison of the number of Ca2+ oscillations between upper and lowest layers on different
days of an osteogenic differentiation. MSC controls have significantly more Ca2+ oscillations than the
differentiated layers (****, p < 0.0001, one-way Anova with Dunnett's multiple comparisons test). At
day 8 the Ca2+ oscillations were significantly lower in number in the lowest layer than in the upper
layers (**, p < 0.01, p = 0. 0038, two-way ANOVA with Sidak's multiple comparisons test). The whiskers
represent the 95th and the 5th percentile.
Figure 9. Cells from lowest (A) and upper (B) layers dissociated on day 15 and put in an osteogenic
medium for 2 weeks. The black spots are the Ca2+ deposits. The calibration bars correspond to 100 µm.

173
Supplementary figure:
Figure 1. Cells growth in osteodifferentiation medium for three consecutive periods of 15 days. Culture
dishes were seeded always with the same number of cells at day 1 and cells were counted after 15
days of culture. Growth is reported as the increase fold in the number of the cells at day 15. HaMSCs
were put in cultured in osteodifferentiation medium for the “first differentiation”. After 15 days, the
upper layers (U1) and the lowest layer (L1) were counted and seeded separately in osteodifferentiation
medium (“second differentiation”). After 15 more days, the upper layers (U2 from U1 and U2 from L1)
and the lowest layer (U2 from L1 and U2 from L1) were counted and seeded separately in
osteodifferentiation medium (“third differentiation”). After 15 days, all the cells were counted for each
condition that is U2(U1), L2(U1), U2(L1) and L2(L1). Each condition was counted three times in three
independent repeats. Diff: differentiation.

174

175
4 SUPPLEMENTARY DATA

176
4.1 EFFECT OF A ONE 100 µS PULSE APPLIED ONCE A DAY ON THE
OSTEODIFFERENTIATION OF HUMAN-ADIPOSE MESENCHYMAL STEM CELLS
I. Introduction
In the first part of this thesis, we assessed the effect of 100 µs pulse on the plasma membrane
(PM) and the endoplasmic reticulum (ER) membranes of DC-3F cells and the human-adipose
mesenchymal stem cells (haMSC). In the second part, we used the same pulse to induce cytosolic Ca2+
spikes in haMSC, and to see the effect of the pulse on the spontaneous Ca2+ oscillations in these latters.
As shown, the 100 µs pulse had different effects on the Ca2+ oscillations according to the electric field
amplitude. In this last part of the thesis, we decided to apply the same type of pulses used before on
haMSC undergoing osteogenic differentiation. The purpose was to combine the classical chemical
factors used to induce an osteogenic differentiation with the delivery of 100 µs pulses (a physical
factor) and to evaluate the effect of the pulses on the speed of differentiation. Since 100 µs pulses can
create cytosolic Ca2+ spikes from different origins (the PM or the PM and the ER), and since they can
control the Ca2+ oscillations in haMSC, it would be useful to use them with haMSC undergoing a
differentiation. The team of Shan Sun (Sun et al. 2007) showed that the Ca2+ oscillations frequency
decreased in MSCs undergoing an osteogenic differentiation. The final goal was to assess if, by
controlling the Ca2+ oscillations frequency, and the PM permeability to the osteogenic factors, 100 µs
pulses could control an osteogenic differentiation.
II. Hypothesis
Two larges effects of the 100 µs electric pulses could be expected:
1- The control of the Ca2+ oscillations: we chose two different electric field amplitudes: 300 and
600 V/cm, because we reported in the second part of the thesis (article n˚ 2) that a pulse of
300 V/cm was able to induce additional oscillation(s) to the existing oscillations in nearly all
the haMSC cells, and that a pulse of 600 V/cm induced a Ca2+ spike that inhibited the normal
oscillations for some minutes. Hence, we intended to study the effect on MSCs differentiation
of these two different outcomes on Ca2+ oscillations.
2- The enhancement of osteogenic factors entry into the cells: As shown in fig. 1A, the
osteogenic factors have a molecular weight smaller than the Yo-pro 1 iodide. Hence, if the cells
were permeabilized to Yo-pro 1 iodide, they should also be permeabilized to the osteogenic
factors. Fig. 1B shows that, with 300 V/cm in MEM α (conductive medium), there was a very
little permeabilization to Yo-Pro 1. However, in a non-conductive medium such as STM, there
was a little permeabilization at 300 V/cm and an obvious permeabilization at 600 V/cm.
However it must be noted that dexamethasone (Dex) is a glucocorticoid steroid. Hence, it
diffuses freely across the PM and has intracellular receptors. Ascorbic acid (Asc) enters the
cells through the glucose transporters GLUT1. The glycerol-2-phosphate (G2P) plays a role at
the outside of the cell since it provides the phosphate necessary for the mineralization. So, Dex
and Asc can normally enter in the cells and G2P does not need to enter. The role of the electric

177
pulse could be just to enhance the entry of these factors in the cells, with probably very limited
effects.
Glycerol-2-phosphate
216 Da
Dexamethasone
392 DaAscorbic acid
176 Da
Yo-pro-1-iodide
620 Da > Osteogenic factors
A
B
Figure 1. A: the relative size of Yo-pro 1 iodide and the osteogenic factors. B: FACS results on the
permeabilization to Yo-pro 1 iodide according to the medium and the electric field amplitude
III. Limitations
The experimental design and the pulse conditions came after initial tests with the electrodes
that could be used with the µsPEFs generators available in our laboratory. The electrode used to deliver
the pulse was finally a Petri PulserTM (BTX, UK) (Fig.2). It is composed of several gold plated electrodes
distant of 2 mm. The electric pulse was delivered by a CliniporatorTM (Igea, Carpi, Italy).

178
Figure 2. The Petri pulser TM
The Petri pulser TM electrode has advantages and inconvenient.
Advantages:
- It is designed to fit into every single well of a 6 well plate or into individual 35 mm Petri dish
(surface of 10 cm2).
- The thin electrodes composing the Petri pulser TM are designed to cover all the surface area of
the well.
Drawbacks:
- It could be used with 830 µl maximum of conductive medium and a maximum of 300 V/cm
could be delivered, otherwise, the Cliniporator is saturated in the electric current (12 A).
- With a conductive medium, an electric current limitation (due to the pulse generator
characteristics) occurred when a pulse of only 300 V/cm is delivered and with a volume of 830
µl (the normal volume to culture the cells in a 10 cm2 dish/well is usually 2 ml). This is why we
were limited by the electric field amplitude and medium volume when a conductive medium
was to be used.
For the delivery of pulses of higher field amplitudes, non-conductive medium (containing or not Ca2+)
was used. The non-conductive medium used was the STM, composed of 250 mM sucrose, 10 mM of
Tris-HCl and 1 mM MgCl2. It has a conductivity of 0.1 S/m and an osmolarity of 287 mOsmol/Kg. The
conductive medium was the MEMα (the normal medium of the cells) which has a conductivity of 1.5
S/m and an osmolarity of 330 mOsmol/Kg.
IV. Experimental design
haMSCs were grown in 6 well plates and let to attain 90-100% confluence. Then the osteogenic
medium was added. This medium change corresponds to day 1 of differentiation. Every day (from day
1 to day 29), the osteogenic medium was removed and 830 µl of pulsing medium was added to the
cells in order to apply one single electric pulse. The pulsing medium was either MEMα (conductive
medium) or STM (non-conductive medium without Ca2+) or STM+CaCl2 (non-conductive medium with
1.8 mM of Ca2+). All the pulsing media contained the classical concentrations of osteogenic factors (100
nM Dex, 200 µM Asc and 10 mM G2P). One pulse of 100 μs was delivered by a CliniporatorTM (Igea,
Carpi, Italy). After the pulse delivery, the pulsing medium was left for 30 min, after which it was
removed and replaced by 2 ml of MEMα with the osteogenic factors. Fig. 3 shows the different
conditions of pulse and medium; 830 µl of the pulsing medium was also added to the control but no
pulse was delivered (sham treated).

179
Figure 3. Experiment design; pulsing media and electric field conditions.
In the next section STM + CaCl2 will be referred as STM+Ca2+ or STM+CaCl2 or STM-CaCl2. When a pulse
was applied, it is referred with the name of the pulse medium and the field amplitude, for example:
STM-Ca 600 means a pulse of 600 V/cm in STM+ CaCl2, STM 300 means a pulse of 300 V/cm applied in
STM.

180
V. Results
Cell counting
The cell number was determined in the same manner as in article 3.
Figure 4. Evolution of the cell number during the different conditions. Data are represented as means
and standard deviations of three different counting for every condition. Standard: haMSCs
undergoing a normal differentiation with medium change twice a week.
Alkaline phosphatase assay and Alizarin Red staining
For internal ALP activity measurement (the cytoplasmic ALP), refer to article 3. To measure the
external ALP activity (that is the ALP located on the cell membrane), medium was discarded and cells
were washed with PBS and fixed with ethanol 95% for 10 minutes. After washing 3 times with PBS, a
BCIP/NBT solution was added (Sigma Aldrich) (1ml for 4 cm2) and cells were put for 10 minutes at 37˚C.
After discarding the solution, cells were washed 3 times with sterile water (protected from light) and
observed under a microscope.
Prior to Alizarin Red S staining, cells were washed in PBS and fixed in 95% methanol for 10 min.2%
Alizarin Red S solution was added for 5 min, then rinsed with water. To quantify the alizarin red
staining, 1ml of 10% cetylperidinium chloride (Sigma Aldrich) was added to each well, and cells were

181
incubated for 20 min to elute the stain. After that, 100 μl of the eluted stain were put in a 96 well plate
and read on the spectrophotometer at 570 nm.
Figure 5. The evolution of internal ALP activity. Data are represented as means and standard
deviations of three different values for every condition.

182
S T M
S T M + C a C l2
M E M
C tr l 3 0 0
V /c m
6 0 0
V /c m
S T M
S T M + C a C l2
M E M
C tr l 3 0 0
V /c m
6 0 0
V /c m
D a y 8 D a y 1 5
D a y 2 2 D a y 2 9
M S C
Figure 6. External ALP staining.

183
Alizarin red staining
Figure 7. Alizarin red staining.
Cetylperidinuium Chloride

184
Figure 8. Quantification of the Ca2+ deposits after elution with cetylperidinium chloride.
Calcium oscillations visualization and analysis
For the methods, refer to article 3.
Nb
re
of
ca
lciu
m o
sc
illa
tio
ns
in 1
5 m
in
ME
M
ME
M 3
00
ST
M
ST
M 3
00
ST
M 6
00
ST
M-C
a
ST
M-C
a 3
00
ST
M-C
a 6
00
Std
dif
f
MS
C
0
5
1 0
1 5
2 0
2 5
D a y 8
D a y 1 5
D a y 2 2
D a y 2 9
M S C (c tr l)
Figure 9. Comparison of calcium oscillations number in 15 min between the different conditions.
Data are represented as means and standard deviations of at least 30 cells per condition. According
to two way Anova, the condition and the day have a significant effect (**** p < 0.0001).
VI. Discussion of the results
The evolution in the cell number during the different conditions of our experiment, except for
the standard differentiation, showed that the number of the cells continued to increase during the
differentiation process in all the conditions including those receiving or not a pulse (Fig. 4). In a
standard differentiation the number of cells increased during the first two weeks then it was stabilized
as it was reported also in article 3. The ALP is an osteodifferentiation marker and its expression increase

185
demonstrates that the MSCs are on the osteogenic route. A normal cycle of internal ALP activity
included an increase on day 8 and a peak on day 15, then a decrease as it was observed in the standard
differentiation (Fig. 5) and in other studies (Quarles et al. 1992, Birmingham et al. 2012, Frohbergh et
al. 2012). However in all the other conditions, the internal ALP activity continued to increase during all
the differentiation process. The cell number and the ALP activity had the same tendency: a tendency
to increase continuously during the differentiation in all the conditions where the medium was daily
changed, unlike the standard differentiation where the cell number was stabilized at the end of the
second week and the ALP activity reached its maximum.
As shown in figure 7, no Ca2+ deposit was observed even at day 29 of osteodifferentiation in
all the conditions where the medium was changed every day. The absence of Ca2+ deposits on cells
supposedly being differentiated in osteoblasts was not expected. However, in a standard
differentiation, the Ca2+ deposits were extremely high, as they should be normally at this level of
differentiation (Langenbach & Handschel 2013). These observations demonstrate that the medium
change every day probably prevented the Ca2+ deposits to occur. This was also corroborated in figure
7; the cells let in their osteogenic medium for 2 days without changing this medium (from day 20 to
day 22) exhibited Ca2+ deposits, and if they were left more days without medium change (from day 25
to day 29), even more Ca2+ deposits were observed. These mineralization problems can explain why
the cell number and the ALP activity increased during all the differentiation process when the medium
was changed every day; in a standard differentiation, when the Ca2+ deposits began to occur, the cell
number stopped increasing and the ALP reached its maximal value. When the medium was changed
every day (in order to apply the pulse, or not for the controls), the mineralization did not occur. This is
why the cell number and the ALP activity continued to increase. During a normal osteogenic
differentiation, the cells undergo first an extensive proliferation followed by the differentiation (Huang
et al. 2007), and the ALP reaches an initial peak followed by a subsequent decrease (Aubin 2001, Huang
et al. 2007). The more the ALP peak occurs rapidly, the more the differentiation is fast (Birmingham et
al. 2012). Hence, in our conditions where the medium was changed every day, the differentiation was
delayed as demonstrated by the ALP cycle which did not reach its maximal value and did not start to
decrease.
However, even though the general observation was a delay in the differentiation under the
conditions where the medium was changed every day, there were further differences when an electric
pulse was applied daily. The application of an electric pulse in STM or STM-Ca induced a decrease in
the internal ALP activity (Fig. 5). At all the days, the intracellular ALP activity was lower when a pulse
of 600 V/cm was applied (except at day 29 in STM). When a pulse of 300 V/cm was applied daily, no
difference in the external ALP staining was observed compared to the control (Fig. 6). However, when
a 600 V/cm electric pulse was applied every day, the external ALP staining was lower at days 8, 15 and
22.
The medium change prevented the mineralization, therefore no analysis of the alizarin red
staining could be done in this case. To compare the Ca2+ deposits, we had to evaluate them when the
medium was not removed for two or four days (from day 20 to 22 and from day 25 to 29 respectively).
When the cells remained 2 days with the osteogenic medium, there were less Ca2+ deposits in STM
300, STM 600 and STM-Ca 600. The observations with 600 V/cm corroborated the results obtained in
internal and external ALP activity. The cetylperidinium chloride elution permitted to evaluate

186
quantitatively the Ca2+ deposits. As it can be seen in figure 8, when the medium was changed every
day, a very little absorbance was detected in all the conditions of STM and STM-Ca. However, the
absorbance was higher (reflecting higher mineralization) when the pulse medium was the MEM α. The
fact that medium was not changed daily allowed to observe more relevant differences between the
conditions. In STM and STM-Ca, when an electric pulse was applied, the mineralization was lower, and
the more the electric field was higher (600 V/cm), the more the mineralization was smaller. After 4
days without medium change, there were little differences between the conditions of each group.
However, in STM-Ca, there was always less mineralization when an electric pulse was applied. These
results corroborated the previous ones: the differentiation was delayed by the application of an
electric pulse and this is proportional to the electric field amplitude. Note that, when the pulse medium
did not contain Ca2+ (the STM medium), the mineralization was always lower than when the cells were
pulsed in a Ca2+ containing medium.
Even though there were significant differences between the conditions and the days, the Ca2+
oscillations did not contradict the previous results. When an electric pulse was applied, the Ca2+
oscillations were either higher than in the control or they were nearly equal, especially when a 600
V/cm electric pulse was applied.
VII. Conclusion
The first objective of this work was to study the effect of an electric pulse applied once a day
on the progress of an osteodifferentiation. Due to many limitations caused by the electrodes and the
generator and the obligation to change the medium every day, the results were not comparable to a
standard differentiation. However, there was an effect of the electric pulse on the retardation of the
differentiation, and the more the electric field amplitude was higher, the more the differentiation was
delayed. Even though this effect was different of what we were expecting when experiment was
designed, a 600 V/cm pulse for example could be used to delay a differentiation when the medium is
changed every day. This effect could be useful to keep the cells in a half differentiated state for, as long
as possible, and to obtain differentiated cells in 4 days only, just by keeping the osteogenic medium
without change.

187
4.2 EXAMPLES OF ELECTRO-INDUCED CALCIUM SPIKES AND SPONTANEOUS
CALCIUM OSCILLATIONS
The two different cell types used in the first part of the thesis (DC-3F and haMSCs) displayed
different shapes of electro-induced Ca2+ spikes in a medium with or without Ca2+. The Ca2+ oscillations
studied in the second and third part of the thesis showed also significant difference in shape and
frequency between pluripotent haMSCs, haMSCs undergoing different differentiations and primary
osteoblasts.
The aim of this part is to elucidate the different shapes of spontaneous Ca2+ oscillations and electro-
induced Ca2+ spikes.
A) Examples of electro-induced Ca2+ spikes:
In the shapes of the Ca2+ spikes presented below, the scales are not the same under the
different conditions, because the small spikes would not be observable using a single scale. The
medium containing Ca2+ was the DMEM without serum. In the absence of serum, the haMSCs rapidly
lose their Ca2+ oscillations. This is why the electro-induced Ca2+ spikes were mainly observed in DMEM
alone. In complete DMEM, the haMSCs presented the spontaneous Ca2+ oscillations normally for at
least 30 minutes (duration of the video recordings). In this medium, the oscillations were observed
either before or before and after the delivery of the electric pulse (depending on the electric field
amplitude). Under all the conditions, except for DC-3F in SMEM-EGTA, the higher the electric field
strength, the larger the duration, sharpness and amplitude of the Ca2+ spikes. On the contrary, when a
very high electric field was applied to DC-3F cells in SMEM-EGTA, the Ca2+ spikes were smaller due to
the leakage of fluo-4 from the large pores of the PM created by the electric field. At 3000 V/cm for
example, the fluorescence level of fluo-4 after the Ca2+ spike decreased below its basic level before the
pulse. The electro-induced Ca2+ spike amplitude was higher in the DC-3F cells than in the haMSCs
because there is a limitation in the fluo-4 content in the latter (already reported in article 1). Moreover,
the Ca2+ spike was longer in the DC-3F cells, either in DMEM or in SMEM-EGTA, probably because the
DC-3F cells do not have the same Ca2+ machinery as the haMSCs. DC-3F cells do not have Ca2+
oscillations and therefore do not possess the powerful Ca2+ pumps that are found in haMSCs, and that
serve to rapidly restore the normal Ca2+ level in the cytoplasm after Ca2+ concentration increased
during the spontaneous Ca2+ oscillation.

188
3 0 0 V /c m 4 5 0 V /c m
6 0 0 V /c m 1 0 0 0 V /c m
h a M S C in D M E M
7 5 0 V /c m 1 0 0 0 V /c m
1 6 0 0 V /c m 2 0 0 0 V /c m
h a M S C in S M E M -E G T A

189
3 0 0 V /c m 4 5 0 V /c m
6 0 0 V /c m 9 0 0 V /c m
D C -3 F in a D M E M
2 5 0 0 V /c m 2 7 5 0 V /c m
3 0 0 0 V /c m 3 5 0 0 V /c m
D C -3 F in S M E M -E G T A

190
T im e (s ) T im e (s )
Flu
ore
sc
ne
ce
in
ten
sit
y (
a.u
)
Flu
ore
sc
ne
ce
in
ten
sit
y (
a.u
)
h a M S C s s p o n ta n e o u s o s c il la t io n s in c o m p le te D M E M .
1 0 0 µ s e le c tr ic p u ls e d e liv e r e d a t t = 3 9 0 s
T im e (s ) T im e (s )
Flu
ore
sc
ne
ce
in
ten
sit
y (
a.u
)
Flu
ore
sc
ne
ce
in
ten
sit
y (
a.u
)
B) Examples of spontaneous Ca2+ oscillations:
The graphs here below represent typical Ca2+ oscillations in different cells. Examples from
haMSCs, haMSCs undergoing osteo, adipo or neurodifferentiation and primary osteoblasts are given.
The scales are the same for all the conditions, except for the neuronal cells which had oscillations of
high amplitude. The average number of Ca2+ oscillations per 30 minutes is also reported in the titles of
the graphs.
Note that, when the haMSCs underwent a neuronal differentiation, they do not display
independent and frequent Ca2+oscillations. Actually, they display a wave propagating from cell to cell.
In most of cases, this intercellular Ca2+ wave was observed only once in a period of 30 minutes for each
well. This wave seemed to start in one or two cells (in comparison with cardiac Ca2+waves, we might
call them “batteries” because they initiate from their own) and propagated to the entire population.
Hence, every cell presented only one single oscillation or a maximum of two in the 30 minutes
observation period, and in this last case, the second oscillation had lower amplitude than the first one.
When haMSCs were in a pluripotent state and until day 15 of osteodifferentiation, each cell
displayed ordered Ca2+ oscillations. At day 29 of osteodifferentiation, the oscillations were less ordered
and started to resemble to those observed in primary osteoblasts. The Ca2+ oscillations frequency
decreased during the osteodifferentiation.
On the contrary, during adipodifferentiation, the oscillations frequency increased and the cells
presented less ordered oscillations.

191
T im e (s ) T im e (s )
Flu
ore
sc
ne
ce
in
ten
sit
y (
a.u
)
Flu
ore
sc
ne
ce
in
ten
sit
y (
a.u
)
P lu r ip o te n t h a M S C s (2 1 o s c illa t io n s /3 0 m in )
T im e (s ) T im e (s )
Flu
ore
sc
ne
ce
in
ten
sit
y (
a.u
)
Flu
ore
sc
ne
ce
in
ten
sit
y (
a.u
)
h a M S C s u n d e r g o in g o s te o d iffe r e n t ia t io n , d a y 1 5 (1 6 o s c illa t io n s /3 0 m in )
T im e (s ) T im e (s )
Flu
ore
sc
ne
ce
in
ten
sit
y (
a.u
)
Flu
ore
sc
ne
ce
in
ten
sit
y (
a.u
)
h a M S C s u n d e r g o in g o s te o d iffe r e n t ia t io n , d a y 2 9 (1 2 o s c illa t io n s /3 0 m in )
T im e (s ) T im e (s )
Flu
ore
sc
ne
ce
in
ten
sit
y (
a.u
)
Flu
ore
sc
ne
ce
in
ten
sit
y (
a.u
)
P r im a r y o s te o b la s ts (8 o s c illa t io n s /3 0 m in )

192
T im e (s ) T im e (s )
Flu
ore
sc
ne
ce
in
ten
sit
y (
a.u
)
Flu
ore
sc
ne
ce
in
ten
sit
y (
a.u
)
h a M S C s u n d e r g o in g a d ip o d iffe r e n t ia t io n , d a y 1 5 (2 5 o s c illa t io n s /3 0 m in )
T im e (s ) T im e (s )
Flu
ore
sc
ne
ce
in
ten
sit
y (
a.u
)
Flu
ore
sc
ne
ce
in
ten
sit
y (
a.u
)
h a M S C s u n d e r g o in g n e u r o d iffe r e n tia t io n , d a y 5 (1 .2 o s c il la t io n s /3 0 m in )

193
IV. DISCUSSION AND
PERSPECTIVES

194

195
This thesis aimed to study the generation, control and consequences of electro-induced calcium
(Ca2+) spikes in the cells by using 100 µs pulses. A one 100 µs pulse was chosen because one pulse
allows us to avoid the study of the repetition frequency of the pulses. Moreover, 100 µs is a classical
pulse duration used in many electroporation applications in vitro and in vivo. In the first part of the
thesis, we aimed to study the interaction of the 100 µs pulse with the PM and ER of two cell lines: the
DC-3F cells and the human-adipose mesenchymal stem cells (haMSC). The DC-3F cells are a hamster
cell line whereas the hAMSC are human primary cells. Moreover, the DC-3F cells are small cells
whereas the haMSC are large ones. The origin and size difference was important for us in order to have
two models of cells and to study the interaction of the electric field with their PM and ER. First, we
hypothesized that even with µsPEF, there is an intracellular electric field that is permitted to flow after
the electroporation of the PM and that this field could be intense enough to permeabilize the cell
organelles. Interestingly, two theoretical studies of Weaver et al. showed that in silico it is possible to
permeabilize the cell organelles using µsPEF (Esser et al. 2010, Weaver et al. 2012). However, no
experimental study had demonstrated this effect. Thus, this was a first track to discover in the first
part of the thesis and to demonstrate such an effect experimentally on living cells. The results obtained
confirmed our expectations. The electro-induced Ca2+ spikes in the haMSCs and DC-3F cells in a
medium without Ca2+ demonstrated that these spikes were originated from the Ca2+ inner stores of
the cells. We also assessed the PM and ER permeabilization thresholds in the two cell types. The
difference in ER architecture and distribution leaded to different proportionalities between the two
cell types. This first study of the thesis presents an importance on 2 levels: electrically and biologically.
Electrically, the demonstration of the permeabilization of inner cellular membranes by µsPEFs was
identified for the first time experimentally. This achievement allows the use of this technology by a
large number of laboratories for the manipulation of not only the PM but also the organelles
membranes. Biologically, the creation of Ca2+ spikes in the cell is a very interesting way to study the
effect of the Ca2+ in many cellular functions. The µsPEFs present a powerful tool to modulate the Ca2+
level in the cell. Since a large number of laboratories are equipped with the µsPEF technology but not
with the nsPEF one, which is more expensive and sophisticated, these laboratories are no more limited
in their applications on the cells because they can use the µsPEF technology to manipulate the PM and
organelles membranes permeability. Depending on the electric field amplitude and the medium used,
the investigator can choose the Ca2+ spike amplitude to impose to the cell, and the origin of the Ca2+
spike (the extracellular medium or the ER or both). Since the Ca2+ constitutes a universal mode of
signaling and it is implicated in nearly every cellular process, the µsPEFs can be used to control key
functions in the cell such as proliferation, differentiation, senescence and apoptosis by controlling Ca2+
levels in a receptor-independent manner .
We used, in this first part of the thesis one electric pulse of 100 µs and two different cell types.
Further investigations of the µsPEF interaction with the organelles membranes could be done on other
cell types and by using many pulses or by modulating the electric field intensity, the pulse duration,
the number of pulses and their repetition frequency. The optimal combination of electric pulse
parameters is to be determined by the investigator depending on the cell type to be used, in order to
obtain optimal efficiency outcomes with minimal cell viability loss. The ER imaging and the calculation
of its dimensions with the cell diameter is of primordial importance to set the right electric parameters
and to understand the results. In our case, the decorating of the ER and the segmentation of the images
to reconstruct the ER geometry revealed large differences between the two cell types and
demonstrated a collective electrical behavior of the ER.

196
In the second part of the thesis, we decided to use the same 100 µs pulse on the haMSC to see
whether this pulse can control the Ca2+ oscillations in the latter. The first part permitted to have an
idea on the origin of the Ca2+ spike (whereas an entry from the external medium or an entry from the
external medium and a release from the ER) according to the electric field amplitude. The Ca2+ is a
universal mode of signaling, and it is implicated in many key cellular functions such as motility, vesicular
transport, proliferation, differentiation and apoptosis (Berridge et al. 2003). The Ca2+ oscillations in the
mesenchymal stem cells control the multipotency of these latters. The frequency of such oscillations
is interpretated by the cell by different transcription factors expression (De Koninck & Schulman 1998),
thus controlling the proliferation and the differentiation of the stem cells. The MSCs are very
interesting candidates for cell therapy and regenerative medicine. The differentiation of the MSCs have
been already performed in many laboratories in order to obtain a large palette of specialized cells such
as osteoblasts, adipocytes, myoblasts, chondrocytes or neuronal cells (Pittenger et al. 1999). Different
chemical factors formulas have been used for every differentiation. Few studies used the
electromagnetic fields alone or combined with the chemical factors to enhance a differentiation. The
electromagnetic fields that have been used include direct current of a very low electric field and a long
time exposition (Sun et al. 2007) or biphasic electric current (Kim et al. 2009a). These fields either alter
the membrane potential and activate VOCCs if they are large enough or do not alter the membrane
potential if the electric field is too low. None of the electromagnetic fields used in the bibliography was
permeabilizing the cell PM. The novelty of our study is the use of a pulsed electric field of a high
intensity capable to permeabilize the cells PM or both the PM and the ER. Indeed, there is a
contribution of the VOCCs due to the induced transmembrane potential, and of the SOCCs due to ER
Ca2+ release, and consequently an activation of the CICR process. The contribution of all these
mechanisms to the electroinduced Ca2+ spike varies depending on the electric field amplitude and
hence the number and diameter of the electropores and the relative increase of Ca++ concentration in
the cytoplasm. The Ca2+ spikes induced by a 100 µs pulse showed a high capacity to modulate the Ca2+
oscillations in the haMSC. The advantage of such a technique is that the investigator can choose the
electric field amplitude in order to obtain different outcomes: either add a further oscillation (thus
increasing the frequency) or inhibit the oscillations for a time proportional to the electric field
amplitude (thus decreasing their frequency), or impose to the cell Ca2+ oscillations of controlled
frequency by applying many 100 µs electric pulses.
The control of Ca2+ oscillations by a pulsed electric field can have large applications on many cell
types presenting or not Ca2+ oscillations. In polarized pancreatic acinar cells for example, an electric
pulse can control enzyme secretion or gene transcription by the creation of Ca2+ spikes of different
strength (Thorn et al. 1993, Lee et al. 1997). If the Ca2+ spike is small, it will be localized in specific
subcellular regions and activate digestive enzymes secretion, but if it is sufficiently large, it will spread
as a wave to the entire cell and controls other cell functions. An electro-induced Ca2+ spike in pancreatic
β cells could control ATP synthesis and insulin secretion (Tsuboi et al. 2003). Therefore, such an
application could present a hope to get larger insulin quantity by pancreatic cells in order to heal
diabetes. Another example is the T lymphocytes which present Ca2+ oscillations that play a crucial role
in the activation of these cells after an antigen binding to T-cell receptor (Lewis 2003). A µsPEF could
be used to activate T lymphocytes without an antigen binding and to induce their proliferation by
controlling their Ca2+ oscillations, which present an important application for active immunotherapy
(Perica et al. 2015). In cardiomyocytes, Ca2+ spikes can induce an action potential (Stuyvers et al. 2000),
thus a contraction. Hence, an electro-induced Ca2+ spike could control the cardiomyocytes excitation-

197
contraction frequency. Furthermore, by controlling the electric field amplitude (hence the amplitude
of the Ca2+ spike), the action potential propagation velocity could be controlled since the velocity of
Ca2+ waves in the heart depends on localized Ca2+ concentration (Kaneko et al. 2000). The excitation-
contraction control by an electric pulse can also be applied on skeletal muscle. In neurons, Ca2+
mediates synaptic transmission (Catterall & Few 2008). A pulsed electric field could be applied to cause
neurotransmitters secretion even without a physiological action potential.
All the interesting applications cited above can be applied in vitro as well as in vivo. The existence of a
variety of electrodes shapes, suitable for different organs makes this possible. From the plate and
needles electrodes (for the superficial organs and the skin) to expandable electrodes (for the brain),
endoscopes (intraluminal) and finger electrodes (for oral and anal cavities), the application of µsPEF in
order to control/heal disorders in vivo could be possible.
The µsPEF showed a high capacity to control the Ca2+ oscillations in the MSCs and could be a very
useful tool to control the MSCs differentiation route and level (since the control of intracellular Ca2+
levels and oscillations have an impact on cell proliferation and differentiation) or to modulate many
cellular functions related to the Ca2+ in different cell types. In the next part of the thesis, we aimed to
study the Ca2+ oscillations in haMSC undergoing osteo, adipo and neurodifferentiation to evaluate,
under our conditions, if there is a fingerprint of Ca2+ oscillations according to the differentiation type
and level. When we tried to dissociate the cells in osteodifferentiation, we found a difficulty to have
fully dissociated cells by using the trypsin only. Since the extracellular matrix in osteogenic
differentiation is known to be rich in collagen I (Franceschi & Iyer 1992, Vater et al. 2011a), we decided
to use the collagenase I in order to dissociate the cells. We observed, after the collagenase I action,
that a cell layer remained in the bottom of the dish. This remaining bottom layer was sensitive to
trypsin. Then, the characterization of the two types of cell layers (the upper layers – collagenase
sensistive, and the lower layer – trypsin sensitive) gave some differences in the stemness markers and
the Ca2+ oscillations. However, the cells of the two cell layers can be put separately in culture to give
terminally differentiated osteoblast. This observation was new in the osteogenic differentiation since
no other study had mentioned yet two types of layers. This new observation was worth to continue it
until the end. The presence of two cell layers type permits to use one cell layer to follow the
differentiation and another one to keep cells in differentiation in order to dissociate them later and
have again many layers. The use of a layer already kept in differentiation permits to obtain mature
osteoblasts in a reduced period of time.
Indeed, the time required for an osteogenic differentiation is normally long (one month) even
with an optimal concentration of the differentiation chemical factors. This time of MSC differentiation
could be a drawback for the cell therapy or the regenerative medicine because in these fields, a large
quantity of differentiated cells is needed in a short time. Many studies tried to combine a physical
factor with the classical chemical factors used for MSC differentiation in order to enhance the
differentiation and to obtain differentiated cells in less time. Such physical factors may be a mechanical
stimulation such as translational or rotational strain (Altman et al. 2002) or tensile strain (Ward et al.
2007), low intensity ultrasounds (Ebisawa et al. 2004), or an electromagnetic field (Sun et al. 2007).
Nearly all the studies that showed a positive effect of a mechanical factor alone or its combination with
chemical factors, demonstrated that there is an implication of the Ca2+ in the transduction of the
physical signal, by changes in the Ca2+ oscillations frequency (Jing et al. 2014), or through the activation
of voltage operated Ca2+ channels (VOCCs) and the increase of intracellular Ca2+ concentrations (Khatib
et al. 2004, Petecchia et al. 2015). The last part of the thesis was to combine the electric pulse, already

198
used to induce cytosolic Ca2+ spikes from different origins and to control the haMSC Ca2+ oscillations,
in haMSC undergoing an osteogenic differentiation. The purpose was to asses, whether by controlling
the Ca2+ oscillations frequency and the permeability of the PM to the osteogenic factors, one 100 µs
electric pulse can modulate an osteogenic differentiation. In the third part of the thesis, after the
observation of the presence of several cell layers in the osteogenic differentiation, we proposed a new
technique in order to obtain mature osteoblasts in 2 weeks instead of four. In this part, we tried to do
the same but in an electroporation-dependent manner. However, due to the electrodes used in order
to cover the whole cell surface of a dish (the Petri Pulser) we were limited by the electric field
amplitude and the volume of the medium because of an electric current limitation. This limitation
came from the generator used that delivers a maximum of 16 A in current. A second limitation of this
study was the time consumption. The investigator had to remove the medium of the cells every day,
replace it with a pulsing (non-conductive) medium, apply the pulse, then put back the osteogenic
medium half an hour later, and this for tens to hundreds of wells every day. This operation took a long
time and could be done only once a day by an investigator. Furthermore, the renewal of the medium
every day in order to apply the pulse prevented the mineralization to occur and resulted in the fact
that the cells continued to proliferate indefinitely. Due to all these limitations and to the lack of time,
the experiment was done only once. However, interesting conclusions were drawn from this last part,
even though the final purpose, which is the achievement of mature osteoblasts in a small period of
time, was not reached. For future experiments, an adapted generator should be used, especially in
term of electric current delivery. Secondly, the generator could be programmed to deliver a pulse (or
many) every hour (or for a period determined by the investigator) without changing the medium. By
this way, the mineralization could occur normally and the comparison of a standard differentiation
(where the medium is changed every 3-4 days) could be done with the differentiation receiving one
(or several) pulse(s) per day. The electric pulse could also be applied with a neurogenic or adipogenic
differentiation in order to study its effect on the evolution of these latter and the time to achieve
terminally differentiated cells. Finally, many combinations of pulses could be done on MSCs in their
stem state in order to see if a pulse (or a set of several pulses with precise frequency and amplitude)
can engage the MSCs in a route of differentiation or another.

199
V. DISCUSSION EN LANGUE
FRANÇAISE

200

201
Durant cette thèse, nous avons visé à étudier la production, le contrôle et les conséquences
de pics calciques électro-induits dans les cellules en utilisant une impulsion électrique de 100 µs. Une
impulsion de 100 µs a été choisie car l’étude d’une impulsion nous délivre de l'étude de la fréquence
des impulsions quand plusieurs impulsions seront délivrées, et de plus car 100 µs est une durée
classique utilisée dans de nombreuses applications liées à l’électroporation. Dans la première partie
de la thèse, nous avons cherché à étudier l'interaction d’une impulsion 100 µs avec la membrane
plasmique (MP) et le réticulum endoplasmique (RE) de deux types de cellules: les cellules DC-3F qui
sont des fibroblastes pulmonaires de hamster chinois, et les cellules souches mésenchymateuses
humaines issues du tissu adipeux (haMSCs). Les cellules DC-3F sont une lignée de cellules de hamster
chinois alors que les haMSCs sont des cellules primaires humaines. De plus, les cellules DC-3F sont des
cellules de petite taille alors que les haMSCs sont des cellules de grande taille. La différence d'origine
et de la taille était importante pour nous afin d'avoir deux modèles de cellules différents et d'étudier
l'interaction du champ électrique avec leur MP et leur RE. Tout d'abord, nous avons émis l'hypothèse
que, même avec les champs électriques pulsés microsecondes (μsPEFs), il existe un champ électrique
intracellulaire pendant l’application du pulse. Ce champ provient du champ externe, qui peut pénétrer
dans la cellule par suite de l'électroporation de la MP. Nous avons fait aussi l’hypothèse que ce champ
pourrait être suffisamment intense pour perméabiliser les organites cellulaires. Fait intéressant, deux
études théoriques de Weaver et al. ont montré que, in silico, il est possible de perméabiliser les
organites cellulaires en utilisant des μsPEFs (Esser et al. 2010, Weaver et al. 2012). Cependant, aucune
étude expérimentale n’a démontré cet effet. Ainsi, ce fut une première piste à découvrir dans la
première partie de la thèse et de démontrer un tel effet expérimentalement sur des cellules vivantes.
Les résultats obtenus ont confirmé nos attentes. Les pics calciques électro-induits dans les cellules
haMSCs et DC-3F dans un milieu externe sans calcium (Ca2+) démontrent que ces pics ont pour origine
le calcium libéré par la perméabilisation des organites cellulaires stockant le Ca2+ surtout le RE. Nous
avons également évalué les seuils de perméabilisation de la MP et des membranes du RE dans les deux
types cellulaires. La différence dans l'architecture et la distribution du RE a abouti à des
proportionnalités différentes entre les deux types de cellules. Cette première étude de la thèse
présente une importance sur deux niveaux: électriquement et biologiquement. Sur le plan électrique,
la démonstration de la perméabilisation des membranes cellulaires internes par les μsPEFs a ainsi été
identifiée pour la première fois expérimentalement au cours de cette thèse. Cette réalisation permet
l'utilisation de cette technologie par un grand nombre de laboratoires pour le but de manipuler, non
seulement la MP, mais aussi les organites cellulaires. Biologiquement, l’induction de pics calciques
dans la cellule est un moyen très intéressant d'étudier l'effet du Ca2+ dans de nombreuses fonctions
cellulaires. Les μsPEFs présentent un outil puissant pour moduler le Ca2+ au niveau de la cellule. Étant
donné qu'un grand nombre de laboratoires est équipé de la technologie microseconde (mais pas de la
technologie nanoseconde, car étant plus coûteuse et sophistiquée), ces laboratoires ne seront plus
limités dans leurs applications sur les cellules, et ils pourront utiliser la technologie μsPEFs pour
manipuler la perméabilité de la MP et les membranes internes. En fonction de l'amplitude du champ
électrique et du milieu utilisé (avec ou sans Ca2+), l'investigateur pourrait choisir l'amplitude du pic
calcique à imposer à la cellule, et l'origine de ce pic (le milieu extracellulaire ou bien le RE ou bien les
deux). Étant donné que le Ca2+ constitue un mode universel de signalisation et qu’il est impliqué dans
presque tous les processus cellulaires, les μsPEFs peuvent être utilisés pour contrôler des fonctions
principales dans la cellule telles que la prolifération, la différenciation, l'apoptose et la sénescence.
Nous avons utilisé dans cette première partie de la thèse une seule impulsion électrique de 100 µs et
deux différents types de cellules. D'autres études visant à étudier l'interaction des μsPEFs avec les

202
membranes des organelles pourraient être effectuées sur d'autres types cellulaires, et en utilisant
plusieurs pulses, ou en modulant l'intensité du champ électrique, la durée, le nombre et la fréquence
de répétition des impulsions. La combinaison optimale des paramètres d'impulsions électriques est à
déterminer par le manipulateur en fonction du type de cellule à utiliser, afin d'obtenir des résultats en
matière d'efficacité optimale et avec un minimum de perte de viabilité cellulaire. L'imagerie confocale
du RE et le calcul de ses dimensions avec le diamètre de la cellule est d'une importance primordiale
pour définir les bons paramètres électriques et pour comprendre les résultats. Dans notre cas, la
décoration du RE et la segmentation des images afin de reconstruire la géométrie du RE ont révélé de
grandes différences entre les deux types de cellules utilisées et ont démontré un comportement
électrique collectif du RE.
Dans la deuxième partie de la thèse, nous avons décidé d'utiliser la même impulsion de 100 µs
avec les haMSCs pour voir si cette impulsion pourrait contrôler les oscillations calciques spontanées
dans ces dernières. La première partie de la thèse a permis d'avoir une idée sur l'origine d’un pic
calcique (si c’est une entrée du Ca2+ du milieu extracellulaire ou bien une entrée du milieu extérieur et
un relargage du RE) selon l'amplitude du champ électrique. Les cellules souches mésenchymateuses
sont parmi les cellules souches les plus utilisées dans la thérapie cellulaire afin de restaurer la fonction
d’un tissu. Les oscillations calciques dans ces cellules contrôlent leur pluripotence et leur
différenciation. La fréquence de ces oscillations est interprétée par la cellule à travers l’expression de
différents facteurs de transcription (Koninck & Schulman 1998), contrôlant ainsi la prolifération et la
différenciation des cellules souches. La différenciation des cellules souches mésenchymateuses a déjà
été effectuée dans de nombreux laboratoires afin d'obtenir une large palette de cellules spécialisées
telles que les ostéoblastes, les adipocytes, les myoblastes, les chondrocytes ou les cellules neuronales
(Pittenger et al. 1999). Différents cocktails de facteurs chimiques sont utilisés dans chaque cas pour
induire la différentiation. Parfois, des facteurs physiques, comme les champs électromagnétiques, ont
été utilisés pour favoriser une différentiation. Les champs électromagnétiques utilisés étaient une
exposition de longue durée à un courant continu d'une amplitude de champ électrique très faible (Sun
et al. 2007) ou bien à un courant électrique biphasique (Kim et al. 2009a). Ces champs soit modifient
le potentiel de la membrane et activent les canaux Ca2+ voltage-dépendants (VOCCs) s’ils sont assez
élevés, ou bien ne modifient pas le potentiel membranaire dans le cas où le champ électrique est trop
faible. Aucun des champs électromagnétiques utilisés dans la bibliographie ne perméabilisait la MP. La
nouveauté de notre étude est l'utilisation d'un champ électrique pulsé d’une haute amplitude de
champ capable de perméabiliser la MP des cellules ou bien à la fois la PM et le RE. En effet, avec
l’impulsion qu’on utilise, il y a aussi une contribution des VOCCs en raison du potentiel
transmembranaire induit, et à cause de la libération du Ca2+ du RE, les canaux calciques dépendant des
stores internes (SOCCs) seront aussi activés. En raison de l’entrée massive du Ca2+ dans le cytosol, « la
libération du Ca2+ induite par le Ca2+ » (LCIC) est donc déclenchée. La contribution de tous ces
mécanismes au pic calcique induit par l’impulsion varie en fonction de l'amplitude du champ
électrique, et donc en fonction du nombre et du diamètre des parties perméabilisées de la membrane.
Les pics calciques induits par une impulsion de 100 µs ont montré une forte capacité à moduler les
oscillations calciques dans les haMSCs. L'avantage d'une telle technique est que l'investigateur pourrait
choisir l'amplitude du champ électrique afin d'obtenir des résultats différents: soit ajouter une
nouvelle oscillation (augmentant ainsi la fréquence des oscillations) ou inhiber les oscillations pendant
un temps d’autant plus long que l'amplitude du champ électrique est forte (diminuant ainsi leur

203
fréquence), ou bien d'imposer à la cellule des oscillations de fréquence controlée en utilisant plusieurs
impulsions de 100 µs.
Le contrôle des oscillations calciques spontanées par un champ électrique pulsé pourrait avoir
plusieurs applications sur de nombreux types cellulaires présentant ou non des oscillations calciques.
Dans les cellules acineuses polarisées du pancréas par exemple, une impulsion électrique permetterait
de contrôler la sécrétion d'enzymes ou la transcription de gènes par la création de pics calciques
d’amplitudes différentes (Thorn et al. 1993, Lee et al. 1997). Si le pic calcique est d’une faible
amplitude, il sera localisé dans des régions cellulaires spécifiques et activer la secrétion d’enzymes
digestives, mais s’il est suffisamment grand, il se répandra comme une vague calcique dans la cellule
entière et activera d’autres fonctions cellulaires. Un pic calcique électro-induit dans les cellules
pancréatiques β pourrait contrôler la synthèse d’ATP et la sécrétion d’insuline (Tsuboi et al. 2003). Par
conséquent, une telle application pourrait présenter un espoir de libérer une plus grande quantité
d'insuline par les cellules pancréatiques afin de traiter le diabète. Un autre exemple sont les
lymphocytes T qui présentent des oscillations calciques jouant un rôle essentiel dans l'activation de
ces cellules après la liaison d’un antigène à leur récepteur (TCR) (Lewis 2003). Un pulse microseconde
pourrait être utilisé pour activer les lymphocytes T sans liaison à l'antigène et induire leur prolifération
en contrôlant les oscillations calciques, ce qui pourrait présenter une application importante pour
l'immunothérapie active (Perica et al. 2015). Dans les cardiomyocytes, les pics calciques induits
pourraient créer un potentiel d'action (Stuyvers et al. 2000), et par suite une contraction. Par
conséquent, un pic calcique induit par une impulsion électrique pourrait contrôler la fréquence
d’excitation et de contraction des cardiomyocytes. De plus, en contrôlant l'amplitude du champ
électrique (et par suite l'amplitude du pic calcique), la vitesse de propagation du potentiel d'action
pourrait être contrôlée car la vitesse des vagues calciques dans le cœur dépend de la concentration
calcique locale (Kaneko et al. 2000). Le contrôle du couplage excitation-contraction par une impulsion
électrique pourrait également être appliqué sur le muscle squelettique. Dans les neurones, le Ca2+ initie
la transmission synaptique (Catterall & Few 2008). Un champ électrique pulsé pourrait être appliqué
pour provoquer la sécrétion de neurotransmetteurs, même en absence d'un potentiel d'action
physiologique.
Toutes les applications intéressantes mentionnées ci-dessus pourraient être appliqués in vitro ainsi
que in vivo. L'existence d'une variété de formes d'électrodes, adaptées aux différents organes le
permet. Des électrodes en plaques ou en aiguilles (pour les organes superficiels et la peau) à des
électrodes expansibles (pour le cerveau), endoscopiques (intraluminaux) et des électrodes en doigts
(pour les cavités orales et anales), l'application des μsPEFs afin de contrôler/guérir des troubles in vivo
pourrait être possible.
Les impulsions électriques microsecondes ont montré une grande capacité à contrôler les
oscillations calciques dans les MSCs. Le contrôle des niveaux du Ca2+ intracellulaire et des oscillations
calciques a un impact sur la prolifération et la différenciation cellulaire. Par conséquent, ces impulsions
pourraient être un outil très utile pour contrôler la voie de différenciation de ces cellules ainsi que le
niveau de cette différentiation ou bien pour moduler de nombreuses fonctions cellulaires en relation
avec le Ca2+ dans différents types cellulaires. Dans la partie suivante de la thèse, nous avons cherché à
étudier les oscillations calciques dans les haMSCs subissant des différentiations osseuse, adipeuse et
neuronale afin d'évaluer, dans nos conditions, s'il y a une empreinte d’oscillations calciques en fonction
du type de différenciation et de son niveau. Lorsque nous avons essayé de dissocier les cellules au

204
cours de la différentiation osseuse, nous avons trouvé une difficulté à avoir des cellules totalement
dissociées en utilisant la trypsine seule. Vu que la matrice extracellulaire dans la différenciation
osseuse est connue pour être riche en collagène I (Franceschi & Iyer 1992, Vater et al. 2011a), nous
avons décidé d'utiliser la collagénase I afin de dissocier les cellules. Nous avons observé, après l'action
de la collagénase I, une couche intacte de cellules qui sont restées au fonds du puits. Cette couche
inférieure restante était sensible à la trypsine. La caractérisation des deux types de couches cellulaires
(les couches supérieures sensibles à la collagénase, et la couche inférieure sensible à la trypsine) a
montré des différences en ce qui concerne les marqueurs de cellules souches et les oscillations
calciques. Cependant, les cellules des deux couches de cellules peuvent être mises en culture
séparément pour donner des ostéoblastes en différenciation terminale, les cellules des couches
supérieures donnant relativement plus de dépôts calciques au bout de 15 jours par rapport aux cellules
de la couche inférieure. Cette observation était nouvelle dans la différenciation osseuse des haMSC
car aucune autre étude n'a encore mentionné deux types de couches aux propriétés différentes. Les
nombreuses différentiations effectuées pour analyser les différentes couches dans la différenciation
ostéogénique et les comparer avec l'évolution des couches dans la différenciation adipeuse et
neuronale. La présence de deux types de couches permet d’utiliser une couche de cellules pour
continuer la différenciation et une autre pour maintenir les cellules en différenciation afin de les
dissocier plus tard et avoir de nouveau plusieurs couches. L'utilisation d'une couche déjà conservée en
état de différenciation permet d’obtenir des ostéoblastes matures dans une période de temps
relativement réduite.
En effet, le temps requis pour une différentiation osseuse est normalement long (un mois),
même avec une concentration optimale des facteurs chimiques de différenciation. Cette période de
différenciation des MSCs pourrait être un inconvénient pour la thérapie cellulaire ou la médecine
régénérative, car dans ces domaines, une grande quantité de cellules différenciées peut être
nécessaire dans un court laps de temps. Peu d’études ont tenté de combiner un facteur physique avec
les facteurs chimiques classiques utilisés pour la différentiation des MSCs afin d'améliorer cette
différentiation et pour obtenir des cellules différenciées en moins de temps. Ces facteurs physiques
peuvent être une stimulation mécanique, comme une tension translationnelle ou rotationnelle
(Altman et al. 2002), une traction (Ward et al. 2007), des ultrasons de faible intensité (Ebisawa et al.
2004), ou un champ électromagnétique (Sun et al. 2007). Presque toutes les études qui ont montré un
effet positif d'un facteur mécanique que ce soit seul ou en combinaison avec des facteurs chimiques,
ont démontré qu'il existe une implication du Ca2+ dans la transduction du signal physique, par des
changements dans la fréquence des oscillations calciques (Jing et al. 2014), ou par l'activation des
VOCCs et l'augmentation de la concentration du Ca2+ intracellulaire (Khatib et al. 2004, Petecchia et al.
2015). La dernière partie de la thèse consistait à combiner l'impulsion électrique, déjà utilisé pour
induire des pics calciques cytosoliques de différentes origines et pour contrôler les oscillations
calciques dans les haMSCs, avec des haMSCs en voie de différenciation osseuse. Le but était
d'investiguer si, en contrôlant la fréquence des oscillations calciques et la perméabilité de la MP aux
facteurs ostéogéniques, une impulsion électrique de 100 µs appliquée une fois par jour pourrait
moduler une différenciation osseuse. Dans la troisième partie de la thèse, après l'observation de la
présence de plusieurs couches de cellules dans la différenciation osseuse, nous avons proposé une
nouvelle technique non basée sur l’électroporation, afin d'obtenir des ostéoblastes matures en moins
de temps que la normale. Dans cette quatrième et dernière partie, nous avons essayé de faire la même
chose, mais d'une manière électroporation-dépendante. Cependant, en raison des électrodes utilisées

205
pour couvrir la totalité de la surface cellulaire d'un puits (le petri pulser TM), il a fallu faire face à une
limitation de l'amplitude du champ électrique applicable et du volume du milieu traitable en raison
d'une limitation en courant électrique. Cette limitation était due au générateur utilisé qui offre un
maximum de 16 A en courant. Une deuxième limite de cette étude était la consommation de temps. Il
fallait enlever le milieu des cellules chaque jour, le remplacer par un milieu (non-conducteur) afin
d’appliquer l'impulsion électrique, puis remettre le milieu ostéogénique une demi-heure plus tard, et
cela pour des dizaines à une centaine de puits tous les jours. Cette opération a pris beaucoup de temps
et ne pourrait se faire qu'une seule fois par jour par une personne. En outre, le renouvellement du
milieu tous les jours afin d'appliquer l'impulsion a empêché la minéralisation de se produire et a
entraîné le fait que les cellules ont continué à proliférer indéfiniment. En raison de toutes ces
limitations, l'expérience a été effectuée une seule fois. Cependant, des conclusions intéressantes ont
été tirées de cette dernière partie, même si le but final, qui est l’obtention d’ostéoblastes matures
dans une petite période de temps, n'a pas été atteint. Pour les expériences futures, un générateur
adapté doit être utilisé, en particulier en termes de livraison de courant électrique. De plus, le
générateur pourrait être programmé pour délivrer une impulsion (ou plusieurs) toutes les heures (ou
pendant une période déterminée par l'investigateur) sans changer le milieu. De cette manière, la
minéralisation devrait pouvoir se produire normalement, et la comparaison d’une différenciation
normale (où le milieu est changé tous les 3-4 jours) pourrait être faite avec la différenciation qui reçoit
une (ou plusieurs) impulsion(s) électriques par jour. L'impulsion électrique pourrait également être
appliquée avec une différentiation neuronale ou adipeuse afin d'étudier son effet sur l'évolution de
celles-ci et le temps pour atteindre des cellules différenciées. Enfin, de nombreuses combinaisons
d'impulsions pourraient être faites sur des MSCs dans leur état souche afin de voir si une impulsion
(ou un ensemble de plusieurs impulsions avec une fréquence et une amplitude précises) pourraient
engager les MSCs dans une voie de différenciation ou une autre.

206

207
VI. REFERENCES

208

209
Abidor IG, Arakelyan VB, Chernomordik LV, Chizmadzhev YA, Pastushenko VF and Tarasevich MR
1979 246 - Electric breakdown of bilayer lipid membranes I. The main experimental facts and
their qualitative discussion. Bioelectrochemistry and Bioenergetics 6: 37–52.
Aksu AE, Rubin JP, Dudas JR and Marra KG 2008 Role of gender and anatomical region on induction
of osteogenic differentiation of human adipose-derived stem cells. Annals of Plastic Surgery
60: 306–322.
Alberts B, Bray D, Hopkin K, Johnson AD, Johnson A, Lewis J, Raff M, Roberts K and Walter P 2009
Essential Cell Biology, 3rd edition.. Garland Science
Alberts B, Johnson A, Lewis J, Morgan D, Raff M, Roberts K and Walter P 2014 Molecular Biology of
the Cell, Sixth Edition. Garland Science
Alberts B, Johnson A, Lewis J, Raff M, Roberts K and Walter P 2002a Molecular Biology of the Cell, 4th
edition.. Garland Science
Alberts B, Johnson A, Lewis J, Raff M, Roberts K and Walter P 2002b Membrane Proteins
Aldridge A, Kouroupis D, Churchman S, English A, Ingham E and Jones E 2013 Assay validation for the
assessment of adipogenesis of multipotential stromal cells—a direct comparison of four
different methods. Cytotherapy 15: 89–101.
Allbritton NL and Meyer T 1993 Localized calcium spikes and propagating calcium waves. Cell Calcium
14: 691–697.
Almeida PFF 2009 Thermodynamics of lipid interactions in complex bilayers. Biochimica Et Biophysica
Acta 1788: 72–85.
Al-Sakere B, André F, Bernat C, Connault E, Opolon P, Davalos RV, Rubinsky B and Mir LM 2007 Tumor
ablation with irreversible electroporation. PloS One 2: e1135.
Altman GH, Horan RL, Martin I, Farhadi J, Stark PRH, Volloch V, Richmond JC, Vunjak-Novakovic G
and Kaplan DL 2002 Cell differentiation by mechanical stress. FASEB journal: official
publication of the Federation of American Societies for Experimental Biology 16: 270–272.
Andrae J, Gallini R and Betsholtz C 2008 Role of platelet-derived growth factors in physiology and
medicine. Genes & Development 22: 1276–1312.
André FM, Gehl J, Sersa G, Préat V, Hojman P, Eriksen J, Golzio M, Cemazar M, Pavselj N, Rols M-P,
Miklavcic D, Neumann E, Teissié J and Mir LM 2008a Efficiency of high- and low-voltage pulse
combinations for gene electrotransfer in muscle, liver, tumor, and skin. Human Gene Therapy
19: 1261–1271.
André FM, Gehl J, Sersa G, Préat V, Hojman P, Eriksen J, Golzio M, Cemazar M, Pavselj N, Rols M-P,
Miklavcic D, Neumann E, Teissié J and Mir LM 2008b Efficiency of high- and low-voltage pulse
combinations for gene electrotransfer in muscle, liver, tumor, and skin. Human Gene Therapy
19: 1261–1271.
Artman M, Ichikawa H, Avkiran M and Coetzee WA 1995 Na+/Ca2+ exchange current density in
cardiac myocytes from rabbits and guinea pigs during postnatal development. The American
Journal of Physiology 268: H1714-1722.
Asavasanti S, Ristenpart W, Stroeve P and Barrett DM 2011 Permeabilization of plant tissues by
monopolar pulsed electric fields: effect of frequency. Journal of Food Science 76: E98-111.
Ashby MC and Tepikin AV 2001 ER calcium and the functions of intracellular organelles. Seminars in
Cell & Developmental Biology 12: 11–17.
Ashton Acton 2012 Issues in Life Sciences: Muscle, Membrane, and General Microbiology: 2011
Edition. ScholarlyEditions
Aubin JE 1998 Bone stem cells. Journal of Cellular Biochemistry. Supplement 30–31: 73–82.

210
Aubin JE 2001 Regulation of osteoblast formation and function. Reviews in Endocrine & Metabolic
Disorders 2: 81–94.
Bae JH, Park J-W and Kwon TK 2003 Ruthenium red, inhibitor of mitochondrial Ca2+ uniporter, inhibits
curcumin-induced apoptosis via the prevention of intracellular Ca2+ depletion and
cytochrome c release. Biochemical and Biophysical Research Communications 303: 1073–
1079.
Baird GS, Zacharias DA and Tsien RY 1999 Circular permutation and receptor insertion within green
fluorescent proteins. Proceedings of the National Academy of Sciences of the United States of
America 96: 11241–11246.
Beebe SJ, Fox PM, Rec LJ, Somers K, Stark RH and Schoenbach KH 2002 Nanosecond pulsed electric
field (nsPEF) effects on cells and tissues: apoptosis induction and tumor growth inhibition. IEEE
Transactions on Plasma Science 30: 286–292.
Beebe SJ, Fox PM, Rec LJ, Willis ELK and Schoenbach KH 2003 Nanosecond, high-intensity pulsed
electric fields induce apoptosis in human cells. FASEB journal: official publication of the
Federation of American Societies for Experimental Biology 17: 1493–1495.
Belehradek J, Orlowski S, Poddevin B, Paoletti C and Mir LM 1991 Electrochemotherapy of
spontaneous mammary tumours in mice. European Journal of Cancer (Oxford, England: 1990)
27: 73–76.
Bennett J and Weeds A 1986 Calcium and the cytoskeleton. British Medical Bulletin 42: 385–390.
Benz R and Zimmermann U 1980 Pulse-length dependence of the electrical breakdown in lipid bilayer
membranes. Biochimica Et Biophysica Acta 597: 637–642.
Berg JM, Tymoczko JL and Stryer L 2002a Lipids and Many Membrane Proteins Diffuse Rapidly in the
Plane of the Membrane
Berg JM, Tymoczko JL and Stryer L 2002b There Are Three Common Types of Membrane Lipids
Berridge MJ 1990 Calcium oscillations. The Journal of Biological Chemistry 265: 9583–9586.
Berridge MJ 1997a Elementary and global aspects of calcium signalling. The Journal of Physiology 499
( Pt 2): 291–306.
Berridge MJ 1997b Elementary and global aspects of calcium signalling.. The Journal of Physiology 499:
291–306.
Berridge MJ, Bootman MD and Roderick HL 2003 Calcium: Calcium signalling: dynamics, homeostasis
and remodelling. Nature Reviews Molecular Cell Biology 4: 517–529.
Berridge MJ, Lipp P and Bootman MD 2000 The versatility and universality of calcium signalling.
Nature Reviews. Molecular Cell Biology 1: 11–21.
Bers DM 2002 Cardiac excitation–contraction coupling. Nature 415: 198–205.
Bibb MJ, Ward JM and Hopwood DA 1978 Transformation of plasmid DNA into Streptomyces at high
frequency. Nature 274: 398–400.
Binggeli R and Weinstein RC 1986 Membrane potentials and sodium channels: hypotheses for growth
regulation and cancer formation based on changes in sodium channels and gap junctions.
Journal of Theoretical Biology 123: 377–401.
Bird GS, Hwang S-Y, Smyth JT, Fukushima M, Boyles RR and Putney JW 2009 STIM1 is a calcium sensor
specialized for digital signaling. Current biology: CB 19: 1724–1729.
Birmingham E, Niebur GL, McHugh PE, Shaw G, Barry FP and McNamara LM 2012 Osteogenic
differentiation of mesenchymal stem cells is regulated by osteocyte and osteoblast cells in a
simplified bone niche. European Cells & Materials 23: 13–27.

211
Black IB and Woodbury D 2001 Adult Rat and Human Bone Marrow Stromal Stem Cells Differentiate
into Neurons. Blood Cells, Molecules, and Diseases 27: 632–636.
Bootman MD and Berridge MJ 1996 Subcellular Ca2+ signals underlying waves and graded responses
in HeLa cells. Current biology: CB 6: 855–865.
Bouzrara H and Vorobiev E 2000 Beet juice extraction by pressing and pulsed electric fields..
International Sugar Journal 102: 194–200.
Brandman O, Liou J, Park WS and Meyer T 2007 STIM2 is a feedback regulator that stabilizes basal
cytosolic and endoplasmic reticulum Ca2+ levels. Cell 131: 1327–1339.
Brenner R, Peréz GJ, Bonev AD, Eckman DM, Kosek JC, Wiler SW, Patterson AJ, Nelson MT and Aldrich
RW 2000 Vasoregulation by the beta1 subunit of the calcium-activated potassium channel.
Nature 407: 870–876.
Breton M and Mir LM 2012 Microsecond and nanosecond electric pulses in cancer treatments.
Bioelectromagnetics 33: 106–123.
Breton M, Silve A and Mir LM 2016 Cell electropulsation Induces Phospholipid Oxidation: the
Membrane Impermeability Rupture Model Reconciles Electroporation and
Electropermeabilization at the Molecular Level. Submitted
Brigger I, Morizet J, Aubert G, Chacun H, Terrier-Lacombe M-J, Couvreur P and Vassal G 2002
Poly(ethylene glycol)-coated hexadecylcyanoacrylate nanospheres display a combined effect
for brain tumor targeting. The Journal of Pharmacology and Experimental Therapeutics 303:
928–936.
Brighton CT, Wang W, Seldes R, Zhang G and Pollack SR 2001 Signal transduction in electrically
stimulated bone cells. The Journal of Bone and Joint Surgery. American Volume 83–A: 1514–
1523.
Brini M and Carafoli E 2011 The Plasma Membrane Ca2+ ATPase and the Plasma Membrane Sodium
Calcium Exchanger Cooperate in the Regulation of Cell Calcium. Cold Spring Harbor
Perspectives in Biology 3: a004168.
van den Brink-van der Laan E, Antoinette Killian J and de Kruijff B 2004 Nonbilayer lipids affect
peripheral and integral membrane proteins via changes in the lateral pressure profile.
Biochimica et Biophysica Acta (BBA) - Biomembranes 1666: 275–288.
Bround MJ, Wambolt R, Luciani DS, Kulpa JE, Rodrigues B, Brownsey RW, Allard MF and Johnson JD
2013 Cardiomyocyte ATP production, metabolic flexibility, and survival require calcium flux
through cardiac ryanodine receptors in vivo. The Journal of Biological Chemistry 288: 18975–
18986.
Bruder SP, Jaiswal N and Haynesworth SE 1997 Growth kinetics, self-renewal, and the osteogenic
potential of purified human mesenchymal stem cells during extensive subcultivation and
following cryopreservation. Journal of Cellular Biochemistry 64: 278–294.
Burdon T, Smith A and Savatier P 2002 Signalling, cell cycle and pluripotency in embryonic stem cells.
Trends in Cell Biology 12: 432–438.
Burgain-Chain A and Scherm D 2013 DNA Electrotransfer: An Effective Tool for Gene Therapy. In
Martin F (ed.) Gene Therapy - Tools and Potential Applications p.. InTech
Burnstock G 2006 Historical review: ATP as a neurotransmitter. Trends in Pharmacological Sciences 27:
166–176.
Cahalan MD, Wulff H and Chandy KG 2001 Molecular properties and physiological roles of ion
channels in the immune system. Journal of Clinical Immunology 21: 235–252.

212
Callamaras N, Marchant JS, Sun XP and Parker I 1998 Activation and co-ordination of InsP3-mediated
elementary Ca2+ events during global Ca2+ signals in Xenopus oocytes. The Journal of
Physiology 509 ( Pt 1): 81–91.
Calvet CY, Famin D, André FM and Mir LM 2014a Electrochemotherapy with bleomycin induces
hallmarks of immunogenic cell death in murine colon cancer cells. Oncoimmunology 3
Calvet CY, Thalmensi J, Liard C, Pliquet E, Bestetti T, Huet T, Langlade-Demoyen P and Mir LM 2014b
Optimization of a gene electrotransfer procedure for efficient intradermal immunization with
an hTERT-based DNA vaccine in mice. Molecular Therapy. Methods & Clinical Development 1:
14045.
Campbell JBR Lisa A Urry, Michael L Ca Neil A (n.d.) Biology, 8th Edition by Neil A. Campbell, Jane B.
Reece, Lisa A. Urry, Michael L. Ca (2008) Hardcover, 8th edition.. Pearson Benjamin Cummings
Campbell NA and Reece JB 2007 Biology: International Edition, 8th edition.. Pearson
Canut H, Carrasco A, Rossignol M and Ranjeva R 1993 Is vacuole the richest store of IP3-mobilizable
calcium in plant cells?. Plant Science 90: 135–143.
Cao Z, Umek RM and McKnight SL 1991 Regulated expression of three C/EBP isoforms during adipose
conversion of 3T3-L1 cells. Genes & Development 5: 1538–1552.
Capes Em, Loaiza R and Valdivia HH 2011 Ryanodine receptors. Skeletal Muscle 1: 18.
Caplan AI 1991 Mesenchymal stem cells. Journal of Orthopaedic Research: Official Publication of the
Orthopaedic Research Society 9: 641–650.
Caplan AI and Bruder SP 2001 Mesenchymal stem cells: building blocks for molecular medicine in the
21st century. Trends in Molecular Medicine 7: 259–264.
Carafoli E, Santella L, Branca D and Brini M 2001 Generation, control, and processing of cellular
calcium signals. Critical Reviews in Biochemistry and Molecular Biology 36: 107–260.
Caride AJ, Filoteo AG, Penheiter AR, Pászty K, Enyedi A and Penniston JT 2001 Delayed activation of
the plasma membrane calcium pump by a sudden increase in Ca2+: fast pumps reside in fast
cells. Cell Calcium 30: 49–57.
Catterall WA 2011 Voltage-Gated Calcium Channels. Cold Spring Harbor Perspectives in Biology 3
Catterall WA and Few AP 2008 Calcium channel regulation and presynaptic plasticity. Neuron 59: 882–
901.
Celsi F, Pizzo P, Brini M, Leo S, Fotino C, Pinton P and Rizzuto R 2009 Mitochondria, calcium and cell
death: A deadly triad in neurodegeneration. Biochimica et biophysica acta 1787: 335–344.
Cemazar M, Parkins CS, Holder AL, Chaplin DJ, Tozer GM and Sersa G 2001 Electroporation of human
microvascular endothelial cells: evidence for an anti-vascular mechanism of
electrochemotherapy. British Journal of Cancer 84: 565–570.
Cha J, Zhang J, Gurbani S, Cheon GW, Li M and Kang JU 2013 Gene transfection efficacy assessment
of human cervical cancer cells using dual-mode fluorescence microendoscopy. Biomedical
Optics Express 4: 151–159.
Chang S and Cohen SN 1979 High frequency transformation of Bacillus subtilis protoplasts by plasmid
DNA. Molecular and General Genetics MGG 168: 111–115.
Chatton JY, Liu H and Stucki JW 1995 Simultaneous measurements of Ca2+ in the intracellular stores
and the cytosol of hepatocytes during hormone-induced Ca2+ oscillations. FEBS letters 368:
165–168.
Chen N, Schoenbach KH, Kolb JF, James Swanson R, Garner AL, Yang J, Joshi RP and Beebe SJ 2004
Leukemic cell intracellular responses to nanosecond electric fields. Biochemical and
Biophysical Research Communications 317: 421–427.

213
Cheng H, Lederer MR, Lederer WJ and Cannell MB 1996 Calcium sparks and [Ca2+]i waves in cardiac
myocytes. The American Journal of Physiology 270: C148-159.
Cho MR 2002 A review of electrocoupling mechanisms mediating facilitated wound healing. IEEE
Transactions on Plasma Science 30: 1504–1515.
Choi JW, Choi BH, Park S-H, Pai KS, Li TZ, Min B-H and Park SR 2013 Mechanical stimulation by
ultrasound enhances chondrogenic differentiation of mesenchymal stem cells in a fibrin-
hyaluronic acid hydrogel. Artificial Organs 37: 648–655.
Claude B and Justin T 1983 Homokaryon production by electrofusion: A convenient way to produce a
large number of viable mammalian fused cells. Biochemical and Biophysical Research
Communications 114: 663–669.
Cole KS 1937 Electric impedance of marine egg membranes. Transactions of the Faraday Society 33:
966–972.
Cone CD and Tongier M 1971 Control of somatic cell mitosis by simulated changes in the
transmembrane potential level. Oncology 25: 168–182.
Cone, Jr. CD 1970 Variation of the Transmembrane Potential Level as a Basic Mechanism of Mitosis
Control. Oncology 24: 438–470.
Cooper GM 2000a Cell Membranes
Cooper GM 2000b The Cell, 2nd edition.. Sinauer Associates
Cooper RA 1978 Influence of increased membrane cholesterol on membrane fluidity and cell function
in human red blood cells. Journal of Supramolecular Structure 8: 413–430.
Coster HG and Simmermann U 1975 The mechanism of electrical breakdown in the membranes of
Valonai utricularis. The Journal of Membrane Biology 22: 73–90.
Coustets M, Al-Karablieh N, Thomsen C and Teissié J 2013 Flow process for electroextraction of total
proteins from microalgae. The Journal of Membrane Biology 246: 751–760.
Coutifaris C, Kao LC, Sehdev HM, Chin U, Babalola GO, Blaschuk OW and Strauss JF 1991 E-cadherin
expression during the differentiation of human trophoblasts. Development (Cambridge,
England) 113: 767–777.
Crowley JM 1973 Electrical Breakdown of Bimolecular Lipid Membranes as an Electromechanical
Instability. Biophysical Journal 13: 711–724.
Csala M, Bánhegyi G and Benedetti A 2006a Endoplasmic reticulum: A metabolic compartment. FEBS
Letters 580: 2160–2165.
Csala M, Bánhegyi G and Benedetti A 2006b Endoplasmic reticulum: a metabolic compartment. FEBS
letters 580: 2160–2165.
Curie T, Rogers KL, Colasante C and Brûlet P 2007 Red-shifted aequorin-based bioluminescent
reporters for in vivo imaging of Ca2 signaling. Molecular Imaging 6: 30–42.
Cyranoski D 2008 Stem cells: 5 things to know before jumping on the iPS bandwagon. Nature News
452: 406–408.
Daleke DL 2007 Phospholipid Flippases. Journal of Biological Chemistry 282: 821–825.
Danielli JF and Davson H 1935 A contribution to the theory of permeability of thin films. Journal of
Cellular and Comparative Physiology 5: 495–508.
Danielsen EM 1995 Involvement of detergent-insoluble complexes in the intracellular transport of
intestinal brush border enzymes. Biochemistry 34: 1596–1605.
Datta N, Pham QP, Sharma U, Sikavitsas VI, Jansen JA and Mikos AG 2006 In vitro generated
extracellular matrix and fluid shear stress synergistically enhance 3D osteoblastic

214
differentiation. Proceedings of the National Academy of Sciences of the United States of
America 103: 2488–2493.
Davalos RV, Mir ILM and Rubinsky B 2005 Tissue ablation with irreversible electroporation. Annals of
Biomedical Engineering 33: 223–231.
Dawson SP, Keizer J and Pearson JE 1999 Fire-diffuse-fire model of dynamics of intracellular calcium
waves. Proceedings of the National Academy of Sciences of the United States of America 96:
6060–6063.
Dayel MJ, Hom EF and Verkman AS 1999 Diffusion of green fluorescent protein in the aqueous-phase
lumen of endoplasmic reticulum. Biophysical Journal 76: 2843–2851.
De Francesco F, Tirino V, Desiderio V, Ferraro G, D’Andrea F, Giuliano M, Libondi G, Pirozzi G, De
Rosa A and Papaccio G 2009 Human CD34/CD90 ASCs are capable of growing as sphere
clusters, producing high levels of VEGF and forming capillaries. PloS One 4: e6537.
De Koninck P and Schulman H 1998 Sensitivity of CaM kinase II to the frequency of Ca2+ oscillations.
Science (New York, N.Y.) 279: 227–230.
DeBruin KA and Krassowska W 1999 Modeling electroporation in a single cell. II. Effects Of ionic
concentrations.. Biophysical Journal 77: 1225–1233.
Decuypere J-P, Monaco G, Missiaen L, De Smedt H, Parys JB and Bultynck G 2011 IP3 Receptors,
Mitochondria, and Ca2+ Signaling: Implications for Aging. Journal of Aging Research 2011
Denecke J 2001 Plant Endoplasmic Reticulum. eLS p.. John Wiley & Sons, Ltd
Deng J, Schoenbach KH, Buescher ES, Hair PS, Fox PM and Beebe SJ 2003 The Effects of Intense
Submicrosecond Electrical Pulses on Cells. Biophysical Journal 84: 2709–2714.
Deng W, Obrocka M, Fischer I and Prockop DJ 2001 In Vitro Differentiation of Human Marrow Stromal
Cells into Early Progenitors of Neural Cells by Conditions That Increase Intracellular Cyclic AMP.
Biochemical and Biophysical Research Communications 282: 148–152.
Deshpande DA, White TA, Dogan S, Walseth TF, Panettieri RA and Kannan MS 2005 CD38/cyclic ADP-
ribose signaling: role in the regulation of calcium homeostasis in airway smooth muscle.
American Journal of Physiology - Lung Cellular and Molecular Physiology 288: L773–L788.
Devaux PF and Morris R 2004 Transmembrane asymmetry and lateral domains in biological
membranes. Traffic (Copenhagen, Denmark) 5: 241–246.
Díaz R and Rubinsky B 2004 A Single Cell Study on the Temperature Effects of Electroporation: 755–
761.
van Dijk A, Niessen HWM, Zandieh Doulabi B, Visser FC and van Milligen FJ 2008 Differentiation of
human adipose-derived stem cells towards cardiomyocytes is facilitated by laminin. Cell and
Tissue Research 334: 457–467.
Dimitrov DS 1984 Electric field-induced breakdown of lipid bilayers and cell membranes: a thin
viscoelastic film model. The Journal of Membrane Biology 78: 53–60.
Dityatev A and El-Husseini A 2006 Molecular Mechanisms of Synaptogenesis. Springer Science &
Business Media
Dolmetsch RE, Xu K and Lewis RS 1998 Calcium oscillations increase the efficiency and specificity of
gene expression. Nature 392: 933–936.
Dominici M, Le Blanc K, Mueller I, Slaper-Cortenbach I, Marini F, Krause D, Deans R, Keating A,
Prockop D and Horwitz E 2006 Minimal criteria for defining multipotent mesenchymal stromal
cells. The International Society for Cellular Therapy position statement. Cytotherapy 8: 315–
317.

215
Dupré DJ, Hébert TE and Jockers R 2012 GPCR Signalling Complexes – Synthesis, Assembly, Trafficking
and Specificity. Springer Science & Business Media
Dushek O, Mueller S, Soubies S, Depoil D, Caramalho I, Coombs D and Valitutti S 2008 Effects of
Intracellular Calcium and Actin Cytoskeleton on TCR Mobility Measured by Fluorescence
Recovery. PLOS ONE 3: e3913.
Eberhard M and Erne P 1991 Calcium binding to fluorescent calcium indicators: calcium green, calcium
orange and calcium crimson. Biochemical and Biophysical Research Communications 180: 209–
215.
Ebisawa K, Hata K-I, Okada K, Kimata K, Ueda M, Torii S and Watanabe H 2004 Ultrasound enhances
transforming growth factor beta-mediated chondrocyte differentiation of human
mesenchymal stem cells. Tissue Engineering 10: 921–929.
El-Amin SF, Lu HH, Khan Y, Burems J, Mitchell J, Tuan RS and Laurencin CT 2003 Extracellular matrix
production by human osteoblasts cultured on biodegradable polymers applicable for tissue
engineering. Biomaterials 24: 1213–1221.
Ellis C 2004 The state of GPCR research in 2004. Nature Reviews Drug Discovery 3: 577–626.
Engler AJ, Sen S, Sweeney HL and Discher DE 2006 Matrix elasticity directs stem cell lineage
specification. Cell 126: 677–689.
Escoffre J-M, Portet T, Wasungu L, Teissié J, Dean D and Rols M-P 2009 What is (still not) known of
the mechanism by which electroporation mediates gene transfer and expression in cells and
tissues. Molecular Biotechnology 41: 286–295.
Escoffre J-M and Rols M-P 2012 Electrochemotherapy: Progress and Prospects. Current
Pharmaceutical Design 18: 3406–3415.
Esser AT, Smith KC, Gowrishankar TR, Vasilkoski Z and Weaver JC 2010 Mechanisms for the
intracellular manipulation of organelles by conventional electroporation. Biophysical Journal
98: 2506–2514.
Europe-Finner GN and Newell PC 1986 Inositol 1,4,5-trisphosphate and calcium stimulate actin
polymerization in Dictyostelium discoideum. Journal of Cell Science 82: 41–51.
Falkenburger BH, Dickson EJ and Hille B 2013 Quantitative properties and receptor reserve of the DAG
and PKC branch of G(q)-coupled receptor signaling. The Journal of General Physiology 141:
537–555.
Fatherazi S, Matsa-Dunn D, Foster BL, Rutherford RB, Somerman MJ and Presland RB 2009 Phosphate
regulates osteopontin gene transcription. Journal of Dental Research 88: 39–44.
Fedida D, Noble D, Rankin AC and Spindler AJ 1987 The arrhythmogenic transient inward current iTI
and related contraction in isolated guinea-pig ventricular myocytes. The Journal of Physiology
392: 523–542.
Felizola SJA, Maekawa T, Nakamura Y, Satoh F, Ono Y, Kikuchi K, Aritomi S, Ikeda K, Yoshimura M,
Tojo K and Sasano H 2014 Voltage-gated calcium channels in the human adrenal and primary
aldosteronism. The Journal of Steroid Biochemistry and Molecular Biology 144 Pt B: 410–416.
Fewtrell C 1993 Ca2+ Oscillations in Non-Excitable Cells. Annual Review of Physiology 55: 427–454.
Fill M and Copello JA 2002 Ryanodine Receptor Calcium Release Channels. Physiological Reviews 82:
893–922.
Flavell SW and Greenberg ME 2008 Signaling mechanisms linking neuronal activity to gene expression
and plasticity of the nervous system. Annual Review of Neuroscience 31: 563–590.
FOSKETT JK, WHITE C, CHEUNG K-H and MAK D-OD 2007 Inositol Trisphosphate Receptor Ca2+
Release Channels. Physiological reviews 87: 593–658.
216
Foundation N 2003 Role of the Sarcoplasmic Reticulum in Smooth Muscle. John Wiley & Sons
Franceschi RT and Iyer BS 1992 Relationship between collagen synthesis and expression of the
osteoblast phenotype in MC3T3-E1 cells. Journal of Bone and Mineral Research: The Official
Journal of the American Society for Bone and Mineral Research 7: 235–246.
Franceschi RT, Iyer BS and Cui Y 1994 Effects of ascorbic acid on collagen matrix formation and
osteoblast differentiation in murine MC3T3-E1 cells. Journal of Bone and Mineral Research:
The Official Journal of the American Society for Bone and Mineral Research 9: 843–854.
Franzini-Armstrong C and Jorgensen AO 1994 Structure and development of E-C coupling units in
skeletal muscle. Annual Review of Physiology 56: 509–534.
Freeman SA, Wang MA and Weaver JC 1994 Theory of electroporation of planar bilayer membranes:
predictions of the aqueous area, change in capacitance, and pore-pore separation.. Biophysical
Journal 67: 42–56.
Frendo JL, Xiao G, Fuchs S, Franceschi RT, Karsenty G and Ducy P 1998 Functional hierarchy between
two OSE2 elements in the control of osteocalcin gene expression in vivo. The Journal of
Biological Chemistry 273: 30509–30516.
Frey W, White JA, Price RO, Blackmore PF, Joshi RP, Nuccitelli R, Beebe SJ, Schoenbach KH and Kolb
JF 2006 Plasma Membrane Voltage Changes during Nanosecond Pulsed Electric Field Exposure.
Biophysical Journal 90: 3608–3615.
Friedenstein AJ, Chailakhjan RK and Lalykina KS 1970 The development of fibroblast colonies in
monolayer cultures of guinea-pig bone marrow and spleen cells. Cell and Tissue Kinetics 3:
393–403.
Friedenstein AJ, Chailakhyan RK, Latsinik NV, Panasyuk AF and Keiliss-Borok IV 1974 Stromal cells
responsible for transferring the microenvironment of the hemopoietic tissues. Cloning in vitro
and retransplantation in vivo. Transplantation 17: 331–340.
Friedenstein AJ, Petrakova KV, Kurolesova AI and Frolova GP 1968 Heterotopic of bone marrow.
Analysis of precursor cells for osteogenic and hematopoietic tissues. Transplantation 6: 230–
247.
Friedman MH 2008 Principles and Models of Biological Transport. Springer Science & Business Media
Friel DD 1995 Calcium oscillations in neurons. Ciba Foundation Symposium 188: 210-223-234.
Frohbergh ME, Katsman A, Botta GP, Lazarovici P, Schauer CL, Wegst UGK and Lelkes PI 2012
Electrospun Hydroxyapatite-Containing Chitosan Nanofibers Crosslinked with Genipin for
Bone Tissue Engineering. Biomaterials 33: 9167–9178.
Frye LD and Edidin M 1970 The Rapid Intermixing of Cell Surface Antigens After Formation of Mouse-
Human Heterokaryons. Journal of Cell Science 7: 319–335.
Futerman AH and Riezman H 2005 The ins and outs of sphingolipid synthesis. Trends in Cell Biology
15: 312–318.
Gaigg B, Simbeni R, Hrastnik C, Paltauf F and Daum G 1995 Characterization of a microsomal
subfraction associated with mitochondria of the yeast, Saccharomyces cerevisiae. Involvement
in synthesis and import of phospholipids into mitochondria. Biochimica Et Biophysica Acta
1234: 214–220.
Garrett RH and Grisham CM 2000 Biochimie. De Boeck Supérieur
Gehl J, Skovsgaard T and Mir LM 1998 Enhancement of cytotoxicity by electropermeabilization: an
improved method for screening drugs. Anti-Cancer Drugs 9: 319–325.
George J, Kuboki Y and Miyata T 2006 Differentiation of mesenchymal stem cells into osteoblasts on
honeycomb collagen scaffolds. Biotechnology and Bioengineering 95: 404–411.

217
Gimble JM, Katz AJ and Bunnell BA 2007 Adipose-Derived Stem Cells for Regenerative Medicine.
Circulation Research 100: 1249–1260.
Golzio M, Teissié J and Rols M-P 2002 Direct visualization at the single-cell level of electrically
mediated gene delivery. Proceedings of the National Academy of Sciences 99: 1292–1297.
Gorter E and Grendel F 1925 ON BIMOLECULAR LAYERS OF LIPOIDS ON THE CHROMOCYTES OF THE
BLOOD. The Journal of Experimental Medicine 41: 439–443.
Gowrishankar TR and Weaver JC 2006 Electrical behavior and pore accumulation in a multicellular
model for conventional and supra-electroporation. Biochemical and biophysical research
communications 349: 643–653.
Gregoire FM, Smas CM and Sul HS 1998 Understanding Adipocyte Differentiation. Physiological
Reviews 78: 783–809.
Gregory CA, Prockop DJ and Spees JL 2005 Non-hematopoietic bone marrow stem cells: Molecular
control of expansion and differentiation. Experimental Cell Research 306: 330–335.
Gronthos S, Franklin DM, Leddy HA, Robey PG, Storms RW and Gimble JM 2001 Surface protein
characterization of human adipose tissue-derived stromal cells. Journal of Cellular Physiology
189: 54–63.
Gruber SJ, Cornea RL, Li J, Peterson KC, Schaaf TM, Gillispie GD, Dahl R, Zsebo KM, Robia SL and
Thomas DD 2014 Discovery of enzyme modulators via high-throughput time-resolved FRET in
living cells. Journal of biomolecular screening 19: 215–222.
Guo D-P, Li X-Y, Sun P, Wang Z-G, Chen X-Y, Chen Q, Fan L-M, Zhang B, Shao L-Z and Li X-R 2004
Ultrasound/microbubble enhances foreign gene expression in ECV304 cells and murine
myocardium. Acta Biochimica Et Biophysica Sinica 36: 824–831.
Harris EH, Boynton JE and Gillham NW 1994 Chloroplast ribosomes and protein synthesis..
Microbiological Reviews 58: 700–754.
Hartzell C, Putzier I and Arreola J 2005 Calcium-activated chloride channels. Annual Review of
Physiology 67: 719–758.
Haudenschild AK, Hsieh AH, Kapila S and Lotz JC 2009 Pressure and distortion regulate human
mesenchymal stem cell gene expression. Annals of Biomedical Engineering 37: 492–502.
Hauner H, Entenmann G, Wabitsch M, Gaillard D, Ailhaud G, Negrel R and Pfeiffer EF 1989 Promoting
effect of glucocorticoids on the differentiation of human adipocyte precursor cells cultured in
a chemically defined medium.. Journal of Clinical Investigation 84: 1663–1670.
Hay E 2012 Macromolecules Regulating Growth and Development. Elsevier
von Heijne G 2007 The membrane protein universe: what’s out there and why bother?. Journal of
Internal Medicine 261: 543–557.
Hempling HG and White S 1984 Permeability of cultured megakaryocytopoietic cells of the rat to
dimethyl sulfoxide. Cryobiology 21: 133–143.
Hepler PK 2016 The Cytoskeleton and Its Regulation by Calcium and Protons. Plant Physiology 170: 3–
22.
Hertwig O, Campbell HJ and Cornell University. College of Veterinary Medicine. Flower-Sprecher
Veterinary Library. fmo 1895 The cell; outlines of general anatomy and physiology .. London,
Sonnenschein and Co., New York, Macmillan and Co.
Hibino M, Itoh H and Kinosita K 1993 Time courses of cell electroporation as revealed by
submicrosecond imaging of transmembrane potential.. Biophysical Journal 64: 1789–1800.
Hille B 2001 Ionic channels of excitable membranes. Second edition. Sinauer Associates, Inc:
Sunderland, MA,USA: 814,818.

218
Hiller S, Abramson J, Mannella C, Wagner G and Zeth K 2010 The 3D structures of VDAC represent a
native conformation. Trends in biochemical sciences 35: 514–521.
Hirano S, Nose A, Hatta K, Kawakami A and Takeichi M 1987 Calcium-dependent cell-cell adhesion
molecules (cadherins): subclass specificities and possible involvement of actin bundles. The
Journal of Cell Biology 105: 2501–2510.
Ho IC, Kim JH, Rooney JW, Spiegelman BM and Glimcher LH 1998 A potential role for the nuclear
factor of activated T cells family of transcriptional regulatory proteins in adipogenesis.
Proceedings of the National Academy of Sciences of the United States of America 95: 15537–
15541.
Hofer AM and Machen TE 1993 Technique for in situ measurement of calcium in intracellular inositol
1,4,5-trisphosphate-sensitive stores using the fluorescent indicator mag-fura-2. Proceedings
of the National Academy of Sciences of the United States of America 90: 2598–2602.
Hofmann GA, Dev SB, Nanda GS and Rabussay D 1999 Electroporation therapy of solid tumors. Critical
Reviews in Therapeutic Drug Carrier Systems 16: 523–569.
Hojman P, Gissel H, Andre FM, Cournil-Henrionnet C, Eriksen J, Gehl J and Mir LM 2008 Physiological
effects of high- and low-voltage pulse combinations for gene electrotransfer in muscle. Human
Gene Therapy 19: 1249–1260.
Holthuis JC, Pomorski T, Raggers RJ, Sprong H and Van Meer G 2001 The organizing potential of
sphingolipids in intracellular membrane transport. Physiological Reviews 81: 1689–1723.
Holthuis JCM and Menon AK 2014 Lipid landscapes and pipelines in membrane homeostasis. Nature
510: 48–57.
Hu Q, Viswanadham S, Joshi RP, Schoenbach KH, Beebe SJ and Blackmore PF 2005 Simulations of
transient membrane behavior in cells subjected to a high-intensity ultrashort electric pulse.
Physical Review E 71
Huang J, Hove-Madsen L and Tibbits GF 2005 Na+/Ca2+ exchange activity in neonatal rabbit
ventricular myocytes. American Journal of Physiology. Cell Physiology 288: C195-203.
Huang Z, Nelson ER, Smith RL and Goodman SB 2007a The sequential expression profiles of growth
factors from osteoprogenitors [correction of osteroprogenitors] to osteoblasts in vitro. Tissue
Engineering 13: 2311–2320.
Huang Z, Nelson ER, Smith RL and Goodman SB 2007b The sequential expression profiles of growth
factors from osteoprogenitors [correction of osteroprogenitors] to osteoblasts in vitro. Tissue
Engineering 13: 2311–2320.
Ikonen E 2008 Cellular cholesterol trafficking and compartmentalization. Nature Reviews Molecular
Cell Biology 9: 125–138.
Iwamoto T, Watanabe Y, Kita S and Blaustein MP 2007 Na+/Ca2+ exchange inhibitors: a new class of
calcium regulators. Cardiovascular & Hematological Disorders Drug Targets 7: 188–198.
Izadpanah R, Trygg C, Patel B, Kriedt C, Dufour J, Gimble JM and Bunnell BA 2006 Biologic properties
of mesenchymal stem cells derived from bone marrow and adipose tissue. Journal of Cellular
Biochemistry 99: 1285–1297.
Jacobson K, Sheets ED and Simson R 1995 Revisiting the fluid mosaic model of membranes. Science
(New York, N.Y.) 268: 1441–1442.
Jaffe LA and Terasaki M 1994 Structural changes in the endoplasmic reticulum of starfish oocytes
during meiotic maturation and fertilization. Developmental Biology 164: 579–587.

219
Jaiswal N, Haynesworth SE, Caplan AI and Bruder SP 1997 Osteogenic differentiation of purified,
culture-expanded human mesenchymal stem cells in vitro. Journal of Cellular Biochemistry 64:
295–312.
Jensen TP, Filoteo AG, Knopfel T and Empson RM 2007 Presynaptic plasma membrane Ca2+ ATPase
isoform 2a regulates excitatory synaptic transmission in rat hippocampal CA3. The Journal of
Physiology 579: 85–99.
Jing D, Baik AD, Lu XL, Zhou B, Lai X, Wang L, Luo E and Guo XE 2014 In situ intracellular calcium
oscillations in osteocytes in intact mouse long bones under dynamic mechanical loading. The
FASEB Journal 28: 1582–1592.
Jokerst JV, Lobovkina T, Zare RN and Gambhir SS 2011 Nanoparticle PEGylation for imaging and
therapy. Nanomedicine (London, England) 6: 715–728.
Jori FP, Napolitano MA, Melone MAB, Cipollaro M, Cascino A, Altucci L, Peluso G, Giordano A and
Galderisi U 2005 Molecular pathways involved in neural in vitro differentiation of marrow
stromal stem cells. Journal of Cellular Biochemistry 94: 645–655.
Kandel ER, Schwartz JH and Jessel TM 2000 Principles of Neural Science4 edition.. McGraw-Hill
Medical
Kaneko T, Tanaka H, Oyamada M, Kawata S and Takamatsu T 2000 Three distinct types of Ca(2+)
waves in Langendorff-perfused rat heart revealed by real-time confocal microscopy.
Circulation Research 86: 1093–1099.
Kao JPY, Li G and Auston DA 2010 Practical aspects of measuring intracellular calcium signals with
fluorescent indicators. Methods in Cell Biology 99: 113–152.
Karp G 2010 Biologie cellulaire et moléculaire: Concepts and experiments. De Boeck Supérieur
Kawano S, Otsu K, Kuruma A, Shoji S, Yanagida E, Muto Y, Yoshikawa F, Hirayama Y, Mikoshiba K
and Furuichi T 2006 ATP autocrine/paracrine signaling induces calcium oscillations and NFAT
activation in human mesenchymal stem cells. Cell Calcium 39: 313–324.
Kawano S, Otsu K, Shoji S, Yamagata K and Hiraoka M 2003a Ca(2+) oscillations regulated by Na(+)-
Ca(2+) exchanger and plasma membrane Ca(2+) pump induce fluctuations of membrane
currents and potentials in human mesenchymal stem cells. Cell Calcium 34: 145–156.
Kawano S, Otsu K, Shoji S, Yamagata K and Hiraoka M 2003b Ca(2+) oscillations regulated by Na(+)-
Ca(2+) exchanger and plasma membrane Ca(2+) pump induce fluctuations of membrane
currents and potentials in human mesenchymal stem cells. Cell Calcium 34: 145–156.
Kawano S, Shoji S, Ichinose S, Yamagata K, Tagami M and Hiraoka M 2002 Characterization of Ca(2+)
signaling pathways in human mesenchymal stem cells. Cell Calcium 32: 165–174.
Kew JNC and Davies CH 2010 Ion Channels: From Structure to Function. Oxford University Press
Khan H, Metra M, Blair JEA, Vogel M, Harinstein ME, Filippatos GS, Sabbah HN, Porchet H, Valentini
G and Gheorghiade M 2009 Istaroxime, a first in class new chemical entity exhibiting SERCA-2
activation and Na-K-ATPase inhibition: a new promising treatment for acute heart failure
syndromes?. Heart Failure Reviews 14: 277–287.
Khatib L, Golan DE and Cho M 2004 Physiologic electrical stimulation provokes intracellular calcium
increase mediated by phospholipase C activation in human osteoblasts. The FASEB Journal
Kim IS, Song JK, Song YM, Cho TH, Lee TH, Lim SS, Kim SJ and Hwang SJ 2009a Novel effect of biphasic
electric current on in vitro osteogenesis and cytokine production in human mesenchymal
stromal cells. Tissue Engineering. Part A 15: 2411–2422.

220
Kim T-J, Seong J, Ouyang M, Sun J, Lu S, Hong JP, Wang N and Wang Y 2009b Substrate rigidity
regulates Ca2+ oscillation via RhoA pathway in stem cells. Journal of cellular physiology 218:
285–293.
Kinosita K, Ashikawa I, Saita N, Yoshimura H, Itoh H, Nagayama K and Ikegami A 1988 Electroporation
of cell membrane visualized under a pulsed-laser fluorescence microscope.. Biophysical
Journal 53: 1015–1019.
Kinosita K and Tsong TY 1977 Formation and resealing of pores of controlled sizes in human
erythrocyte membrane. Nature 268: 438–441.
Klemm DJ, Leitner JW, Watson P, Nesterova A, Reusch JE-B, Goalstone ML and Draznin B 2001 Insulin-
induced Adipocyte Differentiation ACTIVATION OF CREB RESCUES ADIPOGENESIS FROM THE
ARREST CAUSED BY INHIBITION OF PRENYLATION. Journal of Biological Chemistry 276: 28430–
28435.
Koch GL 1987 Reticuloplasmins: a novel group of proteins in the endoplasmic reticulum. Journal of Cell
Science 87 ( Pt 4): 491–492.
Koshimizu TA, Van Goor F, Tomić M, Wong AO, Tanoue A, Tsujimoto G and Stojilkovic SS 2000
Characterization of calcium signaling by purinergic receptor-channels expressed in excitable
cells. Molecular Pharmacology 58: 936–945.
Kotnik T, Bobanović F and Miklavcˇicˇ D 1997 Sensitivity of transmembrane voltage induced by
applied electric fields—A theoretical analysis. Bioelectrochemistry and Bioenergetics 43: 285–
291.
Kotnik T and Miklavcic D 2000 Analytical description of transmembrane voltage induced by electric
fields on spheroidal cells. Biophysical Journal 79: 670–679.
Kotnik T, Pucihar G and Miklavcic D 2010 Induced transmembrane voltage and its correlation with
electroporation-mediated molecular transport. The Journal of Membrane Biology 236: 3–13.
Kreke MR, Sharp LA, Lee YW and Goldstein AS 2008 Effect of intermittent shear stress on
mechanotransductive signaling and osteoblastic differentiation of bone marrow stromal cells.
Tissue Engineering. Part A 14: 529–537.
Krieglstein J, Lippert K and Pöch G 1996 Apparent independent action of nimodipine and glutamate
antagonists to protect cultured neurons against glutamate-induced damage.
Neuropharmacology 35: 1737–1742.
Krutovskikh VA, Piccoli C, Yamasaki H and Yamasaki H 2002 Gap junction intercellular communication
propagates cell death in cancerous cells. Oncogene 21: 1989–1999.
Lan HY, Mu W, Tomita N, Huang XR, Li JH, Zhu H-J, Morishita R and Johnson RJ 2003 Inhibition of
renal fibrosis by gene transfer of inducible Smad7 using ultrasound-microbubble system in rat
UUO model. Journal of the American Society of Nephrology: JASN 14: 1535–1548.
Langenbach F and Handschel J 2013 Effects of dexamethasone, ascorbic acid and β-glycerophosphate
on the osteogenic differentiation of stem cells in vitro. Stem Cell Research & Therapy 4: 117.
Le Gall S, Neuhof A and Rapoport T 2004 The Endoplasmic Reticulum Membrane Is Permeable to Small
Molecules. Molecular Biology of the Cell 15: 447–455.
Lebovka NI, Bazhal MI and Vorobiev E 2001 Pulsed electric field breakage of cellular tissues:
visualisation of percolative properties. Innovative Food Science & Emerging Technologies 2:
113–125.
Lee HC 1993 Potentiation of calcium- and caffeine-induced calcium release by cyclic ADP-ribose. The
Journal of Biological Chemistry 268: 293–299.

221
Lee HC, Aarhus R, Graeff R, Gurnack ME and Walseth TF 1994 Cyclic ADP ribose activation of the
ryanodine receptor is mediated by calmodulin. Nature 370: 307–309.
Lee MG, Xu X, Zeng W, Diaz J, Kuo TH, Wuytack F, Racymaekers L and Muallem S 1997 Polarized
expression of Ca2+ pumps in pancreatic and salivary gland cells. Role in initiation and
propagation of [Ca2+]i waves. The Journal of Biological Chemistry 272: 15771–15776.
Lee RH, Kim B, Choi I, Kim H, Choi HS, Suh K, Bae YC and Jung JS 2004 Characterization and expression
analysis of mesenchymal stem cells from human bone marrow and adipose tissue. Cellular
Physiology and Biochemistry: International Journal of Experimental Cellular Physiology,
Biochemistry, and Pharmacology 14: 311–324.
Lefkimmiatis K, Srikanthan M, Maiellaro I, Moyer MP, Curci S and Hofer AM 2009 Store-operated
cyclic AMP signalling mediated by STIM1. Nature Cell Biology 11: 433–442.
Levin M 2007 Large-scale biophysics: ion flows and regeneration. Trends in Cell Biology 17: 261–270.
Levine ZA and Vernier PT 2010 Life cycle of an electropore: field-dependent and field-independent
steps in pore creation and annihilation. The Journal of Membrane Biology 236: 27–36.
Lewis RS 2003 Calcium oscillations in T-cells: mechanisms and consequences for gene expression.
Biochemical Society Transactions 31: 925–929.
Li L, Bennett SAL and Wang L 2012 Role of E-cadherin and other cell adhesion molecules in survival
and differentiation of human pluripotent stem cells. Cell Adhesion & Migration 6: 59–70.
Li YJ, Batra NN, You L, Meier SC, Coe IA, Yellowley CE and Jacobs CR 2004 Oscillatory fluid flow affects
human marrow stromal cell proliferation and differentiation. Journal of Orthopaedic Research:
Official Publication of the Orthopaedic Research Society 22: 1283–1289.
Lindenburg L and Merkx M 2014 Engineering genetically encoded FRET sensors. Sensors (Basel,
Switzerland) 14: 11691–11713.
Lindroos B, Suuronen R and Miettinen S 2011 The potential of adipose stem cells in regenerative
medicine. Stem Cell Reviews 7: 269–291.
Liou J, Kim ML, Heo WD, Jones JT, Myers JW, Ferrell JE and Meyer T 2005 STIM is a Ca2+ sensor
essential for Ca2+-store-depletion-triggered Ca2+ influx. Current biology: CB 15: 1235–1241.
Lipp P and Niggli E 1996 A hierarchical concept of cellular and subcellular Ca2+-signalling. Progress in
Biophysics and Molecular Biology 65: 265–296.
Litsky ML and Pfeiffer DR 1997 Regulation of the mitochondrial Ca2+ uniporter by external adenine
nucleotides: the uniporter behaves like a gated channel which is regulated by nucleotides and
divalent cations. Biochemistry 36: 7071–7080.
Liu LH, Paul RJ, Sutliff RL, Miller ML, Lorenz JN, Pun RY, Duffy JJ, Doetschman T, Kimura Y, MacLennan
DH, Hoying JB and Shull GE 1997 Defective endothelium-dependent relaxation of vascular
smooth muscle and endothelial cell Ca2+ signaling in mice lacking sarco(endo)plasmic
reticulum Ca2+-ATPase isoform 3. The Journal of Biological Chemistry 272: 30538–30545.
Liu Q, Cheng G, Wang Z, Zhan S, Xiong B and Zhao X 2015 Bone marrow-derived mesenchymal stem
cells differentiate into nerve-like cells in vitro after transfection with brain-derived
neurotrophic factor gene. In Vitro Cellular & Developmental Biology. Animal 51: 319–327.
Lo MMS and Tsong TY 1989 Producing Monoclonal Antibodies by Electrofusion. In Neumann E, Sowers
AE, and Jordan CA (eds.) Electroporation and Electrofusion in Cell Biology pp. 259–270. Springer
US, Boston, MA
Lodish H, Berk A, Kaiser CA, Krieger M, Scott MP, Bretscher A, Ploegh H and Matsudaira P 2007
Molecular Cell Biology6th edition.. W. H. Freeman, New York
222
Lodish H, Berk A, Zipursky SL, Matsudaira P, Baltimore D and Darnell J 2000a Biomembranes:
Structural Organization and Basic Functions
Lodish H, Berk A, Zipursky SL, Matsudaira P, Baltimore D and Darnell J 2000b Molecular Cell Biology,
4th edition.. W. H. Freeman
Loeb J 1904 The Recent Development of Biology. Science 20: 777–786.
Lorich DG, Brighton CT, Gupta R, Corsetti JR, Levine SE, Gelb ID, Seldes R and Pollack SR 1998
Biochemical pathway mediating the response of bone cells to capacitive coupling. Clinical
Orthopaedics and Related Research: 246–256.
Lucas ML and Heller R 2003 IL-12 gene therapy using an electrically mediated nonviral approach
reduces metastatic growth of melanoma. DNA and cell biology 22: 755–763.
Luengo E, Martínez JM, Coustets M, Álvarez I, Teissié J, Rols M-P and Raso J 2015 A Comparative
Study on the Effects of Millisecond- and Microsecond-Pulsed Electric Field Treatments on the
Permeabilization and Extraction of Pigments from Chlorella vulgaris. The Journal of Membrane
Biology 248: 883–891.
Luttrell LM 2002 Activation and targeting of mitogen-activated protein kinases by G-protein-coupled
receptors. Canadian Journal of Physiology and Pharmacology 80: 375–382.
Lytton J 2007 Na+/Ca2+ exchangers: three mammalian gene families control Ca2+ transport.
Biochemical Journal 406: 365–382.
MacLennan DH, Rice WJ and Green NM 1997 The Mechanism of Ca2+ Transport by
Sarco(Endo)plasmic Reticulum Ca2+-ATPases. Journal of Biological Chemistry 272: 28815–
28818.
Malaval L, Liu F, Roche P and Aubin JE 1999 Kinetics of osteoprogenitor proliferation and osteoblast
differentiation in vitro. Journal of Cellular Biochemistry 74: 616–627.
Malgieri A, Kantzari E, Patrizi MP and Gambardella S 2010 Bone marrow and umbilical cord blood
human mesenchymal stem cells: state of the art. International Journal of Clinical and
Experimental Medicine 3: 248–269.
Maltman DJ, Hardy SA and Przyborski SA 2011 Role of mesenchymal stem cells in neurogenesis and
nervous system repair. Neurochemistry International 59: 347–356.
Mank M, Reiff DF, Heim N, Friedrich MW, Borst A and Griesbeck O 2006 A FRET-based calcium
biosensor with fast signal kinetics and high fluorescence change. Biophysical Journal 90: 1790–
1796.
Mansilla MC, Cybulski LE, Albanesi D and de Mendoza D 2004 Control of Membrane Lipid Fluidity by
Molecular Thermosensors. Journal of Bacteriology 186: 6681–6688.
Marcum JM, Dedman JR, Brinkley BR and Means AR 1978 Control of microtubule assembly-
disassembly by calcium-dependent regulator protein. Proceedings of the National Academy of
Sciences of the United States of America 75: 3771–3775.
Mareschi K, Novara M, Rustichelli D, Ferrero I, Guido D, Carbone E, Medico E, Madon E, Vercelli A
and Fagioli F 2006 Neural differentiation of human mesenchymal stem cells: Evidence for
expression of neural markers and eag K+ channel types. Experimental Hematology 34: 1563–
1572.
Marieb EN and Hoehn K 2006 Human Anatomy And Physiology7 Pck edition.. Pearson Prentice Hall
Marion NW and Mao JJ 2006 Mesenchymal stem cells and tissue engineering. Methods in Enzymology
420: 339–361.
Mark MD and Herlitze S 2000 G-protein mediated gating of inward-rectifier K+ channels. European
Journal of Biochemistry 267: 5830–5836.

223
Marsh D 2007 Lateral pressure profile, spontaneous curvature frustration, and the incorporation and
conformation of proteins in membranes. Biophysical Journal 93: 3884–3899.
Marshall CJ 1995 Specificity of receptor tyrosine kinase signaling: Transient versus sustained
extracellular signal-regulated kinase activation. Cell 80: 179–185.
Mauroy C, Portet T, Winterhalder M, Bellard E, Blache M-C, Teissié J, Zumbusch A and Rols M-P 2012
Giant lipid vesicles under electric field pulses assessed by non invasive imaging.
Bioelectrochemistry (Amsterdam, Netherlands) 87: 253–259.
Maxfield FR and Tabas I 2005 Role of cholesterol and lipid organization in disease. Nature 438: 612–
621.
McCormack JG, Halestrap AP and Denton RM 1990 Role of calcium ions in regulation of mammalian
intramitochondrial metabolism. Physiological Reviews 70: 391–425.
Meer G van and Lisman Q 2002 Sphingolipid Transport: Rafts and Translocators. Journal of Biological
Chemistry 277: 25855–25858.
van Meer G, Voelker DR and Feigenson GW 2008 Membrane lipids: where they are and how they
behave. Nature Reviews Molecular Cell Biology 9: 112–124.
Meglič SH, Levičnik E, Luengo E, Raso J and Miklavčič D 2016 The Effect of Temperature on Protein
Extraction by Electroporation and on Bacterial Viability. In Jarm T and Kramar P (eds.) 1st World
Congress on Electroporation and Pulsed Electric Fields in Biology, Medicine and Food &
Environmental Technologies pp. 175–178. Springer Singapore, Singapore
Mehlmann LM, Terasaki M, Jaffe LA and Kline D 1995 Reorganization of the endoplasmic reticulum
during meiotic maturation of the mouse oocyte. Developmental Biology 170: 607–615.
Mekid H and Mir LM 2000 In vivo cell electrofusion. Biochimica et Biophysica Acta (BBA) - General
Subjects 1524: 118–130.
Meldolesi J and Pozzan T 1998 The endoplasmic reticulum Ca2+ store: a view from the lumen. Trends
in Biochemical Sciences 23: 10–14.
Menick DR, Renaud L, Buchholz A, Müller JG, Zhou H, Kappler CS, Kubalak SW, Conway SJ and Xu L
2007 Regulation of Ncx1 gene expression in the normal and hypertrophic heart. Annals of the
New York Academy of Sciences 1099: 195–203.
Ménorval M-A de, Mir LM, Fernández ML and Reigada R 2012 Effects of Dimethyl Sulfoxide in
Cholesterol-Containing Lipid Membranes: A Comparative Study of Experiments In Silico and
with Cells. PLOS ONE 7: e41733.
Metuzals J, Chang D, Hammar K and Reese TS 1997 Organization of the cortical endoplasmic reticulum
in the squid giant axon. Journal of Neurocytology 26: 529–539.
Michael DH and O’Neill ME 1970 Electrohydrodynamic instability in plane layers of fluid. Journal of
Fluid Mechanics 41: 571–580.
Michelangeli F and East JM 2011 A diversity of SERCA Ca2+ pump inhibitors. Biochemical Society
Transactions 39: 789–797.
Miklavčič D, Mali B, Kos B, Heller R and Serša G 2014 Electrochemotherapy: from the drawing board
into medical practice. BioMedical Engineering OnLine 13: 29.
Mir LM, Banoun H and Paoletti C 1988 Introduction of definite amounts of nonpermeant molecules
into living cells after electropermeabilization: direct access to the cytosol. Experimental Cell
Research 175: 15–25.
Mir LM, Belehradek M, Domenge C, Orlowski S, Poddevin B, Belehradek J, Schwaab G, Luboinski B
and Paoletti C 1991 [Electrochemotherapy, a new antitumor treatment: first clinical trial].
Comptes rendus de l’Académie des sciences. Série III, Sciences de la vie 313: 613–618.

224
Mir LM, Bureau MF, Gehl J, Rangara R, Rouy D, Caillaud J-M, Delaere P, Branellec D, Schwartz B and
Scherman D 1999 High-efficiency gene transfer into skeletal muscle mediated by electric
pulses. Proceedings of the National Academy of Sciences of the United States of America 96:
4262–4267.
Mir LM, Gehl J, Sersa G, Collins CG, Garbay J-R, Billard V, Geertsen PF, Rudolf Z, O’Sullivan GC and
Marty M 2006 Standard operating procedures of the electrochemotherapy: Instructions for
the use of bleomycin or cisplatin administered either systemically or locally and electric pulses
delivered by the CliniporatorTM by means of invasive or non-invasive electrodes. European
Journal of Cancer Supplements 4: 14–25.
Mir LM, Moller PH, André F and Gehl J 2005 Electric pulse-mediated gene delivery to various animal
tissues. Advances in Genetics 54: 83–114.
Mir LM, Orlowski S, Poddevin B and Belehradek J 1992 Electrochemotherapy tumor treatment is
improved by interleukin-2 stimulation of the host’s defenses. European Cytokine Network 3:
331–334.
Miranti CK and Brugge JS 2002 Sensing the environment: a historical perspective on integrin signal
transduction. Nature Cell Biology 4: E83-90.
Miranville A, Heeschen C, Sengenès C, Curat CA, Busse R and Bouloumié A 2004 Improvement of
postnatal neovascularization by human adipose tissue-derived stem cells. Circulation 110:
349–355.
Miyawaki A, Llopis J, Heim R, McCaffery JM, Adams JA, Ikura M and Tsien RY 1997 Fluorescent
indicators for Ca2+based on green fluorescent proteins and calmodulin. Nature 388: 882–887.
Mohr JC, de Pablo JJ and Palecek SP 2006 Electroporation of human embryonic stem cells: Small and
macromolecule loading and DNA transfection. Biotechnology Progress 22: 825–834.
Montel-Hagen A, Kinet S, Manel N, Mongellaz C, Prohaska R, Battini J-L, Delaunay J, Sitbon M and
Taylor N 2008 Erythrocyte Glut1 Triggers Dehydroascorbic Acid Uptake in Mammals Unable to
Synthesize Vitamin C. Cell 132: 1039–1048.
Montero M, Lobatón CD, Hernández-Sanmiguel E, Santodomingo J, Vay L, Moreno A and Alvarez J
2004 Direct activation of the mitochondrial calcium uniporter by natural plant flavonoids. The
Biochemical Journal 384: 19–24.
Moreau B, Nelson C and Parekh AB 2006 Biphasic regulation of mitochondrial Ca2+ uptake by cytosolic
Ca2+ concentration. Current biology: CB 16: 1672–1677.
Morth JP, Pedersen BP, Buch-Pedersen MJ, Andersen JP, Vilsen B, Palmgren MG and Nissen P 2011
A structural overview of the plasma membrane Na+,K+-ATPase and H+-ATPase ion pumps.
Nature Reviews Molecular Cell Biology 12: 60–70.
MÜLLER DJ, WU N and PALCZEWSKI K 2008 Vertebrate Membrane Proteins: Structure, Function, and
Insights from Biophysical Approaches. Pharmacological reviews 60: 43–78.
Munro S and Pelham HR 1987 A C-terminal signal prevents secretion of luminal ER proteins. Cell 48:
899–907.
Nagai T, Sawano A, Park ES and Miyawaki A 2001 Circularly permuted green fluorescent proteins
engineered to sense Ca2+. Proceedings of the National Academy of Sciences of the United
States of America 98: 3197–3202.
Nagayama M, Uchida T and Gohara K 2007 Temporal and spatial variations of lipid droplets during
adipocyte division and differentiation. Journal of Lipid Research 48: 9–18.
Nakai J, Ohkura M and Imoto K 2001 A high signal-to-noise Ca(2+) probe composed of a single green
fluorescent protein. Nature Biotechnology 19: 137–141.

225
Nash MS, Young KW, John Challiss RA and Nahorski SR 2001 Intracellular signalling: Receptor-specific
messenger oscillations. Nature 413: 381–382.
Neher E and Sakmann B 1976 Single-channel currents recorded from membrane of denervated frog
muscle fibres. Nature 260: 799–802.
Nehls S, Snapp EL, Cole NB, Zaal KJ, Kenworthy AK, Roberts TH, Ellenberg J, Presley JF, Siggia E and
Lippincott-Schwartz J 2000 Dynamics and retention of misfolded proteins in native ER
membranes. Nature Cell Biology 2: 288–295.
Neumann E, Kakorin S and Toensing K 1999 Fundamentals of electroporative delivery of drugs and
genes. Bioelectrochemistry and Bioenergetics (Lausanne, Switzerland) 48: 3–16.
Neumann E and Rosenheck K 1972 Permeability changes induced by electric impulses in vesicular
membranes. The Journal of Membrane Biology 10: 279–290.
Neumann E, Schaefer-Ridder M, Wang Y and Hofschneider PH 1982 Gene transfer into mouse lyoma
cells by electroporation in high electric fields. The EMBO journal 1: 841–845.
Newman CMH and Bettinger T 2007 Gene therapy progress and prospects: Ultrasound for gene
transfer. Gene Therapy 14: 465–475.
Nicolson GL 2014 The Fluid—Mosaic Model of Membrane Structure: Still relevant to understanding
the structure, function and dynamics of biological membranes after more than 40 years.
Biochimica et Biophysica Acta (BBA) - Biomembranes 1838: 1451–1466.
Niemelä PS, Ollila S, Hyvönen MT, Karttunen M and Vattulainen I 2007 Assessing the Nature of Lipid
Raft Membranes. PLoS Computational Biology 3
Noguchi N, Takasawa S, Nata K, Tohgo A, Kato I, Ikehata F, Yonekura H and Okamoto H 1997 Cyclic
ADP-ribose binds to FK506-binding protein 12.6 to release Ca2+ from islet microsomes. The
Journal of Biological Chemistry 272: 3133–3136.
Nordenfelt P and Tapper H 2011 Phagosome dynamics during phagocytosis by neutrophils. Journal of
Leukocyte Biology 90: 271–284.
Norton WT and Cammer W 1984 Isolation and Characterization of Myelin. In Morell P (ed.) Myelin pp.
147–195. Springer US
O’Brien TW 2003 Properties of human mitochondrial ribosomes. IUBMB life 55: 505–513.
Odermatt A, Barton K, Khanna VK, Mathieu J, Escolar D, Kuntzer T, Karpati G and MacLennan DH
2000 The mutation of Pro789 to Leu reduces the activity of the fast-twitch skeletal muscle
sarco(endo)plasmic reticulum Ca2+ ATPase (SERCA1) and is associated with Brody disease.
Human Genetics 106: 482–491.
Odermatt A, Taschner PE, Khanna VK, Busch HF, Karpati G, Jablecki CK, Breuning MH and MacLennan
DH 1996 Mutations in the gene-encoding SERCA1, the fast-twitch skeletal muscle sarcoplasmic
reticulum Ca2+ ATPase, are associated with Brody disease. Nature Genetics 14: 191–194.
Ohvo-Rekilä H, Ramstedt B, Leppimäki P and Slotte JP 2002 Cholesterol interactions with
phospholipids in membranes. Progress in Lipid Research 41: 66–97.
Olivotto M, Arcangeli A, Carlà M and Wanke E 1996 Electric fields at the plasma membrane level: A
neglected element in the mechanisms of cell signalling. BioEssays 18: 495–504.
Orlowski S, Belehradek J, Paoletti C and Mir LM 1988 Transient electropermeabilization of cells in
culture. Increase of the cytotoxicity of anticancer drugs. Biochemical Pharmacology 37: 4727–
4733.
Ortiz-Gonzalez XR, Keene CD, Verfaillie CM and Low WC 2004 Neural induction of adult bone marrow
and umbilical cord stem cells. Current Neurovascular Research 1: 207–213.

226
Ostrovskaya O, Goyal R, Osman N, McAllister CE, Pessah IN, Hume JR and Wilson SM 2007 Inhibition
of ryanodine receptors by 4-(2-aminopropyl)-3,5-dichloro-N,N-dimethylaniline (FLA 365) in
canine pulmonary arterial smooth muscle cells. The Journal of Pharmacology and Experimental
Therapeutics 323: 381–390.
Overton CE 1895 Ueber die osmotischen eigenschaften der lebenden pflanzen- und tierzelle. Fäsi &
Beer
Owen TA, Aronow M, Shalhoub V, Barone LM, Wilming L, Tassinari MS, Kennedy MB, Pockwinse S,
Lian JB and Stein GS 1990 Progressive development of the rat osteoblast phenotype in vitro:
reciprocal relationships in expression of genes associated with osteoblast proliferation and
differentiation during formation of the bone extracellular matrix. Journal of Cellular Physiology
143: 420–430.
Pairault J and Green H 1979 A study of the adipose conversion of suspended 3T3 cells by using
glycerophosphate dehydrogenase as differentiation marker. Proceedings of the National
Academy of Sciences of the United States of America 76: 5138–5142.
Pakhomov AG, Gianulis E, Vernier PT, Semenov I, Xiao S and Pakhomova ON 2015 Multiple
nanosecond electric pulses increase the number but not the size of long-lived nanopores in
the cell membrane. Biochimica Et Biophysica Acta 1848: 958–966.
Pakhomov AG, Shevin R, White JA, Kolb JF, Pakhomova ON, Joshi RP and Schoenbach KH 2007
Membrane permeabilization and cell damage by ultrashort electric field shocks. Archives of
Biochemistry and Biophysics 465: 109–118.
Palecek J, Lips MB and Keller BU 1999 Calcium dynamics and buffering in motoneurones of the mouse
spinal cord. The Journal of Physiology 520: 485–502.
Pall ML 2013 Electromagnetic fields act via activation of voltage-gated calcium channels to produce
beneficial or adverse effects. Journal of Cellular and Molecular Medicine 17: 958–965.
Palmer AE, Giacomello M, Kortemme T, Hires SA, Lev-Ram V, Baker D and Tsien RY 2006 Ca2+
indicators based on computationally redesigned calmodulin-peptide pairs. Chemistry &
Biology 13: 521–530.
Palmer AE, Jin C, Reed JC and Tsien RY 2004 Bcl-2-mediated alterations in endoplasmic reticulum Ca2+
analyzed with an improved genetically encoded fluorescent sensor. Proceedings of the
National Academy of Sciences of the United States of America 101: 17404–17409.
Papahadjopoulos D, Nir S and Ohki S 1972 Permeability properties of phospholipid membranes: Effect
of cholesterol and temperature. Biochimica et Biophysica Acta (BBA) - Biomembranes 266:
561–583.
Paredes RM, Etzler JC, Watts LT and Lechleiter JD 2008 Chemical Calcium Indicators. Methods (San
Diego, Calif.) 46: 143–151.
Parekh AB and Putney JW 2005 Store-operated calcium channels. Physiological Reviews 85: 757–810.
Parker I, Choi J and Yao Y 1996 Elementary events of InsP3-induced Ca2+ liberation in Xenopus
oocytes: hot spots, puffs and blips. Cell Calcium 20: 105–121.
Parri HR, Gould TM and Crunelli V 2001 Spontaneous astrocytic Ca2+ oscillations in situ drive NMDAR-
mediated neuronal excitation. Nature Neuroscience 4: 803–812.
Parsegian VA 1975 Ion-Membrane Interactions as Structural Forces. Annals of the New York Academy
of Sciences 264: 161–174.
Patel S and Docampo R 2010 Acidic calcium stores open for business: expanding the potential for
intracellular Ca2+ signaling. Trends in Cell Biology 20: 277–286.

227
Patergnani S, Suski JM, Agnoletto C, Bononi A, Bonora M, De Marchi E, Giorgi C, Marchi S, Missiroli
S, Poletti F, Rimessi A, Duszynski J, Wieckowski MR and Pinton P 2011 Calcium signaling
around Mitochondria Associated Membranes (MAMs). Cell Communication and Signaling 9:
19.
Pauly H and Schwan HP 1959 [Impendance of a suspension of ball-shaped particles with a shell; a
model for the dielectric behavior of cell suspensions and protein solutions]. Zeitschrift Für
Naturforschung. Teil B: Chemie, Biochemie, Biophysik, Biologie 14B: 125–131.
Pavlin M, Pavselj N and Miklavcic D 2002 Dependence of induced transmembrane potential on cell
density, arrangement, and cell position inside a cell system. IEEE transactions on bio-medical
engineering 49: 605–612.
Pérez Koldenkova V and Nagai T 2013 Genetically encoded Ca(2+) indicators: properties and
evaluation. Biochimica Et Biophysica Acta 1833: 1787–1797.
Perez-Reyes E and Lory P 2006 Molecular biology of T-type calcium channels. CNS & neurological
disorders drug targets 5: 605–609.
Perica K, Varela JC, Oelke M and Schneck J 2015 Adoptive T Cell Immunotherapy for Cancer. Rambam
Maimonides Medical Journal 6
Perkins G, Renken C, Martone ME, Young SJ, Ellisman M and Frey T 1997 Electron tomography of
neuronal mitochondria: three-dimensional structure and organization of cristae and
membrane contacts. Journal of Structural Biology 119: 260–272.
Petecchia L, Sbrana F, Utzeri R, Vercellino M, Usai C, Visai L, Vassalli M and Gavazzo P 2015 Electro-
magnetic field promotes osteogenic differentiation of BM-hMSCs through a selective action
on Ca2+-related mechanisms. Scientific Reports 5
Peters MA, Teramoto T, White JQ, Iwasaki K and Jorgensen EM 2007 A Calcium Wave Mediated by
Gap Junctions Coordinates a Rhythmic Behavior in C. elegans. Current Biology 17: 1601–1608.
Petersen OH, Michalak M and Verkhratsky A 2005 Calcium signalling: past, present and future. Cell
Calcium 38: 161–169.
Philipson KD, Longoni S and Ward R 1988 Purification of the cardiac Na+-Ca2+ exchange protein.
Biochimica Et Biophysica Acta 945: 298–306.
Piersma AH, Brockbank KG, Ploemacher RE, van Vliet E, Brakel-van Peer KM and Visser PJ 1985
Characterization of fibroblastic stromal cells from murine bone marrow. Experimental
Hematology 13: 237–243.
Pike LJ 2003 Lipid rafts bringing order to chaos. Journal of Lipid Research 44: 655–667.
Pinton P, Pozzan T and Rizzuto R 1998 The Golgi apparatus is an inositol 1,4,5-trisphosphate-sensitive
Ca2+ store, with functional properties distinct from those of the endoplasmic reticulum.. The
EMBO Journal 17: 5298–5308.
Pittenger MF, Mackay AM, Beck SC, Jaiswal RK, Douglas R, Mosca JD, Moorman MA, Simonetti DW,
Craig S and Marshak DR 1999 Multilineage Potential of Adult Human Mesenchymal Stem Cells.
Science 284: 143–147.
Poddevin B, Orlowski S, Belehradek J and Mir LM 1991 Very high cytotoxicity of bleomycin introduced
into the cytosol of cells in culture. Biochemical Pharmacology 42 Suppl: S67-75.
Polak A, Bonhenry D, Dehez F, Kramar P, Miklavčič D and Tarek M 2013 On the electroporation
thresholds of lipid bilayers: molecular dynamics simulation investigations. The Journal of
Membrane Biology 246: 843–850.
Porumb T, Yau P, Harvey TS and Ikura M 1994 A calmodulin-target peptide hybrid molecule with
unique calcium-binding properties. Protein Engineering 7: 109–115.

228
Potter H and Heller R 2011 Transfection by electroporation. Current Protocols in Cell Biology / Editorial
Board, Juan S. Bonifacino ... [et Al.] Chapter 20: Unit20.5.
Prins D and Michalak M 2011 Organellar Calcium Buffers. Cold Spring Harbor Perspectives in Biology
3: a004069.
Pucihar G, Kotnik T, Teissié J and Miklavčič D 2007 Electropermeabilization of dense cell suspensions.
European Biophysics Journal 36: 173–185.
Pullar CE 2011 The Physiology of Bioelectricity in Development, Tissue Regeneration and Cancer. CRC
Press
Purves D, Augustine GJ, Fitzpatrick D, Katz LC, LaMantia A-S, McNamara JO and Williams SM 2001
Ligand-Gated Ion Channels
Putney JW 2009 SOC: now also store-operated cyclase. Nature Cell Biology 11: 381–382.
Qu B, Al-Ansary D, Kummerow C, Hoth M and Schwarz EC 2011 ORAI-mediated calcium influx in T cell
proliferation, apoptosis and tolerance. Cell Calcium 50: 261–269.
Quarles LD, Yohay DA, Lever LW, Caton R and Wenstrup RJ 1992 Distinct proliferative and
differentiated stages of murine MC3T3-E1 cells in culture: an in vitro model of osteoblast
development. Journal of Bone and Mineral Research: The Official Journal of the American
Society for Bone and Mineral Research 7: 683–692.
Ratto GM, Payne R, Owen WG and Tsien RY 1988 The concentration of cytosolic free calcium in
vertebrate rod outer segments measured with fura-2. The Journal of Neuroscience: The Official
Journal of the Society for Neuroscience 8: 3240–3246.
Reddy A, Caler EV and Andrews NW 2001 Plasma membrane repair is mediated by Ca(2+)-regulated
exocytosis of lysosomes. Cell 106: 157–169.
Remm M and Sonnhammer E 2000 Classification of Transmembrane Protein Families in the
Caenorhabditis elegans Genome and Identification of Human Orthologs. Genome Research 10:
1679–1689.
Rems L, Ušaj M, Kandušer M, Reberšek M, Miklavčič D and Pucihar G 2013 Cell electrofusion using
nanosecond electric pulses. Scientific Reports 3
Resende RR, Adhikari A, da Costa JL, Lorençon E, Ladeira MS, Guatimosim S, Kihara AH and Ladeira
LO 2010 Influence of spontaneous calcium events on cell-cycle progression in embryonal
carcinoma and adult stem cells. Biochimica Et Biophysica Acta 1803: 246–260.
Resh MD 1999 Fatty acylation of proteins: new insights into membrane targeting of myristoylated and
palmitoylated proteins. Biochimica et Biophysica Acta (BBA) - Molecular Cell Research 1451:
1–16.
Ridgway EB and Ashley CC 1967 Calcium transients in single muscle fibers. Biochemical and Biophysical
Research Communications 29: 229–234.
Riley RT, Enongene E, Voss KA, Norred WP, Meredith FI, Sharma RP, Spitsbergen J, Williams DE,
Carlson DB and Merrill AH 2001 Sphingolipid perturbations as mechanisms for fumonisin
carcinogenesis.. Environmental Health Perspectives 109: 301–308.
Rizzuto R, Marchi S, Bonora M, Aguiari P, Bononi A, De Stefani D, Giorgi C, Leo S, Rimessi A, Siviero
R, Zecchini E and Pinton P 2009 Ca2+ transfer from the ER to mitochondria: When, how and
why. Biochimica et Biophysica Acta (BBA) - Bioenergetics 1787: 1342–1351.
Robb-Gaspers LD, Rutter GA, Burnett P, Hajnóczky G, Denton RM and Thomas AP 1998 Coupling
between cytosolic and mitochondrial calcium oscillations: role in the regulation of hepatic
metabolism. Biochimica Et Biophysica Acta 1366: 17–32.

229
Robertson JD 1959 The ultrastructure of cell membranes and their derivatives. Biochemical Society
Symposium 16: 3–43.
Robertson JD 1960 The molecular structure and contact relationships of cell membranes. Progress in
Biophysics and Molecular Biology 10: 343–418.
Rodan GA and Noda M 1991 Gene expression in osteoblastic cells. Critical Reviews in Eukaryotic Gene
Expression 1: 85–98.
Rodney GG, Wilson GM and Schneider MF 2005 A Calmodulin Binding Domain of RyR Increases
Activation of Spontaneous Ca2+ Sparks in Frog Skeletal Muscle. Journal of Biological Chemistry
280: 11713–11722.
Rols MP, Delteil C, Serin G and Teissié J 1994 Temperature effects on electrotransfection of
mammalian cells.. Nucleic Acids Research 22: 540.
Rols MP and Teissié J 1990 Electropermeabilization of mammalian cells. Quantitative analysis of the
phenomenon.. Biophysical Journal 58: 1089–1098.
Rooney TA and Thomas AP 1993 Intracellular calcium waves generated by ins(1,4,5)P3-dependent
mechanisms. Cell Calcium 14: 674–690.
Rosen D and Sutton AM 1968 The effects of a direct current potential bias on the electrical properties
of bimolecular lipid membranes. Biochimica et Biophysica Acta (BBA) - Biomembranes 163:
226–233.
Rosen ED and Spiegelman BM 2000 Molecular Regulation of Adipogenesis. Annual Review of Cell and
Developmental Biology 16: 145–171.
Roux S, Bernat C, Al-Sakere B, Ghiringhelli F, Opolon P, Carpentier AF, Zitvogel L, Mir LM and Robert
C 2008 Tumor destruction using electrochemotherapy followed by CpG oligodeoxynucleotide
injection induces distant tumor responses. Cancer immunology, immunotherapy: CII 57: 1291–
1300.
Roy A and Wonderlin WF 2003 The permeability of the endoplasmic reticulum is dynamically coupled
to protein synthesis. The Journal of Biological Chemistry 278: 4397–4403.
Saito K, Chang Y-F, Horikawa K, Hatsugai N, Higuchi Y, Hashida M, Yoshida Y, Matsuda T, Arai Y and
Nagai T 2012 Luminescent proteins for high-speed single-cell and whole-body imaging. Nature
Communications 3: 1262.
Saito K, Hatsugai N, Horikawa K, Kobayashi K, Matsu-Ura T, Mikoshiba K and Nagai T 2010 Auto-
luminescent genetically-encoded ratiometric indicator for real-time Ca2+ imaging at the single
cell level. PloS One 5: e9935.
Saitoh N, Oritani K, Saito K, Yokota T, Ichii M, Sudo T, Fujita N, Nakajima K, Okada M and Kanakura
Y 2011 Identification of functional domains and novel binding partners of STIM proteins.
Journal of Cellular Biochemistry 112: 147–156.
Sale AJ and Hamilton WA 1968 Effects of high electric fields on micro-organisms. 3. Lysis of
erythrocytes and protoplasts. Biochimica Et Biophysica Acta 163: 37–43.
Santo-Domingo J and Demaurex N 2010 Calcium uptake mechanisms of mitochondria. Biochimica Et
Biophysica Acta 1797: 907–912.
Satkauskas S, Bureau MF, Puc M, Mahfoudi A, Scherman D, Miklavcic D and Mir LM 2002 Mechanisms
of in vivo DNA electrotransfer: respective contributions of cell electropermeabilization and
DNA electrophoresis. Molecular Therapy: The Journal of the American Society of Gene Therapy
5: 133–140.

230
Saunders CM, Larman MG, Parrington J, Cox LJ, Royse J, Blayney LM, Swann K and Lai FA 2002 PLCζ:
a sperm-specific trigger of Ca2+ oscillations in eggs and embryo development. Development
129: 3533–3544.
Schantz AR 1985 Cytosolic free calcium-ion concentration in cleaving embryonic cells of Oryzias latipes
measured with calcium-selective microelectrodes. The Journal of Cell Biology 100: 947–954.
Scheurich P, Zimmermann U, Mischel M and Lamprecht I 1980 Membrane fusion and deformation of
red blood cells by electric fields. Zeitschrift Für Naturforschung. Section C: Biosciences 35:
1081–1085.
Scheurich P, Zimmermann U and Schnabl H 1981 Electrically Stimulated Fusion of Different Plant Cell
Protoplasts 12. Plant Physiology 67: 849–853.
Schnitzer JE, McIntosh DP, Dvorak AM, Liu J and Oh P 1995 Separation of caveolae from associated
microdomains of GPI-anchored proteins. Science (New York, N.Y.) 269: 1435–1439.
Schoenbach KH, Beebe SJ and Buescher ES 2001a Intracellular effect of ultrashort electrical pulses.
Bioelectromagnetics 22: 440–448.
Schoenbach KH, Beebe SJ and Buescher ES 2001b Intracellular effect of ultrashort electrical pulses.
Bioelectromagnetics 22: 440–448.
Schoenbach KH, Joshi RP, Kolb JF, Chen N, Stacey M, Blackmore PF, Buescher ES and Beebe SJ 2004
Ultrashort electrical pulses open a new gateway into biological cells. Proceedings of the IEEE
92: 1122–1137.
Schoenbach KH, Joshi RP, Stark RH, Dobbs FC and Beebe SJ 2000 Bacterial decontamination of liquids
with pulsed electric fields. IEEE Transactions on Dielectrics and Electrical Insulation 7: 637–645.
Schultheiss C, Bluhm H, Mayer H-G, Kern M, Michelberger T and Witte G 2002 Processing of sugar
beets with pulsed-electric fields. IEEE Transactions on Plasma Science 30: 1547–1551.
Schwan HP 1957 Electrical properties of tissue and cell suspensions. Advances in Biological and
Medical Physics 5: 147–209.
Scott MA, Nguyen VT, Levi B and James AW 2011 Current Methods of Adipogenic Differentiation of
Mesenchymal Stem Cells. Stem Cells and Development 20: 1793–1804.
Sekiya I, Larson BL, Vuoristo JT, Cui J-G and Prockop DJ 2004 Adipogenic differentiation of human
adult stem cells from bone marrow stroma (MSCs). Journal of Bone and Mineral Research: The
Official Journal of the American Society for Bone and Mineral Research 19: 256–264.
Seo MJ, Suh SY, Bae YC and Jung JS 2005 Differentiation of human adipose stromal cells into hepatic
lineage in vitro and in vivo. Biochemical and Biophysical Research Communications 328: 258–
264.
Serhan CN, Haeggström JZ and Leslie CC 1996 Lipid mediator networks in cell signaling: update and
impact of cytokines. FASEB journal: official publication of the Federation of American Societies
for Experimental Biology 10: 1147–1158.
Sersa G, Kranjc S, Scancar J, Krzan M and Cemazar M 2010 Electrochemotherapy of mouse sarcoma
tumors using electric pulse trains with repetition frequencies of 1 Hz and 5 kHz. The Journal of
Membrane Biology 236: 155–162.
Sharon N 1987 Bacterial lectins, cell-cell recognition and infectious disease. FEBS Letters 217: 145–157.
Sharp LA, Lee YW and Goldstein AS 2009 Effect of low-frequency pulsatile flow on expression of
osteoblastic genes by bone marrow stromal cells. Annals of Biomedical Engineering 37: 445–
453.
Shenoda B 2015 The role of Na+/Ca2+ exchanger subtypes in neuronal ischemic injury. Translational
Stroke Research 6: 181–190.

231
Shibata Y, Voeltz GK and Rapoport TA 2006 Rough Sheets and Smooth Tubules. Cell 126: 435–439.
Shimomura O, Johnson FH and Saiga Y 1962 Extraction, Purification and Properties of Aequorin, a
Bioluminescent Protein from the Luminous Hydromedusan, Aequorea. Journal of Cellular and
Comparative Physiology 59: 223–239.
Shoshan-Barmatz V and Gincel D 2003 The voltage-dependent anion channel: characterization,
modulation, and role in mitochondrial function in cell life and death. Cell Biochemistry and
Biophysics 39: 279–292.
Silve A, Guimerà Brunet A, Al-Sakere B, Ivorra A and Mir LM 2014 Comparison of the effects of the
repetition rate between microsecond and nanosecond pulses: electropermeabilization-
induced electro-desensitization?. Biochimica Et Biophysica Acta 1840: 2139–2151.
Silve A, Leray I and Mir LM 2012 Demonstration of cell membrane permeabilization to medium-sized
molecules caused by a single 10 ns electric pulse. Bioelectrochemistry (Amsterdam,
Netherlands) 87: 260–264.
Silve A, Leray I, Poignard C and Mir LM 2016 Impact of external medium conductivity on cell
membrane electropermeabilization by microsecond and nanosecond electric pulses. Scientific
Reports 6: 19957.
Simmons CA, Matlis S, Thornton AJ, Chen S, Wang CY and Mooney DJ 2003 Cyclic strain enhances
matrix mineralization by adult human mesenchymal stem cells via the extracellular signal-
regulated kinase (ERK1/2) signaling pathway. Journal of Biomechanics 36: 1087–1096.
Simons K and Ikonen E 1997 Functional rafts in cell membranes. Nature 387: 569–572.
Singer SJ and Nicolson GL 1972 The fluid mosaic model of the structure of cell membranes. Science
(New York, N.Y.) 175: 720–731.
Sisalli MJ, Secondo A, Esposito A, Valsecchi V, Savoia C, Di Renzo GF, Annunziato L and Scorziello A
2014 Endoplasmic reticulum refilling and mitochondrial calcium extrusion promoted in
neurons by NCX1 and NCX3 in ischemic preconditioning are determinant for neuroprotection.
Cell Death & Differentiation 21: 1142–1149.
Snutch TP, Peloquin J, Mathews E and McRory JE 2013 Molecular Properties of Voltage-Gated Calcium
Channels
Sperelakis N 2012 Cell Physiology Source Book: Essentials of Membrane Biophysics. Elsevier
Strehler EE and Zacharias DA 2001 Role of alternative splicing in generating isoform diversity among
plasma membrane calcium pumps. Physiological Reviews 81: 21–50.
Stuyvers BD, Boyden PA and Keurs HEDJ ter 2000 Calcium Waves Physiological Relevance in Cardiac
Function. Circulation Research 86: 1016–1018.
Styner M, Sen B, Xie Z, Case N and Rubin J 2010 Indomethacin Promotes Adipogenesis of
Mesenchymal Stem Cells Through a Cyclooxygenase Independent Mechanism. Journal of
cellular biochemistry 111: 1042–1050.
Subhra T, Wang P-C and Gang F 2013 Electroporation Based Drug Delivery and Its Applications. In
Takahata K (ed.) Advances in Micro/Nano Electromechanical Systems and Fabrication
Technologies p.. InTech
Subramanian K and Meyer T 1997 Calcium-induced restructuring of nuclear envelope and
endoplasmic reticulum calcium stores. Cell 89: 963–971.
Sugar IP and Neumann E 1984 Stochastic model for electric field-induced membrane pores.
Electroporation. Biophysical Chemistry 19: 211–225.

232
Sumanasinghe RD, Bernacki SH and Loboa EG 2006 Osteogenic differentiation of human mesenchymal
stem cells in collagen matrices: effect of uniaxial cyclic tensile strain on bone morphogenetic
protein (BMP-2) mRNA expression. Tissue Engineering 12: 3459–3465.
Sun S, Liu Y, Lipsky S and Cho M 2007 Physical manipulation of calcium oscillations facilitates
osteodifferentiation of human mesenchymal stem cells. FASEB journal: official publication of
the Federation of American Societies for Experimental Biology 21: 1472–1480.
Sundelacruz S, Levin M and Kaplan DL 2008 Membrane Potential Controls Adipogenic and Osteogenic
Differentiation of Mesenchymal Stem Cells. PLOS ONE 3: e3737.
Susil R, Šemrov D and Miklavčič D 1998 Electric Field-Induced Transmembrane Potential Depends on
Cell Density and Organizatio. Electro- and Magnetobiology 17: 391–399.
Szabadkai G, Bianchi K, Várnai P, De Stefani D, Wieckowski MR, Cavagna D, Nagy AI, Balla T and
Rizzuto R 2006 Chaperone-mediated coupling of endoplasmic reticulum and mitochondrial
Ca2+ channels. The Journal of Cell Biology 175: 901–911.
Szewczyk MM, Pande J and Grover AK 2008 Caloxins: a novel class of selective plasma membrane
Ca2+ pump inhibitors obtained using biotechnology. Pflügers Archiv: European Journal of
Physiology 456: 255–266.
Tada H, Nemoto E, Foster BL, Somerman MJ and Shimauchi H 2011 Phosphate increases bone
morphogenetic protein-2 expression through cAMP-dependent protein kinase and ERK1/2
pathways in human dental pulp cells. Bone 48: 1409–1416.
Takahashi A, Camacho P, Lechleiter JD and Herman B 1999 Measurement of intracellular calcium.
Physiological Reviews 79: 1089–1125.
Takasawa S, Ishida A, Nata K, Nakagawa K, Noguchi N, Tohgo A, Kato I, Yonekura H, Fujisawa H and
Okamoto H 1995 Requirement of calmodulin-dependent protein kinase II in cyclic ADP-ribose-
mediated intracellular Ca2+ mobilization. The Journal of Biological Chemistry 270: 30257–
30259.
Takei K, Mignery GA, Mugnaini E, Südhof TC and De Camilli P 1994 Inositol 1,4,5-trisphosphate
receptor causes formation of ER cisternal stacks in transfected fibroblasts and in cerebellar
Purkinje cells. Neuron 12: 327–342.
Takekura H, Takeshima H, Nishimura S, Takahashi M, Tanabe T, Flockerzi V, Hofmann F and Franzini-
Armstrong C 1995 Co-expression in CHO cells of two muscle proteins involved in excitation-
contraction coupling. Journal of Muscle Research and Cell Motility 16: 465–480.
Tang QQ, Jiang MS and Lane MD 1999 Repressive effect of Sp1 on the C/EBPalpha gene promoter:
role in adipocyte differentiation. Molecular and Cellular Biology 19: 4855–4865.
Tarek M 2005 Membrane Electroporation: A Molecular Dynamics Simulation. Biophysical Journal 88:
4045–4053.
Teissie J and Rols MP 1986 Fusion of mammalian cells in culture is obtained by creating the contact
between cells after their electropermeabilization. Biochemical and Biophysical Research
Communications 140: 258–266.
Teissié J and Rols MP 1993 An experimental evaluation of the critical potential difference inducing cell
membrane electropermeabilization.. Biophysical Journal 65: 409–413.
Teissie J and Tsong TY 1981 Electric field induced transient pores in phospholipid bilayer vesicles.
Biochemistry 20: 1548–1554.
Tekle E, Wolfe MD, Oubrahim H and Chock PB 2008 Phagocytic clearance of electric field induced
‘apoptosis-mimetic’ cells. Biochemical and Biophysical Research Communications 376: 256–
260.

233
Teramoto T and Iwasaki K 2006 Intestinal calcium waves coordinate a behavioral motor program in C.
elegans. Cell Calcium 40: 319–327.
Terasaki M, Jaffe LA, Hunnicutt GR and Hammer JA 1996 Structural change of the endoplasmic
reticulum during fertilization: evidence for loss of membrane continuity using the green
fluorescent protein. Developmental Biology 179: 320–328.
Thomson JA, Itskovitz-Eldor J, Shapiro SS, Waknitz MA, Swiergiel JJ, Marshall VS and Jones JM 1998
Embryonic stem cell lines derived from human blastocysts. Science (New York, N.Y.) 282: 1145–
1147.
Thorn P, Lawrie AM, Smith PM, Gallacher DV and Petersen OH 1993 Local and global cytosolic Ca2+
oscillations in exocrine cells evoked by agonists and inositol trisphosphate. Cell 74: 661–668.
Thurneysen T, Nicoll DA, Philipson KD and Porzig H 2002 Sodium/calcium exchanger subtypes NCX1,
NCX2 and NCX3 show cell-specific expression in rat hippocampus cultures. Brain Research.
Molecular Brain Research 107: 145–156.
Tieleman DP 2004 The molecular basis of electroporation. BMC Biochemistry 5: 10.
Tien HT and Diana AL 1967 Black lipid membranes in aqueous media: The effect of salts on electrical
properties. Journal of Colloid and Interface Science 24: 287–296.
Timper K, Seboek D, Eberhardt M, Linscheid P, Christ-Crain M, Keller U, Müller B and Zulewski H 2006
Human adipose tissue-derived mesenchymal stem cells differentiate into insulin,
somatostatin, and glucagon expressing cells. Biochemical and Biophysical Research
Communications 341: 1135–1140.
Titushkin I, Sun S, Shin J and Cho M 2010 Physicochemical Control of Adult Stem Cell Differentiation:
Shedding Light on Potential Molecular Mechanisms. BioMed Research International 2010:
e743476.
Tokman M, Lee JH, Levine ZA, Ho M-C, Colvin ME and Vernier PT 2013 Electric Field-Driven Water
Dipoles: Nanoscale Architecture of Electroporation. PLOS ONE 8: e61111.
Toyoshima C, Nakasako M, Nomura H and Ogawa H 2000 Crystal structure of the calcium pump of
sarcoplasmic reticulum at 2.6 |[angst]| resolution. Nature 405: 647–655.
Trevor KT, Cover C, Ruiz YW, Akporiaye ET, Hersh EM, Landais D, Taylor RR, King AD and Walters RE
2004 Generation of dendritic cell-tumor cell hybrids by electrofusion for clinical vaccine
application. Cancer immunology, immunotherapy: CII 53: 705–714.
Trombetta ES and Parodi AJ 2003 Quality control and protein folding in the secretory pathway. Annual
Review of Cell and Developmental Biology 19: 649–676.
Tsien JZ, Huerta PT and Tonegawa S 1996 The Essential Role of Hippocampal CA1 NMDA Receptor–
Dependent Synaptic Plasticity in Spatial Memory. Cell 87: 1327–1338.
Tsien RW 1983 Calcium Channels in Excitable Cell Membranes. Annual Review of Physiology 45: 341–
358.
Tsien RY 1980 New calcium indicators and buffers with high selectivity against magnesium and
protons: design, synthesis, and properties of prototype structures. Biochemistry 19: 2396–
2404.
Tsien RY 1998 The green fluorescent protein. Annual Review of Biochemistry 67: 509–544.
Tsuboi T, da Silva Xavier G, Holz GG, Jouaville LS, Thomas AP and Rutter GA 2003 Glucagon-like
peptide-1 mobilizes intracellular Ca2+ and stimulates mitochondrial ATP synthesis in
pancreatic MIN6 beta-cells.. Biochemical Journal 369: 287–299.

234
Turovsky EA, Kaimachnikov NP, Turovskaya MV, Berezhnov AV, Dynnik VV and Zinchenko VP 2012
Two mechanisms of calcium oscillations in adipocytes. Biochemistry (Moscow) Supplement
Series A: Membrane and Cell Biology 6: 26–34.
Uccelli A, Moretta L and Pistoia V 2008 Mesenchymal stem cells in health and disease. Nature Reviews
Immunology 8: 726–736.
Ullah I, Subbarao RB and Rho GJ 2015 Human mesenchymal stem cells - current trends and future
prospective. Bioscience Reports 35
Unwin N and Henderson R 1984 The structure of proteins in biological membranes. Scientific American
250: 78–94.
Uzman A 2003 Molecular biology of the cell (4th ed.): Alberts, B., Johnson, A., Lewis, J., Raff, M.,
Roberts, K., and Walter, P.. Biochemistry and Molecular Biology Education 31: 212–214.
Vance JE and Vance DE 2008 Biochemistry of Lipids, Lipoproteins and Membranes. Elsevier
VanHouten J, Sullivan C, Bazinet C, Ryoo T, Camp R, Rimm DL, Chung G and Wysolmerski J 2010
PMCA2 regulates apoptosis during mammary gland involution and predicts outcome in breast
cancer. Proceedings of the National Academy of Sciences of the United States of America 107:
11405–11410.
Vassart G and Costagliola S 2011 G protein-coupled receptors: mutations and endocrine diseases.
Nature Reviews Endocrinology 7: 362–372.
Vater C, Kasten P and Stiehler M 2011a Culture media for the differentiation of mesenchymal stromal
cells. Acta Biomaterialia 7: 463–477.
Vater C, Kasten P and Stiehler M 2011b Culture media for the differentiation of mesenchymal stromal
cells. Acta Biomaterialia 7: 463–477.
Veech RL, Kashiwaya Y and King MT 1995 The resting membrane potential of cells are measures of
electrical work, not of ionic currents. Integrative Physiological and Behavioral Science: The
Official Journal of the Pavlovian Society 30: 283–307.
Vernier PT, Levine ZA, Wu Y-H, Joubert V, Ziegler MJ, Mir LM and Tieleman DP 2009 Electroporating
Fields Target Oxidatively Damaged Areas in the Cell Membrane. PLoS ONE 4
Vernier PT, Sun Y and Gundersen MA 2006 Nanoelectropulse-driven membrane perturbation and
small molecule permeabilization. BMC Cell Biology 7: 37.
Vernier PT, Sun Y, Marcu L, Craft CM and Gundersen MA 2004 Nanosecond pulsed electric fields
perturb membrane phospholipids in T lymphoblasts. FEBS letters 572: 103–108.
Vernier PT, Sun Y, Marcu L, Salemi S, Craft CM and Gundersen MA 2003 Calcium bursts induced by
nanosecond electric pulses. Biochemical and Biophysical Research Communications 310: 286–
295.
Viana F, Van den Bosch L, Missiaen L, Vandenberghe W, Droogmans G, Nilius B and Robberecht W
1997 Mibefradil (Ro 40-5967) blocks multiple types of voltage-gated calcium channels in
cultured rat spinal motoneurones. Cell Calcium 22: 299–311.
Vlahovska PM 2015 Voltage-morphology coupling in biomimetic membranes: dynamics of giant
vesicles in applied electric fields. Soft Matter 11: 7232–7236.
Voelker DR 2005 Bridging gaps in phospholipid transport. Trends in Biochemical Sciences 30: 396–404.
Wal J van der, Habets R, Várnai P, Balla T and Jalink K 2001 Monitoring Agonist-induced Phospholipase
C Activation in Live Cells by Fluorescence Resonance Energy Transfer. Journal of Biological
Chemistry 276: 15337–15344.
Ward DF, Salasznyk RM, Klees RF, Backiel J, Agius P, Bennett K, Boskey A and Plopper GE 2007
Mechanical strain enhances extracellular matrix-induced gene focusing and promotes

235
osteogenic differentiation of human mesenchymal stem cells through an extracellular-related
kinase-dependent pathway. Stem Cells and Development 16: 467–480.
Weaver JC and Chizmadzhev YA 1996 Theory of electroporation: A review. Bioelectrochemistry and
Bioenergetics 41: 135–160.
Weaver JC, Smith KC, Esser AT, Son RS and Gowrishankar TR 2012 A brief overview of electroporation
pulse strength-duration space: a region where additional intracellular effects are expected.
Bioelectrochemistry (Amsterdam, Netherlands) 87: 236–243.
Wegner LH, Flickinger B, Eing C, Berghöfer T, Hohenberger P, Frey W and Nick P 2011 A patch clamp
study on the electro-permeabilization of higher plant cells: Supra-physiological voltages induce
a high-conductance, K+ selective state of the plasma membrane. Biochimica Et Biophysica Acta
1808: 1728–1736.
White JA, Blackmore PF, Schoenbach KH and Beebe SJ 2004 Stimulation of capacitative calcium entry
in HL-60 cells by nanosecond pulsed electric fields. The Journal of Biological Chemistry 279:
22964–22972.
Widera G, Austin M, Rabussay D, Goldbeck C, Barnett SW, Chen M, Leung L, Otten GR, Thudium K,
Selby MJ and Ulmer JB 2000 Increased DNA vaccine delivery and immunogenicity by
electroporation in vivo. Journal of Immunology (Baltimore, Md.: 1950) 164: 4635–4640.
Wier WG, ter Keurs HE, Marban E, Gao WD and Balke CW 1997 Ca2+ ‘sparks’ and waves in intact
ventricular muscle resolved by confocal imaging. Circulation Research 81: 462–469.
Wilhelm C, Winterhalter M, Zimmermann U and Benz R 1993 Kinetics of pore size during irreversible
electrical breakdown of lipid bilayer membranes.. Biophysical Journal 64: 121–128.
Wislet-Gendebien S, Hans G, Leprince P, Rigo J-M, Moonen G and Rogister B 2005 Plasticity of
cultured mesenchymal stem cells: switch from nestin-positive to excitable neuron-like
phenotype. Stem Cells (Dayton, Ohio) 23: 392–402.
Wonderlin WF and Strobl JS 1996 Potassium channels, proliferation and G1 progression. The Journal
of Membrane Biology 154: 91–107.
Woodbury D, Reynolds K and Black IB 2002 Adult bone marrow stromal stem cells express germline,
ectodermal, endodermal, and mesodermal genes prior to neurogenesis. Journal of
Neuroscience Research 69: 908–917.
Woodbury D, Schwarz EJ, Prockop DJ and Black IB 2000 Adult rat and human bone marrow stromal
cells differentiate into neurons. Journal of Neuroscience Research 61: 364–370.
Woods NM, Cuthbertson KS and Cobbold PH 1986 Repetitive transient rises in cytoplasmic free
calcium in hormone-stimulated hepatocytes. Nature 319: 600–602.
Wozniak MA, Modzelewska K, Kwong L and Keely PJ 2004 Focal adhesion regulation of cell behavior.
Biochimica Et Biophysica Acta 1692: 103–119.
Wu MM, Llopis J, Adams S, McCaffery JM, Kulomaa MS, Machen TE, Moore HP and Tsien RY 2000
Organelle pH studies using targeted avidin and fluorescein-biotin. Chemistry & Biology 7: 197–
209.
Wuytack F, Dode L, Baba-Aissa F and Raeymaekers L 1995 The SERCA3-type of organellar Ca2+pumps.
Bioscience Reports 15: 299–306.
Wuytack F, Raeymaekers L and Missiaen L 2002 Molecular physiology of the SERCA and SPCA pumps.
Cell Calcium 32: 279–305.
Xiao J, Liang D, Zhao H, Liu Y, Zhang H, Lu X, Liu Y, Li J, Peng L and Chen Y-H 2010 2-
Aminoethoxydiphenyl borate, a inositol 1,4,5-triphosphate receptor inhibitor, prevents atrial
fibrillation. Experimental Biology and Medicine (Maywood, N.J.) 235: 862–868.

236
Yada T, Oiki S, Ueda S and Okada Y 1986 Synchronous oscillation of the cytoplasmic Ca2+
concentration and membrane potential in cultured epithelial cells (Intestine 407). Biochimica
et Biophysica Acta (BBA) - Molecular Cell Research 887: 105–112.
Yamashita J, Kita S, Iwamoto T, Ogata M, Takaoka M, Tazawa N, Nishikawa M, Wakimoto K,
Shigekawa M, Komuro I and Matsumura Y 2003 Attenuation of ischemia/reperfusion-induced
renal injury in mice deficient in Na+/Ca2+ exchanger. The Journal of Pharmacology and
Experimental Therapeutics 304: 284–293.
Yang S-N and Berggren P-O 2006 The Role of Voltage-Gated Calcium Channels in Pancreatic β-Cell
Physiology and Pathophysiology. Endocrine Reviews 27: 621–676.
Yin L, Li Y and Wang Y 2006 Dexamethasone-induced adipogenesis in primary marrow stromal cell
cultures: mechanism of steroid-induced osteonecrosis. Chinese Medical Journal 119: 581–588.
Yoshikawa T, Peel SA, Gladstone JR and Davies JE 1997 Biochemical analysis of the response in rat
bone marrow cell cultures to mechanical stimulation. Bio-Medical Materials and Engineering
7: 369–377.
Zhang Y, Khan D, Delling J and Tobiasch E 2012 Mechanisms Underlying the Osteo- and Adipo-
Differentiation of Human Mesenchymal Stem Cells. The Scientific World Journal 2012
Zhao F, Chella R and Ma T 2007 Effects of shear stress on 3-D human mesenchymal stem cell construct
development in a perfusion bioreactor system: Experiments and hydrodynamic modeling.
Biotechnology and Bioengineering 96: 584–595.
Zhao F, Li P, Chen SR, Louis CF and Fruen BR 2001 Dantrolene inhibition of ryanodine receptor Ca2+
release channels. Molecular mechanism and isoform selectivity. The Journal of Biological
Chemistry 276: 13810–13816.
Zhao Y, Araki S, Wu J, Teramoto T, Chang Y-F, Nakano M, Abdelfattah AS, Fujiwara M, Ishihara T,
Nagai T and Campbell RE 2011 An expanded palette of genetically encoded Ca2+ indicators.
Science (New York, N.Y.) 333: 1888–1891.
Zhong J 2011 From simple to complex: investigating the effects of lipid composition and phase on the
membrane interactions of biomolecules using in situatomic force microscopy. Integrative
Biology 3: 632–644.
Zhu M, Kohan E, Bradley J, Hedrick M, Benhaim P and Zuk P 2009 The effect of age on osteogenic,
adipogenic and proliferative potential of female adipose-derived stem cells. Journal of Tissue
Engineering and Regenerative Medicine 3: 290–301.
Zhu MX, Ma J, Parrington J, Calcraft PJ, Galione A and Evans AM 2010 Calcium signaling via two-pore
channels: local or global, that is the question. American Journal of Physiology - Cell Physiology
298: C430–C441.
Ziegler MJ and Vernier PT 2008 Interface Water Dynamics and Porating Electric Fields for Phospholipid
Bilayers. The Journal of Physical Chemistry B 112: 13588–13596.
Zilberfarb V, Siquier K, Strosberg AD and Issad T 2001 Effect of dexamethasone on adipocyte
differentiation markers and tumour necrosis factor-alpha expression in human PAZ6 cells.
Diabetologia 44: 377–386.

237

238
Abstract
Pulsed electric fields are widely used in research, medicine, food industry and other biotechnological processes. The interaction of one 100 µs pulse with the plasma membrane and the endoplasmic reticulum membrane was evaluated in two different cell types. Pulse amplitude ranged between 100 and 3 000 V/cm. Organelles membrane permeabilization using this kind of pulses was experimentally demonstrated for the first time. The use of such a pulse to control the spontaneous calcium oscillations in human-adipose mesenchymal stem cells was also assessed. By creating electro-induced calcium spikes of different amplitudes, the pulse can either add a supplementary spike, or, on the contrary, inhibit the spontaneous oscillations for some tens of minutes. During this inhibition period, the electric pulse-mediated addition of calcium spikes of desired amplitude and frequency is still possible. The delivery of 100 µs pulses to stem cells undergoing osteodifferentiation was also performed. The electric pulse seemed to delay the differentiation. Moreover, during osteogenic differentiation, cells cultures displayed an organization in a few cell layers. The characterization of these layers gave results that may help to obtain mature osteoblast in less time than usual one. The use of the microsecond electric pulses technology to permeabilize the plasma and the internal cell membranes as well as to modulate internal calcium concentrations is therefore interesting to study the role of calcium in many physiological processes and to manipulate the cell calcium dynamics (oscillations, waves, spikes) in different cell types. Doing so, this available, simple and easy to apply technology could be used for the modulation and the control of basic cellular functions such as proliferation, differentiation and apoptosis. Keywords: microsecond pulsed electric field, electroporation, electropermeabilization, plasma membrane, endoplasmic reticulum, calcium spikes, mesenchymal stem cells, calcium oscillations, osteogenic differentiation.
Résumé
Les champs électriques pulsés sont largement utilisés dans la recherche, la médecine, l'industrie alimentaire et d'autres procédés biotechnologiques. L'interaction d'une impulsion de 100 µs avec la membrane plasmique et la membrane du réticulum endoplasmique a été évaluée dans deux types cellulaires différents. La perméabilisation des organites cellulaires avec ce type d'impulsions est démontrée expérimentalement pour la première fois. L'utilisation d'une telle impulsion afin de contrôler les oscillations calciques spontanées dans les cellules souches mésenchymateuses humaines issues du tissu adipeux a été évaluée. En créant des pics calciques électro-induits d’amplitudes différentes, l'impulsion peut ou bien induire un pic calcique supplémentaire ou bien inhiber les oscillations spontanées pour quelques dizaines de minutes. Cette inhibition rend possible d’imposer à la cellule des pics d’amplitude et de fréquence désirés. Un essai d’application de l'impulsion 100 µs à des cellules souches subissant une différenciation osseuse a aussi été réalisé. Une impulsion électrique semble retarder la différenciation. Lors d'une différenciation osseuse, plusieurs couches cellulaires ont été observées. La caractérisation de ces couches a donné des résultats qui pourraient aider à obtenir des ostéoblastes matures dans un temps moindre que la normale. L'utilisation des champs électriques pulsés microsecondes, pour perméabiliser la membrane plasmique et les membranes internes des cellules, ainsi que pour moduler les concentrations du calcium intracellulaire, semble donc très intéressante pour étudier le rôle du calcium dans de nombreux processus physiologiques et pour manipuler les dynamiques calciques (oscillations, vagues, pics) dans différents types de cellules. Ainsi, cette technologie simple, facile à appliquer et disponible dans beaucoup de laboratoires serait envisageable pour la modulation et le contrôle de fonctions cellulaires basiques telles que la prolifération, la différenciation et l'apoptose. Mots-clés: champ électrique pulsé microseconde, électroporation, électroperméabilisation, membrane plasmique, réticulum endoplasmique, pics calciques, cellules souches mésenchymateuses, oscillations calciques, différenciation osseuse.


![Innere und Äussere Peripherie am Beispiel Tschechiens [Inner and outer periphery: Example of Czechia]](https://static.fdokumen.com/doc/165x107/6319f9e220bd5bb1740c13b4/innere-und-aeussere-peripherie-am-beispiel-tschechiens-inner-and-outer-periphery.jpg)