Numerical Simulation of a Convergent Divergent Supersonic Nozzle ...
Upload
independentCategory
view
1download
0
Fisheries Research 85 (2007) 306–315
Atlantic cod (Gadus morhua L.) in inner and outer coastal zones ofnorthern Norway display divergent genetic signature at non-neutral loci
Jon-Ivar Westgaard ∗, Svein-Erik Fevolden
Norwegian College of Fishery Science, University of Tromso, Breivika, NO-9037 Tromso, Norway
Received 9 November 2006; received in revised form 21 March 2007; accepted 5 April 2007
Abstract
A large majority of Atlantic cod (Gadus morhua) found all year round in outer parts of fjords and along outer coastal areas in general in northern
Norway have a genetic signature at the pantophysin (Pan I) locus that distinguish them from Norwegian coastal cod (NCC) found further inside
fjords in the same areas. The identity of these fish has been controversial and to examine if they represent a distinct coastal cod group, or are
identical to the migratory North East Arctic cod (NEAC) of the Barents Sea, a comparison was conducted at 10 microsatellite loci for 15 samples
comprising each of the three groups inner coastal NCC, outer coastal cod and NEAC. Spatial analysis of molecular variance revealed that the outer
coastal samples cannot be discriminated from NEAC by means of microsatellite markers, supporting the similarity of the two groups at the Pan I
locus. This implies that a portion of the otherwise migratory NEAC, at least in its premature stage, remains in coastal areas in close contact with
the genetically quite distinct NCC group. Both the coalescent-based simulation approach and the lnRH test for selective sweeps proved two of the
microsatellite loci, GMO 34 and GMO 132 to be non-neutral. Notwithstanding, these two loci, together with the acknowledged non-neutral Pan
I locus, which displayed profound linkage disequilibrium to GMO 34 within NEAC, are as yet the only nuclear markers which unambiguously
discriminate between NEAC and NCC. Although the relative contribution of restricted gene flow versus selection as a causative agent for the
divergence between NEAC and NCC has not been assessed, we believe the magnitude of differentiation at the three loci provides rational for
maintaining NEAC and NCC as separate management units.
© 2007 Elsevier B.V. All rights reserved.
Keywords: Atlantic cod; Microsatellites; Population structure; Selection
1. Introduction
The Atlantic cod (Gadus morhua L.) is one of the most valu-
able commercial fish species in the north Atlantic. As such,
its population structure has attained much focus to ascertain
proper management units. In the NE Atlantic particular atten-
tion has been placed on the genetic discrimination between the
large population of migratory cod in the Barents Sea (Northeast
Arctic cod, NEAC) and the more stationary coastal popula-
tion of cod (Norwegian coastal cod, NCC). This subdivision
has gained support from the much used genetic marker pan-
tophysin (Pan I), synonymous to the GM789 locus of Pogson
et al. (1995) and Syp I of Fevolden and Pogson (1997). This
scnDNA locus possesses two allelic classes, of which Pan IB
prevails in NEAC (≈90% on average) and Pan IA equally pre-
∗ Corresponding author. Tel.: +47 77646796; fax: +47 77646020.
E-mail address: [email protected] (J.-I. Westgaard).
vails in the NCC group (Fevolden and Pogson, 1997; Sarvas
and Fevolden, 2005a). This profound difference between two
groups of cod that occur geographically so close to each other,
in part overlap in distribution, has been observed nowhere else in
the cod’s distributional range; in fact it represents a remarkable
divergence in marine fish in general. Pan I is admittedly not a
neutral marker in cod (Fevolden and Pogson, 1997; Pogson and
Fevolden, 2003; Pogson and Mesa, 2004; Sarvas and Fevolden,
2005a,b), and contemporary selection has been reported to
cause differences in allele frequencies between cohorts, between
sexes, and also to have caused excesses of homozygotes in
a local fjord population of cod (Karlsson and Mork, 2003).
Nevertheless, contemporary selection acting on settling cohorts
from one common and homogeneous spawning population has
been dismissed as a causative agent for the extreme Pan I
allele frequency divergence between NEAC and NCC. Rather,
accumulated effect of selection acting over relatively recent his-
torical time (like since the last ice-age) has been suggested to
evoke the divergence between the two groups (Fevolden and
0165-7836/$ – see front matter © 2007 Elsevier B.V. All rights reserved.
doi:10.1016/j.fishres.2007.04.001

J.-I. Westgaard, S.-E. Fevolden / Fisheries Research 85 (2007) 306–315 307
Pogson, 1997; Pogson and Fevolden, 2003; Sarvas and Fevolden,
2005a,b).
As to the distribution of Pan I allele frequencies in fjords and
otherwise near-coastal waters, cod caught well within the fjords
have high frequencies of the Pan IA allele, and thus are suggested
to represent NCC, whereas cod caught in outer parts of the fjords
and along the coast often display high frequencies of the Pan
IB allele (Sarvas and Fevolden, 2005a,b). The identity of the
outer coastal cod displaying high Pan IB frequencies represents a
controversy. At certain seasons they could be NEAC on feeding
or spawning migrations, but their all-year-round presence has
led to speculations whether they represent a separate coastal
variant with Pan I allele frequencies very distinctive from the true
fjord cod, or NEAC which has yet not migrated into the Barents
Sea. Thus, the prime objective of this study was to compare
coastal cod with high Pan IB frequencies with NEAC caught
in the Barents Sea proper and on their major spawning site in
Lofoten. The comparisons are made at a number of microsatellite
markers, which comprise loci within the non-coding regions of
the nuclear DNA and are considered versatile due to their alleged
neutrality (but see below).
The second objective of this study has been a more thor-
ough examination of the contribution of selection in shaping
the genetic divergence between NEAC and NCC. Results from
earlier studies, using different marker classes, have been some-
what contradictory. The general pattern has been that studies
using markers subjected to selection [e.g. blood type E (Møller,
1966, 1968, 1969), haemoblobin (Dahle and Jorstad, 1993) Pan I
(Pogson et al., 1995; Fevolden and Pogson, 1997; Pogson, 2001;
Pogson and Fevolden, 2003; Sarvas and Fevolden, 2005a,b)] has
been able to discriminate between NEAC and NCC, whereas
results from presumed neutral genetic markers have been less
conclusive (mitochondrial cytochrome b sequence, Arnason and
Palsson, 1996, and specific allozymes, Mork and Giaever, 1999).
Nevertheless, a recent comparison of Pan I data with variation
at a number of microsatellite loci in cod from a large geographic
area comprising both NEAC and NCC, revealed very much the
same structuring from the non-neutral and the alleged neutral
markers (Skarstein et al., in press). In the present study, compar-
ison of microsatellite variation in samples that were classified as
true coastal cod (high Pan IA frequencies and taken well within
fjords) or true NEAC (high Pan IB frequencies and taken in
the Barents Sea or on a known spawning site of NEAC) would
enable a test of the neutrality also of the microsatellite markers.
Moreover, Pan I data alone cannot be used to support the long-
standing acknowledgement of fishermen that in several fjords
in northern Norway there exist stationary cod with their own
local spawning sites, quite distinct from the spawning sites of
migratory NEAC (Lofoten and banks off Troms and Finnmark
counties). Thus, the microsatellite data would also allow a pos-
sible discrimination of coastal cod samples that are genetically
homogeneous in terms of Pan I allele frequencies. The neutral-
ity of particularly one of the loci used herein (GMO 132) has
recently been questioned (Karlsson and Mork, 2005; Nielsen et
al., 2006). Whether this would detract it from being a supportive
marker for discriminating between NEAC and NCC, or among
populations within the NCC group, will be discussed.
2. Materials and methods
2.1. Samples
A total of 1107 fish distributed over 15 samples (Table 1)
were selected from the collection of cod samples available at the
Norwegian College of Fishery Science, University of Tromsø.
These samples were all previously analyzed for variation at
the Pan I locus. The geographical area of the samples ranged
from Spitsbergen in the north down to Lofoten in the south
(Fig. 1). The samples were selected according to the prime objec-
tive of the study, namely to compare samples of Atlantic cod
with high Pan IB allele frequencies taken in the outer coastal
areas with alleged NEAC and NCC samples. Thus, the sam-
ples were selected to fit into one of the following three groups:
(1) Samples dominated by the Pan IB allele in coastal areas
of northern Norway. (2) North East Arctic cod (NEAC) sam-
ples from the Barents Sea and Lofoten (Vestfjorden) in the
spawning season of NEAC. (3) Samples dominated by the Pan
IA allele from inner coastal areas of Troms and Finnmark. To
the latter group it was also included one representative of an
outer coastal sample with high Pan IA frequency (AND of
Table 1). Pan IA frequencies are as yet the best criterion avail-
able for an a priori assignment of cod in this area to the coastal
cod group. The samples comprised 0-group cod, juveniles and
adults (Table 1), apart from the outer costal samples dominated
by the Pan IB allele, which consisted exclusively of immature
individuals.
Fig. 1. Map over sampling sites for Atlantic cod included in the study. Sample
abbreviations are as in Table 1.
308 J.-I. Westgaard, S.-E. Fevolden / Fisheries Research 85 (2007) 306–315
Table 1
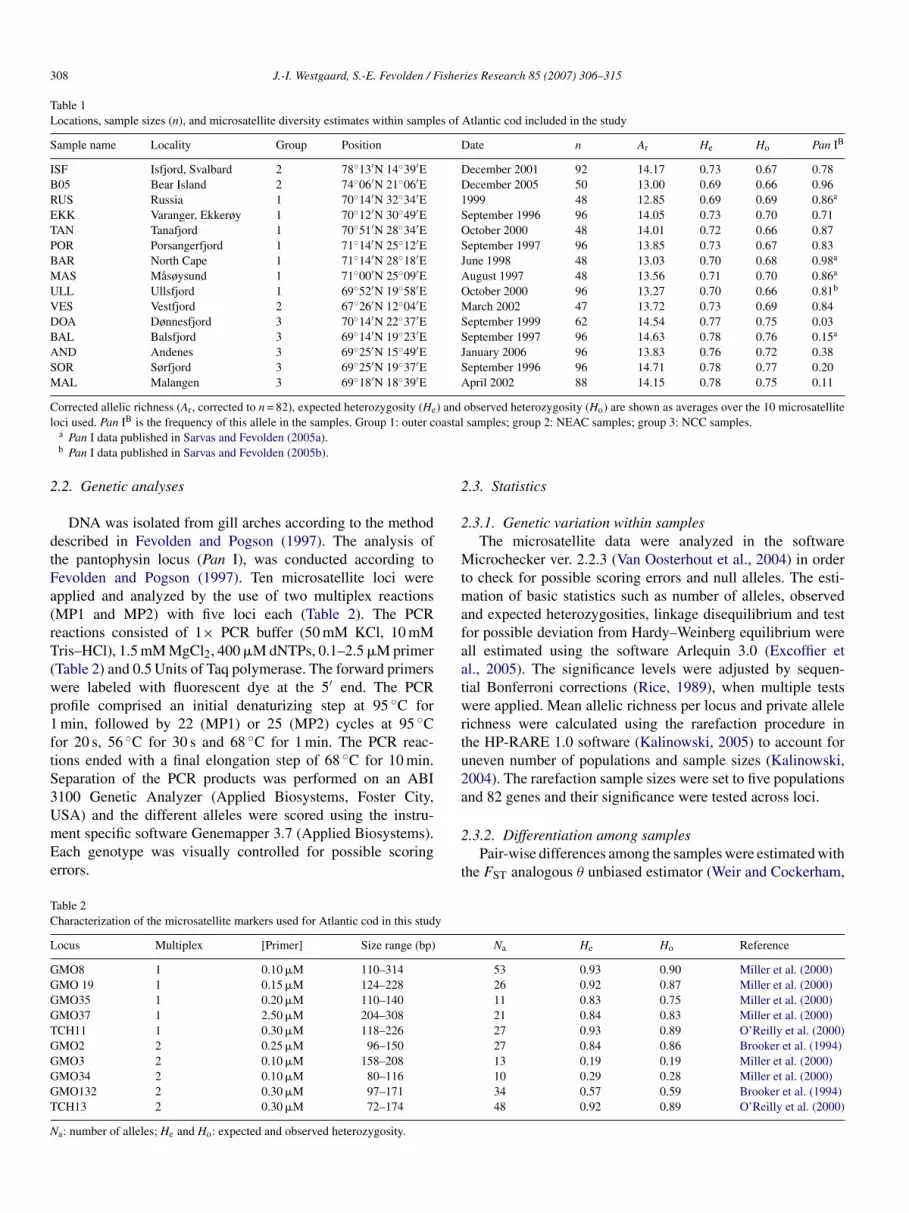
Locations, sample sizes (n), and microsatellite diversity estimates within samples of Atlantic cod included in the study
Sample name Locality Group Position Date n Ar He Ho Pan IB
ISF Isfjord, Svalbard 2 78◦13′N 14◦39′E December 2001 92 14.17 0.73 0.67 0.78
B05 Bear Island 2 74◦06′N 21◦06′E December 2005 50 13.00 0.69 0.66 0.96
RUS Russia 1 70◦14′N 32◦34′E 1999 48 12.85 0.69 0.69 0.86a
EKK Varanger, Ekkerøy 1 70◦12′N 30◦49′E September 1996 96 14.05 0.73 0.70 0.71
TAN Tanafjord 1 70◦51′N 28◦34′E October 2000 48 14.01 0.72 0.66 0.87
POR Porsangerfjord 1 71◦14′N 25◦12′E September 1997 96 13.85 0.73 0.67 0.83
BAR North Cape 1 71◦14′N 28◦18′E June 1998 48 13.03 0.70 0.68 0.98a
MAS Masøysund 1 71◦00′N 25◦09′E August 1997 48 13.56 0.71 0.70 0.86a
ULL Ullsfjord 1 69◦52′N 19◦58′E October 2000 96 13.27 0.70 0.66 0.81b
VES Vestfjord 2 67◦26′N 12◦04′E March 2002 47 13.72 0.73 0.69 0.84
DOA Dønnesfjord 3 70◦14′N 22◦37′E September 1999 62 14.54 0.77 0.75 0.03
BAL Balsfjord 3 69◦14′N 19◦23′E September 1997 96 14.63 0.78 0.76 0.15a
AND Andenes 3 69◦25′N 15◦49′E January 2006 96 13.83 0.76 0.72 0.38
SOR Sørfjord 3 69◦25′N 19◦37′E September 1996 96 14.71 0.78 0.77 0.20
MAL Malangen 3 69◦18′N 18◦39′E April 2002 88 14.15 0.78 0.75 0.11
Corrected allelic richness (Ar, corrected to n = 82), expected heterozygosity (He) and observed heterozygosity (Ho) are shown as averages over the 10 microsatellite
loci used. Pan IB is the frequency of this allele in the samples. Group 1: outer coastal samples; group 2: NEAC samples; group 3: NCC samples.a Pan I data published in Sarvas and Fevolden (2005a).b Pan I data published in Sarvas and Fevolden (2005b).
2.2. Genetic analyses
DNA was isolated from gill arches according to the method
described in Fevolden and Pogson (1997). The analysis of
the pantophysin locus (Pan I), was conducted according to
Fevolden and Pogson (1997). Ten microsatellite loci were
applied and analyzed by the use of two multiplex reactions
(MP1 and MP2) with five loci each (Table 2). The PCR
reactions consisted of 1× PCR buffer (50 mM KCl, 10 mM
Tris–HCl), 1.5 mM MgCl2, 400 �M dNTPs, 0.1–2.5 �M primer
(Table 2) and 0.5 Units of Taq polymerase. The forward primers
were labeled with fluorescent dye at the 5′ end. The PCR
profile comprised an initial denaturizing step at 95 ◦C for
1 min, followed by 22 (MP1) or 25 (MP2) cycles at 95 ◦C
for 20 s, 56 ◦C for 30 s and 68 ◦C for 1 min. The PCR reac-
tions ended with a final elongation step of 68 ◦C for 10 min.
Separation of the PCR products was performed on an ABI
3100 Genetic Analyzer (Applied Biosystems, Foster City,
USA) and the different alleles were scored using the instru-
ment specific software Genemapper 3.7 (Applied Biosystems).
Each genotype was visually controlled for possible scoring
errors.
2.3. Statistics
2.3.1. Genetic variation within samples
The microsatellite data were analyzed in the software
Microchecker ver. 2.2.3 (Van Oosterhout et al., 2004) in order
to check for possible scoring errors and null alleles. The esti-
mation of basic statistics such as number of alleles, observed
and expected heterozygosities, linkage disequilibrium and test
for possible deviation from Hardy–Weinberg equilibrium were
all estimated using the software Arlequin 3.0 (Excoffier et
al., 2005). The significance levels were adjusted by sequen-
tial Bonferroni corrections (Rice, 1989), when multiple tests
were applied. Mean allelic richness per locus and private allele
richness were calculated using the rarefaction procedure in
the HP-RARE 1.0 software (Kalinowski, 2005) to account for
uneven number of populations and sample sizes (Kalinowski,
2004). The rarefaction sample sizes were set to five populations
and 82 genes and their significance were tested across loci.
2.3.2. Differentiation among samples
Pair-wise differences among the samples were estimated with
the FST analogous θ unbiased estimator (Weir and Cockerham,
Table 2
Characterization of the microsatellite markers used for Atlantic cod in this study
Locus Multiplex [Primer] Size range (bp) Na He Ho Reference
GMO8 1 0.10 �M 110–314 53 0.93 0.90 Miller et al. (2000)
GMO 19 1 0.15 �M 124–228 26 0.92 0.87 Miller et al. (2000)
GMO35 1 0.20 �M 110–140 11 0.83 0.75 Miller et al. (2000)
GMO37 1 2.50 �M 204–308 21 0.84 0.83 Miller et al. (2000)
TCH11 1 0.30 �M 118–226 27 0.93 0.89 O’Reilly et al. (2000)
GMO2 2 0.25 �M 96–150 27 0.84 0.86 Brooker et al. (1994)
GMO3 2 0.10 �M 158–208 13 0.19 0.19 Miller et al. (2000)
GMO34 2 0.10 �M 80–116 10 0.29 0.28 Miller et al. (2000)
GMO132 2 0.30 �M 97–171 34 0.57 0.59 Brooker et al. (1994)
TCH13 2 0.30 �M 72–174 48 0.92 0.89 O’Reilly et al. (2000)
Na: number of alleles; He and Ho: expected and observed heterozygosity.

J.-I. Westgaard, S.-E. Fevolden / Fisheries Research 85 (2007) 306–315 309
1984), assuming the infinite allele model (IAM). Tests for
population differentiation were performed as an unbiased esti-
mate of the P-value of a log-likelihood (G) based exact test
(Goudet et al., 1996).
Assignment tests were performed in the software Geneclass2
(Piry et al., 2004) using a Bayesian approach based on Rannala
and Mountain (1997), implemented in the software (assignment
treshhold, 0.05). For the visualization of the relationship among
samples a principal component analysis (PCA) was performed
in GenAlEx 6 (Peakall and Smouse, 2006), a software package
for Microsoft Excel.
2.3.3. Hierarchical structure
In order to define a possible hierarchical structure among
the samples, we used a SAMOVA (spatial analysis of molecu-
lar variance) approach (Dupanloup et al., 2002), using the IAM
based estimator FCT. This approach is an extension of the anal-
ysis of molecular variance (AMOVA) (Excoffier et al., 1992)
in that it incorporates the geographical sampling site into the
genetic data and seeks to define groups of populations that are
geographically homogenous and genetically maximally differ-
entiated from each other. Thus, the software searches for the
configuration of groups with the largest FCT values (variance
among groups) associated with them. This was done in the soft-
ware SAMOVA 1.0 (Dupanloup et al., 2002). Using hierarchical
structure as defined by the SAMOVA a two-tailed permutation
test for differences between the groups of samples for observed
and expected heterozygosity (Ho and He) was performed by
means of the software Fstat 2.9.3 (Goudet, 2001).
2.3.4. Marker neutrality
Two approaches were pursued for testing the microsatel-
lite loci against neutral expectations. First, we applied the
coalescent-based method simulation approach of Beaumont
and Nichols (1996) implemented in the software FDIST2
(http://www.rubic. reading.ac.uk/∼mab/software/fdist2.zip).
This software calculates FST and heterozygosity according to
the method described by Cockerham and Weir (1993). The
expected FST is then calculated from the data as the average
among loci weighted by their heterozygosity. Coalescent
simulations were performed using samples of the same size and
number as the data (i.e. number of populations in the analysis
and the median sample size of all populations), assuming an
island model with 100 islands. Fifty thousand independent loci
were generated using the infinite allele (IAM) mutation model.
From this procedure we get a simulated distribution of FST
values conditional on heterozygosity under a neutral model.
This distribution is then compared to the observed FST values
in order to identify potential outlier loci.
For the second approach we used the lnRH statistic of the
“Schlotterer test”, which is designed for detecting selective
sweeps at hitch-hiking microsatellite loci (Schlotterer, 2002;
Kauer et al., 2003). This statistics calculates the relative vari-
ance in gene diversity within loci, between populations, and
seeks to identify loci that differ in variability from the reminder
of the genome by calculating the ratio of gene diversities in two
populations. Because it is the ratio of genetic variability of two
populations that is calculated, all loci have equal expectations of
variability irrespective of locus-specific mutation rates (Kauer
et al., 2003). Both tests were performed upon pooling the sam-
ples into two groups, one comprising outer coastal samples and
known NEAC samples, while the other group comprised NCC
samples, thus allowing a direct comparison between the two
groups.
3. Results
3.1. Microsatellite DNA variation within the collected
samples
Average heterozygosity in the populations over the 10
microsatellite loci varied from 0.69 to 0.78 (mean 0.73)
(Table 1). Departure from Hardy–Weinberg equilibrium was
found in 5 out of 150 cases, which is within range of what
can be expected by chance. The expected heterozygosity across
the loci varied between 0.19 and 0.93 (Table 2). The number of
sampled alleles for each microsatellite loci ranged from 10 to 53
with an average of 27. Tests for linkage disequilibrium among
the microsatellite loci revealed 5 out of 825 possible signifi-
cant interactions, i.e. far less than expected by chance. However,
including the Pan I locus in the linkage disequilibrium analy-
ses displayed significant interactions between this locus and the
microsatellite GMO 34 in 10 of 11 samples with high Pan IB
frequencies (that is, the a priori alleged NEAC samples plus the
outer coastal samples), affecting the power of the pair-wise FST
statistics. For samples with high Pan IA frequencies (alleged
NCC) no such interactions were found.
3.2. Relationship among the different samples
The pair-wise comparison between samples, based on FST
estimates, provided no significant differences between the outer
coastal samples and the known NEAC samples (Table 3). More-
over, the SAMOVA gave the largest FCT value (0.0104, P < 0.01)
in a two-group configuration where one group comprised outer
coastal samples together with known NEAC samples and the
other group comprised NCC samples. For further statistical anal-
yses, therefore, the outer coastal samples and known NEAC
samples were pooled into one joint NEAC group, whereas the
high frequency Pan IA samples were still considered the NCC
group. Cases of significant FST values were largely found in pair-
wise comparison between NEAC samples, and NCC samples
(Table 3). However, the significance was highly influenced by
the two loci GMO 34 and GMO 132. Removing these loci elim-
inated all but one significant FST value (between samples VES
and MAL; FST = 0.005, P = 0.001). Within the NCC group two
(out of 10 possible) significant FST values were found, compared
to none within the now redefined NEAC group (Table 3).
The two-tailed permutation test of heterozygosity with the
two-group configuration from the SAMOVA revealed signifi-
cant differences between the NEAC and NCC group at the 0.1%
significance level (He = 0.712 and 0.773, respectively). The over-
all assignment success were low (11%), which is in accordance
with the overall low levels of differentiation among samples.

310 J.-I. Westgaard, S.-E. Fevolden / Fisheries Research 85 (2007) 306–315T
able
3
Pai
r-w
ise
FS
Tval
ues
bet
wee
nal
l1
5sa
mp
les
of
Atl
anti
cco
dover
10
mic
rosa
tell
ite
loci
above
the
dia
go
nal
and
the
corr
esp
on
din
gP
-val
ues
bel
ow
the
dia
go
nal
ISF
B0
5R
US
EK
KT
AN
PO
RB
AR
MA
SU
LL
VE
SD
OA
BA
LA
ND
SO
RM
AL
ISF
0.0
00
−0
.00
00
.00
1−
0.0
01
0.0
01
0.0
02
0.0
01
0.0
01
−0
.00
10
.01
30
.00
70
.00
40
.00
80
.00
9
B0
50
.69
0−
0.0
02
0.0
00
0.0
00
0.0
04
−0
.00
0−
0.0
01
−0
.00
0−
0.0
03
0.0
25
0.0
15
0.0
07
0.0
13
0.0
18
RU
S0
.49
10
.76
3−
0.0
00
−0
.00
10
.00
20
.00
10
.00
0−
0.0
02
−0
.00
10
.02
00
.01
30
.00
60
.01
10
.01
3
EK
K0
.05
40
.69
60
.49
90
.00
20
.00
10
.00
2−
0.0
01
0.0
01
−0
.00
10
.01
50
.00
80
.00
40
.00
70
.00
9
TA
N0
.17
10
.20
20
.64
10
.00
60
.00
20
.00
10
.00
00
.00
1−
0.0
02
0.0
17
0.0
09
0.0
07
0.0
11
0.0
12
PO
R0
.06
80
.05
60
.53
10
.09
80
.03
00
.00
30
.00
30
.00
30
.00
10
.01
50
.00
80
.00
50
.00
90
.00
9
BA
R0
.49
30
.52
10
.77
80
.11
00
.13
70
.44
5−
0.0
02
0.0
02
0.0
03
0.0
20
0.0
13
0.0
07
0.0
14
0.0
16
MA
S0
.24
40
.69
30
.15
70
.31
50
.08
50
.08
80
.40
10
.00
1−
0.0
01
0.0
18
0.0
08
0.0
05
0.0
09
0.0
11
UL
L0
.16
90
.85
70
.67
90
.09
10
.04
50
.09
40
.18
90
.26
00
.00
10
.01
90
.01
10
.00
50
.01
10
.01
2
VE
S0
.93
30
.99
30
.89
50
.85
30
.61
10
.78
30
.56
30
.81
10
.79
60
.01
80
.01
00
.00
60
.00
90
.01
1
DO
A0
.00
0***
0.0
00
***
0.0
00
***
0.0
00
***
0.0
00
***
0.0
00
***
0.0
00
***
0.0
00
**
0.0
00
***
0.0
00
***
0.0
01
0.0
06
0.0
07
0.0
01
BA
L0
.00
0*
0.0
00
*0
.00
0**
0.0
00
**
0.0
00
**
0.0
00
***
0.0
00
**
0.0
20
0.0
00
***
0.0
08
0.2
17
0.0
01
0.0
02
−0
.00
1
AN
D0
.00
10
.03
60
.01
00
.00
40
.00
0*
0.0
00
***
0.0
15
0.0
30
0.0
03
0.0
42
0.0
02
0.5
36
0.0
00
0.0
01
SO
R0
.00
0***
0.0
00
*0
.00
0**
0.0
00
**
0.0
00
***
0.0
00
***
0.0
00
**
0.0
03
0.0
00
***
0.0
04
0.0
00
***
0.0
00
*0
.12
70
.00
2
MA
L0
.00
0**
0.0
00
***
0.0
00
***
0.0
00
***
0.0
00
**
0.0
00
***
0.0
00
***
0.0
01
0.0
00
***
0.0
07
0.0
62
0.8
71
0.1
51
0.0
07
Ast
eris
ks
ind
icat
esi
gn
ifica
nt
val
ues
afte
rse
qu
enti
alB
on
ferr
on
ico
rrec
tio
ns
(Ric
e,1
98
9).
*P
<0
.05
;**P
<0
.01
;***P
<0
.00
1.
The PCA plot (Fig. 2) illustrates clearly the clustering of sam-
ples into two groups, in which one comprises NCC samples and
the other NEAC samples plus the outer coastal samples. The plot
also visualizes the higher variance among samples associated
with the NCC group.
3.3. Marker neutrality and mutational impact on the
observed structure
A plot of FST against heterozygosity for each of the 10
microsatellite loci superimposed on the distribution expected
when FST equals 0.01 is shown in Fig. 3. The upper and lower
lines enclose an envelope for the 95% confidence interval under
the IAM. The plot shows a poor fit for the FST estimates under
both mutational models were most loci fall along or below the
lower line. In contrast the locus GMO 34 falls well above the
upper CI, while GMO 132 is located slightly above the upper
line, characterizing both as significant outliers.
The “Schlotterer” test based on the variance in gene diversity
between the pooled samples, lnRH, still holds GMO 34 as an
outlier whereas GMO 132 falls within the 95% CI (Fig. 4). The
direct comparison of allele frequency distribution at the two loci
in the two groups clearly shows reduced variability in the NEAC
group compared to the NCC group (Fig. 5).
4. Discussion
4.1. The identity of near coastal samples with high Pan IB
frequencies
One essential finding of this study is that samples domi-
nated by the Pan IB allele in coastal areas of northern Norway
most probably comprise NEAC, and do not represent a diver-
gent group of coastal cod. The panel of 10 microsatellite markers
revealed no differences between the high frequent Pan IB coastal
samples and samples known to consist of NEAC on the basis of
their Pan I allele frequencies. In conformity with Pan I allele
frequency patterns, two of the microsatellite loci (GMO 34 and
GMO 132) clearly discriminated between outer coastal samples
and samples from the inner parts of fjords. The discriminant
contribution of GMO 34 is, however, weakened by its linkage
disequilibrium with Pan I. The eight remaining, and assumedly
neutral loci failed to discriminate between inner and outer coastal
samples.
The samples from the outer coastal areas were dominated
by immature individuals of a size suggesting the fish were 2–5
years old, according to mean length at age in NEAC (Nakken
and Raknes, 1987). Two different scenarios may have caused the
presence of high frequent Pan IB cod in the coastal zone. One
is that immature NEAC performs feeding migrations southward
to the North-Norwegian coast. It is well known that immature
NEAC performs such migrations in association with the spawn-
ing of capelin in the spring (Hjort, 1914; Eggvin, 1938; Hylen,
1961). However, the sampling time for the outer coastal samples
in this study spans from June to October, which implies that
NEAC migration would not be limited only to the spring. The
alternative scenario, therefore, is that some of the 0-group NEAC

J.-I. Westgaard, S.-E. Fevolden / Fisheries Research 85 (2007) 306–315 311
Fig. 2. PCA plot showing all 15 samples of Atlantic cod included in the study. The dashed line surrounds NCC samples, the solid line surrounds NEAC samples
including outer coastal samples with high Pan IB frequencies. Sample abbreviations are as in Table 1.
Fig. 3. Plot of FST as a function of heterozygosity in the various microsatellite
loci used in the study of Atlantic cod. The upper and lower lines indicate 0.975
and 0.025 quantiles. Solid points represent the different microsatellite loci, only
GMO 34 and GMO 132 are denoted.
Fig. 4. Plot of FST against standardized lnRH estimates for 10 microsatellites
between the NEAC and NCC group of Atlantic cod. Dashed lines indicate the
95% CI (−1.96, +1.96). Solid points represent the different microsatellite loci,
only GMO 34 and GMO 132 are denoted.
do not drift into the Barents Sea their first year of life, which
is the common understanding (Robichaud and Rose, 2004, and
references therein), causing the fish to remain in coastal areas,
including outer and middle parts of fjords, for a prolonged time
during their immature phase. Studies have shown that the disper-
sal of eggs and 0-year-old NEAC is highly dependent on currents
and wind induced mixing in the upper water masses, which may
vary from year to year, and that distribution of 1-year-old cod
most probably is determined by the extent of 0-year-old drift dur-
ing the preceding autumn (Sundby, 1983; Nakken and Raknes,
1987; Vikebo et al., 2005). Also, the distribution of larvae and
pelagic juveniles is dependent upon their vertical position in the
water. Larvae and juveniles drifting close to the surface are more
likely to end up in the central or western Barents Sea, whereas
those lower in the water column are more likely to end up close
to the Norwegian coast or the eastern Barents Sea (Vikebo et al.,
2005). Such buoyancy mechanisms, together with the fact that
NCC fry settle at shallower depths and earlier in the season than
NEAC (Løken et al., 1994; Nostvik and Pedersen, 1999), might
also contribute to prevent NEAC eggs and larvae from mixing
with NCC eggs and larvae. So, whereas the data herein infer that
the predominantly immature cod steadily found in outer coastal
regions of northern Norway cannot be genetically distinguished
from NEAC, it remains obscure whether they represent migra-
tory fish or fish that has yet not migrated up into the Barents
Sea.
4.2. The role of selection in shaping population structure
The genetic divergence found among samples in this study
was mainly displayed upon comparing samples between the
NEAC and the NCC group, the former group redefined to include
also coastal cod with high Pan IB frequencies. Within each of
these groups no profound divergence was found. Moreover, the
divergences that were observed were almost exclusively caused
by two loci, GMO 34 and GMO 132, especially pronounced
when the pooled samples of NEAC and NCC were compared.

312 J.-I. Westgaard, S.-E. Fevolden / Fisheries Research 85 (2007) 306–315
Fig. 5. Allele frequency distribution for the loci GMO 34 (a and c) and GMO 132 (b and d) for the NCC group (a and b) and NEAC group (c and d) of Atlantic cod.
When testing the microsatellite loci against neutral expectations
for the two groups of samples, both GMO 34 and GMO 132 were
detected as outlier loci in the coalescent-based simulation test
(Beaumont and Nichols, 1996). However, the smaller number of
samples and loci included, compared to what is recommended
(Beaumont and Nichols, 1996) reduced the power of this test.
The “Schlotterer” test (Kauer et al., 2003) revealed only GMO
34 as an outlier locus. The narrower distribution in allele fre-
quencies in the NEAC compared to the NCC group (Fig. 5),
together with the significant reduction in heterozygosity in the
NEAC group, may be indicative of selective sweeps at both of
these loci. Additional support for selection at GMO 34 is given
by the profound linkage disequilibrium between this locus and
the Pan I locus, which is acknowledged to be under selectional
constraints (Fevolden and Pogson, 1997; Karlsson and Mork,
2003; Pogson and Fevolden, 2003; Pogson and Mesa, 2004;
Case et al., 2005; Sarvas and Fevolden, 2005a,b).
Differences among natural populations in allele frequencies
at loci subjected to selection and not in neutral loci are consis-
tent with selection modifying frequencies at selected loci at the
same time that gene flow homogenize variation at neutral sites
(Berry and Kreitman, 1993; Veuille et al., 1998; Schmidt et al.,
2000). Loci subjected to selection should, however, not automat-
ically be disqualified as useful genetic markers since they have
the ability to respond to population sub-structuring much faster
than purely neutral markers (e.g. Carvalho and Hauser, 1998;
Pogson and Fevolden, 2003). Even very weak selection (e.g.
s < 0.01) will drive gene frequencies much more quickly than
genetic drift (Gavrilets, 2003), making weakly selected markers
particularly useful when examining differences among popu-
lations with a short evolutionary history. In a recent paper by
Conover et al. (2006), the statement was made that for marine
fishes selection is a potent evolutionary force capable of sus-
taining adaptive divergence on contemporary time scales, not
detectable by FST estimates of neutral markers. Limitations in
using selected markers, however, exist, e.g. in estimating coa-
lescent times and historical gene flow. As to microsatellites,
previous studies have documented that this class of markers may
have a functional role themselves (Kashi and Soller, 1999; Li et
al., 2002), or are linked to regions of the genome which are
subjected to selection (Selkoe and Toonen, 2006). In a recent
study of Atlantic cod, microsatellites (many of the same as used
herein) were used to compare samples from the Baltic Sea, North
Sea, Barents Sea, and Newfoundland (Nielsen et al., 2006). The
authors reported the strongest indication for selection at GMO
132 compared to GMO 34 in the present study, illustrating that
the selectional constraints on a microsatellite locus may vary
with environmental conditions.
4.3. Peculiarities of Atlantic cod in northern Norway
An array of biological evidence, plus claims from local fish-
ermen during centuries, supports the existence of two divergent
populations of cod in northern Norway and the adjacent Barents
Sea. Life-history characteristics, habitat and migration patterns
(Bergstad et al., 1987; Jakobsen, 1987; Berg and Albert, 2003),
growth and maturity, otoliths (Rollefsen, 1934) and morpho-
metrics (Løken et al., 1994), all validate the NEAC and NCC
subdivision, although some of those traits are admittedly plas-
tic. Much of the pattern of divergence observed at present might
have been shaped during the last 10,000 years, i.e. after the last
ice age. Although this study does not provide information rela-

J.-I. Westgaard, S.-E. Fevolden / Fisheries Research 85 (2007) 306–315 313
tive to the time scale at which divergence at the microsatellites
operates, the striking habitat differences and thereby different
selection pressure experienced by NEAC and NCC (open ocean
compared to fjords), may have caused divergence at such short
evolutionary time for non-neutral loci like GMO 132 and GMO
34.
Differences in Pan I allele frequencies of Atlantic cod
between adjacent fjords in northern Norway, and even within
fjords, have previously been suggested to be a result of vary-
ing degree of intermingling between NCC and NEAC (Sarvas
and Fevolden, 2005a). When divergent Pan IA frequencies are
observed among fjord samples that are in Hardy–Weinberg
equilibrium, the existence of separate fjord populations could
be a causative agent (Fevolden and Pogson, 1997; Sarvas and
Fevolden, 2005a; Skarstein et al., in press). There are, however,
samples of alleged NCC in northern Norway with intermedi-
ate Pan I allele frequencies displaying both significant deficits
(caused by intermingling of NEAC and NCC?) and excesses of
heterozygotes (e.g. Sarvas and Fevolden, 2005a,b; own unpub-
lished data). Although the latter observations are not more than
what could be expected by chance, the phenomenon is over-
represented in one specific fjord and has, therefore, become
the subject of a separate study addressing both selection and
interbreeding effects (to be published elsewhere).
The isolation-by-distance pattern reported for Atlantic cod
using microsatellites (Skarstein et al., in press) can be interpreted
as a stepping-stone model of gene flow between neighboring
populations of NCC; thus, the relative strength of migration
will vary in response to geographical distance. In the present
study, NCC samples were selected in order to be as homoge-
nous as possible for high Pan IA frequencies to ensure that the
samples comprise NCC. This enabled a test of the potential of
microsatellites to distinguish among NCC samples where Pan I
allele frequencies could not. Significant differentiation in pair-
wise comparisons of samples was, however, only found in three
cases (Table 3). The one NCC sample from outer coastal regions
(AND, Fig. 1), differed somewhat from the other NCC samples
in its Pan I allele frequencies (Table 1), yet showed no clear evi-
dence of being divergent from the other NCC samples on basis
of the microsatellite data (Table 3). The PCA plot (Fig. 2) clearly
clusters the AND sample with the remaining NCC samples.
The amount of differentiation among samples in the NCC
group could be expected to be higher than in the NEAC group
at non-neutral loci due to the more heterogeneous environment
this group is exposed to (due to, e.g. open versus sill-closed
fjords; Berg and Albert, 2003; Lupus, 2006). Considering the
much smaller population sizes of possible fjord populations
(total number of NCC recruits ≪ 1/10 that of NEAC recruits,
before the decline of the former started, cf. ICES, 2006), this
might also apply to the neutral loci due to the effect of genetic
drift. The examination of nucleotide sequences within the Pan
IA allele comprising six coastal samples of NCC, from a slightly
larger geographic area than the present NCC samples, revealed
significant heterogeneity in the frequency of neutral sites among
different fjord populations (Pogson and Fevolden, 2003). The
homogeneity at neutral microsatellites observed herein is thus
not consistent with the isolation suggested by analysis of neu-
tral sites at the Pan I locus and could suggest the occurrence of
gene flow in this area. The apparent incongruity with the data of
Pogson and Fevolden (2003) may have alternative explanations.
The two marker classes may be different in their evolutionary
history due to different mutational mechanisms, i.e. point muta-
tions versus insertions/deletions of repeat units, and degree of
selective neutrality. Moreover, microsatellites, because of their
evolutionary properties, are subjected to homoplasy, that is two
alleles with the same size are identical by state (IBS) but not
by descent (IBD) (Estoup et al., 2002). In a study compris-
ing 14 microsatellite loci in walleye pollock (O’Reilly et al.,
2004), the authors suggested homoplasy as a possible reason for
the highly polymorphic microsatellites having reduced ability
to detect population structure compared to less variable loci in
a weakly structured marine species.
As for the joint NEAC group, which displayed even stronger
homogeneity among samples (Fig. 3), migratory behavior com-
bined with the absence of barriers for gene flow and large
effective population sizes (average of 600 mill 3-year recruits
from 1946 to 2006; ICES, 2006) contributes to minimize possi-
ble divergent mechanisms (e.g. genetic drift).
5. Conclusion
In conclusion, the findings of the present study clearly states
that the Atlantic cod found all year round in outer coastal regions
of northern Norway cannot be genetically discriminated from
NEAC and is not proven to represent a divergent coastal cod
population. Moreover, the data herein, together with those of
Nielsen et al. (2006), strongly suggest that the microsatellite
loci GMO 34 and GMO 132 show clear evidence of being non-
neutral. Rather than dismissing them, therefore, as population
markers, we consider them valuable supporting tools for dis-
criminating between NEAC and NCC, due to their capability
of revealing population differences on shorter evolutionary time
scales than purely neutral markers, as e.g. the eight remaining
microsatellites assayed herein. Thus, the present data support the
suggestion of Pogson and Fevolden (2003) that the differences
detected between NEAC and NCC is driven by diversifying
selection acting in the recent past (and at present) that is not
reflected in the slower evolution of neutral loci. Moreover, like
for Pan I, we believe that the significant divergence between
NEAC and NCC at the two non-neutral microsatellite loci (FST
values comparing pooled NEAC and NCC samples were 0.105
and 0.033 for GMO 34 and GMO 132, respectively) is a result of
accumulated effects of ongoing selection over generations. The
arguments for extensive gene flow between NEAC and NCC
provided by the homogeneous structure displayed by the neu-
tral microsatellites we believe could be caused by these loci
not being sensitive enough to detect restricted gene flow over
such short evolutionary periods, e.g. since the last ice age. Thus,
we consider the population differences found at the non-neutral
loci as strong support for the historical/biological claim that
NEAC and NCC represent separate populations. We acknowl-
edge the shortcomings of exact data on the quantification of
possible gene flow between the two stocks, and possible geno-
typic/environmental interactions (cf. Case et al., 2006), but to

314 J.-I. Westgaard, S.-E. Fevolden / Fisheries Research 85 (2007) 306–315
ascertain a management policy aimed at conserving biological
diversity we recommend that the separate management of the
two units should be upheld.
Acknowledgements
This work was supported by grants 127357/120 and
153343/120 from the Norwegian Research Council to S.-E.
Fevolden. We thank J. Wolkers for her technical assistance in
analyzing the samples.
References
Arnason, E., Palsson, S., 1996. Mitochondrial cytochrome b DNA sequence
variation of Atlantic cod (Gadus morhua), from Norway. Mol. Ecol. 5,
715–724.
Beaumont, M.A., Nichols, R.A., 1996. Evaluating loci for use in the genetic
analysis of population structure. Proc. Roy. Soc. Lond. B: Biol. 263, 1619–
1626.
Berg, E., Albert, O.T., 2003. Cod in fjords and coastal waters of North Norway:
distribution and variation in length and maturity at age. ICES J. Mar. Sci.
60, 787–797.
Bergstad, O.A., Jorgensen, T., Dragesund, O., 1987. Life-history and ecology
of the gadoid resources of the Barents Sea. Fish Res. 5, 119–161.
Berry, A., Kreitman, M., 1993. Molecular analysis of an allozyme cline-
alcohol-dehydrogenase in Drosophila melanogaster on the east-coast of
North-America. Genetics 134, 869–893.
Brooker, A.L., Cook, D., Bentzen, P., Wright, J.M., Doyle, R.W., 1994. Orga-
nization of microsatellites differs between mammals and cold-water teleost
fishes. Can. J. Fish. Aquat. Sci. 51, 1959–1966.
Carvalho, G.R., Hauser, L., 1998. Advances in the molecular analysis of fish
population structure. Ital. J. Zool. 65, 21–33.
Case, R.A.J., Hutchinson, W.F., Hauser, L., Van Oosterhout, C., Carvalho, G.R.,
2005. Macro- and micro-geographic variation in pantophysin (PanI) allele
frequencies in NE Atlantic cod (Gadus morhua). Mar. Ecol. Prog. Ser. 301,
267–278.
Case, R.A.J., Hutchinson, W.F., Hauser, L., Buehler, V., Clemmesen, C., Dahle,
G., Kjesbu, O.S., Moksness, E., Ottera, H., Paulsen, H., Svasand, T., Thorsen,
A., Carvalho, G.R., 2006. Association between growth and Pan I* genotype
within Atlantic cod full-sibling families. Trans. Am. Fish. Soc. 135, 241–250.
Cockerham, C.C., Weir, B.S., 1993. Estimation of gene flow from F-statistics.
Evolution 47, 855–863.
Conover, D.O., Clarke, L.M., Munch, S.B., Wagner, G.N., 2006. Spatial and
temporal scales of adaptive divergence in marine fishes and the implications
for conservation. J. Fish Biol. 69 (Suppl. C), 21–47.
Dahle, G., Jorstad, K.E., 1993. Hemoglobin variation in cod—a reliable marker
for Arctic cod (Gadus morhua L.). Fish Res. 16, 301–311.
Dupanloup, I., Schneider, S., Excoffier, L., 2002. A simulated annealing
approach to define the genetic structure of populations. Mol. Ecol. 11,
2571–2581.
Eggvin, J., 1938. Oceanographical conditions in North-Norway connected with
the cod fisheries. Fiskeridirektoratets skrifter, Serie Havundersøkelser 5,
23–47.
Estoup, A., Jarne, P., Cornuet, J.M., 2002. Homoplasy and mutation model at
microsatellite loci and their consequences for population genetics analysis.
Mol. Ecol. 11, 1591–1604.
Excoffier, L., Laval, G., Schneider, S., 2005. Arlequin ver. 3.0: an integrated soft-
ware package for population genetics analysis. Evol. Bioinform. 1, 47–50.
Excoffier, L., Smouse, P.E., Quattro, J.M., 1992. Analysis of molecular vari-
ance inferred from metric distances among DNA haplotypes—application
to human mitochondrial–DNA restriction data. Genetics 131, 479–491.
Fevolden, S.E., Pogson, G.H., 1997. Genetic divergence at the synaptophysin
(Syp I) locus among Norwegian coastal and north-east Arctic populations
of Atlantic cod. J. Fish Biol. 51, 895–908.
Gavrilets, S., 2003. Perspective: models of speciation: what have we learned in
40 years? Evolution 57, 2197–2215.
Goudet, J., 2001. FSTAT, a program to estimate and test gene diversities and
fixation indices (version 2.9.3).
Goudet, J., Raymond, M., deMeeus, T., Rousset, F., 1996. Testing differentiation
in diploid populations. Genetics 144, 1933–1940.
Hjort, J., 1914. Fluctuations in the great fisheries of the Northern Europe viewed
in the light of biological research. Rapports et proces-verbaux Reunion
Conseil permanent internationale pour l’Exploration de la Mer 20, 1–
228.
Hylen, A., 1961. Coastal cod and skrei in the Lofoten area. Fiskeridirektoratets
skrifter, Serie Havundersøkelser 13, 27–42.
ICES, 2006. Report of the ICES Advisory Committee on Fishery Management.
Advisory Committee on the Marine Environment and Advisory Committee
on Ecosystems. ICES advice. Books 1–10, 3, 89 pp.
Jakobsen, T., 1987. Coastal cod in northern Norway. Fish Res. 5, 223–234.
Kalinowski, S.T., 2004. Counting alleles with rarefaction: private alleles and
hierarchical sampling designs. Conserv. Genet. 5, 539–543.
Kalinowski, S.T., 2005. HP-RARE 1.0: a computer program for performing
rarefaction on measures of allelic richness. Mol. Ecol. Notes 5, 187–189.
Karlsson, S., Mork, J., 2003. Selection-induced variation at the pantophysin
locus (PanI) in a Norwegian fjord population of cod (Gadus morhua L.).
Mol. Ecol. 12, 3265–3274.
Karlsson, S., Mork, J., 2005. Deviation from Hardy–Weinberg equilibrium, and
temporal instability in allele frequencies at microsatellite loci in a local
population of Atlantic cod. ICES J. Mar. Sci. 62, 1588–1596.
Kashi, Y., Soller, M., 1999. Functional roles of microsatellites and minisatellites.
In: Goldstein, D.B., Schlotterer, C.S. (Eds.), Microsatellites: Evolution and
Applications. Oxford University Press, Oxford, UK, pp. 10–23.
Kauer, M.O., Dieringer, D., Schlotterer, C., 2003. A microsatellite variability
screen for positive selection associated with the “Out of Africa” habitat
expansion of Drosophila melanogaster. Genetics 165, 1137–1148.
Li, Y.C., Korol, A.B., Fahima, T., Beiles, A., Nevo, E., 2002. Microsatel-
lites: genomic distribution, putative functions and mutational mechanisms:
a review. Mol. Ecol. 11, 2453–2465.
Lupus, 2006. Sea Environmental data from Northern Norwegian Fjords and
Coastal Areas. http://lupus.nfh.uit.no.
Løken, S., Pedersen, T., Berg, E., 1994. Vertebrae numbers as an indicator for
the recruitment mechanism of coastal cod of northern Norway. ICES Mar.
Sci. Symposia 198, 510–519.
Miller, K.M., Le, K.D., Beacham, T.D., 2000. Development of tri- and tetranu-
cleotide repeat microsatellite loci in Atlantic cod (Gadus morhua). Mol.
Ecol. 9, 238–239.
Møller, D., 1966. Genetic differences between cod groups in the Lofoten area.
Nature 212, 824.
Møller, D., 1968. Genetic diversity in spawning cod along the Norwegian coast.
Hereditas 60, 1–32.
Møller, D., 1969. The relationship between arctic and coastal cod in their
immature stages illustrated by frequencies of genetic characters. Fiskeridi-
rektoratets skrifter, Serie Havundersøkelser 15, 220–233.
Mork, J., Giaever, M., 1999. Genetic structure of cod along the coast of Norway:
results from isozyme studies. Sarsia 84, 157–168.
Nakken, O., Raknes, A., 1987. The distribution and growth of northeast Arctic
cod in relation to bottom temperatures in the Barents Sea, 1978–1984. Fish
Res. 5, 243–252.
Nielsen, E.E., Hansen, M.M., Meldrup, D., 2006. Evidence of microsatellite
hitch-hiking selection in Atlantic cod (Gadus morhua L.): implications
for inferring population structure in nonmodel organisms. Mol. Ecol. 15,
3219–3229.
Nostvik, F., Pedersen, T., 1999. Catching cod for tagging experiments. Fish Res.
42, 57–66.
O’Reilly, P.T., Canino, M.F., Bailey, K.M., Bentzen, P., 2000. Isolation of twenty
low stutter di- and tetranucleotide microsatellites for population analyses of
walleye pollock and other gadoids. J. Fish Biol. 56, 1074–1086.
O’Reilly, P.T., Canino, M.F., Bailey, K.M., Bentzen, P., 2004. Inverse relation-
ship between F-ST and microsatellite polymorphism in the marine fish,
walleye pollock (Theragra chalcogramma): implications for resolving weak
population structure. Mol. Ecol. 13, 1799–1814.
Peakall, R., Smouse, P.E., 2006. genalex 6: genetic analysis in Excel. Population
genetic software for teaching and research. Mol. Ecol. Notes 6, 288–295.

J.-I. Westgaard, S.-E. Fevolden / Fisheries Research 85 (2007) 306–315 315
Piry, S., Alapetite, A., Cornuet, J.M., Paetkau, D., Baudouin, L., Estoup, A.,
2004. GENECLASS2: a software for genetic assignment and first-generation
migrant detection. J. Hered. 95, 536–539.
Pogson, G.H., 2001. Nucleotide polymorphism and natural selection at the pan-
tophysin (Pan I) locus in the Atlantic cod, Gadus morhua (L.). Genetics 157,
317–330.
Pogson, G.H., Fevolden, S.E., 2003. Natural selection and the genetic differ-
entiation of coastal and Arctic populations of the Atlantic cod in northern
Norway: a test involving nucleotide sequence variation at the pantophysin
(PanI) locus. Mol. Ecol. 12, 63–74.
Pogson, G.H., Mesa, K.A., 2004. Positive Darwinian selection at the pantophysin
(Pan I) locus in marine gadid fishes. Mol. Biol. Evol. 21, 65–75.
Pogson, G.H., Mesa, K.A., Boutilier, R.G., 1995. Genetic population-structure
and gene flow in the Atlantic cod Gadus morhua—a comparison of allozyme
and nuclear Rflp loci. Genetics 139, 375–385.
Rannala, B., Mountain, J.L., 1997. Detecting immigration by using multilocus
genotypes. Proc. Natl. Acad. Sci. U.S.A. 94, 9197–9201.
Rice, W.R., 1989. Analyzing tables of statistical tests. Evolution 43, 223–225.
Robichaud, D., Rose, G.A., 2004. Migratory behaviour and range in Atlantic
cod: inference from a century of tagging. Fish Fish. 5, 185–214.
Rollefsen, G., 1934. The cod otolith as a guide to race, sexual development and
mortality. Rapports et proces-verbaux Reunion Conseil permanent interna-
tionale pour l’Exploration de la Mer 88, 1–15.
Sarvas, T.H., Fevolden, S.E., 2005a. Pantophysin (Pan I) locus divergence
between inshore v. offshore and northern v. southern populations of Atlantic
cod in the north-east Atlantic. J. Fish Biol. 67, 444–469.
Sarvas, T.H., Fevolden, S.E., 2005b. The scnDNA locus Pan I reveals concurrent
presence of different populations of Atlantic cod (Gadus morhua L.) within
a single fjord. Fish Res. 76, 307–316.
Schlotterer, C., 2002. A microsatellite-based multilocus screen for the identifi-
cation of local selective sweeps. Genetics 160, 753–763.
Schmidt, P.S., Duvernell, D.D., Eanes, W.F., 2000. Adaptive evolution of a
candidate gene for aging in Drosophila. Proc. Natl. Acad. Sci. U.S.A. 97,
10861–10865.
Selkoe, K.A., Toonen, R.J., 2006. Microsatellites for ecologists: a practical guide
to using and evaluating microsatellite markers. Ecol. Lett. 9, 615–629.
Skarstein, T.H., Westgaard, J.I., Fevolden, S.E., in press. Comparing microsatel-
lite variation in north-east Atlantic cod (Gadus morhua L.) to genetic
structuring as revealed by the pantophysin (Pan I) locus. J. Fish Biol.
Sundby, S., 1983. A one-dimensional model for the vertical-distribution of
pelagic fish eggs in the mixed layer. Deep Sea Res. 30, 645–661.
Van Oosterhout, C., Hutchinson, W.F., Wills, D.P.M., Shipley, P., 2004. Micro-
checker: software for identifying and correcting genotyping errors in
microsatellite data. Mol. Ecol. Notes 4, 535–538.
Veuille, M., Benassi, V., Aulard, S., Depaulis, F., 1998. Allele-specific popu-
lation structure of Drosophila melanogaster alcohol dehydrogenase at the
molecular level. Genetics 149, 971–981.
Vikebo, F., Sundby, S., Adlandsvik, B., Fiksen, O., 2005. The combined effect
of transport and temperature on distribution and growth of larvae and pelagic
juveniles of Arcto-Norwegian cod. ICES J. Mar. Sci. 62, 1375–1386.
Weir, B.S., Cockerham, C.C., 1984. Estimating F-statistics for the analysis of
population-structure. Evolution 38, 1358–1370.
Copyright © 2022 FDOKUMEN