Prediction of selectivity from morphological conditions: Methodology and a case study on cod ( Gadus...
13
Fisheries Research 97 (2009) 59–71 Contents lists available at ScienceDirect Fisheries Research journal homepage: www.elsevier.com/locate/fishres Prediction of selectivity from morphological conditions: Methodology and a case study on cod (Gadus morhua) Bent Herrmann 1 , Ludvig A. Krag ∗,1 , Rikke P. Frandsen, Niels Madsen, Bo Lundgren, Karl-Johan Stæhr DTU Aqua, Technical University of Denmark, North Sea Science Park, DK-9850 Hirtshals, Denmark article info Article history: Received 4 September 2008 Received in revised form 16 December 2008 Accepted 1 January 2009 Keywords: FISHSELECT Mesh penetration Morphology Size selectivity Atlantic cod Gadus morhua abstract The FISHSELECT methodology, tools, and software were developed and used to measure the morphological parameters that determine the ability of cod to penetrate different mesh types, sizes, and openings. The shape of one cross-section at the cod’s head was found to explain 97.6% of the mesh penetration results obtained in a laboratory experiment. Design guides predicting the 50% retention length (L50) of different mesh types, sizes, and openings were produced and compared with results from sea trials. Results show that the morphology-based simulations can be used to explain both the within-haul and the between- haul variations previously reported from sea trials. Finally, based on the results obtained, ideas to improve the size selection of cod in towed gear are presented. © 2009 Elsevier B.V. All rights reserved. 1. Introduction Cod (Gadus morhua) is economically one of the most important species targeted in the northeast Atlantic trawl fisheries. However, several of the cod stocks inhabiting this region have in recent years been at critically low levels (ICES, 2006). To aid recovery of the cod stocks, several technical measures have been tested and some of these have been implemented in legislation. Examples of these measures are square mesh panels and an increase in codend mesh size, both of which are expected to improve the size selectivity of cod (Madsen et al., 1999, 2002; Kvamme and Isaksen, 2004; Madsen and Stæhr, 2005; Krag et al., 2008). Diamond mesh netting is the commonly used mesh type in towed gear in the northeastern Atlantic. When the size selectivity for cod in diamond mesh codends is estimated experimentally (e.g., in Galbraith et al., 1994), the selection ranges (SR) for single hauls often are relatively large. A large SR value is likely to reflect a large within-haul variation in the selection process. This will, depending on the allowed minimum landing size, increase the risk of catching undersized individuals or losing marketable sizes. Even if individ- ual SR values are small, there can be a problem if the between-haul variation in the 50% retention length (L50) is large. High between- haul variation in L50 has previously been reported on cod in covered codend experiments (e.g., in Dahm et al., 2002). ∗ Corresponding author. Tel.: +45 33963200. E-mail address: [email protected] (L.A. Krag). 1 Equal authorship. The effect on size selectivity of technical measures often is assessed through experimental fishing or by discard sampling from the commercial fishery. These time-consuming trial-and- error methods often lead to insufficient knowledge about the selection processes for different species and fisheries. We believe it would be a better starting point to theoretically assess the mesh sizes and shapes required to make it at least morphologically pos- sible for unwanted species or sizes to penetrate the meshes before the gear is constructed and tested at sea. Broadhurst et al. (2006) also proposed this view. In previous selectivity studies, maximum girth has been the main measure used to relate fish morphology to their ability to pass through meshes (Santos et al., 2006; Tosunoglu, 2007). How- ever, due to differences in deformability of muscle tissue, gut, and bone structures such as the skull, we believe that maximum girth is inadequate to explain the relationship between fish morphology and mesh penetration in towed fishing gear. In the current study we developed a new methodology, FISHSELECT, that includes tools and software to investigate conditions for mesh penetration. The FISHS- ELECT methodology is a framework that assesses the morphological conditions that determine a fish’s ability to physically penetrate a given mesh in a towed fishing gear. The method is based on a com- bination of laboratory experiments with fish, data collection, data analysis and computer simulations. Besides being a new approach towards providing information for both current and future gear designs and fisheries management, we expect the above method- ology to provide information that will extend the use of the codend selectivity simulator PRESEMO (Herrmann, 2005a,b) to enable it to work with species other than round fish and mesh shapes other than diamond-shaped. 0165-7836/$ – see front matter © 2009 Elsevier B.V. All rights reserved. doi:10.1016/j.fishres.2009.01.002
-
Upload
independent -
Category
Documents
-
view
4 -
download
0
Transcript of Prediction of selectivity from morphological conditions: Methodology and a case study on cod ( Gadus...

Ps
BD
a
ARRA
KFMMSA
1
ssbcomsca
tfiowouuvhc
0d
Fisheries Research 97 (2009) 59–71
Contents lists available at ScienceDirect
Fisheries Research
journa l homepage: www.e lsev ier .com/ locate / f i shres
rediction of selectivity from morphological conditions: Methodology and a casetudy on cod (Gadus morhua)
ent Herrmann1, Ludvig A. Krag ∗,1, Rikke P. Frandsen, Niels Madsen, Bo Lundgren, Karl-Johan StæhrTU Aqua, Technical University of Denmark, North Sea Science Park, DK-9850 Hirtshals, Denmark
r t i c l e i n f o
rticle history:eceived 4 September 2008eceived in revised form 16 December 2008
a b s t r a c t
The FISHSELECT methodology, tools, and software were developed and used to measure the morphologicalparameters that determine the ability of cod to penetrate different mesh types, sizes, and openings. Theshape of one cross-section at the cod’s head was found to explain 97.6% of the mesh penetration results
ccepted 1 January 2009
eywords:ISHSELECTesh penetrationorphology
obtained in a laboratory experiment. Design guides predicting the 50% retention length (L50) of differentmesh types, sizes, and openings were produced and compared with results from sea trials. Results showthat the morphology-based simulations can be used to explain both the within-haul and the between-haul variations previously reported from sea trials. Finally, based on the results obtained, ideas to improvethe size selection of cod in towed gear are presented.
ize selectivitytlantic cod Gadus morhua
. Introduction
Cod (Gadus morhua) is economically one of the most importantpecies targeted in the northeast Atlantic trawl fisheries. However,everal of the cod stocks inhabiting this region have in recent yearseen at critically low levels (ICES, 2006). To aid recovery of theod stocks, several technical measures have been tested and somef these have been implemented in legislation. Examples of theseeasures are square mesh panels and an increase in codend mesh
ize, both of which are expected to improve the size selectivity ofod (Madsen et al., 1999, 2002; Kvamme and Isaksen, 2004; Madsennd Stæhr, 2005; Krag et al., 2008).
Diamond mesh netting is the commonly used mesh type inowed gear in the northeastern Atlantic. When the size selectivityor cod in diamond mesh codends is estimated experimentally (e.g.,n Galbraith et al., 1994), the selection ranges (SR) for single haulsften are relatively large. A large SR value is likely to reflect a largeithin-haul variation in the selection process. This will, depending
n the allowed minimum landing size, increase the risk of catchingndersized individuals or losing marketable sizes. Even if individ-al SR values are small, there can be a problem if the between-haul
ariation in the 50% retention length (L50) is large. High between-aul variation in L50 has previously been reported on cod in coveredodend experiments (e.g., in Dahm et al., 2002).∗ Corresponding author. Tel.: +45 33963200.E-mail address: [email protected] (L.A. Krag).
1 Equal authorship.
165-7836/$ – see front matter © 2009 Elsevier B.V. All rights reserved.oi:10.1016/j.fishres.2009.01.002
© 2009 Elsevier B.V. All rights reserved.
The effect on size selectivity of technical measures often isassessed through experimental fishing or by discard samplingfrom the commercial fishery. These time-consuming trial-and-error methods often lead to insufficient knowledge about theselection processes for different species and fisheries. We believeit would be a better starting point to theoretically assess the meshsizes and shapes required to make it at least morphologically pos-sible for unwanted species or sizes to penetrate the meshes beforethe gear is constructed and tested at sea. Broadhurst et al. (2006)also proposed this view.
In previous selectivity studies, maximum girth has been themain measure used to relate fish morphology to their ability topass through meshes (Santos et al., 2006; Tosunoglu, 2007). How-ever, due to differences in deformability of muscle tissue, gut, andbone structures such as the skull, we believe that maximum girthis inadequate to explain the relationship between fish morphologyand mesh penetration in towed fishing gear. In the current study wedeveloped a new methodology, FISHSELECT, that includes tools andsoftware to investigate conditions for mesh penetration. The FISHS-ELECT methodology is a framework that assesses the morphologicalconditions that determine a fish’s ability to physically penetrate agiven mesh in a towed fishing gear. The method is based on a com-bination of laboratory experiments with fish, data collection, dataanalysis and computer simulations. Besides being a new approachtowards providing information for both current and future gear
designs and fisheries management, we expect the above method-ology to provide information that will extend the use of the codendselectivity simulator PRESEMO (Herrmann, 2005a,b) to enable it towork with species other than round fish and mesh shapes otherthan diamond-shaped.
60 B. Herrmann et al. / Fisheries Research 97 (2009) 59–71
F annina
ptfloesh
2
2
(
Fti
ig. 1. Positions of CS1 and CS2 on a cod (A) and the measurement (B and C) and scflatbed scanner.
Using the FISHSELECT methodology, we predicted the selectiveroperties for cod in diamond and square mesh shapes and sizeshat cover a wide range of values used globally in the commercialeets. Furthermore, the present examination also included hexag-nal and rectangular meshes. We use the results obtained here toxplain the variation in estimated selectivity parameters for theame fishing gear used in different experiments, and we suggestow within-haul and between-haul variation could be reduced.
. Material and methods
.1. The FISHSELECT methodology
The FISHSELECT methodology involves the following activities:
(i) The first step of the FISHSELECT methodology is to investigateand quantify the external morphological features of the speciesin question. The length and weight of each fish is recorded andthe positions along the length axis of the fish that are expectedto affect its ability to penetrate different meshes are identi-fied. At these positions, the transverse cross-section shapes areextracted with a MorphoMeter, a mechanical sensing tool, andthen digitized using a flatbed scanner and subsequent digitalimage analysis.
(ii) In subsequent fall-through trials, each fish is presented to aseries of stiff mesh templates representing different sizes and
shapes of meshes. The results, whether or not the fish is ableto fall through the mesh templates, are collected.iii) Then the modeling and simulation functions of the FISHSELECTsoftware are used to combine the measured cross-section datawith information about the geometry of the mesh templates
ig. 2. Example of a scanned MorphoMeter image with a mechanical replica of the outerhe contour detected by contour acquisition routines implemented in the FISHSELECT sndividual MorphoMeter sticks in greater detail. The right picture shows the fit of an ellip
g of a cross-section shape (D) using the mechanical sensing tool MorphoMeter and
to simulate the fall-through trials. Subsequently, the exper-imentally obtained fall-through results are compared withthe simulated fall-through results using various penetrationmodels; the “best penetration model” is determined by inves-tigating the degree of agreement (DA) between the two sets ofresults. The penetration model is capable of including either asingle cross-section or a combination of several cross-sectionsin the simulation, and each cross-section shape can be simu-lated to compress during mesh penetration.
(iv) Finally the best penetration model is run on a virtual populationof fish with assumed morphological properties based on themeasurements, and the output is used to predict basic selectivecharacteristics of new and existing netting designs.
The above list of activities is further elaborated in the followingsections.
2.2. Fish used
Several physiological processes that may change the cross-section shapes and their deformability start as soon as the fishdies. Therefore, all measurements were conducted on fresh fish.In February 2007, a total of 150 cod were caught by jig and gill-net in Skagerrak and the fish were transferred live to holding tankson land. Seventy-five cod in the length range of 29–72 cm wereselected and used in the experiment. All cod were caught in shallow
water (10–20 m) to avoid excessive dilation of the swim bladder.Five fish at a time were taken from the holding tank and killedimmediately before the measurements in a strong solution of ethy-lene glycol mono-phenylether (C6H10O2), which is commonly usedto anaesthetize fish. Each fish was given a unique identificationcross-section contour of a cod (left picture). The crosses are digitized points alongoftware. The bottom blow-up picture shows part of the digitized contour and these to the digitized contour with the top blow-up picture showing details.

B. Herrmann et al. / Fisheries Research 97 (2009) 59–71 61
Table 1Data for the 118 different mesh templates used in the fall-through experiments.
Mesh type Mesh size (mm)
70 80 90 100 110 120 130 140 160 180 200
Diamond (oa)15 x x x20 x x x x x x25 x x x30 x x x x35 x x x40 x x x45 x x x50 x x x55 x x x x x x x x x x60 x x x65 x x x70 x x x75 x x x80 x x x85 x x x x x x x x x x90a x x x x x x x x x
Hexagonal (oa)143.6 x x x x x x x128.3 x x x x x x x106.3 x x x x x x x88.9 x x x x x x x
Mesh type Mesh bar b
70 80 90 100 110 120 130 140 160 180 200
Rectangular (bar a)10 x x x15 x x x20 x x x30 x x x50 x x x70 x x x
M e hexat r hexi a = 90
nti
2
lesbso
2
wMaftatwcto
esh size and the mesh opening angle (oa) are given. a and b refer to bar lengths. Thhe mesh bar (b) in this study is given as k/2 for all hexagonal meshes (see Fig. 3). Foncluded. For example, for bar length b = 10 mm, three different meshes were made:
a Equals square mesh.
umber and its length and weight data were recorded. In additiono the 75 fish used in the full-scale experiment, 20 fish were usedn initial pilot experiments.
.3. Initial experiments
The pilot study was conducted to identify where along the cod’sength axis the cross-section shapes should be measured. Thesexperiments involved both fall-through experiments and mea-urements of cross-section shapes. Both procedures are describedelow. Two cross-sections (CS) were identified for cod: CS1 repre-ented the maximum width and CS2 the maximum height and girthf the fish (Fig. 1A).
.4. Measurement of cross-section shapes
We developed a mechanical sensing tool, the MorphoMeter thatas used to measure cross-section shapes of each cod (Fig. 1). TheorphoMeter consists of adjustable round aluminium sticks that
re mounted close together but can move individually with slightriction. To take measurements, a fish was placed in the MorphoMe-er perpendicular to the sticks. The position of the cross-sectionlong the length of the fish was predefined (Fig. 1A). The sticks of
he MorphoMeter were then moved manually into contact all theay around the circumference of the fish (Fig. 1B and C), leaving aontour of the cross-section shape in the MorphoMeter. Afterwards,he MorphoMeter was scanned on a flatbed scanner (Fig. 1D) tobtain an image of the cross-section shape.
gonal meshes in the table are described by only two parameters (oa and k) becauseagonal meshes x refers to k. For rectangular meshes all combinations of a and b aremm, 120 mm, and 200 mm.
2.5. Estimation of cross-section shape
The image analysis function of the FISHSELECT software wasused to extract and digitize the cross-section shapes from thescanned image. Typically, this resulted in a contour representedby about 120 points along the perimeter (Fig. 2). To simplifythe descriptions of the cross-section shapes, an elliptical shapewas fitted to the points using the software’s least-square fittingmethod (Fig. 2). An ellipse can be described by two parameters;height and width. The morphological relationships between thefitted cross-section shapes and the length of the fish thereforecan be established by fitting the regression functions (pi = ai × lbi ;p1 = width, p2 = height, and l = length) to the data using a least squarealgorithm in the software. Due to the large number of fish inves-tigated, the variance of the different relationships also could besimulated; this was done by assuming that the variation betweenindividuals could be described by variation in the value of parame-ter ai.
2.6. Fall-through experiments
Fall-through experiments were conducted with 118 differentstiff mesh templates cut out in 5 mm thick nylon plates (Table 1;
Fig. 3). The use of stiff mesh templates is justified by assuming thatthe hydrodynamic drag acting on the codend results in a tensionin the mesh bars that makes it unlikely that a fish can distort themesh shape when it attempts to pass through during most partsof the fishing process (Efanov et al., 1987; Herrmann and O’Neill,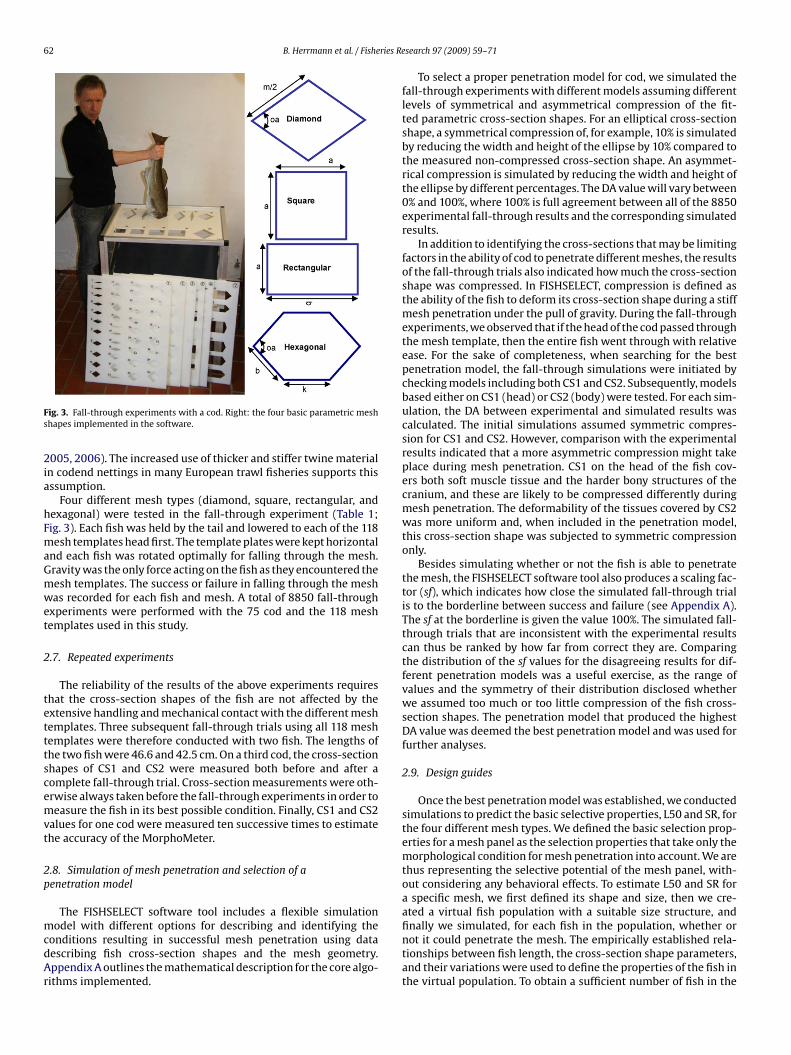
62 B. Herrmann et al. / Fisheries Re
Fs
2ia
hFmaGmwet
2
tetttscemvt
2p
mcdAr
ig. 3. Fall-through experiments with a cod. Right: the four basic parametric meshhapes implemented in the software.
005, 2006). The increased use of thicker and stiffer twine materialn codend nettings in many European trawl fisheries supports thisssumption.
Four different mesh types (diamond, square, rectangular, andexagonal) were tested in the fall-through experiment (Table 1;ig. 3). Each fish was held by the tail and lowered to each of the 118esh templates head first. The template plates were kept horizontal
nd each fish was rotated optimally for falling through the mesh.ravity was the only force acting on the fish as they encountered theesh templates. The success or failure in falling through the meshas recorded for each fish and mesh. A total of 8850 fall-through
xperiments were performed with the 75 cod and the 118 meshemplates used in this study.
.7. Repeated experiments
The reliability of the results of the above experiments requireshat the cross-section shapes of the fish are not affected by thextensive handling and mechanical contact with the different meshemplates. Three subsequent fall-through trials using all 118 meshemplates were therefore conducted with two fish. The lengths ofhe two fish were 46.6 and 42.5 cm. On a third cod, the cross-sectionhapes of CS1 and CS2 were measured both before and after aomplete fall-through trial. Cross-section measurements were oth-rwise always taken before the fall-through experiments in order toeasure the fish in its best possible condition. Finally, CS1 and CS2
alues for one cod were measured ten successive times to estimatehe accuracy of the MorphoMeter.
.8. Simulation of mesh penetration and selection of aenetration model
The FISHSELECT software tool includes a flexible simulation
odel with different options for describing and identifying theonditions resulting in successful mesh penetration using dataescribing fish cross-section shapes and the mesh geometry.ppendix A outlines the mathematical description for the core algo-ithms implemented.
search 97 (2009) 59–71
To select a proper penetration model for cod, we simulated thefall-through experiments with different models assuming differentlevels of symmetrical and asymmetrical compression of the fit-ted parametric cross-section shapes. For an elliptical cross-sectionshape, a symmetrical compression of, for example, 10% is simulatedby reducing the width and height of the ellipse by 10% compared tothe measured non-compressed cross-section shape. An asymmet-rical compression is simulated by reducing the width and height ofthe ellipse by different percentages. The DA value will vary between0% and 100%, where 100% is full agreement between all of the 8850experimental fall-through results and the corresponding simulatedresults.
In addition to identifying the cross-sections that may be limitingfactors in the ability of cod to penetrate different meshes, the resultsof the fall-through trials also indicated how much the cross-sectionshape was compressed. In FISHSELECT, compression is defined asthe ability of the fish to deform its cross-section shape during a stiffmesh penetration under the pull of gravity. During the fall-throughexperiments, we observed that if the head of the cod passed throughthe mesh template, then the entire fish went through with relativeease. For the sake of completeness, when searching for the bestpenetration model, the fall-through simulations were initiated bychecking models including both CS1 and CS2. Subsequently, modelsbased either on CS1 (head) or CS2 (body) were tested. For each sim-ulation, the DA between experimental and simulated results wascalculated. The initial simulations assumed symmetric compres-sion for CS1 and CS2. However, comparison with the experimentalresults indicated that a more asymmetric compression might takeplace during mesh penetration. CS1 on the head of the fish cov-ers both soft muscle tissue and the harder bony structures of thecranium, and these are likely to be compressed differently duringmesh penetration. The deformability of the tissues covered by CS2was more uniform and, when included in the penetration model,this cross-section shape was subjected to symmetric compressiononly.
Besides simulating whether or not the fish is able to penetratethe mesh, the FISHSELECT software tool also produces a scaling fac-tor (sf), which indicates how close the simulated fall-through trialis to the borderline between success and failure (see Appendix A).The sf at the borderline is given the value 100%. The simulated fall-through trials that are inconsistent with the experimental resultscan thus be ranked by how far from correct they are. Comparingthe distribution of the sf values for the disagreeing results for dif-ferent penetration models was a useful exercise, as the range ofvalues and the symmetry of their distribution disclosed whetherwe assumed too much or too little compression of the fish cross-section shapes. The penetration model that produced the highestDA value was deemed the best penetration model and was used forfurther analyses.
2.9. Design guides
Once the best penetration model was established, we conductedsimulations to predict the basic selective properties, L50 and SR, forthe four different mesh types. We defined the basic selection prop-erties for a mesh panel as the selection properties that take only themorphological condition for mesh penetration into account. We arethus representing the selective potential of the mesh panel, with-out considering any behavioral effects. To estimate L50 and SR fora specific mesh, we first defined its shape and size, then we cre-ated a virtual fish population with a suitable size structure, and
finally we simulated, for each fish in the population, whether ornot it could penetrate the mesh. The empirically established rela-tionships between fish length, the cross-section shape parameters,and their variations were used to define the properties of the fish inthe virtual population. To obtain a sufficient number of fish in the
B. Herrmann et al. / Fisheries Research 97 (2009) 59–71 63
Fig. 4. Calculated opening angles (oa) based on data from Herrmann et al. (2007b)vtmp
ews2sst
icemtms(fiot
2w
Es
Fa
Table 2Estimated regression coefficients for CS1 and CS2.
Length vs. weight CS1 CS2
Lengthvs. width
Lengthvs. height
Lengthvs. width
Lengthvs. height
a 2.7 × 10⁻⁶ 0.035 0.173 0.032 0.135b 3.21 1.22 0.99 1.24 1.04sd (a) 2.3 × 10⁻⁷ 0.002 0.007 0.002 0.007R2 0.98 0.95 0.97 0.95 0.94
s. cod-end catch weights at four different distances (in mm) from the catch edge inhe cod-end. The calculations are based on a diamond mesh cod-end with 100 open
eshes in the circumference and with a mesh size of 110 mm made of double 4 mmolyethylene (PE) twine.
ntire selective range of all investigated meshes, the populationas generated by drawing 2000 samples randomly from a uniform
ize distribution. The length range of this population of cod was–80 cm. By assuming a logistic selection curve and treating theimulated penetration data for each mesh as covered codend sizeelection data (Wileman et al., 1996), we estimated L50 and SR withhe built-in function of the FISHSELECT software.
The basic selective properties for each mesh type were collectedn a design guide, which is a plot showing simulated L50 as iso-urves for a relevant range of mesh sizes versus mesh openings forach mesh type. The mesh openings for diamond and hexagonaleshes are given by the opening angle (oa) and as a squareness fac-
or (=100 × (a/b)) (SFA) for rectangular meshes (see Fig. 3). Squareesh represents a special case of each of the other mesh types, thus
quare mesh data are included in the diamond mesh design guideoa = 90◦), in the rectangular mesh design guide (SFA = 100%), and,nally, in the hexagonal mesh design guide (oa = 180◦). For hexag-nal meshes, only designs for which b = 0.5 × k were considered inhis study (see Fig. 3).
.10. Simulation of experimental results from sea trials:ithin-haul variation
To evaluate the relevance of results obtained using the FISHS-LECT methodology we compared them with similar results fromea trials. Galbraith et al. (1994) reported L50 estimates of 29.2 and
ig. 5. Examples of digitized CS1 and CS2 with ellipsoids fitted for small, medium,nd large cod. Length of the fish is shown in brackets.
Length, width and height are given in mm while weight is in g. R2 represents theratio of the variance in the data that is explained by the model to the total variancein the data.
28.4 cm for cod from two single hauls collected using a 109 mmdiamond mesh codend with 104 open meshes around the circum-ference. The corresponding estimates of SR were 6.8 and 8.5 cm.Total catch weights in these two hauls were 1500 and 1330 kg,respectively. A 109 mm mesh size measured with an ICES 4 kgwedge would correspond to a 113 mm mesh size when measuredwith a 5 kg gauge (Ferro and Xu, 1996), as prescribed in legislation.Because the selectivity of diamond meshes predicted by FISHSE-LECT depends on the mesh opening angle (see Fig. 3), the inputvalues for oa for the meshes used in the simulations need to reflectthe experimental fishing conditions. The codend used by Galbraithet al. (1994) was very similar in design to one (mesh size 110 mm,100 open meshes in circumference) studied by Herrmann et al.(2007b). By applying the finite-element method as described inPriour (2001), Herrmann et al. (2007b) estimated how the averageopenness of the meshes is influenced by codend catch weight anddistance from the edge of the catch in the codend. We used the sameinformation to produce the plot shown in Fig. 4 and to estimatehow average oa depends on distance to the edge of the catch andon catch weight. We then used these estimates to obtain realisticvalues for the range of oa values to input into FISHSELECT to simu-late results, which can be compared to those obtained by Galbraithet al. (1994). Fig. 4 clearly shows that the most open meshes occurjust in front of the catch edge. Moving forward in the codend, the oavalue decreases. At a distance of only 1.5 m from the catch edge, theoa value is largely unaffected by the amount of the catch, whereasat the edge of the catch it is very dependent on the amount of catch.As the catch accumulates during the haul, this phenomenon likelyleads to a large within-haul variation of the selection process. It is
therefore important to know both where in the codend and whenthe main escapement of cod takes place.To obtain a realistic mean distribution of oa for the simulation,we made the following assumption: The final and decisive escape
Table 3Width and height measurements (mm) of the ellipsoids fitted to CS1 and CS2 (10repeated measurements conducted on one fish).
CS1 CS2
Width Height Width Height
1 59.00 67.65 64.98 75.852 58.44 67.43 65.90 75.213 60.67 66.26 64.13 76.544 58.42 67.59 65.19 76.235 56.46 67.08 64.26 76.956 58.48 67.68 66.99 73.067 55.71 66.18 65.42 75.678 58.26 65.89 65.34 76.209 57.36 65.48 65.93 75.2210 55.91 67.53 66.06 75.28
Mean 57.87 66.88 65.42 75.62sd 1.53 0.84 0.86 1.07
sd = standard deviation.

64 B. Herrmann et al. / Fisheries Research 97 (2009) 59–71
F oids fir ls in t
atUe6itu(dsebdo
dSeftciconmt(pbcss
ig. 6. Length-based regression lines (solid lines) for width and height of the ellipsepresent the confidence limits (95%) for the simulated variation between individua
ttempts by cod are uniformly distributed throughout the haul inhe zone from the edge of the catch and 1.5 m forward in the codend.sing the catch weights presented in Galbraith et al. (1994) at thend of the hauls, the resulting oa values should range from 15◦ to5◦ with a mean value of approximately 35◦ (Fig. 4). Simulations
n FISHSELECT were used to investigate the influence on the selec-ivity parameters of increasing the range of oa values distributedniformly around a basepoint of 35◦. The best penetration modelsee Section 2.8) and the virtual cod population used when pro-ucing the design guides were used to predict L50 and SR in theimulations. The results for each oa in the ranges were weightedqually, meaning that the total retention data for the codend coulde created by aggregating the retention data for each oa. Retentionata were analyzed as described in Section 2.9 to obtain estimatesf L50 and SR.
In FISHSELECT we generally assume that the mesh shapes do noteform during fish penetration (i.e., the stiff mesh assumption; seeection 2.6). However, for the sake of completeness and to bettervaluate how well the stiff mesh assumption complies with resultsrom experimental fishing, a soft mesh model was implemented inhe FISHSELECT software; this model assumes that the mesh shapean be fully distorted by fish that are attempting to pass throught. Thus, the condition for penetration is that the perimeter of theompressed fish cross-section shape does not exceed the perimeterf the mesh (2 × mesh size). In this model, actual mesh shape doesot influence the selective properties. To investigate whether softesh penetration is of relevance when simulating experimental
rawl fishing, we also attempted to simulate the two Galbraith et al.1994) hauls described above using the soft mesh model. For this
urpose, compression values of cross-section shapes found for theest penetration model for stiff meshes were used to estimate theross-section shape perimeter for use in the soft mesh model. Theame virtual population of cod used previously was used for thisimulation.tted to the cross-section contours for CS1 (left) and CS2 (right). The hatched lineshese regressions.
2.11. Stochastic simulation of between-haul variation ofexperimental results
The spatial distribution of the fish on the fishing ground likelyis not uniform (Greenstreet et al., 1997) and the distribution likelywill vary among hauls. Therefore, the filling pattern of the codendwill vary from haul to haul. Because the oa in a diamond meshcodend depends both on the amount of catch and on the dis-tance to the catch edge (Fig. 4), groups of fish arriving at differentstages during the fishing process will experience different prob-abilities for mesh penetration that are related to the range of oapresent. This mechanism potentially could lead to a between-haulvariation in the size selection process. Additional between-haulvariation in the range of oa values present might result fromcodend pulsing caused by differences in sea state (O’Neill et al.,2003). Whether these mechanisms can lead to between-haul vari-ation in the selection parameters that are of the same order ofmagnitude as those obtained experimentally was investigated byusing the stochastic simulation function of the FISHSELECT soft-ware that enabled simulation of repeated hauls. As input, thisfunction requires: (1) a list of meshes with different oa valuescovering the full ranges of mesh shapes present in all hauls, and(2) a description of the total population of fish arriving in thecodend (composed of different subpopulations). The relative occur-rence of the different meshes in the list was varied randomlywithin predefined limits between hauls and independently for fishbelonging to different subpopulations. For each haul the summedretention data were used to estimate L50 and SR (see Section2.9).
Dahm et al. (2002) presented selectivity data for 95 mmdiamond mesh codends, which correspond to about 99 mm if mea-sured with a 5 kg mesh gauge (Ferro and Xu, 1996). The total catchweight varied from 119 to 1233 kg and results from 43 individualhauls were presented. The stochastic simulation function of FISHS-

ries Re
Earwtibsafcaeotiofsioo2
3
3
fihTvtTcol(s
FC
B. Herrmann et al. / Fishe
LECT was used to simulate these hauls. We first needed to definerealistic range of oa values present in the codend. Based on the
eported catch range and Fig. 4, we selected an oa range of 15–75◦,hich is larger than the range used to simulate the average selec-
ion process in a codend with mesh size of 113 mm. This discrepancys justified because with the smaller mesh size and the same num-er of meshes around the codend, meshes will open more with theame amount of catch due to the shorter codend circumference. Were concerned not only with the average oa range but also with theull range, which includes potential increases that could result fromodend pulsing in some hauls. A virtual population of cod with anverage size structure similar to the population reported in Dahmt al. (2002) was created by summing two virtual subpopulationsf cod normally distributed around the two peaks in the size struc-ure. In the simulated hauls, the two subpopulations were treatedndividually as described above. For each value of oa, the relativeccurrence was varied randomly from 0% to 100% to simulate theact that some values do not appear in some hauls. Three differentimulation scenarios were investigated with 20,000 repeated haulsn each: (i) a penetration model based on CS2 uncompressed and ana range of 15–75◦; (ii) the best penetration model and an oa rangef 15–75◦; and (iii) the best penetration model and an oa range of5–75◦.
. Results
.1. Description of cross-section shapes
Fig. 5 shows examples of digitized cross-section shapes withtted ellipsoids. Length-based regressions for both the width andeight of the ellipsoids fitted to CS1 and CS2 are given in Fig. 6.able 2 lists the regression coefficients. The R2 values (ratio of theariance in the data explained by the model to the total variance inhe data) indicate that the regression models describe the data well.he regression curves for width and height versus fish length indi-ate that the growth in the cross-section shape is not fully isometric
ver the measured length span of the fish. The simulated morpho-ogical variation is in good agreement with the experimental dataFig. 6). This morphological variation increases with increasing fishize (Fig. 6).ig. 7. Iso-DA curves vs. compression of width and height of the ellipsoids fitted toS1. Points along the 45◦ angle line from (0, 0) represent symmetrical compression.
search 97 (2009) 59–71 65
3.2. Repeated measures
The parametric shapes fitted to 10 successive cross-section mea-surements of the same cod varied little in the parameter values.This indicates that the resolution and accuracy of the MorphoMe-ter measurements are acceptable for measuring the outlines ofdeformable objects (Table 3). The largest variation occurred forthe width of CS1, for which 95% of the measurements were within±5.2% of the mean value. When the fall-through experiments ontwo cod were repeated three times, all results for one cod wereidentical in the three experiments for all 118 mesh templates. Thesecond cod, however, was retained by one mesh template in thesecond run, whereas it passed through it in both the first and thirdruns. We considered this difference to be marginal and assumedthat the morphological features relevant for mesh penetration werenot affected noticeably by the extensive fall-through trials. Thisassumption is supported by the measurements of the cross-sectionshapes before and after the trials; deviations were <5%, which iswithin the measuring accuracy reported at the beginning of thissection.
3.3. Penetration model
Simulation results from a full matrix of asymmetric compres-sion ratio combinations ranging from 0% to 24% with a penetrationmodel considering only CS1 (see Section 2.8) were compared toresults from the fall-through trials (see Section 2.6), resulting ina matrix of 169 DA values when using steps of 2%. Iso-DA curvesversus compressions in width (x-axis) and height (y-axis) were con-structed (Fig. 7). The highest DA value (97.6%) was obtained for CS1by compressing the height by 0% and the width by 18%. Simulationsusing a penetration model considering CS2 alone yielded a maxi-mum DA value of 95.7%. Penetration models that considered bothCS1 and CS2 also were tested for 312 combinations of various com-pressions of CS1 and CS2. Both the DA value and the compressionvalue for CS1 in the best combined penetration model were iden-tical to those obtained in the best penetration model consideringCS1 alone. This best combined model requires 32% compression ofCS2, which makes the compressed dimensions of CS2 smaller thanthose of CS1. Fig. 8 illustrates the ellipsoids fitted to the measuredcross-sections for a typical cod along with compressed shapes usedfor this best combined penetration model. Based on our results, weconclude that CS2 is of little importance for the selective processof the mesh for cod and, for simplicity, we chose the penetrationmodel that considers CS1 alone. In the following text, this model isreferred to as the best penetration model. Another way of express-
ing the goodness of the best penetration model is to say that thereis about 2.4% disagreement between the results from fall-throughexperiments and the simulated results. Further validation can beprovided by investigating the distribution of the scaling factors (sf,see Section 2.7) of the disagreeing results (Fig. 9A). For this penetra-Fig. 8. Ellipsoids (outer ellipsoids) fitted to the measured cross-sections CS1 andCS2 and the ellipsoids (inner ellipsoids) used to represent the compressed cross-sections in the best penetration models (compression the height of CS1 by 0% thewidth by 18% and a symmetrical compression of CS2 of 30%). CS1 and CS2 are scaledequally and originate from the same fish.

66 B. Herrmann et al. / Fisheries Research 97 (2009) 59–71
F paringm S1 (th
ttmt
fttalsswmrfe
3
ws
Fs(
◦
ig. 9. Distribution of the scaling factor values for disagreeing results when comodels. (A) Model based on 18% compression of the width and 0% of the height of C
ion model, they are evenly distributed around 100%, indicating thathe penetration model is unbiased. Only 0.5% of the results disagree
ore than the 95% confidence limits for the measuring accuracy onhe cross-section shapes (Section 3.2).
The procedure described above shows that with supportrom the fall-through experiments, we can estimate the poten-ial compression of the measured cross-section shapes. Withhe penetration model assuming an uncompressed cross-sectionpproximation of CS2, we would have severely underestimated theength of cod that can penetrate a given mesh. The result of usinguch a penetration model is illustrated by the distribution of thef values shown in Fig. 9B. The DA value of this penetration modelould only be 87.8%, which represents an increase of the disagree-ent of 500% compared to the best penetration model. The above
esults demonstrate that the FISHSELECT method is a sensitive toolor detecting how good different approximations used in the pen-tration models are.
.4. Design guides
Based on the best penetration model (CS1 alone), design guidesere produced as described in Section 2.9 to predict the basic
elective properties of the four mesh types investigated for cod
ig. 10. Diamond mesh design guide showing iso-L50 curves as a function of meshize (mm) and mesh opening angle (oa; in degrees). The right side of the plotoa = 90◦) corresponds to square meshes.
experimental and simulated fall-through results assuming different penetratione selected best penetration model). (B) Model based on CS2 uncompressed.
(Figs. 10–12). The figures show that the predicted L50 values dependon the actual mesh shape (i.e., the oa values of diamond and hexag-onal meshes and the SFA values in rectangular meshes). Changesin mesh size when oa values or SFA values are low have littleeffect on the predicted L50 for diamond, rectangular, and hexag-onal meshes. The design guides can thus be used to identify theconditions required to obtain a specific and constant selection dur-ing a fishing process. Combined with knowledge about the meshconfigurations (type, size, and oa range) in a specific codend, theyalso can indicate the expected range of selection parameters. Thisrange defines the possible within-haul and between-haul varia-tions and thus also what potentially can be obtained by stabilizingmesh shapes (i.e., reducing the range of mesh openings) duringthe catch build-up process. The estimates for the square meshesthat are a special case in all three guides are the same (e.g., asquare mesh with a mesh size of 200 mm is assigned an L50 valueof approximately 70 cm in all design guides; top right corner inFigs. 10–12).
A maximum L50 value is reached at oa ≈ 75 for a diamondmesh (Fig. 10), at SFA ≈ 70% for rectangular meshes (Fig. 11), and atoa ≈ 120◦ for hexagonal meshes (Fig. 12). Due to the non-isometricgrowth of cod (see Section 3.1 and Figs. 5 and 6), the cross-section
Fig. 11. Rectangular mesh design guide showing iso-L50 curves as a function of meshsize (mm) and squareness factor (SFA; %). The right side of the plot (SFA = 100%)corresponds to square meshes.

B. Herrmann et al. / Fisheries Research 97 (2009) 59–71 67
Fssb
sst
c
Fbe
Table 4FISHSELECT predictions of L50 and SR assuming different ranges of opening angles(oa) in a 113 mm codend.
Source oa range (◦) L50 (cm) SR (cm)
Galbraith 1 29.2 6.8Galbraith 2 28.4 8.5
FISHSELECT 35 29.8 1.230–40 29.9 3.025–45 29.6 4.920–50 29.4 7.315–55 29.2 10.015–65 31.7 11.8Soft mesh 52.2 1.9
ig. 12. Hexagonal mesh design guide showing iso-L50 curves as a function of meshize (k + 2 × b in Fig. 3) (mm) and mesh opening angle (oa; in degrees). The rightide of the plot (oa = 180◦) corresponds to square meshes. Only for designs for which= 0.5 × k.
hape of cod becomes slightly more rounded with increasing fish
ize, and for larger mesh sizes the maximum L50 value will shiftowards higher oa/SFA values.Fig. 13 shows the uncompressed ellipsoids fitted to CS1 and theorresponding compressed ellipsoids used in the best penetration
ig. 13. The optimal mesh configurations for a 36 cm cod, which, according to theest penetration model, will allow it to just pass through (right). The measuredllipsoid of CS1 is shown with the same meshes (left).
The simulation assumes that the final escape attempts are equally distributed alonga part of the codend in front of the catch (see Sections 2.10 and 3.5 for details).Galbraith 1 and 2 refer to results from single tows in Galbraith et al. (1994).
model for the different mesh types, all at optimal oa/SFA. At opti-mal mesh configuration, the highest L50 value for cod for a givenmesh size occurs in hexagonal meshes. The values of the differentminimum mesh sizes needed for a 36 cm cod to pass through themesh are also shown in Fig. 13.
3.5. Results of simulation of within-haul variation ofexperimental size selection
Different scenarios assuming different mesh oa ranges for acodend with mesh size 113 mm were simulated using the best pen-etration model (see Section 3.3). Comparison with sea trial results(Section 2.10) was conducted and Table 4 lists the results. If oawere constant (e.g., 35◦), SR would depend only on the morpho-logical variation of the virtual cod population. A comparison ofthis single-oa SR value with the SR values obtained experimentally(Galbraith 1 and 2 in Table 4) shows that the morphological vari-ation only constitutes about 14% and 18% of the SR value obtainedin sea trials. With increasing oa range of the meshes SR increasesin the simulations. The results in Table 4 (L50, SR versus mesh oarange) show that a realistic prediction of the selectivity parame-ters can be obtained by simply assuming a reasonably wide rangeof mesh oa values. A straightforward explanation of the value ofSR can thus be provided under the stiff mesh assumption. The stiffmesh assumption is further supported by the unrealistic selectionparameter values obtained when applying the soft mesh model(Table 4). Under the soft mesh (see Section 2.10) assumption, nei-ther the number of meshes around the codend circumference northe mesh oa values in the codend (correlated parameters) wouldhave any effect on codend selection. This result would contradictexperimental evidence (Reeves et al., 1992; Galbraith et al., 1994).We therefore conclude that the soft mesh model is of little relevancefor explaining the size selection of a diamond mesh trawl codend.
3.6. Results for stochastic simulation of between-haul variation inexperimental results
The between-haul variation observed and reported by Dahm etal. (2002) was analyzed in the present study using the stochasticsimulation method (see Section 2.11). Dahm et al. (2002) reportedL50 values that varied between 22.5 and 35.2 cm. According to thedesign guide (Fig. 10), the full range of oas (15–75◦) (see Section2.11) would correspond to L50 values between 14 and 37 cm. A valueof 37 cm is quite similar to the experimentally determined maxi-
mum L50 value of 35.2 cm, whereas the lower L50 value of 14 cmis far below the experimental minimum value (22.5 cm). This mayindicate that the place of escapement is not totally random and thatthe likelihood of a final escape attempt increases closer to the catchedge, where the oa is larger. If we instead used the oa as it is at the
68 B. Herrmann et al. / Fisheries Re
F(tr
cFm
hn
but with three different narrower ranges for oa). If the oa range is
ig. 14. Comparison between experimental selectivity data presented by Dahm et al.2002) and stochastic simulations of selectivity data with different models (see Sec-ions 2.11 and 3.6). (�): Single haul experimental results; (�) single haul simulatedesults.
atch edge for a small catch as the lower limit (≈28◦ according toig. 4), Fig. 10 yields an L50 of ≈23 cm, which is close to the observed
inimum value.Next we turn to the results from the 20,000 stochastic simulatedauls for the four scenarios described in Section 2.11. The first sce-ario (i) used an uncompressed CS2 in the penetration model. The
Fig. 15. Explorative simulation of distributions for L50 and SR assumi
search 97 (2009) 59–71
experimental values of L50 and SR found for single tows in Dahmet al. (2002) were compared to the simulated results (Fig. 14A).This penetration model underestimated the value of L50 consid-erably compared to the experimental results. A better agreementwith experimental data was obtained when the best penetrationmodel (scenario (ii) in Section 2.11) was used (Fig. 14B), and evenbetter agreement occurred when the oa range used to generatethe random variation was narrowed from 15–75◦ to 25–75◦ (sce-nario (iii) in Section 2.11) (Fig. 14C). The exclusion of the least openmeshes from the analysis reduced the extent of the possible over-all variation in the selection parameters while still generating goodagreement with the experimental selection parameters, except fora few outliers. This result further indicates that the occurrence ofescapes in front of the catch accumulation in the codend is nota fully random process: The probability is greater that a fish willmake its final escape attempt closer to the catch edge (higher oavalues) than further ahead of the catch. This complies well withobservations reported in Stewart and Robertson (1985).
3.7. Explorative simulation of between- and within-haul variation
In the previous section we showed that stochastic simulationusing scenario (iii) led to results (Fig. 14C) that mainly agreed withthose observed experimentally in sea trials. This was based on thescenario for an oa range of 25–75◦. Fig. 15 plots the simulated results(the bold curve) showing between-haul distributions of L50 and SR.The vertical bars represent mean results from Dahm et al.’s (2002)two cruises. Both of the experimentally obtained results agree wellwith the simulated distributions for both L50 and SR. Assumingthat this scenario simulates the experimental situation well, wecan use it to predict the consequences of altering the range of oaand thus the possible gain of decreasing variability of actual meshshapes in a codend. Simulated results for high oa values that liewithin a narrower range indicate that altering the oa range may bean efficient way to reduce both between- and within-haul variationin the selection process. Fig. 15 shows this effect (i.e., the results ofusing the stochastic simulation process described in Section 2.11,
narrowed down to 55–75◦ (Fig. 15, dotted curve), all cod that enterthe codend will meet rather similar escape conditions. The result isa smaller between-haul variation of both L50 and SR, a higher meanL50, and a lower mean SR.
ng different ranges for oa (see Sections 2.11 and 3.7 for details).
ries Re
4
atoeetdmptmwmimmenoabf
ospmotdaiLiohiectcH
sannsdtat2s(arm2
uib
B. Herrmann et al. / Fishe
. Discussion
Using FISHSELECT methodology, tools, and software, we definednd measured the morphological cross-section shapes that limithe ability of cod to penetrate different mesh configurations. Basedn CS1 measurements, a penetration model was established thatxplains 97.6% of the results obtained during the fall-throughxperiments. The high DA indicates that the morphological fea-ures that are important for cod to pass through meshes are wellefined by the penetration model. The less explanatory penetrationodels, such as those based on criteria using the larger CS2 com-
ressed (DA = 95.7%) or uncompressed (DA = 87.8%), demonstratehat a maximum cross-section measure (i.e., the girth measure-
ent) is inadequate. In static gear like trammel nets or gill nets,here the low mesh bar tension and the thin twine make theesh more flexible, the girth measure may be more relevant than
n towed gear. The large difference between the L50 and SR esti-ates obtained with the stiff mesh model and the soft meshodel indicates that the morphological conditions for mesh pen-
tration are quite different in towed gear and in static fishingets. The comparison of sea trial results with theoretical resultsbtained with FISHSELECT is used to validate the methodologynd illustrate that we were able to provide an explanation foroth within- and between-haul variation in selection parametersor cod.
For a given mesh size, the highest L50 values for cod werebtained with mesh configurations that most closely resemble thehape contour of CS1 when it is compressed, according to the bestenetration model. In general, this is the case for the more openeshes, but among the stiff meshes tested, especially the hexag-
nal mesh, results in high L50 values. The L50 values depend onhe oas of the meshes, especially for the diamond type. The strongependency between the selection parameters and the value of oa,s shown in the design guides, means that the variation of oa dur-ng the fishing process is the primary source of variation in the50 values predicted in the simulations. The variation is highestn the early stages of the catch build-up process and smaller latern when the maximum perimeter of the codend is reached. Allauls will go through these highly variable stages unless the oa
n the codend meshes can be controlled. Such control would allowqual and optimal selective opportunities for all cod entering theodend and would reduce SR. This would reduce considerably bothhe within-haul and between-haul variation of the selection pro-ess. These results are similar to those obtained for haddock byerrmann and O’Neill (2005).
Isaksen and Valdemarsen (1990) reported that shortening theelvedge ropes increased the oa values in diamond mesh codendsnd increased L50 compared to a standard codend. Other mecha-isms that remove the initial stretching tension from the codendetting are likely to have similar effects because they avoid themall oa values. A simple method for increasing the mean oauring a haul is to reduce the number of diamond meshes inhe circumference. This makes the selection process more stablet lower catch weights because the maximum codend perime-er is reached earlier in the fishing process (Herrmann et al.,007b). Experiments with alternatives to diamond mesh, such asquare mesh, in codends have resulted in narrower selection rangesSR) for cod and haddock (Melanogrammus aeglefinus) (Robertsonnd Stewart, 1988; Halliday et al., 1999; He, 2007). This may beelated to the fact that square meshes stay more open than dia-ond meshes during fishing (Robertson and Stewart, 1988; He,
007).The estimates of the oa values for the diamond mesh codend
sed in this study were based on calculations for gear when its towed along the seabed. The haul-back process and its possi-le influence on the mean oa values were not taken in account.
search 97 (2009) 59–71 69
However, experimental data have shown no significant statisticaldifference in L50 for whiting (Merlangius merlangus) and haddockamong the period of towing along the seabed, the haul-back period,and the short period when the trawl is at the surface (Madsen et al.,2008).
The escape of fish along the netting in front of the catch edgeprobably is not distributed evenly. Our simulations agree betterwith experimental data when we assume that the escapes increasetowards the catch edge, which supports prior findings reported inStewart and Robertson (1985).
In our model, the force that the fish can produce during anattempt to penetrate a mesh is set to be equivalent to the forceof gravity. Whether this assumption is realistic is unknown andlacks validation. The rationale behind the assumption is that theforce of gravity increase with the weight of the fish. This complieswell with the assumption that the force a fish can provide dur-ing mesh penetration increases with the size of the fish (Efanov etal., 1987). Comparison with experimental results indicates that thisassumption leads to reasonable results.
The present experiments were conducted in February during thespawning season of cod. The batch of cod examined contained somelarger fish with well-developed gonads, which may have affectedthe measured dimensions of CS2. However, even for those fish,the degree of compression used for CS2 in the penetration modelreduced its dimensions to less than those of CS1 supporting thatthe best penetration model based on CS1 would provide reasonableresults during all seasons.
The information given in the design guides will allow geardesigners and managers to get a quick overview of the basic theo-retical selectivity of different netting designs or escape panels andthe potential improvements that can be obtained by controllingthe oa or SFA values of the meshes. Gear designs can be optimizedtheoretically with relatively low cost by applying the FISHSELECTmethodology before they are tested in expensive sea trials. It is,however, important that gear designs are tested at sea before designparameters are fixed by (e.g., introduction into the legislation),because gear selectivity also is affected by parameters such as fishbehavior, vessel size, and sea state (Wileman et al., 1996). Mor-phologically based simulations also may help gear designers andmanagers to explore and better understand the mechanisms act-ing during selection trials. The morphological data collected andthe mesh penetration models developed during this study can beintegrated into the individual-based predictive codend selectionmodel PRESEMO (Herrmann, 2005a,b). So far, PRESEMO has onlybeen applied to predict different aspects of size selection for a fewspecies of round fish in diamond mesh cod-ends (Herrmann, 2005c;Herrmann and O’Neill, 2005, 2006; Herrmann et al., 2006, 2007a,b;O’Neill and Herrmann, 2007; Sala et al., 2006). An important reasonfor its limited use has been the lack of morphological data rele-vant to mesh penetration for other, important species. Use of themethodology described in this paper will provide this informationand also identify the most suitable models for implementing themorphological condition for mesh penetration for other types ofmesh shapes and for new species. It could thereby form the basisfor extending the predictive power of PRESEMO.
We have presented and demonstrated the use of the FISHSE-LECT methodology and its potential for studying size selection ofround fish in towed gear. We expect that this methodology willbe able to provide useful information on size selectivity of flat-fish but, due to the differences in morphology, the cross-sectionshapes and penetration models likely will be very different from
those found for cod. Providing design guides for more of thespecies that traditionally are caught in the same fisheries will allowquantitative multi-species considerations, where the consequencesfor each catch component can be estimated for different designstrategies.
7 ries Re
A
fifMmfM
A
tsrrdydstficfcfto
0
Frcttt
0 B. Herrmann et al. / Fishe
cknowledgements
The research documented in this paper was conducted withnancial support from a project under the development program
or sustainable fisheries financed by the European Union and Danishinistry of Food, Agriculture, and Fisheries. A special acknowledge-ent goes to Gunnar Vestergaard and Svend Aage Larsen, both
rom DTU Aqua, for valuable help in designing and producing theorphoMeter to assess cross-section shapes of fish.
ppendix A. Generic condition for mesh penetration
This appendix outlines the generic condition implemented inhe FISHSELECT software to evaluate whether a fish cross-sectionhape described by an outside curvature in polar coordinates (� ,f) can pass through a mesh described by an inside curvature (�,m), also in polar coordinates. Fig. 16 illustrates this situation. Theescription of the fish curvature is in a local coordinate system (xf,f), whereas the mesh curvature is described relative to the coor-inate system (xm, ym). The transformation from system (xf, yf) toystem (xm, ym) is conducted by rotation ˚ followed by transla-ions tx and ty. As shown in Fig. 16, the condition that allows thesh cross-section shape curvature to pass through inside the meshurvature can be expressed as: rm(�) − rfm(�) ≥ 0 for all anglesrom 0◦ to 360◦, where rfm is the fish curvature expressed in theoordinate system (xm, ym). Thus, the magnitude of rfm will be aunction of ˚, tx, ty, and rf(� ) for each angle �, or rfm(�, rf(� ), ˚,x, ty). We can investigate whether penetration is possible by meansf a minimization condition. Penetration is possible if:
min(merit(˚, tx, ty)) = 0where
merit(˚, tx, ty) = 1n
n∑i=1
dm(�i, ˚, tx, ty)
wheredm(�, ˚, tx, ty){
0 ∀ rm(�)−rfm(�, rf (� ), ˚, tx, ty) ≥ 0
=(rfm(�, rf (� ), ˚, tx, ty) − rm(�)) ∀ rm(�)−rfm(�, rf (� ), ˚, tx, ty) < 0(1)
The summation is conducted over n discrete angles �i between◦ and 360◦.
ig. 16. Outline of the penetration condition. rm(�) represents the mesh curvatureelative to coordinate system (xm, ym), and rf(� ) represents the fish cross-sectionurvature relative to coordinate system (xf, yf). rfm(�) represents the fish curvatureransformed to be relative to the (xm, ym) coordinate system. Rotation ˚ followed byranslations tx and ty transforms the description from the (xf, yf) coordinate systemo the (xm, ym) coordinate system.
search 97 (2009) 59–71
Penetration is possible if there is at least one set of values (˚, tx,ty) where merit(˚, tx, ty) = 0.
In addition to letting the simulation procedure predict whetheror not the penetration condition given by (1) is fulfilled for a partic-ular fish cross-section shape, we also want to know how close thecondition was from being just fulfilled. To do this we introduce ascaling factor, sf, to scale the fish cross-section shape up (sf > 100)or down (sf < 100) isomorphically:
srfm(�i) = sf × rfm(�i)100
for i ∈ [1; n] (2)
By varying sf and substituting rfm with srfm in (1), we can find themaximum value of sf for which (1) is just fulfilled:
max(sf ) while min(merit(˚, tx, ty)) = 0 (3)
If max(sf) is <100, then the fish cross-section shape is not able topass through the mesh and the value of max(sf) quantifies how farcondition (1) is from being fulfilled. If max(sf) is >100, the fish cross-section shape is able to pass through the mesh and the value ofmax(sf) quantifies how far condition (1) is from being not fulfilled.
Formulas (1)–(3) are generic expressions used to determinewhether a fish cross-section shape is geometrically able to passthrough a mesh. They are independent of the specific shapes ofthe mesh and of the cross-section of the fish. To analyse a specificsituation we have to define rm(�) and rf(� ) for � and � in the inter-val 0–360◦. Parametric descriptions for diamond, square, rectangle,and hexagonal meshes have been implemented in the FISHSELECTsoftware to describe the mesh shapes (see Fig. 3). For description ofcross-section shapes of cod and other round fish, an ellipsoid shapewas used.
References
Broadhurst, M.K., Dijkstra, K.K.P., Reid, D.D., Gray, C.A., 2006. Utility of morpho-logical data for key beach-seine and otter-trawl fisheries: predicting mesh sizeand configuration. New Zealand Journal of Marine and Freshwater Research 40,259–272.
Dahm, E., Wienbeck, H., West, C.W., Valdemarsen, W.J., O’Neill, F.G., 2002. On theinfluence of towing speed and gear size on the selective properties of bottomtrawls. Fisheries Research 55, 103–119.
Efanov, S.F., Istomin, I.G., Dolmatov, A.A., 1987. Influence of the form of fish body andmesh on selective properties of trawls. ICES Document CM 1987/B: 13, 39 pp.
Ferro, R.S.T., Xu, L., 1996. An investigation of the three methods of mesh size mea-surement. Fisheries Research 25, 171–190.
Galbraith, R.J., Fryer, R.J., Maitland, K.M.S., 1994. Demersal pair trawl codend selec-tivity models. Fisheries Research 20, 51–58.
Greenstreet, S.P.R., Tuck, I.D., Grewar, G.N., Armstrong, E., Reid, D.G., Wright, P.J., 1997.An assessment of the acoustic survey technique, Rox Ann, as a means of mappingseabed habitat. ICES Journal of Marine Science 54, 939–959.
Halliday, R.G., Cooper, C.G., Fanning, P., Hickey, W.M., Gagnon, P., 1999. Size selec-tion of Atlantic cod, haddock and pollack (saithe) by otter trawls with squareand diamond mesh codends of 130–155 mm mesh size. Fisheries Research 41,255–271.
He, P., 2007. Selectivity of large mesh trawl codends in the Gulf of Maine. I. Compar-ison of square and diamond mesh. Fisheries Research 83, 44–59.
Herrmann, B., 2005a. Effect of catch size and shape on the selectivity of diamondmesh cod-ends. I. Model development. Fisheries Research 71, 1–13.
Herrmann, B., 2005b. Modelling and simulation of size selectivity in diamond meshtrawl cod-ends. PhD. Thesis. Aalborg University, Denmark, ISBN 87-91200-50-4.
Herrmann, B., 2005c. Effect of catch size and shape on the selectivity of diamondmesh cod-ends. II. Theoretical study of haddock selection. Fisheries Research 71,15–26.
Herrmann, B., O’Neill, F.G., 2005. Theoretical study of the between-haul variationof haddock selectivity in a diamond mesh cod-end. Fisheries Research 74, 243–252.
Herrmann, B., O’Neill, F.G., 2006. Theoretical study of the influence of twine thick-ness on haddock selectivity in diamond mesh cod-ends. Fisheries Research 80,221–229.
Herrmann, B., Priour, D., Krag, L.A., 2006. Theoretical study of the effect of roundstraps on the selectivity in a diamond mesh cod-end. Fisheries Research 80,
148–157.Herrmann, B., Frandsen, R., Holst, R., O’Neill, F.G., 2007a. Simulation-based investiga-tion of the paired-gear method in cod-end selectivity studies. Fisheries Research83, 175–184.
Herrmann, B., Priour, D., Krag, L.A., 2007b. Simulation-based study of the combinedeffect on cod-end size selection of turning meshes by 90 degrees and reducing

ries Re
I
I
K
K
M
M
M
M
O
B. Herrmann et al. / Fishe
the number of meshes in the circumference for round fish. Fisheries Research84, 222–232.
CES, 2006. Report of the ICES Advisory Committee on FISHERY Management, Advi-sory Committee on the Marine Environmental and Advisory Committee onEcosystems. ICES Advice. Books 1-10.6, 310 pp.
saksen, B., Valdemarsen, W.J., 1990. Selectivity in codends with short lastrigde ropes.ICES CM 1990/B: 46.
rag, L.A., Frandsen, R.P., Madsen, N., 2008. Evaluation of a simple means to reducediscard in the Kattegat-Skagerrak Nephrops (Nephrops norvegicus) fishery: Com-mercial testing of different codends and square-mesh panels. Fisheries Research91, 175–186.
vamme, C., Isaksen, B., 2004. Total selectivity of a commercial cod trawl with andwithout a grid mounted: grid and codend selectivity of north-east Artic cod.Fisheries Research 68, 305–318.
adsen, N., Holst, R., Foldager, L., 2002. Escape windows to improve the size selec-tivity in the Baltic cod trawl fishery. Fisheries Research 57, 223–235.
adsen, N., Moth-Poulsen, T., Holst, R., Wileman, D., 1999. Selectivity experimentswith escape windows in the North Sea Nephrops (Nephrops norvegicus) trawlfishery. Fisheries Research 42, 167–181.
adsen, N., Skeide, R., Breen, M., Krag, L.A., Huse, I., Soldal, A.V., 2008. Selectiv-ity in a trawl codend during haul-back operation—an overlooked phenomenon.
Fisheries Research 91, 168–174.adsen, N., Stæhr, K.J., 2005. Selectivity experiments to estimate the effect of escapewindows in the Skagerak roundfish fishery. Fisheries Research 71, 241–245.
’Neill, F.G., McKay, S.J., Ward, J.N., Strickland, A., Kynoch, R.J., Zuur, A.F., 2003. Aninvestigation of the relationship between sea state induced vessel motion andcod-end selection. Fisheries Research 60, 107–130.
search 97 (2009) 59–71 71
O’Neill, F.G., Herrmann, B., 2007. PRESEMO a predictive model of codendselectivity—a tool for fisheries managers. ICES Journal of Marine Science 64,1558–1568.
Priour, D., 2001. Introduction of mesh resistance to opening in a triangular ele-ment for calculation of nets by the finite element method. Communications inNumerical Methods in Engineering 17, 229–237.
Reeves, S.A., Armstrong, D.W., Fryer, R.J., Coull, K.A., 1992. The effect of meshsize, cod-end extension length and cod-end diameter on the selectivityof Scottish trawls and seines. ICES Journal of Marine Science 49, 279–288.
Robertson, J.H.B., Stewart, P.A.M., 1988. A comparison of size selection of haddock andwhiting by square and diamond mesh codends. Journal Du Conseil InternationalPour L’Exploration De La Meer 44, 148–161.
Sala, A., Priour, D., Herrmann, B., 2006. Experimental and theoretical study of redmullet (Mullus barbatus) selection in codends of Mediterranean bottoms trawls.Aquatic Living Resources 19, 317–327.
Santos, M.N., Canas, A., Lino, P.G., Monteiro, C.C., 2006. Length-girth relationship for30 marine fish species. Fisheries Research 78, 368–373.
Stewart, P.A.M., Robertson, J.H.B., 1985. Scottish Fisheries Research Report No. 33, 15pp.
Tosunoglu, Z., 2007. Trawl codend design (44 mm diamond PE mesh) and
the effect on selectivity for Pegellus erythrinus and Pagellus acarne, twospecies with different morphometrics. Journal of Applied Ichthyology 23,578–582.Wileman, D.A., Ferro, R.S.T., Fonteyne, R., Millar, R.B. (Eds.), 1996. Manual of Methodsof Measuring the Selectivity of Towed Fishing Gears. ICES Cooperative ResearchReport, no. 215, 126 pp.