
visual sampling with the eeg alpha oscillation - OhioLINK ETD ...
58
TITLE PAGE VISUAL SAMPLING WITH THE EEG ALPHA OSCILLATION A thesis submitted in partial fulfillment of the requirements for the degree of Master of Science in Biomedical Engineering by KEVIN EUGENE ALEXANDER B.S.B.E, Wright State University, 2018 2020 Wright State University
-
Upload
khangminh22 -
Category
Documents
-
view
3 -
download
0
Transcript of visual sampling with the eeg alpha oscillation - OhioLINK ETD ...
TITLE PAGE VISUAL SAMPLING WITH THE EEG ALPHA OSCILLATION
A thesis submitted in partial fulfillment of the
requirements for the degree of
Master of Science in Biomedical Engineering
by
KEVIN EUGENE ALEXANDER
B.S.B.E, Wright State University, 2018
2020
Wright State University
APPROVAL SHEET WRIGHT STATE UNIVERSITY
GRADUATE SCHOOL
July 27, 2020
I HEREBY RECOMMEND THAT THE THESIS PREPARED UNDER MY
SUPERVISION BY Kevin Eugene Alexander ENTITLED Visual Sampling with the
EEG Alpha Oscillation BE ACCEPTED IN PARTIAL FULFILLMENT OF THE
REQUIREMENTS FOR THE DEGREE OF Master of Science in Biomedical
Engineering.
_____________________________
Sherif Elbasiouny, Ph.D.
Thesis Director
_____________________________
John Gallagher, Ph.D.
Interim Chair, Department of
Biomedical Industrial, and Human
Factors Engineering
Committee on
Final Examination
________________________________
Sherif Elbasiouny, Ph.D.
________________________________
Subhashini Ganapathy, Ph.D.
________________________________
Assaf Harel, Ph.D.
________________________________
Barry Milligan, Ph.D.
Interim Dean of the Graduate School
iv
ABSTRACT
Alexander, Kevin Eugene. M.S.B.M.E., Department of Biomedical, Industrial, and Human
Factors Engineering, Wright State University, 2020. Visual Sampling with the EEG Alpha
Oscillation.
The posterior alpha rhythm, seen in human electroencephalograms (EEG), is posited
to originate from cycling inhibitory/excitatory states of visual relay cells in the thalamus,
which could result in discrete sampling of visual information. Here, we tested this
hypothesis by presenting light flashes at perceptual threshold intensity through closed
eyelids to 20 participants during times of spontaneous alpha oscillations. Alpha phase and
amplitude were calculated relative to each individual’s retina-to-V1 conduction delay,
estimated by the individuals’ C1 visual-evoked potential latency. Our results show that an
additional 20.96% of stimuli are observed when afferenting at V1 during an alpha wave
trough (272.41°) than at peak (92.41°) phase. Additionally, the perception-phase
relationship is observed at high, but not low alpha amplitudes. These results support the
visual sampling hypothesis and, considering the alpha rhythm’s negative correlation with
attention, suggests that the alpha rhythm facilitates attention by down-sampling task-
irrelevant information.

v
TABLE OF CONTENTS
I. INTRODUCTION .................................................................................................. 1
Background ............................................................................................................. 1
Behavior ...................................................................................................... 1
Function ...................................................................................................... 4
Objective and Hypothesis ....................................................................................... 6
II. MATERIALS & METHODS ................................................................................. 8
Participants .................................................................................................. 8
Recording .................................................................................................... 8
Stimuli ......................................................................................................... 9
Data Analysis ............................................................................................ 10
Estimation of t2 ..................................................................................................... 10
Experimental Design ................................................................................. 12
Analysis..................................................................................................... 12
Measuring Observation Rates ............................................................................... 13
Experimental Design ................................................................................. 14
Analysis..................................................................................................... 16
Statistical Analysis .................................................................................... 18
III. RESULTS ............................................................................................................. 19
vi
Individual Retina-to-V1 Conduction Delay (t2) Measurement ............................ 19
Observation Rate Measurement ............................................................................ 20
Phase-Varying Analysis of Visual Observation ................................................... 23
Measuring Induced Activity ................................................................................. 26
t2 Measurements Improve on Prestimulus Measurements ................................... 28
IV. DISCUSSION ....................................................................................................... 32
Attention ............................................................................................................... 35
Neural Mechanism ................................................................................................ 37
Cellular Shutter Effect Generates a Behavioral Graded Gating Effect ................. 39
Alpha wave oscillations in neurological conditions ............................................. 41
REFERENCES ................................................................................................................. 42
vii
LIST OF FIGURES
Figure Page
Figure 1. Methods of estimating t2. .................................................................................. 11
Figure 2. Example of the staircase method used to determine the threshold intensity in a
single participant. ............................................................................................ 15
Figure 3. C1 VEP component averaged across all participants ........................................ 19
Figure 4. At t2, observation rate (OR) for each amplitude and phase condition. ............. 22
Figure 5. At t2, OR as a function of phase for each participant. ...................................... 24
Figure 6. At t2, OR as a function of phase for all participants. ........................................ 25
Figure 7. Measures of induced oscillatory activity. .......................................................... 28
Figure 8. At t = -100ms, OR as a function of phase for all participants. .......................... 29
Figure 9. At t = -100ms, observation rate (OR) for each amplitude and phase condition. 31
Figure 10. Visual pathway from retinal to V1. ................................................................. 39
viii
LIST OF TABLES
Table Page
Table 1. At t2, two (amplitude) x four (phase) within-subjects repeated measures ANOVA
results. ............................................................................................................. 21
Table 2. At t = -100ms, two (amplitude) x four (phase) within-subjects repeated measures
ANOVA results. .............................................................................................. 30
1
I. INTRODUCTION
BACKGROUND
BEHAVIOR
The alpha rhythm/posterior dominant rhythm, a 7-13Hz oscillation, is a notable
characteristic of the human EEG over the occipital cortex. As far back as the 1920s, the
alpha rhythm has been seen to come and go with the closing and opening of the eyes, as
well as during times of inactivity and task engagement (Bazanova and Vernon, 2014) and
was first characterized by Hans Berger in the 1920s and 1930s (Compston, 2010). This,
with the observance of similar frequencies in the auditory cortex (referred to as tau rhythm)
in the absence of auditory stimuli (Tiihonen et al., 1991; Weisz et al., 2011), and
sensorimotor cortex (referred to as mu rhythm) in the absence of sensorimotor engagement
(Pineda, 2005; Bazanova and Vernon, 2014; Garcia-Rill et al., 2016) has led to the cortical
idling hypothesis that states that 7-13 Hz is the default rhythm of cortical areas exhibited
when not engaged in a task or receiving sensory input (Bazanova and Vernon, 2014).
The more modern hypothesis is that the 7-13 Hz rhythm represents sensory
suppression and is largely modulated by the thalamus (Bastiaansen and Brunia, 2001; Ben‐
Simon et al., 2013; Omata et al., 2013; Babiloni et al., 2014). This hypothesis suggests that
the alpha rhythm represents active suppression of task irrelevant cortices in order to
facilitate attention (Ray and Cole, 1985; Sauseng et al., 2005; Ben‐Simon et al., 2013;
Babiloni et al., 2014; Limbach and Corballis, 2017; Janssens et al., 2018). It has also been
found that alpha activity increases with introspective behavior (Ancoli and Green, 1977;
2
Yue et al., 2013) and tasks involving internally directed attention (Cooper et al., 2003; Ben‐
Simon et al., 2013) such as imagination (Cooper et al., 2003), mental arithmetic (Ray and
Cole, 1985), autobiographical recall (Yue et al., 2013), and meditative practices (Tenke et
al., 2017). This is seen as further evidence for the sensory suppression hypothesis of the
alpha rhythm since internally directed attention would deem all external sensory modalities
task irrelevant (Cooper et al., 2003; Ben‐Simon et al., 2013). But this theory does not
necessarily stand in opposition to cortical idling. Idling could easily be interpreted as
inhibition of a cortical area judged to be irrelevant in the absence of incoming stimuli, this
is supported by observation that alpha power decreases when sensory input is anticipated
but still currently absent (Bastiaansen and Brunia, 2001; Hartmann et al., 2012; Babiloni
et al., 2014; Limbach and Corballis, 2017).
Features of the alpha rhythm have also been found to have many correlates in
individual personality traits. In keeping with the inhibitory function of the alpha rhythm,
higher individual alpha power is positively correlated with better emotional regulation and
long-term goal seeking behavior, and this is attributed to stronger thalamocortical
inhibition of antisocial behaviors such as neurosis and alcoholism (Knyazev et al., 2008;
Pavlenko et al., 2009). This behavioral inhibition is especially strong in individuals who
show a strong decrease in alpha power in preparation of a given task (Knyazev et al., 2008)
indicating better regulation of inhibition mechanisms.
3
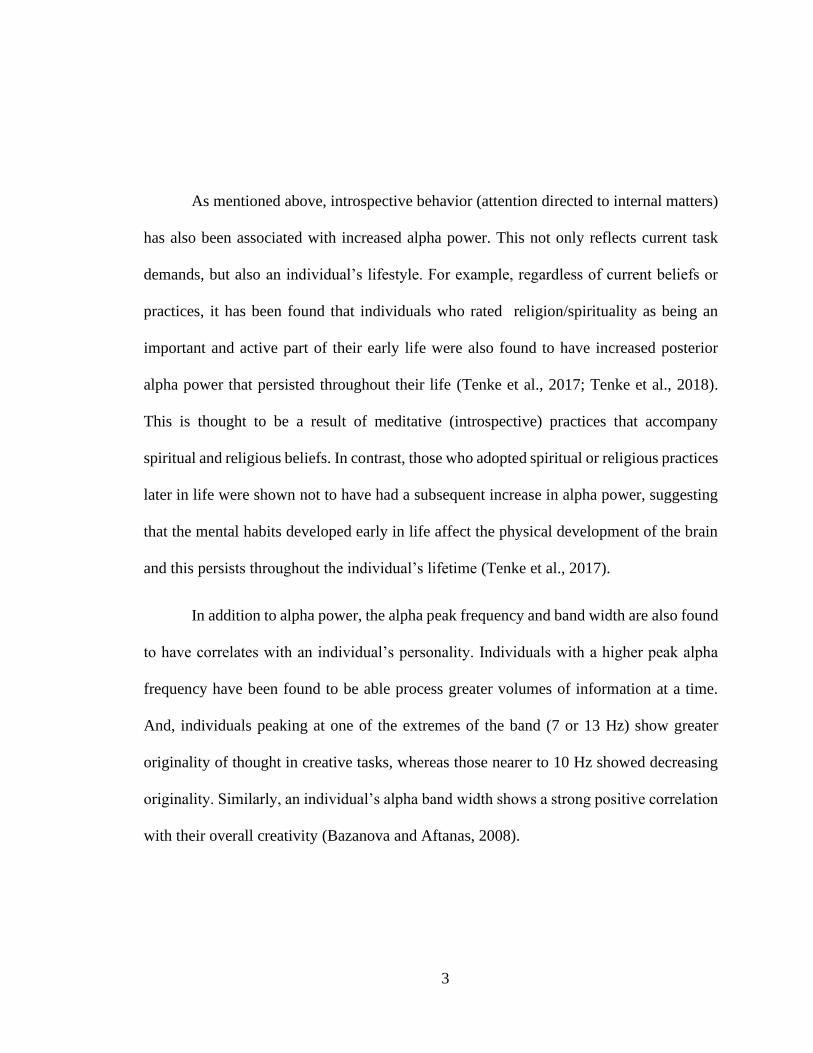
As mentioned above, introspective behavior (attention directed to internal matters)
has also been associated with increased alpha power. This not only reflects current task
demands, but also an individual’s lifestyle. For example, regardless of current beliefs or
practices, it has been found that individuals who rated religion/spirituality as being an
important and active part of their early life were also found to have increased posterior
alpha power that persisted throughout their life (Tenke et al., 2017; Tenke et al., 2018).
This is thought to be a result of meditative (introspective) practices that accompany
spiritual and religious beliefs. In contrast, those who adopted spiritual or religious practices
later in life were shown not to have had a subsequent increase in alpha power, suggesting
that the mental habits developed early in life affect the physical development of the brain
and this persists throughout the individual’s lifetime (Tenke et al., 2017).
In addition to alpha power, the alpha peak frequency and band width are also found
to have correlates with an individual’s personality. Individuals with a higher peak alpha
frequency have been found to be able process greater volumes of information at a time.
And, individuals peaking at one of the extremes of the band (7 or 13 Hz) show greater
originality of thought in creative tasks, whereas those nearer to 10 Hz showed decreasing
originality. Similarly, an individual’s alpha band width shows a strong positive correlation
with their overall creativity (Bazanova and Aftanas, 2008).

4
FUNCTION
However, despite the long history of behavioral research and the alpha rhythm, the
cellular mechanism that give rise to the oscillation and how exactly this facilitates attention
is not well established. In the 1950’s and 60’s alpha oscillations were proposed to represent
a ‘neuronic shutter’ (Lindsley, 1952; Callaway and Alexander, 1960) to down-sample
incoming sensory information to reduce processing load, and similar discrete perceptual
processes are still proposed today (VanRullen and Koch, 2003; VanRullen et al., 2014).
This shutter is thought to occur at the lateral geniculate nucleus (LGN), which relays visual
information to V1. At times, LGN relay cells burst- fire at 10Hz, with a hyperpolarized
refractory period between bursts (Lopes da Silva, 1991; Sherman, 2001; Timofeev and
Bazhenov, 2005; Timofeev and Chauvette, 2011). If many of these cells fire
synchronously, visual afferentation during a widespread refractory period is less likely to
be relayed to V1, resulting in a 10Hz visual shutter. Each burst in LGN relay cells results
in a large excitatory postsynaptic potential (EPSP) at V1, measured as a negative deflection
in the occipital EEG (Timofeev and Bazhenov, 2005), in which higher amplitudes
indicating more synchronous cortical excitation (Pfurtscheller et al., 1996) that results,
according to this model, from excitatory volleys from the LGN relay cells. This alpha
rhythm is thought to reflect EPSPs at V1 resulting from cycling excitability in the LGN
visual-relay cells, which would result in cycling visual sensitivity in phase with the alpha
oscillation.
5
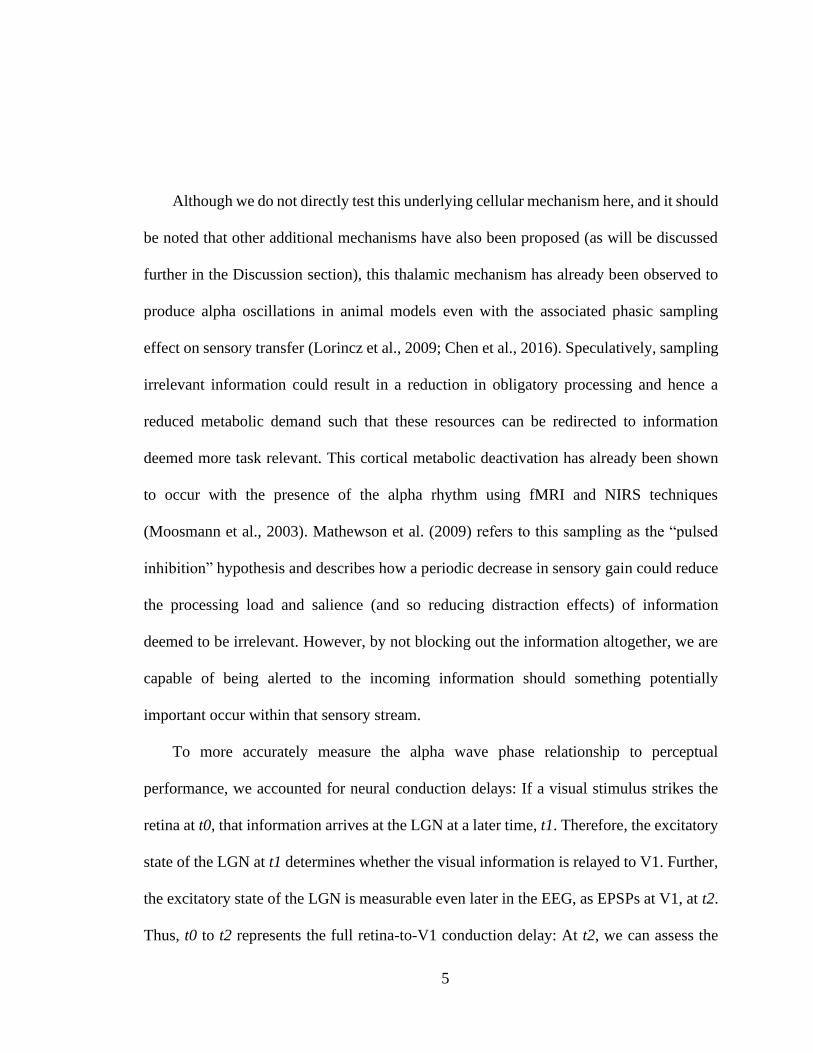
Although we do not directly test this underlying cellular mechanism here, and it should
be noted that other additional mechanisms have also been proposed (as will be discussed
further in the Discussion section), this thalamic mechanism has already been observed to
produce alpha oscillations in animal models even with the associated phasic sampling
effect on sensory transfer (Lorincz et al., 2009; Chen et al., 2016). Speculatively, sampling
irrelevant information could result in a reduction in obligatory processing and hence a
reduced metabolic demand such that these resources can be redirected to information
deemed more task relevant. This cortical metabolic deactivation has already been shown
to occur with the presence of the alpha rhythm using fMRI and NIRS techniques
(Moosmann et al., 2003). Mathewson et al. (2009) refers to this sampling as the “pulsed
inhibition” hypothesis and describes how a periodic decrease in sensory gain could reduce
the processing load and salience (and so reducing distraction effects) of information
deemed to be irrelevant. However, by not blocking out the information altogether, we are
capable of being alerted to the incoming information should something potentially
important occur within that sensory stream.
To more accurately measure the alpha wave phase relationship to perceptual
performance, we accounted for neural conduction delays: If a visual stimulus strikes the
retina at t0, that information arrives at the LGN at a later time, t1. Therefore, the excitatory
state of the LGN at t1 determines whether the visual information is relayed to V1. Further,
the excitatory state of the LGN is measurable even later in the EEG, as EPSPs at V1, at t2.
Thus, t0 to t2 represents the full retina-to-V1 conduction delay: At t2, we can assess the

6
excitability of the LGN at t1, the time of afferentation of a stimulus occurring at t0. This is
the first study, to our knowledge, to directly examine the relationship between visual
observation and spontaneous alpha phase as measured relative to each individual’s
conduction delay, which advances the accuracy and rigor for testing the shutter hypothesis
more than before.
OBJECTIVE AND HYPOTHESIS
The objective of this study is to more robustly test the hypothesis that the alpha rhythm
reflects cyclic excitability states in the visual system with a phase and timing relationship
predicted by the underlying physiology and neural conduction delays. Therefore, we
presented visual stimuli (at t0) to participants during spontaneous occipital alpha activity,
then measured alpha amplitude and phase at t2, which was estimated by the peak latency
of each individual’s C1 visual-evoked potential (VEP) component (Di Russo et al., 2001).
We predicted that visual stimuli at t0 would be more likely observed with alpha phase was
at a trough at t2 (assumed to indicate an LGN excitatory state at t1) than at a peak (an
inhibitory state at t1). Additionally, this alpha phase effect was predicted to be greater at
high alpha amplitudes, indicating greater synchrony in the underlying cellular excitatory
state.
To make these measurements, we binned the trials by alpha amplitude at t2 into high
and low amplitude bins (based on median split), and then binned once more by alpha phase
at t2 into 90° wide bins centered at 0°, 90° (peak), 180°, and 270° (trough). The percentage
of trials reported as being observed within each bin was then calculated, and this was
7
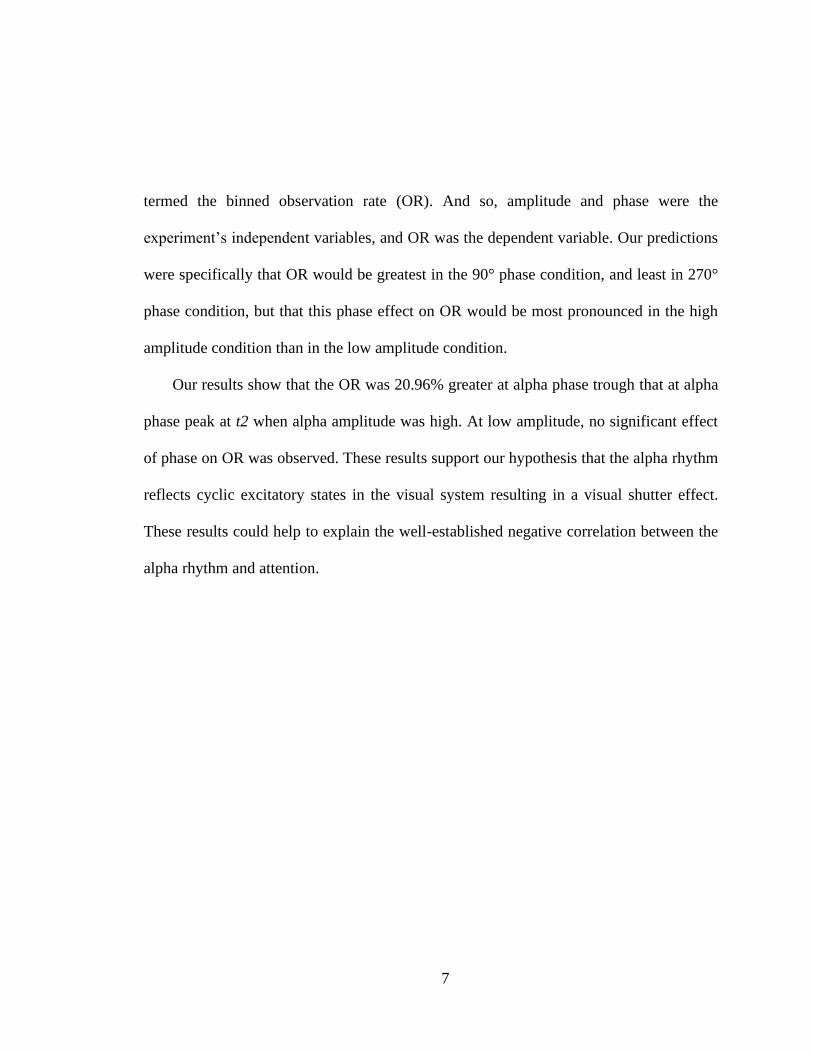
termed the binned observation rate (OR). And so, amplitude and phase were the
experiment’s independent variables, and OR was the dependent variable. Our predictions
were specifically that OR would be greatest in the 90° phase condition, and least in 270°
phase condition, but that this phase effect on OR would be most pronounced in the high
amplitude condition than in the low amplitude condition.
Our results show that the OR was 20.96% greater at alpha phase trough that at alpha
phase peak at t2 when alpha amplitude was high. At low amplitude, no significant effect
of phase on OR was observed. These results support our hypothesis that the alpha rhythm
reflects cyclic excitatory states in the visual system resulting in a visual shutter effect.
These results could help to explain the well-established negative correlation between the
alpha rhythm and attention.
8
II. MATERIALS & METHODS
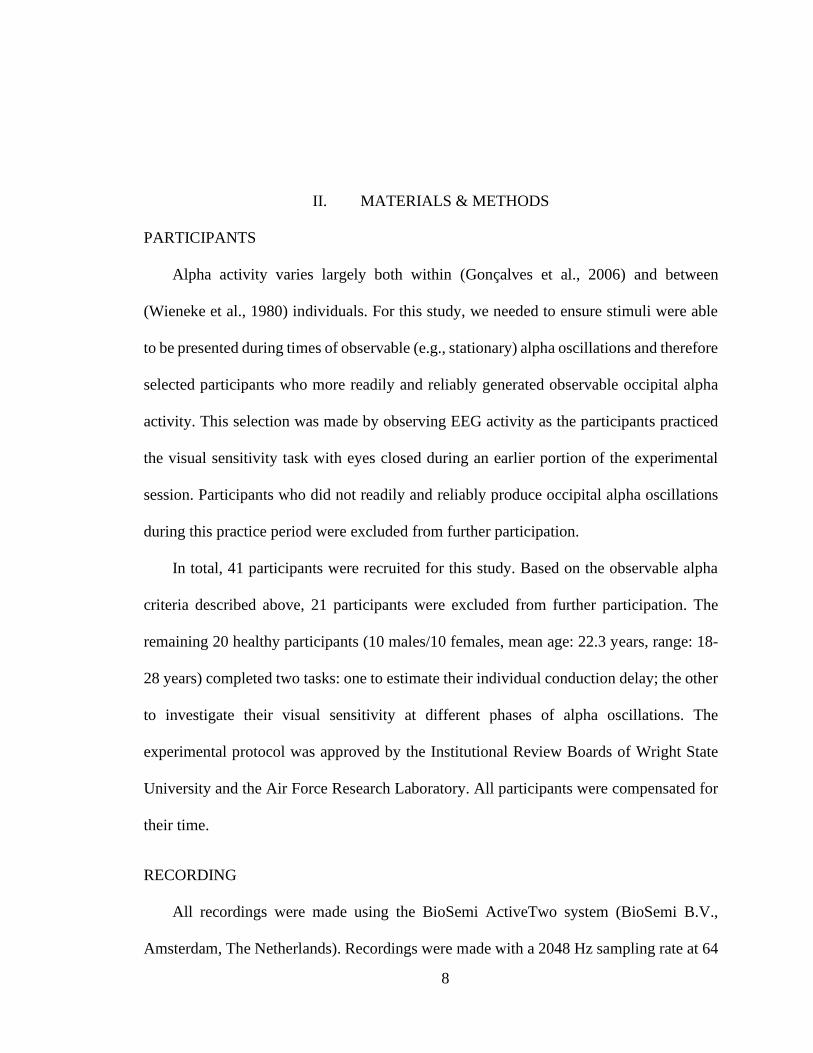
PARTICIPANTS
Alpha activity varies largely both within (Gonçalves et al., 2006) and between
(Wieneke et al., 1980) individuals. For this study, we needed to ensure stimuli were able
to be presented during times of observable (e.g., stationary) alpha oscillations and therefore
selected participants who more readily and reliably generated observable occipital alpha
activity. This selection was made by observing EEG activity as the participants practiced
the visual sensitivity task with eyes closed during an earlier portion of the experimental
session. Participants who did not readily and reliably produce occipital alpha oscillations
during this practice period were excluded from further participation.
In total, 41 participants were recruited for this study. Based on the observable alpha
criteria described above, 21 participants were excluded from further participation. The
remaining 20 healthy participants (10 males/10 females, mean age: 22.3 years, range: 18-
28 years) completed two tasks: one to estimate their individual conduction delay; the other
to investigate their visual sensitivity at different phases of alpha oscillations. The
experimental protocol was approved by the Institutional Review Boards of Wright State
University and the Air Force Research Laboratory. All participants were compensated for
their time.
RECORDING
All recordings were made using the BioSemi ActiveTwo system (BioSemi B.V.,
Amsterdam, The Netherlands). Recordings were made with a 2048 Hz sampling rate at 64
9
channel locations based on the modified combinatorial nomenclature extension of the 10-
10 system (American Electroencephalographic Society, 1994) excluding the inferior chain
with the exception of P9/P10 and Iz (Seeck et al., 2017), with bilateral electrodes on the
mastoid process, infraorbital, and outer canthus locations. Participant responses were
recorded using a low-latency mechanical keyboard (Cherry MX 6.0 [G80-3930], Cherry
GmbH, Auerbach in der Oberpfalz, Germany). This was combined with other task-state
and visual-stimulus timing information via light sensors placed on the monitor to record
events on the ActiveTwo’s 16-bit trigger line (StimTracker 1G, Cedrus Corporation, San
Pedro, California, USA).
STIMULI
All tasks and stimuli were constructed and presented using MATLAB (R2011b; The
MathWorks, Inc., Natick, MA, USA) and the Psychophysics Toolbox (v3.0.13) (Brainard,
1997; Pelli, 1997; Kleiner et al., 2007). This software was run on a Dell Precision T3610
computer (Dell Inc., Round Tock, TX, USA) with the Windows 7 Professional operating
system (Microsoft Corporation, Redmond, WA, USA). Stimuli were presented to
participants on a 24.5”, 240 Hz monitor (BenQ ZOWIE XL2540, BenQ Corporation,
Taipei, Taiwan) providing 4.2 ms temporal resolution for stimulus presentation. Where
relevant, stimulus luminance was measured using a light meter (Light Meter LUX/FC
840020, SPER SCIENTIFIC, Scottsdale, AZ, USA). The participant’s head position was
fixed using a chinrest placed 58 cm from this monitor. The experiment was conducted in a

10
dark room with a natural sound machine (Dohm Classic, Marpac LLC, Wilmington, NC,
USA) to mask noise disturbances.
DATA ANALYSIS
All data analyses were performed in MATLAB (R2019b; The MathWorks, Inc.,
Natick, MA, USA) utilizing the EEGLAB Toolbox (v2019.0) (Delorme and Makeig, 2004)
and the ERPLAB plugin (v7.0.0) (Lopez-Calderon and Luck, 2014). Statistical analyses
were conducted using MATLAB’s Statistics and Machine Learning Toolbox (R2019b; The
MathWorks, Inc., Natick, MA, USA). This software was run on a Lenovo ThinkPad P50
computer (Lenovo, Morrisville, NC, USA) with the Windows 10 Enterprise operating
system (Microsoft Corporation, Redmond, WA, USA).
ESTIMATION OF T2
The peak latency of each participant’s C1 visual-evoked potential (VEP) component
was used as an estimate of their individual retina-to-V1 conduction delay, t2. This
component reflects the arrival of visual information to the primary visual cortex from the
LGN along the optic radiations. However, due to the specific folding of the V1 cortical
area around the calcarine fissure (Figure 1A), the C1 wave shape will vary with the location
of the stimulus in the visual field. Stimuli presented horizontally centered in the visual field
will stimulate spatially opposing V1 neurons whose dipoles will cancel each other out,
yielding no measurable C1 component in the EEG (Clark et al., 1995; Di Russo et al.,
2001). This is similarly the case for stimuli presented approximately 3° below the vertical
11
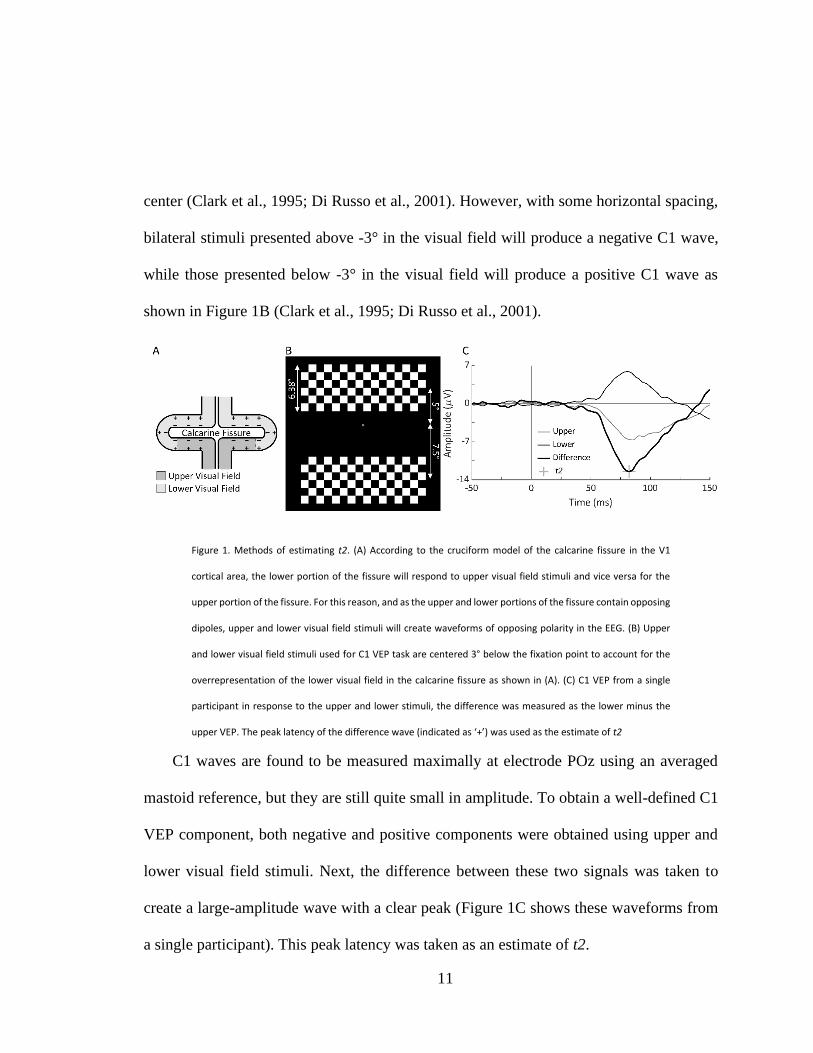
center (Clark et al., 1995; Di Russo et al., 2001). However, with some horizontal spacing,
bilateral stimuli presented above -3° in the visual field will produce a negative C1 wave,
while those presented below -3° in the visual field will produce a positive C1 wave as
shown in Figure 1B (Clark et al., 1995; Di Russo et al., 2001).
Figure 1. Methods of estimating t2. (A) According to the cruciform model of the calcarine fissure in the V1
cortical area, the lower portion of the fissure will respond to upper visual field stimuli and vice versa for the
upper portion of the fissure. For this reason, and as the upper and lower portions of the fissure contain opposing
dipoles, upper and lower visual field stimuli will create waveforms of opposing polarity in the EEG. (B) Upper
and lower visual field stimuli used for C1 VEP task are centered 3° below the fixation point to account for the
overrepresentation of the lower visual field in the calcarine fissure as shown in (A). (C) C1 VEP from a single
participant in response to the upper and lower stimuli, the difference was measured as the lower minus the
upper VEP. The peak latency of the difference wave (indicated as ‘+’) was used as the estimate of t2
C1 waves are found to be measured maximally at electrode POz using an averaged
mastoid reference, but they are still quite small in amplitude. To obtain a well-defined C1
VEP component, both negative and positive components were obtained using upper and
lower visual field stimuli. Next, the difference between these two signals was taken to
create a large-amplitude wave with a clear peak (Figure 1C shows these waveforms from
a single participant). This peak latency was taken as an estimate of t2.
12
EXPERIMENTAL DESIGN
The stimulus used for this task was a 17° wide, 6.38° tall black and white checkerboard
made of 16x6 1.06° squares placed on an otherwise black screen with a fixation point
placed in the center (Figure 1B). The checkerboard was flashed with its center either 5°
above or 7.5° below the fixation point and centered horizontally. The size and placement
of these stimuli were selected to generate maximum amplitude waves (Clark et al., 1995).
A total of 600 upper and 600 lower stimuli were presented in a mixed random order each
with a duration of 33 ms with random 250-450 ms interstimulus-intervals, resulting in a
trial time of approximately 7.5 minutes.
Similarly to Di Russo et al. (2001), participant attention and gaze were maintained on
the fixation point by a sham task performed during the trial. The fixation point would
occasionally flash to a brighter color for 12.6 ms, and the participant was instructed to
watch for this flash and to respond by pressing the space bar.
ANALYSIS
For the C1 VEP analysis, the originally recorded 2048 Hz sampling rate was
maintained but re-referenced to averaged mastoids. All EEG signals were band-pass
filtered from 0.01 to 50 Hz at -6 dB, using a 2nd order IIR Butterworth filter as
implemented in the ERPLAB toolbox (Lopez-Calderon and Luck, 2014), to achieve a zero-
phase filter response. A bipolar vertical electrooculogram (vEOG) signal was created by
subtracting the averaged left and right infraorbital electrodes from the averaged Fp1 and
Fp2 electrodes.
13
The data were epoched from 50 ms prior to 200 ms after stimulus presentation for both
the upper and lower visual stimuli. Blinks within these epochs were detected by sliding a
150 ms window at 75 ms steps over the vEOG signal, and any window containing a peak-
to-peak amplitude of 100 μV or greater was rejected from analysis. Separate average VEPs
were calculated for the upper and lower stimulus trials and were baseline-corrected to the
50 ms pre-stimulus period. The lower visual field VEP was then subtracted from the upper
field VEP to create a difference wave containing a C1 wave with a clear peak.
The C1 peak latency was measured at electrode POz by finding the most negative peak
within the 0-110 ms time window relative to stimulus onset. This peak latency was
calculated for each participant individually and was used as an estimate of their individual
t2.
MEASURING OBSERVATION RATES
This task was designed to be conducted with closed eyes in order to evoke more
frequent (Legewie et al., 1969) and higher amplitude alpha oscillations (Barry et al., 2007).
For this purpose, stimuli were designed such that they could be observed as light flashes
through closed eyelids. The brightness of these flashes was designed to be near threshold
intensity (where participants reported seeing approximately 50% of the stimuli) to prevent
any ceiling or floor effects on performance.
14
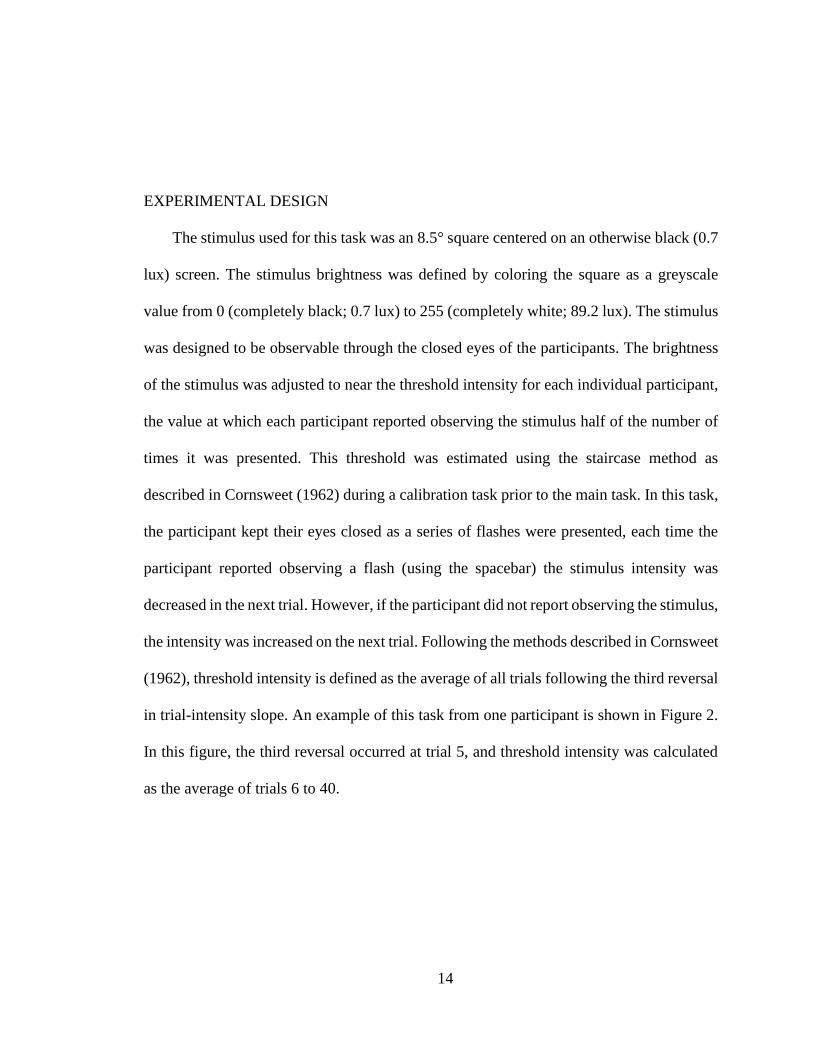
EXPERIMENTAL DESIGN
The stimulus used for this task was an 8.5° square centered on an otherwise black (0.7
lux) screen. The stimulus brightness was defined by coloring the square as a greyscale
value from 0 (completely black; 0.7 lux) to 255 (completely white; 89.2 lux). The stimulus
was designed to be observable through the closed eyes of the participants. The brightness
of the stimulus was adjusted to near the threshold intensity for each individual participant,
the value at which each participant reported observing the stimulus half of the number of
times it was presented. This threshold was estimated using the staircase method as
described in Cornsweet (1962) during a calibration task prior to the main task. In this task,
the participant kept their eyes closed as a series of flashes were presented, each time the
participant reported observing a flash (using the spacebar) the stimulus intensity was
decreased in the next trial. However, if the participant did not report observing the stimulus,
the intensity was increased on the next trial. Following the methods described in Cornsweet
(1962), threshold intensity is defined as the average of all trials following the third reversal
in trial-intensity slope. An example of this task from one participant is shown in Figure 2.
In this figure, the third reversal occurred at trial 5, and threshold intensity was calculated
as the average of trials 6 to 40.

15
Figure 2. Example of the staircase method used to determine the threshold intensity in a single participant. Each
time the participant observed the stimulus, the intensity in the next trial was decreased. If the participant did
not observe the stimulus in one trial, the intensity was increased in the next trial. Threshold intensity was
determined as the average intensity of all trials (trials 6-40 in this example) following the third reversal, or
corner, in the trial-intensity trace (trial 5 in this example). The dashed threshold intensity line in this figure spans
the trials over which the intensities were averaged.
The stimuli used were so dim that the participants’ ability to perceive them was
sensitive to how well their eyes had adapted to the dark. Pilot testing of the task revealed
that, without an adjustment period, the threshold brightness found during the calibration
task would become easier to see over the course of the main task. Although visual
adaptation to the dark will continue over many hours, the most rapid changes occur in the
first 15 minutes, and visual acuity begins to plateau in 20 minutes (Bierings et al., 2018).
Therefore, participants were given 25 minutes in the dark as an adaptation period before
conducting the calibration task to estimate the threshold brightness.
In the main task, the stimuli were flashed for a period of 8.4 ms and the participants
were instructed to respond using the keyboard spacebar any time they observed, or thought
they observed, a flash. The participant had to respond within two seconds of the stimulus
presentation to be considered as a valid response.

16
It was the goal to have as many trials presented during times of well-developed alpha
oscillations as possible. To accomplish this, the experimenter controlled when the stimuli
were presented, manually triggering the onset whenever this rhythm was observed in the
real-time data stream throughout the task. A single experimenter conducted every
experiment in order to maintain some consistency in this judgment. Also, to mitigate any
potential confounding effects of experimenter bias in stimulus prestation timing, a random
interval of less than 750 ms was added between the trigger and the actual presentation of
the stimulus. Admittedly, a better method to accomplish this would be to measure posterior
alpha power in real time and to have the stimulus presentation automated based on some
threshold power; this would remove any experimenter bias. However, due to limitations on
equipment and time, this on-line analysis was not accomplished for the present experiment.
ANALYSIS
All data were down-sampled to 512 Hz and re-referenced to averaged mastoids. The
signal was bandpass filtered from 0.01 to 50 Hz at -6dB using a 2nd order IIR Butterworth
filter, as implemented in the ERPLAB toolbox (Lopez-Calderon and Luck, 2014), to
achieve a zero-phase filter response. A bipolar vEOG signal was created by subtracting the
averaged left and right infraorbital electrodes from the averaged Fp1 and Fp2 electrodes.
To isolate the activities of the left and right visual cortices, a left occipital (LO) signal
was calculated by averaging the channels O1, PO3, and PO7, and a right occipital (RO)
signal was calculated by averaging channels O2, PO4, and PO8. LO and RO were then
convolved with a 10 Hz complex Morlet wavelet to obtain time-domain power and phase
17
signals (Cohen, 2014). A peak-to-peak amplitude signal was then calculated by doubling
the square root of the power signal.
The Morlet wavelet was constructed with a center frequency of 10 Hz containing 22/3
cycles (the recommended minimum (Cohen, 2019)). This cycle count was chosen to
optimize temporal resolution and resulted in a wavelet with a full-width at half maximum
(FWHM) of 101.6 ms in the time domain and 8.87 Hz in the frequency domain. A FWHM
of 8.87 Hz indicates that the wavelet convolution was effectively a bandpass filter with
half-power points of 5.57 and 14.44 Hz, approximating the alpha frequency band.
The following analysis was then performed independently for each participant.
Amplitude and phase were measured from LO and RO at the individuals’ t2 relative to
stimulus onset for both observed and missed trials. Trials in which LO and RO phases
differed by more than 90° were rejected from further analysis to control for alpha
asynchrony between the hemispheres. For each of the remaining trials, a single amplitude
and phase value was obtained by averaging the amplitude and phase of the LO and RO
signals. Phase values were averaged using appropriate statistics for circular quantities
(Berens, 2009). These trials were then divided by median amplitude into high and low
amplitude bins and then further divided by phase using 90° bins centered on 0°, 90°, 180°,
and 270° phase angles. Condition specific observation rates (OR, the percentage of trials
in which the participant observed the stimulus) were then calculated for every bin resulting
in an OR value for each of the 2 (amplitude) x 4 (phase) bins.
18
STATISTICAL ANALYSIS
This analysis resulted in a within-subjects 2x4 repeated measures design with twenty
participants and two factors: amplitude (high, low) and phase (0°, 90°, 180°, 270°). These
data were analyzed using a repeated measures ANOVA, testing both main effect of
amplitude and phase as well as their interaction. Independent t-test and Tukey’s HSD tests
were used to probe any effects found to be significant. All statistical analyses were
conducted using MATLAB’s Statistics and Machine Learning Toolbox (R2019b; The
MathWorks, Inc., Natick, MA, USA).
19
III. RESULTS
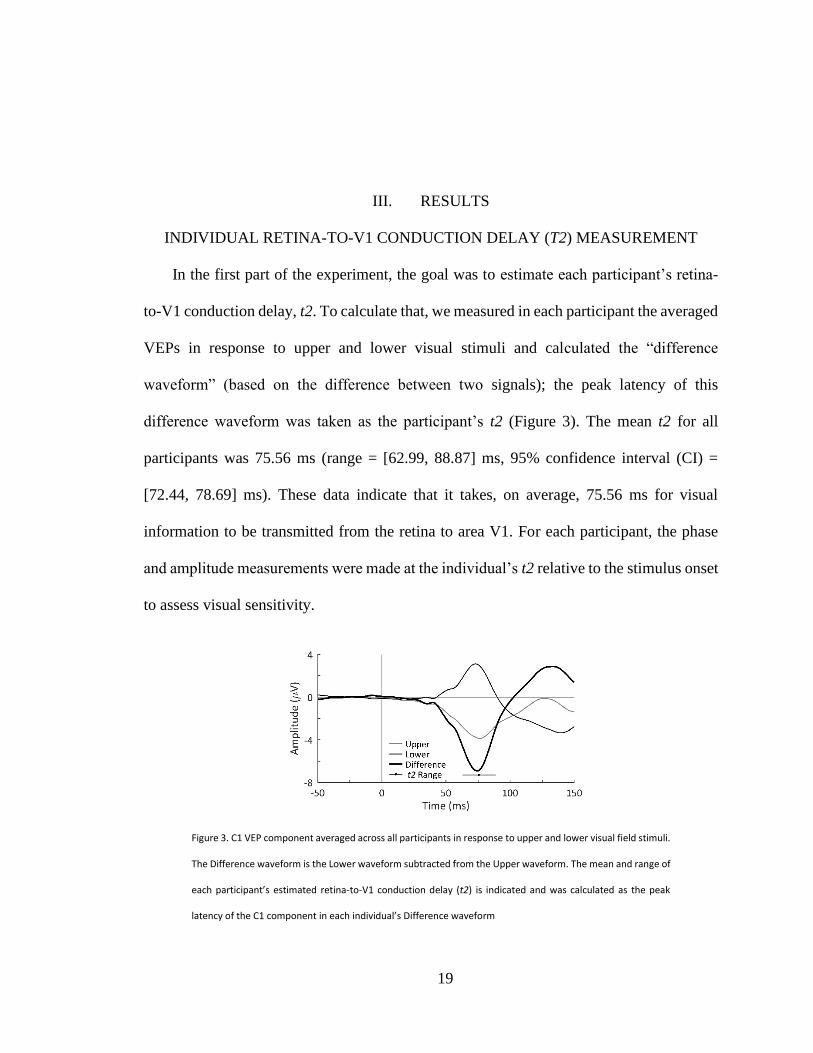
INDIVIDUAL RETINA-TO-V1 CONDUCTION DELAY (T2) MEASUREMENT
In the first part of the experiment, the goal was to estimate each participant’s retina-
to-V1 conduction delay, t2. To calculate that, we measured in each participant the averaged
VEPs in response to upper and lower visual stimuli and calculated the “difference
waveform” (based on the difference between two signals); the peak latency of this
difference waveform was taken as the participant’s t2 (Figure 3). The mean t2 for all
participants was 75.56 ms (range = [62.99, 88.87] ms, 95% confidence interval (CI) =
[72.44, 78.69] ms). These data indicate that it takes, on average, 75.56 ms for visual
information to be transmitted from the retina to area V1. For each participant, the phase
and amplitude measurements were made at the individual’s t2 relative to the stimulus onset
to assess visual sensitivity.
Figure 3. C1 VEP component averaged across all participants in response to upper and lower visual field stimuli.
The Difference waveform is the Lower waveform subtracted from the Upper waveform. The mean and range of
each participant’s estimated retina-to-V1 conduction delay (t2) is indicated and was calculated as the peak
latency of the C1 component in each individual’s Difference waveform
20
OBSERVATION RATE MEASUREMENT
The second part of the experiment aimed to investigate if perceptual performance,
when measured at t2, is higher at an alpha wave trough (i.e., phase angle of 270°) than an
alpha wave peak (i.e., phase angle of 90°). To examine this, we presented light flashes to
each participant through closed eyes. Light flashes were near individual threshold intensity
estimated using the staircase method (Cornsweet, 1962) during a calibration task prior to
the main task to prevent ceiling and floor performance effects. This resulted in the stimuli
of average luminance across participants of 6.48 lux. Use of these near-threshold stimuli
resulting in total observation rates averaging 58.28% across participants.
In total, participants were presented 161.65 stimuli on average during the main task
(range = [120, 200]) where variability in trial count was due to the frequency of alpha burst
occurrence during the experimental period. Interstimulus intervals averaged 12.52 seconds.
Left occipital (LO) and right occipital (RO) amplitude and phase signals were measured
for each participant and analyzed at the participant’s t2 time point, trials in which LO and
RO phases differed by more than 90° were rejected from further analysis resulting in
135.75 trials remaining per participant on average (range = [85, 183]) . The amplitude
measures were split by their median value into two bins (high and low), and the phase
measures were split into four 90° bins centered on 0°, 90°, 180°, and 270° phase angles.
These phase bins in order contained on average across participants 16.15, 15, 14.05, and
16.95 trials in the high amplitude condition, and 18.15, 18.5, 17.75, and 19.2 trials in the
low amplitude condition. This indicates that trial counts in each of the eight conditions
21
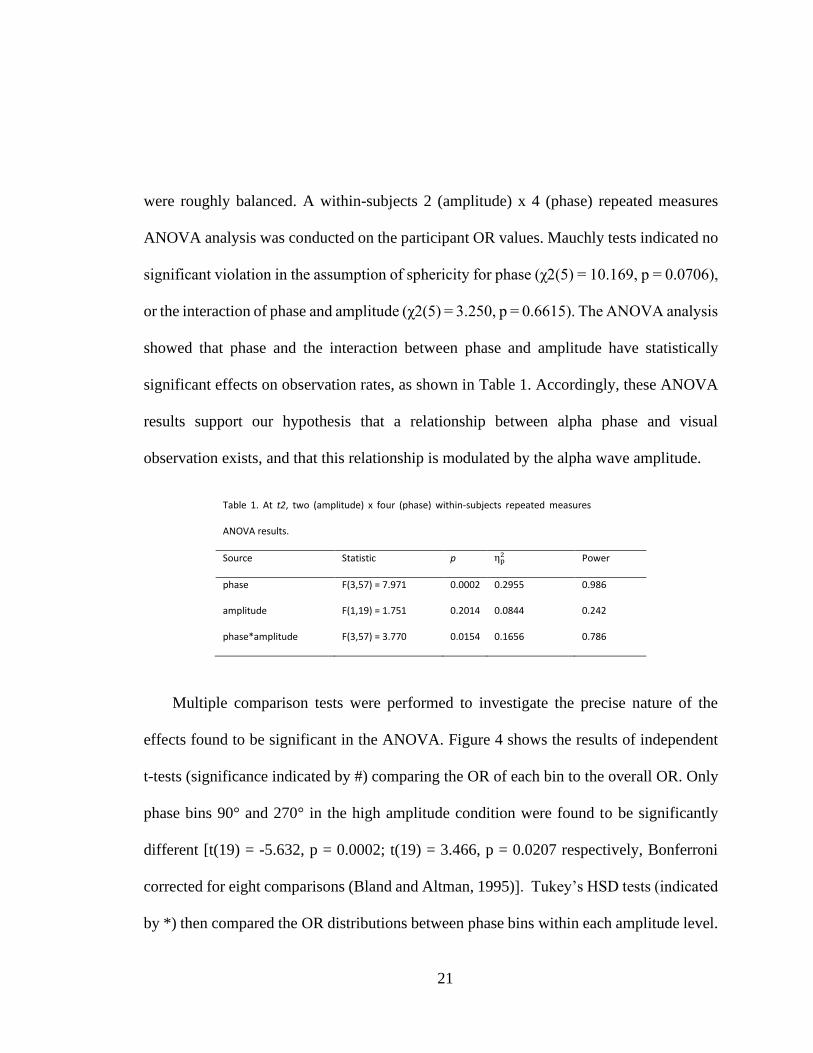
were roughly balanced. A within-subjects 2 (amplitude) x 4 (phase) repeated measures
ANOVA analysis was conducted on the participant OR values. Mauchly tests indicated no
significant violation in the assumption of sphericity for phase (χ2(5) = 10.169, p = 0.0706),
or the interaction of phase and amplitude (χ2(5) = 3.250, p = 0.6615). The ANOVA analysis
showed that phase and the interaction between phase and amplitude have statistically
significant effects on observation rates, as shown in Table 1. Accordingly, these ANOVA
results support our hypothesis that a relationship between alpha phase and visual
observation exists, and that this relationship is modulated by the alpha wave amplitude.
Table 1. At t2, two (amplitude) x four (phase) within-subjects repeated measures
ANOVA results.
Source Statistic p ηp2 Power
phase F(3,57) = 7.971 0.0002 0.2955 0.986
amplitude F(1,19) = 1.751 0.2014 0.0844 0.242
phase*amplitude F(3,57) = 3.770 0.0154 0.1656 0.786
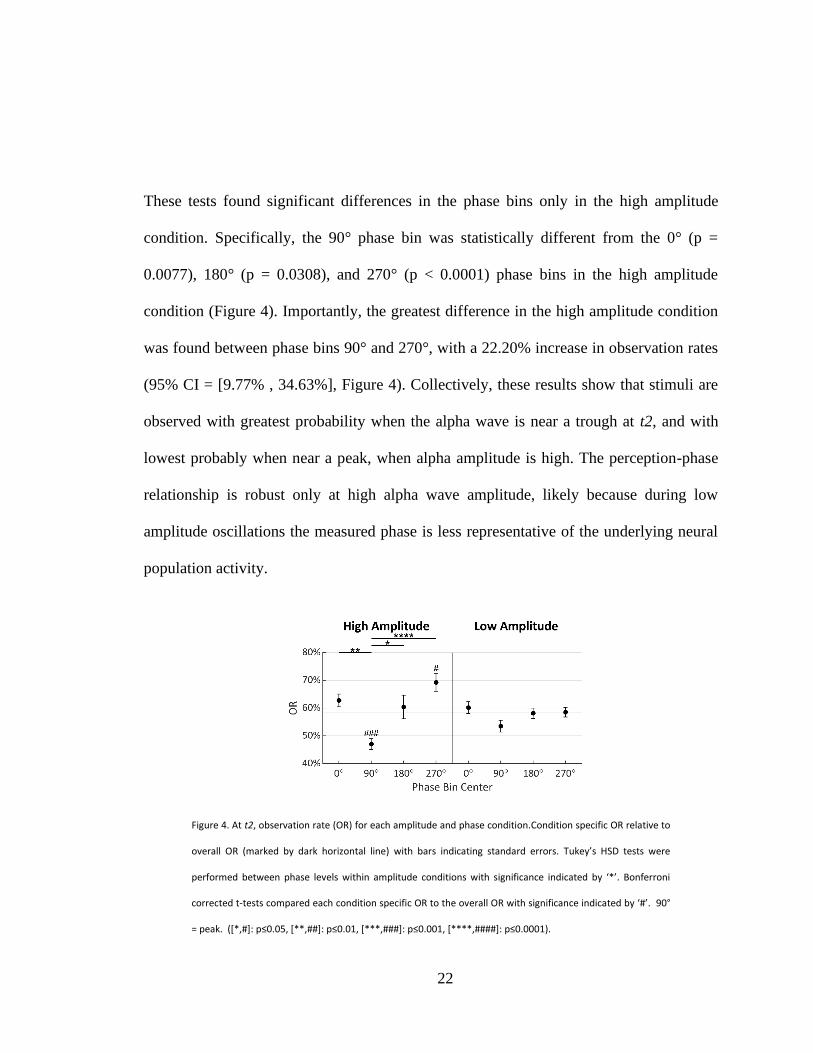
Multiple comparison tests were performed to investigate the precise nature of the
effects found to be significant in the ANOVA. Figure 4 shows the results of independent
t-tests (significance indicated by #) comparing the OR of each bin to the overall OR. Only
phase bins 90° and 270° in the high amplitude condition were found to be significantly
different [t(19) = -5.632, p = 0.0002; t(19) = 3.466, p = 0.0207 respectively, Bonferroni
corrected for eight comparisons (Bland and Altman, 1995)]. Tukey’s HSD tests (indicated
by *) then compared the OR distributions between phase bins within each amplitude level.
22
These tests found significant differences in the phase bins only in the high amplitude
condition. Specifically, the 90° phase bin was statistically different from the 0° (p =
0.0077), 180° (p = 0.0308), and 270° (p < 0.0001) phase bins in the high amplitude
condition (Figure 4). Importantly, the greatest difference in the high amplitude condition
was found between phase bins 90° and 270°, with a 22.20% increase in observation rates
(95% CI = [9.77% , 34.63%], Figure 4). Collectively, these results show that stimuli are
observed with greatest probability when the alpha wave is near a trough at t2, and with
lowest probably when near a peak, when alpha amplitude is high. The perception-phase
relationship is robust only at high alpha wave amplitude, likely because during low
amplitude oscillations the measured phase is less representative of the underlying neural
population activity.
Figure 4. At t2, observation rate (OR) for each amplitude and phase condition.Condition specific OR relative to
overall OR (marked by dark horizontal line) with bars indicating standard errors. Tukey’s HSD tests were
performed between phase levels within amplitude conditions with significance indicated by ‘*’. Bonferroni
corrected t-tests compared each condition specific OR to the overall OR with significance indicated by ‘#’. 90°
= peak. ([*,#]: p≤0.05, [**,##]: p≤0.01, [***,###]: p≤0.001, [****,####]: p≤0.0001).
23
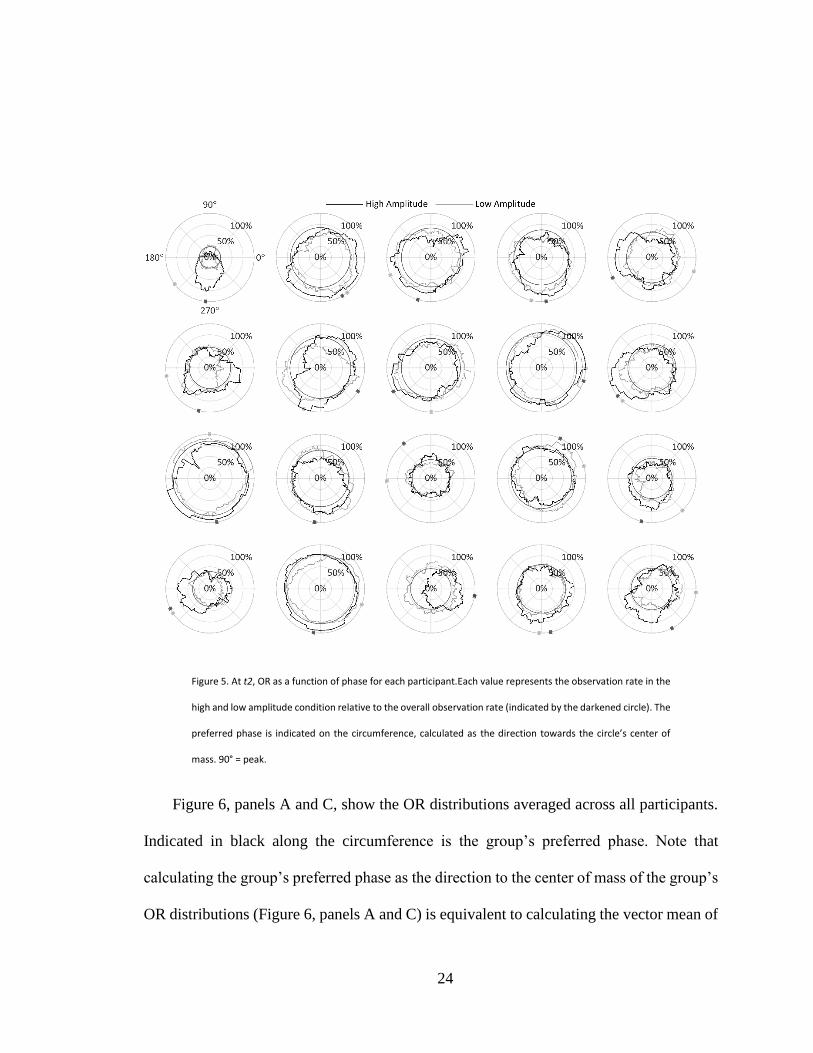
PHASE-VARYING ANALYSIS OF VISUAL OBSERVATION
For a better view of the phase effect, we repeated the original procedure at t2 using
90° phase bins rotated in 1° increments for all 360° phase angles, in order to obtain a
smooth ΔOR distribution. Figure 5 shows this OR for each of the twenty participants in
both the high and low amplitude conditions as a function of the centered alpha phase angle
of the bins. Indicated along the circumference is the direction of the center of mass of these
phase diagrams for each condition, calculated as the angle of the vector mean of each of
the 360 points forming the OR distribution. This angle is referred to here as the preferred
phase and indicates the phase at which stimuli have the highest probability of being
observed given the whole distribution. Note that in the high amplitude condition, the
preferred phase is between 180° and 360° (the negative portion of the alpha cycle) in
eighteen out of the twenty participants. These preferred phase angles have associated
magnitudes indicating how far the distribution’s center of mass is offset in that direction
and the strength of the effect of phase on observation rates. These preferred phase angles
and magnitudes for all participants are shown in Figure 6, panels B and D.
24
Figure 5. At t2, OR as a function of phase for each participant.Each value represents the observation rate in the
high and low amplitude condition relative to the overall observation rate (indicated by the darkened circle). The
preferred phase is indicated on the circumference, calculated as the direction towards the circle’s center of
mass. 90° = peak.
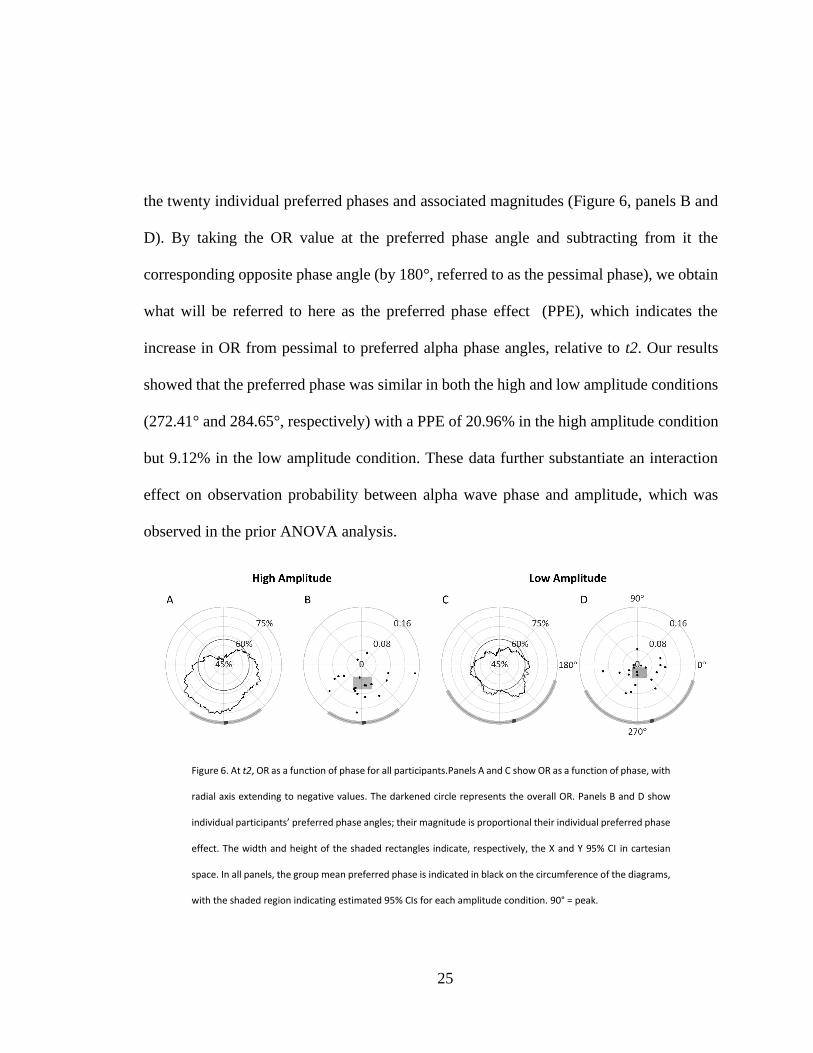
Figure 6, panels A and C, show the OR distributions averaged across all participants.
Indicated in black along the circumference is the group’s preferred phase. Note that
calculating the group’s preferred phase as the direction to the center of mass of the group’s
OR distributions (Figure 6, panels A and C) is equivalent to calculating the vector mean of
25
the twenty individual preferred phases and associated magnitudes (Figure 6, panels B and
D). By taking the OR value at the preferred phase angle and subtracting from it the
corresponding opposite phase angle (by 180°, referred to as the pessimal phase), we obtain
what will be referred to here as the preferred phase effect (PPE), which indicates the
increase in OR from pessimal to preferred alpha phase angles, relative to t2. Our results
showed that the preferred phase was similar in both the high and low amplitude conditions
(272.41° and 284.65°, respectively) with a PPE of 20.96% in the high amplitude condition
but 9.12% in the low amplitude condition. These data further substantiate an interaction
effect on observation probability between alpha wave phase and amplitude, which was
observed in the prior ANOVA analysis.
Figure 6. At t2, OR as a function of phase for all participants.Panels A and C show OR as a function of phase, with
radial axis extending to negative values. The darkened circle represents the overall OR. Panels B and D show
individual participants’ preferred phase angles; their magnitude is proportional their individual preferred phase
effect. The width and height of the shaded rectangles indicate, respectively, the X and Y 95% CI in cartesian
space. In all panels, the group mean preferred phase is indicated in black on the circumference of the diagrams,
with the shaded region indicating estimated 95% CIs for each amplitude condition. 90° = peak.

26
Additionally, 95% confidence intervals (CI) were estimated for the group’s preferred
phase and are indicated as the shaded regions along the circumference of the phase
diagrams. These CIs could only be estimated since there is not a known method of
computing an angular CI on non-unit vectors directly. To estimate these CIs, the twenty
individual preferred phase vectors (with associated magnitudes) were first converted to
cartesian values. Then, two 95% CIs were calculated separately on both the X and Y
components, indicated respectively as the width and height of the shaded rectangles in
Figure 6, panels B and D. The angular interval that encompassed both CIs was then used
to represent the estimated 95% CI on the preferred phase in the polar space, although this
interval will not necessarily be centered on the preferred phase (i.e., mean). In the high
amplitude condition, this resulted in an estimated 95% CI of [234.75°, 309.84°], and in the
low amplitude condition a much wider CI of [206.22°, 344.45°]. Together with Figure 6A
and B, these results show that observations rates are highest at the trough of the alpha wave,
and lowest at the peak. This effect is prominent in the high amplitude condition, but also
to a much lesser extent in the low amplitude condition recalling these effects did not reach
significance in the prior ANOVA.
MEASURING INDUCED ACTIVITY
Alpha band desynchronization and phase resetting are characteristically observed in
response to relevant visual stimuli (Klimesch et al., 2011). It is important to ensure that the
amplitude and phase measurements made here are the result of spontaneous brain activity
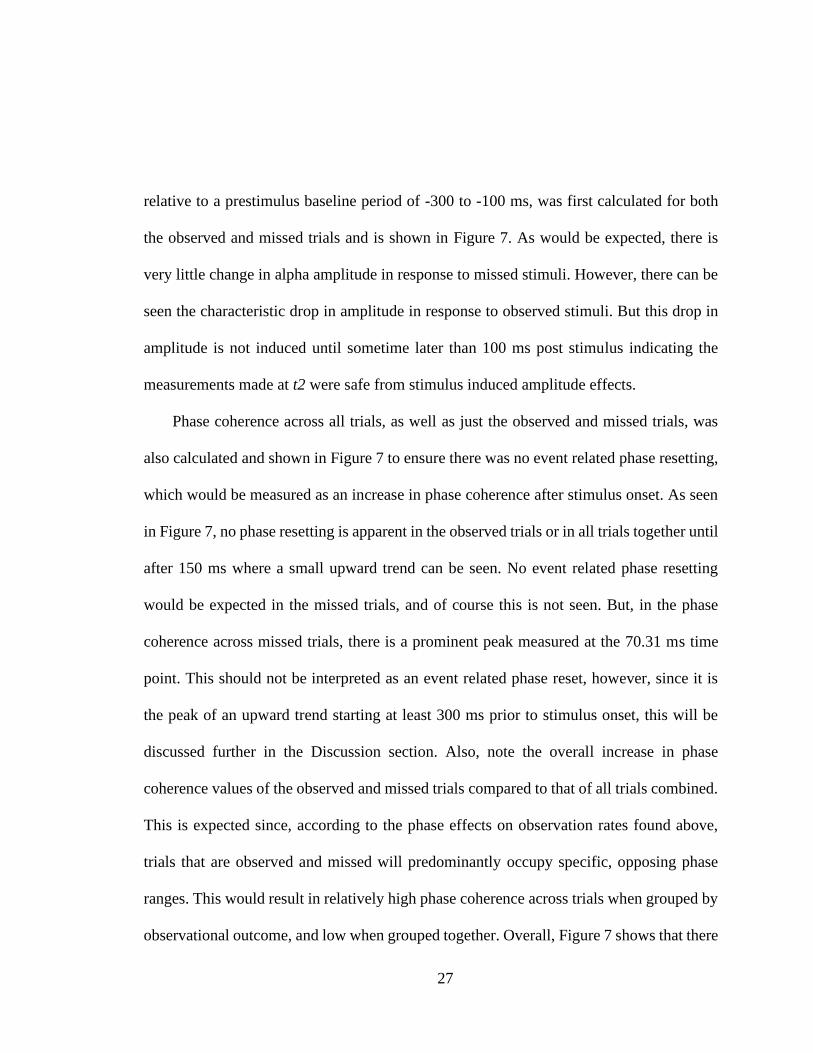
and not simply induced by the stimulus itself. The percent change in alpha amplitude,
27
relative to a prestimulus baseline period of -300 to -100 ms, was first calculated for both
the observed and missed trials and is shown in Figure 7. As would be expected, there is
very little change in alpha amplitude in response to missed stimuli. However, there can be
seen the characteristic drop in amplitude in response to observed stimuli. But this drop in
amplitude is not induced until sometime later than 100 ms post stimulus indicating the
measurements made at t2 were safe from stimulus induced amplitude effects.
Phase coherence across all trials, as well as just the observed and missed trials, was
also calculated and shown in Figure 7 to ensure there was no event related phase resetting,
which would be measured as an increase in phase coherence after stimulus onset. As seen
in Figure 7, no phase resetting is apparent in the observed trials or in all trials together until
after 150 ms where a small upward trend can be seen. No event related phase resetting
would be expected in the missed trials, and of course this is not seen. But, in the phase
coherence across missed trials, there is a prominent peak measured at the 70.31 ms time
point. This should not be interpreted as an event related phase reset, however, since it is
the peak of an upward trend starting at least 300 ms prior to stimulus onset, this will be
discussed further in the Discussion section. Also, note the overall increase in phase
coherence values of the observed and missed trials compared to that of all trials combined.
This is expected since, according to the phase effects on observation rates found above,
trials that are observed and missed will predominantly occupy specific, opposing phase
ranges. This would result in relatively high phase coherence across trials when grouped by
observational outcome, and low when grouped together. Overall, Figure 7 shows that there
28
is no event related amplitude change or phase reset prior to 100 ms post stimulus indicating
that the phase and amplitude measures taken for this study are not the result of stimulus
induced activity, but of ongoing spontaneous oscillations.
Figure 7. Measures of induced oscillatory activity.Change in alpha amplitude, relative to a -300 to -100 ms
baseline interval, and alpha phase coherence for observed and missed stimuli, and all stimuli together in the
phase coherence panel. These figures show no indication of stimulus induced oscillatory effects at the t2 time
point where phase and amplitude measures were made.
T2 MEASUREMENTS IMPROVE ON PRESTIMULUS MEASUREMENTS
To evaluate the benefit of the using the individual t2 time point at which to measure
the alpha phase effect on perceptual performance, the above analysis was repeated instead
at a time point 100 ms prior to stimulus onset. These types of measurements are more
frequently made in prestimulus periods or at stimulus onset in order to avoid measuring
induced oscillatory effects as mentioned above. Whereas in the previous analysis, the four
phase bins centered at 0°, 90°, 180°, and 270° were chosen a priori based on their
theoretical significance at the t2 time point, no prediction could be made about the relevant
phase bins at this prestimulus time point. Instead, the analysis was first performed in 90°
phase bins in 1° increments, as was performed previously (i.e. Figure 6), and the four

29
relevant phase bins were chosen empirically based on the preferred phase in the high
amplitude condition.
The results of this analysis performed over 360 90° bins in both the high and low
amplitude conditions are shown in Figure 8. In the high amplitude condition, a phase effect
on perceptual performance can again be observed, however in this case the preferred phase
was measured at 33.53° (95% CI = [-354.87°, 40.33°]) with a 15.48% PPE. In the low
amplitude condition, the preferred phase was measured at 342.78° (95% CI = [326.04°,
19.99°]) with a 5.22% PPE.
Figure 8. At t = -100ms, OR as a function of phase for all participants.Panels A and C show OR as a function of
phase, with radial axis extending to negative values, the darkened circle represents the overall OR. Panels B and
D show individual participants’ preferred phase angles. The width and height of the shaded rectangles indicate,
respectively, the X and Y 95% CI in cartesian space. In all panels, the group mean preferred phase is indicated in
black on the circumference of the diagrams, with the shaded region indicating estimated 95% CIs for each
amplitude condition. 90° = peak.
Based on the preferred phase measured in the high amplitude condition, the four 90°
phase bins centered at 33°, 123°, 213°, and 303° were chosen for the 2x4 repeated measures
ANOVA analysis. Mauchly tests indicated no significant violation in the assumption of
30
sphericity for phase (χ2(5) = 5.194, p = 0.3926), or the interaction of phase and amplitude
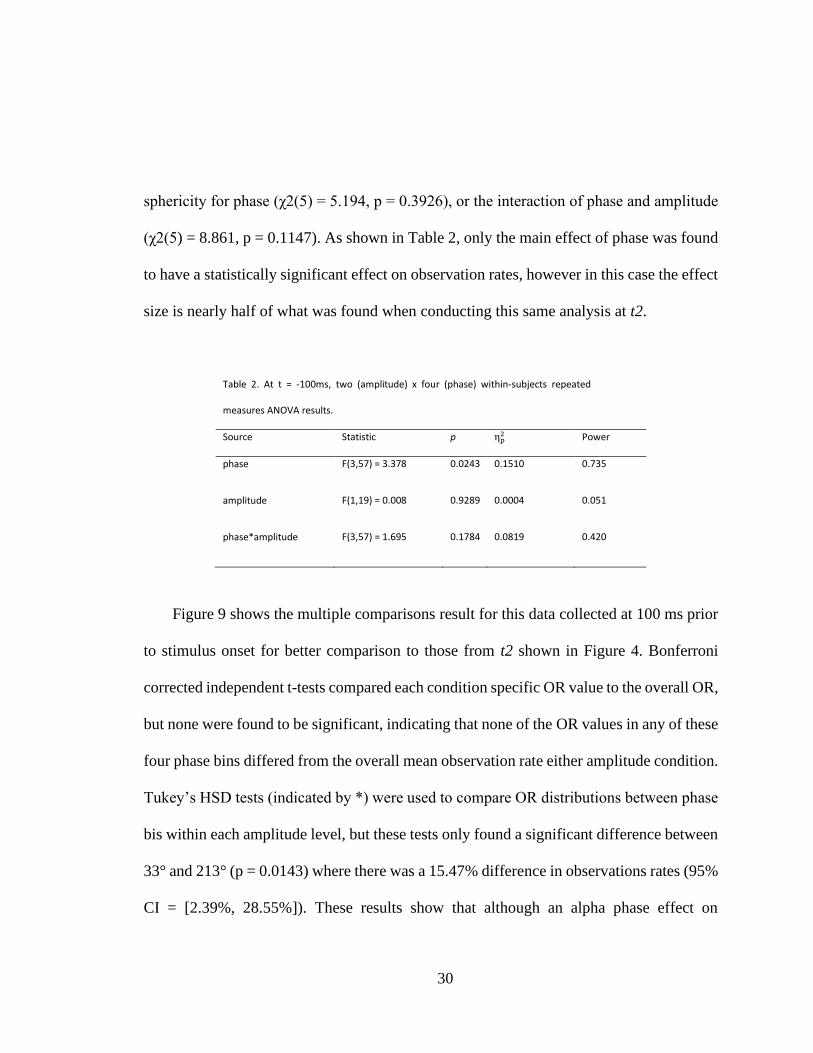
(χ2(5) = 8.861, p = 0.1147). As shown in Table 2, only the main effect of phase was found
to have a statistically significant effect on observation rates, however in this case the effect
size is nearly half of what was found when conducting this same analysis at t2.
Table 2. At t = -100ms, two (amplitude) x four (phase) within-subjects repeated
measures ANOVA results.
Source Statistic p ηp2 Power
phase F(3,57) = 3.378 0.0243 0.1510 0.735
amplitude F(1,19) = 0.008 0.9289 0.0004 0.051
phase*amplitude F(3,57) = 1.695 0.1784 0.0819 0.420
Figure 9 shows the multiple comparisons result for this data collected at 100 ms prior
to stimulus onset for better comparison to those from t2 shown in Figure 4. Bonferroni
corrected independent t-tests compared each condition specific OR value to the overall OR,
but none were found to be significant, indicating that none of the OR values in any of these
four phase bins differed from the overall mean observation rate either amplitude condition.
Tukey’s HSD tests (indicated by *) were used to compare OR distributions between phase
bis within each amplitude level, but these tests only found a significant difference between
33° and 213° (p = 0.0143) where there was a 15.47% difference in observations rates (95%
CI = [2.39%, 28.55%]). These results show that although an alpha phase effect on
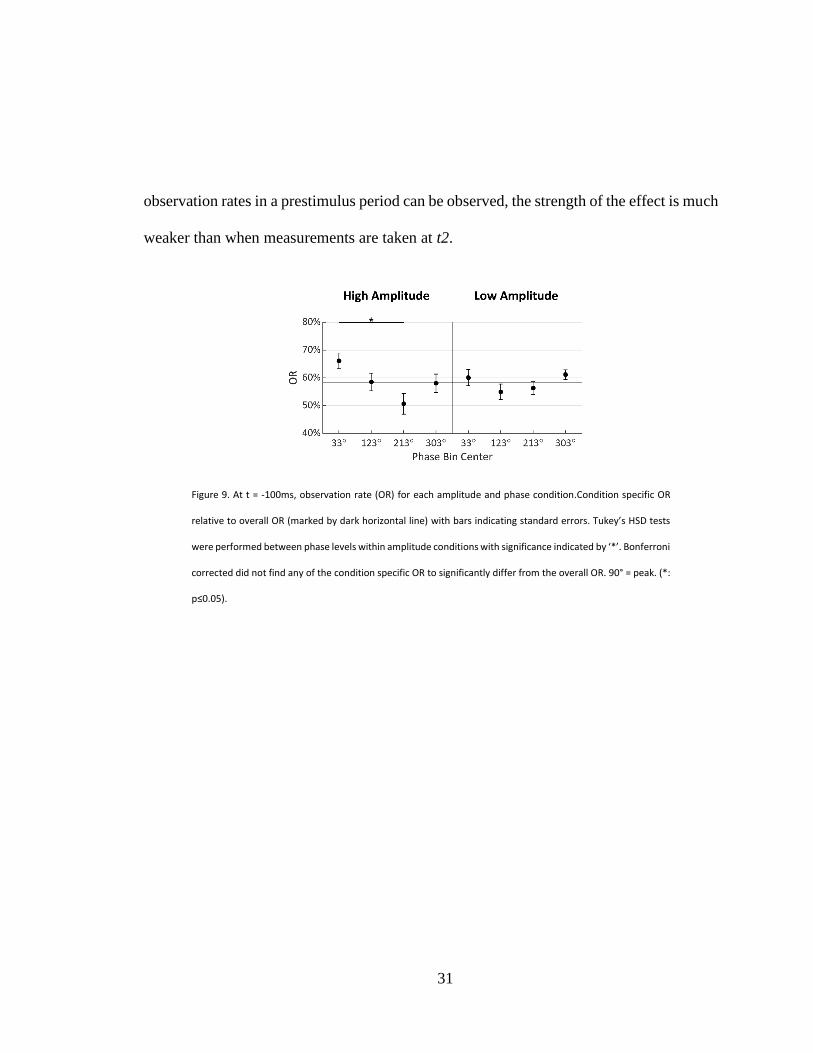
31
observation rates in a prestimulus period can be observed, the strength of the effect is much
weaker than when measurements are taken at t2.
Figure 9. At t = -100ms, observation rate (OR) for each amplitude and phase condition.Condition specific OR
relative to overall OR (marked by dark horizontal line) with bars indicating standard errors. Tukey’s HSD tests
were performed between phase levels within amplitude conditions with significance indicated by ‘*’. Bonferroni
corrected did not find any of the condition specific OR to significantly differ from the overall OR. 90° = peak. (*:
p≤0.05).
32
IV. DISCUSSION
This study presents a novel, controlled method for examining the neuronic shutter
effect, hypothesized to be reflected in the posterior alpha oscillations observed in human
EEG. Our hypothesis was that perceptual performance fluctuates with the alpha rhythm in
a precise phase and timing relationship. To test this relationship, we (1) presented near-
threshold intensity visual stimuli through closed eyes to participants; (2) accounted for
individual retina-to-V1 conduction delays (t2); (3) controlled for asynchrony between
hemispheres; and (4) measured the alpha phase and amplitude relative to t2. Our results
confirm a robust relationship between the alpha rhythm phase and perception, with the
greatest rates of observation occurring at the alpha wave trough (excitatory state) and the
lowest rates at the alpha wave peak (inhibitory state). The perception-phase relationship
appears to be modulated by alpha amplitude as it is observed at high, but not low, alpha
wave amplitude. This work is novel in considering the underlying neural structure and
function of the visual system when predicting the exact phase relationship to perception,
and in controlling for individual neural conduction delay and asynchrony between
hemispheres.
While the alpha wave shutter effect has been previously examined (Dustman and
Beck, 1965; Mathewson et al., 2009; Mathewson et al., 2012; Milton and Pleydell-Pearce,
2016; Kizuk and Mathewson, 2017), this is the first study, to our knowledge, to directly
examine the relationship between perceptual performance and spontaneous alpha phase as
measured relative to each individual’s conduction delay. Previous studies have either
33
measured alpha phase at stimulus onset, t0, or during prestimulus periods (Mathewson et
al., 2009; Mathewson et al., 2012; Milton and Pleydell-Pearce, 2016; Kizuk and
Mathewson, 2017). Accordingly, the phase measurements were not always well aligned
with the LGN excitability state according to the proposed cellular mechanism. Here, when
we accounted for each individual’s conduction delay, as opposed to the group average
conduction delay or measuring at stimulus onset t0, we demonstrated a robust relationship
between the alpha phase and perception. Notably, these results provide the most robust
evidence consistent with cyclic LGN excitability as the cellular mechanism mediating this
effect – though we do not directly examine this mechanism. One study (Dustman and Beck,
1965) measured reactions times, as opposed to observation rates, at alpha phase adjusted
to group average, as opposed to individual conduction delay. This study, similar to ours,
found slowest reaction times at the peak (90°) of the alpha wave, and fastest reaction times
close to the alpha trough (240°).
A 2x4 repeated measures ANOVA found that alpha phase at t2 had a significant effect
on perceptual performance as hypothesized. The interaction effect of phase and amplitude
was also found to be significant; the multiple comparisons tests in Figure 4 show that low
amplitude attenuates the phase effect. This supports the hypothesis that low amplitude
alpha waves reflect asynchronous inhibition within the visual system. Although not part of
our original hypothesis, it is somewhat surprising that no main effect of amplitude was
found since alpha power has sometimes been found to predict perceptual performance
(Ergenoglu et al., 2004; Mathewson et al., 2009; Bruers and VanRullen, 2018). Figure 6
34
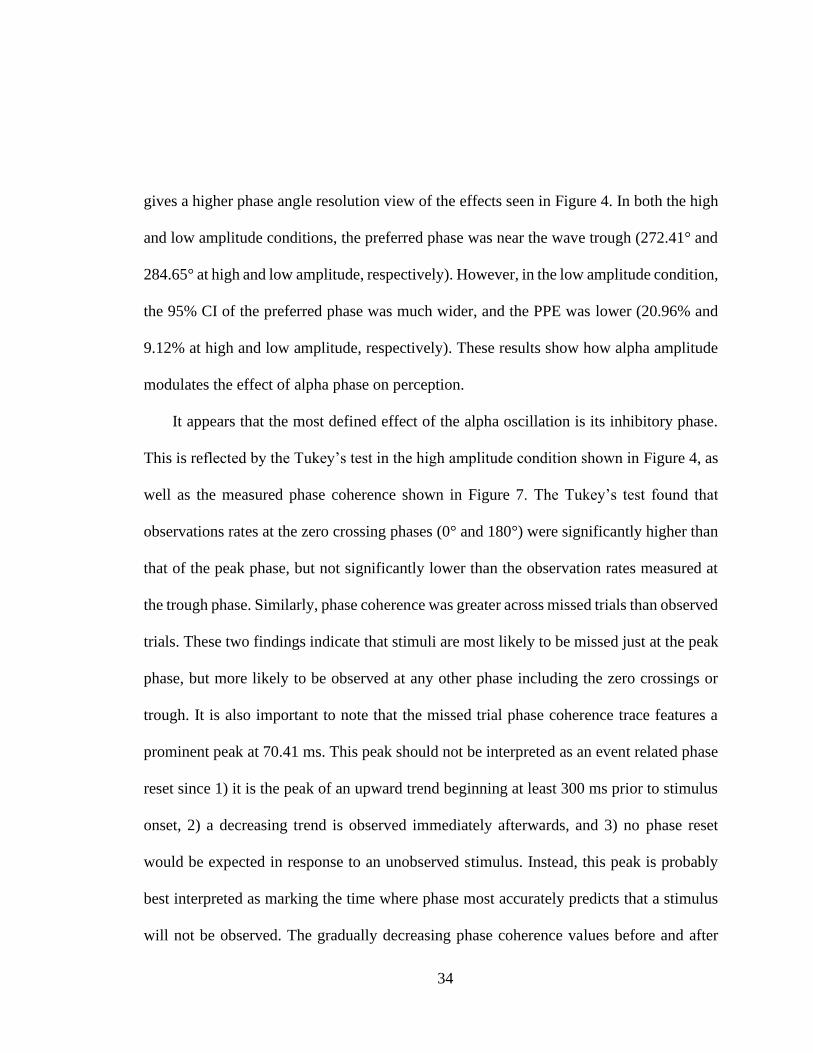
gives a higher phase angle resolution view of the effects seen in Figure 4. In both the high
and low amplitude conditions, the preferred phase was near the wave trough (272.41° and
284.65° at high and low amplitude, respectively). However, in the low amplitude condition,
the 95% CI of the preferred phase was much wider, and the PPE was lower (20.96% and
9.12% at high and low amplitude, respectively). These results show how alpha amplitude
modulates the effect of alpha phase on perception.
It appears that the most defined effect of the alpha oscillation is its inhibitory phase.
This is reflected by the Tukey’s test in the high amplitude condition shown in Figure 4, as
well as the measured phase coherence shown in Figure 7. The Tukey’s test found that
observations rates at the zero crossing phases (0° and 180°) were significantly higher than
that of the peak phase, but not significantly lower than the observation rates measured at
the trough phase. Similarly, phase coherence was greater across missed trials than observed
trials. These two findings indicate that stimuli are most likely to be missed just at the peak
phase, but more likely to be observed at any other phase including the zero crossings or
trough. It is also important to note that the missed trial phase coherence trace features a
prominent peak at 70.41 ms. This peak should not be interpreted as an event related phase
reset since 1) it is the peak of an upward trend beginning at least 300 ms prior to stimulus
onset, 2) a decreasing trend is observed immediately afterwards, and 3) no phase reset
would be expected in response to an unobserved stimulus. Instead, this peak is probably
best interpreted as marking the time where phase most accurately predicts that a stimulus
will not be observed. The gradually decreasing phase coherence values before and after
35
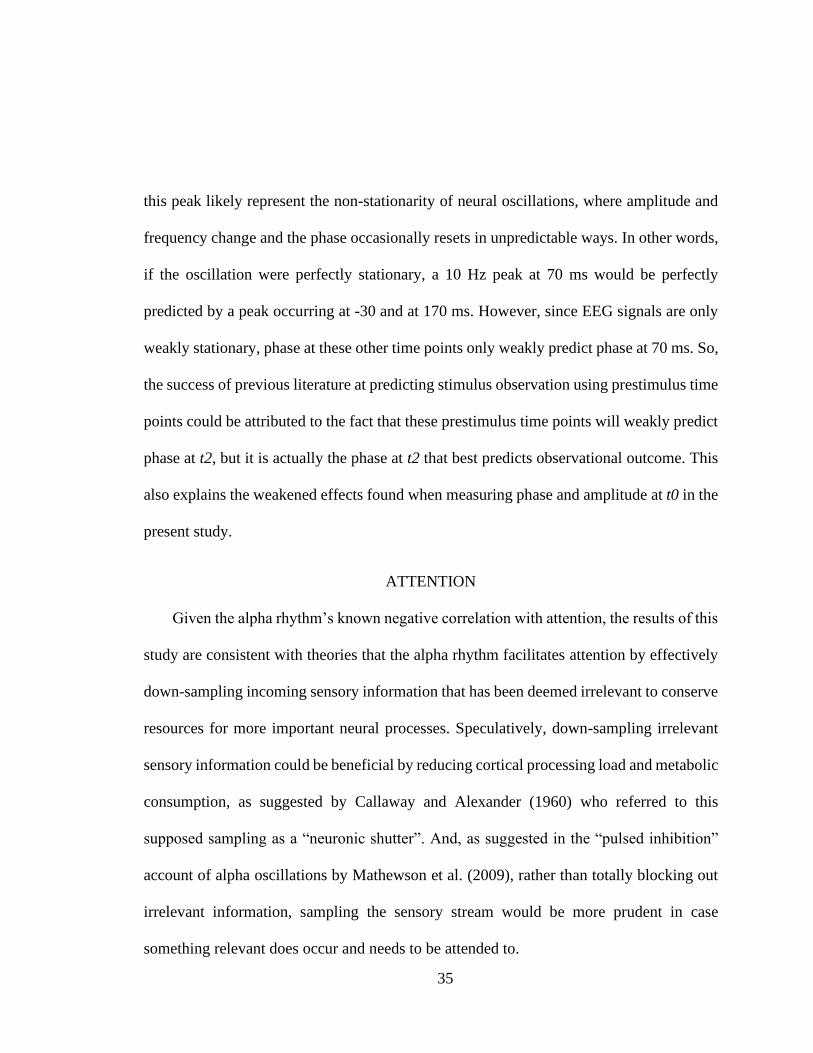
this peak likely represent the non-stationarity of neural oscillations, where amplitude and
frequency change and the phase occasionally resets in unpredictable ways. In other words,
if the oscillation were perfectly stationary, a 10 Hz peak at 70 ms would be perfectly
predicted by a peak occurring at -30 and at 170 ms. However, since EEG signals are only
weakly stationary, phase at these other time points only weakly predict phase at 70 ms. So,
the success of previous literature at predicting stimulus observation using prestimulus time
points could be attributed to the fact that these prestimulus time points will weakly predict
phase at t2, but it is actually the phase at t2 that best predicts observational outcome. This
also explains the weakened effects found when measuring phase and amplitude at t0 in the
present study.
ATTENTION
Given the alpha rhythm’s known negative correlation with attention, the results of this
study are consistent with theories that the alpha rhythm facilitates attention by effectively
down-sampling incoming sensory information that has been deemed irrelevant to conserve
resources for more important neural processes. Speculatively, down-sampling irrelevant
sensory information could be beneficial by reducing cortical processing load and metabolic
consumption, as suggested by Callaway and Alexander (1960) who referred to this
supposed sampling as a “neuronic shutter”. And, as suggested in the “pulsed inhibition”
account of alpha oscillations by Mathewson et al. (2009), rather than totally blocking out
irrelevant information, sampling the sensory stream would be more prudent in case
something relevant does occur and needs to be attended to.
36
It has been shown using simultaneous EEG, fMRI, and PET imaging techniques that
increased alpha power over a sensory cortex is correlated with reduced metabolic
consumption in that cortex (Moosmann et al., 2003). Moosmann et al. (2003) speculated
that this reduced energy consumption could be due simply to the reduced informational
input (as a result of sampling) or to the increased cellular efficiency of synchronized
membrane oscillations in processing and synaptic transmission. This point of cellular
efficiency is complemented by Klimesch et al. (2007) who suggested that, in contrast to
the “cortical-idling” hypothesis, alpha oscillations represent an active top-down inhibition
process that defines strict time-windows during which processing can occur. In his
“inhibition-timing” hypothesis, he proposes that this strict timing of informational transfer
not only allows very for selective information processing, but also increases the efficiency
of the informational transfer.
These above mentioned hypotheses of the alpha rhythm function, the “neuronic
shutter”, the “pulsed inhibition”, and the “inhibition-timing” hypothesis all appear to be
complementary, although perhaps stressing different aspects. The visual sampling effect
found here is presented as support of each of these hypotheses and puts a finer point on the
timing of the effect in a way that is suggestive of the underlying neural mechanism as will
be discussed in the next section.
The prominence of the posterior alpha rhythm when eyes are closed may be due to an
automatic implicit assumption that no relevant information could come in during this state,
37
and this automatic assumption may be difficult to override even when a task demands it
such as did the one performed in the present study. Presumably, the findings of the present
study would also extend to eyes open conditions, however, the prominence of the alpha
rhythm in closed eye conditions made presenting images during times of high amplitude
spontaneous oscillations most efficient. Future studies should conduct a similar analysis in
both eyes open and closed conditions to see if the same effect persists.
NEURAL MECHANISM
Understanding the biological mechanism underlying alpha oscillation is important for
explaining its function. Although simultaneous recordings with fMRI and PET correlated
alpha activity with fluctuations in the thalamus, thus suggesting this might be the origin of
alpha rhythm (Hughes et al., 2004; Omata et al., 2013), so far the precise mechanism in
humans is not yet agreed on. However, sleep spindles, a ~10 Hz alpha-like oscillation that
occurs in 1-3 second bursts during transition to sleep, do have a well-established
mechanism. The sleep spindle mechanism includes a negative feedback loop between the
LGN and the reticular nucleus (RN, shown in Figure 10). Both nuclei have T-type Ca+
channels that, when activated, exhibit burst firing. Between each burst of the LGN, the Ca+
channels of the LGN are known to enter a refractory period, and the RN sends a similar,
but inhibitory, burst to the LGN. During this time, sensory information from the optic nerve
would be less likely to be relayed to V1. Importantly, the refractory periods of these T-type
Ca+ channels are known to result in each nucleus firing at a ~10 Hz rate (Lopes da Silva,
1991; Sherman, 2001; Timofeev and Bazhenov, 2005; Alexander et al., 2006; Timofeev
38
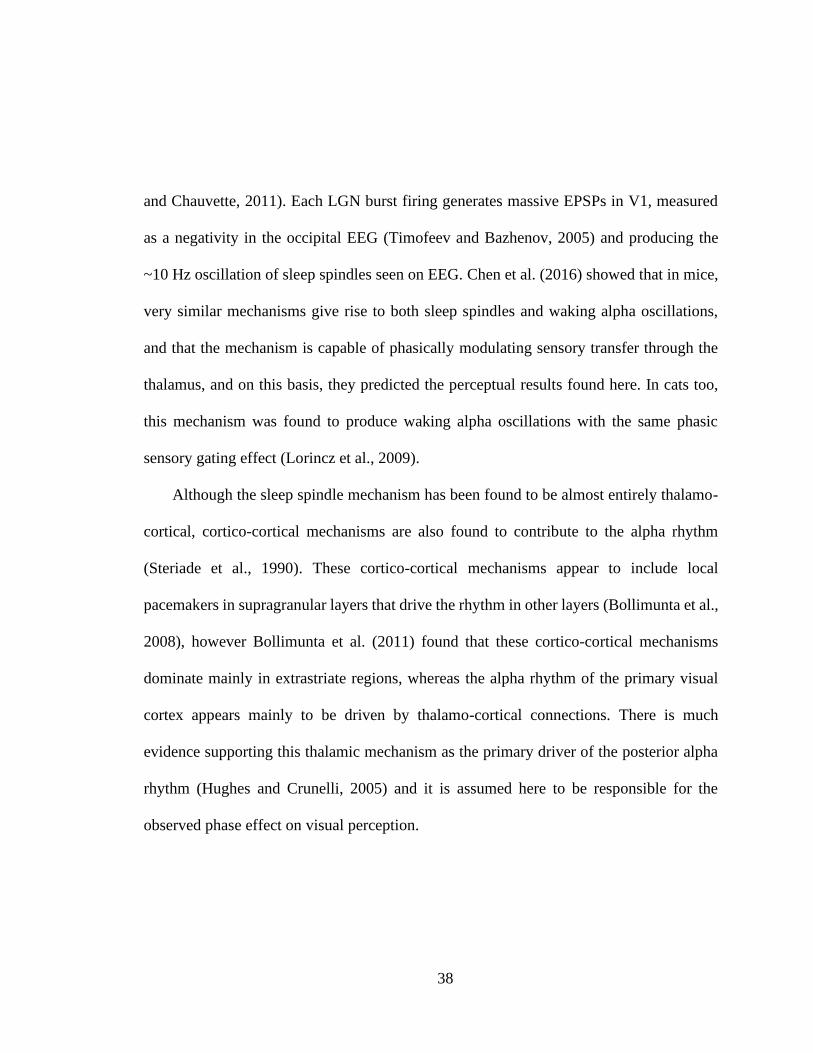
and Chauvette, 2011). Each LGN burst firing generates massive EPSPs in V1, measured
as a negativity in the occipital EEG (Timofeev and Bazhenov, 2005) and producing the
~10 Hz oscillation of sleep spindles seen on EEG. Chen et al. (2016) showed that in mice,
very similar mechanisms give rise to both sleep spindles and waking alpha oscillations,
and that the mechanism is capable of phasically modulating sensory transfer through the
thalamus, and on this basis, they predicted the perceptual results found here. In cats too,
this mechanism was found to produce waking alpha oscillations with the same phasic
sensory gating effect (Lorincz et al., 2009).
Although the sleep spindle mechanism has been found to be almost entirely thalamo-
cortical, cortico-cortical mechanisms are also found to contribute to the alpha rhythm
(Steriade et al., 1990). These cortico-cortical mechanisms appear to include local
pacemakers in supragranular layers that drive the rhythm in other layers (Bollimunta et al.,
2008), however Bollimunta et al. (2011) found that these cortico-cortical mechanisms
dominate mainly in extrastriate regions, whereas the alpha rhythm of the primary visual
cortex appears mainly to be driven by thalamo-cortical connections. There is much
evidence supporting this thalamic mechanism as the primary driver of the posterior alpha
rhythm (Hughes and Crunelli, 2005) and it is assumed here to be responsible for the
observed phase effect on visual perception.
39
Figure 10. Visual pathway from retinal to V1.The LGN/RN negative feedback loop provides a mechanism of
cycling LGN excitability state. This LGN/RN network is known to give rise to sleep spindles. The same, or a similar,
mechanism is expected to give rise the posterior alpha rhythm.
CELLULAR SHUTTER EFFECT GENERATES A BEHAVIORAL GRADED
GATING EFFECT
If the neural mechanism posited above were correct, the neuronic shutter effect would
best be described as occurring at the level of individual LGN relay cells, in which the effect
may occur at a nearly binary level. However, the behavioral effects we observe are graded,
with increasing and decreasing probabilities of stimulus observation. This may be
explained given that oscillating excitatory states are not always synchronized across all
LGN cells. It is not necessarily the case that all cells are simultaneously in burst-mode
firing state; some may concurrently operate in the normal tonic firing state. Thus, one cell
may be in a state of inhibition and not relay to V1, while others may relay visual
information as usual. However, in asynchronous states, the alpha rhythm should be
decreased in amplitude. As shown in this study, at higher alpha amplitudes, the differences
in observation rates between peak and trough phases at t2 increased, presumably indicating
that the measured phase becomes more representative of the excitatory state of larger

40
populations of LGN cells with increasing alpha amplitude. Asynchrony is also important
to consider, not just among cells within an LGN, but between the LGNs of the left and right
hemispheres. As on a cellular level, one LGN may restrict the flow of visual information
while the other relays it. Presumably, if all cells within and between LGNs were in perfect
synchrony, behavior relative to peak/trough phase at t2 would reflect a perfect on/off visual
shutter. This simple relationship wasn’t observed in this study, and it is therefore more
appropriate to describe the proposed neuronic shutter effect at the cellular level generating
a graded, gating effect of perception at the behavioral level.
In sum, to our knowledge, this is the first study to examine the neuronic shutter effect
with an exact phase and timing relationship to perceptual performance predicted by the
underlying physiology of the visual system. The study design is novel and rigorous in
controlling for individual visual conduction delays and hemispheric asynchrony. During
times of high amplitude alpha oscillations, we found participants on average are most likely
to perceive stimuli at waveform trough (272.41°) with observation rates 20.96% greater
than at the opposing peak phase (92.41°). Given the rigor in our phase measurements, these
results provide strong support for a mechanism that modulates perception described by the
neuronic shutter effect and is reflected in the posterior alpha rhythm. Further studies with
conduction delay-adjusted phase measurement are needed to investigate this shutter effect
in the mu and tau rhythms over the sensorimotor and auditory cortices, to explore the
possibility of this mechanism in other sensory systems.
41
ALPHA WAVE OSCILLATIONS IN NEUROLOGICAL CONDITIONS
Reductions in the alpha rhythm amplitude have been observed in, and used as a
biomarker for, various pathological conditions, such as seizure disorders (Aich, 2014) and
Alzheimer’s disease (Prinz and Vitiello, 1989; Montez et al., 2009; Blinowska et al., 2017;
Sharma and Nadkarni, 2020). Our novel technique of accounting for each individual’s
conduction delay could assist future investigations into more accurately identifying and
measuring alpha rhythm changes observed in these pathological disorders. Given the
variable severity of these disorders in patients, the ability to account for the biological
differences among individuals is essential for successful early detection and diagnosis of
these disorders using alpha rhythm changes.

42
REFERENCES
Aich TK (2014) Absent posterior alpha rhythm: An indirect indicator of seizure disorder?
Indian J Psychiatry 56:61-66.
Alexander GM, Carden WB, Mu J, Kurukulasuriya NC, McCool BA, Nordskog BK,
Friedman DP, Daunais JB, Grant KA, Godwin DW (2006) The Native T-Type
Calcium Current in Relay Neurons of The. Neuroscience 141:453-461.
American Electroencephalographic Society (1994) Guideline thirteen: guidelines for
standard electrode position nomenclature. American Electroencephalographic
Society. J Clin Neurophysiol 11:111-113.
Ancoli S, Green KF (1977) Authoritarianism, Introspection, and Alpha Wave
Biofeedback Training. Psychophysiology 14:40-44.
Babiloni C, Del Percio C, Arendt-Nielsen L, Soricelli A, Romani GL, Rossini PM,
Capotosto P (2014) Review: Cortical EEG alpha rhythms reflect task-specific
somatosensory and motor interactions in humans. In: Clinical Neurophysiology,
pp 1936-1945: Elsevier Ireland Ltd.
Barry RJ, Clarke AR, Johnstone SJ, Magee CA, Rushby JA (2007) EEG differences
between eyes-closed and eyes-open resting conditions. Clinical Neurophysiology
118:2765-2773.
Bastiaansen MC, Brunia CH (2001) Anticipatory attention: an event-related
desynchronization approach. Int J Psychophysiol 43:91-107.
43
Bazanova OM, Aftanas LI (2008) Individual measures of electroencephalogram alpha
activity and non-verbal creativity. Neurosci Behav Physiol 38:227-235.
Bazanova OM, Vernon D (2014) Review: Interpreting EEG alpha activity. Neuroscience
and Biobehavioral Reviews 44:94-110.
Ben‐Simon E, Podlipsky I, Okon‐Singer H, Gruberger M, Cvetkovic D, Intrator N,
Hendler T (2013) The Dark Side of the Alpha Rhythm: fMRI Evidence for
Induced Alpha Modulation During Complete Darkness. European Journal of
Neuroscience 37:795-803.
Berens P (2009) CircStat: A MATLAB Toolbox for Circular Statistics. Journal of
Statistical Software 31:21.
Bierings RAJM, Kuiper M, Van Berkel CM, Overkempe T, Jansonius NM (2018) Foveal
Light and Dark Adaptation in Patients With Glaucoma and Healthy Subjects: A
Case-Control Study. PLoS ONE 13.
Bland JM, Altman DG (1995) Multiple Significance Tests: The Bonferroni Method.
BMJ: British Medical Journal 310:170-170.
Blinowska KJ, Rakowski F, Kaminski M, De Vico Fallani F, Del Percio C, Lizio R,
Babiloni C (2017) Functional and effective brain connectivity for discrimination
between Alzheimer's patients and healthy individuals: A study on resting state
EEG rhythms. Clin Neurophysiol 128:667-680.
Bollimunta A, Chen Y, Schroeder CE, Ding M (2008) Neuronal mechanisms of cortical
alpha oscillations in awake-behaving macaques. J Neurosci 28:9976-9988.
44
Bollimunta A, Mo J, Schroeder CE, Ding M (2011) Neuronal mechanisms and attentional
modulation of corticothalamic alpha oscillations. J Neurosci 31:4935-4943.
Brainard DH (1997) The Psychophysics Toolbox. Spatial Vision 10:433-436.
Bruers S, VanRullen R (2018) Alpha Power Modulates Perception Independently of
Endogenous Factors. Frontiers in Neuroscience 12:279.
Callaway E, Alexander JD (1960) The Temporal Coding of Sensory Data: An
Investigation of Two Theories. Journal of General Psychology 62:293-309.
Chen Z, Wimmer RD, Wilson MA, Halassa MM (2016) Thalamic Circuit Mechanisms
Link Sensory Processing in Sleep and Attention. In, pp 83-83.
Clark VP, Fan S, Hillyard SA (1995) Identification of Early Visual Evoked Potential
Generators by Retinotopic and Topographic Analyses. Human Brain Mapping
2:170-187.
Cohen MX (2014) Analyzing Neural Time Series Data: Theory and Practice: MIT Press.
Cohen MX (2019) A Better Way to Define and Describe Morlet Wavelets for Time-
Frequency Analysis. NeuroImage 199:81-86.
Compston A (2010) The Berger rhythm: potential changes from the occipital lobes in
man. Brain 133:3-6.
Cooper NR, Croft RJ, Dominey SJJ, Burgess AP, Gruzelier JH (2003) Paradox Lost?
Exploring the Role of Alpha Oscillations During Externally vs Internally Directed
Attention and the Implications for Idling and Inhibition Hypotheses. International
Journal of Psychophysiology 47:65-74.
45
Cornsweet TN (1962) The Staircase Method in Psychophysics. The American Journal of
Psychology 75:485-491.
Delorme A, Makeig S (2004) EEGLAB: an Open Source Toolbox for Analysis of Single-
Trial EEG Dynamics Including Independent Component Analysis. Journal of
Neuroscience Methods 134:9-21.
Di Russo F, Martínez A, Sereno MI, Pitzalis S, Hillyard SA (2001) Cortical Sources of
the Early Components of the Visual Evoked Potential. Human Brain Mapping
15:95-111.
Dustman RE, Beck EC (1965) Phase of Alpha Brain Waves, Reaction Time and Visually
Evoked Potentials. Electroencephalogr Clin Neurophysiol 18:433-440.
Ergenoglu T, Demiralp T, Bayraktaroglu Z, Ergen M, Beydagi H, Uresin Y (2004) Alpha
rhythm of the EEG modulates visual detection performance in humans. Cognitive
Brain Research 20:376-383.
Garcia-Rill E, D'Onofrio S, Luster B, Mahaffey S, Urbano FJ, Phillips C (2016) The 10
Hz Frequency: A Fulcrum For Transitional Brain States. Transl Brain Rhythm
1:7-13.
Gonçalves SI, de Munck JC, Pouwels PJW, Schoonhoven R, Kuijer JPA, Maurits NM,
Hoogduin JM, Van Someren EJW, Heethaar RM, Lopes da Silva FH (2006)
Correlating the alpha rhythm to BOLD using simultaneous EEG/fMRI: Inter-
subject variability. Neuroimage 30:203-213.
46
Hartmann T, Schlee W, Weisz N (2012) It's only in your head: expectancy of aversive
auditory stimulation modulates stimulus-induced auditory cortical alpha
desynchronization. Neuroimage 60:170-178.
Hughes SW, Crunelli V (2005) Thalamic mechanisms of EEG alpha rhythms and their
pathological implications. In, pp 357-372.
Hughes SW, Lorincz M, Cope DW, Blethyn KL, Kekesi KA, Parri HR, Juhasz G,
Crunelli V (2004) Synchronized Oscillations at Alpha and Theta Frequencies in
the Lateral Geniculate Nucleus. In, pp 253-268: Neuron.
Janssens C, De Loof E, Nico Boehler C, Pourtois G, Verguts T (2018) Occipital Alpha
Power Reveals Fast Attentional Inhibition of Incongruent Distractors.
Psychophysiology 55:1-11.
Kizuk SA, Mathewson KE (2017) Power and Phase of Alpha Oscillations Reveal an
Interaction between Spatial and Temporal Visual Attention. J Cogn Neurosci
29:480-494.
Kleiner M, Brainard D, Pelli D, Ingling A, Murray R, Broussard C (2007) What's New in
Psychtoolbox-3. In, pp 1-16.
Klimesch W, Sauseng P, Hanslmayr S (2007) EEG alpha oscillations: the inhibition-
timing hypothesis. Brain Res Rev 53:63-88.
Klimesch W, Fellinger R, Freunberger R (2011) Alpha oscillations and early stages of
visual encoding. Front Psychol 2:118.
47
Knyazev GG, Levin EA, Savostyanov AN (2008) Impulsivity, anxiety, and individual
differences in evoked and induced brain oscillations. Int J Psychophysiol 68:242-
254.
Legewie H, Simonova O, Creutzfeldt OD (1969) EEG changes during performance of
various tasks under open- and closed-eyed conditions. Electroencephalography &
Clinical Neurophysiology 27:470-479.
Limbach K, Corballis PM (2017) Alpha-power modulation reflects the balancing of task
requirements in a selective attention task. Psychophysiology 54:224-234.
Lindsley DB (1952) Psychological phenomena and the electroencephalogram.
Electroencephalography & Clinical Neurophysiology 4:443-456.
Lopes da Silva F (1991) Neural Mechanisms Underlying Brain Waves: From Neural
Membranes. Electroencephalography and Clinical Neurophysiology 79:81-93.
Lopez-Calderon J, Luck SJ (2014) ERPLAB: An Open-Source Toolbox for the Analysis
of Event-Related Potentials. Frontiers in Human Neuroscience 8.
Lorincz ML, Kekesi KA, Juhasz G, Crunelli V, Hughes SW (2009) Temporal framing of
thalamic relay-mode firing by phasic inhibition during the alpha rhythm. Neuron
63:683-696.
Mathewson KE, Gratton G, Fabiani M, Beck DM, Ro T (2009) To See or Not to See:
Prestimulus Alpha Phase Predicts Visual Awareness. Journal Of Neuroscience
29:2725-2732.
48
Mathewson KE, Prudhomme C, Fabiani M, Beck DM, Lleras A, Gratton G (2012)
Making Waves in the Stream of Consciousness: Entraining Oscillations in EEG
Alpha and Fluctuations in Visual Awareness With Rhythmic Visual Stimulation.
Journal Of Cognitive Neuroscience 24:2321-2333.
Milton A, Pleydell-Pearce CW (2016) The phase of pre-stimulus alpha oscillations
influences the visual perception of stimulus timing. Neuroimage 133:53-61.
Montez T, Poil SS, Jones BF, Manshanden I, Verbunt JP, van Dijk BW, Brussaard AB,
van Ooyen A, Stam CJ, Scheltens P, Linkenkaer-Hansen K (2009) Altered
temporal correlations in parietal alpha and prefrontal theta oscillations in early-
stage Alzheimer disease. Proc Natl Acad Sci U S A 106:1614-1619.
Moosmann M, Ritter P, Krastel I, Brink A, Thees S, Blankenburg F, Taskin B, Obrig H,
Villringer A (2003) Correlates of alpha rhythm in functional magnetic resonance
imaging and near infrared spectroscopy. Neuroimage 20:145-158.
Omata K, Hanakawa T, Morimoto M, Honda M (2013) Spontaneous Slow Fluctuation of
EEG Alpha Rhythm Reflects Activity in Deep-Brain Structures: A Simultaneous
EEG-fMRI Study. PLoS ONE 8:1-12.
Pavlenko VB, Chernyi SV, Goubkina DG (2009) EEG Correlates of Anxiety and
Emotional Stability in Adult Healthy Subjects. In: Neurophysiology, pp 337-345.
Pelli DG (1997) The VideoToolbox software for visual psychophysics: Transforming
numbers into movies. Spatial Vision 10:437-442.
49
Pfurtscheller G, Stancák A, Jr., Neuper C (1996) Event-related synchronization (ERS) in
the alpha band--an electrophysiological correlate of cortical idling: a review.
International journal of psychophysiology : official journal of the International
Organization of Psychophysiology 24:39-46.
Pineda JA (2005) The Functional Significance of Mu Rhythms: Translating “Seeing” and
“Hearing” Into “Doing”. Brain Research Reviews 50:57-68.
Prinz PN, Vitiello MV (1989) Dominant occipital (alpha) rhythm frequency in early stage
Alzheimer's disease and depression. Electroencephalogr Clin Neurophysiol
73:427-432.
Ray WJ, Cole HW (1985) EEG Alpha Activity Reflects Attentional Demands, and Beta
Activity Reflects Emotional and Cognitive Processes. Science 228:750-752.
Sauseng P, Klimesch W, Stadler W, Schabus M, Doppelmayr M, Hanslmayr S, Gruber
WR, Birbaumer N (2005) A Shift of Visual Spatial Attention is Selectively
Associated With Human EEG Alpha Activity. The European Journal Of
Neuroscience 22:2917-2926.
Seeck M, Koessler L, Bast T, Leijten F, Michel C, Baumgartner C, He B, Beniczky S
(2017) The standardized EEG electrode array of the IFCN. Clin Neurophysiol
128:2070-2077.
Sharma R, Nadkarni S (2020) Biophysical basis of alpha rhythm disruption in
Alzheimer's Disease (AD). eNeuro.

50
Sherman SM (2001) Tonic and Burst Firing: Dual Modes of Thalamocortical Relay.
TRENDS in Neurosciences 24:122-126.
Steriade M, Gloor P, Llinas RR, Lopes de Silva FH, Mesulam MM (1990) Basic
mechanisms of cerebral rhythmic activities. Electroencephalogr Clin
Neurophysiol 76:481-508.
Tenke CE, Kayser J, Alvarenga JE, Abraham KS, Warner V, Talati A, Weissman MM,
Bruder GE (2018) Temporal stability of posterior EEG alpha over twelve years.
Clin Neurophysiol 129:1410-1417.
Tenke CE, Kayser J, Svob C, Miller L, Alvarenga JE, Abraham K, Warner V,
Wickramaratne P, Weissman MM, Bruder GE (2017) Association of Posterior
EEG Alpha With Prioritization of Religion or Spirituality: A Replication and
Extension at 20-Year Follow-Up. Biological Psychology 124:79-86.
Tiihonen J, Hari R, Kajola M, Karhu J, Ahlfors S, Tissari S (1991)
Magnetoencephalographic 10-Hz Rhythm From the Human Auditory Cortex.
Neuroscience Letters 129:303-305.
Timofeev I, Bazhenov M (2005) Mechanisms and Biological Role of Thalamocortical
Oscillations.
Timofeev I, Chauvette S (2011) Thalamocortical Oscillations: Local Control of EEG
Slow Waves. Current Topics in Medicinal Chemistry 11:2457-2471.
VanRullen R, Koch C (2003) Is perception discrete or continuous? Trends in Cognitive
Sciences 7:207-213.
51
VanRullen R, Zoefel B, Ilhan B (2014) On the cyclic nature of perception in vision
versus audition. Philos Trans R Soc Lond B Biol Sci 369:20130214.
Weisz N, Hartmann T, Müller N, Lorenz I, Obleser J (2011) Alpha Rhythms in Audition:
Cognitive and Clinical Perspectives. Frontiers in Psychology 2:1-15.
Wieneke GH, Deinema CH, Spoelstra P, Storm van Leeuwen W, Versteeg H (1980)
Normative spectral data on alpha rhythm in male adults. Electroencephalography
and clinical neurophysiology 49:636-645.
Yue W, Chun NW, Siong NK, Tiecheng W, Xiaoping L (2013) An EEG Source
Localization and Connectivity Study on Deception of Autobiography Memories.
In, pp 468-471: IEEE.