VISUAL MONITORING AND ALERTING SYSTEM FOR ARC TYPE METERS
13
INTERNATIONAL JOURNAL OF RESEARCH IN COMPUTER APPLICATIONS AND ROBOTICS www.ijrcar.in Vol.2 Issue.3, Pg.: 29-41 March 2014 S.Sownthar et al Page 29 INTERNATIONAL JOURNAL OF RESEARCH IN COMPUTER APPLICATIONS AND ROBOTICS ISSN 2320-7345 VISUAL MONITORING AND ALERTING SYSTEM FOR ARC TYPE METERS S.Sownthar 1 , C.S.Manikandababu 2 1 PG Scholar, Sri Ramakrishna Engineering College-Coimbatore. [email protected] 2 Asst. Professor (Sr.Gr), Sri Ramakrishna Engineering College-Coimbatore. [email protected] Abstract In the fast industrial growth, it is necessary to avoid unexpected interruption of electrical machines. In this paper, Visual Monitoring and Alerting System have been developed to monitor the electrical parameters such as voltage, current and temperature. The new Algorithm is used to identify the angle of the pointer’s image obtained from the ARC type meters. The obtained angle value is compared with the specified limit. If the angle exceeds the limit then the alarm will be turn on to alert people. The proposed system can be operated in all environmental condition because it utilizes non-invasive technique. Keywords: Visual Monitoring and Alerting System (VMAS), Angular Detection Algorithm (ADA), Region of Interest (ROI). 1. Introduction In industries, it has become necessary to incessant monitor the stipulation of the electrical machines and systems to avoid any unscheduled breakdown during the production process. To protect plants, switchgear systems, and alternators, the non-invasive sensors and controllers plays important roles at the time of integrated faults or catastrophe. In recent years, more attention has been focused on the monitoring of various parameters such as voltage, current, and temperature of electrical systems from control room using remote sensing methods. As the electrical machines are critical components in industrial processes the machine failure may yield an unexpected interruption in the production process, with consequences in costs, product quality, and safety. The measuring instruments such as voltmeters, ammeters, and temperature gauges must be watched continuously and constantly to avoid any devastation in the process. In most of the industrial process, analog type meters and gauges are still being used because human inspectors are very prone to visualize deflection more easily than to recognize a digital display. Hence, to replace the human inspector for supervision and monitoring of electrical parameters, a visual monitoring system (VMS) having knowledge based artificial intelligence is essential. A novel architecture of Angular Detection Algorithm has been developed to identify the geometrical and statistical. features of the pointer’s image position from the captured image of indicating type meters.
-
Upload
independent -
Category
Documents
-
view
0 -
download
0
Transcript of VISUAL MONITORING AND ALERTING SYSTEM FOR ARC TYPE METERS
29 International Journal of Research in Computer Applications And Robotics, x(x): xx-xx
INTERNATIONAL JOURNAL OF RESEARCH IN COMPUTER APPLICATIONS AND ROBOTICS www.ijrcar.in
Vol.2 Issue.3, Pg.: 29-41
March 2014
S . S o w n t h a r e t a l
Page 29
INTERNATIONAL JOURNAL OF
RESEARCH IN COMPUTER
APPLICATIONS AND ROBOTICS
ISSN 2320-7345
VISUAL MONITORING AND ALERTING
SYSTEM FOR ARC TYPE METERS
S.Sownthar
1, C.S.Manikandababu
2
1PG Scholar, Sri Ramakrishna Engineering College-Coimbatore.
[email protected] 2 Asst. Professor (Sr.Gr), Sri Ramakrishna Engineering College-Coimbatore.
Abstract
In the fast industrial growth, it is necessary to avoid unexpected interruption of electrical machines. In this
paper, Visual Monitoring and Alerting System have been developed to monitor the electrical parameters such
as voltage, current and temperature. The new Algorithm is used to identify the angle of the pointer’s image
obtained from the ARC type meters. The obtained angle value is compared with the specified limit. If the angle
exceeds the limit then the alarm will be turn on to alert people. The proposed system can be operated in all
environmental condition because it utilizes non-invasive technique.
Keywords: Visual Monitoring and Alerting System (VMAS), Angular Detection Algorithm (ADA), Region
of Interest (ROI).
1. Introduction
In industries, it has become necessary to incessant monitor the stipulation of the electrical machines and
systems to avoid any unscheduled breakdown during the production process. To protect plants, switchgear
systems, and alternators, the non-invasive sensors and controllers plays important roles at the time of integrated
faults or catastrophe. In recent years, more attention has been focused on the monitoring of various parameters such as voltage, current, and temperature of electrical systems from control room using remote sensing
methods. As the electrical machines are critical components in industrial processes the machine failure may
yield an unexpected interruption in the production process, with consequences in costs, product quality, and
safety. The measuring instruments such as voltmeters, ammeters, and temperature gauges must be watched
continuously and constantly to avoid any devastation in the process. In most of the industrial process, analog
type meters and gauges are still being used because human inspectors are very prone to visualize deflection
more easily than to recognize a digital display. Hence, to replace the human inspector for supervision and
monitoring of electrical parameters, a visual monitoring system (VMS) having knowledge based artificial
intelligence is essential. A novel architecture of Angular Detection Algorithm has been developed to identify
the geometrical and statistical. features of the pointer’s image position from the captured image of indicating
type meters.

30 International Journal of Research in Computer Applications And Robotics, x(x): xx-xx
INTERNATIONAL JOURNAL OF RESEARCH IN COMPUTER APPLICATIONS AND ROBOTICS www.ijrcar.in
Vol.2 Issue.3, Pg.: 29-41
March 2014
S . S o w n t h a r e t a l
Page 30
In our view, a real time visual monitoring system has the following stages: 1) image acquisition; 2) image
pre-processing; 3) segmentation; 4) feature extraction; 5) feature comparison; and 6) display of result along
with Alarm signal. The geometrical, statistical, and wavelet-based image features were used to recognize the
indicated value using feature matching algorithm. Also, the algorithm compares the recognized value with the
set value of parameters and if, it is found beyond the specified limit, it generates various alarms.
2. Background and related work
A literature survey is done for various papers which are essential to know the previously available
techniques and their significance and limitations. It also includes the various supporting papers for the
proposed technique and their advantages. There are many approaches available for monitoring system with
less accuracy. The Dynamic Sliding Window Algorithm (DSWA) provides the visual monitoring system
with high accuracy
R. Sablatnig et al proposed Increasing flexibility for automatic visual inspection: The general
analysis graph [4]. it presented the automatic reading of dial type instruments based only on geometrical lay-
out of the dial of meter or gauges. it provides the initial stage for non invasive technique.
S. G. Liu et al proposed Checking on the quality of gauge panel based on wavelet analysis [1]. The
Wavelet analysis and Hough transform based inspection system created a room for application of soft computing
techniques in the monitoring, calibration or inspection of gauges.
M. R. Mamat et al. proposed Fault detection of 3-phase VSI using wavelet-fuzzy algorithm [7]. This
approach has been presented to detect the 3-phase VSI faults of closed loop fuzzy controlled induction motor.
The features are directly extracted from the wavelet transform of the stator currents. The results clearly show that
wavelet analysis together fuzzy logic, offers a great potential for monitoring and diagnosis of power electronic
drives.
G. G. Acosta et al proposed A current monitoring system for diagnosing electrical failures in
induction motors[8]. This paper used non invasive technique, such as Extended Park’s Vector Approach. it
is one of the complex computational based techniques being used to diagnose any electrical failures in
induction motors.
R. L. Cárdenas et al proposed “Inter-turn short circuit and unbalanced voltage pattern recognition
for three-phase induction motors”[9]. The main perspective is that the monitoring of voltage variation is also
equally useful to detect any flaws either in the motor or in the connected systems
Z. A. Jaffery and A. K. Dubey proposed Real time visual inspection system (RTVIS) for calibration of
mechanical gauges[10]. They have designed a real-time visual inspection system for the calibration of
mechanical gauges using artificial intelligence
.J. Datt et al proposed remote monitoring of different electrical parameters of multi-machine
system using PC. The basic idea is focused on the monitoring of various parameters such as voltage, current,
and temperature of electrical systems from control room using remote sensing methods. The main drawback
is the Throughput of the electrical parameters depends on the Internet bandwidth.
From the literature survey, it is evident that the existing techniques use only geometrical features of
the image. Hence the Accuracy and Reliability are less. The proposed architecture of detection algorithm
identifies the geometrical and statistical features of the pointer’s image position from the captured image of
indicating type meters. The development of visual monitoring system for automatic reading of analog type
gauges or meters ensures robust, economic and user friendliness of the system.
The segmentation is a process in which features or regions having homogeneous characteristics are identified
and grouped together. The image segmentation method involves edge detection, boundary detection, statistical

31 International Journal of Research in Computer Applications And Robotics, x(x): xx-xx
INTERNATIONAL JOURNAL OF RESEARCH IN COMPUTER APPLICATIONS AND ROBOTICS www.ijrcar.in
Vol.2 Issue.3, Pg.: 29-41
March 2014
S . S o w n t h a r e t a l
Page 31
classification, region detection, and thresholding or combination of these techniques. There are numerous
image segmentation techniques available for the segmentation of desired portions or objects from colour,
intensity, and black & white images.
It is expected that the main text will be divided into several sections and subsections as author wishes.
Make sure your breakdown of the main body does not affect the coherence of the flow of arguments or the
continuity of the presentation. It may be a good idea to use appendixes for describing lengthy expressions /
proofs or anything that might influence the readability of the main text.
2.1 Boundary encoding method
To code windows from multiple regions in an image, one must know to which region each window
belongs, so that each window can be decoded with respect to the correct codebook. For generic samples from
multiple classes, one can estimate the distribution of each class label and then code the membership of the
samples using a scheme that is asymptotically optimal for that class distribution. Such coding schemes are
highly inefficient for natural image segmentation, as they do not leverage the spatial correlation of pixels in
the same region.
In fact, for the proposed application, pixels from the same region form a connected component. Thus,
the most efficient way of coding group membership for regions in images is to code the boundary of the region
containing the pixels.
Figure 1 Left: The Freeman chain code of an edge orientation along 8 possible directions.
Middle: Representation of the boundary of a region in an image with respect to the Freeman chain code.
Right: Representation with respect to the difference chain code.
A well-known scheme for representing boundaries of image regions is the Freeman chain code. In this coding
scheme, the orientation of an edge element is quantized along 8 discrete directions. Let {ot}T t=1 denote the
orientations of the T boundary pixels of R. Since each chain code can be encoded using three bits, the coding
length of the boundary of R is
(1)

32 International Journal of Research in Computer Applications And Robotics, x(x): xx-xx
INTERNATIONAL JOURNAL OF RESEARCH IN COMPUTER APPLICATIONS AND ROBOTICS www.ijrcar.in
Vol.2 Issue.3, Pg.: 29-41
March 2014
S . S o w n t h a r e t a l
Page 32
The coding length B(R) can be further improved by using an adaptive Huffman code that leverages
the prior distribution of the chain codes.
Though the distribution of the chain codes is essentially uniform in most images, for regions with smooth
boundaries, we expect that the orientations of consecutive edges are similar, and so consecutive chain codes
will not differ by much. Given an initial orientation (expressed in chain code) ot, the difference chain code of
the following orientation ot+1 is ∆ot . = mod (ot −ot+1,8). Figure 1 compares the original Freeman chain code
with the difference chain code for representing the boundary of a region. Notice for this region, the difference
encoding uses only half of the possible codes, with most being zeroes, while the Freeman encoding uses all
eight chain codes. Given the prior distribution P[∆o] of difference chain codes, B(R) can be encoded more
efficiently using a lossless Huffman coding scheme:
(2)
For natural images, we estimate P[∆o] using images from the BSD that were manually segmented by humans.
which used 1000 images of curves, contour patterns, and shapes obtained from the web. As the regions of
natural images tend to have more smooth boundaries when segmented by humans
2.2 Dynamic region growth
The quality of region-growth techniques is highly dependent on the locations chosen to initialize the growth
procedure. We propose an alternate process for region growth that does not depend exclusively on the initial
assignment of clusters for the final segmentation. The procedure searches for regions where the gradient map
displays no edges. The selected regions form the initial set of seeds to segment the image. The region growth
procedure also accounts for regions, which display similar edge values throughout, by detecting unattached
regions at various edge density levels. Adaptive Threshold Generation: The GSEG algorithm is initiated with a colour space conversion of the input
image from RGB to CIE . This step is vital, because the latter is a better model for the human visual perception
justified by the fact that given two colours, the magnitude difference of the numerical values between them is
proportional to the perceived difference as seen by the human eye, a property that cannot be associated with the
RGB space. Using the acquired data, the magnitude of the gradient of the colour image field is calculated . The
histogram of this gradient map is utilized to determine the seed addition levels employed for dynamic seed
addition. Initially, the objective is to select a threshold for the initiation of the seed generation process. Ideally,
a threshold value could be selected to provide the most edges, while ignoring the noise present in images. The
flowchart of the region growth process is shown below.
The problem is that the nature of images does not allow for this disposition. A single threshold that
may correctly delineate the boundary of a given region may allow other regions to merge incorrectly. Due to
this factor, we propose choosing one of two empirically determined threshold values for initiating the seed
generation process, by validating how far apart the low and high gradient content in the image are, in its
corresponding histogram.

33 International Journal of Research in Computer Applications And Robotics, x(x): xx-xx
INTERNATIONAL JOURNAL OF RESEARCH IN COMPUTER APPLICATIONS AND ROBOTICS www.ijrcar.in
Vol.2 Issue.3, Pg.: 29-41
March 2014
S . S o w n t h a r e t a l
Page 33
Figure 2: Flowchart of a region growth procedure
The idea is that a high initial threshold be used for images in which a large percentage of gradient values
spread over a narrow range and a low initial threshold value be used for images in which a large percentage of
gradient values spread over a wide range, in comparison to the span of the histogram.
2.3 Dynamic sliding window algorithm
The segmentation is a process in which features or regions having homogeneous characteristics are
identified and grouped together. The image segmentation method involves edge detection, boundary
detection, statistical classification, region detection, and thresholding or combination of these techniques.
There are numerous image segmentation techniques available for the segmentation of desired portions or
objects from coloured, intensity, and black & white images.
34 International Journal of Research in Computer Applications And Robotics, x(x): xx-xx
INTERNATIONAL JOURNAL OF RESEARCH IN COMPUTER APPLICATIONS AND ROBOTICS www.ijrcar.in
Vol.2 Issue.3, Pg.: 29-41
March 2014
S . S o w n t h a r e t a l
Page 34
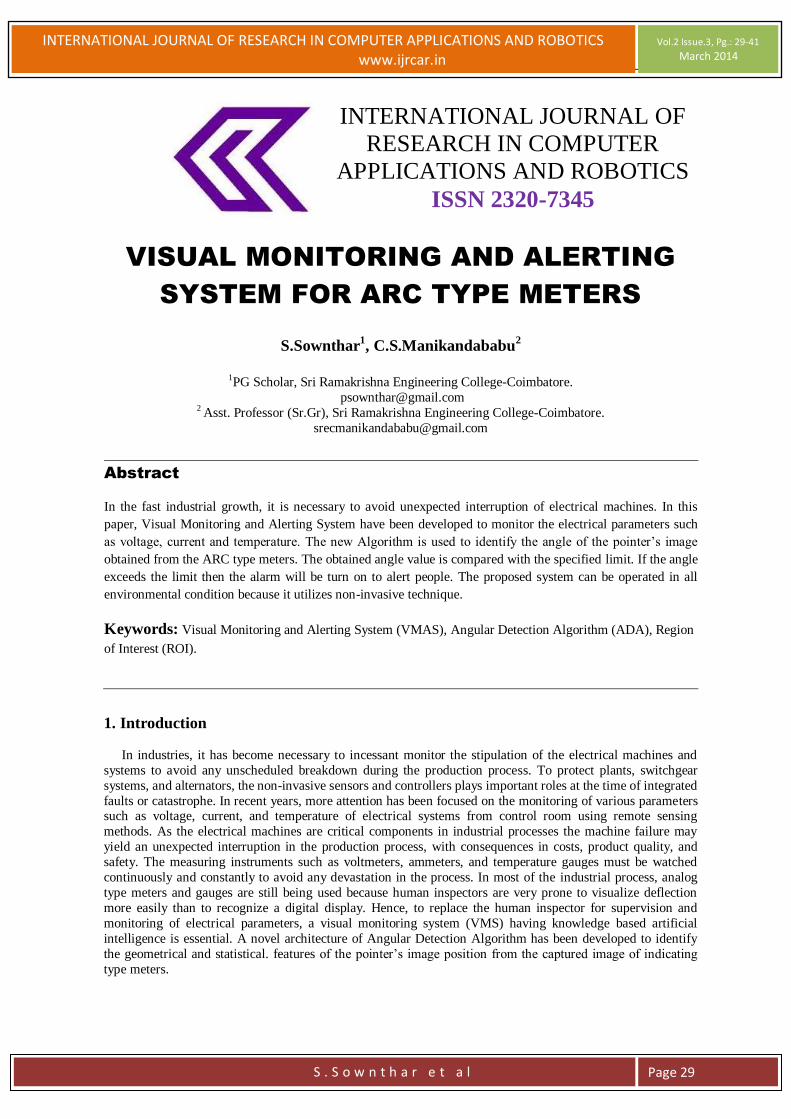
Dynamic Sliding Window Algorithm for Segmentation of Image: The Region Of Interest (ROI) based
sliding window technique for the segmentation of a desired portion (a region having image of pointer of
indicating type meter for RTVMS application) from the captured image is shown in Fig.3
Figure 3: Selection of ROI
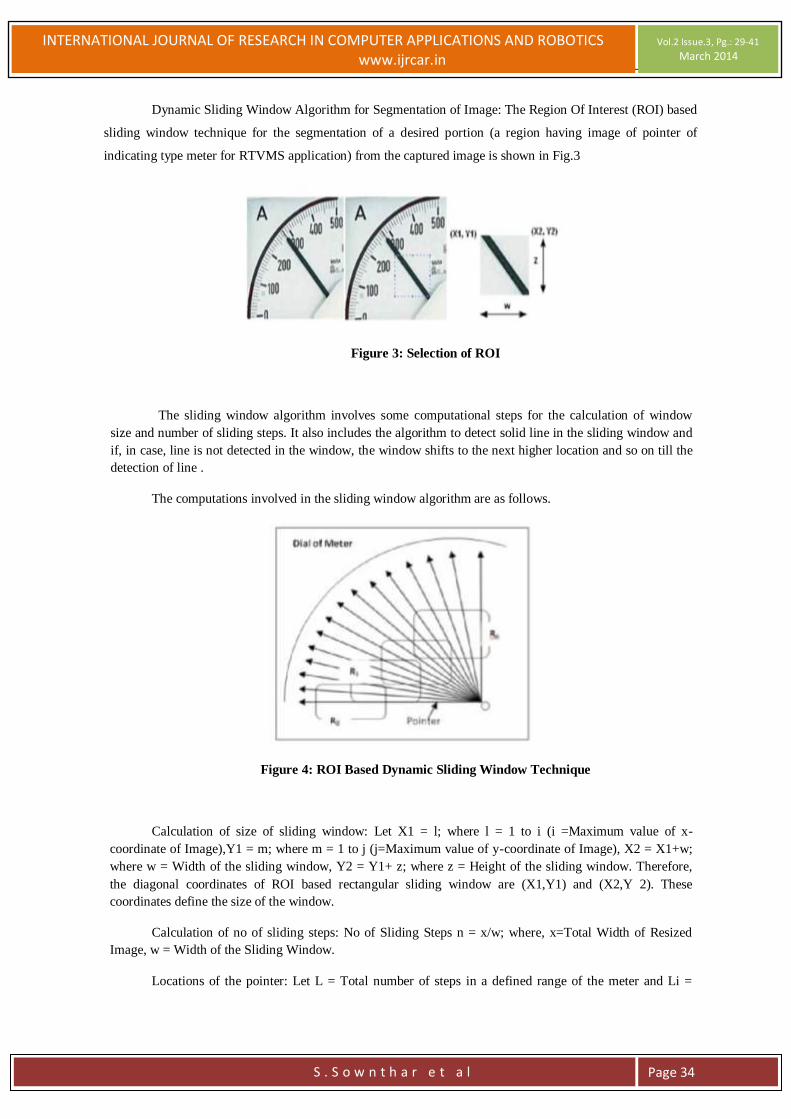
The sliding window algorithm involves some computational steps for the calculation of window
size and number of sliding steps. It also includes the algorithm to detect solid line in the sliding window and
if, in case, line is not detected in the window, the window shifts to the next higher location and so on till the
detection of line .
The computations involved in the sliding window algorithm are as follows.
Figure 4: ROI Based Dynamic Sliding Window Technique
Calculation of size of sliding window: Let X1 = l; where l = 1 to i (i =Maximum value of x-
coordinate of Image),Y1 = m; where m = 1 to j (j=Maximum value of y-coordinate of Image), X2 = X1+w;
where w = Width of the sliding window, Y2 = Y1+ z; where z = Height of the sliding window. Therefore,
the diagonal coordinates of ROI based rectangular sliding window are (X1,Y1) and (X2,Y 2). These
coordinates define the size of the window.
Calculation of no of sliding steps: No of Sliding Steps n = x/w; where, x=Total Width of Resized
Image, w = Width of the Sliding Window.
Locations of the pointer: Let L = Total number of steps in a defined range of the meter and Li =
35 International Journal of Research in Computer Applications And Robotics, x(x): xx-xx
INTERNATIONAL JOURNAL OF RESEARCH IN COMPUTER APPLICATIONS AND ROBOTICS www.ijrcar.in
Vol.2 Issue.3, Pg.: 29-41
March 2014
S . S o w n t h a r e t a l
Page 35
Location of pointer at ith step, where i = {0, 1, 2–(L−1)}.
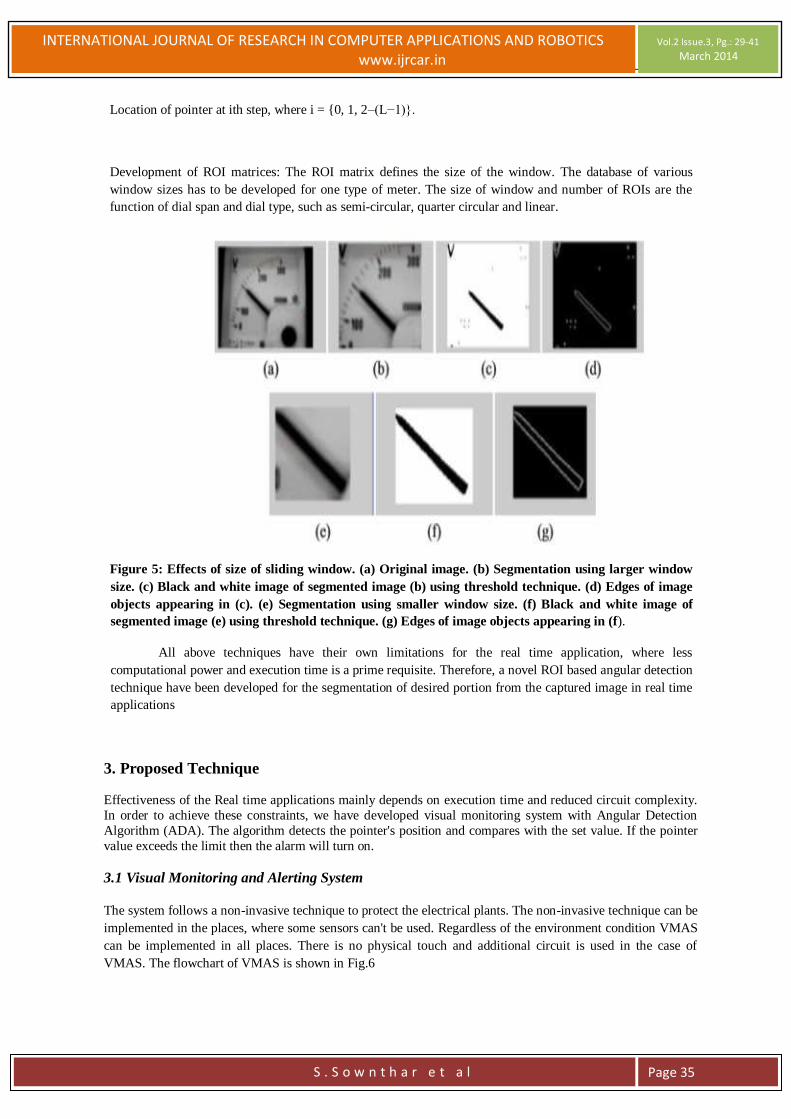
Development of ROI matrices: The ROI matrix defines the size of the window. The database of various
window sizes has to be developed for one type of meter. The size of window and number of ROIs are the
function of dial span and dial type, such as semi-circular, quarter circular and linear.
Figure 5: Effects of size of sliding window. (a) Original image. (b) Segmentation using larger window
size. (c) Black and white image of segmented image (b) using threshold technique. (d) Edges of image
objects appearing in (c). (e) Segmentation using smaller window size. (f) Black and white image of
segmented image (e) using threshold technique. (g) Edges of image objects appearing in (f).
All above techniques have their own limitations for the real time application, where less
computational power and execution time is a prime requisite. Therefore, a novel ROI based angular detection
technique have been developed for the segmentation of desired portion from the captured image in real time
applications
3. Proposed Technique
Effectiveness of the Real time applications mainly depends on execution time and reduced circuit complexity.
In order to achieve these constraints, we have developed visual monitoring system with Angular Detection
Algorithm (ADA). The algorithm detects the pointer's position and compares with the set value. If the pointer
value exceeds the limit then the alarm will turn on.
3.1 Visual Monitoring and Alerting System
The system follows a non-invasive technique to protect the electrical plants. The non-invasive technique can be
implemented in the places, where some sensors can't be used. Regardless of the environment condition VMAS
can be implemented in all places. There is no physical touch and additional circuit is used in the case of
VMAS. The flowchart of VMAS is shown in Fig.6

36 International Journal of Research in Computer Applications And Robotics, x(x): xx-xx
INTERNATIONAL JOURNAL OF RESEARCH IN COMPUTER APPLICATIONS AND ROBOTICS www.ijrcar.in
Vol.2 Issue.3, Pg.: 29-41
March 2014
S . S o w n t h a r e t a l
Page 36
Figure 6: Flowchart of VMAS
3.1.1 Image Acquisition
Image acquisition techniques play an excellent role in the field of visual monitoring and alerting system
(VMAS). The procedure and excellence of image acquisition enables RTVMS to work proficiently and
precisely. The quality of image depends upon the type of camera, position of camera, number of cameras, and
the illumination systems. The illumination techniques help in exploring the characteristics of images under test.
In this approach, webcams with 12 mega pixel resolution and LED based illumination are used. Fig 7 is the
input image for the system
.
Figure 7: Input Image
3.1.2 Image De-noising:

37 International Journal of Research in Computer Applications And Robotics, x(x): xx-xx
INTERNATIONAL JOURNAL OF RESEARCH IN COMPUTER APPLICATIONS AND ROBOTICS www.ijrcar.in
Vol.2 Issue.3, Pg.: 29-41
March 2014
S . S o w n t h a r e t a l
Page 37
The wavelet transform (WT) is a prevailing tool for signal and image processing. It is being applied in many
scientific and engineering fields such as signal pre-processing, image compression, image fusion, computer
graphics, computer vision, feature calculation, image inspection, and pattern recognition. The fundamental
concept involved in multi- resolution wavelet transform is to find average features and details of the image
signal using scalar products with scaling signals and wavelets.
Usually, an image is sullied by various noisy factors during the acquisition and processing of it. This
noisy effect decreases the performance of real time visual monitoring systems. Therefore, the de-noising
process can be implicated as to remove the noise while retaining the quality of the processed image.
The three main steps involved in the de-noising process using wavelet approach are shown in Fig.8
This includes: wavelet transform, thresholding and inverse wavelet transform.
Figure 8:De noising steps
The type of wavelet and thresholding technique decides the efficiency of de-noising process. In this paper, the
de-noising of captured images is done using Daubechies wavelet (db10). The following Fig 9 shows the De-
noised image.
Figure 9: De-noised image

38 International Journal of Research in Computer Applications And Robotics, x(x): xx-xx
INTERNATIONAL JOURNAL OF RESEARCH IN COMPUTER APPLICATIONS AND ROBOTICS www.ijrcar.in
Vol.2 Issue.3, Pg.: 29-41
March 2014
S . S o w n t h a r e t a l
Page 38
3.1.2 Image Segmentation:
The segmentation is a process in which features or regions having homogeneous characteristics are identified
and grouped together. The image segmentation method involves edge detection, boundary detection, statistical
classification, region detection, and thresholding or combination of these techniques. There are numerous
image segmentation techniques available for the segmentation of desired portions or objects from colored,
intensity, and black & white images. Our proposed method uses Angular Detection Algorithm (ADA), the
steps involved in ADA is listed below. and Fig 10 and 11 includes the segmentation process.
1) The vertical growing lines in the image is found
2) Among the lines the longest one is chosen.
3) Mark the starting and end points of the line. Image is converted into matrix. The angle value is
assigned to point based on the column and row value of the matrix.
Figure 10: Edge Detection
Figure 11: Feature Detection
3.1.3 Feature Extraction: In this step required features are obtained from the segmented image. The pointer with
starting and end point is our Region Of Interest (ROI). This is extracted from the previous stage. It is shown in
Fig 12. The angle value to the pointer is assigned based on their co-ordinate position.

39 International Journal of Research in Computer Applications And Robotics, x(x): xx-xx
INTERNATIONAL JOURNAL OF RESEARCH IN COMPUTER APPLICATIONS AND ROBOTICS www.ijrcar.in
Vol.2 Issue.3, Pg.: 29-41
March 2014
S . S o w n t h a r e t a l
Page 39
Figure 12: Feature extraction
3.1.4 Feature Comparison: Once the required feature (pointer position) is extracted from the image then the respective angle
value is assigned to the pointer. the present value of the pointer is compare with the set value. If the obtained
pointer's value exceeds the limit then alarm will be turn on.
4. Implementation and Result
The Result shows the present angle value and measurement value of the meter. The threshold value is set as
default . If the captured value exceeds the set limit then the Alarm will be Turn ON. The output for the
different set value is shown below.
Fig 13 shows the output1, where angle is less than the set value hence there is no Alarm. In Fig 14,
Angle is greater than the set value hence Alarm is turn ON.
IF SET VALUE IS 80:
Figure 13: Output1
IF SET VALUE IS 50:
Figure 14: Output2
40 International Journal of Research in Computer Applications And Robotics, x(x): xx-xx
INTERNATIONAL JOURNAL OF RESEARCH IN COMPUTER APPLICATIONS AND ROBOTICS www.ijrcar.in
Vol.2 Issue.3, Pg.: 29-41
March 2014
S . S o w n t h a r e t a l
Page 40
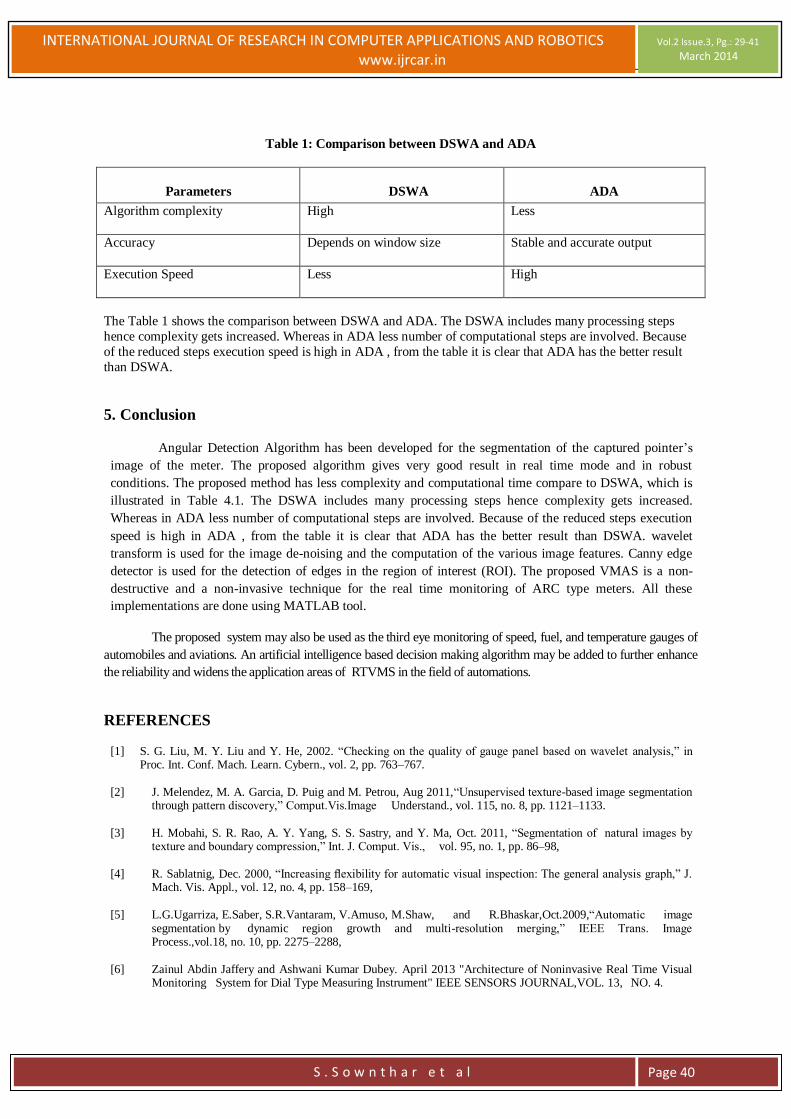
Table 1: Comparison between DSWA and ADA
Parameters DSWA ADA
Algorithm complexity High Less
Accuracy Depends on window size Stable and accurate output
Execution Speed Less High
The Table 1 shows the comparison between DSWA and ADA. The DSWA includes many processing steps
hence complexity gets increased. Whereas in ADA less number of computational steps are involved. Because
of the reduced steps execution speed is high in ADA , from the table it is clear that ADA has the better result
than DSWA.
5. Conclusion
Angular Detection Algorithm has been developed for the segmentation of the captured pointer’s
image of the meter. The proposed algorithm gives very good result in real time mode and in robust
conditions. The proposed method has less complexity and computational time compare to DSWA, which is
illustrated in Table 4.1. The DSWA includes many processing steps hence complexity gets increased.
Whereas in ADA less number of computational steps are involved. Because of the reduced steps execution
speed is high in ADA , from the table it is clear that ADA has the better result than DSWA. wavelet
transform is used for the image de-noising and the computation of the various image features. Canny edge
detector is used for the detection of edges in the region of interest (ROI). The proposed VMAS is a non-
destructive and a non-invasive technique for the real time monitoring of ARC type meters. All these
implementations are done using MATLAB tool.
The proposed system may also be used as the third eye monitoring of speed, fuel, and temperature gauges of
automobiles and aviations. An artificial intelligence based decision making algorithm may be added to further enhance
the reliability and widens the application areas of RTVMS in the field of automations.
REFERENCES
[1] S. G. Liu, M. Y. Liu and Y. He, 2002. “Checking on the quality of gauge panel based on wavelet analysis,” in Proc. Int. Conf. Mach. Learn. Cybern., vol. 2, pp. 763–767.
[2] J. Melendez, M. A. Garcia, D. Puig and M. Petrou, Aug 2011,“Unsupervised texture-based image segmentation through pattern discovery,” Comput.Vis.Image Understand., vol. 115, no. 8, pp. 1121–1133.
[3] H. Mobahi, S. R. Rao, A. Y. Yang, S. S. Sastry, and Y. Ma, Oct. 2011, “Segmentation of natural images by texture and boundary compression,” Int. J. Comput. Vis., vol. 95, no. 1, pp. 86–98,
[4] R. Sablatnig, Dec. 2000, “Increasing flexibility for automatic visual inspection: The general analysis graph,” J. Mach. Vis. Appl., vol. 12, no. 4, pp. 158–169,
[5] L.G.Ugarriza, E.Saber, S.R.Vantaram, V.Amuso, M.Shaw, and R.Bhaskar,Oct.2009,“Automatic image segmentation by dynamic region growth and multi-resolution merging,” IEEE Trans. Image Process.,vol.18, no. 10, pp. 2275–2288,
[6] Zainul Abdin Jaffery and Ashwani Kumar Dubey. April 2013 "Architecture of Noninvasive Real Time Visual Monitoring System for Dial Type Measuring Instrument" IEEE SENSORS JOURNAL,VOL. 13, NO. 4.

41 International Journal of Research in Computer Applications And Robotics, x(x): xx-xx
INTERNATIONAL JOURNAL OF RESEARCH IN COMPUTER APPLICATIONS AND ROBOTICS www.ijrcar.in
Vol.2 Issue.3, Pg.: 29-41
March 2014
S . S o w n t h a r e t a l
Page 41
[7] M. R. Mamat, M. Rizon, and M. S. Khanniche, Feb. 2006, “Fault detection of 3-phase VSI using wavelet-fuzzy algorithm,” Amer. J. Appl. Sci., vol. 3, no. 1, pp. 1642–1648,
[8] G. G. Acosta, C. J. Verucchi, and E. R. Gelso, May 2006, “A current monitoring system for diagnosing electrical failures in induction motors,” Int. J. Mech. Syst. Signal Process., vol. 20, no. 4, pp. 953–965,
[9] R. L. Cárdenas, L. P. S. Fernández, O. Progrebnyak, 2008, and Á. A. C. Mon- tiel, “Inter-turn short circuit and unbalanced voltage pattern recognition for three-phase induction motors,” in Progress in Pattern Recognition, Image Analysis and Applications (Lecture Notes in Computer Science), vol. 5197. Berlin, Germany: Springer- Verlag, pp. 470–478.
[10] Z. A. Jaffery, A. K. Dubey, and R. P. Singh, 2011,“Effect of two dimen- sional image compression on statistical features of image using wavelet approach,” in Proc. IJCA Int. Conf. Workshop Emerg. Trends Technol., vol. 3. Mumbai, India, pp. 1–6.s
[11] J. Datta, S. Chowdhuri, J. Bera, and G. Sarkar, Jan. 2012,“Remote monitoring of different electrical parameters of multi-machine system using PC,” Measurement, vol. 45, no. 1, pp. 118–125,
A Brief Author Biography
S.Sownthar – PG Scholar at Sri Ramakrishna Engineering College, Coimbatore, India. Research interest is Image processing.
C.S.Manikandababu – Assistant Professor (Sr.Gr) at Ramakrishna Engineering College, Coimbatore, India.
Research interest is Image processing.