Factors influencing the usability of collision alerting systems in ...
176
Factors influencing the usability of collision alerting systems in gliding Einflussfaktoren auf die Gebrauchstauglichkeit von Kollisionswarnsystemen im Segelflug Dipl.-Ing. Christoph Georg Santel Dissertation D17 Darmstadt 2016 Fachbereich Maschinenbau Institut für Flugsysteme und Regelungs- technik
-
Upload
khangminh22 -
Category
Documents
-
view
2 -
download
0
Transcript of Factors influencing the usability of collision alerting systems in ...

Factors influencing theusability of collisionalerting systems in glidingEinflussfaktoren auf die Gebrauchstauglichkeit von Kollisionswarnsystemenim SegelflugDipl.-Ing. Christoph Georg SantelDissertation D17Darmstadt 2016
Fachbereich MaschinenbauInstitut für Flugsysteme und Regelungs-technik


Factors influencing the usability of collision alerting systems in glidingEinflussfaktoren auf die Gebrauchstauglichkeit von Kollisionswarnsystemen im Segelflug
Vom Fachbereich Maschinenbauan der Technischen Universität Darmstadt
zurErlangung des Grades eines Doktor-Ingenieurs (Dr.-Ing.)
genehmigte
Dissertation
vorgelegt von
Dipl.-Ing. Christoph Georg Santel
aus Köln
Berichterstatter: Prof. Dr.-Ing. Uwe KlingaufMitberichterstatter: Prof. Dr. phil. Joachim Vogt
Tag der Einreichung: 26. November 2015Tag der mündlichen Prüfung: 02. Februar 2016
Darmstadt 2016
D 17

Bitte zitieren Sie dieses Dokument als:URN: urn:nbn:de:tuda-tuprints-51707URL: http://tuprints.ulb.tu-darmstadt.de/5170
Dieses Dokument wird bereitgestellt von tuprints,E-Publishing-Service der TU Darmstadthttp://[email protected]
Die Veröffentlichung steht unter folgender Creative Commons Lizenz:Namensnennung – Nicht kommerziell – Keine Bearbeitung 3.0 Deutschlandhttp://creativecommons.org/licenses/by-nc-nd/3.0/de/

AbstractThe dissertation at hand identifies and analyzes how well glider pilots use low-costcollision alerting systems. While being generally recognized as a commendabletool for helping glider pilots see and avoid other traffic, these systems have beencited as possible contributing factors in several accidents. In literature, no in-depthresearch on how glider pilots may interpret or misinterpret their indications wasfound.
At the beginning of this dissertation, a market study of human-machine inter-faces for low-cost collision alerting systems is presented. During the study, differenthuman-machine interfaces are taxonomized. The low-complexity and radar-styledisplays were found to be popular display formats. Also it was discovered that aperspective presentation of traffic has been evaluated for military applications, butnot for a gliding context. Thus, a perspective presentation of traffic is proposed.The prototype of a perspective display format for gliding is developed by relyingon a user-centered design process. Then, the design features of the low-complexity,radar-style and perspective displays are compared. This results in several hypothe-ses comparing the usability of the three display formats being postulated.
In order to experimentally evaluate these hypotheses, 137 glider pilots partakein a laboratory experiment. They are presented with traffic information on oneof the three display formats installed in a flight simulator. The participants thenindicate where they suspect the traffic to be located in the outside world while be-ing exposed to different flight conditions. Performance and subjective satisfactionmeasurements are recorded during the experiment.
Inferential statistics are used to evaluate the experimental data. The perspec-tive display format results in the most precise estimates of where traffic is located.Generally, errors in estimating traffic position increase as the participants’ own-ship deviates from straight and level flight. Reaction time does not vary notablybetween display formats or different flight conditions. Subjective learnability andusability ratings favor the perspective display format over the two other formatsanalyzed. Overall, the perspective display format exhibits optimized usability in alldimensions when compared to the other two formats.
During the usability analysis, circumstantial evidence arises which suggests thatnot all participants might interpret the data shown on their display similarly. Aprobable cause for this may be different knowledge deficits which are experiencedbetween participants. These deficits may result in participants mentally modeling
i
the collision alerting system incorrectly, thus leading to incorrect coordinate sys-tems for interpreting the traffic information. A method for identifying these mentalmodels is developed. The ensuing analysis reveals that most participants using low-complexity or radar-style display formats incorrectly interpret traffic information inan ownship-fixed fashion. Contrary, most participants working with the perspec-tive display format perform at least some of the required rotations of their personalcoordinate systems. The concept of different mental models based on differentpersonal coordinate systems shows potential as an analysis tool for future displaydesigns.
From these findings multiple recommendations are deduced. They are directedat different stakeholders in the gliding community, including glider pilots, aircraftowners and operators, regulatory authorities, glider manufacturers, flight schools,competition rule makers and organizers, as well as designers of collision alertingsystems and associated human-machine interfaces. Closing this dissertation, thepotential for future human factors research in the gliding community is highlighted.
ii Abstract
KurzfassungDie vorliegende Dissertation identifiziert und analysiert wie Segelflugpilotenkostengünstige Kollisionswarnsysteme nutzen. Allgemein werden diese Systemeals hilfreiche Werkzeuge wahrgenommen, welche den Piloten bei seiner Aufgabe,Fremdverkehr zu umfliegen, unterstützen. Gelegentlich werden sie auch als po-tentiell beitragende Faktoren bei Unfällen genannt. In der Literatur lassen sichjedoch nur spärliche Forschungsergebnisse finden, wie zutreffend Segelflugpilotendie Anzeigen dieser Systeme interpretieren.Den Beginn der Arbeit bildet eine Marktstudie zu Mensch-Maschine-Schnittstellenfür kostengünstige Kollisionswarnsysteme. Dabei werden die Mensch-Maschine-Schnittstellen kategorisiert. Der Studie zur Folge sind die Anzeige geringer Kom-plexität sowie die radarartige Anzeige beliebte Anzeigeformate. Ebenfalls wurdeermittelt, dass eine perspektivische Verkehrsdarstellung bis jetzt nur für mili-tärische Anwendungen untersucht wurde, nicht aber für den Segelflug. Daherwird eine segelflugtaugliche perspektivische Verkehrsdarstellung vorgeschlagen.Dessen Prototyp wird mittels eines nutzerzentrierten Entwurfsprozesses entwick-elt. Anschließend werden die Eigenschaften der Anzeige geringer Komplexität, derradarartigen Anzeige und der perspektivischen Anzeige verglichen. Der Vergleichführt zu mehreren Hypothesen bezüglich der Gebrauchstauglichkeit.Um diese zu prüfen wird eine Laborstudie durchgeführt, an welcher 137 Segelflug-piloten teilnehmen. Jeder Teilnehmer wird in einem Flugsimulator mit Verkehrs-informationen auf einem der drei Anzeigeformate konfrontiert. Während ver-schiedene Flugzustände durchlaufen werden, geben die Teilnehmer an, wo in derAußenwelt sie den Verkehr vermuten. Messwerte zur Performanz der Probandenund objektivierte Angaben zur subjektiven Zufriedenheit werden während des Ver-suchs aufgezeichnet.Anschließend werden die experimentell erhobenen Daten inferenzstatistisch aus-gewertet. Die Schätzungen der Verkehrsposition sind mit der perspektivischenAnzeige am präzisesten. Die Positionsschätzung wird fehlerbehafteter, sobald daseigene Luftfahrzeug der Probanden vom horizontalen Geradeausflug abweicht.Bei der Reaktionszeit gibt es keinen nennenswerten Unterschied zwischen denAnzeigeformaten oder diversen Flugzuständen. Zusätzlich wird die perspektivischeAnzeige von den Probanden als einfacher erlernbar und besser gebrauchstauglicheingeschätzt. Insgesamt zeichnet sich die perspektivische Anzeige gegenüber den
iii

anderen beiden Formaten durch eine optimierte Gebrauchstauglichkeit in allen Di-mensionen aus.Während der Gebrauchstauglichkeitsanalyse drängt sich der Verdacht auf, dassnicht alle Probanden dasselbe Anzeigeformat gleich interpretieren. Als möglicheUrsache hierfür kommen Wissensdefizite der Probanden in Frage. Diese Wissens-defizite können dazu führen, dass Probanden falsche mentale Modelle der Ko-llisionswarnsysteme entwickeln. Dies wiederum hätte zur Folge, dass sie inko-rrekte persönliche Koordinatensysteme zur Interpretation der Verkehrsinforma-tionen nutzen. Es wird eine Methode entwickelt mit der die unterschiedlichenmentalen Modelle identifiziert werden können. Hierbei zeigt sich, dass die meistenProbanden, welche die Anzeige geringer Komplexität oder die radarartige Anzeigenutzen, die Verkehrsinformationen in einem flugzeugfesten Koordinatensystem in-terpretieren. Für den Fall der perspektivischen Anzeige führen die meisten Proban-den mindestens eine der notwendigen Rotationen ihres persönlichen Koordinaten-systems durch. Das Konzept der unterschiedlichen mentalen Modelle, welches aufunterschiedlichen persönlichen Koordinatensystemen beruht, bietet ein passendesWerkzeug für die zukünftige Beurteilung bestehender oder Entwicklung neuartigerAnzeigeformate.Aus den Ergebnissen der Arbeit werden mehrere Empfehlungen abgeleitet.Diese Empfehlungen richten sich an unterschiedliche Interessengruppen imSegelflug. Dazu zählen unter anderem Segelflugpiloten, Flugzeugeigentümerund -halter, Regulierungsbehörden, Segelflugzeughersteller, Flugausbildungsor-ganisationen, Ersteller von sportlichen Regelwerken, Veranstalter von Segelflug-wettbewerben sowie Entwickler von Kollisionswarnsystemen und deren Mensch-Maschine-Schnittstellen. Abschließend wird aufgezeigt, welches Potential in einerWeiterführung der Forschungsarbeiten zum menschlichen Leistungsvermögen imSegelflug liegt.
iv Kurzfassung

AcknowledgmentsThe dissertation at hand was written during my time as a research associate atTechnische Universität Darmstadt’s Institute of Flight Systems and Automatic Con-trol. As is the case with most research, it is never truly the work of one personalone. This fact remains true with this dissertation. Colleagues, superiors, students,friends and family and many others have contributed in one extent or another. Toall of these people I wish to extend my sincerest gratitude. There are some persons,however, whom I wish to thank personally for their support.
I extend a sincere “thank you!” to the director of the Institute of Flight Systemsof Automatic Control, Prof. Dr.-Ing. Uwe Klingauf. Not only did he secure most ofthe funding for my position and research, but he provided me with the opportunityto freely direct my research to gliding applications. He also acted as my advisor inall doctoral matters. My co-advisor, Prof. Dr. Joachim Vogt, gratefully provided mewith access to the resources of his Work and Engineering Psychology research groupat Technische Universität Darmstadt as well. Prof. Vogt and his research groupalways had an open door for all my questions related to psychological matters.
The first year of funding was provided by a doctoral scholarship of the GermanResearch Foundation’s Research Training Group 1343 “Topology of Technology”. Ithank the representatives of the group for supporting me financially as well as forintroducing me to academic disciplines outside of engineering.
Without continued support from my colleagues, performing my research andwriting my dissertation would have been a rather dull affair. It was them whom Iconfronted with my day-to-day ideas. They took the time to discuss my thoughts,and eventually proofread most of this dissertation. Particularly Paul Haiduk, PaulGerber, Dr.-Ing. Jendrick Westphal and Dr.-Ing. Heike Meinert stood out. Theyprovided me with the everyday discussion and feedback which is so valuable inresearch.
I am also obliged to several students who contributed by setting up and perform-ing the experiments and studies presented in this dissertation. Verena Schochlow,Simon Mehringskötter, Martin Scheringer and Katrin Heinbücher did a splendid jobwhile working on the experiments, surveys and studies.
Of course, the many glider pilots who participated in this study have my grati-tude as well. Unfortunately, but for obvious reasons, they shall remain anonymous.Only with their time and effort was it possible to gather the data presented in this
v

work. These glider pilots were an incredible group of enthusiasts. Who else wouldtravel through half of Germany at their own expense on a working day, participatein an experiment and be happy about having had a chance to contribute to thesport of gliding?
Support from the gliding community did not only come from individualglider pilots. Representatives from Butterfly Avionics, Garrecht Avionik and Üli’sSegelflugbedarf provided me with hardware and support. Through them, I wasable to gain insights into the contemporary design processes associated with col-lision alerting systems and their human-machine interfaces. Within the GermanAeroclub, Günter Forneck acted as my point of contact. He enabled me to presentmy ideas at one of the German Aeroclub’s flight instructor meeting and gather inputthere.
Not all the support required to write a dissertation is technical or professionalin nature. My parents Helga and Dr. Hans-Joachim Santel have encouraged me atevery step of the way to pursue a career in aviation. Finally, without the love ofmy significant other, Anja Bott, I am not certain whether I would have found thestrength to go through with my dissertation.
Darmstadt, Germany in November of 2015 Christoph Santel
vi Acknowledgments

Contents
Nomenclature xi
1 Introduction 1
1.1 Aim of this thesis . . . . . . . . . . . . . . . . . . . . . . . . . . . . . . . . 21.2 Structure of this thesis . . . . . . . . . . . . . . . . . . . . . . . . . . . . . 2
2 State of the art 5
2.1 Glider flight operations, collision avoidance and selected technologies 52.1.1 Quantifying the risk of midair collisions in gliding . . . . . . . 62.1.2 Collision avoidance in gliding . . . . . . . . . . . . . . . . . . . . 82.1.3 Collision alerting systems in gliding . . . . . . . . . . . . . . . . 9
2.1.3.1 Proliferation of low-cost collision alerting systems . 102.1.3.2 Functionality and technical aspects of a quasi-
standard low-cost collision alerting system . . . . . . 102.1.3.3 Regulatory status in Europe . . . . . . . . . . . . . . . 122.1.3.4 Analysis and optimization of low-cost collision
alerting systems . . . . . . . . . . . . . . . . . . . . . . . 132.1.3.5 Midair collisions involving gliders with installed
collision alerting systems . . . . . . . . . . . . . . . . . 142.1.3.6 Need for research and research questions . . . . . . . 15
2.2 Selected aspects of aviation psychology . . . . . . . . . . . . . . . . . . 162.2.1 Situation awareness . . . . . . . . . . . . . . . . . . . . . . . . . . 172.2.2 Traffic awareness . . . . . . . . . . . . . . . . . . . . . . . . . . . . 182.2.3 Mental models . . . . . . . . . . . . . . . . . . . . . . . . . . . . . 182.2.4 Usability . . . . . . . . . . . . . . . . . . . . . . . . . . . . . . . . . 19
2.2.4.1 Measuring effectivity and its influence on trafficawareness . . . . . . . . . . . . . . . . . . . . . . . . . . 20
2.2.4.2 Measuring efficiency and its influence on workload . 212.2.4.3 Measuring user satisfaction . . . . . . . . . . . . . . . 21
2.3 Scientific novelties of the approach presented in this thesis . . . . . . 22
vii

3 Human-machine interfaces of low-cost collision alerting systems in glid-ing 23
3.1 Commercial-off-the-shelf human-machine interfaces . . . . . . . . . . . 233.1.1 Visual human-machine interfaces . . . . . . . . . . . . . . . . . . 26
3.1.1.1 Dedicated traffic displays . . . . . . . . . . . . . . . . . 263.1.1.2 Non-dedicated displays . . . . . . . . . . . . . . . . . . 35
3.1.2 Auditory human-machine interfaces . . . . . . . . . . . . . . . . 363.2 Closing the market gap: Developing a perspective traffic display in
gliding . . . . . . . . . . . . . . . . . . . . . . . . . . . . . . . . . . . . . . . 363.2.1 Conceptual design and prototypical implementation of a per-
spective traffic display . . . . . . . . . . . . . . . . . . . . . . . . . 383.2.1.1 Design process . . . . . . . . . . . . . . . . . . . . . . . 383.2.1.2 Display characteristics . . . . . . . . . . . . . . . . . . . 41
3.3 Hypotheses . . . . . . . . . . . . . . . . . . . . . . . . . . . . . . . . . . . . 43
4 Determining the influence of display formats on usability 47
4.1 Experiment design . . . . . . . . . . . . . . . . . . . . . . . . . . . . . . . 474.2 Participants . . . . . . . . . . . . . . . . . . . . . . . . . . . . . . . . . . . . 524.3 Equipment . . . . . . . . . . . . . . . . . . . . . . . . . . . . . . . . . . . . 534.4 Procedure . . . . . . . . . . . . . . . . . . . . . . . . . . . . . . . . . . . . . 574.5 Experimental task . . . . . . . . . . . . . . . . . . . . . . . . . . . . . . . . 60
4.5.1 Feedback during task . . . . . . . . . . . . . . . . . . . . . . . . . 614.6 Treatment of data and preliminary analysis . . . . . . . . . . . . . . . . 62
5 Results on usability and discussion of results 65
5.1 Visual search error (Hypothesis 1) . . . . . . . . . . . . . . . . . . . . . . 655.1.1 Results . . . . . . . . . . . . . . . . . . . . . . . . . . . . . . . . . . 665.1.2 Discussion . . . . . . . . . . . . . . . . . . . . . . . . . . . . . . . . 68
5.2 Explorative analysis: How different ways of showing distance influ-ence the visual search error . . . . . . . . . . . . . . . . . . . . . . . . . . 695.2.1 Results . . . . . . . . . . . . . . . . . . . . . . . . . . . . . . . . . . 705.2.2 Discussion . . . . . . . . . . . . . . . . . . . . . . . . . . . . . . . . 71
5.3 Reaction time (Hypothesis 2) . . . . . . . . . . . . . . . . . . . . . . . . . 735.3.1 Results . . . . . . . . . . . . . . . . . . . . . . . . . . . . . . . . . . 735.3.2 Discussion . . . . . . . . . . . . . . . . . . . . . . . . . . . . . . . . 74
5.4 User satisfaction (Hypothesis 3) . . . . . . . . . . . . . . . . . . . . . . . 755.4.1 Results . . . . . . . . . . . . . . . . . . . . . . . . . . . . . . . . . . 755.4.2 Discussion . . . . . . . . . . . . . . . . . . . . . . . . . . . . . . . . 76
viii Contents

5.5 Perceived learnability when suppressing familiarity effects . . . . . . . 775.5.1 Results . . . . . . . . . . . . . . . . . . . . . . . . . . . . . . . . . . 785.5.2 Discussion . . . . . . . . . . . . . . . . . . . . . . . . . . . . . . . . 79
5.6 Discussion of technology readiness and overall usability . . . . . . . . 795.7 Criticism of method and potential for future work . . . . . . . . . . . . 805.8 Practical implications of results on glider flight operations . . . . . . . 82
6 Explorative analysis of mental models and their underlying coordinatesystems 85
6.1 Introduction . . . . . . . . . . . . . . . . . . . . . . . . . . . . . . . . . . . 856.2 Method . . . . . . . . . . . . . . . . . . . . . . . . . . . . . . . . . . . . . . 86
6.2.1 An analytical modeling approach to identifying the mentalmodels used by glider pilots when interacting with collisionalerting systems . . . . . . . . . . . . . . . . . . . . . . . . . . . . 876.2.1.1 Proposing plausible mental models . . . . . . . . . . . 876.2.1.2 Predicting participants’ responses . . . . . . . . . . . . 906.2.1.3 Assessing the goodness of fit of each mental model . 936.2.1.4 Selecting the best-fitting mental model for each par-
ticipant . . . . . . . . . . . . . . . . . . . . . . . . . . . . 946.2.2 Verification . . . . . . . . . . . . . . . . . . . . . . . . . . . . . . . 946.2.3 Treatment of data . . . . . . . . . . . . . . . . . . . . . . . . . . . 94
6.3 Results and discussion . . . . . . . . . . . . . . . . . . . . . . . . . . . . . 946.3.1 Frequency of different mental models (Hypothesis 4) . . . . . 95
6.3.1.1 Results . . . . . . . . . . . . . . . . . . . . . . . . . . . . 966.3.1.2 Discussion . . . . . . . . . . . . . . . . . . . . . . . . . . 97
6.3.2 Pilot performance and different mental models (Hypothesis 5) 996.3.2.1 Results . . . . . . . . . . . . . . . . . . . . . . . . . . . . 996.3.2.2 Discussion . . . . . . . . . . . . . . . . . . . . . . . . . . 102
6.4 Conclusion . . . . . . . . . . . . . . . . . . . . . . . . . . . . . . . . . . . . 104
7 Summary and conclusions 107
7.1 Recommendations . . . . . . . . . . . . . . . . . . . . . . . . . . . . . . . . 1097.2 Future scientific work . . . . . . . . . . . . . . . . . . . . . . . . . . . . . 114
References 117
List of figures 131
Contents ix
List of tables 133
A Coordinate systems and transformations 135A.1 Coordinate systems . . . . . . . . . . . . . . . . . . . . . . . . . . . . . . . 135
A.1.1 Traffic pointer coordinate system . . . . . . . . . . . . . . . . . . 135A.1.2 Horizon- and track-fixed coordinate system . . . . . . . . . . . 136A.1.3 Ownship-fixed coordinate system . . . . . . . . . . . . . . . . . . 137A.1.4 Horizon- and heading-fixed coordinate system . . . . . . . . . . 137
A.2 Coordinate transformations . . . . . . . . . . . . . . . . . . . . . . . . . . 137A.2.1 Transformation from horizon- and track-fixed coordinates to
traffic pointer coordinates . . . . . . . . . . . . . . . . . . . . . . 138A.2.2 Transformation from ownship-fixed coordinates to traffic
pointer coordinates . . . . . . . . . . . . . . . . . . . . . . . . . . 139A.2.3 Transformation from horizon- and track-fixed coordinates to
horizon- and heading-fixed coordinates . . . . . . . . . . . . . . 140A.2.4 Transformation from horizon- and track-fixed coordinates to
ownship-fixed coordinates . . . . . . . . . . . . . . . . . . . . . . 141A.3 Describing differences between actual and suspected positions of traffic141
B Interpretation intervals for effect sizes 143B.1 Cramér’s V and Pearson’s bivariate r . . . . . . . . . . . . . . . . . . . . 143B.2 Pearson’s R2 . . . . . . . . . . . . . . . . . . . . . . . . . . . . . . . . . . . 143B.3 η2 and generalized η2 . . . . . . . . . . . . . . . . . . . . . . . . . . . . . 144
C Variations of flight experience and demography with display format 145
D Experimentally evaluating the answer sub-task 149D.1 Introduction . . . . . . . . . . . . . . . . . . . . . . . . . . . . . . . . . . . 149D.2 Method . . . . . . . . . . . . . . . . . . . . . . . . . . . . . . . . . . . . . . 150D.3 Results . . . . . . . . . . . . . . . . . . . . . . . . . . . . . . . . . . . . . . . 151D.4 Discussion . . . . . . . . . . . . . . . . . . . . . . . . . . . . . . . . . . . . 154
E Verifying the analytical modeling approach to identifying pilots’ mentalmodels 155E.1 Introduction . . . . . . . . . . . . . . . . . . . . . . . . . . . . . . . . . . . 155E.2 Method . . . . . . . . . . . . . . . . . . . . . . . . . . . . . . . . . . . . . . 156E.3 Results and discussion . . . . . . . . . . . . . . . . . . . . . . . . . . . . . 156E.4 Conclusion . . . . . . . . . . . . . . . . . . . . . . . . . . . . . . . . . . . . 158
x Contents
Nomenclature
ScalarsNotation Description
F(M ,N) Test score of F test with M numerator and N denominatordegrees of freedom
F ∗(M ,N) Test score of Brown and Forsythe’s robust ANOVA with M nu-merator and N denominator degrees of freedom
H Traffic’s rate of climbJ Cost functionM Mean of sampleP Test score of Page’s trend testR Slant distance to trafficRS Slant distance to traffic, as suspected by the pilotRH Horizontal distance to trafficR2 Ratio of explained variance in multiple regression model,
based on Pearson’s adjusted regression coefficientSD Standard deviation of sampleT (d f ) Test score of Student’s t test with d f degrees of freedomU Test score of Mann-Whitney testV Cramér’s V effect size
c Binary selection switchf Model factori Index of mental modelk Scaling parameter for display symbols and associated labelskε Mapping parameter for mapping elevation information to out-
the-window viewkρ Mapping parameter for mapping relative bearing information
to out-the-window viewp Statistic significancer Pearson’s bivariate correlation coefficient
Continued on next page
xi
Continued from previous page
Notation Description
reffect size Square-rooted ratio of contrast variance to total variancetR Reaction timew Weight of cost function summand
∆H Traffic’s altitude relative to ownship∆R Error in slant distanceΘ Pitch angleΛ Pillai-Bartlett traceΦ Bank angle∆γ Angular error magnitude between the traffic’s actual position
and it’s position as suspected by the pilot∆γ Square-root transformed visual search error∆δ Error in visual elevation∆τ Error in visual bearingχ2(d f ) Test score of χ2 or Fisher’s exact test with d f degrees of free-
dom
α Predefined significance level of testδ Visual elevationε Elevation of traffic, relative to horizontal planeη2 η2 effect size measureη2
G Generalized η2 effect size measure for repeated measures de-signs
ν Drift angleρ Bearing of traffic, relative to ownship’s ground trackτ Visual bearing
VectorsNotation Description
~X S Vector from the pilot’s ownship to the traffic’s position, as sus-pected by the pilot
~X T Vector from the pilot’s ownship to the traffic’s actual position
~x ,~y ,~z Cartesian coordinate axes
xii Nomenclature

MatricesNotation Description
I3 3× 3 identity matrixM Matrix of rotation
SuperscriptsNotation Description′,′′ ,′′′ ,′′′′ ,′′′′′ Intermediate coordinate systemsP Direction of traffic, as predicted by an mental modelS Direction of traffic, as suspected by the pilot
SubscriptsNotation Description
0 Zero-order term1 First-order term
ht Horizon- and track-fixed coordinate systemos Ownship-fixed coordinate systemp Perspective display formatr Radar-style display formatt p Traffic pointer coordinate system
Θ Pitch rotationΦ Bank rotation
ν Drift rotation
xiii
Mathematical NotationNotation Description
max Maximum of samplemin Minimum of sampleX Scalar X~X Vector ~XX Matrix XXt r Transposed Matrix of XX Temporal derivative of X∠�
~x ,~y�
Angle between intersecting vectors ~x and ~y|X | Absolute value of X
Acronyms
AHRS attitude and headingreference system
ANOVA analysis of variance
BFU German Federal Bureau ofAircraft AccidentInvestigation
CAS collision alerting system
COTS commercial off-the-shelf
CS coordinate system
FOV field of view
HMI human-machine interface
LED light-emitting diode
MAC midair collision
MANOVA multivariate analysis ofvariance
MM mental model
OTW out-the-window
SA situation awareness
SUS System Usability Scale
TA traffic awareness
TRL technology readiness level
xiv Nomenclature

1 IntroductionHistorically, gliding has been - and still is - a highly popular air sports activity inGermany as well as in other parts of the world. Gliders and motorgliders repre-sent about 51% of the aircraft registered by the German Federal Aviation Office[72]. Similarly, glider pilot licenses represent the majority of flight crew licensesregistered there [71]. While gliding is mostly an air sports activity – and therefore“flight for fun, or interest’s sake” [152, p. 18] – it represents an important part ofthe aviation community.
The gliding community is often a place of leisurely and sportive competitions.Gliding championships and spot landing contests are carried out frequently. Thissporting aspect is a source of technological development, ingenuity and research.Erb showed that sport aviation is the economically smallest branch of general avi-ation in Germany [49, p. 53]. However, especially the gliding community provideshigh quality technology spill-over to commercial aviation [pp. 163–165]; a factwhich is difficult to quantify in monetary units. Thorbeck noted that gliding re-search is “an [. . . ] incubator for [. . . ] aviation” [142]. He reasoned that it is asource of technological and operational ideas, an environment for conducting ba-sic and applied research and a source of future talents. Hence, one can argue thata functional gliding community is an integral part of the aviation system. Manynew technologies, such as composite materials and laminar flow airfoils [20, pp.105–114] as well as high aspect-ratio wings [pp. 148–158] have been developedfor soaring applications, with the know-how then being transferred to commercialapplications in powered aviation.
Collision avoidance in gliding is mainly achieved using the see and avoid prin-ciple. Wanting to help glider pilots achieve collision avoidance using this prin-ciple, another pioneering technology was introduced. Low-cost collision alertingsystems (CASs) have spread swiftly through the gliding community. The ground-breaking introduction of a viable and successful CAS was honored early-on by thegliding community. The design team of today’s quasi-standard FLARM CAS waspresented with the OSTIV-Prize in 2006 and with the Prince Alvaro de OrleansBorbon Grant in 2007 [63, p. 1].
Other general aviation operator communities continue to lack a low-cost col-lision alerting standard. The collision alerting standard mandated for transport-category aircraft [53, AUR.ACAS.1005] results in equipment to be too expensive
1

and complex to be considered low-cost. Many owners and operators of light air-craft not covered by this mandate may voluntarily install a CAS. Seeing that glidingis an incubator for aviation technologies, it is likely that standardized low-cost CASswill become more popular in other areas of aviation; a process that has already be-gun.
1.1 Aim of this thesis
Low-cost CASs are an emerging technology in gliding and all of general aviation.By accompanying this emerging technology with scientific research a benefit forthe user community of low-cost CASs as well as for the research community isexpected. It is the purpose of this thesis to provide scientific input and guidancefor future developments in the field of low-cost CASs. Another goal is to sensitizeglider pilots as well as flight instructors and training organizations about currentshortcomings of CASs. The thesis also documents recent technical developments inthe gliding community. Last but not least, it illustrates that human factors researchin gliding is necessary and accepted in the community.
1.2 Structure of this thesis
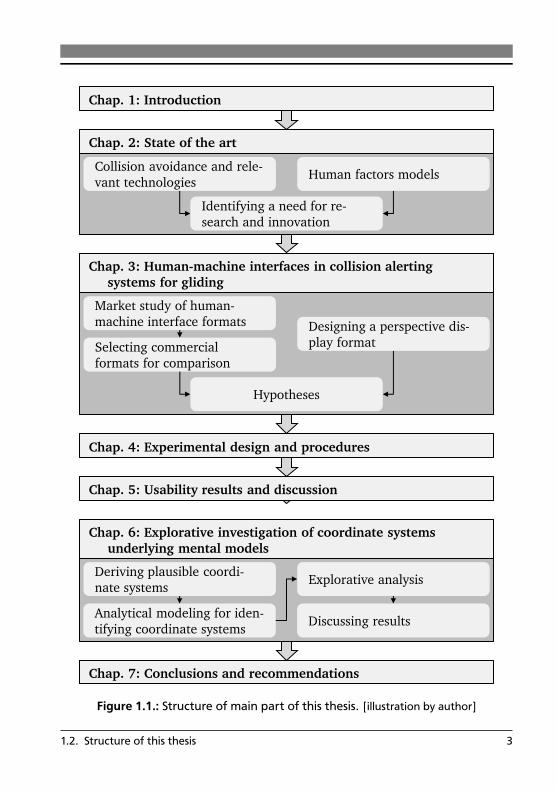
To aid the reader’s orientation when reading the thesis at hand, an overview ofits structure is given. The core structure, which mainly follows the conventions ofhuman factors research, is also visualized in Figure 1.1.
The first chapter introduces the topic of research and provides initial motivation.It demonstrates that research in the gliding field may provide benefits in terms oftechnological and scientific spill-over to other areas of aviation.
Chapter 2 begins with a description of contemporary glider flight operations andhow collision avoidance is achieved today. An overview of CASs in gliding is givenunder consideration of technical, legal and safety aspects. Furthermore, questionsabout the human-machine collaboration between glider pilots and CASs are pre-sented. As these questions regard the field of human factors research, a summaryof selected human factors models is given. In chapter 2 the scientific novelties ofthis thesis, namely a bilateral transfer of research and modeling methods betweenthe fields of aerospace engineering and aviation psychology, are discussed as well.
First findings on the human-machine interfaces (HMIs) used for CASs in glidingare presented in chapter 3. Using a market study, different commercial off-the-shelf HMIs formats are screened. A taxonomy for categorizing these HMIs isgiven and design characteristics of these HMIs formats are discussed. Two com-mercially available products, which are in widespread use, are chosen as a baseline
2 1. Introduction
Chap. 2: State of the art
Human factors models Collision avoidance and rele-
vant technologies
Identifying a need for re-
search and innovation
Chap. 4: Experimental design and procedures
Chap. 5: Usability results and discussion
Chap. 7: Conclusions and recommendations
Designing a perspective dis-
play format
Market study of human-
machine interface formats
Selecting commercial
formats for comparison
Hypotheses
Chap. 6: Explorative investigation of coordinate systems
underlying mental models
Explorative analysis Deriving plausible coordi-
nate systems
Analytical modeling for iden-
tifying coordinate systems Discussing results
Chap. 1: Introduction
Chap. 3: Human-machine interfaces in collision alerting
systems for gliding
Figure 1.1.: Structure of main part of this thesis. [illustration by author]
1.2. Structure of this thesis 3
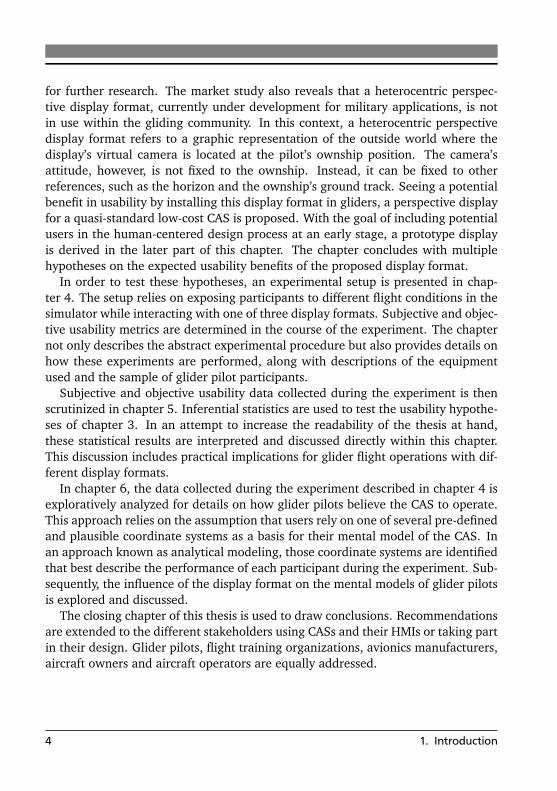
for further research. The market study also reveals that a heterocentric perspec-tive display format, currently under development for military applications, is notin use within the gliding community. In this context, a heterocentric perspectivedisplay format refers to a graphic representation of the outside world where thedisplay’s virtual camera is located at the pilot’s ownship position. The camera’sattitude, however, is not fixed to the ownship. Instead, it can be fixed to otherreferences, such as the horizon and the ownship’s ground track. Seeing a potentialbenefit in usability by installing this display format in gliders, a perspective displayfor a quasi-standard low-cost CAS is proposed. With the goal of including potentialusers in the human-centered design process at an early stage, a prototype displayis derived in the later part of this chapter. The chapter concludes with multiplehypotheses on the expected usability benefits of the proposed display format.
In order to test these hypotheses, an experimental setup is presented in chap-ter 4. The setup relies on exposing participants to different flight conditions in thesimulator while interacting with one of three display formats. Subjective and objec-tive usability metrics are determined in the course of the experiment. The chapternot only describes the abstract experimental procedure but also provides details onhow these experiments are performed, along with descriptions of the equipmentused and the sample of glider pilot participants.
Subjective and objective usability data collected during the experiment is thenscrutinized in chapter 5. Inferential statistics are used to test the usability hypothe-ses of chapter 3. In an attempt to increase the readability of the thesis at hand,these statistical results are interpreted and discussed directly within this chapter.This discussion includes practical implications for glider flight operations with dif-ferent display formats.
In chapter 6, the data collected during the experiment described in chapter 4 isexploratively analyzed for details on how glider pilots believe the CAS to operate.This approach relies on the assumption that users rely on one of several pre-definedand plausible coordinate systems as a basis for their mental model of the CAS. Inan approach known as analytical modeling, those coordinate systems are identifiedthat best describe the performance of each participant during the experiment. Sub-sequently, the influence of the display format on the mental models of glider pilotsis explored and discussed.
The closing chapter of this thesis is used to draw conclusions. Recommendationsare extended to the different stakeholders using CASs and their HMIs or taking partin their design. Glider pilots, flight training organizations, avionics manufacturers,aircraft owners and aircraft operators are equally addressed.
4 1. Introduction
2 State of the artThe current chapter provides an overview of contemporary glider flight operationsand how collision avoidance is achieved today. Because many glider pilots uselow-cost collision alerting systems (CASs), technical and legal aspects of such sys-tems are briefly discussed. Literature is reviewed to determine the state of the artof low-cost CASs regarding their analysis and optimization. As current researchdoes not analyze the human factors implications of these systems for gliding ap-plications, important human factors questions are raised. The second half of thischapter focuses on introducing the human factors tools required to answer thesequestions. The psychological constructs of situation awareness, traffic awareness,mental models and usability are presented. Ways of quantifying these constructsare also discussed. Chapter 2 closes by summarizing the scientific novelties pre-sented within this thesis. Several research methods are transferred between thefields of gliding research and human factors research.
2.1 Glider flight operations, collision avoidance and selected technologies
As mentioned in chapter 1, gliding is primarily a form of sport aviation. It is usuallyperformed by non-professionals outside of commercial or aerial work operations.Therefore it is a general aviation activity [88, p. 1-5]. However, this does not implythat gliding is unregulated. Training and licensing are required for glider pilots tooperate their aircraft.
While flying any heavier than air aircraft, aerodynamic drag of the aircraft diss-ipates energy [21, section 3.4.1]. Because gliders lack an engine to compensatethis energy dissipation, glider pilots must seek updrafts or other meteorologicalphenomena. Using these phenomena, gliders can remain airborne for extended pe-riods of time. Reichmann differentiated between five meteorological phenomenawhich are used in gliding to stay aloft [118, pp. 16–65].
Thermal updrafts are caused by solar radiation. Given a sufficiently unstable ver-tical temperature profile, convective cells develop. The core of these cellsconsists of rising air currents and can be several hundred meters wide [84,section 4.2]. Glider pilots usually circle in this core area to gain altitude.
5

Ridge lift is a form of forced convection. It develops whenever wind flows perpen-dicular to a long obstacle, such as a mountain ridge. The air mass is forcedover the obstacle and rising air exists at the windward side of the obstacle.
Mountain lee waves occur on the downwind side of mountain ridges or individ-ual mountains. These waves require a stable vertical temperature profileand adequate wind speeds [118, p. 56]. The updraft regions, which mayextend several kilometers laterally, are usually characterized by continuousand laminar vertical wind components.
Inversion waves require strong wind shear near the altitude of a temperature in-version. Their wandering location makes inversion waves difficult to use inpractical glider operations.
Dynamic soaring is a means of extracting energy from a wind field with verticalwind gradient [81]. Due to the high load factors required for continuousflight, this method of soaring is rarely used in manned applications.
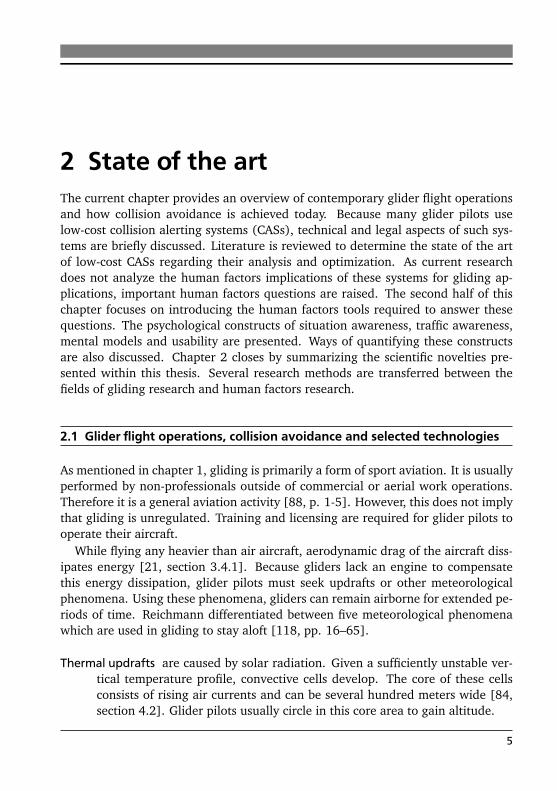
By far the most frequently used meteorological updraft phenomena in glidingare thermal updrafts and ridge lift. Since both updraft phenomena are extremelylimited in their lateral extensions, high local traffic densities of multiple gliders withan increased risk of collisions may occur. Figure 2.1 illustrates high local trafficdensities which may result in a thermal updraft during a gliding competition. Dueto the ever-present risk of a midair collision (MAC), glider pilots are specificallytrained for flights in proximity to other aircraft in these updrafts [75, section 2.5.1;58, chap. 10, sections “Thermal soaring” and “Ridge and slope soaring”].
2.1.1 Quantifying the risk of midair collisions in gliding
An inherent risk of MACs exists whenever multiple gliders fly in close proximity toone another. The German Federal Bureau of Aircraft Accident Investigation (BFU)registered a total of 1841 accidents involving gliders and motorgliders from theyear 2000 to 2013 (see Table 2.1) [73]. Out of these occurrences, a total of 267involved fatal injuries. MACs involving gliders or motorgliders made up 57 of theseaccidents. A total of 26 MACs resulted in fatalities.
Performing Fisher’s exact test on Table 2.1 revealed that the number of fatalaccidents was higher for MACs than for other accident categories. This was a small,yet non-negligible, effect;1 test score χ2(1) = 45.92, significance level α = .05,significance p < .01, Cramér’s V effect size V = .158.
1 The interpretation of effect sizes is discussed in appendix B.
6 2. State of the art
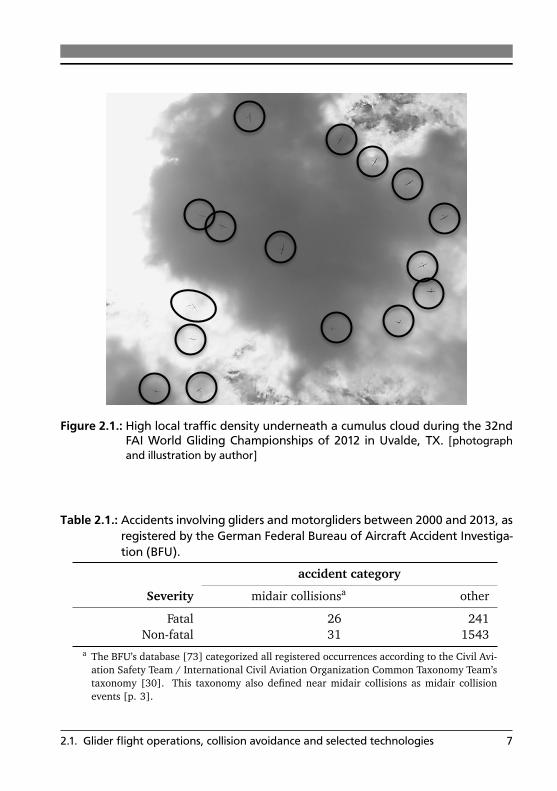
Figure 2.1.: High local traffic density underneath a cumulus cloud during the 32ndFAI World Gliding Championships of 2012 in Uvalde, TX. [photographand illustration by author]
Table 2.1.: Accidents involving gliders and motorgliders between 2000 and 2013, asregistered by the German Federal Bureau of Aircraft Accident Investiga-tion (BFU).
accident category
Severity midair collisionsa other
Fatal 26 241Non-fatal 31 1543
a The BFU’s database [73] categorized all registered occurrences according to the Civil Avi-ation Safety Team / International Civil Aviation Organization Common Taxonomy Team’staxonomy [30]. This taxonomy also defined near midair collisions as midair collisionevents [p. 3].
2.1. Glider flight operations, collision avoidance and selected technologies 7

MACs are rare, representing only 3.1% of all accidents. A similar value of 2.1%was reported by van Doorn and de Voogt in their analysis of United States glideraccidents between 2001 and 2005 [42]. However, MACs have a much higher riskof involving fatalities when occurring. While only 13.5% on non-MAC occurrencesare fatal, this ratio increases to 45.6% for MACs.
Causes and factors contributing to MACs of powered aircraft are generally well-documented [103; 140; 151] and internationally consistent [10]. In the mentionedliterature there is general agreement that most MACs share the following traits.
• The collisions occur in the vicinity of an airport at an altitude below 2000 ftabove ground level, and
• the collisions occur during daytime in good visual meteorological conditions.
Also, Shuch suspected that the quantitative risk of being involved in a MAC is prin-cipally overestimated by pilots [130]. He also estimated that, as pilot experienceincreases, the perceived risk of being involved in a MAC approaches the actual risk.
However, the previously mentioned research on characteristics and perceptionof MACs mostly focused on powered aircraft and did not analyze the peculiaritiesof glider flight operations. Janke et al. analyzed near-misses and MACs registeredby German authorities between 1980 and 2001 [89, section 5.4]. Apparently, near-misses and MACs in Germany are most common between gliders. According totheir assessment, 47.3% of German near-misses and MACs involved two gliders ormotorgliders that were both either thermaling or ridge soaring.
2.1.2 Collision avoidance in gliding
Gliding is almost exclusively carried out under visual flight rules during daytimein visual meteorological conditions. Air traffic control only provides separationbetween visual flight rules traffic in Class B airspace [55, SERA.6001]. In all otherairspace classes, no separation is provided by air traffic control, and thus, gliderpilots must self-separate.
Successful self-separation without the help of onboard tools or air traffic con-trol requires visually acquiring other traffic. This concept is known as the see andavoid principle. Because the traffic is visually acquired by human operators, a hu-man component exists in the air traffic system. Flight experiments conducted byAndrews demonstrated that see and avoid is a non-deterministic process [6]. Ac-cording to his work, the likelihood of visual detection of another aircraft dependedon a multitude of factors, including pilot alertness, target angular size, target con-trast and search time available to the pilot. Due to its stochastic nature see and
8 2. State of the art
avoid cannot always guarantee visual target acquisition, which is the prerequisitefor evasive maneuvering.
Generally, the lack of visual detection of another aircraft is without consequence,unless the aircraft are on a collision course. In the latter case, consequences can bedramatic, culminating in a MAC. The causes for overlooking traffic may be techni-cal, physiological or psychological. Technical causes can be wings or other airframecomponents shielding another aircraft from sight [89, p. 30]. Physiological reasonsmay include low target conspicuity, glare or lack of relative motion. Comprehensivediscussion of the aeromedical factors involved with vision processing can be foundin literature, such as in works by Gibb, Gray, and Scharff [74, chaps. 1–4], Amendt,Knebel, and Wolff [3] and Campbell and Bagshaw [27, section 3.2]. Psychologicalcauses are always present if an adequate physical stimulus for visual detection ofanother aircraft exists but this stimulus is not recognized by the pilot.
On a personal basis, the see and avoid principle is executed by the pilot as partof her or his visual scan. The visual scan is the procedure by which the pilot visuallysurveys the instrument panel as well as the out-the-window view. Guidance is pro-vided to pilots on how to perform these scans. For example, the Federal AviationAdministration [59, section 8-1-6. c.] and International Civil Aviation Organiza-tion [87, p. 8] recommended that pilots spend between 67% and 80% of their timevisually scanning for traffic in a structured pattern. However, Colvin, Dodhia, andDismukes challenged the guidance as being impracticable [33]. Also, the guidanceis directed at pilots of powered aircraft and not directly applicable to the specificsof glider flight operations. Apel emphasized that glider pilots must maintain a con-stant lookout, good situation awareness and a high degree of self-control wheneverthermaling with other gliders [7, section 2.9.4].
2.1.3 Collision alerting systems in gliding
Miniaturization and declining costs of electronic components in the late 1990s haveintroduced CASs as a whole new class of pilot assistance systems in the glidingcommunity. Literature revealed no definition for these low-cost CASs. Therefore,the following definition is introduced:
Definition 1: Low-cost collision alerting systems are a class of pilot as-sistance systems aimed at increasing pilot traffic awareness whilecomplying with the technical, operational and economic require-ments of sport aviation.
These systems usually attempt to increase the traffic awareness of pilots by guid-ing their attention to traffic and aiding in the traffic’s visual identification. Andrews
2.1. Glider flight operations, collision avoidance and selected technologies 9

showed that a well-designed CAS decreases the time needed to visually acquire traf-fic with a given likelihood by guiding the pilot’s gaze into the direction of the traffic[5, p. 37]. Accident investigators see CASs as commendable and practical tools foravoiding MACs [68, p. 12].
Several CASs developed specifically for gliding and air sports applications havebeen patented at the turn of the century. Systems based on satellite navigation[139] as well as radio direction-finding [116] have been proposed at the time.They fulfill the definition of a low-cost CAS. While not specifically developed forthe needs of the gliding community, several other sensing technologies are used incontemporary low-cost CASs worldwide. These include systems based on transpon-der signal analysis [67, section 6.2], Automatic Dependent Surveillance-Broadcast[section 7.3.2], and Traffic Information Service-Broadcast [section 7.3.1].
2.1.3.1 Proliferation of low-cost collision alerting systems
While not required under European air law [54], low-cost CASs have become pop-ular in the European gliding community. 135 of 137 glider pilots participating inthe experiments presented in this thesis have flight experience with low-cost CASs.
A statement by the Swiss Civil Aviation Safety Officer offered a glimpse into thedistribution mechanisms.
The rapid distribution of such [low-cost collision alerting] systemsonly a few months after their introduction was not accomplishedthrough regulatory measures, but rather on a voluntary basis and asa result of the wish on the part of the involved players to contributetowards the reduction of collision risk. [137, p. 103]
This indicated that social mechanisms were apparently involved in the distributionof low-cost CASs. These mechanisms may include concerns for pilot’s safety as wellas social pressures exerted onto the owner or operator.
2.1.3.2 Functionality and technical aspects of a quasi-standard low-costcollision alerting system
According to an unpublished survey of 699 German glider pilots by Steinmetz andGerber, a commercial product derived from a European patent [139] is establishedas a quasi-standard of low-cost CAS for gliding applications in Germany [134].
10 2. State of the art

This CAS product is known as the FLARM2 system. According to the manufacturer“FLARM is designed and built as a non-essential ’situation awareness only’ unit toonly support the pilot, and cannot always provide reliable warnings. In particular,FLARM does not give any guidance on avoiding action” [64, p. 11].
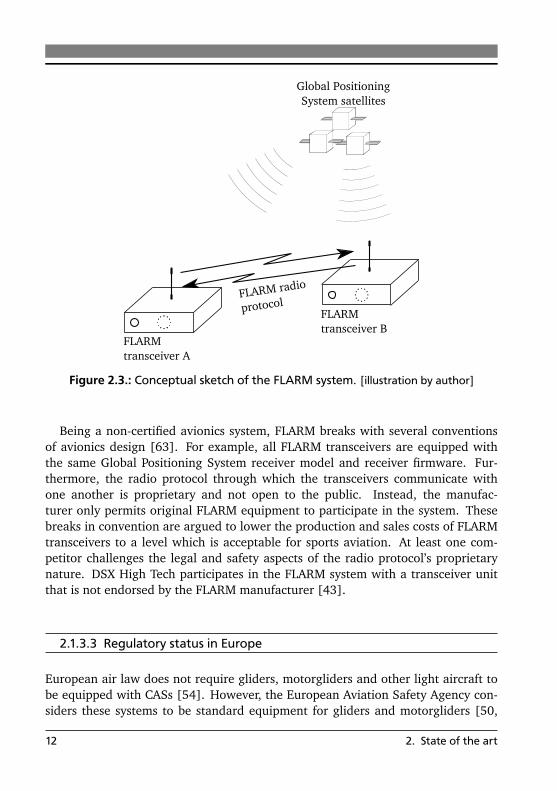
The quasi-standard FLARM CAS was introduced as a commercial product in2004. It was specifically developed for the requirements of the gliding community[123]. It is a cooperative CAS, requiring all participating aircraft to be equippedwith a compatible transceiver box (Figure 2.2). Each transceiver box determinesits own position and track velocity using Global Positioning System and barometricmeasurements. This position and velocity information is then broadcast to othertransceivers using a proprietary radio protocol. Each transceiver uses flight phaseand threat detection algorithms to assign threat levels to the received traffic [64,pp. 2–3]. This threat information is displayed on a simple human-machine in-terface (HMI) integrated into the transceiver’s front. The integrated HMI has thecapability to show only one traffic aircraft at a time. However, information on alltraffic received can be passed to third-party HMI devices through a publicly docu-mented data port [65]. The system’s operating principle is illustrated in Figure 2.3.
Figure 2.2.: FLARM transceiver box of hardware version 3. [photograph by author]
Also, no attitude and heading reference system is incorporated into the FLARMsystem. While this decreases system complexity along with development and pro-duction costs, it has a major influence on HMI design, as will be shown in chapter 3.All traffic information must be derivable from geo-referenced Global PositioningSystem measurements.
2 In some literature FLARM is defined as FLight AlaRM. However the manufacturer, FLARM Tech-nology GmbH of Baar, Switzerland, does not utilize this definition. Instead, the term FLARM isused as a proprietary trade name.
2.1. Glider flight operations, collision avoidance and selected technologies 11
FLARM
transceiver A
FLARM
transceiver B
Global Positioning
System satellites
FLARM radio
protocol
Figure 2.3.: Conceptual sketch of the FLARM system. [illustration by author]
Being a non-certified avionics system, FLARM breaks with several conventionsof avionics design [63]. For example, all FLARM transceivers are equipped withthe same Global Positioning System receiver model and receiver firmware. Fur-thermore, the radio protocol through which the transceivers communicate withone another is proprietary and not open to the public. Instead, the manufac-turer only permits original FLARM equipment to participate in the system. Thesebreaks in convention are argued to lower the production and sales costs of FLARMtransceivers to a level which is acceptable for sports aviation. At least one com-petitor challenges the legal and safety aspects of the radio protocol’s proprietarynature. DSX High Tech participates in the FLARM system with a transceiver unitthat is not endorsed by the FLARM manufacturer [43].
2.1.3.3 Regulatory status in Europe
European air law does not require gliders, motorgliders and other light aircraft tobe equipped with CASs [54]. However, the European Aviation Safety Agency con-siders these systems to be standard equipment for gliders and motorgliders [50,
12 2. State of the art
AMC 21.A.303(c)]. By taking this approach, CAS manufacturers are able to cir-cumvent a costly certification process for their products.
Also, self-regulation within the gliding community makes carrying the quasi-standard FLARM system mandatory in some regions. The French Gliding Feder-ation requires FLARM to be installed on all gliders and tow planes operated byits clubs [121]. Furthermore, recommendations were extended by de Boer to theInternational Gliding Commission to honor the use of low-cost CASs in its contestregulations [18].
2.1.3.4 Analysis and optimization of low-cost collision alerting systems
Janke et al. considered FLARM to be the most promising of four low-cost CASs un-der development at the time of their study [89, pp. 80–83]. However, the authorsdid caution that FLARM would need to be evaluated once being more widely estab-lished. Since then, several technological improvements and studies of the systemhave taken place.
Influences of high traffic densities on the FLARM radio protocol were studied bySchuler [127] and Berweger and Schuler [16]. Their work showed that the radioprotocol is adequate even for extremely high traffic densities. A German patentsuggested that there is potential for improving the antenna hardware of FLARM[40]. Baumgartner and Maeder also proposed improvements to FLARM’s flightphase detection algorithms [14]. According to their work, there is potential forimproving the algorithms in high-wind conditions.
According to FLARM Technology, the design of HMIs is left to industrial partners[63, p. 3]. These external HMIs rely on being fed with the data stream from eachFLARM transceiver [65]. From a human factors perspective, proper HMI designis important since the HMI “acts as a medium between some aspects of the actualinformation in a system [...] and the operator’s perception and awareness of whatthe system is doing, what needs to be done, and how the system functions (themental model)” [155, p. 185].
However, literature research revealed no studies or comprehensive guidance ma-terial discussing human-machine collaboration for the case of low-cost CASs ingliding. Only trivial guidance, such as the recommendation that CASs “shouldhave audio warnings and direct your eyes to the ’threat’” [57, p. 18], is given.This suspicion was fortified by representatives of companies offering FLARM-compatible HMIs.3 The research available focused on how pilots of commercialaircraft [13; 150] and powered general aviation aircraft [77; 78; 157] interact
3 J. Garrecht, personal communication, August 22, 2011; M. Förderer, personal communication,September 24, 2012
2.1. Glider flight operations, collision avoidance and selected technologies 13

with CASs and their HMIs. Generalizing this knowledge to gliding applicationsdoes not seem prudent. The operational demands in glider flight operations aresuspected to be much too different compared to aviation operations.
2.1.3.5 Midair collisions involving gliders with installed collision alertingsystems
Accident investigators repeatedly recommended equipping general aviation aircraftwith CASs to reduce the number of MACs [76; 82]. However, CASs have not beenable to prevent all MACs. Multiple collisions between gliders and/or motorglidersequipped with operational CASs have occurred in Germany [92], Finland [95] andthe United States [105, NTSB Accident ID CEN12LA553AB]. Neis discussed thatnot only technical aspects - but also human factors - contributed to this series ofMACs [107]. The reports from Knoll et al. [92, p. 8] as well as Laine et al. [95, p.15] describe insufficient traffic awareness of the pilots involved as factors duringthese accidents. Knoll et al. also reported a contributing cause. The glider pilots didnot adequately interpret CAS signals. The low-cost CASs installed in the involvedgliders did not fulfill their design goal of increasing pilots’ traffic awareness to asufficient level.
In order to test whether the annual rate of MACs involving gliders has declinedsince the introduction of FLARM, the BFU’s accident data of Table 2.1 was analyzedfurther [73]. The annual number of BFU-registered MACs involving gliders is de-picted in Figure 2.4. The annual MAC rate of the pre-FLARM years of 2000 through2006 was compared to the more recent years, when FLARM was established. Noexact data on how fast FLARM established itself in the German gliding communitywas available. However, Scherer first discussed the system in a pilot’s magazines in2006 [123]. It was assumed that FLARM reached its status as a quasi-standard bythe end of that year.
Twenty-nine MACs occurred between the years of 2000 and 2006 whereastwenty-eight collisions took place from 2007 to 2013. A one-sided two-samplet test for equal variances4 was performed on the data. It provides statisticallyinsignificant results (test score T (12) = 0.17, p = .43). The data provides no in-dication that the introduction of FLARM has reduced the annual rate of glider andmotorglider MACs.5 While not yet statistically traceable, BFU investigators still sus-
4 A Levene test of the data’s variances provided statistically insignificant results.5 To determine the annual rate of MACs, normalizing data on the annual flight time or number
of flights is required. Unfortunately, no reliable data is available at the time of this writing.The European Aviation Safety Agency is currently gathering this information for future safetyassessments [51, p. 5; 52, p. 4].
14 2. State of the art
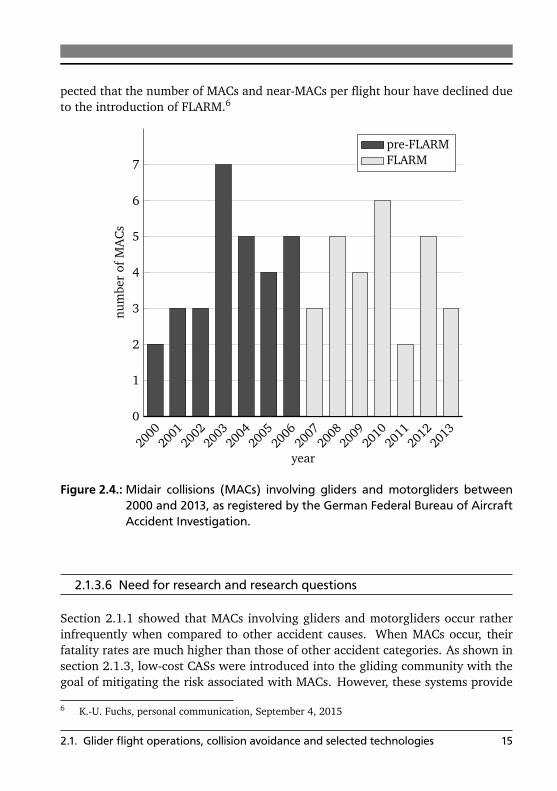
pected that the number of MACs and near-MACs per flight hour have declined dueto the introduction of FLARM.6
0
1
2
3
4
5
6
7
2000
2001
2002
2003
2004
2005
2006
2007
2008
2009
2010
2011
2012
2013
year
num
ber
ofM
AC
s
pre-FLARMFLARM
Figure 2.4.: Midair collisions (MACs) involving gliders and motorgliders between2000 and 2013, as registered by the German Federal Bureau of AircraftAccident Investigation.
2.1.3.6 Need for research and research questions
Section 2.1.1 showed that MACs involving gliders and motorgliders occur ratherinfrequently when compared to other accident causes. When MACs occur, theirfatality rates are much higher than those of other accident categories. As shown insection 2.1.3, low-cost CASs were introduced into the gliding community with thegoal of mitigating the risk associated with MACs. However, these systems provide
6 K.-U. Fuchs, personal communication, September 4, 2015
2.1. Glider flight operations, collision avoidance and selected technologies 15

no absolute protection against MACs and the annual rate of MACs in the Germangliding community has not dropped notably since the introduction of low-cost CASs(section 2.1.3.5). One factor possibly contributing to the collision of CAS-equippedgliders is inadequate traffic awareness of the flight crews involved, associated withimproper comprehension of the HMI signals presented to the pilots. When wishingto prevent this contributing factor from occurring in future accidents, it is necessaryto understand how HMIs of CASs in gliding can be misinterpreted. Then non-ambiguous HMIs can be designed. However, guidance material on proper HMIdesign for the application at hand is lacking in literature. This reveals a scientificneed to study the HMIs of low-cost CASs in gliding applications.
Research questions may be:
• Do current HMIs of low-cost CASs adequately assist glider pilots in visuallyacquiring and avoiding conflicting traffic?
• Do they assist in increasing the pilots’ traffic awareness?
• How can current HMIs be improved to increase the usability of low-cost CASsfor gliding applications?
All of these questions discuss how low-cost CASs influence the pilot. Seeingthat the pilot has to act upon the information presented, the discussion becomesa matter of how low-cost CASs influence the pilot’s behavior. The nature of thesequestions is outside the scope of a purely technical discussion. Instead they belongto the field of aviation psychology and usability research. In the following section,an overview of psychological constructs used to answer these questions is given.
2.2 Selected aspects of aviation psychology
The preceding section shows that collision avoidance in glider flight operationsis not solely achieved through technical means. Instead, the pilot must interpretthe information shown on the CAS’s HMI and determine “what needs to be done”[155, p. 185] to avoid a potential collision. This requires the pilot to have adequateawareness of the traffic nearby as well as an understanding of how the CAS works.How well this awareness is supported by the low-cost CAS is a question of howusable the system is for this task. Adequate usability can be achieved by appropriatedesign processes.
16 2. State of the art

2.2.1 Situation awareness
A term often mentioned in discussions of pilot assistance systems is the concept ofsituation awareness (SA) [64, p. 11]. Endsley provided a commonly used definitionof the concept. “Situation Awareness is the perception of the elements in the envi-ronment within a volume of time and space, the comprehension of their meaning,and the projection of their status in the near future” [46, p.792]. This definitiondescribes SA as a multi-level process, which was also discussed by Endsley, Bolté,and Jones [48, chap. 2].
1. Perception As a first step environmental elements must be perceived by thephysical cues they offer to the pilot.
2. Comprehension After physical cues are observed, they can be integratedinto an understanding of the current state of the elements and compared totheir goals and intentions.
3. Prediction Based on the comprehension of the current states and their de-viation from the goals of the elements, the pilot is capable of estimating theelements’ future states. This is a prediction of element behavior.
Durso and Alexander showed that SA is not an independent construct, butclosely intertwined with other concepts of aviation psychology [44]. Any changein SA leads to changes in the pilot’s performance and workload and vice versa.They also argued that SA can be quantified by implicit performance metrics. Forexample, it is possible to task the pilot with providing her or his estimate of trafficposition and define the pilot’s error in relation to the actual traffic position as a SAmeasure [pp. 225–226]. Also, it is possible to use the pilot’s response times to “themain task of interest” [p. 230] as a workload measure.
Nevertheless, SA as a concept is not free of criticism. Dekker and Hollnagelconsidered SA to be a folk model in human factors [36], which (a) is prone tofocus “on descriptions rather than explanations” [p. 80], (b) is being resistant tofalsifications and (c) leads often to overgeneralization. However, Parasuraman,Sheridan, and Wickens particularly rejected Dekker and Hollnagel’s criticism onthe lack of falsifiability of SA [115].
Casner cautioned about the role of advanced cockpit systems, such as low-costCASs, in the general aviation cockpit [29, pp. 604–607]. In many situations, thesesystems may have detrimental effects on SA, workload and performance. Thiscaution serves as a further motivation for the research presented. It also leads tothe question of how the detrimental impact of these systems may be reduced.
2.2. Selected aspects of aviation psychology 17
2.2.2 Traffic awareness
In the preceding sections, the concept of traffic awareness (TA) was implicitly dis-cussed. It was also an explicit part of Definition 1. Literature treated TA mainly byworking descriptions and categorizations, without offering an explicit definition.
Alexander and Wickens described TA to be “one of a general class of situationawareness (SA) measures which assesses the pilot’s accurate and timely under-standing of the representation of traffic in 3D space” [2, p. 171]. According toWickens TA is a subcategory of spatial awareness [153] while Uhlarik and Comer-ford described it as a surveillance-category component of SA [148, p. 14]. In bothcases TA was considered to be a subcategory of SA. Therefore, it is subject to thesame influences as SA.
For this thesis an explicit definition of TA is introduced. It is defined in analogyto Endsley’s definition of SA [46].
Definition 2: Traffic awareness is the perception of other aircraft onthe ground and in the air within a volume of time and space, thecomprehension of their current phase of flight and flight state, andprojection of their future positions, intentions and maneuvers.
The multi-level structure of SA is retained in this definition of TA. It is illustratedin Figure 2.5. In the case of visual flight rules operations TA should not be derivedfrom the CAS alone, but rather from the out-the-window view.7
2.2.3 Mental models
In order to comprehend (level 2 SA/TA) and predict (level 3 SA/TA) how an ar-bitrary system - such as a CAS - behaves, the pilot must have an idea of how thesystem functions [47]. This idea is often referred to as being the pilot’s mentalmodel (MM) of the system. Rouse and Morris defined MMs as being “the mech-anisms whereby humans are able to generate descriptions of system purpose andform, explanations of system functioning and observed system states, and predic-tions of future system states” [122, p. 7].
Such MMs can take on many shapes, from a mere black box correlation betweeninput and output to an intricate understanding of the system’s internal processes.The models are also subject to change over time, being influenced by the pilot’s
7 In commercial and military aviation, the context of receiving traffic information is different.Traffic is often beyond visual range, and therefore out of sight. In this case TA must be derivedfrom the HMIs alone.
18 2. State of the art
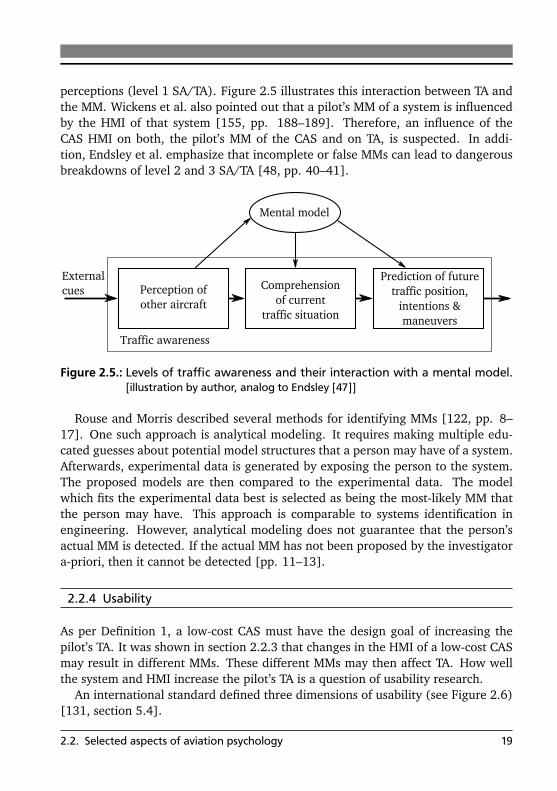
perceptions (level 1 SA/TA). Figure 2.5 illustrates this interaction between TA andthe MM. Wickens et al. also pointed out that a pilot’s MM of a system is influencedby the HMI of that system [155, pp. 188–189]. Therefore, an influence of theCAS HMI on both, the pilot’s MM of the CAS and on TA, is suspected. In addi-tion, Endsley et al. emphasize that incomplete or false MMs can lead to dangerousbreakdowns of level 2 and 3 SA/TA [48, pp. 40–41].
External
cues Perception of
other aircraft
Comprehension
of current
traffic situation
Prediction of future
traffic position,
intentions &
maneuvers
Traffic awareness
Mental model
Figure 2.5.: Levels of traffic awareness and their interaction with a mental model.[illustration by author, analog to Endsley [47]]
Rouse and Morris described several methods for identifying MMs [122, pp. 8–17]. One such approach is analytical modeling. It requires making multiple edu-cated guesses about potential model structures that a person may have of a system.Afterwards, experimental data is generated by exposing the person to the system.The proposed models are then compared to the experimental data. The modelwhich fits the experimental data best is selected as being the most-likely MM thatthe person may have. This approach is comparable to systems identification inengineering. However, analytical modeling does not guarantee that the person’sactual MM is detected. If the actual MM has not been proposed by the investigatora-priori, then it cannot be detected [pp. 11–13].
2.2.4 Usability
As per Definition 1, a low-cost CAS must have the design goal of increasing thepilot’s TA. It was shown in section 2.2.3 that changes in the HMI of a low-cost CASmay result in different MMs. These different MMs may then affect TA. How wellthe system and HMI increase the pilot’s TA is a question of usability research.
An international standard defined three dimensions of usability (see Figure 2.6)[131, section 5.4].
2.2. Selected aspects of aviation psychology 19

Effectivity is one of two user objective performance dimensions of usability. Itmeasures the precision and completeness of how a user performs her or histask with using a system.
Efficiency is the second objective performance dimension. It relates the effectivityto the user’s effort. Different dimensions of effort are the time spent on atask, as well as cognitive, material and monetary effort.
User satisfaction is a subjective measure of the user’s experience while interactingwith the system. It reflects whether the user considers the system to be freeof deficits. In general, satisfaction regards the user’s attitude towards thesystem.
Usability
Effectivity Efficiency
User satisfaction
Performance
Figure 2.6.: Dimensions of usability. [illustration by author]
Bevan and MacLeod clarified that usability is not only an attribute of a system,but must be seen in context of the task that the user performs with the system [17].Gliding is a complex task performed by glider pilots while attending to multiple sub-tasks. One of these sub-tasks is the visual identification of nearby traffic. Ideally, itis supported by a CAS.
2.2.4.1 Measuring effectivity and its influence on traffic awareness
In this thesis, effectivity describes how accurately the HMI of a low-cost CAS guidesthe glider pilot’s glance into the direction of the indicated traffic. If the pilot’sglance is guided into the direct vicinity of traffic, it should be simple for the pilotto visually identify the traffic. Therefore, TA should be good.
Before consciously moving their glance to the direction of suspected traffic, thepilots must form an idea where the traffic may be located. When ~X T is the vector
20 2. State of the art

from the pilot’s ownship to the traffic’s actual location, and ~X S is the vector to thetraffic’s location as suspected by the pilot, then the angular error ∆γ= ∠
�
~X T , ~X S�
can be determined. Whenever the angular error is low, then effectivity is high andvice versa.
Durso and Alexander pointed out that the pilot’s estimation of traffic position isnot only a measure of effectivity but also an implicit performance measure of TA[44, p. 223]. As mentioned above, higher effectivity (lower angular errors) willlead to swifter visual traffic identification (perception; level 1 TA) by the pilot andtherefore result in better TA.
2.2.4.2 Measuring efficiency and its influence on workload
In the study at hand, efficiency is considered to be the relationship between effec-tivity and the glider pilot’s workload experienced during the task of locating trafficwith the CAS. Reaction times to the task of estimating traffic locations from a CASHMI are a primary task performance measure of workload [44, p. 230]. Therefore,reaction times influence efficiency. This relationship between effectivity and reac-tion times is classified as temporal efficiency [17], which will be the focus of thisthesis.
Piloting an aircraft is a process placing multi-task demands on the pilot, resultingin a certain level of workload [154]. Popular workload measures in aviation includephysiological and subjective self-reporting measures [79]. Because reaction timesare sensitive to workload and correlate positively with an increase in workload[109, p. 42-21], temporal efficiency was identified as a key efficiency category.Thus, temporal efficiency was isolated and studied in a laboratory environmentusing a single task being performed by participants.
2.2.4.3 Measuring user satisfaction
User satisfaction measures how well-designed the pilot thinks the low-cost CASand its HMI is for the task of locating other traffic. This subjective assessmentcan be quantified using the System Usability Scale (SUS) [23]. The SUS score isdetermined using a 10 question Likert scale, administered to the user after havingworked with the system. Adjective interpretation guidance for SUS scores wasprovided by Bangor, Kortum, and Miller [12]. The SUS score can be decomposedinto two subscores [96]. These are the usability score and the learnability score.These subscales respectively quantify the user’s perceived effort in working with asystem or learning how to use that system. The remainder of this thesis focuses onthe SUS-derived usability and learnability scores as measures of user satisfaction.
2.2. Selected aspects of aviation psychology 21

2.3 Scientific novelties of the approach presented in this thesis
The thesis at hand attempts to contribute to the scientific body of knowledge inseveral ways. On a methodical level, it exchanges research methods between thefields of gliding research and human factors research (see Figure 2.7). Usability re-search methods, such as questionnaires and laboratory experiments, are applied toa technical system in gliding (chapters 4 and 5). While this is not new to aerospaceresearch in general, gliding has hardly been studied using such human factors ap-proaches. Also the mathematical methods of inferential statistics are uncommonthere. The thesis at hand should be seen as a step beyond the efforts of Jarvis [90]and Morgenstern [102] at establishing human factors research methods in gliding.
Human factors
researchGliding research
Flight mechanics
coordinate systems
Usability analyses
Guidance to
stakeholders
Figure 2.7.: Transfer of research methods in the thesis at hand. [illustration by au-thor]
A transfer of research methods also exists in the opposite direction. In chapter 6,multiple coordinate systems are proposed which may form the basis of MMs devel-oped by glider pilots. The concept of coordinate systems and coordinate transfor-mations relies on the mathematical tools of linear algebra. These are often found inflight mechanics and gliding research, yet are rarely used in human factors work.This exchange of research methods is not an end in itself. Instead, these meth-ods are pooled and funneled with the goal of answering the research questions ofsection 2.1.3.6. The answers gained using this approach allows for guiding rec-ommendations about low-cost CASs to be extended to different stakeholders in thegliding community (chapter 7).
22 2. State of the art
3 Human-machine interfaces oflow-cost collision alerting systemsin gliding
Low-cost collision alerting systems (CASs) must be equipped with some form ofhuman-machine interface (HMI) in order to convey their information to the gliderpilot. In the first part of this chapter, an overview on commercially available HMIsfor low-cost CASs in gliding is provided. From this market overview it is evidentthat a perspective display format has not yet found its way into the glider cockpit.Therefore, a prototypical perspective traffic display format for gliding is proposed.This perspective display format also relies on a horizon-fixed camera attitude. Itis conceptually designed in the second part of this chapter. At the end of thischapter the characteristics of this novel display format is compared to two typicalcommercial off-the-shelf (COTS) formats. This leads to multiple hypotheses aboutdifferences in usability.
3.1 Commercial-off-the-shelf human-machine interfaces
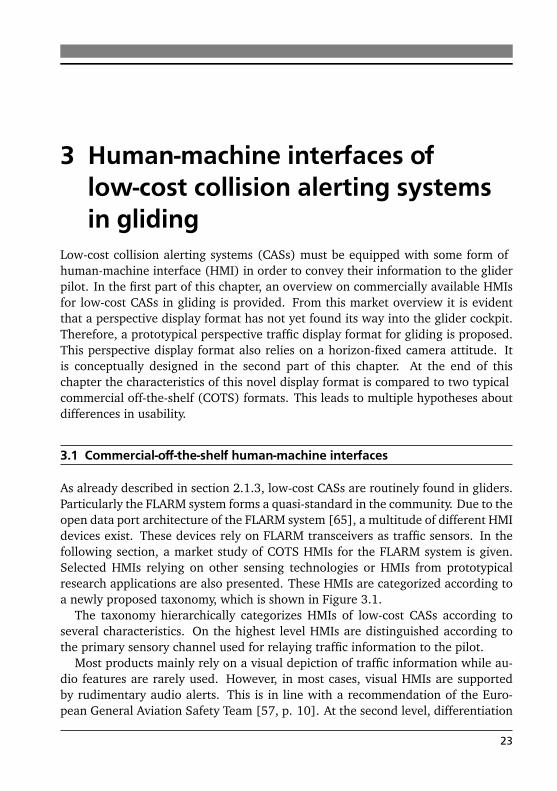
As already described in section 2.1.3, low-cost CASs are routinely found in gliders.Particularly the FLARM system forms a quasi-standard in the community. Due to theopen data port architecture of the FLARM system [65], a multitude of different HMIdevices exist. These devices rely on FLARM transceivers as traffic sensors. In thefollowing section, a market study of COTS HMIs for the FLARM system is given.Selected HMIs relying on other sensing technologies or HMIs from prototypicalresearch applications are also presented. These HMIs are categorized according toa newly proposed taxonomy, which is shown in Figure 3.1.
The taxonomy hierarchically categorizes HMIs of low-cost CASs according toseveral characteristics. On the highest level HMIs are distinguished according tothe primary sensory channel used for relaying traffic information to the pilot.
Most products mainly rely on a visual depiction of traffic information while au-dio features are rarely used. However, in most cases, visual HMIs are supportedby rudimentary audio alerts. This is in line with a recommendation of the Euro-pean General Aviation Safety Team [57, p. 10]. At the second level, differentiation
23
vis
ual
au
dit
ory
ded
icate
dn
on
-ded
icate
dd
ed
icate
dn
on
-ded
icate
d
low
-com
ple
xit
yh
igh
-com
ple
xit
ylo
w-c
om
ple
xit
y
...
...
pri
mary
sen
sory
chan
nel
info
rmati
on
cate
gory
pre
sen
tati
on
com
ple
xity
hu
man
-mach
ine i
nte
rface
s
hig
h-c
om
ple
xit
y
Figu
re3.
1.:T
axon
omy
for
cate
goriz
ing
hum
an-m
achi
nein
terf
aces
oflo
w-c
ost
colli
sion
aler
ting
syst
ems.
[illu
stra
tion
byau
thor
]
24 3. Human-machine interfaces of low-cost collision alerting systems in gliding

is achieved according to the level of dedication. Some products are dedicated tothe task of relaying traffic information to the pilot. Other products integrate thisinformation along with other information, such as terrain and airspace warnings.Presentation complexity is used to differentiate HMI at the third level. Categorizingdedicated auditory and dedicated visual HMIs according to their presentation com-plexity leads to several clearly definable groups of COTS products. Non-dedicatedHMIs are much harder to define using this approach, since the number of non-traffic-related data elements which could possibly be relayed to the glider pilotis quasi infinite. Therefore, these non-dedicated HMIs are only briefly discussedfarther below.
Multiple definitions are introduced as the basis of the HMI taxonomy:
Definition 3: Dedicated traffic HMIs convey only information to thepilot regarding other aircraft in the vicinity of the pilot’s ownship,as processed by a CAS, as well as information on the operatingstatus1 of the CAS.
Definition 4: Non-dedicated traffic HMIs integrate traffic informationfrom a CAS along with information from arbitrary other systems.
Definition 5: Low-complexity traffic displays are dedicated trafficHMIs with a limited number of individually controlled lightedelements. The illumination of each individual element is linkedto a unique meaning.2 One additional information element - suchas distance to the traffic - may be presented alphanumerically.
Definition 6: High-complexity traffic displays are dedicated trafficHMIs with a high number of individually controlled lighted el-ements. A meaning is not derived from the illumination of anindividual element, but much rather from grouping illuminatedelements to form symbols and alphanumeric characters.
Definition 7: Low-complexity auditory traffic HMIs are dedicatedHMIs which relay only limited traffic information to the pilot viaaudio signals. This information is limited to the existence of othertraffic and the severity of collision threats. It is relayed throughrudimentary alert signals, such as gongs, chimes or beepers.
1 The operating status of the CAS can be influenced by characteristics such as electrical power, in-formation exchanged via the radio transceiver, or Global Positioning System position fix quality.
2 For example, the illumination of a certain element may mean that traffic is located within acertain angular interval above the horizon.
3.1. Commercial-off-the-shelf human-machine interfaces 25
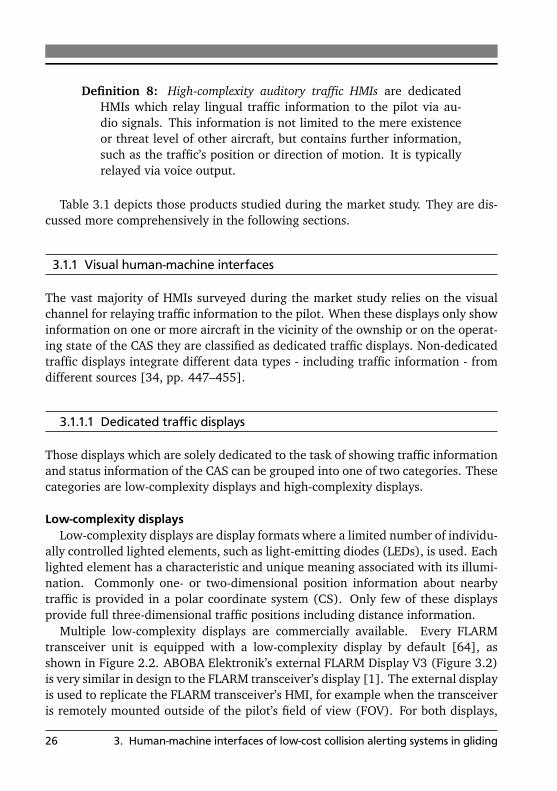
Definition 8: High-complexity auditory traffic HMIs are dedicatedHMIs which relay lingual traffic information to the pilot via au-dio signals. This information is not limited to the mere existenceor threat level of other aircraft, but contains further information,such as the traffic’s position or direction of motion. It is typicallyrelayed via voice output.
Table 3.1 depicts those products studied during the market study. They are dis-cussed more comprehensively in the following sections.
3.1.1 Visual human-machine interfaces
The vast majority of HMIs surveyed during the market study relies on the visualchannel for relaying traffic information to the pilot. When these displays only showinformation on one or more aircraft in the vicinity of the ownship or on the operat-ing state of the CAS they are classified as dedicated traffic displays. Non-dedicatedtraffic displays integrate different data types - including traffic information - fromdifferent sources [34, pp. 447–455].
3.1.1.1 Dedicated traffic displays
Those displays which are solely dedicated to the task of showing traffic informationand status information of the CAS can be grouped into one of two categories. Thesecategories are low-complexity displays and high-complexity displays.
Low-complexity displaysLow-complexity displays are display formats where a limited number of individu-
ally controlled lighted elements, such as light-emitting diodes (LEDs), is used. Eachlighted element has a characteristic and unique meaning associated with its illumi-nation. Commonly one- or two-dimensional position information about nearbytraffic is provided in a polar coordinate system (CS). Only few of these displaysprovide full three-dimensional traffic positions including distance information.
Multiple low-complexity displays are commercially available. Every FLARMtransceiver unit is equipped with a low-complexity display by default [64], asshown in Figure 2.2. ABOBA Elektronik’s external FLARM Display V3 (Figure 3.2)is very similar in design to the FLARM transceiver’s display [1]. The external displayis used to replicate the FLARM transceiver’s HMI, for example when the transceiveris remotely mounted outside of the pilot’s field of view (FOV). For both displays,
26 3. Human-machine interfaces of low-cost collision alerting systems in gliding
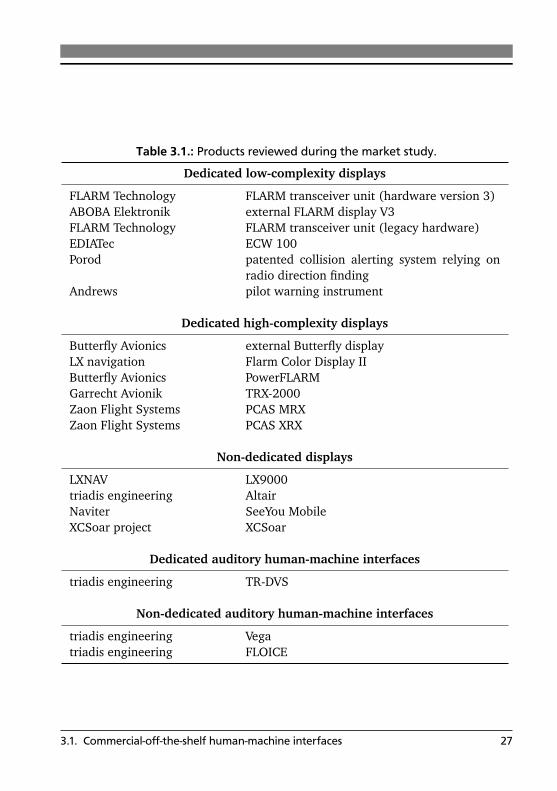
Table 3.1.: Products reviewed during the market study.
Dedicated low-complexity displays
FLARM Technology FLARM transceiver unit (hardware version 3)ABOBA Elektronik external FLARM display V3FLARM Technology FLARM transceiver unit (legacy hardware)EDIATec ECW 100Porod patented collision alerting system relying on
radio direction findingAndrews pilot warning instrument
Dedicated high-complexity displays
Butterfly Avionics external Butterfly displayLX navigation Flarm Color Display IIButterfly Avionics PowerFLARMGarrecht Avionik TRX-2000Zaon Flight Systems PCAS MRXZaon Flight Systems PCAS XRX
Non-dedicated displays
LXNAV LX9000triadis engineering AltairNaviter SeeYou MobileXCSoar project XCSoar
Dedicated auditory human-machine interfaces
triadis engineering TR-DVS
Non-dedicated auditory human-machine interfaces
triadis engineering Vegatriadis engineering FLOICE
3.1. Commercial-off-the-shelf human-machine interfaces 27
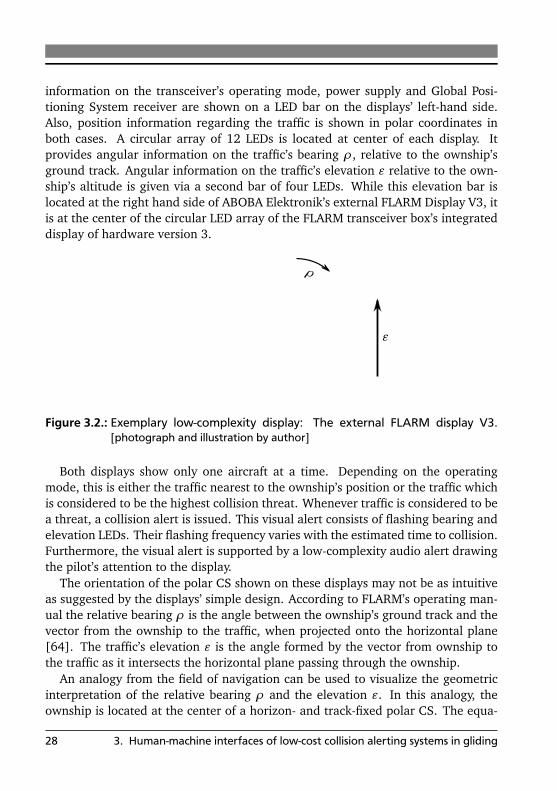
information on the transceiver’s operating mode, power supply and Global Posi-tioning System receiver are shown on a LED bar on the displays’ left-hand side.Also, position information regarding the traffic is shown in polar coordinates inboth cases. A circular array of 12 LEDs is located at center of each display. Itprovides angular information on the traffic’s bearing ρ, relative to the ownship’sground track. Angular information on the traffic’s elevation ε relative to the own-ship’s altitude is given via a second bar of four LEDs. While this elevation bar islocated at the right hand side of ABOBA Elektronik’s external FLARM Display V3, itis at the center of the circular LED array of the FLARM transceiver box’s integrateddisplay of hardware version 3.
ρ
ε
Figure 3.2.: Exemplary low-complexity display: The external FLARM display V3.[photograph and illustration by author]
Both displays show only one aircraft at a time. Depending on the operatingmode, this is either the traffic nearest to the ownship’s position or the traffic whichis considered to be the highest collision threat. Whenever traffic is considered to bea threat, a collision alert is issued. This visual alert consists of flashing bearing andelevation LEDs. Their flashing frequency varies with the estimated time to collision.Furthermore, the visual alert is supported by a low-complexity audio alert drawingthe pilot’s attention to the display.
The orientation of the polar CS shown on these displays may not be as intuitiveas suggested by the displays’ simple design. According to FLARM’s operating man-ual the relative bearing ρ is the angle between the ownship’s ground track and thevector from the ownship to the traffic, when projected onto the horizontal plane[64]. The traffic’s elevation ε is the angle formed by the vector from ownship tothe traffic as it intersects the horizontal plane passing through the ownship.
An analogy from the field of navigation can be used to visualize the geometricinterpretation of the relative bearing ρ and the elevation ε. In this analogy, theownship is located at the center of a horizon- and track-fixed polar CS. The equa-
28 3. Human-machine interfaces of low-cost collision alerting systems in gliding

torial plane of the CS passes through the ownship’s position and is parallel to thehorizontal plane. Its zero-meridian passes through the direction of the ownship’sground track. The traffic’s relative bearing ρ is analogous to longitude whereas itselevation ε is interpreted as latitude. Figure 3.3 visualizes this analogy. For a moreprecise mathematical description of these CSs and angular relations see appendix Ain general and section A.2.1 specifically.
Figure 3.3.: Visualization of the navigation analogy (ownship-fixed Cartesian andpolar coordinate systems). [illustration by author]
When comparing the horizon- and track-fixed CS described within FLARM’soperating manual [64] to the design features on the FLARM transceiver’s inte-grated display (Figure 2.2) or ABOBA Elektronik’s external FLARM Display V3(Figure 3.2), a conflict of information can be identified. Both displays lack in-cockpit clues on proper orientation of the polar CS used to indicate the traffic’sposition. The CS orientation is only described within the respective manuals. Ap-plying Roscoe’s concept of pictorial realism [119] to the available in-cockpit cluesof the low-complexity displays leads to a different polar CS which is suggested topilots. Both displays are installed in a fixed position within the ownship. The fixedinstallation, without other in-cockpit clues, most likely suggests an ownship-fixedpolar CS (Figure 3.4b). This ownship-fixed CS has an equatorial plane whichis parallel to the ownship’s wing plane and its zero-meridian passes through theownship’s longitudinal axis.
There are several design features directly on the two COTS low-complexity dis-plays presented so far which further suggest an ownship-fixed CS. The FLARMtransceiver’s integrated display (Figure 2.2) lacks clues as to where the top of thecircular LED array may be aligned. Due to its ownship-fixed installation, most oftenon the instrument panel and facing the airplane’s longitudinal axis, it suggests that
3.1. Commercial-off-the-shelf human-machine interfaces 29
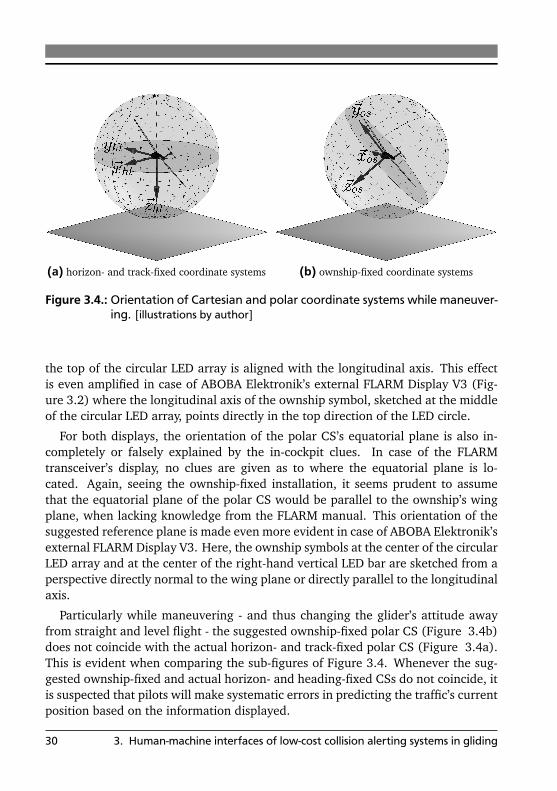
(a) horizon- and track-fixed coordinate systems (b) ownship-fixed coordinate systems
Figure 3.4.: Orientation of Cartesian and polar coordinate systems while maneuver-ing. [illustrations by author]
the top of the circular LED array is aligned with the longitudinal axis. This effectis even amplified in case of ABOBA Elektronik’s external FLARM Display V3 (Fig-ure 3.2) where the longitudinal axis of the ownship symbol, sketched at the middleof the circular LED array, points directly in the top direction of the LED circle.
For both displays, the orientation of the polar CS’s equatorial plane is also in-completely or falsely explained by the in-cockpit clues. In case of the FLARMtransceiver’s display, no clues are given as to where the equatorial plane is lo-cated. Again, seeing the ownship-fixed installation, it seems prudent to assumethat the equatorial plane of the polar CS would be parallel to the ownship’s wingplane, when lacking knowledge from the FLARM manual. This orientation of thesuggested reference plane is made even more evident in case of ABOBA Elektronik’sexternal FLARM Display V3. Here, the ownship symbols at the center of the circularLED array and at the center of the right-hand vertical LED bar are sketched from aperspective directly normal to the wing plane or directly parallel to the longitudinalaxis.
Particularly while maneuvering - and thus changing the glider’s attitude awayfrom straight and level flight - the suggested ownship-fixed polar CS (Figure 3.4b)does not coincide with the actual horizon- and track-fixed polar CS (Figure 3.4a).This is evident when comparing the sub-figures of Figure 3.4. Whenever the sug-gested ownship-fixed and actual horizon- and heading-fixed CSs do not coincide, itis suspected that pilots will make systematic errors in predicting the traffic’s currentposition based on the information displayed.
30 3. Human-machine interfaces of low-cost collision alerting systems in gliding

Work performed by Aretz [8] and Aretz and Wickens [9] indicates that pilotsmentally rotate displays. This mental rotation takes the display from the ownship-fixed CS and rotates it into the direction of the CS suggested by the display format.This mental rotation process demands time from the pilot and the temporal demandincreases as the magnitude of the rotation angle increases [129]. In the case ofthe low-complexity display format, where an ownship-fixed CS is suggested, thetemporal costs are not expected to vary between different flight conditions. Thissuspected indifference is due to the fact that the suggested CS of the low-complexitydisplay format always remains aligned with the ownship-fixed CS.
Some legacy FLARM transceiver boxes feature an integrated low-complexity dis-play lacking any elevation information on the traffic [64]. Therefore, they provideonly one-dimensional information on the relative bearing to traffic. Contrary, EDIA-Tec’s ECW100 is one of several low-complexity displays for FLARM which enhancethe two-dimensional relative bearing and elevation information with an alphanu-meric indication of the horizontal distance to the traffic [45].
Low-complexity display formats for collision alerting applications have alreadybeen proposed in the pre-FLARM era. Porod’s CAS for gliders, described in a Ger-man patent, uses a circular LED array to show one-dimensional bearing informa-tion to the traffic [116]. Andrews analyzed a pilot warning instrument for collisionalerting in powered aviation applications [5]. The instrument showed not onlytwo-dimensional bearing and elevation information but also resolution advisoriesin a low-complexity format.
During a survey conducted within the experimental phase of this thesis 135 of137 participating glider pilots indicated that they have flight experience with low-cost CASs as well as low-complexity display formats. Due to their widespread use,a COTS low-complexity display is used as baseline for comparing other displayformats in the experiment of chapter 4. ABOBA Elektronik’s external FLARM Dis-play V3 [1] is selected as this baseline display. The suggested CS is presentedmore clearly on ABOBA Elektronik’s display than on the FLARM transceiver’s dis-play. Also, the elevation signal should be easier to read on the ABOBA Elektronikdisplay, as it is located outside of the circular LED array.
High-complexity displaysHigh-complexity displays are display formats which have a high number of indi-
vidually controllable visual elements. These elements are arranged in monochro-matic or polychromatic screens. The illumination and color of any individual pixelalone is not linked to a unique meaning. Instead, the meaning is derived fromsymbolic or alphanumeric representations drawn onto the screen using these pix-els. Commercially available high-complexity displays are further categorized as
3.1. Commercial-off-the-shelf human-machine interfaces 31

radar-style and alphanumeric displays. Both formats are discussed in more detailbelow.
Radar-style displays: Commercially available displays in the high-complexitycategory for gliding CASs exclusively rely on a camera position located far abovethe ownship to depict the traffic situation. A map of the traffic’s relative horizon-tal position is drawn, similar to a radar screen used by air traffic controllers. Fullthree-dimensional data is provided for one or more traffic aircraft using symbolsand text.
Two examples of commercial implementations of radar-style display formats forthe FLARM system are the external Butterfly display (Figure 3.5) produced by But-terfly Avionics [25] and LX navigation’s Flarm Color Display II [99]. Both productsare similar in terms of design and suggested CSs. Due to the more comprehensivedocumentation available, the external Butterfly display is discussed as an examplecase in more detail.
In case of no traffic being categorized as a threat, traffic information is given inthe radar-style display format. In this format, a dot forms the ownship symbol atthe center of a two-dimensional polar CS. Two scale rings are located concentricallyaround the ownship symbol. The radius of the outer ring is shown alphanumeri-cally at the screen’s lower left-hand corner. The inner ring’s radius is one half ofthe outer radius. The traffic symbol’s angular coordinate in this polar CS representsits bearing ρ relative to the ownship’s ground track whereas its radial coordinaterepresents the traffic’s horizontal distance RH . Alphanumeric information on oneselected traffic aircraft is given on the screen’s right-hand side. Whenever only oneaircraft is detected by FLARM, that aircraft becomes automatically selected and itsalphanumeric information is automatically displayed. This information includesthe traffic’s altitude ∆H relative to the ownship’s altitude, the traffic’s rate of climbH, its abbreviated identification number and an alphanumeric repetition of its hor-izontal distance RH . In case that a high threat traffic alert is issued, both displays –Butterfly Avionics’ external Butterfly display and LX navigation’s Flarm Color Dis-play II – revert to emulating a low-complexity display format. These alerts are alsoenhanced with low-complexity audio signals, intended to draw the pilot’s visualattention to the display.
The radar-style display format’s external camera position and radar-style mapimplicitly suggest that it is invariant to changes in the ownship’s pitch angle Θand bank angle Φ. This implies a horizon-fixed equatorial plane of the polar CS.However, as is the case with the low-complexity FLARM displays, clues regardingthe proper top direction of the polar CS are lacking. The radar-style display formattherefore suggests a horizon- and heading-fixed CS, while they actually depict ahorizon- and track-fixed system.
32 3. Human-machine interfaces of low-cost collision alerting systems in gliding

∆ρ
∆R
∆H
H
traffic identi-fication numberradius of outer
scale ring
ownshipsymbol
Figure 3.5.: Exemplary radar-style display: The external Butterfly display. [photo-graph and illustration by author]
The radar-style display format’s suggested CS (horizon- and heading-fixed) andactual CS (horizon- and track-fixed) always coincide except when the airplane ex-periences a difference between heading and track. This difference is known asthe drift angle ν and exists in steady-state flight conditions when a crosswind actson the ownship or when a sideslip is being performed. Under these conditions itis assumed that pilots using the radar-style high-complexity display will performsystematic errors when searching for traffic.
In gliding, the radar-style display format is the second most-popular format ofdedicated traffic displays. However, radar-style displays are much less popular thanlow-complexity displays. Only 42 of 137 glider pilots surveyed responded that theyhave flight experience with radar-style display formats. Nevertheless, this formatis considered to be important for comparison. Particularly cross country and con-test pilots use this format due to tactical advantages gained with seeing the rateof climb of other gliders nearby. Due to this popularity among highly experiencedglider pilots, along with the fact that the radar-style display format suggests a CSalready having a proper equatorial plane, it is decided to include a radar-style dis-play in the experimental evaluation of this thesis. For reasons of easy availabilityand ease of installation, Butterfly Avionics’ external Butterfly display [25] is se-lected as the second COTS display for experimental evaluation. Its characteristicsare representative of the class of radar-style high-complexity displays commerciallyavailable for the FLARM CAS.
Contrary to the low-complexity display format, the CS suggested by the radar-style display format is generally not aligned with the ownship-fixed CS. It is sus-pected that when using the radar-style display format, mental rotations are per-formed by glider pilots. These rotations should account for deviations in pitch
3.1. Commercial-off-the-shelf human-machine interfaces 33
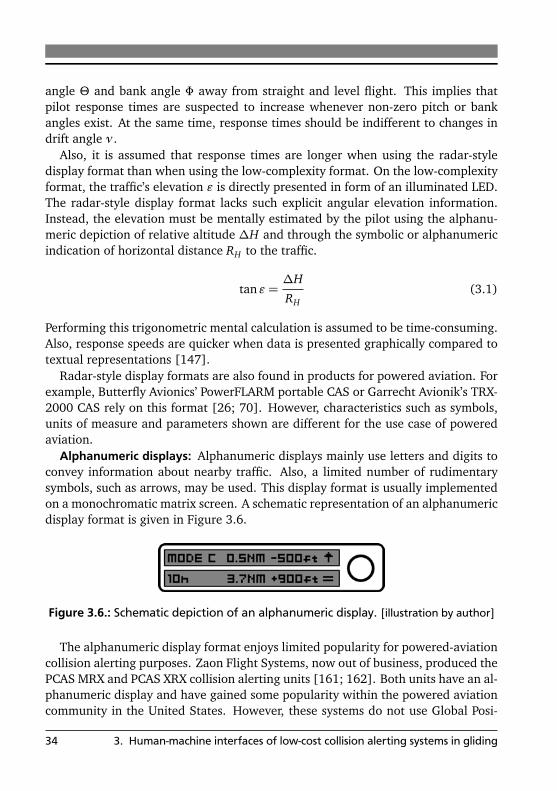
angle Θ and bank angle Φ away from straight and level flight. This implies thatpilot response times are suspected to increase whenever non-zero pitch or bankangles exist. At the same time, response times should be indifferent to changes indrift angle ν .
Also, it is assumed that response times are longer when using the radar-styledisplay format than when using the low-complexity format. On the low-complexityformat, the traffic’s elevation ε is directly presented in form of an illuminated LED.The radar-style display format lacks such explicit angular elevation information.Instead, the elevation must be mentally estimated by the pilot using the alphanu-meric depiction of relative altitude ∆H and through the symbolic or alphanumericindication of horizontal distance RH to the traffic.
tanε =∆H
RH(3.1)
Performing this trigonometric mental calculation is assumed to be time-consuming.Also, response speeds are quicker when data is presented graphically compared totextual representations [147].
Radar-style display formats are also found in products for powered aviation. Forexample, Butterfly Avionics’ PowerFLARM portable CAS or Garrecht Avionik’s TRX-2000 CAS rely on this format [26; 70]. However, characteristics such as symbols,units of measure and parameters shown are different for the use case of poweredaviation.
Alphanumeric displays: Alphanumeric displays mainly use letters and digits toconvey information about nearby traffic. Also, a limited number of rudimentarysymbols, such as arrows, may be used. This display format is usually implementedon a monochromatic matrix screen. A schematic representation of an alphanumericdisplay format is given in Figure 3.6.
Figure 3.6.: Schematic depiction of an alphanumeric display. [illustration by author]
The alphanumeric display format enjoys limited popularity for powered-aviationcollision alerting purposes. Zaon Flight Systems, now out of business, produced thePCAS MRX and PCAS XRX collision alerting units [161; 162]. Both units have an al-phanumeric display and have gained some popularity within the powered aviationcommunity in the United States. However, these systems do not use Global Posi-
34 3. Human-machine interfaces of low-cost collision alerting systems in gliding
tioning System position broadcasting as means of sensing traffic. Instead, they relyon transponder signal analysis and radio direction finding. Individual reports ofglider pilots using these systems under special circumstances have been obtained.Apparently, these systems are used to separate gliders from powered aircraft oper-ating in the vicinity whenever FLARM is not in widespread use.
Within the German gliding community this display format is not widely usedfor collision alerting purposes. Only 2 of 137 participating glider pilots have flightexperience with this format. Due to this low-spread proliferation, along with thedisadvantage of long expected reaction times [147], the alphanumeric display for-mat is not analyzed experimentally.
Perspective displays: None of the commercially available displays for CASs ingliding yet rely on a camera position located at the pilot’s point of view. They do notform a perspective representation of the out-the-window view, as the pilot wouldsee it. The thesis at hand attempts to close this feature gap by designing a perspec-tive display and evaluating its potential for gliding applications (section 3.2).
3.1.1.2 Non-dedicated displays
Non-dedicated traffic displays integrate traffic data with other data of interest tothe glider pilot. Any HMI not only conveying information on the status of the CASand on traffic, but also showing arbitrary other information, is considered non-dedicated. The format on how traffic is depicted in non-dedicated displays varieswith the nature of other data displayed. This other data can range from naviga-tional information on topography, airfields and airspace, to tactical tools such asfinal glide calculations and contest task surveillance. Due to this heterogeneity,extending the taxonomy to sub-levels of non-dedicated displays is inadequate. Be-cause the focus of this thesis is on the interpretation of traffic representations, andnot on data integration, non-dedicated HMIs are excluded from the experimentalstudy. They are only discussed briefly in this market study.
During the market study two different categories of hardware implementationsof non-dedicated traffic displays were found. These were either permanently in-stalled glide computers or portable hardware solutions. Permanently installed glidecomputers are often integrated into the instrument panels of high-performancegliders. Some of these computer systems, such as LXNAV’s LX9000 [98] or tri-adis engineering’s Altair [143], can be interfaced with FLARM transceivers. Thepopularity of using integrated glide computers as non-dedicated traffic displays issimilar to the use of radar-style high complexity displays for the task. 42 of 137participating glider pilots reported that they have flight experience with such units.
3.1. Commercial-off-the-shelf human-machine interfaces 35
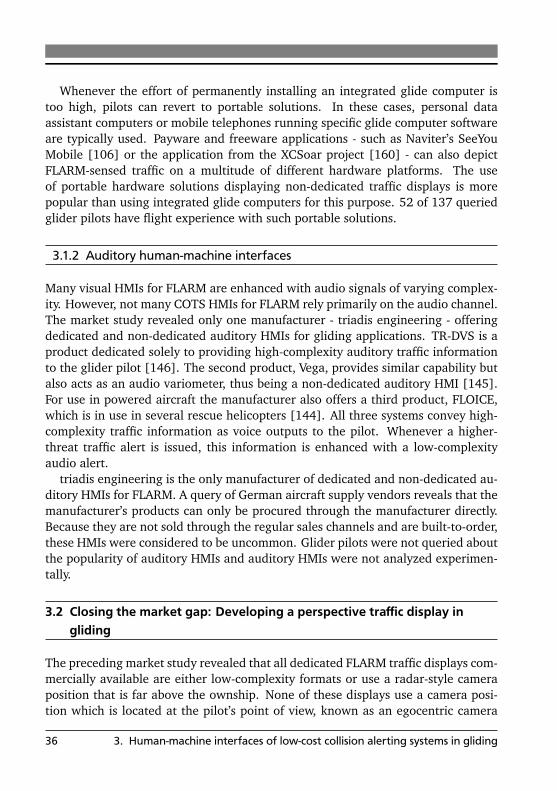
Whenever the effort of permanently installing an integrated glide computer istoo high, pilots can revert to portable solutions. In these cases, personal dataassistant computers or mobile telephones running specific glide computer softwareare typically used. Payware and freeware applications - such as Naviter’s SeeYouMobile [106] or the application from the XCSoar project [160] - can also depictFLARM-sensed traffic on a multitude of different hardware platforms. The useof portable hardware solutions displaying non-dedicated traffic displays is morepopular than using integrated glide computers for this purpose. 52 of 137 queriedglider pilots have flight experience with such portable solutions.
3.1.2 Auditory human-machine interfaces
Many visual HMIs for FLARM are enhanced with audio signals of varying complex-ity. However, not many COTS HMIs for FLARM rely primarily on the audio channel.The market study revealed only one manufacturer - triadis engineering - offeringdedicated and non-dedicated auditory HMIs for gliding applications. TR-DVS is aproduct dedicated solely to providing high-complexity auditory traffic informationto the glider pilot [146]. The second product, Vega, provides similar capability butalso acts as an audio variometer, thus being a non-dedicated auditory HMI [145].For use in powered aircraft the manufacturer also offers a third product, FLOICE,which is in use in several rescue helicopters [144]. All three systems convey high-complexity traffic information as voice outputs to the pilot. Whenever a higher-threat traffic alert is issued, this information is enhanced with a low-complexityaudio alert.
triadis engineering is the only manufacturer of dedicated and non-dedicated au-ditory HMIs for FLARM. A query of German aircraft supply vendors reveals that themanufacturer’s products can only be procured through the manufacturer directly.Because they are not sold through the regular sales channels and are built-to-order,these HMIs were considered to be uncommon. Glider pilots were not queried aboutthe popularity of auditory HMIs and auditory HMIs were not analyzed experimen-tally.
3.2 Closing the market gap: Developing a perspective traffic display ingliding
The preceding market study revealed that all dedicated FLARM traffic displays com-mercially available are either low-complexity formats or use a radar-style cameraposition that is far above the ownship. None of these displays use a camera posi-tion which is located at the pilot’s point of view, known as an egocentric camera
36 3. Human-machine interfaces of low-cost collision alerting systems in gliding
position. Such a position results in a perspective representation of features locatedin the environment. According to a literature review performed by Wickens andPrevett, egocentric display formats allow for superior pilot performance for localguidance tasks, such as visually identifying and avoiding nearby traffic [156].
Egocentric display formats for example can be found in commercial and militaryaviation applications such as synthetic or enhanced vision systems [34, pp. 462–465; 117]. In these applications the display’s virtual camera is not only locatedat the pilot’s eye point, but is also virtually fixed to the airframe. These trulyegocentric displays provide either a virtual or enhanced out-the-window view tothe pilot. They usually have a limited FOV to minimize geometric distortions whichmight hamper interpretability.
Due to the literature review of Wickens and Prevett [156], it is suspected thatglider pilots would benefit from a CASs display format with increased egocentricity.It is the goal of the dissertation at hand to prove that usability will actually increasewhen glider pilots are presented with traffic information in a perspective manner.Therefore, such a display format is devised and implemented prototypically forfurther investigation. This novel display format should at least have increasedegocentricity compared to the COTS display solutions available, provide a largerfield of view than traditional synthetic vision systems and require only parametersfrom the FLARM serial data stream [65].
Möller, Kostka, Neujahr, and Klingauf also require increased egocentricity and alarge FOV for their panoramic environmental display for a military fighter airplane[101]. Due to the distorting effects associated with fixing their projection’s cam-era to the ownship, they gave up true egocentricity and reverted to a horizon- andheading-fixed camera attitude. This format was then called a heterocentric perspec-tive display due to its non-ownship-fixed camera attitude. However, Möller et al.’sapplication had the advantage of being always providing the ownship’s headingthrough the fighter airplane’s attitude and heading reference system.
FLARM currently lacks such heading reference (compare section 2.1.3.2). There-fore the proposed perspective traffic display format for gliding applications mustrely on a horizon- and track-fixed camera attitude, making it also heterocentric.Naturally, by using a track-fixed CS instead of heading-fixed CS on a perspectivedisplay format, concerns about increased pilot workload and decreased perfor-mance arise. However, track-fixing perspective depictions of the environment havenot negatively impacted pilot performance and workload in a turboprop-poweredgeneral aviation aircraft [94]. The respective track-fixed synthetic vision systemwas even certified.
3.2. Closing the market gap: Developing a perspective traffic display in gliding 37

3.2.1 Conceptual design and prototypical implementation of a perspectivetraffic display
The traditional technology-centered approach to designing new systems and HMIsis prone to running into human performance limitations. This is partially due tousers being exposed to the system or HMI during later stages of the design phase,where changes are cumbersome and expensive [48, chap. 1]. In aviation contexts,where operating near the human performance limitations can have catastrophicresults, user-centered design processes are becoming more popular [91]. The keyto user-centered design is including potential users in the design process from thebeginning. Naturally, these users are initially exposed to non-perfect prototypesof a system at a lower technology readiness level (TRL) [56, Annex G] than theircounterparts participating in technology-centered design. Yet it is this early expo-sure that helps the system designer shape the system and HMI around the user’ssubjective and objective needs for their task.
3.2.1.1 Design process
User-centered design is achieved by involving potential users throughout all stagesof the design process. Literature, however, does not provide guidance for applyinguser-centered design to gliding use cases. Thus, the design process (depicted inFigure 3.7) leading to the prototypical perspective display was developed as part ofthe research at hand. According to an international standard, the steps undertakenin this process are only early design steps [132]. Over 1400 potential users wereinvolved in the design and evaluation of the perspective display format’s prototype,most of them in an online survey [80]. Thus, the corresponding design processexhibited a high degree of user-centricity. In comparison, the number of usersinvolved in the technology-driven design processes of the two COTS display formats(low-complexity and radar-style) was about two orders of magnitude lower.3 Thosedesign processes had a much lesser degree of user-centricity.
The design process leading to the prototypical perspective display consisted offour design phases (Figure 3.7). All phases, except the initial background researchphase, included potential users in the design process.
Before beginning the display design, a design goal was defined: The designprocess should lead to a prototypical perspective traffic display for gliding whichcan be used in a simulator study comparing the new display format to selectedCOTS HMIs. Before commencing early experimental analysis, it should have TRL 3
3 M. Förderer, personal communication, September 24, 2012
38 3. Human-machine interfaces of low-cost collision alerting systems in gliding

Definition of design goal
Background research phase
Market study of human-
machine interface formats
Identifying design
parameters from literature
Pen and paper design phase
Large-scale user survey Conceptual sketches
Expert user interviews Evaluating user preferences
Prototype implementation phase
Prototyping Modifications from
expert feedback
Evaluating implementability Hardware selection
Experimental evaluation phase
Commercial off-the-shelf
display evaluation
Perspective display
evaluation
Figure 3.7.: Structure of the perspective display format’s design process. [illustrationby author]
(“experimental proof of concept” [56, Annex G]). If the new format’s suspectedbenefits are supported by objective experimental results its TRL will increase toTRL 4 (“technology validated in lab”).
Background research phaseAfter defining the design goal, the process started with an initial background
research phase. The market study on COTS HMI was part of this phase and was
3.2. Closing the market gap: Developing a perspective traffic display in gliding 39

presented in the preceding section 3.1. Schochlow and Gerber contributed to thisphase with an unpublished review on projection formats and design parameters[126].
Pen and paper design phaseHeinbücher contributed to the following pen and paper design phase [80]. Tak-
ing the results from the preceding background research as well as the existinghypotheses, she developed multiple conceptual sketches of perspective displays.Three subject matter expert pilots, including two pilots of Technische UniversitätDarmstadt’s research flight department provided her with feedback during expertinterviews. Their feedback was used to modify the sketches, which were then pre-sented to a wide range of German glider pilots by means of an online survey. Atotal of 1380 glider pilots provided their opinions on the conceptual displays viathe online survey. Despite the fact that user-centered design is not “asking userswhat they want and then giving it to them” [48, p. 6], the large-scale user surveywas a means of finding display presentations which are accepted in the community.By focusing on accepted display formats, ideally pilot performance and satisfac-tion will increase. Heinbücher then analyzed pilot preferences and recommendedseveral display formats for implementation.
Prototype implementation phaseThese recommendations formed the basis of the prototype implementation
phase. At the beginning of this phase, each recommendation was evaluatedwhether it was implementable or not. Necessary modifications were also made.A prototype format was then implemented on adequate hardware for the experi-mental evaluation in a flight simulator. While implementing the prototype, threesubject matter experts were exposed to the prototypes in expert interviews. Twoof the experts were again pilots from Technische Universität Darmstadt’s researchflight department and the third expert was a cognitive psychologist with a back-ground in usability research. Their suggestions were incorporated into the designof the prototype.
Experimental evaluation phaseAfterwards, the experimental evaluation phase followed. Here, 48 glider pilots
were exposed to the prototype in a laboratory experiment. It was designed andperformed together with Schochlow [125] and Mehringskötter [100]. The exper-iment’s details are described in chapter 4. In order to compare the prototype tocontemporary COTS display formats, an additional 89 glider pilots were exposedto one of two COTS HMIs in the same experiment. Comparing the experimental
40 3. Human-machine interfaces of low-cost collision alerting systems in gliding

usability results from the three displays (chapter 5) allowed for the prototype’s TRLto be evaluated.
3.2.1.2 Display characteristics
The prototypical perspective display format is illustrated in Figure 3.8. It was dis-played on an LG Electronics D605 Optimus L9II mobile phone with a resolution of853× 480 pixels [97]. The mobile phone had a diagonal screen size of 11.9cm.
Traffic was displayed by means of a symmetric cylindrical projection with a hor-izontal FOV of 180 ◦ and a vertical FOV of 90 ◦. The horizontal axis representedthe bearing ρ relative to the ownship’s ground track while the elevation ε was rep-resented along the vertical axis. Both axes were scaled equally with 19.0 ◦/cm andwere marked with ticks and text labels. A marker cross indicated the zero valuesfor ρ and ε. The display’s top half had a light blue background color for elevationsabove the horizon (ε > 0) whereas areas below the horizon (ε < 0) had a lightbrown background. The horizon line remained constant on the display screen, irre-spective of changes in the ownship’s attitude. It did not act as an artificial horizon.This fixed horizon line served to suggest a horizon-fixed CS for the perspectivedisplay format. Since no heading information is available from the FLARM datastream [65], no heading clues were displayed and it was centered relative to theownship’s ground track. Therefore, the perspective display still had a disparity. Itsclues implied a horizon- and heading-fixed CS while actually depicting a horizon-and track-fixed CS.
Traffic received by the system was displayed symbolically. All traffic locatedwithin the display’s FOV (Figure 3.8a) was marked by a stylized glider symbol.Whenever the traffic was outside the display’s FOV, an arrow symbol placed alongthe display’s edge and pointed from the display’s center to the traffic’s hypotheticaltwo-dimensional position. Text labels representing the traffic’s horizontal distanceRH and relative altitude ∆H were placed in the direct vicinity of the glider andarrow symbols.
In order to improve the perspective impression, the sizes of the glider and arrowsymbols as well as the associated text labels were scaled according to the traffic’sslant distance R. Nearby traffic was displayed larger than traffic farther away. Thescaling parameter k had the following form:
k(R) =
1, if R> 4000 m
2+ 500m−R3500 m
, if 4000m≥ R≥ 500m
2, if R< 500 m
(3.2)
3.2. Closing the market gap: Developing a perspective traffic display in gliding 41
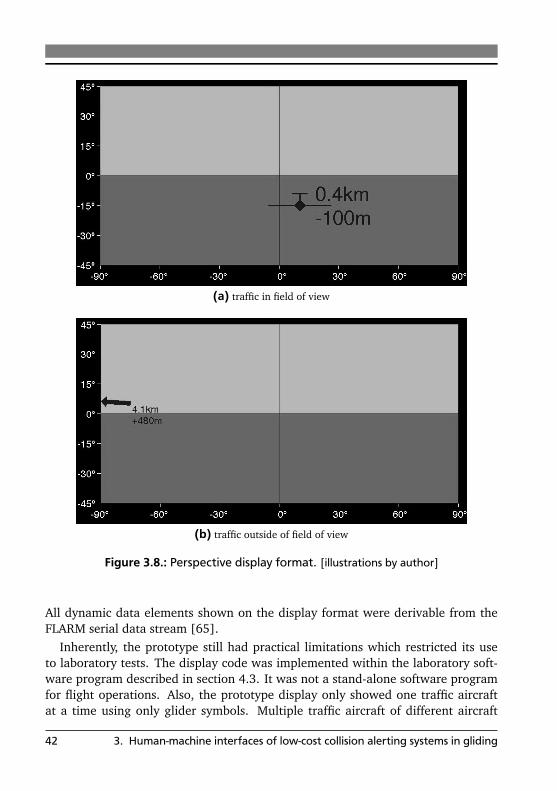
(a) traffic in field of view
(b) traffic outside of field of view
Figure 3.8.: Perspective display format. [illustrations by author]
All dynamic data elements shown on the display format were derivable from theFLARM serial data stream [65].
Inherently, the prototype still had practical limitations which restricted its useto laboratory tests. The display code was implemented within the laboratory soft-ware program described in section 4.3. It was not a stand-alone software programfor flight operations. Also, the prototype display only showed one traffic aircraftat a time using only glider symbols. Multiple traffic aircraft of different aircraft
42 3. Human-machine interfaces of low-cost collision alerting systems in gliding
categories or higher threat aircraft were not introduced. Audio features were notimplemented. The hardware was selected for good readability in the simulator’slow ambient light conditions. Problems associated with the high ambient light con-ditions found during a daytime visual flight still need to be addressed for practicalflight operations.
3.3 Hypotheses
In the discussion of the market study (section 3.1), two concepts from literaturewere used to hypothesize pilot behavior. The first was the concept of pictorial real-ism [119]. It stated that each graphic display format implicitly suggests a CS whichis used to display the data. Whenever the suggested CS and the display’s actualCS do not coincide, errors are expected to arise. These errors can be quantifiedby showing traffic information on a display - but not in the out-the-window view -and then asking the pilot where the traffic is suspected. The angle ∆γ between thetraffic’s actual direction, as seen from the ownship, and the direction suspected bythe pilot is a measure of error magnitude. Since the suggested CS varies with thedisplay format, the following hypothesis was postulated:
Hypothesis 1: Visual search error magnitude ∆γ increases wheneverthe disparity between a display format’s suggested and actual co-ordinate system exists. Larger disparities will lead to larger errormagnitudes. Thus, display formats suggesting an ownship-fixedcoordinate system (low-complexity display) will result in largererror magnitudes than display formats suggesting a horizon- andheading-fixed coordinate system (radar-style and perspective dis-plays).
The second concept introduced during the market study was the concept ofmental rotations [8; 9]. The corresponding train of thought implies that pilotsmust mentally transform data displayed to them from the CS suggested by thedisplay format into their ownship-fixed seating position. The time required to per-form these rotations increases with the magnitude of the rotation. Therefore, largedisparities between the ownship-fixed and suggested CS will result in longer pilotreaction times tR when interpreting the display than small disparities. This resultedin a further hypothesis:
Hypothesis 2: Reaction time tR increases whenever a disparity be-tween a display format’s suggested coordinate system and the
3.3. Hypotheses 43
ownship-fixed coordinate system exists. Larger disparities willlead to a longer reaction time. Display formats suggesting anownship-fixed coordinate system (low-complexity display) will seea shorter reaction time than display formats suggesting a horizon-and heading-fixed coordinate system (radar-style and perspectivedisplays).
Additionally to the objective parameters of visual search error magnitude ∆γand reaction time tR, subjective parameters may also be influenced by display de-sign. HMIs developed by applying user-centered design will likely lead to highersubjective user satisfaction than COTS HMIs developed using more traditional de-sign approaches. Subjective user satisfaction can be quantified using the SystemUsability Scale and its subscales (section 2.2.4.3). The usability subscore can bedirectly interpreted as the user’s satisfaction. The learnability subscore provides aquantification of effort experienced by the user in learning to use a system. Whenthe HMI designer has a good and thorough understanding of the user’s level ofknowledge, then learnability subscores are suspected to benefit. User-centered de-sign is one method to provide the HMI designer with this required feedback on theuser’s level of knowledge. Because the design process of the perspective displayformat showed a much higher degree of user-centricity than the design processesof the two remaining COTS display formats, a third hypothesis was formulated:
Hypothesis 3: Subjective user satisfaction is higher for display for-mats whose design process has a high degree of user-centricity(perspective display). Display formats exhibiting a lower degreeof user-centricity in their design processes (low-complexity andradar-style displays) result in lower subjective user satisfaction.This applies to the aspects of subjective usability and learnability.
All three aforementioned hypotheses discuss influences on the different dimen-sions of usability (see Figure 3.9). Pilot effectivity is subject of Hypothesis 1 whiletemporal efficiency is indirectly discussed when combining Hypotheses 1 and 2.The third usability dimension of user satisfaction is addressed in Hypothesis 3.
The hypotheses assumed that the displays and their associated characteristics,such as their suggested CSs, influence their respective usability. Yet these displaycharacteristics were a result of the respective display design processes. Therefore,the three individual hypotheses were summarized in one global hypothesis:
Global Hypothesis: Increasing user-centricity in the display designprocess results in HMIs which provide optimized usability in allthree usability dimensions.
44 3. Human-machine interfaces of low-cost collision alerting systems in gliding

Usability
Effectivity Efficiency
User satisfaction
Performance
Global Hypothesis
Hypothesis 1 Hypotheses 1 & 2
Hypothesis 3
Figure 3.9.: Hypotheses and corresponding usability dimensions. [illustration by au-thor]
3.3. Hypotheses 45


4 Determining the influence ofdisplay formats on usability
In order to test the usability hypotheses of section 3.3, an experimental design ispresented in the current chapter. The methodical design is discussed by introducingindependent and dependent variables. Following this, the sample of participantsis characterized. Afterwards, hardware and software used during the experimentare presented and the procedure and task performed by the participants are intro-duced. The chapter closes with a description on how the collected data is treatedfor further analysis.
At the onset of this study there was little a priori knowledge about how gliderpilots interact with the human-machine interfaces of low-cost collision alerting sys-tems (CASs). This made it difficult to anticipate the strength of the effects whichwere to be measured. In order to detect potentially small effects, it was decided todesign an experiment in a highly controlled laboratory environment. Participantsonly performed a single task during the resulting experiment, which consisted ofinteracting with the display of a CAS without actually flying the simulator. Alexan-der and Wickens relied on a similar no-fly-task experiment in their evaluation oftraffic displays by pilots of powered aircraft [2]. Naturally, such a highly controlledlaboratory experiment reduces the transferability of the results to actual flight oper-ations. However, it allows effects to be uncovered which may otherwise be maskedby the varying environmental conditions of a less controlled and more realisticfly-task experiment.
4.1 Experiment design
The hypotheses of section 3.3 formed the basis for the experimental analysis andinherently shaped the experiment’s design. Each hypothesis focused on a differentusability dimension and its potential influences. Measurable parameters quantify-ing these different usability dimensions were selected as the experiment’s depen-dent variables. Those factors which were hypothesized to influence the usabilitydimensions were defined as the corresponding independent variables.
Display format was an easily modified independent variable. Each participantwas assigned to one of the three display formats for the experiment. The display
47
format was defined as an independent between-subjects variable with three factorlevels. These factor levels were low-complexity, radar-style, and perspective.
Embedding the different relative orientations of the suggested and actual co-ordinate systems (CSs) in an experimental context was more cumbersome. Thiswas achieved by exposing the participants to different relative orientations, whichwere narratively described as flight conditions. The flight condition was catego-rized as an independent within-subject variable with four factor levels. These fourfactor levels were straight and level flight, horizontal flight with crosswind from theleft, left-hand turning flight, and climbing flight. Different factor levels of flightcondition resulted in different disparities between FLARM’s actual horizon- andtrack-fixed CS on the one hand and the suggested CSs of the different display for-mats on the other hand. Straight and level flight acted as a control factor levelwhere all CSs coincided.
Each flight condition level differed in terms of bank angle Φ, pitch angle Θ anddrift angle ν , as shown in Table 4.1. The relative orientations between the actualhorizon- and track-fixed CS and the CS suggested by each display format are thebasis for evaluating Hypothesis 1. They are described mathematically1 in Table 4.2.Whenever CSs coincided, the respective coordinate transformation was describedby the 3×3 identity matrix I3. Hypothesis 2 can be evaluated by looking at how theCS suggested by each display format is oriented relative to the ownship-fixed CS.How the orientation of these different CSs varies with changes in flight conditionis described in Table 4.2. The factor levels of flight condition were selected sothat the ownship-fixed and horizon- and track-fixed CSs were rotated relative toone another by different orthogonal axes and at different angular magnitudes (seeTable 4.3).
The experimental task, described in the following section 4.5, was repeated 25times per flight condition (repeated measures) by the participants with separatesignals shown on the display. This resulted in a 4×3×25 within-between repeatedmeasures design of the experiment.
During the experiment, participants answered to where they expected the trafficshown on the display to be located in the out-the-window (OTW) view. Theirassumed traffic locations and reaction times were recorded as the experiment’sdependent variables. Since no traffic was shown to participants in the OTW view,their answers were solely based on the interpretation of the stimulus shown on thedisplay. This prevented participants from gaining feedback on how they performedduring the experiment. Lacking feedback, participants were unable to adapt theirbehavior [133, pp. 71–73].
1 see section A.2 for derivation of the respective coordinate transformations
48 4. Determining the influence of display formats on usability
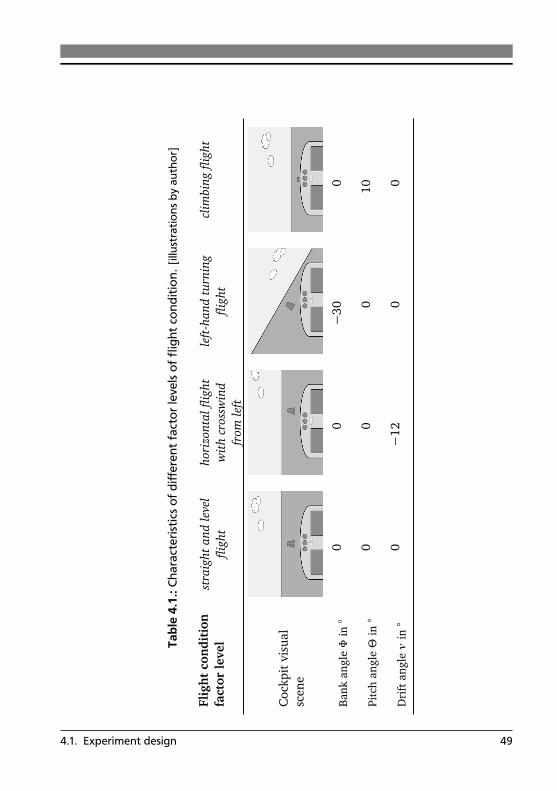
Tabl
e4.
1.:C
hara
cter
istic
sofd
iffer
entf
acto
rlev
elso
fflig
htco
nditi
on.[
illus
trat
ions
byau
thor
]
Flig
htco
ndi
tion
fact
orle
vel
stra
ight
and
leve
lfli
ght
hori
zont
alfli
ght
wit
hcr
ossw
ind
from
left
left
-han
dtu
rnin
gfli
ght
clim
bing
fligh
t
Coc
kpit
visu
alsc
ene
Ban
kan
gleΦ
in◦
00
−30
0
Pitc
han
gleΘ
in◦
00
010
Dri
ftan
gleν
in◦
0−1
20
0
4.1. Experiment design 49
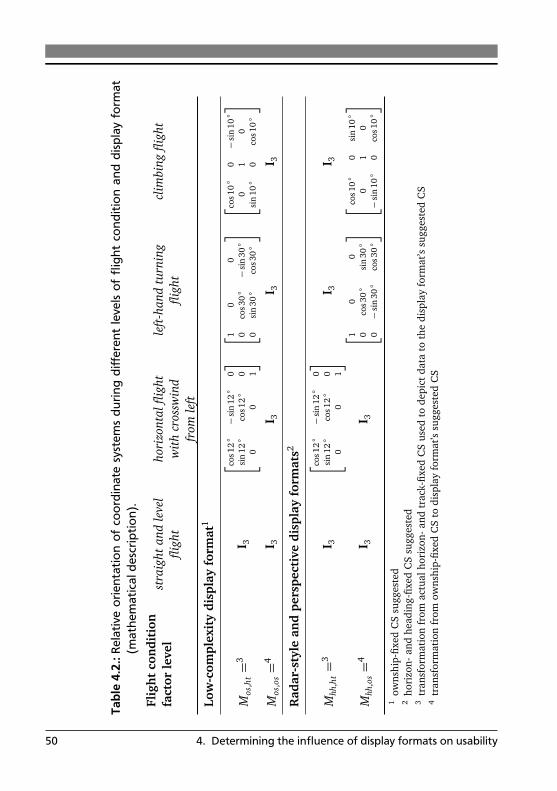
Tabl
e4.
2.:R
elat
ive
orie
ntat
ion
ofco
ordi
nate
syst
ems
durin
gdi
ffer
ent
leve
lsof
fligh
tco
nditi
onan
ddi
spla
yfo
rmat
(mat
hem
atic
alde
scrip
tion)
.Fl
ight
con
diti
onfa
ctor
leve
lst
raig
htan
dle
vel
fligh
tho
rizo
ntal
fligh
tw
ith
cros
swin
dfr
omle
ft
left
-han
dtu
rnin
gfli
ght
clim
bing
fligh
t
Low
-com
plex
ity
disp
lay
form
at1
Mos
,ht=
3I 3
�
cos1
2◦−
sin
12◦
0si
n12◦
cos1
2◦
00
01�
�
10
00
cos3
0◦−
sin
30◦
0si
n30◦
cos3
0◦
��
cos1
0◦
0−
sin
10◦
01
0si
n10◦
0co
s10◦
�
Mos
,os=
4I 3
I 3I 3
I 3
Rad
ar-s
tyle
and
pers
pect
ive
disp
lay
form
ats2
Mhh
,ht=
3I 3
�
cos1
2◦−
sin
12◦
0si
n12◦
cos1
2◦
00
01�
I 3I 3
Mhh
,os=
4I 3
I 3
�
10
00
cos3
0◦
sin
30◦
0−
sin
30◦
cos3
0◦�
�
cos1
0◦
0si
n10◦
01
0−
sin
10◦
0co
s10◦�
1ow
nshi
p-fix
edC
Ssu
gges
ted
2ho
rizo
n-an
dhe
adin
g-fix
edC
Ssu
gges
ted
3tr
ansf
orm
atio
nfr
omac
tual
hori
zon-
and
trac
k-fix
edC
Sus
edto
depi
ctda
tato
the
disp
lay
form
at’s
sugg
este
dC
S4
tran
sfor
mat
ion
from
owns
hip-
fixed
CS
todi
spla
yfo
rmat
’ssu
gges
ted
CS
50 4. Determining the influence of display formats on usability

Tabl
e4.
3.:R
elat
ive
orie
ntat
ion
ofco
ordi
nate
syst
ems(
CSs)
durin
gdi
ffer
entfl
ight
cond
ition
s(gr
aphi
cald
escr
iptio
n).
[illu
stra
tions
byau
thor
]
Flig
htco
ndi
tion
fact
orle
vel
stra
ight
and
leve
lfli
ght
hori
zont
alfli
ght
wit
hcr
ossw
ind
from
left
left
-han
dtu
rnin
gfli
ght
clim
bing
fligh
t
Ori
enta
tion
ofow
nshi
p-fix
edC
S
Ori
enta
tion
ofho
rizo
n-an
dtr
ack-
fixed
CS
4.1. Experiment design 51

4.2 Participants
In total, 137 glider pilots participated in the experiment. However, it was neces-sary to exclude the datasets of 16 participants from further analysis for differentreasons. One participant who interacted with the low-complexity display showedsigns of alcoholic intoxication during the experiment. Thirteen datasets of partici-pants using the radar-style display rendered useless by an initial software recordingerror. Also, recalibrating the touch screen monitor (see section 4.3) became neces-sary during the sessions of two participants interacting with the perspective display.All of these unreliable datasets were purged from further analysis.
Of the remaining participants 121, a total of 8 were female and 113 were male.Descriptive statistics (mean M , standard deviation SD, minimum min and maxi-mum max of each measured dependent variable) of the participants’ demographyand flight experience are provided in Table 4.4.
Table 4.4.: Demographics and flight experience of participants.
Parameter M SD min max
Age in years 27.7 13.8 14 71
Total flight time in glidersin hr
312.3 581.1 0.5 3710.0
Glider flight time withinlast 6 months in hr
13.8 20.4 0.0 150.0
Total number of gliderflights
500.2 675.6 2 4067
Their glider pilot qualification also varied. Thirty-five participants were studentpilots during their pre-solo or post-solo stages of glider flight training. Sixty-sevenparticipants held regular glider pilot licenses without instructor privileges and 19participants held instructor ratings with restricted or full privileges.
Participants were recruited by leaflets placed on the campus of Technische Uni-versität Darmstadt and several airfields in the Darmstadt vicinity. Additionally, theexperiments were advertised in social media groups and many participants becameaware of the campaign by word-of-mouth from former participants. In total, par-ticipants came from 56 different home airfields. To avoid that participants wouldprepare for the experiment, no mention of CASs was made in these advertisements.Instead, only a study about “procedures in sport aviation” was advertised. The only
52 4. Determining the influence of display formats on usability
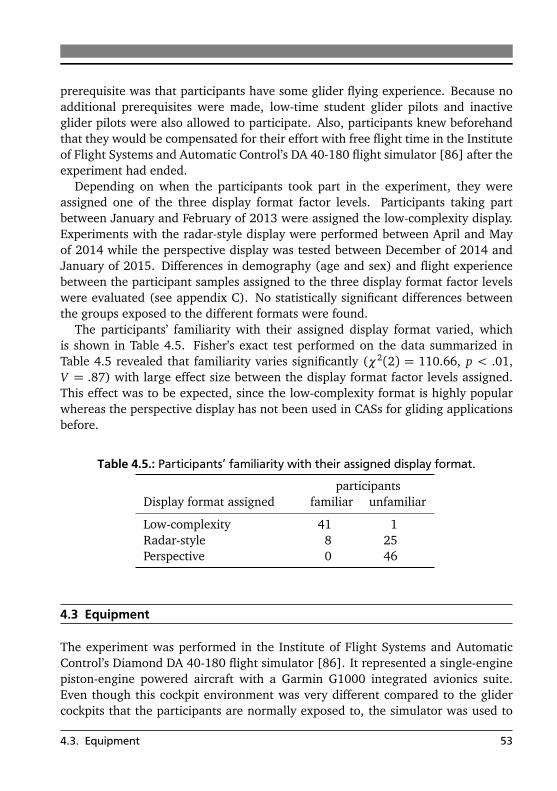
prerequisite was that participants have some glider flying experience. Because noadditional prerequisites were made, low-time student glider pilots and inactiveglider pilots were also allowed to participate. Also, participants knew beforehandthat they would be compensated for their effort with free flight time in the Instituteof Flight Systems and Automatic Control’s DA 40-180 flight simulator [86] after theexperiment had ended.
Depending on when the participants took part in the experiment, they wereassigned one of the three display format factor levels. Participants taking partbetween January and February of 2013 were assigned the low-complexity display.Experiments with the radar-style display were performed between April and Mayof 2014 while the perspective display was tested between December of 2014 andJanuary of 2015. Differences in demography (age and sex) and flight experiencebetween the participant samples assigned to the three display format factor levelswere evaluated (see appendix C). No statistically significant differences betweenthe groups exposed to the different formats were found.
The participants’ familiarity with their assigned display format varied, whichis shown in Table 4.5. Fisher’s exact test performed on the data summarized inTable 4.5 revealed that familiarity varies significantly (χ2(2) = 110.66, p < .01,V = .87) with large effect size between the display format factor levels assigned.This effect was to be expected, since the low-complexity format is highly popularwhereas the perspective display has not been used in CASs for gliding applicationsbefore.
Table 4.5.: Participants’ familiarity with their assigned display format.
participantsDisplay format assigned familiar unfamiliar
Low-complexity 41 1Radar-style 8 25Perspective 0 46
4.3 Equipment
The experiment was performed in the Institute of Flight Systems and AutomaticControl’s Diamond DA 40-180 flight simulator [86]. It represented a single-enginepiston-engine powered aircraft with a Garmin G1000 integrated avionics suite.Even though this cockpit environment was very different compared to the glidercockpits that the participants are normally exposed to, the simulator was used to
4.3. Equipment 53
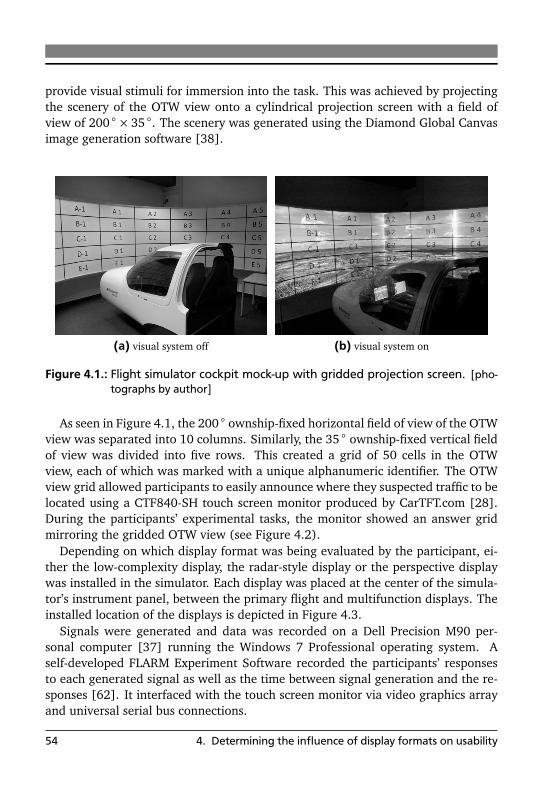
provide visual stimuli for immersion into the task. This was achieved by projectingthe scenery of the OTW view onto a cylindrical projection screen with a field ofview of 200 ◦× 35 ◦. The scenery was generated using the Diamond Global Canvasimage generation software [38].
(a) visual system off (b) visual system on
Figure 4.1.: Flight simulator cockpit mock-up with gridded projection screen. [pho-tographs by author]
As seen in Figure 4.1, the 200 ◦ ownship-fixed horizontal field of view of the OTWview was separated into 10 columns. Similarly, the 35 ◦ ownship-fixed vertical fieldof view was divided into five rows. This created a grid of 50 cells in the OTWview, each of which was marked with a unique alphanumeric identifier. The OTWview grid allowed participants to easily announce where they suspected traffic to belocated using a CTF840-SH touch screen monitor produced by CarTFT.com [28].During the participants’ experimental tasks, the monitor showed an answer gridmirroring the gridded OTW view (see Figure 4.2).
Depending on which display format was being evaluated by the participant, ei-ther the low-complexity display, the radar-style display or the perspective displaywas installed in the simulator. Each display was placed at the center of the simula-tor’s instrument panel, between the primary flight and multifunction displays. Theinstalled location of the displays is depicted in Figure 4.3.
Signals were generated and data was recorded on a Dell Precision M90 per-sonal computer [37] running the Windows 7 Professional operating system. Aself-developed FLARM Experiment Software recorded the participants’ responsesto each generated signal as well as the time between signal generation and the re-sponses [62]. It interfaced with the touch screen monitor via video graphics arrayand universal serial bus connections.
54 4. Determining the influence of display formats on usability
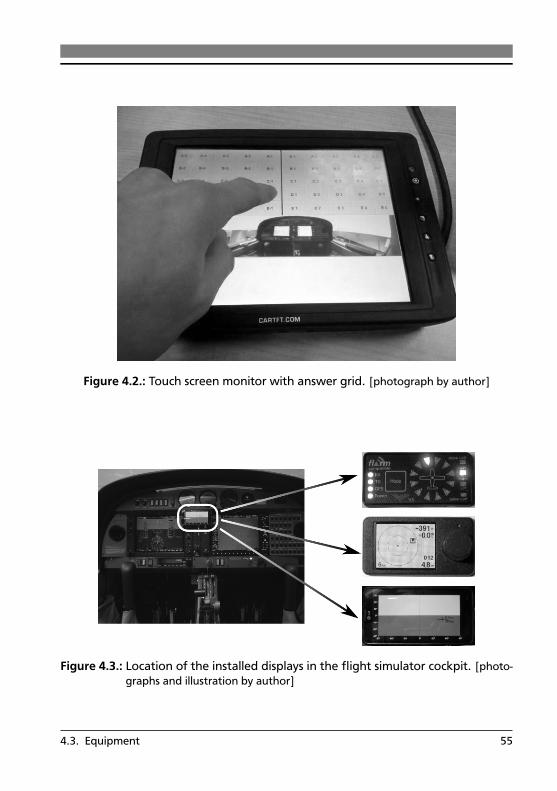
Figure 4.2.: Touch screen monitor with answer grid. [photograph by author]
Figure 4.3.: Location of the installed displays in the flight simulator cockpit. [photo-graphs and illustration by author]
4.3. Equipment 55

How the actual display devices were interfaced with the personal computer var-ied between the types of displays (see Figure 4.4). For the commercial off-the-shelflow-complexity and radar-style displays, their own firmware was used to generatetheir graphics output. This output was based on a traffic signal received from theFLARM Experiment Software on a serial interface running the FLARM Technologyserial protocol [62; 65].
The self-developed perspective display used a D605 Optimus L9II mobile phoneas display hardware, running the Android 4.1.2 operating system [97]. Its graphicscalculations were primarily performed by the FLARM Experiment Software on thepersonal computer [62]. Therefore, the mobile phone acted as an external monitorfor the personal computer. It was connected to the personal computer via a univer-sal serial bus connection. Both devices used the protocol provided by the iDisplayprograms to communicate through this connection [85]. This allowed the mobilephone to be recognized as an additional monitor by the operating system of thepersonal computer.
touch screenmonitor
personalcomputer
commercial off-the-shelfdisplays
video graphicsarray
universalserial bus
serial interfacewith FLARM
protocol
mobile phone
universal serial buswith iDisplay
protocol
Figure 4.4.: Computer hardware and interface setup. [illustration and photographs byauthor]
56 4. Determining the influence of display formats on usability
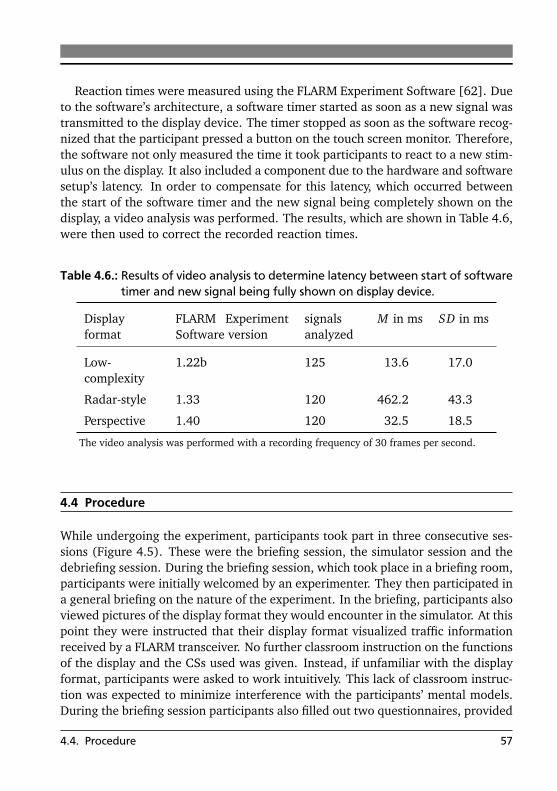
Reaction times were measured using the FLARM Experiment Software [62]. Dueto the software’s architecture, a software timer started as soon as a new signal wastransmitted to the display device. The timer stopped as soon as the software recog-nized that the participant pressed a button on the touch screen monitor. Therefore,the software not only measured the time it took participants to react to a new stim-ulus on the display. It also included a component due to the hardware and softwaresetup’s latency. In order to compensate for this latency, which occurred betweenthe start of the software timer and the new signal being completely shown on thedisplay, a video analysis was performed. The results, which are shown in Table 4.6,were then used to correct the recorded reaction times.
Table 4.6.: Results of video analysis to determine latency between start of softwaretimer and new signal being fully shown on display device.
Displayformat
FLARM ExperimentSoftware version
signalsanalyzed
M in ms SD in ms
Low-complexity
1.22b 125 13.6 17.0
Radar-style 1.33 120 462.2 43.3
Perspective 1.40 120 32.5 18.5
The video analysis was performed with a recording frequency of 30 frames per second.
4.4 Procedure
While undergoing the experiment, participants took part in three consecutive ses-sions (Figure 4.5). These were the briefing session, the simulator session and thedebriefing session. During the briefing session, which took place in a briefing room,participants were initially welcomed by an experimenter. They then participated ina general briefing on the nature of the experiment. In the briefing, participants alsoviewed pictures of the display format they would encounter in the simulator. At thispoint they were instructed that their display format visualized traffic informationreceived by a FLARM transceiver. No further classroom instruction on the functionsof the display and the CSs used was given. Instead, if unfamiliar with the displayformat, participants were asked to work intuitively. This lack of classroom instruc-tion was expected to minimize interference with the participants’ mental models.During the briefing session participants also filled out two questionnaires, provided
4.4. Procedure 57

information on their demography, flight experience and pilot qualifications as wellas on their familiarity with CASs and their human-machine interfaces. At the endof the briefing session, participants signed an informed consent form. Underageparticipants also provided consent from a legal guardian before participating.
Debriefing session in briefing room
Usability questionnaire
Open interview Debriefing
Simulator session in DA 40-180 flight simulator
Familiari-zation
Procedure and task briefings
Test and exper-imental runs
Briefing session in briefing room
Initial briefing
Questionnaires Informed consent
Break
Figure 4.5.: Flow diagram of the experiment’s sessions. [illustration by author]
Next came the simulator session. It was performed in the DA 40-180 flight simu-lator. Participants initially familiarized themselves with the simulator setup and thegridded OTW view. They then seated themselves on the left-hand seat of the simu-lator and placed the touch screen monitor on their lap. While seated, participantswere briefed by the experimenter on the experimental procedure in the simulatorand on the task that they were to perform.
The simulator was set onto the extended runway centerline of a hard surfacerunway at a distance of 3 NM from the threshold and 2000 ft above field elevation.Then the experimental procedure, illustrated in Figure 4.6, commenced. Initially,the FLARM Experiment Software randomized the order of the flight condition’s fourfactor levels [62]. The first level was then selected and the simulator’s attitudewas configured for the first factor level according to Table 4.1. Meanwhile, thesimulator remained frozen. Participants then viewed a written description of theflight condition’s factor level on the touch screen monitor. This description always
58 4. Determining the influence of display formats on usability

clarified that the simulator was tracking along the extended centerline of the hardsurface runway visible in the OTW view. To compensate for the lack of optical flow,caused by the frozen simulator condition, participants then watched a video on thetouch screen monitor. The video had a duration of approximately 15s and showeda maneuver from the cockpit perspective of a light airplane flying at the given flightcondition’s factor level.
Select flight condition‘s factor level
and set simulator
Show narrative text and video on touch screen
monitor
Trial run
(5 signals)
Experimental run
(25 signals)
Participants perform experimental task
Figure 4.6.: Flow diagram of the experimental procedure in the flight simulator. [ill-ustration and photographs by author]
In order to practice their experimental task, participants then performed a prac-tice run. The FLARM Experiment Software selected 5 of the 50 cells of the griddedOTW view [62]. Invisible traffic aircraft were assumed to be located at the centerof each of these five cells. For each invisible traffic aircraft, the slant distance wasrandomly sampled from a rectangular probability density function and varied be-tween 200m and 6000 m. Where necessary, the function’s upper discontinuity wasreduced to a value that bounded the traffic’s position to within 500 m of the own-ship’s altitude. Display signals for each of these five aircraft were then calculatedand shown at intervals of 9s. Because signals were separated by a pause of 2 swhen the displays were blanked, the traffic stimulus on the display was shown for
4.4. Procedure 59
7s. During the practice run, participants’ answers to their experimental task werenot recorded. Before and after the practice run, participants could ask questions toclarify their task.
After these questions were clarified, the first experimental run commenced. Dur-ing the experimental run, the FLARM Experiment Software selected 25 grid cellsof the OTW view [62]. Correspondingly, the experimental run consisted of 25 sig-nals being processed by the participants. Participants’ answers were now recorded.Otherwise the practice and experimental runs were identical. After the first exper-imental run was finished, the experimental procedure was reiterated. The nextfactor level of flight condition was selected and the experimental procedure ofFigure 4.6 was performed. This continued until the participants completed theexperimental runs of all four factor levels.
After the simulator session participants took a break as long as they wished.Following this, the debriefing session commenced in the briefing room. There,participants assessed their display format using the System Usability Scale ques-tionnaire. Before being debriefed on the purpose of the experiment, participantscould express their opinions and experiences with their display format in an openinterview. After the debriefing the experiment was finished. The overall durationof all three sessions was approximately 90 minutes. After the experiment was fin-ished, most participants accepted their compensation and made use of free flighttime in the simulator.
4.5 Experimental task
Participants performed their experimental task during the practice and experimen-tal runs. The task is shown in Figure 4.7. It was briefed to participants at thebeginning of the simulator session. The oral briefing consisted of the followinginstructions:
a) Look at the display as soon as you notice a new signal. Interpret the signal.
b) Glance to the OTW view where you suspect the indicated traffic to be located.Memorize the alphanumeric identifier of the OTW view’s cell where you looked.
c) Answer swiftly where your initial glance was directed by tapping the respectivecell on the touch screen monitor.
Of these three sub-tasks, only the sub-tasks a) and b) are performed duringactual glider flying. Sub-task c) was only inherent to the experiment. Schochlowproposed that the participants’ experimental task could be described as a sequential
60 4. Determining the influence of display formats on usability

a) Read and interpret display
b) Begin visual search
(Where is traffic expected?)
c) Answer on touch screen monitor
No traffic shown in out-the-window view
Figure 4.7.: Flow diagram of the participants’ task during the trial and experimentalruns. [illustration and photographs by author]
task model, consisting of the three sub-tasks a), b) and c) [125, pp. 7–10]. Accord-ing to the works of Donders [41] and Sternberg [135, 136] the time spent by eachparticipant on the respective sub-tasks is cumulative. Therefore, when measuringthe total time spent on all three sub-tasks, the time spent by participants on theflight-relevant sub-tasks a) and b) can be determined, if the time spent on sub-taskc) is known. This is performed in detail in appendix D.
4.5.1 Feedback during task
Traffic was not shown in the OTW view. Showing traffic there was expected toskew participants’ answers to where they found the traffic. However, the questionof interest was where they assumed the traffic to be located.
The invisible traffic approach also implied that participants received no feedbackwhether their answers to the experimental task were correct. This lack of feedbackprecluded the participants from learning the CAS’s actual behavior based on thesignals shown on the displays [133, pp. 71–73]. Since the learning process wasintentionally suppressed, the participants’ mental models of the CAS were assumedto remain constant throughout the experiment.
4.5. Experimental task 61
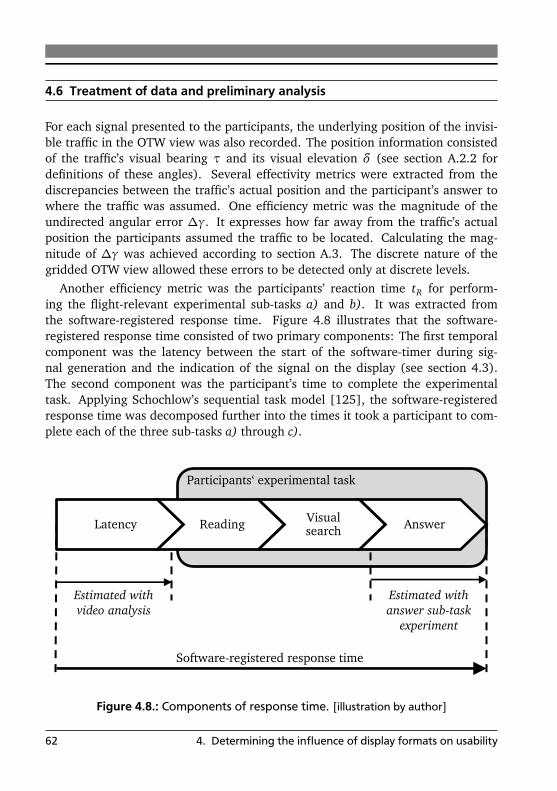
4.6 Treatment of data and preliminary analysis
For each signal presented to the participants, the underlying position of the invisi-ble traffic in the OTW view was also recorded. The position information consistedof the traffic’s visual bearing τ and its visual elevation δ (see section A.2.2 fordefinitions of these angles). Several effectivity metrics were extracted from thediscrepancies between the traffic’s actual position and the participant’s answer towhere the traffic was assumed. One efficiency metric was the magnitude of theundirected angular error ∆γ. It expresses how far away from the traffic’s actualposition the participants assumed the traffic to be located. Calculating the mag-nitude of ∆γ was achieved according to section A.3. The discrete nature of thegridded OTW view allowed these errors to be detected only at discrete levels.
Another efficiency metric was the participants’ reaction time tR for perform-ing the flight-relevant experimental sub-tasks a) and b). It was extracted fromthe software-registered response time. Figure 4.8 illustrates that the software-registered response time consisted of two primary components: The first temporalcomponent was the latency between the start of the software-timer during sig-nal generation and the indication of the signal on the display (see section 4.3).The second component was the participant’s time to complete the experimentaltask. Applying Schochlow’s sequential task model [125], the software-registeredresponse time was decomposed further into the times it took a participant to com-plete each of the three sub-tasks a) through c).
Participants‘ experimental task
Software-registered response time
Estimated with
video analysis
Latency Reading Visual search
Answer
Estimated with
answer sub-task
experiment
Figure 4.8.: Components of response time. [illustration by author]
62 4. Determining the influence of display formats on usability

By estimating the duration of the latency and the participant’s time spent on thesub-task c), the reaction time tR required for sub-tasks a) and b) was estimated.All 100 software-registered response times per participant were treated as follows:First, mean latencies for the display were subtracted. These were known fromvideo analysis (Table 4.6). Secondly, an estimate for the participants’ responsetime to sub-task c) was also subtracted. This second estimate was set to the valueof the between-participants mean response time to the answer sub-task experimentof appendix D. Its value varied solely with the participant’s given answer cell (seeTable D.1a).
All answers having angular error ∆γ ≥ 75 ◦ or reaction time tR ≤ 0s were con-sidered to be univariate outliers. They were removed, and when necessary, theywere conservatively replaced with the participant’s average values of the respectivedependent variable for that factor level of flight condition.
The assumptions and prerequisites necessary for the following statistical proce-dures were checked beforehand. Where necessary, corrections where performed.For example, for statistically significant non-sphericity, the Greenhouse-Geisser cor-rection was applied to the relevant degrees of freedom of an analysis of variance.All statistics tests were performed at a significance level α = .05, except whenstated otherwise.
4.6. Treatment of data and preliminary analysis 63

5 Results on usability and discussionof results
The data collected during the simulator study is analyzed in depth, leading to theresults presented in the following chapter. For each of the three hypotheses ofsection 3.3, inferential statistics are used to analyze the data. Additionally, ex-plorative analyses of the data are performed as well. For easier readability anddidactic reasons, the results are discussed directly following each statistical testprocedure. At the end of the chapter, the results are discussed with regard tothe Global Hypothesis. Also, practical implications for glider flight operations arepointed out.
Throughout the following chapters, it is assumed that readers are familiar withthe standard inferential statistics tests of human factors research. Those readersunfamiliar with the subject are pointed to the statistics textbooks of Ross [120],Tabachnick and Fidell [138], Fields [60] and Pallant [114].
Statistical tests with many data points are seldom performed by hand. Most testsin this thesis were performed using computer software, namely IBM SPSS Statistics,Version 21, and the MATLAB statistics toolbox implemented in the releases R2011band R2014b.
5.1 Visual search error (Hypothesis 1)
The visual search error ∆γ was grouped by unique combinations of different factorlevels of flight condition, display format and signal number. These groups exhibitedstrong non-normality1 and heteroscedasticity2. Applying a square root transforma-tion [113] of the form
∆γ=
r
∆γmax∆γ
(5.1)
improved the distribution characteristics of the transformed visual search error∆γ.In this instance max∆γ = 75 ◦ was the upper boundary of the visual search error
1 assessed using 300 Kolmogorov-Smirnov tests for normality. All 300 tests provide statisticallysignificant results at a Holm’s step-down adjusted significance level.
2 assessed using a Brown-Forsythe test for homogeneity of variances
65
according to the outlier definition of section 4.6. The transformed variable distribu-tions were still non-normal3 and heteroscedastic,4 yet to a much lesser degree thanthe untransformed distributions. The square root transformation (equation 5.1)increased monotonically in the relevant range of values. Therefore, it retained therelative order between the untransformed and transformed error distributions.
Olson stated that multivariate analysis of variance (MANOVA) procedures aremoderately robust to these violations of normality and homoscedasticity [110;111]. O’Brien and Kaiser even recommended using MANOVA procedures to ana-lyze univariate repeated-measures data violating the assumptions [108]. Followingthis recommendation, Hypothesis 1 was assessed using a three-way repeated mea-sures MANOVA, including full interaction between all independent variables, withthe Pillai-Bartlett trace Λ as the test score of choice [111; 112]. In this case, thetransformed visual search error ∆γ was selected as the MANOVA’s only dependentvariable. The display format used by each participant was the MANOVA’s between-subjects independent variable while the flight condition formed a within-subjectindependent variable. Since measurements were taken 25 times for each uniquefactor level combination of participant and flight condition, the signal number -ranging from 1 through 25 - was a further within-subject independent variable.The display format’s factor levels were the low-complexity, radar-style, and perspec-tive formats. Flight condition factor levels were straight and level flight, horizontalflight with crosswind from left, left-hand turning flight, and climbing flight.
5.1.1 Results
The transformed visual search error’s magnitude ∆γ was significantly influencedby the display format (F(2,118) = 55.12, p < .01). Calculating Bakeman’s rec-ommended effect size metric [11] - the generalized η2 effect size for repeatedmeasures univariate analyses of variance (ANOVAs) (η2
G) - revealed that this ef-fect was of small strength (η2
G = .05). Similarly, the flight condition had a smalland statistically significant effect on ∆γ; Λ = 0.73, F(3,116) = 105.54, p < .01,η2
G = .04. A statistically significant interacting effect between the display formatand the flight state on ∆γ also existed; Λ = 0.30, F(6,234) = 6.85, p < .01. Itsstrength, though, was negligible with η2
G = .01. Figure 5.1 illustrates these effectson the untransformed visual search error’s magnitude ∆γ.
3 Again, all 300 Kolmogorov-Smirnov provide statistically significant results at a Holm’s step-down adjusted significance level.
4 assessed using multiple Brown-Forsythe tests for homogeneity of variances and follow-up graph-ical comparisons
66 5. Results on usability and discussion of results
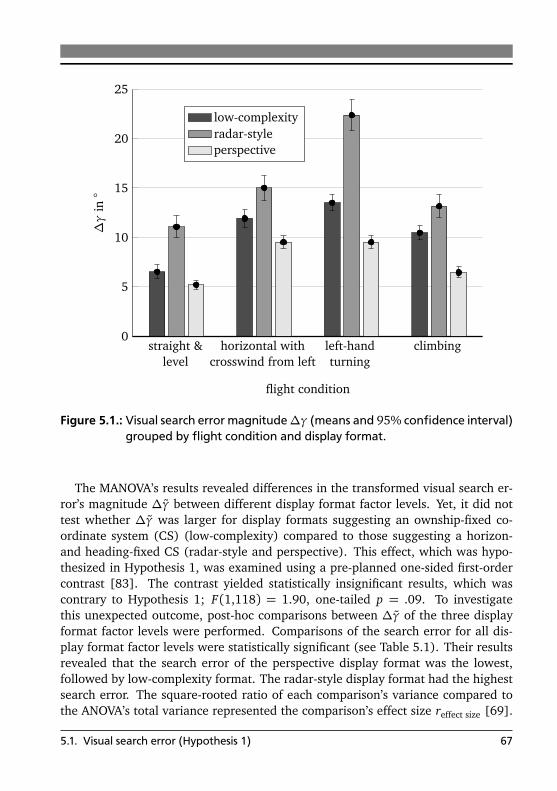
0
5
10
15
20
25
straight &level
horizontal withcrosswind from left
left-handturning
climbing
flight condition
∆γ
in◦
low-complexityradar-styleperspective
Figure 5.1.: Visual search error magnitude∆γ (means and 95% confidence interval)grouped by flight condition and display format.
The MANOVA’s results revealed differences in the transformed visual search er-ror’s magnitude ∆γ between different display format factor levels. Yet, it did nottest whether ∆γ was larger for display formats suggesting an ownship-fixed co-ordinate system (CS) (low-complexity) compared to those suggesting a horizon-and heading-fixed CS (radar-style and perspective). This effect, which was hypo-thesized in Hypothesis 1, was examined using a pre-planned one-sided first-ordercontrast [83]. The contrast yielded statistically insignificant results, which wascontrary to Hypothesis 1; F(1,118) = 1.90, one-tailed p = .09. To investigatethis unexpected outcome, post-hoc comparisons between ∆γ of the three displayformat factor levels were performed. Comparisons of the search error for all dis-play format factor levels were statistically significant (see Table 5.1). Their resultsrevealed that the search error of the perspective display format was the lowest,followed by low-complexity format. The radar-style display format had the highestsearch error. The square-rooted ratio of each comparison’s variance compared tothe ANOVA’s total variance represented the comparison’s effect size reffect size [69].
5.1. Visual search error (Hypothesis 1) 67
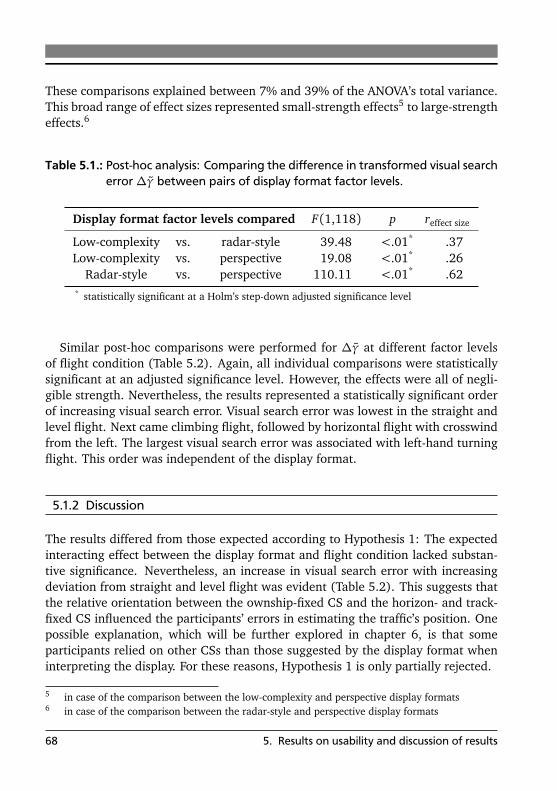
These comparisons explained between 7% and 39% of the ANOVA’s total variance.This broad range of effect sizes represented small-strength effects5 to large-strengtheffects.6
Table 5.1.: Post-hoc analysis: Comparing the difference in transformed visual searcherror∆γ between pairs of display format factor levels.
Display format factor levels compared F(1,118) p reffect size
Low-complexity vs. radar-style 39.48 <.01* .37Low-complexity vs. perspective 19.08 <.01* .26
Radar-style vs. perspective 110.11 <.01* .62* statistically significant at a Holm’s step-down adjusted significance level
Similar post-hoc comparisons were performed for ∆γ at different factor levelsof flight condition (Table 5.2). Again, all individual comparisons were statisticallysignificant at an adjusted significance level. However, the effects were all of negli-gible strength. Nevertheless, the results represented a statistically significant orderof increasing visual search error. Visual search error was lowest in the straight andlevel flight. Next came climbing flight, followed by horizontal flight with crosswindfrom the left. The largest visual search error was associated with left-hand turningflight. This order was independent of the display format.
5.1.2 Discussion
The results differed from those expected according to Hypothesis 1: The expectedinteracting effect between the display format and flight condition lacked substan-tive significance. Nevertheless, an increase in visual search error with increasingdeviation from straight and level flight was evident (Table 5.2). This suggests thatthe relative orientation between the ownship-fixed CS and the horizon- and track-fixed CS influenced the participants’ errors in estimating the traffic’s position. Onepossible explanation, which will be further explored in chapter 6, is that someparticipants relied on other CSs than those suggested by the display format wheninterpreting the display. For these reasons, Hypothesis 1 is only partially rejected.
5 in case of the comparison between the low-complexity and perspective display formats6 in case of the comparison between the radar-style and perspective display formats
68 5. Results on usability and discussion of results
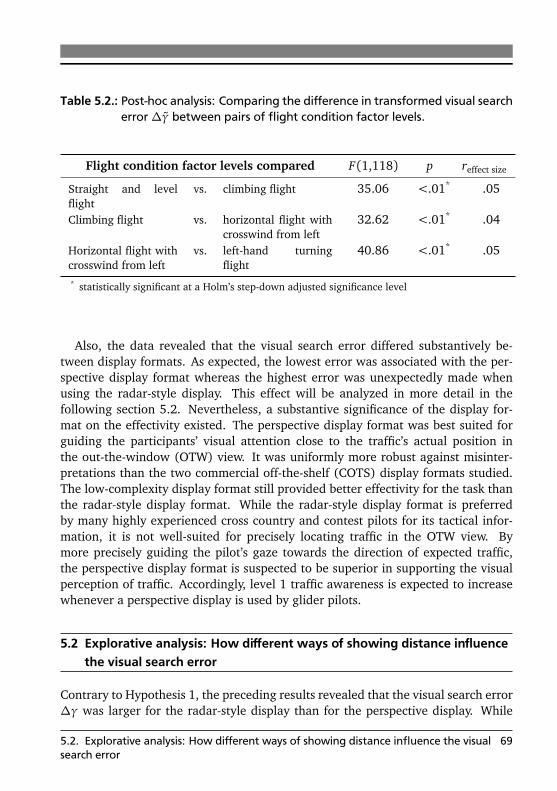
Table 5.2.: Post-hoc analysis: Comparing the difference in transformed visual searcherror∆γ between pairs of flight condition factor levels.
Flight condition factor levels compared F(1,118) p reffect size
Straight and levelflight
vs. climbing flight 35.06 <.01* .05
Climbing flight vs. horizontal flight withcrosswind from left
32.62 <.01* .04
Horizontal flight withcrosswind from left
vs. left-hand turningflight
40.86 <.01* .05
* statistically significant at a Holm’s step-down adjusted significance level
Also, the data revealed that the visual search error differed substantively be-tween display formats. As expected, the lowest error was associated with the per-spective display format whereas the highest error was unexpectedly made whenusing the radar-style display. This effect will be analyzed in more detail in thefollowing section 5.2. Nevertheless, a substantive significance of the display for-mat on the effectivity existed. The perspective display format was best suited forguiding the participants’ visual attention close to the traffic’s actual position inthe out-the-window (OTW) view. It was uniformly more robust against misinter-pretations than the two commercial off-the-shelf (COTS) display formats studied.The low-complexity display format still provided better effectivity for the task thanthe radar-style display format. While the radar-style display format is preferredby many highly experienced cross country and contest pilots for its tactical infor-mation, it is not well-suited for precisely locating traffic in the OTW view. Bymore precisely guiding the pilot’s gaze towards the direction of expected traffic,the perspective display format is suspected to be superior in supporting the visualperception of traffic. Accordingly, level 1 traffic awareness is expected to increasewhenever a perspective display is used by glider pilots.
5.2 Explorative analysis: How different ways of showing distance influencethe visual search error
Contrary to Hypothesis 1, the preceding results revealed that the visual search error∆γ was larger for the radar-style display than for the perspective display. While
5.2. Explorative analysis: How different ways of showing distance influence the visualsearch error
69

comparing the visual representations of both display formats, it became obviousthat the visual search error ∆γ was also influenced by the distance to the traffic.To examine whether distance had the same influence on the visual search error ∆γfor both formats, the experiment’s data was analyzed exploratively.
A pseudo-linear model depicting the influence of the traffic’s slant distance Rand the display format’s factor level on the transformed visual search error ∆γ wasfitted to the data using robust multiple linear regression [104].
∆γ= f0,r + cp · f0,pr +�
f1,r + cp · f1,pr
�
· R (5.2)
with
cp =
(
0 for radar-style display
1 for perspective display(5.3)
In equation 5.2 the parameter f0,r represented the zero-order offset for the radar-style display whereas f0,r+ f0,pr was the offset for perspective display. Analogously,the first-order slopes for each display format were described via f1,r and f1,r+ f1,pr .The dummy variables cp and cp ·R resulted in heteroscedasticity of residuals7 for themodel predictors. No multicollinearity existed for the different predictors.8 Robustregression methods, relying on bootstrapping, still allowed reliable and unbiasedestimators of model parameters to be attained [61, section 8.8].
5.2.1 Results
A multiple linear regression relying on 104 bootstrap samples was performed.The forced entry of all four predictor variables created a model with a moder-ate strength effect size; R2 = .09, F(3,6144) = 203.71, p < .01 with R2 beingthe ratio of explained variance based on Pearson’s adjusted regression coefficient.The estimated parameters of equation 5.2 and their 95% bias-corrected and accel-erated confidence intervals are shown in Table 5.3. All parameter estimates werestatistically significant at an adjusted significance level. When squaring the respec-tive structure coefficients, it was evident that the modeled parameters contributedbetween 39% and 67% of the total modeled variance.
Figure 5.2 illustrates how the model fits to the untransformed visual search errordistribution ∆γ for both display formats. In the figure, the discrete values of thevisual search error, stemming from the experiment’s gridded OTW view and touch
7 assessed using graphical methods8 assessed using the variance inflation factor
70 5. Results on usability and discussion of results

Table 5.3.: Multiple regression results: Parameter estimates with 95% confidenceintervals (CIs) and structure coefficients.
95% CI bounds
Parameter estimate lower upper p structure coeff.
f0,r .530 .510 .550 <.01*
f0,pr −.150 −.172 −.127 <.01* −.623f1,r −.051 1/km −.059 1/km −.044 1/km <.01* −.666f1,pr .015 1/km .006 1/km .024 1/km <.01* −.818* statistically significant at a Holm’s step-down adjusted significance level
screen monitor response, are evident. Both display formats exhibited decreasingvisual search error magnitude with increasing slant distance R. However, the per-spective display format consistently provided a lower visual search error than theradar-style display format in the relevant distances between 200 m and 6000m.
5.2.2 Discussion
While a correlation between slant distance R and visual search error ∆γ is by nomeans sufficient to prove causality, it was suspected that the following effects wereresponsible for the increasing error with decreasing distance. At first, the sus-pected effect on the radar-style display format will be discussed. The horizontaldistance RH being depicted as a radial coordinate on the radar-style display (com-pare Figure 3.5). As the traffic’s slant distance R decreased its horizontal distanceRH decreased as well.
RH = R · cosε (5.4)
This resulted in the traffic symbol moving closer to the ownship symbol at the cen-ter of the radar-style display format’s two-dimensional polar CS. As it moved closerto the polar CS’s origin, judging the traffic symbol’s radial coordinate - which repre-sented the traffic’s relative bearing ρ - became more difficult. An extreme exampleof this was when parts of the traffic symbol overlapped the ownship symbol at thecenter of the polar CS. In this case pilots lacked a reference to judge the traffic’srelative bearing ρ. Inversely, it became easier to judge the traffic’s relative bearingas the distance to the traffic increased. This led to the visual search error of trafficat the maximum distance max R= 6000m being an order of magnitude lower thanthe error associated with traffic being at the minimum distance min R= 200m.
5.2. Explorative analysis: How different ways of showing distance influence the visualsearch error
71
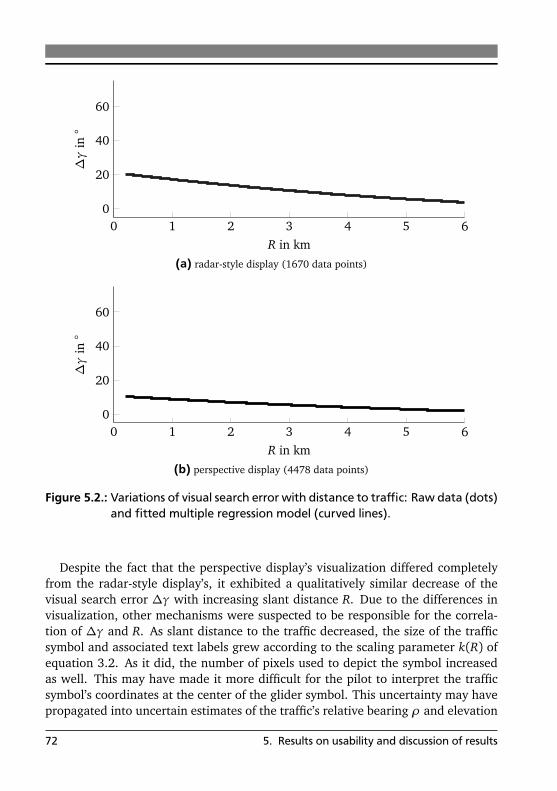
0 1 2 3 4 5 60
20
40
60
R in km
∆γ
in◦
(a) radar-style display (1670 data points)
0 1 2 3 4 5 60
20
40
60
R in km
∆γ
in◦
(b) perspective display (4478 data points)
Figure 5.2.: Variations of visual search error with distance to traffic: Raw data (dots)and fitted multiple regression model (curved lines).
Despite the fact that the perspective display’s visualization differed completelyfrom the radar-style display’s, it exhibited a qualitatively similar decrease of thevisual search error ∆γ with increasing slant distance R. Due to the differences invisualization, other mechanisms were suspected to be responsible for the correla-tion of ∆γ and R. As slant distance to the traffic decreased, the size of the trafficsymbol and associated text labels grew according to the scaling parameter k(R) ofequation 3.2. As it did, the number of pixels used to depict the symbol increasedas well. This may have made it more difficult for the pilot to interpret the trafficsymbol’s coordinates at the center of the glider symbol. This uncertainty may havepropagated into uncertain estimates of the traffic’s relative bearing ρ and elevation
72 5. Results on usability and discussion of results

ε being made by the participant. This, in turn, may have resulted in an increasedvisual search error.
While the identified multiple regression model suggested the aforementionedmechanisms, it did not prove their existence. Still, the model demonstrated that theperspective display format is superior to the radar-style display format in terms ofvisual search error over all slant distances studied. The perspective display formatwas less prone to distance-induced errors in the task of estimating the traffic’sdirection in the OTW view than the radar-style display format. The fact that thepilot’s visual search began at a larger angular distance away from the actual traffic’sposition is expected to lead to more time being required until traffic is successfullylocated in the OTW view. In practice, this longer duration is at least partiallycompensated by increasing traffic conspicuity and traffic visual size as the trafficmoves closer [6].
5.3 Reaction time (Hypothesis 2)
Contrary to the distributions of visual search errors in the previous section 5.1, reac-tion times were normally distributed9 and showed only moderate heteroscedastic-ity.10 Because ANOVAs are slightly conservative under the given heteroscedasticity,they could still be utilized [158]. Hypothesis 2 was assessed using a univariatethree-way repeated measures ANOVA. The ANOVA’s independent variables wereidentical to the MANOVA’s of the previous section 5.1. Full interaction between theANOVA’s three independent variables was regarded. Reaction time tR was selectedas the ANOVA’s dependent variable.
5.3.1 Results
The flight condition provided a statistically significant influence on reaction timeat a negligible strength; F(3,354) = 7.37, p < .01, η2
G < .01. On the other hand,the display format had no main effect on reaction time; F(2,118) = 1.21, p =.30. However, interaction between flight condition and display format significantlyinfluenced the participants’ reaction time; F(6,354) = 2.36, p = .03. This effectwas yet again of negligible strength; η2
G < .01. The results are also illustrated inFigure 5.3.
9 assessed using 300 Kolmogorov-Smirnov tests for normality. All provide statistically insignifi-cant results at a Holm’s step-down adjusted significance level
10 assessed using a Levene test for homogeneity of variances and graphical follow-up analyses
5.3. Reaction time (Hypothesis 2) 73

0
0.5
1
1.5
2
2.5
3
3.5
straight &level
horizontal withcrosswind from left
left-handturning
climbing
flight condition
t Rin
s
low-complexityradar-styleperspective
Figure 5.3.: Reaction time tR (means and 95% confidence interval) grouped byflight condition and display format.
5.3.2 Discussion
Even though statistically significant effects on reaction time existed, those effectswere all of negligible strength. Flight condition and display format, as well as theirinteraction, therefore provided no substantial explanation for the observed vari-ance in reaction time. Thus, Hypothesis 2 was rejected. Mental rotation processesfrom the suggested CS of a display format to the ownship-fixed CS did not serve toexplain the observed differences in reaction time. While pilots likely perform men-tal rotations to align the display’s depictions with the OTW view, these processesare either too swift to make a substantive influence or they don’t necessarily takeplace between the display’s suggested and the ownship-fixed CS. The latter optionwill be explored further in chapter 6.
As already discussed, the temporal cost of using any of the analyzed displayformats did not substantively differ during the experiment. Because the temporalcost was quasi constant, effectivity remained as the only influence on the display
74 5. Results on usability and discussion of results
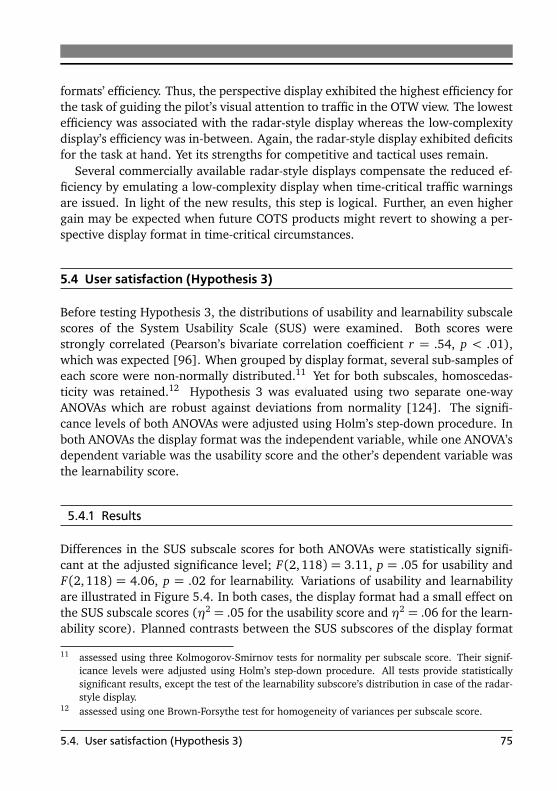
formats’ efficiency. Thus, the perspective display exhibited the highest efficiency forthe task of guiding the pilot’s visual attention to traffic in the OTW view. The lowestefficiency was associated with the radar-style display whereas the low-complexitydisplay’s efficiency was in-between. Again, the radar-style display exhibited deficitsfor the task at hand. Yet its strengths for competitive and tactical uses remain.
Several commercially available radar-style displays compensate the reduced ef-ficiency by emulating a low-complexity display when time-critical traffic warningsare issued. In light of the new results, this step is logical. Further, an even highergain may be expected when future COTS products might revert to showing a per-spective display format in time-critical circumstances.
5.4 User satisfaction (Hypothesis 3)
Before testing Hypothesis 3, the distributions of usability and learnability subscalescores of the System Usability Scale (SUS) were examined. Both scores werestrongly correlated (Pearson’s bivariate correlation coefficient r = .54, p < .01),which was expected [96]. When grouped by display format, several sub-samples ofeach score were non-normally distributed.11 Yet for both subscales, homoscedas-ticity was retained.12 Hypothesis 3 was evaluated using two separate one-wayANOVAs which are robust against deviations from normality [124]. The signifi-cance levels of both ANOVAs were adjusted using Holm’s step-down procedure. Inboth ANOVAs the display format was the independent variable, while one ANOVA’sdependent variable was the usability score and the other’s dependent variable wasthe learnability score.
5.4.1 Results
Differences in the SUS subscale scores for both ANOVAs were statistically signifi-cant at the adjusted significance level; F(2,118) = 3.11, p = .05 for usability andF(2, 118) = 4.06, p = .02 for learnability. Variations of usability and learnabilityare illustrated in Figure 5.4. In both cases, the display format had a small effect onthe SUS subscale scores (η2 = .05 for the usability score and η2 = .06 for the learn-ability score). Planned contrasts between the SUS subscores of the display format
11 assessed using three Kolmogorov-Smirnov tests for normality per subscale score. Their signif-icance levels were adjusted using Holm’s step-down procedure. All tests provide statisticallysignificant results, except the test of the learnability subscore’s distribution in case of the radar-style display.
12 assessed using one Brown-Forsythe test for homogeneity of variances per subscale score.
5.4. User satisfaction (Hypothesis 3) 75
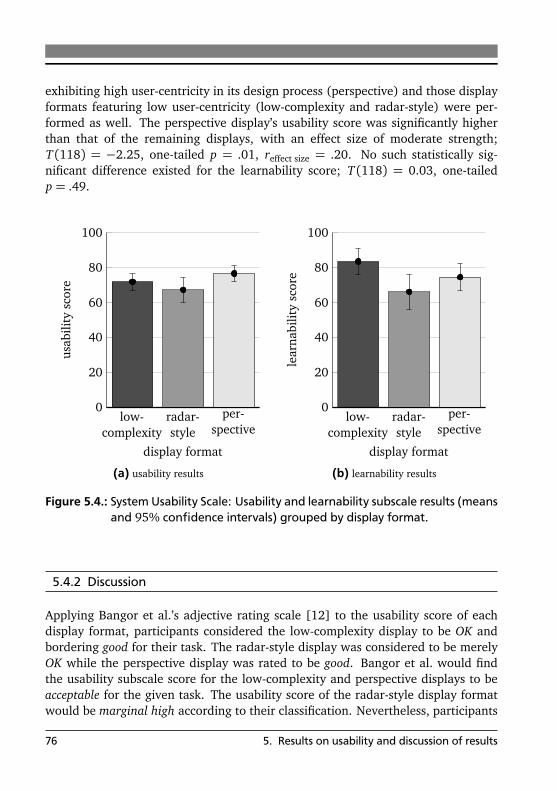
exhibiting high user-centricity in its design process (perspective) and those displayformats featuring low user-centricity (low-complexity and radar-style) were per-formed as well. The perspective display’s usability score was significantly higherthan that of the remaining displays, with an effect size of moderate strength;T (118) = −2.25, one-tailed p = .01, reffect size = .20. No such statistically sig-nificant difference existed for the learnability score; T (118) = 0.03, one-tailedp = .49.
0
20
40
60
80
100
low-complexity
radar-style
per-spective
display format
usab
ility
scor
e
(a) usability results
0
20
40
60
80
100
low-complexity
radar-style
per-spective
display format
lear
nabi
lity
scor
e
(b) learnability results
Figure 5.4.: System Usability Scale: Usability and learnability subscale results (meansand 95% confidence intervals) grouped by display format.
5.4.2 Discussion
Applying Bangor et al.’s adjective rating scale [12] to the usability score of eachdisplay format, participants considered the low-complexity display to be OK andbordering good for their task. The radar-style display was considered to be merelyOK while the perspective display was rated to be good. Bangor et al. would findthe usability subscale score for the low-complexity and perspective displays to beacceptable for the given task. The usability score of the radar-style display formatwould be marginal high according to their classification. Nevertheless, participants
76 5. Results on usability and discussion of results
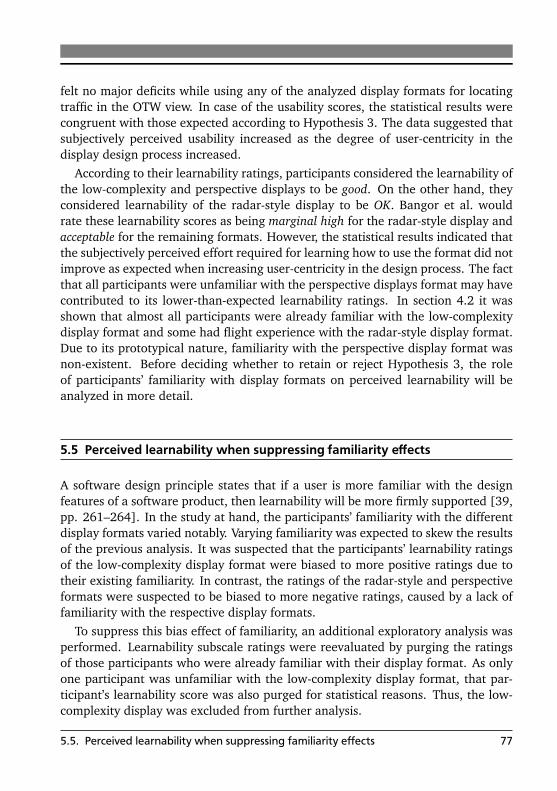
felt no major deficits while using any of the analyzed display formats for locatingtraffic in the OTW view. In case of the usability scores, the statistical results werecongruent with those expected according to Hypothesis 3. The data suggested thatsubjectively perceived usability increased as the degree of user-centricity in thedisplay design process increased.
According to their learnability ratings, participants considered the learnability ofthe low-complexity and perspective displays to be good. On the other hand, theyconsidered learnability of the radar-style display to be OK. Bangor et al. wouldrate these learnability scores as being marginal high for the radar-style display andacceptable for the remaining formats. However, the statistical results indicated thatthe subjectively perceived effort required for learning how to use the format did notimprove as expected when increasing user-centricity in the design process. The factthat all participants were unfamiliar with the perspective displays format may havecontributed to its lower-than-expected learnability ratings. In section 4.2 it wasshown that almost all participants were already familiar with the low-complexitydisplay format and some had flight experience with the radar-style display format.Due to its prototypical nature, familiarity with the perspective display format wasnon-existent. Before deciding whether to retain or reject Hypothesis 3, the roleof participants’ familiarity with display formats on perceived learnability will beanalyzed in more detail.
5.5 Perceived learnability when suppressing familiarity effects
A software design principle states that if a user is more familiar with the designfeatures of a software product, then learnability will be more firmly supported [39,pp. 261–264]. In the study at hand, the participants’ familiarity with the differentdisplay formats varied notably. Varying familiarity was expected to skew the resultsof the previous analysis. It was suspected that the participants’ learnability ratingsof the low-complexity display format were biased to more positive ratings due totheir existing familiarity. In contrast, the ratings of the radar-style and perspectiveformats were suspected to be biased to more negative ratings, caused by a lack offamiliarity with the respective display formats.
To suppress this bias effect of familiarity, an additional exploratory analysis wasperformed. Learnability subscale ratings were reevaluated by purging the ratingsof those participants who were already familiar with their display format. As onlyone participant was unfamiliar with the low-complexity display format, that par-ticipant’s learnability score was also purged for statistical reasons. Thus, the low-complexity display was excluded from further analysis.
5.5. Perceived learnability when suppressing familiarity effects 77
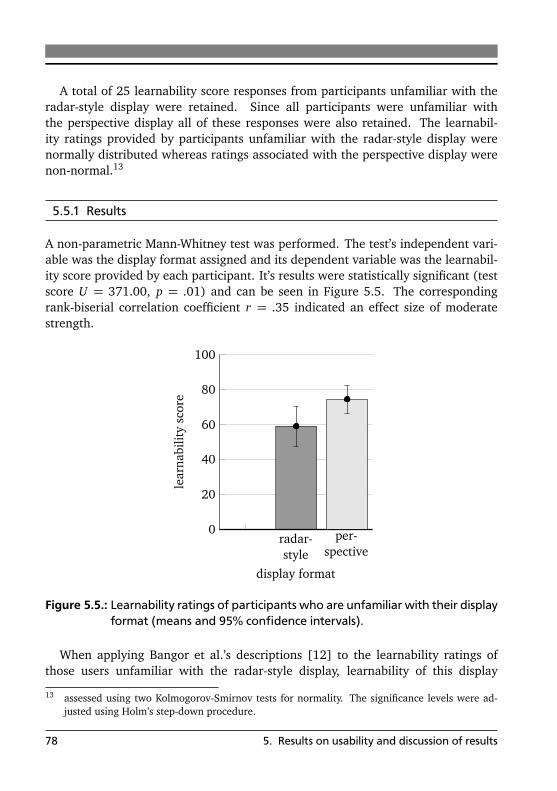
A total of 25 learnability score responses from participants unfamiliar with theradar-style display were retained. Since all participants were unfamiliar withthe perspective display all of these responses were also retained. The learnabil-ity ratings provided by participants unfamiliar with the radar-style display werenormally distributed whereas ratings associated with the perspective display werenon-normal.13
5.5.1 Results
A non-parametric Mann-Whitney test was performed. The test’s independent vari-able was the display format assigned and its dependent variable was the learnabil-ity score provided by each participant. It’s results were statistically significant (testscore U = 371.00, p = .01) and can be seen in Figure 5.5. The correspondingrank-biserial correlation coefficient r = .35 indicated an effect size of moderatestrength.
0
20
40
60
80
100
radar-style
per-spective
display format
lear
nabi
lity
scor
e
Figure 5.5.: Learnability ratings of participants who are unfamiliar with their displayformat (means and 95% confidence intervals).
When applying Bangor et al.’s descriptions [12] to the learnability ratings ofthose users unfamiliar with the radar-style display, learnability of this display
13 assessed using two Kolmogorov-Smirnov tests for normality. The significance levels were ad-justed using Holm’s step-down procedure.
78 5. Results on usability and discussion of results

format would be considered to be marginal low. The adjective associated withlearnability scores remained good for the perspective display format.
5.5.2 Discussion
Learning how to use a new display format was perceived differently by partici-pants, depending on the format they faced. Those participants unfamiliar with agiven display format perceived the perspective display format as being easier tolearn than the radar-style display format. Particularly those participants unfamiliarwith the radar-style display format perceived the learning process as being cumber-some when no guidance - such as an expert checkout or a manual - is provided. Thisdifference in perceived learnability effort was attributed to differences in the designfeatures of each display format. These features were a result of the design process.Again, the display format with a higher degree of user-centricity in its design pro-cess (perspective) exhibited superior learnability than the display format havingexperienced a lesser degree of user-centricity in its design (radar-style). Neitherthe subjective usability results, nor the subjective learnability results, challengedHypothesis 3. Therefore, the hypothesis was retained.
5.6 Discussion of technology readiness and overall usability
The results of the previous sections clearly showed that the prototype of a per-spective display format for a quasi-standard collision alerting system in glidingapplications exhibited improved usability in all subjective and objective usabilitydimensions compared to pre-existing COTS display formats. Since these improve-ments in usability have been verified in a laboratory environment, the perspectivedisplay format’s readiness was raised from technology readiness level 3 (“experi-mental proof of concept” [56, Annex G]) to technology readiness level 4 (“technol-ogy validated in lab”).
The design process used to create the perspective display prototype distinguishedthis display format from the two COTS display formats used for comparison. Whilethe COTS low-complexity and radar-style displays were designed using an ap-proach exhibiting a low degree of user-centricity, the perspective display reliedon a design process with a high degree of user-centricity. Taking into considera-tion the perspective display’s improved usability traits, it is likely that these traitswere a result of the high number of future users involved in the design process.The Global Hypothesis - stating that more user-centric design processes result inoptimized usability - was retained.
5.6. Discussion of technology readiness and overall usability 79
While the design process of the perspective display format led to a display formatwhich increased pilot performance, the underlying psychological mechanisms werenot yet fully understood. Both, the visual search error and reaction time, associatedwith each display format did not always behave as hypothesized. It is possible thatparticipants not only relied on the display format’s suggested CS when interpretingdata shown. Instead, their pre-existing knowledge might have resulted in mentalmodels which relied on different CSs. This possibility will be analyzed further inthe following chapter 6.
5.7 Criticism of method and potential for future work
Before attempting to link the results and interpretations presented within the pre-ceding sections to practical flight operations, a review of the major weak points ofthe experiment was appropriate. Both, the experimental method and the prototyp-ical perspective display, had inherent shortcomings.
Since the study was performed as a laboratory experiment, its results are sub-ject to all criticism generic to laboratory experiments. Laboratory experiments onlyhave limited external validity since their environment consists of highly controlledenvironmental variables whereas the real-world environment does not. The taskperformed by participants during the experiment, for example, was highly artifi-cial. During actual flight, glider pilots would not only concentrate on interpretingtraffic signals, but would need to attend to other simultaneous tasks, such as hand-flying the aircraft, navigating and performing higher-level tactical planning tasks.In real-world flight operations, glider pilots would also receive feedback on whethertheir search for traffic was successful. This is due to the fact that in real-world flightoperations, other traffic is visible OTW. In the simulator, the traffic was not shownin the OTW view in order to prevent participants from adapting their mental mod-els.
Also, the cockpit environment of the experiment was highly unfamiliar to mostglider pilots. Multi-seat gliders are most commonly configured with tandem-seatcockpits and conventional instrumentation. The simulator, however, had a side-by-side cockpit and a digital avionics suite installed. This unusual environment mayhave had influences on the participants’ behavior.
The studied flight conditions can also be seen as being artificial. In real-worldoperations, the pitch, bank and drift angles would vary continuously. In the exper-iment they were only studied at discrete and fixed values. Only one of these anglesdeviated from zero during three of the four levels of flight condition. In real-worldoperations this would be possible only in the calmest of weather conditions.
80 5. Results on usability and discussion of results

Perhaps the most artificial aspect in the experiment was the answer task per-formed by participants. They were asked to estimate the position of traffic indi-cated on the traffic display via an alphanumeric grid placed on the OTW view.They then provided their estimate on a touch screen monitor. Naturally, no suchgrid is available in real-world flight operations. Also, the touch screen monitor wasonly required to record the participants’ estimates and would not be available inreal-world operations. This method of recording participants’ answers was seen asa discretized version of Alexander and Wickens’ answer task [2]. The relativelycoarse discretization in the experiment may have been responsible for increas-ing variance in the data observed. Also, it cannot be said with certainty that theanswers provided by participants were the actual locations where they suspectedtraffic to be located.
The experiment still provided insight into the processing of traffic information byglider pilots. Its major advantage, as with any laboratory experiment, was its highlycontrolled environmental conditions. This increased the experiment’s internal va-lidity and allowed for the detection of effects whose effect sizes were previouslyunknown. It was also the first experiment that systematically analyzed the usabil-ity of low-cost collision alerting systems for gliding applications.
Nevertheless, there is room for improvement of the experimental setup. Futurework should remove the artificial touch screen response and gridded OTW from thesetup. By replacing this with eye-tracking equipment it would be possible to recordmore naturally the locations where participants would begin their visual search.This would also remove the artificial discretization of the participants’ responses.A second area of modification should be the flight conditions. Instead of concen-trating on a limited number of pre-selected flight conditions, the pitch, bank anddrift angles should be varied continuously. Also, combinations where multiple an-gles deviate from zero simultaneously should be studied in an attempt to recreatecommon real-world flight conditions.
Another area of criticism is one of the research objects themselves. Comparedto the two COTS traffic display formats, the perspective display format was still ina prototype stage of development. The prototype was optimized for the simulatorexperiment. It had several design features which might have artificially increasedpilot performance. Firstly, only one traffic aircraft could be shown at a time. Nomethods for preventing clutter or grouping multiple traffic indications were im-plemented. Additionally, the available physical display area for showing trafficinformation was larger than the area available on the COTS formats. Whereas thetwo COTS formats represented traffic in all directions, the perspective display hada limited field of view (FOV). This limited FOV inherently led to a keyhole effect
5.7. Criticism of method and potential for future work 81

[159]. Traffic within the perspective display’s FOV was well defined. Contrary,traffic outside the FOV could not be shown without some ambiguity.
Future operational versions of a perspective traffic display format for glidingapplications would need to overcome the problems of showing traffic outside ofthe perspective FOV. This may be achieved by integrating the perspective formatwith an additional traffic representation, such as a radar-style display format. Theradar-style display format - contrary to the perspective display format - is also ableto show traffic converging from the rear hemisphere. Such multi-display setups,however, may come at the cost of increased mental effort to integrate data shownon both displays. At the same time, the limited FOV of the perspective displayalready covers most traffic situations. Visual flight rules traffic mainly convergesfrom the frontal hemisphere to the ownship [93]. This majority of traffic, therefore,is within the perspective displays format’s FOV. Additionally, aspects such as clutterprevention would need to be addressed.
5.8 Practical implications of results on glider flight operations
Many of the effects identified during the laboratory experiment are expected tocarry over into practical glider flight operations. Therefore, guidance for gliderpilots using the FLARM low-cost collision alerting system was derived. First andforemost FLARM does not show all relevant traffic. For example, some traffic maynot be equipped with a compatible FLARM transceiver or radio signals betweenFLARM transceivers may be blocked by aircraft structural parts. Thus, glider pilotsmust still perform their visual scan in order to detect those aircraft not identifiedby FLARM.
Even if traffic is detected by FLARM, pilots will begin their visual search for theindicated traffic with a random initial offset. These visual search errors increasefor all analyzed display formats whenever the ownship’s attitude deviates from astraight and level flight condition without crosswind. Whenever the magnitudes ofthe bank angle |Φ|, the pitch angle |Θ| or drift angle |ν | deviates from zero, gliderpilots will begin their visual search for traffic in the OTW view farther from thetraffic’s actual position compared to when they search during wind-free straightand level flight. Such a larger offset in the initial OTW visual search for traffic willlead to a larger volume of airspace which needs to be scanned for traffic. As a result,the time until traffic is visually located is expected to increase. Consequently, gliderpilots should plan their tasks in order to allow longer visual searches whenever notflying straight and level.
Particularly prone to a longer visual searches for traffic are flight conditionswhere large deviations from straight and level flight occur. In gliding such con-
82 5. Results on usability and discussion of results
ditions may occur while a) thermaling at high bank angles, b) performing aero-batics14 with high pitch and bank angles, c) flying in mountain wave conditionswith strong winds and corresponding large drift angles, or d) ridge soaring withstrong crosswinds and large drift angles in proximity to terrain. All display formatsanalyzed suffer from reduced pilot performance in these conditions.
14 Even though forbidden by the FLARM manufacturer [64, p. 12], some glider pilots still useFLARM to help in their visual lookout while performing aerobatics (name made anonymous,personal communication, December 2, 2013).
5.8. Practical implications of results on glider flight operations 83


6 Explorative analysis of mentalmodels and their underlyingcoordinate systems
Results from the effectivity and efficiency analyses showed that an assumption un-derlying Hypotheses 1 and 2 may have been violated. Apparently, not all parti-cipants relied on the coordinate system (CS) suggested by each display format’sgraphical design features. At least some pilots may have used different CSs whileinterpreting the traffic information shown to them.
These unexpected results will be exploratively analyzed in this chapter. Suspect-ing that different participants may have used different personal CSs while interpret-ing the same display format, several plausible personal CSs are proposed. TheseCSs are fundamental in describing how each participant may have interpreted thedata shown on each display format. Because these CSs describe how participantsmay have interpreted the data shown, they provide insight into the pilots’ mentalmodels (MMs) of the collision alerting system (CAS). Different MMs used by gliderpilot participants are identified from the experimental data. Thereafter, the conceptof MMs, its influence on pilot performance, as well as its implications for practicalglider flight operations, are explored.
6.1 Introduction
While interpreting traffic information shown on the display format, each partici-pant had to define the orientation of a CS in which to interpret the information in.The traffic information then had to be rotated from the participants’ ownship-fixedseating position to the CS used for interpretation. Initially, it was assumed that allparticipants used the CS which was suggested by the design features of the displayformat they were exposed to. However, the results of the previous chapter suggestthat this assumption was violated. Instead, at least some participants may haveused different CSs, leading to a personal CS for each participant.
Because different pilots may have different MMs of the CAS, their personal CSsmight behave differently to changes in the ownship’s attitude. The actual MM usedby a participant may have been influenced by the suggested CS of a display format.
85

Other factors, such as the participant’s previous knowledge about the CAS andpersonal experience with such systems may have influenced their MMs as well.
During the experiment’s post-simulator open interview (see section 4.4) manyparticipants were unable to verbalize how they believe that traffic indications ontheir display format reacted to changes in the ownship’s attitude. However, sev-eral participants explicitly described that traffic information of the FLARM CASwas always provided in a horizon- and track-fixed CS, due to FLARM’s technicallimitations. These pilots then mentioned that they consciously neglected to alignthe traffic information shown on the display with the horizon- and track-fixed CS.They said that aligning the traffic information with an ownship-fixed CS would al-low them to begin their visual search for traffic in out-the-window (OTW) moreswiftly. According to their explanations, they were aware that by beginning thevisual search process in the OTW view more swiftly - through aligning the trafficinformation with the ownship-fixed CS instead of the heading- and track-fixed CS- a larger visual search error resulted.
Two new hypotheses are derived from the results of chapter 5 and the circum-stantial evidence of the open interviews. The first of these hypotheses assumes thatthe CS suggested by a display format is most important in forming the MMs whichglider pilots might develop.
Hypothesis 4: The likelihood with which a MM might be used by aglider pilot when interpreting traffic information depends on theproperties of the display format used to present the traffic infor-mation. Those MMs that rely on a CS whose behavior is identicalto the CS suggested by the display format’s design features are themost frequent MMs for glider pilots using that display format.
The second hypothesis postulates that pilot performance varies between differentMMs. It is assumed that a trade-off between speed and precision exists.
Hypothesis 5: Different MMs correspond to different pilot perfor-mance. If a glider pilot uses a MM which relies on a CS requiringrotation from the pilot’s ownship-fixed seating position, that pi-lot’s responses will be more precise, but slower, when comparedto pilots using MMs requiring no rotation.
6.2 Method
For further analysis, the MM and associated personal CS of each participant had tobe identified. As many participants were unable to verbalize their MMs, they had
86 6. Explorative analysis of mental models and their underlying coordinate systems
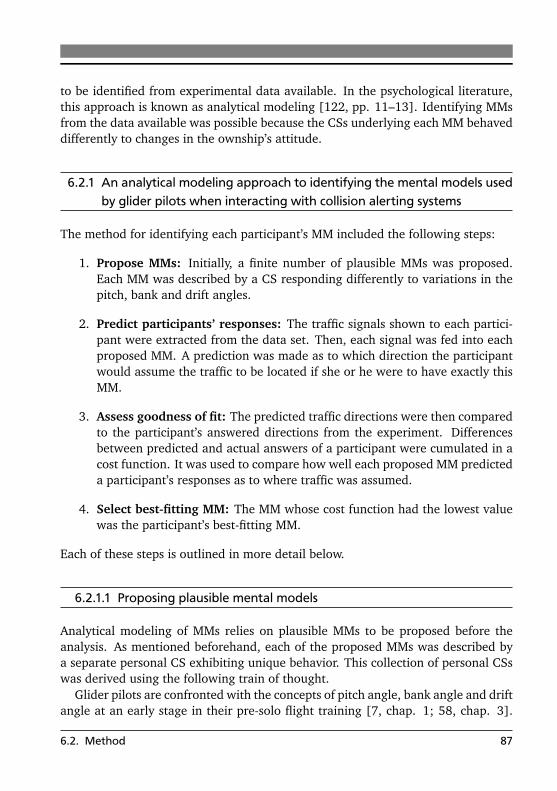
to be identified from experimental data available. In the psychological literature,this approach is known as analytical modeling [122, pp. 11–13]. Identifying MMsfrom the data available was possible because the CSs underlying each MM behaveddifferently to changes in the ownship’s attitude.
6.2.1 An analytical modeling approach to identifying the mental models usedby glider pilots when interacting with collision alerting systems
The method for identifying each participant’s MM included the following steps:
1. Propose MMs: Initially, a finite number of plausible MMs was proposed.Each MM was described by a CS responding differently to variations in thepitch, bank and drift angles.
2. Predict participants’ responses: The traffic signals shown to each partici-pant were extracted from the data set. Then, each signal was fed into eachproposed MM. A prediction was made as to which direction the participantwould assume the traffic to be located if she or he were to have exactly thisMM.
3. Assess goodness of fit: The predicted traffic directions were then comparedto the participant’s answered directions from the experiment. Differencesbetween predicted and actual answers of a participant were cumulated in acost function. It was used to compare how well each proposed MM predicteda participant’s responses as to where traffic was assumed.
4. Select best-fitting MM: The MM whose cost function had the lowest valuewas the participant’s best-fitting MM.
Each of these steps is outlined in more detail below.
6.2.1.1 Proposing plausible mental models
Analytical modeling of MMs relies on plausible MMs to be proposed before theanalysis. As mentioned beforehand, each of the proposed MMs was described bya separate personal CS exhibiting unique behavior. This collection of personal CSswas derived using the following train of thought.
Glider pilots are confronted with the concepts of pitch angle, bank angle and driftangle at an early stage in their pre-solo flight training [7, chap. 1; 58, chap. 3].
6.2. Method 87

These concepts should be intuitive to glider pilots and not require further explana-tion. Coincidentally, the concepts of pitch angle, bank angle and drift angle can beused to describe the relative orientation between FLARM’s horizon- and track-fixedCS and the pilot’s ownship-fixed seating position (see section A.2.4 for a math-ematical description of this coordinate transformation). Each angle describes arotation that is necessary to align the traffic display’s information with FLARM’s CSfrom the pilot’s seating position. On a knowledge level, each participant may haveknown that all of these rotations are required for successful alignment. She or hemight also have knowledge deficits, resulting in the participant being unaware ofsome or all of the required rotations. When experiencing knowledge deficits [133,section 4.2.4] - such as when lacking background information from the FLARMmanual - participants may neglect performing some or all of these rotations. Inthese cases, the personal CS from which the participant may have applied relativebearing and elevation data - as seen on the display - would have been misaligned,and would not have coincided with FLARM’s horizon- and track-fixed CS. The dis-parity between each participant’s personal CS and the CS used by FLARM to presenttraffic information is expected to result in larger visual search errors ∆γ.
Mathematically, the transformation from the participant’s ownship-fixed seatingposition was described as a three-step process:
1. Rotation around the ~x f -axis through the negative bank angle −Φ if the par-ticipant had proper knowledge, or no rotation if a knowledge deficit existed,
2. rotation around the intermediate ~y′′′′
-axis through the negative pitch angle−Θ if the participant had proper knowledge, or no rotation if a knowledgedeficit existed,
3. rotation around the intermediate ~z′′′′′
-axis through the negative drift angle−ν if the participant had proper knowledge, or no rotation if a knowledgedeficit existed.
This behavior was expressed using identity matrices I3 and rotation matrices M.
Mi,os =�
(1− cν ,i) · I3 + cν ,i ·M(~z′′′′′
,− ν)�
· . . .�
(1− cΘ,i) · I3 + cΘ,i ·M(~y′′′′
,−Θ)�
· . . .�
(1− cΦ,i) · I3 + cΦ,i ·M(~xos,−Φ)�
(6.1)
Combining these three steps, the rotation matrix Mi,os described the transformationfrom the participant’s ownship-fixed seating position to the orientation of the CS
88 6. Explorative analysis of mental models and their underlying coordinate systems
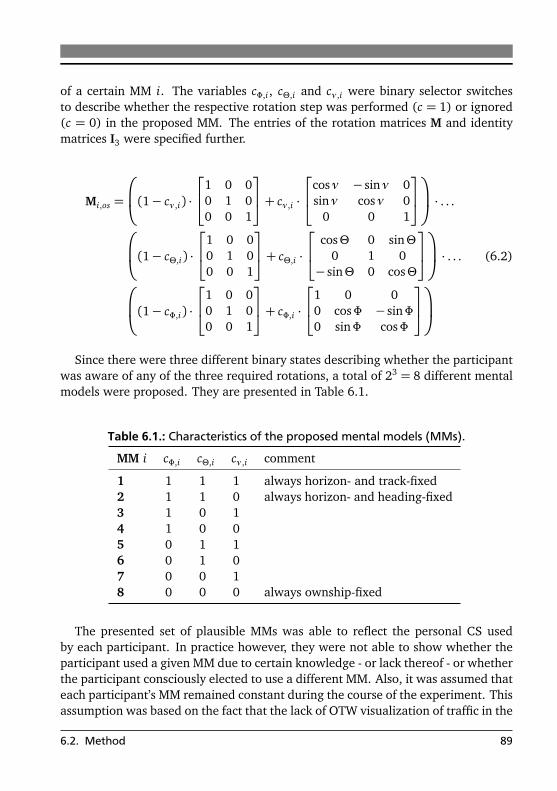
of a certain MM i. The variables cΦ,i , cΘ,i and cν ,i were binary selector switchesto describe whether the respective rotation step was performed (c = 1) or ignored(c = 0) in the proposed MM. The entries of the rotation matrices M and identitymatrices I3 were specified further.
Mi,os =
(1− cν ,i) ·
1 0 00 1 00 0 1
+ cν ,i ·
cosν − sinν 0sinν cosν 0
0 0 1
· . . .
(1− cΘ,i) ·
1 0 00 1 00 0 1
+ cΘ,i ·
cosΘ 0 sinΘ0 1 0
− sinΘ 0 cosΘ
· . . .
(1− cΦ,i) ·
1 0 00 1 00 0 1
+ cΦ,i ·
1 0 00 cosΦ − sinΦ0 sinΦ cosΦ
(6.2)
Since there were three different binary states describing whether the participantwas aware of any of the three required rotations, a total of 23 = 8 different mentalmodels were proposed. They are presented in Table 6.1.
Table 6.1.: Characteristics of the proposed mental models (MMs).
MM i cΦ,i cΘ,i cν ,i comment
1 1 1 1 always horizon- and track-fixed2 1 1 0 always horizon- and heading-fixed3 1 0 14 1 0 05 0 1 16 0 1 07 0 0 18 0 0 0 always ownship-fixed
The presented set of plausible MMs was able to reflect the personal CS usedby each participant. In practice however, they were not able to show whether theparticipant used a given MM due to certain knowledge - or lack thereof - or whetherthe participant consciously elected to use a different MM. Also, it was assumed thateach participant’s MM remained constant during the course of the experiment. Thisassumption was based on the fact that the lack of OTW visualization of traffic in the
6.2. Method 89
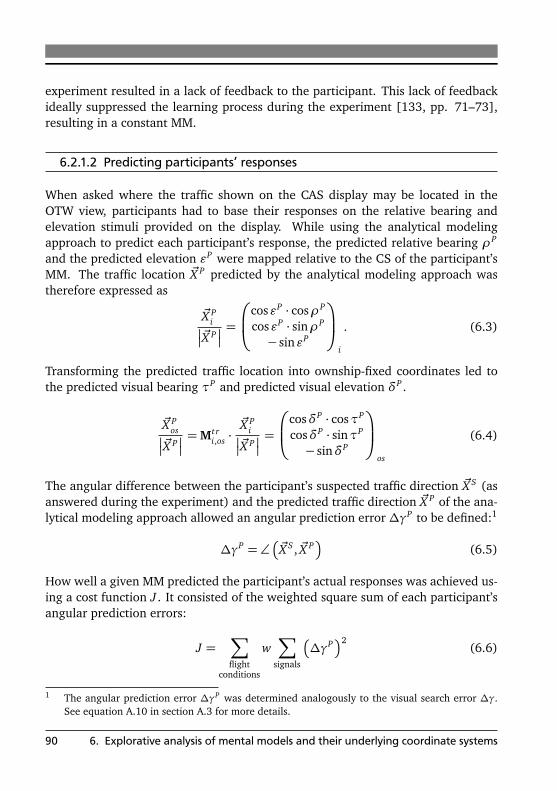
experiment resulted in a lack of feedback to the participant. This lack of feedbackideally suppressed the learning process during the experiment [133, pp. 71–73],resulting in a constant MM.
6.2.1.2 Predicting participants’ responses
When asked where the traffic shown on the CAS display may be located in theOTW view, participants had to base their responses on the relative bearing andelevation stimuli provided on the display. While using the analytical modelingapproach to predict each participant’s response, the predicted relative bearing ρP
and the predicted elevation εP were mapped relative to the CS of the participant’sMM. The traffic location ~X P predicted by the analytical modeling approach wastherefore expressed as
~X Pi
�
�~X P�
�
=
cosεP · cosρP
cosεP · sinρP
− sinεP
i
. (6.3)
Transforming the predicted traffic location into ownship-fixed coordinates led tothe predicted visual bearing τP and predicted visual elevation δP .
~X Pos
�
�~X P�
�
=Mt ri,os ·
~X Pi
�
�~X P�
�
=
cosδP · cosτP
cosδP · sinτP
− sinδP
os
(6.4)
The angular difference between the participant’s suspected traffic direction ~X S (asanswered during the experiment) and the predicted traffic direction ~X P of the ana-lytical modeling approach allowed an angular prediction error ∆γP to be defined:1
∆γP = ∠�
~X S , ~X P�
(6.5)
How well a given MM predicted the participant’s actual responses was achieved us-ing a cost function J . It consisted of the weighted square sum of each participant’sangular prediction errors:
J =∑
flightconditions
w∑
signals
�
∆γP�2
(6.6)
1 The angular prediction error ∆γP was determined analogously to the visual search error ∆γ.See equation A.10 in section A.3 for more details.
90 6. Explorative analysis of mental models and their underlying coordinate systems

The cost function included all responses to all signals over all four factor levels offlight condition by a given participant. Large prediction errors incurred a dispro-portionately higher cost than small prediction errors. Principally, the cost functionmay be skewed by missing values. A high number of missing values reduces thenumber of summands, therefore resulting in a lower cost function. Error deflationwas compensated by multiplying the square sum of prediction errors for each fac-tor level of flight condition with a pre-specified weight w. If the data contained nomissing values for a given factor level of flight condition, then that factor level’sweight w was set to w = 1. If missing values existed, then the weight w of thatfactor level was increased proportionately to the number of missing values, thusraising its cost. This way, the cost function did not prefer factor levels of flightcondition with high numbers of missing values.
Mapping stimuli to predicted response directionIn practice, the participant had to map the relative bearing and elevation in-
formation from the display to the OTW view, using their personal CS. However,the mental map created by this process may have been distorted by numerous psy-chophysiological effects,2 such as the oculogravic illusion [15, p.304]. Also, themap was discretized when only discrete information was shown on the display.Thus, an interrelationship between the stimuli on the display and the predicted rel-ative bearing ρP and the predicted elevation εP of the analytical modeling approachhad to be modeled.
This interrelationship varied between the different display formats. In case of thelow-complexity display format, participants were exposed only to discrete stimuli,requiring discretized mapping of stimuli to relative bearings and elevations. Con-trary, quasi-continuous relative bearing and elevation stimuli were presented onthe radar-style and perspective display formats. Thus, continuous mapping func-tions were selected for these display formats. Simple mathematical functions werechosen to model the mapping process. Following this, the parameters of thesefunctions were identified from the participant’s experimental responses.
Mapping of discrete stimuli: In case of the low-complexity display, participantswere exposed to a total of five discrete elevation light-emitting diodes (LEDs) andeight discrete bearing LEDs during the course of the experiment. These discretestimuli are shown in Figure 6.1.
For each factor level combination of participant and proposed MM, the followingprocedure was performed to map the discrete LEDs to the predicted response direc-tions. Underlying this method was the assumption that illumination of the same el-evation LED would result in the same elevation being suspected by the participant.
2 E. Groen, personal communication, July 7, 2015
6.2. Method 91
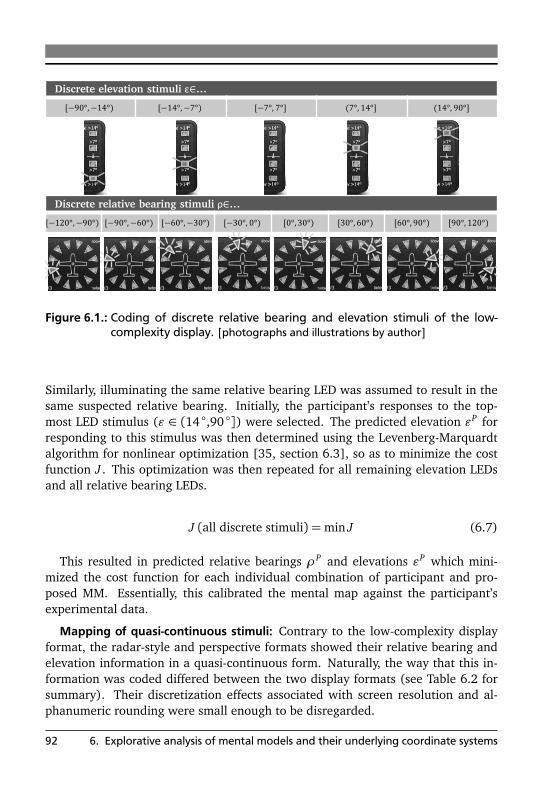
Discrete elevation stimuli ε∈…
[−90°, −14°) [−14°, −7°) [−7°, 7°] (7°, 14°] (14°, 90°]
Discrete relative bearing stimuli ρ∈…
[−120°, −90°) [−90°, −60°) [−60°, −30°) [−30°, 0°) [0°, 30°) [30°, 60°) [60°, 90°) [90°, 120°)
Figure 6.1.: Coding of discrete relative bearing and elevation stimuli of the low-complexity display. [photographs and illustrations by author]
Similarly, illuminating the same relative bearing LED was assumed to result in thesame suspected relative bearing. Initially, the participant’s responses to the top-most LED stimulus (ε ∈ (14 ◦,90 ◦]) were selected. The predicted elevation εP forresponding to this stimulus was then determined using the Levenberg-Marquardtalgorithm for nonlinear optimization [35, section 6.3], so as to minimize the costfunction J . This optimization was then repeated for all remaining elevation LEDsand all relative bearing LEDs.
J (all discrete stimuli) =min J (6.7)
This resulted in predicted relative bearings ρP and elevations εP which mini-mized the cost function for each individual combination of participant and pro-posed MM. Essentially, this calibrated the mental map against the participant’sexperimental data.
Mapping of quasi-continuous stimuli: Contrary to the low-complexity displayformat, the radar-style and perspective formats showed their relative bearing andelevation information in a quasi-continuous form. Naturally, the way that this in-formation was coded differed between the two display formats (see Table 6.2 forsummary). Their discretization effects associated with screen resolution and al-phanumeric rounding were small enough to be disregarded.
92 6. Explorative analysis of mental models and their underlying coordinate systems
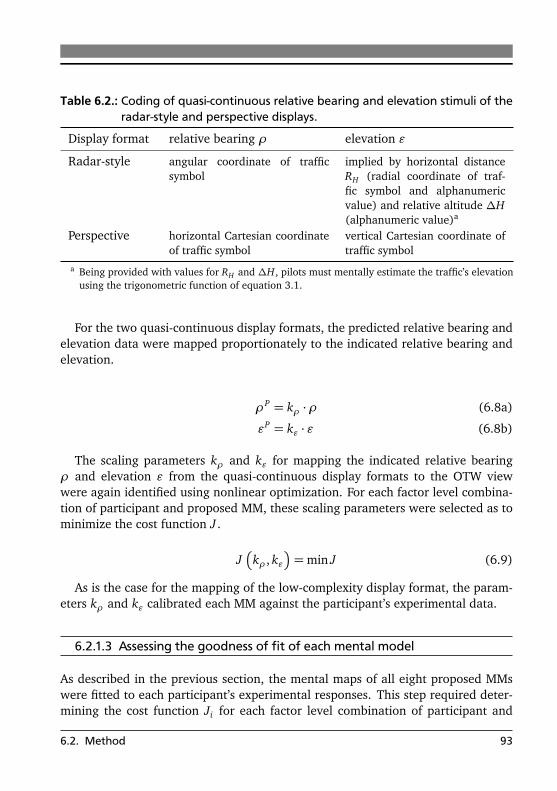
Table 6.2.: Coding of quasi-continuous relative bearing and elevation stimuli of theradar-style and perspective displays.
Display format relative bearing ρ elevation ε
Radar-style angular coordinate of trafficsymbol
implied by horizontal distanceRH (radial coordinate of traf-fic symbol and alphanumericvalue) and relative altitude ∆H(alphanumeric value)a
Perspective horizontal Cartesian coordinateof traffic symbol
vertical Cartesian coordinate oftraffic symbol
a Being provided with values for RH and ∆H, pilots must mentally estimate the traffic’s elevationusing the trigonometric function of equation 3.1.
For the two quasi-continuous display formats, the predicted relative bearing andelevation data were mapped proportionately to the indicated relative bearing andelevation.
ρP = kρ ·ρ (6.8a)
εP = kε · ε (6.8b)
The scaling parameters kρ and kε for mapping the indicated relative bearingρ and elevation ε from the quasi-continuous display formats to the OTW viewwere again identified using nonlinear optimization. For each factor level combina-tion of participant and proposed MM, these scaling parameters were selected as tominimize the cost function J .
J�
kρ, kε�
=min J (6.9)
As is the case for the mapping of the low-complexity display format, the param-eters kρ and kε calibrated each MM against the participant’s experimental data.
6.2.1.3 Assessing the goodness of fit of each mental model
As described in the previous section, the mental maps of all eight proposed MMswere fitted to each participant’s experimental responses. This step required deter-mining the cost function Ji for each factor level combination of participant and
6.2. Method 93

MM i. According to equation 6.6, those MMs which predicted the participant’s an-swers well - by having low prediction errors ∆γP - also had low cost functions Ji .Contrary, high cost functions corresponded to ill-fitting MMs. Therefore, the costfunction Ji quantified how well an MM fit the participant’s experimental responses.
6.2.1.4 Selecting the best-fitting mental model for each participant
Now that the goodness of fit was quantified for each combination of proposed MMand participant, the best-fitting MM i with the lowest cost function Ji was selectedfor each participant. The selected MM i had to satisfy the following equation:
Ji =mini
Ji (6.10)
It was assumed that the best-fitting MM of a participant represented the partici-pant’s actual MM.
6.2.2 Verification
Before the results from the analytical modeling approach were used for furtherstudy, the proposed method had to be verified. The verification procedure is out-lined in appendix E. During verification, the models behaved as hypothesized. Theanalytical modeling approach was therefore considered to be valid.
6.2.3 Treatment of data
Each participant’s best-fitting MM was determined using the method above. Thereaction time tR and visual search error ∆γ were taken from the experimental datapresented in chapter 4. Also, the same treatment of data as in section 4.6 wasapplied.
6.3 Results and discussion
Within the following section, hypotheses about to the frequency and visual searcherror magnitudes of different MMs are tested. To simplify reading, each hypothesisis tested and discussed separately. It should be pointed out that, contrary to allother independent variables introduced so far, the best-fitting MM of each partici-pant was not manipulated by the experimenters in the course of the experiment.
94 6. Explorative analysis of mental models and their underlying coordinate systems

Instead, it was merely measured a posteriori. This limits the experiment’s explana-tory power to describing statistical correlations between the mental models and theobserved dependent variables. Therefore, MMs cannot be identified as being thecause of variations in the data, but only as correlating to these variations.
6.3.1 Frequency of different mental models (Hypothesis 4)
Hypothesis 4 formulated a potential relationship of how often different MMs wereexpected to occur in glider pilots. It assumed that MMs based on a display format’ssuggested CS would be used most frequently by pilots using that display format.In order to test this hypothesis, the frequency of different MMs being identified asbest-fitting had to be known. Also, knowledge on how this frequency varied be-tween display formats was required. Absolute frequencies are shown in Table 6.3.Because the number of participants exposed to each display format varied, the ab-solute frequencies were normalized with the number of participants exposed tothe respective display format. The resulting relative frequencies are graphicallypresented in Figure 6.2.
Table 6.3.: Absolute frequencies of how often different proposed mental models(MMs) were identified as best-fitting.
proposed MM i
Display format 1 2 3 4 5 6 7 8 Σ
low-complexity 2 2 2 4 1 2 2 27 42radar-style 3 4 1 1 2 6 2 14 33perspective 5 2 0 0 9 17 4 9 46
Σ 10 8 3 5 12 25 8 50 121
In order to test Hypothesis 4, two pre-planned Fisher’s exact tests were per-formed on different cross tables. The first of these tests examined all data fromTable 6.3. According to Hypothesis 4, this test was expected to show that thefrequency of MMs varied between different display formats. The second pre-planned test examined the subset of data created by removing the results of thelow-complexity display. Because the radar-style and perspective displays both sug-gested the horizon- and heading-fixed CS, no significant differences in the frequen-cies of their MMs were expected.
6.3. Results and discussion 95

0
10%
20%
30%
40%
50%
60%
70%
MM
1M
M2
MM
3M
M4
MM
5M
M6
MM
7M
M8
best-fitting MM
rela
tive
freq
uenc
ylow-complexityradar-styleperspective
Figure 6.2.: Relative frequencies of how often different proposed mental models(MMs) were identified as best-fitting.
6.3.1.1 Results
The results of the first pre-planned Fisher’s exact test - comparing the MM frequen-cies of all three display formats - showed that there was a statistically significantvariation of how often different MMs occurred; χ2(14) = 38.69, p < .01 with aHolm’s step-down adjusted significance level. The variation of absolute frequen-cies between all three display formats was expected according to Hypothesis 4 andit was moderately strong; Cramér’s V = .40.
Results from the second pre-planned Fisher’s exact test performed on the subsetof data were not as clear-cut. Because the data from the low-complexity display wasremoved from the data set, the second pre-planned test only compared the absolutefrequencies of the radar-style and perspective displays. The effect bordered statis-tical significance at an adjusted significance level; χ2(7) = 12.47, p = .05. Yet theeffect size corresponded to a moderate-strength effect of varying MMs between theradar-style and perspective display formats; V = .40. Upton suggested that theseresults are substantively significant [149]. Thus, they contradict Hypothesis 4.
The effect that radar-style and perspective displays were associated with dif-ferent MMs was unexpected. Due to these unexpected results, full pairwise com-parison of absolute frequencies between all three display formats was performedpost-hoc. This made two additional Fisher’s exact tests necessary. The signifi-cance values for the post-hoc tests were again adjusted using the Holm’s step-down
96 6. Explorative analysis of mental models and their underlying coordinate systems

procedure. The first post-hoc test compared the absolute frequencies of the low-complexity display to those of the radar-style display. It remained statistically in-significant; χ2(7) = 8.55, p = .27. The low-complexity and perspective displayformats were compared in a second post-hoc test, which was statistically signif-icant; χ2(7) = 35.48, p < .01. The variations of absolute frequencies betweenthose two display formats represented a strong effect; V = .60.
Joining the results of the two pre-planned tests and the two post-hoc tests, aclustering of different MMs became evident. The frequencies of best-fitting MMswas similar between the low-complexity and radar-style displays. Both display for-mats had different distributions compared to perspective display. This contradictedHypothesis 4. It was assumed that the radar-style and perspective display formatswould have similar MMs frequencies, and both would differ from the frequenciesassociated with the low-complexity display.
6.3.1.2 Discussion
The results of the first pre-planned Fisher’s exact test showed that the absolutefrequencies of MMs varied between different display formats. The second pre-planned Fisher’s exact test compared the absolute frequencies associated with theradar-style and perspective displays. According to Hypothesis 4, it was expectedthat the second pre-planned test should provide insignificant results, because theradar-style and perspective displays both suggest a horizon- and heading-fixed CS.Instead, it resulted in a p-value barely above the threshold required for statisticalsignificance. At the same time, the associated effect size suggested a moderate-strength effect. Following Upton’s guidance for Fisher’s exact test, the results wereinterpreted as being substantively significant [149]. Even though the radar-styleand perspective displays suggested the same CS, they did not evoke the same MMs.Hypothesis 4 was rejected due to these results.
Further disproving Hypothesis 4 were the results of the first post-hoc Fisher’sexact test. They revealed that the radar-style display had the same frequency dis-tribution of best-fitting MMs as the low-complexity display, although both displayssuggested different CSs. MMs relying on the ownship-fixed CS dominated in parti-cipants using the low-complexity and radar-style displays. More than half3 of theparticipants using these display formats relied on this CS by using MM 8.
Revisiting the concept of pictorial realism [119], and how it was applied to theradar-style display format, led to several new findings. While the radar-style dis-play format exhibited design features associated with a horizon- and heading-fixed
3 41 of 75 participants
6.3. Results and discussion 97

CS (MM 2), the display failed to trigger the associated MM in most participants.Possible explanations for this lack of triggering may have been the abstract sym-bolic and alphanumeric depictions on the display format (compare Figure 3.5).Traffic was depicted using triangles and the ownship was represented by a dot.Geo-fixed features, such as traffic and ownship ground tracks, airspaces, terrainand airfields, were completely missing on the display format. It might be possiblethat these design features are responsible for not triggering the expected MM inmost participants. Instead, most participants used an ownship-fixed CS (MM 8)as their personal CS by default. In case of the low-complexity display format, thestatic ownship-sketches (compare Figure 3.2) were considered to be responsible forconfirming MM 8 and its associated ownship-fixed CS in most participants.
While using the perspective display, participants relied on different MM than theparticipants working with low-complexity or radar-style displays. This was evidentfrom the results of the second pre-planned and second post-hoc Fisher’s exact tests.Only 9 of 46, equaling 19.6%, of participants using the perspective display reliedon an ownship-fixed personal CS (MM 8). Conversely, this means that by far mostparticipants performed at least one rotation to align their personal CS. Of the48 participants using the perspective display format, 33 participants corrected forvariations in the pitch angle Θ, 18 corrected for lead angle ν and 7 corrected forbank angle Φ.
The perspective display format’s design (compare Figure 3.8) had a well-definedhorizon line which remained stationary on the display. At the same time, it lackedan indication that the vertical center line of the display corresponded to the own-ship’s ground track instead of its heading. According to Hypothesis 4, correctionsfor the variations in pitch angle Θ and bank angle Φ should have been equally fre-quent, with only infrequent corrections for the drift angle ν . Why the number ofparticipants correcting for bank angle is much lower than those correcting for pitchangle is not understood. The need for both corrections should have been percepti-ble according to the concept of pictorial realism [119] from the perspective displayformat’s fixed horizon line. At the same time, the number of participants correctingfor the drift angle ν was unexpectedly high, even with a respective clue missingin the display design. Apparently, exposing participants to the novel perspectivedisplay format without a ground track clue on the display nevertheless activatedpassive knowledge in more than one third of the participants. Even without aphysical clue, they recognized that a correction for the drift angle was appropriate.Overall, participants using the perspective display made many more of the neces-sary corrections than participants using the low-complexity radar-style displays.
98 6. Explorative analysis of mental models and their underlying coordinate systems
6.3.2 Pilot performance and different mental models (Hypothesis 5)
Testing Hypothesis 5 was achieved using three pre-planned multivariate analy-ses of variance (MANOVAs) as well as a series of follow-up contrasts. The ini-tial MANOVAs examined whether participants’ performance varied generally be-tween different MMs. Because this was the case, the two performance metrics -visual search error and reaction time - were independently examined using sepa-rate MANOVAs. Afterwards, follow-up contrasts were performed on results whichwere statistically significant according to the MANOVAs.
The analyses had the same independent variables as the analyses of sections5.1 and 5.3. These were the flight condition and signal number (both within-subject) as well as the display format (between-subjects). In this analysis, the best-fitting MM for each participant was introduced as an additional between-subjectsindependent variable. Contrary to all other independent variables, the best-fittingMM was a measured factor and was not manipulated during the experiment. Factorlevels of all other independent variables were the same as in the preceding sections.The factor levels of the best-fitting MM ranged from MM 1 through MM 8. TheMANOVAs regarded full interactions between all independent variables. Dependentvariables for the analyses were the transformed visual search error ∆γ and thereaction time tR.
In previous analyses of similar design (sections 5.1 and 5.3), the prerequisiteassumptions of homoscedasticity and normality were non-problematic. Because thesame statistical methods as in the preceding sections were used, and these methodshave been shown to be adequately robust against violations of assumptions, theassumptions were not examined again.
6.3.2.1 Results
In the initial MANOVA, only the effects associated with the newly introduced inde-pendent variable (best-fitting MM) were examined. The two performance metrics- visual search error ∆γ and reaction time tR - formed the first MANOVA’s depen-dent variables. The best-fitting MM had a statistically significant main effect onthe two performance metrics; Λ = 0.31, F(14, 198) = 2.65, p < .01. Of the in-teracting effects studied, only the three-way interaction between the best-fittingMM, the flight condition and the display format exhibited statistical significance;Λ = 0.86, F(72,594) = 1.39, p = .02. Two-way interactions between best-fittingMM and display format - as well as between best-fitting MM and flight condition -did not significantly influence performance (Λ = 0.48, F(42,594) = 1.22, p = .16
6.3. Results and discussion 99
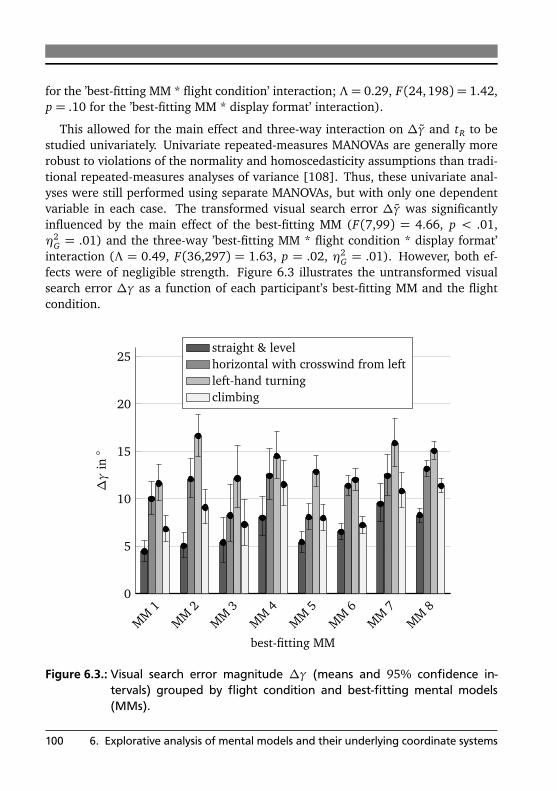
for the ’best-fitting MM * flight condition’ interaction; Λ = 0.29, F(24,198) = 1.42,p = .10 for the ’best-fitting MM * display format’ interaction).
This allowed for the main effect and three-way interaction on ∆γ and tR to bestudied univariately. Univariate repeated-measures MANOVAs are generally morerobust to violations of the normality and homoscedasticity assumptions than tradi-tional repeated-measures analyses of variance [108]. Thus, these univariate anal-yses were still performed using separate MANOVAs, but with only one dependentvariable in each case. The transformed visual search error ∆γ was significantlyinfluenced by the main effect of the best-fitting MM (F(7,99) = 4.66, p < .01,η2
G = .01) and the three-way ’best-fitting MM * flight condition * display format’interaction (Λ = 0.49, F(36,297) = 1.63, p = .02, η2
G = .01). However, both ef-fects were of negligible strength. Figure 6.3 illustrates the untransformed visualsearch error ∆γ as a function of each participant’s best-fitting MM and the flightcondition.
0
5
10
15
20
25
MM
1M
M2
MM
3M
M4
MM
5M
M6
MM
7M
M8
best-fitting MM
∆γ
in◦
straight & levelhorizontal with crosswind from leftleft-hand turningclimbing
Figure 6.3.: Visual search error magnitude ∆γ (means and 95% confidence in-tervals) grouped by flight condition and best-fitting mental models(MMs).
100 6. Explorative analysis of mental models and their underlying coordinate systems
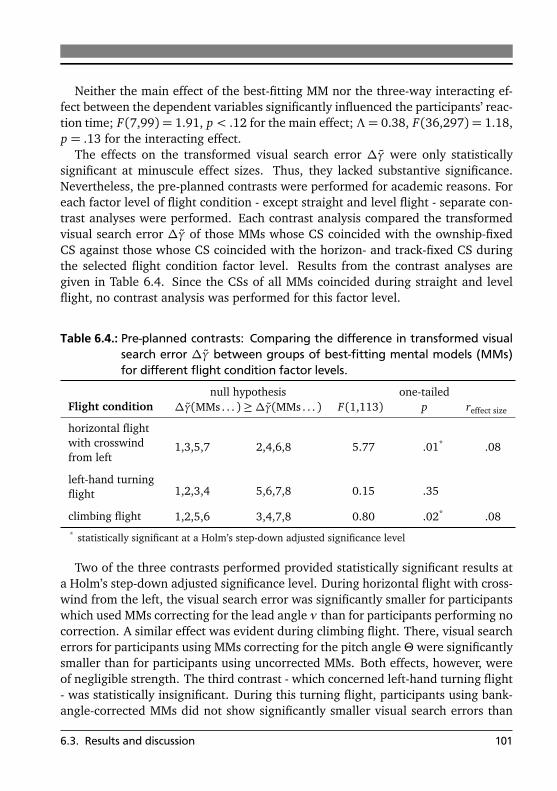
Neither the main effect of the best-fitting MM nor the three-way interacting ef-fect between the dependent variables significantly influenced the participants’ reac-tion time; F(7,99) = 1.91, p < .12 for the main effect; Λ = 0.38, F(36,297) = 1.18,p = .13 for the interacting effect.
The effects on the transformed visual search error ∆γ were only statisticallysignificant at minuscule effect sizes. Thus, they lacked substantive significance.Nevertheless, the pre-planned contrasts were performed for academic reasons. Foreach factor level of flight condition - except straight and level flight - separate con-trast analyses were performed. Each contrast analysis compared the transformedvisual search error ∆γ of those MMs whose CS coincided with the ownship-fixedCS against those whose CS coincided with the horizon- and track-fixed CS duringthe selected flight condition factor level. Results from the contrast analyses aregiven in Table 6.4. Since the CSs of all MMs coincided during straight and levelflight, no contrast analysis was performed for this factor level.
Table 6.4.: Pre-planned contrasts: Comparing the difference in transformed visualsearch error ∆γ between groups of best-fitting mental models (MMs)for different flight condition factor levels.
null hypothesis one-tailedFlight condition ∆γ(MMs . . . )≥∆γ(MMs . . . ) F(1,113) p reffect size
horizontal flightwith crosswindfrom left
1,3,5,7 2,4,6,8 5.77 .01* .08
left-hand turningflight 1,2,3,4 5,6,7,8 0.15 .35
climbing flight 1,2,5,6 3,4,7,8 0.80 .02* .08* statistically significant at a Holm’s step-down adjusted significance level
Two of the three contrasts performed provided statistically significant results ata Holm’s step-down adjusted significance level. During horizontal flight with cross-wind from the left, the visual search error was significantly smaller for participantswhich used MMs correcting for the lead angle ν than for participants performing nocorrection. A similar effect was evident during climbing flight. There, visual searcherrors for participants using MMs correcting for the pitch angleΘwere significantlysmaller than for participants using uncorrected MMs. Both effects, however, wereof negligible strength. The third contrast - which concerned left-hand turning flight- was statistically insignificant. During this turning flight, participants using bank-angle-corrected MMs did not show significantly smaller visual search errors than
6.3. Results and discussion 101

participants not correcting their personal CS for the change in bank angle. Instead,the corresponding two-tailed p-value (p=.70) revealed that the visual search er-ror of the two groups of participants did not differ significantly during left-handturning flight.
6.3.2.2 Discussion
As mentioned at the beginning of section 6.3, each participant’s best-fitting MM wasan observed factor. It was not manipulated during the course of the experiment.Therefore, it was only possible to indicate correlations between the best-fitting MMof a participant and her or his performance. It was not possible to derive a causalrelationship between pilot performance and the MMs exhibited by glider pilots.
Regarding the results of how pilot performance is influenced by the best-fittingMM, limitations of the MM approach have to be admitted. Seeing that there are nosignificant effects on reaction time, the concept of MMs does not explain the ob-served variations in reaction time. These results are similar to those of the usabilityanalysis (section 5.3). In both analyses, it was not possible to detect influences onreaction time. Apparently, the reaction time of participants is influenced by otherunknown factors. Because reaction time is a measure of effort, there are no ob-served differences in effort between glider pilots using different MMs. This factalone is enough to partially reject Hypothesis 5.
Results of how the visual search error varied between different MMs were almostexclusively conformal to Hypothesis 5. All statistical tests performed on the rela-tionships between a participant’s best-fitting MM and her or his exhibited visualsearch errors were statistically significant and as expected, except for one pre-planned contrast. This confirmed that for most factor levels of flight condition,participants who aligned their personal CS of the orientation FLARM’s horizon andtrack-fixed CS predicted more accurately where traffic was located. The one excep-tion was left-hand turning flight. Here, the results indicated no difference in visualsearch error for those participants using a bank-angle-corrected MM than for thoseperforming no correction.
Multiple reasons may have led to these indecisive results. The contrast compar-ing the MMs during left-hand turning flight was a highly unbalanced contrast (seeTable 6.4). Only 26 participants relied on MMs correcting for bank angle, while theremaining 95 participants relied on uncorrected MMs. At the same time, Figure 6.3shows that the confidence intervals associated with left-hand turning flight weregenerally the largest in the data at hand. Therefore, the mean visual search errorof those participants using MMs correcting for variations in bank angle was leastprecisely known. These facts may have served to mask the hypothesized effect in
102 6. Explorative analysis of mental models and their underlying coordinate systems
the data, making it a statistically insignificant effect instead. Overall, the visualsearch error data was interpreted as supporting the concept of the MMs. Differentglider pilots appear to have different MMs relying on distinct CSs. The orientationof the pilot’s personal CS relative to FLARM’s horizon- and track-fixed CS influ-enced the visual search errors of glider pilots. Those pilots aligning their personalCS with FLARM’s CS benefited from lower visual search errors.
While the statistical significance of the results served to support the concept ofMMs as presented at the beginning of this chapter, the extremely small effect sizescriticized the concept’s practicality. Variations in MMs between different partici-pants explain a minuscule part of the variance observed in the overall experiment.Other effects, such as varying the display format or changing the flight condition,were responsible for much larger parts of the observed variance. For all practicalpurposes in flight operations, the concept of MMs has no substantive significance.While unable to reveal notable variations in pilot performance, it does reveal dif-ferent mental strategies used by pilots when interpreting the displays. Thus, it is anacademic concept which may prove useful during the design and analysis of displayformats.
The academic nature of this concept still makes it possible to estimate the effectof the observed MMs on usability. Because it is not known whether certain MMs arecausally responsible for a lower visual search error, it is not possible to say whetherit is possible to reduce pilots’ errors by retraining them on optimized MMs. There isa correlation between a pilot’s MM of the CAS and how effectively traffic is locatedin the OTW view. But for all practical purposes, this correlation is negligible. Fol-lowing the same train of thought, training pilots to optimize their MMs would notserve to notably alter their reaction time required to interpret traffic information.Efficiency in using a CAS for locating traffic is not influenced by different MMs. If apractical recommendation for glider flight operations can be derived from the ob-served data, it is thus: Glider pilots should not expend too much conscious effort inattempting to align their personal CS with the one they would suspect to be correctwhenever interpreting a traffic display. While flying, glider pilots may notice thatthey are using an incorrect MM and may consciously attempt to use a correct oneinstead. Such conscious effort may increase the mental workload without bringinga notable increase in effectivity and efficiency.
In light of the results presented, Hypothesis 5 was partially rejected. While gliderpilots do rely on different MMs, and these models are responsible in varying effec-tivity when using low-cost CASs, these variations are negligible when compared toother effects. Also, there is no effect of these MMs on the time taken to interpretdata shown on a traffic display. Therefore, pilot performance does not vary notably
6.3. Results and discussion 103

between glider pilots using different MMs. Nevertheless, glider pilots do appear touse different personal CSs. Thus, they have different MMs.
Criticism of the analytical modeling approach and potential for further workSeveral shortcomings of the analytical modeling approach may also have been
responsible for its lack of operational relevance. For example, it contained theassumption that a participant’s MM remained constant during the experiment.Another deficit was that no knowledge on the robustness of the identificationmethod of section 6.2 was available. It still is uncertain whether the methodactually detected the MMs used by glider pilots and whether all relevant mod-els were proposed beforehand. Within this thesis only eight different MMs out ofa quasi-infinite number of different MMs were proposed. Other MMs might relyon coordinate transformations using other angles besides the pitch, bank and driftangles. At the same time, it is uncertain whether the method robustly identifies thecorrect MM of a participant, even in light of non-systematic errors being made.
Also, identifying whether the participant performed a rotation around any of thegiven axes was only achieved through one factor level of flight condition for each ofthe three axes. It was not evaluated how these discrete combinations of the pitch,bank and drift angles interacted with the robustness of identifying the correct MMof each participant. Future work would need to concentrate on investigating therobustness of the identification method. Since the current research only observedthe best-fitting MMs, no causal connection to pilot performance could be deducedfrom these observations. In order to show such causality, manipulating the MMs ofglider pilots would be required. This may be achieved by training them a priori ona certain MM.
6.4 Conclusion
During a comparison study on the usability of different display formats for low-costCAS (chapters 4 and 5), some unexplained effects on participants’ effectivity be-came apparent. Studying the experimental data post-hoc raised the suspicion thatdifferent participants may have interpreted the traffic information on the same dis-play format using different personal CSs. It was also suspected that these personalCSs were fundamental in describing the MMs which participants may have formedwhile working with one of the displays of the low-cost CAS in the experiment.
From this starting point, a theory of how pilots may use different CSs was de-veloped. Multiple plausible CSs, forming the basis of multiple plausible MMs, wereproposed. These MMs were based on potential knowledge deficits which may have
104 6. Explorative analysis of mental models and their underlying coordinate systems
been present in the participants. For each participant, the best-fitting of the pre-proposed CSs - and associated MMs - were identified.
It was then determined how often different MMs occurred. Even though thetwo display formats exhibited different suggested CSs, the radar-style and low-complexity display formats elicited similar MMs. For both display formats, parti-cipants mainly relied on ownship-fixed interpretations of the traffic information.Participants using the novel perspective display relied on different MMs. Eventhough the perspective display provided a salient horizontal reference which theo-retically allowed participants to recognize the need for compensating the pitch andbank angles, most participants only corrected for changes in pitch. Conversely, theperspective display provided in-cockpit clues indicating the need for compensat-ing the drift angle. Nevertheless, some participants were able to activate passiveknowledge and correctly compensate for the effects of the drift angle.
The analysis of participant performance during the experiment supported theconcept that pilots use different personal CSs as basis of their MMs. Differencesin how effectively participants performed their task were explainable using thisapproach. However, no differences in the temporal cost associated with using dif-ferent MMs were notable.
The statistical effect of the best-fitting MMs on the participants’ task effectivitywas of minuscule strength. This showed that the analytical modeling approach oflinking MMs to the personal CSs used to interpret traffic information is of littlepractical importance in flight operations. It is much rather a concept of academicinterest relevant during the design and analysis of display formats. Nonetheless,different MMs leave unique traces in participant behavior. Thus, these MMs areidentifiable. Even though MMs resulting in different personal CSs had no substan-tive influence on glider pilot performance when using a CAS, they may have asignificant effect in other aviation applications. Thus, future researchers are pro-vided with an additional tool while studying pilot behavior.
6.4. Conclusion 105


7 Summary and conclusionsThe dissertation at hand started the first chapter by pointing out the importanceof gliding research in an aviation context. Gliding allowed for important technolo-gies to spill over into other areas of aviation in the past. Collision alerting systems(CASs) are one technology which is currently being incubated in the gliding com-munity. The reasons for CASs being developed were explained in chapter 2. There,it was demonstrated that gliders often operate in close proximity to one another.The risk of midair collisions, as being perceived by glider pilots, led to the devel-opment of low-cost CASs. They are commercially available and should assist gliderpilots in their task of seeing and avoiding other traffic. None of these systems,however, can provide absolute protection against midair collisions. Ambiguous in-dications on their human-machine interfaces (HMIs) have been cited as possiblecontributing factors in multiple accidents. Due to this, a need to better understandhow glider pilots might interpret or misinterpret traffic information shown on HMIsof low-cost CASs was identified. As this lack of research bordered the field of hu-man factors, several useful constructs of aviation psychology and usability researchfrom literature were introduced.
A market study of existing HMIs for low-cost CASs in gliding was performed inthe first half of chapter 3. This market study illustrated how traffic information iscurrently displayed on commercial off-the-shelf (COTS) products by taxonomizingthe HMIs. Taxonomy criteria were the primary sensory channel used to relay infor-mation to the pilot, the category of information relayed and the complexity of howthis information is presented. Two COTS baseline display formats - having differ-ent presentation complexity - were identified for future comparison as well. Duringthe study it was revealed that no COTS product or research application used a per-spective presentation of traffic information. According to literature, perspectivepresentations of traffic information showed potential benefit in military applica-tions. Seeing that the same benefits might also apply to gliding applications, aperspective traffic display was designed using a user-centered design process. Thisdesign process was outlined in the second half of chapter 3. A total of 1400 poten-tial users assisted in the process by expressing their preferences in online surveysand participating in the experiments. At the end of that chapter, the characteris-tics of the newly designed perspective display were compared to those of the twobaseline display formats. This led to multiple hypotheses concerning the usabilityof the three display formats to be compared.
107
Chapter 4 presented an experimental laboratory setup capable of testing therole played by traffic displays on where in the out-the-window (OTW) view parti-cipants suspected traffic to be located. During the experiment, a total of 137 gliderpilots were exposed to three different display formats; the low-complexity, radar-style and perspective displays. The experiment was conducted in a “frozen” flightsimulator configured in different flight conditions. Namely, these conditions werestraight and level flight with and without crosswind, turning flight and climbingflight. Participants were presented with traffic information only on their display,and not in the OTW view. Correspondingly, they provided answers as to where inthe OTW view they suspected the traffic to be located.
Results from the preceding laboratory experiment were analyzed using inferen-tial statistics and discussed in chapter 5. Pilot effectivity for the task of estimatingtraffic position varied between display formats and between flight conditions. Thesmallest prediction errors were associated with those pilots using the perspectivedisplay while the largest errors were made by pilots using the radar-style display.For all three display formats, errors grew as the ownship deviated from straight andlevel flight. Conversely, reaction time did not vary notably throughout the exper-iment. Therefore, the highest efficiency was found in pilots using the perspectivedisplay format during straight and level flight. Subjective satisfaction was higherfor those participants using the perspective display format than those using the tworemaining COTS formats. Also, the perspective display’s learnability was perceivedto be higher than the radar-style display’s. Overall, the newly designed perspectivedisplay performed better in all usability dimensions than the two COTS displays.This proved the perspective display’s potential in gliding applications and allowedits technology readiness level to be raised.
The usability results of chapter 5 suggested that not all participants using onedisplay format may have interpreted the traffic information identically. It wasdeemed possible that different participants may have used different personal co-ordinate systems (CSs) when attempting to locate the traffic in the OTW view. Thispossibility was further explored in chapter 6. Each personal CS was suspectedas being the result of each participant’s individual knowledge and to be closelylinked to the participant’s mental model (MM) of the CAS. The data gathered inthe preceding experiment was analyzed using an analytical modeling approach.Eight MMs and their associated CSs were proposed. The MM best describing eachparticipant’s response behavior during the experiment was identified. The major-ity of participants using the low-complexity and radar-style displays exhibited abest-fitting MM associated with an ownship-fixed interpretation of the traffic infor-mation shown. Thus, they did not correct for any deviations from straight and levelflight. The majority of participants using the perspective display format corrected
108 7. Summary and conclusions
at least some deviations from straight and level flight by regarding changes in pitchangle, bank angle or drift angle. While the data supported the proposed concept ofMMs based on different personal CS, the concept did little to explain differences inperformance. For all practical purposes, performance did not vary notably betweendifferent participants with different MMs. Though being of little practical signifi-cance in actual flight operations, the proposed concept of MMs revealed differentstrategies used by pilots in interpreting the different display formats. The conceptprovides a novel tool for analyzing contemporary and novel display designs.
7.1 Recommendations
From the literature review of chapters 2 and 3 and from the experimental results ofchapter 5 and section 6.3, multiple recommendations were deduced. All of theserecommendations aim at assisting glider pilots in increasing their traffic awarenesswithout experiencing detrimental effects on their remaining aspects of situationawareness or overall performance in flight. Parties who may benefit from theserecommendations are glider pilots, aircraft owners and operators, legislative andexecutive regulatory authorities, glider manufacturers, flight schools and their um-brella organizations, competition rule makers and organizers, CAS designers, aswell as HMI designers. Grouped according to the addressed stakeholders, the rec-ommendations are presented below.
Glider pilots• Glider pilots should familiarize themselves with the operating principles of
the CAS installed in the aircraft they fly. They should be able to under-stand the basic operating principles and limitations of the respective system.Questions worth considering are:
– How does the CAS work?
– What information is exchanged between CAS transceivers?
– How are threat assessments performed?
– How is traffic of different threat levels indicated?
– What should be done when receiving a higher-threat traffic alert?
– What happens if an aircraft close by flies into a ’blind spot’ where it isnot detected by a CAS?
• Even when having a CAS available, glider pilots should continue to visuallyscan for traffic. Not all traffic is equipped with a compatible and operational
7.1. Recommendations 109
CAS. There are reports where traffic operated a compatible CAS but effectssuch as electromagnetic shielding prevented if from being properly received.Therefore, not all traffic will be indicated by the installed CAS.
• Despite traffic being indicated on the HMI of a CAS, it should be identifiedvisually before initiating an avoidance maneuver. Current CASs in glidingneither provide adequate resolution advisories nor adequate information onthe traffic’s flight state to reliably evade the traffic. At the time, evasionplanning can only be reliably performed if the traffic is in sight.
• Whenever attempting to visually identify traffic indicated on the HMI, pi-lots should take adequate time for this task. They should keep in mind thattheir initial search will start with an offset from the traffic’s actual position.Therefore, it will take time until the traffic is consciously located. The off-set and time to find traffic increase as the ownship deviates from straightand level flight. They occur any time that pitch, bank or drift angles arenot zero. Finding traffic should take particularly long while a) thermaling,b) performing aerobatics, c) flying in mountain wave conditions with strongwinds, or d) ridge soaring with strong crosswinds in proximity to terrain.
• Glider pilots do not need to expend conscious effort in modifying their MMin flight. Thus far, the research has not shown that the initial offset in thevisual search for traffic would decrease notably.
Aircraft owners and operators• Aircraft owners and operators should equip their gliders with a CAS. All
commercially available systems are cooperative. Thus, the traffic must beequipped with a compatible transceiver as well. The success of a coopera-tive CAS requires each aircraft to broadcast its position. Passively receivingthis information, without sharing the ownship’s position wastes much of thepotential benefit of a CAS. Also, aircraft owners and operators should selecta CAS which is adequate for the planned flights. FLARM is only one of mul-tiple CASs for general aviation applications. While it is extremely popularin parts of Europe, and forms a quasi-standard for gliding there, this is notthe case in other parts of the world. Also, FLARM may not be the system ofchoice when operating in airspace where high amounts of powered, heavyor fast traffic are expected.
• Aircraft owners and operators should ensure that the CAS is installed prop-erly in their aircraft. Though amateur installations are often permissible,they may result in suboptimal placements of antennas and other problems.
110 7. Summary and conclusions

The installation should minimize electromagnetic ’blind spots’ -caused byshielding from aircraft structural parts - in which other traffic cannot bereliably received. This may require installations of additional antennas. Op-erators can confirm the performance of their CAS installation using analysistools such as FLARM Technology’s range analyzer [66].
• Aircraft owners and operators should select an adequate HMI for the CAS in-stalled in their aircraft. The HMI should be adequate for the experience levelof the glider pilots flying the aircraft as well as for the flights to be performed.Low-time glider pilots on a local flight in the vicinity of their departure air-field may not have the capacity to interpret the abstract presentations ona radar-style display format and therefore choose to ignore its indications.In contrast, high-time glider pilots on complex cross-country or competitionflights may actively seek tactical advantages by using a radar-style display.Of course, the choice of an HMI is influenced by the amount of unused panelspace and the availability of glide computers and other avionics, which mayserve as non-dedicated displays.
Legislative and executive regulatory authorities
• Legislative and executive regulatory authorities should allow for non-bureaucratic installation and operation of CASs. In Europe, the introductionof low-cost CASs for the gliding community has breached with many conven-tions of avionics design. Social pressure has led to a swift and widespreadproliferation of these systems. Authorities should evaluate whether enhanc-ing existing regulations is the most effective method to achieve increasedflight safety. Other mechanisms, such as social mechanisms within the avia-tion community or financial incentives may allow for a higher acceptance ofsuch measures.
• Legislative and executive regulatory authorities should support the devel-opment of an ’integrated’ CAS for all airspace users. Current COTS CASsare only isolated solutions for limited groups of operators in the aviationcommunity. FLARM, for example, is primarily used by gliders and light pow-ered aircraft in Europe. It is not used by or able to detect commercial airtransports or military aircraft.
Glider manufacturers• Glider manufacturers should assist aircraft owners and operators in
retrofitting existing gliders with CASs. Particularly, recommendations on
7.1. Recommendations 111
optimal antenna placement for each glider type should be made availableto aircraft owners and operators.
• In ’clean sheet’ glider designs, manufacturers should regard human factorsaspects as well as technical aspects of CASs. Traffic indications should bepart of the cockpit design philosophy and adequately integrated. If a trafficdisplay is used, manufacturers should make sure that adequate panel spaceis available in order to prevent cluttering of traffic information.
Flight schools and their umbrella organizations• Flight schools and their umbrella organizations should integrate popular
CASs into their ground school and flight training curricula. Ground schoolcurricula should address the current knowledge deficits in the operatingfundamentals of these systems. Flight schools and umbrella organizationsshould accept the fact that many glider pilots do not actively study themanual of systems installed in their aircraft. Current flight training ses-sions don’t provide glider pilots with guidance on how they should behavein case of traffic alerts. Potential learning objectives to be addressed in thesesessions are the following: Glider pilots should become aware that ...
– low-cost CASs don’t provide alerts for all conflicting traffic.
– low-cost CASs don’t provide resolution advisories.
– visually identifying the traffic is necessary for reliably resolving trafficalerts.
– even when provided with traffic information or traffic alerts, the visualsearch for traffic will start with an initial offset. Thus, the search is notan instantaneous process. Instead, it requires time and attention.
– the initial offset when visually searching for traffic increases wheneverdeviating from straight and level flight. Thus, the time required forsuccessfully identifying traffic also increases.
– resolving traffic alerts may draw time and attention away from otherhigh priority tasks certain during phases of flight, such as on final ap-proach.
• Flight schools and their umbrella organizations should not attempt to ac-tively manipulate the MMs of student pilots in practical flying sessions. Thework presented does not foresee a notable increase in effectivity when usingcorrect CSs and associated MMs. While not notably increasing effectivity,the pilot’s conscious effort may cause workload, negatively impacting pilotefficiency in using the CAS.
112 7. Summary and conclusions

Competition rule makers and organizers• Competition rule makers and organizers should provide competition pilots
with incentives to use CAS and similar safety systems. This recommendationwas already extended by de Boer [18]. He argued that competition pilotsare role models to many other glider pilots. Acceptance of safety systemsmight rise throughout the community if competition pilots use them. In-stead of relying solely on regulation, more subtle social mechanisms - suchas incentives by competition rule makers - may also achieve the desired goalof increasing flight safety while at the same time benefiting from increasedacceptance within the community.
CAS designers• CAS designers should assist owners, operators and manufacturers in
retrofitting current aircraft with CASs. Together with aircraft manufactur-ers, they should determine optimal antenna placement for each glider type.Also, they should be able to provide information on practical installationsmatters, such as what maximum cable length is able to bridge the distancebetween antenna and transceiver unit without needing signal amplifier.
• CAS designers should make CASs work the way most glider pilots believethem to work. Most glider pilots using COTS display formats, such as thelow-complexity and radar-style displays, believe that traffic is indicated inan ownship-fixed polar CS. If traffic information were shown in such anownship-fixed CS, the CAS would need to be equipped with an attitude andheading reference system (AHRS). A retrofit AHRS solution could receivetraffic information from the transceiver using the FLARM data stream [65].The AHRS would use attitude information about the ownship to transformthe traffic information into ownship-fixed coordinates and pass this data onto an HMI. This approach of installing an AHRS “downstream” from theFLARM transceiver would allow AHRSs to be retrofitted into already FLARM-equipped aircraft. If a “clean sheet” approach to a novel CAS is being made,then an AHRS should be integrated at this phase.
HMI designers• HMI designers should use clearly identifiable and non-abstract symbols to
suggest CSs to glider pilots. They should also expect that such symbols mayactivate passive knowledge in glider pilots about how a system works.
• HMI designers should avoid displaying time-critical traffic alerts on radar-style displays. The visual search error made after retrieving this information
7.1. Recommendations 113
are high and will result in long times until the conflicting traffic is visuallyidentified in an already time-critical situation. Low-complexity and perspec-tive displays result in glider pilots visually identifying traffic more swiftly.HMI designers already switching their displays from a radar-style represen-tation to a low-complexity display in time-critical alerts should continue todo so. Furthermore, they should evaluate whether glider pilots might benefiteven more from a perspective presentation of this time-critical information.
• When developing a radar-style display format, HMI designers should providesalient markers of the ownship’s position. They should also prevent bearingindications from becoming ambiguous whenever traffic is close by.
• When developing a perspective display format and coding distance infor-mation using symbol size, HMI designers should restrict symbols only toreasonable sizes. On the one hand, symbols becoming too large when trafficis close by make it difficult for glider pilots to accurately determine the traf-fic’s position. Small symbols of faraway traffic, on the other hand, make itdifficult for glider pilots to detect and discern the symbols on the display.
• For those HMIs which are perceived as being only marginally learnable, HMIdesigners should assist flight schools and their umbrella organizations indeveloping training materials for these HMIs. Currently, glider pilots ac-tively seeking additional training on such marginally learnable HMIs are leftwithout formalized guidance.
7.2 Future scientific work
Looking at the research presented, potential for future scientific work was identifiedin previous sections. Some of this potential is directly related to the limitations ofthe experimental and analysis methods used.
Potential for improving the experimental setup has been described in section 5.7.The experiment could be optimized by replacing the discrete answer method, real-ized using the gridded OTW view of the simulator and touch screen monitor, witha continuous answer method. In practice, this could be done by installing multi-camera eye-tracking equipment capable of tracking the participant’s eye movementthroughout the simulator’s 200 ◦ × 35 ◦ field of view. Additionally, a future exper-imental setup might replace the nominally scaled single independent variable offlight condition with three separate ratio scaled independent variables, one eachfor the pitch angle Θ, bank angle Φ and drift angle ν . By varying multiple angles
114 7. Summary and conclusions

non-discretely simultaneously, a much higher amount of practically relevant flightconditions could be analyzed experimentally.
Also, the technology readiness level of the perspective display must be raisedfurther before a commercially viable product can be derived. One topic needingto be addressed is the aspect of depicting traffic outside the perspective display’sfield of view. Preventing the risk of clutter through symbolic clustering or filteringalgorithms also needs to be assessed.
As mentioned while discussing the performance variations of different MMs (sec-tion 6.3.2.2), if any statement causally linking different MMs to pilot performanceis to be made, a future experimental setup would need to manipulate participants’MMs to demonstrate this causality. Additionally, further knowledge about the pro-cedure used to identify the different MMs is required for reliable statements to bemade. Such future work should assess whether all relevant MMs are proposed dur-ing analytical modeling. Additional research should demonstrate the robustnessof analytical modeling in identifying the correct MM of participants as well. Oncethese open questions are clarified, the concept of different MMs resulting in differ-ent personal CSs which pilots use while interpreting cockpit displays may prove tobe a valuable human factors tool.
In a broader sense, the thesis at hand showed that human factors is a disciplinewhich has not yet received major attention in the gliding community. While iso-lated studies have applied different research methods to gliding use cases, neitherthe glider cockpit as a workplace, nor the organizational structures found in thegliding community have been analyzed in depth from a human factors perspective.Within this thesis, only the small task of how glider pilots use low-cost CASs to helpthem locate other traffic has been studied. How this task is achieved by the rela-tively heterogeneous glider pilot population while performing complex higher-levelaviation and sporting tasks for recreational purposes has not yet received attention.
Overall, there is large potential for applying human factors methods to glid-ing. Due to a lower technical system complexity compared to many other aviationdomains, non-aviation researchers will find it easier to apply their expertise togliding. This new methodical knowledge might then spill over to the remainingaviation domains. Thus, gliding could once again prove itself as “an importantincubator” [142] for all of aviation.
7.2. Future scientific work 115

References1. ABOBA Elektronik. (2007). External display for FLARM - version 3; display V3:
Operating manual (V 5.1d). Walliswil, Switzerland: Author.2. Alexander, A. L., & Wickens, C. D. (2004). Measuring traffic awareness in
an integrated hazard display. Proceedings of the Human Factors and ErgonomicsSociety Annual Meeting, 48, 171–175. doi: 10.1177/154193120404800137
3. Amendt, R., Knebel, C., & Wolff, W. (2006). Ophthalmologie [Ophthalmology].In H. Pongratz (Ed.), Kompendium der Flugmedizin [Aeromedical compendium](revised ed., pp. 119–138). Fürstenfeldbruck, Germany: Surgeon General of theGerman Air Force, Aeromedical Institute. (Original work published 2004)
4. American Psychological Association. (2007). Publication manual of the AmericanPsychological Association (5th ed.). Washington, DC: Author. (Original workpublished 2001)
5. Andrews, J. W. (1977). Air-to-air visual acquisition performance with pilot warn-ing instruments (PWI) (Project Rep. No. ATC-73). Lexington: Massachusetts In-stitute of Technology, Lincoln Laboratory.
6. Andrews, J. W. (1991). Unalerted air-to-air visual acquisition (Project Rep. No.ATC-152). Lexington: Massachusetts Institute of Technology, Lincoln Laboratory.
7. Apel, K.-H. (1996). Segelflug Praxis: Ausbildung, Weiterbildung, Inübunghaltung[Gliding practice: Initial training, recurrent training, maintaining currency] (2nded.). Heusenstamm, Germany: Deutscher Aero Club Wirtschaftsdienst.
8. Aretz, A. J. (1991). The design of electronic map displays. Human Factors, 33,85–101.
9. Aretz, A. J., & Wickens, C. D. (1992). Mental rotation of map displays. HumanPerformance, 5, 303–328. doi: 10.1207/s15327043hup0504_3
10. Australian Transport Safety Bureau. (2004). Review of midair collisions involv-ing general aviation aircraft in Australia between 1961 and 2003 (Research Rep.No. B2004/0114). Canberra, ACT, Australia: Author.
11. Bakeman, R. (2005). Recommended effect size statistics for repeated measuresdesigns. Behavior Research Methods, 37, 379–384. doi: 10.3758/BF03192707
12. Bangor, A., Kortum, P. T., & Miller, J. T. (2008). An empirical evaluation of theSystem Usability Scale. International Journal of Human-Computer Interaction, 24,574–594. doi: 10.1080/10447310802205776
13. Barraci, N. (2009). Conflict resolution in autonomous operations area airspace(Doctoral dissertation). Technische Universität Darmstadt, Darmstadt, Germany.
117

14. Baumgartner, T. I., & Maeder, U. (2009). Trajectory prediction for low-costcollision avoidance systems. Digital Avionics Systems Conference, 28, 1.C.5-1–1.C.5-8. doi: 10.1109/DASC.2009.5347567
15. Benson, A. J. (2006). Spatial orientation in flight. In D. J. Rainford &D. P. Gradwell (Eds.), Ernsting’s aviation medicine (4th ed., pp. 293–306). Lon-don: Hodder Arnold.
16. Berweger, C. D., & Schuler, L. (2008). Simulationen zur Verbesserung desFLARM-Funkprotokolls [Simulation for improving the FLARM radio protocol].segelfliegen, 6(3), 30–33.
17. Bevan, N., & MacLeod, M. (1994). Usability measurement in con-text. Behaviour & Information Technology, 13, 132–145. doi: 10.1080/01449299408914592
18. de Boer, E. (2011). SAFETY PAYS! A proposal to the International GlidingCommission. Technical Soaring, 35, 37–47.
19. Bortz, J. (2005). Statistik für Human- und Sozialwissenschafler [Statistics forthe humanities and social sciences] (6th ed.). Heidelberg, Germany: Springer.
20. Brinkmann, G., & Zacher, H. (1999). Die Evolution der Segelflugzeuge [Theevolution of sailplanes] (2nd ed.). Bonn, Germany: Bernard & Graefe.
21. Brüning, G., Hafer, X., & Sachs, G. (with Jurzig, W.). (2006). Flugleistungen[Aircraft performance] (3rd ed.). Berlin, Germany: Springer. (Original workpublished 1993)
22. Bronstein, I. N., Semendjajew, K. A., Musiol, G., & Mühlig, H. (2008). Desk-Top Bronstein: Taschenbuch der Mathematik [DeskTop Bronstein: Handbook ofmathematics] (Version 7.0). Haan, Germany: Harri Deutsch. Digitized book onCD-ROM.
23. Brooke, J. (1996). SUS: A quick and dirty usability scale. In P. Jordan,B. Thomas, B. A. Weerdmeester, & I. L. McClelland (Eds.), Usability evaluationin industry (pp. 189–194). London: CRC Press.
24. Brown, M. B., & Forsythe, A. B. (1974). The ANOVA and multiple comparisonsfor data with heterogeneous variances. Biometrics, 30, 719–724. doi: 10.2307/2529238
25. Butterfly Avionics. (2013). Butterfly displays: User- and installation manual(Document version 1.1). Sandhausen, Germany: Author.
26. Butterfly Avionics. (2014). PowerFLARM portable manual (Version 3.41 (inter-national)). Sandhausen, Germany: Author.
27. Campbell, R. D., & Bagshaw, M. (2002). Human performance and limitationsin aviation (3rd ed.). Oxford, United Kingdom: Blackwell Science. doi: 10.1002/9780470774472
28. CarTFT.com. (n.d.). CTF840-SH Datenblatt [CTF840-SH data sheet]. Reutlin-
118 References

gen, Germany: Author.29. Casner, S. M. (2010). General aviation. In E. Salas & D. Maurino (Eds.),
Human factors in aviation (2nd ed., pp. 595–628). Burlington, MA: Elvesier. doi:10.1016/B978-0-12-374518-7.00019-5
30. Civil Aviation Safety Team / International Civil Aviation Organization CommonTaxonomy Team. (2011). Aviation occurrence categories: Definitions and usagenotes (Version 4.2).
31. Cohen, B. H. (2013). Explaining psychological statistics (4th ed.). Hoboken,NJ: Wiley.
32. Cohen, J. (1988). Statistical power analysis for the behavioral sciences (2nded.). Hillsdale, NJ: Erlbaum.
33. Colvin, K., Dodhia, R., & Dismukes, R. K. (2005). Is pilots’ visual scanningadequate to avoid mid-air collisions? International Symposium on Aviation Psy-chology, 13, 104–109.
34. Curtis, M. T., & Jentsch, F. (2010). Aviation displays. In E. Salas & D. Mau-rino (Eds.), Human factors in aviation (2nd ed., pp. 439–478). Burlington, MA:Elvesier. doi: 10.1016/B978-0-12-374518-7.00014-6
35. Dahmen, W., & Reusken, A. (2008). Numerik für Ingenieure und Naturwis-senschaftler [Numerics for engineers and natural scientists] (2nd ed.). Berlin,Germany: Springer. doi: 10.1007/978-3-540-76493-9
36. Dekker, S., & Hollnagel, E. (2004). Human factors and folk models. Cognition,Technology & Work, 6, 79–86. doi: 10.1007/s10111-003-0136-9
37. Dell. (2006). Dell Precision M90 Mobile Workstation. Round Rock, TX.38. Dilo, J. T. (2013). Visualization of external air traffic in the Diamond Global
Canvas visual system (Unpublished diploma thesis). Technische Universität Darm-stadt, Institute of Flight Systems and Automatic Control, Darmstadt, Germany.
39. Dix, A., Finlay, J., Abowd, G. D., & Beale, R. (2004). Human-computer interac-tion (3rd ed.). Harlow, United Kingdom: Pearson.
40. Dolba, B., & Vaupel, T. (2009). German Patent No. DE 20 2009 004 658 U1.Munich, Germany: German Patent and Trade Mark Office.
41. Donders, F. C. (1969). On the speed of mental processes (W. G. Koster, Trans.).Acta Psychologica, 30, 412–431. (Original work published 1868) doi: 10.1016/0001-6918(69)90065-1
42. van Doorn, R. R., & de Voogt, A. J. (2007). Glider accidents: An analysis of143 cases, 2001-2005. Aviation, Space, and Environmental Medicine, 78, 26–28.
43. DSX High Tech. (2007). DSX systems: The T-Advisor module (V 2.0). Bregan-zona, Switzerland: Author.
44. Durso, F. T., & Alexander, A. L. (2010). Managing workload, performance,and situation awareness in aviation systems. In E. Salas & D. Maurino (Eds.),
References 119

Human factors in aviation (2nd ed., pp. 217–247). Burlington, MA: Elvesier. doi:10.1016/B978-0-12-374518-7.00008-0
45. EDIATec. (2011). Betriebshandbuch ECW100 Kollisionswarngerät [Operatingmanual ECW100 collision warning device] (V 1.5). Thierachern, Switzerland:Author.
46. Endsley, M. R. (1988). Situation Awareness Global Assessment Technique(SAGAT). Proceedings of the National Aerospace and Electronics Conference, 3,789–795. doi: 10.1109/NAECON.1988.195097
47. Endsley, M. R. (2000). Situation models: An avenue to the modeling of mentalmodels. Proceedings of the Human Factors and Ergonomics Society Annual Meeting,44, 61–64. doi: 10.1177/154193120004400117
48. Endsley, M. R., Bolté, B., & Jones, D. G. (2003). Designing for situation aware-ness: An approach to user-centered design. London: Taylor & Francis.
49. Erb, M. (2000). Die allgemeine Luftfahrt in Deutschland: Eine Analyse im Span-nungsfeld von Ökonomie und Ökologie [General aviation in Germany: An analysisin the area of conflict between economics and ecology] (Doctoral dissertation).Technische Universität Darmstadt, Darmstadt, Germany.
50. European Aviation Safety Agency. (2012a). AMC and GM to Part 21: Acceptablemeans of compliance and guidance material for the airworthiness and environmen-tal certification of aircraft and related products, parts and appliances, as well asfor the certification of design and production organisations. Cologne, Germany:Author.
51. European Aviation Safety Agency. (2012b). EASA MB 04/2012: Agenda item9c: Roadmap for regulation of GA: Annex 2 - issues to address. Cologne, Germany:Author.
52. European Aviation Safety Agency. (2014, October). GA roadmap: towardssimpler, lighter, better rules for general aviation. Cologne, Germany: Author.
53. European Commission. (2011a). Commission Regulation (EU) No 1178/2011of 3 November 2011 laying down technical requirements and administrativeprocedures related to civil aviation aircrew pursuant to Regulation (EC) No216/2008 of the European Parliament and of the Council. Official Journal ofthe European Union(L 311/1).
54. European Commission. (2011b). Commission Regulation (EU) No 1332/2011of 16 December 2011 laying down common airspace usage requirements andoperating procedures for airborne collision avoidance. Official Journal of the Eu-ropean Union(L 336/20).
55. European Commission. (2012). Commission Regulation (EU) No 923/2012of 26 September 2012 laying down the common rules of the air and operationalprovisions regarding services and procedures in air navigation and amending Im-
120 References
plementing Regulation (EU) No 1035/2011 and Regulations (EC) No 1265/2007,(EC) No 1794/2006, (EC) No 730/2006, (EC) No 1033/2006 and (EU) No255/2010. Official Journal of the European Union(L 281/1).
56. European Commission. (2014). Horizon 2020: Work programme 2014–2015:General annexes (European Commission Decision C (2014) 4995 of 22 July2014).
57. European General Aviation Safety Team. (2010). Collision avoidance: Meth-ods to reduce the risk (Safety promotion leaflet No. GA 1). Cologne, Germany:European Aviation Safety Agency.
58. Federal Aviation Administration. (2003). Glider flying handbook (No. FAA-H-8083-13). Oklahoma City, OK: Author.
59. Federal Aviation Administration. (2014). Aeronautical information manual: Of-ficial guide to basic flight information and ATC procedures (Change 1). OklahomaCity, OK: Author.
60. Fields, A. (2009). Discovering statistics using SPSS (3rd ed.). London: SAGE.61. Fields, A. (2013). Discovering statistics using IBM SPSS statistics (4th ed.).
London: SAGE.62. FLARM Experiment Software, version 1.40 [Computer software and manual].
(2014). Darmstadt, Germany: Technische Universität Darmstadt, Institute ofFlight Systems and Automatic Control.
63. FLARM Technology. (2008). FLARM compatibility considerations. Baar, Switzer-land: Author.
64. FLARM Technology. (2011). Operating manual FLARM collision warning unit:Software version 5.00. Baar, Switzerland: Author.
65. FLARM Technology. (2012). Data port specifications: preliminary: Status pro-tocol version 6.00. Baar, Switzerland: Author.
66. FLARM Technology. (2015). FLARM range analyzer. Retrieved September 4,2015, from http://flarm.com/support/tools-software/flarm-range-analyzer/
67. Flühr, H. (2010). Avionik und Flugsicherungstechnik: Einführung in Kommu-nikationstechnik, Navigation, Surveillance [Avionics and air traffic control technol-ogy: Introduction to communications technology, navigation and surveillance].Heidelberg, Germany: Springer. doi: 10.1007/978-3-642-01612-7
68. Fuchs, K.-U., Himmler, K., Lampert, P., & Klaas, U. (2015). Untersuchungs-bericht [Investigation report] (Final Report No. BFU 3X092-14). Braunschweig,Germany: German Federal Bureau of Aircraft Accident Investigation.
69. Furr, R. M. (2004). Interpreting effect sizes in contrast analysis. UnderstandingStatistics, 3, 1–25. doi: 10.1207/s15328031us0301_1
70. Garrecht Avionik. (2011). TRX-2000: ADS-B traffic monitor: User manual:Installation manual (Revision 1.0b). Bingen, Germany: Author.
References 121

71. German Federal Aviation Office. (2014). Statistik 2013: Lizenzen Luftfahrt-Bundesamt und Bundesländer [Statistics 2013: Licenses German Federal AviationOffice and federal states; Data file]. Braunschweig, Germany: Author. RetrievedSeptember 4, 2015, from http://www.lba.de/SharedDocs/Downloads/DE/SBl/SBl3/Statistiken/Statistik_Luftfahrtpersonal_2013.html?nn=700678
72. German Federal Aviation Office. (2015). Bestand an Luftfahrzeugen inder Bundesrepublik Deutschland [Inventory of aircraft in the Federal Repub-lic of Germany]. Braunschweig, Germany: Author. Retrieved Septem-ber 4, 2015, from http://www.lba.de/DE/Presse_POE/Statistiken/Statistik_Luftfahrzeuge.html?nn=700678
73. German Federal Bureau of Aircraft Accident Investigation. (n.d.). ECCAIRSaccident database: Release 4. Retrieved from http://flugunfall-db.bfu-web.de/e4-web/login.htm
74. Gibb, R., Gray, R., & Scharff, L. (2010). Aviation visual perception: Research,misperception and mishaps. Farnham, United Kingdom: Ashgate.
75. Gliding Commission. (2010). Die Segelflugausbildung: Methodik, Richtlinienund Bestimmungen [Glider flight training: Methods, guidelines and regulations].Braunschweig, Germany: German Aeroclub.
76. Haarhaus, R. (Author). (2014, May 24). Crash am Himmel: Spurensuchenach dem Flugunfall [Crash in the sky: Searching for traces after the aircraftaccident] [Television series episode]. In R. Schäfer (Executive Producer), Exclusivim Ersten [Exclusively on the First German Television Channel]. Frankfurt amMain, Germany: Association of Public Broadcasting Corporations in the FederalRepublic of Germany.
77. Haberkorn, T., Koglbauer, I., & Braunstingl, R. (2014). Traffic displays forvisual flight indicating track and priority cues. IEEE Transactions on Human-Machine Systems, 44, 755–766. doi: 10.1109/THMS.2014.2352496
78. Haberkorn, T., Koglbauer, I., Braunstingl, R., & Prehofer, B. (2013). Require-ments for future collision avoidance systems in visual flight: A human-centeredapproach. IEEE Transactions on Human-Machine Systems, 43, 583–594. doi:10.1109/THMS.2013.2284784
79. Hart, S. G. (2006). NASA-Task Load Index (NASA-TLX); 20 years lateral.Proceedings of the Human Factors and Ergonomics Society Annual Meeting, 50,904–908. doi: 10.1177/154193120605000909
80. Heinbücher, K. (2014). Konzipierung und Präferenzerhebung eines egozen-trischen Verkehrsdisplays für die allgemeine Luftfahrt [Conceptual design of anegocentric traffic display for general aviation and determination of preferences byfuture users] (Unpublished master’s thesis). Technische Universität Darmstadt,Institute of Flight Systems and Automatic Control, Darmstadt, Germany.
122 References
81. Hendriks, F. (1974). Dynamic soaring in shear flow. In AIAA / MIT / SSA2nd international symposium on the technology of low speed and motorless flight.New York: American Institute of Aeronautics and Astronautics. (AIAA Paper No.74-1003) doi: 10.2514/6.1974-1003
82. Horvath, H., Appenzeller, K., Büttner, K., Friedemann, J., de Sybourg, O., &Gerber, C. (2008). Zusammenstoss in der Luft eines Motorflugzeuges Type DV 20und eines Hubschraubers Type AS 332 am 5. März 2007, um 09:53 Uhr UTC, imPlatzbereich des Flugplatzes Zell am See, Salzburg [Mid air collision of an airplane,type of aircraft DV 20, with a helicopter, type of aircraft AS332, on March 5th2007 along the traffic pattern of the airport of Zell am See (LOWZ), Austria] (In-vestigation report No. GZ. BMVIT-85.121/0002-II/BAV/UUB/LF/2008). Vienna,Austria: Austrian Air Accident Investigation Bureau.
83. Howell, G. T., & Lacroix, G. L. (2012). Decomposing interactions using GLMin combination with the COMPARE, LMATRIX and MMATRIX subcommands inSPSS. Tutorials in Quantitative Methods for Psychology, 8, 1–22. Retrieved fromhttp://www.tqmp.org
84. Hupfner, P., & Kuttner, W. (Eds.). (2006). Witterung und Klima [Weather andclimate] (12th ed.). Wiesbaden, Germany: Teubner.
85. iDisplay versions 2.4.2 and 3.0.1 [Computer software]. (2013). Stuttgart,Germany: SHAPE.
86. Institute of Flight Systems and Automatic Control. (2014). Diamond DA 40-180 simulator. Retrieved June 15, 2015, from Technische Universität Darmstadt,Institute of Flight Systems and Automatic Control Web site: http://www.fsr.tu-darmstadt.de/forschung_und_dienstleistung/ausstattung/dsimulator.en.jsp
87. International Civil Aviation Organization. (1989). Pilot skills to make "look-out"more effective in visual collision avoidance (Circular No. 213-AN/130). Montreal,Canada: Author.
88. International Civil Aviation Organization. (2010). Annex 6 to the convention onInternational Civil Aviation: Operation of Aircraft: Part I: International commercialair transport – aeroplanes (9th ed.) (Amendment No. 38). Montreal, Canada:Author.
89. Janke, J., Lang, M., Feuerle, T., Hankers, R., Ronnenberg, A., Stüben, U., &Wassill, K.-H. (2004). Abschlußbericht BEKLAS: Erkennbarkeit von Segelflugzeu-gen und kleinen motorisierten Luftfahrzeugen [BEKLAS final report: Conspicuity ofgliders and light powered aircraft] (Research Rep. No. L-6/2002-50.0300/2002).Bonn, Germany: German Federal Ministry of Transportation, Building and Hous-ing.
90. Jarvis, S. J. (2009). A misjudged approach to a high accident rate: Explorationof accident causes and instructor decisions relating to inexperienced glider pilots
References 123
(Doctoral dissertation). Cranfield University, Cranfield, United Kingdom.91. König, C. (2012). Analyse und Anwendung eines menschzentrierten Gestal-
tungsprozesses zur Entwicklung von Human-Machine-Interfaces im Arbeitskontextam Beispiel Flugsicherung [Analysis and application of a human-centered designprocess for developing human-machine-interfaces in a working context with ex-emplary application to air traffic control] (Doctoral dissertation). TechnischeUniversität Darmstadt, Darmstadt, Germany.
92. Knoll, R., Koss, R., & Brandes, T. (2011). Untersuchungsbericht [Investigationreport] (Final Report No. BFU 3X035-10). Braunschweig, Germany: GermanFederal Bureau of Aircraft Accident Investigation.
93. Kochenderfer, M. J., Espindle, L. P., Edwards, M. W. M., Kuchar, J. K., & Griffith,J. D. (2009). Airspace encounter models for conventional and unconventionalaircraft. USA/Europe Air Traffic Management Research and Development Semi-nar(8).
94. Konrad, G., Colquhoun, W. M., Prô, B., Engels, J., & Feyereisen, T. (2012).Development, flight test and certification of a track-up synthetic vision systemwith HUD-like symbology for the Pilatus PC-12 NG. Avionics Europe Conference &Exhibition.
95. Laine, J., Aaltonen, I., & Halonen, H. (2012). Collision between two sailplanesin Hattula on 12 June 2011 (Investigation Report No. B1/2011L). Helsinki, Fin-land: Safety Investigation Authority of Finland.
96. Lewis, J. R., & Sauro, J. (2009). The factor structure of the System UsabilityScale. In M. Kurosu (Ed.), Human centered design (pp. 94–103). Berlin, Germany:Springer. doi: 10.1007/978-3-642-02806-9_12
97. LG Electronics Deutschland. (2013). LG D605 Optimus L9II Datenblatt [LGD605 Optimus L9II data sheet]. Ratingen, Germany.
98. LXNAV. (2014). LX90xx: GPS navigation system with variometer (includingLX9000 and LX9070) (Version 4.0). Celje, Slovenia: Author.
99. LX navigation. (2014). LX Flarm color display II: User manual. Celje, Slovenia:Author.
100. Mehringskötter, S. (2013). Mentale Modelle beim Umgang mit neuartigen Kolli-sionswarnsystemen im Luftsport [Mental models while operating low-cost collisionalerting systems in sport aviation] (Unpublished bachelor’s thesis). TechnischeUniversität Darmstadt, Institute of Flight Systems and Automatic Control, Darm-stadt, Germany.
101. Möller, C., Kostka, A., Neujahr, H., & Klingauf, U. (2012). Enhancing situa-tional awareness by perspective panoramic information presentation. Proceedingsof the European Association for Aviation Psychology Conference, 30, 232–239.
102. Morgenstern, C. (2012). Sicherheitskultur und menschliche Fehler im Segelflug
124 References
[Safety culture and human errors in gliding] (Unpublished diploma thesis). Uni-versität Regensburg, Regensburg, Germany.
103. Morris, C. C. (2005). Midair collisions: Limitations of the see-and-avoidconcept in civil aviation. Aviation, Space, and Environmental Medicine, 76, 357–365.
104. Nathans, L. L., Oswald, F. L., & Nimon, K. (2012). Interpreting multiple linearregression: A guidebook of variable importance. Practical Assessment, Research &Evaluation, 17(9).
105. National Transportation Safety Board. (n.d.). NTSB docket manage-ment system. Washington, DC: Author. Retrieved from http://www.ntsb.gov/investigations/dms.html
106. Naviter. (2013). SeeYou Mobile help for version 4.50. Kranj, Slovenia: Author.107. Neis, S. (2013). "Midair Collision" trotz Kollisionswarnsystem: Was läuft
schief? [Midair collision even with a collision alerting system: What is goingwrong?] (Unpublished research seminar report). Technische Universität Darm-stadt, Institute of Flight Systems and Automatic Control, Darnstadt, Germany.
108. O’Brien, R. G., & Kaiser, M. K. (1985). MANOVA method for analyzing re-peated measures designs: An extensive primer. Psychological Bulletin, 97, 316-333. doi: 10.1037/0033-2909.97.2.316
109. O’Donnell, R. D., & Eggemeier, F. T. (1986). Workload assessment methodol-ogy. In K. R. Boff, L. Kaufman, & J. P. Thomas (Eds.), Handbook of perception andhuman performance. Volume II, cognitive processes and performance (pp. 42-1–42-49). New York: Wiley.
110. Olson, C. L. (1974). Comparative robustness of six tests in multivariateanalysis of variance. Journal of the American Statistical Association, 69, 894–908.doi: 10.2307/2286159
111. Olson, C. L. (1976). On choosing a test statistic in multivariate analysisof variance. Psychological Bulletin, 83, 579–586. doi: 10.1037/0033-2909.83.4.579
112. Olson, C. L. (1979). Practical considerations in choosing a MANOVA teststatistic: A rejoinder to Stevens. Psychological Bulletin, 86, 1350–1352. doi:10.1037/0033-2909.86.6.1350
113. Osborne, J. W. (2002). Notes on the use of data transformations. PracticalAssessment, Research & Evaluation, 8(6).
114. Pallant, J. (2010). SPSS survival manual: A step by step guide to data analysisusing SPSS (4th ed.). New York: McGraw-Hill.
115. Parasuraman, R., Sheridan, T. B., & Wickens, C. D. (2008). Situation aware-ness, mental workload, and trust in automation: Viable, empirically supportedcognitive engineering constructs. Journal of Cognitive Engineering and Decision
References 125

Making, 2, 140–160. doi: 10.1518/155534308X284417116. Porod, K. (2002). German Patent No. DE 201 17 525 U1. Munich, Germany:
German Patent and Trade Mark Office.117. Prinzel, L. J., III, Comstock, J. R., Jr., Etherington, T., French, G. A., Snow,
M. P., Endsley, M. R., . . . Corker, K. M. (2004). Human factors issues in syntheticvision displays: Government, academic, military, and industry perspectives. Pro-ceedings of the Human Factors and Ergonomics Society Annual Meeting, 48, 75–79.doi: 10.1177/154193120404800117
118. Reichmann, H. (2005). Streckensegelflug [Cross-country soaring] (10th ed.).Stuttgart, Germany: Motorbuch.
119. Roscoe, S. N. (1968). Airborne displays for flight and navigation. HumanFactors, 10, 321–332.
120. Ross, S. M. (2006). Statistik für Ingenieure und Naturwissenschaftler [In-troduction to probability and statistics for engineers and scientists] (3rd ed.;C. Heinisch, Trans.). Munich, Germany: Elsevier. (Original work published2004)
121. Rouaux, J.-E. (2012). CIR12_295. Paris, France: French Gliding Federation.122. Rouse, W. B., & Morris, N. M. (1985). On looking into the black box: Prospects
and limits in the search for mental models (Rep. No. 85-2). Atlanta: GeorgiaInstitute of Technology, Center for Human-Machine Systems Research.
123. Scherer, K. (2006, May). Eine Erfolgsgeschichte voller Idealismus: DieFLARM-Biographie [A success story full of idealism: The FLARM biography].segelfliegen, 4, 25–27.
124. Schmider, E., Ziegler, M., Danay, E., Beyer, L., & Buehner, M. (2010). Isit really robust? reinvestigating the robustness of ANOVA against violations ofthe normal distribution assumption. Methodology, 6, 147–151. doi: 10.1027/1614-2241/a000016
125. Schochlow, V. (2012). Spatial processing of traffic information in sport avi-ation - a randomized controlled study of mental rotation processes in non-pilotparticipants (Unpublished bachelor’s thesis). Technische Universität Darmstadt,Institute of Psychology, Darmstadt, Germany.
126. Schochlow, V., & Gerber, P. (2012). [Literature research on projection formatsand display design parameters]. Unpublished raw data. Darmstadt, Germany:Technische Universität Darmstadt, Institute of Psychology, Work and EngineeringPsychology Research Group.
127. Schuler, L. (2007). Die Wirksamkeit von Warnsystemen durch Simulationerhöhen [Increasing the effectivity of warning systems through simulation]. Fo-rum für Wissen: Warnungen bei aussergewöhnlichen Naturereignissen [Knowledgeforum: Warnings of exceptional natural phenomena], 93–96.
126 References

128. Seth, A., Carlson, K. D., Hatfield, D. E., & Lan, H.-W. (2009). So what?Beyond statistical significance to substantive significance in strategy research.In D. D. Bergh & D. J. Ketchen Jr. (Eds.), Research methodology in strategy andmanagement (Vol. 5, pp. 3–27). Bingley, United Kingdom: Emerald.
129. Shepard, R. N., & Metzler, J. (1971, February). Mental rotation of three-dimensional objects. Science, 171(3972), 701-703. doi: 10.1126/science.171.3972.701
130. Shuch, H. (1992). The influence of flight experience on midair collisionrisk perception. Accident Analysis & Prevention, 24, 655–660. doi: 10.1016/0001-4575(92)90017-D
131. Standards Committee Ergonomics and Standards Committee InformationTechnology and selected IT Applications. (1999). DIN EN ISO 9241-11: Er-gonomische Anforderungen für Bürotätigkeiten mit Bildschirmgeräten: Teil 11: An-forderungen an die Gebrauchstauglichkeit - Leitsätze [Ergonomics requirements foroffice work with visual display terminals (VDTs): Part 11: Guidance on usability].Berlin, Germany: Beuth.
132. Standards Committee Ergonomics and Standards Committee InformationTechnology and selected IT Applications. (2011). DIN EN ISO 9241-210:Ergonomie der Mensch-System-Interaktion: Teil 210: Prozess zur Gestaltung ge-brauchstauglicher interaktiver Systeme [Ergonomics of human-system interaction:Part 210: Human-centered design for interactive systems]. Berlin, Germany:Beuth.
133. Steininger, K. (2000). Handbuch der Flugpädagogik: Lerne Fliegen Lehren[Handbook of flight educational science: Learn to teach flying] (2nd ed.). Ham-burg, Germany: Author.
134. Steinmetz, L., & Gerber, P. (2013). [Survey on proliferation of low-cost colli-sion alerting systems]. Unpublished raw data. Darmstadt, Germany: TechnischeUniversität Darmstadt, Institute of Psychology, Work and Engineering PsychologyResearch Group.
135. Sternberg, S. (1969a). The discovery of processing stages: Extensions ofDonders’ method. Acta Psychologica, 30, 276–315. doi: 10.1016/0001-6918(69)90055-9
136. Sternberg, S. (1969b). Memory-scanning: Mental processes revealed byreaction-time experiments. American Scientist, 57, 421–457.
137. Swiss Civil Aviation Safety Officer. (2010). Stellungnahme CASO (letzteAufdatierung vom 23.03.2010) [Statement of CASO (revised last on May 21,2010)]. In Sicherheitsempfehlungen des Büros für Flugunfalluntersuchungen undStellungnahmen zu deren Umsetzung [Safety recommendations by the Swiss Air-craft Accident Investigation Bureau and statements about their implementation]
References 127

(Rep. No. 2086) (pp. 102–103). Payerne, Switzerland: Swiss Aircraft AccidentInvestigation Bureau.
138. Tabachnick, B. G., & Fidell, L. S. (2013). Using multivariate statistics (6thed.). Boston, MA: Pearson.
139. Le Tallec, C., & Gravier, B. (2002). European Patent No. EP 1095362 (B1).Munich, Germany: European Patent Office.
140. Taneja, N., & Wiegmann, D. A. (2001). Analysis of mid-air collisions incivil aviation. Proceedings of the Human Factors and Ergonomics Society AnnualMeeting, 45, 153–156. doi: 10.1177/154193120104500233
141. Thomas, J. R., Nelson, J. K., & Thomas, K. T. (1999). A generalized rank-order method for nonparametric analysis of data from exercise science: A tu-torial. Research Quarterly for Exercise and Sport, 70, 11–23. doi: 10.1080/02701367.1999.10607726
142. Thorbeck, J. (2009). Gliding research – an important incubator for the entireaviation. Technical Soaring, 33, 7–16.
143. triadis engineering. (2006a). Altair: Glide computer and navigation system:User manual (Revision 1.01 EN). Messen, Switzerland: Author.
144. triadis engineering. (2006b). FLOICE: Kollisionswarnsystem mit akustischerSprachausgabe: Pilotenandbuch: FLOICE 256: Model A, B und C [FLOICE: Col-lision warning system with acoustic voice output: Pilot’s manual: FLOICE 256:Model A, B and C] (Version 0.1). Messen, Switzerland: Author.
145. triadis engineering. (2006c). Vega: Digital voice variometer system: Pilot’smanual (Revision 1.01 EN). Messen, Switzerland: Author.
146. triadis engineering. (2008). TR-DVS: Pilot’s manual (Document Version 1.1).Messen, Switzerland: Author.
147. Tullis, T. S. (1981). An evaluation of alphanumeric, graphic, and color infor-mation displays. Human Factors, 23, 541–550.
148. Uhlarik, J., & Comerford, D. A. (2002). A review of situation awarenessliterature relevant to pilot surveillance functions (Final Rep. No. DOT/FAA/AM-02/3). Washington, DC: Federal Aviation Administration, Office of AerospaceMedicine.
149. Upton, G. J. G. (1992). Fisher’s exact test. Journal of the Royal StatisticalSociety. Series A (Statistics in Society), 155, 395–402. doi: 10.2307/2982890
150. von Viebahn, H. (1997). Konzeption und Untersuchung eines bordautonomenSystems zur Vermeidung von Kollisionen im Luftverkehr [Conceptual design andanalysis of an autonomous onboard system for collision avoidance in aviation](Doctoral dissertation). Technische Hochschule Darmstadt, Darmstadt, Germany.
151. de Voogt, A. J., & van Doorn, R. R. (2006). Midair collisions in U.S. civilaviation 2000-2004: The roles of radio communications and altitude. Aviation,
128 References
Space, and Environmental Medicine, 77, 1252–1255.152. Welch, J. F., Bjork, L., & Bjork, L. (Eds.). (1999). Van Sickle’s modern airman-
ship (8th ed.). New York: McGraw-Hill. doi: 10.1036/0070696330153. Wickens, C. D. (2002). Situation awareness and workload in aviation. Cur-
rent Directions in Psychological Science, 11, 128–133. doi: 10.1111/1467-8721.00184
154. Wickens, C. D. (2008). Multiple resources and mental workload. HumanFactors, 50, 449–455. doi: 10.1518/001872008X288394
155. Wickens, C. D., Lee, J. D., Liu, Y., & Gordon Becker, S. E. (2004). An intro-duction to human factors engineering (2nd ed.). Upper Saddle River, NJ: PearsonPrentice Hall.
156. Wickens, C. D., & Prevett, T. T. (1995). Exploring the dimensions of egocen-tricity in aircraft navigation displays. Journal of Experimental Psychology: Applied,1, 110–135. doi: 10.1037/1076-898X.1.2.110
157. Wickens, C. D., Xu, X., Helleberg, J. R., Carbonari, R., & Marsh, R. (2000).The allocation of visual attention for aircraft traffic monitoring and avoidance:Baseline measures and implications for freeflight (Tech. Rep. No. ARL-00-2/FAA-00-2). Savoy: University of Illinois at Urbana-Champaign, Institute of Aviation,Aviation Research Lab.
158. Wilcox, R. R., Charlin, V. L., & Thompson, K. L. (1986). New MonteCarlo results on the robustness of the ANOVA F, W and F* statistics. Com-munications in Statistics - Simulation and Computation, 15(4), 933–943. doi:10.1080/03610918608812553
159. Woods, D. D. (1984). Visual momentum: a concept to improve the cognitivecoupling of person and computer. International Journal of Man-Machine Studies,21, 229–244. doi: 10.1016/S0020-7373(84)80043-7
160. XCSoar project. (2015). XCSoar 6.7: The open-source glide computer: Usermanual (For XCSoar version 6.7.7).
161. Zaon Flight Systems. (2008, September). Owner’s manual: PCAS MRX. Ad-dison, TX: Author.
162. Zaon Flight Systems. (2011). Owner’s manual: PCAS XRX (Manual Version3.0). Addison, TX: Author.
References 129

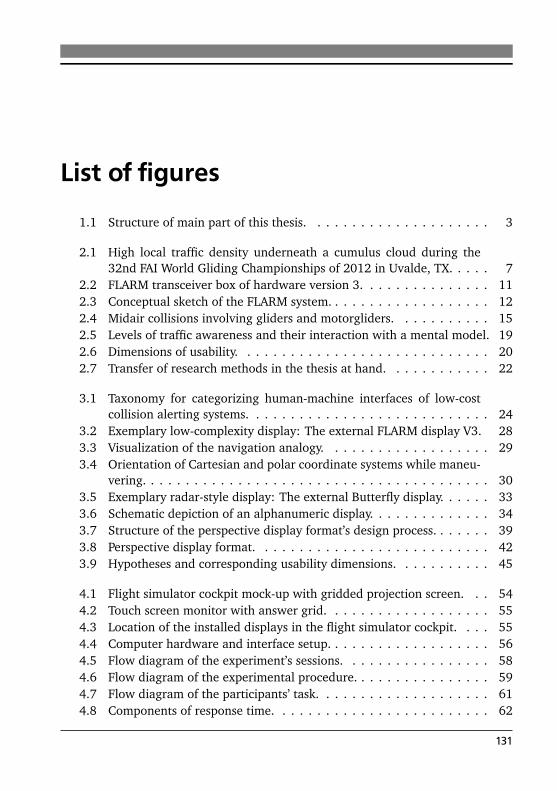
List of figures
1.1 Structure of main part of this thesis. . . . . . . . . . . . . . . . . . . . . 3
2.1 High local traffic density underneath a cumulus cloud during the32nd FAI World Gliding Championships of 2012 in Uvalde, TX. . . . . 7
2.2 FLARM transceiver box of hardware version 3. . . . . . . . . . . . . . . 112.3 Conceptual sketch of the FLARM system. . . . . . . . . . . . . . . . . . . 122.4 Midair collisions involving gliders and motorgliders. . . . . . . . . . . 152.5 Levels of traffic awareness and their interaction with a mental model. 192.6 Dimensions of usability. . . . . . . . . . . . . . . . . . . . . . . . . . . . . 202.7 Transfer of research methods in the thesis at hand. . . . . . . . . . . . 22
3.1 Taxonomy for categorizing human-machine interfaces of low-costcollision alerting systems. . . . . . . . . . . . . . . . . . . . . . . . . . . . 24
3.2 Exemplary low-complexity display: The external FLARM display V3. 283.3 Visualization of the navigation analogy. . . . . . . . . . . . . . . . . . . 293.4 Orientation of Cartesian and polar coordinate systems while maneu-
vering. . . . . . . . . . . . . . . . . . . . . . . . . . . . . . . . . . . . . . . . 303.5 Exemplary radar-style display: The external Butterfly display. . . . . . 333.6 Schematic depiction of an alphanumeric display. . . . . . . . . . . . . . 343.7 Structure of the perspective display format’s design process. . . . . . . 393.8 Perspective display format. . . . . . . . . . . . . . . . . . . . . . . . . . . 423.9 Hypotheses and corresponding usability dimensions. . . . . . . . . . . 45
4.1 Flight simulator cockpit mock-up with gridded projection screen. . . 544.2 Touch screen monitor with answer grid. . . . . . . . . . . . . . . . . . . 554.3 Location of the installed displays in the flight simulator cockpit. . . . 554.4 Computer hardware and interface setup. . . . . . . . . . . . . . . . . . . 564.5 Flow diagram of the experiment’s sessions. . . . . . . . . . . . . . . . . 584.6 Flow diagram of the experimental procedure. . . . . . . . . . . . . . . . 594.7 Flow diagram of the participants’ task. . . . . . . . . . . . . . . . . . . . 614.8 Components of response time. . . . . . . . . . . . . . . . . . . . . . . . . 62
131
5.1 Visual search error magnitude ∆γ grouped by flight condition anddisplay format. . . . . . . . . . . . . . . . . . . . . . . . . . . . . . . . . . . 67
5.2 Variations of visual search error with distance to traffic: Raw dataand fitted multiple regression model. . . . . . . . . . . . . . . . . . . . . 72
5.3 Reaction time tR grouped by flight condition and display format. . . . 745.4 System Usability Scale: Usability and learnability subscale results
grouped by display format. . . . . . . . . . . . . . . . . . . . . . . . . . . 765.5 Learnability ratings of participants who are unfamiliar with their dis-
play format. . . . . . . . . . . . . . . . . . . . . . . . . . . . . . . . . . . . 78
6.1 Coding of discrete relative bearing and elevation stimuli of the low-complexity display. . . . . . . . . . . . . . . . . . . . . . . . . . . . . . . . 92
6.2 Relative frequencies of how often different mental models wereidentified as best-fitting. . . . . . . . . . . . . . . . . . . . . . . . . . . . . 96
6.3 Visual search error magnitude ∆γ grouped by flight condition andbest-fitting mental models. . . . . . . . . . . . . . . . . . . . . . . . . . . 100
A.1 Sequence of transformation steps between coordinate systems. . . . . 138
D.1 Hardware setup of the answer sub-task experiment. . . . . . . . . . . . 151D.2 Experimental distributions of actual and limited error success rates
during answer sub-task experiment. . . . . . . . . . . . . . . . . . . . . . 152
E.1 Histograms of prediction errors. . . . . . . . . . . . . . . . . . . . . . . . 157
132 List of figures

List of tables
2.1 Accidents involving gliders and motorgliders. . . . . . . . . . . . . . . . 7
3.1 Products reviewed during the market study. . . . . . . . . . . . . . . . . 27
4.1 Characteristics of different factor levels of flight condition. . . . . . . . 494.2 Relative orientation of coordinate systems during different levels of
flight condition and display format (mathematical description). . . . 504.3 Relative orientation of coordinate systems during different flight
conditions (graphical description). . . . . . . . . . . . . . . . . . . . . . 514.4 Demographics and flight experience of participants. . . . . . . . . . . . 524.5 Participants’ familiarity with their assigned display format. . . . . . . 534.6 Results of video analysis. . . . . . . . . . . . . . . . . . . . . . . . . . . . 57
5.1 Post-hoc analysis: Comparing the difference in transformed visualsearch error ∆γ between pairs of display format factor levels. . . . . . 68
5.2 Post-hoc analysis: Comparing the difference in transformed visualsearch error ∆γ between pairs of flight condition factor levels. . . . . 69
5.3 Multiple regression results: Parameter estimates with 95% confi-dence intervals and structure coefficients. . . . . . . . . . . . . . . . . . 71
6.1 Characteristics of the proposed mental models. . . . . . . . . . . . . . . 896.2 Coding of quasi-continuous relative bearing and elevation stimuli of
the radar-style and perspective displays. . . . . . . . . . . . . . . . . . . 936.3 Absolute frequencies of how often different proposed mental models
were identified as best-fitting. . . . . . . . . . . . . . . . . . . . . . . . . 956.4 Pre-planned contrasts: Comparing the difference in transformed vi-
sual search error ∆γ between groups of best-fitting mental modelsfor different flight condition factor levels. . . . . . . . . . . . . . . . . . 101
A.1 Characteristics of the traffic pointer coordinate system. . . . . . . . . . 136A.2 Characteristics of the horizon- and track-fixed coordinate system. . . 136A.3 Characteristics of the ownship-fixed coordinate system. . . . . . . . . . 137A.4 Characteristics of the horizon- and heading-fixed coordinate system. 138
133

C.1 Sex of participants, grouped by display format. . . . . . . . . . . . . . . 145C.2 Age and flight experience of participants, grouped by display format. 146
D.1 Results of reaction times during answer sub-task experiment. . . . . . 153
134 List of tables
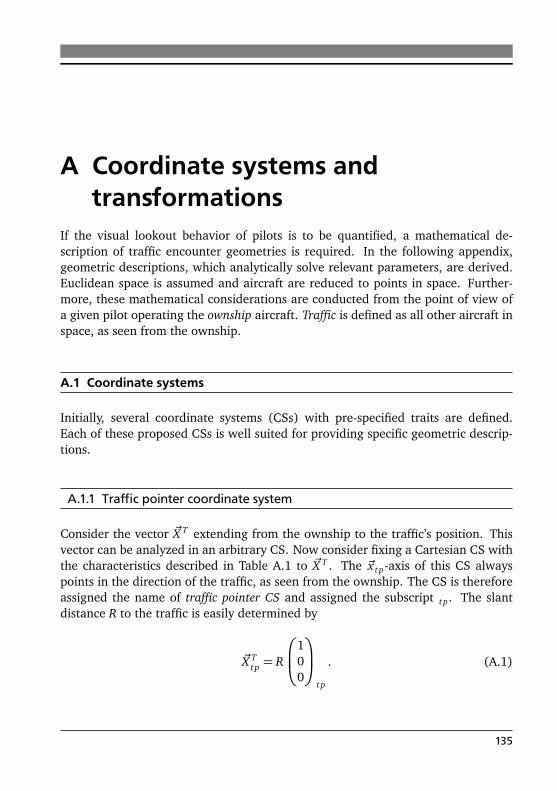
A Coordinate systems andtransformations
If the visual lookout behavior of pilots is to be quantified, a mathematical de-scription of traffic encounter geometries is required. In the following appendix,geometric descriptions, which analytically solve relevant parameters, are derived.Euclidean space is assumed and aircraft are reduced to points in space. Further-more, these mathematical considerations are conducted from the point of view ofa given pilot operating the ownship aircraft. Traffic is defined as all other aircraft inspace, as seen from the ownship.
A.1 Coordinate systems
Initially, several coordinate systems (CSs) with pre-specified traits are defined.Each of these proposed CSs is well suited for providing specific geometric descrip-tions.
A.1.1 Traffic pointer coordinate system
Consider the vector ~X T extending from the ownship to the traffic’s position. Thisvector can be analyzed in an arbitrary CS. Now consider fixing a Cartesian CS withthe characteristics described in Table A.1 to ~X T . The ~x t p-axis of this CS alwayspoints in the direction of the traffic, as seen from the ownship. The CS is thereforeassigned the name of traffic pointer CS and assigned the subscript t p. The slantdistance R to the traffic is easily determined by
~X Ttp = R
100
t p
. (A.1)
135

Table A.1.: Characteristics of the traffic pointer coordinate system.
Axis orientation
~x t p towards traffic aircraft~yt p in horizontal plane, normal to ~x t p, pointing right~zt p normal to ~x t p and ~yt p, pointing down
Origin at position of ownship
A.1.2 Horizon- and track-fixed coordinate system
The fact that FLARM lacks an attitude and heading reference system means thatall position data of traffic must be expressed in a CS which can be derived throughGlobal Positioning System measurements. As the ownship’s current position andposition history is known in World Geodetic System 1984 coordinates [65, SentenceGPRMC], another CS is introduced. This Cartesian CS is solely derived from thecurrent position and position history of the FLARM transceiver. It is referred toas the horizon- and track-fixed CS and carries the subscript ht . The ~xht -~yht -planealways remains horizontal while the ~xht points in the direction of the ownship’sground track. The CS’s characteristics are given in Table A.2.
Table A.2.: Characteristics of the horizon- and track-fixed coordinate system.
Axis orientation
~xht in the horizontal plane, oriented parallel to the ownship’s track~yht in horizontal plane, normal to ~xht , pointing 90 ◦ to the right of
the ownship’s track~zht pointing downwards in the direction of gravity
Origin at position of ownship
136 A. Coordinate systems and transformations
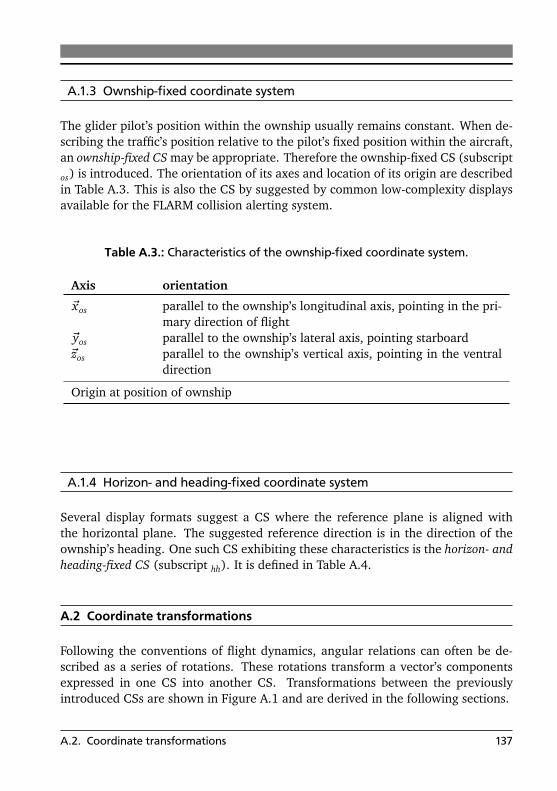
A.1.3 Ownship-fixed coordinate system
The glider pilot’s position within the ownship usually remains constant. When de-scribing the traffic’s position relative to the pilot’s fixed position within the aircraft,an ownship-fixed CS may be appropriate. Therefore the ownship-fixed CS (subscriptos) is introduced. The orientation of its axes and location of its origin are describedin Table A.3. This is also the CS by suggested by common low-complexity displaysavailable for the FLARM collision alerting system.
Table A.3.: Characteristics of the ownship-fixed coordinate system.
Axis orientation
~xos parallel to the ownship’s longitudinal axis, pointing in the pri-mary direction of flight
~yos parallel to the ownship’s lateral axis, pointing starboard~zos parallel to the ownship’s vertical axis, pointing in the ventral
direction
Origin at position of ownship
A.1.4 Horizon- and heading-fixed coordinate system
Several display formats suggest a CS where the reference plane is aligned withthe horizontal plane. The suggested reference direction is in the direction of theownship’s heading. One such CS exhibiting these characteristics is the horizon- andheading-fixed CS (subscript hh). It is defined in Table A.4.
A.2 Coordinate transformations
Following the conventions of flight dynamics, angular relations can often be de-scribed as a series of rotations. These rotations transform a vector’s componentsexpressed in one CS into another CS. Transformations between the previouslyintroduced CSs are shown in Figure A.1 and are derived in the following sections.
A.2. Coordinate transformations 137
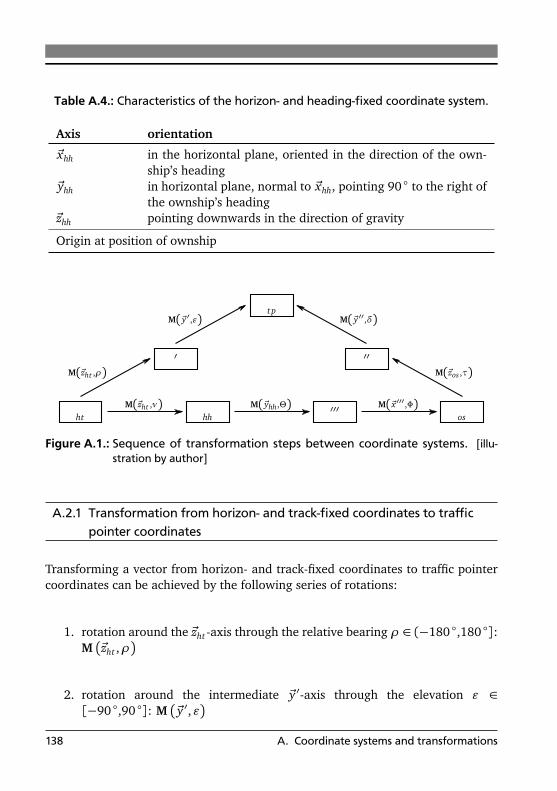
Table A.4.: Characteristics of the horizon- and heading-fixed coordinate system.
Axis orientation
~xhh in the horizontal plane, oriented in the direction of the own-ship’s heading
~yhh in horizontal plane, normal to ~xhh, pointing 90 ◦ to the right ofthe ownship’s heading
~zhh pointing downwards in the direction of gravity
Origin at position of ownship
t p
′′
ht hh′′′
os
′
M(~y′,ε)
M(~zht ,ρ)
M(~y′′,δ)
M(~zos ,τ)
M(~yhh,Θ)M(~zht ,ν) M(~x ′′′,Φ)
Figure A.1.: Sequence of transformation steps between coordinate systems. [illu-stration by author]
A.2.1 Transformation from horizon- and track-fixed coordinates to trafficpointer coordinates
Transforming a vector from horizon- and track-fixed coordinates to traffic pointercoordinates can be achieved by the following series of rotations:
1. rotation around the ~zht -axis through the relative bearing ρ ∈ (−180 ◦,180 ◦]:M�
~zht ,ρ�
2. rotation around the intermediate ~y ′-axis through the elevation ε ∈[−90 ◦,90 ◦]: M
�
~y ′,ε�
138 A. Coordinate systems and transformations

The corresponding rotation matrix Mt p,ht =M�
~y ′,ε� ·M�~zht ,ρ
�
is given as
Mt p,ht =
cosε cosρ cosε sinρ − sinε− sinρ cosρ 0
sinε cosρ sinε sinρ cosε
. (A.2)
The traffic pointer vector ~X T can also be expressed in horizon- and track-fixedcoordinates.
~X Tht =Mht,t p · ~X T
tp
=Mt rtp,ht · ~X T
tp
= R ·
cosε cosρcosε sinρ− sinε
ht
(A.3)
Typically, FLARM-compatible low-complexity displays use these polar coordi-nates (relative bearing ρ and elevation ε) as two-dimensional indications of thetraffic’s positions. This coordinate transformation has a major technical advantage.Whenever the ownship’s current position and position history is known, the rela-tive bearing ρ and elevation ε to the traffic can be calculated solely on positionreports of the traffic. No knowledge of the ownship’s attitude is required, thereforereducing the technical complexity of the collision alerting system. However, thepilot must be aware of how the horizon- and track-fixed CS is located in order tocorrectly interpret the relative bearing and elevation information to the traffic.
A.2.2 Transformation from ownship-fixed coordinates to traffic pointercoordinates
Transforming a vector from ownship-fixed coordinates to traffic pointer coordinatescan be achieved by the following series of rotations:
1. rotation around the ~zos-axis through the visual bearing τ ∈ (−180 ◦,180 ◦]:M�
~zos,τ�
2. rotation around the intermediate ~y ′′-axis through the visual elevation δ ∈[−90 ◦,90 ◦]: M
�
~y ′′,δ�
A.2. Coordinate transformations 139
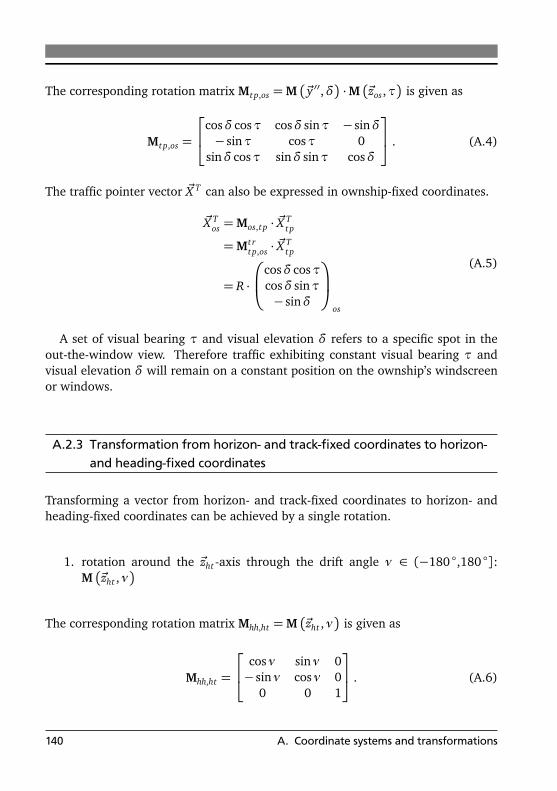
The corresponding rotation matrix Mt p,os =M�
~y ′′,δ� ·M�~zos,τ
�
is given as
Mt p,os =
cosδ cosτ cosδ sinτ − sinδ− sinτ cosτ 0
sinδ cosτ sinδ sinτ cosδ
. (A.4)
The traffic pointer vector ~X T can also be expressed in ownship-fixed coordinates.
~X Tos =Mos,t p · ~X T
tp
=Mt rtp,os · ~X T
tp
= R ·
cosδ cosτcosδ sinτ− sinδ
os
(A.5)
A set of visual bearing τ and visual elevation δ refers to a specific spot in theout-the-window view. Therefore traffic exhibiting constant visual bearing τ andvisual elevation δ will remain on a constant position on the ownship’s windscreenor windows.
A.2.3 Transformation from horizon- and track-fixed coordinates to horizon-and heading-fixed coordinates
Transforming a vector from horizon- and track-fixed coordinates to horizon- andheading-fixed coordinates can be achieved by a single rotation.
1. rotation around the ~zht -axis through the drift angle ν ∈ (−180 ◦,180 ◦]:M�
~zht ,ν�
The corresponding rotation matrix Mhh,ht =M�
~zht ,ν�
is given as
Mhh,ht =
cosν sinν 0− sinν cosν 0
0 0 1
. (A.6)
140 A. Coordinate systems and transformations
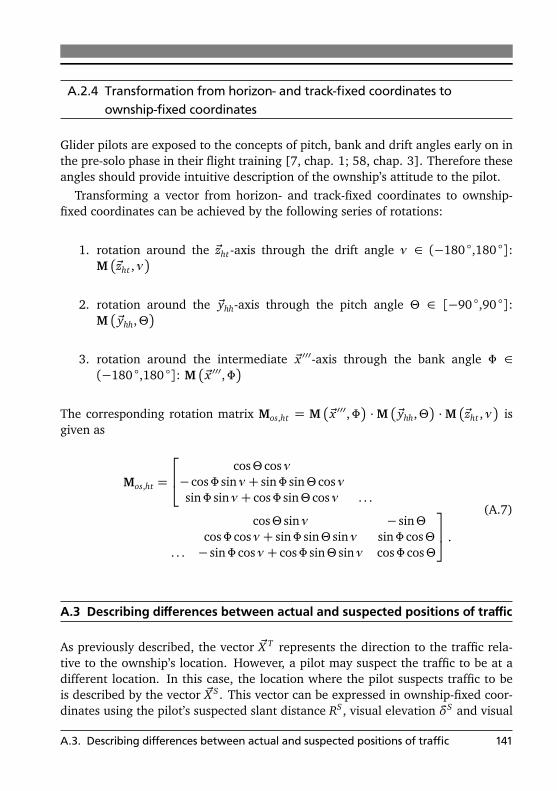
A.2.4 Transformation from horizon- and track-fixed coordinates toownship-fixed coordinates
Glider pilots are exposed to the concepts of pitch, bank and drift angles early on inthe pre-solo phase in their flight training [7, chap. 1; 58, chap. 3]. Therefore theseangles should provide intuitive description of the ownship’s attitude to the pilot.
Transforming a vector from horizon- and track-fixed coordinates to ownship-fixed coordinates can be achieved by the following series of rotations:
1. rotation around the ~zht -axis through the drift angle ν ∈ (−180 ◦,180 ◦]:M�
~zht ,ν�
2. rotation around the ~yhh-axis through the pitch angle Θ ∈ [−90 ◦,90 ◦]:M�
~yhh,Θ�
3. rotation around the intermediate ~x ′′′-axis through the bank angle Φ ∈(−180 ◦,180 ◦]: M
�
~x ′′′,Φ�
The corresponding rotation matrix Mos,ht = M�
~x ′′′,Φ� ·M�~yhh,Θ
� ·M�~zht ,ν�
isgiven as
Mos,ht =
cosΘ cosν− cosΦ sinν + sinΦ sinΘ cosνsinΦ sinν + cosΦ sinΘ cosν . . .
cosΘ sinν − sinΘcosΦ cosν + sinΦ sinΘ sinν sinΦ cosΘ
. . . − sinΦ cosν + cosΦ sinΘ sinν cosΦ cosΘ
.
(A.7)
A.3 Describing differences between actual and suspected positions of traffic
As previously described, the vector ~X T represents the direction to the traffic rela-tive to the ownship’s location. However, a pilot may suspect the traffic to be at adifferent location. In this case, the location where the pilot suspects traffic to beis described by the vector ~X S . This vector can be expressed in ownship-fixed coor-dinates using the pilot’s suspected slant distance RS , visual elevation δS and visual
A.3. Describing differences between actual and suspected positions of traffic 141
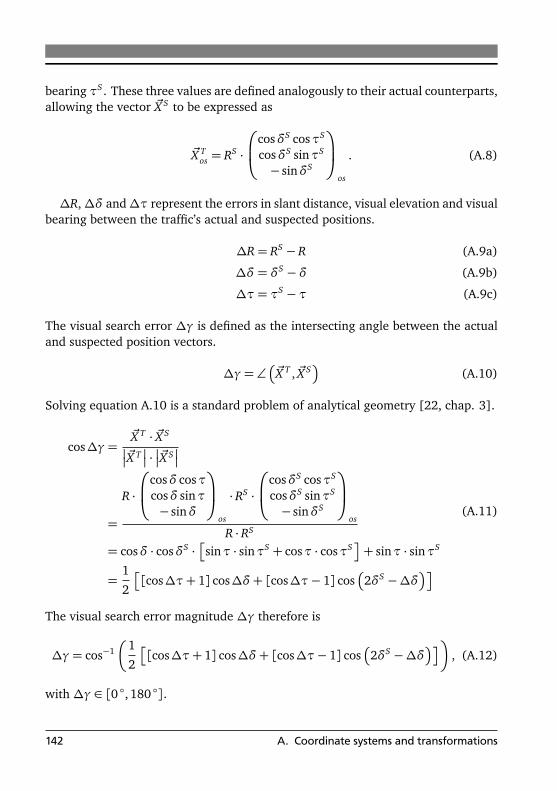
bearing τS . These three values are defined analogously to their actual counterparts,allowing the vector ~X S to be expressed as
~X Tos = RS ·
cosδS cosτS
cosδS sinτS
− sinδS
os
. (A.8)
∆R,∆δ and∆τ represent the errors in slant distance, visual elevation and visualbearing between the traffic’s actual and suspected positions.
∆R= RS − R (A.9a)
∆δ = δS −δ (A.9b)
∆τ= τS −τ (A.9c)
The visual search error ∆γ is defined as the intersecting angle between the actualand suspected position vectors.
∆γ= ∠�
~X T , ~X S�
(A.10)
Solving equation A.10 is a standard problem of analytical geometry [22, chap. 3].
cos∆γ=~X T · ~X S
�
�~X T�
� ·�
�~X S�
�
=
R ·
cosδ cosτcosδ sinτ− sinδ
os
· RS ·
cosδS cosτS
cosδS sinτS
− sinδS
os
R · RS
= cosδ · cosδS ·�
sinτ · sinτS + cosτ · cosτS�
+ sinτ · sinτS
=1
2
�
[cos∆τ+ 1] cos∆δ+ [cos∆τ− 1] cos�
2δS −∆δ��
(A.11)
The visual search error magnitude ∆γ therefore is
∆γ= cos−1�
1
2
�
[cos∆τ+ 1] cos∆δ+ [cos∆τ− 1] cos�
2δS −∆δ��
�
, (A.12)
with ∆γ ∈ [0 ◦, 180 ◦].
142 A. Coordinate systems and transformations

B Interpretation intervals for effectsizes
Estimated effect sizes of statistically significant results reveal the strength of rela-tionships [4, pp. 25–26]. They aid in extending the concept of statistical signifi-cance to substantive significance [128]. Interpreting the numerical values of effectsizes requires interpretation intervals to be defined. However, B. H. Cohen notedthat effect sizes should, whenever possible, be seen in context of experience withsimilar experiments [31, pp. 244–245]. Therefore, the following intervals formno hard boundaries but should be used as a general reference for interpreting theresults.
B.1 Cramér’s V and Pearson’s bivariate r
Cramér’s V is an effect size used during tests of cross tables. Similarly, Pearson’sr describes the strength of bivariate correlations between variables. B. H. Cohendefined interpretation intervals for Cramér’s V [31, pp. 727–728], while J. Cohennamed such intervals for Pearson’s r [32, section 3.2]. The interval boundarieswere defined identically in both cases as follows:
0 ≤ V , |r| < .1, negligible effect.1 ≤ V , |r| < .3, small effect.3 ≤ V , |r| < .5, moderate effect.5 ≤ V , |r| , large effect
B.2 Pearson’s R2
Bortz stated that Pearson’s multivariate regression coefficient R2 (adjusted R2)should be interpreted similarly to the bivariate coefficient [19, pp. 449–451].Therefore, it is interpreted using the following intervals.
0 ≤ R2 < .01, negligible effect.01 ≤ R2 < .09, small effect.09 ≤ R2 < .25, moderate effect.25 ≤ R2 , large effect
143
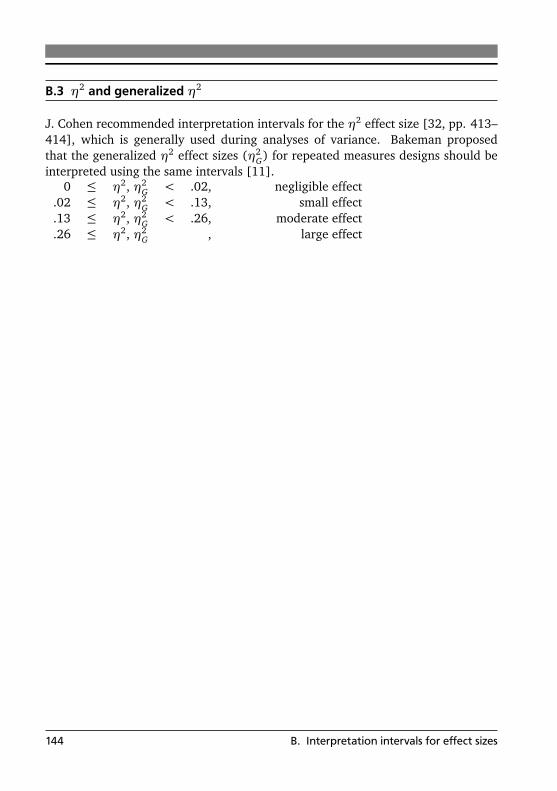
B.3 η2 and generalized η2
J. Cohen recommended interpretation intervals for the η2 effect size [32, pp. 413–414], which is generally used during analyses of variance. Bakeman proposedthat the generalized η2 effect sizes (η2
G) for repeated measures designs should beinterpreted using the same intervals [11].
0 ≤ η2, η2G < .02, negligible effect
.02 ≤ η2, η2G < .13, small effect
.13 ≤ η2, η2G < .26, moderate effect
.26 ≤ η2, η2G , large effect
144 B. Interpretation intervals for effect sizes

C Variations of flight experience anddemography with display format
Participants were assigned to one of three display formats, based on the date thatthey participated in the study. This procedure held the potential that differences inthe participants’ demography and glider flight experience might skew the results.No a priori indications of such skewing were recognized. Nevertheless, to confirmthat no skewing took place, the following hypothesis was evaluated.
Hypothesis 6: The participants’ age, sex and glider flight experiencedo not vary with the assigned display.
Demographic data and flight experience of the participants according to the dis-play assigned are shown in Tables C.1 and C.2.
Table C.1.: Sex of participants, grouped by display format.
Display format female male
low-complexity 3 39radar-style 4 29perspective 1 45
Two statistical tests were performed to evaluate whether participants’ age, sexand glider flight experience varied between display formats. The first test wasa Fisher’s exact test and the second test was multivariate analysis of variance(MANOVA). In both tests the between-subjects independent variable was defined asthe display format assigned to participants with the factor levels of low-complexity,radar-style and perspective displays. Since Hypothesis 6 was tested at α = .05, thesignificance level of each of the two tests was adjusted using Holm’s step downprocedure.
Variations of participants’ sex (nominally scaled dependent variable) and theirassigned display were examined using Fisher’s exact test. The test was applied tothe data of Table C.1. It provided statistically insignificant results at the adjustedsignificance level (χ2(2) = 3.08, p = .21).
145
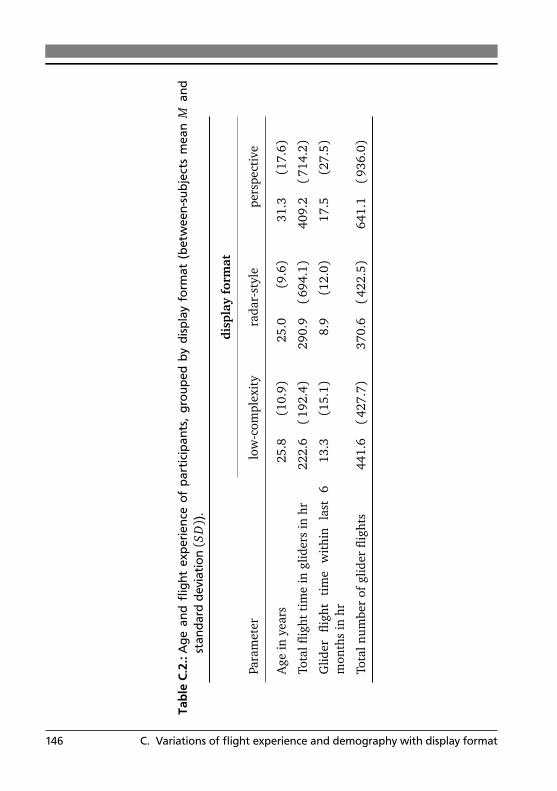
Tabl
eC.
2.:A
gean
dfli
ght
expe
rienc
eof
part
icip
ants
,gr
oupe
dby
disp
lay
form
at(b
etw
een-
subj
ects
mea
nM
and
stan
dard
devi
atio
n(S
D))
.
disp
lay
form
at
Para
met
erlo
w-c
ompl
exit
yra
dar-
styl
epe
rspe
ctiv
e
Age
inye
ars
25.8
(10.
9)25
.0(9
.6)
31.3
(17.
6)
Tota
lflig
htti
me
ingl
ider
sin
hr22
2.6(1
92.4)
290.
9(6
94.1)
409.
2(7
14.2)
Glid
erfli
ght
tim
ew
ithi
nla
st6
mon
ths
inhr
13.3
(15.
1)8.
9(1
2.0)
17.5
(27.
5)
Tota
lnum
ber
ofgl
ider
fligh
ts44
1.6(4
27.7)
370.
6(4
22.5)
641.
1(9
36.0)
146 C. Variations of flight experience and demography with display format

A MANOVA was used to evaluate whether the interval scaled dependent vari-ables of demography and experience varied between display formats. Due to highcorrelations between age and most of the flight experience metrics of Table C.2,only age and glider flight time within the preceding six months were retainedas the MANOVA’s dependent variables. A robust nonparametric variant of theMANOVA [141] was performed. Equality of the covariance matrices was given.1
The MANOVA’s results were statistically insignificant at the adjusted significancelevel as well (test score L(2) = 4.47, p = .11).
These results of the MANOVA and Fisher’s exact test were congruent with Hypo-thesis 6. Thus, it was retained. No systematic difference in demography or flightexperience existed between participants assigned to different display formats.
1 analyzed using Box’s M test
147

D Experimentally evaluating theanswer sub-task
The experimental task of this thesis’s main experiment, which is discussed in sec-tion 4.5, consisted of three sub-tasks. At first, participants were to notice andinterpret the traffic signal shown to them. During the second sub-task, participantsdirected their gaze to the out-the-window view. During the final sub-task, theytapped an answer cell on a touch-screen monitor to indicate where they previouslylooked. The answer sub-task is not found in actual glider flight operations. Instead,it was inherent only to the main experiment.
D.1 Introduction
While studying the results relevant to actual flight operations, it was necessary tocompensate for the influence of the answer sub-task. This required two categoriesof questions about the answer sub-task to be discussed.
• How often do participants provide the touch screen monitor response theyintend to give? How high is the error rate when pressing the touch screenmonitor’s buttons?
• How long does it take the participants to provide their intended touch screenmonitor response? What influences their response time to the answer sub-task?
During the design phase of the main experiment, several research pilots fromTechnische Universität Darmstadt’s flight department provided their expert opin-ions on the tasks. From these expert opinions two hypotheses regarding the answersub-task were derived.
Hypothesis 7: The success rates during the answer sub-task are ade-quate for the experiment. Participants almost exclusively press thebuttons they intend to press.
Hypothesis 8: Response time varies between cells.
149

D.2 Method
In order to test the aforementioned hypotheses, an answer sub-task experimentwas designed. In this experiment, the main experiment’s answer sub-task (Figures4.7 and 4.8) was performed as a stand-alone task by a new sample of participants.This allowed insight into the characteristics of the answer sub-task.
A total of 28 participants performed the answer sub-task experiment. 3 parti-cipants were female, the remainder male. Their ages ranged between 24 and 51years of age (M = 28.2 years, SD = 5.4years). All participants were either stu-dents of Technische Universität Darmstadt or scientific personnel affiliated withthe Institute of Flight Systems and Automatic Control. They did not require flightexperience to participate.
Participants performed the answer sub-task experiment in a quiet office environ-ment. They seated themselves at a conventional office workplace. There, they tookhold of the touch screen monitor also used during the main experiment. The touchscreen monitor showed the main experiment’s answer grid consisting of 50 cells(Figure 4.2). During the answer sub-task experiment, the alphanumeric identifiersof all cells were displayed in randomized order in 4 s intervals on a laptop computerscreen. Participants were instructed to perform the following task:
a) Look at the laptop computer screen. As soon as you notice a new alphanumericidentifier, read the identifier.
b) Swiftly locate and tap the corresponding cell on the answer grid shown on thetouch screen monitor.
The button pressed by the participant as well as the corresponding response timewere recorded as the answer sub-task experiment’s dependent variables. Indepen-dent variables were the row and column identifiers of the cell, as shown on thelaptop computer screen. The hardware setup, shown in Figure D.1, was a sim-plified setup of main experiment’s setup (see section 4.3). Similarly, a modifiedversion of the experimental software was developed for this purpose [100, section5.5.2]. Since the experiment was performed by multiple participants, the parti-cipant’s running identification number was as a repeated measures independentvariable. This resulted in a 5×10×28 within-subject repeated measures design ofthe experiment.
By comparing the alphanumeric identifiers shown to the participants to the cellsthey pressed, each participant’s success rate in pressing the correct button on thetouch screen monitor was calculated. A success rate of 90% or above was arbitrarilydefined as being adequate within the frame of this experiment. Also, a limited errorsuccess rate was determined for each participant. It described the relative number
150 D. Experimentally evaluating the answer sub-task

touch screenmonitor
laptopcomputer D-3
video graphicsarray
universalserial bus
Figure D.1.: Hardware setup of the answer sub-task experiment. [illustration andphotograph by author]
of responses where a participant tapped a response cell which was within one rowvertically and one column horizontally of the commanded cell. Also, response timewas evaluated. Only the response time of correct responses was included. Outlierswere removed.
D.3 Results
Determining whether participants’ responses were adequate (Hypothesis 7) wasperformed by descriptively analyzing their actual (Figure D.2a) and limited error(Figure D.2b) success rates. The actual success rate distribution had a between-subjects mean M = 96.4% (SD = 3.9%). It’s 10th percentile was located at asuccess rate of 90.6%. Naturally, the limited error success rate’s between-subjectsmean was higher at M = 98.2% (SD = 3.3%). The corresponding 10th percentilewas also higher at 96.0%. All participants having scored a success rate of less than90% during the experiment lacked answers for more than one out of the 50 signalsshown. Inversely, all participants having scored a success rate of more than 90%had only one or no missing values.
Influences on the participants’ response time (Hypothesis 8) were determinedusing inferential statistics. The participants’ response time was grouped by the
D.3. Results 151

80% 90% 100%0
20%
40%
60%
success rate
rela
tive
freq
uenc
y
(a) Actual success rate distribution
80% 90% 100%0
20%
40%
60%
limited error success rate
rela
tive
freq
uenc
y
(b) Limited error success rate distribution
Figure D.2.: Experimental distributions of actual and limited error success rates dur-ing answer sub-task experiment.
corresponding answer cell. All distributions of response time were normal1 andexhibited heteroscedasticity.2 The between-subjects means and standard deviationsfor each cell are shown in Table D.1.
Hypothesis 8 was analyzed using a two-way analysis of variance. It’s dependentvariable was the response time of each participant. The column identifiers (−5through −1 and 1 through 5) and row identifiers (A through E) - as answeredby the participants - formed the analysis of variance’s two independent variables.Due to the data’s heteroscedasticity, the robust F ∗ test score proposed by Brown andForsythe was used [24]. Both independent variables as well as their interaction hadstatistically significant effects on the participants’ reaction times (F ∗(4,479.60) =17.46, p < .01, η2 = .05 for row effect; F ∗(9, 479.60) = 2.08, p = .03, η2 =.01 for column effect; F ∗(36, 479.60) = 2.87, p < .01, η2 = .07 for interactionbetween rows and columns). While the effect of the column on reaction time wasof negligible strength, the row and interacting effects were small, but notable.
1 assessed using 50 Kolmogorov-Smirnov tests for normality. All tests provided statistically in-significant results at the Holm’s step-down adjusted significance level.
2 assessed using the Levene test for homogeneity of variances. Its results were statistically signif-icant with F(49, 1297) = 2.03, p < .01.
152 D. Experimentally evaluating the answer sub-task
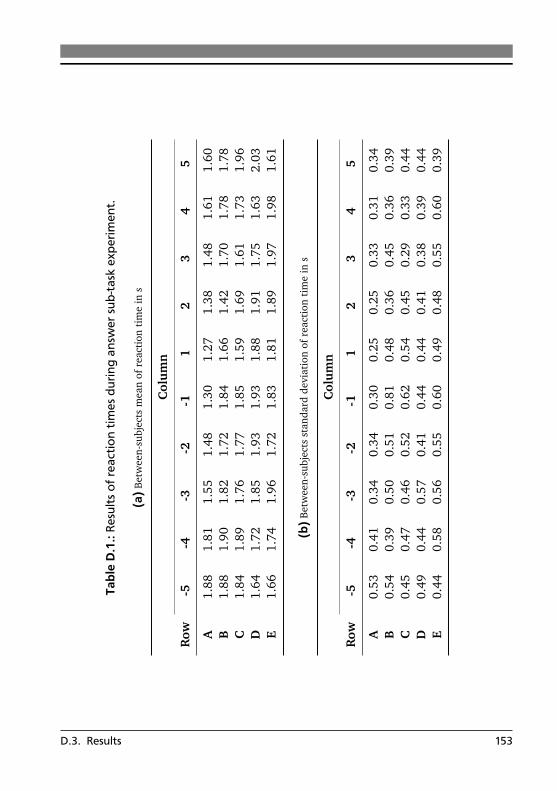
Tabl
eD
.1.:
Resu
ltsof
reac
tion
times
durin
gan
swer
sub-
task
expe
rimen
t.
(a)B
etw
een-
subj
ects
mea
nof
reac
tion
tim
ein
s
Col
um
n
Row
-5-4
-3-2
-11
23
45
A1.
881.
811.
551.
481.
301.
271.
381.
481.
611.
60B
1.88
1.90
1.82
1.72
1.84
1.66
1.42
1.70
1.78
1.78
C1.
841.
891.
761.
771.
851.
591.
691.
611.
731.
96D
1.64
1.72
1.85
1.93
1.93
1.88
1.91
1.75
1.63
2.03
E1.
661.
741.
961.
721.
831.
811.
891.
971.
981.
61
(b)B
etw
een-
subj
ects
stan
dard
devi
atio
nof
reac
tion
tim
ein
s
Col
um
n
Row
-5-4
-3-2
-11
23
45
A0.
530.
410.
340.
340.
300.
250.
250.
330.
310.
34B
0.54
0.39
0.50
0.51
0.81
0.48
0.36
0.45
0.36
0.39
C0.
450.
470.
460.
520.
620.
540.
450.
290.
330.
44D
0.49
0.44
0.57
0.41
0.44
0.44
0.41
0.38
0.39
0.44
E0.
440.
580.
560.
550.
600.
490.
480.
550.
600.
39
D.3. Results 153
D.4 Discussion
The analysis of the success rate showed that for almost all participants 90% ormore of their answers were precise. In these cases, participants pressed the an-swer cells on the touch screen monitor which they intended to press. Whenever anerror occurred, that error was almost exclusively within one row and one columnof the intended answer cell on the monitor’s answer grid. Those 2 of 28 partici-pants having scored success rates of less than 90% had problems performing theirexperimental tasks and therefore missed to perform their task properly on severaloccasions. The scores of these participants were considered to be outliers. The factthat 90% of the participants scored actual success rates of 90.6% or higher, andlimited error success rates of 96.0% or better, illustrates that the answer sub-taskexperiment was performed with acceptable performance by the participants. It isassumed that this acceptable performance carries over into the main experiment.Hypothesis 7 was therefore retained on the basis of these descriptive results.
Results of the analysis of variance showed that the participants’ response timevaried notably between individual answer cells. Accordingly, Hypothesis 8 wasretained. Due to the non-negligible interaction between rows and columns onresponse time, adequate corrections should be performed on the reaction timemeasured during the main experiment. One way of doing so is to subtract thebetween-subjects mean response time of Table D.1a from the main experiment’smeasured reaction time (Figure 4.8). Additionally, this allows for a more plausibledefinition of outliers in the main experiment (section 4.6).
154 D. Experimentally evaluating the answer sub-task
E Verifying the analytical modelingapproach to identifying pilots’mental models
Chapter 6 presented a novel approach to identifying the mental models (MMs)which glider pilots use when interacting with a low-cost collision alerting system(CAS). In this approach, MMs of glider pilots were modeled analytically. This wasachieved by proposing multiple coordinate systems (CSs) to predict pilot responsesto signals shown on the displays of their CAS. The CS - and corresponding MM- best predicting the participant’s expectations where traffic would be located wasthen selected as the pilot’s best-fitting MM. Before using this novel approach it hadto be checked for plausibility and verified.
E.1 Introduction
For verification, the analytical modeling approach used to identify MMs had to pro-vide plausible results. For no factor level of flight condition should the analyticalmodeling approach have skewed the predicted direction of the participants’ an-swers to their task, when compared to their actual answer. Also, the best-fittingMMs should correspond to a notable variation in the participants’ prediction er-ror magnitude ∆γP . The initial motivation behind analyzing the MMs was to ex-plain differences in pilot effectivity when using the CAS. If the analytical modelingapproach can’t explain these results, then it is considered inappropriate for thedesigned task. These considerations led to two separate validation hypotheses.
Hypothesis 9: Throughout all flight conditions, the best-fitting MMfor each participant does not skew prediction results. Instead,answers predicted by the best-fitting MM scatter symmetricallyaround the participant’s actual answers.
Hypothesis 10: The best-fitting MM influences the effectivity demon-strated by participants using a low-cost CAS.
155
E.2 Method
Identification of the best-fitting MM for each participant was performed accordingto section 6.2. For verification purposes not only the magnitude ∆γP of the pre-diction error was of interest but also the direction in which the prediction erroroccurred. By comparing the predicted visual bearing τP of the analytical modelingapproach against the suspected visual bearing τS of the participant, the visual bear-ing prediction error ∆τP was defined. Analogously, a visual elevation predictionerror ∆δP was defined as well. Both prediction errors decomposed the predictionerror’s magnitude ∆γP into two independent directions.
∆τP = τP −τS (E.1a)
∆δP = δP −δS (E.1b)
Outliers were removed, and where necessary, they were conservatively replacedwith the participant’s average values of the respective dependent variable for thatfactor level of flight condition. The assumptions and prerequisites necessary forthe following statistical procedures were checked beforehand. Where necessary,corrections were performed.
E.3 Results and discussion
Hypothesis 9 was examined using multiple Wilcoxon signed rank tests. For eachfactor level combination of participant and flight condition, the distributions of vi-sual bearing prediction error ∆τP and visual elevation prediction error ∆δP weredetermined (see equations E.1). Their frequency distributions are shown in Fig-ure E.1. Each of these distributions was tested whether it conformed to a symmet-ric distribution around the zero median using a one-sample Wilcoxon signed ranktest. This resulted in eight tests per participant and 968 tests in total. Of these 968tests, 18 tests provided statistically significant results at a Holm’s step-down ad-justed significance level. However, all corresponding rank correlation coefficientsr of these statistically significant tests revealed a negligible effect size; |r| < .08.The results revealed that for each factor level combination of participant and flightcondition, the best-fitting MM did not cause substantive systematic errors in pre-dicting the participants’ responses. Instead, the predictions scattered symmetricallyaround the participants’ actual answers in the visual bearing direction and visualelevation direction. Thus, Hypothesis 9 was retained.
156 E. Verifying the analytical modeling approach to identifying pilots’ mental models
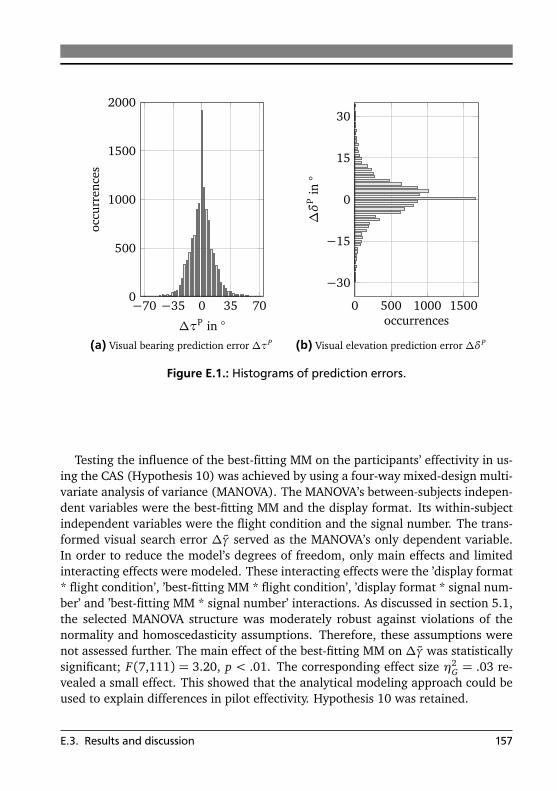
0 500 1000 1500
−30
−15
0
15
30
occurrences
∆δ
Pin
°
−70 −35 0 35 700
500
1000
1500
2000
∆τP in °
occu
rren
ces
(a) Visual bearing prediction error ∆τP
0 500 1000 1500
−30
−15
0
15
30
occurrences∆δ
Pin
°−70 −35 0 35 70
0
500
1000
1500
2000
∆τP in °
occu
rren
ces
(b) Visual elevation prediction error ∆δP
Figure E.1.: Histograms of prediction errors.
Testing the influence of the best-fitting MM on the participants’ effectivity in us-ing the CAS (Hypothesis 10) was achieved by using a four-way mixed-design multi-variate analysis of variance (MANOVA). The MANOVA’s between-subjects indepen-dent variables were the best-fitting MM and the display format. Its within-subjectindependent variables were the flight condition and the signal number. The trans-formed visual search error ∆γ served as the MANOVA’s only dependent variable.In order to reduce the model’s degrees of freedom, only main effects and limitedinteracting effects were modeled. These interacting effects were the ’display format* flight condition’, ’best-fitting MM * flight condition’, ’display format * signal num-ber’ and ’best-fitting MM * signal number’ interactions. As discussed in section 5.1,the selected MANOVA structure was moderately robust against violations of thenormality and homoscedasticity assumptions. Therefore, these assumptions werenot assessed further. The main effect of the best-fitting MM on ∆γ was statisticallysignificant; F(7,111) = 3.20, p < .01. The corresponding effect size η2
G = .03 re-vealed a small effect. This showed that the analytical modeling approach could beused to explain differences in pilot effectivity. Hypothesis 10 was retained.
E.3. Results and discussion 157
E.4 Conclusion
In summary, the analytical modeling approach used to identify the MMs of gliderpilots behaved plausibly. No systematic errors in predicting the responses of partici-pants were made. The approach fulfilled its design goal by uncovering performancedifferences exhibited by participants using a low-cost CAS. Since none of the resultsnegated the approach presented, verification of the mental modeling approach wasconsidered to be successful.
158 E. Verifying the analytical modeling approach to identifying pilots’ mental models