Conceptualization and Usability Evaluation - Archive ouverte ...
208
Abstract Information Visualization in Interactive 3D Virtual Environments: Conceptualization and Usability Evaluation Kaveh Bazargan Harandi Codirection de thèse : M. Gilles Falquet, professeur Mme Claudine Métral, professeure
-
Upload
khangminh22 -
Category
Documents
-
view
2 -
download
0
Transcript of Conceptualization and Usability Evaluation - Archive ouverte ...

Abstract Information Visualization in Interactive 3D Virtual Environments:
Conceptualization and Usability Evaluation
Kaveh Bazargan Harandi
Codirection de thèse : M. Gilles Falquet, professeur
Mme Claudine Métral, professeure

Abstract Information Visualization in Interactive 3D Virtual Environments:
Conceptualization and Usability Evaluation
THÈSE
présentée à la Faculté des sciences économiques et sociales de l’Université de Genève
par Kaveh BAZARGAN HARANDI
sous la codirection de
M. Gilles FALQUET, professeur
Mme Claudine METRAL, professeure
pour l’obtention du grade de
Docteur ès sciences économiques et sociales mention systèmes d’information
Membres du jury de thèse:
M. Gilles FALQUET, Professeur, Co-directeur de thèse, Université de Genève
Mme Claudine METRAL, Professeure, Co-directrice de thèse, Université de Genève M. Dimitri KONSTANTAS, Professeur, Président du jury, Université de Genève
M. Laurent MOCCOZET, Maître d'Enseignement et de Recherche, Université de Genève M. Patrick ROTH, Informaticien, Groupe NTICE, Université de Genève
M. Ahmed SEFFAH, Professeur, Concordia University, Canada
Thèse no 747
Genève, 14 mars 2011

ii Abstract Information Visualization in Interactive 3D Virtual Environments: Conceptualization and Usability Evaluation

iii
ABSTRACT INFORMATION VISUALIZATION IN INTERAC-TIVE 3D VIRTUAL ENVIRONMENTS: CONCEPTUALIZATION AND USABILITY EVALUATION Thèse présentée à la Faculté des sciences économiques et so-ciales de l’Université de Genève
Par Kaveh Bazargan Harandi pour l’obtention du grade de Docteur ès sciences économiques et sociales mention : systèmes d’information
Membres du jury de thèse : M. Gilles Falquet, Professeur, Co-directeur de thèse, Université de Genève Mme Claudine Métral, Professeure, Co-directrice de thèse, Université de Genève M. Dimitri Konstantas, Professeur, Président du jury, Université de Genève M. Laurent Moccozet, Maître d'Enseignement et de Recherche, Université de Genève M. Patrick Roth, Informaticien, Groupe NTICE, Université de Genève M. Ahmed Seffah, Professeur, Concordia University, Canada
Thèse N° 747 Genève, le 14 mars 2011

iv Abstract Information Visualization in Interactive 3D Virtual Environments: Conceptualization and Usability Evaluation

v
La Faculté des sciences économiques et sociales, sur préavis du jury, a autorisé l’impression de la présente thèse, sans entendre, par là, n’émettre aucune opinion sur les propositions qui s’y trouvent énoncées et qui n’engagent que la responsabilité de leur auteur. Genève, le 14 mars 2011 Le doyen Bernard MORARD Impression d'après le manuscrit de l'auteur. © Kaveh Bazargan Harandi, 2011. Tout droit réservés. ISBN 978-2-88903-005-7 Editions SES - Université de Genève

vi Abstract Information Visualization in Interactive 3D Virtual Environments: Conceptualization and Usability Evaluation

vii
و�د جان و ��د بنام �دا
�دید �یا �و ��نای �د خ�ل چ�ید ا�ی باران ز � ���ه
� �ن ن���م قا� او �ست �� م؟ ی � �یا�ت �ن ���� � جای
جان �ورید �و �ود را � ��م �قارت �دید صدف � �نارش �
شا�وار ؤ� �ؤ ��ور �د � کار جایی رسانید � ����ش
ست �دن���ی �و�ت � � ب�ندی از آن یا�ت �و �ست �د �
���ن �ھد شاخ � ��وه �ر � ز��ن �و��ند �ند �وا�ع ) باب �ھارم، � �وا�ع، �و�تان ��خ ا�ل �عدی (
A raindrop tricked from a cloud and was discomfited to see the ocean’s with:
“Where there’s the ocean, who am I? If it exists, then truly I do not!”
But, while with disparagement’s eye it saw itself, an oyster-shell within its bosom dearly cherished it;
And heaven at length so far advanced it cause that it became an imperial pearl, renowned:
Elevation it discovered by first becoming lowly,
Nothingness’ door it pounded until existence came to be!
(Chapter 4, On Humility, The Bustan of Saadi)
Source: Saadi Shirazi, M. [Persian poet of the 13th century] The Bustan of Sheikh-e Ajal Saadi, translated (from Persian) by G.M. Wickns. The Iranian Commission for UNESCO, Tehran, 1985

viii Abstract Information Visualization in Interactive 3D Virtual Environments: Conceptualization and Usability Evaluation

ix Table of Contents
Table of Contents
Abstract ................................................................................................ xiii Résumé ................................................................................................. xv Acknowledgments .............................................................................. xvii List of Figures ...................................................................................... xix List of Tables ...................................................................................... xxv 1. INTRODUCTION .............................................................................. 1
1.1 Motivation ..................................................................................... 1 1.2 Challenges ..................................................................................... 2 1.3 Application Domains .................................................................... 3
1.3.1 Cultural Heritage and Tourism ............................................ 4 1.3.2 Public Participation in Sustainable Urban Planning ............ 5 1.3.3 Advertising, Marketing and Commerce ............................... 6 1.3.4 Training and Simulation ...................................................... 8 1.3.5 Serious Games and In-Game Advertising ........................... 9
1.4 Problem Statement ...................................................................... 11 1.5 Research Questions ..................................................................... 12 1.6 Research Methodology ................................................................ 13 1.7 Organization of this Dissertation ................................................ 15
2. STATE OF THE ART ...................................................................... 17 2.1 Interactive 3D Virtual Environments .......................................... 17
2.1.1 Developing Interactive 3D User Interfaces and 3DVEs ....... 17 2.1.2 Reference Models for Interactive 3DVEs ............................. 18 2.1.3 View Management and Spatial Configuration ...................... 20
2.2 Abstract Information Visualization Techniques ......................... 22 2.2.1 Abstract Information ............................................................. 22 2.2.2 Layout Space of Abstract Info. Visualization Techniques ... 25 2.2.3 Comparison of Abstract Info. Visualization Techniques ...... 32 2.2.4 Taxonomies Related to Abstract Info. Visualization ............ 37 2.2.5 Information Rich Virtual Environments ............................... 40
2.3 Evaluation of Interactive 3D Virtual Environments ................... 41 2.3.1 Navigation Problems in Interactive 3DVEs .......................... 41 2.3.2 Metrics for the Evaluation of Interactive 3DVEs ................. 42 2.3.3 Evaluation Methods for Interactive 3DVEs .......................... 47 2.3.4 Design Guidelines for the Dev. of Interactive DVEs ........... 59 2.3.5 Specific Characteristics of Interactive 3DVEs Evaluation ... 60
2.4 Summary ..................................................................................... 61
x Abstract Information Visualization in Interactive 3D Virtual Environments: Conceptualization and Usability Evaluation
3. AN INTERACTIVE 3DVE FOR USABILITY TESTING ............. 63 3.1 Conceptual Model ....................................................................... 63
3.1.1 Reference 3D Scene .............................................................. 63 3.1.2 Type of Abstract Information ............................................... 64 3.1.3 User Context and Target Object Context .............................. 64 3.1.4 Type of Tasks ........................................................................ 65 3.1.5 Type of Abstract Information Visualization Technique ....... 69
3.2 Methodological Approach ........................................................... 70 3.2.1 Selection of a Reference 3D Scene ....................................... 71 3.2.2 Selection of Related Abstract Information ........................... 71 3.2.3 Selection of User Contexts and Target Object Contexts ...... 72 3.2.4 Definition of the Type of Tasks ............................................ 77 3.2.5 Implementation of Visualization Techniques ....................... 78
3.3 Constrained Navigation Approach .............................................. 84 3.3.1 Controlling the Navigation Skill Variable ............................ 84 3.3.2 Implementation of Constrained Navigation Interactors ........ 85 3.3.3 Using a Gamepad as Input Device ........................................ 86
3.4 Summary ..................................................................................... 88 4. USABILITY TESTING METHODOLOGY ................................... 91
4.1 Interactive 3DVE Prototyping Toolkit ........................................ 92 4.1.1 Testing Environment ............................................................. 92 4.1.2 Technological Setup ............................................................. 93
4.2 Selecting the Participants ............................................................ 93 4.2.1 Target Population and Number of Participants ..................... 93 4.2.2 Profile and Selection Protocol .............................................. 93
4.3 Tasks ........................................................................................... 94 4.3.1 Task List ............................................................................... 94 4.3.2 Training Tasks and Formal Tasks ......................................... 95
4.4 Experimental Design ................................................................... 95 4.4.1 Within vs. Between Subject Design ..................................... 95 4.4.2 Dependant and Independent Variables ................................. 97
4.5 Method and Procedure ................................................................ 98 4.5.1 Participant General Instructions and Task Instructions ........ 98 4.5.2 Procedure .............................................................................. 99
4.6 Usability Metrics and Measurements ........................................ 101 4.6.1 Metrics and Measurements: Effectiveness and Efficiency . 101 4.6.2 Metrics and Measurements for Satisfaction ........................ 101
4.7 Data Collection, Analysis and Presentation .............................. 102 4.7.1 Data Collection and Anaysis ............................................... 102 4.7.2 Data Presentation ................................................................ 102

xi Table of Contents
4.8 Summary ................................................................................... 103 5. CASE STUDIES: EXPERIMENTATIONS & RESULTS ............ 105
5.1 Applying the Methodological Approach ................................... 105 5.1.1 Reference 3D Scene ............................................................ 105 5.1.2 Related Abstract Information .............................................. 106 5.1.3 User Contexts and Target Object Contexts ......................... 107 5.1.4 Type of Tasks ...................................................................... 112 5.1.5 Abstract Information Visualization Techniques ................. 113
5.2 Applying the Usability Testing Methodology ........................... 115 5.2.1 Setup ................................................................................... 115 5.2.2 Participants .......................................................................... 116 5.2.3 Tasks ................................................................................... 117 5.2.4 Experimental Design ........................................................... 118 5.2.5 Method and Procedure ........................................................ 119 5.2.6 Measurements and Data Collection .................................... 120
5.3 Experiment 1: Effect of Constrained Navigation Approach ..... 121 5.3.1 Objective: Impact of Constrained Navigation on Presence 121 5.3.2 Results and Descriptive Statistics ....................................... 122 5.3.3 Discussions ......................................................................... 129
5.4 Experiment 2: Comparison of Two Visualization Techniques . 131 5.4.1 Objective: Comparison of WS-KB and VS-KB Techniques 131 5.4.2 Results and Descriptive Statistics ....................................... 132 5.4.3 Discussions ......................................................................... 140
5.5 Summary ................................................................................... 141 6. CONCLUSION AND PERSPECTIVES ....................................... 143
6.1 Summary ................................................................................... 143 6.2 Contributions ............................................................................. 144 6.3 Limitations ................................................................................ 145 6.4 Practical Impact: Towards a Decision Support KB .................. 147 6.5 Future Work .............................................................................. 148
REFERENCES ................................................................................... 151 APPENDIX ........................................................................................ 169
A. Pre-questionnaire for selecting participants ............................... 169 B. Consent Form ............................................................................. 172 C. Igroup Presence Questionnaire ................................................... 173 D. Screenshots Illustrating Contexts and Techniques ..................... 176

xii Abstract Information Visualization in Interactive 3D Virtual Environments: Conceptualization and Usability Evaluation

xiii Abstract
Abstract
Abstract information refers to information that a user can’t directly obtain just by visualizing the spatial information of objects in a 3D virtual envi-ronment (3DVE). Many interactive visualization techniques have been created to augment 3DVEs with abstract information. Developers of in-teractive 3DVEs who want to augment their 3D models with abstract in-formation have to determine which visualization technique has the highest level of usability for their needs according to different tasks and user con-texts. Therefore, a usability evaluation toolkit is needed to help them compare the usability of different abstract information visualization tech-niques according to specific design needs and contexts. The first part of this thesis reviews the state of the art on interactive 3DVEs development, abstract information visualization techniques and the evaluation of interactive 3DVEs. The layout space of abstract infor-mation visualization techniques, according to a preliminary comparison, is proposed. Taxonomies related to abstract information visualization are analyzed. Specific evaluation considerations related to navigation prob-lems, evaluation metrics and methods and design guidelines for the de-velopment of interactive 3DVEs are presented. Then, in the second part, this thesis presents a conceptual model, reusable toolkit and usability evaluation methodology for comparing the usability of different abstract information visualization techniques. The conceptual model is composed of five elements: reference 3D scene, type of abstract information, user and target object contexts, type of tasks and type of ab-stract information visualization technique. We characterize the design space of any abstract information visualization techniques in interactive 3DVEs by using five layout dimensions: space, shape, location, interac-tion and scale. In order to control the navigation skill variable, the design of a constrained navigation approach for teleporting the user from one user context to another is proposed. Finally, the third part of this thesis presents case studies for validating the proposed conceptual model, the toolkit and the usability evaluation me-thodology by performing usability testing experiments and analyzing their results. A first experiment has been designed to evaluate and validate the constrained navigation approach for controlling the navigation skill varia-ble of the users. The experimental results provide clear evidence that the sense of presence, which is a user satisfaction factor in interactive 3DVEs, is not significantly affected by the constrained navigation ap-proach during the usability testing session. A second experiment has been

xiv Abstract Information Visualization in Interactive 3D Virtual Environments: Conceptualization and Usability Evaluation
designed to validate the conceptual model, the reusable toolkit and the usability testing methodology. This was done trough evaluating and com-paring the usability of two techniques for displaying virtual panels. The conceptual model, the reusable toolkit and the usability evaluation me-thodology have been validated by the experimental results. The contributions of this thesis are a reusable conceptual model, toolkit and usability evaluation methodology for measuring and comparing the usability of abstract information visualization techniques in interactive 3DVEs. Keywords: Human Computer Interaction, Interactive 3D Virtual Envi-ronment, Abstract Information Visualization, Usability Evaluation Me-thodology, Presence

xv Résumé
Résumé
L’information abstraite fait référence à l’information que l’on ne peut pas directement obtenir juste en visualisant les informations spatiales des ob-jets dans un environnement virtuel 3D (EV3D). Il existe plusieurs techni-ques de visualisation de l’information abstraite dans les EV3D interactifs. Afin de pouvoir augmenter leurs modèles 3D avec des informations abs-traites, les développeurs d’EV3D interactifs doivent pouvoir identifier quelle technique de visualisation possède le niveau d’utilisabilité le plus élevé en fonction des différentes tâches et contextes utilisateur. Par conséquent, un outil est nécessaire pour comparer l’utilisabilité de diffé-rentes techniques de visualisation de l’information abstraite en fonction des besoins de conception et des contextes. Dans une première partie, cette thèse propose un état de l’art sur le déve-loppement des EV3D interactifs, les techniques de visualisation d’information abstraites et l’évaluation des EV3D interactifs. L’espace d’affichage pour classifier les techniques de visualisation d’information abstraites, selon une comparaison préliminaire, est proposé. Des taxono-mies relatives à la visualisation d’informations abstraites sont analysées. Des aspects spécifiques relatifs aux problèmes de navigation, aux métri-ques et méthodes d’évaluation et aux heuristiques de développement des EV3D sont présentés. Puis, dans une deuxième partie, cette thèse présente un modèle concep-tuel, un outil et une méthodologie d’évaluation réutilisable pour comparer l’utilisabilité des différentes techniques de visualisation de l’information abstraite. Le modèle conceptuel est composé de cinq éléments : une scène 3D de référence, type d’information abstraite, contextes de utilisateur et de l’objet cible, type de tâche et technique de visualisation d’information abstraite. L'espace de conception des techniques de visualisation d’information abstraites est caractérisé selon cinq dimensions: espace, forme, emplacement, interaction et échelle. Une approche de navigation contrainte est présentée afin de pouvoir contrôler la variable relative à l’habileté de navigation. Enfin, dans une troisième partie, cette thèse présente des études de cas pour la mise en ouvre et la validation de l’approche conceptuelle, de l’outil et de la méthodologie d’évaluation réutilisable en réalisant des tests d’utilisabilité et en analysant leurs résultats. Une première expérience a été conduite pour évaluer et valider l’approche de navigation contrainte pour contrôler la variable relative à l’habilité de navigation des utilisa-teurs. Les résultats permettent de confirmer que la sensation de présence,

xvi Abstract Information Visualization in Interactive 3D Virtual Environments: Conceptualization and Usability Evaluation
qui est un facteur de satisfaction majeur dans les EV3D interactifs, n’est pas significativement influencée par l’approche de navigation contrainte durant les tests d’utilisabilité. Une seconde expérience a été conduite afin de valider le modèle conceptuel, l’outil et la méthodologie d’évaluation réutilisable. Pour ce faire, l’utilisabilité de deux techniques de visualisa-tion pour des panneaux virtuels a été évaluée et comparée. Le modèle conceptuel, l’outil et la méthodologie d’évaluation réutilisable ont étés validées par les résultats des expériences. Les contributions de cette thèse sont un modèle conceptuel, un outil et une méthodologie d’évaluation réutilisables pour mesurer et comparer l’utilisabilité des techniques de visualisation de l’information abstraite dans les EV3D interactifs. Keywords: Interaction Homme Machine, Environnement Virtuel 3D In-teractif, Technique de Visualisation d’Information Abstraite, Méthodolo-gie pour les Tests d’Utilisabilité, Présence

xvii Acknowledgments
Acknowledgments
First and foremost, I’d like to thank my devoted research supervisors: Prof. Gilles Falquet and Prof. Claudine Métral. My interest in human computer interaction research, in general, and usa-bility evaluation and testing, in particular, started with my participation in a post-graduate course, given by Professor Gilles Falquet, entitled: “In-formation System’s Interfaces”. I gradually got involved in an academic atmosphere where I learned the salient feature of interdisciplinary re-search in information systems and human computer interaction. Being a graduate of the Swiss Federal Institute of Technology (EPFL) in applied mathematics, I appreciated to enter the domain of academic uni-versity research. In this regard, Prof. Gilles Falquet, opened the door of his Information System Interfaces (ISI) Lab and guided me in the explora-tion of the topics related to human computer interactions. I had the great opportunity to enter the domain of 3D user interfaces by working on a project co-supervised by Prof. Didier Buchs and Prof. Gilles Falquet. I also enjoyed participating in teaching and learning activities of the ISI Lab and assisting him in guiding of bachelor and master degrees students who took projects with us. Without Prof. Gilles Falquet’s dedicated guidance and support this re-search could never be accomplished. I am thankful to Prof. Claudine Métral who offered me the opportunity to participate in the research activities and projects that she was involved. More specially, in assisting her with teaching and learning activities by providing advanced training for using Google SketchUp and in the con-text of projects related to semantically enriched 3D city models projects. By doing so, she has given me the chance to clarify my research objec-tives and enhance my knowledge and understanding of domain specific 3D applications. Her advices and recommendations have been essential towards completing this research. I would also like to thank all the members of my jury for their valuable comments and suggestions. Prof. Dimitri Konstantas, President of the jury, provided me with signifi-cant advices and precious recommendations for the advancement process related to my Ph.D. completion. The references and resources that Dr. Laurent Moccozet shared with me have been very helpful in completing the state of the art.

xviii Abstract Information Visualization in Interactive 3D Virtual Environments: Conceptualization and Usability Evaluation
Without Dr. Patrick Roth’s support I would have had a very hard time designing and running up my usability tests. I thank him for sharing rele-vant usability specific textbooks and practical research resources with me. Prof. Ahmed Sheffah valuable comments, constructive remarks and chal-lenging questions about the usability testing methodology were very help-ful in improving my Ph.D. dissertation report. I specially thank him for suggesting me to follow the structure of the Common Industry Format (CIF) for usability test reports. I have been honored to receive his glorious comment about my thesis: “The thesis contributions are novel and the research done is timely accu-rate and original. Through the thesis, the candidate demonstrated also his expertise in the area of HCI and his capacity in conducting a challenging research.” Special thanks are also due to my colleagues Alain, Nizar, Jean-Pierre, Jacques, Mathieu, Claire-Lise, Mustapha, Hélène, Camille and many oth-er members of the CUI (Centre Universitaire d’Informatique). Many thanks to Marie-France, Elie, Dorothée, Amélia, Daniel and Nico-las. They have always been a great support in case of need at the CUI. I would also like to thank all the students from the University of Geneva who have participated in the usability tests. Finally, I would like to say “thank you” and express all my gratitude to my dedicated parents, Dr. Farideh Mashayekh (Bazargan) and Prof. Ab-bas Bazargan, who are lifelong learners in their own filed of research. Their continuous affection and support helped me overcome all the diffi-culties and obstacles towards achieving my research objectives.

xix List of Figures
List of Figures
Figure 1: VCF-3D: spatial information before user click .......................... 5 Figure 2: VCF-3D: spatial and related abstract information ...................... 5 Figure 3: 3DVEP: state before user click on a target building ................... 6 Figure 4: 3DVEP: state after user click on a target building ..................... 6 Figure 5: Fanevenues interactive 3D seating and pricing .......................... 7 Figure 6: 9/11 Memorial informational balloons ....................................... 7 Figure 7: 2D Web browsers as objects inside an interactive 3DVE .......... 7 Figure 8: 3D-Driving interactive driving training ...................................... 8 Figure 9: RapidLearning interactive 3DVE training application ............... 8 Figure 10: Text message displayed as overlay ........................................... 9 Figure 11: Text message displayed in the right toolbar ........................... 10 Figure 12: Advertisement panel in Second Life ....................................... 10 Figure 13: Reference model for virtual reality (Fuchs et al., 1999) ......... 18 Figure 14: VEDS components overview (Eastgate, 2001) ...................... 19 Figure 15: Spatial configurations of 3DVEs (Tyndiuk, 2005) ................. 22 Figure 16: Data State Model (Chi, 2000) ................................................. 24 Figure 17: World-fixed and display-fixed windows (Feiner et al., 1993) 25 Figure 18: 2D windows display states (Stoev et al., 2002) ...................... 26 Figure 19: Object space technique [four different views] (Aubry, 2007) 26 Figure 20: World space technique (Bazargan et al., 2009) ...................... 27 Figure 21: User space technique (Bowman et al., 2003) ......................... 27 Figure 22: Display space technique used to identify buildings ................ 28 Figure 23: Viewport space technique used to identify buildings ............. 28 Figure 24: 3D city model without any abstract information .................... 29 Figure 25: Postcard image displayed with the object space technique .... 29 Figure 26: Short text displayed with the object space technique ............. 30 Figure 27: Postcard image displayed with the world space technique ..... 30 Figure 28: Short text displayed with world space technique ................... 30 Figure 29: Short text displayed with user space technique ...................... 31 Figure 30: Postcard image displayed with user space technique ............. 31 Figure 31: Postcard image displayed with viewport space technique ...... 31 Figure 32: Postcard image displayed with display space technique ........ 31 Figure 33: Illustrative Shadows technique (Ritter et al., 2003) ............... 33 Figure 34: Virtual PDA technique (Bazargan and Falquet, 2009) .......... 34 Figure 35: Croquet 3D Windows and buttons (Kadobayashi et al., 2006) .................................................................................................................. 34 Figure 36: Croquet 3D Interactors (Kadobayashi et al., 2006) ................ 34 Figure 37: Interactive 2D Media Layer technique (Bazargan and Falquet, 2009) ......................................................................................................... 35

xx Abstract Information Visualization in Interactive 3D Virtual Environments: Conceptualization and Usability Evaluation
Figure 38: Sidebar technique (Bazargan and Falquet, 2009) ................... 35 Figure 39: 3D Labels technique (Maass and Döllner, 2008) ................... 36 Figure 40: Text display techniques (Chen et al., 2004) ........................... 37 Figure 41: Description of the ring menu technique using the taxonomy . 38 Figure 42: Classification of occlusion management techniques (Elmqist and Tsigas, 2007) ..................................................................................... 39 Figure 43: Single Usability Metric (SUM) model (Sauro and Kindlund, 2005b) ....................................................................................................... 44 Figure 44: Classification of 3DVEs usability evaluation methods (Bowman et al., 2002) .............................................................................. 48 Figure 45: Testbed evaluation (Bowman et al., 1999) ............................. 49 Figure 46: Sequential evaluation (Bowman et al., 1999) ......................... 50 Figure 47: Classification of publications by evaluation method (Dünser et al., 2008) ................................................................................................... 52 Figure 48: Guideline for the property identifiable object (Kaur et al., 1999) ......................................................................................................... 54 Figure 49: 3DVE usability criteria assed by MAUVE (Stanney et al., 2003) ......................................................................................................... 57 Figure 50: Overview of the global architecture of 3DUI-EF (Domingues et al., 2010) ............................................................................................... 58 Figure 51: ConcurTaskTrees (CTT) task types (Paternò et Lecerof, 1997) .................................................................................................................. 67 Figure 52: Task model for goal directed exploration and navigation ...... 68 Figure 53: Generic task model for user interaction .................................. 69 Figure 54: Five layout dimensions of abstract information visualization techniques ................................................................................................. 70 Figure 55: Importing a 3D model from the 3D Warehouse into SketchUp .................................................................................................................. 71 Figure 56: Sample page of the 3D-Llanes project .................................... 72 Figure 57: Sample text page (1D data type) ............................................. 72 Figure 58: Sample virtual panel ............................................................... 72 Figure 59: Sample HTML file .................................................................. 72 Figure 60: Top view of the 3D scene ....................................................... 73 Figure 61: Visual markers positioned inside the 3D scene ...................... 73 Figure 62: Initial orientation and viewpoint in the 1st user context ......... 74 Figure 63: Initial orientation and viewpoint in the 2nd user context ....... 74 Figure 64: Initial orientation and viewpoint in the 3rd user context ........ 75 Figure 65: Initial orientation and viewpoint in the 4th user context ........ 75 Figure 66: Initial orientation and viewpoint in the 5th user context ........ 76 Figure 67: Target object example: newspaper kiosk as a component ...... 76 Figure 68: Goal directed exploration generic task ................................... 77

xxi List of Figures
Figure 69: Scene 4 saved with “Magazine-racks” layer set as invisible (unchecked right box) ............................................................................... 79 Figure 70: Searching and importing the “Magazine-racks” component inside the model ....................................................................................... 79 Figure 71: Scene 4-bis saved with “Magazine-racks” active layer set as visible ....................................................................................................... 79 Figure 72: Customizing the kiosk’s DCs attributes with the onClick and GoToScene functions ............................................................................... 80 Figure 73: Clicking on the kiosk results in displaying the stand rack with some magazine images ............................................................................. 80 Figure 74: Characterization of the out_of_the_box-KB technique using the five layout dimensions ............................................................................. 81 Figure 75: WS-VP-KB abstract information visualisation technique ....... 82 Figure 76: Characterization of the WS-VP-KB technique ........................ 82 Figure 77: Augmenting the 3DVE with a virtual panel using the VS-Virtual_Panel-KB technique .................................................................... 83 Figure 78: Characterization of the VS-VP-KB technique ......................... 83 Figure 79: Constrained navigation interactors (Bazargan et al., 2010) .... 84 Figure 80: Positioning the constrained navigation interactors DCs in the 3D scene (Bazargan, 2010) ...................................................................... 85 Figure 81: Top view of the constrained navigation interactors DCs in the 3D scene (Bazargan, 2010) ...................................................................... 86 Figure 82: Saitek dual action USB gamepad ........................................... 87 Figure 83: Usability testing environment and setup ................................. 92 Figure 84: Karnak temple 3D model with modifications ....................... 105 Figure 85: Text and images concerning Obelisk Unique ....................... 106 Figure 86: Virtual panel about Obelisk Unique ..................................... 106 Figure 87: Initial position and orientation in the 1st user context .......... 107 Figure 88: Initial viewpoint of the user in the 1st user context .............. 108 Figure 89: Initial position and orientation in the 2nd user context ........ 108 Figure 90: Initial viewpoint of the user in the 2nd user context ............ 109 Figure 91: Initial position and orientation in the 3rd user context ......... 109 Figure 92: Initial viewpoint of the user in the 3rd user context ............. 110 Figure 93: Initial position and orientation in the 4th user context ......... 110 Figure 94: Initial viewpoint of the user in the 4th user context ............. 111 Figure 95: Initial position and orientation in the 5th user context ......... 111 Figure 96: Initial viewpoint of the user in the 5th user context ............. 112 Figure 97: Goal directed exploration generic task ................................. 112 Figure 98: VS-VP-KB reusable DCs ....................................................... 114 Figure 99 : WS-VP-KB reusable DCs ..................................................... 114

xxii Abstract Information Visualization in Interactive 3D Virtual Environments: Conceptualization and Usability Evaluation
Figure 100: Using the WS-VP-KB technique DCs to augment the 3DVE ................................................................................................................ 114 Figure 101: Using the VS-VP-KB technique DCs to augment the 3DVE ................................................................................................................ 114 Figure 102: General setting of the usability testing room ...................... 115 Figure 103: Monitor and participant during the usability testing session ................................................................................................................ 116 Figure 104: Initial positions and field of views for all the five user contexts ................................................................................................... 121 Figure 105: Overall responses to the IPQ (Spatial Presence) [n=14] .... 122 Figure 106: Individual responses to the IPQ (Spatial Presence - General Question) [n=14] .................................................................................... 123 Figure 107: Individual responses to the IPQ (Spatial Presence) [n=14] 124 Figure 108: Overall responses to the IPQ (Involvement) [n=14]........... 125 Figure 109: Individual responses to the IPQ (Involvement) .................. 126 Figure 110: Overall responses to the IPQ (Experienced Realism) [n=14] ................................................................................................................ 127 Figure 111: Individual responses to the IPQ (Experienced Realism) .... 128 Figure 112: Initial positions and orientation for all the five user contexts ................................................................................................................ 131 Figure 113: Effect of visualization technique on task completion time (sec) for Task 1 to 5 (Mean time) ........................................................... 133 Figure 114: Effect of visualization technique on task completion time (sec) for Task 1 to 5 (Mean time) ........................................................... 133 Figure 115: Effect of visualization technique on task completion time (sec) for Task 1 to 5 (Median time) ........................................................ 134 Figure 116: Effect of visualization technique on task completion time (sec) for Task 1 to 5 (Geometrical mean time) ...................................... 134 Figure 117: Effect of visualization technique on task completion time (sec) for Task 1 ....................................................................................... 135 Figure 118: Effect of visualization technique on task completion time (sec) for Task 2 ....................................................................................... 136 Figure 119: Effect of visualization technique on task completion time (sec) for Task 3 ....................................................................................... 137 Figure 120: Effect of visualization technique on task completion time (sec) for Task 4 ....................................................................................... 138 Figure 121: Effect of visualization technique on task completion time (sec) for Task 5 ....................................................................................... 139 Figure 122: Speed-accuracy tradeoff curve (Bowman et al., 2008) ....... 141 Figure 123: Displaying the virtual panel with the viewport space technique in the 1st user context ............................................................ 176

xxiii List of Figures
Figure 124: Displaying the virtual panel with the world space technique in the 1st user context ................................................................................. 176 Figure 125: Zoom-in on the virtual panel with the world space technique in the 1st user context ............................................................................. 176 Figure 126: Displaying the virtual panel with the viewport space technique in the 2nd user context ........................................................... 177 Figure 127: Displaying the virtual panel with the world space technique in the 2nd user context ................................................................................ 177 Figure 128: Zoom-in on the virtual panel with the world space technique in the 2nd user context ........................................................................... 177 Figure 129: Displaying the virtual panel with the viewport space technique in the 3rd user context ............................................................ 177 Figure 130: Displaying the virtual panel with the world space technique in the 3rd user context ................................................................................ 178 Figure 131: Zoom-in on the virtual panel with the world space technique in the 3rd user context ............................................................................ 178 Figure 132: Displaying the virtual panel with the viewport space technique in the 4th user context ............................................................ 178 Figure 133: Displaying the virtual panel with the world space technique in the 4th user context ................................................................................ 178 Figure 134: Zoom-in on the virtual panel with the world space technique in the 4th user context ............................................................................ 179 Figure 135: Displaying the virtual panel with the viewport space technique in the 5th user context ............................................................ 179 Figure 136: Displaying the virtual panel with the world space technique in the 5th user context ................................................................................ 179 Figure 137: Zoom-in on the virtual panel with the world space technique in the 5th user context ............................................................................ 179

xxiv Abstract Information Visualization in Interactive 3D Virtual Environments: Conceptualization and Usability Evaluation

xxv List of Tables
List of Tables
Table 1: Comparison of selected abstract information visualization techniques (Bazargan and Falquet, 2009) ................................................ 33 Table 2: IRVE design matrix: abstract information display (Polys, 2006) .................................................................................................................. 40 Table 3: Objective and subjective measures from measuring usability (Hornbaek, 2006) ..................................................................................... 43 Table 4: IPQ subscales and related criteria (I-Group, 2008) .................... 46 Table 5: Usability issues of 3DVE users (Gabbard, 1997) ...................... 53 Table 6: Usability issues of 3DVE users tasks (Gabbard, 1997) ............. 53 Table 7: Usability issues of the user presentation (Gabbard, 1997) ......... 53 Table 8: Counterbalancing of task order for tasks and techniques .......... 97 Table 9: Usability DataLogger tool: list of worksheets ......................... 102 Table 10: Participants profile and main characteristics ......................... 117 Table 11: Counterbalancing of task order for fourteen participants, five tasks and two techniques ........................................................................ 119 Table 12: Raw data on responses to the IPQ (Spatial Presence Questions) ................................................................................................................ 122 Table 13: Raw data on responses to the IPQ (Involvement Questions) . 125 Table 14: Raw data on responses to the IPQ (Experienced Realism) .... 127 Table 15: Task completion time (sec) for each task with each technique ................................................................................................................ 132 Table 16: Descriptive statistics for task completion time (sec) for each task with each technique ........................................................................ 132 Table 17: Statistics for evaluating the effect of visualization technique on task completion time (sec) for Task 1 .................................................... 135 Table 18: Statistics for evaluating the effect of visualization technique on task completion time (sec) for Task 2 .................................................... 136 Table 19: Statistics for evaluating the effect of visualization technique on task completion time (sec) for Task 3 .................................................... 137 Table 20: Statistics for evaluating the effect of visualization technique on task completion time (sec) for Task 4 .................................................... 138 Table 21: Statistics for evaluating the effect of visualization technique on task completion time (sec) for Task 5 .................................................... 139 Table 22: Elements for the construction of a decision support knowledge base for the selection of abstract information visualization techniques . 147

0 Abstract Information Visualization in Interactive 3D Virtual Environments: Conceptualization and Usability Evaluation
1 1. INTRODUCTION
1. INTRODUCTION
1.1 Motivation An interactive virtual environment (3DVE) is a computer-generated 3D world in which a user can interact with computer-generated objects. Spa-tial data for building 3DVEs applications exist in many activity domains such as geosciences, medicine and neuroscience, manufacturing indus-tries, industrial design, automotive engineering and transport, architec-ture, urbanism, landscape design, archeology and cultural heritage. In the majority of these applications, symbolic or abstract information can be added to 3D spatial data to enhance user understanding in order to con-struct meaning from 3D spatial data and abstract information. Abstract information refers to information that a user can’t directly obtain just by visualizing the spatial information of objects in a 3DVE. Abstract infor-mation can be considered as attribute centric or semantic information re-lated to objects that are present in an interactive 3DVE For instance, in archeology and cultural heritage, object semantics is typi-cally just as important as the actual geometry for some specific tasks. Embedding abstract information related to, namely, the original source, date, design and existing knowledge on associated objects can contribute both to the effectiveness and efficient work of a cultural heritage profes-sional and overall user experience of an interactive 3DVE visitor. There are many ways in which abstract information can be added to 3D scenes in order to help the user perform specific tasks within the 3DVEs applications. Once a mode is selected by a 3DVE author or designer, a fundamental question is how to provide the user with tools to interact with the 3DVE and its objects. This is usually done via a 3DVE authoring development tool which is an application that supports the construction of a 3DVE and the definition of objects in that environment. These authoring tools do not provide 3DVEs designers with relevant solu-tion to select a specific mode for adding abstract information to 3D scenes. The reason for this lack of solution is the large variety of repre-sentation schemas and data formats for 3D data and the necessity to make the semantic descriptions independent from the geometric representation of the 3D models. In a study of scientific and technological challenges of virtual reality, Durlach and Mavor (1995) point out that there has been a tendency to

2 Abstract Information Visualization in Interactive 3D Virtual Environments: Conceptualization and Usability Evaluation
ignore or minimize the evaluation of 3DVEs applications. They indicate the need for expert guidance and new toolkits for 3DVEs. Fifteen years later, reflecting on authoring and the design and implementation issues of interactive 3DVEs, Wingrave and LaViola (2010) explain why in contrast to the great advances in 3D data acquisition, digitization, processing and rendering power available for 3DVEs, little has changed regarding their design, implementation and usability evaluation. Although great technological progress has been achieved, the involve-ment of real human end users in the evaluation of 3DVEs applications is still limited compared with the efforts to include virtual humans (Arnold et al., 2008) in, for instance, complex architectural models, reacting in real-time. Understanding the usability of 3DVEs is therefore essential for the im-provement of present and future interfaces which will increasingly inte-grate 3D data with dynamic objects and contents that the users will be able to interact with.
1.2 Challenges Authors and designers of interactive 3DVEs have to find the best ways to integrate additional information into 3D scenes while ensuring end user satisfaction and usability. The designing process thus requires a clear identification and understanding of what different alternatives are and how a specific choice might improve an application for a given task. In order to improve interactive 3DVEs displaying abstract information, designers must be able to measure and compare the impact of different techniques. This process is quite challenging as it requires multiple im-plementations, prototyping and testing with real end users in order to col-lect data and find out which technique is most relevant for a given setting. Although, the field of usability engineering and testing in human comput-er interaction and more specifically 2D user interface design are now well documented with a rich body of academic literature including solid theo-retical frameworks and proven experimental results, much has to be done to adapt and apply such methodologies in the design of 3DVE. The limitations of current usability engineering practices show up when a designer needs to make informed decisions about issues which are 3D specific such as the impact of input device on 3D navigation and interac-tion controls.

3 1. INTRODUCTION
The game design industry has done extensive research and experimenta-tions to study the impact of input device and controller-related issues in designing video games. But, putting apart few exception, the results of such studies have not always been shared with the academic community. As a consequence, designers who are willing to create new interaction techniques and devices have to find their own way for comparing the re-sult of what they’ve created with existing techniques. To make this happen, there is a need for a kind of step by step ben-chmarking procedure and toolkit which can be used by any designer. The results of usability evaluation performed with the toolkit can then be shared with other researchers and reused. A fundamental obstacle to de-signing such usability evaluation toolkit for interactive 3DVE is the inte-roperability with existing 3D modeling and authoring softwares and ease of use. These softwares can’t be used quickly and intuitively without learning and practice. For example, 3D modeling professionals work with different softwares which don’t provide all 3D data formats for exporting and importing files. Besides, adding interactivity to objects within interactive 3DVEs is also done via different dedicated authoring softwares. From an end user pers-pective, it is essential to be able to take into consideration the variety of development tools for building interactive 3DVEs and keep the toolkit easy to learn and use. To be successful and to assist interactive 3DVE designers and developers in comparing the usability of different abstract information visualization techniques in different settings, we must first identify and then overcome many constraints and challenges. We are fully aware that it is doubtable to overcome these problems and challenges all at once and build a comprehensive usability evaluation toolkit which would fit each and every interactive 3DVE designers need. Yet, these important challenges are worth the scientific research efforts.
1.3 Application Domains We present five application domains in which visualizing abstract infor-mation in domain specific 3DVEs is necessary in order to motivate our problem statement.

4 Abstract Information Visualization in Interactive 3D Virtual Environments: Conceptualization and Usability Evaluation
1.3.1 Cultural Heritage and Tourism Visitors are attracted to travel and discover many cultural heritage sites trough the world. The United Nations Educational, Scientific and Cultural Organization (UNESCO) seeks to encourage the identification, protection and preservation of cultural and natural heritage around the world consi-dered to be of outstanding value to humanity. The World Heritage List includes 704 cultural, 180 natural and 27 mixed properties in 151 States Parties (UNESCO-WHC, 2010). Many are unable to travel to these sites for personal reasons such as financial costs. Many visualization strategies are available for the inclusion of 2D and 3D digital technologies in cultural heritage applications (Foni et al., 2010). While extensive efforts have been made to document and present cultural heritage sites to online visitors via dedicated websites such as (1001WONDERS, 2010), rich interactive 3DVE applications are still very limited. In addition, once 3D models of selected cultural heritage sites are gener-ated, the related websites mostly provide links to readymade videos and animations. Therefore, the online visitor can’t take an active role by navi-gating, freely exploring the 3D model and accessing abstract information about specific objects. For example, the geometrical 3D reconstruction models of sites such as Persepolis (PERSEPOLIS-3D, 2010) or Bam (BAM3DCG, 2010) should be enhanced with abstract information, related to different architectural elements, in order to construct online interactive 3DVEs. The Virtual Forbidden City (VFC-3D, 2008) is an online interactive 3DVE where visitors can virtually experience the Forbidden City in Bei-jing. To help online visitors to gain a deeper understanding of the objects that they encounter during their explorations, most impressive artifacts and buildings have additional textual information, photos and multimedia content available to provide a deeper understanding of their purpose and construction. Interactive virtual guided tours lead the visitors to places that help explore important themes about the design and use of the For-bidden City (Figures 1, 2). Designers of the VFC-3D project have been confronted with the chal-lenge of integrating text, images and video content with 3D models to build an interactive 3DVE (VFC-3D, 2008).

5 1. INTRODUCTION
Figure 1: VCF-3D: spatial informa-
tion before user click
Figure 2: VCF-3D: spatial and
related abstract information
1.3.2 Public Participation in Sustainable Urban Planning Sustainable urban planning action consists of a process of complex se-quential stages which start with conception and ends with implementa-tion. It is important to mention that both the population’s and administra-tion involvement and participation, as well as of other interested parties, is a decisive factor for the success of this process. According to a recent study by Amadao and his colleagues (2010), the feedbacks and constructive comments received by the administration from the population are essential during specific process such as road design, buildings density settings, public spaces and facilities location. Consensus needs to be obtained among a broad group to exert strong in-fluence. Tools are therefore needed to share concerns, examine alterna-tives, and propose solutions through collaborative citizen based examina-tion and discussion. Therefore the main concern should be how to ensure the dialogue be-tween the administration’s design team and the local population which do not have the same professional knowledge and background. Many people find it difficult to visualize what a development will look like from 2D plans and understand how planning decisions are made and how their comments are taken into account. Métral and her colleagues (2008, 2009) have proposed to build semantically enriched 3D city models in order to improve decision support. In response to these problems, 3D Virtual Environmental Planning (3DVEP) tools allow people to view and make comments on planning developments in 3D within the context of an existing landscape or citys-cape (VEP, 2007). Counsell and his colleagues provide detailed explana-

6 Abstract Information Visualization in Interactive 3D Virtual Environments: Conceptualization and Usability Evaluation
tions about the need for systematic use of 3DVEPs for public participa-tion in order to influence the final decision outcomes (Counsell et al., 2006). A user evaluation of selected 3DVEP tools indicates that usability of such tools must be improved (Counsell et al., 2009). The researchers also clearly point out the need for integration of 3D data with 2D data and additional information in 3DVEP tools. For instance, the directors of the PAV urban zone project within the Re-public and Canton of Geneva in Switzerland have launched an open con-sultation to collect views, comments and requests on the issue of existing public spaces and facilities from the inhabitants. The outcomes of this open consultation have been published in a report (BAZARURBAIN, 2010) which has been made available to the population online (PAV, 2010). For few specific public buildings, parts of the consultation out-comes could be integrated into the 3DVEP tool (SITG, 2010) which in-cludes all the spatial and identification data related to new buildings (Fig-ures 3, 4).
Figure 3: 3DVEP: state before user
click on a target building
Figure 4: 3DVEP: state after user
click on a target building
1.3.3 Advertising, Marketing and Commerce In recent years, technological developments have made it possible to build interactive 3D models of objects and interactive 3DVE that can be experienced through the Web, using common, low-cost personal comput-ers (Chittaro and Ranon, 2007). Online interactive 3D marketing and product configurator development softwares, such as the ones provided by Aarkid (Aarkid, 2010), have modified the paradigm of conventional merchant / client relationship to a new level where clients can explore, customize and adapt the final product based on their personal desires.

7 1. INTRODUCTION
Häubl and Figueroa (2002) have conducted experiments which show that the availability of interactive 3D product presentations instead of static images may affect some important aspects of buyer behavior, including the amount of time spent examining products and purchase likelihood. Guo and Barnes (2007) provide the same type of analysis after analyzing why people spend real money and time to buy virtual items in virtual. Papastamatiou et al. (2009) present a methodology for the development of interactive 3D virtual reality applications for commercial use. In addition to spatial data, such applications must display textual and graphical in-formation to document and explain some attributes of selected 3D objects. For example, the Fanevenues (FANVENUES3D, 2010) interactive 3D seating maps and online ticketing service displays additional pricing in-formation outside the 3D scene (Figure 5). The National 9/11 Memorial and Museum interactive 3DVE (9/11-3D, 2010) displays abstract infor-mation inside informational balloons that overlay the 3D scene. This way of displaying abstract information creates occlusion problems as the in-formation bubble can’t be moved or resized by the user (Figure 6). The interactive 3DVE of the Linnean Society of London (LINNEAN-3D, 2010) contains 2D Web browser that can display any Web page interac-tively on any surface in the 3D world (Figure 7). Improving the usability of abstract information display within such 3D applications is a crucial success factor which can increase both user experience and sales.
Figure 5: Fanevenues interactive
3D seating and pricing
Figure 6: 9/11 Memorial informa-
tional balloons
Figure 7: 2D Web browsers as objects inside an interactive 3DVE
8 Abstract Information Visualization in Interactive 3D Virtual Environments: Conceptualization and Usability Evaluation
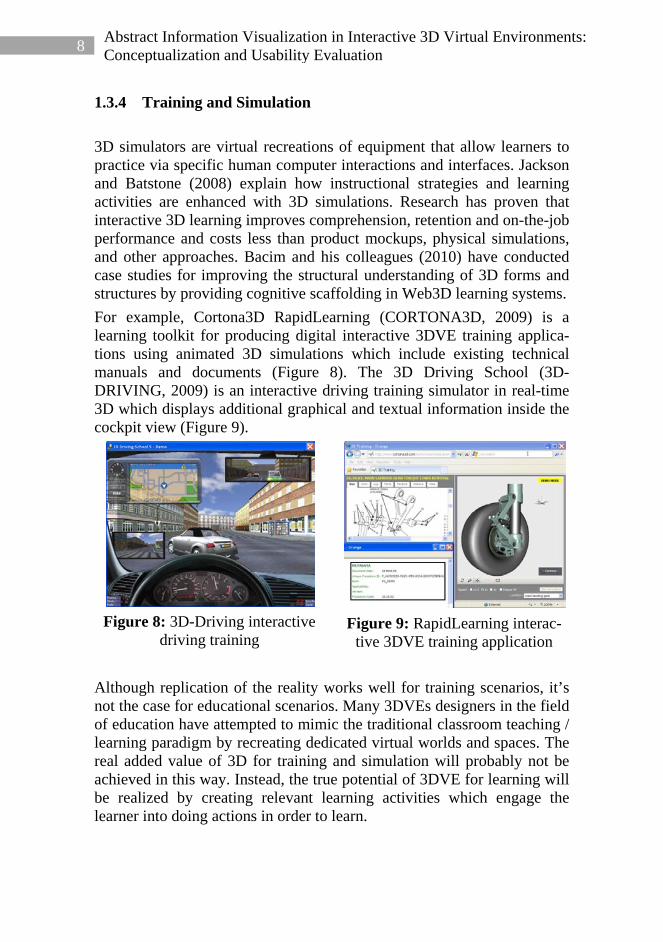
1.3.4 Training and Simulation 3D simulators are virtual recreations of equipment that allow learners to practice via specific human computer interactions and interfaces. Jackson and Batstone (2008) explain how instructional strategies and learning activities are enhanced with 3D simulations. Research has proven that interactive 3D learning improves comprehension, retention and on-the-job performance and costs less than product mockups, physical simulations, and other approaches. Bacim and his colleagues (2010) have conducted case studies for improving the structural understanding of 3D forms and structures by providing cognitive scaffolding in Web3D learning systems. For example, Cortona3D RapidLearning (CORTONA3D, 2009) is a learning toolkit for producing digital interactive 3DVE training applica-tions using animated 3D simulations which include existing technical manuals and documents (Figure 8). The 3D Driving School (3D-DRIVING, 2009) is an interactive driving training simulator in real-time 3D which displays additional graphical and textual information inside the cockpit view (Figure 9).
Figure 8: 3D-Driving interactive
driving training
Figure 9: RapidLearning interac-
tive 3DVE training application
Although replication of the reality works well for training scenarios, it’s not the case for educational scenarios. Many 3DVEs designers in the field of education have attempted to mimic the traditional classroom teaching / learning paradigm by recreating dedicated virtual worlds and spaces. The real added value of 3D for training and simulation will probably not be achieved in this way. Instead, the true potential of 3DVE for learning will be realized by creating relevant learning activities which engage the learner into doing actions in order to learn.

9 1. INTRODUCTION
Learning in 3D is the title of a newly published book by Kapp and O'Driscoll (2010) which advocates the opportunities and advantage of learning and collaborating in interactive 3DVEs for learning. The process of achieving the desired learning objectives, in such environments, takes place at the moment when the lack of knowledge or capability of the learner intersects with the need to have that knowledge or capability to overcome a specific challenge or complete a specific task. According to the authors: “In designing interactive 3DVE for learning, content is the king, but context is the kingdom.” Context is provided by definitions of concepts, topics, procedures and principals which should be available to the learner during his interactions with the environment. Such context can be considered as abstract information which has to be pre-sented to the learner within the 3DVE.
1.3.5 Serious Games and In-Game Advertising A video game is a game played with a computer according to certain rules for entertainment and recreation." Zyda (2005) defines a serious games as: “a game played with a computer in accordance with specific rules that uses entertainment to further government or corporate training, educa-tion, health, public policy, and strategic communication objectives.”. In serious games, users are engaged in 3DVEs that are interesting, informative and interactive (Konstantas et al., 2008). Based on previous research, Djaouti and his collegues (2008, 2010) have created the online Serious Game Classification (Alvarez et al., 2010) according to multiple criteria. In a study concerning serious games dedicated to strengthening programming skills for virtual reality applications, Muratet et al. (2009) explain why usability is a critical success factor in design serious games. For exemple, FoodForce (UN-WFP, 2010) is the first humanaterian serious video game created by the United Nations World Food Programme (Figure 10).
Figure 10: Text message displayed as overlay
10 Abstract Information Visualization in Interactive 3D Virtual Environments: Conceptualization and Usability Evaluation
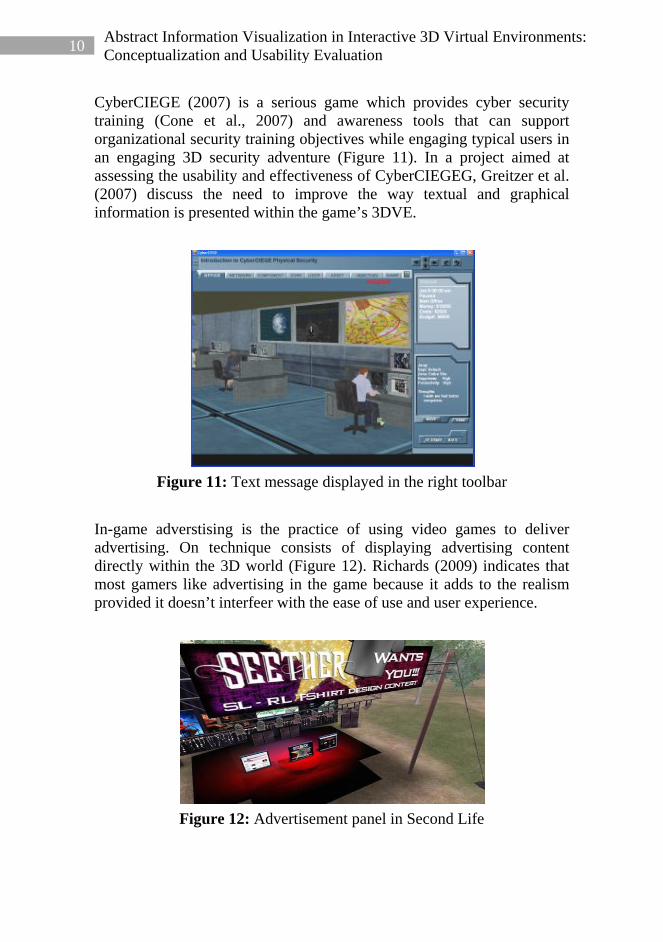
CyberCIEGE (2007) is a serious game which provides cyber security training (Cone et al., 2007) and awareness tools that can support organizational security training objectives while engaging typical users in an engaging 3D security adventure (Figure 11). In a project aimed at assessing the usability and effectiveness of CyberCIEGEG, Greitzer et al. (2007) discuss the need to improve the way textual and graphical information is presented within the game’s 3DVE.
Figure 11: Text message displayed in the right toolbar
In-game adverstising is the practice of using video games to deliver advertising. On technique consists of displaying advertising content directly within the 3D world (Figure 12). Richards (2009) indicates that most gamers like advertising in the game because it adds to the realism provided it doesn’t interfeer with the ease of use and user experience.
Figure 12: Advertisement panel in Second Life

11 1. INTRODUCTION
1.4 Problem Statement The main problem that this research intended to investigate is situated within the design phase of interactive 3DVEs conception. The problem occurs when the designer must select a visualization technique, among a set of available techniques, in order to augment 3D worlds with abstract information related to specific objects in different situations. The type of abstract information can range from a simple textual annotation to text and image in form of a hypertext or any other kind of configuration. We presume that the abstract information to display is already available with a given visual representation and the designer of an interactive 3DVE will use it as it is without modifying it’s visual representation prior to augmenting the 3D world. Therefore, it should be noted that we do not study the underlying problem of abstract information visual representa-tion which is sometime called information visualization. Such problems include, for example, the appropriateness of information encoding and the readability of visual representations. Evaluating information visualization for the above-mentioned perspective has it’s own challenges which has been well studied by the related com-munity and synthetically reported by Sheelagh (2008). Bowman and his colleagues (2003) has proposed the new research area of information-rich virtual environments (IRVE) as the combination of information visualiza-tion and 3D virtual environments for building integrated information spaces. An IRVE connects abstract information with a 3DVE in a way that it is possible to navigate in a 3D perceptual environment that is enc-hanted with the display of abstract information. From the perspective of IRVE, our main problem is thus to explore how different techniques of abstract information visualization for augmenting interactive 3DVE with abstract information in different situations can be evaluated. In order to investigate the above problem, we first need to review the state of the art on interactive 3DVEs development, abstract information visua-lization techniques and the evaluation of interactive 3DVEs. Taxonomies related to abstract information visualization should be analyzed. Specific evaluation considerations related interactive 3DVEs should also be re-viewed. The second objective of this research was to propose a conceptual model in order to support developers of interactive 3DVEs in either identifying an appropriate visualization technique, in terms of usability, for augment-ing their 3D models with abstract information or creating new techniques.

12 Abstract Information Visualization in Interactive 3D Virtual Environments: Conceptualization and Usability Evaluation
Then, in order to evaluate abstract information visualization techniques used to augment 3DVEs, the third objective was to build an interactive 3DVE prototyping toolkit. This toolkit should provide the designers of interactive 3DVEs with an infrastructure and methodology for imple-menting selected techniques for augmenting 3DVEs with abstract infor-mation. The fourth objective was to define the usability evaluation methodology which goes along with the toolkit. Finally, the fifth and last objective was to validate the above mentioned approaches and toolkit by doing case studies in form of experimentations for comparing the usability of two abstract information visualization techniques.
1.5 Research Questions In the general programming approach for the development of interactive 3DVEs, the developers usually directly code and implement some ab-stract information visualization techniques without having any kind of interaction with the end user. Understanding how users interact with 3DVEs is essential for performing usability evaluation of abstract information visualization techniques in interactive 3DVEs. In this regard, we have examined the state of the art on interactive 3DVEs, abstract information visualization techniques and the evaluation of interactive 3DVEs. Navigation in 3DVEs is obviously different from navigation in 2D user interfaces (2DUIs) as it requires dif-ferent skills and tools. The spatial configurations of interactive 3DVEs, a combination of the user’s viewpoint reference frame and movement refer-ence fame, have a great impact on navigation design. Therefore, depend-ing on the spatial configuration, our first question was: (1) What criteria need to be considered when evaluating interactive 3DVEs with regard to navigation? More specifically, how is it possible to control the navigation skill variable when evaluating interactive 3DVEs? One of the main differences between interactive 3DVE and 2DUIs is the ability to generate presence which is the sense of being there. As presence affects the user’s interaction experience, it therefore impacts usability evaluation. Thus, we must figure out what metrics should be used to

13 1. INTRODUCTION
measure presence in interactive 3DVEs. Many well established metho-dology and authoring tools are available for building 2DUIs prototypes for usability testing. In contrast, to our knowledge, very few tools are at developer’s disposal to build interactive 3DVEs prototypes for usability testing. This is a major obstacle for developers of interactive 3DVEs who want to test and compare different abstract information visualization technique according to different elements. Hence, our second question was: (2) What reusable conceptual model and toolkit can be defined and im-plemented to build interactive 3DVEs in order to perform usability tests according to different elements? Designing usability studies for 2DUIs is well documented and best prac-tices are known and used by practitioners to make related measurements and analyze the results. But when it comes to applying the same metho-dology for evaluating the effect of a specific abstract information visuali-zation technique in interactive 3DVEs, some additional considerations and recommendations should be taken into account. These considerations are mainly related to specific characteristics of interactive 3DVEs. So, with respect to usability testing methodology our third question was: (3) What kind of usability testing methodology should be used for per-forming usability tests to compare the usability of abstract information visualization techniques with the toolkit? How should the observations and measurements be carried out as part of the usability evaluation of interactive 3DVEs?
1.6 Research Methodology We first approached our research questions by performing a comprehen-sive state of the art, with a stepwise refinement approach, that started with analyzing the state of the art on related work and ended with focused re-search that has already been accomplished. To this end, we searched and collected relevant references by keeping our three research questions in mind. The main concern was to identify theoretical and practical frame-works that could be reused and extended with regard to our research ob-

14 Abstract Information Visualization in Interactive 3D Virtual Environments: Conceptualization and Usability Evaluation
jectives. It was also important to highlight and understand what the limi-tations of the existing contributions and results are. After completing the review of background work and the state of art, we started to develop our conceptual model, methodological approach and constrained navigation approach. One of our objectives was to enable any developer to use the conceptual model along with any interactive 3DVE development application. Therefore, we adopted an application indepen-dent description of the conceptual model. Nevertheless, we had to illu-strate and practically explain how to use the conceptual model in order to set up and perform usability tests for measuring and comparing the usabil-ity of different abstract information visualization techniques. Therefore, we compared different applications for developing interactive 3DVEs and finally selected Google SketchUp Pro (SketchUp, 2010) software as a starting point for prototyping tool. Our choice was moti-vated by it’s ease of use and unique features for creating 3DVEs by com-bining models imported via the Google Warehouse and adding interactivi-ty to them. Therefore, we provided a guiding example on how to imple-ment the conceptual model with SketchUp. The description of the con-strained navigation approach was also done with application independent explanations and then illustrated with reusable interactors with SketchUp. We also designed and conducted few pilot studies for selecting the input device. The results of the pilot studies and evidence form published re-sults and recommendations motivated the selection of a gamepad as input device. We then used the Common Industry Format (CIF) (ISO/IEC 25062) in order to describe the usability testing methodology with goes along with our toolkit. The CIF guarantees a common format for describing the usa-bility test method and context of testing which can be reused by other developers, researchers and usability professionals. The CIF was also used to provide usability professionals with a standard format for evaluat-ing the technical merit of the usability testing methodology and the usa-bility of abstract information visualization techniques. We finally conducted two cases studies in form of experimentations. The purpose of the first experiment was to validate the constrained navigation approach for controlling the navigation skill variable. The second experi-ment was designed to put the reusable conceptual model, usability testing toolkit and methodology into practice. Key contributions, limitations, practical impacts and future work were also discussed in the conclusion.

15 1. INTRODUCTION
1.7 Organization of this Dissertation Chapter 1 presents the motivations, challenges, applications domains, problem statement, research questions and research methodology. Chapter 2 reviews the state of the art on interactive 3DVEs development, abstract information visualization techniques and the evaluation of inter-active 3DVEs. A general introduction to developing interactive 3DVEs is first given. The impact of view management and spatial configuration on the type of interactive 3DVE application is discussed. Abstract information is defined and the layout space dimension of ab-stract information visualization techniques is discussed. A preliminary comparison of few abstract information visualization techniques is pro-vided. The layout space of abstract information visualization techniques, according to the preliminarily comparison, is proposed. Taxonomies re-lated to abstract information visualization and information rich virtual environments are presented. Then, the evaluation of interactive 3DVEs is reviewed. Navigation prob-lems in interactive 3DVEs, metrics and methods for usability evaluation in interactive 3DVEs are presented. Design guidelines for interactive 3DVEs development are analyzed. Finally the concept of usability eval-uation is extended to interactive 3DVEs by taking into consideration spe-cific issues such as navigation problems. Chapter 3 focuses on building an interactive 3DVE prototyping toolkit for usability testing. In order to evaluate the usability of abstract informa-tion visualization techniques, we have first developed a conceptual model composed of five elements: a reference 3D scene, type of abstract infor-mation, user contexts and target object contexts, type of tasks and type of abstract information visualization technique. The conceptual model is reusable as it is independent from any specific technological and software solution. In the second part of this chapter we present the methodological approach which goes along with the conceptual model by using SketchUp. Finally, we define and implement a constrained navigation approach for control-ling the navigation skill variable. In addition, we also justify the selection of a gamepad as input device for controlling the navigation, selection and interaction. Chapter 4 describes the specific usability testing methodology for mea-suring and comparing the usability of different abstract information visua-

16 Abstract Information Visualization in Interactive 3D Virtual Environments: Conceptualization and Usability Evaluation
lization techniques in interactive 3DVEs. This chapter is structured ac-cording to the Common Industry Format (CIF) (ISO/IEC 25062) in order to make it reusable for the research community. First, the interactive 3DVE prototyping toolkit is explained. The way par-ticipants should be selected and tasks should be defined is discussed. Then, elements related to the experimental design, method and procedure, usability metrics and measurements are presented. Finally, the way data should be collected, analyzed and presented is explained. Chapter 5 presents cases studies in form of experimentation carried out for validating our suggested constrained navigation approach and toolkit by comparing the usability of two abstract information visualization tech-niques. In this chapter we present the design and implementation of a first experiment to evaluate and validate the constrained navigation approach for controlling the navigation skill variable during usability testing in in-teractive 3DVEs. Furthermore, a second experiment is presented in order to validate the conceptual model, toolkit and methodology which go along with the in-teractive 3DVE for usability testing that we have developed. This was achieved trough evaluating and comparing the usability of the WS-Virtual_Panel-KB technique and the VS-Virtual_Panel-KB technique for displaying virtual panels and performing a generic goal oriented explora-tion task in five user contexts. Then, the comparative analysis of the ef-fect of abstract information visualization technique on task completion time for different tasks is discussed. The variability of results is described in connection with the speed-accuracy tradeoff curve. Chapter 6 concludes by highlighting the theoretical and practical contri-butions, limitations, industry impact and new directions and ideas for fu-ture work. The perspective of a reusable decision support knowledge base for comparing the usability of visualization techniques according to spe-cific evaluation contexts is also envisioned. Furthermore, a number of appendices are included at the end to give de-tails about the pre-questionnaire for selecting the participants, the consent form and the IPQ presence questionnaire for evaluating the sense of pres-ence of the participants. The display of virtual panels with the WS-Virtual_Panel-KB technique and VS-Virtual_Panel-KB techniques in the five different user contexts are also illustrated.

17 2. STATE OF THE ART
2. STATE OF THE ART
2.1 Interactive 3D Virtual Environments
2.1.1 Developing Interactive 3D User Interfaces and 3DVEs Gonzalez (2006), Bowman and his colleagues (2008) have reviewed, classified and compared the approaches in 3D user interfaces (3DUIs) development starting from the physical level to the logical level. The re-lated approaches are: (1) programming approach, (2) markup languages, (3) toolkit programming, (4) rendering engines, (5) 3D desktop systems, and (6) model-based 3D UI development approaches. In the programming approach, the developer directly codes and imple-ments the final interface without having any kind of interactions with the end user. For example, the Open Graphics Library (OpenGL, 1992) is the first environment for developing portable, interactive 2D and 3D graphics applications. XML-based markup languages have been proposed for 3D development. For example, Extensible 3D (X3D, 2006) is an open standard for 3D con-tent delivery. Different X3D applets are available which run within a web browser and display the content in 3D across different operation systems. XVR (2007) is another language for developing and controlling cave au-tomatic virtual environments (CAVEs) and desktop virtual reality. In the toolkit programming approach, the developer also directly codes and implements the final interface by using predefined set of elements and objects provided by the toolkit. For example, Open Inventor (SGI, 2003) is an object-oriented 3D toolkit offering a comprehensive solution to interactive graphics programming problems. Alice (CMU, 2008) is also an innovative drag and drop 3D programming environment based on a set of predefined objects. 3D programming languages can be visualized by rendering engines. 3D desktop systems have been designed to provide an alternative for inte-racting with 2D windows by mapping them into 3D space. For example, interacting and navigating with the 3DNA Desktop system (3DNA, 2004) is similar to 3D video games and is fully customizable by the user. With model-based 3DUI development approaches it is possible to specify relevant properties of 3DUIs at different levels of abstraction. El Atifi and Falquet (2006) have defined and used such approaches to specify 3D in-terfaces for accessing knowledge bases.

18 Abstract Information Visualization in Interactive 3D Virtual Environments: Conceptualization and Usability Evaluation
2.1.2 Reference Models for Interactive 3DVEs Fuchs and his colleagues (1999, 2006) have proposed a general multidis-ciplinary diagram for virtual reality (VR) which defines three levels of immersion and interaction with their particular characteristics (Figure 13). They fist provide a theoretical definition: “virtual reality applications al-low one or several people to do sensori-motor, and thus mental, experi-ments in an artificial world, which is either imaginary, or a simulation of some aspects of the real world”. Then, the formulate a technical defini-tion: “virtual reality applications use techniques that are founded on inte-raction in time real with a world virtual, using behavioral interface (BI) allowing the natural immersion of the user”. BI stands for a device which requires human’s natural behavior and without (or with very little) pre-liminary training. In contrast, motor interfaces (MI) are designed to transmit motor responses of the human towards the virtual world. At the bottom stands the sensori-motor immersion and interaction (I²) as the computer is physically connected to the human body by its senses and its motor responses. At the second level mental I² is taken into consideration. On a third level immersion of the man within the virtual world is taken into account. Symmetrically to I² sensori-motor, the computer must man-age the real time software for the physical realization of the virtual world. Symmetrically to mental I² mental, the specific virtual reality software must manage behavioral modeling of the virtual world by providing Be-havioral Software Assistance (BSA) decomposable in basic behaviors which called "Virtual Reality Behavioral Primitives" (VRBP). VRBP are namely: navigation, object handling, visual observation, orientation, lo-comotion, etc.
Figure 13: Reference model for virtual reality (Fuchs et al., 1999)

19 2. STATE OF THE ART
Eastgate (2001) has reviewed a number of software toolkits for building and programming 3DVEs and noticed that none of them can help devel-opers acquire the skills and techniques required to give their interactive 3DVEs utility and usability. In order to overcome this shortcoming, he has proposed a comprehensive structure called the Virtual Environment Development Structure (VEDS) in his Ph.D. thesis. The VEDS structure has been developed based on previously developed models along with the accumulated experiences of interative 3DVs development. The VEDS structure divides the development of interactive 3DVEs into 10 sections: preparation, analysis, specification, overall design, resource acquisition, detail design, building, testing, implementation and evaluation. The prep-aration and the evaluation sections are shown in Figure 14.
Figure 14: VEDS components overview (Eastgate, 2001)
Eastgate (2001) considers that the VEDS can provide “developing struc-ture and guidance for 3DVE development by looking at the application and user requirements in conjunction with the technical options and con-straints”. Although developers of interactive 3DVE can benefit of the VEDS, ten years later, we haven’t yet come across any publication or project which

20 Abstract Information Visualization in Interactive 3D Virtual Environments: Conceptualization and Usability Evaluation
refers to the VEDS during our review of literature. This can be linked to the lack of evaluation and validation of the VEDS by interactive 3DVE developers across a wide spectrum of applications and projects. Neverthe-less, we consider that the VEDS can help developers to improve interac-tive 3DVE utility, reduce time to build, and increase functionality and usability.
2.1.3 View Management and Spatial Configuration
2.1.3.1 View Management View management for abstract information visualization in 3DVEs means maintaining visual constraints in order to present information objects form occluding each other and also other objects in the 3D world (Bell et al., 2000). A view management approach that supports a set of object properties that constrain the layout and the transparency of objects in 3D UIs has been suggested for crating improved 3DVEs (Belle et al., 2001). Layout constraints considerations include: (1) visibility, (2) position, (3) size, (4) transparency and (5) priority. Visibility constraints specify occlu-sion relationships between objects on the view plan. It refers to those ob-jects that a given object should not occlude, and those objects that it is allowed to occlude. Position constraints specify the minimum and the maximum distance to be maintained from other objects or a specific loca-tion on the display or inside the 3D world. In this relation, Stein and Décoret (2008) have extended the position constraints definition by taking into account the 3D coordinates of the anchoring point of the abstract in-formation within the 3D world. Size constraints specify a range of possi-ble sizes for the information objects with are represented in form of 2D. Transparency constraints specify a range of object transparency values. Priority constraints refer to distinguishing between important and less important information objects which are to be included in the 3D world. View management in relation to the integration of text with 3D models in interactive 3DVEs has been studied by Sonnet and his colleagues (2004). The effect of text positioning, connectivity, and visual hints is taken into consideration in their approach. Gabbard, Swan and Hix (2006) have stu-died the effect of text drawing styles, text background texture and lighting on user task performance in the context of view management for aug-mented reality applications. Jankowski and his collogues (2010) have also studied text drawing styles (plain, billboard, anti-interference, shadow), display background texture (video and 3D model) and image polarity for
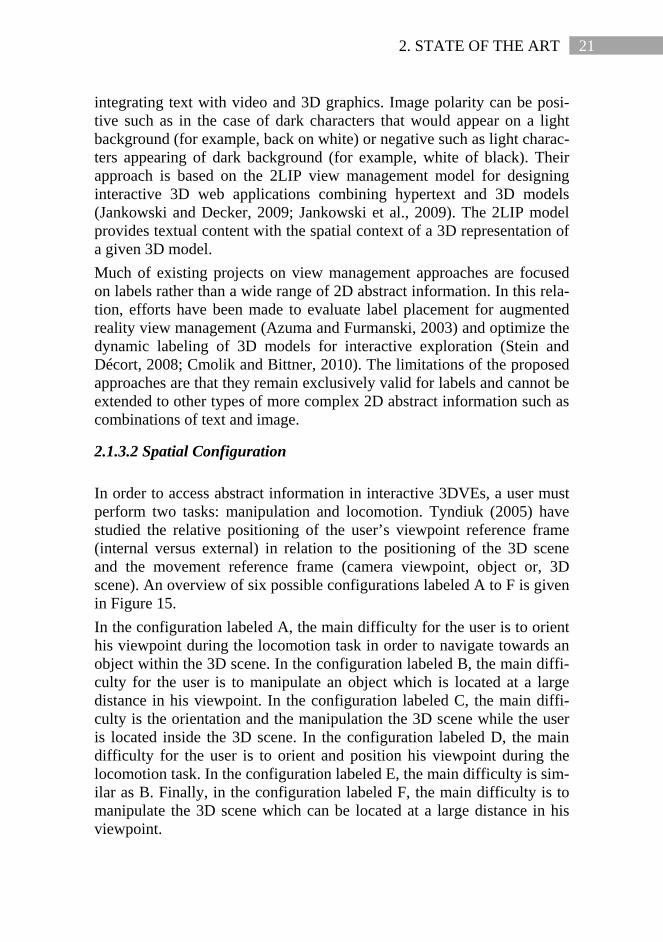
21 2. STATE OF THE ART
integrating text with video and 3D graphics. Image polarity can be posi-tive such as in the case of dark characters that would appear on a light background (for example, back on white) or negative such as light charac-ters appearing of dark background (for example, white of black). Their approach is based on the 2LIP view management model for designing interactive 3D web applications combining hypertext and 3D models (Jankowski and Decker, 2009; Jankowski et al., 2009). The 2LIP model provides textual content with the spatial context of a 3D representation of a given 3D model. Much of existing projects on view management approaches are focused on labels rather than a wide range of 2D abstract information. In this rela-tion, efforts have been made to evaluate label placement for augmented reality view management (Azuma and Furmanski, 2003) and optimize the dynamic labeling of 3D models for interactive exploration (Stein and Décort, 2008; Cmolik and Bittner, 2010). The limitations of the proposed approaches are that they remain exclusively valid for labels and cannot be extended to other types of more complex 2D abstract information such as combinations of text and image.
2.1.3.2 Spatial Configuration In order to access abstract information in interactive 3DVEs, a user must perform two tasks: manipulation and locomotion. Tyndiuk (2005) have studied the relative positioning of the user’s viewpoint reference frame (internal versus external) in relation to the positioning of the 3D scene and the movement reference frame (camera viewpoint, object or, 3D scene). An overview of six possible configurations labeled A to F is given in Figure 15. In the configuration labeled A, the main difficulty for the user is to orient his viewpoint during the locomotion task in order to navigate towards an object within the 3D scene. In the configuration labeled B, the main diffi-culty for the user is to manipulate an object which is located at a large distance in his viewpoint. In the configuration labeled C, the main diffi-culty is the orientation and the manipulation the 3D scene while the user is located inside the 3D scene. In the configuration labeled D, the main difficulty for the user is to orient and position his viewpoint during the locomotion task. In the configuration labeled E, the main difficulty is sim-ilar as B. Finally, in the configuration labeled F, the main difficulty is to manipulate the 3D scene which can be located at a large distance in his viewpoint.

22 Abstract Information Visualization in Interactive 3D Virtual Environments: Conceptualization and Usability Evaluation
Figure 15: Spatial configurations of 3DVEs (Tyndiuk, 2005)
By taking into account the type of spatial configuration it is thus possible to identify the main difficulty in order to use the appropriate abstract in-formation visualization technique for augmenting an interactive 3DVE based on the spatial users’ reference frame (egocentric or internal, ex-ocentric or external). Aubry (2007) has taken a similar approach by taking into account the relation between readability and the level of integration of abstract information in 3DVEs.
2.2 Abstract Information Visualization Techniques
2.2.1 Abstract Information Bowman and his colleagues (2003) have defined the concept of abstract information as information that is not normally directly perceptible in the physical world. In their definition, abstract information refers to abstract structures distinct from the sensory or spatial structure of an interactive 3DVE. In the context of this thesis, abstract information refers to information that a user can’t directly obtain just by visualizing the spatial information of

23 2. STATE OF THE ART
objects in a 3DVE. For example, the color of a car is directly perceptible but it’s owner name, telephone number and address are not. Abstract in-formation can be considered as attribute centric or semantic information related to objects that are present in an interactive 3DVE. The concept of non-geometric information has also been used to qualify abstract informa-tion (Bazargan et al., 2009). Abstract information has four characteristics: content format, content size, content type and content relationship. Content formats are: text, audio, image and video. Content size can be calculated according to the content format and type. For example, the size of a textual content is evaluated in terms of number of characters and the size of an image is calculated in terms of number of pixels. Mackinlay (1986) and latter, Shneiderman (1996) have used a classifica-tion to define a taxonomy which includes seven visual data types: 1D, 2D, 3D, temporal, multidimensional, tree and network. A short description of each data type is given bellow: - 1D data type corresponds to linear data type such as text, program
source code, and alphabetical lists of names which are all organized in a sequential manner.
- 2D data type corresponds to planar or map data, with two attributes, such as schematic orientation maps, city maps, world maps or any other map with 2D layouts.
- 3D data type refers to real-world 3D objects such as molecules, the human body, and buildings have items with volume and some poten-tially complex relationship with other items. [We should notice that geometrical 3D data does not provide abstract information according to our previous definition.]
- Temporal data type refers to numerical data items that have a start and finish time which is not the case in 1D data type. Another distinction with 1D data type is that temporal data items may overlap.
- Multidimensional data type refers to data that is not primarily spatial. The number of attributes of a given item in the collection should therefore be more than three.
- Tree data type concern hierarchies or trees structures which are col-lections of items with each item having a link to one parent item linked to the root.
- Network data type refers to items that have an arbitrary number of links with each other without having a hierarchical structure.

24 Abstract Information Visualization in Interactive 3D Virtual Environments: Conceptualization and Usability Evaluation
The online library of information visualization environments (OLIVE, 1999) is a comprehensive taxonomy which includes examples illustrating each data type. It should be noted that, as highlighted in problem statement of this thesis, we make the hypotheses that the abstract information to be visualized should already be available with a given visual representation. Therefore, the developer of an interactive 3DVE should use the abstract information without modifying it’s visual representation prior to augmenting the 3D world. This is why, the domain of information visualization which con-cerns research into how best to present abstract information using a visual form is not studied in this thesis. The visual representation of the abstract information, also called the view, can be considered as the final result of different data transformation stages and transformation operators. Chi (2000) has proposed the Data State Model (DSM) which breaks down each the visual representation of abstract technique into four data stages and three types of data transformation. The visualization data process is broken into four distinct data stages: value, analytical abstraction, visuali-zation abstraction, and view. Transforming data from one stage to another requires three types of data transformation operators: data transformation, visualization transformation, and visual mapping transformation (Figure 16).
Figure 16: Data State Model (Chi, 2000)
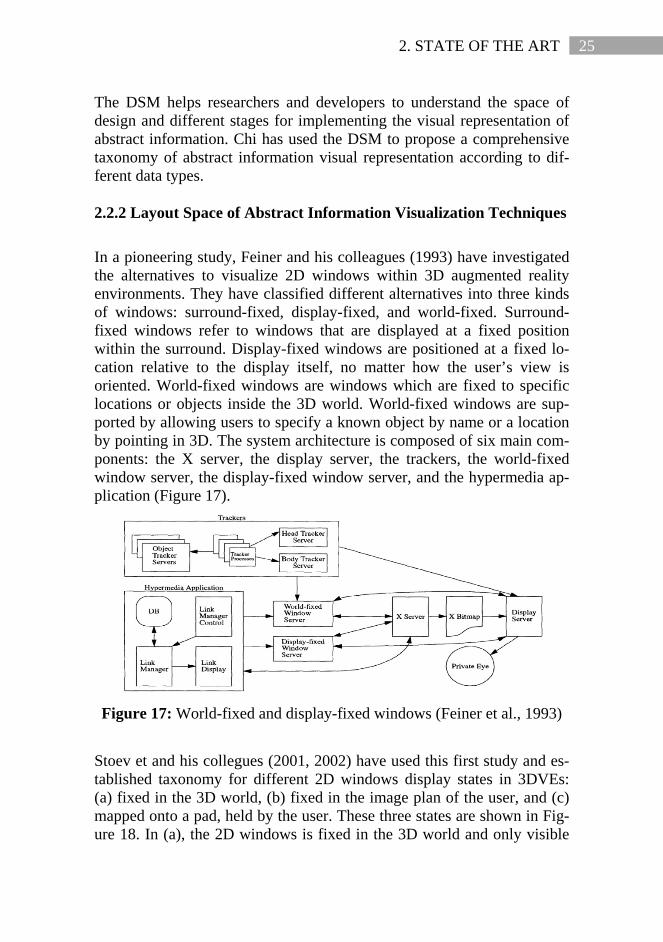
25 2. STATE OF THE ART
The DSM helps researchers and developers to understand the space of design and different stages for implementing the visual representation of abstract information. Chi has used the DSM to propose a comprehensive taxonomy of abstract information visual representation according to dif-ferent data types.
2.2.2 Layout Space of Abstract Information Visualization Techniques In a pioneering study, Feiner and his colleagues (1993) have investigated the alternatives to visualize 2D windows within 3D augmented reality environments. They have classified different alternatives into three kinds of windows: surround-fixed, display-fixed, and world-fixed. Surround-fixed windows refer to windows that are displayed at a fixed position within the surround. Display-fixed windows are positioned at a fixed lo-cation relative to the display itself, no matter how the user’s view is oriented. World-fixed windows are windows which are fixed to specific locations or objects inside the 3D world. World-fixed windows are sup-ported by allowing users to specify a known object by name or a location by pointing in 3D. The system architecture is composed of six main com-ponents: the X server, the display server, the trackers, the world-fixed window server, the display-fixed window server, and the hypermedia ap-plication (Figure 17).
Figure 17: World-fixed and display-fixed windows (Feiner et al., 1993)
Stoev et and his collegues (2001, 2002) have used this first study and es-tablished taxonomy for different 2D windows display states in 3DVEs: (a) fixed in the 3D world, (b) fixed in the image plan of the user, and (c) mapped onto a pad, held by the user. These three states are shown in Fig-ure 18. In (a), the 2D windows is fixed in the 3D world and only visible

26 Abstract Information Visualization in Interactive 3D Virtual Environments: Conceptualization and Usability Evaluation
when viewed from the appropriate direction. In (b) the 2D window is fixed within the image plan of the viewer. In (c), the 2D window is mapped on the surface of a pad held by the user who can freely move it within the 3D world.
Figure 18: 2D windows display states (Stoev et al., 2002)
Chen (2003), Polys (2006) and Aubry (2007) have extended these initial classifications in order to augment interactive 3DVEs with additional non-spatial and symbolic or abstract information. This kind of informa-tion can include numbers, text and two-dimensional images. They have divided abstract information display locations into five categories accord-ing to a user’s perspective and what coordinate space the information re-sides in. Abstract information may be located in object space, world space, user space, viewport space, or display space. Information that stays attached to an object in the environment (even if that object is moved) is termed object space (Figure 19).
Figure 19: Object space technique [four different views] (Aubry, 2007)
In object space technique, as pointed out by Aubry (2007), the position of the abstract information on the screen does not vary with the camera posi-tion (Figure 19 (B)) neither with the camera orientation (Figure 19 (C)) nor with the scale of the visualization (Figure 19 (D)).
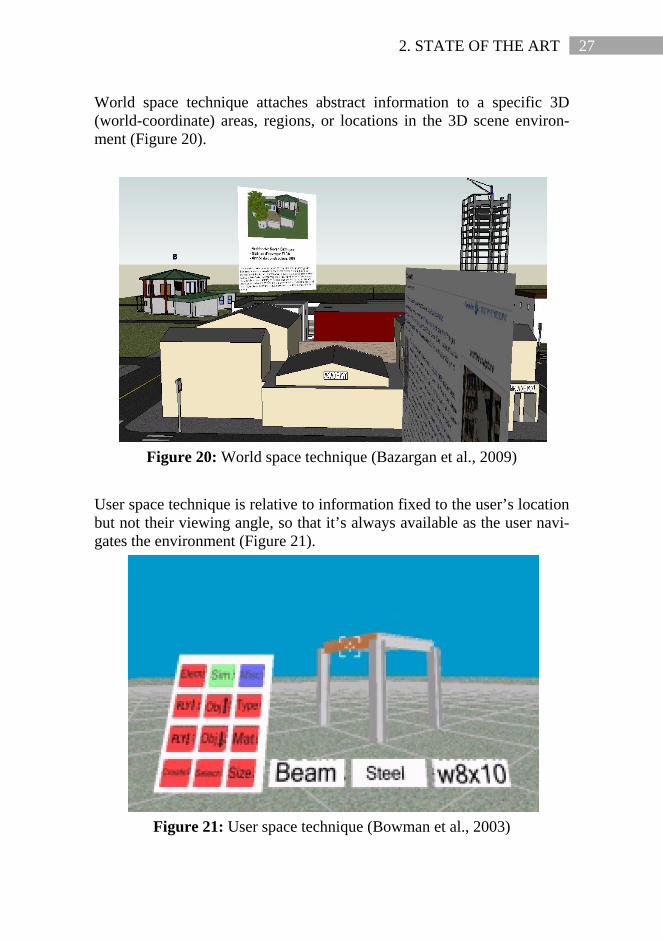
27 2. STATE OF THE ART
World space technique attaches abstract information to a specific 3D (world-coordinate) areas, regions, or locations in the 3D scene environ-ment (Figure 20).
Figure 20: World space technique (Bazargan et al., 2009)
User space technique is relative to information fixed to the user’s location but not their viewing angle, so that it’s always available as the user navi-gates the environment (Figure 21).
Figure 21: User space technique (Bowman et al., 2003)

28 Abstract Information Visualization in Interactive 3D Virtual Environments: Conceptualization and Usability Evaluation
In display space technique abstract information remains at the same loca-tion on the display (screen) surface located outside the rendered view of the virtual environment in some additional screen area (Figure 22).
Figure 22: Display space technique used to identify buildings
Viewport space technique refers to abstract information that is presented at the image plane that overlays the 3DVE where is it always visible re-gardless of the user’s position and viewing orientation (Figure 23).
Figure 23: Viewport space technique used to identify buildings
Guven and Feiner (2006) have finally reformulated their initial classifica-tion into display screen (i.e., screen-stabilized), or fixed to locations with the 3D world (i.e. world-stabilized).

29 2. STATE OF THE ART
Based on the above, we consider five classes of abstract information visu-alization techniques according to the layer space dimension: object space technique, world space technique, user space technique, viewport space technique, or display space technique. We have illustrated each technique used for the display of 1D data type, for example, short descriptive text and 2D data type, for example, old postcard image in a 3D city model (Figures 24 to 32).
Figure 24: 3D city model without any abstract information
Figure 25: Postcard image displayed with the object space technique

30 Abstract Information Visualization in Interactive 3D Virtual Environments: Conceptualization and Usability Evaluation
Figure 26: Short text displayed with the object space technique
Figure 27: Postcard image displayed with the world space technique
Figure 28: Short text displayed with world space technique

31 2. STATE OF THE ART
Figure 29: Short text displayed with user space technique
Figure 30: Postcard image displayed with user space technique
Figure 31: Postcard image displayed with viewport space technique
Figure 32: Postcard image displayed with display space technique
32 Abstract Information Visualization in Interactive 3D Virtual Environments: Conceptualization and Usability Evaluation
It should be pointed out that for each abstract information visualization technique, the spatial configuration, as discussed in Section 2.1.3.2, af-fects the level of integration and the level of text readability in different ways. Abstract information visualization techniques can be used in different spatial configurations. Each abstract information visualization technique is more or less sensitive to basic geometrical transformations related to the camera viewpoint in the 3D scene: change of position, modification of the scale and rotation movement. The related effects are described below. Object space technique is not affected by a change of position of the cam-era viewpoint, a modification of the scale and a rotation movement. The disadvantage of object space technique is that the abstract information which is displayed occludes some parts of the 3D scene. World space technique is affected by a change of position of the camera viewpoint, a modification in scale and a rotation movement. Nevertheless, if virtual panels are such, it is possible to make necessary implementa-tions so that the virtual panels always face the camera viewpoint. In this case, virtual panels are not affected by rotation movements and remain readable at proper scale. User space technique is neither affected by a change of position of the camera viewpoint or a modification of scale. But, the user space tech-nique is sensitive to rotation movement. This is due to the fact that the abstract information is somehow fixed to the user’s location but not their viewing angle. Viewport space technique is neither affected by a change of position of the camera viewpoint nor a modification of scale and a rotation move-ment. The advantage of view port space technique is that it is possible to modify the position of the displayed information in order to eliminate the occlusion problem. Display space technique is also neither affected by a change of position of the camera viewpoint nor a modification of scale and a rotation move-ment.
2.2.3 Comparison of Abstract Information Visualization Techniques We have performed a preliminary classification of selected abstract in-formation visualization techniques in interactive 3DVEs (Bazargan and Falquet, 2009). This preliminary classification is based on three dimen-

33 2. STATE OF THE ART
sions: layout space, type of abstract information and it’s size. The related comparison between some abstract information visualization techniques according to these three dimensions together with typical application do-mains is provided in Table 1. Table 1: Comparison of selected abstract information visualization tech-
niques (Bazargan and Falquet, 2009) Attribute
Technique
Layout space
Type of media
Size of media
Typical application domain
Illustrative Shadows
object & viewport space
short text, image
1 paragraph, small image
3D medical education & training
Virtual PDA
world space
multimedia any size 3D science education
Croquet 3D Windows
user space
multimedia any size collaborative 3D platform
Croquet 3D Interactor
object space
text label, thumbnail
few words, small image
collaborative 3D platform
2D Media Layer
viewport space
multimedia any size virtual museum visit
Sidebar
display space
short text, list, thumbnail
few paragraphs, small image
interactive training & simulation
3D labels object space
text label few words virtual city visit
Illustrative Shadows (Ritter et al., 2003) are projections onto a flat plane that enables schematic illustrations which are focused on specific infor-mation extraction tasks and facilitates the integration of generated textual information that leads to further meaning (Figure 33).
Figure 33: Illustrative Shadows technique (Ritter et al., 2003)

34 Abstract Information Visualization in Interactive 3D Virtual Environments: Conceptualization and Usability Evaluation
Virtual PDAs (Wonderville-3D, 2010) are intended to display information not directly related to a particular object but more general information about the scene. For instance, one of the PDA’s buttons can display a 2D map of the scene, while another button shows messages coming from an automated agent that sends suggestions to the scene visitor (Figure 34).
Figure 34: Virtual PDA technique (Bazargan and Falquet, 2009)
Croquet 3D Windows (Opencobalt, 2010) are general windows that live within the 3D scene (Figure 35(A)). They can display any type of infor-mation: texts, graphs, spreadsheets, images, etc. They also serve as portals to jump to other worlds (scenes). In addition they are equipped with 3D buttons that sit on top of them (Figure 35(B)). The downward arrow but-ton is intended to move the user from her current location to some place in front of the window, from where the window’s content is easy to see.
Figure 35: Croquet 3D Windows and buttons (Kadobayashi et al., 2006)
Croquet 3D Interactors (Kadobayashi et al., 2006) reveal annotations when pointed at a particular object. Interactors act selectively, meaning that they reveal only annotations made through the same interactor. Thus an interactor is a kind of viewpoint related 3D generalization lens (Trapp et al., 2008). Interactors can be combined to simultaneously show annota-tions belonging to several viewpoints (Figure 36).
Figure 36: Croquet 3D Interactors (Kadobayashi et al., 2006)
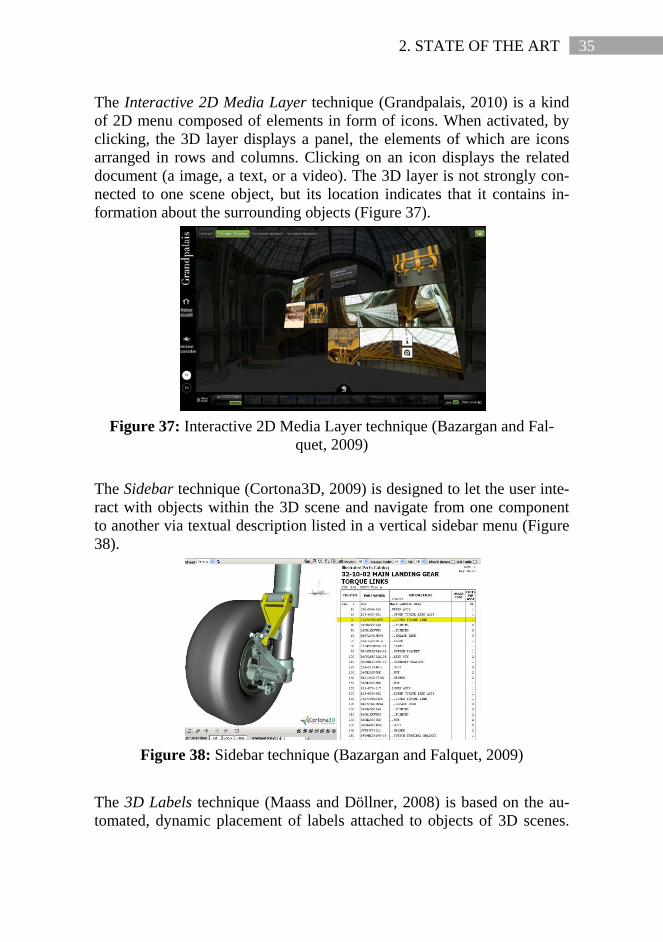
35 2. STATE OF THE ART
The Interactive 2D Media Layer technique (Grandpalais, 2010) is a kind of 2D menu composed of elements in form of icons. When activated, by clicking, the 3D layer displays a panel, the elements of which are icons arranged in rows and columns. Clicking on an icon displays the related document (a image, a text, or a video). The 3D layer is not strongly con-nected to one scene object, but its location indicates that it contains in-formation about the surrounding objects (Figure 37).
Figure 37: Interactive 2D Media Layer technique (Bazargan and Fal-
quet, 2009)
The Sidebar technique (Cortona3D, 2009) is designed to let the user inte-ract with objects within the 3D scene and navigate from one component to another via textual description listed in a vertical sidebar menu (Figure 38).
Figure 38: Sidebar technique (Bazargan and Falquet, 2009)
The 3D Labels technique (Maass and Döllner, 2008) is based on the au-tomated, dynamic placement of labels attached to objects of 3D scenes.

36 Abstract Information Visualization in Interactive 3D Virtual Environments: Conceptualization and Usability Evaluation
These labels are seamlessly integrated into the 3D scene by textured po-lygons aligned to parameterized hulls, which generalize an object’s geo-metry (Figure 39).
Figure 39: 3D Labels technique (Maass and Döllner, 2008)
The treatment of the design space of abstract information visualization techniques in interactive 3DVEs by using the layout space dimension, type and size of abstract information should be extended to include more additional dimensions. For example, the Interactive 2D Media Layer technique has distinctive characteristics that can be taken into account for extending the prelimi-nary classification of techniques. First of all, the media elements are dis-played on a flat 2D surface as small icons. The user can resize the icons in order to read the related texts and visualize the images. The same icons can be displayed on the surface of a cylinder of a cube instead of being displayed on a flat 2D surface. We can therefore conclude that layout form or shape and scale play an important role in shaping design choices when developing abstract information visualization techniques. By analyzing, for example, the Illustrative Shadows and 3D Labels tech-niques, we can realize that the positions of the labels are dynamically cal-culated by the system in order to adapt to the user’s viewpoint. In some other techniques, the layout location remains independent from the users’ viewpoint. Hence, the way a layout location is selected has also a signifi-cant role in the design of abstract information visualization techniques. The functionalities offered by the 3D buttons positioned on the top of Croquet 3D Windows demonstrate how additional interaction features can have a positive impact on the ease of use. Specific interaction features are also available when considering the Interactive 2D Media Layer tech-nique. Therefore, we can notice that layout interaction has also an impor-tant impact on the design of abstract information visualization techniques.

37 2. STATE OF THE ART
2.2.4 Taxonomies Related to Abstract Information Visualization
2.2.4.1 Taxonomy of Text Display Techniques There are many way to display text in interactive 3DVEs. Chen and his colleagues (2004) have proposed a taxonomy of text display techniques based of four dimensions. These dimensions are namely: - Quantity: amount of text embedded, - Visual Attributes: qualitative attributes such as font size, type, color and transparency of the text frame, - Location: this attribute is first divided into position and orientation and then divided into fixed or dynamic, - Variation in time: this attribute refers to visual effects such as animation, marquee and blinking. The first three dimensions of their text display taxonomy are shown in Figure 40. In this figure, HUD refers to Heads-Up Display technique which augments the screen layer with additional abstract information.
Figure 40: Text display techniques (Chen et al., 2004)

38 Abstract Information Visualization in Interactive 3D Virtual Environments: Conceptualization and Usability Evaluation
2.2.4.2 Taxonomy of 3D Menus Visualization Techniques A great variety of 3D menu techniques are available for controlling inter-active 3DVEs and 3D applications. Few usability studies concerning spe-cific menu techniques such as the multimodal selection schemes (Kim et al., 2000), Tulip (Bowman and Wingrave, 2001), ring menu (Gerber and Bechmann, 2004), FingARtips (Buchmann et al., 2004) and the spin menu (Gerber and Bechmann, 2005) have already been conducted. But, systematic usability studies of 3D menu techniques are still missing. Therefore, developers can’t easily make informed decisions for choosing a menu technique for their interactive 3DVE based on a set of classifica-tion criteria and properties. Dachselt and Hübner (2007) have surveyed various 3D menus and developed a taxonomy of 3D menu techniques. There taxonomy allows researchers and developers in the process of choosing, implementing, comparing and optimizing 3D menu techniques. It is also possible to use the taxonomy to create new 3D menu techniques. The taxonomy distinguishes between the following seven main criteria and associated properties: - Intension of use: number of displayed items and hierarchical nature, - Appearance and structure: geometric structure, structural layout, type
of displayed, size and spacing of items, - Placement: reference position, orientation and repositioning, - Invocation and availability: visibility, invocation, animation and col-
lapsibility, - Interaction and input/output setting: interaction device dependence,
application type and setting, dimensionality, feedback/highlighting and visualization of selection path,
- Usability: evaluation criteria and comparison, - Combinability: single menus, aggregation and menu system. This taxonomy has been used to complete a online repository (3D-Componenets, 2010) containing all the surveyed 3D menu techniques. For example, the description of the ring menu is shown in Figure 41.
Figure 41: Description of the ring menu technique using the taxonomy

39 2. STATE OF THE ART
2.2.4.3 Taxonomy of 3D Occlusion Management for Visualization When users navigate in an interactive 3DVE, they are confronted with a major visualization problem caused by the occlusion of objects in the 3D space. Therefore, many occlusion management techniques have been de-veloped by researchers. Elmqvist and Tsigas (2008) have surveyed a total of fifteen different techniques according to a taxonomy composed of sev-en main dimensions and related properties: - Primary purpose: visual task that the technique is primary targeting
[discovery, access, relation], - Disambiguation strength: maximum object interaction that the tech-
nique can handle [proximity, intersection, enclosement, containment], - Depth cues: strength of depth disambiguation cues for the technique
[very low, low, medium, high, very high], - View paradigm: view method used for the technique, i.e. the arrange-
ment and layout of the visual substrate [single, double separate, double integrated, multiple separate, multiple integrated],
- Interaction model: mechanism for target selection as well as opera-tional model for the technique (in terms of user interaction) [pas-sive/online, active/online, passive/offline, active/offline],
- Target invariances: Degree of target invariances preserved using the technique [0–4 aspects: appearance, depth, geometry, location],
- Solution space: space utilized by the technique to achieve its purpose [time, image, view, object].
Five occlusion management patterns have also been identified: Multiple Viewports, Virtual X-Ray, Tour Planner, Volumetric Probe, and Projec-tion Distorter. The classification of 50 occlusion management techniques according to the taxonomy and the design patterns is shown in Figure 42.
Figure 42: Classification of occlusion management techniques (Elmqist
and Tsigas, 2007)

40 Abstract Information Visualization in Interactive 3D Virtual Environments: Conceptualization and Usability Evaluation
2.2.5 Information Rich Virtual Environments Bowman et al. (2003) have defined the concept of information rich virtual environment (IRVE) as a realistic interactive 3DVE, made of 3D graphics and spatial data that is enhanced trough the addition of abstract informa-tion related to objects within the 3D space. In this definition, an interac-tive 3DVE is said to be realistic if it’s perceptible components represent components that would normally be perceptible in the real physical world. In a pioneering research study, Bowman and his colleagues (1998) have developed the Virtual Venue IRVE. Other types of applications devel-oped by Bowman and his colleagues (1999, 2003, 2007), Chen (2003), Polys and his colleagues (2004) provide evidence that IRVEs allow users to better understand the relationships between spatial and abstract data. Designers and developers of IRVEs should take three major parameters into consideration when embedding abstract information into an interac-tive 3DVE. These parameters are the display location, the type of associa-tion and the level of aggregation. As discussed in Section 2.2.2, the dis-play location refers to where the abstract information should be displayed. The type of association refers to the display of links between abstract and perceptual information which can be explicit or implicit. The level of ag-gregation corresponds to the amount of abstract information to be com-bined in a single visualization. Polys (2006) has also proposed the IRVE design matrix for abstract information display (Table 2). Table 2: IRVE design matrix: abstract information display (Polys, 2006)
This matrix indicates the user’s psychological process and the usability impact for each abstract information design parameter. The role of Depth and Gestalt cues in IRVEs for text label layouts have also been studied by Polys and his colleagues (2011) who have formulated design guidelines.
41 2. STATE OF THE ART
2.3 Evaluation of Interactive 3D Virtual Environments
2.3.1 Navigation Problems in Interactive 3DVEs Navigation in 3DVEs consists of orientation (determining one’s present location and viewpoint), wayfinding (determining where one wants to go and planning how to get there) and travelling (actually moving through the environment to reach the destination) (Bowman et al., 2004). Griffiths et al. (2006) have identified three types of navigation based on their com-plexity: (1) simple navigation (cornering, 180° rotation, forward and backward motion), (2) complex navigation (navigation through doorways and navigation onto a specific destination) and (3) free flying navigation (simple and complex pathways, vertical movements and flying through doorways). Whatever the navigation mode, the main problems associated with navi-gation in 3DVEs is the problem of becoming lost or disoriented in the virtual world. Sayers (2004) has attributed this problem to a number of factors, including: moving too close to virtual world objects and cognitive load placed on the user if the movement is not confined to a level plane. Several tools and techniques to support navigation in 3DVEs have been designed. Baker and Wickens (1995) have found out that effective sup-port for navigation enables the users of 3DVEs to answer three questions: “(1) Where am I now?, (2) Where do I want to go?, (3) How do I get there?”. These factors act as common sources for low usability and user frustration (Kaur et al., 1999). Burigat and Chittaro (2007) have compared three navigation aids that help experienced and inexperienced users perform wayfinding task in 3DVEs by pointing out the location of objects or places. Their results highlight that navigation aid based on 3D arrows outperformed, in terms of user performance and preference, the others navigation aids. In an in-depth study of navigation in 3DVEs, Sebok and Nystad (2004) indicate that the importance of navigation to overall perceived usability on VEs is related to the relevance of navigation to the main tasks that the user is trying to accomplish with the system. Thus, if navigation is diffi-cult to perform, perceived usability will be low. In such situations, the authors recommend that most critical factors for improving navigation in 3DVEs are to include target-selection techniques, visual landmarks (viewpoints), gravity, visual momentum (show the tran-sition between current location and landmark) and integrate navigation

42 Abstract Information Visualization in Interactive 3D Virtual Environments: Conceptualization and Usability Evaluation
capabilities into a single device. Results from tests performed with the Nottingham tool for assessment of interaction in virtual environments (NAIVE) covering the main aspects of navigation control and object op-eration provide similar recommendations (Griffiths et al., 2006). Sweeney and Adams (2009) have conducted task based experiments in Second Life and concluded that such improved navigation can increase the sense of attention and immersion in 3DVEs. Tahrani and Moreau (2008) have created an immersive urban path method to analyze urban daylight ambiences. Based on this method, Jallouli and Moreau (2009) have developed an immersive path-based navigation approach for eva-luating the visual and acoustic impact of wind turbines on the observer in wind turbines’ landscapes. Providing the users of 3DVEs with easy to learn navigation tools and techniques which would not require much practice is therefore of particu-lar importance.
2.3.2 Metrics for the Evaluation of Interactive 3DVEs Prior to reviewing the metrics for the evaluation of interactive 3DVEs, we first review the metrics for the evaluation of user interfaces in general. One of the most widely used definitions of the term usability is defined in the International Organization for Standardization (ISO) 9241-11 (ISO, 1998), as follows: “the extent to which a product can be used by specified users to achieve specified goals with effectiveness, efficiency and satis-faction in a given context of use”. Seffah and his colleagues (2004, 2006) have performed a comparative study of usability attributes across existing standards and methods. Seffah and Metzker (2004) have conducted a research which points out how the term usability is a confusing concept in terms of definition and specific attributes according to different standards or models. For in-stance, the term efficiency is not used exactly in the same way from one source to another. To overcome this ambiguity, the authors have proposed the Quality in Use Integrated Measurement (QUIM) model for usability measurement with consistent terms for usability attributes and metrics has been proposed (Seffah et al., 2006). The QUIM model brings together usability factors, criteria, metrics, and data from various standards and models and defines them and their rela-tions with one another is a consistent way.

43 2. STATE OF THE ART
One of the major questions of any research in human computer interaction with specific focus on user interface evaluation is: how to measure usabil-ity. Hornbaek (2006) has reviewed and classified usability measures em-ployed in 180 studies published in core human computer interaction jour-nals and proceedings. Hornback has made a distinction between subjec-tive and objective usability measures. Subjective usability measures con-cern user’s perception of or attitudes towards the user interface, the inte-raction, or the outcome. Objective measures refer to aspects of the inte-raction not dependent on user’s perception. This measure and their rela-tion with usability aspects are shown in Table 3.
Table 3: Objective and subjective measures from measuring usability (Hornbaek, 2006)
Sauro and Kindlund (2005a) have suggested the Single Usability Metric (SUM) model which encapsulates the majority of information in four common usability criteria concerning the three main aspects of usability. The SUM model is a single, standardized and summated usability metric based on a combination of the following components: task completion rates, average number of errors, average time on task, and post-task satis-faction. The four component metrics are combined using standardization
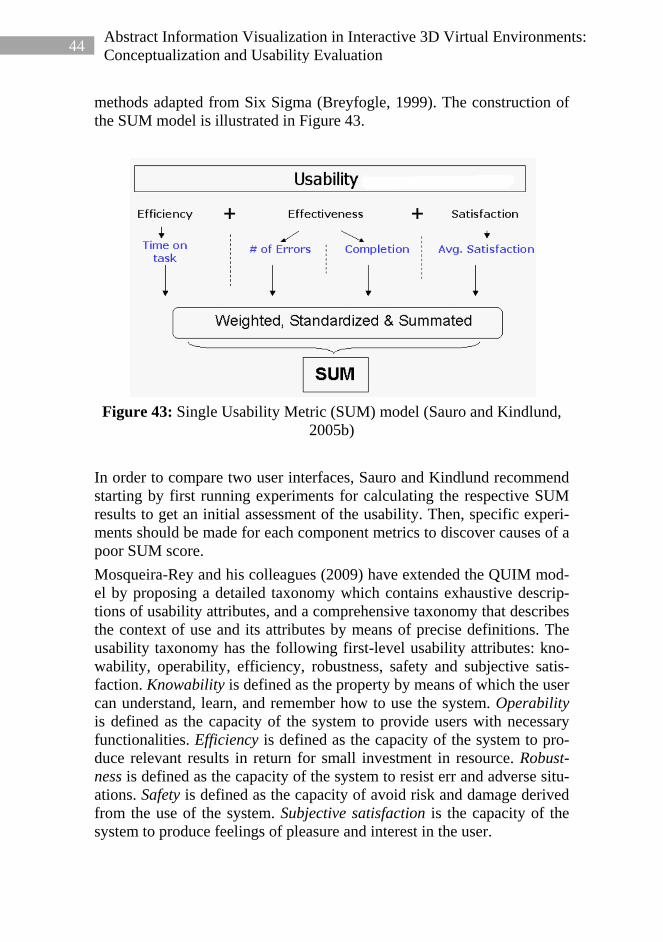
44 Abstract Information Visualization in Interactive 3D Virtual Environments: Conceptualization and Usability Evaluation
methods adapted from Six Sigma (Breyfogle, 1999). The construction of the SUM model is illustrated in Figure 43.
Figure 43: Single Usability Metric (SUM) model (Sauro and Kindlund,
2005b) In order to compare two user interfaces, Sauro and Kindlund recommend starting by first running experiments for calculating the respective SUM results to get an initial assessment of the usability. Then, specific experi-ments should be made for each component metrics to discover causes of a poor SUM score. Mosqueira-Rey and his colleagues (2009) have extended the QUIM mod-el by proposing a detailed taxonomy which contains exhaustive descrip-tions of usability attributes, and a comprehensive taxonomy that describes the context of use and its attributes by means of precise definitions. The usability taxonomy has the following first-level usability attributes: kno-wability, operability, efficiency, robustness, safety and subjective satis-faction. Knowability is defined as the property by means of which the user can understand, learn, and remember how to use the system. Operability is defined as the capacity of the system to provide users with necessary functionalities. Efficiency is defined as the capacity of the system to pro-duce relevant results in return for small investment in resource. Robust-ness is defined as the capacity of the system to resist err and adverse situ-ations. Safety is defined as the capacity of avoid risk and damage derived from the use of the system. Subjective satisfaction is the capacity of the system to produce feelings of pleasure and interest in the user.

45 2. STATE OF THE ART
Seffah and his collegues (2008) have also proposed to take into considera-tion the following categories of measures for usability testing in interac-tive 3DVEs: - objective measures (task demands, task results and correlated measures, error numbers, achieved task levels, etc.), - subjective measures (on-line evaluations, post test evaluation question naires, explanation of high stress events), - psycho-physical measures (detection of the stimulus, recognition of the stimulus, stimuli discrimination, magnitude), - physiological measures (heart rate, blood pressure, respiration rate, ECG), - task performance and learning efficiency. Bowman and his colleagues (2008) have classified usability metrics for evaluation interactive 3DVEs into three categories: (1) system perfor-mance metrics, (2) user satisfaction metrics and (3) user task performance metrics. System performance metrics refers to general hardware performance me-trics such as: average frame rate, average latency or lag, variability in frame rate of lag, network delay and distortion. System performance me-trics are only important if they have an effect on interface performance and user performance. For example, if the frame rate is not “real-time” the user will not experience a sense of presence within interactive 3DVEs. Too much network delay can also affect user task performance in colla-borative 3DVEs. User satisfaction metrics are mostly subjective and measurable via qualit-ative instruments. Examples of user satisfaction metrics are: ease of use and learning, affordance, user experience, presence and user comfort. Affordance refers to indications by the user interface on its use and how it should be used. The two last metrics, namely presence and user comfort, are specific to 3DVEs in comparison to the one used in traditional 2DUI evaluation. Both involvement and immersion are necessary for experienc-ing presence which is the sense of being in control of the 3DVE from inside. Involvement is a psychological state experienced as a consequence of focusing one’s energy and attention on meaningfully related activities and events (Witmer and Singer, 1998). Immersion is a psychological state characterized by perceiving oneself to be enveloped by and interacting

46 Abstract Information Visualization in Interactive 3D Virtual Environments: Conceptualization and Usability Evaluation
with an environment that provides a continuous stream of stimuli and experiences (Slater et al., 1996). Measuring presence in interactive 3DVEs can be done via specific vali-dated questionnaires such as VRUSE (Kalawsky, 1999), MEC-SPQ (Vorderer, 2004), IPQ (I-Group, 2008), PQ and ITQ (Witmer and Singer, 1998). User comfort can be measured by using the simulator sickness questionnaire (SSQ) developed by Kennedy and his colleagues (1993). For instance, the VRUSE questionnaire, composed of 100 questions, measures ten key usability factors are namely: functionality, user input, system output, user guidance and help, consistency, flexibility, simulation fidelity, error correction/handling and robustness, sense of immer-sion/presence and overall system usability. Another example is the Igroup Presence Questionnaire (IPQ) (I-Group, 2008) (Appendix C) which is a scale for measuring the sense of presence experienced in interactive 3DVEs. The IPQ scale construction has been described by Schubert et al. (2001). The IPQ scale that has three indepen-dent subscales all related to Presence (PRES): Spatial Presence (SP), In-volvement (INV) and Experienced Realism (REAL). The detailed description of each criteria related the IPQ subscales are giv-en in Table 4.
Table 4: IPQ subscales and related criteria (I-Group, 2008)
Task performance metrics covers general measures including speed and accuracy and domain-specific measures such as learning, spatial aware-
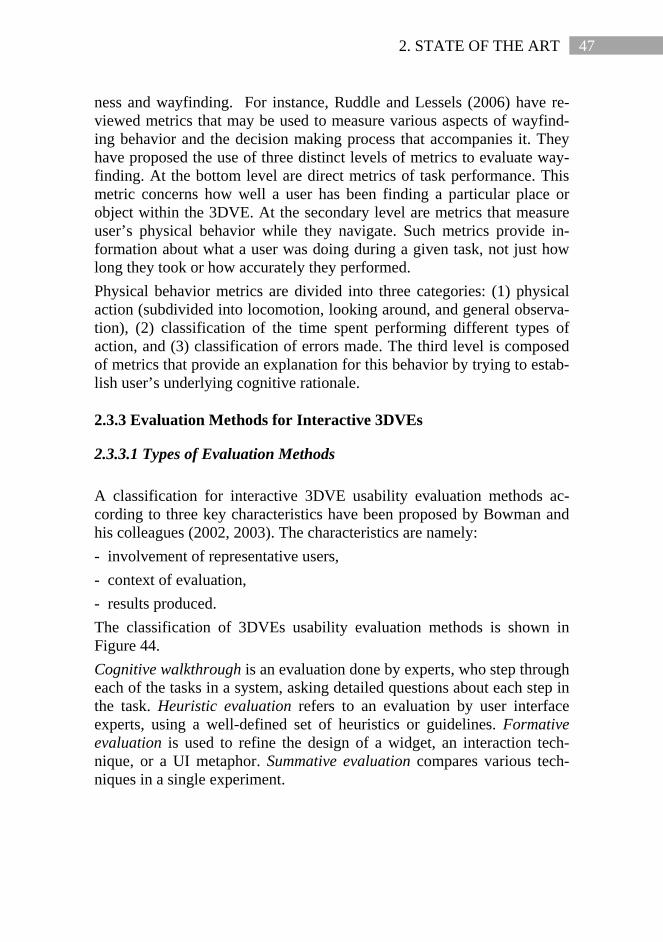
47 2. STATE OF THE ART
ness and wayfinding. For instance, Ruddle and Lessels (2006) have re-viewed metrics that may be used to measure various aspects of wayfind-ing behavior and the decision making process that accompanies it. They have proposed the use of three distinct levels of metrics to evaluate way-finding. At the bottom level are direct metrics of task performance. This metric concerns how well a user has been finding a particular place or object within the 3DVE. At the secondary level are metrics that measure user’s physical behavior while they navigate. Such metrics provide in-formation about what a user was doing during a given task, not just how long they took or how accurately they performed. Physical behavior metrics are divided into three categories: (1) physical action (subdivided into locomotion, looking around, and general observa-tion), (2) classification of the time spent performing different types of action, and (3) classification of errors made. The third level is composed of metrics that provide an explanation for this behavior by trying to estab-lish user’s underlying cognitive rationale.
2.3.3 Evaluation Methods for Interactive 3DVEs
2.3.3.1 Types of Evaluation Methods A classification for interactive 3DVE usability evaluation methods ac-cording to three key characteristics have been proposed by Bowman and his colleagues (2002, 2003). The characteristics are namely: - involvement of representative users, - context of evaluation, - results produced. The classification of 3DVEs usability evaluation methods is shown in Figure 44. Cognitive walkthrough is an evaluation done by experts, who step through each of the tasks in a system, asking detailed questions about each step in the task. Heuristic evaluation refers to an evaluation by user interface experts, using a well-defined set of heuristics or guidelines. Formative evaluation is used to refine the design of a widget, an interaction tech-nique, or a UI metaphor. Summative evaluation compares various tech-niques in a single experiment.

48 Abstract Information Visualization in Interactive 3D Virtual Environments: Conceptualization and Usability Evaluation
Figure 44: Classification of 3DVEs usability evaluation methods (Bow-
man et al., 2002) The gray boxes highlight areas where new generic principals and guide-lines for interactive 3DVEs need to be investigated. For instance, Grossman and Balakrishnan (2004) have introduced and validated a variant of Fitts’ law (1954) that models pointing to trivariate targets in 3DVEs based on previous research (MacKenzie, and Buxton., 1992; Zhai et al., 2004). This variant of Fitt’s law does not require users and can be applied in a generic context to produce quantitative results. But, the GOMS (Goals, Operators, Methods, and Selection) model (Card et al., 1983) that provides quantitative results in an application-specific setting that does not require users has not yet been extended to interactive 3DVEs. Bowman and Hodges (1999) have introduced the testbed evaluation ap-proach in which many smaller experiments or one large experiment can be run, covering as much of the design space as possible. This type of evaluation is done in a generic evaluation context and usually seeks quan-titative results. The process of tesbed evaluation is shown in Figure 45.

49 2. STATE OF THE ART
Figure 45: Testbed evaluation (Bowman et al., 1999)
During the initial evaluation, observation and evaluation of groups of us-ers are performed in order to obtain an intuitive understanding of the ge-neric interaction tasks and current techniques available for the tasks. This process requires building a taxonomy of interaction techniques for the interaction tasks being evaluated, listing outside influence factors on per-formance, and listing performance measures. Outside factors include four types of characteristics with regard to: task (distance to be travelled or size of target object), environment (number of obstacles and level of ac-tivity or motion), user (spatial ability and physical attributes if necessary) and system (lighting model used or the mean framerate). In the next step, a testbed experiment is conducted with formal factorial experimental de-sign and a large number of subjects. The results of running the testbed evaluation are the actual quantitative results, plus a set of guidelines for the usage of the tested techniques. The guidelines and heuristics can then be applied by interactive 3DVE developers. Finally, the results can be used many times to design usable applications, based on the performance requirements of the application specified in terms of application metrics. Polys and his colleagues (2006) have used tested evaluation to determine the effects of task, task mapping and layout space on user performance in information-rich virtual environments.

50 Abstract Information Visualization in Interactive 3D Virtual Environments: Conceptualization and Usability Evaluation
The sequential evaluation approach for the usability evaluation of interac-tive 3DVEs has been presented by Gabbard and his colleagues (1999). This approach is more a complete usability engineering approach which includes design and evaluation of interactive 3DVE user interfaces. By using this approach, developers can improve interactive 3DVE’s user in-terface by using a combination of expert-based and user-based tech-niques. Sequential evaluation is performed in the context of a particular application and can have both quantitative and qualitative results. The sequential evaluation approach is presented in Figure 46.
Figure 46: Sequential evaluation (Bowman et al., 1999)
The sequential evaluation approach is a set of evaluation techniques run in sequence. The techniques include sequentially performing user task analysis, heuristic evaluation, formative evaluation and summative evalu-ation. Depending on the nature of the application, the first three steps may be applied in serial approach (shown by solid black arrows) or iteratively
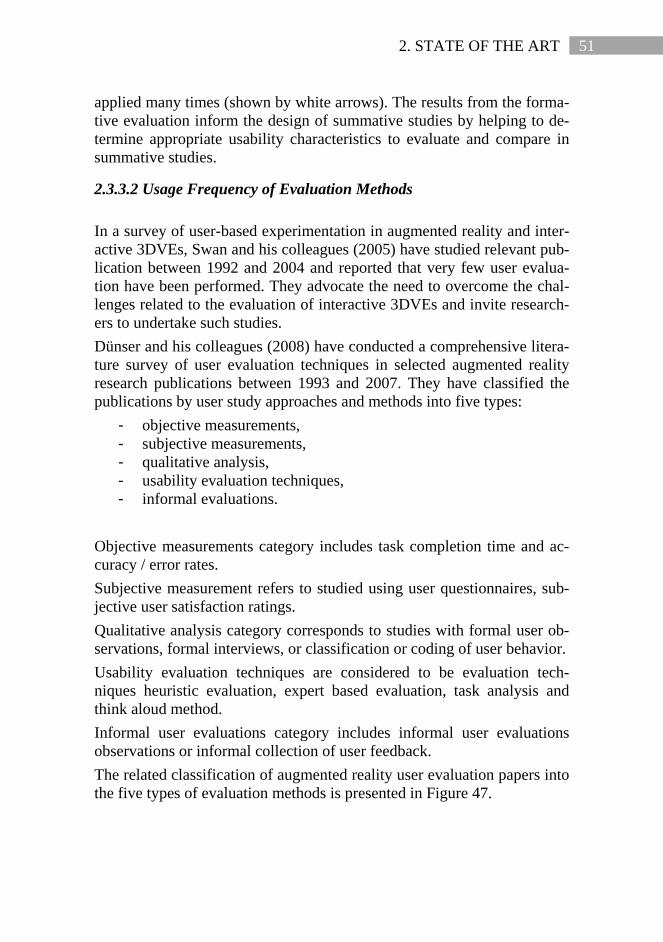
51 2. STATE OF THE ART
applied many times (shown by white arrows). The results from the forma-tive evaluation inform the design of summative studies by helping to de-termine appropriate usability characteristics to evaluate and compare in summative studies.
2.3.3.2 Usage Frequency of Evaluation Methods In a survey of user-based experimentation in augmented reality and inter-active 3DVEs, Swan and his colleagues (2005) have studied relevant pub-lication between 1992 and 2004 and reported that very few user evalua-tion have been performed. They advocate the need to overcome the chal-lenges related to the evaluation of interactive 3DVEs and invite research-ers to undertake such studies. Dünser and his colleagues (2008) have conducted a comprehensive litera-ture survey of user evaluation techniques in selected augmented reality research publications between 1993 and 2007. They have classified the publications by user study approaches and methods into five types:
- objective measurements, - subjective measurements, - qualitative analysis, - usability evaluation techniques, - informal evaluations.
Objective measurements category includes task completion time and ac-curacy / error rates. Subjective measurement refers to studied using user questionnaires, sub-jective user satisfaction ratings. Qualitative analysis category corresponds to studies with formal user ob-servations, formal interviews, or classification or coding of user behavior. Usability evaluation techniques are considered to be evaluation tech-niques heuristic evaluation, expert based evaluation, task analysis and think aloud method. Informal user evaluations category includes informal user evaluations observations or informal collection of user feedback. The related classification of augmented reality user evaluation papers into the five types of evaluation methods is presented in Figure 47.

52 Abstract Information Visualization in Interactive 3D Virtual Environments: Conceptualization and Usability Evaluation
Figure 47: Classification of publications by evaluation method (Dünser et
al., 2008) According to the results of this study, very few studies have included usa-bility evaluation techniques over the years. The authors point out the ab-sence of easy to use frameworks, methodologies and tools for performing such studies as a reason for usability evaluation techniques application not being so common.
2.3.3.3 Taxonomies and Tools for Evaluating Interactive 3DVEs Snow (1996) has conducted experimentations to measure user perfor-mance in 3DVEs which points out the need for developing comprehen-sive usability taxonomies. Based on the results of Snow’s user studies, the interaction framework of Norman (1990) and many other studies, Gab-bard (1997) has developed a taxonomy of usability characteristics in 3DVEs for researchers and developers. This context-driven taxonomy contains four main categories of usability suggestions and considerations and focus on user-centered approaches to 3DVE development. The four main categories of the taxonomy are as follows: - 3DVE Users and User Tasks, - 3DVE UI Input Mechanisms, - Virtual Model, - 3DVE UI Presentation Components.

53 2. STATE OF THE ART
A sample of this taxonomy concerning each category is shown in Tables 5 to 7.
Table 5: Usability issues of 3DVE users (Gabbard, 1997)
Table 6: Usability issues of 3DVE users tasks (Gabbard, 1997)
Table 7: Usability issues of the user presentation (Gabbard, 1997)

54 Abstract Information Visualization in Interactive 3D Virtual Environments: Conceptualization and Usability Evaluation
Although this taxonomy is a significant contribution to usability evalua-tion, it does not explicitly explain in detail how to implement a given usa-bility suggestion. For instance, a developer can’t use this taxonomy to determine which type of visualization technique to use in order to aug-ment a particular interactive 3DVE with abstract information. This is way this taxonomy should be more considered as a foundation for the devel-opment of new interactive 3DVEs usability engineering methods. Kaur (1998) has developed a hypertext-based design advice tool for pre-senting user interface design guidelines for 3DVEs to developers using a theory of interaction in 3DVEs (Kaur et al, 1996a; 1996b). The theoretical framework includes models of interaction for 3DVEs from which abstract usability requirements are proposed. Three interconnected models describe the major modes of interactive be-havior: (1) Task action model, (2) Explore navigate model and (3) System initiative model (Kaur et al., 1999a). The task action model describes the behavior in planning and carrying out specific actions as part of user's task or current goal/intention. The explore navigate model describes less goal-directed behavior when user explores and navigates through the 3DVE. The system initiative model describes reactive behavior to system prompts and events, and to system taking interaction control from the user. The identified design guidelines are categorized into six compo-nents: the user task, spatial layout, viewpoint and user representation, objects, system-initiated behavior, actions and action feedback. All the design guidelines have been validated in user studies (Kaur et al., 1999b). The tool structures the guidelines according to the environment elements involved (events, objects and actions) and general development stages when the guidelines would apply. The related stages are: define require-ments, specify components in 3DVE, specify interactions, design compo-nents, design interactions, build environment and evaluate environment. An example of design guideline to make objects easy to identify is given in Figure 48.
Figure 48: Guideline for the property identifiable object (Kaur et al.,
1999)

55 2. STATE OF THE ART
As the main objective of this tool is to provide usability guidance for 3DVEs, it does not help the developers to figure out how to select a spe-cific abstract information presentation technique among a range of availa-ble techniques. This is a major difficulty for this tool to be used by practi-tioners. Griffiths (2001) has developed the Nottingham Tool for Assessment for Interaction in Virtual Environments (NAIVE) which is a screening tool created as a set of tasks and tests to reliably identify users who would potentially experience relative success or difficulty whilst in 3DVEs. In addition, the NAIVE tool is capable of identifying areas of interaction and navigation that could cause the users most problems. The basic components of the NAIVE tool are navigation interaction, ob-ject interaction and complex object interaction together with navigation. Griffiths and his colleagues (2006) have decomposed the navigation inte-raction component is decomposed into three types based on their com-plexity:
- simple navigation (cornering, 180° rotation, forward and back-ward motion),
- complex navigation (navigation through doorways and navigation onto a specific destination),
- free flying navigation (simple and complex pathways, vertical movements and flying through doorways).
The object interaction component is decomposed into two types. The first involves activating an object which immediately causes an action some-where else in the 3DVE. The second type involves the manipulation (moving and repositioning) of an object that the user has constantly in touch. The NAIVE tool can also be considered as a pre-training and post-training assessment tool for developers of interactive 3DVEs. The View Inspection Tool (VIEW-IT) has been developed by Tromp and Nicholas (2003) as a rapid assessment tool designed to identify the use-fulness of 3DVEs in terms of task-improvement and task-change trough introduction of the new technology in the industry. This tool is based on the cognitive walkthrough methodology. During the assessment, all or specifically targeted elements (such as input devices, output devices, navigation, object interaction, social interaction, etc), are evaluated and scored for visibility feedback, and other usability prin-ciples. These scores summarize and describe the usability of the 3DVE.

56 Abstract Information Visualization in Interactive 3D Virtual Environments: Conceptualization and Usability Evaluation
Karaseitanidis et al. (2006) have coupled VIEW-IT with a set of neuro-physiological and psycho-physiological usability test battery (UTB) to access the user’s health and safety state during the experience with inter-active 3DVEs. The core of the integrated UTB consists of computer based modules which can be used separately or in combination. The modules enable an estimation of mental workload, emotions, stress, strain and level of cogni-tive performance of an interactive 3DVE participant. Measurements in the UTB are done via electroencephalograph, event-related potentials, electrocardiogram (ECG), blood pressure, respiratory response system parameters, dermal response system parameters, gaze system parameters and endocrine parameters. To collect such media data, specific hardware and software is needed. Heavy legal and ethical consid-erations need also to be taken into account. The experimental program includes three types of tests. First, tests that look at existing technology and identified issues associated with its use. The results from these tests form the basis for refinement of existing and development of new application or devices. Second, tests that examine the use of the industrial 3DVE applications built in the VIEW project. Third, tests that examined the effects of independent va-riables, examining the number of UI elements and their impact on the user in terms of usability, ergonomics, and side effects. In addition, self-report pre-immersion and post-immersion evaluation questionnaires are used to measure satisfaction, presence and enjoyment. The Multicriteria Assessment of Usability for Virtual Environments (MAUVE) system, provides a structured approach for achieving usability in VE system design and evaluation (Stanney et al., 2003). MAUVE ex-pands the capabilities of designers and usability practitioners to perform systematic evaluations of interactive 3DVEs. The usability criteria within the MAUVE system incorporate previous research results which indicate that the usability of an interactive 3DVE is influenced by system and user components (Gabbard, 1997; Gabbard et al., 1999; Kaur et al., 1999b). The MAUVE methodology is based on a two-stage evaluation process. In the first stage, 3D specific usability heu-ristics are used to assess the 3DVE usability. The 3D usability heuristics are based on the ones proposed by Nielson (1993) and have been mod-ified to take into account the specificity of 3DVEs. In this stage, an expert evaluator responds to a series of questions related to each of the then usa-bility heuristics presented in Nielsen (1993). The responses scores indi-

57 2. STATE OF THE ART
cate how well the 3DVE perform in each of the ten categories. The expert evaluator can then figure out problematic areas in order to modify and enhance the usability design of the interactive 3DVE. The second stage consists of a multiple criteria decision-making tech-nique that prioritize the 3DVE usability criteria presented in a specific hierarchy according to the needs of a particular application. The specific hierarchy is presented in Figure 49.
Figure 49: 3DVE usability criteria assed by MAUVE (Stanney et al.,
2003)
The evaluator then responds to a series of questions related to each of the 3DVE usability evaluation criteria listed at the lowest level of the hie-rarchy, to determine how well the 3DVE under evaluation performs with respect to those criteria. The final score for a 3DVE is obtained by mul-tiplying the criteria weights by how well the 3DVE performs in terms of the lowest level criteria. MAUVE has been validated by two expert usa-bility evaluators. Although MAUVE’s objective is to enhance the overall usability of an interactive 3DVE, it can’t be used to compare the usability of different abstract information visualization techniques. The Empirical Evaluation Assistant (EEA) is a system designed to rapidly gather feedbacks about the usability of 3D interaction technique during its development lifecycle (Domingues et al., 2007). EEA is based on a know-ledge database where experiments results and evaluation task scenario are used to permit to give assistance to the experimenter during the creation of the evaluation. However, the major problem of this approach is to po-

58 Abstract Information Visualization in Interactive 3D Virtual Environments: Conceptualization and Usability Evaluation
pulate the knowledge database (Domingues et al., 2008). In the meantime, data has been collected by the researchers to enrich the knowledge data-base and incorporated into the 3D User Interface Evaluation Framework (3DUI-EF) designed for empirical evaluation of 3D UIs and interaction techniques (Domingues et al., 2010). The 3DUI-EF supports two kinds of tests which are included in the de-velopment cycle of the 3D interaction techniques. First, system testing which is an iterative debug stage where the experimenter may configure the hardware parameters, adjust the 3D interaction technique internal pa-rameters and improve the 3DVE specifications. The second test is an ac-ceptance testing where the experimenter will perform an empirical evalu-ation with many users. The 3DUI-EF is divided into two distinct tools (Figure 50). The first tool is dedicated to Experimental Protocol Conception (EPC). The second tool is the Measurement and Debug tool (MD). The MD tool permits to gather data and manage the VE environment and devices through modules.
Figure 50: Overview of the global architecture of 3DUI-EF (Domingues
et al., 2010) The 3DUI-EF facilitates the design of an evaluation by assisted selection of useful metrics and factors and comparison of 3D interaction techniques using developed 3DVE and 3DUI. However, it does not include any con-sideration about the complexity of the underlying 3D model, the relative position and context of the user in relation to a target object within the 3DVE. Therefore, it can’t be used to compare the usability of different abstract information presentation techniques.
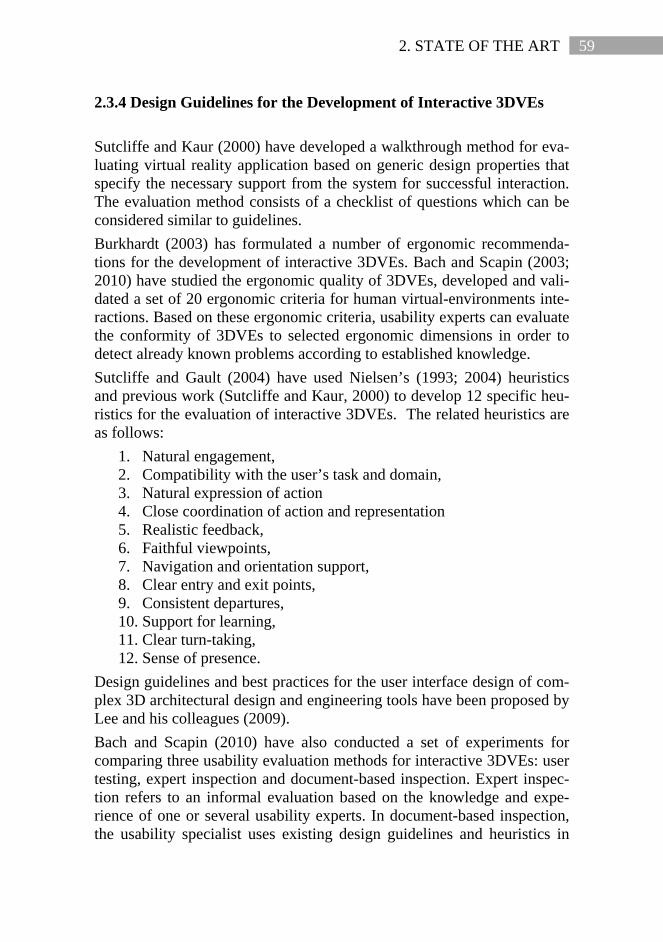
59 2. STATE OF THE ART
2.3.4 Design Guidelines for the Development of Interactive 3DVEs Sutcliffe and Kaur (2000) have developed a walkthrough method for eva-luating virtual reality application based on generic design properties that specify the necessary support from the system for successful interaction. The evaluation method consists of a checklist of questions which can be considered similar to guidelines. Burkhardt (2003) has formulated a number of ergonomic recommenda-tions for the development of interactive 3DVEs. Bach and Scapin (2003; 2010) have studied the ergonomic quality of 3DVEs, developed and vali-dated a set of 20 ergonomic criteria for human virtual-environments inte-ractions. Based on these ergonomic criteria, usability experts can evaluate the conformity of 3DVEs to selected ergonomic dimensions in order to detect already known problems according to established knowledge. Sutcliffe and Gault (2004) have used Nielsen’s (1993; 2004) heuristics and previous work (Sutcliffe and Kaur, 2000) to develop 12 specific heu-ristics for the evaluation of interactive 3DVEs. The related heuristics are as follows:
1. Natural engagement, 2. Compatibility with the user’s task and domain, 3. Natural expression of action 4. Close coordination of action and representation 5. Realistic feedback, 6. Faithful viewpoints, 7. Navigation and orientation support, 8. Clear entry and exit points, 9. Consistent departures, 10. Support for learning, 11. Clear turn-taking, 12. Sense of presence.
Design guidelines and best practices for the user interface design of com-plex 3D architectural design and engineering tools have been proposed by Lee and his colleagues (2009). Bach and Scapin (2010) have also conducted a set of experiments for comparing three usability evaluation methods for interactive 3DVEs: user testing, expert inspection and document-based inspection. Expert inspec-tion refers to an informal evaluation based on the knowledge and expe-rience of one or several usability experts. In document-based inspection, the usability specialist uses existing design guidelines and heuristics in

60 Abstract Information Visualization in Interactive 3D Virtual Environments: Conceptualization and Usability Evaluation
addition to his own judgment. Their study shows that user testing outper-forms the two other usability evaluation methods for interactive 3DVEs. They also point out that user testing is particularly efficient for the diag-nosis of problems that require a particular state of interaction to be detect-able. Expert evaluation is found to be not efficient enough for evaluating the usability of interactive 3DVEs. Document-based inspection is found to be helpful for the identification of problems directly observable, often related to learnability and basic usability issues. Heuristics for the evaluation of 3D video games have been studied and described in detail by several researchers (Pinelle et al., 2008, 2009; Bernhaupt, 2010; Koffel et al, 2010). Lee and his colleagues (2010) have studied usability principals and best practices for the user interface design of complex 3D architectural design and engineering tools.
2.3.5 Specific Characteristics of Interactive 3DVEs Evaluation Many characteristics that are unique to interactive 3DVEs and are key to their usability, such as perceived presence, immersion and real world fi-delity, are not addressed in existing usability methods (Gabbard, 1997). Other characteristics to be taken into account concern the level of exper-tise of the expert evaluators and the skills of participants to interactive 3DVE usability evaluation experimentations (Griffiths et al., 2006). Be-sides, interactive 3DVEs are totally different from 2DUI which are typi-cally used with a keyboard and a mouse to manipulate a traditional graph-ical interface. For example, nontraditional input and output devices are used, which can exclude the use of some types of usability evaluation methodologies. In addition, Dünser and his colleagues (2008) have pointed out the lack of best practices and guidelines about how to proper-ly design experiments, choose the appropriate methods, apply empirical methods, and analyze the results. Distinctive characteristics of interactive 3DVEs evaluation and related guidelines are reported by Bowman and his colleagues (2002, 2004). They are namely: (1) physical environment issues, (2) evaluator issues, (3) user issues, (4) type of usability evaluation and, (5) experimental de-sign. First of all, in interactive 3DVE experimentations, users may be standing rather than sitting, and they may be moving inside a large space, using whole-body movement required by a specific type of input device. Even if the user is sitting and images are viewed on a computer monitor, it is
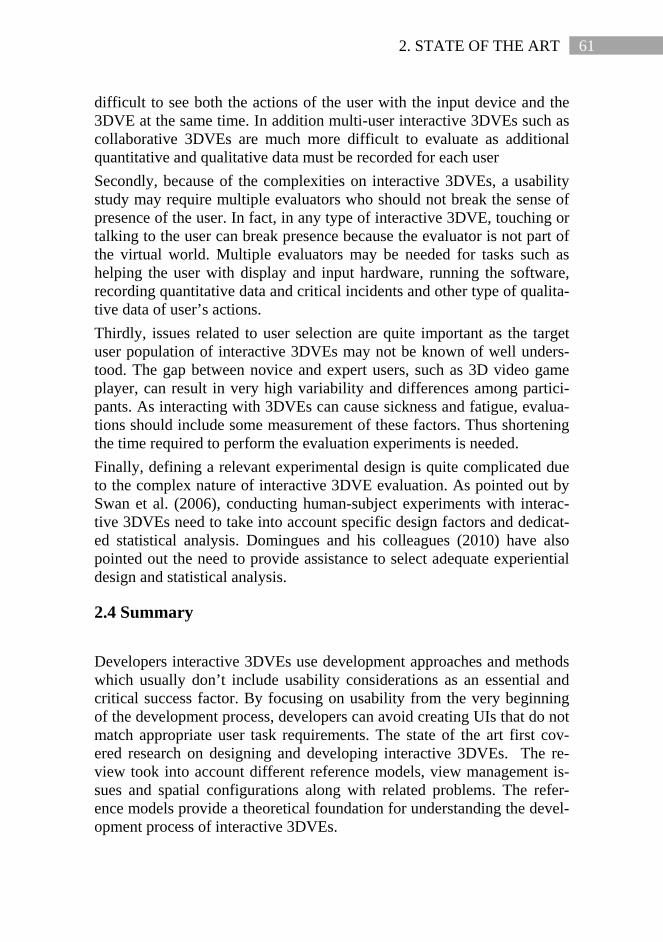
61 2. STATE OF THE ART
difficult to see both the actions of the user with the input device and the 3DVE at the same time. In addition multi-user interactive 3DVEs such as collaborative 3DVEs are much more difficult to evaluate as additional quantitative and qualitative data must be recorded for each user Secondly, because of the complexities on interactive 3DVEs, a usability study may require multiple evaluators who should not break the sense of presence of the user. In fact, in any type of interactive 3DVE, touching or talking to the user can break presence because the evaluator is not part of the virtual world. Multiple evaluators may be needed for tasks such as helping the user with display and input hardware, running the software, recording quantitative data and critical incidents and other type of qualita-tive data of user’s actions. Thirdly, issues related to user selection are quite important as the target user population of interactive 3DVEs may not be known of well unders-tood. The gap between novice and expert users, such as 3D video game player, can result in very high variability and differences among partici-pants. As interacting with 3DVEs can cause sickness and fatigue, evalua-tions should include some measurement of these factors. Thus shortening the time required to perform the evaluation experiments is needed. Finally, defining a relevant experimental design is quite complicated due to the complex nature of interactive 3DVE evaluation. As pointed out by Swan et al. (2006), conducting human-subject experiments with interac-tive 3DVEs need to take into account specific design factors and dedicat-ed statistical analysis. Domingues and his colleagues (2010) have also pointed out the need to provide assistance to select adequate experiential design and statistical analysis.
2.4 Summary Developers interactive 3DVEs use development approaches and methods which usually don’t include usability considerations as an essential and critical success factor. By focusing on usability from the very beginning of the development process, developers can avoid creating UIs that do not match appropriate user task requirements. The state of the art first cov-ered research on designing and developing interactive 3DVEs. The re-view took into account different reference models, view management is-sues and spatial configurations along with related problems. The refer-ence models provide a theoretical foundation for understanding the devel-opment process of interactive 3DVEs.

62 Abstract Information Visualization in Interactive 3D Virtual Environments: Conceptualization and Usability Evaluation
Abstract information and the layout space dimension of abstract informa-tion visualization techniques is discussed. A preliminary comparison of selected abstract information visualization techniques is provided. Three examples of taxonomies related to abstract information visualization in interactive 3DVEs are presented. The first taxonomy concerns text dis-play techniques, the second is related to 3D menu techniques, and the third one concerns occlusion management techniques. Information rich virtual environments and related design issues are also discussed. The challenges related to overcoming the problem of user navigation in interactive 3DVEs have been examined. Also, the differences between usability evaluation metrics for 2DUIs and 3DUIs are reviewed. A classi-fication space for comparing interactive 3DVEs usability evaluation me-thods according to three key characteristics has been presented. The three key characteristics are namely: (i) involvement of the users, (ii) context of evaluation, and (iii) type of results. In order to examine approaches to evaluation of interactive 3DVEs, four different approaches are taken into consideration. Specific design guidelines for interactive 3DVEs develop-ment have been discussed. Many additional factors, such as presence, need to be considered when evaluating and testing the usability of interac-tive 3DVEs in comparison to 2DUIs. Specific characteristics of interac-tive 3DVEs evaluation are: physical environment issues, evaluator issues, user issues, type of usability evaluation and experimental design. The state of the art highlights the distinctive characteristics of interactive 3DVE development with specific focus on abstract information visualiza-tion techniques. Although some specific 3D design guidelines and heuris-tics exist, there are no unanimously well-accepted and universally estab-lished standards which can help developers and designers in selecting an appropriate visualization technique for augmenting interactive 3DVEs with abstract information. Therefore, it is important to expand the capa-bilities of designers and usability practitioners with a reusable toolkit and usability testing methodology. It is expected that the methodology and the toolkit provide the designers and usability practitioners with the ability to perform all necessary changes based on their needs and requirements. Such changes should include the 3D scene, types of abstract information to be visualized, user tasks, contexts and visualization techniques. This is why an interactive 3DVE toolkit for prototyping is needed in order to develop prototypes for performing usability tests in order to measure and compare the usability of abstract information visualization techniques.

63 3. AN INTERACTIVE 3DVE FOR USABILITY TESTING
3. AN INTERACTIVE 3DVE FOR USABILITY TESTING
Developers of interactive 3DVEs who want to augment their 3D models with abstract information have to determine which visualization technique is most suitable for their needs according to different elements. We have grouped these elements into different groups which have re-sulted into the definition of a conceptual model. In addition, by proposing a methodological approach together with a constrained navigation ap-proach we intend to support researchers and developers of novel abstract information visualization techniques in the usability evaluation and choice of appropriate techniques.
3.1 Conceptual Model The conceptual model is composed of five elements: - a reference 3D scene, - types of abstract information, - contexts composed of user contexts and target object contexts, - types of tasks, - types of abstract information visualization techniques. Given a reference 3D scene and a type of abstract information, the objec-tive of the conceptual model is to provide developers of interactive 3DVEs with a decision support knowledge base. The objective is to iden-tify the most relevant abstract information visualization technique, in terms of usability, for performing a certain task and in a certain user con-text for a type of abstract information.
3.1.1 Reference 3D Scene A reference 3D scene is the entire composition of multiple 3D models into a unique 3D model positioned in a 3D space located within a Carte-sian coordinate system defined by three axes. A camera is needed to vi-sualize the 3D scene. The two main properties of the camera are: camera viewpoint (or viewport), and the field of view. As disused in Section 2.1.3.2, the camera viewpoint can be internal and external in relation to the 3D scene. With the camera located inside the

64 Abstract Information Visualization in Interactive 3D Virtual Environments: Conceptualization and Usability Evaluation
3D scene, the user can explore the 3D model by walking inside the 3D scene. The camera has a certain field of view, measured in degrees, which is how much of the 3D scene the user can see on the display at one time. For each application domain a specific reference 3D scene must be consi-dered. This is due to the fact that a unique reference 3D scene can’t in-clude the necessary model complexity, density and level of details rele-vant to all application domains. Nevertheless, it is possible to find similarities between 3D scenes across selected application domains such as: civil engineering interactive 3DVEs for visualizing abstract information about tunnel construction and medical interactive 3DVEs for visualizing abstract information about different types of infections affecting bold vessels.
3.1.2 Type of Abstract Information Abstract information refers to information, related to specific target ob-jects located in the 3D scene, which is not directly perceptible in the real physical world. For example, the color of a car is directly perceptible but the car owner name, telephone number and address is not. Abstract information has three characteristics: content format, content size and content type. Content formats are: text, image and video. Content size is calculated according to the content format and type. For example, the size of a textual content is calculated in terms of number of characters and the size of an image in terms of number of pixels. Dif-ferent data types have been presented in Section 2.2.1.
3.1.3 User Context and Target Object Context It is necessary to take into account the user context target as well as the object context because some abstract information visualization techniques are more or less sensitive to them. For instance, the visualization of a virtual panel which contains an image and a short text implies that the user is able to navigate backwards in or-der to find a position where it would be possible to visualize the whole image and read all the text on the virtual panel. This is obviously difficult to achieve in 3D spaces with geometrical constraints and obstacles such as small closed rooms, high walls and any type of complex scenes where the user is unable to navigate to a relevant position in the 3DVE.

65 3. AN INTERACTIVE 3DVE FOR USABILITY TESTING
The user context is defined by the following attributes: - initial position, initial orientation and initial viewpoint of the user, - navigation space characterized by it’s geometric complexity (number
of parameters needed to describe the navigable space), perime-ter/surface area ratio for 2D shapes or surface area/volume ratio for 3D bodies and, topological complexity (number of holes),
- degrees of freedom for controlling the viewpoint inside the navigation space,
- degrees of freedom for manoeuvering inside the navigation space. In initial position is where the user gets positioned by default when enter-ing into the user context within the 3DVE. The initial orientation sets the orientation of the user by default. The initial viewpoint is the first view-point of the user. The geometric complexity for describing the navigation space can range from low to high: point, line, 2D surface and, 3D body. The topological complexity of the navigation space refers to the way it is composed. The topological complexity can also range from low to high based on the numbers of holes. Degrees of freedom are the set of independent dis-placements and/or rotations that specify the displaced position and orien-tation of the user. The target object context is also characterized by similar attributes related to the geometric complexity and topological complexity. These attributes are namely: number of parameters needed to describe the object, perime-ter/surface area ratio for 2D shapes or surface area/volume ratio for 3D bodies and number of holes.
3.1.4 Type of Tasks As discussed in the state of the art, four elementary tasks have been iden-tified in interactive 3DVEs: system control task, object-pointing task for target object selection, target object manipulation task and, navigation task (Bowman et al., 1999). There are many variables, inherent to the structure of the 3D space, which can affect user performance and there-fore the usability of abstract information visualization techniques. Poupy-rev and his colleagues (1997) have proposed a framework for the syste-matic analysis of task parameters which influence user performance while accomplishing three basic tasks in interactive 3DVEs. The three basic tasks considered in there framework are: object selection, object position-

66 Abstract Information Visualization in Interactive 3D Virtual Environments: Conceptualization and Usability Evaluation
ing and object orientation. For example, the task parameters for the object selection task are: - distance to target, - horizontal and vertical directions to target, - horizontal and vertical size of non-occluded portion, - distance to occluding object, - direction of occlusion, - horizontal and vertical visual size of target, - density of objects around the target, - number of target to be selected. Bowman and his colleagues (2003) have considered two types of visual perception tasks to be accomplished by users in IRVEs: - Spatial information to abstract information: this case refers to a user who starts exploring an interactive 3DVE and then decides to access ab-stract information about a given object. - Abstract information to spatial information: this case refers to a user who starts exploring abstract information about different objects located inside a 3DVE and then decides to identify and explore a given object based on the related abstract information. Polys (2006) has extended the above task types by considering the follow-ing four categories of visual perception tasks in IRVEs: - Exploration: the exploration task refers to free or non-goal directed na-vigation of a user in an interactive 3DVE with the objective of accessing abstract information for some objects. - Search: the search task refers to goal directed navigation in order to per-form a specific query on a predefined object in order to access it’s related abstract information. - Comparison: in this task, the goal of the user is to visualize and compare two or more objects and their related abstract information at the same time. - Pattern finding: the pattern or trend finding task refers to a situation in which the user intends to identify a group of objects based on some com-mon spatial form properties described with abstract information. In a study of occlusion management problems in IRVEs, Elemqvist and Tsigas (2007) have also identified three similar types of visual perception

67 3. AN INTERACTIVE 3DVE FOR USABILITY TESTING
tasks that user can accomplish. These tasks are namely: target discovery, target access and finding spatial relationships. The navigation task has two parts: wayfinding (the cognitive decision-making process by which a movement is planned), and travel (the actual motion from the current location to the new location). Travel consists in setting one’s viewpoint position and orientation in the 3DVE. The specification of the position can be accomplished in three ways: dis-crete target specification, continuous target specification and, one-time target specification. In discrete target specification, the user specifies the goal of the movement and the system moves the user there in some way. In continuous target specification the user is constantly setting the trajec-tory or direction of motion in order to change his or her viewpoint posi-tion and orientation. In one-time target specification, the user defines a path through the space and the system moves the user along that path to-wards a target object. Bowman’s classification is based on an initial categorization of wayfind-ing and travel tasks have been proposed by Daken and Sibert (1996). Three tasks are considered in their categorization: exploration, naive search and primed search. The exploration task consists of any wayfind-ing task in which there is no specific target object. A naive search task is a task in which the user has no a priori knowledge of the target object. In a primed search, the user has a priori knowledge about the location of the target object. Although these categories are mutually exclusive, wayfinding tasks are commonly combined hierarchically to form compound tasks. In general, primed searches to specific area can be followed by naive searches of that area. Primed search is also called goal directed exploration in situations where the 3D scene includes some relevant visual clues about the location of a given target object. The generic task that we consider in our conceptual model is goal directed exploration. In order to formalize the analysis of the goal directed exploration generic task in our interactive 3DVE, we will use different representations of task types (Figure 51) and temporal operators provided by ConcurTaskTrees (CTT) notation (Paterno et Lecerof, 1997; Paterno, 2003).
Figure 51: ConcurTaskTrees (CTT) task types (Paternò et Lecerof, 1997)
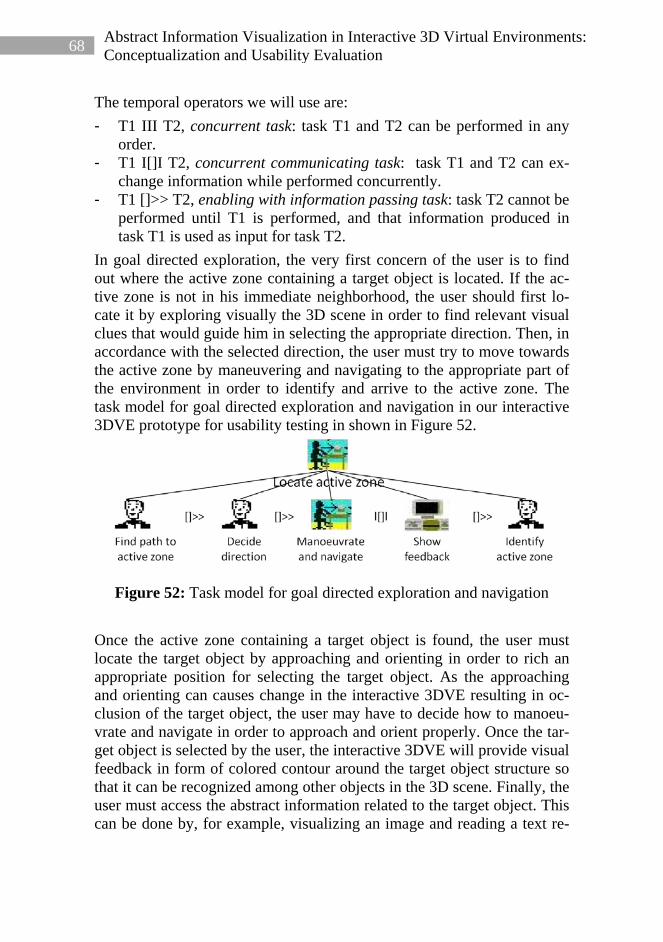
68 Abstract Information Visualization in Interactive 3D Virtual Environments: Conceptualization and Usability Evaluation
The temporal operators we will use are: - T1 III T2, concurrent task: task T1 and T2 can be performed in any
order. - T1 I[]I T2, concurrent communicating task: task T1 and T2 can ex-
change information while performed concurrently. - T1 []>> T2, enabling with information passing task: task T2 cannot be
performed until T1 is performed, and that information produced in task T1 is used as input for task T2.
In goal directed exploration, the very first concern of the user is to find out where the active zone containing a target object is located. If the ac-tive zone is not in his immediate neighborhood, the user should first lo-cate it by exploring visually the 3D scene in order to find relevant visual clues that would guide him in selecting the appropriate direction. Then, in accordance with the selected direction, the user must try to move towards the active zone by maneuvering and navigating to the appropriate part of the environment in order to identify and arrive to the active zone. The task model for goal directed exploration and navigation in our interactive 3DVE prototype for usability testing in shown in Figure 52.
Figure 52: Task model for goal directed exploration and navigation
Once the active zone containing a target object is found, the user must locate the target object by approaching and orienting in order to rich an appropriate position for selecting the target object. As the approaching and orienting can causes change in the interactive 3DVE resulting in oc-clusion of the target object, the user may have to decide how to manoeu-vrate and navigate in order to approach and orient properly. Once the tar-get object is selected by the user, the interactive 3DVE will provide visual feedback in form of colored contour around the target object structure so that it can be recognized among other objects in the 3D scene. Finally, the user must access the abstract information related to the target object. This can be done by, for example, visualizing an image and reading a text re-

69 3. AN INTERACTIVE 3DVE FOR USABILITY TESTING
lated to the selected target object. The generic task model for describing the user interaction in our interactive 3DVE prototype for usability testing is shown in Figure 53.
Figure 53: Generic task model for user interaction
3.1.5 Type of Abstract Information Visualization Technique By extending the analysis presented in Section 2.2.3, we characterize the design space of any abstract information visualization techniques in inter-active 3DVEs by using five layout dimensions (Figure 54): - Layout Space. Five different types of layout spaces are namely: world space, user space, object space, viewport space and display space. - Layout Shape. Abstract information can be represented on a 2D sur-face, a 3D surface or a 3D body within an interactive 3DVE. It should be noted that if the abstract information is represented outside an interactive 3DVE, it must be represented on a 2D surface. - Layout Location. The location of the displayed abstract information can be fixed, adjustable or adaptive. With fixed techniques, the position and orientation of the displayed abstract information remain unchanged. With adjustable techniques, the position and orientation can be modified by the user. With adaptive techniques, the position and orientation of the displayed abstract information is automatically adapted by the system in order to match the user’s position and orientation. - Layout Interaction. The interaction type can be static, adjustable or dynamic. Static techniques don’t provide any user interaction features, adjustable techniques can be customized by the user and dynamic tech-niques provide specific user interaction features such as display on de-mand.

70 Abstract Information Visualization in Interactive 3D Virtual Environments: Conceptualization and Usability Evaluation
- Layout Scale. The scale can be fixed, adjustable or adaptive. Fixed scale can’t be changed, adjustable scale can be modified by the user and with adaptive scale, the system automatically adapts to the location of the user.
Figure 54: Five layout dimensions of abstract information visualization
techniques
3.2 Methodological Approach The conceptual model presented in the previous section can support re-searchers and developers of interactive 3DVEs according to one of the following use cases: - A researcher or developer has identified two abstract information visua-lization techniques (T’ and T’’) which already exist and his or her goal is to evaluate and compare the usability of the techniques according to dif-ferent types of abstract information and tasks. - A researcher or developer has an interactive 3DVE, based on his or her own 3D scene, with different user contexts and target object contexts. He or she has already identified the type of abstract information and type of tasks to be accomplished by the user. His or her goal is to identify the most appropriate abstract information visualization technique for a given combination of information type and task.

71 3. AN INTERACTIVE 3DVE FOR USABILITY TESTING
- A researcher or developer has developed a novel abstract information visualization technique and his or her objective is to evaluate and com-pare it’s usability with other techniques. In the following sections, we will consider a guiding example in order to explain how to use the conceptual model with Google SketchUp as a pro-totyping tool for building an interactive 3DVEs and implementing an ab-stract information visualization technique. The guiding example corres-ponds to third use case.
3.2.1 Selection of a Reference 3D Scene In this guiding example, we consider the case of a developer who wants to find a 3D city model which includes suitable user contexts and target object contexts. By searching the “3D city model” keyword in Google 3D Warehouse (3D-WAREHOUSE, 2010), one can find and import a frag-ment of the 3D model of the city of Llanes, named “Casino y torre” lo-cated in the North of Spain (Figure 55).
Figure 55: Importing a 3D model from the 3D Warehouse into SketchUp
3.2.2 Selection of Related Abstract Information Structured abstract information about different elements of the 3D city model can be found online on dedicated websites. For example, the web-site of the Llanes Digital 3D Project (3D-LLANES, 2010) contains in-formation about different parts and major buildings of the town of Llanes (Figure 56). This information is mostly composed of texts with 1D data type or images with 2D data type (Figure 57).

72 Abstract Information Visualization in Interactive 3D Virtual Environments: Conceptualization and Usability Evaluation
Figure 56: Sample page of the 3D-
Llanes project
Figure 57: Sample text page (1D
data type)
Figure 58: Sample virtual panel
Figure 59: Sample HTML file
The abstract information to be displayed inside the 3DVE has to be re-trieved and stored in separate local folder for texts and images. The final visual representation of the abstract information which is going to aug-ment the 3D scene should be made ready. For example, text and image can be visually represented in form of 2D virtual panels (Figure 58). The abstract information to be displayed over the 3DVE has to be stored into an external HML file containing the related texts and images (Figure 59).
3.2.3 Selection of User Contexts and Target Object Contexts In order to explain how to define the user contexts, we will consider to most simple use case which is limited to a single point on which the user stands and starts orienting his viewpoint.

73 3. AN INTERACTIVE 3DVE FOR USABILITY TESTING
Step 1: Set the default view of the 3D model to Top View in order to ob-tain a global view of the 3D scene from the top (Figure 60). Step 2: Activate the Components Window and search for the “construc-tion barrel” (or any other type of visual marker) via the imbedded 3D Warehouse Search Box. Then, drag and drop the construction barrel com-ponent into the 3D scene and position it according to predefined user po-sitions (Figure 61).
Figure 60: Top view of the 3D scene
Figure 61: Visual markers positioned inside the 3D scene
Step 3: Position the camera and orient the viewpoint according to a pre-defined user context just behind a marker inside the 3D scene so that the user faces a desired target object. Then delete the marker and create a new

74 Abstract Information Visualization in Interactive 3D Virtual Environments: Conceptualization and Usability Evaluation
scene via the Scene Tab Window (Figure 62). Repeat this step for each of the markers (Figures 63, 64, 65, 66). For example, we consider the build-ing indicated by a 3D blue mesh as the unique target object. The initial position, initial orientation and initial viewpoint of the user, in the first user context, are shown in Figure 62. In all user contexts in this example, the user can control the viewpoint but cannot manoeuvrate as the naviga-tion space is limited to a point.
Figure 62: Initial orientation and viewpoint in the 1st user context
The initial position, initial orientation and initial viewpoint of the user, in the second user context, are shown in Figure 63. The user can control the viewpoint but cannot manoeuvrate as the navigation space is limited to a point.
Figure 63: Initial orientation and viewpoint in the 2nd user context

75 3. AN INTERACTIVE 3DVE FOR USABILITY TESTING
The initial position, initial orientation and initial viewpoint of the user, in the third user context, are shown in Figure 64.
Figure 64: Initial orientation and viewpoint in the 3rd user context
The initial position, initial orientation and initial viewpoint of the user, in the fourth user context, are shown in Figure 65.
Figure 65: Initial orientation and viewpoint in the 4th user context

76 Abstract Information Visualization in Interactive 3D Virtual Environments: Conceptualization and Usability Evaluation
The initial position, initial orientation and initial viewpoint of the user, in the fifth user context, are shown in Figure 66.
Figure 66: Initial orientation and viewpoint in the 5th user context
Geometrical elements and components must be grouped to form one enti-ty in form of a single component in order to define a target object. The related entity has to be named accordingly. For example, the newspaper kiosk is shown as a component in Figure 67.
Figure 67: Target object example: newspaper kiosk as a component

77 3. AN INTERACTIVE 3DVE FOR USABILITY TESTING
3.2.4 Definition of the Type of Tasks The generic task that we consider in our methodological approach is goal directed exploration. This generic task is composed of an object-pointing task for target object selection and then information acquisition trough abstract information visualization. The generic task is explained in Figure 68.
Figure 68: Goal directed exploration generic task
In order to do so, we adopt the following configuration: discrete target specification and primed search. The user should thus specify the goal of the movement and the system should move the user to a specific location in some way. In this way the user’s navigation skill variable will not in-fluence the task completion time as locomotion is done the system. This is a fundamental concern with regards to the navigation problems in interac-tive 3DVEs that we discussed in Section 2.3.1. Once the user is positioned a specific location, he or she should start the primed search task. This implies that the user must have a priori know-ledge about the type of target object to point at and select. Then, the user must position and orient his viewpoint according to a predefined user guideline. The user guideline is rotating the viewpoint in the same direc-tion all the time. Once the target object is selected, abstract information related to it is displayed according to a type of information visualization technique. The generic task must be performed in different user contexts in relation to different target objects. The target objects are identified by visual clues such as red question marks. As we’ll see later in Section 3.3.3, we have programmed a gamepad and used it as input device for our interactive 3DVE prototype. When a user presses the START button on the gamepad, the system will move her or him to the first user context in the 3D scene. Once the user is

78 Abstract Information Visualization in Interactive 3D Virtual Environments: Conceptualization and Usability Evaluation
positioned at a specific location, he or she must position and orient his viewpoint according to a predefined user guideline. The user guideline is rotating the viewpoint from left to right. Once the target object is fined and selected, abstract information related to it is displayed according to a type of information visualization technique. Once the virtual panel is dis-played, the participant must read out the caption text under the image. Then, the user presses the START button again and gets positioned at the second user context and so on until reaching the final user context.
3.2.5 Implementation of Visualization Techniques One of the main strength of using SketchUp as a prototyping tool for building interactive 3DVEs is that it is possible to implement any abstract information visualization technique by using scenes, visible layers, com-ponents, Dynamic Components and plugings. SketchUp scenes are saved views of a model which have lot more attributes that just camera positions. Different properties can be stored with each scene. One of these properties is the visible layers. Any SketchUp model has, by default, one layer named “Layer 0”, which is the base layer. By creating a new layer and associating an imported object in a model with the newly created layer, it becomes possible to control the visibility of that object inside a given scene. SketchUp components are models that can be reused within any Sket-chUp models and scenes. Any object inside a model can become a com-ponent. Dynamic Components (DCs) are components that have specific predefined parametric attributes such as name, description, size, location, and number of copies. Custom attributes can be defined by the developer of the dynamic component in order to associate specific behavior to any component in a model. In order to create custom attributes, it is possible to use the build-in DCs Function Library. SketchUp plugings are scripts written in a computer programming lan-guage called Ruby. This is why such plugings are also called Ruby scripts. Smustartd (2010) and the Ruby Library Depot (2010) are compre-hensive online collections of Ruby scripts from software developers and programmers around the world. Examples of how to use scenes, visible layers and DCs with the onClick and GoToScene functions to display all the magazines on a rack stand, available for sale in a kiosk, is sown in Figures 69 to 73.

79 3. AN INTERACTIVE 3DVE FOR USABILITY TESTING
Figure 69: Scene 4 saved with “Magazine-racks” layer set as invisible
(unchecked right box)
Figure 70: Searching and importing the “Magazine-racks” component
inside the model
Figure 71: Scene 4-bis saved with “Magazine-racks” active layer set as
visible

80 Abstract Information Visualization in Interactive 3D Virtual Environments: Conceptualization and Usability Evaluation
Figure 72: Customizing the kiosk’s DCs attributes with the onClick and
GoToScene functions
Figure 73: Clicking on the kiosk results in displaying the stand rack with
some magazine images The out_of_the_box-KB abstract information visualization technique pre-sented in this example can be characterized according to the five layout dimensions presented in Section 3.1.5. The blue lines in Figure 74 indi-cate the values corresponding to each of the five layout dimensions for this technique.

81 3. AN INTERACTIVE 3DVE FOR USABILITY TESTING
Figure 74: Characterization of the out_of_the_box-KB technique using
the five layout dimensions For some types of abstract information visualization technique it is neces-sary to create plugings which are built with scripts programmed in Ruby. Any abstract information visualization techniques for augmenting interac-tive 3DVEs with display, viewport or object as layout space dimension, as discussed in Section 2.2.2, can be implemented in form of reusable plug-ings. Then, the related plugings can be used to import and position ab-stract information in on the display or over the 3D scene by using the spe-cific abstract information visualization techniques. For other abstract information visualization techniques that have user space or world space as layout space dimension, it is necessary to create DCs as the related abstract information should be displayed inside the 3D scene. For instance, the out_of_the_box-KB abstract information visuali-zation technique presented in the previous example has been created by using the DCs methodology. For example, we have implemented the WS-Virtual_Panel-KB (WS-VP-KB) technique in form of reusable DCs. This technique refers to an im-plementation of the World Space technique for displaying a virtual panel inside any 3D scene (Figure 75).

82 Abstract Information Visualization in Interactive 3D Virtual Environments: Conceptualization and Usability Evaluation
Figure 75: WS-VP-KB abstract information visualisation technique
The green lines in Figure 76 indicate the values corresponding to each of the five layout dimensions for the WS-VP-KB technique.
Figure 76: Characterization of the WS-VP-KB technique
We have also implemented the VS-Virtual_Panel-KB (VS-VP-KB) tech-nique in form of reusable SketchUp plugin. This technique refers to an implementation of the viewport space technique for displaying a virtual panel over any 3D scene (Figure 77). This plugin is based on Papasma-dov’s (2010) Museum/Gallery Reference pluging for linking 3D models from and to an external HTML reference document.

83 3. AN INTERACTIVE 3DVE FOR USABILITY TESTING
Figure 77: Augmenting the 3DVE with a virtual panel using the VS-
Virtual_Panel-KB technique The red lines in Figure 78 indicate the values corresponding to each of the five layout dimensions for the VS-VP-KB technique.
Figure 78: Characterization of the VS-VP-KB technique

84 Abstract Information Visualization in Interactive 3D Virtual Environments: Conceptualization and Usability Evaluation
3.3 Constrained Navigation Approach
3.3.1 Controlling the Navigation Skill Variable As discussed in Section 2.3.1, navigation is one of the most common type of operation that people perform in 3DVEs, and is a board term that in-corporates many different types of tasks, from wayfinding (the act of tra-velling between places), to planning routes and giving directions. Ruddle and Lessels (2006) explain how challenging it is to break down user’s locomotion into a sequence of events (movements in a straight line or along curves) interspersed by periods when the user pause for looking around and interaction with objects in the 3DVE. Controlling the naviga-tion skill variable during usability tests is essential as time on task is di-rectly affected by the user’s navigation skill which is obviously different between experienced and inexperienced users. In order to control the navigation skill variable we define a grid based constrained navigation approach to move the user either forward or backward. In order to do so, the 3D models underlying terrain has to be covered by a grid with predefined spacing between each line and column. Each interaction intersection point between a line and a column defines a node that has to be marked with a visual clue on the terrain. In order to navigate from one location to another, the user must use the closet node for either going forward or backward depending on his navigation deci-sion. This implies that the closet node should always be visible in the field of view of the user. In addition the user should not bypass or jump over intermediary nodes for going forward in order to rich his desired destination. The user should always be able to identify the next closest node and select the desired direction to move either forward or backward. The visual representation of the related constrained navigation interactors for two nodes is sown in Figure 79.
Figure 79: Constrained navigation interactors (Bazargan et al., 2010)

85 3. AN INTERACTIVE 3DVE FOR USABILITY TESTING
This approach has tow limitations which are related to the direction of the movement and the orientation of the viewpoint. First, when positioned on a give node, the user is constrained to move either forward or backward. Second, the viewpoint remains unchanged while moving from one node to another. This means that the navigation is decomposed into moving towards a given direction and orienting / maneuvering the point of view. In order words, the point of view is always oriented towards the direction of the movement.
3.3.2 Implementation of Constrained Navigation Interactors We have designed and implemented the constrained navigation interac-tors in form of reusable SketchUp DCs. The main part of the widget is composed of four faces of a square based pyramid with four additional triangles connected to each face on the ground level plan (Figure 80).
Figure 80: Positioning the constrained navigation interactors DCs in the
3D scene (Bazargan, 2010) The 3D scene can easily be covered with these constrained navigation interactors by performing drag and drop form the SketchUp Components Window (Figure 81).

86 Abstract Information Visualization in Interactive 3D Virtual Environments: Conceptualization and Usability Evaluation
Figure 81: Top view of the constrained navigation interactors DCs in the
3D scene (Bazargan, 2010)
If the user decides to move forwards from one position to another, he clicks of the closest pyramid’s face with the forward arrows and gets tele-ported to the summit of the pyramid in front of him. If the user decides to move backward from one position to another, he clicks of the closest tri-angle, connected to the pyramid, with the backward arrows and gets tele-ported to the summit of the pyramid behind him. The user can start ma-neuvering and orienting his viewpoint after being positioned on the sum-mit of a pyramid.
3.3.3 Using a Gamepad as Input Device Two-handed input has often been viewed as a technique to improve the efficiency of human-computer interaction by enabling the user to perform two sub-tasks in parallel, rather than as sequentially selected modes (Bux-ton & Myers, 1986). In a survey of design issues in input devices, Hinck-ley et al. (1994,1998) report that when interacting with 3DVEs, two hands not only improves efficiency, but also help to make spatial input more comprehensible to the user. In this way, users are less likely to become disoriented and they are not subject to additional cognitive load. In a study of two-handed input, Kabbash et al. (1994) have found that 3DVEs users can transfer everyday skills for moving and manipulating objects with two hands to the navigation and operation for controlling 3DVEs with little or no training.

87 3. AN INTERACTIVE 3DVE FOR USABILITY TESTING
In a study of human factors guidelines for interactive 3DVEs and game-based training, Stone (2008) explained how to select an input control de-vice according to the tasks what the users will have to perform. He pro-vides evidence why there is a tendency to expect too much from the mouse and the keyboard. Brown et al. (2010) have explored McNamara and Kirakowski (2006) theoretical framework of interaction to better design and evaluate input device controllers in interactive 3DVEs. They have been applying this theoretical framework to the evaluation and comparison of three different devices: gamepad, keyboard, and force feedback steering wheel. The re-lated case study findings supports that selecting a gamepad as input de-vice comes first on usability performance measures. They also observe that from the total of 12 subjects who took part in the study, almost all test users have been able to operate the gamepad effectively within their first minute of use. We have selected and programmed a Saitek dual action USB gamepad so that it becomes possible to use it as an input device for SketchUp for con-trolling navigation, selection and interaction commands (Figure 82).
Figure 82: Saitek dual action USB gamepad
88 Abstract Information Visualization in Interactive 3D Virtual Environments: Conceptualization and Usability Evaluation
3.4 Summary This chapter first presented a conceptual model for building an interactive 3DVE that can be augmented with abstract information in order to be used for usability testing. The conceptual model is composed of five ele-ments: a reference 3D scene, type of abstract information, contexts com-posed of user contexts and target object contexts, task analysis and type of tasks, type of abstract information visualization technique. Abstract information refers to information that a user can’t directly obtain just by visualizing the spatial information of objects in a 3DVE. The user context is defined by the specific attributes such as: initial position, initial orientation and initial viewpoint of the user, navigation space characte-rized by it’s geometric complexity, specific ratios, topological complexity and, different degrees of freedom. The target object context is also cha-racterized by similar geometric complexity and topological complexity attributes. The generic task is goal directed exploration which is modeled with different representations of task types and temporal operators pro-vided by ConcurTaskTrees (CTT) notation. We characterize the design space of any abstract information visualization techniques in interactive 3DVEs by using five layout dimensions: space, shape, location, interac-tion and scale. The conceptual model is generic as it is independent from any specific technological and software solution. In order words, it is possible to use the conceptual model with different software solutions for prototyping interactive 3DVEs. Given a specific reference 3D scene and a type of abstract information, the objective of the conceptual model is to provide developers of interactive 3DVEs with a decision support knowledge base. The decision support knowledge base would enable them to identify the most relevant abstract information visualization technique, in terms of usability, for performing a certain task and in a certain user context for a type of abstract information. The second part of this chapter explained the methodological approach in form of a toolkit for using the conceptual model with Google SketchUp. Practical issues related to the selection of a 3D scene, abstract informa-tion, user contexts and target objet contexts were discussed. Details con-cerning task procedures and scenarios definition were discussed. Technic-al details related to the implementation of different abstract information visualization techniques by using scenes, visible layers, components, DCs and plugings were illustrated.

89 3. AN INTERACTIVE 3DVE FOR USABILITY TESTING
The third part of this chapter presented the constrained navigation ap-proach for controlling the navigation skill variable during the usability tests. With this approach the user is constrained to move either forward or backward in four cardinal directions. The navigation is decomposed into moving towards a given direction and orienting/maneuvering the point of view. The design and implementation of the constrained navigation inte-ractors as reusable SketchUp DCs were illustrated. The main part of the widget is composed of four faces of a square based pyramid with four additional triangles connected to each face on the ground level plan. The 3D scene can easily be covered with these constrained navigation interac-tors by performing drag and drop form the SketchUp Components Win-dow.

90 Abstract Information Visualization in Interactive 3D Virtual Environments: Conceptualization and Usability Evaluation

91 4. USABILITY TESTING METHODOLOGY
4. USABILITY TESTING METHODOLOGY
The goal of usability testing is to assess and improve the quality of user interfaces. There are three distinct categories of usability testing methods: expert-based testing, automated testing and user-based testing (Lazare et al., 2010). In an expert-based test, a usability expert uses a set of structured princip-als, heuristics and guidelines to inspect the user interface. A comprehen-sive review of heuristics and design principals can be found in the Usabi-litybok (2010). Automated testing refers to a software program that applies a series of expert’s guidelines to a user interface in order to determine where the interface doesn’t meet the guidelines. An overview of automated usability evaluation methods and a taxonomy for comparing various methods is provided by Ivory and Hearst (2001). User-based testing is a technique used to evaluate a user interface by test-ing it with representative users. In the test, these users will try to complete representative tasks in representative environments, or early prototypes of the application’s user interfaces or product (Nielsen, 1994). Based on the experience gained with pilot studies conducted in this re-search, this chapter describes the specific user-based usability testing me-thodology which goes along with the interactive 3DVE prototyping tool-kit that has been described in the previous chapter. The objective of this chapter is to explain how to setup and conduct usability tests in order to measure and compare the usability of different abstract information visua-lization techniques in interactive 3DVEs. This chapter is structured according to ISO/IEC 25062:2006 Software engineering also called Software product Quality Requirements and Eval-uation (SQuaRE), Common Industry Format (CIF) for usability test re-ports. The CIF format is designed for reporting results of formal usability tests in which quantitative measurements were collected, and is particu-larly appropriate for summative/comparative testing. The CIF is intended to be used by usability professionals to generate re-ports that can be used by researchers and usability practitioners to make informed decisions. One of the advantages of using the CIF standardized reporting format is a reduction in training time for researchers and usabili-ty practitioners who are not usability professionals. The CIF also en-hances the potential for increased communication and understanding be-

92 Abstract Information Visualization in Interactive 3D Virtual Environments: Conceptualization and Usability Evaluation
tween different developers and usability professionals thanks to a com-mon language. The CIF includes the following elements:
- description of the prototype to be used, - goals of the test, - test participants including the way to hire and select participants - tasks the users should be asked to perform, - experimental design of the test, - method and procedure by which the test should be conducted, - usability metrics and data collection methods, and - qualitative and quantitative results that should be collected.
This chapter provides a detailed description of the above elements.
4.1 Interactive 3DVE Prototyping Toolkit The general purpose of the interactive 3DVE that we have developed is to measure and compare the usability of different abstract information visua-lization techniques.
4.1.1 Testing Environment It is important to conduct the usability testing session in a clam environ-ment such as a usability lab with the appropriate level of comfort. Any unnecessary object that might be a source of distraction for the user should be removed from the environment. It is also more convenient to use artificial lightning sources instead of natural lighting in order to keep the same level of lighting during the usability testing session. We propose a general desktop human computer interaction setting which is easy to set up and doesn’t require specific expensive devices and material. This gen-eral setting is shown in Figure 83.
Figure 83: Usability testing environment and setup
93 4. USABILITY TESTING METHODOLOGY
4.1.2 Technological Setup The technological setup shown in Figure 83 is a Dell XPS M1330 note-book running on Windows XP Pro SP3 operating system with Intel Core 2 Duo CPU (T5450 @ 1.66 GHz, 2.00 GB of RAM) and NVIDA Ge-Force 8400M GS graphic card connected to an external 2007FPb Dell Monitor. The recommended input device is a Saitek P380 Dual Analog Pad gamepad. Seffah and Habieb-Mammar (2009) have performed a comprehensive review and classification of 47 software tools which can be used in different types of usability studies.
4.2 Selecting the Participants
4.2.1 Target Population and Number of Participants A fundamental success factor of any usability test is selecting representa-tive participants with necessary skills and competencies for performing given tasks. Nielsen (1993) and Rubin (1993) recommend recruiting truly representative participants whenever possible in order to enhance the va-lidity of the usability testing collected data. Therefore, it should be pointed out that for usability testing studies concerning domain specific interactive 3DVE and specific abstract information visualization tasks, representative participants that would match the proper target audience have to be selected. As the interactive 3DVE prototyping toolkit that we have developed can be used with domain specific reference 3D scenes, specific target audiences should be considered accordingly. It is recom-mended to consider a number of participants between twelve and sixteen for usability testing in interactive 3DVEs (Köffel and Livatino, 2008).
4.2.2 Profile and Selection Protocol Demographic factors such as gender, age and education are important factors to consider when selection participants. In addition to traditional factors affecting the selection of participants in any usability testing, spe-cific factors related to 3D have to be taken into account. Specific factors to consider are: level of experience in using interactive 3DVE and 3D video games, frequency of use and issues related to specific physiological and psychological health which can result in lack of presence, sickness and fatigue.

94 Abstract Information Visualization in Interactive 3D Virtual Environments: Conceptualization and Usability Evaluation
In order to screen the potential participants, we have designed a pre-questionnaire for selecting the participants which includes specific ques-tions to assess the above mentioned factors (Appendix A). The responses to the pre-questionnaire should help us determine the profile of each par-ticipant in terms of, for example, experience with 3D applications and gaming experience. It should be noted that a healthy vision for all partici-pants is a very important factor in conducting the usability tests. Depend-ing on the type of input device used during the usability tests it is impor-tant to distinguish between right-handed and left-handed users. The pre-questionnaire is not supposed to inquire about being right-handed or left-handed as using a gamepad as input device implies two-handed interac-tion. There are four strategies for performing sampling and sample size selec-tion for usability testing: random sampling, systematic sampling, strati-fied sampling and convenience sampling (Tullis and Albert, 2008). In random sampling everyone in the population has a roughly equal proba-bility of being selected to participate in the study. By using a random number generator it is possible to guaranty random sampling. In systemat-ic sampling, participants are selected based on predefined criteria. Strati-fied sampling requires creating subsamples of the entire population and ensuring that certain sample sizes are achieved for each subgroup. Con-venience sampling means including anyone willing to participate in a usability testing study. After posting the pre-questionnaire, a sampling frame should be prepared. Based on the responses to the pre-questionnaire, systematic sampling should be applied to exclude people based on predefined criteria. Then, stratified sampling should be applied to select an equal number of males and females. Finally, random sampling should be applied in order to re-cruit about twelve participants. Such sampling frame is consistent with Bowman et al. (2004) tips.
4.3 Tasks
4.3.1 Task List The tasks to be accomplished by the participants in the usability testing sessions depend on the reference 3D scene and the domain specific objec-tives of a particular experimentation. A domain independent task can be the generic goal directed exploration task described in Section 3.1.4. This generic task is composed of an object-pointing task for target object selec-

95 4. USABILITY TESTING METHODOLOGY
tion and then information acquisition trough abstract information visuali-zation. The target objects should be marked objects that are located in different areas of the reference 3D scene. Each target object should be identified with a red question mark visual clue. The generic task should to be performed by each participant in different user contexts located inside the 3D reference scene.
4.3.2 Training Tasks and Formal Tasks Prior to starting the formal usability study, each participant should be allowed to get used to the usability testing environment and the input de-vice. Therefore, a training space within the reference 3D scene should be considered as the training area where the user should be able to accom-plish training tasks in order to learn how to use the input device to interact with the 3DVE. It is important to separate spaces for training and formal testing, within the interactive 3DVE, in order to prevent the learning ef-fect that would bias the usability test results.
4.4 Experimental Design
4.4.1 Within vs. Between Subject Design In order to construct the proper experimental design for comparing the usability of different abstract information visualization techniques we should first answer to the following questions: 1- How many independent variables do we want to investigate in the
experiment? 2- How many different values does each independent variable have? By answering to the first question we can determine whether we need a basic design of a factorial design. If there is only one independent varia-ble to investigate, we should consider a basic one-level design. If there are two or more independent variables, we should use factorial design. The number of conditions that should be considered in the experiment is determined by the answer to the second question. In addition, when comparing two different abstract information visualiza-tion techniques we must decided whether we are going to compare data for each participant to other participants or different data for each partici-

96 Abstract Information Visualization in Interactive 3D Virtual Environments: Conceptualization and Usability Evaluation
pant. The first approach is called between-subject design, and the second approach is known as within-subject design. Between-subject designs are also called independent groups design which require arranging the participants to user groups. Each user group is doing one specific task or a series of tasks. For example, a group uses only one type of abstract information visualization technique. A between-subjects design is used to compare results for different participants, such as differ-ences in task completion time between inexperienced and experienced users or female versus male participants. Because there is generally more variance across a group of participants than a single participant, a be-tween-subject design requires a large sample size. This is due to the fact that the user groups have to consist of users with exactly the same pre-conditions such as the experience with interactive 3DVEs. The advantage of between-subject design is the elimination of correlation effects, be-cause any correlation effects would impact both groups equally (Tillus and Albert, 2010). One more advantage of between-subject design is the minimization of possible learning and practice effects and long experi-ments are easier to conduct, because the user has a limited number of tasks to perform. Using within-subjects designs, each participant gets to do each task with each technique. This is why this approach is also called repeated-measures. A within-subject study does not require a large sample size and allows getting significant results by employing fewer participants. Ac-cording to Köffel and Livatino (2008), within-subject designs require about half participants than between-subject designs which demand an equal number of users in each group. Because each participant is being compared to himself, the differences that can be observed in the data can-not be attributed to differences between participants. It should also be taken into account that there can be a correlation be-tween the results and the fact that participants have started with a certain technique first. Such impact can be the result of practice (improving task completion time performance) or fatigue (decreasing task completion time performance). This is why counterbalancing has to be applied in or-der to randomize the sequence of participants doing tasks. Such a rando-mization would minimize the practice and learning effect. In order to do so, the usability test monitor can randomize the order of tasks by “shuf-fling” the task order prior to each participant. Another way of doing so is creating various orders in advance so that each participant performs each task in a different order. Such task order charts can be automatically gen-erated for a given number of participants and tasks by using the Usability
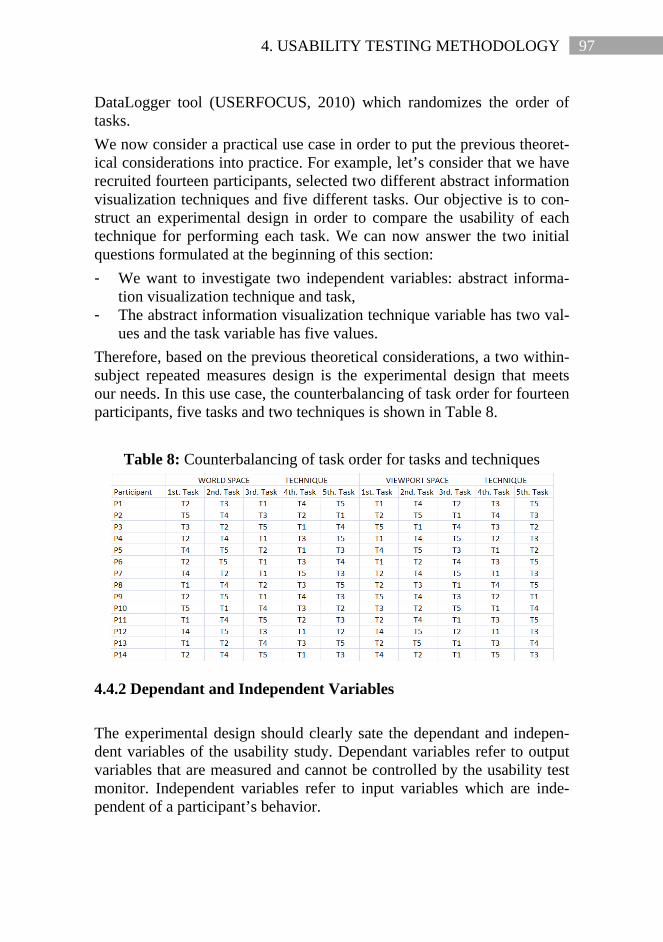
97 4. USABILITY TESTING METHODOLOGY
DataLogger tool (USERFOCUS, 2010) which randomizes the order of tasks. We now consider a practical use case in order to put the previous theoret-ical considerations into practice. For example, let’s consider that we have recruited fourteen participants, selected two different abstract information visualization techniques and five different tasks. Our objective is to con-struct an experimental design in order to compare the usability of each technique for performing each task. We can now answer the two initial questions formulated at the beginning of this section: - We want to investigate two independent variables: abstract informa-
tion visualization technique and task, - The abstract information visualization technique variable has two val-
ues and the task variable has five values. Therefore, based on the previous theoretical considerations, a two within-subject repeated measures design is the experimental design that meets our needs. In this use case, the counterbalancing of task order for fourteen participants, five tasks and two techniques is shown in Table 8.
Table 8: Counterbalancing of task order for tasks and techniques
4.4.2 Dependant and Independent Variables The experimental design should clearly sate the dependant and indepen-dent variables of the usability study. Dependant variables refer to output variables that are measured and cannot be controlled by the usability test monitor. Independent variables refer to input variables which are inde-pendent of a participant’s behavior.

98 Abstract Information Visualization in Interactive 3D Virtual Environments: Conceptualization and Usability Evaluation
There are many independent variables that can be considered in usability testing experimentations for comparing the usability of abstract informa-tion visualization techniques. These independent variables can be related to the type of input and output device, user characteristics, context of use, reference 3D scene, type of abstract information, type of task, user con-text and target object context and type of abstract information visualiza-tion technique. Dependent variables to be measured can be categorized into five groups: efficiency, accuracy, subjective satisfaction, ease of learning and retention rate, and physical and cognitive demand (Lazar et al., 2010). Efficiency refers to task completion time. Accuracy refers to errors made by the user while executing the task. Subjective satisfaction describes the user’s per-ceived satisfaction with the interaction experience. Ease of learning and retention rate refer to how quickly and how easily and individual can learn to use a new application or complete a new task and how long they retain the learned skills (Feng et al., 2005). Physical and cognitive de-mand refers to how long a user can interact with an application without significant fatigue
4.5 Method and Procedure
4.5.1 Participant General Instructions and Task Instructions First the participant should be welcomed, the he or she should be given written instruction and asked to sign a consent form (Appendix A). Prior to starting the formal usability test, each participant should have the op-portunity to get used to the gamepad, the interactive 3DVE, specific target objects and given abstract information visualization technique by practic-ing for five minutes. The first practice phase should take place within a specific area of the reference 3D scene other than the ones used during the formal usability test. At the end of the first practice period, the participant should click on the gamepad’s START button and the usability test moni-tor should start the timer. The monitor ends the timer when the participant completes the related goal directed exploration task. The order in which tasks are to be accomplished by the participants should be randomized and prerecorded according to counterbalancing technique explained in Section 4.1. This means that when the participant clicks on the gamepad’s START button, he gets teleported to a specific user context in the 3DVE and starts performing the related goal directed exploration task. After successfully finishing a task, each participant
99 4. USABILITY TESTING METHODOLOGY
should take a short break and then give a verbal indication to the usability test monitor that she or he is ready to start the next task. Then, the partici-pant should, again, click on the gamepad’s START button and the usabili-ty test monitor should start the timer. The monitor should end the timer when the participant completed the related goal directed exploration task. After the goal directed exploration task has been performed in different user contexts, the participant should be allowed to freely navigate inside the 3DVE, for two minutes, and access abstract information about target objects within the reference 3D scene. At this time, the participant should be authorized to make oral commentaries and remarks concerning the way he perceives abstract information related to target objects. The usa-bility test monitor should not say anything during this time and only take written notes of oral commentaries. Then, the whole process should start again with a different abstract information visualization technique. At the end of the timed usability test session, each participant should complete a presence questionnaire. Presence can be understood as the user’s subjective experience of being virtual present in a 3DVE when being physically located in another environment. In relation to usability, the efficiency and effectiveness of interactive 3DVEs is often measured by the feeling of presence the participant is sensing. The presence ques-tionnaire to be used is the Igroup Presence Questionnaire (Appendix C) provided by the Igroup Consortium (IPQ, 2008).
4.5.2 Procedure As explained before, the tasks to be accomplished by the participants in the usability testing sessions depend on the reference 3D scene and the domain specific objectives of a particular experimentation. A domain in-dependent task can be the generic goal directed exploration task described in Section 3.1.4. This generic task is composed of an object-pointing task for target object selection and then information acquisition trough abstract information visualization. The target objects should be marked objects that are located in different areas of the reference 3D scene. Each target object should be identified with a red question mark visual clue. The ge-neric task should to be performed by each participant in different user contexts located inside the 3D reference scene. The written instructions given to the participants for the part of experiment with viewport space abstract information visualization technique are as follows:

100 Abstract Information Visualization in Interactive 3D Virtual Environments: Conceptualization and Usability Evaluation
1- Click on the gamepad's START button (focus on the computer monitor screen and wait for 2 seconds to get teleported to a predefined area in the reference 3D scene), 2- Identify the target object indicated by a red question mark visual clue by looking around with the gamepad left stick (rotate your point of view from left to right and from bottom to top), 3- Select the target object by pointing on it by clicking on the gamepad's "2" button, using the gamepad’s sticks and then the “action” button, 4- Read aloud the caption displayed under the image displayed on the virtual panel in the top left window, 5- The task is now completed; please wait for the usability test moderator indication and then click again on the gamepad’s START button. After the generic goal directed exploration tasks had performed in all five user contexts, the participant was allowed to freely navigate inside the 3DVE, for two minutes, and access abstract information about target ob-jects within the reference 3D scene. At this time, the participant was au-thorized to make oral commentaries and remarks concerning the way he perceives abstract information related to target objects. The usability test monitor did not say anything during this time and took written notes of all the oral commentaries. Then, the whole process started again with the world space abstract information visualization technique. The written instructions given to the participants for the part of experi-ment with world space abstract information visualization technique are as follows: 1- Click on the gamepad's START button (focus on the computer monitor screen and wait for 2 seconds to get teleported to a predefined area in the reference 3D scene), 2- Identify the target object indicated by a red question mark visual clue by looking around with the gamepad left stick (rotate your point of view from left to right and from bottom to top), 3- Look on the ground level and identify the virtual panel next to the tar-get object, select it by clicking on the gamepad's "2" button, using the gamepad’s sticks and then the “action” button, 4- Click on the gamepad's “zoom” button and read aloud the caption dis-played under the image displayed on the virtual panel. 5- The task is now completed; please wait for the usability test moderator indication and then click again on the gamepad’s START button.

101 4. USABILITY TESTING METHODOLOGY
4.6 Usability Metrics and Measurements
4.6.1 Metrics and Measurements for Effectiveness and Efficiency Effectiveness is related to the accuracy and completeness with which the user achieves the tasks. Effectiveness can be measured via the following criteria: task completion rate, frequency of errors, frequency of assists to the participant from the testers, and frequency of accesses to help or do-cumentation by the participants during each task. The task completion rate refers to the percentage of participants who completely and correctly achieve each task. The frequency of errors refers to the number of time where test participants did not complete the task successfully, or had to attempt portions of the task more than once. Efficiency refers to the level of effectiveness achieved to the quantity of resources expended. It can be assessed by the mean time taken to achieve the task. The mean time taken to complete each task should be measured, together with the range and standard deviation of times across partici-pants.
4.6.2 Metrics and Measurements for Satisfaction Satisfaction concerns a user’s subjective response when using the applica-tion. Many questionnaires are available for measuring satisfaction. Lazar and his colleagues (2010) have accomplished a comprehensive review of such questionnaires. The sense of presence is a specific satisfaction factor that should be taken into account in interactive 3DVEs. The Igroup Pres-ence Questionnaire (Appendix C) can be used to evaluate how partici-pants do feel the sense of presence and comfort in using the interactive 3DVE while moving with constrained navigation approach from one user context to another. The Igroup Presence Questionnaire (IPQ, 2008) is a scale for measuring the sense of presence experienced in a virtual envi-ronment. Questions are grouped into three main categories: spatial pres-ence, involvement and experienced realism. It should also be noted that nature of the tasks to be accomplished by usa-bility test participants impacts the selection of appropriate metrics and measurements for evaluating the satisfaction factor. For example, if a specific task implies heavy mental workload on the participants, psycho-logical measures should also be used to measure factors such as heart rate, heart rate variability and galvanic skin response.

102 Abstract Information Visualization in Interactive 3D Virtual Environments: Conceptualization and Usability Evaluation
4.7 Data Collection, Analysis and Presentation
4.7.1 Data Collection and Anaysis Task completion should be recorded manually with a stop watch with the precision of seconds as units. The Usability DataLogger tool (USERFO-CUS, 2010) has been adapted to our specific usability test needs, by pro-gramming specific Visual Basic macros, in order to include the Igroup Presence Questionnaire. The original version of the Usability DataLogger tool includes the System Usability Scale (SUS) and Perceived Ease of Use & Usefulness Scales. The adapted version of the Usability DataLog-ger tool is an organized collection of worksheets contained within a single Microsoft Excel file. Related worksheet tabs with respective descriptions are displayed in Table 9.
Table 9: Usability DataLogger tool: list of worksheets
4.7.2 Data Presentation The responses to the presence questionnaire should be graphically pre-sented in two ways. We should first interpret the overall distribution of responses to each question and then figure out the impact of each partici-pant on the overall responses. To this end, we should use bar charts and radar charts are prepared. Descriptive statistics would provide analytical review besides statistical analysis of task completion time. Furthermore, bar charts should be employed to compare the overall effect of abstract information visualization technique on task completion time. Finally, to analyze the effect of a given abstract information visualization technique on task completion time for each task, we should use box plots.

103 4. USABILITY TESTING METHODOLOGY
4.8 Summary This chapter describes the specific usability testing methodology for mea-suring and comparing the usability of different abstract information visua-lization techniques in interactive 3DVEs. This chapter is structured ac-cording to ISO/IEC 25062:2006 Software engineering also called Soft-ware product Quality Requirements and Evaluation (SQuaRE), Common Industry Format (CIF) for usability test reports. Task completion time and satisfaction scales related to the sense of pres-ence are the performance metrics we will use in our usability tests. Task completion time will be calculated by recording the start time and the stop time for each task. The Igroup Presence Questionnaire (Appendix C) should be used to evaluate how participants do feel present and comforta-ble in using the interactive 3DVE while moving with constrained naviga-tion interactors from one user context to another. The Igroup Presence Questionnaire (IPQ, 2008) is a scale for measuring the sense of presence experienced in a virtual environment. Questions are grouped into three main categories: spatial presence, involvement and experienced realism. In order to screen the potential participants, a sampling frame should be prepared and a pre-questionnaire (Appendix A) for selecting the partici-pants should be administered. This questionnaire includes specific ques-tions to assess factors such as experience with 3D applications and gam-ing experience. Prior to starting the formal usability test, each participant should be given the opportunity to get used to the gamepad, the interactive 3DVE, specific target objects and given abstract information visualization technique by practicing for five minutes. To this end, the first practice phase should take place within a specific area of the reference 3D scene other than the ones used during the formal usability test. After the generic goal directed exploration task has been performed in different user contexts, the partic-ipant should be allowed to freely navigate inside the 3DVE and access abstract information about target objects within the global 3D scene. The output or response variable is the task completion time in seconds. For each usability test session, the input variables are tasks numbered from T1 to Tn and two given abstract information visualization tech-niques. Tasks T1 to Tn refer to the generic goal directed exploration task that should be accomplished by participants in different user contexts and target object contexts. The responses to the presence questionnaire are to be analyzed and graph-ically presented with bar charts and radar charts.

104 Abstract Information Visualization in Interactive 3D Virtual Environments: Conceptualization and Usability Evaluation

105 5. CASE STUDIES: EXPERIMENTATIONS & RESULTS
5. CASE STUDIES: EXPERIMENTATIONS & RESULTS
In this chapter we present the design and the implementation a first expe-riment to evaluate and validate the constrained navigation approach for controlling the navigation skill variable during usability testing in interac-tive 3DVEs. Furthermore, a second experiment was designed and performed in order to validate the conceptual model, toolkit and methodology which go along with the interactive 3DVE for usability testing that we have developed. This was done trough evaluating and comparing the usability of display-ing virtual panels with the VS-Virtual_Panel-KB viewport space tech-nique and the WS-Virtual_Panel-KB world space technique for perform-ing the generic goal directed exploration task in five user contexts.
5.1 Applying the Methodological Approach
5.1.1 Reference 3D Scene After many preliminary experimental evaluations, we have finally de-cided to use a modified version (Figure 84) of the original Karnak temple 3D model in Google SketchUp format, provided online by the Digital Karnak Project (UCLA, 2008) under “Attribution - Non Commercial - Share Alike 2.5 Generic” license. Karnak is one of the largest temple complexes in the world located in Egypt. The Digital Karnak Project 3D model is quite useful for our usability tests as it has relevant geometrical complexity which can provide a wide range of user contexts and target object contexts.
Figure 84: Karnak temple 3D model with modifications

106 Abstract Information Visualization in Interactive 3D Virtual Environments: Conceptualization and Usability Evaluation
5.1.2 Related Abstract Information Structured abstract information about different elements and parts of the Karnak temple is also provided by the Digital Karnak Project online arc-hive (UCLA, 2008). The information items published in the online arc-hive are organized in different ways: by chronology, by type, by feature and by topic. The types of contents included in the archive are: text and image (Figures 85). The textual information includes archeological and historical descriptions about the objects and indications about the bio-graphical sources used for the 3D model construction. The images illu-strate 2D views of the 3D renderings of the objects or selected photos of the existing state of the object. For the purpose of this research, we have selected text and image information in relation to five obelisks located in different places on the 3D scene.
Figure 85: Text and images concerning Obelisk Unique
Then, we have graphically represented this textual and image information in form of virtual panels for each obelisk (Figure 86). A total of five vir-tual panels have been created; one for each target obelisk.
Figure 86: Virtual panel about Obelisk Unique

107 5. CASE STUDIES: EXPERIMENTATIONS & RESULTS
5.1.3 User Contexts and Target Object Contexts We have selected five user contexts in relation to target objects which are obelisks located in different areas of the 3D scene. The target objects are five obelisks which are identified by red questions marks visual clues. Each obelisk has a square base with 4.40 meters side and a total height of 31.00 meters. In the first user context, the user is positioned in front of an array of col-umns and the target object is located in a closed space, without roof, with a single doorway entrance. The position, initial orientation and initial viewpoint of the user, in the first user context, are shown in Figures 87 and 88. In all user contexts, the user can control the viewpoint but cannot ma-noeuvrate as the navigation space is limited to a point. In the first user context, the initial point of view doesn’t include the red question mark visual clue and includes parts of the related target object.
Figure 87: Initial position and orientation in the 1st user context

108 Abstract Information Visualization in Interactive 3D Virtual Environments: Conceptualization and Usability Evaluation
Figure 88: Initial viewpoint of the user in the 1st user context
In the second user context, the user is positioned just before a doorway which leads to a corridor leading to a second corridor and the target object is located fare away in the background. The initial position, initial orienta-tion and initial viewpoint of the user, in the second user context, are shown in Figures 89 and 90. The initial point of view includes red ques-tion mark visual clue and the related target object.
Figure 89: Initial position and orientation in the 2nd user context

109 5. CASE STUDIES: EXPERIMENTATIONS & RESULTS
Figure 90: Initial viewpoint of the user in the 2nd user context
In the third user context, the user is positioned right at the corner intersec-tion of two walls and the target object is located in the background at the end of a corridor. The initial position, initial orientation and initial view-point of the user, in the third user context, are shown in Figures 91 and 92. The initial point of view includes red question mark visual clue and the related target object.
Figure 91: Initial position and orientation in the 3rd user context

110 Abstract Information Visualization in Interactive 3D Virtual Environments: Conceptualization and Usability Evaluation
Figure 92: Initial viewpoint of the user in the 3rd user context
In the fourth user context, the user is positioned in open space without any geometrical constrains in his immediate neighborhood and the target object, partly occluded by three arrays of columns, is located between the third and fourth array of columns. The initial position, initial orientation and initial viewpoint of the user, in the third user context, are shown in Figures 93 and 94. The initial point of view neither includes the red ques-tion mark visual clue nor the related target object.
Figure 93: Initial position and orientation in the 4th user context

111 5. CASE STUDIES: EXPERIMENTATIONS & RESULTS
Figure 94: Initial viewpoint of the user in the 4th user context
In the fifth user context, the user in on the roof of a temple in front of two obelisks, which are only partly visible, and the target object is the second obelisk in the background. The initial position, initial orientation and ini-tial viewpoint of the user, in the third user context, are shown in Figures 95 and 96. The initial point of view doesn’t include the red question mark visual clue and includes parts of the related target object.
Figure 95: Initial position and orientation in the 5th user context

112 Abstract Information Visualization in Interactive 3D Virtual Environments: Conceptualization and Usability Evaluation
Figure 96: Initial viewpoint of the user in the 5th user context
5.1.4 Type of Tasks The generic task that we consider in our case studies and experimenta-tions is goal directed exploration. This generic task is composed of an object-pointing task for target object selection and then information ac-quisition trough abstract information visualization. The generic task is explained in Figure 97.
Figure 97: Goal directed exploration generic task
In order to do so, we adopt the following configuration: discrete target specification and primed search. The user should thus specify the goal of the movement and the system should move the user to a specific location in some way. In this way the user’s navigation skill variable will not in-fluence the task completion time as locomotion is done the system. This is

113 5. CASE STUDIES: EXPERIMENTATIONS & RESULTS
a fundamental concern with regards to the navigation problems in interac-tive 3DVEs that we discussed in Section 2.3.1. Once the user is positioned a specific location, he or she should start the primed search task. This implies that the user must have a priori know-ledge about the type of target object to point at and select. Then, the user must position and orient his viewpoint according to a predefined user guideline. The user guideline is rotating the viewpoint in the same direc-tion all the time. Once the target object is selected, abstract information related to it is displayed according to a type of information visualization technique. The generic task must be performed in different user contexts in relation to different target objects. The target objects are identified by visual clues such as red question marks. As presented in Section 3.3.3, we have pro-grammed a gamepad and used it as input device for our interactive 3DVE prototype. When a user presses the START button on the gamepad, the system will move her or him to the first user context in the 3D scene. Once the user is positioned at a specific location, he or she must position and orient his viewpoint according to a predefined user guideline. The user guideline is rotating the viewpoint from left to right. Once the target object is fined and selected, abstract information related to it is displayed according to a type of information visualization technique. Once the virtual panel is dis-played, the participant must read out the caption text under the image. Then, the user presses the START button again and gets positioned at the second user context and so on until reaching the final user context.
5.1.5 Abstract Information Visualization Techniques We have used two abstract information visualization techniques for aug-menting interactive 3DVEs with each of the five virtual panels: WS-Virtual_Panel-KB (WS-VP-KB) and VS-Virtual_Panel-KB (VS-VP-KB) techniques. The related implementation of these techniques in form of reusable SketchUp DCs has been presented in Section 3.2.5. The related DCs are shown in the Components Window (Figures 98 and 99). The DCs can be imported and positioned in any 3D scene via drag and drop by using the Components Window (Figures 100 and 101).

114 Abstract Information Visualization in Interactive 3D Virtual Environments: Conceptualization and Usability Evaluation
Figure 98: VS-VP-KB reusable DCs
Figure 99 : WS-VP-KB reusable
DCs
Figure 100: Using the WS-VP-KB technique DCs to augment the 3DVE
Figure 101: Using the VS-VP-KB technique DCs to augment the 3DVE
The display of virtual panels with the WS-VP-KB technique and the VS-VP-KB technique abstract information visualization techniques in the five different user contexts are shown in Appendix D. In the rest of this thesis, we will denominate the WS-VP-KB technique as World Space technique and the VS-VP-KB technique as Viewport Space technique.

115 5. CASE STUDIES: EXPERIMENTATIONS & RESULTS
5.2 Applying the Usability Testing Methodology
5.2.1 Setup We have used the University of Genava’s usability lab testing room for conducting the usability testing evaluations. The room has now window, and is totally isolated, there is no way that participants get distracted by outside factors. Concerning the technological setup, we used a Dell XPS M1330 notebook running on Windows XP Pro SP3 operating system with Intel Core 2 Duo CPU (T5450 @ 1.66 GHz, 2.00 GB of RAM) and NVIDA GeForce 8400M GS graphic card connected to an external 2007FPb Dell Monitor (Figure 102). We also used a Saitek P380 Dual Analog Pad as input de-vice. The participant was sitting on a chair, behind a computer desk, with the gamepad in his hands and had to look at the external dell monitor (Figures 103).
Figure 102: General setting of the usability testing room

116 Abstract Information Visualization in Interactive 3D Virtual Environments: Conceptualization and Usability Evaluation
Figure 103: Monitor and participant during the usability testing session
5.2.2 Participants In order to screen the potential participants, as mentioned previously, we have designed a pre-questionnaire for selecting the participants from the sampling frame. The pre-questionnaire included specific questions to as-sess the above mentioned factors (Appendix A). This pre-questionnaire had been published on the main student employment portal of the Univer-sity of Geneva and our personal homepage. We collected 95 completed pre-questionnaires which formed the sam-pling frame. Based on this, we ended up selecting fourteen participants according to the sampling protocol described in Section 4.2. All partici-pants had the practice of using a desktop computer everyday for at least word processing applications and Internet browsing. The data collected from the participants indicated that they learn new application either ra-pidly or very rapidly. Background data, demographic information on par-ticipants and responses to 3D specific questions are given in Table 10. None of the participants used 3D modeling and authoring software appli-cations such as Autodesk 3ds Max, Blender, Director, Maya, 3DVIA Vir-tools or SketchUp. Half of the participants played 3D video games once a month. Participants who played 3D video games didn’t use interactive 3DVEs or augmented reality applications.

117 5. CASE STUDIES: EXPERIMENTATIONS & RESULTS
Table 10: Participants profile and main characteristics
5.2.3 Tasks The generic task designed to be accomplished in this experiment was goal directed exploration. This generic task is composed of an object-pointing task for target object selection and then information acquisition trough abstract information visualization. The target objects are obelisks that are located in different areas of the 3D scene. Each obelisk is identified by a red question mark visual clue. The generic task has to be performed in the five different areas. The written instructions given to the participants for the part of experiment with viewport space abstract information visualiza-tion technique are as follows: 1- Click on the gamepad's START button (focus on the computer monitor screen and wait for 2 seconds to get teleported to a predefined area in the reference 3D scene), 2- Identify the target obelisk indicated by a red question mark visual clue by looking around with the gamepad left stick (rotate your point of view from left to right and from bottom to top), 3- Select the target obelisk by pointing on it by clicking on the gamepad's "2" button, using the gamepad’s sticks and then the “action” button, 4- Read aloud the caption displayed under the image displayed on the virtual panel in the top left window, 5- The task is now completed; please wait for the usability test moderator indication and then click again on the gamepad’s START button. After the generic goal directed exploration tasks had performed in all five user contexts, the participant was allowed to freely navigate inside the
Participant Gender Age Faculty Level 3D soft. usage 3D game usage Frequency 3DVE usageP1 M 20 Literature B.Sc. No Yes 1 x Month NoP2 F 20 Economy B.Sc. No No NoP3 M 31 Geography M.Sc. No No 1 x Month NoP4 F 19 Law B.Sc. No No NoP5 M 28 Law Ph.D. No No NoP6 M 30 Economy Ph.D. No No NoP7 F 20 Sociology B.Sc. No Yes 1 x Month NoP8 F 21 Politics B.Sc. No No NoP9 M 26 Medecine B.Sc. No Yes 1 x Month No
P10 F 23 Psychology B.Sc. No No NoP11 F 23 Translation M.Sc. No Yes 1 x Month NoP12 F 23 Economy B.Sc. No Yes 1 x Month NoP13 M 28 Informatics Ph.D. No No NoP14 M 20 Economy B.Sc. No Yes 1 x Month No

118 Abstract Information Visualization in Interactive 3D Virtual Environments: Conceptualization and Usability Evaluation
3DVE, for two minutes, and access abstract information about target ob-jects within the global 3D scene. At this time, the participant was autho-rized to make oral commentaries and remarks concerning the way he perceives abstract information related to target objects. The usability test monitor did not say anything during this time and took written notes of all the oral commentaries. Then, the whole process started again with the world space abstract information visualization technique. The written instructions for the experiment with world space abstract information vi-sualization technique are as follows: 1- Click on the gamepad's START button (focus on the computer monitor screen and wait for 2 seconds to get teleported to a predefined area in the reference 3D scene), 2- Identify the target obelisk indicated by a red question mark visual clue by looking around with the gamepad left stick (rotate your point of view from left to right and from bottom to top), 3- Look on the ground level and identify the virtual panel next to the tar-get obelisk, select it by clicking on the gamepad's "2" button, using the gamepad’s sticks and then the “action” button, 4- Click on the gamepad's “zoom” button and read aloud the caption dis-played under the image displayed on the virtual panel. 5- The task is now completed; please wait for the usability test moderator indication and then click again on the gamepad’s START button.
5.2.4 Experimental Design Our objective is to construct an experimental design in order to compare the usability of each technique for performing each task. We can now answer the two fundamental questions formulated in Section 4.4.1: - We want to investigate two independent variables: abstract informa-
tion visualization technique and task, - The abstract information visualization technique variable has two val-
ues and the task variable has five values. Therefore, based on the previous theoretical considerations, a two within-subject repeated measures design is the experimental design that meets our needs. In this use case, the counterbalancing of task order for fourteen participants, five tasks and two techniques is shown in Table 11.

119 5. CASE STUDIES: EXPERIMENTATIONS & RESULTS
Table 11: Counterbalancing of task order for fourteen participants, five tasks and two techniques
5.2.5 Method and Procedure After being welcomed by the usability test moderator, the participant re-ceived an information sheet explaining the project and a consent form (Appendix B) to read and sign. Then the participant was given written instructions of how to use the gamepad to perform the tasks. Prior to starting the formal usability test, each participant practiced for ten minutes in a sub-space of the main interactive 3DVE which was not used during the actual test. At the end of the practice period, the participant clicked on the gamepad’s START button and the monitor started the ti-mer. The monitor ended the timer when the participant ended reading aloud the caption under an image related to a specific obelisk. The tasks order was randomized and prerecorded according to Table 11. This means that when the participant clicked on the START button he got teleported to a specific location in the 3DVE and started the related task. For example, participant P1 first started with the world space technique and Task 2 which corresponds to the generic goal oriented exploration task accomplished in the second user context. Then, after completing Task 2, he would automatically continue with the world space technique and Task 3 which corresponds to the generic goal oriented exploration task accomplished in the third user context. Then, this process automati-cally went on in order to complete Task 1, Task 4 and Task 5 with the

120 Abstract Information Visualization in Interactive 3D Virtual Environments: Conceptualization and Usability Evaluation
world space technique. The same procedure continued with Task 1, Task 4, Task 2, Task 3 and Task 5 with the viewport space technique. After finishing the five tasks with one technique, each participant re-ceived instruction to freely navigate within the 3DVE and interact with obelisks or related information panels. At this time, the participant could make oral commentaries and remarks concerning the way he perceives the abstract information that are displayed in relation to obelisks. Then, the whole process started again with the second technique this time. At the end, each participant received a presence questionnaire. Presence can be understood as the user’s subjective experience of being virtual present in a 3DVE when being actually physically located in another en-vironment. In relation to usability, the efficiency and effectiveness of in-teractive 3DVEs is often measured by the feeling of presence the partici-pant is sensing. The presence questionnaire that we have selected is the Igroup Presence Questionnaire (Appendix C1) is provided by the Igroup Consortium (IPQ, 2008).
5.2.6 Measurements and Data Collection Task completion time was recorded manually with a stop watch with the precision of seconds as units. The Usability DataLogger tool (USERFO-CUS, 2010) has been adapted to our specific usability test needs, by pro-gramming specific Visual Basic macros, in order to include the Igroup Presence Questionnaire. The responses to the presence questionnaire were graphically presented in two ways. We first interpreted the overall responses to each question and then figure out the impact of each participant on the overall responses. To this end, we used bar charts and radar charts are prepared. Descriptive statistics were provided for analytical review besides statis-tical analysis of task completion time. Furthermore, bar charts were em-ployed to compare the overall effect of abstract information visualization technique on task completion time. Finally, to analyze the effect of a giv-en abstract information visualization technique on task completion time for each task, we used box plots.

121 5. CASE STUDIES: EXPERIMENTATIONS & RESULTS
5.3 Experiment 1: Effect of Constrained Navigation Approach
5.3.1 Objective: Impact of Constrained Navigation on Presence In order to control the navigation skill variable, which undoubtedly af-fects the usability tests, we have designed a constrained navigation scena-rio which teleports the users from the first user context to the second user context and so on, towards the fifth user context. The constrained navigation interactors presented in Section 3.3.2 have not been used in this experiment as the five user contexts are five single point locations in different areas of the 3D scene (Figure 104).
Figure 104: Initial positions and field of views for all the five user con-
texts We have used the simplest configuration for our usability tests which is teleporting the user from one single point location on the terrain to anoth-er single point location. Once the user arrived in a predefined location, he began maneuvering by looking around in order to select and interacts with objects located in the 3D scene. In this case the user could not move around by navigating in order to freely explore the 3DVE. This was quite useful as the time on task that we measured was not affected by the user’s navigation skill. This should be quite different between experienced and inexperienced users. As mentioned previously, the Igroup Presence Questionnaire (IPQ) (Ap-pendix C) was used to evaluate how participants do feel present and com-fortable in using the interactive 3DVE while moving with constrained navigation interactors from one user context to another.

122 Abstract Information Visualization in Interactive 3D Virtual Environments: Conceptualization and Usability Evaluation
5.3.2 Results and Descriptive Statistics Raw qualitative data (Tables 12, 13, 14) was collected from the responses to the IPQ presence questionnaire (Appendix C) and analyzed for varia-tions within participants for the overall distribution of responses (Figures 105, 108, 110) and between them for the individual distribution of res-ponses (Figures 106, 107, 109, 111). Questions were answered based on a Likert scale ranging from 1 (fully disagree) to 7 (fully agree). Table 12: Raw data on responses to the IPQ (Spatial Presence Questions)
Figure 105: Overall responses to the IPQ (Spatial Presence) [n=14]
Participant G1 SP1 SP2 SP3 SP4 SP5P1 6 5 2 2 7 6P2 6 7 2 2 6 6P3 6 6 1 1 7 6P4 5 6 2 3 5 7P5 7 7 3 4 7 7P6 5 6 4 2 6 4P7 5 5 2 2 6 6P8 3 6 3 2 6 5P9 7 7 1 4 6 6
P10 6 6 4 3 4 5P11 4 4 3 3 5 4P12 6 7 2 4 6 6P13 7 7 2 2 7 7P14 5 5 2 3 5 5
Presence Questionnaire (Spatial Presence Questions)

123 5. CASE STUDIES: EXPERIMENTATIONS & RESULTS
IPQ General Question (G1): I had a sense of “being there” in the com-puter generated world. Participants were asked whether they had a sense of “being there” in the computer generated world. The sense of “being there” refers to the sense we develop when working or playing within interactive 3DVEs by travel-ing through them and interacting with virtual objects (Schubert et al., 2001). This definition of the concept of “being there” was also provided to participants in written before they would start to respond to the IPQ. Schubert and his colleagues (2001) has conducted case studies which con-firmed that the sense en presence involves at least two components. The first component refers to the sense that we are located in and act from within the 3DVE. The second component refers to the sense that we are concentrating on the 3DVE and ignore the real environment. As shown in Figure 105, overall 86 % of the participants either fully agreed, strongly agreed or moderately agreed that they had a sense of “be-ing there”. The participants’ individual responses to the first general ques-tion are shown in Figure 106. Participant P8 moderately disagreed that she had a sense of “being there”. Participant P11 also neither agreed nor disagreed the he had a sense of “being there”.
Figure 106: Individual responses to the IPQ (Spatial Presence - General
Question) [n=14]

124 Abstract Information Visualization in Interactive 3D Virtual Environments: Conceptualization and Usability Evaluation
Spatial Presence Questions (SP1 - SP5) Five questions were related to spatial presence. As shown in Figure 105, about 93 % of participants, either fully agreed, strongly agreed or mod-erately agreed that they somehow felt that the virtual world surrounded them. The participants’ individual responses to the questions concerning spatial presence are shown in Figure 107. Participant P6 neither agreed nor disagreed that they somehow felt that the virtual world surrounded them. About 86 % of participants either fully disagreed, strongly disa-greed or moderately disagreed while asked whether they felt like they were perceiving pictures. Two participants (14 %), P6 and P10, neither agreed no disagreed with it. When asked whether they did not feel present in the virtual space, 78.5 % of participants either fully disagreed, strongly disagreed or moderately disagreed with it. About 21.5 % of participants neither disagreed nor agreed with not feeling present on the virtual space. About 93 % of participants either fully agreed, strongly agreed or mod-erately agreed with the sense of acting in the virtual space, rather than operating something from outside. However, participant P10 neither agreed no disagreed with it. Most importantly, 85.7 % of participants ei-ther fully agreed, strongly agreed or moderately agreed with filling them-selves present in the virtual space. However, two participants (14.3 %), P6 and P11, neither agreed nor disagreed with filling themselves present in the virtual space.
Figure 107: Individual responses to the IPQ (Spatial Presence) [n=14]
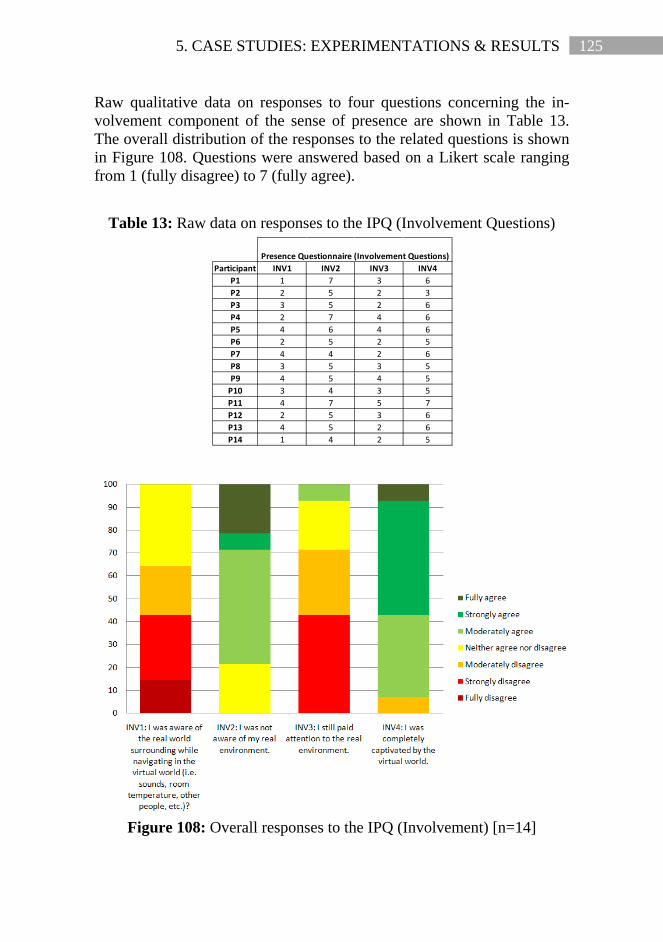
125 5. CASE STUDIES: EXPERIMENTATIONS & RESULTS
Raw qualitative data on responses to four questions concerning the in-volvement component of the sense of presence are shown in Table 13. The overall distribution of the responses to the related questions is shown in Figure 108. Questions were answered based on a Likert scale ranging from 1 (fully disagree) to 7 (fully agree).
Table 13: Raw data on responses to the IPQ (Involvement Questions)
Figure 108: Overall responses to the IPQ (Involvement) [n=14]
Participant INV1 INV2 INV3 INV4P1 1 7 3 6P2 2 5 2 3P3 3 5 2 6P4 2 7 4 6P5 4 6 4 6P6 2 5 2 5P7 4 4 2 6P8 3 5 3 5P9 4 5 4 5
P10 3 4 3 5P11 4 7 5 7P12 2 5 3 6P13 4 5 2 6P14 1 4 2 5
Presence Questionnaire (Involvement Questions)

126 Abstract Information Visualization in Interactive 3D Virtual Environments: Conceptualization and Usability Evaluation
Involvement Questions (INV1 - INV4) Four questions were related to involvement component of the senses of presence. The participants’ individual responses to the questions related to involvement are presented in Figure 109. When participants were asked whether they were aware of the real sur-rounding while navigating in the virtual world, the spectrum of responses covered half of the entire response availability range from neither agree or disagree to fully disagree. About 78.5 % of participants either fully agreed, strongly agreed or moderately agreed that they were not aware of their real environment. Three participants (21.5 %), P7, P10 and P14, neither agreed nor disagreed with it. However, when asked whether they still paid attention to the real environment, 78.5 % of participants either strongly disagreed or moderately disagreed. Three participants (21.5 %), P4, P5 and P9, neither agreed nor disagreed with the fact that they still paid attention to the real environment. But, it would be noted that 86 % of participants either strongly agreed or moderately agreed that they were captivated by the virtual world. However, one participant, P11, fully agreed and one other participant, P2, moderately disagreed with being captivated by the virtual world.
Figure 109: Individual responses to the IPQ (Involvement)

127 5. CASE STUDIES: EXPERIMENTATIONS & RESULTS
Raw qualitative data on responses to three questions concerning the ex-pected realism are shown in Table 14. The overall distribution of the res-ponses to the related questions is shown in Figure 110. Questions were answered based on a Likert scale ranging from 1 (fully disagree) to 7 (ful-ly agree).
Table 14: Raw data on responses to the IPQ (Experienced Realism)
Figure 110: Overall responses to the IPQ (Experienced Realism) [n=14]
Participant REAL1 REAL2 REAL3P1 5 4 1P2 4 4 1P3 6 5 2P4 7 4 3P5 4 4 3P6 5 4 2P7 5 4 1P8 4 5 2P9 5 4 3P10 3 4 1P11 4 5 2P12 3 4 1P13 5 4 3P14 4 4 2
Presence Questionnaire (Experienced Realism Questions)

128 Abstract Information Visualization in Interactive 3D Virtual Environments: Conceptualization and Usability Evaluation
Experienced Realism Questions (REAL1 - REAL3) There were three questions that evaluated participants overall feeling to-wards experienced realism. The participants’ individual responses to the questions related to expected realism are presented in Figure 111. When asked whether the virtual world seemed real to them, half of the participants agreed and the other half neither agreed nor disagreed or moderately disagreed. Participant P3 strongly agreed that the virtual world seemed real to him and participant P4 strongly agreed that the vir-tual world seemed real to her. However, about 78.5 % of the participants neither agreed nor disagreed that their experience seemed consistent with their real world experience. In fact, the REAL2 question was not unders-tood by most of the participants even after they requested the monitor for more explanations. The main raison for this misunderstanding might be linked with the unclear meaning of the following expression in the REAL2 question: “…seem consistent with…”. When participants were asked whether the virtual world seemed more realistic than the real world, about 36 % either fully disagreed, about 36 % strongly disagreed and about 28 % moderately disagreed.
Figure 111: Individual responses to the IPQ (Experienced Realism)
129 5. CASE STUDIES: EXPERIMENTATIONS & RESULTS
5.3.3 Discussions This experiment was designed to evaluate and validate the constrained navigation approach for controlling or the navigation skill variable during usability testing in interactive 3DVEs. The Igroup Presence Questionnaire (IPQ) (Appendix C) has been used to evaluate how participants do feel present and comfortable in using the interactive 3DVE while moving with constrained navigation approach from one user context to another. This questionnaire is composed of a general question about the sense of “being there” followed by questions which can be grouped in three categories: spatial presence, involvement and experienced realism. In response to the first question, 86 % of the participants either fully agreed, strongly agreed or moderately agreed that they had a sense of “be-ing there”. In relation to spatial presence, about 93 % of participants, either fully agreed, strongly agreed or moderately agreed that the somehow felt that the virtual world surrounded them. About 86 % of participants either fully disagreed, strongly disagreed or moderately disagreed while asked wheth-er they felt like they were perceiving pictures. About 93 % of participants also either fully agreed, strongly agreed or moderately agreed with the sense of acting in the virtual space, rather than operating something from outside. Most importantly, about 85.7 % of participants either fully agreed, strongly agreed or moderately agreed with filling themselves present in the virtual space. The responses to the questions concerning the level of involvement indi-cate that about 78.5 % of the participants either fully agreed or moderate-ly agreed that they were not aware of their real environment. When asked whether they still paid attention to the real environment, 78.5 % of the participants either strongly disagreed or moderately disagreed. About 86 % of the participants also either strongly agreed or moderately agreed that they were captivated by the virtual world. When asked whether the virtual world seemed real, half of the partici-pants agreed and the other half neither agreed nor disagreed or moderately disagreed. However, about 78.5 % of the participants neither agreed nor disagreed that their experience seemed consistent with their real world experience. In fact, the question asking whether their experience seemed consistent with their real world experience was not understood by most of the participants. When asked whether the virtual world seemed more rea-

130 Abstract Information Visualization in Interactive 3D Virtual Environments: Conceptualization and Usability Evaluation
listic than the real world, about 36 % either fully disagreed, about 36 % strongly disagreed and about 28 % moderately disagreed. The most important finding is clear evidence that the sense of presence, which is a specific satisfaction factor in interactive 3DVEs, is not signifi-cantly affected by the constrained navigation approach during the usabili-ty testing session. The results also suggest that it is possible to control the navigation skill variable across and between participants during the usa-bility testing session.

131 5. CASE STUDIES: EXPERIMENTATIONS & RESULTS
5.4 Experiment 2: Comparison of Two Visualization Techniques
5.4.1 Objective: Comparison of WS-KB and VS-KB Techniques The objective of this experiment is to compare the usability of the WS-Virtual_Panel-KB (WS-KB) and VS-Virtual_Panel-KB (VS-KB) abstract information visualization techniques. We used the constrained navigation scenario which teleports the users from one user context to another as described in the previous experiment. The constrained navigation interac-tors presented in Section 3.3.2 have not been used in this experiment as the participants did not have to navigate in the 3D scene (Figure 112).
Figure 112: Initial positions and orientation for all the five user contexts
We have used the simplest configuration for our usability tests which is teleporting the user from one user context to another. Once the user ar-rived in a user context, he had to accomplish the goal directed exploration task. This task is composed of an object-pointing task for target object selection and then information acquisition trough abstract information visualization. The target objects are predefined obelisks that are located in different areas of the 3D scene. Each obelisk is identified by a red ques-tion mark visual clue. The generic goal oriented exploration task had to be performed in the five different user contexts. The user had to identify the target obelisk indicated by a red question mark visual clue by reading aloud the caption displayed under the image displayed on the related vir-tual panel.

132 Abstract Information Visualization in Interactive 3D Virtual Environments: Conceptualization and Usability Evaluation
5.4.2 Results and Descriptive Statistics Raw quantitative data on task completion time for each task and each ab-stract information visualization technique is presented in Tables 15.
Table 15: Task completion time (sec) for each task with each technique
Descriptive statistics are presented in Table 16. Then, the effect of each abstract information visualization technique on task completion time is analyzed in Figures 113 to 121. The underlying statistics are also pre-sented in Tables 16 to 21.
Table 16: Descriptive statistics for task completion time (sec) for each
task with each technique
The overall effect of WS-Virtual_Panel-KB (World Space) and VS-Virtual_Panel-KB (Viewport Space) abstract information visualization
Task 1 Task 2 Task 3 Task 4 Task 5 Task 1 Task 2 Task 3 Task 4 Task 512 10 12 16 18 10 10 7 11 1214 11 10 17 22 13 13 10 18 1827 17 15 27 18 16 15 8 18 1127 17 15 27 18 16 15 8 18 1116 12 14 23 19 18 13 11 18 1527 17 14 21 26 20 10 9 14 1513 11 9 15 15 15 11 12 11 1716 9 12 21 19 19 12 9 24 1114 11 11 14 17 9 8 8 16 1323 11 13 20 24 15 9 10 14 1520 18 14 13 26 16 10 10 13 2115 11 14 21 20 26 14 13 15 1725 10 8 12 13 14 9 8 12 13
P13P14
P5P6P7P8P9
P10
WS-Virtual_Panel-KB (World Space) Technique
P11P12
VS-Virtual_Panel-KB (Viewport Space) Technique
P1P3P4
Participant
Task 1 Task 2 Task 3 Task 4 Task 5 Task 1 Task 2 Task 3 Task 4 Task 5Mean 19.78571 12.5 12.28571 18.92857 19.64286 15.64286 11.21429 9.285714 15.42857 14.42857Standard Error 1.634715 0.856456 0.596957 1.277292 1.014224 1.156003 0.656151 0.485262 0.947607 0.803251Median 18 11 12.5 19 19 15.5 10.5 9 14.5 14Mode 27 11 14 21 18 16 10 8 18 13Standard Deviation 6.116542 3.204564 2.233609 4.77919 3.794878 4.325366 2.455091 1.815683 3.545621 3.005489Sample Variance 37.41209 10.26923 4.989011 22.84066 14.4011 18.70879 6.027473 3.296703 12.57143 9.032967Kurtosis -1.87398 -1.01188 -0.74316 -0.72665 -0.21742 1.480119 -1.28149 -0.24267 1.213624 0.024316Skewness 0.182676 0.908115 -0.56308 0.322795 0.302522 0.776555 0.29407 0.673759 0.927718 0.726975Range 16 9 7 15 13 17 7 6 13 10Minimum 12 9 8 12 13 9 8 7 11 11Maximum 28 18 15 27 26 26 15 13 24 21Sum 277 175 172 265 275 219 157 130 216 202Count 14 14 14 14 14 14 14 14 14 14Confidence Level(95.0%) 3.531586 1.85026 1.289648 2.759422 2.191097 2.497392 1.417527 1.048344 2.047181 1.735318
VS-Virtual_Panel-KB (Viewport Space) TechniqueWS-Virtual_Panel-KB (World Space) Technique

133 5. CASE STUDIES: EXPERIMENTATIONS & RESULTS
techniques on task completion time (sec) for Task 1 to 5 is shown in Fig-ure 113.
Figure 113: Effect of visualization technique on task completion time
(sec) for Task 1 to 5 (Mean time)
Figure 114: Effect of visualization technique on task completion time
(sec) for Task 1 to 5 (Mean time)

134 Abstract Information Visualization in Interactive 3D Virtual Environments: Conceptualization and Usability Evaluation
Figure 115: Effect of visualization technique on task completion time
(sec) for Task 1 to 5 (Median time)
Figure 116: Effect of visualization technique on task completion time
(sec) for Task 1 to 5 (Geometrical mean time) Descriptive statistics for evaluating the effect of abstract information vi-sualization technique on task completion time for Task 1 are presented in Tables 17. The effect of abstract information visualization technique on task completion time for Task 1 is shown in Figure 117.

135 5. CASE STUDIES: EXPERIMENTATIONS & RESULTS
Table 17: Statistics for evaluating the effect of visualization technique on task completion time (sec) for Task 1
Figure 117: Effect of visualization technique on task completion time
(sec) for Task 1
As explained in Section 5.1.4, the generic task is first object-pointing for target object selection and then information acquisition trough abstract information visualization. Task 1 consisted in performing the generic task in the first user context as described in Section 5.1.3. The mean time for Task 1 using world space technique was 19.79 seconds (sec) compared to 15.64 sec using the viewport space technique. There was greater variabili-ty in task completion time with world space technique (world space tech-nique standard deviation = 6.12; viewport space technique standard devia-tion = 4.32). Overall, the time to complete Task 1, while using the view-port space technique, was significantly less than using the world space technique. This result can be explained by the fact the participants using the world space technique had to orient their view for the top of the ob-elisk to the ground before selecting the virtual panel. Whereas participants
min q1 median q3 max mean standard deviationWorld Space Technique 12 14.25 18 26.5 28 19.79 6.12Viewport Space Technique 9 13.25 15.5 17.5 26 15.64 4.32
Statistic
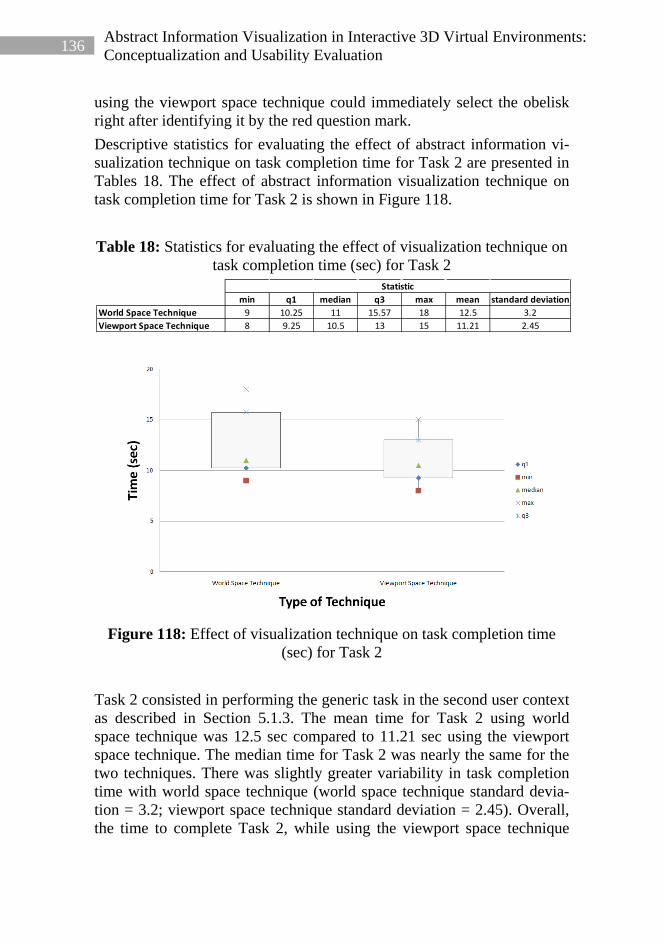
136 Abstract Information Visualization in Interactive 3D Virtual Environments: Conceptualization and Usability Evaluation
using the viewport space technique could immediately select the obelisk right after identifying it by the red question mark. Descriptive statistics for evaluating the effect of abstract information vi-sualization technique on task completion time for Task 2 are presented in Tables 18. The effect of abstract information visualization technique on task completion time for Task 2 is shown in Figure 118. Table 18: Statistics for evaluating the effect of visualization technique on
task completion time (sec) for Task 2
Figure 118: Effect of visualization technique on task completion time
(sec) for Task 2 Task 2 consisted in performing the generic task in the second user context as described in Section 5.1.3. The mean time for Task 2 using world space technique was 12.5 sec compared to 11.21 sec using the viewport space technique. The median time for Task 2 was nearly the same for the two techniques. There was slightly greater variability in task completion time with world space technique (world space technique standard devia-tion = 3.2; viewport space technique standard deviation = 2.45). Overall, the time to complete Task 2, while using the viewport space technique
min q1 median q3 max mean standard deviationWorld Space Technique 9 10.25 11 15.57 18 12.5 3.2Viewport Space Technique 8 9.25 10.5 13 15 11.21 2.45
Statistic

137 5. CASE STUDIES: EXPERIMENTATIONS & RESULTS
was not significantly different than using the world space technique. This result can be explained by the fact that width of the obelisk is nearly equal to the width of the virtual panel in this user context. This result is consis-tent with, Grossman and Balakrishnan (2004). They have also introduced and validated a variant of Fitts’ law (1954) that models pointing to 3D targets in 3DVEs. They have investigated how 3D target object dimen-sions, movement angles, and their interactions affect selection perfor-mance in a 3DVEs. Their experimental results indicate that the 3D object target width is more critical than its height and depth. Descriptive statistics for evaluating the effect of abstract information vi-sualization technique on task completion time for Task 3 are presented in Tables 19. The effect of abstract information visualization technique on task completion time for Task 3 is shown in Figure 119. Table 19: Statistics for evaluating the effect of visualization technique on
task completion time (sec) for Task 3
Figure 119: Effect of visualization technique on task completion time
(sec) for Task 3 Task 3 consisted in performing the generic task in the third user context as described in Section 5.1.3. The mean time for Task 3 using world
min q1 median q3 max mean standard deviationWorld Space Technique 8 11 12.5 14 15 12.28 2.23Viewport Space Technique 7 8 9 10 13 9.28 1.81
Statistic

138 Abstract Information Visualization in Interactive 3D Virtual Environments: Conceptualization and Usability Evaluation
space technique was 12.28 sec compared to 9.28 sec using the viewport space technique. The median time for Task 3 using world space technique was 12.5 sec compared to 9 sec using the viewport space technique. There was greater variability in task completion time with world space tech-nique (world space technique standard deviation = 2.23; viewport space technique standard deviation = 1.81). Overall, the time to complete Task 3, while using the viewport space technique, was significantly less than using the world space technique. Descriptive statistics for evaluating the effect of abstract information vi-sualization techniques on task completion time for Task 4 are presented in Tables 20. The effect of abstract information visualization technique on task completion time for Task 4 is shown in Figure 120.
Table 20: Statistics for evaluating the effect of visualization technique on task completion time (sec) for Task 4
Figure 120: Effect of visualization technique on task completion time
(sec) for Task 4
min q1 median q3 max mean standard deviationWorld Space Technique 12 15.25 19 21 27 18.93 4.78Viewport Space Technique 11 13.25 14.5 21 27 15.43 3.54
Statistic

139 5. CASE STUDIES: EXPERIMENTATIONS & RESULTS
Task 4 consisted in performing the generic task in the fourth user context as described in Section 5.1.3. The mean time for Task 4 using world space technique was 18.93 sec compared to 15.43 sec using the viewport space technique. The median time for Task 4 using world space technique was 19 sec compared to 14.5 sec using the viewport space technique. There was greater variability in task completion time with world space technique (world space technique standard deviation = 4.78; viewport space technique standard deviation = 3.54). Overall, the time to complete Task 4 while using the viewport space technique was significantly less than using the world space technique. This result can be explained by the fact the participants using the world space technique had to orient their view for the top of the obelisk to the ground before selecting the related virtual panel. Whereas participants using the viewport space technique could immediately select the obelisk right after identifying it by the red question mark. Descriptive statistics for evaluating the effect of abstract information vi-sualization techniques on task completion time for Task 5 are presented in Tables 21. The effect of abstract information visualization technique on task completion time for Task 5 is shown in Figure 121. Table 21: Statistics for evaluating the effect of visualization technique on
task completion time (sec) for Task 5
Figure 121: Effect of visualization technique on task completion time
(sec) for Task 5
min q1 median q3 max mean standard deviationWorld Space Technique 13 18 19 21.5 26 19.64 3.79Viewport Space Technique 11 12.25 14 16.5 21 14.43 3
Statistic

140 Abstract Information Visualization in Interactive 3D Virtual Environments: Conceptualization and Usability Evaluation
Task 5 consisted in performing the generic task in the fifth user context as described in Section 5.1.3. The mean time for Task 5 using world space technique was 19.64 sec compared to 14.43 sec using the viewport space technique. The median time for Task 5 using world space technique was 19 sec compared to 14 sec using the viewport space technique. There was greater variability in task completion time with world space technique (world space technique standard deviation = 3.79; viewport space tech-nique standard deviation = 3). Overall, the time to complete Task 5 while using the viewport space technique was significantly less than using the world space technique. This result can be explained by the fact the partic-ipants using the world space technique had to orient their view for the top of the obelisk to the ground before selecting the related virtual panel. Whereas participants using the viewport space technique could imme-diately select the obelisk right after identifying it by the red question mark.
5.4.3 Discussions The underlying objective of this experiment was also to validate our con-ceptual model, toolkit and methodology which go along with the interac-tive 3DVE for usability testing that we have developed. This experiment was designed to evaluate and compare the usability of the viewport space technique and the world space technique for perform-ing the generic task in five user contexts. The generic task that the partic-ipant had to perform in this research was object-pointing task for target object selection and then information acquisition trough abstract informa-tion visualization. We used task completion time as performance metric in this experiment. The results provided empirical evidence that user performance on the main task is significantly affected by the type of abstract information vi-sualization technique and the user context. This important finding is a step forward in validating our approach. We also found that the VS-Virtual_Panel-KB technique has a higher usability than the WS-Virtual_Panel-KB technique for the generic task in all five user contexts. Variability in task completion time for a given abstract information visua-lization technique, the main task and a user context between and across different participants can be partly explained by the speed-accuracy tra-deoff curve introduced by Bowman and his colleagues (2008). There is some curve representing a specific speed/accuracy tradeoff for every task

141 5. CASE STUDIES: EXPERIMENTATIONS & RESULTS
to be performed by participants in interactive 3DVEs. The relationship between speed and accuracy of every task execution can be illustrated with a curve as shown in Figure 122. The more a participant would go faster in performing the task the less accurate he would be. And, the more he would increase his accuracy, the more he would decrease his speed. Even if the users would be instructed to not rush in performing the task and perform the task as naturally as possible, they might end up all over the cure.
Figure 122: Speed-accuracy tradeoff curve (Bowman et al., 2008)
Bowman et al. (2008) suggested a methodology to manage this tradeoff by performing the task three times in different ways. The usability test moderator should ask participants to do the task as quickly a possible on time, as accurately as possible the second time, and then, to balance speed and accuracy the third time. The main problem with the methodology is the learning effect and fatigue that might result from doing the same task three times in different ways. Another methodology to manage the speed-accuracy tradeoff can result from the way the experimental design is defined. By using a between sub-jects design, it become possible to give guidelines and indications to dif-ferent groups of participants for performing the tasks in a specific manner in terms of speed-accuracy balance. In this case, the speed and accuracy factors should also be measured in order to analyze the variability of the results.

142 Abstract Information Visualization in Interactive 3D Virtual Environments: Conceptualization and Usability Evaluation
5.5 Summary In this chapter we focused on two case studies in form of experimenta-tions that have been conducted during the same usability testing session with fourteen participants. We first presented the design and the implementation a first experiment to evaluate and validate the constrained navigation approach for controlling the navigation skill variable during usability testing in interactive 3DVEs. Furthermore, a second experiment was designed and performed in order to validate the conceptual model, toolkit and methodology which go along with the interactive 3DVE for usability testing that we have developed. For the first experiment, the IPQ questionnaire completed by the partici-pants is composed of a general question about the sense of “being there” followed by questions which can be grouped in three categories: spatial presence, involvement and experienced realism. The most important find-ing of the first experiment is clear evidence that the sense of presence, which is a specific satisfaction factor in interactive 3DVEs, is not signifi-cantly affected by the constrained navigation approach during the usabili-ty testing session. The results also suggest that it is possible to control the navigation skill variable across and between participants during the usa-bility testing session. The second experiment was designed to validate conceptual model, tool-kit and methodology which go along with the interactive 3DVE for usa-bility testing that we have developed. This was done trough evaluating and comparing the usability of the WS-Virtual_Panel-KB technique and the VS-Virtual_Panel-KB technique for performing the generic task in five user contexts. The generic task to be performed by a participant was an object-pointing task for target object selection and then information acquisition trough abstract information visualization. Task completion time was used as performance metric in this experiment. The conceptual model, toolkit and usability testing methodology have been validated as the experimental results provide empirical evidence that task completion time is significantly affected by the type of abstract in-formation visualization technique and the user context. We also found that the VS-Virtual_Panel-KB technique has a higher usability than the WS-Virtual_Panel-KB technique for the generic goal oriented exploration task in all five user contexts.

143 6. CONCLUSION AND PERSPECTIVES
6. CONCLUSION AND PERSPECTIVES
6.1 Summary The main problem this research intended to investigate is situated within the design and evaluation phases of interactive 3DVEs conception. The problem occurs when a developer must select an abstract information vi-sualization technique in order to augment 3D models with text, image or video related to specific objects. Furthermore, this thesis aimed at enabl-ing developers of interactive 3DVEs with a usability evaluation toolkit and methodology for comparing abstract information visualization tech-niques. More precisely, the purpose was to assist developers in determin-ing which abstract information visualization technique has the highest level of usability for their specific needs. The first research question was: What criteria need to be considered when evaluating interactive 3DVEs with regard to navigation? More specifical-ly, how is it possible to control the navigation skill variable when evaluat-ing interactive 3DVEs? In our quest, we first tried to understand how eva-luating the usability of interactive 3DVEs differs from 2DUIs usability evaluation in terms of evaluation methodologies and metrics. This was achieved by providing a broad review of literature on user interface eval-uation with focus on interactive 3DVEs. The review of literature also hig-hlighted the criteria which have to be considered when evaluating interac-tive 3DVEs with regard to navigation. The second research question was: What conceptual model and toolkit can be defined and implemented to build interactive 3DVEs in order to perform usability tests according to different elements? Further in our quest, we have attempted to provide a conceptual model in order to sup-port developers of interactive 3DVEs in either identifying an appropriate visualization technique, in terms of usability, for augmenting their 3D models with abstract information or creating new techniques. We sug-gested an interactive 3DVE prototyping toolkit for evaluating the usabili-ty of abstract information visualization techniques used to augment 3DVEs. This toolkit provides the designers and researchers of interactive 3DVEs with an infrastructure and methodology for implementing selected techniques for augmenting 3DVEs with abstract information. We also provided a methodology which goes along with the toolkit for employing the conceptual model. We proposed an approach for controlling the navi-gation skill variable when evaluating interactive 3DVEs by a constrained

144 Abstract Information Visualization in Interactive 3D Virtual Environments: Conceptualization and Usability Evaluation
navigation approach. Although Google SketchUp was used for the im-plementations, the conceptual model is independent from any technologi-cal and software solutions. The last but not least, research question was: What kind of methodology should be used for performing usability tests to compare the usability of abstract information visualization techniques with the toolkit? How should the observation of users be carried out as part of the usability evaluation of interactive 3DVEs? The results obtained from the case studies conducted in form of two expe-rimentations for comparing the usability of the WS-Virtual_Panel-KB technique and the VS-Virtual_Panel-KB validated the constrained naviga-tion approach, conceptual model and toolkit.
6.2 Contributions We have reviewed background literature on interactive 3DVEs develop-ment issues and reference models, 3D abstract information visualization techniques, prototyping and evaluating interactive 3DVEs. Specific eval-uation considerations related to navigation problems, evaluation metrics and methods, design guidelines for the development of interactive 3DVEs in comparison to 2DUIs are highlighted. Developers of interactive 3DVEs who want to augment their 3D models with abstract information have to determine which visualization technique is most suitable for their needs according to different elements. We have grouped these elements into different groups which have resulted into the definition of a conceptual model, reusable toolkit and usability evaluation methodology. The conceptual model is composed of five elements: a reference 3D scene, type of abstract information, contexts composed of user contexts and target object contexts, task analysis and type of tasks, type of abstract information visualization technique. By proposing a methodological ap-proach together with a constrained navigation approach we intended to support researcher and developers of novel abstract information visualiza-tion techniques in the usability evaluation and choice of appropriate tech-niques. In addition, the five layout dimensions introduced for the charac-terization of different abstract information visualization techniques covers all the design space. Therefore, it also enables the identification of new opportunities for improving or creating novel abstract information visua-lization techniques.

145 6. CONCLUSION AND PERSPECTIVES
In order to control the navigation skill variable, we have designed and implemented a constrained navigation approach for teleporting the user from one user context to another. In order to do so we have created con-strained navigation interactors in form of reusable SketchUp dynamic components (DCs). We have also implemented two abstract information visualization techniques for augmenting interactive 3DVEs with virtual panels in form of reusable SketchUp DCs and plugings. We have performed case studies for validating the proposed conceptual model, the toolkit and the usability evaluation methodology by perform-ing usability testing experiments. Results of our first experimentation provide clear evidence that the sense of presence, which is a specific satisfaction factor in interactive 3DVEs, is not significantly affected by the constrained navigation approach during the usability testing session. The results also suggest that it is possible to control the navigation skill variable across and between participants dur-ing the usability testing session. This validates the proposed constrained navigation approach. Results of the second experimentation validate the conceptual model, the reusable toolkit and the usability testing methodology. This was done trough evaluating and comparing the usability of the VS-Virtual_Panel-KB technique and the VS-Virtual_Panel-KB technique, for performing the generic task in five user contexts. The generic task that we considered in our usability tests was goal directed exploration.
6.3 Limitations We should highlight three main limitations in this thesis. The first limita-tion is related to lack of formalization concerning the user context and the target object context within the conceptual model. Such formalization is a perquisite for reusing the results of usability tests for a given set of ab-stract information, task and abstract information visualization technique across different reference 3D scenes. Although the major parameters and attributes for describing the contexts have been identified and explained, separating the description of the con-texts from a specific reference 3D scene is a challenging task. How to formalize the user context and the target object context still remains an open question that needs to be investigated in future research studies. The second limitation concerns the selection of a gamepad as input device and the usability testing methodology. The gamepad is appropriate as

146 Abstract Information Visualization in Interactive 3D Virtual Environments: Conceptualization and Usability Evaluation
long as the task to be accomplished by the user does not require a specific type of input device. In some domain specific interactive 3DVE applica-tions it is necessary to use multiple control point selection techniques with higher degree of freedom in order to select a group of objects or elements and access the related abstract information. Selecting the right input device that would support all the user’s required activities and tasks in an interactive 3DVE is a challenging and difficult problem. As such, it would not be possible to reuse the results of usability tests for measuring the usability of different abstract information visuali-zation techniques in interactive 3DVEs. In some application, it can also be necessary to use different input devices together. It is also important the notice that usability testing methodology should remain strictly the same across all usability tests so that the results remain comparable. Although most of the constraints and recommenda-tions of the usability testing methodology can remain the same from one usability test to another, it is difficult to select and recruit the same target population across different geographical locations. Therefore, it would be challenging to compare the results of one experiment with another, in different labs, in order to reuse the related findings concerning a specific abstract information visulization technique. The third limitation is linked to the underlying hypothesis of this research which considers a single user interacting with a 3DVE for accessing ab-stract information about different objects located in a reference 3D scene. With the generalization of collaborative and multiuser interactive 3DVEs, such as 3D wikis (Roberts et al., 2010), it is necessary consider the con-straints related to number of simultaneous users interacting with the sys-tem. Users might be trying to access abstract information about the same object at the same time, but from different location within the reference 3D scene, with a given visualization technique. For example, a world space technique for visualizing virtual panels with adaptive layout location can only be used in an interactive 3DVE with a single user. Viewport space and display space techniques should be used in the context of multiuser interactive 3DVEs. This is why most multiplayer online 3D games, supporting thousands of simultaneously connected users are generally using viewport space tech-niques to display specific information about selected objects or elements inside the underlying 3D worlds.

147 6. CONCLUSION AND PERSPECTIVES
6.4 Practical Impact: Towards a Decision Support Knowledge Base
Developers of interactive 3DVEs who want to augment their 3D models with abstract information have to determine which visualization technique is most suitable for their needs according to different tasks and user con-texts. The contributions and results of this research support them in doing so. This could be achieved by providing a decision support knowledge base that would enable them to identify the most relevant abstract infor-mation visualization technique according to specific needs. Our experimentations, considering the Karank reference 3D scene, given the generic goal directed exploration task, two visualization techniques (WS-Virtual_Panel-KB and VS-Virtual_Panel-KB), a combination of text and image, five user contexts (UC-Karnak-1 to UC-Karnak-5), and one target object context (TC-Karnak-1) have contributed to filing in ten box-es of a decision support knowledge base as presented in Table 22. Table 22: Elements for the construction of a decision support knowledge
base for the selection of abstract information visualization techniques
The numbers displayed in the last column are the mean task completion times. The lower the task completion time is the higher the usability of the related abstract information visualization technique. Considering the goal directed exploration generic task, the VS-Virtual_Panel-KB tech-nique has outperformed the WS-Virtual_Panel-KB technique in the expe-rimentations. More systematic usability testing with different generic

148 Abstract Information Visualization in Interactive 3D Virtual Environments: Conceptualization and Usability Evaluation
tasks and contexts must be carried out in order to complete this decision support knowledge base. The decision support knowledge base can be extended by adding addi-tional generic tasks and user contexts to support new evaluation settings. It should be possible to consider predefined benchmark reference 3D scene for each application domain specific interactive 3DVE together with application domain specific generic tasks and user contexts. It should also be noted that the results of the experimentations conducted in this research are valid for novice users interacting with a gamepad and a stan-dard desktop display setting. The decision support knowledge base can also be extended by adding new columns which would include different types of users, input devices, and types of output display settings.
6.5 Future Work In this research, a conceptual model and a toolkit has been developed. Based on this, it is now possible to explore a wide range of abstract in-formation visualization techniques in interactive 3DVEs. The case studies experimentations we performed for validating the conceptual model, the toolkit, and the usability evaluation methodology are just a step forward. This achievement is an effort towards improving our understanding of the impact of design choices on usability within interactive 3DVEs. The results we have obtained do validate the conceptual model, the toolkit and the usability evaluation methodology. However, further research for designing and conducting more case studies and experimentations should be undertaken. These would cover several related factors such as different spatial configurations, type of abstract information, visualization tech-niques, generic tasks, user contexts and target object contexts. Further-more, work needs to be done in the area of formalization of our concep-tual model. Towards this end, describing the user context and target ob-ject context with rules written in descriptive logics would be one way of moving forward in this research direction. We have implemented few abstract information visualization techniques for augmenting interactive 3DVEs with virtual panels in form of reusable SketchUp dynamic components (DCs) and plugins with Ruby scripts. We have defined a constrained navigation approach and implemented it in form of reusable constrained navigation interactors DCs. This can be seen as a starting point for building a comprehensive library of reusable DCs

149 6. CONCLUSION AND PERSPECTIVES
for different abstract information visualization techniques and constrained navigation approaches. Such library would give the opportunity to inter-active 3DVEs designers, developers and usability evaluators to focus on setting up their own experiments, instead of spending time and resources for development. In this way, it will become easier for them to compare different abstract information visualization techniques based on their needs. It would be also desirable to share the results of such usability studies with the re-search community in order to build a reusable knowledge base by gradu-ally completing the decision support knowledge base for selecting rele-vant abstract information visualization techniques. As the conceptual model is independent from any specific technological considerations, it doesn’t take into account the type of input device and type of display. Although we have used a gamepad and a standard desk-top computer monitor for our experiments, other input devices and dis-play settings can be used for performing the experimentations. In this way, the type of input device would also become an input variable for our conceptual model. A wide spectrum of display settings are also available for visualizing and interacting with 3DVEs. According to the type of display setting, users may be standing rather than sitting, and they may be moving inside a large space, using body based commands. These considerations point out input factors and parameters that can be included in our conceptual model and toolkit with additional research, implementations and experimenta-tions. Although the digital Karnak 3D model, taken from for domain of cultural heritage, has been used as a reference 3D scene in our experimentations, our toolkit is reusable with other reference 3D scene taken from other application domains. As the scale and configuration of 3D scenes vary across application domains, specific reference 3D scenes should be taken into consideration as benchmarks. It would be helpful to build and suggest domain specific 3D reference scenes to be used by usability practitioners within their own application domains. Comparing the usability of different techniques, for a specific application domain, would then be much easier as the 3D reference scene would remain the same across all experimentations. We have exclusively considered single user interactive 3DVEs in this research. Once an interactive 3DVE is shared among two or more users, such as collaborative 3DVEs, new types of problems happen. For in-

150 Abstract Information Visualization in Interactive 3D Virtual Environments: Conceptualization and Usability Evaluation
stance, a unique object can have multiple target object contexts according to the position of different users. In addition, users trying to perform the same task, on a target object, from different locations, will result in con-flicting user contexts. The conceptual model, toolkit and usability evalua-tion methodology should therefore be adapted to take into account such complexity. Finally, in this research we have focused on the problem of abstract in-formation visualization by taking image and text into consideration. It would be of interest to extend our conceptual model and toolkit in order to include knowledge visualization techniques. For instance, designing and evaluating 3D knowledge visualization techniques for urban planning would be very challenging. Few 3D geo-virtual environments are already used to visualize sustainable urban planning projects. The foreseen re-search would include the exploration and definition of 3D visualization techniques for the visualization of complex urban knowledge and usabili-ty evaluation of those 3D visualization techniques.

151 REFERENCES
REFERENCES
1001WONDERS (2010). 1001wonders.org : UNESCO World Heritage sites in panophotographies - immersive and interactive panoramic images. [online]. [Accessed 17 September 2010]. Available from World Wide Web: <http://www.world-heritage-tour.org> 3D-DRIVING (2009). 3D Driving-School: interactive driving training simulator in realtime 3D. [online]. [Accessed 17 September 2010]. Available from World Wide Web: <http://www.3dfahrschule.de> 3DNA (2004). 3DNA Desktop. [online]. [Accessed 17 September 2010]. Available from World Wide Web: <http://www.3dna.net> 3D-LLANES (2010). Llanes Digital 3D Project. [online]. [Accessed 17 July 2010]. Available from World Wide Web: <http://www.asturias.es/portal/site/LLANES> 3D-WAREHOUSE (2010). 3D Warehouse. [online]. [Accessed 17 July 2010]. Available from World Wide Web: <http://stechup.google.com/3dwarehouse> 9/11-3D (2010). National September 11 Memorial and Museum. [online]. [Accessed 17 September 2010]. Available from World Wide Web: <http://www.national911memorial.org> ALVAREZ, J., Djaouti, D. et al. (2010). Serious Game Classification : The online classification of Serious Games. [online]. [Accessed 17 September 2010]. Available from World Wide Web: <http://serious.gameclassification.com/EN> AMADO, M.P., Santos, C.V., Moura, E.B. and Silva, V.G. (2010). Public Participation in Sustainable Urban Planning. International Journal of Human and Social Sciences. 5(2), pp. 102-108. ANNETT, M.K. and Bischof, W.F. (2010). Investigating the application of virtual reality systems to psychology and cognitive neuroscience research. Presence: Teleoperators and Virtual Environments. 19(2), pp. 131-141. ARNOLD, D., Day, A., Glauert, J., Haegler, S., Jennings, V., Kevelham, B., Laycock, R, Magnenat-Thalmann, N., Maim, J., Maupu, D., Papagiannakis, G., Thalmann, D., Yersin, B., and Rodriguez-Echavarria, K. (2008). Tools for populating cultural heritage environments with interactive virtual humans. In: Pro. of EPOCH Conf. on Open Digital Cultural Heritage Systems., pp. 1-7.

152 Abstract Information Visualization in Interactive 3D Virtual Environments: Conceptualization and Usability Evaluation
ARRKID (2010). Arrkid 3D Marketing and Product Configurator Development. [online]. [Accessed 17 September 2010]. Available from World Wide Web: < http://www.aarkid.com> AUBRY, S. (2007). Annotations et gestion des connaissances en environnement virtuel collaboratif. Thèse de Doctorat. Université de Technologie de Compiègne, France. AZUMA, R. and Furmanski, C. (2003). Evaluating Label Placement for Augmented Reality View Management. In: roceedings of the 2nd IEEE/ACM international Symposium on Mixed and Augmented Reality (October 07 - 10, 2003). IEEE Computer Society, Washington, DC, pp. 66-75. BACH, C. and Scapin, D.L. (2003). Ergonomic criteria adapted to human virtual environment interaction. In: T. BAUDEL, (ed). In Proceedings of the 15th French-Speaking Conference on Human-Computer interaction on 15eme Conference Francophone Sur L'interaction Homme-Machine. Caen, France: ACM, New York, NY, pp. 24-31. BACH, C. and Scapin, D.L. (2010). Comparing Inspections and User Testing for the Evaluation of Virtual Environments. International Journal of Human-Computer Interaction. 26(8), pp. 786-824. BACIM, F., Polys, N., Chen, J., Setareh, M., Li, J., and Ma, L. 2010. Cognitive Scaffolding in Web3D Learning Systems: A Case Study for Form and Structure. In: Proceedings of the 15th international Conference on Web 3D Technology (Los Angeles, California, July 24 - 25, 2010). Web3D '10. ACM, New York, NY, pp. 93-100. BAKER, M.P. and Wickens, C.D. (1995). Human factors in virtual environments for the visual analysis of scientific data. Urbana-Champaign, Illinois. BAM3DCG (2010). Bam3DCG - 3DCG reconstruction and Virtual Reality of Bam and it's cultural landscape. [online]. [Accessed 17 September 2010]. Available from World Wide Web: <http://dsr.nii.ac.jp/Bam3DCG/> BAZARGAN, K. (2010). Usability Evaluation of Abstract Information Visualization Techniques in Interactive 3D Virtual Environments. Paper presented at the COST Action TU0801 Working Group 3 (University of Algarve, Faro, Portugal, 4-5 November 2010). BAZARGAN, K. and Falquet, G. (2009). Specifying the Representation of Non-geometric Information in 3D Virtual Environments. In: Proceedings of the 13th International Conference on Human-Computer

153 REFERENCES
Interaction. Part Ii: Novel interaction Methods and Techniques. J. A. Jacko, Ed. Lecture Notes In Computer Science, vol. 5611. Springer-Verlag, Berlin, Heidelberg, pp. 773-782. BAZARGAN, K., Falquet, G., and Métral, C. (2009). Une infrastructure d'évaluation pour des techniques de représentation de l'information non-géométrique dans les environnements virtuels 3D. In: Proceedings of the 21st International Conference of Association Francophone d'Interaction Homme-Machine. (Grenoble, France, October 13 - 16, 2009): ACM, New York, NY, pp. 151-154. BAZARGAN, K., Falquet, G., and Métral, C. (2010). Testing the Usability of Information Visualization Techniques in Interactive 3D Virtual Environments: a Toolkit. In: Proceedings of IADIS International Conference Interfaces and Human Computer Interaction 2010 (Freiburg, Germany 28 - 30 July 2010), pp. 11-18. BAZARURBAIN (2010). Paroles de voisins et d'usagers – contribution à la qualification de l'identité d'un territoire en devenir et de son intégration aux quartiers alentours. Bazar Urbain, Grenoble, France. BELL, B.A. and Feiner, S.K. (2000). Dynamic space management for user interfaces. In: Proceedings of the 13th Annual ACM Symposium on User interface Software and Technology (San Diego, California, United States, November 06 - 08, 2000). UIST '00. ACM, New York, NY, pp. 239-248. BELL, B., Feiner, S., and Höllerer, T. (2001). View management for virtual and augmented reality. In: 14th Annual ACM Symposium on User interface Software and Technology (Orlando, Florida, November 11 - 14, 2001). UIST '01: ACM, New York, NY, pp. 101-110. BERNHAUPT, R. (ed). (2010). Evaluating User Experience in Games: Concepts and Methods. Springer; 1st Edition. edition (May 18, 2010). BOWMAN, D.A., Coquillart, S., Froehlich, B., Hirose, M., Kitamura, Y., Kiyokawa, K., and Stuerzlinger, W. (2008). 3D User Interfaces: New Directions and Perspectives. IEEE Computer Graphics and Applications. 28(6), pp. 20-36. BOWMAN, D.A., Davis, E.T., Hodges, L.F. and Badre, A.N. (1999). Maintainning spatical orientation during travel in an immersive virtual environment. Presence: Teleoperators and Virtual Environments. 8(6), pp. 618-631. BOWMAN, D.A., Gabbard, J. L., and Hix, D. (2002). A survey of usability evaluation in virtual environments: classification and

154 Abstract Information Visualization in Interactive 3D Virtual Environments: Conceptualization and Usability Evaluation
comparison of methods. Presence: Teleoperators and Virtual Environments. 11(4), pp. 404-424. BOWMAN, D.A., and Hodges, L. (1999). Formalizing the design, evaluation, and application of interaction techniques for immersive virtual environments. The Journal of Visual Languages and Computing. 10(1), pp. 37-53. BOWMAN, D.A., Koller, D., and Hodges, L. (1998). A methodology for the evaluation of travel techniques for immersive virtual environments. Virtual Reality: Research, Development, and Applications. 3(2), pp. 120-131. BOWMAN, D.A., Kruijff, E., Laviola, J. and Poupyrev, I. (2004). 3D User Interfaces theory and practice. Addison Wesley Longman Publishing Co., Inc.. BOWMAN, D.A., North, C., Chen, J., Polys, N. F., Pyla, P. S., and Yilmaz, U. (2003). Information-rich virtual environments: theory, tools, and research agenda. In: Proceedings of the ACM Symposium on Virtual Reality Software and Technology (Osaka, Japan, October 01 - 03, 2003). VRST '03. ACM, New York, NY, pp. 81-90. BOWMAN, D. A., Setareh, M., Pinho, M. S., Ali, N., Kalita, A., Lee, Y., Lucas, J., Gracey, M., Kothapalli, M., Zhu, Q., Datey, A., and Tumati, P. (2003). Virtual-SAP: An Immersive Tool for Visualizing the Response of Building Structures to Environmental Conditions. In: Proceedings of the IEEE Virtual Reality 2003 (March 22 - 26, 2003). VR. IEEE Computer Society, Washington, DC, pp. 243-250. BREYFOGLE, F. (1999). Implementing Six Sigma: Smarter Solutions Using Statistical Methods. John Wiley and Sons. BROWN, M., Kehoe, A., Kirakowski, J. and Pitt, I. (2010). Beyond the Gamepad: HCI and Game Controller Design and Evaluation. In: Regina BERNHAUPT, (ed). Evaluating User Experience in Games, Springer London, pp. 197-219. BURIGAT, S. and Chittaro, L. (2007). Navigation in 3D virtual environments: Effects of user experience and location-pointing navigation aids. Int. J. Hum.-Comput. Stud. 65(11), pp. 945-958. BURKHARDT, J. (2003). Ergonomie et Réalité Virtuelle : quelques apports réciproques. Le Travail Humain, 2003/1(66), pp. 65-91. BUXTON, W., Myers, B. (1986). A Study of Two-Handed Input. In: Proceedings of CHI'86., pp. 321-326.

155 REFERENCES
CHEN, J. (2003). Effective Interaction Techniques in Information-Rich Virtual Environments. In: Procedings of the Young Virtual Reality Conference., pp. 1-6. CHEN, J., Pyla, P. S., and Bowman, D. A. (2004). Testbed Evaluation of Navigation and Text Display Techniques in an Information-Rich Virtual Environment. In: Proceedings of the IEEE Virtual Reality 2004 (March 27 - 31, 2004). VR. IEEE Computer Society, Washington, DC, pp. 181-188. CHI, E.H. (2000). A Taxonomy of Visualization Techniques Using the Data State Reference Model. In Proceedings of the IEEE Symposium on Information Vizualization 2000 (INFOVIS '00). IEEE Computer Society, Washington, DC, USA, pp. 69-75. CHITTARO, L. and Ranon, R. (2007). Adaptive 3D web sites. In: The adaptive web: methods and strategies of web personalization, P. Brusilovsky, A. Kobsa, and W. Nejdl, (ed). Lecture Notes In Computer Science, vol. 4321, Springer-Verlag, Berlin, Heidelberg, pp. 433-462. CMOLIK, L. and Bittner, J. (2010). Layout-aware optimization for interactive labeling of 3D models. Computers and Graphics. 34(4), pp. 378-387. CMU (2008). Carnegie Mellon University - Alice 3D Programming Environment. [online]. [Accessed 17 September 2010]. Available from World Wide Web: <http://www.alice.org> CONE, B.D., Irvine, C.E., Thompson, M.F. and Nguyen, T.D. (2007). A video game for cyber security training and awareness. Computers & Security. 26(1), pp. 63-72. COOPER, A. and Reimann, R. (2003). About face 2.0: The essentials of interaction design. John Wiley & Sons. CORTONA3D (2009). Parallet Graphics, Cortona3D. [online]. [Accessed 3 September 2010]. Available from World Wide Web: <http://www.cortona3d.com> COUNSELL, J., Smith, S., and Bates-Brkljac, N. (2006). Web 3D based dialogue for public participation and the VEPs Project. In: Proceedings of the Conference on information Visualization (July 05 - 07, 2006). IV. IEEE Computer Society, Washington, DC, pp. 343-348. COUNSELL, J., Richman, A., and Holding, A. (2009). Evaluation of 3D Visualisation in the Virtual Environmental Planning Systems Project. In: Proceedings of the 2009 Second international Conference in

156 Abstract Information Visualization in Interactive 3D Virtual Environments: Conceptualization and Usability Evaluation
Visualisation (July 15 - 17, 2009). VIZ. IEEE Computer Society, Washington, DC, pp. 108-113. CYBERCIEGE (2007). CyberCIEGE Educational Video Game. [online]. [Accessed 17 September 2010]. Available from World Wide Web: <http://cisr.nps.edu/cyberciege/index.htm> DJAOUTI, D., Alvarez, J., Jessel, J.P. and Methel, G. (2008). A Gameplay Definition through Videogame Classification. International Journal of Computer Game Technology, 5(1), pp. 35-39. DJAOUTI, D., Alvarez, J., and Jessel, J.P. (2010). Can "Gaming 2.0" help design "Serious Games"?: a comparative study. In: Proceedings of the 5th ACM SIGGRAPH Symposium on Video Games (Los Angeles, California, July 28 - 29, 2010). Sandbox'10. ACM, New York, NY, 11-18, pp. 11-18. DOMINGUES, C., Otmane, S., Davesne, F. and Mallem, M. (2007). Empirical Evaluation Assistant Tool for 3D Interaction Techniques. In: 4th Int. Conference on Enactive Interfaces Grenoble (ENACTIVE'07), Grenoble : France , pp. 89-92. DOMINGUES, C., Otmane, S., Davesne, F. and Mallem, M. (2008). Creating 3D Interaction Technique Empirical Evaluation with the use of a Knowledge Database of Interaction Experiments. In: IEEE Conference on Human System Interaction (HSI 2008). Krakow : Pologne, pp. 170-175. DOMINGUES, C., Otmane, S. and Mallem, M. (2010). 3DUI-EF: Towards a Framework for Easy Empirical Evaluation of 3D User Interfaces and Interaction Techniques. The International Journal of Virtual Reality. 9(1), pp. 73-80. DÜNSER, A., Grasset, R. and Billinghurst, M. (2008). A survey of evaluation techniques used in augmented reality studies. In: ACM SIGGRAPH ASIA 2008 Courses. SIGGRAPH Asia '08: ACM, New York, NY, pp. 1-27. EASTGATE, R. (2001). The Structured Development of Virtual Environments: Enhancing Functionality and Interactivity. Doctoral Thesis. University of Nottingham. EL ATIFI, M. and Falquet, G. (2006). A Specification Language and System for the Three-Dimensional Visualisation of Knowledge Bases. In Interactive Systems. Lecture Notes in Computer Science, Vol. 3941. Springer-Verlag, Berlin / Heidelberg, pp. 126-136. ELMQVIST, N. and Tsigas, P. (2008). A Taxonomy of 3D Occlusion Management for Visualization. IEEE Transactions on Visualization and Computer Graphics. 14(5), pp. 1095-1109.

157 REFERENCES
FANVENUES3D (2010). Fanvenues - 3D Interactive Seating Maps. [online]. [Accessed 3 September 2010]. Available from World Wide Web: <http://www.fanvenues.com/> FEINER, S., Macintyre, B., Haupt, M., and Solomon, E. (1993). Windows on the World: 2D Windows for 3D Augmented Reality. In: Proc. UIST '93 (ACM Symp. on User Interface Software and Technology). Atlanta, GA, November 3-5: ACM Press, pp. 145-155. FENG, J., Karat, C-M. and Sears, A. (2005). How productivity improves in hands-free continious dictation tasks: Lessons learned from a longitudinal study. Interacting with Computers. 17(3), pp. 265-289. FITTS, P.M. (1954). The information capacity of the human motor system in controlling the amplitude of movement. Journal of Experimental Psychology. 47, pp. 381-391. FONI, A. E., Papagiannakis, G., and Magnenat-Thalmann, N. (2010). A taxonomy of visualization strategies for cultural heritage applications. Journal on Computing and Cultural Heritage. 3(1), pp. 1-21. FUCHS, P., Nashashibi, F. and Lourdeaux, D. (1999). A theoritical approach of the design and evaluation of a virtual reality device. In: Proceedings of Virtual Reality and Prototyping'99. Laval, France, pp. 11-20. FUCHS, P., Moreau, G., Burkhardt, J.-M. and Coquillart, S. (2006). Le traité de la réalité virtuelle - Volume 2: L'interfaçage, l'immersion et l'interaction en environnement virtual. Collection Sciences Mathématiques et Informatiques. Presses de l’Ecole des Mines. GABBARD, J.L. (1997). A taxonomy of usability characteristics in virtual environments. Master Thesis. Virginia Polytechnic Institute and State University, Blacksburg, VA. GABBARD, J. L., Hix, D., and Swan, J. E. (1999). User-Centered Design and Evaluation of Virtual Environments. IEEE Comput. Graph. Appl. 19(6), pp. 51-59. GABBARD, J. L., Swan, J. E., and Hix, D. (2006). The effects of text drawing styles, background textures, and natural lighting on text legibility in outdoor augmented reality. Presence: Teleoperators and Virtual Environments. 15(1), pp. 16-23. GONZALEZ CALLEROS, J.M. (2006). A Method for Developing 3D User Interfaces for Information Systems. DEA thesis dissertation,Université catholique de Louvain, Louvain-la-Neuve, Belgium.

158 Abstract Information Visualization in Interactive 3D Virtual Environments: Conceptualization and Usability Evaluation
GRANDPALAIS (2010). Interactive exploration of the Grand Palais architecture and construction history in 3D. [online]. [Accessed 17 September 2010]. Available from World Wide Web: <http://www.grandpalais.fr/visite/fr/> GREITZER, F., Kuchar, O., and Huston, K. (2007). Cognitive science implications for enhancing training effectiveness in a serious gaming context. Journal on Educational Resources in Computing (JERIC). 7(3), pp. 1-16. GRIFFITHS, G. (2001). Virtual environments usability and user competence: the Nottingham Assessment of Interaction within Virtual Environments (NAíVE) Tool. Ph.D. Thesis: School of Mechanical, Materials, Manufacturing Engineering and Management, University of Nottingham. GRIFFITHS, G., Sharples, S., and Wilson, J.R. (2006). Performance of new participants in virtual environments: The Nottingham tool for assessment of interaction in virtual environments (NAÏVE). Int. J. Hum.-Comput. Stud. 64(3), pp. 240-250. GROSSMAN, T. and Balakrishnan, R. (2004). Pointing at trivariate targets in 3D environments. In: Proceedings of the SIGCHI Conference on Human Factors in Computing Systems (Vienna, Austria, April 24 - 29, 2004). CHI '04. ACM, New York, NY, pp. 447-454. GUO, Y. and Barnes, S. (2007). Why people buy virtual items in virtual worlds with real money. ACM SIGMIS Database. 38(4), pp. 69-76. GUVEN, S. and Feiner, S. (2006). Interaction Techniques for Exploring Historic Sites through Situated Media. In: Proceedings of the 3D User interfaces (March 25 - 29, 2006). 3DUI. IEEE Computer Society, Washington, DC, pp. 111-118. HÄUBL, G. and Figueroa, P. (2002). Ineractive 3D presentations and buyer behavior. In: CHI '02 Extended Proceedings of Abstracts on Human Factors in Computing Systems (Minneapolis, Minnesota, USA, April 20 - 25, 2002). CHI '02. ACM, New York, NY, pp. 744-745. HINCKLEY, K., Paush, R., Goble, J. C. and and Kassel, N.F. (1994). A survey of design issues in spatial input. In: Proceedings of UIST’94. ACM, pp. 213-222. HINCKLEY, K., Pausch, R., Proffitt, D., and Kassell, N.F. (1998). Two-handed virtual manipulation. ACM Transactions on Computer-Human Interaction (TOCHI). 5(3), pp. 260-302.

159 REFERENCES
HORNBAEK, K. (2006). Current practice in measuring usability: Challenges to usability studies and research. Internationa Journal of Human-Computer Studies. 64(2), pp. 79-102. IVORY, M.Y. and Hearst, M.A. (2001). The State of the Art in Automated Usability Evaluation of User Interfaces. ACM Computing Surveys. 33(4), pp. 470-516. IPQ (2008). I-Group Presence Questionnaire (IPQ). [online]. [Accessed 17 September 2010]. Available from World Wide Web: <http://www.igroup.org/pq/ipq/index.php> JACKSON, H. and Batstone, G. (2008). Case study: closing the training gap with 3D interactive simulations. In: Proceedings of the 2008 Spring Simulation Multiconference (Ottawa, Canada, April 14 - 17, 2008). Spring Simulation Multiconference. Society for Computer Simulation International, San Diego, CA, pp. 693-698. JALLOULI, J., Moreau, G. (2009). An immersive path-based study of wind turbines' landscape: A French case in Plouguin. Renewable Energy. 34(3), pp. 597-607. JANKOWSKI, J., Jozwowicz, M., Cobos, Y., McDaniel, B., and Decker, S. (2009). 3DWiki: the 3D Wiki engine. In: Proceedings of the 5th international Symposium on Wikis and Open Collaboration (Orlando, Florida, October 25 - 27, 2009). WikiSym '09. ACM, New York, NY, pp. 1-2. JANKOWSKI, J. and Decker, S. (2009). The 2LIP model and its implementations. In: Proceedings of the 20th ACM Conference on Hypertext and Hypermedia (Torino, Italy, June 29 - July 01, 2009). HT '09. ACM, New York, NY, pp. 339-340. JANKOWSKI, J., Samp, K., Irzynska, I., Jozwowicz, M., and Decker, S. (2010). Integrating Text with Video and 3D Graphics: The Effects of Text Drawing Styles on Text Readability. In: roceedings of the 28th international Conference on Human Factors in Computing Systems (Atlanta, Georgia, USA, April 10 - 15, 2010). CHI '10. ACM, New York, NY, 1321-1330, pp. 1321-1330. KABBASH, P., Buxton, W., and Sellen, A. (1994). Two-handed input in a compound task. In: Proceedings of SIGCHI Conference on Human Factors in Computing systems (CHI 94). Boston,Massachusetts, USA, ACM Press, pp. 417–423. KADOBAYASHI, R., Lombardi, J., McCahill, M. P., Stearns, H., Tanaka, K., and Kay, A. (2006). 3D Model Annotation from Multiple
160 Abstract Information Visualization in Interactive 3D Virtual Environments: Conceptualization and Usability Evaluation
Viewpoints for Croquet. In: Proceedings of the Fourth international Conference on Creating, Connecting and Collaborating Through Computing (January 26 - 27, 2006). C5. IEEE Computer Society, Washington, DC, pp. 10-15. KALAWSKY, R.S. (1999). VRUSE: a computerized diagnostic tool for usability evaluation of virtual/synthetic environment systems. Applied Ergonomics. 30, pp. 11-25. KAPP, K.M. and O'Driscoll, T. (2010). Learning in 3D: Adding a New Dimension to Enterprise Learning and Collaboration. Pfeiffer & Company. KARASEITANIDIS, I., Amditis, A., Patel, H., Sharples, S., Bekiaris, E., Bullinger, A., and Tromp, J. (2006). Evaluation of virtual reality products and applications from individual, organizational and societal perspectives-The "VIEW" case study. International Journal of Human-Computer Studies. 64(3), pp. 251-266. KAUR, K. (1998). Designing virtual environments for usability. Ph.D. dissertation, University College London. KAUR, K., Sutcliffe, A. and Maiden, N. (1996). A theory of interaction in virtual environments. In: Proceedings of Third UKVRSIG Conference. De Montfort University, Leicester, pp. 39-52. KAUR, K., Sutcliffe, A. and Maiden, N. (1999a). A design advice tool presenting usability guidance for virtual environments. In: Proceedings of Workshop on User-Centered Design and Implementation of Virtual Environments, pp. 1-7. KAUR, K., Maiden, N. and Sutcliffe, A. (1999b). Interacting with virtual environments: An evaluation of a model of interaction. Interacting with Computers. 11(4), pp. 403-426. KENNEDY, R.S., Lane, N.E., Berbaum, K.S. and Lilienthal, M.G. (1993). Simulator sickness questionnaire: an enhanced method for quantifying simulator sickness. International Journal of Aviation Psychology. 3(3), pp. 203-220. KIM, N., Kim, G.J., Park, C-M, Lee, I., Lim, S.H. (2000). Multimodal menu presentation and selection in immersive virtual environments. In: VR’00: Proceedings of the IEEE virtual reality 2000 conference. IEEE Computer Society, Washington, DC, USA, pp. 281-288. KOFFEL, C. and Livatino., S. (2008). Handbook for Evaluation Studies in VR for Non-Experts. Technical Report in Medialogy, Aalborg University, Denmark.

161 REFERENCES
KOFFEL, C., Hochleitner, W., Leitner, J., Haller, M., Geven, A., and Tscheligi, M. (2010). Using Heuristics to Evaluate the Overall User Experience of Video Games and Advanced Interaction Games. In: R. BERNHAUPT, (ed). Evaluating User Experience in Games: Concepts and Methods, Springer; 1st Edition. edition (May 18, 2010), pp. 233-256. LAZAR, J., Feng, J.H. and Hochheiser, H. (2010). Research Methods in Human-Computer Interactions. John Wiley and Sons. LIVATINO, S., Koeffel, C., Gambin, T., and Mosiej, L. (2007). Evaluation Guidelines for VR Applications. In: Proceedings of the 9th International Conference on Virtual Reality. LIVATINO, S. and Koffel, C. (2007). Handbook for Evaluation Studies in Virtual Reality. In: Proceedings of the IEEE International Conference on Virtual Environments, Human-Computer Interfaces, and Measurement Systems (VECIMS'2007). IEEE, pp. 1-6. KONSTANTAS, D., Kalapanidas, E., Wanatabe, H., Davarakis, C., Kaufmann, H., Fernandez Aranda, F., Lam, T. and Ganchev, T. (2008). Playmancer: A European Serious Gaming 3D Environment. In: Proceedings of the 2nd International Workshop on e-health Services and Terchnologies. EHST'2008. 3rd International Conference on Software and Data Technologies, Porto, Portugal, pp. 51-59. LEE, G., Eastman, C.M., Taunk, T., and Ho, C. (2010). Usability principles and best practices for the user interface design of complex 3D architectural design and engineering tools. International Journal of Human-Computer Studies. 68(1-2), pp. 90-104. LINNEAN-3D (2010). The Linnean Societys of London 3D website. [online]. [Accessed 3 September 2010]. Available from World Wide Web: <http://3d.linnean.org.uk/> MACKENZIE, I. S. and Buxton, W. (1992). Extending Fitts' law to two-dimensional tasks. In: Proceedings of the SIGCHI Conference on Human Factors in Computing Systems (Monterey, California, United States, May 03 - 07, 1992). CHI '92. ACM, New York, NY., pp. 219-226. MACKINLAY, J. (1986). Automating the design of graphical presentations of relational information. ACM Transactions on Graphics 5, 2 (Apr. 1986). 5(2), pp. 110-141. MAASS, S. and Döllner, J. (2008). Seamless Integration of Labels into Interactive Virtual 3D Environments Using Parameterized Hulls. In: Proceedings of the 4th International Symposium on Computational

162 Abstract Information Visualization in Interactive 3D Virtual Environments: Conceptualization and Usability Evaluation
Aesthetics in Graphics, Visualization, and Imaging. Eurographics Association, Lisbon, pp. 33-40. MÉTRAL, C., Falquet, G. and Karatsas, K.. (2008). Ontologies for the Integration of Air Quality Models and 3D City Models. In: Teller J. et AL., (ed). Conceptual Models for Urban Practitioners, Società Editrice Esculapio, Bologna, pp. 27-42. MÉTRAL, C., Falquet, G. and Cutting-Decelle, A.F. (2009). Towards Semantically Enriched 3D City Models: an Ontology-Based Approach. In: Proceedings of the GeoWeb conference (Vancouver, Canada, 2009). International Archives of the Photogrammetry, Remote Sensing and Spatial Information Sciences. Volume XXXVIII-3-4/C3, pp. 40-45. MOSQUEIRA-REY, E., Alonso-Rios, D. and Moret-Bonillo, V. (2009). Usability taxonomy and context-of-use taxonomy for usability analysis. In Proceedings of the 2009 IEEE international conference on Systems, Man and Cybernetics (SMC'09). IEEE Press, Piscataway, NJ, USA, pp. 812-817. MURATET, M., Torguet, P., Jessel, J., and Viallet, F. 2009. Towards a serious game to help students learn computer programming. International Journal of Computer Games Technology. 2009(3), pp. 1-12. NIELSEN, J. (1993). Usability Engineering. Academic Press, Boston. NIELSEN, J. (2004). Heuristics evaluation. In: Nielson, J. and Marck, R.L., (eds). Usability Inspection Methods, John Wiley & Sons, New York. OLIVE. 1999. Online Library of Information Visualization Environments. [online]. [Accessed 17 September 2010]. Available from World Wide Web: < http://otal.umd.edu/Olive/> OPENCOBALT (2010). Open Source Virtual World Browser and Toolkit. [online]. [Accessed 17 September 2010]. Available from World Wide Web: <http://www.opencobalt.org> OPENGL (1992). OpenGL - The Industry Standard for High Performance Graphics. [online]. [Accessed 17 September 2010]. Available from World Wide Web: <http://www.opengl.org> PAPASMADOV, M. (2010). Ruby Script Plugings for SkectchUp. [online]. [Accessed 17 September 2010]. Available from World Wide Web: <http://sites.google.com/site/morisdov/> PAPASTAMATIOU, N., Alexandridis, T., Tsergoulas, K., Michopoulos, A., and Karadimas, N. V. (2009). Virtual reality applications with user

163 REFERENCES
interface for dynamic content development. In: L. Perlovsky, M. Jha, B. Covaci, A. Zaharim, and N. Mastorakis S. LAGAKOS, (ed). Proceedings of the 4th WSEAS international Conference on Computer Engineering and Applications (Cambridge, USA, January 27 - 29, 2010). Electrical And Computer Engineering Series. World Scientific and Engineering Academy and Society (WSEAS), Stevens Point, Wisconsin, pp. 201-206. PATERNO, F. and Lacerof, P. (1997). User interface evaluation using task models. Technical Report CNUCE-B4-97-003, Human Interface in Information System (HIIS) Laboratory, ISTI, CNR, Pisa, Italy. PARERNO, F. (2003). ConcurTaskTrees: An engineered notation for task models. In: Diaper, D., Stanton, N. (eds)., The Handbook of Task Analysis for Human-Computer Interaction, LEA, pp. 483-503. PAV (2010). Etat de Genève, Praille Acacias Vernets. [online]. [Accessed 13 September 2010]. Available from World Wide Web: <http://etat.geneve.ch/pav/accueil.html> PERSEPOLIS-3D (2010). Persepolis 3D Reconstruction. [online]. [Accessed 17 September 2010]. Available from World Wide Web: <http://www.persepolis3d.com/> PINELLE, D., Wong, N., and Stach, T. (2008). Using genres to customize usability evaluations of video games. In: Proceedings of the 2008 Conference on Future Play: Research, Play, Share. (Toronto, Ontario, Canada, November 03 - 05, 2008): Future Play '08. ACM, pp. 129-136. PINELLE, D., Wong, N., Tadeusz, S. and Gutwin, C. (2009). Usability Heuristics for Networked Multiplayer Games. In: Proceedings of GROUP’09. May 10–13, 2009, Sanibel Island, Florida, USA: ACM, pp. 169-178. POLYS, N.F. (2006). Display Techniques in Information-Rich Virtual Environments. Doctoral Thesis. UMI Order Number: AAI3241161, Virginia Polytechnic Institute & State University. POLYS, N.F., Bowman, D.A. and North, C. (2004). Information-rich virtual environments: challenges and outlook. Paper presented at the NASA Virtual Iron Bird Workshop, NASA Ames. POLYS, N.F., Bowman, D.A. and North, C. (2011). The role of Depth and Gestalt cues in information-rich virtual environments. International Journal of Human-Computer Studies. 69(1-2), pp. 30-51. POLYS, N.F., Shupp, L. , Volpe, J., Glina, V. and North, C. (2006). The Effects of Task, Task Mapping, and Layout Space on User Performance in

164 Abstract Information Visualization in Interactive 3D Virtual Environments: Conceptualization and Usability Evaluation
Information-Rich Virtual Environments. Technical Report TR-06-12, Computer Science, Virginia Polytechnic Institute and State University. RICHARDS, J.J. (2009). In-Game Advertising "Facts are Stubborn Things.", Microsoft Advertising Blog & Community. [online]. [Accessed 17 September 2010]. Available from World Wide Web: <http://community.microsoftadvertising.com/ > RITTER, F., Sonnet, H., Hartmann, K., and Strothotte, T. (2003). Illustrative shadows: integrating 3D and 2D information displays. In: roceedings of the 8th international Conference on intelligent User interfaces. IUI '03. ACM, New York, NY, pp. 166-173. ROBERTS, M., Ducheneaut, N. and Smith, T. (2010). The "3D Wiki": blending virtual worlds and web architecture for remote collaboration. In Proceedings of IEEE International Conference on Multimedia and Expo 2010. IEEE Computer Society, Washington, DC, pp. 1166 -1171. RUBIN, J. (1993). Handbook of Usability Testing: How to Plan, Design and Conduct Effective Tests. John Wiley and Sons. RUBY LIBRARY DEPOT (2010). Ruby Library Depot: plugings pour SketchUp. [online]. [Accessed 17 September 2010]. Available from World Wide Web: <http://modelisation.nancy.archi.fr/rld/> RUDDLE, R. A. and Lessels, S. (2006). Three levels of metric for evaluating wayfinding. Presence: Teleoperators and Virtual Environments. 15(6), pp. 637-654. SAYERS, H. 2004. Desktop virtual environments: a study of navigation and age. Interacting with Computers. 16(5), pp.939-956. SEBOK, A., Nystad, E., and Helgar, S. (2004). Navigation in desktop virtual environments: an evaluation and recommendations for supporting usability. Virtual Reality. 8(1), pp. 26-40. SEFFAH, A., Benn, J. and Habieb-Mammar, H. (2008). A low-cost test environment for usability studies of head-mounted virtaul reality systems. Journal of Usability Studies. 3(2), pp. 60-73. SEFFAH, A., Donyaee, M., Kline, R. and Padda, H. (2006). Usability measurement and metrics: A consolidated model. Software Quality Journal. 14(2), pp. 159-178. SEFFAH, A. and Habieb-Mammar, H. (2009). Usability engineering laboratories: limitations and challenges toward a unifying tools/practices environment. Behaviour & Information Technology. 28(3), pp. 281-291.

165 REFERENCES
SEFFAH, A. and Metzker, E. (2004). The obstacles and myths of usability and software engineering. Communications of the ACM. 47(12), pp. 71-76. SEFFAH, A. and Metzker, E. (2008). Adoption-Centric Usability Engineering: Systematic Deployment, Assessment and Improvement of Usability Methods in Software Engineering. Springer Publishing Company, Incorporated. SEFFAH, A., Vanderdonckt, J., and Desmarais, M.C. (2009). Human-Centered Software Engineering: Software Engineering Models, Patterns and Architectures for HCI. Springer Publishing Company, Incorporated. SHEELAGH, C. (2008). Evaluating Information Visualizations. In: Andreas KERREN, John STASKO, Jean-Daniel FEKETE, and Chris NORTH, (eds). Information Visualization, Lecture Notes in Computer Science (LNCS) 4950, Springer Berlin / Heidelberg, pp. 19-45. SGI (2003). Silicon Graphics International - Developer Central Open Source, Open Inventor. [online]. [Accessed 17 September 2010]. Available from World Wide Web: <http://oss.sgi.com/projects/inventor> SHNEIDERMAN, B. (1996). The Eyes Have It: A Task by Data Type Taxonomy for Information Visualizations. In: Proceedings of the 1996 IEEE Symposium on Visual Languages (September 03 - 06, 1996). VL. IEEE Computer Society, Washington, DC., pp. 336-343. SAURO, J. and Kindlund, E. (2005a). A method to standardize usability metrics into a single score. In: Proceedings of the SIGCHI conference on Human factors in computing systems (CHI '05). ACM, New York, NY, USA, pp. 401-409. SAURO, J. and Kindlund, E. (2005b). Using a Single Usability Metric (SUM) to Compare the Usability of Competing Products. In CD-ROM Proceedings of the Human Computer Interaction International Conference. Las Vegas, USA. SITG (2010). Système d'Information du Territoire Genevois - Guichet cartographique 3D. [online]. [Accessed 17 September 2010]. Available from World Wide Web: <http://etat.geneve.ch/geoportail/geo3d> SKETCHUP (2010). Google SketchUp Pro 8. [online]. [Accessed 17 September 2010]. Available from World Wide Web: <http://sketchup.google.com> SLATER, M., Linakis, V., Usoh, M. & Kooper, R. (1996). Immersion, presence, and performance in virtual environments: An experiment using

166 Abstract Information Visualization in Interactive 3D Virtual Environments: Conceptualization and Usability Evaluation
tri-dimensional chess. In: Proceedings of Virtual Reality and Software and Technology Conference. Hong Kong, pp. 163-172. SMUSTARD (2010). Smustard: the Companion to SketchUp. [online]. [Accessed 17 September 2010]. Available from World Wide Web: <http://www.smustard.com/> SNOW, M. (1996). Charting presence in virtual environments and its effects on performance. Doctoral Thesis. Virginia Polytechnic Institute & State University, Blacksburg, VA. SONNET, H., Carpendale, S., and Strothotte, T. (2004). Integrating expanding annotations with a 3D explosion probe. In: Proceedings of the Working Conference on Advanced Visual interfaces (Gallipoli, Italy, May 25 - 28, 2004). AVI '04. ACM, New York, NY, pp. 63-70. STANNEY, K.M., Mollaghasemi, M., Reeves, L., Breaux, R., and Graeber, D.A. (2003). Usability engineering of virtual environments (VEs): identifying multiple criteria that drive effective VE system design. Int. J. Hum.-Comput. Stud. 58(4), pp. 447-481. STEIN, T. and Décoret, X. (2008). Dynamic label placement for improved interactive exploration. In: roceedings of the 6th international Symposium on Non-Photorealistic Animation and Rendering (Annecy, France, June 09 - 11, 2008). NPAR '08. ACM, New York, NY, pp.15-21. STOEV, S.L., Schmalstieg, D. and Straßer, W. (2001). Two-Handed Through-The-Lens-Techniques for Navigation in Virtual Environments. In: Proceedings of the Eurographics Workshop on Virtual Environments (16-18 May, 2001). pp. 51-60. STOEV, S. L. and Schmalstieg, D. (2002). Application and taxonomy of through-the-lens techniques. In: roceedings of the ACM Symposium on Virtual Reality Software and Technology (Hong Kong, China, November 11 - 13, 2002). VRST '02. ACM, New York, NY, pp. 57-64. STONE, R.J. (2008). Human factors guidelines for interactive 3D and games-based training systems design. Human Factors Integration Defence Technology Centre & Human Interface Technologies Team, University of Birmingham (UK). SCHUBERT, T., Friedmann, F. and Regenbrecht, H. (2001). The Experience of Presence: Factor Analytic Insights. Presence: Teleoperators, and Virtual Environments. 10(3), pp. 266-281. SUTCLIFFE, A.G. and Kaur, K.D. (2000). Evaluating the usability of virtual reality user interfaces. Behaviour & Information Technology. 19(6), pp. 415-426.
167 REFERENCES
SWAN, J. Edward II and J. L. Gabbard (2005). Survey of User-Based Experimentation in Augmented Reality. In: Proceedings 1st International Conference on Virtual Reality. Las Vegas, USA, 2005. SWEENEY, B. and Adams, A. (2009). Virtual world users evaluated according to environment design, task based and affective attention measures. In: Proceedings of the 2009 British Computer Society Conference on Human-Computer interaction. Cambridge, United Kingdom: British Computer Society, Swinton, UK, 381-387, pp. 381-387. TAHRANI, S. and Moreau, G. (2008). Integration of immersive walking to analyze urban daylight ambiences. Journal of Urban Design. 13(1), pp. 99-123. TRAPP, M., Glander, T., Buchholz, H. and Döllner, J. (2008). 3D Generalization Lenses for Interactive Focus + Context Visualization of Virtual City Models. In: Proceedings of the 2008 12th International Conference Information Visualisation (IV '08). IEEE Computer Society, Washington, DC, USA, pp. 356-361. TROMP, J., Nichols, S. (2003). VIEW-IT: A VR/CAD inspection tool for use in industry. In: Proceedings of the Human Computer Interaction International Conference 2003 (HCII2003), 22-27 June 2003, Crete, Greece, pp. 1451-1455. TULLIS, T. and Albert, B. (2010). Measuring the User Experience - A companion website to the book by Tom Tullis and Bill Albert. [online]. [Accessed 4 September 2010]. Available from World Wide Web: <http://www.measuringuserexperience.com/> TYNDIUK, F. (2005). Référentiels Spatiaux des Tâches d’Interaction et Caractéristiques de l’Utilisateur influençant la Performance en Réalité Virtuelle. Thèse de Doctorat. Université Victor Ségalen Bordeaux 2. UCLA (2008). Digital Karnak Project, University of California at Los Angeles (UCLA). [online]. [Accessed 17 May 2010]. Available from World Wide Web: <http://dlib.etc.ucla.edu/projects/Karnak/> UNESCO-WHC (2010). UNESCO World Heritage Centre. [online]. [Accessed 13 September 2010]. Available from World Wide Web: <http://whc.unesco.org> UN-WFP (2010). Food Force: The First Humanitarian Video Game, United Nations World Food Programme (WFP). [online]. [Accessed 17 September 2010]. Available from World Wide Web: <http://www.wfp.org/how-to-help/individuals/food-force>

168 Abstract Information Visualization in Interactive 3D Virtual Environments: Conceptualization and Usability Evaluation
USABILITYBOK (2010). Usability Body of Knowledge: Principales of Usable Design. [online]. [Accessed 17 September 2010]. Available from World Wide Web: <http://www.usabilitybok.org/design/p287> USERFOCUS (2010). User experience consultancy & usability training from Userfocus. [online]. [Accessed 17 September 2010]. Available from World Wide Web: <http://www.userfocus.co.uk/> VEP (2007). Virtual Environmental Planning project (VEPs). [online]. [Accessed 13 September 2010]. Available from World Wide Web: <http://www.veps3d.org> VFC-3D (2008). The Virtual 3D Forbidden City: Beyond Space and Time. [online]. [Accessed 17 September 2010]. Available from World Wide Web: <http://www.beyondspaceandtime.org> VORDERER, P., Wirth, W., Gouveia, F.R. et al. (2004). MEC spatial presence questionnaire (MEC-SPQ): short documentation and instructions for application. Report to the European community, project presence: MEC (IST-2001-37661). WINGRAVE, C.A. and LaViola, J.J. (2010). Reflecting on the design and implementation issues of virtual environments. Presence: Teleoperators and Virtual Environments. 19(2), pp. 179-195. WITMER, B. G. and Singer, M. J. 1998. Measuring Presence in Virtual Environments: A Presence Questionnaire. Presence: Teleoperators and Virtual Environments. 7(3), pp. 225-240. WONDERVILLE-3D (2010). Science Alberta Foundation. [online]. [Accessed 17 September 2010]. Available from World Wide Web: <http://www.wonderville.ca> X3D (2006). Web3D Consortium - X3D for Developers. [online]. [Accessed 17 September 2010]. Available from World Wide Web: <http://www.web3d.org/x3d> XVR (2007). VRMedia: XVR, virtual reality on the web. [online]. [Accessed 17 September 2010]. Available from World Wide Web: <http://www.vrmedia.it/Xvr.htm> ZHAI, S., Accot, J., and Woltjer, R. (2004). Human action laws in electronic virtual worlds: an empirical study of path steering performance in VR. Presence: Teleoperators and Virtual Environments. 13(2), pp. 113-127. ZYDA, M. (2005). From Visual Simulation to Virtual Reality to Games. Computer. 38(9), pp. 25-32.

169 APPENDIX
APPENDIX
A. Pre-questionnaire for selecting participants Nom et prénom: Sexe : Age: Cursus d'études [etudiant(e) en (titre du diplôme en préparation)]: Niveau d’études: Numéro de tél. portable: Adresse email : 1. Avez-vous des problèmes de vue, même après correction? (par exem-ple, en rapport avec le daltonisme) ( ) Non ( ) Oui ( ) Ne sais pas 2. A quelle fréquence utilisez-vous un ordinateur ? ( ) Tous les jours ( ) Plusieurs fois par semaine ( ) 1 fois par semaine ( ) 1 fois par mois ( ) Quelques fois par an ( ) Jamais 3. Quels profils correspondent au mieux à votre utilisation d’un ordinateur ? (plusieurs réponses possibles) ( ) Bureautique (par exemple, Open Office, Microsoft Office) ( ) Internet ( ) Jeux vidéo

170 Abstract Information Visualization in Interactive 3D Virtual Environments: Conceptualization and Usability Evaluation
( ) Programmation ( ) Utilisateur de logiciels spécifiques (par exemple, traitement d'image, multimédia) ( ) Autre 4. Avec quel degré de facilité apprenez-vous à utiliser de nouvelles appli-cations ? ( ) Très rapidement ( ) Rapidement ( ) Lentement ( ) Ne sais pas 5. Utilisez-vous des applications 3D (par exemple, Autodesk 3ds Max, Autodesk Maya, Blender, Google SketchUp, Second Life) ? ( ) Oui ( ) Non ( ) Ne sais pas 6. Si oui, à quelle fréquence utilisez-vous ces applications 3D ? ( ) Tous les jours ( ) Plusieurs fois par semaine ( ) 1 fois par semaine ( ) 1 fois par mois ( ) Quelques fois par an ( ) Jamais 7. Jouez-vous aux jeux vidéo 3D? ( ) Oui ( ) Non ( ) Ne sais pas

171 APPENDIX
8. Si oui, à quelle fréquence y jouez-vous? ( ) Tour les jours ( ) Plusieurs fois par semaine ( ) 1 fois par semaine ( ) 1 fois par mois ( ) Quelques fois par an ( ) Jamais 9. Utilisez-vous des applications de réalité virtuelle (autre que des jeux vidéo 3D)? ( ) Oui ( ) Non ( ) Ne sais pas 10. Si oui, à quelle fréquence les utilisez vous? ( ) Tour les jours ( ) Plusieurs fois par semaine ( ) 1 fois par semaine ( ) 1 fois par mois ( ) Quelques fois par an ( ) Jamais

172 Abstract Information Visualization in Interactive 3D Virtual Environments: Conceptualization and Usability Evaluation
B. Consent Form Project Title: Abstract Information Visualization in 3D Virtual Envi-ronments: Conceptualization and Usability Evaluation Researcher: Kaveh Bazargan Harandi (ISI Lab/CUI/UNIGE) Supervisors: Prof. Gilles Falquet and Prof. Claudine Métral (ISI Lab/CUI/ UNIGE)
• I have received information about this research project. • I understand the purpose of the research project and my involve-
ment in it. • I understand that I may withdraw from the research project at any
stage. • I understand that while information gained during the study may
be published, I will not be identified and my personal results will remain confidential.
• I have been informed that there might be taken pictures during the study, which may be published.
I agree with the terms above and indicate my agreement by signing here: Name of participant: ……………………………… Signature: …………………………………….. Date : ……………………………. I have provided information about the research to the research participant and believe that he/she understands what is involved. Researcher’s signature and date: ……………………

173 APPENDIX
C. Igroup Presence Questionnaire The Igroup Presence Questionnaire (IPQ, 2008) is a scale for measuring the sense of presence experienced in a virtual environment (VE). It has been constructed using a large pool of items and two survey waves with approximately 500 participants. Now you'll see some statements about experiences. Please indicate, whether or not each statement applies to your experience. If a question is not relevant to the virtual environment you used, just skip it. You can use the whole range of answers. There are no right or wrong answers, only your opinion counts.
1) In the computer generated world I had a sense of "being there".
fully disagree
fully agree
1 2 3 4 5 6 7
2) Somehow I felt that the virtual world surrounded me.
fully disagree
fully agree
1 2 3 4 5 6 7 3) I felt like I was just perceiving pictures.
fully disagree
fully agree
1 2 3 4 5 6 7 4) I did not feel present in the virtual space.
fully disagree
fully agree
1 2 3 4 5 6 7 5) I had a sense of acting in the virtual space, rather than operating some-
thing from outside.

174 Abstract Information Visualization in Interactive 3D Virtual Environments: Conceptualization and Usability Evaluation
fully disagree
fully agree
1 2 3 4 5 6 7
6) I felt present in the virtual space.
fully disagree
fully agree
1 2 3 4 5 6 7
7) I was aware of the real world surrounding while navigating in the virtual world (i.e. sounds, room temperature, other people, etc.)?
fully disagree
fully agree
1 2 3 4 5 6 7
8) I was not aware of my real environment.
fully disagree
fully agree
1 2 3 4 5 6 7
9) I still paid attention to the real environment.
fully disagree
fully agree
1 2 3 4 5 6 7
10) I was completely captivated by the virtual world.

175 APPENDIX
fully disagree
fully agree
1 2 3 4 5 6 7
11) Did the virtual world seem real to you?
fully disagree
fully agree
1 2 3 4 5 6 7
12) Did your experience in the virtual environment seem consistent with your real world experience?
fully disagree
fully agree
1 2 3 4 5 6 7
13) The virtual world seemed more realistic than the real world.
fully disagree
fully agree
1 2 3 4 5 6 7
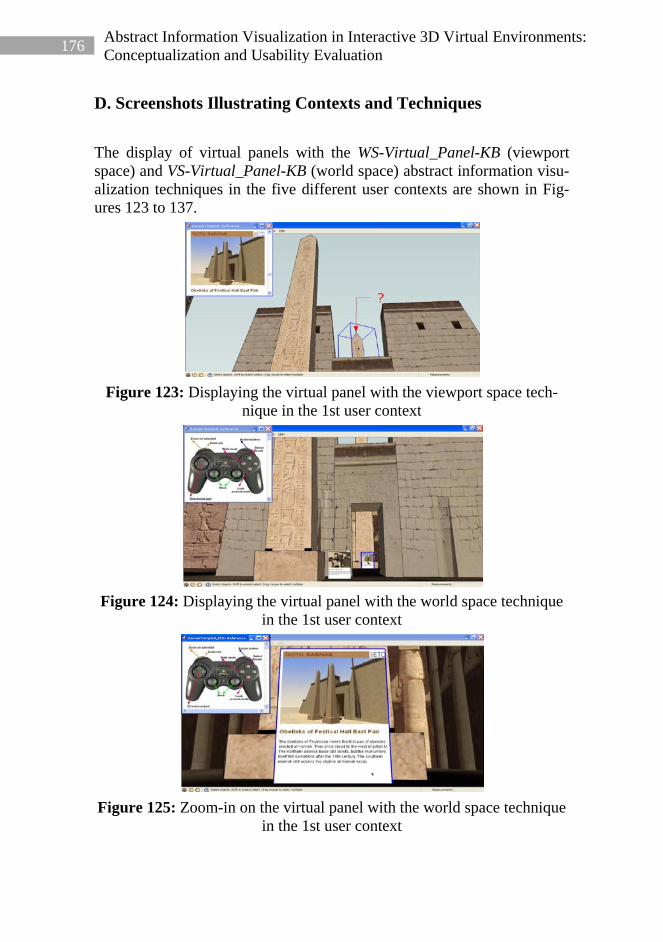
176 Abstract Information Visualization in Interactive 3D Virtual Environments: Conceptualization and Usability Evaluation
D. Screenshots Illustrating Contexts and Techniques The display of virtual panels with the WS-Virtual_Panel-KB (viewport space) and VS-Virtual_Panel-KB (world space) abstract information visu-alization techniques in the five different user contexts are shown in Fig-ures 123 to 137.
Figure 123: Displaying the virtual panel with the viewport space tech-
nique in the 1st user context
Figure 124: Displaying the virtual panel with the world space technique
in the 1st user context
Figure 125: Zoom-in on the virtual panel with the world space technique
in the 1st user context

177 APPENDIX
Figure 126: Displaying the virtual panel with the viewport space tech-
nique in the 2nd user context
Figure 127: Displaying the virtual panel with the world space technique
in the 2nd user context
Figure 128: Zoom-in on the virtual panel with the world space technique
in the 2nd user context
Figure 129: Displaying the virtual panel with the viewport space tech-
nique in the 3rd user context

178 Abstract Information Visualization in Interactive 3D Virtual Environments: Conceptualization and Usability Evaluation
Figure 130: Displaying the virtual panel with the world space technique
in the 3rd user context
Figure 131: Zoom-in on the virtual panel with the world space technique
in the 3rd user context
Figure 132: Displaying the virtual panel with the viewport space tech-
nique in the 4th user context
Figure 133: Displaying the virtual panel with the world space technique
in the 4th user context

179 APPENDIX
Figure 134: Zoom-in on the virtual panel with the world space technique
in the 4th user context
Figure 135: Displaying the virtual panel with the viewport space tech-
nique in the 5th user context
Figure 136: Displaying the virtual panel with the world space technique
in the 5th user context
Figure 137: Zoom-in on the virtual panel with the world space technique
in the 5th user context

180 Abstract Information Visualization in Interactive 3D Virtual Environments: Conceptualization and Usability Evaluation

UNIVERSITÉ DE GENÈVEFACULTÉ DES SCIENCES ÉCONOMIQUES ET SOCIALES Institut de recherche en ingénierie des connaissances et logique de l’espace Uni Mail 40 bd du Pont-d’Arve CH-1211 Genève 4 SUISSE www.unige.ch/ses ISBN 978-2-88903-005-7 Editions SES - Université de Genève
Abstract Information Visualization in Interactive 3DVirtual Environments:
Conceptualization and Usability Evaluation Kaveh Bazargan Harandi These 747 – Mars 2011
Abstract information refers to information that a user can’t directly obtain just by visualizing the spatial information of objects in a 3D virtual environment (3DVE). Many interactive visualization techniques have been created to augment 3DVEs with abstract information. A usability evaluation toolkit is needed to help designers and developers of interactive 3DVEs in comparing the usability of different abstract information visualization techniques according to specific design needs and contexts. The first part of this thesis reviews the state of the art on interactive 3DVEs development, abstract information visualization techniques and the evaluation of interactive 3DVEs. Then, in the second part, this thesis presents a conceptual model, reusable toolkit and usability evaluation methodology for comparing the usability of different abstract information visualization techniques. In order to control the navigation skill variable, the design of a constrained navigation approach for teleporting the user from one user context to another is proposed. Finally, the third part of this thesis presents case studies for validating the proposed conceptual model, the toolkit and the usability evaluation methodology by performing usability testing experiments and analyzing their results. The contributions of this thesis are a reusable conceptual model, toolkit and usability evaluation methodology for measuring and comparing the usability of abstract information visualization techniques in interactive 3DVEs.