Modeling of Selective Laser Sintering of Viscoelastic Polymers
Upload
khangminh22Category
view
1download
0
HAL Id: hal-02931997https://hal.archives-ouvertes.fr/hal-02931997
Submitted on 10 Sep 2020
HAL is a multi-disciplinary open accessarchive for the deposit and dissemination of sci-entific research documents, whether they are pub-lished or not. The documents may come fromteaching and research institutions in France orabroad, or from public or private research centers.
L’archive ouverte pluridisciplinaire HAL, estdestinée au dépôt et à la diffusion de documentsscientifiques de niveau recherche, publiés ou non,émanant des établissements d’enseignement et derecherche français ou étrangers, des laboratoirespublics ou privés.
Viscoelastic analysis of RFDA measurements applied tooxide glasses
Yann Gueguen, Fabrice Célarié, J. Rocherulle, Nourchène Ben Khelil
To cite this version:Yann Gueguen, Fabrice Célarié, J. Rocherulle, Nourchène Ben Khelil. Viscoelastic analysis of RFDAmeasurements applied to oxide glasses. Journal of Non-Crystalline Solids, Elsevier, 2020, 548,pp.120327. �10.1016/j.jnoncrysol.2020.120327�. �hal-02931997�

Viscoelastic analysis of RFDA measurementsapplied to oxide glasses
Nourchene Ben Khelil1,2, Yann Gueguen1, Fabrice Celarie1,and Jean Rocherulle2
1Univ Rennes, CNRS, IPR (Institut de Physique de Rennes) -UMR 6251, Rennes, F-35000, France
2Univ Rennes, CNRS, ISCR (Institut des Sciences Chimiquesde Rennes) - UMR 6226, Rennes, F-35000, France
August 31, 2020
AbstractThe Resonance Frequency and Damping Analysis (RFDA) is now a
common experimental technique to measure the elastic moduli of ma-terials vs. temperature. Nevertheless, the elastic moduli are calculatedassuming that the frequency measured is the natural one, not impactedby any damping. In oxide glasses, a significant damping occurs be-low the glass transition temperature, and it may impact the frequencymeasured, the elastic moduli calculated, as well as the estimated glasstransition temperature. We show here, using the equations of linearviscoelasticity, how we can know if the frequency measured is signif-icantly lowered by damping, and how we can estimate the naturalfrequency to calculate the correct elastic moduli, only from the dataprovided by the RFDA: the frequency measured and the damping.
1 Introduction
The measurement of elastic moduli of glasses is a first and easy measurementto obtain information regarding their structure [1]. Measured vs. tempera-ture, it will provide a glass transition temperature, and it allows to track the
1
Accep
ted m
anus
cript

relaxation mechanisms of glasses [2, 3, 4]. Among all the methods to mea-sure the elastic moduli of glasses, the Resonance Frequency and DampingAnalysis (RFDA) has become very popular, because commercial equipmentshave been developed, as well as standards, and because it is relatively easyto perform measurements at high temperature. The RFDA method, as en-dorsed in its name, allows the measurement of a resonance frequency of amaterial sample and the associated damping. Consequently, the frequencymeasured is not the natural undamped frequency, but a damped frequency.In a recent study, Wang et al. [5] have used various viscoelastic modelsto investigate RFDA measurements and to determine the viscosity and thenon-exponentiality of glass relaxation from the resonance frequency and thedamping. It was a pioneer investigation to show that viscoelastic analysis isadapted to the interpretation of the damping. In their investigation, theyassume that the measured frequency is very close to the natural, undamped,frequency, and they have investigated glasses where the damping was continu-ously increasing. Since the damping peak occurs close to the glass transition,where the elastic moduli is supposed to drastically decrease, we could won-der if the frequency drop observed at the glass transition is not only dueto the elastic moduli drop but at least partially to the damping, inducing awrong estimation of the glass transition temperature (Tg) from the slope ofthe elastic moduli vs. temperature. Additionally, from our experience, someglass samples, especially soda-lime silica glasses, exhibit multiple dampingpeaks vs. temperature with clear frequency (f) decrease associated with thisdamping (i.e.: df/dT show peaks at the same temperatures than damping).As the elastic moduli are calculated assuming that the frequencies measuredare not impacted by any damping, this calculation is wrong as soon as thefrequencies are too much lowered by damping. The questions we want tosolve here are: How do we know if the measured frequency is damped orclose to be natural? And how can we recalculate the natural frequency if wemeasure a damped frequency?
2 Theoretical background
2.1 Natural (undamped) and damped frequencies
For simplicity, to illustrate the problem with simple equations, we use theEuler-Bernoulli beam theory, for a homogenous isotropic sample, in the
2
Accep
ted m
anus
cript

framework of pure linear elasticity. For a free beam of length L, cross sec-tion S and a second moment of area IG, the natural frequency fi of the ith
bending mode is given by:
fi =k2i2π
√IG
d S L4
√E (1)
where E is the Young modulus, and d the density. ki is the ith solu-tion of the equation cos ki cosh ki = 1. So, k21 ∼ 22.3733, k22 ∼ 61.6728,k23 ∼ 120.9032... In other words, f2/f1 = 2.7565 and f3/f1 = 5.4039. Conse-quently, the angular frequency ωi is given by:
ωi = 2π fi = k2i β√E (2)
where β is a factor that only depends on the sample geometry and thedensity of the material. More generally, without the assumption of the Euler-Bernoulli beam theory, µ being the shear elastic modulus:
ωi = γE−i√E, for the bending modes
ωi = γµ−i√µ, for the torsion modes
(3)
γE−i and γµ−i are factor for the ith mode, that depend on the samplegeometry, density, and slightly on the Poisson’s ratio.
These frequencies are the natural frequencies, undamped, and as soon asdamping occur, the displacement of a given point of the beam, in the bendingdirection, can be written as (if no over-damping), assuming each point of thebeam has a single degree of freedom [6]:
u(t) =∑i
u0i sin (ωdi t+ ϕi) exp (−αi t) (4)
ωdi is the damped angular frequency (ωdi < ωi), αi the exponential decayparameter of the ith mode, ϕi a phase lag. The RFDA method provides theωdi and the αi, but not ωi. Consequently if ωdi is significantly lower than ωi,the Young modulus can not be determined using Eq.2 or 3. The questionshere are: how do we know that the difference between ωdi & ωi is significant(since ωi is unknown)? And how can we determine ωi to find E? And all ofthis, only with the data provided by the RFDA?
3
Accep
ted m
anus
cript

2.2 Viscoelastic model
For simplicity, let us consider first an ideal linear viscoelastic material, witha temperature independent natural frequency. This material has a singlerelaxation process, temperature dependent. The relaxation time τ of thisprocess decreases when the temperature (T ) increases. So relaxing (dissipat-ing) events occur at a typical frequency 1/τ , increasing when T increases.The damped frequency will drastically decreases when 1/τ approaches thenatural frequency, and the damping increases. Glasses never shows Debyerelaxation [? ], sometimes multi-modal, so that the damped frequency (fd)will decrease when the natural frequency matches the inverse of the averagerelaxation time of one of these distributions, producing a damping peak perdistribution. Consequently, dfd/dT shows peaks at the same temperaturethan damping.
In oxide glasses, we usually expect to see, from experience made by Dy-namical Mechanical Analysis (DMA), some damping peaks before the glasstransition [8, 9], namely the β & γ-relaxation [10] and a large damping whenapproaching the glass transition, the α-relaxation [10]. The peaks before Tgare basically due to ionic mobilities (alkali, alkali earth): at least one peak perion and one peak due to a mixed ion effect (γ-relaxation); and are also dueto water (β-relaxation) [10]. The peak at Tg is due to the relaxation of theglassy network [10]. Usually the peaks before Tg are convoluted. Because therelaxation time of a glass at Tg is around 100 s, and because samples usedin RFDA have resonance frequencies larger than kHz, the peaks are sup-posed to be shifted to larger temperature, compared to DMA (DMA probingfrequency lower than 100 Hz), but are still supposed to be present. Fromour experience of RFDA, on various oxide glasses, we usually observe, as ex-pected, one broad damping peak before Tg associated sometimes with a smallmeasured frequency (the damped frequency fd) drop, and a high broad peakstarting before Tg, associated with a drastic frequency drop and this is alsowhat is observed by Duang et al. [2, 3]. A typical example will be shown laterwith a soda-lime silica glass. The small frequency drop associated with a lowtemperature damping peak is also observed in silicon nitride and carbide [11].
The viscoelastic behavior on inorganic glasses can be modelled using ageneralised Maxwell model [12], also known as the Wiechert model [13], thatis able to describe the dynamic response of inorganic glasses at low and
4
Accep
ted m
anus
cript

high frequencies [14, 15], even if its physical meaning can be debated [15].Let us consider a viscoelastic material using the Wiechert model, to obtainmultiple damping peaks, and let us assume that most of the damping is duedo viscoelastic dissipation (because it can also be partially due to the wiresupporting the sample, the air...). We consider that the Wiechert model hasno pure elastic branch, so that its relaxation modulus is (Prony serie):
ER(t) = EN∑j=1
ρj exp
(− t
τj
)(5)
τj are the relaxation times, and ρj ≥ 0 the weight of the jth relaxing
process.∑N
j ρj = 1. EL is the Laplace-Carson transform of ER(t)/E, said”normalised relaxance”:
EL(s) =N∑j=1
ρjτj s
1 + τj s(6)
s the Laplace variable. The relationship between ωdi, αi and ωi is givenby [16, 17]:
ωi =
√−s2iEL(si)
where Re(si) = −αi, Im(si) = ±ωdi (7)
If si and EL(si) are known, it is easy to find ωi. On the other side, whenωi and EL(si) are known, it is more difficult to find analytical expression forsi, and thus αi, ωdi. To our knowledge, for N ≥ 4 no analytical solution hasbeen found. But for N = 3, an analytical solution can be found for si usingcomputing software, such as Mathematica1. We use here this solution forN = 3 to calculate si and then αi and ωdi.
2.3 Simulation of RFDA measurement
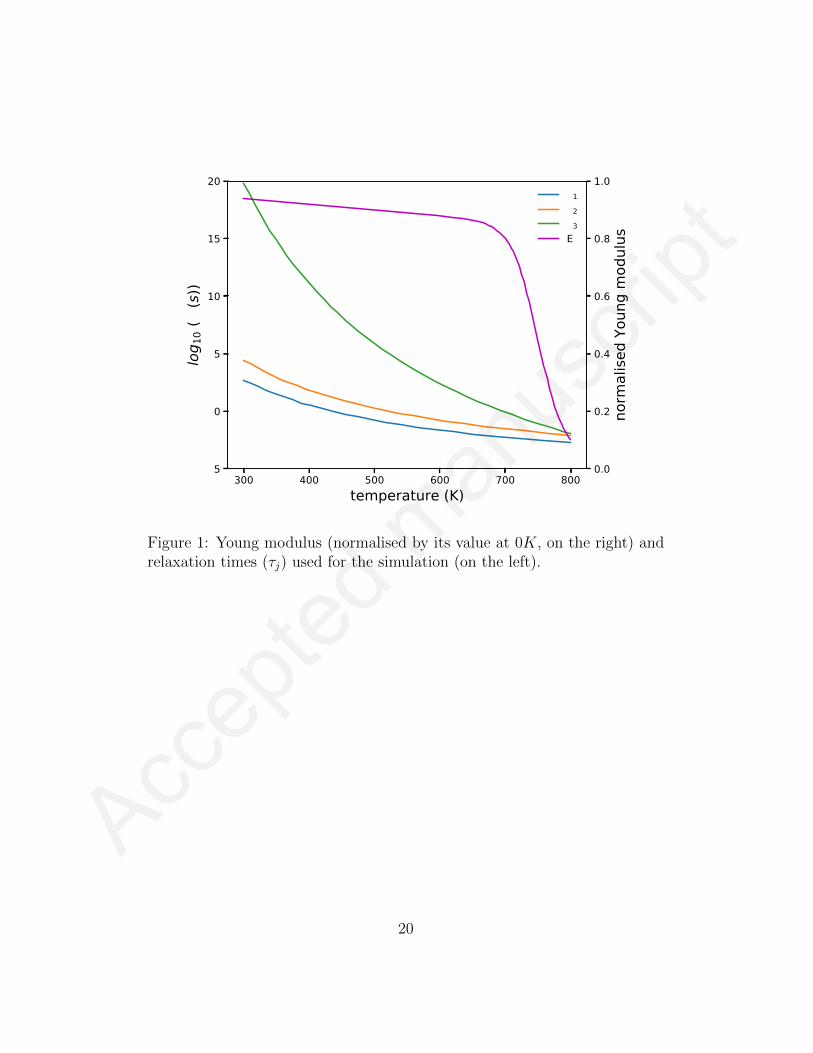
We will investigate how ωdi and αi evolve with temperature for a given Youngmodulus E and a given evolution of the τj. The arbitrary chosen E(T ) andτj(T ) are plotted on Figure 1. ρi are chosen as ρ1 = 0.1, ρ2 = 0.2, ρ3 = 0.7,to qualitatively reproduce the 3 (α− β− γ) typical damping peaks observedin alkali-oxide glasses [8], but ρ1 and ρ2 are chosen 10 times larger than
1https://www.wolfram.com/mathematica
5
Accep
ted m
anus
cript

their expected values to produce large β − γ relaxations to make the Fig-ures more readable (increase the hight of the corresponding damping peaks).The Young modulus of glasses under cooling is usually opposite to the vol-ume/enthalpy change. In the supercooled liquid range (T < Tg) the volumedecreases rapidly under cooling whereas E increases rapidly (dE/dT = −a,a > 0). When Tg is reach, the volume/enthalpy keeps decreasing but with alower rate, whereas E increases with a lower rate (a(T < Tg) < a(T > Tg))[14, 18]. a(T ) has a temperature dependence very similar to the heat ca-pacity, so that the temperature dependence of E can be predicted using theTNM model [4]. Consequently, under heating at constant heating rate, theYoung modulus decreases softly up to Tg and then drops rapidly (this transi-tion is not observed for few glasses, such as fused silica, as an example). Thetemperature dependence of E used here is chosen to reproduce this typicalbehavior of inorganic glasses under heating at constant heating rate. Therelaxation time τj follows arrhenian decays (VFT [19, 20, 21] laws have notbe chosen because they diverge, but the arrhenian law is known to be suffi-cient to described the β and γ relaxations [22]). Again, the parameters forthe temperature dependence of the τj have be chosen to qualitatively repro-duce the α − β − γ relaxations. For simplicity, we choose the solutions ofthe Euler-Bernoulli beam theory, with β = 1/k21 in Eq.2, and at T = 0K:ω1 = 1 rad.s−1 (ω2 = 2.7565 rad.s−1, ω3 = 5.4039 rad.s−1), so that thenormalised Young modulus at 0K is 1.
The corresponding ωdi and αi are calculated using Eq.7 and plotted onFigure 2. As expected, the ωi show trend similar to E, since ωi ∝
√E, and
normalised ωi are perfectly identical. αi show roughly 3 peaks at the temper-ature where τj ∼ 1/ωi (”roughly” because the peaks are convoluted). Theposition of the peaks shifts with i, as expected from experiments on glasses:this shift is used to estimate the activation energy of each τj [2]. On theother side, the ωdi will undergo significant drop every times a damping peakoccurs. The drops do not occur at the same temperature for each mode, be-cause each mode ”probes” at its own frequency: the equalities 1/τj = ωi arenot reach as the same temperatures. E is also noted E∞ in rheology, becauseif its measurement could be made at an infinite frequency, no damping wouldimpact on its measurement, since no relaxation time is ever null: the dropswould be virtually shifted to infinite temperature.
What we would have measured for such theoretical material, from the
6
Accep
ted m
anus
cript

RFDA, are the ωdi and the αi and nothing else. Consequently, using Eq.2,we would have obtained 3 different ”Young moduli”, one per mode measured(if 3 modes are measured). We would have known that they are not realYoung moduli, since they depend on the mode. This is the first way to knowif the frequencies measured are significantly impacted by the damping: ifthe Young moduli calculated for each mode are identical, the frequencies areclosed to the ideal undamped frequencies. Obviously, the best is to havethe first mode, and the highest possible mode to have a very large range offrequencies. Now, if we notice that the Young moduli calculated are differentfrom one mode to an other, how can we estimated the ”real” Young modulus?
2.4 How to determine the natural frequencies formRFDA measurement?
The undamped frequencies (ωi) could be calculated from Eq.7, since si areknown (ωdi and αi are known), but we need to find EL(si) or more specificallythe τj and the ρj. The damping ratio ζ and the Q−1 factor are defined as:
Q−1i = 2 ζ =2αiωi
(8)
Obviously, since ωi are not known, we have to assume in this equationthat:
Q−1i ∼2αiωdi
(9)
It is often assumed (but it is not exact [23]), that Q−1 is equal to the lossfactor:
Q−1i ∼E ′′(ωi)
E ′(ωi)(10)
E ′′ is the loss modulus, and E ′ the storage modulus. For our Wiechertmodel:
7
Accep
ted m
anus
cript

E ′(ωi) = E
N∑j=1
ρjτ 2j ω
2i
1 + τ 2j ω2i
E ′′(ωi) = EN∑j=1
ρjτj ωi
1 + τ 2j ω2i
(11)
Note that E is also noted E∞ because E ′(ω → ∞) = E. Again, ωi arenot known, so we have to assume:
2αiωdi∼ E ′′(ωdi)
E ′(ωdi)=
∑Nj=1 ρj
τj ωdi
1+τ2j ω2di∑N
j=1 ρjτ2j ω2
di
1+τ2j ω2di
(12)
With our model, we can test all the approximations made here. Q−1i =2αi/ωi, approximated Q−1i = 2αi/ωdi, E
′′(ωi)/E′(ωi) and E ′′(ωdi)/E
′(ωdi) areplotted on Figure 3, for the first and third mode (not the second, for sake ofclarity). The results for the other modes are similar. First, the equality sup-posed in Eq.10 is not perfectly correct, as expected. Then, E ′′(ωdi)/E
′(ωdi)is a rather good approximation of 2αi/ωdi: it slightly overestimates 2αi/ωdibut has identical temperature positions for extremum. Consequently, wecan assume that the Eq.12 is quite correct, and so the approximated Q−1
(calculated with the damped frequency) can be fitted, as suggested by thisequation, by finding the adequate value of τj (their temperature dependen-cies) and ρj. We do not need to know E (or ωi) to fit the approximated Q−1.The τj(T ) and ρj found can be injected in Eq.7 to find ωi.
2.5 Maxwell model
In Eq.6, if N = 1, we obtain the Maxwell model, that injected in Eq.7provides the simple and famous relationship:
ωi =√α2i + ω2
di (13)
And using Eq.9:
ωi = ωdi
√(Q−1i
2
)2
+ 1 (14)
8
Accep
ted m
anus
cript
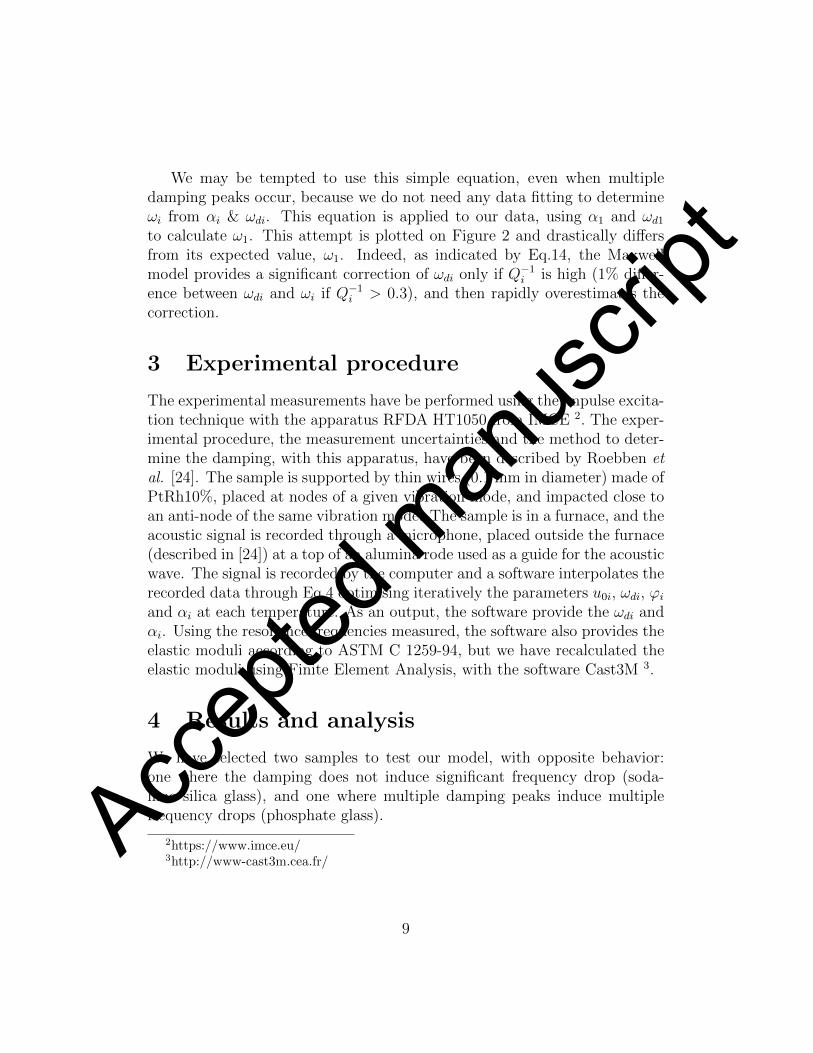
We may be tempted to use this simple equation, even when multipledamping peaks occur, because we do not need any data fitting to determineωi from αi & ωdi. This equation is applied to our data, using α1 and ωd1to calculate ω1. This attempt is plotted on Figure 2 and drastically differsfrom its expected value, ω1. Indeed, as indicated by Eq.14, the Maxwellmodel provides a significant correction of ωdi only if Q−1i is high (1% differ-ence between ωdi and ωi if Q−1i > 0.3), and then rapidly overestimates thecorrection.
3 Experimental procedure
The experimental measurements have be performed using the impulse excita-tion technique with the apparatus RFDA HT1050 from IMCE 2. The exper-imental procedure, the measurement uncertainties and the method to deter-mine the damping, with this apparatus, have been described by Roebben etal. [24]. The sample is supported by thin wires (0.1 mm in diameter) made ofPtRh10%, placed at nodes of a given vibration mode, and impacted close toan anti-node of the same vibration mode. The sample is in a furnace, and theacoustic signal is recorded through a microphone, placed outside the furnace(described in [24]) at a top of an alumina rode used as a guide for the acousticwave. The signal is recorded by the computer and a software interpolates therecorded data through Eq.4 optimising iteratively the parameters u0i, ωdi, ϕiand αi at each temperature. As an output, the software provide the ωdi andαi. Using the resonance frequencies measured, the software also provides theelastic moduli according to ASTM C 1259-94, but we have recalculated theelastic moduli using Finite Element Analysis, with the software Cast3M 3.
4 Results and analysis
We have selected two samples to test our model, with opposite behavior:one where the damping does not induce significant frequency drop (soda-lime silica glass), and one where multiple damping peaks induce multiplefrequency drops (phosphate glass).
2https://www.imce.eu/3http://www-cast3m.cea.fr/
9
Accep
ted m
anus
cript

4.1 Soda-lime silica glass sample
The first sample is a soda-lime silica glass: the window glass Planilux fromSaint Gobain. The sample geometry is 75.32± 0.02× 20.24± 0.02× 2.88±0.02 mm3 heated up at 10 K/min, with a density at room temperature of2.50 ± 0.01 g.cm−3. The supporting PtRh wire were placed at the nodes ofthe first torsion mode. With this configuration, we succeed to obtain the 5first resonance frequencies, 3 corresponding to bending, 2 to torsion. Fromultrasound velocity measurement, we have [25, 26], at room temperatureE = 71.5 ± 0.5 GPa, ν = 0.21 ± 0.01 and µ = 29.5 ± 0.5 GPa. FiniteElement Analysis have been performed using these values, in order to cal-culate the resonance frequencies of this sample, using 3D simulation, withall identical cubic elements with 8 nodes, with a total of 486416 nodes, andto calculate the γµ−i = fi/
√29.5 and γE−i = fi/
√71.5. The experimental
frequencies at room temperature, the γ−i and the corresponding elastic mod-ulus deduced are given in Table 1.
The average elastic moduli found are in the expected range (E = 72.1±0.3 GPa, µ = 29.5±0.2 GPa), but varie from one mode to another, but thesesmall differences between mode can be just due the sample size uncertainty.The corresponding Poisson’s ratio is 0.22± 0.01, in the expected range. Themeasured frequencies vs. temperature are plotted on Figure 4.
As we can see on this Figure, the normalised measured frequencies of samedeformation modes do not depend on the frequencies. They especially dropexactly the same way, at the same time, above 800 K, showing that this dropis not due to the damping (frequency-dependent) but to a decrease of theelastic moduli. Note that the torsion frequencies do not exactly decrease inthe same way as the bending frequencies. This is expected: shear and Youngmoduli do not have the same temperature dependence, since the Poisson’sratio is itself temperature dependent [14, 18]. The difference between thetorsion and bending frequency corresponds to a roughly linear increase ofthe Poisson’s ratio of 0.015 between 300 and 920 K (see inset of Figure 4).
Here, the correction to determine ω from ωd seems needless, since everyfrequency provides the same elastic moduli, within experimental uncertainty,at every temperature. Nevertheless, to show that our model does not ”over-correct” the experimental data, we will apply our model on these data. The
10
Accep
ted m
anus
cript

measured α are shown on Figure 5. Because of the wire position, the dampingof the first and third bending mode, as well as the second torsion modeare noisy, because the wires limit the amplitude of these modes. But thisconfiguration is the best one to obtain that much resonance frequencies withsignificant amplitudes. We assume that the viscoelastic model associatedwith this glass is a Wiechert model with N = 4 cells, and we fit the measuredα using Eq.12:
α(T ) =ωd(T )
2
∑Nj=1 ρj
τj(T ) ωd(T )
1+τj(T )2 ωd(T )2∑Nj=1 ρj
τj(T )2 ωd(T )2
1+τ2j ωd(T )2
(15)
where, with Eaj the activation energy of the relaxation process j:
τj(T ) = τ0j exp
(EajRT
)(16)
The α measured for the bending and torsion are fitted with the sameparameters, even if they are no supposed to be identical, because the last oneinvolves almost pure shear viscoelastic processes, whereas the other involvedalso bulk viscoelastic processes. The fitting parameters are given in Table2. With these fitting parameters, we calculate the relaxance and si at anytemperature to identify the undamped frequency ωi from Eq.7, for each mode,and we calculate the corresponding elastic moduli. They are shown on Figure4. As one can see, the difference between the moduli calculated with dampedfrequencies and undamped frequencies is very low, as expected. However, onecan also see that at T > 500K, the damped frequencies show a very smalldrop associated with the corresponding damping: this is highlighted by thecorrection made, because we see that only above 500 K the damped andundamped frequencies do not overlap. Our model just corrects this verysmall effect of damping.
4.2 Phosphate glass
The second sample is a NaCa(PO3)3 glass. The sample geometry is 35.74±0.02× 13.91± 0.02× 4.96± 0.02 mm3 heated up at 5 K/min, with a densityat room temperature of 2.60 ± 0.01 g.cm−3. The supporting platinum wirewere placed at the nodes of the first torsion mode. For this sample we havemeasured two frequencies corresponding to the first bending and to the firsttorsion mode (16653 and 23836 Hz respectively at room temperature). All
11
Accep
ted m
anus
cript

other frequency modes have too weak signals. The two modes measuredare very similar in their temperature dependence, we focus on the torsionmode here. The data are plotted on Figure 6. As we can see, the frequencymeasured undergoes ”oscillations”, decreasing every time a damping peakoccurs. 9 damping peaks can be distinguished between 475 and 750K. Wewill not try to discuss here the physical origin of this peak: This large numberof peaks could be assigned hydroxide ions mobilities and their interactionswith Na+ & Ca2+, but they obviously do not correspond to 9 different glasstransitions. Even if we do not have the frequencies of the other torsion modes,we clearly know that the frequency measured is a damped frequency. We cannot calculate an elastic modulus with it, directly, and we can not define aglass transition from this data. Consequently, we will use our method tocalculate the undamped frequency. We assume that the viscoelastic modelassociated with this glass is a Wiechert model with N = 9 cells, and we fitthe measured α using Eq.15.
Our best fitting is shown on Figure 6, and the fitting parameters are givenin Table 3. Some parameters clearly indicate that the Arrhenius law is notthe best to fit the data (some τ0 do not have any physical sense ), but again,the VFT will diverge.
With these fitting parameters, we calculate the relaxance and s at anytemperature to identify the undamped frequency ω from Eq.7. As one mightexpect, the right side of this equation has an imaginary part, but very small.We take the modulus for our calculation. The result is shown on Figure 6.As we can see, all the small drops of the damped frequency have disappearedon the calculated undamped frequency, as expected. At ∼ 685K a sharpdecrease of the undamped frequency is observed, associated with some noise,due to the noise on the α measured. It is consistent with the Young modulusdrop expected at the glass transition temperature, expected to be around670 − 700K for this glass: our model does not eliminate this drop becauseit is not due to damping. If we try to calculate the undamped frequencyusing Eq.13-14, the frequency obtained is indistinguishable from the dampedfrequency, underlying that this simple model is not suitable.
It is sometimes assumed that [27]:
ωdi ∼ γµ−i√E ′(ωdi) (17)
12
Accep
ted m
anus
cript

From Eq.11, substituting E by µ (ER by G, E ′ by G′, E ′′ by G′′... termsrelated to Young moduli by terms related to shear moduli):
µ(T ) =
(γ2
9∑j=1
ρjτj(T )2
1 + τj(T )2 ωd(T )2
)−1(18)
All the terms of the right side of this equation are known by direct mea-surement or fitting. It provides an other equation, different from Eq.7, todetermine the elastic moduli. As shown on Figure 7, these two methods(Eq.7 and 18) and are very similar, showing that the approximation of Eq.17is quite correct.
5 Discussion
Oxide glasses have viscosities larger than 1012 Pa.s below Tg, and conse-quently a relaxation time larger than hundreds of seconds [28]. CentimetricRFDA samples, depending on their densities, and on their elastic moduli,have resonance frequencies larger than kHz. Considering the simple Maxwellmodel, we could expect α(T ) = (2τ(T ))−1, and considering Eq.13, if the un-damped frequency is around kHz, the measured frequency (damped), shouldnot be even a ppm lower than the undamped frequency, up to Tg. Conse-quently, we could assume that the RFDA is a suitable method to measurethe elastic moduli of oxide glasses up to Tg and a little bit above, because itis not significantly impacted by any damping. Nevertheless, in many oxideglasses low temperature relaxation (β & γ-relaxation) occurs, and it can in-duce a significant damping, increasing the difference between the undampedand damped frequencies. From our experience on many oxide glasses, theeffect of low temperature relaxation can be seen through a small drop of themeasured frequency, occurring when the damping associated with this relax-ation reaches its maximum. Nevertheless, this drop is not always detectable,depending on the quality of the measurement. A good way to know if themeasured frequency is impacted by damping is to compare the evolution oftwo normalised frequencies, corresponding to the harmonics of a given defor-mation mode (bending mode, torsion mode...), vs. temperature: if they areidentical, they are not impacted by damping, if not, they must be corrected.The two examples presented here shown that sometimes this correction israther needless, sometimes it is a major correction. Unfortunately, measur-
13
Accep
ted m
anus
cript

ing multiple frequencies of multiples deformation modes with good intensitiesand good associated measured damping is not very easy, rather empirical,depending on the sample size and composition, where the sample is impactedand the position chosen for the wires: a given ith mode can be amplified byhitting the sample at its antinode, that would correspond or would be veryclose to the nodes of other modes and drastically reduce their signals. Ex-perimentally, when, at room temperature, one succeed in having good signalfor many modes, frequently, the signal of various modes are lost upon heat-ing. The role of wires and the position where the sample is impacted on theamplitude of the signal, for all the modes where the wires are not at theirnodes, or the sample hit at their antinode, is unclear. The sample geometryfor the soda-lime-silica glass has be selected after various tests on 21 samplegeometries, because it was the one having the larger number of mode withgood quality signals. We were not able to produce such a long sample withthe phosphate glass.
Note that the fitting parameters in Table 2 do not correspond to the ex-pected equilibrium viscosity of the soda-lime-silica glass (η = η0 exp (Ea/(RT )),with η0 = 2.91× 10⁻²⁴ Pa.s and Ea = 571 kJ/mol [26]), but this is not unex-pected. The damping peaks below Tg correspond to, by definition, processesthat are not under equilibrium, and the damping peak(s) well above Tg (αrelaxation), the major contribution to the viscosity (because its ρj is larger),to processes under equilibrium. But this latter can not be properly measured,since the RFDA signal becomes too weak when it occurs (on Figure 5, wejust see the beginning of the α peak). Consequently, a viscosity calculatedfrom the fitting of the damping can not be exactly an equilibrium viscosity,and can not be properly calculated since its major contribution is missing.Wang et al. [5] succeed in determining the viscosity of their glasses fromthe damping, but they observe a single large damping peak. It seems thatwhen β & γ-relaxations occur, the viscosity can not be determined anymorefrom the damping. What is more unexpected is the sharp decrease of theelastic moduli occurring at T > 850 K, whereas ultrasonic measurement at300 kHz, made by Rouxel and Sangleboeuf [29] indicate a sharp decreaseat T ∼ 820 K. Below Tg there is a good agreement between our measure-ments and these ones, but the sharp elastic moduli decrease due to the glasstransition occurs later when measured by RFDA. If our measurement weresignificantly impacted by damping, we would expect the opposite, since ourfrequencies are much lower.
14
Accep
ted m
anus
cript

We could wonder why for the soda-lime-silica glass the damping peak areconvoluted (N = 4 in the Wiechert model, but only two visible peaks onFigure 5), whereas the damping peaks of the NaCa(PO3)3 glass are nicelydeconvoluted (N = 9 for 9 peaks). Two relaxation processes with differentτ0j & Eaj (Eq.16) will produce convoluted peaks when they will have similarrelaxation time in the temperature range investigated and if this relaxationtime is close to the inverse of the natural angular frequency of the sample.So, it is not unexpected to observe situations where peaks are convolutedand other where they are not: for a given glass composition, with RFDA, itwill only depends on the sample geometry.
The correction proposed here is based on linear viscoelasticity. We pro-pose to fit the damping measured using a viscoelastic model, the Wiechertmodel, taking advantage of the fact that, roughly, the damping does notdepend on the undamped frequency that is unknown. To our opinion, thechosen model does not need to capture all the detail of the glass relaxation, assoon as it is able to reproduce the damping peaks. As an exemple, below Tg,the glasses are out of equilibrium: their elastic moduli and relaxation timesare heating-rate dependent [4]. This is not something taken into accounthere. All the results presented in this work are thermal history-dependent.But what we want to emphasize here is that the method to eliminate theeffect of damping does not need to capture this dependence to properly op-erate. In return we can not expect to extract physically sounded parametersfrom the fitting used in the method: we will have to use different fitting pa-rameters for each heating/cooling rate. All we need to apply our method is aviscoelastic model that reproduces the damping at a given heating or coolingrate, even if it does not capture all the physics behind. In other words, allthe fitting parameters found here must only be seen as fitting parametersand nothing else. Additionally, if our investigation shows that the measuredfrequencies do not always allow to determine an elastic moduli, it also showsthat it allows to determine the storage moduli at the damped frequencies(Eq.17). Consequently, the RFDA is also a method to determine the lossand storage moduli at relatively high frequencies, compared to DMA, and isa complementary method to DMA.
It must be noticed that when the wire are placed at the node of a givendeformation mode, the damping of the other modes are increased [24]. Withthe configuration we have chosen, where the wire are at the nodes of firsttorsion mode, it seems that the damping of the first bending mode is notimpacted, this is the reason why we have chosen this configuration. We
15
Accep
ted m
anus
cript

could expect that, if we fit the damping of the first bending mode with aWiechert model, this model will be able to predict the damping of all otherbending mode. But because of the effect of the wires, this fitting will bequantitatively unsuccessful. However, we can expect a qualitative fitting: acorrect prediction of the temperature of the damping peaks. But, again, itis rather difficult to obtain good signals for many modes.
6 Conclusion
Most of oxide glasses exhibit relaxation processes below the glass transitionrange (β & γ-relaxations). During RFDA measurements, these processesinduce a significant damping and this damping can shift the measured fre-quency to a value significantly lower than the natural frequency of the glasssample, inducing a wrong estimation of the elastic moduli. Using the otherfrequencies of the same deformation mode than the first one measured, wecan control if the frequencies measured are impacted by any damping: if theyare not, their normalised evolutions vs. temperature overlap, and the elas-tic moduli can be deduced from these frequencies. If they are impacted bydamping, larger frequencies would show drops at larger temperature. Nev-ertheless, if they are not superimposed, or if the other frequencies are notcorrectly measured, one can not determine the elastic moduli. We use herethe equations of linear viscoelasticity to show how we can determine the elas-tic moduli using the frequencies measured and the damping. Two equationsare used, a first one using the correspondance principle (the Laplace-Carsontransform, Eq.7), and a second one assuming that the moduli calculatedwith the measured frequency is the storage moduli (Eq.18). These two equa-tions provides similar results, removing all apparent elastic moduli dropsdue to damping, letting the expected ”real” drop occurring at Tg. For bothequations, we need to fit the damping using a rheological model of linear vis-coelasticity, with temperature dependent relaxation times. It seems that themodel does not need to capture the complexity of the glass relaxation, but inreturn does not provides any physically sounded parameters. The one shownhere is the Wiechert model, but there is no reason why it would not workwith other linear viscoelastic models. To our opinion, for most oxide glasses,this correction is minor (as exemplified with the soda-lime-silica glass), butfor some samples, as the phosphate glass investigated here, the correctionmade on calculated elastic moduli is larger than 14%. Nevertheless, it must
16
Accep
ted m
anus
cript

be underlined that the relaxation time of oxide glass around Tg being closeto hundreds of seconds, it is not expected to observe any significant damp-ing around Tg when the natural frequency is larger than kHz, but from ourexperience, most of them show significant damping. This is the reason whywe must always pay attention to the frequency measured and ensure that itis not significantly impacted by the damping.
References
[1] J. D. Musgraves, J. Hu, L. E. Calvez (Eds.), Springer handbook of glass,Springer, 2019. Part A, Chapter 7.
[2] R. Duan, G. Roebben, O. V. der Biest, K. Liang, S. Gu, Microstructureresearch of glasses by impulse excitation technique (IET), Journal ofNon-Crystalline Solids 281 (2001) 213 – 220.
[3] R.-G. Duan, G. Roebben, O. V. der Biest, Glass microstructure evalu-ations using high temperature mechanical spectroscopy measurements,Journal of Non-Crystalline Solids 316 (2003) 138 – 145.
[4] W. Liu, H. Ruan, L. Zhang, Revealing structural relaxation of opticalglass through the temperature dependence of young’s modulus, Journalof the American Ceramic Society 97 (2014) 3475–3482.
[5] J. Wang, H. Ruan, X. Wang, J. Wan, Investigating relaxation of glassymaterials based on natural vibration of beam: A comparative study ofborosilicate and chalcogenide glasses, Journal of Non-Crystalline Solids500 (2018) 181 – 190.
[6] E. Gregorova, W. Pabst, P. Diblikova, V. Necina, Temperature depen-dence of damping in silica refractories measured via the impulse excita-tion technique, Ceramics International 44 (2018) 8363 – 8373.
[7] R. Bohmer, K. Ngai, C. Angell, D. Plazek, Nonexponential relaxationsin strong and fragile glass formers, Journal of Chemical Physics 99(1993) 4201–4209.
[8] W. A. Zdaniewski, G. E. Rindone, D. E. Day, The internal friction ofglasses, Journal of Materials Science 14 (1979) 763–775.
17
Accep
ted m
anus
cript

[9] B. Roling, Mechanical loss spectroscopy on inorganic glasses and glassceramics, Current Opinion in Solid State and Materials Science 5 (2001)203–210.
[10] J. Deubener, H. Bornhoft, S. Reinsch, R. Muller, J. Lumeau, L. Glebova,L. Glebov, Viscosity, relaxation and elastic properties of photo-thermo-refractive glass, Journal of Non-Crystalline Solids 355 (2009) 126 – 131.
[11] G. Roebben, R.-G. Duan, D. Sciti, O. V. der Biest, Assessment of thehigh temperature elastic and damping properties of silicon nitrides andcarbides with the impulse excitation technique, Journal of the EuropeanCeramic Society 22 (2002) 2501 – 2509.
[12] L. Duffrene, R. Gy, H. Burlet, R. Piques, Viscoelastic behavior of asoda-lime-silica glass: inadequacy of the KWW function, Journal ofNon-Crystalline Solids 215 (1997) 208–217.
[13] E. Wiechert, Gesetze der elastischen nachwirkung fur constante tem-peratur, Annalen der Physik 286 (1893) 546–570.
[14] L. Duffrene, R. Gy, J. E. Masnik, J. Kieffer, J. D. Bass, Temperaturedependence of the high-frequency viscoelastic behavior of a soda-lime-silica glass, Journal of the American Ceramic Society 81 (1998) 1278–1284.
[15] L. Duffrene, R. Gy, H. Burlet, R. Piques, A. Faivre, A. Sekkat, J. Perez,Generalized maxwell model for the viscoelastic behavior of a soda-lime-silica glass under low frequency shear loading, Rheologica acta 36 (1997)173–186.
[16] N. W. Tschoegl, The phenomenological theory of linear viscoelastic be-havior: an introduction., Springer Science & Business Media, 2012.
[17] P. Djoharian, Shape and Material Design in Physical Modeling SoundSynthesis, in: ICMC 2000 - International Computer Music Conference,Berlin, Germany, 2000, p. n/c. 8 pages.
[18] T. Rouxel, Elastic properties and short to medium range order inglasses., Journal of the American Ceramic Society 90 (2007) 3019–3039.
18
Accep
ted m
anus
cript

[19] H. Vogel, Das temperature-abhangigketsgesetz der viskositat vonflussigkeiten, Phys. Z. 22 (1921) 645–6.
[20] G. S. Fulcher, Analysis of recent measurements of the viscosity of glasses,Journal of the American Ceramic Society 8 (1925) 339–355.
[21] G. Tammann, W. Hesse, Zeitschrift fur anorganische und allgemeineChemie 156 (1926) 245–257.
[22] J. Perez, P. Gobin, Phenomenes de relaxation et frottement interieurdans les solides vitreux, Revue de Physique Appliquee 12 (1977) 819–836.
[23] M. Carfagni, E. Lenzi, M. Pierini, The loss factor as a measure of me-chanical damping, In Proceedings-spie the international society for op-tical engineering. SPIE INTERNATIONAL SOCIETY FOR OPTICALVol. 1 (1998) 580–284.
[24] G. Roebben, B. Bollen, A. Brebels, J. Van Humbeeck, O. Van der Biest,Impulse excitation apparatus to measure resonant frequencies, elasticmoduli, and internal friction at room and high temperature, Review ofScientific Instruments 68 (1997) 4511–4515.
[25] C. Bernard, Indentation and rheology of inorganic glasses from 20 to700 ◦C, Thesis, Universite Rennes 1, 2006.
[26] C. Bernard, V. Keryvin, J.-C. Sangleboeuf, T. Rouxel, Indentationcreep of window glass around glass transition, Mechanics of Materials42 (2010) 196 – 206.
[27] I. Popov, T. P. Chang, Y. Rossikhin, M. Shitikova, Experimental inves-tigation of fly ash and water content on the internal friction of concrete,in: Second International Conference on Mechanics, Materials and Struc-tural Engineering (ICMMSE 2017). Atlantis Press., 2017.
[28] C. Angell, Relaxation in liquids, polymers and plastic crystalsstrong/fragile patterns and problems, Journal of Non-Crystalline Solids131-133 (1991) 13–31.
[29] T. Rouxel, J.-C. Sangleboeuf, The brittle to ductile transition in asoda-lime-silica glass, Journal of Non-Crystalline Solids 271 (2000) 224– 235.
19
Accep
ted m
anus
cript
300 400 500 600 700 800temperature (K)
−5
0
5
10
15
20log 1
0(τ
(s))
0.0
0.2
0.4
0.6
0.8
1.0
norm
alise
d Yo
ung mod
ulus
τ1τ2τ3E
Figure 1: Young modulus (normalised by its value at 0K, on the right) andrelaxation times (τj) used for the simulation (on the left).
20
Accep
ted m
anus
cript

300 400 500 600 700 800temperature (K)
0.5
0.6
0.7
0.8
0.9
1.0
norm
alise
d ω
0.0
0.2
0.4
0.6
0.8
1.0
α(s
−1)
ωi
ωd1ωd2ωd3α1α2α3
√α21 +ω2
d1
Figure 2: Left axis: Normalised natural (undamped) frequencies ωi (all su-perimposed) and damped frequencies ωdi of the ith bending mode (decreasingcurves). They are normalised by their values at 0K. Each bending mode givesthe same normalised natural frequency. Right axis, dashed: correspondingαi (increasing curves).
21
Accep
ted m
anus
cript
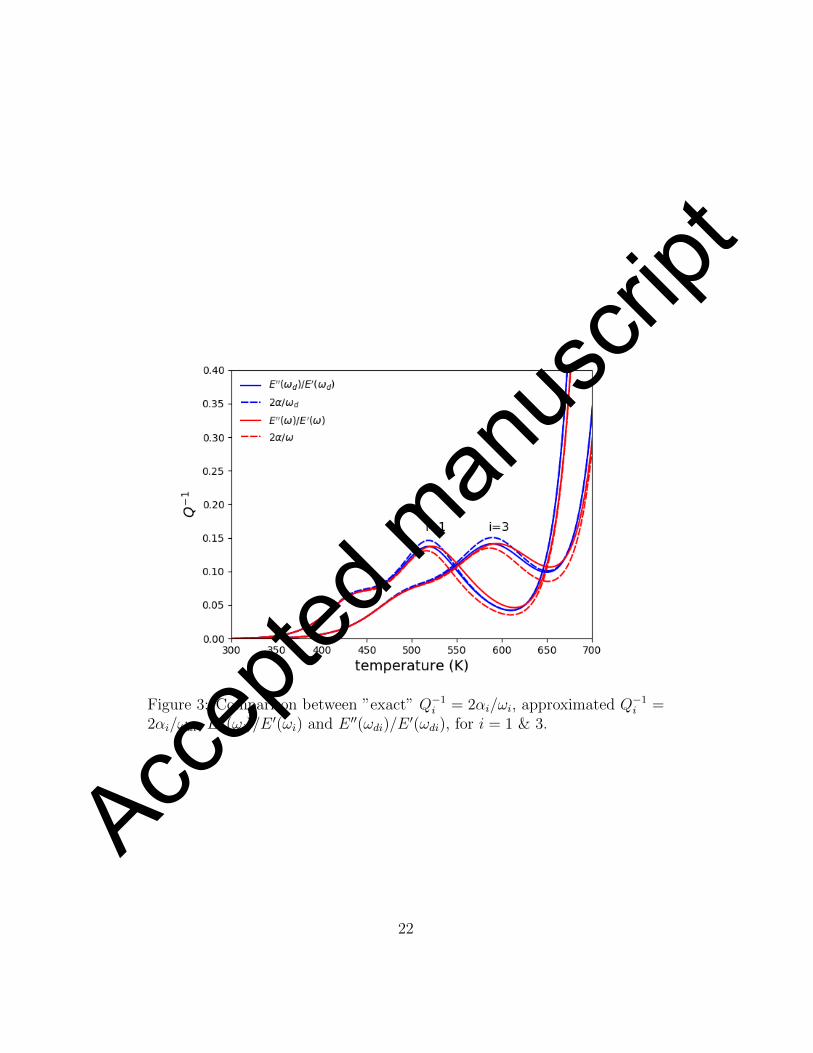
Figure 3: Comparison between ”exact” Q−1i = 2αi/ωi, approximated Q−1i =2αi/ωdi, E
′′(ωi)/E′(ωi) and E ′′(ωdi)/E
′(ωdi), for i = 1 & 3.
22
Accep
ted m
anus
cript

300 400 500 600 700 800 900temperature (K)
0.94
0.96
0.98
1.00
1.02
1.04
ω/ω
RT ben
ding
0.90
0.92
0.94
0.96
0.98
1.00
ω/ω
RT to
rsion
B1B2B3B1cB2cB3c[Rouxel]T1T2T1cT2c 290 390 490 590 690 790 890
T(K)
0.2090.2140.2190.2240.2290.2340.2390.2440.249
ν
Figure 4: Data for the Planilux sample. Normalised measured pulsations(by the pulsations at room temperature ωRT ) vs temperature (equivalent tonormalised measured frequencies: the frequencies are normalised by the val-ues in Table 1): Bi: ith bending mode -bottom-, Ti: ith torsion mode -top-,and normalised calculated undamped frequencies: Bic: ith bending mode,Tic: ith torsion mode. Inset: corresponding evolution of the Poisson’s ra-tio, calculated form the first bending and torsion modes. The square rootof the normalised Young Modulus measured by Rouxel and Sangleboeuf isalso given [29]: ultrasonic measurements, using the long beam mode con-figuration, at 300 kHZ, under nitrogen atmosphere. For this measurement:E(300K) = 72± 1 GPa.
23
Accep
ted m
anus
cript

300 400 500 600 700 800 900temperature (K)
0
50
100
150
200
250
300
350
α(s
−1)
bending 2fit bending 2torsion 1fit torsion 2
Figure 5: α measured for the Planilux sample, for the second bending modeand the first torsion mode.
24
Accep
ted m
anus
cript

400 450 500 550 600 650 700temperature (K)
1.20
1.25
1.30
1.35
1.40
1.45
ω(ra
d.s−
1 )
×105
0
500
1000
1500
2000
2500
3000
3500
α(s
−1)ωd
α measuredfit of αω
Figure 6: Measured angular frequency (named ωd), calculated undampedangular frequency (ω) and corresponding α, measured and fitted, for thefirst torsion mode of the NaCa(PO3)3 sample.
25
Accep
ted m
anus
cript

400 450 500 550 600 650 700temperature (K)
14
15
16
17
18
19
20
shea
r mod
ulus (G
Pa)
123
Figure 7: Calculated shear elastic modulus µ, directly given by the RFDAsoftware (1), using ω = γ
√µ, where ω is the calculated undamped angular
frequency (2) and assuming ωd = γ√G′(ωd) (3). G′ being the equivalent of
E ′ in shear.
26
Accep
ted m
anus
cript

Table 1: 5 first experimental and FEA frequencies for the Planilux sampleat room temperature, γi (= γµ−i for torsion, γE−i for bending) calculatedfrom FEA, and deduced elastic moduli E from experimental frequencies ofbending, µ from torsion.
mode i f exp. (±1 Hz) f FEA (Hz) γ−i (s.√GPa)−1 E or µ (±0.1 GPa)
bending 1 2799 2795 330 71.9torsion 1 6243 6220 1153 29.3bending 2 7681 7653 905 72.2torsion 2 12907 12830 2378 29.6bending 3 14921 14839 1755 72.4
Table 2: Fitting parameters for α of the Planilux sample.
j Ea (kJ/mol) −log10(τ0) ρ
1 58 10.4 0.0032 34 8.5 0.0023 68 8.8 0.0084 203 14.3 0.987
Table 3: Fitting parameters for α of the NaCa(PO3)3 sample.
j Ea (kJ/mol) −log10(τ0 (s)) ρ
1 66 12 0.0032 330 38 0.0043 235 27 0.0104 330 34 0.0145 343 33 0.0186 586 51 0.0287 1047 84 0.0418 1737 133 0.0319 323 27 0.851
27
Accep
ted m
anus
cript
Copyright © 2022 FDOKUMEN