Viral control of bacterial biodiversityevidence from a nutrient‐enriched marine mesocosm...
13
Viral control of bacterial biodiversity – evidence from a nutrient-enriched marine mesocosm experimentRuth-Anne Sandaa, 1 * Laura Gómez-Consarnau, 2 Jarone Pinhassi, 2 Lasse Riemann, 2 Andrea Malits, 3 Markus G. Weinbauer, 3 Josep M. Gasol 4 and T. Frede Thingstad 1 1 University of Bergen, PO Box 7800, Department of Biology, N-5020 Bergen, Norway. 2 Department of Natural Sciences, University of Kalmar, SE-39182 Kalmar, Sweden. 3 Laboratoire d’Océanographie de Villefranche, Université Pierre et Marie Curie Paris VI, UMR 7093, Villefranche-sur-Mer, France. 4 Institut de Ciències del Mar-CSIC. 08003 Barcelona, Catalunya, Spain. Summary We demonstrate here results showing that bottom-up and top-down control mechanisms can operate simul- taneously and in concert in marine microbial food webs, controlling prokaryote diversity by a combina- tion of viral lysis and substrate limitation. Models in microbial ecology predict that a shift in the type of bacterial growth rate limitation is expected to have a major effect on species composition within the com- munity of bacterial hosts, with a subsequent shift in the composition of the viral community. Only moderate effects would, however, be expected in the absolute number of coexisting virus–host pairs. We investigated these relationships in nutrient- manipulated systems, under simulated in situ condi- tions. There was a strong correlation in the clustering of the viral and bacterial community data supporting the existence of an important link between the bacte- rial and viral communities. As predicted, the total number of viral populations was the same in all treat- ments, while the composition of the viral community varied. Our results support the theoretical prediction that there is one control mechanism for the number of niches for coexisting virus–host pairs (top-down control), and another mechanism that controls which virus–host pairs occupy these niches (bottom-up control). Introduction Marine viruses are the most numerous biological compo- nents of the aquatic environment, with concentrations typically around 10 7 particles ml -1 (Bergh et al., 1989). Viruses have significant stimulatory and/or inhibitory effects upon microbial biomass and activity, e.g. bacterial abundance and production (Proctor and Fuhrman, 1990; 1992; Suttle, 2005; 2007). Thereby, viral activity affects not only the structure and composition of communities but also modifies the biogeochemical fluxes of matter and energy bypassing particulate matter transport ‘up’ the food chain to larger organisms, and instead diverting it to dissolved organic matter (DOM) via viral lysis (Bratbak et al., 1992; 1994; Fuhrman and Suttle, 1993; Thingstad and Lignell, 1997; Schwalbach et al., 2004; Winter et al., 2004). In a hypothetical environment, homogenous in time and space, one could imagine at least two extreme mecha- nisms for biodiversity control of prokaryotes. Both mecha- nisms are niche based, in terms of the niche versus neutral theories (Sloan et al., 2006). In the bottom-up model each species is present because it has specialized for a given substrate, leading to a system where each species is limited by a different substrate and, thus, organism diversity reflects the diversity of the available substrates (a ‘food-specialist’ model). The other extreme is a top-down, ‘killing the winner’ type of mechanism (Thingstad and Lignell, 1997), where selective loss pro- cesses like host-specific viral lysis prevent the best com- petitors from sequestering all the available resources. In such a model, a diverse community of coexisting organ- isms, all competing for the same resource, is in principle possible. With viral infection being more specific (‘species’ level) than grazing (which is not species-selective), the total number of organisms in the community would be controlled by grazing, while the loss to lytic viruses would determine the size of each host group and, thus, diversity (Thingstad, 2000). A formalization of this model allows calculation of the number of dominant species, expressed as the ratio between the size of the total community and Received 3 December, 2008; accepted 28 May, 2009. *For corre- spondence. E-mail [email protected]; Tel. (+47) 55584646; Fax (+47) 55589671. Environmental Microbiology (2009) 11(10), 2585–2597 doi:10.1111/j.1462-2920.2009.01983.x © 2009 Society for Applied Microbiology and Blackwell Publishing Ltd
-
Upload
independent -
Category
Documents
-
view
1 -
download
0
Transcript of Viral control of bacterial biodiversityevidence from a nutrient‐enriched marine mesocosm...
Viral control of bacterial biodiversity – evidence froma nutrient-enriched marine mesocosm experimentemi_1983 2585..2597
Ruth-Anne Sandaa,1* Laura Gómez-Consarnau,2
Jarone Pinhassi,2 Lasse Riemann,2 Andrea Malits,3
Markus G. Weinbauer,3 Josep M. Gasol4 andT. Frede Thingstad1
1University of Bergen, PO Box 7800, Department ofBiology, N-5020 Bergen, Norway.2Department of Natural Sciences, University of Kalmar,SE-39182 Kalmar, Sweden.3Laboratoire d’Océanographie de Villefranche,Université Pierre et Marie Curie Paris VI, UMR 7093,Villefranche-sur-Mer, France.4Institut de Ciències del Mar-CSIC. 08003 Barcelona,Catalunya, Spain.
Summary
We demonstrate here results showing that bottom-upand top-down control mechanisms can operate simul-taneously and in concert in marine microbial foodwebs, controlling prokaryote diversity by a combina-tion of viral lysis and substrate limitation. Models inmicrobial ecology predict that a shift in the type ofbacterial growth rate limitation is expected to have amajor effect on species composition within the com-munity of bacterial hosts, with a subsequent shiftin the composition of the viral community. Onlymoderate effects would, however, be expected inthe absolute number of coexisting virus–host pairs.We investigated these relationships in nutrient-manipulated systems, under simulated in situ condi-tions. There was a strong correlation in the clusteringof the viral and bacterial community data supportingthe existence of an important link between the bacte-rial and viral communities. As predicted, the totalnumber of viral populations was the same in all treat-ments, while the composition of the viral communityvaried. Our results support the theoretical predictionthat there is one control mechanism for the number ofniches for coexisting virus–host pairs (top-down
control), and another mechanism that controls whichvirus–host pairs occupy these niches (bottom-upcontrol).
Introduction
Marine viruses are the most numerous biological compo-nents of the aquatic environment, with concentrationstypically around 107 particles ml-1 (Bergh et al., 1989).Viruses have significant stimulatory and/or inhibitoryeffects upon microbial biomass and activity, e.g. bacterialabundance and production (Proctor and Fuhrman, 1990;1992; Suttle, 2005; 2007). Thereby, viral activity affectsnot only the structure and composition of communities butalso modifies the biogeochemical fluxes of matter andenergy bypassing particulate matter transport ‘up’ thefood chain to larger organisms, and instead diverting it todissolved organic matter (DOM) via viral lysis (Bratbaket al., 1992; 1994; Fuhrman and Suttle, 1993; Thingstadand Lignell, 1997; Schwalbach et al., 2004; Winter et al.,2004).
In a hypothetical environment, homogenous in time andspace, one could imagine at least two extreme mecha-nisms for biodiversity control of prokaryotes. Both mecha-nisms are niche based, in terms of the niche versusneutral theories (Sloan et al., 2006). In the bottom-upmodel each species is present because it has specializedfor a given substrate, leading to a system where eachspecies is limited by a different substrate and, thus,organism diversity reflects the diversity of the availablesubstrates (a ‘food-specialist’ model). The other extremeis a top-down, ‘killing the winner’ type of mechanism(Thingstad and Lignell, 1997), where selective loss pro-cesses like host-specific viral lysis prevent the best com-petitors from sequestering all the available resources. Insuch a model, a diverse community of coexisting organ-isms, all competing for the same resource, is in principlepossible. With viral infection being more specific (‘species’level) than grazing (which is not species-selective), thetotal number of organisms in the community would becontrolled by grazing, while the loss to lytic viruses woulddetermine the size of each host group and, thus, diversity(Thingstad, 2000). A formalization of this model allowscalculation of the number of dominant species, expressedas the ratio between the size of the total community and
Received 3 December, 2008; accepted 28 May, 2009. *For corre-spondence. E-mail [email protected]; Tel. (+47) 55584646;Fax (+47) 55589671.
Environmental Microbiology (2009) 11(10), 2585–2597 doi:10.1111/j.1462-2920.2009.01983.x
© 2009 Society for Applied Microbiology and Blackwell Publishing Ltd

the average size of a host group (Thingstad, 2000). Whilethe number of niches in this idealized theoretical scenariois primarily controlled by top-down mechanisms, theability of a host to occupy one of these niches woulddepend on the hosts’ ability to compete for the limitingsubstrate(s). Although these models are simple inconcept, we are not aware of any experimental data criti-cally testing their predictions.
Several recently published studies have indicated thatviral activity has a limited effect on the composition of thebacterial community (Jardillier et al., 2005; Hewson andFuhrman, 2006). Likewise, a recent experimental study(Bouvier and del Giorgio, 2007) has suggested that raremarine bacterial groups are the most susceptible to virallysis, as these phylotypes might have higher intrinsicactivity, higher burst sizes that increase the virus to bac-teria ratio, and lower levels of viral resistance, the finalresult being that they are ‘rare’. They also suggest thatthese rare groups are more effective in resource exploi-tation, and are thus the winners in nutrient acquisition.Most of the studies concerning the effect of viral activityon the host community have been conducted in manipu-lated systems using filtration and dilution experimentswith virus and virus-free treatments removing all otherbiological factors, except bacteria, from the sample (Jar-dillier et al., 2005; Hewson and Fuhrman, 2006; Bouvierand del Giorgio, 2007; Zhang et al., 2007). In the presentstudy we investigated the relationship between virusesand their hosts under simulated in situ conditions.
Our experiment was carried out in nutrient-manipulatedsystems to study the effect of both top-down andbottom-up control of the bacterial community. A series ofmesocosms with coastal north-western Mediterraneanwater was amended with either glucose (+G), phosphate(+P), both nutrients (+GP) or left un-manipulated (C). TheMediterranean Sea is deficient in phosphate (P) relative tonitrogen (Krom et al., 1991; Bethoux et al., 1992), andevidence has been found for P-limited bacterial growthdominating in surface waters (Thingstad et al., 1998; VanWambeke et al., 2002; Pinhassi et al., 2006). Amendingsuch limited water with P, either alone or together withglucose, should therefore create shifts in the limitingfactor for bacterial growth, and subsequently result inchanges in the composition of the prokaryote and viralcommunities. The changes in bacterial and viral commu-nity structure in the mesocosms and their relationshipswere monitored using denaturing gradient gel electro-phoresis (DGGE) and pulsed field gel electrophoresis(PFGE), respectively, while viral and bacterial abun-dances were measured by flow cytometry. Our workinghypothesis was that changing the type of growth ratelimitation of the bacterial community would not substan-tially affect the number of simultaneously coexisting host–virus pairs, but rather affect the selection for dominant
members of the bacterial community, and thus, that viraland bacterial community structure would change inparallel.
Results
Chlorophyll a, bacterial and viral abundance
Chlorophyll a (Chl a) ranged from 0.26 mg l-1 at the begin-ning of the experiment to an average of 1.33 mg l-1 on day5 (Fig. 1). In the control treatment the Chl a concentrationdecreased from day 1, while in all other treatments therewas an increase with a peak on day 5. This increase wasmost pronounced in the two P-amended treatments. Nev-ertheless, addition of glucose alone also resulted in anincrease in Chl a concentration as compared with thecontrol treatment. The abundance of photosynthetic pico-and nanoeukaryotes generally followed the increase inChl a concentrations, with the highest abundances inP-amended treatments (Fig. S1). The highest abundanceof nanoeukaryotes was on day 3 (+G and +GP) and 4(+P), while the picoeukaryotes peaked in all treatments onday 4 (Fig. S1).
Initial bacterial abundance was around 1.0 ¥ 106
cells ml-1 (Fig. 1). In the control treatment abundanceincreased slightly with a peak on day 4 (1.7 ¥ 106
cells ml-1) and thereafter declined throughout the rest ofthe experimental period. A small peak in bacterial abun-dance was also seen in all the other treatments on day 2,with a second peak on day 8 in the two P-amendedtreatments (+P and +GP). Overall, the average bacterialabundance was the highest in the two P-amended treat-ments, with the highest abundance in +P on day 8(3.9 ¥ 106 cells ml-1; Fig. 1).
Total viral abundance was approximately 2.1 ¥ 107 par-ticles ml-1 at the start of the experiment and showed nochanges in the different treatments until day 2 (Fig. 1).From day 2 there was a major increase in the number ofviral particles both in the +GP and in the +P treatments,while only minor changes were seen in the control and +Gtreatments. The increase in viral abundance was thehighest in the +GP treatment, compared with the control,reaching an average of 1.4 ¥ 108 particles ml-1 on day 8while the corresponding number in the +P treatment was8.2 ¥ 107 particles ml-1 (Fig. 1).
Bacterial community dynamics
The DGGE analysis showed that bacterial communitycomposition changed over time and responded to thedifferent treatments (Fig. 2A and B). By cluster analysis ofthe DGGE profiles, a dendrogram consisting of three mainclusters was produced (Fig. 4A). Samples from day 0made up one cluster (I) together with one sample from the
2586 R.-A. Sandaa et al.
© 2009 Society for Applied Microbiology and Blackwell Publishing Ltd, Environmental Microbiology, 11, 2585–2597
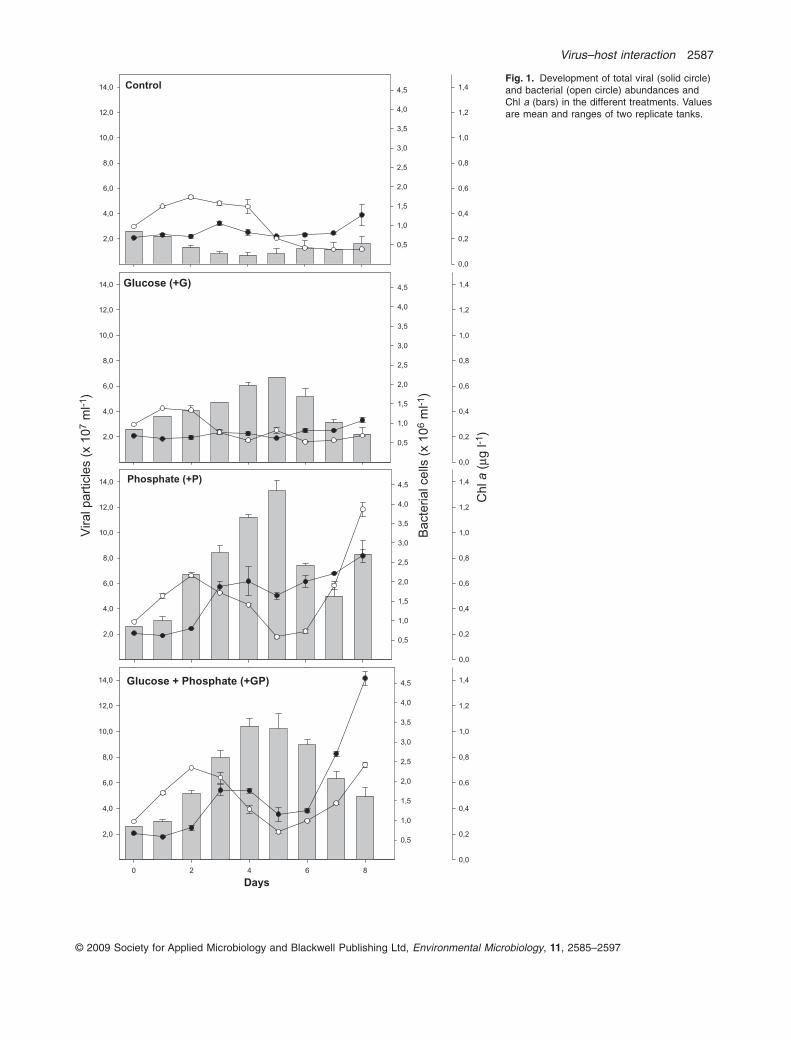
Fig. 1. Development of total viral (solid circle)and bacterial (open circle) abundances andChl a (bars) in the different treatments. Valuesare mean and ranges of two replicate tanks.
Control
0 2 4 6 8
Chl a
(μg
l-1
)
0,0
0,2
0,4
0,6
0,8
1,0
1,2
1,4V
iral part
icle
s (
x 1
07 m
l-1)
2,0
4,0
6,0
8,0
10,0
12,0
14,0
Bacte
rial cells
(x 1
06 m
l-1)
0,5
1,0
1,5
2,0
2,5
3,0
3,5
4,0
4,5
Glucose (+G)
0 2 4 6 8
0,0
0,2
0,4
0,6
0,8
1,0
1,2
1,4
2,0
4,0
6,0
8,0
10,0
12,0
14,0
0,5
1,0
1,5
2,0
2,5
3,0
3,5
4,0
4,5
Phosphate (+P)
0 2 4 6 8
0,0
0,2
0,4
0,6
0,8
1,0
1,2
1,4
2,0
4,0
6,0
8,0
10,0
12,0
14,0
0,5
1,0
1,5
2,0
2,5
3,0
3,5
4,0
4,5
Glucose + Phosphate (+GP)
Days0 2 4 6 8
0,0
0,2
0,4
0,6
0,8
1,0
1,2
1,4
2,0
4,0
6,0
8,0
10,0
12,0
14,0
0,5
1,0
1,5
2,0
2,5
3,0
3,5
4,0
4,5
Virus–host interaction 2587
© 2009 Society for Applied Microbiology and Blackwell Publishing Ltd, Environmental Microbiology, 11, 2585–2597

+G treatment (day 2). Cluster II consisted of samples fromthe C and +G treatments, with two exceptions (+P treat-ment days 6 and 8). The third cluster consisted of samplesfrom the +P and +GP treatments, except for two samples,one from the +G treatment (day 8) and one from the +Ctreatment (day 2).
Since virus infection is dependent on the density ofhosts we focused our analysis on the numerically domi-nant bacterial phylotypes. These were putatively identifiedby scaling the relative contribution of each band to totalintensity in each lane to total bacterial abundance. Phy-lotypes which sometime during the experiment exceededan arbitrary estimated threshold in relative abundance of200 000 cells ml-1 were defined as dominant (Fig. 2B).
Except for Mes1 (Synechococcus), which was seen in alltreatments at the beginning of the experiment, all domi-nant DGGE phylotypes belonged to the Roseobactergroup (Table 1). A pronounced temporal and between-treatment variation in the abundance of individual phylo-types was observed. Two groups of dominant bands werepresent in all treatments practically all through the experi-ment (Mes16/Mes47, and Mes8/Mes9/Mes49). Thesewere the only dominant bands in the +P treatment on day8. Mes15 made a short appearance on day 2 in the +Pand the +GP treatments, but was also detected in theother treatments. Mes26 was detected in both the +G and+GP treatments, while the unidentified band, Mesb, wasdetected in all treatments in the beginning of the
Ba
cte
ria
ce
lls (
x 1
06 m
l-1)
0,0
1,0
2,0
3,0
4,0Mes15
Mes16/47
Mes26
Mes8/9/49
Mes1
Mesb, not identified
Mes28
0 2 4 6 8 0 2 4 6 8 0 2 4 6 8 0 2 4 6 8
Control (C) Glucose (+G) Phosphate (+P) Glucose + Phosphate(+GP)
(a)
(b)
Fig. 2. A. Bacterioplankton composition during the mesocosm experiment as determined by DGGE of PCR-amplified partial 16S RNA genes.Circles denote the exact bands that were sequenced. Numbers refer to phylotype number. Several identical numbers have been inserted tofacilitate visual identification of vertically aligned bands. Day of sampling and treatment is given below each lane.B. Stacked bar plot of the most dominant bacterial phylotypes. The relative intensity of each band was multiplied by total bacterial abundanceand we only show the phylotypes that are estimated to have exceeded at least once 200 000 cells ml-1 following this calculation.
2588 R.-A. Sandaa et al.
© 2009 Society for Applied Microbiology and Blackwell Publishing Ltd, Environmental Microbiology, 11, 2585–2597

experiment. Mes28 was the most dominant band on day 8in the +GP treatment (Fig. 2B).
Viral community dynamics
The PFGE analysis showed that the viral community alsochanged over time and responded to the different treat-ments (Fig. 3A). This was particularly evident from thecluster analysis of the PFGE fingerprints, resulting in adendrogram consisting of two groups. Group I containssamples from the +G and C treatments while group IIconsists of samples from the +GP and +P treatments(Fig. 4B). A total of 23 viral populations were detectedduring the experimental period with genome sizes rangingfrom 30 to 560 kb (Fig. 3A). There was an increase in thenumber of viral populations from 5 on day 0 to a maximumof 13 viral populations on day 6 (+G treatment) (Fig. 3B).The total numbers of viral populations in the +GP and +Ptreatments and in the C and +G treatments were,however, relatively similar (Fig. 3B), despite differences inthe genome size distribution (Fig. 3A). All samples com-prised viral populations in the size range from 30 to194 kb, and seven of these were present in all treatments(Fig. 3A, black dots). The C and +G treatments comprisedseven additional bands (Fig. 3A, red dots), while the +GPand +P treatments comprised eight additional bands, all ina smaller genomic size range (Fig. 3A, green dots). Onepopulation of 48 kb was only detected in the +G and +Psamples on day 6 and 8 (Fig. 3A, blue dots). The numberof bands with different genome sizes between 30 and195 kb was nearly twice as high in the samples from the+GP and +P treatments (16 different genome sizes) com-pared with the C and +G treatments (eight differentgenome sizes) (Fig. 3A).
The Mantel test showed a strong, significant correlationbetween the bacterial and viral clustering (r = 0.924, andP < 0.001) indicating that the changes produced by thetreatments in bacteria were similar to those occurring inthe viruses.
Discussion
Two models, based on two ecological theories ‘theneutral theory’ and ‘the niche partitioning’, have recentlybeen discussed for describing the shapes of prokaryoticcommunities (Sloan et al., 2006; Battin et al., 2007). Theneutral theory (Hubbell, 2001) explains diversity andrelative abundance of species in that the differencesbetween members of an ecological community of trophi-cally similar species are neutral, or irrelevant to theirsuccess (Battin et al., 2007). This is in contrast to thetraditional niche theory that suggests that environmentalfactors and competition for resources drive the differen-tiation of species by natural selection. In the presentstudy we have shown that both top-down (by virus lysis)and bottom-up forces will act in concert shaping prokary-ote community structure. Our observations suggest thatthese mechanisms are niche-based in terms of theabove definitions (Sloan et al., 2006). Before we expandthis discussion, there are a few elements of the resultsworth commenting.
Effect of nutrient limitations
As anticipated from previous research (see Introduction),the microbial community in the sampled Mediterraneansurface waters appeared P-starved at the start of theexperiment. This was suggested by clear increases in
Table 1. Relationship of excited DGGE band sequences (phylotypes) to other sequences in GenBank.
Phylotype Accession No. Closest matching entry in GenBankAccession No.(closest match)
Similarity(%)
Mes1 EF441554 Uncultured bacterium clone PDM-OTU8 AY700638 100Synechococcus sp. WH 8109 AY172836 100
Mes8 EF441555 Uncultured alphaproteobacterium clone JL-ECS-X8 AY663968 99Jannaschia cystaugens AB121782 96
Mes9 EF441556 Uncultured Roseobacter sp. clone ST-13 AY573530 100Roseobacter gallaeciensis AY136134 97
Mes15 EF441558 Uncultured alphaproteobacterium clone PI_4a9f AY580451 98Roseobacter gallaeciensis AY136134 96
Mes16 EF441559 Marine arctic deep-sea bacterium HD9 AJ557871 98Agrobacterium gelatinovorum D88523 96
Mes26 EF441561 Agrobacterium gelatinovorum D88523 98Thalassobacter oligotrophus AJ631302 98
Mes28 EF441562 Roseobacter sp. JL-126 AY745859 98Alphaproteobacterium MBIC1887 AB026492 98
Mes47 EF441568 Roseobacter sp. HYL-SA-18 DQ008594 97Agrobacterium gelatinovorum D88523 97
Mes49 EF441570 Rhodobacteraceae bacterium CL-TA03 AY962292 97Jannaschia cystaugens AB121782 96
Virus–host interaction 2589
© 2009 Society for Applied Microbiology and Blackwell Publishing Ltd, Environmental Microbiology, 11, 2585–2597

particulate P, bacterial production (Tanaka et al., in press)and Chl a in the P-amended treatments (+P and +GP),as well as by the lack of any stimulatory effect of glucoseon bacterial abundance in the +G treatment. Unexpect-edly, the addition of glucose alone (+G) had a positiveeffect on Chl a levels and a slightly negative effect onbacterial abundance. One may speculate that in thisexperiment, performed with relatively low artificial illumi-nation, light (energy) may have been limiting for phy-toplankton growth. Phytoplankton species able to use theexcess glucose as additional energy source could then inprinciple improve their competitive ability for the limitingphosphate, competing favourably against bacteria(Lewitus and Kana, 1994).
Bacterial community dynamics
Changes in the bacterial community were most pro-nounced in the treatments with addition of phosphate.One of these effects was cell number being five and eighttimes higher in the +P and +GP treatments, respectively,compared with the control and the +G treatments. Thebacterial community was dominated by Alteromonas andRoseobacter. These bacteria formed > 50% of total bac-terial counts (Allers et al., 2007). In the first days of theexperiment there was a bloom of Alteromonas in all treat-ments, followed by a pronounced bloom of Roseobacterin the +P and +GP treatments. Our DGGE analysis alsoshows differences within the Roseobacter group between
GP-0 GP-2 GP-4 GP-5 GP-6 GP-8 P-0 P-2 P-4 P-5 P-6 P-8C-0 C-2 C-4 C-5 C-6 C-8 G-0 G-2 G-4 G-5 G-6 G-8
Gen
om
ic s
ize
(kb
)
30
50
70
200
300
400
500
Treatment-Day
(a)
C
+G
+P
+GP
Days
0 2 4 6 8
5
6
7
8
9
10
11
12
13
To
tal n
um
ber
of
PF
GE
ban
ds
C
+G
+P
+GP
(b)
Fig. 3. Viral community structure during the mesocosm experiment as determined by PFGE.A. Schematic outline of the viral populations defined by genome size. The outline is based on three different electrophoresis runs for eachviral sample. Red dots: viral populations present in the control and glucose (+G) treatments. Green dots: viral populations present in thephosphate (+P) and glucose and phosphate (+GP) treatments. Blue dots: viral populations present in the +G and +P treatments. The sizeof the dots represents the intensity of the PFGE bands. Letters indicate treatments; numbers indicate days of sampling.B. Numbers of different viral populations (PFGE bands) over time in the different treatments.
2590 R.-A. Sandaa et al.
© 2009 Society for Applied Microbiology and Blackwell Publishing Ltd, Environmental Microbiology, 11, 2585–2597

treatments, indicating that different members of this groupwere differentially affected by the different nutrient avail-ability. For example, the phylotype Mes28 was seen as avery dominant band in the +GP treatment on day 8.Another phylotype, Mes26, was only detected in the +G(day 8) and +GP treatments (day 4–8). This suggests thatthese single phylotypes have special preferences forgrowth with higher +G or +GP concentrations respectively.
The DGGE bands belonging to Roseobacter and Syn-echococcus showed similar dynamics as the abundanceof these bacterial groups determined by FISH (Allerset al., 2007) or by flow cytometry (Fig. S2). PhylotypeMes1 (Synechococcus sp.) disappeared on day 4 from alltreatments except from the control, simultaneous with asharp decrease in flow-cytometrically determined Syn-echococcus abundance (Fig. S2). Similar trends wereseen for Roseobacter, where there was an increaseduring the experimental period both in the intensity ofbands belonging to the Roseobacter group and in theabundance of Rhodobacteriaceae cells enumerated byCARD-FISH (Allers et al., 2007). The DGGE analysis isbased on PCR-amplified products, a technique known topotentially introduce biases (Wintzingerode et al., 1997).
The quantitativiness of PCR has been disputed, and theprevailing view is that the intensity of the DGGE bandscannot be used as a precise measurement of the abun-dance of the organisms represented by the bands. Onereason is that dominant templates may be evened out inthe final PCR product (Suzuki and Giovannoni, 1996).Consequently analyses of products of end-point PCRs, asin the present study, may falsely suggest a high number ofco-dominant phylotypes. Nevertheless, several studieshave shown that DGGE band intensity may be used as arough estimate of the relative abundance of phylotypes(Riemann et al., 1999; Casamayor et al., 2000). Thus, inour study we combined the relative intensity of the DGGEbands with cell counts to compensate for variations intotal bacterial abundance during the experiment. Hence,the relative contribution of phylotypes, e.g. Roseobacter,to the bacterial community is reported as a cell number inrelative terms (Fig. 2B).
Bacteria became more P-limited during the first 3 daysof the experiment (Tanaka et al., in press), and this wasaccompanied by a change in bacterial communitystructure, for example, with the occurrence of one phylo-type (Mes8/9/49), belonging to the Roseobacter group.This phylotype was present in all treatments from day 2until the end of the experiment, becoming most dominantin the +P and +GP treatment. Interestingly, this phylotypebecame less dominant in the P treatment on day 6, forthereafter to increase in abundance again on day 8. Spe-cific phosphate affinity, defined as specific phosphateuptake rate corrected for the biomass of phytoplanktonand bacterial community, has been used to determine theavailable phosphate pool for osmotrophs (Tanaka et al.,2006). Specific phosphate affinity measured in parallelwith this study suggested an increase from day 5 followedby a decrease of the available phosphate pool in the +Ptreatment on day 8 (Tanaka et al., in press). Thus, thepresence of these phylotypes might be coupled to a dif-ferent extent of P limitation, or to viral lysis as discussedbelow. Few studies have focused on investigatingwhether microdiversity in the 16S rRNA gene is related tovariability in phenotypic properties (Acinas et al., 2004;Selje et al., 2004). Our data suggest that the differentmembers of the Roseobacter group could have differentgrowth requirements for P or as mentioned above, specialpreferences for glucose, while having relatively similar16S rRNA gene sequences.
Viral community dynamics
Addition of phosphate resulted in a major change in viralcommunity structure as compared with the control, whileaddition of glucose had only minor effects. This wasclearly shown by approximately a doubling in theabundance of viral populations with genome sizes
(a)
(b)
I
II III
I II
Treatment-Day
Dis
tance
Dis
tance
Treatment-Day
Fig. 4. Cluster analysis of the DGGE (A) and PFGE (B)fingerprints. First letters indicate treatment; numbers indicate theday of sampling.
Virus–host interaction 2591
© 2009 Society for Applied Microbiology and Blackwell Publishing Ltd, Environmental Microbiology, 11, 2585–2597
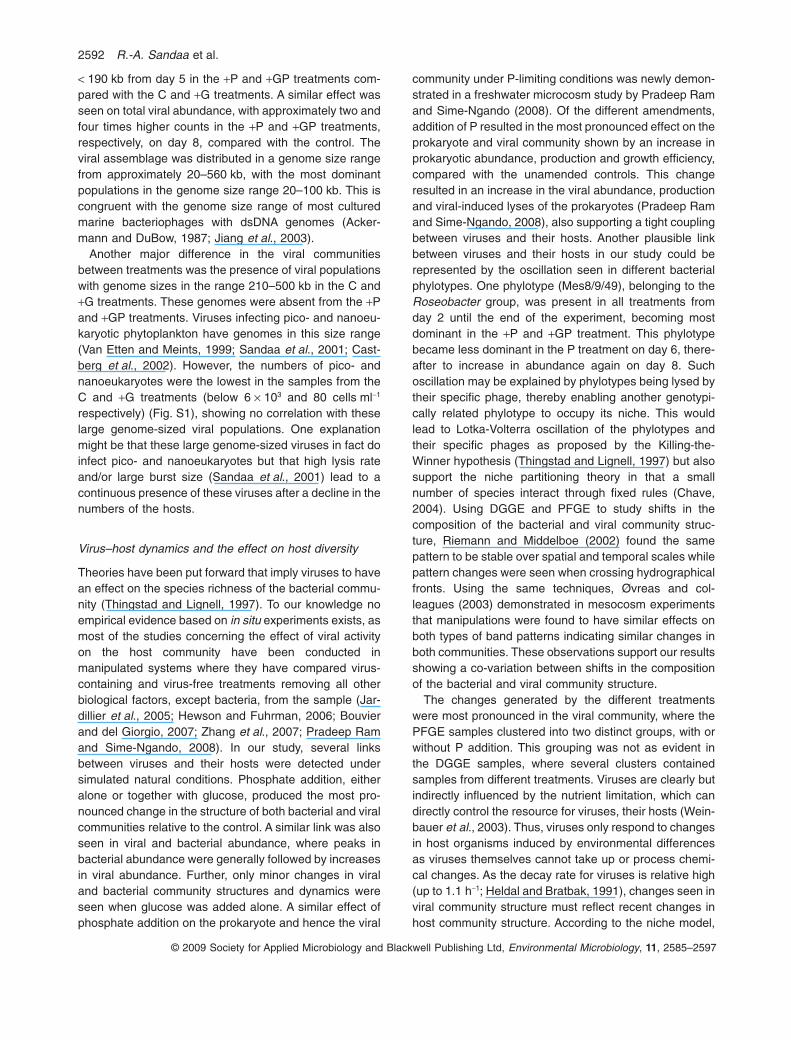
< 190 kb from day 5 in the +P and +GP treatments com-pared with the C and +G treatments. A similar effect wasseen on total viral abundance, with approximately two andfour times higher counts in the +P and +GP treatments,respectively, on day 8, compared with the control. Theviral assemblage was distributed in a genome size rangefrom approximately 20–560 kb, with the most dominantpopulations in the genome size range 20–100 kb. This iscongruent with the genome size range of most culturedmarine bacteriophages with dsDNA genomes (Acker-mann and DuBow, 1987; Jiang et al., 2003).
Another major difference in the viral communitiesbetween treatments was the presence of viral populationswith genome sizes in the range 210–500 kb in the C and+G treatments. These genomes were absent from the +Pand +GP treatments. Viruses infecting pico- and nanoeu-karyotic phytoplankton have genomes in this size range(Van Etten and Meints, 1999; Sandaa et al., 2001; Cast-berg et al., 2002). However, the numbers of pico- andnanoeukaryotes were the lowest in the samples from theC and +G treatments (below 6 ¥ 103 and 80 cells ml-1
respectively) (Fig. S1), showing no correlation with theselarge genome-sized viral populations. One explanationmight be that these large genome-sized viruses in fact doinfect pico- and nanoeukaryotes but that high lysis rateand/or large burst size (Sandaa et al., 2001) lead to acontinuous presence of these viruses after a decline in thenumbers of the hosts.
Virus–host dynamics and the effect on host diversity
Theories have been put forward that imply viruses to havean effect on the species richness of the bacterial commu-nity (Thingstad and Lignell, 1997). To our knowledge noempirical evidence based on in situ experiments exists, asmost of the studies concerning the effect of viral activityon the host community have been conducted inmanipulated systems where they have compared virus-containing and virus-free treatments removing all otherbiological factors, except bacteria, from the sample (Jar-dillier et al., 2005; Hewson and Fuhrman, 2006; Bouvierand del Giorgio, 2007; Zhang et al., 2007; Pradeep Ramand Sime-Ngando, 2008). In our study, several linksbetween viruses and their hosts were detected undersimulated natural conditions. Phosphate addition, eitheralone or together with glucose, produced the most pro-nounced change in the structure of both bacterial and viralcommunities relative to the control. A similar link was alsoseen in viral and bacterial abundance, where peaks inbacterial abundance were generally followed by increasesin viral abundance. Further, only minor changes in viraland bacterial community structures and dynamics wereseen when glucose was added alone. A similar effect ofphosphate addition on the prokaryote and hence the viral
community under P-limiting conditions was newly demon-strated in a freshwater microcosm study by Pradeep Ramand Sime-Ngando (2008). Of the different amendments,addition of P resulted in the most pronounced effect on theprokaryote and viral community shown by an increase inprokaryotic abundance, production and growth efficiency,compared with the unamended controls. This changeresulted in an increase in the viral abundance, productionand viral-induced lyses of the prokaryotes (Pradeep Ramand Sime-Ngando, 2008), also supporting a tight couplingbetween viruses and their hosts. Another plausible linkbetween viruses and their hosts in our study could berepresented by the oscillation seen in different bacterialphylotypes. One phylotype (Mes8/9/49), belonging to theRoseobacter group, was present in all treatments fromday 2 until the end of the experiment, becoming mostdominant in the +P and +GP treatment. This phylotypebecame less dominant in the P treatment on day 6, there-after to increase in abundance again on day 8. Suchoscillation may be explained by phylotypes being lysed bytheir specific phage, thereby enabling another genotypi-cally related phylotype to occupy its niche. This wouldlead to Lotka-Volterra oscillation of the phylotypes andtheir specific phages as proposed by the Killing-the-Winner hypothesis (Thingstad and Lignell, 1997) but alsosupport the niche partitioning theory in that a smallnumber of species interact through fixed rules (Chave,2004). Using DGGE and PFGE to study shifts in thecomposition of the bacterial and viral community struc-ture, Riemann and Middelboe (2002) found the samepattern to be stable over spatial and temporal scales whilepattern changes were seen when crossing hydrographicalfronts. Using the same techniques, Øvreas and col-leagues (2003) demonstrated in mesocosm experimentsthat manipulations were found to have similar effects onboth types of band patterns indicating similar changes inboth communities. These observations support our resultsshowing a co-variation between shifts in the compositionof the bacterial and viral community structure.
The changes generated by the different treatmentswere most pronounced in the viral community, where thePFGE samples clustered into two distinct groups, with orwithout P addition. This grouping was not as evident inthe DGGE samples, where several clusters containedsamples from different treatments. Viruses are clearly butindirectly influenced by the nutrient limitation, which candirectly control the resource for viruses, their hosts (Wein-bauer et al., 2003). Thus, viruses only respond to changesin host organisms induced by environmental differencesas viruses themselves cannot take up or process chemi-cal changes. As the decay rate for viruses is relative high(up to 1.1 h-1; Heldal and Bratbak, 1991), changes seen inviral community structure must reflect recent changes inhost community structure. According to the niche model,
2592 R.-A. Sandaa et al.
© 2009 Society for Applied Microbiology and Blackwell Publishing Ltd, Environmental Microbiology, 11, 2585–2597
different limiting substrates are expected to select fordifferent compositions of host communities, and corre-sponding differences in the composition of the phagecommunities should be expected. If, however, there is atrade-off between competitive ability in terms of nutrientuptake and defence ability against viral infection(Thingstad, 2000), fast-growing competition specialists(r-strategists) would presumably be the least abundant,while their associated viral populations would have thehighest abundances. Further, the defence specialists(K-strategists), being more or less immune to viral attack,would grow slowly, but be more abundant and have anassociated viral population maintained at low abun-dances. If we interpret our results based on this theory,the dominating common DGGE bands in the differenttreatments would represent defence specialists(K-strategists), resisting phage attack, while the changesin the number of viral populations (> 190 kb genomes)may represent bacteriophages lysing fast-growing com-petition specialists (r-strategists). Interestingly, one of thesuggested viral r-strategists, the T7-like Podoviridae(Suttle, 2007), was indeed one of the dominant phagegroups in this experiment (R.-A. Sandaa, unpubl. results).
While pronounced changes were seen in viral commu-nity structure due to the different treatments, the numberof viral populations (PFGE bands) was, nevertheless, thesame in all treatments. Thus, as hypothesized, changes inthe growth rate limitation of the bacterial community didnot produce dramatic effects in the number of simulta-neously coexisting host–virus pairs, but rather selectedfor specific members of the bacterial community. Thisexpectation is based on the concept that competitionunder different types of limitation requires different cellproperties, and thus selects for different hosts. As a result,also the composition of the corresponding viral commu-nity would be expected to change.
The 16S rDNA DGGE analysis did not support theassumptions about similar numbers of coexisting host–virus pairs in the different treatments, based on number ofbacterial phylotypes detected (Fig. S3). This might be dueto limitations in the DGGE method. Due to heterogeneityof 16S rDNA (Fogel et al., 1999), one bacterial speciesmight produce several bands when separated on a DGGEgel (Dahllof et al., 2000). In addition, dissimilar sequencesmay co-migrate to the same position in a DGGE gradient(Muyzer et al., 1998). Thus, it is difficult to interpret thenumber of bacterial species in a sample based on thenumber of DGGE bands. Congruently, the PFGE methoddoes not discriminate between different viral types withsimilar genome sizes. Nevertheless, a similar dynamic inthe number of viral populations was seen between thedifferent treatments.
The effects of nutrient treatments were detected in boththe host and viral populations, although the effect was
most pronounced in the viral community. Thus, our datasupport the speculations that viral infection may affect afew abundant host phylotypes, whereas other phylotypescould be resistant to infections (Schwalbach et al., 2004;Jardillier et al., 2005; Holmfeldt et al., 2007). The alter-ations of the bacterial community could therefore result atfirst from viral lysis of phylotypes that are good competi-tors for nutrients, and then from interspecific competitionfor resources by virus-resistant phylotypes that are lessefficient competitors for nutrients. In addition, the resultssupport our hypothesis that changes in the chemical envi-ronment in a manner that switches the bacterial commu-nity to another type of growth rate limitation do not resultin dramatic effects on the number of simultaneously coex-isting host–virus pairs, but rather shift the selection fordominant members of the bacterial community. Conse-quently, the composition of the corresponding viral com-munity also changes. Taken together, this would suggestthat top-down regulation (by virus infection) andbottom-up regulation (by nutrient availability) both playkey roles in shaping bacterioplankton community compo-sition in aquatic environments. In more general terms ourresults demonstrate the relationship between bottom-upand top-down control on population dynamics, communitystructure and evolutionary change.
If evaluated within the frameworks of the neutral andniche theories, our results suggest that the prokaryoticcommunities are regulated by forces that can beexplained only by the niche theory. The methods we haveapplied in the present study may not be sensitive enoughto capture the full diversity at the species level. Still ourresults do demonstrate a link between changes in thestructure of the prokaryote community and changes seenin the viral community. Nevertheless, in microbial ecology,top-down processes will include both specific viral lysisand grazing by protozoans. In our study, heterotrophicnanoflagellates (HNF) did peak in number after a declinein the bacterial number (Allers et al., 2007). This ind-icates that top-down regulation by grazing could not beneglected as a possible mortality factor in this experiment.Both specific viral lysis and grazing by protozoans havebeen shown to result in roughly equal losses (~40%) ofprokaryotes in marine systems (Suttle, 1994; Fuhrmanand Noble, 1995). It has been emphasized that neutraland niche theories are complementary, not conflicting(Chave, 2004; Leibold, 2008), and that both may be usedto explain different aspects of biodiversity (Kelly et al.,2008). As mentioned, in a simplified model, top-downcontrol by viral lysis may be understood by the nichepartitioning theory. The process is specific by selectivelysis of host populations. This will have a strong bottom-upeffect because lysis alters the quality and quantity ofgrowth-limiting resources (Brussaard et al., 2008).Grazing of prokaryotes by protozoans is, in principle,
Virus–host interaction 2593
© 2009 Society for Applied Microbiology and Blackwell Publishing Ltd, Environmental Microbiology, 11, 2585–2597
stochastic; thus, it might be described more accurately bythe neutral model. In general, it would imply that theregulation of the total number of prokaryotes in a commu-nity shows neutral dynamics, whereas the size of eachhost group, e.g. the diversity, is determined by nichepartitioning.
Experimental procedures
Mesocosm set-up and sampling
Water was collected from 1 m depth at the Blanes Bay Micro-bial Observatory in the Catalan coast (NW Mediterranean,40°40′N, 2°48′E) on 19 October 2004. The water was trans-ported to the laboratory and filled into 200 l tanks. The tankswere maintained at in situ temperature (20°C) with relativelylow light (average 100 mE m-2 s-1) on a 12:12 h light : darkcycle. All tanks, including the controls, received 2 mM NH4Cldaily in order to prevent N limitation. Additionally, mesocosmswere amended daily with 50 nM PO4 (KH2PO4) (treatmentdesignation +P), with 13.25 mM glucose (treatment designa-tion +G) or with both glucose and PO4 at the same concen-trations as in the separate additions (treatment +GP). Thetreatments were set up in duplicates and monitored for a totalof 8 days. All mesocosms were mixed twice a day by hand-held stirring, and samples were taken each morning beforenutrients were added. Samples for viral and bacterial countsand Chl a measurements were collected from both seriesevery day. The samples for DGGE and PFGE were collectedfrom one of the series every second day. Samples for PFGEwere in addition collected on day 5.
Viral and bacterial counts
Total number of bacteria and viruses were determined with aBecton & Dickinson FACSCalibur flow cytometer (BD Bio-science, Franklin Lakes, NJ, USA). For bacteria, samples of1 ml were fixed with 1% buffered paraformaldehyde solution(PFA, pH 7.0) plus 0.05% glutaraldehyde, incubated for10 min at room temperature, then stored in liquid nitrogen.Two hundred microlitres of these samples were stained for10 min with SybrGreen I (Molecular Probes, Eugene, OR,USA). For flow cytometric concentration determination, 10 mlof a solution of yellow-green latex beads (size, 1 mm; finalconcentration, 106 ml-1; Polysciences, Washington, PA, USA)was added to each sample as an internal standard and thebacterial cell numbers were determined from the ratios ofcells to beads.
For viruses, samples of 2 ml were fixed with 0.5% glutaral-dehyde, incubated for 15 min at 4°C, flash-frozen in liquidnitrogen and stored at -80°C until analysis. Each sample wasdiluted 100-fold with TE buffer (10 mM Tris, 1 mM EDTA,pH 8) before they were stained with SYBR Green I (MolecularProbes). The flow cytometer instrumentation and the remain-ing methodology followed the recommendations of Brussaard(2004). Abundances were calculated from the measured flowrate.
Chlorophyll a
Concentrations were determined following standard proce-dures. Subsamples of 150 ml were filtered through GF/F
glass fibre filters and subsequently extracted overnight at 4°Cin 90% acetone. Fluorescence of the extracts was measuredwith a Turner designs fluorometer.
Bacterial community dynamics
Analysis of bacterial community composition and dynamics inthis experiment has been published recently (Allers et al.,2007) where population dynamics of Alteromonas andRoseobacter were examined by DGGE and CARD-FISH. Inthe present study we perform further analyses of bacterialcommunity dynamics and examine the potential linkage tochanges in viral community structure. Thus, the proceduresfor DNA extraction, PCR and DGGE are only briefly outlinedhere.
Microbial biomass from ~700 ml of sample was collectedonto 0.2-mm-pore-size polycarbonate filters (Durapore, Milli-pore). Filters were stored frozen at -70°C in sucrose buffer(0.75 M sucrose, 40 mM EDTA, 50 mM Tris pH = 8.3) untilDNA extraction (Allers et al., 2007). Partial bacterial 16SrRNA genes were PCR amplified using primers GC341F(Muyzer et al., 1993) and 907RM (Muyzer et al., 1998).Excised DGGE bands were sequenced (Allers et al., 2007)and compared with existing prokaryotic sequences inGenBank (NCBI) using BLAST (Altschul et al., 1990).Sequences were submitted to GenBank with Accession No.Mes1, EF441554; Mes8, EF441555; Mes9, EF441556;Mes15, EF441558; Mes16, EF441559; Mes26, EF441561;Mes28, EF441562; Mes47, EF441568; Mes47, EF441570(Table 1, Allers et al., 2007).
Viral community dynamics
Virus particles from 5 l of sample were concentrated down to35 ml using a Vivaflow 200 tangential flow module with acut-off of 100 000 MWCO (Vivascience, Lincon, UK) followingthe manufacturer’s procedure. The concentrate was clarifiedby centrifugation in a swing-out centrifuge (BeckmannJ2-HS), twice at 7000 g for 30 min at 4°C. Viral particles weresubsequently concentrated by ultracentrifugation (BeckmanL8-M with SW-28 rotor) for 2 h at 28 000 r.p.m. at 10°C. Theviral pellet was dissolved in 200 ml of SM buffer (0.1 M NaCl,8 mM MgSO4·7H2O, 50 mM Tris-HCl, 0.005% w/v glycerine).
Four viral agarose plugs were prepared from the 200 mlviral concentrate for PFGE. The samples were run on a 1%w/v SeaKem GTG agarose (FMC, Rockland, Maine) gel in 1¥TBE gel buffer using a Bio-Rad DR-II CHEF Cell (Bio-Rad,Richmond, CA, USA) electrophoresis unit. From each samplewe used three of the plugs and ran them at three differentpulse-ramp conditions in order to separate a large range ofviral genome sizes (Sandaa and Larsen, 2006). Gels werevisualized and digitized using the Fujifilm imaging system,LAS-3000.
Statistical analyses of bacterial and viralcommunity composition
Digitized DGGE images were analysed with the Quantity-one software (Bio-Rad). The software allows identification of
2594 R.-A. Sandaa et al.
© 2009 Society for Applied Microbiology and Blackwell Publishing Ltd, Environmental Microbiology, 11, 2585–2597

different bands and calculation of the contribution of eachband to total band intensity in each lane. The PFGE bandingpatterns were analysed using the computer program GEL2K
(Svein Norland, UoB, Norway), which calculates the molecu-lar weight of the different DNA fragments, the intensity ofeach of the DNA fragments, and determines the presenceor absence of bands. The resultant matrix of both DGGEand PFGE was used for cluster analysis using the GEL2K
program. Clustering was based on simple matching algo-rithm, while the dendrogram was drawn using the completelink method. The significance of the correlation between thetwo matrices in the two data sets was tested by using the freesoftware program ZT version 1.1 (http://www.psb.ugent.be/~erbon/mantel/; Bonnet and Van de Peer, 2002) by runningsimple Mantel test (Mantel, 1967) with 100 000 permutations.
Acknowledgements
We thank Vanessa Balagué and Clara Cardelús for analysesof chlorophyll, and Jordi Felipe, Philippe Catala and PhilippeLebaron for the bacterial abundance determinations. We alsothank Rafel Simó, Maria Vila-Costa, Ramon Massana and therest of the participating scientists for their help in mesocosmset-up and sampling. This study was performed with financialsupport from the EU project BASICS (EVK3-CT-2002-00078), the Research Council of Norway projects: Pame-Nor‘DOC turnover in polar microbial food webs’ and VIPMAP(186142).
References
Acinas, S.G., Klepac-Ceraj, V., Hunt, D.E., Pharino, C.,Ceraj, I., Distel, D.L., and Polz, M.F. (2004) Fine-scalephylogenetic architecture of a complex bacterial commu-nity. Nature 430: 551–554.
Ackermann, H.-W., and DuBow, M.S. (1987) Viruses ofProkaryotes. Boca Raton, FL, USA: CRC Press.
Allers, E., Gómez-Consarnau, L., Pinhassi, J., Gasol, J.M.,Šimek, K., and Pernthaler, J. (2007) Response of Altero-monadaceae and Rhodobacteriaceae to glucose andphosphorus manipulation in marine mesocosms. EnvironMicrobiol 9: 2417–2429.
Altschul, S., Gish, W., Miller, W., Myers, E., and Lipman, D.(1990) Basic local alignment search tool. J Mol Biol 215:403–410.
Battin, T.J., Sloan, W.T., Kjelleberg, S., Daims, H., Head,I.M., Curtis, T.P., and Eberl, L. (2007) Microbial land-scapes: new paths to biofilm research. Nat Rev Microbiol5: 76–81.
Bergh, O., Borsheim, K.Y., Bratbak, G., and Heldal, M. (1989)High abundance of viruses found in aquatic environments.Nature 340: 467–468.
Bethoux, J.M.P., Madec, C., and Gentili, B. (1992) Phospho-rus and nitrogen behaviour in the Mediterranean Sea.Deep Sea Res Part A 39A: 1641–1654.
Bonnet, E., and Van de Peer, Y. (2002) ZT: a software tool forsimple and partial Mantel tests. J Statistical Software 10:1–12.
Bouvier, T., and del Giorgio, P.A. (2007) Key role of selectiveviral-induced mortality in determining marine bacterialcommunity composition. Environ Microbiol 9: 287–297.
Bratbak, G., Heldal, M., Thingstad, T.F., Riemann, B., andHaslund, O.H. (1992) Incorporation of viruses into thebudget of microbial C-transfer – a 1st approach. Mar EcolProg Ser 83: 273–280.
Bratbak, G., Thingstad, F., and Heldal, M. (1994) Viruses andthe microbial loop. Microb Ecol 28: 209–221.
Brussaard, C.P.D. (2004) Optimization of procedures forcounting viruses by flow cytometry. Appl Environ Microbiol70: 1506–1513.
Brussaard, C.P.D., Wilhelm, S.W., Thingstad, F., Weinbauer,M.G., Bratbak, G., Heldal, M., et al. (2008) Global-scaleprocesses with a nanoscale drive: the role of marineviruses. ISME J 2: 575–578.
Casamayor, E.O., Schafer, H., Baneras, L., Pedros-Alio, C.,and Muyzer, G. (2000) Identification of and spatio-temporaldifferences between microbial assemblages from twoneighboring sulfurous lakes: comparison by microscopyand denaturing gradient gel electrophoresis. Appl EnvironMicrobiol 66: 499–508.
Castberg, T., Thyrhaug, R., Larsen, A., Sandaa, R.A., Heldal,M., Van Etten, J.L., and Bratbak, G. (2002) Isolation andcharacterization of a virus that infects Emiliania huxleyi(Haptophyta). J Phycol 38: 767–774.
Chave, J. (2004) Neutral theory and community ecology. EcolLett 7: 241–253.
Dahllof, I., Baillie, H., and Kjelleberg, S. (2000) rpoB-basedmicrobial community analysis avoids limitations inherent in16S rRNA gene intraspecies heterogeneity. Appl EnvironMicrobiol 66: 3376–3380.
Fogel, G.B., Collins, C.R., Li, J., and Brunk, C.F. (1999)Prokaryotic genome size and SSU rDNA copy number:estimation of microbial relative abundance from a mixedpopulation. Microb Ecol 38: 93–113.
Fuhrman, J.A., and Noble, R.T. (1995) Viruses and protistscause similar bacterial mortality in coastal seawater.Limnol Oceanogr 40: 1236–1242.
Fuhrman, J.A., and Suttle, C.A. (1993) Viruses in marineplanktonic systems. Oceanography 6: 51–63.
Heldal, M., and Bratbak, G. (1991) Production and decay ofviruses in aquatic environments. Mar Ecol Prog Ser 72:205–212.
Hewson, I., and Fuhrman, J.A. (2006) Viral impacts uponmarine bacterioplankton assemblage structure. J Mar BiolAssoc UK 86: 577–589.
Holmfeldt, K., Middelboe, M., Nybroe, O., and Riemann, L.(2007) Large variability in host strain susceptibility andphage host-range govern interactions between lytic marinephages and their flavobacterium hosts. Appl Environ Micro-biol 73: 6730–6739.
Hubbell, S.P. (2001) The Unified Neutral Theory of Biodiver-sity and Biogeography. Princeton, NJ, USA: Princeton Uni-versity Press.
Jardillier, L., Bettarel, Y., Richardot, M., Bardot, C., Amblard,C., Sime-Ngando, T., and Debroas, D. (2005) Effects ofviruses and predators on prokaryotic community composi-tion. Microb Ecol 50: 557–569.
Jiang, S., Fu, W., Chu, W., and Fuhrman, J.A. (2003) Thevertical distribution and diversity of marine bacteriophageat a station off Southern California. Microb Ecol 45: 399–410.
Kelly, C.K., Bowler, M.G., Pybus, O., and Harvey, P.H. (2008)
Virus–host interaction 2595
© 2009 Society for Applied Microbiology and Blackwell Publishing Ltd, Environmental Microbiology, 11, 2585–2597
Phylogeny, niches, and relative abundance in natural com-munities. Ecology 89: 962–970.
Krom, M.D., Kress, N., Brenner, S., and Gordon, L.I. (1991)Phosphorus limitation of primary productivity in the EasternMediterranean Sea. Limnol Oceanogr 36: 424–432.
Leibold, M.A. (2008) Ecology: return of the niche. Nature 454:39–41.
Lewitus, A.J., and Kana, T.M. (1994) Responses of estuarinephytoplankton to exogenous glucose: stimulation versusinhibition of photosynthesis and respiration. Limnol Ocean-ogr 39: 182–189.
Mantel, N. (1967) The detection of disease clustering and ageneralized regression approach. Cancer Res 27: 209–220.
Muyzer, G., de Waal, E.C., and Uitterlinden, A.G. (1993)Profiling of complex microbial populations by denaturinggradient gel electrophoresis analysis of polymerase chainreaction-amplified genes coding for 16S rRNA. ApplEnviron Microbiol 59: 695–700.
Muyzer, G., Brinkhoff, T., Nübel, N., Santegoeds, C.,Schäfer, H., and Wawer, C. (1998) Denaturing gradient gelelectrophoresis (DGGE) in microbial ecology. In MolecularMicrobial Ecology Manual, Vol. 3.4.4. Akkermans, A.D.L.,van Elsas, J.D., and de Bruijn, F.J. (eds). Dordrecht, theNetherlands: Kluwer Academic Publishers, pp. 1–27.
Øvreas, L., Bourne, D., Sandaa, R.A., Casamayor, E.O.,Benlloch, S., Goddard, V., et al. (2003) Response of bac-terial and viral communities to nutrient manipulations inseawater mesocosms. Aquat Microb Ecol 31: 109–121.
Pinhassi, J., Gomez-Consarnau, L., Alonso-Sáez, L., Sala,M.M., Vidal, M., Pedrós-Alió, C., and Gasol, J.M. (2006)Seasonal changes in bacterioplankton nutrient limitationand their effects on bacterial community composition inthe NW Mediterranean Sea. Aquat Microb Ecol 44: 241–252.
Pradeep Ram, A.S., and Sime-Ngando, T. (2008) Functionalresponses of prokaryotes and viruses to grazer effects andnutrient additions in freshwater microcosms. ISME J 2:498–509.
Proctor, L.M., and Fuhrman, J.A. (1990) Viral mortality ofmarine-bacteria and cyanobacteria. Nature 343: 60–62.
Proctor, L.M., and Fuhrman, J.A. (1992) Mortality of marine-bacteria in response to enrichments of the virus size frac-tion from seawater. Mar Ecol Prog Ser 87: 283–293.
Riemann, L., and Middelboe, M. (2002) Stability of bacterialand viral community compositions in Danish coastalwaters as depicted by DNA fingerprinting techniques.Aquat Microb Ecol 27: 219–232.
Riemann, L.F., Steward, G., Fandino, L.B., Campbell, L.,Landry, M.R., and Azam, F. (1999) Bacterial communitycomposition during two consecutive NE Monsoon periodsin the Arabian Sea studied by denaturing gradient gel elec-trophoresis (DGGE) of rRNA genes. Deep Sea Res Part II46: 1791–1811.
Sandaa, R.A., and Larsen, A. (2006) Seasonal variations inviral-host populations in Norwegian coastal waters:focusing on the cyanophage community infecting marineSynechococcus species. Appl Environ Microbiol 72:4610–4618.
Sandaa, R.A., Heldal, M., Castberg, T., Thyrhaug, R., andBratbak, G. (2001) Isolation and characterization of two
viruses with large genome size infecting Chrysochromulinaericina (Prymnesiophyceae) and Pyramimonas orientalis(Prasinophyceae). Virology 290: 272–280.
Schwalbach, M.S., Hewson, I., and Fuhrman, J.A. (2004)Viral effects on bacterial community composition in marineplankton microcosms. Aquat Microb Ecol 34: 117–127.
Selje, N., Simon, M., and Brinkhoff, T. (2004) A newly dis-covered Roseobacter cluster in temperate and polaroceans. Nature 427: 445–448.
Sloan, W.T., Lunn, M., Woodcock, S., Head, I.M., Nee, S.,and Curtis, T.P. (2006) Quantifying the roles of immigrationand chance in shaping prokaryote community structure.Environ Microbiol 8: 732–740.
Suttle, C.A. (1994) The significance of viruses to mortality inaquatic microbial communities. Microb Ecol 28: 237–243.
Suttle, C.A. (2005) Viruses in the sea. Nature 437: 356–361.Suttle, C.A. (2007) Marine viruses – major players in the
global ecosystem. Nat Rev Microbiol 5: 801–812.Suzuki, M.T., and Giovannoni, S.J. (1996) Bias caused by
template annealing in the amplification of mixtures of 16SrRNA genes by PCR. Appl Environ Microbiol 62: 625–630.
Tanaka, T., Henriksen, P., Lignell, R., Olli, K., Seppälä, J.,Tamminen, T., and Thingstad, T.F. (2006) Specific affinityfor phosphate uptake and specific alkaline phosphataseactivity as diagnostic tools for detecting P-limited phy-toplankton and bacteria. Estuaries Coasts 29: 1226–1241.
Tanaka, T., Thingstad, T.F., Gasol, J.M., Cardelus, C.,Jezbera, J., Sala, M.M., et al. Determine the ability of phos-phate and glucose for bacteria in P-limited mesocmos ofnorthwestern Mediterranean surface waters. Aquat MicrobEcol (in press).
Thingstad, T.F. (2000) Elements of a theory for the mecha-nisms controlling abundance, diversity, and biogeochemi-cal role of lytic bacterial viruses in aquatic systems. LimnolOceanogr 45: 1320–1328.
Thingstad, T.F., and Lignell, R. (1997) Theoretical models forthe control of bacterial growth rate, abundance, diversityand carbon demand. Aquat Microb Ecol 13: 19–27.
Thingstad, T.F., Zweifel, U.L., and Rassoulzadegan, F.(1998) P limitation of heterotrophic bacteria and phy-toplankton in the northwest Mediterranean. Limnol Ocean-ogr 43: 88–94.
Van Etten, J.L., and Meints, R.H. (1999) Giant viruses infect-ing algae. Annu Rev Microbiol 53: 447–494.
Van Wambeke, F., Christaki, U., Giannokourou, A., Moutin,T., and Souvemerzoglou, K. (2002) Longitudinal and verti-cal trends of bacterial limitation by phosphorus and carbonin the Mediterranean Sea. Microb Ecol 43: 119–133.
Weinbauer, M.G., Christaki, U., Nedoma, A., and Simek, K.(2003) Comparing the effects of resource enrichment andgrazing on viral production in a meso-eutrophic reservoir.Aquat Microb Ecol 31: 137–144.
Winter, C., Smit, A., Herndl, G.J., and Weinbauer, M.G.(2004) Impact of virioplankton on archaeal and bacterialcommunity richness as assessed in seawater batch cul-tures. Appl Environ Microbiol 70: 804–813.
Wintzingerode, F., Goebel, U., and Stackerbrandt, E. (1997)Determination of microbial diversity in environmentalsamples: pitfalls of PCR-based rRNA analysis. FEMSMicrobiol Rev 21: 213–229.
Zhang, R., Weinbauer, M.G., and Qian, P.-Y. (2007) Viruses
2596 R.-A. Sandaa et al.
© 2009 Society for Applied Microbiology and Blackwell Publishing Ltd, Environmental Microbiology, 11, 2585–2597

and flagellates sustain apparent richness and reducebiomass accumulation of bacterioplankton in coastalmarine waters. Environ Microbiol 9: 3008–3018.
Supporting information
Additional Supporting Information may be found in the onlineversion of this article:
Fig. S1. Development of pico- and nanoeukaryote abun-dance. Values given as mean and ranges of two parallelexperiments.
Fig. S2. Development of Synechococcus abundance.Values given as mean and ranges of two parallelexperiments.Fig. S3. Numbers of different DGGE bands over time in thedifferent treatments.
Please note: Wiley-Blackwell are not responsible for thecontent or functionality of any supporting materials suppliedby the authors. Any queries (other than missing material)should be directed to the corresponding author for thearticle.
Virus–host interaction 2597
© 2009 Society for Applied Microbiology and Blackwell Publishing Ltd, Environmental Microbiology, 11, 2585–2597