Spéciation of Chromium in a Chromium Enriched Yeast.
290
Spéciation of Chromium in a Chromium Enriched Yeast. Marian Cullen B.Sc. (Hons). Submitted for the award of Masters of Science. Galway-Mayo Institute of Technology. Supervisor: Dr. Joseph Scanlan. Submitted to the National Council for Educational Awards, July 2000.
-
Upload
khangminh22 -
Category
Documents
-
view
2 -
download
0
Transcript of Spéciation of Chromium in a Chromium Enriched Yeast.
Spéciation of Chromium in a Chromium Enriched Yeast.
Marian Cullen B.Sc. (Hons).
Submitted for the award of Masters of Science.
Galway-Mayo Institute of Technology.
Supervisor: Dr. Joseph Scanlan.
Submitted to the National Council for Educational Awards, July 2000.
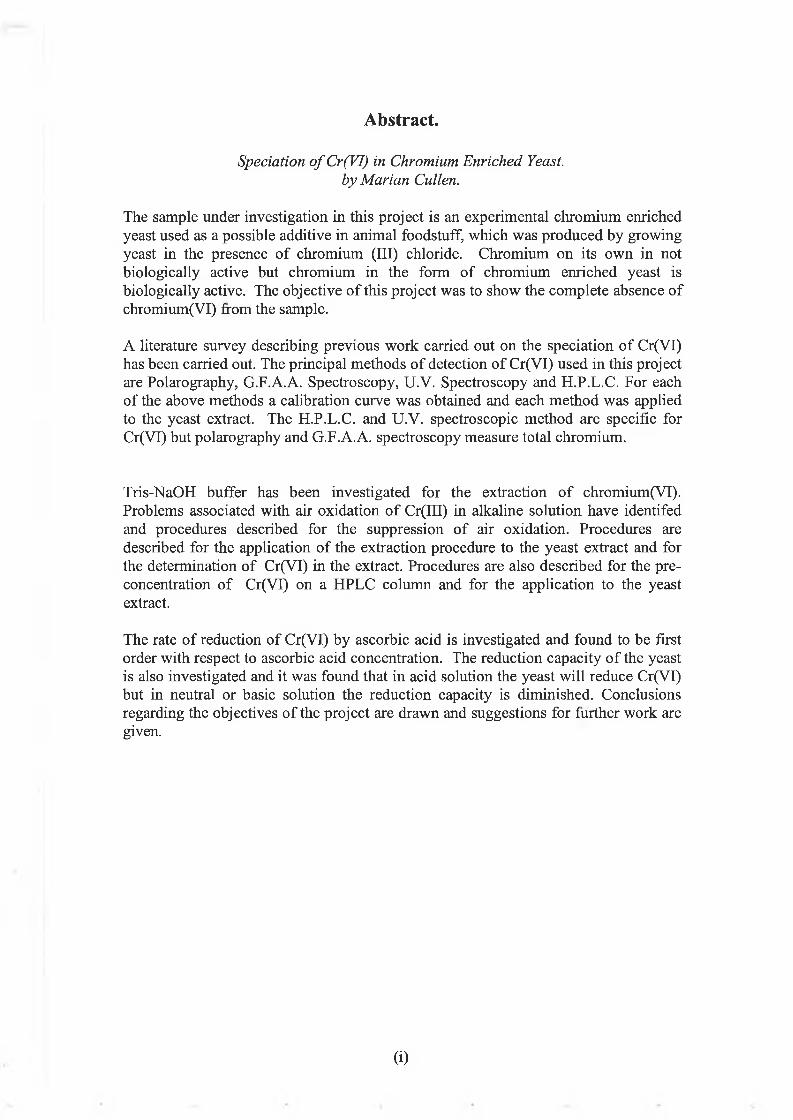
Abstract.
Speciation o f Cr(VI) in Chromium Enriched Yeast, by Marian Cullen.
The sample under investigation in this project is an experimental chromium enriched yeast used as a possible additive in animal foodstuff, which was produced by growing yeast in the presence of chromium (III) chloride. Chromium on its own in not biologically active but chromium in the form of chromium enriched yeast is biologically active. The objective of this project was to show the complete absence of chromium(VI) from the sample.A literature survey describing previous work carried out on the speciation of Cr(VI) has been carried out. The principal methods of detection of Cr(VI) used in this project are Polarography, G.F.A.A. Spectroscopy, U.V. Spectroscopy and H.P.L.C. For each of the above methods a calibration curve was obtained and each method was applied to the yeast extract. The H.P.L.C. and U.V. spectroscopic method are specific for Cr(VI) but polarography and G.F.A.A. spectroscopy measure total chromium.
Tris-NaOH buffer has been investigated for the extraction of chromium(VT). Problems associated with air oxidation of Cr(III) in alkaline solution have identifed and procedures described for the suppression of air oxidation. Procedures are described for the application of the extraction procedure to the yeast extract and for the determination of Cr(VI) in the extract. Procedures are also described for the preconcentration of Cr(VI) on a HPLC column and for the application to the yeast extract.The rate of reduction of Cr(VI) by ascorbic acid is investigated and found to be first order with respect to ascorbic acid concentration. The reduction capacity of the yeast is also investigated and it was found that in acid solution the yeast will reduce Cr(VI) but in neutral or basic solution the reduction capacity is diminished. Conclusions regarding the objectives of the project are drawn and suggestions for further work are given.
(i)
Firstly, I would like to thank Dr. Joe Scanlan, my project supervisor who provided advice and guidance throughout the duration of the project. I would like to thank the Department of Physical Sciences at the Galway-Mayo Institute of Technology for providing research facilities for the project. I would also like to thank the Technical Support Staff and the administrative staff of the college for their assistance. I would also like to thank the Industrial Liaison Office of G.M.I.T., and all the library staff, who helped in locating many books and papers. I would also like to thank my fellow M.Sc. and Ph.D. students, Steve, Lene, Siv, Siobhan, Ken, Michai and Steve for their moral support. I would like to thank Dr. Ronan Power of Alltech Biosciences who provided the yeast sample on which this project and thesis was based. And lastly, I would like to thank Enterprise Ireland and Alltech Bioseciences again for providing financial support for this project under the ARP scheme.
Acknowledgements.
(ii)

Contents.1.0. Introduction. 1
1.1. Discovery and Sources of Chromite. 11.2. Chromium in the Environment. 61.3. Chromium, Uptake, Transportation, Distribution and Excretion. 101.4. Toxicity of Chromium. 131.5. Carcinogenicity of Chromium. 151.6. Essentiality of Chromium. 191.7. Physical and Chemical Properties of Chromium. 221.8. Buffer Solutions. 311.9. Methods of Determination of Cr(VI). 35
1.9.(a). Voltammetry. 351.9.(b). Graphite Furnace Atomic Absorption Spectroscopy. 491.9.(c). U.V. Spectroscopy. 571.9.(d). High Performance Liquid Chromatography. 74
1.10. Reaction of Chromate and Ascorbic Acid. 852.0. Experimental Procedures and Results. 91
2.1.1. Voltammetry. 912.1.1.(a). Introduction. 912.1.1.(b). Reagents and Solutions. 922.1.1. (c). Instrumentation and Glassware. 952.1.1.(d). Methods and Experiments. 97
1. Polarogram of Supporting Electrolyte. 992. Attempted Removal of Peak from Supporting
Electrolyte using Solvent Extraction. 1003. Attempted Removal of Peak from Supporting
Electrolyte by Varying Initial Potential. 1014. Attempted Removal of Peak from Supporting
Electrolyte by Varying Drop Growth Time. 1015. Removal of Peak using EDTA. 1016. The Effect of the Presence of Lead on the Supporting
Electrolyte. 1037. The Effect of Multiple Scanning of a Solution. 1038. The Effect of the Presence of Cr(III) on the Cr(VI) Peak. 1039. The Effect of Passing Cr(III) through an Anion Exchange
Column. 10410. The Effect of Electrolysis Time on the Cr(VI) Peak Height. 10511. Preparation of a Calibration Curve. 10612. Application of Polarography to the Chromium Enriched
Yeast Extract. 10713. The Effect of the Extracting Buffer on the Supporting
Electrolyte. 1092.1.2. Graphite Furnace Atomic Absorption Spectroscopy. 110
2.1.2.(a). Introduction. 1102.1.2.(b). Reagents and Solutions. 1102.1.2.(c). Instrumentation and Glassware. I l l2.1.2.(d). Procedures and Results. I l l
Page
( iii)

1. Preparation of a Calibration Curve.2. Analysis of Chromium Enriched Yeast Extract
111113
2.1.3. U.V. Spectroscopy. 1142.1.3. (a). Introduction. 1142.1.3.(b). Reagents and Solutions. 1152.1.3.(c). Instrumentation and Glassware. 1162.1.3.(d). Procedures and Results. 117
1. Preparation of a Calibration Curve. 1182. The Effect of Time on the Absorbance of the Cr-DPC Complex.
(a). Over Hours. 119(b). Over Days. 121
2.1.4. High Performance Liquid Chromatography. 1222.1.4.(a). Introduction. 1222.1.4.(b). Reagents and Solutions. 1232.1.4.(c). Instrumentation and Glassware. 1252.1.4.(d). Procedures and Results. 125
1. The Effect of Absorbance Setting on Cr-DPC Peak. 1262. The Effect of Cr(VI) on the DPC and Tris-NaOH Peaks. 1273. H.P.L.C. of Cr(III). 1284. Detection of Cr(VI) in Excess Cr(III). 1285. Preparation of a Calibration Curve. 129
2.1.5. Discussion. 1322.2. Extraction of Cr(VI). 134
2.2.1. Extraction of Cr(VI) from Yeast using Tris-NaOH in Presence of Air. 1342.2.1.(a). Reagents and Solutions. 1352.2.1.(b). Apparatus. 1352.2.1.(c). Extraction Procedure. 135
1. Extraction Procedure Carried out in this Section. 1352. To show that Cr(VI) can be Extracted in the Presence of Yeast. 1363. To show that Cr(VI) can be Extracted in the Presence of
Chromium Enriched Y east. 1382.2.2. Extraction of Cr(VI) from Yeast using Tris-NaOH in the Absence
of Air (i.e. under nitrogen). 1402.2.2.(a). Reagents and Solutions. 1402.2.2.(b). Apparatus. 1402.2.2.(c). Extraction Procedure. 141
1. Extraction Procedure carried out in this Section. 1412. To show Air Oxidation of Cr(III) to Cr(VI) in Alkaline
Solution. 1423. To show that the Chromium Enriched Yeast Reduced Cr(VI)
in Inert Atmosphere. 1434. To show Air Oxidation of the Chromium Enriched Yeast
Extract. 144
(iv )
2.2.3. The Effect of Leaving the Chromium Enriched Yeast in Contactwith the Cr(VI) Solution. 146
1. Procedure Carried out in Air. 1462. Procedure Carried out under Nitrogen. 148
2.3. Preconcentration of Cr(VI) by Ion Exchange 1512.3.1. Reagents and Solutions. 1512.3.2. Instrumentation. 1552.3.3. Preconcentration Procedure using Spectrophotometric
Detection. 1562.3.4. Preconcentration Procedure using G.F.A.A. Spectroscopy. 1562.3.5. Establishing Conditions for Elution of Cr(VI) using
Ammonium Buffer. 1571. (a). Effect of Eluent Concentration. 157
(b). Effect of Eluent pH. 160(c). Effect of Column Length. 162
2. Effect of Analyte Concentration. 1632.3.6. Preconcentration of Cr(VI) from Yeast Extracts. 1672.3.7. Establishing Conditions for Elution of Cr(VI) using H 2 S O 4 and
Ascorbic Acid. 1691. Ascorbic Acid Reduction Procedure. 1692. Elution of Cr(VI) Standards. 171
2.3.8. Preconcentration of Cr(VI) from Yeast Extracts. 1732.3.9. Separation of Cr(III) and Cr(VI) by Ion Exchange. 175
(a). Separation of 50ppm Cr(III) and lOOppm Cr(VI) in Tris-NaOHpH 13. 175
(b). Prevention of Air Oxidation of Cr(III) during Extraction Process. 178
(c). Separation of Cr(III) and Cr(VI) from Chromium Enriched Yeast Extract. 180
2.4. Preconcentration of Cr(VI) by H.P.L.C. 1832.4.1. Reagents and solutions. 1832.4.2. Instrumentation. 1832.4.3. Analysis of Chromium Enriched Yeast Extract. 1842.4.4. Reduction of Trace Cr(VI) by the Chromium Enriched
Yeast Extract. 1842.5. Reduction Capacity of Yeast. 186
2.5.1. Reduction of Cr(VI) by Ascorbic Acid. 1862.5.1.(a). Introduction. 1862.5.1.(b). Reagents and solutions. 1872.5.1.(c). Instrumentation. 1892.5.1.(d). Procedure for Reduction of Cr(VI) by Ascorbic Acid. 190 2.5.1 .(e). The Effect of Anaerobic Conditions. 196
2.5.2. Reduction Capacity of Chromium Enriched Yeast. 1992.5.2.(a). Reagents and Solutions. 1992.5.2.(b). Experimental procedures. 2002.5.2.(c). Reduction Capacity of Non Enriched Yeast. 213
(v)

2.5.2.(d). Kinetic Study of the Rate of Reduction of Cr(VI) by Chromium Enriched Yeast using Redox Potential Measurements. 218
1. Redox Potentials of Solutions Containing Chromium Enriched Yeast. 219
2. Redox Titration of Chromium Enriched Yeast usingCr(VI). 222
3.0. Discussion. 228
Appendix. i
Bibliography. xxiv
(vi)

1.0. Introduction.1.1. Discovery and Sources o f Chromite.
Although some three dozen chromium containing minerals are known, chromite is the major economically important source of chromium. Chromite is a dense, black mineral consisting primarily of iron (II) and chromium (III) oxides, with magnesium and aluminium oxides present in lesser amounts. The mineral is the principal source component of chromium ores. It has a unique crystalline structure, but its chemical composition will vary with the location of its source.1.1.1. Discovery.Chromite was discovered in the Ural mountains at the end of the 18th century, but the remoteness of the deposits limited supply and increased costs. In 1811, Isacc Tyson discovered chromite deposits north of Baltimore. The chromite from these deposits was exported to England for processing into chemicals for the textile industry. In 1845 Tyson began production of potassium bichromate at Baltimore to meet the demands of American textile mills and pigment manufacturers. Tysons mines were the worlds leading source of chromite during the second quarter of the 19th century. In 1848, rich chromite ore deposits were discovered in Istanbul and Turkey and these became the world’s biggest source of chromite during the second half of the 19th century. During the first half of the 20th century, additional chromite deposits were found in Greece, Brazil, South Africa, Rhodesia (now Zambia and Zimbabwe), the Philippines, Albania and Madagascar. There has been no commercial mining of chromite in the US since 1961.The total worldwide reserves of chromite are estimated to be 5.5 billion tonnes. Of this 1.5 billion tonnes are considered to be “economically exploitable” deposits, of which billions of tonnes are located in South Africa, and 1.3 billion tons in the Great

Dyke region of southern Zimbabwe. In terms of Zimbabwe’s export earnings chromite is second only to gold. Estimates of the major chromite reserves in the “commercially exploitable” deposits are listed below. (Katz (1994)).
Table 1.1. Commercially Exploitable Chromite Reserves.LOCATION ESTIMATED RESERVES (tonnes)South Africa 1.0 x 10yZimbabwe 1.3 x 10⁸U.S.S.R. 1.2 x 10⁸
India 7.9 x 10⁷Finland 5.0 x 10⁷Brazil 1.7 x 10⁷
Philippines 1.2 x 10⁷Madagascar 1.0 x 10;
Turkey 1.0 x 10⁷
1.1.2. Sources.
Chromium compounds are components of the earth’s crust, and their weathering is responsible for the natural ores of chromium in underground and surface waters, soils, “continental dust”, and air. Their contributions to the total concentration of chromium in the environment are complemented by somewhat larger quantities of chromium released by human activities.1.1.2.(a). Nonanthropogenic Sources of Chromium.
Chromium is the seventh most abundant element in the earth, but the crystal concentration of chromium is much lower than that of the mantel. (lOOjig/g v ’s

5000|j.g/g). The crust of the earth is highly heterogeneous, and the crystal rocks can be divided into the categories of igneous and sedimentary. The process of crystallisation of igneous rocks is complex. The process may begin with the solidification of the dense material olivine (Mg2Si04) which sinks to the bottom of the melt and forms basalt. Insoluble iron salts solidify next, forming the minerals pyrrohotite (FeS), pyrite (FeS2), magnetite (FesO,*), chromite (FeCr204), and ilimenite (FeTiC>3). The bulk of the magma then solidifies to form a continuous series of rocks. Chromium compounds are released from these minerals during the physical, chemical and biological weathering process by which rocks are abraded and/or dissolved. Soils derived from serpentine are particularly rich in chromium. Once released, the chromium compounds can be transported as wind or water borne particulates. Volcanism is an alternative to weathering for the release of chromium compounds. The chromium content of volcanic ash range from 400 to 500j.ig/g. Pacyna and Nriagu (1988) estimate the volcanic emissions of chromium to be 3,900 tonnes per year. They estimated the chromium emissions from windblown dust to be more than 10 time’s greater, 50,000 tonnes per year.
1.1.2.(b). Anthropogenic Sources of Chromium.The chromium content of fossil fuels are low, but the combustion of large quantities of coal (containing 5-50ppm chromium) and of oil (containing 0.1-lppm chromium) are the major anthropogenic sources of environmental chromium in the United States. The ashes from the combustion of fossil fuels, which contain significant amounts of chromium, are disposed of by landfilling. Emissions from chromium chemical manufacturing facilities, from many cooling towers, and from steel mills are other major sources of airborne chromium.

Pacyna and Nriagu (1988) also reported that metallurgical processes are the major source of the anthropogenic chromium atmospheric emissions in Europe, specifically, European metallurgical processes contribute 15,420 tonnes of chromium per year to the atmosphere, and fossil fuel combustion in Europe contributes another 2.779 tonnes of chromium to the atmosphere each year. In the US during 1988, land disposal of chromium from the manufacturing and processing facilities alone was estimated to be22.000 tonnes. Kilau and Shah (1984) reported an annual land disposal of 98,000 tonnes of chromium in the slags from stainless steel production, and Rai and Szelemecka (1990) estimated “ a total of 17,000 tonnes of chromium contained in fly ash is deposited on the land surface in the US annually”. When the contributions from these and those from atmospheric fallout, are added to the tonnage from manufacturing and processing, the annual antropogenic deposition of chromium into/onto the land is easily increased by at least two orders of magnitude.On a global scale, anthropogenic chromium emission to the atmosphere amounts to75.000 tonnes per year. (Katz (1994)).
1.1.3. Production of Ferrochromium and Chromium.
Ferrochromium for stainless steel and other alloy production is prepared by the reduction of chromite with carbon. High carbon ferrochromium was prepared by heating mixtures of chromium and iron oxides with powdered charcoal as early as 1821.Chromium metal may be obtained by reducing chemically produced Cr(III) oxide (Cr20a) with powdered aluminium. The reduction of & 2O3 with silicon in the electric arc furnace has also been employed for the production of chromium metal, as has the electrolysis of chromic acid (CrOj) containing small amounts of sulphuric acid.
4

1.1.4. Production of Chromium Chemicals.
Chromium chemicals became commercially available in the early 19th century with the discovery that chromium could be produced by roasting chromite with soda ash and lime. From the 1820’s to the early 1940’s, the high-lime process was used to produce chromâtes at the Rutherglen works near Glasgow.Tyson’s 1845 potassium bichromate plant at Baltimore used a similar process for the production of chromium chemicals.In the years between the two world wars, the Mutual Chemical Company of America introduced rotary kiln roasting of chromite that had been ball-milled to less than 100 mesh size and mixed with soda ash and lime. From the turn of the century to the mid 1970’s chromâtes were produced from chromite ore by three manufacturing facilities in Hudson county, New Jersey. The chromite was pulverised to 100 mesh size, mixed with soda ash and lime, and roasted at temperatures between 1100-1150°C in rotary kilns to convert the insoluble trivalent chromium compounds in the ore to the more soluble sodium chromate. The sodium chromate was leached from the roast with water and converted to a variety of commercial chromium chemicals.
1.1.5. Uses of Chromium Compounds.
There is a wide range of industrial and commercial uses of trivalent and hexavalent chromium compounds. The inertness of the trivalent chromium oxides makes chromium compounds useful as corrosion inhibitors and as agents for anodising and plating metals. The colours of trivalent and hexavalent chromium compounds with appropriate solubility characteristics, makes them attractive as pigments. Other chromium compounds have been used for sensitising solutions for lithography and photoengraving. The oxidising properties of hexavalent chromium compounds have
5

found applications in the synthesis of organic dyestuffs, while other chromium compounds are used in the dying process. The tanning of leather is possible in hours rather than days because of the tendency of trivalent chromium to form complexes with basic oxygen and/or nitrogen atoms in proteins. Chromium compounds have also been used for pyrochemical purposes, i.e. fire works and some safety matches. Chromium and its compound are ubiquitous in modem society,
1.1.5.(a). Chrome Tanning of Leather.
Commercial development of chrome tanning of leather began at the end of the 19th century and the use of chrome tannage offers several advantages over the use of older vegetable tannins, in that the time required is comparatively short (hours) and the leathers produced by this process are more resistant to wear and heat than those produced by vegetable tannins. Chrome tanning produces a soft, flexible leather. (Katz (1994)).
1.2. Chromium in the Environment.
1.2.1. Chromium in Air.
Ehman et Al, (1987) identified hexavalent chromium in air borne particulates from Texas. Arar et Al (1992), cite 100% conversion of trivalent chromium to hexavalent chromium when sewage sludge conditioned with lime and ferric chloride are incinerated, and they determined hexavalent chromium in the airborne emissions from sewage sludge incinerators. Both Ehman et al and Arar and her associates found that hexavalent chromium was reduced during/after collection of the samples. Environmental transport of the chromium compounds emitted from coal-fired steam generators followed that of windblown dust.
6

1.2.2. Chromium in Water.
Trivalent chromium compounds are deposited into the sea as particulates from the atmosphere. The ultimate fate of these particulates is their incorporation into the seabed sediments. The behaviour of particulate bound chromium compounds transported to the sea by river water is similar to that of the chromium in particulates deposited in the sea from the atmosphere. Cutshall et al (1966), who measured chromium radioactivity in filtered Pacific Ocean water 525Km from the mouth of the Columbia River, proposed that “any Cr(III) in the ocean or in the river would associate with particles and be lost to sedimentation, while Cr(VI) would remain in solution.” They concluded that the reduction of hexavalent chromium to trivalent chromium occurred “only very slowly if at all” and that “losses due to reduction to Cr(III) are small.” Pettine et al (1991), have investigated oxidation kinetics of Cr(III) to Cr(VI) by hydrogen peroxide in an artificial seawater and in samples collected from the coastal waters of the Tyrrhenian Sea 80km south of Rome. They proposed a mechanism in which complexation with borate retarded the sedimentation and increased the oxidation of trivalent chromium. They estimated the half-life of trivalent chromium to be 45 days in surface seawater at a pH of 8 and at a temperature of 25°C.
1.2.3. Chromium in Soils.
The release of chromium from terrestrial sediments and soils is of concern both from fertility/phototoxicity standpoint and from considerations of groundwater contamination/public health. Gupta’s (1984), triphasic soil system model, reproduced in figure 1.1 provides a convenient reference frame for the terrestrial transport and fate of chromium components.
7

Figure 1.1 Triphasic Soil System.The gas phase (air trapped in soil) is approximately 25% by volume of the soil system. The concentrations of metallic compounds with the possible exception of mercury vapour, are insignificant in the gas phase. The solid phase includes a variety of inorganic and organic materials that constitute the skeletal framework or matrix of soils. The liquid phase (soil solution) is approximately 25% by volume of the soil system. Clearly transport of chromium to and from the solid must take place via the soil solution. Factors such as pH (as well as p 0 2 and pC02), solubility, cation (and anion) exchange capacity (CEC), and channel/pore size influence the transport of soil in soil system.Bartlett and James (1979), demonstrated that trivalent chromium was oxidised to hexavalent chromium in fresh soil samples only; dried soil samples lost all capability of oxidising Cr(III) to Cr(VI). Oxides of manganese served as the electron link between the Cr(III)/Cr(VI) redox couple and atmospheric oxygen. The oxidation of trivalent chromium was controlled by the surface characteristics of these oxides and its transport to this surface. The oxidation of trivalent chromium was favoured by its speciation and mobility in the soil and by the age of the immobile manganese(IV) oxide surface and its freedom from absorbed, reduced organics and divalent
8

manganese. Organic acids were appropriately characterised as double-edged redox swords by Bartlett in that they participated in the oxidation-reduction of both redox couples. The reduction of hexavalent chromium by organic (humic, fulvic, gallic, oxalic, citric etc.) acids was slow. The half time for the reduction of hexavalent chromium by the organic material naturally present in soil was several weeks.The processes that control the environmental chemistry of chromium have been identified by Rai et al (1989), as oxidation-reduction reactions, précipitation- dissolution reactions, and adsorption-desorption exchanges. Divalent iron, divalent sulphur and organic materials in the soil were among the potential reductants cited for hexavalent chromium, and manganese dioxide was given primary consideration for the oxidation of trivalent chromium to hexavalent chromium. The Eh-pH diagram (figure 1.2) shows the chromium species dominant under equilibrium conditions and their potentials for oxidation and/or reduction. The solubility of trivalent chromium was very low at the pH values typical for most soils. The influence of pH on solubility of trivalent chromium is shown in the pH solubility diagram, (figure 1.3). (Katz (1994)).
Figure 1.2. Eh-pH diagram fo r the various chromium species.
9

Figure 1.3. pH-Solubility diagram for various chromium species.
1.3. Chromium Uptake, Transportation, Distribution and Excretion.
1.3.1. Chromium in Foods.
In food consumed by humans and animals it is important in which form chromium is present. Biologically active chromium can be found in unrefined sugar syrup from beet and cane, in wheat germ, in black pepper and in beer yeast so therefore these products are useful to prevent chromium deficiency. Fruits contain very little chromium. But more than half of the dietary chromium is originated from other sources (i.e. preparation and cutlery) rather than the foodstuffs themselves. Stress, such as acute exercise, may lead to a reduction of chromium uptake. (Katz (1994)).
1.3.2. Chromium in Living Organisms.
The chromium content of seafish is 0.03-2mg/kg (dry weight). The muscles of mammals contain 0.002 to 0.8mg/kg and mammalian bones 0.1-30mg/kg. In food derived from animals chromium is biologically available in varying doses. Highest amounts of biologically active chromium are found in liver and cheese. Adult
10

humans contain about 5-20mg of chromium, particularly in the spleen and liver. The daily requirement of a human is 0.01-0.04mg of organically complexed chromium or about 0. l-0.03mg of chromium in an inorganic form. (Katz (1994)).
1.3.3. Chromium Uptake by Cells.The oxidation state of chromium strongly influences the rate of chromium uptake. Cr(VI) can easily cross the cell membrane, where the phosphate-sulphate carrier also transports the chromate anions (figure 1.4). Cr(III) does not utilise any specific membrane carrier and its entrance into the cell is obtained by less efficient mechanisms, which is simple diffusion and in the case of animal cells, endocytosis. Cr(III) uptake depends on the nature of the ligand it is complexed with, to such an extent that in some instances cell membranes are particularly impermeable to Cr(III) complexes. Complexes with appropriate lipophilic ligands diffuse into cells with relative ease.
Figure 1.4. Uptake o f Cr(VI) by Cells.The efficient uptake of Cr(VI) by organisms and the manifold toxic effects of Cr(VI) inside the cell, make Cr(VI) contamination a serious environmental hazard in many industrial countries. Cr(VI) is rapidly reduced to Cr(III) inside the cell and its

biological activity depends on the process of its reduction and the subsequent trapping of Cr(III) in different cell compartments. Even in organisms exposed to Cr(VI) chromium is detectable in the reduced state. (Cohen (1993)).
1.3.4. Chromium Uptake within the Body.
The physiological exposure of humans and animals to chromium takes place in the gastro-intestinal (GI) tract, where chromium is introduced with the diet as Cr(III). Because there is a short time of contact of the chromium containing material with the GI epithelia, absorption is influenced by the nature of the Cr(III) complexes. Inorganic Cr(III) is poorly adsorbed, while Cr(III) linked to amino acids or other biomolecules is more readily taken up by diffusion across the plasma membranes. Such organic complexes-referred to as biological active chromium (BAC)-are the most efficient supply of chromium for humans and mammals. Trace amounts of absorbed chromium (below 1 fig/day) are sufficient to maintain chromium balance in man. But because of the low percent absorption, the optimal dietary intake is in the range of 50-200(ig/day. (Guthrie (1982), Langard (1982) and Offenbacher (1986)).
1.3.5. Chromium Transportation and Distribution within the Body.
Absorbed chromium is transported within the body by blood, Cr(III) is bound to plasma proteins, especially transferrin, and Cr(VI) is accumulated by the red blood cells (RBC) where it is reduced to Cr(III). Chromium transported by blood is distributed to tissues and organs, which have different retention capacity. The highest levels of chromium are found in liver, kidneys, spleen and lungs. The data on chromium distribution in the body derive from different sources, namely, nonexposed humans, occupationally exposed workers and experimental mammals. Each

set of data has its limitations and published values of chromium levels in the organs and tissues (eg. liver and blood) of control humans may vary within several orders of magnitude due to analytical problems and/or sample contamination before chromium measurements. (Langard (1982), Guthrie (1982) and Weber (1983)).
1.3.6. Chromium Excretion from the Body.
The main route of chromium excretion is through the kidneys with urine, also after exposure to Cr(III). Two phases can be detected in chromium excretion, a rapid one, corresponding to the clearance of chromium from the blood, and a slower phase representing the clearance from the tissues. Excretion with bile appears to be marginal.
1.4. Toxicity o f Chromium.
1.4.1. Lethality of Chromium Compounds.
An oral dose of 2-5g of soluble hexavalent chromium can be fatal to an adult human. The toxic symptoms demonstrated by an adult human after ingestion of 5 g of a soluble hexavalent chromium compound included gastrointestinal bleeding, massive fluid loss, and death from cardiovascular shock. Humans ingesting less than 2g of a hexavalent chromium compound have developed kidney and liver damage postexposure.The NIOSH Registry data on the acute oral toxicity of trivalent chromium compounds to the rat, listed LD50 values ranging from 1900 to 3300 mg/kg. By comparison the LD5o for sodium chromate was reported to be between 50 and 150 mg/kg. In general, the hexavalent chromium compounds appear to be 10-100 times more toxic than trivalent chromium compounds by the oral route of acute exposure. Some values for
13

the toxicity of trivalent and hexavalent chromium compounds are outlined in Table1.2. In progressing from sodium chromate to calcium chromate to strontium chromate, both solubility and toxicity decrease. This trend may reflect the bioavailability of hexavalent chromium from these compounds. Similarly, the very low toxicity of Cr(III) acetate may reflect low availability of trivalent chromium from the stable acetato chromate (III) ion. (Katz (1994)).
Table 1.2.: Acute Oral Toxicity o f Some Chromium Compounds to the Rat.Compound Name of Compound l d 50/
m gKg1LD50 /
mmolKg' 1CrCl3.6H20 Chromium (III) chloride 1870 7.0
Cr(CH3C 00)3.H20 Chromium (III) acetate 11260 46Cr(N03)3.9H20 Chromium (III) nitrate 3250 8.1
Cr03 Chromium(VI) oxide 80-114 0.8-1.1
NaCr04 Sodium chromate (VI) 52 0.32CaCr04 Calcium chromate (VI) 327 1.7SrCr04 Strontium chromate (VI) 3118 15
Na2Cr2C>7 Sodium dichromate (VI) 51 0.39K2Cr20 7 Potassium dichromate (VI) 57 0.39
(NH4)2Cr20 7 Ammonium dichromate (VI) 54 0.43
1.4.2. Effect of Chromium Compounds on the Kidneys.
Renal damage is the most frequently observed consequence of ingesting chromiumcompounds. Chromium is selectively accumulated in the proximal convoluted tubule.Exposure to high concentrations of chromium compounds cause acute tubularnecrosis. The initial symptom is a marked reduction in urinary output, (200ml/day).
14

If death does not occur from renal failure or from the pulmonary or gastrointestinal toxicity of chromium, this oliguric phase is followed by a polyuric phase in which the output of urine exceeds 3L/day. Subsequently tubular regeneration and restriction ofrenal function result in recovery. (Katz (1994)).
1.4.3. Effect of Chromium Compounds on the Liver.Acute oral chromium intoxication has been reported to cause damage to the human liver. (Toxicological Profile for Chromium 1991). Daily IP injections of rabbits with 2mg/kg of chromium either as chromium (III) nitrate or as potassium dichromate for several weeks produced congestion and dilation of the central veins and sinusoids, discrete foci of necrosis and haemorrhage in the parenchyma, nuclear pleomorphism, multinucleated cells in the lobules, and bile duct prilifieration. In rats treated for 60 days with 2mg/Kg of chromium by IP injection 3 times per week, the liver damage caused by sodium chromate was more severe than that caused by chromium (III) chloride. (Katz (1994)).
1.5. Carcinogenicity o f Chromium.
Many of the earliest attempts to determine which species of chromium compounds were the causative agents for occupationally related cancers utilised inhalation or parenteral exposures with metallic chromium, chromate ore, or several commonly utilised chromium compounds. Although the majority of these studies yielded negative or equivocal results, several studies showed that Cr(VI) species were often carcinogenic from epidemiological studies, from animal experiments and from in- vitro genotoxic or mutagenic tests.
15

1.5.1.(a). Epidemiological Studies.
The greatest levels of exposures to Cr(VI) occur primarily during chromate production, welding processes, chrome pigment manufacture, chrome plating, and spray painting. Exposure to other valence forms of chromium occur primarily during mining ferrochromium and steel production, and during the cutting and grinding of chromium alloys. Epidemiological studies have played a key role in identifying some hexavalent chromium compounds as respiratory carcinogens. As early as 1890, Newman described an adenocarinoma of the inferior turbinate in the nose of a Scottish chromate pigment production worker. In 1935, Pfeil reported lung cancers among German workers who used dichromates to oxidise anthracene and its derivatives for the production of alizarin dyes. Alwens and Jonas (1938) later reported 20 cases of lung cancer among the workers at a chromate producing facility at Greisheim, near Frankfurt.
1.5.1.(b). Animal Experiments.
Oral exposure to chromium compounds does not result in enhanced tumour formation in test animals when compared with vehicle controls. Rats and mice provided with chromic acetate in their drinking water for life did not develop tumours at various body sites at greater rates than did controls. When Cr203 (1800 to 2850 mg/kg/day) was ingested along with other solids (i.e., baked in bread), there again was no enhanced incidence of tumours. Similar long-term feeding studies with Cr(VI) showed that while the total incidence of cancers did not vary from the controls, the development of forestomach carcinomas (as opposed to forestomach papillomas only) occurred only in rats fed K2Cr04 in their drinking water at 9 mg/kg/day for 900 days.
16

Although the corresponding linkage or route of exposure and sites of tumour formation are remarkably similar between humans and mice/rats, this susceptibility to tumour formation varies widely among the commonly used animal models. For example, mice and rats exposed to ZnCrC>4, CaCr04 , or Na2Cr207 atmospheres or intratracheal implants displayed a greater incidence of lung squamous metaplasias, subsequently followed by lung adenomas or adenocarcinomas, than did controls.Direct inhalation and intratracheal, intrapleural, or intrabronchial instillation of Cr(VI) compounds are by far the most common routes of exposure, and tumour formation in animal models most often occur at these sites of deposition. The preponderance of data indicates that neither metallic nor trivalent chromium give rise to lung tumours. (Cohen, M. D. 1993).
1.5.1.(c). Genotoxicity.A variety of short-term tests using different targets and/or end points have been employed to assess genotoxicity.(De Flora and Wetterhahn 1989). These assessments of genotoxicity were undertaken to compliment the epidemiological studies and the animal experiments used for establishing the carcinogenicity of chromium and its compounds. The results obtained from these tests show that the large majority of the positive results were obtained from hexavalent chromium compounds. Trivalent compounds, although more reactive than the hexavalent compounds with purified nucleic acids, did not induce genotoxic effects in the majority of the studies conducted with intact cells. With few exceptions, solutions of hexavalent chromium compounds were consistently positive in cellular systems. Almost 400 out of 450 tests showed that the soluble hexavalent chromium compounds were mutagenic in bacteria. In addition, the soluble hexavalent chromium compounds induced a broad range of
17

genetic effects in yeasts and insects. Soluble trivalent chromium compounds were inactive in cellular systems, but they produced a variety of effects in acellular or subcellular targets. The frequency of positive results with hexavalent chromium compounds was related to their solubilities, hence their bioavailabilities to the target cells. Although some trivalent chromium compounds appear to be capable of producing genetic effects when directly challenged with purified nucleic acids or with subcellular targets, their potential genotoxicity is lost in cellular systems. The results obtained from these genotoxic tests are summarised in Table 1.3. (Katz (1994)).
Table 1.3.: Results o f Genotoxic Tests.Cr(VI) Compounds Cr(III) Compounds
Positive Percentage 88.2 23.0Negative Percentage 8.50 67.5
Total Tests 450 209
1.5.1.(d). Mutagenicity.A common means of detecting mutations in micro-organisms is the selection for reversion in the strains that have a specific nutritional requirement different from that of the wild-type members of the species. The Ames test (Amdur et A1 1991) has received wide attention and utilisation as an assessment of mutagenicity and indicator of carcinogenicity. These tests employ several strains of Salmonella typhimurium that lack phosphoribosyl ATP synthetase, as the enzyme required for histidine synthesis. These strains, designated S. typhimurin his (-), are unable to grow in histidine- deficient media unless reversion or back-mutation to the wild type takes place. The Ames test measures such reversions and thereby makes possible mutagenicity

assessments of many chemical compounds and mixtures of compounds. These assessments of mutagenicity have been interpreted as indicators of carcinogenicity. Using this Ames test only compounds containing hexavalent chromium demonstrated mutagenicity such as CaCr04 , SrCrC>4 and PbCrC>4. None of the trivalent chromium compounds tested demonstrated mutagenicity. (Katz (1994)).
1.6. Essentiality o f Chromium.
Chromium as an essential nutrient helps maintain normal metabolism of glucose, cholesterol and fat. Chromium deficiency leads to glucose intolerance. The criteria established for the essentiality of chromium are;(i). The element is found in all healthy tissues of living organisms.(ii). Its concentration is fairly constant from species to species.(iii). Withdrawal of the element reproducibly produces the same adverse physiological response regardless of the species.(iv). Its return reverses the responses.(v). Physiological responses caused by dietary deficiencies are accompanied by specific biochemical changes.(vi). Dietary supplementation prevents or reverses these biochemical changes.
1.6.1. Chromium Deficiency.The manifestations of chromium deficiency include impaired glucose tolerance, elevated fasting, glycosuria, elevated circulating insulin, decreased insulin binding, decreased insulin receptor number, elevated cholesterol and trigylcerides, decreased high density lipoproteins (HDLs), and hypolycemic symptoms, which include drowsiness, shaking, blurred vision, and profuse sweating. Although decreased sperm
19
count and sterility have been observed in experimental animals, those reproductive pathologies have not been reported in humans.Wallach (1990), has reported that chromium deficiency in experimental animals impairs growth and fertility, and caused a diabetic like state associated with impaired glucose tolerance, hyperinsulinemia, hypercholesterolemis, and enhanced atherogenesis.Kieffer (1979), had reported that chromium deficiency can cause eye cataracts in experimental animals. Maternal chromium deficiency has been suggested as a cause of gestational diabetes in humans.The hypothesis that chromium deficiency can accelerate ageing is supported by data showing that the deficit of bioavailable chromium in processed food and by many studies claiming a progressive decline in body and organ chromium content from birth onwards. Human chromium deficiency has been indisputably proven only in protein- calorie malnutrition and in patients receiving total parental nutrition devoid of chromium supplementation. Polansky et al (1990), reported that stress produced by high-sugar diets, trauma, or exercise will deplete the body of chromium.
1.6.2. Glucose Tolerance Factor.
Glaser and Halpem (1929), who observed that yeast extracts potentiate the action of insulin, were the first to perceive the possible existence of a glucose tolerance factor. Mertz and Schwartz (1955), postulated the existence of a new dietary agent, the glucose tolerance factor. They observed that when laboratory rats were fed a standard commercial diet, their ability to metabolise sugar became impaired. When chromium containing fractions of yeast or yeast concentrates were added to the rats diets, the blood sugar levels became normal. Trivalent chromium was identified as the active
20

component of the molecule, the so-called glucose tolerance factor, the exact nature of which was not known. Mertz (1969) postulated that chromium as glucose tolerance factor acts as a co-factor to bind insulin to receptor sites on membranes and therefore enhances the efficiency of insulin. Dietary chromium had been confirmed as a component of glucose tolerance factor, which improves glucose intolerance in adults, especially the elderly. It has been suggested that the glucose tolerance factor, contains two molecules of nicotinic acid and a small oligopeptide such as glutathione, coordinated to trivalent chromium. This dinicotinato-amino acid-chromium complex is found in many animal tissues and may be synthesised in the liver.
1.6.3. Chromium Dietary Supplementation.Improved glucose tolerance in adults and elderly people was demonstrated following daily supplementation with 150-250 |j,g of chromium as chromic chloride. The effect of chromic chloride supplementation in adult humans took days to weeks to become noticeable, and this interval could not be reduced by increasing the dose. In constrast, Abraham et al (1992), conducted a study in non insulin dependant diabetics and age and sex matched controls. They received either placebo or 250(J,g of chromium as chromium chloride in 5cm3 of syrup. This dose level produced a fourfold to fivefold increase in serum levels.Animal studies, however, suggested that simple chromium salts, regardless of valence state, did not meet the credentials of an essential element. Many of these salts were not absorbed by the foetus in utero, the requirement of the developing foetus for high concentrations notwithstanding. Intestinal absorption of simple chromium compounds was not dependant on nutritional chromium status of the animal, and the
21

rate of elimination was not influenced by superimposed injection of high doses of chromium chloride.It has been postulated that chromium compounds in foods must be absorbed better than simple chromium compounds. Chromium extracted from Brewers yeast was shown to be better absorbed than chromic chloride by the rat. Tuman et al (1978), have reported that most people and animals can convert inorganic chromium to a suitable biologically active form. However, genetically diabetic mice and possibly brittle diabetics and/or people with advanced stages of maturity onset diabetes lose the ability to convert chromium to a usable form and are therefore dependant on preformed, physiologically active forms of chromium. This biologically active chromium (BAC) is trivalent, and it is incorporated into the glucose tolerance factor. (Katz (1994)).
1.7. Physical and Chemical Properties o f Chromium.
Elemental chromium was first prepared and characterised by Louis Vanquelin in 1979. In compounds, chromium demonstrates oxidation numbers of 2+, 3+, 4+, 5+, and 6+. The compounds of the trivalent chromium are the most stable and the most abundant. The hexavalent chromium compounds are well known as laboratory reagents and manufacturing intermediates.
1.7.1. Trivalent Chromium Compounds.The major chemical properties of trivalent chromium compounds in aqueous solution are characterised by the stability of the green hexaaquochromium (III) ion, [Cr(H20)ô] , and the tendency of this ion to precipitate as polymers formed through oxo and/or hydroxo bridging. The electronic configuration of trivalent chromium is
22
In aqueous solution, the hexaaquochromium (III) ion, demonstrates the octahedral2 3geometry of d sp hybridisation and the kinetic inertness towards ligand exchange of
3 • •the t2g state. As the pH of the aqueous system is raised, the hexaaquochromium (III) ion, an acid with a pKa of approximately 4, is neutralised to species such as [Cr(H20)s(0H)]2+ and [Cr(H20)4 (OH)2]+. These species polymerise through oxo and hydroxo bridging. Further deprotonation and polymerisation produce the hydrated chromium (III) oxide. When freshly precipitated the hydrated Cr(III) readily dissolves in both acids and bases;
Cr20 3.nH20 + 20H ' -» 2Cr02' + (n+l)H20.Cr20 3.nH20 +6H+ -» 2[Cr(H20 )6]3+ +nH20.
The hexaaquochromium (III) ion is green, and its absorption spectrum shows maxima at 404 and 570 nm. The molar absorptivities at both wavelengths are low. The absorption maxima change as the co-ordinated water is replaced by other ligands. Soluble trivalent chromium compounds include Cr(N03)3.9H20, CrCl3.6H20 and Cr2(S04)3.18H20.
1.7.1.(a). Chromium (III) Complexes with Inorganic Ligands.
Cr(III) accepts electron pairs from many ligands to form a wide variety of coordinated compounds. The resulting complexes may be cationic, neutral, or anionic, and essentially all of them are hexaco-ordinated. Once formed, complexes of trivalent chromium are quite stable. Ligand displacement, substitution, or exchange reactions are slow. Half-times of tens of hundreds are not uncommon. Trivalent chromium compounds with ammonia molecules and cyanide ions are also known. NH4[Cr(NH3)2(CNS)4], Reineke’s salt, is a precipitant for amines that contains mixed
Is2, 2s2, 2p6, 3s2, 3p6, 3d3.
23

ligands. Complexes with polydentate ligands such as ethlenediaminetetraacetate (EDTA) ions or oxalate ions have also been prepared and characterised.The formation of anionic complexes has been proposed as an explanation for the variations observed in the transport of trivalent chromium into and through the epidermis from aqueous solutions of chromium (III) chloride, chromium (III) sulphate, and chromium (III) nitrate.
1.7.1.(b). Chromium (III) Complexes with Bioligands.
Basic nitrogen, oxygen and sulphur atoms in amino acids, proteins, and other compounds having biological activity have potential electron pair donors for the formation of co-ordination complexes with trivalent chromium. Many such complexes have been prepared and characterised.Samitz and Katz (1964), have identified trivalent chromium complexes with aspartic acid, glutamic acid, isoleucine, methionine, proline, norvaline, and threonine from spectral observations of chromium (III) nitrate solutions incubated with 10-fold molar excesses of the ligand for 48 hours.
1.7.2. Hexavalent Chromium Compounds.
The ground state electron configuration of the hexavalent atom isIs2, 2s2, 2p6, 3s2, 3p6, 4s1, 3d5.
Divalent chromium compounds are basic, trivalent chromium compounds are amphoteric, and hexavalent chromium compounds are acidic. The acid anhydride (CrCb), the acid chloride (CrC^Ck), and a wide variety of metal chromates (MCr04) and metal dichromates (MC^O?) are typical hexavalent chromium compounds. The acid functions have been evaluated.
24

HCr04 ^ H + + Cr042 Ka2 = [H+] [Cr042'] / [HCr04] as has the chromate-dichromate equilibrium.
2HCr04 <=> Cr20 72" + H20 K*ql = [Cr20 72'] / [HCr04‘]The chromate ion is tetrahedral, and the structure of the dichromate ion corresponds to two tetrahadra linked through a comer oxygen. The Cr-O-Cr bond angles in the polymeric species are about 126°C, and the Cr-0 bond lengths of the linking Cr-O-Cr bonds are 179pm, while the Cr-0 bond lengths in the chromate ion and in the dichromate ion are 166 and 163 pm, respectively, (figure 1.5).
H2Cr04 -» H+ + HCr04‘ Kai = [H+] [HCr04 ] / [H2Cr04]
? ? Figurel.5. (a). CrÜ4 ’ ion and (b) C1 2 O7 " ion.
Aqueous solutions of hexavalent chromium compounds absorb in the ultraviolet and violet regions of the spectrum. Those of the chromâtes are distinctly yellow, dichromâtes are orange, and the higher polymers are red. Aqueous solutions of potassium chromate absorb strongly at wavelengths of 370-375nm and demonstrate a molar absorptivity of 4.5 x 10"3L / (mol"1 cm"1). Aqueous solutions of potassium dichromate show absorption maxima near 350 and near 450nm. The molar absorptivities are 2.5 x 10³ and 3.7 x 10²L / (mof'cm"1), respectively.
25

The solubility equilibria of hexavalent chromium compounds are complex and pH dependant. Heavy metal dichromates are usually more soluble than the corresponding metal chromâtes.
1.7.3. Chromium Compounds of Other Oxidation State.
Both the pentavalent and the tetravalent oxidation states of chromium are formed as transient intermediates in the reduction of hexavalent chromium to trivalent chromium. Although both these oxidation states of chromium are thermodynamically unstable, some of their insoluble and co-ordinated compounds are long-lived.
1.7.3.(a). Pentavalent Chromium Compounds.
The electronic configuration of pentavalent chromium isIs2, 2s2, 2p6, 3s3, 3p6, 3d1.
These compounds are paramagnetic because of the unpaired, 3d1, electron. Consequently, many of the transient intermediate pentavalent chromium compounds can be observed by electron spin resonance/electron paramagnetic resonance (ESR/EPR) spectroscopy.Potassium perchromate, or potassium tetraperoxochromate (VI), contains the octaco- ordinate, dodecahedral [Cr(02)4]3" ion. The O2 groups are unsymmetrically coordinated, with Cr-0 bond lengths of 185 and 195pm. The 0 -0 bond length is 141pm.
1.7.3.(b). Tetravalent Chromium Compounds.
The best known of the tetravalent chromium compounds, Cr02, is ferromagnetic. It is used to make high quality recording tape.
26

1.7.3.(c). Divalent Chromium Compounds.Compounds of divalent chromium are vulnerable to air oxidation. The anhydrous divalent salts can be preserved in nitrogen, carbon dioxide, or other inert atmosphere. In aqueous solution, the divalent chromium ion is a powerful reducing agent. In acidic solution it reduces water to liberate hydrogen:
2[Cr(H20 )6]2+ -» 2[Cr(0H)(H20 ) 5]2+ + H2
Chromium (II) acetate dihydrate is among the most stable divalent chromium compound. Cr2(CH3C0 0 )4.2 H20 has an unusual dimeric bridge structure in which each Cr(II) is surrounded by a distorted octahedron made up o f four oxygens from the four bidentate acetate ions, one oxygen from one o f the water molecules, and the other chromium (II). The four acetate ions bridge between the two of the chromium (II) and there is evidence o f chromium to chromium bonding. The chromium to chromium distance is only 2.36pm, and chromium (II) acetate dihydrate is diamagnetic. The electronic configuration of chromium (II) is
Is2, 2s2, 2p6, 3s2, 3p6, 3d4, which indicates four unpaired electrons. (Katz (1994)).
1.7.4. Oxides of Chromium.C r0 3 is a strongly acidic and rather basic covalent oxide o f chromium with a melting point of only 197°C. Its deep red crystals are made up o f chains o f comer-shared CrC>4, tetrahedra. It is commonly called ‘chromic acid’ and is generally prepared by the addition of concentrated H2SC>4 to a saturated aqueous solution of a dichromate. Its strong oxidising properties are widely used in organic chemistry. C r0 3 melts with some decomposition and, if heated above 220-250°C, it loses oxygen to give a succession of lower oxides until the green Cr20 3 is formed.
27

Cr2 0 3 has the corundum structure and it finds wide application as a green pigment. It is a semi-conductor and is anti-ferromagnetic below 35°C. ( > 2 0 3 is the most stable oxide of chromium and is the final product of combustion of the metal, though it is more conveniently obtained by heating ammonium dichromate.
(NH4)2Cr20 7 Cr20 3 + N 2 + 4H20When produced by this method it is unreactive, but, if precipitated as the hydrous oxide (or hydroxide) from aqueous Cr(III) solutions it is amphoteric. It readily
* 3_)_dissolves in acid to give an extensive cationic chemistry based on the [Cr(H20)6] ion, and in alkalis it produces complicated, extensively hydrated chromate (III) species (“chromites”).The third major oxide o f chromium is the brown-black, C r02, which is an intermediate product in the decomposition of CrC>3 to Cr20 3 , and has a rutile structure. It has metallic conductivity and its ferromagnetic properties lead to its commercial importance in the manufacture of magnetic recording tape.
1.7.5. Halides and Oxohalides of Chromium.The group oxidation state of + 6 is attained by chromium only with the strongly oxidising fluorine. This is also true for the +5 oxidation state and in the +4 oxidation state the iodides have a doubtful or unstable existence. In lower oxidation states all the chromium halides are known. In the oxohalides (which are largely confined to the + 6 and +5 oxidation states) chromium forms an oxofluoride in the lower o f these oxidation states.For the preparation o f the yellow CrFg, temperatures o f 400°C and a pressure o f 200- 300 atms are required for its formation and reduction of the pressure causes it to dissociate into CrF5 and F2 even at temperatures as low as -100°C.
28

Of the pentahalides, chromium forms only the fluoride, which is a strongly oxidising, bright red, volatile solid prepared from the elements using less severe conditions than for CrFg.The most stable representative of the tetrahalides are the fluorides, (CrF4, CrCU, CrBr4 and Crl4), CrF4 is an unreactive solid which melts without decomposition at 277°C. All four of the chromium trihalides are known (CrF3, CrCl3, CrBr3 and Crl3), this being much the most stable oxidation state for chromium. They can be prepared by reacting the halogen and the metal, though CrF3 is better obtained from HF and CrCb at 500°C. The fluoride is green, the chloride red-violet, and the bromide and the iodide are dark green to black. In all cases a layer structure leads to octahedral coordination of the metal.Anhydrous chromium dihalides (CrF2, CrCl2, CrBr2 and Crl2), are conveniently prepared by reduction of the trihalide with H2 at 300-500°C. They are all deliquescent and the hydrates can be obtained by reduction of the trihalides using pure chromium metal and aqueous HX. All have distorted octahedral stmctures.The oxohalides o f chromium are very susceptible to hydrolysis. They are yellow to red liquids or volatile solids, the best known is the deep-red liquid, chromyl chloride, Cr0 2 Cl2. It is most commonly encountered as the distillate in quantitative tests for chromium or chloride and can be obtained by heating a dichromate and chloride in concentrated H 2 S O 4 , it is an extremely aggressive oxidising agent.
1.7.6. Sulphides, Selenides, and Tellurides of Chromium.The sulphides, though showing some similarities in stoichiometry to the principle oxides, tend to be more stable in the lower oxidation states of the metal. Thus, chromium forms no trisulphides. Cr2S3 is formed by heating powdered chromium
29
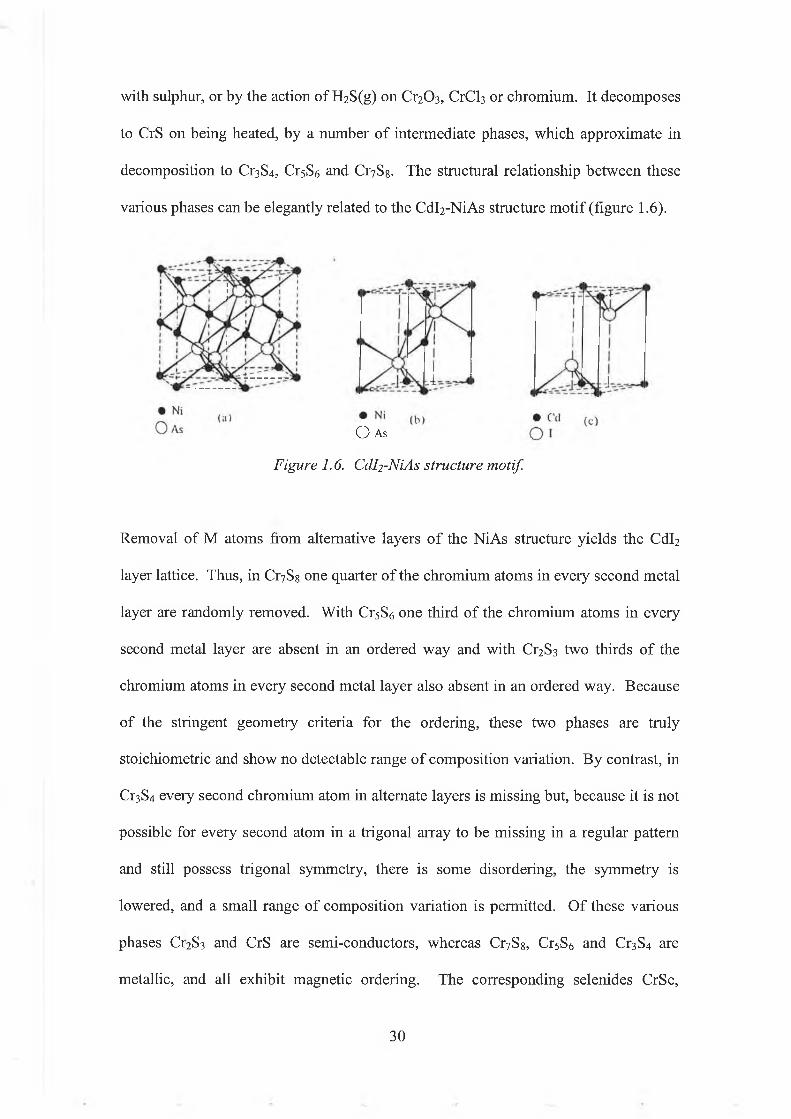
with sulphur, or by the action of H2S(g) on Cr2 0 3 , CrCb or chromium. It decomposes to CrS on being heated, by a number o f intermediate phases, which approximate in decomposition to Cr3S4, Cr5S6 and Cr7Sg. The structural relationship between these various phases can be elegantly related to the Cdl2-NiAs structure motif (figure 1.6).
Removal of M atoms from alternative layers o f the NiAs structure yields the Cdl2
layer lattice. Thus, in Cr7Ss one quarter o f the chromium atoms in every second metal layer are randomly removed. With Cr5S6 one third of the chromium atoms in every second metal layer are absent in an ordered way and with Cr2S3 two thirds of the chromium atoms in every second metal layer also absent in an ordered way. Because of the stringent geometry criteria for the ordering, these two phases are truly stoichiometric and show no detectable range of composition variation. By contrast, in Cr3S4 every second chromium atom in alternate layers is missing but, because it is not possible for every second atom in a trigonal array to be missing in a regular pattern and still possess trigonal symmetry, there is some disordering, the symmetry is lowered, and a small range of composition variation is permitted. Of these various phases Q 2S3 and CrS are semi-conductors, whereas Cr7Sg, Cr5S6 and Cr3S4 are metallic, and all exhibit magnetic ordering. The corresponding selenides CrSe,
O As
Figure 1.6. Cdl2 -NiAs structure motif.
30

Cr7Se8, Cr3Se4, Cr2Se3, Cr5Se8 and Cr7Sei2 are broadly similar, as are the tellurides CrTe, Cr7Tex, Cr5Te6, Cr3Te4, Cr2Te3, and Cr5Te8. (Greenwood (1984)).
1.8. Buffer Solutions.
A solution consisting of a weak acid along with a conjugate base is called a buffer solution because it resists pH changes when diluted (or perhaps concentrated) or when various amounts of acid or base are added. But, there is also a definite limit called the buffer capacity which defines how much acid or base can be added to a given buffer solution before any appreciable change in pH results. This buffer capacity is set by the original amounts of the weak acid and its conjugate, since one or the other is consumed by reaction with the added acid or base.
1.8.1. Factors Affecting the Choice of a Buffer.The buffering ability o f a weakly acidic or basic group is limited approximately to the range pH = pKa +/- 1, the greatest effect being pH = pKa. This is the most important single factor in choosing a buffer for any particular application. However, there are usually a number of other considerations, such as the nature o f the reaction system, the ionic strength, the effects of temperature and dilution, the possibility of forming insoluble or strongly coloured species or otherwise interacting with components of the solution. For example, the effect o f temperature on pKa of the buffer should be known and, preferably should not be very large. This is an important factor for buffers based on Tris (tris(hydroxymethyl)aminomethane) and aliphatic amines. The buffer species should also be chemically stable, should be readily soluble in water and not be readily extracted by organic solvents.
31

A good buffer shows little change in pH if accidentally contaminated with acidic or
basic materials. For a buffer of the type BH+ <=> B + H+, acidic contaminants have
little effects if they are weaker acids than BH+. Similarly, basic contaminants that are weaker bases than B are not important. For measurements o f rates or of physical constants it is often desirable to work under conditions of known low ionic strength. In all cases, the pH of a buffered medium should be determined only after all components have been added and at the temperature o f the final measurements.
1.8.2. Practical Limitations in the Use of Buffers.The suitability of a buffer system for any particular application depends on many factors. Not only must the buffer species be appreciably soluble in water, but it is also important that they do not react with ions or molecules present in the solution. For example, phosphate and pyrophosphate buffers are unsuitable if a solution contains calcium or certain other di- or trivalent cations which form insoluble phosphates, or if reaction progress is followed by a change in phosphate content. Similarly, carbonate buffers can precipitate calcium ions.A difficulty in using bicarbonate/CC^ buffers is that pH consistency requires the use of closed systems equilibrated with a controlled level o f CO2 in the gas phase. Otherwise, loss of CO2 from the solution can lead to a progressive and undesirable rise in pH.On prolonged storage, borax is likely to lose some of its water o f crystallisation unless the container is tightly stoppered. This is not serious when borax is used, on its own, as a buffer standard but it can lead to significant errors in buffers when its strength as an acid or a base is important. The storage o f alkalis and alkaline buffer solutions presents problems of the rapidity with which CO2 is absorbed and because o f the slow
32

attack by reagents on the bottles in which they are stored. With phosphate solutions this can lead to the deposition of calcium phosphate.Where the buffer has metal-complexing ability, problems may arise, particularly if heavy metal ions are present. Competition between metal ions and protons for attachment to buffer species can lead to a lowering o f pH. Other factors which need to be allowed for are the change in pH with dilution of a buffer and, more importantly, the effect of temperature on pKa of a buffer. Tris has a pKa of 8.85 at 0°C, 8.06 at 25°C and 7.72 at 37°C, so that the pH of the Tris buffer can fall by more than 1 pH unit in warming from 0°C to 37°C. Comparable effects are found for other cationic buffers as the aliphatic amines.
1.8.3. Biological Effects.Buffer systems can exert effects on biological systems in three main ways. They may specifically stimulate or depress enzyme activity. They may interfere or react with substrates, inhibitors or cofactors. Non-specifically they may exert effects because o f their ionic strength. In general, buffer concentrations should be kept as low as possible, having regard for the need to maintain pH constancy, and the medium should be adjusted by adding appropriate inorganic and organic ions to simulate physiological conditions.Some common examples o f enzymes inhibited by phosphate ions include carboxypeptidase, fumarase, urease, phosphoglucomutase, carboxylase, arlysulphatase and muscle deaminase. Frequently this inhibition is due to competition of the phosphate with substrates containing phosphate groups or to complex formation with a metal ion essential for the enzyme activity.
33

Tris(hydroxymethyl)aminomethane has been a major biochemical buffer for many years, partly because it is relatively inexpensive and readily available in a highly purified form. However, it has disadvantages. These include its reactivity as a primary amine and its appreciable solubility in inorganic solvents which leads to its accumulation in the biological phases o f reaction systems. Thus, Tris buffer displaces the electron transport-, and phosphorylation-, pH rate profiles for chloroplasts by almost a pH unit when compared with a number o f other buffers. It also inhibits isocitrate dehydrogenase o f pea mitochondria whereas HEPES does not. (Perrin (1974)).
Sirinawin et al (1997), used tricaprylmethyl ammonium chloride (Aliquot-336) for the extraction of Cr(VI) into methyl isobutyl ketone (MIBK). The basic principle o f the extraction was ion-pair extraction of Cr(VI) from an acidic solution. They found that the extraction was affected by the concentration o f chloride, nitrate and sulphate, as well as pH. The most favourable pH-range was between 1 and 3. An extraction time of 2 minutes was found to be optimal. Shorter extraction times gave lower recovery, as did longer extraction times.Flores-Veles et al (1994), used Tris (tris(hydroxymethyl)aminomethane) for the extraction of Cr(VI) from soil samples at pH 9.85 and pH 13. They found that at pH 9.85 the Tris solution did not extract 100% of the Cr(VI) added to the soil. The percentage recovery obtained was lower than 90%. They found that by increasing the pH of the Tris solution to 13 a percentage recovery o f 98.6% was obtained. This meant that strong alkaline media are efficient for the desorption o f chromium in soils.
34

1.9. METHODS OF DETERMINATION OF Cr(VI).
The four main methods of detection of Cr(VI) used in this thesis are(i). Voltammetry.(ii). G.F.A.A. Spectroscopy.(iii). U.V. Spectroscopy.(iv). H.P.L.C.Outlined here are the main principles on which these instruments work and an overview of the reactions involved and previous works carried out using these methods.
1.9.(a). Voltammetry. Principle.In an electrolysis cell the current produced in the cell is a measure of the amount of chemical change occurring at the electrodes. This is a well known principle embodied in Faraday’s Laws. In order for a reaction to occur at an electrode the electrode potential must exceed a critical value. There are a variety of electro-analytical techniques which are designed to measure cell current as a function of electrode potential. These techniques also belong to the branch o f the electro-analytical techniques family known as voltammetry at finite current. If the electrode potential is changed in a linear mode then we have linear sweep voltammetry (LSV). Linear sweep voltammetry may be carried out using a variety of electrode materials such as gold, platinum, carbon and also mercury. If, and only if, mercury in the form of a dropping mercury electrode (DME) is used as the working electrode, we have polarography. The working electrode (WE) in a cell is the electrode where the reaction of interest in occurring. The mercury electrode in polarography takes a

special form consisting of small droplets o f mercury generated at the lower end of a glass tube. This is what is termed the dropping mercury electrode (DME). Polarography is then an example o f voltammetry at controlled potential in which the
working electrode consists o f a dropping mercury electrode and the potential o f the
working electrode is changed in a linear mode. The Czechoslovakian chemist Jaroslav Hegrovsky discovered, reported and established this technique in 1922.
The Dropping Mercury Electrode.Mercury is very toxic and demands a neat and tidy working practice. It is a liquid under normal experimental conditions and thus, presents a smooth homogeneous surface to the solution. It is a good electrical conductor and provides a surface for the required electrode reaction. A good electrode material provides a high voltage limit in anodic and cathodic directions and thus, a wide voltage window for analysis. The voltage window for DME is usually from about +0.2V (SCE) to -2.0V (SCE) with small variations due to differing solution conditions.
Advantages of the DME are;(a). The drops are reproducible in size and each drop grows in an environment identical to that of its predecessor giving rise to reproducible currents for the same conditions.(b). A new surface is presented with each drop so that no appreciable accumulation of reaction product at the surface can occur either as adsorbed species or as precipitates.(c). Species present in the solution, other than those involved in the electrode reaction, are also unable to adsorb to any extent during the lifetime of the drop.
36

(d). Electrolysis is so small that solutions may be analysed many times with no appreciable change in the analyte concentration.(e). The over potential for the reduction o f the hydronium ion is high so that interference’s from reduction of this species do not occur until potentials more negative than -1.6V are reached.
Limitations of this electrode would include;(a). The voltage limit of 0.2V to -2.0V. The use o f non-aqueous solvents and supporting electrolytes such as tetraalkylammonium salts enable the negative limit to be extended to -3V but little can be done about the anodic limit which is determined by the tendency of the mercury to oxidise at potentials in the range 0.0V to 0.2V.(b). The high detection limit. Polarography is best used for metallic cations in the range 10'2 to 10'4 mol dm'3. At concentrations greater than 10‘2 mol dm '3 the large change in concentration at the electrode surface causes the current to become erratic. At concentrations below 10~4 mol dm '3 the capacitative current becomes comparable with the diffusion controlled Faradaic current.(c). Catalytic hydrogen currents. These are caused by organic species adsorbed on the electrode that are capable of protonation.(d). Adsorption currents. These occur if the product of the reaction adsorbs strongly or if the product is insoluble, it simply adheres to the surface.(e). Kinetic currents. These are produced if the reactant or product is also to participate in a non-electrochemical reaction in the solution.All of these effects can cause either distortion of the expected analyte wave or extra waves to appear, sometimes preceding and sometimes following the analyte wave.
37

The DME is operated at negatively applied potentials, so that reduction occurs and (negative) cathodic waves are produced. If positive waves are applied, oxidation occurs producing anodic (positive) waves. The DME consists o f a resevoir of mercury that is pushed through a thin capillary under pressure. A hammer at the top of the capillary controls the drop rate o f the mercury. When the drops emerge in the solution they become the working electrode.During the recording of a polarogram the applied voltage is gradually increased, so that the potential of the working electrode becomes more negative. When the applied potential becomes large enough that the applied electro-motive force (cmf) is greater than the back emf of the cell, an electrochemical reaction occurs at the working electrode and currents begin to flow through the cell.
1. Pulse Polarographic Techniques.Two techniques, normal and differential pulse polarography, are discussed here. These use a complex applied voltage signal and current sampling techniques to minimise interfering background signals and to maximise the analytical signal, giving a greater increased sensitivity. The major drawback of dc (direct current) polarography is that o f the signal to noise ratio, which is unwanted instrumental signal unrelated to the analyte or its concentration, often random and uncertain. With dc polarography the signal is the mean Faradaic current and the principle source o f noise is the capative current for the growing mercury drop. The signal to noise ratio, that is the ratio of the Faradaic current to the capacitative current is greatest at the end o f the drop lifetime. Classical dc polarography records the mean current during the drop lifetime and thus does not record the maximum Faradaic current. It also includes an
38

appreciable contribution from the capacitative current, which leads to a limit of detection of about 5 x 10’5 mol dm'3.
A. Normal Pulse Polarography. (NPP).The basis of this type of polarography is that the potential is kept at a lower voltage until the moment o f measurement, thus preventing electrolysis during most o f the drop lifetime. The potential is kept at a suitable constant base throughout the drop lifetime and the chosen potential signal is imposed as a very short pulse (about 60mS) near the end of the drop lifetime, causing very little electrolysis and depletion. The overall form of the applied voltage signal is a series o f potential pulses, one to each drop rising in a linear ramp with a base potential maintained between the pulses. The currcnt recorded at the end of each pulse is plotted against the potential o f the pulse. The resultant current/potential curve is similar in form to the classical dc polarographic curve but the noise, i.e. the capacitative current, has been dramatically reduced. Thus the sensitivity of the technique has been improved by about two orders
7 3of magnitude giving a limit of detection of about 1 0 " mol dm' .
cOJoC L
15 ms
60ms
1-----
-15 ms current measurement
-60m s potential pulse
-Base potential
Drop lifetime 1-5s
Time
Figure 1.7. Profile o f the Potential Pulse and Current Measurement in NPP.
39

B. Differential Pulse Polarography. (DPP).This technique differs from NPP in that after the potential pulse the potential does not return to a constant base value. Instead the potential pulse is of a small constant amplitude (lO-lOOmV) and is superimposed on a conventional rising linear dc voltage ramp. Again the pulse is imposed for about 60mS near the end o f the drop lifetime when the growth of the drop has almost ceased. The current is measured in two intervals of about 15mS, the first immediately prior to the potential pulse and the second during but near the end o f the potential pulse. The final current signal displayed is then, in fact, the difference of these two currcnt values. This technique produces not a wave but a peak with the maximum current signal at roughly the half wave potential of the classical dc and NP polarography. Electrolysis and depletion occur throughout the drop lifetime with this technique, leading to DPP being typically an order of magnitude more sensitive than NPP, giving a limit o f detection of 10'7 - 1 0 “8 mol dm'3.
Figure 1.8. Profile o f the Potential Pulse and Current Measurement in DPP.
40

Although DPP is the most sensitive direct polarographic technique, an even greater sensitivity can be obtained by employing stripping voltammetry. This method is applicable to a limited number of important analytes and requires the use o f solid or stationary electrodes. The preconcentration or deposition step consists of the controlled electro-deposition, at a fixed potential, of the species o f interest onto the stationary electrode. Since the volume of mercury is small compared to the volume of solution deposited on the electrode preconcentration occurs. This is followed by the determination step, which consists of electrolytically stripping the deposited species back into solution.The main steps involved in stripping voltammetry are;1. The Deposition Step.The most popular electrodes are the hanging mercury drop electrode (HMDE), and the mercury film electrode (MFE) supported on gold or platinum. In metal ion analysis, the mercury electrodes offer the advantage that the deposition product, the metal, dissolves in the mercury to form a liquid amalgam. This offers better reproducibility. The MFE is capable of more sensitive measurements than the HMDE but is less suited to relatively higher trace amounts, since the solubility capacity of a film is less,(a). Stirring.The stirring o f the solution during the deposition step increases the rate at which the analyte reaches the electrode to be deposited. The stirring must be uniform and at a rigidly controlled rate, and it must be gentle otherwise unpredictable eddy effects will occur. Deposition in a still, unstirred solution might appear to offer a much higher reproducibility of conditions but at the cost of a much reduced sensitivity and a much longer deposition time. An alternative to stirring a solution is to rotate the electrode,
2. Stripping Voltammetry.
41

where the electrode usually consists of a rod cut to expose a flat disc. The rod is then rotated about its axis and is usually made of glassy graphite, platinum or gold.(b). Deposition Time.The greatest sensitivity would clearly be obtained by carrying on the deposition process until all the analyte would be deposited on the electrode. But it is best to avoid long deposition times as they often lead to various complications resulting in a loss of proportionality between final signal and the concentration of the analyte. In general a good guide is to choose a deposition time so that only about 2 % of the total analyte is depleted from solution, this allows the rest o f the solution to remain unaltered.(c). Deposition Potential.Usually a potential is chosen a few hundred millivolts larger than the polarographic half wave potential of the analyte. In the analysis of a solution containing a number of metal ions, each metal in it will have its own individual deposition potential. Thus, only one metal or a group of metals can be deposited, avoiding the deposition of other metals which might interfere with the stripping step. The higher the potential, the more types of metals will be deposited and the more interference’s likely.
2. The Stripping Step.There are two stripping procedures o f great significance;(a). Direct Current (DC) or Linear Sweep Stripping Voltammetry.This being the simplest of the procedures involves the imposition of a simple linear voltage scan on the electrode.(i). DC Anodic Stripping Voltammetry. For metal ions a cathodic deposition potential (negative) is set for the depositon time reducing the ions to metal. Then the linear
42

voltage scan is started with the potential moving towards anodic potentials (positive) for the re-oxidation of the metal.(ii). DC Cathodic Stripping Voltammetry. For anodic species an anodic deposition potential (positive) is set oxidising the ions to metal and the stripping step is a voltage scan to cathodic potentials (negative).As the potential scan begins no current initially flows. But when the re-oxidation potential (or re-reduction potential) is reached the current rapidly rises. There is only a fixed amount of material deposited in the deposition step. The current must therefore fall back towards the base line as the last o f the deposited material is reoxidised (or re-reduced). The dc stripping signal thus consists of a peak, the height of which is used to determine the concentration in the solution.(b). Differential Pulse Stripping Voltammetry.The voltage sweep used here is identical to that used in conventional DPP. The current is sampled just before the pulse and almost at the end of the pulse. The first signal is the difference of these 2 current values. At the steeply rising stripping peak this small change in the potential will produce a large change in the electrolysis current whereas, the small change in potential will produce only a very small effect on capative current and other sources of noise. This produces a much greater sensitivity and allows the use of much shorter pre-electrolysis or deposition time. It is because of the greater sensitivity of this technique that it can sometimes even allow the use of a pre-electrolysis deposition step in an unstirred solution, thus avoiding the problems of the reproducibility of the stirring. For concentrations below 50ppb stirring is essential but at higher concentrations it can sometimes be avoided.
43

A. Anodic Stripping Voltammetry.This is concerned almost entirely with trace metal analysis. Metal ions lend themselves particularly well to stripping voltammetry. The metal deposited in the deposition step generally dissolves in the mercury drop to form an amalgam. This avoids any problems with the nature of an insoluble deposit. I f more than one metal ion is deposited they will appear as separate peaks at different potentials in the stripping step. However the formation o f intermetallic compounds can cause problems. When zinc and copper are present in solution there is a tendency to form a Zn/Cu intermetallic compound, when large amounts are deposited at the mercury electrode. When an intermetallic compound is formed the stripping peaks for the constituent metals may be shifted, severely depressed, or even be absent altogether. When an alloy is formed at a solid electrode its dissolution potentials, in the stripping step, may be quite different to those of the constituent metals. Such interfering effects can be minimised or avoided by reducing the deposition time and the total amount of metal deposited. This would lead to a loss in sensitivity but the case of differential stripping voltammetry can effect this.
B. Cathodic Stripping Voltammetry.The most common species determined by cathodic stripping voltammetry are ions such as halides or sulphides, at a mercury electrode. This technique involves the formation of a film of mercury (I) salts on the electrode in the deposition step. The anodic oxidation process involved in the deposition step is in fact the oxidation of mercury (I) ions, which immediately precipitate insoluble mercury (I) salts with the halide ion, onto the surface of the electrode. The subsequent cathodic stripping peak for the mercury (I) salt of each anion has its own individual potential. Cathodic
44

stripping voltammetry has proved suitable for a number o f organic compounds, including drugs and pesticides, which generally contain sulphur and again the deposition step involves anodic (oxidation) formation of an insoluble mercury salt. This method is a highly sensitive one but is suited only to very low levels. (Riley (1987)).
Wang and Lu (1992) used catalytic stripping voltammetry in the presence of cupferron for the measurement of ultra trace levels of chromium. Optimum conditions were obtained at 1 x 10'8 mol dm '3 piperazine-N,N’-bis(ethansulphonic acid) (PIPES) solution at pH 7 containing 1 xlO '4 mol dm '3 cupferron. A potential of -0.82V was used because it provided the best signal-to-background characteristics. Cupferron served as a complexing agent and also as an oxidising agent. The strong adsorption of the chromium-cupferron complex was used as an effective preconcentration step, prior to voltammetric measurements. It was discovered that the longer the preconcentration time, the more the metal complex is adsorbed and the larger the peak current. Using this procedure measurements of parts per trillion was feasible and a detection limit of l.Ong dm' was obtained.
Vukomanovic and vanLoon (1997) employed adsorptive stripping voltammetry with pyrocatechol violet (PCV) for the measurement o f Cr(III) and Cr(VI) in aqueous solutions. They found that a blank containing 6 mmol dm '3 acetate buffer and 0.5(j.mol dm '3 PCV gave a peak at a potential o f -0.53V, and on addition o f Cr(VI) this reduction peak decreased while a new reduction peak at -0.73V increased as the concentration of Cr(VI) added increased. It was found that the growth of the Cr(VI)- PCV reduction peak ceased when the ratio o f Cr(VI) to PCV was approximately
45

equimolar. They also found that no Cr(III) -PCV peak was observed. Maximum separation between reduction peaks of uncomplexed PCV and Cr-PCV was observed at pH 6.7. Total chromium was determined by oxidation of Cr(III) to Cr(Vl) by UV irradiation and an oxygen saturated solution. Using this method and a preconcentration time of 1 minute a detection limit o f 0.15ppb Cr(VI) was established.
Korolczuk and Grabarczyk (1999) used cyclic voltammetry for the determination of traces of Cr(III) in the presence o f bipyridine. Their method is based on the fact that Cr(VI) ions are reduced to Cr(III) after an accumulation of 60s at a potential of -1.0V, and that in the presence of bipyridine the Cr(III)-bipyridine complex is formed. Then during a negative direction scan the complex was reduced to a Cr(II)-bipyridine complex and produced a peak at -1,44V. When the direction o f the scan was changed the Cr(II)-bipyridine complex was oxidised to Cr(III)-bipyridine and an anodic peak was produced. A pH of 4.5 was chosen for the supporting electrolyte (acetate / acetic acid buffer) as a higher pH caused the co-precipitation of hydroxide. An optimum accumulation potential of -0.25V and an optimum equilibrium time of 15s were chosen. Using these parameters a linear calibration curve from 0.156ppb to 1.56ppb Cr(VI) was produced giving a detection limit of 0.05 lppb for Cr(VI) for an accumulation time of 1 2 0 s, and for an accumulation time of 600s a linear curve from0.025ppb to 0.260ppb Cr(VI) was produced with a detection limit of O.OlOppb Cr(VI).
Korolczuk and Grabarczyk (1998) also determined Cr(VI) in reference materials and river water samples spiked with known amounts of Cr(VI) using catalytic currents in the presence o f nitrate. Here an optimum deposition potential of -1.65V was chosen
46

along with an oxidation time of 45s. Any increase in potential or time above those chosen did not cause an increase in the current of the catalytic peak. They also discovered that the minimal deposition time needed for the appearance of the catalytic peak on the voltammogram (t0) is inversely proportional to the Cr(VI) concentration. An optimum pH value o f 9.3 was chosen and using these conditions a linear calibration curve was obtained from 0.026ppb to 0.260ppb Cr(VI). The reference material was analysed using these parameters and the results obtained agreed with the reference value. From this result and from the results obtained from the river water samples analysed this method can be used for Cr(VI) and total chromium determinations.
Cr(III) ions form, in aqueous solutions, strong complexes with ligands such as EDTA, CDTA and DTP A, which are then reduced at the dropping mercury electrode (DME) giving well defined polarograms. Zarebski (1977) used NP and DP polarography to obtain polarograms. He discovered that Cr(III) complexes were reduced at the DME at relatively high potentials (about -1.2V) and that the wave of hydrogen was remarkably close to the wave o f chromium especially in buffered supporting electrolytes. This lead to the limiting current in DPP to be less defined and for NPP the residual current to be higher especially at concentrations close to the detection limit. Therefore an unbuffered supporting electrolyte was used for the analysis. Using a KC1 supporting electrolyte the pH of the solution was found to have a significant influence on the shape and height o f the polarograms of Cr(III)-complexes. At pH lower than 5.5 the hydrogen wave interfered with the chromium wave and at pH higher than 6.4 the limiting current decreased leading to an optimum pH of 6.0. Using these conditions a linear curve from 10'9 mol dm"3 to 10"4 mol dm"3 was
47

produced. A higher sensitivity was achieved by use o f EDTA or DTPA in a nitrate supporting electrolyte using DPP. The use of such an electrolyte lead to a great increase in its NP and DP polarograms which gave a detection limit of 5.2ppb for both Cr(III) and Cr(VI).
Ghandour and El-Shatoury (1996) also used a nitrate supporting electrolyte for the determination of Cr(VI). By using cathodic linear sweep stripping voltammetry (CLSSV) as low as 0.25ppb Cr(VI) was detected and by using differential pulse cathodic stripping voltammetry (DPCSV) as low as 0.52ppb Cr(VI) was detected. They observed that no adsorptive peak was produced at pH <5 or more than 10 and that the peak height reached its maximum between pH 6.96 and 7.37. An optimum initial potential o f +0.10V was chosen as it was observed that the peak height increased as initial potential increased up to 0.0V and reached a maximum value between +0.14V and +0.10V. It was also discovered that the peak height increased with increasing adsorption time up tol20s and became constant at 150s. Using these parameters the precision and accuracy were investigated and found to be satisfactory with RSD = 1.24 and coefficient of variation r = 0.998 for 10 replicate analysis.
48

1.9.(b). Graphite Furnace Atomic Absorption Spectroscopy.Principle.The generation of atoms by means o f an electrically heated graphite furnace atomiser is a technique which is complementary to conventional flame atomic absorption (A.A.), rather than a technique which replaces it. There are many analytical advantages to flame A.A., but there are many trace metal analyses which are only possible by means of a graphite furnace atomiser. With these two techniques for the generation of ground state atoms, plus the vapour generation method for some selective elements, A.A. remains one of the most versatile yet specific methods for the measurement of metals.
Disadvantages of Flame Atomisation.(a). The efficiency of pneumatic nebuliser/spray chamber systems is low; typically about 1 0 %.(b). For the amount of sample finally reaching the flame, the production of atoms in the ground state is governed by many variables such as the flame temperature, interactions between flame gases, matrix components and analyte, chemical interference's, and the extent to which the analyte molecular species are dissociated.(c). The zone of the flame in which absorption actually occurs is only a small section o f the whole flame.(d). The overall effect o f (a), (b) and (c) above is that the number of atoms contributing to the analytical signal is extremely small compared with the total amount of element aspirated.(e). Flame gases also produce distinct absorption and emission bands which can cause interference's and background noise.
49

Advantages of Furnace Atomisation.(a). Sensitivity is better. Graphite furnace atomiser methods are typically 100 times more sensitive than flame methods for most elements in a wide range o f samples.(b). Less sample is needed. Determinations typically can be carried out with only
5(j,L of sample; up to IOOjiL may be accepted. Flame methods normally require about 5 cm3.(c). Sample preparation can be simplified. Many samples such as concentrated acids, viscous liquids, organic solvents and liquids with high dissolved solids can be analysed directly on the graphite furnace atomiser. The higher sensitivity o f the method means that solvent extraction or preconcentration procedures may be avoided; sample preparation and handling may be minimised.However the graphite furnace atomiser is not recommended if;(a). The sample is already in a liquid form and the concentration of the analyte permits a simple analysis by flame A.A.(b). Certain refractory elements such as tungsten, tantalum or zirconium are to be determined. Some elements can not be easily atomised by graphite furnace and flame A.A. remains the best technique.Furnace atomisation is a single measurement analytical technique, i.e. a fixed volume of sample is analysed at one time, in contrast to flame atomisation where the sample is continuously aspirated and many measurements can be taken during the aspiration period.The function o f the graphite furnace is to generate a population o f free atoms so that atomic absorption can be measured. This is generally achieved in 3 stages.
50

1. The Desolvation (Drying) Stage.This part of the programme plays an important role in the determination o f the precision of analysis. The temperature and the time are chosen to give complete desolvation of the sample before the ash stage is reached. Generally, the temperature is set just below the boiling point of the solvent to ensure a sufficiently high rate of vapourisation of the solvent. If the temperature is too high the sample may splatter, resulting in loss of sample to the extremities of the furnace tube or onto the window of the atomiser.The temperature programme for desolvation of samples containing 2 or more solvents, such as strong aqueous acid solutions or mixed organic solvents, may be adjusted to take account of the different boiling points of the solvents. The first temperature o f the desolvation stage is programmed in relation to the lowest boiling constituent of the solvent. As the most volatile solvent is removed, the temperature may be increased to effect vapourisation o f the less volatile solvent. The total dry time will usually be between 1 and 3 seconds.
2. The Ash Stage.An ash or char stage may be necessary to further remove sample matrix components prior to the atomisation stage. Matrix components may vapourise or decompose on heating to give background absorption resulting from absorption by molecular species or light scattering from particulate matter. The time parameters in this stage are optimised for maximum removal o f the sample matrix consistent with no loss o f the analyte element. The ash temperature for organic matrices usually lies in the range 400-800°C and the time is often comparable to the desolvation time.
51

It may not be possible to remove matrix components completely without also causing loss of analyte. In such cases, the background adsorption may overlap the atomic peak and simultaneous background correction is necessary.The temperature-time parameters for this stage may be optimised using measurements of the absorption signal during the atomisation stage. The maximum temperature for ashing may be determined by increasing the ash temperature and measuring the background correction absorbance for the analyte. When loss o f the analyte occurs during the ash stage observable reduction of the absorbance will occur. In some cases the analyte and background peaks can be separated more effectively by matrix modification.
3. The Atomisation Stage.The atomisation temperature and the rate of heating of the atomiser from ash to atomise temperature (the ramp rate) affect the sensitivity of the analysis. Atomisation temperatures vary from element to element and the optimum atomisation temperature may be determined by increasing the programme temperature and measuring the peak atomic absorption. Generally the optimum temperature will be the lowest temperature giving the maximum absorption, since the lifetime of the graphite tube is prolonged at lower temperatures. The peak absorption does not show a continuous increase with atomisation temperature because the rate of loss of atomic vapour from the atomiser also increases with temperature. Loss of atomic vapour occurs by diffusion, convection and expansion o f the gas in the atomiser.The atomisation time is usually set as the minimum time required for complete vapourisation and removal o f the analyte from the atomiser. This is the time required for the atomic absorption signal to return to the baseline.
52

The interference effects may be described as either physical or chemical in the mechanism by which they are produced.Physical effects of viscosity and surface tension are less than for flame A.A., but nevertheless they can affect the reproducibility of sample dispensing. The main effect is in the degree to which the sample spreads inside the graphite tube. Another physical effect is that of the background which can normally be corrected for with the use of a suitably designed background corrector. For practical analysis, it is essential to use a background corrector for graphite furnace work. Chemical interference effects normally demand much more consideration in order to ensure that an accurate answer is obtained from an analysis. These interference's can be categorised as;(a). Volatile component formation, where the analyte element is lost at a relatively low temperature, perhaps during a dry or ashing stage, without undergoing atomisation.(b). Stable compound formation in which one or more relatively stable compounds of the analyte element are formed. More than 1 absorption peak could result because the appearance temperature will depend on the nature of the intermediate chemical form of the element.Controlled chemical interference's effects can be used successfully in changing the appearance temperature and improving the sensitivity of the analyte, or changing the appearance temperature and magnitude of non-atomic absorption due to the matrix.
Development of Varian's Graphite Furnace Atomiser.The first carbon rod atomiser to be produced commercially was developed and marketed by Varian in 1970. This device was largely patterned after the device
Interferences.
53
described by West and William's in 1969. The work head consisted of 2 water cooled terminal blocks which supported a single electrode. The original filament, often referred to as the "west" rod, contained a small indent in the centre of the rod where the samples were evaporated, ashed and atomised. Because the atoms were observed in an open region above the hot graphite this gave rise to several chemical interference's. At about the time that Varian's carbon rod atomiser made its first appearance, commercial graphite furnace atomisers were being developed in Europe and America. The most interesting of these was the heated graphite atomiser based on Massmann's work with the graphite tube. The heated tube concept employed in Massmann's design confined the atoms, and so increased their residence time in the optical path and decreased chemical interference problems. Next a miniature furnace approach was developed by changing the electrode design. This new design was called the "Mini-Massmann" rod. It consisted o f a graphite rod 5mm in diameter with a transverse hole o f 1.5mm diameter. But this design produced a furnace which could
only accommodate volume of a maximum 2\iL.With the introduction o f the Model 63 carbon rod atomiser in 1972, many of these problems which limited the use of "flameless" atomisers were eliminated. The next development in furnace atomisation, the CRA-90 carbon rod atomiser maintained the elegance and simplicity of the Model 63, but offered better power control, increased cooling capability to speed analyses, and temperature readout capability for operator convenience. Two types of furnace atomisers were then available - the tube and the cup. The tube furnace was generally more sensitive; the cup furnace allows the use of powdered or solid samples. To protect the incandescent graphite from excessive corrosion, there is an upward flow of inert gas which surrounds the heated graphite.
54

The next Varian development was the GTA-95, pyrolytic coated graphite atomiser, which offered many advantages over the CRA-90 which include;(a). Analytical sensitivity.(b). High sample volume capacity for improved detection limits and ease o f sample introduction.(c). Multi-step temperature programme to provide exact drying, ashing and atomisation temperatures.(d). Ability to produce a second atomisation during one analysis in order to reduce memory or remove residual contaminants.(e). Inert gas flow can be set at any time during the analytical programming to permit ashing or to enhance the atomisation signal.(f). Simple routine preparation of standard additions and addition of chemical modifiers when coupled to the auto-sampler.
Pyrolytic Graphite Coatings.The pyrolytic graphite coating on the graphite tube is a vital component o f a successful analysis. The thickness of the coat is about 30pm. In the manufacturing process pyrolytic graphite is deposited on the substrate graphite from the vapour phase after thermal decompositon of a simple hydrocarbon such as methane under low pressure. As this deposition proceeds, a dense, dark layer o f graphite carbon is built up over the substrate graphite. The crystals o f the pyrolytic graphite lie virtually parallel to the surface and it is highly anisotropic, both electrically and thermally.
Advantages o f a pyrolytic graphite coating would include;(a). The coating is relatively impermeable to hot gases.
55

(b). It is more resistant to oxidation than normal graphite.(c). It is unreactive chemically, and the tendency for some refractory elements to from carbides is significantly reduced. (Analytical methods for Graphite tube Atomisers (1982)).
Phifer (1995) used graphite furnace atomic absorption spectroscopy (G.F.A.A.S.) for the determination of chromium in medical foods. A fixed atomisation temperature of 2500°C for 5 seconds was selected. The preheating temperature was set at 1600°C for 3 seconds. Using these parameters a linear calibration curve was obtained from 5 to 25 ppb chromium and a detection limit of 0.24 ppb Cr(VI) was established.
Li and Shi (1997) also used G.F.A.A.S. for the analysis of trace Cr(VI) in water after preconccntration on a soluble membrane filter. This method was based on the formation of a chromium (Vl)-salicylflurone (SAF)-tetra-decylpyridinium (TDP) ternary complex, which was then collected on a nitro-cellulose membrane filter. The complex and the membrane filter were then dissolved in concentrated H2SO4. Then using the following conditions the Cr(VI) concentration was determined using G.F.A.A.S.; inject volume of sample 20pL; measuring wavelength 359.3nm; slit 1.3nm; lamp current 7.5mA; drying temperature and time 60-100°C and 40s; ashing temperature and time 2700°C and 8 s. The nitro-cellulose membrane filter was chosen because of its solubility in solvents such as concentrated H2SO4. H2SC>4 was used because it was found that 0 .2 cm3 was sufficient to dissolve the nitro-cellulose membrane and the ternary complex in only half a minute. Using this method the
determination of Cr(VI) less than 0.1 )Ltg dm' was possible.
56

1.9.(c). U.V. Spectroscopy.
Principle.The electronic spectra of molecules are found in the wavelength range 1000-8000A0 of the electromagnetic spectrum. The visible region to which the human eye is sensitive, corresponds to the range of wavelengths between 4000-8000A°. The U.V. region is subdivided into 2 spectral regions. The range between 2000A° and 4000A° is referred to as the near U.V. region. The unit of wavelength commonly used in visible or U.V. spectroscopy is the angstrom unit, A0, or the millimicron, mu, equal to
10 A0. Sometimes the wavelength number, v=l/A,, is also used. The unit of wavenumber is the reciprocal centimetre, cm '1.
Elementary Theory.There are two classes of spectra, mainly emission and absorption spectra. An emission spectrum is obtained by analysing light emitted by a luminous source. An absorption spectrum is obtained by the spectroscopic analysis of the light transmitted by an absorbing medium, which is placed between the light source and the spectroscope. When a molecule absorbs radiation, its energy increases. This increase is equal to the energy o f the photon as expressed by the relation
E = hv = he / A,
where h is Planks constant, v and X are the frequency and the wavelength respectively and c is the velocity of light. The change in energy may be in the electronic, vibrational or rotational energy of the molecule. Changes in electronic energy may involve relatively large quanta. Changes in vibrational energy involve smaller quantities of energy and changes in rotational energy involve quanta even smaller than those involved in vibrational energy. The electronic energy level o f the molecule
57

under normal conditions is called its ground state and the higher energy levels represent the 1st and 2nd excited states respectively. For each electronic level there are the ground state and several possible excited vibrational states and similarly, for every vibrational level there are the ground and excited rotational levels (figure 1.9). The energies associated with electronic transitions are very large. 2 0 0 0 0 cm ' 1 is approximately 56K cal mol' 1 and this energy is sufficient for the dissociation of many molecules. Since electronic transitions occur at even higher frequencies it becomes obvious that these transitions are accompanied by changes in the electronic distribution of molecules. If a molecule absorbs a small amount of energy from a source of radiation in the far infra-red region or the microwave region, only its rotational energy will change, no matter which vibrational or electronic state it is in. If the radiation source is o f greater energy, say in the near infra-red region, then both the vibrational and rotation energies of the molecule will change. If the energy from the radiation is much greater, as in the case o f U.V. light, changes in the electronic, vibrational and rotational energies will take place. Consequently, the U.V. spectrum of a molecule will be more complicated than its rotational or rotational-vibrational spectrum. There will be such a large number o f closely spaced sub-levels as to make the UV spectra of polyatomic molecules, even in the gaseous state, appear only as broad adsorption band or band envelopes.
58

Figure 1.9. Energy levels fo r a polyatom ic molecule and the origin o f absorption
electronic states; E, excited energy state; Vj, V2, J73, different vibrational states. The
closely packed lines represent rotational levels.
In an electronic transition, the excited molecule may rotate to the ground state giving up its excess energy as heat or as fluorescent radiation o f longer wavelength. Another possibility is for the excited molecule to undergo homolytic dissociation or ionisation. While the former process can take place by absorption or radiation in the 2000- 8000A° range, the latter process usually takes place by absorption in the vacuum U.V.-region. Beyond the ionisation potential, there will be a region of continuous absorption.
59

Before the development of adequate theory, Beer and Lambert had proposed laws o f light absorption. These laws are well known in the combined form as the Beer- Lambert law o f light absorption, which states that the fraction o f the incident light absorbs in proportion to the number of molecules in the path. This law is expressed as Absorption or Extinction or Optical Density = logio Io / 1 = Eel. where E is the absorption coefficient, c is the concentration and I is the path length. If c is expressed in mole per litre and I in cm, then the absorption coefficient becomes a molar extinction coefficient. The absorption intensity is usually expressed in terms of E and the majority of the applications in spectroscopy are based on the above mentioned equation.According to the Beer-Lambert law, the absorbance of a solution should remain constant as long as the product o f the concentration and the path length is constant. But this is not always true. Quite often the molar extinction coefficient varies appreciably with the concentration of the solute. These deviations may be due to one of many possible causes; molecular association of the solute at higher concentration; ionisation of the solute in the case of acids, bases and salts; fluorescence of the solute etc.. It is now an accepted rule in spectroscopy that one should not assume the Beer- Lambert law to hold good for any substance without confirming it first. The absorption intensity of an electronic transition at any wavelength is governed by the probability of the transition and the size of the absorbing molecule. The absorption maximum of the band therefore corresponds to the most probable transition in that region of absorption. The extinction coefficient may be expressed as E = kPa where k is a constant of the order IO20, P is the probability and a is the area of cross-section of the molecule.
Absorption Intensity.
60
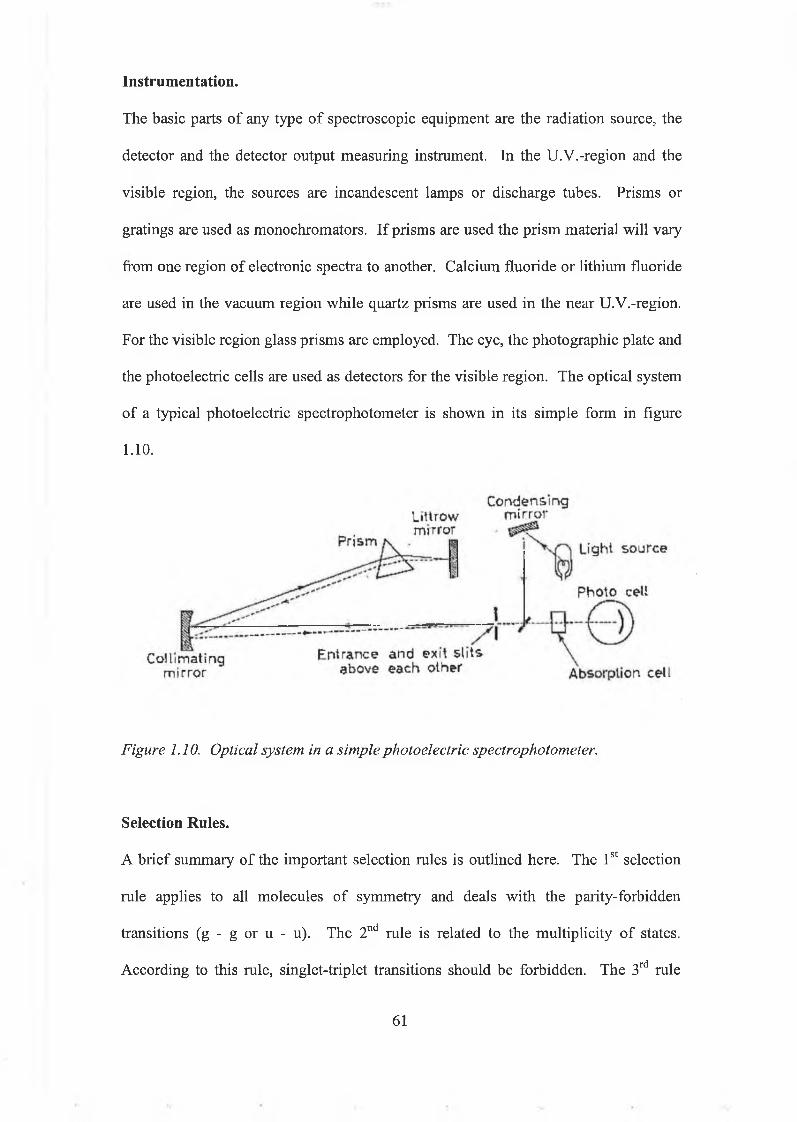
The basic parts of any type o f spectroscopic equipment are the radiation source, the detector and the detector output measuring instrument. In the U.V.-region and the visible region, the sources are incandescent lamps or discharge tubes. Prisms or gratings are used as monochromators. If prisms are used the prism material will vary from one region of electronic spectra to another. Calcium fluoride or lithium fluoride are used in the vacuum region while quartz prisms are used in the near U.V.-region. For the visible region glass prisms are employed. The eye, the photographic plate and the photoelectric cells are used as detectors for the visible region. The optical system of a typical photoelectric spectrophotometer is shown in its simple form in figure 1. 10.
Instrumentation.
Figure 1.10. Optical system in a simple photoelectric spectrophotometer.
Selection Rules.A brief summary of the important selection rules is outlined here. The 1st selection rule applies to all molecules of symmetry and deals with the parity-forbidden transitions (g - g or u - u). The 2nd rule is related to the multiplicity of states. According to this rule, singlet-triplet transitions should be forbidden. The 3rd rule
61

pretains to forbidden transitions arising from the symmetry o f states ( e.g. 260m(.i
band of benzene or the long wavelength bands of C=0, C=S and other chromophores). In addition to these three types of forbidden transitions, there are also other weak transitions which have low intensities.Many forbidden transitions are observed with finite intensity in many molecules due to some intramolecular or intermolecular perturbations. Thus, singlet-triplet transitions occur with increased intensities in the presence o f paramagnetic substances (NO or O2) or in solvents which contain heavy atoms such as ethyl iodine. Vibrational interactions induce allowed character to forbidden transitions in some molecules. For example the forbidden band of benzene at 260m|_i becomes weakly allowed due to the distortion of the D6h symmetry of benzene by bending vibrations.In the case of allowed bands, the symmetric vibrations of the molecules give rise to progressions in the excited state frequency starting from the zeroth vibrational level of the electronic ground state and the relative intensities give a measure of the change in molecular size and shape on excitation. In forbidden transitions which become allowed by a bending or some other vibration, the band origin is not found.Franck and Condon have proposed an important rule for understanding the nature of electronic transitions. According to the Franck-Condon principle, transitions from the vibrational level of one electronic state to the vibrational level o f another occur so rapidly that the position and velocities o f the nuclei have no time to change, i.e., the nuclei remain fixed in position for the duration o f the electronic rearrangement. The potential function of a vibrational mode of a molecule will depend on the electronic state of a molecule and the intemuclear distance in the electronic state will therefore differ from the ground state value. In figure 1.11 the potential energy curves for upper and lower electronic states are shown for cases where the difference in two
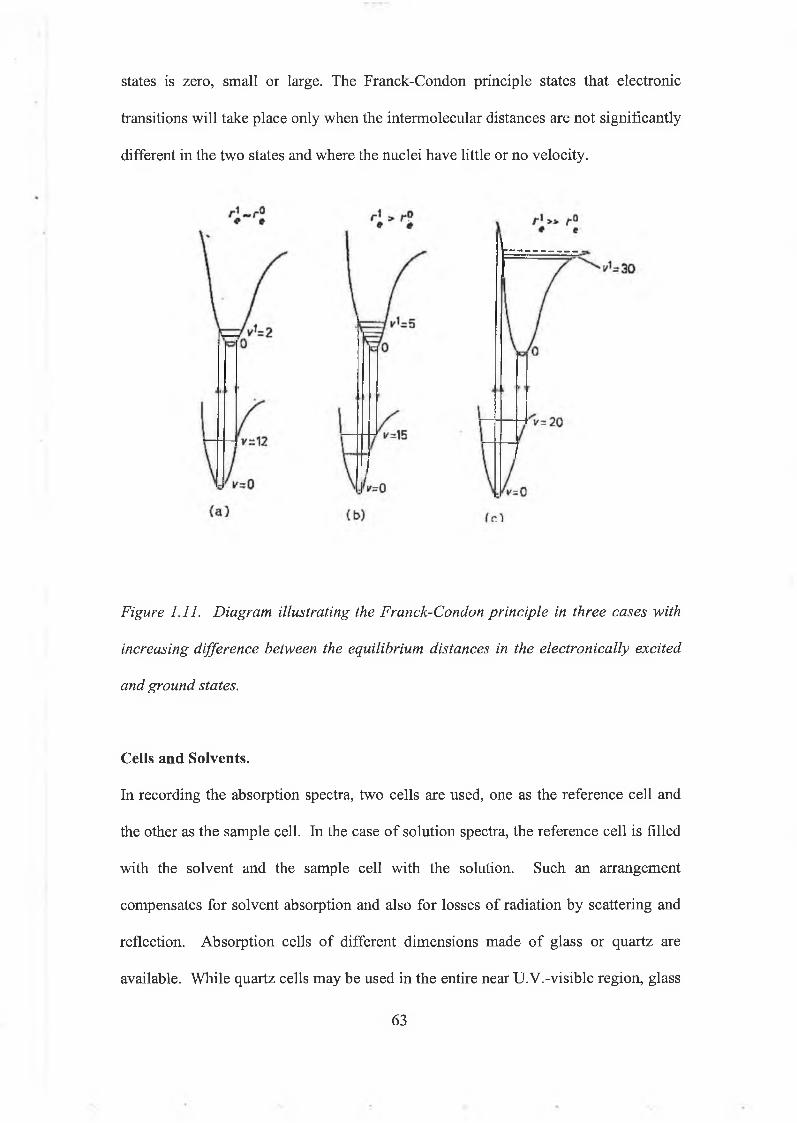
states is zero, small or large. The Franck-Condon principle states that electronic transitions will take place only when the intermolecular distances are not significantly different in the two states and where the nuclei have little or no velocity.
Figure 1.11. Diagram illustrating the Franck-Condon principle in three cases with
increasing difference between the equilibrium distances in the electronically excited
and ground states.
Cells and Solvents.In recording the absorption spectra, two cells are used, one as the reference cell and the other as the sample cell. In the case o f solution spectra, the reference cell is filled with the solvent and the sample cell with the solution. Such an arrangement compensates for solvent absorption and also for losses of radiation by scattering and reflection. Absorption cells of different dimensions made of glass or quartz are available. While quartz cells may be used in the entire near U.V.-visible region, glass
63

cells can be used only for the visible region. Cells of thickness anywhere from 0.1cm to 1 0 cm are available, although 1cm cells are most generally used for everyday work. Spectra o f gases are taken using enclosed cells, with an evacuated cell as a reference. Spectra of solids may be taken in the form of pellets. Pellet holders for the measurement of solids are commercially available. Most o f the spectrophotometric studies are made in solution and the important factor in deciding the choice of solvent is that the solvent should not absorb in the same region as the solute. The solvents one can use for the near U.V.-and visible region are; water, alcohol, acetonitrile, chloroform, dioxane, hexane, iso-octane and cyclohexane. Purified hexane and heptane may be used in the vacuum UV region. (Ultra-Violet and Visible Spectroscopy (1967)).
Reaction of Chromate and Diphenylcarbazide.The reaction between chromate with 1,5-diphenylcarbazide (DPC) has been widely used for the spectrophotometric determination o f chromium since 1900. A very striking feature of this reaction is that the chromium must be present in its hexavalent state and the reaction medium should be sufficiently acidic. When the solution is alkaline, diphenylcarbazide does not react with chromate. This indicates that the reaction is primarily a redox one. However, since other oxidizing agents like nitrate, permanganate, eerie salts, iodine etc. fail to produce the characteristic violet colour with carbazide, it appears probable that the colour produced with chromate is due to some secondary complex formation. Oxidation plays a primary role in the complete process leading to colour formation.Diphenylcarbazide when oxidized with chromate may give rise to carbazone or to its still higher oxidation product carbadiazone or the carbazide molecule itself may be
64

completely ruptured at the C=0 linkage. The chromate molecule will be simultaneously reduced during the oxidation process and chromium in a lower state of valence is expected, which may act as a cation in further complex formation. This is an important factor since both carbazide and carbazone (but not carbadiazone) are known to be typical agents, which can combine with a large number o f metal ions to produce intensely coloured inner complex salts. Reduction o f chromate (Cr6+) in acid medium leads generally to the trivalent (Cr3+) state. But chromic acid is known to be non-reactive towards either carbazide or carbazone. The conclusion drawn from this is that chromium in the bivalent state (Cr2+) is the ion responsible for the colour reaction. (Bose (1954).
Presence of a Single Coloured Complex.In the case o f a mixture o f several coloured complexes, the absorption spectra of solutions containing the reactants in different molar proportions in which they are expected to react would not show a constant wavelength of maximum adsorption. Therefore, mixtures o f chromate-carbazide solutions were prepared in the molar ratios of 1:1, 1:2 and 1:3 keeping the chromium concentration constant and the spectral curves were obtained. In all cases, the wavelength o f maximum absorption remained unchanged, excluding the possibility of formation of several complexes. (Bose
n = n c 6h 5
Cr(II) + CO <=> [Cr(II) carbazone complex] + 2H+
NH-NHC6H5
Diphenylcarbazone
(1954)).
65

Nature of the Complex Formed.The coloured Cr2+ complex may either be a monovalent cation or an inner complex salt. To establish the nature of the complex, whether electrolytic or not, migration studies as well as solubility determinations in non-polar solvents were carried out.
Transport Experiments.Almost saturated solutions of carbazide in alcohol were mixed with aqueous acidified chromate and this mixture was subjected to migration study. Even after 4 hours of electric current, the red colour failed to move within the limbs of the apparatus showing that the compound in non-electrolytic in nature.
Solubility Studies.The solubility of a compound in various non-polar solvents usually indicates its inner complex nature. The reagent carbazide dissolved in non-polar solvents was added to an acidified non-polar solution and the mixture was shaken in a stoppered test tube and allowed to settle. It was found that the nature o f the acid used to acidify the reaction mixture had a profound effect on the partition o f the coloured product between the 2 phases. In organic acid (AcOH) medium and with solvents CeHs and C H C I 3 the coloured product was found to distribute itself between the 2 phases, the distribution being greatly in favour o f the organic solvent, and with cyclohexanol, the aqueous layer was completely colourless. However, when mineral acids such as sulphuric acid ( H 2 S O 4 ) were used the organic layer was almost colourless except in the case o f cyclohexanol. Even then, the colour in the cyclohexanol layer is much less in contrast to that produced in organic acid medium. Thus, the reaction of carbazide
66

or carbazone may be considered to be in conformity with their well-known property of forming inner-complex salts with other bivalent metals. (Bose (1954)).
Stoichiometry of the Reaction.Bose (1954) investigated the stoichiometry o f the reaction of chromate and carbazide and also that o f the reaction of chromate and carbazone and chromous and carbazone.
Chromate-Carbazide system.The reagent carbazide is colourless and though K2& O 4 solutions are slightly coloured, at the dilutions Bose employed, they were for all practical purposes colourless. To determine the maximum composition of carbazide the observed absorbances (A) were directly plotted against composition for equimolecular
chromate-carbazide mixtures at 550m(j. of concentration (i) 4.10 x 10'5M, (ii) 3.10 x 10'5M and (iii) 2.10 x 10'5M. From these curves it was concluded that the maximum composition corresponds to a chromate: carbazide ratio equal to 2:3. The maximum composition proved to be the same for different initial concentrations o f the equimolecular mixtures. The maximum composition was found to be independent of the wavelength of light, which again confirms the existence o f a single complex in the system.Equation (1).
NHNHC,H, N = N C 6H,x 0 5 O /
2Cr(VI) + 3 C O v. ^ 2 [Cr(II) carbazone complex'2] + ÇX) + 4H+n h n h c 6h 5 n =n c 6h 5
diphenylcarbazide diphenylcarbadiazone
67

Carbazone is coloured but again at the dilutions employed it’s contribution to the absorbance could be neglected and again absorbance values were directly plotted against composition. From this it was found that the maximum composition of chromate: carbazone ratio equals 1:3 for the different initial concentrations o f the equimolecular mixtures.Equation (2).
/ n =n c 6h 5 / n =n c 6h 5Cr(VI) + 3 C O ^ [Cr(II) carbazone cmplex " ] + 2 C^O + 4H+
n h n h c 6h 5 n =n c 6h 5
diphenylcarbazide diphenylcarbadiazone
Chromous-Carbazone System.Here the absorbance of a blank acidified carbazone-water mixture was first determined and these values were subtracted from the absorbance values o f the mixture. The corrected absorbance values were then plotted against the composition of the mixture. The maximum composition in this case was then found to correspond to the chromous-carbazone ratio equal to 1 :1 and again it is independent o f the concentration.Equation 3.
N=NC,H,/Cr(II) + C O ^ [Cr(II) carbazone complex ~ \ + 2H+
n h n h c 6h 5
Chromate-Carbazone System.
/ N =N C 6H 5 where carbazone " = C O "

From the above-proposed mechanisms it can be seen that the same coloured complex is produced in all 3 reactions, and that there is a greater sensitivity of diphenylcarbazide as compared to carbazone for hexavalent chromium. The determination of the maximum composition revealed that for the same concentration of chromate, the amount of carbazone required is double that o f carbazide required and hence the superiority o f the carbazide reagent.The primary function of chromate as an oxidizing agent in equation (1) and (2) is stepwise, first from carbazide to carbazone and then from carbazone to carbadiazone which is one of the products of equation (1) and (2). From the composition- absorbance curves for equation (1) and (2 ) it appears that after the maximum composition, any excess of chromate will oxidize Cr+2 to Cr+3 and the carbazone to carbadiazone or its higher oxidation product. But for equation (3) the excess Cr+2 will simply reduce the carbazone to carbazide, which is non-reactive towards bivalent chromium. (Bose(1954)).
Heringer Donmez and Kellenberger (1989) used two variations of DPC analysis for the determination of hexavalent chromium. The first method required the acidification of the sample prior to the introduction of the DPC, while the second method called for the addition of the DPC prior to sample acidification. The second method proved to be the superior in this work because knowing that acid conditions enhance the reaction of Cr(VI) with organic and other reductants, it is suspected that some Cr(VI) might be lost in certain samples. Therefore, by adding the DPC prior to acidification at least the Cr(VI) has a chance of reacting with the indicator (DPC) which will be present with other potential reductants. Indicator colour intensity was measured at 540nm wavelength on a U.V.-visible spectrophotometer. Before any
69

samples were actually analysed, a potential source of error was noted in the preparation o f standards, blanks and controls for the DPC colourimetric measurements. Even though none of the blanks were coloured in the range typical of the indicator several did have a slight yellow or brown tint. When compared to distilled water, these yellowish tinted solutions gave small positive absorbances, and the amount of absorbance was not necessarily proportional to the intensity o f the yellow or brown colour. Therefore without a more appropriate blank (i.e. samples without indicator added) the background error produced a coloured or turbid sample solution which would automatically be calculated as hexavalent chromium. It was also found that iron salts and humic acids produced slightly coloured solutions which absorbed slightly in the DPC measurement range. But these interferences were easily corrected by proper use o f blank and sample controls, which allowed the sample solution to be calibrated as zero absorbance when measured without indicator additions. They also used chromium soil leaching to determine the chromium content of samples with atomic absorption and the second DPC method from above. Since the atomic absorption determination represents total chromium in the leachate, not just hexavalent chromium which was represented by the DPC results a clear contradiction in atomic absorption and the DPC results was observed. Theoretically, the DPC results should never exceed the atomic absorption results for the same samples. But in this case it was found that the DPC results greatly exceeded the atomic absorption results. The conclusion drawn form these results was that although DPC works well in many relatively clean solutions, a complex matrix such as soil leachate poses additional problems. Simple correction commonly used in spectrophotometric analysis are not sufficient to compensate for the highly variable and intense interferences possible in such a matrix.
70

Hoshi and Konuma (1998) preconcentrated the Cr(VI) -DPC complex on a column of chitin in the presence of dodecyl sulphate as counter-ion. They then eluted the Cr(VI)-DPC complex from the column using 1cm3 of 7:3 v/v methanol-lM acetic acid mixture as eluent. The mixture of methanol with 1M acetic acid was selected as eluent because it gave the best reproducibility compared with those o f acetone or N,N-dimethylformamide (DMF) from previous works, and 7:3 v/v methanol-lM acetic acid because the absorbance of the eluent was not reproducible with over 90% of methanol concentration in the eluent. It was also found that the chromium complex collected on the chitin was readily eluted with 1 cm3 of the eluent within 1 minute and that the absorbance of the eluent obtained was constant for at least 60 minutes. The
acalibration curve obtained was linear over the range 0.05-0.6fig of Cr(VI) in 1cm of eluent. The reducing agents, some metal ions in the presence of EDTA and oxoanions did not interfere in concentrations up to 100-1000 times that o f Cr(VI). The common anions and EDTA did not interfere in concentrations up to 5000-10000 times that of Cr(VI). Here the reagent blank was considered as negligible and all measurements were made against distilled water at 540nm.
Allen (1958) also used 1,5-DPC in conjunction with atomic absorption spectrophotometry for the micro determination of chromium. Most investigators of this reaction found that the maximum absorbance occurred at 540mjj,. However,
Allen found a slightly higher value of 546m|^ for his work. The absorbance was 1%
higher at 546mfi than at 540m|J,. He also found that the molar absorbancy index was independent of pH in the range 1.02 to 2.43. However, a significantly lower value was found at pH 0.54, and at pH 3.28 the formation of the coloured reaction product is slow. (At higher pH the reaction is still slower). The reaction in ordinary distilled

water showed no significant difference from those in which triple-distilled water was used. The age o f the 1,5-DPC solution was found to effect the absorbance. The originally colourless 1,5-DPC solution also required an amber colour on standing. Urone (1950) found that the loss o f sensitivity is proportional to the amount of discolouration. The colour of the stock solution therefore provides a convenient criterion for its reliability. As long as the stock solution remains colourless it may be used, but it should be discarded when appreciable colour develops. The concentration o f the DPC and the order of mixing of the reagents was also investigated by Allen. A concentration of 0.5 x 10’3M and 1.0 x 10‘3M gave almost identical results. At a much lower concentration o f 0.1xl0'3M the molar absorbance index was substancially lower. The 6 possible orders of addition of 1,5-DPC solution, sulphuric acid solution and potassium hydrogen chromate solution were tested. From the results obtained Allen concluded that the Cr(VI) and 1,5-DPC should not come into contact before acidification, but otherwise the order of mixing made practically no difference. This result, however, did not agree with that of Heringer Donmez and Kallenberger, Bose or Babko and Palii.
Bartlett and James (1979) used the DPC-chromate reaction for the analysis of chromium in soils. They found that of the 150 fresh field soils checked all but 15 produced positive Cr(VI) tests. Of these 15 negative ones, all but 2 had pH’s less than 6 . These 2 had near neutral pH’s and were found to be highly reduced. Overall the soils were found to oxidise an average of 0.2jimol Cr / g of soil. It was found that the amount of chromium oxidised increased rapidly during the first 24 hour period and then decreased slowly, and that considerably more chromium was formed in moist samples than in dried and rewet samples. Therefore this study showed that a large

proportion of the Cr(VI) may be reduced by the soil if it was not leached out within a few weeks after formation. But these results also indicate that significant amounts of the chromium oxidized by the soil may remain there for a rather long period under favourable conditions, certainly long enough for leaching to occur.
Rubel and Terytze (1999) also used the DPC-chromate reaction for the analysis of chromium in soils. Measurements were obtained at 550nm against a reference cell filled with distilled water. But to account for coloured soil solutions they treated another 10cm3 of the same soil filtrate in the same manner, except this time no DPC was added, only acetone. The absorbance value obtained here was subsequently substracted from that obtained for the same soil filtrate with DPC. For analysis, soils of different types and with different geogenic and anthropogenic chromium concentrations were used. The highest extractable Cr(VI) load was found in the anthropogenic contaminated soils from a former electroplating company site, where 18% of the total chromium extracted was found to be Cr(VI). The method used here was found to be most suitable for a concentration range of approximately 0.2-25 mg/kg soluble Cr(VI) in soils.
73

1.9.(d). High Performance Liquid Chromatography.
Principle.High performance liquid chromatography (H.P.L.C.) is a technique that has arisen from the application to liquid chromatography (L.C.) of theories and instrumentation that were originally developed for gas chromatography (G.C.). In analytical H.P.L.C. the mobile phase is normally pumped through the column at a rate o f l-5cm 3 min"1. If the composition o f the mobile phase is constant, the method is called ‘isocratic’ elution. Alternatively the composition of the mobile phase can be made to change in a predetermined way during the separation, which is a technique called ‘gradient’ elution. Gradient elution is used in situations similar to those used for temperature programming in G.C., and is necessary when the range of retention times of solutes on the column is so large that they can not be eluted in a reasonable time using a single or solvent mixture. In absorption chromatography, for instance, non-polar solvents are absorbed relatively weakly and should be eluted with a non-polar solvent, whereas polar solvents are absorbed more strongly and require a more polar solvent. If the sample contains a wide range o f polarities, the separation could be done by changing the polarity o f the solvent mixture during the separation. In other cases it may be necessary to use gradient elution where other properties of the solvent (e.g. pH or ionic strength) are changed.As in other forms of chromatography, the time taken for the solute to pass through the chromatographic system (the retention time) is a characteristic of the solute for a particular set o f conditions. However, to use retention data on their own for the identification of unknown solutes would be rather like trying to identify an unknown organic compound by simply measuring its melting point or boiling point. Many different solutes will have the same retention times for a particular set o f conditions.
74

Chromatography is an excellent method for the separation o f mixtures but it does not provide the detail necessary for the clear identification of the separated compounds. Such detail is provided by spectrometric techniques. Some detectors can record and store the U.V. spectra of solutions as they emerge from the column. The only restriction on H.P.L.C. for analysis is that the sample must dissolve in a solvent. Thus, H.P.L.C. is suitable for macromolecules, inorganic or other ionic species, labile natural products, pharmaceutical compounds and biochemicals.
An H.P.L.C. requires a high pressure pump and a supply o f mobile phase, a column containing a high efficiency stationary phase, an injection unit for introducing samples onto the column, an on line detector and some method o f displaying the detector signal (figure 1.12). The simplest reservoir is a 1dm glass bottle with a cap drilled to take a 1/8 inch diameter PTFE tube to carry the mobile phase from the reservoir to the pump. The liquid entering the pump should not contain any dust or other particulate matter, as this can interfere with the pumping action and can cause damage if it gets into the seals o f valves. Such material can also collect on top of the column, causing irregular behaviour or maybe even blockages. The mobile phase is, therefore filtered before it enters the pump. This can be done using a stainless steel filter element that is a push fit onto the end of the PTFE tube in the reservoir, or alternatively an in-line filter can be used. The pore size is normally 2 pm.
75
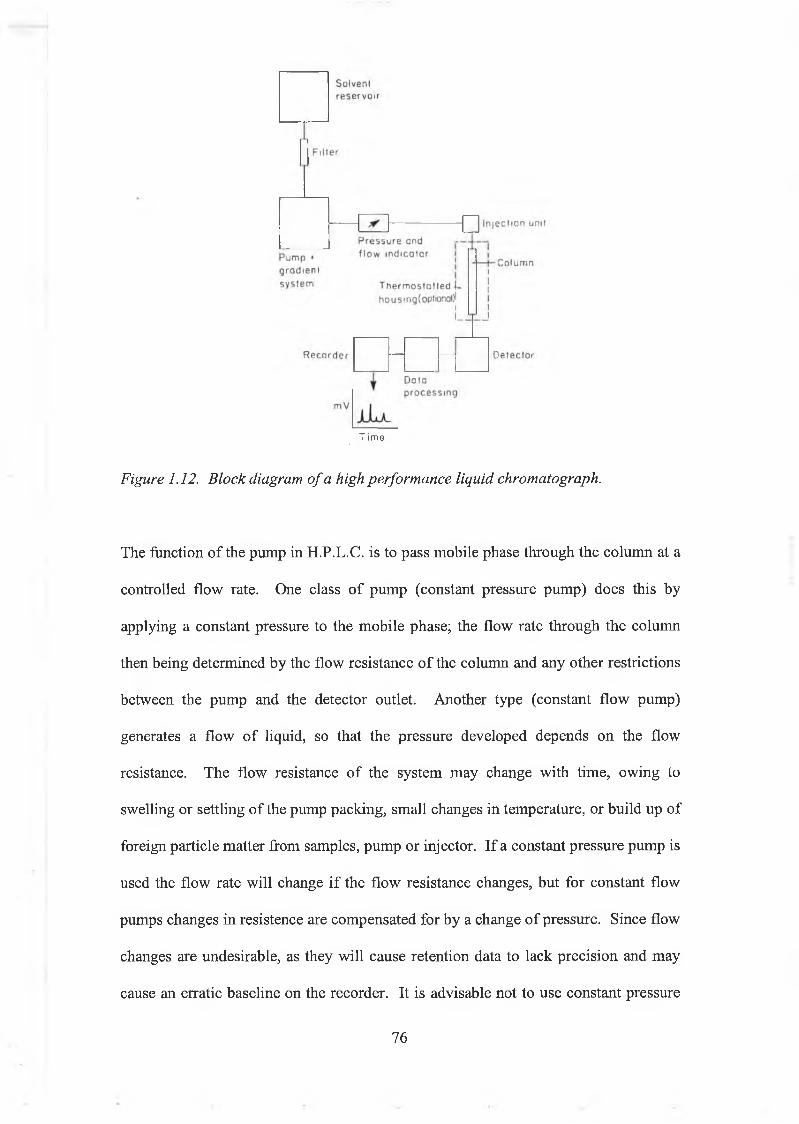
T ¡me
Figure 1.12. Block diagram o f a high performance liquid chromatograph.
The function o f the pump in H.P.L.C. is to pass mobile phase through the column at a controlled flow rate. One class o f pump (constant pressure pump) does this by applying a constant pressure to the mobile phase; the flow rate through the column then being determined by the flow resistance o f the column and any other restrictions between the pump and the detector outlet. Another type (constant flow pump) generates a flow of liquid, so that the pressure developed depends on the flow resistance. The flow resistance of the system may change with time, owing to swelling or settling of the pump packing, small changes in temperature, or build up of foreign particle matter from samples, pump or injector. If a constant pressure pump is used the flow rate will change if the flow resistance changes, but for constant flow pumps changes in resistence are compensated for by a change o f pressure. Since flow changes are undesirable, as they will cause retention data to lack precision and may cause an erratic baseline on the recorder. It is advisable not to use constant pressure
76

pumps in H.P.L.C. instruments. However, they are suitable for packing columns where small changes in flow do not matter.Column inlet pressures in H.P.L.C. can be as much as 200 times atmospheric pressure, but most of the work in analytical H.P.L.C. is done using pressure between about 25 and 100 bar. The pressure developed will depend on the length o f the column, the particle size of the stationary phase, and the velocity and flow rate o f the mobile phase. Because liquids are not very compressible there is not much energy stored in them at high pressure, and the pressures used in H.P.L.C. do not represent a hazard. Many commercial H.P.L.C. instruments provide a forced air oven, which will control temperature with a stability of typically 0.1°C from ambient temperature to 100°C. Because o f the use of flammable solvents, safety considerations are important, so the ovens are usually provided with a facility for nitrogen purging, and are designed to prevent a build up of solvent vapour in the event o f a leak. If temperature control is used, it is important that the sample and the mobile phase are at the right temperature before being introduced to the column, so the mobile phase is normally passed through a preheating coil housed in the oven before it reaches the injection point.Commercial chromatographs use values for sample injection. Although they are expensive, they are easy to use, give good precisions, and are easily adapted for automatic injection. With these devices, the sample is first transferred at atmospheric pressure from a syringe into a sample loop. Turning the valve from load to inject position connects the sample loop into the high pressure mobile phase stream, whereby the contents o f the sample loop are transferred onto the column. A variety of loop volumes are available, commercially 10-50|iL. For smaller volumes than this, the loop is an engraved slot in the body of the valve.
77

The columns most commonly used at the moment are made with 316 grade stainless steel. Other materials used for columns include glass, glass lined steel tube and polyethene or other inert plastics. The inside o f the stainless steel tube should be as smooth as possible, so the tubes are precision drilled or electropolished after manufacture. At the top of the column, there is a distributor for directing the injected sample to the centre of the column and then a stainless steel gauze or frit on top o f the packing. At the lower end there is another frit, and the end o f the packing, and then, for 4.6mm type, a reducing union and a short length of 0.25mm internal diameter tubing to connect the column to the detector.The function o f the detector in H.P.L.C. is to monitor the mobile phase coming from the column. The output of the detector is an electrical signal that is proportional to some property o f the mobile phase and/or the solutes. If this property is possessed essentially by the solute, such as absorption of U.V./visible radiation or electrochemical activity, the detector is called a property detector. The characteristics that are required for an ideal detector are sensitivity, linearity, universal or selective response, predictable response, unaffected by change in conditions, low dead volume, non-destructive and cheap, reliable and easy to use. Sensitivity is the ratio o f output to input, so that a large detector signal for a small amount o f solute is produced. A linear detector will have a response that is directly proportional to the amount or concentration of solute. A universal detector will detect anything in the sample, whereas a selective detector will detect only certain components. Dead volume in a detector will add to the extra-column dispersions, so it must be kept to a minimum. This includes the cell volume of the detector and for spectrometric detectors a reduction in the cell volume is likely to lead to a loss of sensitivity. UV absorbance detectors are by far the most popular detectors in H.P.L.C.. The principle is that the
78

mobile phase from the column is passed through a small flow cell held in the radiation beam of a U.V./visible photometric or spectrophotometric detectors. These detectors are selective in that they will detect only absorbed UV (or visible) radiation. The mobile phase that is used should absorb little or no radiation. Absorbance o f radiation by solutes as a function of concentration is described by the Beer-Lambert Law as A = Eel (section 1.9.(c)., p 60). Strictly this law applies only to monochromatic radiation. However, the detector system does not provide truly monochromatic radiation but rather a narrow band of wavelengths centred around the selected wavelength. Both fixed and variable wavelength U.V. visible detectors are available. The variable types use a deuterium lamp and/or tungsten filament lamp as the radiation source, and can operate from 254nm to 280nm, but other wavelengths are possible. Other less common detectors are;(a). The Photodiode Array Detectors (PDA), where polychromatic radiation is passed through the sample and then is focused onto the entrance slit of a monochromator, which passes a narrow band of wavelengths to the detector.(b). Fluorescence Detectors, where many compounds are capable o f absorbing U.V. radiation and subsequently emitting radiation of a longer wavelength, either instantly (fluorescence) or after a time delay (phosphorescence). Usually, the fraction o f the absorbed energy that is re-emitted is quite low, but for a few compounds values of 0 .1- 1 .0 are obtained, and such compounds are suitable for fluorescence detection.(c). Electrochemical Detectors, which measure either the conductance of the eluent or the current associated with the oxidation or reduction of solutes. To be capable of detection using the first method the solute must be ionic, and using the second method the solute must be relatively easy to oxidise or reduce.
79

(d). Amperometric Detectors, which oxidise or reduce only a small quantity o f the solute (less than 1%), so the currents observed are very low (nanoamps). Such currents are not difficult to use using modem amplifiers and the detector has a high sensitivity.(e). Coulometric Detectors, are small multielectrode devices that can use up to 4 porous graphite working electrodes. The column eluent flows through these electrodes rather then over them and with proper choice of potential the detector reacts with all o f the electroactive solute passing through it.(f). Refractive Index Detectors, sense the difference in refractive index between the column eluent and the reference stream of pure mobile phase. Any solvent can be detected as long as there is a difference in refractive index between the solute and the mobile phase.
The relative distribution of a solute between two phases is determined by the interactions of a solute species with each phase. The relative strengths of these interactions are determined by the variety and the strengths of the intermolecular forces that are present, or, in more general terms, by the polarity o f the sample and that of the stationary phase. Intermolecular forces may be caused by a solute molecule having a dipole moment, whereby it can interact selectively with other dipoles, or if a molecule is a good proton donor or acceptor it can interact with other such molecules by hydrogen bonding. Molecules can also interact via much weaker dispersion forces, which rely on a given molecule being polarised by another molecule.Polarity is a term that is used in chromatography as an index o f the ability of compounds to interact with one another in these various ways. It is applied very
80

freely to solutes, stationary phase and mobile phase. The more polar a molecule, the more strongly it can interact with other molecules through the mechanisms above. If the polarity o f stationary and mobile phase are similar then it is likely that the interaction of solutes with each phase may also be similar, leading to poor separation. Thus, for hydrocarbon-type (non-polar) stationary phase we need a more polar mobile phase, whereas unmodified silica, which is highly polar needs a mobile phase with relatively low polarity. If the separation of solutes that are chemically very similar is required, then stationary phases that are chemically very similar to the solutes should be chosen. The retention of solutes is usually altered by changing mobile phase polarity. (Lindsay (1992)).
Padarauskas and Judzentiene (1998) determined the amount o f chromate in a sample by precolumn complexation with 1,5-diphenylcarbazide. The diphenylcarbazide- chromate complex was then preconcentrated onto a Cis column. Preliminary investigations showed that an optical separation resulted from tests made with mobile phase containing 20% acetonitrile and 6 x 10'3 mol I' 1 H2SO4 . Under these conditions they found that 6 minutes was sufficient for the elution o f the analyte. Minimum detectable concentrations using direct injection of lOOfil and photometric detection at 546nm is approximately 6 ng ml' 1 Cr(VI). On optimizing the preconcentration
o 1procedure it was found that a flow rate of 5 cm min' was considered optimal, that the• * 3critical volume for the concentrator column was approximately 1 0 0 cm and also that 2
x 10‘4 mol I'1 diphenylcarbazide concentration was sufficient. It was also found that most common cations and anions did not interfere with the Cr(VI) enrichment. A linear relationship between peak area and concentration was obtained in the 0.05-2.5 ng cm'3.
81

Pobozy and Wojasinska (1996) determined the amount of chromate in a sample by post column complexation with 1,5-diphenylcarbazide, without retention o f Cr(III) on the H.P.L.C. column. Here an optimum mobile phase was found to be a 4mM phthalate solution of pH 3.5. The obtained peak shape was also found to be affected by the pH of the injected sample solution and a pH of 3.0 was found to be the most favourable. Under these conditions a linear relationship between peak height and concentration in injected samples were obtained up to 2 mg dm '3 for Cr(VI) and up to 5 mg dm" for Cr(III). They also determined the amount of Cr(III) in a sample by post column complexation with DCTA (disodium salt of 1,2-diaminecyclohexane- N,N,N’,N’-tetraacetic acid). Here an optimum mobile phase o f 2mM phthalate pH 3.5 was obtained. The calibration plots which ranged from 10 to 100 ng cm'3 for Cr(III) and from 5 to 50 ng cm '3 for Cr(VI) were both linear.Comparison o f the detection limits o f post column complexation and precolumn complexation with 1,5-diphenylcarbazide shows that the detection limits reported for the post column complexation are greater than those of the precolumn complexation. Thus, the precolumn complexation o f chromate with 1,5-diphenylcarbazide is more sensitive than the post column complexation.
Saverwyns and Van Hecke (1999) investigated the efficiency of a commercially available microbore anion exchange column for chromium spéciation with detection by ICP-MS and hyphenation with micro concentric nebulization. They found that 60mM nitric acid at a flow rate of 80|j,l min '1 was optimum for the mobile phase. At higher concentrations o f mobile phase or at higher flow rate, no baseline separation was obtained. At lower flow rate, Cr(VI) eluted later, leading to a broader peak, and hence to a decrease o f the sensitivity for this compound. Independent investigations
82

concerning the effect of the pH of the mobile phase showed that the pH had no significant influence on the separation, but must be kept between 1 and 7. At a pH less than 1, the CrCU2' appears as H2CrC>4, eluting together with Cr(IIl) in the void
volume. At a pH higher than 7, Cr(lII) will precipitate. A loop size o f 20|j,l was chosen as a compromise between a good sensitivity and baseline separation. The most predominant spectral interferences were expected for real samples containing chloride and/or carbonate ions. It was found that carbon did interfere with Cr(VI) determination, where 12C concentration (m/z = 52) as low as 10 mg dm'3 caused interferences due to co-elution of HCO3' with Cr(VI), and 13C concentrations (at m/z = 53) as low as 250 mg dm'3 caused interferences. At m/z = 53 the determination of Cr(III) was also found to be hampered by 37C1 occurring from a concentration o f 10 mg l '1. At m/z = 53 however no Cl-based spectral interferences could be detected.
Powell and Boomer (1995) used high pressure liquid chromatography (H.P.L.C.) combined with direct injection nebulization (D.I.N.) and inductively coupled plasma mass spectroscopy (I.C.P.-M.S.) to determine the chromium speciation in samples. They found that the eluent flow rate through the column was a major factor affecting analyte separation, retention time, and signal strength. The lower the flow rate, the broader the peak widths, and hence, greater separation. As well, peak height decreases at a lower flow rate. This seemed to indicate a limitation on sensitivity by improving separation. However, using peak area measurements compensated for loss in peak height, and for the most part, detection limits were retained. Eluent strength was another leading factor, which was found to contribute to the overall performance of the chromatographic system. The acid strength was used to determine how long the analyte was retained since trivalent chromium is cationic under acidic conditions.
83

This was found to affect retention time and peak separation o f the resulting chromatogram, which showed differences as very narrow peak widths for the highest acid concentration to extremely broad peak widths for the lowest acid concentration. From these results, the eluent strength chosen as optimum was 0.25% H N O 3 .
Experiments in previous works showed that an increase in sensitivity may be gained by using a larger sample loop. The smaller loop sizes showed good separation, but poor signal. The larger loop sizes showed narrowed peak widths with a distorted signal, which was caused by analyte overloading o f the column. From these results, the optimum sample loop size chosen was IOjj.1. The detection limits obtained here for Cr52 and Cr53 for Cr(III) were 180 and 60 ng dm'3 respectively. Using Cr53, the Cr(VI) detection limit was 180 ng dm'3, and total chromium detection limit was determined to be 30ng dm'3.
84

1.10. Reaction o f Chromate by Ascorbic Acid.
L-ascorbic acid (Vitamin C), found naturally in plants and animals, in not biologically synthesised by humans. The carcinogenicity of chromium (VI) is thought to be related to the oxidation of various cellular constituents. Ascorbic acid, being a constituent of the cell and a good reductant, may therefore function as an antichrome agent in vivo against chromate poisoning.L-ascorbic acid (H2A) is very widely known and used for its reducing properties. Among the many reactions studied are those involving its efficient reduction of many transition-metal ions and complexes by outer- and inner-sphere mechanisms. It has also been shown that L-ascorbic acid is oxidised by the potentially carcinogenic chromium (VI) ion at the body’s physiological pH of 7.40, as well as at lower pH. At physiological conditions most Cr(VI) exists as tetrahedral, CrO^", and pseudo- tetrahedral, HCrCV ions. These ions can easily transverse the cell membrane via preexisting anions, eg. the sulphate transport system.Many small molecules found within the cell are redox active and should be able to reduce chromium (VI) based on their redox potentials. These compounds may be important to the cellular metabolism of chromium (VI). Extrapolation to pH 7.40 using the Nemest equation gives a redox potential o f +0.52V for the chromium (VI) - chromium (III) half-reaction.
C r042' + 4H20 + 3e‘ -> Cr(OH)3 + 5 OH' (1)However, most studies of chromium (VI) oxidations o f small molecules have been carried out under acidic conditions, but some have been carried out under conditions of physiological pH. These studies showed that the chromate reduction by small molecules is kinetically controlled, rather than thermodynamically controlled, and that ascorbic acid reacts at a significant rate at pH 7.40.
85
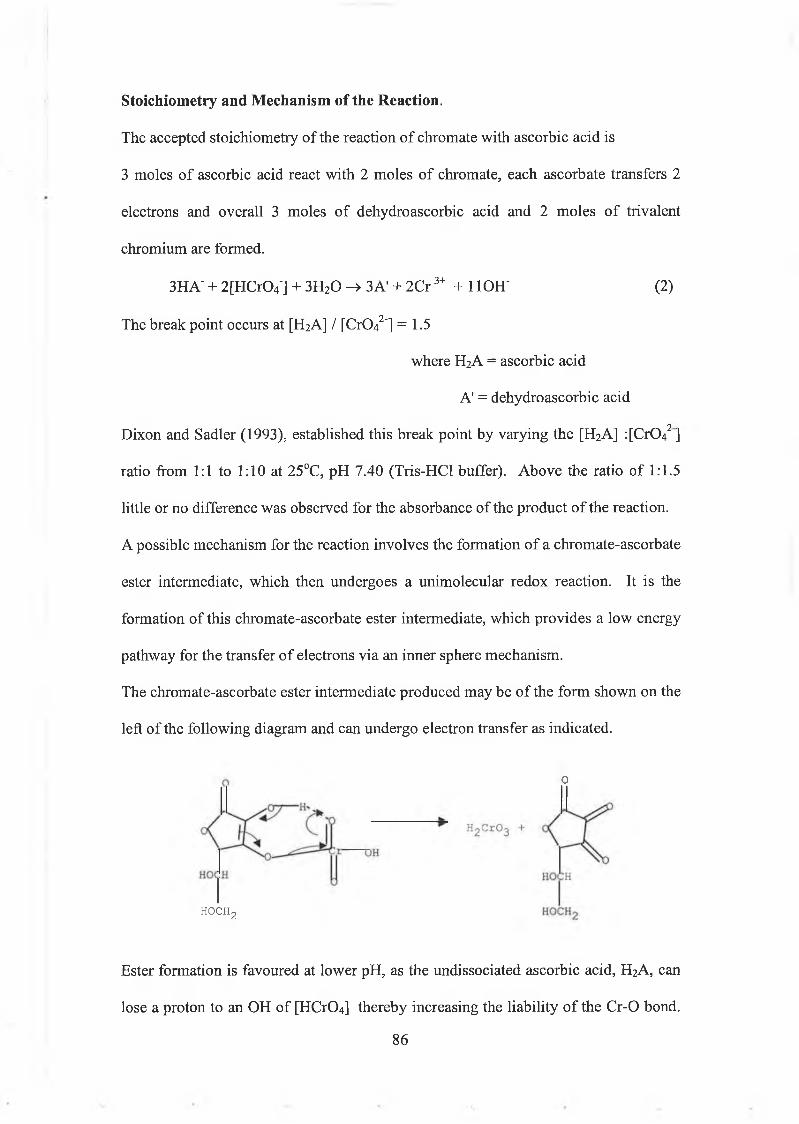
The accepted stoichiometry of the reaction of chromate with ascorbic acid is 3 moles o f ascorbic acid react with 2 moles of chromate, each ascorbate transfers 2 electrons and overall 3 moles o f dehydroascorbic acid and 2 moles o f trivalent chromium are formed.
3HA" + 2[HCrCV] + 3H20 -» 3A' + 2 C r3+ + 11 OH' (2)The break point occurs at [H2A] / [C rO /’] = 1.5
where H2A = ascorbic acidA' = dehydroascorbic acid
Dixon and Sadler (1993), established this break point by varying the [H2A] :[Cr042] ratio from 1:1 to 1:10 at 25°C, pH 7.40 (Tris-HCl buffer). Above the ratio of 1:1.5 little or no difference was observed for the absorbance of the product o f the reaction.A possible mechanism for the reaction involves the formation o f a chromate-ascorbate ester intermediate, which then undergoes a unimolecular redox reaction. It is the formation of this chromate-ascorbate ester intermediate, which provides a low energy pathway for the transfer of electrons via an inner sphere mechanism.The chromate-ascorbate ester intermediate produced may be o f the form shown on the left of the following diagram and can undergo electron transfer as indicated.
Stoichiometry and Mechanism of the Reaction.
o
Ester formation is favoured at lower pH, as the undissociated ascorbic acid, H2A, canlose a proton to an OH of [HCrO^- thereby increasing the liability o f the Cr-0 bond.
86
h o c h 2

This ensures the easy loss o f a molecule o f water. This proposed intermediate could decompose via a second route without the transfer o f electrons. It may revert to the original reactants, and it is this pathway which is described by K r in equation (4).
H2A + [HCrC>4]' < kf > products (4)Kr
It is the formation of this chromate-ascorbate ester intermediate that is thought to be the rate determining step of the reaction. The product o f this reaction is the chromate- ascorbate ester intermediate and the resulting rate expression is
k0bs = k f [ascorbic acid]t + kr (5)where kr and k f are the slope and the intercept respectively from the graph o f k0bs
verses [ascorbic acid]. Since the forward reaction, (kf), gives much larger values than the reverse reaction, (kr), it can be assumed that the reverse reaction is insignificant as a reaction pathway. The equilibrium constant, (K e), can be estimated from k f and kr
for the reaction sinceke = k f! kr (6)
Ascorbic Acid and pH Dependence of the Reaction.Kinetic runs were carried out at 25°C with the ascorbic acid concentration ranging from 0.002 to 0.040 mol dm'3 over the pH range 4.60 to 7.40. The psuedo-first-order rate constants increased with increasing ascorbic acid concentration and decreased as the pH increased at a fixed ascorbic acid concentration. Plots of k0bS v ’s [ascorbic acid] were linear with small intercepts, which decreased with increasing pH. These results indicated that the reaction is first order with respect to the ascorbic acid concentration and also that there is a second step independent o f ascorbic acid concentration making some minor contribution, especially at lower pH. (Dixon and Sadler (1993)).
87

O ’Brien and Woodbridge (1997), also found that the pseudo-first-order rate constants were directly proportional to the concentration of ascorbic acid and that the rate increased with ascorbic acid concentration. A plot of k0t,s v ’s ascorbic acid concentration proved to be linear with slope close to unity, again confirming the reaction as first order with respect to ascorbic acid concentration.According to Dixon and Sadler (1993), the pH dependence of the rate constants suggests that [HCr04]', H2A and HA' are the reactive species in the rate-determining step producing the chromate-ascorbate ester intermediate. The very small concentration of dichromate was such that the amount o f the dimeric product, [Cr2 0 7 ]2', was negligible at all pH values. Below pH 5, H2A is the dominant form of the ascorbic acid whereas above this pH the monoanionic form is predominant. Equation (4) can therefore be represented more completely in terms o f these reactive species, as shown in the following series of equations;
H2A < k°l > HA' + H+ (V)HA' <- h i -> A2' + H+ (8)[HCr04]' <-**-> [Cr04]2' + H+ (9)
HA' + [HCr04]' — -—> Products (10)
HA' + [Cr04]2" — » Products (11)H2A + [HCr04]' Products (12)
H2A + [Cr04] 2" ———» Products (13)The overall rate law consistent with this is represented byRate=(^[H Cr04'] + ¿2[Cr042']) [HA ] + (fo[HCr04'] + ^ [C r0 42']) [H2A] (14)After making the relevant substitutions for concentration of each species the following equation is obtained
88

(15)
Comparing equation (5) and (15) kf is given byf {k]kni[ ir ] + k zknlKc +k3[H+]2)k f— ---------------------------------------- (16)
(ka{+ [ H * W c + [ H +])
Since kr is a minor reaction it can be excluded from further analysis. It was found that the best fits for the rate constants were obtained by considering the ki and k3 pathways to be most significant below pH 5.0 and ki andk2 to be most significant above pH 5.0. According to Connett and Wetterhahn (1985), the pH dependence could be explained if the formation of the chromate-ascorbate ester intermediate is promoted by the presence of extra protons. The slower reactions at higher pH values could be due to OH- becoming the leaving group instead of water. But according to O’Brien and Woodbridge (1997), the small deviation from linearity of the plot of k ^ v’s [H+] and the relatively large percentage error in ki and k2 may suggest that the roll of [H+] is more complex than this.
Effect of Anaerobic Conditions.Dixon and Sadler (1993), reported that under anaerobic conditions L-ascorbic acidrapidly reduced chromium (VI) at a rate which is about 10 times faster than the ratesof reaction carried out in oxygen, and that the rate constants increased as oxygenconcentration decreased. O’Brien and Woodbridge (1997), reported that the reactionshowed no oxygen-dependence in demetallated HEPES or phosphate buffers at anypH (6.80-7.15). However, in Tris-HCl buffer the first-order-rate constants increasedin a non linear fashion as oxygen concentration decreased and suggest that theseresults could be due to a buffer / trace metal ion effect rather than oxygen dependence.
89

This result shows that the reported oxygen-dependence of the chromate-ascorbic acid reaction by Dixon and Sadler (1993), was caused by the use of non-demetallated Tris- HC1 buffer and was not an intrinsic feature of the redox reaction between chromium (VI) and ascorbic acid.
Formation of Cr (V) Intermediates.Goodgame and Joy (1987), added milk to potassium dichromate (K^C^O?) and using EPR spectroscopy observed the formation of Cr (V). The interaction of milk at room temperature gave, within a few minutes, a small, sharp, EPR band at g = 1.980, characteristic of Cr (V). The peak grew over a period of several hours and reached its maximum at approximately 1 day. The main g = 1.980 band was a multiplet, comprising four principle components with approximately 0.9 gauss spacing. It's set of four 53Cr hyperfine bands were also observed and these had 17.9 gauss spacing, a value very similar to those observed for Cr(V) in oxygen donor atom environments. Vitamin C, ascorbic acid, which also reduces Cr(VI) to Cr (III) via Cr(V) species, is also present, but in much lower concentrations. Although the Cr(V) EPR band generated by ascorbic acid occurs at g = 1.979 it does not possess the multiplet structure observed for the Cr(V) complex in milk.
90

2.0. Experimental Procedures and Results.2.1. Voltammetry.2.1.1.(a). Introduction.In this section the method of Wang (1997) for the determination of chromium(VI) using adsorptive catalytic stripping voltammetry has been modified and applied to the determination of chromium(VI) in a chromium enriched yeast extract. The supporting electrolyte used was a phosphate buffer at pH 6.0 containing cupferron. At an initial potential of-lOOmV (v Ag/AgCl) chromium(VI) is adsorbed on to the surface of a static mercury drop electrode as the chromium(III)-cupferron complex. On scanning in a negative direction a chromium reduction peak is observed at —1.0 V due to reduction of the metal centre in the complex..The following experiments were carried out.
1. Polarogram of the Extracting Buffer.2. Attempted Removal of the Peak from the Supporting Electrolyte by
Solvent Extraction.3. Attempted Removal of the Peak from the Supporting Electrolyte by
Varying the Initial Potential.4. Attempted Removal of the Peak from the Supporting Electrolyte by
Varying Drop Growth Time.5. Removal of Peak by EDTA.6. The Effect of the Presence of Lead on the Supporting Electrolyte.7. The Effect of Multiple Scanning on the Cr(VI) Peak Height.8. The Effect of the Presence of Cr(IIl) on the Cr(VI) Peak.9. The Effect of Passing Cr(III) Through an Anion Exchange Column.10. The Effect of Electrolysis Time on Cr(VI) Peak Height.
91

11. Preparation of a Calibration Curve.12. Application of Polarography to the Chromium Enriched Yeast Extract.13. The Effect of the Extracting Buffer on the Supporting Electrolyte.
2.1.1.(b). Reagents and Solutions.Reagents.1. Sodium Dihydrogen Phosphate, NaH2P04-2H20 , F.W.=156.01 g mol'1, May and
Baker Ltd., #48933.2. Cupferron, (N-nitroso-N-phenylhydroxylamine ammonium salt), C6H5N(NO)ONH4
F.W.=155.16 g mol'1, Aldrich Chemical Company Inc., #20688-1.3. EDTA, Ethylenediamine Tetra-Acetic Acid, Disodium salt, F.W.=372.24 g mol'1,
BDH Chemicals Ltd., #28025.4. Potassium Dichromate, K^Q^Ov, F.W.=294.18 g mol'1, Wardle Chemical Company
Ltd., #P04868.5. Chromium (III) Nitrate-9-Hydrate, Cr(N03)3.9H20 , F.W.=400.15 g mol'1, Riedel-
de Haen, #7097A.6. Sodium Hydroxide, NaOH, F.W.=40.0 g mol'1, Wardle Chemical Ltd., #S05652.7. Zinc Sulphate, ZnS04 .7H20 , F.W.=287.54 g m ol1, Wardle Chemical Ltd.,
#216718.8. Amberlite IRA-410, Ionic Form Chloride, Strongly Basic Anion Exchanger,
Sigma Chemical Company, Lot No. 87H0670.9. Chromium Enriched Yeast, Alltech Ireland, Dunboyne, Co. Meath.10. Hydrochloric Acid, HC1, F.W.=36.45g mol’1, S.G.=1.18, BDH Laboratory
Supplies.
92

11. Tris(hydroxymethyl)aminomethane, C4H10NO3, F.W. = 121.14g mol"1, Riedel-de- Haen, #33742.
12. Lead Nitrate, Pb(NÜ3)2, F.W.=331.21g mol"1, Riedel-de-Haen, #71040.
Preparation of Solutions.1. Supporting Electrolyte - 2mM Phosphate, 1 x 10 4 M Cupferron.
2mM Sodium Dihydrogen Phosphate.* ■ 3A 0.0312g sample of sodium dihydrogen phosphate was dissolved in 100cm
of doubly distilled water.0.1 mol dm'3 Cupferron.
A 0.3879g sample of cupferron was dissovled in 25cm of doubly distilled water.A 100|jL aliquot of this was added to 100cm3 of the 2mM sodium dihydrogen phosphate. The pH of this solution was then adjusted to 6 using 0.1M NaOH.
2. O.IMNaOH.A 0.4001g sample of sodium hydroxide was dissolved in 100cm3 of distilled water.
3. 0.01 MEDIA.A 0.3720g sample of ethylenediaminetetra-acetic acid, disodium salt, was dissolved in 100cm3 of distilled water.
4. Cr(VI) Standards.(a). lOOOppm Cr(VI) in doubly distilled water.
• ■ 1 A 0.2829g sample of potassium dichromate was dissolved in 100cm ofdoubly distilled water.
93

(b). 0.1 ppm Cr(VI).A 10cm3 aliquot of lOOOppm Cr(VI) in doubly distilled water was diluted to 100cm3 again with doubly distilled water.
5. Cr(III) Standards.(a). lOOOppm Cr(IIl).
A 0.7696g sample of chromium (III) nitrate-9-hydrate was dissovled in 100cm3 of doubly distilled water.
(b). lOppm Cr(ni).A 1cm3 aliquot of lOOOppm Cr(III) was diluted to 100cm3 with doubly distilled water.
(c). 1 .Oppm Cr(IIl).A 10cm3 aliquot of lOppm Cr(III) was diluted to 100cm3 with doubly distilled water.
(d). 0.1 ppm Cr(III).A 1cm3 aliquot of lOppm Cr(III) was diluted to 100cm3 again with doubly distilled water.
6 . lOppm Zinc.(a). lOOOppm Zinc.
A 0.4398g sample of zinc sulphate was dissolved in 100cm3 of doubly distilled water. A 1cm aliquot of this was diluted to 100cm with doubly distilled water.
7. Anion Exchange Column.A 15g sample of amberlite IRA-410 was weighed and excess doubly distilled water was added. A well stirred slurry of the resin was then transferred into an exchange column insuring that no air bubbles were present.
94

8 . 0. IM Hydrochloric Acid.An 850|xL aliquot of concentrated HC1 was diluted to 100cm3 with doubly distilled water.
9. 0.2M Tris NaOHpH 13.A 12.1152g sample of tris(hydroxymethyl)aminomethane was dissolved in 500cm3 of distilled water. The pH of this solution was adjusted to 13 using 5M NaOH.
10. lOOppmPb.(a). lOOOppmPb.
A 0.1600g sample of lead nitrate were dissolved in 100cm3 of doubly distilled water.
(b). lOOppmPb.A 10cm3 aliquot of lOOOppm Pb was diluted to 100cm3 with doubly distilled water.
2.1.1.(c). Instrumentation.Radiometer Pol 150 Polarographie Analyzer.Radiometer MDE 150 Polarographie Analyzer.Deskjet 520 Hewlett Packard.Nitrogen Cylinder BOC Ltd..Fume Hood, Chemical Systems Control Ltd., Ashbourne, Co. Meath.Dell Optiplex 466/Le.Micropette, Eppendorf, 10|xL.Software, Trace Master 5 Window’s 95.
95

Glassware.All glassware was washed with 0.5% ultra pure nitric acid and rinsed with doubly distilled water prior to use. The polarographic cell was also rinsed with doubly distilled water prior to use and stored in KC1 solution when not in use, as were the electrodes.
96

The general procedure carried out in order to obtain a polarogram was as follows. 10cm3 of supporting electrolyte solution were transferred by pipette into a clean dry polarographic cell and purged for 4 minutes with nitrogen. The preconcentration potential (-100mV) was applied to a fresh mercury drop while the solution was stirred. Following the preconcentration period, the stirring was stopped and after 15 seconds potential was scanned in a negative direction using differential pulse polarography (scan rate of 20mV s’1 and pulse amplitude of 50mV). The scan was terminated at -1500mV. (Wang (1997)). Figure 2.1 represents a typical polarogram obtained for a 2 ppb solution of Cr(VI) during this work using the above procedure. The Cr(VI) peak was observed at approximately -1 ,0V.
2.1.1.(d). Methods and Experiments.
Potential (v Ag/AgCI) /V
Figure 2.1. Typical polarogram obtained for Cr(VI) using the above procedure.
97
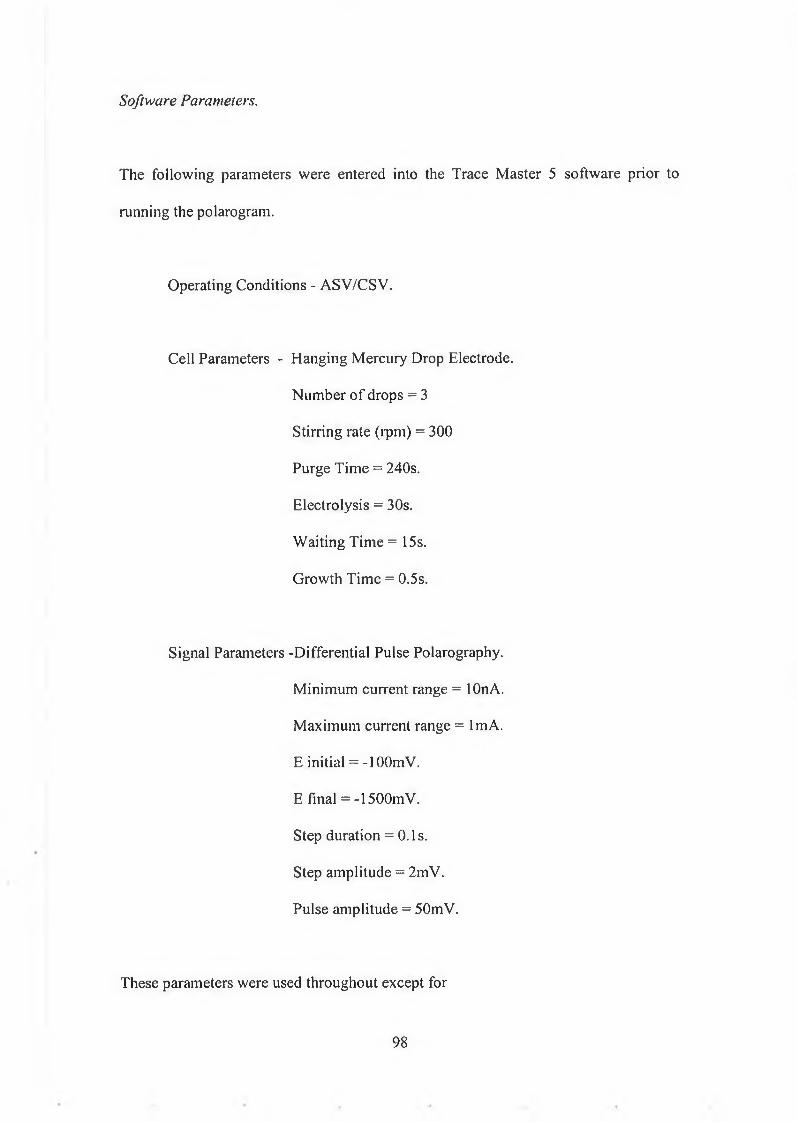
Software Parameters.
The following parameters were entered into the Trace Master 5 software prior to running the polarogram.
Operating Conditions - ASV/CSV.
Cell Parameters - Hanging Mercury Drop Electrode.Number of drops = 3 Stirring rate (rpm) = 300 Purge Time = 240s.Electrolysis = 30s.Waiting Time = 15s.Growth Time = 0.5s.
Signal Parameters -Differential Pulse Polarography.Minimum current range = lOnA.Maximum current range = 1mA.E initial = -lOOmV.E final = -1500mV.Step duration = 0.1 s.Step amplitude = 2mV.Pulse amplitude = 50mV.
These parameters were used throughout except for
98

(a). Effect of electrolysis time, when the electrolysis time was varied from Os to 60s,(b). Effect of E-initial, when E-initial was varied from -650mV to -950mV.(c). Effect of Growth Time, when the growth time was varied from 0.1s to 2.5s.
1. Polar ogram o f the Supporting Electrolyte.Figure 2.2 shows the polarogram obtained for the supporting electrolyte using the parameters set out above. Fig 2.2(a) shows the supporting electrolyte containing 2mM phosphate plus cupferron while Fig 2.2(b) shows the supporting electrolyte containing 2mM phosphate only. The peak at -1.0V in 2.2(b) is the expected location of the chromium peak since cupferron complexes with chromium to produce the chromium peak at approximately this potential. This peak was not reported in the polarogram of the supporting electrolyte in the original reference (Wang 1997) and so was thought to be due to contamination.
Potential (vAg/AgCI) / V
Figure 2.2. Polarograms o f the supporting electrolyte, (a) 2mM Phosphate plus 1 x 1(F4M cupferron and (b) 2mM Phosphate.
99

2. Attempted Removal o f Peak from Supporting Electrolyte by Solvent Extraction.As it was suspected at this stage that the peak in the supporting electrolyte was due to a Cr(III)-cupferron complex which was likely to be uncharged, it was decided to try to
• 3remove the complex from the cupferron solution by solvent extraction. A 25cm aliquot of 0.1M cupferron was shaken with 25cm3 of chloroform. This solution was then heated on a hot plate until the excess chloroform was boiled off. The remainder of the solution was left to cool. Figure 2.3 shows the polarograms obtained for the supporting electrolyte containing cupferron (a) before solvent extraction and (b) after solvent extraction. From these polarograms it can be seen that the extraction of cupferron with chloroform did reduce the peak in the supporting electrolyte but it did not fully remove it.
Potential (v Ag/AgCI) / V
Figure 2.3. Polarograms o f the Supporting Electrolyte containing Cupferron. (a) before extraction and (b) after extraction.
100

3. Attempted Removal o f Peak from Supporting Electrolyte by Varying the Initial Potential.10cm3 of 2mM phosphate containing 1 x 10~4M cupferron were scanned as above resulting in a peak at -1 .0V. The initial potential (Emit) was then varied from -950mV to -650mV in 50mV increments and a polarogram was obtained after each increment. It was observed that as the initial potential became more negative the peak height decreased but was never removed fully. Data for this experiment is given in appendix
4. Attempted Removal o f Peak from Supporting Electrolyte by Varying Drop Growth Time.10cm3 of supporting electrolyte containing 1 x 10'4M cupferron were scanned as above resulting in a peak appearing at -1 .0V. The growth time was then varied from0.1s to 2.5s and a polarogram was obtained after each variation. It was found that as the growth time increased so to did the peak at -1 .0V in the supporting electrolyte. . Data for this experiment is given in appendix 2.2.
5. Removal o f Peak using EDTA.(a). The Effect o f the Presence o f Zinc on the Supporting Electrolyte.At this stage it was suspected that the peak in the supporting electrolyte may have been due to zinc(II) contamination. 10cm3 of the supporting electrolyte (2mM phosphate, 1 x 10~4M cupferron) were scanned as a blank using the parameters set out above. 100(iL of lOppm zinc were then added to the plarographic cell and scanned to produce a large peak at a potential of-l.OV (this peak would overlap with the Cr(VI)
101

peak). Figure 2.4 (a) shows the polarogram obtained when 100(j.L of lOppm zinc were added to the supporting electrolyte.(b). Addition o f 100/./MEDTA.If the peak in the supporting electrolyte was due to zinc(II) then it should be possible to remove the peak using EDTA which forms a strong complex with zinc(II). 100|_iL of 0.01 M EDTA were then added to the solution containing the added zinc and this solution was rescanned. This resulted in the reduction of the peak produced by the added zinc, indicating that the presence of 100|iM of EDTA will remove zinc that may be present in the supporting electrolyte, and so produces a flat baseline at the potential at which the Cr(VI) peak appears. Figure 2.4 (b) shows the polarogram obtained in the presence of 100(j.M EDTA.
Potential (vAg/AgCI) / V
Figure 2.4. Polarograms o f the Supporting Elecrolyte. (a) after addition o f 100/Æ o f lOppm Zinc and (b) after addition o f 100/uMEDTA.Consequently 2m M phosphate and 1 x 10'4M cupferron containing 1 OOjiM EDTA as supporting electrolyte was used for all further analyses.
102

6 . The Effect o f the Presence o f Lead on the Supporting Electrolyte.10cm3 of the supporting electrolyte containing 100p,M EDTA were scanned as above. 1 OOjaL of lOOppm Pb were then added to the polarographic cell and scanned. No peak was obtained. Another 100|j.L of lOOppm Pb were added and scanned. Again no peak was observed, implying that the presence of lead had no effect on the supporting electrolyte.
7. The Effect o f Multiple Scanning on Peak Height.This experiment was performed to show that the quantity of chromium removed from the solution in the preconcentration step was a negligible fraction of the total chromium content. 10cm3 of the supporting electrolyte containing lOOpM EDTA was scanned as a blank. An aliquot of Cr(VI) standard giving 3ppb Cr(VI) was added resulting in a peak at approximately -0.9mV. Five consecutive scans were then carried out on this solution. The average peak height was 99.4966 +/- 0.8828. This result indicates that Cr(VI) is not lost during multiple sacnning, and that continuous rescanning of a solution does not affect the Cr(VI) peak height. Data for this experiment is given in appendix 2.3.
8 . The Effect o f the Presence o f Cr(III) on the Cr(VI) Peak.It was reported in the original paper (Wang 1997) that Cr(III) may also be determined by this method. However in the procedure being developed here the supporting electrolyte contains 0.1xl0'3M EDTA. This should be capable of complexing the Cr(III) and may prevent Cr(III) from interfering with the determination of Cr(VI). 10cm3 of supporting electrolyte containing lOOpM EDTA was scanned as a blank. 300|xL of O.lppm Cr(III) were then added to the polarographic cell, to produce a 3ppb
103
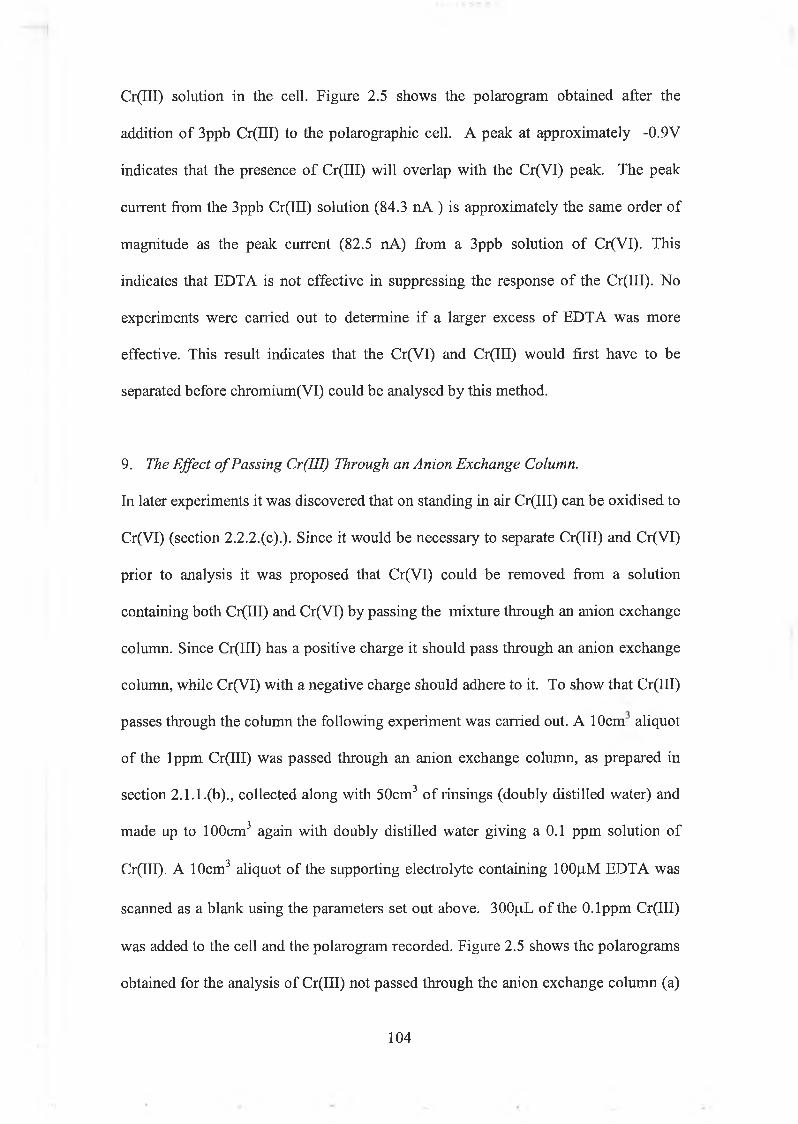
Cr(III) solution in the cell. Figure 2.5 shows the polarogram obtained after the addition of 3ppb Cr(III) to the polarographic cell. A peak at approximately -0.9V indicates that the presence of Cr(III) will overlap with the Cr(VI) peak. The peak current from the 3ppb Cr(III) solution (84.3 nA ) is approximately the same order of magnitude as the peak current (82.5 nA) from a 3ppb solution of Cr(VI). This indicates that EDTA is not effective in suppressing the response of the Cr(III). No experiments were carried out to determine if a larger excess of EDTA was more effective. This result indicates that the Cr(VI) and Cr(III) would first have to be separated before chromium(VI) could be analysed by this method.
9. The Effect o f Passing Cr(III) Through an Anion Exchange Column.In later experiments it was discovered that on standing in air Cr(III) can be oxidised to Cr(VI) (section 2.2.2.(c).). Since it would be necessary to separate Cr(III) and Cr(VI) prior to analysis it was proposed that Cr(VI) could be removed from a solution containing both Cr(III) and Cr(VI) by passing the mixture through an anion exchange column. Since Cr(III) has a positive charge it should pass through an anion exchange column, while Cr(VI) with a negative charge should adhere to it. To show that Cr(III) passes through the column the following experiment was carried out. A 10cm aliquot of the lppm Cr(III) was passed through an anion exchange column, as prepared in section 2.1.1.(b)., collected along with 50cm3 of rinsings (doubly distilled water) and made up to 100cm3 again with doubly distilled water giving a 0.1 ppm solution of Cr(III). A 10cm3 aliquot of the supporting electrolyte containing 100(j,M EDTA was scanned as a blank using the parameters set out above. 300(j.L of the O.lppm Cr(III) was added to the cell and the polarogram recorded. Figure 2.5 shows the polarograms obtained for the analysis of Cr(III) not passed through the anion exchange column (a)
104
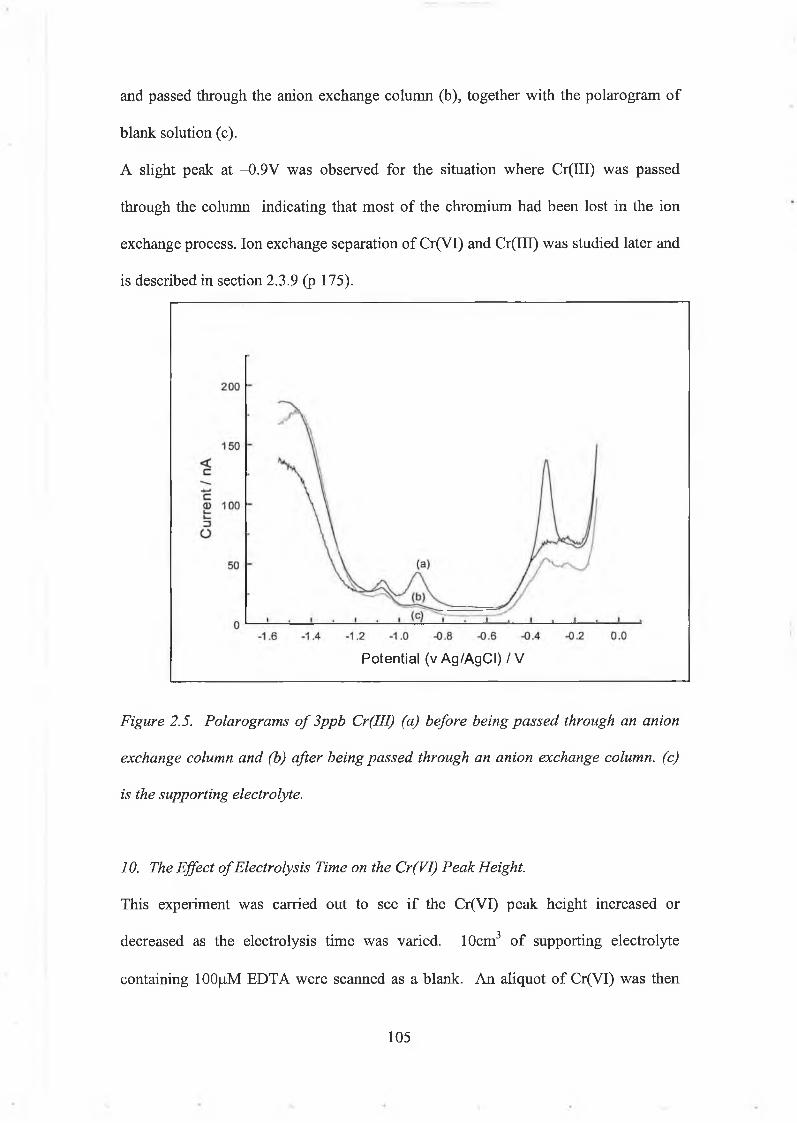
and passed through the anion exchange column (b), together with the polarogram of blank solution (c).A slight peak at -0.9V was observed for the situation where Cr(III) was passed through the column indicating that most of the chromium had been lost in the ion exchange process. Ion exchange separation of Cr(VI) and Cr(III) was studied later and is described in section 2.3.9 (p 175).
Potential (v Ag/AgCI) /V
Figure 2.5. Polarograms o f 3ppb Cr(III) (a) before being passed through an anion exchange column and (b) after being passed through an anion exchange column, (c) is the supporting electrolyte.
10. The Effect o f Electrolysis Time on the Cr(VI) Peak Height.This experiment was carried out to see if the Cr(VI) peak height increased or decreased as the electrolysis time was varied. 10cm3 of supporting electrolyte containing IOOjjM EDTA were scanned as a blank. An aliquot of Cr(VI) was then
105

added to the polarographie cell to produce a 5ppb Cr(VI) concentration and the solution was scanned with the electrolysis time varying from 0 to 60seconds in 10 second increments. A polarogram was obtained after each increment. This resulted in the Cr(VI) peak height increasing as the electrolysis time increased up to 30 seconds, then the Cr(VI) peak did not increase further. An optimum electrolysis time of 30 seconds was selected. Data for this experiment is given in appendix 2.4.
11. Preparation o f a Calibration Curve.A calibration curve was prepared from 0 to 5ppb Cr(VI) by addition of lOOfil aliquots of O.lppm chromium(VI) to 10 cm3 of the supporting electrolyte containing 100|iM EDTA. This resulted in an increase in the peak current as the volume of Cr(VI) added to the cell increased. Figure 2.6 shows the polarograms obtained after the addition of each aliquot of Cr(VI).
Figure 2.6 . Polarograms o f Cr(VI) Standards, (a) Supporting Electrolyte, (b) lppb,(c) 2ppb, (d) 3ppb, (e) 4ppb and (f) 5ppb Cr(VI).
200
o-1.6 -1.4 -1.2 -1.0 -0.8 -0.6 -0.4 -0.2 0.0
Potential (vAg/AgCI) / V
106

A calibration curve from 0 to 5ppb Cr(VI) was produced. Data from this experiment is given in appendix 2.5.
Cone. Cr(VI) / ppb
Figure 2.7. Calibration Curve for Polarography.
The calibration curve was non-linear and the data was fitted to a second orderpolynomial.
Table 2.1. Data from calibration curve for polarography.Parameter Value
Ao 0.32142857+1.03242Ai 29.517857+0.97113a 2 -2.3035714+0.18643R 0.99967R2 0.99934SD 1.13913
12. Application o f Polarography to Chromium Enriched Yeast Extract.The extraction procedure described in Section 2.2.1.(c) was carried out on l.OOlOg of
3 * 3chromium enriched yeast. A 1cm aliquot of the extract was then diluted to 100cm with doubly distilled water and the pH was adjusted to 3.8 (same as that of the Cr(III)
107

in experiment 9 above) using 0.1M HC1. 10cm3of supporting electrolyte containing lOOjaM EDTA were scanned as a blank using the parameters set out above. lOOp-L of the 1 in 100 dilution of the yeast extract was then added to the polarographic cell and scanned, resulting in a peak at -0.9V. This peak could be due to Cr(VI) or it could be Cr(III) since the extraction procedure extracts Cr(III) and Cr(VI). In order to remove Cr(VI) from the yeast extract 100cm3of the extract was passed through an anion exchange column as described above. lOOfjL of the eluent was then analysed as above again resulting in a peak at -0.9V. The peak was reduced compared to that of the yeast extract not passed through the anion exchange column. Figure 2.8 shows the polarograms obtained for analysis of the yeast extract (a) supporting electrolyte (b) passed through an anion exchange column and (c) not passed through an anion exchange column.
Potential (vAg/AgCI) / V
Figure 2.8. Polarograms o f enriched yeast (a) supporting electrolyte (b) after being passed through an anion exchange column (c) before being passed through an anion exchange column.
108

The experiment does not prove that there was Cr(VI) in the yeast extract. The reduction in the peak height may not be due to removal of Cr(VI) but also to loss of Cr(III) as discussed in experiment 9 above. At the time of these experiments it was not appreciated that Cr(III) was lost in the ion exchange process. The fact that Cr(III) and Cr(VI) are both polarographically active requires a more reliable separation of the Cr(VI) prior to analysis. The ion-exchange process requires further study.
13. The Effect o f the Extracting Buffer on the Supporting Electrolyte.10cm3 of the supporting electrolyte containing 100|_iM EDTA were scanned as a blank using the parameters set out above. lOOjaL of 2 x 10'3M Tris-NaOH pH 13 were added and scanned. No peak appeared after the addition of the Tris-NaOH implying that the extracting buffer does not contain Cr(VI) and so is not responsible for the peak at -0.9V in experiment 11 above.
109

2.1.2. Graphite Furnace Atomic Absorption Spectroscopy.2.1.2.(a). Introduction.In this section the method from the Analytical Methods for Graphite Tube Atomizers (Varian 1982) has been modified by adding in an extra step at the end of the ash stage to completely remove matrix components prior to the atomisation stage. The fmal temperature used in the atomisation stage was lower than that recommended since it was found that the recommended temperature caused the graphite tube to bum out.
2.1.2.(b). Reagents and Solutions. Reagents.1. Ultra Pure Nitric Acid, HNO3, F.W.= 63.01 g mol'1, Aldrich Chemical Company
Inc., #25812-1.2. Potassium Dichromate, K2Cr207, F.W.=294.18 g mol'1, Wardle Chemicals Ltd.,
#P04868.
Preparation of Solutions.1. 0.5% Nitric Acid.
5cm3 of ultra pure nitric acid was diluted to 1 dm3 with distilled water.2. Cr(VI) Standards.
(a). lOOOppm Cr(VI).0.2829g ofK2Cr20 7 was dissolved in 100cm3 of 0.5% nitric acid.
(b). 50ppm Cr(VI).5cm3 of lOOOppm Cr(VI) was diluted to 100cm3 with 0.5% nitric acid.
(c). 0.5ppm Cr(VI).lcm3 of 50ppm Cr(VI) was diluted to 100cm3 with 0.5% nitric acid.
110

(d). 0.05ppm Cr(VI).10cm3 of 0.5ppm Cr(Vl) was diluted to 100cm3 with 0.5% nitric acid.
2.1.2.(c). Instrumentation.Spectra AA-10 Atomic Absorption Spectrometer.Varian GTA-96 Graphite Tube Atomiser.Chromium Hollow Cathode Lamp, Pye Unicam Ltd., #39804.Seikosha SL-SOIP Printer.Sample Holders, JVA Analytical Ltd..
Glassware.All glassware was washed with 0.5% ultra pure nitric acid and rinsed with distilled water prior to use. The sample holders were immersed in 0.5% ultra pure nitric acid for 24 hours prior to use.
2.1.2.(d). Procedures and Results.1. Preparation o f a Calibration Curve.Using a blank of 0.5% nitric acid (a sample holder was filled with 0.5% nitric acid
o m ,and placed in the slot named blank), a standard of 50pg dm" Cr(VI) in 0.5% nitricacid (another sample holder was filled with the 50p.g dm'3 Cr(VI) and placed in the slot named standard), and using the following parameters a calibration curve was prepared from 0 to 50ppb Cr(VT). The required aliquots for the standard page are given in Table 2.2 and the furnace parameters are given in Table 2.3. The modifier slot was left empty.
I l l

Table 2.2. Chromium Standards for G.F.A.A. Spectroscopy.Volume of Blank/(|iL) Volume of 0.05ppm Cr(VI)
Standard ([¿L)Blank 20 0
Addition 1 16 4Addition 2 12 8Addition 3 8 12Addition 4 4 16Addition 5 0 20
Furnace Parameters are given in Table 2.2.
Table 2.3. Furnace Parameters for G.F.A.A. Determination o f Chromium.Step No. Temperature
(°C)Time
(seconds)Gas Flow
(dm'3 min'1)Gas Type Read
1 75 5 3 Normal No2 90 60 3 Normal No3 120 10 3 Normal No4 120 2 0 Normal No5 1200 1 0 Normal No6 1200 15 0 Normal No7 2500 1.2 0 Normal Yes8 2500 2 0 Normal Yes9 2500 1.2 3 Normal No
112

Using the above parameters a linear calibration curve was produced from 0 to 50ppb Cr(VI). The data for the calibration curve is given in appendix 2.6.
Result.
p p b Cr ( VI )
Figure 2.9. Calibration Curve for Graphite Furnace Atomic Absorption Spectroscopy.
Table 2.4. Data for calibration curve for G.F.A.A. S.Parameter Value
A 0.00024+0.00128B 0.0038810.00004R 0.99976
SD 0.00176N 6P 8.3511 x 10'*
2. Analysis o f the Chromium Enriched Yeast Extract.1.0008g of the enriched yeast was extracted as in section 2.2.1.(c) and a 1 x 10'5 dilution of this extract was made. A sample holder was then filled with this diluted extracted solution and using the parameters set out in Table 2.3 this solution was analysed. This resulted in an absorbance of 0.1089, implying that the diluted enriched yeast extract contained 28p.g 1 -1. The concentration of the chromium in the extract was calculated as 2.8 gl'1 = 2800 mgl'1 = 2800 ppm. This is total extracted chromium.
113

2.1.3. U.V. Spectroscopy.2.1.3.(a). Introduction.The procedure on which this section is based is a standard method for the detection of Cr(VI) in water analysis (published by the American Public Health Association, American Water Works Association, and Water Pollution Control Association (1971)). The reaction between chromate and diphenylcarbazide is a widely known and used one for the determination of chromium. This reaction is specific for Cr(VI) and so is a suitable method for the detection of Cr(VI) in the enriched yeast sample under investigation here since, the excess Cr(III) in the yeast extract will not interfere with Cr(VI) detection. An excess of Cr(III) was also used in the preparation of the standards for the calibration curve to simulate that of the enriched yeast. In order for this reaction to take place the reaction medium must be sufficiently acidic (approximately pH 2) for the colorimetric reaction to occur. Therefore H2SO4 was added to the diphenylcarbazide solution prior to the reaction with Cr(VI). It is also known that the stability of the colour decreases with time. In this section this decrease was studied. The Cr(VI)-DPC complex absorbs at 540nm.
Experiments carried out in this section include;1. Preparation of a Calibration Curve.2. The Effect of Time on the Absorbance of the Cr(VI)-DPC Complex.
(a). Over Hours.(b). Over Days.
114

Reagents.1. 1,5-Diphenylcarbazide, C13H14N4O, F.W.=242.3g mol"1, Aldrich Chemical Company Inc., #25922-5.2. Potassium Dichromate, K2Q 2O7, F.W.=294.19g mol"1, Wardle Chemical Company Ltd., #P04868.3. Tris(hydroxymethyl)-aminomethane, C4H10NO3, F.W.=121.14g mol"1, Riedel- de Haen, #33742.4. Chromium(III) Chloride, CrCl3.6H20 , F.W.=266.45g mol'1, Riedel-de Haen, #12228.5. Sodium Hydroxide, NaOH, 40.00g mol'1, Wardle Chemical Company Ltd., #S05652.
Preparation of Solutions.1. 1,5-Diphenylcarbazide Solution. (1.67 x 10'3MDPC, 1.47MH2 SO4)
40cm3 o f concentrated H2SO4 were added to 360cm3of doubly distilled water.0.2027g of 1,5-diphenylcarbazide were dissolved in 100cm3of ethanol. These two solutions were mixed with constant stirring. This solution was stored in the dark as light caused discolouration. When discolouration occurred fresh solutions were prepared, i.e., approximately every two weeks.
2. 5MNaOH.20.Og of sodium hydroxide were dissolved in 100cm3of distilled water.
3. 0.2M Tris-NaOHpH 13.As in section 2.1.1 .(b).
2.1.3.(b). Reagents and Solutions.
115

4, 40ppm Cr(III) in Tris-NaOH.0.0512g of chromium(III) chloride were dissolved in 250cm3of 0.2M Tris-NaOH pH13.
5. Cr(VI) Standards.(a). lOOOppm Cr(VI).
0.2829g of potassium dichromate were dissolved in 100cm3of distilled water.(b). lOOppm Cr(VI).
10cm3of lOOOppm Cr(VI) were diluted to 100cm3with distilled water.(c). lOppm Cr(VI).
10cm3of lOOppm Cr(VI) were diluted to 100cm3 with distilled water.
2.1.3.(c). Instrumentation.UV-160, UV-Visible Recording Spectrophotometric, Shimadzu.
Glassware.All glassware was washed with 0.5% ultra pure nitric acid and rinsed with doubly distilled water prior to use.
116

The following parameters were set up in order to obtain the spectrum and the absorbance of the Cr-DPC complex at 540nm in this section.
2.1.3.(d). Procedures and Results.
(a). To obtain the spectrum of a solution.Operating Parameters.Spectrum
1. Meas. Mode Abs2. Scanning Range 800-400nm.3. Rec Range 0.00A-2.00A4. Scan Speed Fast5. No. of Scans 16. Display Mode Sequential
Following this the reference cell and the sample cell were filled with distilled water and these cell were placed in the required slots. Then the instrument was zeroed by pressing AUTO ZERO.Next the sample cell was filled with the solution to be analysed (i.e. the Cr-DPC complex plus excess Cr(III)) and START/STOP was pressed. After the spectrum was recorded and printed, RETURN followed by MODE was pressed.(b). To obtain the absorbance measurement of a solution.After the spectrum of the solution had been produced, PEAK was pressed and the absorbance measurement at 540nm appeared on the screen. This measurement was then printed by pressing PRINT.These parameters were used to produce a spectrum and the absorbance measurement of the Cr-DPC complex
117

A calibration curve from 0 to lppm Cr(VI) in O.lppm increments was obtained, using the parameters set out above by preparing the standards listed in Table 2.5. The concentration of the Cr(III) was chosen so as to simulate the presence of excess Cr(III) in the yeast extract. The DPC reagent was added to the Cr(VI) followed by the addition of the Cr(III) and dilution to 50cm3 with doubly distilled water. Each of these solutions was allowed to stand for 5 minutes to allow the complete formation of the Cr-DPC complex (only Cr(VI) reacts) prior to obtaining the spectrum or absorbance measurement at 540nm.
1. Preparation o f Calibration Curve.
Table 2.5. Cr(VI) Standards.lOppm Cr(VI) / cm3 1.6 x 10'3M DPC /
cm3Volume of 40ppm
Cr(III) in Tris NaOH / cm3
Total Volume / cm3
0.5 5 10 501 5 10 50
1.5 5 10 502 5 10 50
2.5 5 10 503 5 10 50
3.5 5 10 504 5 10 50
4.5 5 10 505 5 10 50
118

It was found that as the Cr(VI) concentration increased so to did the absorbance measurements and a linear calibration curve from 0 to lppm Cr(VI) was obtained (figure 2.10). Data for this experiment are given in appendix 2.7.
Calibration Curve ■ ' x
o.o H 1---------1--------- 1---------1---------1--------- 1---------1--------- 1--------- 1--------- r-0 200 400 600 800 1000
ppb Cr(VI)
Figure 2.10. Calibration Curve for U. V. Spectroscopy.
Table 2.6. Data from calibration curve for TJ. V. spectroscopy.Parameter Value
A 0.01541+0.000407B 0.0005+6.8861 x 10‘6R 0.99913
SD 0.00722N 11P 6.6402 x 1 O'14
2. The Effect o f Time on Absorbance o f the Cr-DPC complex.(a). Over Hours.A 500 ppb Cr(VI) standard solution was prepared by pipetting 2.5cm3 of lOppmCr(VI), 2.5cm3 of DPC and 10cm3 of Cr(III) in Tris-NaOH into a 50cm3 volumetricflask and making up to the mark with doubly distilled water. After 5 minutes, andevery hour following, the spectrum of this solution was analysed and the absorbancewas measured again at 540nm using the parameters set out above. It was found that
119

the absorbance measurements decreased linearly over time. Figure 2.11 represents the absorbance measurements obtained for this experiment and the data is given in appendix 2 .8.______________________________________________________
Time / hours
Figure 2.11. Effect o f time on absorbance o f Cr-DPC complex (hours).
Table 2.7. Data from graph showing the effect o f time on absorbance o f Cr-DPCcomplex (hours).
Parameters ValuesA 0.28857±0.00133B -0.0128310.00044R -0.99767
SD 0.00184N 6P 8.1585 x 10'b
From this graph the percentage decrease in absorbance measurement over 1 hour was calculated as 4.45%. It has been recommended that the absorbance of solutions containing DPC should be taken no longer than 15 minutes after the addition of the DPC to the solution as a decrease in absorbance measurement is obtained after this time limit.
120

This solution was then analysed every 24 hours for 6 days. It was found that the absorbance of the Cr-DPC complex decreased expontenially over the 6 days and reached zero absorbance after the 6 days. This result is represented in figure 2.12 and the data is given is appendix 2.9.
(b). Over Days.
Time / days
Figure 2.12. Effect o f time on absorbance o f Cr-DPC complex (days).
Table 2.8. Data from graph showing the effect o f time on absorbance o f Cr-DPCcomplex (hours).
Parameters ValuesChi 2.8475 x 10'3
Tolerance 0.05A 0.26889±0.00515B 0.60815±0.024
The graph above was fitted to the function A*EXP(-B*X) and the reaction was found to be first order with a rate constant of 0.60815 days'1.
121

2.1.4. High Performance Liquid Chromatography.2.1.4.(a). Introduction.In this section a modification of the method of Padarauskas (1998), which used online preconcentration and determination of Cr(VI) in water by high-performance liquid chromatography with pre-column complexation with 1,5-diphenylcarbazide, was used for the determination of Cr(VI) in the chromium enriched yeast extract. Padauraskas et al. used a dual column technique where the first column was used for preconcentration and the second column was used for the chromatography. In the modification described here the procedure is carried out on a single column. Chromate was preconcentrated on a Ci8 column by passing the extract containing the Cr(VI) through the column for a predetermined length of time after complexation with diphenylcarbazide. After this preconcentration step the sample was eluted from the column using a solution of 6 x 10'3 mol dm'3 H2SO4 and 20% acetonitrile. Direct spectrophotometric detection at 546nm was used to detect the eluted Cr-DPC complex. It was found that the Cr-DPC peak generally eluted between 11 and 12 minutes. Figure 2.13. represents a typical chromatogram obtained using the above preconcentration and elution prodecure for standard 15ppb Cr(VI).
Figure 2.13. Typical chromatogram obtained for 15ppb Cr(VI).
122

Reagents.1. Sulphuric Acid, H2SO4, S.G.=1.84, F.W.=98.07g mol’1. Romil Ltd., Code A-9691.2. Acetonitrile, CH3CN, F.W.= 41.05g mol’1, BDH Chemicals Ltd., #29220.3. 1,5-Diphenylcarbazide, C13H14N4O, F.W.=242.3g mol'1, Aldrich Chemical
Company Inc., #25922-5.4. Potassium Dichromate, K2Cr2C>7, F.W.=294.19g mol'1, Wardle Chemical
Company, Ltd., #P04868.5. Chromium (III) Chloride, CrCl3.6H20 , F.W.=266.45g mol _1, Riedel-de Haen,
#122286. Tris(hydroxymethyl)-aminomethane, C4H10NO3, F.W.=121.14g mol’1, Riedel-de
Haen, #33742.
Preparation of Solutions.1. Mobile Phase: 6 x 1 0~SM H 2SO4 in 20% Acetonitrile.
A 327|o,L aliquot of concentrated H2S04 was added to 300cm3 of distilled water, 200(J.L of acetonitrile was added and this solution was diluted to 1 dm3 with distilled water,
2. 2 x i a 3MDPC in 10% Acetonitrile, 0.048MH2S 0 4.A 10cm3 aliquot of acetonitrile was diluted to 100cm3 with distilled water.0.0485g of 1,5-diphenylcarbazide were dissolved in this and 261.0|iL of concentrated H2SO4 were added.
3. Cr(VI) Standards.(a). lOppm Cr(VI).
2.1.4.(b). Reagents and Solutions.
As in section 2.1.3.(b).
123

(b). lOOppb Cr(VI).lcm3 of lOppm Cr(VI) was diluted to 100cm3 with distilled water.
(c). 5, 10, 15, 20 and 25 ppb Cr(VI).5, 10, 15, 20 and 25 cm3 of lOOppb Cr(Vl) were diluted to 100cm3 with distilled water.
4. Cr(III) Standards in 0.2M Tris-NaOHpH 13.(a). lOOOppm Cr(III) in 0.2M Tris-NaOH pH 13.
0.5128g of chromium (III) chloride was dissolved in 100cm3 of 0.2M Tris- NaOH pH 13.
(b). 500ppb Cr(III) in 0.2M Tris-NaOH pH 13.50(j,l of lOOOppm Cr(III) was diluted to 100cm3 with 0.2M Tris-NaOH pH 13.
(c). 15ppb Cr(III) in 0.2M Tris-NaOH pH 13.3cm3 of 500ppb Cr(III) was diluted to 100cm3 with 0.2M Tris-NaOH pH 13.
7. Cr(VI) Standards in Excess Cr(III).(i). 15ppb Cr(VI) and 15ppb Cr(III) in 0.2M Tris-NaOH pH 13.
15cm3 of lOOppb Cr(VI) was pipetted into a 100cm3 volumetric flask, some distilled water was added along with 15cm3 of lOOppb Cr(III) and made up to the mark with 0.2M Tris-NaOH pH 13.
(ii). 15ppb Cr(VI) and 1.5ppm Cr(III) in 0.2M Tris-NaOH pH 13.15cm3 of lOOppb Cr(VI) was pipetted into a 100cm3 volumetric flask, some distilled water was added along with 150(j.l of lOOOppm Cr(III) and made up to the mark with 0.2M Tris-NaOH pH 13.
(iii). 15ppb Cr(VI) and 50ppm Cr(III) in 0.2M Tris-NaOH pH 13.
124

15cm3 of lOOppb Cr(VI) was pipetted into a 100cm3 volumetric flask, some distilled water was added along with 5cm3 of lOOOppm Cr(III) and made up to the mark with 0.2M Tris-NaOH pH 13.
2.1.4.(c). Instrumentation.UV Spectrophotometric detector SPD-6A, Shimadzu.Liquid Chromatography LC-6A, Shimadzu.3 3 90A Integrator - Hewlett Packard Model 1.Alltech Cis Column I.D. = 4.6mm, length 250mm.
Glassware.All glassware was washed with 0.5% ultra pure nitric acid and rinsed with distilled water prior to use.
2.1.4.(d). Procedures and Results.The general procedure carried out in order to obtain a chromatogram in this section was as follows. A 2.5 cm3 aliquot of 2 x 10"3M DPC in 10% acetonitrile, 0.048M H2SO4 was added to 20cm3 of the solution to be analysed. After 6 minutes (the time taken for the Cr-DPC complex to form) the solution was preconcentrated on the Cig column by passing the complexed sample solution through the column for 8 minutes at a flow rate of 1.5cm3 m in1. Following this preconcentration step analysis of the solution was carried out using 6 x 10'3M H2SO4 in 20% acetonitrile as the mobile phase and the Cr-DPC complex was eluted from the column over a 30 minute period. The appearance of the Cr-DPC complex was signalled using on-line photometric detection at 546 nm. Attenuation was set at 0.16 and absorbance range was 0.64
125

(except when the Cr-DPC complex peak was offscale and then the absorbance range was 1.28).
1. The Effect o f Absorbance Range Setting on Cr-DPC Peak.In order to find the optimum absorbance range to use, the above procedure was carried out using 1 ppm Cr(VI) standard complexed with DPC as described above. The following variations were carried out on the absorbance setting: 1.28, 0.64, 0.32 and 0.16 and the peak area for the Cr-DPC complex eluted each time was recorded. It was found that as the absorbance range decreased the area of the Cr-DPC complex peak increased. The peak areas obtained here are given in Table 2.9.
Table 2.9. Peak Areas o f Cr-DPC Complex obtained after Variation o f the Absorbance Setting.
Absorbance Setting Cr-DPC Complex Peak Area1.28 214140.64 435010.32 899580.16 181140
An absorbance setting of 0.64 was generally used during analysis in this section as a lower absorbance setting usually caused the Cr-DPC complex peak to be offscale.
126

2. Effect o f Cr(VI) on the DPC and Tris-NaOH Peaks.A 12cm3 aliquot of 2 x 10'3M DPC solution was preconcentrated and eluted using the Cig column as outlined above. This resulted in the appearance of a peak with an elution time of 18.07 minutes. Next a 12cm3 aliquot of 0.2M Tris-NaOH solution after adjustment of the pH to 2, using concentrated H2SO4, was preconcentrated and eluted as above. This resulted in the appearance of a peak at 8.09 minutes. Following this a mixture of 0.2M Tris-NaOH and DPC was prepared, by adding 2.5cm3 of 2 x 10'3M DPC to 20cm3 of 0.2M Tris-NaOH and the solution was adjusted to pH 2 using concentrated H2SO4. This solution was then preconcentrated and eluted in the same way. This resulted in the appearance of both of the peaks, which appeared for the DPC and the Tris-NaOH pH 2 (figure 2.14.(a).). Following this a 20cm3 aliquot of 15ppb Cr(VI) in 0.2M Tris-NaOH was adjusted to pH 2, using concentrated H2SO4. A 2.5cm3 aliquot of DPC was then added and the above preconcentration and elution procedure was carried out again. This experiment resulted again in the appearance of the DPC peak at (7.54 minutes), the Cr(VI)-DPC peak (8.55 minutes)and the 0.2M Tris-NaOH pH 2 peak (18.27 minutes) as shown in figure 2.14.(b). Note that 2.14.(b). is recorded at a lower sensitivity then 2.14.(a). The peak areas of DPC and Tris- NaOH are comparable in both chromatograms. The Cr(VI)-DPC peak is clearly much more intense and less spread out than those of the DPC and Tris-NaOH components. Also the small peak which occurs in the blank (figure 2.14.(a).) at 8.74 minutes would cause negligible error in the measurement of 15ppb Cr(VI).
127

Figure 2.14. Chromatograms o f (a) Tris-NaOH and DPC only and (b) Tris-NaOH, DPC and 15ppb Cr(VI).
3. H.P.L.C. o f Cr(IlI).In order to find out if Cr(III) is preconcentratcd onto the column the following experiment was carried out. A 20cm3 aliquot of 15ppb Cr(III) was prepared and the pH was adjusted to 2 using concentrated H2SO4. A 2.5cm3 aliquot of DPC was then added and the preconcentration and elution procedure was carried out as above. This resulted in the appearance of peaks at 7.5 and 18 minutes only, but these are due to the presence of 0.2M Tris-NaOH and DPC respectively, indicating that the Cr(III) did not adhere to or elute from the column and therefore the excess Cr(III) in the chromium enriched sample will not interfere with Cr(VI) detection using this H.P.L.C. method.
4. Detection o f Cr(VI) in Excess Cr(III).Because the enriched yeast extract contains excess Cr(III) over Cr(VI) it was decided to see if Cr(VI) can be detected in excess Cr(III) using this H.P.L.C. preconcentration and elution method as follows. A 20cm3 aliquot of each of the following solutions was
128

O _prepared and adjusted to pH 2 and 2.5cm of 2 x 10 M DPC solution was added and the preconcentration and elution procedure set out above was carried out.
(a). 15ppb Cr(VI) and 15ppb Cr(III) in 0.2M Tris-NaOH pH 13.(b). 15ppb Cr(VI) and 1.5ppm Cr(III) in 0.2M Tris-NaOH pH 13.(c). 15ppb Cr(VI) and 50ppm Cr(III) in 0.2M Tris-NaOH pH 13.
Result;For (a) above a peak of area 1700800 eluted at 9.26 minutes, for (b) a peak of area 1715600 eluted at 8.62 minutes and for (c) a peak of area 1695700 eluted at 8.57 minutes. Since the Cr(VI) peak area remained fairly constant as did the elution time it appears that excess Cr(III) has no effect on the preconcentration or elution of Cr(VI). Therefore, Cr(VI) can be detected in excess Cr(III) using this H.P.L.C. preconcentration and elution method and so if there is Cr(VI) present in the chromium enriched yeast sample this procedure will be able to detect it. The retention time of Cr(VI) in this experiment was shorter than that of previous experiments. This may have been due to instrumentation drift or a change in temperature.
5. Preparation o f Calibration Curve.A calibration curve from 0 to 25 ppb Cr(VI) in 5 ppb increments was prepared by applying the above preconcentration and elution procedure to each of the following Cr(VI) standards: 5 ppb, lOppb, 15ppb, 20ppb and 25ppb. A chromatogram was obtained for each of these Cr(VI) standards which are shown in figure 2.15. It was found that the Cr-DPC complex had a retention time of approximately 11.5 minutes and that as the Cr(VI) concentration increased so too did the area of the Cr-DPC
129

complex peak. Figure 2.16 represents the linear calibration curve obtained from these chromatograms and the data is given in appendix 2 .10.
Figure2.15. Chromatograms of the Cr(VI) standards (a) 5ppb, (b) lOppb, (c) 15ppb, (d) 20ppb and (e) 25ppb Cr(VI).
130

Peak Height 10*
Cone. / ppb Cr(VI)
Figure 2.16. Calibration Curve for High Performance Liquid Chromatography.
Table 2.10. Data from calibration curve for H.P.L.C.Parameters Value
A -1.89212+0.3377469B 0.732772+0.0203669R 0.99884SD 0.3220290N 5P 0.00005
The limit of detection for this method was calculated as follows;Limit of Detection = Intercept + 3 (Standard Deviation) = Y value.
Y = A + B *X => Y - A / B = X
X = Limit of Detection.L.O.D. = 1.89212 + 3 x 0.3220290 = 2.858207
2.858207 - (-1.89212 ) / 0.732772 = 6.48ppb
131

The limits of detection, (sample calculation above), of each of the previous mentioned methods for the detection of Cr(VI) were calculated and found to be;(a). Voltammetry O.lppb(b). G.F.A.A. Spectroscopy 1.36ppb(c). U.V.Spectroscopy. 43.2ppb(d). H.P.L.C. 6.5ppbThe voltammetric method was not suitable for the detection of Cr(VI) in the chromium enriched yeast sample because the Cr(III) peak appears at the same potential as that of the Cr(VI) peak and since the chromium enriched yeast sample contains excess Cr(III) it would interfere with the detection of Cr(VI).The G.F.A.A.spectroscopic method also proved to be unsuitable for the analysis of Cr(VI) in the chromium enriched yeast sample since G.F.A.A. spectroscopy is not specific for Cr(VI), i.e. it measures total chromium, therefore the excess Cr(III) in the enriched yeast sample would interfere with the detection of Cr(VI). Therefore, Cr(III) and Cr(VI) would have to be separated prior to analysis with either of the above described methods.Since the U.V. spectrophotometric method mentioned here, i.e. the Cr-DPC reaction, is specific for Cr(VI) (Cr(IIl) is unreactive to DPC) this method of detection of Cr(VI) would be very suitable for the analysis of Cr(VI) in the chromium enriched yeast sample because the presence of the excess Cr(III) would not interfere with Cr(VI) detection. The limit of detection is high compared to the other techniques and therefore preconcentration is necessary.
2.1.5. Discussion.
132

The H.P.L.C. method developed here would also to be very suitable for the analysis of Cr(VI) in the chromium enriched yeast extract since the Cis column used did not retain Cr(III) or organic matter, i.e. it only retained the Cr-DPC complex. Therefore, the excess Cr(III) present in the chromium enriched yeast sample will not interfere with the detection of Cr(VI) and if there is any Cr(VI) present in the sample, this method for the preconcentration and elution of Cr(VI) in the presence of excess Cr(III) will detect it.The lowest concentration of Cr(VI) that could be detected in the presence of Cr(III) is 6.5ppb. However, the volume of sample used in the preconcentration step was 20cm3. Using a larger volume of sample should decrease the limit of detection. Using a
\ St100cm sample should lower the detection limit to 1.3ppb Cr(VI).
133

2.2.1. Extraction of Cr(VI) from Yeast using Tris-NaOH in the Presence of Air.2.2.1.(a). Reagents and Solutions.1. Tris(hydroxymethyl)aminomethane, C4H10NO3, F.W.=121.14g mol"1, Riedel-de
Haen, #33742.2. Chromium(IIl) Chloride, CrCl3.6H20, F.W. = 266.45g mol'1, Riedel-de Haen,
#12228.3. Potassium Dichromate K2Cr207, F.W. = 294.19g mol'1, Wardle Chemical
Company Ltd., #P04868.4. Chromium Enriched Yeast, Alltech Ireland, Dunboyne, Co. Meath, Ref. 158233.5. Non-Enriched Yeast, Active Dried Yeast, DCL Yeast Limited.6. 1,5-Diphenylcarbazide, C13H14N4O, F.W.=242.3g mol'1, Aldrich Chemical
Company Inc., #25922-5.
Preparation of Solutions.1. 0.2M Tris-NaOH pH 13.
As in section 2.1.1.(b).2. lOppm Cr(VI).
As in section 2.1.3.(b).3. 1.67x1 O' 3 MDPC, 0.6 8 M H2S 0 4.
40cm3 of concentrated H2SO4 were diluted to 400cm3 with doubly distilled water.0.2027g of 1,5-diphenylcarbazide were dissolved in 100cm3 of doubly distilled water. These two solutions were mixed with constant stirring.
2.2. EXTRACTION OF Cr(VI).
134

2.2.1.(b). Apparatus.1. Balance - Mettler AE 160, Supplied by Mason Technology, Dublin.2. Centrifuge - Sigma - 302K.3. 0.45p.m Cellulose Acetate Filter, 47mm, 0.45p,m, Gelman Sciences, Lot No. 63172.4. Polycarbonate Filter Holder, Sortorius.5. Magnetic Stirrer - Bibby HB 501.
2.2.1.(c). Extraction Procedure carried out in the Presence of Air.Flores-Velez et al (1994) used Tris-NaOH pH 13 buffer for the extraction of Cr(VI) from soils and found that it was capable of extracting up to 98.6+/-2.2% of added Cr(VI). The buffer has the advantage that it will extract sparingly soluble Cr(Vl) species. Also Cr(VI) is a weak oxidising agent in alkaline solution and will persist longer than it will in more acidic extraction buffers.
1. The Extraction Procedure in the Presence o f Air.A lg sample of yeast was added to 50cm3 of 0.2M Tris-NaOH pH 13, and immediately agitation of the solution commenced. After 24 hours of stirring, this solution was centrifuged for 30 minutes at a rate of 8000 rpm'1. The solution was then filtered through a 0.45|.im cellulose acetate filter using a polycarbonate filter holder. The filtrate was then made up to 100cm3 using 0.2M Tris-NaOH pH 13 and stored in a 100cm3 volumetric flask. To a 5cm3 aliquot of this extracted solution a 2.5cm3 aliquot of DPC solution was added and made up to 25cm3 using doubly distilled water. After 5 minutes (the time taken for the formation of the Cr(VI)-DPC complex to form) the solution was analysed using the UV spectrophotometric method outlined
135
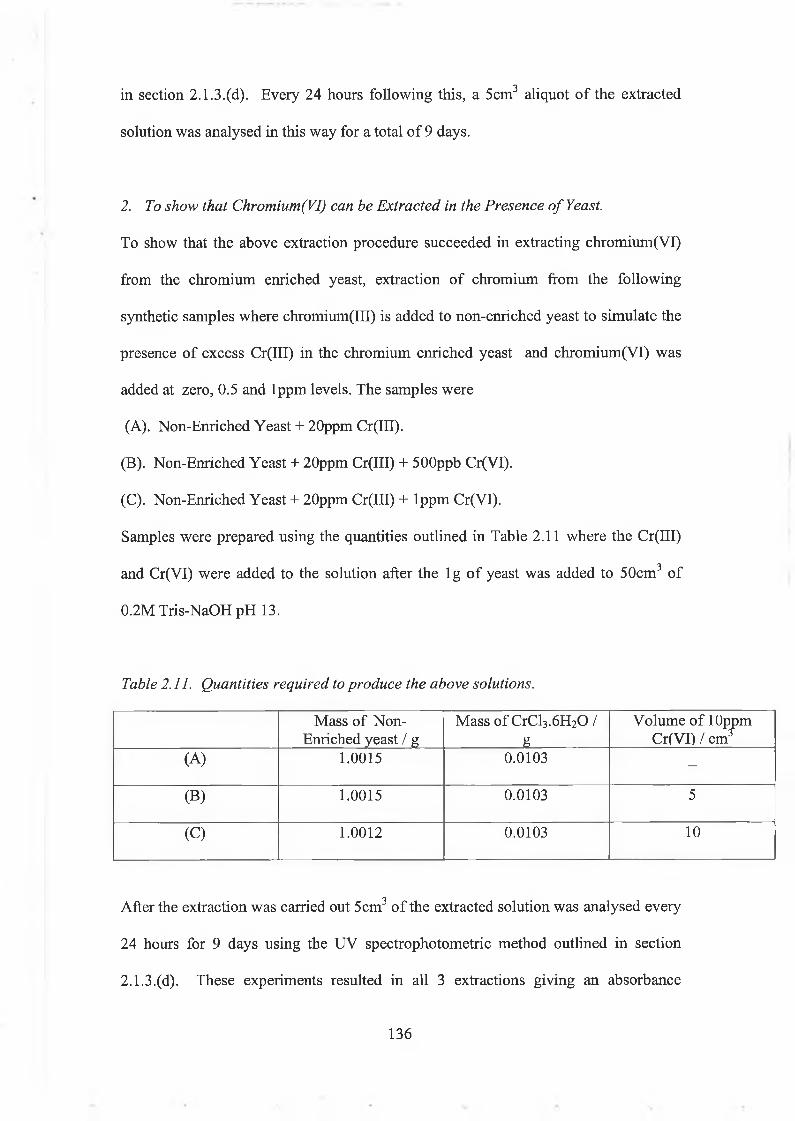
in section 2.1.3.(d). Every 24 hours following this, a 5cm3 aliquot of the extracted solution was analysed in this way for a total of 9 days.
2. To show that Chromium(VI) can be Extracted in the Presence o f Yeast.To show that the above extraction procedure succeeded in extracting chromium(VI) from the chromium enriched yeast, extraction of chromium from the following synthetic samples where chromium(III) is added to non-enriched yeast to simulate the presence of excess Cr(III) in the chromium enriched yeast and chromium(VI) was added at zero, 0.5 and lppm levels. The samples were(A). Non-Enriched Yeast + 20ppm Cr(III).
(B). Non-Enriched Yeast + 20ppm Cr(III) + 500ppb Cr(VI).(C). Non-Enriched Yeast + 20ppm Cr(III) + lppm Cr(VI).Samples were prepared using the quantities outlined in Table 2.11 where the Cr(III) and Cr(VI) were added to the solution after the lg of yeast was added to 50cm3 of0.2M Tris-NaOH pH 13.
Table 2.11. Quantities required to produce the above solutions.Mass of Non-
Enriched yeast / gMass of CrCl3.6H20 /
g
Volume of lOppm Cr(VI) / cm3
(A) 1.0015 0.0103 —(B) 1.0015 0.0103 5(C) 1.0012 0.0103 10
After the extraction was carried out 5 cm3 of the extracted solution was analysed every 24 hours for 9 days using the UV spectrophotometric method outlined in section2.1.3.(d). These experiments resulted in all 3 extractions giving an absorbance
136

reading on day 1 and these readings increased over time. Extract A, which contains no added Cr(VI), gave an absorbance reading on day 1. This implies that air oxidation of Cr(IU) occurs in the extraction process. Extract B and C gave significantly higher Cr(VI) readings on day 1 than extract A. The absorbance was not directly proportional to the concentration of added Cr(VI). This indicates that some reduction of Cr(VI) occurs initially in these experiments, followed by air oxidation. Figure 2.17 represents the absorbance readings obtained for the extraction of these simulated chromium enriched yeast samples and the data is given in appendix 2.11.
To Show That Cr(VI) Can Be Extracted
0 .2 5 - From The Yeast.■ A
0 .2 0 -
A b 0 .1 5 - S
0 .1 0 -
• ►
▲▲
•A
• ■•
▲
•• " ■
• B ■ A
0 .0 5 -■
■■
A = Non-Enriched Yeast + 20ppm Cr(lll)B = Non-Enriched Yeast + 20ppm Cr(lll) + 500ppb Cr(VI)C = Non-Enriched Yeast + 20ppm Cr(lll) + 1ppm Cr(VI)
(12
i ■ i4 6Time / days
■ 18
• i 10
Figure 2.17. To show that chromium(VI) can be extracted from the simulated chromium enriched yeast.
137

3. To Show that Cr(VI) can be Extracted in the Presence o f Chromium Enriched Yeast.
Since the absorbance readings of all 3 extracts in the previous experiment increased over time it was suspected that air oxidation of Cr(III) to Cr(VI) had occurred, which was a factor that was not normally previously considered in chromium speciation studies. In order to find out if this oxidation process also occurred in the presence of chromium enriched yeast the extraction procedure above was carried out on the following solutions;(A). Chromium enriched yeast + 500ppb Cr(VI) + 20ppm Cr(III).(B). Chromium enriched yeast + 500ppb Cr(VI).using the quantities listed in Table 2.12 below by adding the Cr(III) and Cr(VI) to the solution after the chromium enriched yeast was added to the Tris-NaOH buffer. A 5cm3 aliquot of the extracted solution was then analysed every 24 hours for 9 days using the spectrophotometric method in section 2.1.3.(d).
Table 2.12. Quantities required to produce the above solutions.Mass of Chromium Enriched Yeast / g
Mass ofCrCl3.6H20 / g
Volume of lOppm Cr(VI) / cm3
(A) 1.0031 0.0102 5(B) 1.0024 - 5
These extraction procedures resulted in both of the solutions giving an absorbance measurement on day 1 and both these readings increased over time. Solution A, which contained added Cr(III), gave higher absorbance measurements than solution B, which contained no added Cr(III), thus implying that air oxidation of the added Cr(III) to Cr(VI) had occurred more rapidly than that of the bound Cr(III). The rate of
138

increase of the Cr(VI) concentration in both cases was similar. Figure 2.18 represents Ihe absorbance readings obtained for the extraction of these solutions and the data is given in appendix 2.12.
0.35 - To shew that Cr(VI) can be extracted in
0.30 -the presence cfchrcrriim enriched yeast ■ A
0.25 -
Abs0.20 -
■■
■ ■ ■
. * B
0.15 -• *
•
0.10 -• * * A = E rtid ied Yeast+20ppmC>(lll)+500ppbQ{VI)
B = Enridred Yeast + SOCppb Q(VI)
U.UO ~l ■ j i l i I i I i 1) 2 4 6 8 10
Time/days
Figure 2.18. To show air oxidation o f Cr(III) to Cr(VI) in alkaline solution.
139

2.2.2. Extraction of Cr(VI) from Yeast using Tris-NaOH in the Absence of Air (i.e. under Nitrogen).
2.2.2.(a). Reagents and Solutions.1. Tris(hydroxymethyl)aminomethane, C4HioN03F.W.=121.14g mol'1, Riedel-de
Haen, #33742.2. Chromium (III) Chloride,CrCl3.6H20 , F.W.=266.45g mol’1, Riedel-de Haen,
#12228.3. Potassium Dichromate, K^C^Oy, F.W.=294.19g mol"1, Wardle Chemical
Company Ltd., #P04868.4. Chromium Enriched Yeast, Alltech Ireland, Dunboyne, Co. Meath, Ref. 158233.5. Non-Enriched Yeast, Active Dried Yeast, DCL Yeast Limited.6. 1,5-Diphenylcarbazide, C13H14N4O, F.W.=242.3g mol'1, Aldrich Chemical
Company Inc., #25922-5.
Preparation of Solutions.1. 0.2M Tris-NaOHpH 13.
As in section 2.1.1.(b).2. 1.67 x IO' 3 MDPC.
As in section 2.2.1 .(a).3. lOppm Cr(VI).
As in section 2.1.3.(b).
2.2.2.(b). Apparatus.1. Balance - Mettler AE 160, Supplied by Mason Technology, Dublin.2. Centrifuge - Sigma - 302K.
140

3. 0.45(im Cellulose Acetate Filter, 47mm, 0.45p.m, Gelman Sciences, Lot No. 63172.4. Polycarbonate Filter Holder, Sortorius.5. Magnetic Stirrer - Bibby HB 501.6. Nitrogen Cyclinder (Oxygen Free) BOC Ltd..7. Parafilm - American National Can. PM-992.
2.2.2.(c). Extraction Procedure.Since the experiments in the previous section show that in air Cr(III) can be oxidised to Cr(VI) it was decided to carry out the extraction process in the absence of air.
1. The Extraction Procedure carried out in this section was as follows.A 50cm3 aliquot of 0.2M Tris-NaOH pH 13 were de-aerated with nitrogen for 15 minutes. A lg sample of yeast was added to this de-aerated Tris-NaOH and the solution was de-aerated again for 15 minutes. Agitation of the solution commenced immediately and the solution was left stirring, sealed and under nitrogen. After 24 hours the solution was poured into the centrifuge tube and de-aerated while in the tube, sealed with parafilm and centrifuged for 30 minutes at a rate of 8000rpm‘\ The solution was filtered, under nitrogen, through a 0.45pm cellulose acetate filter using a polycarbonate filter holder. The filtrate was then made up to 100cm3 with de-aerated0.2M Tris-NaOH pH 13 and stored in a round bottomed flask under nitrogen. To 5cm3 of the extracted solution 2.5cm3 of DPC solution were added and made up to 25 cm3 with doubly distilled water. After 5 minutes (the time taken for the formation of the Cr(VI)-DPC complex) the solution was analysed using the UV spectrophotometric method in section 2.1.3.(d). Every 24 hours following this, 5cm3 aliquots of this extracted solution were analysed in this way for a total of 9 days.
A 0.0102g sample of CrCl3.6H20 was dissolved in 50cm3 of deaerated 0.2M Tris-3 ■ * 3NaOH pH 13. Immediately a 5cm aliquot of this solution was withdrawn, a 2.5cm
aliquot of DPC solution was added and the solution was diluted to 25cm3 with doubly distilled water. Analysis was then carried out at 540nm. The remainder of the solution was left stirring with nitrogen over it. A 5 cm3 aliquot of this solution was withdrawn and analysed as above on a daily basis. It was found that no absorbance measurements were recorded on day 1 or on any of the 9 days following this.A 0.0102g sample of CrCl3.6H20 was also added to 50cm3 of 0.2M Tris-NaOH pH13. Again a 5cm3 aliquots was withdrawn immediately and analysed at 540nm after the addition of a 2.5cm3 aliquot of DPC and dilution to 25cm3 with doubly distilled water. The remainder of the solution was stirred by bubbling air (saturated with 0.2M Tris-NaOH pH 13) through the solution. It was found that no absorbance was recorded on day 1, but on day 2 an absorbance was recorded and this measurement increased over time. Since an absorbance measurement was recorded for the solution stirred in air and no measurement was recorded for the solution stirred under nitrogen it implies that air oxidation of Cr(III) to Cr(VI) did occur in alkaline solution. Figure 2.19 represents the absorbance measurements obtained for these extractions and the data is given in appendix 2.13.
2. To Show Air Oxidation o f Cr(III) To Cr(VI) in Alkaline Solution.
142

0 .3 0 -1 To Show Air Oxidation Of Cr(lll)- To Cr(VI) In Alkaline Solution .a
0 . 2 5 -•
0 . 2 0 - •. •
° 1 5 "
•
0 . 1 0 -•
0 . 0 5 - A = Tris -N aO H + C r(lll) Extracted i n A rB = Tris-N aO H + Cr(lll) Extracted in Nitrogen
0 . 0 0 -
1 1 i ■ i ■ i - i ■ i0 2 4 6 8 1 0
T i m e / d a y s
Figure 2.19. To show air oxidation o f Cr(III) to Cr(VI) in alkaline solution.
3. To Show That The Chromium Enriched Yeast Reduces Cr(VI) In Inert Atmosphere. The above extraction procedure was carried out on the chromium enriched yeast plus 500ppb Cr(VI) by adding a 5cm3 aliquot of lOppm Cr(Vl) to 1.0005g of the chromium enriched yeast, after it was added to the de-aerated Tris-NaOH buffer, and prior to the second de-aeration step. A 5cm3 aliquot of this extracted solution was then analysed every 24 hours for 9 days resulting in no absorbance being recorded on day 1 or on any of the 9 days following. The extraction procedure in air was also carried out on 1.0003g of the chromium enriched yeast plus 500ppb Cr(VI) as described in section 2.2.1.(c). Again 5cm3 aliquots were analysed every 24 hours for a total of 9 days. This resulted in an absorbance being recorded on day 1 and this absorbance increased over time. Figure 2.20 represents the absorbance obtained for these extractions and the data is given in appendix 2.14. Since no absorbance was recorded for the extraction carried out under nitrogen, it implies that the chromium enriched
143

yeast rapidly reduced the Cr(VI) that was added to it, and since a measurement was recorded for the extraction of the same solution in the presence of air it indicates that the chromium enriched yeast is capable of reducing Cr(VI) in inert atmosphere, in basic solution.
0.22"
0.20-
0.18-
0.16-
To Show that the Yeast Reduced
Cr(VI) in Inert Atmosphere.
■ ■
■ - A
0.14- ■0.12-
Abs 0.10-
0.08- ■■ ■
0.06-
0.04- A = Chromium enriched yeast + Cr(VI) in air
0.02- B = Chromium enriched yeast + Cr(VI) in Nitrogren* ■ • R0.00 "Y
21 • T •4 6 Time / days
▼ • 18 10
Figure 2.20. To show that the chromium enriched yeast reduced Cr(VI) in inert atmosphere.
4. To Show Air Oxidation O f The Chromium Enriched Yeast Extract.The above extraction procedure was carried out on 1.0002g of the chromium enriched yeast and 5cm3 of the extracted solution were analysed every 24 hours for a total of 9 days. Again this extraction prodecure resulted in no absorbance measurement being recorded over the 9 days. The extraction procedure in air was carried out on 1.0005g of the chromium enriched yeast as described in section 2.2.1.(c). Again 5cm of this extracted solution were analysed every 24 hours for a total of 9 days resulting in no
144

absorbance being recorded on day 1 but an absorbance was recorded on day 2 and this absorbance increased over time. Figure 2.21 represents the absorbance obtained for these extractions and the data is given in appendix 2.15. Since no absorbance was recorded for the extraction procedure carried out under nitrogen, and an absorbance was recorded for the extraction of the same solution carried out in the presence of air it indicates that air oxidation of the chromium enriched yeast extract can occur, and that by carrying out the extraction process under nitrogen this oxidation of Cr(III) to Cr(VI) can be eliminated.
To Show Air Oxidation O f The
0 .3 - Enriched Yeast Extract• * A
• •
0 .2 -•
Abs •
•
0 .1 “
■A = Enriched Yeast Extracted in Air B = Enriched Yeast Extracted in Nitrogen
o.o- ■ ■ ■ ■ ■ ■ "B
c12
■ i i , i4 6
Time / days
| 1 |8 10
Figure 2.21. To show air oxidation o f the chromium enriched yeast.
145

2.2.3. Effect of leaving the Chromium Enriched Yeast in Contact with the Cr(VI) Solution.In the above experiments it was shown how air oxidation of Cr(III) to Cr(VI) can occur in a solution of Cr(III) exposed to air at pH 13 and in the chromium enriched yeast extract at pH 13. Therefore it was decided to see if this oxidation process would occur if the chromium enriched yeast was left in contact with the Cr(VI) solution since it was also shown above how the chromium enriched yeast can reduced Cr(VI) in inert atmosphere.1. Procedure carried out in Air.A lg sample of the chromium enriched yeast was added to 50cm3 of the 0.2M Tris- NaOH pH 13 buffer. Immediately a 5 cm3 aliquot of this solution was withdrawn by pipette and filtered through a 0.2p.M syringe filter. A 2cm3 aliquot of this filtered solution was pipetted into a 10cm3 volumetric flask, a 1cm3 aliquot of 1.67 xlO'3M DPC was added and the solution was made up to the mark with doubly distilledwater. After 5 minutes a spectrum of this solution was obtained from 800 to 400nm.The remainder of the solution, containing the chromium enriched yeast, was left with air (saturated with 0.2M Tris-NaOH pH 13) bubbling through it. Every 24 hours following this a 5cm3 aliquot of this solution was withdrawn, filtered and analysed as above.This procedure was applied to(i). 1,0003g of chromium enriched yeast(ii). 1.0012g of chromium enriched yeast + lppm Cr(VI)The lppm Cr(VI) was added to (ii) above by addition of a 5cm3 aliquot of lOppm Cr(VI) to the 50cm3 of Tris-NaOH pH 13 after the lg of chromium enriched yeast had been added.
146

The results of these experiments are shown in figures 2.22.(a) and 2.22.(b). From figure 2.22.(a) it can be seen that initially there was no Cr(VI) detected, but on day 2 a small concentration of Cr(VI) was detectable and this concentration increased on day 5. But on day 6, 7 and 8 the concentration of Cr(VI) decreased, implying that initially there was air oxidation of the Cr(III) in the yeast but the chromium enriched yeast then reduced this oxidised Cr(VI). Figure 2.22.(b) shows a small concentration of Cr(VI) on day 0. This absorbance reading was not observed in the previous experiment because there was no added Cr(VI) in the solution. This concentration slowly increases over day 1, 2, and 5 but on day 6 the concentration of Cr(VI) present had decreased and this concentration decreased further on day 7 again implying initial air oxidation of the Cr(III) in the yeast and then reduction of this oxidised Cr(VI) by the chromium enriched yeast.
400nm 800nm
Figure 2.22. (a). Chromium enriched yeast left in contact with the buffer after (a) 0, (b) 1, (c) 2, (d) 5, (e) 6 , ( f 7, (g) 8 days.
147

Figure 2.22.(b). Chromium enriched yeast + Cr(VI) left in contact with the buffer after (a) 0, (b) 1, (c) 4, (d) 5, (e) 6 , (f) 7 days.
2. Procedure carried out in Nitrogen.A 50cm3 aliquot of 0.2M Tris-NaOH pH 13 was deaerated with nitrogen for 15 minutes. A lg sample of chromium enriched yeast was added to this deaeratedsolution and immediately a 5cm3 aliquot was withdrawn by pipette and filteredthrough a 0.2jxM syringe filter. A 2cm3 aliquot of this solution was then pipetted into a 10cm3 volumetric flask, a 1cm3 aliquot of 1.67 x 10‘3M DPC was added and the solution was made up to the mark with doubly distilled water. After 5 minutes a spectrum of this solution was obtained from 800nm to 400nm. The remainder of the solution containing the chromium enriched yeast was left stirring with nitrogen over it. A 5cm3 of this solution was withdrawn, filtered and analysed on a daily basis. This procedure was carried out on the following solution;(i). 0.9997g of chromium enriched yeast(ii). 1.0005g of chromium enriched yeast + lppm Cr(VI)
148

The lppm Cr(VI) was added to (ii) above by addition of a deaerated 5cm3 aliquot of lOppm Cr(VI) to the 50cm3 of deaerated Tris-NaOH pH 13 after the lg of chromium enriched yeast had been added. The results of these experiments are shown in figure 2.23.(a) and 2.23.(b) respectively.In figure 2.23.(a) it can be seen that on day 0 no Cr(VI) was detected. This agrees with the experiment 4 in section 2.2.2.(c) which shows that oxidation of the chromium enriched yeast extract does not occur in inert atmosphere. But on day 1 Cr(VI) was detected and this concentration of Cr(VI) increased on day 4, 5 and 6 and on day 7 the concentration of Cr(VI) decreased dramatically.Figure 2.23.(b) shows that on day 0 and 1 no Cr(VI) was detected implying that the chromium enriched yeast reduced the added Cr(VI), which agrees with the results obtained in experiment 3 in section 2.2.2.(c). On day 2 Cr(VI) was detected and the concentration increased on day 5, decreased on day 6 and increased again on day 7. These results were unexpected as it had been shown previously that under a nitrogen atmosphere Cr(III) would not be oxidised to Cr(VI) over several days. These experiments are discussed later, section 3.5.5 (page 235).
149

Figure 2.23.(a). Chromium enriched yeast left in contact with the buffer undernitrogen after (a) 0, (b) I, (c) 4, (d) 5, (e) 6 , (f) 7 days.
Figure 2.23.(b). Chromium enriched yeast + Cr(Vl) left in contact with the buffer under nitrogen after (a) 0, (b) 1, (c) 4, (d) 5, (e) 6 , (f) 7days.
150

2.3. PRECONCENTRATION OF Cr(VI) BY ION EXCHANGE.
2.3.1. Reagents and Solutions.
1. Ammonia, NH3, F.W.=17.03g mol'1, BDH GPR, # 27141.2. Tris(hydroxymethyl)aminomethane, C4H10NO3, F.W.=121.14g mol’1, Riedel-de
Haen, #33742.3. Potassium Dichromate, K2Cr207 , F.W. = 294.19g m ol'1, Wardle Chemical
Company Ltd., #P04868.4. Amberlite IRA - 410, Ionic Form Chloride, Strongly Basic Anion Exchanger,
Sigma Chemical Company, Lot No. 87H0670.5. Ammonium Sulphate, (NH4)2S04 , F.W.=132.13g mol'1, Mallinckrodt Analytical
Reagent.6 . 1,5-Diphenylcarbazide, C13H14N4O, F.W.= 242.3g mol"1, Aldrich Chemical
Company Inc., #25922-5.7. Sulphuric Acid, H2S04 , F.W.=98.07g mol"1, Riedel-de Haen, UN-No. 1830.8 . L-Ascorbic Acid, CôOôHg, F.W.=176.13 g m ol'1, BDH Biochemicals Ltd.,
# 44006.9. Ultra Pure Nitric Acid, HNO3, F.W.=63.01g m ol'1, Aldrich Chemical Company
Inc., #25812-1.10. Chromium Enriched Yeast, Alltech Ireland, Dunboyne, Co. Meath, Ref. 158233.11. Non Enriched Yeast, Active Dried Yeast, DCL Yeast Limited.12. Chromium(III) Chloride, CrCl3.6H20 , F.W.=266.45g mol'1, Riedel-de Haen,
#12228.
151

1. 0.2M HN4O H pH 10.13.5cm3 of ammonia were diluted to 1 dm3 with distilled water and the pH was adjusted to 10 using concentrated ammonia.
2. 0.2M Tris-NaOHpH 13.As in section 2.1.1. (b).
3. Cr(VI) Standards.(a). lOOOppm Cr(VI) in Tris-NaOH pH 13.
A mass o f 0.2829g of potassium dichromate was dissolved in 100cm3 o f 0.2M Tris-NaOH pH 13.
(b). lOppm Cr(VI) in Tris-NaOH pH 13.A 1cm3 aliquot of lOOOppm Cr(VI) was diluted to 100cm3 using 0.2M Tris- NaOH pH 13.
(c). lppm Cr(VI) in Tris-NaOH pH 13.A 10cm3 aliquot o f lOppm Cr(VI) was diluted to 100cm3 using 0.2M Tris- NaOH pH 13.
(d). lOOppb Cr(VI) in Tris-NaOH pH 13.A 1cm3 aliquot of lOppm Cr(VI) was diluted to 100cm3 using 0.2M Tris- NaOH pH 13.
(e). lOppb Cr(VI) in Tris-NaOH pH 13.A 1cm3 aliquot of lppm Cr(VI) was diluted to 100cm3 using 0.2M Tris-NaOH pH 13.
(f). lppb Cr(VI) in Tris-NaOH pH 13.A 1cm3 aliquot o f lOOppb Cr(VI) was diluted to 100cm3 using 0.2M Tris- NaOH pH 13.
Preparation of Solutions.
152

(g). 5ppb Cr(VI) in Tris-NaOH pH 13.A 5cm3 aliquot of lOOppb Cr(Vl) was diluted to 100cm3 using 0.2M Tris- NaOH pH 13.
4. 2M (NH4)2S04i 4M NH4O H pH 10.26.4263g of ammonium sulphate were dissolved in 50cm3 of distilled water. 26cm of ammonia were added and this solution was made up to 100cm with distilled water. The pH was adjusted to 10 using concentrated nitric acid.
5. 2M (NH4) 2S 0 4, 2M NH4O H pH 10.26.4263g of ammonia sulphate were dissolved in 50cm o f distilled water. 13cm of ammonia were added and this solution was made up to 100cm3 with distilled water. The pH was adjusted to 10 using concentrated nitric acid.
6. 2M (NH4) 2SO4, 0.8M NH4O H pH 10.■a . -326.4263g of ammonia sulphate were dissolved in 50cm of distilled water. 5.2cm
■3 ,of ammonia were added and this solution was made up to 100cm with distilled water. The pH was adjusted to 10 using concentrated nitric acid.
7. 2M (NH4) 2S 0 4, 8.0M NH4O H pH 10.26.4263g of ammonia sulphate were dissolved in 30cm of distilled water. 52cm of ammonia were added and this solution was made up to 100cm3 with distilled water. The pH was adjusted to 10 using concentrated nitric acid.
8 . 2M (N H 4) 2S 0 4, 8.0M NH4O H pH 11.9.26.4263g of ammonia sulphate were dissolved in 30cm of distilled water. 52cm of ammonia were added and this solution was made up to 100cm3 with distilled water.
153

9. 2M (NH4) 2S 0 4, 4. OM NH4O H pH 9.0.3 326.4263g of ammonia sulphate were dissolved in 50cm o f distilled water. 26cm
of ammonia were added and this solution was made up to 100cm3 with distilled water. The pH was adjusted to 9.0 using concentrated nitric acid.
10. 1,5-Diphenylcarbazide Solution.As in section 2.1.3.(b).
11. 1.45M H2S 0 4.8cm3 of concentrated H2SO4 were diluted to 100cm3 using distilled water.
12. Anion Exchange Columns.(a). Long Columns.
15g of amberlite IRA-410 were weighed and excess distilled water was added. The ion exchange column was half filled with distilled water and with the aid of a funnel the well stirred slurry o f resin was transferred to the ion exchange column until a height of 18cm was reached. The column was allowed to drain to 1cm from the top o f the resin and this excess was maintained throughout.
(b). Short Column.This was prepared in the same way as the long column with the exception that only 7g of amberlite IRA-410 was weighed and the column was packed to a height of 7cm.
13. 0.1MH.2S0 4, 0.1MAscorbic Acid.1M Ascorbic Acid.
17.613 lg of ascorbic acid were dissolved in 100cm3 o f distilled water.2.7cm of H2SO4 were measured, some distilled water was added, 50cm of the 1M Ascorbic Acid were added and this solution was diluted to 500cm with distilled water.
154

14. Cr(VI) Standards.As in section 2.1.2.(b).
15. O.IMH2SO4.2.7cm3 o f concentrated H2SO4 were diluted to 500cm3 with distilled water.
16. Cr(III) Standards in 0.2M Tris-NaOHpH 13.(a). lOOOppm Cr(III) in 0.2M Tris-NaOH pH 13.
0.5128g of CrCl3.6H20 were dissolved in 100cm3 of 0.2M Tris-NaOH pH 13.(b). 50 ppm Cr(HI) in 0.2M Tris-NaOH pH 13.
A 5cm3 aliquot of lOOOppm Cr(III) in 0.2M Tris-NaOH pH 13 was diluted to 100cm3 with 0.2M Tris-NaOH pH13.
17. 50ppm Cr(IlI) and lOOppb Cr(VI) in 0.2M Tris-NaOH p H 13.A 1cm3 aliquot of lOOOppm Cr(VI) in 0.2M Tris-NaOH pH 13 was diluted to 100cm3 with 0.2M Tris-NaOH pHl3. A 1cm3 aliquot of this was then measured, 5cm3 of lOOOppm Cr(III) in 0.2M Tris-NaOH were added and the solution was diluted to 100cm3 again with 0.2M Tris-NaOH pH 13.
2.3.2. Instrumentation.
(a). UV-160, UV-Visible recording Spectrophotometer, Shimadzu.(b). Spectra AA-10 Atomic Absorption Spectrometer.
Varian GTA-96 Graphite tube Atomiser.Chromium Hollow Cathode Lamp, Pye Unicam Ltd., #39804.Seikosha SL-SOIP Printer.Sample Holders, JVA Analytical Ltd..
155

2.3.3. Preconcentration Procedure using U.V. Spectrophotometric Detection.
An ion exchange column was prepared as in section 2.3.1. and conditioned with 100cm3 of 0.2M NH4OH pH 10. The solution to be analysed was next applied to the column and then the column was washed with 25cm3 of 0.2M Tris-NaOH pH 13. The Cr(VI) which adhered to the column was then eluted using 2M (NH4)2S04 , 4M NH4OH pH 10. A flow rate o f 6 drops per 10 seconds was retained throughout. A
-5 n3cm fraction was collected manually every minute, a 2.0cm aliquot o f 1.67 x 10' M DPC was added to each fraction and after the Cr(VI)-DPC complex formed the absorbance measurements were obtained at 540nm using the spectrophotometric method outline in section 2.1.3.(d).
2.3.4. Preconcentration Procedure using G.F.A.A.S.
Again an anion exchange column was prepared as in section 2.3.1. and conditioned with 100cm3 of 0.2M NH4OH pH 10. The solution to be analysed was applied to the column and the column was washed with 25cm3 of distilled water. Any chromium which adhered to the column was reduced to Cr(III) and eluted using 0.1M H 2S O 4/O .IM ascorbic acid by collecting the first 3cm3 fraction immediately and then leaving the eluent in contact with the column for 1 hour before the remaining fractions were collected. This allowed time for the reduction o f chromium prior to elution. After the hour had elapsed 3cm3 fractions were collected every minute and the flow rate was retained at 6 drops per 10 seconds, and the fractions were analysed by G.F.A.A.S. using the parameters set out in section 2.1.2.(d).
156

1. (a). Effect o f Eluent Concentration.Using the procedure set out in section 2.3.3. above a 25cm3 aliquot o f lOppm Cr(VI) in Tris-NaOH pH 13 were applied to the conditioned column, the column was then washed and any Cr(VI) which adhered to the column was then eluted using the
3 3following eluents, by collecting 3cm fractions every minute and adding a 2.0cm aliquot of 1.67 x 10'3M DPC to cach fraction before being analysed by U.V. Spectroscopy;(i). 2M (NH4)2S 0 2, 4M NH4OH pH 10. (figure 2.24.(a).)(ii). 2M (NH4)2S 0 4, 2M NH4OH pH 10. (figure 2.24.(b).)(iii). 2M (NH4)2S 04, 0.8M NH4OH pH 10. (figure 2.25.(a).)(iv). 2M (NH4)2S 0 4, 8.0M NH4OH pH 10. (figure 2.25.(b).)It was found that eluent (i) eluted all the chromium from the column in 11 minutes, eluent (ii) took 41 minutes for the elution of the chromium, eluent (iii) did not remove all the chromium from the column after 30 minutes and eluent (iv) took only 10 minutes for the elution of the chromium.It was also observed that the greater the molarity o f the ammonium hydroxide in the eluent, the quicker the Cr(VI) was eluted from the column, but eluent (iv) above required a large volume of concentrated nitric acid to adjust the solution to pH 10. This large volume of nitric acid used would counteract the effect o f the ammonia, therefore an optimum eluent was chosen as 2M (NH4)2S 0 4, 4M NH4OH pH 10. Figures 2.24.(a), 2.24.(b), 2.25(a) and 2.25.(b) represent the elution profiles obtained using each of the above eluents and the data is given in appendix 2.16-2.19 respectively.
2.3.5. Establishing Conditions for Elution o f Cr(VI) using Am m onium Buffer.
157

25 ml of 10ppm Cr(VI) Eluent : 2M (NH4)2S04, 4M NH4OH pH 10
Î 0.6Î 0.4a§ 0.2
0
a) 0.8 LongColumn
--
n
- i ° i p ] 1 1 I i 1 1 1 1 n n . n , □ Q , . n
n m s 0 ) T - c 0 i i ) N 0 ) r jTime I minutes
Figure 2.24. (a). Elution profile using a long column and 2M (NHjjjSOj, 4M N Ii4OH pH 10 as eluent.
Figure 2.24.(b). Elution profile using a long column and 2M (NH4) 2804, 2M NII4OHpH 10 as eluent.
158

Eluent: 2M (NH4)2S04, 0.8M NH4OH pH 10a>oc(BnL _o(/)n<
1.51
0.50 _1 j | | | | | | | | | | p
N - O CO CD CD CMCN
r i i i l l i i i i ¡ i l l !lOCsl 00
CN
Time I minutes
Figure 2.25.(a). Elution profile using a long column and 2M (NH4) 2S0 4, 0.8M NH40 H p H 10 as eluent.
Eluent: 2M (NH4)2S04, 8M NH40H pH 10
a>oC<0
Ji_O(AJ< 0 JLt * 1— 1— 1— 1— n
^ h-r i- , n |n )n |n |n r | r.|n |- r r | - | ,
CO CO a> CNCNJ
lOCslTime / minutes
Figure 2.25.(b). Elution profile using a long column and 2M (NH4) 2SO4, 8.0MNH4O H pH 10 as eluent.
159

(b). Effect o f Eluent pH._ "5 •Using the procedure set out in section 2.3.3. a 25cm aliquot o f lOppm Cr(VI) in Tns-
NaOH pH 13 were applied to a conditioned column, the column was then washed and any Cr(VI) that adhered to it was then eluted using the following eluents by collecting
n 3 * 33cm fractions every minute and then adding a 2.0cm aliquot of 1.67 x 10' M DPC to each fraction before being analysed by the U.V. spectrophotometric method in section2.1.3.(d).(i). 2M (NH4)2S 0 2, 4M NH4OH pH 11.9. (figure 2.26.)(ii). 2M (NH4)2S 0 2, 4M NH4OH pH 9.0. (figure 2.27.)(iii). 2M (NH4)2S 0 2, 4M NH4OH pH 10. (figure 2.24.(a).)It was found that by using eluent (i) the Cr(VI) was eluted in 23 minutes, eluent (ii)gave an elution time of 20 minutes, whereas eluent (iii) gave a much faster elution time of 11 minutes. Therefore an optimum eluent o f 2M (NH4)2S 0 2, 4M NH4OH pH 10 was used for the elution of Cr(VI) from the anion exchange in all subsequent experiments where analysis was to be carried out using U.V. spectroscopy. Figure 2.24.(a) represents the elution profile obtained for (iii) above, while 2.26 and 2.27 represent the elution profile obtained for (i) and (ii) above and the data is given in appendix 2.16, 2.20 and 2.21 respectively.
160
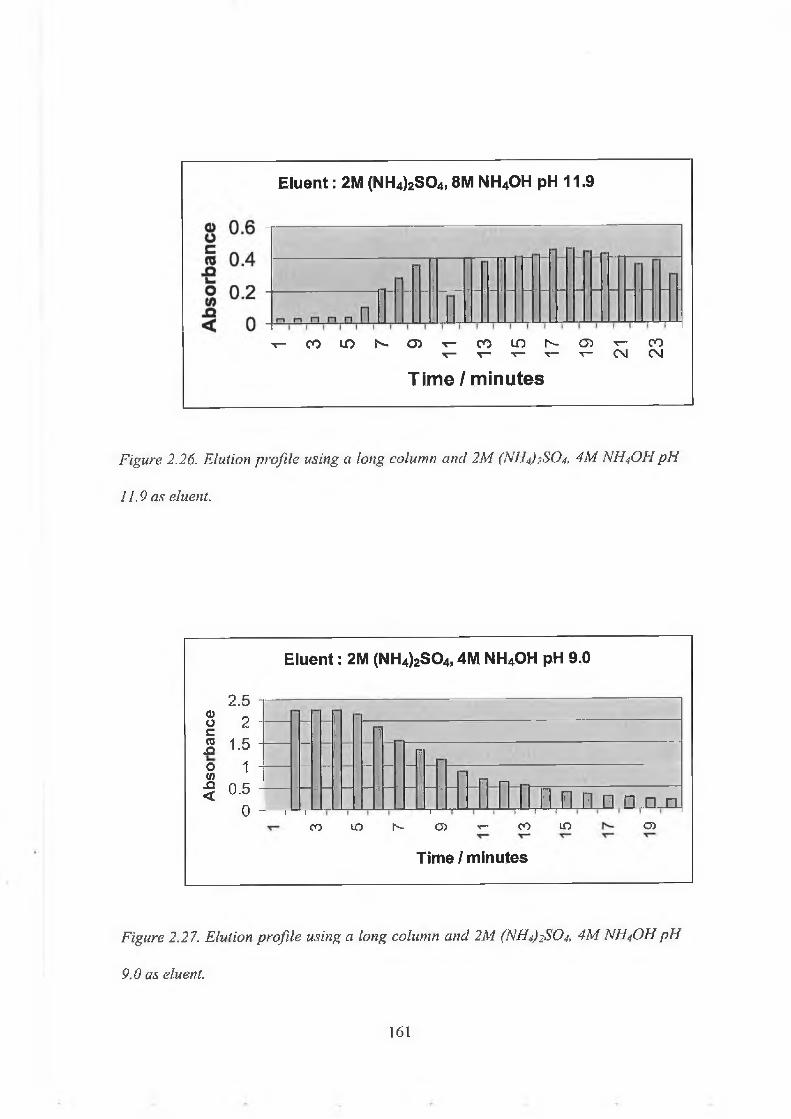
Eluent: 2M (NH4)2S 04, 8M NH4OH pH 11.9
T - c o i o t ^ - O î x - c o m h - a î T - c oT - T - r - T - T - CM CM
Time I minutes
Figure 2.26. Elution profile using a long column and 2M (NH4) 2 8 0 4 , 4M NH4OH pH
11.9 as eluent.
Eluent : 2 M (NH4)2S04, 4M NH4OH pH 9.0
2.5
I 2I 1.5o 1 </>5 0.5
0
■— -
—
*
1_ - \
n __1 1 1 T ------ ------I Q -J n “ 0 0
co to N- cd v- ro LnTime I minutes
CD
Figure 2.27. Elution profile using a long column and 2M (NH4) 2S0 4, 4M NH4OH pH9.0 as eluent.
161

(c). Effect o f Column Length.Again using the procedure in section 2.3.3. a 25cm3 aliquot o f lOppm Cr(VI) in Tris- NaOH pH 13 was applied to both the long conditioned column and the short conditioned column (as prepared in section 2.3.1.). Both of these columns were then washed and any Cr(VI) which had adhered to them was then eluted using 2M (N H ^SO i, 4M NH4OH pH 10 again by collecting 3cm3 fractions manually every minute. A 2.0cm3 aliquot o f 1.67 x 10'3M DPC was then added to each fraction prior to analysis using U.V. spectroscopy. It was found that with the short column the Cr(VI) was eluted in 7 minutes, while it took 11 minutes for the elution of Cr(VI) with the long column, leading to the use of the short column for all further analysis involving ion exchange. Figure 2.24.(a) represents the elution profile for the long column while figure 2.28 represents the elution profile for the short column and the data is given in appendix 2 .22 .
Eluent: 2M (NH4)2SO* 4M NH4OH pH10Short Column
0)c 10 (0-e 5ov> n-Q u <
-□ □_CO 10
-I 1------- 1 I - * I 1
Is*- 05 t— CO LO h«-
Time I minutes
Figure 2.28. Elution profile using a short column and 2M (NH4) 2S04, 4M NH4OH pH10 as eluent. Absorbance measurements were corrected fo r dilution.
162

Again using the procedure in section 2.3.3. the following aliquots o f Cr(VI) concentrations were applied lo a conditioned short column, which was then washed and any Cr(VI) which adhered to the column was then eluted using 2M (N H ^SC ^, 4M NH4OH pH 10 by collecting 3cm3 fractions every minute. A 2.0cm3 aliquot of 1.67 x 10'3M DPC was then added to each o f the fractions before analysis was carried out using the U.V. spectrophotometric method in section 2.1.3.(d).(i). 25cm3 of lOppm Cr(VI) in Tris-NaOH pH 13. (figure 2.28.)(ii). 25cm3 of lppm Cr(VI) in Tris-NaOH pH 13. (figure 2.29.)(iii). 25cm3 o f lOOppb Cr(VI) in Tris-NaOH pH 13. (figure 2.30.)(iv). 1 dm3 of 5ppb Cr(VI) in Tris-NaOH pH 13. (figure 2.31.)An elution profile was obtained for each of the above Cr(VI) concentrations. Experiment (i) is represented by figure 2.28 above, while (ii), (iii) and (iv) above are represented by figures 2.29-2.31 and the data is given in appendix 2.22-2.25 respectively.
2. Effect o f Analtye Concentration.
25ml of 1 ppm Cr(VI) Eluent: 2M (NH4)2S02, 4M NH4OH pH 10
0 0 . 6
1 0.4 o 0.2c/)3 0
u II n n n □ □ FI , , E23 . nI , | | ] — | , ( , I ! I I I Ico lo a ) CO LO h- O)
Time I minutes
Figure 2.29. Elution profile fo r 25cm' o f lppm Cr(VI).
163

25ml of 10Oppb Cr(VI) Eluent: 2M (NH4)2S04, 4M NH4OH pH 10
€ 0.02O(/)S 0
0)g 0.04
- n J V - 1 1 n.n.n,n.n,n,n.n,n,n,n,n,n,„co lo o> T - co lo
Time I minutes
CT>
Figure 2.30. Elution profile o f 25cm3 o f lOOppb Cr(VI).
o 0.03 _§ 0.028 001
5 o
1 Litre of 5ppb Cr(VI)Eluent: 2M (NH4)2S04, 4M NH4OH pH 10
elXLCO LO 05 CO
r rin I— CD
Time I minutes
Figure 2.31. Elution profile o f 1 dm3 o f 5ppb Cr(VI).
164

The percentage recovery for (i) and (ii) above were obtained by applying 25cm of lOppm and 25 cm3 of lppm Cr(VI) to short conditioned anion exchange columns, which were then washed. Following this any Cr(VI) which adhered to the column was then eluted by collecting a total of 50cm3 of 2M (NH|)2S 0 2, 4M NH4OH pH 10 in 1 fraction.
• 3 • * 3 *For eluent (i) a 10cm aliquot of this solution was measured, a 2cm aliquot o f 1.67 x 10'3M DPC was added, the solution was then acidified with concentrated nitric acid and diluted to 100cm3 with distilled water. The absorbance measurement o f this solution at 540nm was found to be 0.182. A control was also prepared by pipetting a 5cm3 aliquot of lOppm Cr(VI) in Tris-NaOH pH 13 into a 100cm3 volumetric flask, a 2cm3 aliquot o f DPC was added along with 10cm3 o f 2M (NH4)2S 0 2, 4M NH4OH pH10. This solution was then acidified using concentrated nitric acid and made up to the mark with distilled water. The absorbance measurement of this solution at 540nm was found to be 0.228 which lead to a percentage recovery of 79.8% being obtained for this solution.For eluent (ii) a 30cm3 aliquot of the fraction was measured, 2cm3 o f 1.67 x 10'3M DPC was added and the solution was diluted to 50cm3 with distilled water. The absorbance measurement of this solution at 540nm was found to be 0.088. A control was then prepared by pipetting a 15cm3 aliquot of lppm Cr(VI) in Tris-NaOH pH 13 into a 50cm3 volumetric flask, 2cm3 of DPC was then added along with 30cm3 of 2M (NH4)2S 0 2, 4M NH4OH pH 10 and the solution was acidified and made up to the mark with distilled water. The absorbance measurement of this solution was obtained at 540nm and found to be 0.121 giving a percentage recovery of 72.7%.For eluent (iii) above the percentage recovery was obtained by applying 25cm of 100ppb Cr(VI) to a conditioned anion exchange column, which was then washed.
165

Any Cr(VI) which adhered to the column was then eluted by collecting a total of 25cm3 of 2M (NH4)2S 0 2, 4M NH4OH pH 10 in 1 fraction. 20cm3 o f this solution was then pipetted into a 25cm3 volumetric flask, a 2cm3 aliquot o f 1.67 x 10 ~3M DPC was added and the solution was made up to the mark with distilled water. The absorbance measurement of this solution at 540nm was found to be 0.055. A control was then prepared by pipetting a 2cm3 aliquot of lppm Cr(VI) in Tris-NaOH pH 13 into a 25cm3 volumetric flask, 2cm3 o f 1.67 x 10'3M DPC were then added along with 20cm3 of 2M (NH4)2S0 2, 4M NH4OH pH 10 and the solution was acidified and made up to the mark with distilled water. The absorbance measurement o f this solution was obtained at 540nm and found to be 0.081 giving a percentage recovery of 67.9%.
Table 2.13. Percentage recovery figures fo r various Cr(VI) standards.Cone. Of Cr(VI) / ppm % Recovery.
10 79.81 72.7
0.1 67.9
From the percentage recovery figures listed in Table 2.13 it can be seen that as the concentration o f Cr(VI) decreased so too did the percentage recovery.
166

The extraction of lg of enriched yeast and lg of non-enriched yeast were carried out in the same way as outlined in section 2.2.2.(c). Extraction was carried out under nitrogen and the filtered extract was applied directly to the column without further dilution. For solution (iii) below 0.0103g of Cr(III)Cl3 was added to lg of nonenriched yeast and the same extraction procedure as for the chromium enriched and the non-enriched yeast above was carried out. These extraction procedures produced the following;(i). 42cm3 of Cr extract from chromium enriched yeast.(ii). 43 cm3 of Cr extract from non-enriched yeast.(iii). 45cm3 of Cr extract from non-enriched yeast containing 20ppm Cr(III).The preconcentration and elution procedure described above was carried out on these solutions by applying them to a conditioned column, which was then washed. Any Cr(VI) which had adhered to the column was then eluted with 2M (NH4)2S04 , 4M NH4OH pH 10 by collecting 3cm3 fractions every minute. A 2cm3 aliquot of 0.1M
H2SO4 was then added to each fraction, to give a pH of 2, along with 400|j.L of 1.67 x 10'3M DPC and each fraction was analysed using the spectrophotometric procedure described in section 2.1.3.(d).Figure 2.32-2.34 represent the elution profiles obtained for these extractions and the data is given in appendix 2.26-2.28 respectively. Sample (i) above did produce a typical elution profile but the absorbance measurements obtained were low. It is possible that air oxidation of Cr(III) may occur during the ion exchange process but this did not occur with sample(iii). Exclusion of air during the ion exchange process would be necessary to completely eliminate this possibility.
2.3.6. Preconcentration of Cr(VI) from Yeast Extracts.
167

Figure 2.32. Elution profile fo r the extracted solution from chromium enriched yeast.
Non Enriched Yeast
©£ 0.03JS 0.02o 0.01tf>3 o T 1— i r
00 ID CD CO LO 05
Time I minutes
Figure 2.33. Elution profile fo r the extracted solution from non enriched yeast.

Non Enriched Yeast + 20ppm Cr(lll)
o 0.06 - | 0.04 o 0.02W§ o - - i - C O L D N - C D T - O O L O r ^ . C J )
Time I minutes
t“ t
Figure 2.34. Elution profile o f the extracted solution from non enriched yeast + 20ppm Cr(IIl).
2.3.7. Establishing Conditions for the Elution of Cr(VI) using H2S 04 and
Ascorbic Acid.
The principle of this method o f preconcentration differs from that previously used. It was found that G.F.A.A. spectroscopy would not tolerate the high ionic strength of the (NH4)2S 0 4, NH4OH buffer used in the previous section. Therefore Cr(VI) was eluted from the column by reduction with acidic ascorbic acid. The eluted fractions were readily analysed by G.F.A.A. spectroscopy, which is more sensitive than the Cr-DPC spectrophotometric method.1. Ascorbic Acid Reduction Procedure.(i). 25cm3 of lppm Cr(VI) in 0.2M Tris-NaOH pH 13 was applied to the anion exchange column, which had been conditioned with 100cm3 o f 0.2M NH4OH pH 10 and then washed with 25 cm3 o f distilled water. Any chromium which adhered to the
o , mcolumn was then reduced and eluted by collecting 3cm fractions every mmute, using0.1M H2S0 4 / 0.1M ascorbic acid as eluent and the absorbance measurement of each
169
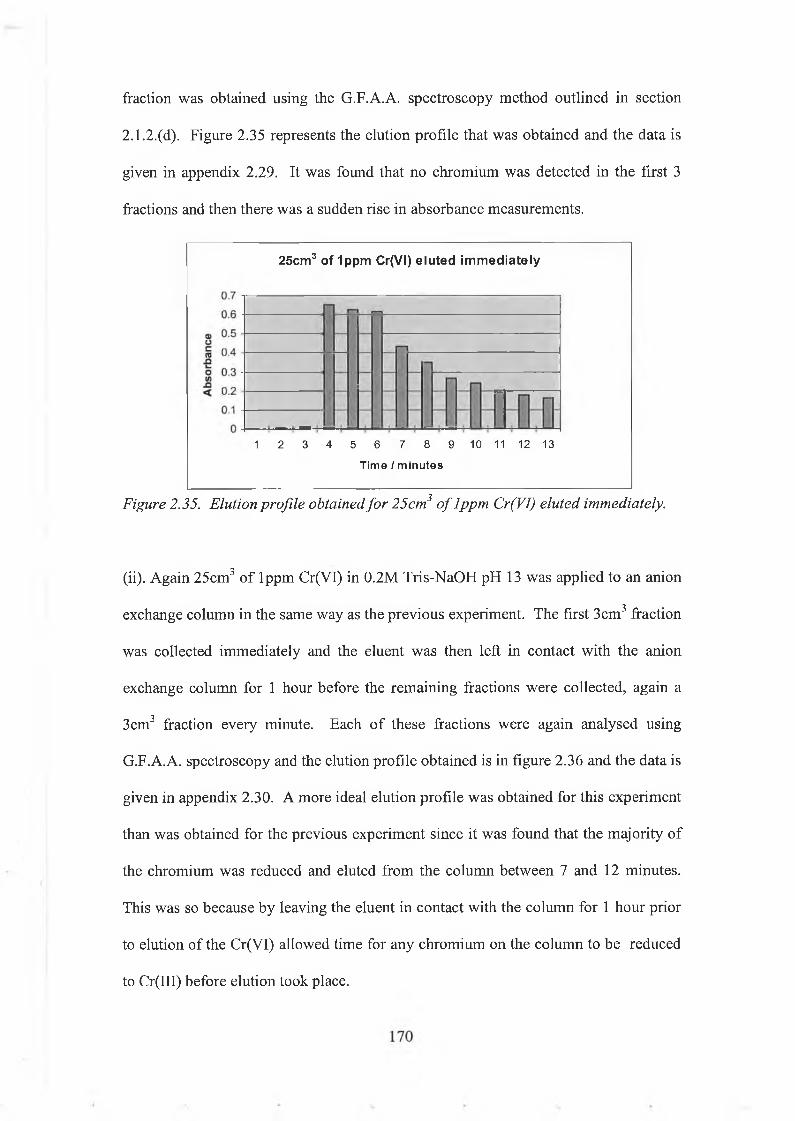
fraction was obtained using the G.F.A.A. spectroscopy method outlined in section2.1.2.(d). Figure 2.35 represents the elution profile that was obtained and the data is given in appendix 2.29. It was found that no chromium was detected in the first 3 fractions and then there was a sudden rise in absorbance measurements.
25cm3 of 1 ppm Cr(VI) eluted im m ediate ly
1 2 3 4 5 6 7 8 9 10 11 12 13Time / minutes
Figure 2.35. Elution profile obtained fo r 25 cm3 o f lppm Cr(VI) eluted immediately.
(ii). Again 25cm3 of lppm Cr(VI) in 0.2M Tris-NaOH pH 13 was applied to an anion exchange column in the same way as the previous experiment. The first 3 cm3 fraction was collected immediately and the eluent was then left in contact with the anion exchange column for 1 hour before the remaining fractions were collected, again a 3cm3 fraction every minute. Each of these fractions were again analysed using G.F.A.A. spectroscopy and the elution profile obtained is in figure 2.36 and the data is given in appendix 2.30. A more ideal elution profile was obtained for this experiment than was obtained for the previous experiment since it was found that the majority of the chromium was reduced and eluted from the column between 7 and 12 minutes. This was so because by leaving the eluent in contact with the column for 1 hour prior to elution of the Cr(VI) allowed time for any chromium on the column to be reduced to Cr(III) before elution took place.

25cm3 of 1 ppm Cr(VI) eluted after 1 hour
0.4<1)
C O L O N - O t- oO I Î î I ^ O )Time / minutes
Figure 2.36. Elution profile obtained fo r 25 cm3 o f lppm Cr(VI) eluted after 1 hour.
2. Elution o f Cr(VI) Standards.The following Cr(VI) standards were preconcentrated and eluted from an anion exchange column by applying them to a conditioned column and then reducing and eluting the Cr(VI) using 0.1M H2SO4 / 0.1M ascorbic acid as eluent and the above procedure, where elution was carried out after the eluent was left in contact with the column for 1 hour, by collecting the first 3cm3 fraction immediately and the remaining 3 cm fractions after 1 hour;(i). 25cm3 of lppm Cr(VI) in Tris-NaOH pH 13.(ii). 25cm3 of lOOppb Cr(VI) in Tris-NaOH pH 13.(iii). 100cm3 o f lOppb Cr(VI) in Tris-NaOH pH 13.(iv). 1 dm3 o f lppb Cr(VI) in Tris-NaOH pH 13.All the fractions from the above procedures were analysed using the G.F.A.A. spectroscopic method as outlined in section 2 .1.2 .(d). and an elution profile was
171

obtained for each o f the standards. The elution profile for (i) above is shown in figure 2.36 while the elution profile for (ii), (iii) and (iv) are shown in figures 2.37-2.39 and the data is given in appendix 2.31-2.33 respectively. It was found that using this preconcentation and reduction procedure as low as 1 ppb Cr(VI) can be detected.
25cm3 of 100ppb Cr(VI) eluted after 1 hour
0.3o> ora 0.2-Q8 o.i < 0
t— c o m i ' - G ) - « — o o L o r ^ o iTime / minutes
Figure 2.37. Elution profile fo r 25 cm3 o f lOOppb Cr(VI) eluted after 1 hour.
100cm3 of 10ppb Cr(VI) e luted after 1 hour
0.30.25
8 0.2 C re-e o.i5 o3 o.i <
0 .05 0
Figure 2.38. Elution profile fo r 100cm3 o f lOppb Cr(VI) eluted after 1 hour.
I l l
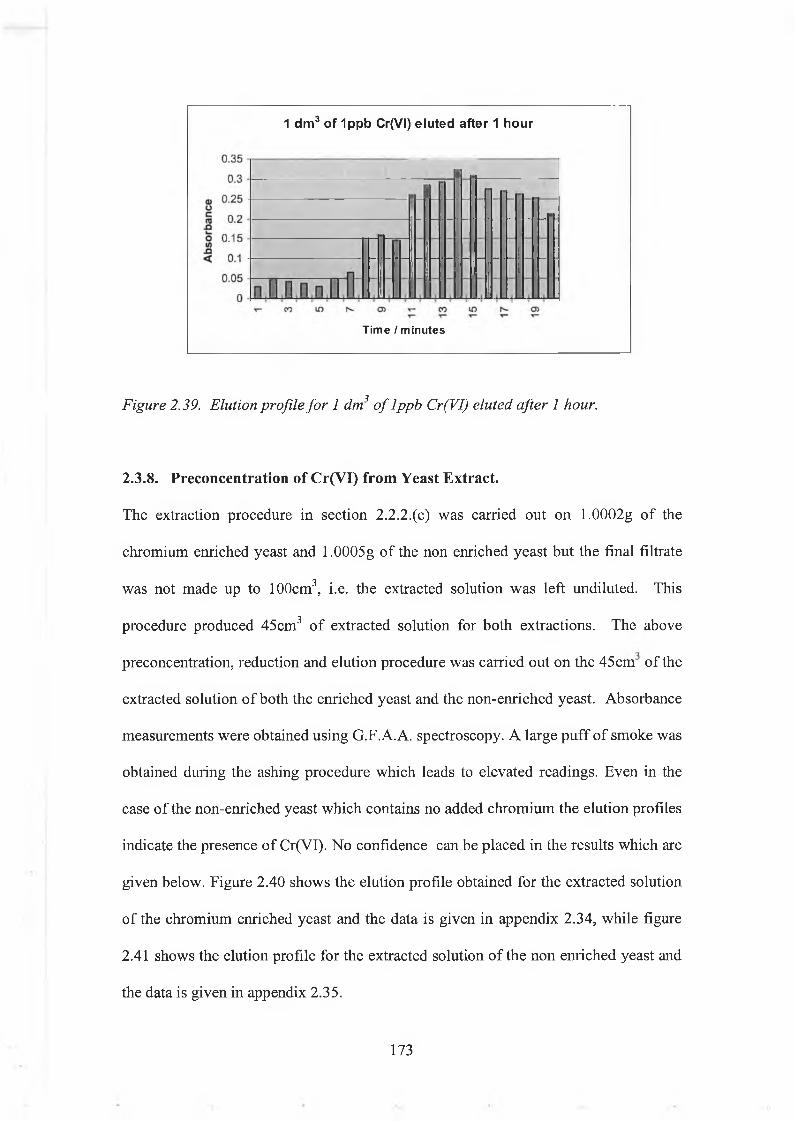
1 dm3 of 1ppb Cr(VI) eluted after 1 hour
Time / minutes
Figure 2.39. Elution profile fo r 1 dm3 o f lppb Cr(VI) eluted after 1 hour.
2.3.8. Preconcentration of Cr(VI) from Yeast Extract.
The extraction procedure in section 2.2.2.(c) was carried out on 1.0002g of the chromium enriched yeast and 1.0005g of the non enriched yeast but the final filtrate was not made up to 100cm3, i.e. the extracted solution was left undiluted. This procedure produced 45cm3 o f extracted solution for both extractions. The above preconcentration, reduction and elution procedure was carried out on the 45cm of the extracted solution of both the enriched yeast and the non-enriched yeast. Absorbance measurements were obtained using G.F.A.A. spectroscopy. A large puff of smoke was obtained during the ashing procedure which leads to elevated readings. Even in the case of the non-enriched yeast which contains no added chromium the elution profiles indicate the presence o f Cr(VI). No confidence can be placed in the results which are given below. Figure 2.40 shows the elution profile obtained for the extracted solution of the chromium enriched yeast and the data is given in appendix 2.34, while figure 2.41 shows the elution profile for the extracted solution of the non enriched yeast and the data is given in appendix 2.35.
173

Chromium Enriched Yeast Extract eluted a fter 1 hour
0.8<Uc 0.6nnown<
0.4
0.2
ELd ,q ,d. ct) co mTime I minutes
Figure 2.40. Elution profile obtained fo r the extract o f the chromium enriched yeast eluted after 1 hour.
Non Enriched Yeast Extract eluted after 1 hour
0.250.2a>u
a 0.15■eo(/)5° 0.10.05
1 2 3 4 5 6 7 8 9 10 11 12 13 14 15 16 17 18 19 20 Time / minutes
Figure 2.41. Elution profile obtained o f the extract from the non enriched yeast eluted after 1 hour.
174

In this section the separation o f Cr(VI) from an excess of Cr(III) by ion exchange was investigated. This is the situation encountered in the yeast extract. Under alkaline conditions Cr(VI) has a negative charge and is retained on an anion exchange resin. Under alkaline conditions Cr(IIl) forms negatively charged complexes such as Cr(OH)63‘ (aq) which will be retained on an ion exchange resin. There may also be complexing by the Tris-NaOH buffer. Theoretically Cr(III) complexation would be reversed in acid solution allowing the retained Cr(III) to be removed from the column using acid solution. Cr(VI) is anionic at all pH values and would only be removed by a high ionic strength buffer such as 2M (NH4)2S 0 4, 4M NH4OH pH 10 or by a reducing buffer such as ascorbic acid, H2S 0 4.
(a). Separation o f 50ppm Cr(III) and lOOppb Cr(VI) in Tris-NaOH p H 13.A control was prepared by pipetting a 5cm3 aliquot of 50ppm Cr(III) and lOOppb Cr(VI) in 0.2M Tris-NaOH pH 13 solution into a 10cm3 volumetric flask and making up to the mark with 0.2M Tris-NaOH pH 13, and the absorbance measurement was obtained using flame A.A. and found to be 0.0994.
An anion exchange column as prepared in section 2.3.1. was conditioned with 100cm3
of 0.2M NH4OH pH 10. A 25cm3 aliquot of 50ppm Cr(III) and lOOppb Cr(VI) in Tris- NaOH pH 13 was applied to the column at a rate o f 6 drops per 10 seconds, and the solution which passed through the column was collected. The column was then washed with distilled water, which was collected along with what had passed through the column until a total of 50 cm3 had been collected. The absorbance measurement of this solution was again obtained using flame A.A. and was found to be 0.0757. By
2.3.9. Separation of Cr(VI) and Cr(III) by Ion Exchange.
175

comparing this absorbance measurement with that of the control the percentage o f the chromium(III) which passed through the column was 76.2%.In alkaline solution Cr(IIl) was retained on the column as anionic hydroxy complexes. Acidification should destroy these complexes. The Cr(III) was eluted from the column using 0.1M H2S 04. The acidic solution was passed through the column for 1 minute and a 3 cm3 fraction was collected. The acid was allowed to stay in contact with the column for 1 hour and then 3cm3 fractions were collected every minute for 9 minutes. The absorbance measurement of each fraction was measured using flame A. A. It was found that any Cr(III) on the column was eluted within 9 minutes. The elution profile obtained here is shown in figure 2.42 and the data is given in appendix 2.36.Cr(VI) is anionic at all pH values and would still be retained on the column. The Cr(VI) on the column was eluted using 2M (NH4)2S 0 4 / 4M NH4OH pH 10 by collecting 3cm3 fractions every minute. A 2cm3 aliquot of 1.67 x 10 3M DPC was then added to each fraction and the absorbance measurements were obtained at 540nm as in section 2.1.3.(d). A typical elution profile was obtained and it was found that the Cr(VI) was eluted from the column in 7 minutes. The elution profile is shown in figure 2.43 and the data is given in appendix 2.37.From the above experiment it has been shown how a trace concentration o f Cr(VI) (lOOppb) can be separated from a large excess (50 ppm) o f Cr(III) and detected spectrophotometrically using DPC.
176

Elution of Cr(lll) from Chromium Mixture
0.060.05
O U.U4 c (0-Q 0.03o(/>n<5 0.02
0.010 a i e i I I—» ¡ I—» j-J i i I I i
4 5 6Time / minute
Figure 2.42. Elution profile obtained fo r Cr(JII) from chromium mixture.
Elution of Cr(VI) from Cr Mixture
o 0 05 -g 0.04 -5 0.03o 0 .02 - in-9 0.01 -
C O L O N - C D t- oO L O ^ - C T i
Time I minutes
n C l . t n . . . n . ! . r u . C l . c
Figure 2.43. Elution profile obtained fo r Cr(VI) from chromium mixture.
I l l

In order to prevent air oxidation o f Cr(III) during the extraction of the chromium yeast the procedure was carried out under nitrogen. It was necessary to demonstrate that no air oxidation occurs during the process of extraction followed by ion exchange before the procedure described in section (a) could be applied to the yeast extract. Therefore the extraction process was simulated using a 50ppm Cr(III) solution in tris NaOH buffer at pH 13. A 45 cm3 aliquot of 0.2M tris NaOH pH 13 was deaerated for 15 minutes and 5 cm3 of 1000 ppm Cr(III) was added and deaerated for a further 5 minutes. The mixture was left stirring overnight. Next day this solution was centrifuged and filtered as described previously in section 2.2.2.(c). A 25cm3 aliquot of this extract was then applied to an anion exchange column as in the previous experiment and eluted with distilled water until a total o f 50cm3 had been collected.
The absorbance o f the solution was found to be 0.0738+0.000499 using flame A.A.A control was prepared by pipetting 5cm3 of 50ppm Cr(UI) in 0.2M Tris-NaOH pH 13 into a 10cm3 volumetric flask and making up to the mark with deaerated distilled water and the absorbance measurement of this was found to be 0.0929 ±0.000916 by
flame A.A. The percentage Cr(III) which passed through the column was found to be 79.0%.As in the previous experiment a solution of 0.1M H2S 0 4 was passed through the column to elute any Cr(III) which was present by collecting 3cm3 fractions every minute. After the first fraction was collected the eluent was left in contact with the column for 1 hour after which the remaining fractions were collected and analysed using flame A.A. It was found that the Cr(III) was eluted from the column in 9 minutes. The elution profile is shown in figure 2.44 and the data is given in appendix2.38.
178

Elution of Cr(lll) from Cr(lll) Standard
0.08g 0.06Cn■E 0.04 -0t/>1 0.02 -
0 L-i I—! L 1 . 1 1 , U , .L L ,- D ,— ^ = i_1 2 3 4 5 6 7 8 9 10
Time / minutes
Figure 2.44. Elution profile obtained fo r Cr (III) from Cr(III) standard.
Following this any Cr(VT) that may have adhered to the column was eluted from the column using 2M (NH4)2S 0 4, 4M NH4OH pH 10 by collecting 3cm3 fractions every minute and analysis was carried out by adding a 2.0cm3 aliquot of 1 x 10'3M DPC to each fraction and obtaining the absorbance measurement at 540nm. Since no colour change was observed after the addition of DPC to the fractions the experiment indicates that no Cr(VI) was present in the fractions and indicates that Cr(HI) was not oxidized to Cr(VT) while on the column or during the elution process. The elution profile for this experiment is shown in figure 2.45 and the data is given is appendix2.39. There is negligible absorbance in the 3-6 minute fractions where Cr(VI) would be eluted.
179

Elution of Cr(VI) from Cr(lll) Standard
i nL 1 1 1 n, n n , D n n n □ h^d , D
CO LO N - O ) T - CO LO
0.02 jQ)Oc 0.015 -<0-Q■_ 0.01 -o(A-Q 0.005<
Time I minutes
Figure 2.45. Elution profile obtained fo r Cr(VI) from Cr(III) standard.
(c). Separation o f Cr(III) and Cr(VI) from a Chromium Enriched Yeast Extract.The extraction procedure as in section 2.2.2.(c) was carried out on 0.9992g of the chromium enriched yeast. A 25cm3 of this extract was then applied to an anion exchange column, again as in the previous experiment, and the absorbance measurement of the solution which passed through the column along with the rinsings was found to be 0.0589 using flame AA.
A control was prepared by pipetting 5cm3 of the chromium enriched yeast extract into a 10cm3 volumetric flask and making up to the mark with deaerated distilled water. The absorbance measurement of this solution was found to be 0.0755 using flame AA. The percentage Cr(III) which passed through the column was found to be 78%.As in the previous separation experiment the 0.1M H2S 0 4 was passed through the column to elute any Cr(III) present by collecting 3 cm3 fractions every minute. The eluent was allowed to remain in contact with the column for 1 hour after the first fraction was collected, after which the remaining fractions could be collected at 1
180

minute intervals. The fractions were analysed using flame A.A. Again it was found that the Cr(III) was eluted from the column in 9 minutes. The elution profile obtained is shown in figure 2.46 and the data is given in appendix 2.40.
Elution of Cr(lll) from Yeast Extract
0.06 - 0.05 -<D
c 0 .04 - ro■£ 0.03 - jo 0 . 0 2 -
< 0.01 -
. ! 1 i -! -- n . __ J . □ _■=,1 2 3 4 5 6 7 8 9 10
Tim e / m inutes
Figure 2.46. Elution profile obtained fo r Cr(III) from the chromium enriched yeast extract.
Following this any Cr(VI) which may have adhered to the column was eluted from the column with 2M (NH4)2S 0 4, 4M NH4OH pH 10 again by collecting 3cm3 fractions every minute and the analysis was carried out by adding 2cm3 o f 1.67 x 10"3M DPC to each fraction and the absorbance measurement was obtained at 540nm. The elution profile is shown in figure 2.47 and the data is given in appendix 2.41. No colour change was observed here after the addition o f the DPC to the fractions and no evidence for the presence o f Cr(VI) in the extracts was observed. The result suggests that that there is no Cr(VI) in the yeast extract.
181

Elution of Cr(VI) from Yeast Extract
Figure 2.47. Elution profile obtained fo r Cr(VI) from the chromium enriched yeast extract.This result indicates that if the Cr(III) is separated from any Cr(VI) in the yeast extract prior to elution o f any adsorbed Cr(VI), air oxidation o f Cr(III) cannot occur during the latter process. This suggests that the elution profile obtained in figure 2.32 (p 168) may have been due to air oxidation.
182

2.4. PRECONCENTRATION OF Cr(VI) BY H.P.L.C..2.4.1. Reagents and Solutions.
1. Acetonitrile, CH3CN, F.W.=41.05g mol"1, BDH Chemicals Ltd., #29220.2. Sulphuric Acid, H2S 0 4, F.W.=98.07g mol'1, S.G.=1.84, Romil Ltd., Code A-9691.3. 1,5-Diphenylcarbazide, C13H 14NO4, F.W.=242.3g m ol'1, Aldrich Chemical Company Inc.,
#25922-5.4. Potassium Dichromate, K2Cr207 , F.W.=294.19g mol"1, Wardle Chemical Company Ltd.,
#P04868.5. Chromium Enriched Yeast, Alltech Ireland,Dunboyne, Co. Meath.
Preparation of Solutions.
1. Mobile Phase. 6 x 10‘3M H2SO4 in 20% Acetonitrile.As in section 2.1.4.(b).
2. 2 x 10'3M DPC in 10% Acetonitrile, 0.048M H2S 0 4.As in section 2.1.4.(b).
3. lppm Cr(VI).As in section 2.3.1.(c).
2.4.2. Instrumentation.
UV Spectrophotometric Detector SPD-6A,Shimadzu.Liquid chromatography LC-6A, Shimadzu.3390A Integrator - Hewlett Packard Model 1.
183

2.4.3. Analysis of Chromium Enriched Yeast Extract.
The extraction procedure as in section 2.2.2.(c). (i.e. under nitrogen) was carried out on 1.0021g of chromium enriched yeast, but before the final filtration step was carried out, the extract was adjusted to pH 2 using 5M H2SO4. To 20cm3 o f this extracted solution, without the final dilution (i.e. the filtrate was not made up to 100cm3 with deaerated 0.2M Tris-NaOH pH13), a 2.5cm3
aliquot of 2.x 10'3M DPC was added and the preconcentration and elution as outlined in section2.1.4.(d). was carried out.It was found that no colour change was observed after the addition of the DPC solution and no Cr(VI) peak appeared after elution indicating that no Cr(VI) was present in the chromium enriched yeast extract. The chromatogram for the extract is given in figure 2.48.(a).
2.4.4. Reduction of Trace Cr(VI) by Chromium Enriched Yeast Extract.
To a 20cm3 aliquot o f the extracted solution from the chromium enriched yeast above the following Cr(VI) concentrations were added, followed by a 2.5cm3 aliquot of 2 x 10~3M DPC and the preconcentration and elution procedure from section 2.1.4.(d). was carried out. By addition of the aliquots of Cr(VI) listed below to 20cm3 of the extracted solution the following concentrations of Cr(VT) were produced; (a) 13ppb Cr(VI), (b) 44ppb Cr(VI) and (c) 88ppb Cr(VI).
(a). 300pL of lppm Cr(VI).
(b). 100p.l of 10ppmCr(VI).
(c). 200p,l of lOppm Cr(VI).It was found that for (a) above a very small Cr(VI) peak of area 1612 was observed at 8.06 minutes after elution and on comparing this peak area with that of the 15ppb Cr(VI) from the calibration curve in section 1.2.4.(d) it implies that the extracted solution from the chromium enriched yeast reduced the majority of the 13ppb Cr(VI) that was added. For (b) a small peak at 8.29 minutes was observed of area 6879 and for (c) a larger peak o f area 307170 was observed at 8.24 minutes, and
184
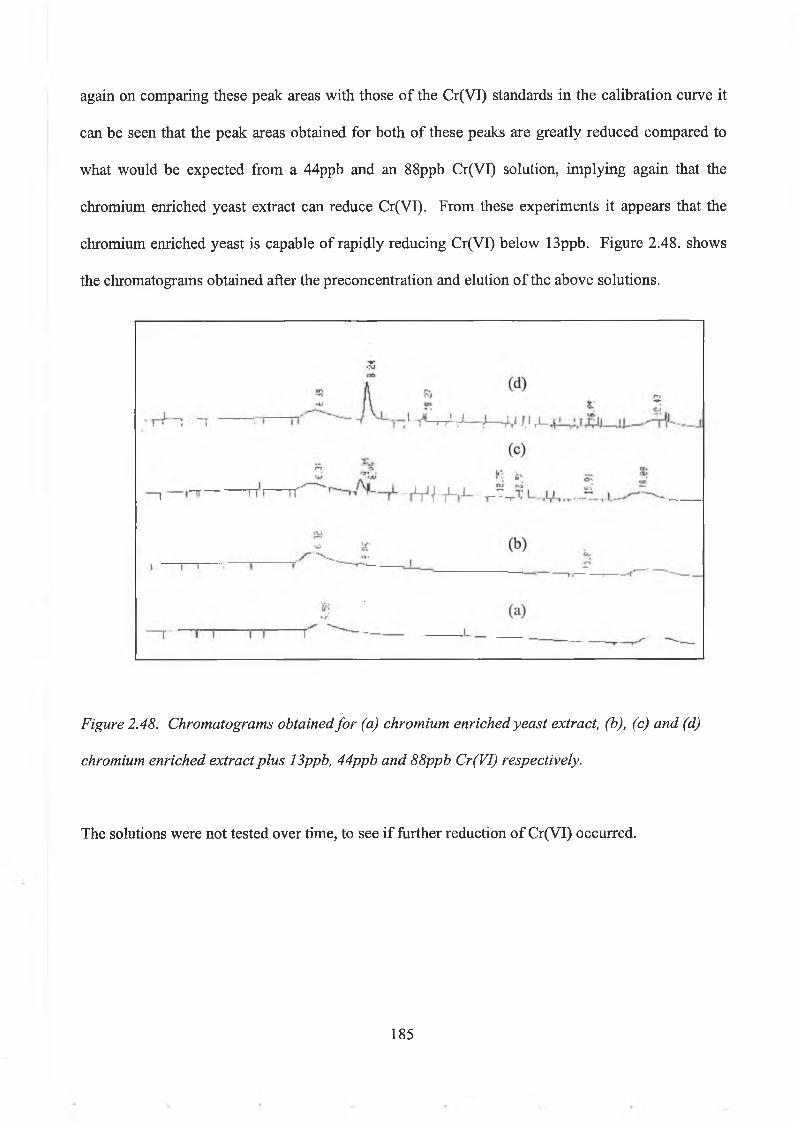
again on comparing these peak areas with those o f the Cr(VI) standards in the calibration curve it can be seen that the peak areas obtained for both o f these peaks are greatly reduced compared to what would be expected from a 44ppb and an 88ppb Cr(VI) solution, implying again that the chromium enriched yeast extract can reduce Cr(VI). From these experiments it appears that the chromium enriched yeast is capable of rapidly reducing Cr(VI) below 13ppb. Figure 2.48. shows the chromatograms obtained after the preconcentration and elution o f the above solutions.
Figure 2.48. Chromatograms obtained fo r (a) chromium enriched yeast extract, (b), (c) and (d) chromium enriched extract plus 13ppb, 44ppb and 88ppb Cr(VI) respectively.
The solutions were not tested over time, to see if further reduction o f Cr(VI) occurred.
185

2.5. Reduction Capacity of Yeast.2.5.1. Reduction of Cr(VI) by Ascorbic Acid.
2.5.1.(a). Introduction.
According to Connett (1985) the rate determining step in the reaction of ascorbic acid and Cr(Vl) is the formation o f a Cr(VI) ester, which rapidly decomposes into the products, Cr(VI) and dehydroascorbic acid. The rate of the reaction is given by
Rate = k[Ascorbic Acid] [Cr(VI)] (1)where k = second order rate constant
In order to determine k the reaction was carried out in excess ascorbic acid. Under these conditions the rate is given by
Rate = kobs [Cr(VI)] (2)where kobs = the pseudo-first-order-rate constant
By combining equations (1) and (2) it is clear thatkobs ~ k[Ascorbic Acid] (3)
By plotting kobs against [Ascorbic Acid] the second order rate constant for the reaction may be determined.
Determination of First Order Rate Constants.
For a first order reaction the concentration (C) o f the reactant decreases with timeC = C0e k°bs 1 (4)
Assuming that the concentration o f Cr(VI) is proportional to the absorbance at 375nm the absorbance at this wavelength may be used to follow the decrease in Cr(VI) concentration.
A = A 0e k°bst (5)
186

A plot of A verses time/seconds will be exponential. The data may be fitted to equation 5 using non linear least squares and the values for A0 and kobs can be obtained. In this section the first order rate constant was determined at 298K, at various ascorbic acid concentrations.
2.5.1.(b). Reagents and Solutions.
Reagents.
1. Trizma (Tris[hydroxymethyl]aminomethane) hydrochloride, C4H nN 0 3.HCl, F.W.=157.6g mol'1, Sigma, #T3254.
2. Ascorbic Acid, C6H80 6, F.W. = 176.13 g m ol'1, BDH Biochemicals, #44006.3. Potassium Dichromate, K2Cr20 7, F.W. = 294.49g mol"1, Wardle Chemical
Company Ltd., #P04868.4. Sulphuric Acid, H2S 0 4, S.G. = 1.84, F.W. = 98.07g mol'1, Romil Ltd., Code A-
9691.5. Sodium Hydroxide, NaOH, F.W. = 40.00g mol"1, Wardle Chemicals Ltd.,
#S05652.6 . Tris(hydroxymethyl)aminomethane, C4H 10NO3, F.W.= 121.12g mol'1, Riedel-de
Haen, #33742.
Preparation of Solutions.
1. 1 Molar Tris-HCl p H 7.4.157.6001 g of Tris(hydroxymethyl)-aminomethane were dissolved in 1 dm3 of distilled water and the pH was adjusted to 7.4 using 5M NaOH.
187

2. Ascorbic Acid Standards.Each of the quantities of ascorbic acid listed in Table 2.14 were dissolved in 90cm3 of 1M Tris-HCl pH 7.4 and the pH was then readjusted to 7.4 using 5M NaOH and the solution was then made up to 100cm3 with 1M Tris-HCl to produce the respective concentrations.
Table 2.14. Quantities o f ascorbic acid dissolved in 100cm3 to produce the required ascorbic acid standards.
Ascorbic Acid / mol dm"3 Ascorbic Acid / g
0.01 0.17600.02 0.3523
0.03 0.5284
0.04 0.7045
0.05 0.8800
0.06 1.0570
5 x 10'3 0.0882
Each of the aliquots o f 5 x 10'3M ascorbic acid listed in Table 2.15 were diluted to 90cm3 with 1M Tris-HCl pH 7.4, the pH was readjusted to 7.4 using 5M NaOH, and each of these solutions were then made up to 100cm3 with 1M Tris-HCl pH 7.4 to produce the respective ascorbic acid concentrations.
188

Table 2.15. Aliquots o f ascorbic acid diluted to 100cm3 to produce the required ascorbic acid standards.
Ascorbic Acid / mol dm '3 5 x 10 3M Ascorbic Acid / cm3
5 x 10⁴ 10
1 x 10'3 20
2 x 10'3 40
3. Potassium Dichromate Standards.(a). 3.7 x 10'4M K2Cr20 7.
0.0105g of K2Cr20 7 were dissolved in 100cm3 o f distilled water.(b). 5.0 x 10'4M K2Cr20 7.
0.0142g of K2Cr20 7 were dissolved in 100cm3 of distilled water.(c). 1 x 10⁻³M K 2Cr20 7.
0.0283g of K2Cr20 7 were dissolved in 100cm3 of distilled water.(d). 2 x 10'3M K2Cr20 7.
0.0567g of K2Cr20 7 were dissolved in 100cm3 of distilled water.
2.5.1.(c). Instrumentation.PH meter, Jenway, Lennox, Model 3310.U.V.-1601, UV-Visible Spectrophotometer, Schimadzu.Expandable Ion Analyzer EA 920, Orion Research.Platinum Wire Electrode.Orion Double Junction Reference Electrode.Computer - Memorex Telex.Strawberry Tree Quick Log Data Acquisition Software.

One of the ascorbic acid standards above, 0.01M - 0.06M was heated to 25°C in a water bath as was the 3.7 x 10'3M K2Cr20 7. Following this a 2cm3 aliquot of the ascorbic acid standard was added to 2cm3 of the 3.7 x 10'4 K2Cr20 7 in a plastic cuvette. Immediately after addition the solution was shaken and the absorbance o f the Cr(VI) at 375 nrn was recorded over the desired period of time (240 s). Instrument parameters were set as follows:
2.5.1.(d). Procedure for the Reduction o f Cr(Vl) by Ascorbic Acid.
Kinetics.
1. Meas Mode2. Meas Time
Lag Time Rate Time
3. Factor4. Rec Range5. Temp Control6 . Time Scale
- Abs.- 240 seconds- 0 seconds.- 10 seconds.- 1.000
- 0.00A -2.00A .- 25°C.- seconds.
Then by pressing the START button the absorbance was recorded. The temperature was maintained at 25°C throughout by using a thermostated cell. When the experiment was complete - RETURN, MODE and then DATA PROCESSING (6) were pressed. From here POINT PICK (6) was selected and the parameters were set as START POINT: 0.0 and INTERVAL: 10.0. This gave the absorbance reading for the reduction of Cr(VI) by ascorbic acid every 10 seconds. From these points a graph of absorbance verses time/seconds was obtained for each o f the ascorbic acidstandards. It was observed that the rate at which the absorbance measurements
190

decreased with time increased as the ascorbic acid concentration increased. Figures 2.49-2.54 represent the decrease in absorbance measurements that were obtained from these experiments. The data is given in appendix 2.42-2.47 respectively. Each of these graphs were then fitted to the function A*exp(-b*x), and the pseudo-first-order-rate constant, (B value = Kobs) was obtained from each graph.
1 .2 - Reduction of Cr(VI) by 0.01 M Ascorbic Acid.■,
1.1 -■
1 .0 -• CHI2 = 2.8616E-5
0 .9 - '■ A 1.22559 0.00318• * u B 0.00356 0.00002
0 .8 -Abs ■
m0 .7 -
‘ *0 .6 -
■■ ■0 .5 - ■
i i - i < i ■ i 1 i >50 100 150 200 250
Time / seconds
Figure 2.49. Reduction o f Cr(VI) by 0.01MAscorbic Acid.
191

2 ' Reduction of Cr(VI) by 0.02M Ascorbic Acid.
1 .0 -
8 0.8- **_ Chi2 = 1.8791E-5ro ■ A 1.19837 0.00311£ ■. B 0.00629 0.00003o5 06 i <
0,4 ~
0.2 H • 1 » 1 » 1 » 1 '------ 1—0 50 100 150 200 250
T im e / seconds
Figure 2.50. Reduction o f Cr(VI) by 0.02M Ascorbic Acid.
1,2-1 Reduction o f Cr(VI) by 0.03M Ascorbic Acid. ■1.0 - ^
*0)| 1 '-a chi* = 5.2066E-5-O 0,6- '■* A i .34836 0.00684° V B 0.01060 0.00007</> ^
-Q ■< 0.4 -
0 .2 -
—1------- ' 1 ' 1 » 1 ■----- 1—50 100 150 200 250
Time / seconds
Figure 2.51. Reduction o f Cr(VI) by 0.03M Ascorbic Acid
192

1 .2 -Reduction of Cr(VI) by 0.04M Ascorbic Acid.
■1 .0 -■
0 .8 -(Do \ Chi3 = 0.000155 0 .6 - ■, A 1.35559 0.01418jOi—O(ftn 0 .4 - <
V B 0.01377 0.00017f c . ^■ .
■ _
0 .2 -
o.o-i | i | i | i (■ . i •
50 100 150 200 250T im e / s e c o n d s
Figure 2.52. Reduction o f Cr(VI) by 0.04M Ascorbic Acid.
1.0
0.8 -
Reduction of Cr(VI) by 0.05M Ascorbic Acid.
£ 0.6 H - Chi2 = 0.0006
0.2 -
o.o-
A 1.27404 0.03395ro% k B 0.01718 0.00051w 0.4 - <
■m
—1-------' 1 ' 1 ■ 1 1------1—50 100 150 200 250
T im e / s e c o n d s
Figure 2.53. Reduction o f Cr(VI) by 0.05M Ascorbic Acid.
193

1 .0 - Reduction of Cr(VI) by 0.06M Ascorbic Acid.• ■L
0.8 “ 1,
V
<D 0.6- 11o ■ Chi2 = 0.00122I—CO A 1.34999 0.06717-QO 0.4- V B 0.02199 0.00112(Oo t i t•U<
0 .2 - ■ -■ -.....................................
0.0-i ■ i ■ i ■ i i >
0 50 100 150 200 250Time / seconds
Figure 2.54. Reduction o f Cr(VI) by 0.06M Ascorbic Acid.
Table 2.16. Pseudo-First-Order-Rate Constants obtained form above graphs.Concentration of Ascorbic Acid /
mol dm 3Pseudo-First-Order-Rate Constant /
seconds _10.01 0.003560.02 0.006290.03 0.010600.04 0.013370.05 0.017180.06 0.02199
From these points the pseudo-first-order-rate constant (Kobs) verses ascorbic acid concentration/mol dm 3 was plotted and this gave a straight line implying that the reaction was first order with respect to ascorbic acid concentration. Figure 2.55
194

represents the straight line obtained from the Kobs values v ’s ascorbic acid concentration and the data is given in appendix 2.48. From this the second rate constant was obtained from the slope of the graph and was found to be 0.366 dm3
mol' 1 s'1.
Ascorbic Acid Cone. / mol dm ‘3
Figure 2.55. Determination o f the second order rate constant.
Table 2.17. Data from the graph o f the determination o f the second order rateconstant.
Parameter ValueA -0.00057±0.00051B 0.36569+0.01320R 0.9974
SD 0.00055N 6P 0.00001
195

Dixon and Sadler (1993), reported that under anaerobic conditions L-ascorbic acid rapidly reduces chromium (VI) at a rate which is about 10 times faster than the rate of reaction carried out in oxygen. But O’Brien and Woodbridge (1997) later showed that this reported oxygen-dependence was caused by the use of non-demetallated Tris-HCl buffer and was not an intrinsic feature of the redox reaction between chromium (VI) and ascorbic acid. In order to fmd out if the presence o f air has any effect on the rate of reduction of Cr(VI) by ascorbic acid the following was carried out.A 2cm3 aliquot of 0.03M ascorbic acid and a 2cm3 aliquot of 3.7 x 10'3M K2Cr20 7
were mixed in a quartz cuvette. Immediately after addition the solution was shaken and the spectrum of the solution was obtained every minute for a total o f 8 minutes. Instrument parameters were entered as follows:
Spectrum
2.1.5.(e). The Effect o f Anaerobic Conditions.
1. Meas Mode - Abs.2 . Scanning Range - 470nm - 350nm.3. Rec. Range - 0.00A - 1.00A.4. Scan Speed - Fast.5. No. of Scans - 8 scans. Int: 60 sec.6 . Display Mode - Overlay.
After the 8 minutes had elapsed and all the spectra were recorded a print out of the spectra were obtained and it was found that most of the Cr(VI) had been reduced by the ascorbic acid in 6 minutes. The spectra obtained from this experiment are shown in figure 2.56.(a).
196

Following this the solution of the 0.03M ascorbic acid was deaerated for 10 minutes using nitrogen as was the solution o f the 3.7 x 10'3M K2Cr20 7. A 2cm3 aliquot o f both of these solutions were then mixed and immediately a cap was placed on top o f the quartz cell to prevent any air from entering the solution. Then this solution was analysed in the same way as the solutions under aerobic conditions, and again a spectrum was recorded every minute for 8 minutes and a print out was obtained. Figure 2.56.(b) represents the spectra obtained for this experiment. Again it was found that most of the Cr(VI) had been reduced within 6 minutes.
Figure 2.56. Spectra obtained fo r the reduction o f Cr(VI) by Ascorbic A cid in (a)aerobic conditions and (b) anaerobic conditions.

On comparing the spectra of each o f the solutions above, (a) in aerobic conditions and(b) in anaerobic conditions, they appear to be quite similar, and the absence of air appeared to have little if any effect on the rate of reduction o f Cr(VI) by ascorbic acidi.e. the rate of reduction o f Cr(VI) by ascorbic acid over 8 minutes was the same regardless of aerobic or anearobic conditions.
198

2.5.2. Reduction Capacity of Chromium Enriched Yeast.
The reduction of Cr(VI) by excess chromium enriched yeast in acid, at pH 7.4 and at pH 13 was studied by following the change in absorbance o f the Cr(VI) peak at 375nm. The reactions were carried out in air and under nitrogen.
2.5.2.(a). Reagents and Solutions.
1. Trizma (T ri s [hydroxym ethyl] am inomethane) hydrochloride, C4H nN 0 3.HCl, F.W.=157.6g m o l1, Sigma, #T3254.
2. Potassium Dichromate, K2Cr20 7, F.W. = 294.49g mol"1, Wardle Chemical Company Ltd., #P04868.
3. Sulphuric Acid, H2S 04, S.G. = 1.84, F.W. = 98.07g mol'1, Romil Ltd., Code A- 9691.
4. Tris(hydroxymethyl)aminomethane, C4H 10NO3, F.W.= 121.12g m o l1, Riedel-de Haen, #33742.
5. Chromium Enriched Yeast, Alltech Ireland, Dunboyne, Co. Meath, Ref. 158233.6 . Non-Enriched Yeast, Active Dried Yeast, DCL Yeast Limited.
Preparation of Solutions.
1. 1M Tris-HCl p H 7.4.As is section 2.5.2.
2. H2S 0 4 Standards.(a). 1M H2S 0 4.
54.54cm3 o f concentrated H2S 0 4 was diluted to 1 dm3 using distilled water.(b). 0.1M H2S 0 4.
100cm3 of 1M H2S 0 4 were diluted to 1 dm3 with distilled water.
199

3. Tris-NaOHpH 13 Standards.(a). 0.2M Tris-NaOH pH 13.
As in section 2.1.3.(b).(b). 0.1M Tris-NaOH pH 13.
50cm3 of 0.2M Tris-NaOH pH 13 were diluted to 100cm3 with distilled water.4. Potassium Dichromate Standards.
(a). lOOOppm Cr(VI).As in section 2.1.1 .(b).
(b). lOOppm Cr(VI).As in section 2.1.3.(b).
(c). lppm, O.lppm, and O.Olppm Cr(VI).As in section 2.3.2.(a).
2.5.2.(b). Experimental Procedures.
To 100cm3 aliquots of (a) 1M H2S 0 4, (b) 1M Tris-HCl pH 7.4, and (c) 0.2M Tris- NaOH pH 13 buffer the quantities of potassium dichromate listed in Table 2.11.(a),(b) and (c) were added and dissolved. Chromium enriched yeast was then added (exact quantities are listed in Table 2.18.(a), (b) and (c)) and 5cm3 extracts were taken from these solutions at various time intervals, filtered through a 0 .2 j.im syringe filter and the absorbance measurement o f each solution was obtained at 375nm using U.V. spectroscopy.
(c). o.o i m h 2s o 4.100cm3 of 0.1M H2S 0 4 were diluted to 1 dm3 with distilled water.
2 0 0

Table 2.18. (a). Quantities o f K 2Cr20 7 and Chromium Enriched Yeast added to 1MHCl pH l.
Cr(Vl) / ppm Mass of K2Cr20 7/g
AirMass of
K2Cr20 7/g Nitrogen
Mass of Enriched Yeast
/ gAir
Mass of Enriched Yeast
/gNitrogen200 0.0567 0.0568 0.2501 0.2504
100 0.0285 0.0286 0.2503 0.2505
50 0.0143 0.0142 0.2504 0.2502
Table 2.18.(b). Quantities o f K2Cr20 7 and Chromium Enriched Yeast added to 1MTris-HCl p H 7.4.
Cr(VI) / ppm Mass ofK2Cr20 7/g
AirMass of
K2Cr20 7/g Nitrogen
Mass of Enriched Yeast
/ gAir
Mass of Enriched Yeast
, / gNitrogen200 0.0569 0.0566 0.2499 0.2498
100 0.0284 0.0285 0.2507 0.2507
25 0.0072 0.0074 0.2503 0.2504
Table 2.18.(c). Quantities o fK 2Cr20 7 and Chromium Enriched Yeast added to 0.2MTris-NaOH pH 13.
Cr(VI) / ppm Mass of K2Cr20 7/g
AirMass of
K2Cr20 7/g Nitrogen
Mass o f Enriched Yeast
/gAir
Mass of Enriched Yeast
/ gNitrogen200 0.0567 0.0566 0.2504 0.2502
100 0.0285 0.0282 0.2502 0.02507
25 0.0073 0.0071 0.2502 0.2507
201

The above procedure was carried out both in the presence of air and in the absence of air (i.e. under nitrogen). For the procedure carried out in the absence o f air the potassium dichromate was dissolved in the buffer and then deaerated for 15 minutes. After the addition of the yeast deaeration was carried out again for 15 minutes, and the solution was kept under nitrogen at all times.Results:(a). For the procedure carried out in 1M H2S 0 4 (acidic solution), both in air and in nitrogen, the yeast continuously reduced the Cr(VI) that was present. The absence of air seemed to have little effect on the rate o f reduction of the Cr(Vl) by the chromium enriched yeast since the rate of reduction of Cr(VI) in the presence o f air appeared to be very similar to that in the absence o f air, for the 200, 100 and 50ppm Cr(VI) solutions. Figures 2.57-2.62 represent the reduction in absorbance measurements obtained over time and the data for these experiments is given in appendix 2.49-2.54.
100 ^i Reduction of 200ppm Cr(VI) by Y east in• Acidic Solution in Air
80 -
-60 - ■
- ■■
% A 40 “ ■" ■ ■ -
20 -
* ■0 -
c1 i ■ i ■ i • i « ,
5 10 15 20 25
Time / hours
Figure 2.57. Reduction o f 200ppm Cr(VI) by chromium enriched yeast in acidicsolution in air.
202

100
80 -
60 -
40 -
20 -
R e d u c t io n o f 2 0 0 p p m C r (V I ) by Y e a s t in
A c id ic S o lu t io n in N 0
Time / hours
Figure 2.58. Reduction o f 200ppm Cr(VI) by chromium enriched yeast in acidic solution in nitrogen.
100 ■ Reduction of 100ppm Cr(VI) by Yeast in Acidic Solution in A ir
40 -
20 -
T10
T15
T20
~ r25
Time / hours
Figure 2.59. Reduction o f lOOppm Cr(VI) by chromium enriched yeast in acidicsolution in air.
203

100 Reduction of 100ppm Cr(VI) by Yeast in Acidic Solution in N ,
■ z80 "
"■60 - < ■Si? ■■40 “ ■
■ ■ ■ ■20 "
0 -I—>—l—'—l—'—l—'—l—i—I—'—l—'—I—■—l—1—I—'—I—'—I—'—I—10 2 4 6 8 10 12 14 16 18 20 22 24
Time / hours
Figure 2.60. Reduction o f lOOppm Cr(VI) by chromium enriched yeast in acidic solution in nitrogen.
100
8 0 -
6 0 -
%A 4 0 -
20-
Reduction of 50ppm Cr(VI) by Yeast in Acidic Solution in Air
i—i—i—i—i—r-0 2 4 6
-i—i—i—i—i—>—i—<—i—i—i—'—i—>—i—•—i—'8 10 12 1 4 16 18 2 0 2 2 2 4
Time / hours
Figure 2.61. Reduction o f 50ppm Cr(VI) by chromium enriched yeast in acidicsolution in air.
204

100 R e d u c t io n o f 5 0 p p m C r (V I ) by Y e a s t inA c id ic S o lu t io n in N ,
80 "
60 -
40
20 ■ ■ ■
—I-10
—r~20
—|—2515
Time / hours
Figure 2.62. Reduction o f 50ppm Cr(VI) by chromium enriched yeast in acidic solution in nitrogen.
(b). For the procedure carried out in 1M Tris-HCl pH 7.4 (neutral solution), both in air and in nitrogen, for all solutions 200, 100 and 25 ppm Cr(VI), initially the enriched yeast appeared to reduce the Cr(VI) that was present, but over time oxidation occurred and the %A increased again. Following this, reduction and oxidation of Cr(VI) occurred periodically over time for all the solutions. Figures 2.63-2.68 represent the absorbance measurements obtained over time and the data for these experiments is given in appendix 2.55-2.60.The %A is the absorbance at time as a percentage of the initial absorbance.
205
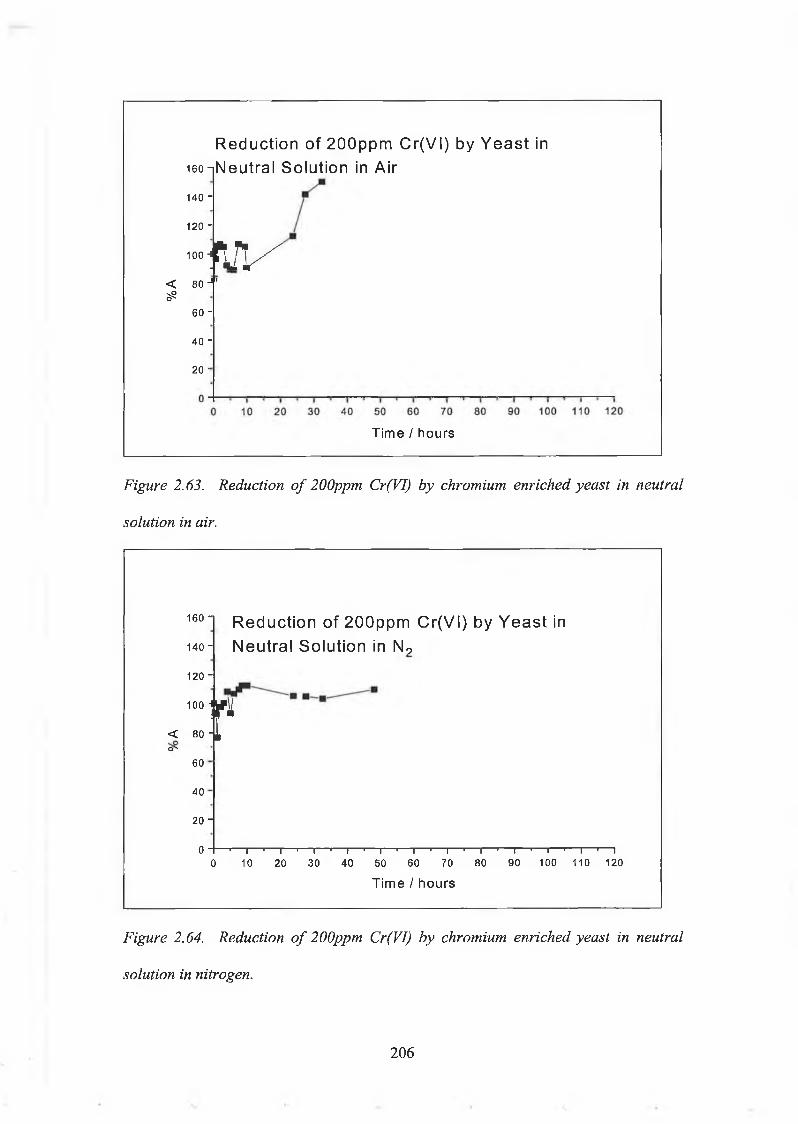
R e d u c t io n o f 2 0 0 p p m C r (V I ) by Y e a s t in
1 6 0 - iNeutra l S o lu t io n in A i r
140 "
120 -
100 ■ M S< 80 J 'sO0s
60 -
40 ~
20 ■
Time / hours
Figure 2.63. Reduction o f 200ppm Cr(VI) by chromium enriched yeast in neutral solution in air.
160 -
1 4 0 -
120 -
100
< 800s
60
40
20 1
Reduction of 200ppm Cr(VI) by Yeast in Neutral Solution in N,
f
o *1—»—i—'—i—>—i—■—i—>—i—»—i—»—i—■—i—'—i—«—i—1—i—■—I0 10 20 30 40 50 60 70 80 90 100 110 120
Time / hours
Figure 2.64. Reduction o f 200ppm Cr(VI) by chromium enriched yeast in neutralsolution in nitrogen.
206

Time / hours
Figure 2.65. Reduction o f lOOppm Cr(VI) by chromium enriched yeast in neutral solution in air.
Time / hours
Figure 2.66. Reduction o f lOOppm Cr(VI) by chromium enriched yeast in neutralsolution in nitrogen.
207

Time / hours
Figure 2.67. Reduction o f 25ppm Cr(VI) by chromium enriched yeast in neutral solution in air.
Time / hours
Figure 2.68. Reduction o f 25ppm Cr(VI) by chromium enriched yeast in neutralsolution in nitrogen.
208

(c). For the procedure carried out in 0.2M Tris-NaOH pH 13 (basic solution), both in air and in nitrogen for all solutions, 200, 100 and 25ppm Cr(VI), again initially the enriched yeast reduced the Cr(VI) but again over time oxidation occurred and the %A increased. This reduction and oxidation o f Cr(VI) occurred periodically over time. Figures 2.69-2.74 represent the absorbance measurements obtained over time and the data for these experiments is given in appendix 2.61-2.66.From the results obtained from the above experiments it can be seen that the chromium enriched yeast will reduce Cr(VI), even as high as 200ppm, in less then 24 hours in acid solution. This is so because in acid solution Cr(Vl) is present as the dichromate ion Cr20 72', which is highly reactive and so readily reacted with organic matter present in the chromium enriched yeast and so it was reduced. In neutral and basic solutions Cr(VI) is present as the hydrogenchromate ion, H C r04" and the chromate ion, C r042' respectively, which are not as oxidising as the dichromate ion. Also Cr(III) is more readily oxidised to Cr(VI) in neutral and in alkaline solution.
209

Time / hours
Figure 2.69. Reduction o f 200ppm Cr(VI) by chromium enriched yeast in basic solution in air.
130 - Reduction of 200ppm Cr(VI) by Yeast in120 - ■ Basic Solution in N2110 -
100 HI . 190 -<
A8 0 -
%A 70 "i \ ^ - — ■
6 0 “
50 -
0■ i < i ■ i ............................................................................ i *
20 40 60 80 100 120 140 1S0Time / hours
Figure 2.70. Reduction o f 200ppm Cr(VI) by chromium enriched yeast in basicsolution in nitrogen.
210

Time / hours
Figure 2.71. Reduction o f lOOppm Cr(VI) by chromium enriched yeast in basic solution in air.
% A
130120 -110 -
100 90 - 80 - 70 “ 60 5040
Reduction of 100ppm Cr(VI) by Yeast in
Basic Solution in N2
i50
1------------------------1—100Time / hours
150
Figure 2.72. Reduction o f lOOppm Cr(VI) by chromium enriched yeast in basicsolution in nitrogen.
211

Reduction of 25ppm Cr(VI) by Yeast in
Time / hours
Figure 2.73. Reduction o f 25ppm Cr(VI) by chromium enriched yeast in basic solution in air.
Time / hours
Figure 2.74. Reduction o f 25ppm Cr(VI) by chromium enriched yeast in basicsolution in nitrogen.

This procedure was carried out in the same way for the acidic, neutral and basic buffer as is was for the experimental procedures for the chromium enriched yeast above, with the exception that only lOOppm Cr(VI) was added and that non-enriched yeast was added. The exact quantities added are listed in Table 2.19.
2.5.2.(c). Reduction Capacity of Non-Enriched Yeast.
Table 2.19. Quantities o f Cr(VI) and non enriched yeast required to produce lOOppm Cr(VI) in the respective buffers.Cr(VI)/ppm Buffer Mass of
K2Cr20 7/g Air
Mass of K2Cr20 7/g Nitrogen
Mass of Non- Enriched Yeast/g
AirMass of Non-
Enriched Yeast/g Nitrogen
100 Acidic 0.0282 0.0282 0.2501 0.2502100 Neutral 0.0280 0.0283 0.2501 0.2502100 Basic 0.0282 0.0284 0.2498 0.2502
Result:(a). For the procedure carried out in acidic solution, for both the solutions carried out in air and in nitrogen, the yeast reduced the Cr(VI) present and the absence of air appeared to have little effect on the rate of reduction. Figure 2.75 and 2.76 represent the absorbance measurements obtained for these experiments and the data is given in appendix 2.67 and 2.68.
(b). For the procedure carried out in neutral solution, initially there was reduction of the Cr(VI) and again oxidation and reduction occurred periodically over time. Figure 2.77 and 2.78 represent the absorbance measurements obtained for these experiments and the data is given is appendix 2.69 and 2.70.
213

(c). For the procedure carried out in basic solution, again reduction of Cr(VI) occurred initially and oxidation and reduction occurred periodically over time. Figure 2.79 and 2.80 represent the absorbance measurements obtained for these experiments and the data is given in appendix 2.71 and 2.72.Again the reduction of Cr(VI) in acid solution here and the non reduction of Cr(VI) in neutral and basic solution is due to the different oxidising powers of the various Cr(VI) species at different pH values.
214

100 -
80-
60 -
4 0 “
20“
Reduction of 100ppm Cr(VI) by Non EnrichedYeast in Acidic Solution in Air
■ ■
T
10T
15Time / hours
T
20T
25
Figure 2.75. Reduction o f 1 OOppm Cr(VI) by non enriched yeast in acidic solution inair.
100
80
Reduction of 100ppm Cr(VI) by Non Enriched Yeast in Acidic Solution in N,
60 -
40
20 -
i10 15
T im e / hours
T20
T25
nitrogen.Figure 2.76. Reduction o f 1 OOppm Cr(VI) by non enriched yeast in acidic solution in
215

Time / hours
Figure 2.77. Reduction o f 1 OOppm Cr(VI) by non enriched yeast in neutral solution in
160
140 i
120
100
< 80 --vO
60
40 ~\
20
/Reduction of 100pp Cr(VI) by Non Enriched Yeast in Neutral Solution in N2
—r~10
—r~20
—I-30
—I-40
—r— 50
Time / hours
Figure 2.78. Reduction o f 1 OOppm Cr(VI) by non enriched yeast in neutral solution in nitrogen.
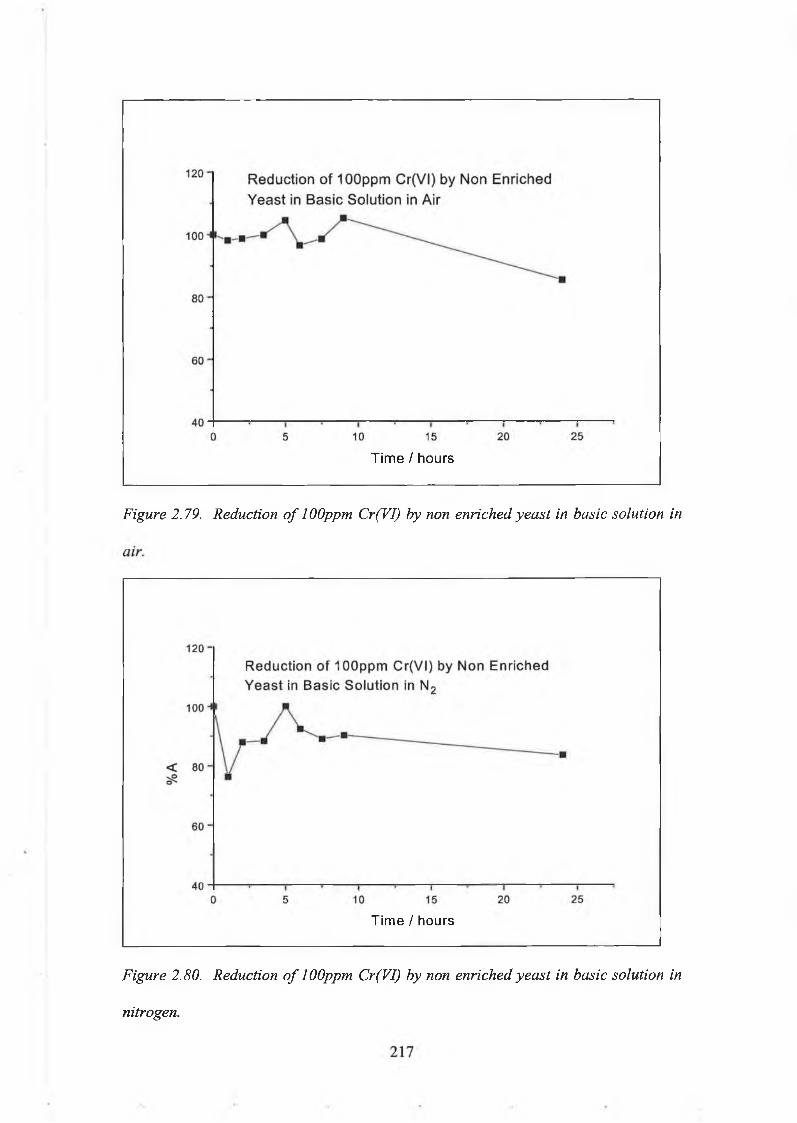
Time / hours
Figure 2.79. Reduction o f 1 OOppm Cr(VI) by non enriched yeast in basic solution in
Time / hours
Figure 2.80. Reduction o f 1 OOppm Cr(Vl) by non enriched yeast in basic solution in nitrogen.

2.5.2.(d). Kinetic Study of the Rate of Reduction of Cr(VI) by Chromium Enriched Yeast using Redox Potential Measurement.These experiments were carried out by the addition of chromium enriched yeast to a solution containing H2S04 and K2Cr20 7. A redox electrode system consisting of a Pt wire electrode and a double junction Ag/AgCl electrode was placed in the stirred solution. The redox potential (E/mV) was displayed on an Orion EA920 meter. The recorder output of the meter was connected to a Strawberry Tree STI PCjr data acquisition card and the redox potential was read into a computer using Strawberry Tree Quicklog software. The software is operated as follows:
At the DOS prompt type C:\QL\GO.C:\QLClick the right hand mouse button and select FILE \ OPEN and open the file named Test. This is a simple data acquisition configuration consisting of four icons as shown below and an on-screen chart.
Double-click on the Analog icon and select channel 1. The units are set to VoltsVAuto V, resolution is set to 0.025% (1ms), and the sample rate is set to 10 Hertz. Double -click on the meter icon and set the Output type to Fixed Point and the Number Format to 6.3. Double-click on the Log icon and set the sample rate to 1 reading every 10 seconds. Click on the chart icon and set the Time axis to 50 sec and the Y-axis range from 0 to 1 Volt. The file may be saved under a new name.
218

Recording is started by clicking File\Log\Start All Logs using the right mouse button, recording is stopped by clicking File\Log\Stop All Logs.
In the experiments described here the recording was started on addition of lg of chromium enriched yeast to the solution of acidic Cr(VI).
1. Redox Potentials o f Solutions containing Chromium Enriched Yeast.The solutions to be analysed were prepared by making a 10cm3 aliquot of lOOOppm Cr(VI) up to 100cm3 with the chosen buffer as outlined in Table 2.20. After the redox potential of this solution was recorded lg of the chromium enriched yeast was added (exact quantities are listed in Table2.20) and the redox potentials were recorded over time using the parameters set out above.
Table 2.20. Quantities o f K2Cr20 7 and chromium enriched yeast added to appropriate buffer.
Volume of lOOOppm Cr(VI) ml
Buffer Mass of Enriched Yeast g
(i). 10 1M H2S04 1.0002(ii). 10 o.i m h 2s o 4 0.9994(iii). 10 0.01M H2S04 0.9998(iv). 10 0.1M Tris NaOH pH 13 1.0005
It was found that for (i), (ii), and (iii) above the redox potentials decreased to a certain potential after the addition of the chromium enriched yeast to the solution, implying that the chromium enriched yeast initially reduced a certain amount of the Cr(VI) in the solution and that the rate of reduction of the Cr(VI) by the chromium enriched
219

yeast (rate of reduction of the redox potential) decreased as the H2S04 concentration decreased. The 1M H2S04 reduced the Cr(VI) in 14 seconds, the 0.1M H2S04 took 30 seconds for reduction, while the 0.01M H2S04 took 50 seconds for reduction to occur. Figures 2.81-2.83 show the decrease in the redox potential of the solution with time for these experiments and the data is given in appendix 2.73-2.75.For (iv) above (alkaline solution) it was observed that the redox potential initially decreased after the addition of the chromium enriched yeast, implying again that the chromium enriched yeast reduced a certain amount of the Cr(VI) that was present in the solution, but then the redox potential increased again, implying that some of the reduced Cr(VI) was reoxidised. The redox potential remained fairly constant from this point. Figure 2.81 represents the redox potentials obtained here and the data is given in appendix 2.76.
Figure 2.81. Change in redox potential with time on addition o f l g o f chromiumenriched yeast to 100 cm3 o f 100 ppm Cr(VI) in 1M H 2S 0 4.
220

0.73-1 7 „ „• 100cm o f 0.1M H 2 S O 4
0 .7 2 - M■ ■■
0.71 - ■0 .7 0 - ■
R e d 0 X 0 .6 9 -■
Potential/Volts 068" ■
0 .6 7 - ■0 .6 6 - ■
0 .6 5 -
■ ■ ■ U ■ m ■0 .6 4 -
0 .6 3 -
0.62 " 1 I 1 I . , , 1 1 1 . , .10 20 30 40 50 60
Time / seconds
Figure 2.82. Change in redox potential with time on addition o f lg o f chromiumenriched yeast to 100 cm3 o f 100 ppm Cr(VI) in 0.1M H2S0 4.
Figure 2.83. Change in redox potential with time on addition o f lg o f chromium enriched yeast to 100 cm3 o f 100 ppm Cr(VI) in 0.01M H2S 0 4.
221

-0.13“ u m 100cm3 of 0.1 M Tris-NaOH
-0.14“
Redox -°-15" Potential /Volts -°-16~
■
■ ..................................................................
- " " ■
-0.17- ■
-0.18-
-0.19-■
-0.20 H » i > i • i ■ i * i ■20 45 70 95 120
Time / seconds
Figure 2.84. Change in redox potential with time on addition o f lg o f chromium enriched yeast to 100 cm3 o f 100 ppm Cr(VI) in 0.1M Tris-NaOH buffer at pH 13.
2. Redox Titration o f Chromium Enriched Yeast using Cr(VI).These experiments were carried out by the addition of Cr(VI) to a solution containing H2S04 and chromium enriched yeast. A lg sample of chromium enriched yeast (exact quantities are listed in Table 2.21) was added to 100cm3 of 1.0M H2S04 . The redox potential of this solution was recorded using a double junction reference electrode and a platinum wire indicator electrode. A titration was carried out by addition of 0.5cm3 aliquots of each of the Cr(VI) standards listed in Table 2.21 to the solution of H2S04 and chromium enriched yeast (except for (vii) below where 1cm3 aliquots were added) and the redox potential was recorded after each addition.
2 2 2

Table 2.21. Quantities o f chromium enriched yeast and Cr(VI) standard added for titration.
Volume of H2S04 / cm3 Mass of chromium enriched yeast / g
Cr(VI) / ppm
(i). 100 1.0004 1000(ii). 100 1.0005 100(iii). 100 1.0006 10(iv). 100 1.0002 1(V). 100 1.0004 0.1(Vi). 100 0.9996 0.01(vii). 100 - 0.01
For solution (i) to (vi) above it was found that as the Cr(Vl) standard was added to the solution of H2S04 and chromium enriched yeast the redox potential of the solution increased and then reached a maximum and eventually levelled off. It was also observed that as the concentration of the Cr(VI) added to the solution decreased the rate at which the redox potential levelled off decreased. Figures 2.85-2.90 represent the titration curves obtained after the addition of the Cr(VI) to chromium enriched yeast and the data is given in appendix 2.77-2.82. Sample (vii) above, which contained no chromium enriched yeast, did not level off even after the addition of 40cm3 of O.Olppm Cr(VI). Figure 2.91 represents the continuous increase in redox potentials obtained in this case after the addition of the Cr(VI) to the H2S04 and the data is given in appendix 2.83
223

Volume of lOOOppm Cr(VI) added / cm3
Figure 2.85. Redox potentials after addition o f 1 OOOppm Cr(VI).
Volume of 100ppm Cr(VI) added / cm3
Figure 2.86. Redox potentials after addition o f lOOppm Cr(VI).
224
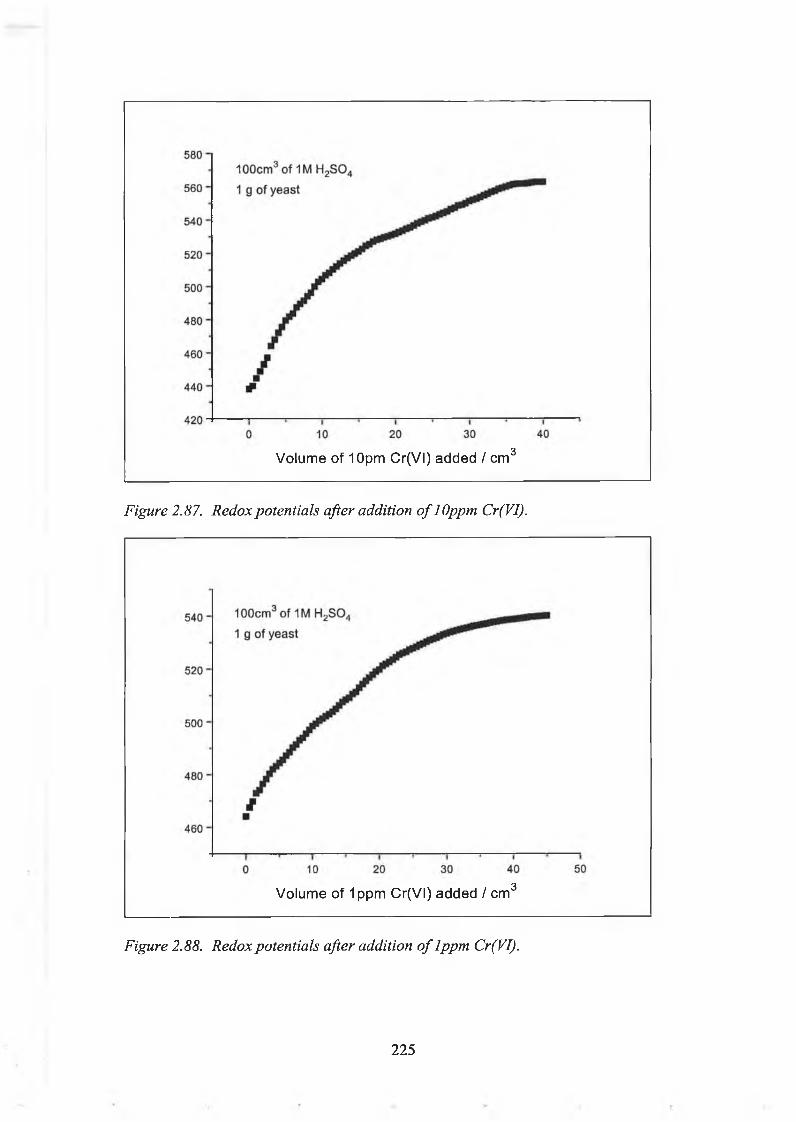
Volume of 10pm Cr(VI) added / cm3
Figure 2.87. Redox potentials after addition o f lOppm Cr(VI).
Volume of 1ppm Cr(VI) added / cm3
Figure 2.88. Redox potentials after addition o f lppm Cr(VI).
225

Volume of 0.1 ppm Cr(VI) added / cm3
Figure 2.89. Redox potentials after addition o f 0. lppm Cr(VI).
>
Volume of 0.01 ppm Cr(VI) added / cm3
Figure 2.90. Redox potentials after addition o f O.Olppm Cr(VI).
226

620 -
100cm3 o f 1M H2S 0 4 «■
610" /
/
600 - /■m
590-
, ■
■/
580 -■■
■■/
5 7 0 - ■■■■■j * i ' i ■ t ■ i j0 10 20 30 40
Volume of O.Olppm Cr(VI) added / cm3
Figure 2.91. Redox potential after addition o f O.Olppm Cr(VI) without addition o fchromium enriched yeast.
227

3.0. Discussion.3.1. Voltammetry.Wang (1997) used adsorptive catalytic stripping voltammetry and a phosphate buffer at pH 6.0 containing cupferron as supporting electrolyte for the determination of Cr(VI). Using this method it was found that by applying an initial potential of - lOOmV (v Ag / AgCl) Cr(VI) was adsorbed onto the surface of a static mercury drop electrode as the Cr(III)-cupferron complex. Then by scanning in a negative direction a chromium reduction peak at -1.0V was observed due to the reduction of the metal centre in the complex.In the work reported here, the supporting electrolyte contained a peak at -1.0V. This peak was not reported in the original method (Wang (1997)). Attempted removal of this peak was carried using solvent extraction (p 100). This procedure succeeded in reducing the peak in the supporting electrolyte but it failed to totally eliminate the peak (fig 2.3, p 100). It was then suspected that zinc may be the cause of this peak and this was confirmed by addition of lOOppb Zn(II) to the supporting electrolyte (fig2.4, p 102). The peak could be eliminated by addition of lOOpM EDTA to the supporting electrolyte (fig 2.4, p 102). A supporting electrolyte containing 100pM EDTA was then used for further analysis. Figure 2.1 (p 97) represents a typical polarogram obtained for 2ppb Cr(VI) using the conditions outline on page 98.It was shown that repeated scanning of a 3 ppb solution gave no significant loss of chromium (p 103). An average peak height of 99.4966 +/- 0.8828 was obtained.A non linear calibration curve was produced from 0 to 5 ppb Cr(Vl) with a limit of detection of O.lppb (fig 2.7, p 107) which makes this polarographic method suitable for the detection of trace concentrations of Cr(VI). The method may be used for direct
228

determination of Cr(VI) but due to the curvature of the line it cannot be used for standard additions.Wang reported that the method also detects Cr(III). A polarogram of 3ppb Cr(III) was obtained (fig 2.5, p i05). In a situation where Cr(III) is present in excess, it would be necessary to separate the Cr(IIl) from the Cr(VI) prior to determination of Cr(VI). It was felt that separation of Cr(VI) from Cr(III) might be possible using an anion exchange column. However it was shown that the chromium in a solution of 1 ppm Cr(III) does not pass through an anion exchange column (fig 2.5, p 105). This experiment was unsuccessful as most of the Cr(IIl) was lost on the anion exchange column.Therefore this polarographic method is unsuitable for the analysis of the chromium enriched yeast extract since the excess Cr(III) present in the sample would interfere with Cr(VI) detection. Also the extracting solution is alkaline and so may affect the pH of the supporting electrolyte buffer if a large quantity is used.
3.2. Graphite Furnace Atomic Absorption Spectroscopy.Using the parameters set out on page 112 a linear calibration curve from 0 to 50 ppb Cr(VI) was produced, giving a limit of detection of 1.36ppb (fig 2.9, p 113). This procedure was then used for the analysis of total chromium in the chromium enriched yeast extract (p 113). It was found that 2800ppm Cr(VI) was present in the chromium enriched yeast extract. This method of detection of chromium is not specific for Cr(VI) and again is unsuitable for the sample under investigation here, unless separation of Cr(VI) and Cr(III) can be achieved.
229

3.3. U.V. Spectroscopy.The principle of this method of detection of Cr(VI) is the reaction between chromate and diphenylcarbazide. This reaction is specific for Cr(VI) and the reaction medium must be sufficiently acidic (pH 2) before the reaction will take place. Using the parameters set out on page 117 a linear calibration curve was produced from 0 to lppm, in the presence of 8 ppm Cr(III), giving a limit of detection of 43.2 ppb. (fig 2.10, p 119). The Cr(III) was added in order to show that excess Cr(III) will not interfere with Cr(VI) analysis. This would be important when the method would be applied to analysis of yeast extract later. It was found that the stability of the Cr-DPC complex decreased over time. Figure 2.11 (p 120) shows how the colour of the Cr- DPC complex decreased linearly over 5 hours and figure 2.12 (p 121) shows how the colour of the complex decreased exponentially over 6 days and reached 0 on the sixth day. By fitting this graph to the function A*EXP(-B*X) the rate constant for the decay of the colour of the Cr-DPC complex was found to be 0.608 days'1. From figure 2.11 (p 120) it can be shown that the absorbance of the Cr-DPC complex decreases by 4.45% in 1 hour. Clearly analysis should be carried out within 30 minutes of the addition of the DPC reagent. This is particularly important in the case of the HPLC method described below (section 3.4.).
3.4. High Performance Liquid Chromatography.Padarauskas (1998) used on line preconcentration and determination of Cr(VI) byH.P.L.C. with precolumn complexation with 1,5-diphenylcarbazide using a dual column technique. A modified version of this technique, using a single column, and the procedure outlined on page 125 was used for the preconcentration and detection of Cr(VI). Figure 2.13 (p 122) shows the chromatogram obtained for the
230

preconcentration of 15ppb Cr(VI) using this modified version. Figure 2.14.(a) (p 128) shows 2 large peaks, that of the DPC and the Tris-NaOH pH 13 solutions. A very small peak at 8.74 minutes was also observed. Figure 2.14.(b) (pl28) shows the DPC peak, the Tris-NaOH peak and the Cr-DPC peak at 8.6 minutes. The intensities of the DPC and Tris-NaOH peak in figure 2.14.(a) appear to be greater than those in figure2.14.(b), but this is so because 2.14.(b) was recorded at a lower sensitivity than2.14.(a). The peak areas in both chromatograms are comparable. The peak at 8.74 minutes in 2.14.(a) would cause negligible error in the measurement of 15ppb Cr(VI). A linear calibration curve from 0 to 25ppb Cr(VI) (fig 2.16, p 131), giving a limit of detection of 6.5ppb was produced using the modified version of the Padarauskas (1998) method. A polarogram of 15ppb Cr(III) was obtained using this method and it was found that no Cr(III) peak appeared in the polarogram. Only the DPC peak and the Tris-NaOH peak were observed.Since the chromium enriched yeast extract contains excess Cr(III) over Cr(VI) it was investigated to see if Cr(VI) could be detected in excess Cr(III) using this method. A mixture containing Cr(VI) and an equal quantity, a 100 fold excess and a 3300 fold excess of Cr(III) was preconcentrated and eluted (pl28). It was found that the Cr(VI) peak, with a similar peak area for each of the mixtures, was observed indicating that Cr(VI) can be detected in the presence of excess Cr(III) and that the presence of Cr(III) does not effect the Cr(VI) peak. Advantages of this preconcentration method using online spectrophotometric detection would include the fact that Cr(III) does not cause an interference and a low limit of detection is obtained.Of the four methods of detection of Cr(VI) described, voltammetry proved to be the most sensitive, but is unsuitable for the sample under investigation here since the excess Cr(III) present in the chromium enriched yeast extract would cause an
231

interference. G.F.A.A. spectroscopy has a low limit of detection for chromium, but again is unsuitable for this chromium enriched yeast sample since it is not specific for Cr(VI). U.V. spectroscopy has the advantage of being specific for Cr(VI) but this is not a sensitive method for the detection of Cr(VI). The H.P.L.C. method, again being specific for Cr(VI), is a more sensitive method for the detection of Cr(VI) and it is the method with the best sensitivity that is specific for Cr(VI).
3.5. Extraction of Chromium from Yeast.1. Choice o f Reagent.Florez-Velez (1995) used Tris-NaOH at pH 13 for the extraction of Cr(VI) from soil samples to which a known quantity of Cr(VI) had been added. They found the percentage recovery of the added Cr(VI) to be 98.6+/-2.2%. This means that this strong alkaline media is efficient for the desorption of chromium in soils. Another advantage of this buffer over an acidic one is that in alkaline solution Cr(VI) is a weak oxidising agent and so will persist longer than it will in a more acidic buffer. Using this Tris-NaOH buffer the extraction process was carried out both in air (p 135) and under nitrogen (p 141) by agitating lg of yeast with 50cm3 of the buffer.
2. Preliminary Experiments on Cr(VI) Extraction.Initially the importance of air oxidation of Cr(III) to Cr(VI) in alkaline solution was not appreciated. Therefore initial experiments were carried out without any attempt to exclude air. In order to find out if Cr(VI) could be recovered from a yeast sample, a simulated chromium enriched yeast was prepared by addition of 0.0103g of Cr(III)Cl3.6H20 to lg of non enriched yeast. The yeast was extracted using 50cm3 of the buffer containing 0, 500 and lOOOppb Cr(VI). After 24 hours the sample was
232

centrifuged and filtered and diluted to 100 cm3. The extract now contains 20ppm Cr(III) after dilution.. The extract was analysed daily for Cr(VI) using DPC reagent after acidification of a 5 cm3 aliquot. The results are given in figure 2.17 (pl37). Even where no Cr(VI) was added the hexavalent state was found in the extract after 24 hours of agitation. Where Cr(VI) was added to the extract the hexavalent state was present in higher concentrations after 24 hours. The absorbance indicates that the yeast partially reduces the excess Cr(VI). This is investigated further below. However, over time curves A and B merged while curve C which, contained 1 ppm Cr(VI) at the start was consistently higher. These results indicate that (i) Cr(VI) can be detected in the yeast extract, (ii) yeast partially reduces excess Cr(Vl) over a 24 hour period and (iii) the increase in Cr(VI) over time, in the case where no Cr(VI) was added implies air oxidation of Cr(III) to Cr(VI).It was felt necessary to investigate whether this air oxidation of Cr(IIl) would still occur even if Cr(III) was bound in the chromium enriched yeast. Therefore two samples were prepared containing (A) lg of chromium enriched yeast to which free Cr(III) had been added and (B) lg of the same yeast to which no Cr(III) had been added. Both samples were extracted with 50cm3 of the Tris-NaOH buffer containing 500ppb Cr(VI). The solutions were centrifuged and filtered and analysed using DPC on a daily basis. The results (fig 2.18, p 139) show the chromium enriched yeast on its own (2.18.B) has partially reduced the added Cr(VI) but the Cr(VI) oxidation eventually occurs over time. The presence of excess free Cr(III) leads to a much higher Cr(VI) level after 24 hours implying easier oxidation of unbound Cr(III) (fig 2.18A).
233
3. Effect o f Air Oxidation.It was decided to investigate the air oxidation of Cr(III) in the absence of yeast. This was carried out by addition of Cr(III) to the Tris-NaOH buffer, without the addition of any yeast, and the solutions stirred in air and under nitrogen. The extraction in air was carried out by continuously bubbling air through the solution. Figure 2.19A (p 143) shows how the extraction in air produced Cr(VI) after 24 hours of agitation and how the concentration of Cr(VI) increased steadily over 9 days while the extraction under nitrogen (Fig 2.19B, p 143) did not produce Cr(VI) even after 9 days of stirring. This experiment shows how air oxidation of Cr(III) can occur in the presence of air in alkaline solution.The chromium enriched yeast was then extracted in air (air was not bubbled through) and under nitrogen, centrifuged and filtered after 24 hours, and analysed on a daily basis using DPC. Figure 2.21 (p 145) shows that in the presence of air Cr(VI) was first detected on day 2 and the concentration increased over time, while the extraction carried out under nitrogen produced no Cr(VI) again implying that air oxidation of Cr(III) in the chromium enriched yeast had occurred. This is the first experiment to show that there is no Cr(VI) in the yeast. The limit of detection using the Cr-DPC method (section 2.1.3.(d).) is 43.6ppb. The initial volume of the extract was 100 cm3. Therefore we can say that the Cr(VI) in the extract is less than 43.6 ppb. The mass of yeast is lg and therefore we can say that the Cr(VI) in the yeast is less than 21.8 ppm.
4. Chromium Enriched Yeast Reduces Cr(VI) in Inert Atmosphere.To show that the chromium enriched yeast reduces Cr(VI) in an inert atmosphere 500ppb Cr(VI) was added to 50 cm3 of Tris-NaOH buffer and lg of the chromium enriched yeast was extracted in air and under nitrogen. The solutions were
234

centrifuged and filtered after 24 hours, and analysed on a daily basis using DPC. The results are shown in figure 2.20 (p 144). Figure 2.20A shows that Cr(VI) was detected on day 1 for the extraction in air while 2.20B shows no Cr(VI). This experiment is important in that it proved that the chromium enriched yeast will reduce 500 ppb of added Cr(VI) in the absence of air in alkaline solution. In the presence of air Cr(VI) persists in the solution after 24 hours in contact with chromium enriched yeast, and the concentration in the extract increases over time. The rate of oxidation is very slow for 3 days until the reducing capacity of the extract becomes exhausted. Then air oxidation occurs more rapidly. In the absence of air the yeast reduces Cr(VI) and no reoxidation occurs. As Cr(VI) is a weak oxidising agent in basic solution we can expect that the yeast will easily reduce Cr(VI) in more acidic solutions. Also air oxidation of Cr(III) to Cr(VI) will be less likely to occur in acid solution. These conclusions are extremely relevant to the question of Cr(VI) presence in a chromium enriched yeast.
5. Effect o f leaving the yeast in contact with the extracting solution.In previous experiments the bulk yeast was separated from the extract after 24 hours. In the experiments described here the yeast was left in contact with the extract which was sampled on a daily basis and analysed for Cr(VI) as described in section 2.2.3. Figure 2.22.(a) (p 147) shows the visible absorption spectrum of the extract after addition of DPC when lg of yeast was stirred with 50cm3 of Tris-NaOH pH 13. The solution was stirred by bubbling air through the mixture and Cr(VI) appears on day 2 and persists for about 4 days before disappearing on day 8. There is no continuous increase in Cr(VI) as happens if the insoluble yeast fraction is separated after 24
235

hours. The presence of the insoluble fraction appears to provide continuous reduction of air oxidised Cr(VI). In the presence of added Cr(VI), figure 2.22.(b), the added Cr(VI) is barely detectable indicating that the yeast is a reducing agent. Low concentrations of Cr(VI) are detected daily until day 7.When the chromium enriched yeast was extracted under nitrogen it was expected that no Cr(VI) would be detected. However, Cr(VI) did appear after 24 hours and persists until day 7 (fig 2.23.(a), p 150). Chromium(VI) would not generally appear after 24 hours under nitrogen and its origin in this case is unclear. In the presence of added chromium(VI) under nitrogen the Cr(VI) is barely detectable immediately after addition, indicating reduction of chromium(VI) initially. There is no chromium(VI) even after 24 hours, but it reappears on day 4. Traces of Cr(VI) are detectable each day up to day 7.These experiments show that yeast reduced Cr(VI). However, over time Cr(VI) seems to appear and this is independent of the absence of air. In both situations the Cr(VI) disappears again. These experiments need to be repeated with greater precautions taken to avoid contamination and to exclude air.3.6. Preconcentration of Cr(VI) by Ion Exchange.1, Preconcentration followed by elution with an ammonium buffer and U. V. detection o f the Cr-DPC complex.In the course of this project it became clear that certain techniques would be useful only if (i) the Cr(VI) in solution could be preconcentrated and/or (ii) the Cr(VI) couldbe separated from the Cr(III).Cr(VI) may be readily preconcentrated on an anion exchange column. The difficulty was in finding a suitable eluent. The normal eluents for Cr(VI) are based on HC1. Acidic eluents had to be avoided here as Cr(VI) is a strong oxidising agent in acid and
236

therefore it may be reduced by organic matter on acidification, if the preconcentration procedure was applied to yeast extracts. The eluent arrived at in this work was based on the mobile phase used for ion chromatography of Cr(VI), which is an ammonium sulphate / ammonium hydroxide buffer. A 25 cm3 aliquot of lOppm Cr(VI) was passed through an ion exchange column and eluted with the buffer and the eluent was collected in 3cm3 fractions which were analysed for Cr(VI) using DPC.
(i). The Effect o f Eluent Concentration and pH.The effect of the eluent concentration and pH were investigated and it was found that the concentration of the buffer was critical (section 2.3.5.). The results in figure 2.24.(a)-2.25.(b) (p 158-159) indicate that clearly the higher the NH4OH concentration the faster the Cr(VI) is removed from the column. It was decided to use 2M (NH4)2S04, 4M NaOH, pH 10 because higher concentrations of NH4OH were too difficult to acidify. It was found that raising the pH to 11.9 (fig 2.26, p 161) gave a much longer elution time. Lowering the pH to 9.0 (fig 2.27. p 161) did not improve the elution time.
(iij. The Effect o f Column Length.The effect of column length was also investigated and it was found that reducing the length of the column significantly reduced the length of time required for the elutionofCr(VI) (fig 2.28, p 162).
(Hi). Application to Cr(VI) Standards.The limit of detection of the diphenylcarbazide method is 43.6ppb. Therefore it was decided to test the ion exchange procedure to see if Cr(VI) could be more readily
237

detected in eluted fractions than in the original solutions. Before trying out very dilute solutions of Cr(VI), 25cm3 aliqouts of lOppm, lppm and lOOppb solutions of Cr(VI) were passed through the column and eluted as described above. The elution profiles are given in figure 2.28-2.30 (p 162-164). None of the solutions would require preconcentration but the quantity of Cr(VI) eluted can not fall too far below that contained in 25cm3 of lOOppb Cr(VI). Otherwise the maximum absorption of the fractions would be too low. In order to test the preconcentration procedure 1 dm3 of 5ppb Cr(VI) was passed through the column and eluted. The elution profile is given in figure 2.3 l(p 164). A purple colour was observed in the fractions. Clearly 5ppb is well below the limit of detection of the spectrophotometric method (43.6ppb) and the method is reliable for the detection of Cr(VI) at this level.
(iv). Percentage Recovery.We have shown that the preconcentration procedure worked for the detection of Cr(VI) in aqueous samples down to 5ppb. It would only be useful for quantitative analysis if the percentage recovery is 100%. The table of the percentage recovery Table 2.13 (p 166) indicates that the percentage recovery is never 100% and falls to 68% when 25cm3 of lOOppb Cr(VI) passes through the column. It was not feasible to investigate this further.
(v). Application to Yeast Extracts.This ion exchange procedure was then applied to the extract when each of the following samples was extracted with 50cm3 of Tris-NaOH pH 13 (p i67).(i). lg of chromium enriched yeast(ii). lg of non enriched yeast
238

All extractions were performed under a nitrogen atmosphere as described in section2.2.2.(c). The extract was centrifuged, filtered and passed through the column without further dilution. The elution profile for the non enriched yeast samples figure 2.33 (p 168) and figure 2.34 (p 169) show no evidence for Cr(VI). This proves the effectiveness of the procedures for excluding oxygen. The extract for the chromium enriched yeast gave an elution profile typical of Cr(VI) elution (figure 2.32, p 168). It was subsequently shown that if Cr(III) is eluted prior to elution of Cr(VI) the elution profile gives no indication of Cr(VI) in the extract. This is discussed in the next section.
2. Preconcentration followed by elution using ascorbic acid reduction and G.F.A.A. spectroscopic detection.The principle of this method was the elution of the Cr(VI) using the acidic ascorbic acid to reduce Cr(VI) to Cr(III), which would not be retained by an anion exchange column.(i). Conditions for the Reduction o f Cr(VI).A 25cm3 aliquot of lppm Cr(VI) was passed through the column and eluted with acidic ascorbic acid (figure 2.35, p 170). The procedure was repeated but the ascorbic acid was allowed to stay in contact with the column for 1 hour to allow the Cr(VI) to be reduced to Cr(III). A visual colour change was observed during this period. All fractions were analysed on G.F.A.A. The elution profile is given in figure 2.36 (p 171). It was found that a more ideal profile was obtained after the ascorbic acid was left in contact with the column for 1 hour prior to elution to allow time for complete reduction of Cr(VI) to Cr(III).
(iii). 1 g of non enriched yeast + 20ppm Cr(III)
239

Elution of 25cm3 aliqouts of lOOOppb, lOOppb and 100cm3 of lOppb Cr(VI) using the above method gave the elution profiles in figure 2.36-2.38 (p 171-172). In order to test the procedure 1dm3 of lppb Cr(VI) was passed through the column and eluted and the fractions analysed on G.F.A.A.. The elution profile (figure 2.39, p 173) indicates the presence of Cr(VI) in the fractions. The technique could be used to detect Cr(VI) in water samples down to lppb Cr(VI).
(Hi). Application to Yeast Extracts.lg of chromium enriched yeast and lg of non enriched yeast were extracted using 50cm3 of Tris-NaOH buffer (page 173) and extracts were passed through an ion exchange column. The elution profiles are given in figure 2.40 and 2.41 (p 174). As pointed out in the experimental G.F.A.A. did not appear to work well in this application indicating chromium in the non enriched yeast extract. Clearly this is wrong and this procedure is of no further value.
3.7. Separation of Cr(III) and Cr(VI).(i). Application to Pure Solutions.In the procedure above no attempt was made to allow for the possibility that Cr(III) might be absorbed onto the ion exchange column. Cr(III) may form anionic hydroxy complexes which adhere to the column and therefore Cr(III) should be removed from the column using H2S04 prior to elution of the Cr(VI). This would be essential if analysis of the eluent is carried out using a technique such as GFAA which is not specific for Cr(VI).
(ii). Application to Cr(VI) Solutions.
240

A 25cm3 mixture of 50ppm Cr(III) and lOOppb Cr(VI) was passed through the column and the effluent collected (page 175). It was rinsed with distilled water until 50cm3 had been collected. It was found that only 76.2% of the chromium passed through the column, so Cr(III) was retained. The Cr(III) was eluted with 0.1M H2S04 and the elution profile shows the removal of the Cr(III) (figure 2.42, p 177). Cr(VI) was then eluted with (NH4)2S04/NH40H pH 10 buffer and the elution profile is given in figure 2.43 (p 177). This procedure in quite successful in demonstrating the separation of Cr(III) and Cr(VI).In order to show that no air oxidation occurs during the process the ion exchange procedure was repeated using 25cm3 of lOOppm Cr(III) which had been agitated for 24 hours, centrifuged and filtered as described on page 178. It was found that 79% of the chromium passed through the column. The elution profile of the retained Cr(III) is given in figure 2.44 (p 179). There is no evidence for Cr(VI) in the fractions figure 2.45 (p 180).
(ii). Application to the Yeast Extract.A 25 cm3 aliqout of the chromium enriched yeast extract was passed through the column and it was found that 78% of the Cr(III) in the extract passed through. The elution profile for the Cr(III) is given in figure 2.46 (p 181) and for Cr(VI) in figure 2.47 (p 182). No colour change was observed in the fractions and no evidence for Cr(VI) is observed. This experiment confirms the results from l.(v) in section 3.6 above. However, the elution profile figure 2.47(p 182) is much better than figure 2.32 (p 168) as a consequence of removing the Cr(III).However in order for this preconcentration procedure to offer any advantage over direct analysis of the extract, a larger volume of the solution of the extract would have
241

to be passed through the column as in the preconcentration of 5ppb Cr(VI) as described in page 163.
3.8. Preconcentration by H.P.L.C.(i). Application to Chromium Enriched Yeast Extract.The preconcentration procedure discussed in section 3.4 above was applied to the chromium enriched yeast extract (extracted in nitrogen), by adding DPC to 20cm3 of the extract, and 12cm3 was preconcentrated and eluted from the column. The chromatogram in figure 2.48.(a) (p 185) shows no evidence for the presence of Cr(Vl). The detection limit for this H.P.L.C. method is 6.5ppb. Therefore the Cr(VI) concentration in the extract is less then 6.5ppb. Since lg of yeast was extracted with 50cm3 of Tris-NaOH buffer which was not further diluted, the concentration of Cr(VI) in the yeast is less than 0.325ppm. By preconcentrating a larger mass of yeast this detection limit could be significantly lowered.
(ii). Reduction o f Trace Cr(VI) by Chromium Enriched Yeast.13ppb, 44ppb and 88ppb Cr(VI) were added to the chromium enriched yeast extract and preconcentrated and eluted from the column. Figure 2.48 (p 185) shows the resulting chromatograms. For the solution containing 13ppb Cr(VI) a very small Cr(VI) peak was observed and on comparing this peak height to that of a 15ppb Cr(VI) standard it can be seen that the peak area in 2.48.(b) is greatly reduced compared to the standard, implying that the chromium enriched yeast extract reduced the added Cr(VI). Chromatograms 2.48.(b) and 2.48.(c) show the resulting chromatograms after the addition of 44ppb and 88ppb Cr(VI). Again on comparing these peak areas with those of standards it is obvious that the chromium enriched
242

yeast extract is capable of reducing added Cr(VI). It was not tested over time to see if any further reduction took place-
3.9. Determination of the Rate of Reduction of Cr(VI) by Ascorbic Acid.The aerobic reduction of Cr(VI) using ascorbic acid was studied at pH 7.4 using Tris- HC1 buffer. The reaction was carried out using pseudo first order conditions as described in section 2.5.1.(d) (p 190). The results are shown in figure 2.49-2.54 (p 191-194). A plot of the pseudo first order constants against ascorbic acid concentration gives the rate constant for the reaction (fig 2.55, p 195). The value obtained was 0.366 dm3 mol'1 s'1 which compares with 0.56+/-0.02 (Dixon (1993)) and 0.36+/-0.01 (Connett(1985)). The zero intercept and linear plot is consistent with the expression
Kobs = a[ascorbic acid] [Cr(VI)]The postulated mechanism involves formation of a Cr(VI)-ascorbic acid ester (p 86) in which case the following equation would apply
HA + Cr(VI) «-*->■ HACr(VI)- i
HACr(VI) > Cr(IV) +AWhere A = dehydroascorbate. The rate law consistent with this mechanism is
- dCr(VI) _ k3ki [AscorbicAcid][Cr(VI)] dt k_ j +k3
Therefore a = Jh b l—k_x + k3If the redox reaction is rapid then k3 » k and the formation of the ester will be the rate determining step and a = kj.
243

O’Brien (1996) found that in Tris-HCl buffer the rate constant was oxygen dependent. This oxygen dependence was briefly studied here but little effect was observed Fig 2.56, p 197). The oxygen dependence may be due to reaction between Cr(VI) and the Tris-HCl buffer. No oxygen dependence was found in phosphate or HEPES buffers.
3.10. Reduction Capacity of Chromium Enriched Yeast.The purpose of these experiments was to determine if the chromium enriched yeast is a reducing agent. Various concentrations of Cr(VI) were allowed to contact 0.25g of(i) chromium enriched yeast and (ii) non enriched yeast, under acidic, neutral and basic conditions, both in the presence of air and absence of air. The Cr(VI) concentration of the supemate was measured over time.
(i). Reduction o f Cr(VI) by chromium enriched yeast in acid solution.Figure 2.57-2.62 (p 202-205) compare the reduction of 200, 100 and 50ppm Cr(VI) by chromium enriched yeast in 1M H2S04 in air and under nitrogen. Cr(VI) is readily reduced in all cases. The curves do not obey any simple rate law. The presence or absence of air appears to have no effect on the rate of reduction. The concentration of Cr(VI) appears to have no effect on the rate of reduction. For example the absorbance of the Cr(VI) falls to about 10% of its original value after 24 hours in all cases (measured under nitrogen). It is therefore unlikely that Cr(VI) can exist in the presence of chromium enriched yeast in acid solution.The experiment was repeated using non enriched yeast under air and nitrogen and very similar results were obtained in each case (figure 2.75-2.76, p 215). However the final Cr(VI) concentration had fallen to 5% of its original value in 24 hours.
244

Figure 2.63-2.68 (p 206-208) shows the reduction of 200, 100 and 25ppm Cr(VI) in neutral (pH7.4) solution in air and under nitrogen. At this pH the behaviour of the reduction process in very dependant on Cr(VI) concentration. At the highest concentration (200ppm) the Cr(VI) absorbance never falls below approximately 80%. In air the %A oscillates before increasing dramatically after 24 hours. This could be explained by air oxidation of the Cr(III) in the enriched yeast. Under nitrogen this dramatic increase does not occur, confirming the oxidation hypothesis. However, under nitrogen oscillation does occur. It is difficult to explain how oxidation of Cr(III) could occur under these conditions. It is possible that other absorbing species are formed which are interfering with Cr(VI) measurement.Using lOOppm Cr(VI) the %A falls to 65% and the oscillation of the %A absorbance is clearly defined. Similar behaviour occurs under nitrogen (fig 2.65-2.66, p 207). On reducing the Cr(VI) concentration to 25ppm very little change in absorbance occurred in air or in nitrogen (fig 2.67-2.68, p 208). When non enriched yeast was used a rapid reduction of the %A occurred initially in nitrogen. This was followed by a dramatic increase. Very little change occurred in air (fig 2.77-2.78, p 216).
(Hi). The Reduction o f Cr(VI) by Chromium Enriched Yeast in Basic Solution.Figure 2.69-2.74 (p 210-212) shows the reduction of 200, 100 and 25ppm Cr(VI) in (basic pH 13) solution, in air and under nitrogen. For the 200ppm solution oscillation of the %A is observed followed by increasing oxidation of Cr(III) to Cr(VI) in air but not in nitrogen. For the lOOppm solution oscillation is observed, followed by increase in oxidation in both cases. For the 25ppm solution air oxidation is much more
(ii). Reduction o f Cr(VI) by chromium enriched yeast in neutral solution.
245

dramatic than under nitrogen. In the case of non enriched yeast (fig 2.79-2.80, p 217) there is much less variation in the %A in both cases.The following conclusions and observations may be drawn,(i). Only in acid solution is Cr(VI) reduced effectively by either chromium enriched yeast or non enriched yeast.(ii). In neutral and basic solutions the %A oscillates.
3.11. Kinetic Study of the Rate of Reduction of Cr(VI) by Chromium Enriched Yeast using Redox Potential Measurements.Figure 2.81-2.83 (p 220-221) shows the change in potential at a platinum wire placed in lOOppm Cr(VI) on addition of lg of chromium enriched yeast. The drop in potential means that the added reagent is reducing. The time taken for the equilibrium potential to be reached depends on H2S04 and in faster in 1M H2S04. This indicates very rapid reduction of Cr(VI) in acid solution. In base (fig 2.84, p 222) the redox potential oscillates. This in reminiscent of the absorbance of Cr(VI) in neutral and basic solution. However, the net change in the redox potential was much smaller than in acid solution.When the experiments were performed by addition of Cr(VI) to lg of chromium enriched yeast in 1M H2S04 (fig 2.85-2.90, p 224-226), continuous increase in the redox potential was observed until a certain potential was reached then the redox potential began to level off implying again the chromium enriched yeast was capable of reducing the added Cr(VI).
246

(a). In this thesis four methods for the determination of Cr(VI) have been investigated. It has been shown that
(i). the spectrophotometric method using DPC is specific for Cr(VI) in the presence of excess Cr(III).(ii). preconcentration of Cr(VI) on a Cig column as a Cr-DPC complex is specific for Cr(VI) in the presence of excess Cr(III).(iii). the limit of detection of the H.P.L.C. method (6.5ppb) is superior to the spectrophotometric method (43.2ppb).
(b). Two ion exchange procedures have been developed for the preconcentration of Cr(VI). It has been shown that
(i). Cr(VI) at a level of 5ppb can be detected by elution with an ammonia buffer and spectrophotometric detection.(ii). Cr(VI) at a level of lppb can be detected by elution with acidic ascorbic acid and G.F.A.A. detection.
(c). A procedure has been developed for the separation of trace Cr(VI) from excess Cr(III) by ion exchange.(d). The importance of air oxidation in Cr(Vl) speciation has been discussed. It has been shown that
(i). Cr(III) is oxidised by air in alkaline solution in the timescale typically used for Cr(VI) extraction.(ii). air oxidation of Cr(III) increases with time.
(e). The extraction of Cr(VI) from a chromium enriched yeast has been studied. It has been shown
(i). that in air Cr(III) in the extract is oxidised to Cr(VI) after 24hours.
Conclusion.
247

(ii). that there is no Cr(VI) in the extract after 24 hours if the procedure is earned out under nitrogen as evidenced by spectrophotomelric and H.P.L.C. analysis of the extract.
(i). The reduction of Cr(VI) by yeast samples in acidic, neutral and basic solution has been studied. It is shown
(i). that yeast samples effectively reduce a large excess of Cr(VI) in 1M H2S04.(ii). that in neutral and basic solution the reduction is often reversible, both in air and under nitrogen.
(g). The rate of reduction of Cr(VI) using a model compund, ascorbic acid was determined at pH 7.4 and the results compared with previous studies.
(h). Further studies need to be earned out in the following areas,(i). the H.P.L.C. method and the ion exchange method could be applied to larger volumes of extract.(ii). the reduction of Cr(VI) by yeast at different pH values.
248

Appendices.
2.1. Effect of Initial Potential on the Cr(VI) Peak Height.E Initial / mV Peak Hieght / nA
-650 54.700-700 51.300-750 47.150-800 40.800-850 34.850-900 31.150-950 28.200
2.2. Effect of Varying Drop Growth Time on Cr{ VI) Peak Height.Drop Size Peak Height / nA
0.1 25.6660.2 30.3330.3 36.1840.4 42.8410.5 48.6661.0 67.2151.5 85.9922.0 102.6662.5 125.333
2.3. Effect of Multiple Scanning on Cr(VI} Peak Height.Scan Number Peak Height / nA
1 100.3332 99.8003 100.4504 98.5005 98.400
2.4. Effect of Electrolysis Time on Cr(VI) Peak Height.Electrolysis Time Peak Height / nA
0 41.60010 87.80020 168.00030 228.00040 248.50050 240.50060 239.500
l
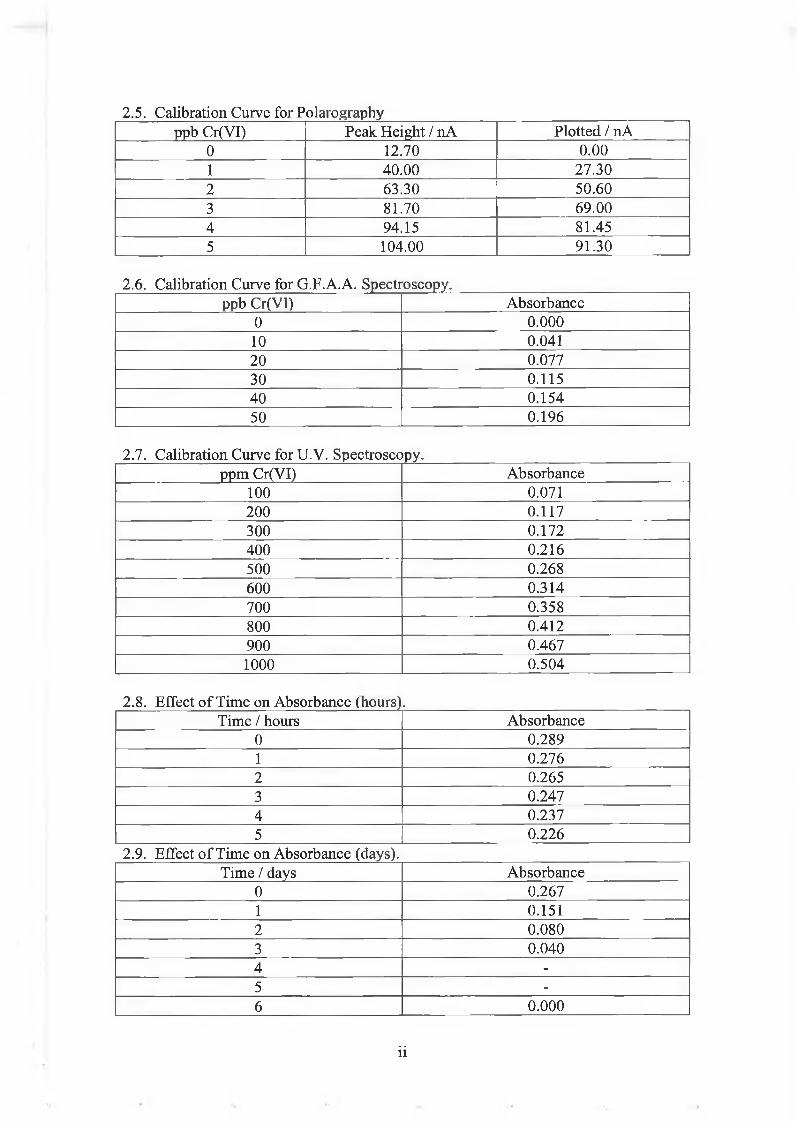
2.5. Calibration Curve for Polarographyppb Cr(VI) Peak Height / nA Plotted / nA
0 12.70 0.001 40.00 27.302 63.30 50.603 81.70 69.004 94.15 81.455 104.00 91.30
2.6. Calibration Curve for G.F.A.A. Spectroscopy.ppb Cr(VI) Absorbance
0 0.00010 0.04120 0.07730 0.11540 0.15450 0.196
2.7. Calibration Curve for U.V. Spectroscopy.ppm Cr(VI) Absorbance
100 0.071200 0.117300 0.172400 0.216500 0.268600 0.314700 0.358800 0.412900 0.4671000 0.504
2.8. Effect of Time on Absorbance (hours).Time / hours Absorbance
0 0.2891 0.2762 0.2653 0.2474 0.2375 0.226
2.9. Effect of Time on Absorbance (days).Time / days Absorbance
0 0.2671 0.1512 0.0803 0.0404 -5 -6 0.000
ii

2.10. Calibration Curve for H.P.L.C.ppb Cr(VI) Peak Height / nA x 10'5
0 05 2.09 x 10_i10 4.99 x 10‘515 9.11 x 10'520 12.78 x 10"525
2.11. To Show That Cr(VI) Can Be Extracted From The Yeast.Time / days Non-Enriched Yeast +
20ppm Cr(III) / Absorbance
Non-Enriched Yeast + 20ppm Cr(III) + 500ppb Cr(VI) /
Absorbance
Non-Enriched Yeast + 20ppm Cr(III) + lppm Cr(VI) / Absorbance
1 0.035 0.088 0.0982 0.037 - 0.1073 0.048 - 0.1144 - 0.096 0.1225 - 0.110 -
6 0.106 0.133 -
7 0.120 0.136 0.1818 0.140 0.149 0.2319 0.168 0.177 0.263
2.12.To Show that Cr(Vl) can be Extracted in Presence of Chromium Enriched Yeast.Time / days Yeast + 20 ppm Cr(III) +
500 ppb Cr(VT)Yeast + 500 ppb Cr(VI)
1 0.164 0.0842 - 0.0963 - 0.0944 0.236 0.1345 0.232 -
6 0.239 0.1707 0.257 0.1748 0.271 0.2029 0.316 0.207
2.13.To Show Air Oxidation Of Cr(lII) To Cr(VI) In Alkaline Solution.Time / days Tris NaOH + 20
ppmCr(III) in AirTris-NaoH + 20 ppm Cr(III) in Nitrogen
0 0 0.001 0.045 0.002 0.087 0.003 - 0.004 - 0.005 0.154 0.006 0.179 0.007 0.193 0.008 0.233 0.009 0.263 0.00
iii

2.14. To Show that Chromium Enriched Yeast Reduces Cr(VI) In Inert Atmosphere.Time / days Yeast + 500 ppb Cr(VI) in
AirYeast + Cr(VI) in Nitrogen
1 0.084 0.002 0.096 0.003 0.094 0.004 0.134 -
5 - 0.006 0.170 0.007 0.174 0.008 0.202 0.009 0.207 0.00
2.15. To Show Air Oxidation Of The Chromium Enriched Yeast Extract.Time / days Yeast in air Yeast in Nitrogen
1 0.000 0.0002 0.142 0.0003 0.171 0.0004 - 0.0005 - -6 0.211 -7 0.244 0.0008 0.292 0.0009 0.292 0.000
2.16. 2M (NH4)2S04.4.0M NH4OH pH 10 25cm3 of lOppm Cr(VI). (Long Column).Fraction Absorbance Fraction Absorbance1 0.01 12 0.3972 0.022 13 0.3123 0.033 14 0.2564 0.124 15 0.2095 0.355 16 0.1356 0.560 17 0.1497 0.696 18 0.0988 0.717 19 0.0869 0.705 20 0.06410 0.304 21 0.05411 0.228 22 0.0572.17. 2M (NH4)2S04.2M NH4OH pH 10. 25cm3 of 1Cppm Cr(V] ). (Long Column).Fraction Abs. Fraction Abs. Fraction Abs. Farction Abs.
1 0.039 12 0.919 23 0.930 34 0.4232 0.039 13 0.937 24 0.856 35 0.3923 0.039 14 1.043 25 0.836 36 0.3784 0.039 15 1.107 26 0.771 37 0.3785 0.050 16 1.142 27 0.659 38 0.2836 0.121 17 1.122 28 0.632 39 0.2487 0.305 18 1.108 29 0.608 40 0.208
iv
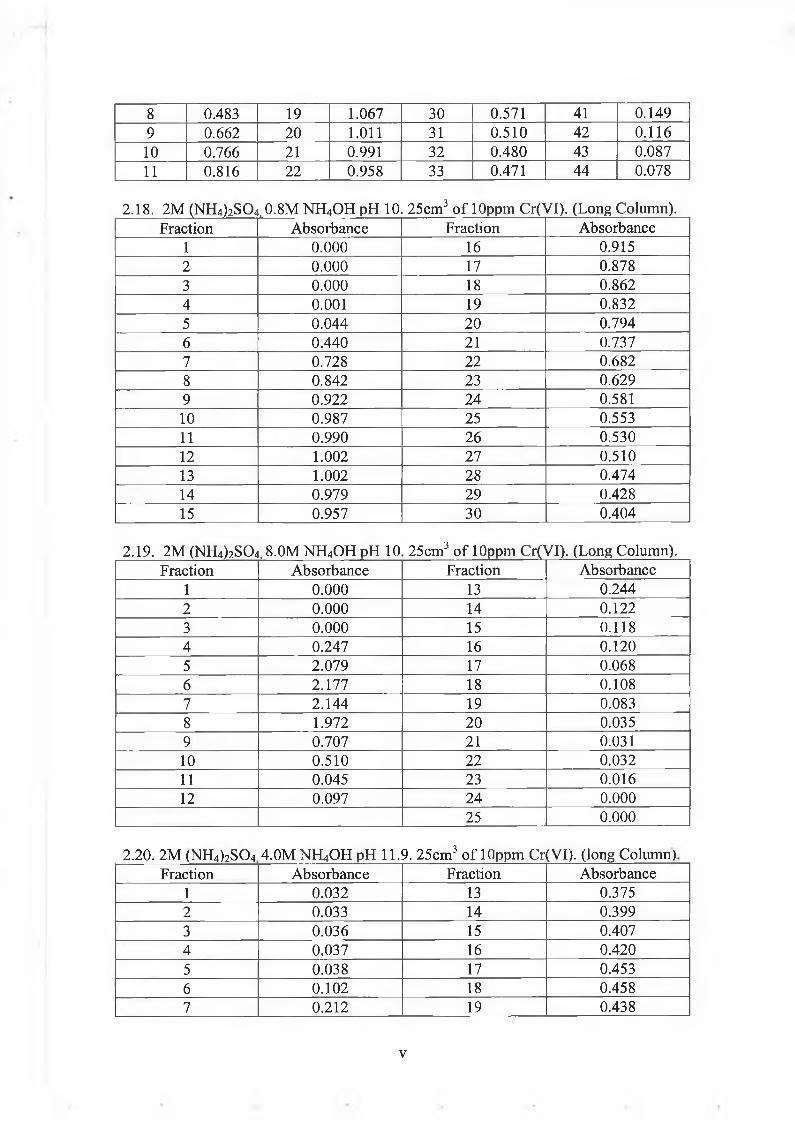
8 0.483 19 1.067 30 0.571 41 0.1499 0.662 20 1.011 31 0.510 42 0.11610 0.766 21 0.991 32 0.480 43 0.08711 0.816 22 0.958 33 0.471 44 0.078
2.18. 2M (NH4)2S04.0.8M NH4OH pH 10. 25cm3 of lOppin Cr(VI), (Long Column).Fraction Absorbance Fraction Absorbance
1 0.000 16 0.9152 0.000 17 0.8783 0.000 18 0.8624 0.001 19 0.8325 0.044 20 0.7946 0.440 21 0.7377 0.728 22 0.6828 0.842 23 0.6299 0.922 24 0.58110 0.987 25 0.55311 0.990 26 0.53012 1.002 27 0.51013 1.002 28 0.47414 0.979 29 0.42815 0.957 30 0.404
2.19. 2M (NH4)2S04,8.0M NH4OH pH 10 25cm3 of lOppm Cr(VI), (Long Column).Fraction Absorbance Fraction Absorbance
1 0.000 13 0.2442 0.000 14 0.1223 0.000 15 0.1184 0.247 16 0.1205 2.079 17 0.0686 2.177 18 0.1087 2.144 19 0.0838 1.972 20 0.0359 0.707 21 0.03110 0.510 22 0.03211 0.045 23 0.01612 0.097 24 0.000
25 0.0002.20. 2M (NH4)2SQ4 4.0M NH4OH pH 11.9. 25cm3 of 1 Oppm Cr(VI). (long Column)
Fraction Absorbance Fraction Absorbance1 0.032 13 0.3752 0.033 14 0.3993 0.036 15 0.4074 0.037 16 0.4205 0.038 17 0.4536 0.102 18 0.4587 0.212 19 0.438
v

8 0.277 20 0.4299 0.360 21 0.41010 0.393 22 0.35811 0.170 23 0.38112 0.405 24 0.299
2.21. 2M (NH4)2S04,4.0M NH4OH pH 9.0. 25cm3 oflOppm Cr(VI). (Long Column).Fraction Absorbance Fraction Absorbance
1 0.001 11 0.6752 2.250 12 0.6053 2.263 13 0.5364 2.254 14 0.4465 2.170 15 0.3776 1.863 16 0.3317 1.546 17 0.2898 1.345 18 0.2659 1.115 19 0.22710 0.858 20 0.206
2.22. 2M (NH4)2S044.0M NH40H pH 10. 25cm3 of lOppm Cr(VI).(Short Column).Fraction Absorbance Fraction Absorbance
1 0.009 10 1.1572 0.351 11 0.9633 6.84 12 0.2464 9.28 13 0.7855 7.06 14 0.6776 5.06 15 0.5527 1.3 16 0.5038 0.208 17 0.4519 0.101 18 0.384
2.23. 2M (NH4)2S04 4.0M NH4OH pH 9.0. 25cmJ of 1 ppm Cr(V ). (Short Column).Fraction Absorbance Fraction Absorbance
1 0.008 11 0.0772 0.011 12 0.0643 0.123 13 0.0594 0.569 14 0.0415 0.398 15 0.0366 0.296 16 0.0327 0.176 17 0.0308 0.132 18 0.0269 0.103 19 0.02610 0.083 20 0.023
2.24. 2M (NH4)2S04 4.QM NH4OH pH 9.0. 25cm~ of lOOppb Cr(VI). (Short Column).Fraction Absorbance Fraction Absorbance
1 0.005 11 0.0112 0.009 12 0.0103 0.035 13 0.0094 0.031 14 0.009
vi

5 0.025 15 0.0096 0.022 16 0.0107 0.015 17 0.0108 0.014 18 0.0099 0.013 19 0.00910 0.011 20 0.010
2.25. 2M (NH4)2S04,4.0M NH4OH pH 10 1 dm3 of 5ppb Cr(Vl) (Short Column).Fraction Absorbance Fraction Absorbance
1 0.003 11 0.0132 0.004 12 0.0113 0.016 13 0.0134 0.025 14 0.0095 0.021 15 0.0106 0.015 16 0.0137 0.014 17 0.0118 0.010 18 0.0119 0.009 19 0.01310 0.015 20 0.012
2.26. 2M (NH4)2S04 4.0M NH4OH pH 10. Chromium Enriched Yeast Extract. (ShortColumn).Fraction Absorbance Fraction Absorbance
1 0.000 11 0.0062 0.002 12 0.0053 0.005 13 0.0044 0.009 14 0.0045 0.012 15 0.0026 0.014 16 0.0027 0.012 17 0.0018 0.011 18 0.0039 0.010 19 0.00410 0.008 20 0.004
2.27. 2M (NH4)2S04 4.0M NH4OH pH 10. Non-Enriched Yeast Extract. (ShortColumn).Fraction Absorbance Fraction Absorbance
1 0.020 11 0.0202 0.025 12 0.0193 0.020 13 0.0204 0.019 14 0.0205 0.019 15 0.0206 0.020 16 0.0207 0.019 17 0.0208 0.020 18 0.0159 0.020 19 0.01510 0.020 20 0.016
vii

2.28. 2M (NH4)2S0 4 ,4 .0 M NH4OH pH 10. Non-Enriched Yeast + 20 ppm Cr(VI).(Short Column).Fraction Absorbance Fraction Absorbance
1 0.018 11 0.0422 0.031 12 0.0403 0.029 13 0.0354 0.028 14 0.0395 0.026 15 0.0376 0.033 16 0.0317 0.032 17 0.0438 0.033 18 0.0479 0.030 19 0.03210 0.043 20 0.021
2.29. 0.1M H2S04,0.1M Ascorbic Acid.25cm3 of lppm Cr(VI). Eluted Immediately,Fraction Absorbance Fraction Absorbance
1 0.001 8 0.3522 0.007 9 0.2693 0.013 10 0.2414 0.653 11 0.2025 0.625 12 0.1806 0.615 13 0.1637 0.431
2.30. 0.1MH2S04,0. M Ascorbic Acid. 25cm3 of lppm Cr(VI). Eluted After 1 Hour.Fraction Absorbance Fraction Absorbance
1 0.024 11 0.3242 0.025 12 0.1673 0.020 13 0.1974 0.026 14 0.1635 0.038 15 0.1516 0.134 16 0.1047 0.264 17 0.1348 0.293 18 0.1069 0.299 19 0.10510 0.367 20 0.083
2.31. 0.1M H2S04,0. M Ascorbic Acid.25cm3 of lOOppb Cr(Vl). iluted After 1 Hour.Fraction Absorbance Fraction Absorbance
1 0.031 11 0.2732 0.041 12 0.2243 0.028 13 0.2134 0.034 14 0.1565 0.036 15 0.1496 0.110 16 0.1167 0.157 17 0.1028 0.209 18 0.1049 0.258 19 0.10710 0.251 20 0.064
viii

2.32. 0.1MH2S04,0. IM Ascorbic Acid.lOOcm3 of lOppb Cr(Vl). Eluted After 1 Hour.Fraction Absorbance Fraction Absorbance
1 0.020 11 0.2572 0.013 12 0.2273 0.015 13 0.1414 0.015 14 0.1265 0.007 15 0.1056 0.009 16 0.0907 0.032 17 0.0838 0.087 18 0.0719 0.132 19 0.05910 0.173 20 0.063
2.33. 0.1M H2SC>4,0.1M Ascorbic Acid. 1 dm3 of lppb Cr(VI). Eluted After 1 Hour.Fraction Absorbance Fraction Absorbance
1 0.031 11 0.2602 0.048 12 0.2843 0.044 13 0.2934 0.039 14 0.3235 0.030 15 0.3066 0.050 16 0.2757 0.065 17 0.2698 0.151 18 0.2619 0.158 19 0.25210 0.147 20 0.212
2.34. 0.1M H2S04 ,0.1M Ascorbic Acid. Chromium Enriched Yeast Extract. ElutedAfter 1 Hour.
Fraction Absorbance Fraction Absorbance1 0.131 11 0.5632 0.061 12 0.4353 0.051 13 0.4204 0.085 14 0.4755 0.554 15 0.6176 0.749 16 0.7117 0.539 17 0.7668 0.867 18 0.4689 0.836 19 0.47310 0.596 20 0.410
2.35. 0.1M H2S04 ,0.1M Ascorbic Acid. Non-Enriched Yeast Extract. Eluted After 1Hour.
Fraction Absorbance Fraction Absorbance1 0.021 11 0.2082 0.012 12 0.1383 0.009 13 0.0704 0.015 14 0.1045 0.042 15 0.088
ix

6 0.035 16 0.1067 0.139 17 0.0758 0.084 18 0.0799 0.074 19 0.04710 0.184 20 0.060
2.36. Elution of Cr(III) From Chromium IVixture.Fraction Absorbance Plotted
1 -0.0051 0.00242 -0.0053 0.00223 -0.0061 0.00144 -0.0063 0.00125 -0.0050 0.00256 0.0149 0.02247 0.0477 0.05528 0.0062 0.01379 -0.0008 0.0067
Eluent -0.00752.37. Elution of Cr(VI) From Chromium Mixture.
Fraction Absorbance Fraction Absorbance1 0.007 11 0.0052 0.009 12 0.0023 0.029 13 0.0014 0.044 14 0.0025 0.031 15 0.0026 0.020 16 00037 0.013 17 0.0028 0.003 18 0.0029 0.005 19 0.00410 0.005 20 0.002
2.38. Elution Of Cr(IlI) From Cr(LlJ) Standard.Fraction Absorbance 1 Absorbance 2 Average Abs. Plotted
1 -0.0025 -0.0020 -0.00225 0.00402 -0.0025 -0.0031 -0.0028 0.003453 0.0019 0.0012 0.00155 0.00784 0.0373 0.0325 0.0349 0.041155 0.0646 0.0644 0.0645 0.070756 0.0132 0.0132 0.0132 0.019457 0.0067 0.0063 0.0065 0.012758 0.0023 0.0027 0.0025 0.008759 0.0009 0.0006 0.00075 0.00710 -0.0015 -0.0014 -0.00145 0.0048
Eluent -0.0065 -0.0060 -0.00625
x

2.39. Elution O f Cr(VI) From Ct'(IlI) Standard.Fraction Absorbance Fraction Absorbance
1 0.019 8 0.0042 0.009 9 0.0033 0.005 10 0.0034 0.005 11 0.0025 0.003 12 0.0026 0.002 13 0.0037 0.003 14 0.003
15 0.0042.40. Elution O:'Cr(III) From Chromium Enriched Yeast Extract.
Fraction Absorbance 1 Absorbance 2 Average Abs. Plotted1 0.0000 -0.0025 -0.00125 0.004402 -0.0025 -0.0036 -0.00305 0.002603 -0.0038 -0.0039 -0.00385 0.001804 0.0033 0.0030 0.00315 0.008805 0.0516 0.0498 0.05070 0.056356 0.0245 0.0260 0.02530 0.030957 0.0104 0.0097 0.01000 0.015758 0.0044 0.0300 0.00370 0.009359 0.0017 0.0021 0.00190 0.0075510 -0.0022 -0.0029 -0.00255 0.00310
Eluent -0.0058 -0.0055 -0.005652.41 .Elution Of Cr(VI) From Chromium Enriched Yeast Extract.
Fraction Absorbance Fraction Absorbance1 -0.002 8 -0.0062 0.009 9 -0.0023 -0.004 10 -0.0014 -0.005 11 -0.0015 -0.006 12 -0.0026 -0.007 13 -0.0037 -0.006 14 -0.002
15 -0.0012.42. Reduction Of Cr(Vl) By Q.01M Ascorbic Acid.
Time / seconds Absorbance Time / seconds Absorbance20 1.134 130 0.77030 1.088 140 0.74640 1.064 150 0.71850 1.026 160 0.69660 1.003 170 0.66970 0.961 180 0.64880 0.927 190 0.62390 0.889 200 0.600100 0.863 210 0.577110 0.833 220 0.562120 0.803 230 0.536
xi

2.43. Reduction O f Cr(Vi) By 0.02M Ascorbic Acid.Time / seconds Absorbance Time / seconds Absorbance
20 1.044 130 0.52930 0.988 140 0.49640 0.933 150 0.46750 0.879 160 0.43860 0.829 170 0.40870 0.755 180 0.38280 0.729 190 0.35990 0.683 200 0.339100 0.643 210 0.317110 0.603 220 0.298120 0.563 230 0.278
240 0.2632.44. Reduction Of Cr(V’I) By 0.03M Ascorbic Acid.
Time / seconds Absorbance Time / seconds Absorbance20 1.080 130 0.33330 0.988 140 0.29940 0.8984 150 0.27250 0.799 160 0.24460 0.717 170 0.22170 0.641 180 0.20080 0.574 190 0.18290 0.516 200 0.168100 0.460 210 0.152110 0.416 220 0.139120 0.369 230 0.130
240 0.1192.45. Reduction Of Cr( VI) By 0.04M Ascorbic Acid.
Time / seconds Absorbance Time / seconds Absorbance20 1.034 130 0.22230 0.906 140 0.19540 0.789 150 0.17250 0.681 160 0.15260 0.589 170 0.13570 0.506 180 0.12280 0.439 190 0.11390 0.380 200 0.101100 0.333 210 0.091110 0.286 220 0.085120 0.251 230 0.080
240 0.075
xii

2.46. Reduction Of Cr(VI) By Q.Q5M Ascorbic Acid.Time / seconds Absorbance Time / seconds Absorbance
20 0.933 130 0.13930 0.775 140 0.12340 0.634 150 0.11250 0.520 160 0.10060 0.432 170 0.09070 0.358 180 0.08380 0.301 190 0.07790 0.254 200 0.072100 0.215 210 0.068110 0.185 220 0.065120 0.162 230 0.063
240 0.0602.47. Reduction Of Cr(VI) By 0.06M Ascorbic Acid.
Time / seconds Absorbance Time / seconds Absorbance20 0.901 130 0.09430 0.700 140 0.08540 0.545 150 0.07950 0.428 160 0.07560 0.338 170 0.07270 0.268 180 0.06980 0.214 190 0.06790 0.173 200 0.066100 0.143 210 0.063110 0.120 220 0.065120 0.104 230 0.063
240 0.0622.48. Determination Of The Second Order Rate Constant
K o b s 1 S [Ascorbate] k o b s ! s [ Ascorbate]0.00356 0.01 0.01377 0.040.00629 0.02 0.01718 0.050.0106 0.03 0.02199 0.06
2.49. Reduction Of 200ppm Cr(VI) By Enriched Yeast In Acidic Solution In Air.Time/hours Absorbance %A Time/hours Absorbance %A
0 1.021 100 6 0.315 30.852111 0.713 69.8335 7 0.284 27.815872 0.605 59.25563 8.5 0.277 27.130263 0.548 53.67287 10 0.256 25.073464 0.439 42.99706 23 0.071 6.953975 0.363 35.55338

2.50. Reduction Of 200ppm Cr(VI) By Enriched Yeast In Acidic Solution In N2.Time/hours Absorbance %A Time/hours Absorbance %A
1 0.940 100.00000 7 0.336 35.744682 0.868 92.34043 8 0.313 33.297873 0.821 87.34043 9 0.288 30.638304 0.565 60.10638 10 0.249 26.489365 0.532 56.59574 11 0.197 20.957456 0.490 52.12766
2.51. Reduction Of lOOppm Cr(VI) By Enriched Yeast In Acidic Solution In Air.Time/hours Absorbance %A Time/hours Absorbance %A
0.0 2.003 100.00000 4.0 0.877 43.784320.5 1.378 68.79680 5.0 0.831 41.487771.0 1.225 61.15826 6.0 0.724 36.145781.5 1.183 59.06141 7.0 0.600 29.955072.0 1.147 57.26410 8.0 0.530 26.460312.5 1.089 54.36845 9.0 0.489 24.413383.0 1.042 52.02197 11.0 0.420 20.96855
24.0 0.240 11.982032.52. Reduction Of lOOppm Cr(VI) By Enriched Yeast In Acidic Solution In N2.Time/hours Absorbance %A Time/hours Absorbance %A
0.00 2.005 100.00000 2.50 0.994 49.576060.25 1.725 86.03491 4.00 0.786 39.202000.50 1.355 67.58105 5.00 0.689 34.364091.00 1.302 64.93766 6.00 0.622 31.022441.50 1.105 55.11222 7.50 0.600 29.925192.00 1.017 50.72319 9.00 0.528 26.33416
2.53. Reduction Of SOppm Cr(VI) By Enriched Yeast In Acidic Solution In Air.Time/hours Absorbance %A Time/hours Absorbance %A
0.00 0.995 100.00000 3.00 0.360 36.18090.25 0.729 73.26633 4.00 0.319 32.06030.50 0.606 60.90452 5.50 0.276 27.738690.75 0.530 53.26633 6.50 0.239 24.020101.00 0.483 48.54271 7.50 0.196 19.698491.25 0.428 43.01508 8.50 0.131 13.165831.50 0.416 41.80905 11.0 0.118 11.85932.00 0.377 37.88945
2.54. Reduction Of 5()ppin Cr(VI) By Enriched Yeast In Acidic Solution InN 2.Time/hours Absorbance %A Time/hours Absorbance %A
0.00 1.057 100.00000 3.00 0.373 35.288550.25 0.664 62.81930 4.00 0.325 30.747400.50 0.601 56.85904 5.00 0.256 24.219490.75 0.578 54.68307 6.00 0.217 20.529801.00 0.574 54.30464 7.00 0.209 19.772941.50 0.528 49.95270 8.00 0.199 18.82687
xiv

2.00 0.450 42.57332 9.00 0.174 16.461682.50 0.391 36.99149 24.0 0.125 11.82592
2.55. Reduction Of 200ppm Cr(VI) By Enriched Yeast In Neutral Solution In Air.Time/hours Absorbance %A Time/hours Absorbance %A
0.00 1.678 100.00000 5.00 1.496 89.153750.25 1.390 82.83671 6.00 1.491 88.855780.50 1.717 102.3242 7.50 1.791 106.734210.75 1.619 96.48391 9.50 1.762 105.005961.00 1.775 105.78069 10.00 1.516 90.345651.50 1.765 105.18474 23.75 1.886 112.395712.00 1.790 106.67461 27.50 2.370 141.239573.00 1.760 104.88677 32.50 2.516 149.940414.00 1.544 92.01430
2.56. Reduction Of 200ppm Cr(Vl) By Enriched Yeast In Neutral Solution In N2.Time/hours Absorbance %A Time/hours Absorbance %A
0.00 1.484 100.00000 6.00 1.585 106.805930.25 1.393 93.86792 7.50 1.628 109.703500.75 1.376 92.72237 8.50 1.669 112.466311.00 1.136 76.54987 10.00 1.668 112.398921.50 1.449 97.64151 23.75 1.561 105.188682.00 1.448 97.57412 27.50 1.556 104.851753.00 1.494 100.67385 32.50 1.533 103.301894.00 1.606 108.22102 48.00 1.627 109.636125.00 1.385 93.32884
2.57. Reduction Of lOQppm Cr(VI) By Enriched Yeast In Neutral Solution In Air.Time/hours Absorbance %A Time/hours Absorbance %A
0.0 0.900 100.00000 7.5 0.669 74.333331.0 0.731 81.22222 9.5 0.731 81.222222.0 0.699 77.66667 24.0 0.737 81.888893.0 0.641 71.22222 29.0 0.707 78.555564.5 0.643 71.44444 48.0 0.607 67.444446.0 0.607 67.44444 120.0 1.083 120.33333
2.58. Reduction Of lOOppm Cr(Vl) By Enriched Yeast In Neutral Solution In N2.Time/hours Absorbance %A Time/hours Absorbance %A
0.0 0.965 100.0000 7.0 1.006 104.24871.0 0.840 87.0466 8.5 0.980 101.55442.5 0.956 99.0673 24.0 0.989 102.48703.5 0.941 97.5129 48.0 0.532 15.260125.0 0.930 96.3731 120.0 0.715 74.0933
xv
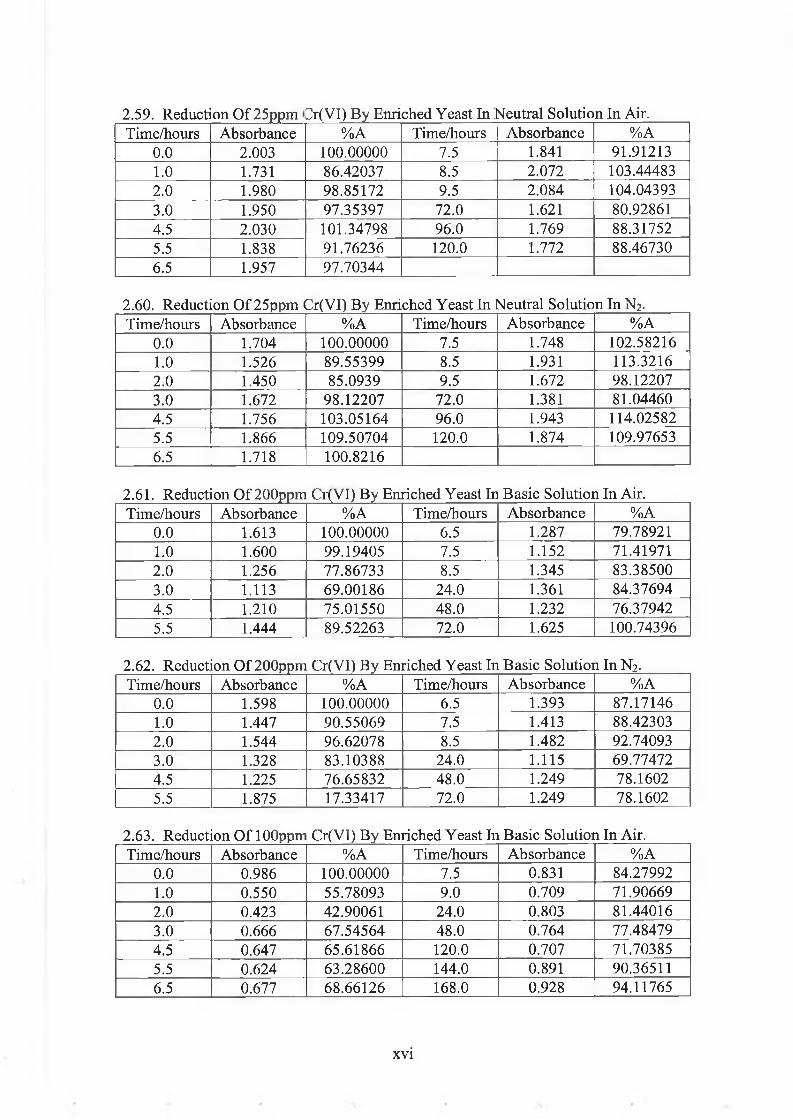
2.59. Reduction Of 25ppm 3r(Vl) By Enriched Yeast In Neutral Solution In Air.Time/hours Absorbance %A Time/hours Absorbance %A
0.0 2.003 100.00000 7.5 1.841 91.912131.0 1.731 86.42037 8.5 2.072 103.444832.0 1.980 98.85172 9.5 2.084 104.043933.0 1.950 97.35397 72.0 1.621 80.928614.5 2.030 101.34798 96.0 1.769 88.317525.5 1.838 91.76236 120.0 1.772 88.467306.5 1.957 97.70344
2.60. Reduction Of 25ppm Cr(VI) By Enriched Yeast In Si eut ral Solution In N2.Time/hours Absorbance %A Time/hours Absorbance %A
0.0 1.704 100.00000 7.5 1.748 102.582161.0 1.526 89.55399 8.5 1.931 113.32162.0 1.450 85.0939 9.5 1.672 98.122073.0 1.672 98.12207 72.0 1.381 81.044604.5 1.756 103.05164 96.0 1.943 114.025825.5 1.866 109.50704 120.0 1.874 109.976536.5 1.718 100.8216
2.61. Reduction Of 200ppin Cr(VI) By Enriched Yeast In Basic Solution In Air.Time/hours Absorbance %A Time/hours Absorbance %A
0.0 1.613 100.00000 6.5 1.287 79.789211.0 1.600 99.19405 7.5 1.152 71.419712.0 1.256 77.86733 8.5 1.345 83.385003.0 1.113 69.00186 24.0 1.361 84.376944.5 1.210 75.01550 48.0 1.232 76.379425.5 1.444 89.52263 72.0 1.625 100.74396
2.62. Reduction Of 200ppm Cr(VI) By Enriched Yeast In Basic Solution In N2.Time/hours Absorbance %A Time/hours Absorbance %A
0.0 1.598 100.00000 6.5 1.393 87.171461.0 1.447 90.55069 7.5 1.413 88.423032.0 1.544 96.62078 8.5 1.482 92.740933.0 1.328 83.10388 24.0 1.115 69.774724.5 1.225 76.65832 48.0 1.249 78.16025.5 1.875 17.33417 72.0 1.249 78.1602
2.63. Reduction Of lOOppm Cr(VI) By Enriched Yeast In Basic Solution In Air.Time/hours Absorbance %A Time/hours Absorbance %A
0.0 0.986 100.00000 7.5 0.831 84.279921.0 0.550 55.78093 9.0 0.709 71.906692.0 0.423 42.90061 24.0 0.803 81.440163.0 0.666 67.54564 48.0 0.764 77.484794.5 0.647 65.61866 120.0 0.707 71.703855.5 0.624 63.28600 144.0 0.891 90.365116.5 0.677 68.66126 168.0 0.928 94.11765
xvi
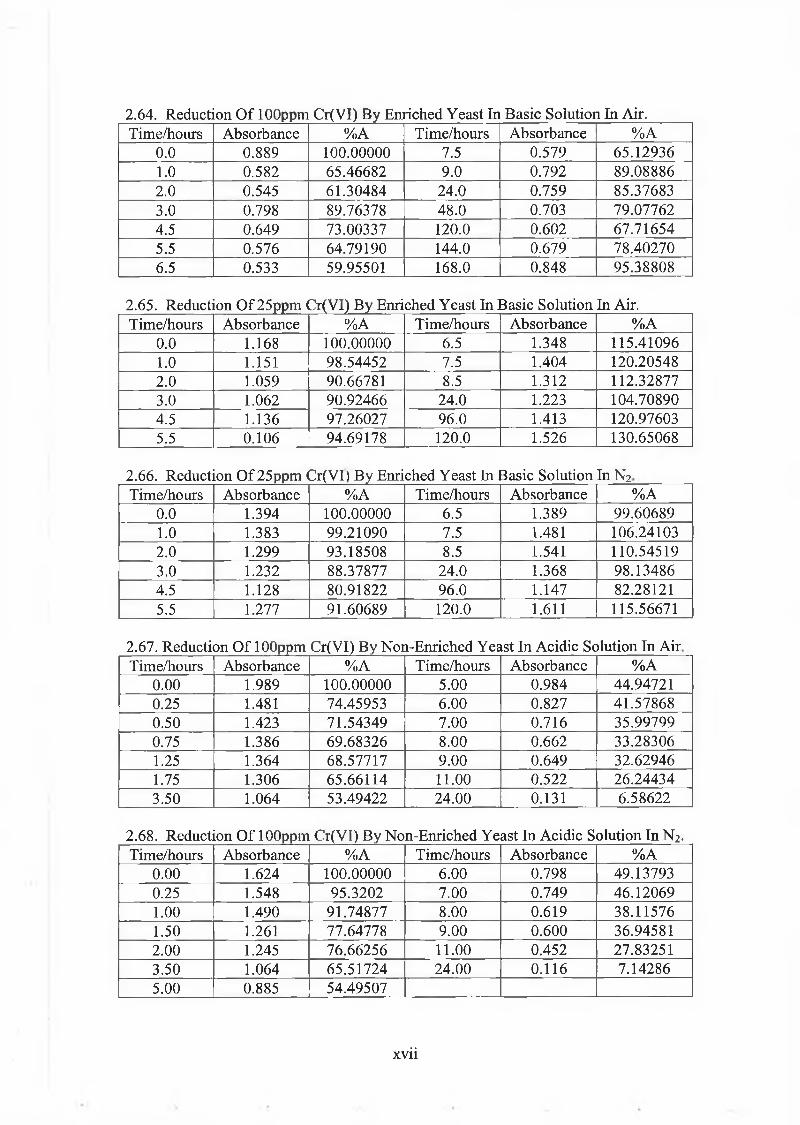
2.64. Reduction Of lOOpptn Cr(VI) By Enriched Yeast In Basic Solution In Air.Time/hours Absorbance %A Time/hours Absorbance %A
0.0 0.889 100.00000 7.5 0.579 65.129361.0 0.582 65.46682 9.0 0.792 89.088862.0 0.545 61.30484 24.0 0.759 85.376833.0 0.798 89.76378 48.0 0.703 79.077624.5 0.649 73.00337 120.0 0.602 67.716545.5 0.576 64.79190 144.0 0.679 78.402706.5 0.533 59.95501 168.0 0.848 95.38808
2.65. Reduction Of 25ppm Cr(Vl) By Enriched Yeast In Basic Solution In Air.Time/hours Absorbance %A Time/hours Absorbance %A
0.0 1.168 100.00000 6.5 1.348 115.410961.0 1.151 98.54452 7.5 1.404 120.205482.0 1.059 90.66781 8.5 1.312 112.328773.0 1.062 90.92466 24.0 1.223 104.708904.5 1.136 97.26027 96.0 1.413 120.976035.5 0.106 94.69178 120.0 1.526 130.65068
2.66. Reduction Of 25ppm Cr(Vl) By Enriched Yeast In Basic Solution In N2Time/hours Absorbance %A Time/hours Absorbance %A
0.0 1.394 100.00000 6.5 1.389 99.606891.0 1.383 99.21090 7.5 1.481 106.241032.0 1.299 93.18508 8.5 1.541 110.545193.0 1.232 88.37877 24.0 1.368 98.134864.5 1.128 80.91822 96.0 1.147 82.281215.5 1.277 91.60689 120.0 1.611 115.56671
2.67. Reduction Of lQOppm Cr(Vl) By Non-Enriched Yeast In Acidic Solution In AirTime/hours Absorbance %A Time/hours Absorbance %A
0.00 1.989 100.00000 5.00 0.984 44.947210.25 1.481 74.45953 6.00 0.827 41.578680.50 1.423 71.54349 7.00 0.716 35.997990.75 1.386 69.68326 8.00 0.662 33.283061.25 1.364 68.57717 9.00 0.649 32.629461.75 1.306 65.66114 11.00 0.522 26.244343.50 1.064 53.49422 24.00 0.131 6.58622
2.68. Reduction Of lQOppm Cr(VI) By Non-Enriched Yeast In Acidic Solution In N2.Time/hours Absorbance %A Time/hours Absorbance %A
0.00 1.624 100.00000 6.00 0.798 49.137930.25 1.548 95.3202 7.00 0.749 46.120691.00 1.490 91.74877 8.00 0.619 38.115761.50 1.261 77.64778 9.00 0.600 36.945812.00 1.245 76.66256 11.00 0.452 27.832513.50 1.064 65.51724 24.00 0.116 7.142865.00 0.885 54.49507
xvii

2.69. Reduction O f lQOppm Cr(VI) by Non-Enriched Yeast in Neutral Solution in air.Time/hours Absorbance %A Time/hours Absorbance %A
0.0 0.938 100.00000 6.0 0.881 93.923240.5 0.920 98.08102 7.5 0.903 96.268661.5 0.868 92.53731 9.0 0.898 95.735612.5 0.953 101.59915 24.0 0.956 101.918983.5 0.900 95.94883 48.0 0.815 86.886995.0 0.817 87.10021 120.0 0.702 74.84009
2.70. Reduction Of lQOppm Cr(VI) by Non-Enriched Yeast in Neutral Solution in N2.Time/hours Absorbance %A Time/hours Absorbance %A
0.0 0.624 100.00000 6.0 0.890 142.628210.5 0.172 27.56410 7.5 0.925 148.237181.5 0.924 148.07692 9.0 0.881 141.185902.5 0.796 127.56410 24.0 0.891 142.788463.5 0.738 118.26923 48.0 0.892 142.948725.0 0.849 136.05769 120.0 0.837 134.13462
2.71. Reduction Of lQOppm Cr(Vl) By Non-Enriched Yeast In Basic Solution In Air.Time/hours Absorbance %A Time/hours Absorbance %A
0.0 0.935 100.00000 6.0 0.903 96.577541.0 0.918 98.18182 7.5 0.922 98.609632.0 0.923 98.71658 9.0 0.984 105.240643.5 0.934 99.89305 24.0 0.799 85.454555.0 0.978 104.59893 96.0 0.813 86.95187
2.12. Reduction Of lQOppm Cr(Vl) By Non-Enriched Yeast In Basic Solution In N2.Time/hours Absorbance %A Time/hours Absorbance %A
0.0 1.054 100.00000 6.0 0.974 92.409871.0 0.804 76.28083 7.5 0.939 89.089182.0 0.927 87.95066 9.0 0.952 90.322583.5 0.931 88.33017 24.0 0.881 83.586345.0 1.055 100.09488 96.0 0.871 82.63757
2.73.Redox Potentials of 1.0M H2S04 .Time/second Potential / V Time/second Potential / V Time/second Potential / V
1 0.806 20 0.708 38 0.7032 0.807 21 0.706 39 0.7033 0.806 22 0.707 40 0.7044 0.8 23 0.706 41 0.7065 0.791 24 0.707 42 0.7066 0.779 25 0.709 43 0.7057 0.778 26 0.709 44 0.7058 0.771 27 0.707 45 0.7059 0.766 28 0.706 46 0.70610 0.745 29 0.707 47 0.70711 0.729 30 0.706 48 0.70712 0.72 31 0.707 49 0.70913 0.711 32 0.707 50 0.709
xviii

14 0.702 33 0.707 51 0.70915 0.703 34 0.706 52 0.70716 0.706 35 0.706 53 0.70817 0.706 36 0.704 54 0.70818 0.706 37 0.706 55 0.70719 0.706 38 0.704
2.74. Redox Potentials of 0.1M H2SO4.Time/second Potential / V Time/second Potential / V Time/second Potential / V
0 725.6 40 661.5 80 659.75 704.1 45 660.6 85 659.710 694.9 50 660.3 90 659.815 685.4 55 659.3 95 660.120 677.3 60 659.7 100 66025 671 65 659.5 105 660.130 666.4 70 659.7 110 660.435 662.1 75 659.4 115 660.5
120 660.72.75. Redox Potentials of 0.0IM H2SO4.Time/second Potential / V Time/second Potential / V Time/second Potential / V
1 0.662 20 0.608 38 0.5882 0.661 21 0.606 39 0.5893 0.66 22 0.605 40 0.5854 0.658 23 0.603 41 0.5865 0.659 24 0.601 42 0.5866 0.655 25 0.597 43 0.5857 0.652 26 0.597 44 0.5858 0.649 27 0.597 45 0.5839 0.646 28 0.597 46 0.58610 0.639 29 0.595 47 0.58411 0.629 30 0.595 48 0.58212 0.627 31 0.595 49 0.58113 0.622 32 0.594 50 0.5814 0.622 33 0.592 51 0.58115 0.621 34 0.591 52 0.58216 0.616 35 0.591 53 0.58117 0.615 36 0.59 54 0.58218 0.613 37 0.588 55 0.58219 0.61 38 0.588 56 0.581
2.76.Redox Potentials of 0.1M Tris-NaOH pH 13.Time/second Potential / V Time/second Potential / V Time/second Potential / V
0 -0.133 40 -0.158 80 -0.1555 -0.132 45 -0.163 85 -0.15510 -0.15 50 -0.157 90 -0.15615 -0.193 55 -0.154 95 -0.15520 -0.162 60 -0.155 100 -0.15625 -0.171 65 -0.155 105 -0.157
xix

30 -0.16 70 -0.154 110 -0.15635 -0.156 75 -0.153 115 -0.156
120 -0.1562.77. Redox Potentials of lOOOppm Cr(Vl) Plus lg of Chromium Enriched Yeast.
/ T \ D n t a n +1(11 j t 1 \ / T \ / / iv m ^ o 1 I \ J / ' \ / I 1 / / . ."VI P A + P M + lnCr(VIVcmJ Potential / V Cr(Vl)/cm3 Potential / V Cr(VI)/cm3 Potential / V0 437.7 10 753.1 20 780.7
0.5 569.5 10.5 755 20.5 781.51 608.5 11 757.2 21 782.3
1.5 634.5 11.5 759.4 21.5 783.32 655.8 12 761.3 22 785.4
2.5 672.2 12.5 763.3 22.5 785.93 684.6 13 764.9 23 785.9
3.5 696.6 13.5 766.3 23.5 786.74 702.8 14 768.2 24 787.3
4.5 709.6 14.5 769.6 24.5 787.75 716 15 770.7 25 788.1
5.5 720.3 15.5 772.1 25.5 7896 725.5 16 773.5 26 790.2
6.5 729.6 16.5 774.3 26.5 791.17 733.3 17 775.6 27 791.9
7.5 736.3 17.5 776.7 27.5 792.18 739.5 18 777.7 28 792.5
8.5 742.4 18.5 779.1 28.5 793.19 745.1 19 779.9 29 793.6
9.5 748.4 19.5 779.9 29.5 794.52.78. Redox, Potentials of lOOppm Cr(VI) Plus lg of Chromium Enriched Yeast.Cr(VI)/cm3 Potential / V Cr(VI)/cmJ Potential / V Cr(VI)/cm Potential / V
0 450.2 10 617 20 654.80.5 474.2 10.5 620.7 20.5 656.71 498.1 11 623.1 21 657.8
1.5 518.2 11.5 625.7 21.5 659.42 531.8 12 628 22 661.5
2.5 541.8 12.5 630.2 22.5 662.53 552.3 13 632.5 23 663.7
3.5 560.2 13.5 633.9 23.5 664.84 566.3 14 636.2 24 665.6
4.5 573.2 14.5 638.4 24.5 667.35 579.8 15 640.9 25 668.3
5.5 584.1 15.5 642.5 25.5 669.66 589.6 16 644.6 26 671.2
6.5 593.4 16.5 645.7 2.5 672.37 598.3 17 647.6 27 673.5
7.5 601.4 17.5 649.1 27.5 674.58 605 18 650.3 28 675.4
8.5 608.8 18.5 652 28.5 6769 611.3 19 653.9 29 676.9
9.5 614.3 19.5 654.4 29.5 678
XX

2.79. Redox]Potentials of lOppm Cr(Vl) P us lg of Chromium Enriched Yeast.Cr(VI)/cm3 Potential / V Cr(VI)/cm3 Potential / V Cr(VI)/cm3 Potential / V
0 438 11.5 510.2 23 537.90.5 439.9 12 512.1 23.5 538.91 444.5 12.5 513.9 24 539.8
1.5 448.8 13 515.5 24.5 540.92 452.9 13.5 517.1 25 541.5
2.5 457 14 518.5 25.5 542.33 464.1 14.5 519.8 26 543.3
3.5 468 15 521 2.5 544.24 472.1 15.5 522.6 27 545.1
4.5 475.6 16 524.4 27.5 546.45 479.5 16.5 525.4 28 547.3
5.5 481.9 17 527 28.5 548.66 483.7 17.5 528.1 29 549
6.5 487.5 18 528.7 29.5 5507 489.5 18.5 529.5 30 551.2
7.5 491.4 19 530.1 30.5 5528 494.1 19.5 530.9 31 552.7
8.5 496.2 20 531.7 31.5 553.79 499.9 20.5 532.6 32 554.7
9.5 502.8 21 533.5 32.5 555.610 504.4 21.5 534.6 33 556.7
10.5 506.8 22 535.4 33.5 557.411 508.2 22.5 536.6 34 558.6
2.80. Redox Potentials of lppm Cr(Vl) Plus lg of Chromium Enriched Yeast.Cr(VI)/cm3 Potential / V Cr(VD/cm3 Potential / V Cr(VT)/cm Potential / Y
0 464.1 14 506.2 28 531.30.5 467.5 14.5 507.5 28.5 531.81 469.8 15 508.4 29 532.4
1.5 472.9 15.5 509.1 29.5 5332 474.1 16 510.5 30 533.4
2.5 476.5 16.5 511.3 30.5 533.93 478.3 17 512.9 31 534.2
3.5 480.3 17.5 514.3 31.5 534.64 482 18 515.5 32 534.9
4.5 483.2 18.5 516.7 32.5 535.25 484.4 19 517.8 33 535.5
5.5 485.6 19.5 519 33.5 535.86 487.2 20 519.8 34 536.2
6.5 488.5 20.5 521.2 34.5 536.47 490.2 21 521.9 35 536.6
7.5 194.4 21.5 522.6 35.5 536.98 493 22 523.5 36 537.1
8.5 493.9 22.5 524.4 36.5 537.49 495.5 23 525.4 37 537.7
9.5 496.9 23.5 526 37.5 537.9
xxi

10 498.4 24 526.5 38 538.110.5 499.3 24.5 527.3 38.5 538.311 500.4 25 527.8 39 538.5
11.5 501.2 25.5 528.4 39.5 538.612 502.1 26 529.1 40 538.7
12.5 502.9 2.5 529.6 40.5 538.913 503.8 27 530.3 41 539.1
13.5 504.9 27.5 530.9 41.5 539.22.81 .Redox Potentials of O.lppm Cr(VI) Plus lg of Chromium Enriched Yeast.Cr(VI)/cmJ Potential / V Cr(VI)/cmJ Potential / V Cr(VI)/cmJ Potential / V
0 459.4 12 489.4 24 495.50.5 459.7 12.5 490.1 24.5 495.61 461.5 13 490.7 25 495.8
1.5 462.5 13.5 491.2 25.5 4962 463.5 14 491.8 26 496.1
2.5 465.6 14.5 492.2 2.5 496.33 467.4 15 492.7 27 496.4
3.5 468.8 15.5 493 27.5 496.64 469.6 16 493 28 496.8
4.5 471.1 16.5 493.2 28.5 496.95 472.4 17 493.2 29 497.1
5.5 474 17.5 493.4 29.5 497.26 475.4 18 493.6 30 497.3
6.5 477.6 18.5 493.8 30.5 497.47 478.9 19 493.9 31 497.6
7.5 480.1 19.5 494.2 31.5 497.78 481.4 20 494.4 32 497.7
8.5 482.8 20.5 494.6 32.5 497.89 483.8 21 494.7 33 497.9
9.5 484.6 21.5 494.8 33.5 497.910 485.7 22 494.9 34 497.9
10.5 486.6 22.5 495.1 34.5 49811 487.8 23 495.2 35 498
11.5 488.7 23.5 495.3 35.5 498.12.82.Redox Potentials of 0.( Plus l g of Chromium Enriched Yeast.Cr(VI)/cmJ Potential / V Cr(VI)/cmJ Potential / V Cr(VI)/cm Potential / V
0 443.4 12 469 24 4770.5 443.6 12.5 469.7 24.5 477.11 444.8 13 470.3 25 477.2
1.5 446.1 13.5 470.7 25.5 477.32 447.6 14 471.3 26 477.4
2.5 449.2 14.5 471.9 2.5 477.43 450.4 15 472.6 27 477.5
3.5 452 15.5 473.1 27.5 477.54 453.5 16 473.5 28 477.6
4.5 455.5 16.5 473.9 28.5 477.6
xxii

5 456.4 17 474.3 29 477.75.5 457.5 17.5 474.8 29.5 4777.76 458.7 18 475.1 30 477.7
6.5 460.3 18.5 475.4 30.5 477.87 461.3 19 475.7 31 477.8
7.5 462.1 19.5 475.9 31.5 477.88 463.2 20 476.2 32 477.9
8.5 464.1 20.5 476.3 32.5 477.99 464.8 21 476.4 33 477.9
9.5 465.6 21.5 476.5 33.5 477.910 466.2 22 476.6 34 478
10.5 466.9 22.5 476.7 34.5 47811 467.5 23 476.8 35 478
11.5 468.2 23.5 476.92.83.Redox Potenials of 0.01[ppm Cr(Vl) without the Addition of Yeast.C r(V I)W Potential / V Cr(VI)/cm3 Potential / V Cr(Vl)/cmJ Potential / V
0 569.4 14 582 28 601.21 569 15 583.2 29 603.72 569 16 584.4 30 604.93 569.3 17 585.7 31 606.24 570.1 18 586.7 32 606.25 571 19 588.3 33 607.36 572 20 590 34 608.47 573.2 21 591.3 35 609.68 574.3 22 592.5 36 610.79 575.4 23 594.2 37 611.910 576.6 24 595.4 38 61311 577.9 25 597 39 614.112 579.3 26 598.4 40 615.313 580.5 27 599.8

Bibliography.Abraham, A. S., Brooks, B. A., and Eyleth, U. (1992), The Effect of Chromium Supplementation on Serum Glucose and Lipids in Patients with and without Non- Insulin Dependant Diabetes. Metabolism, 41, 768-771.
Ahmad, S., Murthy, R. C., and Chandra, S. V. (March 1990). Chromium Speciation by Column Chromatography using a Direct Current Plasma Atomic Emission Spectrometer. Analyst, 115,287-289.
Allen, T. L. (March 1958). Microdetermination of Chromium with 1,5-DPC. Analytical Chemistry, 30, No. 3, 447-450.
Alwens, W., and Jonas, W. (1938). Der Chromat Lunenkrebs. Acta, Union Int. Cancrum, 3, 103.
Amdur, M. O., Daull, J., and Klaassen, C. D. (1991). Casarett and Doull’s Toxicology. 4th Ed., Pergamon Press, New York, pp. 10, 36, 157-158, 209-212.
Analytical Methods for Graphite Furnace Tube Atomisers. (January 1982). Published by Varian.
Arar, E. J., Long, S. E., Martin, T. D., and Gold, S. (1992). Determination of Hexavalent Chromium in Sludge Incinerator Emissions using Ion Chromatography
xxiv
and Inductively Coupled Plasma Mass Spectroscopy. Environ, Sei, Technol, 26, 1944- 1950.Babko, A. K., and Palii, L. A. (1950), Zhur Anal. Khim. 5, 272.
Baetjer, A. M. (1950), Pulmonary Carcinoma in Chromate Workers, I. A. Review of the Literature and Report of Cases. Arch. Ind. Hyg. Occup. Med., 2, 487-504.
Baetjer, A. M. (1950), Pulmonary Carcinoma in Chromate Workers, II. Incidence of Basis of Hospital Records. Arch. Ind. Hyg. Occup. Med., 2, 505-516.
Bartlett, R., and James, B. (1979), Behaviour of Chromium in Soils: III Oxidation. J. Environ. Qual., 8, No. 1.
Bartlett. R. J., and James, B. R. (1979), Oxidation of Chromium in Soils. J. Environ. Qual., 8, 31-35.
Bose, M. (1954), The Reaction of Chromate with Diphenylcarbazide I. Analytical Chimica Acta, 10, 201-208.
Bose, M. (19954), The Reaction of Chromate with Diphenylcarbazide II. Analytical Chimica Acta, 10, 209-221.
Cieslak-Golonka, M. (1995), Toxic and Mutagenic Effects of Chromium (VI). A Review Polyhedron Report No. 61. Polyhedron. 15, No. 21, 3667-3689.
xxv

Cohen, M.D., Kargaoin, B., Klein, C. B., and Costa, M. (1993), Mechanisms of Chromium Carcinogenicity and Toxicity. Critical Reviews in Toxicology, 23 (3): 255-
Connett, P. H., Wetterhahn, K.E. (1985), InVitro Reaction of the Carcinogenic Chromate with Cellular Thiols and Carboxylic Acids. J. Am. Chem. Soc., 107, 4282 - 4288.
Cutshall, N., Johnson, V., and Osterberg, C. (1966), Chromium-51 in Sea Water: Chemistry Science, 152, 202-203.
De Andrade, J.C., Rocha, J. G , and Baccon, N. (February 1985), Sequential Spectrophotometric Determination of Chromium (III) and Chromium (VI) using Flow Injection Analysis. Anaylst, 110, 197-199.
De Flora, S., and Wetterhahn, K., E. (1989), Mechanisms of Chromium Metabolism and Genotoxicity. Life Chem. Rep., 7, 169-244.
Demirata, B., Tor, I., Filik, H., and Afsar, H. (1996), Separation of Cr(III) and Cr(VI) using Melamine-Formaldehyde Resin and Determination of Both Species in Water by F.A.A.S.. Fresenius J. Anal. Chem. 356:375-377.
Dixon, D. A., Sadler, N. P., Dasgupta, T. P., (1993), Oxidation of Biological Substrates by Chromium (VI). Part 1. Mechanism of the Oxidation of L - Ascorbic Acid in Aqueous Solution. J. Chem. Soc. Dalton. Trans., 3489 - 3495.
xxvi

Ehman, D. L., Anselmo, V. C., and Jenks, J. M. (1987), Determination o f Low Levels
o f Airborne Chromium (VI) by Anion Exchange Treatment and Inductively Coulped
Plasma Spectroscopy. Spectroscopy, 3, 33-35.
Flores-Veles, L. M., Gutierrez-Ruiz, M. E., Reyes-Salas, O., Cram-Heydrich, S., and
Baeza-Reyes, A. (1994), Separation o f Cr(VI) in Soil Extracts by Polarographic
Methods. Intern. J. Environ. Anal. Chem., 61. 177-187.
Gaspar, A., Posta, J., and Tothg, R. (November 1996), On-line Chromatographic
Separation and Determination o f Chromium (III) and Chromium (VI) with
Preconcentration o f the Chromium (III) using Potassium Hydrogen Phthalate, in
Various Samples by Flame Atomic Adsorption Spectroscopy. Journal o f Analytical
Atomic Spectroscopy. 11, 1067-1074.
Ghandour, M. A., El-Shantoury, S. A., Aly, A. M. M., and Ahmed, S., M. (1996),
Adsorptive Cathodic Stripping Voltammetry Determination o f Hcxavalent Chromium.
Analytical Letters, 29 (8), 1431-1445.
Glaser, E., and Halpem, G. (1929), Uber die Akivierung des Insulins-Durch
Hefapressaft. Biochem. Z , 207, 377-383.
Goodgame, D. M. L., Joy. A. M. (1987), Formation o f Chromium (V) during the
Slow Reduction o f Carcinogenic Chromium (VI) by Milk and Some o f its
Constituents. Inorgánica Chimica Acta, 135, L5 - L7.
xxvii

Greenwood, N.N., and Eamshaw, A. (1984), Chemistry o f the Elements. Peragamom
Press Ltd..
Gupta, S.K. (1984), Importance o f Soil Solution Composition in Deciding the Best
Suitable Anaytical Criteria for Guidence on Maximum Tolerable Metal Load and in
Assesing Bio-significance o f Metals in Soil. Schweiz, Landswirtsch, Forsch, 23, 209-
225.
Guthrie, B. E., (1982), Chapter 6: The Nutritional Role o f Chromium, in : Langard,
S. (ed.): Biological and Environmental Aspects o f Chromium, Elservier Biomedical,
1982, 117-148. Elsevier, Amsterdam.
Heringer Donmez, L. A.; Kallenberger, W. E. (1989), Soil Leachate: Determination o f
Hexavalent Chromium. Jalca, 84.
Hoshi, S., Konuma, K., Sugawara, K., Uto, M., and Akatsuka, K. (1998), The Simple
and Rapid Spectrophotometric Determination o f Trace Chromium (VI) After
Preconcentration as its Coloured Complex on Chitin. Talanta, 47, 659-663.
Katz, S. A., and Salem, H. (1994), The Biological and Environmental Chemistry o f
Chromium. V. C. H..
Kieffer, F. (1979), Spurenelemente SteurinDie Gesundheit, Sandoz Bull., 52,18-19.

Kilau, H. W., and Shah, I. D. (1984), Chromium-Bearing Waste Slag: Evaluation o f
Leachability when Exposed to Acid Precipitation, in Hazardous and Industrial Waste
Management and Testing. ASTM STP 851, L. P. Jackson, A. R. Rohlik, and A. R.
Conway, Eds., American Society for Testing and Materials, Philadelphia, 61-80.
Korolczuk, M., and Grabarczyk, M. (1998), Voltammetric Determination o f Traces o f
Cr(VI) and Total Chromium using Catalytic Currents in the Presence o f Nitrate.
Chem. Anal. (Warsaw), 43, 257.
Korolczuk, M., and Grabarczyk, M. (1998), Voltammetric Determination o f Cr(VI) in
a Flow System in the Presence o f Diethylenetriamine-Pentaacetic Acid (DTPA)
Following its Deposition in the Metallic State. Analtytica Chimica Acta, 387, 97-
102.
Korolczuk, M., and Grabarczyk, M. (1999), Voltammetric Determination o f Traces o f
Cr(VI) in the Flow System in the Presence o f Bipyridine. Talanta, 49, 703-709.
Langard, S. (1982), Chapter 4: Chromium, in: Waldron, H.A. (ed.): Metals in the
Environmental, pp. 111-132. Academic Press, London.
Li, Z., Shi, Y., Gao, P., Gu, X., and Zhou, T. (1997), Determination o f Trace
Chromium (VI) in Water by Graphite Furnace Atomic Absorption Spectroscopy after
Preconcentration on a Soluble Membrane Filter. Fresenius J Anal Chem, 358:519-
522.
xxix

Lindsay, S. (1992). High Performance Liquid Chromatography. Published by John
Wiley and Sons. New York.
Mertz, W., and Schwartz, K. (1955), Impaired Intravenous Glucose Tolerance as an
Early Sign o f Dietary Necrotic Liver Degeneration. Arch, Biochem. Biophys., 58, 504-
508.
Mertz, W. (1969), Chromium Occurrence and Function in Biological Systems.
Physiol. Rev., 49, 163-239.
Naranjit, D., Thomassen, Y., and Van Loon, J. C. (1979), Development o f a
Procedure for Studies o f the Chromium (III) and Chromium (VI) Contents o f Welding
Fumes. Analytica Chimica Acta, 110, 307-312.
Newman, D. (1890), A Case o f Adenocarcinoma o f the Left Inferior Turbinate Body
and Perforation o f the Nasal Septum in the Person o f a worker in Chrome Pigments.
Glasgow Med. J., 33, 469-470.
O’Brien, P., and Woodbridge, N. (1997), A Study o f the Kinetics o f the Reduction o f
Chromate by Ascorbate under Aerobic and Anaerobic Conditions. Polyhedron. 16,
No. 12, 2081 -2086.
Offenbacher, E. G., Spencer, H., Dowling, H. J., and Pi-Sunyer, F. X. (1986),
Metabolic ChromiumBalances in Men. Am. J. Clin. Nutr., 44, 77-82.
xxx

Pacyna, J., and Nriagu, J. O. (1988), Atmospheric Emissions o f Chromium from
Natural and Anthropogenic Sources, in Chromium in the Natural and Human
Environment. J. O. Nriagu and E. Nieboer, Eds., Wiley, New York, 116-117.
Padarauskas, A., Judzentiene, A., Naujalis, E., and Paliulionyte, V. (1998), On-Line
Preconcentration and Deteermination o f Chromium (VI) in Waters by High
Performance Liquid Chromatography using Precolumn Complexation with 1,5-
diphenylcarbazide. Journal o f Chromatography A, 808, 193-199.
Pankow, J. F., and Janaeur, G. E. (1974), Analysis for Chromium Traces in Natural
Waters. Part I. Preconcentreation o f Chromate from P.P.B. Levels in Aqueous
Solutions by Ion Exchange. Analytica Chimica Acta, 69, 97-104.
Perrin, D. D., and Dempsey, B. (1974), Buffers for pH and Metal Ion Control.
Chapman and Hall Laboratory Manuals. Published by Chapman and Hall Ltd..
Pettine, M., Millero, F. J., and Noce, T. L. (1991), Chromium (III) Interactions in
Seawater through its Oxidation Kinetics. Mar. Chem., 34, 29-46.
Pfeil, E. (1935), Lungentumoran als Berufskrankung in Chrima-tbetriehen. Dtsch.
Med. Wochenschr., 61, 1197-1202.
Phifer, E. C. (1995), Determination o f Chromium and Molybdenum in Medical Foods
by Graphite Furnace Atomic Absorption Spectroscopy. Journal o f AO AC
International, 78, No. 6, 1497-1501.
xxxi

Pobozy, E., Wojasinska, E., and Trojanowicz, M (1996), Ion Chromatographic
Specation o f Chromium with Diphenylcabazide-based Spectrophotometric Detection.
Journal o f Chromatography A, 736, 141-150.
Polansky, M. M., Bryden, N. A., Canary, J. J., and Anderson, R. A. (1990), Benefical
Effects o f Supplemental Chromium (Cr) on Glucose, Insulin and Glucagon o f
Subjects Consuming Controlled Low Chromium Diets. FASEB J., 4, 2964.
Powell, M. J., and Boomer, D. A. (1995), Determination o f Chromium Species in
Environmenal Samples using High Pressure Liquid Chromatography Direct Injection
Nebulization and Inductively Coupled Plasma Mass Spectrometry. Anal. Chem, 87,
2474-2478.
Rai, D., and Szelmeczka, W. (1990), Aqueous Behaviour o f Chromium in Coal Fly
Ash. J. Environ. Qual., 19, 378-382.
Rai, D., Eary, L. E. and Zachara, J. M. (1989), Environmental Chemistry o f
Chromium. Sci, Total Environ, 86, 15-23.
Riley, T. and Watson, A. (1987), Polarography and Other Voltammetric Methods.
Published by John Wiley and Sons Ltd..
Rubel, H. and Terytze, K. (1999), Determination o f Extractable Chromium (VI) in
Soils Using A Photometric Method. Chemosphere, Col. 39, No. 4, 697-708,.

Sahayan, A., C., Arunachalan, J., and Gangadharan, S. (1998), Determination o f
Cr(VI) in Potable Water after Selective Separation o f Cr(III) using ZnO. Canadian
Journal o f Analytical Sciences and Spectroscopy. 43, No. 1, 4-7.
Samitz, M. H., and Katz, S. A. (1964), A Study o f the Chemical Reactions between
Chromium and Skin. J. Invest. Dermatol., 43, 35-43.
Saverwyns, S., Van Heck, K , Vanhaecke, F., Moens, L., and Dams, R. (1999),
Evaulation o f a Commerically available Microbore Anion Exchange Column for
Chromium Spéciation with Detction by ICP-Mass Spectromctry and Hyphenation
with Microconcentric Nebulization. Fresenius J. Anal Chem. 363:490-494.
Sirinawin. W., and Westerland, S. (1997), Analysis and Storage o f Samples for
Chromium Determination in Seawater. Analytica Chimica Acta, 356, 35-40.
Standard Methods fo r Examination o f Water and Wastewater. (1971), 13th Edition.
Prepared and Published Jointly by American Public Health Association, American
Water Works Association, and Water Pollution Control Association.
Toxicological Profile fo r Chromium, Draft, U. S. Department o f Health and Human
Services, Public Health Service, Agency for Toxic Substances and Disease Refistry.
October 1991, 43.
Tuman, R. W. (1978), Chromium Occurrence and Function in Biological Systems.
Physiol. Rev., 49, 163-239.

Ultra-Violet and Visible Spectroscopy, (1967). Chemical Applications. 2nd Edition.
London: Butterworths.
Urone, P. F„ Anders, H. K., I. Bid. (1950), 22, 1317.
Vukomanovic, D. V., vanLoon, G. W., Nakatsu, K., and Zoutman, D., E. (1997),
Determination o f Chromium (VI) and (III) by Adsorptive Stripping Voltammetry with
Pyrocatechol Violet. Microchemical Journal. 57,86-95.
Wallach, S. (1990), Chromuim and Aging in Metal Ions in Biology and Medicine. P.
Ph. Collary, L. A. Poirie, M, Manfait, and J. C. Etienne, Eds., John Libbey Eurotext,
Paris, 299-303.
Walley, C., Hursthouse, A., Rowlett, S., Iqual-Zahid, P., Vaughan, H., and Durant, R.
(1999), Chromium Speciation in Natural Waters Draining Contaminated Land.
Glasgow, U.K. Water, Air and Soil Pollution. 112:389-405.
Wang, J., and Lu, J. (December 1992), Measurement o f Ultratrace Levels o f
Chromium by Adsorptive-Catalytic Stripping Voltammetry in the Presence o f
Cupferron. Analyst, 117, 1913-1917.
Wang, J., Lu, J., Luo, D., Wang, J., and Tian, B. (1997), Simultaneous Adsorptive
Stripping Voltammetric Measurements o f Tracc Chromium, Uranium, and Iron in the
Presence o f Cupferron. Electroanalysis, 9, No. 6., 1247-1251.
xxxiv

Weber, H. (1983), Long-term Study o f the Distribution o f Soluble Chromate-51 in the
Rat afte a Single Intra-trachael Administration. J. Toxicol. Environ. Health, 11, 749-
764.
Zarebski, J. (1977), Alternating Current, Normal and Differential Pulse Polarographie
Studies o f Chromium EDTA, CDTA and DTPA Complexes for Application to the
Determination o f Chromium in Trace Amounts. Chemica Analityczna. 22, 1037.
xxxv