Ontologies enriched with visual information for video annotation
Upload
independentCategory
view
2download
0
A short-term intervention trial with selenate, selenium-enriched yeast and
selenium-enriched milk: effects on oxidative defence regulation
Gitte Ravn-Haren1*, Susanne Bugel2, Britta N. Krath1, Tien Hoac3, Jan Stagsted4, Karina Jørgensen2,
June R. Bresson1, Erik H. Larsen5 and Lars O. Dragsted1
1Department of Toxicology and Risk Assessment, National Food Institute, Technical University of Denmark, Mørkhøj Bygade 19,
2860 Søborg, Denmark2Department of Human Nutrition and Centre for Advanced Food Studies, Faculty of Life Sciences, University of Copenhagen,
Frederiksberg, Denmark3Biomedical Nutrition, Lund Institute of Technology, Lund University, Lund, Sweden4Institute of Food Science, Research Centre Foulum, Faculty of Agricultural Sciences, University of Aarhus, Tjele, Denmark5Department of Food Chemistry, National Food Institute, Technical University of Denmark, Søborg, Denmark
(Received 24 January 2007 – Revised 11 July 2007 – Accepted 6 August 2007)
Increased Se intakes have been associated with decreased risk of cancer and CVD. Several mechanisms have been proposed, including antioxidant
effects through selenoproteins, induction of carcinogen metabolism and effects on the blood lipid profile. In a 4 £ 1 week randomised, double-blind
cross-over study, healthy young men supplemented their usual diet with selenate, Se-enriched yeast, Se-enriched milk or placebo (Se dose was
300mg/d for selenate and Se-enriched yeast, and about 480mg/d for Se-enriched milk) followed by 8-week washout periods. All Se sources increased
serum Se levels after supplementation for 1 week. The effect of the organic forms did not differ significantly and both increased serum Se more than
selenate. Conversely, thrombocyte glutathione peroxidase (GPX) was increased in the periods where subjects were supplemented with selenate but not
in those where they were given Se-enriched yeast or Se-enriched milk. We found no effect on plasma lipid resistance to oxidation, total cholesterol,
TAG, HDL- and LDL-cholesterol, GPX, glutathione reductase (GR) and glutathione S-transferase (GST) activities measured in erythrocytes, GPX
and GR activities determined in plasma, or GR and GST activities in thrombocytes. Leucocyte expression of genes encoding selenoproteins
(GPX1, TrR1 and SelP), and of electrophile response element-regulated genes (GCLC, Fra1 and NQO1) were likewise unaffected at all time points
following intervention. We conclude that thrombocyte GPX is specifically increased by short-term selenate supplementation, but not by short-term
supplementation with organic Se. Short-term Se supplementation does not seem to affect blood lipid markers or expression and activity of selected
enzymes and a transcription factor involved in glutathione-mediated detoxification and antioxidation.
Selenium: Oxidative defence: Electrophile response elements: Glutathione peroxidase: Blood lipids
Low Se intake has been associated with increased risk ofcancer and may influence the risk of CVD1; however, themechanisms are not well understood. Numerous hypotheseshave been proposed to explain potential beneficial effects ofincreased Se intake; among these, increased expression ofselenoproteins, induction of carcinogen metabolism andimproved blood lipid profile2 – 5. Se compounds have beenshown to affect different cellular processes and molecularpathways. Incorporated as selenocysteine, Se is essential forselenoprotein synthesis and function. More than twenty-fiveselenoproteins have been identified, among these the gluta-thione peroxidases (GPX), thioredoxin reductases (TrR) andselenoprotein P (SelP) which play a role in antioxidantdefence6. By reducing oxidative damage to DNA, lipids andproteins, increased expression of selenoproteins may resultin decreased oxidative stress, which has been linked to risk
of cancer and CVD. Increased risk of breast and lung cancerhas been reported in carriers of the variant allele of a GPX1polymorphism7,8 that is associated with lowered GPXactivity9.
Bioavailability and effect on selenoprotein expressiondepends on the form in which the Se compound is present. Inor-ganic Se such as selenite and selenate is less effective in raisingblood Se levels compared with organic Se sources such as sele-nomethionine10 – 13, but has been found equally effective inraising whole-blood GPX activity in long-term supplemen-tation studies. Compared with erythrocyte and plasma GPXactivities, thrombocyte GPX responds to Se supplementationin populations with higher Se status. While erythrocyte andplasma GPX activities plateau at Se intakes corresponding toplasma Se concentrations of about 70–90mg/l and higher,plasma Se levels of about 140–200mg/l are needed to obtain
*Corresponding author: Dr Gitte Ravn-Haren, fax þ45 72347699, email [email protected]
Abbreviations: CRP, C-reactive protein; GPX, glutathione peroxidase; GR, glutathione reductase; GSH, glutathione; GST, glutathione S-transferase; SelP,
selenoprotein P.
British Journal of Nutrition (2008), 99, 883–892 doi: 10.1017/S0007114507825153q The Authors 2007
British
Journal
ofNutrition
saturation of thrombocyte GPX12 – 15. The response in thrombo-cyte GPX is dependent on Se source and it has been suggestedthat the slow response of thrombocyte GPX to organic Sesources is a result of selenomethionine being incorporatednon-specifically into the protein pools before being convertedinto the precursor available for GPX synthesis16,17, whereasinorganic Se sources directly enter into the Se pool availablefor synthesis of selenoproteins. Thrombocyte GPX activityhas been reported to correlate with liver Se and liver GPXactivity18, and may be a more suitable measure to study thebiological effects of Se supplementation over a wider rangeof Se intakes.
Bioavailability of Se from different food sources varies. Sefrom bread and meat were equally efficient in raising plasmaSe level and resulted in a similar thrombocyte GPX activity19.In another study, Se-enriched wheat increased plasma anderythrocyte Se levels comparable with Se-enriched yeast butresulted in a higher thrombocyte GPX activity that was similarto selenate12. Se from fish was found to be a good source ofdietary Se, resulting in a better retention of Se comparedwith Se-enriched yeast and selenate20. Dairy products areone of the main Se sources in the Danish diet, accountingfor 18 % of dietary Se intake21 and Se-enriched milk mightprovide a realistic means of improving dietary Se status inpopulations with low dietary Se intakes, especially since thebioavailability of milk Se is at least 66 %22.
The cancer-protective effects of Se have, based on numer-ous rodent cancer models, been linked to increased expressionof protective enzymes. These include the selenoproteins GPX,thioredoxin reductase, SelP as well as phase 2 detoxificationenzymes, such as NAD(P)H:quinone oxidoreductase (NQO1)and glutathione S-transferases (GST)23. Reduced glutathione(GSH) is a cofactor for GPX and necessary for GSH conju-gation by GST. The catalytic subunit of g-glutamylcysteineligase (GCLC) is involved in the de novo synthesis ofGSH24,25. Common for GCLC and genes encoding phase 2detoxification enzymes is the presence of electrophile responseelements in the promoter region (TGACNNNGC), which med-iate the transcriptional up regulation in response to a variety ofinducing agents26. Fra1, a member of the Fos family of AP-1transcription factors, has been shown to down regulate NQO1and GCLC gene expression27,28. Se could modulate these generesponses through electrophile response elements. The induc-tion of protective enzymes by Se is involved in keeping cellu-lar components in their appropriate redox state, which couldbe important in reducing risk of cancer and CVD.
Se supplementation (200mg/d for 3 months) has previouslybeen reported to decrease plasma and LDL oxidation, decreaselevels of erythrocyte oxidised GSH, increase reduced GSHand increase glutathione reductase (GR) and GPX activity insubjects under oxidative stress3. These results suggest thatdietary Se supplementation can activate the GSH system anddecrease lipid oxidation, thereby possibly reducing the riskof CVD. However, not all studies support a beneficial effectof increased Se intake on blood lipids. In the SU.VI.MAXstudy29 where subjects were supplemented with low doses ofantioxidants, including Se, for 7.5 years, no improved lipidprofile was observed. On the contrary, results suggested preva-lence of hypertriacylglycerolaemia in supplemented men andhyperlipidaemia in supplemented women29. Results fromstudies investigating the relationship between Se status and
CVD are inconclusive and further studies are needed to clarifywhether effects on lipoproteins are involved in the possibleprotective effect of Se.
The present study was initiated to examine the acute effectson oxidative defence and risk factors for CVD of supplemen-tation with high doses of different forms of Se. Three differentSe sources were used and compared with placebo: selenate,Se-enriched yeast and Se-enriched milk. Se status wasassessed by serum Se levels and acute effects on markers ofoxidative defence. Risk factors for CVD were determined bymeasuring activities of GPX, GR and GST in plasma, erythro-cytes or thrombocytes, expression of GPX1, TrR1, SelP,GCLC, NQO1 and the transcription factor Fra1 in leucocytes,as well as plasma lipid resistance to oxidation, plasmaTAG, C-reactive protein (CRP; a marker of inflammatoryresponse), and total, LDL- and HDL-cholesterol.
Materials and methods
Subjects
Twenty healthy men aged 18–40 years were recruited byadvertisement at local universities in the Copenhagen area.Exclusion criteria were smoking, obesity (BMI . 30 kg/m2),family history of chronic diseases, use of any medication,heavy physical exercise (.10 h/week), high intake of fish(more than two times per week) and use of vitamin or mineralsupplements 2 weeks and Se supplements 8 weeks beforeentry into the study. The subjects received oral and writteninformation concerning the study before they gave their writ-ten consent. All twenty subjects completed the study. Theresearch protocol was approved by the Scientific Ethics Com-mittee of the municipalities of Copenhagen and Frederiksberg(01–135/04).
Study design
The study was performed as a randomised, double-blind,4 £ 1 week cross-over study. Subjects supplemented theirusual diet with one of four test meals 8 weeks apart. Testmeals were coded with different colours and given inrandom order. The code was not broken until all analyseswere completed and the results were analysed statistically.On the first day of each intervention period, the subjectswere served a standardised breakfast (which contained thetest meal) and a standardised lunch at the Department ofHuman Nutrition at the University of Copenhagen, Frederiks-berg, Denmark. Subjects were not allowed to consume otherfoods during the stay except for water. They were asked tofinish breakfast within 30 min. On the second day of eachintervention period they were served the test meal withbreakfast immediately after blood sampling (t ¼ 24 h) andwere supplied with 5 litres frozen milk and five tablets forthe last days of the intervention week. They were asked tokeep daily records of test-meal consumption and wellbeingduring the study. The four test meals consisted of 1 litre ofmilk (Se-enriched or control milk) and a tablet (Se-enrichedyeast, selenate or placebo). Se-enriched milk (480mg Se/d)was given with a placebo tablet, and control milk with Se-enriched yeast (300mg Se/d), selenate (300mg Se/d) or pla-cebo tablets.
G. Ravn-Haren et al.884
British
Journal
ofNutrition
Validation of food-frequency questionnaire
An FFQ was used to estimate the dietary Se intake of thestudy participants before inclusion. The FFQ was validatedagainst a 7 d diet record in a pilot study. Twelve subjectswere asked to fill in the FFQ and to register all dietaryintakes for seven consecutive days. The FFQ was filled inbefore the diet record.
The FFQ was divided into multiple categories with sevenmain groups of daily groceries, from where Danes usuallycover their dietary Se intake. The main groups are: meat,fish for dinner, accompaniments for dinner, bread meals,food taken with bread, dairy products and grains, cereals, andvitamin–mineral supplements. There were sub-questions inevery category, such as ‘how often’ a specific type of foodand ‘how large’ a portion was consumed per meal. Thefrequency questions included: times per week, times permonth, and rarely or never. Portion-size quantification wasasked by use of a folio. When it was not possible to determinethe weight with these methods, it was asked how much of apack of meat was consumed, or how much of a whole chickenor chicken breast was consumed. The dose (mg Se/d) wasdetermined after the interview from a result diagram. The con-centration of Se per 100 g for specific food types was insertedbeforehand in the diagram.
Dietary Se intakes based on the 7 d food records were calcu-lated using the Dankost program version 3000 (Dansk CateringCenter A/S, Herlev, Denmark; http://www.dankost.dk).
Subjects were issued with diet record books and calibratedelectronic scales. Where a meal was not displayed with preciseingredients, a similar standard meal was used, which wasencoded in the Dankost program. Where the amount was notdisplayed, for example one piece of bread, a ‘typical weightof food’ was used30. Where a specific food type was notencoded in the Dankost program, a table from the food data-base (http://www.foodcomp.dk) from the National Food Insti-tute (Mørkhøj, Søborg, Denmark) was used.
Selenium-enriched milk
Se-enriched milk was produced at the Faculty of Agricul-tural Sciences, Foulum, Denmark. Eight dairy cows weresupplemented with about 100 mg Se in the form of Seyeast (SelPlex; Alltech Inc., Nicholasville, KY, USA) perd for 3 d, and milk from the fourth day of supplementationwas pasteurised, adjusted to 1·5 % fat, and bottled at a localdairy plant (Osteriet Hinge, Kjellerup, Denmark). Controlmilk was produced in parallel from eight dairy cows thatreceived no extra Se supplementation. Initial Se analysesof the milk showed that the Se-enriched milk containedabout 350mg Se/l compared with control levels of about12mg/l. On the basis of these results, subjects were dailysupplemented with Se contained in 1 litre of milk. Milkwas frozen at 2208C until used. Control analyses ofthe milk performed at two independent laboratories afterthe intervention study was terminated suggested that theSe concentration of both Se-enriched and control milk washigher than first anticipated. These results showed a meanSe concentration of about 480 and about 25mg/l for theSe-enriched milk and control milk, respectively31.
Blood sampling and sample handling
Fasting blood samples were drawn in the morning of day 1(t ¼ 0), 2 (t ¼ 24 h), 8 (t ¼ 1 week) and after 4 weeks (t ¼ 4weeks). On day 1, postprandial blood samples were taken 3 h(t ¼ 3 h) and 6 h (t ¼ 6 h) after the test meal was served. Allblood samples were taken after 10 min supine resting. Breakfastwas served after the first blood sample was taken (t ¼ 0) andlunch immediately after the 3 h blood sample.
Blood samples drawn in plain tubes (Becton Dickinson,Franklin Lakes, NJ, USA) were centrifuged (3000 g; 15 minat room temperature) and serum isolated for analysis of Sestatus. Blood samples were collected in 10 ml EDTA-coatedtubes (Becton Dickinson) for isolation of plasma, thrombo-cytes and erythrocytes for measurement of lipid oxidation,plasma lipids and enzyme activities, and buffy coat for deter-mination of gene expression. Samples were centrifuged for15 min (150 g at room temperature) and thrombocytes isolatedfrom the thrombocyte-rich plasma (1500 g; 5 min at room tem-perature). The thrombocyte pellet was washed twice in 0·9 %NaCl and re-suspended in 0·5 ml 0·9 % NaCl. Erythrocytes andbuffy coat were isolated by centrifugation (1500 g; 10 min at48C). The pearly white buffy-coat layer containing leucocyteswas carefully removed from the top for RNA purification andremaining erythrocytes were lysed by adding an equal amountof MilliQ water to the tube. Total RNA was extracted using aQIAamp RNA blood mini kit (QIAgen, Ballerup, Denmark).Serum, plasma, thrombocytes, erythrocytes and RNA werestored at 2808C until analysis.
Serum selenium status
Se in serum was measured by inductively coupled plasma(ICP)–MS using the standard mode as described by Prusz-kowski32. Serum was diluted twenty times before aspirationinto the ICP–MS. Seronorm (Nycomed Pharma Diagnostics,Oslo, Norway) was used as reference material. The assignedvalue was 83mg Se/l and values between 79 and 86mg Se/lwere obtained. Se was determined as 82Se with a CV , 5 %.All serum samples from one individual were analysed in thesame run to minimise the influence of inter-assay variation.
Plasma lipid oxidation
Plasma lipid resistance to oxidation was determined according toMayer et al.33. The time-dependent decrease in fluorescenceintensity was followed using a Wallac 1420 multilabel counterfrom Perkin Elmer (Life Sciences, Allerød, Denmark). Thefluorescent marker (1-palmitoyl-2-((2-(4-(6-phenyl-trans-1,3,5-hexatrienyl)-phenyl)ethyl)-carbonyl)-sn-glycero -3-phos-phocholine) was purchased from Chemica Technologies (Bend,OR, USA). The inter-day variation in lag time for a controlplasma sample was 4 %.
Blood lipids and plasma C-reactive protein
Plasma cholesterol, TAG, and HDL- and LDL-cholesterol levelswere determined using commercially available kits from RocheDiagnostics, Basel, Switzerland (catalogue no. 12016630 122,12016648 122, 03030024 122 and 03038777 122, respectively).
Short-term effects of selenium sources 885
British
Journal
ofNutrition
Analyses were performed on a Cobas Mira-plus (Roche Diag-nostics), with inter-day variations of ,3 %.
Plasma CRP levels were determined on an Immulite 1000analyser (Diagnostic Products Corporation, Los Angeles,CA, USA) using a chemiluminescent enzyme immunometricassay (catalogue no. LKCR-10; Diagnostic Products Corpor-ation), with a CV , 7 %.
Defence enzyme activities in erythrocytes, plasma andthrombocytes
GR and GPX activities were determined spectrophotometri-cally on a Cobas Mira analyser (Roche Diagnostics, Basel,Switzerland) in erythrocyte lysates, plasma and thrombocytelysates according to Wheeler et al.34, using t-butyl-hydroper-oxide as substrate for GPX. GST activity was measured inerythrocyte and thrombocyte lysates as previously describedusing 1-Cl-2,4-dinitrobenzene as substrate35. Activitiesmeasured in erythrocytes were related to the amount of Hbin the sample, whereas activities determined in plasma andthrombocytes were related to protein concentrations. Hb andprotein contents were determined using commercially avail-able kits (catalogue no. HG 980; Randox, Ardmore, UK,and catalogue no. A11A01669; ABX Diagnostics, Montpel-lier, France, respectively). Control samples (erythrocytes,plasma and thrombocytes) were included for every tenthsample analysed. Inter- and intra-day variations for the controlsamples were 11·9 and 6·9 %, and 6·4 and 3·8 % for plasmaGPX and GST respectively, 8·9 and 2·8 %, and 5·6 and3·3 %, and 17 and 4 % for erythrocyte GPX, GR and GSTrespectively, and 17 and 8 %, and 19 and 4 % and 19 and7·6 % for thrombocyte GPX, GR and GST, respectively.
Leucocyte mRNA quantification of GPX1, TrR1, SelP, GCLC,NQO1 and Fra1
Total leucocyte RNA was quantified spectrophotometricallyby measuring optical density (OD)260 and the purity was
tested by measuring OD260:280 ratios using the NanoDropw
ND-1000 UV-Vis spectrophotometer. First-strand cDNA wassynthesised from 500 ng of total RNA in a total volume of10ml with Random Hexamer primer and Superscripte IIRNase H-RT according to the manufacturers (Invitrogen,Taastrup, Denmark).
Primers and TaqManw probes were designed using theprimer analysis software Primer Express v. 1.5 (Applied Bio-systems, Stockholm, Sweden), based on sequences from theGenbank database (Table 1). Whenever possible, the forwardand reverse primers were placed in exons separated by anintron. A primer and probe set for the eukaryotic 18 s rRNAendogenous control was obtained from Applied Biosystems(Stockholm, Sweden).
TaqMan PCR assays for each of the six gene targets wereperformed in triplicate on cDNA samples in ninety-six-welloptical plates on a 7900HT FAST Real-Time PCR System(Applied Biosystems). The PCR reactions were performed ina total volume of 10ml containing 2 ng cDNA according toprotocols from Applied Biosystems. Primer and probe concen-trations were 900 and 300 nM, respectively. The amplificationconditions were: 958C for 20 s, forty-five cycles of 958C for 1 sand 608C for 20 s.
The results were calculated using the comparative Ctmethod with 18 s rRNA as endogenous control as describedpreviously (Applied Biosystems, 2001, User Bulletin no. 2,ABI PRISM 7700 Sequence Detection System; Applied Bio-systems, Foster City, CA, USA).
PCR efficiency was tested for each target gene normalised to18 s rRNA. A value of the slope less than 0·1 was obtained for allgenes.
Inter-plate variation for a control sample was 3·4, 2·8, 0·7,2·3, 2·4 and 2·8 % for GPX1, TrR1, SelP, GCLC, NQO1 andFra1, respectively.
Statistical analysis
All data are presented as mean values and standard deviations.Statistical analyses were performed using SAS (SAS Institute,
Table 1. Primers and probes used for real-time polymerase chain reaction analysis
Gene Genbank no. Primers and probes Sequence 50-30
GPX1 AY327818 Sense CCCGTGCAACCAGTTTGGAntisense TGAGGGAATTCAGAATCTCTTCGTTaqManw probe 6-FAM-CATCAGGAGAACGCC-MGB
TrR1 NM_003330 Sense GAAGAACATGGCATCAAGTTTATAAGAAntisense CCTGGTGTCCCTGCTTCAATTaqManw probe 6-FAM-TTCGTACCAATTAAAGTTG-MGB
SelP NM_005410 Sense TTACTGTGAAAAGAAATGTGGAAACTGAntisense GCCAAAGATACACGTTTACAAAAGTCTaqManw probe 6-FAM-TCTCTCACGACTCTCAAA-MGB
GCLC NM_001498 Sense CGGCACAAGGACGTTCTCAAntisense ACCGGACTTTTTTATTTTCATGATCATaqManw probe 6-FAM-CGATGAGGTGGAATAC-MGB
NQO1 NM_000903 Sense CTTCAATCCCATCATTTCCAGAAAntisense GACTCGGCAGGATACTGAAAGTTCTaqManw probe 6-FAM-CATCACAGGTAAACTGAAG-MGB
Fra1 NM_005438 Sense GCCGCCCTGTACCTTGTATCAntisense CAGTGCCTCAGGTTCAAGCATaqManw probe 6-FAM-CTTTCCCCAGGGCCT-MGB
GPX1, glutathione peroxidase 1; TrR1, thioredoxin reductase 1; SelP, selenoprotein P; GCLC, g-glutamylcys-teine ligase catalytic subunit; NQO1, NAD(P)H:quinone oxidoreductase 1; Fra1, FOS-like antigen 1; 6-FAM,6-carboxyfluorescein; MGB, minor groove binding.
G. Ravn-Haren et al.886
British
Journal
ofNutrition
Cary, NC, USA). Treatment effects were analysed usingPROC MIXED in the SAS System, with treatment (placebo,selenate, Se-enriched yeast or Se-enriched milk), order (theorder in which the four test meals were provided) andperiod (four periods) as fixed factors, subject as a randomfactor and baseline measurements and weight as covariate.If period effects were statistically significant, period wasexcluded from the model statement and included in therepeated statement together with subject (subject £ period).Data that could not meet the criteria of variance homogeneityand normal distribution (determined by residual plot examin-ation) were log transformed. For all tests a P value less than0·05 was considered statistically significant. Spearman orPearson correlations were used to identify correlatingvariables.
Results
Validation of food-frequency questionnaire
Validation of the FFQ used showed that it was comparablewith the use of a 7 d food record (r 0·815; P¼0·001). How-ever, in the present study we found no correlation betweenserum Se levels and dietary Se intake estimated using theFFQ (P¼0·213).
Baseline characteristics of study participants
Baseline characteristics for the study participants were as fol-lows: age 26·8 (SD 5·04) years; weight 78·9 (SD 9·22) kg; BMI23·4 (SD 1·97) kg/m2 and estimated dietary Se intake 49·8(SD 13·6) mg/d. No extreme values for habitual dietary Seintake were reported.
Compliance
Based on the participant’s record on milk and tablet intake,only one participant failed to finish 1 litre of milk becausethe milk was sour. When the code was broken after the endof the analytical work, this milk turned out to be controlmilk, and the data were not excluded from the statisticalanalyses.
Serum selenium levels
No increase in serum Se levels was observed with any Sesource within the first 24 h (Table 2), but after 1 week of Sesupplementation, significant increases in serum Se levelswere observed for all three Se sources. The organic Sesources, Se-enriched yeast and Se-enriched milk, increasedserum Se levels most after 1 week (P,0·0001 for both com-pared with placebo) and more than selenate (P¼0·0008 andP,0·0001, respectively, compared with selenate), while sele-nate supplementation resulted in smaller yet still statisticallysignificant increase in serum Se level (P¼0·0109, comparedwith placebo). Serum Se levels after Se-enriched yeast orSe-enriched milk supplementation were not significantlydifferent (P¼0·2093), but were still significantly higher thancontrols after 3 weeks washout, whereas levels after selenatesupplementation quickly returned to baseline.
Enzyme activities
There was a statistically significant treatment effect on thrombo-cyte GPX activity (P¼0·0152). Thrombocyte GPX activity wassignificantly increased after 1 week (P¼0·0052), but dependedon Se source. No increase in thrombocyte GPX activity wasfound when supplementing with either Se-enriched yeast orSe-enriched milk (P¼0·2258 and P¼0·4394, respectively,compared with placebo). Selenate was the only Se sourceresulting in increased thrombocyte GPX (P¼0·0007 comparedwith placebo). None of the forms of Se supplementation affectedactivities of plasma GR or GPX, erythrocyte GR, GPX or GST,or GR or GST measured in thrombocytes (Table 2) (P.0·05,for all). Serum Se concentrations correlated weakly but posi-tively with plasma and thrombocyte GPX at baseline (r 0·176and r 0·451, respectively; P,0·0001 for both), while weakcorrelation in the opposite direction was observed witherythrocyte GPX activity (r 20·134; P¼0·008).
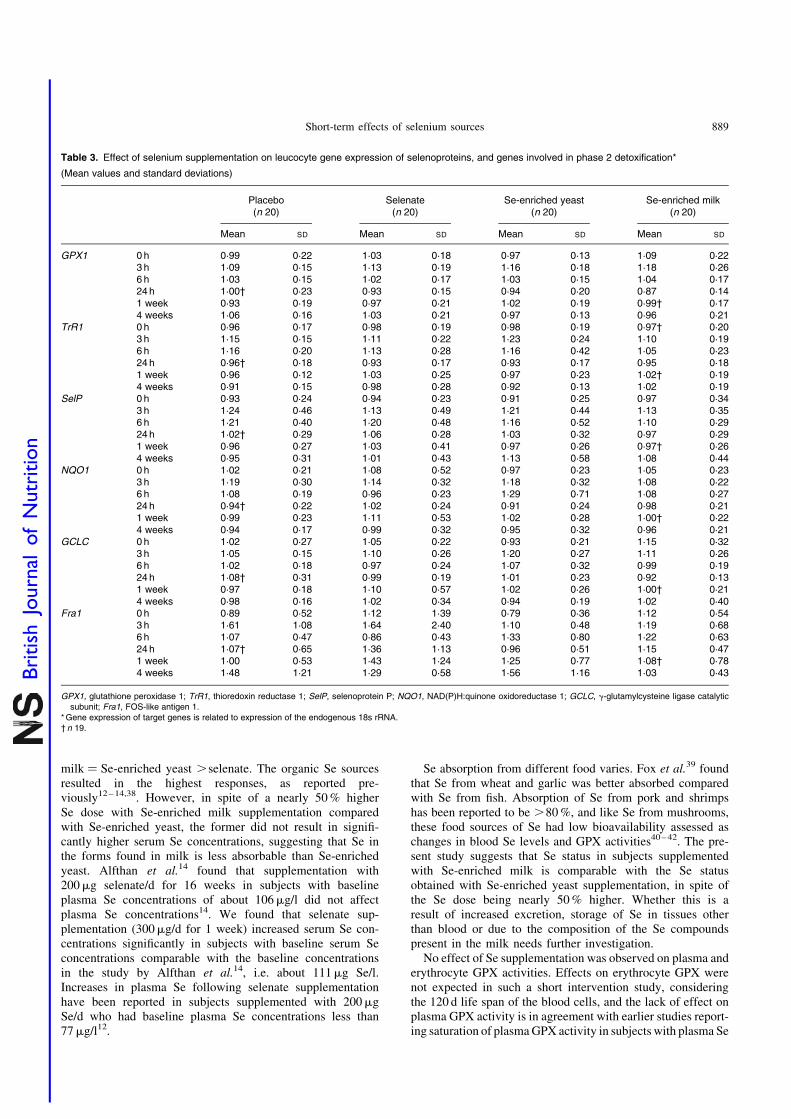
Gene expression
We found no effect of any form of Se on expression of theselected selenoproteins (GPX1, SelP and TrR1; P.0·05, forall) or genes involved in carcinogen metabolism (GCLC,NQO1 and Fra1; P.0·05, for all) in leucocytes (Table 3).There was a statistically significant effect of time on allexpression markers except Fra1, an effect that was indepen-dent of Se.
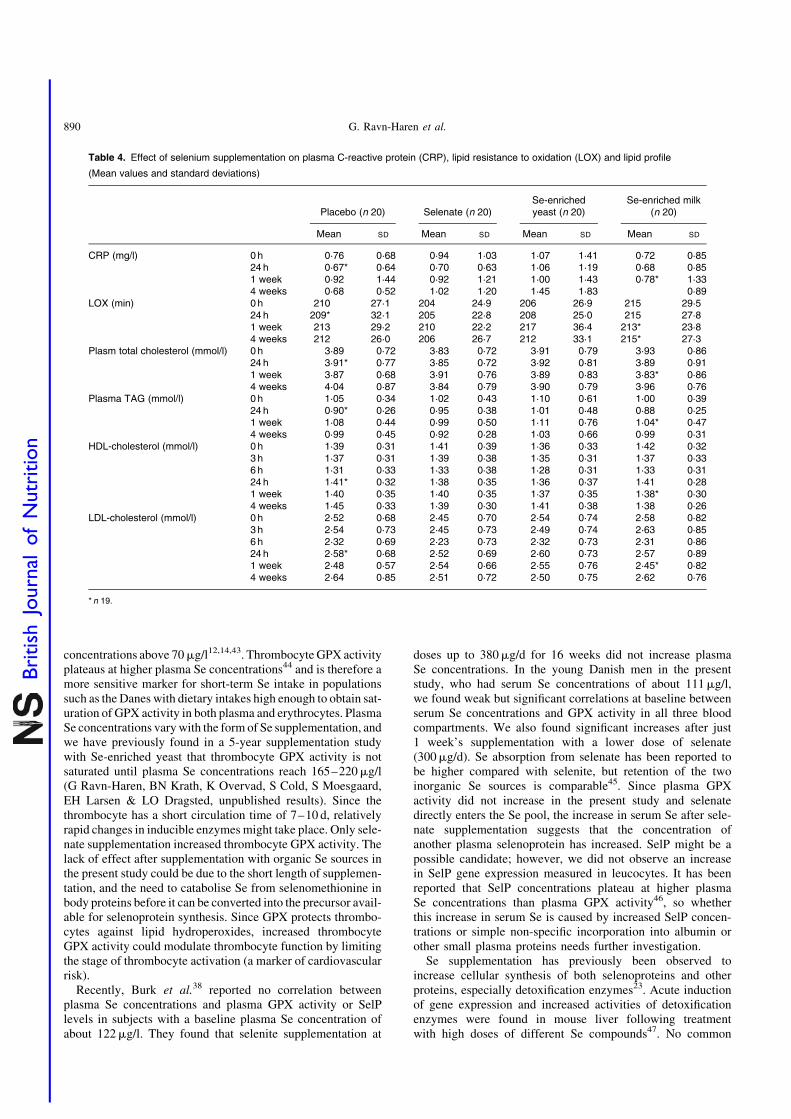
Plasma lipid resistance to oxidation and plasma lipids andcholesterol
We found no treatment effect on plasma lipid resistance to oxi-dation, plasma TAG, CRP, and total, LDL- and HDL-cholesterol(P.0·05, for all) (Table 4). In spite of the lack of effect of Sesupplementation, we found weak yet statistically significantpositive correlations between serum Se and plasma TAG, andtotal- and LDL-cholesterol (r 0·359, r 0·392 and r 0·330, respect-ively; P,0·0001, for all) at baseline. The correlation betweenserum Se levels and HDL-cholesterol was much weaker(r 0·107; P¼0·032). After 1 week’s supplementation, onlytotal and LDL-cholesterol were still positively correlatedwith serum Se levels (r 0·277, P¼0·014 and r 0·246, P¼0·03,respectively).
Discussion
A low Se intake has been associated with increased risk ofoxidative stress-related chronic diseases, such as cancer andCVD1. The potential beneficial effects of increased Seintake may be linked, through selenoproteins, to antioxidanteffects, to induced carcinogen metabolism and to alterationsin lipid profile. Dietary Se intake estimated with the FFQhas previously been reported to correlate with plasma Se con-centrations36,37, but we were not able to show this in the pre-sent study. However, daily dietary Se intake calculated usingthe FFQ reflected the intake of Danish adults, according tothe latest survey21. In the present study, supplementinghealthy young men with 300mg Se/d as selenate, Se-enrichedyeast or 480mg Se/d as Se-enriched milk for 1 week signifi-cantly increased serum Se concentrations, with Se-enriched
Short-term effects of selenium sources 887
British
Journal
ofNutrition
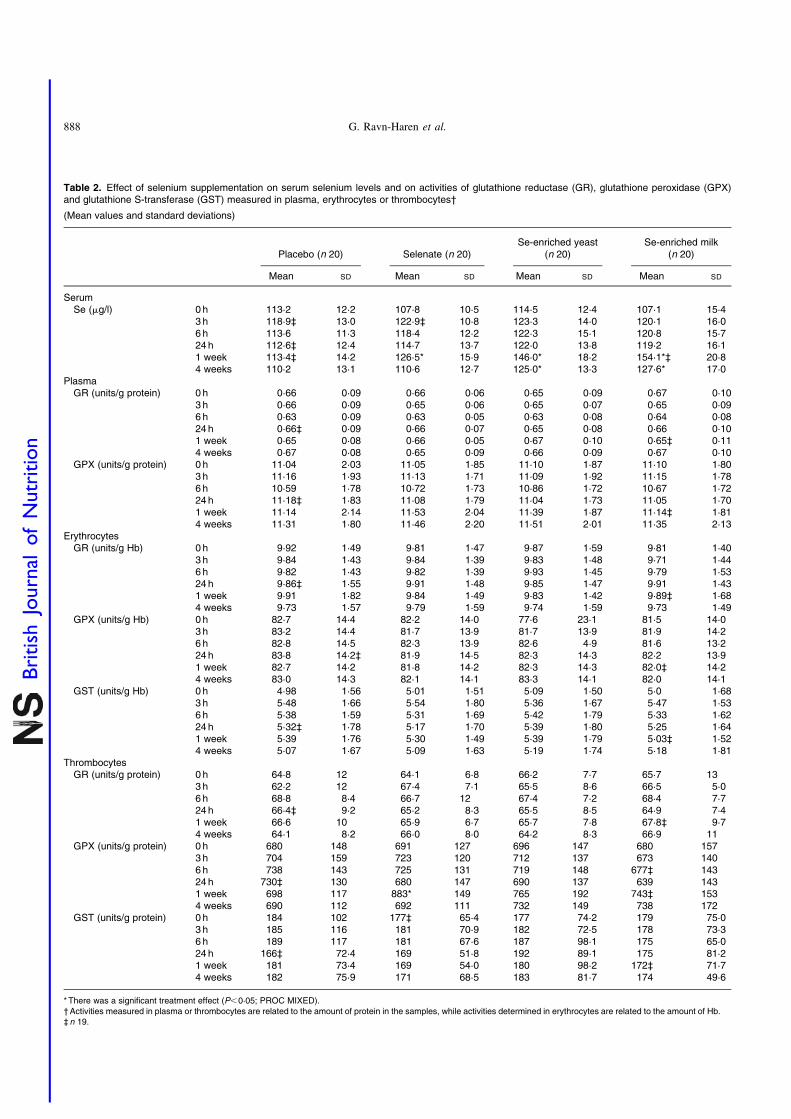
Table 2. Effect of selenium supplementation on serum selenium levels and on activities of glutathione reductase (GR), glutathione peroxidase (GPX)and glutathione S-transferase (GST) measured in plasma, erythrocytes or thrombocytes†
(Mean values and standard deviations)
Placebo (n 20) Selenate (n 20)Se-enriched yeast
(n 20)Se-enriched milk
(n 20)
Mean SD Mean SD Mean SD Mean SD
SerumSe (mg/l) 0 h 113·2 12·2 107·8 10·5 114·5 12·4 107·1 15·4
3 h 118·9‡ 13·0 122·9‡ 10·8 123·3 14·0 120·1 16·06 h 113·6 11·3 118·4 12·2 122·3 15·1 120·8 15·724 h 112·6‡ 12·4 114·7 13·7 122·0 13·8 119·2 16·11 week 113·4‡ 14·2 126·5* 15·9 146·0* 18·2 154·1*‡ 20·84 weeks 110·2 13·1 110·6 12·7 125·0* 13·3 127·6* 17·0
PlasmaGR (units/g protein) 0 h 0·66 0·09 0·66 0·06 0·65 0·09 0·67 0·10
3 h 0·66 0·09 0·65 0·06 0·65 0·07 0·65 0·096 h 0·63 0·09 0·63 0·05 0·63 0·08 0·64 0·0824h 0·66‡ 0·09 0·66 0·07 0·65 0·08 0·66 0·101 week 0·65 0·08 0·66 0·05 0·67 0·10 0·65‡ 0·114 weeks 0·67 0·08 0·65 0·09 0·66 0·09 0·67 0·10
GPX (units/g protein) 0 h 11·04 2·03 11·05 1·85 11·10 1·87 11·10 1·803 h 11·16 1·93 11·13 1·71 11·09 1·92 11·15 1·786 h 10·59 1·78 10·72 1·73 10·86 1·72 10·67 1·7224h 11·18‡ 1·83 11·08 1·79 11·04 1·73 11·05 1·701 week 11·14 2·14 11·53 2·04 11·39 1·87 11·14‡ 1·814 weeks 11·31 1·80 11·46 2·20 11·51 2·01 11·35 2·13
ErythrocytesGR (units/g Hb) 0 h 9·92 1·49 9·81 1·47 9·87 1·59 9·81 1·40
3 h 9·84 1·43 9·84 1·39 9·83 1·48 9·71 1·446 h 9·82 1·43 9·82 1·39 9·93 1·45 9·79 1·5324h 9·86‡ 1·55 9·91 1·48 9·85 1·47 9·91 1·431 week 9·91 1·82 9·84 1·49 9·83 1·42 9·89‡ 1·684 weeks 9·73 1·57 9·79 1·59 9·74 1·59 9·73 1·49
GPX (units/g Hb) 0 h 82·7 14·4 82·2 14·0 77·6 23·1 81·5 14·03 h 83·2 14·4 81·7 13·9 81·7 13·9 81·9 14·26 h 82·8 14·5 82·3 13·9 82·6 4·9 81·6 13·224 h 83·8 14·2‡ 81·9 14·5 82·3 14·3 82·2 13·91 week 82·7 14·2 81·8 14·2 82·3 14·3 82·0‡ 14·24 weeks 83·0 14·3 82·1 14·1 83·3 14·1 82·0 14·1
GST (units/g Hb) 0 h 4·98 1·56 5·01 1·51 5·09 1·50 5·0 1·683 h 5·48 1·66 5·54 1·80 5·36 1·67 5·47 1·536 h 5·38 1·59 5·31 1·69 5·42 1·79 5·33 1·6224h 5·32‡ 1·78 5·17 1·70 5·39 1·80 5·25 1·641 week 5·39 1·76 5·30 1·49 5·39 1·79 5·03‡ 1·524 weeks 5·07 1·67 5·09 1·63 5·19 1·74 5·18 1·81
ThrombocytesGR (units/g protein) 0 h 64·8 12 64·1 6·8 66·2 7·7 65·7 13
3 h 62·2 12 67·4 7·1 65·5 8·6 66·5 5·06 h 68·8 8·4 66·7 12 67·4 7·2 68·4 7·724 h 66·4‡ 9·2 65·2 8·3 65·5 8·5 64·9 7·41 week 66·6 10 65·9 6·7 65·7 7·8 67·8‡ 9·74 weeks 64·1 8·2 66·0 8·0 64·2 8·3 66·9 11
GPX (units/g protein) 0 h 680 148 691 127 696 147 680 1573 h 704 159 723 120 712 137 673 1406 h 738 143 725 131 719 148 677‡ 14324h 730‡ 130 680 147 690 137 639 1431 week 698 117 883* 149 765 192 743‡ 1534 weeks 690 112 692 111 732 149 738 172
GST (units/g protein) 0 h 184 102 177‡ 65·4 177 74·2 179 75·03 h 185 116 181 70·9 182 72·5 178 73·36 h 189 117 181 67·6 187 98·1 175 65·024 h 166‡ 72·4 169 51·8 192 89·1 175 81·21 week 181 73·4 169 54·0 180 98·2 172‡ 71·74 weeks 182 75·9 171 68·5 183 81·7 174 49·6
*There was a significant treatment effect (P,0·05; PROC MIXED).†Activities measured in plasma or thrombocytes are related to the amount of protein in the samples, while activities determined in erythrocytes are related to the amount of Hb.‡n 19.
G. Ravn-Haren et al.888
British
Journal
ofNutrition
milk ¼ Se-enriched yeast .selenate. The organic Se sourcesresulted in the highest responses, as reported pre-viously12 – 14,38. However, in spite of a nearly 50 % higherSe dose with Se-enriched milk supplementation comparedwith Se-enriched yeast, the former did not result in signifi-cantly higher serum Se concentrations, suggesting that Se inthe forms found in milk is less absorbable than Se-enrichedyeast. Alfthan et al.14 found that supplementation with200mg selenate/d for 16 weeks in subjects with baselineplasma Se concentrations of about 106mg/l did not affectplasma Se concentrations14. We found that selenate sup-plementation (300mg/d for 1 week) increased serum Se con-centrations significantly in subjects with baseline serum Seconcentrations comparable with the baseline concentrationsin the study by Alfthan et al.14, i.e. about 111mg Se/l.Increases in plasma Se following selenate supplementationhave been reported in subjects supplemented with 200mgSe/d who had baseline plasma Se concentrations less than77mg/l12.
Se absorption from different food varies. Fox et al.39 foundthat Se from wheat and garlic was better absorbed comparedwith Se from fish. Absorption of Se from pork and shrimpshas been reported to be .80 %, and like Se from mushrooms,these food sources of Se had low bioavailability assessed aschanges in blood Se levels and GPX activities40 – 42. The pre-sent study suggests that Se status in subjects supplementedwith Se-enriched milk is comparable with the Se statusobtained with Se-enriched yeast supplementation, in spite ofthe Se dose being nearly 50 % higher. Whether this is aresult of increased excretion, storage of Se in tissues otherthan blood or due to the composition of the Se compoundspresent in the milk needs further investigation.
No effect of Se supplementation was observed on plasma anderythrocyte GPX activities. Effects on erythrocyte GPX werenot expected in such a short intervention study, consideringthe 120 d life span of the blood cells, and the lack of effect onplasma GPX activity is in agreement with earlier studies report-ing saturation of plasma GPX activity in subjects with plasma Se
Table 3. Effect of selenium supplementation on leucocyte gene expression of selenoproteins, and genes involved in phase 2 detoxification*
(Mean values and standard deviations)
Placebo(n 20)
Selenate(n 20)
Se-enriched yeast(n 20)
Se-enriched milk(n 20)
Mean SD Mean SD Mean SD Mean SD
GPX1 0 h 0·99 0·22 1·03 0·18 0·97 0·13 1·09 0·223 h 1·09 0·15 1·13 0·19 1·16 0·18 1·18 0·266 h 1·03 0·15 1·02 0·17 1·03 0·15 1·04 0·1724h 1·00† 0·23 0·93 0·15 0·94 0·20 0·87 0·141 week 0·93 0·19 0·97 0·21 1·02 0·19 0·99† 0·174 weeks 1·06 0·16 1·03 0·21 0·97 0·13 0·96 0·21
TrR1 0 h 0·96 0·17 0·98 0·19 0·98 0·19 0·97† 0·203 h 1·15 0·15 1·11 0·22 1·23 0·24 1·10 0·196 h 1·16 0·20 1·13 0·28 1·16 0·42 1·05 0·2324h 0·96† 0·18 0·93 0·17 0·93 0·17 0·95 0·181 week 0·96 0·12 1·03 0·25 0·97 0·23 1·02† 0·194 weeks 0·91 0·15 0·98 0·28 0·92 0·13 1·02 0·19
SelP 0 h 0·93 0·24 0·94 0·23 0·91 0·25 0·97 0·343 h 1·24 0·46 1·13 0·49 1·21 0·44 1·13 0·356 h 1·21 0·40 1·20 0·48 1·16 0·52 1·10 0·2924h 1·02† 0·29 1·06 0·28 1·03 0·32 0·97 0·291 week 0·96 0·27 1·03 0·41 0·97 0·26 0·97† 0·264 weeks 0·95 0·31 1·01 0·43 1·13 0·58 1·08 0·44
NQO1 0 h 1·02 0·21 1·08 0·52 0·97 0·23 1·05 0·233 h 1·19 0·30 1·14 0·32 1·18 0·32 1·08 0·226 h 1·08 0·19 0·96 0·23 1·29 0·71 1·08 0·2724h 0·94† 0·22 1·02 0·24 0·91 0·24 0·98 0·211 week 0·99 0·23 1·11 0·53 1·02 0·28 1·00† 0·224 weeks 0·94 0·17 0·99 0·32 0·95 0·32 0·96 0·21
GCLC 0 h 1·02 0·27 1·05 0·22 0·93 0·21 1·15 0·323 h 1·05 0·15 1·10 0·26 1·20 0·27 1·11 0·266 h 1·02 0·18 0·97 0·24 1·07 0·32 0·99 0·1924h 1·08† 0·31 0·99 0·19 1·01 0·23 0·92 0·131 week 0·97 0·18 1·10 0·57 1·02 0·26 1·00† 0·214 weeks 0·98 0·16 1·02 0·34 0·94 0·19 1·02 0·40
Fra1 0 h 0·89 0·52 1·12 1·39 0·79 0·36 1·12 0·543 h 1·61 1·08 1·64 2·40 1·10 0·48 1·19 0·686 h 1·07 0·47 0·86 0·43 1·33 0·80 1·22 0·6324h 1·07† 0·65 1·36 1·13 0·96 0·51 1·15 0·471 week 1·00 0·53 1·43 1·24 1·25 0·77 1·08† 0·784 weeks 1·48 1·21 1·29 0·58 1·56 1·16 1·03 0·43
GPX1, glutathione peroxidase 1; TrR1, thioredoxin reductase 1; SelP, selenoprotein P; NQO1, NAD(P)H:quinone oxidoreductase 1; GCLC, g-glutamylcysteine ligase catalyticsubunit; Fra1, FOS-like antigen 1.
*Gene expression of target genes is related to expression of the endogenous 18s rRNA.† n 19.
Short-term effects of selenium sources 889
British
Journal
ofNutrition
concentrations above 70mg/l12,14,43. Thrombocyte GPX activityplateaus at higher plasma Se concentrations44 and is therefore amore sensitive marker for short-term Se intake in populationssuch as the Danes with dietary intakes high enough to obtain sat-uration of GPX activity in both plasma and erythrocytes. PlasmaSe concentrations vary with the form of Se supplementation, andwe have previously found in a 5-year supplementation studywith Se-enriched yeast that thrombocyte GPX activity is notsaturated until plasma Se concentrations reach 165–220mg/l(G Ravn-Haren, BN Krath, K Overvad, S Cold, S Moesgaard,EH Larsen & LO Dragsted, unpublished results). Since thethrombocyte has a short circulation time of 7–10 d, relativelyrapid changes in inducible enzymes might take place. Only sele-nate supplementation increased thrombocyte GPX activity. Thelack of effect after supplementation with organic Se sources inthe present study could be due to the short length of supplemen-tation, and the need to catabolise Se from selenomethionine inbody proteins before it can be converted into the precursor avail-able for selenoprotein synthesis. Since GPX protects thrombo-cytes against lipid hydroperoxides, increased thrombocyteGPX activity could modulate thrombocyte function by limitingthe stage of thrombocyte activation (a marker of cardiovascularrisk).
Recently, Burk et al.38 reported no correlation betweenplasma Se concentrations and plasma GPX activity or SelPlevels in subjects with a baseline plasma Se concentration ofabout 122mg/l. They found that selenite supplementation at
doses up to 380mg/d for 16 weeks did not increase plasmaSe concentrations. In the young Danish men in the presentstudy, who had serum Se concentrations of about 111mg/l,we found weak but significant correlations at baseline betweenserum Se concentrations and GPX activity in all three bloodcompartments. We also found significant increases after just1 week’s supplementation with a lower dose of selenate(300mg/d). Se absorption from selenate has been reported tobe higher compared with selenite, but retention of the twoinorganic Se sources is comparable45. Since plasma GPXactivity did not increase in the present study and selenatedirectly enters the Se pool, the increase in serum Se after sele-nate supplementation suggests that the concentration ofanother plasma selenoprotein has increased. SelP might be apossible candidate; however, we did not observe an increasein SelP gene expression measured in leucocytes. It has beenreported that SelP concentrations plateau at higher plasmaSe concentrations than plasma GPX activity46, so whetherthis increase in serum Se is caused by increased SelP concen-trations or simple non-specific incorporation into albumin orother small plasma proteins needs further investigation.
Se supplementation has previously been observed toincrease cellular synthesis of both selenoproteins and otherproteins, especially detoxification enzymes23. Acute inductionof gene expression and increased activities of detoxificationenzymes were found in mouse liver following treatmentwith high doses of different Se compounds47. No common
Table 4. Effect of selenium supplementation on plasma C-reactive protein (CRP), lipid resistance to oxidation (LOX) and lipid profile
(Mean values and standard deviations)
Placebo (n 20) Selenate (n 20)Se-enrichedyeast (n 20)
Se-enriched milk(n 20)
Mean SD Mean SD Mean SD Mean SD
CRP (mg/l) 0 h 0·76 0·68 0·94 1·03 1·07 1·41 0·72 0·8524 h 0·67* 0·64 0·70 0·63 1·06 1·19 0·68 0·851 week 0·92 1·44 0·92 1·21 1·00 1·43 0·78* 1·334 weeks 0·68 0·52 1·02 1·20 1·45 1·83 0·89
LOX (min) 0 h 210 27·1 204 24·9 206 26·9 215 29·524 h 209* 32·1 205 22·8 208 25·0 215 27·81 week 213 29·2 210 22·2 217 36·4 213* 23·84 weeks 212 26·0 206 26·7 212 33·1 215* 27·3
Plasm total cholesterol (mmol/l) 0 h 3·89 0·72 3·83 0·72 3·91 0·79 3·93 0·8624 h 3·91* 0·77 3·85 0·72 3·92 0·81 3·89 0·911 week 3·87 0·68 3·91 0·76 3·89 0·83 3·83* 0·864 weeks 4·04 0·87 3·84 0·79 3·90 0·79 3·96 0·76
Plasma TAG (mmol/l) 0 h 1·05 0·34 1·02 0·43 1·10 0·61 1·00 0·3924 h 0·90* 0·26 0·95 0·38 1·01 0·48 0·88 0·251 week 1·08 0·44 0·99 0·50 1·11 0·76 1·04* 0·474 weeks 0·99 0·45 0·92 0·28 1·03 0·66 0·99 0·31
HDL-cholesterol (mmol/l) 0 h 1·39 0·31 1·41 0·39 1·36 0·33 1·42 0·323 h 1·37 0·31 1·39 0·38 1·35 0·31 1·37 0·336 h 1·31 0·33 1·33 0·38 1·28 0·31 1·33 0·3124 h 1·41* 0·32 1·38 0·35 1·36 0·37 1·41 0·281 week 1·40 0·35 1·40 0·35 1·37 0·35 1·38* 0·304 weeks 1·45 0·33 1·39 0·30 1·41 0·38 1·38 0·26
LDL-cholesterol (mmol/l) 0 h 2·52 0·68 2·45 0·70 2·54 0·74 2·58 0·823 h 2·54 0·73 2·45 0·73 2·49 0·74 2·63 0·856 h 2·32 0·69 2·23 0·73 2·32 0·73 2·31 0·8624 h 2·58* 0·68 2·52 0·69 2·60 0·73 2·57 0·891 week 2·48 0·57 2·54 0·66 2·55 0·76 2·45* 0·824 weeks 2·64 0·85 2·51 0·72 2·50 0·75 2·62 0·76
* n 19.
G. Ravn-Haren et al.890
British
Journal
ofNutrition
pattern of effects was observed with similar Se compoundsand there was rarely concordance between effects on mRNAand enzyme activity. We found no effect of the different Secompounds on gene expression in human leucocytes andactivity of phase 2 enzymes. This does not exclude a possibleeffect on carcinogen metabolism in liver, but raises questionson the validity of the use of blood samples as a surrogatemarker of Se-induced gene expression in other target organs.
A high level of serum Se has been associated in a prospec-tive study with reduced oxidative stress to lipids determined asexcreted isoprostanes48. Here, we have investigated the short-term effects of high doses of Se on a marker of plasma lipidresistance to oxidation but we did not find a similar effect.
Elevated levels of CRP, and total and LDL-cholesterol,decreased levels of HDL-cholesterol and oxidised LDL arerisk factors for CVD. Studies of Se and CVD risk are not con-clusive. In former skin-cancer patients, supplementation with200mg Se/d as Se-enriched yeast significantly decreased therisk of cancer, while no effect was seen on the prevention ofCVD during 7.6 years of follow-up49. In the SU.VI.MAX29
study where subjects were supplemented with nutritionaldoses of antioxidants, including 100mg Se/d, with a medianfollow-up time of 7.5 years, no effect was reported on totalcholesterol29. They concluded that long-term supplementationwith antioxidants did not improve the lipid profile. On the con-trary they found prevalence of hypertriacylglycerolaemia withantioxidant supplementation in men. Subjects in the presentstudy were healthy and had normal CRP, normal total, HDL-and LDL- cholesterol and TAG levels at inclusion and wefound no acute effect of Se supplementation on plasma total,HDL- and LDL-cholesterol, CRP or plasma TAG levels. Bothnegative and no associations between CRP and Se levels havebeen reported in subjects with various pathological conditionscompared with healthy subjects50,51. In healthy subjects,serum Se concentrations were predicted by serum total choles-terol, CRP concentrations and dietary Se52, but results fromthe present study do not support any short-term effect of highSe intake on risk factors for CVD. The duration of the interven-tion (1 week) may not be long enough to affect blood lipids.However, the weak but highly significant positive correlationsbetween serum Se levels and blood lipids could be due tolong-term effects or reflect effects of a dietary Se source thatare independent of Se. The present study does not suggest anyshort-term beneficial effects of increased Se intake on theserisk markers and further investigation is needed to concludewhether Se supplementation has any effects on blood lipidsthat could result in decreased risk of CVD.
Acknowledgements
We thank all the individuals who volunteered for the studyand Vibeke Kegel, Ella Jessen, Berit Hoielt, Kira Larsen,Hanne L. Pedersen, Hanne Jensen, Elin Skytte and MarianneHansen for excellent technical support. The study was finan-cially supported by a grant from the Committee for researchand development of the Oresund region. University of Copen-hagen and Biomedical Nutrition at Lund University are mem-bers of the European Union NoE Environmental Cancer Risk,Nutrition and Individual Susceptibility (ECNIS; no. 513943),which partly supported the study.
References
1. Rayman MP (2000) The importance of selenium to human
health. Lancet 356, 233–241.
2. Ip C (1986) The chemopreventive role of selenium in carcino-
genesis. Adv Exp Med Biol 206, 431–447.
3. Hussein O, Rosenblat M, Refael G & Aviram M (1997) Dietary
selenium increases cellular glutathione peroxidase activity and
reduces the enhanced susceptibility to lipid peroxidation of
plasma and low-density lipoprotein in kidney transplant recipi-
ents. Transplantation 63, 679–685.
4. Traulsen H, Steinbrenner H, Buchczyk DP, Klotz LO & Sies H
(2004) Selenoprotein P protects low-density lipoprotein against
oxidation. Free Radic Res 38, 123–128.
5. Wadkar-Navsariwala V, Prins GS, Swanson SM, Birch LA, Ray
VH, Hedayat S, Lantvit DL & Diamond AM (2006) Selenopro-
tein deficiency accelerates prostate carcinogenesis in a trans-
genic model. Proc Natl Acad Sci U S A 103, 8179–8184.
6. Saito Y, Sato N, Hirashima M, Takebe G, Nagasawa S & Taka-
hashi K (2004) Domain structure of bi-functional selenoprotein
P. Biochem J 381, 841–846.
7. Ratnasinghe D, Tangrea JA, Andersen MR, Barrett MJ, Virtamo
J, Taylor PR & Albanes D (2000) Glutathione peroxidase codon
198 polymorphism variant increases lung cancer risk. Cancer
Res 60, 6381–6383.
8. Hu YJ & Diamond AM (2003) Role of glutathione peroxidase 1
in breast cancer: loss of heterozygosity and allelic differences in
the response to selenium. Cancer Res 63, 3347–3351.
9. Ravn-Haren G, Olsen A, Tjonneland A, Dragsted LO, Nexo BA,
Wallin H, Overvad K, Raaschou- Nielsen O & Vogel U (2006)
Associations between GPX1 Pro198Leu polymorphism, erythro-
cyte GPX activity, alcohol consumption and breast cancer risk
in a prospective cohort study. Carcinogenesis 27, 820–825.
10. Thomson CD, Burton CE & Robinson M (1978) On supple-
menting the selenium intake of New Zealanders. 1. Short exper-
iments with large doses of selenite or selenomethionine. Br J
Nutr 39, 579–587.
11. Thomson CD, Robinson MF, Campbell DR & Rea HM (1982)
Effect of prolonged supplementation with daily supplements of
selenomethionine and sodium selenite on glutathione peroxidase
activity in blood of New Zealand residents. Am J Clin Nutr 36,
24–31.
12. Levander OA, Alfthan G, Arvilommi H, Gref CG, Huttunen JK,
Kataja M, Koivistoinen P & Pikkarainen J (1983) Bioavailabil-
ity of selenium to Finnish men as assessed by platelet gluta-
thione peroxidase activity and other blood parameters. Am J
Clin Nutr 37, 887–897.
13. Thomson CD, Robinson MF, Butler JA & Whanger PD (1993)
Long-term supplementation with selenate and selenomethio-
nine: selenium and glutathione peroxidase (EC 1.11.1.9) in
blood components of New Zealand women. Br J Nutr 69,
577–588.
14. Alfthan G, Aro A, Arvilommi H & Huttunen JK (1991)
Selenium metabolism and platelet glutathione peroxidase
activity in healthy Finnish men: effects of selenium yeast, sele-
nite, and selenate. Am J Clin Nutr 53, 120–125.
15. Neve J (1995) Human selenium supplementation as assessed by
changes in blood selenium concentration and glutathione per-
oxidase activity. J Trace Elem Med Biol 9, 65–73.
16. Neve J, Vertongen F & Capel P (1988) Selenium supplemen-
tation in healthy Belgian adults: response in platelet glutathione
peroxidase activity and other blood indices. Am J Clin Nutr 48,
139–143.
17. Butler JA, Thomson CD, Whanger PD & Robinson MF (1991)
Selenium distribution in blood fractions of New Zealand women
taking organic or inorganic selenium. Am J Clin Nutr 53,
748–754.
Short-term effects of selenium sources 891
British
Journal
ofNutrition
18. Thomson CD, Steven SM, van Rij AM, Wade CR & Robinson
MF (1988) Selenium and vitamin E supplementation: activities
of glutathione peroxidase in human tissues. Am J Clin Nutr 48,
316–323.
19. van der Torre HW, Van DW, Schaafsma G, Wedel M &
Ockhuizen T (1991) Effect of various levels of selenium in
wheat and meat on blood Se status indices and on Se balance
in Dutch men. Br J Nutr 65, 69–80.
20. Fox TE, Van den Heuvel EG, Atherton CA, et al. (2004) Bioa-
vailability of selenium from fish, yeast and selenate: a compara-
tive study in humans using stable isotopes. Eur J Clin Nutr 58,
343–349.
21. Lyhne N, Christensen T, Groth MV, et al. Danskernes
Kostvaner 2000-2002. Hovedresultater, Søborg, Denmark:
Danish Institute for Food and Veterinary Research.
22. Chen J, Lindmark-Mansson H, Drevelius M, Tidehag P, Hall-
mans G, Hertervig E, Nilsson A & Akesson B (2004) Bioavail-
ability of selenium from bovine milk as assessed in subjects
with ileostomy. Eur J Clin Nutr 58, 350–355.
23. El Bayoumy K & Sinha R (2005) Molecular chemoprevention
by selenium: a genomic approach. Mutat Res 591, 224–236.
24. Gipp JJ, Chang C & Mulcahy RT (1992) Cloning and
nucleotide sequence of a full-length cDNA for human liver
g-glutamylcysteine synthetase. Biochem Biophys Res Commun
185, 29–35.
25. Gipp JJ, Bailey HH & Mulcahy RT (1995) Cloning and
sequencing of the cDNA for the light subunit of human liver
g-glutamylcysteine synthetase and relative mRNA levels for
heavy and light subunits in human normal tissues. Biochem
Biophys Res Commun 206, 584–589.
26. Chen C & Kong AN (2004) Dietary chemopreventive com-
pounds and ARE/EpRE signaling. Free Radic Biol Med 36,
1505–1516.
27. Venugopal R & Jaiswal AK (1996) Nrf1 and Nrf2 positively and
c-Fos and Fra1 negatively regulate the human antioxidant
response element-mediated expression of NAD(P)H:quinone
oxidoreductase1 gene. Proc Natl Acad Sci U S A 93,
14960–14965.
28. Jardine H, MacNee W, Donaldson K & Rahman I (2002) Mol-
ecular mechanism of transforming growth factor (TGF)-b1-
induced glutathione depletion in alveolar epithelial cells.
Involvement of AP-1/ARE and Fra-1. J Biol Chem 277,
21158–21166.
29. Hercberg S, Bertrais S, Czernichow S, et al. (2005) Alterations
of the lipid profile after 7.5 years of low-dose antioxidant sup-
plementation in the SU.VI.MAX Study. Lipids 40, 335–342.
30. Andersen LT, Jensen H & Haraldsdottir J (1996) Typiske vægte
for madvarer (Typical weights for foods). Scand J Nutr 4,
S129–S152.
31. Sloth JJ, Larsen EH, Bugel SH & Moesgaard S (2003) Determi-
nation of total selenium and Se-77 in isotopically enriched
human samples by ICP-dynamic reaction cell-MS. J Anal At
Spectrom 18, 317–322.
32. Pruszkowski E (2004) Selenium Determination in Blood and
Serum with ICP-MS. Waltham, MA: PerkinElmer.
33. Mayer B, Schumacher M, Brandstatter H, Wagner FS &
Hermetter A (2001) High-throughput fluorescence screening of
antioxidative capacity in human serum. Anal Biochem 297,
144–153.
34. Wheeler CR, Salzman JA, Elsayed NM, Omaye ST & Korte
DW Jr (1990) Automated assays for superoxide dismutase,
catalase, glutathione peroxidase, and glutathione reductase
activity. Anal Biochem 184, 193–199.
35. Dragsted LO, Pedersen A, Hermetter A, et al. (2004) The 6-a-
day study: effects of fruit and vegetables on markers of
oxidative stress and antioxidative defense in healthy non-
smokers. Am J Clin Nutr 79, 1060–1072.
36. Pedersen A (1993) The relationship between selenium intake,
selenium status, and platelet-specific proteins in young healthy
Danes, Master’s Thesis, Royal Vetarinary and Agricultural
University, Frederiksberg, Denmark.
37. Jørgensen K (2005) Selenium and endothelial function,
Master’s Thesis, Royal Veterinary and Agricultural University,
Frederiksberg, Denmark.
38. Burk RF, Norsworthy BK, Hill KE, Motley AK & Byrne DW
(2006) Effects of chemical form of selenium on plasma
biomarkers in a high-dose human supplementation trial.
Cancer Epidemiol Biomarkers Prev 15, 804–810.
39. Fox TE, Atherton C, Dainty JR, Lewis DJ, Langford NJ, Baxter
MJ, Crews HM & Fairweather-Tait SJ (2005) Absorption of
selenium from wheat, garlic, and cod intrinsically labeled with
Se-77 and Se-82 stable isotopes. Int J Vitam Nutr Res 75,
179–186.
40. Mutanen M (1986) Bioavailability of selenium in mushrooms,
Boletus edulis, to young women. Int J Vitam Nutr Res 56,
297–301.
41. Bugel SH, Sandstrom B & Larsen EH (2001) Absorption and
retention of selenium from shrimps in man. J Trace Elem
Med Biol 14, 198–204.
42. Bugel S, Sandstrom B & Skibsted LH (2004) Pork meat: a good
source of selenium? J Trace Elem Med Biol 17, 307–311.43. Tarp U, Hansen JC, Overvad K, Thorling EB, Tarp BD &
Graudal H (1987) Glutathione peroxidase activity in patients
with rheumatoid arthritis and in normal subjects: effects of
long-term selenium supplementation. Arthritis Rheum 30,
1162–1166.
44. Alfthan G, Xu GL, Tan WH, Aro A, Wu J, Yang YX, Liang
WS, Xue WL & Kong LH (2000) Selenium supplementation
of children in a selenium-deficient area in China: blood sel-
enium levels and glutathione peroxidase activities. Biol Trace
Elem Res 73, 113–125.
45. Van Dael P, Davidsson L, Munoz-Box R, Fay LB & Barclay D
(2001) Selenium absorption and retention from a selenite- or
selenate-fortified milk-based formula in men measured by a
stable-isotope technique. Br J Nutr 85, 157–163.
46. Xia Y, Hill KE, Byrne DW, Xu J & Burk RF (2005) Effective-
ness of selenium supplements in a low-selenium area of China.
Am J Clin Nutr 81, 829–834.
47. El-Sayed WM, boul-Fadl T, Lamb JG, Roberts JC & Franklin
MR (2006) Effect of selenium-containing compounds on hepatic
chemoprotective enzymes in mice. Toxicology 220, 179–188.
48. Helmersson J, Arnlov J, Vessby B, Larsson A, Alfthan G &
Basu S (2005) Serum selenium predicts levels of F2-isopros-
tanes and prostaglandin F2a in a 27 year follow-up study of
Swedish men. Free Radic Res 39, 763–770.
49. Stranges S, Marshall JR, Trevisan M, Natarajan R, Donahue RP,
Combs GF, Farinaro E, Clark LC & Reid ME (2006) Effects of
selenium supplementation on cardiovascular disease incidence
and mortality: secondary analyses in a randomized clinical
trial. Am J Epidemiol 163, 694–699.
50. Maehira F, Luyo GA, Miyagi I, Oshiro M, Yamane N, Kuba M
& Nakazato Y (2002) Alterations of serum selenium concen-
trations in the acute phase of pathological conditions. Clin
Chim Acta 316, 137–146.
51. Mayland C, Allen KR, Degg TJ & Bennet M (2004) Micronu-
trient concentrations in patients with malignant disease: effect
of the inflammatory response. Ann Clin Biochem 41, 138–141.
52. Ghayour-Mobarhan M, Taylor A, New SA, Lamb DJ & Ferns
GA (2005) Determinants of serum copper, zinc and selenium
in healthy subjects. Ann Clin Biochem 42, 364–375.
G. Ravn-Haren et al.892
British
Journal
ofNutrition
Copyright © 2022 FDOKUMEN