Evaluating a Rapid On-Farm Nutrient Determination Model for Use in Implementing Nutrient Management...
26
EVALUATING A RAPID ON-FARM NUTRIENT DETERMINATION MODEL FOR USE IN IMPLEMENTING NUTRIENT MANAGEMENT PLANS ∗ STEPHEN F. HIGGINS 1,∗ , MARK S. COYNE 2 , SCOTT A. SHEARER 1 and JOHN P. FULTON 3 1 Biosystems and Agricultural Engineering Department, University of Kentucky; 2 Department of Plant and Soil Sciences, University of Kentucky; 3 Biosystems Engineering Department, Auburn University, Auburn, Alabama ( ∗ author for correspondence: e-mail: [email protected]) (Received 30 June 2005; accepted 9 December 2005) Abstract. Government regulatory agencies recommend nutrient management plans (NMPs) for an- imal operations to reduce non-point source pollution. These plans require manure analysis for total nitrogen (TN) and total phosphorus (TP), and use indices to determine nutrient availability. This study evaluated a rapid on-farm method to predict TN and TP concentrations of swine slurries. A field investigation based on this rapid assessment procedure was used to evaluate the effect of a NMP on corn yield and soil fertility. Manure grab samples were collected to validate the rapid on-farm model for predicting TN and TP. A corn crop was raised on two phosphorus (P) soil test levels (medium and excessive) using three randomized complete blocks with two replications of three treatments. Rapid on-farm models were accurate ( P ≤ 0.05) for predicting manure TN and TP. The rapid model manure application rate produced grain yields that were significantly higher than inorganic-N fertilization treatments (13,000 kg ha −1 versus 9,000 kg ha −1 )(P ≤ 0.05). Potas- sium chloride extractable soil P and ammonium were not significantly different (P ≥ 0.05) in ma- nure treatments compared with the inorganic-N treatment. Analysis of ear leaf N, P, and K and grain yields demonstrated that the rapid model manure application developed by a NMP met crop requirements. Keywords: environment, nutrient, manure application, site-specific, precision agriculture, swine, animal feeding operation Introduction Manure application rates are generally designed to meet crop growth requirements for N. However, the ratio of N to P, particularly in poultry and swine manure, using an N-based system typically supplies the soil with more P than crops can use. Manure P availability can be greater (Goss and Stewart, 1979) and also lower (Gracey, 1984) than inorganic-P sources. For example, Laboski and Lamb (2003) determined that high rates of injected swine manure provided more available P than inorganic P ∗ The investigation reported in this paper (04-05-107) is in connection with a project of the Kentucky Agricultural Experiment Station and is published with the approval of the Director. Mention of trade names are for information purposes only and do not imply endorsement by the Kentucky Agricultural Experiment Station. Water, Air, and Soil Pollution (2006) 171: 333–358 DOI: 10.1007/s11270-005-9059-9 C Springer 2006
Transcript of Evaluating a Rapid On-Farm Nutrient Determination Model for Use in Implementing Nutrient Management...

EVALUATING A RAPID ON-FARM NUTRIENT DETERMINATIONMODEL FOR USE IN IMPLEMENTING NUTRIENT
MANAGEMENT PLANS∗
STEPHEN F. HIGGINS1,∗, MARK S. COYNE2, SCOTT A. SHEARER1
and JOHN P. FULTON3
1Biosystems and Agricultural Engineering Department, University of Kentucky; 2Department ofPlant and Soil Sciences, University of Kentucky; 3Biosystems Engineering Department, Auburn
University, Auburn, Alabama (∗author for correspondence: e-mail: [email protected])
(Received 30 June 2005; accepted 9 December 2005)
Abstract. Government regulatory agencies recommend nutrient management plans (NMPs) for an-
imal operations to reduce non-point source pollution. These plans require manure analysis for total
nitrogen (TN) and total phosphorus (TP), and use indices to determine nutrient availability. This
study evaluated a rapid on-farm method to predict TN and TP concentrations of swine slurries.
A field investigation based on this rapid assessment procedure was used to evaluate the effect of
a NMP on corn yield and soil fertility. Manure grab samples were collected to validate the rapid
on-farm model for predicting TN and TP. A corn crop was raised on two phosphorus (P) soil test
levels (medium and excessive) using three randomized complete blocks with two replications of
three treatments. Rapid on-farm models were accurate ( P ≤ 0.05) for predicting manure TN and
TP. The rapid model manure application rate produced grain yields that were significantly higher
than inorganic-N fertilization treatments (13,000 kg ha−1 versus 9,000 kg ha−1) ( P ≤ 0.05). Potas-
sium chloride extractable soil P and ammonium were not significantly different (P ≥ 0.05) in ma-
nure treatments compared with the inorganic-N treatment. Analysis of ear leaf N, P, and K and
grain yields demonstrated that the rapid model manure application developed by a NMP met crop
requirements.
Keywords: environment, nutrient, manure application, site-specific, precision agriculture, swine,
animal feeding operation
Introduction
Manure application rates are generally designed to meet crop growth requirementsfor N. However, the ratio of N to P, particularly in poultry and swine manure, using anN-based system typically supplies the soil with more P than crops can use. ManureP availability can be greater (Goss and Stewart, 1979) and also lower (Gracey, 1984)than inorganic-P sources. For example, Laboski and Lamb (2003) determined thathigh rates of injected swine manure provided more available P than inorganic P
∗The investigation reported in this paper (04-05-107) is in connection with a project of the Kentucky
Agricultural Experiment Station and is published with the approval of the Director. Mention of trade
names are for information purposes only and do not imply endorsement by the Kentucky Agricultural
Experiment Station.
Water, Air, and Soil Pollution (2006) 171: 333–358
DOI: 10.1007/s11270-005-9059-9 C© Springer 2006

334 S. F. HIGGINS ET AL.
fertilizers while Qian and Schoenau (2000) demonstrated that a single applicationof swine manure did not have an impact on increasing labile P forms in soils.
Thom and Dollarhide (2002) reported that soils with low initial P soil test valuesrequired more phosphate fertilizer to raise the soil test value by one unit than soilswith higher initial soil test values. Pote et al. (2003) supported this conclusionwhen they reported that poultry manure applied to the soil surface caused a greaterincrease in soil test P when applied to soil with higher initial soil test P values.
The specifications of manure equipment tend to apply manure as a waste ratherthan a resource, allowing manures to be over-applied effortlessly (Nowak et al.,1998). Mancl and Slates (2003) asked 101 farmers to estimate an application rateconducted at a field demonstration. Sixty-five percent of the farmers surveyed un-derestimated solid manure application rates; 50% of the farmers surveyed estimatedapplications rates of less than one-half the actual application rate, suggesting thatproducers may be applying twice as much material as needed. Although manureapplications are considered N-based, Schmidt et al. (1996), Sikora (2000), andDou et al. (2001) indicated that few animal producers submit manure samplesfor analysis, implying that manure application rates are not calculated for manyfarms.
The NRCS requires animal manure testing for total nitrogen (TN) and total phos-phorus (TP) to develop application rates for nutrient management plans (NMPs)(NRCS-590, 2001). Rapid on-farm methods for determining TN and TP could allowproducers to rapidly assess nutrient concentration in manure for calculating properapplication rates (Chescheir et al., 1985; Tunney and Bertrand, 1989; Stevens et al.,1995; Van Kessel et al., 1999). However, most of these methods are designed tomeasure N forms, and their use has not been widely adopted.
Chescheir et al. (1985), Tunney and Bertrand (1989), and Van Kessel et al. (1999)used the coefficient of determination (R2) from linear regression equations to eval-uate the accuracy of rapid nutrient determination methods. The aforementionedstudies also compared regression equations (slope and intercept) to previously con-ducted research. Van Kessel et al. (1999) plotted actual versus predicted values,evaluated regression equations by the R2 values, and determined if the slopes andintercepts, of regression equations, were significantly different from one and zero,respectively.
Manure TN and TP determination, along with soil fertility and crop information,would allow producers to concurrently meet crop needs and regulatory require-ments. There has been extensive research on the use of swine manure on yield andsoil fertility (Choudhary et al., 1996), but there is a lack of knowledge on whetherrecommended NMP practices attain their desired outcome. Although, the USDA-NRCS has been made responsible for developing NMPs, and State offices are ableto implement alternative best management practices (BMPs), and develop availablenutrient coefficients based on application method, physical and chemical propertiesof soils, and climatic conditions, these guidelines have seldom been verified withfield investigations.
EVALUATING A RAPID ON-FARM NUTRIENT DETERMINATION MODEL 335
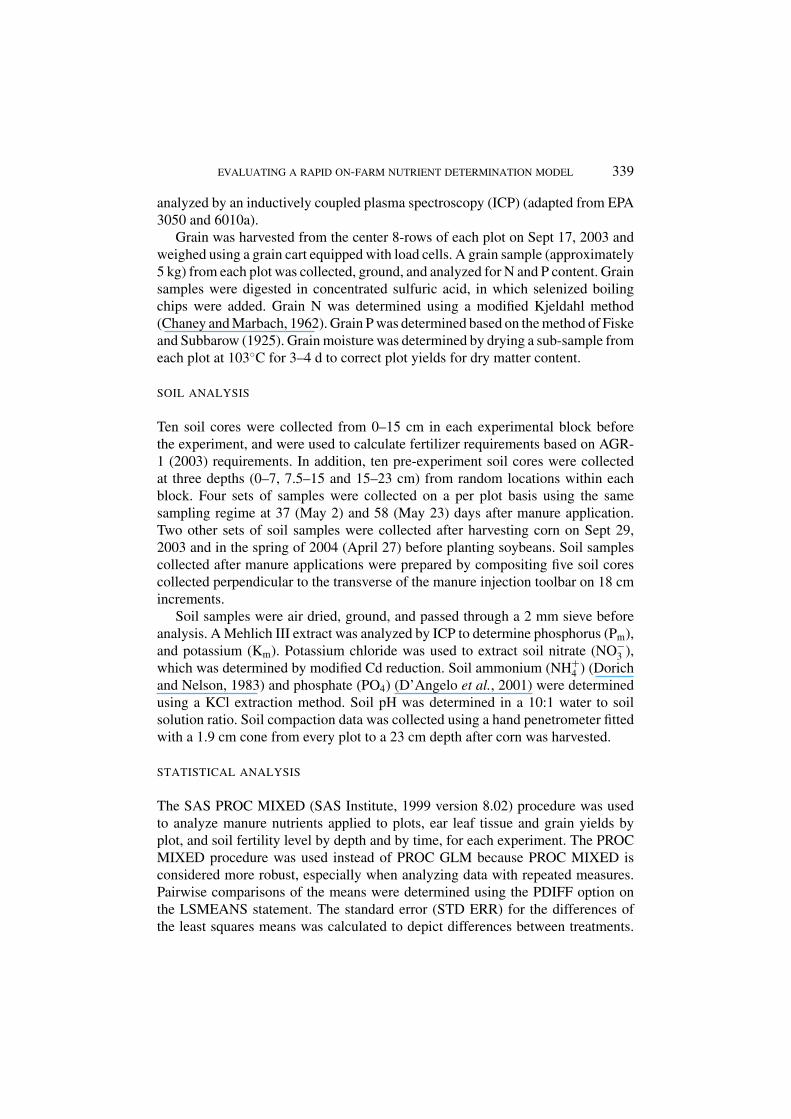
The effect of a swine manure NMP on crop yield and soil fertility can be mea-sured using physical and analytical methods. Soil fertility can be assessed by mea-suring soil nitrate (NO−
3 ), ammonium (NH+4 ), soluble P (orthophosphate), and soil
test P (Mehlich III). Likewise, the effectiveness of manure nutrients relative to inor-ganic fertilizer applications can be conducted using crop yield and tissue analysis.However, luxury consumption of nutrients can provide similar dry matter yields,while demonstrating inefficient nutrient use. Consequently, evaluating nutrient suf-ficiency levels in crop tissues can be used as a measurement criterion.
The goal of this study was to conduct a field investigation to evaluate a rapidon farm TN and TP determination procedure, while simultaneously evaluating theeffect of a NMP on corn yield and soil fertility. The objectives of this study were to:
1. Verify an on-farm model to predict TN and TP in manure samples based onstandard evaluation indicators.
2. Conduct a field experiment to compare the effects on soil fertility and crop pa-rameters of a model based NMP versus a producer defined manure applicationrate using inorganic N-application as a control, in which the NMP manure ap-plication rate would be determined using a rapid on-farm nutrient determinationmodel.
Materials and Methods
MANURE SAMPLING
Manure for the experiment originated from a single anaerobic holding pit locatedunder a slatted finishing barn floor. The manure was agitated for approximatelyfive minutes using a vertical PTO powered centrifugal pump. Manure grab sampleswere collected from each load applied using a valve on the discharge side of themanure pump that loaded the manure wagons. Sub-samples were collected onone-minute intervals during wagon loading, which required approximately fiveminutes. These sub-samples were composited into a single one-liter sample bottle.The composited samples were transported on ice to the laboratory where they werestored in a refrigerated chamber at approximately 1.1◦C.
TN AND TP DETERMINATION
A sub-sample of manure from each manure sample bottle was evaluated analyti-cally to determine TN and TP and validate a rapid nutrient determination modelprocedure. The TN concentration was determined using a LECO (St. Joseph, MI)C and N analyzer (Peters, 2003). Total Pand K concentrations were determined viaashing and dissolution of the ash in HCl and HNO3 prior to analysis by inductivelycoupled plasma spectrophotometry (Peters, 2003). Solids content was measured

336 S. F. HIGGINS ET AL.
gravimetrically from 50–60 mL of liquid sample dried 48 h at 103 ± 2◦C. Testresults for TN, TP, and TS were reported on a percent of total mass wet-basis.
The remaining manure sample, which ranged from 600 to 800 ml, was processedusing a rapid on-farm determination model to predict TN and TP (Higgins et al.,2004a). The procedure consisted of transferring the manure to a 1000 ml graduatedcylinder (10-ml gradations) to record the initial sample volume, sieving the manurethrough an American Society for Testing and Materials (ASTM) standard wirescreen sieve (0.85 mm), then collecting and measuring the volume of the liquidportion passing through the sieve (filtrate). The filtrate volume divided by the initialvolume defined the “liquid ratio.” The liquid ratio value and the barn from which themanure was collected were entered into two model equations developed to predictTN and TP (Higgins et al., 2004a). Predicted TN and TP concentrations were usedto calculate manure application rates using worksheet No. 2 of the NRCS-590-KY(2001) guidelines. Plots of actual versus predicted nutrient concentrations and aregression of the data were used to evaluate model accuracy.
NMP DEVELOPMENT
The Kentucky Agriculture Water Quality Act of 1994 was passed to protect surfaceand groundwater resources from pollution caused by agricultural activities. This actrequires that all landowner/land users with ten or more acres used for agriculturaloperations must develop and implement a water quality plan. Livestock operationslocated on the acreage must also develop a nutrient management plan (NRCS-590)to protect natural resources.
A nutrient management plan involves sampling soils and manures, identifyingrealistic yield goals, and calculating manure application rates based on crop removalrates, application method, and soil test values. A N-based manure application wasimplemented because the Mehlich III soil test P values for the field were less than448 kg ha−1 (NRCS-590-KY, 2001). A realistic yield goal of 9,400 kg ha−1 of corngrain was assumed. The recommended N application rate for soils in these studiesranged from 159–196 kg ha−1 (AGR-1, 2003); 168 kg ha−1 was selected to matchthe inorganic-N treatment, which was applied on June 13, 2003.
FIELD EXPERIMENTS
Research plots were established in a cooperator’s field located in Shelby County,Kentucky. The plots were blocked based on soil test P levels (Mehlich III) as medium(30 < P < 67 kg ha−1, Experiment A) and excessive (P > 224 kg ha−1 ExperimentB) according to AGR-1 (2003) recommendations for corn-grain (Figure 1). Eachexperiment included three randomized complete blocks with two replications ofthree treatments (Figure 2). Plot width was influenced by the manure applicatorand was 12.2 m with a length of 60.8 m to reduce border effects. Each plot hadan effective harvest area of approximately 6 m by 52 m. The design tested two

EVALUATING A RAPID ON-FARM NUTRIENT DETERMINATION MODEL 337
Figure 1. Field diagram illustrating the soil series and location of the six blocks of the field experiments
(A, medium P soil; B, excessive P soil). (ShB – Shelbyville) (LoC – Lowell).
Figure 2. (A) Plot diagram illustrating the treatments and replications of the two experiments and
three blocks within each experiment.
different manure application rates and an inorganic fertilizer control, on the meansof yield and plant and soil nutrient composition.
Experiment A was conducted predominantly on a Shelbyville soil (Fine-silty,mixed, mesic Mollic Hapludalf) with a 2–6 percent slope. Experiment B was

338 S. F. HIGGINS ET AL.
Figure 2. (B) Actual versus predicted TN for finishing barn manure samples with a 1:1 reference
line.
conducted on Shelbyville soil with a 2–6 percent slope, and Lowell soil (Fine,mixed, active, mesic, Typic Hapludalf) with a 6–12 percent slope (Figure 1). Theresearch plots and the entire field were planted with corn (Zea mays) Pioneer 34B23at 68,400 plants ha−1 on April 15, 2003. A weather station located 3.9 km from thefield provided ambient temperature and rainfall data that was comparable to a Na-tional Weather Service (NWS) County weather station located 7.2 km from the field.
MANURE APPLICATION RATES AND PLOT TREATMENT
The “producer” manure specified application rate and the inorganic-N plot ratewere determined to be approximately 88 m3 ha−1 and 168 N kg ha−1, respectively.Manure was injected approximately 11.5 cm below the soil surface using four widesweeps on March 26, and the entire plot area was disked to a depth of approximately11.5 cm five days later.
PLANT TISSUE AND GRAIN ANALYSES
Ear leaf samples were collected at silking from 10–15 plants within each plot,and analyzed for TN, K, and P, to determine the effect of application strategiesand possible interactions. Ear leaf TN was determined using a LECO combustioninstrument (St. Joseph, MI). Ear leaf P and K were determined by subjecting samplesto wet acid digestion using a combination of HCl and HNO3 acids, which was
EVALUATING A RAPID ON-FARM NUTRIENT DETERMINATION MODEL 339
analyzed by an inductively coupled plasma spectroscopy (ICP) (adapted from EPA3050 and 6010a).
Grain was harvested from the center 8-rows of each plot on Sept 17, 2003 andweighed using a grain cart equipped with load cells. A grain sample (approximately5 kg) from each plot was collected, ground, and analyzed for N and P content. Grainsamples were digested in concentrated sulfuric acid, in which selenized boilingchips were added. Grain N was determined using a modified Kjeldahl method(Chaney and Marbach, 1962). Grain P was determined based on the method of Fiskeand Subbarow (1925). Grain moisture was determined by drying a sub-sample fromeach plot at 103◦C for 3–4 d to correct plot yields for dry matter content.
SOIL ANALYSIS
Ten soil cores were collected from 0–15 cm in each experimental block beforethe experiment, and were used to calculate fertilizer requirements based on AGR-1 (2003) requirements. In addition, ten pre-experiment soil cores were collectedat three depths (0–7, 7.5–15 and 15–23 cm) from random locations within eachblock. Four sets of samples were collected on a per plot basis using the samesampling regime at 37 (May 2) and 58 (May 23) days after manure application.Two other sets of soil samples were collected after harvesting corn on Sept 29,2003 and in the spring of 2004 (April 27) before planting soybeans. Soil samplescollected after manure applications were prepared by compositing five soil corescollected perpendicular to the transverse of the manure injection toolbar on 18 cmincrements.
Soil samples were air dried, ground, and passed through a 2 mm sieve beforeanalysis. A Mehlich III extract was analyzed by ICP to determine phosphorus (Pm),and potassium (Km). Potassium chloride was used to extract soil nitrate (NO−
3 ),which was determined by modified Cd reduction. Soil ammonium (NH+
4 ) (Dorichand Nelson, 1983) and phosphate (PO4) (D’Angelo et al., 2001) were determinedusing a KCl extraction method. Soil pH was determined in a 10:1 water to soilsolution ratio. Soil compaction data was collected using a hand penetrometer fittedwith a 1.9 cm cone from every plot to a 23 cm depth after corn was harvested.
STATISTICAL ANALYSIS
The SAS PROC MIXED (SAS Institute, 1999 version 8.02) procedure was usedto analyze manure nutrients applied to plots, ear leaf tissue and grain yields byplot, and soil fertility level by depth and by time, for each experiment. The PROCMIXED procedure was used instead of PROC GLM because PROC MIXED isconsidered more robust, especially when analyzing data with repeated measures.Pairwise comparisons of the means were determined using the PDIFF option onthe LSMEANS statement. The standard error (STD ERR) for the differences ofthe least squares means was calculated to depict differences between treatments.
340 S. F. HIGGINS ET AL.
Different letters, based on principles of the Duncan’s multiple range tests, wereadded to depict observed differences between the least squares means.
Results and Discussion
MANURE NUTRIENT DETERMINATION AND APPLICATION RATES
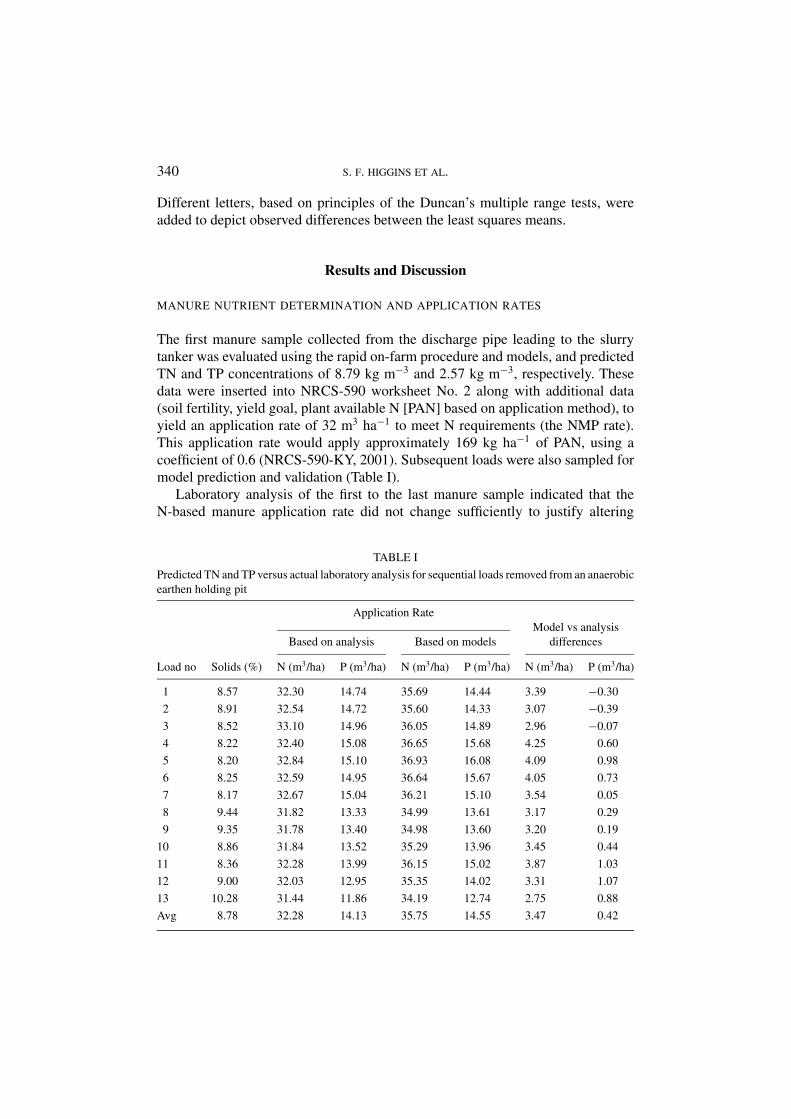
The first manure sample collected from the discharge pipe leading to the slurrytanker was evaluated using the rapid on-farm procedure and models, and predictedTN and TP concentrations of 8.79 kg m−3 and 2.57 kg m−3, respectively. Thesedata were inserted into NRCS-590 worksheet No. 2 along with additional data(soil fertility, yield goal, plant available N [PAN] based on application method), toyield an application rate of 32 m3 ha−1 to meet N requirements (the NMP rate).This application rate would apply approximately 169 kg ha−1 of PAN, using acoefficient of 0.6 (NRCS-590-KY, 2001). Subsequent loads were also sampled formodel prediction and validation (Table I).
Laboratory analysis of the first to the last manure sample indicated that theN-based manure application rate did not change sufficiently to justify altering
TABLE I
Predicted TN and TP versus actual laboratory analysis for sequential loads removed from an anaerobic
earthen holding pit
Application Rate
Based on analysis Based on models
Model vs analysis
differences
Load no Solids (%) N (m3/ha) P (m3/ha) N (m3/ha) P (m3/ha) N (m3/ha) P (m3/ha)
1 8.57 32.30 14.74 35.69 14.44 3.39 −0.30
2 8.91 32.54 14.72 35.60 14.33 3.07 −0.39
3 8.52 33.10 14.96 36.05 14.89 2.96 −0.07
4 8.22 32.40 15.08 36.65 15.68 4.25 0.60
5 8.20 32.84 15.10 36.93 16.08 4.09 0.98
6 8.25 32.59 14.95 36.64 15.67 4.05 0.73
7 8.17 32.67 15.04 36.21 15.10 3.54 0.05
8 9.44 31.82 13.33 34.99 13.61 3.17 0.29
9 9.35 31.78 13.40 34.98 13.60 3.20 0.19
10 8.86 31.84 13.52 35.29 13.96 3.45 0.44
11 8.36 32.28 13.99 36.15 15.02 3.87 1.03
12 9.00 32.03 12.95 35.35 14.02 3.31 1.07
13 10.28 31.44 11.86 34.19 12.74 2.75 0.88
Avg 8.78 32.28 14.13 35.75 14.55 3.47 0.42
EVALUATING A RAPID ON-FARM NUTRIENT DETERMINATION MODEL 341
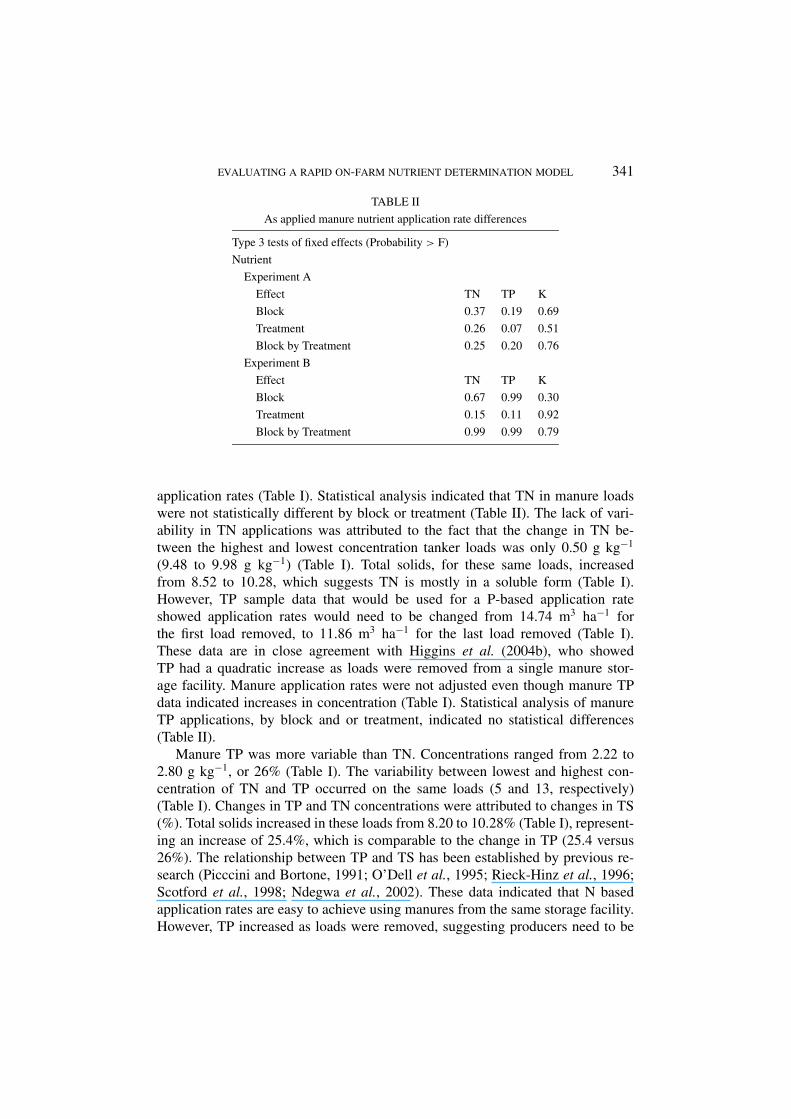
TABLE II
As applied manure nutrient application rate differences
Type 3 tests of fixed effects (Probability > F)
Nutrient
Experiment A
Effect TN TP K
Block 0.37 0.19 0.69
Treatment 0.26 0.07 0.51
Block by Treatment 0.25 0.20 0.76
Experiment B
Effect TN TP K
Block 0.67 0.99 0.30
Treatment 0.15 0.11 0.92
Block by Treatment 0.99 0.99 0.79
application rates (Table I). Statistical analysis indicated that TN in manure loadswere not statistically different by block or treatment (Table II). The lack of vari-ability in TN applications was attributed to the fact that the change in TN be-tween the highest and lowest concentration tanker loads was only 0.50 g kg−1
(9.48 to 9.98 g kg−1) (Table I). Total solids, for these same loads, increasedfrom 8.52 to 10.28, which suggests TN is mostly in a soluble form (Table I).However, TP sample data that would be used for a P-based application rateshowed application rates would need to be changed from 14.74 m3 ha−1 forthe first load removed, to 11.86 m3 ha−1 for the last load removed (Table I).These data are in close agreement with Higgins et al. (2004b), who showedTP had a quadratic increase as loads were removed from a single manure stor-age facility. Manure application rates were not adjusted even though manure TPdata indicated increases in concentration (Table I). Statistical analysis of manureTP applications, by block and or treatment, indicated no statistical differences(Table II).
Manure TP was more variable than TN. Concentrations ranged from 2.22 to2.80 g kg−1, or 26% (Table I). The variability between lowest and highest con-centration of TN and TP occurred on the same loads (5 and 13, respectively)(Table I). Changes in TP and TN concentrations were attributed to changes in TS(%). Total solids increased in these loads from 8.20 to 10.28% (Table I), represent-ing an increase of 25.4%, which is comparable to the change in TP (25.4 versus26%). The relationship between TP and TS has been established by previous re-search (Picccini and Bortone, 1991; O’Dell et al., 1995; Rieck-Hinz et al., 1996;Scotford et al., 1998; Ndegwa et al., 2002). These data indicated that N basedapplication rates are easy to achieve using manures from the same storage facility.However, TP increased as loads were removed, suggesting producers need to be

342 S. F. HIGGINS ET AL.
aware of the TP concentration and the placement of these higher TP manure loads insoils.
Laboratory analysis of the first manure sample collected showed that therewere 9.7 kg m−3 TN and 2.52 kg m−3 TP. These data were inserted into theNRCS-590-KY (2001) worksheet in place of the predicted concentration to de-termine the application rate that should have been applied. The calculated manurerate was determined to be 29 m3 ha−1 representing a net difference of 3.0 m3 ha−1
between methods, or a difference of 17.5 kg ha−1 of PAN.Accuracy of the rapid models was determined by plotting the actual versus the
measured nutrient concentrations (Figures 3 and 4) and comparing to a 1:1 line,as demonstrated by Van Kessel et al. (1999), Agouridis and Edwards (2003) andHiggins et al. (2004a). Regressions of the actual versus predicted TN and TP valuesresulted in slopes and intercepts that were within the 95% confidence intervals of aslope of one and an intercept of zero. Additionally, the coefficient of determination(R2) provided by the regressions for verifying the models for TN and TP, 0.71 and0.79, respectively, was used to verify accuracy. Criteria outlined by Agouridis andEdwards (2003), used to evaluate the coefficient of determination, suggest thatthe rapid models were fairly successful at determining TN and TP. Manure TNprediction error was attributed to the fact that two loads of manure were removedfrom the holding pit in late December 2002 to prevent pit overflow, which alteredthe conditions of the anaerobic batch and for unknown reasons raised the TN level
Figure 3. Actual versus predicted TP for finishing barn manure samples with a 1:1 reference line.
EVALUATING A RAPID ON-FARM NUTRIENT DETERMINATION MODEL 343
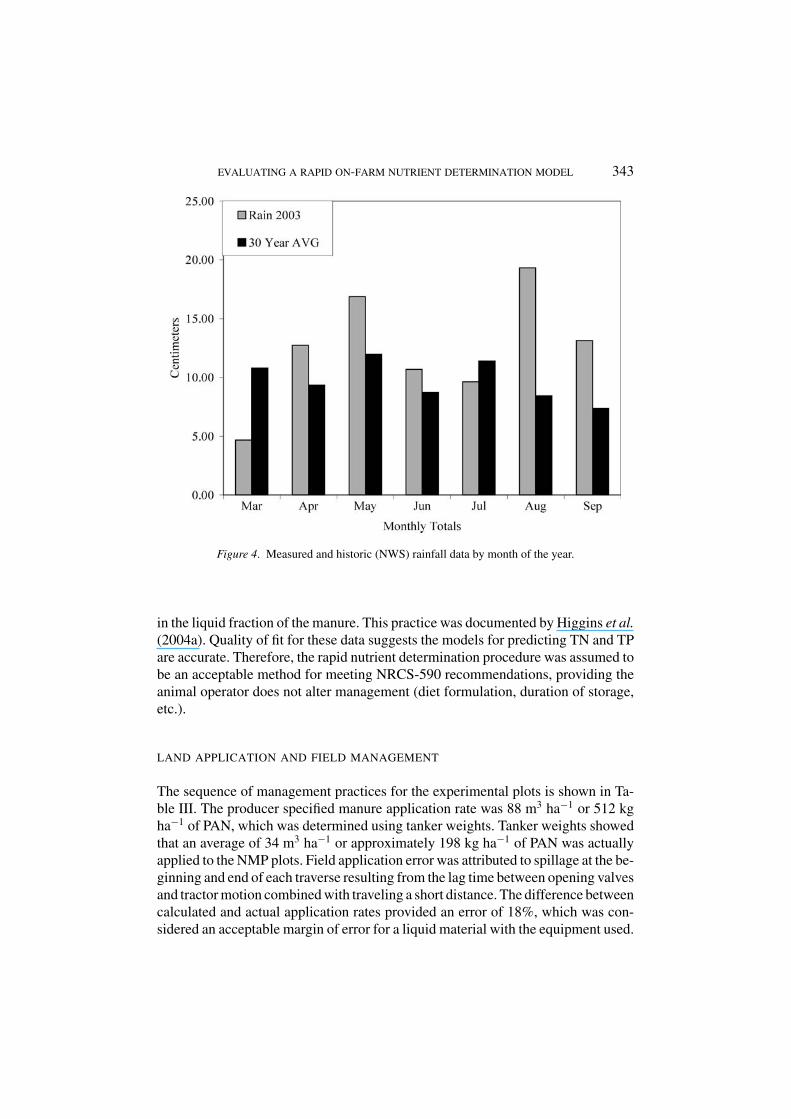
Figure 4. Measured and historic (NWS) rainfall data by month of the year.
in the liquid fraction of the manure. This practice was documented by Higgins et al.(2004a). Quality of fit for these data suggests the models for predicting TN and TPare accurate. Therefore, the rapid nutrient determination procedure was assumed tobe an acceptable method for meeting NRCS-590 recommendations, providing theanimal operator does not alter management (diet formulation, duration of storage,etc.).
LAND APPLICATION AND FIELD MANAGEMENT
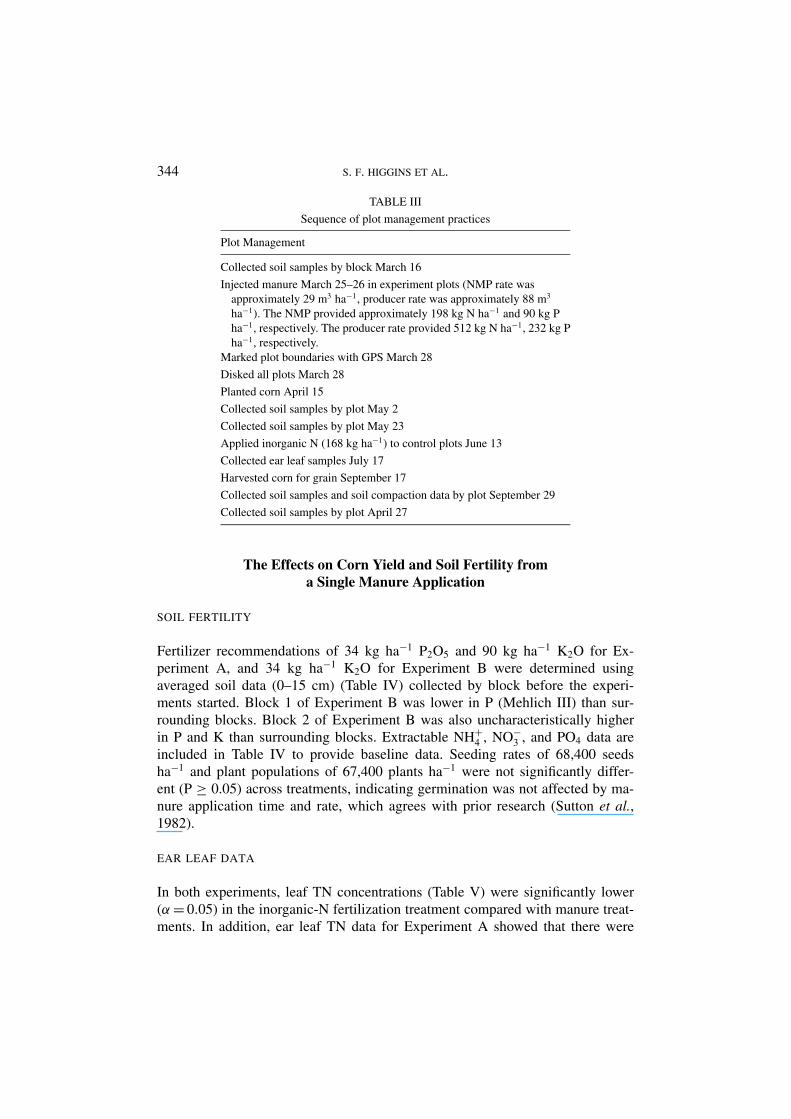
The sequence of management practices for the experimental plots is shown in Ta-ble III. The producer specified manure application rate was 88 m3 ha−1 or 512 kgha−1 of PAN, which was determined using tanker weights. Tanker weights showedthat an average of 34 m3 ha−1 or approximately 198 kg ha−1 of PAN was actuallyapplied to the NMP plots. Field application error was attributed to spillage at the be-ginning and end of each traverse resulting from the lag time between opening valvesand tractor motion combined with traveling a short distance. The difference betweencalculated and actual application rates provided an error of 18%, which was con-sidered an acceptable margin of error for a liquid material with the equipment used.
344 S. F. HIGGINS ET AL.
TABLE III
Sequence of plot management practices
Plot Management
Collected soil samples by block March 16
Injected manure March 25–26 in experiment plots (NMP rate was
approximately 29 m3 ha−1, producer rate was approximately 88 m3
ha−1). The NMP provided approximately 198 kg N ha−1 and 90 kg P
ha−1, respectively. The producer rate provided 512 kg N ha−1, 232 kg P
ha−1, respectively.
Marked plot boundaries with GPS March 28
Disked all plots March 28
Planted corn April 15
Collected soil samples by plot May 2
Collected soil samples by plot May 23
Applied inorganic N (168 kg ha−1) to control plots June 13
Collected ear leaf samples July 17
Harvested corn for grain September 17
Collected soil samples and soil compaction data by plot September 29
Collected soil samples by plot April 27
The Effects on Corn Yield and Soil Fertility froma Single Manure Application
SOIL FERTILITY
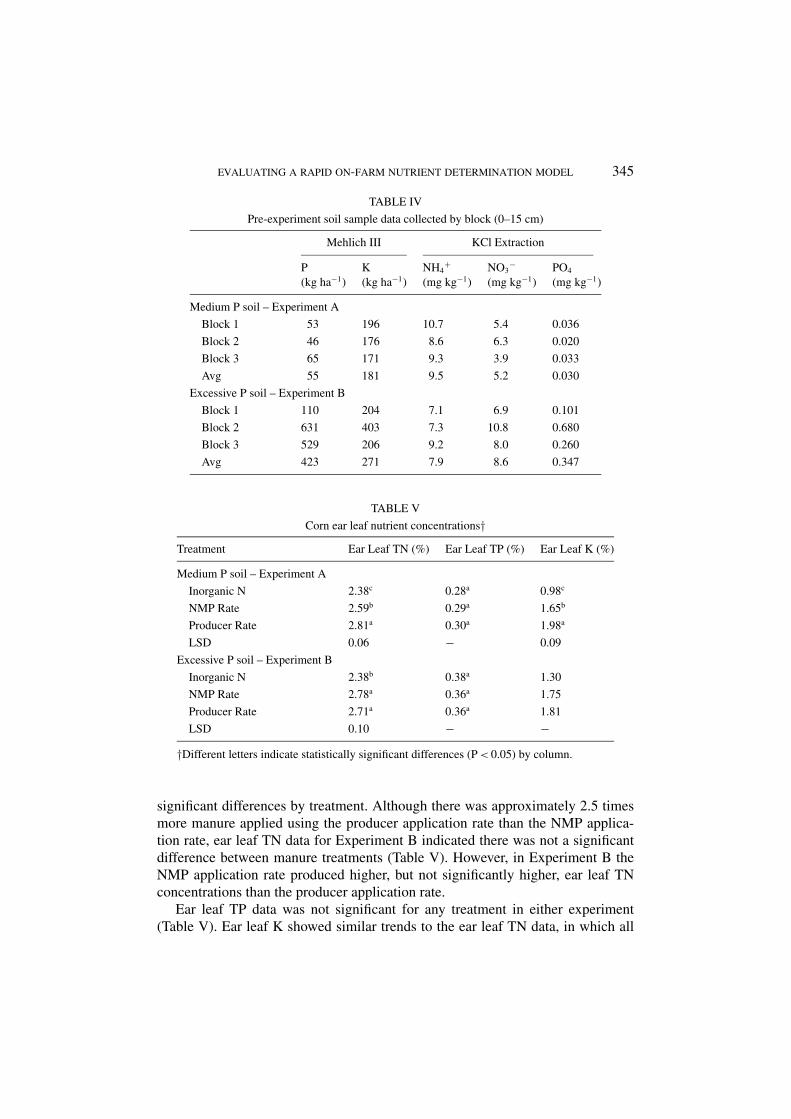
Fertilizer recommendations of 34 kg ha−1 P2O5 and 90 kg ha−1 K2O for Ex-periment A, and 34 kg ha−1 K2O for Experiment B were determined usingaveraged soil data (0–15 cm) (Table IV) collected by block before the experi-ments started. Block 1 of Experiment B was lower in P (Mehlich III) than sur-rounding blocks. Block 2 of Experiment B was also uncharacteristically higherin P and K than surrounding blocks. Extractable NH+
4 , NO−3 , and PO4 data are
included in Table IV to provide baseline data. Seeding rates of 68,400 seedsha−1 and plant populations of 67,400 plants ha−1 were not significantly differ-ent (P ≥ 0.05) across treatments, indicating germination was not affected by ma-nure application time and rate, which agrees with prior research (Sutton et al.,1982).
EAR LEAF DATA
In both experiments, leaf TN concentrations (Table V) were significantly lower(α = 0.05) in the inorganic-N fertilization treatment compared with manure treat-ments. In addition, ear leaf TN data for Experiment A showed that there were
EVALUATING A RAPID ON-FARM NUTRIENT DETERMINATION MODEL 345
TABLE IV
Pre-experiment soil sample data collected by block (0–15 cm)
Mehlich III KCl Extraction
P
(kg ha−1)
K
(kg ha−1)
NH4+
(mg kg−1)
NO3−
(mg kg−1)
PO4
(mg kg−1)
Medium P soil – Experiment A
Block 1 53 196 10.7 5.4 0.036
Block 2 46 176 8.6 6.3 0.020
Block 3 65 171 9.3 3.9 0.033
Avg 55 181 9.5 5.2 0.030
Excessive P soil – Experiment B
Block 1 110 204 7.1 6.9 0.101
Block 2 631 403 7.3 10.8 0.680
Block 3 529 206 9.2 8.0 0.260
Avg 423 271 7.9 8.6 0.347
TABLE V
Corn ear leaf nutrient concentrations†
Treatment Ear Leaf TN (%) Ear Leaf TP (%) Ear Leaf K (%)
Medium P soil – Experiment A
Inorganic N 2.38c 0.28a 0.98c
NMP Rate 2.59b 0.29a 1.65b
Producer Rate 2.81a 0.30a 1.98a
LSD 0.06 − 0.09
Excessive P soil – Experiment B
Inorganic N 2.38b 0.38a 1.30
NMP Rate 2.78a 0.36a 1.75
Producer Rate 2.71a 0.36a 1.81
LSD 0.10 − −†Different letters indicate statistically significant differences (P < 0.05) by column.
significant differences by treatment. Although there was approximately 2.5 timesmore manure applied using the producer application rate than the NMP applica-tion rate, ear leaf TN data for Experiment B indicated there was not a significantdifference between manure treatments (Table V). However, in Experiment B theNMP application rate produced higher, but not significantly higher, ear leaf TNconcentrations than the producer application rate.
Ear leaf TP data was not significant for any treatment in either experiment(Table V). Ear leaf K showed similar trends to the ear leaf TN data, in which all

346 S. F. HIGGINS ET AL.
the treatments in Experiment A were significantly different (P ≤ 0.05), and manuretreatments in Experiment B were not statistically different (P ≥ 0.05).
YIELDS
Grain yields in inorganic-N treatments were significantly lower (P ≤ 0.05) than ma-nure treatments in both experiments (Table VI), even though optimum agronomicN rates were used. Manure treatment grain yields (Table VI) were not statisticallydifferent (P ≥ 0.05) within field investigations, even though the producer rate ap-plied approximately 2.5 times more manure than the rapid model treatment. Thesedata indicate there was not a yield benefit for applying the additional manure.
Large differences between the inorganic-N and manure treatment yields raisedconcerns about the validity of the data especially considering that the rapid modelmanure application rate was supposed to apply the same amount of N as theinorganic-N treatment. A possible explanation for the yield difference could beattributed to a greater mineralization of organic-N. Nitrogen fractionation resultscompiled by Cabrera and Gordillo (1995) and Mathers and Goss (1979) showed
TABLE VI
Grain and surplus N and P data collected by treatment for two field experiments
Treatment
Grainyield(kg ha−1)
GrainN(%)
GrainP(%)
RemovedN(kg ha−1)
RemovedP(kg ha−1)
SurplusN(kg ha−1)
SurplusP(kg ha−1)
Medium P soil – experiment A
Inorganic N 9,100b 1.12b 0.24b 101b 22b 49b −22c
NMP Rate 12,840a 1.30a 0.27a 167a 35a 31b 55b
ProducerRate
13,210a 1.34a 0.27a 177a 35a 336a 197a
LSD 828 0.04 0.01 11 3 11 3
Excessive P soil – Experiment B
Inorganic N 9,340b 1.15b 0.27a 108b 25b 42b −25c
NMP Rate 13,000a 1.33a 0.29ab 173a 38a 25b 52b
ProducerRate
13,930a 1.38a 0.31b 192a 43a 321a 189a
LSD 1,000 0.03 0.02 9 3 13 4
Surplus N and P represent the amount of nutrient removed by the grain versus what was
applied by manure and inorganic sources.
† Different letters within the same column indicate statistically significant differences (P ≤0.05).

EVALUATING A RAPID ON-FARM NUTRIENT DETERMINATION MODEL 347
that PAN for swine manure was approximately 90% during the first year, which issubstantially higher than the NRCS coefficient of 60% used to calculate availableN in this study. Furthermore, research by Mikkelsen et al. (1995) suggests thatmoisture and temperature regimes are major factors controlling organic N reten-tion and mineralization. Weather data was compared to 30 year averages, whichindicated that spring and summer months were wetter than normal, which mighthave favored microbial activity and greater manure-N mineralization (Figure 4) aswell as promoting leaching and denitrification of inorganic N from the inorganicN fertilization treatment. This would have lead to continued availability of inor-ganic N in manure treatments relative to the inorganic N fertilizer treatment duringperiods of most rapid plant N uptake (July and August).
GRAIN QUALITY AND NUTRIENT REMOVAL
There were not significant differences (P ≥ 0.05) in grain N, which is correlatedto grain protein, between the two manure treatments for either experiment (TableVI). Although grain producers are not compensated for higher grain protein, onthis farm the grain harvested from manured fields was used as feed for the hogoperation. Market hogs for this swine enterprise demonstrated a positive responseto higher protein feeds, in that hogs are able to reach market weights quicker thanhogs on lower protein diets. Therefore, the higher protein diet provides potentialfinancial benefits to the producer. However, the additional manure provided by theproducer rate did not increase grain N concentrations beyond the NMP rate, andindicates that applying the additional manure was an inefficient use of nutrients.
Grain P (Table VI) was significantly different by treatment in Experiment A (P ≤0.05), and approached significance in Experiment B (P ≤ 0.10). In medium P soils(Experiment A), grain P was not significantly different in the manure treatments.In excessive P soils (Experiment B), the inorganic-N treatment and the rapid modeltreatments were not significantly different. Significant differences in the producergrain P data could be attributed to the higher manure TP applied using the producermanure rate. The excessive P soil experiment produced an imbalance of P, whichwas attributed to higher soil test P concentrations.
Nutrient removal and surplus N and P values (Table VI) were calculated by mul-tiplying element concentrations by yield, which was subtracted from the calculatedN and P in the manure applications. The surplus data, which was calculated usingSAS – PROC MIXED (SAS Institute, 1999) demonstrated that the producer ratesignificantly (P ≤ 0.001) over applied N in both experiments, whereas surplus Nfor the rapid model manure application rates were not significantly different fromthe inorganic-N treatment (Table VI). Surplus P data (Table VI) were significantlydifferent by treatment (P ≤ 0.001) and also indicated that the producer manureapplication rate provided a tremendous amount of unutilized P.
348 S. F. HIGGINS ET AL.
EXTRACTABLE NO−3 AND NH4
+
The primary reason for collecting manure samples on May 2 and 23 was to evaluatechanges in soil P. These samples were also used to evaluate extractible NO−
3 andNH+
4 . However, it should be noted that the inorganic-N application was not madeuntil June 13 (Table III). Therefore, the NO−
3 and NH+4 data for the inorganic-N
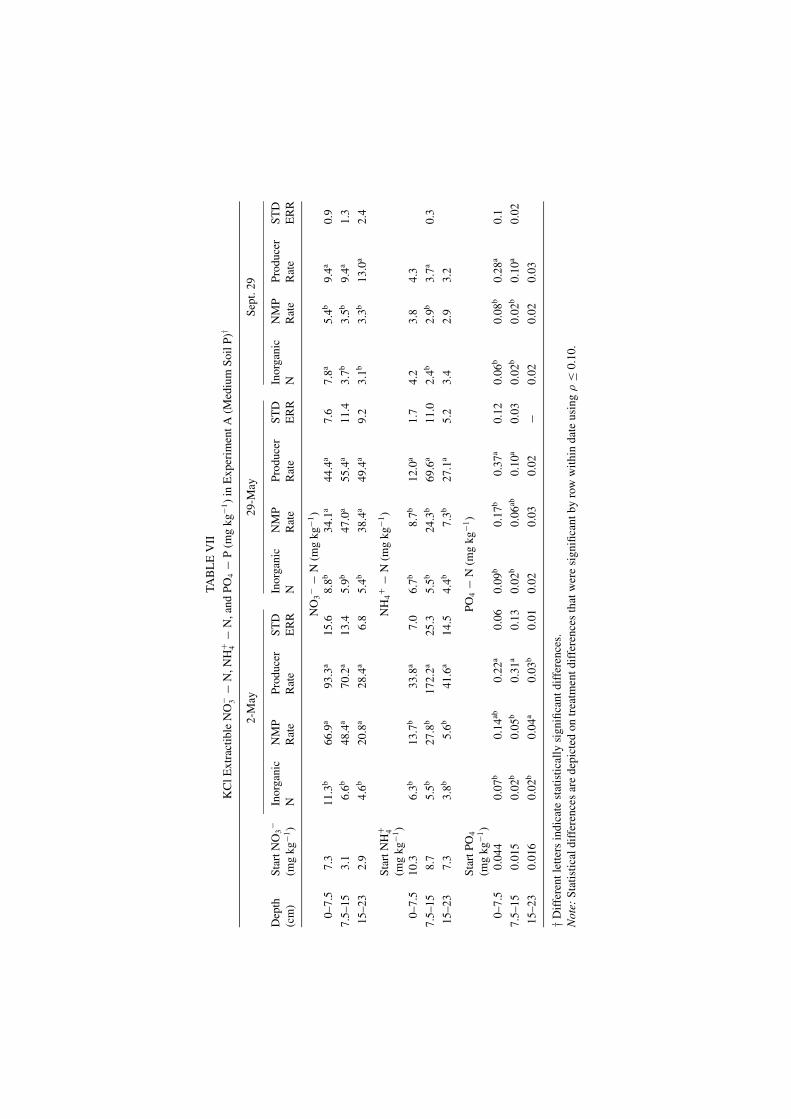
treatment on May 2 and 23 should not be compared against manure treatmentsuntil September 29 (Tables VII and VIII). Nitrate concentrations in the producerrate and NMP rate treatments were not significantly different (P ≥ 0.05) in soilsamples collected on May 2 and May 29 (Tables VII and VIII), with one exception;data from Experiment B (Table VIII) collected on May 2 for the 0 to 7.5 cm depthwere all different by treatment (P ≤ 0.05). Even though the manure was injected toa depth of approximately 11 cm, NO−
3 data by depth shows significant (P ≤ 0.05)migration into the 15–23 cm depths. On Sept. 29, NO−
3 concentrations of samplescollected at the 0 to 7.5 cm depth were not significantly different for the inorganic-Nand producer treatments (P ≥ 0.05) for Experiment A (Table VII), suggesting thatthe manure N had been depleted, lost, or immobilized.
The ear leaf N and K (Table V) and soil NO−3 (Tables VII and VIII) concentra-
tions demonstrated that the Experiment B NMP manure application rate producedhigher ear leaf N and K concentrations than the producer application rate. Thisobservation was considered an inconsistency in the data, because the producer rateapplied more N. Higher N and K concentrations in ear leaf and soil NO−
3 data wereattributed to greater denitrification of the mineralized manure N. Reduction in Nwould also prevent K from being taken up based on Atterburg’s principles (Black,1993).
Rainfall data shown in Figure 4, suggests precipitation events may havecontributed to denitrification. In addition, the soil hydrology was classified asmoderate and moderately slow for Experiment A and B, respectively, suggest-ing wetter conditions in Experiment B soils. Additionally, Sutton et al. (1995)showed that greater denitrification was obtained is soils with finer texturedsoils.
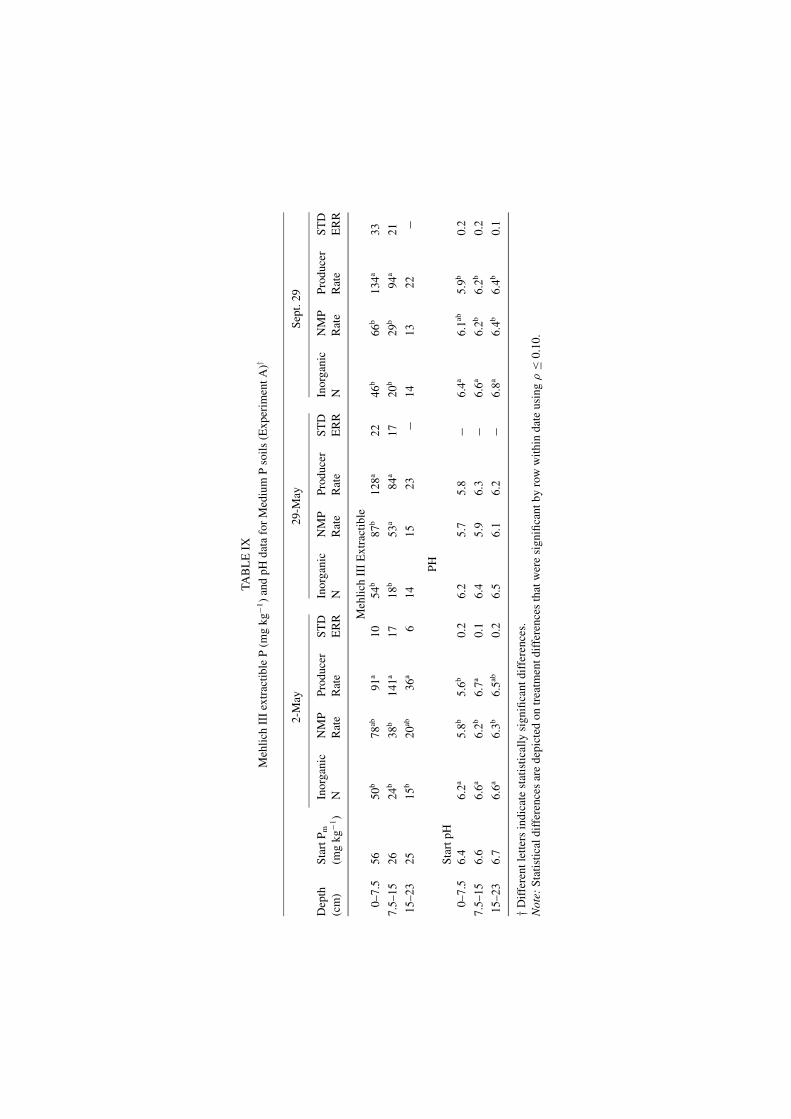
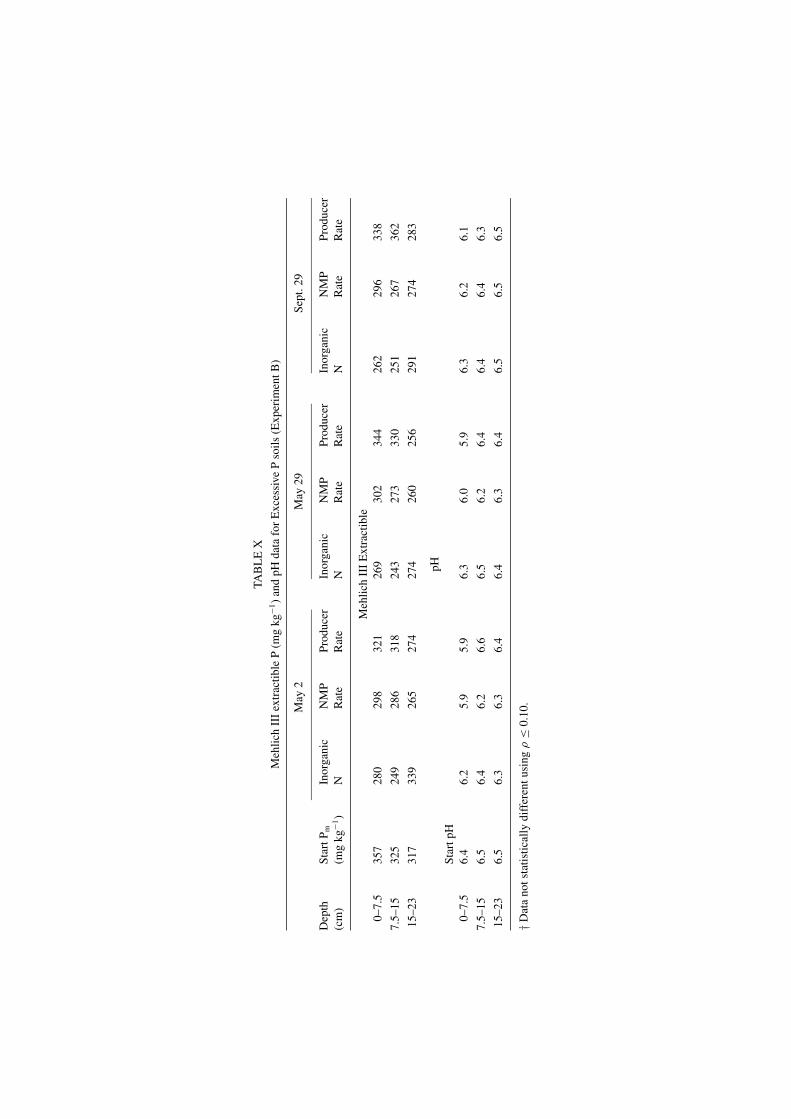
There was a significant decrease in pH in Experiment A soil (Table IX) asmanure rate increased (P ≤ 0.05) for samples collected at the 7.6 to 15 cm depth,which was the same depth where the manure was injected. However, a change inpH by treatment was not significant in Experiment B (Table X) suggesting thatnitrification was suppressed in Experiment (B).
Surplus N data (Table VI) showed that concentrations for the inorganic-N andNMP treatments were not statistically different (P ≥ 0.05), supporting the idea thatmost of the N in these treatments was utilized. Actually, grain N and yield datashowed that more N was used in the NMP rate than the inorganic-N treatment.In Experiment A (Table VII), nutrient concentrations measured in soil samplescollected at 7.5 to 23 cm depth on Sept. 29 were also not significantly different

EVALUATING A RAPID ON-FARM NUTRIENT DETERMINATION MODEL 349
between the inorganic-N and NMP rate treatments, indicating that the NMP ratemet the target N application, and were at background levels.
Nitrate data in Experiment B (Table VIII) was similar to Experiment A (TableVII), with the exception that none of the soil NO−
3 concentrations for inorganic-Nand the rapid model were significantly different (P ≤ 0.05) for Sept. 29 (Tables VIIand VIII). Nitrate data for May 2 and 29 were higher in the NMP rate treatmentthan the producer rate at the 7.5 to 23 cm depths.
TA
BL
EV
II
KC
lE
xtr
acti
ble
NO
− 3−
N,
NH
+ 4−
N,
and
PO
4−
P(m
gk
g−1
)in
Ex
per
imen
tA
(Med
ium
So
ilP
)†
2-M
ay2
9-M
ayS
ept.
29
Dep
th
(cm
)
Sta
rtN
O3−
(mg
kg
−1)
Ino
rgan
ic
N
NM
P
Rat
e
Pro
du
cer
Rat
e
ST
D
ER
R
Ino
rgan
ic
N
NM
P
Rat
e
Pro
du
cer
Rat
e
ST
D
ER
R
Ino
rgan
ic
N
NM
P
Rat
e
Pro
du
cer
Rat
e
ST
D
ER
R
NO
3−
−N
(mg
kg
−1)
0–
7.5
7.3
11
.3b
66
.9a
93
.3a
15
.68
.8b
34
.1a
44
.4a
7.6
7.8
a5
.4b
9.4
a0
.9
7.5
–1
53
.16
.6b
48
.4a
70
.2a
13
.45
.9b
47
.0a
55
.4a
11
.43
.7b
3.5
b9
.4a
1.3
15
–2
32
.94
.6b
20
.8a
28
.4a
6.8
5.4
b3
8.4
a4
9.4
a9
.23
.1b
3.3
b1
3.0
a2
.4
NH
4+
−N
(mg
kg
−1)
Sta
rtN
H+ 4
(mg
kg
−1)
0–
7.5
10
.36
.3b
13
.7b
33
.8a
7.0
6.7
b8
.7b
12
.0a
1.7
4.2
3.8
4.3
7.5
–1
58
.75
.5b
27
.8b
17
2.2
a2
5.3
5.5
b2
4.3
b6
9.6
a1
1.0
2.4
b2
.9b
3.7
a0
.3
15
–2
37
.33
.8b
5.6
b4
1.6
a1
4.5
4.4
b7
.3b
27
.1a
5.2
3.4
2.9
3.2
PO
4−
N(m
gk
g−1
)S
tart
PO
4
(mg
kg
−1)
0–
7.5
0.0
44
0.0
7b
0.1
4ab
0.2
2a
0.0
60
.09
b0
.17
b0
.37
a0
.12
0.0
6b
0.0
8b
0.2
8a
0.1
7.5
–1
50
.01
50
.02
b0
.05
b0
.31
a0
.13
0.0
2b
0.0
6ab
0.1
0a
0.0
30
.02
b0
.02
b0
.10
a0
.02
15
–2
30
.01
60
.02
b0
.04
a0
.03
b0
.01
0.0
20
.03
0.0
2−
0.0
20
.02
0.0
3
†Dif
fere
nt
lett
ers
ind
icat
est
atis
tica
lly
sig
nifi
can
td
iffe
ren
ces.
Not
e:S
tati
stic
ald
iffe
ren
ces
are
dep
icte
do
ntr
eatm
ent
dif
fere
nce
sth
atw
ere
sig
nifi
can
tb
yro
ww
ith
ind
ate
usi
ng
ρ≤
0.1
0.

TA
BL
EV
III
KC
lE
xtr
acti
ble
NO
− 3−
N,
NH
+ 4−
N,
and
PO
4−
P(m
gk
g−1
)in
Ex
per
imen
tB
(Ex
cess
ive
So
ilP
)†
2-M
ay2
9-M
ayS
ept.
29
Dep
th
(cm
)
Sta
rtN
O3−
(mg
kg
−1)
Ino
rgan
ic
N
NM
P
Rat
e
Pro
du
cer
Rat
e
ST
D
ER
R
Inorg
anic
N
NM
P
Rat
e
Pro
du
cer
Rat
e
ST
D
ER
R
Inorg
anic
N
NM
P
Rat
e
Pro
du
cer
Rat
e
ST
D
ER
R
NO
3−
−N
(mg
kg
−1)
0-7
.51
31
1.0
c7
0.3
b1
10
.4a
7.5
11
.6b
34
.5a
39
.7a
10
.38
.0b
7.9
b1
1.3
a1
.3
7.5
-15
4.1
7.3
b7
1.1
a5
7.2
a1
3.3
7.3
b5
2.9
a5
0.3
a1
6.3
3.3
b4
.5b
8.9
a1
.4
15
-23
2.7
56
.3b
29
.9a
26
.3a
8.1
6.1
b4
8.3
a4
3.7
a1
3.6
2.6
c4
.1b
11
.3a
0.7
NH
4+
−N
(mg
kg
−1)
Sta
rtN
H+ 4
(mg
kg
−1)
0-7
.58
.65
.7b
13
.8b
38
.5a
7.1
6.7
b9
.3ab
13
.0a
2.5
4.6
4.4
4−
7.5
-15
75
.7b
43
.5b
13
0.7
a2
3.2
5.4
b1
2.9
b7
8.9
a1
2.7
2.2
b2
.6b
3.4
a0
.2
15
-23
74
.3b
7.1
b1
7.8
a5
.84
.6b
8.8
b2
4.2
a5
.23
.63
.13
.6−
PO
4−
P(m
gk
g−1
)S
tart
PO
4
(mg
kg
−1)
0-7
.50
.45
50
.25
b0
.52
ab0
.65
a0
.01
60
.29
b0
.44
ab0
.68
a0
.15
0.2
40
.34
0.4
2−
7.5
-15
0.2
39
0.1
70
.24
0.3
3−
0.1
40
.24
0.3
4−
0.1
50
.18
0.4
2−
15
-23
0.1
83
0.1
70
.16
0.1
3−
0.1
30
.13
0.1
3−
0.1
70
.15
0.1
5−
†Dif
fere
nt
lett
ers
ind
icat
est
atis
tica
lly
sig
nifi
can
td
iffe
ren
ces.
Not
e:S
tati
stic
ald
iffe
ren
ces
are
dep
icte
do
ntr
eatm
ent
dif
fere
nce
sth
atw
ere
sig
nifi
can
tb
yro
ww
ith
ind
ate
usi
ng
ρ≤
0.1
0.
TA
BL
EIX
Meh
lich
III
extr
acti
ble
P(m
gk
g−1
)an
dp
Hd
ata
for
Med
ium
Pso
ils
(Ex
per
imen
tA
)†
2-M
ay2
9-M
ayS
ept.
29
Dep
th
(cm
)
Sta
rtP
m
(mg
kg
−1)
Inorg
anic
N
NM
P
Rat
e
Pro
du
cer
Rat
e
ST
D
ER
R
Inorg
anic
N
NM
P
Rat
e
Pro
du
cer
Rat
e
ST
D
ER
R
Inorg
anic
N
NM
P
Rat
e
Pro
du
cer
Rat
e
ST
D
ER
R
Meh
lich
III
Ex
trac
tib
le
0–
7.5
56
50
b7
8ab
91
a1
05
4b
87
b1
28
a2
24
6b
66
b1
34
a3
3
7.5
–1
52
62
4b
38
b1
41
a1
71
8b
53
a8
4a
17
20
b2
9b
94
a2
1
15
–2
32
51
5b
20
ab3
6a
61
41
52
3−
14
13
22
−P
H
Sta
rtp
H
0–
7.5
6.4
6.2
a5
.8b
5.6
b0
.26
.25
.75
.8−
6.4
a6
.1ab
5.9
b0
.2
7.5
–1
56
.66
.6a
6.2
b6
.7a
0.1
6.4
5.9
6.3
−6
.6a
6.2
b6
.2b
0.2
15
–2
36
.76
.6a
6.3
b6
.5ab
0.2
6.5
6.1
6.2
−6
.8a
6.4
b6
.4b
0.1
†Dif
fere
nt
lett
ers
ind
icat
est
atis
tica
lly
sig
nifi
can
td
iffe
ren
ces.
Not
e:S
tati
stic
ald
iffe
ren
ces
are
dep
icte
do
ntr
eatm
ent
dif
fere
nce
sth
atw
ere
sig
nifi
can
tb
yro
ww
ith
ind
ate
usi
ng
ρ≤
0.1
0.
TA
BL
EX
Meh
lich
III
extr
acti
ble
P(m
gk
g−1
)an
dp
Hd
ata
for
Ex
cess
ive
Pso
ils
(Ex
per
imen
tB
)
May
2M
ay2
9S
ept.
29
Dep
th
(cm
)
Sta
rtP
m
(mg
kg
−1)
Inorg
anic
N
NM
P
Rat
e
Pro
du
cer
Rat
e
Inorg
anic
N
NM
P
Rat
e
Pro
du
cer
Rat
e
Inorg
anic
N
NM
P
Rat
e
Pro
du
cer
Rat
e
Meh
lich
III
Ex
trac
tib
le
0–
7.5
35
72
80
29
83
21
26
93
02
34
42
62
29
63
38
7.5
–1
53
25
24
92
86
31
82
43
27
33
30
25
12
67
36
2
15
–2
33
17
33
92
65
27
42
74
26
02
56
29
12
74
28
3
pH
Sta
rtp
H
0–
7.5
6.4
6.2
5.9
5.9
6.3
6.0
5.9
6.3
6.2
6.1
7.5
–1
56
.56
.46
.26
.66
.56
.26
.46
.46
.46
.3
15
–2
36
.56
.36
.36
.46
.46
.36
.46
.56
.56
.5
†Dat
an
ot
stat
isti
call
yd
iffe
ren
tu
sin
gρ
≤0
.10
.

354 S. F. HIGGINS ET AL.
Adding the concentrations of NO3− and NH4
+ (Table VII and VIII), acrossdepths for May 2 and manure treatment, shows that the Experiment A manuretreatments gave concentration differences with a ratio of approximately 2.4:1, whichis in agreement with the difference in manure application rates. However, the ratiofor the Experiment B manure treatments for May 2 is less (1.8:1), suggesting thatgreater losses occurred in the producer rate treatment. In both experiments, theproducer rate treatment shows a migration of NH4
+ into the 15 to 23 cm depth,whereas in most cases the NMP rate treatment data is not significantly different(P ≥ 0.05) from the inorganic-N treatment, suggesting there was not movementthrough the soil profile.
EXTRACTABLE PO4 (PE)
Potassium chloride extractable P (PE) concentrations of soil samples collected forExperiment A (0–15 cm depth) were significantly higher (P ≤ 0.10) in the producermanure application rate than the inorganic or NMP rates (Table VII). Soil samplescollected on every date indicated that the PE concentrations for the NMP ratetreatment were not significantly different from the inorganic-N treatment. Analysisconducted on samples collected the following spring (data not shown) showed thatPE concentrations were significantly different (P ≤ 0.05) in the same depths asthe other dates (0–15 cm depth). The only other nutrient that showed statisticallysignificant differences, for either experiment, was soil test P in Experiment A soils.
Changes in PE concentrations over the dates were only significant in the NMPrate treatment, in which the concentrations merely decreased to approximately thesame level as the inorganic-N treatment. The PE data do not support a downwardmovement of PE, which has been shown in manure application research on fineparticle size soils (Sutton et al., 1995).
Extractible P (PE) data collected from Experiment B plots were significantlydifferent (P ≤ 0.05) only in the soils collected on the second date (May 29th) and atthe 0–7.5 cm depth, where the NMP rate treatment was not significantly different (P≥ 0.05) from the inorganic-N and producer rate treatments (Table VIII). Changesin PE were significant by date (P ≤ 0.10) for the inorganic–N treatment at the 15-23 cm depth, and for producer and NMP rate treatments at the 0–7.6 cm depth.Overall, the PE data were much higher in the excessive P soils than the medium Psoils (Tables IV, VII, and VIII).
Mehlich III P (M3P)Soil M3P was significantly different (P ≤ 0.05) by treatment in Experiment A(Table IX) for the first two depths, but not for Experiment B at any depth (TableX). Analysis of soil M3P by date of sample collection and depth indicated thattreatment concentrations did not change with time or move down through the soilprofile (P ≥ 0.05). Research suggests that soil texture influences whether P movesthrough the soil profile, wherein coarser textured soils allow infiltration through

EVALUATING A RAPID ON-FARM NUTRIENT DETERMINATION MODEL 355
the soil profile (Sutton et al., 1995). In addition, Laboski and Lamb (2003) showedthat manure applications did not change in most soils over a 9-month period.
Soil M3P data collected before the experiment began (Table IV) indicated thatP fertilizer was needed at 34 kg P2O5 ha−1 for the medium P soil (Experiment A).Although P fertilizer was not added to the inorganic-N treatment, manure applica-tions provided 90 kg P ha−1 and 232 kg P ha−1, for the NMP rate and producer ratetreatments, respectively (using load application averages). However, ear leaf P con-centrations indicated P was not significant by treatment in Experiment A plots. Inaddition, yield differences between the two experiments indicated that soil M3P didnot significantly contribute to yield, even though pre-experiment soil M3P levelswere approximately 55 and 423 kg ha−1 for Experiments A and B, respectively.
Conclusions
Regressions of actual versus predicted manure TN and TP concentrations showedthat a rapid on farm derived model was accurate in predicting manure TN and TP(P ≤ 0.05) and developing a nutrient management plan. The NMP manure applica-tion rate produced grain yields that were significantly higher than inorganic-N treat-ments, and the NMP rate also produced concentrations of extractable P and NH4
+
that were not significantly different (P ≥ 0.05) from the inorganic-N treatment.Crop yield and grain N concentrations were not significantly different between thetwo manure rates, even though the producer determined rate was approximately2.5 times higher than the NMP rate. Grain yields, ear leaf N, and surplus N dataindicated that the higher application rate determined by the producer did not con-tribute to yields and possibly became a potential pollutant. In one field experiment,ear leaf N and K, soil pH, NO3
−, and NH4+ data suggested the higher manure rate
led to denitrification in the soil.Analysis of grain N and P, and ear leaf tissue N and P demonstrated that the
NMP manure application rate that met crop requirements. Mehlich III extractible Pand KCl extractable PO4 in the producer rate treatments were significantly different(P ≤ 0.05) and approached significant differences (0.10), respectively, relative to theinorganic-N and NMP treatments, whereas the NMP rate and inorganic-N treatmentwere not significantly different from each other. The field experiment conductedin excessive P soils did not produce significant changes in Mehlich III P. A lackof significant Mehlich III P data in this experiment suggests that inferences aboutthe application of manure to soils containing high concentrations of extractable Pare not significant, which is contrary to previous research. It is believed that thesite specific variability or variance in soil sample analysis was sufficiently large toobscure differences.
The on-farm rapid model approach was a viable method for meeting NRCS-NMP recommendations while maintaining yields, and could be used to reduce the
356 S. F. HIGGINS ET AL.
increase in soil test P, soluble P, NO3−, and NH4
+ compared to the rate used by thisproducer. These data suggest that using an on-farm determined nutrient availabilitymode is a useful method for applying swine manure to meet regulatory requirementsand crop requirements. Using this approach will enable producers to take advan-tage of the fertility value of manures while minimizing potential environmentaldamage.
Acknowledgments
The authors extend their appreciation for the statistical assistance of Marie Gantz,Statistics Department; chemical analysis by Frank Sikora, Danny Reid, and RickWells, of Regulatory Services; the assistance of Jim Crutchfield and Tami Smithfor conducting lab analysis; and the cooperation of Jim Ellis, co-owner, Worth andDee Ellis Farms in Shelbyville KY. Without their assistance this study would nothave been possible. Funding for this project was provided in part by a grant fromthe General Assembly of the Commonwealth of Kentucky – Senate Bill 271.
References
AGR-1.: 2002–2003. ‘Lime and fertilizer recommendations’, University of Kentucky, Lexington, KY.
Agouridis, C. T. and Edwards, D. R.: 2003, ‘The development of relationships between constituent
concentrations and generic hydrological variables’, Transactions of the ASAE 46, 245–256.
Black, C. A.: 1993, ‘Soil fertility and control,’ CRC Press. Boca Raton, FL.
Cabrera, M. L. and Gordillo, R. M.: 1995, Nitrogen release from land-applied animal manures. In K.
Steele (ed) Animal waste and the land-water interface CRC Press, Boca Raton, FL. 393–403.
Chaney, A. L. and Marbach, E. P.: 1962, ‘Modified reagents for determination of urea and ammonia’,
Clinical Chemistry 8, 130–132.
Chescheir, G. M., Westerman, P. W. and Safley, L. M.: 1985, ‘Rapid methods for determining nutrients
in livestock manures’, Transactions of the ASAE 28, 1817–1824.
Choudhary, M., Bailey, L. D. and Grant. C. A.: 1996, ‘Review of the use of swine manure in crop
production: effects on yield and composition and on soil and water quality’, Waste Managementand Research 14, 581–595.
D’Angelo, E., Crutchfield, J. and Vandeiviere. M.: 2001, ‘Rapid, sensitive, microscale determination
of phosphate in water and soil’, Journal of Environmental Quality 30, 2206–2209.
Dorich, R. A. and Nelson, D. W.: 1983, ‘Direct colorimetric measurement of ammonium in potassium
chloride extracts of soils’, Soil Science Society of America Journal 47, 833–836.
Dou, Z., Galligan, D. T., Ramberg, C. F., Meadows, C. and Ferguson. J. D.: 2001, A survey of dairy
farming in Pennsylvania: nutrient management practices and implications’, Journal of DairyScience 84, 966–973.
Fiske, C. H. and Subbarow, Y.: 1925, ‘The colorimetric determination of phosphorus’, Journal ofBiological Chemistry 66, 375–400.
Goss, D. W. and Stewart, B. A.: 1979, ‘Efficiency of phosphorus utilization by alfalfa from manure
and superphosphate’, Science Society of America Journal 43, 523–528.
Gracey, H. I.: 1984, ‘Availability of phosphorus in organic manures compared with monoammonium
phosphate’, Agricultural Wastes 11, 133.

EVALUATING A RAPID ON-FARM NUTRIENT DETERMINATION MODEL 357
Higgins, S. F., Shearer, S. A., Coyne, M. S. and Fulton, J. P.: 2004a, ‘A rapid method for determining
TN and TP concentrations in swine slurry using historical data’, Trans. of the ASAE 47, 1727–1737.
Higgins, S. F., Shearer, S. A., Coyne, M. S. and Fulton, J. P.: 2004b, ‘Relationship of total nitrogen and
total phosphorus concentration to solids content in animal waste slurries’, Applied Engineeringin Agriculture 20, 355–364.
Laboski, C. A. M. and Lamb, J. A.: 2003, ‘Changes in soil test phosphorus concentration after
application of manure or fertilizer’, Science Society of America Journal 67, 544–554.
Mancl, K. M. and Slates, J. D.: 2003. ‘Farmer estimates of manure application rates’, In Ninth
international animal, agricultural and food processing wastes proceedings. Research Triangle
Park, NC, October 12. Amer. Soc. Agric. Eng. St. Joseph, MI. pp. 200–203.
Mathers, A. C. and Goss, D. W.: 1979, ‘Estimating animal waste applications to supply crop nitrogen
requirements’, Science Society of America Journal 43, 364–366.
Mikkelsen, R. L., Zublena, J. P. and Molloy, S. A.: 1995, ‘Seasonal effects on nitrogen mineralization
from organic wastes added to soils’, In C.E. Ross (ed.) International symposium on agricultural
and food processing wastes. Amer. Soc. Agric. Eng. St. Joseph, MI. pp. 162–169.
Ndegwa, P. M., Zhu, J. and Luo, A.: 2002, ‘Stratification of solids, nitrogen and phosphorus in swine
manure in deep pits under slatted floors’, Bioresource Technology 83, 203–211.
Nowak, P., Shepard, R. and Madison. F.: 1998, ‘Farmers and manure management: a critical analysis’,
In J. L. Hatfield and B. A. Stewart (eds.) Animal wastes utilization: effective use of manure as a
soil resource. Lewis Publishers. Boca Raton, FL. pp. 1–32.
NRCS-590.: 2001, Natural resources conservation service conservation practice standard – Nutrient
management – Code 590. NRCS, KY. 5, 24–01.
O’Dell, J. D., Essington, M. E. and Howard, D. D.: 1995, ‘Surface application of liquid swine manure:
chemical variability’, Communications in Soil Science and Plant Analysis 26 (19 20), 3113–3120.
Peters, J.: 2003, ‘Recommended methods of manure analysis (A3769). Cooperative Extension Pub-
lishing, University of Wisconsin’, Madison, WI.
Piccinini, S. and Bortone, G.: 1991, ‘The fertilizer value of agricultural manure: Simple rapid methods
of assessment, Journal of Agricultural Engineering Research 49, 197–208.
Pote, D. H., Lory, J. A. and Zhang, H.: 2003, ‘Does initial soil P level affect water-extractible soil P
response to applied P’, Advances in Environmental Research 7, 503–509.
Qian, P. and Schoenau, J. J.: 2000, ‘Fractionation of P in soil as influenced by a single addition of
liquid swine manure’, Canadian Journal of Soil Science 80, 561–566.
Rieck-Hinz, A. M., Miller, G. A. and Schafer, J. W.: 1996, ‘Nutrient content of dairy manure from
three handling systems’, Journal of Production Agriculture 9, 82–86.
SAS Institute.: 1999, ‘The SAS system for Windows’, Release 8.02. SAS Institute Inc., Cary, NC.
Schmidt, D. R., Jacobson, L. D. and Schmitt, M. A.: 1996, ‘A manure management survey of Minnesota
swine producers: summary of responses’, Applied Engineering in Agriculture 12, 591–594.
Scotford, I. M., Cumby, T. R., Han, L. and Richards, P. A.: 1998, ‘Development of a prototype nutrient
sensing system for livestock slurries’, Journal of Agricultural Engineering Research 69, 217–228.
Sikora, F. J.: 2000, ‘Summary of animal waste slurries analyses at the University of Kentucky’,
In Proceedings of the 2000 Southern Soil Fertility Conference. Memphis, TN, 10–11 October.
Samuel Roberts Noble Foundation. Ardmore OK. pp. 107–112.
Stevens, R. J., O’Bric, C. J. and Carton, O. T.: 1995, Estimating nutrient content of animal slurries
using electrical conductivity, Journal of Agricultural Science, Cambridge 125, 233–238.
Sutton, A. L., Huber, D. M. Joern, B. C. and Jones, D.D.: 1995, ‘Management of nitrogen in swine
manure to enhance crop production and minimize pollution’, Proc. 7th Inter. Symp. on Agric. and
Food Processing Wastes. ASAE. Chicago, IL. June 18–20. pp. 532–540.
Sutton, A. L., Nelson, D. W., Hoff, J. D. and Mayrose, V. B.: 1982, ‘Effects of injection and surface
applications of liquid swine manure on corn yield and soil composition’, Journal of EnvironmentalQuality 11, 468–472.

358 S. F. HIGGINS ET AL.
Thom, W. and Dollarhide, J.: 2002, ‘Phosphorus soil test change following the addition of phosphorus
fertilizer to 16 Kentucky soils’, Agronomy Notes 34(2) University of Kentucky. Lexington KY.
Tunney, H. and Bertrand, M.: 1989, ‘Rapid field tests for estimating dry matter and fertilizer value of
animal slurries’, In Dodd and Grace (eds.) Land and water use. Balkema, Rotterdam. 363–369.
Van Kessel, J. S., Thompson, R. B. and Reeves, J. B.: 1999, ‘Rapid on farm analysis of manure
nutrients using quick tests’, Journal of Production Agriculture 12, 215–224.