VHL-Regulated MiR-204 Suppresses Tumor Growth through Inhibition of LC3B-Mediated Autophagy in Renal...
26
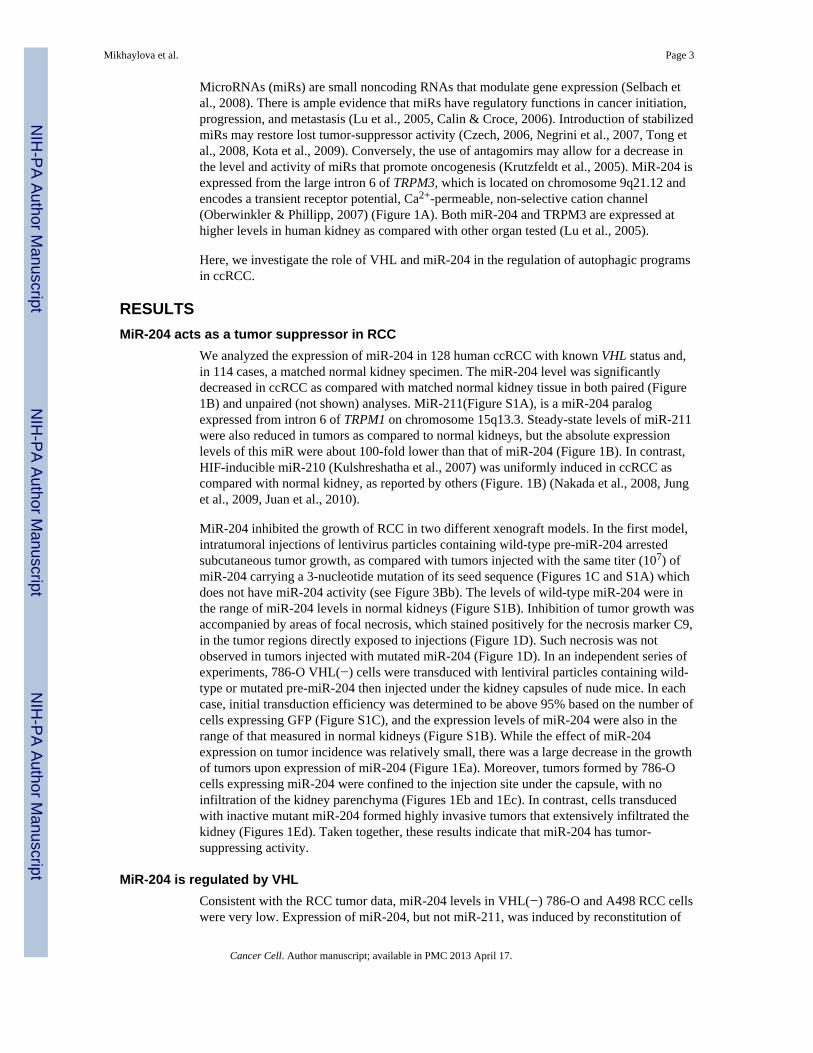
VHL-regulated miR-204 Suppresses Tumor Growth through Inhibition of LC3B-mediated Autophagy in Renal Clear Cell Carcinoma Olga Mikhaylova 1,6 , Yiwen Stratton 1,6 , Daniel Hall 1 , Emily Kellner 1 , Birgit Ehmer 1 , Angela F. Drew 1 , Catherine A. Gallo 1 , David R. Plas 1 , Jacek Biesiada 3 , Jarek Meller 2,3 , and Maria F. Czyzyk-Krzeska 1,4,5 1 Department of Cancer and Cell Biology, University of Cincinnati College of Medicine, Cincinnati, OH, 45267-0505 2 Department of Environmental Health, University of Cincinnati College of Medicine, Cincinnati, OH 45267-0056 3 Division of Biomedical Informatics Cincinnati Children's Hospital Medical Center, Cincinnati, OH 45229 4 VA Research Service, Department of Veterans Affairs, Cincinnati, OH 45220 Summary The von Hippel-Lindau tumor-suppressor gene (VHL) is lost in most clear cell renal cell carcinomas (ccRCC). Here, using human ccRCC specimens, VHL-deficient cells, and xenograft models, we show that miR-204 is a VHL-regulated tumor suppressor acting by inhibiting macroautophagy, with MAP1LC3B (LC3B) as a direct and functional target. Importantly, higher tumor grade of human ccRCC was correlated with a concomitant decrease in miR-204 and increase in LC3B levels, indicating that LC3B-mediated macroautophagy is necessary for RCC progression. VHL, in addition to inducing endogenous miR-204, triggered the expression of LC3C, an HIF-regulated LC3B paralog, that suppressed tumor growth. These data reveal a function of VHL as a tumor suppressing regulator of autophagic programs. INTRODUCTION Clear cell renal cell carcinoma (ccRCC), the most frequent and malignant type of renal cancer, is characterized by early loss of the von Hippel-Lindau tumor-suppressor gene (VHL) in a majority (60%–80%) of tumors. One well-recognized oncogenic effect of VHL loss is induction of the hypoxia inducible factor (HIF) and HIF-regulated genes, which stimulate angiogenesis and thus provide nutrients necessary for tumor growth (Gossage & Eisen, 2010). Discovery of this pathway laid the groundwork for the development of several anti-angiogenic therapeutic approaches for treatment of ccRCC (Heng & Bukowski, 2008). However, anti-angiogenic therapies have not lived up to their initial promise, which suggests 5 Corresponding author: Maria F. Czyzyk-Krzeska, M.D., Ph.D., Department of Cancer and Cell Biology, The Vontz Center for Molecular Studies, University of Cincinnati College of Medicine, 3125 Eden Avenue, Cincinnati, OH 45267-0521, Tel: (513) 558-1957, Fax: (513) 558-5422, [email protected]. 6 The first two authors contributed equally to the manuscript. Publisher's Disclaimer: This is a PDF file of an unedited manuscript that has been accepted for publication. As a service to our customers we are providing this early version of the manuscript. The manuscript will undergo copyediting, typesetting, and review of the resulting proof before it is published in its final citable form. Please note that during the production process errors may be discovered which could affect the content, and all legal disclaimers that apply to the journal pertain. NIH Public Access Author Manuscript Cancer Cell. Author manuscript; available in PMC 2013 April 17. Published in final edited form as: Cancer Cell. 2012 April 17; 21(4): 532–546. doi:10.1016/j.ccr.2012.02.019. NIH-PA Author Manuscript NIH-PA Author Manuscript NIH-PA Author Manuscript
-
Upload
independent -
Category
Documents
-
view
2 -
download
0
Transcript of VHL-Regulated MiR-204 Suppresses Tumor Growth through Inhibition of LC3B-Mediated Autophagy in Renal...
VHL-regulated miR-204 Suppresses Tumor Growth throughInhibition of LC3B-mediated Autophagy in Renal Clear CellCarcinoma
Olga Mikhaylova1,6, Yiwen Stratton1,6, Daniel Hall1, Emily Kellner1, Birgit Ehmer1, Angela F.Drew1, Catherine A. Gallo1, David R. Plas1, Jacek Biesiada3, Jarek Meller2,3, and Maria F.Czyzyk-Krzeska1,4,5
1Department of Cancer and Cell Biology, University of Cincinnati College of Medicine, Cincinnati,OH, 45267-05052Department of Environmental Health, University of Cincinnati College of Medicine, Cincinnati,OH 45267-00563Division of Biomedical Informatics Cincinnati Children's Hospital Medical Center, Cincinnati, OH452294VA Research Service, Department of Veterans Affairs, Cincinnati, OH 45220
SummaryThe von Hippel-Lindau tumor-suppressor gene (VHL) is lost in most clear cell renal cellcarcinomas (ccRCC). Here, using human ccRCC specimens, VHL-deficient cells, and xenograftmodels, we show that miR-204 is a VHL-regulated tumor suppressor acting by inhibitingmacroautophagy, with MAP1LC3B (LC3B) as a direct and functional target. Importantly, highertumor grade of human ccRCC was correlated with a concomitant decrease in miR-204 andincrease in LC3B levels, indicating that LC3B-mediated macroautophagy is necessary for RCCprogression. VHL, in addition to inducing endogenous miR-204, triggered the expression ofLC3C, an HIF-regulated LC3B paralog, that suppressed tumor growth. These data reveal afunction of VHL as a tumor suppressing regulator of autophagic programs.
INTRODUCTIONClear cell renal cell carcinoma (ccRCC), the most frequent and malignant type of renalcancer, is characterized by early loss of the von Hippel-Lindau tumor-suppressor gene(VHL) in a majority (60%–80%) of tumors. One well-recognized oncogenic effect of VHLloss is induction of the hypoxia inducible factor (HIF) and HIF-regulated genes, whichstimulate angiogenesis and thus provide nutrients necessary for tumor growth (Gossage &Eisen, 2010). Discovery of this pathway laid the groundwork for the development of severalanti-angiogenic therapeutic approaches for treatment of ccRCC (Heng & Bukowski, 2008).However, anti-angiogenic therapies have not lived up to their initial promise, which suggests
5Corresponding author: Maria F. Czyzyk-Krzeska, M.D., Ph.D., Department of Cancer and Cell Biology, The Vontz Center forMolecular Studies, University of Cincinnati College of Medicine, 3125 Eden Avenue, Cincinnati, OH 45267-0521, Tel: (513)558-1957, Fax: (513) 558-5422, [email protected] first two authors contributed equally to the manuscript.Publisher's Disclaimer: This is a PDF file of an unedited manuscript that has been accepted for publication. As a service to ourcustomers we are providing this early version of the manuscript. The manuscript will undergo copyediting, typesetting, and review ofthe resulting proof before it is published in its final citable form. Please note that during the production process errors may bediscovered which could affect the content, and all legal disclaimers that apply to the journal pertain.
NIH Public AccessAuthor ManuscriptCancer Cell. Author manuscript; available in PMC 2013 April 17.
Published in final edited form as:Cancer Cell. 2012 April 17; 21(4): 532–546. doi:10.1016/j.ccr.2012.02.019.
NIH
-PA Author Manuscript
NIH
-PA Author Manuscript
NIH
-PA Author Manuscript

that tumor growth and survival might be supported by alternative sources of nutrients suchas autophagy.
Autophagy is a complex and tightly regulated homeostatic process that allows a cell toeliminate defective organelles and molecules and to recycle nutrients for survival underdeprived conditions. Dependence of cancer cells on such oncogenic autophagy has beendemonstrated (Degenhardt et al., 2006, Jin et al., 2007). Conversely, changes in the rate ofautophagy may result in metabolic imbalance and cell death (Mathew et al., 2007, White &DiPaola, 2009). Classic macroautophagy involves a process utilizing ubiquitin-like cascadesof ATG proteins leading to the formation of double-membrane autophagosomes containingcytoplasm, ribosomes, and other organelles. Autophagosomes ultimately fuse withlysosomes and targeting the cargo for proteolytic degradation (He & Klionsky, 2009). Theinitial step includes formation of an isolation membrane (phagophore), which can originatefrom the endoplasmic reticulum (Axe et al., 2008), outer mitochondrial membrane (Hailey etal., 2010), or plasma membrane (Ravikumar et al., 2010). The diverse origins of membranesfor autophagic vacuoles create the possibility for adaptive and alternative autophagicprograms that can be activated during different types or durations of starvation in a cell-type-specific manner. Phagophores interact with several regulatory multiprotein complexes,including mTOR and AMPK-regulated ULK complexes and the Beclin 1/class III PI3Kcomplex. Further processing of the phagophore to the mature autophagosome requirescovalent conjugation of ATG12 to ATG5 via a mechanism involving the E1-like enzymeATG7 and the E2-like enzyme ATG10. The ATG12-ATG5 conjugate forms a complex withATG16L and carries the final E3-like conjugation of the microtubule-associated proteinlight chain (MAP1LC3, here referred to as LC3) on an exposed C-terminal glycine tophosphatidylethanolamine (PE) initiated by the ubiquitinylation-like cascade processed byATG7(E1) and ATG3 (E2) factors (Tanida et al., 2004). The appearance of the lipidatedform of LC3 (LC3-II) in the autophagosome membrane is a commonly used marker ofongoing autophagy, and can be quantified by end-point flux analysis in the presence oflysosomal inhibitors (Rubinsztein et al., 2009, Klionsky et al., 2008).
In contrast to a single LC3 (ATG8) in yeast, mammalian cells have six different orthologs ofATG8 (LC3A, LC3B, LC3C, GABARAP, GABARAPL1, and GATE16/GABARAPL2)(Tanida et al., 2004). While tissue-specific patterns of expression and intracellularlocalization have been reported (Tanida et al., 2004), the precise functions of the individualorthologs are not well understood. Specific involvement of the different orthologs atdifferent stages of autophagosome formation was observed in HeLa cells, with the LC3family participating in earlier stages of autophagosome membrane elongation, and theGABARAP family involved in later stages of maturation (Weidberg et al., 2010). At leastsome functional redundancy among orthologs is expected based on similarities in sequenceand structure (Wu et al., 2006) and the overlapping partner-protein binding patterns(Behrends et al., 2010). Interestingly, an alternative ATG5-/ATG7-/LC3B-independentpathway of autophagy has been described, wherein autophagosomes are derived from trans-Golgi and late endosomes in a RAB9-dependent manner (Nishida et al., 2009). Theexistence of multiple autophagic programs suggests differential functions dependent on thecellular context. Therapeutic manipulations of autophagy may provide anti-cancertreatments alternative to or supporting of anti-angiogenic therapies. In that respect, thesmall-molecule STF-62247 has been identified as a stimulator of autophagy leading to celldeath and inhibition of RCC growth in xenograft models (Turcotte et al., 2008). On the otherhand, inhibition of autophagy by chloroquine appears to cause robust tumor regression in thecase of pancreatic cancer (Yang et al., 2011). Thus, autophagy represents a therapeutic targetin need of further investigation.
Mikhaylova et al. Page 2
Cancer Cell. Author manuscript; available in PMC 2013 April 17.
NIH
-PA Author Manuscript
NIH
-PA Author Manuscript
NIH
-PA Author Manuscript
MicroRNAs (miRs) are small noncoding RNAs that modulate gene expression (Selbach etal., 2008). There is ample evidence that miRs have regulatory functions in cancer initiation,progression, and metastasis (Lu et al., 2005, Calin & Croce, 2006). Introduction of stabilizedmiRs may restore lost tumor-suppressor activity (Czech, 2006, Negrini et al., 2007, Tong etal., 2008, Kota et al., 2009). Conversely, the use of antagomirs may allow for a decrease inthe level and activity of miRs that promote oncogenesis (Krutzfeldt et al., 2005). MiR-204 isexpressed from the large intron 6 of TRPM3, which is located on chromosome 9q21.12 andencodes a transient receptor potential, Ca2+-permeable, non-selective cation channel(Oberwinkler & Phillipp, 2007) (Figure 1A). Both miR-204 and TRPM3 are expressed athigher levels in human kidney as compared with other organ tested (Lu et al., 2005).
Here, we investigate the role of VHL and miR-204 in the regulation of autophagic programsin ccRCC.
RESULTSMiR-204 acts as a tumor suppressor in RCC
We analyzed the expression of miR-204 in 128 human ccRCC with known VHL status and,in 114 cases, a matched normal kidney specimen. The miR-204 level was significantlydecreased in ccRCC as compared with matched normal kidney tissue in both paired (Figure1B) and unpaired (not shown) analyses. MiR-211(Figure S1A), is a miR-204 paralogexpressed from intron 6 of TRPM1 on chromosome 15q13.3. Steady-state levels of miR-211were also reduced in tumors as compared to normal kidneys, but the absolute expressionlevels of this miR were about 100-fold lower than that of miR-204 (Figure 1B). In contrast,HIF-inducible miR-210 (Kulshreshatha et al., 2007) was uniformly induced in ccRCC ascompared with normal kidney, as reported by others (Figure. 1B) (Nakada et al., 2008, Junget al., 2009, Juan et al., 2010).
MiR-204 inhibited the growth of RCC in two different xenograft models. In the first model,intratumoral injections of lentivirus particles containing wild-type pre-miR-204 arrestedsubcutaneous tumor growth, as compared with tumors injected with the same titer (107) ofmiR-204 carrying a 3-nucleotide mutation of its seed sequence (Figures 1C and S1A) whichdoes not have miR-204 activity (see Figure 3Bb). The levels of wild-type miR-204 were inthe range of miR-204 levels in normal kidneys (Figure S1B). Inhibition of tumor growth wasaccompanied by areas of focal necrosis, which stained positively for the necrosis marker C9,in the tumor regions directly exposed to injections (Figure 1D). Such necrosis was notobserved in tumors injected with mutated miR-204 (Figure 1D). In an independent series ofexperiments, 786-O VHL(−) cells were transduced with lentiviral particles containing wild-type or mutated pre-miR-204 then injected under the kidney capsules of nude mice. In eachcase, initial transduction efficiency was determined to be above 95% based on the number ofcells expressing GFP (Figure S1C), and the expression levels of miR-204 were also in therange of that measured in normal kidneys (Figure S1B). While the effect of miR-204expression on tumor incidence was relatively small, there was a large decrease in the growthof tumors upon expression of miR-204 (Figure 1Ea). Moreover, tumors formed by 786-Ocells expressing miR-204 were confined to the injection site under the capsule, with noinfiltration of the kidney parenchyma (Figures 1Eb and 1Ec). In contrast, cells transducedwith inactive mutant miR-204 formed highly invasive tumors that extensively infiltrated thekidney (Figures 1Ed). Taken together, these results indicate that miR-204 has tumor-suppressing activity.
MiR-204 is regulated by VHLConsistent with the RCC tumor data, miR-204 levels in VHL(−) 786-O and A498 RCC cellswere very low. Expression of miR-204, but not miR-211, was induced by reconstitution of
Mikhaylova et al. Page 3
Cancer Cell. Author manuscript; available in PMC 2013 April 17.
NIH
-PA Author Manuscript
NIH
-PA Author Manuscript
NIH
-PA Author Manuscript
wild-type VHL in 786-O and A498 cells, while expression of miR-210 was repressed underthe same conditions, as expected (Figure 2A). Conversely, VHL knockdown in the VHL-positive Caki-1 cell line led to decreased expression of miR-204 (Figure 2B). Moreover,there was a positive and significant correlation between normalized miR-204 levels andVHL protein levels in normal human kidneys (Figures 2C and 2D). We also found thatVHL-induced expression of miR-204 correlated with expression of two short transcriptsfrom TRPM3, TRPM3-005 and -010, but not with expression of the large transcriptencoding the full-length protein (Figures S2A and S2B). A transcriptional module with aputative promoter was identified upstream from the first exon of these short transcripts,suggesting that miR-204 is co-expressed with transcripts that do not encode the full-lengthprotein. We have also determined that expression of miR-204 was not regulated by hypoxialasting from 8 to 48 hr (Figure S2C), treatment with prolyl hydroxylase inhibitor, DMOG,(Figure S2D), or inhibition of HIF-2α by siRNAs (Figure S2E), while all these treatmentsaltered expression of HIF-regulated miR-210 as predicted. These data establish that VHLpositively regulates expression of miR-204 in a manner most likely coordinate with some ofthe TRPM3 transcripts but independent of HIF activity.
MiR-204 is cytotoxic to VHL(−) but not VHL(+) cellsIn our search for the tumor-suppressing mechanism of miR-204, we found that expression ofexogenous miR-204 in VHL(−) cells was cytotoxic if cells were cultured in starvationconditions (Figures 3A and 3B). Importantly, the same dose of exogenous miR-204 was notcytotoxic to 786-O or A498 RCC cells reconstituted with wild-type VHL, which showseveral features of normal epithelial cells and are characterized by suppressed ability to formtumors in xenograft models, or to HK-2-immortalized renal epithelial cells (Figure 3Ba).The levels of exogenous miR-204 measured in VHL(−) or VHL(+) RCC cells or HK2 cellsa were very similar. The effect required miR-204 targeting activity as mutation of threenucleotides within the core binding site of miR-204 abolished this cytotoxic effect (Figure3Bb). Figure 3C shows an example of dying VHL(−) cells with extensive cytoplasmicvacuolization, in contrast to healthy VHL(+) cells. The cytotoxic effect of miR-204 wassignificantly attenuated when cells were continuously grown in 10% serum (Figure 3Bb).Similarly, if VHL(−) RCC cells starved for 48 hr were treated with fresh medium containing10% FCS for 6 hr before miR-204 was applied, the cytotoxic effect of miR-204 was greatlydiminished (Figure 3D). Moreover, when cells were treated with 10 mM glucose 16 hr afteraddition of miR-204 (before the beginning of massive cell death), cell death was greatlyreduced (Figure 3E), suggesting that cell death resulted from starvation.
By using different approaches, we excluded a role for caspase-mediated apoptosis (FiguresS3A and S3B), necroptosis (Figure S3C), or cathepsin-mediated cell death as causes of thecell death (Figures S3D). Moreover, at the cell densities used in these experiments, allVHL(−) and VHL(+) cells proliferated at similar rates and no differences in their cell cyclekinetics were observed, despite starvation (not shown).
MiR-204 inhibits macroautophagy downstream of autophagosome initiationThe above findings prompted us to investigate the role of miR-204 in the regulation ofstarvation-induced autophagy. Treatment with miR-204 did not cause additional cell deathafter autophagy was inhibited with an upstream inhibitor of macroautophagy, 3-methyladenine (Figure S4A). Moreover, similar to the effects of miR-204, inhibition ofautophagy by knockdown of the upstream regulator, ATG5, resulted in significantly higherdeath of VHL(−) cells as compared to VHL(+) cells (Figure S4B), supporting the idea thatVHL(−) cells are more dependent on autophagy and therefore more sensitive to itsinhibition.
Mikhaylova et al. Page 4
Cancer Cell. Author manuscript; available in PMC 2013 April 17.
NIH
-PA Author Manuscript
NIH
-PA Author Manuscript
NIH
-PA Author Manuscript
Using transmission electron microscopy (TEM) to quantify the number of autophagicvesicles, we found that treatment with miR-204 significantly reduced the number ofautophagic vesicles in VHL(−) but not in VHL(+) cells, an effect measured in both thepresence and absence of the autophagy inhibitor, chloroquine (Figure 4A). Moreover thevesicles present in VHL(−) cells treated with miR-204 were smaller and less developed ascompared with those in the untreated cells. This indicates that miR-204 inhibits theformation of autophagic vesicles.
Next we determined whether miR-204 exerted its effect during autophagosome initiation ormaturation. MiR-204 did not alter mTORC1 pathway activity (Figure S4C), indicating thatthe effects of miR-204 were not mediated by inhibition of this pathway. Recently, Weidberget al., (2010) reported that inhibition of autophagy by knocking down subfamilies of LC3sor GABARAPs, which function at the level of autophagosome maturation, resulted in theaccumulation of upstream regulators that participate in forming the initial membranes, suchas ATG12-ATG5 and ATG16L punctate structures. Treatment with miR-204 alonesignificantly increased the number of cells expressing both ATG5-ATG12 and ATG16Lpunctate structures and induced an increase in the number of ATG16L puncta per cell inVHL(−) cells, but not in VHL(+) cells, grown in 0.1% serum (Figures 4B, 4C, S4D).Inhibition of autophagy by chloroquine alone also resulted in increased numbers of VHL(−)786-O and A498 cells expressing ATG5-ATG12 puncta, with the effects significantlyweaker in VHL(+) cells (Figure 4B). Chloroquine alone had a stronger effect in VHL(−)cells than miR-204 alone, and simultaneous treatment with both agents resulted in anaccumulation of a similar magnitude to that induced by chloroquine alone. In the case ofATG16L puncta, chloroquine and miR-204 had similar effects on the number of cells withthese puncta, particularly in 786-O cells (Figures 4C and S4D). Taken together, these datasuggest that miR-204 exerts its effect downstream of the formation of the initial phagophoremembranes and possibly at the level of autophagosome maturation.
The presence of the lipidated form of LC3 (LC3-II) in the autophagosome membrane is amarker of effective autophagy, we therefore measured accumulation of the lipidated formsof the LC3s and GABARAPs. The accumulation of LC3B-II was inhibited in VHL(−) cellsby miR-204 in the absence of chloroquine (Figure 5A, lanes 6 and 5 in each panel).Treatment with chloroquine, as expected, induced accumulation of LC3B-II (Figure 5A,compare lanes 7 vs. 5), but miR-204 inhibited this accumulation by two to three fold as well(Figure 5A, compare lanes 7 and 8). In contrast, while LC3B-II accumulated in response tochloroquine in VHL(+) cells, this response was not affected by miR-204 (Figure 5A lanes 1–4). Similarly, while increased accumulation of LC3B-II was observed in HK-2 cells inresponse to chloroquine, levels of LC3B-II were not affected by miR-204 (Figure S5A).Treatment with miR-204 had no effect on the expression of LC3B mRNA in either cell line(Figure S5B). The accumulation of LC3A-II was not affected by VHL or miR-204 in anyconsistent manner. Surprisingly, LC3C-II was expressed only in VHL(+) RCC cells. Amongthe GABARAP-like proteins, only GABARAPL2-II showed slightly decreased expressionin response to miR-204 (Figure 5A), and the dependence of its overall expression on VHLvaried depending on the cell line. GABARP-II was predominantly expressed in 786-OVHL(+) cells and barely detectable in A498 cells. We were unable to detect expression ofGABARAPL1 protein. Immunofluorescence staining confirmed the effects of miR-204 onthe endogenous LC3B in VHL(−) and VHL(+) RCC cells (Figure S5C) and the results wereconsistent with the accumulation of LC3B-II as measured by western blot (Figure 5A).Overall, these data indicate that miR-204 inhibits starvation-induced macroautophagy inVHL(−) but not VHL(+) RCC cells at the stages of autophagosome maturation, and not atinitiation.
Mikhaylova et al. Page 5
Cancer Cell. Author manuscript; available in PMC 2013 April 17.
NIH
-PA Author Manuscript
NIH
-PA Author Manuscript
NIH
-PA Author Manuscript
Knockdown of LC3B resulted in a significantly higher rate of cell death in VHL(−) cells ascompared with VHL(+) cells in both 786-O and A498 cells (Figures 5B, S5D). This resultfurther supports the concept of a specific dependence of VHL(−) cells on an ATG5/LC3B/miR-204–regulated autophagic program.
LC3B is a direct target of miR-204 and it is necessary for miR-204 cytotoxic activityTo identify specific miR-204 targets with potential relevance in the regulation of autophagy,we used several miR target-prediction algorithms (Pictar, TargetScan, Miranda, Sanger) andfound conserved miR-204 sites in the 3’UTRs of two direct regulators of autophagy, LC3Band LC3B2. Because LC3B2 is not expressed in 786-O cells, we concentrated our furtheranalysis on LC3B.
The miR-204 binding site in LC3B mRNA is a broadly conserved element located between55 and 61 bp of the LC3B 3’UTR (Figure 6Aa). The 3’UTR of LC3B with the wild-type,but not with a mutant, miR-204–binding site conferred repression by miR-204 to a luciferasereporter (Figure 6Ab). Furthermore, as expected, inhibition of miR-204 activity by usingmiRZip anti-204 (Mavrakis et al. 2010, Veronese et al., 2010, Loven et al., 2010) or siRNA(80%–90% knockdown) upregulated LC3B protein expression in VHL(+) RCC cells (Figure6B), indicating that LC3B is under constitutive repression by endogenous miR-204. Thisobservation was further supported by a significant negative correlation between levels ofmiR-204 and LC3B protein in the subpopulation of human ccRCC tumors with the wild-type VHL (Figures 6C and 6D). Importantly, the increased accumulation of LC3B-II in thepresence of chloroquine in VHL(+) 786-O cells with miR-204 knocked down, as comparedwith control VHL(+) cells, indicates an induction of macroautophagy (Figure 6E, lanes 3and 4). Moreover, levels of endogenous LC3B were higher in VHL(−) as compared withVHL(+) RCC cells (Figure 5A), consistent with higher levels of endogenous miR-204 inVHL(+) cells.
Most importantly, re-expression of LC3B lacking the 3’UTR, and therefore insensitive tomiR-204, protected VHL(−) 786-O cells from miR-204 cytotoxicity (Figure 6F). Cells fromthe same transfection that had lost LC3B-RFP (RFP-negative cells) or cells transfected withRFP alone demonstrated significant miR-204–induced cytotoxicity (Figure 6F). This rescuefrom cell death by expression of RFP-LC3B was accompanied by a reduction in theaccumulation of ATG16L-positive puncta in response to miR-204 in RFP-LC3B–transfectedcells (Figures 6G and S6A-S6B) as compared to the effect of miR-204 on nontransfectedcells (RFP-negative cells) or cells transfected with RFP alone (Figure 6G and Figures S6C-S6D).
Next we asked if miR-204 was cytotoxic to cells with LC3B knocked down. In the firstapproach, we used 786-O and A498 pools of cells with LC3B stably knocked down (FigureS6E). Because all cells with stable LC3B knockdown grew very slowly and progressivelydied in medium containing 0.1% serum, they were initially seeded in higher numbers toassure a similar degree of confluence for cells in the control and LC3B knockdown pools atthe time of treatment with miR-204. Under these conditions, miR-204 did not have acytotoxic effect on 786-O or A498 cells with LC3B knockdown, but remained cytotoxic tothe control cells (Figure 6H). We also performed another experiment where VHL(−) cellswere plated at the same densities, starved as in Figure 3A, and then transiently transfectedwith miR-204, siRNA for LC3B, or both, along with the respective negative controls (FigureS6F). The effects of miR-204 and LC3B siRNA on cell death were similar, and there was noadditional effect when miR-204 and LC3B siRNA were applied together (Figure S6F).
Mikhaylova et al. Page 6
Cancer Cell. Author manuscript; available in PMC 2013 April 17.
NIH
-PA Author Manuscript
NIH
-PA Author Manuscript
NIH
-PA Author Manuscript
LC3C protects VHL(+) RCC cells from loss of LC3B-mediated autophagyThe presence of VHL protected RCC cells from the cytotoxic effects of miR-204 and LC3Bknockdown. We found that VHL is a strong inducer of a largely uncharacterized LC3Bparalog, LC3C (Figures 5A, 7A, S7A). Reconstitution of VHL in RCC cells induced(Figures 5A and 7A), while knockdown of VHL in Caki-1 cells (Figure S7A) reducedexpression of LC3C-II. This regulation occurred at the level of mRNA (Figure 7B) and wasresponsive to HIF-2α. Knockdown of HIF-2α induced LC3C mRNA (Figure 7C), whileactivation of HIF-2α using DMOG repressed LC3C mRNA (Figure 7D). The high levels ofLC3C in VHL(+) cells suggested that LC3C may protect VHL(+) cells from inhibition ofLC3B-mediated autophagy. Testing this possibility, we found that single LC3C knockdown(Figure S7B) had comparable to the single knockdown of LC3B and relatively minor effecton VHL(+) cell survival in response to serum starvation, while double LC3B/LC3Cknockdown (Figure S7B) reduced the viability of VHL(+) cells to the levels measured inVHL(−) cells (Figure 7E).
LC3B-dependent autophagy is necessary for RCC tumor growthWe then tested the hypothesis that LC3B-mediated autophagy is necessary for tumorgrowth. Injection of pre-formed subcutaneous tumors with lentiviral particles containingshRNAs against LC3B or ATG5 every other day for 9 days resulted in significant inhibitionof tumor growth, as compared with tumors injected with scrambled shRNA (Figure 8A). Asimilar result was obtained when cell lines with stable expression of shRNA targeting LC3Bor ATG5 were injected into the kidneys of nude mice, and growth of orthotopic tumors wasdetermined after 10 weeks. 786-O VHL(-) cells formed tumors in 83% of mice, which was areproducible incidence in at least 5 independent experimental series performed in ourlaboratory over the last two years (see also Yi et al., 2010). In contrast, injection of cellswith knockdown of LC3B or ATG5 resulted in reduced tumor growth (Figure 8B). Similarresults were obtained using A498 cells, where the formation of tumors was completelyinhibited by the knockdown of either LC3B or ATG5 (Figure 8C). These data indicate thatATG5/LC3B-mediated macroautophagy is necessary for the growth of VHL(−) RCC tumorsin nude mice.
Next, we determined the status of LC3B and ATG5 in 102 human kidney-ccRCC tumorpairs by using quantitative immunoblotting with a set of reference standards to normalizeresults from multiple blots (Yi et al., 2010). We found a significant correlation betweentumor-kidney ratios of the normalized protein levels for LC3B (all three forms) and ATG5(Figure S8A). Importantly, we found that LC3B levels positively correlated with tumorgrade, while miR-204 levels showed a negative correlation (Figure 8D) suggesting that lossof miR-204 and activation of autophagy are critical regulators of cancer progression insporadic human ccRCC.
Finally, we tested the role of LC3C in the tumor-suppressing activity of VHL. Knockdownof LC3C in VHL(+) 786-O and A498 cells (Figure S7B) increased the incidence of smalltumor formation by both cell lines when injected into the kidneys of nude mice (Figure 8E).Moreover, analysis of the human ccRCC kidney-tumor pairs revealed decrease in LC3Cprotein expression in majority of tumors (Figure S8B). These results support the role ofLC3C as a regulator of an autophagic program involved in tumor suppression.
DISCUSSIONA large majority of human ccRCC is characterized by early loss of VHL. Here, we identifytwo pathways that are regulated by VHL and contribute significantly, although in oppositedirection, to ccRCC tumor growth (Figure 8F). The data clearly demonstrate that formationof RCC tumors by VHL(−) RCC cells in nude mice requires active LC3B/ATG5-dependent
Mikhaylova et al. Page 7
Cancer Cell. Author manuscript; available in PMC 2013 April 17.
NIH
-PA Author Manuscript
NIH
-PA Author Manuscript
NIH
-PA Author Manuscript

autophagy. Consistent with this, progression of human ccRCC is associated with increasinglevels of LC3B protein. We propose that the crucial event leading to activation of this pro-tumorigenic autophagic program is the loss of miR-204 and de-repression of LC3B, whichin turn, stimulates and/or maintains autophagy. It is also likely that miR-204 regulates anetwork of targets that influence macroautophagy through mechanisms and pathwaysconverging at the level of LC3B and maturation of the autophagosome, without affectingphagophore initiation. This renders cancer cells addicted to macroautophagic activity, and,thus, subject to synthetic lethality when macroautophagy is inhibited by exogenousmiR-204, with necrotic cell death caused by starvation.
We have also discovered that VHL, through inhibition of HIF, induces LC3C. LC3C, so faruncharacterized, contributes to basic autophagic activity in VHL(+) cells at a level similar toLC3B, but it also mediates an anti-tumorigenic autophagic activity as its knockdownincreased the incidence of small tumors in VHL(+) cells. At present, the biochemicalactivity of such a program is not understood, but there is growing evidence for autophagicprograms that are not mediated by ATG5/LC3B (Nishida et al., 2009) or ULK1/2 (Cheonget al., 2011). Thus, LC3C could be a part of such yet unidentified pathway, or couldparticipate in a non-autophagic tumor-suppressing pathway. Moreover, an LC3C-specificautophagic program could have selectivity towards specific pro-oncogenic targets.Interestingly, the potential functional differences between LC3C and LC3B/LC3A could berelated to the fact that LC3C contains an unstructured C-terminus domain that is not presentin other family members. The mechanism by which HIF represses expression of LC3Cremains to be investigated, but the LC3C proximal promoter contains E2-boxes, similar tothose that mediate HIF-dependent inhibition of E-cadherin mRNA by ZFHX1B and SNAI1(Estaban et al., 2006, Evan et al., 2007).
The requirement for macroautophagy in RCC cells, and the protective activity of LC3C innormal cells, creates a unique opportunity for the use of miR-204 or miR-204–likeapproaches in the treatment of RCC. Such strategies would spare normal epithelial cellswhile killing malignant tumor cells. In particular, a therapeutic approach inducing cytotoxic,rather than cytostatic effects is desirable as the currently used anti-angiogenic treatments areonly cytostatic. Importantly, treatments for pancreatic cancer involving general inhibitors ofautophagy, such as chloroquine, are currently in clinical trials (Yang et al., 2011).
While VHL is a positive regulator of miR-204 expression in normal tissues, it is likely thatfactors additional to the loss of VHL could trigger decreased miR-204 expression,particularly during cancer progression. In that respect, miR-204 is expressed from locus9q21.12, and published data indicate that chromosome 9 is the second most frequently lostchromosome, after 3p, in RCC (20%-30% of tumors) decreased expression of genes fromthis region (Fukunaga et al., 2002, Yoshimoto et al., 2007, Toma et al., 2008). Our initialevidence points towards coordinated expression of miR-204 with short, but not full-size,TRPM3 transcripts, which could represent a more general mechanism for expression ofintronic miRs from long genes.
Taken together, our findings indicate that VHL regulates at least two autophagic programs,through an HIF-independent pathway activating miR-204 and an HIF-regulated pathwayactivating LC3C.
EXPERIMENTAL PROCEDURESHuman RCC tumors
Fresh-frozen samples of renal clear cell carcinomas (n=128) and matched normal kidneys(n=114) were obtained and analyzed for VHL gene sequence and protein expression as
Mikhaylova et al. Page 8
Cancer Cell. Author manuscript; available in PMC 2013 April 17.
NIH
-PA Author Manuscript
NIH
-PA Author Manuscript
NIH
-PA Author Manuscript
described before (Yi et al., 2010). Specimens were also analyzed for expression of miR-204,miR-211, and miR-210. All human samples were anonymous and exempted from IRBprotocol.
Cell culture methods and treatmentsPools of human VHL(−) and VHL(+) 786-O and Caki-1 cells were described by us before(Mikhaylova et a., 2008, Yi et al., 2010); A498 cells were obtained from Dr. W. G. KaelinJr., (DFI, Harvard medical School). HK-2 cells were purchased from ATCC. All cells wereauthenticated (Genetica, Cincinnati, OH). For miR-204 treatments, cells were plated in 12-well cell culture dishes at 3,000 per well in normal medium. 24 hr later, the medium wasreplaced with fresh medium containing 10% or 0.1% serum. After the next 48 hr, cells weretransduced with lentiviral particles containing wild-type or mutated pri-miR-204, ortransfected with the respective short pre-miR-204, in each case with the appropriate negativecontrols. Cell viability was determined 48 hr after miR-204 treatment by trypan blueexclusion. For the LC3-II flux experiments, cells were plated and treated as described above,and 24 hr after miR-204 treatment, cells were treated with 100 μM chloroquine to inhibitlysosomal function. Cells were collected at the indicated times and analyzed by PAGE forthe proteins of interest.
Quantitative RT-PCRTotal RNA was extracted using the mirVana miRNA Isolation kit (Ambion). For microRNAanalysis, the samples were first reverse transcribed using the TaqMan microRNA ReverseTranscription kit and miR-specific primers and probes (TaqMan microRNA Assays, AppliedBiosystems), and quantified with real-time PCR on an Applied Biosystems 7900HT FastReal-Time PCR System. The small nucleolar RNA (snoRNA) RNU44 was used as theinternal control for the −ΔCt calculation. Data are presented normalized to snoRNU44, or asratios of the normalized values between paired cell lines differing in the status of VHL ortumor/kidney pairs. For mRNA, qRT-PCR was performed as described before (Yi et al.,2010) and the sequence of primers is provided in the Supplemental ExperimentalProcedures.
Constructs and plasmidsThe following miR-204 reagents were used: Pre-miR-204 precursor and Pre-miR negativecontrol were purchased from Ambion (Pre-miR-204™ miRNA Precursor Molecules, andnegative control Pre-miR™ miRNA Precursor Molecule). Anti-miR-204 and thecorresponding negative control were purchased from Dharmacon (miRIDIAN HairpinInhibitor: human hsa-miR-204, and miRIDIAN microRNA Hairpin Inhibitor NegativeControl #1). HIV-based lenti-miR pri-micro RNA-204 construct and control lentivectorwere from System Biosciences (microRNA Expression Construct Lenti-miR-204MI0000284 and corresponding lentivector negative control). To alter the miR-204 coresequence, site-directed mutagenesis was performed on PMIRH204 to replace the core CCCsequence with a GGG sequence (GenScript). The mutation was verified by sequencing. Listof siRNA and shRNA constructs is provided in the Supplemental Experimental Procedures.All lentiviral DNA constructs were VSV-G envelope packaged (Cincinnati Children’sHospital Medical Center Viral Vector Core) and infected into cells followed by plasmid-appropriate selection. The LC3B-RFP construct contained human LC3B-myc fused to RFPfrom pDsRed1-N1 in the PRK5 vector and was a gift from Drs. P. Dennis and C. Mercer(University of Cincinnati). The Luciferase-LC3B-3’UTR construct was based onpLightSwitch_3’UTR vector and purchased from Switchgear Genomics.
Mikhaylova et al. Page 9
Cancer Cell. Author manuscript; available in PMC 2013 April 17.
NIH
-PA Author Manuscript
NIH
-PA Author Manuscript
NIH
-PA Author Manuscript
Transfections and transduction experimentsTransient transfections of microRNA constructs or pools of siRNAs were performed usingLipofectamine 2000 according to the manufacturer’s protocol. Transductions with lentiviralparticles were performed using 2 μg/ml of polybrene.
Western blot analysisTotal cellular lysates were obtained by lysing cells in RIPA buffer containing proteinase andphosphatase inhibitors. 5 to 30 μg of extracts were separated on 12% polyacrylamide gelsand transferred onto PVDF membrane. Blots were probed with relevant antibodies describedin Supplemental Experimental Procedures. Quantitative immunoblotting for human RCCtumors and matched kidneys was performed as described in (Yi et al., 2010).
Mouse xenograft experimentsAll experiments on mice were performed in accordance with University of CincinnatiIACUC approved protocol. For the intra-kidney injections, 30,000 cells were resuspended inMatrigel to a final volume of 30 μl, and then slowly injected into the parenchyma of thekidneys of 4- to 5-week-old athymic nude mice and tumors were collected after 10–12weeks. For the subcutaneous injections, 1x 10⁶ cells in cell culture medium were injectedsubcutaneously into the flanks of the same strain of nude mice. After 6 weeks, these tumorsreached an approximate average volume of 50 mm3 and mice were randomly assigned togroups in which the tumors would be injected with specific viral particles containingconstructs encoding mutant miR-204, wild-type miR-204, or specific shRNAs. For eachcontrol and experimental condition, the same titer of viral particles was used. Injectionswere performed with 25 μl of supernatant every other day for a period of 9 days. Beforeinjections, three standard dimensions of the tumor were measured with a protractor and thevolume of the tumor was calculated using the equation d1 × d2 × d3 × π/6. At the end of theexperiments, mice were sacrificed and tumors were fixed in 4% paraformaldehyde, paraffinembedded, and H&E stained or processed for immunocytochemistry using a monoclonalantibody against Complement Component 9 (Vector Laboratories).
Immunofluorescence stainingCells were plated on coverslips and treated with miR-204. At the end of the experiment,cells were fixed in 4% paraformaldehyde, permeabilized, and blocked in 0.3% Triton and0.1% Triton with 3% BSA, and incubated with primary antibody for 1hr at 37°C. Cells werethen washed and incubated with the Alexa 488-labeled secondary antibody for 1h at roomtemperature. Confocal images were acquired on a Zeiss LSM510 confocal or by using aZeiss Axioplan 2 microscope with the appropriate filter cubes and a Zeiss Axiocam MRm torecord the images. The number of cells expressing puncta and the number of puncta per cellwere counted manually.
Preparation of samples and TEMSamples were processed in the Electron Microscopy Core at Cincinnati Children’s HospitalMedical Center. Briefly, cells were washed with PBS and resuspended in 0.2 M cacodylatebuffer with 3% glutaraldehyde. Cells were post-fixed with 1% Osmium tetroxide (ElectronMicroscopy Sciences, Fort Washington, PA) with 0.2 M sodium cacodylate buffer for 1hour at 4°C. After three washes with 0.2 M sodium cacodylate buffer, cells wereresuspended in 1% agarose (type IX, Sigma), centrifuged for 5 min at 3,000 rpm, and left for24 hr at 4°C. The following day, samples were dehydrated and embedded in LX-112embedding medium (Ladd Research Industries, Burlington, VT). Samples were thenpolymerized for 48 hr at 60°C, cut into 100 nm thick sections on a USA Reichert-JungUltraCut E microtome, positioned on 200 mesh grids, and stained with uranyl acetate and
Mikhaylova et al. Page 10
Cancer Cell. Author manuscript; available in PMC 2013 April 17.
NIH
-PA Author Manuscript
NIH
-PA Author Manuscript
NIH
-PA Author Manuscript
lead citrate. TEM was performed on a JEOL 1230 TEM at an accelerating voltage of 80kV.Images were acquired with an AMT Advantage Plus 2K x 2K digital camera connected tothe TEM.
LC3B rescue experimentsCells were plated at 85,000 cells per 60 mm plate in regular medium containing 10% FBS.Transfections with LC3B-RFP or RFP construct were performed 24 hr later usingLipofectamine LTX and PLUS reagent (Invitrogen) according to the manufacturer’sprotocol. Expression of RFP was clearly visible by 24 hr to 30 hr after transfection. Cellswere then collected and sorted using a BD FACSAria. Sorted cells were plated at a densityof 5,000 per well in 12-well plates in normal medium with 10% FBS with added antibioticsand antimycotics. 24 hr after plating, the medium was replaced with medium containing0.1% serum. After 48 hr of starvation, cells were transfected with 25 nM of pre-miR-204precursor or a negative control construct (Ambion) by using Lipofectamine 2000. On thelast day, cells were collected, stained with DAPI to distinguish live cells, and the percentageof RFP+ cells was determined, among both viable and dead cell populations, by flowcytometry.
Statistical analysisFor descriptive statistics, data are expressed as mean ±SEM unless indicated otherwise.Analysis of differential expression was performed using one-way analysis of variance(ANOVA), followed by Tukey-Kramer multiple comparison tests. Differences whereP<0.05 were considered to be statistically significant. In quantitative immunoblottingexperiments, we used log2-transformed normalized values to facilitate robust and outlier-insensitive analyses. Standard box-and-whisker plots were used to compare distributions ofthe normalized abundance measure for individual proteins. Correlations between variableswere assessed by means of regression analysis and by Pearson and Spearman rankcorrelation coefficients.
Supplementary MaterialRefer to Web version on PubMed Central for supplementary material.
AcknowledgmentsThis work was supported in part by the following grants NCI CA122346, DoD W81XWH-07-02-0026, BLR&DVA Merit Award to MCK, and UC P30-ES006096 CEG; DRP and CAG were supported by NCI CA133164. Wethank Drs. P. Dennis and C. Mercer for LC3B-RFP constructs, K. Winstead for the collection of human ccRCCtumors, Z. Shan for the histological preparation of tumor sections, G. Ciraolo for processing tissues for TEM, J.Neumann for injection of mice, G. Doerman for preparing the figures, Dr. M. Daston for editorial assistance, andundergraduate students P. Bastola and P.J. Krzeski for technical assistance.
ReferencesAxe EL, Walker SA, Manifava M, Chandra P, Roderick HL, Habermann A, Griffiths G, Ktistakis NT.
Autophagosome formation from membrane compartments enriched in phosphatidylinositol 3-phosphate and dynamically connected to the endoplasmic reticulum. J Cell Biol. 2008; 18:685–701.[PubMed: 18725538]
Behrends C, Sowa ME, Gygi SP, Harper JW. Network organization of the human autophagy system.Nature. 2010; 466:68–76. [PubMed: 20562859]
Calin GA, Croce CM. MicroRNA signatures in human cancers. Nat Rev Cancer. 2006; 6:857–866.[PubMed: 17060945]
Cheong H, Lindsten T, Wu J, Lu C, Thompson CB. Ammonia-induced autophagy is independent ofULK1/ULK2 kinases. Proc Natl Acad Sci USA. 2011; 108:11121–11126. [PubMed: 21690395]
Mikhaylova et al. Page 11
Cancer Cell. Author manuscript; available in PMC 2013 April 17.
NIH
-PA Author Manuscript
NIH
-PA Author Manuscript
NIH
-PA Author Manuscript

Czech MP. MicroRNAs as therapeutic targets. N Engl J Med. 2006; 354:1194–1215. [PubMed:16540623]
Degenhardt K, Mathew R, Beaudoin B, Bray K, Anderson D, Chen G, Mukherjee C, Shi Y, Gélinas C,Fan Y, Nelson DA, Jin S, White E. Autophagy promotes tumor cell survival and restricts necrosis,inflammation, and tumorigenesis. Cancer Cell. 2006; 10:51–64. [PubMed: 16843265]
Esteban MA, Tran MG, Harten SK, Hill P, Castellanos MC, Chandra A, Raval R, O'Brien TS,Maxwell PH. Regulation of E-cadherin expression by VHL and hypoxia-inducible factor. CancerRes. 2006; 66:3567–3575. [PubMed: 16585181]
Evans AJ, Russell RC, Roche O, Burry TN, Fish JE, Chow VW, Kim WY, Saravanan A, MaynardMA, Gervais ML, et al. VHL promotes E2 box-dependent E-cadherin transcription by HIF-mediated regulation of SIP1 and snail. Mol Cell Biol. 2007; 27:157–169. [PubMed: 17060462]
Fukunaga K, Wada T, Matsumoto H, Yoshihiro S, Matsuyama H, Naito K. Renal cell carcinoma:allelic loss at chromosome 9 using the fluorescent multiplex-polymerase chain reaction technique.Hum Pathol. 2002; 33:910–914. [PubMed: 12378516]
Gossage L, Eisen T. Alterations in VHL as potential biomarkers in renal-cell carcinoma. Nat Rev ClinOncol. 2010; 7:277–288. [PubMed: 20368728]
Hailey DW, Rambold AS, Satpute-Krishnan P, Mitra K, Sougrat R, Kim PK, Lippincott-Schwartz J.Mitochondria supply membranes for autophagosome biogenesis during starvation. Cell. 2010;141:656–667. [PubMed: 20478256]
He C, Klionsky DJ. Regulation mechanisms and signaling pathways of autophagy. Ann Rev Genet.2009; 43:67–93. [PubMed: 19653858]
Heng DY, Bukowski RM. Anti-angiogenic targets in the treatment of advanced renal cell carcinoma.Curr Cancer Drug Targets. 2008; 8:676–682. [PubMed: 19075590]
Jin S, DiPaola RS, Mathew R, White E. Metabolic catastrophe as a means to cancer cell death. J CellSci. 2007; 120:379–383. [PubMed: 17251378]
Juan D, Alexe G, Antes T, Liu H, Madabhushi A, Delisi C, Ganesan S, Bhanot G, Liou LS.Identification of a microRNA panel for clear-cell kidney cancer. Urology. 2010; 75:835–841.[PubMed: 20035975]
Jung M, Mollenkopf HJ, Grimm C, Wagner I, Albrecht M, Waller T, Pilarsky C, Johannsen M,Stephan C, Lehrach H, et al. MicroRNA profiling of clear cell renal cell cancer identifies a robustsignature to define renal malignancy. J Cell Mol Med. 2009; 13:3918–3928. [PubMed: 19228262]
Klionsky DJ, Abeliovich H, Agostinis P, Agrawal DK, Aliev G, Askew DS, Baba M, Baehrecke EH,Bahr BA, Ballabio A, et al. Guidelines for the use and interpretation of assays for monitoringautophagy in higher eukaryotes. Autophagy. 2008; 4:151–175. [PubMed: 18188003]
Kota J, Chivukula RR, O'Donnell KA, Wentzel EA, Montgomery CL, Hwang HW, Chang TC,Vivekanandan P, Torbenson M, Clark KR, et al. Therapeutic microRNA delivery suppressestumorigenesis in a murine liver cancer model. Cell. 2009; 137:1005–1017. [PubMed: 19524505]
Krützfeldt J, Rajewsky N, Braich R, Rajeev KG, Tuschl T, Manoharan M, Stoffel M. Silencing ofmicroRNAs in vivo with 'antagomirs'. Nature. 2005; 438:685–689. [PubMed: 16258535]
Kulshreshtha R, Ferracin M, Wojcik SE, Garzon R, Alder H, Agosto-Perez FJ, Davuluri R, Liu CG,Croce CM, et al. A microRNA signature of hypoxia. Mol Cell Biol. 2007; 27:1859–1867.[PubMed: 17194750]
Lovén J, Zinin N, Wahlström T, Müller I, Brodin P, Fredlund E, Ribacke U, Pivarcsi A, Påhlman S,Henriksson M. MYCN-regulated microRNAs repress estrogen receptor-alpha (ESR1) expressionand neuronal differentiation in human neuroblastoma. Proc Natl Acad Sci USA. 2010; 107:1553–1558. [PubMed: 20080637]
Lu J, Getz G, Miska EA, Alvarez-Saavedra E, Lamb J, Peck D, Sweet-Cordero A, Ebert BL, Mak RH,Ferrando, et al. MicroRNA expression profiles classify human cancers. Nature. 2005; 435:834–838. [PubMed: 15944708]
Mathew R, Karantza-Wadsworth V, White E. Role of autophagy in cancer. Nat Rev Cancer. 2007;7:961–967. [PubMed: 17972889]
Mavrakis KJ, Wolfe AL, Oricchio E, Palomero T, de Keersmaecker K, McJunkin K, Zuber J, James T,Khan AA, Leslie CS, et al. Genome-wide RNA-mediated interference screen identifies miR-19
Mikhaylova et al. Page 12
Cancer Cell. Author manuscript; available in PMC 2013 April 17.
NIH
-PA Author Manuscript
NIH
-PA Author Manuscript
NIH
-PA Author Manuscript
targets in Notch-induced T-cell acute lymphoblastic leukaemia. Nature Cell Biol. 2010; 12:372–379. [PubMed: 20190740]
Mikhaylova O, Ignacak ML, Barankiewicz TJ, Harbaugh SV, Yi Y, Maxwell PH, Schneider M, VanGeyte K, Carmeliet P, Revelo MP, et al. The von Hippel-Lindau tumor suppressor protein and Egl9-type proline hydroxylases regulate the large subunit of RNA Polymerase II in response tooxidative stress. Mol Cell Biol. 2008; 28:2701–2717. [PubMed: 18285459]
Nakada C, Matsuura K, Tsukamoto Y, Tanigawa M, Yoshimoto T, Narimatsu T, Nguyen LT, HijiyaN, Uchida T, Sato F, et al. Genome-wide microRNA expression profiling in renal cell carcinoma:significant down-regulation of miR-141 and miR-200c. J Pathol. 2008; 216:418–427. [PubMed:18925646]
Negrini M, Ferracin M, Sabbioni S, Croce CM. MicroRNAs in human cancer: from research totherapy. J Cell Sci. 2007; 120:1833–1840. [PubMed: 17515481]
Nishida Y, Arakawa S, Fujitani K, Yamaguchi H, Mizuta T, Kanaseki T, Komatsu M, Otsu K,Tsujimoto Y, Shimizu S. Discovery of Atg5/Atg7-independent alternative macroautophagy.Nature. 2009; 461:654–658. [PubMed: 19794493]
Oberwinkler J, Phillipp SE. TRPM3. Handb Exp Pharmacol. 2007; 179:253–67. [PubMed: 17217062]Ravikumar B, Moreau K, Jahreiss L, Puri C, Rubinsztein DC. Plasma membrane contributes to the
formation of pre-autophagosomal structures. Nat Cell Biol. 2010; 12:747–757. [PubMed:20639872]
Rubinsztein DC, Cuervo AM, Ravikumar B, Sarkar S, Korolchuk V, Kaushik S, Klionsky DJ. Insearch of an "autophagomometer. " Autophagy. 2009; 5:585–589.
Selbach M, Schwanhäusser B, Thierfelder N, Fang Z, Khanin R, Rajewsky N. Widespread changes inprotein synthesis induced by micro RNAs. Nature. 2008; 455:58–63. [PubMed: 18668040]
Tanida I, Ueno T, Kominami E. LC3 conjugation system in mammalian autophagy. Int J Biochem CellBiol. 2004; 36:2503–2518. [PubMed: 15325588]
Toma MI, Grosser M, Herr A, Aust DE, Meye A, Hoefling C, Fuessel S, Wuttig D, Wirth MP,Baretton GB. Loss of heterozygosity and copy number abnormality in clear cell renal cellcarcinoma discovered by high-density affymetrix 10K single nucleotide polymorphism mappingarray. Neoplasia. 2008; 10:634–642. [PubMed: 18592004]
Tong AW, Nemunaitis J. Modulation of miRNA activity in human cancer: a new paradigm for cancergene therapy? Cancer Gene Ther. 2008; 15:341–355. [PubMed: 18369380]
Turcotte S, Chan DA, Sutphin PD, Hay MP, Denny WA, Giaccia AJ. A molecule targeting VHL-deficient renal cell carcinoma that induces autophagy. Cancer Cell. 2008; 14:90–102. [PubMed:18598947]
Veronese A, Lupini L, Consiglio J, Visone R, Ferracin M, Fornari F, Zanesi N, Alder H, D'Elia G,Gramantieri L, et al. Oncogenic Role of miR-483-3p at the IGF2/483 Locus. Cancer Res. 2010;70:3140–3149. [PubMed: 20388800]
Weidberg H, Shvets E, Shpilka T, Shmiron F, Shinder V, Elazar Z. LC3 and GATE/GABARAPsubfamilies are both essential yet act differently in autophagosome biogenesis. The EMBO J.2010; 29:1792–1802.
White E, DiPaola RS. The double-edged sword of autophagy modulation in cancer. Clin Cancer Res.2009; 15:5308–5316. [PubMed: 19706824]
Wu J, Dang Y, Su W, Liu C, Ma H, Shan Y, Pei Y, wan B, Guo J, Yo L. Molecular cloning andcharacterization of rat LC3A and LC3B- two novel markers of autophagosome. Biochem BiophysRes Comm. 2006; 339:437–442. [PubMed: 16300744]
Yi Y, Mikhaylova O, Mamedova A, Bastola P, Biesiada J, Alshaikh E, Levin L, Sheridan RM, MellerJ, Czyzyk-Krzeska MF. VHL-dependent patterns of RNA Polymerase II hydroxylation in humanrenal clear cell carcinomas. Clin Cancer Res. 2010; 16:5142–5152. [PubMed: 20978146]
Yang S, Wang X, Contino G, Liesa M, Sahin E, Ying H, Bause A, Li Y, Stommel JN, Dell’Antonio G,et al. Pancreatic Cancers require autophagy for tumor growth. Genes & Dev. 2011; 25:717–729.[PubMed: 21406549]
Yoshimoto T, Matsuura K, Karnan S, Tagawa H, Nakada C, Tanigawa M, Tsukamoto Y, Uchida T,Kashima K, Akizuki S, et al. High-resolution analysis of DNA copy number alterations and geneexpression in renal clear cell carcinoma. J Pathol. 2007; 213:392–401. [PubMed: 17922474]
Mikhaylova et al. Page 13
Cancer Cell. Author manuscript; available in PMC 2013 April 17.
NIH
-PA Author Manuscript
NIH
-PA Author Manuscript
NIH
-PA Author Manuscript
Significance
ccRCC tumor growth depends on abundant angiogenesis and activation of glycolyticmetabolic pathways that result from VHL loss and induction of hypoxia-inducible factor(HIF) and HIF targets. Here we show that loss of VHL also promotes, in an HIF-independent manner, access to nutrients from intracellular sources through activation ofLC3B-mediated autophagy. This autophagic program is necessary for tumor growth. Inaddition, VHL, by repressing HIF, induces expression of LC3C, which exercises tumor-suppressing activity. These findings support a role for VHL as a tumor suppressor in thecontrol of different autophagic programs. Addiction of cancer cells to oncogenicautophagy creates the possibility that miR-204 could be used in ccRCC therapy withminimal effects on normal renal cells.
Mikhaylova et al. Page 14
Cancer Cell. Author manuscript; available in PMC 2013 April 17.
NIH
-PA Author Manuscript
NIH
-PA Author Manuscript
NIH
-PA Author Manuscript
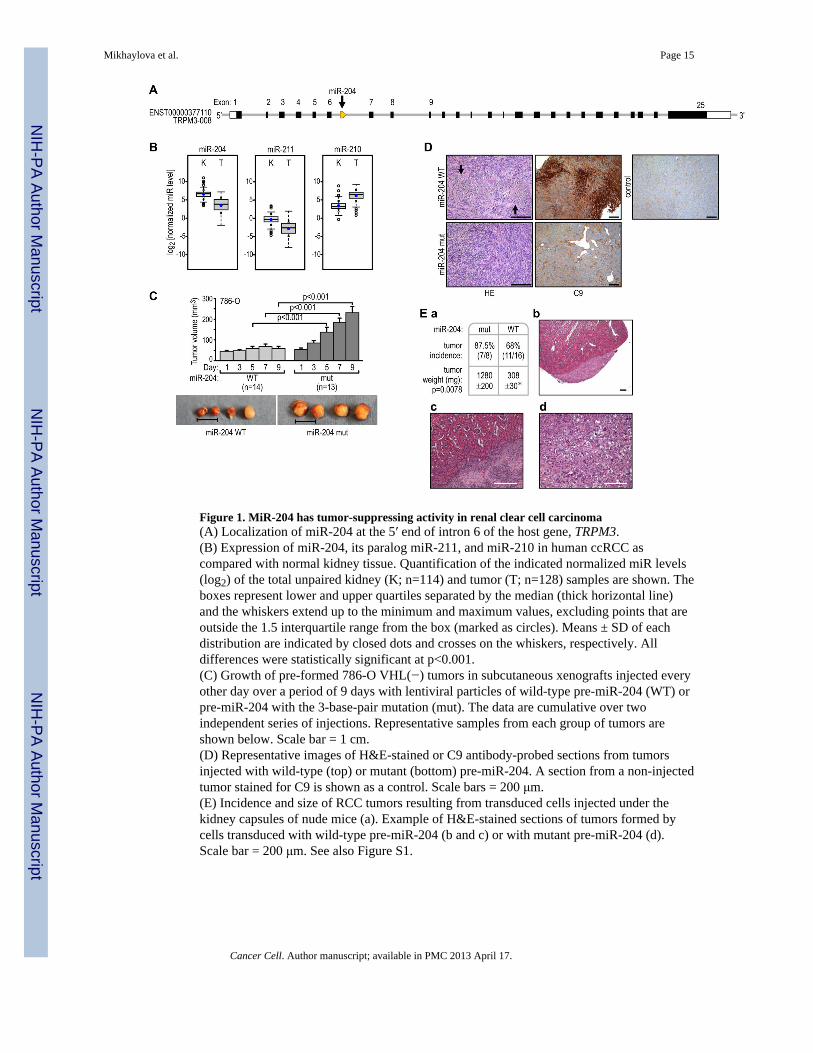
Figure 1. MiR-204 has tumor-suppressing activity in renal clear cell carcinoma(A) Localization of miR-204 at the 5′ end of intron 6 of the host gene, TRPM3.(B) Expression of miR-204, its paralog miR-211, and miR-210 in human ccRCC ascompared with normal kidney tissue. Quantification of the indicated normalized miR levels(log2) of the total unpaired kidney (K; n=114) and tumor (T; n=128) samples are shown. Theboxes represent lower and upper quartiles separated by the median (thick horizontal line)and the whiskers extend up to the minimum and maximum values, excluding points that areoutside the 1.5 interquartile range from the box (marked as circles). Means ± SD of eachdistribution are indicated by closed dots and crosses on the whiskers, respectively. Alldifferences were statistically significant at p<0.001.(C) Growth of pre-formed 786-O VHL(−) tumors in subcutaneous xenografts injected everyother day over a period of 9 days with lentiviral particles of wild-type pre-miR-204 (WT) orpre-miR-204 with the 3-base-pair mutation (mut). The data are cumulative over twoindependent series of injections. Representative samples from each group of tumors areshown below. Scale bar = 1 cm.(D) Representative images of H&E-stained or C9 antibody-probed sections from tumorsinjected with wild-type (top) or mutant (bottom) pre-miR-204. A section from a non-injectedtumor stained for C9 is shown as a control. Scale bars = 200 μm.(E) Incidence and size of RCC tumors resulting from transduced cells injected under thekidney capsules of nude mice (a). Example of H&E-stained sections of tumors formed bycells transduced with wild-type pre-miR-204 (b and c) or with mutant pre-miR-204 (d).Scale bar = 200 μm. See also Figure S1.
Mikhaylova et al. Page 15
Cancer Cell. Author manuscript; available in PMC 2013 April 17.
NIH
-PA Author Manuscript
NIH
-PA Author Manuscript
NIH
-PA Author Manuscript
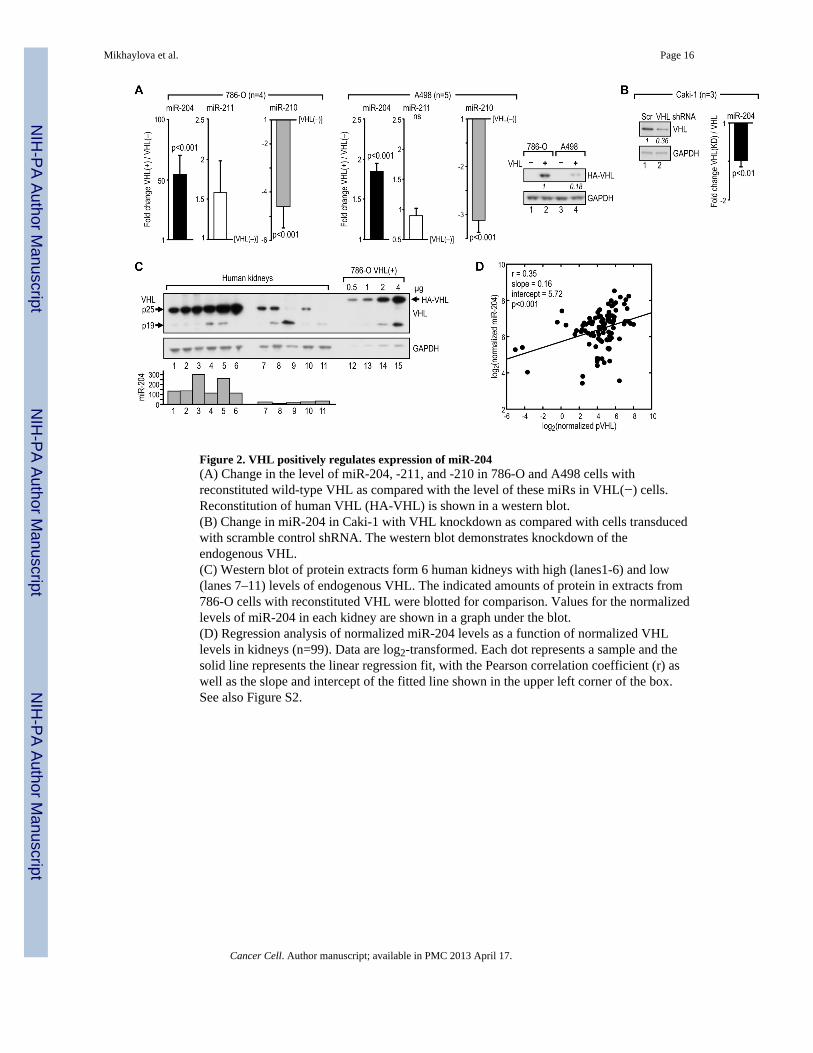
Figure 2. VHL positively regulates expression of miR-204(A) Change in the level of miR-204, -211, and -210 in 786-O and A498 cells withreconstituted wild-type VHL as compared with the level of these miRs in VHL(−) cells.Reconstitution of human VHL (HA-VHL) is shown in a western blot.(B) Change in miR-204 in Caki-1 with VHL knockdown as compared with cells transducedwith scramble control shRNA. The western blot demonstrates knockdown of theendogenous VHL.(C) Western blot of protein extracts form 6 human kidneys with high (lanes1-6) and low(lanes 7–11) levels of endogenous VHL. The indicated amounts of protein in extracts from786-O cells with reconstituted VHL were blotted for comparison. Values for the normalizedlevels of miR-204 in each kidney are shown in a graph under the blot.(D) Regression analysis of normalized miR-204 levels as a function of normalized VHLlevels in kidneys (n=99). Data are log2-transformed. Each dot represents a sample and thesolid line represents the linear regression fit, with the Pearson correlation coefficient (r) aswell as the slope and intercept of the fitted line shown in the upper left corner of the box.See also Figure S2.
Mikhaylova et al. Page 16
Cancer Cell. Author manuscript; available in PMC 2013 April 17.
NIH
-PA Author Manuscript
NIH
-PA Author Manuscript
NIH
-PA Author Manuscript

Figure 3. Cytotoxic effects of miR-204 in VHL(−) RCC cells are eliminated by reconstitutedwild-type VHL(A) Time line of the procedures performed during the course of experiments shown in B–E.In all experiments cells were plated at a density of 3,000 per well and the number of livecells treated with the scramble controls was between 10,000 and 20,000 at the time ofcollection (also see Figure 3C). Treatments were repeated at least three times in triplicate.(B) Percentages of live cells determined by trypan blue exclusion 48 hr after administrationof (a) short pre-miR-204 at the indicated concentrations as compared with the same cellstreated with scramble control (Scr) at the same concentrations or (b) lentiviral miR-204particles administered to the indicated cells as compared with the same cells treated withmutated miR-204 or empty virus (EV) in the presence of 0.1% or 10% serum. In (a) allexperiments were performed in the presence of 0.1% serum.(C) Example of a TEM microphotograph of VHL(-) cells dying from miR-204 cytotoxicity(left) and of live VHL(+) cells (right) under the same conditions. Scale bars = 2μm.(D) Numbers of live cells when fresh medium containing 10% serum was given 6 hr beforeadministration of miR-204 (see panel A).(E) Numbers of live cells when medium was supplemented with 10 mM glucose aftertreatment with miR-204 (see panel A). See also Figure S3.
Mikhaylova et al. Page 17
Cancer Cell. Author manuscript; available in PMC 2013 April 17.
NIH
-PA Author Manuscript
NIH
-PA Author Manuscript
NIH
-PA Author Manuscript
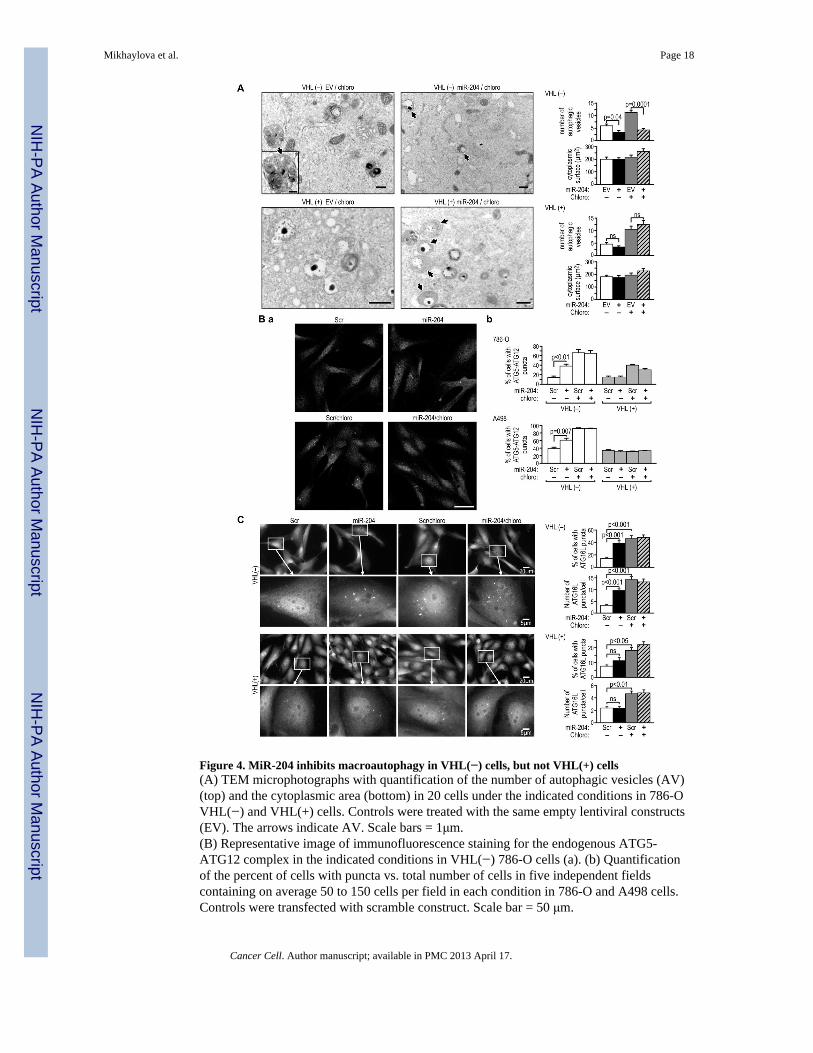
Figure 4. MiR-204 inhibits macroautophagy in VHL(−) cells, but not VHL(+) cells(A) TEM microphotographs with quantification of the number of autophagic vesicles (AV)(top) and the cytoplasmic area (bottom) in 20 cells under the indicated conditions in 786-OVHL(−) and VHL(+) cells. Controls were treated with the same empty lentiviral constructs(EV). The arrows indicate AV. Scale bars = 1μm.(B) Representative image of immunofluorescence staining for the endogenous ATG5-ATG12 complex in the indicated conditions in VHL(−) 786-O cells (a). (b) Quantificationof the percent of cells with puncta vs. total number of cells in five independent fieldscontaining on average 50 to 150 cells per field in each condition in 786-O and A498 cells.Controls were transfected with scramble construct. Scale bar = 50 μm.
Mikhaylova et al. Page 18
Cancer Cell. Author manuscript; available in PMC 2013 April 17.
NIH
-PA Author Manuscript
NIH
-PA Author Manuscript
NIH
-PA Author Manuscript
(C) Representative image of immunofluorescence staining for endogenous ATG16L punctain 786-O VHL(−) and VHL(+) cells under the indicated conditions. Percent of cellsexpressing puncta under the indicated conditions was calculated as in (B). 100 cellsexpressing puncta were analyzed for each condition, with the exception of non-treatedcontrols where the number of cells with puncta was small and only 30 to 50 cells werecounted. Control cells were treated with scramble construct. Scale bars are as indicated inthe figure. All measurements shown in this figure were performed on cells grown in 0.1%serum and 24–30 hr after treatment with miR-204. This was approximately 24 hr before celldeath was observed as shown in Figure 3B. See also Figure S4.
Mikhaylova et al. Page 19
Cancer Cell. Author manuscript; available in PMC 2013 April 17.
NIH
-PA Author Manuscript
NIH
-PA Author Manuscript
NIH
-PA Author Manuscript
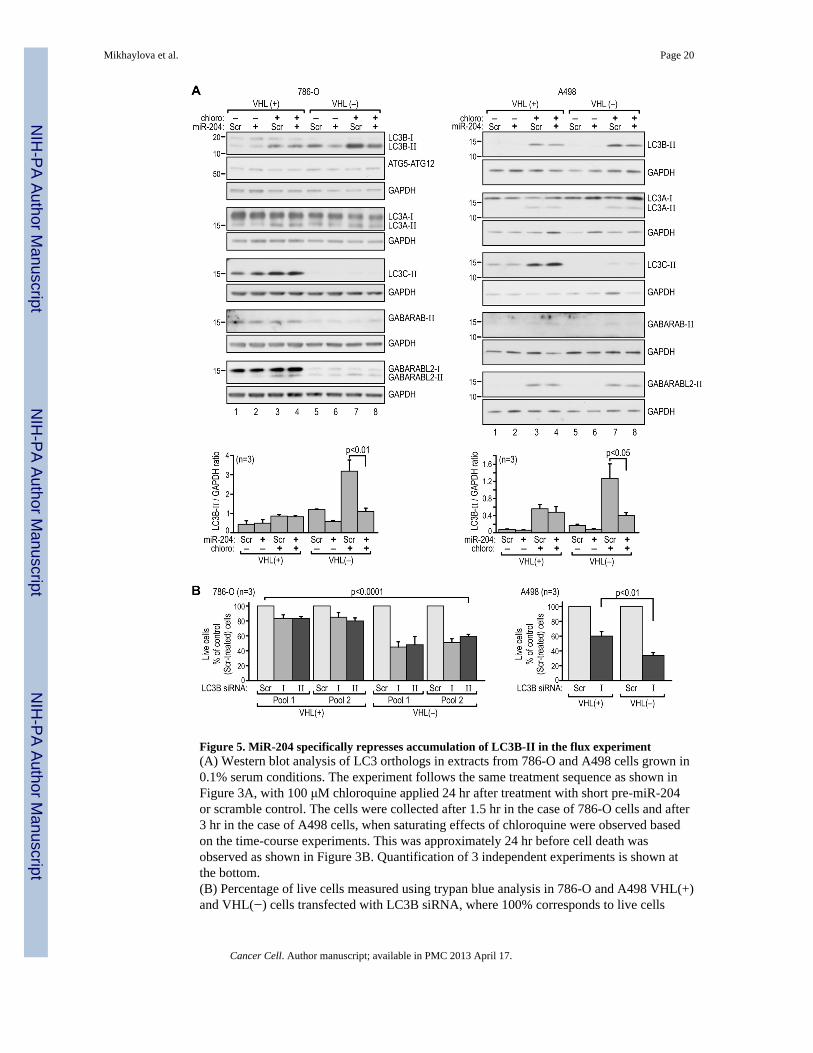
Figure 5. MiR-204 specifically represses accumulation of LC3B-II in the flux experiment(A) Western blot analysis of LC3 orthologs in extracts from 786-O and A498 cells grown in0.1% serum conditions. The experiment follows the same treatment sequence as shown inFigure 3A, with 100 μM chloroquine applied 24 hr after treatment with short pre-miR-204or scramble control. The cells were collected after 1.5 hr in the case of 786-O cells and after3 hr in the case of A498 cells, when saturating effects of chloroquine were observed basedon the time-course experiments. This was approximately 24 hr before cell death wasobserved as shown in Figure 3B. Quantification of 3 independent experiments is shown atthe bottom.(B) Percentage of live cells measured using trypan blue analysis in 786-O and A498 VHL(+)and VHL(−) cells transfected with LC3B siRNA, where 100% corresponds to live cells
Mikhaylova et al. Page 20
Cancer Cell. Author manuscript; available in PMC 2013 April 17.
NIH
-PA Author Manuscript
NIH
-PA Author Manuscript
NIH
-PA Author Manuscript

counted after transfection with scramble control construct. Time line as shown in Fig. S4A.See also Figure S5.
Mikhaylova et al. Page 21
Cancer Cell. Author manuscript; available in PMC 2013 April 17.
NIH
-PA Author Manuscript
NIH
-PA Author Manuscript
NIH
-PA Author Manuscript

Figure 6. MAP1LC3B is a direct target of miR-204(A) Sequence of the wild-type (WT) miR-204 site in the 3’UTR of LC3B, and mutation(mut) of the core binding site (a). (b) The 3’UTR of LC3B with the wild-type but not mutantmiR-204 site confers regulation by miR-204 to the luciferase reporter construct.(B) Effects of an anti–miR-204 lentiviral Zip or siRNAs on LC3B protein expression in 786-O VHL(+) RCC cells shown by western blot and quantification of 3 independentexperiments.(C) Regression analysis showing negative correlation between normalized miR-204 leveland normalized LC3B protein level in human ccRCC tumors with the wild-type VHL,performed as described in Figure 2D.
Mikhaylova et al. Page 22
Cancer Cell. Author manuscript; available in PMC 2013 April 17.
NIH
-PA Author Manuscript
NIH
-PA Author Manuscript
NIH
-PA Author Manuscript
(D) Representative western blot showing tumors with high and low levels of LC3B.Normalized values of miR-204 levels for each tumor are shown in a graph below the blot.Expression of LC3B in 786-O cells is shown as reference.(E) Western blot showing accumulation of LC3B-II in 786-O VHL(+) cells treated withanti-miR-204 in the absence or presence of 100 μM chloroquine.(F) 786-O VHL(−) cells transfected with RFP-LC3B or RFP were sorted, plated, andmaintained for 48 hr in medium containing 0.1% serum. Cells were then treated with 25 nMshort pre-miR-204 or scramble control construct and, 48 hr later, stained by DAPI. Fractionof live cells was determined among the stained and unstained cells in both conditions.(G) Quantification of endogenous ATG16L puncta per cell in 786-O VHL(−) cellstransfected with LC3B-RFP or RFP alone and treated with miR-204 as in (F). Red cells: (+)indicates cells expressing RFP fluorescence from either construct; (−) indicates cells that didnot express RFP fluorescence. Numbers of cells (n) in which puncta were counted is shownbelow the graph.(H) Effect of LC3B knockdown on cell death induced by miR-204. 786-O or A498 VHL(−)cells stably transfected with two different LC3B shRNAs or scramble construct wereadditionally transfected with miR-204 or scramble control. Two independent pools of 786-Ocells expressing LC3B sh I RNA were used (Pool 1 and Pool 2). N, non-treated cells; L,cells transfected with Lipofectamine only; Scr, cells transfected with scramble pre-miR-204control; 204, cells transfected with 50 nM of pre-miR-204. See also Figure S6.
Mikhaylova et al. Page 23
Cancer Cell. Author manuscript; available in PMC 2013 April 17.
NIH
-PA Author Manuscript
NIH
-PA Author Manuscript
NIH
-PA Author Manuscript
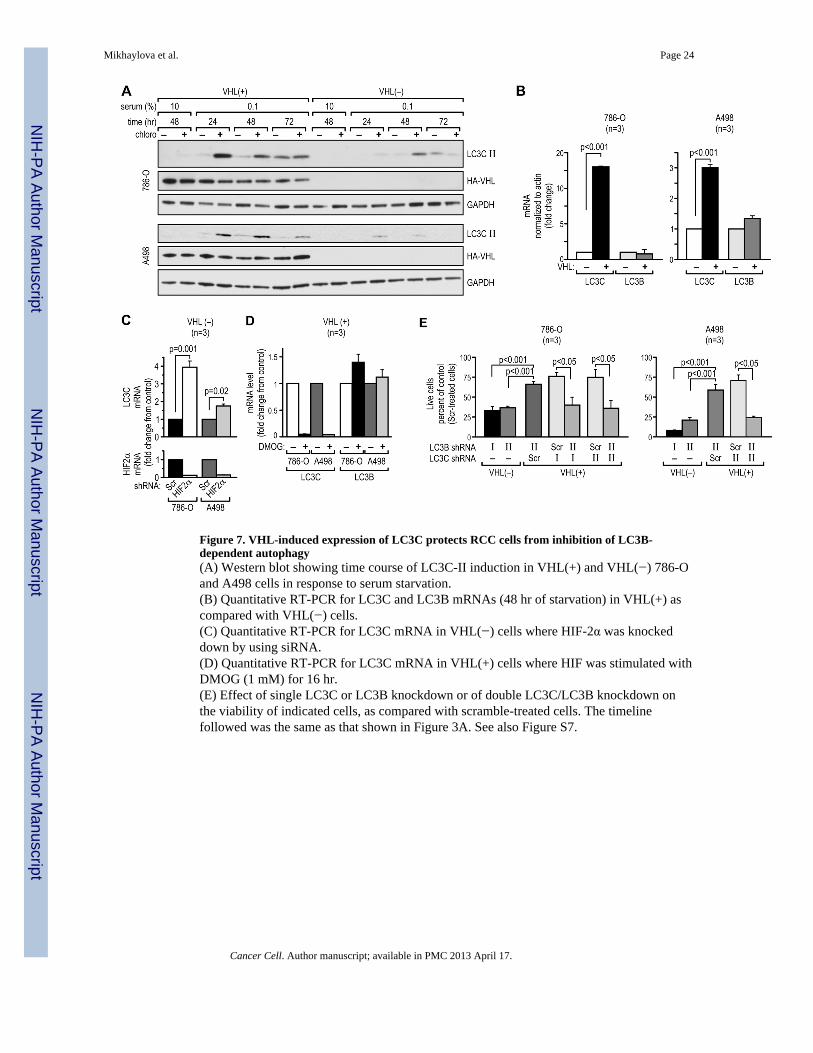
Figure 7. VHL-induced expression of LC3C protects RCC cells from inhibition of LC3B-dependent autophagy(A) Western blot showing time course of LC3C-II induction in VHL(+) and VHL(−) 786-Oand A498 cells in response to serum starvation.(B) Quantitative RT-PCR for LC3C and LC3B mRNAs (48 hr of starvation) in VHL(+) ascompared with VHL(−) cells.(C) Quantitative RT-PCR for LC3C mRNA in VHL(−) cells where HIF-2α was knockeddown by using siRNA.(D) Quantitative RT-PCR for LC3C mRNA in VHL(+) cells where HIF was stimulated withDMOG (1 mM) for 16 hr.(E) Effect of single LC3C or LC3B knockdown or of double LC3C/LC3B knockdown onthe viability of indicated cells, as compared with scramble-treated cells. The timelinefollowed was the same as that shown in Figure 3A. See also Figure S7.
Mikhaylova et al. Page 24
Cancer Cell. Author manuscript; available in PMC 2013 April 17.
NIH
-PA Author Manuscript
NIH
-PA Author Manuscript
NIH
-PA Author Manuscript
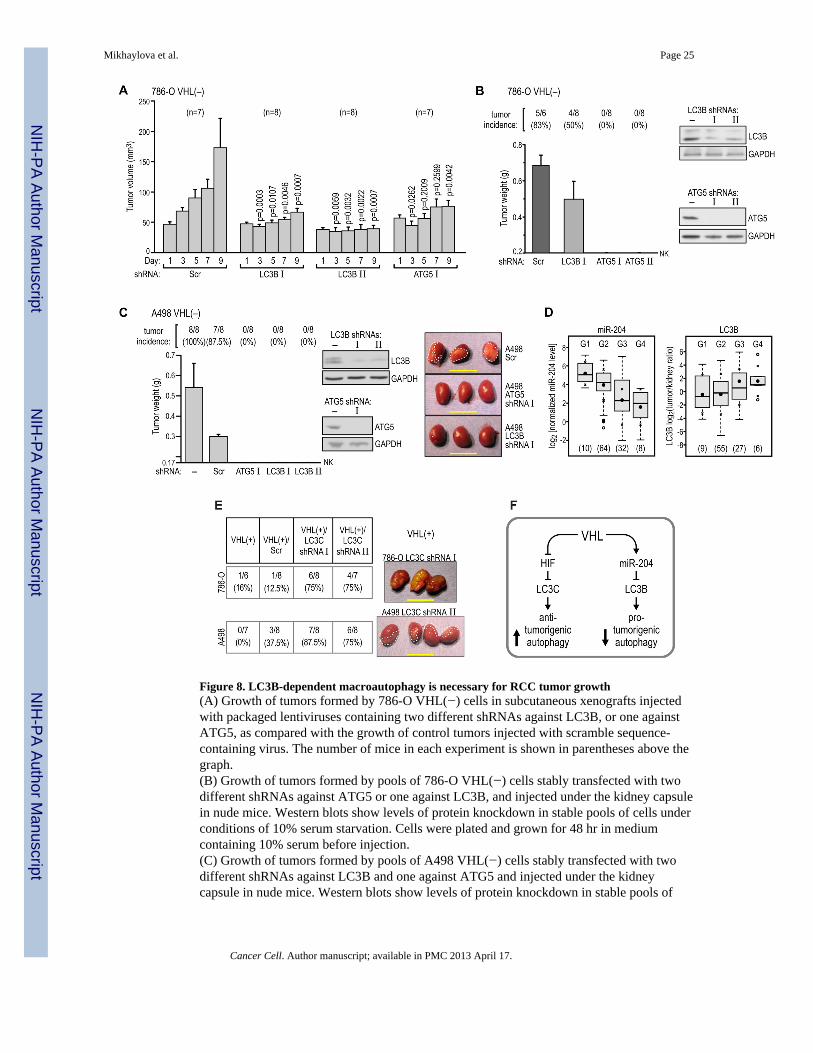
Figure 8. LC3B-dependent macroautophagy is necessary for RCC tumor growth(A) Growth of tumors formed by 786-O VHL(−) cells in subcutaneous xenografts injectedwith packaged lentiviruses containing two different shRNAs against LC3B, or one againstATG5, as compared with the growth of control tumors injected with scramble sequence-containing virus. The number of mice in each experiment is shown in parentheses above thegraph.(B) Growth of tumors formed by pools of 786-O VHL(−) cells stably transfected with twodifferent shRNAs against ATG5 or one against LC3B, and injected under the kidney capsulein nude mice. Western blots show levels of protein knockdown in stable pools of cells underconditions of 10% serum starvation. Cells were plated and grown for 48 hr in mediumcontaining 10% serum before injection.(C) Growth of tumors formed by pools of A498 VHL(−) cells stably transfected with twodifferent shRNAs against LC3B and one against ATG5 and injected under the kidneycapsule in nude mice. Western blots show levels of protein knockdown in stable pools of
Mikhaylova et al. Page 25
Cancer Cell. Author manuscript; available in PMC 2013 April 17.
NIH
-PA Author Manuscript
NIH
-PA Author Manuscript
NIH
-PA Author Manuscript
cells. Cells were treated as in panel B. Photographs of representative tumors are shown withdashed lines drawn to help visualize the tumors.(D) There is a significant decrease in the level of miR-204 (p<0.001) and a significantincrease in the level of LC3B (p<0.05) correlating with tumor grade in human ccRCCtumors. Because of the small number of tumors classified as Grades 1 and 4, the statisticalcomparison was made between combined subpopulations of G1+G2 vs. G3+G4 tumors. Thenumber of tumors of each grade is provided in parentheses at the bottom. Statistics werecalculated as in Figure 1B. Means ± SD are shown.(E) Formation of tumors in orthotopic xenografts by VHL(+) 786-O and A498 with stableknockdowns of LC3C using two different LC3C shRNAs in each cell line. The table listsnumbers of mice analyzed and photographs of representative tumors are shown. Dashedlines help visualize tumorigenic infiltrate of A498 cells. All scale bars = 1 cm.(F) Schematic representation of the role of VHL in the regulation of autophagy in RCCtumor growth. See also Figure S8.
Mikhaylova et al. Page 26
Cancer Cell. Author manuscript; available in PMC 2013 April 17.
NIH
-PA Author Manuscript
NIH
-PA Author Manuscript
NIH
-PA Author Manuscript