Vertical profiling of aerosol particles and trace gases over the central Arctic Ocean during summer
27
Atmos. Chem. Phys., 13, 12405–12431, 2013 www.atmos-chem-phys.net/13/12405/2013/ doi:10.5194/acp-13-12405-2013 © Author(s) 2013. CC Attribution 3.0 License. Atmospheric Chemistry and Physics Open Access Vertical profiling of aerosol particles and trace gases over the central Arctic Ocean during summer P. Kupiszewski 1,2 , C. Leck 1 , M. Tjernström 1 , S. Sjogren 3 , J. Sedlar 4 , M. Graus 5,6 , M. Müller 7 , B. Brooks 8 , E. Swietlicki 3 , S. Norris 9 , and A. Hansel 7 1 Department of Meteorology and Bert Bolin Centre for Climate Research, Stockholm University, 10691 Stockholm, Sweden 2 Laboratory of Atmospheric Chemistry, Paul Scherrer Institute, 5232 Villigen PSI, Switzerland 3 Department of Physics, Lund University, Lund, Sweden 4 Swedish Meteorological and Hydrological Institute, Remote Sensing Division, Norrköping, Sweden 5 Cooperative Institute for Research in Environmental Sciences (CIRES), University of Colorado, Boulder, CO 80309, USA 6 NOAA Earth Sciences Research Lab, Chemical Sciences Division, Boulder, CO 80305, USA 7 Institute of Ion and Applied Physics, University of Innsbruck, 6020 Innsbruck, Austria 8 National Centre for Atmospheric Science, Leeds, UK 9 Institute for Climate and Atmospheric Science, School of Earth and Environment, University of Leeds, UK Correspondence to: P. Kupiszewski ([email protected]) Received: 4 March 2013 – Published in Atmos. Chem. Phys. Discuss.: 19 April 2013 Revised: 27 October 2013 – Accepted: 12 November 2013 – Published: 19 December 2013 Abstract. Unique measurements of vertical size-resolved aerosol particle concentrations, trace gas concentrations and meteorological data were obtained during the Arctic Sum- mer Cloud Ocean Study (ASCOS, www.ascos.se), an Inter- national Polar Year project aimed at establishing the pro- cesses responsible for formation and evolution of low-level clouds over the high Arctic summer pack ice. The experiment was conducted from on board the Swedish icebreaker Oden, and provided both ship- and helicopter-based measurements. This study focuses on the vertical helicopter profiles and on- board measurements obtained during a three-week period when Oden was anchored to a drifting ice floe, and sheds light on the characteristics of Arctic aerosol particles and their distribution throughout the lower atmosphere. Distinct differences in aerosol particle characteristics within defined atmospheric layers are identified. Within the lowermost couple hundred metres, transport from the marginal ice zone (MIZ), condensational growth and cloud processing develop the aerosol population. During two of the four representative periods defined in this study, such in- fluence is shown. At altitudes above about 1 km, long-range transport occurs frequently. However, only infrequently does large-scale subsidence descend such air masses to become entrained into the mixed layer in the high Arctic, and there- fore long-range transport plumes are unlikely to directly in- fluence low-level stratiform cloud formation. Nonetheless, such plumes can influence the radiative balance of the plane- tary boundary layer (PBL) by influencing formation and evo- lution of higher clouds, as well as through precipitation trans- port of particles downwards. New particle formation was oc- casionally observed, particularly in the near-surface layer. We hypothesize that the origin of these ultrafine particles could be in biological processes, both primary and secondary, within the open leads between the pack ice and/or along the MIZ. In general, local sources, in combination with upstream boundary-layer transport of precursor gases from the MIZ, are considered to constitute the origin of cloud condensation nuclei (CCN) particles and thus be of importance for the for- mation of interior Arctic low-level clouds during summer, and subsequently, through cloud influences, for the melting and freezing of sea ice. 1 Introduction The Earth has experienced a statistically significant warm- ing over the past century, mainly as a result of the an- thropogenic greenhouse effect (IPCC, 2007). The Arctic is Published by Copernicus Publications on behalf of the European Geosciences Union.
Transcript of Vertical profiling of aerosol particles and trace gases over the central Arctic Ocean during summer

Atmos. Chem. Phys., 13, 12405–12431, 2013www.atmos-chem-phys.net/13/12405/2013/doi:10.5194/acp-13-12405-2013© Author(s) 2013. CC Attribution 3.0 License.
Atmospheric Chemistry
and PhysicsO
pen Access
Vertical profiling of aerosol particles and trace gases over the centralArctic Ocean during summer
P. Kupiszewski1,2, C. Leck1, M. Tjernström 1, S. Sjogren3, J. Sedlar4, M. Graus5,6, M. Müller 7, B. Brooks8,E. Swietlicki3, S. Norris9, and A. Hansel7
1Department of Meteorology and Bert Bolin Centre for Climate Research, Stockholm University, 10691 Stockholm, Sweden2Laboratory of Atmospheric Chemistry, Paul Scherrer Institute, 5232 Villigen PSI, Switzerland3Department of Physics, Lund University, Lund, Sweden4Swedish Meteorological and Hydrological Institute, Remote Sensing Division, Norrköping, Sweden5Cooperative Institute for Research in Environmental Sciences (CIRES), University of Colorado, Boulder, CO 80309, USA6NOAA Earth Sciences Research Lab, Chemical Sciences Division, Boulder, CO 80305, USA7Institute of Ion and Applied Physics, University of Innsbruck, 6020 Innsbruck, Austria8National Centre for Atmospheric Science, Leeds, UK9Institute for Climate and Atmospheric Science, School of Earth and Environment, University of Leeds, UK
Correspondence to:P. Kupiszewski ([email protected])
Received: 4 March 2013 – Published in Atmos. Chem. Phys. Discuss.: 19 April 2013Revised: 27 October 2013 – Accepted: 12 November 2013 – Published: 19 December 2013
Abstract. Unique measurements of vertical size-resolvedaerosol particle concentrations, trace gas concentrations andmeteorological data were obtained during the Arctic Sum-mer Cloud Ocean Study (ASCOS,www.ascos.se), an Inter-national Polar Year project aimed at establishing the pro-cesses responsible for formation and evolution of low-levelclouds over the high Arctic summer pack ice. The experimentwas conducted from on board the Swedish icebreakerOden,and provided both ship- and helicopter-based measurements.This study focuses on the vertical helicopter profiles and on-board measurements obtained during a three-week periodwhen Odenwas anchored to a drifting ice floe, and shedslight on the characteristics of Arctic aerosol particles andtheir distribution throughout the lower atmosphere.
Distinct differences in aerosol particle characteristicswithin defined atmospheric layers are identified. Withinthe lowermost couple hundred metres, transport from themarginal ice zone (MIZ), condensational growth and cloudprocessing develop the aerosol population. During two ofthe four representative periods defined in this study, such in-fluence is shown. At altitudes above about 1 km, long-rangetransport occurs frequently. However, only infrequently doeslarge-scale subsidence descend such air masses to becomeentrained into the mixed layer in the high Arctic, and there-
fore long-range transport plumes are unlikely to directly in-fluence low-level stratiform cloud formation. Nonetheless,such plumes can influence the radiative balance of the plane-tary boundary layer (PBL) by influencing formation and evo-lution of higher clouds, as well as through precipitation trans-port of particles downwards. New particle formation was oc-casionally observed, particularly in the near-surface layer.We hypothesize that the origin of these ultrafine particlescould be in biological processes, both primary and secondary,within the open leads between the pack ice and/or along theMIZ. In general, local sources, in combination with upstreamboundary-layer transport of precursor gases from the MIZ,are considered to constitute the origin of cloud condensationnuclei (CCN) particles and thus be of importance for the for-mation of interior Arctic low-level clouds during summer,and subsequently, through cloud influences, for the meltingand freezing of sea ice.
1 Introduction
The Earth has experienced a statistically significant warm-ing over the past century, mainly as a result of the an-thropogenic greenhouse effect (IPCC, 2007). The Arctic is
Published by Copernicus Publications on behalf of the European Geosciences Union.
12406 P. Kupiszewski et al.: Vertical profiling of aerosol particles and trace gases
a region particularly susceptible to climate change and haswarmed at a rate more than twice that of the global aver-age since the mid-1960s (Jeffries and Richter-Menge, 2012).General Circulation Models (GCMs) project that this trendwill continue over the course of the 21st century (Hollandand Bitz, 2003; ACIA, 2005). Furthermore, summer sea iceextent is decreasing rapidly (Lindsay, 2009), with model sim-ulations projecting that the summer Arctic may become es-sentially ice-free by or even before the mid-21st century(Holland et al., 2006). Meanwhile, climate models face manyissues when projecting Arctic climate; there is a large scatterbetween model simulations, larger than for any other regionon Earth (Raisanen, 2001; ACIA, 2005; Serreze and Francis,2006). This is likely due to inaccurate descriptions of manyof the physical feedbacks and processes within the Arctic cli-mate system (Prenni et al., 2007). Clouds, and related climatefeedbacks, are a major cause of uncertainty in climate modelprojections (Soden and Held, 2006; IPCC, 2007). Clouds arealso considered to be one of the most important factors forthe surface energy balance in the Arctic (Intrieri et al., 2002).
Clouds both reflect incoming solar radiation and enhancethe downward longwave flux by emitting infrared radiation(Ramanathan et al., 1989; Curry et al., 1993; Zhang et al.,1996). As one of the primary determinants of the surfaceenergy balance (Curry and Ebert, 1992; Curry et al., 1993;Mauritsen et al., 2011; Sedlar et al., 2011) they influencethe freezing, melting and thickness of the perennial sea ice(Maykut and Untersteiner, 1971; Kay and Gettelman, 2009).The shortwave reflectivity and longwave emissivity of cloudsare affected by the number concentration of aerosol particles,which, via their role as cloud condensation nuclei (CCN),facilitate the formation of liquid cloud droplets and deter-mine cloud optical and microphysical properties (Curry et al.,2000; Garrett and Zhao, 2006; Mauritsen et al., 2011), suchas albedo, life-time and optical depth.
The limited impact of anthropogenic and continentalsources and the resulting low particle concentrations in thesummertime Arctic (Bigg et al., 1996; Covert et al., 1996;Leck and Persson, 1996b; Nilsson and Leck, 2002; Heintzen-berg et al., 2006; Heintzenberg and Leck, 2012), alongwith the semi-permanent ice cover, contribute to a complexrelationship between aerosol particles, low-level stratiformclouds, radiation and surface albedo (Leck and Bigg, 2007;Sedlar et al., 2011; Heintzenberg and Leck, 2012). The highalbedo of sea ice and snow, in combination with low insola-tion, results in low clouds having a warming effect at the sur-face during most of the year (Walsh and Chapman, 1998; In-trieri et al., 2002), in contrast to the net global cooling effect(Schneider, 1972; Ramanathan et al., 1989). Furthermore, thesemi-permanent ice cover together with the low particle con-centrations results in a high sensitivity of the climate system;even small changes in either have a strong impact on the en-ergy balance and summer ice-melt (Leck and Bigg, 2007;Mauritsen et al., 2011; Heintzenberg and Leck, 2012).
Meanwhile, field-study-based analysis of aerosol–cloudinteractions in the high Arctic has been severely hamperedby difficulties in conducting in situ measurements in a re-mote and hostile environment. A further complication is thefrequently occurring vertical stratification of aerosol and gasconcentrations (Bigg et al., 1996, 2001). The formation ofaerosol layers is governed by several factors, such as atmo-spheric mixing and air mass origin over the Arctic, as wellas the sources of the precursor gases and aerosol particlesthemselves. A number of hypotheses regarding the sourcesof the high Arctic summer aerosol have been put forwardand a brief overview follows.
Whilst the regional, and specifically the inner-Arctic,lower troposphere is widely considered to be one of thecleanest in the world in summer (Bigg et al., 1996; Heintzen-berg et al., 2006), long-range transport of pollution plumesleads to episodic increases in aerosol concentrations at al-titudes above the planetary boundary layer (PBL). Accord-ing to Pacyna and Oehme (1988), transport of organic pol-lutants, such as hexachlorocyclohexane, hexachlorobenzene,pentachlorobenzene andα-chlordane – mainly from the for-mer Soviet Union, but also from North America and Eu-rope – could be responsible for observed plumes. It hasalso been suggested that boreal forest fires, occurring pre-dominantly in the summer (Stohl, 2006; Stohl et al., 2006)contribute to the pollution plumes at an altitude of severalkilometres (Shipham et al., 1992; Koch and Hansen, 2005;Stohl et al., 2006). In spring, the widespread use of pes-ticides in Asia, Europe and North America would explainthe elevated concentrations of organic compounds measuredby Pacyna and Oehme (1988) at a number of Arctic islandstations. In contrast to the long-range transport sources de-scribed above, Hegg et al. (1995) found that in situ parti-cle production is likely to be taking place aloft. This viewwas also shared by Garrett et al. (2002) who suggested thathomogeneous-bimolecular nucleation of sulphuric acid andwater vapour may be responsible for the high concentrationsof 20–300 nm diameter particles, which they frequently de-tected within several hundred metres above low-level stratusclouds. Wiedensohler et al. (1996) presented statistical evi-dence to suggest that in situ particle production observed inthe PBL over the Arctic pack ice area probably originatedfrom higher altitudes. Hence it was speculated that the freetroposphere was a possible origin of newly formed particlesin the Arctic. Subsequently, Leck and Bigg (1999) used thePBL structure and the vertical distribution of particles duringnucleation events to show that, if the newly formed particlesdid come from above, they had to come from a level lessthan 140 m above the surface, and not from the free tropo-sphere. Particles with sizes below 50 nm in diameter duringfour Arctic icebreaker expeditions, in the summers of 1991(Leck et al., 1996), 1996 (Leck et al., 2001), 2001 (Lecket al., 2004; Tjernström et al., 2004) and 2008 (Paatero et al.,2009; Tjernström et al., 2013), have been shown to be pro-duced by in situ fine-particle sources over the high Arctic
Atmos. Chem. Phys., 13, 12405–12431, 2013 www.atmos-chem-phys.net/13/12405/2013/

P. Kupiszewski et al.: Vertical profiling of aerosol particles and trace gases 12407
pack ice and possibly have their origin in the open water be-tween ice floes (Leck and Bigg, 1999, 2010; Heintzenberget al., 2006; Heintzenberg and Leck, 2012).
Due to the usually low concentrations of aerosol particlesover the inner Arctic pack ice area in summer, naturalsurface particle sources have been emphasized as beingmuch more important than transport from continentalsources (Leck and Persson, 1996b; Leck and Bigg, 1999,2005a, 2010; Bigg and Leck, 2001b; Kerminen and Leck,2001; Leck et al., 2002; Chang et al., 2011). One suchlocal source over the central Arctic Ocean is dimethylsulphide (DMS), which, via photochemical oxidation andsubsequent condensation on pre-existing particles, formsmethanesulfonate (CH3SO−
3 ) and non-sea-salt sulphate(nss SO2−
4 ) (Heintzenberg and Leck, 1994; Leck andPersson, 1996a, b; Quinn et al., 2007). DMS is a gas ofphytoplankton origin, and its production and breakdown inthe water column must be regarded as a result of complexphysiological and ecological interactions, as demonstratedin Leck et al. (1990). Its concentration in water and airhas a high seasonal variability, peaking during the summermonths as a result of heightened biological productivity,with the highest concentrations being found in open waterat the ice margin (Leck and Persson, 1996a, b). The im-portance of this precursor gas may increase as climatewarming over the Arctic proceeds; an in-crease in summer concentrations of MSA−
and nss SO2−
4 (12 % and 8 %yr−1, respectively) has al-ready been measured, based on an analysis of 1976–2008data from Barrow, Alaska (Quinn et al., 2009).
Organic particulate matter found in the summer Arcticcould be created via several pathways. Fu et al. (2009) dis-covered that oxidation of biogenic volatile organic com-pounds, such as isoprene, contributed to the aerosol popu-lation in the Canadian high Arctic. Another mechanism –which has been considered based on observations of parti-cle growth at Summit, Greenland – is the release, and subse-quent condensation, of organics from the snowpack (Ziembaet al., 2010). Recent results have clearly demonstrated thatbiogenic microcolloids shown to be polymer gels (Chin et al.,1998; Orellana et al., 2007), produced by phytoplankton andsea ice algae biological secretions, could constitute an im-portant source of CCN in the pristine high Arctic summer(Orellana et al., 2011). These results verify past studies of thesummer aerosol–cloud relationship over the Arctic pack ice(Bigg and Leck, 2001a, 2008; Leck et al., 2002; Bigg et al.,2004; Leck and Bigg, 2005a, b, 2010). The polymer micro-gels are emitted directly from open leads via bubble bursting(Norris et al., 2011) and are made up of heat-resistant, highlysurface-active and highly hydrated (99 % water) polysac-charide molecules spontaneously forming three-dimensionalnetworks inter-bridged by divalent ions (Ca2+/Mg2+), towhich other organic compounds, such as proteins and lipids,are readily bound (Decho, 1990).
The variety of local and long-range transport aerosolsources impacting different atmospheric vertical layersclearly suggests that predictions of cloud properties based onsurface aerosol concentration measurements are both highlycomplex and uncertain and are critically dependent on theboundary layer evolution and atmospheric mixing betweenthe surface and aloft. Consequently, in order to better under-stand low-level stratiform cloud formation over the pack icein summer, emphasis should be placed on vertical profilingof the atmosphere. Such an approach provides valuable infor-mation on the importance of the respective aerosol sources asCCN precursors, and on the mechanisms via which aerosolparticles are transported vertically and entrained within low-level stratiform clouds.
In this context, the vertical profiles of size-resolved aerosolparticles and meteorological data, obtained with a helicopterduring the Arctic Summer Cloud Ocean Study (ASCOS)(www.ascos.se) in 2008 and presented in this paper, con-stitute a unique and important data set. It should be notedthat there are a number of existing publications on verticalaerosol measurements over the Arctic using aircraft (e.g. Ya-manouchi et al., 2005; Engvall et al., 2008), as well as un-manned aerial systems (Bates et al., 2013). However, thesestudies have predominantly taken place at lower latitudesthan the ASCOS study, where additional atmospheric mecha-nisms and processes are of importance. Only two other cam-paigns have conducted similar (albeit less comprehensive)measurements of the vertical stratification of aerosol, and gasphase DMS, over the high Arctic north of 80◦: the ArcticOcean Experiment 1996 (AOE-96) (Bigg et al., 2001; Lecket al., 2001) and the Arctic Ocean Experiment 2001 (AOE-2001) (Lundén et al., 2010), with the latter also includingacetonitrile measurements.The present study focuses on 38of the vertical helicopter profiles, obtained during a three-week period while the Swedish icebreakerOden was an-chored to a drifting ice floe within the high Arctic pack icearea. The helicopter aerosol profiles are analysed in conjunc-tion with meteorological data and onboard particle measure-ments, with simultaneous profiling of DMS and acetonitrile(used as tracers for air that has been in contact with sea andbiomass burning, respectively), with the aim of establishingthe characteristics of Arctic aerosol particles and their dis-tribution throughout the lower atmosphere. In particular, thevertical stratification of aerosol particles and its dependence,or lack thereof, on local sources, aerosol processing, trans-port pathways and atmospheric mixing are presented.
2 Geographical setting, instrumentation and methods
2.1 The Arctic Summer Cloud Ocean Study 2008expedition
The data analysed in this study and presented in this paperwere obtained during ASCOS in 2008, an Arctic cruise on
www.atmos-chem-phys.net/13/12405/2013/ Atmos. Chem. Phys., 13, 12405–12431, 2013

12408 P. Kupiszewski et al.: Vertical profiling of aerosol particles and trace gases
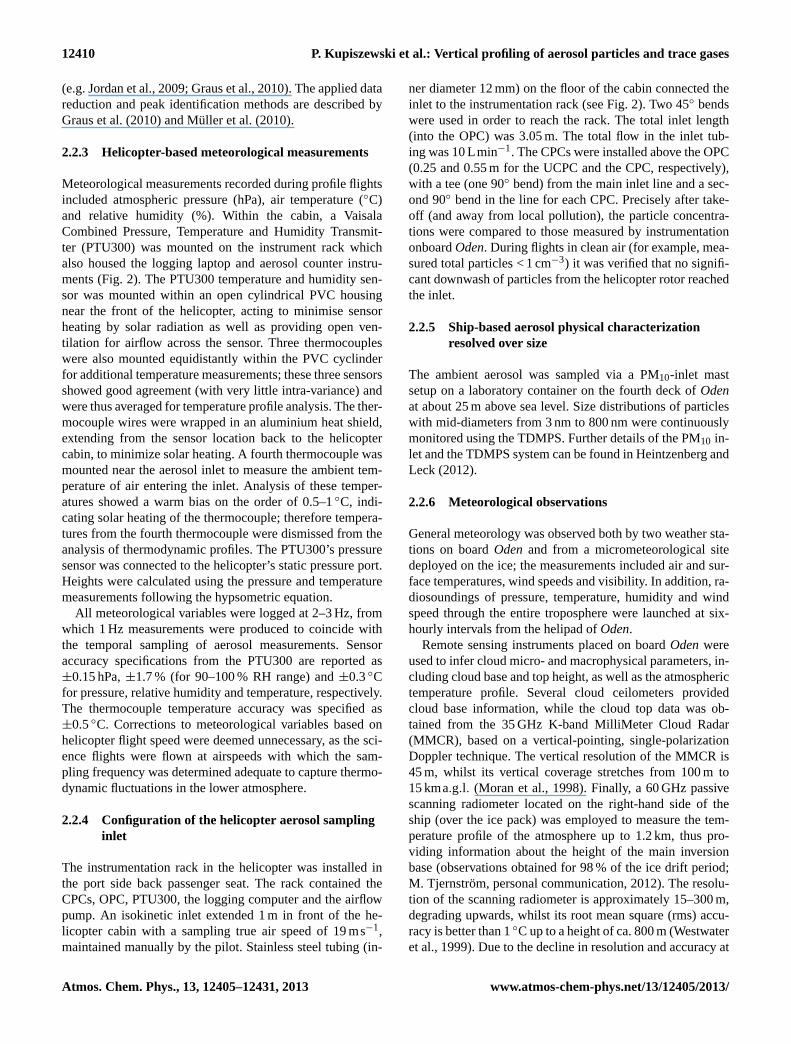
Fig. 1.Odenicebreaker track (pink) with the ice-drift path enlargedin the insert marked red. The circle indicates the start of the ice-drift. The observed ice edge on 12 August 2008 is given by the thinblue line.
board the Swedish icebreakerOden, carried out as part ofthe International Polar Year (IPY) 2007–2008. The expedi-tion was highly interdisciplinary, with a plethora of measure-ments being conducted in the fields of marine biology, atmo-spheric chemistry, oceanography and meteorology. The over-riding aim of the expedition was improving our understand-ing of low-level stratiform cloud formation and evolution insummer over the central Arctic Ocean (north of 80◦), in or-der to clarify processes between the surface, cloud layers andfree atmosphere. One particular focus was placed on the con-nections between marine microbiological productivity (as itis most active during this period), CCN and cloud formation.
The expedition departed from Longyearbyen, Svalbard on2 August 2008 (day of year, DoY, 215; note the leap year),and headed north for the pack ice of the central Arctic Ocean(see Fig. 1). On 12 August (DoY 225)Odenwas anchoredto a large ice floe, slightly north of 87◦ N, and proceeded todrift with the ice floe for the following three weeks (referredto henceforth as the ice drift), until midnight between 1 and2 September (DoY 245–246). For further cruise details seePaatero et al. (2009) and Tjernström et al. (2013).
2.2 Instrumentation
2.2.1 Helicopter-based particle counters
Two condensation particle counters (CPCs) placed on boardthe helicopter (Fig. 2) were employed in parallel in order tomeasure the concentration of submicrometre aerosol parti-
Fig. 2.The ASCOS 2008 expedition helicopter with instrument andair inlet locations.
cles. Each of the CPCs measured the integral number con-centration of particles with a diameter over a certain thresh-old. Details of the operating principles can be found in Her-mann and Wiedensohler (2001). The two CPCs used werethe TSI model 3025 Ultrafine Condensation Particle Counter(UCPC) and the TSI model 7610 CPC. The UCPC detectedparticles larger than 3 nm in diameter, whilst the CPC de-tected particles larger than 14 nm in diameter. The upper de-tection limit of the CPCs in the system was approximately3 µm. In order to verify the functioning of the CPCs, CPCconcentrations measured whilst the helicopter was on deckwere compared with those obtained using the twin differ-ential mobility particle sizer (TDMPS) on boardOden. Thecounts agreed to within±20 %.
The Compact Lightweight Aerosol Spectrometer Probe(CLASP) optical particle counter (OPC), developed at theUniversity of Leeds, is theoretically able to determine theconcentration of aerosols between 300 nm and 30 µm in di-ameter. However, due to the inlet and subsequent tubinglosses in our experiment, few particles larger than the 50 %cut-off diameter of 9.5 µm reach the instruments. The tem-poral resolution of the instrument is 10 Hz, making it wellsuited for aircraft sampling. In-depth information about theworkings of the CLASP is given by Hill et al. (2008).The CLASP OPC and the CPCs were placed on board thehelicopter in the left back seat, on a common instrumenta-tion rack (Fig. 2).
By employing two CPCs with different threshold diam-eters and subtracting the integral number concentration ofthe CPC from that of the UCPC, the number concentrationof particles in the diameter size range 3–14 nm, (approxi-mately representing the ultrafine particle concentration) was
Atmos. Chem. Phys., 13, 12405–12431, 2013 www.atmos-chem-phys.net/13/12405/2013/
P. Kupiszewski et al.: Vertical profiling of aerosol particles and trace gases 12409
obtained. Particles in this size range will be referred to asD3−14. By subtracting the integral number concentration ofthe OPC instrument from that of the CPC, the number con-centration of particles in the diameter size range 14–300 nm,henceforth referred to asD14−300, was obtained. Whilstthis size range encompasses both Aitken-mode and smalleraccumulation-mode particles, by number it mainly representsthe Aitken mode (due to the generally much higher numberconcentrations of smaller particles). Finally, the number con-centration of particles larger than 300 nm, representing largeraccumulation-mode particles, was measured by the OPC andthese particles will be referred to asD>300.
The aerosol particle number concentration data from boththe CPC and OPC counters has been adjusted for standardtemperature (0◦C) and pressure (1013.25 hPa), as defined byNIST (the National Institute of Standards and Technology),and has been provided at a frequency of 1 Hz. Furthermore,the following corrections were applied to the instrumentationdata: first, adjustments were made to the UCPC data in orderto account for changes in the amount of air pumped by theinstrument with altitude. This was necessary as the air flow iscontrolled by a pressure sensor, with the pressure drop overa capillary kept constant over time. Therefore, the volumeflow rate increases with height (as density decreases), leadingto excessively high concentrations being recorded at greateraltitudes (almost linearly up to 6 % error at 3500 m). Second,both the UCPC and CPC concentrations were corrected foractual flow readings done at intervals between the flights. Airflow in the CPC was controlled using a critical orifice, witha constant volume flow when the temperature of the orificeand air stream remains constant, which was approximatelythe case (potential errors are relatively low at 3 % for a 10 Kdifference in temperature).
Data collected from the CLASP instrument have been cor-rected for losses through the sample tubing based on tubinglength, as well as the number and angle of bends (tubing di-mensions as described in Sect. 2.2.4). To adjust the data forvariations in relative humidity (RH) during sampling, the fol-lowing steps were taken: the outside temperature and RH –as measured by a PTU300 sensor (see Sect. 2.2.3) – weretaken as the starting conditions of the sampled air. The RHat the entrance of the CLASP unit was then calculated (gen-erally around 20 %), based on the starting conditions and anassumed cabin temperature of 20◦C, and the data were thencorrected to an RH of 0 % (dry size).
However, neither the CPC nor the OPC data have beencorrected for losses due to inlet transmission efficiency de-pending on variations in flight speed and orientation. Fur-thermore, counting errors could occur due to changes in thesample temperature during transmission through the samplelines. As the sample is transferred from the colder ambientenvironment to the warmer helicopter interior, evaporationof volatile particle constituents could take place, resultingin a decrease in the size of the particles, possibly to belowthe lower detection limit of the instruments; such a process
would result in undercounting of the total particle number.The data have not been corrected to account for this possibil-ity.
From the ship, the helicopter was flown perpendicular tothe wind direction, and turned slightly upwind before the re-turn flight. This method was chosen in order to ensure sam-pling of unpolluted air, as well as not to disturb the measure-ments on board the ship.
2.2.2 Helicopter-based gas-phase DMS and acetonitrile
A custom-built, portable air-sampling unit was installed inthe helicopter for eight flights for off-line volatile organiccompound (VOC) analysis. The heated VOC inlet (1/4′′
Silcosteel®; Restek Corporation, Bellefonte, PA, USA) wasmounted to the aerosol inlet, protruding 1 m from the front ofthe helicopter (Fig. 2). A pump (KNF Neuberger, Balterswil,Switzerland) continuously drew ambient air through a mani-fold, to which eight SilcoCan® air monitoring canisters (6 Lvolume; Restek Corporation, Bellefonte, PA, USA) wereconnected via shut-off valves. A pressure gauge recorded thepressure in the manifold.
Before each flight, all SilcoCans were preconditioned at50◦C by evacuation, refilled with VOC-free air, and finallyevacuated to a pressure below 2 mbar before the samplingunit was strapped into the helicopter. Air samples were col-lected at different heights at the discretion of the flight sci-entist by manually closing the pump valve and opening anindividual SilcoCan. The filling took about 30 s (height-dependent) during which the helicopter was flown at a con-stant elevation. After sampling, the SilcoCan was shut offand the pump valve was re-opened to keep the inlet purgedwith ambient air.
After each flight, the portable air sampling unit was imme-diately taken to the VOC laboratory on board the icebreakerOden. The SilcoCans were heated to 50◦C and connected tothe ship-based high resolution proton transfer reaction timeof flight mass spectrometer (PTR-TOF-MS) by a heated Sil-costeel coated inlet capillary. The PTR-TOF-MS sampled theconserved air for about 30 min for each individual canister.The long sampling time allowed for a limit of detection inthe low ppt(v) range for most VOCs. All SilcoCans were typ-ically analysed within 12 h after the end of the flight.
Dynamic dilution of a∼ 1 ppm(v) calibration gas stan-dard (Apel-Riemer Inc., USA), containing acetonitrile, ace-tone and 14 other VOCs (but not DMS) was used for inter-mittent sensitivity calibrations of the PTR-TOF-MS. The ac-curacy of the calibrations using the gas standard VOCs incombination with the dilution setup is estimated to be 13 %or better. For DMS, a liquid calibration unit (LCU) was usedfor cross-calibration with acetone. For the LCU, there is ad-ditional inaccuracy due to the mixing of acetone and DMS ina Hamilton® syringe. The accuracy of the DMS calibration isestimated to be better than 20 %. Details about the PTR-TOF-MS technology and performance are described elsewhere
www.atmos-chem-phys.net/13/12405/2013/ Atmos. Chem. Phys., 13, 12405–12431, 2013
12410 P. Kupiszewski et al.: Vertical profiling of aerosol particles and trace gases
(e.g. Jordan et al., 2009; Graus et al., 2010). The applied datareduction and peak identification methods are described byGraus et al. (2010) and Müller et al. (2010).
2.2.3 Helicopter-based meteorological measurements
Meteorological measurements recorded during profile flightsincluded atmospheric pressure (hPa), air temperature (◦C)and relative humidity (%). Within the cabin, a VaisalaCombined Pressure, Temperature and Humidity Transmit-ter (PTU300) was mounted on the instrument rack whichalso housed the logging laptop and aerosol counter instru-ments (Fig. 2). The PTU300 temperature and humidity sen-sor was mounted within an open cylindrical PVC housingnear the front of the helicopter, acting to minimise sensorheating by solar radiation as well as providing open ven-tilation for airflow across the sensor. Three thermocoupleswere also mounted equidistantly within the PVC cyclinderfor additional temperature measurements; these three sensorsshowed good agreement (with very little intra-variance) andwere thus averaged for temperature profile analysis. The ther-mocouple wires were wrapped in an aluminium heat shield,extending from the sensor location back to the helicoptercabin, to minimize solar heating. A fourth thermocouple wasmounted near the aerosol inlet to measure the ambient tem-perature of air entering the inlet. Analysis of these temper-atures showed a warm bias on the order of 0.5–1◦C, indi-cating solar heating of the thermocouple; therefore tempera-tures from the fourth thermocouple were dismissed from theanalysis of thermodynamic profiles. The PTU300’s pressuresensor was connected to the helicopter’s static pressure port.Heights were calculated using the pressure and temperaturemeasurements following the hypsometric equation.
All meteorological variables were logged at 2–3 Hz, fromwhich 1 Hz measurements were produced to coincide withthe temporal sampling of aerosol measurements. Sensoraccuracy specifications from the PTU300 are reported as±0.15 hPa,±1.7 % (for 90–100 % RH range) and±0.3◦Cfor pressure, relative humidity and temperature, respectively.The thermocouple temperature accuracy was specified as±0.5◦C. Corrections to meteorological variables based onhelicopter flight speed were deemed unnecessary, as the sci-ence flights were flown at airspeeds with which the sam-pling frequency was determined adequate to capture thermo-dynamic fluctuations in the lower atmosphere.
2.2.4 Configuration of the helicopter aerosol samplinginlet
The instrumentation rack in the helicopter was installed inthe port side back passenger seat. The rack contained theCPCs, OPC, PTU300, the logging computer and the airflowpump. An isokinetic inlet extended 1 m in front of the he-licopter cabin with a sampling true air speed of 19 ms−1,maintained manually by the pilot. Stainless steel tubing (in-
ner diameter 12 mm) on the floor of the cabin connected theinlet to the instrumentation rack (see Fig. 2). Two 45◦ bendswere used in order to reach the rack. The total inlet length(into the OPC) was 3.05 m. The total flow in the inlet tub-ing was 10 Lmin−1. The CPCs were installed above the OPC(0.25 and 0.55 m for the UCPC and the CPC, respectively),with a tee (one 90◦ bend) from the main inlet line and a sec-ond 90◦ bend in the line for each CPC. Precisely after take-off (and away from local pollution), the particle concentra-tions were compared to those measured by instrumentationonboardOden. During flights in clean air (for example, mea-sured total particles < 1 cm−3) it was verified that no signifi-cant downwash of particles from the helicopter rotor reachedthe inlet.
2.2.5 Ship-based aerosol physical characterizationresolved over size
The ambient aerosol was sampled via a PM10-inlet mastsetup on a laboratory container on the fourth deck ofOdenat about 25 m above sea level. Size distributions of particleswith mid-diameters from 3 nm to 800 nm were continuouslymonitored using the TDMPS. Further details of the PM10 in-let and the TDMPS system can be found in Heintzenberg andLeck (2012).
2.2.6 Meteorological observations
General meteorology was observed both by two weather sta-tions on boardOdenand from a micrometeorological sitedeployed on the ice; the measurements included air and sur-face temperatures, wind speeds and visibility. In addition, ra-diosoundings of pressure, temperature, humidity and windspeed through the entire troposphere were launched at six-hourly intervals from the helipad ofOden.
Remote sensing instruments placed on boardOdenwereused to infer cloud micro- and macrophysical parameters, in-cluding cloud base and top height, as well as the atmospherictemperature profile. Several cloud ceilometers providedcloud base information, while the cloud top data was ob-tained from the 35 GHz K-band MilliMeter Cloud Radar(MMCR), based on a vertical-pointing, single-polarizationDoppler technique. The vertical resolution of the MMCR is45 m, whilst its vertical coverage stretches from 100 m to15 kma.g.l. (Moran et al., 1998). Finally, a 60 GHz passivescanning radiometer located on the right-hand side of theship (over the ice pack) was employed to measure the tem-perature profile of the atmosphere up to 1.2 km, thus pro-viding information about the height of the main inversionbase (observations obtained for 98 % of the ice drift period;M. Tjernström, personal communication, 2012). The resolu-tion of the scanning radiometer is approximately 15–300 m,degrading upwards, whilst its root mean square (rms) accu-racy is better than 1◦C up to a height of ca. 800 m (Westwateret al., 1999). Due to the decline in resolution and accuracy at
Atmos. Chem. Phys., 13, 12405–12431, 2013 www.atmos-chem-phys.net/13/12405/2013/
P. Kupiszewski et al.: Vertical profiling of aerosol particles and trace gases 12411
greater altitudes, retrieving inversions above 500 ma.g.l. be-comes increasingly difficult. The retrieval algorithm requiresa “first-guess” profile; here interpolated profiles from the six-hourly soundings are applied. This implies that with increas-ing altitude above∼ 800 m, the observations gradually loseinformation beyond that of radiosonde interpolation. Boththe MMCR and scanning radiometer were designed by theEarth System Research Laboratory (ESRL) of the NationalOceanic and Atmospheric Administration (NOAA) in Boul-der, Colorado.
2.3 Air mass trajectories and time spent over the packice
In order to establish the origin of inflowing air masses, three-dimensional 5- and 10-day backward air parcel trajectorieswere calculated. The receptor point was set at 100 m alti-tude (for period-based analysis) or at the altitude of the ob-served plume when investigating specific long-range trans-port events. The Hybrid Single Particle Lagrangian Inte-grated Trajectory Model (HYSPLIT) (Draxler and Rolph,2011; Rolph, 2011) was used for the trajectory calculationsbased on data from the Global Data Assimilation System(GDAS) of the National Weather Service’s National Centerfor Environmental Prediction (NCEP). Vertical motion in thetrajectory runs was calculated using the model’s vertical ve-locity fields.
Back trajectories have several sources of uncertainty; thespatial and temporal resolution of the gridded meteorologicaldata that is used and the fact the stochastic motions such as,for example, turbulence in the PBL, cannot be recovered bythe backwards calculations. This uncertainty generally growswith the length of the trajectory, but may also be smaller orlarger for different episodes. For example, transport withina single air mass is likely more reliable, while transport inthe vicinity of strong gradients, such as frontal zones, cancreate bifurcations and should be considered with care.
The time spent over the pack ice by the air mass since lastcontact with open sea, referred to as days over ice (DOI),was calculated for the purposes of ASCOS as in Nilsson(1996). This calculation uses the HYSPLIT back trajectoriesin combination with maps of sea-ice distribution. The latterwere created based on data from the National Snow and IceData Center (NSIDC), Boulder, United States, obtained bythe AMSR-E sensor on board the Aqua satellite, and the fi-nal analysis was conducted at the University of Bremen.
3 Observations of meteorological conditions during theice drift
The general meteorological conditions encountered duringASCOS, and in particular those during the ice drift phase,are summarized in Tjernström et al. (2012), while Sedlaret al. (2011) describes the evolution of the surface energy
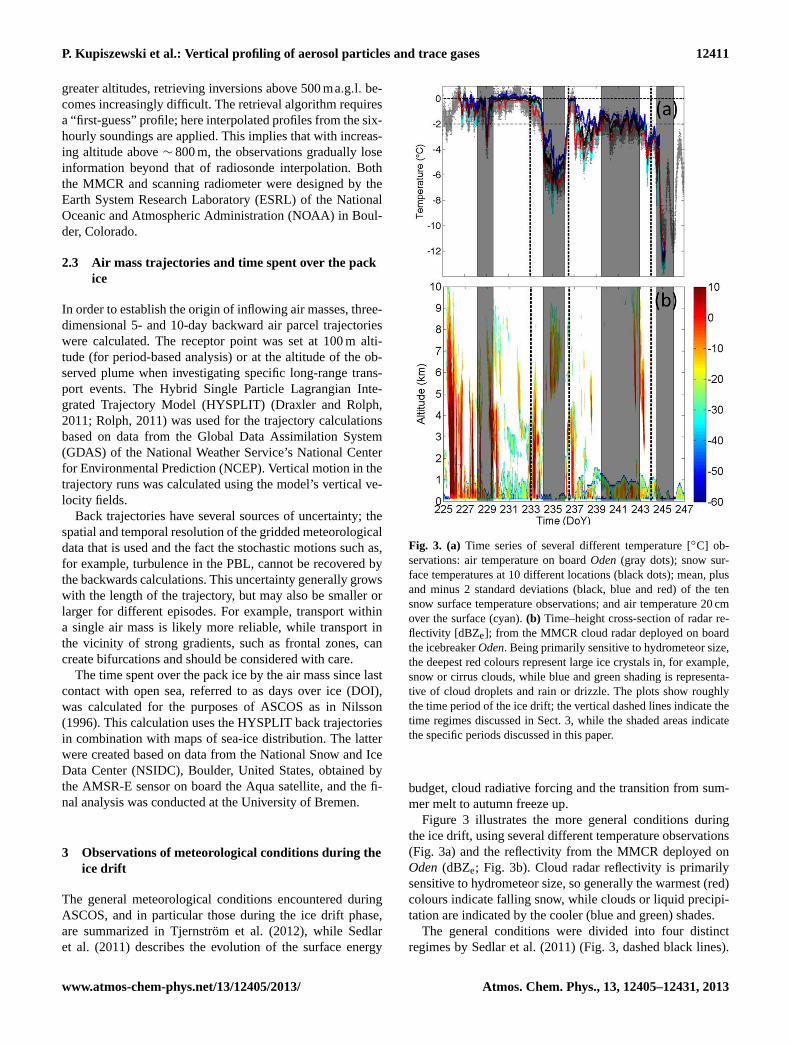
Fig. 3. (a) Time series of several different temperature [◦C] ob-servations: air temperature on boardOden(gray dots); snow sur-face temperatures at 10 different locations (black dots); mean, plusand minus 2 standard deviations (black, blue and red) of the tensnow surface temperature observations; and air temperature 20 cmover the surface (cyan).(b) Time–height cross-section of radar re-flectivity [dBZe]; from the MMCR cloud radar deployed on boardthe icebreakerOden. Being primarily sensitive to hydrometeor size,the deepest red colours represent large ice crystals in, for example,snow or cirrus clouds, while blue and green shading is representa-tive of cloud droplets and rain or drizzle. The plots show roughlythe time period of the ice drift; the vertical dashed lines indicate thetime regimes discussed in Sect. 3, while the shaded areas indicatethe specific periods discussed in this paper.
budget, cloud radiative forcing and the transition from sum-mer melt to autumn freeze up.
Figure 3 illustrates the more general conditions duringthe ice drift, using several different temperature observations(Fig. 3a) and the reflectivity from the MMCR deployed onOden(dBZe; Fig. 3b). Cloud radar reflectivity is primarilysensitive to hydrometeor size, so generally the warmest (red)colours indicate falling snow, while clouds or liquid precipi-tation are indicated by the cooler (blue and green) shades.
The general conditions were divided into four distinctregimes by Sedlar et al. (2011) (Fig. 3, dashed black lines).
www.atmos-chem-phys.net/13/12405/2013/ Atmos. Chem. Phys., 13, 12405–12431, 2013
12412 P. Kupiszewski et al.: Vertical profiling of aerosol particles and trace gases
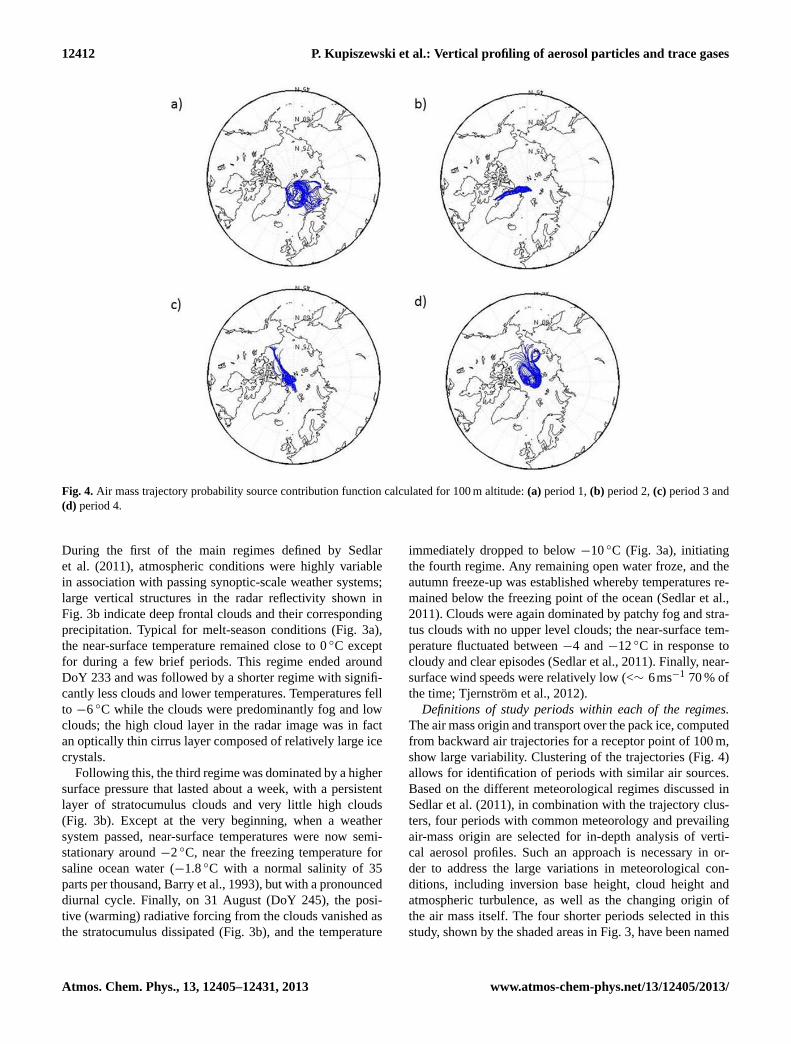
Fig. 4. Air mass trajectory probability source contribution function calculated for 100 m altitude:(a) period 1,(b) period 2,(c) period 3 and(d) period 4.
During the first of the main regimes defined by Sedlaret al. (2011), atmospheric conditions were highly variablein association with passing synoptic-scale weather systems;large vertical structures in the radar reflectivity shown inFig. 3b indicate deep frontal clouds and their correspondingprecipitation. Typical for melt-season conditions (Fig. 3a),the near-surface temperature remained close to 0◦C exceptfor during a few brief periods. This regime ended aroundDoY 233 and was followed by a shorter regime with signifi-cantly less clouds and lower temperatures. Temperatures fellto −6◦C while the clouds were predominantly fog and lowclouds; the high cloud layer in the radar image was in factan optically thin cirrus layer composed of relatively large icecrystals.
Following this, the third regime was dominated by a highersurface pressure that lasted about a week, with a persistentlayer of stratocumulus clouds and very little high clouds(Fig. 3b). Except at the very beginning, when a weathersystem passed, near-surface temperatures were now semi-stationary around−2◦C, near the freezing temperature forsaline ocean water (−1.8◦C with a normal salinity of 35parts per thousand, Barry et al., 1993), but with a pronounceddiurnal cycle. Finally, on 31 August (DoY 245), the posi-tive (warming) radiative forcing from the clouds vanished asthe stratocumulus dissipated (Fig. 3b), and the temperature
immediately dropped to below−10◦C (Fig. 3a), initiatingthe fourth regime. Any remaining open water froze, and theautumn freeze-up was established whereby temperatures re-mained below the freezing point of the ocean (Sedlar et al.,2011). Clouds were again dominated by patchy fog and stra-tus clouds with no upper level clouds; the near-surface tem-perature fluctuated between−4 and−12◦C in response tocloudy and clear episodes (Sedlar et al., 2011). Finally, near-surface wind speeds were relatively low (<∼ 6ms−1 70 % ofthe time; Tjernström et al., 2012).
Definitions of study periods within each of the regimes.The air mass origin and transport over the pack ice, computedfrom backward air trajectories for a receptor point of 100 m,show large variability. Clustering of the trajectories (Fig. 4)allows for identification of periods with similar air sources.Based on the different meteorological regimes discussed inSedlar et al. (2011), in combination with the trajectory clus-ters, four periods with common meteorology and prevailingair-mass origin are selected for in-depth analysis of verti-cal aerosol profiles. Such an approach is necessary in or-der to address the large variations in meteorological con-ditions, including inversion base height, cloud height andatmospheric turbulence, as well as the changing origin ofthe air mass itself. The four shorter periods selected in thisstudy, shown by the shaded areas in Fig. 3, have been named
Atmos. Chem. Phys., 13, 12405–12431, 2013 www.atmos-chem-phys.net/13/12405/2013/
P. Kupiszewski et al.: Vertical profiling of aerosol particles and trace gases 12413
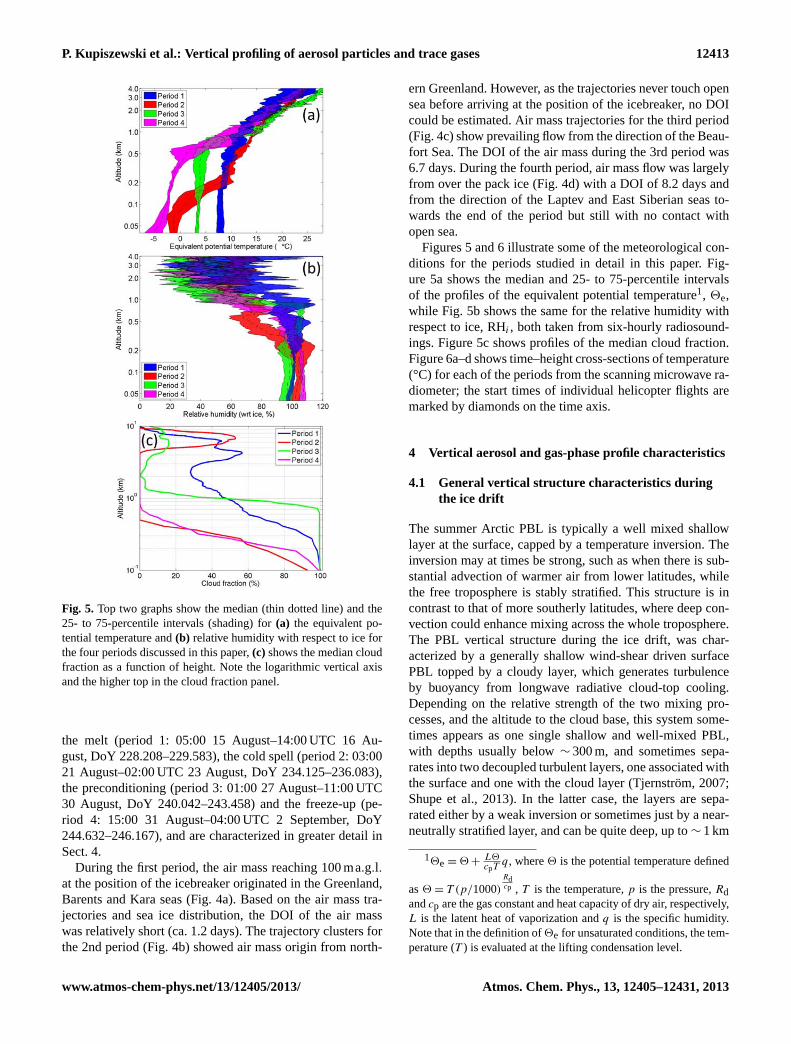
Fig. 5. Top two graphs show the median (thin dotted line) and the25- to 75-percentile intervals (shading) for(a) the equivalent po-tential temperature and(b) relative humidity with respect to ice forthe four periods discussed in this paper,(c) shows the median cloudfraction as a function of height. Note the logarithmic vertical axisand the higher top in the cloud fraction panel.
the melt (period 1: 05:00 15 August–14:00 UTC 16 Au-gust, DoY 228.208–229.583), the cold spell (period 2: 03:0021 August–02:00 UTC 23 August, DoY 234.125–236.083),the preconditioning (period 3: 01:00 27 August–11:00 UTC30 August, DoY 240.042–243.458) and the freeze-up (pe-riod 4: 15:00 31 August–04:00 UTC 2 September, DoY244.632–246.167), and are characterized in greater detail inSect. 4.
During the first period, the air mass reaching 100 ma.g.l.at the position of the icebreaker originated in the Greenland,Barents and Kara seas (Fig. 4a). Based on the air mass tra-jectories and sea ice distribution, the DOI of the air masswas relatively short (ca. 1.2 days). The trajectory clusters forthe 2nd period (Fig. 4b) showed air mass origin from north-
ern Greenland. However, as the trajectories never touch opensea before arriving at the position of the icebreaker, no DOIcould be estimated. Air mass trajectories for the third period(Fig. 4c) show prevailing flow from the direction of the Beau-fort Sea. The DOI of the air mass during the 3rd period was6.7 days. During the fourth period, air mass flow was largelyfrom over the pack ice (Fig. 4d) with a DOI of 8.2 days andfrom the direction of the Laptev and East Siberian seas to-wards the end of the period but still with no contact withopen sea.
Figures 5 and 6 illustrate some of the meteorological con-ditions for the periods studied in detail in this paper. Fig-ure 5a shows the median and 25- to 75-percentile intervalsof the profiles of the equivalent potential temperature1, 2e,while Fig. 5b shows the same for the relative humidity withrespect to ice, RHi , both taken from six-hourly radiosound-ings. Figure 5c shows profiles of the median cloud fraction.Figure 6a–d shows time–height cross-sections of temperature(°C) for each of the periods from the scanning microwave ra-diometer; the start times of individual helicopter flights aremarked by diamonds on the time axis.
4 Vertical aerosol and gas-phase profile characteristics
4.1 General vertical structure characteristics duringthe ice drift
The summer Arctic PBL is typically a well mixed shallowlayer at the surface, capped by a temperature inversion. Theinversion may at times be strong, such as when there is sub-stantial advection of warmer air from lower latitudes, whilethe free troposphere is stably stratified. This structure is incontrast to that of more southerly latitudes, where deep con-vection could enhance mixing across the whole troposphere.The PBL vertical structure during the ice drift, was char-acterized by a generally shallow wind-shear driven surfacePBL topped by a cloudy layer, which generates turbulenceby buoyancy from longwave radiative cloud-top cooling.Depending on the relative strength of the two mixing pro-cesses, and the altitude to the cloud base, this system some-times appears as one single shallow and well-mixed PBL,with depths usually below∼ 300 m, and sometimes sepa-rates into two decoupled turbulent layers, one associated withthe surface and one with the cloud layer (Tjernström, 2007;Shupe et al., 2013). In the latter case, the layers are sepa-rated either by a weak inversion or sometimes just by a near-neutrally stratified layer, and can be quite deep, up to∼ 1 km
12e = 2 +L2cpT
q, where2 is the potential temperature defined
as2 = T (p/1000)Rdcp , T is the temperature,p is the pressure,Rd
andcp are the gas constant and heat capacity of dry air, respectively,L is the latent heat of vaporization andq is the specific humidity.Note that in the definition of2e for unsaturated conditions, the tem-perature (T ) is evaluated at the lifting condensation level.
www.atmos-chem-phys.net/13/12405/2013/ Atmos. Chem. Phys., 13, 12405–12431, 2013
12414 P. Kupiszewski et al.: Vertical profiling of aerosol particles and trace gases
or more (Tjernström et al., 2012). Consequently, the strati-fication of the PBL is dominated by moist adiabatic strati-fication (Fig. 5b), but closer to the surface it is sometimesmore stably stratified (Tjernström, 2005); this is when themixing from cloud-top cooling does not reach the surface-based PBL. This neutral stability is also visible in the poten-tial temperature probability profile from the ASCOS 2008expedition, with near-constant potential temperature belowapproximately 500 m altitude (periods 1, 3 in Fig. 5a).
Low clouds dominated the generally cloudy conditionsduring the ice drift (Sedlar et al., 2011), with cloud basesoften below 100 m (Fig. 5c). The presence of fog was alsocommon. Cloud tops varied from several hundred metres to∼ 1 km, with cloud thickness very rarely exceeding 1 km, ex-cept for in frontal clouds associated with weather systems.Visibility was bimodal; < 1 km and > 20 km under even verylow clouds (in the absence of snow fall) (Tjernström et al.,2012). Contributing to these conditions was an essentiallyunlimited source of water vapour, which was made availabledue to open leads, melt ponds and snow, as well as synopticadvection associated with intermittent frontal passages. Asa consequence, RH was consistently close to 100 % – withrespect to (wrt) water when the temperature was close tozero, and with respect to ice when the temperature was below(in fact very often> 100 %wrt ice, see Fig. 5b). Addition-ally, specific humidity often increased with height over thePBL-capping inversion. This is a condition that rarely occurselsewhere but is frequent in the Arctic (Sedlar et al., 2012)and implies that entrainment across the inversion is a mois-ture source for the boundary layer rather than a sink.
4.2 General aerosol characteristics over the ice drift
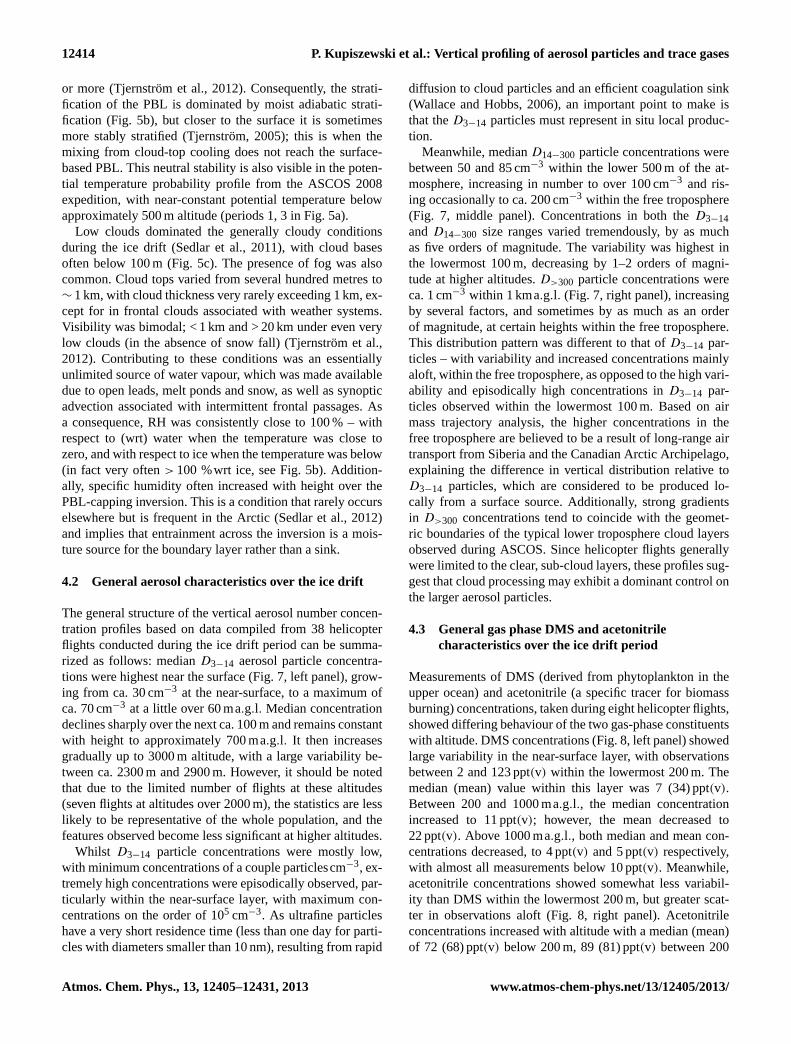
The general structure of the vertical aerosol number concen-tration profiles based on data compiled from 38 helicopterflights conducted during the ice drift period can be summa-rized as follows: medianD3−14 aerosol particle concentra-tions were highest near the surface (Fig. 7, left panel), grow-ing from ca. 30 cm−3 at the near-surface, to a maximum ofca. 70 cm−3 at a little over 60 ma.g.l. Median concentrationdeclines sharply over the next ca. 100 m and remains constantwith height to approximately 700 ma.g.l. It then increasesgradually up to 3000 m altitude, with a large variability be-tween ca. 2300 m and 2900 m. However, it should be notedthat due to the limited number of flights at these altitudes(seven flights at altitudes over 2000 m), the statistics are lesslikely to be representative of the whole population, and thefeatures observed become less significant at higher altitudes.
Whilst D3−14 particle concentrations were mostly low,with minimum concentrations of a couple particlescm−3, ex-tremely high concentrations were episodically observed, par-ticularly within the near-surface layer, with maximum con-centrations on the order of 105 cm−3. As ultrafine particleshave a very short residence time (less than one day for parti-cles with diameters smaller than 10 nm), resulting from rapid
diffusion to cloud particles and an efficient coagulation sink(Wallace and Hobbs, 2006), an important point to make isthat theD3−14 particles must represent in situ local produc-tion.
Meanwhile, medianD14−300 particle concentrations werebetween 50 and 85 cm−3 within the lower 500 m of the at-mosphere, increasing in number to over 100 cm−3 and ris-ing occasionally to ca. 200 cm−3 within the free troposphere(Fig. 7, middle panel). Concentrations in both theD3−14and D14−300 size ranges varied tremendously, by as muchas five orders of magnitude. The variability was highest inthe lowermost 100 m, decreasing by 1–2 orders of magni-tude at higher altitudes.D>300 particle concentrations wereca. 1 cm−3 within 1 kma.g.l. (Fig. 7, right panel), increasingby several factors, and sometimes by as much as an orderof magnitude, at certain heights within the free troposphere.This distribution pattern was different to that ofD3−14 par-ticles – with variability and increased concentrations mainlyaloft, within the free troposphere, as opposed to the high vari-ability and episodically high concentrations inD3−14 par-ticles observed within the lowermost 100 m. Based on airmass trajectory analysis, the higher concentrations in thefree troposphere are believed to be a result of long-range airtransport from Siberia and the Canadian Arctic Archipelago,explaining the difference in vertical distribution relative toD3−14 particles, which are considered to be produced lo-cally from a surface source. Additionally, strong gradientsin D>300 concentrations tend to coincide with the geomet-ric boundaries of the typical lower troposphere cloud layersobserved during ASCOS. Since helicopter flights generallywere limited to the clear, sub-cloud layers, these profiles sug-gest that cloud processing may exhibit a dominant control onthe larger aerosol particles.
4.3 General gas phase DMS and acetonitrilecharacteristics over the ice drift period
Measurements of DMS (derived from phytoplankton in theupper ocean) and acetonitrile (a specific tracer for biomassburning) concentrations, taken during eight helicopter flights,showed differing behaviour of the two gas-phase constituentswith altitude. DMS concentrations (Fig. 8, left panel) showedlarge variability in the near-surface layer, with observationsbetween 2 and 123 ppt(v) within the lowermost 200 m. Themedian (mean) value within this layer was 7 (34) ppt(v).Between 200 and 1000 ma.g.l., the median concentrationincreased to 11 ppt(v); however, the mean decreased to22 ppt(v). Above 1000 ma.g.l., both median and mean con-centrations decreased, to 4 ppt(v) and 5 ppt(v) respectively,with almost all measurements below 10 ppt(v). Meanwhile,acetonitrile concentrations showed somewhat less variabil-ity than DMS within the lowermost 200 m, but greater scat-ter in observations aloft (Fig. 8, right panel). Acetonitrileconcentrations increased with altitude with a median (mean)of 72 (68) ppt(v) below 200 m, 89 (81) ppt(v) between 200
Atmos. Chem. Phys., 13, 12405–12431, 2013 www.atmos-chem-phys.net/13/12405/2013/

P. Kupiszewski et al.: Vertical profiling of aerosol particles and trace gases 12415
Fig. 6.Time–height cross-sections of temperature [◦C] from a scanning microwave radiometer for the four periods:(a) period 1,(b) period 2,(c) period 3 and(d) period 4. In each panel start times for helicopter flights discussed in this paper are marked with diamonds on the timeaxis, and the time axis is adjusted to the same total length for all periods.
Fig. 7. Vertical aerosol number size concentration profiles taken across 38 flights carried out during the ice drift of the ASCOS 2008expedition. The three sub-plots show concentrations of particles with diameters of 3–14 nm, 14–300 nm and over 300 nm respectively. Pointsare individual observations, the continuous line is the median of the measurements and the dashed lines are the upper and lower quartiles ofthe observations.
www.atmos-chem-phys.net/13/12405/2013/ Atmos. Chem. Phys., 13, 12405–12431, 2013

12416 P. Kupiszewski et al.: Vertical profiling of aerosol particles and trace gases
Fig. 8. Vertical dimethyl sulphide (DMS) and acetonitrile concentration profiles taken during eight flights carried out during the ice driftperiod of the ASCOS 2008 expedition. Blue and green points show DMS and acetonitrile concentrations respectively; error bars show the95 % confidence interval.
and 1000 m and 104 (105) ppt(v) above 1000 m. Consider-ing the long atmospheric lifetime of acetonitrile (0.45 yr ac-cording to Hamm and Warneck, 1990) and the large differ-ence in concentrations observed between the layers closestto the surface and the free troposphere, the central ArcticOcean appears to be a sink area for acetonitrile. The highacetonitrile concentrations in the free troposphere can be ex-plained by biomass burning advected via long-range plumetransport from lower latitudes (Warneke et al., 2009, 2010).The vertical trends of DMS were consistent with the packice model study by Lundén et al. (2010) in that the observa-tions in Fig. 8 typically showed highest concentrations nearthe surface and decreased exponentially with height. Max-ima of DMS(g) above the local boundary layer were presentin about 3 % of the modelled profiles. These maxima werefound in association with frontal zones.
4.4 Period 1: melt, 15–16 August (DoY 228–229)
Helicopter flight period 1 is embedded in the first of theregimes discussed in Sect. 3.1. Thus, it commenced dur-ing the end of the melt season in a period characterised bylarge variability and high synoptic activity, with frequentfog and drizzle, along with persistent low-level stratiformcloud cover, generally located within the PBL (Figs. 3b,5c). The boundary layer depth was variable (∼ 200–500 m)and a pulse of warm air aloft associated with the passing ofa weak high-pressure ridge between the two frontal systemsmarked the start and end of this period. The broadening ofthe 25–75 percentile intervals (Fig. 5a, b) in the slightly sta-
ble 300–800 m interval indicates this larger variability aloft,while below 200 m the median profiles show quasi-constantvalues with height. This is indicative of nearly well-mixedconditions. RHi was high, near 100 %, up to 1 kma.g.l., and2e had the largest values of the periods; large variability inRHi aloft (> 1 km, 20–100 %) is indicative of the formation,layering and dispersal of higher clouds. The profile of themedian cloud fraction in Fig. 5c, evaluated from the cloudradar, shows near 100 % cloudiness below 200–300 m, butalso considerable cloud fractions through much of the tropo-sphere, with a minimum at 30 % around 1–2 km but a sub-stantial cloud fraction aloft. Of all periods discussed in thispaper, this is the period with the largest vertical extent ofcloud cover. During the helicopter flights, cloud base was vi-sually observed at 180 m (±20 m) on 15 August (DoY 228)and at 125 m (±25 m) on 16 August (DoY 229). This was ingood agreement with the ceilometer measurements, accord-ing to which the cloud base was at 206 m and 118 m duringthe flights on 15 August (DoY 228) and 16 August (DoY229) respectively. The cloud top of the lowermost cloud layerwas reached on 15 August (13:16 UTC) at 270 m, observedvisually and confirmed by RH decreasing from a constantvalue of 100 % in cloud to 97.7 % above cloud top.
Helicopter aerosol profiles from the melt period (Fig. 9a)show raised concentrations ofD>300 particles within thelowermost 100 ma.g.l. On 15 (16) August, concentrationsbelow 100 m were ca. 7 cm−3 (4 cm−3), declining to ca.2 cm−3 (1 cm−3) within the lowermost cloud layer. Thenumber size distribution of particles obtained using theTDMPS on boardOdenshows a strong bimodal distribution
Atmos. Chem. Phys., 13, 12405–12431, 2013 www.atmos-chem-phys.net/13/12405/2013/
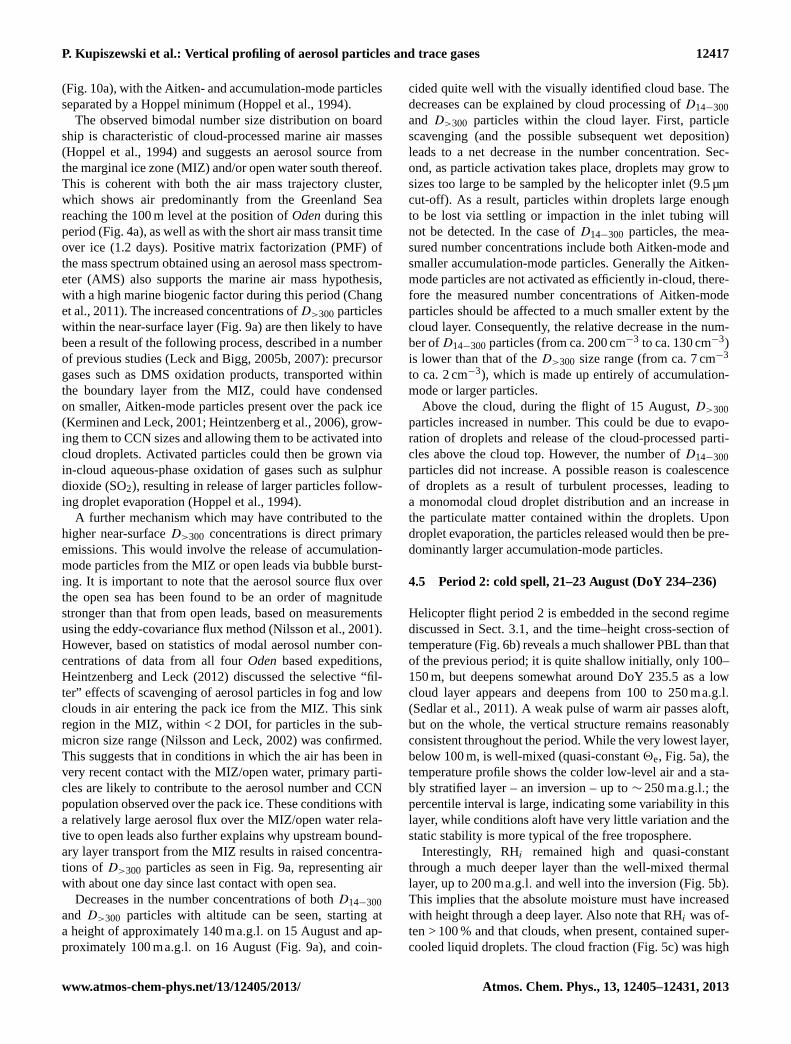
P. Kupiszewski et al.: Vertical profiling of aerosol particles and trace gases 12417
(Fig. 10a), with the Aitken- and accumulation-mode particlesseparated by a Hoppel minimum (Hoppel et al., 1994).
The observed bimodal number size distribution on boardship is characteristic of cloud-processed marine air masses(Hoppel et al., 1994) and suggests an aerosol source fromthe marginal ice zone (MIZ) and/or open water south thereof.This is coherent with both the air mass trajectory cluster,which shows air predominantly from the Greenland Seareaching the 100 m level at the position ofOdenduring thisperiod (Fig. 4a), as well as with the short air mass transit timeover ice (1.2 days). Positive matrix factorization (PMF) ofthe mass spectrum obtained using an aerosol mass spectrom-eter (AMS) also supports the marine air mass hypothesis,with a high marine biogenic factor during this period (Changet al., 2011). The increased concentrations ofD>300 particleswithin the near-surface layer (Fig. 9a) are then likely to havebeen a result of the following process, described in a numberof previous studies (Leck and Bigg, 2005b, 2007): precursorgases such as DMS oxidation products, transported withinthe boundary layer from the MIZ, could have condensedon smaller, Aitken-mode particles present over the pack ice(Kerminen and Leck, 2001; Heintzenberg et al., 2006), grow-ing them to CCN sizes and allowing them to be activated intocloud droplets. Activated particles could then be grown viain-cloud aqueous-phase oxidation of gases such as sulphurdioxide (SO2), resulting in release of larger particles follow-ing droplet evaporation (Hoppel et al., 1994).
A further mechanism which may have contributed to thehigher near-surfaceD>300 concentrations is direct primaryemissions. This would involve the release of accumulation-mode particles from the MIZ or open leads via bubble burst-ing. It is important to note that the aerosol source flux overthe open sea has been found to be an order of magnitudestronger than that from open leads, based on measurementsusing the eddy-covariance flux method (Nilsson et al., 2001).However, based on statistics of modal aerosol number con-centrations of data from all fourOden based expeditions,Heintzenberg and Leck (2012) discussed the selective “fil-ter” effects of scavenging of aerosol particles in fog and lowclouds in air entering the pack ice from the MIZ. This sinkregion in the MIZ, within < 2 DOI, for particles in the sub-micron size range (Nilsson and Leck, 2002) was confirmed.This suggests that in conditions in which the air has been invery recent contact with the MIZ/open water, primary parti-cles are likely to contribute to the aerosol number and CCNpopulation observed over the pack ice. These conditions witha relatively large aerosol flux over the MIZ/open water rela-tive to open leads also further explains why upstream bound-ary layer transport from the MIZ results in raised concentra-tions of D>300 particles as seen in Fig. 9a, representing airwith about one day since last contact with open sea.
Decreases in the number concentrations of bothD14−300and D>300 particles with altitude can be seen, starting ata height of approximately 140 ma.g.l. on 15 August and ap-proximately 100 ma.g.l. on 16 August (Fig. 9a), and coin-
cided quite well with the visually identified cloud base. Thedecreases can be explained by cloud processing ofD14−300and D>300 particles within the cloud layer. First, particlescavenging (and the possible subsequent wet deposition)leads to a net decrease in the number concentration. Sec-ond, as particle activation takes place, droplets may grow tosizes too large to be sampled by the helicopter inlet (9.5 µmcut-off). As a result, particles within droplets large enoughto be lost via settling or impaction in the inlet tubing willnot be detected. In the case ofD14−300 particles, the mea-sured number concentrations include both Aitken-mode andsmaller accumulation-mode particles. Generally the Aitken-mode particles are not activated as efficiently in-cloud, there-fore the measured number concentrations of Aitken-modeparticles should be affected to a much smaller extent by thecloud layer. Consequently, the relative decrease in the num-ber ofD14−300 particles (from ca. 200 cm−3 to ca. 130 cm−3)is lower than that of theD>300 size range (from ca. 7 cm−3
to ca. 2 cm−3), which is made up entirely of accumulation-mode or larger particles.
Above the cloud, during the flight of 15 August,D>300particles increased in number. This could be due to evapo-ration of droplets and release of the cloud-processed parti-cles above the cloud top. However, the number ofD14−300particles did not increase. A possible reason is coalescenceof droplets as a result of turbulent processes, leading toa monomodal cloud droplet distribution and an increase inthe particulate matter contained within the droplets. Upondroplet evaporation, the particles released would then be pre-dominantly larger accumulation-mode particles.
4.5 Period 2: cold spell, 21–23 August (DoY 234–236)
Helicopter flight period 2 is embedded in the second regimediscussed in Sect. 3.1, and the time–height cross-section oftemperature (Fig. 6b) reveals a much shallower PBL than thatof the previous period; it is quite shallow initially, only 100–150 m, but deepens somewhat around DoY 235.5 as a lowcloud layer appears and deepens from 100 to 250 ma.g.l.(Sedlar et al., 2011). A weak pulse of warm air passes aloft,but on the whole, the vertical structure remains reasonablyconsistent throughout the period. While the very lowest layer,below 100 m, is well-mixed (quasi-constant2e, Fig. 5a), thetemperature profile shows the colder low-level air and a sta-bly stratified layer – an inversion – up to∼ 250 ma.g.l.; thepercentile interval is large, indicating some variability in thislayer, while conditions aloft have very little variation and thestatic stability is more typical of the free troposphere.
Interestingly, RHi remained high and quasi-constantthrough a much deeper layer than the well-mixed thermallayer, up to 200 ma.g.l. and well into the inversion (Fig. 5b).This implies that the absolute moisture must have increasedwith height through a deep layer. Also note that RHi was of-ten > 100 % and that clouds, when present, contained super-cooled liquid droplets. The cloud fraction (Fig. 5c) was high
www.atmos-chem-phys.net/13/12405/2013/ Atmos. Chem. Phys., 13, 12405–12431, 2013
12418 P. Kupiszewski et al.: Vertical profiling of aerosol particles and trace gases
Fig. 9a.Vertical profiles of aerosol particle number concentration and temperature during ASCOS 2008 expedition helicopter flights, Period1: 13:04–13:32 UTC, 15 August (DoY 228) 2008 (red); 07:10–08:00 UTC, 16 August (DoY 229) 2008 (blue).
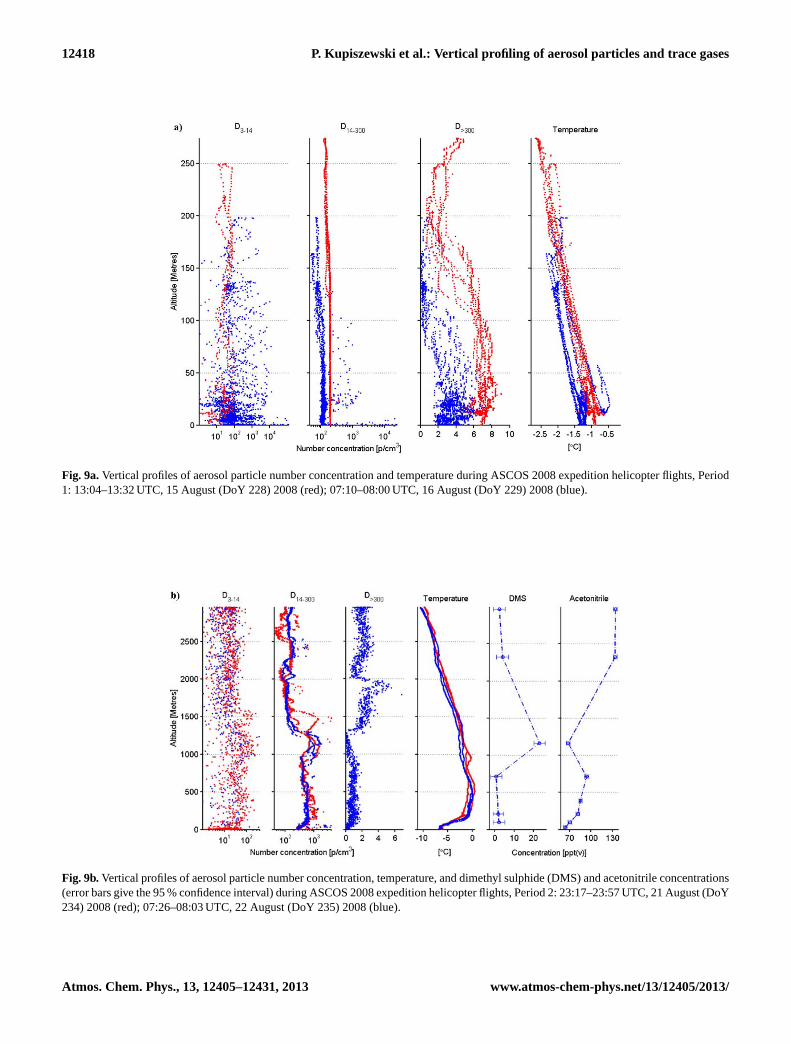
Fig. 9b.Vertical profiles of aerosol particle number concentration, temperature, and dimethyl sulphide (DMS) and acetonitrile concentrations(error bars give the 95 % confidence interval) during ASCOS 2008 expedition helicopter flights, Period 2: 23:17–23:57 UTC, 21 August (DoY234) 2008 (red); 07:26–08:03 UTC, 22 August (DoY 235) 2008 (blue).
Atmos. Chem. Phys., 13, 12405–12431, 2013 www.atmos-chem-phys.net/13/12405/2013/

P. Kupiszewski et al.: Vertical profiling of aerosol particles and trace gases 12419
near the surface but decreased rapidly with altitude, exceptfor the semi-transparent cirrus layer 6–7 kma.g.l. discussedearlier (Sect. 3.1). Most of the clouds were in the form offog or very low stratus with the exception of the upper cirruslayer.
Profiles from both flights conducted during the cold spellshow strong increases in theD14−300 mode concentrationsat ca. 1000–1500 ma.g.l., with raised DMS concentrationsand a local acetonitrile minimum measured during the flighton 22 August (Fig. 9b). A further characteristic feature isa plume ofD>300 particles between 1300 and 2000 ma.g.l.during the flight on 22 August (no profile is available inthis size range for the 21 August flight due to instrumen-tal issues). Meanwhile, the particle number size distribu-tion as measured by the TDMPS instrument on board shipshows a single Aitken mode in aerosol number concentration(Fig. 10b). The single Aitken- modal distribution suggests anaerosol population sourced in the free troposphere (Covertet al., 1996; Heintzenberg et al., 2004). This is also sup-ported by analysis of lead-210 content from on boardOden;lead-210 is a tracer for land contact that has been employedsuccessfully in previous studies (Paatero et al., 2010; Changet al., 2011). The measured concentrations of ca. 35 µBqm−3
are relatively low – this is a value typical of contact with non-bare (e.g. ice-sheet covered) land. The air trajectory show-ing a subsiding pathway from the free troposphere via acrossGreenland to the surface also points to an air mass of freetropospheric origin. Finally, the low marine biogenic factor(Chang et al., 2011) also suggests an air mass arriving atthe surface without recent contact with the marine-influencedPBL.
As regards the aerosol plumes observed aloft, the back tra-jectories suggest that the air was advected from the CanadianArctic Archipelago, and had a downwards-sloping pathwayas it moved towards the high Arctic as shown in Figs. 4b and11.
4.6 Period 3: preconditioning, 27–30 August(DOY 240–243)
Period 3 is the longest time period discussed in this paper andthe helicopter flights analysed in detail below occurred nearthe end of this regime. Period 3 was characterized by a stra-tocumulus layer with intermittent periods of multiple cloudlayers below 1500 ma.g.l. (Fig. 3b). The capping inversionat the top of the clouds is visible in Fig. 6c as it varies inheight from approximately 600 m up to > 1200 ma.g.l. (theupper limit of this instrument) in response to synoptic vari-ability. Another interesting feature seen is a secondary inver-sion that forms around 200 ma.g.l. just before DoY 241.5,coinciding with a vertical rise of the cloud layer by∼ 300 m.A low-level jet with a local wind maximum develops near200 ma.g.l., causing a decoupling of the cloud-driven tur-bulent mixed layer (400–800 ma.g.l.) and shear-driven PBLfrom the surface to∼ 200 ma.g.l. Eventually a brief sec-
ondary cloud layer develops in response to the mechanicalmixing of the PBL and moistening from evaporation and/orsublimation of precipitation from the original, but now upper,cloud layer. This case indicates the delicate balance betweenmesoscale forcing and cloud-driven mixing and diabatic pro-cesses occurring in the lower Arctic troposphere where themixing generated by surface- and cloud-induced turbulencetogether become no longer sufficient to keep the whole layermixed. Statistical profiles in Fig. 5a and b also reflect thisstructure. Below 100 ma.g.l., the variability in temperatureis small; it then increases with altitude to about 800 m andthen decreases again up through the very stable interface tothe free troposphere. The main cause for the increased vari-ability in the 200–800 m layer were the changes in altitude ofthe original single cloud layer and the formation of the sec-ondary inversion – which becomes further enhanced by theformation of a low-level cloud layer near 200 ma.g.l. The RHsupports this analysis; RHi increases with height from thesurface to∼ 200 m, then decreases in a layer∼ 200–400 mbut increases again from 400 m to almost 1 km and then fallsrapidly to∼ 40 % in the free troposphere (Fig. 5b); thus alsohere the moist layer is deeper than the mixed layer. In thelower moist layer, RHi mostly remains at or below 100 %; inthe upper layer however, RHi is almost always> 100 %.
Tjernström et al. (2012) offers the following explanationfor this vertical structure. Turbulent mixing by surface fric-tion is able to mix the lowest 100–200 m at most, whilethe cloud-generated turbulence (from cloud-top cooling bylongwave radiation) mixed a much deeper layer, from thecloud top downward. When one or the other, or both, wasstrong and/or the distance between the surface and the cloudbase was sufficiently small, the two processes combined andcaused a single deep, well-mixed layer from the surface tocloud top. When this did not happen, such as around DoY241.5, the layers separated and the cloud layer was essen-tially decoupled from any processes at the surface, such asturbulent surface fluxes. Turbulent surface fluxes were thuslimited in vertical extent to only about 200 ma.g.l. The radar-derived cloud fraction for period 3 (Fig. 5c) remains closeto 100 % below 800 ma.g.l. Below some hundreds of me-tres this is probably an overestimate, due to the fact that theradar picks up the signal from the quasi-constant frozen pre-cipitation; unfortunately this is impossible to separate fromthe actual cloud. The emergence of an independent cloudlayer below 200 ma.g.l., as observed by the cloud ceilometer,also contributed to the high cloud fraction. Ceilometer mea-surements of clouds base indicate that patchy fog and lowclouds were common during this period. At about 800 m,however, the cloud fraction drops dramatically to very lowvalues through the rest of the free troposphere, consistentwith the low RH.
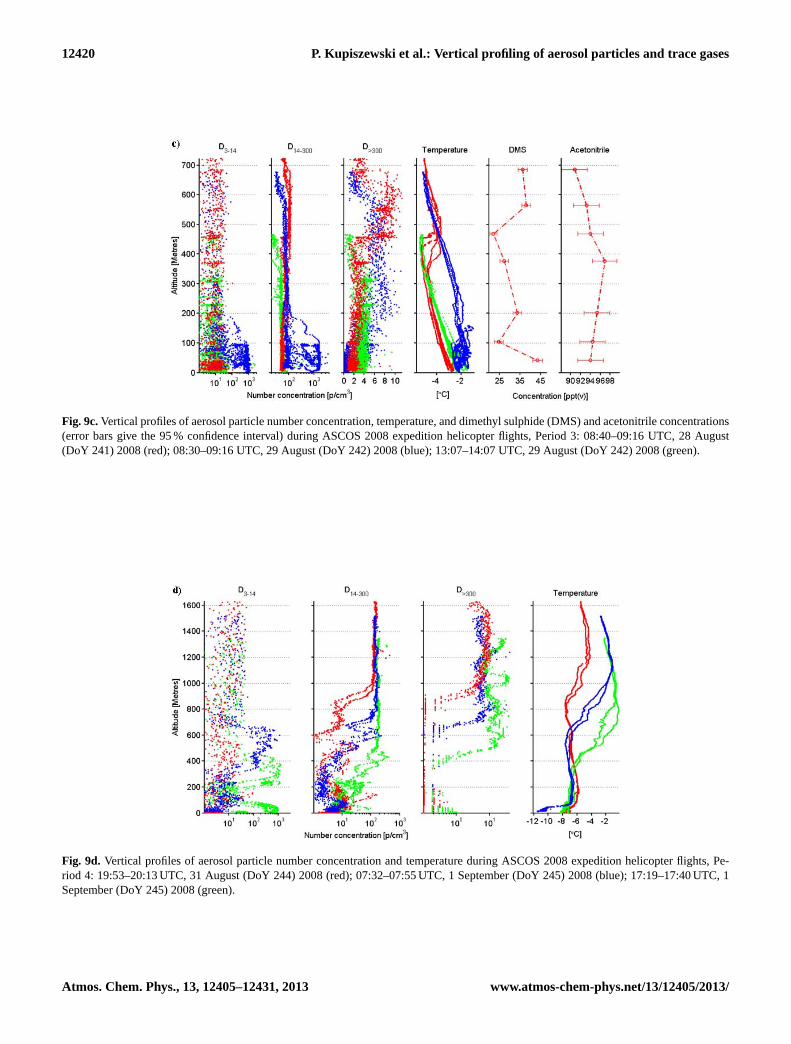
The helicopter aerosol concentration profile obtained dur-ing the flight on 28 August shows a well-defined plume ofD>300 particles with raised concentrations between approxi-mately 400 and 700 m (Fig. 9c), coinciding with an increase
www.atmos-chem-phys.net/13/12405/2013/ Atmos. Chem. Phys., 13, 12405–12431, 2013
12420 P. Kupiszewski et al.: Vertical profiling of aerosol particles and trace gases
Fig. 9c.Vertical profiles of aerosol particle number concentration, temperature, and dimethyl sulphide (DMS) and acetonitrile concentrations(error bars give the 95 % confidence interval) during ASCOS 2008 expedition helicopter flights, Period 3: 08:40–09:16 UTC, 28 August(DoY 241) 2008 (red); 08:30–09:16 UTC, 29 August (DoY 242) 2008 (blue); 13:07–14:07 UTC, 29 August (DoY 242) 2008 (green).
Fig. 9d. Vertical profiles of aerosol particle number concentration and temperature during ASCOS 2008 expedition helicopter flights, Pe-riod 4: 19:53–20:13 UTC, 31 August (DoY 244) 2008 (red); 07:32–07:55 UTC, 1 September (DoY 245) 2008 (blue); 17:19–17:40 UTC, 1September (DoY 245) 2008 (green).
Atmos. Chem. Phys., 13, 12405–12431, 2013 www.atmos-chem-phys.net/13/12405/2013/

P. Kupiszewski et al.: Vertical profiling of aerosol particles and trace gases 12421
in cloud base height across the same vertical depth. Thelower boundary of the plume is in good agreement with theinversion base, as inferred from the in-flight temperature pro-file (Fig. 9c). Furthermore, vertical profiles of the Richardsonnumber indicate sustained turbulence between ca. 400 and700 m (I. Brooks, personal communication, 2011), suggest-ing the confined nature of the plume is indeed a result ofvertical mixing via cloud-driven buoyancy circulations pen-etrating a few hundred metres below cloud base. Chemicaltracer analysis shows a local DMS maximum of 37 ppt(v)
at 600 ma.g.l. (Fig. 9c) indicating contact with marine areas,pointing to the possible involvement of DMS oxidation prod-ucts in the growth of the accumulation particles; DMS alsoshows a local maxima just above the surface which may havecontributed to the development of a lower, secondary cloudlayer and decoupling observed shortly after this flight.
The following flight on 29 August at ca. 09:00 UTC showsa broader layer, from ca. 100 m to 600 m with raisedD>300particle concentrations (Fig. 9c). A single cloud layer witha base descending from 700 m to approximately 550 m oc-curred just prior to the flight in response to the low-level jetwith decreasing height during the same time. A breakdown ofthe decoupling between the turbulent sub-cloud layer and theturbulent surface layer, resulting in a deepening of the mixedlayer throughout the 29th, was visible in the Richardsonnumber profile (I. Brooks, personal communication, 2011),explaining the widening of theD>300 particle plume relativeto the distribution measured during the previous flight. A thinlayer of air with limited mixing within the lowest ca. 100 m,as well as the weak temperature inversion visible in the in-flight profile (Fig. 9c) may have prevented mixing down ofthe particles all the way to the surface. Consequently, it couldbe hypothesized that the cloud is partially responsible for thedecrease of the height of the plume’s upper boundary due toactivation and more rapid deposition of particles at the upperedge of the plume.
A further feature in the vertical aerosol profile on 29 Au-gust at ca. 09:00 UTC are very high concentrations, on theorder of 1000–2000 cm−3, of bothD3−14 andD14−300 par-ticles below 100 ma.g.l. At this time, an increase in particleconcentrations within the size range of approx. 3–30 nm wasdetected by the TDMPS on boardOden(Fig. 10c). See pe-riod 4 for possible explanations.
A third flight conducted 4.5 h later shows that the layerof air with raisedD>300 particle concentrations reached thesurface (Fig. 9c), which can be explained by the deepeningof the mixed layer down to ground level at this time, thesubsidence of cold air from aloft and an almost completedisappearance of the temperature inversion. An increase inaccumulation-mode particle concentrations is also detectedby the TDMPS on boardOden (Fig. 10c), confirming thehelicopter measurements. The upper extent of the plume ofD>300 particles has decreased in altitude relative to the pre-vious flight, which may be due to a further lowering of thecloud base before the flight to ca. 430 m. For a further in-
depth case-based analysis of the interactions between theboundary layer, surface fluxes, aerosol concentrations andstratiform clouds during this period, the reader is referred toShupe et al. (2013).
4.7 Period 4: freeze-up, 31 August–2 September(DoY 244–246)
The final period, occurring at the end of the ice drift, is twodays long and structurally bears some resemblance to pe-riod 2. It was dominated by subsidence and dissipation ofthe stratocumulus layer, previously present for almost a week(see above). Figure 6d shows the subsiding warm air aloft,with a main capping inversion descending from∼ 800 m es-sentially down to the surface. Cloud fraction averaged overthis period was low and only reached near 95 % just abovethe surface (Fig. 5c). Two pulses of relatively warmer tem-peratures (Fig. 3a) were associated with patches of clouds orfog, primarily around midday on DoY 245.
Similar to in period 2, there was a dramatic temperaturedrop at the surface as a consequence of the dissipation of thesurface-warming clouds (Sedlar et al., 2011); near-surfacetemperatures dropped to below−10◦C, (Fig. 3a). As a con-sequence, the PBL was stably stratified (Fig. 5a). Comparedto period 2, which was also stably stratified except for thelowest 50–100 m, period 4 was continuously stably stratifiedall the way down to the surface. However, the stability inthe capping inversion of period 2 was much stronger thanin period 4; the layer between 100 and 300–400 ma.g.l. dur-ing period 4 has a structure reminiscent of a residual layer,clearly showing the remnants of mixing by the previousstratocumulus layer. Thus the temperature profile in Fig. 5ashows a variable but stable layer between the surface and∼ 150 m; above this the stability is weaker in the layer upto ∼ 400 m followed by the capping inversion, which is up toa kilometer in height. The enhanced variability is indicatedby the broadening of the inter-quartile range of equivalentpotential temperature (Fig. 5a).
RHi was > 100 % in a layer from the surface up to∼ 200 m, (Fig. 5b); however, in contrast to the previous peri-ods, where the RHi and cloud fraction profiles were consis-tent, the cloud fraction was high at the surface but droppedoff with altitude – to 80 % at 200 m, and below 40 % above300 m where RHi was still ∼ 100 %. Clouds were entirelyabsent above 800 m. This period coincided with an episodeof very low concentrations of cloud condensation nuclei, de-scribed in detail in Mauritsen et al. (2011), where they iden-tified a tenuous Arctic cloud regime and subsequent surfaceforcing strongly linked to the absence of CCN despite suffi-ciently large RH present.
Based on the helicopter profiles, concentrations ofD>300aerosol particles were very low within the lowermost fewhundred metres (Fig. 9d, e), with concentrations usuallybelow 0.5 cm−3, as compared to ca. 4–7 cm−3 during pe-riod 1, ca. 1 cm−3 during period 2 and ca. 2–10 cm−3 during
www.atmos-chem-phys.net/13/12405/2013/ Atmos. Chem. Phys., 13, 12405–12431, 2013
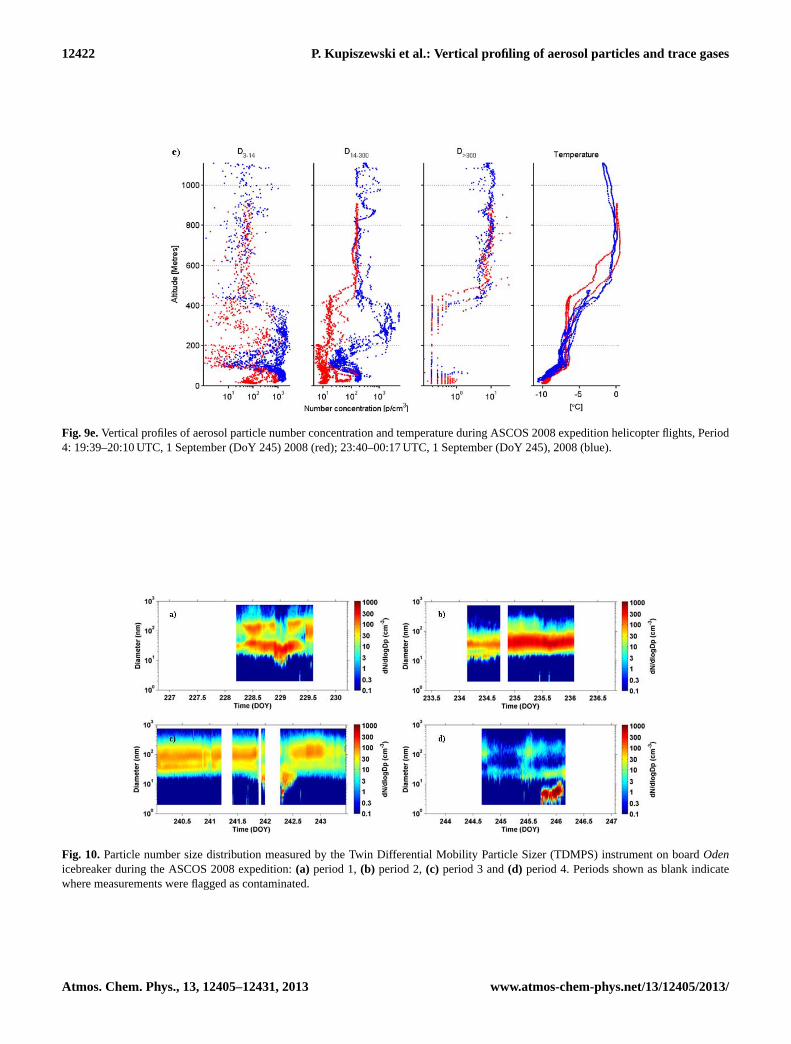
12422 P. Kupiszewski et al.: Vertical profiling of aerosol particles and trace gases
Fig. 9e.Vertical profiles of aerosol particle number concentration and temperature during ASCOS 2008 expedition helicopter flights, Period4: 19:39–20:10 UTC, 1 September (DoY 245) 2008 (red); 23:40–00:17 UTC, 1 September (DoY 245), 2008 (blue).
Fig. 10. Particle number size distribution measured by the Twin Differential Mobility Particle Sizer (TDMPS) instrument on boardOdenicebreaker during the ASCOS 2008 expedition:(a) period 1,(b) period 2,(c) period 3 and(d) period 4. Periods shown as blank indicatewhere measurements were flagged as contaminated.
Atmos. Chem. Phys., 13, 12405–12431, 2013 www.atmos-chem-phys.net/13/12405/2013/
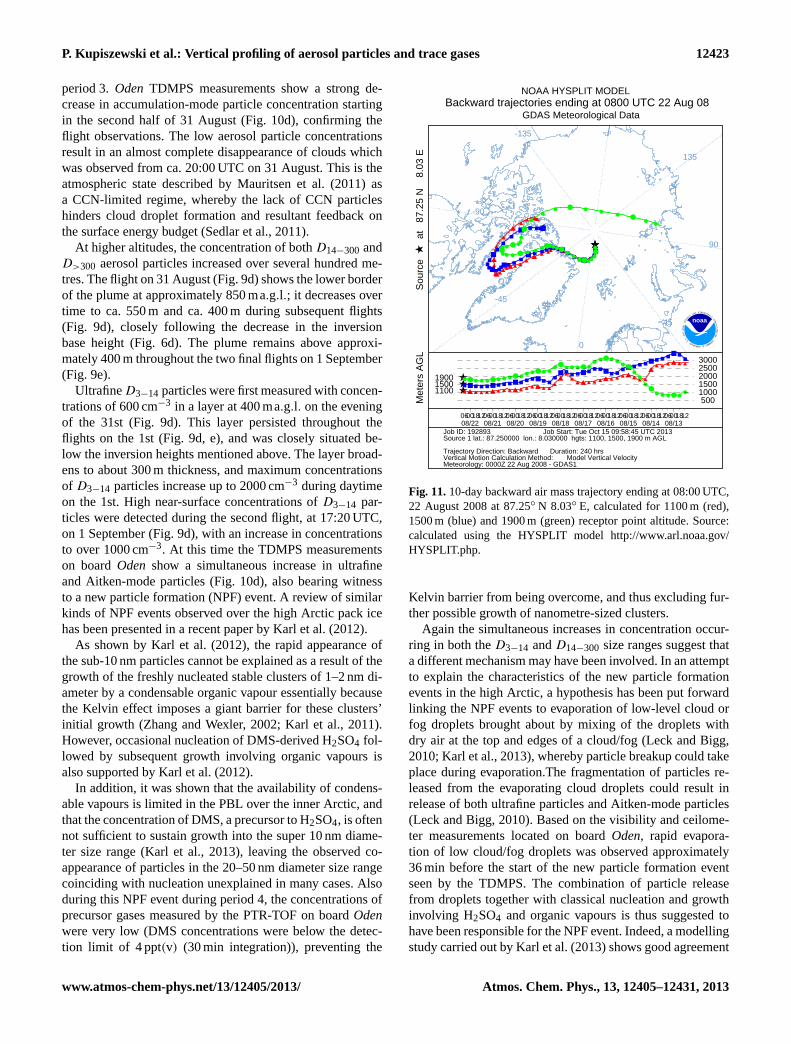
P. Kupiszewski et al.: Vertical profiling of aerosol particles and trace gases 12423
period 3.Oden TDMPS measurements show a strong de-crease in accumulation-mode particle concentration startingin the second half of 31 August (Fig. 10d), confirming theflight observations. The low aerosol particle concentrationsresult in an almost complete disappearance of clouds whichwas observed from ca. 20:00 UTC on 31 August. This is theatmospheric state described by Mauritsen et al. (2011) asa CCN-limited regime, whereby the lack of CCN particleshinders cloud droplet formation and resultant feedback onthe surface energy budget (Sedlar et al., 2011).
At higher altitudes, the concentration of bothD14−300 andD>300 aerosol particles increased over several hundred me-tres. The flight on 31 August (Fig. 9d) shows the lower borderof the plume at approximately 850 ma.g.l.; it decreases overtime to ca. 550 m and ca. 400 m during subsequent flights(Fig. 9d), closely following the decrease in the inversionbase height (Fig. 6d). The plume remains above approxi-mately 400 m throughout the two final flights on 1 September(Fig. 9e).
UltrafineD3−14 particles were first measured with concen-trations of 600 cm−3 in a layer at 400 ma.g.l. on the eveningof the 31st (Fig. 9d). This layer persisted throughout theflights on the 1st (Fig. 9d, e), and was closely situated be-low the inversion heights mentioned above. The layer broad-ens to about 300 m thickness, and maximum concentrationsof D3−14 particles increase up to 2000 cm−3 during daytimeon the 1st. High near-surface concentrations ofD3−14 par-ticles were detected during the second flight, at 17:20 UTC,on 1 September (Fig. 9d), with an increase in concentrationsto over 1000 cm−3. At this time the TDMPS measurementson boardOden show a simultaneous increase in ultrafineand Aitken-mode particles (Fig. 10d), also bearing witnessto a new particle formation (NPF) event. A review of similarkinds of NPF events observed over the high Arctic pack icehas been presented in a recent paper by Karl et al. (2012).
As shown by Karl et al. (2012), the rapid appearance ofthe sub-10 nm particles cannot be explained as a result of thegrowth of the freshly nucleated stable clusters of 1–2 nm di-ameter by a condensable organic vapour essentially becausethe Kelvin effect imposes a giant barrier for these clusters’initial growth (Zhang and Wexler, 2002; Karl et al., 2011).However, occasional nucleation of DMS-derived H2SO4 fol-lowed by subsequent growth involving organic vapours isalso supported by Karl et al. (2012).
In addition, it was shown that the availability of condens-able vapours is limited in the PBL over the inner Arctic, andthat the concentration of DMS, a precursor to H2SO4, is oftennot sufficient to sustain growth into the super 10 nm diame-ter size range (Karl et al., 2013), leaving the observed co-appearance of particles in the 20–50 nm diameter size rangecoinciding with nucleation unexplained in many cases. Alsoduring this NPF event during period 4, the concentrations ofprecursor gases measured by the PTR-TOF on boardOdenwere very low (DMS concentrations were below the detec-tion limit of 4 ppt(v) (30 min integration)), preventing the
-135
-90
-45
0
45
90
135
★▲▲▲
▲▲▲▲▲
▲▲▲▲▲▲▲▲▲▲▲
▲▲▲▲▲▲▲▲
▲▲▲▲
▲
▲
▲▲
▲▲▲▲▲
★■■■
■■■■■
■■■■■■■■■■
■■■■■■■■■
■■■
■
■
■
■ ■ ■■■■■
★●●●
●●●●●
●●●●●●●●●●●●●
●●● ● ● ●●
●
●
●
●● ● ●
●● ●
●●
★ ▲▲▲ ▲ ▲▲▲ ▲ ▲▲▲ ▲ ▲▲▲ ▲▲
▲▲
▲▲▲▲ ▲ ▲▲▲ ▲ ▲▲▲ ▲ ▲
▲▲ ▲ ▲▲▲ ▲
★ ■ ■ ■ ■ ■ ■ ■ ■ ■ ■ ■ ■ ■ ■ ■ ■■
■ ■■ ■ ■ ■
■ ■ ■ ■ ■■ ■ ■ ■ ■ ■ ■ ■ ■
■ ■■
★ ● ● ● ● ● ● ● ● ● ● ●● ● ● ● ●
● ● ● ● ● ● ●●
● ● ● ●● ●
●●
●●
● ● ● ● ●●
500 1000 1500 2000 2500 3000
1100 1500 1900
060008/22
1812060008/21
1812060008/20
1812060008/19
1812060008/18
1812060008/17
1812060008/16
1812060008/15
1812060008/14
1812060008/13
1812
NOAA HYSPLIT MODEL Backward trajectories ending at 0800 UTC 22 Aug 08
GDAS Meteorological Data
Sou
rce
★at
87
.25
N
8.0
3 E
Met
ers
AG
LJob ID: 192893 Job Start: Tue Oct 15 09:58:45 UTC 2013Source 1 lat.: 87.250000 lon.: 8.030000 hgts: 1100, 1500, 1900 m AGL Trajectory Direction: Backward Duration: 240 hrs Vertical Motion Calculation Method: Model Vertical Velocity Meteorology: 0000Z 22 Aug 2008 - GDAS1
NA
TI
ON
AL
O
CE
A
NI C
AND A TMOS PHERI C
A
DM
IN
IS
TR
AT
ION
U. S
. DEPARTMENT OF COMMER
C
E
noaa
Fig. 11.10-day backward air mass trajectory ending at 08:00 UTC,22 August 2008 at 87.25◦ N 8.03◦ E, calculated for 1100 m (red),1500 m (blue) and 1900 m (green) receptor point altitude. Source:calculated using the HYSPLIT modelhttp://www.arl.noaa.gov/HYSPLIT.php.
Kelvin barrier from being overcome, and thus excluding fur-ther possible growth of nanometre-sized clusters.
Again the simultaneous increases in concentration occur-ring in both theD3−14 andD14−300 size ranges suggest thata different mechanism may have been involved. In an attemptto explain the characteristics of the new particle formationevents in the high Arctic, a hypothesis has been put forwardlinking the NPF events to evaporation of low-level cloud orfog droplets brought about by mixing of the droplets withdry air at the top and edges of a cloud/fog (Leck and Bigg,2010; Karl et al., 2013), whereby particle breakup could takeplace during evaporation.The fragmentation of particles re-leased from the evaporating cloud droplets could result inrelease of both ultrafine particles and Aitken-mode particles(Leck and Bigg, 2010). Based on the visibility and ceilome-ter measurements located on boardOden, rapid evapora-tion of low cloud/fog droplets was observed approximately36 min before the start of the new particle formation eventseen by the TDMPS. The combination of particle releasefrom droplets together with classical nucleation and growthinvolving H2SO4 and organic vapours is thus suggested tohave been responsible for the NPF event. Indeed, a modellingstudy carried out by Karl et al. (2013) shows good agreement
www.atmos-chem-phys.net/13/12405/2013/ Atmos. Chem. Phys., 13, 12405–12431, 2013
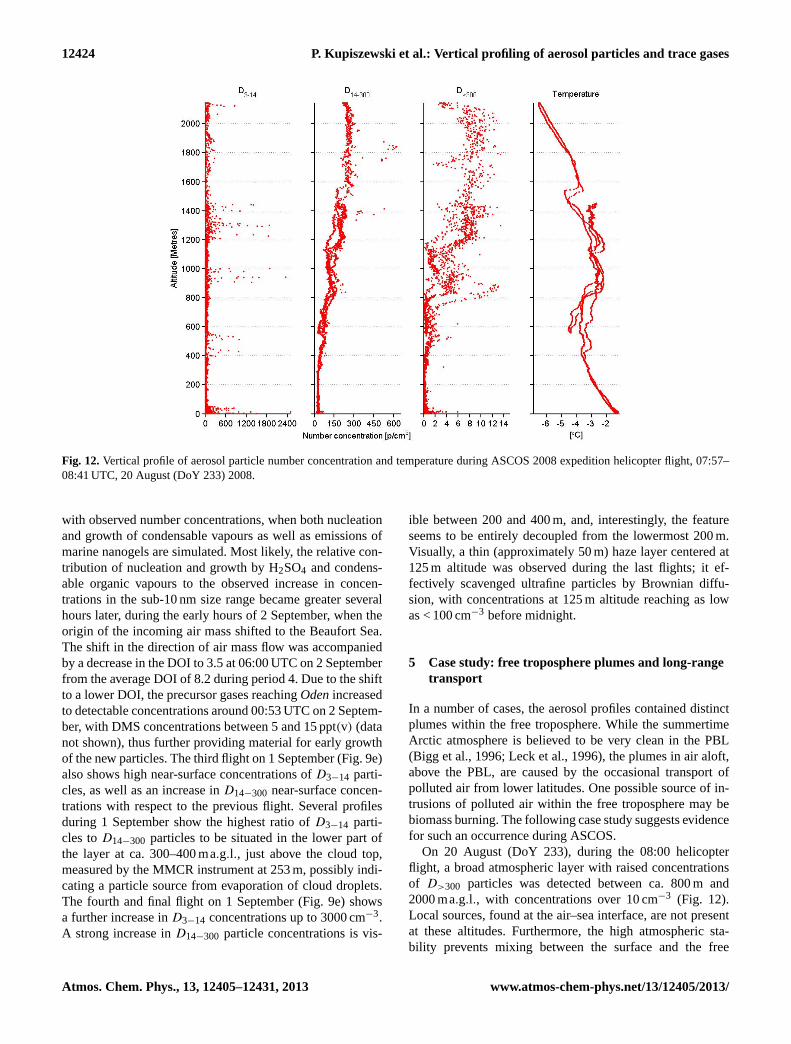
12424 P. Kupiszewski et al.: Vertical profiling of aerosol particles and trace gases
Fig. 12.Vertical profile of aerosol particle number concentration and temperature during ASCOS 2008 expedition helicopter flight, 07:57–08:41 UTC, 20 August (DoY 233) 2008.
with observed number concentrations, when both nucleationand growth of condensable vapours as well as emissions ofmarine nanogels are simulated. Most likely, the relative con-tribution of nucleation and growth by H2SO4 and condens-able organic vapours to the observed increase in concen-trations in the sub-10 nm size range became greater severalhours later, during the early hours of 2 September, when theorigin of the incoming air mass shifted to the Beaufort Sea.The shift in the direction of air mass flow was accompaniedby a decrease in the DOI to 3.5 at 06:00 UTC on 2 Septemberfrom the average DOI of 8.2 during period 4. Due to the shiftto a lower DOI, the precursor gases reachingOdenincreasedto detectable concentrations around 00:53 UTC on 2 Septem-ber, with DMS concentrations between 5 and 15 ppt(v) (datanot shown), thus further providing material for early growthof the new particles. The third flight on 1 September (Fig. 9e)also shows high near-surface concentrations ofD3−14 parti-cles, as well as an increase inD14−300 near-surface concen-trations with respect to the previous flight. Several profilesduring 1 September show the highest ratio ofD3−14 parti-cles toD14−300 particles to be situated in the lower part ofthe layer at ca. 300–400 ma.g.l., just above the cloud top,measured by the MMCR instrument at 253 m, possibly indi-cating a particle source from evaporation of cloud droplets.The fourth and final flight on 1 September (Fig. 9e) showsa further increase inD3−14 concentrations up to 3000 cm−3.A strong increase inD14−300 particle concentrations is vis-
ible between 200 and 400 m, and, interestingly, the featureseems to be entirely decoupled from the lowermost 200 m.Visually, a thin (approximately 50 m) haze layer centered at125 m altitude was observed during the last flights; it ef-fectively scavenged ultrafine particles by Brownian diffu-sion, with concentrations at 125 m altitude reaching as lowas < 100 cm−3 before midnight.
5 Case study: free troposphere plumes and long-rangetransport
In a number of cases, the aerosol profiles contained distinctplumes within the free troposphere. While the summertimeArctic atmosphere is believed to be very clean in the PBL(Bigg et al., 1996; Leck et al., 1996), the plumes in air aloft,above the PBL, are caused by the occasional transport ofpolluted air from lower latitudes. One possible source of in-trusions of polluted air within the free troposphere may bebiomass burning. The following case study suggests evidencefor such an occurrence during ASCOS.
On 20 August (DoY 233), during the 08:00 helicopterflight, a broad atmospheric layer with raised concentrationsof D>300 particles was detected between ca. 800 m and2000 ma.g.l., with concentrations over 10 cm−3 (Fig. 12).Local sources, found at the air–sea interface, are not presentat these altitudes. Furthermore, the high atmospheric sta-bility prevents mixing between the surface and the free
Atmos. Chem. Phys., 13, 12405–12431, 2013 www.atmos-chem-phys.net/13/12405/2013/
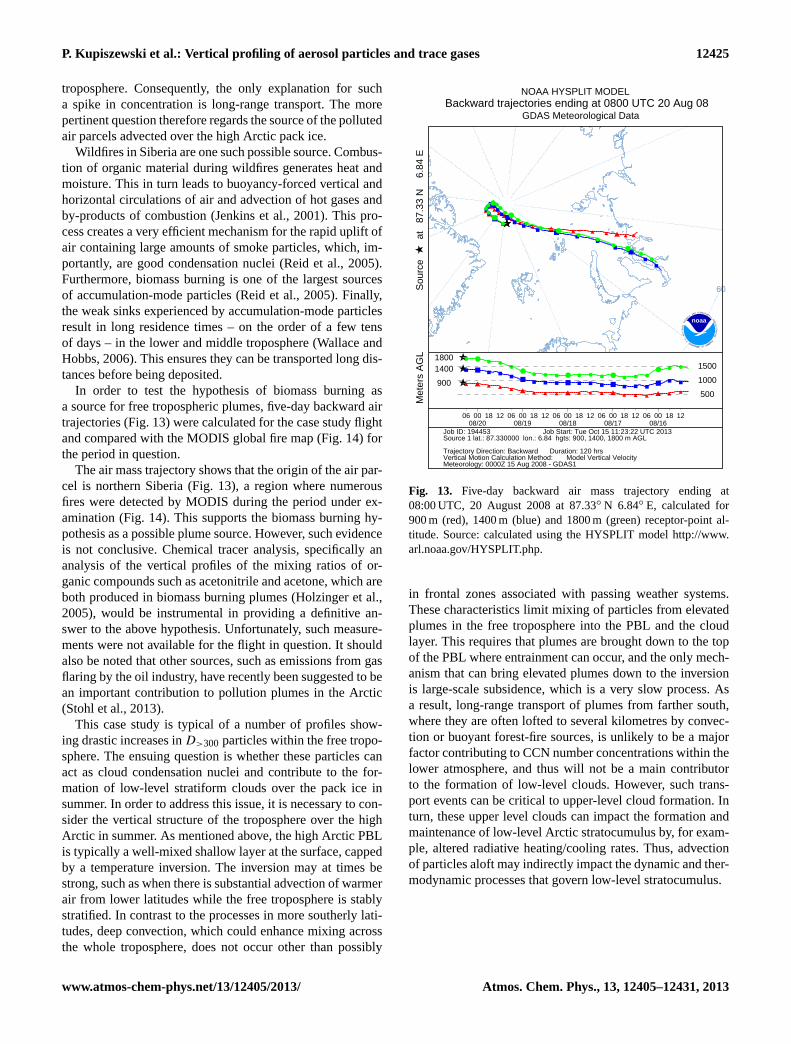
P. Kupiszewski et al.: Vertical profiling of aerosol particles and trace gases 12425
troposphere. Consequently, the only explanation for sucha spike in concentration is long-range transport. The morepertinent question therefore regards the source of the pollutedair parcels advected over the high Arctic pack ice.
Wildfires in Siberia are one such possible source. Combus-tion of organic material during wildfires generates heat andmoisture. This in turn leads to buoyancy-forced vertical andhorizontal circulations of air and advection of hot gases andby-products of combustion (Jenkins et al., 2001). This pro-cess creates a very efficient mechanism for the rapid uplift ofair containing large amounts of smoke particles, which, im-portantly, are good condensation nuclei (Reid et al., 2005).Furthermore, biomass burning is one of the largest sourcesof accumulation-mode particles (Reid et al., 2005). Finally,the weak sinks experienced by accumulation-mode particlesresult in long residence times – on the order of a few tensof days – in the lower and middle troposphere (Wallace andHobbs, 2006). This ensures they can be transported long dis-tances before being deposited.
In order to test the hypothesis of biomass burning asa source for free tropospheric plumes, five-day backward airtrajectories (Fig. 13) were calculated for the case study flightand compared with the MODIS global fire map (Fig. 14) forthe period in question.
The air mass trajectory shows that the origin of the air par-cel is northern Siberia (Fig. 13), a region where numerousfires were detected by MODIS during the period under ex-amination (Fig. 14). This supports the biomass burning hy-pothesis as a possible plume source. However, such evidenceis not conclusive. Chemical tracer analysis, specifically ananalysis of the vertical profiles of the mixing ratios of or-ganic compounds such as acetonitrile and acetone, which areboth produced in biomass burning plumes (Holzinger et al.,2005), would be instrumental in providing a definitive an-swer to the above hypothesis. Unfortunately, such measure-ments were not available for the flight in question. It shouldalso be noted that other sources, such as emissions from gasflaring by the oil industry, have recently been suggested to bean important contribution to pollution plumes in the Arctic(Stohl et al., 2013).
This case study is typical of a number of profiles show-ing drastic increases inD>300 particles within the free tropo-sphere. The ensuing question is whether these particles canact as cloud condensation nuclei and contribute to the for-mation of low-level stratiform clouds over the pack ice insummer. In order to address this issue, it is necessary to con-sider the vertical structure of the troposphere over the highArctic in summer. As mentioned above, the high Arctic PBLis typically a well-mixed shallow layer at the surface, cappedby a temperature inversion. The inversion may at times bestrong, such as when there is substantial advection of warmerair from lower latitudes while the free troposphere is stablystratified. In contrast to the processes in more southerly lati-tudes, deep convection, which could enhance mixing acrossthe whole troposphere, does not occur other than possibly
60
60
★▲▲
▲▲▲▲▲
▲▲▲
▲▲
▲ ▲ ▲ ▲ ▲ ▲ ▲ ▲
★■■
■■■■■
■■
■■
■■ ■
■■
■■
■
■
★●●
●●●●●
●● ●
●●
●●
●●
●●
●●
★ ▲ ▲ ▲ ▲ ▲ ▲ ▲ ▲ ▲ ▲ ▲ ▲ ▲ ▲ ▲ ▲ ▲ ▲ ▲ ▲
★ ■ ■ ■ ■■
■ ■ ■ ■ ■ ■ ■ ■ ■ ■ ■ ■■ ■ ■
★ ● ● ● ●●
●● ● ● ● ● ● ● ● ● ● ●
● ● ●
500
1000
1500
900
1400 1800
06 0008/20
18 12 06 0008/19
18 12 06 0008/18
18 12 06 0008/17
18 12 06 0008/16
18 12
NOAA HYSPLIT MODEL Backward trajectories ending at 0800 UTC 20 Aug 08
GDAS Meteorological Data
Sou
rce
★at
87
.33
N
6.8
4 E
Met
ers
AG
LJob ID: 194453 Job Start: Tue Oct 15 11:23:22 UTC 2013Source 1 lat.: 87.330000 lon.: 6.84 hgts: 900, 1400, 1800 m AGL Trajectory Direction: Backward Duration: 120 hrs Vertical Motion Calculation Method: Model Vertical Velocity Meteorology: 0000Z 15 Aug 2008 - GDAS1
NA
TI
ON
AL
O
CE
A
NI C
AND A TMOS PHERI C
A
DM
IN
IS
TR
AT
ION
U. S
. DEPARTMENT OF COMMER
C
E
noaa
Fig. 13. Five-day backward air mass trajectory ending at08:00 UTC, 20 August 2008 at 87.33◦ N 6.84◦ E, calculated for900 m (red), 1400 m (blue) and 1800 m (green) receptor-point al-titude. Source: calculated using the HYSPLIT modelhttp://www.arl.noaa.gov/HYSPLIT.php.
in frontal zones associated with passing weather systems.These characteristics limit mixing of particles from elevatedplumes in the free troposphere into the PBL and the cloudlayer. This requires that plumes are brought down to the topof the PBL where entrainment can occur, and the only mech-anism that can bring elevated plumes down to the inversionis large-scale subsidence, which is a very slow process. Asa result, long-range transport of plumes from farther south,where they are often lofted to several kilometres by convec-tion or buoyant forest-fire sources, is unlikely to be a majorfactor contributing to CCN number concentrations within thelower atmosphere, and thus will not be a main contributorto the formation of low-level clouds. However, such trans-port events can be critical to upper-level cloud formation. Inturn, these upper level clouds can impact the formation andmaintenance of low-level Arctic stratocumulus by, for exam-ple, altered radiative heating/cooling rates. Thus, advectionof particles aloft may indirectly impact the dynamic and ther-modynamic processes that govern low-level stratocumulus.
www.atmos-chem-phys.net/13/12405/2013/ Atmos. Chem. Phys., 13, 12405–12431, 2013
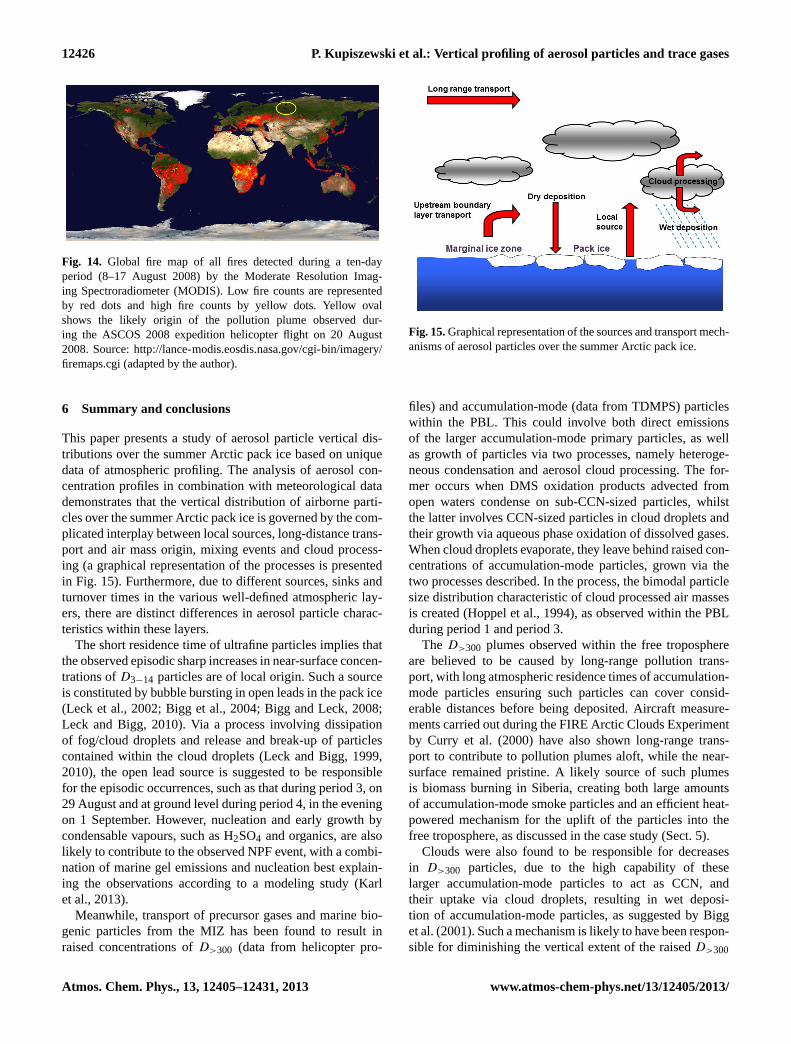
12426 P. Kupiszewski et al.: Vertical profiling of aerosol particles and trace gases
Fig. 14. Global fire map of all fires detected during a ten-dayperiod (8–17 August 2008) by the Moderate Resolution Imag-ing Spectroradiometer (MODIS). Low fire counts are representedby red dots and high fire counts by yellow dots. Yellow ovalshows the likely origin of the pollution plume observed dur-ing the ASCOS 2008 expedition helicopter flight on 20 August2008. Source:http://lance-modis.eosdis.nasa.gov/cgi-bin/imagery/firemaps.cgi(adapted by the author).
6 Summary and conclusions
This paper presents a study of aerosol particle vertical dis-tributions over the summer Arctic pack ice based on uniquedata of atmospheric profiling. The analysis of aerosol con-centration profiles in combination with meteorological datademonstrates that the vertical distribution of airborne parti-cles over the summer Arctic pack ice is governed by the com-plicated interplay between local sources, long-distance trans-port and air mass origin, mixing events and cloud process-ing (a graphical representation of the processes is presentedin Fig. 15). Furthermore, due to different sources, sinks andturnover times in the various well-defined atmospheric lay-ers, there are distinct differences in aerosol particle charac-teristics within these layers.
The short residence time of ultrafine particles implies thatthe observed episodic sharp increases in near-surface concen-trations ofD3−14 particles are of local origin. Such a sourceis constituted by bubble bursting in open leads in the pack ice(Leck et al., 2002; Bigg et al., 2004; Bigg and Leck, 2008;Leck and Bigg, 2010). Via a process involving dissipationof fog/cloud droplets and release and break-up of particlescontained within the cloud droplets (Leck and Bigg, 1999,2010), the open lead source is suggested to be responsiblefor the episodic occurrences, such as that during period 3, on29 August and at ground level during period 4, in the eveningon 1 September. However, nucleation and early growth bycondensable vapours, such as H2SO4 and organics, are alsolikely to contribute to the observed NPF event, with a combi-nation of marine gel emissions and nucleation best explain-ing the observations according to a modeling study (Karlet al., 2013).
Meanwhile, transport of precursor gases and marine bio-genic particles from the MIZ has been found to result inraised concentrations ofD>300 (data from helicopter pro-
Fig. 15.Graphical representation of the sources and transport mech-anisms of aerosol particles over the summer Arctic pack ice.
files) and accumulation-mode (data from TDMPS) particleswithin the PBL. This could involve both direct emissionsof the larger accumulation-mode primary particles, as wellas growth of particles via two processes, namely heteroge-neous condensation and aerosol cloud processing. The for-mer occurs when DMS oxidation products advected fromopen waters condense on sub-CCN-sized particles, whilstthe latter involves CCN-sized particles in cloud droplets andtheir growth via aqueous phase oxidation of dissolved gases.When cloud droplets evaporate, they leave behind raised con-centrations of accumulation-mode particles, grown via thetwo processes described. In the process, the bimodal particlesize distribution characteristic of cloud processed air massesis created (Hoppel et al., 1994), as observed within the PBLduring period 1 and period 3.
The D>300 plumes observed within the free troposphereare believed to be caused by long-range pollution trans-port, with long atmospheric residence times of accumulation-mode particles ensuring such particles can cover consid-erable distances before being deposited. Aircraft measure-ments carried out during the FIRE Arctic Clouds Experimentby Curry et al. (2000) have also shown long-range trans-port to contribute to pollution plumes aloft, while the near-surface remained pristine. A likely source of such plumesis biomass burning in Siberia, creating both large amountsof accumulation-mode smoke particles and an efficient heat-powered mechanism for the uplift of the particles into thefree troposphere, as discussed in the case study (Sect. 5).
Clouds were also found to be responsible for decreasesin D>300 particles, due to the high capability of theselarger accumulation-mode particles to act as CCN, andtheir uptake via cloud droplets, resulting in wet deposi-tion of accumulation-mode particles, as suggested by Bigget al. (2001). Such a mechanism is likely to have been respon-sible for diminishing the vertical extent of the raisedD>300
Atmos. Chem. Phys., 13, 12405–12431, 2013 www.atmos-chem-phys.net/13/12405/2013/
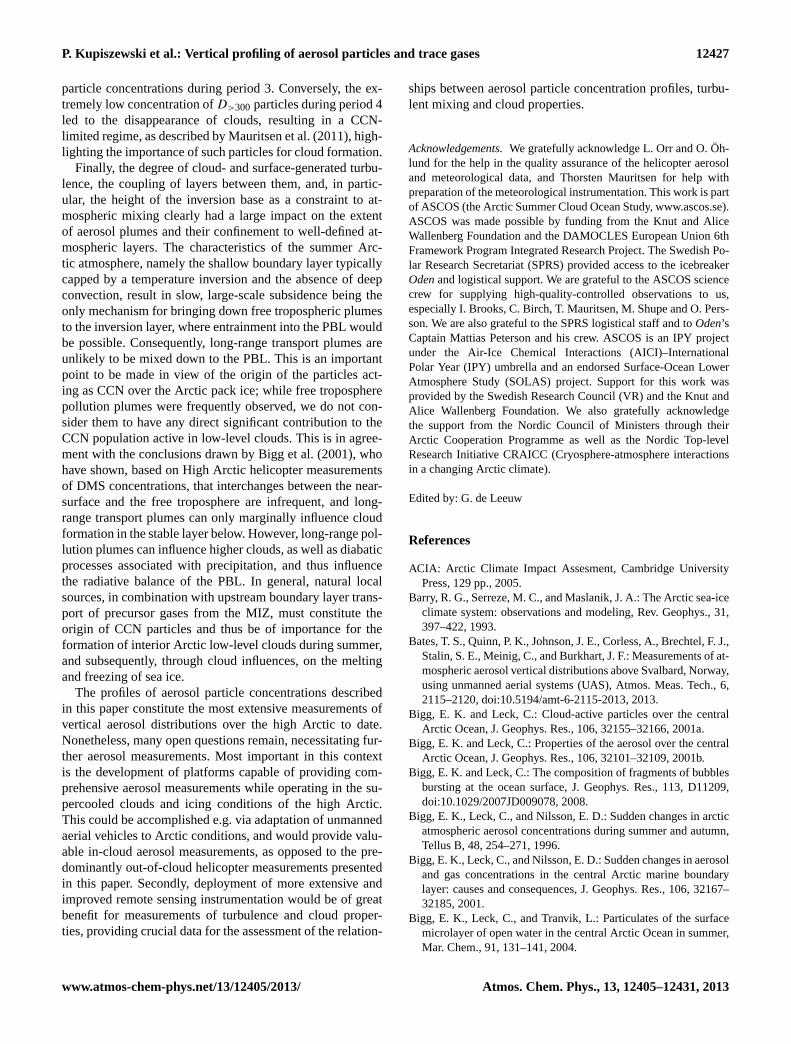
P. Kupiszewski et al.: Vertical profiling of aerosol particles and trace gases 12427
particle concentrations during period 3. Conversely, the ex-tremely low concentration ofD>300 particles during period 4led to the disappearance of clouds, resulting in a CCN-limited regime, as described by Mauritsen et al. (2011), high-lighting the importance of such particles for cloud formation.
Finally, the degree of cloud- and surface-generated turbu-lence, the coupling of layers between them, and, in partic-ular, the height of the inversion base as a constraint to at-mospheric mixing clearly had a large impact on the extentof aerosol plumes and their confinement to well-defined at-mospheric layers. The characteristics of the summer Arc-tic atmosphere, namely the shallow boundary layer typicallycapped by a temperature inversion and the absence of deepconvection, result in slow, large-scale subsidence being theonly mechanism for bringing down free tropospheric plumesto the inversion layer, where entrainment into the PBL wouldbe possible. Consequently, long-range transport plumes areunlikely to be mixed down to the PBL. This is an importantpoint to be made in view of the origin of the particles act-ing as CCN over the Arctic pack ice; while free tropospherepollution plumes were frequently observed, we do not con-sider them to have any direct significant contribution to theCCN population active in low-level clouds. This is in agree-ment with the conclusions drawn by Bigg et al. (2001), whohave shown, based on High Arctic helicopter measurementsof DMS concentrations, that interchanges between the near-surface and the free troposphere are infrequent, and long-range transport plumes can only marginally influence cloudformation in the stable layer below. However, long-range pol-lution plumes can influence higher clouds, as well as diabaticprocesses associated with precipitation, and thus influencethe radiative balance of the PBL. In general, natural localsources, in combination with upstream boundary layer trans-port of precursor gases from the MIZ, must constitute theorigin of CCN particles and thus be of importance for theformation of interior Arctic low-level clouds during summer,and subsequently, through cloud influences, on the meltingand freezing of sea ice.
The profiles of aerosol particle concentrations describedin this paper constitute the most extensive measurements ofvertical aerosol distributions over the high Arctic to date.Nonetheless, many open questions remain, necessitating fur-ther aerosol measurements. Most important in this contextis the development of platforms capable of providing com-prehensive aerosol measurements while operating in the su-percooled clouds and icing conditions of the high Arctic.This could be accomplished e.g. via adaptation of unmannedaerial vehicles to Arctic conditions, and would provide valu-able in-cloud aerosol measurements, as opposed to the pre-dominantly out-of-cloud helicopter measurements presentedin this paper. Secondly, deployment of more extensive andimproved remote sensing instrumentation would be of greatbenefit for measurements of turbulence and cloud proper-ties, providing crucial data for the assessment of the relation-
ships between aerosol particle concentration profiles, turbu-lent mixing and cloud properties.
Acknowledgements.We gratefully acknowledge L. Orr and O. Öh-lund for the help in the quality assurance of the helicopter aerosoland meteorological data, and Thorsten Mauritsen for help withpreparation of the meteorological instrumentation. This work is partof ASCOS (the Arctic Summer Cloud Ocean Study,www.ascos.se).ASCOS was made possible by funding from the Knut and AliceWallenberg Foundation and the DAMOCLES European Union 6thFramework Program Integrated Research Project. The Swedish Po-lar Research Secretariat (SPRS) provided access to the icebreakerOdenand logistical support. We are grateful to the ASCOS sciencecrew for supplying high-quality-controlled observations to us,especially I. Brooks, C. Birch, T. Mauritsen, M. Shupe and O. Pers-son. We are also grateful to the SPRS logistical staff and toOden’sCaptain Mattias Peterson and his crew. ASCOS is an IPY projectunder the Air-Ice Chemical Interactions (AICI)–InternationalPolar Year (IPY) umbrella and an endorsed Surface-Ocean LowerAtmosphere Study (SOLAS) project. Support for this work wasprovided by the Swedish Research Council (VR) and the Knut andAlice Wallenberg Foundation. We also gratefully acknowledgethe support from the Nordic Council of Ministers through theirArctic Cooperation Programme as well as the Nordic Top-levelResearch Initiative CRAICC (Cryosphere-atmosphere interactionsin a changing Arctic climate).
Edited by: G. de Leeuw
References
ACIA: Arctic Climate Impact Assesment, Cambridge UniversityPress, 129 pp., 2005.
Barry, R. G., Serreze, M. C., and Maslanik, J. A.: The Arctic sea-iceclimate system: observations and modeling, Rev. Geophys., 31,397–422, 1993.
Bates, T. S., Quinn, P. K., Johnson, J. E., Corless, A., Brechtel, F. J.,Stalin, S. E., Meinig, C., and Burkhart, J. F.: Measurements of at-mospheric aerosol vertical distributions above Svalbard, Norway,using unmanned aerial systems (UAS), Atmos. Meas. Tech., 6,2115–2120, doi:10.5194/amt-6-2115-2013, 2013.
Bigg, E. K. and Leck, C.: Cloud-active particles over the centralArctic Ocean, J. Geophys. Res., 106, 32155–32166, 2001a.
Bigg, E. K. and Leck, C.: Properties of the aerosol over the centralArctic Ocean, J. Geophys. Res., 106, 32101–32109, 2001b.
Bigg, E. K. and Leck, C.: The composition of fragments of bubblesbursting at the ocean surface, J. Geophys. Res., 113, D11209,doi:10.1029/2007JD009078, 2008.
Bigg, E. K., Leck, C., and Nilsson, E. D.: Sudden changes in arcticatmospheric aerosol concentrations during summer and autumn,Tellus B, 48, 254–271, 1996.
Bigg, E. K., Leck, C., and Nilsson, E. D.: Sudden changes in aerosoland gas concentrations in the central Arctic marine boundarylayer: causes and consequences, J. Geophys. Res., 106, 32167–32185, 2001.
Bigg, E. K., Leck, C., and Tranvik, L.: Particulates of the surfacemicrolayer of open water in the central Arctic Ocean in summer,Mar. Chem., 91, 131–141, 2004.
www.atmos-chem-phys.net/13/12405/2013/ Atmos. Chem. Phys., 13, 12405–12431, 2013
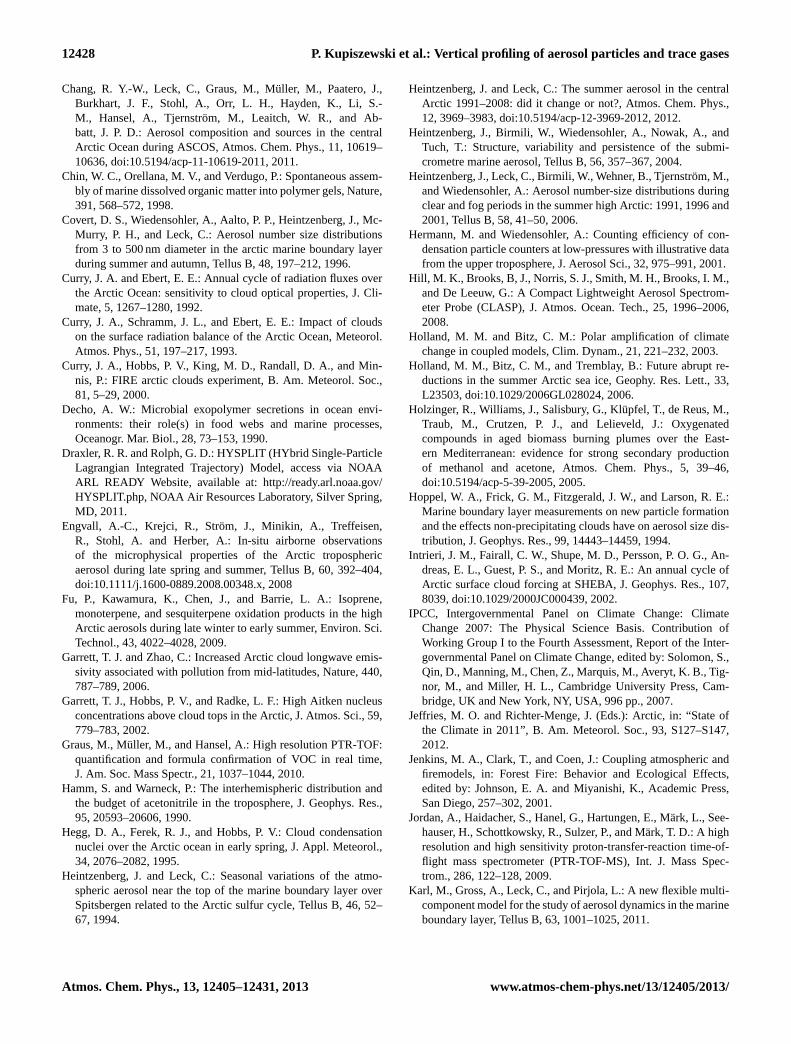
12428 P. Kupiszewski et al.: Vertical profiling of aerosol particles and trace gases
Chang, R. Y.-W., Leck, C., Graus, M., Müller, M., Paatero, J.,Burkhart, J. F., Stohl, A., Orr, L. H., Hayden, K., Li, S.-M., Hansel, A., Tjernström, M., Leaitch, W. R., and Ab-batt, J. P. D.: Aerosol composition and sources in the centralArctic Ocean during ASCOS, Atmos. Chem. Phys., 11, 10619–10636, doi:10.5194/acp-11-10619-2011, 2011.
Chin, W. C., Orellana, M. V., and Verdugo, P.: Spontaneous assem-bly of marine dissolved organic matter into polymer gels, Nature,391, 568–572, 1998.
Covert, D. S., Wiedensohler, A., Aalto, P. P., Heintzenberg, J., Mc-Murry, P. H., and Leck, C.: Aerosol number size distributionsfrom 3 to 500 nm diameter in the arctic marine boundary layerduring summer and autumn, Tellus B, 48, 197–212, 1996.
Curry, J. A. and Ebert, E. E.: Annual cycle of radiation fluxes overthe Arctic Ocean: sensitivity to cloud optical properties, J. Cli-mate, 5, 1267–1280, 1992.
Curry, J. A., Schramm, J. L., and Ebert, E. E.: Impact of cloudson the surface radiation balance of the Arctic Ocean, Meteorol.Atmos. Phys., 51, 197–217, 1993.
Curry, J. A., Hobbs, P. V., King, M. D., Randall, D. A., and Min-nis, P.: FIRE arctic clouds experiment, B. Am. Meteorol. Soc.,81, 5–29, 2000.
Decho, A. W.: Microbial exopolymer secretions in ocean envi-ronments: their role(s) in food webs and marine processes,Oceanogr. Mar. Biol., 28, 73–153, 1990.
Draxler, R. R. and Rolph, G. D.: HYSPLIT (HYbrid Single-ParticleLagrangian Integrated Trajectory) Model, access via NOAAARL READY Website, available at:http://ready.arl.noaa.gov/HYSPLIT.php, NOAA Air Resources Laboratory, Silver Spring,MD, 2011.
Engvall, A.-C., Krejci, R., Ström, J., Minikin, A., Treffeisen,R., Stohl, A. and Herber, A.: In-situ airborne observationsof the microphysical properties of the Arctic troposphericaerosol during late spring and summer, Tellus B, 60, 392–404,doi:10.1111/j.1600-0889.2008.00348.x, 2008
Fu, P., Kawamura, K., Chen, J., and Barrie, L. A.: Isoprene,monoterpene, and sesquiterpene oxidation products in the highArctic aerosols during late winter to early summer, Environ. Sci.Technol., 43, 4022–4028, 2009.
Garrett, T. J. and Zhao, C.: Increased Arctic cloud longwave emis-sivity associated with pollution from mid-latitudes, Nature, 440,787–789, 2006.
Garrett, T. J., Hobbs, P. V., and Radke, L. F.: High Aitken nucleusconcentrations above cloud tops in the Arctic, J. Atmos. Sci., 59,779–783, 2002.
Graus, M., Müller, M., and Hansel, A.: High resolution PTR-TOF:quantification and formula confirmation of VOC in real time,J. Am. Soc. Mass Spectr., 21, 1037–1044, 2010.
Hamm, S. and Warneck, P.: The interhemispheric distribution andthe budget of acetonitrile in the troposphere, J. Geophys. Res.,95, 20593–20606, 1990.
Hegg, D. A., Ferek, R. J., and Hobbs, P. V.: Cloud condensationnuclei over the Arctic ocean in early spring, J. Appl. Meteorol.,34, 2076–2082, 1995.
Heintzenberg, J. and Leck, C.: Seasonal variations of the atmo-spheric aerosol near the top of the marine boundary layer overSpitsbergen related to the Arctic sulfur cycle, Tellus B, 46, 52–67, 1994.
Heintzenberg, J. and Leck, C.: The summer aerosol in the centralArctic 1991–2008: did it change or not?, Atmos. Chem. Phys.,12, 3969–3983, doi:10.5194/acp-12-3969-2012, 2012.
Heintzenberg, J., Birmili, W., Wiedensohler, A., Nowak, A., andTuch, T.: Structure, variability and persistence of the submi-crometre marine aerosol, Tellus B, 56, 357–367, 2004.
Heintzenberg, J., Leck, C., Birmili, W., Wehner, B., Tjernström, M.,and Wiedensohler, A.: Aerosol number-size distributions duringclear and fog periods in the summer high Arctic: 1991, 1996 and2001, Tellus B, 58, 41–50, 2006.
Hermann, M. and Wiedensohler, A.: Counting efficiency of con-densation particle counters at low-pressures with illustrative datafrom the upper troposphere, J. Aerosol Sci., 32, 975–991, 2001.
Hill, M. K., Brooks, B, J., Norris, S. J., Smith, M. H., Brooks, I. M.,and De Leeuw, G.: A Compact Lightweight Aerosol Spectrom-eter Probe (CLASP), J. Atmos. Ocean. Tech., 25, 1996–2006,2008.
Holland, M. M. and Bitz, C. M.: Polar amplification of climatechange in coupled models, Clim. Dynam., 21, 221–232, 2003.
Holland, M. M., Bitz, C. M., and Tremblay, B.: Future abrupt re-ductions in the summer Arctic sea ice, Geophy. Res. Lett., 33,L23503, doi:10.1029/2006GL028024, 2006.
Holzinger, R., Williams, J., Salisbury, G., Klüpfel, T., de Reus, M.,Traub, M., Crutzen, P. J., and Lelieveld, J.: Oxygenatedcompounds in aged biomass burning plumes over the East-ern Mediterranean: evidence for strong secondary productionof methanol and acetone, Atmos. Chem. Phys., 5, 39–46,doi:10.5194/acp-5-39-2005, 2005.
Hoppel, W. A., Frick, G. M., Fitzgerald, J. W., and Larson, R. E.:Marine boundary layer measurements on new particle formationand the effects non-precipitating clouds have on aerosol size dis-tribution, J. Geophys. Res., 99, 14443–14459, 1994.
Intrieri, J. M., Fairall, C. W., Shupe, M. D., Persson, P. O. G., An-dreas, E. L., Guest, P. S., and Moritz, R. E.: An annual cycle ofArctic surface cloud forcing at SHEBA, J. Geophys. Res., 107,8039, doi:10.1029/2000JC000439, 2002.
IPCC, Intergovernmental Panel on Climate Change: ClimateChange 2007: The Physical Science Basis. Contribution ofWorking Group I to the Fourth Assessment, Report of the Inter-governmental Panel on Climate Change, edited by: Solomon, S.,Qin, D., Manning, M., Chen, Z., Marquis, M., Averyt, K. B., Tig-nor, M., and Miller, H. L., Cambridge University Press, Cam-bridge, UK and New York, NY, USA, 996 pp., 2007.
Jeffries, M. O. and Richter-Menge, J. (Eds.): Arctic, in: “State ofthe Climate in 2011”, B. Am. Meteorol. Soc., 93, S127–S147,2012.
Jenkins, M. A., Clark, T., and Coen, J.: Coupling atmospheric andfiremodels, in: Forest Fire: Behavior and Ecological Effects,edited by: Johnson, E. A. and Miyanishi, K., Academic Press,San Diego, 257–302, 2001.
Jordan, A., Haidacher, S., Hanel, G., Hartungen, E., Märk, L., See-hauser, H., Schottkowsky, R., Sulzer, P., and Märk, T. D.: A highresolution and high sensitivity proton-transfer-reaction time-of-flight mass spectrometer (PTR-TOF-MS), Int. J. Mass Spec-trom., 286, 122–128, 2009.
Karl, M., Gross, A., Leck, C., and Pirjola, L.: A new flexible multi-component model for the study of aerosol dynamics in the marineboundary layer, Tellus B, 63, 1001–1025, 2011.
Atmos. Chem. Phys., 13, 12405–12431, 2013 www.atmos-chem-phys.net/13/12405/2013/
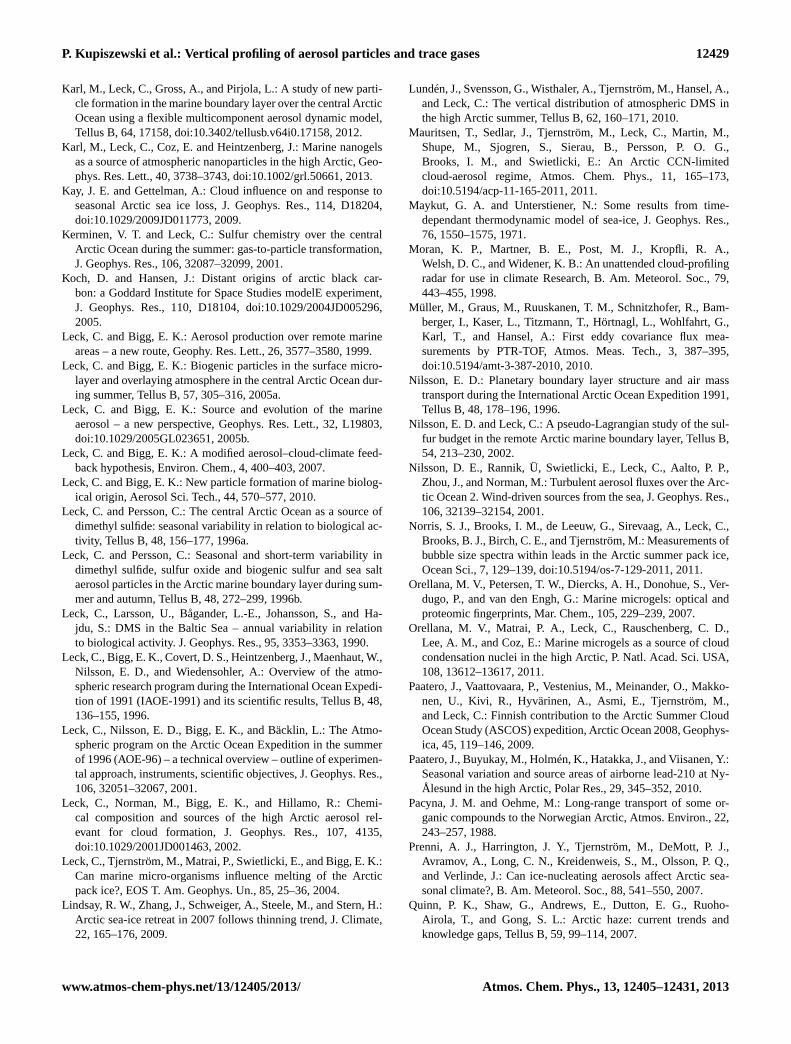
P. Kupiszewski et al.: Vertical profiling of aerosol particles and trace gases 12429
Karl, M., Leck, C., Gross, A., and Pirjola, L.: A study of new parti-cle formation in the marine boundary layer over the central ArcticOcean using a flexible multicomponent aerosol dynamic model,Tellus B, 64, 17158, doi:10.3402/tellusb.v64i0.17158, 2012.
Karl, M., Leck, C., Coz, E. and Heintzenberg, J.: Marine nanogelsas a source of atmospheric nanoparticles in the high Arctic, Geo-phys. Res. Lett., 40, 3738–3743, doi:10.1002/grl.50661, 2013.
Kay, J. E. and Gettelman, A.: Cloud influence on and response toseasonal Arctic sea ice loss, J. Geophys. Res., 114, D18204,doi:10.1029/2009JD011773, 2009.
Kerminen, V. T. and Leck, C.: Sulfur chemistry over the centralArctic Ocean during the summer: gas-to-particle transformation,J. Geophys. Res., 106, 32087–32099, 2001.
Koch, D. and Hansen, J.: Distant origins of arctic black car-bon: a Goddard Institute for Space Studies modelE experiment,J. Geophys. Res., 110, D18104, doi:10.1029/2004JD005296,2005.
Leck, C. and Bigg, E. K.: Aerosol production over remote marineareas – a new route, Geophy. Res. Lett., 26, 3577–3580, 1999.
Leck, C. and Bigg, E. K.: Biogenic particles in the surface micro-layer and overlaying atmosphere in the central Arctic Ocean dur-ing summer, Tellus B, 57, 305–316, 2005a.
Leck, C. and Bigg, E. K.: Source and evolution of the marineaerosol – a new perspective, Geophys. Res. Lett., 32, L19803,doi:10.1029/2005GL023651, 2005b.
Leck, C. and Bigg, E. K.: A modified aerosol–cloud-climate feed-back hypothesis, Environ. Chem., 4, 400–403, 2007.
Leck, C. and Bigg, E. K.: New particle formation of marine biolog-ical origin, Aerosol Sci. Tech., 44, 570–577, 2010.
Leck, C. and Persson, C.: The central Arctic Ocean as a source ofdimethyl sulfide: seasonal variability in relation to biological ac-tivity, Tellus B, 48, 156–177, 1996a.
Leck, C. and Persson, C.: Seasonal and short-term variability indimethyl sulfide, sulfur oxide and biogenic sulfur and sea saltaerosol particles in the Arctic marine boundary layer during sum-mer and autumn, Tellus B, 48, 272–299, 1996b.
Leck, C., Larsson, U., Bågander, L.-E., Johansson, S., and Ha-jdu, S.: DMS in the Baltic Sea – annual variability in relationto biological activity. J. Geophys. Res., 95, 3353–3363, 1990.
Leck, C., Bigg, E. K., Covert, D. S., Heintzenberg, J., Maenhaut, W.,Nilsson, E. D., and Wiedensohler, A.: Overview of the atmo-spheric research program during the International Ocean Expedi-tion of 1991 (IAOE-1991) and its scientific results, Tellus B, 48,136–155, 1996.
Leck, C., Nilsson, E. D., Bigg, E. K., and Bäcklin, L.: The Atmo-spheric program on the Arctic Ocean Expedition in the summerof 1996 (AOE-96) – a technical overview – outline of experimen-tal approach, instruments, scientific objectives, J. Geophys. Res.,106, 32051–32067, 2001.
Leck, C., Norman, M., Bigg, E. K., and Hillamo, R.: Chemi-cal composition and sources of the high Arctic aerosol rel-evant for cloud formation, J. Geophys. Res., 107, 4135,doi:10.1029/2001JD001463, 2002.
Leck, C., Tjernström, M., Matrai, P., Swietlicki, E., and Bigg, E. K.:Can marine micro-organisms influence melting of the Arcticpack ice?, EOS T. Am. Geophys. Un., 85, 25–36, 2004.
Lindsay, R. W., Zhang, J., Schweiger, A., Steele, M., and Stern, H.:Arctic sea-ice retreat in 2007 follows thinning trend, J. Climate,22, 165–176, 2009.
Lundén, J., Svensson, G., Wisthaler, A., Tjernström, M., Hansel, A.,and Leck, C.: The vertical distribution of atmospheric DMS inthe high Arctic summer, Tellus B, 62, 160–171, 2010.
Mauritsen, T., Sedlar, J., Tjernström, M., Leck, C., Martin, M.,Shupe, M., Sjogren, S., Sierau, B., Persson, P. O. G.,Brooks, I. M., and Swietlicki, E.: An Arctic CCN-limitedcloud-aerosol regime, Atmos. Chem. Phys., 11, 165–173,doi:10.5194/acp-11-165-2011, 2011.
Maykut, G. A. and Unterstiener, N.: Some results from time-dependant thermodynamic model of sea-ice, J. Geophys. Res.,76, 1550–1575, 1971.
Moran, K. P., Martner, B. E., Post, M. J., Kropfli, R. A.,Welsh, D. C., and Widener, K. B.: An unattended cloud-profilingradar for use in climate Research, B. Am. Meteorol. Soc., 79,443–455, 1998.
Müller, M., Graus, M., Ruuskanen, T. M., Schnitzhofer, R., Bam-berger, I., Kaser, L., Titzmann, T., Hörtnagl, L., Wohlfahrt, G.,Karl, T., and Hansel, A.: First eddy covariance flux mea-surements by PTR-TOF, Atmos. Meas. Tech., 3, 387–395,doi:10.5194/amt-3-387-2010, 2010.
Nilsson, E. D.: Planetary boundary layer structure and air masstransport during the International Arctic Ocean Expedition 1991,Tellus B, 48, 178–196, 1996.
Nilsson, E. D. and Leck, C.: A pseudo-Lagrangian study of the sul-fur budget in the remote Arctic marine boundary layer, Tellus B,54, 213–230, 2002.
Nilsson, D. E., Rannik, Ü, Swietlicki, E., Leck, C., Aalto, P. P.,Zhou, J., and Norman, M.: Turbulent aerosol fluxes over the Arc-tic Ocean 2. Wind-driven sources from the sea, J. Geophys. Res.,106, 32139–32154, 2001.
Norris, S. J., Brooks, I. M., de Leeuw, G., Sirevaag, A., Leck, C.,Brooks, B. J., Birch, C. E., and Tjernström, M.: Measurements ofbubble size spectra within leads in the Arctic summer pack ice,Ocean Sci., 7, 129–139, doi:10.5194/os-7-129-2011, 2011.
Orellana, M. V., Petersen, T. W., Diercks, A. H., Donohue, S., Ver-dugo, P., and van den Engh, G.: Marine microgels: optical andproteomic fingerprints, Mar. Chem., 105, 229–239, 2007.
Orellana, M. V., Matrai, P. A., Leck, C., Rauschenberg, C. D.,Lee, A. M., and Coz, E.: Marine microgels as a source of cloudcondensation nuclei in the high Arctic, P. Natl. Acad. Sci. USA,108, 13612–13617, 2011.
Paatero, J., Vaattovaara, P., Vestenius, M., Meinander, O., Makko-nen, U., Kivi, R., Hyvärinen, A., Asmi, E., Tjernström, M.,and Leck, C.: Finnish contribution to the Arctic Summer CloudOcean Study (ASCOS) expedition, Arctic Ocean 2008, Geophys-ica, 45, 119–146, 2009.
Paatero, J., Buyukay, M., Holmén, K., Hatakka, J., and Viisanen, Y.:Seasonal variation and source areas of airborne lead-210 at Ny-Ålesund in the high Arctic, Polar Res., 29, 345–352, 2010.
Pacyna, J. M. and Oehme, M.: Long-range transport of some or-ganic compounds to the Norwegian Arctic, Atmos. Environ., 22,243–257, 1988.
Prenni, A. J., Harrington, J. Y., Tjernström, M., DeMott, P. J.,Avramov, A., Long, C. N., Kreidenweis, S., M., Olsson, P. Q.,and Verlinde, J.: Can ice-nucleating aerosols affect Arctic sea-sonal climate?, B. Am. Meteorol. Soc., 88, 541–550, 2007.
Quinn, P. K., Shaw, G., Andrews, E., Dutton, E. G., Ruoho-Airola, T., and Gong, S. L.: Arctic haze: current trends andknowledge gaps, Tellus B, 59, 99–114, 2007.
www.atmos-chem-phys.net/13/12405/2013/ Atmos. Chem. Phys., 13, 12405–12431, 2013
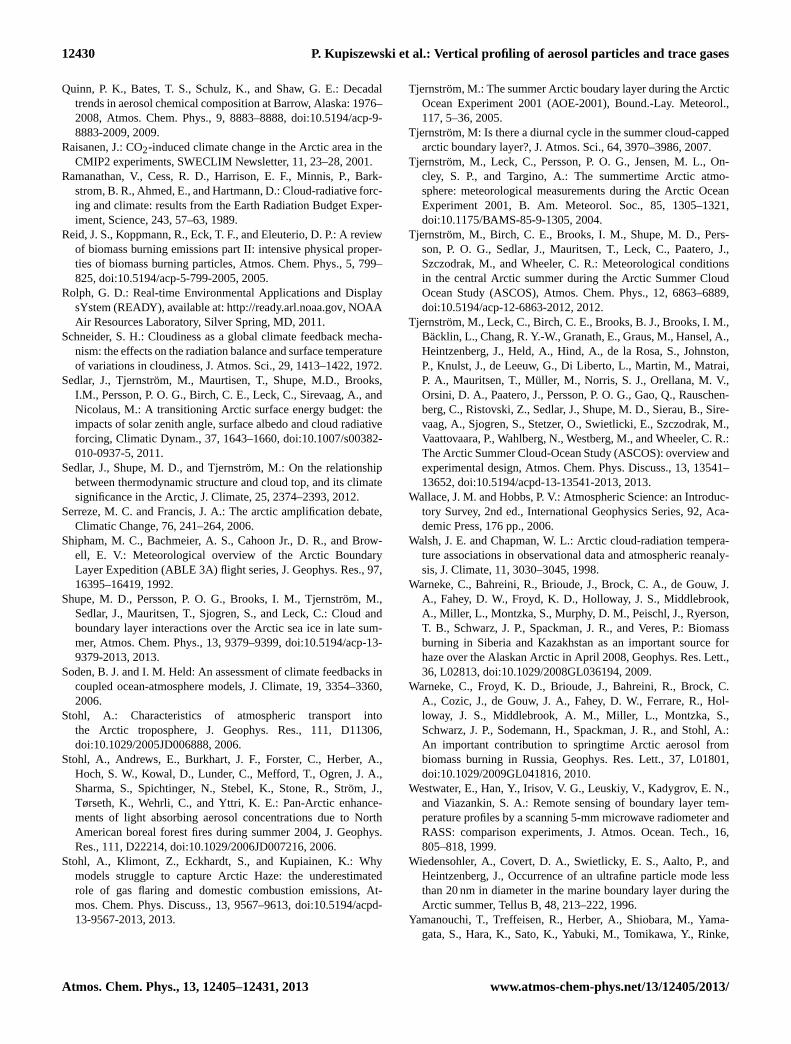
12430 P. Kupiszewski et al.: Vertical profiling of aerosol particles and trace gases
Quinn, P. K., Bates, T. S., Schulz, K., and Shaw, G. E.: Decadaltrends in aerosol chemical composition at Barrow, Alaska: 1976–2008, Atmos. Chem. Phys., 9, 8883–8888, doi:10.5194/acp-9-8883-2009, 2009.
Raisanen, J.: CO2-induced climate change in the Arctic area in theCMIP2 experiments, SWECLIM Newsletter, 11, 23–28, 2001.
Ramanathan, V., Cess, R. D., Harrison, E. F., Minnis, P., Bark-strom, B. R., Ahmed, E., and Hartmann, D.: Cloud-radiative forc-ing and climate: results from the Earth Radiation Budget Exper-iment, Science, 243, 57–63, 1989.
Reid, J. S., Koppmann, R., Eck, T. F., and Eleuterio, D. P.: A reviewof biomass burning emissions part II: intensive physical proper-ties of biomass burning particles, Atmos. Chem. Phys., 5, 799–825, doi:10.5194/acp-5-799-2005, 2005.
Rolph, G. D.: Real-time Environmental Applications and DisplaysYstem (READY), available at:http://ready.arl.noaa.gov, NOAAAir Resources Laboratory, Silver Spring, MD, 2011.
Schneider, S. H.: Cloudiness as a global climate feedback mecha-nism: the effects on the radiation balance and surface temperatureof variations in cloudiness, J. Atmos. Sci., 29, 1413–1422, 1972.
Sedlar, J., Tjernström, M., Maurtisen, T., Shupe, M.D., Brooks,I.M., Persson, P. O. G., Birch, C. E., Leck, C., Sirevaag, A., andNicolaus, M.: A transitioning Arctic surface energy budget: theimpacts of solar zenith angle, surface albedo and cloud radiativeforcing, Climatic Dynam., 37, 1643–1660, doi:10.1007/s00382-010-0937-5, 2011.
Sedlar, J., Shupe, M. D., and Tjernström, M.: On the relationshipbetween thermodynamic structure and cloud top, and its climatesignificance in the Arctic, J. Climate, 25, 2374–2393, 2012.
Serreze, M. C. and Francis, J. A.: The arctic amplification debate,Climatic Change, 76, 241–264, 2006.
Shipham, M. C., Bachmeier, A. S., Cahoon Jr., D. R., and Brow-ell, E. V.: Meteorological overview of the Arctic BoundaryLayer Expedition (ABLE 3A) flight series, J. Geophys. Res., 97,16395–16419, 1992.
Shupe, M. D., Persson, P. O. G., Brooks, I. M., Tjernström, M.,Sedlar, J., Mauritsen, T., Sjogren, S., and Leck, C.: Cloud andboundary layer interactions over the Arctic sea ice in late sum-mer, Atmos. Chem. Phys., 13, 9379–9399, doi:10.5194/acp-13-9379-2013, 2013.
Soden, B. J. and I. M. Held: An assessment of climate feedbacks incoupled ocean-atmosphere models, J. Climate, 19, 3354–3360,2006.
Stohl, A.: Characteristics of atmospheric transport intothe Arctic troposphere, J. Geophys. Res., 111, D11306,doi:10.1029/2005JD006888, 2006.
Stohl, A., Andrews, E., Burkhart, J. F., Forster, C., Herber, A.,Hoch, S. W., Kowal, D., Lunder, C., Mefford, T., Ogren, J. A.,Sharma, S., Spichtinger, N., Stebel, K., Stone, R., Ström, J.,Tørseth, K., Wehrli, C., and Yttri, K. E.: Pan-Arctic enhance-ments of light absorbing aerosol concentrations due to NorthAmerican boreal forest fires during summer 2004, J. Geophys.Res., 111, D22214, doi:10.1029/2006JD007216, 2006.
Stohl, A., Klimont, Z., Eckhardt, S., and Kupiainen, K.: Whymodels struggle to capture Arctic Haze: the underestimatedrole of gas flaring and domestic combustion emissions, At-mos. Chem. Phys. Discuss., 13, 9567–9613, doi:10.5194/acpd-13-9567-2013, 2013.
Tjernström, M.: The summer Arctic boudary layer during the ArcticOcean Experiment 2001 (AOE-2001), Bound.-Lay. Meteorol.,117, 5–36, 2005.
Tjernström, M: Is there a diurnal cycle in the summer cloud-cappedarctic boundary layer?, J. Atmos. Sci., 64, 3970–3986, 2007.
Tjernström, M., Leck, C., Persson, P. O. G., Jensen, M. L., On-cley, S. P., and Targino, A.: The summertime Arctic atmo-sphere: meteorological measurements during the Arctic OceanExperiment 2001, B. Am. Meteorol. Soc., 85, 1305–1321,doi:10.1175/BAMS-85-9-1305, 2004.
Tjernström, M., Birch, C. E., Brooks, I. M., Shupe, M. D., Pers-son, P. O. G., Sedlar, J., Mauritsen, T., Leck, C., Paatero, J.,Szczodrak, M., and Wheeler, C. R.: Meteorological conditionsin the central Arctic summer during the Arctic Summer CloudOcean Study (ASCOS), Atmos. Chem. Phys., 12, 6863–6889,doi:10.5194/acp-12-6863-2012, 2012.
Tjernström, M., Leck, C., Birch, C. E., Brooks, B. J., Brooks, I. M.,Bäcklin, L., Chang, R. Y.-W., Granath, E., Graus, M., Hansel, A.,Heintzenberg, J., Held, A., Hind, A., de la Rosa, S., Johnston,P., Knulst, J., de Leeuw, G., Di Liberto, L., Martin, M., Matrai,P. A., Mauritsen, T., Müller, M., Norris, S. J., Orellana, M. V.,Orsini, D. A., Paatero, J., Persson, P. O. G., Gao, Q., Rauschen-berg, C., Ristovski, Z., Sedlar, J., Shupe, M. D., Sierau, B., Sire-vaag, A., Sjogren, S., Stetzer, O., Swietlicki, E., Szczodrak, M.,Vaattovaara, P., Wahlberg, N., Westberg, M., and Wheeler, C. R.:The Arctic Summer Cloud-Ocean Study (ASCOS): overview andexperimental design, Atmos. Chem. Phys. Discuss., 13, 13541–13652, doi:10.5194/acpd-13-13541-2013, 2013.
Wallace, J. M. and Hobbs, P. V.: Atmospheric Science: an Introduc-tory Survey, 2nd ed., International Geophysics Series, 92, Aca-demic Press, 176 pp., 2006.
Walsh, J. E. and Chapman, W. L.: Arctic cloud-radiation tempera-ture associations in observational data and atmospheric reanaly-sis, J. Climate, 11, 3030–3045, 1998.
Warneke, C., Bahreini, R., Brioude, J., Brock, C. A., de Gouw, J.A., Fahey, D. W., Froyd, K. D., Holloway, J. S., Middlebrook,A., Miller, L., Montzka, S., Murphy, D. M., Peischl, J., Ryerson,T. B., Schwarz, J. P., Spackman, J. R., and Veres, P.: Biomassburning in Siberia and Kazakhstan as an important source forhaze over the Alaskan Arctic in April 2008, Geophys. Res. Lett.,36, L02813, doi:10.1029/2008GL036194, 2009.
Warneke, C., Froyd, K. D., Brioude, J., Bahreini, R., Brock, C.A., Cozic, J., de Gouw, J. A., Fahey, D. W., Ferrare, R., Hol-loway, J. S., Middlebrook, A. M., Miller, L., Montzka, S.,Schwarz, J. P., Sodemann, H., Spackman, J. R., and Stohl, A.:An important contribution to springtime Arctic aerosol frombiomass burning in Russia, Geophys. Res. Lett., 37, L01801,doi:10.1029/2009GL041816, 2010.
Westwater, E., Han, Y., Irisov, V. G., Leuskiy, V., Kadygrov, E. N.,and Viazankin, S. A.: Remote sensing of boundary layer tem-perature profiles by a scanning 5-mm microwave radiometer andRASS: comparison experiments, J. Atmos. Ocean. Tech., 16,805–818, 1999.
Wiedensohler, A., Covert, D. A., Swietlicky, E. S., Aalto, P., andHeintzenberg, J., Occurrence of an ultrafine particle mode lessthan 20 nm in diameter in the marine boundary layer during theArctic summer, Tellus B, 48, 213–222, 1996.
Yamanouchi, T., Treffeisen, R., Herber, A., Shiobara, M., Yama-gata, S., Hara, K., Sato, K., Yabuki, M., Tomikawa, Y., Rinke,
Atmos. Chem. Phys., 13, 12405–12431, 2013 www.atmos-chem-phys.net/13/12405/2013/

P. Kupiszewski et al.: Vertical profiling of aerosol particles and trace gases 12431
A., Neuber, R., Schumachter, R., Kriews, M., Ström, J., Schrems,O., and Gernandt, H.: Arctic Study of Tropospheric Aerosol andRadiation (ASTAR) 2000: Arctic haze case study, Tellus B, 57,141–152, doi:10.1111/j.1600-0889.2005.00140.x, 2005.
Zhang, K. M. and Wexler, A. S.: A hypothesis for growthof fresh atmospheric nuclei, J. Geophys. Res., 107, 4577,doi:10.1029/2002JD002180, 2002.
Zhang, T., Stamnes, K., and Bowling, S. A.: Impact of clouds onsurface radiative fluxes and snowmelt in the Arctic and Subarctic,J. Climate, 9, 2110–2123, 1996.
Ziemba, L. D., Dibb, J. E., Griffin, R. J., Huey, L. G., and Beck-man, P. J.: Observations of particle growth at a remote, Arcticsite, Atmos. Environ., 44, 1649–1657, 2010.
www.atmos-chem-phys.net/13/12405/2013/ Atmos. Chem. Phys., 13, 12405–12431, 2013