Vapour -Liquid Equilibrium measurements of CO 2 based mixtures: experimental apparatus and testing...
10
Available online at www.sciencedirect.com Energy Procedia 00 (2013) 000–000 www.elsevier.com/locate/procedia 1876-6102 © 2013 The Authors. Published by Elsevier Ltd. Selection and peer-review under responsibility of ATI NAZIONALE. 68th Conference of the Italian Thermal Machines Engineering Association, ATI2013 Vapour - Liquid Equilibrium measurements of CO 2 based mixtures: experimental apparatus and testing procedures Silvia Lasala a,* , Paolo Chiesa a , Daniele Di Bona a,b , Stefano Consonni a,b a Politecnico di Milano – Department of Energy – Via Lambruschini 4, 20156 Milano, Italy b LEAP – Via Nino Bixio 27, 29121 Piacenza, Italy, www.leap.polimi.it Abstract At present, the accurate evaluation of the thermo-physical behaviour of multicomponent fluids represents a crucial element for studying and simulating low CO2 emission energy conversion technologies. In order to extend the range of application of the available thermodynamic models, an intense experimental research activity has been performed in recent years. The main purpose of this paper is to describe the experimental and modelling procedures applied by the authors to measure and to analyse data extracted from the Vapour-Liquid Equilibrium apparatus recently installed at LEAP laboratory. This test rig allows the characterization of mixture phase equilibrium properties on the basis of the static-analytical method, within the pressure and temperature ranges of 0 – 20 MPa and -60 – 200 °C. Finally, the paper reports the most relevant features and the main guidelines for the instruments calibration procedures. © 2013 The Authors. Published by Elsevier Ltd. Selection and peer-review under responsibility of ATI NAZIONALE. Keywords: Vapor-Liquid Equilibrium measurements; carbon dioxide; closed-cycle working fluid; mixture. 1. Motivation During the last decade, concerns regarding the need of stabilizing the greenhouse gases concentration in the atmosphere have supported the growth of low CO2 emission technologies for energy conversion. In particular, closed-cycle power plants such as Organic Rankine Cycles (ORCs) and carbon dioxide Brayton and Rankine cycles are widely recognized as an attractive option for medium capacity energy conversion systems [1-6]. The introduction of Rankine cycles based on organic fluids, instead of water, has allowed the exploitation of several * Corresponding author. Tel.: +39-0523-35-6824. E-mail address: [email protected]
Transcript of Vapour -Liquid Equilibrium measurements of CO 2 based mixtures: experimental apparatus and testing...
Available online at www.sciencedirect.com
Energy Procedia 00 (2013) 000–000
www.elsevier.com/locate/procedia
1876-6102 © 2013 The Authors. Published by Elsevier Ltd.
Selection and peer-review under responsibility of ATI NAZIONALE.
68th Conference of the Italian Thermal Machines Engineering Association, ATI2013
Vapour - Liquid Equilibrium measurements of CO2 based mixtures:
experimental apparatus and testing procedures
Silvia Lasalaa,*, Paolo Chiesaa, Daniele Di Bonaa,b, Stefano Consonnia,b
aPolitecnico di Milano – Department of Energy – Via Lambruschini 4, 20156 Milano, Italy
bLEAP – Via Nino Bixio 27, 29121 Piacenza, Italy, www.leap.polimi.it
Abstract
At present, the accurate evaluation of the thermo-physical behaviour of multicomponent fluids represents a crucial element for
studying and simulating low CO2 emission energy conversion technologies. In order to extend the range of application of the
available thermodynamic models, an intense experimental research activity has been performed in recent years. The main purpose
of this paper is to describe the experimental and modelling procedures applied by the authors to measure and to analyse data
extracted from the Vapour-Liquid Equilibrium apparatus recently installed at LEAP laboratory. This test rig allows the
characterization of mixture phase equilibrium properties on the basis of the static-analytical method, within the pressure and
temperature ranges of 0 – 20 MPa and -60 – 200 °C. Finally, the paper reports the most relevant features and the main guidelines
for the instruments calibration procedures.
© 2013 The Authors. Published by Elsevier Ltd.
Selection and peer-review under responsibility of ATI NAZIONALE.
Keywords: Vapor-Liquid Equilibrium measurements; carbon dioxide; closed-cycle working fluid; mixture.
1. Motivation
During the last decade, concerns regarding the need of stabilizing the greenhouse gases concentration in the
atmosphere have supported the growth of low CO2 emission technologies for energy conversion.
In particular, closed-cycle power plants such as Organic Rankine Cycles (ORCs) and carbon dioxide Brayton and
Rankine cycles are widely recognized as an attractive option for medium capacity energy conversion systems [1-6].
The introduction of Rankine cycles based on organic fluids, instead of water, has allowed the exploitation of several
* Corresponding author. Tel.: +39-0523-35-6824.
E-mail address: [email protected]

2 S. Lasala et al. / Energy Procedia 00 (2013) 000–000
low-temperature energy sources, such as solar, geothermal and biomass ones. Being based on the well-known steam-
water cycle technology, the ORC is currently a widely spread form of energy production. On the other hand,
supercritical carbon dioxide closed-cycles offer the potential of equivalent or higher cycle efficiency compared to
supercritical or superheated steam cycles at temperatures relevant for nuclear, solar and geothermal energy conversion
systems [7]. The most important innovation introduced by these closed cycles is the possibility of varying their
working fluid, considered as a further degree of freedom. Up to now, only pure fluids have been employed but it is
also being evaluated the possibility of using mixtures. In fact, it has been widely attested that performance and
flexibility of both these cycles can be improved by adopting multicomponent fluids [8]. The use of mixtures as ORC
working fluids can be extremely attractive when both hot and cold sinks are characterized by variable temperature
profiles. Indeed, mixture temperature glides arising during condensation and evaporation would maximize the heat
exchanges effectiveness thus resulting in an improved efficiency. In the case of CO2 gas cycle, the increase of pure
CO2 critical temperature by the addition of some specific components would greatly improve the efficiency of the
cycle itself, benefitting from the advantages of carbon dioxide real gas effects [9].
Another important option for the reduction of CO2 emissions is represented by carbon dioxide capture and storage
(CCS) technologies. Thorough studies are being dedicated to the optimal design of these processes. Nevertheless,
some issues still need to be addressed. In fact, depending on the fuel conversion process and on the applied carbon
dioxide capture technology, different types and quantities of impurities are included in the captured CO2 streams
[10,11]. The current major difficulty consists of evaluating the modification of the thermodynamic behaviour of these
CO2 streams caused by the presence of such impurities.
On the basis of the above considerations, it can be stated that the challenge of improving the efficiency of low
emissions energy processes requires an in-depth analysis of the thermo-physical properties of multicomponent fluids.
Nonetheless, the lack of an equation of state being valid for all fluids at any temperature and pressure has entailed the
necessity of defining thermodynamic models for each specific application, for which the minimum required accuracy
level is only achievable by calibrating semi-empirical models on experimental data [12].
The purpose of the research activity undertaken from LEAP laboratory [13-17] is to investigate the thermodynamics
of those particular fluids which could be relevant for the development of low CO2 emission power technologies.
Therefore, as an integration of what was described in [13], this paper aims to present the testing and modelling
procedures applied from the authors to experiment with the VLE apparatus recently installed at LEAP.
2. Experimental apparatus
This section introduces the features of the experimental apparatus used at LEAP to perform vapour-liquid
equilibrium measurements. The basic equipment has been designed and manufactured in 2012 by “ARMINES, Centre
of Thermodynamics and Processes”, established at MINES ParisTech.
This phase equilibrium test rig, schematically represented in Fig.1, enables the measurement of VLE
thermodynamic properties (P, T, x, y) of different fluids based on CO2, N2, O2, CO, H2S, SO2, Ar, CH3OH, ORC
working fluids and refrigerants. Temperature and pressure operating conditions range respectively from 213 K to 473
K and from 10 bar to 199 bar.
The apparatus is based on a static-analytical method [18,19], therefore coexisting phases remain inside the cell
during measurements (static method) and compositions of both liquid and vapour phases are determined by sampling
and then by analysing them (analytical method).
With reference to Figure 1 and Table 1, the apparatus consists of a measurement circuit and two systems for loading,
respectively, liquid and gaseous components in the equilibrium cell. In particular, the measurement circuit is composed
by:
pressure and temperature measurement devices (1a-1e, 2a-2e);
a cell in which vapour and liquid phases of the mixture are in equilibrium (4);
a sampling device for withdrawing vapour and liquid samples from the cell (6, 7);
a gas chromatograph for measuring samples composition (8);
a thermostatic bath that controls temperature of the equilibrium cell (12);

S. Lasala et al. / Energy Procedia 00 (2013) 000–000 3
A detailed description of these components will be given in section 2.1. Moreover, section 2.2 delineates features
of the loading circuits.
Fig. 1. Schematic of the VLE apparatus.
Table 1. Notation of the apparatus components shown in Fig. 1.
Notation Component Notation Component
1a-1e Pressure transducers 12 Thermostatic bath control system
2a-2d 100 ohm platinum probes 13 Stirrer electrical motor
3a-3e Temperature regulators 14 Vacuum pump
4 Equilibrium cell TCD GC Thermal conductivity detector
5 Optoelectronic displacement rule INJ Injector
6 ROLSI liquid phase C1 Component n. 1 (gas)
7 ROLSI vapour phase C2 Component n. 2 (gas)
8 Gas chromatograph (GC) C3 Component n. 3 (liquid or gas)
9 Gas tank V1-V14 Valves
10 Thermo regulated sample transfer line Vg Gas loading valve
11 Liquid loading volume Vliq Liquid loading valve
4 S. Lasala et al. / Energy Procedia 00 (2013) 000–000
2.1. Vapour – Liquid Equilibrium cell and sampling devices
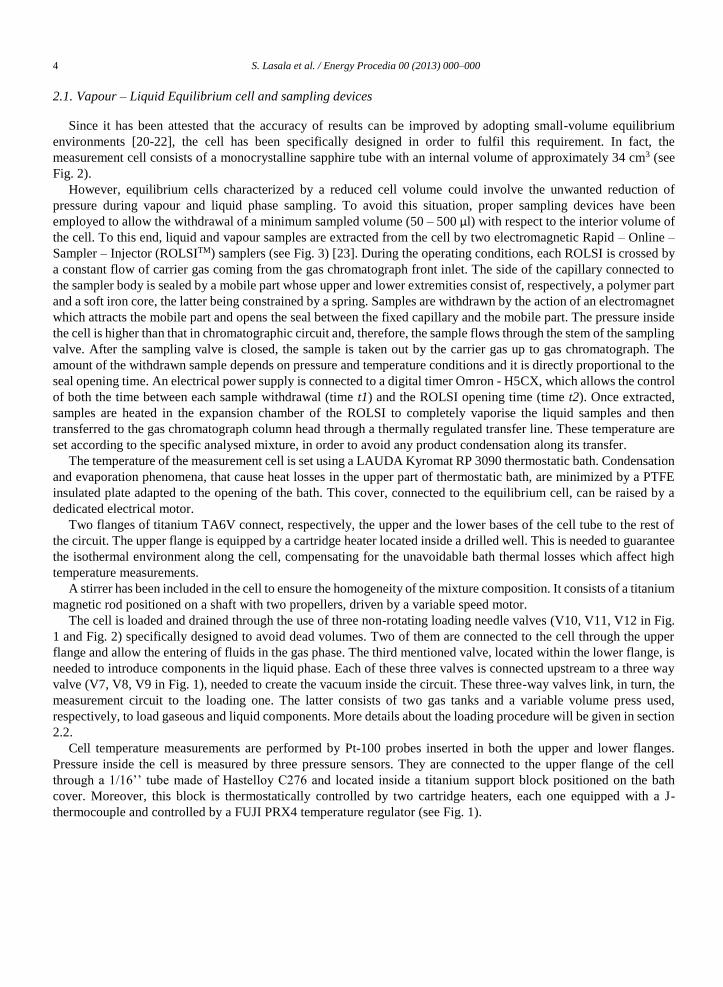
Since it has been attested that the accuracy of results can be improved by adopting small-volume equilibrium
environments [20-22], the cell has been specifically designed in order to fulfil this requirement. In fact, the
measurement cell consists of a monocrystalline sapphire tube with an internal volume of approximately 34 cm3 (see
Fig. 2).
However, equilibrium cells characterized by a reduced cell volume could involve the unwanted reduction of
pressure during vapour and liquid phase sampling. To avoid this situation, proper sampling devices have been
employed to allow the withdrawal of a minimum sampled volume (50 – 500 μl) with respect to the interior volume of
the cell. To this end, liquid and vapour samples are extracted from the cell by two electromagnetic Rapid – Online –
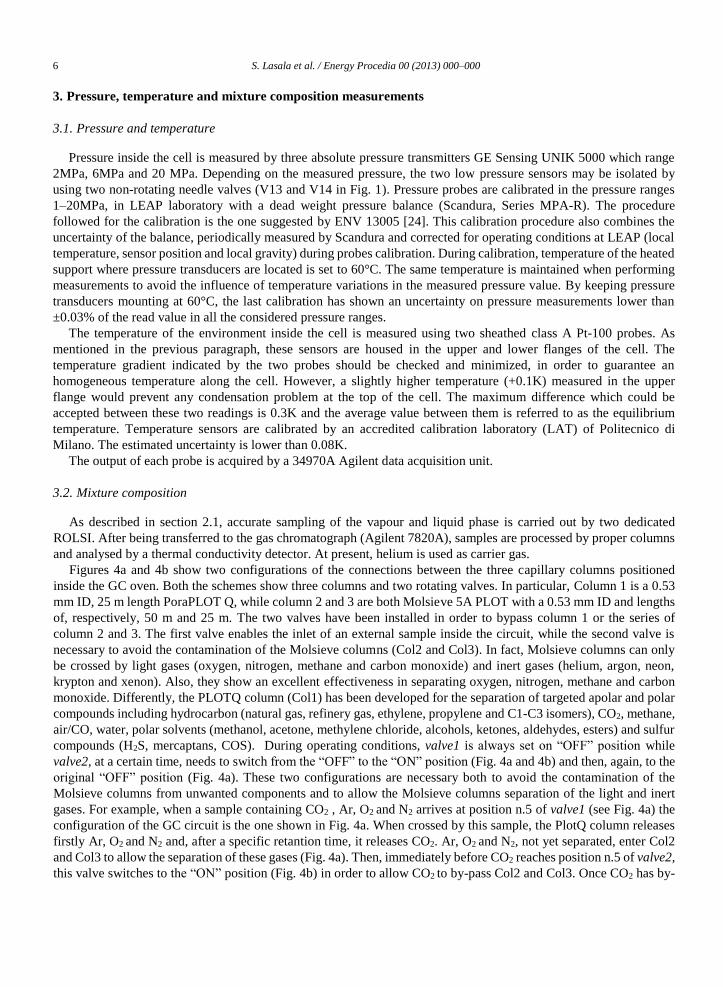
Sampler – Injector (ROLSITM) samplers (see Fig. 3) [23]. During the operating conditions, each ROLSI is crossed by
a constant flow of carrier gas coming from the gas chromatograph front inlet. The side of the capillary connected to
the sampler body is sealed by a mobile part whose upper and lower extremities consist of, respectively, a polymer part
and a soft iron core, the latter being constrained by a spring. Samples are withdrawn by the action of an electromagnet
which attracts the mobile part and opens the seal between the fixed capillary and the mobile part. The pressure inside
the cell is higher than that in chromatographic circuit and, therefore, the sample flows through the stem of the sampling
valve. After the sampling valve is closed, the sample is taken out by the carrier gas up to gas chromatograph. The
amount of the withdrawn sample depends on pressure and temperature conditions and it is directly proportional to the
seal opening time. An electrical power supply is connected to a digital timer Omron - H5CX, which allows the control
of both the time between each sample withdrawal (time t1) and the ROLSI opening time (time t2). Once extracted,
samples are heated in the expansion chamber of the ROLSI to completely vaporise the liquid samples and then
transferred to the gas chromatograph column head through a thermally regulated transfer line. These temperature are
set according to the specific analysed mixture, in order to avoid any product condensation along its transfer.
The temperature of the measurement cell is set using a LAUDA Kyromat RP 3090 thermostatic bath. Condensation
and evaporation phenomena, that cause heat losses in the upper part of thermostatic bath, are minimized by a PTFE
insulated plate adapted to the opening of the bath. This cover, connected to the equilibrium cell, can be raised by a
dedicated electrical motor.
Two flanges of titanium TA6V connect, respectively, the upper and the lower bases of the cell tube to the rest of
the circuit. The upper flange is equipped by a cartridge heater located inside a drilled well. This is needed to guarantee
the isothermal environment along the cell, compensating for the unavoidable bath thermal losses which affect high
temperature measurements.
A stirrer has been included in the cell to ensure the homogeneity of the mixture composition. It consists of a titanium
magnetic rod positioned on a shaft with two propellers, driven by a variable speed motor.
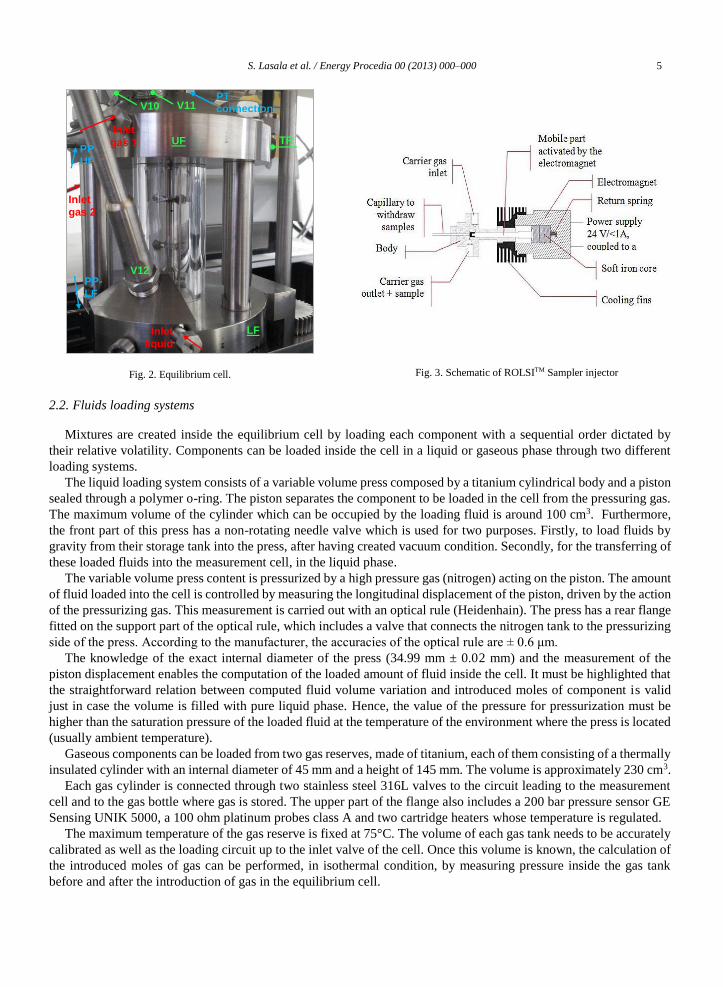
The cell is loaded and drained through the use of three non-rotating loading needle valves (V10, V11, V12 in Fig.
1 and Fig. 2) specifically designed to avoid dead volumes. Two of them are connected to the cell through the upper
flange and allow the entering of fluids in the gas phase. The third mentioned valve, located within the lower flange, is
needed to introduce components in the liquid phase. Each of these three valves is connected upstream to a three way
valve (V7, V8, V9 in Fig. 1), needed to create the vacuum inside the circuit. These three-way valves link, in turn, the
measurement circuit to the loading one. The latter consists of two gas tanks and a variable volume press used,
respectively, to load gaseous and liquid components. More details about the loading procedure will be given in section
2.2.
Cell temperature measurements are performed by Pt-100 probes inserted in both the upper and lower flanges.
Pressure inside the cell is measured by three pressure sensors. They are connected to the upper flange of the cell
through a 1/16’’ tube made of Hastelloy C276 and located inside a titanium support block positioned on the bath
cover. Moreover, this block is thermostatically controlled by two cartridge heaters, each one equipped with a J-
thermocouple and controlled by a FUJI PRX4 temperature regulator (see Fig. 1).
S. Lasala et al. / Energy Procedia 00 (2013) 000–000 5
Fig. 2. Equilibrium cell.
Fig. 3. Schematic of ROLSITM Sampler injector
2.2. Fluids loading systems
Mixtures are created inside the equilibrium cell by loading each component with a sequential order dictated by
their relative volatility. Components can be loaded inside the cell in a liquid or gaseous phase through two different
loading systems.
The liquid loading system consists of a variable volume press composed by a titanium cylindrical body and a piston
sealed through a polymer o-ring. The piston separates the component to be loaded in the cell from the pressuring gas.
The maximum volume of the cylinder which can be occupied by the loading fluid is around 100 cm3. Furthermore,
the front part of this press has a non-rotating needle valve which is used for two purposes. Firstly, to load fluids by
gravity from their storage tank into the press, after having created vacuum condition. Secondly, for the transferring of
these loaded fluids into the measurement cell, in the liquid phase.
The variable volume press content is pressurized by a high pressure gas (nitrogen) acting on the piston. The amount
of fluid loaded into the cell is controlled by measuring the longitudinal displacement of the piston, driven by the action
of the pressurizing gas. This measurement is carried out with an optical rule (Heidenhain). The press has a rear flange
fitted on the support part of the optical rule, which includes a valve that connects the nitrogen tank to the pressurizing
side of the press. According to the manufacturer, the accuracies of the optical rule are ± 0.6 μm.
The knowledge of the exact internal diameter of the press (34.99 mm ± 0.02 mm) and the measurement of the
piston displacement enables the computation of the loaded amount of fluid inside the cell. It must be highlighted that
the straightforward relation between computed fluid volume variation and introduced moles of component is valid
just in case the volume is filled with pure liquid phase. Hence, the value of the pressure for pressurization must be
higher than the saturation pressure of the loaded fluid at the temperature of the environment where the press is located
(usually ambient temperature).
Gaseous components can be loaded from two gas reserves, made of titanium, each of them consisting of a thermally
insulated cylinder with an internal diameter of 45 mm and a height of 145 mm. The volume is approximately 230 cm3.
Each gas cylinder is connected through two stainless steel 316L valves to the circuit leading to the measurement
cell and to the gas bottle where gas is stored. The upper part of the flange also includes a 200 bar pressure sensor GE
Sensing UNIK 5000, a 100 ohm platinum probes class A and two cartridge heaters whose temperature is regulated.
The maximum temperature of the gas reserve is fixed at 75°C. The volume of each gas tank needs to be accurately
calibrated as well as the loading circuit up to the inlet valve of the cell. Once this volume is known, the calculation of
the introduced moles of gas can be performed, in isothermal condition, by measuring pressure inside the gas tank
before and after the introduction of gas in the equilibrium cell.
V10 V11
TR UF
LF
PP-UF
PP-LF
PT connection
V12
Inlet
liquid
Inlet
gas 1
Inlet
gas 2
6 S. Lasala et al. / Energy Procedia 00 (2013) 000–000
3. Pressure, temperature and mixture composition measurements
3.1. Pressure and temperature
Pressure inside the cell is measured by three absolute pressure transmitters GE Sensing UNIK 5000 which range
2MPa, 6MPa and 20 MPa. Depending on the measured pressure, the two low pressure sensors may be isolated by
using two non-rotating needle valves (V13 and V14 in Fig. 1). Pressure probes are calibrated in the pressure ranges
1–20MPa, in LEAP laboratory with a dead weight pressure balance (Scandura, Series MPA-R). The procedure
followed for the calibration is the one suggested by ENV 13005 [24]. This calibration procedure also combines the
uncertainty of the balance, periodically measured by Scandura and corrected for operating conditions at LEAP (local
temperature, sensor position and local gravity) during probes calibration. During calibration, temperature of the heated
support where pressure transducers are located is set to 60°C. The same temperature is maintained when performing
measurements to avoid the influence of temperature variations in the measured pressure value. By keeping pressure
transducers mounting at 60°C, the last calibration has shown an uncertainty on pressure measurements lower than
±0.03% of the read value in all the considered pressure ranges.
The temperature of the environment inside the cell is measured using two sheathed class A Pt-100 probes. As
mentioned in the previous paragraph, these sensors are housed in the upper and lower flanges of the cell. The
temperature gradient indicated by the two probes should be checked and minimized, in order to guarantee an
homogeneous temperature along the cell. However, a slightly higher temperature (+0.1K) measured in the upper
flange would prevent any condensation problem at the top of the cell. The maximum difference which could be
accepted between these two readings is 0.3K and the average value between them is referred to as the equilibrium
temperature. Temperature sensors are calibrated by an accredited calibration laboratory (LAT) of Politecnico di
Milano. The estimated uncertainty is lower than 0.08K.
The output of each probe is acquired by a 34970A Agilent data acquisition unit.
3.2. Mixture composition
As described in section 2.1, accurate sampling of the vapour and liquid phase is carried out by two dedicated
ROLSI. After being transferred to the gas chromatograph (Agilent 7820A), samples are processed by proper columns
and analysed by a thermal conductivity detector. At present, helium is used as carrier gas.
Figures 4a and 4b show two configurations of the connections between the three capillary columns positioned
inside the GC oven. Both the schemes show three columns and two rotating valves. In particular, Column 1 is a 0.53
mm ID, 25 m length PoraPLOT Q, while column 2 and 3 are both Molsieve 5A PLOT with a 0.53 mm ID and lengths
of, respectively, 50 m and 25 m. The two valves have been installed in order to bypass column 1 or the series of
column 2 and 3. The first valve enables the inlet of an external sample inside the circuit, while the second valve is
necessary to avoid the contamination of the Molsieve columns (Col2 and Col3). In fact, Molsieve columns can only
be crossed by light gases (oxygen, nitrogen, methane and carbon monoxide) and inert gases (helium, argon, neon,
krypton and xenon). Also, they show an excellent effectiveness in separating oxygen, nitrogen, methane and carbon
monoxide. Differently, the PLOTQ column (Col1) has been developed for the separation of targeted apolar and polar
compounds including hydrocarbon (natural gas, refinery gas, ethylene, propylene and C1-C3 isomers), CO2, methane,
air/CO, water, polar solvents (methanol, acetone, methylene chloride, alcohols, ketones, aldehydes, esters) and sulfur
compounds (H2S, mercaptans, COS). During operating conditions, valve1 is always set on “OFF” position while
valve2, at a certain time, needs to switch from the “OFF” to the “ON” position (Fig. 4a and 4b) and then, again, to the
original “OFF” position (Fig. 4a). These two configurations are necessary both to avoid the contamination of the
Molsieve columns from unwanted components and to allow the Molsieve columns separation of the light and inert
gases. For example, when a sample containing CO2 , Ar, O2 and N2 arrives at position n.5 of valve1 (see Fig. 4a) the
configuration of the GC circuit is the one shown in Fig. 4a. When crossed by this sample, the PlotQ column releases
firstly Ar, O2 and N2 and, after a specific retantion time, it releases CO2. Ar, O2 and N2, not yet separated, enter Col2
and Col3 to allow the separation of these gases (Fig. 4a). Then, immediately before CO2 reaches position n.5 of valve2,
this valve switches to the “ON” position (Fig. 4b) in order to allow CO2 to by-pass Col2 and Col3. Once CO2 has by-
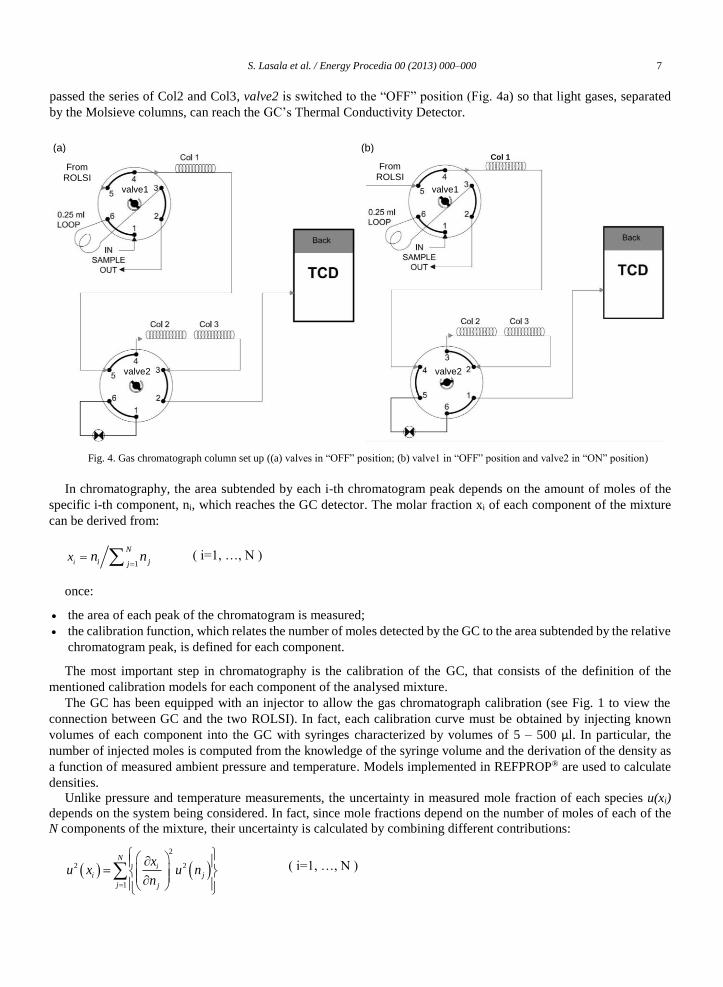
S. Lasala et al. / Energy Procedia 00 (2013) 000–000 7
passed the series of Col2 and Col3, valve2 is switched to the “OFF” position (Fig. 4a) so that light gases, separated
by the Molsieve columns, can reach the GC’s Thermal Conductivity Detector.
Fig. 4. Gas chromatograph column set up ((a) valves in “OFF” position; (b) valve1 in “OFF” position and valve2 in “ON” position)
In chromatography, the area subtended by each i-th chromatogram peak depends on the amount of moles of the
specific i-th component, ni, which reaches the GC detector. The molar fraction xi of each component of the mixture
can be derived from:
1i
N
i jjx n n
( i=1, …, N )
once:
the area of each peak of the chromatogram is measured;
the calibration function, which relates the number of moles detected by the GC to the area subtended by the relative
chromatogram peak, is defined for each component. The most important step in chromatography is the calibration of the GC, that consists of the definition of the
mentioned calibration models for each component of the analysed mixture.
The GC has been equipped with an injector to allow the gas chromatograph calibration (see Fig. 1 to view the
connection between GC and the two ROLSI). In fact, each calibration curve must be obtained by injecting known
volumes of each component into the GC with syringes characterized by volumes of 5 – 500 μl. In particular, the
number of injected moles is computed from the knowledge of the syringe volume and the derivation of the density as
a function of measured ambient pressure and temperature. Models implemented in REFPROP® are used to calculate
densities.
Unlike pressure and temperature measurements, the uncertainty in measured mole fraction of each species u(xi)
depends on the system being considered. In fact, since mole fractions depend on the number of moles of each of the
N components of the mixture, their uncertainty is calculated by combining different contributions:
2
2 2
1
Ni
i j
j j
xu x u n
n
( i=1, …, N )
valve1
valve2
From ROLSI
valve1
(a)
valve2
From ROLSI
Col 1 (b)
8 S. Lasala et al. / Energy Procedia 00 (2013) 000–000
In particular, since the derived number of moles nj depends both on the measured area subtending each peak and
on the calibration model, the uncertainty u(nj) is evaluated considering the estimated standard deviation of the mean
area Ai,m, u(Ai,m), and the uncertainties which affect the calibration models. The former contribution, u(Ai,m), is
estimated by considering five measurements for each calibration point. The latter source of error is strictly related to
the uncertainty u(nref,j) of the estimated number of moles of each component introduced through syringes and
considered as a reference during the calibrations. More specifically, u(nref,j) is computed by evaluating:
the uncertainty of the syringe volume u(Vsyr), declared by the manufacturer;
the uncertainty of measured pressure P and temperature T, u(P) and u(T), used to evaluate density;
the uncertainty of the thermodynamic model used to calculate density, declared by REFPROP, u(ρmod);
Hence, u(nj) is derived from the following expression:
2 2 2 2 2
, , , ,2 2 2 2 2 2
,
j rif j rif j rif j rif j
j i m syr mod
n n n n nu n u A u V u P u T u
A V P T
The calibration procedure also consists of setting the two characteristic sampling times t1 and t2 (see section 2.1)
and the commutation time of the GC valve 2. Time t1 is set higher than the time required to separate the products
inside columns. Time t2 is adjusted from 0.05 ms to 1 s, depending on the studied system and on the desired withdrawn
amount of the sample.
4. Experimental procedure
The main objective of these measurements is to extract VLE isothermal phase diagrams for the binary mixture of
interest. In particular, phase diagrams are obtained by first introducing into the cell the less volatile component and
then by progressively increasing the pressure by introducing the second component. For each pressure level the
composition of vapour and liquid phase is measured and a phase diagram is obtained.
This section details the procedure followed to carry out such measurements for binary mixtures, with the apparatus
described above.
4.1. Preliminary operations
Before starting the operating procedure, it is necessary to set the following parameters:
temperature of the ROLSI, TR (usually set to 90°C);
temperature of the sample transfer line (TR+10°C);
temperature of the cell pressure transducers mounting (coincident with the calibration temperature);
temperature of the gas tanks pressure transducer mounting (coincident with the calibration temperature);
A further preliminary step consists of setting the thermostatic bath temperature at the value dictated by the isotherm
under study. During the bath temperature stabilization, the vacuum should be created in the whole measurement and
loading circuits, to allow the filling of pure components inside the cell.
4.2. Measuring procedure
With the cell inside the bath, the first and less volatile component can be introduced. Once the bath has reached a
stable thermal regime, the cell should be lifted out of the bath in order to check the achievement of a vapour-liquid
equilibrium inside the cell volume. Then, the cell should be re-immersed waiting for thermal stability. Also, the set
bath temperature should be adjusted until the temperature values recorded by the sensors inside the cell show the
achievement of the desired temperature. At equilibrium, pressure and temperature are measured and samples of both
the phases are withdrawn and analysed. Three samples of both liquid and vapour phases must be extracted from the
two ROLSI to clean their capillaries from the presence of residual air. If air is effectively absent from the cell, next
S. Lasala et al. / Energy Procedia 00 (2013) 000–000 9
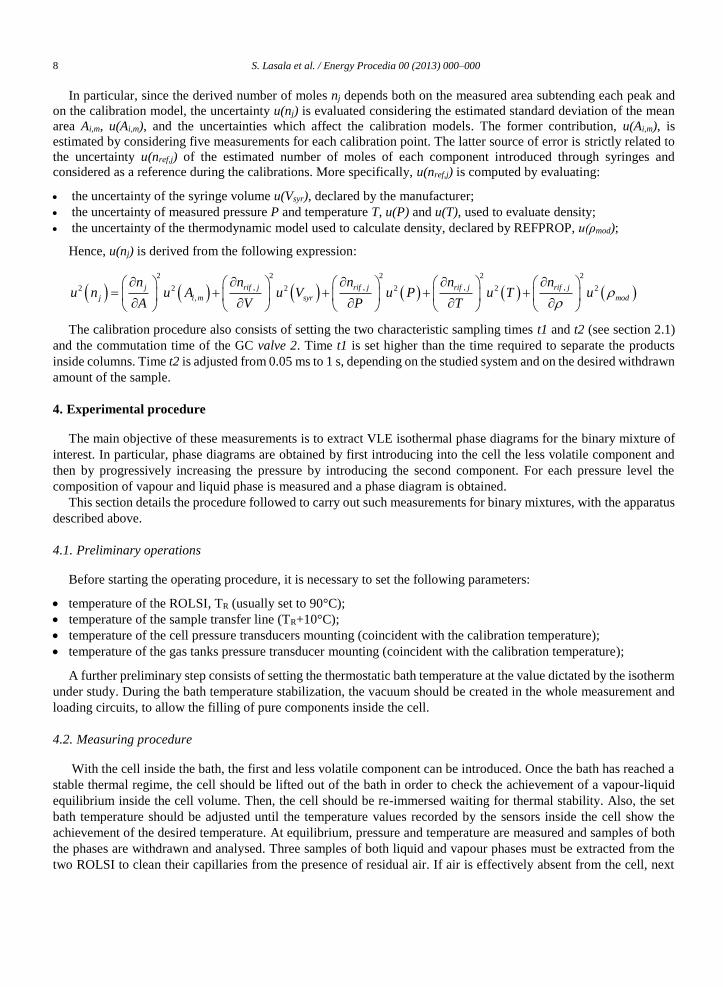
samples should show only the presence of the first pure component. The first point (1) of the phase diagram (see Fig.
5 point 1) has been acquired (with reference to Fig. 5 xCO2=100%).
Afterwards, the vacuum should be done in all the loading circuit, up to the inlet valves of the cell. A small fraction
of the second component can be therefore introduced, leading to an increase in pressure. When pressure has stabilized,
after the extraction of three samples from liquid and vapour ROLSI to clean the capillaries, five samples are withdrawn
and analysed for each phase. Averaging the five composition measurements for each phase, bubble and dew points at
the new pressure level are obtained (2L and 2V in Fig. 5).
Proceeding similarly, by progressively introducing the second component and recording pressure, temperature and
liquid and vapour phases composition at each step, the whole phase diagram is obtained.
Fig. 5. Example of an extracted phase diagram
5. Data analysis
The measured variables in VLE mixtures are the liquid and vapour molar fractions of each component i (xi and yi),
temperature T and pressure P. From the celebrated phase rule of J.W. Gibbs [12], it can be derived that, for a
multicomponent non-reacting system in vapour-liquid equilibrium, the number of independent variables that must be
fixed to establish its intensive state coincides with the number of components of the system. For example, in the case
of a binary mixture (i=2) in vapour-liquid equilibrium and subjected to an isothermal increase of pressure, to any pair
of measured T and xi it is possible to derive P and yi by applying Bubble Pressure Calculation methods [12, 25]. The
derived fundamental criterion for phase equilibrium states that when multiple phases at the same P and T are in
equilibrium, the chemical potential of each species is the same in all phases. To facilitate the application of equilibrium
criteria to vapour (V) – liquid (L) equilibrium calculations, the fugacity is used in place of the chemical potential [12].
In general, results of VLE calculations mostly depend on the model used to express the fugacity in terms of
pressure, temperature and phases composition. Two methods are applied for representing these relationships, the
equation-of-state method and the activity coefficient method. The equation-of-state method derives all properties of
both phases from an equation of state, while the activity coefficient method applies different models for the evaluation
of liquid and vapour phase properties. In fact, while vapour phase properties are still derived from an equation of state,
properties of liquid phases are obtained by summing properties of pure components and including a mixing or an
excess term. Most of these models contain semi-empirical parameters which need to be regressed by minimizing the
Mean Squared Error (MSE) between model predictions and experimental data obtained from the apparatus presented
through this paper. More details can be found in [12]. Also, statistical analysis of residuals is carried out [26]. When
experimental data are analysed, different models are considered and a comparison between results is performed.
Furthermore, the applied data consistency tests are the point test and the direct test proposed by Van Ness [25, 27].
1
2L 2V
3L 3V
4L 4V

10 S. Lasala et al. / Energy Procedia 00 (2013) 000–000
6. Conclusions
The test rig installed at LEAP enables the extraction of reliable experimental data for vapour – liquid equilibrium
measurements in a small volume equilibrium cell, within the pressure and temperature ranges of 0 – 20 MPa and -60
– 200 °C. At present, the focus of the experimental activity is on studying the thermodynamics of mixtures for CO2
capture and storage applications and of advanced working fluids for closed power cycles such as organic Rankine
cycles and supercritical closed-cycle gas turbines.
Acknowledgements
The authors would like to thank “Fondazione Piacenza e Vigevano” for contributing to the realization of the VLE
apparatus.
References
[1] Invernizzi C. Closed Power Cycle: Thermodynamic Fundamentals and Applications. London: Springer-Verlag; 2013.
[2] Angelino G. Real gas effects in carbon dioxide cycles. ASME Paper 69-GT-102
[3] Angelino G. Perspectives for the Liquid Phase Compression Gas Turbine. Journal of Engineering for Power, Trans. ASME; April 1967; Vol.
89, No. 2: 229-237
[4] Angelino G. Carbon Dioxide Condensation Cycles for Power Production. ASME Paper 1968; No. 68-GT-23.
[5] Angelino G. Real Gas Effects in Carbon Dioxide Cycles. ASME Paper 1969; No. 69-GT-103.
[6] Feher EG. The supercritical thermodynamic power cycle. Advances in Energy Conversion Engineering. Intersociety Energy Conversion
Engineering Conference 1967.
[7] Ma Z, Turchi CS, Advanced Supercritical Carbon Dioxide Power Cycle Configurations for Use in Concentrating Solar Power Systems.
Supercritical CO2 Power Cycle Symposium 2011.
[8] Angelino G, Colonna di Paliano P. Multicomponent working fluids for organic Rankine cycles (ORCs). Energy 1998; 23: 449 - 463.
[9] Invernizzi C, Van der Stelt T. Supercritical and real gas Brayton cycles operating with mixtures of carbon dioxide and hydrocarbons.
Proceedings of the Institution of Mechanical Engineers, Part A: Journal of Power and Energy 2012; 226; 5: 682 - 693. [10] Visser E, et al.. Dynamis CO2 quality recommendations. International Journal of Greenhouse Gas Control 2008; 2:478-487.
[11] Li H, et al.. PVTxy properties of CO2 mixtures relevant for CO2 capture, transport and storage: Review of available experimental data and
theoretical models. Applied Energy 2011; 88: 3567-3579.
[12] Smith JM, Van Ness HC, Abbott MM. Introduction to Chemical Engineering Thermodynamics, 7th edition. New York: McGraw-Hill; 2005
[13] Valenti G, et al. Pressure-volume-temperature measurements of CO2-N2-O2 mixtures from -10°c to 150°c and from vacuum to 200 bar:
description of the experimental apparatus based on a vibrating tube densimeter, atti del "63° Congresso Nazionale ATI (Associazione
Termotecnica Italiana)", Palermo, Settembre 2008.
[14] Mantovani M, et al.. P-ρ-T Measurements of CO2-N2 Mixtures in Supercritical Conditions, atti del "65° Congresso Nazionale ATI
(Associazione Termotecnica Italiana)", Domus de Maria (CA), Settembre 2010.
[15] Mantovani M, et al.. Supercritical pressure–density–temperature measurements on CO2–N2, CO2–O2 and CO2–Ar binary mixtures, The
Journal of Supercritical Fluids, Volume 61, Pages 34-43, Gennaio 2012
[16] Mantovani M. Oxy-Combustion Flue Gases Purification Systems: Numerical and Experimental Analysis. Milano : s.n., 2010.
[17] Mazzoccoli M. Carbon Capture, Storage and Transportation (CCS&T) Process: General Aspects and Focus on CO2 Pipeline Modelling.
Genova : s.n., 2011.
[18] Morgan DI, Kobayashi R. Direct vapor pressure measurements of ten n-alkanes m the 10-C28 range. Fluid Phase Equilibria 1994; 97: 211 –
242.
[19] Di Nicola G, et al.. Vapor–Liquid-Equilibrium (VLE) properties of R-32+R-134a system derived from isochoric measurements. Fluid Phase
Equilibria 1998; 153: 143 -165.
[20] Baba-Ahmed A, et al.. New equipment using a static analytic method for the study of vapour–liquid equilibria at temperatures down to 77K.
Fluid Phase Equilibria 1999; 166: 225–236.
[21] Courtial X, et al.. Vapor-liquid equilibrium in the n-butane + methanol system, measurement and modeling from 323.2 to 443.2 K. Fluid
Phase Equilibria 2009; 277: 152–161.
[22] Narasigadu C, et al.. A novel static analytical apparatus for phase equilibrium measurements. Fluid Phase Equilibria 2013; 338: 188-196.
[23] Guilbot P, et al.. Rapid on-line sampler-injector: a reliable tool for HT-HP sampling and on-line GC analysis. Analusis 2000; 28: 426-431.
[24] ENV 13005 - Guide to the expression of uncertainty in measurement. U ENV - UNI–CEI Metrologia Generale, Italy; 2000
[25] Van Ness CH. Thermodynamics in the treatment of vapor/liquid equilibrium (VLE) data. Pure & Appl. Chem. 1995; 67: 859-872
[26] Wisniak J, Polishuk A. Analysis of residuals - a useful tool for phase equilibrium data analysis. Fluid Phase Equilibria 1999; 164: 61–82
[27] Van Ness HC, Byer SM, Gibbs RE. Vapor-Liquid equilibrium: Part I. An appraisal of data reduction methods. AIChE J. 1973; 19: 238-244