Vanuatu Infrastructure Strategic Investment Plan 2015 – 2024
204
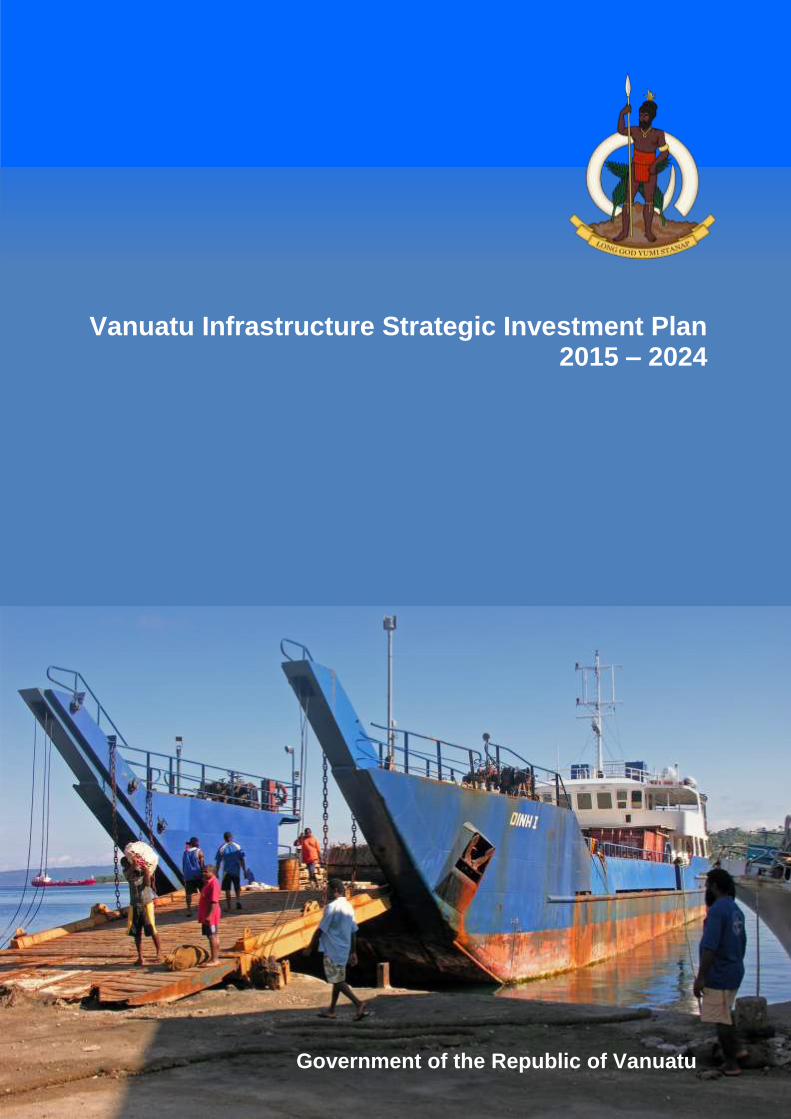
Vanuatu Infrastructure Strategic Investment Plan 2015 – 2024 Government of the Republic of Vanuatu
-
Upload
khangminh22 -
Category
Documents
-
view
1 -
download
0
Transcript of Vanuatu Infrastructure Strategic Investment Plan 2015 – 2024
Vanuatu Infrastructure Strategic Investment Plan 2015 – 2024
Government of the Republic of Vanuatu
This report is published under the auspices of the Government of Vanuatu (GoV), with the support of the Pacific Region Infrastructure Facility (PRIF). The report was prepared by Philippe Bergeron, Christopher Cheatham and Bikenibeu Ieremiah working under the guidance of the PRIF Coordination Office and with administrative support by the Asian Development Bank. PRIF is a multi-development partner coordination, research and technical facility which supports infrastructure development in the Pacific. PRIF Members include Asian Development Bank (ADB), Australian Department of Foreign Affairs and Trade (DFAT), European Union and European Investment Bank (EU/EIB), Japan International Cooperation Agency (JICA), New Zealand Ministry of Foreign Affairs and Trade (NZMFAT), and the World Bank Group. The views expressed in this report are those of the authors and do not necessarily reflect the views and policies of ADB, its Board of Governors or the governments they represent or any of the other PRIF Members. None of the above parties guarantees the accuracy of the data included in this publication nor accepts responsibility for any consequence of their use. The use of information contained in this report is encouraged with appropriate acknowledgement. This report may only be reproduced with the permission of both the Government of Vanuatu and the PRIF Coordination Office on behalf of the PRIF Members. Acknowledgements
The authors would like to express their appreciation for the support provided by everyone consulted during the course of preparing the VISIP, in particular Director General of the Prime Minister’s Office Johnson Naviti Marakipule, Director General of the Ministry of Infrastructure and Public Utilities Johnson Iauma Binaru, and Director of Department of Strategic Policy Planning And Aid Coordination, Nebcevanhas Benjamin Shing for their oversight and guidance, and their staff for their help and assistance throughout the process. Thanks to Charlie Namaka who provided assistance to the consultant team on a daily basis. The team is also very grateful for the logistical support provided by the ADB country team: Nancy Wells and Laisa Boedoro, and the technical guidance provided by the PRIF Coordination Office.
For more information, contact: Government of Vanuatu Department of Strategic Policy, Planning and Aid Coordination Private Mail Bag 9053 Prime Minister’s Office Port Vila, VANUATU [email protected] PRIF Coordination Office c/- Asian Development Bank Level 20, 45 Clarence Street, Sydney NSW 2000, Australia [email protected] www.theprif.org
Cover photo: Phillip Capper, ‘Vanuatu inter-island ferry, Port Vila’. Creative Commons Attribution 2.0 Generic https://creativecommons.org/licenses/by/2.0/
Vanuatu Infrastructure Strategic Investment Plan 2015 – 2024
Government of the Republic of Vanuatu


VISIP 2015 - 2024
i
Contents
Contents i Executive Summary vii
1 INTRODUCTION 1
1.1 PURPOSE AND SCOPE 1 1.2 VISIP 2015 PROCESS 2 1.3 VISIP ROLE IN GOVERNMENT PLANNING 3
2 INFRASTRUCTURE CHALLENGES 5
2.1 GROWTH DRIVERS 5 2.2 INFRASTRUCTURE PLANNING 7
2.2.1 Background 7 2.2.2 National Planning 8 2.2.3 National Development Policy and Planning 8 2.2.4 Policy In Transition 9 2.2.5 Institutional Responsibilities For Infrastructure 10
2.3 SECTORAL STRATEGIES, CORPORATE PLANS AND PROJECTS 13 2.3.1 Agriculture 14 2.3.2 Education 16 2.3.3 Energy, Climate Change, & Disaster Risk Management 18
2.3.3.1 Energy 18 2.3.3.2 Climate and Disaster Risk Resilience 21 2.3.3.3 Projects (Energy, Climate Change, & Disaster Risk Management) 22
2.3.4 Health 24 2.3.5 Telecommunication and ICT 26 2.3.6 Transport 29
2.3.6.1 Transport - Road 29 2.3.6.2 Transport - Aviation 33 2.3.6.3 Transport - Shipping 35
2.3.7 Tourism 39 2.3.8 Water Supply and Sanitation (MIA, MIPU, & MLNR) 40
2.3.8.1 Water Supply 41 2.3.8.2 Drainage and Sanitation 44 2.3.8.3 Solid Waste Management 46 2.3.8.4 Projects (Water Supply and Sanitation) 48
2.3.9 Other Social Sectors (PMO, Youth & Sport And Justice) 49 2.4 ASSET MANAGEMENT AND MAINTENANCE 51
3 VISIP METHODOLOGY 53
3.1 STEP 1: CRITERIA AND SCOPE 54 3.1.1 Criteria Group 1: Project Scale and Status With The Affected Community 55 3.1.2 Criteria Group 2: Operational Sustainability 55 3.1.3 Criteria Group 3: Policy Framework 56 3.1.4 Criteria Group 4: Financial And Economic Impact 57
3.2 STEP 2: PROJECT GENERATION 57 3.3 STEP 3: PROJECT EVALUATION 58 3.4 STEP 4: PROJECT PRIORITISATION 58 3.5 STEP 5: FINANCIAL CERTIFICATION AND GOV APPROVAL (FUTURE STEP) 58 3.6 STEP 6: REVIEW/UPDATE (FUTURE STEP) 60
4 PRIORITISATION OF PROJECTS FOR VISIP 2015 61
4.1 PROJECT SELECTION PROCESS 61 4.2 ONGOING PROJECTS 64 4.3 SCORING OF INFRASTRUCTURE IN VISIP 2015 LONG LIST 67 4.4 VISIP 2015 PRIORITY LIST OF PROJECTS 71
4.4.1 Category 1: Individual Public Investment Projects 71 4.4.2 Category 2: Bundled Public Investment Projects 72 4.4.3 Category 3: Private Public Investment Projects 74 4.4.4 Spread of Proposed Investments By Sectors & Geographically 74
5 FUNDING STRATEGY 77
5.1 GOVERNMENT FINANCIAL STRATEGY 77 5.2 VISIP FUNDING STRATEGY 80 5.3 INFRASTRUCTURE FUNDING REQUIREMENTS 80
5.3.1 Estimating Capital and Annual O&M Costs 80

VISIP 2015 - 2024
ii
5.3.2 Estimating The Whole of Life Costs 85 5.3.3 Funding For Maintenance 86
5.4 RECENT INFRASTRUCTURE FUNDING 87 5.4.1 Private Sector Participation and Public Private Partnerships 88 5.4.2 State-Owned Enterprises 88
5.5 VANUATU GOVERNMENT BUDGET 88 5.6 DEVELOPMENT PARTNER CONTRIBUTIONS 89
5.6.1 Sector Priorities 89 5.6.2 Estimated Development Partner Funding Capacity 90
5.7 OVERALL FUNDING ENVELOPE 91 5.7.1 GoV Own Resources 91 5.7.2 Concessional Loan And Grant Funding 91 5.7.3 Private Sector Funding 91 5.7.4 Overall Funding Envelope 92
5.8 TENTATIVE INVESTMENT PLAN FOR NEW PROJECTS 92
6 IMPLEMENTING THE VISIP 95
6.1 IMPLEMENTATION NEEDS 95 6.1.1 Implementation Capacity 95 6.1.2 Processes, Procedures, and Tools 96 6.1.3 Financial Planning, Budgeting, And Management 96
6.2 IMPLEMENTATION AND MANAGEMENT STRATEGY 97 6.2.1 A Holistic Approach To Infrastructure 97 6.2.2 Strategic Oversight/Portfolio Management 97 6.2.3 Project Oversight 97 6.2.4 Assisting Project Development 98 6.2.5 Coordination 99
6.3 CAPACITY DEVELOPMENT 101 6.3.1 Sector-Wide Issues And Opportunities 101 6.3.2 Portfolio Management Capacity 102 6.3.3 Project Delivery Capacity 102 6.3.4 Sector-Wide Capacity 102
6.4 MONITORING, REPORTING AND UPDATING VISIP 103 6.4.1 Portfolio Review 103 6.4.2 VISIP Results Framework 104 6.4.3 Updating The Visip 106
APPENDICES APPENDIX 1: PROJECT PROFILE TEMPLATE 108 APPENDIX 2: PROJECT PRIORITISATION EVALUATION FORM 110 APPENDIX 3: GUIDING QUESTIONS FOR PROJECT SCORING 112 APPENDIX 4: VISIP 2014 LONG LIST OF PROJECTS 114 APPENDIX 5: INFRASTRUCTURE PRIORITISATION MODEL (TEMPLATE WITH GRAPH) 123 APPENDIX 6: PROJECT PROFILES – SHORT-LISTED PRIORITY PROJECTS 125 APPENDIX 7: LIST OF CONSULTATIONS AND PEOPLE MET 177 APPENDIX 8: DOCUMENTS REVIEWED 180

VISIP 2015 - 2024
iii
List of Tables
Table 1: Population by Province and Urban Area ............................................................................................................... 7 Table 2: Population by Island .............................................................................................................................................. 7 Table 3: Institutional Responsibilities for Infrastructure ..................................................................................................... 11 Table 4: Existing Sector Plans and Studies ....................................................................................................................... 13 Table 5: Summary of Proposed Agriculture Projects ......................................................................................................... 16 Table 6: Summary of Education Infrastructure (Status 2011)............................................................................................ 16 Table 7: Summary of Identified Ongoing Education Related Projects ............................................................................... 17 Table 8: Summary of Proposed Education Related Projects ............................................................................................. 18 Table 9: Current Access to Electrical Energy in Vanuatu .................................................................................................. 18 Table 10: Summary of Power Infrastructure ...................................................................................................................... 19 Table 11: Main Source of Household Power for Lighting .................................................................................................. 19 Table 12: Main Source of Household Power for Cooking .................................................................................................. 20 Table 13: Summary of Identified Ongoing Energy Projects ............................................................................................... 23 Table 14: Summary of Proposed Energy Projects ............................................................................................................ 23 Table 15: Summary of Health Infrastructure (Status 2009) ............................................................................................... 25 Table 16: Summary of Ongoing Health-Related Projects .................................................................................................. 26 Table 17: Summary of Proposed Health Care Related Projects ....................................................................................... 26 Table 18: Summary of Telecommunications/ICT Infrastructure ........................................................................................ 26 Table 19: Summary of Identified Ongoing ICT Projects .................................................................................................... 28 Table 20: Summary of Proposed ICT Projects .................................................................................................................. 28 Table 21: Summary of Road Infrastructure ....................................................................................................................... 29 Table 22: Lengths of Roads by Type of Surface ............................................................................................................... 30 Table 23: Summary of Ongoing Road Projects ................................................................................................................. 32 Table 24: Summary of Proposed Road Projects ............................................................................................................... 32 Table 25: Summary of Aviation Infrastructure ................................................................................................................... 33 Table 26: Summary of Proposed Air Transport Projects ................................................................................................... 35 Table 27: Summary of Shipping Infrastructure .................................................................................................................. 35 Table 28: Numbers of Visits by Cruise Ships to the Ports in Vanuatu, 2009-2013 ............................................................ 36 Table 29: Summary of Ongoing Maritime Project .............................................................................................................. 38 Table 30: Summary of Proposed Maritime Projects .......................................................................................................... 38 Table 31: Summary of Identified Ongoing Tourism Projects ............................................................................................. 40 Table 32: Summary of Proposed Tourism Projects ........................................................................................................... 40 Table 33: Summary of Water Supply Infrastructure .......................................................................................................... 41 Table 34: Main Source of Household Drinking Water Supply ............................................................................................ 41 Table 35: Main Source of Household Washing Water Supply ........................................................................................... 42 Table 36: Summary of Drainage & Sanitation Infrastructure ............................................................................................. 44 Table 37: Types of Toilet by Number of Households ........................................................................................................ 44 Table 38: Summary of Solid Waste Management Infrastructure ....................................................................................... 47 Table 39: Method of Waste Disposal by Number of Households ...................................................................................... 47 Table 40: Summary of Identified Ongoing Water Supply and Sanitation Projects ............................................................. 48 Table 41: Summary of Proposed Water Supply and Sanitation Projects........................................................................... 49 Table 42: Summary of Identified Ongoing Projects (PMO, MFAICET, Youth and Justice) ............................................... 50 Table 43: Summary of Proposed Projects(PMO, Youth and Justice) ................................................................................ 51 Table 44: Typical Weighting of Groups of Criteria ............................................................................................................. 58 Table 45: List of Ongoing Infrastructure Projects .............................................................................................................. 65 Table 46: Priority Individual Public Infrastructure Investment under VISIP 2015 ............................................................... 71 Table 47: Proposed Priority Bundled Public Infrastructure Investment under VISIP 2015 ................................................ 72 Table 48: Priority Privately funded Public Infrastructure Investment under VISIP 2015 .................................................... 74 Table 49: Selected Economic and Financial Indicators with Projections, 2008-18 ............................................................ 79 Table 50: Ongoing Projects Funding ................................................................................................................................. 81 Table 51: Funding Requirements for VISIP 2015 .............................................................................................................. 84 Table 52: Maintenance Cost Requirement for Ongoing and Proposed Projects ............................................................... 86 Table 53: Sources of Funding for Infrastructure Maintenance* (VUV million) ................................................................... 87 Table 54: Current Development partners Activity Trend in Vanuatu ................................................................................. 89 Table 55: Estimate of Potential Annual Infrastructure Funding ......................................................................................... 91 Table 56: Annual Funding Available for Infrastructure Development ................................................................................ 92 Table 57: Tentative Programming of Priority Investment under VISIP 2015 ..................................................................... 93 Table 58: VISIP Implementation Roles (Arrangements) .................................................................................................... 97 Table 59: Summary of Key VISIP Functions and Institutional Responsibilities ............................................................... 100 Table 60: Summary of Capacity Development Activities ................................................................................................. 103 Table 61: VISIP Overall Results Framework ................................................................................................................... 104

VISIP 2015 - 2024
iv
List of Figures
Figure 1: Real Annual GDP Growth (%) .............................................................................................................................. 6 Figure 2: Public Debt Stock (VUV millions) ......................................................................................................................... 6 Figure 3: Overview of Sanitation Coverage Trends in Vanuatu......................................................................................... 42 Figure 4: Overview of Sanitation Coverage Trends in Vanuatu......................................................................................... 45 Figure 5: Aligning VISIP Prioritisation Criteria with NSDP ................................................................................................. 54 Figure 6: VISIP Methodology ............................................................................................................................................ 59 Figure 7: Diagram of Institutional Linkages for VISIP ........................................................................................................ 60 Figure 8: Project Selection Process Applied under VISIP 2015 ........................................................................................ 62 Figure 9: Sectoral Spread by Value of Ongoing Development …………………………………………………………………………64 Figure 10: Geographic Spread of Ongoing Development ................................................................................................. 64 Figure 11: Per Capita Investment/Province (Ongoing Projects: USD/Capita) ................................................................... 64 Figure 12: Scoring of VISIP 2015 Long List (Multi-Sector, Road, Aviation, & Shipping) ................................................... 67 Figure 13: Scoring of VISIP 2015 Long List (Urban & Rural Water Supply, Urban Solid Waste, Power Supply & Tourism)
................................................................................................................................................................................. 68 Figure 14: Scoring of VISIP 2015 Long List (ICT & Education) ......................................................................................... 69 Figure 15: Scoring of VISIP 2015 Long List (Health, Youth & Sport, Justice, Foreign Affairs, Agriculture, PMO) ............. 70 Figure 16: Sectoral Spread of Short Listed Priority Investments – VISIP 2015 ................................................................. 75 Figure 17: Geographic Spread of Short List of Priority Investments – VISIP 2015 ............................................................ 75 Figure 18: Per Capita Investment/Province (Proposed Projects: USD/Capita) ................................................................. 75 Figure 19: Development partner Grants and Investment................................................................................................... 78
VISIP 2015 - 2024
v
Abbreviations ACU Aid Coordination Unit ADB Asian Development Bank AVL Airports Vanuatu Limited CAAV Civil Aviation Authority of Vanuatu CG Criteria Group COM Council of Ministers CSO Civil Society Organisation DCO Development Committee of Officials DEPC Department of Environmental Protection and Conservation DFAT DG
Department of Foreign Affairs and Trade –Australia Director General
DMGRWS Department of Mines, Geology, and Rural Water Supply DOEd Department of Education DOEn Department of Energy DOH Department of Health DPH Department of Ports and Harbours DRR&DM Disaster Risk Reduction and Disaster Management DSPPAC Department of Strategic Policy, Planning and Aid Coordination EIB European Investment Bank EU European Union GEF Global Environment Fund GFDRR Global Facility for Disaster Reduction and Recovery GoV Government of Vanuatu HH Household HSS Health Sector Strategy 2010-2016 HSS HRO Human Resource Organisations ICT Information & Communication Technology IFC International Finance Corporation (of the World Bank Group) IMF International Monetary Fund IMO International Maritime Organization JICA Japan International Cooperation Agency JMP WHO/UNICEF Joint Monitoring Programme MALFFB Ministry of Agriculture, Livestock, Fisheries, Forestry and Bio-security MCA Millennium Challenge Account MCC Millennium Challenge Corporation MCCDRM Ministry of Climate Change and Disaster Risk Management M&E Monitoring and Evaluation MFAICET Ministry of Foreign Affairs, International Cooperation & External Trade MFEM Ministry of Finance and Economic Management MIA Ministry of Internal Affairs MIPU Ministry of Infrastructure and Public Utilities MJCS Ministry of Justice and Community Services MLNR Ministry of Land and Natural Resources MOE Ministry of Education MOH Ministry of Health MTTCI Ministry of Trade, Tourism, Commerce and Industry MYDST Ministry of Youth Development, Sport and Training NACCC National Advisory Committee for Climate Change NDMO National Disaster Management Office NPP New Project Proposals NSDP National Sustainable Development Plan NSO National Statistics Office NZMFAT New Zealand Ministry of Foreign Affairs and Trade O&M Operation and Maintenance OMA Office of Maritime Affairs OGCIO Office of the Government Chief Information Officer PAA Priorities and Action Agenda 2006-2015 PACC Pacific Adaptation to Climate Change PacRIS Pacific Catastrophe Risk Information System PaH Ports and Harbours PASO Pacific Aviation Safety Office PCO Pacific Region Infrastructure Facility Coordination Office PEO Provincial Education Office PHO Provincial Health Office PIAC Pacific Infrastructure Advisory Centre PLAS Planning Long, Acting Short 2009-2012 PMO Prime Minister’s Office
VISIP 2015 - 2024
vi
PPP Public Private Partnership PRIF Pacific Region Infrastructure Facility PSC Public Service Commission PSP Private Sector Participation PVMC Port Vila Municipal Council PVUDP Port Vila Urban Development Project PWD Public Works Department PWU Public Works Utilities PWWA Pacific Water and Waste Association REDI Rural Economic Development Initiative SOE State Owned Enterprise SOPAC Secretariat of the Pacific Community, Applied Geoscience and Technology Division SPC Secretariat of the Pacific Community SPREP Secretariat of the Pacific Regional Environment Programme SWM Solid Waste Management TA Technical Assistance TOR Terms of Reference TRR Telecommunication & Radio Communications Regulator TVL Telecom Vanuatu Ltd UNDP United Nations Development Programme UNELCO Union Electrique du Vanuatu UNICEF URA
United Nations Children’s Fund Utilities Regulatory Authority
VCCI Vanuatu Chamber of Commerce and Industry VDMG Vanuatu Department of Meteorology and Geohazards VISIP 2015 Vanuatu Infrastructure Strategic Investment Plan 2015 - 2024 VISSP Vanuatu Inter-Island Support Project VLGC Vanuatu Lands Governance Committee VPMU Vanuatu Project Management Unit VOC Vehicle Operating Costs VTIP Vanuatu Tourism Infrastructure Project VTSSP Vanuatu Transport Sector Support Programme VUI Vanuatu Utilities and Infrastructure Limited VUV Vanuatu Vatu (currency unit) WB WHO
World Bank World Health Organization
Currency Equivalents Currency Unit Vatu (VUV) VUV1 = USD0.01071 USD1 = VUV93,35
VISIP 2015 - 2024 | Executive Summary
vii
Executive Summary
The Vanuatu Infrastructure Strategic Investment Plan 2015 – 2024 (VISIP 2015) sets out an optimal set of strategic infrastructure investments for Vanuatu. Further, it suggests how to fund and implement these investments, and recommends institutional developments for planning effective, practical, and sustainable, infrastructure in the context of identified and expected financing over the coming decade. VISIP 2015 will be considered for adoption with the National Sustainable Development Plan (NSDP), which the Government of Vanuatu (GoV) is expected to approve in early 2015. To establish full coherence with the NSDP and comprehensively address the issues facing the country, the VISIP includes social infrastructure in addition to economic infrastructure.
In particular, the VISIP:
updates the list of infrastructure projects in the draft infrastructure plan prepared in 2012, but never formally adopted, to include sectoral progress and new policy development since 2012;
recommends prioritising infrastructure projects by their linkages with other governmental policies and strategies;
considers new projects, including in the social infrastructure sectors (health, education, justice, internal affairs) that may support sustainable socio-economic development; and
recommends how VISIP can become a dynamic infrastructure project pipeline development process rather than just a static list of priority projects.
Infrastructure Challenge and Need for VISIP
Infrastructure is the foundation for developing urban and rural areas, operating industries and commerce, improving living standards, delivering community services and driving economic growth. Vanuatu has made substantial progress in providing infrastructure, and planning for further investment is underway in individual sub-sectors.
However, the current stock of GoV supported infrastructure assets is largely failing to provide the services for which they were intended, primarily because assets are provided inadequate resources for operation and maintenance (O&M) once they are deployed. Indeed, maintaining and operating assets needs to be accorded a higher priority than expanding the asset base. The report strives to address critical challenges for developing public infrastructure in Vanuatu by:
making infrastructure sustainable by systematically identifying O&M requirements and resourcing them;
integrating infrastructure planning into routine public administration processes for more transparency and alignment with evolving government policy and strategic priorities; and
providing a framework to guide developing partner support for future infrastructure development.
VISIP 2015 Methodology
The project selection methodology is based on four criteria groups (CGs) and their sub-criteria that can be quantitatively and objectively scored based on information about proposed projects.
CGs and their sub-criteria were selected to dovetail into the three pillars of the upcoming NSDP. This ensures that project selection follows emerging GoV policy and to help sector analysts and the Department of Strategic Policy, Planning and Aid Coordination (DSPPAC) score and rank projects in a manner consistent with the NSDP for future VISIP updates. Indeed, to facilitate such updates the VISIP 2015 prioritisation methodology is structured as a process to be periodically repeated to reflect the country’s changing socio-economic situation and GoV’s evolving policies and priorities.

VISIP 2015 - 2024 | Executive Summary
viii
Figure ES-1 shows the VISIP projects pipeline development flow process through government and external institutions.
Figure ES-1: VISIP Methodology
Other Plans, e.g. urban,
rural, agricultural, etc.
Develop Criteria, Scope
Project
Profile
NSDP Report + Review
Prioritisation/Process Sector Plan
Shortlist of Projects
Projects Ongoing +
Completed
VISIP
Asset Management
Affordability
Funding Strategy
Capital Sources
Debt Strategy
Monitor / Track
Implementation /
Delivery Budget + Plan
VISIP 2015 Activities

VISIP 2015 - 2024 | Executive Summary
ix
VISIP 2015 Outcome
VISIP 2015 considered candidate projects across seven economic and social sectors as well as multi-sectoral projects. Information on the projects was drawn from several sources and discussion with relevant ministries and agencies, although availability of detailed data varied widely between sectors and projects. Figure ES-2 shows the outcome of the
priority projects selection process.
Figure ES-2: Project Selection Process under VISIP 2015
Sectoral Wish Lists
(193 Projects) (VUV19.90 b)
($m 2.132 USD)
Long List VISIP 2015
(80 Projects) (VUV16.89 b)
(USD1.809 m)
Screening based on updated project information, project profile, & updated strategic orientation
VISIP 2015 Short List of Proposed Priority
Projects (26 Projects) (VUV37.98 b) (USD407 m)
Scoring and
weighting based on 4 groups of multiple criteria
Ongoing (O) List Priority Projects
VISIP 2015 (26 Projects) (VUV33.14 b) (USD355 m)
Short List of Public Priority Projects
(18 Projects) (VUV21.10 b) (USD226 m)
Privately Financed Public
Priority Projects (1 Project)
(b 10,08 VUV) ($m 108 USD)
New Proposed (P) & Important
Unplanned (IU) Projects
(9 Projects) (VUV37.43 b) (USD401 m)
Recommended for inclusion through discussion with sector ministries/ agencies
Short List of Priority Projects
Committed by GoV to Seek DP
Financing
Separation of ongoing (O)
projects under
implementation
Long List VISIP 2012 (Draft)
(68 Projects) (VUV98.58 b) (USD1.056 m)
List refinement based on project
information
Decision by GoV/DCO & COM guided by
DSPPAC
Short List of Bundled Public Priority
Projects (7 Projects) (VUV6.81 b) (USD73 m)
Short List of Privately Financed Public
Priority Projects (1 Project)
(VUV10.08 b) (USD108 m)

VISIP 2015 - 2024 | Executive Summary
x
Table ES-1 summarises the ongoing projects and short list of proposed investment projects by sub-sector.
Table ES-1: Summary of Investment by Infrastructure Sub-Sector (in VUV billion)
Sector Ongoing
Implementation Future
Committed Future
Proposed Total
Maintenance Cost p.a.
Multi-Sector 3.64 2.10 5.74 0.14
Transport – Road 7.65 9.96 17.62 0.44
Transport – Aviation 2.03 2.03 0.05
Transport – Shipping 9.45 5.49 14.93 0.37
Water Supply 0.37 0.09 0.52 0.98 0.02
Solid Waste 0.14 0.14 0.00
Energy/Power 2.76 0.22 13.20 16.19 0.40
Telecommunications/ ICT
3.86 2.16 6.02 0.15
Tourism 1.68 1.68 0.04
Agriculture 0.56 0.56 0.01
Disaster Management 0.37 0.37 0.01
Education 0.53 1.49 2.03 0.05
Health 1.51 1.51 0.04
PMO (Convention Centre) 1.34 1.34 0.03
Sub-Total 1.81 36.16
Total 33.18 37.98 71.15 1.78
Development partners remain engaged in supporting infrastructure in Vanuatu and stand ready to provide assistance for projects and programs under a final and GoV-endorsed VISIP 2015. However, they also emphasise three concerns:
infrastructure development needs to be centralised and better grounded in GoV policy, with local and community resources (especially land) fully mobilised;
project management and implementation capacity at agency and ministry levels should be strengthened and absorptive capacity thereby increased; and
adequate resources for operating and maintaining projects should be systematically provided to ensure sustainability.
With the exception of the recently completed Vanuatu National Energy Road Map 2013-2020, there is a dearth of robust sector plans for infrastructure. Ministries with responsibilities for infrastructure need to develop and/or update their sectoral plans, identifying and documenting their priority investment focus and specific projects to facilitate future VISIP updating. The ministries include Ministry of Infrastructure and Public Utilities (MIPU), Ministry of Land and Natural Resources (MLNR), Ministry of Climate Change and Disaster Risk Management (MCCDRM), Office of the Government Chief Information Officer (OGCIO), as well as Ministry of Health (MOH) and Ministry of Education (MOE).
The three transportation sub-sectors (road, aviation, and shipping) under MIPU and the Public Works Department (PWD) necessitate the formulation of an Integrated National Transportation Plan that will:
identify sub-sector internal and interdependency issues;
prioritise investment projects and balance them with maintenance needs; and
plan for institutional strengthening as well as capacity development (government, national consultants, contractors) and recommend reforms in the sub-sectors especially on interacting with stakeholders.
Proposed future priority investments have been grouped into three categories:
A list of high priority individual public infrastructure projects needing DP support for implementation funding – consists of 18 projects with a potential VUV21.10 billion (USD226 million) investment value.
A list of bundled sector projects (comprising many smaller mostly rural projects) needing development partner funding – rural roads, domestic airports, local jetties, and water supply. The total investment value of those bundled projects may be too large to implement in 10 years with foreseeable DP funding; implementation will thus need to be carried out over a longer timeframe. The realistic investments for the next 10 years in this category, consists of seven sector projects with an estimated VUV6.81 billion (USD73 million) investment value, which would be in line with foreseeable levels of development partner funding over the coming decade.
A privately-funded public infrastructure project under Public Private Partnership (PPP) arrangements – a power supply project (geothermal) with a potential VUV10.08 billion (USD108 million) investment value.
VISIP 2015 - 2024 | Executive Summary
xi
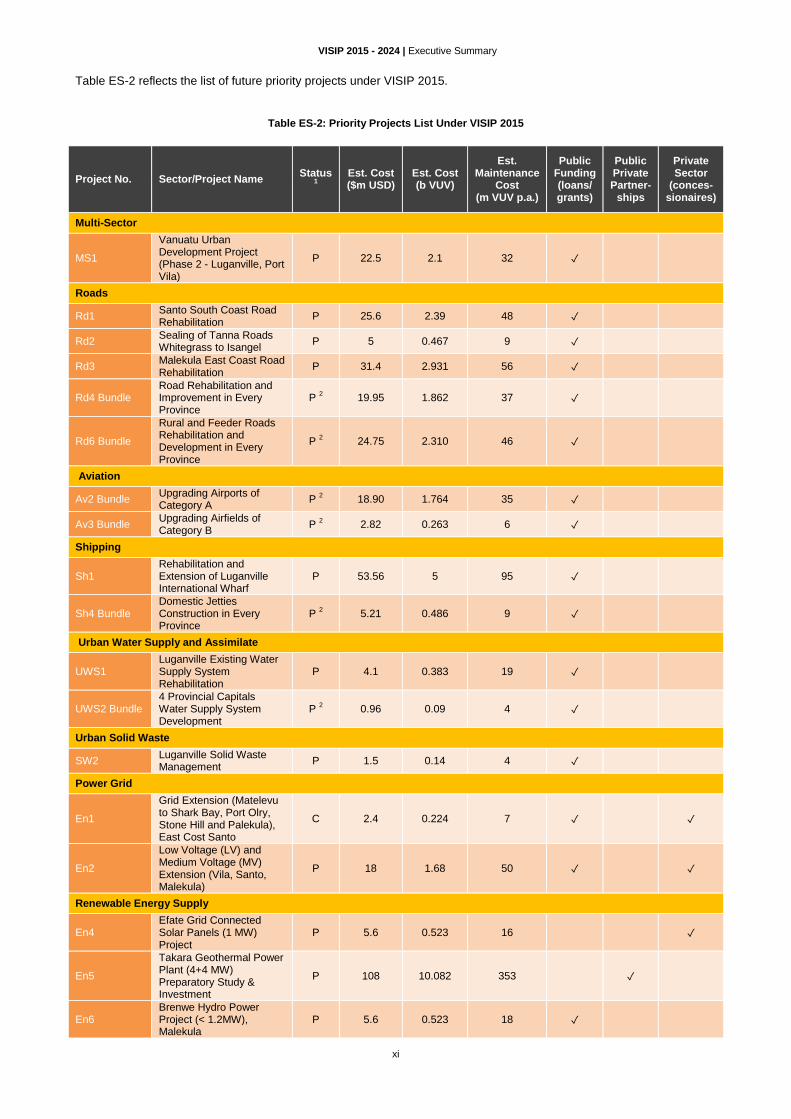
Table ES-2 reflects the list of future priority projects under VISIP 2015.
Table ES-2: Priority Projects List Under VISIP 2015
Project No. Sector/Project Name Status
1
Est. Cost ($m USD)
Est. Cost (b VUV)
Est. Maintenance
Cost (m VUV p.a.)
Public Funding (loans/ grants)
Public Private Partner-
ships
Private Sector
(conces-sionaires)
Multi-Sector
MS1
Vanuatu Urban Development Project (Phase 2 - Luganville, Port Vila)
P 22.5 2.1 32 ✓
Roads
Rd1 Santo South Coast Road Rehabilitation
P 25.6 2.39 48 ✓
Rd2 Sealing of Tanna Roads Whitegrass to Isangel
P 5 0.467 9 ✓
Rd3 Malekula East Coast Road Rehabilitation
P 31.4 2.931 56 ✓
Rd4 Bundle Road Rehabilitation and Improvement in Every Province
P 2 19.95 1.862 37 ✓
Rd6 Bundle
Rural and Feeder Roads Rehabilitation and Development in Every Province
P 2 24.75 2.310 46 ✓
Aviation
Av2 Bundle Upgrading Airports of Category A
P 2 18.90 1.764 35 ✓
Av3 Bundle Upgrading Airfields of Category B
P 2 2.82 0.263 6 ✓
Shipping
Sh1 Rehabilitation and Extension of Luganville International Wharf
P 53.56 5 95 ✓
Sh4 Bundle Domestic Jetties Construction in Every Province
P 2 5.21 0.486 9 ✓
Urban Water Supply and Assimilate
UWS1 Luganville Existing Water Supply System Rehabilitation
P 4.1 0.383 19 ✓
UWS2 Bundle 4 Provincial Capitals Water Supply System Development
P 2 0.96 0.09 4 ✓
Urban Solid Waste
SW2 Luganville Solid Waste Management
P 1.5 0.14 4 ✓
Power Grid
En1
Grid Extension (Matelevu to Shark Bay, Port Olry, Stone Hill and Palekula), East Cost Santo
C 2.4 0.224 7 ✓ ✓
En2
Low Voltage (LV) and Medium Voltage (MV) Extension (Vila, Santo, Malekula)
P 18 1.68 50 ✓ ✓
Renewable Energy Supply
En4 Efate Grid Connected Solar Panels (1 MW) Project
P 5.6 0.523 16 ✓
En5
Takara Geothermal Power Plant (4+4 MW) Preparatory Study & Investment
P 108 10.082 353 ✓
En6 Brenwe Hydro Power Project (< 1.2MW), Malekula
P 5.6 0.523 18 ✓

VISIP 2015 - 2024 | Executive Summary
xii
Project No. Sector/Project Name Status
1
Est. Cost ($m USD)
Est. Cost (b VUV)
Est. Maintenance
Cost (m VUV p.a.)
Public Funding (loans/ grants)
Public Private Partner-
ships
Private Sector
(conces-sionaires)
En7 Sarakata Hydro Power Extension Project (+600 KW), Santo
P 4.25 0.397 14 ✓
Rural Water Supply
RWS1 Rural Water Supply Lamap, East Malo, Wala Rono, West Ambae
C 1 0.093 2 ✓
RWS2 Bundle Rural Water Supply in Every Province
P 2 0.5 0.047 2 ✓
ICT
ICT7 New Government Data Centre + Backup
P 1 0.093 2 ✓
ICT11
Implementation of iGov Strategic Plan (including planning of WB/ADB ICT loan package)
P 20.15 1.881 47 ✓
ICT14
Expansion of Government Broadband Network (GBN), Phase 2 (more connectivity in provincial capitals and towns)
P 2 0.187 5 ✓
Education
Ed1 Reconstruction College Malapoa
C 16.00 1.494 30 ✓
Agriculture
Ag1 National Diagnostic Laboratory Bureau of Standards
P 6.00 0.560 22 ✓
26 Total 406.75 37.970 968
1 P=Proposed, C=Committed 2 Corresponding to 30 % of sub-projects value within each bundle expected to be fundable within 10 years
The figures below provide a perspective of the distribution of priority projects investments by sector (Figure ES-3), and province (Figure ES-4), and, given the disparity in populations in the provinces the per capita investment amounts in each province (Figure ES-5).
Figure ES-3: Sectoral Spread of Short List of Priority Investments – VISIP 2015
Figure ES-4: Geographic Spread of Short List of Priority Investments – VISIP 2015
Multi Sectors 6%
Road 26%
Aviation 5%
Shipping 14%
Water Supply & Sanitation
2%
Energy 35%
ICT 6%
Agriculture 1%
Education 4%
Torba 0%
Sanma 28%
Penama 0%
Malampa 9%
Shefa 39%
Tafea 1%
Multi-Provinces
23%

VISIP 2015 - 2024 | Executive Summary
xiii
Figure ES-5: Per Capita Investment/Province (Proposed Projects: USD/capita)
Funding Strategy
CAPITAL INVESTMENT
The factors constraining infrastructure investment in Vanuatu are:
limited domestic public financial resources available for infrastructure investment; and
limited institutional capacity to absorb and execute infrastructure investment (from domestic or external sources).
GoV funds little infrastructure and other capital expenditure from domestic revenues. It relies on a narrow tax base (VAT, excise, import duties). Barring a broadening of this base, it is unlikely that GoV could self-fund major infrastructure projects in the medium term. Development partner grants (and more recently concessional loans) have been the main finance source for infrastructure. Clearly domestic resources for infrastructure investment, to augment those from the development partners, will need to increase (along with institutional capacity) for the pace of infrastructure investment to rise commensurate with GoV’s development goals.
The strategy for financing economic infrastructure priority projects under VISIP 2015, developed with the Ministry of Finance and Economic Management (MFEM), reflects the following principles:
Ensure that the available funding for economic infrastructure from GoV and its development partners roughly matches the total capital and maintenance expenditures for the proposed investments in VISIP.
Ensure that funds are available for adequately operating and maintaining new infrastructure and that the assessments of proposed projects are based on the lifetime costs of infrastructure assets.
Use civil society organisations (CSOs) as instruments for achieving GoV’s social and community objectives to avoid compromising the financial performance of existing or potential new state-owned enterprises (SOE) or private utilities.
Continue to develop a GoV debt management strategy to ensure infrastructure investment do not lead to debt distress; prioritise using grants to fund infrastructure investment; and strictly limit using loans for those investments that will best boost the country’s productive capacity.
For ongoing and proposed priority projects, a mixture of external grants and concessional loans will cover investment costs; for proposed projects, grants are preferred but some concessional loan finance will also be needed.
The total funding requirement for capital costs for ongoing and proposed projects amounts to about VUV71.2 billion (USD763 million) over the next 10 years. For the new projects the proposed investment over 2014-2025 amounts to VUV37.99 billion (USD407 million). Funding modalities for these investments are likely to be:
Public investment (DP grants, local+concessional borrowing): VUV25.48 billion (USD273 million)
Private Sector (concessionaires): VUV2.43 billion (USD26 million)
Public private partnerships: VUV10.08 billion (USD108 million)
For proposed priority investment projects, the following split of fund sources has been estimated:
Grants: VUV11.7 billion (USD125 million)
Loans: VUV13.8 billion (USD148 million)
Private funding: VUV12.4 billion (USD133 million)
0
500
1000
1500
2000
2500
0
2442
11
1017
1992
154 407

VISIP 2015 - 2024 | Executive Summary
xiv
As public debt was around 22.5% of GDP at end 2014, well within the 40% threshold suggested by the IMF, the proposed additional loans appear affordable.
MAINTENANCE EXPENDITURES
Maintaining public infrastructure is critically important in Vanuatu. Currently, most budgetary allocations dedicated to maintaining infrastructure are limited to domestic aerodromes and some roads. It remains below the threshold for sustaining maintenance and reinvestment of public assets. GoV funding for infrastructure O&M has averaged slightly less than VUV1.0 billion annually largely for roads and airstrips.
There is a substantial gap in maintenance funding, with most public infrastructure unsupported by preventative maintenance or with no capacity to plan and implement maintenance programs. In addition while this VISIP focuses on ongoing infrastructure projects and prioritised proposed projects, there is no information about GoV’s total existing infrastructure assets. Given the limited funding for maintenance available, much of this stock is probably in disrepair and needs rehabilitation. The cost of such ‘backlog’ maintenance is unknown.
A broad process of systematically estimating recurrent operation and maintenance expenses is in its initial stages, especially in MOH and MOE, which are managing diverse and dispersed investment assets. To sustain the investment benefits that VISIP 2015 proposes, it will be critical to secure sufficient funding for operating and maintaining all ongoing and proposed new projects. Table ES-3 summarises the demand for funding of maintenance for the sub-sectors.
Table ES-3: Maintenance Cost Requirement for Ongoing and Proposed Projects (VUV million p.a.)
Sector GoV Consolidated
Revenue Appropriations
PPP/SOE (User Fees)
Private Sector Concessionairs
(User Fees) Total
O P O P O P O P
Urban Development 91 32 91 32
Roads 191 196 191 196
Aviation 40 40
Shipping 236 104 236 104
Urban Water Supply 9 23 9 23
Solid Waste 4 4
Power Grid 64 57 64 57
Renewable Energy 5 401 5 401
Climate Change Adaptation 9 9
Tourism 42 42
Rural Water Supply 4 4
ICT 96 54 96 54
Education 13 30 13 30
Agriculture 22 22
Health 38 38
Justice ?? ??
Public Buildings 34 34
Total 654 384 165 556 9 27 832 963
* O=Ongoing Projects, P=Proposed Projects
These costs aggregate in the following indicative sums:
GoV-financed stand-alone projects VUV1.13 billion p.a. (USD12 million)
GoV-financed bundled projects VUV0.14 billion p.a. (USD1.5 million)
PPP/private sector projects VUV0.52 billion p.a. (USD5.6 million)
ANNUAL FUNDING AVAILABLE FOR INFRASTRUCTURE DEVELOPMENT
Data from implementing committed ongoing projects highlight that the current level of actual development partner spending in Vanuatu, is around USD60 million (VUV5.6 billion) annually. This is considered at or near the country’s current maximum absorptive capacity. Assuming that 75% of that spending is for direct infrastructure investment, a reasonable target for sustained partner funded infrastructure investment in Vanuatu is approximately USD45 million (VUV4.2 billion) annually.
Therefore, the average annual funding for investment available for implementing the priority projects retained under VISIP 2015 is expected to be as Table ES-4 shows.

VISIP 2015 - 2024 | Executive Summary
xv
Table ES-4: Annual Funding Available for Infrastructure Development
Funding Source Expected Funding Available Annually
for Investment (Billion VUV) Percent of Total
Government Of Vanuatu 0.1 1.4%
Private Sector 2.5 36.8%
Donor Concessional Loans And Grants
4.2 61.8%
Total 6.8 100%
A significant increase in investment beyond these levels will require extensive reforms to operations budgeting and to project preparation and selection procedures as proposed in the report. Broadening the tax base to increase GoV revenues for supporting infrastructure will help relax the current capacity constraints on Vanuatu in developing its infrastructure. It will also allow a gradual increase in infrastructure investment in the future.
Programming Priority Investment
Table ES-5 provides a tentative programming of priority investment for new projects documented in VISIP 2015 for 2015-2024. In the table, the ranking of the project by implementation timing follows the scoring of the projects along the VISIP project prioritisation methodology as in the report. The higher the scoring, the earlier project implementation should begin.
Given the current backlog of ongoing investment, budget availability for new publicly funded investment is expected to begin to appear only in 2018-2019. It is noteworthy that expenditure on public-funded projects declines towards the end of the 2023-2024 planning period as projects in the shortlist are implemented. The VISIP process is meant to provide a continuously updated long list of projects. At periodic intervals, new projects will be added to the shortlist as infrastructure planning though updates of the VISIP. Funding for such new projects is expected to be available from continued external funding support, private sector contributions to infrastructure, and gradually increased contributions from GoV internal resources. GoV recognises the need to initiate new capacity development for the infrastructure sector. The larger ‘infrastructure capacity system’ includes the capacities of institutions and individuals from government, SOEs, private sector, civil society, and development partners.
VISIP implementation requires high quality enabling institutional environment surrounding the investment plan as it emphasises managing an investment portfolio instead of individual projects. The management of VISIP depends on clearly defining the central oversight and implementation agencies’ roles. These include the Prime Minister’s Office (PMO), DSPPAC’s Vanuatu Project Management Unit (VPMU), MFEM, line agencies with cross-sectoral responsibilities such as MIPU (which will assist other ministries in preparing project profiles, scheduling and supporting of maintenance activities, and liaising with local communities), and the project-sponsoring line ministries themselves.
DSPPAC will manage VISIP implementation centrally. However, VISIP projects need sub-sector capacity building in project areas, to design approaches to strengthen local economies and create livelihoods such as using labour-intensive methods and local contractors when possible (key for project selection criteria). VISIP’s monitoring and evaluation (M&E) should develop and apply a narrow set of measures to track gains in sector-wide capacity.
The updating of the VISIP must be anchored in national development plans which can be expected to evolve. Overarching goals of improving living standards, and supporting inclusive human development and economic growth are unlikely to change, but relative merits of specific investments and of sectors will and criteria governing investment priorities must respond to changing priorities of the GoV. Regular VISIP reviews and updates will ensure continuing alignment with national priorities. This report sets out the key functions, institutional responsibility the key activities for VISIP updates. They are detailed in Chapter 6 (table 59). As noted earlier, capacity development needs to go hand in hand with VISIP implementation. The main recommendations for capacity development activities to enable efficient application of the proposed enhanced institutional responsibilities are detailed in Chapter 6 (Table 60)
Technical assistance should come from local training institutions and others from the Pacific region. Sources of support should come from academe, non-profit research institutions, and regional training centres to complement country-based resources. Also, peer learning can be a most effective and convincing means to support change. ICT will provide more opportunity for real-time linking of Vanuatu’s infrastructure planning with other Pacific island countries’ experiences.
VISIP managers, whether in DSPPAC, VPMU, or line ministries, need good information to support decision-making. Rather than focus on individual VISIP inputs and activities, an M&E Framework has been proposed for the implementation of VISIP that suggest performance indicators for goals, outcomes and outputs, in alignment with national development goals. The overall results framework is presented in Chapter 6 (Table 61).
In terms of reporting, DSPPAC will update its portfolio and database of large investments, including VISIP priority projects on a regular basis, with brief quarterly activity reviews and an annual report. Quarterly reviews will inform

VISIP 2015 - 2024 | Executive Summary
xvi
stakeholders of major portfolio activities and share success stories about implementation or results of a particular active VISIP investments. Annual reports will analyse the progress and status of the entire VISIP portfolio, discussing investments completed, funded, or committed. Further, they will check each investment in the pipeline and assumptions about readiness, sequence, cost, and funding sources; note outstanding issues to decide if the plan needs adjusting; and review the update process to see if it helps manage VISIP effectively.
DSPPAC, in line with its mandate, will organise periodic meetings with developing partners to share information on project progress or problems and update them on the evolving project pipeline and emerging projects.

VISIP 2015 - 2024 | Executive Summary
xvii
Table ES-5: Programming Priority Investment Projects under VISIP 2015
Project No. Project Name Estimated
Cost (b VUV)
Implementation Years
Value in b VUV
2013 and
earlier 2014 2015 2016 2017 2018 2019 2020 2021 2022 2023 2024
On Going Projects 33.180 9.48 4.74 4.74 4.74 4.74 4.74
New Proposed Publicly Financed Investment Projects
MS1 Vanuatu Urban Development Project (Phase 2 - Luganville, Port Vila)
2.100 5 0.42 0.42 0.42 0.42 0.42
En4 Efate Grid Connected Solar Panels (1 MW) Project 0.523 3 0.17 0.17 0.17
UWS1 Luganville Existing Water Supply System Rehabilitation 0.383 2 0.19 0.19
En6 Brenwe Hydro Power Project (< 1.2MW), Malekula 0.523 3 0.17 0.17 0.17
En7 Sarakata Hydro Power Extension Project (+600 KW), Santo
0.397 2 0.20 0.20
En1 Grid Extension (Matelevu to Shark Bay, Port Olry, Stone Hill and Palekula), East Cost Santo
0.224 2 0.11 0.11
Ag1 National Diagnostic Laboratory Bureau of Standards 0.560 3 0.19 0.19 0.19
Rd2 Sealing of Tanna Roads Whitegrass to Isangel 0.467 3 0.16 0.16 0.16
ICT11 Implementation of iGov Strategic Plan including planning of WB/ADB ICT loan package
1.881 5 0,38 0.38 0.38 0.38 0.38
ICT7 New government Data Centre + Backup 0.093 2 0.05 0.05
Rd1 Santo South Coast Road Rehabilitation 2.390 5 0.48 0.48 0.48 0.48 0.48
UWS2 Bundle 4 Provincial capitals Water Supply System Development
0.090 2 0.04 0.04
Rd3 Malekula East Coast Road Rehabilitation 2.931 6 0.49 0.49 0.49 0.49 0.49 0.49
Av2 Bundle Upgrading Airports of Category A 1.764 4 0.44 0.44 0.44 0.44
Sh4 Bundle Domestic Jetties Construction in Every Province 0.486 3 0.16 0.16 0.16
ICT14 Expansion of Government Broadband Network (GBN), Phase 2 (more connectivity in provincial capitals and towns)
0.187 2 0.09 0.09
SW2 Luganville Solid Waste Management 0.140 2 0.07 0.07
Sh1 Rehabilitation and Extension of Luganville International Wharf
5.000 6 0.83 0.83 0.83 0.83 0.83 0.83
Av3 Bundle Upgrading Airfields of Category B 0.263 2 0.13 0.13
En2 Low Voltage (LV) and Medium Voltage (MV) extension (Vila, Santo, Malekula)
1.680 4 0.42 0.42 0.42 0.42
Rd4 Bundle Road Rehabilitation and Improvement in Every Province
1.862 4 0.47 0.47 0.47 0.47
Rd6 Bundle Rural and Feeder Roads Rehabilitation and Development in Every Province
2.310 5 0.46 0.46 0.46 0.46 0.46
RWS1 Rural Water Supply Lamap, East Malo, Wala Rono, West Ambae
0.093 2 0.05 0.05
RWS2 Bundle Rural Water Supply in Every Province 0.047 2 0.02 0.02
Ed1 Reconstruction College Malapoa 1.494 4 0.37 0.37 0.37 0.37
25 Total Public Funded Projects 4.74 4.74 5.28 6.35 6.58 3.80 4.93 5.12 4.36 3.52 2.16
New Proposed Privately Financed Investment Project
En5 Takara Geothermal Power Plant (4+4 MW) Preparatory Study & Investment
10.082 9 1.12 1.12 1.12 1.12 1.12 1.12 1.12 1.12 1.12
26 Grand Total 27.89 4.74 4.74 6.40 7.47 7.70 4.92 6.05 6.24 5.48 4.64 3.28

VISIP 2015 - 2024 | Executive Summary
xviii
MAP OF VANUATU
Courtesy of National Statistics Office, Vanuatu
VISIP 2015 - 2024 | Introduction
1
1 Introduction
VISIP 2015 builds on a draft infrastructure plan that was prepared in 2012, but was never formally adopted. VISIP 2015 covers social as well as economic infrastructure priorities and presents a Strategic Investment Plan for 2015-2024 for the Council of Ministers and Parliament to adopt to complement NSDP, which GoV is preparing for early 2015 approval. Its preparation was coordinated with PMO and MIPU and was supported by the Pacific Region Infrastructure Facility Coordination Office (PCO).
1
In particular, the VISIP:
updates the list of infrastructure projects in the 2012 draft plan to include sectoral progress and new policy development since that time;
recommends prioritising infrastructure projects by their linkages with other governmental policies and strategies;
considers new projects, including in the social infrastructure sectors (health, education, justice, internal affairs) that may support sustainable socio-economic development; and
recommends how VISIP can become a dynamic infrastructure project pipeline development process rather than just a static list of priority projects.
1.1 Purpose and Scope
VISIP 2015 outlines Vanuatu’s priorities and plans for major infrastructure for the coming decade -- up to 2024. Specifically, it sets out a list of priority projects, and also recommends processes and institutional responsibilities within GoV that will allow successful implementation, monitoring and evaluation of these strategic investments. The types of infrastructure considered cover the commonly termed ‘Economic Infrastructure’ as well as ‘Social Infrastructure’. Economic infrastructure (e.g. transport, power, water supply, communication) directly facilitates business activity and economic growth (e.g. industry, commerce, trade, tourism, food production). Social infrastructure refers to assets and buildings that accommodate social services (education, health, youth and sport facilities, justice and community services)
2. Social infrastructure fosters economic development indirectly by nurturing the population’s well-being and
productivity in the medium and longer term.
The report analyses the demand for economic and social infrastructure and documents the proposed priority investments for Vanuatu, along with a funding strategy. The report also recommends government actions for:
making VISIP the main infrastructure projects pipeline instrument to attract development partner funding; and
securing the long-term sustainability of infrastructure assets proposed in the pipeline by explicitly recognising maintenance needs.
1 PRIF is a partnership between the Asian Development Bank, DFAT, EIB, EU, JICA, NZMFAT, and the World Bank Group. 2 Agriculture and Water Supply/Sanitation straddle these broad definitions.

VISIP 2015 - 2024 | Introduction
2
VISIP 2015 covers the following infrastructure sub-sectors:
Agriculture Solid Waste Management
Energy and Power Transport (roads and bridges, wharves and jetties,
airports, airstrips)
Health Facilities Telecommunications and Information Technology
Justice and Community Services Tourism
Sanitation and Drainage Water Supply
Schools Youth and Sport Development
Infrastructure, vital for economic and social development, provides the foundation for developing urban and rural areas, operating industries and commerce, and delivering services to the community. Although Vanuatu has progressed in providing infrastructure and planning for investment is underway in individual sub-sectors, challenges remain:
making infrastructure sustainable by identifying resources for maintenance and operation;
intergrating the prioritisation and planning of infrastructure into GoV’s routine public administration;
aligning development of the pipeline with evolving governmental policy and strategic priorities; and
guiding development partner assistance to infrastructure in line with strategic priorities VISIP 2015.
The current stock of GoV-supported infrastructure assets is largely failing to deliver planned services, because they receive inadequate resources for their O&M once they are deployed. School buildings, sports stadiums, health facilities, courthouses, and GoV buildings as well as key transport and other assets are falling into disrepair and often become unusable well within design life.
VISIP 2015 recommends that operational and asset management considerations should not be side issues to consider after infrastructure investment decision making, but should be core to the investment decisions themselves. Maintaining and competently operating the current stock of assets should be prioritised in parallel with expanding the current asset stock. As such, the report includes an updated methodology for prioritising projects. It tailors the list of projects proposed for investment in accordance with to GoV’s capacity and resources to operate and maintain each investment over the life of the asset.
1.2 VISIP 2015 Process
The preparation of the VISIP involved two stages:
STAGE 1: REVIEW AND CONSULTATION
The long list of projects to potentially include in VISIP 2015 was first compiled from the draft 2012 plan and then updated through consultations, and in line with developments in the past two years. Stage 1 integrated five tasks:
Update the long list and structure of projects in VISIP 2012 based on evolved GoV policies and strategies.
Review new GoV policies and strategies related to economic and social infrastructure development and other sector plans and studies.
Consult with ministries covering productive sectors to update infrastructure requirements consistent with new governmental policies and targets. The ministries include MIPU; Ministry of Agriculture, Livestock, Fisheries, Forestry and Bio-Security (MALFFB); Ministry of Foreign Affairs, International Cooperation & External Trade (MFAICET); Ministry of Tourism, Trade, Commerce and Ni-Vanuatu Businesses (MTTCNVB); MLNR; and MCCDRM as well as the social sectors MOH; MOE; Ministry of Justice and Community Services (MJCS); Ministry of Youth Development, Sport and Training (MYDST); and Ministry of Internal Affairs (MIA).
Prepare an updated long list of projects and complementary measures to meet the demand for infrastructure for 5-10 years, including indicative cost estimates.
Organise a workshop with key stakeholders to review the proposed long list to ensure that it reflects a coherent program of infrastructure investments, measures, and interventions for achieving national objectives and requirements.

VISIP 2015 - 2024 | Introduction
3
STAGE 2: PRIORITISATION AND FINALISATION OF THE VISIP 2015 DOCUMENT
This included seven tasks:
Develop and agree with the VISIP Steering Committee (VISIPSC) to a prioritisation framework including a methodology and criteria for ranking projects.
Prepare preliminary cost estimates for priority projects including capital and recurrent funding requirements in the proposed investment portfolio.
Update the institutional assessment and recommend improvement for governance and management for implementing and managing VISIP.
Prepare a draft prioritised investment program, an underlying funding strategy, and draft implementation schedule, for VISIPSC.
Develop workshops to find governmental consensus on the prioritised investment program.
Finalise VISIP 2015 with updated concise and comprehensive project summaries for priority projects for formal GoV approval.
Train governmental staff in the VISIP process and project prioritisation methodology to enable future VISIP updates.
The VISIP 2015 process involved wide consultation among policy makers in government, and with providers and users of infrastructure and funding agencies. These consultations included meetings with individual stakeholders and stakeholder groups (including the private sector and civil society), and five workshops bringing stakeholders together at critical stages in the preparation process (see Appendix 8).
1.3 VISIP Role in Government Planning
GoV intends to formally adopt VISIP 2015 as its primary reference for considering infrastructure priorities: including those funded form its own resources, and those supported by its development partners. It therefore needs to have a clear position and role within GoV’s existing framework for operations, planning, and decision-making.
The VISIP will be integrated with evolving national development plans and government policies, sector plans, and line ministries’ corporate plans. As Chapter 3 outlines, the line ministries will support VISIP by encapsulating their priority project concepts into project profiles such as those in appendix 6. Equally importantly, they are tasked with working closely with rural communities that their projects will affect. Such work includes resolving land issues and securing communities’ in-kind contributions to project construction, operation, maintenance, and security. Line ministries will also be responsible for updating their respective sector plans and ensuring that they are consistent with the overall infrastructure investment program (i.e. VISIP). MIPU, as the GoV’s lead line ministry involved in infrastructure development, will assist all other line ministries in preparing their project profiles and ensuring that investments are well integrated across sectors.
To combine the project concepts from the ministries in a coherent, fundable, and practical implementation plan consistent with GoV policies requires two key roles at senior GoV levels for integration and project selection and coordination:
i. The Department of Strategic Policy, Planning and Aid Coordination (DSPPAC) will be responsible for:
aligning infrastructure investment projects with GoV policy and priorities;
short listing projects for subsequent development using the selection process Chapter 3 describes; and
liaising with developing partners to secure funding commitments to the project short list.
ii. The Ministry of Finance and Economic Management will consult with DSPPAC to:
review the project short list as it is being prepared; and
evaluate the extent to which the GoV budget can realistically support the life cycle costs (staffing, operations, asset maintenance, energy, utility needs) of the envisaged investments.

VISIP 2015 - 2024 | Introduction
4
These functions will integrate the VISIP with GoV priorities and capacities, and enable alignment with infrastructure sector and sub-sector plans. It is also intended as a basis for infrastructure development and development partner financing discussions between GoV and developing partners and the private sector, giving these stakeholders confidence in the rationale behind and commitment to proposed investments. The VISIP will be subject to ongoing monitoring and updating, as Chapter 3 discusses.
The following chapters introduce roles and institutional linkages that support the process for formulating the VISIP.

VISIP 2015 – 2024 | Infrastructure Challenges
5
2 Infrastructure
Challenges
2.1 Growth Drivers
Vanuatu’s economy is founded largely on agriculture and services. Based on GDP estimates at 2012 prices, agriculture, fishing, and forestry account for around 22.5% of output and 65% of the labour force, with crop production dominating. Industry accounts for only around 9.5% and 5% of employment with the major contributors being construction, manufacturing, and electricity and water supply. The service sector accounts for nearly 68% of output and 30% of employment with the major contributors being public administration, retail trade, finance and insurance, transport, real estate, and accommodation and food services.
The service sector relates primarily to tourism. This puts premium importance on developing less costly air, land, and sea transport services to improve market linkages within the country and with the outside world; this also applies to communications and energy in urban and rural areas. Most residents live in rural areas, and rely on agricultural production for their subsistence and for generating cash incomes. GoV wishes to integrate more people across Vanuatu into the growing national economy to better distribute the benefits of economic growth and to strengthen local human resource inputs in that growth.
Vanuatu’s population is young and youth unemployment is a growing problem, with crime increasing. GoV is considering professional training, agricultural support services, and increased access to education and health, justice, and sports. Infrastructure development can help most by supporting good climate-resilient transport and communications (supporting market development), water supply and sanitation (supporting health), least-cost electrification (improving productivity), and other facilities supporting productive youth activities.
Looking at the macroeconomic trend and recent GoV budget papers, Vanuatu is still in a phase of relatively low economic growth. Given its high degree of openness to the global economy and global recession-related delays to implementing major donor-funded construction projects, Vanuatu’s economic activity has picked up only gradually from 2012. A recovery in tourist air arrivals and strong copra exports partially offset persistent weaknesses in the construction, financial services, and several key agricultural commodity sectors.
Vanuatu has achieved a period of sustained positive economic growth since 2003, following years of fluctuating performance (Figure 1). The real annual increase in gross domestic product (GDP) peaked at 8.5% in 2006 and held above 5% for 3 years before slowing to 3.3% in 2009, and less than 2% in 2010-2012. Estimated growth for 2013 is 2.8% which is expected to rise slightly and stabilise at 3.2% in 2014-2016.

VISIP 2015 – 2024 | Infrastructure Challenges
6
Figure 1: Real Annual GDP Growth (%)
Source: World Bank Statistical Data; Government of Vanuatu, 2013 Budget Papers.
Vanuatu’s economic activity should strengthen slightly in the years ahead. GoV allocated VUV494 million for new projects proposals (NPP) in the 2013 budget. These included VUV109 million to boost service delivery in the health and education sectors, VUV40 million for trade and agriculture to boost the productive sector, and VUV125 million to OGCIO for managing the government IT system (especially the i-Government network) which is expected to generate cost savings and additional revenue for the government.
Also in 2013, GoV started drawing down loans to fund the Port Vila Lapetasi International Multi-Purpose Wharf Development Project and the Vanuatu Inter-Island Shipping Project supported by ADB, DFAT, and NZMFAT. GoV had hoped that these projects would help drive strong future economic growth. Emerging delays in their implementation due to limited absorption capacity in the sector may blunt their future economic impact.
Deficit financing has intensified borrowings, with new borrowing growing by 13% on average between 2008 and 2011; slower though than the average 42% growth recorded between 2004 and 2007. New borrowing in 2012 pushed the total stock of public debt (domestic and foreign) to a new high at VUV 15,750 million in 2012 (19% of GDP); up by 7% from its level in 2011 (VUV14,676 million).
At the end of 2012, total public and public external debt remained low at 21.6 and 13.9 percent of GDP respectively, which is below the 40% threshold identified by IMF
3 as Figure 2 shows.
Figure 2: Public Debt Stock (VUV millions)
Source: Department of Finance and Treasury (DOFT)
3 IMF Country Report 13/169, 2013 Article IV Consultation Report for Vanuatu (June 2013) pp.5, 17.

VISIP 2015 – 2024 | Infrastructure Challenges
7
GoV may need to raise this ratio further over the medium term, following its new borrowing plans for public investment projects. At the macroeconomic level, Vanuatu appears to be able to absorb the considerable external financial flows necessary for realising its goals for infrastructure in the coming years. According to the IMF:
4
“The economy is gradually turning around after weak growth in 2010–11 on the back of increasing tourism income. Inflation remains low, and the balance of payments stable. The fiscal position is sound, with fiscal deficits on the decline. Credit growth has slowed significantly. In the medium term, growth is expected to be driven by rising public investment, in part financed by external loans. Macroeconomic and prudential buffers are strong. Net international reserves are high, and public and external debt low. The risk of debt distress is low, and expected to remain so. … In the longer run, financing continued investment while preserving low debt will require additional revenue measures. At the same time, structural reforms to improve the functioning of markets and institutions and to create a more business-friendly environment are needed to boost the growth potential.”
There are strong indications that development partners remain closely engaged in infrastructure development in Vanuatu and are keen to move projects and programs forward under VISIP 2015, endorsed by GoV. Looking ahead, the key partners for infrastructure investment will remain, in addition to World Bank and ADB – urban development and maritime transport: Japan International Cooperation Agency (JICA) – maritime transport, agriculture, tourism, health;, NZMFAT – health, tourism, maritime and air transport; Australian Aid (DFAT) – land transport, maritime transport, rural energy, education; and China – land transport, public buildings, sport facilities, social services. The private sector is also significantly involved in renewable energy, urban and rural electrification, information and communication technology (ICT), and water utilities in urban areas.
2.2 Infrastructure Planning
2.2.1 BACKGROUND
Vanuatu’s geographic and demographic structure poses obstacles to efficient development. Around 250,0005 people are
scattered over about 80 widely distributed islands, of which 64 have residents (2009 national census). This makes travel difficult and costly. The distance from the southernmost to northernmost islands is over 800 km. About 75% of the population lives in rural areas, and 55% live on islands with no significant urban centres (see Table 1 and Table 2). Just under a quarter of the population lives in the two urban areas of Port Vila and Luganville, and these are the only two areas with any significant formal urban services.
Table 1: Population by Province and Urban Area
Shefa Sanma Torba Penama Malampa Tafea Total Port Vila Luganville
Population 78,723 45,855 9,359 30,819 36,724 32,540 234,020 43,275 12,786
% of population 33.6 19.6 4.0 13.2 15.7 13.9 100.0 18.5 5.5
No. of households 15,930 9,213 1,766 6,620 7,991 5,853 47,373 9,054 2,552
Source: National Census 2009
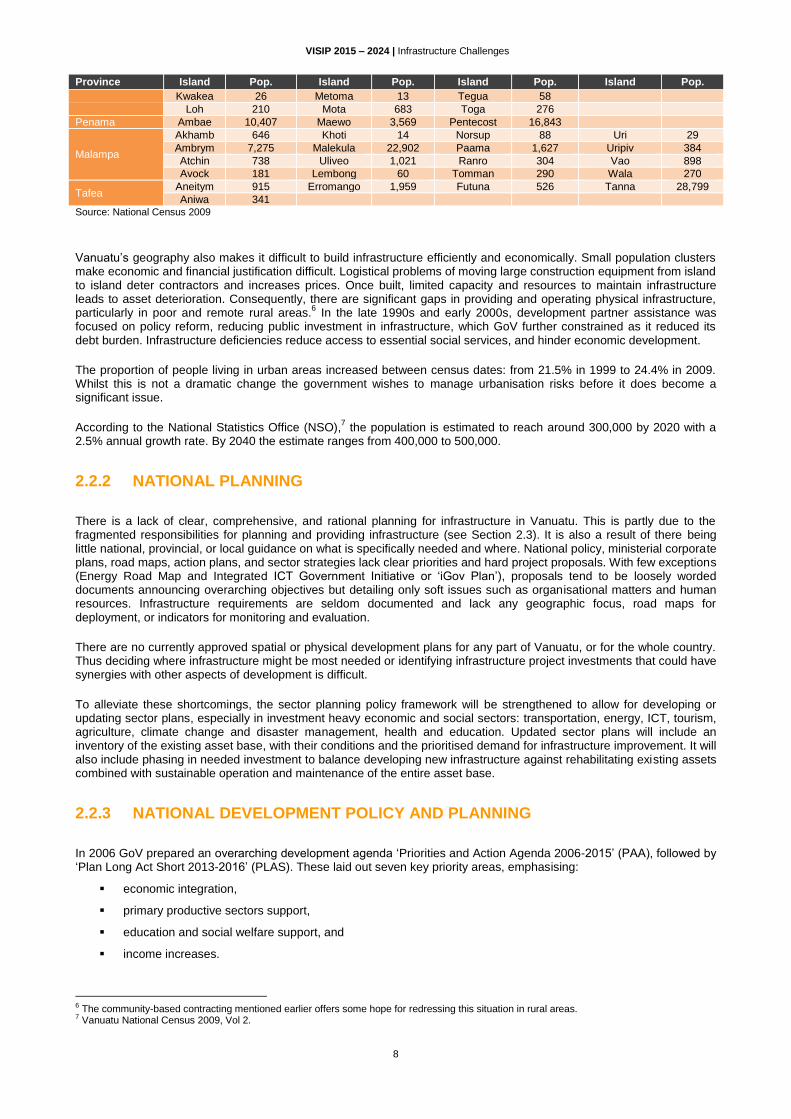
Table 2: Population by Island
Province Island Pop. Island Pop. Island Pop. Island Pop.
Shefa
Buninga 128 Ifira 811 Makira 106 Tongariki 267
Efate 65,734 Iririki 98 Mataso 74 Tongoa 2,300
Emae 743 Kakula 4 Moso 237
Emau 602 Lamen 440 Nguna 1,255
Epi 5,207 Lelepa 387 Pele 330
Samma
Aore 556 Malo 4,279 Mavea 207 Tangoa 394
Araki 140 Malokilikili 13 Santo 39,601 Tutuba 609
Bokissa 56
Torba Gaua 2,491 Merelava 647 Motalaba 1,451 Ureparapara 437
Hiu 269 Merig 12 Rah 189 Vanualava 2,597
4 IMF Country Report 13/169, 2013 Article IV Consultation Report for Vanuatu (June 2013) pp.5, 17.
5 The 2009 National Census, the latest available, recorded a total population of 234,020. For subsequent years, the National Statistics Office (NSO) assumes a 2.5% growth rate up to 2025.
VISIP 2015 – 2024 | Infrastructure Challenges
8
Province Island Pop. Island Pop. Island Pop. Island Pop.
Kwakea 26 Metoma 13 Tegua 58
Loh 210 Mota 683 Toga 276
Penama Ambae 10,407 Maewo 3,569 Pentecost 16,843
Malampa
Akhamb 646 Khoti 14 Norsup 88 Uri 29
Ambrym 7,275 Malekula 22,902 Paama 1,627 Uripiv 384
Atchin 738 Uliveo 1,021 Ranro 304 Vao 898
Avock 181 Lembong 60 Tomman 290 Wala 270
Tafea Aneitym 915 Erromango 1,959 Futuna 526 Tanna 28,799
Aniwa 341 Source: National Census 2009
Vanuatu’s geography also makes it difficult to build infrastructure efficiently and economically. Small population clusters make economic and financial justification difficult. Logistical problems of moving large construction equipment from island to island deter contractors and increases prices. Once built, limited capacity and resources to maintain infrastructure leads to asset deterioration. Consequently, there are significant gaps in providing and operating physical infrastructure, particularly in poor and remote rural areas.
6 In the late 1990s and early 2000s, development partner assistance was
focused on policy reform, reducing public investment in infrastructure, which GoV further constrained as it reduced its debt burden. Infrastructure deficiencies reduce access to essential social services, and hinder economic development.
The proportion of people living in urban areas increased between census dates: from 21.5% in 1999 to 24.4% in 2009. Whilst this is not a dramatic change the government wishes to manage urbanisation risks before it does become a significant issue.
According to the National Statistics Office (NSO),7 the population is estimated to reach around 300,000 by 2020 with a
2.5% annual growth rate. By 2040 the estimate ranges from 400,000 to 500,000.
2.2.2 NATIONAL PLANNING
There is a lack of clear, comprehensive, and rational planning for infrastructure in Vanuatu. This is partly due to the fragmented responsibilities for planning and providing infrastructure (see Section 2.3). It is also a result of there being little national, provincial, or local guidance on what is specifically needed and where. National policy, ministerial corporate plans, road maps, action plans, and sector strategies lack clear priorities and hard project proposals. With few exceptions (Energy Road Map and Integrated ICT Government Initiative or ‘iGov Plan’), proposals tend to be loosely worded documents announcing overarching objectives but detailing only soft issues such as organisational matters and human resources. Infrastructure requirements are seldom documented and lack any geographic focus, road maps for deployment, or indicators for monitoring and evaluation.
There are no currently approved spatial or physical development plans for any part of Vanuatu, or for the whole country. Thus deciding where infrastructure might be most needed or identifying infrastructure project investments that could have synergies with other aspects of development is difficult.
To alleviate these shortcomings, the sector planning policy framework will be strengthened to allow for developing or updating sector plans, especially in investment heavy economic and social sectors: transportation, energy, ICT, tourism, agriculture, climate change and disaster management, health and education. Updated sector plans will include an inventory of the existing asset base, with their conditions and the prioritised demand for infrastructure improvement. It will also include phasing in needed investment to balance developing new infrastructure against rehabilitating existing assets combined with sustainable operation and maintenance of the entire asset base.
2.2.3 NATIONAL DEVELOPMENT POLICY AND PLANNING
In 2006 GoV prepared an overarching development agenda ‘Priorities and Action Agenda 2006-2015’ (PAA), followed by ‘Plan Long Act Short 2013-2016’ (PLAS). These laid out seven key priority areas, emphasising:
economic integration,
primary productive sectors support,
education and social welfare support, and
income increases.
6 The community-based contracting mentioned earlier offers some hope for redressing this situation in rural areas. 7 Vanuatu National Census 2009, Vol 2.

VISIP 2015 – 2024 | Infrastructure Challenges
9
Nearing the end of this planning period, and having had a change of government, Vanuatu is at a policy crossroads. After extensive national consultation the GoV has broadened its focus beyond simply economic growth and now also emphasises improved social services, protection of cultural values, protection of the environment, and resilience to climate change and natural disaster risks.
The ongoing consultative process within GoV and the present technical assistance (TA) are inputs to NSDP, which is is on track for adoption by the Council of Ministers to in the first half of 2015. Previous governments’ priorities have not been officially superseded and many are still relevant to the current discussion. A summary of PLAS and PAA elements key to VISIP 2015 follows.
PAA outlines seven key GoV development priorities:
i. Private Sector Development and Employment Creation
ii. Macroeconomic Stability and Equitable Growth
iii. Good Governance and Public Sector Reform
iv. Primary Sector Development, Environment, Climate Change, and Disaster Risk Management
v. Provision of Better Health Services, Especially in Rural Areas
vi. Education and Human Resource Development
vii. Economic Infrastructure and Support Services
The seven priorities are not ranked. GoV recognises that these goals are interdependent and must proceed together. Of chief relevance to VISIP 2015 is priority vii although there are elements of priority iv and vi. that also need to be taken into account. Under priority iv, key sub-tasks are to improve climate resilience by protecting coastlines and water supplies through reduced pollution and to finalise and implement the Vanuatu climate change policy including its integration in the PAA, sector plans, and ministry corporate plans. Under priority vi, a key sub-task is to deliver a school infrastructure development program that improves the stock of school facilities and equipment and mitigates the impact of national disasters.
In priority vii a key policy objective (7.1) is to ensure the provision of competitively priced, quality infrastructure, utilities and services, either through public enterprises or through private sector partnerships and competition.
PLAS 2013-2016 mirrors these priorities, except that under priority vi it also includes a strategy to support and strengthen holistic development of youth and conduct and ensure quality sports for all. Youth activities and development of sports facilities are high GoV priorities that VISIP 2015 addresses.
The project list VISIP 2015 retains aligns with the PAA, PLAS, and NSDP’s current strategic orientation. Given the evolving governmental policy for development planning, the VISIP priority project lists (the projects pipeline) will be updated periodically to ensure its continued alignment with the national policy framework for development planning.
2.2.4 POLICY IN TRANSITION
As set out in the emerging NSDP,8 national policy rests on three pillars:
1 Sustainable economic development focused on the traditional economy and on economic policy and
planning, with priorities to:
strengthen and encourage ‘kastom’ or the traditional economy alongside the cash economy;
develop the primary sector to ensure sustainable resource use that benefits current and future generations;
empower the private sector to increase green employment opportunities; and
cut costs by expanding renewable energy, both by major urban energy producers and also in small-scale rural contexts.
8 The ‘zero’ draft of the NSDP is currently before Parliament (Feb 2015). Once endorsed, the first draft will become the basis for public consultations.

VISIP 2015 – 2024 | Infrastructure Challenges
10
2 Sustainable human and social development focused on cultural, human, and social development, with priorities to:
expand educational opportunities and develop the sustainability skills for the workforce;
improve health services, especially for rural communities, based on promoting Melanesian nutrition and lifestyles;
promote good government and public sector services that empower traditional leadership structures; and
strengthen communities and families through increased valuation and promotion of social networks.
3 Sustainable natural resource and environmental management and development focused on protecting the environment and natural resources and reducing climate change/disaster risks, with priorities to:
maintain and capture the value of critical ecosystem services, even in remote and rural areas;
enforce comprehensive, clear, and conservative development controls to ensure that the economy does not grow detrimentally to the environment;
ensure protection for the diverse natural and social resources (including indigenous foods); and
integrate climate change and disaster risk policy and action, so that risk is managed holistically and effectively.
Economic integration and growth are still expressed as high priorities (pillar 1), but social development, environmental protection, and climate change/disaster risk management are more prominent among government goals than they were in the 2006-2015 planning cycle.
GoV recognises that infrastructure investment is key to achieving development goals, and that infrastructure must be of high quality and focussed on sectors instrumental for economic and social development (transport, education, health). Infrastructure must also be sustainable for the country’s capacity to staff, operate, and maintain it. Selecting future infrastructure projects for investment in Vanuatu must reflect these recognised realities.
Importantly, the donor community’s more constrained resource availability for Vanuatu increases the need for a more strategic view of infrastructure investment. Absence of a sustainable maintenance framework for existing public assets particularly concerns the development partners consulted. This needs to be addressed at the national level for donor community confidence and therefore their willingness to keep the current support momentum.
2.2.5 INSTITUTIONAL RESPONSIBILITIES FOR INFRASTRUCTURE
Vanuatu has a complex and fragmented set of institutions, in and outside government, active in infrastructure development and services. Table 3 shows the major institutions’ roles in each subsector. This section notes key challenges in and across institutions for managing and coordinating infrastructure investments, along with broader institutional issues around managing project implementation.
PMO is responsible for medium- and long-term national development plans. DSPPAC in PMO is responsible for monitoring and guiding infrastructure project development in general, following national objectives. DSPPAC is coordinating VISIP 2015’s development.
Responsibility for major project implementation rests with the Vanuatu Project Management Unit (VPMU). Its core staff previously managed the Millennium Challenge Account (MCA) project. This was a stand-alone unit that operated beside normal government procedures, as a good model for managing large projects. Following the MCA project, VPMU continued to oversee all major projects, especially donor-funded ones. It now operates under PMO.
MFEM is responsible for the GoV budget. Within MFEM, the Treasury lays out a macro fiscal framework to guide development partner investments.
Large infrastructure investment decisions have been rather reactive with funding opportunities from bi-lateral development partners and international finance institutions.
Although line ministries sponsoring projects in their sectors liaise with local communities to ascertain community support for a project (including in-kind) and the availability of land, MLNR is ultimately responsible for resolving issues related to the land required for physical infrastructure in each subsector. Land use is complex, as most land in Vanuatu is not owned by individuals but is customary land with communal rights. Balancing the need for national development with honouring customary land rights has been challenging. It is common for grievances to end up in an overburdened Customary Land Tribunal. Some cases, often lasting a year or more, delay or stop infrastructure construction altogether and raise costs substantially. The Vanuatu Land Governance Committee (VLGC), with Director General MLNR as chair,

VISIP 2015 – 2024 | Infrastructure Challenges
11
has proposed land reform measures, but land issues are likely to remain sensitive. Each investment must examine land issues, and early in the process.
MIA coordinates among six provincial and three municipal governments. It performs a cross-cutting policy function for all infrastructure subsectors. The Physical Planning Unit advises local governments on development planning, zoning, and enforcement. Like MLNR, it lacks adequate technical staff to fulfil its mandate, and its planning function appears to duplicate MLNR’s. With these constraints, ministries with immediate staff presence and technical capacity in a particular area are often called upon to provide services that may or may not exceed their mandates. For example, MIPU’s PWD has operational units in each province and may fulfil land resolution functions.
Currently coordination between GoV central agencies and the line ministries that implement projects is insufficient. The project-orientation of most infrastructure investment strains ministries’ capacity to work programmatically and strategically. And while central agencies have skilled and experienced staff, their capacity is still inadequate to manage a portfolio of large investments. Often, their capacity is spent managing development partner relationships and diverse development partner driven requirements.
MIPU is directly responsible for transport infrastructure in land, aviation, and shipping. ICT has been moved to OGCIO under PMO. MIPU is also involved in planning urban water supplies (with MLNR). It operates the water utility in Luganville municipality and four other provincial capitals in remote island towns. Because sanitation and drainage is associated with road construction, MIPU’s PWD often provides this infrastructure. Further, although MCCDRM is officially responsible for the energy sector (moved in 2013 from MLNR), PWD operates small power generation facilities in two remote island towns. It operates these water supply and power plants in remote islands because it has a critical, though inadequate, mass of staff and operations in the provinces. For cases like these, it is too costly to set up separate ministry facilities to build and operate small-scale infrastructure services.
With all these mandates, MIPU faces severe shortages of skilled staff in its Port Vila office and provincial PWD operations. PWD has 30% of its posts unfilled. Most of its few engineers are mainly generalists, not specialist engineers (civil, structural). Some skilled engineers have been promoted to management where their engineering expertise becomes less relevant.
For land and marine transport subsectors, particularly in remote islands, PWD and Ports and Harbours (PaH) are responsible for much of the policy and planning work along with practical aspects of regulation and monitoring. The Civil Aviation Authority of Vanuatu (CAAV) mainly regulates the aviation sector with the Pacific Aviation Safety Office (PASO) at Port Vila’s national airport. Being stretched so thin in planning, operating, and maintaining infrastructure and with limited budget, PWD and PaH have great difficulty maintaining existing infrastructure. Much of the available funds is diverted from budgeted purposes into the emergency rehabilitation of critical, mostly urban infrastructure leaving few resources for maintenance. Provincial PWD directors complain that only a portion of the stated budget arrives in the provinces. This leads to rapid deterioration in infrastructure assets, particularly roads until they become unusable due to lack of maintenance.
The public works units in Port Vila and Luganville municipalities are responsible for small roads while their sanitation units collect solid waste. Their efficiency as infrastructure providers and operators is low. Roads are in poor repair and sanitation services uneven. MIPU and the municipalities or provincial authorities may not be the best institutional choice for providing infrastructure services. The use of local contractors and island-based labour including training programmes, pioneered under VTSSP, may prove more efficient and transparent as a model for future infrastructure implementation, operation, and maintenance, particularly away from larger urban centres.
The Department of Environmental Protection and Conservation (DEPC) now under MCCDRM regulates sanitation and solid waste. The formal collection of rubbish and establishment of dumpsites are limited to a few urban areas and larger towns, with local mayoral offices managing. DEPC is also responsible for pollution control, which should affect infrastructure investments and the need for environmentally friendly project designs.
Table 3: Institutional Responsibilities for Infrastructure
Sector Scope of Services Institution Providing
Services Regulation/Monitoring Planning/ Policy
National Planning
Development Economic Land access
PMO (DSPPAC) MFEM MLNR
DSPPAC Treasury Reserve Bank Lands Tribunal
MFEM VLGC
Transport – Land National municipalities (3)
PWD (MIPU) PWU
PWD PWU
PWD, MIA PPU, MIA
Transport Aviation Airports (all) International airports (3)
CAAV (MIPU) CAAV/ Airports Vanuatu Ltd
PASO CAAV
CAAV MIA
Transport –Shipping
National (all) Port Vila Luganville
(MIPU) DPH DPH/ Ifira Wharf and Stevedoring Ltd
OMA DPH
DPH MIA

VISIP 2015 – 2024 | Infrastructure Challenges
12
Sector Scope of Services Institution Providing
Services Regulation/Monitoring Planning/ Policy
Lenakel DPH/ Northern Island Stevedoring Co Ltd DPH/ Lenakel Wharf and Stevedoring Ltd
Water Supply
National (all) Port Vila Luganville Lakatoro Isangel Saratamata Villages
MLNR/ UNELCO GDF Suez PWD-Sanma PWD-Malampa PWD-Tafea PWD-Penama DMGRWS (MLNR) Village Water Committees
URA, DMGRWS (MLNR) DMGRWS, PWD
Solid Waste Management
Port Vila Luganville
Port Vila Sanitation Unit Municipal Government
DEPC (MCCDRM) MIA
Sanitation and Drainage
National (all) Port Vila Luganville
PWD Port Vila Sanitation Unit Municipal Government PWD
DEPC (MCCDRM) MIA
Telecom/ICT National TVL, Digicel, E-Gov, Telsat, Canal, Interchange, VRDTCA
TRR OGCIO
Energy/Power
National Port Vila Luganville Lenakel, Lakatoro Saratamata, Sola
DOEn (MCCDRM) UNELCO DOEn/ VUI UNELCO PWD
URA MCCDRM
Health Curative and preventive health care
DOH (MOH) PHO (in each Province)
Auditor General MOH
Education Primary and secondary schools, TVET
DOEd (MOE) PEO (in each Province)
Auditor General MOE
Source: GoV communications; VISIP 2012.
Table 3 denotes the division between the governmental department and the public or private corporation operating the infrastructure with a right slash ‘/’ between them. Major international wharves; Port Vila’s water supply; telecoms including mobile phone, cable television, and Internet; and most power stations are operated privately, by charter, concession, or license. Airports Vanuatu Limited (AVL), an SOE, operates the international airports. The table excludes other small private sector infrastructure service providers. Except for telecom, competition has been slow among these corporations. Involving PWD (not set up as a service vendor and revenue collector) in operating and maintaining public infrastructure limits the prospect of predictable revenue streams from infrastructure. This discourages private sector investment and action.
Electricity rates are uniform across the country even for those with cheaper local sources. Alternative energy sources are being explored, but low demand densities in rural areas may inhibit cost reductions for consumers. Internet speeds in Vanuatu, in urban areas and especially in rural areas, is slow, with many in the private sector calling for the construction of a second undersea fibre optic cable to PNG via Solomon Islands to complement the existing one to Fiji.
Utility regulators in electricity, water, and telecoms are challenged to balance the need for quality and reliability in infrastructure services with the mandate for access and affordability. Table 3 does not show the larger roles of the private sector and civil society in infrastructure services. The private sector is likely to invest in and drive investment in the next 5-10 years, especially in sectors like ICT, tourism, energy, and water. Civil society groups will continue to push for infrastructure that reaches Vanuatu’s poorer populations.
If Vanuatu grows demographically and economically as projected, development partner roles will also shift or moderate. GoV needs to be more assertive in defining and owning its portfolio of priority investments and in coordinating regularly with development partners. This would bring all development partners around one table in sharing sector constraints and issues facing the country. Effective GoV donor coordination will help identify more creative partnership modalities for using the private sector, communities, and civil society. This would strengthen national systems and harmonise procedures throughout the investment cycle. In many line agencies functions such as policy, planning, implementation oversight, and monitoring are weak due to lack of funds and/or technical capacity. The government relies on external senior advisors in ministries or regulators. It is GoV’s intention to build capacity, replacing many of these positions with national staff.

VISIP 2015 – 2024 | Infrastructure Challenges
13
2.3 Sectoral Strategies, Corporate Plans and Projects
To date, line ministries responsible for infrastructure assets development or management do not have a comprehensive analysis of their sectors nor sub-sectoral infrastructure preparatory studies along with investment needs specified by location, although this has improved in some sectors in the past two years. Moreover, they do not as yet have clear infrastructure development and management plans that anticipate infrastructure needs, set priorities, and estimate budget requirements that take into account the need for sustainable operation and management. Table 4 summarises the situation by sector.
Table 4: Existing Sector Plans and Studies
Sector/Sub-Sector Sector Plans and Studies Infrastructure-Relevant Comments
Ministry of Infrastructure and Public Utilities
Sector Strategy, 2013 Corporate Plan 2014-2016
General brief document without any priority list of investment need List challenges, issues, and need for solution as an action plan; but without priority list of investment need
Transport – Road
No sub-sector plan – road inventory and condition survey still being updated PVUDP TA reports for Port Vila identified priority roads and drainage
Transport – Aviation
AVL Master Plan, 1998. Scoping Study, 2011
AVL Master Plan outdated and needing revision Scoping study provides a rationale for repairing and upgrading all airports and indicates priorities
Transport – Shipping Inter-Island Shipping TA reports 2013 & 2014 Reports give some background and rationale for domestic shipping infrastructure and services – needs updating
Water Supply Water Strategy for Vanuatu 2008-2018
Strategy set policies but no locational priorities; Objective 6 highlights the desirability of developing provincial master plan for water infrastructure.
Drainage & Sanitation PVUDP TA reports for Port Vila Sanitation Master Plan for Port Vila, 1998 (ADB)
Identify priority roads and drainage, and sanitation needs – master plan needs updating
Solid Waste Management National Solid Waste Management Strategy and Action Plan, 2011
Strategy provides general policy background, plans for improving management and services – no locational priorities
Energy/Power Vanuatu National Energy Road Map 2013-2020 Utilities Regulation Authority (URA) reports
Provide a good overview and identify a clear group of planned investment and some priorities Reports give some sector oversight
Telecommunications/ICT
OGCIO Vanuatu Integrated Government Initiative (or iGov Plan), 2012 Telecommunications and Radio-Communications Regulator reports
Provide long list of ambitious and well-structured investment needs for a wide range of projects from new cable to computer equipment for ministries and agencies to promote iGov Reports give some sector oversight
Tourism and Trade Vanuatu Strategic Tourism Action Plan 2014-2018
Strategy Priority 3: Invest in planning and building infrastructure – document infrastructure investment needs without prioritised list
Agriculture Overarching Productive Sector Policy 2012-2017
All priorities generally worded toward agricultural output-oriented objectives and targets No list of infrastructure needs
Climate Change and Disaster Risks Management
Disaster Risk Reduction and Disaster Management National Action Plan (2006-2016)
List a number of practical actions on air, land, and water transport to secure functionalities during/after disaster –some infrastructure related No list of priority infrastructure needs
Health Health Sector Strategy 2010-2016 No priority action foreseen in developing, upgrading, or renovating health services infrastructure
Education
Vanuatu Education Sector Strategy (VESS) 2007-2016 Vanuatu Education Road Map (VERM) Vanuatu Education Sector Program 2013-2017 Inclusive Education Policy & Strategy Plan 2010-2020
No priority action foreseen in developing, upgrading, or renovating schools infrastructure
Youth Development, Training and Sport
Vanuatu Youth Empowerment Strategy 2010-2019
No priority action foreseen in developing, upgrading, or renovating sport or youth infrastructure
Justice and Community Services
No atrategy nor action plan No priority action foreseen in developing, upgrading, or renovating justice infrastructure

VISIP 2015 – 2024 | Infrastructure Challenges
14
Sector/Sub-Sector Sector Plans and Studies Infrastructure-Relevant Comments
Internal Affairs Policy Direction 2010-2020 No priority action foreseen in developing, upgrading, or renovating justice infrastructure
Foreign Affairs No strategy nor action plan No priority action foreseen in developing, upgrading, or renovating infrastructure
Except for the recently completed Vanuatu National Energy Road Map 2013-2020, there are few recent and robust sector plans to guide public infrastructure planning. Infrastructure heavy ministries (MIPU, MLNR, MCCDRM, OGCIO, MOH, and MOE) need to develop or update such sectoral plan identifying and documenting priority investment orientation and projects to allow future VISIP updating.
The three transportation sub-sectors (road, aviation, shipping) under MIPU and PWD need an Integrated National Transportation Plan that will:
i. identify sub-sector internal and interdependency issues;
ii. prioritise investment projects and balance them with maintenance needs; and
iii. plan institutional strengthening and capacity development (government, national consultants, contractors), and recommend reforms in the sub-sectors especially for interacting with stakeholders.
The following sections present the current situation in each sector. For each ministry there is an overview on infrastructure project status with underlying policies and plans for future projects. The project lists are split into two groups. The first includes ongoing projects implemented in each sector. The second refers to future projects for which the ministry was able to provide enough information to formulate a reasonably complete project profile (see Appendix 1). The analysis reflects information gathered from meetings with the GoV, ministries, and other agencies and the review of sector and project reports.
Some sectoral lists include bundled projects (highlighted as bundled in the ‘Type’ column). These projects comprise many similar smaller projects across all islands and provinces (rural feeder roads, jetties, rural water supply) that cannot be differentiated without the completion of prefeasibility studies, (that are yet to be done). The investment cost has been estimated for the bundled project’s underlying sub-projects. The sub-projects within bundled projects, and their estimated costs are presented in the overall project long-list for proposed projects in Appendix 4.
‘Important but Unplanned’ (IU) is a new category projects, introduced in VISIP 2015. An IU project reflects an investment that ministries and agencies consider very important for fulfilling their mandates, but for which not enough project information (perhaps not even a project concept paper) is available. Such a project cannot be ‘scored’ under VISIP 2015, but their inclusion in the project long list may stimulate a ministry to prepare a project concept and profile as in the template Appendix 1 outlines. Then it can be included in the pipeline of demanded projects and scored in future VISIP updating.
2.3.1 AGRICULTURE
Current Situation
Vanuatu’s fertile soil and generally favourable climate have the potential to produce a wide range of agricultural, forestry, and fisheries products for domestic and export markets. A productive agriculture sector is important for the national economy, vital for food security and rural poverty alleviation, and also provides links to downstream industries such as agricultural processing. Agriculture consists of two sub-sectors: subsistence smallholder farming, and large commercial farms and plantations.
The majority of Vanuatu’s population depends on agriculture and other primary sectors such as fisheries and forestry for their economic sustenance. While the primary sector constitutes 21% of GDP (2010-2012), almost 75% of the population depends on this sector. Further, this sector contributes almost 60% to Vanuatu’s merchandise exports (average over 2011-2013). A significant proportion of exports from the manufacturing sector are value-added primary products. Moreover, being a small island economy, Vanuatu imports many food products.
Due to the significance of exports and imports of raw and processed primary products to Vanuatu’s economy, the country requires adequate diagnostic testing and certification facilities for food, animal, and plant products. Vanuatu currently lacks such facilities.
In 2012, the Australia funded Pacific Horticultural and Agricultural Market Access (PHAMA) programme commissioned a study ‘Establishing Diagnostic Services in Vanuatu’. The study inspected Vanuatu’s laboratory facilities and concluded that: “None of the existing laboratories visited are currently at the ISO/IEC 17025:2005 standard, for multiple reasons,

VISIP 2015 – 2024 | Infrastructure Challenges
15
including the standard of facilities available, the standard of suitable quality procedures being used and the suitability of current laboratory equipment available.” The report recommended constructing a central diagnostic facility to bring together all the diagnostic functions to ensure cost-effective provision of diagnostic services in Vanuatu.
The lack of diagnostic facilities caused the following problems:
Increased cost of export certification: primary products can be exported to developed country markets such as Australia, New Zealand, or the European Union only after they have been certified to meet those countries’ standards.
Reduced ability to regulate imported primary products: the absence of sufficient laboratory facilities for food, animal, and plant products reduces the ability of the GoV to regulate imports of these products and take adequate measures to prevent the entry of new pests and diseases into the country.
Reduced ability to ensure food safety in Vanuatu: the absence of adequate laboratory facilities reduces local authorities’ ability to ensure the safety of food and water produced and sold for human consumption in Vanuatu, and carries a significant risk for the country.
Risk of violating international treaty obligations: Vanuatu is signatory to international treaties and protocols related to animal and plant safety, as well as bilateral quarantine protocols, and the absence of adequate diagnostic facilities creates the risk that Vanuatu violates its international obligations.
Strategy and Plans
The priority and strategy for agriculture under the update 2012 of the PAA 2006-2016 follows:
Strategy 4.1.4: Improve and strengthen research and development in agriculture, livestock, fisheries and forestry.
- Indicator: Expenditure on research and development.
Strategy 4.3.1: Strengthen and improve quarantine and biosecurity services. - Indicator: Number of quarantine certificates issued.
The Overarching Productive Sector Policy 2012-2017 includes three pillars:
revitalise the productive sector, local food production, and marketing systems;
improve farm incomes and livelihoods; and
support low carbon, equitable broad-based sustainable economic growth.
Some strategies are relevant for infrastructure.
The following underlying strategies have an infrastructure dimension:
Strategy 1.4: Improve market structures for transport and sale of livestock and fresh produce, and promote and encourage the introduction of rural market centres/outlets.
Strategy 2.8: Establish the feasibility of a central accredited food testing facility.
Strategy 3.6: Establish and maintain farm access feeder roads.
Ongoing Projects: Agriculture
There is no major agriculture-related infrastructure project identified as ongoing besides the roads and naval infrastructure mentioned above.
Proposed Projects: Agriculture
Table 5 shows proposed projects in the agriculture sector.

VISIP 2015 – 2024 | Infrastructure Challenges
16
Table 5: Summary of Proposed Agriculture Projects
Project No.
Project Island Province Est. Value
(b VUV) Est. Value
($m)
Development partner(s) Interest
Status
MALFFB
Agriculture
Ag1 National Diagnostic Laboratory for Bio-Security Assessment
Efate Shefa 0.560 6.00 NZMFAT1 P
Ag2 Warehouse Rovo Bay Epi Shefa 0.010 0.107 Undefined P
Ag3 Warehouse Bwatnapni – Central Pentecost
Pentecost Penama 0.010 0.107 Undefined P
Total Agriculture 0.580 6.21 1 NZMFAT may be interested to contribute to part of the project cost, other contributors needed
Source: MALFFB Datasets
2.3.2 EDUCATION
Current Situation
The Ministry of Education is mandated to provide education for all. Education is considered a pre-eminent tool for achieving increased economic prosperity, social welfare, and stability in the country. Vanuatu’s latest development agenda in the sector, the Vanuatu Education Sector Strategy (VESP) 2007-2016 has as its vision ‘an educated, healthy and wealthy Vanuatu’. The agenda sets primary education as one of its three overarching goals.
There is no documented inventory of all schools in the country. A TA project under MOE that NZMFAT sponsored has just started an inventory for the ministry’s infrastructure assets particularly in the primary school sector. Table 6 gives an overview of the infrastructure in the sector based on data available from the Vanuatu Education Sector Strategy 2007-2016, and updated by MOE’s Facility & Asset Management Unit.
Table 6: Summary of Education Infrastructure (Status 2011)
Assets Quantities
Pre-Schools 797
Primary Schools (Grade 1-6) 402
Pupils in Primary Schools 45,600
Junior High Schools (Grade 7-10) 63
Students in Junior High Schools 15,000
Senior High Schools (Grade 11-13) 23
Students in Senior High Schools 4,500
Vocational and Technical Schools 3 (Vanuatu Institute of Technology plus two provincial TVET centres established in Luganville and Tanna)
Provincial Education Offices (PEO) 6 (Port Vila PEO, Efate, Shefa; Luganville PEO, Santo: Sanma; Isangel PEO, Tanna: Tafea ; Norsup PEO, Malekula: Malampa; Sola PEO, Vanua Lava: Torba; and Saratamata PEO, Ambae: Penama)
Source: Vanuatu Education Sector Strategy 2007-2016.
MOE provides teachers (salaries, allowances, and scholarships) and funding for operational needs such as training, infrastructure, and teacher support.
In most provinces the communities may be involved in constructing and maintaining the schools, which are not necessarily built using robust public construction standards. According to MOE’s Facility & Asset Management Unit, which has launched a thorough survey and inventory of the schools assets, half the buildings are semi-permanent or of bush materials, and virtually no major maintenance has taken place in the last 20 years.
Primary schools vary in size from as few as 60 pupils to 300/400 in urban areas. Nearly half of them may be too small and below the ideal critical mass needed to enable a sustainable operation not excessively overburdening MOE’s limited budget for teachers and operation.
A junior high school with an average 240 students would be similar in complexity to a primary school, but would also need four specialist classrooms, a bigger library, a staff room, a computer room, a full size school hall’ and more sports facilities. The number of junior high schools has expanded rapidly in the past 10 years with little new investment. Some are too small to be sustainable and overburden the budget for teachers and operations. In addition the condition of the

VISIP 2015 – 2024 | Infrastructure Challenges
17
physical assets tends to be appalling. It is estimated that bringing primary and secondary schools up to a basic standard would require an investment corresponding to about half a new construction value.
Most senior high schools form part of a junior high school. About 20% of the senior high school students are boarders who live at the high school premises.
Around 44% of schools are on customary land, 27% are GoV owned, 12% are owned by other agencies, and no data is currently available for the remainder. Land disputes create problems in some schools.
MOE’s strategy for improving school maintenance (after thorough renovation) should be to rely on using community-based methodologies and funding approaches supporting the provincial facilities officers – providing technical expertise and supervising quality and expenditure. With 6 provinces and about 70 schools, each officer would look after around 12 schools.
Strategy and Plans
With education and human resource development its 6th core priorities, PAA update 2012 says that serious concerns remain about the quality of education. It points to poor 2010 examination results for years 8 and 10. The PAA sees quality education relying on sound infrastructure and in-service and teacher training.
The priorities and strategy for education infrastructure under update 2012 of the PAA 2006-2016 include the following:
Strategy 6.1.2: Deliver a school infrastructure development program that improves the stock of school facilities and equipment and mitigates the impact of national disasters.
- Indicators: Percentage of primary schools meeting National infrastructure Standards (by province and urban/rural; Total number of classrooms constructed (by province and urban/rural) related to additional number of students; Percentage of primary schools with access to clean, safe water; - Percentage of primary schools with standard sanitation.
The Vanuatu Education Sector Program (VESP) 2007-2016 foresees its 4th and 5th implementation strategies as follows:
Strategy 4: Engage the community through school based management.
Strategy 5: Provide locally relevant and efficient delivery of facilities and equipment.
The Inclusive Education Policy & Strategy Plan 2010-2020 (completed in 2012) has no priority for rehabilitating school infrastructure.
Ongoing Projects
Table 7 shows ongoing projects in the education sector that reflect construction.
Table 7: Summary of Identified Ongoing Education Related Projects
Project No.
Project Island Province Est. Value
(b VUV) Est. Value
($m)
Development partner(s) Interest
Status Timing
(if known)
MOE
O-Ed1 Vanuatu Education Support Program (Pilot Rehabilitation Primary Schools) (VESP)
Select Islands
Vanuatu 0.439 4.70 NZMFAT,
Australian Aid1
O 2014 - 2018
O-Ed2 Yearly build-up of 4 to 6 2-class primary school buildings
Vanuatu 0.934 1.00 Japanese
Government (Volunteers)
2
O 2000 - open ended
Total ME 0.532 5.70 1 USD4,70 m correspond to the Infrastructure Investment only
2 Yearly new investment of about USD0,1 m for more than 10 years
Source: MOE Datasets
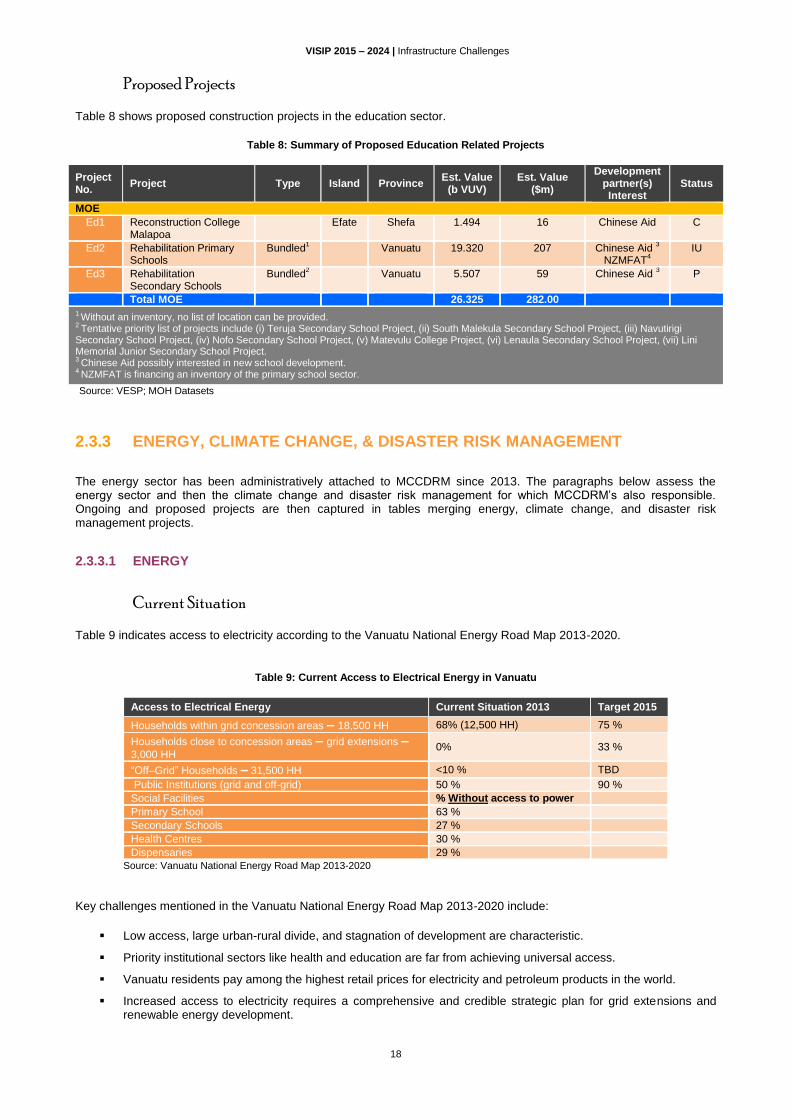
VISIP 2015 – 2024 | Infrastructure Challenges
18
Proposed Projects
Table 8 shows proposed construction projects in the education sector.
Table 8: Summary of Proposed Education Related Projects
Project No.
Project Type Island Province Est. Value
(b VUV) Est. Value
($m)
Development partner(s) Interest
Status
MOE
Ed1 Reconstruction College Malapoa
Efate Shefa 1.494 16 Chinese Aid C
Ed2 Rehabilitation Primary Schools
Bundled1 Vanuatu 19.320 207 Chinese Aid
3
NZMFAT4
IU
Ed3 Rehabilitation Secondary Schools
Bundled2 Vanuatu 5.507 59 Chinese Aid
3 P
Total MOE 26.325 282.00
1 Without an inventory, no list of location can be provided. 2 Tentative priority list of projects include (i) Teruja Secondary School Project, (ii) South Malekula Secondary School Project, (iii) Navutirigi Secondary School Project, (iv) Nofo Secondary School Project, (v) Matevulu College Project, (vi) Lenaula Secondary School Project, (vii) Lini Memorial Junior Secondary School Project. 3 Chinese Aid possibly interested in new school development. 4 NZMFAT is financing an inventory of the primary school sector.
Source: VESP; MOH Datasets
2.3.3 ENERGY, CLIMATE CHANGE, & DISASTER RISK MANAGEMENT
The energy sector has been administratively attached to MCCDRM since 2013. The paragraphs below assess the energy sector and then the climate change and disaster risk management for which MCCDRM’s also responsible. Ongoing and proposed projects are then captured in tables merging energy, climate change, and disaster risk management projects.
2.3.3.1 ENERGY
Current Situation
Table 9 indicates access to electricity according to the Vanuatu National Energy Road Map 2013-2020.
Table 9: Current Access to Electrical Energy in Vanuatu
Access to Electrical Energy Current Situation 2013 Target 2015
Households within grid concession areas – 18,500 HH 68% (12,500 HH) 75 %
Households close to concession areas – grid extensions – 3,000 HH
0% 33 %
“Off–Grid” Households – 31,500 HH <10 % TBD
Public Institutions (grid and off-grid) 50 % 90 %
Social Facilities % Without access to power
Primary School 63 %
Secondary Schools 27 %
Health Centres 30 %
Dispensaries 29 %
Source: Vanuatu National Energy Road Map 2013-2020
Key challenges mentioned in the Vanuatu National Energy Road Map 2013-2020 include:
Low access, large urban-rural divide, and stagnation of development are characteristic.
Priority institutional sectors like health and education are far from achieving universal access.
Vanuatu residents pay among the highest retail prices for electricity and petroleum products in the world.
Increased access to electricity requires a comprehensive and credible strategic plan for grid extensions and renewable energy development.

VISIP 2015 – 2024 | Infrastructure Challenges
19
Table 10 shows an overview of infrastructure in the power sector.
Table 10: Summary of Power Infrastructure
Brief Description of Key Infrastructure Infrastructure Performance
Efate Operated by UNELCO in Port Vila - mix of diesel and wind farm - overall wind farm provides 25% of output (up to 60% at times 3% comes from copra Planning two new turbines in 2013 Santo Power supplied by VUI in Luganville - combination of hydro (3 turbines, total 1,200 kW) and 5 diesel turbines (2,850 kW) - peak demand is around 1,650 kW - capacity adequate for now Split varies between hydro and diesel - hydro provides up to 80% Two off-grid companies using copra interested to join the grid Tanna UNELCO provides power using 3 diesel generators Solar meets about 4% of demand 200 more users will come onto the grid when extension to airport complete Hydro may have some potential on Tanna Malekula UNELCO concession provides electricity on Malekula Three generators with capacity of 340 kW/h Other Islands Provincial governments operate power supply in Saratamata (Ambae) and Sola VERD programme providing power to rural areas (WB and Australian Aid)
General 28% of population on grid 80% of urban population on grid 45% of HH use kerosene lamps for lighting 85% of HH use wood/coconut shells for cooking Cost to consumers (55.83Vt per kwh) standardised to all customers on grids in Efate, Luganville, Tanna, and Malekula Efate Supply reliable (average power outages of less than 5 minutes per customer per year) Serving about 10,000 customers Not all HH in informal areas have connections Santo Supplying about 2,700 consumers, plus street lighting Supply reliable (average power outages of around 15 minutes per customer per year) Informal areas mostly not on grid New hydro source being investigated Potential for solar being investigated on Santo More street lighting needed in Luganville Tanna 650 users Solar meets about 4% of demand 200 more users will come onto the grid when extension to airport is complete Hydro may have some potential on Tanna
Source: VISIP 2012; Vanuatu National Energy Road Map 2013-2020
At present, diesel generators produce electricity in Vanuatu with some from other sources: hydroelectric, wind, solar, and coconut oil. Alternative sources are being investigated and there is increasing domestic usage of solar power and heating systems. Table 11 reflects the main household power sources and Table 12 summarises the main power sources for cooking.
Table 11: Main Source of Household Power for Lighting
Shefa Sanma Torba Penama Malampa Tafea Total Port Vila Luganville
Electricity-Main Grid 9,646 2,406 23 166 523 494 22,544 7,551 1,735
Own generator 420 218 22 47 104 31 1,028 129 57
Solar 449 258 89 130 407 338 1,756 61 24
Gas 113 266 44 103 382 430 1,376 19 19
Torch 12 7 0 1 16 2 49 8 3
Kerosene lamp 3,936 4,873 406 4,691 5,670 3,321 23,626 470 259
Coleman lamp 116 342 661 1,237 659 307 3,382 24 36
Candles 1,180 593 21 66 117 191 3,316 778 370
Wood coconut 25 94 168 96 42 677 1,144 6 36
Others 33 156 332 83 71 62 758 8 13
Source: National Census 2009

VISIP 2015 – 2024 | Infrastructure Challenges
20
Table 12: Main Source of Household Power for Cooking
Shefa Sanma Torba Penama Malampa Tafea Total Port Vila Luganville
Electricity 390 45 2 5 8 11 841 34.5 35
Kerosene 30 19 0 3 10 1 74 5 6
Wood/Coconut shells 10,231 8,368 1,752 6,411 7,840 5,762 46,559 4,301 1,894
Charcoal 385 14 0 79 11 2 812 308 13
Gas 4,866 752 11 117 114 66 10,597 4,078 593
Others 28 15 1 5 8 11 96 17 11
Source: National Census 2009
Efate
Electricity in Port Vila is supplied under Union Electrique du Vanuatu’s (UNELCO) private concession. In addition to a bank of diesel generators, a wind farm north-west of Port Vila supplements the output. Overall the wind turbines provide about 25% of the total output (UNELCO figure). The Castelrock
9 study for the World Bank (WB) suggests the contribution
of wind power is closer to 11%. Small contributions also come from solar and coconut oil. UNELCO supplies 10,000 customers in its concession area, which is the municipal boundary plus 15km. Not all households in informal settlement areas are on the grid. It anticipates an annual increase of 4% in consumer numbers. The increased consumption will be met with one new diesel generator and two additional wind turbines. Diesel storage is currently at Paray Bay, close to the urban area. There are proposals to relocate this facility, possibly to Forari wharf.
UNELCO has signed an MOU with the company that holds the license for explorations into geothermal power on Efate. Following WB-funded feasibility studies, a concession contract was awarded to an Australian company
10 for validating
the plants prospective capacity and then design-building it. However, little progress has been made in proving the resource since the concession contract was signed.
Santo
The concession to supply electricity in Luganville is being litigated. Vanuatu Utilities and Infrastructure Ltd. (VUI is in the interim operating under an MOU rather than a full concession agreement as UNELCO has challenged the way in which GoV tendered and awarded the contract to VUI. Whilst the legal case is pending VUI will not invest significantly in equipment or system extension.
Diesel turbines (2,800 kW) and one hydroelectric plant (1,200 kW) generate the electricity. Maximum demand is around 1,500 kW with adequate capacity for now. The split between diesel and hydro varies, with hydro providing up to 70% of the output at times. VUI supplies about 2,700 consumers and is keen to bring more on to the grid, including extensions into informal areas such as Pepsi. A new hydro source is being investigated. Two off-grid companies using copra show interest in joining the grid.
Tanna
UNELCO operates three diesel generators with a combined 270 kW capacity. This provides power to around 650 users. Solar contributes about 4% of total output. About 200 more users will come on to the grid when an extension to the airport is complete. Communities along the road also want connection and this will eventually include a new 650-plot subdivision south of the airport. Two further generators will be installed to accommodate the extensions. Hydro may have some potential on Tanna.
Other Islands
UNELCO provides electricity on just one other island – Malekula. Here, three generators provide a capacity of 340 kW. A Vanuatu Energy for Rural Development (VERD) programme (Australia funding) was considered but has insufficient support so far to move to implementation. The program would have targeted rural areas with Phase 1 targeting rural government institutions, businesses, and commercial centres.
9 Vanuatu: Efate Geothermal Power and Island-Ring Grid Development Framework, Castlerock Consulting, January 2012 10 Geodynamics Company

VISIP 2015 – 2024 | Infrastructure Challenges
21
Strategy and Plans
The priorities and strategy for energy under the update 2012 of the PAA 2006-2016 include the following:
Strategy 7.1.9: Extend the coverage of rural electrification by the most cost efficient means. - Indicator: Proportion of rural population with access to electricity
Strategy 7.1.10: Promote, explore expand and invest on the use of potential renewable energy, especially where these can be used effectively in remote locations.
- Indicator: Proportion of rural population with access to electricity generated from renewable and non-renewable energy resources.
The Vanuatu National Energy Road Map 2013-2020 lists the following priorities for action and investment:
Access: Access to secure, reliable, and affordable electricity for all Citizens by 2030
Petroleum Supply: Reliable, secure and affordable petroleum supply throughout Vanuatu
Affordability: A more affordable and low-cost energy service in Vanuatu
Energy Security: An energy secure Vanuatu at all times
Climate Change: Mitigating climate change through renewable energy and energy efficiency
The main objective is to develop a strategic investment planning framework for scaling up electricity access nationwide by 2030.
Main infrastructure priority for the petroleum sector in the road map:
Upgrade the safety of infrastructure especially for the Petroleum Pacific Company storage tanks.
Main infrastructure priorities in the electricity sector:
Increase the electricity connection rate through grid extension and micro-grid or individual access development in off-grids areas.
Achieve a greater diversity of energy sources through promoting renewable energy (wind, solar, geothermal).
Increase the use of renewable energy and improve energy efficiency and conservation to mitigate climate change risks.
2.3.3.2 CLIMATE AND DISASTER RISK RESILIENCE
Current Situation
Island countries such as Vanuatu are particularly vulnerable to the potential effects of climate change. According to a WB report
11 it is also a country with the highest exposure to natural disasters. Infrastructure planning and design needs to
account for this. There has been much international discussion on this issue with Pacific countries for years. However, specific quantitative studies directly relevant to Vanuatu have been undertaken only recently.
In its Fourth Assessment Report12
the Intergovernmental Panel on Climate Change (IPCC) outlined that for small island states in the Pacific, the following scenarios could be identified with some confidence:
Rise in sea level from 0.5 metre to 1 metre by 2100.
Increase in surface air temperature between 1.6o and 3.4oC by 2100.
Rise or fall in rainfall by about 20% from current averages leading to more intense floods or droughts by 2100.
Increased frequency of more El-Nino like conditions leading to higher rainfall in the central Pacific and northern Polynesia.
Increased intensity of cyclones with wind speeds increasing by up to 20%; unknown if cyclones will become more frequent.
11 Natural Disaster Hotspots, World Bank, 2005. 12 Fourth Assessment Report,The Intergovernmental Panel on Climate Change, 2003.

VISIP 2015 – 2024 | Infrastructure Challenges
22
In Vanuatu, climate resilience concerns has gained traction with the creation of MCCDRM, which also oversees the energy sector. This has been done against a background in which several Pacific countries have consciously restructured and integrated their disaster management and climate change programmes to boost implementation efficiency and approach the cross cutting issues of disasters and climate change more strategically.
The National Advisory Committee for Climate Change (NACCC) gained formal recognition and a clear mandate from the Council of Ministers (COM) in 2000. It currently coordinates studies and projects with funding from government and development partners, and takes an active role in regional initiatives such as the Secretariat for the Pacific Regional Environment Programme (SPREP) and the Pacific Adaptation to Climate Change (PACC).
Regionally, the Secretariat of the Pacific Community (SPC)/South Pacific Applied Geoscience Commission (SOPAC) provides oversight on climate risk and disaster management in the Pacific. In particular it manages the Pacific Catastrophe Risk Information System (PacRIS). PacRIS has information on 14 Pacific island countries and on Timor-Leste. The system houses a comprehensive historical catalogue of earthquakes and tropical cyclones, a database of geo-referenced fixed assets, and probabilistic analyses and risk mapping.
One NACCC project is particularly relevant to VISIP: the pilot study into vulnerability and adaptation on the Epi island. The study is assessing and measuring the actual potential impacts on the island and its infrastructure. Study outcomes will include estimates for infrastructure (roads, small wharf, airfield) to adapt. The results of this study will be particularly useful for estimating adaptation costs for VISIP projects and other infrastructure projects.
Strategy and Plan
According to update 2012 of the PAA 2006-2016, climate change issues are being addressed through the development of a climate change policy. The policy, although drafted in 2010, has yet to be adopted.
Disaster prone areas have ongoing programmes for disaster risk management. Activities have begun in some communities for reducing disaster risk with support from provincial governments and area councils. However, this approach depends on communities, individuals, and development partner initiatives. A cornerstone of Vanuatu’s Disaster Risk Reduction and Disaster Management (DRR&DM) strategy is its reliance on traditional knowledge and implementation through traditional governance systems.
The National Task Force and working groups for disaster risk reduction structure functions with the National Disaster Management Office (NDMO) acting as the secretariat. The challenge is for all sectors to include disaster risk reduction and disaster management in their budget planning and processes. Mainstreaming hazard risk management is constrained by resources (skills, capacity, finance) and some communities and provinces have begun developing and implementing DRR&DM plans. Penama province recently completed its DRR&DM based on considerable community consultation. This work is ongoing.
Work to fully integrate DRR into policies and programmes has begun in the education and health sectors with development partner assistance. Discussions are underway to promote DRR and climate change adaptation strategies and policies within the tourism industry. Traditional coping mechanisms particularly on food security during disasters are being researched and documented for policy development.
The coverage of disaster risk assessments and routine monitoring and surveillance has expanded as resources permit. Capacity for using the information is limited. NGO partners are actively mainstreaming DRR&DM in ongoing projects and programmes.
The priorities and strategy for climate change and disaster risk management under the update 2012 of the PAA 2006-2016 follow:
Strategy 4.5.2: Encourage the development of protected areas.
- Indicator: Number and size of protected areas with a map, survey, management plan and management
Strategy 4.6.2: Empower communities to design and implement their strategies for DRR and DRM. - Indicator: Number of communities with their disaster risk reduction
2.3.3.3 PROJECTS (ENERGY, CLIMATE CHANGE, & DISASTER RISK MANAGEMENT)
Most climate change relevant projects have been mainstreamed in every other infrastructure project to ensure climate impacts are minimised, reduced, or addressed as in development partner safeguard requirements. However, as this work is just beginning it is insufficiently documented to enable a meaningful scoring under VISIP 2015.

VISIP 2015 – 2024 | Infrastructure Challenges
23
Ongoing Projects
Table 13 shows the list of identified ongoing projects in the Energy, Climate Change & Disaster Risk Management sector.
Table 13: Summary of Identified Ongoing Energy Projects
Project No.
Project Island Province Est. Value
(b VUV)
Est. Value ($m)
Development partner(s) Interest
Status Timing (if known)
MCCDRM
Grid Development
O-En1 Vanuatu Rural Electricity Project (Off Grid Home and Public Facilities) (VREP)
Vanuatu 1.400 15 NZMFAT / WB
1), 2)
O 2012-2017
O-En2 Lighting of Luganville Town Streets
Santo Sanma 0.233 2.5 VUI O 2011-2016
O-En3 GPOBA Grid Based Electricity Project
0.452 4.85 Australian AID
/ WB 3)
O
2014-2018
O-En4 UAE Solar Grid Connected Project, Vila
Efate Shefa 0.466 5 UAE O 2014-2015
Renewable Energy Supply
O-En5 Demonstration Rural Biofuel Project (Malekula, Ambae, Vanu Lava)
0.205 2.2 EU O 2012 - 2015
Climate Change
O-DM1 Environmental Improvement Measures
0.373 4 PEC O
Total MCCDRM 3.132 33.55 1 Australian Aid developed the initial study 2 NZMFAT financed 5.2 mUSD / WB managed 3 Australian Aid financed / WB managed
Source: DOEn Datasets; Vanuatu National Energy Road Map 2013-2020
Proposed Projects
Table 14 shows proposed projects in the Energy, Climate Change & Disaster Risk Management sector.
Table 14: Summary of Proposed Energy Projects
Project No.
Project Type Island Province Est.
Value (b VUV)
Est. Value ($m)
Development Partner(s) Interest
Status Timing
(when known)
MCCDRM
Grid Extension
En1 2 3
Grid extension (Matelevu to Shark Bay, Port Olry, Stone Hill and Palekula), East Cost Santo 2)
Santo Sanma 0.224 2.4
No Clear Concession-
aire; Undefined
P
En2 2 3
Low voltage (LV) and medium voltage (MV) extension (Vila, Santo, Malekula 2)
Malekula Malampa 1.680 18 Undefined P
Fossil Energy Supply
En3
Relocation of 2 new 5 million litre storage tanks in Port Vila, Efate
Efate Shefa 0.936 10 GoV?
Renewable Energy Supply
En4 Efate Grid Connected Solar Panel Project
Efate Shefa 0.522 5.6 EU / UNELCO
/ GoV C
En5
Takara Geothermal Power Plant (4+4 MW), (Preparatory Study) Takara Geothermal Power Plant (4+4 MW) , (Investment)
Efate Shefa 10.081 108 Private
Investment 1
P 2014-2015

VISIP 2015 – 2024 | Infrastructure Challenges
24
Project No.
Project Type Island Province Est.
Value (b VUV)
Est. Value ($m)
Development Partner(s) Interest
Status Timing
(when known)
En6 2 3
Brenwe Hydro Power Project (< 1.2MW), Malekula
Malekula Malampa 0.522 5.6 Undefined P 2018-2021
En7 2 3
Sarakata Hydro Power Extension Project (+600 KW), Santo
Santo Sanma 0.397 4.25 Undefined P 2018-2021
Disaster Risks Management
DM1 Provincial Disaster Management Offices (4 provinces)
0.084 0.9 Undefined P
Total MCCDRM 14.446 154.75
1 Capacity validating study currently undertaken by Geo-Dynamics from Australia 2 Projects have feasibility study that provide updated project details
3 Projects En1, En2, En6 and En7 may be bundled into a Sector Project through the ADB supported Energy Access Project
Source: DOEn Datasets; Vanuatu National Energy Road Map 2013-2020.
2.3.4 HEALTH
Current Situation
Government health services comprise a four-tier system: referral hospitals, health centres, dispensaries, and community supported aid posts.
The two referral hospitals include Vila Central Hospital in Port Vila and Northern Provincial Hospital in Luganville, with a range of specialist outpatient clinics. Doctors, nurses, and health professionals provide obstetric, medical, paediatric, surgical, inpatient and outpatient services. Inpatient services include medical, surgical, maternity and neonatal, paediatric, infectious diseases, psychiatry, ear nose and throat, and eye care. Allied health services include laboratory, radiology, orthotics, nutrition, pharmacy, dental, and physiotherapy.
Provincial hospitals are in Torba (Torba mini-hospital), Penama (Lolowai Hospital), Malampa (Norsup Hospital) and Tafea (Lenakel Hospital). They provide obstetric, medical, paediatric, surgical, inpatient and outpatient services. The only doctor at Lenakel is an expatriate Canadian doctor on a six-monthly rotation basis.
The Norsup Hospital has one recently graduated junior doctor while Lolowai Hospital and Torba Mini Hospital are yet to be assigned doctors. In the absence of a doctor, the health service team comprises a nurse practitioner, a nurse, and a midwife.
Health centres serve a population of 5-8,000 and are staffed by nurse practitioner, midwife, registered nurse, and nurse aid possibly with a driver and vehicle providing essential primary health care through outpatient consultations and MCH/RH services. Each has around 10-15 inpatient beds for paediatrics, medical, and maternity patients.
Dispensaries are serving a population of up to 5,000. They are staffed by a registered nurse and nurse aid providing essential primary health care through general outpatient consultations for common illnesses, MCH/RH services, and with 2 to 4 inpatient beds. The beds are for stabilising patients before transfer to provincial hospital.
The country is divided into the Northern and Southern Health Care Directorates. The Northern Health Care Directorate in Luganville is responsible for the delivery of curative and preventive health services in Torba, Sanma, Penama, and Malampa Provinces. The Southern Health Care Directorate coordinates health services provided by the southern provinces of Shefa and Tafea.
Each province is made up of several islands divided into zones with health facilitie distributed among these zones. There is a referral hospital in each of the two Health Care Directorates. Community and preventive services include: malaria control, environmental health, immunisations, reproductive health, MCH/Reproductive Health/Family Planning, STIs and HIV/AIDS, TB/leprosy, IMCI, and nutrition and health promotion programs.
Each province has a provincial administration including a rural health office responsible for administering health facilities in the province right down to dispensaries. The government is now better defining the functions for each health facility level and corresponding resource packages to support the revitalising primary health care. Table 15 shows the type and number of government-funded facilities in each province.

VISIP 2015 – 2024 | Infrastructure Challenges
25
A TA under the MOH sponsored by Australian Aid is completing a thorough inventory of the Ministry’s infrastructure assets. Table 15 outlines the sector’s infrastructure based on data from the Vanuatu Education Sector Strategy 2007-2016 updated with data available from the Facility & Asset Management Unit from the Ministry.
Table 15: Summary of Health Infrastructure (Status 2009)
Province Hospital Health
Centres Dispensaries Aid Post
Total Facilities
Torba 1 3 5 20 29
Sanma 1 8 18 56 80 Penama 1 6 23 36 63
Malampa 1 8 21 44 72
Shefa 1 4 14 42 69
Tafea 1 4 13 33 50 Total 6 37 89 231 363
Source: Health Services Delivery Profile, WHO, 2012
MOH provides the staff at each facility (salaries, allowances, scholarships) and funds operational needs such as medicines and equipment. MOH also provides housing for key staff at most of the facilities.
Service quality in rural areas is poor due to weak institutional capacity at provincial, district, and local levels. In-service training for health professionals is conducted but the lack of supervision, funds, and other resources compromise the ability to deliver quality services. Even if there are adequate technical skills for service delivery, the lack of basic equipment and supplies disallows providers from delivering essential health services.
The general state of buildings in the health sector is poor and under-maintained, with fairly frequent natural disasters including cyclones and earthquakes worsening the situation. The TA expert team supporting MOH estimates a need for building renovation for all health facilities amounting on average to about USD75,000 for a health centre, USD45,000 for a dispensary and USD32,000 for a staff house.
A key issue is also the lack of a functioning health information system. The current monthly reporting of health facility data is cumbersome and time-consuming for busy staff resulting in incomplete and inaccurate data from most health
facilities. Health information is not being used to inform planning and decision-making.
Strategy and Plans
The provision of better health services, especially in rural areas is the 5th
core priority in PAA update 2012. The priorities and strategy for health care infrastructure under update 2012 of the PAA 2006-2016 include the following:
Strategy 5.2.1: Provide individual, family, community and population oriented services using the Primary Health Care (PHC) approach in the context of the Healthy Islands (HI)
- Indicators: Referral guidelines and mechanisms developed; Number of outpatients per 1000 population.
Strategy 5.3.2: Upgrade and equip Health Facilities at all levels of health care from dispensaries, health centres, provincial hospitals and referral hospitals.
- Indicators: Percentage of assets older than their planned life duration.
The Health Sector Strategy 2010-2016 (HSS) stipulates the vision for the country’s health sector development and is being used to better coordinate health development partner assistance.
The broad health sector objectives include:
ensuring equitable access to health services at all levels of services,
improving the quality of services delivered at all levels, and
promoting good management and effective and efficient use of resources.
These may require developing a health facilities rehabilitation programme to underpin other objectives.
Ongoing Projects
Table 16 lists the ongoing projects in the Health Care infrastructure sector.

VISIP 2015 – 2024 | Infrastructure Challenges
26
Table 16: Summary of Ongoing Health-Related Projects
Project No.
Project Type Island Province Est. Value
(b VUV) Est. Value
($m)
Development partner(s) Interest
Status Timing
(if known)
MOH
O-He1 Redevelopment of the Vila Central Hospital
Efate Shefa 1.289 13.80 JICA O 2012 - 2014
O-He2 Pilot Rehabilitation Rural Health Centres and Dispensaries
Selective Islands
0.130 1.40 Australian Aid O 2010 - 2016
O-He3 Refurbishing Aneityum Dispensary
Aneityum Tafea 0.016 0.17 P&O Cruise O 2013-2014
O-He4
Disaster Risk Mitigation Infrastructure and Equipment at Hospitals
Efate Shefa 0.541 0.58 Australian Aid O 2010-2016
O-He5 Improvement of Pharmaceutical Storage
0.006 0.06 Australian Aid O 2010-2016
O-He6 Lolowai Hospital Refurbishment
Ambae Penama 0.019 0.21 Rotary
International O
2013-2014
Total MOH 1.514 16.22 1 Chinese Aid possibly interested in new larger health facilities.
Source: MOH Datasets
Proposed Projects
Table 17 shows proposed infrastructure projects in the Health Care sector.
Table 17: Summary of Proposed Health Care Related Projects
Project No.
Project Type Island Province Est. Value
(b VUV)
Est. Value ($m)
Development partner(s) Interest
Status Timing (if known)
MOH
He1
Rehabilitation Hospitals, Health Centres and Dispensaries
Bundled3
Vanuatu 2.072 22.20 Australian Aid
2
Chinese Aid?1
IU
Total MOH 2.072 22.20 1 Chinese Aid possibly Interested on new larger health facilities 2 Australian Aid financed an extensive inventory of existing infrastructure country wide
3 Complete list of location and cost available in the Australian Aid office at MOH
Source: MOH Datasets
2.3.5 TELECOMMUNICATION AND ICT
Current Situation
Table 18 summarises the sub-sector.
Table 18: Summary of Telecommunications/ICT Infrastructure
Brief Description of Key Infrastructure Infrastructure Performance
General 2 mobile telecom networks 7 broadband Internet providers 80 Digicel towers 65 TVL towers 7 government towers Remote islands in Vanuatu too distant to be linked by microwave; have satellite linkages
General 95% of population has mobile phone coverage 11,000 Internet users 7,000 fixed line subscribers 1,500 connections in government system
Source: OGCIO Datasets

VISIP 2015 – 2024 | Infrastructure Challenges
27
The telecommunications and ICT sub-sector has changed dramatically following the opening of services to competition, and the introduction of a regulation authority, the Telecommunications and Radio-Communications Regulator (TRR). There are now seven companies providing broadband Internet, of which Digicel and TVL also provide mobile telephone services.
According to TRR13
there are over 11,000 internet users. Digicel reports that 95% of the population now has mobile phone coverage.
14 In addition there are approximately 7,000 fixed line subscribers. Digicel has 80 towers and TVL
around 65. GoV also has 7 towers providing its e-government service. This provides direct interconnections between most of the main government offices throughout the main islands, with 1,500 connections. (The system was implemented with support from the Chinese Government).
Many islands in Vanuatu are too distant to be linked by microwave and use expensive satellite connections.
Overall Vanuatu’s Internet service quality compare unfavourably with other Pacific island countries. It ranks 6 out of 8 for international bandwidth, and is the most expensive. GoV has started a programme providing Internet access booths in rural areas; these are commonly linked with schools. This is still embryonic though.
Strategy and Plans
Through its National ICT Services Policy,15
GoV envisages ‘ICT For All’ backed up by the Universal Service Policy. A Universal Access Policy (UAP)
16 sets some key targets for extending services to rural areas and outer islands.
OGCIO recently assembled information and uses GIS software to document current telecommunications and Internet services, and where the commercial sector is planning to introduce services. This exercise identified areas not served and the budget required to provide services into those areas. The programme will include the hardware for digital services and also capacity building and training for service providers and consumers particularly in remote areas. Funding for this will be a combination of grant money, TRR surplus licence funds, and money raised under the Universal Service Levy on operators. However, GoV intervention might be required to support infrastructure development and take up in the uneconomic areas and communities.
GoV is considering the option for submarine cable connections from neighbouring countries (Fiji and New Caledonia). There is strong argument for the cables for Vanuatu to not depend on just one source. This is seen as critical to Internet growth in Vanuatu and to economic development. The private sector appears to be struggling to raise the capital and loans required and may require government or development partner support. Extending the cables to Santo and Tanna is also being considered.
The priorities and strategy for ICT infrastructure and services under the update 2012 of the PAA 2006-2016 follow:
Strategy 5.3.3: Strengthen the capacity of the Health Information System (HIS) to support evidence based policy and programming, and optimise the use of ICT technology.
- Indicators: Rate of return of monthly reports from health facilities;
Strategy 7.1.11: Extend communications services to remote areas by using innovative technology options.
- Indicators: Telephones lines per 100 population (TRR); Cellular subscribers per 100 population (TRR); - Internet users per 100 population (TRR); Teledensity (TRR); Percentage coverage of mobile cellular network (localities, land area, population); Availability of value-added services.
OGCIO successfully mobilises public and private funding for developing application-oriented ICT projects. It is the logical interlocutor for funding agencies interested to advance the sector. OGCIO has a long list of proposed projects and is optimistic about mobilising private funding for several of these projects from major Internet companies.
In a country with scarce managerial resources, OGCIO’s professionalism is remarkable. It deserves full support from sponsors and development partners.
Ongoing Projects
Table 19 lists ongoing projects in the ICT Sector.
13 TRR Annual Report 2010 14 Interview with Digicel CEO 15 A National Information and Communications Technology (ICT) Services Policy, Government of Vanuatu, 20 May 2011. 16 The Universal Access Policy (UAP) for Telecommunications & Radiocommunications Services, MIPU,10 Oct 2011.
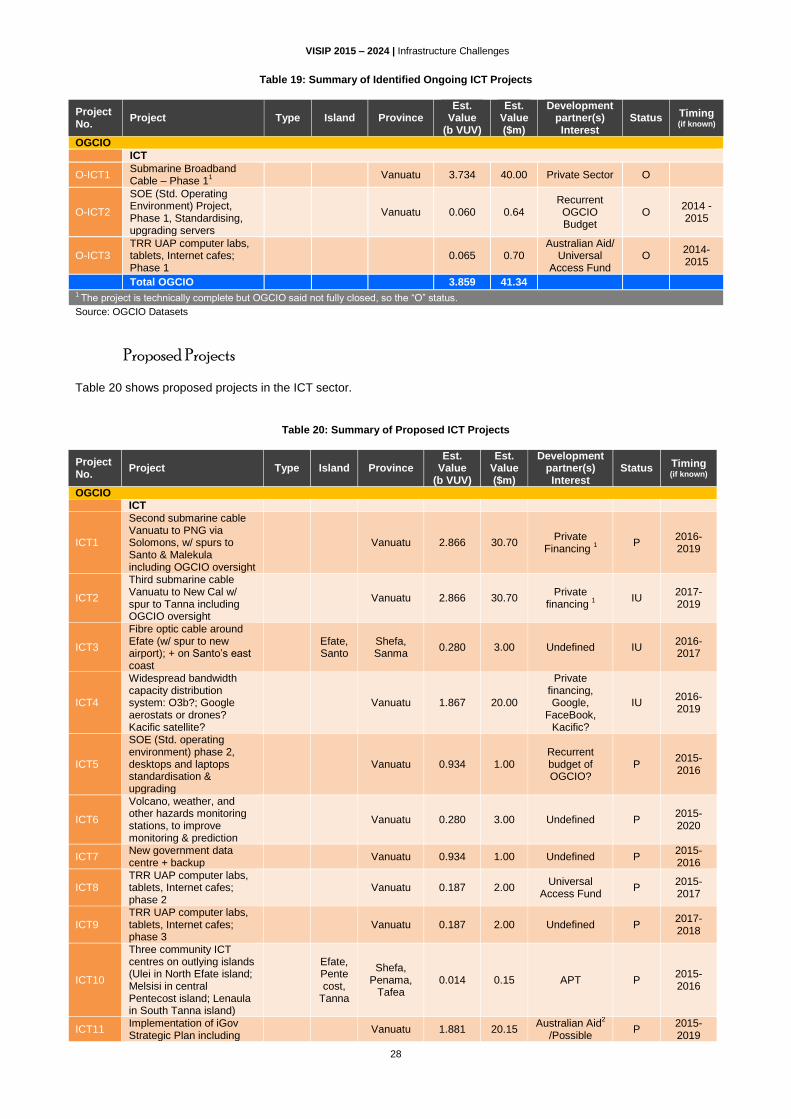
VISIP 2015 – 2024 | Infrastructure Challenges
28
Table 19: Summary of Identified Ongoing ICT Projects
Project No.
Project Type Island Province Est.
Value (b VUV)
Est. Value ($m)
Development partner(s) Interest
Status Timing (if known)
OGCIO
ICT
O-ICT1 Submarine Broadband Cable – Phase 1
1
Vanuatu 3.734 40.00 Private Sector O
O-ICT2
SOE (Std. Operating Environment) Project, Phase 1, Standardising, upgrading servers
Vanuatu 0.060 0.64 Recurrent OGCIO Budget
O 2014 - 2015
O-ICT3 TRR UAP computer labs, tablets, Internet cafes; Phase 1
0.065 0.70 Australian Aid/
Universal Access Fund
O 2014-2015
Total OGCIO 3.859 41.34 1 The project is technically complete but OGCIO said not fully closed, so the “O” status.
Source: OGCIO Datasets
Proposed Projects
Table 20 shows proposed projects in the ICT sector.
Table 20: Summary of Proposed ICT Projects
Project No.
Project Type Island Province Est.
Value (b VUV)
Est. Value ($m)
Development partner(s) Interest
Status Timing (if known)
OGCIO
ICT
ICT1
Second submarine cable Vanuatu to PNG via Solomons, w/ spurs to Santo & Malekula including OGCIO oversight
Vanuatu 2.866 30.70 Private
Financing 1
P 2016-2019
ICT2
Third submarine cable Vanuatu to New Cal w/ spur to Tanna including OGCIO oversight
Vanuatu 2.866 30.70 Private
financing 1
IU 2017-2019
ICT3
Fibre optic cable around Efate (w/ spur to new airport); + on Santo’s east coast
Efate, Santo
Shefa, Sanma
0.280 3.00 Undefined IU 2016-2017
ICT4
Widespread bandwidth capacity distribution system: O3b?; Google aerostats or drones? Kacific satellite?
Vanuatu 1.867 20.00
Private financing, Google,
FaceBook, Kacific?
IU 2016-2019
ICT5
SOE (Std. operating environment) phase 2, desktops and laptops standardisation & upgrading
Vanuatu 0.934 1.00 Recurrent budget of OGCIO?
P 2015-2016
ICT6
Volcano, weather, and other hazards monitoring stations, to improve monitoring & prediction
Vanuatu 0.280 3.00 Undefined P 2015-2020
ICT7 New government data centre + backup
Vanuatu 0.934 1.00 Undefined P 2015-2016
ICT8 TRR UAP computer labs, tablets, Internet cafes; phase 2
Vanuatu 0.187 2.00 Universal
Access Fund P
2015-2017
ICT9 TRR UAP computer labs, tablets, Internet cafes; phase 3
Vanuatu 0.187 2.00 Undefined P 2017-2018
ICT10
Three community ICT centres on outlying islands (Ulei in North Efate island; Melsisi in central Pentecost island; Lenaula in South Tanna island)
Efate, Pentecost,
Tanna
Shefa, Penama,
Tafea 0.014 0.15 APT P
2015-2016
ICT11 Implementation of iGov Strategic Plan including
Vanuatu 1.881 20.15 Australian Aid
2
/Possible P
2015-2019

VISIP 2015 – 2024 | Infrastructure Challenges
29
Project No.
Project Type Island Province Est.
Value (b VUV)
Est. Value ($m)
Development partner(s) Interest
Status Timing (if known)
planning WB/ADB ICT loan package
WB/ADB Soft loan + grants
ICT12 Upgrades to SmartStream FMIS + HRMIS
Vanuatu 0.934 1.00 Undefined P 2015-2016
ICT13 Eventual replacement of SmartStream FMIS + HRMIS
Vanuatu 1.400 15.00 Undefined P 2019-2023
ICT14
Expansion of Government Broadband Network (GBN), Phase 2 (more connectivity in provincial capitals and towns)
Vanuatu 0.187 2.00 Possible
WB/ADB loan P
ICT15 Expansion of GBN, Phase 3 (more connectivity in outlying govt offices)
Vanuatu 0.187 2.00 Possible
WB/ADB loan P
ICT16 ICTs for cultural and language preservation
Vanuatu 0.934 1.00 Possible
WB/ADB loan P
ICT17 ICTs in education (to correct historic absence of investment in this area)
IU Vanuatu 1.867 20.00 Undefined IU
ICT18 ICTs in health (to correct historic absence of investment in this area)
IU Vanuatu 1.867 20.00 Unclear/
Christiansen Fund?
IU
ICT19
Incorporating ICTs to enable success in all sectoral and ministerial projects
IU Vanuatu 1.867 20.00
Ministerial budgets and development
partner projects
IU
Total OGCIO 18.175 194.70 1 Oversight is GoV contribution 2 Study financed by Australian Aid
Source: OGCIO Datasets
2.3.6 TRANSPORT
2.3.6.1 TRANSPORT - ROAD
Current Situation
Table 21 gives an overview of the sub-sector.
Table 21: Summary of Road Infrastructure
Brief Description of Key Infrastructure Infrastructure Performance
General Estimated 1,800 km of road – inventory currently being reviewed* 234 km sealed, 1,142 km gravel, 400 km earth Efate 158 km sealed, 34 km gravel Efate Ring Road (130 km) Some Port Vila tertiary roads unsealed Santo 76 km sealed, 279 km gravel Santo East Coast Road (50 km) Some tertiary roads in Luganville unsealed Tanna No sealed roads – VTSSP rehabilitating 71km Other Islands No sealed roads VTSSP rehabilitating 35km on Malekula and 40km on Ambae
Road condition survey currently being updated – roads generally in poor condition other than after recent projects Frequency and quality of maintenance generally poor even in urban areas Poor road conditions affecting economic activity (especially agriculture and tourism) Lack of adequate drainage results in further deterioration
Source: MIPU 2011
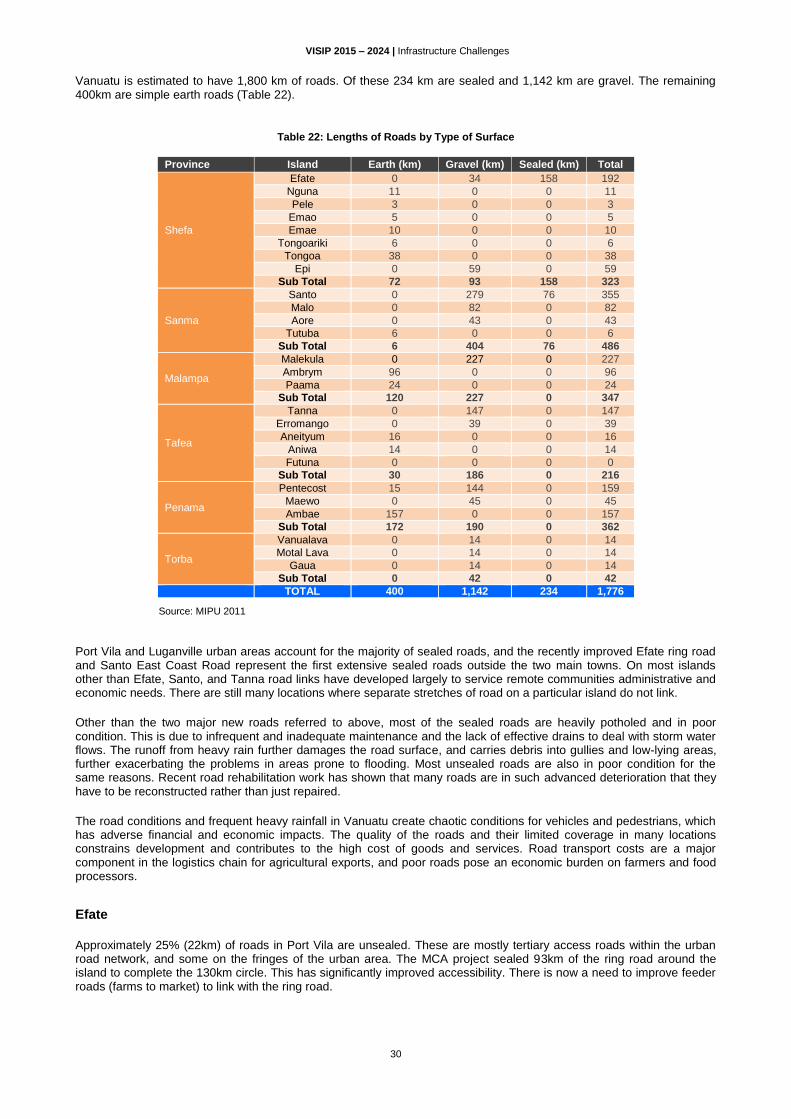
VISIP 2015 – 2024 | Infrastructure Challenges
30
Vanuatu is estimated to have 1,800 km of roads. Of these 234 km are sealed and 1,142 km are gravel. The remaining 400km are simple earth roads (Table 22).
Table 22: Lengths of Roads by Type of Surface
Source: MIPU 2011
Port Vila and Luganville urban areas account for the majority of sealed roads, and the recently improved Efate ring road and Santo East Coast Road represent the first extensive sealed roads outside the two main towns. On most islands other than Efate, Santo, and Tanna road links have developed largely to service remote communities administrative and economic needs. There are still many locations where separate stretches of road on a particular island do not link.
Other than the two major new roads referred to above, most of the sealed roads are heavily potholed and in poor condition. This is due to infrequent and inadequate maintenance and the lack of effective drains to deal with storm water flows. The runoff from heavy rain further damages the road surface, and carries debris into gullies and low-lying areas, further exacerbating the problems in areas prone to flooding. Most unsealed roads are also in poor condition for the same reasons. Recent road rehabilitation work has shown that many roads are in such advanced deterioration that they have to be reconstructed rather than just repaired.
The road conditions and frequent heavy rainfall in Vanuatu create chaotic conditions for vehicles and pedestrians, which has adverse financial and economic impacts. The quality of the roads and their limited coverage in many locations constrains development and contributes to the high cost of goods and services. Road transport costs are a major component in the logistics chain for agricultural exports, and poor roads pose an economic burden on farmers and food processors.
Efate
Approximately 25% (22km) of roads in Port Vila are unsealed. These are mostly tertiary access roads within the urban road network, and some on the fringes of the urban area. The MCA project sealed 93km of the ring road around the island to complete the 130km circle. This has significantly improved accessibility. There is now a need to improve feeder roads (farms to market) to link with the ring road.
Province Island Earth (km) Gravel (km) Sealed (km) Total
Shefa
Efate 0 34 158 192
Nguna 11 0 0 11
Pele 3 0 0 3
Emao 5 0 0 5
Emae 10 0 0 10
Tongoariki 6 0 0 6
Tongoa 38 0 0 38
Epi 0 59 0 59
Sub Total 72 93 158 323
Sanma
Santo 0 279 76 355
Malo 0 82 0 82
Aore 0 43 0 43
Tutuba 6 0 0 6
Sub Total 6 404 76 486
Malampa
Malekula 0 227 0 227
Ambrym 96 0 0 96
Paama 24 0 0 24
Sub Total 120 227 0 347
Tafea
Tanna 0 147 0 147
Erromango 0 39 0 39
Aneityum 16 0 0 16
Aniwa 14 0 0 14
Futuna 0 0 0 0
Sub Total 30 186 0 216
Penama
Pentecost 15 144 0 159
Maewo 0 45 0 45
Ambae 157 0 0 157
Sub Total 172 190 0 362
Torba
Vanualava 0 14 0 14
Motal Lava 0 14 0 14
Gaua 0 14 0 14
Sub Total 0 42 0 42
TOTAL 400 1,142 234 1,776

VISIP 2015 – 2024 | Infrastructure Challenges
31
In Port Vila a previous ADB project17
improved roads and included traffic engineering improvements. Since then, a lack of attention and maintenance has resulted in a general deterioration of the urban road network. Road damage from storm water is a particular problem in Port Vila due to the many hills and inadequate drainage system. The Port Vila Urban Development Project (PVUDP) will rehabilitate about 22km of existing roads in five drainage catchment areas, including the central business districts. The project will also provide new and improved drainage and thereby reduce wear and tear on the roads. This will go some way towards addressing the priority needs for primary and secondary urban roads. However, other catchment areas also require attention and the majority of tertiary roads throughout Port Vila will still be unsealed.
Santo
Around 60% of roads in urban Luganville are unsealed and many are in poor condition. The provincial government sees improving and sealing of these roads as a high priority.
The completed MCA East Coast Road (50 km) has significantly improved accessibility for the eastern side of Santo, but access to the West and South is still poor. The route west of Luganville will require crossings over watercourses.
The north-western part of Santo Island is an important cocoa-producing area but has very poor land access.
Tanna
All roads on Tanna and in the municipality of Lenakel are unsealed and in poor condition. The road to the main tourist attraction, the Mount Yasur volcano, is in particularly bad condition in certain sections. Dust emissions are a noted cause of health problems on the island.
The Australian Aid supported project VTSSP18
is rehabilitating 71km of roads on main islands. It is understood that a second VTSSP phase may include additional roads on key islands.
Other Islands
Feeder roads need improvement on all islands. VTSSP is rehabilitating 35km of priority roads on Malekula and 40km on Ambae, and a second phase may extend to other islands. VTSSP experience shows that not maintaining unsealed roads has resulted in many roads requiring reconstruction rather than just repair or rehabilitation.
Strategy and Plans
Government plans and policies recognise that the existing poor quality of road infrastructure needs to be addressed to remove bottlenecks to economic and social development. The aim is to provide for improved, efficient, and competitive transport services at lower costs.
The priorities and strategy for road and land transport under update 2012 of the PAA 2006-2016 follow:
Strategy 7.1.2: Properly rehabilitate and maintain the road network.
- Indicator: Percentage of the road network that have been maintained.
Strategy 7.1.3: Improve road administration by amending the road and land transport.
- Indicators: Road and land transport legislation amended; - Land Transport Authority established.
Strategy 7.1.4: Review the Infrastructure Master Plan, priorities projects and only construct new roads when economic benefits have been demonstrated.
- Indicators: Percentage of total VIMP roads constructed and maintained.
The MIPU Corporate Plan 2011-2013 included the following ambitious objective: “Within the next 10 years 1,800km of road upgrading, sealed and climate-proofed. This is intended to include sealing of 420km and construction of 303km of new roads”. That objective is absent in the MIPU Corporate Plan 2014-2016 and the focus has now shifted to
maintaining and rehabilitating existing road assets.
The ongoing VTSSP Project assists MIPU and PWD in improving rehabilitation and maintenance of road transport infrastructure, with focus on agreed works in the islands of Ambae, Tanna, and Malekula. Project strategy is to use and
17 Vanuatu Urban Infrastructure Project, 1997-2003, ADB. 18 VTSSP is part of the Governance for Growth Program. Through this program Australian Aid supports GoV in undertaking a range of (government-led) studies and initiatives.

VISIP 2015 – 2024 | Infrastructure Challenges
32
strengthen local private sector capacity to undertake works, using small- and medium-scale contracting and labour-based technology methods, managed through PWD.
There is also a need to review road standards, particularly with the relatively high cost of road works in Vanuatu. A road maintenance policy framework is also needed for financing road maintenance through the development of a road development fund. A concept of a ‘Transport Infrastructure Maintenance Fund’, as referenced elsewhere in this report, has been developed with Australian assistance in mid-2014, and is being circulated and discussed in GoV.
Ongoing Projects: Road Transport
Table 23 lists current projects in the Road Transport sector.
Table 23: Summary of Ongoing Road Projects
Project No.
Project Type Island Province Est.
Value (b VUV)
Est. Value ($m)
Development partner(s) Interest
Status Timing (if known)
MIPU
Road
O-Rd1 Vanuatu Transport Sector Support Program – (VTSSP)
Bundled Vanuatu 1.363 14.60 Australian Aid O 2009-2017
O-Rd2 Tanna Rural Roads and Malekula Ring Road Rehabilitation
Tanna,
Malekula Tafea,
Malampa 5.134 55.00
China Aid (Exim Bank)
O
O-Rd3 Epi Roads Rehabilitation
Epi Shefa 1.158 12.40 Multiple
Development partners
O
Total Ongoing Road 7.655 82.00 Source: VPMU and MIPU Datasets
Proposed Projects: Road Transport
Table 24 shows committed and proposed projects in the Road Transport sector. The grouping of road sub-projects is drawn from MIPU and the Ministry of Agriculture lists. See Appendix 4 for the sub-projects constituting a bundled project.
Table 24: Summary of Proposed Road Projects
Project No.
Project Type Island Province Est. Value
(b VUV) Est. Value
($m)
Development partner(s) Interest
Status
MIPU
Road
Rd1 Santo South Coast Road Rehabilitation
Santo Sanma 2.390 25.60 China Aid
(Eximbank) 1)
P
Rd2 Sealing of Tanna Roads Whitegrass to Isangel
Tanna Tafea 0.467 5.00 Undefined P
Rd3 Malekula East Coast Road Rehabilitation
Malekula Malampa 2.931 31.40 Undefined P
Rd4 Road Rehabilitation and Improvement in Every Province
Bundled
Torba, Sanma, Penama, Malampa,
Shefa, Tafea
6.208 66.50 Undefined P
Rd5 Santo Big Bay Highway Rehabilitation
Santo Sanma No data No data Undefined P
Rd6
Rural and Feeder Roads Rehabilitation and Development in Every Province
Bundled
Torba, Sanma, Penama, Malampa,
Shefa, Tafea
7.701 82.50 Undefined P
Total Roads 19.697 211.00 1 China Aid Loan on hold due to lack of local funding.
Source: MIPU Datasets

VISIP 2015 – 2024 | Infrastructure Challenges
33
2.3.6.2 TRANSPORT - AVIATION
Current Situation
Table 25 gives an overview of the sub-sector.
Table 25: Summary of Aviation Infrastructure
Brief Description of Key Infrastructure Infrastructure Performance
29 airports 3 main airports operated by Airports Vanuatu Limited – the other 26 by PWD Efate Bauerfield – runway length 2,600m Navigation equipment: International and domestic terminals Santo Pekoa – length of runway 2,000m Navigation equipment: NDB and DME system. Both systems are failing due to age. HF and VHF communication systems International and domestic terminals. Tanna Whitegrass runway currently 1,230m Navigation equipment: NDB system only No runway lights Other Islands 26 other domestic airfields
Port Vila international arrivals 2013: 13,1500 Luganville international arrivals 2013: 4130 Runway overlay urgently needed at Bauerfield Extension of runway to 2,800m would accommodate most planes except largest wide body two aisles planes like the B747 and the A380 Repairs and navigation equipment upgrading needed on all airfields seeking international certification.
There are 29 airfields in Vanuatu. Airports Vanuatu Limited (AVL) operates the three main airports at Port Vila (Bauerfield), Luganville (Pekoa), and Tanna (Whitegrass). The other 26 are regulated by CAAV and run by the PWD.
A 2011 scoping study that Australian Aid funded examined the airfields’ conditions and needs. The report recommends establishing five airfield categories to guide standards, planning, and investment. These are:
i. International certified (the 3 main airports)
ii. Domestic certified – Norsup, Lenorore, Longana19
iii. Outer island aerodromes with scheduled services
iv. Outer island aerodromes with ad hoc services
v. Private airstrips
Efate
Bauerfield airport is Vanuatu’s principal international gateway and handles around 250,000 international passengers per year. At present the runway is long enough to accommodate most commercial aircraft, although for some (Boeing 767, 777 and Airbus A330) has weight restrictions. The former government proposed it would be necessary to bring Boeing 747s to Vanuatu that would require a new airport. This proposal has recently been reconsidered. The new generation of aircraft heralded by the Boeing 787 require shorter landing distances. Along with this, a moderate extension to the Bauerfield runway will accommodate all but the B747 and Airbus A380. Projections of passenger numbers and accommodation capacities illustrate that, with improvements, Bauerfield can cope with demand for at least the next 20 years.
20 AVL is contracting consultants to prepare a master plan for Bauerfield improvements.
19 While this is the ideal target the scoping study recommends, it will be extremely difficult to achieve the proposed category ‘B’ at Longana due to physical constraints (other than for the ATR 42 which is not operating). 20 Working Paper, Future Airport Options for Vanuatu, Airports Vanuatu, November 2006.
VISIP 2015 – 2024 | Infrastructure Challenges
34
Santo
Pekoa airport in Luganville operates primarily as a domestic airport, although there are a few weekly flights to and from Australia. The airport would require significant improvement and extension to accommodate wide-bodied aircraft. These improvements will be necessary if there is significant investment in tourism on Santo, and would be complementary to improvements in other facilities such as the international wharf. GoV desires to spread the passenger load and develop Pekoa to reduce Port Vila airport’s primacy.
Tanna
Whitegrass airport is adequate for current operations with ATR, but would need extending for larger aircraft. This is likely to be required if tourist numbers increase as expected with the developing volcano tourism. In particular there is a demand for direct flights to New Caledonia, which has close historic and cultural links with Tanna. Improved navigational aids will also be required.
Extension of the UNELCO grid on Tanna will shortly reach the airport. This will enable runway lighting, thereby significantly increasing the schedule options for flights.
Other Islands
Only three of the remaining outer island airports have been built to accommodate the ATR 42: Norsup, Lonorore, and Longana. Norsup and Lonorore can be upgraded to take the ATR 72, but the terrain at Longana makes this difficult.
Most ‘C’ aerodromes are poorly maintained and unsafe. At present none meet the standards proposed for this category, but most can do so with improvements. Improved drainage and tree lopping is required on many small airstrips.
Planning for the small airstrips is difficult with no comprehensive and reliable data on travel demand and latent demand.
Strategy and Plans
Vanuatu depends on its airfields. Internationally they are the gateways for tourism, a major contributor to GDP, and domestically they are the primary means of travel between the islands.
It is understood21
that the option to build a brand new airport on Efate has been shelved. GoV is keen to repair and improve Bauerfield to an acceptable standard.
In the long term there must be some doubt regarding the sustainability of 29 airports in a country, whose population, at current growth rates, will not reach half a million until 2035. It is envisaged that once improved road and inter-island shipping facilities are available the island airports can be rationalised. In the meantime there is a need to keep them operational within acceptable safety standards.
The majority of the outer island airports need repairs and some upgrading of facilities for operations and safety. Most of these can be achieved with moderate investment. The priority and strategy for aviation under update 2012 of the PAA 2006-2016 follow:
Strategy 7.1.1: Ensure adequate maintenance and upgrading of existing domestic airports and airstrips.
- Indicator: Percentage of total number of airstrips serviceable at standards.
The MIPU Corporate Plan 2011-2013 includes the ambitious objective: “Within the next 10 years, all 26 outer island airport runways are upgraded/climate-proofed, and new airports constructed, where necessary”. That objective is absent from the MIPU Corporate Plan 2014-2016 and the focus is shifting to incrementally upgrading existing airfields.
Ongoing Projects: Air Transport
There are currently no major air transport infrastructure projects identified.
21 Interview with PMO spokesperson.

VISIP 2015 – 2024 | Infrastructure Challenges
35
Proposed Projects: Air Transport
Table 28 shows committed and proposed projects in the Air Transport sector. The grouping of high and medium priority airports are drawn from the scoping study above. See Appendix 4 for sub-projects constituting a bundled project with their estimated cost.
Table 26: Summary of Proposed Air Transport Projects
Project No.
Project Type Island Province Est.
Value (b VUV)
Est. Value ($m)
Development partner(s) Interest
Status
MIPU
Aviation
Av1 Construction of New International Airport, Efate
Efate Shefa 32.673 350 Private
Investment P
Av2 Upgrading Airports of Category A (International certified)
Bundled Efate, Santo, Tanna
Shefa, Sanma, Tafea
5.881 63 Undefined P
Av3 Upgrading Airports of Category B (Domestic certified)
Bundled
Norsup, Pentecost,
Ambae Mota Lava
Malampa, Penama,
Torba 0.877 9.4 Undefined
1 P
Av4
Rehabilitation and Upgrading of Cat. C Domestic Aerodromes in Every Province
Bundled Vanuatu 0.952 10.2 Undefined P
Total Aviation 40.383 432.6 1 NZMFAT could be supportive for ICT and navigation systems component in Lonorore and Mota Lava airfields.
Source: MIPU Datasets
2.3.6.3 TRANSPORT - SHIPPING
Current Situation
Table 27 gives an overview of the sub-sector.
Table 27: Summary of Shipping Infrastructure
Brief Description of Key Infrastructure Infrastructure Performance
General 2 main ports 6 small wharves on other islands Maritime charts dated and inaccurate Few navigation aids available to shipping Efate Major harbour in Port Vila with international and domestic wharves Forari wharf on eastern side of Efate potential for development as secondary port Santo International and domestic wharves Tanna Small wharf at Lenakel only usable when sea fairly calm Other Islands Little maritime infrastructure on other islands Small wharf at Litz Litz (Malekula) 6 wharves, 8 jetties Elsewhere landing on beaches
Very high demand for berth space in Port Vila – current provision inadequate Management issues in Port Vila International wharf in Port Vila in reasonable condition but needs additional mooring aids for larger ships Other wharves generally in poor condition International and domestic wharves in Luganville, and wharves at Lenakel (Tanna) and Litz Litz (Malekula) all need repair Lack of reliable charts may result in some shipping companies avoiding Vanuatu 111 cruise ship visits to Port Vila scheduled in 2012 108 calls at other islands (15 to Luganville) No. of cruise ship passengers per year: 200,000 Cargo ships per year: Port Vila: 98 in 2011 Santo: 58 in 2011 Tonnage: 163,555m
3 of cargo discharged from Port Vila wharf
in 2011
Vanuatu depends on water transport with its population spread over 64 populated islands. However, limited infrastructure restricts cargo and passenger movement. Inadequate wharves and jetties constrain vessels from calling at many destinations in all but ideal weather conditions, including the main jetty for Isangel in Tanna. Restricted access causes

VISIP 2015 – 2024 | Infrastructure Challenges
36
increased waiting times and costs, and prevents some vessels from reaching rural areas altogether. Inadequate and unsafe facilities also cause difficulty in safe passenger embarkation, and also loss of goods because of transfering them by small craft to and from ships standing at sea while unable to anchor.
Remote outer-island communities are among the poorest in Vanuatu. They are widely dispersed and so passenger and cargo demand is low. This undermines the viability of private shipping providers that service these locations. Operators are often forced by financial necessity to migrate to routes with sufficient passenger and cargo volumes to maintain commercial viability, or to reduce the frequency of ship calls to build demand. This results in low trade volumes in remote areas. Without strategic measured attention to outer-island shipping and transport, it is unlikely poverty will reduce and almost certain that out-migration will increase. The NZ- and ADB-supported Vanuatu Inter-Island Shipping Support Project intends to strengthen inter-island shipping infrastructure and establish strategic subsidised shipping routes and schedules to many islands in Vanuatu.
The cruise ship business has grown significantly in recent years and is projected to continue at the recent high traffic levels. Table 28 shows the frequency of cruise ship visits over the last five years.
Table 28: Numbers of Visits by Cruise Ships to the Ports in Vanuatu, 2009-2013
Port 2009 2010 2011 2012* 2013*
Port Vila 50 57 73 111 126
Mystery Island 23 21 57 55 74
Wala 9 11 15 18 18
Champagne Beach 6 4 13 17 16
Pentecost 3 5 5 3 2
Luganville 2 2 6 15 16
* Scheduled
Source: South Sea Shipping
The principal wharves are in Port Vila and Luganville. There are also wharves on Malekula and Tanna that are adequate for conventional ships, but not in all sea conditions. The majority of calls to outer islands are made directly to a beach, or by lighters.
Vanuatu waters are not well charted. Some charts date back to the 19th
century. To date, cruise ships largely rely on their own vessels’ logs for navigating Vanuatu’s waters. The International Maritime Organisation (IMO) has indicated that for Vanuatu to remain an IMO member it should have modern charts by 2015. Shipping operators
22 are likely to become
more circumspect; hydrographic and bathymetric surveys should be undertaken urgently.
There are also very few navigation aids available to shipping.
Efate
All international vessels, including cargo ships and cruise liners, use the international wharf in Port Vila. Sharing this single facility constrains the number of ships visiting the wharf. The cruise shipping industry in particular has unmet demand. The wharf itself is adequate but needs more mooring bollards to enable larger ships to use it.
Facilities in the area adjacent to the wharf, particularly along the access road are basic and could be improved. However, reports that up to a third of cruise ship passengers stay on board due to the area’s poor appearance are incorrect. Very few ships’ passengers do not venture into Port Vila.
Given the economic importance of the sector, three projects are ongoing or planned in Port Vila. The first is the ‘Port Vila Lapetasi International Multipurpose Wharf Development Project’ funded under JICA and Australian Aid. This would provide a separate international container port leaving the existing wharf exclusively for cruise ships. This project, however, has experienced ballooning cost estimates, and financing is now uncertain. The second is the aforementioned Inter-Island Shipping Support Project, funded under ADB and NZMFAT, which will include improving domestic wharves throughout the country. Finally there is a Vanuatu Tourism Infrastructure Project funded under NSMFAT, EIF (WTO), and GoV, which will improve the sea front between Port Side and Fatumaru Bay.
Havanah Harbour on Efate’s north-west side has some potential for cruise ships but would require significant landside infrastructure to support it.
22 VISIP 2012 Report, Meeting with South Sea Shipping, Vanuatu, January 2012.

VISIP 2015 – 2024 | Infrastructure Challenges
37
Santo
Luganville has an international wharf and a domestic wharf. The international wharf is old, built during WWII, and extended in 1985. It is situated on the eastern edge of Luganville’s urban area. About 400m east of this is the domestic Simonsen Wharf.
Large cargo ships (38 in 2011) and the occasional cruise ship (6 in 2011) visit the international port. However, the old section is in poor condition with the sea wall collapsing. The walling of the newer section is sound but the bollards for securing large vessels (e.g. large cruise ships) are inadequate. The longest visiting ship length is 290m, but most ships are around 240m. Mooring arrangements, even for the 240m ships, are unsatisfactory as the vessels extend beyond the wharf limits. Additional bollards, probably beyond the wharf, are needed to provide optimal fore and aft mooring points. These will be critical to maintain and grow the cruise ship trade.
The ADB and NZMFAT Inter-Island Shipping Support Project will rehabilitate the wharf/jetty at the domestic port (Simonsen) but does not propose improvements to the international port.
Luganville is an important entry point for tourism in North Vanuatu. Improving the international wharf will foster tourism in Santo, which is seen to have some potential. Latest estimates in a scoping study for the rehabilitating and extending the Luganville international wharf mentions USD53.56 million for a comprehensive upgrading scheme.
A recent August 2014 report from Carnival Australia assessed the repair and upgrading of Luganville international wharf as a low-ranked investment opportunity against other opportunities such as opening Tanna as a tourism destination. This assessment however may provide an incomplete picture. The Carnival report assessed only the benefits from tourism, while Luganville international wharf could also generate benefits in international trading of goods.
Repairing Luganville wharf is an imperative if it is to retain cruise traffic; its poor state poses safety concerns. A scoping of repair costs should be undertaken as an option for fully redeveloping the wharf precinct, to gain an exact understanding of the minimum investment required. Sanma Provincial Government Council only gave the cost-benefit uses estimate for wharf repair only. Wharf repair and targeted upgrade of services at Luganville could also help reduce any future capacity constraints and congestion in Port Vila due to increased cruise traffic.
Tanna
Lenakel’s small wharf is serviceable, but needs some repairs to prevent deterioration and also to avoid damage to boats. It is the primary transit point for the rest of the island. However, the wharf is inconvenient for Port Resolution residents on the island’s eastern side, which is also the location of the island’s main tourist attraction, the Mount Yasur volcano. There has been some discussion on developing a second wharf on Tanna, although it is understood that the island’s marine and land topography would preclude the establishing a facility for large ships.
Other Islands
There is little maritime infrastructure on other islands. There are small wharves at Litz Litz (Malekula), Loltong (Pentecost), Sola (Vanua Lava), and Anelgowhat (Aneityum). Elsewhere cargo and passengers use beach landings.
Strategy and Plans
Improved and extended shipping infrastructure will boost international and domestic shipping opportunities.
The priority and strategy for shipping under update 2012 of the PAA 2006-2016 follow:
Strategy 7.1.5: Maintain and upgrade existing marine infrastructure including storage facilities.
- Indicators: - Percentage of wharves maintained.
In the Shipping sector, the Corporate Plan for MIPU 2011-2013 included the following objectives: (i) upgrade and repair/maintain port navigational systems in Port Vila and Santo; and (ii) improve port infrastructure and facilities.
Ongoing Projects: Maritime Transport
Table 29 lists ongoing projects in the Maritime Transport sector.
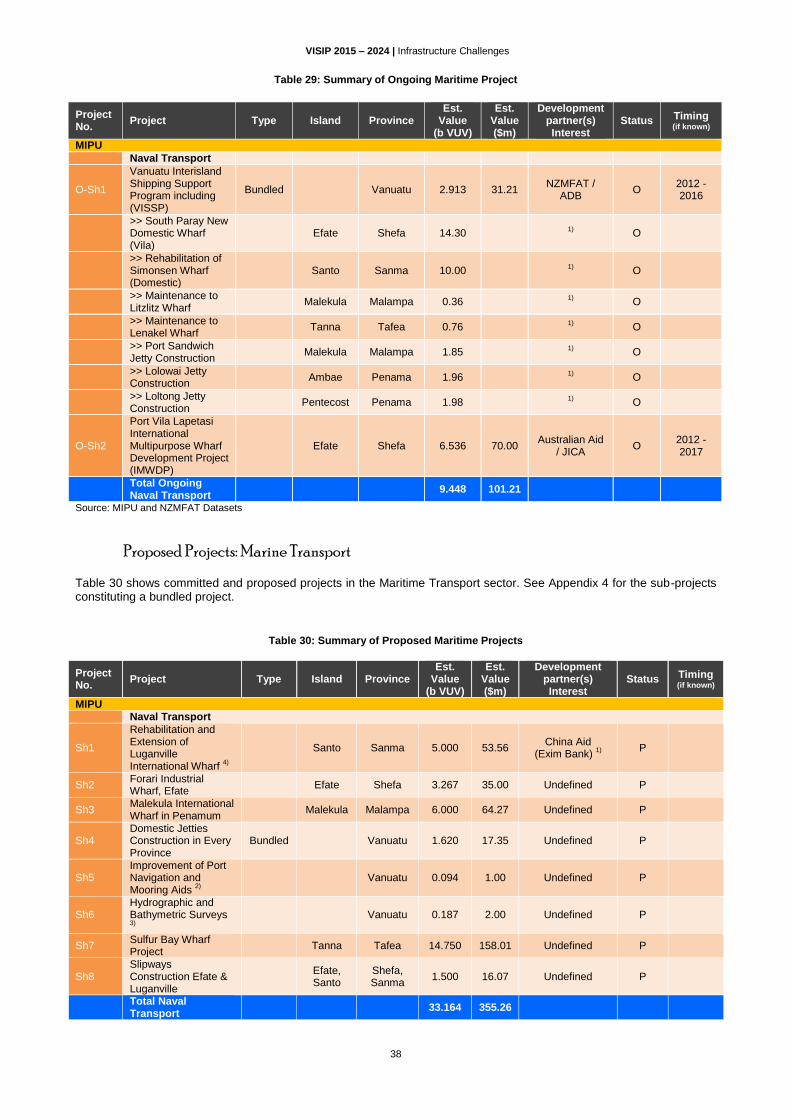
VISIP 2015 – 2024 | Infrastructure Challenges
38
Table 29: Summary of Ongoing Maritime Project
Project No.
Project Type Island Province Est.
Value (b VUV)
Est. Value ($m)
Development partner(s) Interest
Status Timing
(if known)
MIPU
Naval Transport
O-Sh1
Vanuatu Interisland Shipping Support Program including (VISSP)
Bundled Vanuatu 2.913 31.21 NZMFAT /
ADB O
2012 - 2016
>> South Paray New Domestic Wharf (Vila)
Efate Shefa 14.30 1) O
>> Rehabilitation of Simonsen Wharf (Domestic)
Santo Sanma 10.00 1) O
>> Maintenance to Litzlitz Wharf
Malekula Malampa 0.36 1) O
>> Maintenance to Lenakel Wharf
Tanna Tafea 0.76 1) O
>> Port Sandwich Jetty Construction
Malekula Malampa 1.85 1) O
>> Lolowai Jetty Construction
Ambae Penama 1.96 1) O
>> Loltong Jetty Construction
Pentecost Penama 1.98 1) O
O-Sh2
Port Vila Lapetasi International Multipurpose Wharf Development Project (IMWDP)
Efate Shefa 6.536 70.00 Australian Aid
/ JICA O
2012 - 2017
Total Ongoing Naval Transport
9.448 101.21
Source: MIPU and NZMFAT Datasets
Proposed Projects: Marine Transport Table 30 shows committed and proposed projects in the Maritime Transport sector. See Appendix 4 for the sub-projects constituting a bundled project.
Table 30: Summary of Proposed Maritime Projects
Project No.
Project Type Island Province Est.
Value (b VUV)
Est. Value ($m)
Development partner(s) Interest
Status Timing (if known)
MIPU
Naval Transport
Sh1
Rehabilitation and Extension of Luganville International Wharf
4)
Santo Sanma 5.000 53.56 China Aid
(Exim Bank) 1)
P
Sh2 Forari Industrial Wharf, Efate
Efate Shefa 3.267 35.00 Undefined P
Sh3 Malekula International Wharf in Penamum
Malekula Malampa 6.000 64.27 Undefined P
Sh4 Domestic Jetties Construction in Every Province
Bundled Vanuatu 1.620 17.35 Undefined P
Sh5 Improvement of Port Navigation and Mooring Aids
2)
Vanuatu 0.094 1.00 Undefined P
Sh6 Hydrographic and Bathymetric Surveys 3)
Vanuatu 0.187 2.00 Undefined P
Sh7 Sulfur Bay Wharf Project
Tanna Tafea 14.750 158.01 Undefined P
Sh8 Slipways Construction Efate & Luganville
Efate, Santo
Shefa, Sanma
1.500 16.07 Undefined P
Total Naval Transport
33.164 355.26

VISIP 2015 – 2024 | Infrastructure Challenges
39
Project No.
Project Type Island Province Est.
Value (b VUV)
Est. Value ($m)
Development partner(s) Interest
Status Timing (if known)
1 Project under evaluation by Chinese Exim Bank. 2 Port navigation aids to be integrated in main ports /wharf rehabilitation projects. 3 Hydrographic surveys for cruise ships according to SOLAS obligations have been completed for four locations: Luganville, Champagne Bay, Wala (Malekula) and Pangi (Pentecost) with NZMFAT support. Additional surveys for Port Vila and Aneityum may still be necessary. 4 A recent Carnival Australia report (IFC, Australian Aid) ranks the international wharf rehabilitation and extension project as low for potential economic benefits from a tourism perspective. But it doesn’t consider the potentially significant benefits the wharf could generate from trading activities.
Source: MIPU Datasets
2.3.7 TOURISM
Current Situation
Cruise ship visits continue to increase as European and Asia Pacific tourists travel between Vanuatu’s numerous islands.
Infrastructure development is central to the Vanuatu travel and tourism sector growing. Infrastructure development has received positive attention from private, public, and non-governmental organisations, which is helping develop the national infrastructure base. A variety of tourism infrastructure development projects took place in the last 3 years including the NZMFAT funded Malampa Tourism Call Centre at Lakatoro, as well as the Tafea Tourism Council working with local communities to improve roads around White Sands and Nepraintata.
There remains however much room for improvement. The poor state of the Port Vila and Luganville wharves, the delay of town beautification programmes in Port Vila and Luganville, the need for improved airports and infrastructure and services can discourage tourists and dampen confidence of investors in the tourism sector.
Since 2013 an ongoing project under NZMFAT, EIF (WTO), and GoV called the Vanuatu Tourism Infrastructure Project (VTIP), is intended to address these deficiencies by rehabilitating and upgrading the Port Vila sea front between the port side and Fatumaru Bay.
A key Vanuatu Tourism Office strategy is to develop the tourism infrastructure on outer islands to encourage visitors to venture out of Port Vila (now the main tourist destination in Vanuatu) and travel to other parts of the country like Malekula, Ambrym, and Paama. Further, islands such as Lopevi are being explored for tourism. So, the opportunity for ecotourism can become an interesting pillar for future tourism development. Ecotourism aligns with the sustainable management, conservation, and preservation of the environment, and has the added advantage of promoting cost effectiveness through ‘low impact’ tourism initiatives. Sustainable tourism initiatives are a climate change adaptation priority area in the National Adaptation Plan of Action (NAPA).
To address the strategic move toward outlying islands, focused small-scale infrastructure and service improvements are needed in several islands with growing tourism areas. Examples include upgrades at Luganville (Santo) and Lenakel (Tanna).
Strategy and Plans
The priority and strategy for tourism under the update 2012 of the PAA 2006-2016 follows:
Strategy 1.5.2: Increased tourism facilities and product range in both outer islands and urban centres.
- Indicator: Number of hotel rooms by province and by category.
Under the Vanuatu Strategic Tourism Action Plan 2014-2018, the following priority is recorded regarding infrastructure: Priority 3: Invest in planning and building infrastructure that will benefit tourism.
Specific aim under the Objective 3: Infrastructure and Transport is to encourage development and maintenance in key tourism infrastructure and transport services with the goal to improve tourism services through planned infrastructure.
Planned actions include:
3.1: Upgrade the Luganville (Santo) tourist wharf and facilities.
3.2 Implement the town beautification plan for Luganville.

VISIP 2015 – 2024 | Infrastructure Challenges
40
3.3: Implement the town beautification plan for Port Vila.
3.4: Complete the Tourism Infrastructure Project (Port Vila Seawall & Seafront; Cruise Ship Precinct; Fatumaru Park).
3.12: Upgrade and maintain the existing international airport infrastructure at Bauerfield (Efate), Pekoa (Santo), and Whitegrass (Tanna) airports.
3.13: Upgrade and maintain domestic airports at Lonorore (Pentecost) and Maewo airport (Maewo).
3.14: Upgrade and maintain domestic airports at Norsup (Malakula), North Ambrym Airport (Ambrym), and Mota Lava (Banks).
Ongoing Projects: Tourism
Table 31 shows the list of ongoing projects in the Tourism sector.
Table 31: Summary of Identified Ongoing Tourism Projects
Project No.
Project Type Island Province Est.
Value (b VUV)
Est. Value ($m)
Development partner(s) Interest
Status Timing (if known)
MTTCNVB
Tourism
O-To1
Vanuatu Tourism Infrastructure Project (Sea Front, Fatumaru Bay, Port Side) (VTIP)
Efate Shefa 1.680 18.00 NZMFAT, EIF (WTO), Gov.
Van. 1)
O 2013-2016
Total Tourism 1.680 18.00
1 Sea wall contributed by the GoV
Source: MTTCI Datasets
Proposed Projects: Tourism
Table 32 shows proposed projects in the Tourism sector.
Table 32: Summary of Proposed Tourism Projects
Project No.
Project Type Island Province Est.
Value (b VUV)
Est. Value ($m)
Development partner(s) Interest
Status Timing
(if known)
MTTCNVB
Tourism
To1 Port Vila Ward Council Tourism Project
Efate Shefa 0.010 0.107 undefined P 2015-2017
To2 Vanuatu Tourism Infrastructure Project Luganville
Santo Sanma 2.987 32.00 undefined P
Total Tourism 2.997 32.11 Source: MTTCI Datasets
2.3.8 WATER SUPPLY AND SANITATION (MIA, MIPU, & MLNR)
The water and sanitation sector is fragmented between three ministries and local agencies. Urban water supply is MIPU’s responsibility with implementation under the provincial governments. Drainage and sanitation is under MIA with implementation also under the provincial government. Finally rural water supply is under the Rural Water Supply (RWS) Section under MLNR.
The three subsectors are briefly reviewed below with the projects documented together thereafter.
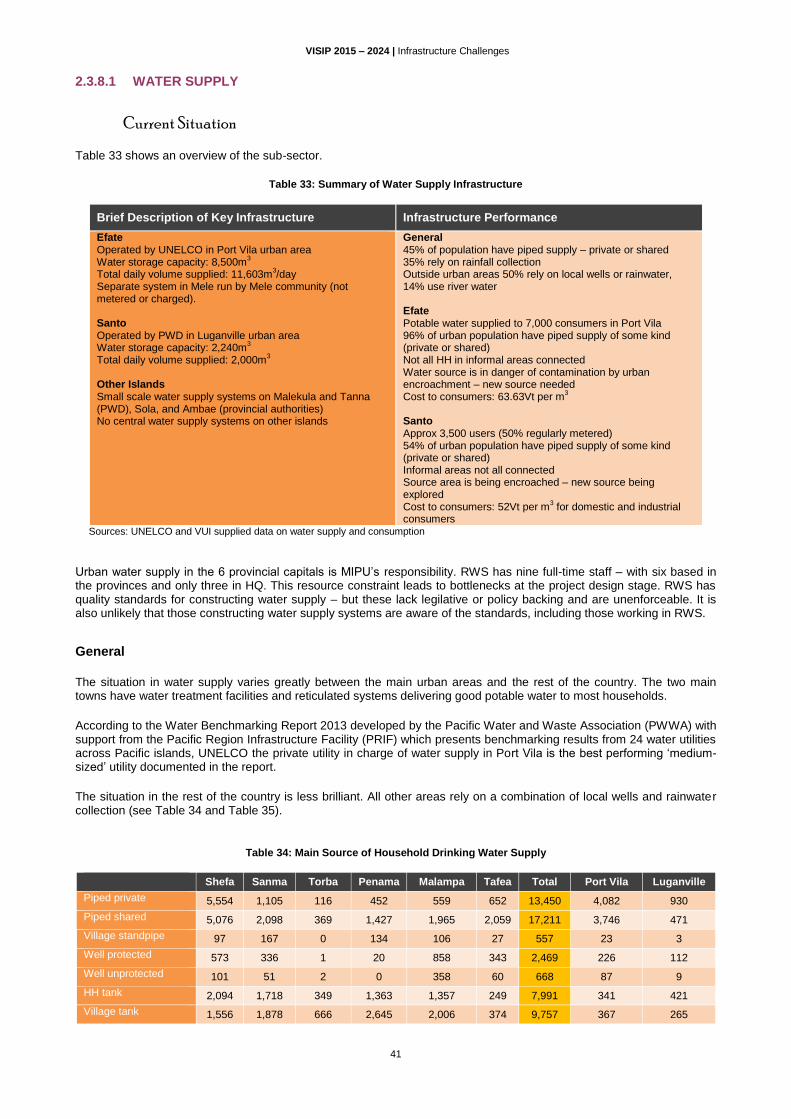
VISIP 2015 – 2024 | Infrastructure Challenges
41
2.3.8.1 WATER SUPPLY
Current Situation
Table 33 shows an overview of the sub-sector.
Table 33: Summary of Water Supply Infrastructure
Brief Description of Key Infrastructure Infrastructure Performance
Efate Operated by UNELCO in Port Vila urban area Water storage capacity: 8,500m
3
Total daily volume supplied: 11,603m3/day
Separate system in Mele run by Mele community (not metered or charged). Santo Operated by PWD in Luganville urban area Water storage capacity: 2,240m
3
Total daily volume supplied: 2,000m3
Other Islands Small scale water supply systems on Malekula and Tanna (PWD), Sola, and Ambae (provincial authorities) No central water supply systems on other islands
General 45% of population have piped supply – private or shared 35% rely on rainfall collection Outside urban areas 50% rely on local wells or rainwater, 14% use river water Efate Potable water supplied to 7,000 consumers in Port Vila 96% of urban population have piped supply of some kind (private or shared) Not all HH in informal areas connected Water source is in danger of contamination by urban encroachment – new source needed Cost to consumers: 63.63Vt per m
3
Santo Approx 3,500 users (50% regularly metered) 54% of urban population have piped supply of some kind (private or shared) Informal areas not all connected Source area is being encroached – new source being explored Cost to consumers: 52Vt per m
3 for domestic and industrial
consumers Sources: UNELCO and VUI supplied data on water supply and consumption
Urban water supply in the 6 provincial capitals is MIPU’s responsibility. RWS has nine full-time staff – with six based in the provinces and only three in HQ. This resource constraint leads to bottlenecks at the project design stage. RWS has quality standards for constructing water supply – but these lack legilative or policy backing and are unenforceable. It is also unlikely that those constructing water supply systems are aware of the standards, including those working in RWS.
General
The situation in water supply varies greatly between the main urban areas and the rest of the country. The two main towns have water treatment facilities and reticulated systems delivering good potable water to most households.
According to the Water Benchmarking Report 2013 developed by the Pacific Water and Waste Association (PWWA) with support from the Pacific Region Infrastructure Facility (PRIF) which presents benchmarking results from 24 water utilities across Pacific islands, UNELCO the private utility in charge of water supply in Port Vila is the best performing ‘medium-sized’ utility documented in the report.
The situation in the rest of the country is less brilliant. All other areas rely on a combination of local wells and rainwater collection (see Table 34 and Table 35).
Table 34: Main Source of Household Drinking Water Supply
Shefa Sanma Torba Penama Malampa Tafea Total Port Vila Luganville
Piped private 5,554 1,105 116 452 559 652 13,450 4,082 930
Piped shared 5,076 2,098 369 1,427 1,965 2,059 17,211 3,746 471
Village standpipe 97 167 0 134 106 27 557 23 3
Well protected 573 336 1 20 858 343 2,469 226 112
Well unprotected 101 51 2 0 358 60 668 87 9
HH tank 2,094 1,718 349 1,363 1,357 249 7,991 341 421
Village tank 1,556 1,878 666 2,645 2,006 374 9,757 367 265

VISIP 2015 – 2024 | Infrastructure Challenges
42
Shefa Sanma Torba Penama Malampa Tafea Total Port Vila Luganville
Bottled water 192 260 16 61 51 9 831 135 107
River lake spring 449 1,249 209 489 655 1,943 5,024 27 3
Others 238 351 38 29 76 137 1,120 20 231
Source: National Census 2009
Table 35: Main Source of Household Washing Water Supply
Source: National Census 2009
Rural water supply is sourced groundwater, surface water, or rainwater catchments, depending on an island’s geomorphology. In addition to traditional human contamination, rural communities’ water supplies are compromised by exposure to potential contaminants from volcanic ash and gas emissions. The migration of people into the islands’ interiors also threatens the quality of surface water supplying downstream coastal villages.
The Utilities Regulatory Authority (URA) oversees UNELCO’s operations. There is some uncertainty however over URA’s role in other towns where GoV operates the water supply (PWD in Luganville, Lakatoro, Norsup, and Lenakel, and the provincial authorities in Sola and Saratamata.
Water supply, particularly for rural areas, has been absent from high-level planning in Vanuatu for some time. Responsibility for water supply planning and implementation is fragmented across several government agencies, all of which face resource constraints in skilled staff and budgets.
Figure 3 provides an overview of the water supply coverage trends in urban and rural context according to the latest data (April 2014) from the WHO/ UNICEF Joint Monitoring Programme (JMP) for water supply and sanitation in Vanuatu. Accordingly the water supply service situation as a whole is deteriorating in spite of UNELCO’s excellent rating in Port Vila according to the PWWA report.
Shefa Sanma Torba Penama Malampa Tafea Total Port Vila Luganville
Piped private 6,385 1,743 99 523 686 603 14,231 4,357 1,405
Piped shared 5,604 2,562 233 1,265 2,017 1,729 17,985 3,971 604
Village standpipe 259 198 0 117 116 18 731 19 4
Well protected 767 607 129 39 1,002 383 3,261 177 157
Well unprotected 233 320 111 18 1,193 50 2,177 109 143
HH tank 875 830 236 1,199 693 100 4,097 44 120
Village tank 414 478 178 1,986 882 108 4,146 51 49
Sea 29 12 1 2 22 97 177 13 1
River lake spring 1,250 2,160 692 1,355 1,290 2,615 9,723 308 53
Others 114 303 87 116 90 150 881 5 16
Figure 3: Overview of Sanitation Coverage Trends in Vanuatu
Source: WHO/ UNICEF Joint Monitoring Programme (JMP) 2014

VISIP 2015 – 2024 | Infrastructure Challenges
43
Efate
In Port Vila, UNELCO supplies good quality water to over 7,000 customers. This covers most of the urban area although some informal settlements are not in the system. Urban encroachment and contamination threaten the existing water source. Potential new sources are being explored.
The Mele area, in the northern part of the greater Port Vila area, is served from a different source and is operated by a Village Water Committee. Users pay no fee for water but meters may be introduced. There is no water treatment and it is reported that the water quality is not good. It is understood that the Church of the Latter Day Saints (LDS) is funding the construction of small water treatment systems in three schools in Mele. The supply of potable water from here will be distributed around Mele by tanker. There are no water treatment and supply systems elsewhere on Efate.
Santo
PWD in Luganville supplies water to approximately 3,400 users. Of these only about 50% are regularly metered. Informal settlements such as ‘Pepsi’ are not on the supply network. Water is drawn from a shallow aquifer near the Sarakarta River. A water protection zone was established some years ago but has been encroached upon such that during heavy rain and flooding in the low area where the pumping station is situated the raw water becomes polluted. A new source has already been identified, including testing with boreholes. However, it has yet to be developed due to lack of funding. There are no water treatment and supply systems elsewhere on Santo.
Tanna
Water supply is a priority for Tanna. There is no municipal water supply in Lenakel. All water is drawn from local wells and rainwater storage. PWD has identified a potential source but further development has yet to be funded. There is a small system PWD operates in Isangel supplying government buildings.
Other Islands
On Malekula PWD operates small water supply schemes in Lakatoro and Norsup. On Sola and Ambae (Saratamata) provincial authorities manage small-scale schemes.
There are no central water supply systems on other islands, but there are community water schemes. Some islands (Aniwa and Ambae) have acute water supply problems. Those areas that rely on rainwater suffer significantly when dry periods extend beyond rainwater storage tank capacities.
Strategy and Plans
The priorities and strategy for climate change and disaster risk management under the update 2012 of the PAA 2006-2016 follow:
Strategy 7.1.12: Extend the coverage of improved water supplies in rural areas. - Indicators: Proportion of rural population with access to clean water supplies; Proportion of
population using an improved sanitation facility (total, rural and national); Number of RWS schemes implemented per year.
Strategy 7.1.14: Improve solid waste and sanitation management in Port Vila, and Luganville
- Indicator: Solid waste disposal and sanitation planned infrastructure planned and built.
The Vanuatu National Water Strategy 2008-2018 sets out key targets:
Water master plans developed for each province to prioritise water and sanitation projects following standards, guidelines, and regulations VoG adopts
Sustainable sanitation systems established in communities that provincial master plans prioritise
That 95% of the population has regular access to a sustainable safe drinking water supply
The 2011-2014 MIPU Corporate Plan included as objective: “Within the next 10 years water supply networks on Sola, Luganville, Saratamata, Lakatoro/Norsup, and Isangel upgraded to 24-hour service”. That objective or its updated form is absent from the MIPU Corporate Plan 2014-2016.

VISIP 2015 – 2024 | Infrastructure Challenges
44
2.3.8.2 DRAINAGE AND SANITATION
Current Situation
Table 36 shows an overview of the sub-sector. There is no sewerage system in Vanuatu including the main urban areas. Statistics from the 2009 National Census (see Table 36 and Table 37) illustrate the difference between urban and rural areas. In urban areas the majority of households have toilets that flush to septic tanks.
23 Almost 50% of rural households
have a pit latrine, many of which are open pits.24
Table 36: Summary of Drainage & Sanitation Infrastructure
Brief Description of Key Infrastructure Infrastructure Performance
General No waterborne sewerage network or treatment anywhere in Vanuatu Efate Septic tanks in formal areas in Port Vila Septage disposal at dump site Limited drainage system in Port Vila Santo Septic tanks in formal areas of Luganville Septage disposed at dump site Minimal drainage in urban area Tanna No drainage network – some side drains and culverts getting road improvements under VTSSP Most sanitation by pit latrines/VIP toilets Other Islands No drainage systems on other islands Sanitation primarily by pit latrines
General 47% of HH use pit latrines 22% use VIP toilets 21% have flush toilets (with septic tanks) Efate 82% of urban HH have flush toilets Poor sanitation in informal settlements Septage disposal not to sanitary standards Drain and gully maintenance is poor and adds to flooding – flooding occurs frequently in certain drainage ‘hot spots’ Santo 42% of urban HH have flush toilets Poor sanitation in informal settlements Septage disposal not to sanitary standards Flooding occurs due to flat terrain, particularly in Pepsi informal area Tanna & Other Islands Outside urban areas 93% of HH use private or shared pit latrine
Source: VISIP 2012, MIA Datasets
Table 37: Types of Toilet by Number of Households
Shefa Sanma Torba Penama Malampa Tafea Total Port Vila Luganville
Flush private 5,176 1,160 28 172 205 164 11,928 4,128 895
Flush shared 2,693 260 7 37 25 26 5,638 2,414 176
Water seal private 981 489 38 40 1,008 7 2,962 286 113
Water seal shared 916 332 6 14 281 6 2,290 476 259
VIP-private 1,327 1,558 755 418 1,118 1,626 7,462 324 336
VIP-shared 1,205 779 113 90 694 868 4,508 555 204
Pit latrine 2,488 3,837 707 4,512 3,624 2,326 18,394 402 498
Pit latrine shared 1,120 755 85 1,295 989 649 5,427 465 69
None 24 43 27 42 47 181 370 4 2
Source: National Census 2009
In urban areas the proximity of unhygienic sanitation facilities to formal and informal water sources is a significant concern. There is a need for significant investment in sanitation and sewage treatment soon. In rural areas the low density of population means that this is generally not a major issue.
Stormwater drainage is also primarily an urban issue at present. Port Vila and Luganville suffer localised flooding during heavy rain.
23 WASH Sector Brief, Vanuatu, 2011. 24 UNICEF Pacific Health and Sanitation Programme 2008-2012, Mid-term Review.
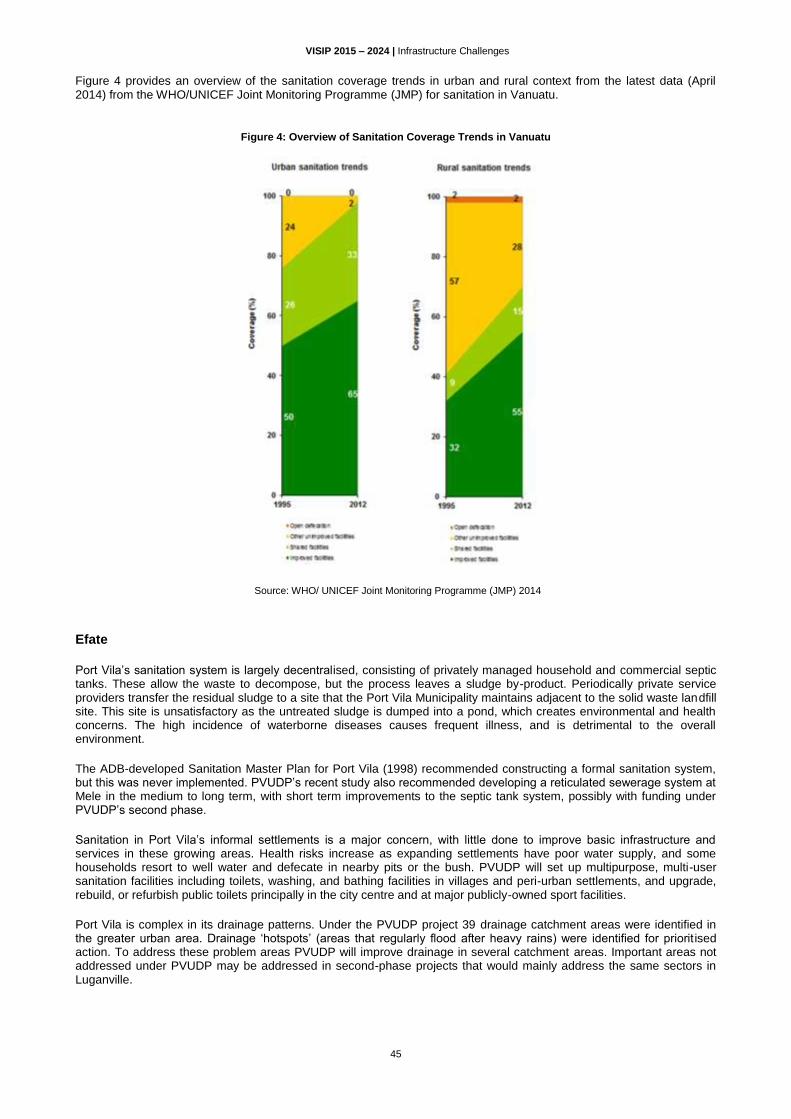
VISIP 2015 – 2024 | Infrastructure Challenges
45
Figure 4 provides an overview of the sanitation coverage trends in urban and rural context from the latest data (April 2014) from the WHO/UNICEF Joint Monitoring Programme (JMP) for sanitation in Vanuatu.
Figure 4: Overview of Sanitation Coverage Trends in Vanuatu
Source: WHO/ UNICEF Joint Monitoring Programme (JMP) 2014
Efate
Port Vila’s sanitation system is largely decentralised, consisting of privately managed household and commercial septic tanks. These allow the waste to decompose, but the process leaves a sludge by-product. Periodically private service providers transfer the residual sludge to a site that the Port Vila Municipality maintains adjacent to the solid waste landfill site. This site is unsatisfactory as the untreated sludge is dumped into a pond, which creates environmental and health concerns. The high incidence of waterborne diseases causes frequent illness, and is detrimental to the overall environment.
The ADB-developed Sanitation Master Plan for Port Vila (1998) recommended constructing a formal sanitation system, but this was never implemented. PVUDP’s recent study also recommended developing a reticulated sewerage system at Mele in the medium to long term, with short term improvements to the septic tank system, possibly with funding under PVUDP’s second phase.
Sanitation in Port Vila’s informal settlements is a major concern, with little done to improve basic infrastructure and services in these growing areas. Health risks increase as expanding settlements have poor water supply, and some households resort to well water and defecate in nearby pits or the bush. PVUDP will set up multipurpose, multi-user sanitation facilities including toilets, washing, and bathing facilities in villages and peri-urban settlements, and upgrade, rebuild, or refurbish public toilets principally in the city centre and at major publicly-owned sport facilities.
Port Vila is complex in its drainage patterns. Under the PVUDP project 39 drainage catchment areas were identified in the greater urban area. Drainage ‘hotspots’ (areas that regularly flood after heavy rains) were identified for priorit ised action. To address these problem areas PVUDP will improve drainage in several catchment areas. Important areas not addressed under PVUDP may be addressed in second-phase projects that would mainly address the same sectors in Luganville.

VISIP 2015 – 2024 | Infrastructure Challenges
46
Santo
Luganville urban households use flush toilets discharging to septic tanks. In informal settlements they use pit latrines or the bush. Septage is taken to the town’s landfill site. Luganville’s low development density means that properly constructed and maintained septic tanks are acceptable for the foreseeable future. The sanitation situation in informal areas creates a potential health hazard, both on site and adjacent areas. Pepsi informal settlement expansion has already polluted the aquifer from which the town’s water is drawn.
There are no current projects or proposals specifically for improving sanitation in the town and its peri-urban areas. However, it is hoped that this might be a component in PVUDP Phase 2, which is intended to also cover Luganville.
Surface flooding occurs in Luganville during heavy rain. As well as the limited drainage network, and poor maintenance and cleaning of drains, the high water table exacerbates flooding. The major flooding occurs in the Pepsi informal settlement, which has developed in a protected area next to the Sarakarta River. The unsurfaced access roads in this area and some other coastal communities become impassable after heavy rains without a 4-wheel drive vehicle.
Other Islands
There are no drainage systems on other islands. VTSSP is providing side drains on some roads it is repairing/reconstructing on Tanna, Malekula, and Ambrym. For sanitation, households throughout the islands rely primarily on pit latrines and the bush.
Strategy and Plans
The sanitation subsector is conspicuous in its absence from the government’s key planning documents.
While drainage and sanitation are covered in the PVUSP multi-sectoral urban project and are foreseen under VUDP 2 for Luganville, there is no sectoral planning document for the rest of the country.
GoV might consider developing a sanitation sub-sector plan addressing the need for improved sanitation especially in the two major urban centres as well as the provincial capitals and other major human settlements, especially those attracting tourism.
With most settlements being predominantly rural, centralised or semi-centralised sanitation services may be unaffordable. Onsite decentralised sanitation solutions are expected to be the most responsive solution across the country, except in selective Port Vila and Luganville urban and peri-urban areas. They may also apply to a few provincial capital city centres where centralised sewage collection and treatment systems may be appropriate and affordable. Besides providing a master plan for developing a wastewater management solution in Port Vila and Luganville, the sub-sector plan should:
encourage MoH in systematically documenting the social impact of poor sanitation such as prevalence of diarrheal disease and child mortality due to water borne diseases;
recommend alternative efficient decentralised or semi-centralised sanitation options and provide detailed design, construction, operation and maintenance of such solutions maximising efficiency while relying on local material and workmanship;
explore incentives for households to build state of the art decentralised sanitation solutions;
propose sustainable solutions for cost effective servicing and periodic cleaning of on-site decentralised sanitation solutions across the country; and
promote awareness-building campaigns on household hygiene and on-site sanitation measures at household level.
2.3.8.3 SOLID WASTE MANAGEMENT
Current Situation
Table 38 gives an overview of the sub-sector.
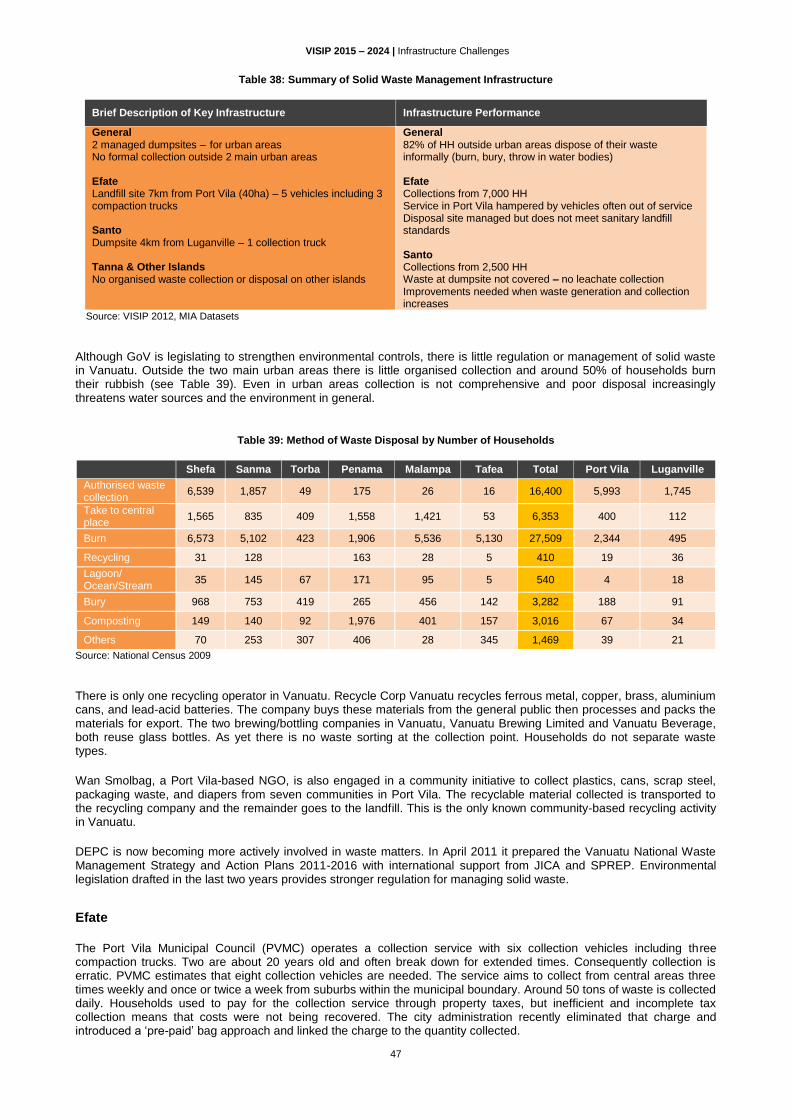
VISIP 2015 – 2024 | Infrastructure Challenges
47
Table 38: Summary of Solid Waste Management Infrastructure
Brief Description of Key Infrastructure Infrastructure Performance
General 2 managed dumpsites – for urban areas No formal collection outside 2 main urban areas Efate Landfill site 7km from Port Vila (40ha) – 5 vehicles including 3 compaction trucks Santo Dumpsite 4km from Luganville – 1 collection truck Tanna & Other Islands No organised waste collection or disposal on other islands
General 82% of HH outside urban areas dispose of their waste informally (burn, bury, throw in water bodies) Efate Collections from 7,000 HH Service in Port Vila hampered by vehicles often out of service Disposal site managed but does not meet sanitary landfill standards Santo Collections from 2,500 HH Waste at dumpsite not covered – no leachate collection Improvements needed when waste generation and collection increases
Source: VISIP 2012, MIA Datasets
Although GoV is legislating to strengthen environmental controls, there is little regulation or management of solid waste in Vanuatu. Outside the two main urban areas there is little organised collection and around 50% of households burn their rubbish (see Table 39). Even in urban areas collection is not comprehensive and poor disposal increasingly threatens water sources and the environment in general.
Table 39: Method of Waste Disposal by Number of Households
Source: National Census 2009
There is only one recycling operator in Vanuatu. Recycle Corp Vanuatu recycles ferrous metal, copper, brass, aluminium cans, and lead-acid batteries. The company buys these materials from the general public then processes and packs the materials for export. The two brewing/bottling companies in Vanuatu, Vanuatu Brewing Limited and Vanuatu Beverage, both reuse glass bottles. As yet there is no waste sorting at the collection point. Households do not separate waste types.
Wan Smolbag, a Port Vila-based NGO, is also engaged in a community initiative to collect plastics, cans, scrap steel, packaging waste, and diapers from seven communities in Port Vila. The recyclable material collected is transported to the recycling company and the remainder goes to the landfill. This is the only known community-based recycling activity in Vanuatu.
DEPC is now becoming more actively involved in waste matters. In April 2011 it prepared the Vanuatu National Waste Management Strategy and Action Plans 2011-2016 with international support from JICA and SPREP. Environmental legislation drafted in the last two years provides stronger regulation for managing solid waste.
Efate
The Port Vila Municipal Council (PVMC) operates a collection service with six collection vehicles including three compaction trucks. Two are about 20 years old and often break down for extended times. Consequently collection is erratic. PVMC estimates that eight collection vehicles are needed. The service aims to collect from central areas three times weekly and once or twice a week from suburbs within the municipal boundary. Around 50 tons of waste is collected daily. Households used to pay for the collection service through property taxes, but inefficient and incomplete tax collection means that costs were not being recovered. The city administration recently eliminated that charge and introduced a ‘pre-paid’ bag approach and linked the charge to the quantity collected.
Shefa Sanma Torba Penama Malampa Tafea Total Port Vila Luganville
Authorised waste collection
6,539 1,857 49 175 26 16 16,400 5,993 1,745
Take to central place
1,565 835 409 1,558 1,421 53 6,353 400 112
Burn 6,573 5,102 423 1,906 5,536 5,130 27,509 2,344 495
Recycling 31 128 163 28 5 410 19 36
Lagoon/ Ocean/Stream
35 145 67 171 95 5 540 4 18
Bury 968 753 419 265 456 142 3,282 188 91
Composting 149 140 92 1,976 401 157 3,016 67 34
Others 70 253 307 406 28 345 1,469 39 21
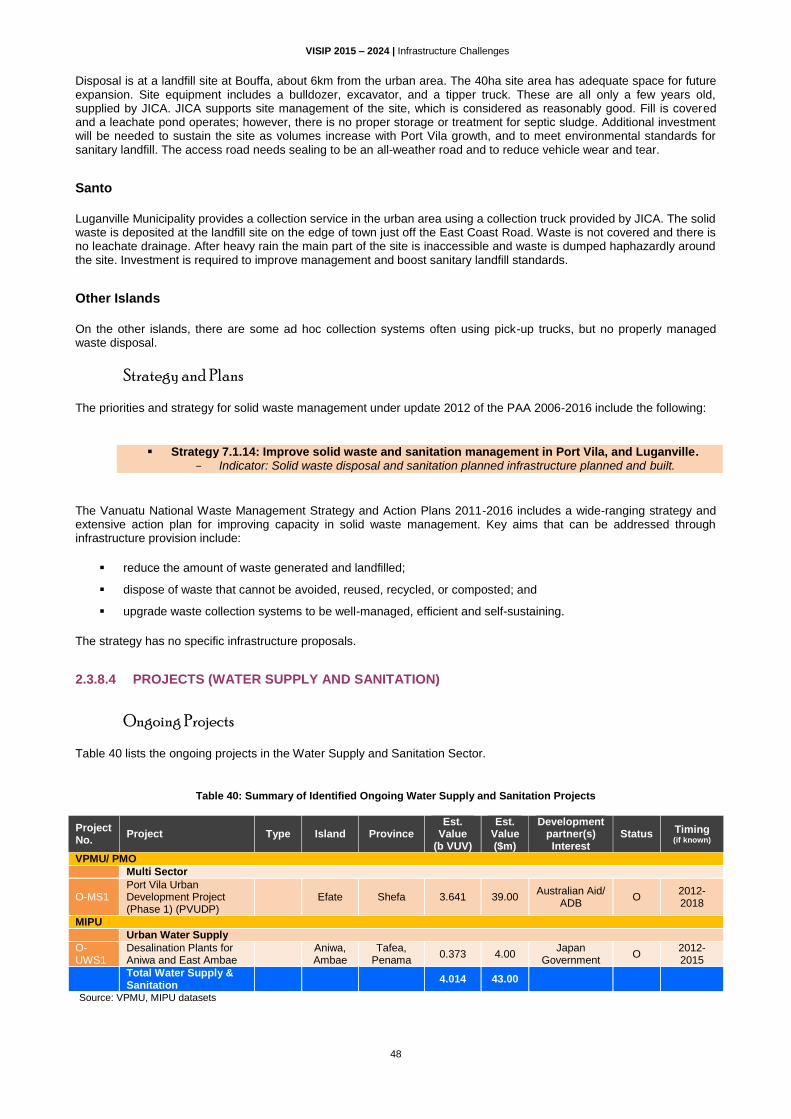
VISIP 2015 – 2024 | Infrastructure Challenges
48
Disposal is at a landfill site at Bouffa, about 6km from the urban area. The 40ha site area has adequate space for future expansion. Site equipment includes a bulldozer, excavator, and a tipper truck. These are all only a few years old, supplied by JICA. JICA supports site management of the site, which is considered as reasonably good. Fill is covered and a leachate pond operates; however, there is no proper storage or treatment for septic sludge. Additional investment will be needed to sustain the site as volumes increase with Port Vila growth, and to meet environmental standards for sanitary landfill. The access road needs sealing to be an all-weather road and to reduce vehicle wear and tear.
Santo
Luganville Municipality provides a collection service in the urban area using a collection truck provided by JICA. The solid waste is deposited at the landfill site on the edge of town just off the East Coast Road. Waste is not covered and there is no leachate drainage. After heavy rain the main part of the site is inaccessible and waste is dumped haphazardly around the site. Investment is required to improve management and boost sanitary landfill standards.
Other Islands
On the other islands, there are some ad hoc collection systems often using pick-up trucks, but no properly managed waste disposal.
Strategy and Plans
The priorities and strategy for solid waste management under update 2012 of the PAA 2006-2016 include the following:
Strategy 7.1.14: Improve solid waste and sanitation management in Port Vila, and Luganville. - Indicator: Solid waste disposal and sanitation planned infrastructure planned and built.
The Vanuatu National Waste Management Strategy and Action Plans 2011-2016 includes a wide-ranging strategy and extensive action plan for improving capacity in solid waste management. Key aims that can be addressed through infrastructure provision include:
reduce the amount of waste generated and landfilled;
dispose of waste that cannot be avoided, reused, recycled, or composted; and
upgrade waste collection systems to be well-managed, efficient and self-sustaining.
The strategy has no specific infrastructure proposals.
2.3.8.4 PROJECTS (WATER SUPPLY AND SANITATION)
Ongoing Projects
Table 40 lists the ongoing projects in the Water Supply and Sanitation Sector.
Table 40: Summary of Identified Ongoing Water Supply and Sanitation Projects
Project No.
Project Type Island Province Est.
Value (b VUV)
Est. Value ($m)
Development partner(s) Interest
Status Timing (if known)
VPMU/ PMO
Multi Sector
O-MS1 Port Vila Urban Development Project (Phase 1) (PVUDP)
Efate Shefa 3.641 39.00 Australian Aid/
ADB O
2012- 2018
MIPU
Urban Water Supply
O-UWS1
Desalination Plants for Aniwa and East Ambae
Aniwa, Ambae
Tafea, Penama
0.373 4.00 Japan
Government O
2012- 2015
Total Water Supply & Sanitation
4.014 43.00
Source: VPMU, MIPU datasets

VISIP 2015 – 2024 | Infrastructure Challenges
49
Proposed Projects
Table 41 shows the proposed projects in the Water Supply and Sanitation sector.
Table 41: Summary of Proposed Water Supply and Sanitation Projects
Project No.
Project Type Island Province Est.
Value (b VUV)
Est. Value ($m)
Development partner(s) Interest
Status Timing (if known)
VPMU/PMO
Multi-Sector
MS1
Vanuatu Urban Development Project (Phase 2 - Luganville, Port Vila) (VUDP 2)
Efate, Santo
Sanma 2.100 22.50 Australian Aid/
ADB P
2015 – 2020
Total VPMU/ PMO 2.100 22.50 MIPU
Urban Water Supply
UWS1
Luganville Existing Water Supply System Rehabilitation and New Water Sources
Santo Sanma 0.383 4.10 No Clear
Concessionaire; Undefined
P
UWS2 4 Provincial Capitals Water Supply System Development
Bundled
Malekula, Tanna, Vanua Lava,
Pentecost
Malampa, Tafea, Torba,
Penama
0.299 3.20 undefined P
Urban Solid Waste
SW1 Port Vila Solid Waste Collection Trucks
Efate Shefa 0.093 1.00 Undefined P
SW2 Luganville Solid Waste Management
Santo Sanma 0.140 1.50 NZMFAT?1 P
SW3 Lenakel Town Dumpsite
Tanna Tafea 0.093 1.00 Undefined P
Total MIPU 1.008 10.80 MNLR
Rural Water Supply
RWS1
Rural Water Supply Lamap, East Malo, Wala Rono, West Ambae
Malo,
Ambae Sanma, Penama
0.028 0.30 NZMFAT, UNICEF
2
C
RWS2 Rural Water Supply in Every Province
Bundled Vanuatu 0.155 1.66 Undefined P
Total MNLR 0.183 1.96 1 NZMFAT may be interested in this component under the multi-sector project highlighted above (VUDP2). 2 NZMFAT financed, UNICEF managed.
Source: VPMU; MIPU & MLNR Datasets
2.3.9 OTHER SOCIAL SECTORS (PMO, YOUTH & SPORT AND JUSTICE)
Three other sectors do have ongoing infrastructure projects and proposals although they may not be well underpinned in clear sectoral strategies and plans.
Prime Minister’s Office
PMO, with Chinese Aid (grants), is developing a new international Congress Hall in Port Vila. It is also developing, with grants from Chinese Aid, a new PMO office.
Ministry of Foreign Affairs, International Coordination and External Trade
MFAICET shares responsibility for international aid and external trade with other ministries and PMO. Update 2012 of the PAA 2006-2016 mentions the following infrastructure priority:
Strategy 3.1.4: Continue to strengthen and expand Foreign Affairs and External Trade relations. - Indicators: Percentage of strategic locations with a representation of Vanuatu.

VISIP 2015 – 2024 | Infrastructure Challenges
50
Ministry of Youth Development, Sports and Training
GoV recently established MYDST and the Vanuatu Youth Empowerment Strategy (YES) 2010-2019. It redesigned the Nabanga Sports Program and created the Provincial Youth Councils in 2009 and National Youth Council in 2010.
Although MYDST has a broad mandate it has relatively few staff. It lacks information and data on youth employment and other youth issues and will need to develop coordination skills to ensure that youth issues are addressed in other sectors.
The GoV is concerned with the risk of unemployment among youths leading to increased inactivity and criminality. GoV therefore wants to improve youth and sport facilities countrywide.
The priorities and strategy for Youth and Sport under update 2012 of the PAA 2006-2016 include the following:
Strategy 6.4.3: To support and strengthen holistic development of youth and to conduct and ensure quality sports for all.
- Indicator: National Sports Strategic Plan approved and implemented.
Ministry of Justice and Community Services
One important policy objective under update 2012 of the PAA 2006-2016 concerns providing stable institutions particularly for law and justice. In July 2009 the first Vanuatu Law and Justice Sector Strategy and Action Plan 2009-2014 was launched with results indicators and timeframes. The recently established Law Reform Commission is yet to be fully operational. Capacity building and institutional strengthening of the legal sector is ongoing.
GoV rents the Supreme Court building from the Municipality of Port Vila.
There is no specific priority under update 2012 of the PAA 2006-2016 on justice-related infrastructure.
Ongoing Projects
Table 42 lists ongoing infrastructure projects under PMO, Youth and Justice Ministries.
Table 42: Summary of Identified Ongoing Projects (PMO, MFAICET, Youth and Justice)
Project No.
Project Island Province Est. Value
(b VUV) Est. Value
($m) Development
partner(s) Interest Status Timing
(if known)
PMO
O-PM1 Convention Centre Efate Shefa 1.344 14.40 China Aid O
MJCS
O-Ju1 Police Posts Rehabilitation
Vanuatu No data Australian Aid O 2014 - 2016
Total 1.344 14.40 Source: China Aid, PMO Datasets
Proposed Projects
Table 43 shows proposed infrastructure projects in the education sector.

VISIP 2015 – 2024 | Infrastructure Challenges
51
Table 43: Summary of Proposed Projects (PMO, Youth and Justice)
Project No.
Project Type Island Province Est.
Value (b VUV)
Est. Value ($m)
Development partner(s) Interest
Status Timing (if known)
PMO
PM1 Redesign and Construction of PM Office
Efate Shefa 0.896 9.60 China Aid C
MFAICET
FA1 Extension to Department of Foreign Affairs Bldg
Efate Shefa 0.149 1.60 Undefined P 2015-2017
FA2 Repair of SPC Country Office
Efate Shefa 0.009 0.10 Undefined P 2015-2017
FA3 Vanuatu Chancery Suva, Fiji
0.243 2.60 Undefined P 2015-2017
FA4 Building to House International Organisations
Efate Shefa 0.149 1.60 Undefined P 2015-2018
Total MFAICET 0.551 5.90
MYDST
Yo1 National Sports Complex-Port Vila
Efate Shefa 0.896 9.60 China Aid C
Yo2 Ministry of Youth and Sports New Office Buildings
Efate Shefa 0.140 1.50 Undefined P
Yo3 Provincial Youth and Sports Offices x5, one in each province
Vanuatu 0.047 0.50 Undefined P
Yo4 Multi-Purpose Courts in Rural Areas x 12, 2 in each province
Vanuatu 0.034 0.36 Undefined P
Yo5 Youth Centres x 12, 2 in each province
Vanuatu 0.056 0.60 Undefined P
Yo6 Luganville Multi-Purpose Sports Hall
Santo Sanma 0.028 0.30 Undefined P
Total MYDST 1.200 12.86
MJCS
Ju1 Correctional Services, Vila, Tanna, & Luganville
0.859 9.20 NZMFAT1 C
Ju2 Hall of Justice Efate Shefa 2.520 27.00 Undefined P
Ju3 Justice on Boat Vanuatu 0.056 0.60 Undefined P
Ju4 Ministry of Justice Building
Efate Shefa 0.280 3.00 Undefined P
Ju5 Ministry of Justice Sector House X5
Vanuatu 0.056 0.60 Undefined P
Total MJCS 3.771 40.40 1 NZMFAT may be interested to contribute part of the project cost, other contributors needed.
Source: PMO, MFAICET, MYDST, MJCS Datasets
2.4 Asset Management and Maintenance
Vanuatu’s current infrastructure stock exceeds the level of assets that the GoV can operate and maintain sustainably. Many infrastructure assets are being unduly dissipated because of poor maintenance. Vanuatu needs to focus its infrastructure investments to strategically key sectors (under GoV policy) and limit infrastructure stocks to levels which it can afford to maintain.
Currently, the Government does not have any official asset management policy or any clear strategy for asset maintenance. The responsibility for developing assets register and asset management plan and their funding is delegated to the line Ministries.
Ministries have traditionally paid scant attention to asset maintenance or providing resources from their budgets to meet it
25. Moreover, maintenance costs need revising over time and thus without a systematic approach are difficult to
estimate. Recently however, there has been some increased attention to maintenance. MIPU has proposed setting up a National Transport Infrastructure Maintenance Fund (TIMF) to address the assets management issue, although its implementation is not assured. TA supported by Australian Aid recently completed a thorough inventory of the infrastructural assets of the Ministry of Health and TA, sponsored by NZMFAT started a similar effort to inventory the
25 This discussion refers primarily to non-revenue projects (public infrastructure such as roads), which do not on their own produce a revenue stream from sales that could support maintenance.

VISIP 2015 – 2024 | Infrastructure Challenges
52
infrastructural assets of the primary school sector. These are emerging models that could be used to widen the development of public assets registers in other sectors.
The GoV must review these numbers while considering if public revenue can support the short-listed projects. Accurate maintenance cost estimates for an asset will be honed over time through an iterative process, beginning with an initial rough estimate that is steadily refined as experience is gained in operating the asset. The revisions will be reflected in updated budgets over time. However, the initial estimate of annual maintenance cost should be based on a standard ‘rule of thumb’ say, a percentage of the asset’s initial costs. For the maintenance cost estimates that accompany the current VISIP shortlist, for example, the annual maintenance cost per project averages 2.5% of the estimated initial project cost. Specifically, the assets in the VISIP short list, total about USD407million (VUV39.1 billion) over the planning period, and translate to requiring an annual average amount of USD10.3million (VUV989 million) maintenance (roughly 2.5%). Ultimately, however, the initial maintenance cost estimate should be derived from each sponsoring ministry’s own calculations, which in turn should be based on asset management principles.
A key recommendation of the VISIP 2015 is that operational and asset management considerations should not be side issues to be considered after the infrastructure investment decisions have been made, but rather become of core importance to the investment decisions themselves. Maintaining and efficiently operating the current stock of assets should have much higher priority than expanding the stock. As further highlighted in Chapter 6, DSPPAC needs to take a policy facilitating role in this respect and coordinate and monitor then together with MFEM the overall implementation of sectoral assets development and management plans.

VISIP 2015 - 2024 | VISIP Methodology
53
3 VISIP
Methodology
The methodology for developing VISIP 2015 is straightforward (reducing risk of errors in usage) yet flexible, enabling the selection of projects that best promote GoV priorities.
Steps for developing the VISIP:
For the preparation of VISIP 2015, the first four steps were carried out under the TA supported by PCO, which culminates in this report. DSPPAC and MFEM will undertake Step 5 (financial certification and government approval) before GoV finally approves the VISIP 2015 project short list (Step 6). Step 7 will be implemented periodically.
The infrastructure project generation and selection process this report outlines has twin objectives:
identifying, framing, and documenting the long and short lists of projects under VISIP 2015; and
testing an approach to updating the long and short lists that could be adopted long term, considering the country’s changing socioeconomic situation and VoG’s evolving policies and priorities.
The process embodies a two-way flow between line ministries and central government planning and budgeting agencies (DSPPAC, MFEM), in which the project documentation and investment lists are iteratively refined until a final project short list outcome is accepted, and GoV and development partners produce funding commitments.
Step 7: Monitoring, evaluating and review/update (future step)
Step 6: Government Approval (future step)
Step 5: Financial Assessment and Certification (future step)
Step 4: Project Prioritisation
Step 3: Project Evaluation
Step 2: Project Generation
Step 1: Criteria and Scope
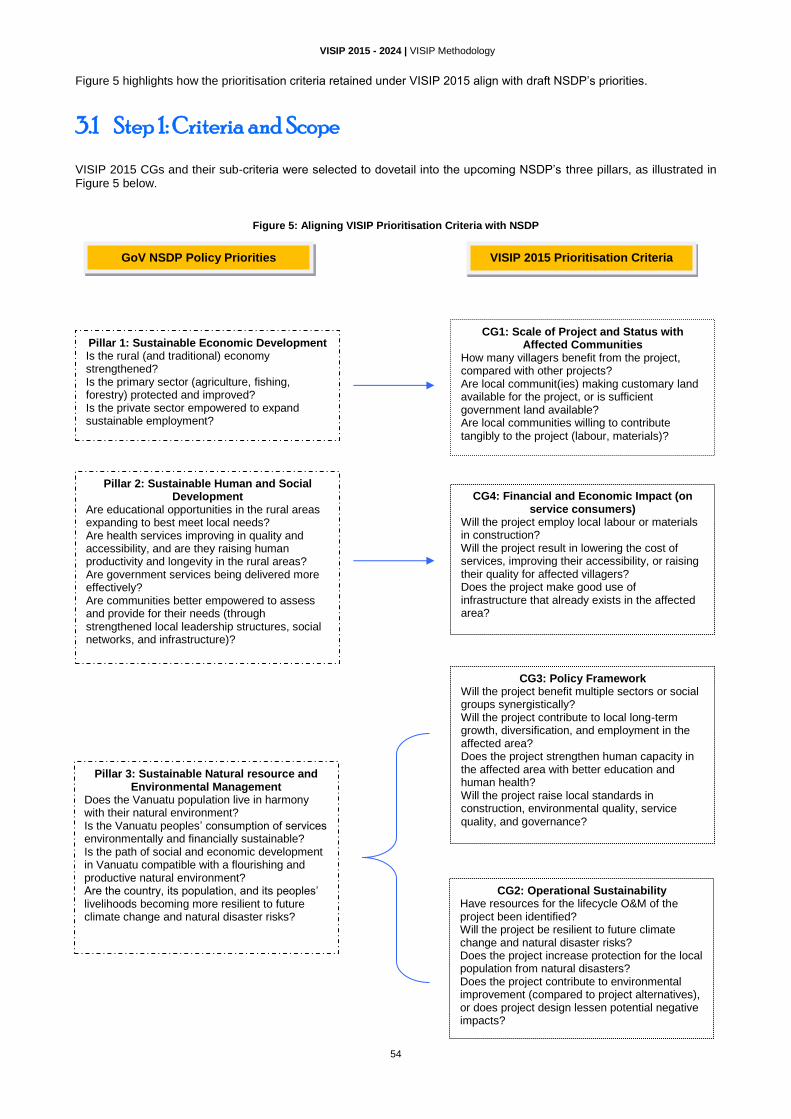
VISIP 2015 - 2024 | VISIP Methodology
54
Figure 5 highlights how the prioritisation criteria retained under VISIP 2015 align with draft NSDP’s priorities.
3.1 Step 1: Criteria and Scope
VISIP 2015 CGs and their sub-criteria were selected to dovetail into the upcoming NSDP’s three pillars, as illustrated in Figure 5 below.
Figure 5: Aligning VISIP Prioritisation Criteria with NSDP
GoV NSDP Policy Priorities VISIP 2015 Prioritisation Criteria
Pillar 1: Sustainable Economic Development Is the rural (and traditional) economy strengthened? Is the primary sector (agriculture, fishing, forestry) protected and improved? Is the private sector empowered to expand sustainable employment?
Pillar 2: Sustainable Human and Social Development
Are educational opportunities in the rural areas expanding to best meet local needs? Are health services improving in quality and accessibility, and are they raising human productivity and longevity in the rural areas? Are government services being delivered more effectively? Are communities better empowered to assess and provide for their needs (through strengthened local leadership structures, social networks, and infrastructure)?
Pillar 3: Sustainable Natural resource and Environmental Management
Does the Vanuatu population live in harmony with their natural environment? Is the Vanuatu peoples’ consumption of services environmentally and financially sustainable? Is the path of social and economic development in Vanuatu compatible with a flourishing and productive natural environment? Are the country, its population, and its peoples’ livelihoods becoming more resilient to future climate change and natural disaster risks?
CG1: Scale of Project and Status with Affected Communities
How many villagers benefit from the project, compared with other projects? Are local communit(ies) making customary land available for the project, or is sufficient government land available? Are local communities willing to contribute tangibly to the project (labour, materials)?
CG4: Financial and Economic Impact (on service consumers)
Will the project employ local labour or materials in construction? Will the project result in lowering the cost of services, improving their accessibility, or raising their quality for affected villagers? Does the project make good use of infrastructure that already exists in the affected area?
CG3: Policy Framework Will the project benefit multiple sectors or social groups synergistically? Will the project contribute to local long-term growth, diversification, and employment in the affected area? Does the project strengthen human capacity in the affected area with better education and human health? Will the project raise local standards in construction, environmental quality, service quality, and governance?
CG2: Operational Sustainability Have resources for the lifecycle O&M of the project been identified? Will the project be resilient to future climate change and natural disaster risks? Does the project increase protection for the local population from natural disasters? Does the project contribute to environmental improvement (compared to project alternatives), or does project design lessen potential negative impacts?

VISIP 2015 - 2024 | VISIP Methodology
55
As discussed in Section 2.2, government policy on national development is being revised, due to the recent change in government and end of the current policy implementation period as described in the Priorities and Action Agenda 2006-2015. A transition or an evolution of government policy regarding national development is a normal political process and may be expected to continue over the long term. Therefore, it is important that the methodology for project selection under the VISIP incorporate some flexibility at GoV senior levels that allows for evolving government priorities. This will require periodic review of the CGs to ensure they continuously reflect GoV priorities as they evolve. Changing CG constituents will be DSPPAC’s responsibility, as DSPPAC articulates GoV development policy.
DSPPAC also periodically conveys to the ministries GoV’s concerns regarding their performance in delivering the outcomes that the GoV wants, as reflected in evolving policy. If policy, for example, indicates that a substantially improved health service delivery outcome is needed, then DSPPAC would be expected to consult with the MOH (and with ministries responsible for sanitation and solid waste) and ask that projects be developed that actively support this outcome. DSPPAC has first responsibility for following and articulating GoV policy priorities as they evolve, and for liaising with ministries to ensure that the policies are meaningfully enacted. The four CGs, or ‘themes’ that are to be scored for project prioritisation are outlined below.
3.1.1 CRITERIA GROUP 1: PROJECT SCALE AND STATUS WITH THE AFFECTED COMMUNITY
This CG generally refers to the degrees of (i) the project’s direct benefit to recipient communities, and (ii) the community’s acceptance of the project. As a broad measure, ‘degree of benefit’ refers to the number of individuals or households that benefit from a project, whereas ‘degree of acceptance’ refers to the support that communities show for the project by making land available and/or contributing labour and other forms of in-kind support for it.
Quantifiable Parameters
Criteria 1.1: Number of beneficiaries
This reflects the estimated number of persons or households likely to benefit directly from the project; the higher the number (relative to other projects), the higher the score for this parameter. Criteria 1.2: Land availability
If the community is willing to make customary land available in a suitable location for the project, then the score for this criterion is high. Alternatively, if sufficient government land is available the score will also be high. Significant land issues or uncertainties about the availability of land for the project will result in a 0 or low score. Criteria 1.3: Co-funding commitment of the beneficiary communities
If the community expresses tangible support for the project, with in-kind contributions of labour for construction, operations, maintenance, and/or security services, then the score for this criterion is high (depending on the degree of such support). Absence of in-kind support indicates a 0 or low score. In-kind contributions are not the same as willingness to work on a project for a wage.
3.1.2 CRITERIA GROUP 2: OPERATIONAL SUSTAINABILITY
This CG refers to (i) the degree to which resources can be identified—at the project specification stage—for staffing, operating, and maintaining the resulting facility over its operating lifetime; (ii) the facility’s degree of vulnerability to climate change and natural disaster risks; and (iii) its impact on the environment.
Quantifiable Parameters
Criteria 2.1: Identified resources for operations and maintenance
Resources for O&M include staff costs, energy costs, and particularly asset maintenance costs. The sponsoring line ministry (with MIPU assistance) must carefully estimate such costs as an annual ‘operating budget’ for the facility. GoV must often provide the resources for covering the budget, but the private sector can provide them for certain projects. Development partners will only rarely provide the costs incurred over the project’s operating lifetime. At the early stages of project identification (concept stage), it is difficult to identify resources for O&M with certainty, except if the private sector appears willing to make an early commitment (for example to own and operate an energy project). For government projects, GoV’s willingness to meet the project’s O&M costs must be estimated. Later as the project is evaluated and ranked, MFEM will (or will not) certify that government resources are likely to be available to support the project, and the score for this parameter can then be adjusted.
VISIP 2015 - 2024 | VISIP Methodology
56
Where O&M resources are readily identifiable, the score for this parameter will be high. Significant uncertainty over such resources availability will result in the 0 or low score. Criteria 2.2: Contribution to climate resilience and disaster risk reduction
If the project concept includes design features that recognise and address climate risks and contribute to disaster risk reduction, the score for this criterion will be high. Resilience to climate risks and natural disasters can be seen in careful location planning, or design features that make the facility less vulnerable to extreme natural events. (For certain projects, e.g., school building construction, disaster risk reduction in the local community will be enhanced by using the facility as needed as a community shelter. If the design is robust enough to enable this, the score for this criterion will be high.) Investments with unaddressed vulnerabilities will receive a 0 or low score under this criterion. Criteria 2.3: Contribution to environmental protection (not only not negative, but reinforcing positive impact rated higher)
A project’s negative environmental will result in a 0 score. However, a project with a neutral environmental impact will not necessarily earn a high score, because some projects may conceivably have a positive impact on the environment (e.g., a ‘green’ energy project such as wind or solar, displacing a diesel power station). Projects that have a positive impact will earn a higher score for this criterion.
3.1.3 CRITERIA GROUP 3: POLICY FRAMEWORK
Projects that are clearly inconsistent—or even at odds—with current GoV policy (e.g., those that substantially increase a community’s vulnerability to risk, or undermine economic integration, or have a demonstrably negative environmental impact without clear mitigation features, etc.) will not continue on to evaluation and scoring. Among those found to be broadly consistent with GoV policy and do continue to evaluation, however, this CG measures the project’s relative potential to enhance and reinforce progress towards accomplishing GoV’s policy goals.
Quantifiable Parameters
Criteria 3.1: Synergistic linkages integrating social and economic development
A project that features a ‘positive feedback’ for achieving development goals will score high for this criterion. Examples of such projects include a road designed to improve farmers’ access to markets, that also provides an important link between the affected communities and provincial schools and health facilities; or a road that connects farmers in a remote location to markets and more frequent outreach services, and also opens opportunities to install radio towers to improve cell phone and Internet coverage in the area, or provides a right of way for electrical grid extensions or water lines, etc. A project without clear synergistic linkages would score low for this criterion. Criteria 3.2: Contribution to economic growth and local employment
A project which opens opportunities for economic diversification in an area, for example a road, continuous water supply, green energy supply, or coastal development which improves prospects (and returns) for tourism development in the area at the same time that it supports traditional livelihoods will score high for this criterion. A high score for this criterion will also be given to a project that increases spin-off employment opportunities, either by encouraging increased local participation in farming and/or fishing activities, or formal employment in tourism or social sectors such as teaching and health care, or even manufacturing. A high score would also be given to a project that trains the local community, making them qualified for higher-paying jobs. Criteria 3.3: Social improvements which help to strengthen rural welfare and integrate the economy
A project directly contributing to improved health and education services or to otherwise strengthening social support and human welfare in the affected area will earn a high score for this criterion. Projects that meet this standard will also include youth-oriented facilities (sports fields, stadiums, etc.) to keep the local youth productively occupied, as well as police/justice services that improve public safety, dispute resolution, and rights protection. Improvements in social services strengthen the social and cultural cohesion of the country and improve human productivity. Projects with little of such social impact will score low in this criterion. Criteria 3.4: Consistency with regulatory requirements (including environmental regulations)
To score high on this criterion, a project must demonstrate conformance with existing regulations, including construction standards, zoning restrictions (if applicable), and environmental regulations. (In the project profile, the line ministry must indicate awareness of the regulatory requirements to which the project may be subject in the affected area.)

VISIP 2015 - 2024 | VISIP Methodology
57
3.1.4 CRITERIA GROUP 4: FINANCIAL AND ECONOMIC IMPACT
This CG measures the project’s direct impact on the affected population by:
i. employment and procurement during construction;
ii. reduction in direct user costs for services (e.g., electricity tariffs, communications charges, time and expense of transport, etc.); and
iii. better and more efficient use of existing infrastructure in the affected area, that is expected to come about because of the project.
Quantifiable Parameters
Criteria 4.1: Local employment and procurement for construction
A relatively high degree of local employment generated for constructing a project-related facility, and/or a relatively high degree of local procurement of materials (e.g., timber or aggregate used in construction) will earn a high score under this criterion. Foreign-assisted projects that import labour and/or materials from overseas, displacing potential local labour and procurement, would earn 0 or low scores. Criteria 4.2: Impact on infrastructure users’ costs and efficiency
Projects that improve the terms of supply of services (from the users’ view) score high for this criterion. Examples include a road which reduces vehicle wear, fuel cost, and/or travel time from field to market, a wharf and shipping project that increases the frequency and/or reduces the cost of interisland marine transport, or a mini-hydroelectricity scheme that displaces the need for costly diesel (self-) generation. Criteria 4.3: Optimal use of existing infrastructure
A project which improves or optimises using existing infrastructure in the affected area will score high for this criterion, as it emphasises using past investments more efficiently rather than replacing them. For example, a road project alleviating a land access problem will also raise the value of an existing wharf that’s still serviceable but has been under-used or has fallen into disuse because of land access problems. Similarly, a better communications system installed in a remote area will increase farmers’ marketing capability and thus the flow-through of products to market, thereby increasing use of the wharf. Similar cases can be made for existing schools, health facilities, or sporting complexes in the affected area. Moreover, where infrastructure has been already installed, and facilities still exist but in degraded condition, it may be preferable to rehabilitate existing structures rather than develop new facilities, especially in rural contexts. This is not least because local communities may have contributed resources to those facilities. Rehabilitation will preserve and build upon the local contribution.
3.2 Step 2: Project Generation
Each line ministry will generate infrastructure project concepts within its developmental responsibilities and goals. The line ministry sponsoring a particular project will prepare a standard project profile, a simple 2-page form describing the project’s essential features and costs. With MIPU experienced in infrastructure implementation and with requisite engineering expertise, it can assist other line ministries in preparing the project profiles.
The line ministry sponsoring a project is responsible for consulting with the affected local communities to determine the project’s local impact and, in particular, whether the affected communities accept the project and are willing to support it. Chief concerns to be addressed at the local level in the early project preparation stages are whether the communities are prepared to make land available (or alternatively whether there is sufficient government land for the project in the area), and whether they might be willing to contribute in-kind support like materials or labour for operations, maintenance, security services, etc.
Project profiles, once completed, are passed to DSPPAC in PMO. In each ministry’s sector plan (periodically updated), the project profiles are included as ‘pipeline projects’ and approved projects are included as an ‘investment program’.
Appendix 1 sets out the template for the recommended project profile.

VISIP 2015 - 2024 | VISIP Methodology
58
3.3 Step 3: Project Evaluation
A sector analyst (SA) within DSPPAC evaluates each project profile as it comes in. The project’s overall conformity (as described in the project profile) with current GoV policies and priorities is assessed first; projects not conforming are considered no further.
The SA then scores conforming project profiles, according to a standard evaluation template, designed with the same structure as the project profile. The template contains the prioritisation criteria (discussed in the next section) used in project selection. Projects that reach the end of Step 3 (i.e., have been found to conform with current GoV policy and have been evaluated and scored) then constitute the government’s ‘long list’ of infrastructure projects for potential implementation.
Appendix 2 sets out the recommended evaluation scoring template.
3.4 Step 4: Project Prioritisation
In this step, the scores from the evaluation template are transferred into an electronic spreadsheet prioritisation tool that adds the scores for each project based on relative weightings applied to the criteria (the weightings reflect GoV policy priorities, and can be changed as priorities evolve over time). The result of applying the prioritisation tool to the long list of potential projects is a ranking of potential projects, presented both numerically and graphically for easy reference. Top-ranked projects are accorded the highest priority for implementation.
The methodology for project selection was designed as a quantitative measuring process to reduce ambiguities in evaluation. For each project criterion discussed below, a score of 0, 1, 2, or 3 is given using the evaluation template, based on information provided as requested in the project profile. For several sub-criteria, a score of 0 indicates no contribution of the project to the criterion in question, a score of 1 indicates a weak contribution, 2 a moderate contribution, and 3 a strong contribution.
As presented above, there are four main ‘themes’ or CGs used to score and rank projects under the retained project prioritisation process. Each group’s sub-criteria are the quantifiable (scoreable) parameters used in the project ranking process. Not all groups need carry equal weight in scoring. Rather, the relative weighting in each group can be set to reflect GoV’s current policy emphases, and the weightings can be changed to keep pace with policy as it evolves. The sum of the weightings across the four groups must equal 100%, but the constituent weightings can vary. Table 44 shows the weighting distribution retained for the scoring and ranking of projects under the VISIP 2015.
Table 44: Typical Weighting of Groups of Criteria
Criteria Group Weight
1: Project Scale and Status with the Affected Community 20%
2: Operational Sustainability 40%
3: Policy Framework 20%
4: Financial and Economic Impact 20%
Total weighting, Groups 1-4 100%
Source: VISIP 2015 TA Works
This particular weighting distribution assigns the highest priority to the operational sustainability of the infrastructure, which is a major concern for the government and partners. If evolving GoV policies were to shift emphasis to other themes, the relative weighting of respective CGs could be adjusted accordingly.
Appendix 3 suggests sample questions to help DSPPAC’s sector analyst score projects, especially for criteria that require an integrative approach. Appendix 5 contains a fax of the main scoring sheet in the priorit isation tool, for a hypothetical list of 10 projects (for illustration purposes).
3.5 Step 5: Financial Certification and GoV Approval (future step)
DSPPAC presents and discusses the ranked project list with MOF, MFEM, and with development partners to determine the overall commitment the government can make to the ongoing staffing, operation, and maintenance of the ranked infrastructure projects. This determination defines the cut-off point (moving down the list from the top-ranked projects) for

VISIP 2015 - 2024 | VISIP Methodology
59
sustainable infrastructure investment that the government of the day is prepared and capable to support financially. The cut-off point chiefly reflects GoV’s priority for supporting infrastructure development relative to other (non-infrastructure) priorities. This refers to the total commitment to infrastructure GoV is willing to make through the operational periods for the projects on the shortlist. Liaison between MFEM and DSPPAC on support to infrastructure O&M is a key requirement of the VISIP process. The cut-off point so determined then defines GoV’s sustainable infrastructure ‘short list’. The short list is then sent to the Development Committee Officials (DCO) and COM for approval. Following this it is discussed in detail with the donor community to finalise the commitment of external assistance to infrastructure development within the 10-year VISIP horizon.
Figure 6: VISIP Methodology
Other Plans, e.g. urban,
rural, agricultural, etc.
Develop Criteria, Scope
Project
Profile
NSDP Report + Review
Prioritisation/Process Sector Plan
Shortlist of Projects
Projects Ongoing +
Completed
VISIP
Asset Management
Affordability
Funding Strategy
Capital Sources
Debt Strategy
Monitor / Track
Implementation /
Delivery Budget + Plan
VISIP 2015 Activities
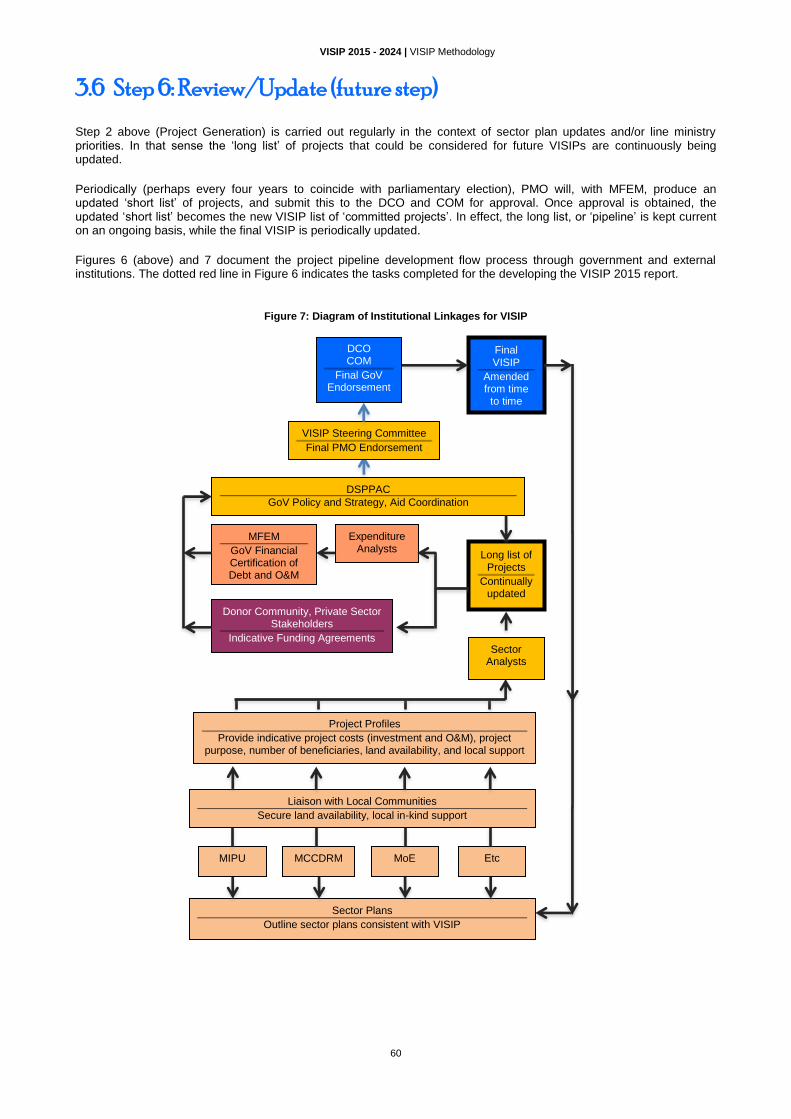
VISIP 2015 - 2024 | VISIP Methodology
60
3.6 Step 6: Review/Update (future step)
Step 2 above (Project Generation) is carried out regularly in the context of sector plan updates and/or line ministry priorities. In that sense the ‘long list’ of projects that could be considered for future VISIPs are continuously being updated.
Periodically (perhaps every four years to coincide with parliamentary election), PMO will, with MFEM, produce an updated ‘short list’ of projects, and submit this to the DCO and COM for approval. Once approval is obtained, the updated ‘short list’ becomes the new VISIP list of ‘committed projects’. In effect, the long list, or ‘pipeline’ is kept current on an ongoing basis, while the final VISIP is periodically updated.
Figures 6 (above) and 7 document the project pipeline development flow process through government and external institutions. The dotted red line in Figure 6 indicates the tasks completed for the developing the VISIP 2015 report.
Figure 7: Diagram of Institutional Linkages for VISIP
MIPU MCCDRM MoE Etc
Liaison with Local Communities
Secure land availability, local in-kind support
Sector Plans
Outline sector plans consistent with VISIP
Sector Analysts
DSPPAC
GoV Policy and Strategy, Aid Coordination
Long list of Projects
Continually updated
MFEM
GoV Financial Certification of Debt and O&M
Costs
Donor Community, Private Sector Stakeholders
Indicative Funding Agreements
Expenditure Analysts
VISIP Steering Committee
Final PMO Endorsement
Project Profiles
Provide indicative project costs (investment and O&M), project purpose, number of beneficiaries, land availability, and local support
DCO COM
Final GoV Endorsement
Final VISIP
Amended from time
to time

VISIP 2015 - 2024 | Prioritisation of Projects for VISIP 2015
61
4 Prioritisation of Projects
for VISIP 2015
4.1 Project Selection Process
The project selection process under VISIP 2015 (as outlined in Figure 8) applied the following steps:
Wish List
Collect sectoral and ministerial ‘wish lists’ comprising (i) ongoing projects; (ii) the 2012 draft infrastructure plan long list of projects (parts of which appeared outdated); and (iii) new projects identified or followed by the line agencies and ministries. This list yielded 193 projects with a total (and improbable) VUV199 billion investment value.
Separate out projects in implementation
Ongoing projects were identified and their latest estimated project costs based on available or ongoing feasibility studies, design, and tender documentation was reviewed. This yielded a list of 26 projects with a total investment supported by development partners amounting to VUV33.1 billion (USD355 million) that are under implementation. Based on project implementation estimates, this corresponds to an annual amount of development partner supported investment of around VUV4.74 billion (USD50.8 million). Excluding capacity development components embedded in the development projects, this corresponds to around VUV4.20 billion (USD45 million) of development partner financed infrastructure annually. The current USD45 million investment in new projects annually may represent an upper limit for GoV’s capacity to implement new projects each year. Development partners already struggle to avoid delays in implementing such a volume of projects.
Arriving at the Long List of Projects
The remaining wish lists was into consolidated sectoral project lists based on reviewing additional documentation received about those projects. These lists represent the sectoral list of proposed projects reflected in Chapter 2. As in Paragraph 2.3 consider several different project types and status in those lists.
Bundled projects were developed. These are ‘sector projects’ that aggregate several smaller but similar projects proposed in islands and provinces around the country (rural roads, smaller domestic airports, shipping jetties, rural water supply). The bundling approach simplifies and enhances the credibility of the prioritisation methodology for smaller projects that can not be differentiated, scored, and ranked among themselves or compared with larger projects in other sectors.
A category of ‘Important Unplanned’ (IU) was also introduced as a possible project status. An IU was given to project ideas important to ministries and agencies for fulfilling their mandates, but for which no project information could be obtained.
The resulting aggregated long list of projects yielded 80 projects with a total VUV16.9 billion (USD1.891 million) investment value.

VISIP 2015 - 2024 | Prioritisation of Projects for VISIP 2015
62
Figure 8: Project Selection Process Applied under VISIP 2015
Sectoral Wish Lists
(193 Projects) (VUV199 b)
(USD2.132 m)
Long List VISIP 2015
(80 Projects) (VUV16.89 b)
(USD1.809 m)
Screening based on updated Project Information, Project Profile & Updated Strategic Orientation
VISIP 2015 Short List of Proposed Priority
Projects (26 Projects) (VUV37.98 b) (USD407 m)
Scoring and
Weighting based on 4 Groups of Multiple Criteria
Ongoing (O) List Priority Projects
VISIP 2015 (26 Projects) (VUV33.14 b) (USD355 m)
Short List of Public Priority Projects
(18 Projects) (VUV21.10 b) (USD226 m)
New Proposed (P) & Important
Unplanned (IU) Projects
(9 Projects) (VUV37.43 b) (USD401 m)
Recommended for Inclusion through Discussion with Sector Ministries/ Agencies
Short List of Priority Projects
GoV Committed to Seek Donor
Financing
Separation of Ongoing (O)
Projects under
Implementation
Long List Draft 2012 VISIP
(68 Projects) (VUV98.58 b) (USD1.056 m)
List Refinement based on Received Project
information
Decision by GoV/DCO & COM guided by
DSPPAC
Short List of Bundled Public Priority
Projects (7 Projects) (VUV6.81 b) (USD73 m)
Short List of Privately Financed Public
Priority Projects (1 Project)
(VUV10.08 b) (USD108 m)
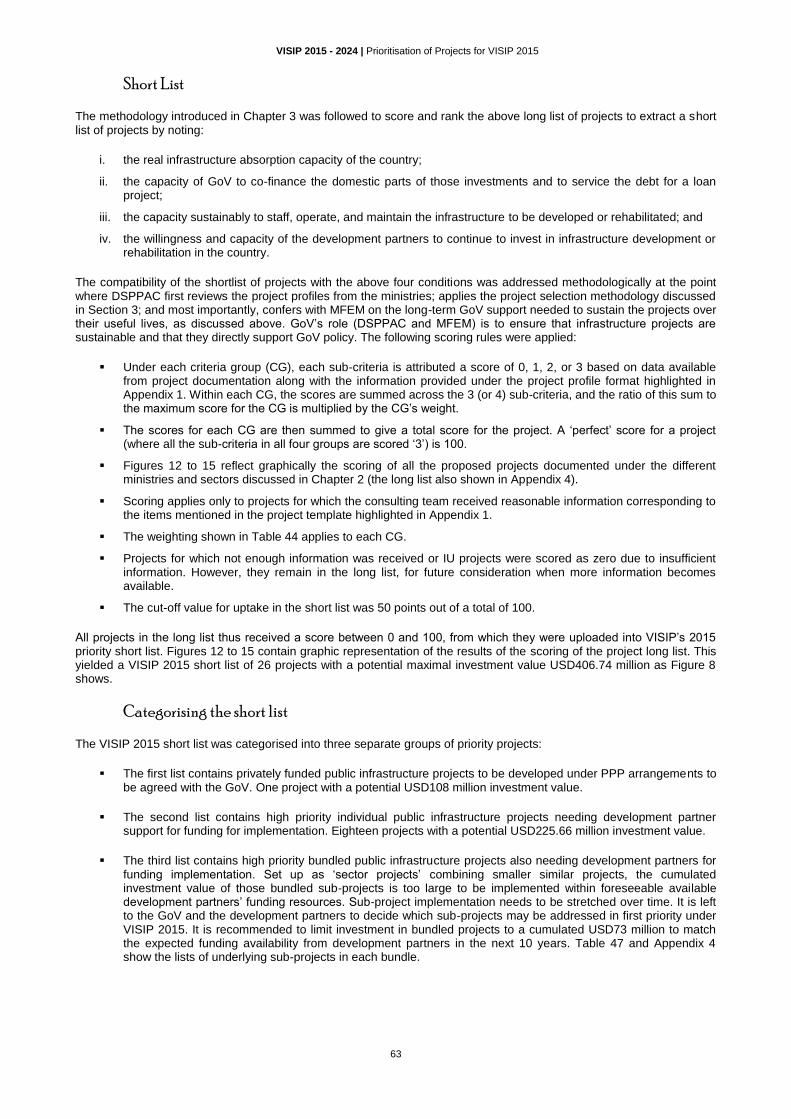
VISIP 2015 - 2024 | Prioritisation of Projects for VISIP 2015
63
Short List
The methodology introduced in Chapter 3 was followed to score and rank the above long list of projects to extract a short list of projects by noting:
i. the real infrastructure absorption capacity of the country;
ii. the capacity of GoV to co-finance the domestic parts of those investments and to service the debt for a loan project;
iii. the capacity sustainably to staff, operate, and maintain the infrastructure to be developed or rehabilitated; and
iv. the willingness and capacity of the development partners to continue to invest in infrastructure development or rehabilitation in the country.
The compatibility of the shortlist of projects with the above four conditions was addressed methodologically at the point where DSPPAC first reviews the project profiles from the ministries; applies the project selection methodology discussed in Section 3; and most importantly, confers with MFEM on the long-term GoV support needed to sustain the projects over their useful lives, as discussed above. GoV’s role (DSPPAC and MFEM) is to ensure that infrastructure projects are sustainable and that they directly support GoV policy. The following scoring rules were applied:
Under each criteria group (CG), each sub-criteria is attributed a score of 0, 1, 2, or 3 based on data available from project documentation along with the information provided under the project profile format highlighted in Appendix 1. Within each CG, the scores are summed across the 3 (or 4) sub-criteria, and the ratio of this sum to the maximum score for the CG is multiplied by the CG’s weight.
The scores for each CG are then summed to give a total score for the project. A ‘perfect’ score for a project (where all the sub-criteria in all four groups are scored ‘3’) is 100.
Figures 12 to 15 reflect graphically the scoring of all the proposed projects documented under the different ministries and sectors discussed in Chapter 2 (the long list also shown in Appendix 4).
Scoring applies only to projects for which the consulting team received reasonable information corresponding to the items mentioned in the project template highlighted in Appendix 1.
The weighting shown in Table 44 applies to each CG.
Projects for which not enough information was received or IU projects were scored as zero due to insufficient information. However, they remain in the long list, for future consideration when more information becomes available.
The cut-off value for uptake in the short list was 50 points out of a total of 100.
All projects in the long list thus received a score between 0 and 100, from which they were uploaded into VISIP’s 2015 priority short list. Figures 12 to 15 contain graphic representation of the results of the scoring of the project long list. This yielded a VISIP 2015 short list of 26 projects with a potential maximal investment value USD406.74 million as Figure 8 shows.
Categorising the short list
The VISIP 2015 short list was categorised into three separate groups of priority projects:
The first list contains privately funded public infrastructure projects to be developed under PPP arrangements to be agreed with the GoV. One project with a potential USD108 million investment value.
The second list contains high priority individual public infrastructure projects needing development partner support for funding for implementation. Eighteen projects with a potential USD225.66 million investment value.
The third list contains high priority bundled public infrastructure projects also needing development partners for funding implementation. Set up as ‘sector projects’ combining smaller similar projects, the cumulated investment value of those bundled sub-projects is too large to be implemented within foreseeable available development partners’ funding resources. Sub-project implementation needs to be stretched over time. It is left to the GoV and the development partners to decide which sub-projects may be addressed in first priority under VISIP 2015. It is recommended to limit investment in bundled projects to a cumulated USD73 million to match the expected funding availability from development partners in the next 10 years. Table 47 and Appendix 4 show the lists of underlying sub-projects in each bundle.

VISIP 2015 - 2024 | Prioritisation of Projects for VISIP 2015
64
4.2 Ongoing Projects
Table 45 lists the ongoing projects. Figures 9 to 11 document the spread by value of investments by sectors as well as geographically by province and per capita. By sector, the majority of ongoing projects by value focus on transport (marine and land), followed distantly by communications. Geographically, over half of the ongoing projects by value are in the capital island (Efate, Shefa Province), while nearly a quarter cover multiple provinces. Shefa, the Port Vila province, benefits most from investment per capita.
Figure 9: Sectoral Spread by Value of Ongoing Development Figure 10: Geographic Spread of Ongoing Development
partner Investments partner investments
Figure 11: Per Capita Investment/Province (Ongoing Projects: USD/Capita)
Multi Sector 11%
Road 23%
Aviation 0%
Shipping 28%
Water Supply & Sanitation
1%
Energy 08%
ICT 12%
Tourism 5%
Education 2%
Disaster Risk
Management
1%
Health 5%
PMO 4%
Torba 0%
Sanma 4%
Penama 2%
Malampa 9%
Shefa 53%
Tafea 9%
Multi-Provinces
23%
0.00
500.00
1,000.00
1,500.00
2,000.00
2,500.00
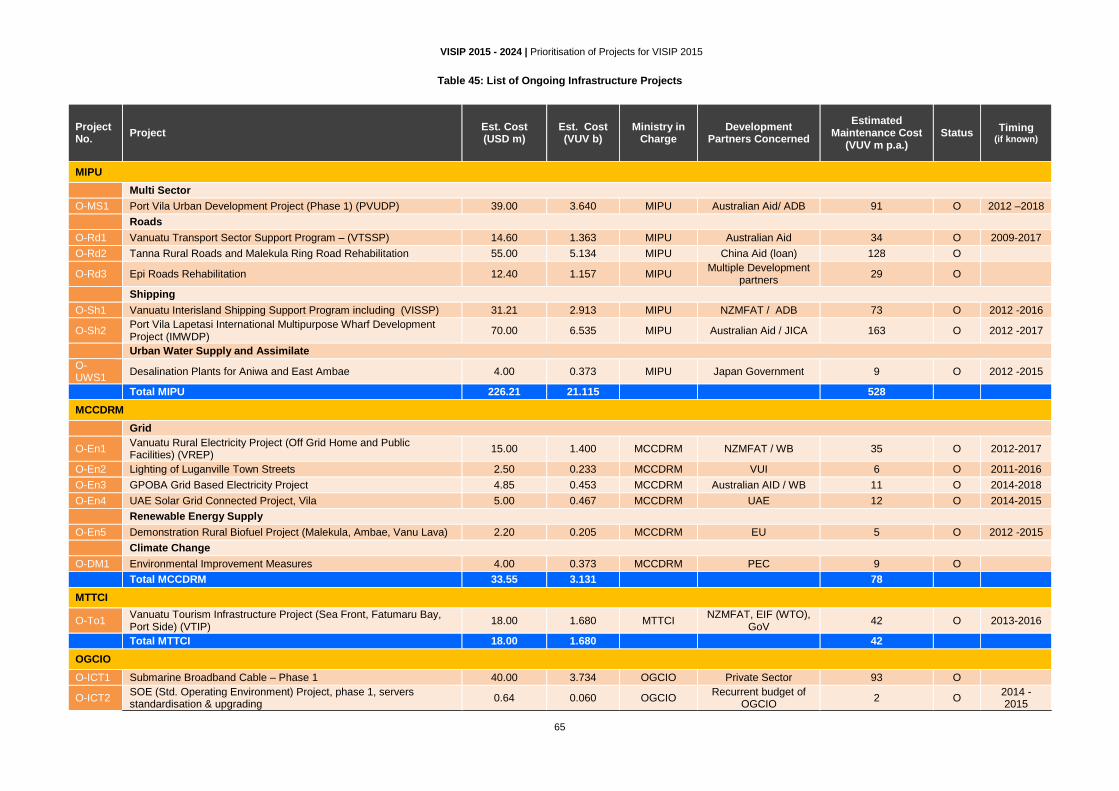
VISIP 2015 - 2024 | Prioritisation of Projects for VISIP 2015
65
Table 45: List of Ongoing Infrastructure Projects
Project No.
Project Est. Cost (USD m)
Est. Cost (VUV b)
Ministry in Charge
Development Partners Concerned
Estimated Maintenance Cost
(VUV m p.a.) Status
Timing (if known)
MIPU
Multi Sector
O-MS1 Port Vila Urban Development Project (Phase 1) (PVUDP) 39.00 3.640 MIPU Australian Aid/ ADB 91 O 2012 –2018
Roads
O-Rd1 Vanuatu Transport Sector Support Program – (VTSSP) 14.60 1.363 MIPU Australian Aid 34 O 2009-2017
O-Rd2 Tanna Rural Roads and Malekula Ring Road Rehabilitation 55.00 5.134 MIPU China Aid (loan) 128 O
O-Rd3 Epi Roads Rehabilitation 12.40 1.157 MIPU Multiple Development
partners 29 O
Shipping
O-Sh1 Vanuatu Interisland Shipping Support Program including (VISSP) 31.21 2.913 MIPU NZMFAT / ADB 73 O 2012 -2016
O-Sh2 Port Vila Lapetasi International Multipurpose Wharf Development Project (IMWDP)
70.00 6.535 MIPU Australian Aid / JICA 163 O 2012 -2017
Urban Water Supply and Assimilate
O-UWS1
Desalination Plants for Aniwa and East Ambae 4.00 0.373 MIPU Japan Government 9 O 2012 -2015
Total MIPU 226.21 21.115 528
MCCDRM
Grid
O-En1 Vanuatu Rural Electricity Project (Off Grid Home and Public Facilities) (VREP)
15.00 1.400 MCCDRM NZMFAT / WB 35 O 2012-2017
O-En2 Lighting of Luganville Town Streets 2.50 0.233 MCCDRM VUI 6 O 2011-2016
O-En3 GPOBA Grid Based Electricity Project 4.85 0.453 MCCDRM Australian AID / WB 11 O 2014-2018
O-En4 UAE Solar Grid Connected Project, Vila 5.00 0.467 MCCDRM UAE 12 O 2014-2015
Renewable Energy Supply
O-En5 Demonstration Rural Biofuel Project (Malekula, Ambae, Vanu Lava) 2.20 0.205 MCCDRM EU 5 O 2012 -2015
Climate Change
O-DM1 Environmental Improvement Measures 4.00 0.373 MCCDRM PEC 9 O
Total MCCDRM 33.55 3.131 78
MTTCI
O-To1 Vanuatu Tourism Infrastructure Project (Sea Front, Fatumaru Bay, Port Side) (VTIP)
18.00 1.680 MTTCI NZMFAT, EIF (WTO),
GoV 42 O 2013-2016
Total MTTCI 18.00 1.680 42
OGCIO
O-ICT1 Submarine Broadband Cable – Phase 1 40.00 3.734 OGCIO Private Sector 93 O
O-ICT2 SOE (Std. Operating Environment) Project, phase 1, servers standardisation & upgrading
0.64 0.060 OGCIO Recurrent budget of
OGCIO 2 O
2014 - 2015

VISIP 2015 - 2024 | Prioritisation of Projects for VISIP 2015
66
Project No.
Project Est. Cost (USD m)
Est. Cost (VUV b)
Ministry in Charge
Development Partners Concerned
Estimated Maintenance Cost
(VUV m p.a.) Status
Timing (if known)
O-ICT3 TRR UAP computer labs, tablets, Internet cafes; phase 1 0.70 0.065 TRR Australain Aid/
Universal Access Fund
2 O 2014-2015
Total OGCIO 41.34 3.859 96
MOE
O-Ed1 Vanuatu Education Support Program (Pilot Rehabilitation Primary Schools) (VESP)
4.70 0.439 MOE NZMFAT, Australian
Aid 11 O 2014 -2018
O-Ed2 Yearly Build up of 4 to 6 2-Class Primary School Buildings 1.00 0.093 MOE Japan Government
(Volunteers) 2 O
2000 - open ended
Total MOE 5.70 0.532 13
MOH
O-He1 Redevelopment of the Vila Central Hospital 13.80 1.288 MOH JICA 32 O 2012 -2014
O-He2 Pilot Rehabilitation Rural Health Centres and Dispensaries 1.40 0.131 MOH Australian Aid 3 O 2010 -2016
O-He3 Refurbishing Aneityum Dispensary 0.17 0.016 MOH P&O Cruise 0,4 O 2013-2014
O-He4 Disaster Risk Mitigation Infrastructure and Equipments at Hospitals 0.58 0.054 MOH Australian Aid 1 O 2010-2016
O-He5 Improvement of Pharmaceutical Storage 0.06 0.006 MOH Australian Aid 0,2 O 2010-2016
O-He6 Lolowai Hospital Refurbishment 0.21 0.020 MOH Rotary International 1 O 2013-2014
Total MOH 16.22 1.515 38
MJCS
O-Ju1 Police Post Rehabilitation No data No data MJCS Australian Aid No data O 2014 -2016
Total MJCS
PMO
O-PM1 Convention Centre 14.40 1.344 PMO China Aid 34 O 2013-2016
Total PMO 14.40 1.344 34
Grand Total Ongoing Projects 355.42 33.176 830

VISIP 2015 - 2024 | Prioritisation of Projects for VISIP 2015
67
4.3 Scoring of Infrastructure in VISIP 2015 Long List
Figures 12 to 15 summarise the scoring and consequent ranking of the long listed proposed infrastructure investment identified in Chapter 2.3.
Figure 12: Scoring of VISIP 2015 Long List (Multi-Sector, Road, Aviation, & Shipping)
.0 10.0 20.0 30.0 40.0 50.0 60.0 70.0 80.0 90.0
Multi Sector
Vanuatu Urban Development Project (Phase 2) - MS1
Road
Santo South Coast Road Rehabilitation - Rd1
Sealing of Tanna Roads Whitegrass to Isangel - Rd2
Malekula East Coast Road Rehabilitation -Rd3
Road Rehabilitation in Every Province - Rd4
Santo Big Bay Highway Rehabilitation- Rd5
Rural Feeder Roads in Every Province -Rd6
Aviation
Construction of New International Airport, Efate -Av1
Upgrading Airport Category A or Assimilate - Av2
Upgrading Airports of Category B - Av3
Upgrading Aerodromes of Category C - Av4
Shipping
Rehab. & Extension Luganville International Wharf - Sh1
Forari Industrial Wharf, Efate - Sh2
Malekula International Wharf in Penamum - Sh3
Domestic Jetties Construction in Every Province - Sh4
Improvement of Port Navigation and Mooring Aids - Sh5
Hydrographic and Bathymetric Surveys -Sh6
Sulfur Bay Wharf Project - Sh7
Slipways Construction Efate & Luganville - Sh8
Scale & Status
Operational Sustainability
Policy Framework
Financial & Economics

VISIP 2015 - 2024 | Prioritisation of Projects for VISIP 2015
68
Figure 13: Scoring of VISIP 2015 Long List (Urban & Rural Water Supply, Urban Solid Waste, Power Supply & Tourism)
0 10 20 30 40 50 60 70 80 90
Urban Water Supply and Assimilate
Luganville Water Supply System Rehabilitation - UWS1
4 Provincial capitals Water Supply System - UWS2
Urban Solid Waste
Port Vila Solid Waste Collection Trucks - SWM1
Luganville Solid Waste Management - SWM2
Lenakel Town Dumpsite - SWM3
Energy / Grid
Grid Extension East Cost Santo - En1
Low - Medium Voltage (LV-MV) extension - En2
Fossile Energy Supply
Relocation of 2 new storage tanks in Port Vila - En3
Renewable Energy Supply
Efate Grid Connected Solar Panel Project - En4
Takara Geothermal Power Plant Study & Investment - En5
Brenwe Hydro Power Project (< 1.2MW), Malekula - En6
Sarakata Hydro Power Extension Project (+600 KW)- En7
Disaster Risks Management
Provincial Disaster Management Offices - DM1
Rural Water Supply
Rural Water Supply Lamap, East Malo, Wala Rono, West Ambae - RWS1
Rural Water Supply in Every Province - RWS2
Tourism
Port Vila Ward Council Tourism Project - To1
Luganville Tourism Infrastructure Project - To2
Scale & Status
Operational Sustainability
Policy Framework
Financial & Economics

VISIP 2015 - 2024 | Prioritisation of Projects for VISIP 2015
69
Figure 14: Scoring of VISIP 2015 Long List (ICT & Education)
,
0 10 20 30 40 50 60 70 80 90
ICT
Second submarine cable - ICT1
Third submarine cable - ICT2
Fiber optic cable around Efate - ICT3
Widespread bandwidth capacity distribution - ICT4
SOE (Std. Operating Environment) phase 2 - ICT5
Volcano, weather and hazards monitoring - ICT6
New government data center + backup - ICT7
TRR UAP computer labs, tablets, etc.; phase 2 - ICT8
TRR UAP computer labs, tablets, etc. ; phase 3 - ICT9
Three community ICT centers Outlying islands - ICT10
Implementation of iGov Strategic Plan - ICT11
Upgrades to SmartStream FMIS + HRMIS - ICT12
Rplacement of SmartStream FMIS + HRMIS - ICT13
Expansion Gov. Broadband (GBN), Phase 2 - ICT14
Expansion Gov. Broadband (GBN), Phase 3 - ICT15
ICTs for cultural and language preservation - ICT16
ICTs in education - ICT17
ICTs in health - ICT18
ICTs in all sectoral and ministerial projects - ICT 19
Education
Reconstruction College Malopoa - Ed1
Rehabilitation All Primary Schools - Ed2
Rehabilitation All Secondary Schools - Ed3
Scale & Status
Operational Sustainability
Policy Framework
Financial & Economics
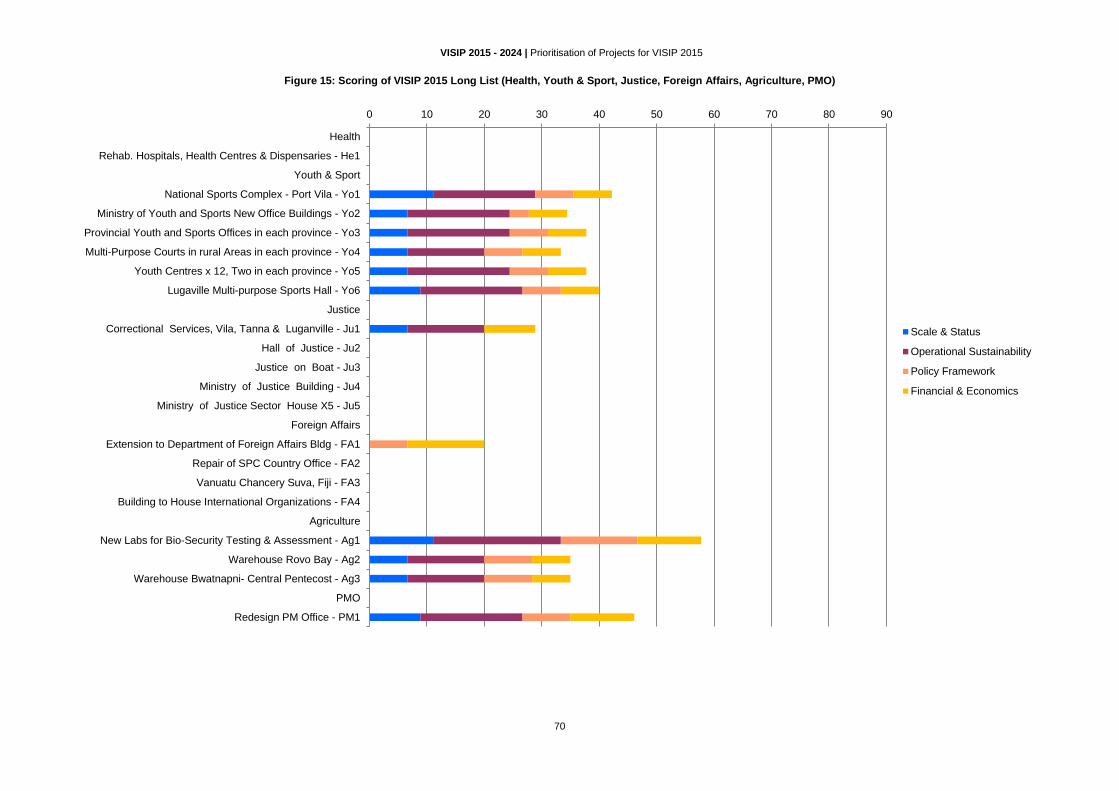
VISIP 2015 - 2024 | Prioritisation of Projects for VISIP 2015
70
Figure 15: Scoring of VISIP 2015 Long List (Health, Youth & Sport, Justice, Foreign Affairs, Agriculture, PMO)
0 10 20 30 40 50 60 70 80 90
Health
Rehab. Hospitals, Health Centres & Dispensaries - He1
Youth & Sport
National Sports Complex - Port Vila - Yo1
Ministry of Youth and Sports New Office Buildings - Yo2
Provincial Youth and Sports Offices in each province - Yo3
Multi-Purpose Courts in rural Areas in each province - Yo4
Youth Centres x 12, Two in each province - Yo5
Lugaville Multi-purpose Sports Hall - Yo6
Justice
Correctional Services, Vila, Tanna & Luganville - Ju1
Hall of Justice - Ju2
Justice on Boat - Ju3
Ministry of Justice Building - Ju4
Ministry of Justice Sector House X5 - Ju5
Foreign Affairs
Extension to Department of Foreign Affairs Bldg - FA1
Repair of SPC Country Office - FA2
Vanuatu Chancery Suva, Fiji - FA3
Building to House International Organizations - FA4
Agriculture
New Labs for Bio-Security Testing & Assessment - Ag1
Warehouse Rovo Bay - Ag2
Warehouse Bwatnapni- Central Pentecost - Ag3
PMO
Redesign PM Office - PM1
Scale & Status
Operational Sustainability
Policy Framework
Financial & Economics

VISIP 2015 - 2024 | Prioritisation of Projects for VISIP 2015
71
4.4 VISIP 2015 Priority List of Projects
The paragraphs below summarise the priority list of infrastructure projects identified for VISIP 2015. It is divided into three categories (individual public investment, bundled public investment, and private funded public investment):
4.4.1 CATEGORY 1: INDIVIDUAL PUBLIC INVESTMENT PROJECTS
Table 46 outlines the 18 individual public infrastructure investments in the short list identified under VISIP 2015. The total cumulated investment value amounts to VUV21 billion (USD225 million).
Table 46: Priority Individual Public Infrastructure Investment under VISIP 2015
Project No.
Sector/Project Name Investment
Value (VUV b)
Investment Value
(USD m)
Maintenance Rate p.a.
%
Maintenance Cost p.a.
(VUV m p.a.) Status
1
Multi Sector
MS1 Vanuatu Urban Development Project (Phase 2 - Luganville, Port Vila)
2.100 22.50 1.33 32 P
Roads
Rd1 Santo South Coast Road Rehabilitation 2.390 25.60 1.96 48 P
Rd2 Sealing of Tanna Roads Whitegrass to Isangel 0.467 5.00 2.00 9 P
Rd3 Malekula East Coast Road Rehabilitation 2.931 31.40 1.90 56 P
Shipping
Sh1 Rehabilitation and Extension of Luganville International Wharf
5.000 53.56 1.90 95 P
Urban Water Supply and Assimilate
UWS1 Luganville Existing Water Supply System Rehabilitation
0.383 4.10 4.9 19 P
Urban Solid Waste
SW2 Luganville Solid Waste Management 0.140 1.50 3.0 4 P
Power Grid
En1 2 3
Grid Extension (Matelevu to Shark Bay, Port Olry, Stone Hill and Palekula), East Cost Santo
0.224 2.40 3.0 7 C
En2 2 3
Low Voltage (LV) and Medium Voltage (MV) extension (Vila, Santo, Malekula)
1.680 18.00 3.0 50 P
Renewable Energy Supply
En4 Efate Grid Connected Solar Panels (1MW) Project
0.522 5.60 3.0 16 P
En6 2 3
Brenwe Hydro Power Project (< 1.2MW), Malekula
0.522 5.60 3.5 18 P
En7 2 3
Sarakata Hydro Power Extension Project (+600 KW), Santo
0.397 4.25 3.5 14 P
Rural Water Supply
RWS1 Rural Water Supply Lamap, East Malo, Wala Rono, West Ambae
0.093 1.00 2.0 2 C
ICT
ICT7 New government Data Centre + Backup 0.093 1.00 2.5 2 P
ICT11 Implementation of iGov Strategic Plan including planning of WB/ADB ICT loan package
1.881 20.15 2.5 47 P
ICT14 Expansion of Government Broadband Network (GBN), Phase 2 (more connectivity in provincial capitals and towns)
0.187 2.00 2.5 5 P
Education
Ed1 Reconstruction College Malapoa 1.494 16.00 2.0 30 C
Agriculture
Ag1 National Diagnostic Laboratory Bureau of Standards
0.560 6.00 4.0 22 P
18 Total 21.065 225.66 470

VISIP 2015 - 2024 | Prioritisation of Projects for VISIP 2015
72
Project No.
Sector/Project Name Investment
Value (VUV b)
Investment Value
(USD m)
Maintenance Rate p.a.
%
Maintenance Cost p.a.
(VUV m p.a.) Status
1
1 P=Proposed, C=Committed 2 Projects have feasibility study providing updated details 3 Projects En1, En2, En6, and En7 may be bundled into a sector project through the ADB supported Energy Access Project
4.4.2 CATEGORY 2: BUNDLED PUBLIC INVESTMENT PROJECTS
Table 47 outlines the short list of bundled public infrastructure investments identified for VISIP 2015 together with their sub-projects and costs. The investment value expected to be implemented over the next 10 years under these bundled projects amounts to VUV6.8 billion (USD73 million). Due to expected restricted budget availability, this corresponds to 30% of the cumulated value of all the bundled sub-projects documented in Table 47. Political decision makers will decide which sub-projects should be implemented as first priority based on the available approved funding envelope for such bundled projects.
Table 47: Proposed Priority Bundled Public Infrastructure Investment under VISIP 2015
Project No.
Sector/Project Name Investment
Value (VUV b)
Investment Value
(USD m)
Maintenance Rate p.a. %
Maintenance Cost
(VUV m p.a.)
Road
Rd4 (Bundle)
Priority Sub-Projects1 1.862 19.95 2.0 37
Road Rehabilitation and Improvement in Every Province (Total Bundle)
6.208 66.50
Pentecost Roads Rehabilitation 25.10
Paama Roads Improvement 0.70
Ambae Roads Construction 0.90
Maewo Roads Rehabilitation 8.40
Erromango Roads Rehabilitation 1.30
Efate Tourism Roads Rehabilitation 3.70
Malo Island Roads Rehabilitation 16.10
Malekula South Coast Road Construction 10.30
Rd6 (Bundle)
Priority Sub-Projects1 2.310 24.75 2.0 46
Rural and Feeder Roads Rehabilitation and Development in Every Province (Total Bundle)
7.701 82.50
Efate Rural Roads Rehabilitation 5.40
Moto Lava Rural Roads Rehabilitation 0.60
Vanua Lava Rural Roads Rehabilitation 0.60
Santo Rural Roads Rehabilitation 28.40
Ambrym Rural Roads Construction 3.70
Part Rehabilitation and New Feeder Road Vao inland Road (15km)
3.00
Part Rehabilitation and New Feeder Road Atchin Inland Road (20km)
4.00
Part Rehabilitation and New Feeder Road Orap Inland Road (15km)
3.00
Part Rehabilitation and New Feeder Road Limap Inland Road (20km)
5.20
Part Rehabilitation and New Feeder Road Lambubu-Tisvel Road (15km)
3.00
Part Rehabilitation and New Feeder Road Bamboo-Vanafo Road (15km)
3.00
Part Rehabilitation and New Feeder Road Beleru Road (20 km)
4.00
Part Rehabilitation and New Feeder Road Ngala-South Epi Road (15km)
3.00
Rehabilitation Feeder Road Teouma shopping Inland Road (20km)
2.60
Rehabilitation Feeder Road Chief Karu Inland Road (20km)
2.60
Rehabilitation Feeder Road House Kingdom 2.60

VISIP 2015 - 2024 | Prioritisation of Projects for VISIP 2015
73
Project No.
Sector/Project Name Investment
Value (VUV b)
Investment Value
(USD m)
Maintenance Rate p.a. %
Maintenance Cost
(VUV m p.a.)
Inland Road (20km)
Rehabilitation Feeder Road DucklakeIinland Road (20km)
2.60
New Feeder Road Middle Bush Road (20km) 5.20
Aviation
Av2 (Bundle)
Priority Sub-Projects 1.764 18.90 2.0 35
Upgrading Airports Category A (Total Bundle) 5.881 63.00
Bauerfield Airport Improvement - runway, taxiways, apron
15.00
Bauerfield Terminal Improvements 20.00
Upgrading of Pekoa Airport, Santo 17.00
Upgrading of Whitegrass Airport, Tanna 11.00
Av3 (Bundle)
Priority Sub-Projects 1 0.263 2.82 2.0 6
Upgrading Airports of Category B (Total Bundle)
0.877 9.39
Upgrading of Norsup Aerodrome 5.20
Upgrading of Lonorore, Longana & Mota Lava Aerodromes
4.20
Shipping
Sh4 (Bundle)
Priority Sub-Projects 1 0.486 5.21 1.9 9
Domestic Jetties Construction in Every Province (Total Bundle)
1.620 17.35
Jetty plus Warehouse and WC at Point cross 1.45
Jetty plus Warehouse and WC at Avunatari 1.45
Jetty plus Warehouse and WC at Narovrovo 1.45
Jetty plus Warehouse and WC at Toak 1.45
Jetty plus Warehouse and WC at Bwatnapni 1.45
Jetty plus Warehouse and WC at South West Bay
1.45
Jetty plus Warehouse and WC at Sola- Motalava
1.45
Jetty plus Warehouse and WC at Ngala 1.45 .
Jetty plus Warehouse and WC at Ravenga 1.45
Jetty plus Warehouse and WC at Analcauhat 1.45
Jetty plus Warehouse and WC at Dillions Bay 1.45
Jetty plus Warehouse and WC at Harold Bay 1.45
Urban Water Supply and Assimilate
USW2 (Bundle)
Priority Sub-Projects 1) 0.090 0.96 4.9 4
4 Provincial capitals Water Supply System Development (Total Bundle)
0.299 3.20
Lakatoro Water Supply Project 0.80
Isangel Water Supply Project 1.00
Sola Water Supply Project (Sola, Santa Maria, Torba REDI Tourism Project, Arep School)
0.20
Saratamata Water Supply and Sanitation Project (North Pentecost, Saratamata, Londua School)
1.20
Rural Water Supply
RWS2 (Bundle)
Priority Sub-Projects1 0.047 0.50 4.9 2
Rural Water Supply in Every Province (Total Bundle)
0155 1.66
Dillons Bay Water 0.050
Wintua Water Supply 0.050
Ikwarramanu Water Supply 0.060
Latano Water Supply 0.070

VISIP 2015 - 2024 | Prioritisation of Projects for VISIP 2015
74
Project No.
Sector/Project Name Investment
Value (VUV b)
Investment Value
(USD m)
Maintenance Rate p.a. %
Maintenance Cost
(VUV m p.a.)
Londua Rainwater Catchment 0.050
Lamkail Water Supply 0.040
Yanepkasu Water Supply 0.080
Crab Bay Water Supply 0.020
Faralou Water Supply 0.050
Nguna Water Supply 0.150
Haehivo Water Supply 0.660
SE Santo Drilling 0.120
Malo Drilling 0.130
Malo Handpump Replacement 0.090
Palumsi (Pangi) Water Supply 0.040
7 Total 1 6.822 73.08 142
1 Priority sub-projects to be confirmed up to 30% of total bundled projects values
4.4.3 CATEGORY 3: PRIVATE PUBLIC INVESTMENT PROJECTS
Table 48 documents the privately funded public infrastructure investment of the short list identified under VISIP 2015.
Table 48: Priority Privately funded Public Infrastructure Investment under VISIP 2015
Project No.
Sector/Project Name Investment
Value (VUV b)
Investment Value
(USD m)
Maintenance Rate p.a. %
Maintenance Cost p.a.
(VUV m p.a.)
Renewable Energy Supply
En5 Takara Geothermal Power Plant (4+4 MW) Preparatory Study & Investment
10.082 108.00 3.5 353
1 Total 10.082 108.00 353
4.4.4 SPREAD OF PROPOSED INVESTMENTS BY SECTORS & GEOGRAPHICALLY
Figures 16 to 18 document the spread by value of proposed investments by sectors and geographically by province as well as per capita. In comparison with ongoing projects (see previous section), the proposed investments retain a similar sector emphasis on road transport, a reduction in the relative importance of maritime transport, but significantly increased emphasis on energy. Geographically, there is a better spread of projects in the proposed list compared to the ongoing projects: the proposed projects are less concentrated in the capital island.

VISIP 2015 - 2024 | Prioritisation of Projects for VISIP 2015
75
Figure 16: Sectoral Spread of Short Listed Priority Investments – VISIP 2015
Figure 17: Geographic Spread of Short List of Priority Investments – VISIP 2015
Figure 18: Per Capita Investment/Province (Proposed Projects: USD/Capita)
Source: VISIP 2015 Calculation
Torba 0%
Sanma 28%
Penama 0% Malampa
9%
Shefa 39%
Tafea 1%
Multi-Provinces
23%
0
500
1000
1500
2000
2500
0
2442
11
1017
1992
154
407
Multi Sectors 6%
Road 26%
Aviation 5%
Shipping 14%
Water Supply & Sanitation
2%
Energy 35%
ICT 6%
Agriculture 1%
Education 4%

VISIP 2015 - 2024 | Prioritisation of Projects for VISIP 2015
76
VISIP 2015 – 2024 | Funding Strategy
77
5 Funding Strategy
5.1 Government Financial Strategy
Section 22 of the Public Finance and Economic Management (PFEM) Act requires the GoV to pursue its policy objectives using the principles of responsible fiscal management including:
reducing and then managing total state debt at prudent levels to provide a buffer against factors that may adversely affect the level of total state debt in the future;
ensuring that, unless such levels have been achieved, the total overall state expenditures in each financial year are less than its total overall receipts in the same financial year;
achieving and maintaining levels of the state net worth that provide a buffer against factors that may adversely affect the state's net worth in the future;
managing prudently the fiscal risks facing the state; and
pursuing policies consistent with a reasonable degree of predictability about the level and stability of tax rates for future years.
Vanuatu has been a conservative borrower. This trend is likely to continue under current fiscal policies, although loan finance for infrastructure has increased lately, due primarily to the Port Vila (and Luganville) Urban Development Project and the Inter-Island Shipping Support Project funded by ADB, the Tanna and Malekula Roads Upgrade Project and the Convention Centre in Port Vila funded by China, and the JICA-funded International Wharf Project in Port Vila (currently on hold pending a financial resolution for meeting higher than expected capital costs).
Budget documents in 2014 and 2015 state GoV’s fiscal and debt management policies as follows (the text is from the 2015 budget but is expressed similarly in the 2014’s budget):
“Budget Management
The 2015 budget will be managed in a way that is consistent with the Public Finance and Economic Management Act. The Government will ensure that there is effective administration, compliance and enforcement of the existing tax to provide enough funding to meet Government expenditure programs and activities. In addition, the Government will continue to commit itself in managing state debt and implement revenue and expenditure measures to achieve a balanced budget in 2015.
“Government Debt and Borrowing
The Government will continue to manage state debt at a prudent and sustainable level in 2015 and years thereafter. From 2015 onwards, new borrowing will be prioritise towards productive purpose such as capital investment projects that will enhance economic growth and generate future capacity to repay the loans bestowed upon future generations. In addition, repayment of state debt will depend on the revenue raised and implementation of expenditure programmes.”
In the 2015 budget, debt management policy is succinctly summarised as “…debt maintained at prudent levels so its share of GDP remains below 40.0 per cent”.
26 Vanuatu’s current external debt level is about 12% of GDP.
GoV currently funds very little infrastructure and other capital expenditure from domestic revenues. It relies on a narrow tax base (largely VAT, excise, and import duties); barring a broadening of this, it is unlikely that the government will be able to fund major infrastructure projects from domestic revenues in the medium term. Development partner grants (and
26 IMF, Vanuatu: 2013 Article IV Consultation – Staff Report.

VISIP 2015 – 2024 | Funding Strategy
78
more recently concessional loans) have been the main source of finance for infrastructure. Table 49 summarises the broad aggregates in the national budget in recent years.
The medium-term projections IMF27
prepared for central government operation show capital expenditure against cash grants from donors, as in Figure 19. The figure is evidence of a highly constrained infrastructure investment in Vanuatu. There appear to be two major issues behind this: (i) severely limited domestic public financial resources available for infrastructure investment; and (ii) limited institutional capacity to absorb and execute infrastructure investment (from domestic or external sources). As the VISIP proceeds, both constraints are expected to ease and the ‘funding envelope’ available to infrastructure investment should expand. However, in the short term resource constraints will limit what can be accomplished.
It is clear that domestic resources for infrastructure investment, to augment those from the donor community, need to be increased (as discussed below), to raise the pace of infrastructure investment commensurate with GoV’s development goals.
Figure 19: Development partner Grants and Investment
27 IMF, Vanuatu: 2013 Article IV Consultation – Staff Report.

VISIP 2015 – 2024 | Funding Strategy
79
Table 49: Selected Economic and Financial Indicators with Projections, 2008-18
Est. Projected
2008 2009 2010 2011 2012 2013 2014 2015 2016 2017 2018
Nominal GDP, VUV billion 61.6 65.1 67.9 70.3 72.9 76.4 81.1 87.0 93.0 100.0 107.0
Output and prices (annual % change)
Real GDP 6.5 3.3 1.6 1.4 2.3 3.3 4.2 4.8 4.5 4.3 4.0
Consumer Prices (period average)
4.2 5.2 2.7 0.7 1.4 1.4 1.9 2.3 2.8 3.0 3.0
Government finance (% GDP)
Revenue 27.0 26.0 24.6 22.4 21.7 22.7 23.9 23.6 23.1 22.5 21.9
Domestic Revenue 20.5 18.9 18.1 18.3 18.7 18.4 18.5 18.6 18.7 18.8 18.8
Grants 6.4 7.1 6.5 4.1 3.0 4.3 5.3 5.0 4.4 3.7 3.1
Expenditure 27.0 26.8 27.1 24.6 23.3 23.7 26.0 26.6 26.7 24.8 24.0
Expense 22.0 20.4 22.2 21.9 21.7 23.2 22.8 22.5 22.4 22.1 21.9
Investment 5.0 6.4 4.9 2.7 1.6 0.6 3.2 4.2 4.3 2.7 2.1
Investment, VUV billion 3.1 4.2 3.3 1.9 1.2 0.5 2.6 3.7 4.0 2.7 2.2
Debt and Debt Service (% GDP)
Public Debt (end of period) 20.6 20.5 19.4 20.9 21.6 21.6 22.5 24.0 25.9 26.4 26.7
Domestic 4.2 3.8 4.8 6.0 7.7 8.8 10.5 10.6 10.4 11.2 12.5
External 16.4 16.7 14.5 14.8 13.9 12.8 12.0 13.4 15.5 15.2 14.2
Debt Service 0.9 1.1 0.9 1.0 1.0 2.2 1.8 2.0 2.2 2.3 2.2
Source: IMF, Vanuatu: 2013 Article IV Consultation – IMF Country Report No 13/169 / Table 3 / p.19
Given that, under the current fiscal constraints, there is little expectation that government will move to finance a significant infrastructure investment from domestic revenues, the IMF
28 has recommended (and GoV is in agreement)
that the tax base be broadened to include a modest income tax, explicitly to relax a constraint in infrastructure investment (and maintenance):
“The fiscal space for scaling up public investment or for higher spending on maintenance and social services is constrained. Vanuatu has been relying on a mix of grants and concessional borrowing to finance
public investment, including the current pipeline of projects scheduled for implementation during 2013–2017, which would raise public debt by around 4¼ percentage points by 2017. Maintaining the debt-to-GDP ratio broadly constant over the long term without tax policy measures would result in public investment declining to below 1 percent of GDP. To sustain higher levels of capital spending without raising the debt-to- GDP ratio further, new non debt-creating sources of revenue will be needed to supplement aid flows.
“Vanuatu’s domestic revenue, at 18½ percent of GDP, is low relative to its Pacific island peers, suggesting scope to increase revenue. There are various options for domestic revenue mobilisation:
- “Strengthening compliance should result in continued improvements in VAT collection, but the scope for further improvements is relatively narrow.
- “Raising the VAT rate from the current 12.5 percent to 15 percent could yield additional revenue relatively quickly, but would disproportionately hit the poorer segments of the population and would likely generate lower revenue than an income tax (some 1–1 ½ percent of GDP).
- “Conversely, the introduction of an income tax, levied on both wage earners and corporates, could yield between 3 and 4 percent of GDP at modest tax rates, and bring greater equity to the tax system. Staff estimates suggest that additional revenue of this magnitude would allow for sustaining the rate of public investment at a level consistent with higher growth, as well as finance a modest increase in current expenditure.”
Prior to 2010 the budget was more-or-less balanced but since 2010, GoV has run deficits of 1.0% or greater of GDP. The 2013 budget estimates a deficit equivalent to 1.0% of GDP, forecast to grow to 2.1% of GDP in 2014 and between 2.0% and 3.0% of GDP in subsequent years. This reflects a higher level of development expenditure financed by concessional borrowing. IMF analysis indicates that Vanuatu’s debt management has been prudent and the country is not over-indebted (implying that further infrastructure loan debt could be incurred). But the analysis suggests the country should seek external assistance as grants primarily, and should increase domestic tax revenues. Confidence in current debt management assumes “…strict public expenditure restraint, especially in investment, in the absence of higher revenues …. The authorities should maintain their cautious borrowing policies to protect strong fiscal cushions, in particular given significant fiscal contingencies. They need to carefully assess financing of new projects with a view to maintaining debt sustainability.”
28 Ibid.

VISIP 2015 – 2024 | Funding Strategy
80
5.2 VISIP Funding Strategy
The strategy for financing economic infrastructure priority projects in the VISIP has been developed with MFEM. GoV’s direct funding from current revenues for infrastructure investment has been negligible, and is not expected to increase significantly in the short term. GoV funding for infrastructure O&M has averaged slightly less than VUV1.0 billion annually (about 1% of GDP), largely for roads and airstrips. A comprehensive effort to prioritising investments to follow VISIP and estimating recurrent operation and maintenance expenses systematically is in its initial stages. Potential contributions from development partners are better known, but GoV is engaging with the donor community using new policies and GoV investment priorities especially for funding O&M. The following principles will guide the funding strategy:
i. Ensure that available funding for economic infrastructure from GoV and its development partners roughly matches the total capital and maintenance expenditures for the proposed investments in VISIP (Section 1.6.2).
ii. Ensure that funds are made available for operating and maintaining new infrastructure for the infrastructure’s lifetime. Line ministries sponsoring projects for the VISIP short list will estimate such costs by preparing project profiles. After DSPPAC review, ministries refine estimates as project preparation proceeds under the VISIP project selection process (Section 1.3.3).
iii. Use CSOs to achieve GoV’s social and community objectives so as to not undermine the financial performance of existing or potential new SOEs or private utilities.
iv. Continue to develop a GoV debt management strategy to ensure that debt distress through infrastructure investment does not occur. Use grants to fund infrastructure investment and strictly limit the use of loans to those investments that will best boost the country’s productive capacity (Section 1.7.2).
5.3 Infrastructure Funding Requirements
5.3.1 ESTIMATING CAPITAL AND ANNUAL O&M COSTS
In assessing the funding requirements to support VISIP, the line ministries identify the timing and programming of the priority projects for DSPPAC confirmation. This process involves (i) refining the project short list using the VISIP selection methodology; and (ii) discussing potential contributions to the short list from external sources and the GoV, by consulting development partners and MFEM. This is an iterative process during the first year of VISIP implementation. Once funding is secured for the shortlisted projects, they will be implemented over 10 years. The line ministries will confirm this as they continue detailed feasibility studies for each project.
Tables 50 and 51 summarise the investment and annual O&M costs of ongoing and proposed shortlisted projects, with funding sources and indicative timing estimates.
For ongoing and proposed projects, external grants and concessional loans fund investment costs. Grants are preferred for proposed projects, but some concessional loan finance will also be needed. A spread between loans, grants, and private funding is estimated. Where a project is funded by a loan and a grant, a 50-50 split is assumed.
For the priority proposed investment projects, using similar assumptions the following split of funding has been estimated:
Grants: VUV11.71 billion
Loans : VUV13.89 billion
Private funding: VUV12.37 billion

VISIP 2015 – 2024 | Funding Strategy
81
Table 50: Ongoing Projects Funding
Project No.
Project
Est. Cost ($m
USD)
Est. Cost
(b VUV)
Ministry in Charge
Source(s) of Investment
Finance
Type of Finance Estimated
Maintenance Cost
(m VUV p.a.)
Status Timing
(when known)
Lo
an
Gra
nt
Pri
vate
MIPU
Multi-Sector
O-MS1 Port Vila Urban Development Project (Phase 1) (PVUDP)
39.00 3.640 MIPU Australian Aid/
ADB ✓ ✓ 91 O
2012 –2018
Road
O-Rd1 Vanuatu Transport Sector Support Program – (VTSSP)
14.60 1.363 MIPU Australian Aid ✓ 34 O 2009-2017
O-Rd2 Tanna Rural Roads and Malekula Ring Road Rehabilitation
55.00 5.134 MIPU China Aid (loan) ✓ 128 O ??
O-Rd3 Epi Roads Rehabilitation 12.40 1.157 MIPU Multiple
Development partners
✓ 29 O ??
Shipping
O-Sh1 Vanuatu Inter-Island Shipping Support Program including (VISSP)
31.21 2.913 MIPU NZMFAT/ADB ✓ ✓ 73 O 2012 - 2016
O-Sh2 Port Vila Lapetasi International Multipurpose Wharf Development Project (IMWDP)
70.00 6.535 MIPU Australian Aid/
JICA ✓ ✓ 163 O
2012 - 2017
Urban Water Supply
O-UWS1 Desalination Plants for Aniwa and East Ambae 4.00 0.373 MIPU Japan
Government ✓ 9 O
2012 - 2015
Total MIPU 226.21 21.115 528
MCCDRM
Grid
O-En1 Vanuatu Rural Electricity Project (Off Grid Home and Public Facilities) (VREP)
15.00 1.400 MCCDRM NZMFAT/WB ✓ 35 O 2012-2017
O-En2 Lighting of Luganville Town Streets 2.50 0.233 MCCDRM VUI ✓ 6 O 2011-2016
O-En3 GPOBA Grid Based Electricity Project 4.85 0.453 MCCDRM Australian AID
/WB ✓ 11 O
2014-2018
O-En4 UAE Solar Grid Connected Project, Vila 5.00 0.467 MCCDRM UAE ✓ 12 O 2014-2015
Renewable Energy Supply
O-En5 Demonstration Rural Biofuel Project (Malekula, Ambae, Vanu Lava)
2.20 0.205 MCCDRM EU ✓ 5 O 2012 - 2015

VISIP 2015 – 2024 | Funding Strategy
82
Project No.
Project
Est. Cost ($m
USD)
Est. Cost
(b VUV)
Ministry in Charge
Source(s) of Investment
Finance
Type of Finance Estimated
Maintenance Cost
(m VUV p.a.)
Status Timing
(when known)
Lo
an
Gra
nt
Pri
vate
Climate Change
O-DM1 Environmental Improvement Measures 4.00 0.373 MCCDRM PEC ✓ 9 O
Total MCCDRM 33.55 3.131 78
MTTCI
O-To1 Vanuatu Tourism Infrastructure Project (Sea Front, Fatumaru Bay, Port Side) (VTIP)
18.00 1.680 MTTCI NZMFAT, EIF (WTO), GoV
✓ 42 O 2013-2016
Total MTTCI 18.00 1.680 42
OGCIO
O-ICT1 Submarine Broadband Cable – Phase 1 40.00 3.734 OGCIO Private Sector ✓ 93 O
O-ICT2 SOE (Std. Operating Environment) Project, phase 1, servers standardisation & upgrading
0.64 0.060 OGCIO Recurrent budget
of OGCIO 2 O
2014 - 2015
O-ICT3 TRR UAP computer labs, tablets, Internet cafes; phase 1
0.70 0.065 TRR Australian Aid/
Universal Access Fund
✓ ✓ 2 O 2014-2015
Total OGCIO 41.34 3.859 96
MOE
O-Ed1 Vanuatu Education Support Program (Pilot Rehabilitation Primary Schools) (VESP)
4.70 0.439 MOE NZMFAT,
Australian Aid ✓ 11 O
2014 - 2018
O-Ed2 Yearly Build-up of 4 to 6 - 2 Classes Primary School Buildings
1.00 0.093 MOE Japan
Government (Volunteers)
✓ 2 O 2000 - open
ended
Total MOE 5.70 0.532 13
MOH
O-He1 Redevelopment of the Vila Central Hospital 13.80 1.288 MOH JICA ✓ 32 O 2012 - 2014
O-He2 Pilot Rehabilitation Rural Health Centres and Dispensaries
1.40 0.131 MOH Australian Aid ✓ 3 O 2010 - 2016
O-He3 Refurbishing Aneityum Dispensary 0.17 0.016 MOH P&O Cruise ✓ 0,4 O 2013-2014
O-He4 Disaster Risk Mitigation Infrastructure and Equipments at Hospitals
0.58 0.054 MOH Australian Aid ✓ 1 O 2010-2016
O-He5 Improvement of Pharmaceutical Storage 0.06 0.006 MOH Australian Aid ✓ 0,2 O 2010-2016
O-He6 Lolowai Hospital Refurbishment 0.21 0.020 MOH Rotary
International ✓ 1 O
2013-2014
Total MOH 16.22 1.515 38
MJCS

VISIP 2015 – 2024 | Funding Strategy
83
Project No.
Project
Est. Cost ($m
USD)
Est. Cost
(b VUV)
Ministry in Charge
Source(s) of Investment
Finance
Type of Finance
Estimated Maintenance
Cost (m VUV p.a.)
Status Timing
(when known)
Lo
an
Gra
nt
Pri
vate
O-Ju1 Police Post Rehabilitation No data No data MJCS Australian Aid ✓ No data O 2014 - 2016
Total MJCS
PMO
O-PM1 Convention Centre 14.40 1.344 PMO China Aid ✓ 34 O 2013-2016
Total PMO 14.40 1.344 34
Grand Total Ongoing Projects 355.42 33.176 13.02 15.20 4.96 830

VISIP 2015 – 2024 | Funding Strategy
84
Table 51: Funding Requirements for VISIP 2015
Project No. Sector / Project name Status1
Estimated Cost
($m USD)
Estimated Cost
(b VUV)
Estimated Maintenance
Cost (m VUV p.a.)
Public Funding (loans/ grants)
Public Private Partner-
ships
Private sector
(conces-sionaires)
Multi-Sector
MS1
Vanuatu Urban Development Project (Phase 2 - Luganville, Port Vila)
P 22.50 2.100 32 ✓
Road
Rd1 Santo South Coast Road Rehabilitation
P 25.60 2.390 48 ✓
Rd2 Sealing of Tanna Roads Whitegrass to Isangel
P 5.00 0.467 9 ✓
Rd3 Malekula East Coast Road Rehabilitation
P 31.40 2.931 56 ✓
Rd4 Bundle Road Rehabilitation and Improvement in Every Province
P2 19.95 1.862 37 ✓
Rd6 Bundle
Rural and Feeder Roads Rehabilitation and Development in Every Province
P2 24.75 2.310 46 ✓
Aviation
Av2 Bundle Upgrading Airports of Category A
P2 18.90 1.764 35 ✓
Av3 Bundle Upgrading Airfields of Category B
P2 2.82 0.263 6 ✓
Shipping
Sh1
Rehabilitation and Extension of Luganville International Wharf
P 53.56 5.000 95 ✓
Sh4 Bundle Domestic Jetties Construction in Every Province
P2 5.21 0.486 9 ✓
Urban Water Supply and Assimilate
UWS1 Luganville Existing Water Supply System Rehabilitation
P 4.10 0.383 19 ✓
UWS2 Bundle 4 Provincial Capitals Water Supply System Development
P2 0.96 0.090 4 ✓
Urban Solid Waste
SW2 Luganville Solid Waste Management
P 1.50 0.140 4 ✓
Power Grid
En1
Grid Extension (Matelevu to Shark Bay, Port Olry, Stone Hill and Palekula), East Cost Santo
C 2.40 0.224 7 ✓ ✓
En2
Low Voltage (LV) and Medium Voltage (MV) Extension (Vila, Santo, Malekula)
P 18.00 1.680 50 ✓ ✓
Renewable Energy Supply
En4 Efate Grid Connected Solar Panels (1 MW) Project
P 5.60 0.523 16 ✓
En5
Takara Geothermal Power Plant (4+4 MW) Preparatory Study & Investment
P 108.00 10.082 353 ✓
En6 Brenwe Hydro Power Project (< 1.2MW), Malekula
P 5.60 0.523 18 ✓

VISIP 2015 – 2024 | Funding Strategy
85
Project No. Sector / Project name Status1
Estimated Cost
($m USD)
Estimated Cost
(b VUV)
Estimated Maintenance
Cost (m VUV p.a.)
Public Funding (loans/ grants)
Public Private Partner-
ships
Private sector
(conces-sionaires)
En7 Sarakata Hydro Power Extension Project (+600 KW), Santo
P 4.25 0.397 14 ✓
Rural Water Supply
RWS1
Rural Water Supply Lamap, East Malo, Wala Rono, West Ambae
C 1.00 0.093 2 ✓
RWS2 Bundle Rural Water Supply in Every Province
P 2) 0.50 0.047 2 ✓
ICT
ICT7 New Government Data Center + Backup
P 1.00 0.093 2 ✓
ICT11
Implementation of iGov Strategic Plan including planning WB/ADB ICT loan package
P 20.15 1.881 47 ✓
ICT14
Expansion of Government Broadband Network (GBN), Phase 2 (more connectivity in provincial capitals and towns)
P 2.00 0.187 5 ✓
Education
Ed1 Reconstruction College Malapoa
C 16.00 1.494 30 ✓
Agriculture
Ag1 National Diagnostic Laboratory Bureau of Standards
P 6.00 0.560 22 ✓
26 Total 406.75 37.970 968
1 P=Proposed, C=Committed 2 Corresponding to 30% of sub-projects value within each bundle expected to be funded within 10 years
The tables show that the programme for ongoing projects up to 2018 is relatively well defined and funds committed, as would be expected. Proposed projects, however, are not so well defined. Projects to be implemented in these years are yet to be fully scoped, or are at the feasibility study stage, with key details still be to be resolved. The total funding requirement for capital costs for ongoing and proposed projects amounts to about VUV71.2 billion over the next 10 years.
Many of the projects identified as priorities in the VISIP will require several years for implementation because of their scale and complexity. Moreover, as discussed below, very substantial operation and maintenance expenditures are estimated for the ongoing and proposed shortlist of projects (some VUV1.8 billion annually) that will need to be programmed into GoV commitments to sustain the projects. At present, this may be difficult for GoV to accommodate in its budgeting and accounting systems.
It may therefore be desirable, with donor assistance, to create specialised funds or special purpose vehicles to enable project delivery. GoV has been discussing a specialised maintenance fund for the transport sector, under which a ‘trust fund’ agreement would receive contributions from donor and GoV funds. These would be expended for closely defined purposes under independent management (with donor participation). If it proves successful, the concept could be extended to other sectors, such as health, education, and public buildings.
5.3.2 ESTIMATING THE WHOLE OF LIFE COSTS
A key objective of the VISIP process is to develop a sustainable infrastructure investment plan. This should allow for ongoing costs and initial capital costs. The VISIP must incorporate these ‘whole of life costs’.
For the purposes of the VISIP whole of life costs have been defined to include:
i. concept development and planning – the cost of planning studies, developing the design concept, and associated studies such as environmental impact assessments;
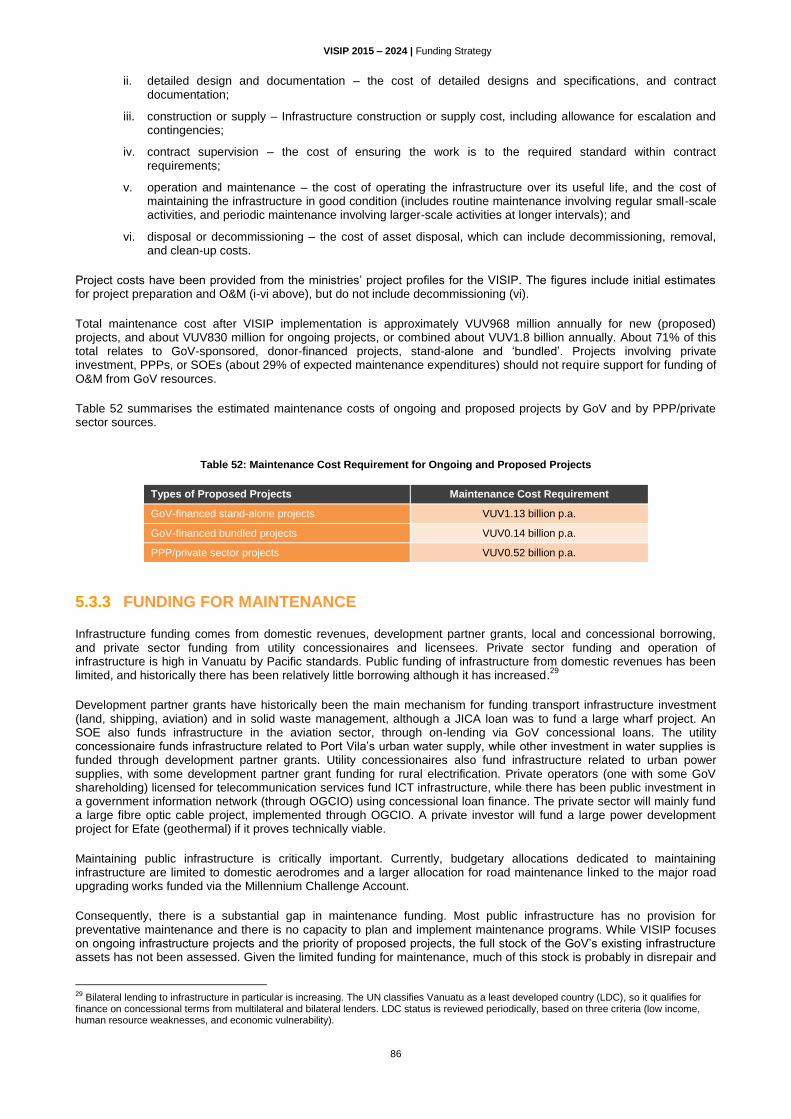
VISIP 2015 – 2024 | Funding Strategy
86
ii. detailed design and documentation – the cost of detailed designs and specifications, and contract documentation;
iii. construction or supply – Infrastructure construction or supply cost, including allowance for escalation and contingencies;
iv. contract supervision – the cost of ensuring the work is to the required standard within contract requirements;
v. operation and maintenance – the cost of operating the infrastructure over its useful life, and the cost of maintaining the infrastructure in good condition (includes routine maintenance involving regular small-scale activities, and periodic maintenance involving larger-scale activities at longer intervals); and
vi. disposal or decommissioning – the cost of asset disposal, which can include decommissioning, removal, and clean-up costs.
Project costs have been provided from the ministries’ project profiles for the VISIP. The figures include initial estimates for project preparation and O&M (i-vi above), but do not include decommissioning (vi).
Total maintenance cost after VISIP implementation is approximately VUV968 million annually for new (proposed) projects, and about VUV830 million for ongoing projects, or combined about VUV1.8 billion annually. About 71% of this total relates to GoV-sponsored, donor-financed projects, stand-alone and ‘bundled’. Projects involving private investment, PPPs, or SOEs (about 29% of expected maintenance expenditures) should not require support for funding of O&M from GoV resources.
Table 52 summarises the estimated maintenance costs of ongoing and proposed projects by GoV and by PPP/private sector sources.
Table 52: Maintenance Cost Requirement for Ongoing and Proposed Projects
Types of Proposed Projects Maintenance Cost Requirement
GoV-financed stand-alone projects VUV1.13 billion p.a.
GoV-financed bundled projects VUV0.14 billion p.a.
PPP/private sector projects VUV0.52 billion p.a.
5.3.3 FUNDING FOR MAINTENANCE
Infrastructure funding comes from domestic revenues, development partner grants, local and concessional borrowing, and private sector funding from utility concessionaires and licensees. Private sector funding and operation of infrastructure is high in Vanuatu by Pacific standards. Public funding of infrastructure from domestic revenues has been limited, and historically there has been relatively little borrowing although it has increased.
29
Development partner grants have historically been the main mechanism for funding transport infrastructure investment (land, shipping, aviation) and in solid waste management, although a JICA loan was to fund a large wharf project. An SOE also funds infrastructure in the aviation sector, through on-lending via GoV concessional loans. The utility concessionaire funds infrastructure related to Port Vila’s urban water supply, while other investment in water supplies is funded through development partner grants. Utility concessionaires also fund infrastructure related to urban power supplies, with some development partner grant funding for rural electrification. Private operators (one with some GoV shareholding) licensed for telecommunication services fund ICT infrastructure, while there has been public investment in a government information network (through OGCIO) using concessional loan finance. The private sector will mainly fund a large fibre optic cable project, implemented through OGCIO. A private investor will fund a large power development project for Efate (geothermal) if it proves technically viable.
Maintaining public infrastructure is critically important. Currently, budgetary allocations dedicated to maintaining infrastructure are limited to domestic aerodromes and a larger allocation for road maintenance linked to the major road upgrading works funded via the Millennium Challenge Account.
Consequently, there is a substantial gap in maintenance funding. Most public infrastructure has no provision for preventative maintenance and there is no capacity to plan and implement maintenance programs. While VISIP focuses on ongoing infrastructure projects and the priority of proposed projects, the full stock of the GoV’s existing infrastructure assets has not been assessed. Given the limited funding for maintenance, much of this stock is probably in disrepair and
29 Bilateral lending to infrastructure in particular is increasing. The UN classifies Vanuatu as a least developed country (LDC), so it qualifies for finance on concessional terms from multilateral and bilateral lenders. LDC status is reviewed periodically, based on three criteria (low income, human resource weaknesses, and economic vulnerability).

VISIP 2015 – 2024 | Funding Strategy
87
needs rehabilitation. The cost of such ‘backlog’ maintenance is unknown, as is the amount that GoV should be spending annually to maintain existing assets.
Significant changes are emerging in financing infrastructure. More interest is being shown in bilateral and multilateral concessional loan finance, with committed projects in infrastructure for shipping and urban development involving a mix of concessional loans and development partner grants. However, in the short term Vanuatu’s conservative debt management approach will emphasise financing infrastructure investments with grants rather than loans. Public-private partnerships (PPPs) and private sector funding are being used to fund energy/power, aviation, and ICT infrastructure investments. These changes reflect a push to diversify and boost infrastructure investment, which recognises that infrastructure plays a key role in sustaining a healthy economy. Until financial and institutional constraints to infrastructure investment and maintenance can be relaxed, the scope for financially sustainable new infrastructure investment remains constrained.
While the immediate constraint is the capacity to plan and implement maintenance, it is important to secure sufficient funding for O&M in the design of new projects and support for ongoing ones. Table 53 summarises sources for funding maintenance for sub sectors.
Table 53: Sources of Funding for Infrastructure Maintenance* (VUV million)
Sector GoV Consolidated
Revenue Appropriation
PPP/SOE (User Fees)
Private sector concessionaire
(User Fees) Total
O P O P O P O P
Urban Development 91 32 91 32
Roads 191 196 191 196
Aviation 40 40
Shipping 236 104 236 104
Urban Water Supply 9 23 9 23
Solid Waste 4 4
Power Grid 64 57 64 57
Renewable Energy 5 401 5 401
Climate Change Adaptation 9 9
Tourism 42 42
Rural Water Supply 4 4
ICT 96 54 96 54
Education 13 30 13 30
Agriculture 22 22
Health 38 38
Justice ?? ??
Public Buildings 34 34
Total 654 384 165 556 9 27 832 963 * O=Ongoing Projects, P=Proposed Projects
Infrastructure maintenance could compete more successfully for funding in the budget process if there is better demonstration of its effectiveness. For project formulation, line ministries will need to set out a project’s essential concept in a brief project profile that must include at least preliminary estimates of O&M costs for the project over its life. These estimates will be refined iteratively as the project is developed further and as experience is gained with similar projects. As the capacity to plan and manage maintenance improves, GoV can explore more options for boosting maintenance funding. These include reallocation within the budget, and new revenue measures (as IMF has recommended).
5.4 Recent Infrastructure Funding
Table 50 (section 5.3.1) summarises expenditure on infrastructure development projects in Vanuatu from all sources, including GoV, development partners, and the private sector. As mentioned, GoV ongoing direct expenditure on infrastructure investment is negligible, currently limited to environmental improvements, a contribution to a foreshore upgrade project for tourism in Port Vila, and development of a GoV Internet network. Current GoV expenditure for infrastructure maintenance is also small (under VUV1 billion).
The private sector is supporting approximately VUV4 billion in infrastructure investments, primarily for an undersea fibre-optic cable (VUV3.7 billion) to improve Internet services and telecommunications, but including projects to upgrade street lighting in Luganville, and two small projects to refurbish rural health facilities. The balance of ongoing infrastructure investment, more than VUV28 billion planned to be expended from 2012 to 2018, is provided through concessional loans and development partner grants.

VISIP 2015 – 2024 | Funding Strategy
88
5.4.1 PRIVATE SECTOR PARTICIPATION AND PUBLIC PRIVATE PARTNERSHIPS
Among Pacific island countries, Vanuatu has long been well advanced in involving the private sector in infrastructure service provision, especially in the urban (and limited rural) electricity supply, urban water supply, telecommunications, and maritime transport. The private sector is likely fund undersea cable facilities to support broadband communications. Though the electricity and urban water supply are monopolies under long-term concessionaire agreements, telecommunications has benefited from the introduction of limited competition to replace the traditional monopoly model. Vanuatu has also been a regional leader in developing effective regulation over the electricity supply, the water supply, and telecommunications. Regulation of maritime safety is also close to reality, with legislation pending. PPPs are expected to be instrumental in developing grid-connected renewable energy.
5.4.2 STATE-OWNED ENTERPRISES
Because the private sector has long been involved in core infrastructure sectors in Vanuatu (electricity, water, telecommunications, maritime transport), SOEs are not as prominent in service delivery as they are in other Pacific island countries (Fiji, the Solomon Islands, PNG). The only major SOE investing in infrastructure in Vanuatu is Airports Vanuatu Ltd (AVL). As an SOE, AVL has been profitable and can meet some maintenance expenditures, but has little capacity to fund new investment. It is subject to the Civil Aviation Authority of Vanuatu.
OGCIO, an agency in PMO, acts somewhat like an SOE as it undertakes direct investment (largely with private sector funds) and provides services for a fee.
UNELCO and VUI maintain infrastructure in the urban power sub-sector and for Port Vila water supply and both are subject to URA regulation. Telecom Vanuatu Ltd, Digicel, and Telsat maintain telecoms infrastructure, all under TRR regulation. This arrangement leaves Vanuatu well placed compared to Pacific neighbours, with private companies performing well in technical dimensions of performance. In contrast to SOE or private sector-sponsored projects, the many projects involving GoV public investment will rely on the national budget for maintenance funding.
5.5 Vanuatu Government Budget
There is little expectation that government will move to finance a significant amount of infrastructure investment from domestic revenues.
In 2013 GoV started drawing down loans to fund the Port Vila Lapetasi International Multi-Purpose Wharf Development Project and the Vanuatu Inter-Island Shipping Project supported by ADB, DFAT, and NZMFAT. Despite Government hopes that these projects would help drive strong future economic growth, emerging delays in their implementation due to limited absorptive capacity in the sector may blunt their future economic impact. Recent deficit financing has intensified borrowings, with new borrowing growing by 13% on average between 2008 and 2011; albeit slower than the average 42% growth recorded between 2004 and 2007. New borrowing in 2012 pushed the total stock of public debt (domestic and foreign) up 7% to a new high at VUV15.75 million in 2012 (19% of GDP); up 7% from its level in 2011. At the end of 2014, total public and public external debt remained low at 22.5 and 12 percent of GDP respectively, which is below the 40% threshold identified by IMF.
30
GoV determines its budget annually, from budget requests from line ministries and under prevailing financial instructions. For infrastructure, DSPPAC and MFEM lead the process. DSPPAC liaises with donors for funding for infrastructure investment, although line ministries now also liaise with donors. The VISIP process will strengthen these linkages, with DSPPAC’s project selection process geared to ensure that approved projects are in line with GoV policy. In turn, MFEM will review the selected projects’ budget implications to ensure their financial sustainability. Each bid from the line ministries will be supported by standardised documentation, setting out the project’s rationale.
Once DSPPAC approaches development partners about funding the line ministry bids that have been selected for inclusion in VISIP, DSPPAC sends them to COM, which approves them for implementation. Where development partner funding is allocated to a scheme, this is identified and required match funding is set aside in the budget.
The funding for infrastructure directly from the national budget is expected to progressively rise to support an increasing share of the proposed investment plan documented in VISIP 2015.
30 IMF Country Report 13/169, 2013 Article IV Consultation Report for Vanuatu, June 2013, p.5.

VISIP 2015 – 2024 | Funding Strategy
89
5.6 Development Partner Contributions
5.6.1 SECTOR PRIORITIES
Historically, development partner contributions to infrastructure development in Vanuatu have not been limited by a scarcity of available funding, but by a dearth of good projects. Therefore, the key for securing donor commitments for future projects will be showing policy compliance, value for money in project feasibility assessments, and commitment to sustain project services over the funded assets’ lifetimes.
Development partners emphasised three recommendations during consultations for this report:
infrastructure development requests be centralised and better grounded in GoV policy, with local and community resources (especially land) fully mobilised;
project management and implementation capacity at senior and ministry government levels be strengthened and project absorptive capacity increased; and
projects’ resources for operational and maintenance needs be consistently provided to ensue sustainability.
Donors remain engaged in infrastructure development in Vanuatu and are keen to move projects and programs forward under a final and GoV-endorsed VISIP 2015. The private sector is also significantly involved in renewable power supply, urban and rural electrification, ICT, and urban water utilities.
Development partners’ priority areas of support in infrastructure are not expected to change much overall. Table 54 summarises these:
ADB – urban development (including sanitation and solid waste), marine transport
Australian Aid – roads, ports, grid-connected renewable energy development, telecommunications, health, education, justice (police)
European Union – rural renewable energy development
JICA and Japan Government – marine ports, urban water supply, education, health
New Zealand – marine transport, off-grid renewable energy, tourism, education
World Bank – rural renewable energy development (on-grid and off-grid)
China – rural roads, public buildings
UAE – urban grid-connected renewable energy
Table 54: Current Development partners Activity Trend in Vanuatu
Project No.
Project Cost Est. ($m)
Development Partner
Sponsors
Expected Timing
Disbursement years
Disbursement p.a.
MIPU
Multi Sector
O-MS1 Port Vila Urban Development Project
(Phase 1) (PVUDP) 39.00
Australian
Aid/ADB 2012-2018 7 5.57
Road
O-Rd1 Vanuatu Transport Sector Support
Program – (VTSSP) 14.60 Australian Aid 2009-2017 9 1.62
O-Rd2 Tanna Rural Roads and Malekula
Ring Road Rehabilitation 55.00 China Aid (loan) 2014-2020 7 7.86
O-Rd3 Epi Roads Rehabilitation 12.40
Multiple
Development
partners
2013-2017 5 2.48
Shipping
O-Sh1 Vanuatu Interisland Shipping
Support Program including 31.21 NZMFAT/ ADB 2012-2016 5 6.24
O-Sh2
Port Vila Lapetasi International
Multipurpose Wharf Development
Project (IMWDP)
70.00 Australian
Aid/JICA 2012-2017 6 11.67
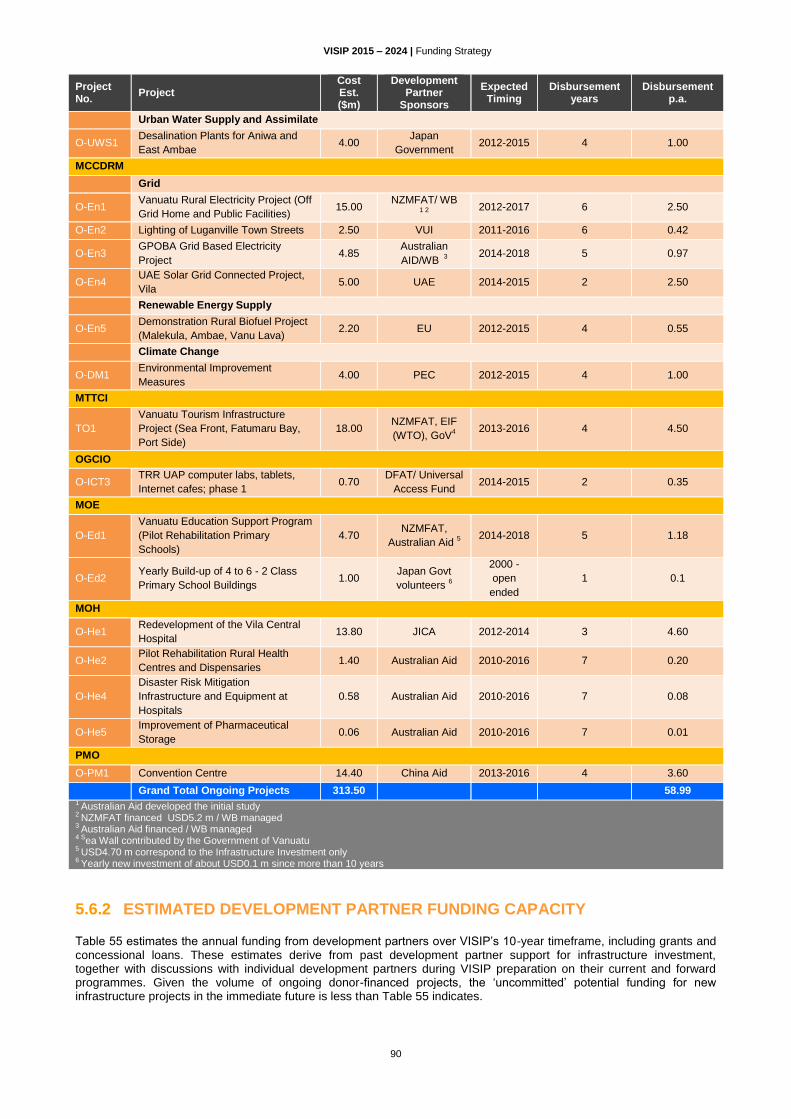
VISIP 2015 – 2024 | Funding Strategy
90
Project No.
Project Cost Est. ($m)
Development Partner
Sponsors
Expected Timing
Disbursement years
Disbursement p.a.
Urban Water Supply and Assimilate
O-UWS1 Desalination Plants for Aniwa and
East Ambae 4.00
Japan
Government 2012-2015 4 1.00
MCCDRM
Grid
O-En1 Vanuatu Rural Electricity Project (Off
Grid Home and Public Facilities) 15.00
NZMFAT/ WB 1 2
2012-2017 6 2.50
O-En2 Lighting of Luganville Town Streets 2.50 VUI 2011-2016 6 0.42
O-En3 GPOBA Grid Based Electricity
Project 4.85
Australian
AID/WB 3
2014-2018 5 0.97
O-En4 UAE Solar Grid Connected Project,
Vila 5.00 UAE 2014-2015 2 2.50
Renewable Energy Supply
O-En5 Demonstration Rural Biofuel Project
(Malekula, Ambae, Vanu Lava) 2.20 EU 2012-2015 4 0.55
Climate Change
O-DM1 Environmental Improvement
Measures 4.00 PEC 2012-2015 4 1.00
MTTCI
TO1
Vanuatu Tourism Infrastructure
Project (Sea Front, Fatumaru Bay,
Port Side)
18.00 NZMFAT, EIF
(WTO), GoV4
2013-2016 4 4.50
OGCIO
O-ICT3 TRR UAP computer labs, tablets,
Internet cafes; phase 1 0.70
DFAT/ Universal
Access Fund 2014-2015 2 0.35
MOE
O-Ed1
Vanuatu Education Support Program
(Pilot Rehabilitation Primary
Schools)
4.70 NZMFAT,
Australian Aid 5
2014-2018 5 1.18
O-Ed2 Yearly Build-up of 4 to 6 - 2 Class
Primary School Buildings 1.00
Japan Govt
volunteers 6
2000 -
open
ended
1 0.1
MOH
O-He1 Redevelopment of the Vila Central
Hospital 13.80 JICA 2012-2014 3 4.60
O-He2 Pilot Rehabilitation Rural Health
Centres and Dispensaries 1.40 Australian Aid 2010-2016 7 0.20
O-He4
Disaster Risk Mitigation
Infrastructure and Equipment at
Hospitals
0.58 Australian Aid 2010-2016 7 0.08
O-He5 Improvement of Pharmaceutical
Storage 0.06 Australian Aid 2010-2016 7 0.01
PMO
O-PM1 Convention Centre 14.40 China Aid 2013-2016 4 3.60
Grand Total Ongoing Projects 313.50 58.99 1 Australian Aid developed the initial study
2 NZMFAT financed USD5.2 m / WB managed
3 Australian Aid financed / WB managed
4 Sea Wall contributed by the Government of Vanuatu 5 USD4.70 m correspond to the Infrastructure Investment only 6 Yearly new investment of about USD0.1 m since more than 10 years
5.6.2 ESTIMATED DEVELOPMENT PARTNER FUNDING CAPACITY
Table 55 estimates the annual funding from development partners over VISIP’s 10-year timeframe, including grants and concessional loans. These estimates derive from past development partner support for infrastructure investment, together with discussions with individual development partners during VISIP preparation on their current and forward programmes. Given the volume of ongoing donor-financed projects, the ‘uncommitted’ potential funding for new infrastructure projects in the immediate future is less than Table 55 indicates.

VISIP 2015 – 2024 | Funding Strategy
91
Table 55: Estimate of Potential Annual Infrastructure Funding
Donor Potential Annual Infrastructure Funding, including
committed* ($ million)
Australian Aid 30
JICA 9
EU 1
World Bank 8
ADB 5
AFD 1
NZ Aid Program 10
China 10
Other 1
Total 74
*Including grants and concessional loans Note: these are indicative estimates, based on discussions with donors
Development partner funding for adaptation to climate change is also a potential source of funding for investment in infrastructure, under the newly-created MCCDRM. Climate change adaptation funding – offered as grants to small island developing countries – is increasing in volume from the Global Environment Facility and other sources, including bilateral funds from the UK, Germany, and Japan.
Potential donor funding is not the most important constraint to infrastructure investment. Current annual donor spending in Vanuatu (USD60 million or VUV5.7 billion) is at or near the limit of the country’s absorptive capacity. Assuming that 75% of spending as in Table 54 is for direct infrastructure investment (not for capacity building programmes and similar activities), a reasonable target for sustained donor-funded infrastructure investment in Vanuatu is approximately USD45 million (VUV4.2 billion) annually. To ensure a high-quality pipeline of projects to absorb even this funding would require extensive reforms to operations budgeting and project selection procedures as this VISIP proposes.
5.7 Overall Funding Envelope
5.7.1 GoV OWN RESOURCES
It is assumed that development funding from GoV internal resources for infrastructure for this plan’s duration will remain quite small at approximately VUV0.1 billion VUV annually. That said, this constrained amount could be increased if GoV expands its tax base as the IMF has recommended.
5.7.2 CONCESSIONAL LOAN AND GRANT FUNDING
Public indebtedness for infrastructure has risen recently and the IMF has advised GoV to constrain the growth in public debt. A specific debt management strategy has not yet been adopted. The public debt remains well below the IMF’s benchmark of 40% of GDP. It is assumed, therefore, that new proposed infrastructure projects will be met by a mixture of grants and concessional loans, with grants preferred.
Vanuatu will be able to sustainably absorb external funding (grants and concessional loans) of about USD45 million (VUV4.2 billion) annually to support investment in priority infrastructure, as VISIP 2015 is implemented. Development partners indicate that average annual funding of this level is available, if a pipeline of good and sustainable projects is developed under VISIP.
5.7.3 PRIVATE SECTOR FUNDING
The magnitude of available funding from the private sector is difficult to assess, as several organisations in this sector feel such information confidential. Further, the scope for new private sector investment in infrastructure in Vanuatu is limited as the private sector is already heavily committed to infrastructure in Vanuatu. A large PPP-type project in the infrastructure shortlist is the grid-connected geothermal energy project for Efate. Though potential private sector contribution to this project is VUV10.4 billion, there is much uncertainty regarding the project. This uncertainty includes which entities are willing to risk the resources to prove the commercial viability of developing the geothermal resource in Efate, and the relative contributions to investment from the private and public sectors.
Still, private sector companies involved in the core infrastructure sectors (especially electricity, water, telecommunications) are profitable and would have substantial funds available for further profitable infrastructure investments in these sectors. For developing the VISIP investment plan, it has been assumed that the amount of such

VISIP 2015 – 2024 | Funding Strategy
92
funding available will be roughly equivalent to the maximum investment indicated in Table 51 (Proposed Projects] for PPP/Private Sector funding, or about VUV2.5 billion annually.
5.7.4 OVERALL FUNDING ENVELOPE
Table 56 below summarises infrastructure funding likely to be available to GoV annually from the various sources described above.
Table 56: Annual Funding Available for Infrastructure Development
Funding Source Expected Funding Available per Annum
for Investment (VUV billion) Percent of Total
Government of Vanuatu 0.1 1.4%
Private Sector 2.5 36.8%
Development partner Concessional Loans and Grants
4.2 61.8%
Total 6.8 100.0%
Based on these estimates, about VUV68.0 billion in funding will be available during the next 10 years, of which approximately VUV35.0 billion is already committed and VUV33.0 billion uncommitted.
The volume of development partner grant-funding is constrained by Vanuatu’s present inability to absorb a substantially greater volume of projects and execute them efficiently. VISIP assigns central project management and execution roles to VPMU, working with the line ministries involved in the projects. With a broadening of the tax base to increase GoV revenues for infrastructure, this development will help relax the current capacity constraints on Vanuatu in developing its infrastructure. It will also allow for a gradual increase in the viable rate of infrastructure investment.
5.8 Tentative Investment Plan for New Projects
Table 57 provides a tentative investment plan for new priority projects identified and documented in the VISIP for 2015-2024. The phasing in of projects follows the scoring of the priority project as shown in figures 12-15 (in Chapter 4). The higher the scoring, the earlier the project would be implemented. The estimated 10 year investment plan for new projects of VUV28 billion fits within the estimated envelope of available funding of VUV33 billion.
Given the implementation backlog of ongoing investments, budget availability for new publicly funded investment is expected to begin to appear only in 2018-2019. As Table 57 shows, towards the end of the planning period, expenditure on public-funded projects falls off as projects in the shortlist are implemented. However, as noted earlier the VISIP process has been designed to generate a frequently refreshed pipeline of projects. It follows that new projects would be added to the shortlist in line infrastructure planning and consequent updates to the VISIP. Funding would also be assed in the VISIP updates, and in this context review available from continued external funding support, private sector contributions to infrastructure, and possibly a gradual increase in contributions from GoV internal resources.
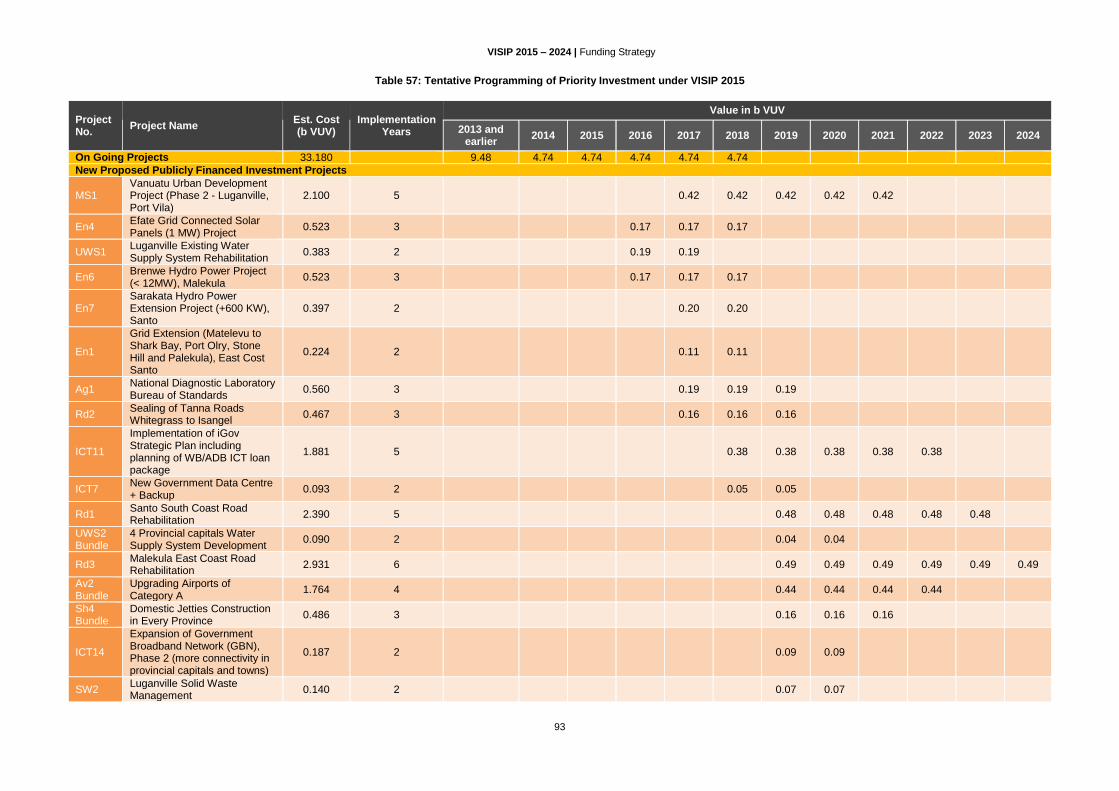
VISIP 2015 – 2024 | Funding Strategy
93
Table 57: Tentative Programming of Priority Investment under VISIP 2015
Project No.
Project Name Est. Cost (b VUV)
Implementation Years
Value in b VUV
2013 and earlier
2014 2015 2016 2017 2018 2019 2020 2021 2022 2023 2024
On Going Projects 33.180 9.48 4.74 4.74 4.74 4.74 4.74
New Proposed Publicly Financed Investment Projects
MS1 Vanuatu Urban Development Project (Phase 2 - Luganville, Port Vila)
2.100 5 0.42 0.42 0.42 0.42 0.42
En4 Efate Grid Connected Solar Panels (1 MW) Project
0.523 3 0.17 0.17 0.17
UWS1 Luganville Existing Water Supply System Rehabilitation
0.383 2 0.19 0.19
En6 Brenwe Hydro Power Project (< 12MW), Malekula
0.523 3 0.17 0.17 0.17
En7 Sarakata Hydro Power Extension Project (+600 KW), Santo
0.397 2 0.20 0.20
En1
Grid Extension (Matelevu to Shark Bay, Port Olry, Stone Hill and Palekula), East Cost Santo
0.224 2 0.11 0.11
Ag1 National Diagnostic Laboratory Bureau of Standards
0.560 3 0.19 0.19 0.19
Rd2 Sealing of Tanna Roads Whitegrass to Isangel
0.467 3 0.16 0.16 0.16
ICT11
Implementation of iGov Strategic Plan including planning of WB/ADB ICT loan package
1.881 5 0.38 0.38 0.38 0.38 0.38
ICT7 New Government Data Centre + Backup
0.093 2 0.05 0.05
Rd1 Santo South Coast Road Rehabilitation
2.390 5 0.48 0.48 0.48 0.48 0.48
UWS2 Bundle
4 Provincial capitals Water Supply System Development
0.090 2 0.04 0.04
Rd3 Malekula East Coast Road Rehabilitation
2.931 6 0.49 0.49 0.49 0.49 0.49 0.49
Av2 Bundle
Upgrading Airports of Category A
1.764 4 0.44 0.44 0.44 0.44
Sh4 Bundle
Domestic Jetties Construction in Every Province
0.486 3 0.16 0.16 0.16
ICT14
Expansion of Government Broadband Network (GBN), Phase 2 (more connectivity in provincial capitals and towns)
0.187 2 0.09 0.09
SW2 Luganville Solid Waste Management
0.140 2 0.07 0.07

VISIP 2015 – 2024 | Funding Strategy
94
Project No.
Project Name Est. Cost (b VUV)
Implementation Years
Value in b VUV
2013 and earlier
2014 2015 2016 2017 2018 2019 2020 2021 2022 2023 2024
Sh1 Rehabilitation and Extension of Luganville International Wharf
5.000 6 0.83 0.83 0.83 0.83 0.83 0.83
Av3 Bundle
Upgrading Category B Airfields
0.263 2 0.13 0.13
En2 Low Voltage (LV) and Medium Voltage (MV) extension (Vila, Santo, Malekula)
1.680 4 0.42 0.42 0.42 0.42
Rd4 Bundle
Road Rehabilitation and Improvement in Every Province
1.862 4 0.47 0.47 0.47 0.47
Rd6 Bundle
Rural and Feeder Roads Rehabilitation and Development in Every Province
2.310 5 0.46 0.46 0.46 0.46 0.46
RWS1 Rural Water Supply Lamap, East Malo, Wala Rono, West Ambae
0.093 2 0.05 0.05
RWS2 Bundle
Rural Water Supply in Every Province
0.047 2 0.02 0.02
Ed1 Reconstruction College Malapoa
1.494 4 0.37 0.37 0.37 0.37
25 Total Public Funded Projects
4.74 4.74 5.28 6.35 6.58 3.80 4.93 5.12 4.36 3.52 2.16
New Proposed Privately Financed Investment Project
En5 Takara Geothermal Power Plant (4+4 MW) Preparatory Study & Investment
10.082 9 1.12 1.12 1.12 1.12 1,12 1.12 1.12 1.12 1.12
26 Grand Total 27.89 4.74 4.74 6.40 7.47 7.70 4.92 6.05 6.24 5.48 4.64 3.28

VISIP 2015 - 2024 | Implementing the VISIP
95
6 Implementing the
VISIP
This chapter outlines the way in which VISIP will be managed and implemented by GoV. It is based on the overall approach to VISIP specification and implementation discussed in Chapter 3. The needs and opportunities for institutional strengthening are highlighted, particularly at the strategic level. The chapter also discusses approaches to monitoring and evaluation.
6.1 Implementation Needs
GoV recognises the need to initiate new capacity development for the infrastructure sector supporting VISIP implementation. The larger ‘infrastructure capacity system’ includes institutional and individual capacities from GoV, SOEs, private sector, civil society, and donors. Selected capacity building efforts will occur at levels paralleling VISIP sub-sectors: in oversight institutions that are operating across sectors, and in all key economic and social infrastructure sectors discussed above. VISIP needs strong high-level skills for portfolio management in DSPPAC, project implementation oversight in VPMU, financial oversight in MFEM, project formulation and maintenance assistance from MIPU, and large project management in the line agencies.
Implementing the VISIP will require managing a portfolio of project investments, rather than individual projects. Managing the VISIP process depends on clearly defined roles for the central oversight and implementation agencies (PMO-DSPPAC;VPMU;MFEM), line agencies with cross-sectoral responsibilities such as MIPU (which will assist other ministries in preparing project profiles, scheduling and supporting maintenance, and liaising with local communities), and the project-sponsoring line ministries themselves.
DSPPAC is the key government unit to manage the VISIP process. This unit, though not managing direct project implementation, will oversee the investment portfolio’s progress. DSPPAC requires adequate predictable resources for this expanded role. Also under PMO, VPMU will oversee contract management and implementation of large infrastructure investments including taking responsibility for the central oversight of VISIP projects.
Finally, the VISIP process must be synchronised with future national development plans and the VISIP must be updated as these plans evolve. Overarching goals of reducing hardship and supporting inclusive human development and economic growth are unlikely to change. However, criteria governing investment priorities must respond to GoV’s and the peoples’ changing priorities. Regular VISIP reviews and updates will ensure continuing alignment with national priorities.
6.1.1 IMPLEMENTATION CAPACITY
Given the requirements for implementation, the government will decide where it is practicable to (i) build on existing capacity; (ii) hire new capacity; and (iii) outsource capacity from contractors, consultants, or advisors. VPMU has reconfigured capacity built during the MCA project, while MIPU has a continuing program of professional training. However, no higher-level leadership development program is in place. Where government can use capacity only intermittently, outsourcing may be practical. Advisors contribute best when clearly linked to strengthening long-term capacity. For sector and VISIP sustainability, building or hiring capacity is a strategic investment.
DSPPAC will manage VISIP centrally. However, VISIP projects need sub-sector capacity building in project areas, to design approaches to strengthen local economies and create livelihoods such as using labour-intensive methods and local contractors when possible (a key project selection criteria). This should be a strategic decision, which VISIP monitors across applicable projects. Whenever possible, capacity investments should apply immediately to VISIP as well
VISIP 2015 - 2024 | Implementing the VISIP
96
as have long-term strategic value for infrastructure services. VISIP’s M&E should develop and apply a narrow set of measures to track gains in sector-wide capacity.
6.1.2 PROCESSES, PROCEDURES, AND TOOLS
As standard procedures and tools should manage the investment portfolio and project implementation, coordination, and monitoring by central agencies, a standard project selection methodology is adopted for VISIP 2015. It is envisaged that donors will become familiar with the methodology GoV central agencies adopt (recommending improvements to better integrate the methodology with their own project evaluation processes) and move toward harmonised reporting systems that would be applicable across the donor community and in government. Line agencies will benefit from a support package with a set of standard tools as recommended herein, to simplify implementation across VISIP projects.
Knowledge management
To strengthen long-term sector-wide capacity, implementing the VISIP process will need to create opportunities for informal exchange of lessons, ideas, good practices, and also constraints. Active learning and exchange in the infrastructure sector should become the norm.
Communication Plan
A targeted communication plan to share the VISIP process, consultations, and outcomes with diverse stakeholders linking VISIP to Vanuatu’s long-term vision will be needed. As a start a summary note for prospective donors explaining VISIP priorities, criteria, project pipeline, and investment opportunities could be drawn up. A brochure, for national leaders and communities could outline VISIP’s projects, complementary activities, and anticipated benefits, along with briefing notes for elected officials and civil servants summarising efforts. Select practical research could support VISIP implementation, such as a study commissioned to identify how to strengthen tender and procurement implementation by comparing good practice in the Pacific.
Linking to i-Gov
The potential of using Vanuatu’s existing and upcoming e-governance facility, ‘i-Gov,’ for efficient data sharing, storage, and management should be incorporated as the VISIP is updated. The updating process would need to identify mechanisms to capture, document, and share good practice throughout VISIP’s 10-year span, and link these to M&E as well as capacity development at different levels.
6.1.3 FINANCIAL PLANNING, BUDGETING, AND MANAGEMENT
The Public Finance and Economic Management Act is the key piece of legislation governing public financial management in Vanuatu. The Act requires effective economic, fiscal, and financial management and responsibility by government, to provide accompanying accountability arrangements, together with compliance with those requirements, and to require the government to produce a range of economic and financial statements. MFEM will take up a of multi-year infrastructure budgeting oversight role, which accurately incorporates into the budgeting process the financial implications of Vanuatu’s infrastructure investment program (VISIP).
DSPPAC will strengthen its capacity to develop a comprehensive infrastructure project database, to be integrated with GoV’s budgeting process. This would be an instrumental step for GoV’s financial planning and asset management.
Those VISIP projects funded through the national budget (with or without donor support) will use government processes for financial management, based on a centralised financial management information system that MFEM operates with links by wide area network to most implementing agencies. The systematic use of program budgeting will increase budget transparency and coverage.
VPMU will manage implementation of projects included in the VISIP (both the Urban Infrastructure Project and the Vanuatu Inter-Island Shipping Project are already handled this way). This will assist in addressing weaknesses in the procurement system, while continuing to use the government budget system and the accounting, recording, and reporting systems.
Implementation and financial management processes for other VISIP projects (those involving the private sector) may vary from project to project, depending on the funding and implementing agencies involved and the funding modality.

VISIP 2015 - 2024 | Implementing the VISIP
97
6.2 Implementation and Management Strategy
6.2.1 A HOLISTIC APPROACH TO INFRASTRUCTURE
Vanuatu has mostly taken a project-by-project approach to investment decisions. Under the recommended project preparation and selection methodology, VISIP represents a change of thinking toward a comprehensive ‘infrastructure sector’ approach, integrating investments developed as projects at sub-sector levels. This shift to managing a large project pipeline will help Vanuatu reach its national goals more quickly than conventional practice, where each sub-sector rests in a separate silo. Staff will appreciate connectivity and make more strategic links across infrastructure sub-sectors. The initiatives suggested support this transition, identifying and supporting a sector-wide capacity building system, moving away from disjointed efforts.
DSPPAC as central coordinator and MIPU as primary implementing agency assist other line ministries in preparing project profiles, liaising with local communities, project design, and project supervision. It will benefit from a standard, simplified, sector-wide arrangement with development partners for infrastructure investments. This is important because infrastructure service delivery in Vanuatu is too complicated given the country’s size and capacity. Simplified and streamlined infrastructure delivery will provide higher quality services to more people more quickly. Initially, this will mean greater reliance on centralised units such as VPMU to manage project oversight. Strengthening budgeting and procurement procedures in MFEM have already produced benefits, though implementation still needs strengthening.
6.2.2 STRATEGIC OVERSIGHT/PORTFOLIO MANAGEMENT
Implementation of the VISIP process requires discipline to follow established criteria, balanced with a flexible and open approach to adapt to change when justified. VISIP should be managed from an office reasonably protected from political interference. Table 58 outlines the institutions needed to implement the process. DSPPAC is central to the process. It will appraise the business case for infrastructure investment based on sound multi-sector analysis and potential development outcomes. DSPPAC will also hold all updated sector plans and strategies.
Using the methodology proposed for VISIP 2015, candidate projects will undergo careful scrutiny, using transparent criteria to ensure the selected projects are an optimal set contributing to broad-based growth and poverty reduction. Changes to this portfolio will similarly require careful consideration; DSPPAC will need to have the technical capacity to apply VISIP criteria (intended to evolve with changes in GoV policies and priorities) to emerging projects and those coming from sector plans. VISIP must remain free from interference that might influence or distort decision making, while responding to opportunities to include initiatives as they come, even those superseding others in the portfolio.
Table 58: VISIP Implementation Roles (Arrangements)
Important Roles VISIP
coordinator Central agencies
Line agencies or private sector
Portfolio management DSPPAC
Portfolio review DSPPAC
Portfolio update DSPPAC
Project appraisal DSPPAC
Feasibility and project design
X (with assistance from MIPU and
MCCDRM)
Funding/development partner coordination
DSPPAC ACU
Financial management MFEM
Project management VPMU
Build/Install infrastructure X
(with assistance from MIPU)
Reporting VPMU
Monitoring and evaluation DSPPAC M&E X
Maintenance X
(with assistance from MIPU)
6.2.3 PROJECT OVERSIGHT
VPMU has a mandate to manage large projects assigned by its steering committee. This mandate will be extended to incorporate managing GoV-supported infrastructure projects implemented under VISIP (individual or bundled). Reporting on VISIP will be aligned with that of VPMU.

VISIP 2015 - 2024 | Implementing the VISIP
98
Staff needs advanced skills in analysis, project management, and coordination, plus solid experience working with high-level stakeholders. Such a group is being formed in VPMU. Complementary initiatives to strengthen VPMU capacity will help it oversee all infrastructural projects. Though some may be smaller, these investments are essential – even a precondition to achieving many expected results. Like DSPPAC, VPMU may still need technical assistance to fulfil its role.
Table 59 shows VPMU responsibility for overall project management/oversight including reporting and handover. VPMU will also coordinate across the other units in the PMO for appraisal, donor coordination, financial management, and M&E without duplicating the roles of these respective units. During implementation, VPMU will closely coordinate with relevant line agencies.
Infrastructure sector agreement with the donor community
Donors of course play a key role in the generation of a ‘project pipeline’ and (crucially) in the formation of the VISIP’s project short list. Donors supporting large infrastructure investments will need to review, comment on, and endorse the VISIP’s project selection methodology and DSPPAC’s investment plan that emerges from it. Donor input in the VISIP process will be an important element in the GoV’s review and ultimate approval of the short list.
Fiscal and procurement arrangement
A fiscal endorsement from MFEM, as discussed, that resources to support the operation and maintenance of GoV-supported projects can be identified, will generate confidence throughout the stakeholder community (the GoV, development partners, Ministries, and affected local communities) that the projects will be sustainable and will deliver the services they are intended to provide. Vanuatu’s MCA-funded large roads project was carried out with these provisions with positive result. VISIP projects will continue to follow World Bank/ADB procurement guidelines, with an independent procurement agent receiving sealed bids.
6.2.4 ASSISTING PROJECT DEVELOPMENT
The primary line agency responsible for project feasibility and design, installation of infrastructure, and operation and maintenance is MIPU. Though capacity is limited, the PWD within MIPU has operations divisions with personnel and heavy equipment in each province. MIPU is responsible for transport sectors (land, aviation, and shipping) and urban drainage and sanitation. The DMGRWS under MLNR is responsible for rural water supply. MCCDRM is responsible for energy/power and for climate change and disaster risk management. Climate change will affect most of VISIP’s sectors/sub-sectors. Climate change adaptation is now a key driver of future infrastructure development in Vanuatu. Development partner interest and funding commitment are strong. The Ministry of Climate Change and Disaster Risk Management is GoV’s primary institutional capacity for coordinating activity in this area.
MIPU and MCCDRM will review sub-sector plans of all other infrastructure-related line agencies to ensure that proposed investments exploit opportunities created by VISIP projects and meet appropriate construction standards. Also, DSPPAC will ensure that sub-sector plans are consistent with the VISIP pipeline. Qualified staff from DSPPAC, such as the infrastructure analyst, will help line agencies link their plans to the VISIP.
The sector plan of MIPU requires special mention because, as discussed above, (i) MIPU’s activities will be cross-sectoral to a highly significant degree as MIPU assists other Ministries in project development, implementation, and operation and maintenance activities, and (ii) the transport sector is directly under MIPU’s responsibility and has many intrinsic cross-sectoral linkages. The goal of transport sector development is gradually to develop an integrated and affordable transport network throughout all Provinces in the country, by means of discrete investments that link land, air, and marine transport services in an optimal and least-cost way. For example, rural roads are needed that link productive and populated hinterlands with wharves and jetties for the movement of goods to markets and people to places of employment and higher-level schooling. Reasonable air services are needed at strategic points in all Provinces to encourage new markets and sources of livelihoods (e.g., tourism) and the time-critical delivery of medical services, food supplies, etc. It is vitally important that transport investments be planned and executed with such optimal linkages foremost in mind.
In the context of developing and updating its sector plan, the MIPU will devote particular attention to developing a transport sector plan which presents optimal linkages across discrete projects for investment and operations and maintenance of road networks, harbour restorations and wharves/jetties construction, and upgrade of airports and provincial airstrips.
Planning cycles
Under the VISIP process, Ministries will maintain up to date sector plans, timing them with the cycle for periodically updating the final VISIP, as discussed in Chapter 3. Each plan will also forecast future demand for infrastructure including the impact that migration will have on demand. For example, land transport needs an updated plan establishing road standards, with an updated road inventory to inform decision-making and selection of priority investments. Sector/

VISIP 2015 - 2024 | Implementing the VISIP
99
subsector plans will be updated and kept consistent with the VISIP, coinciding with national plans with a ten-year long-term plan and a medium-term update every five years driven by priorities of national development plans.
Plans will include long-term asset management to maintain investments based on assets inventory. Plans to commit adequate operational resources (e.g., for staffing, equipment, etc) are equally important. It may be difficult to obtain investment plans from privately operated utilities, but alignment with their plans is necessary. Plans will suggest complementary activities in institutional development.
6.2.5 COORDINATION
Under the VISIP process, plans will take a system-wide view, leveraging potential synergies across sectors in provinces or particular islands. Plans that are coordinated in this way also foster cooperation among line and central agencies when they are implemented.
Coordination between Central and Line Agencies
The Development Committee of Officials (DCO), weekly meeting of Directors and Director Generals across ministries, is the primary cross-agency coordinating mechanism for infrastructure. Once VISIP is formally adopted, their standing agenda will include infrastructure. DSPPAC’s infrastructure analyst will participate when the DCO requires information on infrastructure. This will also apply to the Council of Ministers meeting periodically to approve the final VISIP.
Infrastructure analyst
To strengthen coordination between DSPPAC and line agencies, DSPPAC will increase and formalise the role of the infrastructure analyst as a project and policy coordinator and broker of information. The analyst will regularly join MIPU’s and VPMU’s management meetings for mutual exchange to inform decision-making and troubleshoot implementation challenges. Together, they will define specific expectations so the role supports both the PMO and the line agency. The analyst will also work closely with the PMO’s M&E Unit and apprise them of existing project status, and when new projects enter the pipeline. M&E of infrastructure projects takes place at two levels: in detail, at the project level, and in summary through PMO’s M&E unit, reporting to senior civil service staff, elected officials, and development partners.
Harmonising/ Integrating Functions across Line Agencies
Better harmonisation and integration across line agencies will improve infrastructure services. Through e-Gov, line agencies will be able to access and use central systems such as FMIS to register, track, and budget for maintenance of infrastructure assets. A clear example of synergy across line agencies is between MIPU and MLNR in rural water supply systems or MIPU and MALFFB for rural productive infrastructure like jetties or feeder roads. Since PWD is present in the provinces, they have designed and installed basic water supply systems for towns and villages. They also are proposing more small water projects in different provinces. A multi-agency retreat, involving professional staff, should identify synergies (and duplications) and develop action plans to exploit them. Spatial development plans and zoning produced by MLNR, the need for feeder roads for agricultural export, as examples, should inform infrastructure service planning and decision-making in the transport sector.
This could be done with the help of a GIS system, which can enable a particular project development layer, say showing new education sector facilities, to be overlain with another layer showing agricultural sector developments, with both overlain on a road sector project development map, and would thus demonstrate how the road investment can provide benefits across sectors. The more remote the island or rural area, the more likely an island-based approach will be more efficient than a single specialised sector approach.
Due to lack of funds or qualified staff, a government agency may have limited capacity to fulfil one or more of its assigned roles. In these cases, an agency could integrate, share, or move functions to a unit better positioned to act. Sometimes, it can rationalise roles, decentralising some or turning to private sector providers when government is unlikely to undertake the role in the future.
Private Sector Engagement
The private sector in Vanuatu is very prominent in the country in providing public infrastructure services. Its involvement in new and existing infrastructure assets moves along a continuum of activities from design, construction, operation, finance, to ownership. As a matter of policy, (i) Government will shed services where the private sector can provide better quality, more affordable services, accessible to more people, unless there is a compelling case for continuing government ownership and operation and (ii) services will be outsourced where feasible, provided through PPPs or privatisation.

VISIP 2015 - 2024 | Implementing the VISIP
100
The private sector fulfils a number of useful roles for infrastructure. For example it:
informs government about current and future demand for infrastructure;
identifies the infrastructure needed to address bottlenecks to investment;
shares reform ideas that would remove constraints and open greater competition;
supplies project goods and services, including building and installation of infrastructure;
identifies PPP opportunities;
operates and maintains infrastructure services; and
rehabilitates infrastructure investments.
The uptake of private sector infrastructure delivery services will depend on financially feasibility; competitive through bids by competent skilled providers; subject to regulation; and linked to an implementing agency to monitor performance and develop the partnership agreement with a private sector organisation with access to financing.
The VTSSP project, for example, helped set up private island-based contractors as a labour-based approach to generating livelihoods while rehabilitating roads. Currently, MIPU plans to rely more on outsourcing infrastructure construction and operation than providing services directly. VISIP has identified power grid extensions set aside for private funding through utility concessions. Large projects such as developing the Takara geothermal resource and extending the submarine broadband cable will be PPP-funded. Besides constructing roads, opportunities for the expansion of private sector involvement in infrastructure include waste management and water supply projects.
The Vanuatu Chamber of Commerce, supported by the government, has a membership of three to four thousand businesses and is a strong representative voice and broker of information.
Linking with Civil Society to Extend Development Benefits
Umbrella groups, like VANGO, provide entry points for dialogue as they represent smaller organisations, some lacking capacity, access, or voice in national issues. They advocate for affordability, quality, and reach to poor communities and people - a constructive intermediary for the voice of the people to demand services. VANGO can help advocate for sustainable maintenance of infrastructure and play a role in mobilising community based support for the maintenance of rural infrastructure.
Working closer to the ground, civil society organisations are often better than government agencies at helping the poor in local communities gain benefits from access to infrastructure. When informed about large projects, they can prepare downstream links to community-based initiatives and institutions such as churches. Investing in regional hubs brings infrastructure closer to many outside these centres and may slow migration with better support for rural livelihoods on their islands.
In sequential order, the main functions of VISIP implementation and corresponding institutional responsibilities are summarised below in Table 59.
Table 59: Summary of Key VISIP Functions and Institutional Responsibilities
Function Key Institutions and Responsibilities Key Activities
1. Project Development
MIPU (own projects and assistance to other Ministries):
Project Profiles
Project-level feasibility/design studies
Project installation
O&M functions (through PWD personnel & equipment)
Line Ministries:
Local community liaison and identification of project impacts and beneficiaries
MCCDRM:
Climate change and disaster risk management
Review subsector plans
Ensure project design and installation standards
Ensure project-level risk minimisation
Assist Ministries to carry out O&M functions
Preparation of estimates of project and sector-level impacts and beneficiaries
Preparation of project- and sector level results frameworks
Line Ministries:
Sector plans
Asset Management Plan (each project)
Update sector plans in sync with VISIP planning cycle
Budget for operational needs (e.g., project staffing) asset maintenance

VISIP 2015 - 2024 | Implementing the VISIP
101
Function Key Institutions and Responsibilities Key Activities
2. VISIP Coordination
DSPPAC:
Project analysis and selection
Securing funding arrangements
Securing political approval of VISIP shortlist for implementation
Analyse project profiles and feasibility/design studies from MIPU and the line Ministries
Select projects for shortlist according to VISIP methodology and alignment with GoV policy
Coordinate VISIP shortlist with donor community and secure funding agreements
Coordinate VISIP shortlist with MFEM and secure GoV budgetary support of O&M of projects, based on line Ministries’ estimates
Present shortlist and funding arrangements to DCO and COM for approval of implementation
3. Project Management and Oversight
VPMU:
Tendering
Project supervision
Liaison with line Ministries on project progress, with MIPU
DSPPAC:
Maintain VISIP shortlist
Determine detailed project costs and implementation arrangements and construction period
Tender and award contracts
Supervise contracts, attend commissioning of new projects
Keep VISIP project shortlist updated with latest cost estimates and impacts
4. Monitoring, Reporting and Updating VISIP
DSPPAC:
Monitoring and Evaluation (M&E)
Production of periodic reports MIPU and Line Ministries:
Preparation of Results Frameworks at sector and project level
Incorporate M&E results into evolving project and sector planning
Updating sector plans
Monitor progress against project-level and sector-level Results Frameworks
Prepare quarterly and annual reports of project performance by sector
Integrate sector projects approved for the VISIP shortlist into Sector Plans
Modify projects and sector plans to reflect M&E results
Update VISIP shortlist to reflect changes in project approach mandated by M&E analysis
6.3 Capacity Development
6.3.1 SECTOR-WIDE ISSUES AND OPPORTUNITIES
‘Ownership’ of VISIP as an ongoing process is the necessary condition for building sector-wide capacity in infrastructure - broad-based ownership, starting with the government. The demand for development must translate to a demand for the capacity to manage change. The conventional approach to institutional development has been project-driven not portfolio-based. The investment portfolio is demanding. So, capacity development must complement the ten-year portfolio, beyond individual projects. The project-driven approach has largely failed to build Vanuatu’s capacity in infrastructure. There is a critical mass of development partners with long-term commitments to infrastructure, and a systemic approach to capacity development, as recommended in VISIP 2015, is developed to match this.
Investments in institutional development in both central and line agencies, before projects begin, will complement investments in infrastructure. This will result in capacity building, sometimes supported by hiring new capacity or outsourcing. Regardless of the means of creating capacity, the goal should be to sustain it within the larger system.
Overall, institutional capacity to manage infrastructure in Vanuatu remains weak. Large road projects face serious challenges implementing tender and procurement, sometimes decreasing the planned number or length of roads constructed. To achieve the right mix of national and international interest in bidding, the government will also strengthen the capacity of national contractors to compete and beat international firms based on their comparative advantage.
Competition for government positions will increase by strengthening incentives and recruitment practices. Management training will emphasise maintenance capacity and budgeting for adequate resources – perhaps from disparate sources -

VISIP 2015 - 2024 | Implementing the VISIP
102
throughout projects’ operational phases, as sustainability planning is crucial to realising the full services of an asset throughout its life.
6.3.2 PORTFOLIO MANAGEMENT CAPACITY
DSPPAC capacity as portfolio manager
DSPPAC’s capacity as the lead department for development planning and the manager of the investment portfolio will be developed, DSPPAC will strengthen its ability to manage, review, and update the VISIP portfolio.. One approach is to provide technical assistance on-site for an initial period (say six months) followed by regular (perhaps quarterly) TA visits for five years.
VPMU capacity to oversee multiple projects
With multiple projects in the pipeline, VPMU needs more capacity to work with different investments, at different stages, simultaneously. A TA would help VPMU fulfil this role and oversee several large projects. The same TA could be available to selected line agencies that will eventually take on implementation of large projects. Currently, MIPU lacks the capacity to manage a ministry-wide pipeline of large projects. Like DSPPAC, an initial intensive focus on setting up procedures could lead to periodic TA for VPMU and selected line agencies staggered several times a year for five years.
Maintain and extend MFEM capacity
In recent years, MFEM has been the focus of concerted efforts to strengthen the government’s financial management capacity. In the expanded investment portfolio under VISIP, the role of MFEM in establishing sound financial controls will increase, beginning with analysis of the long term fiscal impacts of short-listed infrastructure investments. Over a five- to ten-year period, MFEM will need to extend good practices to strengthen counterparts, including finance officers, in line agency departments, such as PWD, who will inevitably assume a greater role in financial management in the future. Focused technical assistance combined with specific opportunities for professional development or short-term external placements will help maintain positive momentum. MFEM recruitment practices must remain strong with reasonably competitive packages offered to skilled professionals.
6.3.3 PROJECT DELIVERY CAPACITY
VISIP calls for the capacity to manage a number of large projects at different stages of implementation at once, with MIPU in a key role of assisting all other line Ministries to prepare and implement projects, and MCCDRR assisting them in risk management. Both Ministries are gearing up for these roles, but are not currently ready to undertake them without external assistance. Development partners, with long-term infrastructure sector commitment, will be encouraged to consider well-placed technical assistance that bridges the management of several projects. Currently, development partners are often practically limited to TA instruments tied their projects. MIPU and MCCDRR need assistance with a multi-project focus—such TA could potentially strengthen capacity to manage projects of other development partners.
MIPU, as described elsewhere in this report, has both official and ad hoc responsibilities in asset maintenance throughout the country. Formalisation of MIPU’s cross-sectoral maintenance responsibilities will be coordinated by DSPPAC as part of their portfolio management functions. To enable MIPU to fulfil these responsibilities to a higher standard, MIPU will urgently develop commercial relations with local private companies, which could carry out many of these recurrent functions under contract. The costs of the contracts will be supported by maintenance funding provided by the line Ministries that sponsor the projects, with MIPU managing the contracts and supervising the work. To take up this role, training in tendering and contract management would be provided to MIPU under the above technical assistance.
6.3.4 SECTOR-WIDE CAPACITY
Whenever possible, technical assistance should come from local training institutions and others from the Pacific region. Sources of support should come from academe, non-profit research institutions, and regional training centres to complement country-based resources. Also, peer learning is one of the most effective and convincing means to support change. ICT provides more opportunity for real-time linking of Vanuatu’s infrastructure planning with the experience of other Pacific island countries. Cross-country peer groups could emerge from parallel infrastructure investment planning in other Pacific countries. Such groups could share successes and challenges, and exchange lessons gathered from managing their countries’ infrastructure investment portfolios. These relationships can lead to occasional face-to-face exchanges over time. Whenever civil servants engage in formal study exchange or secondment, they should draft a professional development plan, approved by senior managers, describing what they hope to gain from the experience. Their management would commit to use the strengthened capacity. On return or upon completion, they should frame a reintegration plan, anticipating opportunities to apply learning in their agency or organisation.
Table 60 summarises the major recommendations for capacity development made in VISIP 2012 and repeated in VISIP 2015. The general initiatives are more likely to support long-term sector wide capacity development for infrastructure,
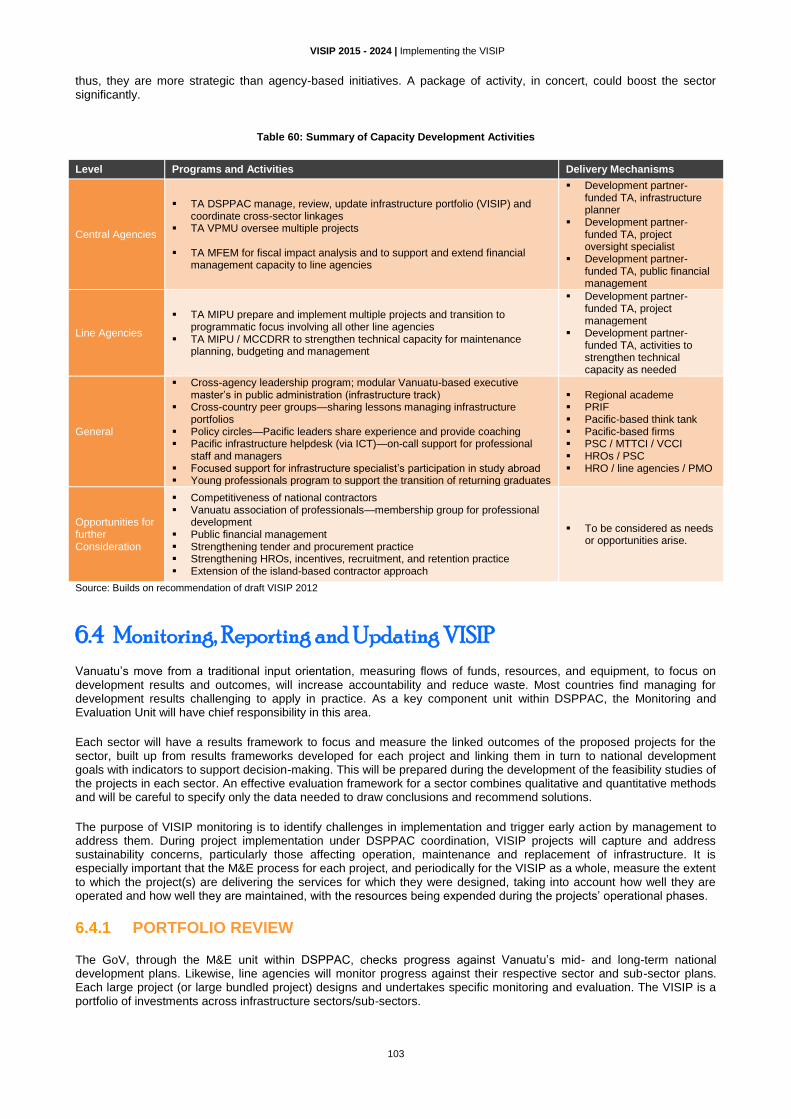
VISIP 2015 - 2024 | Implementing the VISIP
103
thus, they are more strategic than agency-based initiatives. A package of activity, in concert, could boost the sector significantly.
Table 60: Summary of Capacity Development Activities
Level Programs and Activities Delivery Mechanisms
Central Agencies
TA DSPPAC manage, review, update infrastructure portfolio (VISIP) and coordinate cross-sector linkages
TA VPMU oversee multiple projects
TA MFEM for fiscal impact analysis and to support and extend financial management capacity to line agencies
Development partner-funded TA, infrastructure planner
Development partner-funded TA, project oversight specialist
Development partner-funded TA, public financial management
Line Agencies
TA MIPU prepare and implement multiple projects and transition to programmatic focus involving all other line agencies
TA MIPU / MCCDRR to strengthen technical capacity for maintenance planning, budgeting and management
Development partner-funded TA, project management
Development partner-funded TA, activities to strengthen technical capacity as needed
General
Cross-agency leadership program; modular Vanuatu-based executive master’s in public administration (infrastructure track)
Cross-country peer groups—sharing lessons managing infrastructure portfolios
Policy circles—Pacific leaders share experience and provide coaching Pacific infrastructure helpdesk (via ICT)—on-call support for professional
staff and managers Focused support for infrastructure specialist’s participation in study abroad Young professionals program to support the transition of returning graduates
Regional academe PRIF Pacific-based think tank Pacific-based firms PSC / MTTCI / VCCI HROs / PSC HRO / line agencies / PMO
Opportunities for further Consideration
Competitiveness of national contractors Vanuatu association of professionals—membership group for professional
development Public financial management Strengthening tender and procurement practice Strengthening HROs, incentives, recruitment, and retention practice Extension of the island-based contractor approach
To be considered as needs or opportunities arise.
Source: Builds on recommendation of draft VISIP 2012
6.4 Monitoring, Reporting and Updating VISIP
Vanuatu’s move from a traditional input orientation, measuring flows of funds, resources, and equipment, to focus on development results and outcomes, will increase accountability and reduce waste. Most countries find managing for development results challenging to apply in practice. As a key component unit within DSPPAC, the Monitoring and Evaluation Unit will have chief responsibility in this area.
Each sector will have a results framework to focus and measure the linked outcomes of the proposed projects for the sector, built up from results frameworks developed for each project and linking them in turn to national development goals with indicators to support decision-making. This will be prepared during the development of the feasibility studies of the projects in each sector. An effective evaluation framework for a sector combines qualitative and quantitative methods and will be careful to specify only the data needed to draw conclusions and recommend solutions.
The purpose of VISIP monitoring is to identify challenges in implementation and trigger early action by management to address them. During project implementation under DSPPAC coordination, VISIP projects will capture and address sustainability concerns, particularly those affecting operation, maintenance and replacement of infrastructure. It is especially important that the M&E process for each project, and periodically for the VISIP as a whole, measure the extent to which the project(s) are delivering the services for which they were designed, taking into account how well they are operated and how well they are maintained, with the resources being expended during the projects’ operational phases.
6.4.1 PORTFOLIO REVIEW
The GoV, through the M&E unit within DSPPAC, checks progress against Vanuatu’s mid- and long-term national development plans. Likewise, line agencies will monitor progress against their respective sector and sub-sector plans. Each large project (or large bundled project) designs and undertakes specific monitoring and evaluation. The VISIP is a portfolio of investments across infrastructure sectors/sub-sectors.

VISIP 2015 - 2024 | Implementing the VISIP
104
Normally, the M&E unit gathers the results of specific evaluation activities at each level and presents progress and challenges in summary form to senior government staff, elected officials, and development partners. However, managing the VISIP portfolio of large strategic infrastructure investments, along with the capacity to achieve them, requires a new approach, similar to a portfolio review focused on the larger intended results and outcomes. Though data collection may change little, this new result-oriented approach is geared to inform investment decisions, shape the portfolio, and keep capacity strong.
As an example, the PRIF identified a strategic set of broad Pacific infrastructure results the VISIP portfolio will manage for, in the context of promoting national development policy. The following broad evaluation questions point to the results:
Access - Is inclusive access to infrastructure services supporting growth and reducing poverty?
Quality- Are infrastructure services getting better and more reliable?
Efficiency - Are the time, effort, and costs for building, operating, and maintaining infrastructure decreasing even as services improve?
Affordability - Do infrastructure services provide value for money for all users?
Capacity - Is the whole system for choosing infrastructure investments and delivering them improving?
Given VISIP’s ten-year time horizon, M&E will focus mainly on high-level VISIP implementation activities including institutional strengthening through the whole capacity system of the infrastructure sector. As outlined above, VISIP identifies strategic actions to catalyse capacity building activity across sub-sectors. To the extent possible, M&E will consider whether VISIP has realised this potential ‘multiplier effect.’
6.4.2 VISIP RESULTS FRAMEWORK
Results-focused
VISIP managers, whether in DSPPAC, the VPMU, or the line Ministries, need good information to support decision-making. Rather than focus on individual VISIP inputs and activities, M&E will examine the changes and benefits brought about by the VISIP portfolio, such as the outcomes of VISIP implementation and contribution to Vanuatu’s national development goals. When measuring outcomes directly is not possible, VISIP will consider key outputs as proxies for outcomes. A detailed Results Framework will be prepared for each of VISIP’s major sectors (e.g., transport, education, health, energy, telecommunications), incorporating project linkages and integrated into a brief overview Results Framework, similar to the ‘VISIP Overview Results Framework’ illustrated in Table 61.
Table 61: VISIP Overall Results Framework
Objectives Performance Indicators Data Sources Risks / Opportunities and Constraints
Goals
Infrastructure services contribute to inclusive (broad-based and gender-balanced) economic growth, human development, and poverty reduction, with increasing resilience to climate risks
Increase cash income /capita of beneficiaries
Poverty reduction Increase in quality of life indices
Accelerated achievement of MDG goals, in relation to
Water supply
Sanitation
Maternal and infant mortality
Incidence of poverty
Reduction in disease
Reduction in climate and disaster risk vulnerability
(HIES) (GDP/capita)
(HDI; MPI; HIES)
MDG Monitoring Reports
Vulnerability Assessments
M&E Unit summary reports
Sector-specific Results Frameworks
Potential change in status to middle-income could affect development partner interest
Institutional capacity building efforts are insufficient to achieve desired level of infrastructure project implementation
Outcomes
Better access to quality, affordable, efficient, and sustainable infrastructure services (transport, electricity, education, health, youth facilities, water, tourism, ICT, sanitation, justice, solid waste)
Strengthened capacity to plan, finance, manage, staff,
Access to infrastructure increased in rural and urban underserved areas, in all VISIP infrastructure sectors
Tourism markets in Provinces created or expanded
Private sector investment in productive sectors (e.g., tourism, primary industries) increased
Line agencies sector plans and quarterly/annual reports
NSO, utilities, operators periodic reports
M&E unit summary reports
Tourism Board, VTO
DSPPAC quarterly reviews and annual reports
GoV Budget Report
Strong development partner interest in infrastructure
Continued strong capacity to manage and deliver infrastructure through private sector
Potential political interference in infrastructure project selection, or contracting of construction and/or maintenance services
Lack of systems thinking

VISIP 2015 - 2024 | Implementing the VISIP
105
Objectives Performance Indicators Data Sources Risks / Opportunities and Constraints
operate, and maintain large infrastructure investments in selected central and line agencies
Sector plans produced by all Ministries, integrated into the VISIP
All infrastructure projects supported by identified resources adequate to operate and maintain them efficiently through their useful lives
Infrastructure assets produce reliable services over their full design lives
within infrastructure sector
Weak commitment of the civil service to a portfolio approach to infrastructure; preservation of a ‘silo approach’ in line Ministries
Outputs
New infrastructure services (roads, power plants, water supplies, airport runways, domestic aerodromes, submarine cable, solid waste management, schools, health facilities, youth (sports) facilities, etc), in line with evolving GoV policy
Staff completed mentoring through TA; formal/ informal education and staff training ; used helpdesk, policy circles, taskforce, and professional association
Effective sharing of experience and knowledge gained from VISIP implementation, across sectors and Ministries.
New major infrastructure projects provided in close reflection of VISIP schedule and priority ranking
Asset maintenance and operational staffing provided under each project to ensure quality service delivery through the asset’s life
Alignment of project priorities with evolving National Strategic Development Plan
Number of formal and informal seminars and courses undertaken by staff in each ministry/ department
Changes in key staff job descriptions
Number of graduates and applicants to programs
Number of cross-sectoral seminars on lessons learned and key issues
Use of i-GoV to disseminate VISIP updates and project information
Updated VISIPs; quarterly reviews; annual reports DSPPAC quarterly reviews and annual reports
Line agency project reports and sector plans/reviews
Periodic updates of the National Strategic Development Plan
Annual Institutional Score (report card) for selected central and line agencies
Professional development and reintegration plans of staff doing formal/ non formal programs
Personnel and performance reviews by each central agency and each line Ministry
VISIP quarterly and annual reports
Strength of HR and restructuring in line Ministries
Weak incentives to hire and retain quality staff
The Implementation and Management Strategy in Section 6.2 calls for quarterly reviews and an annual report of the VISIP portfolio. The annual report is the key to portfolio management. However, the process could easily degenerate into a rote cataloguing exercise if not guarded by the systems approach —looking for portfolio-wide contributions to the outcomes described above. Thus VISIP will blend qualitative and quantitative M&E methods, careful to collect only the data needed to draw conclusions and recommend changes. Most VISIP data will come straight from the M&E unit in PMO. Besides results data, evaluation will draw out ‘results stories’ highlighting successes throughout implementation and initial operation of infrastructure. This will build support for VISIP, while recognising leaders and the accomplishments in their communities. This results orientation may leverage the activities of community service organisations and local communities who can apply local contributions in cash or kind to stimulate action in areas such as health, agriculture, education, and livelihoods. This extension of benefits represents a high level of development impact.
Each VISIP project will have a results framework to focus on and measure project outcomes; these results will cascade upward to sector level of the VISIP portfolio. Therefore, each specific activity connects logically to a greater result ending with a clear link to a national development goal. Project indicators will be straightforward and meaningful, able to inform practical decision-making during project implementation. Initial selection methodology criteria will continue to gauge whether a project is on track to deliver intended results. Where possible, projects will collect comparable data, harmonising some with widely accepted infrastructure indicators for international comparison.

VISIP 2015 - 2024 | Implementing the VISIP
106
6.4.3 UPDATING THE VISIP
DSPPAC will modify its portfolio and database of large investments, including VISIP on a rolling basis, with brief quarterly reviews of activity and an annual report. VISIP should align reporting to government planning and budget cycles. For transparency and accountability, most public sector information generated in the course of VISIP implementation will be publicly available.
Quarterly/annual reports
A quarterly review, as short as a two-sided brief, will inform stakeholders of major portfolio activities for the quarter and share success story(ies) about implementation or results of a particular active VISIP investment(s). The annual reports will analyse the progress and status of the entire VISIP portfolio, discussing investments completed, funded, or committed. Further, they will check each investment in the pipeline and assumptions about readiness, sequence, cost, and funding sources; note outstanding issues to decide if the plan needs adjusting; and review the update process to see if it helps manage VISIP effectively.
Periodic Meetings with the Donor Community
In carrying out its donor coordination activities, DSPPAC will introduce and orchestrate periodic regular meetings with the community of development partners to enhance the sharing of information on projects progress or problems and update the development partners on the evolving project pipeline and emerging projects.

VISIP 2015 - 2024 | Appendices
107
Appendices

VISIP 2015 - 2024 | Appendix 1
108
Appendix 1: Project Profile Template
Item
Brief Information to be Provided
1 Sponsoring Ministry/Agency
2 Dates Date of First Submission:
Date of Latest Update:
3 Project Name (with acronym)
4 Project Ownership:
Proposed Owner responsible for the infrastructure: Proposed Operator/Owner responsible for Operation and Maintenance:
5 Alignment with Governmental and Ministerial Policies
Highlight the specific priority of current ministerial strategy/Road map addressed in the project:
6 Project Timeframe Construction period (years):
Operating period (years):
7 Project Development Status (concept, prefeasibility, feasibility stage etc.)
8 Locations and Areas Affected (provinces, islands, villages)
On-going or planned other projects in the same area:
9 Project Components (with quantities e.g., “xx km of road”, “xx m
2 of terminal building”, “xx
meters pipelines”, “training”, etc)
10 Linkage with other Infrastructure (none, low, medium, high)
Degree of linkage:
Brief description:
11 Regulatory Requirements to Comply With under the Project (construction standards, etc. [list])
12 Project Beneficiaries (approximate types and number of persons or households benefitting [say which])
Types of beneficiaries (e.g., residential, business, farmer, etc.): 1. 2. etc
Number of beneficiaries: 1. 2. etc
13 Project Benefits/Outcomes
Brief description [be specific and quantitative: e.g., XX households gain access to health care facilities, preservation of cultural heritage, etc
14
Local Employment and Procurement during Construction (number of Ni-Vans employed, each year of construction; value of local materials procured for construction)
Degree of employment impact (high, medium, low):
Brief description (Ni-Vanuatu employed in construction, value of local materials):
15 Job Creation Potential during Operations Degree of employment impact (high, medium, low):
Number of new employed in operations:

VISIP 2015 - 2024 | Appendix 1
109
Item
Brief Information to be Provided
16 Resilience of Project Assets to Climate Change and Natural Disaster Risk
Degree of resilience built into project design (high, medium, low):
Major climate change and natural disaster risks:
Main risk mitigation measures:
17 Land Availability for Project
Brief description (customary or GoV land; dispute risks; status of land negotiations):
18 Environmental Improvement Potential
Rating (high, medium, low, negative):
19 Community Contribution Commitment
Short description (cash, labour, materials, land, etc.):
20 Investment Value, VUV million
Including design/supervision, technical assistance, works, labour, materials, equipment, etc.):
21 Estimated Annual O&M Cost, VUV million/year
(i) Operation cost (staff, consumables, energy, others)
(ii) Asset maintenance cost:
(iii) Operational subsidies needed? If yes, estimate annual amount (VUV m):
22 Potential Funding Sources Initial Investment (% of total project investment cost)
GoV: xx %
Donors:
Grants: xx %
Loans: xx %
Private Sector: xx %
23 Potential Funding Sources O&M Costs (% of total project O&M costs)
GoV: xx %
Donors (grants): xx %
Private Sector: xx %
24 Environmental and Involuntary Resettlement Risks
Short description of impacts, and of people or assets affected (if any)

VISIP 2015 - 2024 | Appendix 2
110
Appendix 2: Project Prioritisation Evaluation Form
# Item Input Prioritisation Criteria
Scoring Score
1 Sponsoring Ministry/Agency
2 Dates (first submission and latest update/s)
3 Project Name (with acronym)
4 Project Owner: Proposed owner to be legally responsible for the infrastructure:
5 Alignment with Governmental and Ministerial Policies:
Clear priority area/s of current ministerial strategy/ies /road map(s) addressed in the project:
Should the project not clearly align with a current sectoral/ministerial strategy priority, the project should not be considered or evaluated further
6 Project Timeframe (if known) (i) construction period (years) (ii) operating period (years)
7 Project Development Status (availability of concept, prefeasibility, feasibility, etc.)
8 Locations and Areas Affected (province(s), island(s), village/s
9
Project Components (new and/or rehabilitated infrastructure; synergy with other infrastructure; quantities e.g., “xx km of road”, “xx m
2 of
terminal bldg”, “xx meters pipelines”, “training”, etc)
4.3
No improvement 0
Little improvement 1
Good improvement 2
Strong improvement 3
10
Linkage with Other Infrastructure and Sectors (describe synergy opportunities and list sectors benefiting)
3.1
No linkage with policy priority(ies)
0
Policy Linkage(s) with Little synergy
1
Policy/ies Linkage/s with medium synergy
2
Policy/ies linkage/s with high synergy
3
11 Regulatory Requirement to be Addressed under the Project (construction standards, etc.)
3.3
No improvement 0
Little improvement 1
Good improvement 2
Strong improvement 3
12 Project Beneficiaries (identity and approximate number of persons or households)
1.1
No data 0
Less than 10.000 1
10.000 < x < 100.000 2
More than 100.000 3
13
Project Benefits/Outcomes (Brief description of socio-economic gains, XX households gain access to health care facilities, better education, etc)
3.4
1 sector benefiting 0
2 sectors benefiting 1
3 sectors benefiting 2
4 and more sectors benefiting
3
14
Local Employment and Procurement during Construction (list local opportunity for employment/ procurement during construction)
4.1
No 0
Low 1
Medium 2
High 3
15
Job Creation Potential (list type and numbers of jobs expected to be created after project construction and completion)
3.2
No 0
Low 1
Medium 2
High 3
16
Resilience of Project Assets to Climate Change and Natural Disaster Risks (list resiliencies expected to be enabled through the project implementation)
2.2
No resilience impact 0
Little resilience impact
1
Medium resilience impact
2
High resilience impact
3
17
Land Availability (describe land requirement and expected source of land; customary or GoV land, status of land negotiation)
1.2
Land issue not addressed
0
Land issue under study
1
Land issue under 2

VISIP 2015 - 2024 | Appendix 2
111
# Item Input Prioritisation Criteria
Scoring Score
negotiation
Land issue fully clarified
3
18
Environmental Improvement Potential (list expected environmental improvement and/or deterioration caused by the project)
2.3
Negative overall impact
0
Low positive impact 1
Medium positive impact
2
High positive impact 3
19 Community Contribution Commitment (cash, labour, land, etc. [short description])
1.3
No contribution addressed
0
Little contribution foreseen
1
Medium contribution foreseen
2
High contribution foreseen
3
20 Investment Value (incl design, supervision, labour, materials, equipment)
VUV million
4.2
No efficiency gain 0
Little efficiency gain 1
22
Potential Funding Sources Initial Investment (% of total project from: GoV, Donors (grant or loan), or Private Investment)
GoV: xx % Donors: grant xx %, loan xx% Private Sector: xx %
Moderate efficiency gain
2
High efficiency gain 3
21
Estimated Annual Operation and Maintenance (O&M) Cost (i) staff, consumables, energy, others; (ii) asset maintenance)
(i) Operation cost: VUV million/year (ii) Maintenance: cost: VUV million/year (iii) Demand for operational subsidies
2.1
O&M not addressed 0
O&M mostly from Government
1
23
Potential Funding Sources O&M Costs (% of total project from: GoV, donors (grant or loan), or private Investment)
GoV: xx % Donors: grant xx %, loan xx% Private Sector: xx %
O&M partially covered
2
O&M fully secured 3
24
Environmental and Involuntary Resettlement Risk (short description of impacts, number of people or assets affected)
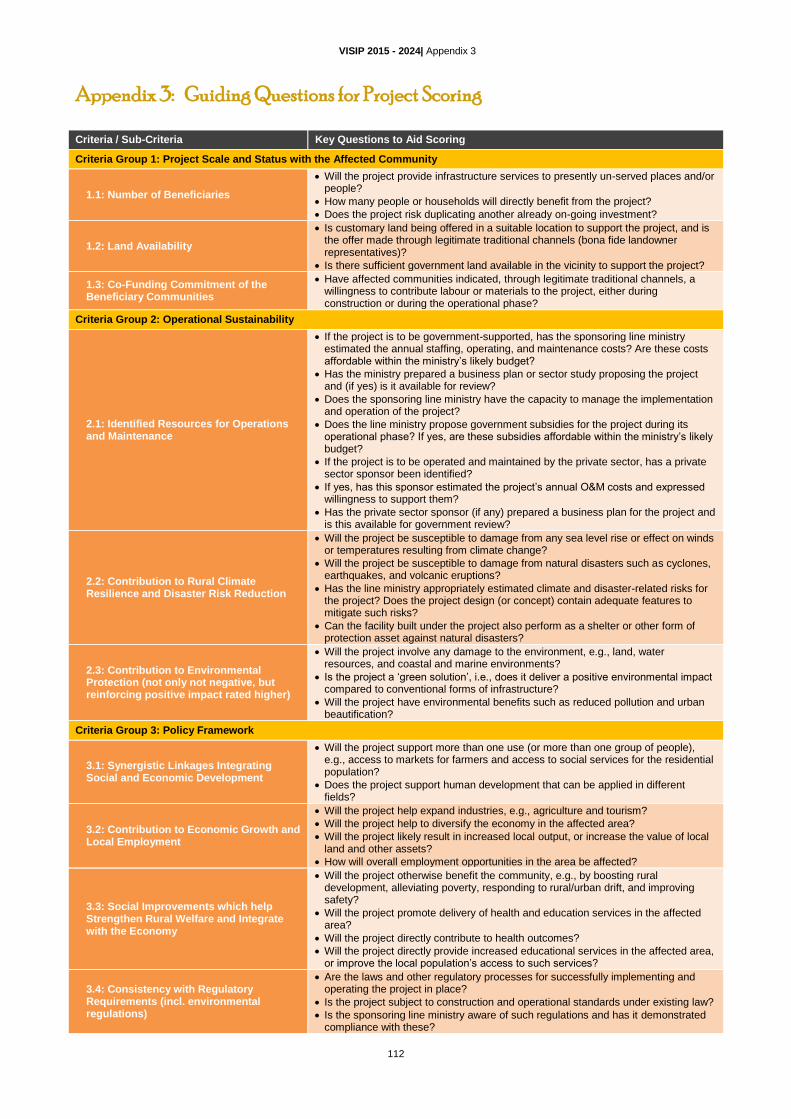
VISIP 2015 - 2024| Appendix 3
112
Appendix 3: Guiding Questions for Project Scoring
Criteria / Sub-Criteria Key Questions to Aid Scoring
Criteria Group 1: Project Scale and Status with the Affected Community
1.1: Number of Beneficiaries
Will the project provide infrastructure services to presently un-served places and/or people?
How many people or households will directly benefit from the project?
Does the project risk duplicating another already on-going investment?
1.2: Land Availability
Is customary land being offered in a suitable location to support the project, and is the offer made through legitimate traditional channels (bona fide landowner representatives)?
Is there sufficient government land available in the vicinity to support the project?
1.3: Co-Funding Commitment of the Beneficiary Communities
Have affected communities indicated, through legitimate traditional channels, a willingness to contribute labour or materials to the project, either during construction or during the operational phase?
Criteria Group 2: Operational Sustainability
2.1: Identified Resources for Operations and Maintenance
If the project is to be government-supported, has the sponsoring line ministry estimated the annual staffing, operating, and maintenance costs? Are these costs affordable within the ministry’s likely budget?
Has the ministry prepared a business plan or sector study proposing the project and (if yes) is it available for review?
Does the sponsoring line ministry have the capacity to manage the implementation and operation of the project?
Does the line ministry propose government subsidies for the project during its operational phase? If yes, are these subsidies affordable within the ministry’s likely budget?
If the project is to be operated and maintained by the private sector, has a private sector sponsor been identified?
If yes, has this sponsor estimated the project’s annual O&M costs and expressed willingness to support them?
Has the private sector sponsor (if any) prepared a business plan for the project and is this available for government review?
2.2: Contribution to Rural Climate Resilience and Disaster Risk Reduction
Will the project be susceptible to damage from any sea level rise or effect on winds or temperatures resulting from climate change?
Will the project be susceptible to damage from natural disasters such as cyclones, earthquakes, and volcanic eruptions?
Has the line ministry appropriately estimated climate and disaster-related risks for the project? Does the project design (or concept) contain adequate features to mitigate such risks?
Can the facility built under the project also perform as a shelter or other form of protection asset against natural disasters?
2.3: Contribution to Environmental Protection (not only not negative, but reinforcing positive impact rated higher)
Will the project involve any damage to the environment, e.g., land, water resources, and coastal and marine environments?
Is the project a ‘green solution’, i.e., does it deliver a positive environmental impact compared to conventional forms of infrastructure?
Will the project have environmental benefits such as reduced pollution and urban beautification?
Criteria Group 3: Policy Framework
3.1: Synergistic Linkages Integrating Social and Economic Development
Will the project support more than one use (or more than one group of people), e.g., access to markets for farmers and access to social services for the residential population?
Does the project support human development that can be applied in different fields?
3.2: Contribution to Economic Growth and Local Employment
Will the project help expand industries, e.g., agriculture and tourism?
Will the project help to diversify the economy in the affected area?
Will the project likely result in increased local output, or increase the value of local land and other assets?
How will overall employment opportunities in the area be affected?
3.3: Social Improvements which help Strengthen Rural Welfare and Integrate with the Economy
Will the project otherwise benefit the community, e.g., by boosting rural development, alleviating poverty, responding to rural/urban drift, and improving safety?
Will the project promote delivery of health and education services in the affected area?
Will the project directly contribute to health outcomes?
Will the project directly provide increased educational services in the affected area, or improve the local population’s access to such services?
3.4: Consistency with Regulatory Requirements (incl. environmental regulations)
Are the laws and other regulatory processes for successfully implementing and operating the project in place?
Is the project subject to construction and operational standards under existing law?
Is the sponsoring line ministry aware of such regulations and has it demonstrated compliance with these?

VISIP 2015 - 2024| Appendix 3
113
Criteria / Sub-Criteria Key Questions to Aid Scoring
Criteria Group 4: Financial and Economic Impact
4.1: Local employment and procurement for construction
Will the project directly employ ni-Vanuatu in construction? How many, and for what duration?
Will the project require materials procured locally? If yes, what proportion of total project investment costs is attributable to local materials?
If the project is donor grant-funded, has the donor insisted on importing labour and materials into Vanuatu for the project?
4.2: Impact on costs and efficiency of infrastructure users
Will the project involve user charges?
Will the project result in lower costs for infrastructure users through lower tariffs or slower growth in tariffs?
Will the project result in other cost reductions for infrastructure users, e.g., time savings and lower operating costs?
4.3: Optimal Use of Existing Infrastructure
Will the project involve rehabilitating infrastructure, or new infrastructure?
Will the project avoid duplicating services, i.e., serving a need that it is already addressed in another way?
Will the project have any impact on the use of existing infrastructure in the area?

VISIP 2015 - 2024 | Appendix 4
114
Appendix 4: VISIP 2014 Long List of Projects
List of Proposed (P) and Committed (C) Projects
Project No.
Project Type Island Province Est. Cost
($m)
Sub-Projects
Costs ($m) Ministry
Donor(s) Interest
Status Timing (if known)
MIPU
Road 225.60
Rd1 Santo South Coast Road Rehabilitation Santo Sanma 25.60 MIPU China Aid
(loan)1
P
Rd2 Sealing of Tanna Roads Whitegrass to Isangel Tanna Tafea 5 MIPU Undefined P
Rd3 Malekula East Coast Road Rehabilitation Malekula Malampa 31.40 MIPU Undefined P
Rd4 Road Rehabilitation and Improvement in Every Province Bundled
Torba, Sanma, Penama, Malampa,
Shefa, Tafea
66.50 MIPU Undefined P
Pentecost Roads Rehabilitation Pentecost Penama 25.10 P
Paama Roads Improvement Paama Penama 0.70 P
Ambae Roads Construction Ambae Penama 0.90 P
Maewo Roads Rehabilitation Maewo Penama 8.0 P
Erromango Roads Rehabilitation Erromango Tafea 1.30 P
Efate Tourism Roads Rehabilitation Efate Shefa 3.70 P
Malo Island Roads Rehabilitation Malo Sanma 16.10 P
Malekula South Coast Road Construction Malekula Malampa 10.30 P
Rd5 Santo Big Bay Highway Rehabilitation Santo Sanma 14.60 P
Rd6 Rural and Feeder Roads Rehabilitation and Development in Every Province
Bundled
Torba, Sanma, Penama, Malampa,
Shefa, Tafea
82.50 MIPU Undefined P
Efate Rural Roads Rehabilitation Efate Shefa 5.40 P
Moto Lava Rural Roads Rehabilitation Moto Lava Torba 0.60 P
Vanua Lava Rural Roads Rehabilitation Vanua Lava Torba 0.60 P
Santo Rural Roads Rehabilitation Santo Sanma 28.40 P
Ambrym Rural Roads Construction Ambrym Malampa 3.70 P
Part Rehabilitation and New Feeder Road Vao inland Road (15km)
Malekula Malampa 3.00 P

VISIP 2015 - 2024 | Appendix 4
115
Project No.
Project Type Island Province Est. Cost
($m)
Sub-Projects
Costs ($m) Ministry
Donor(s) Interest
Status Timing (if known)
Part Rehabilitation and New Feeder Road Atchin Inland Road (20km)
Malekula Malampa 400 P
Part Rehabilitation and New Feeder Road Orap Inland Road (15km)
Malekula Malampa 3.00 P
Part Rehabilitation and New Feeder Road Limap Inland Road (20km)
Malekula Malampa 5.20 P
Part Rehabilitation and New Feeder Road Lambubu-Tisvel Road (15km)
Malekula Malampa 3.00 P
Part Reahbilitation and New Feeder Road Bamboo-Vanafo Road (15km)
Santo Sanma 3.00 P
Part Rehabilitation and New Feeder Road Beleru Road (20km)
Santo Sanma 4.00 P
Part Rehabilitation and New Feeder Road Ngala-South Epi Road (15km)
Epi Shefa 3.00 P
Rehabilitation Feeder Road Teouma shopping Inland Road (20km)
Efate Shefa 2.60 P
Rehabilitation Feeder Road Chief Karu Inland Road (2 km)
Efate Shefa 2.60 P
Rehabilitation Feeder Road House Kingdom Inland Road (20km)
Efate Shefa 2.60 P
Rehabilitation Feeder Road DucklakeIinland Road (20km)
Efate Shefa 2.60 P
New Feeder Road Middle Bush Road (20km) Tanna Tafea 5.20 P
Aviation 432.60
Av1 Construction of New International Airport, Efate Efate Shefa 350.00 MIPU Private Invest-ment
P
Av2 Upgrading Airport Category A or Assimilate Bundled Efate, Santo, Tanna
Shefa, Sanma, Tafea
63.00 MIPU Undefined P
Bauerfield Airport Improvement - runway, taxiways, apron
Efate Shefa 1500 Australian
Aid? P
Bauerfield Terminal Improvements Efate Shefa 20.00 P
Upgrading of Pekoa Airport, Santo Santo Sanma 17.00 P
Upgrading of Whitegrass Airport, Tanna Tanna Tafea 11.00 P
Av3 Upgrading Airports of Category B Bundled
Norsup, Pentecost,
Ambae Mota Lava
Malampa, Penama, Torba
9.40 MIPU Undefined P
Upgrading of Norsup Aerodrome Norsup Malampa 5.20
Upgrading of Lonorore, Longana & Mota Lava Aerodromes
Pentecost,
Ambae, Mota Lava
Penama, Torba 4.20 NZMFAT2

VISIP 2015 - 2024 | Appendix 4
116
Project No.
Project Type Island Province Est. Cost
($m)
Sub-Projects
Costs ($m) Ministry
Donor(s) Interest
Status Timing (if known)
Av4 Rehabilitation and upgrading of Cat. C domestic aerodromes in every Province
Bundled Vanuatu 10.20 MIPU Undefined P
Rehabilitation and upgrading of Cat. C domestic aerodromes, Phase 1
5.70
Rehabilitation and upgrading of Cat. C domestic aerodromes, Phase 2
4.50
Shipping 347.26
Sh1 Rehabilitation and Extension of Luganville International Wharf Santo Sanma 53.56 MIPU China Aid?
4
P
Sh2 Forari Industrial Wharf, Efate Efate Shefa 35.00 MIPU Undefined P
Sh3 Malekula International Wharf in Penamum Malekula Malampa 64.27 MIPU Undefined P
Sh4 Domestic Jetties Construction in Every Province Bundled Vanuatu 17.35 MIPU Undefined P
Jetty plus Warehouse and WC at Point cross Pentecost Penama 1.45 P
Jetty plus Warehouse and WC at Avunatari Malo Sanma 1.45 P
Jetty plus Warehouse and WC at Narovrovo Maewo Penama 1.45 P
Jetty plus Warehouse and WC at Toak Ambrym Malampa 1.45 P
Jetty plus Warehouse and WC at Bwatnapni Malekula Malampa 1.45 P
Jetty plus Warehouse and WC at South West Bay Malekula Malampa 1.45 P
Jetty plus Warehouse and WC at Sola- Motalava Motalava Torba 1.45 P
Jetty plus Warehouse and WC at Ngala Epi Shefa 1.45 P
Jetty plus Warehouse and WC at Ravenga Tongoa Shefa 1.45 P
Jetty plus Warehouse and WC at Analcauhat Aneityum Tafea 1.45 P
Jetty plus Warehouse and WC at Dillions Bay Erromango Tafea 1.45 P
Jetty plus Warehouse and WC at Harold Bay Futuna Tafea 1.45 P
Sh5 Improvement of Port Navigation and Mooring Aids Vanuatu 1.00 MIPU Undefined P
Sh6 Hydrographic and Bathymetric Surveys Vanuatu 2.00 MIPU Undefined P
Sh7 Sulfur Bay Wharf Project Tanna Tafea 158.01 MIPU Undefined P
Sh8 Slipways Construction Efate & Luganville Efate, Santo Shefa, Sanma 16.07 MIPU Undefined P
Total MIPU 1,005.46

VISIP 2015 - 2024 | Appendix 4
117
Project No.
Project Type Island Province Est. Cost
($m)
Sub-Projects
Costs ($m) Ministry
Donor(s) Interest
Status Timing (if known)
1 China Aid Loan on Hold Due to Lack of Local Funding 2 NZMFAT may have interest for ICT and navigation systems component 3 NZMFAT may have interest in a SW Component under the VUDP 2 4 Project under Evaluation by Chinese Exim Bank 5 Port Navigation Aids to be integrated in main Ports /Wharf Rehabilitation projects 6 Hydrographic surveys for cruise ships and according to SOLAS obligations have been completed for 4 locations: Luganville, Champagne bay, Wala (Malekula) and Pangi (Pentecost) with NZMFAT support. Additional surveys for Port Vila and Aneityum may still be necessary
MCCDRM
Grid
En1 Grid Extension (Matelevu to Shark Bay, Port Olry, Stone Hill and Palekula), East Cost Santo
Santo Sanma 2.40 MCCDRM
No Clear Concessio
naire; Undefined
P
En2 Low-Voltage (LV) and Medium-Voltage (MV) Extension (Vila, Santo, Malekula)
Malekula Malampa 18.00 MCCDRM Undefined P
Fossile Energy Supply
En3 Relocation of 2 new 5-million-litre storage tanks in Port Vila, Efate
Efate Shefa 10.00 MCCDRM GoV
Renewable Energy Supply
En4 Efate Grid Connected Solar Panels (1 MW) Project Efate Shefa 5.60 MCCDRM EU /
UNELCO / GoV
C
En5 Takara Geothermal Power Plant (4+4 MW) , (Preparatory Study) Takara Geothermal Power Plant (4+4 MW) , (investment)
Efate Shefa 108.00 MCCDRM Private Invest-ment
1
P 2014-2015
En6 Brenwe Hydro Power Project (< 1.2MW), Malekula Malekula Malampa 5.60 MCCDRM Undefined P 2018-2021
En7 Sarakata Hydro Power Extension Project (+600 KW), Santo Santo Sanma 4.25 MCCDRM Undefined P 2018-2021
Disaster Risks Management
DM1 Provincial Disaster Management Offices (4 provinces) 0.90 MCCDRM Undefined P
Total MCCDRM 154.75
1 Study being undertaken by Geo-Dynamics from Australia
MIA, MIPU & MLNR (Water Supply & Sanitation)
Multi Sector
MS1 Vanuatu Urban Development Project (Phase 2 - Luganville, Port Vila) (VUDP 2)
Efate, Santo Sanma 22.50 PMO/VPM
IU Australian Aid/ ADB
P 2015-2020
Total PMO/VPMU 22.50
MIPU

VISIP 2015 - 2024 | Appendix 4
118
Project No.
Project Type Island Province Est. Cost
($m)
Sub-Projects
Costs ($m) Ministry
Donor(s) Interest
Status Timing (if known)
Urban Water Supply
UWS1 Luganville Existing Water Supply System Rehabilitation and New Water Sources
Santo Sanma 4.10 MIPU
No Clear Concessio
naire; Undefined
P
UWS2 4 Provincial Capitals Water Supply System Development Bundled
Malekula, Tanna,
Vanua Lava, Pentecost
Malampa, Tafea, Torba, Penama
3.20 MIPU Undefined P
Lakatoro Water Supply Project Malekula Malampa 0.80 MIPU Undefined P
Isangel Water Supply Project Tanna Tafea 1.00 MIPU Undefined P
Sola Water Supply Project (Sola, Santa Maria, Torba REDI Tourism Project, Arep School)
Vanua Lava Torba 0.20 MIPU Undefined P
Saratamata Water Supply and Sanitation Project (North Pentecost, Saratamata, Londua School)
Pentecost Penama 1.20 MIPU Undefined P
Urban Solid Waste
SW1 Port Vila Solid Waste Collection Trucks Efate Shefa 1.00 MIPU Undefined P
SW2 Luganville Solid Waste Management Santo Sanma 1.50 MIPU NZMFAT1 P
SW3 Lenakel Town Dumpsite Tanna Tafea 1.00 MIPU Undefined P
Total MIPU 10.80
MLNR
Rural Water Supply
RWS1 Rural Water Supply Lamap, East Malo, Wala Rono, West Ambae
Malo,
Ambae Sanma, Penama 0.30
NZMFAT, UNICEF
2
C
RWS2 Rural Water Supply in Every Province Bundled Vanuatu 1.66 Undefined P
Dillons Bay Water Erromango Tafea 0.050 MLNR P
Wintua Water Supply Malekula Malampa 0.050 MLNR P
Ikwarramanu Water Supply Tanna Tafea 0.060 MLNR P
Latano Water Supply Pentecost Penama 0.070 MLNR P
Londua Rainwater Catchment Ambae Penama 0.050 MLNR P
Lamkail Water Supply Tanna Tafea 0.040 MLNR P
Yanepkasu Water Supply Tanna Tafea 0.080 MLNR P
Crab Bay Water Supply Malekula Malampa 0.020 MLNR P
Faralou Water Supply Malekula Malampa 0.050 MLNR P
Nguna Water Supply Nguna Shefa 0.150 MLNR P

VISIP 2015 - 2024 | Appendix 4
119
Project No.
Project Type Island Province Est. Cost
($m)
Sub-Projects
Costs ($m) Ministry
Donor(s) Interest
Status Timing (if known)
Haehivo Water Supply Pentecost Penama 0.660 MLNR P
SE Santo Drilling Santo Sanma 0.120 MLNR P
Malo Drilling Malo Sanma 0.130 MLNR P
Malo Handpump Replacement Malo Sanma 0.090 MLNR P
Palumsi (Pangi) Water Supply Pentecost Penama 0.040 MLNR P
Total MLNR 1.96
1 NZMFAT may be interested in this component under the Multi-Sector Project highlighted above (VUDP2)
2 NZMFAT financed, UNICEF Managed
MTTCNVB
To1 Port Vila Ward Council Tourism Project Efate Shefa 0.107 MTTCNVB Undefined P 2015-2017
To2 Vanuatu Tourism Infrastructure Project Luganville Santo Sanma 32.00 MTTCNVB Undefined P
Total MTTCNVB 32,11
OGCIO
ICT1 Second Submarine Cable - Vanuatu to PNG via Solomons, w/spurs to Santo & Malekula including OGCIO oversight
Vanuatu 30.70 OGCIO;
Inter-change
Private Financing
1
P 2016-2019
ICT2 Third Submarine Cable -- Vanuatu to New Cal w/ spur to Tanna including OGCIO oversight
Vanuatu 30.70 OGCIO;
Interchange?
Private financing
1
IU 2017-2019
ICT3 Fiber Optic Cable around Efate (w/spur to new airport); + on E coast of Santo
Efate, Santo Shefa, Sanma 3.00 OGCIO;
Inter-change?
Undefined IU 2016-2017
ICT4 Widespread Bandwidth Capacity Distribution System: O3b?; Google aerostats or drones? Kacific satellite?
Vanuatu 20.00 OGCIO
Private financing, Google,
FaceBook, Kacific?
IU 2016-2019
ICT5 SOE (Std. Operating Environment) Phase 2 – desktop and laptop standardisation & upgrading
Vanuatu 1.00 OGCIO Recurrent budget of OGCIO?
P 2015-2016
ICT6 Volcano, Weather and Other Hazards Monitoring Stations – improve monitoring & prediction
Vanuatu 3.00 Meteo Undefined P 2015-2020
ICT7 New Government Data Centre + backup Vanuatu 1.00 OGCIO Undefined P 2015-2016
ICT8 TRR UAP Phase 2 – computer labs, tablets, Internet cafes Vanuatu 2.00 TRR Universal Access Fund
P 2015-2017
ICT9 TRR UAP Phase 3 – computer labs, tablets, Internet cafes Vanuatu 2.00 TRR Undefined P 2017-2018

VISIP 2015 - 2024 | Appendix 4
120
Project No.
Project Type Island Province Est. Cost
($m)
Sub-Projects
Costs ($m) Ministry
Donor(s) Interest
Status Timing (if known)
ICT10 Three Community ICT Centres on outlying islands (Ulei in North Efate island; Melsisi in central Pentecost Island; Lenaula in South Tanna Island)
Efate,
Pentecost, Tanna
Shefa, Penama, Tafea
0.15 TRR APT P 2015-2016
ICT11 Implementation of iGov Strategic Plan – including planning WB/ADB ICT loan package
Vanuatu 20.15 OGCIO
Australian Aid
2) /
Possible WB/ADB
Soft loan + grants
P 2015-2019
ICT12 Upgrades to SmartStream FMIS + HRMIS Vanuatu 1.00 MFEM Undefined P 2015-2016
ICT13 Eventual Replacement of SmartStream FMIS + HRMIS Vanuatu 15.00 MFEM Undefined P 2019-2023
ICT14 Expansion of Government Broadband Network (GBN), Phase 2 (more connectivity in provincial capitals and towns)
Vanuatu 2.00 OGCIO Possible WB/ADB
loan P
2015-2017
ICT15 Expansion of Government Broadband Network (GBN), Phase 3 (more connectivity in outlying govt offices)
Vanuatu 2.00 OGCIO Possible WB/ADB
loan P
2017-2019
ICT16 ICTs for Cultural and Language Preservation Vanuatu 1.00
OGCIO; Vanuatu Cultural Centre
Possible WB/ADB
loan P
2015-2018
ICT17 ICTs in Education (to correct historic absence of investment in this area)
Vanuatu 20.00 OGCIO;
MoE Undefined IU
2015-2020
ICT18 ICTs in Health (to correct historic absence of investment in this area)
Vanuatu 20.00 OGCIO;
MoE
Unclear/ Christiansen Fund?
IU 2015-2021
ICT19 Incorporating ICTs – to enable success in all sectoral and ministerial projects
Vanuatu 20.00 OGCIO;
all ministries
Ministerial budgets
and donor projects
IU 2015-2020+
Total OGCIO 194.70
1 Oversight is Contribution by GoV 2 Study Financed by Australian Aid
MOE
Ed1 Reconstruction College Malapoa Efate Shefa 16.00 MOE Chinese
Aid C
Ed2 Rehabilitation All Primary Schools Bundled
1
Vanuatu 207.00 ME Chinese Aid?
3
NZMFAT 4
IU
Ed3 Rehabilitation All Secondary Schools Bundled
2
Vanuatu 59.00 ME Chinese
Aid? 3
P
Total MOE 282.00

VISIP 2015 - 2024 | Appendix 4
121
Project No.
Project Type Island Province Est. Cost
($m)
Sub-Projects
Costs ($m) Ministry
Donor(s) Interest
Status Timing (if known)
1 In the absence of an inventory, no list of location can be provided 2 Tentative priority list of projects include (i) Teruja Secondary School project, (ii) South Malekula Secondary School project, (iii) Navutirigi Secondary School project, (iv) Nofo Secondary School project, (v) Matevulu College project, (vi) Ienaula Secondary School project, (vii) Lini Memorial Junior Secondary School. 3 Chinese Aid possibly Interested in new school development 4 NZMFAT is financing an inventory of the primary school sector
MOH
He1 Rehabilitation All Hospitals, Health Centres and Dispensaries Bundled
3
Vanuatu 22.20 MOH
Australian Aid
2
Chinese Aid?
1
IU
Total MOH 22.20
1 Chinese Aid possibly Interested in new larger health facilities 2 Australian Aid-financed and extensive inventory of existing infrastructure country wide
3 Complete list of location and cost available from Australian Aid office in MOH
MYDST
Yo1 National Sports Complex - Port Vila Efate Shefa 9.60 MYSD China Aid C
Yo2 Ministry of Youth and Sports New Office Buildings Efate Shefa 1.50 MYSD Undefined P
Yo3 Provincial Youth and Sports Offices x5, one in each province Vanuatu 0.50 MYSD Undefined P
Yo4 Multi-Purpose Courts in Rural Areas x 12, 2 in each province Vanuatu 0.36 MYSD Undefined P
Yo5 Youth Centres x 12, Two in each province Vanuatu 0.60 MYSD Undefined P
Yo6 Lugaville Multi-purpose Sports Hall Santo Sanma 0.30 MYSD Undefined P
Total MYSD 12.86
MJCS
Ju1 Correctional Services, Vila, Tanna & Luganville 9.20 MJCS NZMFAT1 C
Ju2 Hall of Justice Efate Shefa 27.00 MJCS Undefined P
Ju3 Justice on Boat Vanuatu 0.60 MJCS Undefined P
Ju4 Ministry of Justice Building Efate Shefa 3.00 MJCS Undefined P
Ju5 Ministry of Justice Sector House X5 Vanuatu 0.60 MJCS Undefined P
Total MJCS 40.40
1 NZMFAT may be interested to contribute part of the project cost; other contributors needed
MFAICET
FA1 Extension to Department of Foreign Affairs Bldg Efate Shefa 1.6 MFAICET Undefined P 2015-2017
FA2 Repair of SPC Country Office Efate Shefa 0.1 MFAICET Undefined P 2015-

VISIP 2015 - 2024 | Appendix 4
122
Project No.
Project Type Island Province Est. Cost
($m)
Sub-Projects
Costs ($m) Ministry
Donor(s) Interest
Status Timing (if known)
2017
FA3 Vanuatu Chancery Suva, Fiji 2.6 MFAICET Undefined P 2015-2017
FA4 Building to House International Organisations Efate Shefa 1.6 MFAICET Undefined P 2015-2018
Total MFAICET 5.9
MALFFB
Ag1 New Labs for Testing and Bio-Security Assessment Efate Shefa 6.00 MALFFB NZMFAT1 P
Ag2 Warehouse Rovo Bay Epi Shefa 0.107 MALFFB Undefined P
Ag3 Warehouse Bwatnapni- Central Pentecost Pentecost Penama 0.107 MALFFB Undefined P
Total MALFFB 6.21
1 NZMFAT may be interested to contribute part of the project cost; other contributors needed
PMO
PM1 Redesign and Construction of PM Office Efate Shefa 9.60 PMO China Aid C
Total PMO 9.60
Grand Total Proposed Projects 1,801.45

VISIP 2015 - 2024 | Appendix 5
123
Appendix 5: Infrastructure Prioritisation Model (Template with Graph)
The Excel model was tested with DSPPAC staff at Workshop 4 on 12 August and handed to DSPPAC on the completion of the work.

VISIP 2015 - 2024 | Appendix 5
124
Infrastructure Prioritisation Model
0 10 20 30 40 50 60 70 80 90 100
Project 1
Project 2
Project 3
Project 4
Project 5
Project 6
Project 7
Project 8
Project 9
Project 10
Project 11
Project 12
Project 13
Project 14
Project 15
Project 16
Project 17
Project 18
Scale & Status
Operational Sustainability
Policy Framework
Financial & Economics

VISIP 2015 - 2024 | Appendix 6
125
Appendix 6: Project Profiles – Short-Listed Priority Projects
MULTI SECTOR
MS1 Vanuatu Urban Development Project (Phase 2 - Luganville, Port Vila) Item
Project Information
1 Sponsoring Ministry/Agency MIPU
2 Dates Date of First Submission: 2012
Date of Latest Update: 30 July 2014
3 Project Name (with acronym) Vanuatu Urban Development Project (Phase 2)
4 Project Owner: Owner responsible for the infrastructure: Operator responsible for maintenance: Municipalities of Port Vila and Luganville, Provincial Administrations
5 Alignment with Governmental and Ministerial Policies
Clear priority areas of current ministerial strategies/road maps addressed in the project: PAA Policies:
Expanding access to markets for products from rural areas
Improving roads and other infrastructure
Lowering the cost of doing business and increasing competitiveness through reduced costs of transportation and utilities
6 Project Timeframe Construction period (years): 2015-2020
Operating period (years): 30 years
7 Project Development Status (concept, prefeasibility, feasibility stage etc.)
Prefeasibility study being developed
8 Locations and Areas Affected (provinces, islands, villages)
Port Vila and Luganville
9 Project Components (with quantities e.g., “xx km of road”, “xx m
2 of terminal building”, “xx
meters pipelines”, “training”, etc)
Project is expected to include initial works in a piped sewerage system, and further road and drainage improvements in other Port Vila catchments It will also include urban infrastructure improvements in Luganville comprising roads, drains, and sanitation, plus capacity building in the municipal administrations The scope could include solid waste management in Luganville if the separate SW management project does not go ahead separately
10 Linkage with other Infrastructure (none, low, medium, high)
Degree of linkage: Multiple linkage with tourism, energy, water supply and sanitation, education and health
Brief description: Improved urban infrastructure situation for population, commerce and tourism
11 Regulatory Requirements to Comply With Under the Project (construction standards, etc. [list])
12 Project Beneficiaries (approximate types and number of persons or households benefitting [say which])
Types of beneficiaries (e.g., residential, business, farmer, etc.) 1. Residential, 2. Commerce, 3, Tourism, 4. Road Traffic 4. Cultural Heritage Promoters
Number of beneficiaries: Not yet estimated
13 Project Benefits/Outcomes
Brief description (be specific and quantitative: e.g., XX households gain access to health care facilities, etc): Port Vila and Luganville are the main urban areas in Vanuatu and the centres for commerce and service industries. They are important gateways for tourism, which is a major contributor to GDP. Improvements in the environmental conditions in the informal housing areas in of these towns will assist poor households to lift themselves out of poverty. Reduced travel times and lower levels of wear and tear on vehicles will also aid economic growth.
14
Local Employment and Procurement during Construction (number of Ni-Vans employed, each year of construction; value of local materials procured for construction)
Degree of employment impact (high, medium, low): Medium
Brief description (Ni-Vanuatu employed in construction, value of local materials): Ni-Vanuatu may be asked to contribute labour for works implemented under the project
15 Job Creation Potential during Operations Degree of employment impact (high, medium, low):
Number of new employed in operations:

VISIP 2015 - 2024 | Appendix 6
126
Item
Project Information
Medium Around 15 new employees to maintain the infrastructure (estimated)
16 Resilience of Project Assets to Climate Change and Natural Disaster Risk
Degree of resilience built into project design (high, medium, low): High resilience Medium risk
Major Climate Change and Natural Disaster risks: Earthquake, cyclone, climate change
Main risk mitigation measures: Infrastructure will be designed for earthquake and climate change tolerance
17 Land Availability for Project Brief description (customary or GoV land; dispute risks; status of land negotiations): Unclarified at this time
18 Environmental Improvement Potential Rating (high, medium, low, negative): Medium to High
19 Community Contribution Commitment Short description (cash, labour, materials, land, etc.): Labour and land (estimated)
20 Investment Value, VUV million
Including design/supervision, technical assistance, works, labour, materials, equipment, etc.): USD22.50 million (VUV2100 million)
21 Estimated Annual O&M Cost, VUV million/year
(i) Operation cost (staff, consumables, energy, others)
(ii) Asset maintenance cost:
USD300,000 annually (estimated)
(iii) Operational subsidies needed? No subsidy foreseen
22 Potential Funding Sources Initial Investment (% of total project investment cost)
GoV: Funding source to be determined
Donors:
Grants:
Loans:
Private Sector:
23 Potential Funding Sources O&M Costs (% of total project O&M costs)
GoV: Funding source to be determined
Donors (grants):
Private Sector:
24 Environmental and Involuntary Resettlement Risks
Short description of impacts, and of people or assets affected (if any): Unclarified for now

VISIP 2015 - 2024 | Appendix 6
127
ROAD
Rd1 Santo South Coast Road Rehabilitation Item
Project Information
1 Sponsoring Ministry/Agency MIPU
2 Dates Date of First Submission: 2012
Date of Latest Update: 30 July 2014
3 Project Name (with acronym) Santo South Coast Road Rehabilitation
4 Project Owner: Owner responsible for the infrastructure: Operator responsible for maintenance: PWD Sanma Province Office
5 Alignment with Governmental and Ministerial Policies
Clear priority areas of current ministerial strategies/road maps addressed in the project: MIPU Priorities 2013: (i) to enable user responsive infrastructure connecting to the future; (ii) to promote decentralisation through consultative implementation and maintenance of appropriate, resilient, sustainable infrastructure and services to strengthen social & economic development in the provinces
6 Project Timeframe Construction period (years): 3 years
Operating period (years): 20 years
7 Project Development Status (concept, prefeasibility, feasibility stage, etc.)
Prefeasibility study
8 Locations, and Areas Affected (provinces, islands, villages)
East Coast of Santo, Sanma
9 Project Components (with quantities e.g., “xx km of road”, “xx m
2 of terminal building”, “xx
meters pipelines”, “training”, etc)
The project involves rehabilitating 71km of roads from Luganville to Tassiriki and rehabilitating 22km of feeder roads on the South Coast. The South Coast road is the only road serving the south and west coast villages of Santo. The project will also include reconstructing10 river crossings. The absence of these river crossings disallows access to markets. The South Coast is a major producing area for cocoa, kava, timber, livestock, fisheries, aquaculture, bamboo and firewood. Poor road conditions discourage farmers from getting their produce to markets as the cost of transportation is high and also the chances of making a successful trip is low. The works will include clearance, pavement reconstruction, drainage improvement, and bridge construction. Current road conditions are very poor making vehicular access difficult with low volumes of produce reaching markets.
10 Linkage with other Infrastructure (none, low, medium, high)
Degree of linkage: Medium
Brief description: Agriculture, Commerce, Education, Tourism, Health
11 Regulatory Requirements to Comply With under the Project (construction standards, etc. [list])
National/international roads design and safety standards
12 Project Beneficiaries (approximate types and number of persons or households benefitting [say which])
Type(s) of beneficiaries: 1. Local Population 2. Tourism 3. Farmers 4. Commerce 5. Secondary Schools 6. Health Centres
Number of beneficiaries 1 to 6: To be clarified
13 Project Benefits/Outcomes
Brief description: The project will improve access to farms and allow access for the first time to link isolated villages to the commercial centres and social services. Road transport is vital for business, social, health, and education-related activities. The roads on South Santo will also be benefit agriculture and tourism. The improved roads will reduce travelling time for all road users. It will also encourage the increase of production and encourage farmers to sell more products at markets.
14
Local Employment and Procurement during Construction (number of Ni-Vans employed, each year of construction; value of local materials procured for construction)
Degree of employment impact (high, medium, low): Low to Medium
Brief description (Ni-Vanuatu employed in construction, value of local materials): Mostly labour for road rehabilitation, maintenance, and upgrading works
15 Job Creation Potential during Operations
Degree of employment impact (high, medium, low): Direct employment: Low Indirect employment: Medium
Number of new employed in operations:
Not yet documented – to be clarified

VISIP 2015 - 2024 | Appendix 6
128
Item
Project Information
16 Resilience of Project Assets to Climate Change and Natural Disaster Risk
Degree of resilience built into project design (high, medium, low): Medium
Major climate change and natural disaster risks: The South Coast road crosses low lying terrain that floods regularly All roads constructed from gravel pavements will easily disintegrate with the increased rainfall being experienced Main risk mitigation measures: Designed for flood protection Bridges designed to overcome major flooding events
17 Land Availability for Project Brief description (customary or GoV land; dispute risks; status of land negotiations): Not known nor clarified yet
18 Environmental Improvement Potential Rating (high, medium, low, negative): Low to Medium environmental improvement
19 Community Contribution Commitment Short description (cash, labour, materials, land, etc.): Communities to be invited to contribute to the sustainable maintenance of the rehabilitated roads segments
20 Investment Value VUV million
Including design/supervision, technical assistance, works, labour, materials, equipment, etc.): USD25,60 million (VUV2.39 billion)
21 Estimated Annual O&M Cost VUV million/year
(i) Operation cost (staff, consumables, energy, others)
(ii) Asset maintenance cost:
USD500,000 (estimated)
(iii) Operational subsidies needed? No subsidy foreseen
22 Potential Funding Sources Initial Investment (% of total project investment cost)
GoV: Funding source to be determined
Donors:
Grants:
Loans:
Private Sector:
23 Potential Funding Sources O&M Costs (% of total project O&M costs)
GoV: Road maintenance fund 50 %
Donors (grants):
Private Sector: Local communities 50 %
24 Environmental and Involuntary Resettlement Risks
Short description of impacts, and any people or assets affected: No resettlement foreseen; to be confirmed

VISIP 2015 - 2024 | Appendix 6
129
Rd2 Sealing of Tanna Roads Whitegrass to Isangel Item
Project Information
1 Sponsoring Ministry/Agency MIPU
2 Dates Date of First Submission: 2012
Date of Latest Update: 1 August 2014
3 Project Name (with acronym) Sealing of Tanna Roads between Whitegrass to Isangel
4 Project Owner: Owner responsible for the infrastructure: Operator responsible for maintenance: PWD Tafea Province Office
5 Alignment with Governmental and Ministerial Policies
Clear priority areas of current ministerial strategies/road maps addressed in the project: MIPU Priorities 2013: (i) to enable user responsive infrastructure
connecting to the future; (ii) to promote decentralisation through consultative implementation and maintenance of appropriate, resilient, sustainable infrastructure and services to boost social & economic development in the provinces
6 Project Timeframe Construction period (years): 2 years
Operating period (years): 20 years
7 Project Development Status (concept, prefeasibility, feasibility stage etc.)
Prefeasibility study
8 Locations, and Areas Affected (provinces, islands, villages)
Coastal Road between Whitegrass and Isangel, Tanna, Tafea
9 Project Components (with quantities e.g., “xx km of road”, “xx m
2 of terminal building”, “xx
meters pipelines”, “training”, etc)
Length of the road section: 12 km Due to a generally weaker subgrade and poor base course material used in the roadwork, it is necessary to seal sections of the road between the Whitegrass airport and Isangel to prevent erosion and deterioration of the pavement. The work will include a double bituminous surface dressing. The project would also include provision/renewal of road signs.
10 Linkage with other Infrastructure (none, low, medium, high)
Degree of linkage: Medium to High
Brief description: Agriculture, Commerce, Education, Tourism, Health
11 Regulatory Requirements to Comply With under the Project (construction standards, etc. [list])
National/international roads design and safety standards
12 Project Beneficiaries (approximate types and number of persons or households benefitting [say which])
Types of beneficiaries 1. Local Population 2. Tourism 3. Farmers 4. Commerce 5. Secondary Schools 6. Health Centres
Number of beneficiaries 1 to 6: To be clarified
13 Project Benefits/Outcomes
Brief description: The sealing will reduce maintenance costs. It will also improve health in roadside villages, as sealing would reduce dust emission from passing traffic. A sealed pavement will also reduce surface runoff and reduce sediment displacement in the surrounds. The sealed area will reduce the roughness index of the road and improve comfort for passengers traveling the road. This road is also important for tourism and agriculture, as it is the main cross-island link. It is expected that more roadside markets will be created as road conditions improve. The improved roads will reduce VOC and traveling time for all road users.
14
Local Employment and Procurement during Construction (number of Ni-Vans employed, each year of construction; value of local materials procured for construction)
Degree of employment impact (high, medium, low): Low to Medium
Brief description (Ni-Vanuatu employed in construction, value of local materials): Mostly labour for road rehabilitation, maintenance, and upgrading works
15 Job Creation Potential during Operations
Degree of employment impact (high, medium, low): Direct employment: Low Indirect employment: Medium to High
Number of new employed in operations: Not yet documented. To be clarified
16 Resilience of Project Assets to Climate Change and Natural Disaster Risk
Degree of resilience built into project design (high, medium, low): Medium to High
Major climate change and natural disaster risks: Tanna has an active volcano that produces ash over the land Susceptibility to landslides and washouts is relatively high on Tanna Main risk mitigation measures: Project will be designed for flood protection
17 Land Availability for Project Brief description (customary or GoV land; dispute risks; status of land negotiations):

VISIP 2015 - 2024 | Appendix 6
130
Item
Project Information
Not known nor clarified yet
18 Environmental Improvement Potential Rating (high, medium, low, negative): Low to Medium environmental improvement
19 Community Contribution Commitment Short description (cash, labour, materials, land, etc.): Communities to be invited to contribute to the sustainable maintenance of the rehabilitated roads segments
20 Investment Value, VUV million
Including design/supervision, technical assistance, works, labour, materials, equipment, etc.): USD5.0 million (VUV467 million)
21 Estimated Annual O&M Cost, VUV million/year
(i) Operation cost (staff, consumables, energy, others)
(ii) Asset maintenance cost: 100.000 USD (estimated)
(iii) Operational subsidies needed? No subsidy foreseen
22 Potential Funding Sources Initial Investment (% of total project investment cost)
GoV: Funding source to be determined
Donors:
Grants:
Loans:
Private Sector:
23 Potential Funding Sources O&M Costs (% of total project O&M costs)
GoV: Road maintenance fund 50 %
Donors (grants):
Private Sector: Local communities 50 %
24 Environmental and Involuntary Resettlement Risks
Short description of impacts, and of any people or assets affected: No resettlement foreseen; to be confirmed

VISIP 2015 - 2024 | Appendix 6
131
Rd3 Malekula East Coast Road Rehabilitation Item
Project Information
1 Sponsoring Ministry/Agency MIPU
2 Dates Date of First Submission: 2012
Date of Latest Update: 1 August 2014
3 Project Name (with acronym) Malekula East Coast Road Rehabilitation
4 Project Owner: Owner responsible for the infrastructure: Operator responsible for maintenance: PWD Malampa Province Office
5 Alignment with Governmental and Ministerial Policies
Clear priority areas of current ministerial strategies/road maps addressed in the project: MIPU Priorities 2013: (i) To enable user responsive infrastructure connecting to the future; (ii) To promote decentralisation through consultative implementation and maintenance of appropriate, resilient, sustainable infrastructure and services to boost social, & economic development in the provinces
6 Project Timeframe Construction period (years): 4 years
Operating period (years): 20 years
7 Project Development Status (concept, prefeasibility, feasibility stage etc.)
Prefeasibility Study
8 Locations and Areas Affected (provinces, islands, villages)
Malekula East Coast, Malampa
9 Project Components (with quantities e.g., “xx km of road”, “xx m
2 of terminal building”, “xx
meters pipelines”, “training”, etc)
The project involves rehabilitation of 70km of main road linking Lakatoro in the North to Lamap in the South and will also upgrade 13 river crossings. The project is critical as it provides links to the commercial centre and also to major air and shipping ports. It also links all the main feeder roads linking the villages of central and south Malekula. The feeder roads have not been maintained and accessibility is hindered by poor road conditions, which discourage farmers from getting their produce to markets as the cost of transportation is high and the journey is uncomfortable. The absence of engineered river crossings also discourages many farmers from transporting their products to markets. The works will include clearance, pavement reconstruction, drainage improvement, and crossing construction. Current road conditions are very poor making vehicular access difficult and lower volumes of produce reach markets.
10 Linkage with other Infrastructure (none, low, medium, high)
Degree of linkage: Medium
Brief description: Agriculture, Commerce, Education, Tourism, Health
11 Regulatory Requirements to Comply With under the Project (construction standards, etc. [list])
National / international roads design and safety standards
12 Project Beneficiaries (approximate types and number of persons or households benefitting [say which])
Type(s) of beneficiaries (e.g., residential, business, farmer, etc.) 1. Local Population 2. Tourism 3. Farmers 4. Commerce 5. Secondary Schools 6. Health Centres
Number of beneficiaries 1 to 6: To be clarified
13 Project Benefits/Outcomes
Brief description: The project will improve access to farms and also link isolated villages to the commercial centres and social services. Road transport is vital for business, social, health and education-related activities. The East Coast Road Rehabilitation project will also benefit agriculture and tourism. The improved roads will reduce travel time for all road users. It will also encourage increased production and encourage farmers to sell more products at markets. It also provides passengers traveling by air with access to Norsup or Lamap airports.
14
Local Employment and Procurement during Construction (number of Ni-Vans employed, each year of construction; value of local materials procured for construction)
Degree of employment impact (high, medium, low) Low to Medium
Brief description (Ni-Vanuatu employed in construction, value of local materials): Mostly labour for road rehabilitation, maintenance and upgrading works
15 Job Creation Potential during Operations
Degree of employment impact (high, medium, low): Direct employment: Low Indirect employment: Medium to High
Number of new employed in operations: Not yet documented. To be clarified
16 Resilience of Project Assets to Climate Change and Natural Disaster Risk
Degree of resilience built into project design (high, medium, low): Medium to Low
Major climate change and natural disaster risks: The East Coast road traverses flat terrain, which is regularly affected by excessive storm water runoff, flooded rivers, and creeks. All roads constructed from gravel

VISIP 2015 - 2024 | Appendix 6
132
Item
Project Information
pavements will disintegrate with the increased rainfall being experienced. Designed for flood protection
17 Land Availability for Project Brief description (customary or GoV land; dispute risks; status of land negotiations): Not known nor clarified yet
18 Environmental Improvement Potential Rating (high, medium, low, negative): Low to Medium environmental improvement
19 Community Contribution Commitment Short description (cash, labour, materials, land, etc.): Communities to be invited to contribute to the sustainable maintenance of the rehabilitated roads segments
20 Investment Value, VUV million
Including design/supervision, technical assistance, works, labour, materials, equipment, etc.): USD31.4 million (VUV2.93 billion)
21 Estimated Annual O&M Cost, VUV million/year
(i) Operation cost (staff, consumables, energy, others)
(ii) Asset maintenance cost: Estimated USD600,000/year
(iii) Operational subsidies needed? No subsidy foreseen
22 Potential Funding Sources Initial Investment (% of total project investment cost)
GoV: Funding source to be determined
Donors:
Grants:
Loans:
Private Sector:
23 Potential Funding Sources O&M Costs (% of total project O&M costs)
GoV: Road maintenance fund 50 %
Donors (grants):
Private Sector: Local communities 50 %
24 Environmental and Involuntary Resettlement Risks
Short description of impacts and any people or assets affected: No resettlement foreseen; to be confirmed
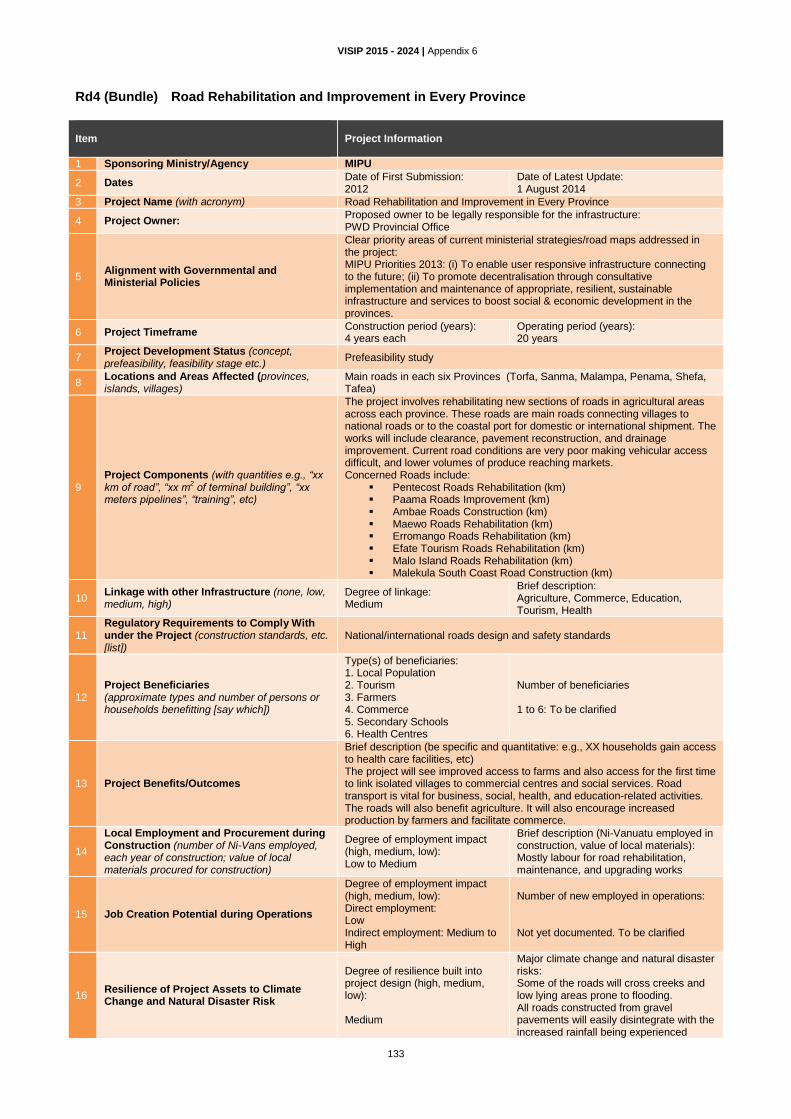
VISIP 2015 - 2024 | Appendix 6
133
Rd4 (Bundle) Road Rehabilitation and Improvement in Every Province Item
Project Information
1 Sponsoring Ministry/Agency MIPU
2 Dates Date of First Submission: 2012
Date of Latest Update: 1 August 2014
3 Project Name (with acronym) Road Rehabilitation and Improvement in Every Province
4 Project Owner: Proposed owner to be legally responsible for the infrastructure: PWD Provincial Office
5 Alignment with Governmental and Ministerial Policies
Clear priority areas of current ministerial strategies/road maps addressed in the project: MIPU Priorities 2013: (i) To enable user responsive infrastructure connecting to the future; (ii) To promote decentralisation through consultative implementation and maintenance of appropriate, resilient, sustainable infrastructure and services to boost social & economic development in the provinces.
6 Project Timeframe Construction period (years): 4 years each
Operating period (years): 20 years
7 Project Development Status (concept, prefeasibility, feasibility stage etc.)
Prefeasibility study
8 Locations and Areas Affected (provinces, islands, villages)
Main roads in each six Provinces (Torfa, Sanma, Malampa, Penama, Shefa, Tafea)
9 Project Components (with quantities e.g., “xx km of road”, “xx m
2 of terminal building”, “xx
meters pipelines”, “training”, etc)
The project involves rehabilitating new sections of roads in agricultural areas across each province. These roads are main roads connecting villages to national roads or to the coastal port for domestic or international shipment. The works will include clearance, pavement reconstruction, and drainage improvement. Current road conditions are very poor making vehicular access difficult, and lower volumes of produce reaching markets. Concerned Roads include:
Pentecost Roads Rehabilitation (km) Paama Roads Improvement (km) Ambae Roads Construction (km) Maewo Roads Rehabilitation (km) Erromango Roads Rehabilitation (km) Efate Tourism Roads Rehabilitation (km) Malo Island Roads Rehabilitation (km) Malekula South Coast Road Construction (km)
10 Linkage with other Infrastructure (none, low, medium, high)
Degree of linkage: Medium
Brief description: Agriculture, Commerce, Education, Tourism, Health
11 Regulatory Requirements to Comply With under the Project (construction standards, etc. [list])
National/international roads design and safety standards
12 Project Beneficiaries (approximate types and number of persons or households benefitting [say which])
Type(s) of beneficiaries: 1. Local Population 2. Tourism 3. Farmers 4. Commerce 5. Secondary Schools 6. Health Centres
Number of beneficiaries 1 to 6: To be clarified
13 Project Benefits/Outcomes
Brief description (be specific and quantitative: e.g., XX households gain access to health care facilities, etc) The project will see improved access to farms and also access for the first time to link isolated villages to commercial centres and social services. Road transport is vital for business, social, health, and education-related activities. The roads will also benefit agriculture. It will also encourage increased production by farmers and facilitate commerce.
14
Local Employment and Procurement during Construction (number of Ni-Vans employed, each year of construction; value of local materials procured for construction)
Degree of employment impact (high, medium, low): Low to Medium
Brief description (Ni-Vanuatu employed in construction, value of local materials): Mostly labour for road rehabilitation, maintenance, and upgrading works
15 Job Creation Potential during Operations
Degree of employment impact (high, medium, low): Direct employment: Low Indirect employment: Medium to High
Number of new employed in operations: Not yet documented. To be clarified
16 Resilience of Project Assets to Climate Change and Natural Disaster Risk
Degree of resilience built into project design (high, medium, low): Medium
Major climate change and natural disaster risks: Some of the roads will cross creeks and low lying areas prone to flooding. All roads constructed from gravel pavements will easily disintegrate with the increased rainfall being experienced

VISIP 2015 - 2024 | Appendix 6
134
Susceptibility to landslides and washouts is relatively high Design will be for flood protection
17 Land Availability for Project Brief description (customary or GoV land; dispute risks; status of land negotiations): Not known nor clarified yet
18 Environmental Improvement Potential Rating (high, medium, low, negative): Low to Medium environmental improvement
19 Community Contribution Commitment Short description (cash, labour, materials, land, etc.): Communities to be invited to contribute to the sustainable maintenance of the rehabilitated roads segments
20 Investment Value, VUV million
Including design/supervision, technical assistance, works, labour, materials, equipment, etc.): USD66.5 million for 8 roads on different islands (see point 9 above) USD19.95 million (VUV1.86 billion) for a first batch of sub-projects
21 Estimated Annual O&M Cost, VUV million/year
(i) Operation cost (staff, consumables, energy, others)
(ii) Asset maintenance cost:
USD150,000 annually per road (estimated)
(iii) Operational subsidies needed?
No subsidy foreseen
22 Potential Funding Sources Initial Investment (% of total project investment cost)
GoV: Funding source to be determined
Donors:
Grants:
Loans:
Private Sector:
23 Potential Funding Sources O&M Costs (% of total project O&M costs)
GoV: Road maintenance fund 50 %
Donors (grants):
Private Sector: Local communities
50 %
24 Environmental and Involuntary Resettlement Risks
Short description of impacts, and of any people or assets affected: No resettlement foreseen; to be confirmed

VISIP 2015 - 2024 | Appendix 6
135
Rd6 (Bundle) Rural and Feeder Roads Rehabilitation and Development in Every Province Item
Project Information
1 Sponsoring Ministry/Agency MIPU
2 Dates Date of First Submission: 2014
Date of Latest Update: 30 July 2014
3 Project Name (with acronym) Rural and Feeder Road Rehabilitation and Development in Every Province
4 Project Owner: Owner responsible for the infrastructure: Operator responsible for maintenance: PWD Provincial Offices
5 Alignment with Governmental and Ministerial Policies
Clear priority areas of current ministerial strategies/road maps addressed in the project: MIPU Priorities 2013: (i) To enable user responsive infrastructure connecting to the future; (ii) To promote decentralization through consultative implementation and maintenance of appropriate, resilient, sustainable infrastructure and services to boost social & economic development in the provinces
6 Project Timeframe Construction period (years): 2 to 3 years each
Operating period (years): 20 years
7 Project Development Status (concept, prefeasibility, feasibility stage etc.)
Concept and partially prefeasibility study
8 Locations and Areas Affected (provinces, islands, villages)
Rural and Feeder roads in Every Province (Torfa, Sanma, Malampa, Penama, Shefa, Tafea)
9 Project Components (with quantities e.g., “xx km of road”, “xx m
2 of terminal building”,
“xx meters pipelines”, “training”, etc)
The project involves rehabilitating new sections of roads in agricultural areas across each province. These roads are feeder roads connecting farms to the main road or to the coastal port for domestic or international shipment. The works will include clearance, pavement reconstruction, and drainage improvement works. Current road conditions are very poor making vehicular access difficult and lower volumes of produce reach markets. Concerned Roads include:
Efate Rural Roads Rehabilitation (km) Moto Lava Rural Roads Rehabilitation (km) Vanua Lava Rural Roads Rehabilitation (km) Santo Rural Roads Rehabilitation (km) Ambrym Rural Roads Construction (km) Part Rehabilitation & New Feeder Road Vao inland Road (15km) Part Rehabilitation and New Feeder Road Atchin Inland Road (20km) Part Rehabilitation and New Feeder Road Orap Inland Road (15km) Part Rehabilitation and New Feeder Road Limap Inland Road (20km) Part Rehabilitation & New Feeder Road Lambubu-Tisvel Road (15km) Part Rehabilitation & New Feeder Road Bamboo-Vanafo Road (15km) Part Rehabilitation and New Feeder Road Beleru Road (20km) Part Rehabilitation and New Feeder Road Ngala-South Epi Road (15km) Rehabilitation Feeder Road Teouma shopping Inland Road (20km) Rehabilitation Feeder Road Chief Karu Inland Road (20km) Rehabilitation Feeder Road House Kingdom Inland Road (20km) Rehabilitation Feeder Road DucklakeIinland Road (20km) New Feeder Road Middle Bush Road (20km)
10 Linkage with other Infrastructure (none, low, medium, high)
Degree of linkage: Medium
Brief description: Agriculture, Commerce, Education, Tourism, Health
11 Regulatory Requirements to Comply With under the Project (construction standards, etc. [list])
National/international roads design and safety standards
12 Project Beneficiaries (approximate types and number of persons or households benefitting [say which])
Type(s) of beneficiaries: 1. Local Population 2. Tourism 3. Farmers 4. Commerce 5. Secondary Schools 6. Health Centres
Number of beneficiaries 1 to 6: To be clarified
13 Project Benefits/Outcomes
Brief description: The project will see improved access to farms and also access for the first time to link isolated villages to the commercial centres and social services. Road transport is vital for business, social, health and education-related activities. The roads will also be beneficial for agriculture. It will also encourage increased production by farmers.
14
Local Employment and Procurement during Construction (number of Ni-Vans employed, each year of construction; value of local materials procured for construction)
Degree of employment impact (high, medium, low) Low to Medium
Brief description (Ni-Vanuatu employed in construction, value of local materials): Mostly labour for road rehabilitation, maintenance and upgrading works

VISIP 2015 - 2024 | Appendix 6
136
Item
Project Information
15 Job Creation Potential during Operations
Degree of employment impact (high, medium, low): Direct employment: Low Indirect employment: Medium to High
Number of new employed in operations: Not yet documented. To be clarified
16 Resilience of Project Assets to Climate Change and Natural Disaster Risk
Degree of resilience built into project design (high, medium, low): Medium
Major Climate Change and Natural Disaster risks: Some of the roads will cross creeks and low lying areas prone to flooding. All roads constructed from gravel pavements will easily disintegrate with the increased rainfall experienced in the country Susceptibility to landslides and washouts is relatively high Design will be for flood protection
17 Land Availability for Project Brief description (customary or GoV land; dispute risks; status of land negotiations): Not known nor clarified yet
18 Environmental Improvement Potential Rating (high, medium, low, negative): Low to medium environmental improvement
19 Community Contribution Commitment Short description (cash, labour, materials, land, etc.): Communities to be invited to contribute to the sustainable maintenance of the rehabilitated roads segments
20 Investment Value, VUV million
Including design/supervision, technical assistance, works, labour, materials, equipment, etc.): USD82.5 million for 18 roads in different Islands (see point 9 above) USD24.75 million (VUV 2.31 billion) for a first batch of sub-projects
21 Estimated Annual O&M Cost, VUV million/year
(i) Operation cost (staff, consumables, energy, others)
(ii) Asset maintenance cost:
USD90,000 USD annually for each road in average
(iii) Operational subsidies needed? No subsidy foreseen
22 Potential Funding Sources Initial Investment (% of total project investment cost)
GoV: Funding source to be determined
Donors:
Grants:
Loans:
Private Sector:
23 Potential Funding Sources O&M Costs (% of total project O&M costs)
GoV: Road maintenance fund 50 %
Donors (grants):
Private Sector: Local communities 50 %
24 Environmental and Involuntary Resettlement Risks
Short description of impacts, and of any people or assets affected: No resettlement foreseen; to be confirmed

VISIP 2015 - 2024 | Appendix 6
137
AVIATION
Av2 (Bundle) Upgrading Airports of Category A Item
Project Information
1 Sponsoring Ministry/Agency MIPU
2 Dates Date of First Submission: 2011
Date of Latest Update: 30 July 2014
3 Project Name (with acronym) Upgrading Category A (International Certified) Aerodromes
4 Project Owner: Owner responsible for the infrastructure: Operator responsible for the maintenance:
5 Alignment with Governmental and Ministerial Policies
Clear priority areas of current ministerial strategies/road maps addressed in the project:
6 Project Timeframe Construction period (years): 3 years
Operating period (years): 20 years
7 Project Development Status (concept, prefeasibility, feasibility stage etc.)
Scoping Study 2011 updated later by MIPU
8 Locations and Areas Affected (provinces, islands, villages)
Bauerfield – Port Vila, Efate, Shefa Pekoa – Santo, Sanma Whitegrass – Tanna, Tafea
9 Project Components (with quantities e.g., “xx km of road”, “xx m
2 of terminal building”, “xx
meters pipelines”, “training”, etc)
Bauerfield: Extension of Apron; New stub taxiway; Runway re-sheet; Replacement of VOR Pekoa: Extension of Apron; New stub taxiway; Runway re-sheet; Replacement of VOR; Design and promulgate GPS (RNAV) runway approach; Whitegrass: Extension of Apron; New stub taxiway; Runway re-sheet; Replacement of VOR; Design and promulgate GPS (RNAV) runway approach; Install runway, apron, and taxiway lighting; Prepare a Type A obstacle limitation chart; Lop trees to be clear of approach and departure splay
10 Linkage with other Infrastructure (none, low, medium, high)
Degree of linkage: Medium to High
Brief description: Tourism, Commerce, Disaster Management
11 Regulatory Requirements to Comply With under the Project (construction standards, etc. [list])
International Aviation Regulation on Certified Airport for International Operation
12 Project Beneficiaries (approximate types and number of persons or households benefitting [say which])
Type(s) of beneficiaries (e.g., residential, business, farmer, etc.) 1. Tourism 2. Commerce 3. Administration
Number of beneficiaries 1. Not documented 2. Not documented 3. Administration
13 Project Benefits/Outcomes
Brief description: With the current situation maximising the full use of the airports is fairly limited. The introduction of lights, GPS positioning, and the clearing of trees will improve safety levels and convenience for all passengers. At Bauerfield, the congestion of the apron and the runway pavement has shown weakness and deterioration. These shortfalls are serious and may impact on flights into Bauerfield. The project will safeguard continued flights into Bauerfield, which is currently the main international airport for Vanuatu. The project will benefit the tourism industry and also have great impact on the
national economy.
14
Local Employment and Procurement during Construction (number of Ni-Vans employed, each year of construction; value of local materials procured for construction)
Degree of employment impact (high, medium, ) Undefined yet
Brief description (Ni-Vanuatu employed in construction, value of local materials); Undefined yet
15 Job Creation Potential during Operations Degree of employment impact (high, medium, low): Medium to High
Number of new employed in operations: Undefined yet (limited increase)
16 Resilience of Project Assets to Climate Change and Natural Disaster Risk
Degree of resilience built into project design (high, medium, low): Medium to Low
Major climate change and natural disaster risks:
Main risk mitigation measures:
17 Land Availability for Project Brief description (customary or GoV land; dispute risks; status of land negotiations): Undefined current issues
18 Environmental Improvement Potential Rating (high, medium, low, negative): Low to Medium
19 Community Contribution Commitment Short description (cash, labour, materials, land, etc.): Undefined
20 Investment Value, VUV million
Including design/supervision, technical assistance, works, labour, materials, equipment, etc.): Bauerfield: USD15-20 million (VUV3.26 billion)

VISIP 2015 - 2024 | Appendix 6
138
Item
Project Information
Pekoa: USD17 million (VUV1.59 billion) Whitegrass: USD11 million (VUV1.03 billion)
21 Estimated Annual O&M Cost, VUV million/year
(i) Operation cost (staff, consumables, energy, others):
To be determined
(ii) Asset maintenance cost:
2 % of investment cost (estimation)
(iii) Operational subsidies needed? No subsidy foreseen
22 Potential Funding Sources Initial Investment (% of total project investment cost)
GoV:
Donors:
Grants: 100 %
Loans:
Private Sector:
23 Potential Funding Sources O&M Costs (% of total project O&M costs)
GoV:
Donors (grants):
Private Sector: 100 % Airlines/ Passengers using the Airports
24 Environmental and Involuntary Resettlement Risks
Short description of impacts, and of any people or assets affected: Little or no relocation necessary Low expected environmental impact (to be controlled)

VISIP 2015 - 2024 | Appendix 6
139
Av3 (Bundle) Upgrading Airfields of Category B Item
Project Information
1 Sponsoring Ministry/Agency MIPU
2 Dates Date of First Submission: 2011
Date of Latest Update: 30 July 2014
3 Project Name (with acronym) Upgrading Aerodromes of Category B (Domestic Certified)
4 Project Owner: Owner responsible for the infrastructure: Operator responsible for maintenance:
5 Alignment with Governmental and Ministerial Policies
Clear priority areas of current ministerial strategies/road maps addressed in the project:
6 Project Timeframe Construction period (years): 2015-2020
Operating period (years): 20 years
7 Project Development Status (concept, prefeasibility, feasibility stage, etc.)
Scoping Study 2011
8 Locations and Areas Affected (provinces, islands, villages)
Norsup: Malekula, Malampa Lonorore: Pentecost, Penama Longana: Ambae, Penama Mota Lava: Mota Lava, Torba
9 Project Components (with quantities e.g., “xx km of road”, “xx m
2 of terminal building”, “xx
meters pipelines”, “training”, etc)
Norsup: Acquire or lease required land for strip lengthening and widening; Widen strip to 150 m; Lengthen strip to provide for runway length and RESA; Design and construct new 30 m wide runway; Build a new apron toward the north end of the strip, Design and construct a new stub taxiway to the new apron, Drains on existing and new strip; Lengthen strip to provide for runway length and RESA; New perimeter drains and fences; Relocate and expand apron adjacent to the terminal and clear the strip; Design and promulgate GPS (RNAV) approaches to both runway direction; prepare a type A obstacle limitation chart, Lop trees to be clear of approach and departure splay and transition surfaces. Lonorore: Widen strip to 150 m; Drains on existing and new strip; Lengthen strip to provide for runway length and RESA; New perimeter drains and fences; Relocate and expand apron adjacent to the terminal and clear the strip; Design and promulgate GPS (RNAV) approaches to both runway direction; prepare a type A obstacle limitation chart, Lop trees to be clear of approach and departure splay and transition surfaces; Longana: (doubt of category B can be achieve without very large additional earthworks) same as Lonorore; Mota Lava: Widen strip by clearing vegetation; maintenance to terminal building, install visual runway markers
10 Linkage with other Infrastructure (none, low, medium, high)
Degree of linkage: Medium to High
Brief description: Tourism, Commerce, Disaster Management
11 Regulatory Requirements to Comply With under the Project (construction standards, etc. [list])
International Aviation Regulation on Certified Airport for Domestic Operation
12 Project Beneficiaries (approximate types and number of persons or households benefitting [say which])
Types of beneficiaries (population catchment) 1.Norsup 17,000 2.Lonorore 12630 3. Moto Lava 1450
Number of beneficiaries 1. 2. etc
13 Project Benefits/Outcomes
Brief description: With the current situation, maximising the full use of the aerodromes is fairly limited. The improvement of aprons, runways, and taxi as well as the introduction of lights; and GPS positioning and the clearing of trees will improve safety levels and convenience for all passengers and increase the airports’ capacities
14
Local Employment and Procurement during Construction (number of Ni-Vans employed, each year of construction; value of local materials procured for construction)
Degree of employment impact (high, medium, low): Low
Brief description (Ni-Vanuatu employed in construction, value of local materials): The cutting of trees may be subcontracted to local people
15 Job Creation Potential during Operations
Degree of employment impact (high, medium, low): Low to Medium
Number of new employed in operations: Improved airports and terminals are expected to generate some minor employment for future enhanced operation and maintenance
16 Resilience of Project Assets to Climate Change and Natural Disaster Risk
Degree of resilience built into project design (high, medium, low): Norsup and Lonorore Medium to High MotaLava: Low
Major climate change and natural disaster risks: Norsup and Lonorore airfield are close to sea level; meaning medium to high climate change and disaster risks. Paved runways are susceptible to

VISIP 2015 - 2024 | Appendix 6
140
Item
Project Information
earthquakes
17 Land Availability for Project
Brief description (customary or GoV land; dispute risks; status of land negotiations): Norsup: Acquisition of 1 ha necessary Lonorore : Acquisition of 1 ha necessary Mota Lava: Nil
18 Environmental Improvement Potential Rating (high, medium, low, negative): Medium to Low
19 Community Contribution Commitment Short description (cash, labour, materials, land, etc.): Undefined for now
20 Investment Value, VUV million
Including design/supervision, Technical Assistance, works, labour, materials, equipment, etc.): Norsup: USD5.2 million (VUV485 million) Lonorore: USD4 million (VUV373 million) Longana: uncosted due to doubt on applicability Mota Lava: USD0.20 million (VUV18.7 million)
21 Estimated Annual O&M Cost, VUV milion/year
(i) Operation cost (staff, consumables, energy, others)
(ii) Asset maintenance cost: 2% of investment cost (estimation)
(iii) Operational subsidies needed? No subsidy foreseen
22 Potential Funding Sources Initial Investment (% of total project investment cost)
GoV:
Donors:
Grants: 100%
Loans:
Private Sector:
23 Potential Funding Sources O&M Costs (% of total project O&M costs)
GoV:
Donors (grants):
Private Sector: 100% Airlines/Passengers using the Airports
24 Environmental and Involuntary Resettlement Risks
Short description of impacts, and of any people or assets affected: Little or no relocation necessary Low expected environmental impact (to be controlled)

VISIP 2015 - 2024 | Appendix 6
141
SHIPPING
Sh1 Rehabilitation and Extension of Luganville International Wharf Item
Project Information
1 Sponsoring Ministry/Agency MIPU
2 Dates Date of First Submission: 1 August 2014
Date of Latest Update: 1 August 2014
3 Project Name (with acronym) Rehabilitation and Extension of Luganville International Wharf
4 Project Owner: Owner responsible for the infrastructure: Operator responsible for maintenance: Publicly-owned company operating and managing the wharf
5 Alignment with Governmental and Ministerial Policies
Clear priority areas of current ministerial strategies/road maps addressed in the project: MIPU Priorities 2013: (i) To enable user responsive infrastructure connecting to the future; (ii) To promote decentralization through consultative implementation and maintenance of appropriate, resilient, sustainable infrastructure and services to boost social & economic development in the provinces
6 Project Timeframe Construction period (years): 4 years
Operating period (years): 20 years
7 Project Development Status (concept, prefeasibility, feasibility stage etc.)
Prefeasibility study
8 Locations and Areas Affected (provinces, islands, villages)
Luganville, Santo, Sanma
9 Project Components (with quantities e.g., “xx km of road”, “xx m
2 of terminal building”, “xx
meters pipelines”, “training”, etc)
Repaired platform 5400 m2; New Wharf Platform 125mx20m with 35.000 m
2
concrete platform; 2.600 m2 Terminal, 1.500 m
2 Shed; Scale bridge; Fence
10 Linkage with other Infrastructure (none, low, medium, high)
Degree of linkage: High
Brief description: Tourism, Commerce, Agriculture
11 Regulatory Requirements to Comply With under the Project (construction standards, etc. [list])
National/international harbor design and safety standards
12 Project Beneficiaries (approximate types and number of persons or households benefitting [say which])
Type(s) of beneficiaries (e.g., residential, business, farmer, etc.) 1. Local Population 2. Tourism 3. Farmers 4. Commerce
Number of beneficiaries 1 to 4: To be clarified
13 Project Benefits/Outcomes
Brief description [be specific and quantitative: e.g., XX households gain access to health care facilities, etc] The rehabilitated international wharf will stimulate tourism and commerce in Luganville and Santo and neighboring islands and provinces
14
Local Employment and Procurement during Construction (number of Ni-Vans employed, each year of construction; value of local materials procured for construction)
Degree of employment impact (high, medium, low): Low to Medium
Brief description (Ni-Vanuatu employed in construction, value of local materials): Mostly labour for wharf rehabilitation works
15 Job Creation Potential during Operations
Degree of employment impact (high, medium, low): Direct employment: Low Indirect employment: High
Number of new employed in operations: Not yet documented. To be clarified
16 Resilience of Project Assets to Climate Change and Natural Disaster Risk
Degree of resilience built into project design (high, medium, low): Medium to Low
Major climate change and natural disaster risks: The wharf will be built using international standards and will accommodate reasonable natural disaster risks like earthquake and cyclone
17 Land Availability for Project Brief description (customary or GoV land; dispute risks; status of land negotiations): No land issue to be expected (to be controlled)
18 Environmental Improvement Potential Rating (high, medium, low, negative): Low to Medium environmental improvement
19 Community Contribution Commitment Short description (cash, labour, materials, land, etc.): A public company to be clarified will be entrusted with managing, operating, and maintaining the wharf
20 Investment Value, VUV million
Including design/supervision, technical assistance, works, labour, materials, equipment, etc.): USD53.56 million (VUV5 billion)
21 Estimated Annual O&M Cost, VUV million/year
(i) Operation cost (staff, consumables, energy, others)
(ii) Asset maintenance cost: USD1 million annually (estimation)

VISIP 2015 - 2024 | Appendix 6
142
Item
Project Information
(iii) Operational subsidies needed? No subsidy foreseen
22 Potential Funding Sources Initial Investment (% of total project investment cost)
GoV: Funding source to be determined
Donors:
Grants:
Loans:
Private Sector:
23 Potential Funding Sources O&M Costs (% of total project O&M costs)
GoV:
Donors (grants):
Private Sector: users of the wharf services
100%
24 Environmental and Involuntary Resettlement Risks
Short description of impacts, and of any people or assets affected: No resettlement need to be expected
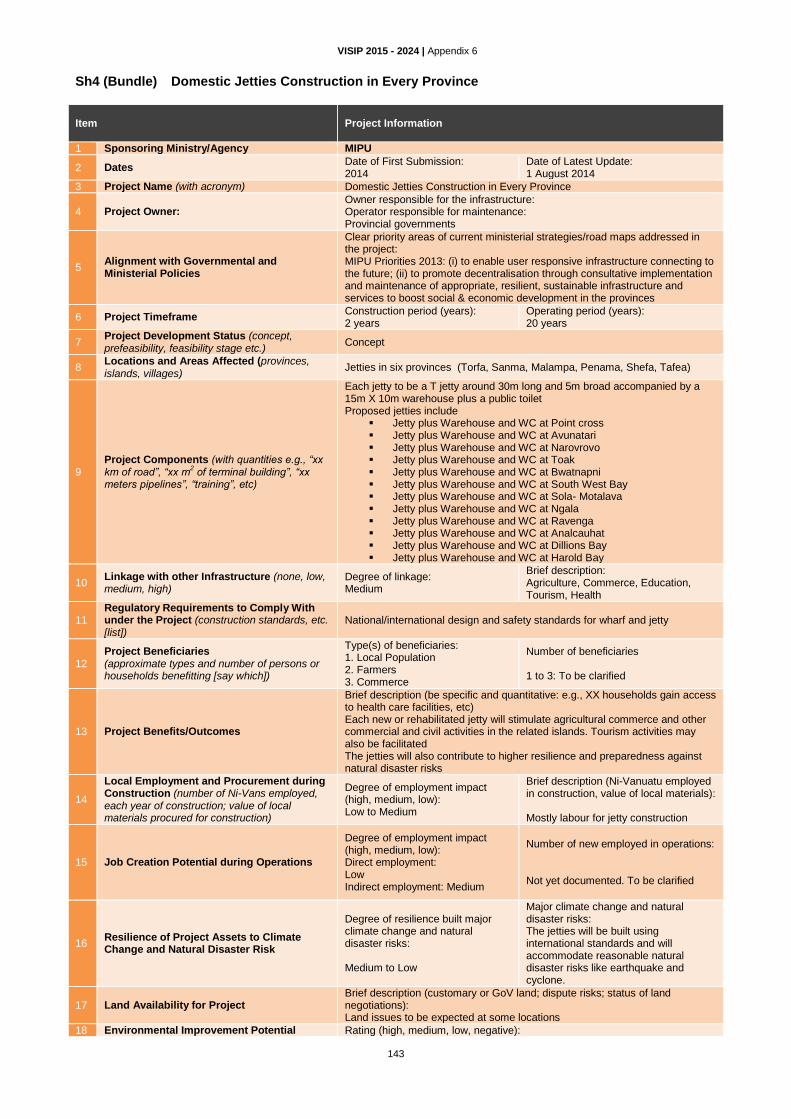
VISIP 2015 - 2024 | Appendix 6
143
Sh4 (Bundle) Domestic Jetties Construction in Every Province Item
Project Information
1 Sponsoring Ministry/Agency MIPU
2 Dates Date of First Submission: 2014
Date of Latest Update: 1 August 2014
3 Project Name (with acronym) Domestic Jetties Construction in Every Province
4 Project Owner: Owner responsible for the infrastructure: Operator responsible for maintenance: Provincial governments
5 Alignment with Governmental and Ministerial Policies
Clear priority areas of current ministerial strategies/road maps addressed in the project: MIPU Priorities 2013: (i) to enable user responsive infrastructure connecting to the future; (ii) to promote decentralisation through consultative implementation and maintenance of appropriate, resilient, sustainable infrastructure and services to boost social & economic development in the provinces
6 Project Timeframe Construction period (years): 2 years
Operating period (years): 20 years
7 Project Development Status (concept, prefeasibility, feasibility stage etc.)
Concept
8 Locations and Areas Affected (provinces, islands, villages)
Jetties in six provinces (Torfa, Sanma, Malampa, Penama, Shefa, Tafea)
9 Project Components (with quantities e.g., “xx km of road”, “xx m
2 of terminal building”, “xx
meters pipelines”, “training”, etc)
Each jetty to be a T jetty around 30m long and 5m broad accompanied by a 15m X 10m warehouse plus a public toilet Proposed jetties include
Jetty plus Warehouse and WC at Point cross Jetty plus Warehouse and WC at Avunatari Jetty plus Warehouse and WC at Narovrovo Jetty plus Warehouse and WC at Toak Jetty plus Warehouse and WC at Bwatnapni Jetty plus Warehouse and WC at South West Bay Jetty plus Warehouse and WC at Sola- Motalava Jetty plus Warehouse and WC at Ngala Jetty plus Warehouse and WC at Ravenga Jetty plus Warehouse and WC at Analcauhat Jetty plus Warehouse and WC at Dillions Bay Jetty plus Warehouse and WC at Harold Bay
10 Linkage with other Infrastructure (none, low, medium, high)
Degree of linkage: Medium
Brief description: Agriculture, Commerce, Education, Tourism, Health
11 Regulatory Requirements to Comply With under the Project (construction standards, etc. [list])
National/international design and safety standards for wharf and jetty
12 Project Beneficiaries (approximate types and number of persons or households benefitting [say which])
Type(s) of beneficiaries: 1. Local Population 2. Farmers 3. Commerce
Number of beneficiaries 1 to 3: To be clarified
13 Project Benefits/Outcomes
Brief description (be specific and quantitative: e.g., XX households gain access to health care facilities, etc) Each new or rehabilitated jetty will stimulate agricultural commerce and other commercial and civil activities in the related islands. Tourism activities may also be facilitated The jetties will also contribute to higher resilience and preparedness against natural disaster risks
14
Local Employment and Procurement during Construction (number of Ni-Vans employed, each year of construction; value of local materials procured for construction)
Degree of employment impact (high, medium, low): Low to Medium
Brief description (Ni-Vanuatu employed in construction, value of local materials): Mostly labour for jetty construction
15 Job Creation Potential during Operations
Degree of employment impact (high, medium, low): Direct employment: Low Indirect employment: Medium
Number of new employed in operations: Not yet documented. To be clarified
16 Resilience of Project Assets to Climate Change and Natural Disaster Risk
Degree of resilience built major climate change and natural disaster risks: Medium to Low
Major climate change and natural disaster risks: The jetties will be built using international standards and will accommodate reasonable natural disaster risks like earthquake and cyclone.
17 Land Availability for Project Brief description (customary or GoV land; dispute risks; status of land negotiations): Land issues to be expected at some locations
18 Environmental Improvement Potential Rating (high, medium, low, negative):
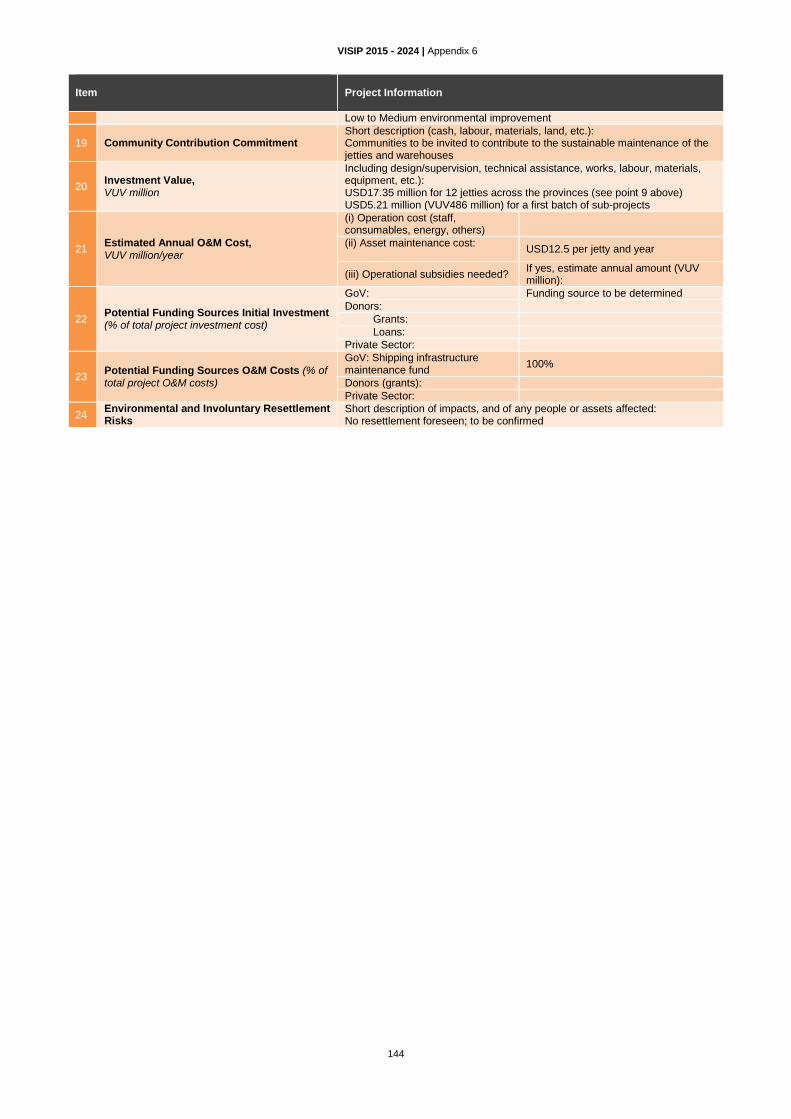
VISIP 2015 - 2024 | Appendix 6
144
Item
Project Information
Low to Medium environmental improvement
19 Community Contribution Commitment Short description (cash, labour, materials, land, etc.): Communities to be invited to contribute to the sustainable maintenance of the jetties and warehouses
20 Investment Value, VUV million
Including design/supervision, technical assistance, works, labour, materials, equipment, etc.): USD17.35 million for 12 jetties across the provinces (see point 9 above) USD5.21 million (VUV486 million) for a first batch of sub-projects
21 Estimated Annual O&M Cost, VUV million/year
(i) Operation cost (staff, consumables, energy, others)
(ii) Asset maintenance cost:
USD12.5 per jetty and year
(iii) Operational subsidies needed? If yes, estimate annual amount (VUV million):
22 Potential Funding Sources Initial Investment (% of total project investment cost)
GoV: Funding source to be determined
Donors:
Grants:
Loans:
Private Sector:
23 Potential Funding Sources O&M Costs (% of total project O&M costs)
GoV: Shipping infrastructure maintenance fund
100%
Donors (grants):
Private Sector:
24 Environmental and Involuntary Resettlement Risks
Short description of impacts, and of any people or assets affected: No resettlement foreseen; to be confirmed
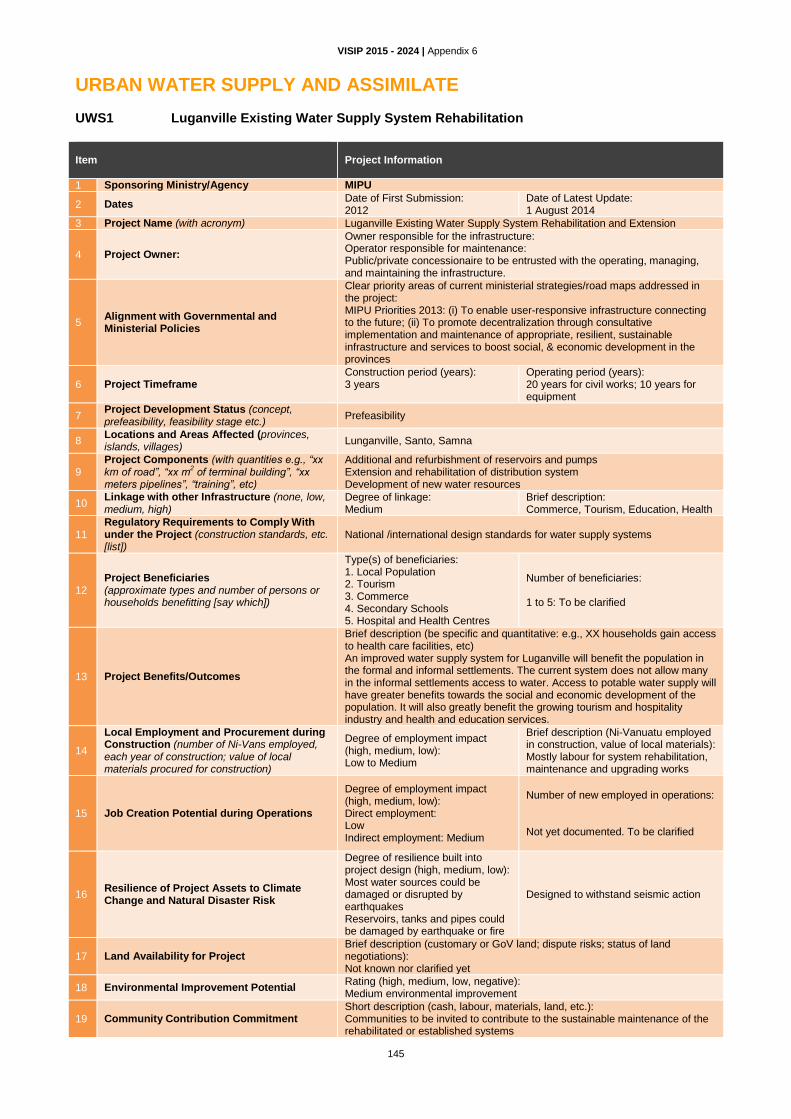
VISIP 2015 - 2024 | Appendix 6
145
URBAN WATER SUPPLY AND ASSIMILATE
UWS1 Luganville Existing Water Supply System Rehabilitation Item
Project Information
1 Sponsoring Ministry/Agency MIPU
2 Dates Date of First Submission: 2012
Date of Latest Update: 1 August 2014
3 Project Name (with acronym) Luganville Existing Water Supply System Rehabilitation and Extension
4 Project Owner:
Owner responsible for the infrastructure: Operator responsible for maintenance: Public/private concessionaire to be entrusted with the operating, managing, and maintaining the infrastructure.
5 Alignment with Governmental and Ministerial Policies
Clear priority areas of current ministerial strategies/road maps addressed in the project: MIPU Priorities 2013: (i) To enable user-responsive infrastructure connecting to the future; (ii) To promote decentralization through consultative implementation and maintenance of appropriate, resilient, sustainable infrastructure and services to boost social, & economic development in the provinces
6 Project Timeframe Construction period (years): 3 years
Operating period (years): 20 years for civil works; 10 years for equipment
7 Project Development Status (concept, prefeasibility, feasibility stage etc.)
Prefeasibility
8 Locations and Areas Affected (provinces, islands, villages)
Lunganville, Santo, Samna
9 Project Components (with quantities e.g., “xx km of road”, “xx m
2 of terminal building”, “xx
meters pipelines”, “training”, etc)
Additional and refurbishment of reservoirs and pumps Extension and rehabilitation of distribution system Development of new water resources
10 Linkage with other Infrastructure (none, low, medium, high)
Degree of linkage: Medium
Brief description: Commerce, Tourism, Education, Health
11 Regulatory Requirements to Comply With under the Project (construction standards, etc. [list])
National /international design standards for water supply systems
12 Project Beneficiaries (approximate types and number of persons or households benefitting [say which])
Type(s) of beneficiaries: 1. Local Population 2. Tourism 3. Commerce 4. Secondary Schools 5. Hospital and Health Centres
Number of beneficiaries: 1 to 5: To be clarified
13 Project Benefits/Outcomes
Brief description (be specific and quantitative: e.g., XX households gain access to health care facilities, etc) An improved water supply system for Luganville will benefit the population in the formal and informal settlements. The current system does not allow many in the informal settlements access to water. Access to potable water supply will have greater benefits towards the social and economic development of the population. It will also greatly benefit the growing tourism and hospitality industry and health and education services.
14
Local Employment and Procurement during Construction (number of Ni-Vans employed, each year of construction; value of local materials procured for construction)
Degree of employment impact (high, medium, low): Low to Medium
Brief description (Ni-Vanuatu employed in construction, value of local materials): Mostly labour for system rehabilitation, maintenance and upgrading works
15 Job Creation Potential during Operations
Degree of employment impact (high, medium, low): Direct employment: Low Indirect employment: Medium
Number of new employed in operations: Not yet documented. To be clarified
16 Resilience of Project Assets to Climate Change and Natural Disaster Risk
Degree of resilience built into project design (high, medium, low): Most water sources could be damaged or disrupted by earthquakes Reservoirs, tanks and pipes could be damaged by earthquake or fire
Designed to withstand seismic action
17 Land Availability for Project Brief description (customary or GoV land; dispute risks; status of land negotiations): Not known nor clarified yet
18 Environmental Improvement Potential Rating (high, medium, low, negative): Medium environmental improvement
19 Community Contribution Commitment Short description (cash, labour, materials, land, etc.): Communities to be invited to contribute to the sustainable maintenance of the rehabilitated or established systems

VISIP 2015 - 2024 | Appendix 6
146
Item
Project Information
20 Investment Value, VUV million
Including design/supervision, technical assistance, works, labour, materials, equipment, etc.): USD4.10 million (VUV383 million)
21 Estimated Annual O&M Cost, VUV million/year
(i) Operation cost (staff, consumables, energy, others)
Not yet known for new, rehabilitated and expanded system
(ii) Asset maintenance cost: USD200,000 (estimated)
(iii) Operational subsidies needed? No subsidy foreseen
22 Potential Funding Sources Initial Investment (% of total project investment cost)
GoV: Funding source to be determined
Donors:
Grants:
Loans:
Private Sector:
23 Potential Funding Sources O&M Costs (% of total project O&M costs)
GoV:
Donors (grants):
Private Sector: Beneficiary population and commercial users
100%
24 Environmental and Involuntary Resettlement Risks
Short description of impacts, and of any people or assets affected: Resettlement need not addressed yet

VISIP 2015 - 2024 | Appendix 6
147
UWS2 (Bundle) Provincial Capitals Water Supply System Development Item
Project Information
1 Sponsoring Ministry/Agency MIPU
2 Dates Date of First Submission: 2014
Date of Latest Update: 1 August 2014
3 Project Name (with acronym) Provincial Capitals Water Supply System Development in 4 Provinces
4 Project Owner:
Owner responsible for the infrastructure: Operator responsible for maintenance: Public/ private concessionaire to be entrusted with operating, managing, and maintaining the infrastructure
5 Alignment with Governmental and Ministerial Policies
Clear priority areas of current ministerial strategies/road maps addressed in the project: MIPU Priorities 2013: (i) To enable user responsive infrastructure connecting to the future; (ii) To promote decentralization through consultative implementation and maintenance of appropriate, resilient, sustainable infrastructure and services to boost social & economic development in the provinces
6 Project Timeframe Construction period (years): 3 years
Operating period (years): 20 years for civil works; 10 years for equipment
7 Project Development Status (concept, prefeasibility, feasibility stage etc.)
Prefeasibility
8 Locations and Areas Affected (provinces, islands, villages)
Sola, Vanua lava, Torba Saratamata, Ambae, Penama Lakatoro, Malekula, Malampa Isangel, Tanna, Tafea
9 Project Components (with quantities e.g., “xx km of road”, “xx m
2 of terminal building”, “xx
meters pipelines”, “training”, etc)
Additional and refurbishment of reservoirs and pumps Extension and rehabilitation of distribution system Development of new water resources in each of the four provincial capitals Sola, Saratamata, Lakatoro, & Isangel
10 Linkage with other Infrastructure (none, low, medium, high)
Degree of linkage: Medium
Brief description: Commerce, Tourism, Education, Health
11 Regulatory Requirements to Comply With under the Project (construction standards, etc. [list])
National/international design standards for water supply systems
12 Project Beneficiaries (approximate types and number of persons or households benefitting [say which])
Types of beneficiaries: 1. Local Population 2. Tourism 3. Commerce 4. Secondary Schools 5. Hospital and Health Centres
Number of beneficiaries: 1 to 5: To be clarified
13 Project Benefits/Outcomes
Brief description: Improved water supply system in provincial capitals will benefit the population in the formal and informal settlements. The current systems allow many in the informal settlements no access to water. Access to potable water supply will have greater benefits towards the social and economic development of the population. It will also greatly benefit tourism and hospitality, commerce, and health and education services.
14
Local Employment and Procurement during Construction (number of Ni-Vans employed, each year of construction; value of local materials procured for construction)
Degree of employment impact (high, medium, low): Low to Medium
Brief description (Ni-Vanuatu employed in construction, value of local materials): Mostly labour for system rehabilitation, maintenance and upgrading works
15 Job Creation Potential during Operations
Degree of employment impact (high, medium, low): Direct employment: Low Indirect employment: medium
Number of new employed in operations: Not yet documented. To be clarified
16 Resilience of Project Assets to Climate Change and Natural Disaster Risk
Degree of resilience built into project design (high, medium, low): Most water sources could be damaged or disrupted by earthquakes Reservoirs, tanks, and pipes could be damaged by earthquake or fire
Designed to withstand seismic action
17 Land Availability for Project Brief description (customary or GoV land; dispute risks; status of land negotiations): Not known nor clarified yet
18 Environmental Improvement Potential Rating (high, medium, low, negative): Low to Medium environmental improvement
19 Community Contribution Commitment Short description (cash, labour, materials, land, etc.): Communities to be invited to contribute to the sustainable maintenance of the rehabilitated or established systems
20 Investment Value, Including design/supervision, technical assistance, works, labour, materials,

VISIP 2015 - 2024 | Appendix 6
148
Item
Project Information
VUV million equipment, etc.): USD3.20 million for 4 water supply systems (see point 9 above) USD0.96 million (VUV89.6 million) for a first batch of sub-projects
21 Estimated Annual O&M Cost, VUV million/year
(i) Operation cost (staff, consumables, energy, others)
Not yet known for new, rehabilitated and expanded system
(ii) Asset maintenance cost:
USD50,000 for each provincial capital (roughly estimated)
(iii) Operational subsidies needed? If yes, estimate annual amount (VUV million):
22 Potential Funding Sources Initial Investment (% of total project investment cost)
GoV: Funding source to be determined
Donors:
Grants:
Loans:
Private Sector:
23 Potential Funding Sources O&M Costs (% of total project O&M costs)
GoV:
Donors (grants):
Private Sector: Beneficiary population and commercial users
100%
24 Environmental and Involuntary Resettlement Risks
Short description of impacts, and of any people or assets affected: Resettlement need not addressed yet

VISIP 2015 - 2024 | Appendix 6
149
URBAN SOLID WASTE SW2 Luganville Solid Waste Management Item
Project Information
1 Sponsoring Ministry/Agency MCCDRM/DEPC
2 Dates Date of First Submission: 10 August 2014
Date of Latest Update: 10 August 2014
3 Project Name (with acronym) Luganville Solid Waste Management
4 Project Owner: Owner responsible for the infrastructure: Operator responsible for maintenance: Municipal administration of Luganville
5 Alignment with Governmental and Ministerial Policies
Clear priority area (s) of current Ministerial Strategy(ies) / Road Map(s) addressed in the project: Aligned with the priority of the Vanuatu National Waste Management Strategy 2011-2016
6 Project Timeframe Construction period (years): 1 year
Operating period (years): 20 years
7 Project Development Status (concept, prefeasibility, feasibility stage etc.)
Concept
8 Locations and Areas Affected (provinces, islands, villages)
Luganville, Santo, Sanma
9 Project Components (with quantities e.g., “xx km of road”, “xx m
2 of terminal building”, “xx
meters pipelines”, “training”, etc)
Improvement of the solid waste collection (collection trucks) and disposal system (sanitary landfill, compacting truck) as well as recycling system for recyclable in the Luganville urbanised area
10 Linkage with other Infrastructure (none, low, medium, high)
Degree of linkage: Low
Brief description: Improved solid waste disposal improve sanitary health in the residential areas Recyclable can be a source of revenues for small local businesses
11 Regulatory Requirements to Comply With under the Project (construction standards, etc. [list])
To be clarified
12 Project Beneficiaries (approximate types and number of persons or households benefitting [say which])
Types of beneficiaries (e.g., residential, business, farmer, etc.): 1. Local communities 2. Commerce 3. Tourism
Number of beneficiaries: To be clarified
13 Project Benefits/Outcomes
Brief description (be specific and quantitative: e.g., XX households gain access to health care facilities, etc) Improved solid waste disposal improve sanitary health in the residential areas Recycling can be a revenue source for small local businesses
14
Local Employment and Procurement during Construction (number of Ni-Vans employed, each year of construction; value of local materials procured for construction)
Degree of employment impact (high, medium, low): Low to Medium
Brief description (Ni-Vanuatu employed in construction, value of local materials): Ni Vanuatu can be employed for tasks linked to the development of the sanitary landfill
15 Job Creation Potential during Operations Degree of employment impact (high, medium, low): Low
Number of new employed in operations: Additional staff for the improved system may be necessary (to be controlled)
16 Resilience of Project Assets to Climate Change and Natural Disaster Risk
Degree of resilience built into project design (high, medium, low): High resilience
Major climate change and natural disaster risks: Earthquake, volcano, cyclone, tsunami
Main risk mitigation measures: Landfill site design and specification to take into account local natural disaster risks
17 Land Availability for Project
Brief description (customary or GoV land; dispute risks; status of land negotiations): Not yet addressed. Additional land space for landfill may be necessary. To be clarified
18 Environmental Improvement Potential Rating (high, medium, low, negative): Medium, Improved sanitary health in Luganville’s urban areas
19 Community Contribution Commitment Short description (cash, labour, materials, land, etc.): To be clarified
20 Investment Value, VUV million
Including design/supervision, technical assistance, works, labour, materials, equipment, etc.): USD1.5 million (VUV140 million)
21 Estimated Annual O&M Cost, (i) Operation cost (staff, To be defined

VISIP 2015 - 2024 | Appendix 6
150
Item
Project Information
VUV million/year consumables, energy, others)
(ii) Asset maintenance cost:
3% of investment cost (estimation)
(iii) Operational subsidies needed?
No subsidies foreseen
22 Potential Funding Sources Initial Investment (% of total project investment cost)
GoV: 10%
Donors:
Grants: 90%
Loans:
Private Sector:
23 Potential Funding Sources O&M Costs (% of total project O&M costs)
GoV:
Donors (grants):
Private Sector: Beneficiary population
100%
24 Environmental and Involuntary Resettlement Risks
Short description of impacts, and of any people or assets affected: Not yet addressed. Possible land acquisition necessary
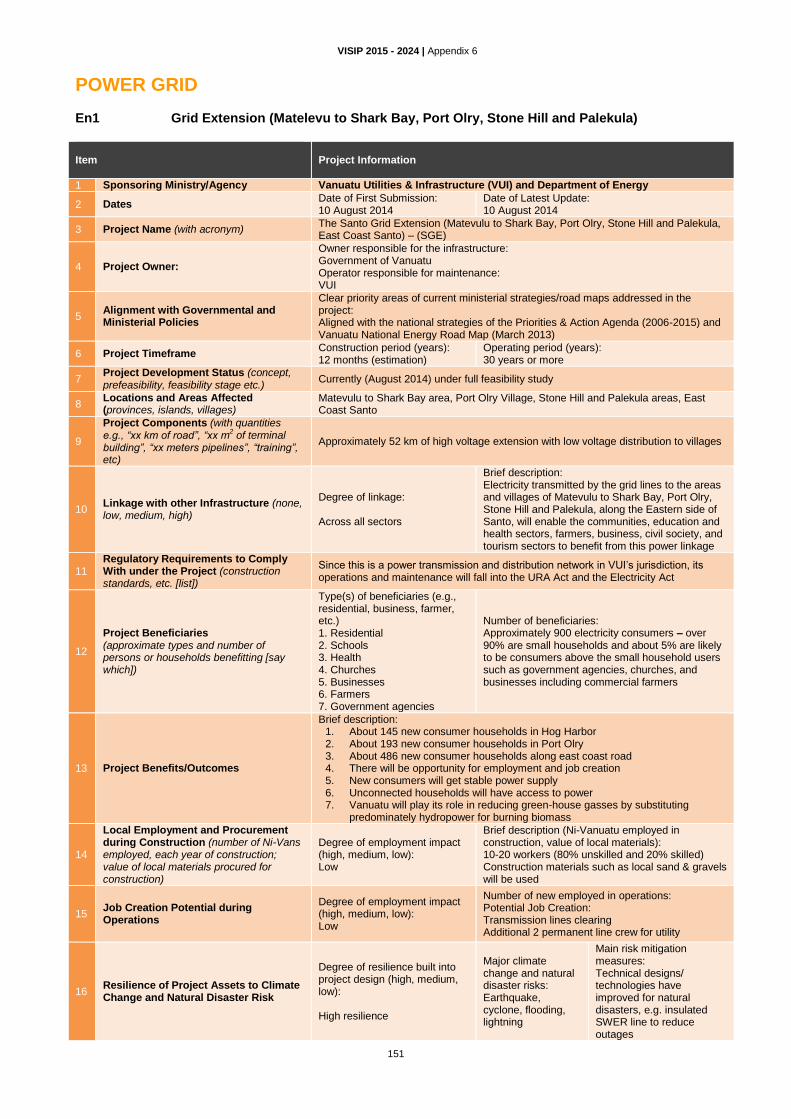
VISIP 2015 - 2024 | Appendix 6
151
POWER GRID
En1 Grid Extension (Matelevu to Shark Bay, Port Olry, Stone Hill and Palekula) Item
Project Information
1 Sponsoring Ministry/Agency Vanuatu Utilities & Infrastructure (VUI) and Department of Energy
2 Dates Date of First Submission: 10 August 2014
Date of Latest Update: 10 August 2014
3 Project Name (with acronym) The Santo Grid Extension (Matevulu to Shark Bay, Port Olry, Stone Hill and Palekula, East Coast Santo) – (SGE)
4 Project Owner:
Owner responsible for the infrastructure: Government of Vanuatu Operator responsible for maintenance: VUI
5 Alignment with Governmental and Ministerial Policies
Clear priority areas of current ministerial strategies/road maps addressed in the project: Aligned with the national strategies of the Priorities & Action Agenda (2006-2015) and Vanuatu National Energy Road Map (March 2013)
6 Project Timeframe Construction period (years): 12 months (estimation)
Operating period (years): 30 years or more
7 Project Development Status (concept, prefeasibility, feasibility stage etc.)
Currently (August 2014) under full feasibility study
8 Locations and Areas Affected (provinces, islands, villages)
Matevulu to Shark Bay area, Port Olry Village, Stone Hill and Palekula areas, East Coast Santo
9
Project Components (with quantities e.g., “xx km of road”, “xx m
2 of terminal
building”, “xx meters pipelines”, “training”, etc)
Approximately 52 km of high voltage extension with low voltage distribution to villages
10 Linkage with other Infrastructure (none, low, medium, high)
Degree of linkage: Across all sectors
Brief description: Electricity transmitted by the grid lines to the areas and villages of Matevulu to Shark Bay, Port Olry, Stone Hill and Palekula, along the Eastern side of Santo, will enable the communities, education and health sectors, farmers, business, civil society, and tourism sectors to benefit from this power linkage
11 Regulatory Requirements to Comply With under the Project (construction standards, etc. [list])
Since this is a power transmission and distribution network in VUI’s jurisdiction, its operations and maintenance will fall into the URA Act and the Electricity Act
12
Project Beneficiaries (approximate types and number of persons or households benefitting [say which])
Type(s) of beneficiaries (e.g., residential, business, farmer, etc.) 1. Residential 2. Schools 3. Health 4. Churches 5. Businesses 6. Farmers 7. Government agencies
Number of beneficiaries: Approximately 900 electricity consumers – over 90% are small households and about 5% are likely to be consumers above the small household users such as government agencies, churches, and businesses including commercial farmers
13 Project Benefits/Outcomes
Brief description: 1. About 145 new consumer households in Hog Harbor 2. About 193 new consumer households in Port Olry 3. About 486 new consumer households along east coast road 4. There will be opportunity for employment and job creation 5. New consumers will get stable power supply 6. Unconnected households will have access to power 7. Vanuatu will play its role in reducing green-house gasses by substituting
predominately hydropower for burning biomass
14
Local Employment and Procurement during Construction (number of Ni-Vans employed, each year of construction; value of local materials procured for construction)
Degree of employment impact (high, medium, low): Low
Brief description (Ni-Vanuatu employed in construction, value of local materials): 10-20 workers (80% unskilled and 20% skilled) Construction materials such as local sand & gravels will be used
15 Job Creation Potential during Operations
Degree of employment impact (high, medium, low): Low
Number of new employed in operations: Potential Job Creation: Transmission lines clearing Additional 2 permanent line crew for utility
16 Resilience of Project Assets to Climate Change and Natural Disaster Risk
Degree of resilience built into project design (high, medium, low): High resilience
Major climate change and natural disaster risks: Earthquake, cyclone, flooding, lightning
Main risk mitigation measures: Technical designs/ technologies have improved for natural disasters, e.g. insulated SWER line to reduce outages

VISIP 2015 - 2024 | Appendix 6
152
Item
Project Information
17 Land Availability for Project
Brief description (customary or GoV land; dispute risks; status of land negotiations): Land required for project is within existing road right of way Project site is public road right of way – only issue will be compensating existing land owners for trimming/cutting their trees that extend into the right of way
18 Environmental Improvement Potential Rating (high, medium, low, negative): Low impact – some trees may need cutting
19 Community Contribution Commitment Short description (cash, labour, materials, land, etc.): Local community to be involved in site preparation and tree cutting
20 Investment Value, VUV million
Including design/supervision, technical assistance, works, labour, materials, equipment, etc.): USD2.4 million (VUV224 million)
21 Estimated Annual O&M Cost, VUV million/year
(i) Operation cost (staff, consumables, energy, others)
Not available yet
(ii) Asset maintenance cost: 3% investment cost (estimation)
(iii) Operational subsidies needed?
Not foreseen
22 Potential Funding Sources Initial Investment (% of total project investment cost)
GoV:
Donors:
Grants: 100%
Loans:
Private Sector:
23 Potential Funding Sources O&M Costs (% of total project O&M costs)
GoV:
Donors (grants):
Private Sector: 100% (to be covered in the tariff structure of the electricity concessionaire -VUI)
24 Environmental and Involuntary Resettlement Risks
Short description of impacts, and of any people or assets affected: 1. Valuable trees will be harvest by landowners before clearing site or they may be
compensated 2. Loss of cash crop trees may require compensation

VISIP 2015 - 2024 | Appendix 6
153
En2 Low Voltage (LV) and Medium Voltage (MV) Extension (Vila, Santo, Malekula) Item
Project Information
1 Sponsoring Ministry/Agency Department of Energy, UNELCO and VUI
2 Dates Date of First Submission: 10 August 2014
Date of Latest Update: 10 August 2014
3 Project Name (with acronym) Low Voltage (LV) and Medium Voltage (MV) Extension (Vila, Santo, Malekula)
4 Project Ownership:
Owner responsible for the infrastructure: Government of Vanuatu Operator responsible for Operation and Maintenance: UNELCO, VUI
5 Alignment with Governmental and Ministerial Policies
Highlight the specific priority of current ministerial strategy/road map addressed in the project: Aligned with the national strategies of the Priorities & Action Agenda (2006-2015) and Vanuatu National Energy Road Map (March 2013)
6 Project Timeframe Construction period (years): 2 years
Operating period (years): 30 years
7 Project Development Status (concept, prefeasibility, feasibility stage etc.)
Prefeasibility study available with updated details
8 Locations and Areas Affected (provinces, islands, villages)
Vila, Efate, Shefa Santo, Sanma Malekula, Malampa
9 Project Components (with quantities e.g., “xx km of road”, “xx m
2 of terminal building”,
“xx meters pipelines”, “training”, etc)
Extension of the medium voltage and low voltage grid networks in the periphery of the existing grid networks in the three islands
10 Linkage with other Infrastructure (none, low, medium, high)
Degree of linkage: Across all sectors
Brief description: Electricity transmitted by the grid lines to peripheral areas will enable residents, communities, the education and health sectors, institutions, farmers, businesses, civil society, and tourism sectors to benefit from this power linkage
11 Regulatory Requirements to Comply With under the Project (construction standards, etc. [list])
Technical specification and regulations to be respected for investment, operation and maintenance fall under the URA Act and the Electricity Act
12 Project Beneficiaries (approximate types and number of persons or households benefitting [say which])
Type(s) of beneficiaries (e.g., residential, business, farmer, etc.): 1. Residential 2. Schools 3. Health 4. Churches 5. Businesses 6. Farmers 7. Government agencies
Number of beneficiaries: Approximately 15,000 users (to be controlled)
– over 80% are small households and about10% are likely to be consumers above the small household users such as government agencies, churches, and businesses including commercial farmers
13 Project Benefits/Outcomes
Brief description [be specific and quantitative: e.g., XX households gain access to health care facilities, etc] Access to the electrical grid is critical to improve the life quality of users and for access to a multiplicity of services (including Internet) increasingly important for benefiting of social, economic, commercial and governmental services
14
Local Employment and Procurement during Construction (number of Ni-Vans employed, each year of construction; value of local materials procured for construction)
Degree of employment impact: (high, medium, low) Low to Medium
Brief description (Ni-Vanuatu employed in construction, value of local materials) Local labour and construction materials such as sand & gravels to be locally provided
15 Job Creation Potential during Operations Degree of employment impact (high, medium, low): Low
Number of new employed in operations: Transmission lines clearing; Power transformer maintenance Additional 10 permanent line crew for utilities concerned
16 Resilience of Project Assets to Climate Change and Natural Disaster Risk
Degree of resilience built into project design (high, medium, low): High resilience
Major climate change and natural disaster risks: Earthquake,, cyclone, flooding, lightning
Main risk mitigation measures: Technical designs/ technologies adapted to withstand local natural disasters; use of insulated SWER line thereby reducing outages
17 Land Availability for Project
Brief description (customary or GoV land; dispute risks; status of land negotiations): Land required for project is expected to be mostly within existing road right of way (to be controlled)
Project site is public road right of way – only issue will be compensating existing
land owners for trimming/cutting their trees that extend into the right of way

VISIP 2015 - 2024 | Appendix 6
154
Item
Project Information
18 Environmental Improvement Potential Rating (high, medium, low, negative):
Low impact – some trees may have to be cut
19 Community Contribution Commitment Short description (cash, labour, materials, land, etc.): Local community to be involved in site preparation and trees cutting
20 Investment Value, VUV million
Including design/supervision, technical assistance, works, labour, materials, equipment, etc.): USD18 million (VUV1.68 billion)
21 Estimated Annual O&M Cost, VUV million/year
(i) Operation cost (staff, consumables, energy, others)
Not available yet
(ii) Asset maintenance cost:
3% Investment Cost (estimation)
(iii) Operational subsidies needed?
Not foreseen
22 Potential Funding Sources Initial Investment (% of total project investment cost)
GoV:
Donors:
Grants: 100%
Loans:
Private Sector:
23 Potential Funding Sources O&M Costs (% of total project O&M costs)
GoV:
Donors (grants):
Private Sector: 100% (to be covered in the tariff structure of the electricity concessionaire –UNELCO, VUI)
24 Environmental and Involuntary Resettlement Risks
Short description of impacts, and of any people or assets affected: Landowners will harvest valuable trees before clearing or they may be compensated Loss of cash crop trees may have to be compensated
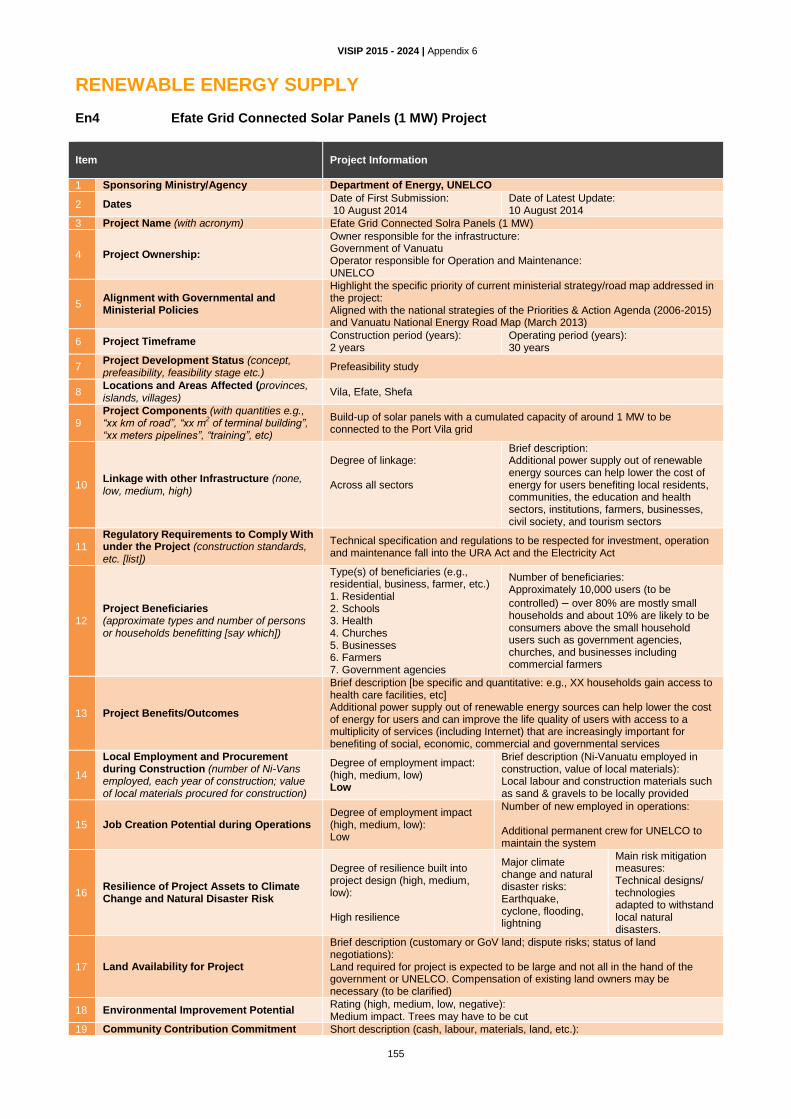
VISIP 2015 - 2024 | Appendix 6
155
RENEWABLE ENERGY SUPPLY
En4 Efate Grid Connected Solar Panels (1 MW) Project Item
Project Information
1 Sponsoring Ministry/Agency Department of Energy, UNELCO
2 Dates Date of First Submission: 10 August 2014
Date of Latest Update: 10 August 2014
3 Project Name (with acronym) Efate Grid Connected Solra Panels (1 MW)
4 Project Ownership:
Owner responsible for the infrastructure: Government of Vanuatu Operator responsible for Operation and Maintenance: UNELCO
5 Alignment with Governmental and Ministerial Policies
Highlight the specific priority of current ministerial strategy/road map addressed in the project: Aligned with the national strategies of the Priorities & Action Agenda (2006-2015) and Vanuatu National Energy Road Map (March 2013)
6 Project Timeframe Construction period (years): 2 years
Operating period (years): 30 years
7 Project Development Status (concept, prefeasibility, feasibility stage etc.)
Prefeasibility study
8 Locations and Areas Affected (provinces, islands, villages)
Vila, Efate, Shefa
9 Project Components (with quantities e.g., “xx km of road”, “xx m
2 of terminal building”,
“xx meters pipelines”, “training”, etc)
Build-up of solar panels with a cumulated capacity of around 1 MW to be connected to the Port Vila grid
10 Linkage with other Infrastructure (none, low, medium, high)
Degree of linkage: Across all sectors
Brief description: Additional power supply out of renewable energy sources can help lower the cost of energy for users benefiting local residents, communities, the education and health sectors, institutions, farmers, businesses, civil society, and tourism sectors
11 Regulatory Requirements to Comply With under the Project (construction standards, etc. [list])
Technical specification and regulations to be respected for investment, operation and maintenance fall into the URA Act and the Electricity Act
12 Project Beneficiaries (approximate types and number of persons or households benefitting [say which])
Type(s) of beneficiaries (e.g., residential, business, farmer, etc.) 1. Residential 2. Schools 3. Health 4. Churches 5. Businesses 6. Farmers 7. Government agencies
Number of beneficiaries: Approximately 10,000 users (to be
controlled) – over 80% are mostly small households and about 10% are likely to be consumers above the small household users such as government agencies, churches, and businesses including commercial farmers
13 Project Benefits/Outcomes
Brief description [be specific and quantitative: e.g., XX households gain access to health care facilities, etc] Additional power supply out of renewable energy sources can help lower the cost of energy for users and can improve the life quality of users with access to a multiplicity of services (including Internet) that are increasingly important for benefiting of social, economic, commercial and governmental services
14
Local Employment and Procurement during Construction (number of Ni-Vans employed, each year of construction; value of local materials procured for construction)
Degree of employment impact: (high, medium, low) Low
Brief description (Ni-Vanuatu employed in construction, value of local materials): Local labour and construction materials such as sand & gravels to be locally provided
15 Job Creation Potential during Operations Degree of employment impact (high, medium, low): Low
Number of new employed in operations: Additional permanent crew for UNELCO to maintain the system
16 Resilience of Project Assets to Climate Change and Natural Disaster Risk
Degree of resilience built into project design (high, medium, low): High resilience
Major climate change and natural disaster risks: Earthquake, cyclone, flooding, lightning
Main risk mitigation measures: Technical designs/ technologies adapted to withstand local natural disasters.
17 Land Availability for Project
Brief description (customary or GoV land; dispute risks; status of land negotiations): Land required for project is expected to be large and not all in the hand of the government or UNELCO. Compensation of existing land owners may be necessary (to be clarified)
18 Environmental Improvement Potential Rating (high, medium, low, negative): Medium impact. Trees may have to be cut
19 Community Contribution Commitment Short description (cash, labour, materials, land, etc.):

VISIP 2015 - 2024 | Appendix 6
156
Item
Project Information
Local Community to be involved in site preparation and trees cutting
20 Investment Value, VUV million
Including design/supervision, technical assistance, works, labour, materials, equipment, etc.): USD5.60 million (VUV522.76 million)
21 Estimated Annual O&M Cost, VUV million/year
(i) Operation cost (staff, consumables, energy, others):
Not available yet
(ii) Asset maintenance cost:
3% Investment Cost (estimation)
(iii) Operational subsidies needed? Not foreseen
22 Potential Funding Sources Initial Investment (% of total project investment cost)
GoV:
Donors:
Grants:
Loans:
Private Sector: 100 %
23 Potential Funding Sources O&M Costs (% of total project O&M costs)
GoV:
Donors (grants):
Private Sector: 100% (to be covered in the tariff structure of the electricity concessionaire – UNELCO
24 Environmental and Involuntary Resettlement Risks
Short description of impacts, and of any people or assets affected: Valuable trees will be harvest by landowners before clearing or they may be compensated Loss of cash crop trees may have to be compensated

VISIP 2015 - 2024 | Appendix 6
157
En5 Takara Geothermal Power Plant (4+4 MW) Preparatory Study & Investment Item
Project Information
1 Sponsoring Ministry/Agency Kuth Energy (Geo-dynamics) Australia
2 Dates Date of First Submission: 10 August 2014
Date of Latest Update: 10 August 2014
3 Project Name (with acronym) Takara Geothermal Power Plant
4 Project Owner:
Owner responsible for the infrastructure: Kuth Energy (Geo-dynamics) Australia Operator responsible for Maintenance: Kuth Energy (Geo-dynamics) Australia
5 Alignment with Governmental and Ministerial Policies
Clear priority areas of current ministerial strategies/road maps addressed in the project: Aligned with the national strategies of the Priorities & Action Agenda (2006-2015) and Vanuatu National Energy Road Map (March 2013)
6 Project Timeframe Construction period (years): 3-4 years
Operating period (years): 30 years
7 Project Development Status (concept, prefeasibility, feasibility stage, etc.)
Project Feasibility study completed and now awaiting slim hole drilling to test the potential of the geothermal resource
8 Locations and Areas Affected (provinces, islands, villages)
Takara area, North Efate, Shefa Province
9 Project Components (with quantities e.g., “xx km of road”, “xx m
2 of terminal building”, “xx
meters pipelines”, “training”, etc)
First stage development 4 MW
10 Linkage with other Infrastructure (none, low, medium, high)
Degree of linkage: Across all sectors
Brief description: Electricity produced from the plant will be transmitted from Takara to link with current power supply towards North Efate, thus along the route, communities, education & health, farmers, businesses, tourism sectors will benefit
11 Regulatory Requirements to Comply With under the Project (construction standards, etc. [list])
Since this will be regarded as a Power Utility, its operations will fall under the URA Act, the Electricity Act and the Geothermal Act
12 Project Beneficiaries (approximate types and number of persons or households benefitting [say which])
Type(s) of beneficiaries (e.g., residential, business, farmer, etc.) 1. Residential 2. Schools 3. Health 4. Churches 5. Businesses 6. Farmers 7. Government agencies
Number of beneficiaries: 1. Approximately 66,000 people in rural
Efate will benefit from having power 2. Approximately 44,000 people in Port
Vila will benefit
13 Project Benefits/Outcomes
Brief description [be specific and quantitative: e.g., XX households gain access to health care facilities, etc] 37 villages around Efate 10 health centres from Mele Maat to Rentapao 9 schools from Mele Maat to Rentapao 2 resorts There will be opportunity for employment and job creation Consumers will get stable power supply and less volatile electricity tariffs Unconnected households will have access to power Vanuatu will play its role in reducing greenhouse gasses
14
Local Employment and Procurement during Construction (number of Ni-Vans employed, each year of construction; value of local materials procured for construction)
Degree of employment impact (high, medium,
low): Medium
Brief description (Ni-Vanuatu employed in construction, value of local materials): There will be Ni-Vanuatu employed in site clearing and construction
15 Job Creation Potential during Operations Degree of employment impact (high, medium, low): Medium
Number of new employed in operations: Directly minimal
16 Resilience of Project Assets to Climate Change and Natural Disaster Risk
Degree of resilience built into project design (high, medium, low): High resilience
Major Climate Change and Natural Disaster risks: Earthquake, cyclone, lightning
Main risk mitigation measures: Technical designs/technologies have improved for natural disasters, e.g., automatic shutdown systems
17 Land Availability for Project Brief description (customary or GoV land; dispute risks; status of land negotiations):

VISIP 2015 - 2024 | Appendix 6
158
Item
Project Information
Project site is customary land. Since pre-feasibility stage and now during the feasibility stage, the land owners and claimants have been continuously informed of the project. They expressed their willingness to participate together towards completing the project construction while they are proceeding in the courts to identify the correct land owners
18 Environmental Improvement Potential Rating (high, medium, low, negative): Medium
19 Community Contribution Commitment Short description (cash, labour, materials, land, etc.): 1. Land will to be given up for the project 2. Some valuable trees may have to be cut
20 Investment Value, VUV million
Including design/supervision, technical assistance, works, labour, materials, equipment, etc.): 1
st Stage Development (Site development, slim hole drilling, geothermal plant –
4MW, Transmission & Distribution), approximately USD108 million (VUV101 billion)
21 Estimated Annual O&M Cost, VUV million/year
(i) Operation cost (staff, consumables, energy, others)
Approximately USD2.404 million (VUV240,400,000)/year
(ii) Asset maintenance cost: Included in above figure
(iii) Operational subsidies needed?
No subsidies foreseen
22 Potential Funding Sources Initial Investment (% of total project investment cost)
GoV:
Donors:
Grants:
Loans:
Private Sector: 100%
23 Potential Funding Sources O&M Costs (% of total project O&M costs)
GoV:
Donors (grants):
Private Sector: 100%
24 Environmental and Involuntary Resettlement Risks
Short description of impacts, and of any people or assets affected: Land occupied by the project will be leased and or compensated Land owners will harvest valuable trees before clearing or they can be compensated Loss of cash crop trees will be compensated

VISIP 2015 - 2024 | Appendix 6
159
En6 Brenwe Hydro Power Project (< 1.2MW), Malekula Item
Project Information
1 Sponsoring Ministry/Agency Department of Energy
2 Dates Date of First Submission: 22 August 2009
Date of Latest Update: Included in a list of projects submitted to the Chinese Government on 6 May 2014
3 Project Name (with acronym) Brenwe Hydro Power Project (BHPP)
4 Project Owner:
Owner responsible for the infrastructure: Government of Vanuatu Operator Responsible for Maintenance: UNELCO
5 Alignment with Governmental and Ministerial Policies
Clear priority areas of current ministerial strategies/road maps addressed in the project: Aligned with the national strategies of the Priorities & Action Agenda (2006-2015) and Vanuatu National Energy Road Map (March 2013)
6 Project Timeframe Construction period (years): Estimated 24 months
Operating period (years): 30 years or more
7 Project Development Status (concept, prefeasibility, feasibility stage, etc.)
Currently (2014) under full feasibility study
8 Locations and Areas Affected (provinces, islands, villages)
Unmet/Brenwe, Northwest Malekula, Malampa Province
9 Project Components (with quantities e.g., “xx km of road”, “xx m
2 of terminal building”, “xx
meters pipelines”, “training”, etc)
Option 1. 600 kW Option 2. 400 kW
10 Linkage with other Infrastructure (none, low, medium, high)
Degree of linkage: Across all sectors
Brief description: Electricity produced from the plant will be transmitted from NW of Malekula to link with current power supply in Lakatoro and Norsup, thus communities, education, health, farmers, businesses, tourism sectors will benefit
11 Regulatory Requirements to Comply With under the Project (construction standards, etc. [list])
Since this will be regarded as a Power Utility, its operations will fall under the URA Act and the Electricity Act.
12 Project Beneficiaries (approximate types and number of persons or households benefitting [say which])
Types of beneficiaries (e.g., residential, business, farmer, etc.) 1. Residential 2. Schools 3. Health 4. Churches 5. Businesses 6. Farmers 7. Government agencies
Number of beneficiaries Approximately 1,500 electricity consumers
– 90% are mostly small households and 10% are large consumers such as government agencies, churches, and businesses including commercial farmers
13 Project Benefits/Outcomes
Brief description [be specific and quantitative: e.g., XX households gain access to health care facilities, etc] 526 consumers already connected to the power supply in Lakatoro and Norsup will benefit from power produced by Hydropower About 550 new consumers along the NE coast of Malekula to have access to hydro power About 400 new consumers along NW coast of Malekula to have access to hydro power Current 420 kW of installed diesel capacity will be supplemented with hydro capacity
14
Local Employment and Procurement during Construction (number of Ni-Vans employed, each year of construction; value of local materials procured for construction)
Degree of employment impact (high, medium, low): Medium
Brief description (Ni-Vanuatu employed in construction, value of local materials): 50-80 workers (40% unskilled and 60% skilled) Construction materials such as local sand, gravel, & timber will be used
15 Job Creation Potential during Operations
Degree of employment impact (high, medium, low): Low to medium
Number of new employed in operations: Potential Job Creation: Hydro operators Hydro ground maintenance Transmission lines clearing
16 Resilience of Project Assets to Climate Change and Natural Disaster Risk
Degree of resilience built into project design (high, medium, low): High resilience
Major climate change and natural disaster risks: Earthquake, cyclone, flooding, lightning
Main risk mitigation measures: Technical designs/technologies have improved for natural disasters, e.g. automatic shutdown systems
17 Land Availability for Project Brief description (customary or GoV land; dispute risks; status of land

VISIP 2015 - 2024 | Appendix 6
160
Item
Project Information
negotiations):
Land required for project is 4.41 ha – major portion of this land is very steep ridges Project site is customary land – since pre-feasibility stage to feasibility stage, the land owners and claimants have been continuously informed of the project. An MOA has also been signed with land owners and claimants expressing their willingness to participate together towards completing the project construction
18 Environmental Improvement Potential Rating (high, medium, low, negative): Low
19 Community Contribution Commitment
Short description (cash, labour, materials, land, etc.): Land will to be given up for the project Some valuable trees may have to be cut Some fishing sites in the river may have to be forgone
20 Investment Value, VUV million
Including design/supervision, Technical Assistance, works, labour, materials, equipment, etc.): Option 1: 600 kW – USD6.45 million (VUV602 million) Option 2: 400 kW – USD5.60 million (VUV522 million)
21 Estimated Annual O&M Cost, VUV million/year
(i) Operation cost (staff, consumables, energy, others):
Not available yet
(ii) Asset maintenance cost:
3.5% of investment cost (estimation)
(iii) Operational subsidies needed?
If yes, estimate annual amount (VUV million): No subsidy foreseen
22 Potential Funding Sources Initial Investment (% of total project investment cost)
GoV:
Donors:
Grants: 100% Op1 100% Op2
Loans:
Private Sector:
23 Potential Funding Sources O&M Costs (% of total project O&M costs)
GoV:
Donors (grants):
Private Sector: 100% (to be covered in the tariff structure of the electricity concessionaire - UNELCO)
24 Environmental and Involuntary Resettlement Risks
Short description of impacts, and of any people or assets affected: Land occupied by the project will be leased and or compensated Land owners will harvest valuable trees before clearing or they can be compensated Loss of cash crop trees will be compensated

VISIP 2015 - 2024 | Appendix 6
161
En7 Sarakata Hydro Power Extension Project (+600 KW), Santo Item
Project Information
1 Sponsoring Ministry/Agency Department of Energy
2 Dates Date of First Submission: New project August 2014
Date of Latest Update: New Project August 2014
3 Project Name (with acronym) Sarakata Hydro Expansion (SHE)
4 Project Owner:
Owner responsible for the infrastructure: Government of Vanuatu Operator responsible for maintenance: VUI
5 Alignment with Governmental and Ministerial Policies
Clear priority area (s) of current Ministerial Strategy(ies) / Road Map(s) addressed in the project: Aligned with the national strategies of the Priorities & Action Agenda (2006-2015) and Vanuatu National Energy Road Map (March 2013)
6 Project Timeframe Construction period (years): Estimated to 12 months
Operating period (years): 30 years or more
7 Project Development Status (concept, prefeasibility, feasibility stage etc.)
Currently (August 2014) under Full Feasibility Study
8 Locations and Areas Affected (provinces, islands, villages)
Fanafo Area, East Santo, Sanma Province
9 Project Components (with quantities e.g., “xx km of road”, “xx m
2 of terminal building”, “xx
meters pipelines”, “training”, etc)
Raise existing weir by 0.4m Heightening walls of sedimentation basin Elevate existing water canal Modify head tank (forebay) New penstock Extension of existing power house New turbine with generator of 300 kW + 300 kW
10 Linkage with other Infrastructure (none, low, medium, high)
Degree of linkage: Across all sectors
Brief description: Electricity produced from this additional 300 kW + 300 kW will be transmitted into the existing grid around the Luganville Concession area, therefore the communities, education & health facilities, farmers, businesses, civil societies, and tourism sectors will all benefit
11 Regulatory Requirements to Comply With under the Project (construction standards, etc. [list])
This project will be part of the current Power Utility (VUI) operations in Luganville. Its operations will fall under the URA Act and the Electricity Act
12 Project Beneficiaries (approximate types and number of persons or households benefitting [say which])
Type(s) of beneficiaries (e.g., residential, business, farmer, etc.) 1. Residential 2. Schools 3. Health facilities 4. Churches 5. Businesses 6. Farmers 7. Tourism 7. Government agencies
Number of beneficiaries: Luganville population of 13,167 (2009) Santo population of 39,606 (2009)
13 Project Benefits/Outcomes
Brief description (be specific and quantitative: e.g., XX households gain access to health care facilities, etc) 2,789 Consumers already connected to the power supply in Luganville will benefit from power to be produced by hydro expansion About 1,800 new consumers to have access to hydro power Current installed diesel generators will only be used as stand-by
14
Local Employment and Procurement during Construction (number of Ni-Vans employed, each year of construction; value of local materials procured for construction)
Degree of employment impact (high, medium, low): Medium
Brief description (Ni-Vanuatu employed in construction, value of local materials): 50-80 workers (40% unskilled and 60% skilled) Construction materials such as local sand, gravel, & timber will be used
15 Job Creation Potential during Operations Degree of employment impact (high, medium, low): Low to medium
Number of new employed in operations: Potential Job Creation: Hydro operators Hydro ground maintenance Transmission lines clearing
16 Resilience of Project Assets to Climate Change and Natural Disaster Risk
Degree of resilience built into project design (high, medium, low): High resilience
Major Climate Change and Natural Disaster risks: Earthquake, cyclone, flooding, lightning
Main risk mitigation measures: Technical designs/technologies have improved for natural disasters, e.g. automatic shutdown systems

VISIP 2015 - 2024 | Appendix 6
162
Item
Project Information
17 Land Availability for Project
Brief description (customary or GoV land; dispute risks; status of land negotiations): There will be no need for additional land required The current two parcels of land (5 ha & 18 ha) are sufficient Government has already made land premium payments to custom owners for the 18 ha land. Negotiations for 5 ha payments on-going
18 Environmental Improvement Potential Rating (high, medium, low, negative): High (Diesel generators will completely be stopped and used only as stand-by
19 Community Contribution Commitment Short description (cash, labour, materials, land, etc.): None
20 Investment Value, VUV million
Including design/supervision, Technical Assistance, works, labour, materials, equipment, etc.): USD4,25 million (VUV398 million)
21 Estimated Annual O&M Cost, VUV million/year
(i) Operation cost (staff, consumables, energy, others)
Not available yet
(ii) Asset maintenance cost: 3.5% of investment cost (estimation)
(iii) Operational subsidies needed?
No subsidy foreseen
22 Potential Funding Sources Initial Investment (% of total project investment cost)
GoV:
Donors:
Grants: 100%
Loans:
Private Sector:
23 Potential Funding Sources O&M Costs (% of total project O&M costs)
GoV:
Donors (grants):
Private Sector: 100% (to be covered in the tariff structure of the electricity concessionaire -VUI)
24 Environmental and Involuntary Resettlement Risks
Short description of impacts, and of any people or assets affected: Amount of water in the natural river bed will decrease but will not adversely affect the ecological life of the river
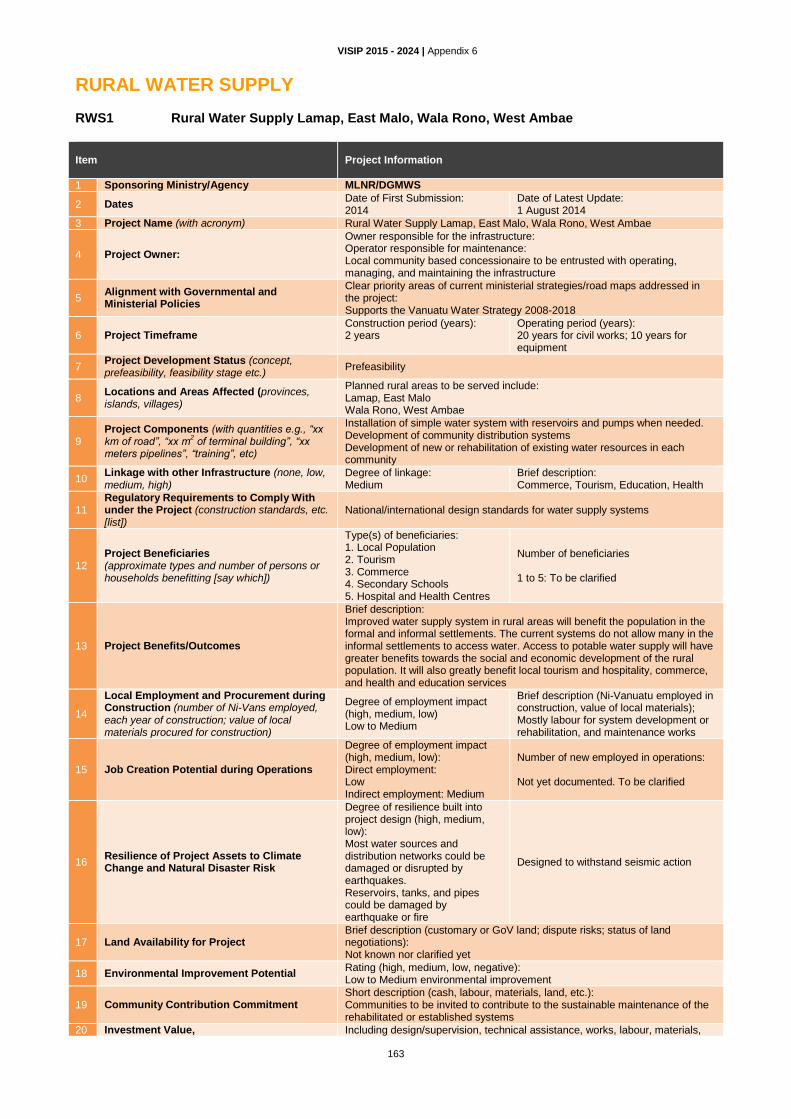
VISIP 2015 - 2024 | Appendix 6
163
RURAL WATER SUPPLY RWS1 Rural Water Supply Lamap, East Malo, Wala Rono, West Ambae Item
Project Information
1 Sponsoring Ministry/Agency MLNR/DGMWS
2 Dates Date of First Submission: 2014
Date of Latest Update: 1 August 2014
3 Project Name (with acronym) Rural Water Supply Lamap, East Malo, Wala Rono, West Ambae
4 Project Owner:
Owner responsible for the infrastructure: Operator responsible for maintenance: Local community based concessionaire to be entrusted with operating, managing, and maintaining the infrastructure
5 Alignment with Governmental and Ministerial Policies
Clear priority areas of current ministerial strategies/road maps addressed in the project: Supports the Vanuatu Water Strategy 2008-2018
6 Project Timeframe Construction period (years): 2 years
Operating period (years): 20 years for civil works; 10 years for equipment
7 Project Development Status (concept, prefeasibility, feasibility stage etc.)
Prefeasibility
8 Locations and Areas Affected (provinces, islands, villages)
Planned rural areas to be served include: Lamap, East Malo Wala Rono, West Ambae
9 Project Components (with quantities e.g., “xx km of road”, “xx m
2 of terminal building”, “xx
meters pipelines”, “training”, etc)
Installation of simple water system with reservoirs and pumps when needed. Development of community distribution systems Development of new or rehabilitation of existing water resources in each community
10 Linkage with other Infrastructure (none, low, medium, high)
Degree of linkage: Medium
Brief description: Commerce, Tourism, Education, Health
11 Regulatory Requirements to Comply With under the Project (construction standards, etc. [list])
National/international design standards for water supply systems
12 Project Beneficiaries (approximate types and number of persons or households benefitting [say which])
Type(s) of beneficiaries: 1. Local Population 2. Tourism 3. Commerce 4. Secondary Schools 5. Hospital and Health Centres
Number of beneficiaries 1 to 5: To be clarified
13 Project Benefits/Outcomes
Brief description: Improved water supply system in rural areas will benefit the population in the formal and informal settlements. The current systems do not allow many in the informal settlements to access water. Access to potable water supply will have greater benefits towards the social and economic development of the rural population. It will also greatly benefit local tourism and hospitality, commerce, and health and education services
14
Local Employment and Procurement during Construction (number of Ni-Vans employed, each year of construction; value of local materials procured for construction)
Degree of employment impact (high, medium, low) Low to Medium
Brief description (Ni-Vanuatu employed in construction, value of local materials); Mostly labour for system development or rehabilitation, and maintenance works
15 Job Creation Potential during Operations
Degree of employment impact (high, medium, low): Direct employment: Low Indirect employment: Medium
Number of new employed in operations: Not yet documented. To be clarified
16 Resilience of Project Assets to Climate Change and Natural Disaster Risk
Degree of resilience built into project design (high, medium, low): Most water sources and distribution networks could be damaged or disrupted by earthquakes. Reservoirs, tanks, and pipes could be damaged by earthquake or fire
Designed to withstand seismic action
17 Land Availability for Project Brief description (customary or GoV land; dispute risks; status of land negotiations): Not known nor clarified yet
18 Environmental Improvement Potential Rating (high, medium, low, negative): Low to Medium environmental improvement
19 Community Contribution Commitment Short description (cash, labour, materials, land, etc.): Communities to be invited to contribute to the sustainable maintenance of the rehabilitated or established systems
20 Investment Value, Including design/supervision, technical assistance, works, labour, materials,

VISIP 2015 - 2024 | Appendix 6
164
Item
Project Information
VUV million equipment, etc.): USD1 million (VUV93.35 million)
21 Estimated Annual O&M Cost, VUV million/year
(i) Operation cost (staff, consumables, energy, others)
Not yet known for new, rehabilitated and expanded system
(ii) Asset maintenance cost:
USD5,000 for each rural system (roughly estimated)
(iii) Operational subsidies needed?
If yes, estimate annual amount (m VUV):
22 Potential Funding Sources Initial Investment (% of total project investment cost)
GoV:
Donors:
Grants: UNICEF, NZMFAT 100%
Loans:
Private Sector:
23 Potential Funding Sources O&M Costs (% of total project O&M costs)
GoV:
Donors (grants):
Private Sector: Beneficiary population and commercial users
100%
24 Environmental and Involuntary Resettlement Risks
Short description of impacts, and of any people or assets affected: Resettlement need not addressed yet

VISIP 2015 - 2024 | Appendix 6
165
RWS2 (Bundle) Rural Water Supply in Every Province Item
Project Information
1 Sponsoring Ministry/Agency MLNR/DGMWS
2 Dates Date of First Submission: 2014
Date of Latest Update: 1 August 2014
3 Project Name (with acronym) Rural Water Supply in Every Province
4 Project Owner:
Owner responsible for the infrastructure: Operator responsible for maintenance: Local community-based concessionaire to be entrusted with operating, managing, and maintaining the infrastructure
5 Alignment with Governmental and Ministerial Policies
Clear priority areas of current ministerial strategies/road maps addressed in the project: Supports the Vanuatu Water Strategy 2008-2018
6 Project Timeframe Construction period (years): 3 years
Operating period (years): 20 years for civil works; 10 years for equipment
7 Project Development Status (concept, prefeasibility, feasibility stage etc.)
Prefeasibility
8 Locations and Areas Affected (provinces, islands, villages)
Planned rural areas to be served include: Dillons Bay Water Supply Wintua Water Supply Ikwarramanu Water Supply Latano Water Supply Londua Rainwater Catchment Lamkail Water Supply Yanepkasu Water Supply Crab Bay Water Supply Faralou Water Supply Nguna Water Supply Haehivo Water Supply SE Santo Drilling Malo Drilling Malo Handpump Replacement Palumsi (Pangi) Water Supply
9 Project Components (with quantities e.g., “xx km of road”, “xx m
2 of terminal building”, “xx
meters pipelines”, “training”, etc)
Installation of simple water system with reservoirs and pumps when needed. Development of community distribution systems Development of new or rehabilitation of existing water resources in each community
10 Linkage with other Infrastructure (none, low, medium, high)
Degree of linkage: Medium
Brief description: Commerce, Tourism, Education, Health
11 Regulatory Requirements to Comply With under the Project (construction standards, etc. [list])
National / international design standards for water supply systems
12 Project Beneficiaries (approximate types and number of persons or households benefitting [say which])
Types of beneficiaries: 1. Local Population 2. Tourism 3. Commerce 4. Secondary Schools 5. Hospital and Health Centres
Number of beneficiaries 1 to 5: To be clarified
13 Project Benefits/Outcomes
Brief description: Improved water supply system in rural areas will benefit the population in the formal and informal settlements. The current systems do not allow many in the informal settlements to access water. Access to potable water supply will have greater benefits for the social and economic development of the rural population. It will also greatly benefit local tourism and hospitality, commerce, and health and education services
14
Local Employment and Procurement during Construction (number of Ni-Vans employed, each year of construction; value of local materials procured for construction)
Degree of employment impact (high, medium, low): Low to Medium
Brief description (Ni-Vanuatu employed in construction, value of local materials) Mostly labour for system development or rehabilitation, and maintenance works
15 Job Creation Potential during Operations
Degree of employment impact (high, medium, low): Direct employment: Low Indirect employment: Medium
Number of new employed in operations: Not yet documented. To be clarified
16 Resilience of Project Assets to Climate Change and Natural Disaster Risk
Degree of resilience built into project design (high, medium, low): Earthquakes could damage most water sources and distribution networks Earthquakes or fires could damage reservoirs, tanks, and pipes
Designed to withstand seismic action

VISIP 2015 - 2024 | Appendix 6
166
Item
Project Information
17 Land Availability for Project Brief description (customary or GoV land; dispute risks; status of land negotiations): Not known nor clarified yet
18 Environmental Improvement Potential Rating (high, medium, low, negative): Low to Medium environmental improvement
19 Community Contribution Commitment Short description (cash, labour, materials, land, etc.): Communities to be invited to contribute to the sustainable maintenance of the rehabilitated or established systems
20 Investment Value, VUV million
Including design/supervision, Technical Assistance, works, labour, materials, equipment, etc.): USD1.66 million for 15 rural water supply systems (see point 9 above) USD0.50 million (VUV46,68 million) for a first batch of sub-projects
21 Estimated Annual O&M Cost, VUV million/year
(i) Operation cost (staff, consumables, energy, others)
Not yet known for new, rehabilitated, and expanded system
(ii) Asset maintenance cost:
USD5,000 for each rural system (roughly estimated)
(iii) Operational subsidies needed?
If yes, estimate annual amount (m VUV):
22 Potential Funding Sources Initial Investment (% of total project investment cost)
GoV:
Donors:
Grants: 100%
Loans:
Private Sector:
23 Potential Funding Sources O&M Costs (% of total project O&M costs)
GoV:
Donors (grants):
Private Sector: Beneficiary population and commercial users
100%
24 Environmental and Involuntary Resettlement Risks
Short description of impacts, and of people or assets affected (if any): Resettlement need not addressed yet

VISIP 2015 - 2024 | Appendix 6
167
ICT ICT7 New government Data Centre + Backup Item
Project Information
1 Sponsoring Ministry/Agency OGCIO
2 Dates Date of First Submission: 2011
Date of Latest Update: 30 July 2014
3 Project Name (with acronym) New Government Data Centre + Backup
4 Project Owner: Owner responsible for the infrastructure: Operator responsible for maintenance: OGCIO
5 Alignment with Governmental and Ministerial Policies
Clear priority area s of current ministerial strategies/ Road Map(s) addressed in the project: Fully aligns with National ICT Policy and National Cybersecurity Policy, which require robust, reliable, secure, and redundant ICT infra.
6 Project Timeframe Construction period (years): 2 years
Operating period (years): 7 years
7 Project Development Status (concept, prefeasibility, feasibility stage etc.)
High level plan developed in 2011. However detailed planning of each project, that is the DC and the Backup, in terms of detailed business case, location analysis, detailed requirements analysis, tech specs, procurement plan, all need to be done.
8 Locations, and Areas Affected (provinces, islands, villages)
DC would be on Efate; backup might be on Efate or on Santo if a sub cable was available. Benefits to the entire country
9 Project Components (with quantities e.g., “xx km of road”, “xx m
2 of terminal building”, “xx
meters pipelines”, “training”, etc)
Data Centre building or installed shipping container building; plus identical backup centre located elsewhere, linked preferably by fibre or possibly microwave.
10 Linkage with other Infrastructure (none, low, medium, high)
Degree of linkage: High
Brief description: Strong links to other infra and GoV projects, in that almost all ICT systems run by Ministries would be housed at the DC and backed-up at the backup location.
11 Regulatory Requirements to Comply With under the Project (construction standards, etc. [list])
Infrastructure construction will require construction standards for DC and backup. This will likely be facilitated by shipping the DC as a modular unit in a shipping container. These are commercially available.
12 Project Beneficiaries (approximate types and number of persons or households benefitting [say which])
Type and number of beneficiaries (e.g., residential, business, farmer, etc.): 1. DIRECT: Civil Servants: 2000; 2. INDIRECT (since all apps will be housed here): Businessmen (large down to micro): 5000; Large farmers/ag/related: 1000; School children: 71000; Teachers: 5000; Ed Admin: 1500; Health workers: 2000; health patients: 10000; Women expecting or with young children, and their kids (getting better public health info): 10000; misc. citizens able to better interact with GoV: 30000. Currently the DC and backup at located at Meteo and MFEM, both are moderately vulnerable to major disasters, and hence the "dis-beneficiaries" are potentially numerous, of continuing the current system.
13 Project Benefits/Outcomes
Brief description (be specific and quantitative: e.g., XX households gain access to health care facilities, etc) Major benefits would be realised by 2000 civil servants whose systems are improved and more secure. INDIRECT benefits would be realised by about 80,000 in education having better materials, inputs, outputs and outcomes; about 22,000 involved in health having similarly improved outcomes; about 8,000 involved in commerce/tourism/agriculture/investment/fisheries/micro-enterprises etc would benefit in terms of ability to conduct e-commerce, e-booking, e-sales, etc., all of which is quite limited now. Current frictional costs of poor citizen-government interaction will be reduced, as will corruption, delays, lack of info in the marketplace, etc.
14
Local Employment and Procurement during Construction (number of Ni-Vans employed, each year of construction; value of local materials procured for construction)
Degree of employment impact (high, medium, low): Low impact
Brief description (Ni-Vanuatu employed in construction, value of local materials): Actual niVan construction impacts will be low, since mostly footings, an access road, fencing, etc. will be needed
15 Job Creation Potential during Operations Degree of employment impact (high, medium, low): Low
Number of new employed in operations: Low. The DC and backup will require about 2 engineers and technicians on call, but they will only access the facilities when needed. A 24 guard system at each location will be needed, generating about 3 jobs x 2 locations = 6.

VISIP 2015 - 2024 | Appendix 6
168
Item
Project Information
16 Resilience of Project Assets to Climate Change and Natural Disaster Risk
Degree of resilience built into project design (high, medium, low): High resilience Low risk
Major climate change and natural
disaster risks: High resilience – low risk. Both DCs will be built to high CC and disaster stds, with backup, fallover, low vulnerability location, etc. Having said that, in major disasters such as huge cyclones or volcanic eruptions, one data centre might be damaged, but will have backups.
17 Land Availability for Project
Brief description (customary or GoV land; dispute risks; status of land negotiations): Land issues will need to be negotiated. A possible location for the main DC would be at the cable landing station in Mele; there land issues would be minimal, since existing land devoted to ICT could be leased. Only about 1/10 hectare is needed per centre.
18 Environmental Improvement Potential
Rating (high, medium, low, negative): Medium to High. ICTs generally improve GoV operations and reduce the environmental impacts of other infra projects. For example, the Lands MIS/GIS could improve Land's ability to regulate and prevent illegal land development. The Web Portal Development Project would allow citizens and small businesses to get info, register new businesses, do transactions, etc. all from smart phones or laptops, thus avoiding numerous trips from outer islands to provincial capitals, PV, or Luganville. All these systems will be housed at the DC.
19 Community Contribution Commitment Short description (cash, labour, materials, land, etc.): None expected
20 Investment Value, m VUV
Including design/supervision, technical assistance, works, labour, materials, equipment, etc.): USD1 million (VAVU93.35 million)
21 Estimated Annual O&M Cost, m VUV/year
(i) Operation cost (staff, consumables, energy, others)
Ops cost: USD75000 per year plus technology refresh of $200,000 M USD every 4 years. Operation subsidies: all costs will need to be borne by OGCIO's recurrent budget
(ii) Asset maintenance cost:
(iii) Operational subsidies needed?
22 Potential Funding Sources Initial Investment (% of total project investment cost)
GoV: 5 %
Donors:
Grants: 25 %
Loans: 70 %
Private Sector:
23 Potential Funding Sources O&M Costs (% of total project O&M costs)
GoV: 90 %
Donors (grants): 10 %
Private Sector:
24 Environmental and Involuntary Resettlement Risks
Short description of impacts, and of any people or assets affected: Centre and backup will likely be located off a main road. Village impact should be minimal to none. Environmental risks, resettlement and related are actually reduced by ICT iGov projects, including the DC, which houses all the numerous I-GOV applications. For example, the Emergency and Disaster MIS under iGov would provide improved warning and response systems that would save lives and assets, and reduce risk to NiVans. Similarly, risks of NCDs (non-communicable diseases such as diabetes and stroke), currently a major burden on the health care system and forecast to become much worse, would be reduced by much improved public health and diet information
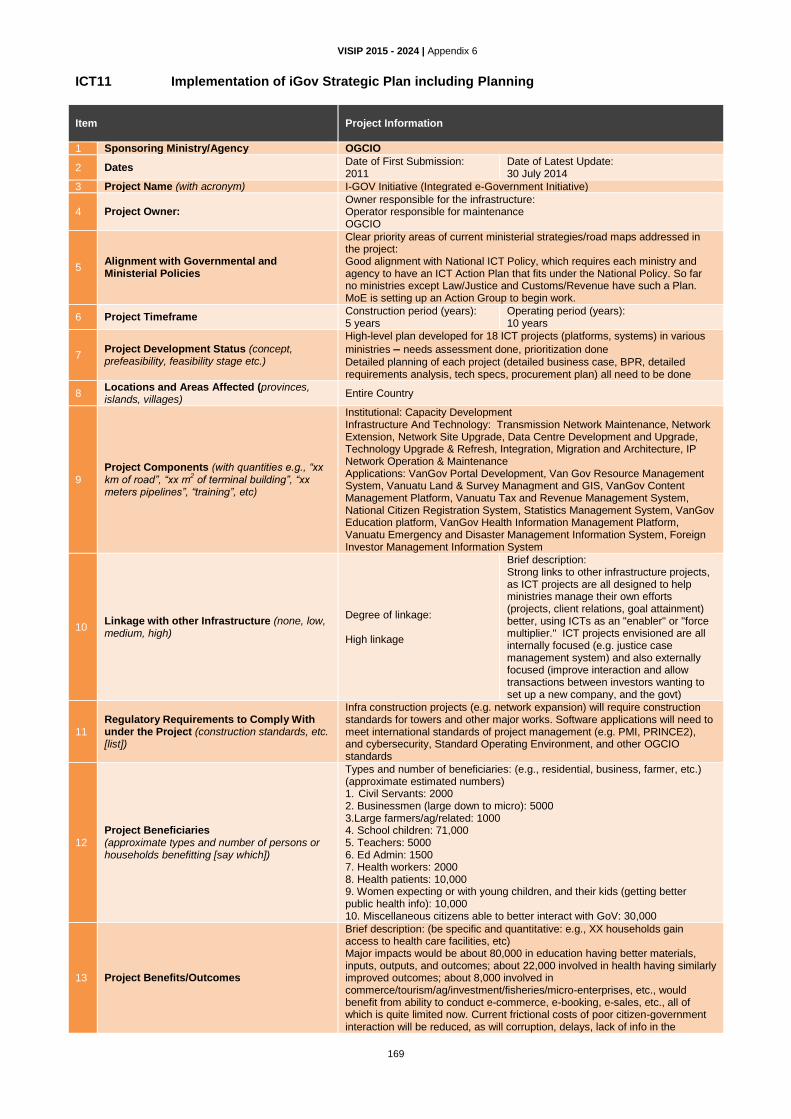
VISIP 2015 - 2024 | Appendix 6
169
ICT11 Implementation of iGov Strategic Plan including Planning Item
Project Information
1 Sponsoring Ministry/Agency OGCIO
2 Dates Date of First Submission: 2011
Date of Latest Update: 30 July 2014
3 Project Name (with acronym) I-GOV Initiative (Integrated e-Government Initiative)
4 Project Owner: Owner responsible for the infrastructure: Operator responsible for maintenance OGCIO
5 Alignment with Governmental and Ministerial Policies
Clear priority areas of current ministerial strategies/road maps addressed in the project: Good alignment with National ICT Policy, which requires each ministry and agency to have an ICT Action Plan that fits under the National Policy. So far no ministries except Law/Justice and Customs/Revenue have such a Plan. MoE is setting up an Action Group to begin work.
6 Project Timeframe Construction period (years): 5 years
Operating period (years): 10 years
7 Project Development Status (concept, prefeasibility, feasibility stage etc.)
High-level plan developed for 18 ICT projects (platforms, systems) in various
ministries – needs assessment done, prioritization done Detailed planning of each project (detailed business case, BPR, detailed requirements analysis, tech specs, procurement plan) all need to be done
8 Locations and Areas Affected (provinces, islands, villages)
Entire Country
9 Project Components (with quantities e.g., “xx km of road”, “xx m
2 of terminal building”, “xx
meters pipelines”, “training”, etc)
Institutional: Capacity Development Infrastructure And Technology: Transmission Network Maintenance, Network Extension, Network Site Upgrade, Data Centre Development and Upgrade, Technology Upgrade & Refresh, Integration, Migration and Architecture, IP Network Operation & Maintenance Applications: VanGov Portal Development, Van Gov Resource Management System, Vanuatu Land & Survey Managment and GIS, VanGov Content Management Platform, Vanuatu Tax and Revenue Management System, National Citizen Registration System, Statistics Management System, VanGov Education platform, VanGov Health Information Management Platform, Vanuatu Emergency and Disaster Management Information System, Foreign Investor Management Information System
10 Linkage with other Infrastructure (none, low, medium, high)
Degree of linkage: High linkage
Brief description: Strong links to other infrastructure projects, as ICT projects are all designed to help ministries manage their own efforts (projects, client relations, goal attainment) better, using ICTs as an "enabler" or "force multiplier." ICT projects envisioned are all internally focused (e.g. justice case management system) and also externally focused (improve interaction and allow transactions between investors wanting to set up a new company, and the govt)
11 Regulatory Requirements to Comply With under the Project (construction standards, etc. [list])
Infra construction projects (e.g. network expansion) will require construction standards for towers and other major works. Software applications will need to meet international standards of project management (e.g. PMI, PRINCE2), and cybersecurity, Standard Operating Environment, and other OGCIO standards
12 Project Beneficiaries (approximate types and number of persons or households benefitting [say which])
Types and number of beneficiaries: (e.g., residential, business, farmer, etc.) (approximate estimated numbers) 1. Civil Servants: 2000 2. Businessmen (large down to micro): 5000 3.Large farmers/ag/related: 1000 4. School children: 71,000 5. Teachers: 5000 6. Ed Admin: 1500 7. Health workers: 2000 8. Health patients: 10,000 9. Women expecting or with young children, and their kids (getting better public health info): 10,000 10. Miscellaneous citizens able to better interact with GoV: 30,000
13 Project Benefits/Outcomes
Brief description: (be specific and quantitative: e.g., XX households gain access to health care facilities, etc) Major impacts would be about 80,000 in education having better materials, inputs, outputs, and outcomes; about 22,000 involved in health having similarly improved outcomes; about 8,000 involved in commerce/tourism/ag/investment/fisheries/micro-enterprises, etc., would benefit from ability to conduct e-commerce, e-booking, e-sales, etc., all of which is quite limited now. Current frictional costs of poor citizen-government interaction will be reduced, as will corruption, delays, lack of info in the

VISIP 2015 - 2024 | Appendix 6
170
Item
Project Information
marketplace, etc.
14
Local Employment and Procurement during Construction (number of Ni-Vans employed, each year of construction; value of local materials procured for construction)
Degree of employment impact (high, medium, low): High impact
Brief description (Ni-Vanuatu employed in construction, value of local materials): Actual Ni-Van construction impacts will be low, and focused on some towers and some infrastructure. However, the iGov project will require training and hiring of about 360 ICT engineers, assistants, consultants, technicians, installers, etc. (18 projects x 20 per project)
15 Job Creation Potential during Operations Degree of employment impact (high, medium, low): Medium
Number of new employed in operations: Once the 18 systems are in, maintenance, ops, upgrades and technology refreshes will all be needed. Est. 100 NiVans need on-going training at the technician up to engineer level
16 Resilience of Project Assets to Climate Change and Natural Disaster Risk
Degree of resilience built into project design (high, medium, low): High resilience Low impact
Major climate change and natural disaster risks: All ICT infrastructure and projects will be built to very high climate change and disaster risks reduction standards, with backup, failover, low vulnerability location, etc. Having said that, in major disasters such as huge cyclones or volcanic eruptions, some towers, data centres etc. might be damaged, but will have backups
17 Land Availability for Project
Brief description (customary or GoV land; dispute risks; status of land negotiations): Land issues may be a problem for new tower locations; OGCIO has a better track record on this than private operators Other than that, land issues hardly affect these projects
18 Environmental Improvement Potential
Rating (high, medium, low, negative): Medium to High ICTs generally improve GoV operations and reduce the environmental impacts of other infra projects. For example, the Lands MIS/GIS could improve Land's ability to regulate and prevent illegal land development. The Web Portal Development Project would allow citizens and small businesses to get info, register new businesses, do transactions, etc. all from smart phones or laptops
– thus avoiding numerous trips from outer islands to provincial capitals, PV, or
Luganville
19 Community Contribution Commitment
Short description (cash, labour, materials, land, etc.): Towers and access roads to towers may require village labor and access
permission – most other ICT projects such as applications have no such
impacts or requirements
20 Investment Value, VUV million
Including design/supervision, technical assistance, works, labour, materials, equipment, etc.): USD20.15 million (VUV1.88 billion)
21 Estimated Annual O&M Cost, VUV million/year
(i) Operation cost (staff, consumables, energy, others)
Operation cost: USD1 million/yr; asset maintenance: USD0.5 million/yr, plus USD3 million technology refresh every 5 years Operation costs will be offset by an estimated 20%-300% revenues, depending on the project, averaging about 35%. (For example, the business case for Customs/Rev showed that that ICT project would pay for itself, capital and operation, threefold each year after the first year, but that is an exceptional payoff example)
(ii) Asset maintenance cost:
(iii) Operational subsidies needed?
22 Potential Funding Sources Initial Investment (% of total project investment cost)
GoV: 5%
Donors:
Grants: 25%
Loans: 70%
Private Sector:
23 Potential Funding Sources O&M Costs (% of total project O&M costs)
GoV: 55%
Donors (grants): 10%
Private Sector: 35%
24 Environmental and Involuntary Resettlement Risks
Short description of impacts, and of any people or assets affected: Environmental risks and resettlement are actually reduced by ICT iGov projects. For example, the Emergency and Disaster MIS under iGov would provide improved warning and response systems that would save lives and assets, and reduce risk to Ni Vans. Similarly, risks of NCDs (non-communicable diseases such as diabetes and stroke), currently a major burden on the health care system and forecast to become much worse, would be reduced by much improved public health and diet information

VISIP 2015 - 2024 | Appendix 6
171
ICT14 Expansion of Government Broadband Network (GBN), Phase 2 Item
Project Information
1 Sponsoring Ministry/Agency OGCIO
2 Dates Date of First Submission: 2011
Date of Latest Update: 30 July 2014
3 Project Name (with acronym) Government Broadband Network (GBN) Expansion Phase 2: Increased coverage in provincial capitals and towns. (Phase 1: initial links to provincial capitals, is already complete and operational)
4 Project Owner Owner responsible for the infrastructure: Operator responsible for maintenance: OGCIO, Government of Vanuatu
5 Alignment with Governmental and Ministerial Policies
Clear priority areas of current ministerial strategies/road maps addressed in the project: Full alignment with National ICT Policy, National Cybersecurity Policy, and Universal Access Policy, which require high coverage of ICTs across the whole geography and population of the country, all with robust, reliable, secure and redundant ICT infrastructure
6 Project Timeframe Construction period (years): 3 years
Operating period (years): 10 years
7 Project Development Status (concept, prefeasibility, feasibility stage etc.)
High level plan developed in 2011 – Detailed planning required for each
project (expansion in each provincial capital, town, or large village, as a detailed business case, location analysis, detailed requirements analysis, tech specs, procurement plan)
8 Locations and Areas Affected (provinces, islands, villages)
Focus on all six provincial capitals, providing connectivity to the GBN for all government buildings. Also other major town/villages on other major inhabited
islands – Benefits to the entire country
9 Project Components (with quantities e.g., “xx km of road”, “xx m
2 of terminal building”, “xx
meters pipelines”, “training”, etc)
Microwave links, other links, WiFi or WiMax points, servers, cabinets, air conditioning, power, UPSs (universal power supply units), wiring, and related.
10 Linkage with other Infrastructure (none, low, medium, high)
Degree of linkage: Multi-sectoral across all sectors
Brief description: Strong links to other infra and GoV projects, because GoV civil servants and employees communicate across the GBN, which carries voice, data, video, etc
11 Regulatory Requirements to Comply With under the Project (construction standards, etc. [list])
Infrastructure construction will require construction standards for microwave and other transmission and electrical equipment. Commercial contractors will likely be used for many of the installations.
12 Project Beneficiaries (approximate types and number of persons or households benefitting [say which])
Types of beneficiaries (e.g., residential, business, farmer, etc.): 1. DIRECT: Civil Servants: 2,000; 2. INDIRECT (since all apps will be and are carried over the GBN): Businessmen (large down to micro): 5000; Large farmers/ag/related: 1,000; School children: 71000; Teachers: 5000; Ed Admin: 1,500; Health workers: 2,000; Health patients: 10,000; Women expecting or with young children, and their kids (getting better public health info): 10,000; misc. citizens able to better interact with GoV: 30,000
Number of beneficiaries: 1. See other column 2. See other column
13 Project Benefits/Outcomes
Brief description: [be specific and quantitative: e.g., XX households gain access to health care facilities, etc] Major benefits for 2000 civil servants whose communications and transmission of applications are improved and more secure INDIRECT benefits for about 80,000 in education having better materials, inputs, outputs, and outcomes; about 22,000 involved in health having similarly improved outcomes; about 8,000 involved in commerce/tourism/ agriculture/investment/fisheries, etc., would benefit from conducting e-commerce, e-booking, e-sales, etc., all of which is limited now Current frictional costs of poor citizen-government interaction will be reduced, as will corruption, delays, lack of info in the marketplace, etc
14
Local Employment and Procurement during Construction (number of Ni-Vans employed, each year of construction; value of local materials procured for construction)
Degree of employment impact (high, medium, low): Modest impact
Brief description (Ni-Vanuatu employed in construction, value of local materials): NiVan construction by contractors will be undertaken and will be supplemented and overseen by existing and new OGCIO engineers Most materials and equipment will be imported, by necessity

VISIP 2015 - 2024 | Appendix 6
172
Item
Project Information
15 Job Creation Potential during Operations
Degree of employment impact (high, medium, low): Low for operation Medium for enabled environment
Number of new employed in operations: The expanded GBN will require about 6 additional engineers, technicians and help desk operators. Improved and more transparent government action may generate new jobs opportunities
16 Resilience of Project Assets to Climate Change and Natural Disaster Risk
Degree of resilience built into project design (high, medium, low): High resilience Low risk
Major climate change and natural disaster risks: All systems will be built to hi CC and disaster standards, with high strength and resilience But, in major disasters such as huge cyclones or volcanic eruptions, some systems will likely be damaged, since many are by necessity on top of
mountains or buildings – replacement
will take days, not months
17 Land Availability for Project
Brief description (customary or GoV land; dispute risks; status of land negotiations): Land issues should be minimal, since most major towers exist and what is needed is expanding the "campus" network in provincial capitals, via short line of sight shots to other buildings, followed by internal wiring and WiFi installations.
18 Environmental Improvement Potential
Rating (high, medium, low, negative): Medium to High CTs generally improve GoV operations and reduce the environmental impacts of other infra projects. For example, the Lands MIS/GIS could improve Land's ability to regulate and prevent illegal land development. The Web Portal Development Project would allow citizens and small businesses to get info, register new businesses, do transactions, etc. all from smart phones or laptops, thus avoiding numerous trips from outer islands to provincial capitals, PV or Luganville. All these systems will be carried over in the expanded GBN
19 Community Contribution Commitment
Short description (cash, labour, materials, land, etc.): Village/community impact and contribution should be minimal to none, since GoV buildings in provincial capitals and large villages will be the target, and contractors or OGCiO staff will be used for installation and maintenance
20 Investment Value, VUV million
Including design/supervision, technical assistance, works, labour, materials, equipment, etc.): USD2 million (VUV187 million)
21 Estimated Annual O&M Cost, VUV million/year
(i) Operation cost (staff, consumables, energy, others)
Ops cost: USD220,000 per year (mostly salaries of additional personnel) plus technology refresh of USD200,000 every 5 years Operat. subsidies: all costs will come from OGCIO's recurrent budget
(ii) Asset maintenance cost:
(iii) Operational subsidies needed?
22 Potential Funding Sources Initial Investment (% of total project investment cost)
GoV: 5%
Donors:
Grants: 25%
Loans: 70%
Private Sector:
23 Potential Funding Sources O&M Costs (% of total project O&M costs)
GoV: 90%
Donors (grants): 10%
Private Sector:
24 Environmental and Involuntary Resettlement Risks
Short description of impacts, and of any people or assets affected: Environmental risks, resettlement and related are actually reduced by ICT iGov projects, including the expanded GBN, which carries the numerous i-GOV applications. For example, the Emergency and Disaster MIS under iGov would provide improved warning and response systems that would save lives and assets, and reduce risk to NiVans. Similarly, risks of NCDs (non-communicable diseases such as diabetes and stroke), currently a major burden on the health care system and forecast to become much worse, would be reduced by much improved public health and diet information. All this info would go over the GBN, with the exception of some traffic on commercial mobile phone systems

VISIP 2015 - 2024 | Appendix 6
173
EDUCATION Ed1 Reconstruction College Malapoa Item
Project Information
1 Sponsoring Ministry/Agency MOE
2 Dates Date of First Submission: 26 August 2014
Date of Latest Update: 26 August 2014
3 Project Name (with acronym) Malapoa College New Development
4 Project Ownership: Proposed owner responsible for the infrastructure: Proposed operator/owner responsible for operation and maintenance: MOE
5 Alignment with Governmental and Ministerial Policies
Highlight the specific priority of current ministerial strategy/road map addressed in the project: Project supports MOE’s corporate plan
6 Project Timeframe Construction period (years): 3 years
Operating period (years): 20 years
7 Project Development Status (concept, prefeasibility, feasibility stage etc.)
Project concept
8 Locations and Areas Affected (provinces, islands, villages)
Port Vila, Shefa Province
9 Project Components (with quantities e.g., “xx km of road”, “xx m
2 of terminal building”, “xx
meters pipelines”, “training”, etc)
Redevelopment of college for 1,800 students including housing for teachers and ancillary staff
10 Linkage with other Infrastructure (none, low, medium, high)
Degree of linkage: Low
Brief description: Essential beneficiary will be the pupils and teachers of the school
11 Regulatory Requirements to Comply With under the Project (construction standards, etc. [list])
Department of Education regulatory requirement for standard of schools buildings
12 Project Beneficiaries (approximate types and number of persons or households benefitting [say which])
Types of beneficiaries: (e.g., residential, business, farmer, etc.) 1. Pupils attending schools 2. Teacher and ancillary staff
Number of beneficiaries: About 1,800 students, teachers including ancillary staff and people on the island will benefit from this project
13 Project Benefits/Outcomes
Brief description: [be specific and quantitative: e.g., XX households gain access to health care facilities, etc] About 800 people will be affected directly while about 1,000 people will be affected indirectly
14
Local Employment and Procurement during Construction (number of Ni-Vans employed, each year of construction; value of local materials procured for construction)
Degree of employment impact: (high, medium, low) Medium to High
Brief description (Ni-Vanuatu employed in construction, value of local materials): Project is expected to employ Ni-Vanuatu during construction
15 Job Creation Potential during Operations Degree of employment impact (high, medium, low): Medium to Low
Number of new employed in operations: To be clarified
16 Resilience of Project Assets to Climate Change and Natural Disaster Risk
Degree of resilience built into project design (high, medium, low): High to Medium
Major climate change and natural disaster risks: The buildings will be built according to international standards and accommodate local natural disaster risks like earthquake and cyclone
17 Land Availability for Project Brief description (customary or GoV land; dispute risks; status of land negotiations): The school will be redeveloped on government land
18 Environmental Improvement Potential Rating (high, medium, low, negative): Medium to High
19 Community Contribution Commitment Short description (cash, labour, materials, land, etc.): Land contribution where ever needed
20 Investment Value, VUV million
Including design/supervision, technical assistance, works, labour, materials, equipment, etc.): USD16 million (VUV1.49 billion)
21 Estimated Annual O&M Cost, VUV million/year
(i) Operation cost (staff, consumables, energy, others)
To be clarified
(ii) Asset maintenance cost: 2% of building costs (estimated)
(iii) Operational subsidies needed?
No subsidy foreseen
22 Potential Funding Sources Initial Investment (% of total project investment cost)
GoV:
Donors:
Grants: China Aid 100%
Loans:
Private Sector:
23 Potential Funding Sources O&M Costs (% of GoV: MOE 60%

VISIP 2015 - 2024 | Appendix 6
174
Item
Project Information
total project O&M costs) Donors (grants):
Private Sector: School service users
40%
24 Environmental and Involuntary Resettlement Risks
Short description of impacts, and of any people or assets affected: No resettlement expected
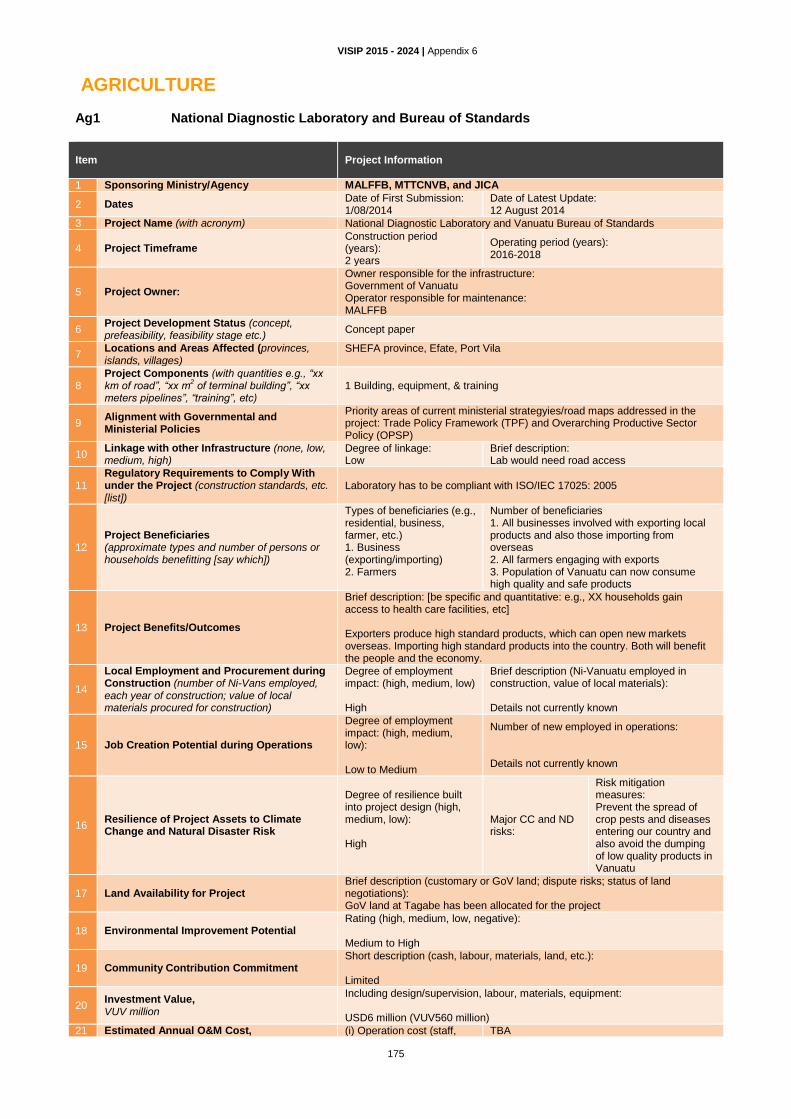
VISIP 2015 - 2024 | Appendix 6
175
AGRICULTURE Ag1 National Diagnostic Laboratory and Bureau of Standards Item
Project Information
1 Sponsoring Ministry/Agency MALFFB, MTTCNVB, and JICA
2 Dates Date of First Submission: 1/08/2014
Date of Latest Update: 12 August 2014
3 Project Name (with acronym) National Diagnostic Laboratory and Vanuatu Bureau of Standards
4 Project Timeframe Construction period (years): 2 years
Operating period (years): 2016-2018
5 Project Owner:
Owner responsible for the infrastructure: Government of Vanuatu Operator responsible for maintenance: MALFFB
6 Project Development Status (concept, prefeasibility, feasibility stage etc.)
Concept paper
7 Locations and Areas Affected (provinces, islands, villages)
SHEFA province, Efate, Port Vila
8 Project Components (with quantities e.g., “xx km of road”, “xx m
2 of terminal building”, “xx
meters pipelines”, “training”, etc) 1 Building, equipment, & training
9 Alignment with Governmental and Ministerial Policies
Priority areas of current ministerial strategyies/road maps addressed in the project: Trade Policy Framework (TPF) and Overarching Productive Sector Policy (OPSP)
10 Linkage with other Infrastructure (none, low, medium, high)
Degree of linkage: Low
Brief description: Lab would need road access
11 Regulatory Requirements to Comply With under the Project (construction standards, etc. [list])
Laboratory has to be compliant with ISO/IEC 17025: 2005
12 Project Beneficiaries (approximate types and number of persons or households benefitting [say which])
Types of beneficiaries (e.g., residential, business, farmer, etc.) 1. Business (exporting/importing) 2. Farmers
Number of beneficiaries 1. All businesses involved with exporting local products and also those importing from overseas 2. All farmers engaging with exports 3. Population of Vanuatu can now consume high quality and safe products
13 Project Benefits/Outcomes
Brief description: [be specific and quantitative: e.g., XX households gain access to health care facilities, etc] Exporters produce high standard products, which can open new markets overseas. Importing high standard products into the country. Both will benefit the people and the economy.
14
Local Employment and Procurement during Construction (number of Ni-Vans employed, each year of construction; value of local materials procured for construction)
Degree of employment impact: (high, medium, low) High
Brief description (Ni-Vanuatu employed in construction, value of local materials): Details not currently known
15 Job Creation Potential during Operations
Degree of employment impact: (high, medium, low): Low to Medium
Number of new employed in operations: Details not currently known
16 Resilience of Project Assets to Climate Change and Natural Disaster Risk
Degree of resilience built into project design (high, medium, low): High
Major CC and ND risks:
Risk mitigation measures: Prevent the spread of crop pests and diseases entering our country and also avoid the dumping of low quality products in Vanuatu
17 Land Availability for Project Brief description (customary or GoV land; dispute risks; status of land negotiations): GoV land at Tagabe has been allocated for the project
18 Environmental Improvement Potential Rating (high, medium, low, negative): Medium to High
19 Community Contribution Commitment Short description (cash, labour, materials, land, etc.): Limited
20 Investment Value, VUV million
Including design/supervision, labour, materials, equipment: USD6 million (VUV560 million)
21 Estimated Annual O&M Cost, (i) Operation cost (staff, TBA

VISIP 2015 - 2024 | Appendix 6
176
Item
Project Information
VUV million/year consumables, energy, others)
(ii) Asset maintenance cost TBA
(iii) Operational subsidies needed?
If yes, estimate annual amount (VUV million):
22 Potential Funding Sources Initial Investment (% of total project investment cost)
GoV
Donors: Japan
Grants 100%
Loans
Private Sector
23 Potential Funding Sources O&M Costs (% of total project O&M costs)
GoV 50%
Donors (grants)
Private Sector 50%
24 Environmental and Involuntary Resettlement Risks
Short description of impacts, and of people or assets affected: No issue foreseen in this category

VISIP 2015 - 2024| Appendix 7
177
Appendix 7: List of Consultations and People Met
Date Agency People Met Position
3 July 2014 Prime Minister’s Office (PMO) Nebcevanhas Benjamin Shing Director, Department of Strategic Policy Planning And Aid Coordination (DSPPAC)
4 July 2014 Vanuatu Project Management Unit (VPMU)
Johnson Wabaiat Wakanomune Project Director VPMU
Tony Teford Advisor VPMU
Andre Iatipu National Engineer VMPU
7 July 2014 WB/ADB Nancy Wells WB/ADB Offices Representative
7 July 2014 Ministry of Infrastructure and Public Utilities (MIPU)
Johnson Iauma Director General MIPU
Junior Shim George A/Project Manager
Eric Malessas Executive Officer (EO)
Milarthney Aga Engineer water & Sanitation
7 July 2014 Ministry of Climate Change and Disaster Risk Management (MCCDRM)
Shadrack Welegtabit Director National Disaster Management Office
8 July 2014 Ministry of Land & Natural Resources
Christopher Loan Director/Commissioner of Mines – Department of Geology, Mines & Water resources.
8 July 2014 Ministry of Youth & Sports Development.
Joe Iautim Director Youth & Sports Division
8 July 2014 Ministry of Health Viran Tovu Acting Director General
9 July 2014 Australian Aid
Charles Andrew Infrastructure Advisor - Consultant
Kevin Smith First Secretary Development Corporation
Henry Vira Senior Program Manager Infrastructure & Land
Alice Kalontano Program Manager Infrastructure & PACMAS
9 July 2014 Japan International Cooperation Agency (JICA)
Asano Yoko Project Formulation Advisor (Aid Coordination)
Moriya Tsutomu Residential Representative
9 July 2014 Ministry of Justice & Community Services
Mark Bebe Director General MJCS
9 July 2014 Ministry of Health Scott Monteiro Director Procurement, Asset Management Unit
10 July 2014 Ministry of Education Bob Nikaih Principal Architect
Gordon Craig Infrastructure Advisor
10 July 2014 Ministry of Internal Affairs Jeffrey Kaitip Principal physical planner
10 July 2014 Office of the Government Chief Information Officer
Fred Samuel Government Chief Information Officer
Llewellyn M.Toulmin iGovernment Strategic Advisor
11July 2014 Ministry of Finance and Economic Management Finance and Administration
Dorothy Ericson Deputy Director
11 July 2014 Ministry of Trade, Tourism, Commerce & Industry
George Borugu Director, Department of Tourism
14 July 2014 Ministry of Agriculture, Livestock, Forestry, Fisheries & Biosecurity.
Meriam Toalak A/Director (Biosecurity)
Nambo Moses Senior Livestock Officer, Department of Livestock
Alfred Baniuri Executive officer, MALFFB
Livo Mele Director of Agriculture
Philemon Ala Department of Forestry
WORKSHOP 1 15 July 2014
MIPU Jr George Shim A/Project Manager
MIPU Eric Maless Executive Officer
COM Nadine Alatoa Secretary COM
DOFT Letlet August A/Director DOFT
MYSD William Nasak Director General
DSPPAC Benjamin Shing Director
MOH Viran Tovu A/Director General
MJCS Sai Roqara 2nd
Political Advisor
MJCS Johnny Marango A/Director General
MOE Yoan Mariasua Chief Executive Officer
MYDST Kerthsou Tiu 1st
Political Advisor
MOFAICET Johnny Koanapo Director General
Consultant - VISIP Philippe Bergeron Team Leader
Consultant - VISIP Chris Cheatham International Economist
Consultant - VISIP Bikenibeu Ieremiah National Engineer
17 July 2014 MFFICET Johnny Koanapo Director General MFFICET
Sumbue Antas Director External Trade
18 July 2014
DSPPAC Nebcevanhas Benjamin Shing Director, Department of Strategic Policy Planning And Aid Coordination (DSPPAC)

VISIP 2015 - 2024| Appendix 7
178
Date Agency People Met Position
21 July 2014
Vanuatu National Statistics Office Benuel Lenge Senior Statistician, Statistical Leadership and Coordination Section
21 July 2014 Department of Tourism Head Office Jerry R Spooner Principal Accreditation Officer
22 July 2014
MIPU Eric Issac Malessas Executive Officer, Ministry of Infrastructure & Public Utilities
22 July 2014
VANGO Leah Nimoho Senior Officer, Vanuatu Associate of Non-Government Organisation
23 July 2014
MIPU Junior Shim George A/Project Manager
24 July 2014 VTSSP Philip Warren Team Leader, Vanuatu Transport Sector Support Program
24 & 25 July 2014
MIPU Sam Namuri Director, Public Works Department
WORKSHOP 2 28 July 2014
MIPU Jr George Shim A/Project Manager
MALFFB Alfred Bani Executive Officer
MIPU Johnson Binaru Director General
MIPU Markmon Batie Maritime Affairs
MTTCNVB James Ttangis Project Officer
MOH Hensley Garae A/Director General
MTTCNVB Willie Luen PTDO
PWD Jone Roqara Deputy Director
PWD Samuel Namuri Director
PWD Fredison Engineer
PWD Morgan Train Engineer
PWD Jason A Envir & Social Office
PWD Dick Abel Principal Architect
PWD Wesley Simon Fleet Manager
VTSSP Philip Warren Team Leader
PWD Junior Shim George Acting Project Manager
MIPU Alick Massing 2nd
Political Advisor
MOH Sanven T. Manager Asset
Consultant - VISIP Philippe Bergeron Team Leader
Consultant - VISIP Bikenibeu Ieremiah National Engineer
29 July 2014 New Zealand High Commission Jimmy Nipo
Senior Development Program Coordinator
Mikaela Nyman Development Counsellor
29 July 2014 Ministry of Education John Niroa Acting Director, MOE, Youth Development & Training
29 July 2014 MCCDRM- Directorate of Energy Jesse Benjamin Director DOE
31 July 2014 Ministry of Lands, Geology and Mines, and Rural Water Supply
Erickson Sammy Senior Officer, Department of Water Resources
31 July 2014 The Embassy Of People’s Republic of China
Yang Xuhong First Secretary, China Embassy
31 July 2014 Office of the Government Chief Information Officer
John Jack Senior Officer
Llewellyn M.Toulmin iGovernment Strategic Advisor
1 August 2014 Utilities Regulator Authority Romney Marum Manager, URA
1 August 2014 MIPU
Sam Namuri Director, Public Works Department
Philip Warren Team Leader, Vanuatu Transport Sector Support Program
4 August 2014 Department of Energy Leo Moli Senior Officer
5 August 2014 Australian Aid
Charles Andrew Infrastructure Advisor - Consultant
Kevin Smith First Secretary Development Corporation
Henry Vira Senior Program Manager Infrastructure & Land
Alice Kalontano Program Manager Infrastructure & PACMAS
5 August 2014 Japan International Cooperation Agency (JICA)
Moriya Tsutomu Residential Representative
7 August 2014 MIPU Sam Namuri Director, Public Works Department
7 August 2014 MLNR Christopher Loan Director/Commissioner of Mines – Department of Geology, Mines & Water resources.
7 August 2014 Department of Energy Leo Moli Senior Officer
WORKSHOP 3 8 August 2014
PCO Lorena Estigarribia Project Officer
MTTCNVB James Tatangis Representative
NZHC Jimmy Nipo SDPC
PWD Jone Roqara Deputy Director
Dept of Works John Tasso Deputy
OGCIO Fred Samuel PMO
PMO Johnson Naviti Director General
MALFFB Livu Mele Director Agriculture
MYDST William Nasak Director General
E/Office Fr Charles Vatu PEO
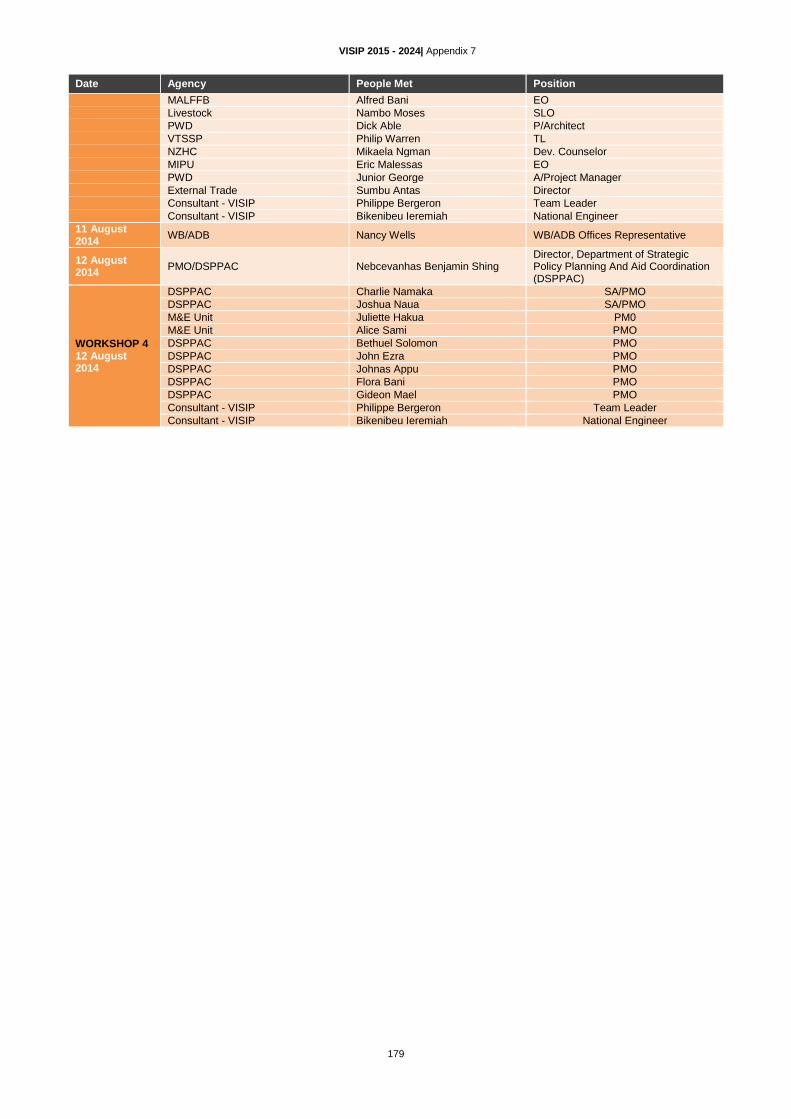
VISIP 2015 - 2024| Appendix 7
179
Date Agency People Met Position
MALFFB Alfred Bani EO
Livestock Nambo Moses SLO
PWD Dick Able P/Architect
VTSSP Philip Warren TL
NZHC Mikaela Ngman Dev. Counselor
MIPU Eric Malessas EO
PWD Junior George A/Project Manager
External Trade Sumbu Antas Director
Consultant - VISIP Philippe Bergeron Team Leader
Consultant - VISIP Bikenibeu Ieremiah National Engineer
11 August 2014
WB/ADB Nancy Wells WB/ADB Offices Representative
12 August 2014
PMO/DSPPAC Nebcevanhas Benjamin Shing Director, Department of Strategic Policy Planning And Aid Coordination (DSPPAC)
WORKSHOP 4 12 August 2014
DSPPAC Charlie Namaka SA/PMO
DSPPAC Joshua Naua SA/PMO
M&E Unit Juliette Hakua PM0
M&E Unit Alice Sami PMO
DSPPAC Bethuel Solomon PMO
DSPPAC John Ezra PMO
DSPPAC Johnas Appu PMO
DSPPAC Flora Bani PMO
DSPPAC Gideon Mael PMO
Consultant - VISIP Philippe Bergeron Team Leader
Consultant - VISIP Bikenibeu Ieremiah National Engineer

VISIP 2015 - 2024 | Appendix 8
180
Appendix 8: Documents Reviewed
The following documents (hard copies) were reviewed during the course of VISIP 2014 TA and handed to DSPPAC on completion of the work.
ADB, Country Operations Business Plan – Vanuatu 2012-2014
ADB, Country Partnership Strategy – Vanuatu 2010-2014
ADB, Vanuatu Inter-Island Shipping Project (Phase II), Final Report Volume 1 – Main Report (2011)
Australian Aid, Urbanisation Issues, Port Vila and Luganville, Fact-finding Study (2011)
EC, 10th EDF Programme of the European Commission, 2008-2013
FAO, Vanuatu Overarching Productive Sector Policy Report on Consultation during 12-30 (July 2010)
IHO, The Need for National Hydrographic Services Publication M-2 (2011)
MALFFB, Overarching Productive Sector Policy, 2012-2017 (PMO)
MCCDRM, Vanuatu National Energy Road Map 2013-2020 (Department of Energy, March 2014)
MFEM, Government of Vanuatu, Budget 2014
MFEM, Government of Vanuatu, Budget 2015
MFEM, Priorities and Action Agenda 2006-2015, An Educated, Healthy and Wealthy Vanuatu (2006)
MIA, Vanuatu Ministry of Internal Affairs, Policy Direction 2010-2020, Efalfal Bay Resolution (2009)
MIA, Vanuatu National Waste Management Strategy and Action Plans 2011-2016
MIPU, Annual Report 2013
MIPU, Corporate Plan 2014-2016
MIPU, National Transport Infrastructure Maintenance Fund (June 2014)
MIPU, National Transport Infrastructure Maintenance Fund, Working Draft Concept Paper (June 2014)
MIPU, Sector Strategy (2013)
MIPU, Proposed Vanuatu Infrastructure Improvement Projects (2012)
MIPU, Vanuatu Aerodrome Scoping Study (2011)
MIPU, Vanuatu Aviation Infrastructure Scoping Study: Phase 1 and 2 Draft Scoping Study Report Volume 1 (2011)
MJCS, Vanuatu Correction Services- Infrastructure Plan 2014-2018
MNLR – DGMWR, Vanuatu Water Strategy 2008-2018, Department of Geology, Mines and Water Resources (2009)
MOE, Inclusive Education Policy & Strategic Plan 2010-2020 (2011)
MOH, Annual Report 2013
MOH, Health Sector Strategy 2010 – 2016 (2010)
MOH, National Medicines Policy, 2013-2017 (2013)
MOH, Vanuatu National Strategic Plan on HIV and STS (2014-2018)
MTTNVB, Industrial Policies, Final Draft
MTTNVB, Micro-, Small and Medium Enterprise (MSME) Policy and Strategy for Vanuatu (April 2011)
MTTNVB, National Cruise Tourism Action Plan 2012-2020 (2011)
MTTNVB, Trade Policy Framework 2012 (April 2012)
MTTNVB, Vanuatu Tourism Action Plan (2008)
MYDST, Vanuatu Youth Empowerment Strategy 2010 – 2019
OGCIO, i-Government Documents, Attachments 3, 4 & 5 (2011)
OGCIO, National Information and Communication Technology Policy (2013)
OGCIO, Vanuatu Universal Access Policy (2013)
PMO, Government of the Republic of Vanuatu, Priorities and Action Agenda (PAA) 2006 – 2015 (2012 Update)
PMO, Government of the Republic of Vanuatu, Planning Long, Acting Short (PLAS) 2013 – 2016
PMO, National Population Policy 2011-2020
UN, Millennium Development Goals, 2010 Report for Vanuatu