A Baseline Survey of Coastal Villages in Vanuatu
84
Inside this issue A baseline survey of coastal villages in Vanuatu G. Nimoho, A. Seko, L. Iinuma, W. Nishiyama and T. Wakisaka p. 3 Editor Kenneth Ruddle Asahigaoka-cho 7-22-511 Ashiya-shi Hyogo-ken Japan 659-0012 Email: [email protected] Production Fisheries Information Section SPC, BP D5, 98848 Noumea Cedex New Caledonia Fax: +687 263818 Email: [email protected] www.spc.int/coastfish Produced with financial assistance from Australia, France and New Zealand Secretariat of the Pacific Community ISSN 1025-7497 Issue 32 – December 2013 TRADITIONAL Marine Resource Management and Knowledge information bulletin Editor’s note This edition of the SPC Traditional Marine Resource Management and knowledge Information Bulletin is devoted to presenting a comprehensive, data-rich report on a baseline survey conducted by the Vanuatu Fisheries Department, the Japan International Cooperation Agency, and IC Net Ltd., a Japanese company that provides technical assistance and training for development projects, as part of the “Project for Promotion of Grace of the Sea at Coastal Villages in Vanuatu Phase 2”. The purpose of the project is to ensure the effective practice of community-based coastal resource management in selected locations, through the provision of technical assistance from the Vanuatu Fisheries Department. This project includes many components. At the outset it conducted a participatory survey in target communities to understand their economic and social conditions and activities of coastal resource management. It also ran workshops in Port Vila and target sites on coastal resource management planning, to review and revise existing plans and formulate annual plans for strengthening community activities. Several on-going pilot activities have resulted from the survey and workshop as supporting measures to achieve sound and sustainable community- based coastal resource management. So far these include the management of FADs by communities, community fishing activity recording and analysis to understand the current situation of local fishing activities, catch trends, and the economics of local fishing activities, shell craft making and marketing, modification of the local canoe to equip it with both a sail and outboard engine so as to improve access to offshore areas and reduce fuel expenditures, and giant clam culture by target communities. More activities will likely be added. Kenneth Ruddle
-
Upload
independent -
Category
Documents
-
view
0 -
download
0
Transcript of A Baseline Survey of Coastal Villages in Vanuatu

Inside this issue
A baseline survey of coastal villages in VanuatuG. Nimoho, A. Seko, L. Iinuma, W. Nishiyama and T. Wakisaka
p. 3
Editor
Kenneth RuddleAsahigaoka-cho 7-22-511Ashiya-shi Hyogo-kenJapan 659-0012Email: [email protected]
Production Fisheries Information Section SPC, BP D5, 98848 Noumea Cedex New Caledonia Fax: +687 263818Email: [email protected] www.spc.int/coastfish
Produced with financial assistance from Australia, France and New Zealand
Secretariat of the Pacific Community ISSN 1025-7497
Issue 32 – December 2013
TRADITIONALM ar ine R esource M anagement and K nowledge
information bulletin
Editor’s note
This edition of the SPC Traditional Marine Resource Management and knowledge Information Bulletin is devoted to presenting a comprehensive, data-rich report on a baseline survey conducted by the Vanuatu Fisheries Department, the Japan International Cooperation Agency, and IC Net Ltd., a Japanese company that provides technical assistance and training for development projects, as part of the “Project for Promotion of Grace of the Sea at Coastal Villages in Vanuatu Phase 2”. The purpose of the project is to ensure the effective practice of community-based coastal resource management in selected locations, through the provision of technical assistance from the Vanuatu Fisheries Department.
This project includes many components. At the outset it conducted a participatory survey in target communities to understand their economic and social conditions and activities of coastal resource management. It also ran workshops in Port Vila and target sites on coastal resource management planning, to review and revise existing plans and formulate annual plans for strengthening community activities.
Several on-going pilot activities have resulted from the survey and workshop as supporting measures to achieve sound and sustainable community-based coastal resource management. So far these include the management of FADs by communities, community fishing activity recording and analysis to understand the current situation of local fishing activities, catch trends, and the economics of local fishing activities, shell craft making and marketing, modification of the local canoe to equip it with both a sail and outboard engine so as to improve access to offshore areas and reduce fuel expenditures, and giant clam culture by target communities. More activities will likely be added.
Kenneth Ruddle

2 SPC Traditional Marine Resource Management and Knowledge Information Bulletin #32 – December 2013
Port Vila
Torres Islands
Banks Islands
MaewoAmbae
Pentecost
EspirituSanto
Ambrym
Epi
Tanna
Aneityum
Luganville
Malo
20° S —
18° S —
16° S —
14° S —
168° E166° E 170° E
Shepherd Group
Malekula
—— —
Efate
Erromango
Analcauhat Umtech
Port Patrick
Crab BayUriv & Uripiv
Moso
MangaliliuLelepa
Vanuatu and the seven locations (red dots) where surveys took place.
© Copyright Secretariat of the Pacific Community, 2013All rights for commercial / for profit reproduction or translation, in any form, reserved. SPC authorises the partial reproduction or
translation of this material for scientific, educational or research purposes, provided that SPC and the source document are properly acknowledged. Permission to reproduce the document and/or translate in whole, in any form, whether for commercial / for profit or
non-profit purposes, must be requested in writing. Original SPC artwork may not be altered or separately published without permission. The views expressed in this Bulletin are those of the authors and are not necessarily shared by the Secretariat of the Pacific Community.
Original text: EnglishSecretariat of the Pacific Community, Fisheries Information Section
BP D5, 98848 Noumea Cedex, New Caledonia Telephone: +687 262000; Fax: +687 263818; [email protected]; http://www.spc.int/coastfish

1. Introduction
The baseline survey that forms the focus of this study was done for the “Project for Promotion of Grace of the Seas for Coastal Villages in Vanuatu, Phase 2”. Supported financially by the Japan Inter-national Cooperation Agency and coordinated locally by the Vanuatu Fisheries Department (VFD), the project will last 34 months, from January 2012 until November 2014. It has two main objectives: 1) to improve the conservation of coastal environ-ments and the sustainable use of coastal resources in selected target areas; and 2) to promote commu-nity-based coastal resource management (CBCRM) in rural areas. Both goals will be attained through the provision of technical assistance by VFD.
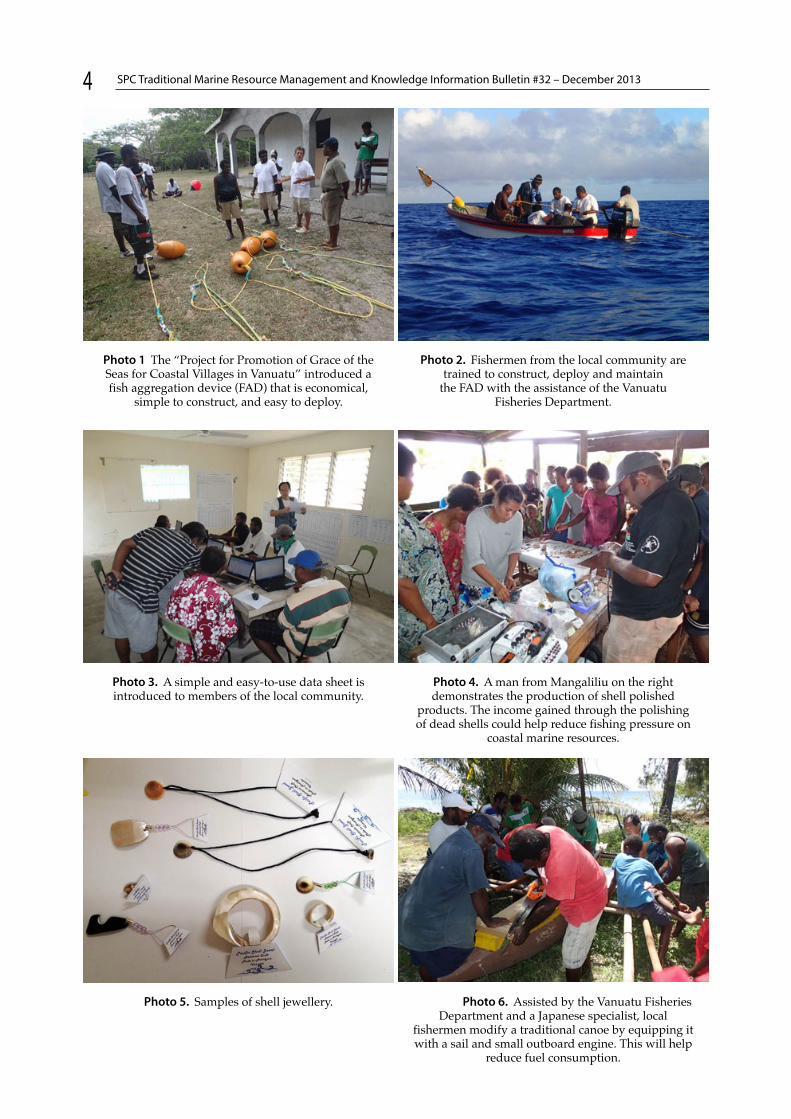
The project includes several pilot activities that involve the community-based management of fish aggregation devices (FADs). At local work-shops, community members learn how to assem-ble (Photo 1) and deploy FADs in coastal or offshore areas (Photo 2), develop a FAD manage-ment guideline, and organise FAD management committees. Another project activity involves the recording and analysing of fishing activities, which helps communities to better understand current catch trends and the economics of the vari-ous fishing pursuits. It also helps train community members to analyse their own fishing activities by recording information on data sheets and enter the data into a computer (Photo 3). These activities are aimed at organising local systems of fishing data collection and analysis to provide a foundation for future local CBCRM activities. Shell craft making and marketing is being promoted to enhance com-munity awareness of coastal resources and alter-native income sources. The project organises local workshops with women’s groups to teach shell craft making and to advise on marketing (Photos 4 and 5). Yet another project activity is modify-ing the design of local canoes in order to improve access to offshore areas (Photo 6). The model developed to date uses both a sail and an outboard
engine (Photo 7), which improves access to off-shore resources and reduces fuel expenditures for fishing activities. To generate alternative income sources, the project also promotes giant clam cul-ture by local communities. The project provided juvenile giant clams (Tridacna maxima and T. squa-mosa) and culture cages to Moso Island in north-ern Efate (Photo 8). The project has also released trochus and green snails in the coastal waters of Uripiv Island near Malekula, and, with local com-munities, regularly monitors the propagation con-ditions of released shellfish (Photo 9).
In Vanuatu, as in most other developing countries, statistical data and other published and unpub-lished sources of information required to design and implement development projects (as well as to target specific communities), either do not exist or are of limited usefulness. Inevitably, this requires that comprehensive surveys be conducted to collect basic information essential for understanding con-ditions and issues. The baseline survey conducted for this project consists of three main components: 1) questionnaire-based surveys, 2) workshops, and 3) a literature review. The information acquired is being used to design and implement the pilot pro-jects. The baseline survey was conducted between May and August 2012, with additional surveys con-ducted between September and November 2012. This publication reports on the results of the survey to date, although a supplementary survey will be conducted later.
In each target community, three different types of questionnaires were used to interview community representatives, randomly selected households and residents. The principal objective of these interviews was to understand the general characteristics and existing conditions of the communities, particularly regarding fisheries and coastal resource manage-ment, as well as to understand community mem-bers’ perceptions regarding CBCRM. Three types of workshops were conducted. At the community level, workshops covered all target communities and were
3SPC Traditional Marine Resource Management and Knowledge Information Bulletin #32 – December 2013
A baseline survey of coastal villages in VanuatuGraham Nimoho,1* Akiya Seko,2* Mitsuo Iinuma,3
Kazuo Nishiyama4 and Tomonori Wakisaka5
1 Fisheries Department of Vanuatu: [email protected] IC NET Ltd: [email protected] IC NET Ltd: [email protected] IC NET Ltd: [email protected] IC NET Ltd: [email protected]* Corresponding authors
4 SPC Traditional Marine Resource Management and Knowledge Information Bulletin #32 – December 2013
Photo 1 The “Project for Promotion of Grace of the Seas for Coastal Villages in Vanuatu” introduced a fish aggregation device (FAD) that is economical,
simple to construct, and easy to deploy.
Photo 3. A simple and easy-to-use data sheet is introduced to members of the local community.
Photo 4. A man from Mangaliliu on the right demonstrates the production of shell polished
products. The income gained through the polishing of dead shells could help reduce fishing pressure on
coastal marine resources.
Photo 5. Samples of shell jewellery. Photo 6. Assisted by the Vanuatu Fisheries Department and a Japanese specialist, local
fishermen modify a traditional canoe by equipping it with a sail and small outboard engine. This will help
reduce fuel consumption.
Photo 2. Fishermen from the local community are trained to construct, deploy and maintain
the FAD with the assistance of the Vanuatu Fisheries Department.

5SPC Traditional Marine Resource Management and Knowledge Information Bulletin #32 – December 2013
Photo 7. Sea trials of the “modified canoe” demonstrated that with a good wind local fishermen do not need to rely on outboard engines.
Photo 8. With assistance from the Vanuatu Fisheries Department, community members rear
juvenile giant clams for sale for aquarium use. This is expected to generate an alternative income
that could contribute to improving coastal resource management.
Photo 9. Release of trochus and green snails on the reefs at Uripiv (Malekula). The trochus and green snail numbers were nearly depleted in Malekula.
For stock enhancement and awareness-raising purposes, the project released green snails and trochus on the reef in front of the community.

participated in by community representative Chief Councils, marine protected area (MPA) committee members, church group members, and VFD staff. The objective of these workshops was to understand the challenges confronting the target communities and the requirements that must be met to achieve sustainable CBCRM (Photo 10). Similarly, a rapid rural appraisal (RRA) workshop covered all target communities, and was participated in by commu-nity representative Chief Councils, MPA committee members, church group members, and VFD staff. The objective of the RRA workshop was to under-stand the existing use of fisheries resources by com-munities, and to produce a fishing ground map and a fishing calendar for each site (Photo 11). An insti-tutional development/organisational strengthening (ID/OS) workshop was held with VFD staff and related non-governmental organisations (NGOs) in order to analyse the institutional capability of com-munities, and identify an appropriate strategy for VFD to promote CBCRM. Finally, a literature review was conducted to complement the information col-lected through the baseline survey. This review included scientific articles, project (survey) reports, guidelines and manuals related to CBCRM in Pacific Island countries, including Vanuatu.
2. Methodology
2.1. Questionnaire-based surveys
Three kinds of questionnaires were used (“Sheet 1”, “Sheet 2” and “Sheet 3”; see Appendix 1), depend-ing on the interviewee. Interviews using Sheet 1 were conducted with representatives of all 23 tar-get communities (Table 1). In Vanuatu, a chief is in charge of the administration of each community; therefore, community chiefs were considered the appropriate interviewees for Sheet 1. All chiefs are male (with the exception of Mapest on Malekula), and range in age between 32 and 83.
6 SPC Traditional Marine Resource Management and Knowledge Information Bulletin #32 – December 2013
Photo 10. Facilitated by project team members, in June 2012, villagers of Sunae examine the problems, challenges and counter-measures of marine coastal
resource management.
Photo 11. To understand the current level of exploitation of resources, a Japanese specialist
confirms the mapped location of coastal fishing grounds with fishermen from Aneityum.
Table 1. Main characteristics of the three questionnaires.
Title Target group Objective Main topics
Sheet 1 Community representatives
Understand the overall profile of each community
Number of households; population change; basic infrastructure and services; economic activities; community cooperatives and/or associations
Sheet 2 Households Identify the economic and social structure of households in target communities
Household information includes: • Number of members, ages, occupations, educational levels• Economic activities: monthly income and living cost, fishing
activities, fish consumption, social capital
Sheet 3 Community residents
Understand community members’ awareness and opinions of, and participation in coastal resource management
Awareness and recognition of fisheries resource condition; compliance with resource management activities including marine protected area; change in fishing activities; opinions regarding the resource management plans

Sheet 2 (see Table 2) is broken down by the number of households and individuals. On Malekula, some small communities have fewer than 10 households.
Sheet 3 interviewees were asked about their per-ceptions regarding CBCRM, including their recog-nition of resource conditions; level of compliance with resource management activities, including MPAs; changes in fishing activities; and opinions about the resource management plans. To avoid bias, interviewees for Sheet 3 included both men and women, and young and old because results were expected to differ significantly according
to gender and age. Table 3 shows the numbers of interviewees for Sheet 3 by target community, gen-der and age group.
All interviewers were selected from among resi-dents of target communities. Project team members gave interviewers detailed instructions on how to conduct interviews, and interviewers underwent a pre-test to ensure that information was collected as instructed. After the project team members con-firmed the results of the pre-test, interviewers went ahead and implemented the questionnaire-based surveys in the target communities.
7SPC Traditional Marine Resource Management and Knowledge Information Bulletin #32 – December 2013
Table 2. Target communities, households and interviewees for Sheet 2.
Province Island Target area Target communities of the survey
Total number of
households
No of households covered by
Sheet 2
Percentage covered in the
community (%)
Tafea Aneityum Aneityum Analcauhat 136 22 16.2
Umetch 34 8 23.5
Port Patrick 40 8 20.0
Subtotal of Aneityum 210 38 18.1
Malampa Malekula Crab Bay Barrick 13 6 46.2
Bushman Bay 6 5 83.3
Hatbol 48 6 12.5
Limap 20 6 30.0
Lingarakh 52 11 21.2
Lowni 20 4 20.0
Lo Sarsar 3 3 100.0
Mapest 8 5 62.5
New Bush 7 5 71.4
Portidur 37 6 16.2
Teremp 22 5 22.7
Tevaliant 37 6 16.2
TFC* 30 4 13.3
Tembimbi 35 6 17.1
Subtotal of Crab Bay 338 78 23.1
Uri Uri 17 5 29.4
Uripiv Uripiv 90 16 17.8
Subtotal of Uri-Uripiv 107 21 19.6
Shefa Efate Mangaliliu Mangaliliu 70 12 17.1
Lelepa Lelepa 100 13 13.0
Subtotal of Lelepa and Mangaliliu 170 25 14.7
Moso Sunae 14 5 35.7
Tasiriki 63 7 11.1
Subtotal of Moso 77 12 15.6
Total 902 174 19.3
Source: Project baseline survey* TFC refers to Terfick Company, although this name is rarely used. Instead, local people refer to the community as TFC.

8 SPC Traditional Marine Resource Management and Knowledge Information Bulletin #32 – December 2013
Table 3. Number of interviewees for Sheet 3 by age group and gender.
Province Island Target area Target communities of the survey
Total number of population
No of population covered by
Sheet 3
Male Female No answer
Age group Age group
unde
r 20
20–4
0
over
40
unde
r 20
20–4
0
over
40
Tafea Aneityum Aneityum Analcauhat
915*
51 7 9 10 8 7 10
Umetch 15 3 2 4 2 2 2
Port Patrick 25 5 4 3 2 4 2 5
Subtotal of Aneityum (%) 91 (9.9) 15 15 17 12 13 14 5
Malampa Malekula Crab Bay Barrick 160** 10 4 4 2
Bushman Bay 20-30** 10 2 1 3 2 2
Hatbol Over 100** 10 1 1 3 2 3
Limap 100** 10 1 2 1 2 2 2
Lingarakh Over 200** 14 13 1
Lowni 60** 8 1 3 2 2
Lo Sarsar 12** 5 1 2 1 1
Mapest 25** 10 2 1 1 1 4 1
New Bush 25** 10 2 1 2 4 1
Portidur Over 100** 10 4 1 2 2 1
Teremp Over 100** 10 2 2 1 3 2
Tevaliant 100** 5 3 2
TFC 30** 7 4 1 1 1
Tembimbi Over 100** 10 1 2 1 1 5
Subtotal of Crab Bay (%) 129 16 39 13 13 23 10 15
Uri Uri Over 100** 10 5 1 1 3
Uripiv Uripiv Over 100** 27 2 8 5 7 2 3
Subtotal of Uri-Uripiv (%) 37 2 13 6 7 3 0 6
Shefa Efate Mangaliliu Mangaliliu 270* 25 5 6 3 3 4 4
Lelepa Lelepa 387* 38 4 8 2 1 12 11
Subtotal of Lelepa & Mangaliliu (%) 63 (9.6) 9 14 5 4 16 15 0
Moso Sunae237*
16 3 3 3 2 2 3
Tassiriki 17 1 6 2 3 5
Subtotal of Moso (%) 33 (13.9) 4 9 5 5 7 3 0
Total 353
* Vanuatu Statistics Office. National Census of Population and Housing 2009** Interviewed by the project team members

2.2. Workshops
The date and time, venue, participation, and activities conducted for the three workshops are described in Table 4.
3. Survey results: Current status of coastal resources
3.1. Review of previous survey reports
The literature reviewed contained terms that are different from CBCRM, but which are used in a similar context. These terms include co-manage-ment, village-based management, and community-based resource management. Here, the meaning of CBCRM follows the definition provided by the Sec-retariat of the Pacific Community (SPC) (2010:2) for community-based fisheries management (CBFM): “CBFM refers to a management system under which communities take a leading role in managing fisheries and adjacent coastal areas in partnership with, or with support from, a promoting agency.”
3.2. CBCRM in the Pacific Islands
In a comparative survey of coastal resource man-agement in the Pacific Islands, the World Bank (2000:45) stated that “there is growing consensus among experts that much of the management needs to be carried out by local communities.” Johannes (2002) explained that in the 1970s, CBCRM prac-tices in the Pacific Islands had declined, owing to
factors such as the spread of the cash economy, emerging export markets, improved harvesting and transport technology, burgeoning popula-tions, and the decline of traditional authority. However, Johannes also confirmed that, at least in Vanuatu, Samoa, Cook Islands and Fiji, CBCRM that was once declining had undergone a renais-sance since the 1990s, and that CBCRM practices had increased, owing to factors such as a growing perception of resource scarcity, the re-strength-ening of traditional village-based marine tenure authority through legal recognition and govern-ment support, better conservation education, and increasingly effective assistance and advice from regional and national governments and NGOs.
In designing the baseline survey and pilot pro-jects, the project took into consideration various guidelines and manuals produced by SPC for the promotion of CBCRM in the Pacific Islands region, including:
1. “Guide to information sheets on fisheries man-agement for communities” (2011), which is designed to assist fishing communities, and people working with them, by providing infor-mation on marine species and advice on appro-priate fisheries management options.
2. “Community-based ecosystem approach to fisheries management” (2010).6 This docu-ment describes how an ecosystem approach to
9SPC Traditional Marine Resource Management and Knowledge Information Bulletin #32 – December 2013
Table 4. Outline of the workshops.
Name of workshop
Period and venue Total number and affiliation of participants
Activities
Community Workshop
25 May–15 June 2012(7 days) in 6 target communi-ties: Aneityum, Mangaliliu, Lelepa, Sunae, Tasiriki, Malekula
113Community representative chief councilsMPA committee membersChurch group membersVFD staffProject members
Focus group discussionsProblem analysis with describing problem treesObjective analysis
ID/OS Workshop
June 11–13, 2012 (3 days)at the VFD Conference Room
11VFD staffRelated NGOsProject members
SWOT* analysisStakeholder analysis
Fish Calendar Workshop
18 May–1 July 2012(1 day) in the three target communities of Aneityum, Mangaliliu, Malekula
20Fishers in target communities
Interviews
* SWOT = strength, weakness, opportunity and threat
6 According to Garcia et al. (2003:6), an ecosystem approach to fisheries “... strives to balance diverse societal objectives, by taking account of the knowledge and uncertainties of biotic, abiotic and human components of ecosystems and their interactions and applying an integrated approach to fisheries within ecologically meaningful boundaries.”

fisheries can be merged with community-based fisheries management in Pacific Island coun-tries, and refers to the merger of approaches as the community-based ecosystem approach to fisheries management (CEAFM). Thus, it com-bines the three different perspectives of fisher-ies management, ecosystem management and community-based management.
3. “Socioeconomic fisheries survey in Pacific Islands: A manual for the collection of a mini-mum dataset.” (2007). SPC developed this manual in recognition of the fact that a lack of information and knowledge about the status and use of coastal marine resources, particularly on subsistence and small-scale artisanal fisher-ies, is a major constraint to determining what management interventions are needed. The manual focuses on collecting a core minimum set of social and economic data on fishing com-munities, using structured questionnaire sur-veys, which is considered the easiest and most effective way in terms of the required time, and financial and human resource inputs. Using the same format, SPC hopes to connect the fisheries social and economic information in one country with that of others. Together with the manual, SPC has developed “SEMCoS”,7 a downloadable software that automates analyses and uses the collected data.
4. “Underwater visual fish census surveys” (2002). This manual describes an underwater visual census survey method developed by the French Institute of Research for Development (IRD), and tested in a number of different locations, including New Caledonia, Tonga and Fiji. The manual contains theoretical background infor-mation, practical design and procedures for the survey, and utilisation of the data obtained.
5. “Fisheries management by communities: A manual on promoting the management of subsistence fisheries by Pacific Island com-munities”.(2000). This manual provides tech-nical background on fisheries and the marine environment and serves as a guide on promot-ing and encouraging their management by Pacific Island communities, with an emphasis on subsistence fisheries. It introduces basic resource management measures such as lim-ited entry, limited fishing gear and methods, closed areas and seasons, catch size and quan-tity limits, together with government roles to promote the involvement of communities in resource management.
3.3. CBCRM in Vanuatu
3.3.1. The sociocultural background
Vanuatu provides an excellent example of the way in which existing traditional systems of coastal resource management can serve as a base on which to build modern systems of management. Ruddle et al. (1992) pointed out that, as much as possi-ble, management schemes should be designed to: include effective indigenous strategies; conform closely to existing social, cultural and marine habi-tat boundaries; and adapt appropriate pre-existing (traditional) institutions underlying such custom-ary tenure systems, particularly where there is a paucity or lack of physical and administrative infrastructure, trained manpower and funds. In Vanuatu, marine tenure rooted in custom is the pri-mary institution that underpins community-based management and is also the primary link between VFD and communities (Amos 1993). Under the Independence Constitution (1980), all land and customary fishing grounds that had been alienated reverted to their customary owners, with whom they now reside (Government of Vanuatu 1980a).
3.3.2. Outline of the structure of the traditional system
This section is based on Ruddle 1994, which has been updated by more recent sources, as indicated in the text.
3.3.2.1. Marine territories and boundaries
Legally, based on Vanuatu’s Land Reform Regu-lation (No. 31) of 1980, the rights of indigenous customary owners of inshore waters extend sea-ward only to the seaward slope of the fringing reef (Government of Vanuatu 1980b). Taurakoto (1984) observed that, according to Melanesian custom, seaward boundaries in Vanuatu extended as far as a person could fish or dive for shells. Seaward reefs in deeper waters are not owned. However, many vil-lages make claims for more extensive areas, some extending to the horizon and including sea areas between the reef slope and offshore islands (Fair-bairn 1990). The villagers of Eton Village on Efate claim that their sea area extends for 50 m beyond the reef slope, and in Eratap Village (also on Efate), villagers extend their claim by 100 m to embrace four small islands. Where villagers on one island own land on a neighbouring island, the sea area between the islands is claimed to belong to the vil-lagers. For example, villagers on Uripiv Island, the “home” island, claim the sea area between it and Uriv Island (Fairbairn 1990). Villages are generally
10 SPC Traditional Marine Resource Management and Knowledge Information Bulletin #32 – December 2013
7 SEMCoS = socioeconomic manual companion software

far apart from one another and so the sea territories separating them are large. The sea territory of Eton Village, for example, extends for 35–40 km on either side of the village proper (Fairbairn 1990). Lateral boundaries of sea territories are seaward extensions of terrestrial boundaries, with some marked by large rivers. However, many lateral boundaries are imprecisely marked and have given rise to serious disputes.
3.3.2.2. Fishing rights
Johannes and Hickey (2004) stated that the clans, chiefs or villages owning land have the rights to adjacent coastal waters. Sea areas may be subdi-vided and the rights allocated to family heads. The rights to coastal waters contiguous to traditional land holdings are sustained by Chapter 12, Article 73 of the Constitution of Vanuatu, which states that “all land in the Republic belongs to the indigenous custom owners and their descendants”. The Land Reform Act (Cap. 123) specified further that the term “land” includes “land extending to the seaside of any offshore reef but no further”. As a rule, vil-lagers have exclusive and equal rights to use adja-cent reef fishing grounds (David 1990). In general, reefs and lagoons remain the common property of the villages, although there are individual owner-ship rights (Fairbairn 1990).
However, there is considerable diversity within Vanuatu. According to Taurakoto (1984), reef boundaries are determined based on where a per-son’s ancestors landed on an island, or what rights they negotiated, and also on the area of land above the high water mark owned by a person. In cer-tain areas on Ambae Island, as well as in southeast Ambrym, the scarce reefs are minutely subdivided, with single coral rocks on reefs allocated to heads of families, trespassing on which requires payment of compensation. In yet other parts of the island, access anywhere is free to all residents (Kenneth and Silas 1986). On Lelapa Island, all reefs were divided as the property of the six chiefs of the six villages on the islands (Taurakoto 1984).
Although ownership rights are clearly recognised, the precise geographical areas to which these rights apply are often unclear. Rights are most straightfor-ward where authority is vested in a single person, the village chief, who then controls the entire reef on behalf of the village. Ownership is also clear-cut in isolated locations.
Landowners have special rights in adjacent waters, including that to lease parts of their reefs, although this right is subject to the approval of the Village (or Area) Council and the chiefs. Such exclusive rights also include using areas close to land for such special purposes as mooring sites, construction of fish traps, or the establishment of breeding areas for shellfish.
Acquisition of rights
Primary rights of resident villagers are inherited (Taurakoto 1984). Inland villages without primary rights to coastal waters gain access to fisheries through kinship ties to coastal villagers, because the interior was settled by migrants from the coast. However, such a right may be either reciprocal, with coastal villages gaining hunting rights in the interior, or be granted in return for a traditional payment of pigs, kava (Piper methysticum), taro, or other valued items (Fairbairn 1990).
Rights of outsiders
Neighbouring villagers are generally allowed to use fishing areas if they first inform the owning vil-lage and, generally, also receive the permission of the Village Council. Hitherto, such an arrangement seems to have been reciprocal, although the practise is now rare. Commercialisation has now become a consideration in granting access rights. At Erakor Village on Efate Island, all outsiders must now seek the permission of the Village Council and pay a fee. One outsider was harvesting sea cucumbers, for which he paid an annual fee of approximately USD 90, and another was harvesting trochus and paying an annual fee of about USD 18 (Fairbairn 1990).
3.3.2.3. Rules
Johannes (l998) noted taboos or bans that included prohibitions on the harvesting of certain species, areal and temporal closures, and gear restrictions.
3.3.2.4. Traditional authority
There appear to be significant differences in local control and management of lagoon and reef areas (Fairbairn 1990). However, they are generally con-trolled by the Village Council, composed of village chiefs and elders, and sometimes by an Area Coun-cil, made up of leaders from several villages, and by landowners. There is much blurring of author-ity, but usually the Village Council is the paramount authority, although the principal chief is often the dominant influence, especially if he is also a major landowner.
Enforcement is problematical because of the large size of village sea territories. Poaching is discour-aged by posting public notices on adjacent land bor-ders, and Eton and Erakor villages regularly use the radio to warn against poaching.
In almost every instance, the Village Council is the principal authority governing reef and lagoon use. It has the power to impose fishing bans, enforce gov-ernment regulations, resolve conflicts with neigh-bouring villages, and grant access rights and other arrangements with outsiders. An Area Council has an important role in reef and lagoon management,
11SPC Traditional Marine Resource Management and Knowledge Information Bulletin #32 – December 2013

particularly when the areas and interests of sev-eral villages are concerned. In the past, traditional leaders often have had the right to introduce man-agement measures over larger areas under their domain on behalf of various clans (Johannes and Hickey 2004).
3.3.2.5. Sanctions
A chief and his council punish those who infringe a management taboo. Compliance appears to be higher when a taboo is established using custom-ary practices (Johannes and Hickey 2004). Punish-ment appears to be graduated and includes both economic and social forms. Punishment for break-ing management rules ranges from simple verbal admonitions to fines that can be paid either in cash or in kind. The latter consists of local articles of food, mats or items of customary significance such as pigs or kava (Piper methysticum). Where tradi-tional authority is still highly regarded, the shame and embarrassment at being caught and fined is an additional social punishment.
3.3.3. Using traditional systems for modern community-based management
In 2001, Johannes and Hickey conducted a survey of 21 of the fishing villages originally studied by Johannes in 1993, to learn which resource manage-ment methods were perceived as being successful by villagers. Success was ascertained by two crite-ria. First, whether measures remained in operation 8–10 years after implementation. Like most conser-vation measures, those implemented in the early-1990s required fishermen to make sacrifices. Closing trochus harvesting, for example, meant foregoing income from selling the shell. Sacrifices judged as worthwhile by villagers meant the relevant man-agement measures would still be operating. Second, the degree of implementation of additional meas-ures implemented after 1993.
Survey results indicated a high rate of approval by villagers. Compared with 40 marine resource management measures in the 21 villages in 1993 by 2001, 5 had lapsed, whereas 51 new measures had been implemented. In 2001, the main marine resource management measures were 18 fishing ground closures, 11 trochus closures, 11 taboos on taking turtles, 10 sea cucumber closures, 8 spear-fishing taboos, and 7 controls or bans on using nets. All of the turtle taboos had been implemented since l993. Of the five measures that had lapsed, three involved fishing ground closures. However, during the same period six new closures were ini-tiated in five other villages.
Formerly, villagers could take turtles and their eggs whenever they were encountered. No prohibi-tions on taking them were found in l993 (Johannes
1998), but in 2001, more than 60% of the commu-nities interviewed had imposed prohibitions. Such taboos comprised 11 of the 51 new regulations, and involved 11 of the 21 villages (Johannes and Hickey 2004). It is noteworthy that this regulation on tur-tle harvesting was largely attributed to the perfor-mances of a travelling theatre group called “Wan Smol Bag”, which in 1995 presented a play that emphasised the plight of sea turtles and the need to conserve them. This play reinforced villagers’ per-ception of the gradual decline in sea turtle numbers during previous decades. In addition to suggest-ing that turtles should not be killed, the play also recommended the selection of a “turtle monitor” to encourage turtle conservation and to tag nesting and accidentally netted turtles. As a consequence, by 2003 200 turtle monitors were based in more than 100 villages. The monitors reported violators to the chiefs and also actively persuaded people to neither disturb nesting females nor harvest the eggs. From June 2001, the turtle monitors changed their name to vanua-tai resource monitors (“Vanua” means land, and “t” means sea), to reflect their expanded mandate from just turtle monitors to monitors of all marine resources (Johannes and Hickey 2004).
Communities that retain strong local marine resource management systems coupled with a local conservation ethic might be expected to transform their pre-existing or traditional management sys-tems for a modern purpose. Particularly important in this is the existence of a conservation ethic. A marine conservation ethic exists in Vanuatu. In the mid-l990s, 12 Vanuatu fishing villages employed 48 individual marine resource management measures (Anderson and Mees 1999). Enhancing, preserving or protecting marine resources were the explicit reasons given for 43 of these measures. Research by Johannes and Hickey (2004) demonstrated that most villages surveyed had a marine conservation ethic because they were not only aware of the need for local marine resource management, but were also addressing this need. However, none of that would guarantee the successful adaptation of a traditional system to a modern purpose. That would likely be undercut by the existence of major disputes within a community, such as those that have arisen from colonial histories, changing perceptions of resource valuation or rapid population growth coupled with migration, urbanisation, and the abandonment of remote rural regions (Ruddle 1994).
The success of the revival and growth of commu-nity-based management in Vanuatu is remarkable compared with most other Pacific Island coun-tries. Important factors in this success include: 1) A firm basis in traditional marine tenure that was reinforced by a cultural revival in which the fieldworker network of the Vanuatu Cultural Cen-tre assisted communities with strengthening and
12 SPC Traditional Marine Resource Management and Knowledge Information Bulletin #32 – December 2013

reviving traditional management systems. This also formed part of the general cultural revival since national independence in 1980; 2) Strong vil-lage leadership; 3) Village cohesion; 4) Demonstra-tion of the value of trochus closures by VFD, which catalysed the growth of community-based man-agement and led communities to experiment with management based on gear restrictions or quo-tas, among others for other important resources; 5) An awareness that was heightened by training villagers and the participatory re-stocking of reefs with trochus coupled with follow-up monitoring. A dedicated focus on just trochus, a commercially valuable resource, was critically important. Once benefits became apparent villages considered how to improve the management of other resources. Further, trochus is an easily managed resource for which the benefits of management can be readily seen; and 6) The incorporation of selected modern elements within the traditional framework. For example, a major consequence of urbanisation is a loss of traditional values. So in peri-urban villages in Vanuatu, chiefs who find their decisions regard-ing marine resource rules repeatedly ignored refer offenders to the police.
3.3.3.1. Legal background
Article 73 of the Constitution of Vanuatu states that “all land in the Republic belongs to the indigenous custom owners and their descendants.” Section 3 of the Land Reform Act Chapter 123 states that the land shall include “...extending to the seaside of any foreshore reef but no further” (Kuemlan-gan 2004). These provisions support the customary marine tenure (CMT) system, which is fundamen-tally important because most CBCRM practices in Vanuatu are based on CMT. The Vanuatu govern-ment is empowered to establish “marine reserves” and “community conservation areas” (CCAs), as defined by the Fisheries Act and the Environmen-tal Management and Conservation Act, respec-tively. Although marine reserves and CCAs are the legal resource management and protection tools, they have seldom been applied to coastal fisheries resources in Vanuatu.
3.3.3.2. Introduction and extension of CBCRM
CBCRM was successfully introduced in Vanuatu during the early-1990s for trochus (Tectus niloticus). Johannes and Hickey (2004) noted that the con-tributing factors to the successful introduction of CBCRM in Vanuatu included the initiative shown by VFD in reaching out to communities with a species-specific focus on just trochus, rather than on coastal resources in general. VFD surveyed the trochus stock in communities and provided advice on regular multi-year closures followed by brief openings (Amos 1993). It was left to the community to decide whether or not to act on this advice. the
initiative shown by the VFD in reaching out to the communities with a species-specific focus just on trochus, rather than on coastal resources in general
Johannes and Hickey (2004) also confirmed the increase of CBCRM practices in Vanuatu. They stated that between 1993 and 2001, the number of CBCRM measures put into practice had more than doubled in selected communities, from 40 in 1993 to 86 in 2001. (In order to make an inter-community comparison, Johannes and Hickey [2004] classified CBCRM measures into 11 groups: trochus, fishing ground closures, turtles, sea cucumber, spearfish-ing, use of nets, MPAs, giant clams, crabs, destruc-tive fishing methods, and miscellaneous.) After perceiving the effectiveness of CBCRM measures and benefits that recovered or recovering resources brought, communities applied additional measures, not only for trochus but for other species. Aware-ness activities developed by Wan Smol Bag played a significant role in convincing communities of the need for resource management.
Although Johannes and Hickey (2004) indicated a revival of CBCRM, Raubani (2006) wrote that that throughout Vanuatu the current CBCRM still has many weaknesses because of the lack of clearly defined property rights for land and adjacent reefs (including access rights for the resources inhabiting the reefs), as well as the conditions of communities, such as a weakening respect for and cooperation with the community leader and the low availability of alternative livelihoods. Raubani (2006:19) stated that (according to his personal communication with Hickey):
“...a number of the traditional manage-ment practices are still in practice in areas further from the urban centers which are less subjected to Western influence and thus still maintain their values and beliefs. For instance in Torba Province, many areas of Malampa, Penama, and Tafea Province, people in many villages would still hold onto these practices as they have main-tained their values and beliefs to this day.”
4. Information on the target sites
4.1. Aneityum
Johannes and Hickey (2004) investigated the exist-ing CBCRM measures in Analcauhat as of 1993 and 2001. Their results showed that CBCRM measures increased from three in 1993 to four in 2001 (CBCRM measures for trochus, fishing closures, and miscel-laneous in 1993. In 2001, the CBCRM measure for sea cucumber was added). Biological surveys and simple stock assessments were conducted by IRD in 2011–2012 in Analcauhat, for trochus, green snail, and giant clams inside and outside the taboo area
13SPC Traditional Marine Resource Management and Knowledge Information Bulletin #32 – December 2013

(Table 5). Tentative results are summa-rised by Dumas (in press).
4.2. Malekula
VFD (2011) presented the results of under-water visual census stock assessment sur-veys in Uri, Uripiv and the Crab Bay area, in Malekula. VFD indicated that the aver-age size and abundance of sea cucumbers in the surveyed areas have remain small despite the national moratorium declared in 2007, possibly because of their slow growth rate and the illegal harvesting after the moratorium.
The Vanuatu Environment Unit (2007a, 2007b) presented detailed findings from surveys of households, reef fish, fish mar-keting, and crab marketing conducted using questionnaires and focusing on the use and management of the land crab, Cardiosoma hirtipes. These findings pro-vide good baseline information on the status of resources, coastal resource use, and socioeconomic conditions of the communities around Crab Bay.
Two considerations for project implementation have been stressed by the Vanuatu Environment Unit. First, it is important to understand differ-ences among communities. For example, only a few communities participate in commercial fishing. Although in some communities most households engage regularly in subsistence fishing, in others less than half the households fish regularly. Sec-ond, possible weaknesses of the Community Area Resource Map and Action Plan include the level of reliance on external organisations; the largely unmet assumption that provincial staff and public servants based on Malekula would facilitate pro-jects; and a lack of a philosophy on adaptive man-agement. Hence, projects must be designed in a way that nurtures local capacity and initiative. Further, because the chiefs in the Crab Bay area no longer receive full support and cooperation from commu-nity members, it may be necessary to consider sup-plementary approaches to reach and engage people who do not cooperate fully with a chief’s requests.
Johannes and Hickey (2004) also investigated CBCRM measures that existed in Uri and Uripiv in 1993 and 2001. Their results showed that meas-ures increased from 4 in 1993 to 12 in 2001 in Uri, and in Uripiv from 1 in 1993 to 4 in 2001. In 2001, CBCRM measures increased for: fishing ground closures; the taking of turtles, sea cucumbers and giant clams; spearfishing and using nets; marine protected areas; and “miscellaneous”, according to the categorisation of Johannes and Hickey.
SPC (2003) conducted an underwater visual cen-sus (UVC) survey for finfish and invertebrates,
and a socioeconomic survey for Uri and Uripiv. The results demonstrate that: 1) existing manage-ment measures in Uri and Uripiv were adequate to ensure the sustainable use of finfish resources at the current fishing level, and that 2) resources in Uri and Uripiv were in good condition. However, reef finfish should be considered as a complemen-tary, rather than the principal, source of food and income because the band of reef surrounding Uri and Uripiv may be too narrow to sustain intense long-term fishing pressure.
4.3. Efate
Johannes and Hickey (2004) investigated CBCRM measures that existed in Mangaliliu in 1993 and 2001, and found that measures there had increased from three in 1993 to four in 2001. In 1991, CBCRM measures for trochus harvesting, fishing ground closures, and “miscellaneous” were in place. In 2001, a measure for sea cucumbers was added.
Beckensteiner (2011) conducted a similar survey in 2011 and found that four more CBCRM meas-ures were in place in Mangaliliu, dealing with the exploitation of shells and the use of fishing gear. The survey conducted by Beckensteiner (2011) tar-geted seven communities on Efate Island (Paunang-isu, Siviri, Mangaliliu, Eratap, Takara, Tanoliu and Emua), which allowed an inter-community com-parison. The survey pointed out that community management plans tend to be induced by external parties, such as NGOs and donors, and the scope of the plan (either a comprehensive resource manage-ment plan or just an MPA plan) tends to be affected by such external agencies. The survey also noted that most fishermen wish to change or upgrade their management system and seem sensitive to changes in their reef resources, frequently demonstrating a
14 SPC Traditional Marine Resource Management and Knowledge Information Bulletin #32 – December 2013
Table 5. Results of stock assessment by the French Institute of Research for Development (IRD) in Aneityum.
AnalcauhatInside taboo area
Outside taboo area
Species: Trochus (Tectus niloticus)
Mean density (#/ha) 560.8 97.5
Total stock (extrapolation) (kg) 430.8 30.0
Species: green snail (Turbo marmoratus)
Mean density (#/ha) 50.0 2.5
Species: Giant clam (Tridacna maxima)
Mean density (#/ha) 73.3 27.5
* Surveys are ongoing; therefore, results are subject to modification.

desire to protect them.. Finally, the survey found that overall, the sustainability of local rules seems low when external agen-cies are no longer present.
SPC (2003) conducted a UVC survey for finfish and invertebrates, and a socioeco-nomic survey for Moso Island. The main results demonstrate that finfish resources in Moso appear to be in relatively good condition, although some impact from fishing is suspected. The survey further noted the following:
• trochus were present but found only at low levels;
• green snails were not found;
• income opportunities from fisheries alone are limited (owing to the distance to the most productive fishing ground, which is the outer reef) and the dis-tance, time and costs involved in mar-keting finfish at Port Vila; and
• the community of Moso is unable to enforce the rules governing access to its fishing grounds, and suffers from frequent illegal intrusions in the distant outer reef by fishermen from Lelepa.
Biological surveys and simple stock assess-ments were conducted by IRD in 2011–2012 in Mangaliliu, for trochus, green snails and giant clams inside and outside the taboo area (Table 6). The tentative results are sum-marised by Dumas (in press).
5. Observations and perceptions of fishermen
5.1. Trends (increase/decrease) by species group
The baseline survey conducted so far demon-strates that fisheries resources in the target com-munities have been increasing, except for those of Moso on Efate (Tables 7 and 8). For a more detailed, species-specific survey of each site, target fisheries resources from each site were categorised into different groups (Table 9). Ease of accessibil-ity to fisheries resources in coastal communities of Vanuatu depends on their distance offshore and the fishing gear used. For most community mem-bers, resources within the reef are easy to access because they do not require expensive inputs such as a boat, fuel or modern gear. Therefore, such resources tend to be fished heavily unless man-aged effectively. Interviews were conducted to understand community members’ perceptions regarding the condition of each group of fisheries resources (Table 10).
5.2. Changes in size and/or species composition
Interviews were conducted in order to under-stand community members’ perceptions regarding changes in the average size of fisheries resources (Table 11).
The main points demonstrated by Tables 10 and 11 are summarised below.
• Community members from Aneityum perceive that crustaceans within the reef (lobster) are decreasing, whereas finfish groups outside the reef (i.e. large pelagic and bottom species) are increasing. Information with which to judge the condition of tuna resources is lacking.
• Community members from Malekula perceive that resources are generally in good condition, whereas bottom finfish and land crab resources are decreasing.
15SPC Traditional Marine Resource Management and Knowledge Information Bulletin #32 – December 2013
Table 6. Results of stock assessment by the French Institute of Research for Development (IRD) in Mangaliliu.
MangaliliuInside taboo area
Outside taboo area
Species: Trochus (Tectus niloticus)
Mean density (#/ha) 90.0 22.5
Total stock (extrapolation) (kg) 1,220.0 894.0
Species: green snail (Turbo marmoratus)
Mean density (#/ha) 21.4 6.0
Total stock (extrapolation) (kg) 549.0 998.0
Species: Giant clam (Tridacna maxima)
Mean density (#/ha) 121.4 141.2
Total stock (extrapolation) (kg) 3,109.0 23,314.0
* Surveys are ongoing; therefore, results are subject to modification.
Table 7. Trends in fisheries resources in target areas.
Aneityum Malekula Efate Overall
Increased 3 6 3 12
(%) 100.0 50.0 100.0 66.7
No change 0 6 0 6
(%) 0.0 50.0 0.0 33.3
Decreased 0 2 0 2
(%) 0.0 16.7 0.0 11.1

16 SPC Traditional Marine Resource Management and Knowledge Information Bulletin #32 – December 2013
Table 8. Trends in fish catches in target areas.
Island Target area Target community Trend of fish catch
Aneityum Aneityum Analcauhat Increased
Umetch Increased
Port Patrick Increased
Malekula Crab Bay Barrick Increased
Bushman Bay No change
Hatbol no answer
Limap, No change
Lingarakh Increased
Lowni Increased
Lo Sarsar Increased
Mapest No change
New Bush No change
Portidur Increased
Teremp Increased
Tevaliant No change
TFC Increased
Tembimbi No change
Uri Uri Increased
Uripiv Uripiv Increased
Efate Mangaliliu Mangaliliu Increased
Lelepa Lelepa No change
Moso Sunae Decreased
Tassiriki Decreased
Source: Project baseline survey
Table 9. Target species at each site.
Aneityum Malekula Efate
Crab Bay Uri and Uripiv Moso Mangaliliu and Lelepa
Within reef
shellfish trochus, green snail, giant clam
giant clam giant clam
crustacean lobster lobster lobster lobster
others octopus octopus octopus, squid octopus, squid
finfish mullet, blue fish pico, big bel, blue fish, napoleon, mustash fish, mullet
red mouth, mullet, mustash fish,
blue fish, parrot fish,
Out of the reef
finfish (small pelagic)
mangroo, sardine
mangroo, sardine mangroo, sardine
mangroo, sardine
finfish (large pelagic)
tuna, wahoo, dogtooth tuna, marlin
yellowfin tuna, skipjack, trevally trevally, tuna, dogtooth tuna, skipjack, marlin
yellowfin tuna, skipjack, wahoo, dolphinfish, dogtooth tuna
finfish (bottom)
poulet, snapper, brim, grouper
poulet, snapper, grouper poulet, snapper poulet, snapper
Others (land) crab mud crab, red crab, white crab mud crab

17SPC Traditional Marine Resource Management and Knowledge Information Bulletin #32 – December 2013
Table 10. Trends in resource condition by species group at each site.
Aneityum Malekula Efate
Crab Bay Uri and Uripiv Moso (Tassiriki and
Sunae)
Mangaliliu and Lelepa
Within taboo
Out of taboo
Within taboo
Out of taboo
Within taboo
Out of taboo
Within taboo
Out of taboo
Within taboo
Out of taboo
Within reef
shellfish ↑ ↑*2 ↑ ↑ ↑ ↑ - - →*6 →*6
crustacean ↑ ↓ ↑ ↑ ↑ ↑ *3 ↓ ↓ ↓
others ↑ ↓ ↑ ↑ ↑ ↑ ↓*4 ↓*4 ↑ ↓
finfish ↑ ↓ ↑ ↑ ↑ ↑ ↓ ↓ → ↓*2
Out of the reef
finfish (small pelagic) ↓ - ↑ ↑ ↑ ↑ ↓ ↓ *7
finfish (large pelagic) - ↑*1 - ↑ - ↑ - *5 - ↑*2
finfish (bottom) - ↑ - ↑ - ↓ - → - ↑*2
Others (land) crab - - ↓ ↓ ↓ ↓ - - - -
↑, →, and ↓indicates “increasing”, “remains same” and “decreasing”, respectively*1: Includes species that are not currently utilised and there is not enough information to judge the resource condition*2: Includes species perceived as “remains same”*3: Not many found and difficult to say it is increasing or decreasing*4: Sunae perceived as “remains same” while Tassiriki perceived as “decreasing”*5: Mixed result with “not sure because there is no catch” and “remains same”*6: Includes “increasing”*7: Community members perceive that mangroo is decreasing but sardine is increasing
Table 11. Trends in average size of marine species.
Aneityum Malekula Efate
Crab Bay Uri and Uripiv Moso (Tassiriki and
Sunae)
Mangaliliu and Lelepa
Within taboo
Out of taboo
Within taboo
Out of taboo
Within taboo
Out of taboo
Within taboo
Out of taboo
Within taboo
Out of taboo
Within reef
shellfish ↑ *1 ↑ ↑ ↑ ↑ - - → →
crustacean ↑ ↑ ↑ ↑ ↑ ↑ *7 ↓ → →
others ↑ ↓ ↑ ↑ ↑ ↑ ↓*8 ↓*8 ↑ ↑
finfish ↑ ↓ ↑ ↑ ↑ ↑ ↓ ↓ → ↓*2
Out of the reef
finfish (small pelagic) ↑ *2 - ↑*4 - ↑*4 - ↓ - →
finfish (large pelagic) - ↑*3 - ↑*3 - ↑*3 - →*3 - ↑*3
finfish (bottom) - ↑ - ↑*5 -w ↑*5 - →*3 - ↑*3
Others (land) crab - - ↑ ↓ ↑*6 ↓*6 - - ↓ ↓
↑, →, and ↓ indicates the average fish size is “getting bigger”, “remains same” and “getting smaller”, respectively*1: Community members perceive that the average size of trochus is getting bigger while that of giant clam is getting smaller*2: Community members perceive that the average size of mangroo is getting bigger while that of sardine is getting smaller*3: Includes species that are not currently utilised, and there is not enough information to judge the average size*4: Community members perceive that the average size of mangroo is getting bigger while that of sardine remains the same*5: Community members perceive that the average size of snapper and grouper is getting bigger while that of poulet is getting smaller*6: Community members perceive that the average size of mud crab has remained same*7: Not found many within marine protected area*8: Community members in Sunae perceive that the average size of squid and octopus has remained the same*9: Includes some species that are perceived as remaining the same size

• Community members from Moso Island (Tas-siriki and Sunae) perceive that many of their fisheries are decreasing, whereas those in Man-galiliu and Lelepa perceive that their fisheries resources are better preserved and more abun-dant than those of Moso Island.
• In general, reef fisheries resources are used and even perceived of as being over utilised. On the other hand, coastal community members do not fully use large pelagic and deep bottom species, and lack information to evaluate the condition of these resources.
6. Use of coastal resources
Fish calendars (Appendix 2) were developed in a dedicated workshop, and describe the seasonality, fishing method, catch size, unit size, average mar-ket price, and frequency of fishing operations per week for the target species.
6.1. Species targeted
According to these fish calendars, there are 34 species in the target areas, and fishery products differ depending on the target area. In Aneityum and Malekula, 19 species are identified, whereas 11–13 species occur in Lelepa, Mangaliliu and Tas-siriki. Seven species are targeted in all or almost all areas: skipjack tuna (Katsuwonus pelamis), poulet (Etelis radiosus), mangroo (bigeye scad, Selar cru-menophthalmus), grouper (Epinephelus spp.), octo-pus (Octopus cyanea), sardine (Hypoatherina bamesi, Atherinomorus lacunosus), and blue fish (parrotfish) (Scarus sp., Chlorurus sp.). Trochus (Tectus niloti-cus), green snail (Turbo marmoratus), clam shell, and shellfish occur only in Aneityum, and karong (Caranx spp.), pico (Siganus spp.), big bel (Para-luteres prionurus), red mouth (Lethrinus miniatus), and some species of crab are targeted particularly in Malekula. Lobsters (Panulirus penicillatus, P. ver-sicolor, Parribacus caledonicus), some of the most important income-producing resources, occur in Aneityum, Mangaliliu and Sunae. About 85% of the species targeted in Tassiriki are the same as those in Aneityum. Further, more than 80% of the target species in Mangaliliu were also identified in Sunae. Although Lelepa is close to Sunae, the similarity in species between them is less than that found elsewhere.
6.2. Fishing gear used
Table 12 shows the types of fishing gear used in target areas. Some respondents noted that several types of fishing gear are owned by a family, whereas in several communities of Malekula, and especially in Uri and Uripiv, families own fewer types. The
variety and number of gear items possessed by each household varies depending on the community.
The handline is the most common fishing gear used. More than 76% of households in Malekula use it, as do 85% of households in Aneityum and 75% in Efate. The second most common fishing gear is the spear gun, used by 49% of households in Ane-ityum and 63% in Efate. Gill nets are used by 20% of respondents in Malekula. Cast nets are uncommon in Efate and Aneityum, whereas in Malekula, 24% of the total number of cast net users live. Fish traps are not used anywhere.
Over 40% of all households in the target areas own a boat, but only about 7% of respondents in all tar-get areas own an outboard motor, a much lower rate than for fishing gear ownership. For instance, only 3 households out of 100 in Malekula own an out-board motor.
6.2.1. Current level of utilisation
Figure 1 indicates the average monthly fish catch volume by fishing ground in each target area. The total volume of monthly fish catch was the largest in Aneityum, at over 465 kg. At 350 kg, Crab Bay had the second largest volume. Both Lelepa and Mangaliliu, and Moso, in Efate, had a catch of 200 kg/month. Production in Uri and Uripiv was 155 kg/month, the lowest among all areas.
The main fishing area in Aneityum is located off-shore, although some fish are caught in the coastal area. According to MPA committee members, this is considered as fishing around or near the edge of a reef. Fish caught this way include snappers.
The fish catch trend in Crab Bay is similar to that of Aneityum. Barrick and TFC8, the main fishing com-munities in Crab Bay, have more significant catches than do villages in coastal areas. However, TFC depends more on reef resources than does Barrick, where more than half the catch is from outside the reefs (Fig. 2).
In Uri and Uripiv (Malekula), and Moso (Efate), fishing pressure on reefs fronting the community is high. In Moso, the catch volume from the reef is the highest among all areas. According to one commu-nity member, the majority of the reef fish harvest comprises shellfish taken mainly for consumption by the harvesting household.
A Community Workshop revealed high fishing pressure in the coastal areas of Lelepa and Mangal-iliu. Many people fish outside the traditional taboo area of their own community, which is usually in front of the village. However, some reportedly fish
18 SPC Traditional Marine Resource Management and Knowledge Information Bulletin #32 – December 2013
8 TFC refers to Terfick Company, although this name is rarely used. Instead, local people refer to the community as TFC.

19SPC Traditional Marine Resource Management and Knowledge Information Bulletin #32 – December 2013
Table 12. Quantity of boats, outboard engines (OBE) and fishing gear used in target areas.
Fishing gear
# of surveyed households
Own boats
Own OBE
Hand line
Spear gun
Gill net
Cast net
Fish trap
Malekula 84 30 1 76 19 28 20 0
Barrick 6 4 6 4 4 3 0
Bushman Bay 5 5 0 2 1 0
Hatbol 6
Limap 6
Lingarakh 11 11 11 9 9 10 0
Lo Sarsar 3 2 0 2 0 0
Lowni 4 2 1 4 0 1 0 0
Mapest 5 4 1 2 2 0
New Bush 5 5 1 2 0 0
Portidur 6 2 6 0 3 1 0
Tembimbi 6 2 5 0 0 1 0
Teremp 5 4 1 2 0 0
Tevaliant 6 4 0 1 0 0
TFC 5 4 4 2 0 1 0
Uri 5 5 5 0 0 0 0
Uripiv 16 12 2 11 1 0 1 0
Efate 40 20 4 30 25 9 1 0
Lelepa 14 9 4 12 6 1 0 0
Mangaliliu 12 3 12 10 6 1 0
Sunae 6 5 2 3 2 0 0
Tassiriki 8 3 4 6 0 0 0
Aneityum 39 12 6 33 19 8 5 0
Analcauhat 23 7 4 21 11 3 3 0
Port Patrick 8 5 2 8 6 5 2 0
Umetch 8 4 2 0 0 0
0 50
100 150 200 250 300 350
Aneityum
Malekula
(C
rab Bay)
Malekula
(Uri &
Urip
iv) Efate
(Moso
)Efate
(Lelepa &
Mangaliliu)
Reef in frontof the community
Coastal areas (within 3 miles)
O�shore areas(beyond 3 miles)
Catc
h (k
g)
Location
Figure 1. Monthly fish catch volume by fishing area.

in other communities’ taboo area. Some partici-pants pointed out that these violations have caused tension among the communities in this region.
6.3. Processing, marketing and pricing
As shown in Table 13, in the Efate and Malekula areas, most target communities sell their products in neighbouring communities, such as at the pub-lic markets in Port Vila and Lakatoro. No respond-ent sold fishery products to middlemen. At the workshop, participants assumed that people sold
their own products directly to local wholesalers or retailers. More detailed information was obtained through interviews with community members (Tables 14–19).
Fish processing is practically non-existent in the target sites. The only exception is Aneityum, where boiled lobster is sold to tourists visiting Mystery Island. Octopus, small pelagic finfish (bigeye scad and sardine), and shellfish harvested within the reef tend to be either consumed within the fisher-man’s household or used for bait, whereas bottom
20 SPC Traditional Marine Resource Management and Knowledge Information Bulletin #32 – December 2013
0
100
200
300
400
500
600
Barrick
Lowni
Mapest
New Bush
Tembim
bi TFC
Bushman Bay
Lingarakh
Lo Sarsar
Portidur
Teremp
Tevalia
nt
O�shore areas (beyond 3 miles)
Coastal areas (within 3 miles)
Reef in front of the community
Catc
h (k
g)
Location
Figure 2. Monthly fish catch volume in Crab Bay.
Table 13. Market channels for local fisheries and other products in target areas.
Overall Efate Malekula Aneityum
Agriculture Market in community 8 34.8% 1 25.0% 5 31.3% 2 50.0%
Market in neighbouring areas 15 65.2% 3 75.0% 10 62.5% 2 50.0%
Middlemen 11 47.8% 0 0.0% 10 62.5% 1 25.0%
Local stores/shops 4 17.4% 1 25.0% 2 12.5% 1 25.0%
Household consumption 7 30.4% 0 0.0% 5 31.3% 2 50.0%
Fisheries Market in community 9 39.1% 1 25.0% 5 31.3% 3 75.0%
Market in neighbouring areas 15 65.2% 4 100.0% 9 56.3% 2 50.0%
Middlemen 0 0.0% 0 0.0% 0 0.0% 0 0.0%
Local stores/shops 7 30.4% 0 0.0% 5 31.3% 2 50.0%
Household consumption 10 43.5% 1 25.0% 7 43.8% 2 50.0%
Livestock Market in community 10 43.5% 1 25.0% 7 43.8% 2 50.0%
Market in neighbouring areas 13 56.5% 2 50.0% 9 56.3% 2 50.0%
Middlemen 4 17.4% 0 0.0% 4 25.0% 0 0.0%
Local stores/shops 7 30.4% 1 25.0% 5 31.3% 1 25.0%
Household consumption 6 26.1% 1 25.0% 3 18.8% 2 50.0%

21SPC Traditional Marine Resource Management and Knowledge Information Bulletin #32 – December 2013
Table 14. Processing, marketing and pricing of marine species in Aneityum.
Species Processing Market channel Selling price Cost
Within reef
shellfish trochus none 100% sold to processors shell: VUV 300/kg Fuel 3 gallons per trip VUV 300/ litreEngine oil VUV 100/ 5 litre of fuelFishing hook 5-6 (VUV 70/ hook)Wire and rope VUV 200/m
giant clams none 100% household consumption
crustacean lobster boiled for tourists
90% sold to tourists 10% household consumption
AUD 20–50/ lobster
others octopus none 100% household consumption (and bait for fishing)
finfish mullet, blue fish none 50% sold household within community 50% household consumption
mullet: VUV 150/fish blue fish: VUV 800–1,000/fish
Outside reef
finfish (small pelagic)
mangroo, sardine
none 100% sold consumption (and bait for fishing)
mangroo: VUV 150/fish sardine: VUV 100/fish
finfish (large pelagic)
tuna, wahoo, marlin
none 95% sold within community 5% household consumption
VUV 400/kg
skipjack none 100% household consumption (and bait for fishing)
VUV 400/kg
finfish (bottom)
poulet, snapper none 90% sold within community 10% household consumption
VUV 400/kg
grouper none 95% sold within community 5% household consumption
VUV 400/kg
Note: VUV 100.00 = AUD 1.06 or USD 1.08 (31 August 2012)

22 SPC Traditional Marine Resource Management and Knowledge Information Bulletin #32 – December 2013
Table 15. Processing, marketing and pricing of marine species in Malekula.
Species Processing Market channel
Selling price Cost
in community in town
Within reef
shellfish giant clam (Natarai)
none 100% household consumption
Fuel 5–10 litres (VUV 250/litre)Bait VUV 500–1,000Transport VUV 1,000
crustacean lobster none 90% sold in town 10% household consumption
VUV 700/kg VUV 700/kg
others octopus none 40% sold in town 30% sold to nearby community 30% household consumption
VUV 300–700/ unit
VUV 350/kg
finfish rabbitfish, red mouth, mustash fish, mullet
none 50% sold in town 10% sold to nearby community 40% household consumption
VUV 300/kg VUV 250–350/kg
Outside reef
finfish (small pelagic)
mangroo none 70% sold to nearby community 30% household consumption
VUV 20–40/ fish
sardine none 10% sold to fishers for bait 90% household consumption
finfish (large pelagic)
skipjack none 90% sold in town 10% household consumption
VUV 250/kg VUV 250–300/kg
trevally none 10% sold in town 10% sold to nearby community 30% sold within community 50% household consumption
VUV 300/kg VUV 250–300/kg
finfish (bottom)
poulet none 90% sold in town 10% household consumption
VUV 300/kg VUV 400–500/kg
snapper none 90% sold in town 10% household consumption
VUV 300/kg VUV 350–450/kg
grouper none 70% sold in town 30% household consumption
VUV 300/kg VUV 250/kg
Note: VUV 100.00 = AUD 1.06 or USD 1.08 (31 August 2012)

23SPC Traditional Marine Resource Management and Knowledge Information Bulletin #32 – December 2013
Table 16. Processing, marketing and pricing of marine species in Sunae, Efate.
Species Processing Market channel
Selling price Cost
in community in town
Within reef
shellfish Food: VUV 300Ice: VUV 300Battery: VUV 400Transport (truck): VUV 1,000Fuel: VUV 360Market: VUV 400
crustacean lobster none 60% sold in town 40% household consumption
VUV 1,000/kg
others octopus none 30% sold in town 70% self-household consumption
VUV 1,000/kg
squid none 50% sold in town 50% self-household consumption
VUV 1,000/kg
finfish mustash fish, red mouth, mullet
none 90% sold in town 10% self-household consumption
VUV 500/kg
Outside reef
finfish (small pelagic)
mangroo none 90% sold in town 10% household consumption
VUV 200–300/kg VUV 500/kg
sardine none 20% sold within com-munity 80% household consumption
VUV 400/kg
finfish (large pelagic)
tuna, skipjack
none 60% sold to nearby com-munity 40% household consumption
VUV 600–700/kg
finfish (bottom)
poulet, snapper
none 100% sold to nearby restau-rant (Havannah)
VUV 800–1,000/kg
Note: VUV 100.00 = AUD 1.06 or USD 1.08 (31 August 2012)

24 SPC Traditional Marine Resource Management and Knowledge Information Bulletin #32 – December 2013
Table 17. Processing, marketing and pricing of marine species in Tassiriki, Efate.
Species Processing Market channel Selling price Cost
in community
in town
Within reef
shellfish none Ice: VUV 1,000Transport: VUV 1,500Market fee: VUV 400Boat fee: VUV 2,000Battery: VUV 800
crustacean none
others squid none 100% sold in town
VUV 1,500/kg
octopus none 100% sold in town
VUV 1,000/unit
finfish red mouth, mullet, blue fish
none 70% sold in town 10% sold within community 20% household consumption
VUV 300/kg VUV 500/kg
Outside reef
finfish (small pelagic)
mangroo none 70% sold in town 10% sold within community 20% household consumption
VUV 300/kg VUV 500/kg
sardine none 100% household consumption
finfish (large pelagic)
tuna, skipjack none not much catch
finfish (bottom)
poulet, snapper none not much catch
Note: VUV 100.00 = AUD 1.06 or USD 1.08 (31 August 2012)

25SPC Traditional Marine Resource Management and Knowledge Information Bulletin #32 – December 2013
Table 18. Processing, marketing, and pricing in Lelepa, Efate.
Species Processing Market channel Selling price Cost
in community
in town
Within reef
shellfish giant clam none 70% sold in town 30% household consumption
VUV 200/ piece of laplap
Transport: VUV 4,000Ice: VUV 1,000Battery: VUV 1,000Fuel: VUV 2,000Food and drink: VUV 400
crustacean none
others squid none not much catch
finfish blue fish, parrotfish
none 50% sold in town 30% sold within community 20% household consumption
VUV 300/kg VUV 600–700/kg
Outside reef
finfish (small pelagic)
sardine none 50% sold in town 50% household consumption
VUV 200/kg VUV 600/kg
mangroo none 40% sold in town 20% sold nearby community 40% household consumption
VUV 150/fish no information
finfish (large pelagic)
yellowfin tuna none 80% sold in town 20% household consumption
VUV 500–600/kg
VUV 1,000–1,500/kg
skipjack none 69% sold in town 20% sold to nearby com-munity 1% sold within community 10% household consumption
VUV 500–600/kg
VUV 1,000–1,500/kg
wahoo none 90% sold in town 10% household consumption
VUV 1,000–1,500/kg
finfish (bottom)
poulet none 80% sold in town 20% household consumption
VUV 500–600/kg
VUV 1,000–1,500/kg
Note: VUV 100.00 = AUD 1.06 or USD 1.08 (31 August 2012)

26 SPC Traditional Marine Resource Management and Knowledge Information Bulletin #32 – December 2013
Table 19. Processing, marketing and pricing of marine species in Mangaliliu, Efate.
Species Processing Market channel Selling price Cost
in community
in town
Within reef
shellfish none Transport: VUV 3,000Ice: VUV 1,000Battery: VUV 1,000Fuel: VUV 2,000Food and drink: VUV 400
crustacean lobster none 100% sold in town
VUV 1,000/kg
others squid none 80% sold in town 20% household consumption
VUV 300–350/kg
VUV 2,000/unit
octopus none 80% sold in town 20% household consumption
VUV 300–350/kg
VUV 450/kg
finfish blue fish none 80% sold in town 20% household consumption
VUV 300–350/kg
VUV 450/kg
Outside reef
finfish (small pelagic)
mangroo none 80% sold in town 20% household consumption
VUV 300–350/kg
VUV 450/kg
finfish (large pelagic)
tuna none 80% sold in town 20% household consumption
VUV 300–350/kg
VUV 600/kg (Bon Marché)
skipjack none 80% sold in town 20% household consumption
VUV 300–350/kg
VUV 500–700/fish
wahoo, dogtooth tuna
none 80% sold in town 20% household consumption
VUV 300–350/kg
VUV 600/kg
finfish (bottom)
poulet none 100% sold in town (inc. nearby restaurant)
VUV 600–800/kg
VUV 1,000/kg
snapper none 50% sold in town 50% household consumption
VUV 300–350/kg
VUV 450/kg (Bon Marche)
Note: VUV 100.00 = AUD 1.06 or USD 1.08 (31 August 2012)

finfish (poulet, snapper, grouper) and large pelagic finfish (tuna, wahoo) tend to be sold for cash.
7. Characteristics of fishing communities
According to the 2009 national census, the rural popula-tion of Vanuatu increased 20.6% between 1999 and 2008, thereby leading to an increased production and con-sumption of marine resources for household use. The results of the questionnaire-based surveys also show that the population increased between 2010 and 2012 in all 23 target communities, except Lowni and Mapest on Malekula.
Table 20 shows the number of communities with social infrastructures for education, health care and public trans-port. In Aneityum and Efate, primary schools and health posts (or clinics) exist in most target communities. However, irregularly operated boats are the only means of public transport for Aneityum. Most Malekula communities have good access to central towns although many lack a school.
7.1. Social characteristics
7.1.1. Equality in the target societies
To understand the gap in each community regarding participation in social activi-ties, project team members asked communities about the level of equality in education, property and land owner-ship, social status, generation, tensions between long-term settlers and newcomers, poli-tics, and religion (Table 21). Responses were scored as fol-lows and averaged by com-munity: 1 = not at all; 2 = somewhat; and 3 = very much so. Therefore, the higher the average score, the stronger the perceived existing inequity.
27SPC Traditional Marine Resource Management and Knowledge Information Bulletin #32 – December 2013
Table 20. Existence of social infrastructure in target communities.
Aneityum Malekula Efate Overall
Number of target communities 3 16 4 23
Primary school exists
Yes 3 5 3 11
No 0 10 1 11
Secondary school exists
Yes 1 1 0 2
No 2 13 4 19
Health post / clinic exists
Yes 3 7 3 13
No 0 8 1 9
Public transport available
every day 1 13 3 17
4–6 days/week 0 1 0 1
1–3 days/week 2 2 1 5
Source: Project baseline surveyNote: For some questions, total figures do not match the total number of target commu-
nities because some respondents did not answer the questions.
Table 21. Average scores regarding the gap in social activities.
Aneityum Malekula Efate
Crab Bay Uri and Uripiv Moso Lelepa and
Mangaliliu
Education 1.19 1.23 1.60 1.83 1.88
Property 1.64 1.59 1.50 1.83 2.12
Land 2.16 1.73 2.27 1.25 2.20
Social status 1.38 1.24 1.75 1.83 1.96
Generation 1.66 1.33 2.00 1.83 2.12
Ancient and new settlers 1.83 1.18 1.80 1.42 1.96
Political party 2.35 1.17 1.86 1.67 2.16
Religion 1.82 1.43 2.20 1.50 2.08
Total 12.21 9.47 12.78 11.66 14.4
Average 1.75 1.36 1.87 1.65 2.06
Source: Project baseline surveyNote: The answers “Not at all,” “Somewhat,” and “Very much” were given the scores of 1, 2,
and 3, respectively. The higher the score, the larger the gap.

Lelepa and Mangaliliu show relatively high scores in most areas. In contrast, the Crab Bay area shows generally lower scores. Land issues generate gaps in all communities except Moso, as do political issues in Aneityum, Lelepa and Mangaliliu.
7.1.2. Disputes in the community
As shown in Figure 3, disputes exist in each target community, with some 60% of interviewees answer-ing that their community experiences some dis-putes. The ratios in Aneityum, and Uri and Uripiv are high, whereas those in Crab Bay and Moso are relatively low.
In Aneityum, “the difference of clans”, which inter-viewees attributed to racism, is the most signifi-cant cause of dispute in the community (Fig. 4). In
contrast, the main cause of dispute in Uri, Uripiv, Lelepa and Mangaliliu is “division/no cooperation in the community (Fig. 5).
7.1.3. Participation in community activities
In all target areas, the majority of people answered that the willingness to participate in community activities is “high” or “average”. However, in Lelepa and Mangaliliu, the ratio for “high” is lower than other regions (Fig. 6).
Results also vary by community within a region. For example, Crab Bay, Lingarakh, Barrick, and Limap are considered suitable for community par-ticipatory activities, whereas Lowni and Tevaliant are not.
28 SPC Traditional Marine Resource Management and Knowledge Information Bulletin #32 – December 2013
72%
47%
68%
42%
60%
28%
53%
32%
58%
40%
0%
10%
20%
30%
40%
50%
60%
70%
80%
90%
100%
Aneityum Malekula(Crab Bay)
Malekula(Uri & Uripiv)
Efate(Moso)
Efate (Lelepa &
Mangaliliu)
No
Yes
Location
Perc
enta
ge o
f int
ervi
ewee
s
Figure 3. Perceptions about the existence of disputes in the community.

29SPC Traditional Marine Resource Management and Knowledge Information Bulletin #32 – December 2013
Racism 22%
Division / no cooperation
17%
Quarrel / dispute
8% Contraveningcommunity
rules or regulations6%
Others 19%
No disputes 28%
Not able to express
one's opinion10%
Others 21%
No disputes
32%
Uri and Uripiv
Family issues 12% Others
24%
No
disputes 40%
Division / no cooperation
37%
Lelepa and Mangaliliu
Division / no cooperation
24%
0%
10%
20%
30%
40%
50%
60%
70%
80%
90%
100%
No data
5. Very high
4. High
3. Average
2. Low
1. Very low
Aneityum Malekula(Crab Bay)
Malekula(Uri & Uripiv)
Efate(Moso)
Efate (Lelepa &
Mangaliliu)
Location
Perc
enta
ge o
f int
ervi
ewee
s
Figure 4. Causes of disputes in Aneityum.
Figure 5. Causes of disputes in Uri and Uripiv, and Lelepa and Mangaliliu.
Figure 6. Willingness to participate in community activities.
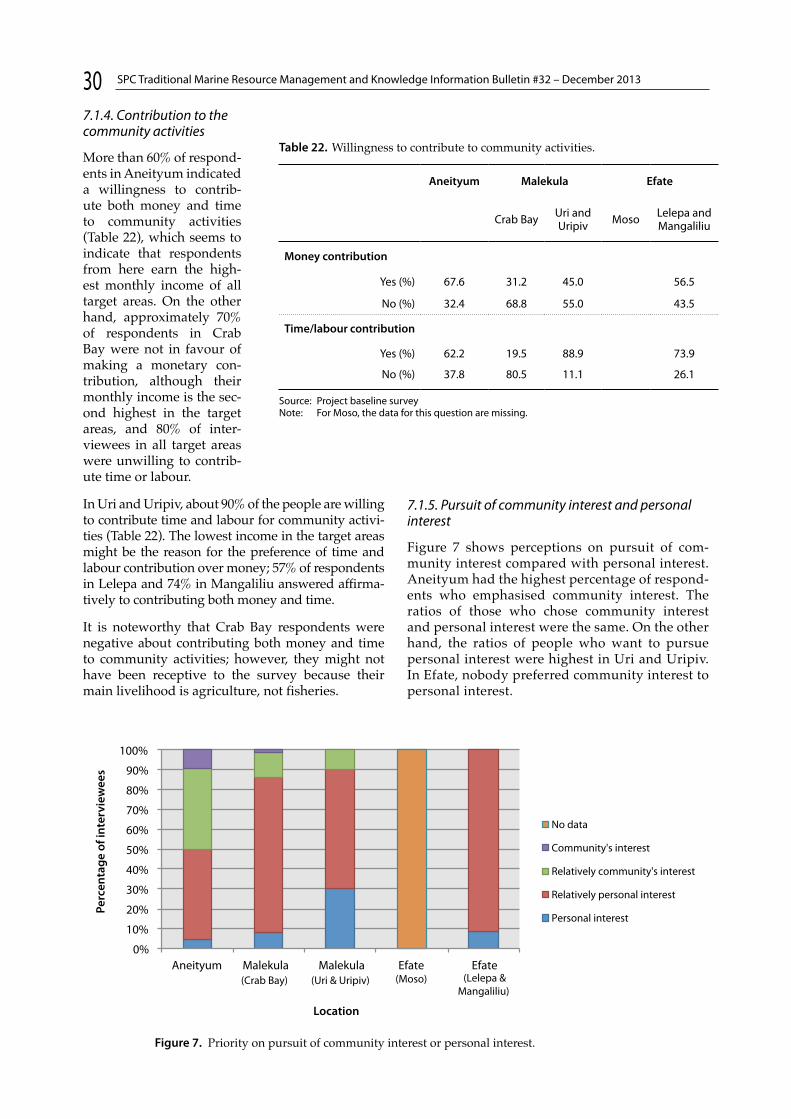
7.1.4. Contribution to the community activities
More than 60% of respond-ents in Aneityum indicated a willingness to contrib-ute both money and time to community activities (Table 22), which seems to indicate that respondents from here earn the high-est monthly income of all target areas. On the other hand, approximately 70% of respondents in Crab Bay were not in favour of making a monetary con-tribution, although their monthly income is the sec-ond highest in the target areas, and 80% of inter-viewees in all target areas were unwilling to contrib-ute time or labour.
In Uri and Uripiv, about 90% of the people are willing to contribute time and labour for community activi-ties (Table 22). The lowest income in the target areas might be the reason for the preference of time and labour contribution over money; 57% of respondents in Lelepa and 74% in Mangaliliu answered affirma-tively to contributing both money and time.
It is noteworthy that Crab Bay respondents were negative about contributing both money and time to community activities; however, they might not have been receptive to the survey because their main livelihood is agriculture, not fisheries.
7.1.5. Pursuit of community interest and personal interest
Figure 7 shows perceptions on pursuit of com-munity interest compared with personal interest. Aneityum had the highest percentage of respond-ents who emphasised community interest. The ratios of those who chose community interest and personal interest were the same. On the other hand, the ratios of people who want to pursue personal interest were highest in Uri and Uripiv. In Efate, nobody preferred community interest to personal interest.
30 SPC Traditional Marine Resource Management and Knowledge Information Bulletin #32 – December 2013
0%
10%
20%
30%
40%
50%
60%
70%
80%
90%
100%
No data
Community's interest
Relatively community's interest
Relatively personal interest
Personal interest
Aneityum Malekula(Crab Bay)
Malekula(Uri & Uripiv)
Efate(Moso)
Efate (Lelepa &
Mangaliliu)
Location
Perc
enta
ge o
f int
ervi
ewee
s
Table 22. Willingness to contribute to community activities.
Aneityum Malekula Efate
Crab Bay Uri and Uripiv Moso Lelepa and
Mangaliliu
Money contribution
Yes (%) 67.6 31.2 45.0 56.5
No (%) 32.4 68.8 55.0 43.5
Time/labour contribution
Yes (%) 62.2 19.5 88.9 73.9
No (%) 37.8 80.5 11.1 26.1
Source: Project baseline surveyNote: For Moso, the data for this question are missing.
Figure 7. Priority on pursuit of community interest or personal interest.

7.1.6. Purposes and proportion of production (subsistence vs commercial)
The survey revealed that the purpose of production varies significantly, depending on species. Crus-taceans (lobster) and large pelagic fish (e.g. tuna, wahoo, marlin) are sold to generate cash income, whereas, small pelagic fish (such as sardine and big-eye scad) and shellfish (giant clams) tend to be con-sumed in the producing household. Small pelagic fish are also used as bait (see above, Tables 13–19).
7.1.7. Economic performance of fishing operations
Table 23 shows the cost of fishing operations for each target site. The main costs are fuel, engine lubricants and transport, and the average total operational cost is approximately VUV 5,000.9 Fish prices vary from around VUV 300–1,000/kg, depending on the
site and species. A single fishing operation needs to yield 5–19 kg of fish just to cover operational costs. However, only a very small percentage of house-holds have their own outboard engine (see Table 12). Tables 14–18 show that community members catch some species mainly for household consump-tion. In such cases no transport costs are incurred.
7.2. Types of livelihood engaged in by fishing communities
7.2.1. Livelihood condition in target communities
About 60% of respondents in the target communi-ties said that their “livelihood condition” is above average, whereas about 30% answered that their livelihood condition had remained at the average level. More than 80% felt that their livelihood condi-tion had improved (Table 24).
31SPC Traditional Marine Resource Management and Knowledge Information Bulletin #32 – December 2013
Table 23. Cost of fishing operations (in VUV).
Aneityum Malekula Mangaliliu Lelepa Tassiriki Sunae Average
Fuel 1,140 1,875 2,000 2,000 0 360 1,229
Lubricants 1,000 0 0 0 0 0 167
Battery 0 0 1,000 1,000 800 400 533
Fishing hook 385 0 0 0 0 0 64
Bait 0 750 0 0 0 0 125
Transport 0 1,000 3,000 4,000 3,500 1,000 2,083
Market fee 0 0 0 0 400 400 133
Ice 0 0 1,000 1,000 1,000 300 550
Food and drink 0 0 400 400 0 0 133
Total 2,525 3,625 7,400 8,400 5,700 2,460 5,018
Source: Project baseline survey
Table 24. Livelihood condition in target communities.
Aneityum Malekula Efate Overall # (%) # (%) # (%) # (%)
Current livelihood condition
Better than average 0 (0.0) 12 (75.0) 3 (75.0) 15 (65.2)
Average 3 (100.0) 4 (25.0) 1 (25.0) 8 (34.8)
Worse than average 0 (0.0) 0 (0.0) 0 (0.0) 0 (0.0)
Total 3 (100.0) 16 (100.0) 4 (100.0) 23 (100.0)
Change in livelihood condition
Improved 3 (100.0) 14 (87.5) 2 (50.0) 19 (82.6)
Unchanged 0 (0.0) 0 (0.0) 2 (50.0) 2 (8.7)
Worsened 0 (0.0) 2 (12.5) 0 (0.0) 2 (8.7)
Total 3 (100.0) 16 (100.0) 4 (100.0) 23 (100.0)
Source: Project baseline survey
9 The rate of exchange for the ni-Vanuatu vatu (VUV) on 31 August 2012 was VUV 100.00 = AUD 1.06 or USD 1.08.

In the target communities, men gen-erally ranked agriculture as their first priority economic activity, and fisher-ies as second (Table 25). However, in the Efate area fisheries were ranked as being more important than agriculture, and in the Aneityum area tourism was ranked second, following agriculture. For women, agriculture tends to be the primary economic activity in the target communities, and they ranked fisheries lower than men did. In Efate, handicraft/catering is the second most important economic activity for women after agriculture, and in the Aneityum area, tourism is the most important eco-nomic activity for women.
Table 26 shows the main products of the agriculture, fisheries and livestock sectors in the target communities. (For fisheries products see Appendix 2.) Each target community produces various primary sector products, and although there is a range of products, there is little difference among the tar-get areas. In recent years the production of agricultural, fisheries and livestock has increased in most communities.
7.2.2. Income from fishing and other activities
Table 27 shows average monthly income by economic activity and target area. With approximately VUV 108,500, Aneityum has the highest monthly average income among the target areas. Its main income is derived from tour-ism, which amounts to approximately VUV 27,500 per month. The income of
32 SPC Traditional Marine Resource Management and Knowledge Information Bulletin #32 – December 2013
Table 25. Priority on economic activities by gender in target areas.
Average score
Economic activities Aneityum Malekula Efate Overall
Men
Agriculture 2.00 2.88 2.00 2.61
Fisheries 1.00 1.00 2.50 1.26
Forestry 1.00 1.00 0.30
Tourism 1.67 0.50 0.30
Livestock 0.33 0.25 0.22
Marketing 0.13 0.09
Women
Agriculture 2.00 2.25 2.00 2.17
Marketing 1.50 0.50 1.13
Handicraft / Catering 0.33 0.31 1.75 0.57
Fisheries 0.33 0.44 0.50 0.43
Tourism 3.00 0.39
Livestock 0.33 0.25 0.22
Church 0.13 0.17
Forestry 0.25 0.04
Source: Project baseline surveyNote: The ranks of economic activities are quantified as scores as follows:
First-ranked economic activity: 3.0; second-ranked, 2.0; third-ranked, 1.0
Table 26. Main agricultural and livestock products in target areas.
Aneityum Malekula Efate
Agriculture Vegetable, kava, taro, vanilla, cof-fee, pepper
Vegetable, taro, manioc, yam, banana, coco-nuts, fuelwood,copra, cocoa
Vegetable, manioc, yam, banana, coco-nuts, fuelwood
Livestock Pig, chicken, cow
Pig, chicken, foal, cow, goat
Pig, chicken, foal, cow
Source: Project baseline survey
Table 27. Average monthly income by region.
Aneityum Malekula Efate
Crab Bay Uri and Uripiv Moso Lelepa and Mangaliliu
vatu (%) vatu (%) vatu (%) vatu (%) vatu (%)
Fisheries 13,179 (12.1) 8,914 (9.2) 3,412 (17.0) 9,100 (22.9) 11,190 (21.5)
Agriculture 12,080 (11.1) 17,235 (17.8) 2,938 (14.7) 8,318 (20.9) 5,100 (9.8)
Livestock 9,125 (8.4) 8,583 (8.9) 7,250 (13.9)
Tourism 27,467 (25.3) 8,750 (22.0) 14,125 (27.1)
Remittance 10,000 (9.2) 37,333 (38.6)
Others 36,667 (33.8) 24,692 (25.5) 13,667 (68.3) 13,600 (34.2) 14,375 (27.6)
Total 108,518 (100.0) 96,757 (100.0) 20,017 (100.0) 39,768 (100.0) 52,040 (100.0)
Note: The vatu (VUV) 100.00 = AUD 1.06 or USD 1.08 (31 August 2012)

approximately VUV 36,500 in the “others” category is composed mainly of wages related to public ser-vice, and sales of boat fuel.
Crab Bay recorded the second highest monthly income at approximately VUV 97,000, although about 65% of this is categorised as “remittance” and “others.” According to discussions with Amal-Crab Bay MPA committee members, these are mostly wages earned by working in plantations. Agricul-ture is the other main source of livelihood in Crab Bay, based mainly on coconut and cacao. In con-trast, only a few communities depend on fisheries. As shown in Figure 8, income from fisheries is rela-tively important in Barrick and TFC.
The monthly income of villagers in Uri and Uripiv is the lowest among the target areas, and is less than 20% of that of Aneityum. Almost 70% of the total monthly income is categorised as “others” because one respondent classified their spouse’s VUV 58,000/month income as “others.” In Uri and Uripiv, “other” income sources consist mainly of salaries received by civil servants or shopkeepers. If this amount is excluded, the average monthly income in Uri and Uripiv as a whole is approxi-mately VUV 11,000. Given this low cash income, livelihoods in Uri and Uripiv exist at a subsistence economic level.
Livelihoods in Moso are similar to those of Lelepa and Mangaliliu. However, the people of Lelepa and
Mangaliliu are engaged in livestock raising, and their monthly income is approximately VUV 7,000. In Lelepa and Mangaliliu the portion of income derived from agriculture is less than that of Moso. In neither area do people rely on remittances, and the income categorised as “others” comes mainly from the sale of fuelwood. As shown in Figure 8, tourism is a key means of livelihood in Efate, which is close to Port Vila, the capital.
7.2.3. Seasonality of fishing and other livelihoods
As shown in the fish calendars (Appendix 2), fishing activities in the target areas differ by predominant species as well as according to climate and marine environmental factors such as tide. In all areas, fishing activities generally become more frequent and varied from May to September. In Aneityum as well, during the period May–November, fishing peaks for particular species. For example, octopus is caught only from May through July, although it occurs throughout the year in other areas. On the other hand, from December to April or May, only half of the species in the area can be found, although the remainder are available all year. The variety of species found in Tassiriki and Mangaliliu (Efate) is less than that of Aneityum. However, the seasonal trend of fishing activities is similar to that of Ane-ityum, although the locations where these fishing methods are practiced differ by island. From June to September, all species that occur in those areas are targeted. Winter in Lelepa — July through
33SPC Traditional Marine Resource Management and Knowledge Information Bulletin #32 – December 2013
0
20,000
40,000
60,000
80,000
100,000
120,000
140,000
Barrick
Limap
Lowni
Mapes
t
New B
ush
Tembim
bi TFC
Bushm
an B
ay
Hatbol
Linga
rakh
Lo S
arsar
Portidu
r
Terem
p
Teva
liant
Other
Remittance
Tourism
Livestock
Agriculture
Fisheries
Mon
thly
inco
me
(VU
V)
Location
Figure 8. Components of average monthly income in Crab Bay.

September — is the peak fishing season for small pelagic fish, particularly sardines.
Many species occur over the course of a year in Sunae and Malekula without identifiable peaks for fishing. However, yellowfin tuna and skipjack tuna occur only from March through May in Malekula.
In addition to fishing, most people in the target communities engage in agriculture, producing mostly taro, cassava and banana. Except for Crab Bay, where agricultural production is the main livelihood activity, farming is for household sub-sistence. The seasons for agricultural and fisheries activities are not clearly distinguished in any of the target communities.
8. Awareness of the importance of coastal resource management
8.1. Level of awareness by community
The overall trend of each community regarding its perception with respect to CBCRM is shown in Table 28. (The values in the table indicate the aver-age score for each question; the higher the aver-age score, the more positive the perception.) The results for Aneityum are contrary to those of Crab Bay. Many respondents in both regions recognise an increase of resources in coastal areas. However,
their perception regarding CBCRM is nearly dia-metrically opposite, with most respondents in Aneityum having relatively negative perceptions, whereas those in Crab Bay are more positive.
A CBCRM plan establishes rules and regulations for the use of fisheries resources, including a pro-hibition on fishing within a community MPA. It is important to identify the degree of understanding of community members in the target areas regard-ing resource use rules stipulated in resource man-agement plans. This should make it possible to adopt appropriate strategy for raising awareness.
Nearly 70% of respondents in Crab Bay (Malekula) answered that they “completely understand” the resource management plan. This is the highest percentage among all target areas. If those who responded “understand some” are included, almost 100% of respondents had at least some under-standing of the resource management plan. (Only 1 respondent out of 124 in Crab Bay responded that he/she does “... not understand at all” the resource management plan.) In contrast, only 26% of interviewees in Uri and Uripiv, both of whom are members of the Resource Management Com-mittee, replied that they “completely understand” the resource management plan. In Aneityum, 35% of respondents answered “do not understand at
34 SPC Traditional Marine Resource Management and Knowledge Information Bulletin #32 – December 2013
Table 28. Trends in community members’ recognition, interest and opinions on community-based coastal resource management.
Aneityum Malekula Efate Average
Crab Bay Uri and Uripiv Moso Lelepa and
Mangalilu
Recognition on the resource condition *2 4.28 4.76 3.48 1.75 3.19 3.49
Level of understanding of the Resource Management Plan *3 2.16 3.51 2.91 2.33 3.06 2.80
Opinion regarding the Resource Manage-ment Plan *4 3.46 3.84 3.41 3.97 3.54 3.64
Frequency of participation in CBCRM *5 1.81 1.96 2.15 1.09 2.31 1.86
Compliance with MPA *6 3.68 4.59 4.09 4.41 4.13 4.18
Change in fishing activities *7 1.87 1.74 2.00 1.42 1.97 1.80
Opinions on MPA *8 2.16 2.90 2.43 2.45 2.46 2.48
Source: Project baseline surveyNote: The figures in the table indicate the average score for each question; the higher the average score, the more positive the perception.These values are calculated based on the following answers: *2 1: Still much decreased; 2: Somewhat decreased; 3: Remained the same; 4: Somewhat increased; 5: Much increased*3 1: Do not understand at all; 2: Understand a little; 3: Somewhat understand; 4: Completely understand*4 1: Not appropriate; 2: A little appropriate; 3: Somewhat appropriate; 4: Very appropriate*5 1: None; 2: Once or twice; 3: Three to four times; 4: More than five times*6 1: The entire community fails to comply; 2: The majority of the community members do not comply; 3: About a half of the community
members comply; 4: The majority of the community members comply; 5: The entire community complies*7 1: No change; 2: Somewhat reduced*8 1: I do not need the taboo area; 2: Partial openings should be allowed; 3: Taboo areas should be protected continuously

all” when asked about the resource management plan. On Efate, 18% of respondents in Moso and 3% in Lelepa and Mangaliliu said that they “do not understand at all” the resource management plan (Fig. 9). These results must be analysed, taking into account the differences by community, gender and age, and then reflected in the review of the existing resource management plan.
Overall, most respondents indicated that they agree with the existing resource management plan. However, there are differences among communi-ties. More than 85% of respondents from Crab Bay and from Moso, answered that they “very much”
appreciate the existing resource management plan. Elsewhere, as in Aneityum, Uri and Uripiv, Lelepa and Mangaliliu, 26–44% of interviewees responded that they appreciate it, and a small percentage of the interviewees responded that they do not appre-ciate it. Negative opinions were expressed only in Lelepa. For reviewing the existing resource man-agement plan, it is important to analyse these nega-tive opinions (Fig. 10).
Although current resource management activi-ties are limited to relatively simple ones, such as meetings and cleaning beaches, the frequency of participation may indicate community members’
35SPC Traditional Marine Resource Management and Knowledge Information Bulletin #32 – December 2013
29% 44% 26%
67%
86%
56%
97%
70%
0%
10%
20%
30%
40%
50%
60%
70%
80%
90%
100%
Very appropriate
Somehow appropriate
Not appropriate
Aneityum Malekula(Crab Bay)
Malekula(Uri & Uripiv)
Efate(Moso)
Efate (Lelepa &
Mangaliliu)
Location
Perc
enta
ge o
f int
ervi
ewee
s
52%
26% 21%
91%
39%
23%
56% 61%
9%
18%
16% 14%
18%
9% 4% 18%
26%
0%
10%
20%
30%
40%
50%
60%
70%
80%
90%
100%
More than �ve times
Three–four times
Once or twice
None
Aneityum Malekula(Crab Bay)
Malekula(Uri & Uripiv)
Efate(Moso)
Efate (Lelepa &
Mangaliliu)
Location
Perc
enta
ge o
f int
ervi
ewee
s
Figure 9. Level of understanding of the Resource Management Plan by community.
Figure 10. Opinions on the Resource Management Plan by community.

interest in resource management. About 44% of respondents in Lelepa and Mangaliliu, and 9% in Moso answered that they have participated in resource management activities more than three times per year. These represent the highest and lowest percentages among the communities sur-veyed (Fig. 11).
Nearly 70% of respondents in Crab Bay and 56% in Moso answered that the whole community wants to keep the resource management plan, which indicates a relatively high level of compliance. In contrast, only 11% of respondents in Aneityum answered that the whole community wants to keep
the resource management plan, indicating a poten-tially low level of compliance (Fig. 11).
In Crab Bay, 91% of respondents answered that the MPA (taboo area) should be protected. Similar per-centages were found percentage in Uri and Uripiv (Malekula), and in Moso, Lelepa and Mangaliliu (Efate), who said that MPA should be protected and it should be opened partially (e.g. for a certain period of time, for a certain area, or for certain spe-cies). In Aneityum, 84% of respondents answered that the MPA should be opened partially (Fig. 12). To strengthen CBCRM, the differences among com-munities in terms of resource condition, opinions
36 SPC Traditional Marine Resource Management and Knowledge Information Bulletin #32 – December 2013
35%
18%
45%
31%
71%
70%
53%
20%
69%
26% 12%
44%
0%
10%
20%
30%
40%
50%
60%
70%
80%
90%
100%
Completely understand
Understand some
Don’t understand at all
Aneityum Malekula(Crab Bay)
Malekula(Uri & Uripiv)
Efate(Moso)
Efate (Lelepa &
Mangaliliu)
Location
Perc
enta
ge o
f int
ervi
ewee
s
13%
30%
10% 16% 26%
54%
20%
47%
28%
35%
11%
69%
38%
56%
39%
0%
10%
20%
30%
40%
50%
60%
70%
80%
90%
100%
The whole community complies
The majority of the community complies
About a half of community complies
The majority of community does not comply
The whole community does not comply at all
Aneityum Malekula(Crab Bay)
Malekula(Uri & Uripiv)
Efate(Moso)
Efate (Lelepa &
Mangaliliu)
Location
Perc
enta
ge o
f int
ervi
ewee
s
Figure 11. Frequency of participation in community-based coastal resource management by community in last year.
Figure 12. Compliance with marine protected areas by community.

of community members, and strength of existing organisations should all be taken into account. In Aneityum, where fisheries resources remain healthy and where the target community is well organised, it may be appropriate to change CBCRM activities from a total ban on fishing within the MPA to allow-ing some use of resources (Fig. 13).
8.2. Level of awareness of CBCRM by different social groups
Because the baseline survey did not differentiate the level of awareness by different social groups, it was necessary to conduct an additional question-naire survey, which is summarised in Table 29.
There is a marked gap between decision makers and non-decision makers regarding their understanding of the CBCRM plan, with the latter tending to have a poorer understanding of it. Most interviewees (non-decision makers) in Aneityum do not under-stand the plan, whereas most of those (also non-decision makers) in Malekula responded that they understood only the taboo area, but not the entire plan. Regardless of this gap in understanding, both decision makers and non-decision makers seem to consistently appreciate and accept the CBCRM plan and the change in fishing activities that it requires.
In terms of the level of understanding of the resource management plan by gender, 27% of male
and 32% of female respondents were clearly nega-tive towards the plan, whereas 42% of male and 20% of female respondents answered that they “completely understand” the plan (Fig. 14).
Compared with other groups, those 30–45 years old hold more negative opinions on the existing resource management plan (Fig. 15). This trend is especially clear in Aneityum (Fig. 16), Lelepa and Mangaliliu (Fig. 17). In Uri and Uripiv, however, younger age groups have more negative opinions (Fig. 18).
This could be because the 30–45 age group needs more cash income and food for their families than do other groups, thus it is important to provide alternative sources of income or food along with resource management. Younger age groups are critical for resource management in the future, so awareness-raising activities may need to be con-ducted in cooperation with youth groups, which exist in almost all communities.
9. Institutional structure
Existing management bodies and their functions, local processes of consultation and decision-making (consensus building), social systems and organisa-tions to support CBCRM, and supporting services and activities provided by public institutions (VFD and others), donors and NGOs are summarised for each site in Tables 30–37.
37SPC Traditional Marine Resource Management and Knowledge Information Bulletin #32 – December 2013
84%
9%
57% 55% 54%
16%
91%
43% 45% 46%
0%
10%
20%
30%
40%
50%
60%
70%
80%
90%
100%
The taboo areas should be protected continuously
Partial openinigs should be allowed
I don't need the taboo area
Aneityum Malekula(Crab Bay)
Malekula(Uri & Uripiv)
Efate(Moso)
Efate (Lelepa &
Mangaliliu)
Location
Perc
enta
ge o
f int
ervi
ewee
s
Figure 13. Opinions on marine protected areas by community.

38 SPC Traditional Marine Resource Management and Knowledge Information Bulletin #32 – December 2013
Table 29:. Level of awareness of community-based coastal resource management (CBCRM) by social group.
Aneityum Malekula Efate
Crab Bay Uri and Uripiv
Mangaliliu Lelepa Tassiriki Sunae
D
ecis
ion
mak
er
Non
dec
isio
n m
aker
Dec
isio
n m
aker
Non
dec
isio
n m
aker
Dec
isio
n m
aker
Non
dec
isio
n m
aker
Dec
isio
n m
aker
Non
dec
isio
n m
aker
Dec
isio
n m
aker
Non
dec
isio
n m
aker
Dec
isio
n m
aker
Non
dec
isio
n m
aker
Dec
isio
n m
aker
Non
dec
isio
n m
aker
5 20 5 25 5 25 6 10 5 10 5 10
Understanding of CBCRM plan
Yes 4 2 4 16 4 9 4 8 5 10 5 9
understand only taboo 0 3 1 9 1 16 0 0 0 0 0 1
No 1 15 0 0 0 0 2 2 0 0 0 0
Acceptance of CBCRM plan
Yes 5 19 5 25 5 23 3 10 5 10 5 10
No 0 1 0 0 0 2 3 0 0 0 0 0
impossible to decide 0 0 0 0 0 0 0 0 0 0 0 0
Appreciation of CBCRM plan
Yes 5 19 5 23 5 25 4 10 5 9 5 10
Yes, a little 0 0 0 0 0 0 2 0 0 1 0 0
No 0 1 0 2 0 0 0 0 0 0 0 0
Change in fishing activities
avoid catching small size fish 2 3 4 14 0 4 0 0 0 0 0 1
avoid catching certain kinds of fish 2 13 0 0 4 11 0 0 4 9 5 9
reduce the fishing time 1 1 0 11 1 0 3 5 1 1 0 0
reduce the amount of catch 0 1 1 0 0 10 2 5 0 0 0 0
others 0 2 0 0 0 0 1 0 0 0 0 0
Desire to keep taboo
should be protected continuously 2 7 5 20 1 11 4 8 5 8 4 9
should be opened at certain periods 3 13 0 0 4 14 2 2 0 1 1 1
a part of taboo should be opened 0 0 0 0 0 0 0 0 0 1 1 1
Source: Project baseline survey
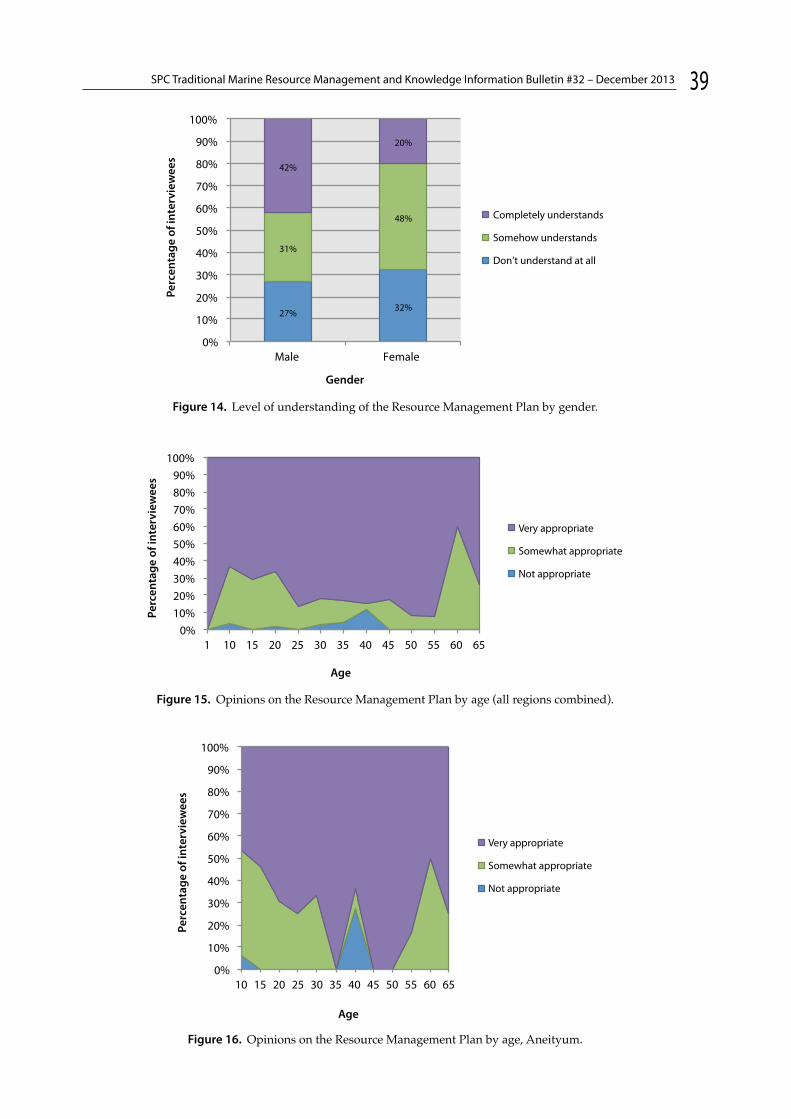
39SPC Traditional Marine Resource Management and Knowledge Information Bulletin #32 – December 2013
27% 32%
31%
48%
42%
20%
0%
10%
20%
30%
40%
50%
60%
70%
80%
90%
100%
Male Female
Completely understands
Somehow understands
Don’t understand at all
Perc
enta
ge o
f int
ervi
ewee
s
Gender
0% 10% 20% 30% 40% 50% 60% 70% 80% 90%
100%
1 10 15 20 25 30 35 40 45 50 55 60 65
Very appropriate
Somewhat appropriate
Not appropriate
Age
Perc
enta
ge o
f int
ervi
ewee
s
0%
10%
20%
30%
40%
50%
60%
70%
80%
90%
100%
10 15 20 25 30 35 40 45 50 55 60 65
Very appropriate
Somewhat appropriate
Not appropriate
Age
Perc
enta
ge o
f int
ervi
ewee
s
Figure 14. Level of understanding of the Resource Management Plan by gender.
Figure 15. Opinions on the Resource Management Plan by age (all regions combined).
Figure 16. Opinions on the Resource Management Plan by age, Aneityum.

40 SPC Traditional Marine Resource Management and Knowledge Information Bulletin #32 – December 2013
0%
10%
20%
30%
40%
50%
60%
70%
80%
90%
100%
10 15 20 25 30 35 40 45 50 55 60 65
Very appropriate
Somewhat appropriate
Not appropriate
Age
Perc
enta
ge o
f int
ervi
ewee
s
0%
10%
20%
30%
40%
50%
60%
70%
80%
90%
100%
10 15 20 25 30 35 45 55 60
Very appropriate
Somewhat appropriate
Not appropriate
Age
Perc
enta
ge o
f int
ervi
ewee
s
6%
50%
10% 7%
18%
38%
37%
6%
27%
6%
37%
17%
18%
13%
18%
50%
80%
30% 29%
0%
10%
20%
30%
40%
50%
60%
70%
80%
90%
100%
Much increased
Somewhat increased
Remains the same
Somewhat decreased
Still much decreased
Aneityum Malekula(Crab Bay)
Malekula(Uri & Uripiv)
Efate(Moso)
Efate (Lelepa &
Mangaliliu)
Location
Perc
enta
ge o
f int
ervi
ewee
s
Figure 14. Level of understanding of the Resource Management Plan by gender.
Figure 15. Opinions on the Resource Management Plan by age (all regions combined).
Figure 16. Opinions on the Resource Management Plan by age, Aneityum.

Table 30. Institutional arrangements in Aneityum.
Resource management (access) committee/ Taboo area committee
Members Chairman (1), Vice chairman (1), Secretary (1), Treasurer (1)
Founded in: 2007 (MPA was set in 2001)
No. of members: 6 members (6 tribes)
Yearly budget Mystery Island Tourism Association offers operational fund (VUV 50–60,000 every month)
Current activities and their frequency
Irregular meeting (depend on agenda) Reef check (twice a year) Coral planting Fish feeding Giant clam and trochus farming Monitoring in marine protected area (MPA) and around the areas Awareness of coastal resource in community Tours in MPA for tourists
Supporting organizations and systems
Wan Smol Bag Theatre FSPV/FSPI (Foundation for People for South Pacific Vanuatu International) French Institute of Research for Development, Vanuatu Fisheries Department, Department of Forestry, Japan International Cooperation Agency (Grace of the Sea)
Remarks
Decision-making and announcement processThe committee meeting makes any decisions regarding operation and activities. Usual three staff members do not attend the committee meeting. They work according to the decision of the committee meeting. The committee comprises the representa-tives of only 6 tribes, even though there are 15 tribes living in the Analcauhat area.
Table 31. Institutional arrangements in Malekula (Crab Bay).
Resource management committee
Members Total 18 membersOne representative each from 16 communities. Plus one extra from Uripiv and LingarakhBoard members consist of the Chair (Lingarakh rep.), Secretary (Barrick rep.), Executive (Portindur rep.) plus Mr Kevin from VFD.
Founded in: 2002
No. of members: Total 18 members
Yearly budget VUV 300,000/year planned in 2012. However, income (by fundraising) has not been realized as planned. The committee has VUV 114,000 deposit.
Current activities and their frequency
Education Clean up – this year education and clean-up activities do not take place because there is no fund from the provincial government.Data collection on crab – every month data is collected. Reef check (finished) – done in 2008 but not realised since then.Kava night – realised only during MESCAR project for 2 weeks. Not realized since then.Turtle monitoring – there are turtle monitors but they don’t seem to be active.Regular meeting – it used to be every month but reduced to 4 times in 2011, and 4 times (planned) in 2012.
Supporting organizations and systems
Department of Fisheries, Department of Forestry, Environmental department, Malampa Pro-vincial government, Wan Smol Bag, Japan International Cooperation Agency, TEVUV (Technical Vocational Education Training), Fish market in Lakatoro
Remarks Main concern before was monitoring. Now it is socioeconomic development and awareness raising. The committee wants to build water system with bathroom and toilet in Crab Bay. Water is avail-able in MAPEST. From MAPEST to Crab Bay the distance is 3 km. The cost for installing the water pipe is around VUV 1 million.
Decision-making and announcement process1. Executive makes agenda and calls the meeting.2. In the meeting, participants discuss the agenda (18 committee members).3. After the discussion, chairman makes decision.4. Chairman confirms the decision with all the members (especially those who were absent in the meeting).
41SPC Traditional Marine Resource Management and Knowledge Information Bulletin #32 – December 2013

Table 32. Institutional arrangements in Malekula (Uri).
Resource management (access) committee / Taboo area committee
Members 4 in each committee
Founded in: 1994
No. of members: 4 in each committee
Yearly budget Up to 10,000
Current activities and their frequency
Monitoring in every 2 years Tour guide for yachts (4–5 yachts per year) Fee collection for fishing in the access area, VUV 500–1,000 per full day fishing for selling fish. If it is only for self-consumption, no fee.
Supporting organizations and systems
Japan International Cooperation Agency, Vanuatu Fisheries Department, Turtle monitor
Remarks
Decision-making and announcement process
1. Discussion within the committee2. Chairman decides based on the discussion3. Chairman announces the decision to the community
Table 33. Institutional arrangements in Malekula (Uripiv).
Resource management committee
Members No resource management committee exists in Uripiv
Founded in:
No. of members:
Yearly budget
Current activities and their frequency
Trochus and green snail release (conducted by Grace of the Sea Phase II)
Supporting organizations and systems
Japan International Cooperation Agency, Vanuatu Fisheries Department
Remarks
Decision-making and announcement process
Owner’s family members decides by themselves on the use of the reef (such as taboo or fines against the violation of taboo)
42 SPC Traditional Marine Resource Management and Knowledge Information Bulletin #32 – December 2013

Table 34. Institutional arrangements in Mangaliliu.
Resource management committee
Members President (1), Secretary (1), Treasurer (1), Members (3)
Founded in: 2006
No. of members: 6
Yearly budget None
Current activities i) Resource monitoring (mainly shell fish) ii) Collaboration with Vanuatu Fisheries Department (VFD)
Frequency of the activities i) not very active, irregular ii) only when there is any projects or specific activities
Supporting organizations and systems
VFD, Japan International Cooperation Agency, Peace Corps, Wan Smol Bag, Vanua Tai (turtle monitor), French Institute of Research for Development
Remarks Resource management committee considers that• legal support is needed for marine protected area (MPA);• management is necessary for not only current target species but also other species;• resources are decreasing outside MPA;• development of pelagic/deep-sea fisheries is necessary.
Decision-making and announcement process
The issues that families cannot solve and that need decision made by whole community are dealt with as follows (e.g. land issue, construction of public buildings):
1. Community organisations (e.e. resource management committee) submit the request to chief council.2. Chief Council discusses the agendas submitted from community organisations, or any other agendas that Chief
Council considers appropriate, and makes decision. Any community members can participate into the discussion of the Chief Council as observers, and express their opinions.
3. The decision made by the Chief Council will be announced to the whole community through the head of family.
Table 35. Institutional arrangements in Lelepa.
Resource management committee
Members Not functioning right now. Used to have 3 members from Lelepa and another 3 members from Mangaliliu
Founded in: 2007
No. of members: Use do have 3 members from Lelepa and another 3 members from Mangaliliu
Yearly budget No budget
Current activities and their frequency
Not functioning right now.
Supporting organizations and systems
Vanuatu Fisheries Department, Japan International Cooperation Agency, Wan Smol Bag (vanua-tai)
Remarks
Decision-making and announcement process
1. General meeting in the community (all organisations in the community participate)2. Agree after the discussion3. Chief confirm
43SPC Traditional Marine Resource Management and Knowledge Information Bulletin #32 – December 2013

Table 36. Institutional arrangements in Tassiriki.
Resource management committee
Members No committee for fisheries resource management, only Terry Fictor
Founded in: 2005
No. of members: 1 member
Yearly budget No budget
Current activities and their frequency
Monitoring of the giant clam (Tridacna gigas) Clean-up campaign
Supporting organizations and systems
Japan International Cooperation Agency, Tamarana guesthouse (help cleaning), School chil-dren (clean up beach), Wan Smol Bag (turle monitor)
Remarks Mr Fictor considers that it is necessary to upgrade the taboo area into marine protected area (legalised)
Decision-making and announcement process
1. Whole community share the idea, and discuss.2. Chief takes the decision (chief is the owner of the part of taboo area).
Table 37. Institutional arrangements in Sunae.
Marine resource management committee
Members 3: Derek French (chairman), Lauta Joel and Thompson Tamata
Founded in: 2006 Japan International Cooperation Agency (JICA) phase 1)
No. of members: 4
Yearly budget 0
Current activities and their frequency
Attend meeting for JICA (Grace of the Sea) Establish taboo area and monitor Respect fisheries law Take care of Tridacna gigas Ocean nursery for Tridacna maxima Attend other meeting related with fisheries
Supporting organizations and systems
JICA, Tasi Vanua (turtle monitor), Vanuatu Fisheries Department,
Remarks
Decision-making and announcement process
1. Derek French makes the proposal with the marine committee2. Proposal is taken to the Chief Council3. Proposal is discussed in whole community4. Chairman of the Chief Council takes the decision5. Reef owner: chief (whole community is one family, united)
44 SPC Traditional Marine Resource Management and Knowledge Information Bulletin #32 – December 2013

45SPC Traditional Marine Resource Management and Knowledge Information Bulletin #32 – December 2013
Table 38: Existence of cooperative associations in primary sector in target areas.
Aneityum Malekula Efate Overall
Number of target communities 3 16 4 23
Community Development Committee 1 2 1 4
Cooperative 2 4 1 7
Health Committee 3 7 3 13
Parent–Teacher Association 3 3 2 8
Youth Group 3 13 4 20
Women Group 3 11 4 18
Sport Group 3 5 3 11
Cultural Group 3 0 2 5 Others (Charch, Vanwood) 0 2 0 2
Table 39. Existing resource management rules and enforcement measures in Aneityum.
Target site Mystery Island
Aneityum Island as a whole
Aneityum Island as a whole
Target species All species Lobster Trochus
Rule Protect all species
Minimum catch size: 25 cm. Smaller lobsters should be released.
Minimum and maximum catch size (9–13cm)
Enforcement measures
Marine protected area committee col-lects the lobster catch data and checks the size.
Marine protected area committee collects the data.
Source: Project baseline survey
Table 40. Existing resource management rules and enforcement measures in Malekula.
Target site Crab Bay Crab Bay Uri Uripiv
Target species Land crab All species All species
Rule i) Taboo and access area ii) Minimum catch size (4 fingers) iii) closed season
(Spawning season: December–January) iv) Monthly sales data in the market
Taboo and access area
Taboo and access area
Enforcement measures
i) 5,000 vatu as fine. Monitoring by community ii) Check in the market iv) Committee asks women in the market
VUV 5,000 as fine. Monitored by community
VUV 15,000 fine There is no need for the enforcement measures because everybody respects the taboo area.
Source: Project baseline survey
There is a limited number of cooperatives and asso-ciations for the primary sector in the target com-munities (Table 38). In the Efate area, there is only one agriculture association, located in Lelepa. In the Malekula area there are agricultural associations in several inland communities. However, only the fisheries cooperative for Uri and Uripiv communi-ties is located in the area. In Aneityum, there is no cooperative for either the agriculture or fisheries sectors. There is only a livestock association in the Port Patrick community.
9.1. Current coastal resource management measures
Existing resource management and enforcement measures for each target site are shown in Tables 39–41.
More than 80% of members of the 14 communi-ties near the Crab Bay MPA (Malekula) and those in Aneityum recognise that fisheries resources in their MPAs have increased since implementation of

Table 41. Existing resource management rules and enforcement measures in Efate.
Target site Mangaliliu Lelepa Tassiriki Sunae
Target species All species Trochus, giant clams, green snail, and bubu shell
All species All species All species
Rule Taboo area Total ban Taboo area Taboo area Taboo area
Enforcement measures
Maximum VUV 15,000–20,000 as fine. Monitored by the Village Council.
VUV 3,000 as fine. Monitored by Chiefs Council.
VUV 3,000 as fine. Monitored by community
Monitored by the community. Chiefs Council decides the penalty for violators.
Source: Project baseline survey
of 25,000–70,000 each year. This estimate is based on data derived from interviews with local people in Aneityum. One cruise ship brings around 1,000–1,500 tourists, although not all of them go ashore. Assuming that 500–1,000 tourists land on Mystery Island, and 50–70 cruise ships visit Aneityum each year, the estimated total annual number of tourists ranges from 25,000 to 70,000. Their expenditure on local food and souvenirs creates a major market opportunity for Aneityum people.
9.2.2. Malekula (Crab Bay, Uri and Uripiv)
The 14 communities scattered around Crab Bay lack a significant local market because the number of households is only 3–52 per community, and totals only 338 for the entire area. Therefore, they send their products to Lakatoro, the main market on Malekula Island, which is about an hour away by public trans-portation or charter bus. However, in some remote communities people must walk to the main road to catch the transport, which makes access to the com-munity difficult during periods of heavy rain.
Uri and Uripiv are small islands that are about 20 minutes from Lakatoro by boat. Many people com-mute from their island to Lakatoro because daily boat transport is available.
At present, the Malekula area receives few tour-ists. Cruise ships from Australia and New Zealand make regular visits to a location just north of Laka-toro, but this provide little benefit to communities in Crab Bay, Uri and Uripiv. Attractions for tourists would have to be created in order to market this area for tourism.
Access to Port Vila, Vanuatu’s capital, is provided by a flight between Norsup (about 15–20 minutes from Lakatoro) and Port Vila that operates daily, except on Saturdays. There is also a regular cargo ship schedule.
46 SPC Traditional Marine Resource Management and Knowledge Information Bulletin #32 – December 2013
CBCRM, as do more than 50% of community mem-bers in Uri and Uripiv (Fig. 19). In contrast, in Efate 13% of respondents in Moso and 47% in Lelepa and Mangaliliu found that fisheries resources had increased, indicating a relatively wide gap between adjacent communities. (According to the survey, more community members in Mangaliliu recog-nise the resource increase than in Lelepa.) This rec-ognition gap correlates with the perception of the effectiveness of the resource management plan, which is analysed below. This must be taken into account when reviewing existing resource manage-ment plans, to ensure community participation in resource management activities.
Except for those in Moso, most respondents answered that they had changed some of their bad fishing activities (e.g. stopped catching small fish) after the introduction of CBCRM. This indicates that CBCRM could change community members’ behaviour (Fig. 20).
9.2. Important external factors: Access to the market and transport
9.2.1. Aneityum
Transport is limited in Aneityum. Several shipping companies operate between Tanna and Aneityum, but only once or twice per month. Air Vanuatu operates a regular airfreight service between Tanna and Aneityum every Tuesday and Saturday. How-ever, the poor condition of the airfield sometimes prevents landing. At present, the Chief Committee in Aneityum limits the marketing of fisheries prod-ucts to just within the island in order to ensure that local demand is met as well as to prevent overex-ploitation of fisheries resources.
Despite such difficulties, Aneityum receives many cruise ship tourists from Australia and New Zea-land, with an estimated total number in the range

47SPC Traditional Marine Resource Management and Knowledge Information Bulletin #32 – December 2013
6%
50%
10% 7%
18%
38%
37%
6%
27%
6%
37%
17%
18%
13%
18%
50%
80%
30% 29%
0%
10%
20%
30%
40%
50%
60%
70%
80%
90%
100%
Much increased
Somewhat increased
Remains the same
Somewhat decreased
Still much decreased
Aneityum Malekula(Crab Bay)
Malekula(Uri & Uripiv)
Efate(Moso)
Efate (Lelepa &
Mangaliliu)
Location
Perc
enta
ge o
f int
ervi
ewee
s
13% 26%
58%
87% 74%
100%
42%
97%
0%
10%
20%
30%
40%
50%
60%
70%
80%
90%
100%
Somehow reduced
No change
Aneityum Malekula(Crab Bay)
Malekula(Uri & Uripiv)
Efate(Moso)
Efate (Lelepa &
Mangaliliu)
Location
Perc
enta
ge o
f int
ervi
ewee
s
Figure 19. Recognition of resource condition by communities.
Figure 20. Change in fishing activities by communities.

9.2.3. Efate
In terms of the target communities, Mangaliliu has the most favourable market access because it takes only about 30–40 minutes to reach Port Vila. Peo-ple living in Lelapa, Tassiriki and Sunae take a boat from their islands to the main island, where both public transport and a charter bus are available.
10. Analysis
Based on information derived from the question-naire-based surveys and workshops, the project team identified challenges confronting coastal resource management at each site (i.e. Aneityum, Malekula and Efate). In this concluding section we consider approaches to tackle these challenges.
10.1. Aneityum
10.1.2. Current issues, opportunities and challenges for CBCRM
Tourist cruise ships from Australia have been visit-ing Aneityum for over 30 years, and this has got-ten local communities to organise themselves. As a result, the average monthly income in Aneityum is the highest among all target communities. Further, coastal fisheries resources have been closely associ-ated with the development of tourism because the communities have sought to preserve them in order to maintain tourism, their main income source.
In the early-1990s shellfish with high economic value declined as a consequence of overharvest-ing, and this resulted in a ban on shellfish har-vesting that was enacted by the Government of Vanuatu, and the CBCRM that was initiated in the late-1990s. Together, these actions helped increase shellfish resources. In 2007, the MPA around Mystery Island was established. It has become important for tourism, and a resource manage-ment plan that included an article on the MPA has gone into effect. In general, the preservation of coastal resources inside the MPA has been success-ful because many community members recognise an increase of resources as being the result of the long-term implementation of CBCRM.
On the other hand, some residents are concerned about a decrease in reef fisheries resources, espe-cially lobsters, which at present are sold only to tourists. The possibility of marketing other fisher-ies products has not been considered, so this exclu-sive reliance on lobsters to generate a cash income accelerates the decrease in stocks, which are recog-nised as potentially facing a collapse. At the com-munity workshop, both community members and VFD were greatly concerned about the decline in local reef fisheries resources, which they believe is caused by people catching juvenile fish outside the MPA, an increasing demand for fish owing to
population growth in the face of limited alternative sources of animal protein, a weakening of the tra-ditional governance system, and a general lack of awareness of the issues involved.
Most community members believe that it is nec-essary to allow a partial opening of the MPA (see above, Fig. 13). Further, almost half of all commu-nity members think that other members lack the will to maintain the MPA in the future (see above, Fig. 12).
Possible ways to promote CBCRM
A pilot project to promote a transition from the ban on fishing to the use of resources under a sustainable resource management regime has been discussed in Aneityum. The main objective would be the reduc-tion of fishing pressure on lobster resources through a diversification of fishing activities, and alternative means of income generation.
The MPA committee will organise farmers and fish-ermen under the traditional chiefs’ rule. The com-mittee aims to develop fishery production outside the reefs, which are important protein resources, and manage them sustainably in close cooperation with the fishermen’s organisation. Simultaneously, the demand for reef fish must be managed in order to balance their preservation with economic activ-ity, if sustainable coastal resource management is to be ensured.
To confront those challenges, based on the results of surveys and workshops, the project proposes to adopt a comprehensive approach to design the pilot project using five possible solutions. These are:
1. Provision of an alternative source of income linked with tourism, such as the development of new fishery products, handicrafts and other items for tourists;
2. Diversification of fishing areas and target resources, including the catching of nearshore pelagic resources;
3. Interventions on fishing activities by setting size limits for lobsters and controlling the opening of MPAs;
4. Boosting awareness on sustainable coastal resource management by involving women; and
5. Strengthening MPA committee, especially to plan resource management that would include handling demands for the increased coastal resource use, raising community awareness by organising fora (e.g. to report on resource conditions based on surveys), and supervising alternative means of making a livelihood out-side the reef.
48 SPC Traditional Marine Resource Management and Knowledge Information Bulletin #32 – December 2013

Considerations for implementing pilot projects
In designing and implementing the pilot projects, it is necessary to consider that the ratio of disputes in Aneityum is the highest among the regions sur-veyed, although the willingness of people to par-ticipate in community activities is also the highest. This seeming contradiction may indicate a willing-ness to put aside personal conflicts for the sake of the wider community interest.
From the viewpoint of social characteristics in this area, despite past success with coastal resource management, the level of understanding of coastal resource management in the community has been insufficient. Further, the level of understanding among women is lower than that of men, indicat-ing the importance of raising awareness on coastal resource management through the participation of women. In addition, although most respond-ents agree with the plan, 33% hold some degree of negative opinion including “(not complete but) somehow appropriate” and “not appropriate” (see above, Fig. 10). This should be taken into considera-tion when implementing the pilot projects.
10.2. Malekula
10.2.1. Current issues, opportunities and challenges for CBCRM
Inhabitants of Crab Bay harvest land crabs for sale, although their main livelihood is agriculture and they do no other kind of fishing. Management of the land crab resource has been widely acknowl-edged as exemplifying a successful MPA because most community members in Crab Bay recognise the increase of coastal resources (see above, Table 8). The average monthly income in Crab Bay is the second highest among the target communities, fol-lowing Aneityum (see above, Table 27).
On the other hand, people in Uri and Uripiv harvest land crabs in addition to engaging in other fishing activities. The average monthly income in these villages is the lowest among the target areas, and amounts to a subsistence livelihood. With respect to resource management, respondents from Uri and Uripiv differed in their recognition of increase or decrease in the resource after implementing CBCRM. This difference could be because some vil-lagers fish around Crab Bay, whereas others harvest resources in the Uri and Uripiv islands.
At the community workshop participants from Malekula raised a concern over poaching and igno-rance of local fishing rules. The MPA committee understands the significance of enhancing their monitoring capacity, despite their MPAs being located in 16 different communities. To realise effective resource management, the MPA commit-tee must raise funds for personnel to monitor and
survey fishing activities in the Crab Bay area.
From the viewpoint of social characteristics in this area, Crab Bay people show a high level of under-standing of the resource management plan, whereas those of Uri and Uripiv do not (see above, Fig. 9). In addition, most Crab Bay respondents answered that the existing resource management plan is “very appropriate” and that the entire community wants to retain it. However, the people of Uri and Uripiv responded negatively (see above, Figs. 10 and 12).
Possible ways to promote CBCRM
A pilot project will be promoted to bring together the different emphases of the individual CBCRM activi-ties in both Uri and Uripiv, and Crab Bay. Its prin-cipal objective is the strengthening of the Resource Management Committee via enhanced financial mechanisms and management capabilities.
Because the backgrounds of Uri and Uripiv, and Crab Bay differ, the project has adopted different measures for these regions. In Uri and Uripiv, the focus is on the preservation of coastal resources, including the development of alternative liveli-hoods, which could help reduce fishing pressure in the reef. In contrast, in Crab Bay the focus is on enhancing the existing MPA committee’s activities, especially its capacity to organise community activ-ities. Further, in Malekula the aim is to bring these different measures together under the Amal-Crab Bay MPA Committee, to enhance the regional capac-ity for sustainable coastal resource management.
Based on the results of the surveys and workshops the pilot project will adopt the following compre-hensive four-pronged approach.
1. Enhance inter-community cooperation to enable well-coordinated fishing and marketing to meet buyer requirements. (This will require the com-munities to make a financial contribution to the committee.)
2. Diversify fishing areas and target resources, including use of nearshore pelagic resources.
3. Add value to fishery products through collec-tive efforts to promote intra- and inter-island fish marketing.
4. Strengthen the MPA Committee, especially to handle finances and improve its capacity to manage and organise community activities.
Considerations for implementing pilot projects
For designing and implementing these pilot projects, the existing gaps between Crab Bay and Uri-Uripiv must be bridged in order to strengthen CBCRM in this area. In Crab Bay, a low level of willingness to par-ticipate in community activities was identified (see
49SPC Traditional Marine Resource Management and Knowledge Information Bulletin #32 – December 2013

above, Table 22). Motivation to contribute time and money for community activities is also low, although not many disputes occur, according to respondents. Further, since the principal livelihood activity in this region is not fisheries it could be challenging to organ-ise additional community participatory activities for coastal resource management. Rather, it is necessary to design a pilot project focused on enhancing exist-ing activities of the MPA Committee.
On the other hand, the people of Uri and Uripiv are willing to offer their time and labour, but not finan-cial resources, for community activities (Table 22). This reflects that the average monthly income in Uri and Uripiv was the lowest among the target com-munities (Table 27) and that their coastal resources are decreasing. Thus, it is essential to introduce alternative income-generating activities to Uri and Uripiv to bridge the gaps between the two areas, in conjunction with improving the condition of coastal resources by such means as raising funds from a portion of the profit gained by the alternative liveli-hood activities, and enhancing resource monitoring by the MPA Committee.
10.3. Efate
10.3.1. Current issues, opportunities and challenges for CBCRM
Efate, where the first phase of the project was implemented, has several advantages for CBCRM, including easy access to government services and the large markets of the capital. Nevertheless, CBCRM is not fully established in Efate owing to the challenges caused by social and cultural differ-ences among the communities in the area. At the community workshop, participants from Efate were greatly concerned by the declining trend of coastal resources, both inside and outside the reef.
Many respondents to the questionnaire-based sur-vey in Moso acknowledged a decline in resources both within and outside the reef. In contrast, rec-ognition of the issue by respondents in Lelepa and Mangaliliu varied, with almost half admitting a decrease. Although Lelepa, Mangaliliu and Moso use the fisheries resources of adjacent areas, their recognition of the resource condition and opinions regarding the management plan differ (see Figs. 19 and 20).
On the east side of Moso, facing the main island of Efate, where the communities are located, igno-rance of the taboo area by local people is regarded as a problem. On the west side, adjacent to the open ocean and lacking community people, poaching by outsiders is identified. The respondents of Moso considered that high priority should be given to education and awareness raising for resource pres-ervation, as the results indicate that most people in
Moso do not understand the MPA resource man-agement plan (see above, Fig. 9). (This occurred because, owing to friction among communities, Moso was excluded from the target communities selected to develop a resource management plan in the first phase of the project.)
In addition, in Lelepa and Mangaliliu, those who recognise the resource increase hope for a tempo-rary opening of the MPA, just as in Aneityum (Fig. 21). In contrast, the people of Moso differ in their views. Further, like in Moso those who acknowledge a resource increase after implementing the resource management plan tend voluntarily to limit their own fishing activities (Fig. 22). This seems to be a positive effect. Lelepa, Mangaliliu and Moso show different tendencies regarding compliance with the resource management plan and opinions about MPAs. In this, perceptions regarding and willingness to participate in resource management are complicated.
As mentioned above, the coastal resource manage-ment plan drafted by the representatives of the four communities in the first phase of the project has not been finalised, thus implementation of the region-wide coastal resource management plan is pending. Also, a planned Fishermen’s Association is yet to be established. To realise sustainable resource man-agement in Efate, communities sharing the same resources must to work together to overcome their differences.
Possible ways to promote CBCRM
A pilot project is planned to establish activities in each community, with the objective of improving compliance with management measures through enhanced functions of management units.
As a basic first step in tackling the above-mentioned challenges it is necessary to bring people from each community together for activities. Then it could be possible to establish an inter-community-based MPA Committee. Meanwhile, the project proposes to establish specific purpose groups, such as a “Shell Culture Cage Group” or “A Fish Aggregating Device (FAD) Fisher’s Group”, composed of mem-bers from every community involved in such activi-ties. Through such specific purpose groups, the project intends to establish a working relationship that extends beyond the boundary of each commu-nity in Efate.
Based on the results of the surveys and workshops, the project proposes a comprehensive approach to the design of the pilot project, based on the follow-ing five solutions:
1. Provision of alternative sources of income, such as a shellfish ocean nursery, as well as a village-based fish promotion event, and souvenir pro-duction linked with tourism.
50 SPC Traditional Marine Resource Management and Knowledge Information Bulletin #32 – December 2013

51SPC Traditional Marine Resource Management and Knowledge Information Bulletin #32 – December 2013
25% 42%
75% 67%
91% 75%
26% 33%
75% 58%
25% 33%
9% 25%
74% 67%
0% 10% 20% 30% 40% 50% 60% 70% 80% 90%
100%
Som
ewha
t inc
reas
ed
Som
ewha
t dec
reas
ed
Still
muc
h de
crea
sed
Muc
h in
crea
sed
Som
ewha
t inc
reas
ed
Rem
ains
the
sam
e
Som
ewha
t dec
reas
ed
Still
muc
h de
crea
sed
Efate (Moso) Efate (Lelepa & Mangaliliu)
The taboo areas should be protected continuously
Partial openings should be allowed
Location
Perc
enta
ge o
f int
ervi
ewee
s
100%
58% 44%
9%
42% 56%
100% 100% 100% 91%
100%
0% 10% 20% 30% 40% 50% 60% 70% 80% 90%
100%
Som
ewha
t inc
reas
ed
Som
ewha
t dec
reas
ed
Still
muc
h de
crea
sed
Muc
h in
crea
sed
Som
ewha
t inc
reas
ed
Rem
ains
the
sam
e
Som
ewha
t dec
reas
ed
Still
muc
h de
crea
sed
Somehow reduced No change
Perc
enta
ge o
f int
ervi
ewee
s
Efate (Moso) Efate (Lelepa & Mangaliliu)
Location
Figure 21. Relationship between the recognition of resource condition and opinion on marine protected areas, Efate.
Figure 22. Relationship between the recognition of resource condition and change in the fishing activities, Efate.

2. Enhancement of inter-community cooperation through the joint organisation of that fish pro-motion event, using community-based coopera-tion practices and with activity-specific working groups, including the shell culture cage group and FAD fishers’ group.
3. Diversification of fishing areas and target resources, including use of nearshore pelagic resources. Offshore fishing development is difficult to realise within the project period because of limited resources and environmental considerations.
4. Interventions on fishing activities by MPAs.
5. Strengthening of the MPA Committee, espe-cially for monitoring and supervision to prevent poaching and violating the taboo areas.
Considerations for implementing pilot projects
In designing and implementing these pilot pro-jects, it should recalled that the attempt to establish a region-wide MPA Committee with all the com-munities in Efate in the first phase of the project seems to have failed, owing to a lack of cooperation among the communities. The experiences of the project as well as the results of the baseline survey indicate that additional challenges to bringing peo-ple together exist within the community. For exam-ple, in Lelepa and Mangaliliu the willingness to participate in community activities is very low, and respondents perceive an inequity regarding social activities. In contrast, respondents in Moso indicate the highest communal reliability. The most funda-mental and appropriate approach is to strengthen the resource management capacity of each commu-nity as the first step of to ensuring future solidarity beyond existing boundaries.
11. References
Amos M. 1993. Traditionally based marine resource management systems in Vanuatu. Traditional Marine Resource Management and Knowl-edge Information Bulletin 2:14–17.
Anderson J.A. and Mees C.C. 1999. The perfor-mance of customary marine tenure in the management of community fishery resources in Melanesia. Final Technical Report to the UK Department for International Develop-ment, London, MRAG Ltd.
Beckensteiner J. 2011. La gestion villageoise des pêches récifales sur l’île d’Efaté (Vanuatu) : Situations et enjeux d’après les savoirs locaux. http://www.masters-biologie-ecologie.com/ARTIO/IMG/pdf/Beckensteiner_Jennifer_StageM2IEGB_2011.pdf [accessed on 30 Sep. 2013]. (unpaginated).
David G. 1990. Strategies of reef resources exploita-tion in Pacific Islands: The case of Vanuatu. Proceedings of the International Society of Reef Studies, Noumea, New Caledonia. p. 61–74.
Dumas P. (n.d.). Assessing the ecological efficiency of tabu areas in Vanuatu. Unpublished project report. Port Vila: Fisheries Department.
Fairbairn T.I.J. 1990. Reef and lagoon tenure in the Republic of Vanuatu and prospects for mari-culture development. Research Reports and Papers in Economics of Giant Clam Maricul-ture No. 13. St. Lucia, Department of Econom-ics, University of Queensland.
Garcia S.M., Zerbi A., Aliaume C., Do Chi T. and Lasserre G. 2003. Fisheries Management. 2. The ecosystem approach to fisheries. FAO Technical Guidelines for Responsible Fisher-ies. Rome: FAO.
Government of Vanuatu.1980a. The Constitution of the Republic of Vanuatu. Port Vila, Govern-ment Printer.
Government of Vanuatu.1980b. Land Reform Regu-lation No. 31 of 1980. Port Vila, Government Printer.
Johannes R.E. 1998. Government-supported, vil-lage-based management of resources in Vanuatu. Ocean and Coastal Management 40:165–186.
Johannes R.E. 2002. The renaissance of commu-nity-based marine resource management in Oceania. Annual Reviews of Ecology and Sys-tematics 33:317–40.
Johannes R.E. and Hickey F.R. 2004. The evolution of village-based marine resoure management in Vanuatu between 1993 and 2001.Coastal Region and Small Island papers 15. Paris, UNESCO.
Kenneth D. and Silas H. 1986.Vanuatu: Traditional diversity and modern uniformity. p. 68–85. In: Anon. (ed). Land rights of Pacific women. Suva, Institute of Pacific Studies, University of the South Pacific.
Kuemlangan B. 2004. Creating legal space for com-munity-based fisheries and customary marine tenure in the Pacific: Issues and opportunities. FishCode Review. No. 7. Rome, FAO. 2004.
Raubani J.J. 2006. Community fisheries manage-ment (CFM): Future considerations for Vanu-atu. Port Vila: Vanuatu Fisheries Department.
Ruddle K. 1994. A guide to the literature on tradi-tional community-based fishery management in the Asia-Pacific tropics. Fisheries Circular No. 869, FIPP/C869. Rome, FAO.
52 SPC Traditional Marine Resource Management and Knowledge Information Bulletin #32 – December 2013

Ruddle K., Hviding E. and Johannes R.E. 1992. Marine resources management in the context of customary tenure. Marine Resource Eco-nomics 7:249–273.
SPC (Secretariat of the Pacific Community). 2000. Fisheries management by communities: A manual on promoting the management of subsistence fisheries by Pacific Island com-munities. Noumea, New Caledonia: Secretar-iat of the Pacific Community. 87 p.
SPC. 2002. Underwater visual fish census surveys — Proper use and implementation. Noumea, New Caledonia: Secretariat of the Pacific Community. 54 p.
SPC. 2003. Vanuatu country report: Profile and results from survey work at Paunangisu vil-lage, Moso Island, Uri and Uripiv islands and the Maskelyne Archipelago (July to December 2003). Noumea, New Caledonia: Secretariat of the Pacific Community. 391 p.
SPC. 2007. Socioeconomic fisheries surveys in Pacific Islands: A manual for the collection of a mini-mum dataset. Noumea, New Caledonia: Secre-tariat of the Pacific Community. 129 p.
SPC. 2010. A community-based ecosystem approach to fisheries management: Guidelines for Pacific Island countries. Noumea, New Cal-edonia: Secretariat of the Pacific Community. 54 p.
SPC. 2011. Guide to information sheets on fisheries management for communities. Noumea, New Caledonia: Secretariat of the Pacific Commu-nity. 24 p.
Taurakoto P. 1984. Customary rights to reefs and landings. p. 14. In: Larmour P. (ed). Land ten-ure in Vanuatu. Suva, Fiji: University of the South Pacific.
Vanuatu Environment Unit. 2007a. Socioeconomic study of the Crab Bay villages of central Male-kula, Vanuatu, Volume I: Overview. Port-Vila, Vanuatu: Vanuatu Environment Unit VMU.
Vanuatu Environment Unit. 2007b. Socioeconomic study of the Crab Bay villages of Central Malekula, Vanuatu, Volume II: Detailed find-ings. Port-Vila, Vanuatu: Vanuatu Environ-ment Unit VMU.
Vanuatu Fisheries Department. 2011. Bichlamar project 2011–2012. Sea cucumber stock assess-ment. Port Vila, Vanuatu: Vanuatu Fisheries Department.
World Bank. 2000. Voice from the village: A com-parative study of coastal resource manage-ment in the Pacific Islands. Washington D.C.: World Bank.
12. Acknowledgments
We wish to thank all the partners of this survey: the Japan International Cooperation Agency, Vanuatu Fisheries Department, and the Marine Protected Area Management Committee member. Without their strong commitment this survey could not have been accomplished. We are especially grateful to the village communities of the survey sites for their strong collaborative participation throughout the survey period. In particular we thank the people of Aneityum, Mangaliliu, Lelepa, Sunae and Tassiriki in North Efate and Uripiv and Crab Bay communi-ties in Malekula. This study is dedicated to the peo-ple of Vanuatu.
53SPC Traditional Marine Resource Management and Knowledge Information Bulletin #32 – December 2013

54 SPC Traditional Marine Resource Management and Knowledge Information Bulletin #32 – December 2013
Appendix 1: Questionnaires used for the survey
A - 1
Appendix 1: Questionnaires used for the Survey
1.0 Preliminary Information
1.1 Province 1.2 Village / Community 1.3 Name of Enumerator 1.4 Date of Interview
2.0 Profile of Community Leaders / Representative
2.1 Name of leader / representative: 2.2 Gender □ 1. Male □ 2. Female 2.3 Age: years old 2.4 Ethnicity: 2.5 Education □ 1. No school attendance □ 2. Primary school □ 3. Secondary school
Attainment: □ 4. High school □ 5. Collage / University □ 6. Other (specify) 2.6 Contact Phone Number
3.0 Community Characteristics
3.1 How many years has this community been existence? about years 3.2 How many households are in this community? about households 3.3 In the last 3 years, the population of this community has
□ 1. Increased □ 2. Decreased □ 3. Remained the same 3.4 What are the two main reasons for increasing, decreasing or no change in the population of
this community? a. b.
3.5 What are the three main economic activities for men in the community: a. b. c.
3.6 What are the three main economic activities for women in the community: a. b. c.
3.7 What is the main route that inhabitants use to reach this community? □ 1. Land road □ 2. Foot path □ 3. Sea □ 4. Other (specify)
Sheet 1 Questionnaire for community representatives
Code Number
Project for Promotion of Grace of the Seas for Coastal Village in Vanuatu Phase 2

55SPC Traditional Marine Resource Management and Knowledge Information Bulletin #32 – December 2013
A - 2
3.8 In the last three years, the road leading to this community has: □ 1. Improved □ 2. Worsened □ 3. Remained the same
3.9 The availability of housing in this community is: □ 1. Enough □ 2. Not enough
3.10 In the last three years, the quality of housing in this community has: □ 1. Improved □ 2. Worsened □ 3. Remained the same
3.11 What are the main two reasons that housing in this community has improved, worsened or remained the same?
a) b)
3.12 In the last three years, the overall quality of life of the people living in this community has: (consider job availability, safety and security, environment, housing, etc.) □ 1. Improved □ 2. Worsened □ 3. Remained the same
3.13 Overall, the level of living of this community may be characterized as: □ 1. Wealthy □ 2. Well-do □ 3. Average □ 4. Poor □ 5. Very Poor
4.0 Principal Services
4.1 Drinking Water 4.1.1 How is the water obtained?
□ 1. River □ 2. Rain □ 3. Well □ 4. Other (specify) 4.1.2 Currently, the potable water service is:
□ 1. Very Good □ 2. Good □ 3. Average □ 4. Poor □ 5. Very Poor 4.1.3 What are the two main problems with the portable water service?
a) b)
4.2 Communication Service 4.2.1 Can the people use cellular phones in this community?
□ 1. Yes □ 2. No 4.2.2 What percentage of household do you think have cellular phones in this community?
□ 1. Majority of households (more than 80%) □ 2. At least 50% of households □ 3. Less than 50% of households
4.3 Sewage 4.3.1 Do the roads of this community have sufficient sewers and drains to handle excess water and
prevent flooding, when it rains? □ 1. Yes □ 2. No
4.3.2 What other sewage and waste water systems are used in this community? □ 1. Traditional toilet □ 2. Water-flush toilet □ 3. River / Sea □ 4. Other (specify)

56 SPC Traditional Marine Resource Management and Knowledge Information Bulletin #32 – December 2013
A - 3
4.4 Garbage Disposal 4.4.1 What is the main solid waste disposal method?
□ 1. Burn it □ 2. Throw on disposal lots □ 3. Throw into river / sea □ 4. Bury it □ 5. Other (specify)
4.5 Transport 4.5.1 Public transport (bus, boat, etc.) is available:
□ 1. Every day □ 2. 4 - 6 days per week □ 3. 1 - 3 days per week □ 4. None 4.5.2 What other types of transport do people in this community use to go to neighbouring communities?
□ 1. Walking □ 2. Bicycle □ 3. Horse □ 4. Canoe □ 5. Car / Pickup
4.6 Recreation 4.6.1 Does this community have sport fields or recreational areas?
□ 1. Yes □ 2. No 4.6.2 In the three years, the condition of the sport fields and recreational areas has:
□ 1. Improved □ 2. Worsened □ 3. Remained the same
4.7 What are important needs for this community? Specify most important needs for public service. Priority No.1 Priority No.2 Priority No.3
5.0 Social Condition and Services 5.1 Labour migration
5.1.1 Are there members of this community who go to other places to work during certain period of the year? □ 1. Yes □ 2. No
5.1.2 Where do they go to work primarily? □ 1. To a city in the island □ 4. To a rural area in the island □ 2. To a city in another island □ 5. To a rural area in another island □a rural area in another islandnd □ 6. To rural areas in another country
5.2 Education Primary School
5.2.1 Does this community have a public primary school? □ 1. Yes □ 2. No
5.2.2 Is the number of teachers in the primary school sufficient for the number of students? □ 1. Yes □ 2. No
5.2.3 The physical condition of the primary school is: □ 1. Very Good □ 2. Good □ 3. Average □ 4. Poor □ 5. Very Poor
If not so good, specify what is in poor condition (roof, wall, furniture, etc.)
Secondary School 5.2.4 Does this community have a public secondary school?
□ 1. Yes □ 2. No

57SPC Traditional Marine Resource Management and Knowledge Information Bulletin #32 – December 2013
A - 4
5.2.5 Is the number of teachers in the secondary schools sufficient for the number of students? □ 1. Yes □ 2. No
5.2.6 The physical condition of the secondary school is: □ 1. Very Good □ 2. Good □ 3. Average □ 4. Poor □ 5. Very Poor
If not so good, specify what is in poor condition (roof, wall, furniture, etc.)
5.3 Health 5.3.1 What are the two principal health problems affecting children in the community
a) b)
5.3.2 What are the two principal health problems affecting adult men in the community a) b)
5.3.3 What are the two principal health problems affecting adult women in the community a) b)
5.3.4 Does this community have a health clinic or post? □ 1. Yes □ 2. No
5.3.5 Does the health clinic or post regularly have sufficient: a. Medicine □ 1. Sufficient □ 2. Insufficient □ 3. None b. Equipment □ 1. Sufficient □ 2. Insufficient □ 3. None c. Patient beds □ 1. Sufficient □ 2. Insufficient □ 3. None d. Physicians □ 1. Sufficient □ 2. Insufficient □ 3. None e. Nurses □ 1. Sufficient □ 2. Insufficient □ 3. None
6.0 Agriculture, Livestock or Fisheries
6.1 What are the three principal products of agriculture, livestock or fisheries in this community? Agriculture Livestock Fisheries a1. l1. f1. a2. l2. f2. a3. l3. f3.
6.2 Where do the people of this community generally sell their products? Agriculture Livestock Fisheries □ 1. Community market □ 1. Community market □ 1. Community market □ 2. Market in neighbouring areas □ 2. Market in neighbouring areas □ 2. Market in neighbouring areas □ 3. Middlemen □ 3. Middlemen □ 3. Middlemen □ 4. Local stores / shops □ 4. Local stores / shops □ 4. Local stores / shops □ 5. Only household consumption □ 5. Only household consumption □ 5. Only household consumption □ 6. Other □ 6. Other □ 6. Other

58 SPC Traditional Marine Resource Management and Knowledge Information Bulletin #32 – December 2013
A - 5
6.3 What are the two most important problems facing this community for getting their products to markets and earning?
a) b)
6.4 Does this community have any type of agriculture, livestock and fisheries organization such as a cooperative or association?
Agriculture Livestock Fisheries □ 1. Yes □ 2. No □ 1. Yes □ 2. No □ 1. Yes □ 2. No
6.5 Dose this community have any institution or person (either in this community or nearby) that provides credit or loans to agriculture, livestock fisheries producers? □ 1. Yes □ 2. No
What kind of institution or persons that provides credit or loans? □ 1. Commercial bank □ 2. Government office □ 3. NGO □ 4. Community group □ 5. Church □ 6. Middlemen □ 7. Other (specify)
6.6 In the last three years, the yields or catch of the products in this community have: Agriculture Livestock Fisheries □ 1. Increased □ 1. Increased □ 1. Increased □ 2. Decreased □ 2. Decreased □ 2. Decreased □ 3. Remained the same □ 3. Remained the same □ 3. Remained the same
6.7 In the last three years, the sale of the products (no matter within/outside this community) have: Agriculture Livestock Fisheries □ 1. Increased □ 1. Increased □ 1. Increased □ 2. Decreased □ 2. Decreased □ 2. Decreased □ 3. Remained the same □ 3. Remained the same □ 3. Remained the same
7.0 Community Support
7.1 Which of the following organizations exist in this community? □ 1. Community development committee □ 6. Women’s group □ 2. Cooperative (fisheries, agriculture, etc.) □ 7. Sport group □ 3. Parent-teacher association □ 8. Cultural group □ 4. Health committee □ 9. Other (specify) □ 5. Youth group
7.2 Which persons or organizations help or support these community-based organizations? □ 1. Local government □ 6. NGO □ 2. National government □ 7. Business group □ 3. Politician □ 8. Prosperous citizen □ 4. Religious organizations □ 9. The community as a whole □ 5. School / Teachers □ 10. Other (specify)

59SPC Traditional Marine Resource Management and Knowledge Information Bulletin #32 – December 2013
A - 6
7.3 Which building do people in this community regularly use for meeting and gathering? □ 1. Community center □ 5. Health center □ 2. Home of community chief □ 6. Government office □ 3. Home of other local leaders □ 7. Business / Commercial building □ 4. Church or religious building □ 8. Other (specify)
7.4 Which members of the community participate most in solving the issues facing the community? By gender By age
□ 1. Men □ 1. Youth □ 2. Women □ 2. Adults □ 3. Men and women equally □ 3. Older persons □ 4. Neither participate □ 4. Youth, adults and elders equally
□ 5. None participate
8.0 Collective Action Solidarity
8.1 People from the same village / neighbourhood often get together to address a particular issues that face the community, fix a problem, improve the quality of life, or something similar. Which of the following issues has this village / neighborhood tried to address in the last three years?
□ 1. Education □ 7. Recreational and cultural resources □ 2. Health □ 8. Security □ 3. Public services □ 9. Child Care □ 4. Road and transportt □ 10. Technical services of agriculture / livestock / fisheries □ 5. Market □ 11. Natural resource protection □ 6. Credit □ 12. Other (specify)

60 SPC Traditional Marine Resource Management and Knowledge Information Bulletin #32 – December 2013
A - 7
9.0 List of Community Institutions
9.1 What are the groups, organizations, or associations that function in this community? *Have the group list all the organizations, formal and informal, that exist in the community. *Make sure all different types of organizations are included (agriculture, fisheries, credit, religious, recreational, health, education, etc.) and that the list is as complete as possible. *Have the group go through the list and identify which institutions are most important in meeting community needs.
*Norm: It is not necessary to describe contents, but please specify whether the norm is in verbal or in written. *Frequency of meetings: In case of having regular meeting, how many times per week / month / year?
In case of irregular meeting, how many times did they have one in last year? *Level of participation: Is the current level of participation More Active / Same / Less Active, compared
with the past? 9.2 Which groups play the most active role in helping improve the well-being of community members?
9.3 How did these community groups or organizations get started (government initiative, through government donation, NGO donations, grassroots initiative, etc.)?
10.0 Trust and Cooperation in the Community
10.1 Do people in this community generally trust one another in matters of lending and borrowing? □ 1. Yes □ 2. No
10.2 In the last three years, has the level of trust in this community improved, worsened, or stayed the same? □ 1. Improved □ 2. Worsened □ 3. Stayed the same
10.3 Do you agree or disagree with the following statement? People here look out mainly for the welfare of their own families and they are not much concerned with community welfare.
□ 1. Strongly agree □ 2. Agree □ 3. Disagree □ 4. Strongly disagree
1: More active 2: Same 3: Less active
1: In verbal 2: In written 3: None
Norm Name No. of
members Main activities Time per week/ month/year
Frequency of meeting
Level of participation

61SPC Traditional Marine Resource Management and Knowledge Information Bulletin #32 – December 2013
A - 8
1.0 Preliminary Information
1.1 Province 1.2 Village / Community 1.3 Name of Enumerator 1.4 Date of Interview
2.0 Profile of Household Representative
2.1 Name of representative: 2.2 Sex : □ 1. Men □ 2. Women 2.3 Age : years old 2.4 Ethnicity : 2.5 Education
attainment :
□ 1. No school attendance □ 2. Primary school □ 3. Secondary school □ 4. High school □ 5. Collage / University □ 6. Other
Contact Phone Number
3.0 Household Structure and Economy
3.1 Structure of household
3.2 Household economy - What are the three main economic activities in your family?
*Economic activity: Please select from the following items. 1. Agriculture; 2. Fisheries; 3. Livestock; 4. Forestry; 5. Tourism; 6. Office work In case of others, please specify it.
No.1 No.2 No.3
How long have you lived here? (years) Education Level
Economic activity Main activities / products
Sheet 2 Questionnaire for household representatives
Code Number
Project for Promotion of Grace of the Seas for Coastal Village in Vanuatu Phase 2
Where does he (she) live? Occupation Sex (M or F) Age

62 SPC Traditional Marine Resource Management and Knowledge Information Bulletin #32 – December 2013
A - 9
3.2.1 What is the average income of your family? Average income of the household: vatu / month by income source
1. Agriculture vatu / month 2. Fisheries vatu / month 3. Livestock vatu / month 4. Tourism vatu / month 5. Remittance vatu / month 6. Other vatu / month
3.2.2 What is the average living cost of your family? Average living cost of the household: vatu / month By cost items
1. Food vatu / month 2. Education vatu / month 3. Electricity / Fuel vatu / month 4. Phone vatu / month 5. Transport vatu / month 6. Medical / Health vatu / month 7. Other vatu / month
4.0 Fishing Activities
4.1 What is the average amount of fish catch? kg / day
4.2 How many days does your family go to fishing per week? □ Everyday □ 5 - 6 days per week □ 3 - 4 days per week □ 1 - 2 days per week
4.3 Do you have boat or canoe for fishing activity? □ 1. Yes □ 2. No
If yes, what type of boat or canoe do you have? □ 1. Wooden canoe without sail □ 2. Wooden canoe with sail □ 3. Aluminum boat □ 4. Plastic (FRP) boat □ 5. Other (specify)
4.4 Do you have own outboard engine? □ 1. Yes □ 2. No
If yes, what type of outboard engine does you have? □ 1. Two stroke engine □ 2. Four stroke engine Horse power (HP):
4.5 What type of fishing gears do you use? □ 1. Handline □ 2. Spear gun □ 3. Gill net □ 4. Cast net □ 5. Fish trap □ 6. Other (specify)
4.6 Where are the main fishing ground? □ 1. Reef in front of the community □ 2. Coastal areas (within 3 miles) □ 3. Offshore areas (beyond 3 miles) □ 4. Other (specify)

63SPC Traditional Marine Resource Management and Knowledge Information Bulletin #32 – December 2013
A - 10
5.0 Consumption
5.1 During an average / normal week, on how many days do you prepare fish and other seafood for your family? 7 days 5 - 6 days 3 - 4 days 1 - 2 days None
a. Fresh fish □ □ □ □ □ b. Other seafood □ □ □ □ □
5.2 Where do you normally get your fish and seafood from? a. Fish
□ 1. Caught by myself / member of this family □ 2. Get it from somebody in the family / community (no money paid) □ 3. Buy it at (specify) Which is the most important source?
□ 1. Caught □ 2. Given □ 3. Bought b. Shellfish / Sea cucumber
□ 1. Caught by myself / member of this family □ 2. Get it from somebody in the family / community (no money paid) □ 3. Buy it at (specify) Which is the most important source?
□ 1. Caught □ 2. Given □ 3. Bought
6.0 Structural Social Capital
6.1 Organizational Density and Characteristics What community groups, organizations or associations do your family members belong to? Do you consider yourself / your family member to be active in the groups? Are you / your family member a leader in the group? Which of these groups is the most important to your household?
Name of organization 1: No.1, 2: No.2 3: No.3
Importance Who belongs? Degree of participation
1:Household Head, 2:Wife, 3.Child, 4:Elder, 5:Other
1:Leader, 2:Very Active, 3:Somewhat active, 4:Not Active

64 SPC Traditional Marine Resource Management and Knowledge Information Bulletin #32 – December 2013
A - 11
6.2 Network and Mutual Support Organization If the primary school of this community went without a teacher for a long time (say six months or more), which people in this community do you think would get together to take some action about it?
□ 1. No one in the village / neighborhood would get together. □ 2. Local government □ 3. Village / neighbourhood association □ 5. The entire village / neighbourhood □ 4. Parents of school children □ 6. Other (specify)
6.3 Exclusion 6.3.1 Differences often exist between people living in the same community.
To what extent do differences such as the following tend to divide people in this community? 1. Not at all 2. Somewhat 3. Very much
a. Differences in education □ □ □ b. Differences in wealth / material possessions □ □ □ c. Differences in land holdings □ □ □ d. Differences in social status □ □ □ e. Differences between men and women □ □ □ f. Differences between younger and old generation □ □ □ g. Differences between long-time inhabitants and □ □ □ new settlers h. Differences in political party affiliations □ □ □ i. Differences in religious beliefs □ □ □ j. Other differences (specify) □ □ □
6.3.2 Do these differences cause problems in this community? □ 1. Yes □ 2. No
If yes, what are they?
6.3.3 How are these problems usually handled? □ 1. People work it out between themselves □ 5. Religious leaders mediate □ 2. Family / household members intervene □ 6. Judicial leader mediate □ 3. Neighbours intervene □ 7. Other (specify) □ 4. Community leader mediate
6.4 Previous Collective Action 6.4.1 In the past year, how often have members of this community got together, and jointly petitioned
government officials or political leaders with community development as their goal? □ 1. Never □ 2. Once □ 3. A couple of times □ 4. Frequently
6.4.2 Were any of these actions successful? □ 1. Yes, all were successful □ 2. Some were successful and others not □ 3. No, none were successful

65SPC Traditional Marine Resource Management and Knowledge Information Bulletin #32 – December 2013
A - 13
7.2.6 Please say whether in general you agree or disagree with the following statements: a. Most people in this community are basically honest and can be trusted.
□ 1. Strongly agree □ 2. Agree □ 3. Disagree □ 4. Strongly disagree b. People are always interested only in their own welfare.
□ 1. Strongly agree □ 2. Agree □ 3. Disagree □ 4. Strongly disagree c. If I have a problem, there is always someone to help me.
□ 1. Strongly agree □ 2. Agree □ 3. Disagree □ 4. Strongly disagree d. Most people in this community are willing to help if you need it.
□ 1. Strongly agree □ 2. Agree □ 3. Disagree □ 4. Strongly disagree e. If you lose a pig or a goat, someone in this community would help look for it or would return it to you.
□ 1. Strongly agree □ 2. Agree □ 3. Disagree □ 4. Strongly disagree

66 SPC Traditional Marine Resource Management and Knowledge Information Bulletin #32 – December 2013
A - 14
1.0 Preliminary Information
1.1 Province 1.2 Village / Community 1.3 Name of Enumerator 1.4 Date of Interview
2.0 Profile of Interviewee (if you have answered Sheet 1 or 2, please write only your name)
2.1 Name of interviewee: 2.2 Sex : □ 1. Male □ 2. Female 2.3 Age : years 2.4 Ethnicity : 2.5 Education □ 1. No school attendance □ 2. Primary schooll □ 3. Secondary school
Attainment : □ 4. High school □ 5. College / University □ 6. Other Contact Phone Number
3.0 Consciousness of Coastal Resource Management
3.1 Do you think that the coastal resources (reef fish, shellfish, sea cucumber, etc.) of this community have increased or decreased or stayed the same because of the coastal resource management plan?
□ 1. Much increased □ 2. Somewhat increased □ 3. Stayed the same □ 4. Somewhat decreased □ 5. Still much decreased
3.2 Do you understand the contents of the coastal resource management plan? □ 1. Completely understand □ 2. Somewhat understand □ 3. A little understand □ 4. Not understand at all
3.3 Do you think the content of coastal resource management plan is appropriate for this community? □ 1. Very appropriate □ 2. Somewhat appropriate □ 3. A little appropriate □ 4. Not appropriate
Sheet 3 Questionnaire on coastal resource management
Code Number
Project for Promotion of Grace of the Seas for Coastal Village in Vanuatu Phase 2

67SPC Traditional Marine Resource Management and Knowledge Information Bulletin #32 – December 2013
A - 15
3.4 Last year, how many times did you or your family participate in coastal resource management activities, such as a meeting, beach cleaning, reef checking, etc.?
□ 1. More than five times □ 2. Three - four times □ 3. Once or twice □ 4. None
3.5 Do you think that the this community wants to keep / respect the coastal resource management plan? □ 1. The whole community keep it □ 2. The majority of the community keep it. □ 3. About a half of community keep it. □ 4. The majority of community does not keep it. □ 5. The whole community does not keep it at all.
3.6 After the coastal resource management plan was introduced, have you changed your fishing and collecting activities at t sea?
□ 1. I avoid catching small size fish □ 2. I avoid catching certain kinds of fish, shellfish, sea cucumber, etc.
□ 3. I reduce the fishing time at sea. □ 4. I reduce the amount of fish catch □ 5. Nothing changed □ 6. Other (specify)
3.7 Do you want to maintain the coastal resource management plan for this community? □ 1. The taboo areas should be protected continuously. □ 2. The taboo areas should be opened at a certain period.
□ 3. A part of the taboo areas should be opened. □ 4. Some marine products should be allowed to be caught in the taboo areas. □ 5. I don't need the taboo area.

68 SPC Traditional Marine Resource Management and Knowledge Information Bulletin #32 – December 2013
Appendix 2: Fish calendars
A -
16
App
endi
x 2:
Fish
cal
enda
rs
Dat
e: 2
4th
of M
ay 2
012
Jan
Feb
Mar
Apr
May
Jun
Jul
Aug
Sep
Oct
Nov
Dec
Lobs
ter
peak
, with
wea
l cur
rent
Snap
per
Brim
Tuna
Wah
oo
Dog
toot
h tu
na
Skip
jack
Mar
in
Gro
uper
(Los
)
Oct
opus
Gre
en S
nail
Big
eye
(she
llfish
)
Mul
let
Man
groo
Blu
e fis
h (P
arro
t fish
)
by h
and,
stic
k w
ith w
ire, v
ery
shal
low
and
no
divi
ngne
cess
ary
2-3
octp
usfo
r bai
t or s
elf
cons
umpt
ion
low
tide
bet
ter
spea
r gun
alm
ost e
very
day
Cas
t net
, gill
net
not a
ll pa
rt of
isla
nd
Cas
t net
, gill
net
Cas
t net
, gill
net
die
whe
n to
o m
any
som
e pa
rt is
tabo
o
tabb
o
5kg
300/
kg(m
ainl
y fo
r sel
fco
nsum
ptio
n)
Col
lect
ion
with
out d
ivin
g
peak
peak
Nor
mal
ly fo
r sel
fco
nsum
ptio
n, n
ot fo
rsa
les.
300/
kg o
f tro
ca s
hell
low
tide
100-
200
fish
100/
fish
Hig
h Se
ason
Fish
ing
Seas
on
2-3
kg /
fish
Han
dlin
e, 8
0-10
0m
ever
yday
in p
eak
time
Traw
ling
with
arti
ficia
l bai
t,su
ch a
s oc
topu
s, sq
uid
etc
feed
ing
on fl
ying
fish
and
smal
l squ
id
Han
dlin
e80
-100
m20
-30
fishe
s(1
-3 k
g/fis
h)30
0/kg
5kg
/ fish
15-2
0 kg
/ fis
h
Rem
arks
day:
sca
re w
ith o
ctop
usni
ght:
Div
ing
with
ligh
t5
lobs
ters
/fish
/wee
ksm
all:
25 A
UD
larg
e: 6
0 A
UD
new
moo
n ha
tchi
ng,
norm
ally
less
than
5m
wat
er d
epth
Ope
ratio
nda
ys/w
eek
2-3
days
/wee
k
300/
kgB
ait:
Oct
opus
, cra
b,he
lmet
cra
b, s
ardi
ne,
man
groo
, sm
all t
una,
skip
jack
3-4
days
/wee
k
3-4
days
/wee
k
3-4
days
/wee
k
Han
dlin
e80
-100
m20
-30
fishe
s(1
-3 k
g/fis
h)30
0/kg
Fish
Nam
eFi
shin
g Se
ason
Fish
ing
Met
hod
Cat
ch A
mou
ntSi
ze P
er H
ead
Ave
rage
Pric
e(v
atu)
6 fis
hes
15-2
0kg
/ fish
Sard
ine
Cla
m S
hell
Troc
hus
Han
dlin
e.R
ed: 2
00-3
00m
othe
rs: 1
00-1
50m
20-3
0 fis
hes
(1-3
kg/
fish)
Poul
et (w
hite
, silv
er,
gold
, and
red)
peak
peak
peak
peak
, with
wea
k cu
rren
t
peak
, with
wea
k cu
rren
t
Fish
cal
enda
r: A
neity
um
Peak
fish
ing
seas
on
Fish
ing
seas
on
peak
, with
wea
k cu
rren
t

69SPC Traditional Marine Resource Management and Knowledge Information Bulletin #32 – December 2013
A -
17
Dat
e: 1
4th
of J
une
2012
Jan
Feb
Mar
Apr
May
Jun
Jul
Aug
Sep
Oct
Nov
Dec
Yel
low
fin tu
na
Skip
jack
Kar
ong
treva
lly
Poul
et
Snap
per
Gro
uper
Pico
(Raf
fit fi
sh)
Red
Mou
th
Big
bel
Blu
e fis
h (p
arro
t fish
)
Nap
oleo
n (b
ig p
arro
t)
Mus
tash
fish
Man
groo
3-5d
ays/
wee
k
Mul
let
Sard
in
Red
cra
b
Whi
te c
rab
Mud
cra
b
Oct
opus
bait
for h
andl
ine
dry
seas
on
Hig
h Se
ason
Fish
ing
Seas
on
Han
dlin
e
Onl
y on
ce/w
eek
(eve
ry T
uesd
ay)
for c
rab/
fish
in th
ear
ea o
wne
d by
the
plan
tatio
n
Trol
ling
3kg/
pc30
0/kg
in m
arke
t
Gilln
et &
line
fish
ing
280/
kg
30va
tu/fi
sh
300/
kg
600/
kg in
mar
ket
Col
lect
ion
by h
and
Col
lect
ion
by h
and
2kg/
12pc
s (g
ettin
gsm
alle
r)25
0/12
pcs
Div
ing
with
spe
ar
Col
lect
ion
by h
and
2kg/
crab
Div
ing
with
spe
ar
Div
ing
with
spe
ar
5day
s/w
eek
inse
ason
Fish
Nam
eFi
shin
g Se
ason
Fish
ing
Met
hod
Cat
ch A
mou
ntSi
ze P
er H
ead
Ave
rage
Pric
e(v
atu)
3-
5pcs
/kg
300/
kg in
mar
ket
Rem
arks
Trol
ling
300/
kg in
mar
ket
5day
s/w
eek
inse
ason
Ope
ratio
nda
ys/w
eek
Han
dlin
e
280/
kg
400/
kg in
mar
ket
Trol
ling
40-8
0fish
es,
1
0-20
kg
Han
dlin
e10
kg2-
3kg
5-8k
g/pc
400/
kg in
mar
ket
8day
s/m
onth
(eve
ry4d
ays
arou
nd N
ew&
Ful
l moo
n)
Div
ing
with
spe
ar
Div
ing
with
spe
ar28
0/kg
mes
h siz
e:2.
5-3f
inge
r, ny
lon
mon
o
Cas
tnet
and
Gilln
et
Gilln
et &
line
fish
ing
300/
fish
280/
kg
300-
500p
cs/d
ay
8-10
kg/d
ayG
illnet
Gilln
et (c
anoe
w 2
-4fis
hers
)
280/
kg
280/
kg
Fish
cal
enda
r: M
alak
ula
Peak
fish
ing
seas
on
Fish
ing
seas
on
Fish
cal
enda
r: M
alek
ula

70 SPC Traditional Marine Resource Management and Knowledge Information Bulletin #32 – December 2013
A -
18
Dat
e: 2
9th
of M
ay 2
012
Jan
Feb
Mar
Apr
May
Jun
Jul
Aug
Sep
Oct
Nov
Dec
Mul
let
Man
groo
Sard
in
Mus
tash
fish
2-5
lobs
ters
Red
mao
Car
on
Poul
etH
andl
ine
Snap
per
Mar
in
Tuna
Skip
jack
Lobs
tor
800/
kg
Oct
opus
800-
1,00
0/fis
h
Cut
tlefis
h (s
quid
)
800-
1,00
0/kg
(res
taur
ants
)
Hig
h Se
ason
Fish
ing
Seas
on
Div
ing
with
spe
ar
1-5p
cs/d
ay
Div
ing
with
spe
ar
Nig
ht d
ivin
g w
ith li
ght
Trol
ling
Trol
ling
400/
20fis
hes
Trol
ling
Gill
net (
nigh
t tim
e), D
ivin
gw
ith s
pear
gun
(you
ngfis
hers
)10
kg2-
3kg
Gill
net (
nigh
t tim
e), D
ivin
gw
ith s
pear
gun
(you
ngfis
hers
)
800-
1,00
0/kg
(res
taur
ants
)
400/
fish
Han
dlin
e
Ope
ratio
nda
ys/w
eek
400/
fish
400/
fish
Gill
net (
nigh
t tim
e), D
ivin
gw
ith s
pear
gun
(you
ngfis
hers
)
Rem
arks
Gill
net (
sein
net
)20
-30p
cs ~
100
pcs
400/
2fish
es (P
ort
Vila
mar
ket)
3-4d
ays/
wee
kFu
ll m
oon
& n
ewm
oon
tine
is be
tter,
Nor
nally
day
time
oper
atio
nG
ill ne
t (se
in n
et)
Ave
rage
Pric
e(v
atu)
400/
3-4f
ishes
Gill
net &
cas
t net
Fish
Nam
eFi
shin
g Se
ason
Fish
ing
Met
hod
Cat
ch A
mou
ntSi
ze P
er H
ead
Fish
cal
enda
r: Su
nae,
Efa
te
Peak
fish
ing
seas
on
Fish
ing
seas
on
Fish
cal
enda
r: Su
nae,
Efa
te

71SPC Traditional Marine Resource Management and Knowledge Information Bulletin #32 – December 2013
A -
19
Dat
e: 2
9th
of M
ay 2
012
Jan
Feb
Mar
Apr
May
Jun
Jul
Aug
Sep
Oct
Nov
Dec
Blu
e fis
h (P
arro
t fish
)
Red
mao
(Gro
uper
)
Poul
et (r
ed, s
ilver
,go
lden
& w
hite
)
Brim
(Blu
e &
whi
te)
Han
dlin
e
Tuna
Dog
toot
h tu
na
Skip
jack
Cut
tlefis
h (s
quid
)sp
ear g
un
Oct
opus
Man
groo
gill
Cas
t net
Mul
let
Gill
net
peak
peak
peak
Traw
ling
with
arti
ficia
l bai
t,su
ch a
s oc
topu
s, sq
uid
etc
less
than
400
/kg
10kg
/ fis
h
no u
se o
f boa
t
Num
ber o
f cre
w:
4fis
hers
/ OB
E bo
at,
1fish
er/c
anoe
3,00
0/pc
(3kg
/pc)
1,00
0/pc
(big
)
400/
kgin
side
of b
ay
insid
e of
bay
insid
e of
bay
Hig
h Se
ason
Fish
ing
Seas
on
2 kg
/ fis
h
spea
r gun
Gill
net
Div
ing
with
spe
ar g
un20
-30k
g1-
2kg,
3-4
kg40
0/kg
Ope
ratio
nda
ys/w
eek
2hrs
/day
,4d
ays/
wee
k
Ave
rage
Pric
e(v
atu)
800/
kg
5kg
/ fish
1,00
0/kg
(blu
e),
400/
kg (w
hite
)
Rem
arks
3-4
days
/wee
k
Fish
Nam
eFi
shin
g Se
ason
Fish
ing
Met
hod
Cat
ch A
mou
ntSi
ze P
er H
ead
Sard
ine
Div
ing
with
spe
ar g
un
Div
ing
with
spe
ar g
un
20 k
g / f
ish
Gar
o (S
napp
er)
Han
dlin
e10
kg2-
3kg
Fish
cal
enda
r: Ta
sirik
i, Ef
ate
Peak
fish
ing
seas
on
Fish
ing
seas
on
Fish
cal
enda
r: Ta
ssik
iri, E
fate

72 SPC Traditional Marine Resource Management and Knowledge Information Bulletin #32 – December 2013
A -
20
Dat
e: 7
th o
f Jun
e 20
12
Jan
Feb
Mar
Apr
May
Jun
Jul
Aug
Sep
Oct
Nov
Dec
Yel
low
fin tu
na
Skip
jack
Wah
oo
Dol
phin
fish
Bon
ito
Sard
in60
0/kg
Squi
d
Man
groo
Blu
e fis
hdi
ving
w. s
pear
gun
Parr
ot fi
sh
Trol
ling
Trol
ling
You
ng to
ugh
fishe
rsfo
r div
ing
win
ter
Fish
Nam
eFi
shin
g Se
ason
Fish
ing
Met
hod
Cat
ch A
mou
ntSi
ze P
er H
ead
Ope
ratio
nda
ys/w
eek
Rem
arks
Han
dlin
e w
ith w
oode
n re
el1-
2kg,
3-5
kg1,
000/
kg fo
r 3-
5kg/
pc, 7
00kg
for 1
-2k
g/pc
3day
s/w
eek
Trol
ling
Ave
rage
Pric
e(v
atu)
5,00
0vat
u fo
rw
oode
n re
elm
ater
ials,
ski
pjac
k &
boni
to a
re b
est b
ait
450/
kg (2
00/k
g fo
rlo
cal)
Trol
ling
300/
kg
Trol
ling
divi
ng w
. spe
ar g
un
Hig
h Se
ason
Fish
ing
Seas
on
Poul
et (r
ed, s
ilver
,w
hite
, yel
low
, bra
wn
&bl
ack)
Fish
cal
enda
r: Le
lepa
, Efa
te
Peak
fish
ing
seas
on
Fish
ing
seas
on
e
Fish
cal
enda
r: Le
lepa
, Efa
te
5,00
0 va
tu fo
r w
oode
n re
el m
ater
i-al
s, sk
ipja
ck a
nd
boni
to a
re b
est b
ait
1000
/kg
fo
r 3–5
kg/
pc,
700/
kg
for 1
–2 k
g/pc

73SPC Traditional Marine Resource Management and Knowledge Information Bulletin #32 – December 2013
A -
21
Dat
e: 2
9th
of M
ay 2
012
Jan
Feb
Mar
Apr
May
Jun
Jul
Aug
Sep
Oct
Nov
Dec
Blu
e fis
h (P
arro
t fish
)
Red
mao
(Sna
pper
)
Car
on, R
ainb
ow
Lobs
ter
clos
eni
ght d
ivin
g w
ith li
ght
2-5
lobs
ters
1,00
0/kg
Poul
et (r
ed, s
ilver
,go
lden
& w
hite
)5
OB
E bo
ats
and
1can
oe b
e op
rera
ting
Tuna
Skip
jack
500-
700/
fish
Wah
oo
Dog
toot
h tu
na
Cut
tlefis
h (s
quid
)sp
ear g
un
Oct
opus
Man
groo
gill
Hig
h Se
ason
Fish
ing
Seas
on
Trol
ling
with
arti
ficia
l bai
t,su
ch a
s oc
topu
s, tu
be e
tc
Gill
net
200-
300p
cs/d
ay10
0/3f
ishes
spea
r gun
350/
kg
2,00
0/pc
600/
kg in
Bon
Mar
che
Han
dlin
e10
kg2-
3kg
800/
kg
Ope
ratio
nda
ys/w
eek
Rem
arks
Div
ing
with
spe
ar g
un10
-20k
g1-
2kg,
3-4
kg45
0/kg
half
day,
4day
s/w
eek
Mai
n cu
stom
er is
Bon
Mar
che
supe
rm
arke
t,
For f
ishne
w m
oon
is go
odtim
e fo
r nig
ht d
ivin
gD
ivin
g w
ith s
pear
gun
Ave
rage
Pric
e(v
atu)
Div
ing
with
spe
ar g
un
Fish
Nam
eFi
shin
g Se
ason
Fish
ing
Met
hod
Cat
ch A
mou
ntSi
ze P
er H
ead
Fish
cal
enda
r: M
anga
liliu
, Efa
te
Peak
fish
ing
seas
on
Fish
ing
seas
on
Fish
cal
enda
r: M
anga
liliu
, Efa
te

74 SPC Traditional Marine Resource Management and Knowledge Information Bulletin #32 – December 2013
A -
22
App
endi
x 3:
Agr
icul
ture
cal
enda
r
Jan
Feb
Mar
Apr
May
Jun
Jul
Aug
Sep
Oct
Nov
Dec
Prep
arat
ion
Har
vest
Prep
arat
ion
Har
vest
Prep
arat
ion
Har
vest
Prep
arat
ion
Har
vest
Prep
arat
ion
Har
vest
Prep
arat
ion
Har
vest
Prep
arat
ion
Har
vest
Prep
arat
ion
Har
vest
Prep
arat
ion
Har
vest
Prep
arat
ion
Har
vest
Prep
arat
ion
Har
vest
Prep
arat
ion
Har
vest
Prep
arat
ion
Har
vest
Rem
arks
Mai
n pr
oduc
tIs
land
Site
Ave
rage
Pric
e (V
atu)
Seas
on
Urip
iv
Mal
alul
a
Crab
Bay
Wat
er T
aro
Taro
Ana
lcau
hat
Ane
ityum
Man
ioc
Kum
ala
(Sw
eet P
otat
o)
Taro
Bana
na
Man
ioc
Taro
Bana
na
Man
ioc
Mai
ze
Taro
Man
galil
iuEf
ate
400~
500v
atu/
bag
Man
ioc
50kg
bag
400~
500v
atu/
bunc
h
Firs
t har
vest
is N
ovem
ber -
Dec
embe
r, se
cond
har
vest
is Ju
ly -
Dec
embe
r
200v
atu/
bund
le5
mai
z/bu
ndle
Appendix 3: Agriculture calendar
Mal
ekul
a

75SPC Traditional Marine Resource Management and Knowledge Information Bulletin #32 – December 2013
Appendix 4: Objective analysis A -
23
App
endi
x 4:
Obj
ectiv
e an
alys
is
(Ane
ityum
)
teac
h in
Anei
tyum
sch
ool
Educ
atio
n Stop
har
vest
ing
unde
r siz
e
Teac
hth
roug
h tr
andi
tiona
l cla
n ed
ucat
ion
syst
em
incl
ude
fishe
ries m
anag
emen
t in
scho
ol sy
llubu
s
Prod
uce
vide
o sh
ow to
edu
cate
pe
ople
Post
ers
Man
agem
ent P
lan
Dist
ribut
e co
pies
of m
anag
emen
tpl
an
Revi
ewm
anag
emen
t pla
n
Alte
rnat
ive
deve
lopm
ent
Deve
lop
poul
et, t
una,
wah
oo,
snap
per,
praw
n cu
isin
ary
for
crui
ser s
hip
Obt
ain
free
zer,
ice
mak
ing
mac
hine
,and
ice
box
Prov
ide
data
for a
ll m
arin
e re
sour
ceco
nsum
ed ar
ound
the
insla
nd
Deve
lop
smok
e fis
h, sh
ellfi
sh
polis
hing
Fish
erm
ens'
ass
ocia
tion
Cont
rol t
he s
uppl
y of
ban
ned
fish
gear
(sm
all m
esh
net a
nd s
mal
l ho
ok e
tc)
Enfo
rce
the
fishe
ries r
egul
atio
n (c
hief
coun
cil,
VFD,
MPA
co
mm
ittee
)
Trai
ngpe
ople
in-m
anag
emen
t-p
roje
ct p
ropo
sal
-acc
ount
ing
-bus
ines
s ski
lls-s
tati
stic
s-a
war
enes
s
Impr
ove
fishi
ng te
chno
logy
and
fis
h ha
ndlin
g
Obt
ain
nece
ssar
y ge
ars a
ndsk
ills
N
C
S
18
16
19
N
C
S
0
02
N
C
S
21
21
19N
C
S3
61
Votin
g ru
le:
Inte
rms o
f (N
) nee
ds, (
C) co
st &
ben
efit,
(S)
sust
aina
bilit
y, p
artic
ipan
ts vo
te fo
r 2 o
f the
4
optio
ns m
ade
durin
g th
e w
orks
hop.
Ther
e w
ere
21 p
artic
ipan
ts. S
o to
tal v
otes
are
42
for e
ach
crite
ria (N
, C, a
nd S
) if t
here
wer
e no
ab
sten
sion
(Ane
ityum
)

76 SPC Traditional Marine Resource Management and Knowledge Information Bulletin #32 – December 2013
A -
24
App
endi
x 4:
Obj
ectiv
e Ana
lysis
(Mal
akul
a)
Clim
ate
chan
geN
ot e
noug
h fin
ance
supp
ort
vanu
atu
govt
. pro
vinc
e,
and
NG
Osh
ould
giv
e m
ore
finan
cial
supp
ort
Poac
hing
Com
mitt
ee m
ust h
ave
mor
e m
eetin
g to
sol
ve
the
prob
lem
No
resp
ect f
or fi
shin
g ru
les
Mor
e aw
aren
ess i
s ne
cess
ary f
or th
e co
mm
ittee
P
S5
0
P
S8
0
P
S1
10
P
S0
1
Votin
g ru
le:
Inte
rms o
f (P)
pro
blem
(S) s
olut
ion,
par
ticip
ants
vot
e fo
r 2 o
f the
4
optio
ns m
ade
durin
g th
e w
orks
hop.
Pr
oble
m m
eans
the
mos
t ser
ious
and
impo
rtan
t pro
blem
for t
he
fishe
ries r
esou
rce
man
agem
ent
Solu
tion
mea
ns th
at i
t is a
sol
utio
n th
at th
ey th
ink
they
can
sol
ve
Diff
culty
of m
anag
emen
t of
prot
ecte
d ar
ea
P
S6
1
Diff
ciul
ty in
fish
ing
equi
pmen
t
need
eng
ine
repa
iring
tr
aini
ng.
P
S4
1
Mor
e Ed
ucat
ion
and
awar
enss
for t
he
com
mun
ity is
nec
essa
ry
We
need
she
ll po
lishi
ng
tool
s
need
mor
e tr
aini
ng a
bout
fis
hing
tech
niqu
e
No
rese
arch
and
info
rmat
ion
of fi
shin
g gr
ound
Nee
d fu
ndin
g fo
r new
fish
ing
grou
nd
P
S2
1
VFD
need
to p
rovi
de
mor
e fis
hing
equ
ipm
ent
and
gear
We
need
she
ll po
lishi
ng to
ols
Land
dis
pute
Educ
atio
n th
roou
gh
disc
ussi
on
Nee
d fu
ndin
g of
new
FAD
Land
clai
man
tssh
ould
ha
ve m
eetin
g to
sol
ve
land
dis
pute
bet
wee
n
P
S2
0
Mar
ket p
robl
em
Educ
atio
n th
roou
gh
disc
ussi
onEd
ucat
ion
thro
ough
di
scus
sion
VFD,
MPA
com
mitt
ee,
and
fishe
rmen
ass
ocia
tion
shou
ld h
ave
mee
ting
and
com
e up
with
one
oric
e fo
r fis
h, cr
ab e
tc
P
S0
3
Dest
roy
of fi
shin
g gr
ound
Educ
atio
n th
roou
gh
disc
ussi
onEd
ucat
ion
thro
ough
di
scus
sion
Educ
atio
n th
roou
gh
disc
ussi
onSt
op sh
ips f
rom
anc
horin
g in
the
tabo
o ar
ea
P
S0
3
We
need
she
ll po
lishi
ng
tool
s
Nee
d tr
aini
ng o
n ho
w to
ki
ll th
e cr
own
of th
orn
No
othe
ralte
rnat
ive
mea
ns
Educ
atio
n th
roou
gh
disc
ussi
on
build
war
ffor
the
anch
orag
e
Educ
atio
n th
roou
gh
disc
ussi
onEd
ucat
ion
thro
ough
di
scus
sion
Educ
atio
n th
roou
gh
disc
ussi
onm
ake
Crab
Bay
as a
to
uris
t des
tinat
ion
(one
da
y tou
r, bu
sh tr
ekki
ng
P
S1
0
No
fishe
rmen
Ass
soci
atio
n
MPA
com
mitt
ee sh
ould
ha
ve fi
sher
s ass
ocia
tion
P
S0
0
Com
mitt
ee sh
ould
mak
e m
ore
fund
rais
ing
If th
e co
mm
ittee
cann
otso
lve
the
prob
lem
, the
y w
ill g
o to
the
polic
e
Com
mitt
ee sh
ould
get
the
poac
hers
fine
d
Nee
dw
ater
syst
em fo
r so
meb
ay to
sta
y at C
rab
bay t
aboo
are
a
Nee
d su
rvei
lanc
e bo
at fo
r th
e ta
boo
area
Nee
d ra
nger
who
sta
y at
th
e ar
ea a
nd m
onito
r
need
one
tru
ck
Mor
e aw
aren
ess s
houl
dbe
giv
en fr
om M
PA
(Mal
ekul
a)(M
alek
ula)

77SPC Traditional Marine Resource Management and Knowledge Information Bulletin #32 – December 2013
A -
25
App
endi
x 4:
Obj
ectiv
e an
alys
is
(Man
galil
iu, E
fate
)
Lele
ma
MPA
pla
n st
ep 1
.3En
forc
e an
d se
curit
y ne
ed t
o be
st
reng
then
ed.m
ore
villa
ge p
olic
e is
nec
essa
ry.
Mon
itorin
gan
den
forc
emen
t
Mor
e su
veirl
lanc
e w
ork
is
nece
ssar
y.bo
at a
nd fu
el fo
r sur
veill
ance
are
Alte
rnat
ive
deve
lopm
ent
Prov
ide
fund
ing
for B
agal
ow (R
oi
mat
a do
mai
n)
Nee
d go
od q
ualit
y ro
ad (f
rom
the
mai
n ro
adto
the
com
mun
ity)
Mar
ketin
g
Nee
d a
hous
e fo
r tou
rists
.
Nee
d m
arke
t on
the
mai
n ro
adw
ith to
ilet f
acili
ty
FIsh
ing
dive
rsifi
catio
n
impr
ove
the
desi
gn o
f FAD
, and
de
ploy
it.
N
C
S
1
2
3
N
C
S
2714
14
N
C
S24
2
1
13N
C
S2
6
3
Votin
g ru
le:
Inte
rms o
f (N
) nee
ds, (
C) co
st &
ben
efit,
(S)
sust
aina
bilit
y, p
artic
ipan
ts vo
te fo
r 2 o
f the
4 o
ptio
ns
mad
e du
ring
the
wor
ksho
p.
Ther
e w
ere
21 p
artic
ipan
ts. S
o to
tal v
otes
are
42
for
each
crite
ria (N
, C, a
nd S
) if t
here
wer
e no
abs
tens
ion
FIsh
erm
ens
Asso
ciat
ion
Esta
blis
h fis
herm
ens a
ssoc
iatio
n
N
C
S
1
10
8
Nat
ural
Dis
aste
r
Crow
n of
Tho
rn n
eed
to b
e co
llect
ed
N
C
S
11
2
Man
agem
ent P
lan
Educ
atio
nal a
war
enes
sfor
scho
ol
Actio
n pl
an fo
r man
agem
ent p
lan
N
C
S
23
14
Nee
d go
od fa
cilit
ies f
or M
ama'
s ca
terin
g
Aqua
cultu
re(P
raw
n, g
roup
er)
Com
mun
ity la
nd L
and
deve
lopm
ent (
for a
gric
ultu
re)
Awar
enes
s on
mar
ine
and
terr
estr
ial r
esou
rces
Trai
ning
fors
ewin
g, n
eckl
ess
prod
uctio
n, t
rem
al d
rill,
polis
hing
fo
r she
ll
Nee
dge
nera
tor f
or th
e m
achi
nes
for h
andi
craf
t
prov
ide
boat
and
gear
s for
fis
hing
(M
anga
liliu
, Efa
te)

78 SPC Traditional Marine Resource Management and Knowledge Information Bulletin #32 – December 2013
A -
26
App
endi
x 4:
Obj
ectiv
e an
alys
is
(Lel
epa,
Efa
te)
New
FAD
des
ign.
FAD
regu
latio
n by
Chi
ef C
ounc
il an
d fis
herm
ensa
ssoc
iatio
n
Fish
ing
Dive
rsifi
catio
n
Gov
ernm
ent s
houl
d pr
ovid
e fu
elsu
bsid
ies t
o fis
herm
ens
asso
ciat
ion
Fish
erm
enAs
soci
atio
n
Fish
erm
en a
ssoc
iatio
n m
ust h
ave
regu
latio
n
Fish
dis
trib
utio
nan
dM
arke
ting
Nee
d on
e in
ce m
achi
ne to
re
duce
tran
spor
tex
pens
es to
Vila
Fish
pro
cess
ing,
smok
ing,
dryi
ng e
tc
Educ
atio
n an
dAw
aren
ess
we
mus
tenf
orce
the
rule
s in
the
Lele
ma
man
agem
ent p
lan
N
C
S
0
8
5
N
C
S
90
0
N
C
S9
1
1
9N
C
S3
1
0
Votin
g ru
le:
Inte
rms o
f (N
) nee
ds, (
C) co
st &
ben
efit,
(S) s
usta
inab
ility
, par
ticip
ants
vo
te fo
r 2 o
f the
4 o
ptio
ns m
ade
durin
g th
e w
orks
hop.
Ther
e w
ere
21 p
artic
ipan
ts. S
o to
tal v
otes
are
42
for e
ach
crite
ria (N
, C,
and
S) if
ther
e w
ere
no a
bste
nsio
n
Man
agem
ent P
lan
Lele
ma
wor
king
gro
up
shou
ld im
prov
e th
e se
curit
y for
MPA
N
C
S
0
0
0
Ante
rlativ
eDe
velo
pmen
t
Nee
dso
meo
ne w
ith
crea
tive
idea
s to
give
us
mor
e id
eas
N
C
S
38
7
Man
agem
ent p
lan
need
to
be
revi
ewed
and
re-
intr
oduc
ed
New
fish
ing
met
hods
and
te
chni
que
are
requ
ired
Aqua
cultu
re
Fish
erm
en a
ssoc
iatio
n m
ust b
e re
gist
ered
We
need
hel
p m
arke
ting
from
JICA
and
VFD
for
cram
shel
l
we
shou
ld le
t you
th a
nd
scho
ol ch
ildre
n kn
ow
abou
t mar
ine
spec
ies
Wom
ensh
ould
be
invo
lved
in d
ecis
ion-
mak
ing
proc
ess
Lele
pa w
orki
ng g
roup
sh
ould
do
mor
e aw
aren
ess t
o th
e sc
hool
Youn
gne
ed to
att
end
mor
e w
orks
hop
from
the
VFD
and
JICA
JICA
and
VFD
shou
ld g
ive
awar
enss
to th
e yo
uth
how
to lo
ok a
fter
the
Colle
ct m
arin
e sp
ecie
s on
ce/t
wic
e a
wee
k ou
tsid
e M
PA
Lele
ma
regi
onal
coun
cil o
f ch
iefs
and
lele
ma
wor
king
gr
oup
shou
ld a
ssis
t
We
need
she
ll po
lishi
ng
tool
s
Nee
d m
ore
tous
ism
tr
aini
ng
New
Lodg
e, b
anga
low
co
nstr
uctio
n is
alre
ady
inco
nsul
tatio
n bu
t no
t
Exte
ntio
n fu
nd f
or w
ater
pr
ojec
ts
(Lel
epa,
Efa
te)

79SPC Traditional Marine Resource Management and Knowledge Information Bulletin #32 – December 2013
A -
27
App
endi
x 4:
Obj
ectiv
e an
alys
is
(Tas
irik
i, Ef
ate)
Set u
p co
nser
vatio
n ar
ea
Ove
rfis
h(r
eeff
ish)
Lim
it fis
hing
to o
nce
a w
eek
Poac
her
Nee
d bo
at to
mon
itor
Man
agem
ent
Plan
MPA
mus
t be
long
and
bi
g
Fish
erm
enAs
soci
atio
n
Form
ass
ciat
ion
N
C
S
1
0
0
N
C
S
00
0
N
C
S
0
0
0
N
C
S
0
0
0
Votin
g ru
le:
Inte
rms o
f (N
) nee
ds, (
C) co
st &
ben
efit,
(S) s
usta
inab
ility
, par
ticip
ants
vo
te fo
r 2 o
f the
4 o
ptio
ns m
ade
durin
g th
e w
orks
hop.
Ther
e w
ere
21 p
artic
ipan
ts. S
o to
tal v
otes
are
42
for e
ach
crite
ria (N
, C,
and
S) if
ther
e w
ere
no a
bste
nsio
n
Mat
eria
lsan
dBo
ats
N
C
S
0
1
0
Educ
atio
nan
dAw
aren
ess
Crea
t nic
e en
viro
nmen
t fo
r stu
dent
s.pr
ovid
e do
uble
cla
ssro
om
N
C
S
80
65
75
Prov
ide
fishi
ng b
oat t
o fis
h aw
ay
from
reef
We
need
she
ll po
lishi
ng
tool
s
Prov
dete
ache
rs h
ouse
Alte
rnat
ive
Inco
me
Prov
ide
trai
ning
on
Cook
ing
and
sew
ing
for w
omen
N
C
S
6061
60
Exte
ntio
nof
pre
-sch
ool
We
need
she
ll po
lishi
ng to
ols
Prov
ide
mor
e in
form
atio
n ab
out
tour
ism
Clim
ate
Chan
ge
N
C
S
10
1
Prov
ide
guie
st h
ouse
N
C
S
6061
60
Mar
ketin
g
Prov
ide
Ice
mac
hine
N
C
S
0
0
0
Fina
ncia
l sou
rce
for
mon
itorin
g ac
tivity
Ask f
or h
elp
dona
tion
Nee
d m
ore
educ
atio
n an
d aw
aren
essa
t sch
ools
Prov
ide
tool
s fo
rfis
hing
Prov
ide
boat
s fo
rfis
hing
Incr
ease
clas
sroo
m
Prov
ide
cont
aine
r sto
rage
Prov
ide
cent
ral s
ellin
g po
int c
ool
room
stor
age
and
pow
er
gene
rato
r
VFV
prov
ides
tran
spor
t to
go
arou
nd to
buy
fis
h
Prov
ide
mor
e pl
aces
for s
elin
g fis
h
Stab
ilize
the
fish
pric
e 40
0vt
/ ro
pe
Impr
ove
fish
pric
e
(T
assi
riki
, Efa
te)

80 SPC Traditional Marine Resource Management and Knowledge Information Bulletin #32 – December 2013
A -
28
App
endi
x 4:
Obj
ectiv
e Ana
lysis
(Sun
ae, E
fate
)
New
eng
ines
for b
oats
and
cano
es
Fish
ing
Dive
rsifi
catio
n
Reno
vate
boa
t
Clim
ate
Chan
ge
Torc
h an
d ba
tter
y to
se
arch
and
des
troy
crow
n of
thor
n in
nig
ht ti
me
Fish
erm
ens
Asso
ciat
ion
Form
fish
erm
ens
asso
ciat
ion
Alte
rnat
ive
Deve
lopm
ent
Tour
ism
dev
elop
men
t w
ith ka
yack
N
C
S
2
4
3
N
C
S
00
2
N
C
S1
2
2N
C
S8
5
3
Votin
g ru
le:
Inte
rms o
f (N
) nee
ds, (
C) co
st &
ben
efit,
(S) s
usta
inab
ility
, par
ticip
ants
vo
te fo
r 2 o
f the
4 o
ptio
ns m
ade
durin
g th
e w
orks
hop.
Ther
e w
ere
21 p
artic
ipan
ts. S
o to
tal v
otes
are
42
for e
ach
crite
ria (N
, C,
and
S) if
ther
e w
ere
no a
bste
nsio
n
Men
talit
y
N
C
S
1
0
0
Man
agem
ent P
lan
Lega
lize
MPA
via
VFD
N
C
S
4 1
5
1 ne
w b
oatw
ith e
ngin
e fo
r co
mm
unity
Tour
ism
dev
elop
men
t w
ith sn
orke
ling
in c
ram
ar
ea
Loca
l gue
st h
ouse
We
need
she
ll po
lishi
ng
tool
s
Nee
d m
ore
tous
ism
tr
aini
ng
Educ
atio
n an
d Aw
aren
ess
Educ
atio
n th
roou
gh d
iscu
ssio
n
N
C
S
2 6
3
VFD
awar
enes
s and
su
ppor
t
(S
unae
, Efa
te)

81SPC Traditional Marine Resource Management and Knowledge Information Bulletin #32 – December 2013
App
endi
x 5:
IDO
S (in
stitu
tiona
l dev
elop
men
t/org
anis
atio
nal s
tren
gthe
ning
) ana
lysi
s
Nat
iona
l gov
ernm
ent a
genc
ies
Dep
artm
ent o
f Fi
nanc
e D
epar
tmen
t of
Coo
pera
tives
Min
istry
of
Agr
icul
ture
Dep
artm
ent o
f To
uris
m
Dep
artm
ent o
f C
usto
m
Polic
e (la
w
enfo
rcem
ent)
Dep
artm
ent o
f En
viro
nmen
t
Fish
erie
s ind
ustry
(e
.g. f
orei
gn v
esse
ls)
Fish
erm
en’s
A
ssoc
iatio
ns/C
oope
rativ
es
Fish
ers
Fish
Mar
ket
Farm
er’s
Ass
ocia
tion
(Agr
icul
ture
, Liv
esto
ck)
Soci
al g
roup
s in
com
mun
ity
Rel
igio
us g
roup
You
th g
roup
Wom
en’s
gro
up
Scho
ol
Child
ren
Chu
rch
Mai
n do
nor
orga
niza
tions
SPC
(Reg
iona
l or
gani
zatio
n)
IRD
(Res
earc
h gr
oup)
JIC
A G
race
of
Seas
Pro
ject
Oth
er d
onor
org
aniz
atio
ns
Hea
d of
Trib
e
Cou
ncil
of
Chi
efs
FFA
FAO
SPR
EP
(Pac
ific
FSP
(Fou
ndat
ion
for P
eopl
e of
the
Sout
h Pa
cific
)
Loca
l NG
O
Ree
f Che
ck
Van
uatu
Van
ua-T
hai
Res
ourc
e M
onito
r
Tasi
-Van
ua
(Wan
Sm
ol
Bag
The
ater
) En
viro
nmen
t M
onito
r (v
illag
e le
vel)
Loca
l ass
ocia
tions
in c
omm
unity
MPA
C
omm
ittee
Tour
ism
A
ssoc
iatio
n
Ass
ocia
tion
for
Res
ort a
nd
Bun
galo
w
Envi
ronm
ent
Com
mitt
ee
Van
uatu
Mar
itim
e C
olle
ge
TVET
(Tra
inin
g in
stitu
tion)
USP
(Uni
vers
ity o
f th
e So
uth
Paci
fic)
Prov
inci
al
Gov
ernm
ent
Mem
bers
of
Parli
amen
t
Prov
inci
al
Cou
ncil
Land
Ow
ner
Ree
f Ow
ner
Fish
erie
s Dep
artm
ent
Van
uatu
Cul
ture
C
entre
Bas
ic q
uest
ion:
H
ow d
oes t
he F
ishe
ries
Dep
artm
ent i
mpr
ove
com
mun
ity-b
ased
Coa
stal
R
esou
rce
Man
agem
ent?
Serv
ice
Fund
C
oope
ratio
n
Pres
sure
Con
flict
Inst
itutio
n-gr
amm
e: V
anua
tu F
ishe
ries D
epar
tmen
t,11
July
201
2
Appendix 5: IDOS (institutional development/organisational strengthening) analysis
Inst
itutio
n-gr
amm
e: V
anua
tu F
ishe
ries
Dep
artm
ent,1
1 Ju
ly 2
012

82 SPC Traditional Marine Resource Management and Knowledge Information Bulletin #32 – December 2013
12 Ju
ly 2
012
Exte
rnal
fact
or a
naly
sis
12
July
201
2
Not
all
isla
nds h
ave
Fish
. Dep
t. st
aff
Trad
ition
al
fam
ily sy
stem
is
too
stro
ng
Supp
ly
of in
put
No
fishi
ng g
ear
shop
in ru
ral
area
s
Thr
eat
Fish
ers i
n ru
ral
com
mun
ities
lack
al
tern
ativ
e fis
hing
met
hod
Lim
ited
finan
cial
as
sist
ance
to
supp
ort F
AD
pr
ogra
m in
co
mm
uniti
es
Not
eno
ugh
fund
s to
visi
t rur
al
com
mun
ities
Opp
ortu
nity
Mor
e yo
uths
are
ed
ucat
ed in
the
rura
l co
mm
uniti
es
Goo
d co
mm
unic
atio
n m
anag
emen
t sy
stem
Aw
aren
ess i
n th
e co
mm
uniti
es
Off
icer
s to
expa
nd
know
ledg
e in
dat
a co
llect
ion
/ ana
lysi
s
Fish
erie
s D
epar
tmen
t
Polic
y is
not
im
plem
ente
d
Enf
orce
men
t is l
imite
d in
co
mm
unity
-bas
ed C
RM
Res
ourc
es n
eed
prop
er
man
agem
ent;
mor
e re
gula
tions
nee
ded
for
high
val
ue sp
ecie
s
Cul
tura
l go
vern
ance
Mor
e yo
uths
mig
rate
to
urba
n ar
eas
Prov
inci
al st
ruct
ure
bloc
ks
loca
l com
mun
icat
ion
Wea
k tra
ditio
nal
gove
rnan
ce
Fish
erie
s Dep
t. is
sl
owly
pro
mot
ing
coop
erat
ion
amon
g st
akeh
olde
rs
Fish
erie
s Dep
t. im
plem
ents
liv
elih
ood
proj
ect f
or c
omm
unity
Rur
al c
omm
ittee
has
go
od u
nder
stan
ding
of
reso
urce
m
anag
emen
t Tra
ditio
nal g
over
nanc
e sy
stem
is a
bas
is o
f res
ourc
e m
anag
emen
t
Mor
e tra
inin
g fo
r ex
tens
ion
offic
ers
Nee
d to
stre
ngth
en
Fish
ers A
ssoc
iatio
ns
Ope
ratio
n bu
dget
for
exte
nsio
n of
ficer
s is
not e
noug
h
Bet
ter w
ays t
o co
ntro
l and
man
age
data
are
nee
ded
Fish
ers A
ssoc
iatio
ns a
re
very
slow
to e
stab
lish
in
isla
nd
Mor
e fis
hers
’ ass
ocia
tions
ne
ed to
be
regi
ster
ed
Poor
impl
emen
tatio
n of
ac
tion
plan
Nee
d to
impl
emen
t mor
e pr
ojec
ts to
hel
p V
FD
Dev
elop
men
t
Fish
erie
s Dep
t la
cks r
esou
rce
offic
es
No
trans
port
for
offic
ers t
o vi
sit o
ther
co
mm
uniti
es
Nee
d to
impr
ove
offic
ers’
cap
aciti
es
Not
eno
ugh
Fish
. D
ept.
staf
f in
prov
ince
cen
ter
Inte
rest
ed N
GO
s he
lp so
me
sect
ors
Muc
h po
tent
ial t
o de
velo
p th
e fis
herie
s sec
tor
Goo
d ne
twor
k/
colla
bora
tion
with
N
GO
s
Rur
al p
opul
atio
n is
fu
lly a
war
e of
nee
d fo
r coa
stal
reso
urce
m
anag
emen
t
Coo
pera
tion
with
ot
her
gove
rnm
ent
agen
cies
Supp
ort t
o fis
herm
en w
ith
duty
exe
mpt
ion
Freq
uent
land
di
sput
es
Clo
se m
onito
ring
for t
he
fishi
ng a
ctiv
ity o
f for
eign
ve
ssel
s
No
coop
erat
ion
betw
een
Fish
erie
s Dep
t. an
d ot
her
gove
rnm
ent a
genc
ies
Not
eno
ugh
follo
w-u
p vi
sits
to c
omm
uniti
es
Not
eno
ugh
visi
ts o
f sen
ior
offic
ers t
o pr
ovin
cial
ce
nter
s
Dis
pute
reso
lutio
n th
roug
h vi
llage
cou
rt sy
stem
Goo
d re
latio
ns b
etw
een
chie
fs a
nd c
omm
uniti
es
Dem
and
for
fish
is h
igh
Fish
erm
en a
re tr
aine
d on
bas
ic C
RM
Com
mun
ities
nee
d Fi
sher
ies D
ept.
Col
lect
ion
of d
ata
from
mar
ket v
ende
rs
has b
een
inef
fect
ive
No
awar
enes
s in
the
com
mun
ities
Con
flict
bet
wee
n ch
iefs
an
d go
vern
men
t de
partm
ents
Mor
e tra
inin
g fo
r fis
herm
en a
nd fi
sh
farm
ers n
eede
d Diff
icul
ties o
f tra
nspo
rtatio
n in
isla
nds
Fish
erm
en d
o no
t pro
vide
da
ta to
Fis
herie
s Dep
t.
Nee
d fo
r a
bett
er
fish
mar
ket f
or
fishe
rmen
at P
ort
Vila
Serv
ice
deliv
ery
to r
ural
co
mm
uniti
es is
ver
y lim
ited
Hig
h pr
ice
of fi
sh
Info
rmat
ion
flow
is v
ery
slow
bet
wee
n Fi
sher
ies
Dep
t. an
d co
mm
uniti
es
Fish
ers a
ssoc
iatio
ns sh
ould
be
incl
uded
in th
e Fi
sher
ies
Dep
t. pr
ogra
m
Inco
me
gene
ratio
n in
ru
ral a
reas
is li
mite
d
Pric
e of
fish
ge
ar g
oes u
p
Not
eno
ugh
fish
in
fish
mar
ket
Wea
k co
ordi
natio
n of
pr
ovin
cial
gov
ernm
ent
1
4
Res
ourc
e m
onito
ring
syst
em
is in
pla
ce
4
5
1
Fish
ers A
ssoc
iatio
n w
ill
help
Fis
heri
es D
ept.
prov
ide
data
2
1 1
3
4
5
Top
5
Opp
ortu
nitie
s T
op 5
Thr
eats
Polic
y/ru
le/e
nvir
onm
ent/e
cono
my/
cultu
re
Dem
and
of o
utpu
t
Exte
rnal
fact
or a
naly
sis,
12
July
201
2

83SPC Traditional Marine Resource Management and Knowledge Information Bulletin #32 – December 2013
Inte
rnal
fact
or a
naly
sis,
12 Ju
ly 2
012
N
ot e
noug
h Fi
sher
ies
Dep
t. st
aff m
embe
rs in
pr
ovin
cial
cen
ters
Faci
litie
s are
not
fu
lly u
tiliz
ed b
y of
ficer
s
Ther
e ar
e fa
cilit
ies i
n fis
herie
s cen
ters
Mis
sion
Inpu
t
Out
put
Lack
of t
rans
porta
tion
for o
ffic
ers t
o vi
sit
rura
l com
mun
ities
D
epar
tmen
t of F
ishe
ries
Stre
ngth
Wea
knes
s R
ank
Bas
ic q
uest
ion:
H
ow d
oes t
he F
ishe
ries D
epar
tmen
t im
prov
e co
mm
unity
-bas
ed c
oast
al re
sour
ce m
anag
emen
t?
Man
agem
ent s
tyle
Res
earc
h an
d de
velo
pmen
t St
rate
gy
Hum
an r
esou
rce
deve
lopm
ent
Fund
s are
not
ver
y ac
cess
ible
. Fu
nds f
or sm
all
proj
ects
are
ava
ilabl
e th
roug
h co
llabo
ratio
n w
ith N
GO
s. B
udge
ts a
re in
adeq
uate
fo
r ext
ensi
on o
ffic
ers t
o ca
rry
out a
ctiv
ities
in
rura
l com
mun
ities
.
Lack
of a
cces
s to
Proj
ect D
evel
opm
ent
Fund
(PD
F)
Off
icer
s exp
and
know
ledg
e in
dat
a an
alys
is a
nd
colle
ctio
n
Rec
urre
nt b
udge
t is n
ot
dist
ribut
ed a
mon
g al
l ex
tens
ion
cent
ers.
VFD
pro
vide
s liv
elih
ood
prog
ram
s fo
r com
mun
ity
VFD
can
supp
ort
fishe
rmen
with
dut
y ex
empt
ion
Not
eno
ugh
visi
ts o
f se
nior
off
icer
s to
prov
inci
al o
ffic
es
Dep
artm
ent b
udge
t is
not l
arge
eno
ugh
to
reac
h co
mm
uniti
es.
Prov
inci
al F
ishe
ries
of
ficer
s sho
uld
have
co
ntro
l ove
r th
eir
own
budg
ets.
Lack
of f
eedb
ack
of
data
col
lect
ion
Lack
of f
orm
al
netw
orki
ng w
ith
MO
U
Coa
stal
reso
urce
m
anag
emen
t pla
n is
not
fu
lly im
plem
ente
d.
Lac
k of
dat
a su
bmis
sion
by
exte
nsio
n of
ficer
s
Not
eno
ugh
follo
w-u
p vi
sits
to
com
mun
ities
Lac
k of
dat
a co
llect
ion
Dep
t. sh
ould
ac
know
ledg
e pr
ovin
cial
off
icer
re
ports
and
en
cour
age
offic
ers
with
feed
back
.
Ope
ratio
n bu
dget
for
exte
nsio
n of
ficer
s is n
ot
enou
gh. Fi
nanc
e
Fund
s of d
onor
ag
enci
es a
re
acce
ssib
le.
Fund
s of p
rovi
ncia
l go
vern
men
ts a
re
avai
labl
e fo
r ext
ensi
on
offic
ers.
Qua
rterly
repo
rting
by
exte
nsio
n of
ficer
s is
very
poo
r.
Lac
k of
reg
ular
m
eetin
gs
Lack
of d
ata
man
agem
ent
Lack
of i
nfor
mat
ion
shar
ing
amon
g de
velo
pmen
t off
icer
s
Man
agem
ent o
f the
D
ivis
ion
is n
ot
resp
onsi
ve to
off
ice
need
s.
Dep
t. ex
ecut
ives
hol
d re
gula
r mee
tings
Stru
ctur
e Pr
omot
e so
cial
in
tera
ctio
n am
ong
all s
taff
mem
bers
.
Off
icer
s hav
e go
od
rela
tions
with
pr
ovin
cial
go
vern
men
t.
Lack
of o
ffic
ers
assi
gned
sole
ly fo
r co
asta
l res
ourc
e m
anag
emen
t
Lack
of f
ield
as
sist
ance
Org
aniz
atio
nal C
ultu
re
Dev
elop
men
t of
ficer
s hav
e to
o m
uch
wor
k to
do.
Goo
d lin
kage
be
twee
n Fi
sher
ies
Dep
t. an
d pr
ovin
cial
go
vern
men
t sy
stem
s Fi
sher
ies o
ffic
ers
resp
ect l
ocal
co
mm
unity
.
Lack
of t
rain
ing
prog
ram
s for
ex
tens
ion
offic
ers
Exte
rnal
(o
vers
eas)
tra
inin
g is
av
aila
ble
for
offic
ers
Goo
d ne
twor
k w
ith
NG
Os
VFD
is w
orki
ng
toge
ther
with
MPA
co
mm
ittee
Not
eno
ugh
cons
iste
ncy
in w
ork
plan
s
Lac
k of
fish
erie
s de
velo
pmen
t pol
icy
VFD
cab
util
ize
past
or
exis
ting
rese
arch
res
ults
Alte
rnat
ive
fishe
ry is
pr
omot
ed in
com
mun
ities
Job
desc
ript
ion
and
shar
ing
Job
desc
riptio
n is
ve
ry c
lear
. 1
2
3 3
3
1
2
4
2
4 4
4 6
Not
eno
ugh
awar
enes
s in
com
mun
ities
Ran
k
Inte
rnal
fact
or a
naly
sis,
12
July
201
2

84 SPC Traditional Marine Resource Management and Knowledge Information Bulletin #32 – December 2013
Bas
ic q
uest
ion:
H
ow d
oes t
he V
anua
tu F
ishe
ries
Dep
artm
ent (
VFD
) im
prov
e co
mm
unity
-bas
ed c
oast
al re
sour
ce
man
agem
ent?
Opp
ortu
nity
T
hrea
t
Dem
and
for
fish
is h
igh
Fish
er a
ssoc
iatio
ns h
elp
Fish
erie
s Dep
artm
ent t
o pr
ovid
e da
ta
Tra
ditio
nal g
over
nanc
e sy
stem
is a
bas
is o
f coa
stal
re
sour
ce m
anag
emen
t
Fish
er a
ssoc
iatio
n is
ver
y sl
ow to
be
set u
p in
isla
nds
Lac
k of
bet
ter
fish
mar
kets
in
mai
n to
wns
in is
land
E
nfor
cem
ent o
f co
mm
unity
-bas
ed c
oast
al
fishe
ries
man
agem
ent i
s lim
ited
Strength
Off
icer
s exp
and
know
ledg
e in
dat
a an
alys
is a
nd
colle
ctio
n
Pres
ent f
ishe
ries p
rodu
ctio
n da
ta to
pro
mot
e lo
cal f
ish
sale
Tr
ain
fishe
rs o
n da
ta
colle
ctio
n sy
stem
D
eliv
er k
now
ledg
e an
d da
ta
to st
reng
then
trad
ition
al
gove
rnan
ce
Expl
ain
data
col
lect
ion
syst
em to
pro
mot
e or
gani
zing
fis
her a
ssoc
iatio
ns
Trai
n fis
hers
to c
olle
ct fi
sh
data
thro
ugh
fish
mar
kets
R
aise
aw
aren
ess o
n fis
herie
s re
sour
ces t
hrou
gh d
ata
colle
ctio
n in
com
mun
ities
V
FD c
an su
ppor
t fis
herm
en
with
dut
y ex
empt
ion
Prom
ote
duty
exe
mpt
ion
prog
ram
mes
to in
crea
se
fishi
ng a
ctiv
ities
and
pr
oduc
tion
Enco
urag
e fis
hers
to su
bmit
GR
N o
n a
mon
thly
bas
is
Incr
ease
fish
ing
dive
rsifi
catio
n to
enh
ance
tra
ditio
nal m
anag
emen
t sy
stem
Prom
ote
Fish
erie
s Dep
t’s
supp
ort t
hrou
gh d
uty
exem
ptio
n to
enc
oura
ge fi
sher
as
soci
atio
n re
gist
ratio
n
Prom
ote
finan
cial
supp
ort t
o es
tabl
ish
fish
mar
ket o
utle
ts
Use
dut
y ex
empt
ion
to
enfo
rce
coas
tal r
esou
rce
man
agem
ent
VFD
can
util
ise
past
and
ex
istin
g re
sear
ch r
esul
ts
App
ly re
sear
ch d
ata
to m
ake
effic
ient
and
val
uabl
e fis
hing
m
etho
ds
Trai
n fis
hers
to u
tilis
e ne
w
fishi
ng te
chno
logi
es a
nd d
ata
colle
ctio
n m
etho
ds
Pres
ent p
ast r
esea
rch
resu
lts
to c
omm
uniti
es
Con
duct
stoc
k as
sess
men
t to
estim
ate
quan
tity
of fi
sh
reso
urce
s
Con
duct
feas
ibili
ty st
udy
to
esta
blis
h fis
h m
arke
ts
acco
rdin
g to
pas
t stu
dies
Prov
ide
broc
hure
s and
in
form
atio
n of
fish
erie
s re
sour
ce st
atus
V
FD is
wor
k to
geth
er w
ith
mar
ine
prot
ecte
d ar
ea
(MPA
) com
mitt
ees
Prom
ote
to u
tilis
e op
en a
cces
s fis
hing
are
as (n
on-M
PA)
Dev
elop
MPA
man
agem
ent
plan
for d
ata
colle
ctio
n En
cour
age
com
mun
ity
parti
cipa
tion
in re
sour
ce
man
agem
ent
Org
anis
e fis
her a
ssoc
iatio
ns
thro
ugh
MPA
com
mitt
ees
Con
duct
live
lihoo
d im
prov
emen
t act
iviti
es (f
ood
secu
rity)
with
MPA
co
mm
ittee
s
Trai
n co
mm
uniti
es o
n re
sour
ce m
anag
emen
t with
M
PA c
omm
ittee
s
Off
icer
s hav
e go
od r
elat
ions
w
ith p
rovi
ncia
l go
vern
men
ts
Trai
n fis
hers
to p
rom
ote
fish
prod
uctio
n Pr
ovid
e fis
h st
orag
e fa
cilit
ies
to su
ppor
t fis
her a
ssoc
iatio
ns
W
ork
with
pro
vinc
ial
gove
rnm
ent c
ounc
ils to
or
gani
se fi
sher
ass
ocia
tion
Seek
pro
vinc
ial g
over
nmen
t su
bsid
ies t
o de
velo
p fis
h m
arke
ts
Seek
pro
vinc
ial a
ssis
tanc
e fo
r co
asta
l res
ourc
e m
anag
emen
t
Ext
erna
l tra
inin
g (o
vers
eas)
is
ava
ilabl
e fo
r of
ficer
s Tr
ain
fishe
rs to
lear
n ne
w
fishi
ng te
chni
ques
Im
prov
e te
chni
cal a
ssis
tanc
e to
fish
er a
ssoc
iatio
ns
Rai
se a
war
enes
s of f
ishe
rs
and
deve
lop
a cl
ear b
ase
of
data
col
lect
ion
Con
duct
com
mun
ity
awar
enes
s pro
gram
mes
for
orga
nizi
ng fi
sher
ass
ocia
tions
Con
duct
com
mun
ity
awar
enes
s pro
gram
mes
for
fish
mar
ket s
yste
ms
Trai
n co
mm
uniti
es o
n co
asta
l re
sour
ce m
anag
emen
t
Weakness
Lac
k of
reg
ular
mee
tings
Hol
d m
eetin
gs to
dis
cuss
fish
su
pply
with
loca
l fis
hers
H
old
mee
tings
to im
prov
e da
ta c
olle
ctio
n an
d qu
ality
w
ith fi
sher
ass
ocia
tion
Con
duct
aw
aren
ess m
eetin
gs
of tr
aditi
onal
gov
erna
nce
in
targ
et a
reas
Rai
se c
omm
unity
aw
aren
ess
on fi
sher
ass
ocia
tion
regu
latio
ns
Impr
ove
the
subm
issi
on o
f m
onth
ly a
udit
repo
rts fr
om
fish
mar
kets
Hol
d re
gula
r mee
tings
to
addr
ess r
esou
rce
man
agem
ent
issu
es
Lac
k of
fish
erie
s de
velo
pmen
t pol
icy
Dev
elop
coa
stal
fish
erie
s de
velo
pmen
t pol
icy
or p
lan
Impr
ove
linka
ge b
etw
een
fishe
r ass
ocia
tion
byla
ws a
nd
fishe
ries p
olic
y
Esta
blis
h co
nnec
tion
betw
een
tradi
tiona
l gov
erna
nce
syst
em
and
fishe
ries p
olic
y
Cre
ate
byla
ws o
f fis
her
asso
ciat
ion
on p
rovi
ncia
l fis
herie
s cen
ters
Cre
ate
byla
ws t
o he
lp d
evel
op
fish
mar
kets
; Dev
elop
a p
lan
to b
uild
new
fish
mar
kets
in
ever
y pr
ovin
cial
cen
ter
Dev
elop
a p
rope
r pol
icy
to
empo
wer
the
com
mun
ity fo
r co
asta
l res
ourc
e m
anag
emen
t
Lac
k of
dat
a su
bmis
sion
by
exte
nsio
n of
ficer
s Im
prov
e da
ta su
bmis
sion
sy
stem
from
ext
ensi
on
offic
ers
Impr
ove
data
col
lect
ion
from
fis
her a
ssoc
iatio
ns
Impr
ove
data
subm
issi
on
cond
ition
to st
reng
then
tra
ditio
nal g
over
nanc
e
Set u
p fis
her a
ssoc
iatio
n fo
r da
ta c
olle
ctio
n fr
om fi
sher
s Im
prov
e da
ta c
olle
ctio
n on
pr
ovin
cial
fish
erie
s cen
ters
an
d fis
h m
arke
ts
Impr
ove
data
col
lect
ion
cond
ition
for c
oast
al re
sour
ce
man
agem
ent
Lac
k of
feed
back
on
data
co
llect
ion
Rep
ort f
ish
prod
uctio
n ba
ck
to fi
sher
s R
epor
t dat
a an
alys
is re
sults
to
fishe
rs
Util
ise
tradi
tiona
l net
wor
ks to
im
prov
e da
ta su
bmis
sion
Fi
sher
ies D
ept.
offic
ers
prov
ides
feed
back
col
lect
ed
data
to fi
sher
s
Rep
ort d
ata
anal
ysis
resu
lts to
fis
h m
arke
ts
Impr
ove
data
info
rmat
ion
diss
emin
atio
n to
com
mun
ities
Not
eno
ugh
follo
w-u
p vi
sits
to
com
mun
ities
C
onta
ct c
omm
uniti
es
regu
larly
for f
ollo
w-u
p vi
sits
C
ondu
ct re
gula
r vis
its to
fis
her a
ssoc
iatio
ns
Incr
ease
follo
w-u
p vi
sits
to
com
mun
ities
C
ondu
ct re
gula
r vis
its to
ex
istin
g fis
her a
ssoc
iatio
ns
C
ondu
ct re
gula
r vis
its fo
r co
mm
unity
-bas
ed
man
agem
ent
Fish
erie
s pro
vinc
ial o
ffic
ers
do n
ot c
ontr
ol th
eir
own
budg
ets
Dev
elop
wor
k pl
an a
nd
cost
-bud
get b
reak
dow
n Es
tabl
ish
netw
ork
betw
een
fishe
r ass
ocia
tion
and
prov
inci
al o
ffic
ers
Impr
ove
prov
inci
al o
ffic
er
capa
citie
s to
cont
rol t
heir
budg
et o
pera
tion
M
onito
r pro
vinc
ial b
udge
t op
erat
ion
thro
ugh
regu
lar
visi
ts b
y se
nior
off
icer
s
Allo
cate
suff
icie
nt b
udge
ts fo
r co
mm
unity
-bas
ed
man
agem
ent p
rogr
amm
es
Stra
tegi
c or
ient
atio
n: F
ishe
ries
Dep
artm
ent,
Vanu
atu,
13
July
201
2

![Music of Vanuatu: Celebrations and Mysteries [CD album + ebook]](https://static.fdokumen.com/doc/165x107/6314e718511772fe45102133/music-of-vanuatu-celebrations-and-mysteries-cd-album-ebook.jpg)