Sustainable Livelihoods in Traditional Fishing Villages on ...
410
Sustainable Livelihoods in Traditional Fishing Villages on Rote Island, Indonesian: Providing a FRESH Start for the next generation Author King, Paul Gerard Published 2019-09-04 Thesis Type Thesis (PhD Doctorate) School School of Environment and Sc DOI https://doi.org/10.25904/1912/871 Copyright Statement The author owns the copyright in this thesis, unless stated otherwise. Downloaded from http://hdl.handle.net/10072/387391 Griffith Research Online https://research-repository.griffith.edu.au
-
Upload
khangminh22 -
Category
Documents
-
view
1 -
download
0
Transcript of Sustainable Livelihoods in Traditional Fishing Villages on ...

Sustainable Livelihoods in Traditional Fishing Villages onRote Island, Indonesian: Providing a FRESH Start for the nextgeneration
Author
King, Paul Gerard
Published
2019-09-04
Thesis Type
Thesis (PhD Doctorate)
School
School of Environment and Sc
DOI
https://doi.org/10.25904/1912/871
Copyright Statement
The author owns the copyright in this thesis, unless stated otherwise.
Downloaded from
http://hdl.handle.net/10072/387391
Griffith Research Online
https://research-repository.griffith.edu.au

Sustainable Livelihoods in Traditional Fishing Villages
on Rote Island, Indonesian:
Providing a FRESH Start for the next generation
Paul G. King
Bachelor of Arts Asian and International Studies First Class Honours
Centre of Excellence Sustainable Development Indonesia
School of Environment and Science
Griffith University
Submitted in fulfilment of the requirements of the degree of
Doctor of Philosophy
February 2019

i | P a g e
Abstract
Sustainable Livelihoods in small-scale fishing villages throughout Southeast Asia is the
region’s greatest poverty alleviation problem. Small-scale fisheries are frequently
characterised as an occupation of last choice, and fisher folk as the poorest of all.
Landlessness, few productive assets and a limited skills set for these folk gives little
choice other than a marine livelihood strategy, resulting in, at best, little more than a
subsistence life style. Additionally, coastal and marine social-ecological systems are
fragile and vulnerable to political, social and environmental shocks. Indonesia, with a
population of over 250 million people, 81,000 kilometres of coast line and thousands of
small-scale fishing communities, faces seemingly unsurmountable poverty alleviation
challenges. This research centres on traditional fishers of Rote Island, Indonesia, who
have endured challenges to their livelihoods due to changed maritime boundaries in
the Timor and Arafura Seas during the late 20th Century, resulting in them being
dispossessed of their traditional fishing grounds. They have also been confronted with
environmental degradation due to the 2009 Montara oil spill in the Timor Sea, which is
reported to have all but wiped out their seagrass farming micro-enterprises. While
governments and NGOs have spent many millions of dollars on poverty alleviation
projects in the East Nusa Tenggara Province of Indonesia, remote fishing villages have
not always benefited from large infrastructure projects or generic community
development programs. Real progress is slow; too slow for the current generation of
traditional fishermen to have a sustainable income to provide a FRESH Start (Food,
Residence, Education, Social status and Health services) for the next generation so
that they can have more livelihood choices than their parents, and to prevent them
suffering livelihood stagnation or slip-back.
Providing a FRESH Start for the next generation, in essence, is a core generational
priority for people in most societies. For the traditional fishers of Rote Island, it is no
different; but “How can the current generation of fishers, on Rote Island, lift above a
subsistence income to provide a FRESH Start for the next generation?”
Three small fishing villages, Pepela, Tanjung Pasir and Landu Thie, on Rote Island, in
the Province of East Nusa Tenggara, were chosen as case study sites to investigate
this question. This research project used a true, mixed-methods, bottom-up data
collection approach that was guided by the tenets of Sustainable Livelihoods, Social
Impact Assessment and Needs Assessment. Initial quantitative demographic and
socio-economic data was collected by way of government statistical data and added to

ii | P a g e
with data collected during a random household survey within the three small fishing
villages. The household surveys were completed on a “one on one” basis, and not a
“drop off - pick up later” basis. Hence, the household surveys also facilitated just as
many, dense and data-rich informal interviews. Focus discussion groups added to this
rich local knowledge gained about the villagers’ history, culture and their livelihood
priorities, strategies and challenges. Formal interviews with government officials, key
informants and local stakeholders informed the research of lessons learned from past
government projects and the rationale behind current initiatives. The author
empowered the voices from the micro-level to enable them to guide the thesis
discussion.
Results showed that, although the three fishing villages are located in the same district
municipality, only 100 kilometres apart, they are very different in demographics, internal
political structure, available resources and hence current livelihood strategies.
Notwithstanding these differences, a commonality exposed in the villages was multi-
faceted intergroup tensions that can be explained through Intergroup Threat Theory.
Modernisation is seen, through a normative / neoliberal lens by many governments and
development agencies, as a necessary part of future development strategies to provide
the current and future generations with rewarding and sustainable livelihoods.
However, the fishers view modernisation with suspicion and fraught with threats, both
realistic and symbolic. They view modernisation as either their saviour or their nemesis,
depending on the scale and pace of introduction, and who has access to, and control of
the modern technology, modern structure of institutions, and modern supply chains and
agents for their produce. While the Central and District governments do seem to have
the political will and financial commitment to alleviate poverty in traditional fishing
villages on Rote Island, purposive realignment of macro-level initiatives with micro-level
aspiration should help improve development project efficacy.

iii | P a g e
Statement of Originality

iv | P a g e
Table of Contents
Abstract ......................................................................................................................... i
Statement of Originality ................................................................................................. iii
Table of Contents ......................................................................................................... iv
List of Figures .............................................................................................................. xii
List of Tables .............................................................................................................. xiii
List of Photos ............................................................................................................... xv
List of Maps ................................................................................................................ xvi
Preface ...................................................................................................................... xvii
Acknowledgements ..................................................................................................... xix
Acknowledgement of Published and Unpublished Papers Included in this Thesis ....... xxi
Publications, Conferences and Seminars related to this thesis ................................. xxiii
Publications: ............................................................................................................. xxiii
Unpublished Reports: ............................................................................................... xxiii
Keynote Speaker: ..................................................................................................... xxiii
Presentations: ........................................................................................................... xxiii
International Workshop Participation: ........................................................................ xxiv
Guest Lecturer: ......................................................................................................... xxiv
Small-Scale Fishing Villages visited during the term of this thesis.............................. xxv
Glossary ................................................................................................................... xxvi
Introduction .............................................................................................. 1 Chapter 1
1.1 Thesis Topic Introduction ....................................................................................... 2
1.2 Historical Background ............................................................................................ 7
1.3 Research Problem ............................................................................................... 10
1.4 Research Aim ...................................................................................................... 11
1.5 Specific Objectives of the Research..................................................................... 12
1.6 Research Questions ............................................................................................ 13
1.7 Significance of the Research ............................................................................... 14
1.8 Outline of the Thesis: ........................................................................................... 15

v | P a g e
PART 1: LITERATURE REVIEW ................................................................................ 18
The Sustainable Development – Sustainable Livelihood Nexus: Research Chapter 2
matters for East Nusa Tenggara ................................................................................. 19
2.1 Introduction .......................................................................................................... 20
Abstract ............................................................................................................... 21
2.1.1 Introduction ............................................................................................ 22
2.1.2 Exposing the SD-SL Nexus ................................................................... 23
2.1.3 East Nusa Tenggara Matters ................................................................. 30
2.1.4 Conclusion ............................................................................................. 32
2.2 Conclusion ........................................................................................................... 34
Sustainable Livelihood and Intergroup Relations ................................... 35 Chapter 3
3.1 Introduction .......................................................................................................... 36
3.2 Social Capital ....................................................................................................... 38
3.2.1 The Social Capital Matrix ....................................................................... 39
3.2.2 Indicators ............................................................................................... 41
3.2.3 Weaknesses .......................................................................................... 43
3.3 Social Science ..................................................................................................... 45
3.3.1 Conservatism and Liberalism ................................................................. 45
3.3.2 Marxism, Feminism and Constructivism ................................................. 47
3.4 Intergroup Relations ............................................................................................ 50
3.4.1 Intergroup Threat ................................................................................... 54
3.4.2 Realistic Threat ...................................................................................... 57
3.4.3 Symbolic Threat ..................................................................................... 58
3.4.4 Integrated Threat Theory ....................................................................... 59
3.5 Rote Island Matters .............................................................................................. 62
3.6 Conclusion ........................................................................................................... 66
Traditional Fishing in East Nusa Tenggara, Indonesia ........................... 68 Chapter 4
4.1 Introduction .......................................................................................................... 69
4.2 Maritime Boundaries in the Timor Sea ................................................................. 71
4.3 Traditional Fishers of East Nusa Tenggara .......................................................... 78
4.4 Socio-Economic Status ........................................................................................ 80

vi | P a g e
4.5 Maritime Culture .................................................................................................. 86
4.6 Conclusion ........................................................................................................... 88
PART 2: METHODOLOGY ......................................................................................... 90
Research Design ................................................................................... 91 Chapter 5
5.1 Introduction .......................................................................................................... 92
5.2 Methodology of the Research .............................................................................. 94
5.2.1 Positivist Social Science (PSS) .............................................................. 94
5.2.2 Interpretive Social Science (ISS) ........................................................... 94
5.2.3 Critical Social Science (CSS), ................................................................ 95
5.3 Author Self Acknowledgement ............................................................................. 96
5.4 Methods of Data Collection .................................................................................. 96
5.4.1 Case Study ............................................................................................ 98
5.4.2 Sustainable Livelihoods Approach ......................................................... 99
5.4.3 Social Impact Assessment ................................................................... 103
5.4.4 Need Assessment ............................................................................... 106
5.5 Data Collection Instrument Design ..................................................................... 109
5.6 Conclusion ......................................................................................................... 110
Research Data Collection and Study Sites .......................................... 112 Chapter 6
6.1 Introduction ........................................................................................................ 113
6.2 Case Study Sites ............................................................................................... 114
6.3 Collaborative Research...................................................................................... 120
6.3.1 The Research Team ............................................................................ 120
6.3.2 Research Assistants ............................................................................ 121
6.3.3 Logistics .............................................................................................. 122
6.4 Research Focal Point ........................................................................................ 123
6.5 Quantitative Data ............................................................................................... 126
6.5.1 Household Survey (HS) Questionnaire Development .......................... 126
6.5.2 Household Survey Implementation ...................................................... 127
6.5.3 Quantitative Data Analysis Process ..................................................... 128

vii | P a g e
6.6 Qualitative Data ................................................................................................. 130
6.6.1 Formal Interviews ................................................................................ 130
6.6.2 Informal Interviews............................................................................... 131
6.6.3 Focus Discussion Groups (FDGs) ....................................................... 131
6.6.4 Indicative Questions for Interviews and FDGs ..................................... 133
6.6.5 Researcher Observation ...................................................................... 134
6.6.6 Qualitative Data Analysis Process ....................................................... 134
6.7 Ethical Issues .................................................................................................... 138
PART 3: RESULTS and DISCUSSION ..................................................................... 140
Rote Ndao Government Report and Published Paper .......................... 141 Chapter 7
7.1 Introduction ........................................................................................................ 142
7.1.1 Statement of Contribution .................................................................... 143
7.2 Pepela Results .................................................................................................. 144
7.2.1 Socio Economic Background ............................................................... 144
7.2.2 Social Capital....................................................................................... 153
7.2.3 Welfare Status ..................................................................................... 156
7.2.4 Gender Issues ..................................................................................... 158
7.2.5 Offshore and Cross-border Fishing ...................................................... 159
7.2.6 Alternative Livelihood ........................................................................... 163
7.2.7 Concluding Remarks ........................................................................... 168
7.3 Landu Thie Results ............................................................................................ 170
7.3.1 Landu Thie Village ............................................................................... 170
7.3.2 History / Culture ................................................................................... 171
7.3.3 Population Data ................................................................................... 174
7.3.4 Education ............................................................................................ 177
7.3.5 Health and Nutrition ............................................................................. 180
7.3.6 Social Status........................................................................................ 183
7.3.7 Gender Issues ..................................................................................... 185
7.3.8 Suggested Alternative Livelihood Projects ........................................... 185

viii | P a g e
7.4 AJABS Published Paper: Traditional Fishermen in Rote Island: Alternative
Livelihood to Illegal Fishing Activities in the Indonesian-Australian Transboundary
Waters ...................................................................................................................... 193
7.4.1 Statement of Contribution To Co-Authored Published Paper ............... 193
ABSTRACT .............................................................................................................. 194
1 INTRODUCTION ............................................................................................ 194
2 Contextualising the research .......................................................................... 196
a. History of Rotenese Traditional Fishermen .................................................... 196
b. History of Poverty in Papela ........................................................................... 198
c. Sustainable Economic Development .............................................................. 200
3 METHODS ..................................................................................................... 202
a. Sustainable Livelihoods ................................................................................. 202
b. Case Study Site ............................................................................................. 203
c. Data Collection ............................................................................................... 203
4 RESULTS ...................................................................................................... 204
a. Existing Conditions of Papela Fishermen ....................................................... 204
b. Previous Alternative Sustainable Livelihood Activities .................................... 206
c. Analysis of Policy Distortions and Market Failures of Salt Pond Business ...... 207
5 DISCUSSION ................................................................................................. 208
6 CONCLUSIONS ............................................................................................. 210
ACKNOWLEDGEMENTS ......................................................................................... 211
Bibliography .............................................................................................................. 212
Interview and FDG Qualitative Data ..................................................... 217 Chapter 8
8.1 Introduction ........................................................................................................ 218
8.2 Indicative Questions for Interviews and FDGs ................................................... 220
8.3 Current Status of Case Study Sites ................................................................... 222
8.3.1 Economic Status .................................................................................. 222
8.3.2 Current Livelihoods .............................................................................. 224
8.3.3 Alternative and Modernised Livelihoods ............................................... 226
8.3.4 Education ............................................................................................ 229
8.3.5 Education ............................................................................................ 232

ix | P a g e
8.3.6 Government Assistance ....................................................................... 234
8.4 Future Development Perspectives ..................................................................... 237
8.4.1 Next Generation Matters ...................................................................... 237
8.4.2 Micro Perspectives for the Future ........................................................ 240
8.4.3 Macro Perspectives for the Future ....................................................... 242
8.5 Intergroup Relations Affecting Development ...................................................... 246
8.5.1 Pessimism and Hope ........................................................................... 246
8.5.2 Realistic Threat and Conflict ................................................................ 248
8.5.3 Symbolic Threat and Group Identity ..................................................... 250
8.5.4 Negative Stereotype and Outgroup Attitude ......................................... 252
Discussion and Recommendations ...................................................... 254 Chapter 9
9.1 Introduction ........................................................................................................ 255
9.2 Current Socio-Economic Status ......................................................................... 257
9.2.1 Demographics ..................................................................................... 257
9.2.2 Economic Status .................................................................................. 258
9.2.3 Current Livelihoods .............................................................................. 260
9.2.4 Education ............................................................................................ 262
9.2.5 Social Capital....................................................................................... 264
9.3 Micro-Level Aspirations for the Future ............................................................... 267
9.3.1 Next Generation Matters ...................................................................... 267
9.3.2 Micro-Level Perspectives ..................................................................... 268
9.4 Macro-Level Initiatives for the Future ................................................................. 270
9.4.1 Macro-Level Perspectives.................................................................... 270
9.4.2 Past Livelihood Trials and Tribulations................................................. 272
9.4.3 Micro-Level Perceptions of Marco-Level Initiatives .............................. 274
9.5 Explaining Development Synergy through an ITT Lens ..................................... 277
9.5.1 Realistic Threats .................................................................................. 280
9.5.2 Symbolic Threats ................................................................................. 281
9.5.3 Negative Stereotyping and Out-Group Attitudes .................................. 282
9.6 Sustainable Livelihood Framework .................................................................... 284

x | P a g e
9.7 Conclusion ......................................................................................................... 286
Conclusion ....................................................................................... 289 Chapter 10
10.1 Research Overview ........................................................................................... 290
10.2 The Significant Finding of the Research ............................................................ 292
10.3 Other Major Research Findings ......................................................................... 293
10.3.1 Household Livelihood and Economic Status ........................................ 293
10.3.2 Micro-Level Aspirations ....................................................................... 294
10.3.3 Macro-Level Future Initiatives .............................................................. 295
10.3.4 Micro-Level Perceptions of Macro-Level Initiatives .............................. 295
10.4 Recommendations ............................................................................................. 297
10.4.1 Micro-Level Recommendations ........................................................... 297
10.4.2 Macro-Level Recommendations .......................................................... 298
10.4.3 Future Research Recommendations ................................................... 299
Appendix I Universitas Nusa Cendana Research Cover Page ................................ 300
Appendix II Governor of NTT Research Approval Letter ......................................... 301
Appendix III District of Rote Ndao Research Approval Letter .................................. 302
Appendix IV Ethics Clearance Certificate ................................................................ 303
Appendix V Rio Declaration 1992 ........................................................................... 305
Appendix VI List of Laws and Agreements negotiated between the Australian and
Indonesian Governments during the period 1958-2008. ............................................ 310
Appendix VII Memorandum of Understanding Between the Government of Australia
and the Government of the Republic of Indonesia Regarding the Operations of
Indonesian Traditional Fisheries in Areas of the Australian Exclusive Fishing Zone and
Continental Shelf ...................................................................................................... 311
Appendix VIII Agreed Minutes of Meeting Between Officials of Indonesia and Australia
on Fisheries .............................................................................................................. 314
Appendix IX Map of Maritime Boundary Coordinates in Timor Sea ......................... 320
Appendix X Informant and Respondent Consent Form ........................................... 321
Appendix XI Household Survey Questionnaire ........................................................ 322
Appendix XII BKKBN Indicators .............................................................................. 336

xi | P a g e
Appendix XIII FDG Attendance Sheet Papela Men- Women ................................... 337
Appendix XIV FDG Attendance Sheet Landu Men- Women-Youth ......................... 339
Appendix XV Economic Cost Analysis of Salt Farming ........................................... 342
Bibliography .............................................................................................................. 355
Bibliography for Chapter 2: The Sustainable Development – Sustainable Livelihood
Nexus: Research matters for East Nusa Tenggara ................................................... 374
Bibliography for the Government Report ................................................................... 378

xii | P a g e
List of Figures
Figure 1 (a) Scheme of sustainable development: at the confluence of three constituent
parts, (b) A representation of sustainability showing how both economy and society are
constrained by environmental limits ............................................................................ 24
Figure 2 Sustainable livelihoods: a framework for analysis ......................................... 27
Figure 3 The Scope and Forms of Social Capital ........................................................ 40
Figure 4 Riek et al.’s Potential model of intergroup threat .......................................... 59
Figure 5 Intergroup relations at the centre of this research ......................................... 64
Figure 6 Sustainable livelihoods: a framework for analysis ....................................... 100
Figure 7 Different SIA Research Timelines; Predictive and Longitudinal ................... 105
Figure 8 Research Topic Focal Point and Significance ............................................ 124
Figure 9 Distribution of economic sector for livelihoods in Papela, 2016 .................. 145
Figure 10 Distribution of the level of education of people in Tanjung, 2016 .............. 149
Figure 11 Percentage of Additional Daily Consumption for the Family in Papela ..... 151
Figure 12 Education Level of the People in Papela .................................................. 153
Figure 13 Proportion of the allocation of revenue proceeds from each fishing trip .... 162
Figure 14 Household Survey Graphs (a) Main Work Type, (b) Household Activities 176
Figure 15 Pie Chart of Household Expense Distribution in Landu Village................. 177
Figure 16 Sustainable Livelihood Approach (SLA) Framework ................................ 202
Figure 17 Distribution of Population and level of welfare in Papela, 2016 ................ 204
Figure 18 Intergroup linkages among the case study villages .................................. 278
Figure 19 Developed Sustainable Livelihood Framework ......................................... 285
Figure 20 Salt Exporting Countries and the Volume of Import into Indonesia in 2016 345
Figure 21 National Production of Salt by the People (million ton) 2012-2016 ............ 345

xiii | P a g e
List of Tables
Table 1 2016 BPS Data, Highest Level of Education attained for; the Province of NTT,
Kupang City and the District of Rote Ndao .................................................................. 81
Table 2 Linking types of need assessment, method, informants and information gained
................................................................................................................................. 108
Table 3 Example of Excel Worksheet showing Coding columns .............................. 128
Table 4 Example of results from statistical analysis using RT developed Data Codes
................................................................................................................................. 129
Table 5 Data Collection Summary ............................................................................. 137
Table 6 Distribution of Population, Number of Households and Gender in Papela, 2016
................................................................................................................................. 145
Table 7 Number of Vehicles owned by the inhabitants of Papela ............................. 148
Table 8 The Average of major spending for a family with four children .................... 150
Table 9 Distribution of Additional Food Consumption for the families in Papela ....... 151
Table 10 Community Involvement in Papela ............................................................. 154
Table 11 Household Internal Communication ........................................................... 154
Table 12 Decision making in Papela ........................................................................ 155
Table 13 Decision Making in Tanjung Pasir ............................................................. 155
Table 14 The average Expenditure for each Offshore/Cross Border Fishing Trip ..... 161
Table 15 Village land area in Southwest Rote .......................................................... 171
Table 16 Monthly Temperature and Humidity Data for RoteNdao ............................ 173
Table 17 Monthly Rain Data for Rote Ndao .............................................................. 174
Table 18 Work Force Data by Village for Southwest Rote ........................................ 174
Table 19 Household Main Work Type and Additional Income data for Landu Village175
Table 20 Household Monthly Income in Landu Village ............................................. 176
Table 21 Household Monthly Expenses in Landu Village ......................................... 177
Table 22 Landu Respondent Personal Data ............................................................ 178
Table 23 Education Level of 18-50 years and 50+ Age Groups ............................... 179
Table 24 Total Family Education Costs .................................................................... 179
Table 25 Health Status of the Landu Village Population ........................................... 181
Table 26 Staple and Additional Foods in the Diet of the Landu Village Population ... 182
Table 27 Types of Additional Foods and Frequency of Consumption in Landu ........ 182
Table 28 Meal Frequency of Respondents in Landu ................................................ 183
Table 29 Frequency of Household and Number of topics commonly discussed ....... 184
Table 30 Landu Respondent involvement in external activities ................................ 184
Table 31 Landu Household Decision Maker Data .................................................... 184

xiv | P a g e
Table 32 Results of Divergence Analysis of the Business of Community Salt
Production in Papela, 2017 ....................................................................................... 208
Table 33 Pepela Darat, Tanjung Pasir and Landu Thie Respondent Biodata ........... 257
Table 34 Monthly Household Income in Pepela Darat, Tanjung Pasir and Landu Thie
Village ....................................................................................................................... 258
Table 35 Household Main Work Type and Additional Income Activity data .............. 260
Table 36 Education Status for Working Age Respondents ....................................... 262
Table 37 Monthly Household Education Costs ......................................................... 262
Table 38 Community Activities and Social Capital .................................................... 265
Table 39 Household Communication and Number of Topics Discussed ................... 265
Table 40 Types and Real Value Input and Output Components of the Production of
Community’s Salt in Papela Village, Sub-regency of East Rote, in 2017 ................... 344
Table 41 Actual Value and Social Input-Output for Salt Production by the community in
Papela Village, Sub-Regency of East Rote, in 2017 ................................................. 346
Table 42 Types and Social Value of Input and Output Components of Salt Production
by the People in Papela Village, Sub-Regency of East Rote, in 2017 ....................... 347
Table 43 Result of Divergence Analysis of the Business of Community Salt Production
in Papela Village, East Rote Sub-Regency, 2017 ..................................................... 350

xv | P a g e
List of Photos
Photo 1 Aerial Photograph of Pepela Darat and Tanjung Pasir ................................ 115
Photo 2 Aerial Photograph of Landu Thie ................................................................ 119
Photo 3 Early morning at Pepela Jetty ..................................................................... 146
Photo 4 Preparation for offshore fishing by traditional fishermen in Papela .............. 147
Photo 5 Living in poverty, Bajonese / Bugisnese community in Papela .................... 148
Photo 6 Long line and float method of seagrass farming .......................................... 164
Photo 7 (a) Shoreline method of seagrass farming (b) Seagrass drying rack ........... 165
Photo 8 Salt production ponds Pepela ..................................................................... 167
Photo 9 (a) Landu Primary School (b) Landu semi complete Junior High School ..... 178
Photo 10 Landu Health Clinic ................................................................................... 181
Photo 11 Construction Project Information Boards (a) Landu Junior High School
(b) Dam Wall on Landu Hill ....................................................................................... 186
Photo 12 (a) Desalination Plant (b) Fresh Water Distribution Tank in Landu Village . 188
Photo 13 Scenery from Landu Hill and Beach Front – Possible sites for Villa or
Homestay ................................................................................................................. 190
Photo 14 Living in Poverty, Tanjung Pasir, Papela ................................................... 205

xvi | P a g e
List of Maps
Map 1 Maritime Arrangements between Australia and Indonesia in the Timor and
Arafura Seas .............................................................................................................. 71
Map 2 Maritime Arrangements between Australia and Indonesia in the Timor and
Arafura Seas .............................................................................................................. 72
Map 3 Case Study Sites on Rote Island ................................................................... 115
Map 4 Landu Island, Southwest Subdistrict of Rote Island ....................................... 170
Map 5 The States (Nusaks) of Rote showing traditional borders .............................. 172
Map 6 Map of Rote-Ndao District in East Nusa Tenggara Province, Indonesia ........ 196
Map 7 The MoU Box located in the Australian Exclusive Economic Zone ................ 197

xvii | P a g e
Preface
This research project was conducted as a team research project recognising research
objects of a MoU between Griffith University, Brisbane, Australia and Nusa Cendana
University, Kupang, Indonesia and was facilitated under the auspices of Nusa Cendana
University. There were four researchers, including the PhD Candidate, and a research
assistant who, to varying degrees, were involved in the planning, research proposal
development, design of data collection tools, data collection, survey data collation,
transcribing of interviews, translation of interviews, data analysis, and report writing.
The team members were:
Research Chair: Prof Fredrik Benu, Rector of Nusa Cendana University, Kupang,
Indonesia,
Researcher: Dr Agus Nalle, Senior Lecturer Agro-economics, Nusa Cendana
University, Kupang, Indonesia,
Researcher: Ms Moni Muskanan, Lecturer Accounting/ Public Sector Administration,
Nusa Cendana University, Kupang, Indonesia,
PhD Candidate: Paul King, Griffith University,
Research Assistant, Maria Wilhelsya Inviolata Watu Raka (Viol)
Contributions to Research Project:
Research proposal and design; King 60%, Benu 40%,
Research planning; Benu 30%, Muskanan 30%, King 30%, Nalle 10%,
Case study site selection; King 100%,
Case study sites scoping visits; King 60%, Benu 40%,
Household survey design; Benu 33%, Muskanan 33%, King 33%,
Household survey data collection; Viol 30%, King 20%, Muskanan 20%, Nalle 10%,
Taher 10%, Ardani 10%,
Household survey data collation; King 100%,
Household survey data analysis; King 60%, Benu 40%,
Interview and FDG participation; King 80%, Benu 60%, Muskanan 40%, Nalle 40%,
Interview transcripts in Indonesian; Viol and Nusa Cendana University students 100%,
Transcript translation Indonesian to English; King 100%,
Report for District Government; Benu 40%, King 40%, Muskanan 10%, Nalle 10%,
Report editing; King 100%,
Qualitative data coding; King 100%,
Analysis of coded data; King 100%,
PhD Thesis writing; King 100%,

xviii | P a g e
Post Research Projects:
Drip-feed irrigation trial project; Benu 100%
Salt farm feasibility study; Nalle 100%
Village financial management project; Muskanan 100%
Outputs from this collaborative research project are:
Report to Rote Ndao District Government, Research Team,
Journal paper published in AJABS, Research Team,
Conference presentation, Prof Fred Benu,
PhD Thesis, Paul King.

xix | P a g e
Acknowledgements
This research project grew out of common research interests between Professor Fred
Benu, Rector of Nusa Cendana University, Kupang, Indonesia, and I, after meeting
socially nearly 3 years ago. I thank Dr Philiphi de Rozari for that introduction. I am
forever grateful for the invitation to participate in this collaborative research, between
Griffith University and Nusa Cendana University. I express warm thanks to the
research team and friends; Professor Fred Benu, Dr Agus Nalle and Ms Moni
Muskanan for their open and welcoming approach to this collaborative project.
Professor Fred Benu was also Research Chair and my External Supervisor
For my Principal Supervisor, Dr Peter Davey, thank you for your patience and ongoing
support over this long process, for your insightful comments and doodles, and above all
for fostering a friendly and positive supervisory relationship for me and other CESDI
alumni. Peter is a master at creating and extending professional networks. For the
students at CESDI this has included Ministers and former Ministers of State from
Indonesia, and many academics from various top level Indonesian universities. For my
Associate Supervisor, Emeritus Professor Roy Rickson, thank you for helping to give
this thesis its conceptual footing, and for Ms Lucinda Chappell, Griffith International,
Regional Manager Southeast Asia, for continued support for my PhD.
To Oma, Ermi, Ade and Ria, Wanti, Jaka and Arga, and all my Kupang family
(Keluarga Besar Ndoen, Adoe, Saudilla), I can’t express enough thanks for your
generous, warm-hearted and unconditional hospitality over the past 10 years; forever
indebted. To my other friends in Kupang and Rote, Philiphi de Rozari, his wife Sandra
and children, Monika and Joanna, Jermi and Rosa Haning, and so many more, too
many to mention individually, I thank you for your friendship and support.
I must thank my long-time friend, Bapak Leopold Nisnoni, Raja of Kupang, who first
invited me to visit Kupang, after our meeting at a conference in Bali. We have had
many a good laugh over Bapak’s formal title and my family name. Pak Leo’s dedication
to his people in Kupang is inspirational. At that same conference, in 2007, I had the
great pleasure of meeting Bapak Sadli Ardani, a fisher from Pepela, who was at the
conference to relate the trials and tribulations of life as a traditional fisher. From that
time on, we have maintained regular contact, albeit at that time, via an unreliable 2G
phone network. On every occasion when I have visited Pepela, Pak Sadli, his wife, Ibu
Sumi, and two children, Hakiki and Shinta, have provided me with accommodation and

xx | P a g e
warm hospitality. I thank Pak Sadli, his family and other fishers of Pepela, and their
families, for welcoming me into their community. I also thank the Village Head, Pak
Samuel Messakh, and the people from Landu Thie for their warm conversations and
enthusiastic participation.
Having been attached to CESDI, at Griffith University, for many years, there are
numerous good friends who have wished me well along the way, Ermi, Philiphi, Yenny,
Celica, Steve, Tin Tin, Nunik and Ana, among many others. All are CESDI alumni who
happily shared their humour, culture, nasi goreng and beef rendang; such is the
camaraderie at CESDI.
It would be remiss of me not to thank my long term friends, Michael and Denis, who
have always been close at hand, or close to a phone, to offer support with good
humoured and positive conversations. Also a thank you to Bob, Eva and boys, Chris,
Mr D, Graham, Graham and Annie, Wendy, Oxy, Bongo and others from the HHH
running club, who are always quick to “pull your leg” and have a laugh, and
remembering Mike, Andy and Tra.
Last, but by no means least, my own family, 6 siblings, Helen, Peter, Mary, Elizabeth,
Angela and John, my children, Emma and Mathew, and grandchildren, Mallee,
Leewana and Boudhi, who have all wondered what I am doing with my time, and to my
late parents who both passed away during the course of my PhD. My parents knew the
value of education and toiled hard to afford a good education for their 7 children, and
remembering Fr John Dobson, a long-time family friend, who passed away only a few
days ago.

xxi | P a g e
Acknowledgement of Published and Unpublished Papers Included in this
Thesis

xxii | P a g e

xxiii | P a g e
Publications, Conferences and Seminars related to this thesis
Publications:
Benu, F., King, P. G., Nalle, A. & Muskanan, M., 2018. Traditional Fishermen in Rote
Island: An Alternative Livelihood to Illegal Fishing Activities in the Indonesian-Australian
Transboundary Waters. American Journal of Agricultural and Biological Sciences,
13(2), pp. 64-76.
King, P. G., 2018. The Sustainable Development – Sustainable Livelihood Nexus:
Research matters for Rote Island, Indonesia. Ocean & Coastal Management, In
Revision.
Unpublished Reports:
Benu, F., King, P. G., Nalle, A. & Muskanan, M., 2017. The Economic Livelihoods of
Traditional Fishermen in Rote Island in Relation to the Activities of Illegal Fishing in
Transboundary Water of Indonesia and Australia. Research Report for District
Government of Rote Ndao, Kupang: Nusa Cendana University.
King, P. G., 2007. The Australian Government’s Responses To IUU Fishing In Its
Northern Waters. Unpublished Honours, Griffith Business School, Department of
International Business and Asian Studies, Griffith University
Keynote Speaker:
2015 April 11, ICER-PH 2015 Universitas Hasanuddin, Makassar Indonesia
Topic: Linking Sustainable Livelihoods and Health Risks in Small-Scale Fishing
Villages in Southeast Asia: Subsistence is not enough!
Presentations:
2013 November 27, Universitas Brawijaya, Malang, Faculty of Fisheries and Marine
Science, SEPK Research Seminar Group
Topic: Sustainable Livelihoods in small-scale fishing villages in Southeast Asia:
Subsistence is not enough!
2013 September 6, Griffith Asia Institute – Southeast Asia Group, Griffith University,
Brisbane, Australia,
Topic: Livelihoods in small-scale fishing villages in Southeast Asia: Subsistence is not
enough!

xxiv | P a g e
International Workshop Participation:
2012 January 31 - February 1, Climate Change Adaptation Project: Climate Futures
and Rural Livelihood Adaptation Strategies in NTB Province – Indonesia, Terara
District Scenario Planning Workshop, CSIRO, UnRam, BAPPEDA BLHP, Australia –
Indonesia Project. Mataram, Lombok, Indonesia
2011 December 21 - 22, Climate Change Adaptation Project: Climate Futures and
Rural Livelihood Adaptation Strategies in NTB Province – Indonesia, Jerowaru District
Scenario Planning Workshop. CSIRO, UnRam, BAPPEDA BLHP, Australia – Indonesia
Project. Mataram, Lombok, Indonesia
2011 October 17-19, Diskusi Regional Forum Kawasan Timur Indonesia dan Yayasan
BaKTI, Adaptasi Terhadap Perubahan Iklim untuk Pulau-Pulau Kecil di Kawasan
Timur, Indonesia, Lombok
Guest Lecturer:
2017 August 18, Universitas Nusa Cendana, Kupang, Indonesia,
School of Environment Post Graduate Program,
Topic: Social Capital Matters for Sustainable Marine Resource Management in
Southeast Asia
2013 November, Universitas Brawijaya, Malang, Indonesia
Faculty of Fisheries and Marine Science, Department of Fisheries Social Economics,
Undergraduate Program,
Topics: 8 Lectures in Total
(1) Illegal, Unregulated and Unreported Fishing (IUU): Fisheries Future?
(2) Social Capital for Sustainable Marine Resource Management
(3) Sustainable Fisheries, Sustainable Livelihoods, Creative Thinking
(4) Sustainable Livelihoods in small-scale fishing villages in Southeast Asia:
Subsistence is not enough!

xxv | P a g e
Small-Scale Fishing Villages visited during the term of this thesis
Pepela, Rote Island NTT
Tanjung Pasir, Rote Island NTT
Landu Thie, Rote Island NTT
Nembrela, Rote Island NTT
Kupang, Timor Island NTT
Kakap River, West Kalimantan
Sinkawang, West Kalimantan
Singa, West Kalimantan
Jimbaran, Bali
Benoa, Bali
Desa Les, Bali
Sendang Biru, East Java
Senggigi, Lombok NTB
Batam, Batam Island
Makassar, South Sulawesi
Bira, South Sulawesi
Bulu Kumba, South Sulawesi
Buntal, Sarawak, East Malaysia
Halong Bay, Vietnam
Dili, Timor Leste
Tibar, Timor Leste
Liquica. Timor Leste
Ulmera, Timor Leste
Dunwich, Stradbroke Island, Australia

xxvi | P a g e
Glossary
Adat Traditional
Air Water
Anak Child
Anak anak Children
Bendang Small aquaculture fish
Beta (Kupang dialect) I, me , my
Betong (Kupang dialect) We, including people being addressed
Bodhi Batang Small, narrow, motor-powered fishing boat
Bodhi Jolor Long, narrow, motor-powered fishing boat
Budidaya Aquaculture
Bupati District Head
Darat Land based
Demarga Jetty
Desa Village
Dinas District or Local government office
DKP (Departmen Kelautan dan Perikanan) District or Local Government Department
of Fisheries and Marine Affairs
Dong (Kupang dialect) They, them
Dusun Sub-village / Hamlet
ENT (= NTT) East Nusa Tenggara
Gotong Royong Community mutual help
Hiu Shark
Ikan Fish
Kabupaten District government area
Kapal Ship or Boat
Katong (Kupang dialect) We, not including people being addressed
Kebun Garden
Kecamatan Government Sub-district
Kepala Desa Village Head
KKP (Kementrian Kelautan dan Perikanan) Ministry of Fisheries and Marine Affairs
Lomba Traditional sail-powered fishing boat
Lontar Palm tree native to Rote
Maneleo Rotenese traditional village advisor
NTT (= ENT) Nusa Tenggara Timor
Nusak Traditional Rotenese District / Kingdom

xxvii | P a g e
Oe (Kupang dialect) Water
Pasir Sand
Penyu Turtle
Perahu Traditional sail-powered fishing boat
PNS (Pegawai Negeri Sipil) Public servant
Raja King of traditional kingdom
Raskin Government rice subsidy for the poor
Rupiah (Rp) Indonesian currency (US$1 = Rp13,000)
SD (Sekolah Dasar) Primary School
SMA (Sekolah Menengah Atas) Senior High School
SMK (Sekolah Menengah Kerja) Vocational Education High School
SMP (Sekolah Menengah Pertama) Junior High School
Sirip Hiu Shark fin
Sonde (Kupang dialect) No, not
Tanjung Spit
Trepang Sea cucumber
Tuak lontar Nectar from Lontar Palm, can be
fermented into an alcohol drink

1 | P a g e
Introduction Chapter 1

2 | P a g e
1.1 Thesis Topic Introduction
Sustainable Livelihoods in small-scale fishing villages throughout Southeast Asia is one
of the region’s greatest poverty alleviation problems (UNFAO, 2000). Small-scale
fisheries are frequently characterised as an occupation of last choice, and fisher folk as
the poorest of all (Béné, 2003). Landlessness, few productive assets and a limited
skills set for these folk gives little choice other than exploitation of marine natural
resources as a livelihood strategy, resulting in, at best, little more than a subsistence
existence. Additionally, coastal and marine social-ecological systems are fragile and
vulnerable to political, social and environmental shocks (Béné, 2009). Indonesia, with a
population of over 250 million people, 81,000 kilometres of coast line and thousands of
small-scale fishing communities, faces seemingly unsurmountable poverty alleviation
challenges (World Bank, 2015). Rote Island in the East Nusa Tenggara (NTT) Province
of Indonesia, just to the north of Australia, has fifty-eight such fishing communities
(Haning, 2017) characterised as ‘traditional fishing’ communities because of the local
fishers’ historical use of sail powered boats, basic hand line and small net catch gear,
and rudimentary navigational aids as they endeavour to find a sustainable livelihood, in
waters off shore from their home ports (Fox, 1998; Stacey, 2007).
People, who live at the fringe of society, both socially and spatially, face many
challenges. Their livelihoods are vulnerable to a range of political pressures, social
forces and environmental events. Some examples of the challenges that the
‘traditional’ fishing communities of Rote Island face are changing government policies,
modernising society, over exploitation of natural resources, environmental degradation
and extreme weather events (Butcher, 2004; Campbell & Wilson, 1993; Fox, et al.,
2009), which together interact to pose significant threats to the region’s poverty
alleviation and development prospects, as well as its socio-economic stability and
resilience (Bastaman, 2009). Examples of shocks endured by the traditional fishers of
Rote Island are the changed maritime boundaries in the Timor and Arafura Seas during
the late 20th Century (Forbes, 1995) which resulted in them being dispossessed of their
traditional fishing grounds (Balint, 2005; Campbell & Wilson, 1993), and environmental
degradation due to the 2009 Montara oil spill in the Timor Sea is reported to have all
but wiped out their seagrass farming micro-enterprises (Nolan & Vincent, 2010). While
governments and NGOs have spent many millions of dollars on poverty alleviation
projects in the Province of NTT (AusAID, 2013), remote fishing villages have not
always benefited from large infrastructure projects or generic community development
programs (Fox & Sen, 2002; Fox, et al., 2009). Additionally, data from this research

3 | P a g e
show that the villagers do not always embrace government development policies and
strategies for change because of realistic and symbolic threats. Real progress has
been slow; too slow for the current generation of traditional fishers to have a
sustainable income sufficient enough to achieve their expressed aspiration of providing
a FRESH Start1 (Food, Residence, Education, Social status and Health services) for
the next generation, so that they can have more expanded livelihood choices than their
parents, and to prevent them suffering livelihood stagnation or slip-back.
Three small fishing villages, Pepela Darat, Tanjung Pasir and Landu Thie, on Rote
Island in the Province of East Nusa Tenggara, were chosen as case study sites in this
mixed methods research, designed to investigate the livelihood dilemmas in small
traditional fishing villages. These villages were selected because of their close
proximity to the changed maritime boundaries, between Australia and Indonesia, which
have impacted their livelihood strategies and are made up of three distinct ethnic
groups. Hence, comparing the commonalities and the differences of how the fishers in
these villages have adapted to the changed conditions may expose the strengths and
weaknesses of alternative livelihood and development projects. Additionally, the three
villages are relatively close to each other meaning they have similar environmental
conditions which minimises the effect of one variable on the research results. In fact,
Pepela Darat and Tanjung Pasir are two different dusun (sub-village) within the village
of Pepela. Pepela Darat is located on a hill behind the local jetty and is mainly made up
of immigrants from South Sulawesi who now consider themselves as Rotenese. Some
of these fishers have intermarried with local Rotenese women. Tanjung Pasir is a sand
spit approximately 400 meters along the beach from the jetty and is a homogenous
community made up entirely of the Bajau Laut ethnic group, originating from Southeast
Sulawesi, who are commonly known as “Sea Gypsies”. Landu Thie is a small village
some 100 km away from Pepela but made up entirely of people with Rotenese
ethnicity. Their close proximity has also kept research field logistic costs within budget
These traditional fishing villages, a long distance from centres of political power and
modern society, have always been considered poor and disadvantaged (Barlow &
1 FRESH is an acronym developed by the author for:
Food: adequate fresh nutritious food consumption at a minimum 2 times per day Residence: solid structure walls, roof and floors, adequate furniture, electricity and reticulated water, Education: a minimum of senior high school completed Social Status: equal access to natural resources, information and opportunity, self-esteem Health services: unrestricted access to health services, medication, clean drinking water and sanitation

4 | P a g e
Gonowarsito, 2009; Fox & Sen, 2002). The changed maritime boundaries that
dispossessed the fishers of their traditional fishing grounds of over several centuries
(Campbell & Wilson, 1993; Stacey, 2007), and failed seagrass farming because of
disease and reported environmental damage from the Montara oil leak, have forced
these fishers to, more recently, change their livelihood strategies. However, not all of
these new activities are income producing, environmentally sustainable or legal (Fox &
Sen, 2002; Fox, et al., 2009).
This research project used true bottom-up, mixed methods research data collection
techniques that were guided by the tenets of Sustainable Livelihoods, Social Impact
Assessment and Needs Assessment. Initial quantitative demographic and socio-
economic data was collected by way of government statistical data and added to by
data collected during a random household survey within the three small fishing villages.
The household surveys were completed on a “one on one” basis, and not a “drop off -
pick up later” basis. Hence, the household surveys also facilitated just as many, dense
and data-rich informal interviews. Focus discussion groups added to this rich local
knowledge gained about the villagers’ history, culture, and their livelihood aspirations,
priorities, strategies and challenges. Formal interviews held with both key informants
and stakeholders within the villages, and district government officials, informed the
research of lessons learned from past government projects and the rationale behind
current policy initiatives. Researcher observation and inductive reasoning played a
major role in the conclusions reported in the final chapters.
The research results confirm that, although the villages are different in demographic
make-up, the majority of households in these fishing villages are still living below, or
vulnerably close to, the poverty line. However, the villagers express differences in
future livelihood hopes and aspirations for themselves and the next generation, ranging
from maintain the status quo, fisher designed modernisation strategies to migration out.
Commonly, all of the fishers and their wives aspire for a better future for their children,
and agree that their household incomes are not sufficient or stable enough to afford the
necessities to provide their children with enhanced livelihood opportunities for the
future. Many of the younger generation had already withdrawn from school or university
because household incomes are not sustainable at a sufficient level to cover all
household expenses. Without a number of vital necessities, the next generation are
destined to follow the current generation into a subsistence existence and a
dependency on declining natural resource and an uncertain livelihood.

5 | P a g e
The author developed an acronym, FRESH Start, for these necessities expressed by
the fishers and their wives. The acronym is used regularly throughout the thesis to
express this aspiration. FRESH Start stands for the following elements:
Food: adequate fresh nutritious food consumption at a minimum 2 times per
day
Residence: solid structure walls, roof and floors, adequate furniture, electricity
and reticulated water,
Education: a minimum of senior high school completed
Social Status: equal access to natural resources, information and opportunity,
self-esteem
Health services: unrestricted access to health services, medication, clean
drinking water and sanitation
Results also suggest that the villagers express perception of intergroup threat among
the villages and between the villages and the government. The villages compete for
attention and government aid; while at the same time expressing a common reticence
to embrace the central and district governments’ visions for modernisation and future
development.
Modernisation is seen, through a normative / neoliberal lens by many governments and
development agencies, as a necessary part of future development strategies to provide
the current and future generations with rewarding and sustainable livelihoods.
However, the fishers view modernisation with suspicion and fraught with threats, both
realistic and symbolic. They view modernisation as either their saviour or their nemesis,
depending on the scale and pace of introduction, and who has access to, and control of
the modern technology, modern structure of institutions, and modern supply chains and
agents for their produce. While the Indonesian central government and the Rote Ndao
district governments do seem to have the political will and financial commitment to
alleviate poverty in traditional fishing villages on Rote Island, purposive realignment of
macro-level initiatives with micro-level aspiration should improve development project
efficacy.
For the current generation of fishers, modernisation should not be introduced as a
quantum leap; it should be introduced in stages, taking into account their limited formal
education, their cultural reticence and a pervasive and limiting self-image as being
traditional fishers. The already modernised, better educated and tech savvy next

6 | P a g e
generation should be more favourably placed to confidently embrace modern
technology and contemporary development concepts.

7 | P a g e
1.2 Historical Background
Natural resource exploitation, including over-exploitation, is part of NTT’s development
history dating back to the 1600s at the beginning of the Dutch colonial period.
Sandalwood, gold, bees wax and slaves were the main targets during that period. As a
consequence, Timor is now devoid of the fragrant Sandalwood tree (Ormeling, 1957).
The Indonesian post-colonial period, 1945 to the present, has been a period of marine
resource exploitation. Increasingly large-scale illegal fishing activities from both foreign
and domestic ports have depleted fish stocks in Indonesian fisheries (Butcher, 2002;
Butcher, 2004; Litbang "Kompas"/RSW/BIM, 2012). As a result of various phenomena,
including illegal fishing, changing maritime boundaries in the late Twentieth Century,
and environmental degradation, there have been significant social and economic
challenges imposed on the traditional fishing communities in NTT and their relationship
with the marine environment (Fox & Sen, 2002; Fox, et al., 2009).
Traditional Indonesian fishers have, and still do go to sea in small sail-powered boats,
five to ten meters long, with crews of up to seven men and boys. They navigate using
the sun, stars, and clouds hovering above sand atolls and the presence and flight path
of birds (Balint, 2005; Fox, 1998; Stacey, 2007). Their fishing equipment is hand nets,
and hand lines and hooks. With small steps towards modernization, some fishermen
have started to use locally built, long, thin, wooden dinghies, called bodhi, powered by
small, 4 - 5 horse power outboard motors, rudimentary navigational systems and
charts, occasionally hand held GPS systems, and simple motorised fish net and line
retrieval systems (Fegan, 2001; King, 2007). Their traditional fishing grounds extend
well into what is now considered Australian waters including along the northern
Australia mainland coastline, and islands and atolls between Australia and Indonesia in
the Timor Sea (Campbell & Wilson, 1993; Fox, et al., 2009; Stacey, 2007). Their
communities are normally remote from municipalities and centres of education, health
services and government administration posts, and where housing and living conditions
are simple and sometimes squalid (Balint, 2005; Barlow & Gonowarsito, 2009; Stacey,
2007).
Prior to the initial changes in maritime boundaries in 1969, traditional fishermen of
eastern Indonesia, including those from Rote Island, voyaged legally to within 3
nautical miles (NM) of the Australian coastline, and regularly but illegally, onto
Australian soil to pursue their livelihoods (Fox, 1998; MacKnight, 1976; MacKnight,
1986). In 1969 and 1970, both Indonesia and Australia extended their territorial zones
8 | P a g e
to 12 NM, and in 1979 and 1980 the boundaries were again extended by each
government claiming an Exclusive Economic Zone (EEZ) to the 200NM mark. Between
1971 and 1989 numerous other laws, treaties and MoUs were enacted regarding the
maritime and sea-bed boundaries in the Timor Sea, resulting in a loss of traditional
fishing grounds for eastern Indonesian fishers (Campbell & Wilson, 1993; Forbes,
1995; Forbes, 2007). These changes in the maritime boundaries restricted the
livelihood pursuits of the Rote Island traditional fishers to waters that were being
plundered by the highly commercialised and mechanised legal and illegal fishing
activities in Indonesian waters (Butcher, 2004; Fegan, 2001; Gillett, 1996). The
Australian waters became heavily protected by Australian Navy, Customs, Border
Force and Fisheries agencies, but were alluringly abundant with natural marine
resources (Balint, 2005). Hence, the impoverished village fishers continued to voyage
into what are now known as Australian waters (Balint, 2005; Campbell & Wilson, 1993;
Fox, et al., 2009). In an effort to maintain a household income, they themselves
become illegal fishers in Australian waters, often resulting in arrest and detention in
Australian jails, while their boats and fishing gear are confiscated and burnt as a
deterrent to them again returning to their former traditional fishing grounds, in
Australian waters (Balint, 2005; Stacey, 2007). Some of these fishers restricted their
activities to the depleted Indonesian waters, while others sought an alternative
livelihood (Carnegie, 2008; Fox, et al., 2009; Resosudarmo & Jotzo, 2009).
Fox & Sen (2002) studied socio-economic issues facing traditional Indonesian fishers
in eastern Indonesia, including Rote Island, for Environment Australia, recommending
alternative livelihood strategies but were not specific in their recommendations other
than to comment that tourism and alternative products, such as handicrafts, could be
included in future, alternative income strategies. They also recommended that existing
village middlemen and traders should be considered in alternative livelihood strategies.
However, Barlow & Gonowarsito (2009) wrote that, although there had been gradual
improvements in infrastructure, poverty and disadvantage still persisted. They
concluded that the path to poverty alleviation was through more infrastructure
improvements funded by the government, agricultural production and marketing
improvements, and micro-finance programs facilitated by NGOs, but they made no
recommendations for the village level except to say that east Indonesians are robust
people and can respond vigorously to change. They also recommend that any research
about livelihoods in eastern Indonesia should involve community involvement (Barlow
& Gonowarsito, 2009). Sembiring, et al. (2012) recommended that the 1974 MoU

9 | P a g e
(Memorandum of Understanding Between the Government of Australia and the
Government of the Republic of Indonesia Regarding the Operations of Indonesian
Traditional Fisheries in Areas of the Australian Exclusive Fishing Zone and Continental
Shelf, 1974) should be reviewed because technology developments had outdated the
MoU caveats. They also recommended that local government help develop village level
fishing cooperatives to improve supply chain profits and the profit sharing
arrangements between the fishers and the boat owners who dominate the long
practised arrangements.
Previous research and reports inform us that fishing communities on Rote Island suffer
from enduring poverty, and despite gradual improvements in important infrastructure,
poverty persists, especially in the traditional fishing villages remote from major
government centres. In response, this research, which centres on a case study
employing observer / participant data collection methods and a local stakeholder
participation approach, as recommended above and supported by the UNDP and many
other development agencies, will study the challenges to a sustainable livelihood for
these fishing households. The villages chosen for the case study are Pepela, Tanjung
Pasir and Landu Thie on Rote Island, East Nusa Tenggara (NTT).

10 | P a g e
1.3 Research Problem
Although much aid and attention has flowed into development projects in NTT,
traditional fishing communities are still considered poor and vulnerable to livelihood
shocks. Their subsistence level of household income does not afford them the
opportunities provided by the improvements in infrastructure, such as roads, bridges,
schools, hospitals and telecommunication services. To take advantage of these
improvements in infrastructure, so as to provide a FRESH start to the next generation,
the current generation of household providers require a consistent and sustainable
surplus income. Subsistence is not enough.
The villages selected for analysis in this research show high and enduring levels of
poverty (Barlow & Gonowarsito, 2009; BPS Provinsi NTT, 2016a; BPS Provinsi NTT,
2016b). They exemplify, from study and prior observation, an interaction of the socio-
economic factors and livelihood drivers that this thesis has focused on such as; access
to natural resources, livelihood strategies, education standard and existing skills sets,
access to nutritious food and health services as well as assessing their social status
and institutional processes.
Because the socio-economic challenges and needs of the fishers from these villages
are affected by numerous internal and external livelihood drivers, research is needed to
assess how these traditional fishers have responded to the changed conditions to meet
theirs and the next generation’s needs. The responses to challenges and livelihood
uncertainties for the current generation of fishers also have an impact on the next
generation’s livelihood choices, and hence their livelihood strategies, resulting in, for
them, socio-economic improvement, stagnation or, in the worst case, slip-back.

11 | P a g e
1.4 Research Aim
The aim of this research is to investigate the challenges to a sustainable livelihood for
the current generation traditional fishers on Rote Island, in the Province of NTT,
Indonesia. Livelihoods for the current generation directly affect the trajectory of the
livelihoods of the next generation.
By using a case study approach, this research aims to;
1) investigate the current economic status and livelihoods strategies in the three case
sites so as to provide specific recommendations for possible alternative livelihood
approaches, and
2) add to the conceptual discourse on sustainable livelihood in traditional fishing
communities by investigating restrained efficacy of development projects through an
Intergroup Threat Theory lens.

12 | P a g e
1.5 Specific Objectives of the Research
To review the existing literature regarding Sustainable Livelihood and
Sustainable Development for small scale fishing communities, including the
literature on fishing villages on Rote Island and to review the literature on
Intergroup Threat Theory,
To develop data collection instruments to measure and analyse past and
existing livelihood strategies and results, based on key indicators presented in
the literature,
To operationalise the developed data collection instruments in three small-scale
fishing villages on Rote Island, namely Papela, Tanjung Pasir and Landu Thie,
To analyse the findings, discuss the challenges and barriers, and posit
recommendations to improve current generation sustainable livelihood
strategies in the three case study villages,
To theorise about commonalities and differences in the findings across the case
study sites,
To design a Sustainable Livelihood framework appropriate for use in Indonesia
or other Southeast Asia countries.

13 | P a g e
1.6 Research Questions
The central research question for this research is:
How can the current generation of fishers on Rote Island lift above a subsistence
income to provide a FRESH Start for the next generation?
There are a number of secondary research questions to help answer the research
question. These are:
1 What is the socio-economic status, past and present, of fishers in the selected
fishing villages on Rote Island?
2 What are the aspirations and needs, as expressed by the villagers (the micro-
level), to provide an improved future for the next generation?
3 What are the future initiatives and development programs planned by the
central and district governments (the macro-level)?
4 What are the micro-level perceptions of macro-level initiatives?
5 Can Intergroup Threat Theory explain a lack of development program efficacy?

14 | P a g e
1.7 Significance of the Research
This research will make a significant contribution to these aspects:
Provide direction for sustainable livelihood strategies and community
development projects in traditional fishing communities on Rote Island,
Help empower traditional fishers and communities to have a voice in the
planning and implementation of alternative livelihood strategies,
Assist government and NGO decision making, policy development and
implementation, and promote awareness of aligning project plans with fisher
aspirations and self-identified needs,
Add to the literature on sustainable livelihoods and poverty alleviation in
traditional fishing communities, focusing on Rote Island but not limited to, by
introducing a Social Psychology lens, Intergroup Threat Theory, to theorise on
the efficacy of macro level interventions as viewed from the micro level,
Complement the existing development literature by emphasising a bottom-up
approach for framing livelihood strategies in poor, natural resource reliant
communities in developing countries. Furthermore it will add to the area studies
literature on Indonesia with implications for the Australian-Indonesian
relationship.

15 | P a g e
1.8 Outline of the Thesis:
Chapter 1 Introduction:
The Introduction outlines the thesis aims and objectives regarding sustainable
livelihoods for fishers on Rote Island, and introduces the concepts underpinning the
thesis, being Sustainable Development and Sustainable Livelihoods. It provides a brief
background to NTT and Rote Island fishing communities. Chapter 1 also provides the
Aims and Objectives of the research along with the research design, significance, and
thesis structure.
Part 1: LITERATURE REVIEW
The Literature Review contains three chapters. The first two chapters, Chapter 2: The
Sustainable Development – Sustainable Livelihood Nexus: Research matters for Rote
Island, Indonesia and Chapter 3: Sustainable Livelihood and Intergroup Relations form
the conceptual framework for the thesis. The third chapter of this literature review,
Chapter 4: Traditional Fishing in East Nusa Tenggara, Indonesia, contextualises the
research in traditional fishing village.
Chapter 2 The Sustainable Development – Sustainable Livelihood Nexus:
Research matters for Rote Island, Indonesia:
This chapter is a paper that has been submitted for publication as a discussion paper in
Ocean and Coastal Management. It is at “Revision Request” stage. The paper argues
that there is a nexus between Sustainable Development and Sustainable Livelihoods.
These two concepts underpin the authors approach to the thesis. The chapter then
links the literature review of these concepts to the thesis problem and question
regarding poverty alleviation in fishing villages on Rote Island.
Chapter 3 Sustainable Livelihood and Intergroup Relations:
Chapter 3 adds a third concept to the two concepts reviewed in Chapter 2 to complete
the conceptual framework for this thesis, being Sustainable Development, Sustainable
Livelihood and Intergroup Threat Theory. The third concept is a Social Psychology (SP)
lens through which to view the qualitative research data. During field research FDGs,
interviews and personal asides, the author observed that the villagers were reticent to
embrace all government, NGO and outside investor development projects. Open and
Axial coding (Neuman, 2008), during the qualitative data analysis process, produced
an outcropping (Neuman, 2008) of this phenomenon pointing to perceptions of threat
felt by the different groups of fishers. Hence, Intergroup Threat Theory, as a SP
discourse is presented in Chapter 4.

16 | P a g e
Chapter 4 Traditional Fishing in East Nusa Tenggara, Indonesia:
The purpose of this chapter is to provide a background and contextualisation of the
thesis in fisheries-dependent, traditional, fishing communities in the province of NTT,
and in particular on Rote Island. It outlines the changes in maritime boundaries
between Australia and Indonesia which enforced changes to their livelihood strategies.
The chapter also draws to attention the fishers’ impoverished socio-economic
conditions, historical evidence of past livelihood activities, and their future livelihood
challenges.
Part 2: METHODOLOGY
The Methodology part of the thesis contains two chapters as follows;
Chapter 5 Research Design:
This chapter examines appropriate research methods that are a best fit for this
comparative socio-economic analysis of three traditional fishing villages on Rote Island.
The author justifies a Critical Social Science methodology incorporating a case study
as a best fit to expose rich, relevant data. The approach chosen is common to a
number of impact assessment and development strategy methodologies, namely
Sustainable Livelihood Approach (SL), Social Impact Assessment (SIA) and Needs
Analysis.
Chapter 6 Research Data Collection and Study Sites:
This chapter introduces the three case study villages, Papela, Tanjung Pasir and
Landu Thie. It explains the differences between the three villages, ethnically and in
their political and social structures that influence their livelihood strategies. This chapter
outlines the collaborative structure and logistics of the research as well as providing
information about the mixed methods approach to data collection in the case study
sites.
Part 3: RESULTS and DISCUSSION
This part of the thesis contains three chapters. Chapter7 and Chapter 8 present both
the quantitative and qualitative research data, and Chapter 9 is the Discussion and
Recommendations chapter:
Chapter 7 Rote Ndao Government Report and Published Paper:
Section 7.2 and Section 7.3 are direct excerpts from an unpublished report as
presented to the Rote Ndao District government following the completion of the
research (Benu, et al., 2017). Fundamentally, these sections report on the
demographic and livelihood data results. Much of the livelihood recommendations as

17 | P a g e
reported by the research team to the district government are contained in this chapter.
The author of this thesis was instrumental in the writing of the government report.
Relevant bibliography has been included separately, following the thesis bibliography.
Section 7.4 is a full copy of a journal paper written by the research team members,
including the author of this thesis, and published in AJABS in July, 2018 (Benu, et al.,
2018).
Discussions in the chapter sections encompass a holistic socio-economic status of the
villages which includes: income levels, food consumption, housing standards,
education levels, gender matters, social status and health status. Recommendations
from the research are also contained in the published journal paper.
Chapter 8 Interview and FDG Qualitative Data:
Chapter 8 presents the raw qualitative data that emerged as salient during a Grounded
Theory style coding process (Glaser & Strauss, 1967; Neuman, 2008). The data is
categorised into the most salient codes and further segregated by village. This data
has been presented in tabular format to facilitate Comparative Analytic discussion
(Neuman, 2008) and recommendations in the closing two chapters. By presenting the
data in this format, the author seeks to empower the voices from the micro-level (the
fishers) to guide the discussion and eventual research findings and recommendations.
Chapter 9 Discussion and Recommendations:
This chapter discusses and answers the primary research question, “How can the
current generation of fishers on Rote Island lift above a subsistence income to provide
a FRESH Start for the next generation?” as put in Chapter 1. In this chapter, the author
draws links between the research questions, research data and literature review to
posit answers to the questions and recommendations for future livelihood policies and
strategies.
Chapter 10 Conclusion:
This chapter briefly summaries the research and its findings, and reflects back to the
research project’s original aims and objectives.

18 | P a g e
PART 1: LITERATURE REVIEW

19 | P a g e
The Sustainable Development – Sustainable Livelihood Nexus: Chapter 2
Research matters for East Nusa Tenggara

20 | P a g e
2.1 Introduction
The entirety of Chapter 2 is a journal paper submitted by the author of this thesis, to an
Elsevier publication, Ocean and Coastal Management, as a sole-authored paper. The
paper title is, “The Sustainable Development – Sustainable Livelihood Nexus:
Research matters for East Nusa Tenggara”. The paper was written as an early
publication from the thesis literature review. However, the paper was only submitted
earlier this year. Its current status is “Submit Revision”.
This chapter presents the core concepts for the design and implementation of this
research, being Sustainable Development and Sustainable Livelihood. It exposes the
nexus between the two concepts and relates their importance for the Province of East
Nusa Tenggara, Indonesia. The concepts of SD and SL are continually referenced in
the thesis and also underpin the thesis recommendations for future livelihood strategies
for the current generation so that they can provide a FRESH Start for the next
generation.
This chapter should be read in conjunction with Chapter 3: Sustainable Livelihood and
Intergroup Relations. Chapter 3 introduces a third concept, Intergroup Threat Theory,
which underpins the qualitative data analysis process that draws conclusions on
intergroup relations as each vie for a sustainable livelihood

21 | P a g e
The Sustainable Development – Sustainable Livelihood
Nexus:
Research matters for East Nusa Tenggara
Abstract
Sustainable development (SD) definitions refer to development practices that use
natural resources to meet society’s needs while conserving the environment so that
needs can be met not only for the current, but also for future generations. Hence,
explicitly, SD conveys the concept of "needs" for the world's poor and links the
discourse of SD with that of Sustainable Livelihoods (SL). The literature on SD and SL
supports the bringing together of these two concepts and the exposing of their inherent
nexus, as evidenced by the rise in importance of these concepts in academic and
government agendas, at both the national and international levels. The literature also
discusses the three interdependent constituent parts of SD, environment, economy and
society, the search for their confluence, and their influence on humanity, poverty
alleviation and SL. Some authors suggest that the term “sustainable livelihood” is
synonymous with, and gives greater clarity than, the term “sustainable development”.
This paper discusses the SD and SL nexus in the context of small rural communities,
terrestrial and coastal, in developing regions such as eastern Indonesia, concluding
that sustainable and secure livelihoods are a central objective of SD. Without
sustainable and secure livelihoods, development in small rural villages in eastern
Indonesia would stagnate at, or slip back to, a subsistent existence. However, for this
generation to provide for the needs and improved livelihood strategies for the next
generation, a FRESH start, subsistence is not enough.
Keywords: Sustainable development, Sustainable livelihoods, Poverty alleviation,
Small-scale fishing communities, Eastern Indonesia.

22 | P a g e
2.1.1 Introduction
Sustainable development refers to development practices that use natural resources to
meet society’s needs while conserving the environment so that needs can be met not
only for the current, but also for future generations. The term “Sustainable
Development” was first defined by the Brundtland Commission, in 1987, and has
become the most often-quoted definition of sustainable development (Brundtland &
Khalid, 1987; Smith & Rees, 1998). The Brundtland Commission definition conveys the
concept of "needs" for the world's poor, which should be an overriding priority for
society, and the concept of limitations fostered by the state of technology and social
structure on the environment's ability to meet present and future needs (Brundtland &
Khalid, 1987; Harding, et al., 2009). The literature on Sustainable Development (SD)
and Sustainable Livelihood (SL) supports the Brundtland Commission’s bringing
together of these two concepts and the exposing of their inherent nexus (Brundtland &
Khalid, 1987), as evidenced by the rise in importance of these concepts in academic
and government agendas at both the national and international levels. The literature
also discusses the three interdependent constituent parts of SD, environment,
economy and society, and their influence on humanity, poverty alleviation and SL
(Giddings, et al., 2002; Harding, et al., 2009). While there are inherent similarities and
differences between SD and SL, Hopwood, et al. (2005) suggest that the term
“sustainable livelihood” is almost synonymous with, and gives greater clarity than, the
term “sustainable development”.
This paper discusses the SD and SL nexus in the context of small rural communities,
terrestrial and coastal, in developing regions such as eastern Indonesia, concluding as
Redclift (1992, p.398) stated, that “the central objective of sustainable development,
therefore would be to ensure that the poor have access to sustainable and secure
livelihoods”. Without sustainable and secure livelihoods development, small rural
villages in eastern Indonesia would stagnate at, or slip back to, a subsistent existence.
However, subsistence is not enough for the current generation to provide the next
generation with a FRESH Start2 for improved livelihood choices.
2 FRESH is an acronym developed by the author for:
Food: adequate fresh nutritious food consumption at a minimum 2 times per day Residence: solid structure walls, roof and floors, adequate furniture, electricity and reticulated water, Education: a minimum of senior high school completed Social Status: equal access to natural resources, information and opportunity, self-esteem Health services: unrestricted access to health services, medication, clean drinking water and sanitation

23 | P a g e
2.1.2 Exposing the SD-SL Nexus
The SD paradigm elevates concerns for the carrying capacity of the planet Earth to a
place within the major social challenges facing humanity. As early as the 1970s, the
term “sustainability” was used to describe an economy in balance with basic ecological
support systems (Stivers, 1976, p.187). Many environmentalists and ecologists have
concerns about the limits to growth and have promoted an alternative of a “steady state
environment” (Daly, 1973). The concept of sustainable development confronts the
growing recognition of the link between escalating environmental problems and socio-
economic issues to do with poverty and inequality resulting in concerns about a healthy
future for humanity (Davey, 2009; Harding, et al., 2009).
The concept of SD is traditionally broken into three constituent parts: environmental
sustainability, economic sustainability and socio-political sustainability (Harding, 1998),
with UNESCO (2001) adding a fourth, cultural sustainability. It is often conceptualised
by three interconnecting rings of equal size which is simplistic and not always the case.
This view risks approaching and tackling issues of sustainable development in a
segmented manner. However, it does show the case for balance of the three areas and
a need to broker all three to achieve sustainability at their confluence.
Dividing SD into three almost isolated and independent sectors, Figure 1(a), can divert
attention from important social issues that reach to the heart of real and permanent SD
fixes; these include those issues concerning the nature of our society, policy priorities,
decision making and currently favoured interest groups (Giddings, et al., 2002). More
accurately, the relationship between society, economy and environment can be
presented as three concentric rings with the economy nested within society, which in
turn is nested within the environment (Giddings, et al., 2002).
The concentric nested model, Fig 1(b), rather than the three-ring model, shows
integration and interdependence of the three sectors of the traditional concept of SD
(Giddings, et al., 2002; Harding, 1998). This again is a very simplified depiction of SD
reducing multi-faceted complex issues into three quantifiable sectors, as most humans
live their lives in all three areas (Giddings, et al., 2002).

24 | P a g e
(a)
(b)
Figure 1 (a) Scheme of sustainable development: at the confluence of three constituent
parts, (b) A representation of sustainability showing how both economy and society are
constrained by environmental limits (Harding, 1998, p. 38) 3
The Brundtland Report stresses that humanity, whether in an industrialized or a rural
subsistence society depends for its livelihood and basic existence on the environment
and natural resources (Brundtland & Khalid, 1987). In other words, the economy and
society’s well-being, now and in the future, depend on a sustainable environment and
sustainable natural resource usage. Past patterns of unbridled economic growth and a
trickle-down theory for the poor have damaged the environment upon which all
societies depend, with a reported downward spiral of poverty and unsustainable
3 Author awaiting Permissions from The Federation Press, Sydney, for reproduction of these
figures.

25 | P a g e
environmental degradation (Rees, 1998). The sustainable development that Brundtland
proposed is a means to eradicate poverty, meet human needs and ensure that all get a
fair share of resources. Social justice today and in the future is a crucial component of
the concept of SD (Hopwood, et al., 2005). Freudenburg, as reviewed by Krannich
(2012), was a strong proponent of including inquiry into social justice and access to
natural resources in all sociological research about natural resource-based rural
communities.
In an unequal society it is those who are least powerful who suffer poverty and lack
of access to resources. The poor also have to bear the heaviest burdens of ill-
health, war and ecological problems (Hopwood, et al., 2005, p. 49).
Contempoary thinking in the field of Sustainable Development acknowledges the
importance of different cultural definitions of needs, and departs from older established
practices by accepting the currents of thought that sustainable development can be
defined by communities themselves with an ensuing automatic process of self-
realization and empowerment (Redclift, 2005). In fact, Freudenburg, recognising
numerous ways in which context matters, espoused for researchers, as he did, an
initial “extended (16 month) period of on-site and in-depth ethnographic research” for
full understanding of the spatial and temporal context of development targeted
communities. He also encouraged longitudinal data collection to track patterns of
adaptation, change and development trajectory over time (Krannich, 2012, p. 21). The
practical outcome is that if communities are not fostered to be architects of their own
change and development, then SD will never be achieved. Congruently if this process
is not facilitated they are unlikely to take ownership for something they do not see as
their own (Bridger, 1999; Fenton, Coakes, & Marshall, 2003; Ife, 2002; Redclift, 1992).
According to Hopwood, et al. (2005), SD and SL are interdependent paradigms which
carry both a Daly (1992) qualitative and, as suggested by Daly, a Brundtland (1987)
quantitative viewpoint. Daly suggested that it would be clearer to speak of ‘sustainable
livelihoods’, because of varying definitions and ambiguities concerned with the term
SD. Hopwood, et al.’s ‘sustainable livelihood’ approach recognises the nexus between
the concept of SD and the SL needs in developing countries especially for
marginalized, remote or impoverished peoples. SD promotes development that is
environmentally conscious and having an awareness of the planet’s finite carrying
capacity, and intergenerational equity and responsibilities. However, Brundtland’s
.sustainable development is skewed by some sectors to mean ‘sustainable growth’ that

26 | P a g e
more often than not only benefits the elites, with very little trickle down to the poor
(Daly, 1992). SL, while being environmentally conscious, focuses more on intra-
generational equity and responsibilities, ensuring that the poor benefit from equitable
access to, and distribution of, resources. SL fosters equitable access and distribution of
resources to all sectors of society so that all can have a sustainable livelihood
(Scoones, 2009).
The concept of SL is a way of thinking about a variety of issues prominent in the
discourse about the relationship between poverty and the environment. Livelihoods
perspectives start with how different people in different places live (Scoones, 2009).
Scoones (1998, p. 5) offers this definition of Sustainable Livelihood:
A livelihood comprises the capacities, assets (including both material and social
resources) and activities required for a means of living. A livelihood is sustainable
when it can cope with and recover from stresses and shocks, and maintain or
enhance its capabilities and assets, while not undermining the natural resource
base.
SL core concepts are that it is a way of thinking poverty alleviation at the micro-level,
taking into account the contextual realities on the ground. Scoones (2009) adds that
“quintessential sustainable livelihoods analysis is integrative, locally-embedded, cross-
sectoral and informed by a deep field engagement and a commitment to action”.
Scoones (1998) also developed a SL Framework (Figure 2) that operationalises the SL
concepts into a research analytical tool.
SL is a sub-paradigm of Poverty Alleviation (Allison & Ellis, 2001) and a closely aligned
methodology to that sought for research in eastern Indonesia. The concept of a
livelihood strategy approach emerged out of the growing literature on SL in which
attention is paid to the ways in which local people can meet their basic and ongoing
needs for food, shelter and social standing, as well as have access to education and
health services, through productive work, while preserving the environment for future
generations’ livelihoods (Chambers & Conway, 1991; Walker, et al., 2001). Walker,
Mitchell, & Wismer (2001 p. 307 ) recommend that “host communities should be
involved in planning and decision making, to enhance opportunity for success and
allow local people to anticipate, adapt and realize whatever potential there might be to
develop altered or new livelihood strategies”.

27 | P a g e
Scoones has given us in Fig 2 a generic framework for sustainable livelihood analysis,
and suggests three formative questions for any SL research/ project.
How can we assess who achieves a sustainable livelihood and who doesn’t? In
other words: what are the relevant outcome indicators?
What are the livelihood resources, institutional processes and livelihood strategies
which are important in enabling or constraining the achievement of sustainable
livelihoods for different groups of people?
What are the practical, operational and policy implications of adopting a
sustainable livelihood approach? (Scoones, 1998, p. 3).
Figure 2 Sustainable livelihoods: a framework for analysis (Scoones, 1998, p. 4)4
All of Scoones’ questions refer to social equity in relation to resource access,
institutional influence and the incumbent political system. He calls for “a more
thorough-going political analysis” in SL research while at the same time contemplating
micro-level macro-level linkages in resource and livelihood trajectories (Scoones,
2009). Rickson, Rickson, Hoppe, & Burch (2015) also concern themselves with the
incumbent political and social systems that influence natural resource access,
especially in “contested terrains”. Accordingly, both also promote acquisition of local
knowledge and history via local community participation as a crucial early stage of SL
4 https://www.ids.ac.uk/publications/copyright-and-permissions

28 | P a g e
strategy development (Rickson, Rickson, Hoppe, & Burch, 2015; Scoones, 2009).
Scoones’ generic framework and questions are particularly useful and adaptable to an
inquiry about enablers and constraints for sustainable livelihoods in the context of small
rural villages in developing regions
A SL approach is primarily concerned with why poor people remain poor, rather than
why people become poor (McDowell, 2002). However, statistical socio-economic data,
written and oral histories and cultural insights are imperative for holistic SL research.
Such data/ information gathering is normally commenced during the project scoping
phase and is added to on an ongoing basis by using Grounded/Action research data
collection methods (Scoones, 1998). This historical background data is valuable as it
focuses attention on both the quality and quantity of livelihoods in a given context, as
well as prior shocks and known vulnerabilities, thereby enabling researchers to
understand the possible impact of identified challenges and risks to livelihoods
(McDowell, 2002; Mulligan & Nadarajah, 2008). Researchers will also have a better
understanding of communities’ resilience to shocks and their adaptability to new
income-producing activities, their cultural norms, values and world views that converse
with these new activities and the existing formal and informal institutional structures
that facilitate or impede the activities (McDowell, 2002). Sustainability of livelihoods
inherently means environmental sustainability, especially for communities that have a
single resource livelihood (Ferrol-Schulte, et al., 2013).
Some authors, Cernea (1997), Scoones (1998, 2009), Walker, Mitchell, & Wismer
(2001) among them, contend that changes in livelihood strategy are normally adaptive
responses to changes in seven key interacting components:
Biophysical (loss of access to resources, local environment change and
constraints);
Political/Legal (impacts of new laws, promotion of governmental ideals);
Economic (increased perceived needs, changes in opportunities);
Social (changes in interaction patterns, values or wellbeing);
Cultural (changes in traditional practices and beliefs);
Psychological (stress, future outlook) (Walker, et al., 2001, p. 298); and
Natural phenomena (natural disaster, climate change, extreme weather events)5.
5 The Author felt it necessary to add the last point as major natural events can also impact on
livelihood strategies.

29 | P a g e
Accordingly, Scoones (1998, p.3) proposes that fundamental questions for sustainable
livelihood assessment are: What is the context of a particular case study area? What is
the available capital (natural and human)? What are the achievable strategies and
locally guided outcomes? And finally, what institutions, formal or informal, mediate the
scope of livelihood strategies and outcomes? Therefore it can be said that SL is a
concept that considers three important factors for development – objectives, scope and
priorities – so as to enhance progress in poverty elimination. The importance of SL is to
provide direction for poor people to achieve enduring improvements against the
challenges and poverty indicators that the people define (Ashley & Carney, 1999, p.
1).The views of both Scoones and Ashley and Carney help bridge the gap between a
quantitative SD approach and a qualitative SL approach as proposed by Daly (1992),
and provide a resonance for this paper and its focus on research concepts for small
rural terrestrial and marine communities in eastern Indonesia.
The conundrum for both SD and SL is the word ‘Sustainable'. Worldviews, values and
norms influence the posture taken by different governments, institutions and
communities and that posture can determine the relative weakness or strength of
sustainability (Harding, Hendricks, & Faruqi, 2009; Williams & Millington, 2004). It can
be said that weak SD arises when resources, both renewable and non-renewable, are
thought to be able to be replaced or developed without a need to reduce consumption,
thus placing livelihoods and economic growth in prime place. This can also be defined
as an anthropocentric approach. The alternative view of eco-centrism places the
environment as having prime importance and dismisses the importance of livelihoods
and economic growth. Strong SD is defined as “bio-centric egalitarianism”; that is when
human consumption needs are reduced or kept in check to reach environmental
sustainability. In this approach, human needs and environmental needs are considered
as equal and interdependent (Williams & Millington, 2004, p. 102).
Sustainability can be defined as,
… the capacity of human systems to provide for the full range of human concerns
in the long term. Sustainability, when applied to humans, refers both to long-term
survival of our species and the quality of our lives (Goldie, et al., 2005, p. 3).
In other words, to reach sustainability we must develop human systems that deal with
inter- and intra-generational challenges while developing communities that are founded
on sustainable livelihoods, a sustainable natural resource base and internal social
cohesion (Goldie, Douglas, & Furnass, 2005; Harding, Hendricks, & Faruqi, 2009;
McMichael, 2005).

30 | P a g e
In 1992, the United Nations Agenda 21 and Local Agenda 21 were released as
guidelines for governments and NGOs to consider when implementing development
projects (UNDESA, 1992). Both explicitly acknowledge the interdependence of the
three pillars of SD with humanity and sustainable livelihood. Agenda 21 led to the
creation of the Millennium Development Goals’ (MDGs) paradigm and the ensuing
Sustainable Development Goals (SDGs), which set empirical targets for poverty
alleviation, access to education and health services for all, environmental sustainability,
and equality and equity (UNDESA, 1992).
2.1.3 East Nusa Tenggara Matters
The Indonesia government, finding synergy with the MDGs and Agenda 21, has
adopted that framework to support community development (Government of Indonesia,
1997). Hence in the 1990s the Indonesian government shifted to a more holistic
approach that viewed the poor as potential actors in solving local development and
environmental problems. They employed a more participatory approach to programs
such as IDT 1994 - 1997 and PROMIS 1998 - 2005. Dendi, Heile, & Makambombu
(2009) noted that the first suffered from leakage due to poor monitoring and evaluation
stages of the program and was curtailed by the Asian Economic Crisis. The second
took on lessons from the first and provided more guidance and monitoring (Dendi, et
al., 2009). The lesson learned is that, while these communities ought to be and need to
be given the opportunity to participate in the development of their livelihood programs,
local capacity needs to be built to ensure program sustainability and success in
conjunction with program monitoring strategies developed for improved governance
(Dendi et al., 2009; Wahab, 2010).
Hence, the sustainable livelihood (SL) debate focused on developing countries and
environmental protection that has continued for several decades is highly relevant to
Indonesia where problems of poverty, unemployment and environmental degradation
are pervasive (Dendi et al., 2009; Puspasari, 2007; Zuryani, 2006). Eastern Indonesian
provinces still face huge entrenched problems of poverty (Resosudarmo & Jotzo,
2009). For example, in Nusa Tenggara Timor (NTT), most people are heavily reliant on
agriculture, livestock and marine resource activities at an artisan or traditional level
(Ormeling, 1957). Part of the NTT problem lies in unfavourable climatic conditions (a
short wet season with low and variable rainfall) combined with rocky infertile soil and
mountainous terrain (Barlow & Gonowarsito, 2009; Fox, et al., 2009). In the 1970s and
1980s the Indonesian Government adopted a centralized, top-down approach to

31 | P a g e
development vis-a-vis a green revolution package that provided new, high-yielding
seed varieties, credit schemes, subsidies and road and irrigation infrastructure (Dendi,
et al., 2009). In the mountainous and coastal areas in NTT, farmers and fishers did not
receive the same benefits to their livelihoods as in other regions (Dendi et al., 2009).
Barlow & Gonowarsito (2009) reports that 73 % of NTT’s population are dependent on
rural livelihoods be that agriculture, forestry or fisheries, where income and wages are
low and there is constant pressure on maintaining even basic subsistence levels of
income (Hugo, 2005). Eastern Indonesia relies on small fishing communities to provide
even the most basic of livelihoods (Fox & Sen, 2002; Fox, Adhuri, Therik, & Carnegie,
2009). According to Allison & Ellis (2001), small-village fisheries are often “the
occupation of last resort” and its fishers are known as “the poorest of the poor”. Yet
little has been reported about the communities’ own priorities or capacities for
development.
To develop a SL strategy, the communities’ priorities and capacities are the starting
point. Based on results from research by Kronen, Vunisea, Magron, & McArdle (2010)
in fishing communities in the South Pacific Ocean, major indicators and drivers should
be identified through culturally informed community participatory research at the
regional and local levels, and should identify priorities, advantages, limitations and
vulnerabilities of the target communities to guide development policies for regional
coastal fisheries management and alternative livelihood strategies.
Landlessness and a limited skill set, for the fishermen of NTT, give them little choice for
a livelihood other than their existing fishing activities or a foraging (forestry or coastline)
livelihood strategy, resulting in little more than a subsistence level existence (Fox &
Sen, 2002; Fox et al., 2009; King, 2007). While NTT may be rich in natural resources
and show sustainable development at the provincial level, at individual district level it
may not be, depending on natural resource usage in that area. Purwanti, et al. (2017)
in their research in Cengkrong coastal area of Prigi Bay. Java, found that past
livelihood projects had resulted in environmental degradation. Mangroves forests had
been cleared, causing environmental damage to the mangrove forests and tidal zones,
as well as damaging the spawning grounds for fish, crustations and other marine biota.
As a result, livelihood income declined in the Cengkrong coastal area.
The coastal zones of NTT have also suffered environment degradation from mangrove

32 | P a g e
clearing, and illegal fishing practices by local fishers such as the use of fish bombs and
potassium cyanide to catch fish, which destroys coral reefs and fish breeding grounds
as a result (King, 2007). Illegal fishing in the Timor Sea by large-scale foreign and
domestic enterprises has also been reported to put substantial pressure on fish stocks
(Butcher, 2004).Additionally, intensive seagrass farming in some bays and waterways
has resulted in the spread of seagrass disease and the deteration of local water quality
affecting other marine life in the area (Benu, et al., 2018).
For the fishing communities of NTT, protecting the coastline ecosystems is of high
priority. Landless fishers rely on these coastline ecosystems for their livelihood and
household income. Sustainable development at the local level must be a major focus
during poverty alleviation and livelihood programs, so that the livelihoods that are
created or enhanced can be sustainable too. For the current generation of small-scale
fishers in NTT to enable expanded livelihood choices for the next generation, it must
provide adequate nutritious Food, Residence with electricity and reticulated water, a
minimum of high school Education, Social status that facilitates access to information
and opportunity, as well as unrestricted access to Health services, medication, clean
drinking water and sanitation (UNFAO, 2000). However, subsistence is not enough to
provide the next generation with a FRESH Start
2.1.4 Conclusion
This paper has reviewed some of the literature on sustainable development by first
defining SD, SL and sustainability. Loose and misleading definitions of SD have
spawned an alternative dialogue on ‘sustainable livelihoods’ for greater clarity. Next the
paper has also contextualised the discussion for this thesis within the conceptual
framework of SD, SL and sustainability in developing countries and traditional fishing
communities. From the 1980s these concepts have risen in importance on academic
and government agendas at both national and international level because of global
recognition that natural resources and the planet’s carrying capacity are finite, that
current consumption rates are not sustainable, and that there is inequality in the
consumption of natural resources in today’s societies. The three interdependent
constituent parts of SD – environment, economy and society – are discussed, and
linked with humanity’s needs and survival. This leads to a discussion of the nexus
between SD, SL and community development, concluding, as Redclift says, that “the
central objective of sustainable development, therefore would be to ensure that the
poor have access to sustainable and secure livelihoods” (Redclift, 1992, p. 398). This

33 | P a g e
point is supported by Ashley & Carney, (1999), who draw the parallel that sustainable
livelihood is a way of thinking about the objectives, scope and priorities for
development, in order to enhance progress in poverty elimination, a key element in the
Rio Declaration, Agenda 21, local agenda 21 and the Millennium Development Goals
(UNDESA, 1992; UNEP, 1992; United Nations General Assembly, 2000).
In the case of eastern Indonesia, including NTT, while governments and NGOs have
spent hundreds of millions of dollars on poverty alleviation projects, real progress has
been slow, too slow to prevent livelihood stagnation or slip-back by the next generation
(AusAID, 2013). Therefore, further research in eastern Indonesian provinces is
necessary to investigate why these people are still so poor. Appropriate questions
might be: What are their needs as defined by them? (Bradshaw, 1972) What are the
available resources? What are contextually appropriate livelihood strategies? What are
the enablers and inhibitors to these livelihood strategies? How do we measure
achievement? and When do we declare that the developed livelihood strategies are
sustainable? Accordingly, true bottom-up participatory research (Frasera, et al., 2006)
incorporating needs assessments with a sustainable livelihoods approach is required to
empower the local people to develop achievable small-scale projects that help to ease
the burden of providing future generations with a FRESH Start.

34 | P a g e
2.2 Conclusion
The chapter has presented the core concepts for the design and implementation of this
research, being Sustainable Development and Sustainable Livelihood. It exposes the
nexus between the two concepts and relates their importance for the Province of East
Nusa Tenggara, Indonesia. The concepts of SD and SL are continually referenced in
the thesis as they have influence on the design and operationalisation of the research
and underpin the thesis recommendations for future livelihood strategies for the current
generation so that they can provide a FRESH Start for the next generation.
Scoones (1998) places social capital as one of the main elements to be investigated,
and developed, in development research with a SL approach. Strong social capital is
not only the groups and institutions that can influence sustainable development, it is the
glue that binds all the working parts together in harmonious concert. Alternatively, if
social capital is weak because of perceptions of real or symbolic threats from other
individual’s, group’s or institution’s actions or intentions, development projrect efficacy
could be compromised.
The following Chapter 3: Sustainable Livelihood and Intergroup Relations compliment
this chapter by introducing a third concept, Intergroup Threat Theory (ITT), to complete
the thesis conceptual framework. ITT, as an analytical lens, underpins the qualitative
data analysis and discussion in Chapter 9 leading to the thesis conclusion and
recommendations.

35 | P a g e
Sustainable Livelihood and Intergroup Relations Chapter 3

36 | P a g e
3.1 Introduction
The objective of this chapter is to add to the conceptual framework discussed in
Chapter 2, Sustainable Development (SD) and Sustainable Livelihoods (SL), in that it
draws a link between SL and Intergroup Relations (IR), which are an integral part of
any SL development project. In Scoones’ (1998) SL framework Social Capital (SC) is
highlighted as one of the main elements to be investigated and developed, in
development research and projects. Strong social capital binds together the individuals,
groups and institutions that can positively influence development efficacy. However, if
social capital is weak because of perceptions of real or symbolic threats from other
individual’s, group’s or institution’s actions or intentions, development projrect efficacy
could be compromised. It is therefore important that, when there appears to be a stale
in development, or a lack of project efficay contary to the effort and funding expended,
IR between individuals, groups and institutions should be investigated to expose
perceptions of realistic or symbolic threats by any of the entities.
IR is present between different entities within the micro, meso and macro levels, and is
also present during any inter-level interactions between the micro – meso - macro
levels. IR focused research can help to expose social phenomena that influence and
guide development aspirations and opportunities, the eventual outcomes of pre-project
negotiations and at the implementation stage. At the practitioner level, many authors
promote the investigation of quality and quantity of existing Social Capital (SC) as the
basis for IR (Woolcock, 2001), and at the theorist level many authors discuss social
science paradigms and promote the investigation and theorising of inherent individual
and group perspectives within a Social Psychology (SP) discourse as the basis for IR
(Brown, 2000; Crawford, 2017; Hogg & Abrams, 1998; Riek, et al., 2006; Sachdev &
Bourhis, 1985; Tajfel & Turner, 1979). Not only should IR be investigated at the
practitioner, real world level, but also at the theorist, metaphysical level.
This chapter makes a distinction between SP and SC in relation to social research, and
it makes a distinction about their place in SL research. Both are necessary components
of social research and both are discourses about how entities such as individuals,
households, groups, institutions, and even nations interact. However, they are very
different. SP is the metaphysical analysis of human actions, reactions and interactions,
which allows the social scientist to theorise and generalise about these interactions,
while SC inquiry counts real world agencies that facilitate these actions, reactions and
interactions, and assesses, evaluates and validates these agencies. SP theorising

37 | P a g e
primarily analyses verbal and non-verbal qualitative data to generalise about
similarities, differences or exceptions across research subjects or phenomena and SC
is often measured and presented as quantitative data resulting from surveys
(Woolcock, 2001).
Social Science’s two basic paradigms that underpin all SP discourse are conservatism
and liberalism. Some authors suggest that these two paradigms are diametrically
opposed in their tenets and that there is a conservative-liberal continuum along which
one’s perspectives is nested (Conover & Feldman, 1981). Others suggest that not only
are conservative and liberal perspectives dispositional, but also situational (Jost, et al.,
2003). Indeed, both conservative and liberal influences are inherently present in all
human actions, reactions and interactions. An entity, as defined above, will express, in
a metaphysical way, its values and view point through one of these perspectives as it
interacts with another entity. By recognising these metaphysical expressions, social
scientists are able to generalise or theorise about the quality of SC that may or may not
exist between entities and about the existence of any realistic and symbolic threats that
may present as a result of these entity interactions (Riek, et al., 2006). It is possible for
an entity to express a conservative perspective at one point in time and an idealist’s
liberal perspective at another time, depending on situationality of events and the prior
relationship and interactions with different other entities (Jost, et al., 2003).
This research aims to investigate the metaphysical expressions between different
entities in three traditional fishing villages on Rote Island, Indonesia. Of major
importance is how these entities resonate with each other in the design and
implementation of poverty alleviation and development projects. Historical data
presented in the next chapter and the results and discussion chapters reveal that
development has been slow; slower than expected from effort and funding already
allocated to numerous poverty alleviation projects in this area, and too slow to provide
the next generation of villagers with a FRESH Start. Threats to the success of these
development projects and proposals can be analysed by using a SP lens employing an
intergroup threat theory (ITT) framework (Riek, et al., 2006).

38 | P a g e
3.2 Social Capital
In the late Twentieth Century there was growing interest in Social Capital (SC) in
development circles (Pretty & Ward, 2001). The social relations and social norms that
make up SC were considered an essential element of Sustainable Livelihood
(Coleman, 1988; Carney, 1998; Grootaert & van Bastelaer, 2001; Pretty & Ward, 2001;
Putnam, 1993; Scoones, 1998; Scoones, 2009)
Coleman (1990, p. 302) wrote that SC
is defined by its function. It is not a single entity, but a variety of different entities
having two characteristics in common: They all consist of some aspect of a social
structure, and they facilitate certain actions of individuals who are within the
structure.
A review of definitions of SC by Maas, et al. (2015) found terms such as social
organisation, trust, norms, reciprocity bonds and networks were universal in the
definitions, and its function is to facilitate cooperation for the mutual benefit of those
considered part of the networks. They found that social capital can be summarized as
“networking and social values that can facilitate individuals and communities to achieve
common goals in an effective and efficient ways” (Maas, et al., 2015, p. 721). While the
word capital is normally used in economic discourses referring to material transactions,
SC is non-material transactions involving trust, norms, reciprocity, and networks
(Coleman, 1988).
It is not possible that society consists of a set of independent individuals, functioning
independently to achieve their own independent goals. Any interaction between
individuals required to achieve the individuals’ goals sets up a social system consisting
of the physical and psychological ebbs and flows of these interactions between
interdependent individuals (Coleman, 1990). As Woolcock (2001, p. 69) put it “In
essence, where human capital resides in individuals, social capital resides in
relationships”. Cooperative social interaction is critical for societies to prosper
economically and for sustainable development (Grootaert & van Bastelaer, 2001).
Social capital refers to the values, norms, relationships, groups and organisations that
shape the quality and quantity of a society's social interactions (Grootaert & van
Bastelaer, 2001). Social capital is not just the sum of the norms, relationships, groups
and organisations which define a society; it is the glue that binds the society together
(Fine, 2001; Putnam, 1993). Woolcock (2001, p. 67) used the age old adage that “who
you know is more important than what you know”.

39 | P a g e
Over the last few decades, an increasing amount of research results suggest that the
density of social networks, institutions and organisations that facilitate inter-personal,
inter-group and inter-institutional interactions significantly affects the efficiency and
sustainability of development programs (Carnegie, 2008; Grootaert & van Bastelaer,
2001). This efficiency and sustainability is reported to be a result of collective action
facilitated by shared values, norms and networks that are referred to as SC (Woolcock,
2001). When researchers and practitioners collaborate to incorporate SC analysis and
enhancement into development projects, they find that project activities have a greater
likelihood of being sustained well after the withdrawal of support agencies such as
government departments and NGOs (Pretty & Ward, 2001).
However, Coleman (1990) and Scoones (2009) cautioned against considering SC as a
“one cap fits all” solution to successful community development projects. While there is
widespread concensus about the important role of networks, instutions and other forms
of SC in development projects, what works in one context at a certain time may be
useless or even harmful in a different context or at a different time (Woolcock, 2001).
Scoones (2009) implored researchers to take a more political look at SC in
communities to determine, not just the quantity of SC that exists, but also what quality
of SC exists in the community, and to also investigate whether there are any
impediments to that quality that may inhibit optimum and sustainable outcomes.
3.2.1 The Social Capital Matrix
The World Bank’s Social Capital Initiative (SCI) successfully completed research in
twelve different projects in developing countries across the globe. Results showed that
social capital is a pervasive component and catalyst for progress in many development
projects, including poverty reduction and livelihood projects (Grootaert & van Bastelaer,
2001). SC can enable positive outcomes for poverty reduction projects by linking micro
and macro levels to facilitate the movement of useful development and livelihood
information for poor communities, with flow-ons at the district and national levels
(Grootaert & van Bastelaer, 2001)
The most convincing evidence supporting the social capital discourse comes from
micro level studies; that is, at the household and community level, when
interconnectedness between individuals and neighbours, community associations and
networks, and the depth and breadth of community participation are investigated
(Woolcock, 2001). Social interconnections form at, and between, all structural levels

40 | P a g e
through a diversity of different entities, networks, groups and institutions at each level.
At the local level these can include the individuals, households, neighbours, religious
and sporting groups, women’s guilds and labour or industry organisations (Pretty &
Ward, 2001). Whether at the micro, meso, or macro level, social capital exerts its
influence on community development and livelihood projects.
Figure 3 presents a matrix analysis of SC mapping scope versus form. Scope is the
different levels that participants operate from during a given social interaction. It is
possible for the one individual to operate at the 3 different levels during different
situational interactions; for example, an individual will have micro level interactions with
their family and neighbours, they will have meso level interactions when attending a
local group meeting, and if they have interactions with, or work for, a government
department or NGO they will have macro level interactions. SC takes 2 forms,
structural and cognitive. Structural is the tangible, visible forms of social capital such as
government institutions and associated laws and regulations, while cognitive form is
the abstract, non-tangible elements of relations such as values, norms and trust.
Figure 3 The Scope and Forms of Social Capital
The micro level of SC is defined as “those features of social organization, such as
networks of individuals or households, and the associated norms and values, that
create externalities for the community as a whole” (Putnam, 1993, as cited by
Grootaert & van Bastelaer, 2001, p. 4).
Adapted from (Grootaert & van Bastelaer, 2001, p. 20)

41 | P a g e
The meso level of SC is defined as “a variety of different entities [which] all consist of
some aspect of social structure, and [which] facilitate certain actions of actors - whether
personal or corporate actors - within the structure” (Coleman, 1990, as cited by
Grootaert & van Bastelaer, 2001, p. 4).
The macro level of SC is defined as “the political regime, the rule of law, the court
system, and civil and political liberties” (Grootaert & van Bastelaer, 2001, p. 5). The
political regime is taken to include government departments, at the national, provincial
and local level, NGOs, researchers and other institutions and organisations that have
an influential relationship with the micro and meso level. .
SC can also be divided into two distinct types, Structural and Cognitive SC. While
structural SC is in the physical domain, cognitive SC falls into the psychological
domain. Structural social capital facilitates information sharing such as, technology
transfers, industry changes, market access, micro-finance and future opportunities.
Collective action and group decision making through functional roles, social networks
and various social structures, all having their own rules, procedures, and precedents
also make up structural SC. As such, SC is a relatively objective and externally
observable construct (Grootaert & van Bastelaer, 2001, p. 5). Cognitive SC is a more
subjective and abstract form in that it encompasses individual and group perceptions
influenced by shared norms, values, trust, attitudes, and beliefs (Uphoff, 2000).
Cognitive SC therefore influences relations with other group members or members of
other groups. It can have positive and negative impacts on group decisions and group
actions, by either promoting, frustrating or delaying group or intergroup processes. The
SCI provide evidence that “both cognitive and structural capital matter and that social
capital is a relevant concept at both the micro and macro levels” (Grootaert & van
Bastelaer, 2001, p. 22).
3.2.2 Indicators
High levels of social capital are usually the result of multiple memberships of
organizations and inter-groups relations. However, It is possible to have a dense array
of groups and organizations, each with its own agenda protecting its own interests with
minimal intergroup activities (Pretty & Ward, 2001). Organizational density may be
high, but intergroup connectedness low (Cernea, 1993). Optimum levels of social
capital are indicated by high group and organizational density and active cross
organizational linkages (Pretty & Ward, 2001). Putnam (1993) provided evidence that

42 | P a g e
the density and diversity of local groups and organisations were a catalyst for the
sharing of formal and informal information and social trust. The ensuing social cohesion
aids the facilitation of effective governance and economic development (Woolcock,
2001) Evans (1992) as cited by Woolcock (2001, p. 66) explained that the capacity of
state institutions and the strength of state-community relations had a major influence
on whether the state was “developmental” or “predatory”. Weak, hostile and indifferent
state institutions have different effects on community livelihoods and development
projects (Woolcock, 2001).
Whether researching at the micro, meso, or macro level, it is important to recognize the
multidimensional nature of SC sources, because SC permeates all levels and exerts its
influence on sustainable development and community economics (Woolcock, 2001).
Hence, there is a need to be able to measure SC both quantitatively and qualitatively.
The SCI put forward three types of indicators for SC being;
1) Membership in local associations and networks,
2) Indicators of trust and adherence to norms and
3) Indicators of collective action (Grootaert & van Bastelaer, 2001).
Data regarding membership in local associations and networks are normally gleaned
via surveys that record the number of associations, their membership numbers, and
their inclusiveness or membership boundaries. This data indicates the associations’
internal decision making processes and if it is a democratically inclusive process or not
(Grootaert & van Bastelaer, 2001).
Data regarding trust and adherence to norms can be gleaned by way of multiple choice
survey question that rank the quality of trust and adherence to norms across guided
divisions of a spectrum. This data are more appropriately gleaned during field research
that includes interviews, group discussion and researcher observation. Trust and
adherence to norms helps foster reciprocity of assistance throughout the community,
reduces the incidence of free-riding, and local crime and conflict. This is an indicator of
social cognitive interconnectedness (Grootaert & van Bastelaer, 2001; Patrick, et al.,
2006).
Indicators of collective action can be measured through the display of successfully
completed cooperative community projects. Community cooperation is especially
indicated when collective action is not a compulsion by external forces such as
43 | P a g e
government directives and state laws and regulations (Grootaert & van Bastelaer,
2001). Communities graced with a rich stock of eclectic social networks and community
groups are in a more favourable position to deal with poverty, vulnerabilities and
shocks, resolve conflict and equitably share new information and opportunities.
Conversely, the absence of associations and social networks can have profoundly
negative impacts (Woolcock, 2001). How communities confront opportunities and risks
is dependent on the quality and the interconnectedness of the institutions that are
influential in, and toward, that community (Woolcock, 2001).
Research on poverty and people living at the fringe of society, both spatially and
socially, often leads to conclusions about powerlessness and exclusion from decision
making processes needing to be addressed by strengthening community SC through
all levels, horizontally and vertically (Grootaert & van Bastelaer, 2001; Patrick, et al.,
2006). However some critics express that SC is not a panacea for all ills that befall a
community. More SC is not necessarily better (Woolcock, 2001). Not with standing this
assertion, Maas et al. (2015) argue that SC significantly affects sustainable livelihood
strategies. They posit that macro policy interventions at the micro level, that is at the
individual, household and community level, often are not able to satisfy the aspirations
of the people and the government’s development policies. The conflict between
modern neo-liberal approaches and former state planned and centred interventions
presents ongoing challenges of political power and economic consequences (Fine,
2001).
3.2.3 Weaknesses
It should also be remembered that SC does have fundamental downsides as well as
benefits. It is not costless in that it requires, time, effort and capital input. It quickly
deteriorates and is hard to rebuild, hence there are maintenance costs as well
(Grootaert & van Bastelaer, 2001; Pretty & Ward, 2001; Woolcock, 2001).
All forms of capital, natural, physical, human, financial and social, can be an asset. The
benefits that accompany formal and informal displays of SC include information sharing
and pooling on technology, and market opportunities and changes reducing livelihood
failures and opportunism by others (Fine, 2001; Grootaert & van Bastelaer, 2001;
Woolcock, 2001). SC also promotes community group activities and decision making
(Grootaert & van Bastelaer, 2001).

44 | P a g e
Development researchers suggest that SC should be used as a tool for poverty
alleviation projects and be seen as a universal ingredient and determinant of progress
in development projects (Grootaert & van Bastelaer, 2001).The converse could result in
impotent bargaining power for the community when “consulted” on governmental
development planning, while in turn rendering any community empowerment stagnant
(Maas, et al., 2015).
Patrick et al. (2006) also comment on government programs implemented in Indonesia
to increase small land holder incomes, reporting that most failed to realise the expected
benefits. The resulting community responses have engrained a negative perception of
government planning, including their ability to implement long-term development
programs. Many communities only see government usefulness as source of free credit
and grant money with few sustainable obligations and outcomes.
If SC is strong it binds together the individuals, groups and institutions that can
positively influence development efficacy. However, if social capital is weak because of
perceptions of real or symbolic threats, development projrect efficacy could be
compromised. It is therefore important that, when there appears to be a stale in
development, or a lack of project efficay contary to the effort and funding expended, IR
between individuals, groups and institutions should be investigated to expose
perceptions of realistic or symbolic threats by any of the entities.
Woolcock (2001) argues that the ways and means of creating beneficial ties and
eliminating threats, between the community and the different agents involved in
development programs, must be included as a paramount part of any development
project. It is all about “getting the social relations right” (Woolcock, 2001, p. 82).

45 | P a g e
3.3 Social Science
Winch (1990) wrote that the analysis of natural phenomena is different from the
analysis of social phenomena in that in analysing natural phenomena scientists look to
understand causes, but for social phenomena social scientists look to understand
motives and reasons. The social sciences, as the study of people and society, have
many competing branches, paradigms, theories, philosophies and world views that
provide explanations for social phenomena or are prescriptive as to the way things
should be (Shimko, 2008). Congruently, there are as many disciplines making up the
social sciences, such as sociology, social psychology, education research, organization
studies, history, anthropology and International Relations, just to name a few (Bryman,
1988; Dunne, et al., 2007). According to Shimko (2008) the debates, over the last few
centuries, about explanations and prescriptions have their bases founded on three
dominant branches, conservatism and liberalism and Marxism. The former two,
conservatism and liberalism, have their roots in Greek philosophy and Marxism took its
place as a dominant branch in the mid to late 1800s. In more recent times feminism
and constructivism have challenged that dominance. While Conservatism and
Liberalism seek to theorise on the personal and group, dispositional and situational
responses to social realities, Marxism, Feminism and Constructivism are paradigms
that focus on the system level and theorise about, class, gender and constructs of
identity and shared understandings (Shimko, 2008). Not only do these dominant
branches provide the foundation for explanatory and critical socials theories, but also
allow theorists to ponder about the motives and reasons for social phenomena at the
individual, group and system levels, or in other words at the micro, meso and macro
levels.
3.3.1 Conservatism and Liberalism
Conservatism, also known as realism, has three main assumptions that seek to explain
the actions and reactions of people. The first is a pessimistic view of human nature, in
that human nature is a mix of good and bad and that the latter is always present. The
second is that people are not individualists, but rather are inherently social creatures
that crave social identity through group memberships. Hence, they always gravitate
towards family groups, social groups and political groups among other collective
entities. The third assumption is that conservatives believe that social conflict, of some
form, is inevitable (Shimko, 2008).
Conservative thinking does not dismiss the fact that humans are capable of rational

46 | P a g e
and ethical thought and action, but it does assert that flawed human nature, group
identity, and group egoism that is a part of group identity, will inevitably lead to social
conflict (Shimko, 2008). Conservatives recognise that communal bonds are fragile and
can be tested by unilateral advantage being exerted by other individuals or groups
(Dunne, et al., 2007). Gilpin, as cited by Shimko (2008, p. 50), stated that “… in a world
of scarce recources and conflict over those resources, human beings confront one
another ultimately as members of groups not as individuals.” While Jost, et al. (2003, p.
339) asserted that “the core ideology of conservatism stresses resistance to change
and justification of inequality and is motivated by needs that vary situationally and
dispositionally to manage uncertainty and threat.” Wilson (1973), as cited by Jost, et al.
(2003, p. 240) defines conservatism as “resistance to change and the tendency to
prefer safe, traditional and conventional forms of institutions and behaviour.”
Jost, et al. (2003) expressed salient points that resonate with aims of this thesis when
they posit that motives to overcome fear, threat, and uncertainty could increase the
preponderance for conservative perspectives and reactions to manifest, especially
among members of disadvantaged and low-status groups.
The alternative dominant paradigm to conservatism, or realism, in the social sciences,
for understanding social reality is liberalism, or idealism (Shimko, 2008). Shimko (2008,
p. 53) defines liberalism as “social, political, and economic philosphy based on a
positive view of human nature, the inevitability of social progress, and the harmony of
interests”. Conover & Feldman (1981) proposed an understanding of the difference
between conservatism and liberalism perspectives, not as if they were views from
different sides of the same coin, but as if they were totally different currencies.
Liberalism potrays people as rational, ethical and moral beings, whose flaws are
momentary aberations and not impediments to social progress and the harmony of
interests, while conservatism portrays people as inherently pessimistic about human
nature, as social beings that seek the security of groups over isolation, and as having a
view point that conflict was inevitable (Shimko, 2008).
Although, Shimko (2008) argues that a harmony of interests is in direct contrast with
the concervative view of the ineveitably of a confict of interests, Conover & Feldman
(1981) argued that while liberals and conservatives differ in that their views are from
the opposite side of the field, they are not necesarily bipolar. While conservatives are
said to be less tolerant of ambiguity, less open to new experiences, and more avoidant

47 | P a g e
of uncertainty compared with liberals (Jost, et al., 2003), Conover & Feldman (1981)
concluded that the major distinction that defines liberals and conservatives has to do
with acceptance of, versus resistance to, change. In fact, Nail, et al. (2009) discussed a
“reactive-liberal hypothesis” where liberals are inclined to act consevatively when under
threat. They wrote that liberals have a tendency to respond situationally to threats by
becoming more conservative, although being dispositionally liberals (Nail, et al., 2009).
Crawford (2017) made comparisons between liberal and conservative tendencies
saying that conservatives tend to be more psychologically and physiologically sensitive
than liberals when confronted with environmental stimuli generally, but especially when
confronted with stimuli that are negatively skewed, whether threatening, unexpected or
of unfamiliar structure. Nail, et al. (2009) concluded that major threats, uncertainties
and shocks, more often than not, elicit a tendency toward conservative social
dispositionality. Whether this tendency is expressed directly in terms of increased
political [group] conservatism, or more subliminal in terms of increased psychological
conservatism, depends on the particulars of the situation.
3.3.2 Marxism, Feminism and Constructivism
As noted previously Conservatism and Liberalism are social and political paradigms
that purport to provide explanations for individual and group actions and responses,
both dispositional and situational, to social realities and how the social, economic and
political world works. However, Marxism, Feminism and Constructivism are paradigms
that focus on the system or organisational level of society and theorise about the
influence of class, gender and constructs of identity and shared understandings as
explanations for how the social, economic and political world works (Shimko, 2008).
The paradigm of Marxism focuses on production and the distribution of profits from that
production and was founded on observations made by Karl Marx during the
industrialization period when factory owners lived an elite and affluent lifestyle
compared to the factory workers who worked long hours and lived in squalid conditions
(Booth, 1985; Leff, 1993). The bourgeoisie (the factory owners) were made affluent by
the production efforts of the proletariat (the factory workers). It was actually Marx who
coined the term capitalism (Shimko, 2008). In essence, the factory owners owned and
controlled the means of production and the factory workers supplied the labour for
production at a rate determined by the factory owner. Hence, the bourgeoisie held an
unequal and exploitative relationship with the proletariat (Booth, 1985). Marxism holds

48 | P a g e
the premise that conflicts of interest over scarce resources (wealth and assets) lead to
social conflicts that can be explained by class and income disparities.
Marxism also holds that economic power is entwined with political power, which allows
class to influence political and policy decisions made at the government level and
hence ensconcing economic, political and social disparities within the state system.
While conservatives and liberalists concern themselves with the explanation of
individual and group relations and the catalytic influences of dispositionality and
situationality, Marxists concern themselves with the explanation of economic, political
and social disparities and the catalytic influences of class and state structure (Booth,
1985; Niemi, 2011).
While Marxism stresses the importance of economic class in understanding how the
world works, Feminism stresses the importance of gender and male dominance to this
understanding. Feminists argue that while the only real physiological difference
between men and women is associated with reproduction, there are many sociological
differences (Shimko, 2008). Their view point is not about sex, that is, being male or
female; it is about gender, or masculinity and femininity. Shimko (2008) adds that the
social construct of roles favours men in positions of power over women and cites as an
example the comparitivally few women who have been national leaders on the world
stage. Feminists argue that this inequality extends across all social, political and
economic aspects of life and at all levels from the micro to the macro. Some consider
the pervasiveness of male dominance is so great that it often goes unnoticed (Creaven,
2000; Shimko, 2008).
Feminism is not just about women, it is about critical analysis of what feminists
proclaim to be gender norms that inherently promote gender inequality and sustain the
dominance of men in positions of social, economic and political power (Shimko, 2008;
Wright, 1994). Some femininist authors, when writing about organisational sociology,
suggest that organisational structures are not gender neutral, but are steeped in bias
towards displays of msacalinity and the maintainance of it as the dominant determinant
in hierachical configurations and reward systems (Acker, 1990).
Shimko (2008) attempts to explain the bias and inequality against the feminine by
saying that a woman showing mascline traits will receive greater social and political
acceptance than a man showing feminine traits. However, others describe feminism as

49 | P a g e
fostering a different type of political expression in that is infused with feelings, passions
and emotions, but also one that recognises “a critical links between affect and
gendered, sexualised, racialised and classed relations of power” (Pedwell &
Whitehead, 2012, p. 116).
Marxism and Feminism are both emancipary social theory that critically analysis
different types of oppression, class and gender, and they both share aspirations for the
elimination of oppression from social, economic and political aspects of life (Wright,
1994) In more recent years Constuctivism has grow out of these two social inquiry
theories. Constuctivists believe that objective reality does not exist, but that reality is
born out of individual experiences and is a constuct of identities, norms and learned
behaviours (Shimko, 2008). Mackenzie & Knipe (2006, p. 3) suggest that constuctivism
followed on from phenomenolgy theories and hermeneutic approaches, and that
constructivists look for meanings of reality imbeded in people’s experiences and that
reality is socially constructed. Constuctivists use the eyes of the research participants
as the prefered view point to understand social phenomena. Mackenzie & Knipe (2006)
also posit that constructivism uses an interperative approach to understanding
phenomena in that they do not start with a theory but rather they inductively build
meaning out of mostly qualitaive data, with quanitative data sometimes being used to
support, deepen and triangulate the hermeneutics approach.
Marxism, Feminism and Constructivism are all explanatory mechanisms to help give
understanding of social phenomena. They look for transformation and emancipatory
outcomes to socual problems. However, Shimko (2008, p. 68) stated that “it is not
always helpful to think in terms of a realist, liberal, Marxist, feminists, or constructivist
position. Instead it is better to approach debates in terms of arguments and rationales”.

50 | P a g e
3.4 Intergroup Relations
In the last section, it was shown that SC has come to the fore in social research,
especially in poverty alleviation and development studies. The benefits of SC are
information pooling and sharing and reduction in opportunism and free riding by other
individuals and groups. It is based on social interaction of group assistance and
reciprocity that leads to both physical and psychological interconnectedness and it has
been described as the glue that binds society together.
While some authors suggest that SC analysis should be a universal ingredient in all
community development programs, other authors caution against SC becoming seen
as an elixir for all social and community ills. The common ground is that SC analysis is
important. Its scope reaches across and connects all political levels of development,
the micro, meso and macro levels, and it is present in both structural and psychological
forms. Patrick, et al. (2006) presented examples of development project failure that led
to negative group attitiudes and responses towards government planning and
implementation of poverty alleviation programs. Whether it be large projects involving
an array of agencies or village level development programs, positive outcomes that are
benefical for all parties are reliant on the positive inputs of cooperative and balanced
interconnectedness between individuals and groups.
As Woolcock wrote, “the qualitative aspects of SC should not be neglected” (2001, p.
70) and “getting the social relations right” is crucial (2001, p. 82). He advocated
focusing on primary social networks as the source of SC is more important that
focusing on its known outcomes of trust, tolerance, and cooperation.
Tajfel (1970) essentially wrote about social discrimination, such as race, religion and
language, and how these elements can lead to social conflict. He divided social conflict
into two categories, those caused by predjudice and discrimination the other having
psycological causation. Coser (1956) as cited by Tajfel (1970, p. 96) saw social conflit
as either “rational” or “irrational”. Rational causation brought on by a genuine,
competitive conflict of interests and the irrational as accumulated emotional tensions.
However, Tarjel argued that most cases of conflict between groups, exhibit an intricate
interdependence of social and psychological causation (Tajfel, 1970).
The groups that people belong to is a reflection of how people see themselves. They
see similarities and parallels with their own group members, or the in-group, and they
51 | P a g e
see differences and crossed purposes with members of other groups, or the out-group
(Hogg & Abrams, 1998; Turner & Oakes, 1986). Social identity influences how people
behave and is akin to group identification (Ashforth & Mael, 1989; Hogg & Abrams,
1998).
Tajfel & Turner (1979), in fleshing out Tajfel’s earlier intergroup discrimination theories
posited a Social Identity Theory (SIT) which holds a position that “human interaction
ranges on a spectrum from being purely interpersonal on the one hand to purely
intergroup on the other” (Hornsey, 2008, p. 206). However, Tajfel & Turner suggested
that a purely interpersonal interaction and a purely intergroup interaction are rare
because there is always some group influence on interpersonal relations, and there is
always some personal or idiosyncratic influence on intergroup relations (Hornsey,
2008). Turner & Oakes (1986) then suggested that social identity could be a
psychological process that ‘depersonalized’ self-image and fostered group behaviour.
They proposed SIT as an intergroup relations and social conflict analysis tool. Self-
Categorization Theory (SCT) emerged from this concept. The aim of which also was to
explain the social psychological basis of group phenomena, that is, to identify the
mechanisms by which individuals become a psychological group collective (Turner &
Oakes, 1986, pp. 240-241). Social identity concepts are now widely used as an
explanatory tool in social research (Brown, 2000).
SCT has three distinct levels of conception: self-categorization as a human being (the
superordinate category) based on differentiations between species, in-group out-group
categorizations (the self as a social category) based on differentiations between groups
of people (class, race, nationality, occupation, etc.) and personal self-categorizations
(the subordinate level) based on differentiations between oneself as a unique individual
and other (relevant) in-group members (Turner & Oakes, 1986, p. 241). In-group out-
group categorizations indicate the existence of social relations between people
displaying similar and different norms and values as deemed salient by society (Turner
& Oakes, 1986).
SIT and SCT emanate from “the same ideological and meta-theoretical perspective”,
and they share many of "the same assumptions and methods” (Hornsey, 2008, p. 207).
SIT also puts forward the concept of self-image or self-categorisation being an
amalgamation of personal identity and idiosyncratic characteristics, and a social
identity aligning itself with salient group classifications. Therefore, one’s social identity

52 | P a g e
pulsates with a feeling of inclusion to some human collective (Ashforth & Mael, 1989).
When a collective displays befitting characteristics and a feeling of affinity with the
collective rises, people see themselves and other collective cohorts less as individuals
and more as quintessential representatives of that in-group or collective (Hornsey,
2008). People categorise themselves and others into diverse social collectives that
may be based on parameters such as; race, religion, language spoken, place of birth,
place of residence, livelihood strategy, recreational activities, opportunities and threats.
Individuals can have more than one identity, depending on contextual influences
(Ashforth & Mael, 1989). SIT represents a theorisation of how the social context affects
intergroup or inter-collective relations (Hornsey, 2008).
Although society is essentially made up of individuals, it is partitioned into relatively
distinct social groups and classifications, dependent on peoples’ norms, values,
opinions, and practices learnt from their in-group. Different groups dress differently,
have different mottos, totems, values, different lexicon and behaviour, have different
occupations, and reside in different localities (Ashforth & Mael, 1989; Hogg & Abrams,
1998). It has been shown that groups can relish this type of discrimination, sometimes
called in-group bias, and that relative group strengths can be influential for intergroup
attitudes. Brown’s (2000) view is that SIT should ponder on the how, why and when
groups show overt and covert signs of hostility and mistrust towards another.
Tajfel was of the opinion that SIT is essentially a theory of social change (Hornsey,
2008). SIT was the first social psychological theory to take into account the stratified
relations of status and power between groups and that intergroup posture is a result of
people’s cognition of alternatives to the status quo (Hornsey, 2008). It also offers the
opportunity to theorise over the relationship between the individual and the group, and
collective responses arising from individual cognitions. For example, a collective sense
of deprivation or inequality could be a catalyst for group members to take collective
action to atone the real or perceived injustices (Brown, 2000). The study of collective
behaviour by groups of individuals should take a social psychological approach to
issues of intergroup relations.
Fine, 2001 (p. 106) stated that “Inequality - in particular, income inequality - is, for
example, bad for the health of the poor because of relative deprivation”. Weeratunge,
et al. (2015) concurred by stating that relative deprivation and distributional justice are
interrelated concepts. Likewise, deprivation of social capital has detrimental effects on

53 | P a g e
local communities and the wider society alike. Communities experiencing deprivation of
SC are sick and will continue to ail until they are graced with more and the new SC
assimilates and resonates with the communities’ existing SC and values and
aspirations. Not only is the community itself ill, but incidence of health problems for the
inhabitants are high as a result of social capital deprivation and fragility (Fine, 2001).
Often when groups have a sense of deprivation, real or perceived, of one or more of
the essential capitals that underpin an acceptable lifestyle, especially income
deprivation, it will engage in collective dissent or protest. Relative Deprivation Theory
(RDT) “proposes that the driving force behind feelings of discontent and subsequent
collective action is a perception of discrepancies between what one’s group currently
experiences and what it is entitled to expect” (Brown, 2000, p. 749). Congruently, at
times, collective action is related to group identification as well as the group’s relative
deprivation. In both cases, self-categorisation and group identification are antecedent
to collective action (Brown, 2000).
Even at times of loss, hardship, failure or missed opportunity, people will choose and
maintain group membership. This is a form of group action. The members adhere
because they have collectively experienced both successes and failures of the group.
This experience creates history and reinforces individual and group identity. Awareness
of one’s out-groups solidifies awareness of one's in-group leading to intergroup
comparisons, which can positively and negatively affect individual feelings of self-
esteem (Ashforth & Mael, 1989). When events lead to individual and group expressions
of fear, being under threat, and uncertainty increased levels of conservatism may
present themselves. This is particularly so among members of disadvantaged and low-
status groups (Jost, et al., 2003). Some people will take a conservative posture in a
search for certainty, while others may adopt a conservative posture as a result of a
threat to self-esteem (Jost, et al., 2003). In the case of real or perceived objective
conflicts, such as unfair access to resources and technology and unfair distribution of
income, the conflict can quickly increase in intensity, or if a chronic condition tensions
may become engrained, thus inhibiting future attempts at resolution. “Group
memberships are psychologically salient and mutually exclusive” (Brown, 2000, p.
768).
Jost, et al. (2003, p. 352) provided a list of conditions that are associated with both
individual and group political conservatism:

54 | P a g e
(1) mental rigidity and closed-mindedness, including (a) increased dogmatism and
intolerance of ambiguity, (b) decreased cognitive complexity, (c) decreased
openness to experience, (d) uncertainty avoidance, (e) personal needs for order
and structure, and (f) need for cognitive closure;
(2) lowered self-esteem;
(3) fear, anger, and aggression;
(4) pessimism, disgust, and contempt;
(5) loss prevention;
(6) fear of death;
(7) threat arising from social and economic deprivation; and
(8) threat to the stability of the social system.
This report concluded that “a set of interrelated epistemic, existential, and ideological
motives successfully predict the holding of politically conservative attitudes” (Jost, et
al., 2003, p. 366).
Social psychologists differentiate between automatic and controlled processes, and
ponder over the relationship between the two. They also ponder over psychological
and situational phenomena at the cognitive, affective and behavioural levels and have
found substance in a number of sub-areas including, stereotyping, judgements and
behaviour in intergroup contexts (Brown, 2000).
3.4.1 Intergroup Threat
Intergroup threat is a product of intergroup bias and prejudice. Riek, et al. (2006, p.
336) define intergroup threat as what “occurs when one group's actions, beliefs, or
characteristics challenge the goal attainment or well-being of another group”. Stephan,
et al. (2009, p. 2) define intergroup threat as “when members of one group perceive
that another group is in a position to cause them harm “. There is a relationship
between intergroup threat and negative outgroup attitudes (Riek, et al., 2006).
Social Identity Theory (SIT) explains real-life social conflict and change by analysing
the processes of intergroup discrimination (Hogg & Abrams, 1998). SIT maintains that
the very existence of social groups is a precedent and catalytic for intergroup conflict.
Thus, the theory concurs with conservatism’s pessimistic view of intergroup harmony
(Ashforth & Mael, 1989). SIT has become an influential and much utilised concept for
the analysis of group processes and intergroup relations. It has extended its influence
outside of social psychology and refreshed the definition and approach to group-

55 | P a g e
mediated phenomena (Hornsey, 2008).
The effects on intergroup relations are the cause for the rise to importance of
intergroup threat analysis (Stephan & Stephan, 2000). They are largely destructive,
even when the response of the group, which is under threat, is a subdued behavioural
response such as entering negotiation or compromise, or embarking on deterrence
strategies (Stephan, et al., 2009). In-group and out-group relations are often tested by
competition and hostility, even when objective sources of conflict, such as over scarcity
of resources, are absent (Ashforth & Mael, 1989). Threats felt or perceived by
members of the in-group can cause an increase in in-group identification, that is, threat
increases group ties and salience (Riek, et al., 2006). Stephan et al. (2009) posit that
members tend to favour their own group and exhibit negative attitudes and hostility
toward other groups, especially under real or objective threats. Groups may even
benefit from promoting and provoking greater distinction between themselves and other
groups, especially to demote standing and claims from the competitive out-group
(Ashforth & Mael, 1989). However, as Tajfel & Turner (1979) point out there is a grey
area between objective conflict and social competition.
Realistic, physical or objective threat is about physical harm or a loss of resources,
while symbolic, meaning, or social competition threat is about the integrity or validity of
the in-group’s meaning system (Crawford, 2017; Stephan, et al., 2009; Tajfel & Turner,
1979). Crawford (2017, p. 356) puts it succinctly by stating that the distinction between
meaning threats and physical threats is equivalent to the distinction between threats to
“systems of meaning and value” and threats to “existential realities”.
Economic or social competition between groups often ignites discriminatory behaviour
by one or both of the groups (Tajfel & Turner, 1979). Members of groups view
themselves as the in-group and other groups as out-groups. In-group members will
harmonise with pejorative perceptions of the out-group. Similarly, any real or perceived
slights against other members of the in-group will resonate within all members of the
group (Ashforth & Mael, 1989). In-group bias justifies maintaining social distance and
debasement of the out-group (Ashforth & Mael, 1989).
Stephan, et al. (2009), although proponets of intergroup threat theory, also used tribal
psychology as another way of explaining intergroup threat and conflict. They propose
that tribes that have the capabilities to harm or deprive the in-group of a life sustaining

56 | P a g e
resource may threaten the existence of the group. Tribes that express different values
and norms could threathen the the value foundations of the in-group. A tribal
psychology mindset can also give life to threats that do not exist, which can be
explained as a default defence against not perceiving a threat when a threat does exist
(Stephan, et al., 2009). Most intergroup conflict possess an intricate mix of social and
psychological causation (Tajfel, 1970).
Jost et al.’s (2003) used a Motivated Social Cognition (MSC) perspective, and Hibbing,
et al. (2014) used a similar perspective called Negative Bias (NB) to explain how
people can take up politically conservative posture when confronted by chronic threats
and conflict or a critical need deprivation (Crawford, 2017). MSC and NB perspectives
support notions that conservative political persuasions emanate from deep-seated
psychological or physiological needs when confronted with threat and potentially
negative circumstances (Crawford, 2017). Conservatives are especially responsive to
negative stimuli and events (Hibbing, et al., 2014, p. 297). Crawford maintains that
liberals and conservatives are similarly affected by and responsive to meaning threats,
but conservatives are differentially influenced by and responsive to physical threats
(Crawford, 2017, p. 354).
Stephan & Stephan (2000) developed the Integrated Threat Theory (ITT) which
provides a holistic and integrated response to social conflict analysis. ITT, as they
proposed in a book chapter titled, Integrated Threat Theory of Prejudice (Stephan &
Stephan, 2000), combines under the one theory the elements of realistic threat,
symbolic threat, negative stereotypes and intergroup anxiety. However, they later
revised their assertion that there were four types of intergroup threat. In the 2009 book
chapter titled, Intergroup Threat Theory (Stephan, et al., 2009), the four types of threat
were condensed to two types of threat, realistic threat and symbolic threat. They
conceded that negative stereotypes and intergroup anxiety were not threats as such,
but were “a cause of threat involving characteristics of the out-group that could have a
negative impact on the in-group (e.g., aggressiveness, deviousness, immorality).
Indeed, negative stereotypes have been found to be a significant predictor of both
realistic and symbolic threats (Stephan, et al., 2009, p. 2).
The definitions of realistic threat and symbolic threat in the revised version of ITT
differentiated between realistic group threat and realistic individual threat, as was
symbolic group threat and symbolic individual threat (Stephan, et al., 2009).
57 | P a g e
realistic group threats are threats to a group’s power, resources, and general
welfare,
Symbolic group threats are threats to a group’s religion, values, belief system,
ideology, philosophy, morality, or worldview.
Realistic individual threats concern actual physical or material harm to an individual
group member such as pain, torture, or death, as well as economic loss,
deprivation of valued resources, and threats to health or personal security.
Symbolic individual threats concern loss of face or honour and the undermining of
an individual’s self-identity or self-esteem (Stephan, et al., 2009, pp. 3-4).
3.4.2 Realistic Threat
One of the earliest theories to ponder on the causes and consequences of intergroup
threat was the Realistic Group Conflict Theory (RGCT). RGCT holds the tenet that
when two or more groups are vying for the same resources, especially scarce, tangible
resources that underpin people’s wellbeing, health and livelihoods, conflict and
negative out-group attitudes will surface (Riek, et al., 2006; Tajfel, 1982).
Early research using RGCT only addressed threats when the individual was directly
affected, but threats are still perceived by individuals when the group as a whole is
threatened (Riek, et al., 2006). Objective threat to group interests causes intergroup
conflict, which could lead to group action (Tajfel & Turner, 1979). However when there
is an imbalance in power or status between the two groups, the subordinate group may
acquiesce to the superior group because of an internalised perception that they are
inferior or second class (Tajfel & Turner, 1979).
Tajfel & Turner (1979) put that the aetiology of intergroup hostility is competiing group
interests over real life assets. When competition is complementary, positive
interdependent cooperation could develop, but conflicting interests could be a catalyst
for overt social conflict. They added that heightened intra-group identification is also a
result of conflicts of interest (Riek, et al., 2006). Negative out-group attitudes, low levels
of support for action programs and sterotyping are related with incompatable goals and
perceived competition between groups (Riek, et al., 2006).
Crawford (2017, p. 357) refers to physical threats when discussing realistic threat. He
defines physical threat as “concrete concerns regarding the violation of one’s physical
safety and well-being through the potential of death or other physical trauma”. Jost, et
al. (2003, p. 355) refer to a motivated social cognition perspective and divide threat into

58 | P a g e
chronic or acute threats, where chonic threat is a “dispositionally heightened needs for
closure of perception of threat” and acute as “experiences of uncertainty of threat”.
Whether these threats are chronic or acute threats, people adopt a conservative
position for uncertainty and threat management (Crawford, 2017) and that
conservatives are more likely to respond to negative stimuli and events (Hibbing, et al.,
2014).
3.4.3 Symbolic Threat
Realistic threat theories provide an explanation about conflict over objective
phenomena, such as natural resources, income distribution of income, money and
asset control, but they do not give an explanation about bias and negative out-group
attitudes in the absence of realistic threats (Riek, et al., 2006). Riek, et al. (2006, p.
337) call these threats symbolic treats. Symbolic threats emerge when individuals, or
an in-group that they are a member of, perceive that their cultural values, norms and
response expectations are under threat. These psychological threats, rather than
physiological threats, inflate the salience of in-group values and norms and can
increase intergroup bias and negative out-group attitudes. Symbolic threat analysis
was formulated to explain racism and an anti-Black bias of Whites in the Americas and
for biases against immigrants, symbolic and intergroup bias threat theories have been
used with compelling results under other intergroup conditions and contexts (Riek, et
al., 2006).
Crawford (2017, p. 354) calls symbolic threats, meaning threats. He posits that
meaning threats compared to physical threats “include more abstract concerns
regarding the violation of one’s senses of belonging, identity, purpose, significance,
continuity, or certainty”. He adds that responses to what Nam, et al. (2013) call Belief-
Inconsistent threats, such as, “Information, events, or experiences that are incongruent
with one’s prior beliefs or expectations can represent threats to important values,
beliefs, and identities” (Crawford, 2017, p. 357). Symbolic threat theory aligns bias
responses with perceived threats to cultural values and negative out-group attitudes
intensify as the perceived differences in in-group out-group values increase. These
intensified attitudes may also impede social and development policies designed to aid
the in-group (Riek, et al., 2006).
Realistic threat is evident when people feel that their personal assets and wellbeing, or
access to, are threatened by others, and symbolic threat is evident when people feel

59 | P a g e
that their values, norms, social identity or self-esteem are threatened by others (Riek,
et al., 2006).
3.4.4 Integrated Threat Theory
Early critics of realistic conflict and symbolic threat theories portrayed them as
confliction perspectives of intergroup relations. However, these two theories are now
seen by researchers as complementary theories and can be used in tandem to
investigate diverse causes of intergroup conflict and negative out-group attitudes, hat is
that realistic threat and symbolic threat, both affect out-group attitudes at the same time
(Riek, et al., 2006).
Stephan & Stephan (2000) proposed an Integrated Threat Theory (ITT) that had four
elements: realistic threat, symbolic threat, intergroup anxiety, and negative stereotypes.
ITT recognises realistic threat as similar to that defined by RGCT including
“perceptions of competition, conflicting goals, and threats to physical and economic
well-being of the in-group”, and it recognises symbolic threat as “similar to symbolic
racism, where threat arises from a conflict in values, norms, and beliefs between
groups” (Riek, et al., 2006, p. 338). Conflicting goals and perceived competition
between groups influence negative outgroup attitudes, resistance to affirmative action
programs, and stereotyping (Riek, et al., 2006). Stereotyping is often accompanied by
favourable or unfavourable attitudes toward members of the out-group (Tajfel, 1982)
and deindividualising and depersonalising of out-group members result from negative
stereotyping (Ashforth & Mael, 1989).
Figure 4 Riek et al.’s Potential model of intergroup threat (Riek, et al., 2006, p. 347)

60 | P a g e
Stephan & Stephan (2000) included intergroup anxiety and negative stereotyping forms
of intergroup threat and asserted they represent unique types of threats. Riek, et al.
(2006) added that intergroup anxiety create feelings of uneasiness and awkwardness
Figure 4 shows the results of Riek, et al.’s (2006) extensive review of the ITT literature.
It shows the interconnectedness of threat inputs filtered through a cacophony of
emotions that influence intergroup behaviours and out-group attitudes. However,
Stephan, et al. (2009), in a paper titled “Intergroup Threat Theory”, revised their 2000
Integrated Threat Theory by converging the four original threats: realistic threat,
symbolic threat, intergroup anxiety, and negative stereotypes, into the two most salient
threats, realistic threat and symbolic threat. They rationalised that intergroup anxiety,
and negative stereotypes are actually antecedents to threat perception and social
conflict. Negative stereotyping is connected with negative expectations about the
behaviour of out-group members (Riek, et al., 2006).
Intergroup anxiety and negative expectations are consequences of negative
stereotyping resulting from prior unfavourable contact and history of group conflict with
out-groups, and the higher the level of negative contact the higher the level of
perceived threat (Riek, et al., 2006). Out-group size, status differences and relative
power also can ignite intergroup anxiety and negative expectations (Stephan, et al.,
2009). Although Stephan et al.’s original theory was based on both low and high power
groups feeling similar levels of intergroup threat, their revised theory conceded that
“low power groups are more likely than high power groups to experience threats, but
that high power will react more strongly to threat … low power groups are highly
susceptible to perceiving threats because they are at the mercy of more powerful
groups” (Stephan, et al., 2009, p. 6). In reality, intergroup relations are more inclined to
be antagonistic than complementary (Stephan, et al., 2009).
Intergroup threat theory is a social psychology theory related with perceptions of threat.
The theory posits that the perception of threat by the in-group, even when there is not,
can have real consequences. Hence, the theory is more concerned about perceived
out-group threats to the in-group, when none exists, than actual overt, objective threats
(Stephan, et al., 2009). Apprehensions of threat are responses to a variety of sources,
including concerns that the out-group will exploit the in-group, will perceive the in-group
as prejudiced, and will challenge the in-group’s values (Stephan, et al., 2009). Finally,
the level of perceived threat from another group depends on prior history between the

61 | P a g e
groups, the members’ cultural values, the context of the groups’ interactions and
individual difference variables (Stephan, et al., 2009).

62 | P a g e
3.5 Rote Island Matters
This research project about sustainable livelihoods in small-scale fishing communities
uses three small fishing villages on Rote Island, in the Province of East Nusa Tenggara
(NTT) Indonesia, as case study sites. The villages are poor communities of traditional
and artisan fishers who ply their trade for a meagre income. Although governments and
NGOs have applied numerous livelihood programs and invested millions of dollars in
an effort to lift these villages out of enduring poverty, progress has been slow, with
many villages still living a subsistence level of lifestyle. Most livelihoods on Rote Island,
and in fact many places throughout Indonesia and Southeast Asia, still rely on income
from natural recourse extraction.
Natural resource extraction and income distribution systems necessitate collective
action and at least some form of formal or informal institutions; collective or group
action for extraction effort of the resources and institutions that determine who has
access to the resources, who receives a share of the production income and how much
each should receive (Pretty & Ward, 2001). In the case sites on Rote Island, the
participants in the extraction group-action are the local traditional and artisan fishers
who normally work for bosses or investors who own the boats and catch gear used for
the natural resource extraction. It is the bosses and investors who control the income
distribution system and institutions for their current livelihood activities, and government
departments who dominate development and poverty alleviation activities (Fox, et al.,
2009; Therik, 2008).
Maas, et al. (2015), in their research in fishing communities near Medan in North
Sumatera, found that poverty was a result of basic necessities for life and personal
development not being fulfilled, such as food, health, education, employment and
infrastructure. Other research reported by Patrick, et al. (2006, p. 5) found that “the
poor and poorest rely on patron-client ties to mitigate their poverty from day to day, but
that these ties serve only to reinforce their disadvantage into the longer term “. Their
position is such that they have little chance of influencing and renegotiating the
inequality in the distribution of production proceeds (Schutkowski, 2006).
The fishers of Rote Island are caught in this form of patron-client poverty trap with the
boat and fishing gear owners, commonly called the “Boss” (Therik, 2008).
Consequently, they have difficulty fulfilling household daily basic needs that are

63 | P a g e
perquisites for a FRESH Start6 (Food, Residence, Education, Social status and Health
services) for the next generation, so that they can secure an alternative livelihood that
does not expose them to the cyclical debt that their parents endure. A key element of a
FRESH Start is for the next generation to have access to social capital and hence
social status. Scoones (1998) explicity promotes social capital as a essential element
of any livelihood development project, while Allison & Ellis (2001) and Allison &
Horemans (2006) extend Scoones’ assertions to small-scale fishing communities.
Patrick, et al. (2006) reported on government livelihood development programs
implemented in the West Nusa Tenggara (NTB) Province of Indonesia, saying that
most of these [government] programs have failed to realise the expected benefits.
As a result, some communities have developed a negative perception of
governments’ ability to assist long-term development and many regard government
as a source of free credit and grant money with no ensuing responsibilities to repay
or develop sustainable systems (Patrick, et al., 2006, p. 8).
Regional development planning is also reported to stifle community bargaining power,
rendering any program objectives of community empowerment and community
aspirations of planning participation as impotent (Maas, et al., 2015). Carnegie (2008)
found in her research in the village of Oelua, on Rote Island, that local people develop
their own self-identity and intergroup relations as an inherent element of their livelihood
activities.
The purpose of regional planning is to analysis and understand the existing contextual
dynamics and to address any enabling and inhibiting factors of the desired program
outcomes, then to plan an appropriate strategy to achieve those outcomes. This
requires the blending of locally accessible resources, local human and social capacities
and available technology, and to encourage and acknowledge local participation in the
planning and implementation stages (Maas, et al., 2015). There is an over-emphasis
on material motivation in development planning at the macro level, and not enough
6 FRESH is an acronym developed by the author for:
Food: adequate fresh nutritious food consumption at a minimum 2 times per day Residence: solid structure walls, roof and floors, adequate furniture, electricity and reticulated water, Education: a minimum of senior high school completed Social Status: equal access to natural resources, information and opportunity, self-esteem Health services: unrestricted access to health services, medication, clean drinking water and sanitation

64 | P a g e
attention paid to socio-cultural drivers (Carnegie, 2008). Development, involving even
small amounts of social change, requires analysis of the social psychology of existing
and possible social conflict (Tajfel & Turner, 1979). Fox & Sen (2002), in their report on
Rotenese traditional fishers, warned of the possibilty of social conflict between
traditional fishers and their bosses/agents when modifing livelihood strategies in
Rotenese small-scale fishing communities.
The relationship between fishers on Rote Island and their Boss is multifaceted. On the
one hand there is abundant social capital between them, as the Boss provides them
with work, provides supplies for their voyages and loans them money to cover
household needs. However, it is the Boss that they become indebted to and the Boss
ais the one who controls the distribution system of fishing proceeds. This distraibution
system is skewed in favour of the Bosses and agents (Fox & Sen, 2002; Therik, 2008).
Figure 5 shows the fundamental intergroup linkages that play a role in the livelihood
strategies of fishers in the Rotenese fishing villages under study. At the micro level, the
three villages, A, B, and C compete for natural resources and social identity. They also
compete for government and NGO development funding and aid. These social
interactions could present both realistic and symbolic threats among the villages.
Figure 5 Intergroup relations at the centre of this research
The micro-macro linkages are important to this research. Intergroup relations between
Government
NGOs
Researchers
Fishing Bosses
Agents
Village
C
Village
A
Village
B

65 | P a g e
the fishers and their bosses and agents that purchase their produce can be in conflict
due to real or perceived inequality of income distribution. Hence, the fishers may
experience or perceive a realistic threat and have negative outgroup attitudes towards
their bosses and agents.
Equally catalytic for intergroup conflict is the relationship between the fishers and
government departments and NGOs. The planning and implementation of development
programs often lead to a conflict of interest between the micro and macro (Fine, 2001).
Although the government and NGOs may act normatively when designing development
and livelihood plans, the fishers may feel both realistic and symbolic threats.
Government policy regarding access to natural resources could be perceived as a
realistic threat by the fishers. Additionally, government and NGO modernisation plans
and plans to change resource type or extraction methods could be perceived as
symbolic threats. Because of these perceived threats, fishers may develop negative
out-group attitudes, leading to negative stereotyping affecting future government and
aid programs.
Macro-macro linkages that are completely out of the control or influence of the micro
level could also ignite perceived realistic and symbolic threats for the villagers.
In the results and discussion chapters, the author uses the tenets of ITT to report on
the intergroup relations of the fishers in the three case study village, on Rote Island,
with other groups that influence their livelihood strategies. In particular, the micro-
macro linkages are reported on from the micro level; that is, placing the fishers as the
in-group, and groups at the macro level as the out-group.

66 | P a g e
3.6 Conclusion
The rationale of this chapter is to add to the conceptual framework for this thesis,
Sustainable Development (SD) and Sustainable Livelihoods (SL), in that it has drawn a
link between SL and Intergroup Relations (IR) that are integral parts of any SL
development project. IR is present in and between different entities within the micro,
meso and macro levels. At the practitioner level, many authors promote the
investigation of quality and quantity of existing Social Capital (SC) as the basis for IR
(Woolcock, 2001), and at the theorist level many authors discuss social science
paradigms and promote the investigation and theorising of inherent individual and
group perspectives within a Social Psychology (SP) discourse as the basis for IR
(Brown, 2000; Crawford, 2017; Hogg & Abrams, 1998; Riek, et al., 2006; Sachdev &
Bourhis, 1985; Tajfel & Turner, 1979).
This chapter has made a distinction between SP and SC in relation to social research,
and it also made a distinction about their place in SL research. As outlined, they are
very different. SP is the metaphysical analysis of human actions, reactions and
interactions, which allows the social scientist to theorise and generalise about these
interactions, while SC inquiry counts real world agencies that facilitate these actions,
reactions and interactions, and assesses, evaluates and validates these agencies. SP
theorising primarily analyses verbal and non-verbal qualitative data and generalises
about similarities, differences or exceptions across research subjects or phenomena.
SC is often measured and presented as quantitative data (Woolcock, 2001).
Social Science’s two basic paradigms that underpin all SP discourse, conservatism and
liberalism, were introduced along with the roles of Marxism, Feminism and
Constructivism in research regarding social phenomena. An entity, individual or group,
will express, in a metaphysical way, its values and view point through one of these
perspectives as it interacts with another entity. It is possible for an entity to express a
conservative perspective at one point in time and an idealist’s perspective at another
time, depending on the context of events and the prior relationship and interactions
with the other entities (Jost, et al., 2003). ITT was then introduced as a SP theory that
helps to conceptualise real and perceived threats that emerge when groups compete
for resources or feel that their identity is threatened.
From the literature review presented in this chapter, it seems not unreasonable to
assume that realistic and symbolic threats exist between different entities in the three

67 | P a g e
case study villagers. Inherent in these threats, either as antecedents or products of,
there are found the elements of in-group identity and esteem, negative out-group
attitudes, negative stereotyping and intergroup anxiety that manifest themselves in
individual or group responses to intergroup interactions.
This research shows evidence that there is potential for perceived real and symbolic
threats at the micro-micro and micro-macro levels that may affect development and
livelihood project efficacy. Hence, this chapter has sought to justify the incorporation of
an SP approach to this research regarding the metaphysical expressions between
different entities in three traditional fishing villages on Rote Island, Indonesia. Of major
importance is how these entities resonate with each other in the design and
implementation of poverty alleviation and development projects Threats to the success
of these development projects and proposals can be analysed by using a SP lens
employing an Intergroup Threat Theory (ITT) framework (Riek, et al., 2006).

68 | P a g e
Traditional Fishing in East Nusa Tenggara, Indonesia Chapter 4

69 | P a g e
4.1 Introduction
This thesis is a social analysis of village-level fishing communities on Rote Island,
Indonesia, and assesses the challenges to a sustainable livelihood for these traditional
fishers since the changing of maritime boundaries in the Timor Sea in the late
Twentieth Century (Forbes, 1995). These communities have always been considered
poor and disadvantaged (Barlow & Gonowarsito, 2009). The changed maritime
boundaries have not only dispossessed the fishermen of their traditional fishing
grounds that were familiar to them for over several centuries (Balint, 2005; Campbell &
Wilson, 1993), but have forced some fishermen to more recently shift to alternative
livelihood strategies. Degraded marine and reef environments and extreme weather
events also are drivers for this shift in livelihood (Fox & Sen, 2002).
Three small fishing villages, Pepela Darat, Tanjung Pasir and Landu Thie, on Rote
Island in the Province of East Nusa Tenggara, were chosen as case study sites in this
mixed methods research, designed to investigate the livelihood dilemmas in small
traditional fishing villages. These villages were selected because of their close
proximity to the changed maritime boundaries, between Australia and Indonesia, which
have impacted their livelihood strategies and are made up of three distinct ethnic
groups. Hence, comparing the commonalities and the differences of how the fishers in
these villages have adapted to the changed conditions may expose the strengths and
weaknesses of alternative livelihood and development projects. Additionally, the three
villages are relatively close to each other meaning they have similar environmental
conditions which minimises the effect of one variable on the research results. In fact,
Pepela Darat and Tanjung Pasir are two different dusun (sub-village) within the village
of Pepela. Pepela Darat is located on a hill behind the local jetty and is mainly made up
of immigrants from South Sulawesi who now consider themselves as Rotenese. Some
of these fishers have intermarried with local Rotenese women. Tanjung Pasir is a sand
spit approximately 400 meters along the beach from the jetty and is a homogenous
community made up entirely of the Bajo ethnic group, originating from Southeast
Sulawesi, who are commonly known as “Sea Gypsies”. Landu Thie is a small village
some 100km away from Pepela but made up entirely of Rotenese ethnicity. Their close
proximity has also kept research field logistic costs within budget
The changes in the maritime boundaries, mentioned above and explained in more
detail in Sub-section 4.4, restricted the livelihood pursuits of the East Nusa Tenggara
(NTT) traditional fishermen to waters that were being plundered through highly

70 | P a g e
commercialised and mechanised, legal and illegal fishing activities in Indonesian
waters (Butcher, 2004; Gillett, 1996). However, the impoverished village fishers
continued to voyage into what are now known as Australian waters. This effort to
maintain a household income, by themselves becoming illegal fishers in Australian
waters, resulted in their arrest and detention in Australian jails, while their boats and
fishing gear were burnt as a deterrent to returning to their familiar fishing grounds in
Australian waters (Stacey, 2007). Some of these fishers restricted their activities to the
depleted Indonesian waters and others sought an alternative livelihood (Fox, et al.,
2009).
This chapter briefly contextualises the research by introducing the literature of
traditional fishers on Rote Island, their maritime culture and their socio-economic
status. The chapter also presents the new maritime boundaries that resulted from a
suite of maritime boundary treaties, agreements and MoU between the Australian and
Indonesian governments and compares the two governments’ efforts of management,
surveillance and enforcement of law for protecting their natural resources. The two
governments’ responses show a wide gap in capacity to manage their respective
Exclusive Economic Zones (EEZ).
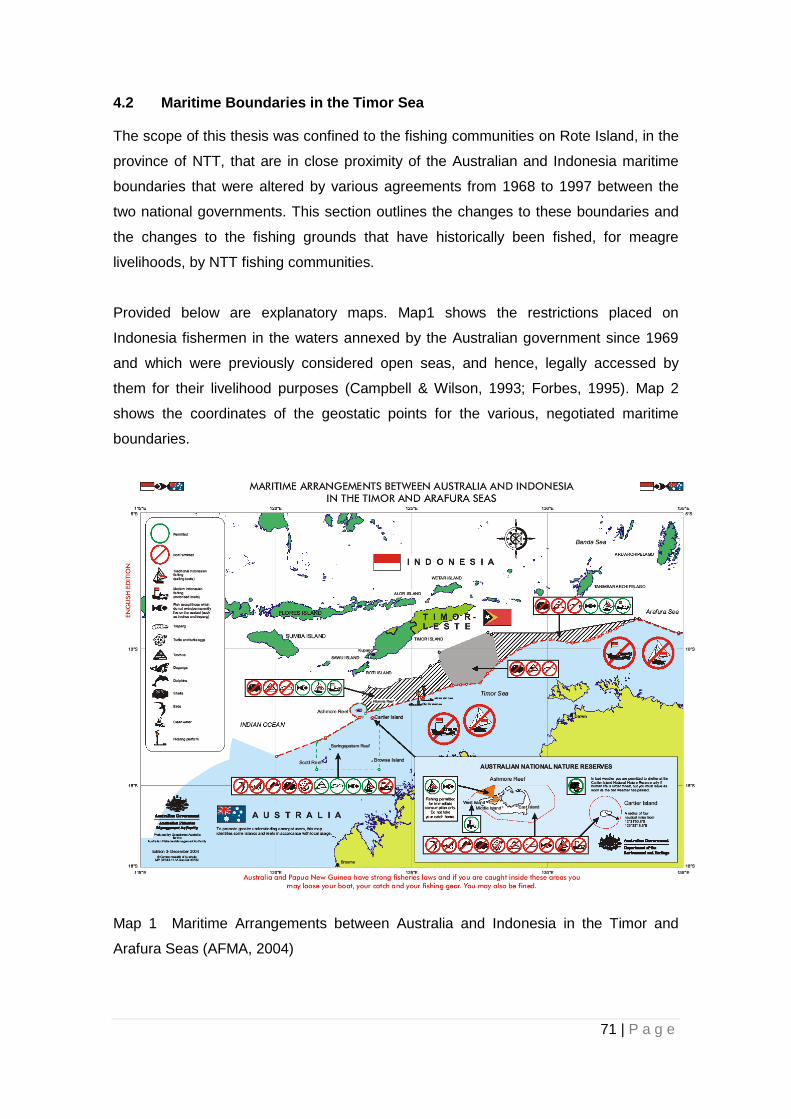
71 | P a g e
4.2 Maritime Boundaries in the Timor Sea
The scope of this thesis was confined to the fishing communities on Rote Island, in the
province of NTT, that are in close proximity of the Australian and Indonesia maritime
boundaries that were altered by various agreements from 1968 to 1997 between the
two national governments. This section outlines the changes to these boundaries and
the changes to the fishing grounds that have historically been fished, for meagre
livelihoods, by NTT fishing communities.
Provided below are explanatory maps. Map1 shows the restrictions placed on
Indonesia fishermen in the waters annexed by the Australian government since 1969
and which were previously considered open seas, and hence, legally accessed by
them for their livelihood purposes (Campbell & Wilson, 1993; Forbes, 1995). Map 2
shows the coordinates of the geostatic points for the various, negotiated maritime
boundaries.
Map 1 Maritime Arrangements between Australia and Indonesia in the Timor and
Arafura Seas (AFMA, 2004)

72 | P a g e
Map 2 Maritime Arrangements between Australia and Indonesia in the Timor and
Arafura Seas (AFMA, 2004)

73 | P a g e
Australia and Indonesia share a maritime border of some 2000 kilometres. The border
stretches from its most easterly point at Latitude 10.50’S Longitude 139.12’E to a point
in the west at Latitude 11.35’S Longitude 123.14’E. The most easterly point is that point
where the maritime boundaries of three nations meet, that of Australia, Indonesia and
Papua New Guinea. The westerly point of Indonesia’s maritime boundary with
mainland Australia is just to the west of Ashmore Reef, and with Christmas Island
south of the island of Java (AFMA, 2004; Fox, 1998).
In 1958 new conventions and regulations codifying international maritime jurisdiction
were negotiated at the United Nations Convention on the Law of the Sea. This
convention was the focal point for negotiations, in 1971, between Australia and
Indonesia regarding their claims to the sea, their jurisdictional limits and responsibilities
in the Timor and Arafura Seas (Rauf, 1995).
The territorial boundaries of both nations were increased from 3 Nm to 12 Nm in
1969/1970 and they both claimed an Exclusive Economic Zones (EEZ) of 200 Nm in
1979/1980. While this was in accord with other nations’ expansion activities across the
globe, that were ratified by UNCLOS 1982, it has resulted in overlapping claims by
Australia and Indonesia and the recognition of Indonesia as an archipelagic state
(Butcher, 2004; Forbes, 1995). Following the move by both the Australian and
Indonesian governments on their maritime territorial claims in the late 1960s, numerous
agreements were deemed necessary to alleviate conflicting claims on their overlapping
EEZs (Campbell & Wilson, 1993).The agreements and conventions that form the suite
of regulations governing Australia’s and Indonesia’s claim to jurisdiction are listed
below.
International Laws:
The 1958 Geneva Conventions on the Continental Shelf
The 1982 United Nation Convention on the Law of the Sea UNCLOS III.
Australia – Indonesia Agreements:
The 1969/70 12 Nm Territorial Zone Declaration by Australia and Indonesia
The 1971 Australia and Indonesia Seabed Boundary Agreements
The 1972 Australia and Indonesia Seabed Boundary Agreements
The 1973 Australia (Papua New Guinea) – Indonesia
The 1974 MoU between Australia and Indonesia
The 1979/80 200Nm EEZ Declaration by Australia and Indonesia
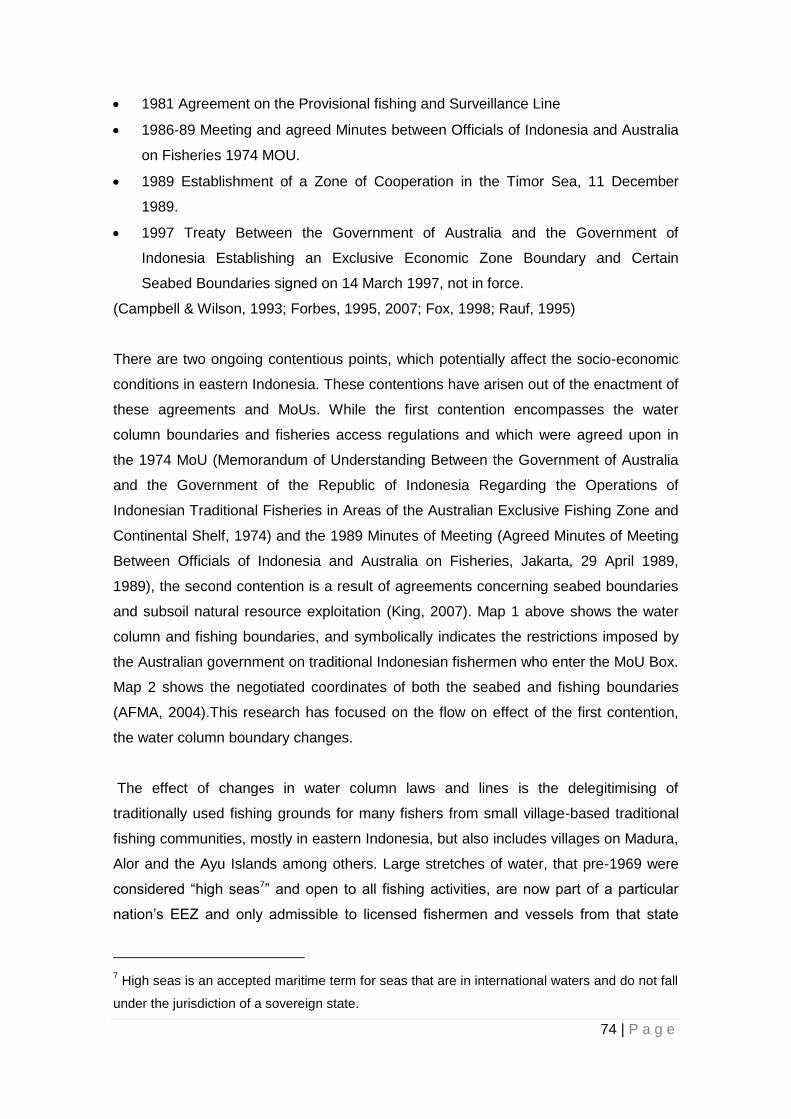
74 | P a g e
1981 Agreement on the Provisional fishing and Surveillance Line
1986-89 Meeting and agreed Minutes between Officials of Indonesia and Australia
on Fisheries 1974 MOU.
1989 Establishment of a Zone of Cooperation in the Timor Sea, 11 December
1989.
1997 Treaty Between the Government of Australia and the Government of
Indonesia Establishing an Exclusive Economic Zone Boundary and Certain
Seabed Boundaries signed on 14 March 1997, not in force.
(Campbell & Wilson, 1993; Forbes, 1995, 2007; Fox, 1998; Rauf, 1995)
There are two ongoing contentious points, which potentially affect the socio-economic
conditions in eastern Indonesia. These contentions have arisen out of the enactment of
these agreements and MoUs. While the first contention encompasses the water
column boundaries and fisheries access regulations and which were agreed upon in
the 1974 MoU (Memorandum of Understanding Between the Government of Australia
and the Government of the Republic of Indonesia Regarding the Operations of
Indonesian Traditional Fisheries in Areas of the Australian Exclusive Fishing Zone and
Continental Shelf, 1974) and the 1989 Minutes of Meeting (Agreed Minutes of Meeting
Between Officials of Indonesia and Australia on Fisheries, Jakarta, 29 April 1989,
1989), the second contention is a result of agreements concerning seabed boundaries
and subsoil natural resource exploitation (King, 2007). Map 1 above shows the water
column and fishing boundaries, and symbolically indicates the restrictions imposed by
the Australian government on traditional Indonesian fishermen who enter the MoU Box.
Map 2 shows the negotiated coordinates of both the seabed and fishing boundaries
(AFMA, 2004).This research has focused on the flow on effect of the first contention,
the water column boundary changes.
The effect of changes in water column laws and lines is the delegitimising of
traditionally used fishing grounds for many fishers from small village-based traditional
fishing communities, mostly in eastern Indonesia, but also includes villages on Madura,
Alor and the Ayu Islands among others. Large stretches of water, that pre-1969 were
considered “high seas7” and open to all fishing activities, are now part of a particular
nation’s EEZ and only admissible to licensed fishermen and vessels from that state
7 High seas is an accepted maritime term for seas that are in international waters and do not fall
under the jurisdiction of a sovereign state.

75 | P a g e
(Campbell & Wilson, 1993; Forbes, 2007). Indonesian traditional village fishermen have
historically voyaged to what are now within the Australian Fishing Zone for hundreds of
years (Balint, 2005; Fox, 1998; Fox & Sen, 2002; MacKnight, 1976).
Since the maritime boundaries were changed, fishing activities by Indonesian fishers
are considered illegal by Australian authorities when non-traditional fishermen enter
any part of the Australian EEZ or when traditional fishermen using traditional boats and
equipment stray out of the MoU Box, as defined in a 1989 Practical Guidelines for
Implementing the 1974 MoU between Australia and Indonesia (See Map 1 and 2). The
agreement, in accordance with the historical narrative, does state that Indonesian
traditional fishermen are still allowed to moor at two other small islands to replenish
their fresh water supplies; East Islet (12015' SL - 123007' EL) and Middle Island (12015'
SL - 123003' EL) (Agreed Minutes of Meeting Between Officials of Indonesia and
Australia on Fisheries, Jakarta, 29 April 1989, 1989).
The flow on effect for the second contention for Indonesians, regarding seabed
boundaries, is a reduced exploration and exploitation area, in the Timor and Arafura
Seas, for oil and gas reserves below the seabed surface that could potentially fund
development projects and infrastructure for the NTT province, similar to that afforded in
the province of Aceh for their natural resource reserves and to Timor Leste under a
different set of agreements with the Australian government (Forbes, 2007; Tanoni,
2008).
While the new maritime boundaries in themselves do not directly cause illegal fishing
activities, once put into place they classified certain activities as illegal and have
exposed weaknesses in the Indonesian governments management of maritime natural
resources and the marine environment in general (Fegan, 2001; Fox, 1998; UNFAO,
2000). Illegal, Unreported and Unregulated (IUU) fishing activities costs Indonesian
communities their food supply and livelihood, and the Indonesian government large
amounts of taxes and export revenues (Litbang "Kompas"/RSW, 2012; Litbang
"Kompas"/RSW/BIM, 2012). The Indonesian government’s Department of Marine
Affairs and Fisheries (Departmen Kelautan dan Perikanan / DKP) has estimated the
losses to Indonesia from IUU to be as much as US$1.9 billion per year and other
sources estimate the losses to be as high as US$4 billion (DKP, 2005a; DKP, 2005b).
IUU fishing activities have been seen as “rules of the game” for many foreign and
Indonesian fishing consortiums over the past few decades, decimating traditional

76 | P a g e
fishing grounds of Indonesia’s small-scale fisheries. Without universal compliance with
the new lines and laws, or the capacity to enforce them, their benefits are lost to the
intended recipients, typifying “a tragedy of the commons” scenario (Hardin, 1968;
Hardin, 1974).
The Arafura and Timor Seas in Indonesian waters, directly to the north of Australia, are
heavily fished and surveillance is spasmodic and sporadic (Fox, et al., 2009). As the
marine resource extraction of Indonesian waters, by both local and foreign fishing
vessels, has depleted previously healthy levels of biomass, eastern Indonesian
fishermen have shifted their operations eastwards and southwards (King, 2007). During
the Suharto period, commercial trawlers were banned elsewhere in Indonesian waters,
but were allowed to legally exploit the Arafura and Timor Seas to Australia’s north
(Butcher, 2002). An armada of fishing vessels, some legal others illegal, compete with
each other to exploit the available resources. The increasingly mechanised operations
of these large fishing fleets have disrupted and diminished the opportunities for the
small-boat fishermen of Eastern Indonesia to derive a living from the sea (Butcher,
2002; Litbang "Kompas"/RSW, 2012). The small-boat fishermen have seen their legal
fishing grounds within Indonesian waters plundered and available stocks decimated
(Balint, 2005; Butcher, 2004). They have been forced to either continue their voyaging
into what is now Australian waters risking detention by the Australian government and
an ever mounting debt to the fishing bosses, or to seek alternative livelihoods (Stacey,
2007; Therik, 2008).
The Australian government’s capacity to monitor its fisheries is vastly different to that of
the Indonesian government’s capacity (AFMA, 2004; DKP, 2005c; UNFAO, 2000). The
Australian government has the budget revenue to spend on surveillance and detention
activities as well as departmental capacity building and research. While the village-level
fishermen of eastern Indonesia have to contend with almost unprotected waters in
Indonesia’s Exclusive Economic Zone (EEZ) which are overexploited by both legal and
illegal fishing activities. If voyaging into Australian waters abundant with fish stock, in
their efforts to secure a livelihood, they need to contend with well organised and funded
Australian border surveillance apparats protecting Australia’s fisheries’ revenue (Balint,
2005; Campbell & Wilson, 1993; Fox, et al., 2009).
Apprehension by Australian border surveillance officials can mean, for Indonesian
fishermen, a prison sentence in an Australian detention centre and having their boats

77 | P a g e
and gear confiscated and burnt (Balint, 2005; Fox, 1998; Stacey, 2007). Poor fishing
communities in the province of NTT feel that their rights have been withdrawn by not
being able to voyage to their traditional fishing grounds near Ashmore Reef and close
to the Australian mainland (Campbell & Wilson, 1993). With little chance of finding an
alternative livelihood in a fringe community, the fishermen are compelled to continue to
ply the only trade they know with reduced income, or to turn to other, sometimes illegal
methods of securing a sustainable livelihood (Fox & Sen, 2002; Fox, et al., 2009).

78 | P a g e
4.3 Traditional Fishers of East Nusa Tenggara
There is documentation of a continuum of early visits to the northern waters of Australia
by fishermen in sail-powered perahu8, small fishing boats, collecting trochus shells and
trepang9, and navigating by landmarks, the stars and clouds which hover over the
warm sands of shoals and reefs, dating back to the 1600s (Balint, 2005; Fox, 1998).
These traditional fishermen either dived to collect sedentary marine specimens or used
hook and line and small hand nets to catch reef fish that were for home consumption or
to be sold through local markets at their home villages (Fox, 1998). Many of these
fishers sailed from small fishing villages located on islands close to Australian waters,
most notably Roti Island located at the western end of West Timor and only 79 Nm
from Ashmore Reef. Ashmore Reef and Cartier Islet are part of the Australian territory
but 190 Nm from the Australian mainland (Campbell & Wilson, 1993). Britain handed
them to Australia in 1933 under the Ashmore and Cartier Islands Acceptance Act, even
though they have been long considered, by Indonesian village fishermen, as a part of
their traditional fishing grounds (Campbell & Wilson, 1993; Forbes, 2007).
In 2003, Drs Melkianus Adeo, member of the Eastern Indonesia Parliament, said that
“traditional fishermen for generations had been fishing Ashmore Reef, know to the
Indonesian fishermen as Pulau Pasir (Sand Island)” (Kompas, 2003). During the Dutch
colonial times, fishermen who wanted to fish near Ashmore Reef were required to buy
a permit from the Dutch administration office in Kupang, on Timor Island (Kompas,
2003). Hence at that time the Dutch considered Ashmore Reef and surrounding islets
as a part of their East Indies colony.
Early incursions into Australian waters, by Indonesian “traditional fishermen” went
largely unreported until the late 1940s and early 1950s (Balint, 2005; Fox, 1998). The
Australian government’s concerns regarding traditional Indonesian fishermen entering
Australia waters started after sightings of foreign fishermen in the vicinity of Ashmore
Reef, located at the western end of the Timor Sea; between Roti Island, the
southernmost, inhabited, Indonesian island and the northwest of Western Australia
(Campbell & Wilson, 1993). The Australian government then implemented policies to
combat the issue of illegal entry into Australian waters by foreign fishers between
8 Perahu is the Indonesian name for a small wooden fishing boat, they can be powered by sail
or small motors.
9 Trepang (echinoderms from the class Holothuroidea) is the Indonesian name for sea
cucumber, sometimes called Bêche-de-mer, sand fish among a variety of other names

79 | P a g e
Australia and Indonesia (Balint, 2005; Stacey, 2007). Recent media reports stated that
Indonesian fishers are returning to Australian waters because of catch failings at home
and that there are at least 200 cases of illegal fishing per year conducted by traditional
fishers from Rote Island, mainly from Papela in East Rote, and that currently there are
about 210 Indonesian fishermen detained in Australia Detention Centres (Collins, 2017;
Victory News, 2017).
While the early incursions into Australian waters collecting trepang and trochus shells
did have a commercial purpose, the methods of collection were traditional; tidal zone
foraging and diving for sedentary marine resources as well as using rudimentary fish
catch gear (MacKnight, 1976), as in hunting and gathering societies (Schutkowski,
2006). Many fishers still sail to the MoU Box in the Timor Sea in traditional sail powered
boats, as per the regulations set out in the 1974 MoU and its 1989 amendment as
discussed in Section 3.2 (Ardani, 2010). Others use small motorised boats for local and
coastline fishing. All the fishers of NTT, including the fishers at the focus of this
research, at most, can be considered artisan fishers. However, there is little diversity in
their target catch and most of the crew, during early voyages and now, are dependent
on the captain and the boat owners for their livelihood (Therik, 2008). The fishers
become indebted to the boat owners who require repayment by way of obligation to
join future fishing expeditions. Poor catches and debts to the boat owners can, and
more often than not, perpetuate a cycle of poverty (Balint, 2005; Therik, 2008).
These NTT fishermen had been dispossessed of their traditional fishing grounds by
central government policies leaving them with “human adaptability to resource
accessibility” (Schutkowski, 2006) challenges of changing the destination of their
fishing activities or changing their livelihood strategies to alternative pursuits in order to
earn a household income and to provide a FRESH Start for the next generation (Fox,
1998; Fox, et al., 2009).

80 | P a g e
4.4 Socio-Economic Status
Eastern Nusa Tenggara (Nusa Tenggara Timor, or NTT), according to Barlow &
Gonowarsito (2009), is one of the poorest provinces in Indonesia and one of the
poorest regions of the world. It has a history of natural resource extraction and over-
exploitation dating back to the 1600s, at the beginning of the Dutch colonial period
(Ormeling, 1957). The Indonesian post-colonial period, 1945 to the present, has been a
period of marine resource over exploitation. Increasingly large scale illegal fishing
activities by both foreign and domestic boats have depleted fish stocks in Indonesian
fisheries (Butcher, 2002; Butcher, 2004; Litbang "Kompas"/RSW/BIM, 2012). As a
result of illegal fishing in Indonesian waters and changing maritime boundaries in the
Timor Sea, between 1968 and 1989, there have been socio-economic impacts on the
traditional fishermen in eastern Indonesia, their livelihood strategies and their
relationship with the marine environment (Fox & Sen, 2002).
The population of the province of NTT, in 2016, was 5,203,514 and 153,792 for the
District of Rote Ndao where the case study villages are located (BPS Provinsi NTT,
2016a). In 2016 there were 2,277,068 people in the NTT work force with 1,214,060, 54
percent, of them having a rural based livelihood. Indonesian BPS demographic
statistics include all people over 15 years of age, and not studying, as part of the work
force (BPS Provinsi NTT, 2017). The 2015 BPS10 Rote Ndao figures show that 61
percent of the NTT working age population focus their livelihood activities in the rural
sector11. The 2015 published figures for Rote Ndao show that 69 percent of the work
force was engaged in the rural sector (BPS Provinsi NTT, 2016c).
Accordingly, the economy of NTT is dominated by the rural sector which, in 2003,
accounted for 35 percent of Provincial GDP (PGDP). Although fisheries contributed
only 3 per cent of PGDP, its products are significant in exports terms to the region
(NTT Provincial Government, 2008). In 2015 the agriculture and fisheries sector
contribution had reduced to 29.65 percent of PGDP due to increases in tourism and
service sectors (BPS Provinsi NTT, 2016d). The figures indicate that GDP contribution
from the rural sectors is well below the participation rate for the province of NTT, and
even more so for the case study district of Rote Ndao.
10 BPS is the Bureau of Statistics. 3 levels of government in Indonesia have BPS departments;
National, Provincial and District.
11 Rural sector activities in BPS figures includes; agriculture, horticulture, live-stock, forestry and
fisheries’ activities.

81 | P a g e
The average population poverty rates in the Province of NTT for the years 2015 to
2017 are high at 22.61, 22.19 and, 21.85 percent respectively. Inspection of the BPS
Poverty Rate by district in NTT shows that there is a wide gap in poverty figures from
one district to the next. For example, for the same years, the provincial capital city,
Kupang, registered 10.21, 9.97 and 9.81 percent, respectively, and Rote Ndao District
30.49, 29.60 and 28.81 percent, respectively (BPS Provinsi NTT, 2018a). The villages
at the focus of this research register high levels of enduring poverty, while a short boat
trip away, the capital city population register substantially better figures. Some reports
suggest that the income of traditional fishermen in Rote Ndao, can be as low as
Rp20000 (A$2.20), after expenses, from a night at sea (Ardani, 2010). For a family of
more than two persons, this did not even reach the target, of US$1 per capita per day,
set under MDG 1, at that time (United Nations General Assembly, 2000). The
fishermen of Rote Ndao also contend with a life expectancy of 63.4 years, the third
lowest of the 21 districts of NTT, while their capital city compatriots have a life
expectancy of 68.6 years (BPS Provinsi NTT, 2018b)
Table 1 2016 BPS Data, Highest Level of Education attained for; the Province of NTT, Kupang City and the District of Rote Ndao (BPS Provinsi NTT, 2018c)
Highest Level of Education Completed
% of Population
Highest Level of Education >
Primary School Not completed
Primary School
Senior High School
Tertiary Education
Province of NTT
33.30 33.77 13.75 4.94
Kupang City 9.46 22.44 35.14 12.96
District of Rote Ndao
34.24 38.43 14.16 4.10
Barlow & Gonowarsito (2009) reported that in 2003, over 79 percent of the province’s
806,000 school children were attending primary school, with the balance attending
junior or senior high school. In the same year, 43 percent of the 3 million people, aged
10 years and over, had either not attended or not completed primary school. A further
34 percent had completed primary school only, while 21 percent had finished high
school and only 2 percent had attended a tertiary institution. The 2017 school
participation rates for the Province are 2017; 95.40% Primary School participation,
67.16% Junior High School participation, and 53.32% participation for Senior High
School participation (BPS Provinsi NTT, 2018d). The 2017 BPS education figures show
an improvement in provincial school participation rates from the 2003 figures. The
Indonesian Government, assisted by international aid, has improved access to schools

82 | P a g e
and education over the last decade. However, Highest Level of Education attained is
still lagging in remote areas.
Many of the fishermen that now live and fish in the District of Rote Ndao originate from
poor fishing communities in the Province of Southeast Sulawesi and South Sulawesi
(Firman, 2001). There, they also have a low standard of education and low level of
income. In an education standard survey only 33.9 percent had higher than a primary
school education, and only 5.6 percent had completed junior high school (Firman,
2001). A survey taken on Wawonii Island in 1998 showed that 84.7 percent of
fishermen earned between Rp5000 and Rp15000 each time they went to sea (Firman,
2001).
Their new home location on Roti Island and their old home location in southern
Sulawesi are similar, in that the natural environment is not conducive to high levels of
agriculture, indicated by the fact that both places import most of their rice supplies
(Firman, 2001; Fox & Sen, 2002). Hence the fishermen of these regions are compelled
to fish locally or extend their voyages to distant waters when fish are not available in
their local region and when an opportunity arises to continue to ply their only trade
(Balint, 2005).
Ormeling (1957) recognised that, in many communities, the lower the level of
modernisation and cultural development, including technical ability and social-
economic organisation, the narrower is the selection of natural resources in which the
community can choose an alternative livelihood (Ormeling, 1957). In some tropical
areas the cultural level is so low that the restrictive influences of the environment
virtually become controls of the livelihood choices (Ormeling, 1957). This would seem
to be the case for the District of Rote Ndao and many other traditional communities in
Indonesia and Southeast Asia.
While the communities of this research are not culturally under-developed as in
Omerling’s description, they do have low levels of modernisation and are resource
dependent on marine resources. From previous centuries when Rote Island fishers
exploited both the local coastline and the waters and coastline of northwest Australia,
they have used traditional catch methods (Balint, 2005; Therik, 2008). The small village
fishers have continued to employ traditional catch methods for numerous reasons,
including that to be able to fish in the MoU Box just inside Australian waters they must
maintain a traditional posture to avoid apprehension and detention in Australian jails

83 | P a g e
(Balint, 2005; Stacey, 2007), and for most the cost of modernising is out reach because
of subsistence incomes and the poverty trap of debt to boat owner for whom they work
(Therik, 2008).
The fishers of NTT, and particularly the fishers at the focus of this research, because of
their physical isolation and a lack of alternative employment, are natural resource
dependent for their household livelihoods (Bailey & Pomeroy, 1993). Natural resource
dependency has associated vulnerabilities which, in a traditional fisher’s case are
exacerbated by the fact that they are dependent on natural resources that are part of
the open commons and are competed for by an increasing number of small-scale
fishers, as well as by large, modernised, fishing enterprises that may originate from
distant ports (Bailey & Pomeroy, 1993; Butcher, 2004).
The fishers at the focus of this research have, over a period of time, tried alternative
livelihoods, as mentioned above, predominantly with a marine resource focus (Bria,
2014; Fox & Sen, 2002). The alternative livelihood that has shown the best results is
seagrass cultivation (Sembiring, et al., 2012). This was first introduced the Head of
District of Kupang when Rote Island came under that jurisdiction. Further funding for
this alternative livelihood was provided by Head of District Rote Ndao, after the island
was made a separate municipality (Haning, 2017), the Australian Government Direct
Aid Program and via private funding (AusAID, 2013). This alternative livelihood proved
successful until disease and a report oil leak, in 2009, from the Montara Oil rig
decimated their crops (Tanoni, 2008). Sea grass farming had an additional bonus for
local economies because it is a gender friendly livelihood activity (Sembiring, et al.,
2012). Salt farming and fish ponds are other alternative livelihoods that have received
funding on Rote Island, but the ventures quickly faded or had limited positive effect on
local employment opportunities (Umar, 2017). The women of the village have also tried
micro enterprises to help supplement household incomes. These activities are normally
in the area of small kiosk operation, small cake baking for local sale, and arts and
crafts for traditional ceremony use or for sale to the occasional visitor to the village
(Bria, 2014).
A consequence of the subsistence, or near subsistence, existence of these fishers, is
that they struggle to provide household necessities for the wellbeing and development
of their children, so that they are enabled to choose an alternative, non-resource

84 | P a g e
dependent livelihood. Subsistence is not enough to provide a FRESH12 start for the
next generation. As a result of subsistence level incomes and cyclical debt to the boat
owners, these fishers are obligated to enact what Susilo & Purwanti (2017, p. 814) call
“self-exploitation” and “prioritize short-term safety instead of seeking for greater long-
term benefit”. Here, “short term safety” means short term economic gain to maintain
economic buoyancy to provide basic, household necessities. Susilo & Purwanti (2017),
following research in Javanese fishing villages, propose that subsistence ethics should
be considered which obliges boat owners to provide a minimum, subsistence level
income to the fishers, even if catch proceeds are at a seasonal low or curtailed by
extreme weather events.
Even at the provincial level, alternative livelihoods in NTT are limited by a lack of
modern civic infrastructure. There are only a few ports developed to the stage to
handle any level of exports, namely Kupang, Atapupu and Ende (Barlow &
Gonowarsito, 2009). The ports are barely developed, the largest being the Port of
Tenau, in Kupang, is not properly equipped to handle containers. Telecommunications
in Indonesia, including NTT, has improved vastly with the spreading of mobile phone
services which help facilitate inter-island communication and trade within the
archipelago (Barlow & Gonowarsito, 2009). Most people now have some access to a
phone, if they can afford the prepaid credit, and if the signal is sufficiently strong and
consistent. In 2003, only 33 percent of the provinces 812,200 households were
connected to the electricity grid with Kupang and its environs consuming 40 percent of
electricity generated in NTT (Barlow & Gonowarsito, 2009). Regarding connections to
reticulated water supply, in 2015, there were only 58,455 connections for the full
Province of NTT and only 2,410 water connections in the District of Rote Ndao (BPS
Provinsi NTT, 2016b). Most households buy clean water in 19 litre bottles for drinking
water, and collect from local streams or buy from tanker trucks to store in tanks or
drums for general household water usage. Inconsistent and unstable electricity
12 FRESH is an acronym developed by the author for:
Food: adequate fresh nutritious food consumption at a minimum 2 times per day
Residence: solid structure walls, roof and floors, adequate furniture, electricity and reticulated
water,
Education: a minimum of senior high school completed
Social Status: equal access to natural resources, information and opportunity, self-esteem
Health services: unrestricted access to health services, medication, clean drinking water and
sanitation

85 | P a g e
generation and a lack of a reliable clean water supply are major inhibitors to alternative
livelihood strategies for the village level fishermen because any level of manufacturing
and value added processing is limit, except for local consumption and village-level,
cottage industries.
Physically, economically and politically, the Province of NTT is a long way from the
capital of Indonesia, Jakarta. Economically, NTT faces major obstacles, such as its
peripheral location, lack of modern infrastructure, limited resources, and neglect by
national administrations (Barlow & Gonowarsito, 2009). NTT scores below the national
average on most economic indicators (Hugo, 2005) and lagged in most MDG indicators
(BAPPENAS, 2010). The heaviest concentration of poor provinces is in eastern
Indonesia, and only Papua has above average regional domestic product due to its
mineral natural resource wealth and its small population (Hugo, 2005).

86 | P a g e
4.5 Maritime Culture
The Universal Declaration on Cultural Diversity (UNESCO, 2001) proposed that
"...cultural diversity is as necessary for humankind as biodiversity is for nature”.
UNESCO recognises cultural diversity as “one of the roots of development understood
not simply in terms of economic growth, but also as a means to achieve a more
satisfactory intellectual, emotional, moral and spiritual existence". In this vision, cultural
diversity is promoted as the fourth area of sustainable development along with the
environment, economy and society (see Chapter 2). Culture is important for human life
because it is a reflection of the past and at the same time a guide for the future. Culture
is shared beliefs, values and behaviours of a social group and encompasses all that
people have learnt as members of society. It is the ultimate guideline for human
behaviour (Ardani, 2017).
For traditional fishers, from the time of their birth till the time of their death, they have a
reliance on the sea economically, culturally, socially and spiritually (Pannell, 2007). The
fishing communities in NTT also have a spiritual connection with the sea, a nautilus
cosmology. Many know no other mode or source of life and livelihood (Ardani, 2010;
Boomgaard, 2007; Stacey, 2007).
In both Indonesia and Australia, indigenous folk lore and cosmology are pervasive and
inherent to local perceptions of territoriality and resource ownership. These
cosmologies provide the moral histographies enculturating values and norms seen as
implicate to the order of things, people and their livelihoods, as such their worldviews
(Pannell, 2007). The relationship between cosmology, geography and sovereignty of
traditional lands and waters has caused disagreements and disputes for many
indigenous societies (Pannell, 2007). People’s relationship to the sea is perceived by
them as a physical setting and part of a system of folk lore based upon a land-sea
dichotomy for a range of economic activities (Pannell, 2007). There is also a cultural
symbolism of the boat in traditional fishing communities inherent in their experiences of
everyday life (Howitt, 1989; Southon, 1994).
Schutkowski (2006) suggests that there have been socio-cultural changes in traditional
fishing communities that are a result of socio-political changes. In many fishing villages,
modes of production have changed. During the traditional periods, foraging and hunting
were the modes of production, before any forms of modernisation were utilised,
distribution of catch proceeds was more equally distributed and fishers were bonded in

87 | P a g e
a subsistence culture. More modern modes of production require higher levels of
enterprise and corporate involvement with distribution of catch proceeds skewed
towards the investors of the production assets (Fox, et al., 2009; Therik, 2008). This
socio-political change has changed some fishers from having a subsistence culture
existence to having an economic subsistence existence with very few rights to
challenge the inequalities (Schutkowski, 2006). Fisheries development has also
changed post-catch processing. Under a subsistence culture post catch processing
involved the salting and drying of fish for later consumption or local trading. Ice and
refrigeration have become the requirements of export-lead, fisheries development, an
expense outside of the reach of traditional fishing households (Widodo, 2007).
At the macro level, there is a push to move away from traditional methods of production
and post-catch processing to modernise and corporatize Indonesia’s small-scale
fisheries. The traditional subsistence culture of many coastline villages is under threat
by fast paced development plans, leaving fishers culturally and economically
vulnerable (Susilo & Purwanti, 2017). Susilo & Purwanti (2017) theorised about social
insurance for small-scale and traditional fishers calling for subsistence ethics that
would garuntee access to natural resources and provide a minimum subsistence level
income from their patron-client relationship with fishing enterprises and corporations.
Schutkowski (2006) suggests that a change in social conditions in subsistence
communities often precedes an adapation of subsistence modes.
A considerable number of traditional fishers throughout Indonesia, including the
Province of NTT, in an effort to maintain their inherited culture, have looked for
alternative marine focused livelihoods. One alternative livelihood that some fishing
communities have embraced is sea grass farming (Sembiring, et al., 2012). To aid this
transition, funding for the development of sea grass farming was provided, in limited
amounts, by the then Kupang District Government and the Australian Government
under a Direct Aid Program from the Australian Embassy in Jakarta. Other funding was
provided privately (Ardani, 2010). This alternative form of natural marine resource
extraction has been introduced to many areas in Indonesia including; North Sulawesi,
Southeast Sulawesi, Halmahera and Nusa Tenggara Timor, and maintains their
maritime culture with a seaward focus for income producing activities (Boomgaard,
2007).

88 | P a g e
4.6 Conclusion
This chapter has outlined the scope of the research for this thesis. The study area for
this research project is set in the West Timor and Rote Island areas of the eastern
Indonesia Province of Nusa Tenggara Timor. This area holds a set of causal variables
due to the changing maritime boundaries in the Timor Sea. These boundary changes
have restricted their fishing voyages as a direct result of Indonesian and Australian
central government negotiations and policy decisions (Ardani, 2010; Campbell &
Wilson, 1993; Tanoni, 2008).
East Nusa Tenggara has a history of natural resource extraction and over-exploitation
dating back to the 1600s. In the 1990s and 2000s, increasingly large-scale, illegal
fishing activities by both foreign and domestic boats depleted fish stocks in Indonesian
fisheries (Butcher, 2004; Gillett, 1996). As a result of this illegal fishing and changing
maritime boundaries in the Timor Sea, between 1968 and 1997, there have been social
and economic impacts on the traditional village fishers in NTT and their relationship
with the marine environment (Fox, 2002).
The combination of these changes to the maritime boundaries and highly
commercialised and mechanised, legal and illegal, fishing activities in Indonesian
waters have altered the livelihood pursuits of the NTT traditional fishers (Ardani, 2010).
In an effort to maintain a household income many have been forced to become illegal
fishermen in Australian waters, resulting in their arrest, detention in Australian jails and
confiscation of their boats and fishing gear. Some of these fishermen have restricted
their activities to the depleted Indonesian waters while others sought an alternative
livelihood (Fox, 2009).
This thesis has not taken a political science posture to investigate the changing of the
maritime boundaries, or the negotiations therein, but is a socio-science investigation
into the economic status of traditional fishes in NTT, and more particularly Rote Island,
and the challenges for them to attain a sustainable livelihood to provide the next
generation with a FRESH Start. Some of these challenges include government policies,
commercialised over-exploitation of natural resources, environmental degradation and
extreme weather events. Results from this research may be applied, in a broader
sense, to many artisan level fishing communities in Southeast Asia.
This chapter contextualised the research introducing the literature of traditional fishers
89 | P a g e
in NTT, their maritime culture and their socio-economic status. It also presented the
new maritime boundaries that resulted from a suite of maritime boundary treaties,
agreements and MoU between the Australian and Indonesian governments and
compared the two governments’ efforts of management, surveillance and enforcement
of law for protecting their natural resources. The two governments’ responses show a
wide gap in capacity to manage their respective Exclusive Economic Zones (EEZ).

90 | P a g e
PART 2: METHODOLOGY

91 | P a g e
Research Design Chapter 5

92 | P a g e
5.1 Introduction
“Qualitative researchers do not narrowly focus on a specific question, but ponder
the theoretical-philosophical paradigm in an inquisitive, open-ended settling-in
process as they adopt a perspective … The qualitative researcher is likely to
collect, analyse and interpret data simultaneously” (Neuman, 2008, p. 15).
Social scientists use the word methodology to indicate how they gain knowledge of the
world, that is, the general stance that the researcher is taking; for example, the
researcher as the designer of empirical experiments, the researcher as objective
observer, or the researcher as a participant in the activities under study (Evans &
Gruba, 2002). Hence, methodological choice exposes the research conceptual
approaches and provides the basis for using a particular suite of data collection
methods, and justifies and guarantees the process of mediation between research
questions, research method used to operationalise them, and the data generated
(Clough & Nutbrown, 2002). As discussed in Chapter 2, Sustainable Development and
Sustainable Livelihoods provide the fundamental conceptual platform for the research
questions for this thesis about sustainable livelihoods for traditional fishers in the
Province of East Nusa Tenggara (NTT), Indonesia.
To select an appropriate research recipe for the purpose of operationalising the
research questions, firstly the author’s methodological choice will be discussed,
followed by a discussion on the appropriate choice of data collection methods to
analysis the sustainable livelihoods and development conditions in NTT fishing villages.
Numerous texts regarding research style and choices help with the identification of the
research methodological approach and the methods chosen to be used.
The purpose of this chapter is to show the rationale behind the selection of researcher
posture and data collection methods for this socio-economic analysis. The
methodological approach used for this research was Critical Social Science and data
collection methods employed a Case Study model. The suite of data collection
methods adopted are a hybrid of collection methods based on Scoones’ (1998)
Sustainable Livelihood Approach, which has been adapted to include, the benefits of
longitudinal research as promoted by Social Impact Assessment (SIA) tenets.
Additionally, as an auxiliary concept Need Assessment is introduced, explaining its four
elements and the level of analysis they represent; that is, observation and analysis of a
particular phenomenon, from a micro and/or a macro vantage point. This socio-
economic enquiry about Sustainable Livelihood, in marine resource-dependant fishing

93 | P a g e
villages in NTT, Indonesia, specifically Rote Island, has, as (Neuman, 2008) says about
many social science enquires, drawn on and displays characteristics from a number of
closely related social science research styles.

94 | P a g e
5.2 Methodology of the Research
Methodology is the researchers approach to the research questions (Neuman, 2008).
There are three principle methodologies associated with the social sciences. They are
given a variety of names to categorise a researcher’s posture, defining the researcher
as a designer of empirical experiments, a researcher as objective observer, or a
researcher as a participant in the activities under study (Evans & Gruba, 2002).
Neuman (2008) calls them Positivist Social Science (PSS), Interpretive Social Science
(ISS) and Critical Social Science (CSS), while Clough & Nutbrown (2002) call them
Normative, Interpretative and Critical. For the purpose of this discussion the author will
follow the Neuman titles.
5.2.1 Positivist Social Science (PSS)
A researcher employing a PSS posture for research will remain detached, neutral and
objective as they analysis different aspects of social life, study data and replicate the
findings of others (Neuman, 2008). PSS is a normative study of society and the social
system based on natural science models of pure data and rigid objectivity. It
predominantly uses medium to large scale surveys and data sets to measure the
specific and generalise about macro-concepts such as; society, institutions, norms,
positions, roles and expectations (Clough & Nutbrown, 2002). Neuman (2008) puts that
PSS generates nomothetic explanations of research findings, supported by
instrumental orientated methods that are used from a technocratic perspective.
5.2.2 Interpretive Social Science (ISS)
ISS researchers often use participant observation and field research to acquire in-
depth knowledge about how people create meaning in everyday life in context
(Neuman, 2008). ISS is normally a non-statistical, small-scale research that requires
the personal involvement of the researcher to understand meaning of actions and
social intercourse more than the causes. It looks at the micro-concepts of individual
viewpoints, constructs, meaning and definitions of rituals, situations and place (Clough
& Nutbrown, 2002). Clough & Nutbrown (2002) state that interpretive researchers fall
into the categories of phenomenologists’, symbolic interactionists and ethno
methodologists. While PSS researchers involve themselves with large amounts of data,
about large numbers of people, collected with dispassionate research methods, the ISS
researcher may spend long periods of time with a small number of people, almost
exclusively using fieldwork data collection methods to consider subjective meanings
embedded in actions, social relations and conversations (Clough & Nutbrown, 2002;
95 | P a g e
Neuman, 2008). ISS is idiographic and inductive research providing outsiders with a
feel of social reality within specific contexts (Neuman, 2008).
5.2.3 Critical Social Science (CSS),
By using a CSS approach to research, the researcher is proposing to critique and
transform social relations by exposing the subliminal elements of social relations and
empowering people. CSS mixes nomothetic and ideograph approaches; hence, it can
be said that CSS is a hybrid of elements from both PSS and ISS (Neuman, 2008). CSS
is linked with a political stance of emancipation of individuals and groups with
aspirations to transform people and societies. It explores both macro and micro
concepts of political interests and the operation of power (Clough & Nutbrown, 2002).
CSS sees people as rational decision makers living within specific social structures. In
a rotational sense, people create society and society shapes people. People can make
choices, but are limited to what they see as possible. Numerous material and socio-
cultural factors interact with what they see as possible or not. How people react in the
material world depends on how they see, think or feel (Neuman, 2008).
Research with a CSS perspective is normally small-scale research about societies,
groups or individuals conducted by critical theorists, action researchers or practitioner
researchers. CSS critiques the specific and is driven by on emancipatory interests
(Clough & Nutbrown, 2002).

96 | P a g e
5.3 Author Self Acknowledgement
I originally studied about fishing activities in the Timor and Arafura Seas for my BA
Asian and International Honours Dissertation, in 2007. Later that year I was a Session
Rapporteur at IAJ-TGAP (International Association of Jurists for Maritime Delimitation
in Timor Sea and in the Pacific Rim) 2007 Conference, Bali Indonesia. During that
session a Rotenese fishermen, Pak Sadli Ardani, spoke of his life and livelihood
struggles. I immediately became interested in the livelihood strategies of this group of
people.
Since that time I have visited Papela, a fishing village on Rote Inland in the East Nusa
Tenggara Province, and home to Pak Sadli, on at least four occasions. On each
occasion I have stayed at his house, experiencing the everyday life of local fishers and
traders. These were not research orientated visits. However, the visits acted as
opportunities for observation and scoping, and to develop and maintain social relations
with local fishers, who became my key informants for this research project.
In 2009, I provided Rp 2,000,000 (Aus$200) funding for a seagrass farming project for
a small group of fishers as an alternative source of income. In 2011, I provided an
additional Rp 2,000,000 (Aus$200), the labour costs to build a 4.5m wooden boat used
for fishing and seagrass farming.
I acknowledge a close association with some key informants and local villagers living in
the case study sites. This long term association has helped facilitate access to rich in-
depth local knowledge of Rotenese history, culture and livelihoods not afforded to all
visitors and researchers.
5.4 Methods of Data Collection
Social research, Neuman (2008, p. 24) writes, “… involves learning something new
about the world… [It] is a collection of methods people use systematically to produce
knowledge.” He divides it into two fields, Basic Research and Applied Research. Basic
research adds to fundamental knowledge about the world, and focuses on refuting or
supporting theories about how the social world operates. Basic Research is the source
of most new scientific ideas and ways of thinking about the world (Neuman, 2008).
Applied Research is a study to address a specific concern, or to offer solutions to a
problem, and rarely do applied researchers build, test or connect to a larger theory. It is
research designed to offer practical solutions to a concrete problem or address the

97 | P a g e
immediate and specific needs of clinicians or practitioners (Neuman, 2008). The
purpose of academic research by sociologists, political scientists and anthropologists
is, within their respective fields, to try to find answers to theoretical questions. In
contrast, the purpose of applied social research is to use data so that decisions can be
made (Rubin & Babbie, 1993). By the inherent nature of the research questions and
aims of this thesis; that is, that it had the purpose to address a specific practical issue,
an applied research methodology was initially thought to be the appropriate approach.
However, contemplation of research data from case study sites exposed commonalities
that could generate conceptual discussions and theory development. The data
generated by a grounded theory style, data collection process (Glaser & Strauss,
1967), allowed the researcher to assemble a rich and deep understanding of the case
study sites, to inform and empower village fishers with livelihood adaptation choices, as
well as contribute to discussion on theoretical questions that influence sustainable
livelihood approaches, especially in natural resource-dependant villages.
Applied social research can be divided into 3 distinct types being; Evaluation Research,
Action Research and Social Impact Assessment Research (SIA). Evaluation research
asks questions like “Does it [a policy, program, or set of instructions] work?” (Neuman,
2008, p. 26). This type of research can be of a formative or summative nature
depending on whether the purpose of the research is to monitor outcomes on a
continuous basis or looks at final program outcomes. Action research treats knowledge
as power (Neuman, 2008). It incorporates ordinary and popular knowledge, makes the
objects of research participate in the research process, and focuses on power as a
goal of empowerment (Neuman, 2008, p. 26). SIA has a purpose to estimate the likely
consequences of a planned change, and it can be used for planning and making
choices between alternative policies. Hence, SIA researchers are often called on to
work in a multi-disciplinary research framework (Vanclay, 2003).
The SIA approach guides the framework for many social science research projects. It
initially asks questions about the project community, its demographic status, its political
and economic frameworks, and the existing linkages between formal and informal
institution. Bell & Newby (1971) wrote on community studies and imposed a minimum
definition stating that “community studies must be concerned with the study of the
interrelationship of social institutions in a locality”. However, George Hillary’s paper
“Definitions of Community: Areas of Agreement” analysed ninety-four definitions of
community concluding that, all definitions deal with people and that the common
98 | P a g e
components of community are area, common ties and social interactions (Bell &
Newby, 1971).
Some authors suggest that, as there seems to be as many community study methods
as there have been community studies it would be considered alarming if a scientist’s
results were a product of their method of research rather than the phenomena under
study, (Bell & Newby, 1971). Hence, community studies rely on data from multiple
sources and collection techniques, which provides their research data with validity and
accuracy via triangulation. However, participant observation remains central to all
social research (Bell & Newby, 1971). Observation can be a catalyst for initial inquiry, it
can help with triangulation of data, and it can lead inductive inquiry into community
verbal and non-verbal expressed needs.
5.4.1 Case Study
Case studies are commonly used in social science research and are seen as a prime
example of qualitative research (Clough & Nutbrown, 2002; Evans & Gruba, 2002).
They are seen as a way for researchers to generalise about cases and to create theory
(Evans & Gruba, 2002). A researcher will look for common features in a number of
cases. They will look in depth at many features from a small number of cases. There
may be only two or three cases that they in the research that they generalise from
(Neuman, 2008).
A case study should not be confused with a study. While a study looks at particular
phenomena or problems related to an individual, community, group or institution, a
case study will generalise about commonalities that the researcher perceives as
existing across the cases studied (Evans & Gruba, 2002). A study will identify problems
and opportunities and conclude with recommendations on particular cases. A case
study may also identify problems and opportunities and conclude with
recommendations, but more importantly will identify common patterns exhibited by the
individuals, communities, groups or institutions and annunciate concepts and principles
that most likely explain the existence of these commonalities (Evans & Gruba, 2002).
Commonalities found may also include the consequences or threats of decisions or
policies by agencies and governments (Neuman, 2008). Hence, case studies enable
the researcher to link the micro level (individuals, communities, groups or institutions)
with the macro level (government policy, large social structures, and processes
(Neuman, 2008).

99 | P a g e
As much contemplation and hypothesising over data collected during a case study,
looking for and rationalising commonalities, happens after the data collection many
researchers leave unanswered questions that form the basis of future research (Evans
& Gruba, 2002). The case study researcher tests existing theory or attempts to build
new, but does not make hard and fast conclusions, rather he or she introduces new
concepts and theories to be discussed and tested at a later date, or by other
researchers in the same field (Evans & Gruba, 2002).
5.4.2 Sustainable Livelihoods Approach
Sustainable Livelihoods (SL) is a sub-paradigm of Poverty Alleviation (Allison & Ellis,
2001) and a closely aligned methodology to that sought for this research project. The
concept of a livelihood strategy approach has been developed with reference to the
growing literature on SL in which attention is paid to the ways in which local people can
meet their basic and ongoing needs for food, shelter and social standing, as well as
access to education and health services, through productive work, while preserving the
environment for future generation livelihoods (Walker, et al., 2001). Walker, et al.,
(2001, p. 307) recommend that
host communities should be involved in planning and decision making, to enhance
opportunity for success and allow local people to anticipate, adapt and realize
whatever potential there might be to develop altered or new livelihood strategies
A SL approach is primarily concerned with why poor people remain poor, rather than
why people become poor (McDowell, 2002). However, statistical socio-economic data,
written and oral histories, and cultural insights are imperative for holistic SL research.
Such data/information gathering is normally commenced during the project scoping
phase and is added to on an ongoing basis by using a suite of social-science research
data collection methods (Scoones, 1998). Historical background data is valuable as it
focuses attention on both the quality and quantity of livelihoods in a given context, as
well as prior shocks and known vulnerabilities, thereby enabling researchers to
understand the possible impact of identified challenges and risks to livelihoods
(McDowell, 2002; Mulligan & Nadarajah, 2008). Researchers will also have a better
understanding of the community’s needs, resilience to shocks and their adaptability to
new income-producing activities, their cultural norms, values and world views that
converse with these new activities, and the existing formal and informal institutional
structures that facilitate or impede the activities (McDowell, 2002). Sustainability of
livelihoods inherently means environmental sustainability, especially for communities
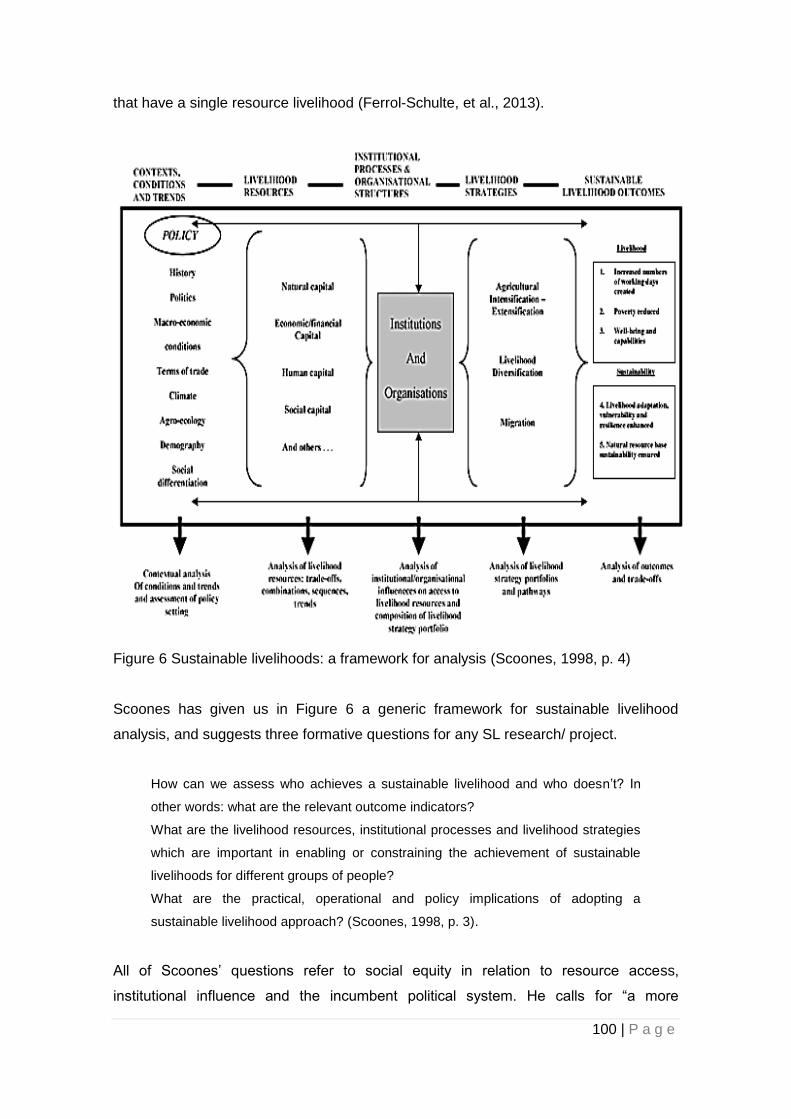
100 | P a g e
that have a single resource livelihood (Ferrol-Schulte, et al., 2013).
Figure 6 Sustainable livelihoods: a framework for analysis (Scoones, 1998, p. 4)
Scoones has given us in Figure 6 a generic framework for sustainable livelihood
analysis, and suggests three formative questions for any SL research/ project.
How can we assess who achieves a sustainable livelihood and who doesn’t? In
other words: what are the relevant outcome indicators?
What are the livelihood resources, institutional processes and livelihood strategies
which are important in enabling or constraining the achievement of sustainable
livelihoods for different groups of people?
What are the practical, operational and policy implications of adopting a
sustainable livelihood approach? (Scoones, 1998, p. 3).
All of Scoones’ questions refer to social equity in relation to resource access,
institutional influence and the incumbent political system. He calls for “a more

101 | P a g e
thorough-going political analysis” in SL research while at the same time contemplating
micro-level to macro-level linkages in resource and livelihood trajectories (Scoones,
2009). Rickson et al. (2015) also concern themselves with the incumbent political and
social systems that influence natural resource access, especially in “contested
terrains”. Accordingly, both also promote acquisition of local knowledge and history via
local community participation as a crucial early stage of SL strategy development
(Rickson, et al., 2015; Scoones, 2009). Scoones’ generic framework and questions are
particularly useful and adaptable to an inquiry about enablers and inhibitors for
sustainable livelihoods in the context of small rural villages in developing regions.
Some authors, Cernea (1997), Scoones (1998; 2009), Walker, et al. (2001) among
them, contend that changes in livelihood strategy are normally adaptive responses to
changes in seven key interacting components:
Biophysical (loss of access to resources, local environment change and
constraints);
Political/Legal (impacts of new laws, promotion of governmental ideals);
Economic (increased perceived needs, changes in opportunities);
Social (changes in interaction patterns, values or wellbeing);
Cultural (changes in traditional practices and beliefs);
Psychological (stress, future outlook) (Walker, et al., 2001, p. 298); and
Natural phenomena (natural disaster, climate change, extreme weather events)13
.
As stated in Chapter 2, Scoones (1998, p.3) proposes that fundamental questions for
sustainable livelihood assessment are:
What is the context of a particular case study area? What is the available capital
(natural and human)? What are the achievable strategies and locally guided
outcomes? And finally, what institutions, formal or informal, mediate the scope of
livelihood strategies and outcomes?
Therefore it can be said that SL is a concept that considers three important factors for
development – objectives, scope and priorities – so as to enhance progress in poverty
alleviation. The importance of SL is to provide direction for poor people to achieve
enduring improvements against the challenges and poverty indicators that the people
13 The Author felt it necessary to add the last point as major natural events can also impact on
livelihood strategies.

102 | P a g e
themselves define (Ashley & Carney, 1999; Bridger, 1999).The views of both Scoones,
and Ashley and Carney, help bridge the gap between a quantitative SD approach and
a qualitative SL approach as proposed by Hopwood, et al. (2005), and provide a
resonance for this paper and its focus on research concepts for small, marine-
resource, dependent communities in the Province of East Nusa Tenggara.
The conundrum for both SD and SL is the word ‘Sustainable'. Worldviews, values and
norms influence the posture taken by different governments, institutions and
communities and that posture can determine the relative weakness or strength of
sustainability within different areas (Harding, et al., 2009; Williams & Millington, 2004).
It can be said that weak SD arises when resources, both renewable and non-
renewable, are thought to be able to be replaced or developed without a need to
reduce consumption, thus placing livelihoods and economic growth in prime place. This
can also be defined as an anthropocentric approach. The alternative view of eco-
centrism places the environment as having prime importance and dismisses the
importance of livelihoods and economic growth. Strong SD is defined as “bio-centric
egalitarianism”; that is when human consumption needs are reduced or kept in check
to reach environmental sustainability. In this approach, economic needs, social needs
and environmental needs are considered as equal and interdependent (Williams &
Millington, 2004, p. 102). Chapter 2 had a more in-depth discussion on the SD-SL
nexus.
Sustainability can be defined as,
… the capacity of human systems to provide for the full range of human concerns
in the long term. Sustainability, when applied to humans, refers both to long-term
survival of our species and the quality of our lives (Goldie, et al., 2005, p. 3).
In other words, to reach sustainability we must develop human systems that deal with
inter- and intra-generational challenges while developing communities that are founded
on sustainable livelihoods, a sustainable natural resource base and internal social
cohesion (Goldie, et al., 2005; Harding, et al., 2009; McMichael, 2005).
The United Nations, over decades, has created urgency for society’s attention to
focused on poverty alleviation, sustainable livelihoods, social inclusion and equality,
and environmental sustainability. In 1987 the Brundtland Commission drew attention to
the finite status of natural resources and the environment. In 1992, the United Nations

103 | P a g e
released the Rio Declaration (UNEP, 1992) and Agenda 21 and Local Agenda 21 were
released as guidelines for governments and NGOs to consider when implementing
development projects (UNDESA, 1992). All have explicitly acknowledged the
interdependence of the three pillars of SD with humanity and sustainable livelihood.
Agenda 21 led to the creation of the Millennium Development Goals’ (MDGs) paradigm
which set eight goals and empirical targets for poverty alleviation, access to education
and health services for all, environmental sustainability, and equality and equity. The
MDGs agenda spanned the years 2000 to 2015 (United Nations General Assembly,
2000). The 1 January, 2016, was the start date for the ensuing Sustainable
Development Goals (SDGs), which expands the MDGs to 17 Goals and 169 Targets
(United Nations, 2018a). Both the MDGs and the SDGs place Poverty Alleviation as
the Number 1 Goal. The SDGs propose that US$ 1.90 per person per day is
considered sufficient to raise a household above the poverty line (United Nations,
2018b).
5.4.3 Social Impact Assessment
Social Impact Assessment includes the processes of analysing, monitoring and
managing the intended and unintended social consequences, both positive and
negative, of planned interventions (policies, programs, plans, projects) and any
social change processes invoked by those interventions. Its primary purpose is to
bring about a more sustainable and equitable biophysical and human environment
(Vanclay, 2003, p. 5).
Social Impact Assessment (SIA) is recognised as a small, but extremely important, sub
paradigm of the larger impact assessment paradigm that guides predictions of positive
and negative impacts form planned policies, programs, plans and projects, and is
intrinsically connected with other impact assessment sub paradigms, such as economic
impact and environmental impact assessments (Lockie, 2001). The recognition of the
importance of SIA has emerged over the last half century, and was first institutionalised
as a part of impact assessment through the US National Environmental Policy Act
1969, although in practice it has remained the poorer cousin of environmental impact
assessment (EIA) (Freudenburg, 1986; Howitt, 1989; Lockie, 2001). SIA has many
times been rolled into a socio-economic impact commentary but the two, social and
economic, have their own place in assessment requiring different methodologies and
methods to explain their assessment outcomes. For example, public participation and
consultation is far more an important part of the process in a social impact assessment
impact study than in an economic impact assessment study which is largely based on

104 | P a g e
empirical statistical data (Lockie, 2001). Locke asserts that SIA must take a more
significant role in setting the agenda for all aspects of impact assessment and to
develop the relationship between scientific assessment and public participation. This
has the potential to create more holistic, strategic and effective impact assessments
(Becker & Vanclay, 2003; Lockie, 2001).
SIA is defined in terms of effort to assess or estimate, in advance, the social
consequences that are likely to follow from specific policy actions (including
programs, and the adoption of new policies), and specific government actions
(including buildings, large projects, and leasing large tracts of land for resource
extraction) particularly in the context of the US National Environment Policy Act of
1969 or ‘NEPA’ (Interorganizational Committee on Guidelines and Principles, 1994,
p. 108).
Vanclay (2003, p. 6) asserts that
SIA is analysing, monitoring and managing the social consequences of
development and to assess the social impacts of planned interventions or events,
and to develop strategies for this monitoring and management of these impacts.
Burdge (2003) defines SIA as a systematic analysis in advance of development events
(project implementation, policy change, and planned development) to predict the likely
impacts on people and / or their community. Vanclay (2003) implied that SIA is for
planned “future” interventions and events; in other words, an extrapolation of perceived
consequences that will emerge in the future, after a planned event has been enacted.
SIA can also serve as a post-event, post-emergence of consequences analysis, hence,
a form of monitoring and evaluation facilitating remedial actions that may be needed to
rectify unintended negative consequences, or to enhance unforeseen positive
consequences and to serve as part of the planning process for any other similar
planned future event (Taylor, et al., 2000).
Lockie (2001) also comments on this “act of prediction” within SIA. He promotes
Burdge’s view of a comparative analysis which involves using post hoc studies of
similar developments or policies elsewhere to identify possible impacts at the site in
interest. Burdge, et al. (1995) wrote that proof of impacts cannot be estimated with any
confidence in advance, but potential impacts can be identified that cannot be ruled out
with confidence (Burdge, et al., 1995; Rickson, et al., 1998).

105 | P a g e
So what are social impacts? The US Interorganizational Committee on Guidelines and
Principles for Social impact Assessment defines social impacts as,
the consequences to human populations of any public or private actions that alter
the ways in which people live, work, play, relate to one another, organise to meet
their needs, and generally cope as members of society. The term also includes
cultural impacts involving changes to the norms, values, and beliefs that guide and
rationalise their cognition of themselves and their society (Lockie, 2001, p. 278).
Lockie (2001) explained that this broad definition has its strength in that it encourages
impact assessors to focus on those changes that are important to a particular situation
and to allocate priority to those circumstances where statistical measurements alone
are unlikely to provide satisfactory answers. However, social impact assessments
conducted by different practitioners can give different results, which suggest that some
impact assessments are little more than public relations’ exercises (Becker & Vanclay,
2003; Lockie, 2001). Taylor et al. (2000) and Burdge (2003), in response to this level of
uncertainty, suggest longitudinal research as a framework for the SIA.
Figure 7 Different SIA Research Timelines; Predictive and Longitudinal
Despite the claims of objectivity, a technocratic-positivist’s approach fails to take into
account world views, norms and values of the complex social make-up of the particular
communities and geographic localities that are the focus of an SIA (Lockie, 2001).
However, a technocratic approach is often favoured by practitioners with engineering,
or natural sciences’, training background supporting government and developers with
quantitative data on economic and employment growth indicators (Lockie, 2001).
Community and public participation, to them, only serves to complicate clear,
empirically based decisions with uninformed public-opinion based on emotion and
Tb ---------------Tc
(a) Vanclay Predictive SIA
Ta --------Tb --------------Tc --------Td
(Past) (Present) (Future) (Far Future)
(b) Taylor et al. and Burdge Longitudinal SIA
106 | P a g e
subjectivity (Lockie, 2001). Rickson, et al. (1998) wrote that it is all about power. A
technocratic approach only serves to privilege a “natural” scientific view over a
sociological view. Howitt claimed that the social impact assessment process itself is
part of a process of social change, with significant social and political consequences
(Howitt, 1989; 2001). It covers all impacts on people and their communities, of a socio-
cultural, economic and biophysical nature (Howitt, 2001; van Schooten, et al., 2003;
Vanclay, 2002). Practitioners of SIA must have awareness that impacts vary from
group to group within society; particularly the impacts experienced by vulnerable,
minority groups within the community, compared to majority, mainstream groups. This
should be of primary concern during the SIA process (Vanclay, 2002).
SIA promotes empowerment of local people, gender equality, equality and equity for
minority groups and other vulnerable or marginalised members of society, alleviation of
dependency, and poverty reduction (Burdge, 2003; Rickson & Rickson, 1990; Roberts,
2003; Vanclay, 2003) and happens at three levels; micro, meso and macro levels
(Becker, 2001, p. 317).
Vanclay (2003) writes that,
The goal of impact assessment is to bring about a more ecologically, socio-
culturally and economically sustainable and equitable environment. Impact
assessment therefore promotes community development and empowerment,
builds capacity, and develops social capital ensuring that positive outcomes are
maximised.
Through a participatory process, SIA builds on local knowledge to understand the
concerns and needs of stakeholders who can contribute to the assessment of impacts,
the analysis of alternatives, and monitoring of the planned strategies and outcomes
(Vanclay, 2003). Acknowledging that social, economic and biophysical impacts are
inherently interconnected and that change in one domain may lead to change in
another domain, allows the SIA researcher to develop an understanding of impact
pathways, cumulative impacts and second and higher order impacts, both positive and
negative (Vanclay, 2003, pp. 6-7). When SIA is longitudinal in character, it both uses
and generates research findings (Taylor, et al., 2000).
5.4.4 Need Assessment
Need Assessment is an applied research tool in which one gathers descriptive

107 | P a g e
information about an individual’s, household’s or community’s need issue, or concern,
including the issues magnitude, scope, and severity (Bradshaw, 1972), Many authors
support the concept of local knowledge and community participation as an essential
part of development (Carruthers, 2001; Dover, 2005; Hopwood, et al., 2005; Walker, et
al., 2001). The United Nations explicitly encourages this approach in the decision
making process for community development as outlined in the Local Agenda 21,
MDGs, and SDGs guidelines (UN Economic and Social Development, 2009; United
Nations, 2018a).
There are four types of needs assessment which are most frequently used in
development programs, in particular in public health program planning and health
promotion (Bradshaw, 1972; Chu, 2009). Similarly, it can be used as a tool in SL
strategy planning. The four types are normative needs, felt needs, expressed needs
and comparative needs.
Normative need is the needs which are defined by experts such as professionals,
consultants and decision makers at the upper level of the organisation at both
national and provincial level.
Felt need is the needs which are defined by the individual and community.
Expressed need is the needs which are expressed or demonstrated by community
members. Expressed needs are demonstrated by action and organisation.
Comparative need is the needs that are explained by comparison of certain issues
in other different areas with similar characteristics (Bradshaw, 1972; Chu, 2009).
Need Assessment connects and contrasts macro and micro level perspectives of
community needs. Normative Need is an assessment at the Macro level. It can be used
during government policy development, as a part of government or institution budget
setting, or by aid agents setting program and location priorities, while Felt Need is the
need explicitly verbalised by the target individual, household or community, the Micro
level. The community is aware of their need and openly expresses that need when and
if they are given a political voice. The macro-micro linkage is not always strong, which
can lead to a wide contrast in desired programs and outcomes.
Expressed Need also emanates from the Micro level, but is expressed by non-verbal
means such as individual and group actions, non-action, and emotions and tones that
arise from different activities and discussions, while Comparative Need is the

108 | P a g e
perspectives of researchers and experts, Macro level, with local cultural knowledge
from studies across similar communities. These Needs can be used to moderate and
link micro-macro and macro-micro perspectives.
Table 2 Linking types of need assessment, method, informants and information gained (adapted from Bradshaw, 1972)
Types of Need Assessment
Methods
Used
Informant
List
Information
Gained
Normative Need (Macro Level)
Literature, Report and Document review. In-depth interviews
Government officials and academics at the district and village levels
National, district and village government policy, direction and recommendations
Felt Need (Micro Level)
In-depth interviews, Focus Discussion Groups, Informal meetings
Local government and community leaders, villagers, fishers, wives, family members and other stakeholders
Capacity building expectations, Community member challenges, suggested solutions and aspirations.
Expressed Need (Micro Level)
In-depth interviews, Focus Discussion Groups, Informal meetings, Researcher Observation.
Local government officials, community leaders and members, fishers, wives, family members and related stakeholders.
Sustainable livelihood needs, community needs, group and individual perspectives. Cultural and social drivers.
Comparative Need (Macro Level)
Researcher Observation, Document review, In-depth interview, Focus Discussion Groups, Informal meetings.
Researchers, Literature review and comparative reports.
Contextualised specific needs and generalised perspectives and theorising.

109 | P a g e
5.5 Data Collection Instrument Design
Applying Scoones’ four questions (Scoones, 1998, p. 3) to this research, we see that
the first two questions (What is the context of a particular case study area? and What is
the available capital (natural, human)?) concern the analysis of various aspects of the
case study sites including; demographics, geography, history, culture and social
structure. Data for the analysis of these aspects is predominantly collected by using
quantitative data collection methods such as, analysis of government statistics and
previous research reports, and by conducting a household / village survey. Qualitative
data collection methods help to triangulate these findings.
Scoones’ last two questions (What are the achievable strategies and locally guided
outcomes? and What institutions, formal or informal, mediate the scope of livelihood
strategies and outcomes?) concern gaining understanding of various stakeholders’
aspirations for the future, perceptions of achievable strategies, and the challenges
faced to enact the these strategies and to achieve their aspirations. This understanding
is predominantly exposed with qualitative data collection techniques such as, formal
and informal interviews, FDGs and researcher observation. Many authors advocate
that bottom-up aspirations and perceptions must be included in any community
analysis, and Burdge, et al. (1995) and Vanclay (2003) advocate that Social Impact
Assessment (SIA) must be included in any development and livelihood projects.
Hence, to accommodate Scones’ four fundamental questions for sustainable livelihood
assessment, and to achieve a Hopwood, et al. (2005) micro-level perspective of
achievable livelihood strategies, mixed-methods, data collection instruments were
designed that allow the author, to quantitatively and qualitatively assess the current
status of villagers in the study sites, to investigate past and current development
strategies employed in the villages, and to develop an understanding of the bottom up
perspective of these development strategies, the micro level perspective.
Importantly, the data collection instrument design allowed the author and research
team to efficiently access the voices at the micro-level in the three ethnically different
case study sites. The ensuing rich data enabled the author to theorise about similarities
and differences in the villagers’ livelihood strategies.

110 | P a g e
5.6 Conclusion
This chapter has discussed the methodology of the research and methods of data
collection adopted for this research project. The characteristics of PSS, ISS and CSS
were outlined concluding that CSS is the best fit for this enquiry into traditional fishing
villages in the Indonesian province of NTT. CSS combines positivist, impersonal, data-
collection techniques of PSS and the personal involvement / observer techniques that
ISS espouses. CSS allows the researcher to study both a particular phenomenon,
affecting an individual, group or institution, and the study of commonalities across
individuals, groups or institutions. Hence, results from research conducted with a CSS
posture can add to formulation of conclusions and recommendations concerning
particular phenomenon, and it can facilitate the testing or development of theories.
Data collection methods for this research were influenced by a Sustainable Livelihood
Approach, Social Impact Assessment and Need Assessment principles. By refining and
integrating Scoones’ (1998) framework for SL with a Burdge (2003) / Taylor, et al.
(2000) longitudinal, SIA framework and a micro level Need Assessment, data collected
can appropriately guide the development and implementation of holistic livelihood
strategies that reduce fragilities, vulnerabilities and feelings of disempowerment, while
increasing program synergy and hence efficacy, sustainability, resilience and
ownership in NTT traditional fishing villages.
An SL approach, encompassing Need Assessment, looks at the ways in which local
people can meet their basic and ongoing needs, as defined by them, for food and
shelter, as well as for security and dignity, through meaningful work, while
simultaneously striving to minimize environmental degradation, accomplish
rehabilitation, and address concerns about social justice (Walker, et al., 2001). It is
used to inform researchers and local communities alike of either, extended, modified or
alternative livelihood strategies that are socially, culturally and environmentally
appropriate for the area in question.
An SIA primarily, as (Vanclay, 2003, p. 6) puts it,
is analysing, monitoring and managing the social consequences of development
and to assess the social impacts of planned interventions or events, and to develop
strategies for this monitoring and management of these impacts

111 | P a g e
Awareness of social impacts must take a more significant role in setting the agenda for
all aspects of community and development assessment and to bridge the gap between
scientific, empirical assessment and qualitative, felt and expressed need assessment.
This has the potential to create more holistic, strategic and effective pre, mid, and post
program assessments (Lockie, 2001; Roberts, 2003).
Blending an SL approach with an SIA approach satisfies contemporary community
development theories, including those outlined by the United Nations, through its
Agenda 21, Local Agenda 21, MDGs and SDGs. This hybrid approach encompasses
the empowerment of local people, enhancement of the position of women and children,
an increase in equity for minority groups and other disadvantaged or marginalised
members of society, and capacity building for the alleviation of poverty and resource
dependency (Rickson & Rickson, 1990; UNDESA, 1992).

112 | P a g e
Research Data Collection and Study Sites Chapter 6

113 | P a g e
6.1 Introduction
Chapter 5 introduced the discussion on research methodology. From the three main
postures that are taken by researchers, Positivist, Interpretive, and Critical, a Critical
Social Science methodology was seen as the approach required to give true justice
and rigor to this research project concerning the livelihoods of traditional fishers on
Rote Island, Indonesia.
Critical Social Science implies, by its inherent characteristics, that it is the correct
researcher posture for a Case Study that employs a mixed methods suite of data
collection instruments. This Case Study investigates both the similarities and the
differences between the villages in relation to their current socio-economic status and
livelihood strategies, and their perspectives for future strategies that will enable them to
provide a FRESH Start for the next generation. In accordance with the research
posture taken by the author and the research aims, this chapter outlines the methods
used, the development of instruments, and the analytical processes used to compile
both quantitative and qualitative results that expose the villages’ and villagers’
commonalities and differences. These results are presented and discussed in the next
three chapters.
Bryman (1988) wrote that quantitative research is typically seen to comprise of social
surveys and experimental investigations, while qualitative research is aligned with
participant observation and semi-structured, in-depth interviewing. For this research
project, a mixed methods approach was employed. Quantitative data was collected
predominately by way of a household survey (HS). Along with the HS, Focus
Discussion Groups (FDGs) and interviews also gave opportunities for empirical data
collection and cross checking of findings from previous studies by other researchers,
already discussed in the literature review chapters. The latter group of data collection
methods also present the opportunity to cross-check HS data. Qualitative data
collected was the result of inquiry by way of formal and informal, semi-structured
interviews, FDGs, researcher observation and personal conversations.

114 | P a g e
6.2 Case Study Sites
East Nusa Tenggara (Nusa Tenggara Timor, NTT) is one of the poorest provinces in
Indonesia and, in fact, one of the poorest regions of the world. The province is home to
many variations in culture among the different regions. Since poverty is concentrated in
the rural areas where most people live, efforts to improve provincial living standards
must focus on areas outside of the major municipality of Kupang. The economy of NTT
is dominated by agriculture, which accounts for 35 per cent of provincial GDP in 2003.
Fisheries contribute only 3 per cent of GDP, although fish products are significant in
exports and for local coastal economies (Barlow & Gonowarsito, 2009).
Provincial, district and sub-district government and politics have changed dramatically
since Indonesia’s move to full democracy in the late 1990s and the implementation of
decentralisation in the early 2000s (Barlow & Gonowarsito, 2009). This implementation
of decentralisation has reduced the power of central and provincial authorities and
increased that of the District Head (Bupati) and district officials. This change has not
been as dramatic in NTT as in the richer provinces due to continuing high remittances
from the centre (Barlow & Gonowarsito, 2009). The Village Law (No. 6 2014) further
devolved government budget expenditure responsibilities to the 73,000 village heads
throughout Indonesia (Berenschot & Vel, 2017). For many villages, this new law has
exposed schisms in intra-village relations between village elites and power holders,
and the grass roots villagers (White, 2017), while maintaining old micro-macro
tensions. The NTT provincial and district governments remain important in formulating
overall development policies and in transmitting development initiatives from Jakarta.
The office and staff of the Bupati (District Head are still important in determining the
nature of government improvements in their districts (White, 2017)
In NTT, despite steady improvements, infrastructure and services outside the chief
municipalities remain poor. The road system is among the worst in Indonesia, although
it is slowly being improved. Interior roads are frequently unsealed, spasmodically and
sporadically serviced, and often impassable during the annual, three to four month
rainy season. In fact, most rural roads in NTT, other than the main Kupang to Atapupu
(a border town with Timor Leste) highway, can only be accessed by four wheel drive
vehicles and motorcycles even in the dry season (Barlow & Gonowarsito, 2009). Over
the last five years, the author has noticed good improvements in telecommunication
and internet services in Kupang, the Provincial Capital of NTT, and at village level on
Rote Island.

115 | P a g e
The three case study sites chosen for this research project are located on Rote Island
in NTT, the closest inhabited Indonesian island to Australia.
Map 3 Case Study Sites on Rote Island
Photo 1 Aerial Photograph of Pepela Darat and Tanjung Pasir (Google Earth 27-08-
2018)
Landu
Pepela
Tanjung Pasir
Pepela Darat
Pepela Darat and Tanjung Pasir
Study Sites

116 | P a g e
(1) Pepela Darat, is an ethnically diverse community in the village of Pepela, a recently
declared village in its own right, in the Sub-district of East Rote (Kecamatan Rote
Timor), District of Rote Ndao (Kabupaten Rote Ndao), located on the north-eastern end
of Rote Island. The villagers of Pepela Darat, those that live on the hill behind the jetty,
are made up of generational immigrants from South Sulawesi, Alor, Timor and local
Rotenese, some in inter-ethic marriages. These people live on the hill behind the jetty.
(2) Tanjung Pasir (Sand Spit), an ethnically, homogenous, sub-village (Dusun) of
Pepela, located on a sand spit less than 400m from the centre of Pepela Darat. These
people are all of Bajau Laut ethnicity, a group sometimes called “sea gypsies”. They
originate from Southeast Sulawesi and live a transient lifestyle, sailing from Bajo village
to Bajo village throughout eastern Indonesia. However, many have now made Tanjung
Pasir a permanent home.
(3) Landu Thie (Desa Landu), Sub-district of Southwest Rote (Kecamatan Barat Daya),
District of Rote Ndao (Kabupaten Rote Ndao), an ethnically, homogenous, village
located on a small island near the south-western end of Rote Island. The villagers are
all, bar a few, of Rotenese ethnicity. Although Landu Thei comes under the jurisdiction
of the new state system, old Rotenese society laws and folk lore still abide.
N.B. Pepela is commonly spelt two ways, Pepela and Papela. Pepela has been chosen
for this thesis to follow the spelling on the village official letter head. For the sake of this
thesis, Pepela is called Pepela Darat, meaning Land Pepela, to distinguish it from
Tanjung Pasir, which is actually a sub-village of Pepela.
These three villages were selected, for this social research into sustainable livelihoods
in small-scale fishing villages, for a number of reasons. Firstly, more than 75 % of
households, in these villages, have fishing and other marine resource centred activities
as their main livelihood strategy. Agricultural activities are only a minor livelihood
activity of the people in these villages (Bria, 2014). In many cases, the fishing activities
of the fishers from these villages are not only along local coastlines in Indonesia’s
Exclusive Economic Zone (EEZ), but also around the transboundary waters of
Indonesia and Australia. Secondly, these villages have, over the last two decades,
received funding and aid, as a part of poverty alleviation programs, from various
sources, including the Indonesian central, provincial and district governments, the
Australian government and a number of NGOs. Thirdly, a number of households in
these villages have experience engaging in alternative livelihoods as a source of
income for their household. These include seaweed cultivation, trepang and fish

117 | P a g e
aquaculture, salt farming and temporary migration out, among other strategies (Benu
et.al, 2018). Therefore, the fishers’ experiences and history are rich with lessons
learned regarding alternative livelihoods and prior macro-level, poverty-alleviation
interventions. Fourthly, the three villages have a different ethnic, and hence cultural,
make up. Pepela Darat is a mix of 2nd, 3rd and 4th generation immigrants from South
Sulawesi, who are the majority, immigrants from other islands in NTT, and local
Rotenese people. Tanjung Pasir people are all of Bajau Laut ethnicity, and all but a few
in Landu Thie are original Rotenese. These demographic differences allow for
theorising about similarities and differences in the results between case study sites.
Finally, these three fishing villages exemplify the conditions of many traditional fishing
villages in NTT in that they are marine resource dependent and have a subsistence
level existence. Hence, findings and recommendations from this research may be able
to be duplicated for other fishing villages with contextual adaptions.
In a recent case published by Australian authorities, about eight fishers from Rote were
detained by Australian Maritime Border Command (AMBC) because of illegal fishing
activities in the Australian EEZ (Victory News, 2 May 2017).
The District of Rote Ndao is one of the 92 outer islands of Indonesia, located near the
transboundary waters of neighbouring countries, namely Australia and Timor Leste.
Rote Ndao has 2000 km2 of land and 570 km of coastline and is one of the 21 districts
of the East Nusa Tenggara (NTT) province in the southern part of Indonesia (BPS
Kabupaten Rote-Ndao, 2016).
Timor Leste to the east is the nearest neighbouring country, while Australia is the
closest neighbour to the south of Rote. The geographical position of Rote Island at the
eastern most end of the India Ocean gives Rote an important strategic position for
Indonesia. This island is bordered by the Sawu Sea in north and west, by the Banda
Sea in the east and by the Timor Sea to the south. The Sawu Sea itself is an expansive
national marine conservation area in the eastern part of Indonesia, abundant with
natural resources including oil, minerals and marine flora and fauna, and was
enshrined in law by the Minister of Fisheries and Marine Affairs in 2014 (Kementerian
Kelautan dan Perikanan Republik Indonesia, 2014). Because of its strategic
geographic position not only for Indonesia, but also for neighbouring countries, Timor
Leste and Australia, there are many conservation projects conducted in the Sawu Sea
by numerous government and non-government organizations.

118 | P a g e
The current population of Pepela is 1469 people with 82% of household heads identify
their occupation as fishermen (BPS Kabupaten Rote-Ndao, 2017a). Pepela is
reportedly the largest fishing village on the island of Rote and possibly the largest
exclusive fishing village in the Timor area. It is the hub and organisation centre for crew
recruitment for long distance voyaging into Australian waters (Fox, 2002). Pepela has
linkages to many fishing villages on Rote, Flores, Alor and Timor, from which both
captains and crew are recruited. Pepela is also the site of a settlement of Bajau Laut
fishers, located on an adjacent sand spit called Tanjung Pasir, who regularly sail into
Australian waters (see Photo 1). Most of these Bajau Laut have come from the Tukang
Besi Islands of Southeast Sulawesi and continue to maintain close contacts with their
home villages (Stacey, 2007).
Originally, during proposal writing for this research project, the whole of Pepela was
treated as one case study site, but because the RT recognised that the demographics
and livelihood aspirations of the Bajau Laut households, living on Tanjung Pasir, were
different from the other households in Pepela, it was decided to treat them as two
different case study sites. Hence this study has three case study sites, not two as
originally planned.
Landu Thei14 is actually a small island located approximately 600m of the southwest
coast of Rote Island. It has a land area of only 6 km2, and a current population of 906
people (BPS Kabupaten-Rote-Ndao, 2017b). For the purpose of this research project
Landu Thei is referred to as a part of Rote Island, as many people do, as it is included
in the sub-district of Southwest Rote.
Landu is a smaller village than Pepela, and is 96 % ethnically homogenous. Almost all
inhabitants are direct descendants of original Rotenese people. The village internal
political system is still based on a traditional clan system, with communal lands and
political rights ensconced in a few more powerful clans. This is explained in more detail
in the Landu Results section in Chapter 6. The fishers from Landu Thei are now mostly
coastal fishers. They stopped off-shore voyaging to the Indonesian Australian
transboundary waters in 2006, when many of their boats and fishing gear were
14 Landu Thei should not be confused with Landu Leko, another sub-district located on the
northeast corner of Rote Island. History suggests that the original inhabitants of Landu Thei
come from Landu Leko to escape the wrath of Dutch colonisers who were involved in the slave
trade (Fox, 1977).

119 | P a g e
confiscated and destroyed by Australian authorities after they strayed into the
Australian waters (Messakh, 2017).
Photo 2 Aerial Photograph of Landu Thie (Google Earth 08-10-2018)
The three case study sites chosen for this research, Pepela Darat, Landu Thei and
Tanjung Pasir, are quite diverse villages in size, ethnicity, current livelihood strategies
and future aspirations for the next generation. Hence, they are considered appropriate
choices to generate a true case study where commonalities and differences can be
analysed and generalised on to fill a theoretical gap in the literature on small-scale
fishing community livelihood development.
Rote Island
Landu Thie
Study Site

120 | P a g e
6.3 Collaborative Research
This is a collaborative research project between Nusa Cendana University, Kupang,
Indonesia and Griffith University, Brisbane Australia and falls under the auspice of a
MoU signed between the two universities in 2012, and resigned in August, 2018.
Discussions on common research interests of the author, Griffith University, and Prof
Benu, Nusa Cendana University, in December 2015, lead to the collaboration taking
traction in March 2017. The title of the collaboration project was The Economic
Livelihoods of Traditional Fishermen on Rote Island, Eastern Indonesia and Their
Activities in The Transboundary Waters of Indonesia and Australia.
The PhD proposal of the author, as submitted for Confirmation, was used as the major
basis for the collaboration project proposal, and only amended with an analysis on salt
farming, using Policy Analysis Matrix. The salt farming analysis is mentioned only
briefly in this thesis discussion, as it was an extension to the original research proposal,
and mainly the responsibility of another member of the Research Team (RT). However,
the Salt Farm Analysis is attached as Appendix XV.
Below is a list of the research personnel who contributed to this project. Complete
details of the individual contributions of the research team, for this collaborative
research, are outlined in the thesis Preface.
6.3.1 The Research Team
Research Chair:
Prof. Ir. Fredrik L. Benu, M.Si., Ph.D.
Rector (Vice-Chancellor), Universitas Nusa Cendana
NIDN: 0019116506
Research Interests: Agribusiness, Sustainable Livelihoods
Griffith University recommendations for Contribution of others In all cases, it is imperative that students acknowledge the work of others. This includes full and proper referencing of all quotations, conclusions of findings reached by others, and important ideas and concepts. Since contemporary research, and the work of research higher degree students in particular, is increasingly collaborative or team-based, a contribution to the research project by others is common. Research may be jointly published, may be carried out in collaborative teams, and may be done and/or written with the technical, statistical, editorial, or physical assistance of others. A statement precisely outlining the contributions of others to the intellectual, physical and written work must be set out at the beginning of every research higher degree thesis. (Please see Preface)

121 | P a g e
Phone: +62 8123798246
Email: [email protected]
Team Member 1 (The author)
Paul G. King BA Asian and International Studies,
PhD Candidate, Griffith University, Australia
GUID: s2098979
Research Interests: Sustainable Livelihoods, Small-scale fishing communities
Team Member 2
DR. Ir. Agus A. Nalle, M.Si.
Senior Lecturer, Universitas Nusa Cendana
NIDN: 0025086207
Research Interest: Agro Economy
Team Member 3
Moni W. Muskanan, SE, MPA.
Senior Lecturer, Universitas Nusa Cendana
NIDN: 0016018201
Research Interests: Institutional Accounting and Governance
6.3.2 Research Assistants
1) Maria Wilhelsya Inviolata Watu Raka, B Law
Junior Researcher, IRGSC, Kupang
AAS Recipient 2018
Research Interests: Environmental Law
2) Shinta Ardani,
Senior High School Student
Pepela Resident
Research Interests: Maritime Law
3) Musa Taher
Rote Ndao Cultural Advisor and District Civil Servant

122 | P a g e
6.3.3 Logistics
This research project was based in Kupang, West Timor, where Research Team (RT)
meetings were held before and after the data collection period, the first being on 19
July, 2017. The meetings discussed and debated the development of the data
collection instruments, the data collection timetable, data analysis, and final report.
Prof. Benu, Research Chair, and the author travelled to Rote Island for a scoping visit
between 30 July and 2 September, 2017. During the scoping visit, both case study
sites, Pepela and Landu Thei, were visited for initial meetings with Village Heads, and
local residents, to garner permission and local support, and to discuss research
purpose and timing. A meeting was also held with the Rote Ndao District Head (Bupati)
Lenard Haning who supported and encouraged the proposed research, and provided a
formal research approval letter (See Appendix III).
The data collection phase was conducted from 20 to 28 September, 2017. Initially the
author, Moni Muskanan (Team Member 3) and Maria Inviolata (Research Assistant)
travelled to Rote Island from Kupang to commence data collection. Prof. Benu
(Research Chair) and Dr Nalle (Team Member 2) travelled to Rote Island two days
after, while Moni Muskanan returned to Kupang after four days in the field.
Moni Muskanan was in the field from 20-25 September.
Prof. Benu and Dr Nalle were in the field from 24-28 September.
The author and Maria Inviolata (RA 1) were in the field from 20-28 September. Shinta
Ardani (RA 2) is domiciled in Pepela and assisted the team when in Pepela and Musa
Taher (RA 3) lives in Ba’a, the municipal centre of Rote Ndao District.
Transport during the data collection phase encompassed various forms including; for
the Kupang to Ba’a (Main town on Rote Island) and return travel, airplane and inter-
island commercial ferry service was used. For transport on Rote Island a self-drive
rented car, small wooden ferry boat and motor bikes were used. The author is fully
licensed to drive cars and motor bikes in Indonesia.
During the data collection phase the research team based themselves at a small
homestay / hotel in Ba’a, approximately one hour travel from either case study village.
However, Prof Benu and the author stayed overnight in Pepela during the scoping visit.

123 | P a g e
6.4 Research Focal Point
The aim of this research is to investigate the needs and challenges to a sustainable
livelihood for the fishing communities in East Nusa Tenggara. It follows a conceptual
framework that blends the tenets from Sustainable Development (SD) and Sustainable
Livelihood (SL). Figure 1(a) and (b) in Chapter 2 show the three basic elements of SD,
i.e. environment, social and economic elements, and illustrates that sustainable
development exists at the confluence of these three elements.
As discussed in Chapter 2, SD and SL are interdependent paradigms which carry both
a Daly (1992) qualitative and, as suggested by Daly, a Brundtland et al. (1987)
quantitative viewpoint. Daly suggested that greater clarity would be to speak of
“sustainable livelihoods”. Daly’s “sustainable livelihood” approach makes a connection
between the concept of SD and the needs of developing countries especially for
marginalized peoples such as those at the focus of this thesis.
Scoones (1998, p. 5) gives us this definition for Sustainable Livelihood;
A livelihood comprises the capacities, assets (including both material and social
resources) and activities required for a means of living. A livelihood is sustainable
when it can cope with and recover from stresses and shocks, maintain or enhance
its capabilities and assets, while not undermining the natural resource base.
Scoones suggested that the fundamental areas of inquiry for sustainable livelihood
assessment are;
What is the context of a particular case study area?
What is the available capital (natural, human)?
What are the achievable strategies and locally guided outcomes? And finally,
What institutions, formal or informal, mediate the scope of livelihood strategies and
outcomes? (Scoones, 1998, p. 3).
Before answering the Scoones SL assessment questions, it is important to confirm the
focal point of this inquiry. Figure 8, helps to identify and explain to the reader the
rational, central focal point and desired outcome of the research. All current generation
livelihoods in traditional fishing villages in eastern Indonesia are based on natural
resource exploitation as displayed in Figure 8. The current generation of fishers are
tasked with providing the next generation the five pillars of support for their livelihoods,
as outlined by the MDGs and SDGs, academics and BPKKN. The author has

124 | P a g e
combined the five pillars under an acronym FRESH Start (Food: adequate fresh
nutritious food consumption at a minimum 2 times per day, Residence: solid structure
walls, roof and floors, adequate furniture, electricity and reticulated water, Education: a
minimum of senior high school completed, Social Status: equal access to natural
resources, information and opportunity, self-esteem, and Health services: unrestricted
access to health services, medication, clean drinking water and sanitation).
Figure 8 Research Topic Focal Point and Significance (Diagram developed by the author)
If the current generation of fishers do have sufficient livelihood income to fulfil the
requirements of the five pillars of a FRESH Start for the next generation, then the next
Residenc
e
Foo
d
Educatio
n
Healt
h
Environment
Coastal and Marine Social-Ecological System
Statu
s
(Research Focal Point)
Current Generation Livelihoods
Marine Resource Exploitation
Next Generation Livelihoods
Expanded Choices
Environment
Ec
on
om
ic
Su
pp
ort
or
Sli
p-b
ack
En
viro
nm
en
tal
Co
ns
erv
atio
n o
r De
gra
da
tion
Sustainable
Livelihoods

125 | P a g e
generation will have expanded livelihood opportunities compared to their parents with
less pressure on the natural environment. In the future, this would enable economic
support to feedback from next generation livelihood income to the current generation
as they age. It should also enable environmental conservation of the natural
environment as the next generation’s livelihood strategies would be less reliant on
resource exploitation and more reliant on alternative, more modern livelihood
strategies. In the end, this should lead to sustainable livelihoods for future generations
to come, as espoused by the Bruntland Commission and the Rio Declaration. If the
current generation does not have sufficient livelihood income to fulfil the requirements
of all 5 pillars, the next generation may experience economic stagnation or slip-back,
and the environment may experience further degradation due to sustained or increased
pressure due to unchanged livelihood strategies from one generation to the next.
.
Hence, the focal point of this research and thesis is the current generation’s livelihoods,
while the ultimate beneficiaries of the research should be future generations and the
environment.
The following sections will present the data collection methods employed to investigate
the livelihood strategies and their challenges for the current generation of fishers in
eastern Indonesia.

126 | P a g e
6.5 Quantitative Data
Initial quantitative data was collected during the literature review about fishing
communities and activities in eastern Indonesia presented in Chapter 3. Additional data
was collected online from the NTT Province Bureau of Statistics and the Rote Ndao
District Bureau of Statistics. This data related to district and village demographics,
geography and historical data on fisher and household income.
A Household Survey (HS) was the major field instrument used to collect quantitative
data that was then statistically analysed using Excel Spreadsheet software.
6.5.1 Household Survey (HS) Questionnaire Development
For the design and development of the HS questionnaire, the RT met on at least four
occasions over a two week period in Kupang. The aim of the questionnaire was to
collect quantitative data in the two case study sites regarding village demographics,
household income and expenditure, and household members and welfare level. As all
members of the RT, including the author, are fluent in reading and writing Indonesian
language, the questionnaire was drafted in Indonesian language. An English language
version was not written. A copy of the final draft of the HS questionnaire is presented in
Appendix XI.
The developed questionnaire was in part adapted from on a HS used in Indonesia by
the Population and Family Planning Board for the National Population, Family Planning
and Family Development Program.
The HS questionnaire collects data in the following area;
1) Respondent Personal Data, 5 sets of questions,
2) Household Food and Nutrition Consumption, 4 sets of questions,
3) Residence Construction and Amenities, 10 sets of questions,
4) Household Members’ Education Status, 8 sets of questions,
5) Respondent and Household Social Status, 12 sets of questions,
6) Respondent Health Status and Health Services, 7 sets of questions,
7) Household Economy, 14 sets of questions,
All questionnaires used in the field had a Consent Form front cover that provided
participants with research information and their rights as a participant. Signed copies of
the Consent Forms are held in archives by the author

127 | P a g e
6.5.2 Household Survey Implementation
The HS was conducted in two case study villages with a target of surveying 10% of
households. The HS data collection was performed by the author, one other RT
member, Moni Muskanan and three Research Assistants (RAs) in Pepela, and by the
author, Moni Muskanan and two RAs in Landu Thei.
Selection of households for the survey was done on a random walk bases within the
villages. Respondents were surveyed mostly in front of their homes, or in close
proximity to their home. Conducting the surveys in the respondents natural setting,
surrounded by everyday life, had a two-fold advantage. Firstly the respondent was in a
familiar, relaxed environment, surrounded by spouse, children and sometimes friends
who often joined in the survey or prodded and supplemented information. Secondly the
RT members and RAs were able to make simultaneous critical observations of
household conditions and family members, many times instigating informal interviews
as a part of the survey. Extra note taking space was provided at the bottom of each
survey page, specifically for that purpose. 56 surveys were taken in Pepela and 16
surveys were taken in Landu Thie.
Very few villagers that were approached declined to be surveyed. There are a number
of possible contributing factors for this. The RT member and RAs who conducted
surveys are local NTT people who spoke the same dialect and slang and hence
developed an immediate affinity. The author, although a westerner, speaks an
advanced level of Indonesian language and has visited and stayed in the villages on a
number of previous scoping visits15, hence having history and familiarity with villagers.
This point will be elaborated on, in the findings chapter, regarding researchers who
have collected data in these villages.
47 HS were completed in Pepela, from 377 Households living in 339 houses (Kantor
Desa Pepela, 2015), 12.5% of households, 13.9% of houses.
9 HS were completed in Tanjung Pasir, from 125 Households living in 43 houses
(Kantor Desa Pepela, 2015), 7.2% of households, 20.9% of houses
16 HS were completed in Landu Thei, from 196 Households living in 106 houses
(Marten, 2017), 8.2% of households, 15.1% of houses.
15 The author has previously visited Pepela for initial observation in February 2010, December
2011, December 2012 and July 2014, and Landu in July 2014.
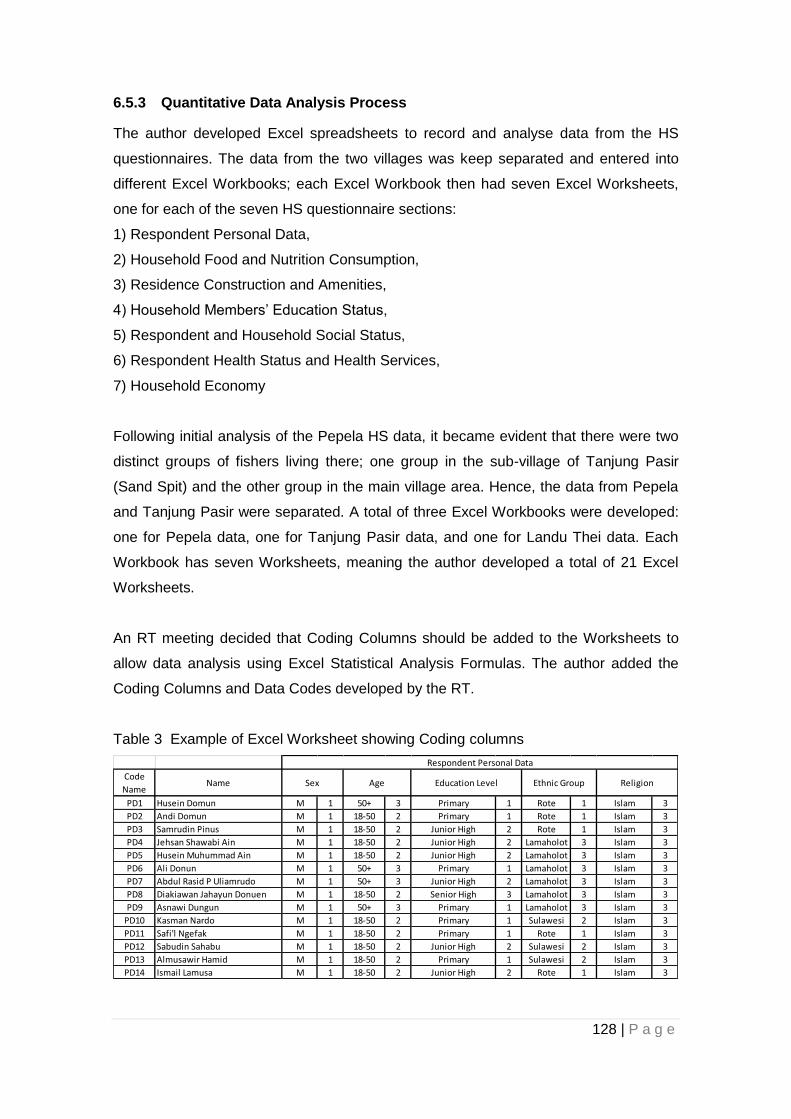
128 | P a g e
6.5.3 Quantitative Data Analysis Process
The author developed Excel spreadsheets to record and analyse data from the HS
questionnaires. The data from the two villages was keep separated and entered into
different Excel Workbooks; each Excel Workbook then had seven Excel Worksheets,
one for each of the seven HS questionnaire sections:
1) Respondent Personal Data,
2) Household Food and Nutrition Consumption,
3) Residence Construction and Amenities,
4) Household Members’ Education Status,
5) Respondent and Household Social Status,
6) Respondent Health Status and Health Services,
7) Household Economy
Following initial analysis of the Pepela HS data, it became evident that there were two
distinct groups of fishers living there; one group in the sub-village of Tanjung Pasir
(Sand Spit) and the other group in the main village area. Hence, the data from Pepela
and Tanjung Pasir were separated. A total of three Excel Workbooks were developed:
one for Pepela data, one for Tanjung Pasir data, and one for Landu Thei data. Each
Workbook has seven Worksheets, meaning the author developed a total of 21 Excel
Worksheets.
An RT meeting decided that Coding Columns should be added to the Worksheets to
allow data analysis using Excel Statistical Analysis Formulas. The author added the
Coding Columns and Data Codes developed by the RT.
Table 3 Example of Excel Worksheet showing Coding columns
Code
NameName
PD1 Husein Domun M 1 50+ 3 Primary 1 Rote 1 Islam 3
PD2 Andi Domun M 1 18-50 2 Primary 1 Rote 1 Islam 3
PD3 Samrudin Pinus M 1 18-50 2 Junior High 2 Rote 1 Islam 3
PD4 Jehsan Shawabi Ain M 1 18-50 2 Junior High 2 Lamaholot 3 Islam 3
PD5 Husein Muhummad Ain M 1 18-50 2 Junior High 2 Lamaholot 3 Islam 3
PD6 Ali Donun M 1 50+ 3 Primary 1 Lamaholot 3 Islam 3
PD7 Abdul Rasid P Uliamrudo M 1 50+ 3 Junior High 2 Lamaholot 3 Islam 3
PD8 Diakiawan Jahayun Donuen M 1 18-50 2 Senior High 3 Lamaholot 3 Islam 3
PD9 Asnawi Dungun M 1 50+ 3 Primary 1 Lamaholot 3 Islam 3
PD10 Kasman Nardo M 1 18-50 2 Primary 1 Sulawesi 2 Islam 3
PD11 Safi'l Ngefak M 1 18-50 2 Primary 1 Rote 1 Islam 3
PD12 Sabudin Sahabu M 1 18-50 2 Junior High 2 Sulawesi 2 Islam 3
PD13 Almusawir Hamid M 1 18-50 2 Primary 1 Sulawesi 2 Islam 3
PD14 Ismail Lamusa M 1 18-50 2 Junior High 2 Rote 1 Islam 3
Sex Age Ethnic GroupEducation Level Religion
Respondent Personal Data

129 | P a g e
Table 4 Example of results from statistical analysis using RT developed Data Codes
Education Level Ethnic Group Religion
Male 89% 18-50 70% Primary 37% Rote 65% Protestant 2%
Female 11% 50+ 30% Junior High 59% Sulawesi 11% Islam 98%
Senior High 4% Lamaholot 20%
50+ with Primary 50%
50+ with Junior High 50%
50+ with Senior High 0%
18-50 with Primary 28%
18-50 with Junior High 63%
18-51 with Senior High 6%
Sex Age
130 | P a g e
6.6 Qualitative Data
Qualitative data is collected by non-experimental processes that facilitate the
interpretation of quality, intensity and values of events and real life situations. The data
collected often includes written, spoken and observed expressions of time, place,
history, culture, and social and situational processes (Clough & Nutbrown, 2002). Data
collection methods closely associated with qualitative research are; literature review of
government and academic research reports, formal and informal interviews, focus
discussion groups (FDGs) and researcher observation. The aim of this type of data
collection methods is to go beyond empirical data gained in experimental research, to
contextualise a phenomenon or problem that requires understanding from the
perspectives of various stakeholders. In case study research, qualitative data can help
identify the differences and similarities among the cases studied (Evans & Gruba,
2002)
The following sections explain the qualitative data collection process relating to this
research project.
6.6.1 Formal Interviews
Formal interviews were held with 18 key informants and stakeholders. They included
the elected Head of Rote Ndao District, the Secretary of the Rote Ndao Department of
Fisheries and Marine Affairs, Heads of Villages and sub-villages, traditional fishers, and
villagers engaged in alternative livelihoods. The two interviews with government
officials were pre-arranged to be held at their official offices. However as the Head of
District was ill, three members of the RT, Fred Benu, Agus Nalle and the author, were
invited for an evening meeting at Head of District’s official home (Rumah Dinas Bupati).
Moni Muskanan and the author interviewed the Secretary of the Rote Ndao
Department of Fisheries and Marine Affairs. All other formal interviews were organized
and conducted in the villages. A request was made for an interview with the Pepela
Village Head (Kepala Desa), Muhamud Kawilarang, but because he was away from the
village at the time, an interview was not conducted.
All interviews were conducted in Indonesian language and voice recorded. Transcripts
of the interviews were written up in Excel spreadsheets in Indonesian language by an
RA and students from Universitas Nusa Cendana. The author then translated the
transcripts into English language for theme analysis and presentation in the results and
discussions chapters.

131 | P a g e
The 18 formal interviewees are listed here:
Rote Ndao District Head (Bupati): Lenard Haning,
Rote Ndao Department of Fisheries Secretary: Samuel Haning,
Pepela Village Head (Kepala Desa): Muhamud Kawilarang,
Pepela Fisher Spokesperson: Sadli Ardani,
Pepela Fishers x 2: Joksan Soh, Ahkmad Sanggaria,
Pepela Salt Farmer: Umar,
Tanjung Pasir Sub-village Head (Kepala Dusun): Mahmud Nauting,
Tanjung Pasir Fishers x 4: Hartono, Haji Nawin, Sunbanu, Jacki Dulu,
Landu Thei, Village Head (Kepala Desa): Samuel Messahk,
Landu Thei Village Secretary (Sekretaras Desa): Marten,
Landu Thei Village Leader/Sea grass farmer: Hakim,
Landu Thei Fishers x 2: Lens Mooy, Jesheskiel Henuk,
Landu Thei, Elder and historian (Maneleo): Johanas Mooy
6.6.2 Informal Interviews
As stated in the Implementation of the Household Survey section, the HS design and
method of implementation were developed specifically to facilitate Informal Interviews.
The RT members and RAs were trained to allow, and encourage, HS respondents to
elaborate on HS questions beyond empirical data answers, and to express aspirations
and needs for the future, especially for their children, the next generation. This
readiness to digress from a structured survey questionnaire helps capture the
spontaneity of engagement with participants who wish to express in more depth
emotions and felt needs of the pre-set or tangential topics.
In Pepela, 12 of the 47 HS completed provided additional rich qualitative data about
village life, livelihood strategies, and aspirations for the future, and in Landu Thei, 5 of
the 16 HS completed also provided additional rich insights. These interviews were not
voice recorded; hence there are no transcripts of the interviews. However, notes from
these conversations were recorded in the Notes Box at the bottom of each page of the
questionnaire or on its reverse side.
6.6.3 Focus Discussion Groups (FDGs)
Focus Discussion Groups (FDGs) are interviews held with a homogenous group of
people to discuss a common interest topic. They are normally groups of 6 to 12 people
brought together to openly discuss, debate and elaborate on specific topics or

132 | P a g e
behaviours and attitudes towards a specific topic (Neuman, 2008). Participants may
express ideas, causes and solutions to a common phenomenon without feeling
pressured to focus on all points as in a one on one interview (Clough & Nutbrown,
2002). FDGs also give the opportunity for researchers to cross reference empirical data
collected in surveys.
FDGs were used in this research to compliment the empirical data collected in the HS
and the opinions and needs expressed by fishers and household members in the
formal and informal interviews. There were five FDGs held in total: two FDGs in Pepela
and three FDGs in Landu Thei. There were no FDGs conducted at Tanjung Pasir
because of time constraints in the field for this research project, and numerous authors
(Stacey, 2007; Therik, 2008) have conducted research solely focused on this sub-
village of Pepela. However RT members, Moni Muskanan and the author, did interview
the Tanjung Pasir Sub-village Head and four traditional Bajo fishers.
In both Pepela and Landu Thei, RT members, Agus Nalle and the author, conducted
the Fishers FDG and the Research Chair, Fred Benu, conducted the Fishers’ Wives
FGD. An additional Youth FDG was conducted in Landu Thei by the Research Chair
and the author. All FDGs were conducted in Indonesian language. As with the formal,
the FDGs were voice recorded, transcribed to Excel spreadsheets by RAs, and then
translated into English language by the author for theme analysis.
In Pepela, the FDGs were convened under a hired marque in the front yard of Key
Informant’s house, Sadli Ardani. In Landu Thei the FDGs were convened on the front
terrace area of the Village Head’s house. All FDG participants signed a Consent Form
and a FDG Attendance Sheet before or during the FDG, and all participants received
an attendance gift of Rp50,000 (Approx. AUD$5) after the FDG. The RT also funded a
buffet lunch in each village for the participants that was prepared by the village women
and served at completion of the FDGs.
The FDGs in Pepela were held on 26 August, 2017.
14 participants attended the Fishers FDG, and
8 participants attended the Women’s FDG.
The FDGs in Landu Thei were held on 25 August, 2017.
15 participants attended the Fishers FDG,
10 participants attended the Women’s FDG, and
6 participants attended the Youth’s FDG.

133 | P a g e
6.6.4 Indicative Questions for Interviews and FDGs
In accordance with Griffith University Research Ethics Clearance requirements, the
author prepared a list of Indicative Questions to be used to guide the formal and
informal interviews and the FDGs. The RT used the list of Indicative Questions at
regular intervals during the interviews and FDGs to focus the discussion on livelihoods
for traditional fishers, and as a check list of interview discussion points. The list of
questions was developed in both Indonesian and English languages. Presented here is
the English version.
Indicative Questions for:
1) Interviews with Government and NGO officials:
1. Do traditional fishing communities come under your jurisdiction? 2. What is your role in regard to traditional fishing communities and fishermen and
their families? 3. Are there any projects that you know (Past, Present, and Future) that support/
help develop these communities and their livelihoods? 4. Have these projects been successful? Lessons learned? 5. What are the current and future goals for you organisation with regard to
traditional fishing communities, fishermen and their families? 6. Can you compare the current generation livelihood opportunities with that of a
generation ago? What have been the challenges? 7. Do you think the next generation have different livelihood aspirations to their
parents? 8. What is needed for the next generation to achieve their goals? 9. How will the current generation provide for the next generation to achieve their
livelihood aspirations? What will be the challenges? 10. How do you think we can measure livelihood improvements in traditional fishing
communities?
2) Interviews and Focus Group Discussions in Traditional Fishing Community (Questions were modified depending on the group involved):
1. Are you happy with your livelihood? Is your family happy? 2. What do you and your family need for an acceptable life standard? 3. What challenges are there for this standard of living and a stable income?
(Government, economic, environmental, social, cultural) 4. Have there been any Government or NGO projects now or in the past to help
you with better more stable livelihood? Lessons learned? 5. Can you compare your generation’s livelihood opportunities with that of
previous generations? What have been the differences in challenges? 6. Do you think the next generation have different livelihood aspirations to your
generation? 7. What are the next generation’s needs to achieve their goals? 8. How will your generation provide the next generation’s needs to achieve their
livelihood aspirations? What will be the challenges? 9. Do you think there need to be changes in your livelihood strategies to better
provide for your family?

134 | P a g e
10. What changes can you do yourself for a sustainable livelihood: can you name some small project ideas: for your household, for your neighbourhood, for your community?
11. How can the Government or NGOs be lobbied to do more livelihood development projects?
12. How do you think we can measure livelihood improvements in your traditional fishing community?
6.6.5 Researcher Observation
Participant observation is a form of ethnography (Neuman, 2008). In qualitative
research, participant observation and informal interviews are seen as data collection
methods that allow the researcher to get closer to the people they were investigating
without imposing conceptual frameworks on them (Bryman, 1988). In general,
participant observation is critically looking, looking for something, looking for things we
know, and looking for things we don’t know. It is looking for information (Clough &
Nutbrown, 2002). Participant observation provides initial insights and speculations that
can lead to better understanding of phenomenon and hence hypotheses (Bryman,
1988).
When in the field, the RT members and RAs were asked to note observations of
sameness or difference, and to use these observations to guide and extend inquiry
particularly in relation to household welfare and livelihood strategy; for example,
chickens or goats near a home triggered questions about additional income from
domestically breeding small farm animals. Observations were noted by the RT
members and RAs in the provided boxes on HS Questionnaires or in field note pads
during interviews, FDGs or during movements around the villages. Additionally the
author kept a daily Research Journal of the research progress, village events,
observations and early hypothesising and theorising, during the research development
and field research stages.
Observations of non-verbal language for example; happiness, displeasure, disinterest,
anxiety, despair, hope and aspirations, were of particular interest to the author. Non-
verbal language displayed by participants and informants lead to extended inquiry, a
deeper understanding of expressed needs at the micro level and the realisation of the
existence of intra and intergroup tensions.
6.6.6 Qualitative Data Analysis Process
The author used a Grounded Theory (Glaser & Strauss, 1967) style approach to

135 | P a g e
analysis the qualitative data lifted from the interviews and FDGs conducted in the two
study sites. Neuman (2008) says that grounded theory pursues generalisations by
compariing social situations. He adds that some social researchers, instead of
developing new theory through a pure Grouned Theory approach, analyse qualiative
data about micro level events and situations and connects them with marco level social
forces to reconstruct existing theory to inform about about the micro level (Neuman,
2008).
Qualitative researchers analyse qualitative data by a process called coding. Coding
requires organising the raw data into batches of data that support or express distinct
concepts, often called codes. Neuman (2008, p. 460) says that coding combines two
activities, “mechanical data reduction and analytical categorisation of data”. Strauss
(1987) proclaimed that qualitative data coding involves three stages; Open Coding,
Axial Coding, and Selective Coding. Open Coding happens during the first read of the
data collected by interviews surveys or observation, and seeks to understand this data
by applying initial real world categories and concepts that groups the data under
explanatory headings or codes. The second stage, Axial Coding, critically inspects the
initial Codes used by the research data analyst during the Open Coding stage to
rename, reorder, expand, contract, divide or combine the codes so that they more
closely reflect and interact with the raw data. Having critically reconfigured the Codes
during the Axial Coding process, the researcher, through the Selective Coding stage
seeks to rise above the raw, mundane data to generalise across studies to theorise
about the commonality or differences among phenomena, events, causes and
consequences (Neuman, 2008).The data analysis process that the author used aligns
closely with the three part process described here.
The author investigated the use of NVIVO software to aid with qualitative data analysis
by attending NVIVO training workshops hosted by Griffith University. However,
because this research project did not have large numbers of interviews and FDGs to
code and analysis it was decided to use spreadsheet software as the tool to aid
analysis. The process of analysis was as follows. As stated in an earlier section, all the
Formal Interviews and FDGs were conducted in Indonesian language and voice
recorded. The interviews and FDGs were transcribed to Excel spreadsheets in
Indonesian language by an RA and students from Universitas Nusa Cendana. The
author then translated the transcripts into English language in the next column of the
Excel spreadsheet, for theme analysis and presentation in the results and discussions
chapters.

136 | P a g e
The first stage of analysis, Open Coding, required a division between interviews with
government and village officials, and the interviews and FDGs with fishers, women’s
groups and village youth. For the latter group, the Codes that surfaced on the first pass
were real world codes and produced headings closely aligned with the HS
questionnaire survey such as, Food and Nutrition, Education, Health and Current
Livelihood. Other codes such as History, Alternative Livelihoods, Seagrass farming,
Hopelessness and Government Aid were progressively added. Hence the Axial Coding
actually started during the first pass in the Open Coding stage. For the former group,
the Government and Village Officials, Codes that surfaced during Open Coding were
Education, Village Current Livelihoods, Alternative Livelihoods, Seagrass farming,
Government Aid, and Modernisation. During this Open Coding stage, the codes that
surfaced for the two different groups were in parallel except for a few codes such as
modernisation and hopelessness.
The Axial Coding stage required, both looking forward to the Selective Coding stage,
and looking back to the Open Coding. This thought process was to marry the research
aim and research questions with relevant data elicited during the interviews, FDGs and
researcher observation. Some codes were brought forward from the Open Coding
stage and several codes evolved from the backward and forward thought process.
Themes and codes that evolved were chosen because they promoted generalising
about commonalities and differences that were exposed in the study sites during the
data collection process. The data suggested commonalities and differences in the
perspectives of the villagers regarding, Education, Alternative Livelihoods,
Modernisation, Pessimism for the future, Groupism, and Intergroup conflict.
For the author, the Selective Coding stage facilitated the emergence of commonalities,
such as insights into the perspectives of the villagers, the micro level, as they viewed
modernisation, government aid and development projects, the macro level. Differences
that emerged were in relation to their perspectives on education and alternative
livelihoods for the next generation. The commonalities and differences in these
perspectives are discussed in the results chapter. The commonalities expose the micro
level perspective of the macro level, and the differences expose ethnic and cultural
diversities between villages located in close proximity to each other.

137 | P a g e
Table 5 Data Collection Summary
Key Informant/ Stakeholders
In-depth Interviews
Informal Interviews
Focus Discussion Groups
Observation and document analysis
Head of District Rote Ndao, Dept. of Fisheries officials, Village Heads, Academics and Researchers
Livelihood past activities, Lessons learned, Current Status, Future plans, Normative Need.
As per In-depth interviews.
Demographic Statistics, Livelihood and Aid projects, Government Reports and Annual Statistics Legislation outcomes
Traditional Fishers Livelihood past activities, Lessons learned, Current Status, Future plans, FRESH, Felt Need.
As per In-depth interviews.
Livelihood past activities, Lessons learned, Current Status. Future plans- FRESH Felt Need.
Livelihood status and Aid projects, Cultural norms, Expressed and Comparative Need
Women’s Groups Livelihood past activities, Lessons learned, Current Status, Future plans, FRESH, Felt Need.
Livelihood past activities, Lessons learned, Current Status, Future plans, FRESH, Felt Need.
Livelihood status and Aid projects, Cultural norms, Expressed and Comparative Need
Youth (Next Generation)
Edu standard, Future aspirations,- FRESH Felt Need
Edu standard, Future aspirations,- FRESH Felt Need
Expressed and Comparative Need

138 | P a g e
6.7 Ethical Issues
“Many ethical issues involve a balance between two values: the pursuit of scientific
knowledge and the rights of those being studied or of others in society. Potential
benefits – such as advancing understanding of social life, improving decision making, or
helping research participants - must be weighed against potential costs – such as loss
of dignity, self-esteem, privacy, or democratic freedoms” (Neuman, 2008, p. 129).
The ethical issues are the concerns, dilemmas and conflicts that arise over the proper
way to conduct research.
Newman (2006) lists;
Scientific Misconduct - Research Fraud,
Unethical but Legal – Power, Ethical Issues Involving Research Participants,
Origin of Research Participant Protection,
Physical Harm, Psychological Abuse, and Legal Jeopardy,
Deception,
Informed Consent,
Covert Observation,
Special Populations and New Inequalities,
Privacy, Anonymity, and Confidentiality,
Participants’ Information as Private Property,
Mandated Protection of Research Participant
As this research project spans a number of social science research paradigms and a
variety of research methods facilitating government department level through to village
level data collection, there are a number of research ethical issues to be considered.
As opposed to natural science research which normally only utilise a normative and
positivists approach, this research project also employs Interpretive and Critical
approaches through researcher observation and participation (Clough & Nutbrown,
2002).
All research projects are subject to the obligations of the first five issues mentioned by
Newman above (Neuman, 2008). Covert Observation, Special Populations and New
Inequalities are not concerns for this project.
The remaining issues of Informed Consent, Privacy, Anonymity, and Confidentiality,

139 | P a g e
Participants’ Information as Private Property, and Mandated Protection of Research
Participants will be maintained and participants will be given a choice, or not to be
involved in interviews and focus discussion groups.
All participants will be fully informed of the research aims and objects prior to
participation and they will be asked to sign an Informed Consent Form as stipulated by
the Griffith University Ethics Committee. A Consent Form was attached to the front
cover of the HS questionnaires which all respondents signed on completion of the
survey, and all participants of FDGs signed a Consent Form and an FDG Attendance.
Interviewees were also asked for permission to voice record the interviews and were
also asked to sign Consent Forms. A copy of the Consent Form and FDG Attendance
Form are attached as Appendices.
Ethical Clearance was received from the Griffith University Ethics Committee also
attached in the Appendices (see Appendix IV).

140 | P a g e
PART 3: RESULTS and DISCUSSION

141 | P a g e
Rote Ndao Government Report and Published Paper Chapter 7

142 | P a g e
7.1 Introduction
This chapter presents results from the research in the form of two chapters extracted
from a research report to the District Government of Rote Ndao, and a research paper
published in the American Journal of Agriculture and Biological Science. Section 7.2
Pepela Results and Section 7.3 Landu Results are the two chapters extracted from the
government report and Section 7.4 AJABS Published Paper: “Traditional Fishermen in
Rote Island: Alternative Livelihood to Illegal Fishing Activities in the Indonesian-
Australian Transboundary Waters” is the journal paper replicated in its entirety.
In tandem, Sections 7.2, 7.3 and 7.4, present much of the quantitative data collected
via the research Household Survey, in the three case study villages, and from the
Provincial and District government Bureau of Statistics. The data presented includes
demographic and occupation statistics, income and expenditure data, education and
health status, and social capital and gender equity patterns. The three sections also
discuss alternative livelihood opportunities, for the future, in the three villages; as such,
the three sections also contribute to the discussion and recommendations chapter of
this thesis.
Because of the nature of the two papers and their different audiences, each section
puts its own conclusion and there is an amount of repetition of background information
and research results data between Sections 7.2 and 7.3 and Section 7.4. This may
also be the case with other sections of this thesis.
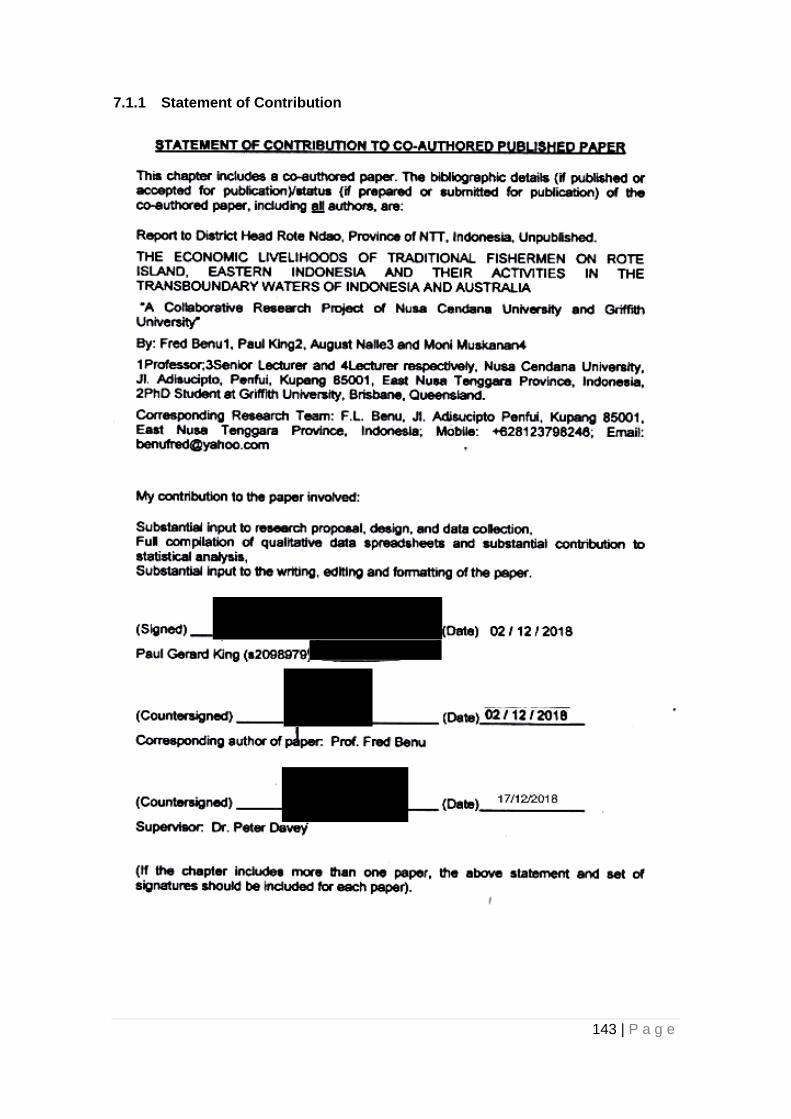
143 | P a g e
7.1.1 Statement of Contribution

144 | P a g e
7.2 Pepela Results
7.2.1 Socio Economic Background
Papela is one of the traditional fishing villages in the eastern part of Rote Island.
This village, Papela, consists of 4 Dusun (sub-villages) namely Tanjung Pasir, Tasisu,
Analaso and Manulalulean. Based on the secondary data published by the local
government, this village has 502 households. According to Government's classification,
53 households out of the 502 households have an economic status of pre-welfare. This
figure shows that about 89 % of the population is living under the poverty line. Most of
the poor people are living in Tanjung Pasir and Tasisu sub-villages. It should be noted
also that people living in Tanjung Pasir are ethnically Bajo and Bugis people and their
main economic activity is fishing. Fishermen from Tanjung Pasir are actually the main
actors involved in fishing in the Australian territorial waters based on the 1974 MoU
agreement between the Indonesian and Australian governments (see Appendix VII and
VIII).It is easy to understood that fishing is one of the economic livelihood activities for
these poor local people. The reason for the local people who live in this sub-village
becoming fishermen is that they follow their ancestral income activities from a culturally
inherited background. Additionally, from a logical economic framework perspective,
fishing is the only economic activity conducted by these local people as there is no
alternative economic livelihood activity that they can engage in that is supported by
these culturally inherited skills set (Benu, et al., 2017).
The Bajo and Bugis ethnic groups are actually from Sulawesi, the Bajo from
Southeast Sulawesi, near the Buton and Tukang Besi island groups, and the Bugis
from the Makassar area in South Sulawesi. Over the last few centuries, some of these
people seasonally migrate to Papela, on Rote Island, to engage in fishing activities as
outsiders, while others are now permanent residents living in the small sub-village of
Tanjung Pasir. Those who have taken up permanent residency now consider
themselves as Rotenese and live in relative harmony with the original people as
neighbours creating a multi-ethnic group society. The Bugis and Bajo people are skilful
fishermen as they have a lot of experience with both traditional as well as modern
fishing techniques. This knowledge has been transferred to the local people over many
years. Based on this transfer of knowledge, there are many local fishermen who are
also engaged in fishing activities with various techniques for their livelihood strategy.
Some of the local fishermen have also been fishing in the transboundary waters near
the Indonesian-Australian maritime border for many years.
Table 6 shows the Welfare Status of the households in the four sub-villages in
Papela including a male-female breakdown of the village population.

145 | P a g e
Table 6 Distribution of Population, Number of Households and Gender in Papela, 2016
No.
Dusun
Households
Poor House holds
Pre -Welfare
Households
Population Total
Men Women
1 Tanjung 125 122 3 292 276 568
2 Tasisu 138 123 15 249 251 500
3 Anlaso 107 85 22 214 204 418
4 Manulalulen 132 119 13 273 276 549
Total 502 449 53 1028 1007 2035
Source: BPMD, Rote Ndao, 2016
Secondary data shows that the main economic activity for livelihood of the
people live in this village is fishing, where more than 74 % of the people work as
fishermen. Other economic activities are farming (7.18 %), Informal Sector (4.4 %) and
public servant (8.64 %).
Figure 9 Distribution of economic sector for livelihoods in Papela, 2016
Most of the fishermen in Papela are now practising a traditional fishing
technique using small boats and limited fishing equipment. Some basic equipment they
usually use for fishing are small nets and hand lines. Many of them also utilise semi-
modern fishing practices with a variety of modern equipment. However, because of a
lack of capital, they have little opportunity to buy the modern equipment available to
those in a better financial position. Hence, these fishermen usually work for a boat
owner that they call the "Boss". The Boss with an abundance of capital equips some of
his vessels with radios, geographic positioning systems (GPS), some semi-modern
fishing equipment including larger nets and ice bins to preserve their catch. The Boss
74.55%
7.18%
4.40%
1.14% 10.93% 0.82% 0.98%
Fisher
Farmer
Informal Sector
Businessman
Civil Servant
Craftsman
Other

146 | P a g e
even provides cash and supplies for the traditional fishermen for when they go close to
Australian territorial waters.
There are at least two local Bosses living in Papela, while some other Bosses
live in Kupang, the capital city of East Nusa Tenggara Province, in West Timor. Based
on the information gathered from in-depth interviews with local fishermen and the
Bosses, we know that both parties agree to collaborate in this business based on a
common agreement. The Boss will provide all fishing equipment including a large
vessel, fuel, supplies (food, water, coffee, sugar, cigarette, milk, etc.) for at least one
week, and, in fact, also lends some money for daily consumption for the fishermen’s
families while they are offshore for fishing. At the same time, local fishermen also agree
that the proceeds from the sale of catch during the fishing trip such as fish, sea
cucumber, shark fin, plus any other consumable or saleable species will be shared into
three parts. The first part (one third out of the total proceeds) will be allocated to the
owner (the Boss) of the vessel as well as all fishing equipment. The second part
(another one third out of the total proceeds) will be allocated for the supplies provider
(the Boss) and the third part (the last one third out of the total proceeds) will be divided
among all the crew after having deducted all operational cost that have been provided
by the Boss.
Photo 3 Early morning at Pepela Jetty (Photo Paul G King)

147 | P a g e
Photo 4 Preparation for offshore fishing by traditional fishermen in Papela (Photo Paul G King)
Sugi, one of the local Bosses in Papela, explained that the agreement is an
informal agreement based on a common practice used by the local people for many
years. However, this common practice and agreement actually puts the traditional
fishermen as an inferior party in the negotiations for sharing the proceeds of the fishing
trip with the Boss. From that agreement, it can be understood that the Boss will actually
get two thirds of the proceeds, and the crew will get only one third of the proceeds.
Even then, that portion will be shared among all the crew. Usually there are 3 to 4
fishermen who join the vessel for the voyage including the captain. Indeed, the
agreement also puts the crew (traditional fishermen) as the big risk takers, as they
have to face the sometimes dangerous weather conditions. In the event of poor catch
results, because of bad weather conditions, the proceeds are used up covering the
cost of supplies and the cost of fuel. As the cost of daily consumption of the
fishermen’s families during the boat’s time at sea is often financed by the Boss, this
money needs to be refunded as well. Hence, there can be a large debt for the crew that
will be collected by the Boss after the next profitable fishing voyage.
If we try to figure out the condition of traditional fishermen living in the Tanjung
Pasir Dusun, Papela, then we can identify that all of these Bajonese / Bugisnese
people are really living in poverty. Almost all of these fishermen regularly go fishing
close to the transboundary waters between Indonesia and Australia and also into the

148 | P a g e
designated MoU Box. The Boss will provide a large vessel and more complete fishing
equipment.
The houses of the Bajo and Bugis fishers are dominantly a temporary stage
house with wooden floors and wooden walls. They are living in dirty conditions with
poor sanitation, sometimes two or three families living together in the one house with
no bedroom, one emergency bathroom and all children and parents sleeping together
in a big open room. The level of education in Tanjung Pasir is the lowest compared to
the other dusuns. Another indicator that might be used to verify the poverty conditions
in Tanjung Pasir is the number of motor vehicles owned by the inhabitants. There are
only 24 units of motorbikes owned by the 568 people living in Tanjung Pasir. There are
no other vehicle assets owned by them, except for traditional boats and public vehicles
for transportation and mobilisation.
Table 7 Number of Vehicles owned by the inhabitants of Papela
Dusun Type of Vehicles
Motorbike Car Truck
Tanjung Pasir 24 - -
Tasisu 123 7 2
Anlaso 145 8 4
Manulalulean 76 - -
Total 368 15 6
Source: BPMD, Rote Ndao, 2016
Photo 5 Living in poverty, Bajonese / Bugisnese community in Papela (Photo Fred Benu)

149 | P a g e
There are only two people with a high level of education and 25 people with a
medium level among the 568 people living in Tanjung Pasir (see Figure 10). When we
asked about the importance of education for children, many of the respondents said
that it is important for children to have education, but only for elementary school and
maybe a middle education level such as Junior or Senior High school, depending on
enough money to pay. The most important thing is that their children can read and
write, which is generally enough for the parents. Then the children are required to help
their parents to earn money for daily living. The boys often work for the Boss, the same
as their parents are doing, and the girls usually help their mother doing daily house
activities and preparing for marriage still teenagers.
Source: Source: BPMD, Rote Ndao, 2016
Figure 10 Distribution of the level of education of people in Tanjung, 2016
If we analyse this situation, then we can understand that there is no alternative
livelihood for the local people living in Papela, especially those living in Tanjung Pasir.
The only economic activity for their livelihood is fishing. Allowing the young generation
to only have the choice of becoming a fisherman is akin to putting them in the same
poverty trap as their parents. To alleviate this problem, education for the children to
reach a higher level of formal education is important to provide them with enough
knowledge and skills, and to prepare them for alternative economic activities to have a
better future. A higher level of education also will open the gate for the younger
generation to find alternative livelihoods outside of their own village, such as in Kupang
or in Bali or Java. Education is a strategic approach to overcome the problems of
poverty facing the local people in Papela and at the same time being a long term
strategic approach to overcome the problem of illegal fishing in Australian waters.
77.50%
15.00% 6.94% 0.56%
Primary
Yunior High School
Senior High School
University

150 | P a g e
Regarding the poverty trap faced by the people of Papela, we learnt from the
information gathered during the women’s Focus Discussion Group (FDG) that the
income from offshore fishing, by their husbands close to and inside the Australian
Economic Zone, is not enough to cover their living costs. In fact, sometimes they need
to borrow money from the Boss because of the insufficient income received from their
husbands’ offshore fishing voyages resulting in additional debt also collected by the
Boss after the next fishing trip, or at least be accounted for as a part of the next sharing
of proceeds between the Boss and the crew. In a normal situation, each housewife
would receive Rp.1 million up to Rp.1.5 million on average for every fishing trip. This
income will be allocated for daily consumption, health, education, social spending, as
well as other living costs. In some cases, housewives need to solve the problem of
limited income by doing secondary jobs such as fish traders, stall keepers, and small
snack sales. These part-time jobs can actually create enough extra income for the
families to overcome the problem of inconsistent and limited incomes from their
husbands’ fishing voyages.
Table 8 The Average of major spending for a family with four children
No. Items Monthly
Spending (Rp)
Yearly spending
(Rp.)
Percentage
(%)
1 Daily consumption 1.500.000 18.000.000 45.99
2 Coffee, sugar and milk 100.000 1. 200.000 3.07
3 Health 17.000 200.000 0.51
4 Education including lunch
snack for children
500.000 6.000.000 15.33
5 Donation for local Mosque
or Church
20.000 240.000 0.61
6 Social (Marriage/Death) 167.000 2.000.000 5.10
7 Cigarettes 500.000 6.000.000 15.33
8 Electricity and water 250.000 3.000.000 7.66
9 Others 200.000 2.500.000 6.39
Total 3.254.000 39.140.000 100
Source: FGD with women Group, Papela

151 | P a g e
In normal weather conditions, fishermen will make three fishing trips every month in the
period from April until October. This means that the local fishermen working for a Boss
will earn an average of Rp 3 million per month. The average family's major spending
every month is described in Table 8. It can be concluded from the average expenses
outlined in Table 8 that in a normal month (good weather condition, etc.) the income
earned from fishing activities has actually been allocated for various family economic
and social purposes with not enough money to set aside savings. Almost half of the
family’s income (50%) is allocated for daily consumption (including additional food and
drink such as coffee, sugar and milk).
Data gathered from the household survey shows that 98 % of the people
surveyed consume rice as their main staple food. The data also shows that all of the
families usually have additional food (such as meat, vegetable, fish, etc.) as a part of
their daily consumption (see Table 9).
Source: Primary data Analysis Figure 11 Percentage of Additional Daily Consumption for the Family in Papela
Table 9 Distribution of Additional Food Consumption for the families in Papela
Additional
Food
Frequency
Fish Vegetable Meat Eggs Fruit
%
Daily 79 55 0 0 2
1-2/Week 19 40 4 38 2
1-2/Month 0 2 15 13 9
Infrequent 0 0 36 15 5
Source: Primary Data Analysis
3 Added Foods 30%
5 Added Foods 13%
2 Added Foods 43%
4 Added Foods 14%
Number of Additional Foods for Daily Consumption

152 | P a g e
Table 9 indicates the type of additional food consumption and the consumption
frequency, i.e. is daily, weekly or monthly consumption by the families in Papela, based
on the analysis of the household survey data collected.
Other major expense items are cigarettes and children education costs (roughly
15 % for each item). When we investigate the amount of income spending by category
based on the amount of money spent and the product purchased, it can be seen that
cigarettes have the same spend as children’s education. It can be reasoned that
spending on cigarettes is actually a misuse of spending power for poor people as it has
no productive outcome. Smoking is discretionary spending that people should reduce,
or even delete from their list of income spending by changing their behaviour.
A survey conducted by U.S. Census Bureau in 2014 (Health Equity, 2017)
shows that people living below the poverty level and people having lower levels of
educational attainment have higher rates of cigarette smoking than the general
population. At the same time, a survey conducted by Hu, et al. (2004) in China found
that, reducing expenditure on cigarettes could release household resources to spend
on food, housing, and other goods that improve living standards. Liu, et al. (2006) in
their research “Cigarette smoking and Poverty in China” found in their research that the
excessive medical spending attributable to smoking may have caused the poverty rate
to increase by 1.5% for the urban population and by 0.7% for the rural population.
In reality, each fishermen's family should have enough savings to accommodate
important spending such as; education for children especially when they aspire to
continue their education at university, improving and/or renewing their productive and
non-productive asset, and other emergency spending. However, during the months of
November to March when weather conditions during the wet season can quickly
deteriorate, the economic condition of a fishermen's family can also quickly deteriorate.
Because of a lack of income, there are many children in Papela who only
receive a maximum of 12 years of formal education, finishing after senior high school.
Some of these children, especially those living in Tanjung Pasir, only have 6 years of
formal education up to Junior High School. To date, less than 10 children from Papela
have continue their education to university level. Based on Household Survey data that
was collected in Papela, there are only 4 % of the population that have completed
Senior High School. 37 % of the population have completed a primary school education
and 59 % have graduated from Junior High School.

153 | P a g e
Source: Primary data Analysis
Figure 12 Education Level of the People in Papela
Some of the children from the village who have graduated from university have
already found employment outside of the fisheries sector. They have obtained jobs in
some formal sectors such as education, the government sector, and the private sector
in Kupang and Java. These achievements have motivated other members of the
younger generation in the village to continue their studies through to university level.
However, many households still have the problem with meeting the costs of education.
Hasni, one of fishers’ wives present at the FGD mentioned that "there are many
children who have graduated from Senior High School who want to continue their
studies at university, but they have a problem with the cost of attending university that
can't be covered by their parent".
7.2.2 Social Capital
Social capital is another important factor in community development and
attempts to overcome poverty in small remote villages such as the subject of this
research. The World Bank defines social capital as ”the norms and networks that
enable collective action. It refers to the institutions, relationships and norms that shape
the quality and quantity of a society’s social interactions” (Beugelsdijk & van Schaik,
2005, p. 302). Social capital is not just the sum of the institutions which underpin a
society – it is the glue that holds them together (Fine, 2001).
The household surveys and interviews conducted in this research project gave
insight into the level of social capital that exists in Papela. The data that was collected
indicates the percentage of the Papela population who are engaged with community
institutions or organizations. Table 10 also shows the level of social capital within the
households. This knowledge is important when planning participatory poverty
Primary School, 37%
Junior High School, 59%
Senior High School, 4%
Primary School Junior High School Senior High School

154 | P a g e
alleviation projects. Measuring a communities’ level of communication and interaction
helps identify existing institutions that may serve as agents for projects, and also
identifies any cultural norms that may influence project implementation.
Table 10 Community Involvement in Papela
Involved in community
Organization
Active Group Membership
Extended Family Activities
Donation to Activities
Yes 38 % Active 63 % Yes 98 % Yes 96 %
No 62 % Passive 38 % No 2 % No 4 %
Source: Primary Data Analysis
Table 10 indicates the levels of involvement in community activities outside of
their household by Papela respondents. While 98% of the population is regularly
involved in extended family activities, only 38% are involved in formal community
organizations. However 63% are active in some form of group activity outside of their
household.
Table 11 Household Internal Communication
Frequency of family
Communication
Topic of Communication
LHS No. of Topic
Seldom 26 % 1 9 %
Often 28 % 2 17 %
Always 70 % 3 49 %
4 26 %
Source: Primary Data Analysis
Table 11 shows that, internally, 70% of households “Always” discuss various
topics of interest. Economics and education are the most frequently discussed topics
inside the house; economics meaning household finances. For the Papela community,
data reported in Table 12 shows that, while women dominate the household decision
making for the children’s education, household activities and secondary income
activities, in Papela 80% of households make shared financial decisions. Women
dominate most decision making because often the men are at sea when the decisions
need to be made.

155 | P a g e
Table 12 Decision making in Papela
Status
Family Decision Maker
Family
Finances
Main
Income
Education Home Seagrass Fishing Additional
Income
Father 4% 100% 16% 2% 75% 100% 21%
Mother 15% 0% 58% 66% 25% 0% 79%
Shared 80% 0% 26% 32% 0% 0% 0%
Source: Primary Data Analysis
For the small neighbourhood of Tanjung Pasir, the data indicate different
results. Involvement in community activities is higher at 56%, but involvement in
extended family activities is lower at 78%. This may be because many of the fishermen
from Tanjung Pasir are originally from Southeast Sulawesi and live remote from their
extended families. Data also show that household communication is less frequent for
households in Tanjung Pasir and that education is not an important conversation topic
as in other neighbourhoods in Papela. Household economics is the dominate topic of
conversation in Tanjung Pasir. Table 13, regarding decision making in Tanjung Pasir,
shows that decision making is only shared in 11% of households. There is demarcation
in decision making in Tanjung Pasir; men dominate the decisions on the major income
activities with little or no input to decision making on the children’s education or
household activities. Men are not involved in the day to day running of the house
except for providing the majority of household income. This could be in response to the
fishermen spending longer periods of time at sea, up to one month. Hence, the
Tanjung Pasir fishermen are not engaged in household activities as much as their
Papela counterparts.
Table 13 Decision Making in Tanjung Pasir
Status
Family Decision Maker
Family
Finances
Main
Income Education Home Seagrass Fishing
Additional
Income
Father 33% 100% 0% 0% 50% 100% 0%
Mother 56% 0% 100% 100% 13% 0% 100%
Shared 11% 0% 0% 0% 38% 0% 0%
Source: Primary Data Analysis

156 | P a g e
Although Tanjung Pasir is actually a neighbourhood (Dusun) of Papela, it is a
community with different expressions of social capital because of different ethnic and
cultural backgrounds and a different purpose for them residing in Papela. This point is
demonstrated by the fact that although both communities originate from outside of
Rote, the households of Papela have been there for more than one generation and
now consider themselves as Rotenese. The households of Tanjung Pasir are a more
transient community and still consider themselves as being from Sulawesi with strong
linkages back to extended families there. Hence any poverty alleviation projects to be
run in Papela may need to consider different approaches depending on which
neighbourhood group is the focus of the project.
7.2.3 Welfare Status
As mentioned in the previous section, the description of welfare in Papela was
analysed based on welfare classifications outlined by BKKBN (BKKBN, 2014). These
classifications are based on a range of indicators regarding social, economy, cultural,
as well as family planning categories. There are 12 indicators for the classification of
welfare status of the family according to BKKBN. These include religion, food, clothing,
housing, health, education, family planning, saving, interaction in the family, interaction
in the community, source of information, and their role in the community. However, in
this analysis, the category of family planning is assumed given because the analysis is
reporting on socio-economic and cultural aspects only. All the indicators were used to
categorize a particular family in one of five categories of welfare status, namely: (i) Pre-
Welfare; (ii) Welfare I; (iii) Welfare II; (iv) Welfare III; and (v) Welfare III Plus (BKKBN,
2014).
Fifty-six respondents were randomly selected from the families in Papela to be
interviewed about their livelihoods. Based on the analysis, 71.43 % of families in
Papela are categorized with the status of "Welfare III". The interpretation of the welfare
status as "Welfare III” is that the family can fulfil all the indicators of welfare including (i)
having meals twice or more in a day, (ii) Different clothing (for work, casual, and home
clothes), (iii) have a comfortable house (with permanent roof, floor and wall), (iv) all
family members have access to health facilities, (v) all the children between 7 - 15
years have access to education facilities, (vi) all the members of the family can carry
out worship according to their religion, (vii) Having a meal with meat/egg/ fish once a
week, (viii) having one new piece of clothing once a year for each family member; (ix)
the floor area of the house at least 8 M2; (x) all the members of the family have
remained healthy in the last 3 months; (xi) at least one of the members of the family

157 | P a g e
has a permanent job for income generation; (xii) all the members of the family between
10-60 years can read and write; (xiii) family members always try to improve the quality
of their spiritual life, (xiv) some income is allocated for saving; (xv) having dinner or
lunch together at least once a week for building communication; (xvi) participate in the
community’s agendas; and (xvii) having access to information from
newspaper/magazine/radio/TV (BKKBN, 2014).
At the same time, there are only 17.85 % out of the total number of families who
are categorised as "Pre-Welfare" and the rest 10.71 % are categorized as a "Welfare
II" family. The families with a status of "Welfare II" can't fulfil five indicators of welfare
including (i) Family members always try to improve the quality of their spiritual life, (ii)
Some income is allocated for saving; (iii) Having dinner or lunch together at least once
a week for building communication; (iv) Participate in the community’s agendas; and (v)
having access to information from newspaper/magazine/radio/TV (BKKBN, 2014).
The families with a status of Pre-Welfare can't fulfil twelve indicators of welfare
including (i) all the members of the family can carry out worship according to their
religion, (ii) having a meal with meat/egg/ fish once a week, (iii) having one new piece
of clothing once a year for each family member; (iv) the floor area of the house at least
8 M2; (v) all the members of the family remained healthy in the last 3 months; (vi) At
least one of the members of the family has a permanent job for income generation; (vii)
All the members of the family between 10-60 years can read and write; (viii) Family
members always try to improve the quality of their spiritual life, (ix) Some income is
allocated for savings; (x) Having dinner or lunch together at least once a week for
building communication; (xi) Participate in the community’s agendas; and (xii) having
access to information from newspaper/magazine/radio/TV (BKKBN, 2014).
It can be understood that based on the classification of welfare by BKKBN,
many of the families who live in Papela are categorized as family with "Enough
Welfare" (71 % Welfare III), because they can fulfil many of the indicators of welfare
developed by BKKBN. However, It should be noted as well that not all of indicators are
economic indicators, such as the indicators for carrying out worship according to their
religion, staying healthy in the last 3 months, members of the family can read and write,
family members always try to improve the quality of their spiritual life, having dinner or
lunch together, participate in the community’s agendas, and having access to local,
national and global news and information from newspapers/magazines/radio/TV. All of
these non-economic indicators are easy to be fulfilled, but the indicators concerning
household economics are generally more difficult to be fulfilled. The indicators of
household economics such as $1.90 per capita income/day (World Bank, 2018) or

158 | P a g e
2100 calories of consumption per capita/day (The Central Bureau of Statistic of
Indonesia) are the most accepted indicators of poverty. Hence, welfare status of the
family according to BKKBN classifications is more vulnerable in the long run, especially
when there is an unexpected shock in economic indicators. It could be deduced from
the previous classification of poverty according to the economic indicators (Table 6),
that almost 90 % of the households in Papela are poor and the rest of the households
(about 10 %) are a pre-welfare family.
7.2.4 Gender Issues
As a patriarchal community, people in Papela defer decision making in the
family and community to the men. As the head of the household, the man always
makes the important decisions including household income (whether they have to
borrow money from the Boss or not), the children’s education, children’s marriage,
social engagement, plus other family decisions. Also men will decide on how long they
should go for offshore fishing and at the end, they will decide on the amount of money
that they should give to the family. Indeed, it is the man who has the responsibility to
make a living for the family, but they also skim 15 - 20 % of the total income for their
own purposes such as cigarettes, coffee and the cost of mobile phone credit. The
women in Papela also accept the status quo concerning the role of their husband in the
family and community. Umi, one of the fishermen’s wives mentioned in the FGD
process that "the husband, as the head of household will decide the future of their
children including education and marriage, because they have the responsibility to
make a living".
However, women as housewives also have an important role in decision
making. Women will make decisions about daily spending for consumption, allocation
of income for other purposes including, household necessities, and the children’s daily
food consumption at home and at school, school uniforms and clothing and other
expenditures. Women also will normally decide on the number of children they should
have, and in some cases, women will decide about whether to do, or not to do, part
time activities for additional income.
The status of men is culturally seen as more superior to woman, and in some
cases parents also put boys as the first consideration in family decision making. The
reason being that from their cultural perspective, boys will take the legacy of the family
and the responsibility to provide income for the family. While, parents feel that their
responsibility to girls is to provide them with enough education until they become
mature teenagers and are ready for marriage. From then the girls will be married and
under someone else’s care. Accordingly, parents give serious consideration before

159 | P a g e
making decisions to spend money on the girls’ education and other aspirations for the
future. However, when asked about the equity between girls and boys, parents always
say that they are treated equally.
As supported by this research, in a patriarchal community immersed in poverty,
such as in Papela, women are always more vulnerable than men. Poverty has a close
correlation with the issue of gender. In 2014, The Centre for Poverty Research,
University of California, published research findings that show poverty rates by gender
ranging from 13 % for males to 16 % for females. Females disproportionately comprise
a greater percentage of the population living in poverty than their percentage of the
general population, while males are underrepresented (Center for Poverty Research,
2014). At the same time, Batthyany, et al. (2017) in their research “Poverty eradication
and gender justice” stated that
:
"Poverty affects men, women, boys, and girls, but it is experienced differently by people
of different ages, ethnicities, family roles and sex. Due to women’s biology, their social
and cultural gender roles, and culturally constructed subordination, they face
disadvantageous conditions which accumulate and intensify the already numerous
effects of poverty".
7.2.5 Offshore and Cross-border Fishing
There are three types of fishermen that voyage from Papela, Rote Island. The
first is cross-border fishermen. The life of these kinds of fishermen depends mainly on
the boss. Their fishing grounds are in the waters of the MoU BOX area located south of
Rote Island just inside the Australian Exclusive Economic Zone (EEZ). They fish using
traditional boats and traditional fishing equipment. The catch they are looking for is fish
in general, shark, sea cucumber (trepang), and Trochus Shells. The second are off-
shore fishermen. They use small one-cylinder-motorised boats of their own or boats
owned by investors or businessmen. Their fishing locations are inside Indonesian
waters. They target mackerel tuna and tuna fish. They usually go fishing at 3 am and
return at 2 pm. They will not spend weeks or sometimes months at sea like the cross-
border fishermen. The third type of fishermen is coastal fishermen/seaweed farmers or
cultivators. They only target fish and sea cucumber and some also cultivate seaweed.
Seaweed activities are gender friendly. Hence many of the fishermen’s wives are active
in seaweed production and the decisions about this activity (see Table 13). All their
livelihood activities are done using small amounts of capital and simple equipment with
their catch being sold locally or through outside agents in the case of seaweed and sea
cucumber.

160 | P a g e
Generally, there are three types of fishing boats that are being used by the local
fishermen. The first type is a small size with 1 Gross Ton capacity, usually called "Bodi
Batang" operating with a crew of 2-3 members. The second is of a larger size with 3
Gross Ton capacity, usually called "Bodhi" and the third is a sailboat that local people
call "Perahu Layar" (sail boat) or Lambo with a capacity of 8 Gross Ton. Only the last
two types of boat with 5-6 crew members are used by the local fishermen for offshore
as well as cross-border fishing in the transboundary waters between Indonesia and
Australia. The difference between the "Bodi" and “Perahu Layar" is that the Bodhi
usually is powered by an engine and may have a modernised navigation system such
as a radio and a GPS, while the "Perahu Layar" is a sail powered boat, usually without
an engine, but has a navigation system such as a radio and a GPS when they go for
offshore or cross-border fishing.
As regulated in an agreement between the Australian and Indonesian
Governments, the "Perahu Layar” is the only boat allowed to be used to enter the MoU
Box in Australian waters for fishing activities (cross-border fishing).The original fishing
agreement was signed by the Indonesian and Australian Governments in 1974, but the
MoU Box was added to the agreement in 1989 after both countries extended their
Exclusive Economic Zones to 200 nautical miles in 1979 and 1980. The motorised
“Bodis” are not allowed to cross the maritime border to enter the MoU Box (see Map 1
and Appendix VII and VIII).
Sugi, one of the Bosses in Papela, mentioned in an interview that he started his
business in 2007. He started the business with Rp 25 million credit from a bank to buy
a boat. After 10 years he is still running the business with 13 sailboats. He is engaging
in a special business with all his crews concentrating only on the capture of shark for
their fins. However, all parts of the shark including fins, backbones, shark meat and
shark skins are traded items for the markets in Java and overseas. All of these tradable
parts of the shark are collected from cross-border fishing activities in the Australia EEZ,
especially inside the MoU Box.
Each boat will have a crew of six, including a captain, and the average
operational cost is roughly Rp.5 million for fuel and equipment. The Boss has to spend
another Rp.4 million for supplies for the crew (See Table 14). So the boss will spend
roughly between Rp.9 million and Rp.10 million in total per trip for offshore or cross-
border fishing. At the same time, each fishing trip’s proceeds will be on average of
between Rp.40 million and Rp.50 million that will be shared between the Boss and the
crew in a system as outlined in detail below.

161 | P a g e
Table 14 The average Expenditure for each Offshore/Cross Border Fishing Trip
Items Expenditure (Rp.) Proportion (%)
Food and Drink 484,500 11.72
Additional Food 155,000 3.75
Medicine 48,000 1,16
Fishing Equipment 280,000 6.78
Other Supporting Fishing Equipment 3,165,000 76.59
Total 4,132,500 100
Source: Primary Data Analysis
There are at least three methods of selling the catch, i.e.
(1) The cross-border fishermen: Their catch is controlled by the boss, i.e. the
boat owner. The price of the catch and regulations are also determined by the boss.
The catch must not be sold, even with a higher price to other people or to other
businessman, except to their boss. Goods supplied to the fishermen such as rice,
coffee, cigarette, and other rations are higher in price than the local market price.
Supplies are on average 50 % higher than the reasonable selling price. Ironically, the
proceeds of the catch are not the actual sale price received by the Boss. In event of the
fishermen being arrested by Australian Border Control officers for fishing outside of the
designated areas, it could take at least 3-5 years of future fishing trips to pay off their
debts to the Boss.
The revenue proceeds from each fishing trip will be shared in three portions.
The first portion is 33 % of the total is allocated to the Boss, the second portion is
allocated to redeem back the cost of supplies that have been spent by the Boss, and
the third portion is actually the rest of the revenue that will be distributed among all the
crew including one part for the owner of the fishing equipment (the Boss again). If 6
crew members join the boat and the revenue gained from the trip is about Rp.30
million, then the Boss will get Rp.9 million from the first portion. After that, another Rp.4
million is deducted from the rest of the revenue to redeem back the cost of supplies
(the second portion is Rp.21 million minus Rp4 million). The last portion is about Rp.17
million is divided among the 6 crew members plus the owner of the fishing equipment,
the Boss. So each crew will get roughly Rp.2.43 million and the Boss will get Rp.15.4
million from each fishing trip that earns Rp.30 million of revenue. In other words, we
can say that the crew will get 48.6 % and the Boss roughly will get 51.3 % from the

162 | P a g e
total revenue received from each fishing trip. The actual allocation of revenue from
each fishing trip can be seen in the Figure 13.
Source: Primary data analysis
Figure 13 Proportion of the allocation of the revenue proceeds from each fishing trip
Pak Sadli, one of the key informants in Papela mentioned in the interview that:
"Unfortunately, however, the temporary happiness would be disappeared when the
boss called the skipper to account for the existing debt: The fisherman must pay off
the debt for rations and debts associated with other provisions for the voyage, as
well as losses associated with the long-line fishing gear and fishing equipment. All
these debts are listed for, and belong to the skippers. So, the debts must be paid
off by the skippers. This is an unjust or an unfair share. If the business makes a
profit then it is shared among all, but if there is a loss then it would become the
responsibility of the skippers".
As previously stated; to make matters worse for the crew, the price of goods in
the form of rations is doubled on the one hand, and the price of catch is not able to be
negotiated by the crew, as it is decided by the boss. This is the payment system used
between the Boss and the fisherman. The Bosses become richer while the fishermen
eventually become entrapped in a poverty cycle.
(2) Off shore fishermen: The catch of the off shore fishermen is sold sometimes
to the local traders and the price is in accordance with the current market conditions.
These voyages have only two to three crew members, unlike the cross-border
fishermen who have six to seven crew members. These fishermen have all migrated
from Wakatobi, Southeast Sulawesi, and have now lived for many years in Papela,
East Rote. They reside together in a place called Tanjung Pasir.
(3) Coastal fishermen/Seaweed farmers or cultivators: They use small boats
sometimes motorised with Honda GX 160 motors they call “ketinting” engines. At other
29.99%
13.33%
8.10%
48.58%
The Owner of the boat Reedem back
The owner of fishing equipment The crew

163 | P a g e
times they use small boats with oars or small sails. They go fishing at 4 pm and return
home in the morning. Their catch is sold directly to the consumer or sometimes to a
local trader. The proceeds from their catch may only be enough to buy two kilograms of
rice. The poor catch results stem from the use of rudimentary fishing lines and nets,
meaning that they cannot compete with outside fishermen coming from other parts of
Indonesia whose fishing equipment is of a more modern type and their activities
sometimes illegal. Consequently, the coastal fishermen should also have an alternative
income such as from cultivating or farming seaweed with a long line and float system.
The income from seaweed farming can be significant, depending on several factors: 1)
enough capital to buy lanyard, anchor rope, strap, buoys, seed and labour, 2). the
weather must not be too hot and the location for seaweed cultivation must always be
exposed to moderate currents, waves, and wind, 3) harvest time and market
conditions. The dried seagrass is sold to local traders at varying prices between
Rp8,000 and Rp15,000 per kilogram dried weight. Some unscrupulous buyers will
cheat the seagrass farmers by tampering with the accuracy of the scales.
Consequently, for a 50 kilogram sack of seaweed a farmer may receive payment for
only 47 to 48 kilograms of dried seaweed.
7.2.6 Alternative Livelihood
As mentioned in the previous section, the traditional fishermen in Papela are
willing to change the pattern of earning their livelihoods from being fishermen crossing
the sea border and going to MoU Box Area in Australian waters, to become cultivators
of seaweed. According to Trono (1990), until about 1980 seaweed production was
harvested from wild stock and only limited cultivation took place in the Philippines and
Indonesia. Many organisations have introduced seaweed cultivation programs for local
people as an alternative livelihood strategy rather than dealing with the risk of long
distance voyaging to the transboundary waters between Indonesia and Australia.
These risks include extreme weather conditions, illness and accident at sea, and
detention by Australian authorities for illegal fishing if they happen to enter Australian
waters outside of the MoU Box Area or are not permitted to enter the MoU Box Area.
Crawford (2002) mentioned that: "Development of alternative livelihoods has become a
popular policy to uplift the socio economic status of small-scale fisher and to reduce
fishing pressure on overexploited fisheries". One alternative livelihood is seaweed
farming.
Various organizations, such as Indonesian Central, Provincial and Local
government departments, Australian Government departments and foreign aid through

164 | P a g e
NGOs, have introduced seagrass cultivation programs since the 1990s. In 1990s, when
Rote-Ndao was a Sub-District of the Kupang District, the District Head of Kupang
(Bupati) introduced a program of seaweed cultivation with recommended species to be
cultivated such as Eucheuma, Gracilaria and Porphyra among others. Seaweed farms
can be located near natural seagrass and reef flats with approximately one meter of
water at low tide. Some experts recommend the cutting of seagrasses and removal of
sea urchins prior to farm construction. Seedlings are then tied to a monofilament line
and strung between mangrove stakes driven into the substrate (Juanich, 1988). This
method of cultivation is still practiced by many farmers including people in Papela.
Photo 6 Long line and float method of seagrass farming (Photos Paul G King)

165 | P a g e
In 2007, another seaweed cultivation program, introduced by the Bupati of
Kupang and funded by the Australian Embassy Direct Aid Program (Rp 27,000,000),
proved to provide the local fishermen with good harvests and enough profit to raise
their livelihood incomes. Ten local fishermen became seagrass farmers for that
program. Following that project many traditional fishermen changed their livelihood
from fishing to seaweed cultivation. Based on this experience, if fishermen invest
approximately Rp. 500.000 for 180 meter of rope, floats and seed to cultivate seagrass,
then they can produce 75 Kg of dry seaweed. The price of dry-seaweed at the time
was about Rp. 10.000 / kg, meaning a profit of almost Rp. 250.000
(a)
(b)
Photo 7 (a) Shoreline method of seagrass farming (b) Seagrass drying rack (Photos Paul G King)

166 | P a g e
However, this success story waned when the Montara oil spill disaster in
August 2009 affected seagrass production. The Montara oil spill is one of Australia's
worst oil disasters. The Montara oil and gas field is located to the north west of the
Australian mainland, 650km west of Darwin in the Timor Sea. The Montara oil spill was
an oil and gas leak that subsequently left a major oil slick in the Timor Sea that caused
an environmental disaster reaching the shores of Indonesian islands facing the Timor
Sea (http://www.offshore-technology.com/projects/montara-oil-field/). The Australian
Department of Resources, Energy and Tourism estimated there were about 2,000
barrels (320m3)/day spilt into the Timor Sea; a figure five times the 400 barrels
(64m3)/day estimated by the drilling company PTTEP Australasia
(http://www.abc.net.au/news/2009-10-22/oil-leaking-five-times-faster-than-
thought/1113420) .
To overcome the oil spill disaster, Australian authorities used a Hercules aircraft
to spray 10,000 litres of chemical dispersant onto parts of the slick. Ongoing aerial
spraying with dispersants was the primary early response to the spill. Spraying from
vessels commenced on 30 August and continued until 1 November utilizing 118,000
litres of dispersant. Six different chemical dispersants were used, including Slickgone
NS, Slickgone LTSW, Ardrox 6120, Tergo R40, Corexit 9500 and Corexit 9527. In total,
184,135 litres of chemical dispersants were sprayed. Biologists said that the after
effects of the Montara oil spill could be catastrophic for marine ecosystems, with claims
that although it is a light weight crude oil spilling from the platform, it can still have toxic
effects on birds, marine invertebrates, coral and marine algae (Buckeridge, 2009).
Eight years after the Montara event, seaweed cultivation conducted by local
fishermen is still affected by the spilt oil and the ensuing usage of dispersants. The
quality of seaweed production has deteriorated substantially. Currently, there are few
traditional fishermen in Papela involved in seagrass cultivation because the income is
not enough to cover the cost of production and to be seen as an alternative livelihood
for the local people. Their livelihoods are again focused on fishing activities and
voyages to the Indonesian-Australian transboundary waters for offshore and cross
border fishing excursions. In 2013 the Rote District government provided Rp 2,000,000
to seagrass farmers to buy new rope and floats in an attempt to reinvigorate the
seagrass industry in Rote. This measure had limited success only.
Never the less, there are some other new alternative economic activities that
could be introduced to the people in Papela as their new alternative livelihood. These
activities include horticulture cultivation and salt ponds. However, these two alternative
economic activities also have environmental impact problems. Horticultural activities

167 | P a g e
are prospective small-scale businesses, especially for local people with small land
holdings. The main problem is the lack of water for irrigation. Hence, prototypes of
simple new irrigation techniques such as drip irrigation technology could be
implemented in a horticultural project to help overcome the problem of a lack of water.
The development of a salt pond business requires a large investment for the
appropriate land and equipment. Salt ponds also have measureable impacts on the
environment, as this type of business needs expansive land clearance, especially of
mangrove vegetation in flat tidal zones. Hence, the financial analysis of both of these
prospective alternative livelihoods should consider the environmental costs and hence
sustainability before introducing the activities to the local people, as an economic
activity for an alternative livelihood.
Photo 8 Salt production ponds Pepela (Photos Paul G. King)

168 | P a g e
Alternative livelihoods also must be sustainable livelihoods. Scoones (1998, p. 5) gives
us this definition for Sustainable Livelihood;
“A livelihood comprises the capacities, assets (including both material and social
resources) and activities required for a means of living. A livelihood is sustainable when
it can cope with and recover from stresses and shocks, maintain or enhance its
capabilities and assets, while not undermining the natural resource base.”
The importance of sustainable livelihood is to provide direction for poor people
to achieve enduring improvements against the challenges and poverty indicators that
they define (Ashley & Carney, 1999, p. 1).The views of both Scoones and, Ashley and
Carney help bridge the gap between a quantitative sustainable development approach
and a qualitative sustainable livelihood approach as proposed by Daly and provides a
resonance for this research project and its focus on traditional fishing communities in
Eastern Indonesia.
7.2.7 Concluding Remarks
Since the beginning of the 17th century up until now, the traditional fishermen of
Rote have made regular offshore fishing trips to Ashmore Reef in the south of the
Timor Sea. This is also attested by the agreement between the Indonesian and
Australian Governments signed first in 1974. Although the local people have fished in
what are now transboundary waters between Indonesia and Australia since the
beginning of 17th century with their simple and traditional navigational systems, more
recently the traditional navigational systems has been improved with some modern
systems, such as GPS and radio.
Many of the traditional fishermen in Papela work for a boat owner that they call
the "Boss". The relationship between fishermen and the Boss is based on an informal
agreement following a common practice used by the local people for many years.
However, this common practice and agreement actually makes the traditional
fishermen an inferior party in the negotiations for sharing the proceeds of the fishing
trip with the Boss.
The revenue proceeds from each fishing trip are shared in three portions. The
first portion, 33 % of the total, is allocated to the Boss, the second portion is allocated
to redeem back the cost of supplies that have been provided by the Boss, and the third
portion is the remainder of the revenue that will be distributed among all the crew
including one part for the owner of the fishing equipment; usually the Boss. In normal
weather conditions, transboundary fishermen will make one voyage per month and off-

169 | P a g e
shore fishermen make three fishing trips per month, in the period from April until
October. The local fishermen who work for a Boss will earn an average Rp 3 million per
month.
If the livelihood of traditional fishermen in Papela is considered subsistence and
limited, allowing the next generation to only have the same choice of becoming a
fisherman, is the same as allowing them to slip into the same poverty trap as their
parents. Education is important for the young generation to open up their thinking, to
provide them with enough knowledge and skills, and to prepare them for alternative
economic activities for a better future.
As discussed above, poverty has a close correlation with the issue of gender.
Indeed, in a patriarchal community surrounded by poverty, like the people in Papela,
women are always more vulnerable than men. Hence, any implemented sustainable
livelihood projects should include gender friendly activities which are chosen and
developed by women themselves. These activities will help strengthen the leadership
and economic status of women and children, hence reducing their vulnerability and
increasing their resilience.
The households of Tanjung Pasir Dusun of Papela Village are a more transient
community and still consider themselves as being from Sulawesi with strong linkages
back to extended families in Sulawesi. Hence any poverty alleviation projects to be run
in Papela may need to consider different approaches depending on which
neighbourhood is the focus of the project.
One of the approaches that might be taken to overcome the problem of poverty
in Papela is by reducing the amount of spending for amenities purpose, or even delete
this waste item from the list of income spending by changing people's behaviour.
Smoking is one of the behaviours that should be changed because the cost of
cigarettes accounts for about 15 % of the total spending of the family. Reducing
cigarette expenditure could release household resources to spend on food, housing,
education, health services and other goods that raise the standard of living and provide
alternative opportunities for the next generation.

170 | P a g e
7.3 Landu Thie Results
7.3.1 Landu Thie Village
The Village of Landu Thie (Desa Landu) is in the Subdistrict of Southwest Rote
(Kecamatan Barat Daya), District of Rote Ndao (Kabupaten Rote Ndao), an ethnically
homogenous village located on a small island near the south-western end of Rote
Island (see Map 4).
Map 4 Landu Island, Southwest Subdistrict of Rote Island
Landu village/Island is located at the southern end of the Southwest Subdistrict
of Rote with the Timor Sea at its southern coastline with coordinates of Latitude -10.91,
Longitude 122.95. It is one of the smallest villages by land area in the subdistrict with a
land area of only 6 km2, which is 5.24% of the subdistrict. Landu’s topography is of a
sand island on the coastal flats with a central mountain and small natural water springs.
Because of its sand soil and a limited amount of fresh drinking and irrigation water,
opportunities for a farming or garden focused livelihood are limited. Rainfall in the
District of Rote is limited to three to four months of the year with near nil rainfall in the
Dry Season. Hence, the main focus of livelihoods for the people of Landu is marine
natural resources exploitation. As it is only a short sea voyage to the Indonesian-
Australian Maritime Border, transboundary fishing voyages have played a large part in
Pulau
Landu
Landu
Island

171 | P a g e
their livelihoods. Fishermen from Landu regularly joined boats from Papela as crew
members for sailing to the Australian border waters and MoU Box. That is until recent
times, when many of the boats from Landu were confiscated and burnt by Australian
border surveillance officers for fishing illegally in Australian waters. They have now
changed their focus to self-funded, with small amounts of District Government aid,
coastal fishing, seagrass farming or other outside work opportunities.
Table 15 Village land area in Southwest Rote
Village Name Village Land Area
km2
% of Land Area to
Total of Subdistrict
01. Oeseli 6,17 5,39
02. Oebou 4,53 3,95
03. Lalukoen 5,04 4,40
04. Oetefu 8,18 7,14
05. Oehandi 8,55 7,46
06. Meoain 8,29 7,24
07. Oebafok 7,87 6,87
08. Batutua 9,41 8,21
09. Dolasi 8,48 7,40
10. Lekik 7,64 6,67
11. Oebatu 8,86 7,73
12. Mbokak 9,80 8,55
13. Oelasin 15,75 13,75
14. Landu 6,00 5,24
Source: (BPS Kabupaten-Rote-Ndao, 2017b)
7.3.2 History / Culture
Landu Island has history and culture that goes back to well before the Dutch
and Portuguese occupation of parts of eastern Indonesia. Today, Landu Thie is part of
a new state system under the government of the Republic of Indonesia. Prior to that
Landu was part of an old royal society, the kingdom of Thie. The kingdom of Thie was
one of the 19 kingdoms on the island of Rote (Haning, 2017). Rote is an island formerly
known as “Lolo Neo Do Tenu Hatu“, others call it by the name of “Nes Do Male” or
“Lino Do Nes” which means island deserted and uninhabited. Rote’s name originated
from the time of the first arrival of Portuguese traders and missionaries to Indonesia in
the 17th Century. The lineage of the Kings of Thie can be traced back to before the
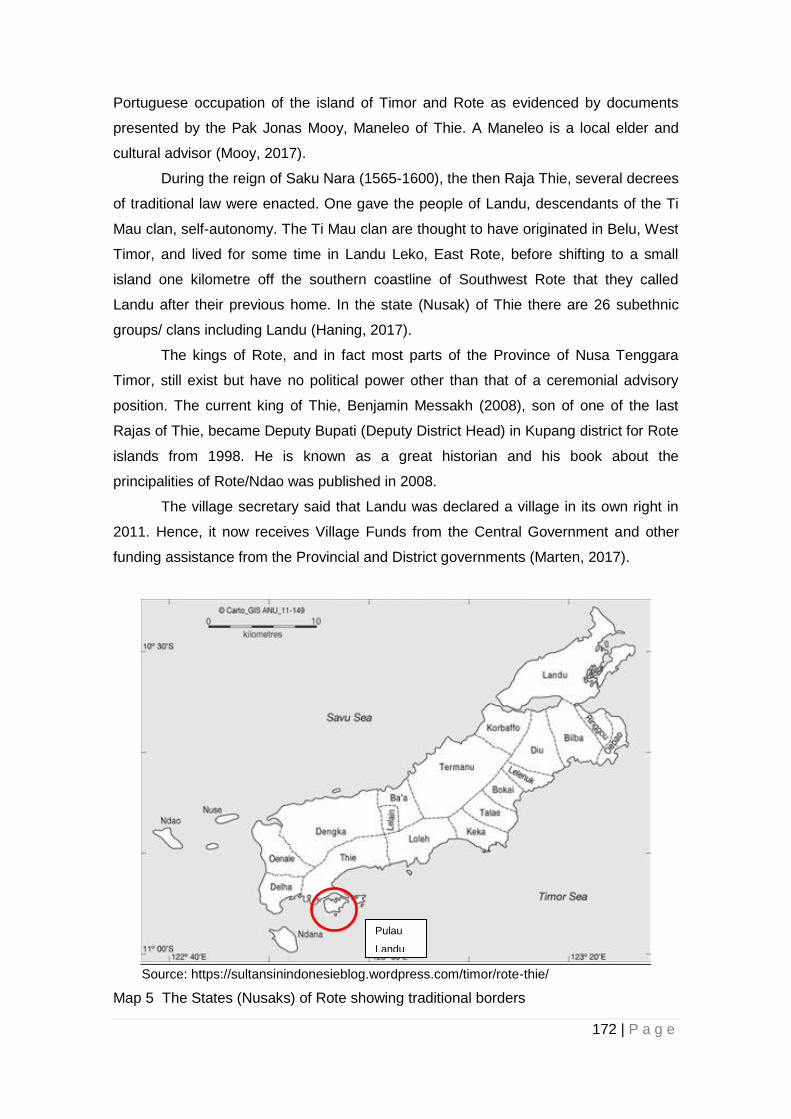
172 | P a g e
Portuguese occupation of the island of Timor and Rote as evidenced by documents
presented by the Pak Jonas Mooy, Maneleo of Thie. A Maneleo is a local elder and
cultural advisor (Mooy, 2017).
During the reign of Saku Nara (1565-1600), the then Raja Thie, several decrees
of traditional law were enacted. One gave the people of Landu, descendants of the Ti
Mau clan, self-autonomy. The Ti Mau clan are thought to have originated in Belu, West
Timor, and lived for some time in Landu Leko, East Rote, before shifting to a small
island one kilometre off the southern coastline of Southwest Rote that they called
Landu after their previous home. In the state (Nusak) of Thie there are 26 subethnic
groups/ clans including Landu (Haning, 2017).
The kings of Rote, and in fact most parts of the Province of Nusa Tenggara
Timor, still exist but have no political power other than that of a ceremonial advisory
position. The current king of Thie, Benjamin Messakh (2008), son of one of the last
Rajas of Thie, became Deputy Bupati (Deputy District Head) in Kupang district for Rote
islands from 1998. He is known as a great historian and his book about the
principalities of Rote/Ndao was published in 2008.
The village secretary said that Landu was declared a village in its own right in
2011. Hence, it now receives Village Funds from the Central Government and other
funding assistance from the Provincial and District governments (Marten, 2017).
Source: https://sultansinindonesieblog.wordpress.com/timor/rote-thie/
Map 5 The States (Nusaks) of Rote showing traditional borders
Pulau
Landu
Landu
Island

173 | P a g e
5.3 Geography and climate data for Landu Village.
Air temperatures and humidity are typically tropical with the highest temperature
and lowest humidity occurring at the end of the dry season (see Table 16 and Table
17). Rainfall is at its highest during the months of December through to March, with the
middle months of the year receiving very little rainfall. The long, hot, dry season and a
rocky topography through the whole of the Rote Ndao District make any agriculture
activities difficult and uncertain in any village. The village of Landu, being located on an
island, has additional challenges to farming activities. The soil is predominately sand
and there is limited fresh water supply from natural springs that, even with careful
rationing, run dry before the onset of the wet season. The transport of additional fresh
water supplies to the island is logistically difficult and expensive.
Table 16 Monthly Temperature and Humidity Data for Rote Ndao
Rote Ndao District Monthly Temperature and Humidity 2016
Month Air Temperature (oC) Humidity (%)
Max Min Max Min Av
January 33,80 20,40 93 75 83
February 33,60 19,40 97 73 86
March 33,40 20,00 96 83 88
April 34,20 18,40 85 73 80
May 34,00 18,60 96 77 84
June 32,80 18,80 89 71 80
July 35,20 16,00 88 63 76
August 33,20 17,60 84 65 73
September 34,40 19,40 92 71 77
October 35,20 21,00 84 60 73
November 35,20 21,40 85 66 74
December 33,20 21,20 91 74 84
Source: Stasiun Meteorologi Lekunik Baa Kecamatan Rote Barat Daya dalam Angka 2017

174 | P a g e
Table 17 Monthly Rain Data for Rote Ndao
Rote Ndao District Monthly Rain Fall 2016
Month Monthly Rain Fall
(mm)
Days of Rain
January 145,3 16
February 191,4 19
March 282,8 22
April 2,2 3
May 144,7 9
June 20,0 7
July 6,7 3
August 1,0 2
September 58,7 5
October 20,0 7
November 61,7 9
December 231,4 23
Source: Stasiun Meteorologi Lekunik Baa Kecamatan Rote Barat Daya dalam Angka 2017
7.3.3 Population Data
According to 2016 Rote Ndao District statistics, the village of Landu has the
smallest village population in the Southwest (Rote Barat Daya) Subdistrict of Rote. It
has a population of 864 people, made up by 431 males and 433 females, up by 4.1%
on 2015 population figures and has the second lowest population density of 144 people
per square kilometre. Data also shows that there are 196 households in Landu with an
average of 4 persons per household (BPS Kabupaten-Rote-Ndao, 2017b).
Table 18 shows the work type engaged in by the local population in each village
in the Southwest Subdistrict of Rote. The figure 300 in the farming column for Landu
seems to be incorrect as interviews, observations and a household survey done in the
village of Landu revealed that there are no farming activities in Landu. In the past there
have been many seagrass farmers but seagrass farming is monitored by, and comes
under the jurisdiction of the Department of Fisheries as do fishing activities.
Table 18 Work Force Data by Village for Southwest Rote

175 | P a g e
Number of Population 10 years and above according to work type
Village Work Type
Public Servant
Army and
Police
Pensioner Farmer Fisher Private Business
Office Work
Other
01. Oeseli 11 - 3 950 183 7 5 -
02. Oebou 7 2 1 834 - - - -
03. Lalukoen 14 1 3 870 - 23 11 600
04. Oetefu 18 2 3 867 96 17 3 490
05. Oehandi 16 1 3 986 - 31 15 580
06. Meoain 38 - 1 762 - 18 2 85
07. Oebafok 33 3 1 564 - 48 3 -
08. Batutua 78 12 18 830 140 10 5 600
09. Dolasi 9 69 1 450 78 10 - 60
10. Lekik 9 - 1 - - 20 5 170
11. Oebatu 17 - 3 429 - 8 3 -
12. Mbokak 19 - 5 968 - 29 12 510
13. Oelasin 5 - 2 1 460 114 12 13 470
14. Landu 2 - 1 300 287 5 3 40
Subdistrict Totals
276 90 46 10,270 898 238 80 3 605
Source: Kecamatan Rote Barat Daya dalam Angka 2017
Table 19 Household Main Work Type and Additional Income data for Landu Village
Source: Household Survey
Data from the Household Survey conducted show that 68.8% of households in
Landu have fishing as their main livelihood activity, 18.8% are traders and owners of
small kiosks. No household surveyed had, at that time, seagrass farming as a main
Main
Work Type
Households
Engaged in
Work Type
Fishing 68.8% 68.8%
Farming 0.0% 0.0%
Livestock 0.0% 6.3%
Seagrass 0.0% 12.5%
Trader 18.8% 18.8%
Other 12.5% 62.5%

176 | P a g e
source of income. However 12.5% of households had seagrass farming as a part of
their livelihood activities.
Figure 14 Household Survey Graphs (a) Main Work Type, (b) Household Activities
The Household Survey Charts in Figure 14 show that fishing activities and
trading or operating a small kiosk are the main income sources for the people of Landu
Village. However, for many households in Landu, livelihood activities are not limited to
just one type of activity. Many households are active with two or three different types of
activities. However, even with two or three income streams, in a good income month
most households are still under the US$1.90 per person per day per person poverty
indicator of the World Bank (UNDP, 2016). For a household of four people, two children
only, the household income should be in excess of Rp3,000,000 per month.
Households Survey data (see Table 20) showed that the average household income in
Landu is Rp1,356,429, when the highest and lowest responses were removed from the
calculation. This is well below the World Bank poverty line. Only the highest income
households fulfil that indicator.
Table 20 Household Monthly Income in Landu Village
Main Work Type
Fishing
Farming
Livestock
Seagrass
Trader
Other
Households Engaged in Work Type
Fishing
Farming
Livestock
Seagrass
Trader
Other
Monthly Income and Source (Rp)
Calculated on Answers Given
Main Income When Other
Income
Total Income
Average Monthly 736,000 450,000 1,405,625
Highest Monthly 2,100,000 1,200,000 3,300,000
Lowest Monthly 100,000 100,000 200,000
Ave Monthly ignoring
Highest and Lowest
680,000 392,857 1,356,429

177 | P a g e
Household Survey data also showed that after normal household expenses,
even in a good income month, there is little or no money left for savings. Less than
30% of Landu households operate a bank account, and for those that do it is normally
used by outside working children to return financial support to the home village for their
parents and younger siblings.
Table 21 Household Monthly Expenses in Landu Village
Monthly Expenses (Rp)
Calculated on Answers Given
Food
Expense
Clothes Education Social
Costs
Fuel Household Other
Expenses
Total Monthly
Expenses
648,667 50,000 376,200 183,333 270,000 122,286 23,333 Ave 1,131,867
1,500,000 50,000 760,000 500,000 500,000 600,000 100,000 Hi 2,732,000
30,000 50,000 130,000 50,000 10,000 2,000 5,000 Low 95,000
630,769 50,000 359,000 137,500 300,000 50,800 8,750 1,088,538
Figure 15 Pie Chart of Household Expense Distribution in Landu Village
7.3.4 Education
From Household Survey data, as shown in the Table 22, 63% of the
respondents in Landu Village had only completed Primary School, 25% had completed
Junior High School and only 13% had completed Senior High school. Interviews
revealed that there had been about 10 students from Landu who had gone on to study
at university.
Food Expense
Clothes
Debt Repayment
Education
Electricity
Water
Social Costs
Fuel
Household
Other Expenses

178 | P a g e
Table 22 Landu Respondent Personal Data
(a)
(b)
Photo 9 (a) Landu Primary School (b) Landu semi complete Junior High School (Photos Paul G. King)
There is only one school on Landu, a Primary School, although a Junior High
School is currently being built. At the primary school there are 135 students, 74 boys
Male 69% 18-50 75% Primary 63% Rote 94% Protestan 100%
Female 31% 50+ 25% Junior High 25% Sulawesi 6% Islam 0%
Senior High 13%
Sex Age Education Level Ethnic Group Religion

179 | P a g e
and 61 girls. These students are taught by six government teachers and three non-
government/ honorary teachers (BPS Kabupaten-Rote-Ndao, 2017b). Once students
have finished primary school they must travel to the mainland, Rote Island, to attend
Junior High School and Senior High School in major towns, or a university in the
District or Provincial capitals (Marten, 2017).
Junior High students, at the moment, must travel daily to Batutua Junior High,
one of four Junior High schools in the Southwest Rote Subdistrict. 640 students attend
Batutua Junior High School with 35 teacher and the Senior High school students go to
Oetefu where there is the only Senior High school in the subdistrict. 740 students from
all around the subdistrict attend this Senior High school, taught by 48 teachers. There
is also one Technical High school in Meoain, another small town in the Southwest Rote
Subdistrict. This is a private school that has only 64 students. Landu does not have a
pre-school (BPS Kabupaten-Rote-Ndao, 2017b).
To go to the Junior High school and the Senior High School students must
travel approximately two kilometres by boat to Rote Island, then by motorbike or
minibus to school. The cost of the boat trip for students is Rp 5,000 return (50c Aus),
although the Indonesian Central government, via the Village Fund, now allocates funds
for these transport costs.
Table 23 Education Level of 18-50 years and 50+ Age Groups
Age of Respondent Education Level %
50+ With Primary 75%
50+ With Junior High 25%
50+ With Senior High 0%
18-50 With Primary 58%
18-50 With Junior High 25%
18-50 With Senior High 17%
Table 24 Total Family Education Costs
Total Family Education Costs (Rp)
Average Family Education Cost 395,000
Highest Family Education Cost 850,000
Lowest Family Education Cost 110,000

180 | P a g e
Data from the Household Survey in Table 23 show us that the younger age
group has on average a higher education standard than the older age group. This is in
line with the United Nations MDGs and SDGs and shows that in more recent years
education in Landu Village has increased in value and is seen as an important step in
developing a livelihood strategy. This is despite the struggle to pay increasing
education costs as see in Table 24. Education costs are the second highest household
cost behind food costs. The Rote Ndao Bureau for Statistics figures show that a higher
number of female students compared to male students attends Junior High and Senior
High schools in the subdistrict of Southwest Rote. This is a good indicator for gender
equality, but it may also indicate that boys are dropping out of school to help with
household income.
7.3.5 Health and Nutrition
Pulau Landu has one health sub-clinic with one nurse. A sub-clinic can
medicate minor illnesses and cuts and abrasions. The sub-clinic is not equipped or
authorised to provide medical care for child birth, or serious illness or injury. Women
from Landu must travel to Ba’a, the District Capital, to give birth or have a home birth
that carries all of the associated medical risks (Marten, 2017). Rote Ndao Bureau of
Statics’ data shows that only four births out of twenty-three to Landu parents were an
unaided home birth. According to the same data there are no doctors practising
medicine in the Southwest Subdistrict of Rote (BPS Kabupaten-Rote-Ndao, 2017b).
Landu infants do have access to a complete range of vaccinations while the women
have access to most types of family planning information and contraception. Some
reports in the past have said that the midwife assigned to the Landu Pustu (health sub-
clinic) has not always been in attendance during clinic times.

181 | P a g e
Photo 10 Landu Health Clinic (Photo Paul G. King)
The health status of the Landu Village population is shown in Table 25 below.
Fifty percent of the population report that they are seldom sick while the remainder say
they are often sick. However, none of the respondents reported suffering from serious
illness. 81% reported they suffered from minor level illnesses only. About 13% of
people self-medicated their condition and 88% visited the local health clinic for
consultation and to purchase medication. 63% of the respondents have National Health
Insurance (KIS); hence their clinic costs and medication are free. The other 37% have
no health cover so need to self-fund their health and medical needs. The only place for
dental care in the Sub-district of Southwest Rote is in Batutua on the main land.
Table 25 Health Status of the Landu Village Population
How often are you sick?
Type of illness Where do you go for
Health Service? Health Insurance
Seldom 50% Minor 81% Don't take Medication
0% National Health
Card 63%
Often 50% Medium 19% Self-Medicate 13% Health
Insurance 0%
Always 0% Serious 0% Local clinic 88% No Health
Cover 38%
Doctor 0%
The nutrition level of the Landu population as analysed from Household Survey
Data (Table 26 and Table 27) show that the basic staple food for almost all of the
population is rice. A small number supplement rice with corn. The staple food is served

182 | P a g e
with a variety of other optional foods. 63% of the population consume four additional
foods over a period of time and 25% will consume five different types of foods. 13% will
only ever consume 2 types of additional foods.
Table 26 Staple and Additional Foods in the Diet of the Landu Village Population
Type of Staple
Food
No of Additional
Foods
Rice 94% 2 Add Food 13%
Rice / Corn 6% 3 Add Food 0%
4 Add Food 63%
5 Add Food 25%
The main types of additional foods that people consume in Landu Village are
fish, vegetables, meat (chicken, pork or goat), eggs and fruit. Fish is consumed daily by
81% of the population and the remaining 19% would consume fish at least 1-2 times /
week. Vegetables are consumed by 87% of the population 1-2 times / week, while only
7% consume vegetables on a daily basis. Meat of any type is consumed by 50% of the
population 1-2 / month. Eggs are consumed 1-2 / week by 38% of the population and
44% consume eggs only 1-2 / month. It should be noted that no one consumes meat,
eggs or fruit on a daily basis. In fact, fruit is consumed by only 19% of the population 1-
2 / week, 6% infrequently; meaning that 75% of the Landu Village population never eat
fruit. Vegetable and fruit consumption in Landu is restricted by a lack of fertile land and
a lack of a consistent supply of fresh irrigation water to establish a community
vegetable garden, distance and transport needs to travel to the nearest market, and
purchasing power of their meagre income.
Table 27 Types of Additional Foods and Frequency of Consumption in Landu
Additional Foods
Frequency Fish Vege Meat Eggs Fruit
Daily 81% 7% 0% 0% 0%
1-2/Weekly 19% 87% 0% 38% 19%
1-2/Month 0% 7% 50% 44% 0%
Infrequent 0% 0% 38% 6% 6%
The data from the Household Survey (Table 28) shows us that while 50% of
the population eat a minimum of 2 meals per day, 31% of the population eat on

183 | P a g e
average less than 2 meals per day. It appears that the villagers in Landu lack a
complete diet covering all nutritional food groups and have, on average, a low
consumption frequency.
Table 28 Meal Frequency of Respondents in Landu
7.3.6 Social Status
Personal Data collected during the Household Survey show that 94% of the
population of Landu are Rotenese by ethnicity and 100% are Protestant. However,
according to Rote Ndao Bureau of Statics, there are four Muslims that live on Landu
Island, although there is no mosque. The closest mosque is at Batutua. During informal
interviews with Landu residents, it was learned that several of the small number of
Muslims who had settled in Landu had converted to become Protestants. Those few
who have retained Islam leave the island for important Islamic celebrations. In
essence, but for a small number of exceptions, the Landu Village is ethnically and
religiously homogeneous. According to the Rote Ndao Bureau of Statistics (2017),
there has been no in or out migration from Landu. However interviews tell us that some
people desire to shift to Kupang or Jakarta to find work and better income.
Table 29 shows a high frequency rate for household conversation with a
number of different topics discussed on a regular basis. The most common topics
discussed are economics, education and family issues. When analysing the data in
Table 30 Respondent involvement in external activities, it is seen that while a large
majority of Respondents said that they attended extended family and community group
activities, only a minority of them are involved in the organisational side of the activities.
They said that those activities were managed by village and family elders. As Landu
Village is ethnically homogenous, all community activities and celebrations are
overseen by a Maneleo. A Maneleo is an elder statesman of the villages that is an
advisor on traditional matters. Hence, while the Landu villagers regularly receive
information on village matters and are in attendance at activities outside of their
households, decisions on important family celebrations and village matters, such as the
expenditure of village funds, are made for them. Rotenese history and culture, and kin
group play an influencing role in a household’s social status in Landu Village.
Meals per Day
< 2 times/day 31%
2 times/day 50%
2-3 times/day 19%

184 | P a g e
Table 29 Frequency of Household and Number of topics commonly discussed
Frequency of Family Communication
No of Topics
Seldom 6% 1 7%
Often 25% 2 14%
Always 69% 3 71%
4 7%
Table 30 Landu Respondent involvement in external activities
Involved in
Community
Organisation
Active Group
Membership
Extended Family
Activities
Family Leader/
Advisor
Yes 38% Active 83% Yes 94% Yes 19%
No 63% Passive 17% No 6% No 81%
When analysing decision making within the Landu households, data shows us
that for overall financial decisions, the women make the decisions in 47% of
households, with 33% of households using mutual consultation in the decision making
process. However a number of areas have defined rolls. The men predominantly
makes the decisions relating to the major household income activity and matters to do
with fishing, while the women makes most other decisions including additional income
activities, children’s education, and other household activities. Seagrass matters are
reported as a 100% women’s concern. However, during an interview, a fisherman
spoke of his dried seagrass stock ready to be sold
Table 31 Landu Household Decision Maker Data
Family Decision Maker
Household
Finances
Main
Income Education Home Farm Seagrass Fishing
Add
Income
Father 20% 94% 33% 19% #DIV/0! 0% 100% 27%
Mother 47% 6% 67% 81% #DIV/0! 100% 0% 73%
Shared 33% 0% 0% 0% #DIV/0! 0% 0% 0%

185 | P a g e
7.3.7 Gender Issues
Gender issues have also become evident through analysis of data from the
Household Survey, the Rote Ndao Bureau of Statistics and interviews. In Landu
seagrass farming is mostly done by women as additional household income. However
in recent times the number of people farming seagrass has reduced dramatically
reportedly because of plant viruses and the Montara oil spill in the Timor Sea in August
2009.
Kiosks are also sources of additional household income. These can be set up in
a front room of a house or from a table at the front of a house. Women and children are
the main operators of this form of additional income activity. Kiosks owners are often
asked to provide credit by customers when awaiting payment for work, or during a low
income period.
Another gender issue is the provision of adequate women’s and infant health
services. Reproductive health and early childhood health are matters that need to be
fully addressed to help enable sustainable community development. Full time
attendance of a nurse and a midwife in a modern, well equipped clinic is an essential
foundation for village human capital capacity building.
7.3.8 Suggested Alternative Livelihood Projects
The need for sustainable alternative livelihoods in Landu Village is evident.
Using the BKKBN welfare indicators, most villagers living there are at Stage 2
Household Welfare level, with a number lagging in the Stage 1 Household Welfare
level and a few in the Stage 3 Household Welfare category. None of the villagers are in
the lowest level, Pre-Household Welfare. This means that most villagers are only living
at a subsistence level.
Alternative livelihoods can be new introduced activities or re-energised current
livelihood activities. Many livelihood activities require a minimum level of infrastructure
such as readily available fresh water, a reliable source of electricity and easy access to
education and health services. These minimum levels of infrastructure are paramount
for any community development programs whether designing sustainable livelihood
strategies for the current village population of productive age, or for enabling future
livelihood strategies for the next generation in their productive years. There are
currently two infrastructure projects moving to completion stage in Landu Village: the
construction of a Junior High school and the construction of a dam wall.

186 | P a g e
(a)
(b)
Photo 11 Construction Project Information Boards (a) Landu Junior High School (b) Dam Wall on Landu Hill (Photos Paul G. King)
The completion of the Junior High school, although running overtime, will mean
that Junior High students will not have to leave the island for schooling until they enter
Senior High school. This will have at least three effects,
1) School attendance figures will improve at the Junior High level because of a closer
proximity of the school reducing both drop-out and truancy rates. Also, an elevated
level of respect for a higher education will ensue. This is particularly important for boys.
Data from the Rote Ndao Bureau of Statistics show that current enrolment figures at
Junior High and Senior High schools in the Southwest Sub-district of Rote are
dominated by girls (BPS Kabupaten-Rote-Ndao, 2017b).

187 | P a g e
2) The Central Government will save on the transport funding assistance given to the
village for travel costs for students to attend schools on Rote Island. Interview data
reveals that the Central Government allocates Rp 25,000,000 per year for school
transport costs (Marten, 2017).
3). Better levels of education will lead the next generation to find employment in the
formal economic sector, such as the civil service, education, health or large scale
business enterprises, as compared to most of their parents and older villagers whose
education level only allows access to the informal sector.
Focus on strengthening the PAUD program, Pendidikan Anak Usia Dini, or
Early Childhood Education and Development (ECED) through the local Posyandu
(Health clinic) will help ingrain a learning culture from a young age.
The construction of the dam wall, on the hill behind the main village area, will
redirection water run-off during rain events in the wet season. This will help maintain a
sustainable supply of fresh drinking water via several natural springs that surface close
to the foot of the hill and close to the village. Not only will the new dam improve health
factors by a better supply of clean water for cooking and washing purposes, but it also
opens up the possibility of reenergising village vegetable garden projects that have
wasted over a number of years. Revitalised community garden projects will help
improve nutrition intake by the villagers at minimal ongoing costs.
Maintenance of existing infrastructure should also be placed with a high priority.
Landu Village does not have a jetty for ease of embarking and disembarking
passengers and cargo to water taxis that provide a transport system to the mainland.
However, there is evidence of a jetty that has been in disrepair for a long period of
time.
Additionally, in 2012, a Central Government PNPM project installed a
desalination plant and distribution tanks around the village. The desalination plant is
now in disrepair and the tanks are only used to store rain water from the short wet
season. The Landu Village Secretary said that maintenance of the plant had already
been actioned. If maintenance programs and servicing costs are included in project
plans such as this, the benefits to the villagers would be more sustainable and hence
the flow on for their livelihood strategies.

188 | P a g e
(a)
(b)
Photo 12 (a) Desalination Plant (b) Fresh Water Distribution Tank in Landu Village (Photos Paul King)

189 | P a g e
Seagrass farming has proven to be a viable alternative livelihood strategy for
many fishing households on Rote Island. Landu Village is one place where this is true.
Seagrass farming was introduced in 2000 around the time that Landu fishermen
agreed not to continue fishing in the Indonesia-Australian transboundary waters and
MoU Box. Seagrass as a livelihood strategy took a sharp downturn after the 2009
Montara Oil Spill when there was an almost complete failure of the seagrass crop.
Although the Rote-Ndao District Government, in 2014, allocated Rp 2,000,000 to each
seagrass farmer to continue their efforts, results have been disappointing and many
crops continue to fail due to seagrass viruses.
The importance of finding a solution to the seagrass farming problems is
profound. Interviews and Household Survey data informed us that seagrass farming is
mainly done by women, hence it contributes to gender equity solutions, providing real
income for women and easing household financial challenges that have prevented the
households from rising to the next stage of welfare status as calculated by the BKKBN
welfare indicators.
Trepang aquaculture is another alternative marine based livelihood opportunity.
Trepang aquaculture has received a lot of attention by researchers such as Australia’s
CSIRO in the western Pacific Ocean and it has been trialled previously in a number of
villages on Rote Island without much success. Landu has the internal organisational
structure and cultural influence for trepang aquaculture to be a joint village project.
There are many suitable places near Landu Village to trail such a project, away from
outside interference.
Tourism homestay and villa accommodation situated at various vantage points
on Landu Island is also a possible alternative income for Landu villagers. These
homestays and villas would attract tourists and provide local employment with good
income prospects for both the hospitality workers and the village finances. This type of
project should remain a village enterprise and not part of private investment so that
control is maintained on visitor access and to provide the opportunity to develop
cultural tourism activities. Tourism development is a current focus for the NTT
Provincial government

190 | P a g e
Photo 13 Scenery from Landu Hill and Beach Front – Possible sites for Villa or Homestay (Photos Paul King)
Migration out is regularly put up as an important alternative for livelihood
strategies. This can take the form of short term migration or long term, more
permanent, migration. Short term migration out has been previously undertaken by
villagers in Landu. A number of fishermen have taken up employment with large foreign
fishing enterprises. A number of interviewees mentioned that they had worked on

191 | P a g e
fishing boats based in Italy and Malta (Mooy, 2017). Others have worked for fishing
companies in Brisbane and Darwin in Australia. Their income was substantially higher
than from their fishing efforts in the village. However, this does require separation from
family and one interviewee stated that he would like to take up such a work opportunity
but would prefer his family to accompany him (Jenksal, 2017). Other short term
migration has happened, but normally to Kupang, Bali or Jakarta to work in the informal
sector in restaurants, cafes and spas.
Long term migration out seems to happen in two ways. As mentioned above,
some villagers move to Kupang, Bali, Jakarta or overseas, to work in informal
employment opportunities promoted by restaurants, cafes and spas. This type of work
carries risks and does not always provide permanent, well paid employment as
promised or envisaged. For those that wish to be employed in the formal sector,
education and good health is important. The younger generation’s improved access to
a higher level of education and better health services provides expanded employment
opportunities compared to that of previous generations. They have the qualifications
and physical stamina to apply for better paying positions away from the village, and
later to return financial support to family members who have remained in the village.
This external funding helps pay for education, a nutritious diet and now affordable
health services for younger siblings and family members to also raise their welfare
status. Many villagers stated that improvement for their children’s future prospects and
welfare is their main purpose for enduring their subsistence life style.
Internet based livelihoods for village people are not unrealistic. As education
levels rise and internet networks improve their coverage and signal reliability, there are
opportunities for the younger, tech-savvy generation to expand their employment
opportunities by way of online employment, doing web design, dedicated software
applications, and animated gaming and marketing solutions. The expansion and
upgrading of internet services will dramatically change the employment landscape in an
archipelagic state such as Indonesia. If local Junior and Senior High schools can
provide Information and Computer Technology (ICT) classes, this will help students
take advantage of a rapidly expanding employment space.
As a foundation stone for sustainable livelihood strategies, fresh water,
electricity and access to education and health services are important. Social capital is
the glue that brings them together as a positively functioning integrated system.
Because Landu Village is an ethnically homogeneous community, social capital is
inherent. Rotenese history and culture influences all village decisions. Harnessing this
already available social capital for information sharing, livelihood opportunity

192 | P a g e
recognition and project development will place Landu Village at an advantage
compared to other ethnically diverse and sometimes splintered villages as they plan a
future with an elevated welfare status.

193 | P a g e
7.4 AJABS Published Paper: Traditional Fishermen in Rote Island: Alternative
Livelihood to Illegal Fishing Activities in the Indonesian-Australian
Transboundary Waters
7.4.1 Statement of Contribution To Co-Authored Published Paper

194 | P a g e
Traditional Fishermen in Rote Island:
An Alternative Livelihood to Illegal Fishing Activities
in the Indonesian-Australian Transboundary Waters
Fred Benu*a, Paul G. Kingb, Agus Nallec, Moni Muskanand
aProfessor c Senior Lecturer and dLecturer respectively, Nusa Cendana University, Jl. Adisucipto, Penfui, Kupang 85001, East Nusa Tenggara Province, Indonesia. bPhD Candidate, Centre of Excellence Sustainable Development Indonesia (CESDI), School of Environment, Griffith University, Australia. Corresponding Research Team: F.L. Benu, Jl. Adisucipto Penfui, Kupang 85001, East Nusa Tenggara Province, Indonesia; Mobile: +628123798246; Email: [email protected]
ABSTRACT At the moment there are about 210 Indonesian fishermen, many from Rote Island, the
majority from the village of Papela, still detained in Australia Detention Centres for
carrying on illegal fishing activities in the Australian Exclusive Economic Zone. These
fishing activities are not driven by economic factors only, but also by their historical
background. By understanding the economic, historical and socio-cultural background
of the fishermen, a comprehensive solution for illegal fishing might be established. This
research aims to ascertain an alternative economic activity for the fishermen that can
give increased job opportunities for the fishermen to attain a sustainable livelihood as
part of sustainable economic development. This research has used qualitative and
quantitative analysis techniques including stakeholder interviews, descriptive researcher
observations, a household survey and Policy Analysis Matrix (PAM). The results of the
research show that; (i) since the beginning of the 17th century, the traditional fishermen
of Papela have made regular offshore fishing trips to waters that are now within the
Australian Exclusive Economic Zone; (ii) based on socio-cultural assessment and
economic calculations, a salt pond business is an efficient business with comparative
advantages for the Papela fishermen as an alternative source of income; and (iii) even
though, a salt pond business has economic potential and has already been conducted
by a small number of people in Papela, the government’s will to support the salt farmer
seems weak.
Keywords: Illegal fishing, socio-cultural values; historical background; economic
development; alternative livelihood, policy analysis matrix, sustainable development.
1 INTRODUCTION There have been many studies conducted on livelihood strategies in
marginalised fishing villages. Most of these studies were conducted in developing

195 | P a g e
countries and were driven by the fact that most fishermen are living in poverty in
villages located in rural, remote areas, with very few alternative employment
opportunities (Allison & Ellis, 2001; Allison & Horemans, 2006; Anderson & Obeng,
2017; Béné, 2006; Christy Jr., 1986; Knudsen, 2016; Weeratunge, et al., 2015; Purcell
& Pomeroy, 2015). Fishermen have been labelled as “the poorest of the poor” (Bene,
2003). Bene reviewed the perceptions embraced by academics, international agencies
and practitioners about the relationship between fisheries and poverty in developing
countries. He identified two perspectives with which to perceive poverty in fisheries,
which are “They are poor because they are fishermen”, and “they are fishermen
because they are poor”. These statements describe the poverty in fisheries in the
sense that whatever they try to do, they will remain poor, and being a fisherman is an
economic activity of last resort for the poor (Allison & Horemans, 2006; Béné, 2006).
A number of authors explain that the fishery activities in those areas are
identified as Small-Scale Fisheries (SSF) carrying on artisanal fishing activities. They
are always depicted as having very low income levels and causing the over-exploitation
of the environment and biological resources (Allison & Ellis, 2001; Allison & Horemans,
2006; Béné, 2009; Knudsen, 2016; Weeratunge, et al., 2015) However, the fishers still
maintain their subsistence living activities while ignoring future sustainability because of
the lack of alternative skills and readily available alternative income sources (Knudsen,
2016).
Hence, to propose a solution to alleviate poverty in fishing villages requires a
broad and comprehensive approach to understanding the cause and nature of poverty
in the fisheries’ context. It cannot be simplified only to the level of income and
consumption, and/or environmental (resource scarcity) dimensions. This does not deny
the fact that fisher folks’ resource dependence and the open-access nature of fisheries,
together, lead to resource degradation and impoverished fishing communities (Allison
& Ellis, 2001; Allison & Horemans, 2006). The fishers’ reasons for continuing to fish in
over-exploited waters are more complicated than economic factors only (Knudsen,
2016). It is also necessary to have a comprehensive understanding of the socio-cultural
and institutional dimension of poverty in fisheries for better interpretation of the internal
factors deriving from the fishermen’s socio-economic background and the external
factors (policies, institutions and organizations) that influence the fishers access to
resources and livelihood activities to cope with various forms of stress and shocks
(Allison & Horemans, 2006).
This research dealt with the issue of the socio-economic and cultural
background of the traditional fishermen of Rote Island (See Map 6) that has influenced

196 | P a g e
the practice of illegal fishing in the trans-boundary waters between Indonesia and
Australia. By understanding the economic, historical and socio-cultural background of
the local traditional fishermen in Papela, alternative livelihood strategies can be
proffered to help curtail fishing activities that become, illegal resulting in detention,
when these fishermen stray into Australian waters
The specific aims of the research are, (i) to identify and explain some of socio-
cultural factors determining the local people’s livelihoods; (ii) based on the socio-
cultural assessment and economic calculations, suggest an alternative livelihood with
comparative advantages for the Papela fishermen as a source of complementary
income using their existing skills; and (iii) to analyse government policy for enhancing
alternative livelihoods for the local people.
Map 6 Map of Rote-Ndao District in East Nusa Tenggara Province, Indonesia
2 Contextualising the research
a. History of Rotenese Traditional Fishermen The District of Rote Ndao is one of the 92 outer islands of Indonesia, located
near the trans-boundary waters of neighbouring countries, including Australia and
Timor Leste. Rote Ndao has 2 000 Km2 of land and 570 km of coastline. Historically,
according to Sadli Ardani (2017), one of the traditional narrators of Papela, the story of
offshore fishing activities to Ashmore Reef commenced in 1680 by Ama Rohi. At that
time, Captain Rohi together with his crew were fishing in and around the Timor Sea,
but because of bad weather conditions and a sudden storm, they were carried further
out to sea and accidently discovered a cluster of sand islands in the south of the Timor
Sea. The year of 1680 is calculated based on the story that in 1817 some fishermen
from Solor, East Flores, arrived in Papela. They related a story told by the fifth
generation of Captain Rohi about their ancestor’s voyage to Ashmore Reef.

197 | P a g e
The first island Captain Rohi and his crew arrived on was devoid of fresh water,
so they only had coconuts to drink. Captain Rohi and his crew dug a well to find fresh
water, but having only found brackish water; they moved to a second island and dug
another well, this time finding drinkable water. Since that time, Rotenese fishermen,
especially fishermen from Papela, have made regular offshore fishing voyages to
Ashmore Reef (Sand Island/Pulau Pasir), which is now inside the Australian EEZ (See
Map 7).
The history of regular offshore fishing voyages to Sand Island since the
beginning of 17th century is attested by the agreement between the Indonesian and
Australian Governments signed first in 1974 (Memorandum of Understanding Between
the Government of Australia and the Government of the Republic of Indonesia
Regarding the Operations of Indonesian Traditional Fisheries in Areas of the Australian
Exclusive Fishing Zone and Continental Shelf, 1974). Hence, the rights of traditional
fishermen from Rote, to go fishing in the trans-boundary waters, have been affirmed by
both Governments. However, both countries still have a problem with the definition of
"traditional", which defines who should be categorized as "traditional fishermen". The
definition of traditional fishermen is important because those who are considered
traditional have the right to collect the resources near the five tiny islands found in the
MoU Box to the northwest of Australia. The definition of traditional used gives sense to
the notion of ‘tradition’ by specifying not just methods and type of vessels used, but
also by the historical continuity of such fishing activities (Campbell & Wilson, 1993).
Map 7 The MoU Box located in the Australian Exclusive Economic Zone (Fox & Sen, 2002)

198 | P a g e
However, since the maritime boundaries were changed, fishing activities by
Indonesian fishers are considered illegal by Australian authorities when non-traditional
fishermen enter any part of the Australian EEZ or when traditional fishermen using
traditional boats and equipment stray out of the MoU Box, as defined in a 1989
Practical Guidelines for Implementing the 1974 MoU between Australia and Indonesia
(See Map 7). The agreement, in accordance with the historical narrative, does state
that Indonesian traditional fishermen are still allowed to moor at two other small islands
to replenish their fresh water supplies; East Islet (12015' SL - 123007' EL) and Middle
Island (12015' SL - 123003' EL) (Agreed Minutes of Meeting Between Officials of
Indonesia and Australia on Fisheries, Jakarta, 29 April 1989, 1989).
A recent media report stated that there are at least 200 cases of illegal fishing
per year conducted by traditional fishermen from Rote Island, mainly from Papela in
East Rote, and that currently there are about 210 Indonesian fishermen detained in
Australia Detention Centres (Victory News, 2017). These traditional fishermen carry on
their fishing activities not only in Indonesian waters, but also in the MoU Box in
Australian waters, which encompasses Ashmore Reef, or Pulau Pasir (Sand Island) as
it is known by the Indonesian fishermen, and a number of other reefs and atolls. These
fishing practices are not driven merely by economic factors, but also by their socio-
historical background (Balint, 2005).
b. History of Poverty in Papela Since the 1970s, many studies have been conducted in Roti Island, especially
related to illegal fishing in the trans-boundary waters between Australia and Indonesia.
Most of the studies are related to Rotenese fishermen who access the MoU Box, and
focus on different perspectives including: social-culture, law, economy, public
administration, anthropology, among others (Adhuri, 2012; Fox & Sen, 2002; Stacey,
2007).
According to Carnegie (2010) and Fox (1977), Rote Island is in a relatively
isolated geographic location. Nevertheless, Rote Island has a complex history which
blends elements of local customs and ongoing interaction with people from outside
through trade and cultural exchanges that have influenced their livelihood strategies.
Historically, according to Barlow & Gonowarsito (2009), and as Fox (1977) put it:
“Rote’s maritime context has ensured continued contact with other peoples, particularly
through religious missions, commerce, and colonization”.
Traditionally, Rotenese livelihoods and social hierarchies have been organized
around the harvest of the lontar palm (Borassus flabellifer). Their livelihoods have also
relied on subsistence agricultural and fishing activities. A case study conducted by

199 | P a g e
Pellu (2008) in Landu Leko, East Rote, found that over the past few decades, the
majority of people in the villages have stopped their palm tapping activities. The reason
behind this change is the reduction of time allocated to tapping activities because of
additional time allocated to activities in rice fields, tending seaweed farms and
occasionally going off-shore to fish. In 2001, a seaweed farming industry was initiated
by the Australian Agency for International Development (AusAID), as a means of
additional income and economic survival (Barlow & Gonowarsito, 2009; Carnegie,
2008).
Papela, situated in the eastern part of Rote Island, is one of the most frequent
objects of empirical studies, as the majority of households are traditional fishers and
many of them are involved in illegal fishing activities to gain a household income. There
are various determinants of livelihood strategies driving Rotenese fishers, but in Papela
their socio-culture background has a strong influence shaping their fishing livelihood
activities (Adhuri, 2012; Fox & Sen, 2002). The studies about Papela reveal that more
than 80% of household heads identify their occupation as full-time fishers (Fox, 2002).
Papela is the organizational centre for crew recruitment for voyages to the MoU Box in
the Australian EEZ; it is also the initial marketing centre for the marine products
obtained on these voyages (Fox & Sen, 2002; Sembiring, et al., 2012).
Most Papela fishermen originate from Makassar in South Sulawesi, Alor,
another island in East Nusa Tenggara, or are Bajo people from Southeast Sulawesi.
Their ancestors came to Rote during their voyages south to the fish-rich waters where
Indonesian sea water flows from the Pacific Ocean to the Indian Ocean (Gordon, 2005,
cited by Benu et.al, 2017). They have been fishing in the region since 1720
(MacKnight, 1976; 1986), or maybe even earlier, since 1640, according to Ganter
(2008). They originally focused on gathering sea cucumber (trepang, edible
Holothuroidea) for trade with the Chinese (Clark & May, 2013). However, according to
Prescott et al. (2015), recent fishing activities also targeted fish from several
commercial species, namely Indian Mackerel (Rastrelliger spp.), Herring
(Herklotsichthys spp.), Sardines (Sardinella spp.), and small Tuna of the family
Scombridae (e.g. Auxisthazard). Although in some years significant catches also
include Squid (Uroteuthisbartschi) and other less common species. Marine Turtles are
also taken for consumption or sale if caught as by catch.
In his survey, Fox (2002) found that education levels in Papela are much lower
than in the rest of the island of Rote, noting the existence of a local primary school (SD
Negeri) with only eight full-time teachers. Fox (2002) found that 52% of the population
had completed primary school, while none of the Bajo fishermen who live at Tanjung

200 | P a g e
Pasir, a rudimentary sub-village of Papela located on a small sand spit adjacent to the
main village, had completed primary school, and most were reported to be illiterate. An
additional 27% of the Papela population had completed junior high school and a further
16% had completed senior high school. No one was reported to have had any
education beyond high school. Children as young as twelve are taken on fishing
voyages to be educated on the ways of the sea and their socio-cultural heritage. Local
government statistics confirm this pattern (BPS Kabupaten Rote-Ndao, 2017), that
Londalusi, of which Papela forms a significant part, still has the lowest school
attendance in East Rote. Only 85% of school age children (7-12 years) attend primary
school compared to rates of over 90 to 100% for other districts.
Fox and Sen (2002) stated that seasonal factors affect employment patterns.
During the west monsoon from January to April, winds and waves limit fishing. Only the
Bajo in Papela are reported to fish regularly during this season. However, 93% of the
population is involved in fishing during the east monsoon from May to June and again
from September to December. July and August are a time of strong winds and most
fishermen curtail fishing during this period. Alternative income sources vary for
households in Papela, especially during the monsoon season. They included local
trading, particularly of dried fish, day labour for local construction, boat building and
repair, seagrass farming, and small kiosks, selling daily needs, run from the front of
their houses. There are few horticulture activities because of landless, which is
common for most fishing households. Thus, rice and other basic food stuffs must be
purchased locally or obtained by trading fish. When in need, households borrow from
wealthy local perahu (boat) owners, for whom they work and to whom they may well be
related, or alternatively borrow from local traders. Most Papela families are bound by
bonds of dependence based on kinship and debt (Fox, et al., 2009; Sembiring, et al.,
2012; Therik, 2008).
Overall, most of the previous studies tend to specifically assess how the
changes in maritime boundaries (1974 MoU, the 1983 declaration of the Ashmore Reef
Nature Reserve and the 1989 Review of the 1974 MoU to include a MoU Box (Forbes,
1995)) deprive the fishers of a livelihood, and describe their poverty and subsistence
living conditions (Balint, 2005; Stacey, 2007). This paper actually adds to the previous
studies by assessing the poverty and the local context, and then proposes livelihood
strategies to improve poverty alleviation efforts in Papela.
c. Sustainable Economic Development As stated in Section 1.1, the definition of poverty in fishing villages has evolved
from basic measurements of income and consumption, the predominant criteria in

201 | P a g e
development economics in the 1960s. Analysis now includes a comprehensive
measurement of basic needs and basic human rights, including the psychological
aspects such as the feelings of powerlessness, humiliation and insecurity (Allison &
Horemans, 2006; Béné, 2006). There is new recognition that poverty is not just a
failure to meet minimum nutrition or subsistence levels of income, but also includes the
deprivation of the materials and rights required to meet minimally acceptable human
needs such as health and education, clean water and sanitation services, and resource
access required to sustain livelihoods (Allison & Ellis, 2001; Allison & Horemans,
2006). Alleviating poverty means developing access to the minimally acceptable
human needs, while still maintaining the environment in a sustainable livelihood
system. This process is called sustainable development (SD) (Hopwood, et al., 2005;
Horner, 2013).
Hopwood, et al., (2005) describe how SD has evolved from status quo,
reformation and transformation stages. Status quo proposes development but sees
neither the environment nor society as overwhelming issues while a reformation
approach critically acknowledges current policies of most businesses and
governments, and trends within society, but ignores a collapse in ecological or social
systems in the development process. The current comprehensive approach of SD is
transformation, which recognizes the environment and society as fundamental features
of sustainable development and it acknowledges the significant links between human
activities and the environment (Horner, 2013).
In the context of Sustainable Economic Development (SED) in tandem with
Sustainable Livelihoods (SL), humans have a right of freedom to economic
development (ED), called expansion of freedoms, which is not merely freedom of
economic activities (the freedom to enter into market exchanges) or political activities
(the freedom to vote and be an active citizen), but humans also have rights to consider
true freedom to access social services such as health care, sanitation, nutrition, and
education (Sen, A., 1999, cited in Miletzki & Broten, 2017). At the same time, humans
have the responsibility to maintain the environment to sustain a livelihood system. SD
has a strong commitment to social equity, with a view that access to livelihood, good
health, resources and economic and political decision making are all connected. In the
absence of people having control over their lives and resources, inequality and
environmental degradation are inevitable (Hopwood, et al., 2005; Horner, 2013; Meier,
1976). To maintain social equity, strong commitment from the stakeholders to maintain
the environment based on their responsibilities is needed (Meier, 1976). Consequently,
it can be seen that there is a strong relationship between poverty, SL and ED and SD,

202 | P a g e
in which reducing poverty by applying a SL approach is one of most important
indicators to achieving SED (Allison & Ellis, 2001; Béné, 2009; Béné, 2006; Knudsen,
2016).
Put in other words, it is necessary to approach poverty alleviation with a SL
perspective to attain SED. The assessment of poor fishermen in most empirical studies
is multi-dimensional in nature (Knudsen, 2016), and is characterized by overcrowded
living conditions with inadequate services, low levels of education and a lack of skills
and assets (particularly land), living in remote and isolated communities, poorly
organised, politically voiceless and often highly exposed to accidents and natural
disasters (Allison & Horemans, 2006). This indicates that, in general, fishers have not
been endowed with their rights of freedom (Miletzki & Broten, 2017) as measured by
four discrimination indicators in poverty assessment; social marginalization, economic
exclusion, class exploitation, and political disempowerment in the livelihood system
(Béné, 2006).
3 METHODS
a. Sustainable Livelihoods To assess the current living conditions of the fishermen in Papela and propose
a multi-dimensional solution, this paper operationalizes a Sustainable Livelihood
Approach (SLA) and its main principles (Allison & Horemans, 2006; Scoones, 1998).
Figure 16 demonstrates the process that a SLA proposes to assess the level of local
livelihood assets, i.e. Human, Natural, Financial, Physical and Social Capital, along
with the policies, institutions and processes that the fishers have access to, to enable
sustainable livelihood strategies and. outcomes that in the long run will support the
fishers to cope with stresses, shocks, trends, and seasonality (Allison & Ellis, 2001;
Allison & Horemans, 2006; Bebbington, 1999; Carney, 1998; Reardon & Vosti, 1995;
Sherbinan, et al., 2007).
Source: Allison & Horemans, 2006 Figure 16 Sustainable Livelihood Approach (SLA) Framework

203 | P a g e
Capital assets need to be further divided into asset groups that are owned,
controlled, claimed, or by some other means available for the fishers’ sustainable
livelihood pursuits. They are grouped into five categories: Physical Capital is separated
into household level (boats, fishing gear, houses, cars, bikes and bicycle) and
community level (access to infrastructure such as harbours, road networks, clinics and
schools). Financial Capital is control and access to savings, credit, and insurance,
while Natural Capital is determined by biomass of fish stocks, area of sea bed leased
or accessed by licence, land owned, crops cultivated and other natural resources.
Human Capital includes the fishers ‘capabilities’ including their health, labour,
education, knowledge and skills, and Social Capital is related to the kinship networks,
associations, membership organisations and peer-group networks that can assist the
fishers with information, technology transfers and support that facilitate opportunities
for them to advance their living standards (Allison & Horemans, 2006; Sherbinan, et al.,
2007).
b. Case Study Site Papela village, the case study site, is a multi-ethnic group community in the Sub-
district of East Rote located on the north-eastern end of Rote Island. The catalyst and
importance of this research is evident by a newspaper story in May, 2017, which
reports that there are at least 200 cases of illegal fishing per year conducted by
traditional fishermen from Rote Island, especially from the village of Papela, and that
there are about 210 of Indonesian fishermen held in Australia Detention Centres
(Victory News, 2017). These traditional fishermen are carrying on their fishing activities
not only in the Indonesian Exclusive Economic Zone (EEZ), but also in the Australian
EEZ, especially in the waters around Ashmore Reef, or Pulau Pasir (Sand Island) as it
is known by the Indonesian fishermen. These fishing practices are not driven merely by
economic factors, but also by their socio-historical background (Nolan, 2010) and other
multi-dimensional issues (Fox & Sen, 2002; Sembiring, et al., 2012). This village was
selected also based on the fact that for more than 80 % of households, fishing and other
marine resource centred activities are their main livelihood (Benu, et al., 2017).
c. Data Collection Primary data collection involved formal interviews with key informants including
community leaders, religious leaders, traditional leaders, and district and village
government officials. Focus discussion groups (FDG) and interviews were also
conducted with members of the community, such as fishermen, their wives and family,
and village youth. Data was also collected by way of a household survey using a
simple random sampling technique of 10 % of households that either have regular

204 | P a g e
fishing activities or seaweed cultivation activities as their main form of income. The
interviews and FDGs were guided by prepared purposive questions. The primary data that
was collected from the local household members was in relation to input and output
activities of fishing excursions and seaweed cultivation. This included fish catch data,
seaweed cultivation data, number of labours, quantity and quality of tools and equipment,
input costs, revenue, cost of production, gross margins, time allocation, and number of
families and their level of education attained. Government officials also expanded on
government policies and programs.
The secondary data that was collected includes information reported in
documents published by government and non-government organizations, and private
sector organizations at the national, provincial and district level. This data includes total
fish catch data, seaweed harvest data, number of inhabitants, number of fishermen,
amount of gear and equipment for fishing, existing infrastructure, total output of
regional economic activities, government policies and budget allocations, available
transportation, among other related data.
Salt farm production was analysed using Policy Analysis Matrix (PAM).
Pearson, et al. (2003) said that PAM was a flexible research tool in that it can be used
for project or policy analysis. Quantitative data focusing on data required for the
analysis of government policy for salt production using PAM was collected. This data
included the price of all input costs, total revenue, government subsidies and taxes, and
productivity and profitability that influence the economic viability of salt farming as an
alternative livelihood strategy.
4 RESULTS
a. Existing Conditions of Papela Fishermen This research found that under the globally accepted indicators of poverty and
household economics such as $2 per capita income/day (World Bank) or 2100 calories
of consumption per capita/day (The Central Bureau of Statistic of Indonesia), it could
be deduced that almost 90 % of the households in Papela are poor.
No.
Dusun
Househol
ds
Poor Househol
ds
Prewelfare
Households
Population Total Men Wome
n 1 Tanjung 125 122 3 292 276 568 2 Tasisu 138 123 15 249 251 500 3 Anlaso 107 85 22 214 204 418 4 Manulalul
en 132 119 13 273 276 549
Total 502 449 53 1028 1007 2035
Source: BPMD, Rote Ndao, 2016 Figure 17 Distribution of Population and level of welfare in Papela, 2016

205 | P a g e
For the Bajo people who live in Tanjung Pasir, a sand spit sub-village of the
village of Papela, the survey reveals that their houses are predominantly a temporary
stage house with rough wooden floors and wooden walls. They are living in squalid
conditions with poor sanitation. Commonly, two or three families live together in the one
house with no bedroom, one emergency bathroom and all children and parents
sleeping together in a big open room. The survey also found that, for alternative
income, they do not have any productive assets such as livestock, land, vehicles and
so forth. Moreover, the education data shows that almost 80% of fishermen are only
primary school graduates, and less than 1% are university graduates. The most
important education standard to the Bajo people is that their children can read and
write. After this point, children are called on to help their parents to earn money for
daily living expenses. The boys can work for the Boss (the boat owner) along with their
father and friends, and the girls assist their mother doing some daily house activities
and preparing to get married when they are teenagers.
Photo 14 Living in Poverty, Tanjung Pasir, Papela (Photo Fred Benu)
When we analyse the prevailing conditions, we come to understand that there is
little opportunity for an alternative livelihood for the local people living in Papela. The
only immediately accessible economic activity for their livelihood is fishing. Allowing the
younger generation to have only the same choice of becoming a fisherman or a
housemaid and assistant can be equated to promoting them into the same enduring
poverty trap as their parents, which is socially not sustainable. However, comments
made during interviews and FDGs revealed that the traditional fishermen in Papela are
willing to change, or supplement, the pattern of earning their livelihoods from being off-
shore and transboundary fishermen to other activities matching their skills set and
limited access to capital.

206 | P a g e
b. Previous Alternative Sustainable Livelihood Activities The first attempted alternative livelihood programs were seaweed cultivation
programs. These programs have been introduced for local people as an alternative
livelihood strategy since the 1990s by various organisations, such as Indonesian
Central, Provincial and Local Government departments, Australian Government
departments and foreign aid organisations, and NGOs. In 2007, a seaweed cultivation
program was introduced by the local government, and funded by the Australian
Embassy Direct Aid Program, provided the local fishermen with good harvests and
enough profit to raise their livelihood and living standards (Ardani, 2017). Based on that
experience, the fishermen invested approximately Rp 500 000 (US$ 50) for 180 meter
of rope, floats and seed to cultivate seaweed which produces approximately 75 Kg of
dry-seaweed, returning a profit of almost Rp 300 000 (US$ 30) or, if they had access to
funds for 10 rope lengths, approximately Rp 3 million (US$ 300) for a month. However,
this success story was halted with the Montara oil spill disaster in August 2009, which
dramatically affected seaweed production (Ardani, 2017). The Montara oil and gas field
is located to the north west of the Australian mainland, 650 km west of Darwin in the
Timor Sea. The Montara oil spill was an oil and gas leak that subsequently left a major
oil slick in the Timor Sea that caused an environmental disaster reaching the shores of
Indonesian islands facing the Timor Sea (Offshore Technology, 2018).
There are other new alternative economic activities that are being trialled in
Papela, such as horticulture cultivation and salt production. However, these projects
cannot be adopted by all fishermen because of land requirements and start-up costs.
This study found that if new drip-feed irrigation technology could be implemented into
horticultural projects, results may show positive returns in large-scale applications, but,
for small scale landholders, irrigation projects like this require high investment.
Additionally, using this technology actually reduces the labour needed for horticultural
activities and therefore does not open new job opportunities for the fishermen or other
household members.
The second, new, alternative livelihood is the development of a salt pond
business, which also requires a large investment for the appropriate land and
equipment. While the Rote-Ndao Regency government is keen to foster a local salt
production industry by its inclusion in Regency budget allocations (Haning, 2017), to
date, the only salt farming project that has been developed is a small private enterprise
(Umar, 2017).
Salt ponds have measureable impacts on the environment, as this type of
business needs expansive land clearance, especially of mangrove vegetation in flat
tidal zones. However, an in-depth interview with Umar (2017), who was also an illegal

207 | P a g e
fisherman in the 1970s and detained in Australia for 2 months, and who started a salt
production business in 2006, stated that he made a large initial investment, but now the
business can return a profit of more than Rp50 million (US$ 5,000) in a year, and give
a small number of job opportunities for local fishermen.
c. Analysis of Policy Distortions and Market Failures of Salt Pond Business Pearson et al (2003) have said that market failure is one of the causes of
divergence. The market is said to have failed when its product is unable to be created
or manufactured for a competitive price and does not reflect social opportunity cost that
in turn creates allocation of resources as well as efficient product output. There are
three types of market failure that cause divergence, namely: (i) monopoly, that is when
sellers control market price; or monopsony, when buyers control market price; (ii)
negative externalities, that is input costs that an involved stakeholder cannot endure
the costs incurred; (iii) positive externalities, that is when a share of output benefits
cannot be receive by an involved stakeholder. Therefore, a policy is said to be efficient
and beneficial for the community if the government is able to create and apply a policy
that can eliminate market failure, can put aside inefficient aims, and can result in a non-
distortive policy.
Divergence of an output cost of an economic activity, or of a commodity, causes
obtained private income to differ from social income, thus causing an output transfer
(Pearson et al., 2003). Divergence may be positive to cause implicit subsidy or
resource transfers which add to system profit. Divergence may be negative too, to
cause tax implicitly or resource transfer that reduces system profit.
To measure the value-free output transfer, it is approximated by the ratio of the
nominal output protection coefficient. This ratio compares domestic price (private) with
social price. If NPCO > 1, then domestic price is higher than import price (or export
price). Thus, the system is accepting protection. If NPCO < 1, then domestic price is
lower than world price which is not protected. In such situation, there is no policy
transfer when the domestic price is equal to the world price. So, NPCO = 1. Table 32
shows the results of divergence of the business of community salt production in
Papela.

208 | P a g e
Table 32 Results of Divergence Analysis of the Business of Community Salt Production in Papela, 2017
No Description Unit Value
1. Output Divergence: Output Transfer (OT) Co-efficiency of Nominal Output Protection (NPCO)
US$/year Ratio
(1 462 857) 0.9435
2. Tradable Input Divergence: Input Transfer (IT) Co-efficiency of Nominal Input Protection (NPCI)
US$/year Ratio
148 1.104 9
3. Domestic Factor Divergence: Factor Transfer (FT)
US$/year
1 378 114
4. Input and Output Divergence: Policy of Net Transfer (NT) Probability Co-efficiency (PC) Effective Protection Co-efficiency (EPC) Producer’s Subsidy Ratio (SRP)
US$/year Ratio Ratio Ratio
(4 321 444) 0.182 5 0.830 3 (0.137 4)
Source: Primary Data, 2017 (processed) 5 DISCUSSION Following analysis and consideration of the research data, with regard to
alternative sustainable livelihood strategies for village fishermen, results point to a salt
pond business as a best-fit alternative income for fishermen. These businesses require
large initial investment in infrastructure, land, and operational expenses, along with
strong commitment from the fishermen and substantial government intervention.
This proposal is based on several factors:
Regarding social benefits to the community; salt pond businesses require more
employees than horticulture cultivation activities using drip-feed irrigation. Hence, they
give more job opportunities for the fishermen. Research data shows that a one hectare
salt pond requires more than 10 employees, while horticulture cultivation with drip
irrigation needs only 2 labourers.
Papela still has plenty of available land, which technically is more suitable for a salt
pond business than horticultural activities. However, this would need District
government assistance for the fishermen to have access to adequate sized plots of flat
land close to tidal zone.
From a socio-historical perspective, the fishermen are more willing to be involved with
maritime-based activities, such as seaweed cultivation and a salt pond business than
land based horticultural activities.
This is evidenced by the successful uptake of seaweed cultivation before the
Montara oil spill disaster, and Pak Umar’s profitable experience with a salt pond
business. Additionally, the national demand for salt is high with the biggest
consumption by industry causing scarcity of salt supply. This scarcity of salt is currently

209 | P a g e
overcome by a government policy of importing salt in large quantities from a number of
exporting countries. However, government policy should be refocused to capitalise on
small business and employment opportunities in small, remote fishing villages.
Detailed results of salt pond production analysis, based on data received from
Umar (2017), as presented in Table 32, show that the Output Transfer (OT) value
obtained is negative. The negative value can be interpreted as the consumer pays
while the producer receives cheaper output price than the normal price. In other words,
the producer of the community’s salt in Papela Village indirectly gives incentive to
consumers. The NPCO value of the production of the community’s salt in Papela
Village is as much as 0.9435. This value shows that when the actual output price of salt
production is Rp1 000/kg (US$ 0.10), the salt farmer only receives on average 4.6%
less than the normal price which is Rp1 049/kg (US$ 0.1049)
The results of the analysis of the IT value of community’s salt production in
Papela Village, shows the amount of IT value of Rp 1 480 472 / year (US$ 148). The
positive value of IT implies implicitly that the salt farmer is taxed due to the existing
policy of IT value. The NPCI value of the community’s salt production has a value
greater than one, which can implicitly explain that the tradable input price at the
domestic price level ranges from 0.01% (1.1049/100) to the social price, i.e. more
expensive than the social price. Based on the description of the result, it seems that
there is relatively little protection for the tradable input producer.
The results of FT value analysis of the community’s salt production in Papela
Village show a positive value of Rp 1 378 114 / year (US$ 138). The positive FT value
means that the salt farmer is paying implicit tax due to existing policies or transfers to
domestic factor producers. The Labour factor is a major domestic determinant factor in
the production of the community’s salt, being as much as 37.97% of the total cost of
production and depending on the number of labourers involved
The NT value of the community’s salt production is negative. The negative NT
value in essence shows that the salt farmer profit is more in deficit, implicitly due to
market failure of input and output factors. The scale of NT value indicates that the salt
farmer in Papela Village receives an actual profit lower than the social profit of the NT
value that is Rp. 4 321 444 / year (US$ 432). The value of PC on the community’s salt
production is smaller than one. This means that private profit received by the salt
farmer is still lower than the social benefit at the proportion which is equal to the PC
value.
The average Effective Protective Coefficient (EPC) is 0.8303 which means that
the added value of output at the private price of the community’s salt production is 83%

210 | P a g e
of the added value at the point of complete competitiveness.
The Subsidy Ratio Producer indicator (SRP) of the community’s salt production
shows a negative value of 0.1374 on average. The scale of the SRP value gives an
understanding of the distortive policy of the government on average, and/or market
failure, resulting in the profit of the salt farmer being reduced by approximately 13.74%
of the economic revenue. The most dominant factor faced in the field of business or in
the market is that the sale price is still lower that the social price.
The NPCI ratio shows how much the domestic price (private price) of tradable
input differs from the efficient price (social price). If the NPCI > 1, it means that the
tradable input domestic price is more expensive than the input price at the level of
world price. It also means that the system seems to be subsidized by existing policies.
If the NPCI = 1, it means there is no transfer, and the price of domestic input does not
differ from the world input price. The NPCI value being greater that one and the NPCO
value being smaller than one, strengthens the notion that government policy is
relatively less protective to the community’s salt enterprise. Consequently, the added
value obtained from the use of tradable inputs is still lower at the level of cost price
compared to the social benefit or social price. This shows that the government has not
been able to formulate policy incentive for the development of the community’s salt
production in Papela Village in particular, and East Nusa Tenggara (NTT) in general.
Another external condition that determines the actual price received by the salt
farmer is closely related to the fluctuating trend of the Indonesian Rupiah exchange
rate as a depreciated exchange rate of the Rupiah directly affects the price and
competitiveness of the community’s salt. As the import of salt continues, the price of
domestic salt must compete with the imported product in order to grab a share of the
market.
The environmental issues connected with salt production and the technology
and technical aspects of salt production also need to be studied further, however, these
aspects are not covered in this research.
6 CONCLUSIONS The specific aims of the research were, (i) to identify and explain some of socio-
cultural factors determining the local people’s livelihoods; (ii) based on the socio-
cultural assessment and economic calculations, suggest an alternative livelihood with
comparative advantages for the Papela fishermen as a source of complementary
income using their existing skills; and (iii) to analyse government policy for enhancing
alternative livelihoods for the local people.
211 | P a g e
These conclusions can be drawn from the research:
(i) Since the beginning of the 17th century up until now, the traditional fishermen
of Rote have made regular offshore fishing trips to Ashmore Reef in the south of the
Timor Sea. This is attested by the agreement between the Indonesian and Australian
Governments signed first in 1974 and revised in 1989;
Reflecting on the socio-economic and human factors determining the livelihood
of traditional fishermen in Rote, allowing the young generation to have only the choice
of becoming a fisherman or household help is the same as promoting them in the same
enduring poverty trap as their parents. Attaining a higher level of education than their
parents is important for the younger generation to provide them with enough
knowledge and skills to confidently look for and embrace alternative livelihood
strategies;
(ii) The business of community salt production by the people in Rote is an
efficient business that has competitiveness from a social aspect as a higher number of
labourers are required, and from the economic aspect, because of a high demand to
increase national salt production. Community salt production also has competitive and
comparative advantages and can be used as an alternative source to overcome the
scarcity of salt production and to fulfil domestic demand. Further study is needed
concerning the environmental safety aspects of salt production and the technology
used.
(iii) The results of policy analysis shows that the government’s will to support
the salt farmer seems to be still weak, indicated by the lower value of output received,
while at the same time the producer has to pay more expensive input price. Anticipated
local government policy to increase the development of community salt production is
expected to be a suitable alternative livelihood activity that will help reduce
dependence of local labour on fishing activities that carry risks and restrictions,
especially in the transboundary waters between Indonesia and Australia.
ACKNOWLEDGEMENTS
We would like to thank the Nusa Cendana University, Kupang Indonesia, which has
fully supported this work under the research grant Penelitian Pimpinan in 2017.
We would also like to show our gratitude to the Local Government of Rote Ndao,
Village Government, and fishing community in Papela for their cooperation as a group
of respondents to describe the existing conditions for Papela fishermen.

212 | P a g e
Bibliography
Adhuri, D. S., 2012. Traditional and 'Modern' Trepang Fisheries on the Border of the
Indonesia and Australian Fishing Zone, Canberra: Australian National University.
AFMA, n.d. AFMA Schedule of Coordinates on MP 02/343 11.4A GeoCat 63765, s.l.:
s.n.
Agreed Minutes of Meeting Between Officials of Indonesia and Australia on Fisheries,
Jakarta, 29 April 1989 (1989).
Agreement between Australia and Indonesia concerning Certain Boundaries between
Papua New Guinea and Indonesia. Australian Treaty Series 1974 No. 26. Jakarta
(1974).
Allison, E. & Ellis, F., 2001. The livelihoods approach and management of small-scale
fisheries. Journal of Marine Policy, Volume 25, pp. 377-388.
Allison, E. H. & Horemans, B., 2006. Putting principles of the Sustainable Livelihoods
Approach into fisheries development policy and practice. Journal of Marine Policy,
30(6), pp. 757-766.
Anderson, A. R. & Obeng, B. A., 2017. Enterprises socially situated in a rural poor
fishing community. Journal of Rural Studies, Volume 49, pp. 23-31.
Ardani, S., 2017. Papela fishing history [Interview] (16 08 2017).
Balint, R., 2005. Troubled Waters: Borders, boundaries and possession in the Timor
Sea. Crows Nest: Allen & Unwin.
Barlow, C. & Gonowarsito, R., 2009. Socio-Economic Conditions and Poverty
Allieviation in East Nusa Tenggara. In: B. Resosudarmo & F. Jotzo, eds. Working
with Nature against Poverty: Development, Resources and the Environment in East
Indonesia. Singapore: ISEAS Publishing.
Bebbington, A. J., 1999. Capitals and capabilities: a framework for analysing peasant
viability, rural livelihoods, and poverty. World Development, 27(12), pp. 2021-2044.
Béné, C., 2006. When Fishery Rhymes with Poverty: A First Step Beyond the Old
Paradigm on Poverty in Small-Scale Fisheries. World Development, 31(6), pp. 949-
975.
Béné, C., 2009. Are Fishers Poor and Vulnerable? Assessing Economic Vulnerability in
Small-Scale Fishing Communities. Journal of Development Studies, 45(6), pp. 911-
933.
213 | P a g e
Benu, F., King, P. G., Nalle, A. & Muskanan, M., 2017. The Economic Livelihoods of
Traditional Fishermen in Rote Island in Relation to the Activities of Illegal Fishing in
Transboundary Water of Indonesia and Australia. Research Report, Kupang: Nusa
Cendana University.
Benu, F., Mudita, W. & Muskanan, M., 2017. [Online]
Available at: http://medcraveonline.com/HIJ/HIJ-01-00013.pdf
Bodin, O. & Crona, B. I., 2009. Journal of Environmental Change, 19(3), pp. 366-374.
BPS Kabupaten Rote-Ndao, 2016. Statistik Kesejahteraan Rakyat Kabupaten Rote
Ndao 2015, Ba'a: BPS Kabupaten Rote Ndao.
BPS Kabupaten Rote-Ndao, 2017. Kecamatan Rote Timor dalam Angka 2016, s.l.:
BPS Kabupaten Rote-Ndao.
BPS Kabupaten-Rote-Ndao, 2017. Kecamatan Rote Barat Daya dalam Angka 2016,
Ba'a: BPS Kabupaten-Rote-Ndao.
Briggs, J., 2009. Diversity, Endemism and Evolution in the Coral Triangle. Journal of
Biogeography, 36(10), pp. 2008-2010.
Campbell, B. & Wilson, B., 1993. The Politics of Exclusion: Indonesian Fishing in the
Australian Fishing Zone. Singapore: Indian Ocean Centre for Peace Studies.
Carnegie, M., 2008. Development prospects in Eastern Indonesia: Learning from
Oelua's diverse economy. Asia Pacific Viewpoint, 29(3), pp. 354-369.
Carnegie, M., 2010. Living with difference in rural Indonesia: What can be learned from
national and regional agendas?. Journal of Southeast Asian Studies, 41(3), pp.
449-481.
Carney, D., 1998. Implementing the Sustainable Rural Livelihoods Approach, London:
Overseas Development Institute U.K..
Chambers, R. & Conway, G. R., 1991. Sustainable Rural Livelihoods: Practical
Concepts for the 21st Century. IDS Discussion Paper 296.
Christy Jr., F., 1986. Special characteristics and problems of small-scale fisheries
management in developing countries. In: E. Miles, R. Pealy & R. Stokes, eds.
Natural resource economics and policy applications. Seattle: University of
Washington Press, pp. 118-151.
Clark, M. & May, S. K., 2013. Macassan History and Heritage: Journeys, Encounters
and Influences. Canberra: ANU E-Press.

214 | P a g e
Edyvane, K. S. & Penny, S. S., 2017. Trends in derelict fishing nets and fishing
activities in northern Australia: implications for transboundary fisheries management
in the shared Arafura and Timor Seas. Fisheries Research, Volume 188, pp. 23-37.
Forbes, V. L., 1995. The Maritime Boundaries of the Indian Ocean Region. Singapore:
Singapore University Press.
Fox, J. J., 1977. Harvest of the Palm: Ecological Change in Eastern Indonesia. London:
Harvard University Press.
Fox, J. J., 1998. Reefs and shoals in Australia-Indonesia relations: traditional
Indonesian fishermen. In: A. Milner & M. Quilty, eds. Australia in Asia: Episodes.
Melbourne: Oxford University Press Australia, pp. 111-139.
Fox, J. J., Adhuri, D. S., Therik, T. & Carnegie, M., 2009. Searching for Livelihood: The
Dilemma of Small-Boat Fishermen in Eastern Indonesia. In: B. P. Resosudarmo &
F. Jotzo, eds. Working with Nature Against Poverty. 1 ed. Singapore: ISEAS
Publishing.
Fox, J. J. & Sen, S., 2002. A Study of Socio-Economic Issues Facing Traditional
Indonesian Fishers Who Access the MOU Box, Canberra: A Report for
Environment Australia.
Ganter, R., 2008. Muslim Australians: the deep histories of contact. Journal of
Australian Studies, 32(4), pp. 481-492.
Gordon, A., 2005. Oceanography of the Indonesia Seas. Oceanography, 18(4), pp. 14-
27.
Haning, L., 2017. Head of Rote-Ndao Regency formal interview [Interview] (26 August
2017).
Hopwood, B., Mellor, M. & O'Brien, G., 2005. Sustainable development: mapping
different approaches. Journal of Sustainable Development, 13(1), pp. 38-52.
Horner, N., 2013. What Is Social Work?. 4th ed. London: Sage Publishing.
King, P. G., 2007. The Australian Government’s Responses To IUU Fishing In Its
Northern Waters. (Unpublished Honours Thesis): Griffith University, Brisbane,
Australia.
Knudsen, M., 2016. Poverty and Beyond: Small-Scale Fishing in Overexploited Marine
Environments. Human Ecology, 44(3), pp. 341-352.
Leach, M., Mearns, R. & Scoones, I., 1997. Challenges to Community Based

215 | P a g e
Sustainable Development: Dynamics, Entitlements, Institutions. IDS Bulletin, 28(4),
pp. 4-14.
MacKnight, C. C., 1976. The Voyage to Marege': Macassan Trepangers in Northern
Australia. Melbourne: Melbourne University Press.
MacKnight, C. C., 1986. Macassans and the Aboriginal past. Archaeology in Oceania,
Volume 21, pp. 69-75.
Meier, G. M., 1976. Leading Issues in Economic Development. 3rd ed. New York:
Oxford University Press.
Meier, G. M., 1984. Emerging From Poverty: The Economics That Really Matters. New
York: Oxford University Press.
Memorandum of Understanding Between the Government of Australia and the
Government of the Republic of Indonesia Regarding the Operations of Indonesian
Traditional Fisheries in Areas of the Australian Exclusive Fishing Zone and
Continental Shelf (1974).
Miletzki, J. & Broten, N., 2017. An Analysis of Amartya Sen's Development as
Freedom. London: The Macat Library.
Monke, E. A. & Pearson, S. R., 1989. Policy Analysis Matrix for Development. London:
Cornell University Press.
Nolan, B., 2010. Ekonomi Politik Masyarakat Nelayan Skala Kecil: Sebuah Studi
Perbandingan Masyarakat Pendatang di Rote Ndao dan Jawa Timur. ACICIS
Research Report. Malang, Universitas Muhammadiyah.
Offshore Technology, 2018. Montara Oil Field, Timor Sea. [Online]
Available at: http://www.offshore-technology. com/projects/montara-oil-field/
[Accessed 10 May 2018].
Pearson, S. R., Gotsch, C. & Bahri, S., 2003. Aplikasi Policy Analysis Matrix pada
Pertanian Indonesia. 1st ed. Jakarta: Yayasan Obor.
Pellu, L. H., 2008. A Domain United, A Domain Divided: An Ethnographic Study of
Social Relations and Social change among the People of Landu. s.l.:PhD Thesis,
Australian National University.
Prabowo, R., 2010. Kebijakan Pemerinta Dalam Mewujudkan Ketahanan Pangan Di
Indonesia. Journal of Mediagro, 6(2), pp. 62-73.
Prescott, J., Riwu, J., Steenbergen, D. J. & Stacey, N., 2015. Governance and

216 | P a g e
Governability: The Small-Scale Purse Seine Fishery in Pulau Rote, Eastern
Indonesia. In: Interactive Governance for small-Scale fisheries. Europe: Springer,
pp. 61-84.
Purcell, S. W. & Pomeroy, R. S., 2015. Driving small-scale fisheries in developing
countries. Frontiers in Marine Science, Volume 2.44.
Reardon, T. & Vosti, S. A., 1995. Links between rural poverty and the environment in
developing countries: Asset categories and investment poverty. World
Development, 23(9), pp. 1495-1506.
Santha, S., 2014. Adaptation to coastal hazards: The livelihood struggles of a fishing
community in Kerala, India. Disasters, 39(1), pp. 69-85.
Scoones, I., 1998. Sustainable Rural Livelihoods: A Framework for Analysis. IDS
Working Paper 72.
Sembiring, P. et al., 2012. Analisis Manajemen Rantai Pasok Produk Perikaman Di
Kabupaten Rote Ndao (Studi Kasus Nelayan MoU Box 1974). Jakarta:
Kementrian/Lembaga: Balitbang Kementerian Pertahanan.
Sherbinan, A. et al., 2007. Rural household demographics, livelihoods and the
environment. Global Environmental Change, Volume 18, pp. 38-53.
Stacey, N., 2007. Boats to Burn: Bajo Fishing Activity in the Australian Fishing Zone.
Canberra: ANU E Press.
Therik, W., 2008. Nelayan Dalam Bayang Juragan: Potret Kehidupan Nelayan
Tradisional Bajo di Tanjung Pasir, Pulau Rote, Nusa Tenggara Timur. Salatiga:
Working Paper Institute of Indonesia Tenggara Studies, Universitas Satya Wacana.
Umar, 2017. Salt Farm Production [Interview] (16 08 2017).
Victory News, 2017. Australia Tangkap Nelayan NTT. Victory News Kupang, 2 May.
Weeratunge, N. et al., 2015. Small-scale fisheries through the wellbeing lens. Journal
of Fish and Fisheries, 15(2).

217 | P a g e
Interview and FDG Qualitative Data Chapter 8

218 | P a g e
8.1 Introduction
Reflecting back to Scoones’ (1998, p.3) four fundamental questions for a sustainable
livelihood approach, as introduced in Chapter 2,
What is the context of a particular case study area?
What is the available capital (natural and human)?
What are the achievable strategies and locally guided outcomes?
And finally, what institutions, formal or informal, mediate the scope of livelihood
strategies and outcomes?,
This chapter moves to put order and meaning to the vast amount of qualitative data
collected during the field research stage of this project
Below are presented the qualitative responses obtained from analysis of the interviews
and FDGs conducted in the three case study sites. In an effort to allow the voices from
the micro-level to be distinctly heard, the author has presented the responses in
tabulation format, similar to how quantitative data is tabulated into spreadsheets
distinguishing various themes and relevant associated data.
The FDGs and interviews were guided by a number of broad, open ended questions
relating to the fisher households’ socio-economic status, current livelihood strategies
and future aspirations. A copy of indicative questions that guided discussion topics at
FDGs and interviews is shown in the following Section 8.2, and earlier in Section 6.7.4.
Cited in the tables in the following sections are samples of translations of the
conversations and comments made by fishers, their family members, predominantly
wives, village officials and district government officials.
The FDGs and interviews were semi structured discussions guided by a set of
purposive questions. The questions were not asked in any particular order; allowing the
interviewees and participants to traverse salient themes in order and importance that
they determined. Depth and breadth of answers varied according to theme salience
expressed by each of the stakeholder groups. Hence, responses presented in the
following subsections are not categorised by question but by theme and group. Brief
descriptions of the themes are given at the dead of each subsection, but analysis and
discussion are left until Chapter 9.
A number of important themes identified in the literature review were followed by using
a Grounded Theory style analysis using Open Coding, Axial Coding and Selective
coding as discussed in Chapter 6. The seven themes that maintained salience during

219 | P a g e
this process are: Economic Status, Current Livelihoods, Alternative and Modernised
Livelihoods, Education, Social Capital, Government Assistance and Next Generation
Matters. The presentation of this data has not only been separated into the seven
themes, but has also been divided into the three case study sites. This prepares the
data for theme analysis, in the discussion chapter, to report on the similarities and
differences among the case study sites, in their current status and their aspirations and
challenges for the future.
In an attempt to maintain, where possible, anonymity of the FDG participants and
interviewees, codes have been assigned to them when citing their comments, as
follows. This is not completely possible for district and village leaders. There are a
number of comments, coded Anon, that the author has also maintained anonymity
across case study sites. These are presented at the end of the relevant section.
Site: PD = Pepela Darat, TP = Tanjung Pasir, Lan = Landu Thie,
Event: FDG 1st, FDG 2nd, WFDG (Women’s FDG), YFDG (Youth FDG},
followed by a Participant number. Interviews do not have an event code.
Lan VH = Landu Thie Village Head,
Lan VS = Landu Thie Village Secretary,
Lan VE = Landu Thie Village Elder,
Bupati = Head of Rote Ndao District government,
RDF Sec = Head of Rote Ndao District Department of Fisheries.
The Pepela Village Head was not available for an interview at the time of the field
research.
Throughout this thesis the author has used US Dollar to Indonesian Rupiah exchange
rate of US$1 = Rp13,000, unless otherwise stated.

220 | P a g e
8.2 Indicative Questions for Interviews and FDGs
Presented in this section are indicative questions used during Interviews and FDGs.
The questions were developed based on themes identified in the literature review. Here
they are presented in English language, but an Indonesian language version of the
indicative questions was used in the field by the research team. The questions were
used as a discussion guide only and where not raised in any particular order. The
answers to these questions underwent further theme analysis to guide the discussion
and findings in this research.
Indicative Questions for:
1) Interviews with Government and NGO officials:
1. Do traditional fishing communities come under your jurisdiction? 2. What is your role in regard to traditional fishing communities and fishermen and
their families? 3. Are there any projects that you know (Past, Present, and Future) that support/
help develop these communities and their livelihoods? 4. Have these projects been successful? Lessons learned? 5. What are the current and future goals for you organisation with regard to
traditional fishing communities, fishermen and their families? 6. Can you compare the current generation livelihood opportunities with that of a
generation ago? What have been the challenges? 7. Do you think the next generation have different livelihood aspirations to their
parents? 8. What is needed for the next generation to achieve their goals? 9. How will the current generation provide for the next generation to achieve their
livelihood aspirations? What will be the challenges? 10. How do you think we can measure livelihood improvements in traditional fishing
communities?
2) Interviews and Focus Group Discussions in Traditional Fishing Community (Questions were modified depending on the group involved):
1. Are you happy with your livelihood? Is your family happy? 2. What do you and your family need for an acceptable life standard? 3. What challenges are there for this standard of living and a stable income?
(Government, economic, environmental, social, cultural) 4. Have there been any Government or NGO projects now or in the past to help
you with better more stable livelihood? Lessons learned? 5. Can you compare your generation’s livelihood opportunities with that of
previous generations? What have been the differences in challenges? 6. Do you think the next generation have different livelihood aspirations to your
generation? 7. What are the next generation’s needs to achieve their goals? 8. How will your generation provide the next generation’s needs to achieve their
livelihood aspirations? What will be the challenges? 9. Do you think there need to be changes in your livelihood strategies to better
provide for your family?

221 | P a g e
10. What changes can you do yourself for a sustainable livelihood: can you name some small project ideas: for your household, for your neighbourhood, for your community?
11. How can the Government or NGOs be lobbied to do more livelihood development projects?
12. How do you think we can measure livelihood improvements in your traditional fishing community?

222 | P a g e
8.3 Current Status of Case Study Sites
Applying the first two of Scoones’ four questions, (Scoones, 1998, p. 3) to this
research, (What is the context of a particular case study area? and What is the
available capital (natural, human)?), we see that they concern the analysis of various
aspects of the case study sites including human and physical capital available;
demographics, geography, history, culture and social structure. The qualitative data
collected to aid in answering these first two questions are presented in the following
subsections.
8.3.1 Economic Status
This subsection is a summary of salient comments made by the research participants
in relation to their current economic status. Common expressions across the three
study sites concern an inability to afford basic needs and the entrapment of debt for
those who work for a Boss. They have aspirations but an inability to achieve them.
Pepela Darat
PD Fisher 1: … [my] friends here are half dead, [we are] a milking / work horse … PD Fisher 2: … we have income, it is not consistent. Basically our incomes are like the tidal waters … PD Fisher 3 … yes we want better but our income is not enough, if our income was better we could fulfil all our desires … PD FDG 2nd Fisher 6 … there's no freedom from debt, depends on conversations with the boss only … PD FDG 2nd Fisher 5 … Yes nearly all have debt to the boss … PD FDG 1st Fisher 7 … several years ago there was an issue when fishermen here were invited to do people smuggling and many were arrested in Australia … it was an opportunity to clear debt … technically every day we have living costs, people need to live and need money … we don’t want to borrow from the Boss, the Boss doesn’t trust and it causes arguments in the home because of the problem of living costs, they are like mafia …
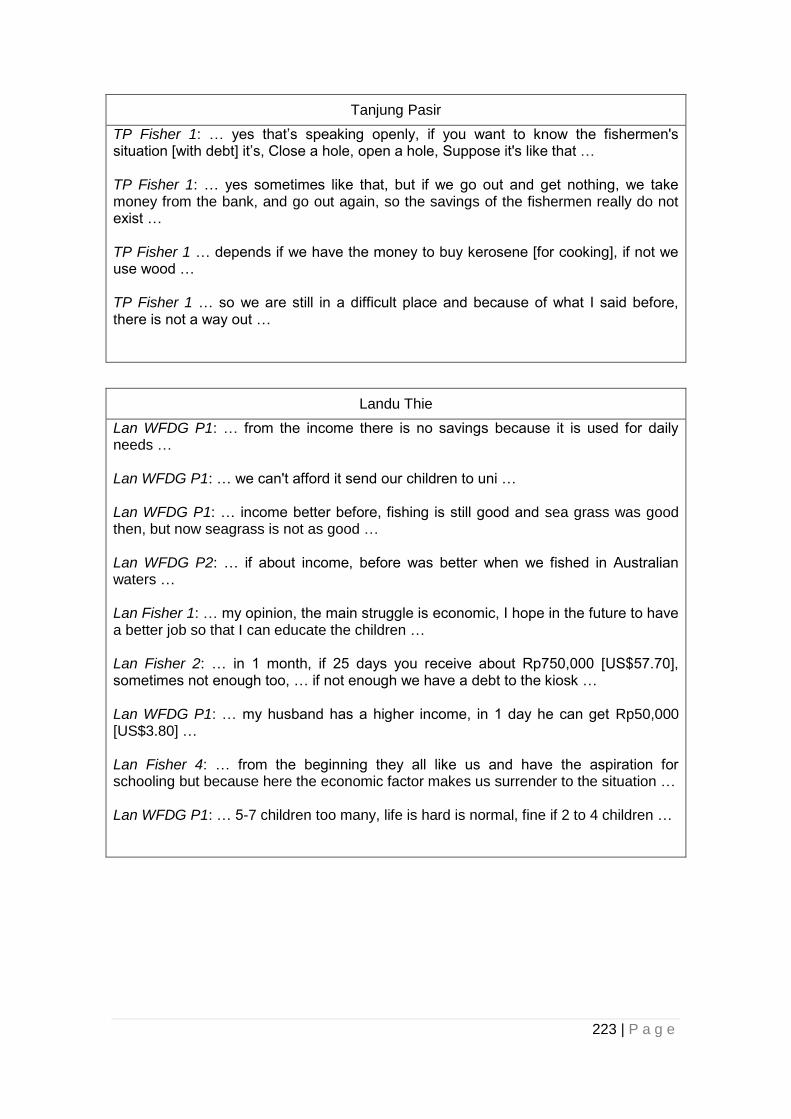
223 | P a g e
Tanjung Pasir
TP Fisher 1: … yes that’s speaking openly, if you want to know the fishermen's situation [with debt] it’s, Close a hole, open a hole, Suppose it's like that … TP Fisher 1: … yes sometimes like that, but if we go out and get nothing, we take money from the bank, and go out again, so the savings of the fishermen really do not exist … TP Fisher 1 … depends if we have the money to buy kerosene [for cooking], if not we use wood … TP Fisher 1 … so we are still in a difficult place and because of what I said before, there is not a way out …
Landu Thie
Lan WFDG P1: … from the income there is no savings because it is used for daily needs … Lan WFDG P1: … we can't afford it send our children to uni … Lan WFDG P1: … income better before, fishing is still good and sea grass was good then, but now seagrass is not as good … Lan WFDG P2: … if about income, before was better when we fished in Australian waters … Lan Fisher 1: … my opinion, the main struggle is economic, I hope in the future to have a better job so that I can educate the children … Lan Fisher 2: … in 1 month, if 25 days you receive about Rp750,000 [US$57.70], sometimes not enough too, … if not enough we have a debt to the kiosk … Lan WFDG P1: … my husband has a higher income, in 1 day he can get Rp50,000 [US$3.80] … Lan Fisher 4: … from the beginning they all like us and have the aspiration for schooling but because here the economic factor makes us surrender to the situation … Lan WFDG P1: … 5-7 children too many, life is hard is normal, fine if 2 to 4 children …

224 | P a g e
8.3.2 Current Livelihoods
The subsection presents the comments made about their current livelihood strategies,
confirming that all are fishers, there is one fisher woman living in Landu Thie, The
fishers also describe their different boat types, their relationship with their Boss. Most
fishers from Pepela Darat and Tanjung Pasir work for a Boss voyaging to the MoU Box,
while most fishers from Landu Thie work for themselves as coastline fishers.
Pepela Darat
PD Fisher 3: … I don’t have a boss, I work for myself … PD FDG 2nd Fisher 5: … I started to go to sea when I was 11 … PD FDG 2nd Fisher 5: … About 20 boats from here go to the MoU now … PD FDG 1st PNS … the boss gets a lot of income and fishers only get this much ... all is a game, the price is set by him, all is up to him ... He holds the reins ... PD FDG 1st PNS … the person who makes them powerless is the big boss … PD FDG 2nd Fisher 5 … Yes nearly all have debt to the boss … PD Fisher 4 … because I work alone, we sell for us only, so the money is not divided with other fishermen, sell for me only … District Head … 50 boats are still allowed to go to the MoU Box, the boats from NW and SW that are allowed are listed with the names of the crew, GPS and boat names, so the boats and crew are already listed … and what can be taken and the amount, also the [fishing} places are fixed …
Tanjung Pasir
TP Fisher 1: ... sometimes you don't want to go to sea again because you have children n grandchildren, I already have 5 grandchildren … TP Fisher 2: … no I don’t get sick much, but the sea conditions influences this If I get sick and continue to go down, later I will be sick …
Landu Thie
Lan VH: … all of them are fishermen, there are no farmers … Lan VH: … some [villagers] work overseas, but many also went to Ashmore Reef, but now they have stopped because in 2006, 10s of their boats were burnt by the Australian Government because they were prohibited to go to the area of transboundary waters …

225 | P a g e
Lan WFDG P2: … Australia burnt about 20 boats … Lan FDG P1: … now, we don’t dare to still go to the border area, we only catch fish in the local waters around here … Lan VS: … most are coastal fishers. Some go long on journeys but they go on a larger boat, the owners/boss live in Papela … Lan Fisher 3: … seagrass [farming] started in 2000, before 2000 many sailed on long voyages. I've been to Darwin to work on large [commercial] boats … Lan FDG P1: ... cost of canoe Rp7,500,000 [US$577], if bodhi batang Rp15 million [US$1,159], and bodhi jolor about Rp30-40 million [US$2,300-3,050] … Lan FDG P1: ... can't count them [number of boats here. The issue is that everyone here is a fishermen, so every household has a canoe, here there are 188 families and all have a canoe …Bodhi batang about 50, bodhi jolor not many, about 20 … Lan FDG P1: ... bodhi batang is a small boat with only 3 crew ... While bodhi jolor is bigger and can have 25 passengers, most use a small motor, about 5 HP, jolor motor is about 24HP … Lan WFDG P1: … yes we each have a boat, one for passengers and 1 for fishing … Lan VH: … about fish catch, before was better because we caught more fish, and we worked as crew, while the skipper is from Pepela and the proceeds were divided by 3 less the supplies … Lan VH: … continue to sell the catch but the results are not constant and sometimes sell to an agent, we use canoes with oars and sell around here only … Lan Fisher 2: … yes coastline [fishing] only, already not brave to go a long way … sometimes I go in the morning until 12 midday … if I go in the afternoon until 9/10 pm … Lan Fisher 2: … not very much because we use small boats and only get small results … sell the catch directly to trader … Lan FDG P1: … fish just around here Ba'a to Ndao. It depends on the season … Lan FDG P1: … food was guaranteed in jail in Australia, but different here … Lan WFDG P1: … I live here and work as a fisher woman …

226 | P a g e
8.3.3 Alternative and Modernised Livelihoods
This subsection relates the fishers’ experiences with alternative livelihoods and the
attempts by KKP to modernise their catch effort. KKP provided two 10 ton fibre boats to
Pepela Darat, and another 2 to Landu Thie, to be used by registered cooperatives
made up of about 10 fishers. Seagrass farming and temporary migration out are
alternative livelihood strategies also used by the villagers. Women contribute to
household incomes by baking cakes and sweets and running small kiosks. They are
also the main participants in seagrass farming in Landu Thie.
Pepela Darat
PD FDG 1st Fisher 7: … as I have said, and all the fishermen agree, but the boss doesn't. There is 1 solution that profits the boss, and the fishermen will profit too, he [the Boss] gives as a salary 1 boat at a fixed price, a finished price of Rp75 mil, but all of the income they get will be repayments, it can be done because all the income you will get ... but after the repayments he has a boat ... PD FDG 2nd Fisher 5: … yes, the fibre boats [fibre boats supplied by KKP] are not in accordance with the fishermen's requests … PD FDG 2nd Fisher 7: … so 4 years ago I was a seagrass farmer, after seagrass doesn't work anymore I have an oil business … PD Fisher 1 … yes there are GPS and solar cell but not radio … PD Fisher 3: … yes maybe 20 years ago there was a salt farm but already closed, the government owned it and we worked there … yes the government owned and we were offered only a percentage, but when it was time to divide we didn’t get our percentage, so we were tricked and for 2 months we didn’t go fishing … PD Fisher 3: … yes I have a rice field but have lost for last 2 years because of no rain … and additional income from selling sand … PD Fisher 1 … the fibre boats are big, maybe 10 ton … to take it out we need complete documents, and the captain needs a licence … Anon: … We have to anticipate the village fund in the future success, not long after a big boss plays in the background and plays with the village officials or whoever to bloke it ...

227 | P a g e
Tanjung Pasir
TP Fisher 2: … I don't fish any more. I get income from being a wood worker and boat builder…we look after boss boats, boss can look after us. We don't have money … TP Fisher 2: … and my wife often makes cakes for sale … TP Fisher 3: … My wife also makes money from selling cakes … TP Fisher 2 … for the KKP funding we hope for, from the government rolling funds … who wants to work can have funds ... We can take to sell clothes, or other things, fish, buy from the fishermen with profit, and go to Kupang to sell …
Landu Thie
Lan VH: … our own efforts sometimes from seagrass, so the outcomes from seagrass help finance our homes, but the few who continue are the women … Lan WFDG P1: … we have a motorbike … purchased from the proceeds from seagrass, fishing income is for daily needs, seagrass is for additional income … Lan VS: … About the Montara oil leak we've been interviewed too, if the oil was on top of the water things would be very different …it is still at the bottom the water [which] is not good, there is still oil sediment at the bottom … Lan Fisher 3: … for seagrass usually by oneself, better alone, so now everyone works alone ... Lan Fisher 3: … In these years, 2003, 2004, 2005,2006 the [seagrass] price was up to Rp20,000/kg, that's the buyers price, and now 2017 already changed, Rp10,000/kg, this is because of 2008 [Montara 2009], value also depends on the size, value in the weight … Lan Fisher 3: … in 2017, the harvest is only 500kg and only 50% try, the results give one household one month at most Rp 500,000 … Lan FDG P1: … seagrass now is only a little bit, not even 10 people, only around 7-8 people … Lan Fisher 1: … yes before I grew seagrass… The equipment is stored at the moment, so not anymore ... There is no seed … Pak Fred FDG wrap up: … so possibly the seagrass influenced by the oil spill about 20 years but it’s not 10 years yet from 2008 [August 2009], almost 10 years but will have an influence for 20 years. 10 years more. It will reduce over 20 years … Lan VH: … some work in Jakarta or Kupang, the most go to Jakarta, some go to Kupang to work and on Italian boats too and also to Australia to work in the big fishing enterprises and markets … Lan YFDG P1: … most of the friends before for years when they pass [school] work away from here, in Java …

228 | P a g e
Lan YFDG P3: … Another I know already gone to Jakarta to become a security guard … Lan WFDG P3: … the only work opportunity in Ba'a is look after a photocopy shop. Here [on Rote] the prospects are less than good, so we have to go away for work … Lan VH: … there are no fish ponds, prawn or lobster ponds or trepang here … Lan WFDG P1: … there aren’t any other craft industries here … Lan YFDG P2: … working on foreign boats my monthly salary 500 Euro, or Rp7,500,000 [US$577] per month, food and drinks the company responsibility … contact for 2 years 6 months and savings Rp140,000,000 [US$10,770] and money to build a home … I stopped because I wanted to be with my wife and child … Lan Fisher 1: … I know about foreign boat work from Facebook … so I applied, cost from here to Spain is their [the company] responsibility … Lan Fisher 1: … another ship operated in Indonesia [waters] ... But if docking have to go to Brisbane, For me to be there alone is not a problem. But because I had been away from the family a long I come home … Lan Fisher 2: … Want to go Overseas for work but … Mrs have to stay, we go Mrs find a life … Lan VS: … before this village head many people worked away … Lan Fisher 2: … I also catch lobster … Lobster season starts in January for 3 months maybe 5-6 months, fishing month 9-10 [September, October] until January … Lan Fisher 1: … I use a spear gun, dive in the sea ... Using the equipment that I bought in Europe … Lan Fisher 1: … Diving a maximum Rp250,000 [US$19.25] per day ... While the minimum is Rp50,000-100,000 [US$3.85-7.70] … Lan Fisher 1: … Mama helps to by selling cakes and also artefacts, sells fried food and cakes … Lan Fisher 1: … now I also do [make and sell] cylinders of ice …

229 | P a g e
8.3.4 Education
In this subsection the villagers express the desire to educate their children, but are
constrained by the cost of schooling and of university costs in Kupang, the provincial
capital. The current generation sees education as a passport to a better future but the
costs are out of reach. The villagers also report that even though the government
schools should be free to attend, there are many costs and fees presented to them.
Pepela Darat
PD FDG 1st Fisher 8: … government schools here are not free, to enrol is free, …
PD Fisher 2: … yes my children want to go to uni if we have income, it is not consistent Basically the tidal waters are like our income … PD Fisher 4: … we need help for the children to go to uni, then we don’t have to make that effort … PD Fisher 3: … the 1st child finished SMA (Senior High School) but did not go to uni because there wasn’t the money, the 2nd child went to SMK (Technical High School) but decided to leave … and for the 3rd child, a girl, we pay Rp175,000 [US$13.50] registration cost and Rp15,000 [US$1.15] per month … Lunch money is Rp5000 [US40c] per day but if we only have Rp2,000 [US15c], then she only gets RP2,000 … PD FDG 1st Fisher 8: … there is a problem with costs for uni … also if we don’t pay the SPP (School Development Contribution) costs, the school holds the certificate … PD FDG 2nd Fisher 7: … There are other livelihood alternatives but they are for the future generation. So let us prepare the costs for their education as high as possible so in the future there is hope for the next generation … PD Fisher 2: … yes my children want to go to uni … PD Fisher 3: … Yes it is truly my wish that the children finish school, only they don’t want to continue, only finish Junior High School … I don’t force them to go, for school needs money …
Tanjung Pasir
TP Fisher 1: … yes, the name is costs for the fisherman … it's what I said before, some people are satisfied, some are not … TP Fisher 1: … it is mum who educates them. I only want to do fishing only … TP Fisher 2: … I don't know more, those that went to school had time, but money not a problem, wanted what he wanted, go to school more or follow to sea, he wanted to sail …

230 | P a g e
TP Fisher 2: … my brother’s children at that time they hadn't finished Senior High School, they pushed for him to keep going until he has a degree in Semarang, now a Master … at that time I said “try, some break through” … so he has younger siblings who have done all education … They live ok now, and accommodation for my children in Sulawesi, I don't pay for school either … TP Fisher 4: … my son wanted to be a fisherman and didn’t want to go to school, not because we couldn’t afford, they asked not to go to school … TP Fisher 5 … the second child finished school and now works as a teacher … and the third child finished school and is now doing a Master at Brawijaya University in Malang …
Landu Thie
Lan WFDG P1: … we can't afford to send our children to uni … Lan WFDG P1: … other students come home after finishing uni, but then go again … Lan Fisher 2: … yes we have solar power … in the day for 2 hours from 10am - 12pm and at night from 6 - 10 pm … children study using an oil light … Lan Fisher 2: … we have radio for news, no internet … Lan YFDG P3: … Yes, at that time I had an opportunity to go to Undana. In Kupang I lived with my older sibling in the area of Walikota. I did the test for SNMPTN (Selection test to study to be a teacher) and passed to go to Primary School Teachers’ College and went for the payment interview, but I was called home by my parents because we didn't have enough money … Lan YFDG P3: … There's many, around 10, people did not go on to uni … Only one person went to Undana, her name is Dxxx Pxx, studied English teaching in Faculty of Teaching and Education Undana … Lan VS: … we already have a Junior High School, not yet Senior High School … not yet enough teachers, there are honor teachers (only small amount of pay or voluntary) … the teachers are originally from here, they studied in Kupang and returned … Lan YFDG P1: … some students want to continue school on Rote … they stop school not because of cost but distance … Lan Fisher 4: … from the beginning they are all like us and have the same aspiration for schooling, but because here the economic factor makes us surrender to the situation … Lan Fisher 1: … I finished Primary School only but travelled overseas for work … All 6 of my children go to school or have already finished SMA (Senior High School) … the 1st child finished SMA, but didn’t go to uni because of economics/money ... Now works in Jakarta … Lan VH: … after Senior High most go to uni …

231 | P a g e
Lan VS: … not many from here go to uni … some have finished but yet to find work. but they can come home to help the village … also become teachers and business people, not just public servants … Lan Fisher 1: … here the average pay for school ... for 2 children at Senior High School every 3 months we pay Rp90,000 [US$6.90] per person, Junior High the same … there is a new Junior High School will be free after registered at the Central Government and there is money for uniforms and other needs … and for Primary School also free …

232 | P a g e
8.3.5 Education
This subsection presents the voices of the micro concerning social capital in the study
sites. The people from Pepela Darat and Tanjung Pasir speak of neighbourhood
mutual help activities but dismiss any notion of valid institutional support. However, the
people from Landu Thie do express more involvement and interest in institutional
activities as well as community help groups under their old society traditions.
Pepela Darat
PD FDG 1st Fisher 8: … the problem here, we are all new comers … PD FDG 2nd Fisher 7: … about a fishermen’s group / coop here, if you want to say there is but there isn't, If you want to say there isn't but there is … PD Fisher 3: … and what’s more, for example, we help to build houses … in the family we help each other like that … Tenaga. Gotong royong …
Tanjung Pasir
TP Fisher 1: … many ways we help each other … if we are here [on Rote Island] all this family is family … here [this house] is special for those from Wakatobi … three households here now … TP Fisher 3: … after 10 years here, I am still not active at the mosque … TP Fisher 4: … I’m go to the mosque but not active …
Landu Thie
Lan VE: … Now the person/family/clan who occupies the most land still Messakh, Tola Messakh … Tola Messakh was 1st here, but it's already divided among others … in the centre [of Landu Island] there are 2 families, and west Landu is the Kiki family … in the east so Tola Messakh still owns, it is our island but divided with several clans, because TM the first here but the 2nd divided, the 3rd person divided again, the arrivals asked for a part … Lan Fisher 2: … yes community help, here we are involved in that, sometimes the coastal people/ fishers are involved also … Lan WFDG P1: … it's the women that make that decision because we [women] know the economic situation in the household … Lan Fisher 2: … we have a radio for news, no internet …

233 | P a g e
Lan WFDG P1: … about bride price here, it is not expensive, except people from outside, if from this area the price is enough for the party, air susu money, and brother money … Lan WFDG P5: … the church collection on Sundays, there are 3 collections and the decade vow … amounts are normally read from the pulpit every Sunday, is about Rp700,000 [US$54] average every household gives about Rp10-20,000 [US$0.77-1.54] … if it is a funeral normally every household will give around Rp20-25,000 [US$1.55-1.90], if a close relationship can be Rp100,000 [US$7.70] … Lan VS: … [the school transport money] it's from the District government, but [paid] via the village account … Lan VH: … Maneleo (village traditional advisor) are involved in village politics and in solving problems … besides that they also attend wedding ceremonies and give traditional welcomes and introduction … Lan Fisher 1: … for village activities, I'm not involved in anything and for the church I’m at the edge only ... As a vocalist at the church only, in a vocalist group … Lan VS: … here there is only 1 fishing coop, Nusa Messakh is the Chairman … the name of the cooperation is Fishermen's Cooperation … the village head's wife is the treasurer, the coop has received Rp20 million [US$1,540] from the District Government plus from the Central Government … Lan Fisher 1: … yes we often use social media to find information from the internet and about work … the internet signal here is difficult, we have to go to Ba'a, and from the beach the signal is sometimes good enough …

234 | P a g e
8.3.6 Government Assistance
The subsection helps voice the villagers’ thoughts on existing government assistance
and its delivery. Fishers from Pepela Darat and Landu Thie expressed dissatisfaction
about the fibre boats granted to them by KKP, saying that they were a misfit with their
needs. Some express that they receive the government basic welfare programs such
as RASKIN and PKH, while other say they do not receive this government assistance
or any other aid or information on how to access it. A final anonymous statement
strongly expresses dissatisfaction with government welfare programs.
Pepela Darat
PD FDG 1st Fisher 7: … here's 1 example, the 3 fibre boats that the government [KKP]
gave, info is that 1 boat cost Rp600 million [US$46,154], if they buy sail boats can buy 12 sail boats[for that money], for 3 fibre boats is equal to 36 sail boats, here they push for sail boats but get motor boats … or like this, example if 5 people 1 boat, so every team has a boat, the fibre boats are big maybe 10 ton ... and to take it out we need complete documents, and the captain needs a licence … PD FDG 2nd Fisher 5: … the fibre boats [from the Central Government] are not in accordance with the fishermen's requests … PD FDG 1st Fisher 7: … it is a policy made by the government that is a big loss to the
fishermen ... and what’s more what was said by them last year happened ... So if they want to make something [a policy or intervention] they want to include the district fishermen who know more, if they involve the local government not just in the office … PD Fisher 4: … the government help we get is called PKH (Family Planning Program) … PD Fisher 4: … about the role of the government, we [must] work, work and work, if we just sit and hope for continual help we will have a bankrupt country. I think like this, maybe many people say that the government should give this and that to us here, but we [Indonesia] is not Australia or an advanced country, we know that actually we are a poor country …
Tanjung Pasir
TP Fisher 1: … I have never received help from the government, but can't get upset ... although no food, we can't get upset also ... We have to be responsible for the risks, whatever happens we are responsible … TP Fisher 2: … our problems are when you're older we go to where … we have a life to lead too, and dream about how this government can help us or not, I often dream like that, the problem is I am old … TP Fisher 5: … I haven’t got any information about government aid …

235 | P a g e
TP Fisher 5: … There hasn’t been any programs by the District Government which touch the needs of the fishermen … and about the Village Fund it is organised without involving us … TP Fisher 1: … there has been aid but it came from Jakarta, sometimes it appears then sometimes not, sometimes blocked, and sometimes cancelled … we wait but it doesn't happen, it was talked about, we all gave data, all our complaints and requests for fishing needs like motors … TP Fisher 2: … Kepala Dusun … we often talk about that. If there are officers from KKP here, recently they were here … but no action …
Landu Thie
Lan VS: … The village plan is not annual, usually 3 years for a program and usually help with goods only, for example rope for seagrass farmers to tie the seagrass, and nets for the fishers … the role of the village government is to help, usually fishing people, because aquaculture not well known so most received nets … and help for seagrass in 2012, not from village government from the District government … Lan VS: … the village fund helps the fishermen with rope, that's all we support with … Lan VS: … before this village head many people worked away on large fishing boats … Lan VS: … All our village projects have worked, only the fibre boats from the central government has failed … from the time they were brought here from Ba'a they have sat here unused … Better to have small boats, operational cost are high for the big boats ... Lan VS: …. the fibre boats are not suitable, because if there is a big wind they are too light … Lan VS: … small boats are better because they are easier to control, because for the fibre boats no training given and we’re not used to them … need 6 days training but only received 2 days … in the end we don't trust the boats … the fibre boats are not what we hoped for. With the aid money we can buy or built wooden boats … Lan VS: … there was 14 children who go to STP (Sekolah Tinggi Perikanan, Fisheries University) at Pasar Minggu in Jakarta, but not from here … Lan VS: … for 2016 fund we will supply 50 small motors which is easier than canoes that were given … and 2017 Village Plan is for small kiosk only … Lan VS: … in 2016 there are fibre water tanks, because its dry here, 109 fibre tanks … the pipes are from PNPM (National Program for Community Empowerment) in 2012 … Lan VS: … the desalination machine is not from PNPM but from Central Government … broken down now but can be fixed with village funds, we just fixed it, bought a new dynamo ... Lan VS: … we already suggested and get funding help Rp25million [US$1,923] for 23 children who go to school on the mainland [Rote Island] … funding is for transport, because every day they use a ferry to go to school …
236 | P a g e
Lan Fisher 3: … yes rope [for seagrass farming] is aid from District Government Fisheries, but previously we buy ourselves … there's aid for seed too … Lan Fisher 2: … there is RASKIN program for free rice from the government, 4 times a year 15kg every time … it’s not enough, we have to buy more … Lan Fisher 2: … the village government gives us nets … over the past few years, once only in 2015 we received, each family only 3 nets … Lan Fisher 1: … about help only family planning, we get is called PKH (Conditional Cash Transfer, Social Assistance Program} … yes still get it, 3 months Rp500,000 [US$38.50] … Lan VS: … there is no infant and mother health program at the clinic here …
Anon: … We don’t hear about assistance from above [the government], my opinion I
don’t hear although all people in the village get it, we have never received the rice
assistance RASKIN … don’t want to hope too much but in reality I focus on finding a
living for my life myself, I don’t want to be helped by the government, because although
the central and district government will delete the name … truly we don’t care, all is
attached to above … we register at the RT (neighbourhood registrar) and is connected
to the central government, but it is deleted by the lower government if not from their
group, they select again, They will give money for those that are close to them. Some
people request assistance, plead. I don’t want, if they want to give [assistance] please
do, or if not I don’t care …

237 | P a g e
8.4 Future Development Perspectives
Applying the last two of Scoones’ four questions (What are the achievable strategies
and locally guided outcomes? and What institutions, formal or informal, mediate the
scope of livelihood strategies and outcomes?), the following subsections present the
data collected to aid in the analysis of these concerns, and the understanding the
various stakeholders’ aspirations for the future, perceptions of achievable strategies,
and the challenges faced to enact the these strategies and to achieve their aspirations.
8.4.1 Next Generation Matters
This subsection presents the villagers’ aspirations for the next generation. It is
unanimous across the three villages that the current generation have aspirations that
their children receive better education than themselves and that their life and
livelihoods are not the struggle that theirs is. Many of the youth would like the
opportunity to go to university, but the parents say that costs are a barrier. A few only
of the younger generation have been able to attend university, to later return to the
village or to find employment elsewhere and return funds to the village.
Pepela Darat
PD FDG 1st Fisher 8: … we would like to see change, so that the next generation is not like their father again … PD FDG 1st Fisher 7: … What measures my happiness and I am afraid will not be reached if I die soon and leave my children in a weak condition … PD FDG 2nd Fisher 7: … There are other alternative livelihoods but they are for the future generation. So let us prepare the costs for their education as high as possible so in the future there is hope for the next generation … PD Fisher 2: … yes my children want to go to uni … PD Fisher 4: … my wishes for the future are that the children have better than me, both education and life … PD Fisher 4: … we have to save and train our children … I train them to be independent and work … and later go to uni, not just uni but have to work too … PD FDG 1st PNS: … If they have education they may not want to go to sea any more, Meaning from school they can be renewed … PD Fisher 3: … because of the costs I cannot think about her dreams, I don’t know what she will become …

238 | P a g e
Tanjung Pasir
TP Fisher 1: … if I had the money, from me they become a doctor … and for the youngest, she wants to be a bank worker … TP Fisher 1: … we get information from radio, internet, social media like Facebook if there is a smart kid around with FB, we can't at other times … TP Fisher 3: … When I talk to the children in Sulawesi we talk about their health not their school achievements … we have been separated for 10 years (participant showed emotions at this point) … according to them they will stop to earn money to continue school … I do not know their aspirations, they plan to work in North Malaysia … TP Fisher 1: … I hope they can go far, there aspirations come true ... Yes not like us people here, because we have already past / too late, stupid, can’t make effort again … our efforts to work for that, hopefully they don't suffer like us … TP Fisher 1: … it’s about finances and funds ... If I can fulfil, then no difficulties, but if there is no finances, even though they are smart, they cannot advance ...
Landu Thie
Lan VH: … some who have finished school work in Jakarta or Kupang … most go to Jakarta or Kupang or work on Italian boats, and Australian boats too, in the big fishing enterprises and markets … Lan YFDG P3: … Yes I what to go to Jakarta or Kupang … from my friends experience in Jakarta we can get massage work in a Spa, café, restaurant, and apartment … yes work here is a problem, hence we want to go to Jakarta to get work then we can help our parents … Lan VH: … many come home for a while then continue to find work … Lan VH: … only 1, Pak Sxx Hxxxx is a Junior High teacher at Kupang Junior High No.3 … He graduated from SPG in Kupang … Lan YFDG P3: … There's many, around 10, people did not go on to uni … Only one person went to Undana, her name is Dxxx Pxx, studied English teaching in Faculty of Teaching and Education Undana … Lan VH: … after uni they come home, but then go again … Lan WFDG P3: … the only work opportunity in Ba'a is to look after a photocopy shop
… Here the prospects are less than good, so we have to go away for work … Lan YFDG P1: … so the gist is like this, that all young people wish for education, that's the beginning aspiration … they are like that because of the economic factor, so that after they finish Senior or Junior high they can help the parents … Lan YFDG P1: … I would like to be a teacher … Lan Fisher 2: … my dreams for children, a life better than ours … the children’s

239 | P a g e
schooling is better … Lan Fisher 1: … I haven’t asked the 1st child yet, but I think [study] in English language … but at first he asked about becoming a policeman but I don't want because the funds aren't enough and I asked him to take ITS economy …

240 | P a g e
8.4.2 Micro Perspectives for the Future
From this subsection we see that the three villagers’ have different perspectives for the
future. The fishers from Pepela Darat express concerns about the misdirected fibre
boat program from KKP and its misspent money and missed opportunities. The
Tanjung Pasir fishers express that their future as they grow old is bleak and the people
from Landu Thie hope for education for their children and migration out for better job
prospects.
Pepela Darat
PD FDG 2nd Fisher 7: … There are other alternatives but they are for the future generation. So let us prepare the costs for their education as high as possible so in the future there is hope for the next generation … PD FDG 1st Fisher 7: … here's 1 example, the 3 fibre boats that the government [KKP]
gave, info is that 1 boat cost Rp600 million [US$46,154], if they buy sail boats can buy 12 sail boats [for equivalent money], for 3 fibre boats is equal to 36 sail boats, here they push for sail boats but get motor boats … or like this, example if 5 people 1 boat, so every team has a boat … the fibre boats are big maybe 10 ton and to take it out we need complete documents, and the captain needs a licence … so I suggest for here all small boats, boat name engraved with who [uses it] ... So it can be supplied with radio and GPS, actually 48 units [Radio and GPS sets] to be given, but we only got 11, the rest still coming … PD FDG 1st Fisher 8: … so later you can help by expressing that to the government (fisher request to the author), Head of Fisheries is one who can help the weak community with boats, not big boats … PD FDG 2nd Fisher 5: … the fibre boats are not in accordance with the fishermen's suggestions … PD FDG 1st Fisher 7: … it is a policy made by the government that is a big loss to the
fishermen ... and what’s more what was said by them last year happened ... So if they want to make something [a policy or intervention] they want to include the district fishermen who know more, if they involve the local government not just in the office …
Tanjung Pasir
TP Fisher 1: … I have never received help from the government, but can't get upset ... although no food, we can't get upset also ... We have to be responsible for the risks, whatever happens we are responsible … TP Fisher 2: … our problems are when you're older we go to where … we have a life to lead too, and dream about how this government can help us or not, I often dream like that, the problem is I am old …

241 | P a g e
Landu Thie
Lan Fisher 1: … my opinion, the main struggle is economic, I hope in the future to have a better job so that I can educate the children … Lan WFDG P1: … according to me, children who have completed school are better off to go elsewhere for work … we don't have schooling, hence we think the children must have schooling … Lan Fisher 1: … the 1st child, he asked about becoming a policeman but I don't want because the funds aren't enough and I asked him to take ITS economy … the 2nd said recently police ... But I said not enough money, then he said if not police then the army ... 3rd wants to go to uni to become PNS … Lan Fisher 1: … my dreams is that they can continue to go to school, live to become a good person, and to have a better job than us, and to live independently … Lan Fisher 1: … yes, can't have too many hands (meaning income avenues), if you can do it yourself … Lan VS: … if they [KKP] want to help, we want to have a say, or if they give money we can do it ourselves then later they can come and inspect …

242 | P a g e
8.4.3 Macro Perspectives for the Future
This subsection presents the governments perspectives for the future. Excerpts from
interviews with the Bupati (District Head of Government) and the District Head of
Department of Fisheries are presented below. They outline district government aid for
fishers and seagrass farmers, as well as providing data on the current boats registered
for voyages to the MoU Box. They also explain the central government’s, desire to
modernise the fishers catch effort and the institutional framework to support their
activities by granting 10 ton fibre boats to villages and regulating cooperatives for their
operation. The Bupati informed the researchers that a quantity of smaller fibre boats
had been commissioned by the district government for the fishing villages of Rote. The
smaller boats had not been distributed to villages at the time of this research.
Pepela Darat
Bupati (District Head): … 50 boats are still allowed to go to the MoU Box, between the boats from NW and SW Roti and they are listed by names of the crew, GPS and boat names which are used, so the boats and crew are already listed and also what can be taken, the amount also the places are fixed. The list is held in the Department of Fisheries office … Bupati: … about Landu [Papela] they rely on Mulut Seribu i.e. seagrass, and if its destroyed it depends on the water current, and if its ruined it’s because of the currents are weak and disturbs the growth of the sea grass, and at the time that it grew well it influenced the Landu [Pepela] economy … Bupati: … fibre boats, Yes some from the Provincial and some from the Central Governments are not being used … there is a reason from the community because the operational costs are high, higher than the income from the catch so the fishermen have a loss … Bupati: … in Papela there is already a salt factory and is being formalised. That factory is in Faifuah Village, 40 hectares waits for the issuing of the permit, the principle is ready, the technology used is geo membrane … RDF Sec (Rote Department of Fisheries Secretary): … for our case in Rote there are 58 coastline fishing villages, we have already reached out to them all … aquaculture is still across 10 subdistricts … yes, for the moment 2018, 2016-2018 we want to increase the aquaculture on land [fresh water aquaculture] … RDF Sec: … because recently we tried Bandeng (small pond fish) in Pepela harbour … truly the results are pleasing / good ... But there is not an investor who wants to take [buy] them ... the community sold them but the price was low, and they didn't want to continue … RDF Sec: … for west Rote continues to be our love … Ndao for squid … RDF Sec: … not too much news about Trepang aquaculture trials, we didn’t receive news, only last year there was a westerner Mr Dxxx … but till now there is no

243 | P a g e
development for trepang … RDF Sec: ... seagrass starts to be good again bit by bit, but in places it is still down including Mulut Seribu is not yet improved ... but for west Rote it is up again including Dela, starting to be good … RDF Sec: … at the beginning our plans were for possibly small boats too … the problems is we can't go back we must advance {modernise). How can we have the same results as Bunguwangi or large cities if we are still traditional? ... So, for the future not traditional fishermen but more modern … if we want to change, fishers want to change to modern then don't continue traditional [methods]. We have to modernise, hence we force the 10 ton boats … if we force now, but if they are comfortable with traditional they will not develop … now modern fibre boats, they don't want more traditional [boats] ... from before 2014 they still use traditional, so now they’re still like that … they [the traditional fishers] still block anything which is new, Up to 2014 government help was traditional, now modern … RDF Sec: … from 2016, when I’m here (made the Department Secretary) the catch fishermen get, still get also including from Fisheries Central Government, 55 [fibre] boats … modern fishing boats Mr Paul (addressing the author), here in Rote we are traditional until 2016, we now enter in [the plans of] the Department of Fisheries and Marine Affairs (KKP) from the Central Government, we receive last year, 2016, 55 fishing boats (3 for Pepela and 3 for Landu) … yes for the 3 boats they are 10 GT ... the registration letters are still being processed … Officers from KKP went home last week, too busy to make the permits, permit to sail ... Yes so for the 55 boats to now there are no permits, soon they will be done … RDF Sec: … yes that's true {the fibre boats have thin hulls and are light), but at the moment we must compel them, we are forced by the fishermen at the same time we force them, n while we compel the fishermen we are raising human resources … KKP did a survey first, but the thickness they reached depends on the contractor ... The manufacturer make it like that … RDF Sec: … There is 6 [fishing] cooperative here [on Rote Island], last year we formed fishing coops, because that help [the fibre boats] has to be used by a coop … help come directly to the coops … it’s a national regulation … if they already use a coop, but it’s not registered they cannot use it, so have to have a lawyer, if not KKP don't want … RDF Sec: … about the fishers afraid the coop will make more bosses / captains, the Boss cannot be the same as coop … they [the fishers] are in the coop monitoring, so the skippers are monitored. So they can't dominate … RDF Sec: … KKP will also make more PPI [fish jetty for trading fish and buying fuel] like in Kupang at Oeba ... Make all focused there … all the boats from the coop must have 1 goal [home port] in PPI so our control is not difficult ... if they not to PPI, we find information about where they are, because all the boats have a mooring number and monitored from DKP (District Fisheries Department) … RDF Sec: … meaning all is focused for both the finance and results from the coop, that’s why the government via KKP regulates to make a coop … so if they want finance they must go via the coop ... later the coop will sell [the catch] to PELINDO (Indonesia Port Corporations} ... RDF Sec: … so all are included with our contributions handed to them … we don't

244 | P a g e
determine, they determine themselves. ... so for the big or little results they determine themselves, according to their capabilities not ours … RDF Sec: … about the conservation area in the Savu Sea, which includes Rote, in accordance with regulation 23 is not in the [jurisdiction] of district capital because up to 12 Nautical Miles is already the responsibility of the Provincial Government since 2016 … the publishing [of information] continues … then what is happening now will finish but the next generation will like ... so if we continue with the publishing [information] and oholo (traditional / village level conservation regulations / sanctions) in always, all will want ... these activities to now must continue because they are traditional sanctions … Bupati: … yes I have a plan to provide boats like the community ask for, from APBD (Anggaran Pendapatan dan Belanja Daerah, district budget) I have prepared 12 boats for the community, and from APBN (national budget) I prepared 55 boats for the communities, they are made from fibre and at the moment in Kupang, complete with nets and motors … so in total there are 67 boats in accordance with the communities wishes … Bupati: … I am also considering a program with Undana for training the youth in the area of dry land farming, like has been done by Bupati Sabu, Bupati So'e and Bupati Manggarai, with the aim of preparing the youth for the future …
Tanjung Pasir
RDF Sec: … about Tanjung Pasir … I think that the education problem is relative ... Depends on whether they want to or not ... Because their life is the sea which influences …
Landu Thie Village Plan
Bupati: … In fact I support them for finding work outside the area of Landu because my opinion is people who leave in the area, can self-manage themselves, and are not stuck in the area that is very difficult … Lan VS: … before this village head many people worked away … Lan VS: … the village fund helps the fishermen with rope, that's all we support with … Lan VS: … All our village projects have worked, only the fibre boats from the central government has failed … from the time they were brought here from Ba'a they have sat here unused … Better to have small boats, operational cost are high for the big boats ... Lan VS: ... the fibre boats are not suitable, because if there is a big wind they are too light … Lan VS: … small boats are better because they are easier to control, because for the fibre boats no training given and we’re not used to them … need 6 days training but only received 2 days … in the end we don't trust the boats … the fibre boats are not

245 | P a g e
what we hoped for. With aid money we can buy or built wooden boats … Lan VS: … there was 14 children who go to STP (Sekolah Tinggi Perikanan, Fisheries University) at Pasar Minggu in Jakarta, but not from here … Lan VS: … for the 2016 village fund we will supply 50 small motors (not delivered as at August, 2017) which is easier than canoes that were given … and 2017 Village Plan is for small kiosk only …

246 | P a g e
8.5 Intergroup Relations Affecting Development
This section presents the qualitative data collected during the field research for the
purpose of theorising on intergroup relations and threats, real or perceived, which may
affect development and livelihood strategies in the three case study sites. Intergroup
Threat Theory (ITT), as discussed in Chapter 3, outlines characteristics which help to
identify the presence of such phenomena. The author has presented the data under
modified headings (boxes) that have been adapted from the ITT concepts. The data is
also categorised by case study site to again allow for an analytic comparison approach
to be used in the discussion of similarities and differences among the sites. The
headings are as follows: Pessimism and Hope, Realistic Threat and Conflict, Symbolic
Threat and Group Identity and Negative Stereotype and Outgroup Attitude.
8.5.1 Pessimism and Hope
Conservatism, also known as realism, has a number of main assumptions that seek to
explain the actions and reactions of people. The first is a pessimistic view of human
nature, in that human nature is a mix of good and bad and that the latter is always
present. The second is that people are not individualists, but rather are inherently
social creatures that crave social identity through group memberships. Hence, they
always gravitate towards family groups, social groups and political groups among other
collective entities (Shimko, 2008).
This subsection presents the micro voices expressing pessimism with their and their
groups’ economic and social status.
Pepela Darat
PD FDG 1st Fisher 8: … all my friends here are half dead, like a milking / work horse … PD FDG 2nd Fisher 6: … there's no freedom from debt, depends on conversations with the boss only ... PD Fisher 3: … because of the costs I cannot think about her dreams, I don’t know what she will become … PD Fisher 3: … I don’t know if we have a life or not … if God still gives life, only our situation is still like this … PD FDG 2nd Fisher 7: … There are other alternatives but they are for the future generation. So let us prepare the costs for their education as high as possible so in the future there is hope for the next generation …

247 | P a g e
Tanjung Pasir
TP Fisher 2: … our problems are when you're older we go to where … we have a life to lead too, and dream about how this government can help us or not, I often dream like that, the problem is I am old … TP Fisher 5: … our homes are not good, like a goat shed with sand floor … TP Fisher 1: … so we are still in a difficult place and because of what I said before, there is not a way out … TP Fisher 1: … yes I am sick sometimes, the name is people … TP Fisher 1: … I hope they can go far, there aspirations come true ... Yes not like us people here, because we have already past / too late, stupid, can’t make effort again … our efforts to work for that, hopefully they don't suffer like us …
Landu Thie
Lan Fisher 2: … we cannot find an alternative income, for example be a trader, or something like that. there isn't anything else … Lan Fisher 2: … that is one aspiration of the community, our ancestors used self-made power, in our time there's not one who can do that again … so this year just have to work … Lan YFDG P3: … I did pass the Bidikmisi test for a university scholarship, but my parents were afraid in the middle of semester my scholarship might stop, because according to them after uni I won't get work better, so they say working first while studying … Lan WFDG P3: … Here the prospects [for work] are less than good, so we have to go away for work … Lan Fisher 1: … my opinion, the main struggle is economic, I hope in the future to have a better job so that I can educate the children …

248 | P a g e
8.5.2 Realistic Threat and Conflict
Realistic threats are conflicts over objective phenomena, such as natural resources,
distribution of income, money and asset control, among others (Riek, et al., 2006).
Tajfel & Turner (1979) put that the aetiology of intergroup hostility is competiing group
interests over real life assets. When competition is complementary, positive
interdependent cooperation could develop, but conflicting interests could be a catalyst
for overt social conflict.
This subsection presents villagers’ perceptions of realistic threats concerning catch
proceeds’ distrbution, household income, livelihood failutes and workplace physical
risk.
Pepela Darat
PD FDG 1st PNS: … the boss gets a lot of income and fishers only get this much ... all is a game, the price is set by him, all is up to him ... He holds the reins ... PD FDG 1st PNS: … the person who makes them powerless is the big boss … PD Fisher 4: … yes there are risks at sea, better here [on land], a small income but I enjoy … PD FDG 2nd Fisher 5: … Yes nearly all have debt to the boss … PD FDG 2nd Fisher 6: … there's no freedom from debt, depends on conversations with the Boss only … PD FDG 2nd Fisher 7: … Starting from 2007 the boss started to get heavy, with giving a choice of going fishing in his sail boat or going to another Boss but have to pay the debt first … Boss Sugi: … there is no responsibility taken for a fisherman that has a disaster or accident, because there is no promise attached [by me] … PD FDG 1st Fisher 8: … to sell the fish must go to him [the Boss], he dominates all because he is that … We need a person who's a type of ombudsman … the humanitarian value has to come with the Boss ... Sadly, friends here life is wagered but at what value, then he comes and dominates again, this is what I see from before, not in this boss, you have to be crushed first ...

249 | P a g e
Tanjung Pasir
Boss Sugi: … Yes, we have an agreement with national insurance company for Rp250,000/year [US$19.23] … if someone dies their heirs can get help as much as Rp7 million [US$538.50], from the side of the boss there is no responsibility for a fisherman that has a disaster or accident, because there is no promise attached …
Landu Thie
Lan VS: … if they [the government] want to help, we want a say. Or if they give us money we can do it ourselves, then later they can come and inspect … Lan WFDG P5: … from the beginning they are all like us and have the aspiration to go to school, but because here the economic factor makes us surrender to the situation … Lan Fisher 2: … I do coastline fishing only … already not brave to go a long way … Lan Fisher 2: … now there isn't any seagrass work, only fishing, and when go diving for lobster, end up almost half dead …
Anon: … We don’t hear about assistance from above [the government], my opinion I
don’t hear although all people in the village get it, we have never received the rice
assistance RASKIN … don’t want to hope too much but in reality I focus on finding a
living for my life myself, I don’t want to be helped by the government, because although
the central and district government will delete the name … truly we don’t care, all is
attached to above … we register at the RT (neighbourhood registrar) and is connected
to the central government, but it is deleted by the lower government if not from their
group, they select again, They will give money for those that are close to them. Some
people request assistance, plead. I don’t want, if they want to give [assistance] please
do, or if not I don’t care …
250 | P a g e
8.5.3 Symbolic Threat and Group Identity
Crawford (2017, p. 354) calls symbolic threats, meaning threats. He posits that
meaning threats compared to physical threats “include more abstract concerns
regarding the violation of one’s senses of belonging, identity, purpose, significance,
continuity, or certainty”. Symbolic threats emerge when individuals, or an in-group that
they are a member of, perceive that their cultural values, norms and response
expectations are under threat. These psychological threats, rather than physiological
threats, inflate the salience of in-group values and norms and can increase intergroup
bias and negative out-group attitudes.
This subsection presents the qualitative data gleaned from interviews and FDGs that
exemplify the villagers’ perception of symbolic threats.
Pepela Darat
PD FDG 1st Fisher 7: … the professional fisher can do all, meaning the type of work for fishermen, at times he can be a coastline fisher or at other times a cross border fisher, so for a professional this is the minimum … they can change from cross border can be off-shore and also coastline … not normally on off shore though … PD FDG 1st Fisher 8: … the problem we are all new comers … PD FDG 1st Fisher 8: … about ponds, the land people have more, that's the issue, and technically they are the only ones that have land here … PD FDG 1st Fisher 8: … basically everyone is a fishermen 12 months, the west wind season we change to coastal fishermen, because of the wet season we're not on land, still count on going to sea … PD Fisher 4: … about the Bajo people, many of the children don’t go to school and when I ask why they say they can’t afford to pay, but they follow the children’s wants, who don’t want to go … PD FDG 1st Fisher 8: … the focus is only fishing. Will die being a fishermen, die if a fishermen or not … PD FDG 1st Fisher 7: … yes and we are still stupid people, still lower [than other groups] … PD Fisher 3: … but what is most important, to help to save the family name, Xxxx … PD FDG 2nd Fisher 6: … so from this I can conclude that to become a boss, because the boss's side has family connections so they help each other, so who becomes [a boss] is not for other people only to people in their family environment … PD Fisher 3: … because of the costs I cannot think about her dreams, I don’t know what she will become …

251 | P a g e
Tanjung Pasir
TP Fisher 1: … if we are valued from our home, [this is] normal for the community here, sometimes people own homes like this, sometimes simple yes, sometimes they live in a family house, don't own land, don't own a place … TP Fisher 1: … from the beginning we are fishermen … and no cool box, I'm a traditional fisherman … TP Fisher 1: … we [Tanjung Pasir residents] are all arrivals from Sulawesi, all … TP Fisher 2: … yes, if we don't eat fish, we Bajo have a taste for the bones, can't work no power, weak, so eat fish ... If we continually eat vegetables also no good …
Landu Thie
Lan VH: … all of them are fishermen, there are no farmers … Lan WFDG P1: … I live here and work as a fisher woman … Lan Fisher 2: … technically we are fishermen, when we had seagrass it was submerged in the sea … surely there's a 1,000 names for fishers like that … Lan Fisher 2: … that is one aspiration of the community, our ancestors used self-made power, in our time there's not one who can do that again … so this year just have to work …
Anon: … sometimes the village head doesn't want to listen, in village consultation; we
say A can bet its B …

252 | P a g e
8.5.4 Negative Stereotype and Outgroup Attitude
Stephan & Stephan (2000) conceded that negative stereotypes and intergroup anxiety
were not threats as such, but were “a cause of threat involving characteristics of the
out-group that could have a negative impact on the in-group (e.g., aggressiveness,
deviousness, immorality). They rationalised that intergroup anxiety, and negative
stereotypes are actually antecedents to threat perception and social conflict (Stephan,
et al., 2009, p. 2). Negative stereotyping is connected with negative expectations about
the behaviour of out-group members (Riek, et al., 2006)
This subsection presents the negative stereotyping and out-group attitudes expressed
by micro-level members about other micro-level members and groups, and about the
macro-level.
Pepela Darat
PD Fisher 3: … yes the government owned and we were offered only a percentage, but when it was time to divide we didn’t get our percentage, so we were tricked and for 2 months we didn’t go fishing … PD FDG 2nd Fisher 6: … there's no freedom from debt, depends on conversations with the boss only … PD FDG 2nd Fisher 7: … Starting from 2007 the boss started to get heavy, with giving a choice of going fishing in his sail boat or going to another Boss but have to pay the debt first … PD FDG 1st Fisher 7: … yes and we are still stupid people, still lower [than other groups] … PD FDG 1st PNS: … the person who makes them powerless is the big boss … PD FDG 2nd Fisher 7: … the one that owns the land is a boss from Papela, he has a Rotenese grandmother, come and marry with a person here and stayed in the area … PD Fisher 4: … for the Bajo people, the man is busy making money, and he has a wife who is busy spending it, wasteful … if one has a home they all have a home, if one has food they all have food … PD Fisher 4: … the Bajo get money that they spend in a minute, extravagant … the government gives them things and they sell them, then shift again … their culture, creatures that live to shift continuously … but they say they never get government assistance of any type, they speak empty words … PD Fisher 4: … the District Head always gives them assistance for political reasons, not for their prosperity … Boss Sugi: … there is no responsibility taken for a fisherman that has a disaster or accident, because there is no promise attached …

253 | P a g e
Tanjung Pasir
TP Fisher 2: … as head of the sub-village, we often talk about aid if there are officers from KKP here, recently they were here, but no action … TP Fisher 1: … there has been aid but it came from Jakarta, sometimes it appears then sometimes not, sometimes blocked, and sometimes cancelled … we wait but it doesn't happen, it was talked about, we all gave data, all our complaints and requests for fishing needs like motors … TP Fisher 5: … for us Bajo here we don’t get any government assistance, assistance is given to the Pepela fishermen only …
Landu Thie
Lan VH: … one other thing, apologies if there has been research like this sometime which means there are those that don't understand so in the delivery, If slowly it lets them understand what is said, then the community here also ... We are if there not money / cigarettes for the attendants or not, technically money for sitting, it's not a problem, in this village ... Lan Fisher 1: … sometimes the government make wrong policy too …
Anon: … sometimes the village head doesn't want to listen, in village consultation; we
say A can bet its B …

254 | P a g e
Discussion and Recommendations Chapter 9

255 | P a g e
9.1 Introduction
What is the context of a particular case study area? What is the available capital
(natural, human)? What are the achievable strategies and locally guided
outcomes? And finally, what institutions, formal or informal, mediate the scope of
livelihood strategies and outcomes? (Scoones, 1998, p. 3).
The first aim of this research has been “to investigate the current economic status and
livelihoods strategies in the three case sites so as to provide specific recommendations
for possible alternative livelihood approaches”. A conceptual framework that blends the
tenets from Sustainable Development (SD) and Sustainable Livelihood (SL) has
underpinned this socio-economic investigation. As discussed in Chapter 2, SD and SL
are interdependent paradigms which carry both a Daly (1992) qualitative and, as
suggested by Daly, a Brundtland et al. (1987) quantitative viewpoint. Hopwood, et al.
(2005) suggested that greater clarity would be to speak of “sustainable livelihoods”.
Hopwood, et al.’s “sustainable livelihood” approach makes a connection between the
concept of SD and the needs of developing countries especially for marginalized
peoples such as those at the focus of this thesis.
The second aim of the research is “to add to the conceptual discourse on sustainable
livelihood in traditional fishing communities by investigating restrained efficacy of
development projects through an Intergroup Threat Theory lens”. In Chapter 4 the
author justified the incorporation of a Social Psychology approach to investigate the
metaphysical expressions between different entities in three traditional fishing villages
on Rote Island, Indonesia. Of major importance is how these entities resonate with
each other in the design and implementation of poverty alleviation and development
projects. Threats to the success of these development projects and proposals are
analysed by using a SP approach employing an Intergroup Threat Theory (ITT)
framework (Riek, et al., 2006). While other authors discuss individual and group social
capital, influential formal and informal institutions and in-group out group conflicts at the
micro-level when discussing poverty alleviation and development research, they rarely
discuss intergroup threats, real or perceived, that influence project planning and
efficacy of project uptake, especially by the micro level for macro level interventions.
This chapter discusses both the quantitative and qualitative data presented in the
previous two chapters to help answer the research questions presented in Chapter 1.
Answering these questions should fulfil the research aims.

256 | P a g e
The central research question for this research is:
How can the current generation of fishers on Rote Island lift above a subsistence
income to provide a FRESH Start for the next generation?
There are a five secondary research questions to help answer the research question.
These are:
1 What is the socio-economic status, past and present, of fishers in the selected
fishing villages on Rote Island?
2 What are the aspirations and needs, as expressed by the villagers (the micro-
level), to provide an improved future for the next generation?
3 What are the future initiatives and development programs planned by the
central and district governments (the macro-level)?
4 What are the micro-level perceptions of macro-level initiatives?
5 Can Intergroup Threat Theory explain a lack of development program efficacy?
This chapter compares and contrasts data collected from the three case study villages
to display the similarities and differences between the villages in their responses to the
challenge of providing the next generation with a FRESH Start. Section 9.2, Current
Socio-Economic Status, blends Household Survey (HS) quantitative data with interview
and FDG response qualitative data to compare and contrast the current economic
statuses of the three case study sites, to address Question 1. Section 9.3, Micro-Level
Aspirations for the Future, presents FDG and interview responses to help answer
Question 2. Similarly Section 9.4, Macro-Level Initiatives for the Future, addresses
Question 3 and Question 4. Finally, Section 9.5, Explaining Development Synergy
through an ITT Lens, puts an argument for the use of ITT to explain an apparent lack of
development synergy, and to address Question 5. In this discussion chapter, the author
has intentionally allowed the voices from the micro-level to be heard, by purposively
selecting salient comments from FDG and interview transcripts to help convey the
micro-level current socio-economic status and their aspirations for the future. In a
similar fashion, the author has reported the macro-level’s prescription for the future and
the micro-macro intergroup relations that shape project design and the efficacy of
implementation.
This chapter should be read in conjunction with the conclusions and specific
recommendations for alternative livelihoods, for the three case study villages, already
presented in Chapter 7 in the extracts from the report to the Government of Rote Ndao
(Benu, et al., 2017) and the journal paper published in AJABS (Benu, et al., 2018). See
Sections 7.2.6, Section 7.2.7, Section 7.3.8 and Section 7.4.5.

257 | P a g e
9.2 Current Socio-Economic Status
What is the socio-economic status, past and present, of fishers in the selected fishing
villages on Rote Island?
Based on World Bank calculations 108.78 million people or 49 percent of the total
population of Indonesia are living in poverty or are vulnerable to economic slip (Maas,
et al., 2015). The Province of East Nusa Tenggara, including Rote Island, has always
been considered among the poorest provinces in Indonesia (Barlow & Gonowarsito,
2009; Fox & Sen, 2002).
The UNDP Indonesia Country Report 2016, reports that “5.9 percent of the population
(14,644,000 people) are multi-dimensionally poor while an additional 8.1 percent live
near multidimensional poverty (20,113,000). As their economic indicator of poverty,
they use a poverty line of US$1.90 per person per day; using a currency exchange rate
of US$1 = Rp13,000. The poverty line in Indonesia Rupiah is Rp24,700 (UNDP, 2016).
9.2.1 Demographics
Table 33 Pepela Darat, Tanjung Pasir and Landu Thie Respondent Biodata
Respondent Biodata (%)
Sex Age Education Level Ethnic Group Religion
P=Pepela T=Tanjung L=Landu
P T L P T L P T L P T L P T L
Male 89 100 69 18-50
70 44 75 Prim ary
37 67 63 Rote 65 0 94 Protest
ant 2 0 99
Female 11 0 31 50+ 30 56 25 Junior High
59 33 2 Sula wesi
11 100 6 Islam 98 100 1
Senior High
4 0 13 NTT
Island 20 0 0
Source: Household Survey Data
Demographic data collected from all village respondents, from HS and FDGs and
interviews, shows a number of similarities and differences among the villages. Ethnic
group and religion show the greatest differences. In Pepela Darat and Tanjung Pasir,
although the majority of people are descendants of people from Sulawesi, many people
living in Pepela Darat now claim to be Rotenese. The Tanjung Pasir fishers are a
transient community of traditional fishers who continue to defer allegiance to their
Bajau Laut ethnicity originally based in Southeast Sulawesi, and in fact some still own
family houses there. Nearly all Tanjung Pasir children, who continue their schooling to

258 | P a g e
Senior High School, return to Sulawesi to live with family and attend school. The village
of Landu Thie is almost homogenous, in that almost all people are original Rotenese. A
few have inter-married with outsiders, and many of these outsiders have changed
religion from Islam to Protestant. The data collected about religion is clear. Pepela
Darat and Tanjung Pasir are 98% and 100%, respectively, Muslims, while Landu Thie
is predominantly Christian.
Education data from the villages are not dissimilar. Tanjung Pasir shows the lowest
average education level attained. Pepela Darat has the highest percentage of people to
have completed Junior High School, where as in Landu Thie a larger percentage have
completed Senior High School but the majority have only completed Primary School.
9.2.2 Economic Status
Table 34 Monthly Household Income in Pepela Darat, Tanjung Pasir and Landu Thie Village
Source: Household Survey Data
Using the same economic poverty line indicator as UNDP of Rp24,700 per day or
Monthly Income and Source (Rp) (US$1=Rp13,000)
Main Income If Other Income Total Income
Average Income Pepela Darat
1,406,522 609,615 1,798, 936 (138.40)
Tanjung Pasir 1,677,778 2,700,000 2,622,222 (201.70)
Landu Thie 736,000 450,000 1,405,625 (108.12)
Highest Income (H) Pepela Darat
2,500,000 2,200,000 6,200,000 (476.92)
Tanjung Pasir 5,000,000 5,000,000 5,600,000 (430.77)
Landu Thie 2,100,000 1,200,000 3,300,000 (253.85)
Lowest Income (L) Pepela Darat
400,000 50,000 500,000 (38.46)
Tanjung Pasir 400,000 600,000 400,000 (30.77)
Landu Thie 100,000 100,000 200,000 (15.38)
Average Income omitting H&L Pepela Darat
1,404,545 567,000 1,730,000 (133.08)
Tanjung Pasir 1,385,714 2,500,000 2,514,286 (194.40)
Landu Thie 680,000 392,857 1,356,429 (104.34)

259 | P a g e
Rp741,000 per month per person, and extrapolating to a relatively, small family of four
persons, two adults and two children, a monthly household income of Rp2,964,000
(say Rp3 million) is required to maintain existence above that indicator. Most
households in these villages support four to six children. Table 34 shows that all three
villages have average monthly household incomes well below Rp3 million, the UNDP
indicator. It is only the highest income households that exceed that figure.
In the following excerpts from FDGs and interview, fishers and fishers’ wives express
that they endure conditions of economic hardship and deprivation.
Pepela Darat participant comments:
PD Fisher 2: … we have income, it is not consistent. Basically our incomes are like the
tidal waters …
PD Fisher 3 … yes we want better but our income is not enough, if our income was
better we could fulfil all our desires …
PD FDG 2nd Fisher 5 … Yes nearly all have debt to the boss …
Tanjung Pasir participant comments:
TP Fisher 1: … yes that’s speaking openly, if you want to know the fishermen's
situation [with debt] it’s, Close a hole, open a hole, Suppose it's like that …
TP Fisher 1: … yes sometimes like that, but if we go out and get nothing, we take
money from the bank, and go out again, so the savings of the fishermen really do not
exist …
TP Fisher 1 … depends if we have the money to buy kerosene [for cooking], if not we
use wood …
Landu Thie participant comments:
Lan WFDG P1: … from the income there is no savings because it is used for daily
needs …
Lan WFDG P2: … if about income, before was better when we fished in Australian
waters …
Lan Fisher 2: … in 1 month, if 25 days you receive about Rp750,000 [US$57.70],
sometimes not enough too, … if not enough we have a debt to the kiosk …
Lan WFDG P1: … 5 to 7 children too many, life is hard is normal, fine if 2 to 4 children
…
From household income data and participant comments, it can be concluded that
fishers’ income, and hence household economic status, is in a continuous state of flux,
mostly resulting in indebtedness to their Boss, and rarely resulting in a surplus for
safety net savings. Meaning that the majority of fisher households in all three villages
are still living below the poverty line indicator; that is, in a state of subsistence.

260 | P a g e
9.2.3 Current Livelihoods
Current livelihoods in all three case study sites are predominantly marine resource
focused. That is, they earn an income from fishing or seagrass farming. From the past
generation to the current generation, livelihoods have changed because of newly
imposed maritime boundaries in the late Twentieth Century. Many changed their
livelihoods to seagrass farming but this was impeded on by the 2009 Montara oil leak.
More recently villagers have again been dependent on fishing activities for their
household incomes.
Table 35 Household Main Work Type and Additional Income Activity data
Source: Household Survey Data
Pepela Darat participant comments:
PD FDG 1st PNS … the boss gets a lot of income and fishers only get this much ... all
is a game, the price is set by him, all is up to him ... He holds the reins ...
PD FDG 2nd Fisher 7: … so 4 years ago I was a sea grass farmer, after seagrass
doesn't work anymore I have an oil business …
PD Fisher 4 … because I work alone, we sell for us only, so the money is not divided
with other fishermen, sell for me only …
PD Fisher 3: … yes I have a rice field but have lost for last 2 years because of no rain
… and additional income from selling sand …
PD FDG 1st Fisher 7 … several years ago there was an issue when fishermen here
were invited to do people smuggling and many were arrested in Australia … it was an
opportunity to clear debt … we don’t want to borrow from the Boss, the Boss doesn’t
trust and it causes arguments in the home because of the problem of living costs, they
are like mafia …
Household Livelihood Activities
Main Activity All Activities
Pepela Darat
Tanjung Pasir
Landu Thie
Pepela Darat
Tanjung Pasir
Landu Thie
Fishing 87% 78% 68.8% 87% 78% 68.8%
Farming 0% 0% 0% 0% 0% 0%
Livestock 0% 0% 0% 0% 0% 6.3%
Seagrass 0% 0% 0% 17% 0% 12.5%
Trader 4% 11% 18.8% 11% 11% 18.8%
Other 9% 11% 12.5% 26% 56% 62.5%

261 | P a g e
Tanjung Pasir participant comments:
TP Fisher 1: ... sometimes you don't want to go to sea again because you have
children and grandchildren … I already have 5 grandchildren …
TP Fisher 2: … I don't fish any more. I get income from being a wood worker and boat
builder…we look after boss boats, boss can look after us. We don't have money …
TP Fisher 2: … and my wife often makes cakes for sale for extra income …
TP Fisher 3: … My wife also makes money from selling cakes for extra…
Landu Thie participant comments:
Lan VH: … all of them are fishermen, there are no farmers … continue to sell the catch
but the results are not constant and sometimes sell to an agent … we use canoes with
oars and sell around here only …
Lan WFDG P1: … I live here and work as a fisher woman …
Lan VH: … some [villagers] work overseas, but many also went to Ashmore Reef, but
now they have stopped because in 2006, 10s of their boats were burnt by the
Australian Government because they were prohibited to go to the area of
transboundary waters …
Lan YFDG P2: … working on foreign boats my monthly salary 500 Euro, or
Rp7,500,000 [US$577] per month, food and drinks the company responsibility …
contact for 2 years 6 months and savings Rp140,000,000 [US$10,770] and money to
build a home … I stopped because I wanted to be with my wife and child …
Lan WFDG P1: … we have a motorbike … purchased from the proceeds from
seagrass, fishing income is for daily needs, seagrass is for additional income …
Lan FDG P1: … seagrass now is only a little bit, not even 10 people, only around 7-8
people …
Lan Fisher 2: … I also catch lobster … Lobster season starts in January for 3 months
maybe 5-6 months, fishing month 9-10 [September, October] until January …
District Head … 50 boats are still allowed to go to the MoU Box, the boats from NW
and SW [of Rote Island] that are allowed are listed with the names of the crew, GPS
and boat names, so the boats and crew are already listed … and what can be taken
and the amount, also the [fishing} places are fixed …
As evidenced by the quantitative and qualitative data above, many households have
more than one income stream. While fishing activities are the main source of
household income in all the case study sites, in Pepela and Landu many used
seagrass farming as an additional income, but at present very few of the participants
still do. As in all of the villages, numerous women make cakes and snacks to sell to the
school children or from their front door. Various other forms of additional incomes
activities are engaged in from time to time, including salt farming, fish and trepang
aquaculture, boat building and repairs, day-labour construction work, and small-time
trading. Carnegie (2008) calls this a diverse economy in her research in Oelua, another
fishing village on Rote Island.

262 | P a g e
Many of the fishers express a feeling of entrapment through debt to their Boss, not
allowing any opportunity to move to other livelihoods. For those who are seagrass
farmers, their endeavours have been curtailed by events beyond their control.
9.2.4 Education
Education data, Table 36 and Table 37, shows us that the education standard of the
younger generation (18 – 50 years) of current-day fishers is higher that the older
generation (50+ years) fishers, except for in Tanjung Pasir. This may be an aberration
of a small sample group, but it may also display the Bajau Laut people’s disinterest in
education as a priority for the younger generation. This fact is evidenced by a number
of comments by Tanjung Pasir participants below.
Table 36 Education Status for Working Age Respondents
Education Status for Working Age Respondents
Age and Education Level
of Respondents Pepela Darat Tanjung Pasir Landu Thie
All Ages With Primary 37% 67% 63%
All Ages With Junior High 59% 33% 2%
All Ages With Senior High 4% 0% 13%
18-50 With Primary 28% 100% 58%
18-50 With Junior High 63% 0% 25%
18-50 With Senior High 6% 0% 17%
50+ With Primary 50% 40% 75%
50+ With Junior High 50% 60% 25%
50+ With Senior High 0% 0% 0%
Source: Household Survey Data
Table 37 Monthly Household Education Costs
Monthly Household Education Costs (Rp)
Pepela Darat Tanjung Pasir Landu Thie
Average Family Education Cost 358,676 166,667 395,000
Highest Family Education Cost 1,060,000 250,000 850,000
Lowest Family Education Cost 20,000 10,000 110,000
Source: Household Survey Data
The following comments from the research participants are expressions of desire for
263 | P a g e
the children to be educated. However, these desires are often tempered by high
education costs. Although national schools should be free for students, not only are the
School Development Funds to contribute to but also the cost of accommodation and
transport, if studying away from home.
Pepela Darat participant comments:
PD Fisher 3: … the 1st child finished SMA (Senior High School) but did not go to uni
because there wasn’t the money, the 2nd child went to SMK (Technical High School)
but decided to leave … and for the 3rd child, a girl, we pay Rp175,000 [US$13.50]
registration cost and Rp15,000 [US$1.15] per month … Lunch money is Rp5000
[US40c] per day but if we only have Rp2,000 [US15c], then she only gets RP2,000 …
PD FDG 1st Fisher 8: … there is a problem with costs for uni … also if we don’t pay the
SPP cost (School Development Contribution) the school holds the certificate …
PD Fisher 3: … Yes it is truly my wish that the children finish school, only they don’t
want to continue, only finish Junior High School … I don’t force them to go, for school
needs money …
Tanjung Pasir participant comments:
TP Fisher 4: … my son wanted to be a fisherman and didn’t want to go to school, not
because we couldn’t afford, they asked not to go to school …
TP Fisher 5 … the second child finished school and now works as a teacher … and the
third child finished school and is now doing a Master at Brawijaya Uni in Malang …
Landu Thie participant comments:
Lan Fisher 2: … yes we have solar power … in the day for 2 hours from 10am - 12pm
and at night from 6 - 10 pm … children study using an oil light …
Lan YFDG P3: … Yes, at that time I had an opportunity to go to Undana, in Kupang. ...
I did the test for SNMPTN (Selection test to study to be a teacher) and passed to go to
Primary School Teachers’ College and went for the payment interview, but I was called
home by my parents because we didn't have enough money …
Lan VS: … we already have a Junior High School, not yet Senior High School … not
yet enough teachers, there are honor teachers (only small amount of pay or voluntary)
… the teachers are originally from here, they studied in Kupang and returned …
In contrast, while participants in Pepela and Landu said that education costs were an
inhibiting factor to educating their children, a number of Tanjung participants said that
cost was not an issue. It is their children’s choice to go to school or not. However, there
are also examples of Bajau people, but not residents of Tanjung, being very well
educated.
Data shows that over a fifteen year period, 2002 – 2017, education levels had
improved in Pepela Darat and Tanjung Pasir. Fox & Sen (2002) reported that education

264 | P a g e
levels in Pepela were much lower than in the rest of the island of Rote. Based on a
local research survey, in 2002, only about 52% of the population had completed
elementary school. None of the Bajau living in Tanjung Pasir had completed
elementary school and most were reported to be illiterate. However, out of the original
and long term residences, an additional 27% had completed junior high school and a
further 16% had completed senior high school. No one was reported to have had any
education beyond high school. Therik (2008) reported that only 12% of Bajau people
had completed primary school. In 2011, 70% or 183 students attending primary school
in Pepela, Roti Island, were children of fishermen (Istini, 2011) Therik and Fox’s
education figures for Tanjung Pasir and figures from this research do not completely
line up, but nevertheless there has been improvement in education standards. Now
there is a Junior High School in Pepela and a Senior High School in a nearby village. In
early scoping for this research project, it was learnt that text books and teaching aids,
such as computers and projectors, are not always available for the teachers’ use.
Only in the last few months, 4G internet network has become available in Pepela. As
recent as 2014, only 2G network was available in any part of Rote Island (author
observation}. This major infrastructure upgrade will help improve education standards
and open up more job opportunities for the tech-savvy younger generation.
9.2.5 Social Capital
Scoones (1998) places social capital as one of the main elements to be investigated,
and developed, in development research with a SL approach. Strong social capital is
not only the groups and institutions that can influence sustainable development, it is the
glue that binds all the working parts together in harmonious concert. Alternatively, if
social capital is weak because of perceptions of real or symbolic threats from other
individual’s, group’s or institution’s actions or intentions, development projrect efficacy
could be compromised.
As discussed in Section 3.2 Social Capital of this thesis, SC can be divided into two
distinct types, Structural and Cognitive SC. While structural SC is in the physical
domain, that is institutions, organisations, and social and interest groups, cognitive SC
falls into the psychological domain; that is, norms, values, trust, gender equity and
equal access to resources and information. For harmonious concert to occur between
micro level groups, and between the micro level and macro level groups, both forms of
SC must be strong.

265 | P a g e
Table 38 Community Activities and Social Capital
Community Activities and Social Capital (%)
Involved in Community Organisation
Active Group Membership
Extended Family Activities
Extended Family Leader / Advisor
Donate to Community/Family
Activities
P = Pepela T=Tanjung L = Landu
P T L P T L P T L P T L P T L
Yes 38 56 38 Active 63 83 83 Yes 98 78 94 Yes 76 19 Yes 96 88 94
No 62 44 62 Passive 38 17 17 No 2 22 6 No 24 81 No 4 13 6
Source: Household Survey Data
Table 39 Household Communication and Number of Topics Discussed
Household Communication (%)
Frequency of Family Communication No of Topics
Regularly Discussed
P = Pepela Darat T = Tanjung Pasir L = Landu Thie
P T L
e.g. Economics Education
Family issue
P T L
Seldom 2 0 6 1 9 11 7
Often 28 44 25 2 17 44 14
Always 70 56 69 3 49 33 71
4 26 11 7
Source: Household Survey Data
Pepela Darat participant comments:
PD FDG 1st Fisher 8: … the problem here, we are all new comers …
PD FDG 2nd Fisher 7: … about a fishermen’s group / coop here, if you want to say
there is but there isn't, If you want to say there isn't but there is …
PD Fisher 3: … and what’s more, for example, we help to build and repair houses … in
the family we help each other like that … Tenaga Gotong royong [community mutual
help activities]…
Tanjung Pasir participant comments:
TP Fisher 1: … many ways we help each other … if we are here [on Rote Island] all
this family is family … here [this house] is special for those from Wakatobi … three
households here now …
TP Fisher 3: … after 10 years here, I am still not active at the mosque …
TP Fisher 4: … I go to the mosque but not active …

266 | P a g e
Landu Thie participant comments:
Lan Fisher 2: … yes community help, here we are involved in that, sometimes the
coastal people / fishers are involved also …
Lan Fisher 2: … we have a radio for news, no internet …
Lan WFDG P5: … the church collection on Sundays, there are 3 collections and the
Decade Vow … amounts are normally read from the pulpit every Sunday, is about
Rp700,000 [US$54] average, every household gives about Rp10-20,000 [US$0.77-
1.54] … if it is a funeral normally every household will give around Rp20-25,000
[US$1.55-1.90], if a close relationship can be Rp100,000 [US$7.70] …
Lan VS: … here there is only 1 fishing coop, Nusa Messakh is the Chairman … the
name of the cooperation is Fishermen's Cooperation … the village head's wife is the
treasurer, the coop has received Rp20 million [US$1,540] from the District Government
plus from the Central Government …
In all three case study sites there are discernible levels of informal social capital
(psychological domain) within households and among the residents, but there is very
little evidence of formal organisations or institutions (physical domain) that actively
mediate community activities except for Landu Thie where the Village Head controls
village funds and projects reported in Chapter 7. However, the mosque in Tanjung
Pasir, two mosques in Pepela Darat, and the church in Landu Thie do act as hubs for
religious and cultural activities for the villagers.
Landu, being ethnically homogenous Rotenese still has an old society internal clan
structure operating within a new state system. Village elders, Maneleo, and village
heads hold great authority in all things, cultural and economic, and clan membership
can influence access to information and opportunity. At the same time Pepela Darat
and Tanjung Pasir are two, ethically different, sub-villages sharing the same village
administration and village fund. The relationship between Pepela Darat residents and
Tanjung Pasir residents is one of acceptance and tolerance, and is not the warm
symbiotic relationship between ethically different communities that Carnegie (2010)
speaks of in Oelua, another fishing village in northwest Rote Island. Pepela Darat
residents view the Bajau Laut living in Tanjung Pasir with disdain, and the Tanjung
Pasir residents view Pepela Darat fishers as competitors for village finds and
government aid.

267 | P a g e
9.3 Micro-Level Aspirations for the Future
What are the aspirations and needs, as expressed by the villagers (the micro level), to
provide an improved future for the next generation?
Sustainable Livelihood’s (SL) core concept is that a SL approach is a way of thinking
about poverty alleviation at the micro-level, taking into account the contextual realities
on the ground. Scoones (2009) adds that “quintessential sustainable livelihoods
analysis is integrative, locally-embedded, cross-sectoral and informed by a deep field
engagement and a commitment to action”. Walker, et al. (2001, p. 307) recommend
that “host communities should be involved in planning and decision making, to enhance
opportunity for success and allow local people to anticipate, adapt and realise whatever
potential there might be to develop altered or new livelihood strategies”.
In accordance with SL core concepts, this section draws on FDG and interview
comments, and voiced and expressed aspirations of the fishers and their household
members, (the micro-level) to create a better understanding of their view for the future.
Most notably, all participants, except some Bajau Laut fishers living at Tanjung Pasir,
first expressed the need for education for the children so that they can have a better
start to life than their parents. Some Bajau Laut people display indifference for the need
to educate the children, even if they have the financial means to afford the costs. They
allow their children, especially boys, to choose between formal education at school,
and informal, culturally based education at sea.
However, reality is that education costs, along with food, clothing and health costs,
require a sustainable and consistent household income at a level that provides a cash
surplus for savings and to build a small financial cushion to ensure resilience to poor
income periods.
The next two subsections present the voices from the micro as they express their
perspective of the future for both the next generation and themselves.
9.3.1 Next Generation Matters
In this subsection, the author has presented voices that emphatically express a desire
for their children to have better education than themselves, and hence, livelihood
choices other than the marine resource dependency and ensuing indebtedness that
they endure. Education is a key element of human capital in Scoones’ (1998) SL

268 | P a g e
Framework that positively affects livelihood strategies in poverty alleviation projects.
Pepela Darat participant comments:
PD FDG 1st PNS: … If they have education they may not want to go to sea any more,
Meaning from school they can be renewed …
PD FDG 2nd Fisher 7: … There are other livelihood alternatives but they are for the
future generation. So let us prepare the costs for their education as high as possible so
in the future there is hope for the next generation …
PD FDG 1st Fisher 8: … we would like to see change, so that the next generation is not
like their father again …
PD Fisher 2: … yes my children want to go to uni …
PD Fisher 3: … because of the costs I cannot think about her dreams, I don’t know
what she will become …
PD Fisher 4: … we have to save and train our children … I train them to be
independent and work … and later go to uni, not just uni but have to work too …
Tanjung Pasir participant comments:
TP Fisher 1: … I hope they can go far, their aspirations come true ... Yes not like us
people here, because we have already passed / too late, stupid, can’t make effort
again … our efforts are to work for that, hopefully they don't suffer like us …
TP Fisher 1: … it’s about finances and funds ... If I can fulfil, then no difficulties, but if
there is no finances, even though they are smart, they cannot advance …
TP Fisher 1: … if I had the money, from me they become a doctor … and for the
youngest, she wants to be a bank worker …
Landu Thie participant comments:
Lan YFDG P1: … so the gist is like this, that all young people wish for education, that's
the beginning aspiration … they are like that because of the economic factor, so that
after they finish Senior or Junior high they can help the parents …
Lan YFDG P1: … I would like to be a teacher …
Lan Fisher 2: … my dreams for the children, a life better than ours … the children’s
schooling is better …
Lan Fisher 1: … he asked about becoming a policeman but I don't want because the
funds aren't enough and I asked him to take ITS economy …
Lan YFDG P3: … Yes I what to go to Jakarta or Kupang … from my friends experience
in Jakarta we can get massage work in a Spa, café, restaurant, and apartment … yes
work here is a problem, hence we want to go to Jakarta to get work then we can help
our parents …
Lan WFDG P1: … according to me, children who have completed school are better off
to go elsewhere for work … we don't have schooling, hence we think the children must
have schooling …
9.3.2 Micro-Level Perspectives
As in the last subsection, this subsection, presents voices that, when analysed, are
expressions of hopelessness and uncertain prospects for the future. Education, seen

269 | P a g e
as a step away from livelihood uncertainty for the next generation, has costs that
require a sustainable income that is a step to far for most of the current generation. The
government interventions prescribed to resolve economic hardship in these fishing
villages, according to the fishers, are misaligned with their culture, skill set and
aspirations for their future.
Pepela Darat participant comments:
PD FDG 2nd Fisher 5: … yes, the fibre boats are not in accordance with the fishermen's
requests …
PD FDG 1st Fisher 7: … here's 1 example, the 3 fibre boats that the government [KKP]
gave, info is that 1 boat cost Rp600 million [US$46,154], if they buy sail boats can buy
12 sail boats [for that money], for 3 fibre boats is equal to 36 sail boats, here they push
for sail boats but get motor boats … or like this, example if 5 people 1 boat, so every
team has a boat … the fibre boats are big maybe 10 ton, and to take it out we need
complete documents, and the captain needs a licence …
PD Fisher 4: … about the role of the government, we [must] work, work and work, if we
just sit and hope for continual help we will have a bankrupt country. I think like this,
maybe many people say that the government should give this and that to us here, but
we [Indonesia] is not Australia or an advanced country, we know that actually we are a
poor country …
Tanjung Pasir participant comments:
TP Fisher 2 … for the KKP funding we hope for, from the government rolling funds …
who wants to work can have funds ... We can take to sell clothes, or other things, fish,
buy from the fishermen with profit, and go to Kupang to sell …
Landu Thie participant comments:
Lan VS: …. the fibre boats are not suitable, because if there is a big wind they are too
light … and the fibre is thin, and difficult for us to repair …
Lan VS: … small boats are better because they are easier to control, because for the
fibre boats no training given and we’re not used to them … need 6 days training but
only received 2 days … in the end we don't trust the boats … the fibre boats are not
what we hoped for. With the aid money we can buy or built wooden boats …
Lan VS: … for 2016 fund we will supply 50 small motors which is easier than canoes
that were given … and 2017 Village Plan is for small kiosk only …
Lan WFDG P3: … the only work opportunity in Ba'a [District Capital City] is look after a
photocopy shop. Here [on Rote] the prospects are less than good, so we have to go
away for work …
Lan VH: … our own efforts sometimes from seagrass, so the outcomes from seagrass
help finance our homes, but the few who continue are the women …
Lan FDG P1: … now, we don’t dare to still go to the border area, we only catch fish in
the local waters around here …

270 | P a g e
9.4 Macro-Level Initiatives for the Future
What are the future initiatives and development programs planned by the central and
district governments (the macro-level)?
What are the micro-level perceptions of macro-level initiatives?
Carnegie (2008, p. 355) posits that a neoliberal approach has informed the
development paradigm for a number decades. She explains that “the neoliberal vision
[for development] is that with appropriate institutional support, self-employed traders
and producers in the informal sector will establish (or become employees of) small and
medium-sized (capitalist) enterprises through a gradual process of transition to formal
labour markets and business practice”. She adds that economic motivations and the
harnessing of informal social capital networks to establish capitalistic economic
practices at village do not always produce the neoliberalists’ desired outcomes
(Carnegie, 2008).
The following description of central and district governments initiatives for the
development of the three case study villages reflects Carnegie’s (2009) assertions. The
central government has released a prescription for the future economic development of
small-scale fishing villages which the district government is obliged to implement and
administer. The central government has a vision to modernise small fishing
communities by providing large fibre boats (estimated 10 Gross Ton), gear and an
organisational framework through centrally registered, locally base fisher coops with
designated home ports, and future plans for centralising catch collection points.
The district and local governments publicly voice support for the central governments
vision of modernisation; but being closer to the ground, they surreptitiously agree with
the villagers’ reluctance to fully embrace the central government’s prescription, and
have allocated some of their budget to help fill the gap in the micro-level aspirations.
The following excerpts are from transcripts of interviews with the Bupati (District Head
of Rote Ndao), RDF Sec (Secretary of Rote Ndao Department of Fisheries and Marine
Affairs) and Lan VS (Landu Thie Village Secretary).
9.4.1 Macro-Level Perspectives
RDF Sec: … at the beginning our plans were for possibly small boats … the problems
is we can't go back we must advance {modernise). How can we have the same results

271 | P a g e
as Bunguwangi or large cities if we are still traditional? ... So, for the future not
traditional fishermen but more modern … if we want to change, fishers want to change
to modern then don't continue traditional [methods]. We have to modernise, hence we
force the 10 ton boats … if we force now, but if they are comfortable with traditional
they will not develop … now modern fibre boats, they don't want more traditional
[boats] ... from before 2014 they still use traditional, so now they’re still like that … they
[the traditional fishers] still block anything which is new, Up to 2014 government help
was traditional, now modern …
RDF Sec: … from 2016, when I’m here (became the Department Secretary) the catch
fishermen get, still get also including from Fisheries Central Government, 55 [fibre]
boats … modern fishing boats Mr Paul (addressing the author), here in Rote we are
traditional until 2016, we now enter in [the plans of] the Department of Fisheries and
Marine Affairs (KKP) from the Central Government, we receive last year, 2016, 55
fishing boats (3 for Pepela and 3 for Landu) … yes for the 3 boats they are 10 GT ...
the registration letters are still being processed … Officers from KKP went home last
week, too busy to make the permits, permit to sail ... Yes so for the 55 boats to now
there are no permits, soon they will be done …
RDF Sec: … There is 6 [fishing] cooperative here [on Rote Island], last year we formed
fishing coops, because that help [the fibre boats] has to be used by a coop … help
come directly to the coops … it’s a national regulation … if they already use a coop, but
it’s not registered they cannot use it, so have to have a lawyer, if not KKP don't want …
RDF Sec: … KKP will also make more PPI [fish industry docks for trading fish and
buying fuel] like in Kupang at Oeba ... Make all focused there … all the boats from the
coop must have 1 goal [home port] in PPI so our control is not difficult ... if they not to
PPI, we find information about where they are, because all the boats have a mooring
number and monitored from DKP (District Fisheries Department) …
RDF Sec: … meaning all is focused for both the finance and results from the coop,
that’s why the government via KKP regulates to make a coop … so if they want finance
they must go via the coop ... later the coop will sell [the catch] to PELINDO (Indonesia
Port Corporations} ...
Lan VS: … small boats are better because they are easier to control, because for the
fibre boats no training given and we’re not used to them … need 6 days training but
only received 2 days … in the end we don't trust the boats … the fibre boats are not
what we hoped for. With aid money we can buy or built wooden boats …
Lan VS: … for the 2016 village fund we will supply 50 small motors (not delivered as at
August, 2017) which is easier than canoes that were given … and 2017 Village Plan is
for small kiosk only …
RDF Sec: … about Tanjung Pasir … I think that the education problem is relative ...
Depends on whether they want to or not ... Because their life is the sea which
influences …

272 | P a g e
Bupati: … in Papela there is already a salt factory and is being formalised. That factory
is in Faifuah Village, 40 hectares waits for the issuing of the permit, the principle is
ready, and the technology used is geo membrane …
Bupati: … In fact I support them for finding work outside the area of Landu because my
opinion is people who leave in the area, can self-manage themselves, and are not
stuck in the area that is very difficult …
9.4.2 Past Livelihood Trials and Tribulations
During the first two decades of the Twentieth Century there have been a number of
government and privately funded projects that have reached the three case study
villages. Very few have enjoyed any sense of success and sustainability. There are
also a number of government aid programs that have not reached all fisher households
in the three villages, for example; free education as in Kupang, and other parts of the
province, KIS (National Health Insurance), Raskin (Rice for the Poor) and PKH (Poor
family direct cash assistance). The trials, tribulations and elusive government support
programs influence the villagers perceptions of any new livelihood projects,
government or private funded. The following comments from FDGs and interview bear
out this point.
PD Fisher 3: … yes maybe 20 years ago there was a salt farm but already closed, the
government owned it and we worked there … yes the government owned and we were
offered only a percentage, but when it was time to divide we didn’t get our percentage,
so we were tricked and for 2 months we didn’t go fishing …
Lan VS: … About the Montara oil leak [2009] we've been interviewed too, if the oil was
on top of the water things would be very different …it is still at the bottom the water
[which] is not good, there is still oil sediment at the bottom …
Prof Fred (Research Chair) FDG wrap up: … so possibly the seagrass will be
influenced by the oil spill about 20 years but it’s not 10 years yet from 2008 [August
2009], almost 10 years but will have an influence for 20 years. 10 years more …
RDF Sec: … because recently we tried Bandeng (small pond fish) in Pepela harbour …
truly the results are pleasing / good ... But there is not an investor who wants to take
[buy] them ... the community sold them but the price was low, and they didn't want to
continue …
RDF Sec: … there aren’t any [Department of] Fisheries projects that have failed …
truthfully Bandeng [fish aquaculture project] did not fail … didn't fail just the investor
didn't collect them [the fish] ... After he provided the equipment ... The agreement was
for him to collect the fish .but he left without collecting … the community sold them but
the price was low . . And they [local fishers] didn't want to continue … he [the investor]
273 | P a g e
had a problem with the project ... But the community wanted … Their energy was low
because of that … and after the fish were past the age the people didn't take them …
we have the conditions here but I think the people didn't want … better to take [fish]
straight from the sea ... The price is good and don't have to wait ... We have an
economy here … but fish live in the sea and cheap ... results of pond fish are different
…
PD FDG 2nd Fisher 5: … yes, the fibre boats are not in accordance with the fishermen's
requests …
Lan VS: … All our village projects have worked, only the fibre boats from the central
government has failed … from the time they were brought here from Ba'a they have sat
here unused … Better to have small boats, operational cost are high for the big boats .
Listed below are a number of livelihood related projects implemented for the fishers in
the case study sites. Many are failed or discontinued projects.
Post Research Project 2017 ... (Benu, et al., 2017) A Small Drop of Hope for the Dry
Ground: Introducing Drip Irrigation to Rote Island, Indonesia, to Convince Fishermen to
Farm during the Dry Season for an Alternative Livelihood. This was a drip-feed
horticultural project in Daiama, a small village near Pepela, set up to trial a new
irrigation technique for vegetable farms on Rote Island. Nusa Cendana University
funded and set up the project. The project ran well initially, but in a short time the local
villagers returned to using the pump and a hand held hose watering system, eliminating
the storage tank and drip-feed pipes.
10 GT Fibre Boats (2016) … KKP provided the fishers in Pepela Darat and Landu Thie
with 10 GT fibre boats in a modernisation program for fishing effort. 3 boats were
provided to each village. These boats have sat idle since the day they arrived because
of licences and certification paper work required, and reticence by the fishers to
embrace this type of boat.
GPS and Navigation Lights (2014) … AFMA provided and installed a GPS system and
navigation lights to all traditional boats, which were registered to sail to the MoU Box in
Australian waters.
Desalination Plant Landu Thie (2014) … (Author observation, 2014, 2017) a water
desalination plant was installed in Landu, funded by the central government, it
eventually broke down and remained idle for several years as a maintenance contact
was not included, leaving the local villages to organise maintenance and pay costs for

274 | P a g e
a modern piece of equipment.
Trepang Aquaculture Project, 2014 … (Author observation (2014), A trial project for
trepang breeding was set up in shallow waters near Tanjung Pasir. The trepang grew
to a saleable size before the breeding pens were raided and the stock stolen. The
project was then abandoned.
Seagrass Project, 2007 … Direct Aid Program, funded by Australian Aid, provided
funds Rp20.000,000, to a group of Pepela fishers to engage in seagrass farming … At
the time the project was successful, but an application for a second round of funding
went unheeded.
Seagrass Project, 2000 … Original seagrass project on Rote Island initiated by Bupati
of Kupang was reported as a major success until a seagrass virus decimated the crop.
Traditional fishing grounds (Post 1974) … Fishing activities were restricted by changed
maritime boundaries between Indonesia and Australia resulting in reduced catch if
fishing in Indonesia’s overexploited waters, or risking apprehension and destruction of
fishing equipment if entering Australian waters to fish their tried and tested traditional
fishing grounds.
9.4.3 Micro-Level Perceptions of Marco-Level Initiatives
Imposed changes by distant policy makers or non-resident researchers are often
rejected or fade quickly if there is no immediate gratification from those changes
leaving negative outcomes and resistance to any future attempts at change (Roberts,
2003; Stiglitz, 2002). The previous section highlighted a number of livelihood trials that
failed. Hence, the villagers often return to, or remain with, their tried and tested
traditional methods and life support strategies, for a known sense of uncertainty rather
than changing to a prescribed, unknown sense of uncertainty. Hence, unsurprisingly,
the fishers in the three case study villages, Pepela Darat, Tanjung Pasir and Landu
Thie, all exhibit negative perceptions of macro-level promises, livelihood initiatives and
modernisation strategies.
Presented here are a sample of comments made during FDGs and interviews that
convey the micro-level perspective of macro-level funding and initiatives.

275 | P a g e
Pepela Darat participant comments:
PD Fisher 4: … about the role of the government, we [must] work, work and work, if we
just sit and hope for continual help we will have a bankrupt country. I think like this,
maybe many people say that the government should give this and that to us here, but
we [Indonesia] is not Australia or an advanced country, we know that actually we are a
poor country …
PD FDG 1st Fisher 7: … it is a policy made by the government that is a big loss to the
fishermen ... So if they want to make something [a policy or intervention] they want to
include the district fishermen who know more, if they involve the local government not
just in the office …
PD FDG 2nd Fisher 5: … the fibre boats [from the Central Government] are not in
accordance with the fishermen's requests …
Tanjung Pasir participant comments:
TP Fisher 1: … there has been aid but it came from Jakarta, sometimes it appears then
sometimes not, sometimes blocked, and sometimes cancelled … we wait but it doesn't
happen, it was talked about, we all gave data, all our complaints and requests for
fishing needs like motors …
TP Fisher 2: … Kepala Dusun (Head of Sub-village) … we often talk about that. If there
are officers from KKP here, recently they were here … but no action …
TP Fisher 5: … There hasn’t been any programs by the District Government which
touch the needs of the fishermen … and about the Village Fund it is organised without
involving us …
Landu Thie participant comments:
Lan VS: …. the fibre boats are not suitable, because if there is a big wind they are too
light …
Lan VS: … All our village projects have worked, only the fibre boats from the central
government has failed … from the time they were brought here from Ba'a they have sat
here unused … Better to have small boats, operational cost are high for the big boats
...
Lan VS: … for 2016 [Village] fund we will supply 50 small motors which is easier than
canoes that were given (yet to arrive as of August 2017) … and 2017 Village Plan is for
small kiosk only …
Lan VS: … if they [the government] want to help, we want a say. Or if they give us
money we can do it ourselves, then later they can come and inspect …
Anon: … sometimes the village head doesn't want to listen, in village consultation; we
say A can bet it’s B …
Anon: … We don’t hear about assistance from above [the government], my opinion I
don’t hear although all people in the village get it, we have never received the rice
assistance RASKIN (rice for poor people) … don’t want to hope too much but in reality I
focus on finding a living for my life myself, I don’t want to be helped by the government,
because although the central and district government will delete the name … truly we
don’t care, all is attached to above … we register at the RT (neighbourhood registrar)

276 | P a g e
and it’s connected to the central government, but it is deleted by the lower government,
if not from their group, they select again, They will give money for those that are close
to them. Some people request assistance, plead. I don’t want, if they want to give
[assistance] please do, or if not I don’t care …

277 | P a g e
9.5 Explaining Development Synergy through an ITT Lens
Can Intergroup Threat Theory explain a lack of development program efficacy?
Individuals, groups and subgroups within communities are not homogenous, nor are
they all egalitarian in nature (Agrawal and Gibson 1999). There are different levels of
politics, education, social status, incomes, livelihoods and livelihood aspirations. There
are also different genders, religions, classes and clan memberships. They all vibrate
and resonate at different frequencies and at different pitches (Agrawal and Gibson
1999). Rickson, et al. (2015) posit that conflict between community groups, business
men and government agencies during planning and implementation of development
projects are often fraught with relations of social power, trust and distrust. It is through
community participation processes that these diversities can be recognised,
harmonised and included in development and policy planning (Harding et al., 2009;
Roberts, 2003). The first step is to recognise them in an effort to allay, or circumvent
possible negative project outcomes and, in fact, to ensure that the project progresses
past the planning and implementation stages.
Carnegie (2010) argued in her report on research in another village, on Rote Island,
that governments could learn from how the Oelua villagers perceive and manage
difference, meaning interactions at the micro to micro level. My argument is that
governments could also learn by analysing the micro to macro level interactions at an
early stage of development planning, an inter-level assessment if you like, so as to
allay or circumvent negative, pre-conceived perceptions of project designers and the
strategies they carry. Perceptions of threat or failure emerge even more quickly and
stronger when project recipients hold negative attitudes and stereotyping toward
project donors. Stephan et al. (2009, p. 2) define intergroup threat as “when members
of one group perceive that another group is in a position to cause them harm “. There is
a relationship between intergroup threat and negative outgroup attitudes (Riek, et al.,
2006). Negative outgroup attitudes and negative stereotyping can be either a
precedent to, or a result of, realistic and symbolic threats (Stephan, et al., 2009).
Scoones (2009) calls for “a more thorough-going political analysis” in SL research while
at the same time contemplating micro-level macro-level linkages in resource and
livelihood trajectories. DfID were explicit in their guidance sheets on SL, stating that
while SL is people centred so that policy development is “based on understanding of
the realities of struggle of poor people themselves, on the principle of their participation

278 | P a g e
in determining priorities for practical intervention”, it also asserts that SL should bridge
the gap between the micro level and the macro level and that it is committed to
environmental, economic, social and institutional sustainability (Scoones, 2009, p. 180)
For the purposes of such an analysis, the author uses an Intergroup Threat Theory
(ITT) template, as discussed and described in Chapter 4, for exposing Realist and
Symbolic threats that exist in and between the three case study villagers at the micro to
micro level, and also between the villagers and their Bosses and between the villagers
and the district and central governments at the micro to macro level. Figure 18 shows
the various intergroup linkages that are examined for realistic and symbolic threats that
may explain a lack of efficacy in macro-level prescribe livelihood development projects.
Figure 18 Intergroup linkages among the case study villages
Again, in this discussion chapter the author has purposively selected salient excerpts,
from the FDGs and interviews, to allow the voices from the micro to guide the
discourse concerning realistic and symbolic threats, real or perceived, in and among
the three case villages on Rote Island. A number of other authors discuss the quality
and quantity of social capital that exists within small-scale fishing communities for
development planning purposes. They also expose intergroup tensions and rivalries at
the micro to micro level, but few, if any, have used and ITT approach to discuss
Government
NGOs
Researchers
Fishing Bosses
Private Agents
Landu
Thie
Pepela
Darat
Tanjung
Pasir

279 | P a g e
intergroup relations at the micro to micro level and between the micro and macro level.
This author recognises, in the case study villages, the existence of a diversity of
intergroup threats that influence poverty alleviation projects, especially those imposed
by macro level outsiders.
At the micro to micro level both realistic and symbolic threats are observed, especially
between the villagers of Pepela Darat and Tanjung Pair. Both of these locations are
actually sub-villages, sharing distributions from the same village fund. Their vying for a
better share of these funds can be classified as presenting realistic threats to each
other, as is their completion for district and central government aid. Because most
Bajau fishers are involved in shark capture, and the Pepela fishers are involved in fish
capture, realistic threats caused by competition for natural resources are minimal.
Micro-level symbolic threats, between Pepela and Tanjung, are explicit and are on
display when they express comments on each other’s character and habits. While the
inhabitants of both villages originate from Sulawesi, they are ethnically different There
is almost disdain for the Bajau people living in Tanjung, by the fishers of Pepela, and
reciprocal characterisations of the Pepela people by the Bajau fishers, while more tacit
are still evident. The close proximity of these villages to each other may exacerbate
these threats. They are able to observe each other’s daily activities and at times
intermingle socially. Both villages, however, display little impression that these
intergroup threats exist to any extent with fishers in the village of Landu. Landu is
located approximately 100 kilometres away. While some Landu fishers have crewed on
boats from Pepela and Tanjung, and quietly may still do, there is not day to day
contact. The Landu fishers are local coastlines fisher, so there is no realistic threat or
competition for natural resources and because they have their own village fund there is
no conflict over distribution with the Pepela and Tanjung inhabitants.
Evidence also gives cause to conclude that in all three villages there are realistic and
symbolic threats between the micro-level and the macro-level, or are caused by
imposed macro level interventions. Fishers from all three villages express negative out-
group attitudes and stereotyping towards government interventions as expressed in
comments in Sub-section 9.4.2, Past Livelihood Trials and Tribulations. In accordance,
the central government vision to impose neoliberal modernisation and practices on
small-scale fishing villages has drawn negative group responses by the fishers openly

280 | P a g e
refusing to embrace and cooperate with the strategy.
The fishers feel a symbolic threat caused by an affront to their group identity. They are
not modern fishers using modern large fibre boats; they are traditional fishers that use
small wooden boats that are sail powered, or powered by small motors to a maximum
of 25 HP. For the Tanjung fishers, this is engrained in their culture, and for the other
two villages, they are generational fishers too that have no other skills to suit alternative
livelihoods.
Realistic threats exist in that there is no guarantee that incomes will improve by shifting
their catch methods away from traditional methods to more modern ones. However, the
greatest realistic threat to their future is that the proposed coops to coordinate and
manage the larger fibre boats will eventually be taken over by business men or Boss-
style operatives that will again dominate them through debt and distributional injustice.
The fishers in all villages agree that they need macro-level support for them to be able
to provide the next generation with a Fresh Start to fulfil their livelihood aspirations.
However, the fishers’ vision for their future livelihoods is in contrast with the
government’s vision. Their hope is for a more independent scenario reaping a modest
level of consistent income to cover their daily needs, while the government fulfils
promises of free education and health care. Avenues to the fishers’ vision are
facilitated by government grants of small boats and fishing gear, and by access to
micro-finance via a government or NGO rolling fund as start-up funds to new micro-
enterprises.
However, until the government embraces a true micro-level consultation process prior
to project planning, incorporates results from that process in final plans, and preforms a
micro to macro threat analysis to circumvent any existing or potential treats that may
impede project efficacy, projects themselves will continue to suffer realistic threats of
failure.
9.5.1 Realistic Threats
This section provides evidence of existing realistic threats perceived by the fishers (the
micro-level). They express that the Boss holds all the power in their relationship
causing income distribution to be inequitable. Some fishers also perceive skewed
distribution of government attention and aid towards other villages. The following
comments are lifted directly from the FDG and interview transcripts.

281 | P a g e
PD FDG 1st PNS … the person who makes them powerless is the big boss …
PD FDG 1st Fisher 7 … several years ago there was an issue when fishermen here
were invited to do people smuggling and many were arrested in Australia … it was an
opportunity to clear debt … we don’t want to borrow from the Boss … it causes
arguments in the home because of the problem of living costs, they are like mafia …
PD FDG 1st Fisher 8: … to sell the fish must go to him [the Boss], he dominates all
because he is that … We need a person who's a type of ombudsman … the
humanitarian value has to come with the Boss ... Sadly, for friends here life is wagered
but at what value, then he comes and dominates again, this is what I see from before,
not in this boss, you have to be crushed first …
PD Fisher 4: … the District Head always gives them [the Bajau Laut in Tanjung Pasir]
assistance for political reasons, not for their prosperity …
TP Fisher 5: … for us Bajau here we don’t get any government assistance; assistance
is given to the Pepela fishermen only …
Boss Sugi: … there is no responsibility taken for a fisherman that has a disaster or
accident, because there is no promise attached …
Anon: … We have to anticipate the village fund in the future success, not long after a
big boss [might] play in the background and play with the village officials or whoever to
block it …
9.5.2 Symbolic Threats
This section provides evidence of symbolic threats perceived at the micro-level. The
fishers are proud of their craft as fishers and more so that they are traditional fishers.
Sudden movements in modernization are perceived to threaten this group identity.
Symbolic threats are also perceived between fisher villages. Each perceives the other
as different, having different norms and values that are not mutually acceptable, and
one should not be mistaken as belonging to the other group.
PD FDG 1st Fisher 7: … the professional fisher can do all, meaning, at times they can
be a coastline fisher or at other times a cross border fisher, so for a professional this is
the minimum … they can change from cross border can be off-shore and also coastline
… not normally on off shore though …
PD FDG 1st Fisher 8: … about ponds [fresh or salt], the land people have more, that's
the issue, and technically they are the only ones that can own and use land here …
PD Fisher 4: … about the Bajau people, many of the children don’t go to school and
when I ask why they say they can’t afford to pay, but they follow the children’s wants,
who don’t want to go [to school] …
PD FDG 1st Fisher 7: … yes and we are still stupid people, still lower [than other
groups] …

282 | P a g e
TP Fisher 1: … if we are valued from our home, [this is] normal for the community here,
sometimes people own homes like this, sometimes simple yes, sometimes they live in
a family house, don't own land, don't own a place …
TP Fisher 1: … from the beginning we are fishermen … and no cool box, I'm a
traditional fisherman …
TP Fisher 1: … we [Tanjung Pasir residents] are all arrivals from Sulawesi, all …
TP Fisher 2: … yes, if we don't eat fish, we Bajau Laut have a taste for the bones, can't
work no power, weak, so eat fish ... If we continually eat vegetables also no good …
Lan VH: … all of them are fishermen, there are no farmers …
Lan Fisher 2: … technically we are fishermen, when we had seagrass it was
submerged in the sea … surely there's a 1,000 names for fishers like that …
9.5.3 Negative Stereotyping and Out-Group Attitudes
The section also uses the voices from the micro-level to exposes the existence of
negative stereotyping and out-group attitudes between micro-level groups and also
between the micro-level and macro-level. Prior history of macro-level failed initiatives or
unfulfilled promises of aid leads to negative stereotyping of future project and predicted
project outcomes. Different groups at the micro-level also hold mutual negative out-
group attitudes as evidenced below.
PD Fisher 3: … yes the government owned [salt ponds] and we were offered only a
percentage, but when it was time to divide we didn’t get our percentage, so we were
tricked and for 2 months we didn’t go fishing …
PD Fisher 4: … for the Bajau people, the man is busy making money, and he has a
wife who is busy spending it, wasteful … if one has a home they all have a home, if one
has food they all have food …
PD Fisher 4: … the Bajau get money that they spend in a minute, extravagant … the
government gives them things and they sell them, then shift [migrate] again … their
culture, creatures that live to shift continuously … but they say they never get
government assistance of any type, they speak empty words …
TP Fisher 5: … for us Bajau Laut here we don’t get any government assistance;
assistance is given to the Pepela Darat fishermen only …
TP Fisher 2: … as head of the sub-village, we often talk about aid if there are officers
from KKP here, recently they were here, but no action …
TP Fisher 1: … there has been aid but it came from Jakarta, sometimes it appears then
sometimes not, sometimes blocked, and sometimes cancelled … we wait but it doesn't
happen, it was talked about, we all gave data, all our complaints and requests for
fishing needs like motors …
Lan VH: … one other thing, apologies if there has been research like this sometime
which means there are those that don't understand so in the delivery, if slowly it lets
them understand what is said, then the community here also ... We are ok if there is not

283 | P a g e
money / cigarettes for the attendants or not, technically money for sitting, it's not a
problem, in this village …
Lan Fisher 1: … sometimes the government makes wrong policy too …
Anon: … We don’t hear about assistance from above [the government], my opinion I
don’t hear although all people in the village get it, we have never received the rice
assistance RASKIN … don’t want to hope too much but in reality I focus on finding a
living for my life myself, I don’t want to be helped by the government, because although
the central and district government will delete the name … truly we don’t care, all is
attached to above … we register at the RT (neighbourhood registrar) and is connected
to the central government, but it is deleted by the lower government if not from their
group, they select again, They will give money for those that are close to them. Some
people request assistance, plead. I don’t want, if they want to give [assistance] please
do, or if not I don’t care …

284 | P a g e
9.6 Sustainable Livelihood Framework
To satisfy the final specific objective of the research project; to design a Sustainable
Livelihood framework appropriate for use in Indonesia or other Southeast Asia
countries, the author has adapted the FAO diagram (DFID, 2000, p. 50) that appears in
Chapter 7.
The adapted SL framework diagram (see Figure 19) puts people and households at the
centre as does the FAO diagram as opposed to the Scoones SL Framework diagram
where institutions are at the centre of the framework. The author chooses to make
people and households the centre of focus for the research as well as for the
developed SL Framework diagram. On the left hand side are the External Enablers and
Inhibitors of household livelihood strategies and to the right hand side are the
outcomes that are influenced by strong or weak livelihood strategies.
When applying the developed framework, analysis of the Internal Enablers and
Inhibitors, the SL approach should include a Need Assessment at the micro-level, and
the SIA component should include an ITT analysis of the multifaceted intergroup
threats that are inherent in most development projects.
For the developed SL diagram, the author has included a Monitoring and Evaluation
Feedback loop. This feedback loop facilities adjustments to livelihood strategies both at
the micro-level, Internal Enablers and Inhibitors, and at the macro-level, External
Enablers and Inhibitors. In other words, by following the circular dynamics of the
framework, governments and practitioners should be able to forward advice on the
realignment of mismatched micro-level aspirations and macro-level initiatives to help
improve development project efficacy.

285 | P a g e
Fig
ure
19 D
evelo
pe
d S
usta
inab
le L
ive
lihoo
d
Fra
me
wo
rk (
Ad
apte
d fro
m F
AO
Su
sta
inab
le L
ive
lihoo
d D
iagra
m
ain

286 | P a g e
9.7 Conclusion
This chapter has presented the research findings by using the quantitative data
obtained from the Household Survey and empowering the voices from the micro, in
FDGs and interviews, to lead the discussion on the villagers’ socio-economic statuses,
current livelihoods, aspirations for the next generation and their perceptions of macro-
level prescriptions for future livelihood strategies.
Demographically these villages are different. The fishers from Pepela Darat are
descendants of Makassar fishers who migrated to Pepela a number of generations
ago, but they now call themselves Rotenese. The fishers from Tanjung Pasir are of
Bajau Laut ethnicity, originating from Southeast Sulawesi, and the fishers from Landu
Thie are all original Rotenese. Their formal education levels are not dissimilar, although
the fishers of Tanjung Pasir have the poorest level of education. While, both Pepela
Darat and Tanjung Pasir are almost 100% Muslim, Landu is almost 100% Christian.
The fishers’ economic statuses in all three case study villages are similar. In all
villagers the majority of households are poor and living below the accepted poverty
indicator of US$1.90 per person per day. Their income can only afford a subsistence
lifestyle. This is in accordance with other research findings (Bria, 2014; Fox & Sen,
2002; Therik, 2008).
Current livelihood strategies in the three case study village are diverse. The fishers of
Pepela Darat are flexible in their fishing activities. Some sail to the MoU Box in pursuit
of shark, some are off-shore fishers targeting pelagic and reef fish, while others are
coastal fishers fishing for daily needs and to sell to local fish traders, normally women.
Seagrass farming has also been prominent in Pepela Darat fishers’ livelihood
strategies up until the Montara oil leak in August, 2009. The fishers from Tanjung Pasir
are mainly long distance voyagers working for a Boss. They voyage in sail powered
Lambo boats and target shark in the MoU Box. Only a few of the Tanjung Pasir fishers
engage in seagrass farming; they are predominantly and culturally predisposed to be
fishers, but a number are proficient wooden boat builders. The livelihoods of Landu
Thie fishers are diverse. While most do not sail to the MoU Box now, since 2006 when
the village lost 20 boats to Australian surveillance officers, they now are local coast line
fishers only. Some Landu Thie fishers have worked on foreign fishing boats overseas,
in Italy, Spain and Australia, and almost all have tried seagrass farming, but now only a
handful of women still engage in seagrass farming. A number of fishers in Landu Thie

287 | P a g e
also dive for lobster when the waters are warm enough. In all villages, quite a number
of women make snacks to sell to school children or from small kiosks at the front of
their houses.
An aspect that almost all are in unison with is their aspirations for the future for their
children. They all hope that their children do not have to endure the tribulations that
they have had to. Most believe that education, to as high a level as possible, is the only
way out. They will not have to be fishers and can have a better life. Fishers from
Tanjung Pasir, while saying that education is a way out for their children, express a
level of indifference for the need for education and allow their children to choose to go
to school or not. Culturally, the Bajau Laut are mariners and they are proud of their
boys who choose a life on the sea.
The analysis of intergroup threats shows that realistic threats and symbolic threats,
which could impede on development project efficacy, are present at the micro level.
Realistic threats over competition for government aid exist between Pepela Darat
fishers and Tanjung Pasir fishers. All fishers who work for a Boss experience realistic
threats due to the income distribution system used. Between the micro and macro
level, realistic threat is most discernible and concerning for efficacy of project planning,
implementation and sustainability. They have experienced project failure in the past
that leaves them with a sense of uncertainty for any new proposed projects, whether
they be government or privately funded. Accordingly, fishers fear that the new model
for the small-scale fisheries sector, as prescribed by the central government, could
continue or deepen, rather than alleviate, their poverty trap if business men or private
interests take control of fisher coops. For this reason, fishers have engaged in group
action by refusing to use the new, modern, fibre boats, with a 10 GT capacity, supplied
by the central government. Fisher would prefer to endure a known uncertainty, than
risk an unknown uncertainty.
In essence, this research has confirmed that the fishers in the three case study
villages, Pepela Darat, Tanjung Pasir and Landu Thie, still live at or below the poverty
line, or at an economic subsistence level. This was also the finding in research in 2002
and 2014 (Bria, 2014; Fox & Sen, 2002). Although they have differing demographics,
they all aspire for their children to have a better life than them. Most agree that
education is the best strategy for their children to improve their chances of a better
lifestyle. To afford the education costs, they engage a diverse range of income

288 | P a g e
producing activities, mostly fishing, which in itself has at least three strategies, sailing
to the MoU Box in Australian waters, off-shore fishing and local coastal fishing.
However, subsistence is not enough to provide the next generation with a FRESH
Start.
ITT has proven to be an appropriate approach and provided a plausible cause as to
why the efficacy of recent modernisation strategies by the central government is less
than optimum. Realistic and symbolic threats perceived at the micro-level in relation to
prescribed macro-level development projects are impeding project efficacy.

289 | P a g e
Conclusion Chapter 10

290 | P a g e
10.1 Research Overview
This thesis has investigated sustainable livelihoods in small-scale fishing communities
in the East Nusa Tenggara Province of Indonesia. Small-scale fisheries are frequently
characterised as an occupation of last choice, and fisher folk as the poorest of all.
Landlessness, few productive assets and a limited skills set for these folk gives little
choice other than a marine livelihood strategy, resulting in, at best, little more than
subsistence living.
This research centred on three small fishing villages, Pepela Darat, Tanjung Pasir and
Landu Thie, on Rote Island, in the Province of East Nusa Tenggara. Fishers from these
villages have endured challenges to their livelihoods due to changed maritime
boundaries in the Timor and Arafura Seas during the late Twentieth Century, resulting
in them being dispossessed of their traditional fishing grounds. They have also been
confronted with environmental degradation due to the 2009 Montara oil spill in the
Timor Sea, which is reported to have all but wiped out their seagrass farming micro-
enterprises. While governments and NGOs have spent many millions of dollars on
poverty alleviation projects in the East Nusa Tenggara Province of Indonesia, remote
fishing villages have not always benefited from large infrastructure projects or generic
community development programs. Real progress is slow; too slow for the current
generation of traditional fishermen to have a sustainable income to provide a FRESH
Start (Food, Residence, Education, Social status and Health services) for the next
generation so that they can have more livelihood choices than their parents, and to
prevent them suffering livelihood stagnation or slip-back.
The aims of the research have been to:
1) investigate the current economic status and livelihoods strategies in the three case
sites so as to provide specific recommendations for possible alternative livelihood
approaches, and
2) add to the conceptual discourse on Sustainable Livelihood in traditional fishing
communities by investigating restrained efficacy of development projects through an
Intergroup Threat Theory lens.
These research aims were operationalised via case studies, in the three small fishing
villages on Rote Island, which employed a true, mixed-method, bottom-up data
collection approach that was guided by the tenets of Sustainable Livelihoods, Social
Impact Assessment and Needs Assessment. Data collection methods used were a

291 | P a g e
household survey, FDGs, formal and informal interviews and researcher observation
and focused on answering the central research question: How can the current
generation of fishers on Rote Island lift above a subsistence income to provide a
FRESH Start for the next generation?
Household surveys were completed on a random, “one on one” basis, at or near the
respondents’ homes. Hence, the household surveys also facilitated just as many,
dense and data-rich informal interviews. Focus discussion groups added to this rich
local knowledge gained about the villagers’ history, culture and their livelihood
priorities, strategies and challenges. Formal interviews with government officials, key
informants and local stakeholders informed the research of lessons learned from past
government projects and the rationale behind current initiatives. In the discussion
chapter, the author empowered the voices from the micro-level to enable them to guide
the research conclusions.

292 | P a g e
10.2 The Significant Finding of the Research
A commonality exposed in all three case study villages was multi-faceted intergroup
tensions and threats, micro-level to micro-level and micro-level to macro level, which
can be explained through Intergroup Threat Theory. Modernisation is seen, through a
normative / neoliberal lens by many governments and development agencies, as a
necessary part of future development strategies to provide the current and future
generations with rewarding and sustainable livelihoods. However, the current
generation fishers view modernisation with suspicion and fraught with threats, both
realistic and symbolic.
Realistic threats exist at the micro-level to micro-level when the different villages vie for
government attention and aid. Realistic threats also exist between the micro-level and
macro-levels when fishers are forced to abide by an inequitable income distribution
system between the Boss and boat crews, and also when they perceive that
government initiatives may leave them in the same inequitable position if proposed
fisher coops are usurped by the same Bosses or other business investors. The fishers
would prefer to endure a known uncertainty rather than be faced with an unknown
uncertainty.
Symbolics threats also exist. At the micro-level to micro-level, Pepela Darat and
Tanjung Pasir fishers, see each other as different, with different sets of norms and
values. They perceive differences in cultural identities, livelihood aspirations,
household financial management and the value of education. However, all fishers
perceive symbolic threats from government calls for modernisation. Their group identity
is that they are traditional fishers. Any macro-level initiative that threatens this identity
is received with suspicion and negative out-group attitudes.
Multi-faceted intergroup tensions and threats could explain a lack of development
program efficacy. ITT has proven to be an appropriate approach and provided a
plausible cause as to why the efficacy of recent modernisation strategies by the central
government is less than optimum. Realistic and symbolic threats perceived at the
micro-level in relation to prescribed macro-level development projects are impeding
project efficacy

293 | P a g e
10.3 Other Major Research Findings
10.3.1 Household Livelihood and Economic Status
Results show that the economic status of the fishers’ households had not improved
since Fox & Sen (2002) Therik (2008) and (Bria, 2014) released their research findings.
In all three case study villages, the majority of household incomes are below the World
Bank poverty line of US$1.90 / day / person, or Rp3,000,000 for a two adult two
children household, and many have a household income below the abject poverty line
of US$1 / day / person, or Rp1,560,000 for the same size household. It could be
concluded that most households in these villages exist at a subsistence or near
subsistence level. Notably, smoking is one behaviour that should be modified. It
accounts for an average of 15 % of total household spending. Reducing discretional
spending such as smoking could release valuable household resources.
Current livelihood strategies in the three case study village are diverse. The fishers of
Pepela Darat are flexible in their fishing activities. Some sail to the MoU Box in pursuit
of shark, some are off-shore fishers targeting pelagic and reef fish, while others are
coastal fishers fishing for daily needs and to sell to local fish traders, normally women.
Seagrass farming has also been prominent in Pepela Darat fishers’ livelihood
strategies up until the Montara oil leak in August, 2009. The fishers from Tanjung Pasir
are mainly long distance voyagers working for a Boss. They voyage in sail powered
Lambo boats and target shark in the MoU Box. Only a few of the Tanjung Pasir fishers
engage in seagrass farming; they are predominantly and culturally predisposed to be
fishers, but a number are proficient wooden boat builders. The livelihoods of Landu
Thie fishers are diverse. While most do not sail to the MoU Box now, since 2006 when
the village lost 20 boats to Australian surveillance officers, they now are local coast line
fishers only. Some Landu Thie fishers have worked on foreign fishing boats overseas,
in Italy, Spain and Australia, and almost all have tried seagrass farming, but now only a
handful of women still engage in seagrass farming. A number of fishers in Landu Thie
also dive for lobster when the waters are warm enough. In all villages, quite a number
of women make snacks to sell to school children or from small kiosks at the front of
their houses.
Poverty often has a close correlation with gender equity. In poor patriarchal
communities, women and children are always more vulnerable than men. To foster
women’s and household resilience to income or expenditure shocks, sustainable
livelihood projects should include gender friendly activities. Seagrass farming has
294 | P a g e
proven to be one such activity. Hence, resolving the seagrass farming problems of
disease and the environmental impacts of the 2009 Montara oil leak is profound in
contributing to gender equity solutions.
Alternative livelihoods can be new introduced activities or re-energised current
livelihood activities. However, many livelihood activities require a minimum level of
infrastructure such as readily available fresh water, a reliable source of electricity and
easy access to education and health services, and now communication networks that
facilitate internet based livelihoods, taking advantage of a rapidly expanding
employment space. These minimum levels of infrastructure are paramount for any
community development program, whether designing sustainable livelihood strategies
for the current village population of productive age, or for enabling future livelihood
strategies for the next generation in their productive years.
Better levels of education will lead the next generation to find employment in the formal
economic sector, such as the civil service, education, health, IT or large scale business
enterprises, as compared to most of their parents and older villagers whose education
level only allows access to the informal sector.
In essence, this research has confirmed that the fishers in the three case study
villages, Pepela Darat, Tanjung Pasir and Landu Thie, still live at or below the poverty
line, or at an economic subsistence level. This was also the finding in research in 2002
and 2014 (Bria, 2014; Fox & Sen, 2002). Although they have differing demographics,
they all aspire for their children to have a better life than them. Most agree that
education is the best strategy for their children to improve their chances of a better
lifestyle. To afford these education costs, as well as other daily household needs, the
fishers and their wives engage in a diverse range of income producing activities, but
fishing activities remain the main source of household income. However, subsistence
level income is not enough to provide the next generation with a FRESH Start.
10.3.2 Micro-Level Aspirations
The Tanjung Pasir villagers, transient fishers from Sulawesi, view fishing and marine
resource extraction as inherently cultural. They have indifferent views on education for
their children’s future, and are equally happy to see the children follow them as fishers,
even though there is self-realisation that their existence is on the margins of society.
For the Pepela Darat and Landu Thie fishers, they are more open to alternative

295 | P a g e
livelihoods and a diverse village economy. They see education as the key to their
children’s future way out of poverty. However, fulfilling the costs of providing senior
high school and university level education, along with sufficient nutritious food, suitable
residence and access to health services for the household, seems out of reach for
them. While some Tanjung Pasir children do elect to be educated back in Sulawesi,
many choose to follow their parents to sea. However, the Pepela and Landu Thie
children aspire to be educated, more locally in Kupang, or to migrate out for better
employment prospects, and to possibly return financial assistance to the village.
10.3.3 Macro-Level Future Initiatives
The Central and District governments do seem to have the political will and financial
commitment to alleviate poverty in traditional fishing villages on Rote Island. Their
initiatives for the future include the modernising of the small-scale fishing villages in the
Rote Ndao fishery. In 2016 - 2017, the Central Government supplied 10 GT fibre boats
to villages throughout Indonesia, including three to each of Pepela Darat and Landu
Thie. Each boat is estimated to cost Rp600 million (US$46,150). The District
government, while openly supporting the call to modernisation by the Central
Government, are reported to have allocated funding for smaller boats. In association
with the fibre boats, the Central Government is imposing a formal management
structure via a network of registered fisher coops that are responsible for the operation
of the boats and their adherence to home port mooring and catch reporting. Future
plans are to centralise post-catch processing through Pelindo, Indonesia’s port
authority.
The Rote Ndao Government, from time to time provides assistance to the fishers for
seagrass cultivation. This assistance may be scheduled again as the surrounding seas
recover from the reported environmental damage caused by the 2009 Montara oil spill.
At the village level, village funds provide assistance through local projects, such as the
rain water diversion wall in Landu Thie and minor road works in Pepela.
10.3.4 Micro-Level Perceptions of Macro-Level Initiatives
Although the three fishing villages are located in the same district municipality, only 100
kilometres apart, they are very different in demographics, internal political structure,
available resources and hence current livelihood strategies. Notwithstanding these
differences, fishers in all villages perceive both realistic and symbolic threats
associated with macro-level initiatives. They have witnessed and been the target of

296 | P a g e
numerous previous initiatives, or promises of proposed initiatives that have not
delivered the espoused outcomes. Hence, the fishers’ have reticence to embrace new
initiatives. The 10 GT fibre boats supplied by the Central Government have sat idle
since they were delivered, a form of group action. They view modernisation as either
their saviour or their nemesis, depending on the scale and pace of introduction, and
who has access to, and control over the modern technology, modern structure of
institutions, and modern supply chains and agents for their produce.

297 | P a g e
10.4 Recommendations
The importance of SL is to provide direction for poor people to achieve enduring
improvements against the challenges and poverty indicators that they define (Ashley &
Carney, 1999, p. 1).
The recommendations suggested by the author have been guided by knowledge
gained during this micro-level focused research project. The fishers, at the micro-level,
in all three case study villages, Pepela Darat, Tanjung Pasir and Landu Thie, have their
own individual and group identities. They are protective of these identities, even when
they self-acknowledge their miserable conditions. They desire a sense of personal
dignity and self-determination for their efforts to provide the next generation with a
FRESH Start.
10.4.1 Micro-Level Recommendations
1) As verbally expressed by fishers during FDGs, fishers should be given the
opportunity to choose between being an individual or small-group artisan fisher,
working on larger Boss operated boats, or choosing to exit fishing activities for other
marine or land based income generating activities. This may require access to micro-
finance to first clear debt to the Boss.
2) Fishers should be encouraged to engage in a diverse set of income producing
activities similar to Carnegie’s (2008) findings in Oelua, and as one fisher said in an
informal interview “to have many hands”.
3) Gender neutral activities, such as seagrass farming activities and small cottage
industries involving snack production, clothes and shoe agencies and arts and craft
production, attacking start-up micro-finance should be encouraged. Fox & Sen (2002)
also proposed the latter, and a number of women during the Women’s FDGs requested
further assistance with the former.
4) With the recent upgrading to a 4G telephone network on Rote Island, the villagers, if
in range of a mobile phone tower, should have improved access to internet education
aids, such as search engines and tutorial applications. ITC employment is now within
reach to help expand livelihood choices for members of the next generation who have
a higher level of education.

298 | P a g e
10.4.2 Macro-Level Recommendations
While governments seem to have the political will and financial commitment for poverty
alleviation programs in fishing villages on Rote Island, and other villages throughout
NTT, there are a number of recommendations from this research:
1) The District governments of NTT, especially that of Rote Ndao, should implement a
FRESH program to assist the current generation ready the next generation for
alternative and more modern livelihoods, which will alleviate the pressure on local
natural resources and for them to voyage to the Australian – Indonesian transboundary
waters for a fishers’ subsistence livelihood.
2) To assist the current generation of fishers, on Rote Island, to be able to provide a
FRESH Start for the next generation, the NTT Provincial Government and the Rote
Ndao District Government should ensure that all villagers receive the benefits of
existing programs such as, free education at government schools, KIS, the national
health insurance, PKH, direct family assistance, Raskin, a subsidised rice program for
poor people and the PAUD program, Early Childhood Education and Development
(ECED). This research found during FDGs and interviews that this was not always the
case. This step should alleviate some pressure on fishers’ household budgets.
3) The government should regulate equitable income distribution on Boss / privately
owned boats, to ameliorate the poverty trap (debt to the Boss as outlined in this thesis)
and subsequent compulsion to work for boat owners to repay that debt, as opposed to
choosing to work for the boat owners or to change to an alternative livelihood. Susilo &
Purwanti (2017) call this “subsistence ethics”.
4) The government should slow down their race to modernisation as outlined during an
interview with the Secretary of the Rote Ndao Department of Fisheries. Modernisation
should be staggered over a 5 to 10 year period. The next generation will be the agents
of change as they are better educated and more tech-savvy than the current
generation of fishers. As suggested by a number of fishers during FDGs, the first
stages should provide both smaller Bodhi style boats and motors, and one or two larger
boats that are operated as a pilot program subsidised by the government for a period of
at least 1 year to provide the local fishers with operating data and experience.
5) This research has shown, using an ITT framework, there is evidence that the micro-

299 | P a g e
level perceive realistic and symbolic threats regarding macro level development
interventions. Therefore, the government should, as a part of a holistic, pre-project
Social Impact Assessment, assess for the existence of micro-level to macro-level
perceptions of threat to all development interventions, which may impede on project
efficacy,
10.4.3 Future Research Recommendations
1) Research is required to investigate the cost effectiveness of totally transitioning
traditional fisheries to modern based enterprises, or whether other, less expensive,
locally identified initiatives might produce better short to medium term livelihood
outcomes, including economic, social, cultural and environmental sustainability. Some
fishers, when expressing dismay at the cost of the central government fibre boat
initiative during FDGs, said that, under supervision from KKP, the money would be
better spent locally, with local input on design and fit out.
2) Research should include structured longitudinal analysis of all government
department policies and interventions designed for alleviating poverty and improving
livelihoods. Susilo & Purwanti (2017) support a development frame, as developed by
the author and presented in Section 9.6, with monitoring and feedback loops to expose
strenghts and weakness of strategies and policies, and to allow for respones to lessons
learned.
3) Researchers and practitioners should be encouraged to revisit, monitor and maintain
long term relationships with the micro-level so as to prevent negative out-group
attitudes and stereotyping to their and subsequent researchers’ detriment. Some of the
participants, during FDGs and interviews, made comments of government people and
researchers coming for brief periods of time, making promises and never returning.
This experience has developed a Negative Stereotype toward researchers and
government officials alike.

300 | P a g e
Appendix I Universitas Nusa Cendana Research Cover Page
HALAMAN PENGESAHAN PENELITIAN PIMPINAN UNIVERSITAS NUSA CENDANA
Kupang, Juni 2017 Mengetahui, Kepala Biro Administrasi Umum dan Keuangan Ketua Peneliti, Ir. Benny J. Pandie Prof. Ir. Fredrik L. Benu, M.Si., Ph.D. NIP. 19600330198003 1 001 NIP. 19651119199003 1 002
Menyetujui,
Ketua Lemlit Undana
Prof. DR. Mintje Ratoe Oedjoeh, M.Pd. NIP. 19510701197803 2 001
Ketua Peneliti (Research Chair)
a. Nama Lengkap : Prof. Ir. Fredrik L. Benu, M.Si., Ph.D.
b. NIDN : 0019116506
c. Jabatan Fungsional : Guru Besar
d. Prodi : Agribisnis
e. Nomor HP : 08123798246
f. Alamat Email : [email protected]
Anggota Peneliti 1 (Team Member 1)
g. Nama Lengkap :Paul G. King
h. NIDN
i. Perguruan Tinggi : Griffith University, Australia
Anggota Peneliti 2 (Team Member 2)
j. Nama Lengkap : DR. Ir. Agus A. Nalle, M.Si.
k. NIDN : 0025086207
l. Perguruan Tinggi : Universitas Nusa Cendana
Anggota Peneliti 3 (Team Member 3)
m. Nama Lengkap : Moni W. Muskanan, SE., MPA.
n. NIDN : 0016018201
o. Perguruan Tinggi : Universitas Nusa Cendana
Lama Penelitian Keseluruhan : 1 tahun
Usulan Penelitian Tahun Ke : 1
Biaya Penelitian Keseluruhan : Rp.100,000,000
Biaya Penelitian Tahun Berjalan : Rp.100,000,000
Diusulkan ke DPRM : 0
Dana Internal PT : Rp.100,000,000
Dana Institusi Lain : 0
Biaya Luaran Tambahan : 0

301 | P a g e
Appendix II Governor of NTT Research Approval Letter

302 | P a g e
Appendix III District of Rote Ndao Research Approval Letter

303 | P a g e
Appendix IV Ethics Clearance Certificate

304 | P a g e

305 | P a g e
Appendix V Rio Declaration 1992
Rio Declaration on Environment and Development
The United Nations Conference on Environment and Development,
Having met at Rio de Janeiro from 3 to 14 June 1992,
Reaffirming the Declaration of the United Nations Conference on the Human
Environment, adopted at Stockholm on 16 June 1972, and seeking to build upon it,
With the goal of establishing a new and equitable global partnership through the
creation of new levels of cooperation among States, key sectors of societies and
people,
Working towards international agreements which respect the interests of all and
protect the integrity of the global environmental and developmental system,
Recognizing the integral and interdependent nature of the Earth, our home,
Proclaims that:
Principle 1
Human beings are at the centre of concerns for sustainable development. They are
entitled to a healthy and productive life in harmony with nature.
Principle 2
States have, in accordance with the Charter of the United Nations and the principles
of international law, the sovereign right to exploit their own resources pursuant to
their own environmental and developmental policies, and the responsibility to ensure
that activities within their jurisdiction or control do not cause damage to the
environment of other States or of areas beyond the limits of national jurisdiction.
Principle 3
The right to development must be fulfilled so as to equitably meet developmental and
environmental needs of present and future generations.
Principle 4
In order to achieve sustainable development, environmental protection shall
constitute an integral part of the development process and cannot be considered in
isolation from it.
Principle 5
All States and all people shall cooperate in the essential task of eradicating poverty
as an indispensable requirement for sustainable development, in order to decrease
the disparities in standards of living and better meet the needs of the majority of the
people of the world.
Principle 6
The special situation and needs of developing countries, particularly the least
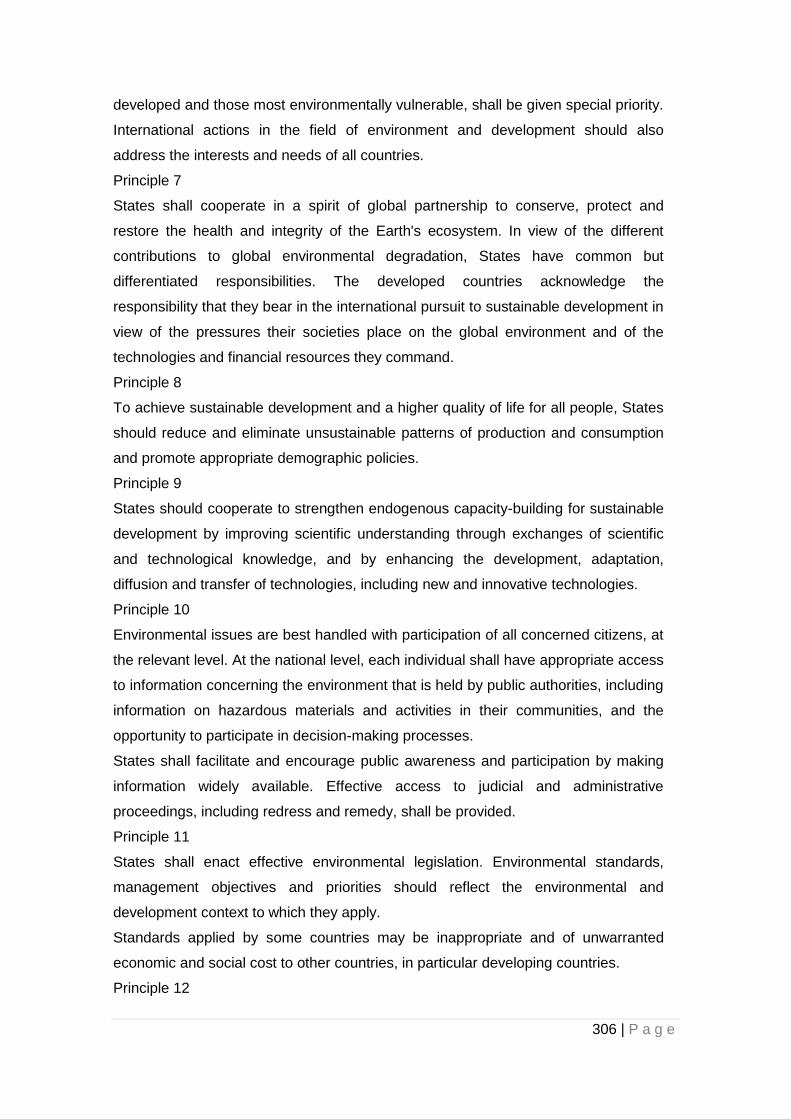
306 | P a g e
developed and those most environmentally vulnerable, shall be given special priority.
International actions in the field of environment and development should also
address the interests and needs of all countries.
Principle 7
States shall cooperate in a spirit of global partnership to conserve, protect and
restore the health and integrity of the Earth's ecosystem. In view of the different
contributions to global environmental degradation, States have common but
differentiated responsibilities. The developed countries acknowledge the
responsibility that they bear in the international pursuit to sustainable development in
view of the pressures their societies place on the global environment and of the
technologies and financial resources they command.
Principle 8
To achieve sustainable development and a higher quality of life for all people, States
should reduce and eliminate unsustainable patterns of production and consumption
and promote appropriate demographic policies.
Principle 9
States should cooperate to strengthen endogenous capacity-building for sustainable
development by improving scientific understanding through exchanges of scientific
and technological knowledge, and by enhancing the development, adaptation,
diffusion and transfer of technologies, including new and innovative technologies.
Principle 10
Environmental issues are best handled with participation of all concerned citizens, at
the relevant level. At the national level, each individual shall have appropriate access
to information concerning the environment that is held by public authorities, including
information on hazardous materials and activities in their communities, and the
opportunity to participate in decision-making processes.
States shall facilitate and encourage public awareness and participation by making
information widely available. Effective access to judicial and administrative
proceedings, including redress and remedy, shall be provided.
Principle 11
States shall enact effective environmental legislation. Environmental standards,
management objectives and priorities should reflect the environmental and
development context to which they apply.
Standards applied by some countries may be inappropriate and of unwarranted
economic and social cost to other countries, in particular developing countries.
Principle 12

307 | P a g e
States should cooperate to promote a supportive and open international economic
system that would lead to economic growth and sustainable development in all
countries, to better address the problems of environmental degradation. Trade policy
measures for environmental purposes should not constitute a means of arbitrary or
unjustifiable discrimination or a disguised restriction on international trade.
Unilateral actions to deal with environmental challenges outside the jurisdiction of the
importing country should be avoided. Environmental measures addressing
transboundary or global environmental problems should, as far as possible, be
based on an international consensus.
Principle 13
States shall develop national law regarding liability and compensation for the victims
of pollution and other environmental damage. States shall also cooperate in an
expeditious and more determined manner to develop further international law
regarding liability and compensation for adverse effects of environmental damage
caused by activities within their jurisdiction or control to areas beyond their
jurisdiction.
Principle 14
States should effectively cooperate to discourage or prevent the relocation and
transfer to other States of any activities and substances that cause severe
environmental degradation or are found to be harmful to human health.
Principle 15
In order to protect the environment, the precautionary approach shall be widely
applied by States according to their capabilities. Where there are threats of serious
or irreversible damage, lack of full scientific certainty shall not be used as a reason
for postponing cost-effective measures to prevent environmental degradation.
Principle 16
National authorities should endeavour to promote the internalization of environmental
costs and the use of economic instruments, taking into account the approach that the
polluter should, in principle, bear the cost of pollution, with due regard to the public
interest and without distorting international trade and investment.
Principle 17
Environmental impact assessment, as a national instrument, shall be undertaken for
proposed activities that are likely to have a significant adverse impact on the
environment and are subject to a decision of a competent national authority.
Principle 18
States shall immediately notify other States of any natural disasters or other

308 | P a g e
emergencies that are likely to produce sudden harmful effects on the environment of
those States. Every effort shall be made by the international community to help
States so afflicted.
Principle 19
States shall provide prior and timely notification and relevant information to
potentially affected States on activities that may have a significant adverse
transboundary environmental effect and shall consult with those States at an early
stage and in good faith.
Principle 20
Women have a vital role in environmental management and development. Their full
participation is therefore essential to achieve sustainable development.
Principle 21
The creativity, ideals and courage of the youth of the world should be mobilized to
forge a global partnership in order to achieve sustainable development and ensure a
better future for all.
Principle 22
Indigenous people and their communities and other local communities have a vital
role in environmental management and development because of their knowledge
and traditional practices. States should recognize and duly support their identity,
culture and interests and enable their effective participation in the achievement of
sustainable development.
Principle 23
The environment and natural resources of people under oppression, domination and
occupation shall be protected.
Principle 24
Warfare is inherently destructive of sustainable development. States shall therefore
respect international law providing protection for the environment in times of armed
conflict and cooperate in its further development, as necessary.
Principle 25
Peace, development and environmental protection are interdependent and
indivisible.
Principle 26
States shall resolve all their environmental disputes peacefully and by appropriate
means in accordance with the Charter of the United Nations.
Principle 27
States and people shall cooperate in good faith and in a spirit of partnership in the

309 | P a g e
fulfilment of the principles embodied in this Declaration and in the further
development of international law in the field of sustainable development.
Source: Report of the United Nations Conference on the Human Environment,
Stockholm, 5-16 June 1972
(United Nations publication, Sales No. E.73.II.A.14 and corrigendum), chap. I.
© United Nations Environment Programme

310 | P a g e
Appendix VI List of Laws and Agreements negotiated between the Australian
and Indonesian Governments during the period 1958-2008.
International Laws
The 1958 Geneva Conventions on the Continental Shelf
The 1982 United Nation Convention on the Law of the Sea UNCLOS III.
Australia – Indonesia Agreements (See Treaties list in References)
The 1969/70 12 Nm EEZ Declaration by Australia and Indonesia
The 1971 Australia and Indonesia Seabed Boundary Agreements
The 1972 Australia and Indonesia Seabed Boundary Agreements
The 1973 Australia (Papua New Guinea) – Indonesia
The 1974 memorandum of Understanding between Australia and Indonesia
The 1979/80 200Nm EEZ Declaration by Australia and Indonesia
1981 Agreement on the Provisional fishing and Surveillance Line
1983 Declaration on 28 July of the Ashmore Reef as a National Nature Reserve
1986-89 Meeting and agreed Minutes between Officials of Indonesia and Australia on
Fisheries 1974 MOU.
1989 Establishment of a Zone of Cooperation in the Timor Sea, 11 December 1989.
1997 Treaty Between the Government of Australia and the Government of Indonesia
Establishing an Exclusive Economic Zone Boundary and Certain Seabed Boundaries
signed on 14 March 1997, not in force.
(Balint, 2005; Campbell, 1993; Forbes, 1995, 2007; Fox, 2009; Rauf, 1995)

311 | P a g e
Appendix VII Memorandum of Understanding Between the Government of
Australia and the Government of the Republic of Indonesia Regarding the
Operations of Indonesian Traditional Fisheries in Areas of the Australian
Exclusive Fishing Zone and Continental Shelf
Following discussions held in Jakarta on 6 to 7 November 1974, the
representatives of the Government of Australia and of the Republic of Indonesia
have agreed to record the following understandings.
1. These understandings shall apply to operations by Indonesian traditional
fishermen in the exclusive fishing zone and over the continental shelf adjacent to
the Australian mainland and offshore islands.
By “traditional fishermen” is meant the fishermen who have traditionally taken
fish and sedentary organisms in Australian waters by methods which have been the
tradition over decades of time.
By “exclusive fishing zone” is meant the zone of waters extending twelve miles
seaward off the baseline from which the territorial sea of Australia is measured.
2. The Government of the Republic of Indonesia understands that in relation to
fishing in the exclusive Australian fishing zone and the exploration for and
exploitation of the living natural resources of the Australian continental shelf, in
each case adjacent to :
Ashmore Reef (Pulau Pasir) (Latitude 12° 15’ South Longitude 123° 03, East)
Cartier Islet (Latitude 12° 32’ South, Longitude 123° 33’ East) Scoot Reef (Latitude
14° 03’ South, Longitude 121° 47” East) Seringapatam Reef (Pulau Batu) (Latitude
11° 37’ South, Longitude 122° 03’ East) Browse Islet (Latitude 14° 06’ South,
Longitude 123° 32’ East).
The Government of Australia will, subject to paragraph 8 of these understandings,
refrain from applying its laws regarding fisheries to Indonesian traditional fishermen
who conduct their operations in accordance with these understandings.
3. The Government of the Republic of Indonesia understands, that, in the parts of

312 | P a g e
the areas described in paragraph 2 of the understandings where the Government of
Australia is authorized by international law to regulate fishing or exploitation for or
exploitation of the living natural resource of the Australian continental shelf by
foreign nationals, the Government of Australia will permit operations by Indonesian
nationals subject to the following conditions:
a. Indonesian operation in the areas mentioned in paragraph 2 of the understandings
shall be confined to traditional fishermen.
b. Landings by Indonesian traditional fishermen shall be confined to East Islet
(Latitude 12°15’ South, Longitude123° 07’ East) and Middle Islet (Latitude 12°15’
South, Longitude 123° 03, East) of Ashmore Reef for the purpose of obtaining
supplies of fresh water.
c. Traditional Indonesian fishing vessels any take shelter within the island groups
described in paragraph 2 of these understanding but the persons on board shall not
to ashore except as allowed in (b) above.
4. The Government of the Republic of Indonesia understands that Indonesian
fishermen will not be permitted to take turtles in the Australian exclusive fishing
zone. Trochus, beche de mer, abalone, green snail, sponges and all molluscs will
not be taken from the seabed from high water marks to the edge of the continental
shelf, except the seabed adjacent to Ashmore and Cartier Islands, Browse Islet and
the Scott and Seringapatam Reefs.
5. The Government of the Republic of Indonesia understands that the persons on
board Indonesian fishing vessels engaging in fishing in the exclusive Australian
fishing zone or exploring for or exploiting the living natural resources of the
Australian continental shelf, in either case in areas other than those specified in
paragraph 2 of these understandings, shall be subject to the provisions of
Australian law.
6. The Government of Australia understands that the Government of the Republic of
Indonesia will use its best endeavours to notify all Indonesian fishermen likely to
operate in areas adjacent to Australia of the contents of these understandings
7. Both Governments will facilitate the exchange of information concerning the
activities of the traditional Indonesian fishing boats operating in the area west of

313 | P a g e
the Timor Sea.
8. The Government of the Republic of Indonesia understands that the Government
of Australia will, until the twenty-eight day of February 1975, refrain, from applying
its laws relating to fisheries to Indonesian traditional fishermen in areas of the
Australian exclusive fishing zone and continental shelf other than these specified in
paragraph 2 of these understandings.
Signed:
A.G. Bollen,
First Assistant Secretary
Fisheries Division,
Australian Department of Agriculture
And
Agus Yaman,
Director of Consular affairs
Department of Foreign Affairs of Indonesia
Jakarta, November 7, 1974

314 | P a g e
Appendix VIII Agreed Minutes of Meeting Between Officials of Indonesia and
Australia on Fisheries
1. In accordance with the agreement reached by Mr. Ali Alatas, the Foreign
Minister of Indonesia and Senator Gareth Evans, the Foreign Minister of Australia in
Canberra on 2 March 1989. Officials from Indonesia and Australia met in Jakarta on
28 and 29 April 1989 to discuss activities of Indonesian fishing vessels under the
Memorandum of Understanding between the Government of the Republic of
Indonesia and the Government of Australia regarding the operation of Indonesia
traditional fisherman in an area of the Australian Fishing Zone and Continental
Shelf, concluded in Jakarta on 7 November 1974. They also discussed activities of
Indonesian fishing vessels in the Australian Fishing Zone off the coast of North West
Australia and in the Arafura Sea, and fishing in the waters Christmas Island and
Java.
Memorandum of Understanding of 1974
2. Official reviewed the operation of the MOU. Both sides stressed their desire
to address the issues in a spirit of cooperation and good neighbourliness. They
noted that there had been a number of developments since 1974 which had
affected the MOU. In 1974 Australia and Indonesia exercised jurisdiction over
fisheries on 12 nautical miles from their respective territorial sea baselines. In 1979
and 1980, Australia and Indonesia respectively extended their fisheries jurisdiction
to 200 nautical miles from their respective territorial sea baselines, and in 1981 a
provisional fishing line was agreed. Since the areas referred to in the MOU are
south of this line, new arrangement are necessary for the access by Indonesian
traditional fishermen to these areas under the MOU.
3. The Australian side informed the Indonesian side that there were also
changes in the status of Ashmore Reef and Cartier Islet as a separate territory of
the Commonwealth of Australia and the establishment of the Ashmore Reef
National Nature Reserve. The Australian side further informed that there had been
a considerable increase in the number of Indonesian fishermen visiting the
Australian Fishing Zone and a depletion of fishery stocks around the Ashmore Reef;
that wells on Middle Islet and East Islet where Indonesian traditional fishermen

315 | P a g e
were permitted under the MOU to land for taking fresh water had been
contaminated; that Australia had also incurred international obligation to protect
wildlife, including that in the territory of Ashmore and Cartier Islands. The
Indonesian side took note of this information.
4. Since the conclusion of the MOU, both Indonesia and Australia had become
parties to the Convention on International Trade in Endangered Species of Wild
Fauna and Flora (CITES).
5. The Indonesian and Australian Officials discussed the implications of the
developments mentioned in the preceding paragraphs. They affirmed the continued
operation of the MOU for Indonesian traditional fishermen operating by traditional
methods and using traditional fishing vessels. An Australian proposal that
Indonesian traditional fishermen could conduct fishing not only in the areas
adjacent to Ashmore Reef, Cartier Islet, Scott Reef, Seringapatam Reef and Browse
Islet as designated in the MOU, but in a wider “box” area in the Australian Fishing
Zone and Continental Shelf was welcomed by the Indonesian side. A sketch map
and coordinates of this “box” area appears in Annex I of this Agreed Minutes.
6. In view of the development that had occurred since 1974 as highlighted
above, officials considered that to improve the implementation of the MOU,
practical guidelines for implementing the MOU as appears in the Annex of these
Agreed Minutes were considered necessary.
7. The Indonesian side informed the Australian side on measures that had
been and were being taken by the Indonesian authorities to prevent breaches of
the MOU. The Indonesian side also indicated its willingness to assist in preventing
breaches of the MOU and to take necessary steps to inform Indonesian fishermen of
the practical guidelines annexed to this Agreed Minutes.
8. The Indonesian and Australian Officials agreed to make arrangement for
cooperation in developing alternative income projects in Eastern Indonesia for
traditional fishermen traditionally engaged in fishing under the MOU. The
Indonesian side indicated they might include mariculture and nucleus fishing
enterprise scheme (Perikanan Inti Rakyat or P.I.R). Both sides mutually decided to
discuses the possibility of channelling Australian aid funds to such projects with
appropriate authorities in their respective countries.

316 | P a g e
North West Coast of Australia
9. The Indonesian and Australian Officials discussed matters related to the
activities of Indonesian fishing vessels in the Australian Fishing Zone off the coast
of North West Australia. They noted that those activities were outside the scope of
the MOU and that Australian would take appropriate enforcement action. The
Australian side indicated the legal and economic implications of such activities.
10. The Indonesian and Australian officials felt the need for a long-term
solution to the problem. To this end, they agreed to make arrangements for
cooperation in projects to provide income alternatives in Eastern Indonesia for
Indonesian fishermen engaged in fishing off the coast of North West Australia. The
Indonesian side indicated that they might include mariculture and nucleus fishing
enterprise scheme (Perikanan Inti Rakyat or P.I.R). Both side decided mutually to
discuses the possibility of channelling Australian aid funds to such projects with
appropriate authorities in their respective countries.
Arafura Sea
11. Indonesian and Australian officials discussed the activities of Indonesian
non-traditional fishing vessels in the Arafura Sea on the Australian side of the
provisional fishing line 0f 1981. Officials agreed that both Governments should take
effective measures, including enforcement measures, to prevent Indonesian non-
traditional fishing vessels from fishing on the Australian side of the provisional
fishing line without the authorization of the Australian authorities.
12. Officials agreed to make arrangements for cooperation in exchange of
information on shared stocks in the Arafura Sea for the purpose of effective
management and conservation of the stocks.
Fishing in waters between Christmas Island and Jaya and other waters
13. The Officials of Indonesia and Australia noted that fisheries delimitation in
waters between Christmas Island and Java and in the west of the provisional fishing
line remained to be negotiated and agreed. Pending such an agreement, the
Officials noted that both Governments would endeavour to avoid incidents in the
area overlapping jurisdictional claims.

317 | P a g e
Wildlife Cooperation
14. The Indonesian and Australian Officials considered the mutual advantages
of the exchange of information on wildlife species populations believed to be
common to both countries. It was agreed that each country’s nature conservation
authorities would exchange information on such wildlife populations and
management programs and cooperation in the management of wildlife protected
areas. In the first instance Indonesian authorities would be consulted on the
management plan for the Ashmore Reef National Nature Reserve.
Consultations
15. The Indonesian and Australian Officials agreed to hold consultations as and
when necessary to ensure the effective implementation of the MOU and Agreed
Minutes.
Jakarta, 29 April 1989
Nugroho Wisnumurti Alan Brown
Head of the Indonesian Head of the Australian
Delegation Delegation
CO-ORDINATES OF MOU AREA ( “THE BOX” )
The area bounded by the line:
a) Commencing at the point of Latitude 12° 11’ 50” South, Longitude 123° 48’ 00”
East;
b) running thence south-westerly along the geodesic to the point of Latitude 12° 19’
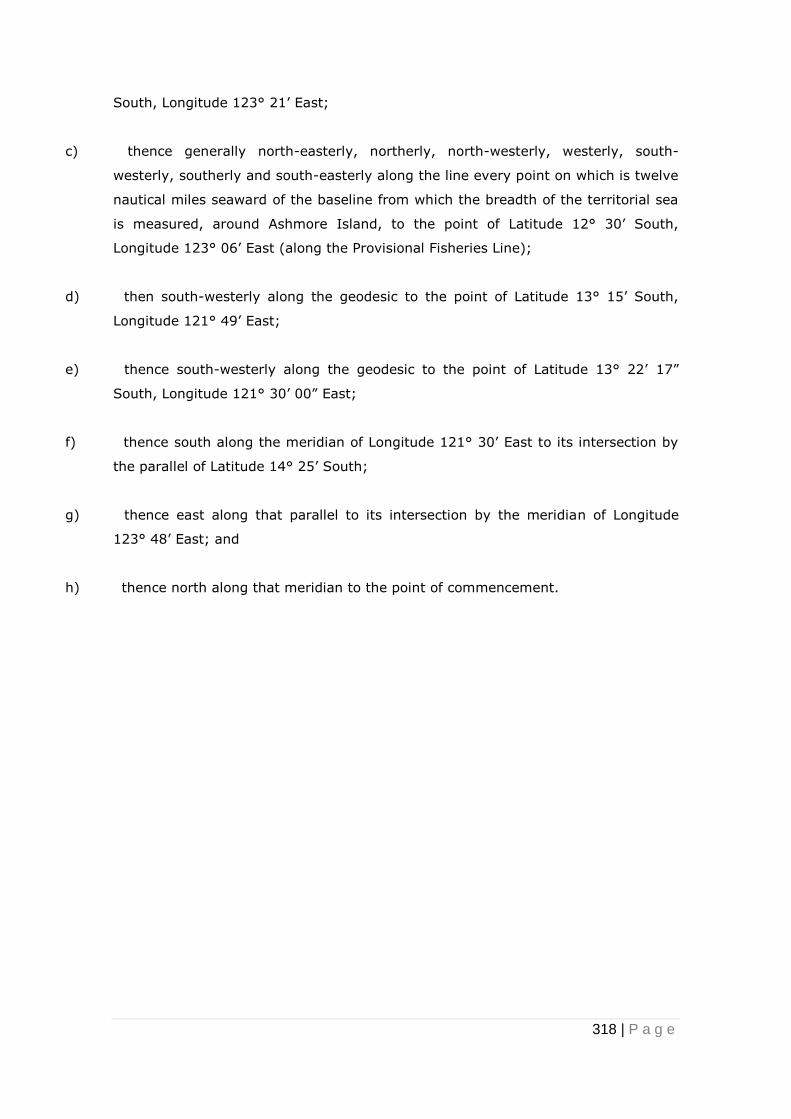
318 | P a g e
South, Longitude 123° 21’ East;
c) thence generally north-easterly, northerly, north-westerly, westerly, south-
westerly, southerly and south-easterly along the line every point on which is twelve
nautical miles seaward of the baseline from which the breadth of the territorial sea
is measured, around Ashmore Island, to the point of Latitude 12° 30’ South,
Longitude 123° 06’ East (along the Provisional Fisheries Line);
d) then south-westerly along the geodesic to the point of Latitude 13° 15’ South,
Longitude 121° 49’ East;
e) thence south-westerly along the geodesic to the point of Latitude 13° 22’ 17”
South, Longitude 121° 30’ 00” East;
f) thence south along the meridian of Longitude 121° 30’ East to its intersection by
the parallel of Latitude 14° 25’ South;
g) thence east along that parallel to its intersection by the meridian of Longitude
123° 48’ East; and
h) thence north along that meridian to the point of commencement.

319 | P a g e
PRATICAL GUIDELINES
FOR
IMPLEMENTING THE 1974 MOU
1. Access to the MOU area would continue to be limited to Indonesian traditional
fishermen using traditional methods and traditional vessels consistent with the
tradition over decades of time; which does not include fishing methods or vessels
utilizing motors or engines.
2. The Indonesian traditional fishermen would continue to conduct traditional
activities under the MOU in the area of the Australian Fishing zone and the
continental shelf adjacent to Ashmore Reef, Cartier Islet, Scott Reef, Seringapatam
Reef and Browse Islet. In addition Indonesian traditional fishermen would be able
to conduct traditional fishing activities in an expanded area as described in the
sketch map and coordinates attached to Annex I of the Agreed Minutes.
3. To cope with the depletion of certain stocks of fish and sedentary species in the
Ashmore Reef area, the Australian Government had prohibited all fishing activities
in the Ashmore Reef National Nature Reserve, but was expected soon to adopt a
management plan for the Reserve which might allow some subsistence fishing by
the Indonesian traditional fishermen. The Australian side indicated that Indonesia
would be consulted on the draft plan. Because of the low level of stock, the taking
of sedentary species particularly Trochus niloticus in the Reserve would be
prohibited at this stage to allow stocks to recover. The possibility of renewed
Indonesian traditional fishing of the species would be considered in future reviews
of the management plan.
4. As both Australia and Indonesia are parties to CITES, Officials agreed that any
taking of protected wild life including turtles and clams, would continue to be
prohibited in accordance with CITES.
5. Indonesian traditional fishermen would be permitted to land on West Islet for the
purpose of obtaining supplies of fresh water. The Indonesian side indicated its
willingness to discourage Indonesian traditional fishermen from landings on East
and Middle Islet because of the lack of fresh water on the two islets.

320 | P a g e
Appendix IX Map of Maritime Boundary Coordinates in Timor Sea
Map of Maritime Boundary Coordinates in Timor Sea

321 | P a g e
Appendix X Informant and Respondent Consent Form

322 | P a g e
Appendix XI Household Survey Questionnaire
Consent Form Peneliti Prof. Ir. Fredrik L. Benu, M.Si., Ph.D , Ketua Peneliti [email protected] Paul King, Anggota Peneliti p.king @ griffith.edu.au Agus Nalle, Anggota Peneliti [email protected] Moni W. Muskanan, Anggota Peneliti [email protected] Alamat institusi peneliti: Universitas Nusa Cendana Jalan Adisucipto, Penfui- Kupang, Nusa Tenggara Timur - Indonesia Dengan menandatangani di bawah ini , saya menyatakan bahwa saya telah membaca dan memahami paket informasi dan khususnya telah mencatat bahwa : • Saya mengerti bahwa keterlibatan saya dalam penelitian ini akan mencakup satu atau lebih hal berikut : Wawancara Formal , Informal Interview , Focus Group Discussions . • Saya memiliki pertanyaan dijawab untuk kepuasan saya ; • Saya memahami risiko yang terlibat ; • Saya mengerti bahwa tidak akan ada manfaat langsung kepada saya dari keikutsertaan saya dalam penelitian ini ( ini mungkin perlu diubah untuk beberapa proyek ) ; • Saya mengerti bahwa partisipasi saya dalam penelitian ini adalah sukarela ; • Saya memahami bahwa jika saya memiliki pertanyaan tambahan saya dapat menghubungi tim peneliti ; • Saya memahami bahwa saya bebas untuk menarik setiap saat , tanpa penjelasan atau hukuman ; • Saya memahami bahwa saya dapat menghubungi Manager, Etika Penelitian , di Griffith University Research Manusia Komite Etika di +61 7 3735 4375 ( atau [email protected] ) jika saya memiliki keprihatinan apapun tentang perilaku etis proyek , dan Saya setuju untuk berpartisipasi dalam proyek tersebut . Saya setuju dengan masuknya informasi pribadi saya dalam publikasi atau pelaporan hasil dari penelitian ini dalam proyek .
Nama: Tanda tangan: Tanggal:

323 | P a g e
Data Diri Responden Nama : Jenis Kelamin : Umur :
Dibawah 18
18 tahun-50 tahun
Diatas 50 tahun
Tingkat Pendidikan: Suku Asli :
Rote
Sabu
Sulawesi (Bajo, Makasar, dan Bugis )
Lamaholot (Alor, Flotim, Lembata dan Adonara)
Lain-Lain :..............
Agama :
Protestan Katolik Islam Lain-Lain :..............
Laki-Laki
Perempuan
Dibawah SMP
SMP s/d SMA
Diatas SMA

324 | P a g e
Makanan dan Nutrisi 1 Apa makanan pokok anda sehari-hari?
a. Nasi b. Jagung c. Ubi d. Lain-Lain
(Sebutkan)....
2. Apa menu tambahan anda sehari-hari
a. Sayur b. Ikan c. Daging d. Telur e. Buah f. Lain-lain :..................
3 Seberapa sering anda mengkonsumsi menu tambahan tersebut
Jenis Makan Tambahan Setiap
hari
1- 2 kali dalam
seminggu
1 - 2 kali dalam
sebulan
kurang dari 2 kali
dalam sebulan
a. Sayur b. Ikan c. Daging d. Telur f. Lain-lain :..................
4 Berapa kali anda makan dalam sehari?
a. < 2 kali b. 2 kali b. 2-3 kali c. Lebih dari tiga kali
Catatan:

325 | P a g e
Rumah/Tempat Tinggal
1 Apakah anda memiliki rumah pribadi?
a. Ya
b. Tidak, (Sebutkan alasannya)............
2 Apakah rumah pribadi anda dibangun dengan bahan-bahan sbb:
a. Apakah jenis atap rumah yang terluas terbuat dari:
i. Daun/Rumbia
ii. Seng/Asbes
iii. Genteng/Sirap
Iv. Lainnya (sebutkan).......
b. Apakah dinding rumah anda yang terluas terbuat dari:
i. Ubin.Keramik/Marmer
ii. Semen/Papan
iii. Tanah
iv. Lainnya (sebutkan)....
3 Berapa luas rumah/bangunan keseluruhan (m2)?
4 Berapa orang yang tinggal dan menetap di rumah anda?
5 Berapa jumlah rumah tangga yang tinggal dan menetap di rumah anda?
6 Apakah sumber penerangan utama?
a. Listrik
b. Genset/Diesel
c. Lampu minyak
d. Lainnya (sebutkan)............
Catatan:

326 | P a g e
7 Apakah air minum anda bersumber dari:
a. Ledeng/Kemasan
b. Sumur terlindung/pompa
c. Air hujan/air sungai
d. Lainnya (sebutkan)............
8 Apakah bahan bakar utama untuk memasak menggunakan:
a. Listrik/Gas
b. Minyak Tanah
c. Arang/Kayu api
d. Lainnya (sebutkan)............
9 Apa saja perabotan rumah tangga anda?
a. Meja
b. Kursi
c. Tempat Tidur
d. Lemari makan
e. Lemari pakaian
f. Peralatan masak, makan dan minum
g. Lain-lain:..............
10 Apakah jumlah perabotan rumah tangga anda memadai?
a. Ya
b. Tidak (sebutkan perabotan yanng tidak memadai)
Pendidikan
1 Apakah anda bersekolah?
a. Ya
b. Tidak, (Jelaskan alasannya)
2 Apakah anda dapat membaca dan menulis?
a. Ya
b. Tidak
3 Apakah anda memiliki pendidikan informal?
a. Ya, sebutkan..............
b. Tidak, sebutkan alasannya............
Catatan:

327 | P a g e
4 Berapa jumlah anak anda yang bersekolah?
(Lanjutkan dengan mengisi tabel berikut)
Anak Ke
Tingkatan Sekolah
Jarak Sekolah Dengan Rumah (dalam Km)
Alat Transportasi ke Sekolah
1
2
3
4
5
6
7
5 Berapa jumlah anak anda yang tidak bersekolah?
(Lanjutkan dengan mengisi tabel berikut)
Anak Ke
Umur Alasan Tidak Bersekolah
Kemampuan Membaca dan
Menulis (Pilih Ya atau Tidak)
1
2
3
4
5
6
7
Catatan:

328 | P a g e
6
Berapa biaya sekolah masing-masing anak ? (mohon mengisi kolom berikut ini)
Anak Ke
Uang SPP
Biaya Kebutuhan
Sekolah (Buku, alat
tulis, transportasi,
dll)
Total Biaya Sekolah (Dalam Rupiah/bulan)
Sumber Pembiayaan
Ket
1
2
3
4
5
6
7
8
9
10
7 Apakah anak-anak anda memiliki pendidikan informal?
a. Ya, sebutkan..............
b. Tidak, sebutkan alasannya............
8 Berapa nilai rata-rata anak-anak anda di sekolah dan apa cita-citanya?
Anak Ke
Dibawah 60
Antara 60-80 Di atas 80 Cita-Cita
1
2
3
4
5
6
7
Catatan:

329 | P a g e
Status Sosial
1 Seberapa sering anda saling berkomunikasi dalam keluarga?
a. Jarang
b. Sering
c. Selalu
2 Apa topik yang sering dibicarakan dalam komunikasi keluarga anda?
a. Ekonomi
b. Pendidikan
c. Sosial
d. Masalah keluarga
e. Lain-lain
3 Apakah anda terlibat dalam organisasi kemasyarakatan?
a. Ya, sebutkan
b. Tidak, sebutkan alasannya
4 Bagaimana keterlibatan anda dalam organisasi kemasyarakatan?
a. Aktif
b. Pasif
5 Apakah anda sering terlibat dalam acara kekeluargaan?
a. Ya
b. Tidak, sebutkan alasannya
6 Apakah anda mendominasi dalam keputusan-keputusan keluarga besar anda?
a.Ya, sebutkan contoh keputusan apa?
b. Tidak, sebutkan alasannya
Catatan:

330 | P a g e
7 Apakah anda secara sukarela memberikan sumbangan materiil untuk kegiatan-kegiatan sosial?
a. Ya
b. Tidak, sebutkan alasannya
8 Seberapa sering anda terlibat dalam penyelesaian masalah-masalah sosial ekonomi dalam masyarakat?
a. Tidak pernah
b. Kadang-kadang
c. Sering
d. Sangat sering
9 Bagaimana anda memperoleh informasi terkini tentang aktivitas ekonomi?
a. Keluarga
b.Teman
c. Program pemerintah
d. LSM
e. Lain-lain
10 Bagaimana anda memperoleh informasi tentang berita-berita terkini?
a. Surat kabar/ Majalah
b. Radio
c. Televisi
d. Media Sosial
e. Internet
f. Lain-lain………
Catatan:

331 | P a g e
11 Siapakah yang lebih dominan dalam mengurus hal-hal berikut ini:
(Centanglah pada pilihan ayah atau ibu)
No Aktivitas Ayah Ibu
1 Mencari nafkah (penghasilan utama)
2 Pendidikan anak
3 Pekerjaan rumah tangga
4 Mengurus kebun, sawah, ladang
5 Budidaya rumput laut
6 Mencari ikan
7 Mengurus penghasilan penghasilan tambahan (kios, jualan sayur ojek)
12 Siapa yang bertanggungjawab dalam pengambilan keputusan tentang penggunaan keuangan rumah tangga?
a. Ayah
b. Ibu
c. Ayah dan Ibu
Pelayanan Kesehatan
1 Seberapa sering anda sakit?
a. Jarang
b. Sering
c. Selalu
2 Apa penyakit yang sering diderita?
a. Penyakit ringan (batuk, pilek, dll.)
b. Penyakit sedang (batuk berkepanjangan, diare, dll)
c. Penyakit beresiko tinggi (kanker, tumor, dll)
3 Jika anda sakit, bagaimanakah cara pengobatannya?
a. Tidak berobat
b.. Berobat sendiri (menggunakan cara dan obat tradisional)
c. Pergi ke puskemas/pustu
d. Pergi ke praktek dokter
e. Pergi ke rumah sakit
Catatan:

332 | P a g e
4 Apakah anda dan keluarga adalah peserta dari kartu peserta kesehatan berikut ini:
a. KIS
b. BPJS/JKN
5 Jika anda adalah peserta BPJS/JKN, di kelas berapa iuran per bulan anda?
a. Kelas 1 (Rp.80,000/orang)
b. Kelas 2 (Rp.51,000/orang)
c. Kelas 3 (Rp.25,500/orang0
6 Jika anda berobat menggunakan jasa medis (pustu/puskesmas/RS/dr.keluarga), bagaimana cara anda membayarnya?
a. Tidak membayar (sudah terccover pada kartu BPJS/JKN/KIS)
b. Biaya sendiri (Pasien Umum)
7 Jika dengan biaya sendiri/pasien umum apakah anda dapat membayarnya?
a. Ya
b. Tidak, (sebutkan alasannya)
Ekonomi
1 Apa pekerjaan anda sekarang?
a. Nelayan
b. Petani
c. Peternak
c. Pekerja rumput laut
d. Pedagang
e. Lain-lain:..............
Catatan:

333 | P a g e
2 Berapa penghasilan dan pengeluaran anda dalam sebulan?
No Keterangan Jumlah (Dalam Rupiah) %
1 Rata-rata pendapatan
Pendapatan utama
Pendapatan tambahan
Lain-lain:
Jumlah pendapatan
2 Rata-rata pengeluaran:
Makanan
Pakaian
Perumahan
Kesehatan
Cicilan Hutang
Pendidikan anak
Biaya sosial
Pembelian BBM/Solar
Other:
Jumlah Pengeluaran
3 Sisa Pendapatan
3 Jika sisa pendapatan negatif, bagaimana anda menutupinya?
a. Berhutang
Berhutang kepada:
i. Bos
ii. Bank
iii. Lain-lain:…
b. Meminta bantuan saudara/keluarga dekat
c. Memilih untuk tidak memenuhi kebutuhan tersebut
Catatan:

334 | P a g e
4 Apakah anda memiliki rekening bank?
a. Ya
b. Tidak (sebutkan alasannya)..............
5 Untuk apakah rekening bank itu digunakan?
a. Menabung (sisa pendapatan)
b. Hutang
c. Lain-lain........
6 Seberapa sering anda menabung:
a. Setiap bulan
b. Sekali dalam 3 bulan
c. Saat memiliki penghasilan luar biasa (penjualan aset, dll)
7 Apa aset produktif yang anda miliki yang dapat menghasilkan uang?
a. Tanah
b. Mobil
c. Motor
d. Perahu
e. Binatang (sapi, kerbau, ayam, dll)
f. Komputer
g. Rumah untuk dikontrakan/disewakan
h. Lain-lain.................
8 Apa aset non produktif yang anda miliki?
a. Tanah
b. Rumah
c. Motor
d. Mobil
e. Televisi
f. Lain-lain......
9 Apakah ada bantuan ekonomi yang pernah anda nikmati?
Catatan:

335 | P a g e
a. Ya, (Sebutkan)...........
b. Tidak
10 Darimanakah sumber bantuan tersebut?
a. Pemerintah
b. LSM
c. Perusahaan swasta
d. Perusahaan BUMN/BUMD
e. Lain-lain:..............
11 Seberapa sering bantuan tersebut diberikan?
a. Bulanan
b. Tahunan
c. Pada peristiwa tertentu
12 Kapan anda menerima bantuan tersebut?
13 Apakah anda masih menerima bantuan tersebut hingga sekarang?
a. Ya,
b. Tidak, (Kapan terkahir kali anda menerima bantuan tersebut?)
14 Berbentuk apakah jenis bantuan tersebut:
a. Barang
b. Jasa
c. Uang
d. Lain-Lain......
Catatan:

336 | P a g e
Appendix XII BKKBN Indicators
Data Pembangunan Keluarga
1) Keluarga membeli satu stel pakaian baru untuk seluruh anggota keluarga minimal
setahun sekali;
2) Seluruh anggota keluarga makan minimal 2 kali sehari;
3) Seluruh anggota keluarga bila sakit berobat ke fasilitas kesehatan;
4) Seluruh anggota keluarga memiliki pakaian yang berbeda untuk di rumah,
bekerja/sekolah dan bepergian;
5) Seluruh anggota keluarga makan daging/ikan/telur minimal seminggu sekali;
6) Seluruh anggota keluarga menjalankan ibadah agama sesuai ketentuan agama
yang dianut;
7) Pasangan usia subur dengan dua anak atau lebih menjadi peserta KB;
8) Keluarga memiliki tabungan dalam bentuk uang/emas/tanah/hewan minimal senilai
Rp 1.000.000,-;
9) Keluarga memiliki kebiasaan berkomunikasi dengan seluruh anggota keluarga;
10) Keluarga ikut dalam kegiatan sosial di lingkungan RT;
11) Keluarga memiliki akses informasi dari surat kabar/majalah/radio/tv/lainnya;
12) Keluarga memiliki anggota yang menjadi pengurus kegiatan sosial;
13) Keluarga mempunyai balita ikut kegiatan Posyandu;
14) Keluarga mempunyai balita ikut kegiatan BKB;
15) Keluarga mempunyai remaja ikut kegiatan BKR;
16) Ada anggota keluarga masih remaja ikut PIK-R/M;
17) Keluarga lansia atau mempunyai lansia ikut kegiatan BKL;
18) Keluarga mengikuti kegiatan UPPKS;
19) Jenis atap rumah terluas;
20) Jenis dinding rumah terluas;
21) Jenis lantai rumah terluas;
22) Sumber penerangan utama;
23) Sumber air minum;
24) Bahan bakar utama untuk memasak;
25) Fasilitas tempat buang air besar;
26) Status kepemilikan rumah/bangunan tempat tinggal;
27) Luas rumah/bangunan keseluruhan (m2);
28) Jumlah orang yang tinggal dan menetap dirumah/bangunan.

337 | P a g e
Appendix XIII FDG Attendance Sheet Papela Men- Women

338 | P a g e

339 | P a g e
Appendix XIV FDG Attendance Sheet Landu Men- Women-Youth
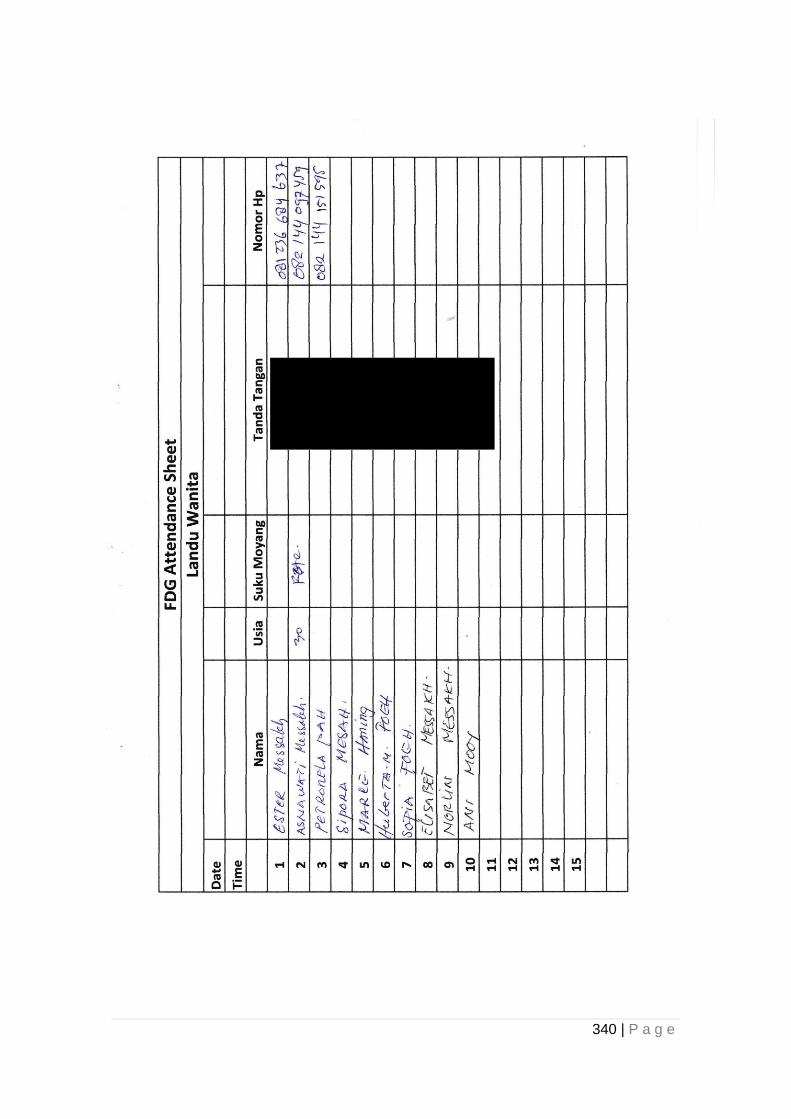
340 | P a g e

341 | P a g e

342 | P a g e
Appendix XV Economic Cost Analysis of Salt Farming
Analysis of Competitiveness
Assessment of competitiveness of a commodity can be traced by the indicators
of Private Cost Ratio (PCR) and Domestic Resource Cost Ratio (DRCR). PCR is the
indicator of the competitive advantage that shows the ability of a system to pay the cost
of domestic resources and still be competitive at the private cost. DRCR is the indicator
of comparative advantage that shows the amount of domestic resources that can be
saved to produce a unit of foreign exchange (Pearson et al, 2005).
PCR is measured by comparing the cost of domestic factors to the added value
of output on the private cost. PCR is used to measure how much domestic resource
cost is to be sacrificed to gain the added value of one foreign exchange unit, only if a
commodity is produced domestically. At the same time it is a measurement unit of
competitiveness in an actual economy. If the PCR value is less than one, then the
commodity cultivated has a competitive advantage.
DRCR is a comparison between cost of domestic factor and added value of
output at social cost, and it is an indicator of comparative advantage. An economic
activity which has DRCR < 1 indicates that the business is economically efficient in
making use of domestic resources, or it has comparative advantage. The fulfilment of
domestic demand is more advantageous in the increase of domestic production. DRCR
> 1 indicates that economic activity undertaken suffers losses. In other words it is
unfeasible to cultivate. Accordingly, the undertaken activity is economically inefficient in
making use of domestic resources. The fulfilment of domestic demand, in addition, is
more advantageous through import. The value of DRCR = 1 indicates that the
undertaken economic activity provides normal profit. The normal profit is caused by the
fact that the cost of domestic resources used is relatively the same as the revenue
earned after deducting the tradable input costs used in the production process.
Monke and Pearson (1989) said that there were two approaches used to
allocate costs in domestic and foreign components, i.e. direct approach, and total
approach. Direct approach has assumed that all tradable input costs of import and
domestic production is valued as foreign cost components and it is used when
additional demand of tradable input can be fulfilled in international trade. Non-tradable
input of domestic market is determined as a domestic component, and foreign input
used in the process of non-tradable goods. This is still counted as a component of
foreign cost. Total approach has assumed that each tradable input cost is classified
into foreign and domestic cost components. The adding of tradable input can be
fulfilled from domestic production only if it is possible to be manufactured domestically.

343 | P a g e
Based upon the assumption and understanding, the total approach in allocating cost
into foreign and domestic components has been used in this research.
Analysis of Private Cost Ratio (PCR)
PCR analysis, which is principally in the calculation of input and output value
used, is the market price or the actual price that applies at the location of the review.
The salt farming undertaken today in Papela Village, Sub-district of East Rote, is a
community business that has not provided work for many people. This is allegedly
related to the lack of capital on the one hand. On the other hand, the availability of
potential land sufficiently large enough to be utilized for the development of salt pond
areas. To answer the question as to whether or not the business of salt ponds engaged
in by a small part of the Papela community has competitiveness, Private Cost Ratio
(PCR) index and Domestic Resource Cost Ratio (DRCR) are calculated.
Based on the actual conditions of the business of the community’s salt water
pond, several input components are used. It is assumed that the inputs can be
classified into domestic components (generally manufactured domestically), and
foreign components (generally these components are to be imported). Accordingly, the
private amount and private values can be calculated as presented in Table 28.
Table 28 shows that the total component cost which consists of tradable factor
costs and domestic factor costs for a salt pond with land size of 1 hectare reaches a
cost of Rp. 29,035,000. The component of tradable factor costs is Rp. 15,600,000.
(53.73%) while domestic factor cost is Rp. 13,435,000, (46.27%). The highest cost in
the component of tradable factor costs is for the water pump and scales, i.e. definite
cost. The highest variable cost is for providing sacks. In terms of domestic factor
components, labour and land have claimed the highest costs.
Salt production calculated in this analysis is based upon actual production that
can be gained by the local salt farmers. It is more or less 30 tons per hectare per year.
This potential production is lower than that of Kupang Regency, Sabu Raijua, Lembata
and Negakeo. In these regencies the production can be two up to three times bigger. It
is understandable that better technology has been used in the production process in
the regencies. The use of geomembrane technology has meant that the production
capacity of salt is much bigger.
Based on the value of available production component costs, the result for PCR
value is as much as 0.933. The value of PCR < 1 shows that the salt farming business
by the salt farmers in Papela Village, Sub-regency of East Rote, has a competitive
advantage and it is feasible financially. The PCR value calculated suggests that to

344 | P a g e
obtain a higher foreign exchange, a lower cost of domestic resources is required. It
means that the smaller the PCR value obtained, the more competitive is the salt
farming business by the local salt farmers. The result of this analysis compared to a
different analytical approach (calculation of financial feasibility) carried out by Nahib et
al (2013), found a similar result. Nahib et al did a case study in the coastal areas of
Kupang Regency and found the value of B/C ratio as much as 2.2. The finding
suggests that each unit of cost invested will give twice as much profit.
Table 40 Types and Real Value Input and Output Components of the Production of Community’s Salt in Papela Village, Sub-regency of East Rote, in 2017
No Types of Input and Output
Physical Unit
Volume Price per Unit
Input-Output Value (Rp.)
Percent
A. Tradable Factors
1. Electric Water Pump
@ 1 5.000.000 5.000.000 32,05
2. Spiral hose Metre 20 10.000 200.000 1,28
3. Plastic Bucket @ 20 20.000 400.000 2,56
4. 100kg-capacity Scales
@ 1 2.000.000 2.000.000 12,82
5. Boot Pair 10 50.000 50.000 3,21
6. Sack Sheet 2.500 3.000 7.500.000 48,05
Total A 15.600.000 57,73
B. Domestic Factors
1. Land Ha 1 1.500.000 1.50.000 11,16
2. Labour
2.1. Production Supervisor
HKP 50 50.000 2.500.000 18,61
2.2 Harvest HKP 70 50.000 3.500.000 26,05
3. Shovel @ 10 45.000 450.000 3,35
4. Petrol Litre 50 6.500 325.000 2,42
5. Diesel Oil Litre 15 25.000 375.000 2,79
6. Guluk Beton @ 2 200.000 400.000 2,98
7. Sorkot Besi @ 5 250.000 1.250.000 9,30
8. Sorkot Kayu @ 10 75.000 750.000 5,58
9. Jedengan & Singutan
@ 5 200.000 1.000.000 7,44
10. Baume Meter @ 1 50.000 50.000 0,37
11. Depreciation
11.1 Depreciation of Pond Building
% 5 1.500.000 75.000 0,56
11.2. Depreciation of Tools
% 3 12.000.000 360.000 2,68
11.3. Depreciation of Salt % 3 30.000.000 900.000 6,70
Total B 13.435.000 46,27
C. Output
Salt Production Ton/Year 30 1.000.000 30.000.000 Source: Primary Data, 2017 (processed)

345 | P a g e
Analysis of Domestic Resource Cost Ratio (DRCR)
This analysis is conducted with the consideration that salt production for
fulfilling national demand is not just from domestic production but also from importation
from other countries (see Figure 9). Salt importation is done in anticipation of
inadequate domestic supply. For domestic salt production, a number of input factors
are not manufactured domestically but are input factors of foreign components that also
imported. Accordingly, adjustment of input and output values in the form of social value
of each component used has to be calculated.
.
Figure 20 Salt Exporting Countries and the Volume of Import into Indonesia in 2016
National salt production has fluctuating results, recorded as 2.5 million tons in
2012 and only 118 tons in 2016 (see Figure 10). The variation of production between
years is suspected to be directly correlated with climate and weather conditions.
Weather and climate factors are the main determinants of the national production of
salt by local people. Apart from the weather and climate factors, the amount of capital
available and the mastery of technology have often become the main obstacles for the
national production of salt.
Figure 21 National Production of Salt by the People (million ton) 2012-2016
1.800
0.381
0.005 0.003
0.919
0.370 0.368
0.091
2012 2013 2014 2015 2016
2.5
1.2
2.5 2.9
0.118

346 | P a g e
As the national demand of salt is fairly high with industry being the biggest
consumer, there is a scarcity of salt production. Such scarcity is anticipated. Hence,
there is a policy of importing salt in large quantities from a wide variety of salt
producing countries. In 2016, Australia was the largest salt supplier to Indonesia. It
reached 1.8 million tons (45.74%) from the total import of 3.93 million tons.
Domestic salt production and salt import data required to fulfil national demand,
show the importance to increase national salt production effort. Such effort can be
conducted through attempts to make use of potential community salt production that
occurs in most regions, including East Nusa Tenggara (NTT). To answer whether or
not the salt production activity in NTT has comparative advantage, a study needs to be
conducted, and one approach of the study is by calculating the DRCR value.
In the DRCR analysis, adaptation for both input and output costs is done.
Adaptation for domestic tradable input costs is done by excluding foreign components.
This is calculated according to the latest Table I-O Indonesia in 2010. Domestic input
component costs are specifically done for factors whose usage compete strongly with
other usage, i.e. labour in this respect. The calculation of the social value of labour is
done by correcting actual cost to the rate of open unemployment in Rote-Ndao
Regency. Up to the year 2016, the unemployment rate in the Regency reached 2.37%.
CIF value (Cost, Insurance, and Freight) is calculated by considering that the product is
an imported one. The social value of salt production is similar to the CIF value,
calculated to be Rp. 1,049 per kg. This is higher than the actual cost. Such a value is
calculated in accordance with input value and tradable costs as well as the valid
exchange rate.
Based upon the above mentioned consideration, the calculation of social value
of input and output for the activity of salt production by the people of the sub-regency of
East Rote is presented in Table 29.
Table 41 Actual Value and Social Input-Output for Salt Production by the community in Papela Village, Sub-Regency of East Rote, in 2017
No Description Unit Actual Value
(Rp.)
Social Value
1. Motor Pump Unit 5.000.000 4.582.185
2. Spiral Hose Metre 10.000 9.009
3. Plastic Bucket @ 20.000 19.162
4. Scales Unit 2.000.000 1.818.090
5. Boot Pair 50.000 45.005
6. Sack Sheet 3.000 2.682
7. Labour HKP 50.000 38.150
8. Product Kg 1.000 1.049
Source: Primary Data, 2017 (processed)

347 | P a g e
Table 42 Types and Social Value of Input and Output Components of Salt Production by the People in Papela Village, Sub-Regency of East Rote, in 2017 No Type of Input and
Output
Physical
Unit
Volume Cost per Unit
(Rp.)
Input Output
Value
Percent
A. Tradable Factor
1. Motor Pump @ 1 4.582.185 4.582.185 32,45
2. Spiral hose Metre 20 9.009 180.175 1,28
3. Plastic Bucket @ 20 19.162 383.240 2,71
4. 100kg Capacity
Scales
@ 1 1.818.090 1.818.090 12,88
5. Boot Pair 10 45.005 45.053 3,19
6. Sack Sheet 2.500 2.682 6.705.785 47,49
Total A 14.119.528 53,94
B Domestic Factor
1. Land Ha 1 1.500.000 1.500.000 12,44
2. Labour
2.1
.
Production
Supervisor
HKP 50 38.150 1.907.500 15,82
2.2 Harvest HKP 70 38.150 2.670.500 22,15
3. Spade @ 10 45.000 450.000 3,73
4. Petrol Litre 50 6.500 325.000 2,70
5. Diesel Oil Litre 15 25.000 375.000 3,11
6. Guluk Beton @ 2 200.000 400.000 3,32
7. Sorkot Besi @ 5 250.000 1.250.000 10,37
8. Sorkot Kayu @ 10 75.000 750.000 6,22
9. Jedengan and
Singutan
@ 5 200.000 1.000.000 8,29
10. Baume Meter @ 1 50.000 50.000 0,41
11. Depreciation
11.
1
Depreciation of
salt pond
Construction
% 5 1.500.000 75.000 0,62
11.
2.
Equipment
Depreciation
% 3 12.000.000 360.000 2,99
11.
3
Depreciation of
Salt
% 3 31.462.857 943.886 7,83
Total B 12.056.886 46,06
C. Output:
Salt Production Ton/Year 30 1.048.762 31.462.857
Source: Primary Data, 2017 (processed)
From the number of input-output types used with the socter pumpial value to
analyse DRCR, value and proportions are presented in Table 30. The table shows the
total component of cost which consists of tradable factor cost and domestic factor

348 | P a g e
costs. One hectare of salt ponds returns Rp 26,176,414. The tradable factor cost is as
much as Rp14,119,528 (53.94%). Domestic factor cost is Rp 12,056,886 (46.06%). For
the component costs of the tradable factor, the biggest costs are for weighing scales
(variable factor), and water pump (fixed cost). The biggest portion of domestic factor
cost is for labour and land.
Based on the value of the component costs and the production available, the
calculation of the value of the Domestic Resource Cost Ratio (DRCR) is 0.695. The
value of DRCR < 1 shows that community salt farming business by the people in
Papela Village, East Rote Sub-Regency, has a comparative advantage, and socially
feasible. The low value of DRCR in the salt production business in Papela Village is
caused more by the low cost of domestic components, especially for the main costs of
land and labour. In general, the land used cannot be cultivated for farming because the
land has high salinity.
Similarly, the labour in general has so called high opportunity cost for labour
that can encourage villagers to shift from other activity units that deal with fishing and
farming. This condition, in the future, is very advantageous because labourers in the
village are generally traditional fishermen that go fishing to the MOU Box near Ashmore
Reef. They face fishing cost problems as outlined in Chapter 4 and also strict
regulations enforced by the Australian Government. It is for these reasons that the
business of community salt production can be an acceptable alternative offered to the
people to overcome the scarcity of work faced by the labourers and the local
community.
The DRCR value obtained can explain that to obtain a single unit of foreign
exchange, a lower cost of domestic resources is required, i.e. as much as the DRCR
value. The DRCR value which is smaller than one indicates that the salt farming
business in Papela region of East Rote has potential to be a salt farming region.
Furthermore, salt importing activity to fulfil local and national demand can be
substituted with the salt farming business in the region. Therefore, it is necessary to
develop the area policy more precisely and purposefully so as to optimize the utilization
of available natural resources.
Analysis of Policy Distortions and Market Failures
Government policy regarding economic activities has potential to give a signal
to business people to decide whether or not to go on with their business. The policies
applied by the government can be positive or negative to economic agents. Every
agribusiness actor expects incentives for income to play its role in agribusiness
development. It is worth remembering that without any additional incentives, the

349 | P a g e
agribusiness actors will be reluctant to pursue future agribusiness activities. The key to
increase performance in the agribusiness sector, therefore, is to create economic
incentives that support the attractiveness of agribusiness (Prabowo, 2010). This
condition also applies to the development of salt production businesses in Indonesia
which is importing salt to overcome the domestic demand.
Inter-territorial or inter-state trade activity occurs when a region or country is
producing a commodity at the business/farm with a relatively low cost. This creates an
incentive to export to regions or countries that have higher production costs. If the cost
of similar imported commodities is lower than the cost of domestic product, then it will
weaken the competitiveness of domestic products as consumers will tend to buy the
product with a lower price. Consequently, demand for the domestic product will
decrease and hence a decrease in income for local producers. Huka et al (2014) have
said that price plays an important role in determining farmers’ responses to changing
market conditions. When the price of a product is higher than the production cost, it will
give a direct incentive to small-scale farmers in developing their business (Hans, 1999
as quoted in Huka et al, 2014).
Pearson et al (2005) have said that market failure is one of the causes of
divergence. Markets are said to have failed when it is unable to create a competitive
price and reflect social opportunity cost that in turn creates allocation of resources as
well as efficient production.
There are three types of market failure that cause divergence, namely:
(1) monopoly, that is sellers control the market price; or monopsony, that is
buyers control market price,
(2) negative externalities, that is costs where the party who raises it cannot be
burdened by the cost incurred,
(3) positive externalities, that is benefits where the party who raises it cannot
receive any compensation or reward of the benefit incurred.
Therefore, a policy is said to be efficient if the government is able to create and
enact policies that can prevent market failure, can put aside non efficient aims, and can
override distorted policies.
Divergence is caused by distorted policy, i.e. government intervention that
causes market price to differ from its efficiency price. Taxes, subsidies, trade barriers
or price regulation may lead to divergence. The application of distortive policy to
achieve non efficient aims (equity or food security) will inhibit the efficient allocation of
resources, and in itself will generate divergence. Import tariffs are applied to increase
farmers’ incomes (equity objective) and increase domestic production (food security
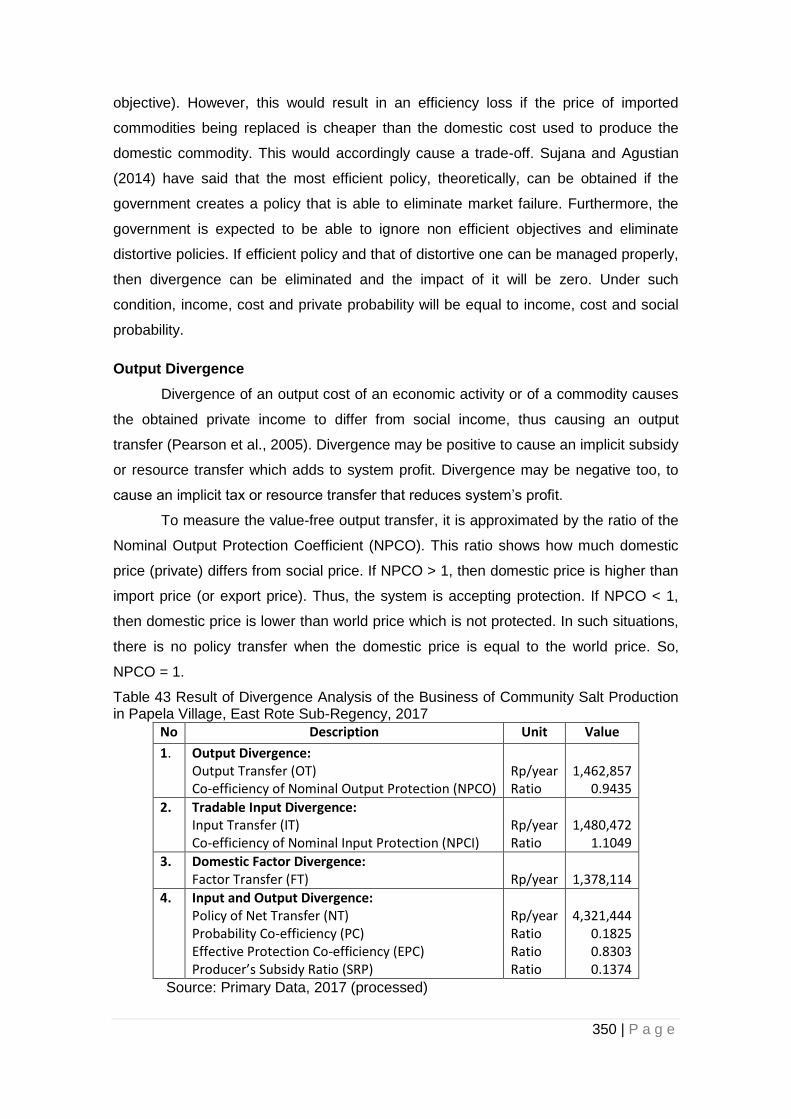
350 | P a g e
objective). However, this would result in an efficiency loss if the price of imported
commodities being replaced is cheaper than the domestic cost used to produce the
domestic commodity. This would accordingly cause a trade-off. Sujana and Agustian
(2014) have said that the most efficient policy, theoretically, can be obtained if the
government creates a policy that is able to eliminate market failure. Furthermore, the
government is expected to be able to ignore non efficient objectives and eliminate
distortive policies. If efficient policy and that of distortive one can be managed properly,
then divergence can be eliminated and the impact of it will be zero. Under such
condition, income, cost and private probability will be equal to income, cost and social
probability.
Output Divergence
Divergence of an output cost of an economic activity or of a commodity causes
the obtained private income to differ from social income, thus causing an output
transfer (Pearson et al., 2005). Divergence may be positive to cause an implicit subsidy
or resource transfer which adds to system profit. Divergence may be negative too, to
cause an implicit tax or resource transfer that reduces system’s profit.
To measure the value-free output transfer, it is approximated by the ratio of the
Nominal Output Protection Coefficient (NPCO). This ratio shows how much domestic
price (private) differs from social price. If NPCO > 1, then domestic price is higher than
import price (or export price). Thus, the system is accepting protection. If NPCO < 1,
then domestic price is lower than world price which is not protected. In such situations,
there is no policy transfer when the domestic price is equal to the world price. So,
NPCO = 1.
Table 43 Result of Divergence Analysis of the Business of Community Salt Production in Papela Village, East Rote Sub-Regency, 2017
No Description Unit Value
1. Output Divergence: Output Transfer (OT) Co-efficiency of Nominal Output Protection (NPCO)
Rp/year Ratio
1,462,857
0.9435
2. Tradable Input Divergence: Input Transfer (IT) Co-efficiency of Nominal Input Protection (NPCI)
Rp/year Ratio
1,480,472
1.1049
3. Domestic Factor Divergence: Factor Transfer (FT)
Rp/year
1,378,114
4. Input and Output Divergence: Policy of Net Transfer (NT) Probability Co-efficiency (PC) Effective Protection Co-efficiency (EPC) Producer’s Subsidy Ratio (SRP)
Rp/year Ratio Ratio Ratio
4,321,444
0.1825 0.8303 0.1374
Source: Primary Data, 2017 (processed)

351 | P a g e
Table 31 shows the calculation of output transfer value and NPCO of a
community salt production in Papela Village, Sub-Regency of East Rote. The OT value
obtained shows a negative one. The negative value can be interpreted that consumer
pays while producer receives cheaper output price than normal price. In other words,
producer of people’s salt in Papela Village indirectly gives incentive to consumer.
NPCO value of the production of the community’s salt in Papela Village is as
much as 0.9435. The value shows that the actual output price of salt production is
Rp.1,000/kg. Salt farmer only receive 4.6% on average, lower than the social price
which is Rp.1,049 / kg.
A condition that is strongly suspected to determine the low actual price received
by the salt farmer is closely related to the fluctuating trend of the Rupiah exchange
rate. In 2016 the social exchange rate (Shadow Exchange Rate, SER) of the
Indonesian Rupiah against American Dollar was Rp. 15,137 / US Dollar. It is more
expensive than the official exchange rate of Rp. 13,400. In this situation, the
depreciated exchange rate of Rupiah directly affects the price of the community’s salt.
As the import of salt continues, the price of domestic salt must compete with imported
product in order to grab a share of the market.
Tradable Input Divergence
Pearson et al (2005) have said that divergence on tradable inputs causes
tradable input costs to differ from social costs as well as Input Transfer (IT). IT
divergence can be positive and can be negative. The positive one can cause an implicit
tax or transfer of resources out of the system. The negative IT divergence, on the
contrary, can lead to implicit subsidies or transfers of resources into the system.
To measure IT divergence which is free of currency value, a co-efficiency ratio
of input nominal protection is used, Normal Protection Co-efficiency on Input (NPCI).
NPCI ratio shows how much the domestic price (private price) of tradable input differs
from the efficient price (social price). If the NPCI > 1, it means that tradable input
domestic price is more expensive than the input price at the level of world price. It also
means that the system seems to be subsidized by existing policy. If the NPCI = 1, it
means there is no transfer, and the price of domestic input does not differ from the
world input price.
The results of the analysis showing the IT value of community’s salt production
in Papela Village, Sub-Regency of East Rote, is presented in Table 4. It shows the
amount of IT value of Rp. 1,480,472 / year. The positive value of IT implies implicitly
the salt famer is taxed due to the existing policy of IT value.

352 | P a g e
The NPCI value of the community’s salt production has a value greater than
one, which can implicitly explain that the tradable input price at the domestic price level
ranges from 0.01% to the social price, i.e. more expensive than the social price. Based
on the description of the result, it seems that there is relatively little protection for the
tradable input producer.
Divergence of Domestic Factor
Divergence in domestic factors (such as labour, capital, and land) can cause
the domestic factor of the domestic price to differ from the social price, thereby creating
a domestic factor transfer (Pearson et al, 2005). Transfer of positive factor causes tax
implicitly and transfer resources out of the system; while the transfer of negative factor
causes subsidy implicitly or resource transfer into the system.
Various empirical studies in many developing countries show that significant
market failure at the market of domestic factor is very common. Transfer of domestic
factor may also arise due to distorted policies such as market distortion, labour and
capital arising from tax or subsidy, price regulation, or highly distortive microeconomic
policy. Saptana (2010) said that government policy to eliminate market distortion is
needed, particularly to eliminate market incompleteness (market failure, oligopoly-
oligopsony, monopoly-monopsony, cartels), and to decrease or reduce high transaction
cost.
The results of FT value analysis of the community’s salt production in Papela
Village show a positive value of Rp. 1,378,114 / year. The positive FT value means that
the salt farmer is paying implicit tax due to existing policy or transfer to domestic factor
producers. The Labour factor is a major domestic determinant factor in the production
of the community’s salt in Papela Village, being as much as 37.97% and depending on
the number of labourers involved. The determination of a labourer’s wage that is
corrected with the unemployment rate, and used as a price limit, seems to be lower
than the real price of the wage paid. This therefore causes the price of the private
domestic factor to be greater than the social price paid.
Input and Output Divergence
Some indicators have been used to know the overall divergence in the salt
production in Papela Village, Sub-Regency of East Rote. The indicators are: Net
Transfer (NT), Probability Coefficient (PC), Effective Protection Coefficient (EPC), and
Subsidy Ratio to Producer (SRP).

353 | P a g e
Looking from profit identity perspective, NT is the total of output transfer,
tradable input transfer, and domestic factor transfer. Judging from the identity of
divergence, NT is the difference between private profit and social benefit. If a policy is
able to eliminate market failure, and if all distortive policies are revoked, then
divergence will be suppressed and net transfer will be zero. Net transfer will also be
zero if the distortion in the output price is erased by the distortion at the input price of
the same value but with different mark.
PC measures the impact of all transfers on private profit and social benefit. The
PC is equal to the ratio between private profit and social benefit. The PC is calculated
by the use of the same data as when NT is calculated, so as to make it possible to
compare the NT between different systems. The PC is also an extension of the EPC by
including factor cost (together with tradable input revenue cost).
PC compares the added value at the domestic price level with the added value
at the world price level. The aim of EPC is to show the level of simultaneous protection
to tradable input and output, or to show the impact of combined transfers which are
caused by a policy transfer, either output transfer or input transfer. EPC is one other
form of ERP, that is; a commonly used trade distortion. ERP = (EPC-1) x 100%.
SRP is a ratio used to measure transfer impact. It is a comparison between NT
and the output value at the world price level. SRP shows the extent to which the
income increases or decreases due to the effect of transfer. If market failure is not
significant, then the SRP shows the net effect of distortive policy on the system. A
negative SRP value indicates that the prevailing government policy causes producers
to incur less production costs than the cost of counter-production to produce.
The analysis of the value of NT, PC, EPC and SRP on the production of the
community’s salt in Papela Village can be seen in Table 4. The NT value of the
community’s salt production is negative. The negative NT value in essence shows that
the salt farmer profit is more in deficit and implicit due to government policy and market
failure of output and input factors. The scale of NT value indicates that the salt farmer
in Papela Village receives an actual profit lower than the social profit of the NT value
that is Rp. 4,321,444 / year. The NT in another form is shown by the probability
coefficient (PC), i.e. the ratio between private profit and social benefit. The value of PC
on the community’s salt production is smaller than one. It means that private profit
received by the salt farmer is still lower than the social benefit at the proportion which is
equal to the PC value. The PC calculation result shows the salt production farmer is
still dealing with government policy such as implicit tax.
354 | P a g e
The average Effective Protective Coefficient (EPC) is 0.8303 which means that
the added value of output at the private price of the community’s salt production is 83%
of the added value at the point of complete competitiveness. The NPCI value being
greater that one and the NPCO value being smaller than one, strengthens the notion
that government policy is relatively less protective to the community’s salt enterprise.
Consequently, the added value obtained from the use of tradable input is still lower at
the level of cost price compared to the social benefit or social price. This shows that the
government has not been able to formulate policy incentive for the development of the
community’s salt production in Papela Village in particular, and East Nusa Tenggara
(NTT) in general.
Subsidy Ratio Producer indicator (SRP) of the community’s salt production
shows a negative value of 0.1374 on average. The scale of SRP value gives an
understanding that the distortive policy of the government on average, and/or market
failure, result in the profit of the salt farmer reduced by approximately 13.74% of the
economic revenue. The most dominant factor faced in the field of business or in the
market is that sale price is still lower that social price. A more protective policy for the
salt farmer is through determination and application of a consistent sale price of the
product, including control in the market. This is an alternative policy that can be applied
by the regional or provincial government. Capital aid with quality control is also an
important step in strengthening the bargaining position of the salt farmer.
Concluding Remarks
Based on the overall discussion in relation to the analysis of competitiveness in
the community’s salt production in Papela Village, the Sub-Regency of East Rote, Rote
Ndao Regency, five conclusions can be drawn. They are formulated as follows:
1. The business of community salt production by the salt farmers in Papela Village
is an efficient business and has competitiveness from either the financial aspect
or the economic aspect. It also has competitive and comparative advantages.
2. The result of policy analysis shows that the government’s will to support the salt
farmer seems to be still weak, indicated by the lower value of output received,
while at the same time the producer has to pay an input of a more expensive
price.
3. The community’s salt production business in Papela Village) in general can be
used as an alternative to overcome the scarcity of salt production and to fulfil
domestic demand.
4. The policy of the local government to increase the development of community salt production, especially in Papela, is assured to be an alternative livelihood activity to help curb dependence of the local labour on fishing activities that carry restrictions, especially in Ashmore Reef waters.

355 | P a g e
Bibliography
Acker, J., 1990. Hierarchies, Jobs, Bodies: A Theory of Gendered Organizations.
Gender and Society, 4(2), pp. 139-158.
AFMA, 2004. Maritime Arrangements between Australia and Indonesia in the Timor
and Arafura Seas, Canberra: Geoscience Australia.
Agreed Minutes of Meeting Between Officials of Indonesia and Australia on Fisheries,
Jakarta, 29 April 1989 (1989).
Agreement between Australia and Indonesia concerning Certain Boundaries between
Papua New Guinea and Indonesia. 12 February 1973. Australian Treaty Series No.
26. (1974).
Allison, E. & Ellis, F., 2001. The livelihoods approach and management of small-scale
fisheries. Journal of Marine Policy, Volume 25, pp. 377-388.
Allison, E. H. & Horemans, B., 2006. Putting principles of the Sustainable Livelihoods
Approach into fisheries development policy and practice. Journal of Marine Policy,
30(6), pp. 757-766.
Ardani, N. H., 2017. A Study on the Dowry in Wedding Ceremony of Rotenese,
Unpublished Skripsi, Kupang: Aryasatya Deo Muri University.
Ardani, S., 2010. Reflexions of a Fisherman [Interview] (July 2010).
Ashforth, B. E. & Mael, F., 1989. Social Identity Theory and the Organisation. Academy
of Management Review, Volume 14, pp. 20-39.
Ashley, C. & Carney, D., 1999. Sustainable livelihoods: Lessons from early experience,
London: Department for International Development.
AusAID, 2013. Indonesia Country Report. [Online]
Available at:
http://www.ausaid.gov.au/countries/eastasia/indonesia/Pages/home.aspx
[Accessed July 2014].
Badan Kependudukan dan Keluarga Berencana Nasional, 2015. Pendataan Keluarga
2015, Jakarta: BkkbN.
Bailey, C. & Pomeroy, C., 1993. Resource Dependency and Community Stability in
Coastal Fishing Communities in Southeast Asia. Portland, Oregon: American
Fisheries Society.

356 | P a g e
Balint, R., 2005. Troubled Waters: Borders, boundaries and possession in the Timor
Sea. Crows Nest: Allen & Unwin.
BAPPENAS, 2010. Report on the Achievement of the Millenium Development Goals
Indonesia 2010, Jakarta: Ministry of National Development Planning.
Barlow, C. & Gonowarsito, R., 2009. Socio-Economic Conditions and Poverty
Allieviation in East Nusa Tenggara. In: B. Resosudarmo & F. Jotzo, eds. Working
with Nature against Poverty: Development, Resources and the Environment in East
Indonesia. Singapore: ISEAS Publishing.
Bastaman, H., 2009. Building Community Resilience to the Security Implications of
Climate Change: The Role of Faith‐Based and Environment NGOs in the Regions,
Conference Climate Insecurities, Human Security Four Seasns Hotel, Singapore:
RSIS Centre for Non‐Traditional Security Studies.
Batthyany, K. et al., 2017. Gender and Poverty: A Case of Entwined Inequality. ournal
of Social Watch, Poverty Eradication and Gender Justice..
Becker, H. A., 2001. Social imapct assessment.. European Journal of Operational
Research, Volume 128, pp. 311-321.
Becker, H. A. & Vanclay, F., 2003. The International Handbook of Social Impact
Assessment: Conceptual and Methodological Advances. Cheltenham, UK: Edward
Elgar.
Bell, C. & Newby, H., 1971. Community studies. An introduction to the sociology of the
local community. London: George Allen & Unwin.
Béné, C., 2003. When Fishery Rhymes with Poverty: A First Step Beyond the Old
Paradigm on Poverty in Small-Scale Fisheries. World Development, 31(6), pp. 949-
975.
Béné, C., 2009. Are Fishers Poor and Vulnerable? Assessing Economic Vulnerability in
Small-Scale Fishing Communities. Journal of Development Studies, 45(6), pp. 911-
933.
Benu, F., King, P. G., Nalle, A. & Muskanan, M., 2017. The Economic Livelihoods of
Traditional Fishermen in Rote Island in Relation to the Activities of Illegal Fishing in
Transboundary Water of Indonesia and Australia. Research Report, Kupang: Nusa
Cendana University.

357 | P a g e
Benu, F., King, P. G., Nalle, A. & Muskan, M., 2018. Traditional Fishermen in Rote
Island: An Alternative Livelihood to Illegal Fishing Activities in the Indonesian-
Australian Transboundary Waters. American Journal of Agricultural and Biological
Sciences, 13(2), pp. 64-76.
Benu, F., Mudita, I. W. & Muskanan, M., 2017. A Small Drop of Hope for the Dry
Ground: Introducing Drip Irrigation to Rote Island, Indonesia, to Convince
Fishermen to Farm during the Dry Season for an Alternative Livelihood. Horticulture
International Journal, 1(3), pp. 1-5.
Berenschot, W. & Vel, J., 2017. New law, new villages?. Inside Indonesia, Volume 128.
Beugelsdijk, S. & van Schaik, T., 2005. Social capital and growth in European regions:
an empirical test. European Journal of Political Economy, Volume 21, p. 301–324.
BKKBN, 2014. Tata Cara Pelaksanaan Pencatatan dan Pelaporan Pendataan
Keluarga, Jakarta: Badan Kependudukan dan Keluarga Bencana Nasional.
Boomgaard, P., 2007. In a state of flux:Water as a daedly and a life-giving force in
Southeast Asia. In: P. Boomgaard, ed. A World of Water: Rain, Rivers and Seas in
Southeast Asia. Singapore: NUS Press.
Booth, D., 1985. Marxism and Development Sociology: Interpreting the Impasse. World
Development, 13(7), pp. 761-787.
BPS Kabupaten Rote-Ndao, 2016. Statistik Kesejahteraan Rakyat Kabupaten Rote
Ndao 2015, Ba'a: BPS Kabupaten Rote Ndao.
BPS Kabupaten Rote-Ndao, 2017a. Kecamatan Rote Timor dalam Angka 2016, s.l.:
BPS Kabupaten Rote-Ndao.
BPS Kabupaten-Rote-Ndao, 2017b. Kecamatan Rote Barat Daya dalam Angka 2016,
Ba'a: BPS Kabupaten -Rote Ndao.
BPS Provinsi NTT, 2016a. Distribusi Persentase Produk Domestik Regional Bruto
(PDRB) Atas Dasar Harga yang Berlaku (ADHB) Menurut Lapangan Usaha di
Provinsi NTT, 2010-2016. [Online]
Available at: https://ntt.bps.go.id/dynamictable/2016/11/21/354/distribusi-
persentase-produk-domestik-regional-bruto-pdrb-atas-dasar-harga-yang-berlaku-
adhb-menurut-lapangan-usaha-di-provinsi-ntt-2010-2016.html
[Accessed May 10 2018].
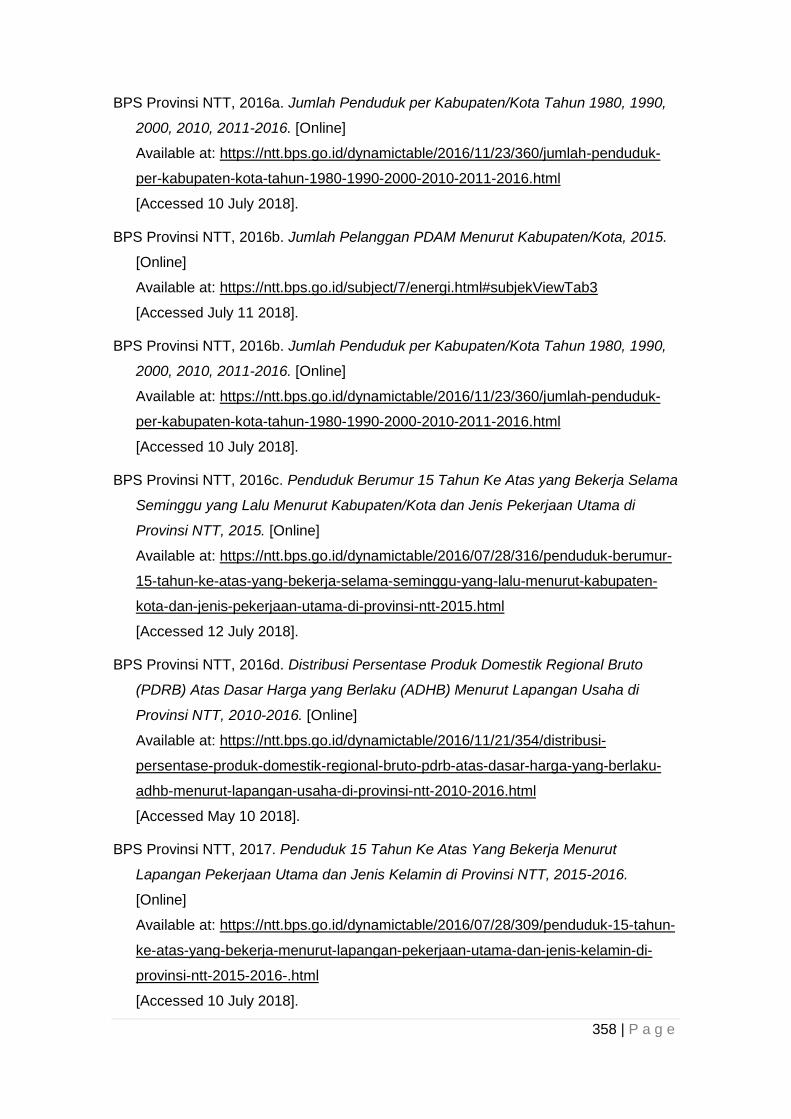
358 | P a g e
BPS Provinsi NTT, 2016a. Jumlah Penduduk per Kabupaten/Kota Tahun 1980, 1990,
2000, 2010, 2011-2016. [Online]
Available at: https://ntt.bps.go.id/dynamictable/2016/11/23/360/jumlah-penduduk-
per-kabupaten-kota-tahun-1980-1990-2000-2010-2011-2016.html
[Accessed 10 July 2018].
BPS Provinsi NTT, 2016b. Jumlah Pelanggan PDAM Menurut Kabupaten/Kota, 2015.
[Online]
Available at: https://ntt.bps.go.id/subject/7/energi.html#subjekViewTab3
[Accessed July 11 2018].
BPS Provinsi NTT, 2016b. Jumlah Penduduk per Kabupaten/Kota Tahun 1980, 1990,
2000, 2010, 2011-2016. [Online]
Available at: https://ntt.bps.go.id/dynamictable/2016/11/23/360/jumlah-penduduk-
per-kabupaten-kota-tahun-1980-1990-2000-2010-2011-2016.html
[Accessed 10 July 2018].
BPS Provinsi NTT, 2016c. Penduduk Berumur 15 Tahun Ke Atas yang Bekerja Selama
Seminggu yang Lalu Menurut Kabupaten/Kota dan Jenis Pekerjaan Utama di
Provinsi NTT, 2015. [Online]
Available at: https://ntt.bps.go.id/dynamictable/2016/07/28/316/penduduk-berumur-
15-tahun-ke-atas-yang-bekerja-selama-seminggu-yang-lalu-menurut-kabupaten-
kota-dan-jenis-pekerjaan-utama-di-provinsi-ntt-2015.html
[Accessed 12 July 2018].
BPS Provinsi NTT, 2016d. Distribusi Persentase Produk Domestik Regional Bruto
(PDRB) Atas Dasar Harga yang Berlaku (ADHB) Menurut Lapangan Usaha di
Provinsi NTT, 2010-2016. [Online]
Available at: https://ntt.bps.go.id/dynamictable/2016/11/21/354/distribusi-
persentase-produk-domestik-regional-bruto-pdrb-atas-dasar-harga-yang-berlaku-
adhb-menurut-lapangan-usaha-di-provinsi-ntt-2010-2016.html
[Accessed May 10 2018].
BPS Provinsi NTT, 2017. Penduduk 15 Tahun Ke Atas Yang Bekerja Menurut
Lapangan Pekerjaan Utama dan Jenis Kelamin di Provinsi NTT, 2015-2016.
[Online]
Available at: https://ntt.bps.go.id/dynamictable/2016/07/28/309/penduduk-15-tahun-
ke-atas-yang-bekerja-menurut-lapangan-pekerjaan-utama-dan-jenis-kelamin-di-
provinsi-ntt-2015-2016-.html
[Accessed 10 July 2018].

359 | P a g e
BPS Provinsi NTT, 2018a. Persentase Penduduk Miskin Menurut Kabupaten/Kota di
Provinsi Nusa Tenggara Timur, 2015-2017. [Online]
Available at: https://ntt.bps.go.id/dynamictable/2017/08/31/451/persentase-
penduduk-miskin-menurut-kabupaten-kota-di-provinsi-nusa-tenggara-timur-2015-
2017.html
[Accessed 10 July 2018].
BPS Provinsi NTT, 2018b. Umur Harapan Hidup Menurut Kabupaten/Kota Provinsi
Nusa Tenggara Timur, 2010-2017. [Online]
Available at: https://ntt.bps.go.id/dynamictable/2015/03/06/19/-metode-baru-umur-
harapan-hidup-menurut-kabupaten-kota-provinsi-nusa-tenggara-timur-2010-
2017.html
[Accessed 10 July 2018].
BPS Provinsi NTT, 2018c. Persentase Penduduk Berumur 10 Tahun Ke Atas Menurut
Kabupaten/Kota dan Pendidikan Tertinggi yang Ditamatkan di Provinsi Nusa
Tenggara Timur, 2015-2016. [Online]
Available at: https://ntt.bps.go.id/dynamictable/2017/08/23/404/persentase-
penduduk-berumur-10-tahun-ke-atas-menurut-kabupaten-kota-dan-pendidikan-
tertinggi-yang-ditamatkan-di-provinsi-nusa-tenggara-timur-2015-2016.html
[Accessed 10 July 2018].
BPS Provinsi NTT, 2018d. Angka Partisipasi Murni (APM) Menurut Jenjang Pendidikan
(persen) di Provinsi Nusa Tenggara Timur, 2011-2017. [Online]
Available at: https://ntt.bps.go.id/dynamictable/2015/03/12/50/angka-partisipasi-
murni-apm-menurut-jenjang-pendidikan-persen-di-provinsi-nusa-tenggara-timur-
2011-2017.html
[Accessed 10 July 2018].
Bradshaw, J. R., 1972. The concept of social need. New Society. New Society, Volume
496, pp. 640-643.
Bria, M. D., 2014. Livelihood Strategies of Indonesian Fishers off Northern Australia,
Unpublished Master Thesis, Perth: University of Western Australia.
Bridger, J., 1999. Toward an interactional approach to sustainable community
development. Journal of Rural Studies, Volume 15, pp. 377-387.
Brown, R., 2000. Social Identity Theory: past achievements, current problems and
future challenges. European Journal of Social Psychology, Volume 30, pp. 745-778.

360 | P a g e
Brundtland, G. H. & Khalid, M. e. a., 1987. Our Common Future. s.l.:World Commission
on Environment and Development.
Bryman, A., 1988. Quantity and Quality in Social Research. London: Routledge.
Buckeridge, J., 2009. Expert comment on West Atlas oil spill (Archived from the original
on 5 November 2009). 9 November.
Burdge, R. et al., 1995. Guidelines and principles for social imapct assessment.
Environmental Imoact Assessment Review, Volume 15, pp. 11-43.
Burdge, R. J., 2003. The practice of social impact assessment background. [Online]
Available at:
http://www.tandfonline.com/action/journalInformation?journalCode=tiap20
[Accessed 15 May 2017].
Butcher, J. G., 2002. Getting into Trouble: The Diaspora of Thai Trawlers, 1965-2002.
International Journal of Maritime History, Volume XIV.
Butcher, J. G., 2004. The Closing of the Frontiers: A History of the Marine Fisheries of
Southeast Asia c. 1850-2000. Singapore: Institute of Southeast Asian Studies.
Campbell, B. & Wilson, B., 1993. The Politics of Exclusion: Indonesian Fishing in the
Australian Fishing Zone. Singapore: Indian Ocean Centre for Peace Studies.
Carnegie, M., 2008. Development prospects in Eastern Indonesia: Learning from
Oelua's diverse economy. Asia Pacific Viewpoint, 29(3), pp. 354-369.
Carnegie, M., 2010. Living with difference in rural Indonesia: What can be learned for
national and regional political agendas? Journal of Southeast Asian Studies. 41(3),
pp. 449-481.
Carney, D., 1998. Implementing the Sustainable Rural Livelihoods Approach, London:
Overseas Development Institute U.K..
Carruthers, D., 2001. From opposition to orthodoxy: The remaking of sustainable
development. Journal of Third World Studies: Americus, 18(2), pp. 93-112.
Center for Poverty Research, 2014. How does Gender Relate to Poverty Status,
California: Center for Poverty Research, University of California.
Cernea, M., 1997. The risks and reconstruction model for resettling displaced
populations. World Environment, Volume 25, pp. 1569-1587.
Cernea, M. M., 1993. The Sociologist's Approach to Sustainable Development.
Finance and Development, 30(4).

361 | P a g e
Chambers, R. & Conway, G. R., 1991. Sustainable rural livelihoods: Practical concepts
for the 21st Century. IDS Discussion Paper 296.
Chu, C., 2009. Health program planning and evaluation. Course Guide School of
Environment, Griffith University.
Clough, P. & Nutbrown, C., 2002. A Student’s Guide to Methodology. London: Sage
Publications.
Coleman, J. S., 1988. Social Capital in the Creation of Human Capital. The American
Journal of Sociology, 94(Supplement: Organizations and Institutions: Sociological
and Economic Approaches to the Analysis of Social Structure), pp. S95-S120.
Coleman, J. S., 1990. Foundations of Social Capital. [Online]
Available at:
https://s3.amazonaws.com/academia.edu.documents/32866829/Coleman-
Foundations_of_Social_Theory-
ch_12.PDF?AWSAccessKeyId=AKIAIWOWYYGZ2Y53UL3A&Expires=154069999
9&Signature=aLvdy%2BxHOAZ8RCwtowLJydmd82M%3D&response-content-
disposition=inline%3B%20filename%3DF
[Accessed 12 September 2018].
Collins, B., 2017. Illegal Indonesian, Timorese fisherman return to Australian waters
driven by failings at home. [Online]
Available at: http://www.abc.net.au/news/2017-05-26/illegal-indonesian-fisherman-
returning-to-northern-australian/8561798
[Accessed 2 April 2018].
Conover, P. J. & Feldman, S., 1981. The Origins and Meaning of Liberal/Conservative
Self-Identifications. American Journal of Political Science, Vol. 25, No. 4 (Nov.,
1981), pp. 617-645, 25(4), pp. 617-645.
Crawford, J. T., 2017. Are Conservatives More Sensitive To Threat Than Liberals? It
Depends On How We Define Threat and Conservatism. Social Cognition, 35(4), pp.
354-373.
Creaven, S., 2000. Marxism and Realism. [Online]
Available at:
file:///D:/a%20PAUL%20DAta/Documents/1%20A%20Uni/a%20PhD%202018/Articl
es%20and%20sources/Marxism/Creaven%20S.%202000%20Marxism%20and%20
Realism%209781134562213_googlepreview.pdf
[Accessed 01 October 2018].

362 | P a g e
Daly, H. E., 1973. Toward a Steady-State Economy. s.l.:W. H. Freeman & Co..
Daly, H. E., 1992. Allocation, distribution and scale towards an economics that is
efficient, just and sustainable. Ecological Economics, Volume 6, pp. 185-193.
Davey, P., 2009. Environmental Health Action: Creating Liveable Healthy Cities in the
Asia-Pacific. Singapore, Environmental Health Action: Creating Liveable Healthy
Cities in the Asia-Pacific Forum.
Dendi, A., Heile, H. J. & Makambombu, S., 2009. Improving the Livelihood of the Poor:
Challenges and lessons from East Nusa Tenggara. In: B. Resosudarmo & F. Jotzo,
eds. Working with Nature Against Poverty: Development, Resources and the
Environment in Eastern Indonesia. Singapore: ISEAS.
DFID, 2000. Forum on Operationalizing Participatory Ways of Applying Sustainable
Livelihoods A p p r o a c h e s. United Kingdom, UNFAO.
DKP, 2005a. Departmen Kelautan dan Perikanan Tangani Illegal Fishing. Press
Release, 14 January.
DKP, 2005b. Menyimak Kinerja Pengawasan dan Penertiban IUU Fishing.. Press
Release, 21 December.
DKP, 2005c. Proceedings of the National Workshop on Illegal, Unreported and
Unregulated (IUU) Fishing - 28 April 2005. Jakarta, Research Centre for Capture
Fisheries, Agency for Marine and Fisheries Research, Department of Marine Affairs
and Fisheries.
Dover, S., 2005. Environment and Sustainability Policy: creation, implementation,
evaluation. Annadale: The Federation Press.
Dunne, T., Kurki, M. & Smith, S., 2007. International Relations Theory: Discipline and
Diversity. Oxford: Oxford University Press.
Evans, D. & Gruba, P., 2002. How to write a better Thesis. Melbourne: Melbourne
University Press.
Fegan, B., 2001. Supplement to August 2001 Fieldwork Report on Red Snapper: Data
from PT Dharma Samudera Processing & Dr Butcher’s Research in Jakarta and
Thailand, Snapper Project. Canberra: CSIRO Project Number FIS/97/165.
Fenton, M., Coakes, S. & Marshall, N., 2003. Vulnerability and capacity measurement.
In: The International Handbook of Social Impact Assessment. Cheltenham: Edward
Elgar Publishing Limited.

363 | P a g e
Ferrol-Schulte, D., Wolff, M., Ferse, S. & Glaser, M., 2013. Sustainable Livelihoods
Approach in tropical coastal and marine social–ecological systems: A review,
Marine Policy. Marine Policy, Volume 42, pp. 253-258.
Fine, B., 2001. Social Capital versus Social Theory: Political economy and social
science at the turn of the millennium. [Online]
Available at: file:///D:/a%20PAUL%20DAta/Downloads/epdf.tips_social-capital-
versus-social-theory-political-econ.pdf
[Accessed 01 October 2018].
Firman, A. H. B., 2001. People Participation in the Use of Sea Fishery Resource (Case
study: Wawonii Island, Southeast Sulawesi). Jakarta, University of Indonesia.
Forbes, V. L., 1995. The Maritime Boundaries Of The Indian Ocean Region. Singapore:
Singapore University Press.
Forbes, V. L., 2007. Fables, Fabrications and Facts: National Maritime Jurisdiction in
the Arafura and Timor Sea. IAJ-Timor Gap Conference, Bali, October 2007.
Fox, J. J., 1977. Harvest of the Palm: Ecological Change in Eastern Indonesia. London:
Harvard University Press.
Fox, J. J., 1998. Reefs and shoals in Australia-Indonesia relations: traditional
Indonesian fishermen. In: A. Milner & M. Quilty, eds. Australia in Asia: Episodes.
Melbourns: Oxford University Press Australia, pp. 111-139.
Fox, J. J., Adhuri, D. S., Therik, T. & Carnegie, M., 2009. Searching for Livelihood: The
Dilemma of Small-Boat Fishermen in Eastern Indonesia. In: B. P. Resosudarmo &
F. Jotzo, eds. Working with Nature Against Poverty. 1 ed. Singapore: ISEAS
Publishing.
Fox, J. J. & Sen, S., 2002. A Study Of Socio-Economic Issues Facing Traditional
Indonesian Fishers Who Access The MOU Box, Canberra: A Report for
Environment Australia.
Frasera, E. D. et al., 2006. Bottom up and top down: Analysis of participatory
processes for sustainability indicator identification as a pathway to community
empowerment and sustainable environmental management. Journal of
Environmental Management, Volume 78, pp. 114-127.
Freudenburg, W. R., 1986. Social Impact Assessment. Annual Review Sociology,
Volume 12, pp. 451-478.

364 | P a g e
Giddings, B., Hopwood, B. & O'Brien, G., 2002. Environment, economy and society:
Fitting them together into sustainable development. Sustainable Development,
Volume 10, pp. 187-196.
Gillett, R., 1996. Workshop Presentation Paper Number 1: Marine Fisheries Resources
and Management in Indonesia with Emphasis on the Exclusive Economic Zone,
Jakarta: Directorate General of Fisheries in Cooperation with the Food and
Agriculture Organisation of the United Nations.
Glaser, B. G. & Strauss, A. L., 1967. The Discovery of Grounded Theory: Strategies for
Qualitative Research. Chicago: Aldine Publishing Company.
Goldie, J., Douglas, B. & Furnass, B., 2005. An urgent need to change direction. In: J.
Goldie, B. Douglas & B. Furnass, eds. In Search of Sustainability. Melbourne:
CSIRO Publishing.
Government of Indonesia, 1997. Agenda 21 Indonesia: Section IV Natural Resource
Management, s.l.: United Nations Commission on Sustainable Development Fifth
Session.
Grootaert, C. & van Bastelaer, T., 2001. Understanding and Measuring Social Capital:
A Synthesis of Findings and Recommendation from the Social Capital Initiative.
Washington, The World Bank Social Development Department Publications.
Haning, P. A., 2017. Pulau Landu Daerah otonom dari Nusak (Kerajan) Thei. [Online]
Available at: http://paulahaning.blogspot.com.au/2017/06/pulau-landu.html
Haning, S., 2017. Interview Secretary Department of Fisheries Rote Ndao [Interview]
(26 August 2017).
Hardin, G., 1968. The Tradgedy of the Commons. [Online]
Available at: http://science.sciencemag.org/
[Accessed 7 September 2017].
Hardin, G., 1974. Lifeboat Ethics: A Case Against Helping the Poor. Psychology Today,
Volume 8(4), pp. 38-43.
Harding, R., 1998. Environmental decision-making: The roles of scientists, engineers,
and the public. Sydney: The Federation Press.
Harding, R., Hendricks, C. M. & Faruqi, M., 2009. Environmental decision Making:
exploring complexity and context. Sydney: The Federation Press.

365 | P a g e
Hibbing, J. R., Smith, K. B. & Alford, J., 2014. Differences in negativity bias underlie
variations in political ideology. Behavioral and Brain Science, Volume 37, pp. 297-
350.
Hogg, M. A. & Abrams, D., 1998. Social Identifications: A Social Psychology of
Iintergroup Relations and Group Processes. [Online]
Available at: https://epdf.tips/social-identifications-a-social-psychology-of-
intergroup-relations-and-group-pro.html
[Accessed 20 September 2018].
Hopwood, B., Mellor, M. & O'Brien, G., 2005. Sustainable Development: Mapping
Different Approaches. Journal of Sustainable Development, 13(1), pp. 38-52.
Hornsey, M. J., 2008. Social Identity Theory and Self-categorization Theory: A
Historical Review. Social and Personality Psychology Compass, 2(1), pp. 204-222.
Howitt, R., 1989. Social impact assessment and resource development: issues from
the Australian experience. Australian Geographer, Volume 20, pp. 153-166.
Howitt, R., 2001. Rethinking Resource Management: Justice, sustainability and
indigenous people. London: Routledge.
Hugo, G., 2005. Second-Class Citizens?: Poverty and Mobility Mark the Neglected
East. Inside Indonesia, Volume 82.
Hu, T. et al., 2004. Smoking, Standard of Living, and Poverty in China. Tobacco
Control 2005, Volume 14, pp. 247-250.
Ife, J., 2002. Community developemnt: community-based alternatives in an age of
globilisation. Sydney: Pearson Education Australia.
Interorganizational Committee on Guidelines and Principles, 1994. Guidelines and
Principles Social Impact Assessment. Impact Assessment, 12(2), pp. 107-152.
Istini, 2011. Pepela School Principle interview, 2011 [Interview] (22 November 2011).
Jenksal, 2017. Interview Landu Fisher Jenksal [Interview] (26 August 2017).
Jost, J. T., Glaser, J., Kruglanski, A. W. & Sulloway, F. J., 2003. Political Conservatism
as Motivated Social Cognition. Psychological Bulletin, 129(3), p. 339–375.
Juanich, G. L., 1988. Manual on Seaweed Farming (Eucheuma spp.).
ASEAN/SF/88/Manual No.2, ASEAN/UNDP/FAO Regional Small-Scale Coastal
Fisheries Development Project, Manila: ASEAN.

366 | P a g e
Kantor Desa Pepela, 2015. Surat Pengantar Nomor: 038/005/DSP/2015, Pepela:
Kantor Kepala Desa.
Kementerian Kelautan dan Perikanan Republik Indonesia, 2014. Keputusan Menteri
Kelautan dan Perikanan Republik Indonesia Nomor 5/KEPMEN-KP/2014 tentang
Kawasan Konservasi Perairan Nasional Laut Sawu dan Sekitarnya di Provinsi Nusa
Tenggara Timor, Jakarta: Kementerian Kelautan dan Perikanan Republik
Indonesia.
Khodijah, K., 2014. Sustainable Livelihoods of Fishermen Households Headed by
Women (Case Study in Riau Islands Province of Indonesia). Asian Social Science,
10(9), pp. 187-196.
King, P. G., 2007. The Australian Government’s Responses To IUU Fishing In Its
Northern Waters. (Unpublished honours thesis): Griffith University, Brisbane,
Australia.
King, P. G., 2018. The Sustainable Development – Sustainable Livelihood Nexus:
Research matters for eastern Indonesia. Ocean & Coastal Management, Volume In
Review.
Kompas, 2003. Larangan Australia Sulitkan Nelayan Rote-Ndao. [Online]
Available at: http://www.kompas.com/utama/news/0307/09/052805.htm
Krannich, R. S., 2012. Social Change in Natural Resource-Based Rural Communities:
The Evolution of Sociological Research and Knowledge as Influenced by William R.
Freudenburg. Journal of Environment Studies Science, Volume 2, pp. 18-27.
Kronen, M., Vunisea, A., Magron, F. & McArdle, B., 2010. Socio-Economic Drivers and
Indicators for Artisanal Coastal Fisheries in Pacific Island Countries and Territories
and Their Use for Fisheries Management Strategies. Marine Policy, Volume 34, pp.
1135-1143.
Leff, E., 1993. Marxism and the Environmental Question: From the Critical Theory of
Production to an Environmental Rationality for Sustainable Development.
Capitalism, nature, socialism, 4(1), pp. 44-66.
Litbang "Kompas"/RSW/BIM, 2012. Ikan Indonesia Terus Dicuri. Kompas, 4 June, p. 1.
Litbang "Kompas"/RSW, 2012. Di Laut Kita Kalah. Kompas, 5 June, p. 1.
Liu, Y., Rao, K. & Mao, Z. Z., 2006. Cigarette Smoking and Poverty in China. Social
Science & Medicine Journal, 11 December, 63(11), pp. 2784-2790.
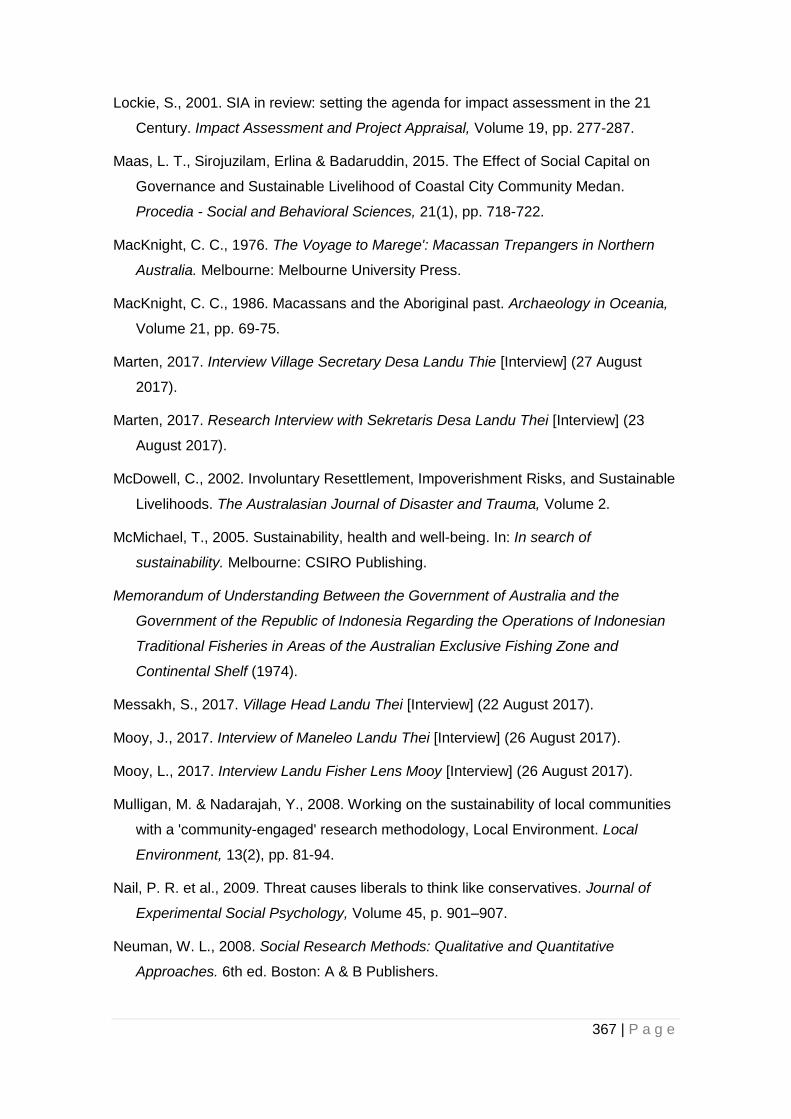
367 | P a g e
Lockie, S., 2001. SIA in review: setting the agenda for impact assessment in the 21
Century. Impact Assessment and Project Appraisal, Volume 19, pp. 277-287.
Maas, L. T., Sirojuzilam, Erlina & Badaruddin, 2015. The Effect of Social Capital on
Governance and Sustainable Livelihood of Coastal City Community Medan.
Procedia - Social and Behavioral Sciences, 21(1), pp. 718-722.
MacKnight, C. C., 1976. The Voyage to Marege': Macassan Trepangers in Northern
Australia. Melbourne: Melbourne University Press.
MacKnight, C. C., 1986. Macassans and the Aboriginal past. Archaeology in Oceania,
Volume 21, pp. 69-75.
Marten, 2017. Interview Village Secretary Desa Landu Thie [Interview] (27 August
2017).
Marten, 2017. Research Interview with Sekretaris Desa Landu Thei [Interview] (23
August 2017).
McDowell, C., 2002. Involuntary Resettlement, Impoverishment Risks, and Sustainable
Livelihoods. The Australasian Journal of Disaster and Trauma, Volume 2.
McMichael, T., 2005. Sustainability, health and well-being. In: In search of
sustainability. Melbourne: CSIRO Publishing.
Memorandum of Understanding Between the Government of Australia and the
Government of the Republic of Indonesia Regarding the Operations of Indonesian
Traditional Fisheries in Areas of the Australian Exclusive Fishing Zone and
Continental Shelf (1974).
Messakh, S., 2017. Village Head Landu Thei [Interview] (22 August 2017).
Mooy, J., 2017. Interview of Maneleo Landu Thei [Interview] (26 August 2017).
Mooy, L., 2017. Interview Landu Fisher Lens Mooy [Interview] (26 August 2017).
Mulligan, M. & Nadarajah, Y., 2008. Working on the sustainability of local communities
with a 'community-engaged' research methodology, Local Environment. Local
Environment, 13(2), pp. 81-94.
Nail, P. R. et al., 2009. Threat causes liberals to think like conservatives. Journal of
Experimental Social Psychology, Volume 45, p. 901–907.
Neuman, W. L., 2008. Social Research Methods: Qualitative and Quantitative
Approaches. 6th ed. Boston: A & B Publishers.

368 | P a g e
Niemi, W. L., 2011. Karl Marx’s sociological theory of democracy: Civil society and
political rights. The Social Science Journal, Volume 48, pp. 39-51.
Nolan, B. & Vincent, P., 2010. Australian law on Rote?. Inside Indonesia, 102 (Oct -
Dec).
NTT Provincial Government, 2008. East Nusa Tenggara Public Expenditure Analysis
(NTT-PEA).Interium Report 2008, Kupang: s.n.
Ormeling, F., 1957. The Timor problem: A geographical interpretation of an
underveloped island. The Hague: Wolters, Groningen and Nijhoff.
Pannell, S., 2007. Of gods and monsters: Indigenous sea cosmologies, primiscuous
geographies and the depths of local sovereignty. In: P. Boomgaard, ed. A World of
Water: Rain, rivers and seas in Southeast Asian Histories. Singapore: NUS Press.
Patrick, I., Marshall, G., Abdurrahman, M. & Ambarawati, . I., 2006. Determining the
Role of Social Capital in Linking Smallholders with Agribusiness. Sydney, Australian
Agricultural & Resource Economic Society.
Pedwell, C. & Whitehead, A., 2012. Affecting feminism: Questions of feeling in feminist
theory. Feminist Theory, 13(2), pp. 115-129.
Pretty, J. & Ward, H., 2001. Social Capital and the Environment. World Development,
29(2), pp. 209-227.
Purwanti, P., Susilo Edi, E. & Indrayani, E., 2017. Household Economic Activities of
Coastal Resource Users’ Community in Cengkrong Coastal Area, Prigi Bay,
Trenggalek District. RJOAS, 2(62), pp. 91-99.
Puspasari, S., 2007. Sustainable Development: A Case for Indonesia. Jakarta: National
Development Planning Agency (Bappenas).
Putnam, R., 1993. The Prosperour Community: Social Capital and Public Life. [Online]
Available at: http://staskulesh.com/wp-
content/uploads/2012/11/prosperouscommunity.pdf
[Accessed 01 October 2018].
Redclift, M., 1992. The Meaning of Sustainable Development. Geo/forum, Volume 23,
pp. 395-403.
Redclift, M., 2005. Sustainable Development (1987–2005): An Oxymoron Comes of
Age. Sustainable Development, Volume 13, pp. 212-227.

369 | P a g e
Rees, W. E., 1998. How should a parasite value its host?. Ecological Economics,
Volume 25, pp. 49-52.
Resosudarmo, B. & Jotzo, F., 2009. Development, Resources and Environment in
Eastern Indonesia. In: Working with Nature Against Poverty: Development,
Resources and the Environment in East Indonesia. Singapore: ISEAS Publishing.
Rickson, R. E., Rickson, K. E., Hoppe, P. & Burch, D., 2015. Global Companies and
Local Community Relations:Power, Access and Partenership in Food Production
and Rural Resource Development. In: Edward Elgar Handbook on the Globalization
of Agriculture. London: Edward Edgar Publishing, pp. 368-386.
Rickson, R. E. & Rickson, S. T., 1990. Assessing Rural Development: The Role of The
Social Scientist. Envvironmntal Imapct Assessment Review, Volume 10, pp. 103-
112.
Rickson, R. E., Western, J. & Burdge, R., 1998. The use of social impact assessment
knowledge in development decisions. In: R. E. Burdge, ed. s.l.:s.n.
Riek, B. M., Manis, E. W. & Gaertner, S. L., 2006. Intergroup Threat and Outgroup
Attitudes: A Meta-Analytic Review. Personality and Social Psychology Review,
10(4), pp. 336-353.
Roberts, R., 2003. Involving the Public. In: H. A. Becker & F. Vanclay, eds. The
International Handbook of Social Impact assessment: Conceptual and
Methodilogical Approach. Cheltenham: Edward Elgar Publishing Limited, pp. 258-
277.
Rubin, A. & Babbie, E., 1993. Research Methods for Social Work (Copyright 2009).
[Online]
Available at:
https://www.researchgate.net/profile/Allen_Rubin3/publication/237131811_Researc
h_Methods_for_Social_Work/links/55de3b0908ae79830bb5871f/Research-
Methods-for-Social-Work.pdf
[Accessed 21 August 2017].
Sachdev, I. & Bourhis, R. Y., 1985. Social categoriszation and power differentials in
group relations. European Journal of Social Psychology, Volume 15, pp. 415-434.
Schutkowski, H., 2006. Human Ecology: Biocultural Adaptations in Human
Communities. Berlin: Springer-Verlag.

370 | P a g e
Scoones, I., 1998. Sustainable Rural Livelihoods: A Framework for Analysis. IDS
Working Paper 72.
Scoones, I., 2009. Livelihood perspectives and rural development. Journal of Peasant
Studies, 36(1).
Sembiring, P. et al., 2012. Analisis Manajemen Rantai Pasok Produk Perikaman Di
Kabupaten Rote Ndao (Studi Kasus Nelayan MoU Box 1974). Jakarta:
Kementrian/Lembaga: Balitbang Kementerian Pertahanan.
Shimko, K. L., 2008. International Relations: Perspectives and Controversies. Boston:
Houghton Mifflin Company.
Smith, C. & Rees, G., 1998. Economic Development. USA: Palgrave Macmillan.
Southon, M., 1994. The navel of the perahu: meaning and values in the maritime
trading economy of a Butonese village, Master's Thesis, Canberra: Australia
National University.
Stacey, N., 2007. Boats to Burn: Bajo Fishing Activity in the Australian Fishing Zone.
Canberra: ANU E Press.
Stephan , W. G. & Stephan, C. W., 2000. An integrated threat theory of prejudice. In: S.
Oskamp, ed. "The Claremont Symposium on Applied Social Psychology" Reducing
prejudice and discrimination. Mahwah, NJ, US: Lawrence Erlbaum Associates
Publishers, pp. 23-45.
Stephan, W. G., Ybarra, O. & Morrison, K. R., 2009. Intergroup Threat Theory. In: T. D.
Nelson, ed. Handbook of Prejudice, stereotyping, and discrimination. New York:
Psychology Press, pp. 43-59.
Stiglitz, J. E., 2002. Participation and Development: Perspectives from the
Comprehensive Development Paradigm. Review of Development Economics, 6(2),
pp. 163-182.
Stivers, R., 1976. The sustainable society: Ethics and economic growth. Philidephia:
Westminster Press.
Susilo, E. & Purwanti, P., 2017. New Perspective on Subsistence Ethics: Criticism on
the Fishery Development in Indonesia. Journal of Research in Ecology, 5(2), pp.
810-819.
Tajfel, H., 1970. Experiments in Intergroup Discrimination. Scientific American, pp. 96-
102.

371 | P a g e
Tajfel, H., 1982. Social Psychology of Intergroup Relations. Annual Review
Psychology, Volume 33, pp. 1-39.
Tajfel, H. & Turner, J., 1979. An Intergrative Theory of Intergroup Conflict. [Online]
Available at: http://ark143.org/wordpress2/wp-content/uploads/2013/05/Tajfel-
Turner-1979-An-Integrative-Theory-of-Intergroup-Conflict.pdf
[Accessed 05 October 2018].
Tanoni, F., 2008. Skandal Laut Timor: Sebuah Barter Politik-Ekonomi Canberrs-
Jakarta?. Kupang: Yayasan Peduli Timor Barat.
Taylor, N., Goodrich, C., Fitzgerald, G. & McClintock, W., 2000. The Value of
longitudinal research as a basis for subsequent social impact assessment. Hong
Kong: International Association for Impact Assessment.
Therik, W., 2008. Nelayan Dalam Bayang Juragan: Potret Kehidupan Nelayan
Tradisional Bajo di Tanjung Pasir, Pulau Rote, Nusa Tenggara Timur. Salatiga:
Working Paper Institute of Indonesia Tenggara Studies, Universitas Satya Wacana.
Turner, J. C. & Oakes, P. J., 1986. The significance of the social identity concept for
social psychology with reference to individualism, interactionism and social
influence. [Online]
Available at: https://onlinelibrary.wiley.com/doi/pdf/10.1111/j.2044-
8309.1986.tb00732.x
[Accessed 10 October 2018].
Umar, 2017. Salt Farm Production [Interview] (16 08 2017).
UN Economic and Social Development, 2009. Core Publications Agenda 21 [Online].
Available: , s.l.: DSD Resources.
UNDESA, 1992. Agenda 21: The United Nations Programme of Action from Rio, s.l.:
s.n.
UNDP, 2016. Human Development Report 2016: Human Development for Everyone,
Briefing note for countries on the 2016 Human Development Report Indonesia.
UNEP, 1992. Rio Declaration on Environment and Development. United Nations
Conference on Environment and Development, 3 to 14 June 1992 Rio de Janeiro,
UNEP.
UNESCO, 2001. UNESCO Universal Declaration on Cultural Diversity. s.l., UNESCO.
UNFAO, 2000. FAO Fisheries Country Profile - The Republic of Indonesia May 2000.
s.l., s.n.
372 | P a g e
United Nations General Assembly, 2000. Resolution 55/2 United Nations Millennium
Declaration. [Online]
Available at: http://www.un.org/en/ga/search/view_doc.asp?symbol=A/RES/55/2
United Nations, 2018a. The Sustainable Development Agenda. [Online]
Available at: https://www.un.org/sustainabledevelopment/development-agenda/
[Accessed 8 August 2018].
United Nations, 2018b. Poverty - United Nations Sustainable Development. [Online]
Available at: https://www.un.org/sustainabledevelopment/poverty/
[Accessed 8 August 2018].
Uphoff, N., 2000. Understanding Social Capital: Learning from the Analysis and
Experience of Participation. In: P. Dasgupta & I. Serageldin, eds. Social Capital: A
Multifaceted Perspective. Washington: The International Bank for Reconstruction
and Development/The World Bank, pp. 215-249.
van Schooten, M., Vanclay, F. & Slootweg, R., 2003. Conceptualising social change
processes and social impacts. In: H. Becker & F. Vanclay, eds. The International
Handbook of Social Impact Assessment. Cheltenham: Edward Elgar Publishing
Limited, pp. 74-91.
Vanclay, F., 2002. Conceptualising Social impacts. Environmental Impact Assessment
Review, Volume 22, pp. 183-211.
Vanclay, F., 2003. SIA Principles: International Principles For Social Impact
Assessment. Impact Assessment and Project Appraisal, Volume 21, pp. 5-11.
Victory News, 2017. Australia Tangkap Nelayan NTT. Victory News Kupang, 2 May.
Wahab, D., 2010. Overvie w of the Impelemntation of Agenda 21: New challenges and
opportunities, s.l.: s.n.
Walker, J., Mitchell, B. & Wismer, S., 2001. Livelihood Strategy Approach to
Community Based Planning and Assessment: A Case Study of Mola, Indonesia.
Impact Assessment and Project Appraisal, Volume 19, pp. 297-309.
White, B., 2017. The myth of the harmonious village. Inside Indonesia, Volume 128.
Widodo, S. K., 2007. Dinamika Kebijakan Tehadap Neylan: Tinjauan Historis Pada
Neylan Pantai Utara Jawa, 1900-2000, Pidato Pengukuhan, Semarang: Badan
Penerbit Universitas Diponegoro.
Williams, C. C. & Millington, A. C., 2004. The Diverse and Contested Meanings of
Sustainable Development. The Geographical Journal, Volume 170, pp. 99-104.

373 | P a g e
Woolcock, M., 2001. The Place of Social Capital in Understanding Social and
Economic Outcomes. [Online]
Available at:
https://www.researchgate.net/profile/Michael_Woolcock2/publication/269576288_T
he_Place_of_Social_Capital_in_Understanding_Social_and_Economic_Outcome/li
nks/57c77f6c08ae28c01d4f84ee.pdf
[Accessed 20 October 2018].
World Bank, 2015. Indonesia - Country partnership framework for the period FY16 - 20
(English). [Online]
Available at:
http://documents.worldbank.org/curated/en/195141467986374707/Indonesia-
Country-partnership-framework-for-the-period-FY16-2
[Accessed 20 August 2018].
World Bank, 2018. Poverty & Equity Data Portal. [Online]
Available at: http://povertydata.worldbank.org/poverty/home/
[Accessed 17 August 2018].
Wright, E. O., 1994. Explanation and Emancipation in Marxism and Feminism. [Online]
Available at: https://www.ssc.wisc.edu/~wright/SOC621/wriexp.pdf
[Accessed 12 September 2018].
Zuryani, N., 2006. Empowerment and Development Initiatives: Two Villages from the
European Union Project in Northern Bali. (Unpublished doctoral dissertation):
Newcastle University, Australia.

374 | P a g e
Bibliography for Chapter 2: The Sustainable Development – Sustainable
Livelihood Nexus: Research matters for East Nusa Tenggara
Allison, E. & Ellis, F., 2001. The livelihoods approach and management of small-scale fisheries. Journal of Marine Policy, Volume 25, pp. 377-388.
Ashley, C. & Carney, D., 1999. Sustainable livelihoods: Lessons from early experience, London: Department for International Development.
AusAID, 2013. Indonesia Country Report. [Online]
Available at: http://www.ausaid.gov.au/countries/eastasia/indonesia/Pages/home.aspx
[Accessed July 2014].
Barlow, C. & Gonowarsito, R., 2009. Socio-Economic Conditions and Poverty Allieviation in East Nusa Tenggara. In: B. Resosudarmo & F. Jotzo, eds. Working with Nature against Poverty: Development, Resources and the Environment in East Indonesia. Singapore: ISEAS Publishing.
Bradshaw, J. R., 1972. The concept of social need. New Society. New Society, Volume 496, pp. 640-643.
Bridger, J., 1999. Toward an interactional approach to sustainable community development. Journal of Rural Studies, Volume 15, pp. 377-387.
Brundtland, G. H. & Khalid, M. e. a., 1987. Our Common Future. s.l.:World Commission on Environment and Development.
Cernea, M., 1997. The risks and reconstruction model for resettling displaced populations. World Environment, Volume 25, pp. 1569-1587.
Chambers, R. & Conway, G. R., 1991. Sustainable rural livelihoods: Practical concepts for the 21st Century. IDS Discussion Paper 296.
Daly, H. E., 1973. Toward a Steady-State Economy. s.l.:W. H. Freeman & Co..
Daly, H. E., 1992. Allocation, distribution and scale towards an economics that is efficient, just and sustainable. Ecological Economics, Volume 6, pp. 185-193.
Davey, P., 2009. Environmental Health Action: Creating Liveable Healthy Cities in the Asia-Pacific. Singapore, Environmental Health Action: Creating Liveable Healthy Cities in the Asia-Pacific Forum.
Dendi, A., Heile, H. J. & Makambombu, S., 2009. Improving the Livelihood of the Poor: Challenges and lessons from East Nusa Tenggara. In: B. Resosudarmo & F. Jotzo, eds. Working with Nature Against Poverty: Development, Resources and the Environment in Eastern Indonesia. Singapore: ISEAS.
Fenton, M., Coakes, S. & Marshall, N., 2003. Vulnerability and capacity measurement. In: The International Handbook of Social Impact Assessment. Cheltenham: Edward Elgar Publishing Limited.
Ferrol-Schulte, D., Wolff, M., Ferse, S. & Glaser, M., 2013. Sustainable Livelihoods Approach in tropical coastal and marine social–ecological systems: A review, Marine Policy. Marine Policy, Volume 42, pp. 253-258.

375 | P a g e
Fox, J. J., Adhuri, D. S., Therik, T. & Carnegie, M., 2009. Searching for Livelihood: The Dilemma of Small-Boat Fishermen in Eastern Indonesia. In: B. P. Resosudarmo & F. Jotzo, eds. Working with Nature Against Poverty. 1 ed. Singapore: ISEAS Publishing.
Fox, J. J. & Sen, S., 2002. A Study Of Socio-Economic Issues Facing Traditional Indonesian Fishers Who Access The MOU Box, Canberra: A Report for Environment Australia.
Frasera, E. D. et al., 2006. Bottom up and top down: Analysis of participatory processes for sustainability indicator identification as a pathway to community empowerment and sustainable environmental management. Journal of Environmental Management, Volume 78, pp. 114-127.
Giddings, B., Hopwood, B. & O'Brien, G., 2002. Environment, economy and society: Fitting them together into sustainable development. Sustainable Development, Volume 10, pp. 187-196.
Goldie, J., Douglas, B. & Furnass, B., 2005. An urgent need to change direction. In: J. Goldie, B. Douglas & B. Furnass, eds. In Search of Sustainability. Melbourne: CSIRO Publishing.
Government of Indonesia, 1997. Agenda 21 Indonesia: Section IV Natural Resource Management, s.l.: United Nations Commission on Sustainable Development Fifth Session.
Harding, R., 1998. Environmental decision-making: The roles of scientists, engineers, and the public. Sydney: The Federation Press.
Harding, R., Hendricks, C. M. & Faruqi, M., 2009. Environmental decision Making: exploring complexity and context. Sydney: The Federation Press.
Hopwood, B., Mellor, M. & O'Brien, G., 2005. Sustainable Development: Mapping Different Approaches. Journal of Sustainable Development, 13(1), pp. 38-52.
Hugo, G., 2005. Second-Class Citizens?: Poverty and Mobility Mark the Neglected East. Inside Indonesia, Volume 82.
Ife, J., 2002. Community developemnt: community-based alternatives in an age of globilisation. Sydney: Pearson Education Australia.
Khodijah, K., 2014. Sustainable Livelihoods of Fishermen Households Headed by Women (Case Study in Riau Islands Province of Indonesia). Asian Social Science, 10(9), pp. 187-196.
King, P. G., 2007. The Australian Government’s Responses To IUU Fishing In Its Northern Waters. (Unpublished honours thesis): Griffith University, Brisbane, Australia.
Krannich, R. S., 2012. Social Change in Natural Resource-Based Rural Communities: The Evolution of Sociological Research and Knowledge as Influenced by William R. Freudenburg. Journal of Environment Studies Science, Volume 2, pp. 18-27.
Kronen, M., Vunisea, A., Magron, F. & McArdle, B., 2010. Socio-Economic Drivers and Indicators for Artisanal Coastal Fisheries in Pacific Island Countries and Territories and Their Use for Fisheries Management Strategies. Marine Policy, Volume 34, pp. 1135-1143.
McDowell, C., 2002. Involuntary Resettlement, Impoverishment Risks, and Sustainable Livelihoods. The Australasian Journal of Disaster and Trauma, Volume 2.

376 | P a g e
McMichael, T., 2005. Sustainability, health and well-being. In: In search of sustainability. Melbourne: CSIRO Publishing.
Mulligan, M. & Nadarajah, Y., 2008. Working on the sustainability of local communities with a 'community-engaged' research methodology, Local Environment. Local Environment, 13(2), pp. 81-94.
Ormeling, F., 1957. The Timor problem: A geographical interpretation of an underveloped island. The Hague: Wolters, Groningen and Nijhoff.
Puspasari, S., 2007. Sustainable Development: A Case for Indonesia. Jakarta: National Development Planning Agency (Bappenas).
Redclift, M., 1992. The Meaning of Sustainable Development. Geo/forum, Volume 23, pp. 395-403.
Redclift, M., 2005. Sustainable Development (1987–2005): An Oxymoron Comes of Age. Sustainable Development, Volume 13, pp. 212-227.
Rees, W. E., 1998. How should a parasite value its host?. Ecological Economics, Volume 25, pp. 49-52.
Resosudarmo, B. & Jotzo, F., 2009. Development, Resources and Environment in Eastern Indonesia. In: Working with Nature Against Poverty: Development, Resources and the Environment in East Indonesia. Singapore: ISEAS Publishing.
Rickson, R. E., Rickson, K. E., Hoppe, P. & Burch, D., 2015. Global Companies and Local Community Relations:Power, Access and Partenership in Food Production and Rural Resource Development. In: Edward Elgar Handbook on the Globalization of Agriculture. London: Edward Edgar Publishing, pp. 368-386.
Scoones, I., 1998. Sustainable Rural Livelihoods: A Framework for Analysis. IDS Working Paper 72.
Scoones, I., 2009. Livelihood perspectives and rural development. Journal of Peasant Studies, 36(1).
Smith, C. & Rees, G., 1998. Economic Development. USA: Palgrave Macmillan.
Stivers, R., 1976. The sustainable society: Ethics and economic growth. Philidephia: Westminster Press.
UNDESA, 1992. Agenda 21: The United Nations Programme of Action from Rio, s.l.: s.n.
UNEP, 1992. Rio Declaration on Environment and Development. United Nations Conference on Environment and Development, 3 to 14 June 1992 Rio de Janeiro, UNEP.
UNESCO, 2001. UNESCO Universal Declaration on Cultural Diversity. s.l., UNESCO.
UNFAO, 2000. FAO Fisheries Country Profile - The Republic of Indonesia May 2000. s.l., s.n.
United Nations General Assembly, 2000. Resolution 55/2 United Nations Millennium Declaration. [Online]
Available at: http://www.un.org/en/ga/search/view_doc.asp?symbol=A/RES/55/2

377 | P a g e
Wahab, D., 2010. Overvie w of the Impelemntation of Agenda 21: New challenges and opportunities, s.l.: s.n.
Walker, J., Mitchell, B. & Wismer, S., 2001. Livelihood Strategy Approach to Community Based Planning and Assessment: A Case Study of Mola, Indonesia. Impact Assessment and Project Appraisal, Volume 19, pp. 297-309.
Williams, C. C. & Millington, A. C., 2004. The Diverse and Contested Meanings of Sustainable Development. The Geographical Journal, Volume 170, pp. 99-104.
Zuryani, N., 2006. Empowerment and Development Initiatives: Two Villages from the European Union Project in Northern Bali. (Unpublished doctoral dissertation): Newcastle University, Australia.

378 | P a g e
Bibliography for the Government Report
Agreement between Australia and Indonesia concerning Certain Boundaries between Papua New Guinea and Indonesia. 12 February 1973. AUSTRALIAN TREATY SERIES 1974 No. 26. Jakarta, Australian Government Publishing Service Canberra.
“Agreed Minutes of Meeting Between Officials of Indonesia and Australia on Fisheries”, Jakarta, 29 April 1989, http://www.deplu.go.id/?catergory_id=115&news_id=655&main_id=84.
AFMA, Schedule of Coordinates on MP 02/343 11.4A GeoCat 63765.
Ardani, S. 2010. RE: Reflexions of a Fisherman. Correspondence with KING, P.G.
Ardani, S. 2012. Fisherman in Papela, Private notes.
Arsyad, L., 2005. Pengantar Perencanaan Pembangunan Ekonomi Daerah. Edisi Kedua. Penerbit BPFE-Yogyakarta.
Ashley, C. & Carney, D. 1999. Sustainable livelihoods: Lessons from early experience. London: Department for International Development.
ATSEA, 2012. Transboundry Diagnostic Analysis for the Arafura and Timor Sea. www.atsea-program.org
Barlow, C., and Gondowarsito, Ria 2009. Socio-Economic Conditions and Poverty Allieviation in East Nusa Tenggara. In: Resosudarmo, B. P., and Jotzo, Frank (ed.) Working with Nature against Poverty: Development, Resources and the Environment in East Indonesia. Singapore.
Bureau of Statistics Republic of Indonesia, 2010.
Bureau of Statistics Rote Ndao, 2017.
BPS Kabupaten-Rote-Ndao, 2016. Statistik Kesejahteraan Rakyat Kabupaten Rote Ndao 2015.
BPS Kabupaten-Rote-Ndao, 2017. Kecamatan Rote Barat Daya dalam Angka 2016.
BPS Kabupaten-Rote-Ndao, 2017. Kecamatan Rote Timor dalam Angka 2016.
Butcher, J. G. 2002. Getting into Trouble: The Diaspora of Thai Trawlers, 1965-2002. International Journal of Maritime History, XIV.
Butcher, J. G. 2004. The Closing of the Frontiers: A History of the Marine Fisheries of Southeast Asia c. 1850-2000, Singapore, Institute of Southeast Asian Studies.
Cafiero, C., 2003. Agricultural Policies in Development Countries. Training Materials. Ministry of Agriculture and Agrarian Reform. National Policy, Damascus.
Carnegie, M. (2008). Development prospects in Eastern Indonesia: Learning from Oelua’s diverse economy. Asia Pacific Viewpoint, 29(3), 354-369.
Carnegie, M. (2010). Living with difference in rural Indonesia: What can be learned for

379 | P a g e
national and regional political agendas? Journal of Southeast Asian Studies, 41(3), 449-481.
Crawford, B. 2002. Seaweed Farming: An Alternative Livelihood for Small-Scale Fishers? : Coastal Resources Center University of Rhode Island.
Daly, H. E. 1993. Section-1, Chapter-1 of Agenda-21 (International Policies to Accelerate Sustainable Development in Developing-Countries and Related Domestic Policies) - Unced. Population and Environment, 15, 66-69.
DKP Economic Empowerment of Coastal Community Development Programs. http://www.dkp.go.id/ .
“DKP Pacu Produksi Perikanan Maluku”, Department of Marine Affairs and Fisheries Indonesia Press Release, 12 April 2007, http://www.dkp.go.id/content.php?c=3840.
“Exploitasai Perikanan Di Pantura Berlebihan”, Media Indonesia, 30 June 2006, http://intra.lipi.go.id/masuk.cgi?berita&&&&2006&2&1160002814 (visited 23/10/06).
“FAO Fisheries Country Profile – The Republic of Indonesia May 2000”, Food and Agriculture Organisation of the United Nation, http://www.fao.org/fi/fcp/en/IDN/profile.htm (visited 30/10/2006).
Fox, J. 1977. Harvest of the Palm: Ecological Change in Eastern Indonesia. London: Harvard University Press.
Fox, J. J. 1998. Reefs and Shoals in Australia- Indonesian Relations: Traditional Indonesian Fishermen. In: QUILTY, A. M. A. M. (ed.) Australia in Asia: Episodes. Melbourne: Oxford University Press Australia.
Fox, James J. (2002), A Study of Socio-Economic Issues Facing Traditional Indonesian Fishers Who Access to MOU Box. Research School of Pacific and Asian Studies The Australian National University.
Fox, J. J., ADHURI, DEDI S., THERIK, TOM, AND CARNEGIE. MICHELLE 2009. Searching for Livelihood: The Dilemma of Small-Boat Fishermen in Eastern Indonesia. In: RESOSUDARMO, B. P., AND JOTZO, FRANK (ed.) Working with Nature Against Poverty. 1st ed. Singapore: ISEAS Publishing.
Gillett, R., 1996. Workshop Presentation Paper Number 1: Marine Fisheries Resources and Management in Indonesia with Emphasis on the Exclusive Economic Zone. Jakarta: Directorate General of Fisheries in Cooperation with the Food and Agriculture Organisation of the United Nations.
Goulet, Denis, 1971. The Cruel Choice: A New Concept in the Theory of Development. Atheneum, New York, NY, USA: xv + 362 pp.
Herrick, Bruce & Kindleberger, Charles P. 1983. Economic Development, 4th edn. McGraw-Hill, Tokyo, Japan: xvi + 542 pp., illustr.
ILO (1976). Employment, Growth and Basic Needs, A One World Problem. ILO, Geneva, Switzerland: 68 pp.

380 | P a g e
IUCN (1980). World Conservation Strategy: Living Resource Conservation for Sustainable Development: IUCN-UNEPWWF, Gland, Switzerland: pack of c. 50 unnumbered.
IUU Fishing costs Indonesia $4 Billion per year. Kompas 4 June 2012.
Kadariah; L. Karlina dan C. Gray., 1978. Pengantar Evaluasi Proyek. Lembaga Penerbit FE UI, Jakarta.
Kronen, M., Vunisea, A., Magron, F. & McAdle, B. 2010. Socio-economic drivers and indicators for artisanal coastal fisheries in Pacific island countries and territories and their use for fisheries management strategies. Marine Policy 34, 1135-1143.
Lee, James A. & Goodland, Robert, 1986. Economic development and the environment. Finance and Development, 23(4), pp. 36-9.
Ma, Michelle. 2017. Diversification key to resilient fishing communities, University of Washington. www.washington. Edu/news/2017/01/17).
Meier, Gerald M. (1976). Leading Issues in Economic Development, 3rd edn. Oxford University Press, New York, NY, USA: xv+ 862 pp.
Meier, Gerald M. (1984). Emerging From Poverty: The Economics That Really Matters. Oxford University Press, New York, NY, USA: ix +25 pp.
“Memorandum of Understanding Between the Government of Australia and the Government of the Republic of Indonesia regarding the Operations of Indonesian traditional Fisheries in an Area of the Australian Exclusive Fishing Zone (AEFZ) and Continental Shelf”, 7 November 1974, http://www.deplu.go.id/?category_id=115&news_id=654&main_id=84.
Monke, E.A., S.R. Pearson. 1989. Policy analysis Matrix for Development. Cornel University Press. Ithaca, London.
Nainggolan, P., 2014. Crucial Problems in The Outmost Archipelagic Municipality Rote Ndao, Sekretariat Jenderal DPR RI
Nolan, Brooke (2011). Ekonomi Politik Masyarakat Nelayan Skala Kecil: Sebuah Studi Perbandingan Masyarakat Pendatang di Rote Ndao dan Jawa Timur, Disertasi, Universitas Muhammadiyah Malang, Malang.
Paulus, C. Agusta, 2016. The Development of Sustainable Livelihoods for Peasant-Fisher in Rote Island East Nusa Tenggara. International Conference on Technology, Innovation, and Society (ICTIS).
Pellu, Lintje H., (2008). A Domain United, A Domain Divided, An Ethnographic Study of Social Relations and Social Change among the People of Landu, East Rote, Eastern Indonesia. Thesis, The Australian National University.
Pearson, S.R, C. Gotsch, S. Bahri, 2005. Aplikasi Policy Analysis Matrix. Pertanian Indonesia. Edisi Pertama. Penerbit Yayasan Obor, Indonesia, Jakarta.
“Proceedings of the National Workshop on Illegal, Unreported and Unregulated (IUU) Fishing” Jakarta Indonesia 28 April 2005, Research Centre for Capture Fisheries

381 | P a g e
Agency for Marine and Fisheries Research Department of Marine Affairs and Fisheries, http://www.dkp.go.id.
Redclift, M. 1992. The Meaning of Sustainable Development. Geo/forum Voiume, 23, 395-403.
Resosudarmo, B and Jotzo, F. 2009, ‘Development, Resources, and The Environment in Eastern Indonesia’, in Budi R Resosudarmo and Frank Jotzo (ed), Working with Nature Against Poverty: Development, Resources and the Environment in Eastern Indonesia, Institute of Southeast Asian Study (ISAS), Singapore, pp. 1-18
Scoones, I. 1998. Sustainable Rural Livelihoods: A Framework for Analysis IDS Working Paper 72.
Soekartawai. 1996. Dasar Penyusunan Evaluasi Proyek. Pustaka Sinar Harapan, Jakarta.
Streeten, Paul, BurkiI, Shahid Javed, Haq, Mahbub Ul, Hicks, Norman & Stewart, Frances (1981). First Things First: Meeting Basic Needs in Developing Countries. Oxford University Press for The World Bank, New York, NY, USA: x + 206 pp., illustr.
Stewart, Frances (1985). Planning To Meet Basic Needs. Macmillan,London, England: ix + 244 pp.
Sultans in Indonesia: https://sultansinindonesieblog.wordpress.com/timor/rote-thie/
Tanone, Ferdi, 2008. Skandal Laut Timor, Sebuah Barter Politik-Ekonomi Canberra-Jakarta, Yayasan Peduli Timor Barat (YPTB), Kupang.
Tolba, Mostafa K., quoted in BISWAS, Margaret R. & BISWAS, Asit K. (1984). Complementarity between environmental and development processes. Environmental Conservation, 11(1), p. 39.
Tanoni, F. 2008. Skandal Laut Timor: Sebuah Barter Politik-Ekonomi Canberrs-Jakarta?, Kupang, Yayasan Peduli Timor Barat.
United Nations General Assembley 2000. Resolution 55/2 United Nations Millennium Declaration. http://www.un.org/en/ga/search/view_doc.asp?symbol=A/RES/55/2 .
Unknown, Victory News, 2 May 2007
Wright, Cassandra, Lewis, Belinda, 2012. On the Edge of Crisis: Contending Perspectives on Development, Tourism, and Community Participation on Rote Island, Indonesia Austrian Journal of South-East Asian Studies, 5(1), 102-127.
www.abc.net.au/news/2009-10-22/oil-leaking-five-times-faster-than-thought/1113420 .
www.offshore-technology.com/projects/montara-oil-field/ .