DELAWARE 2024
44
Office of Occupational & Labor Market Information Delaware Department of Labor Patrice Gilliam-Johnson, Ph.D., Secretary August, 2016 DELAWARE 2024 Occupation & Industry Projections
-
Upload
khangminh22 -
Category
Documents
-
view
0 -
download
0
Transcript of DELAWARE 2024

Office of Occupational & Labor Market InformationDelaware Department of Labor
Patrice Gilliam-Johnson, Ph.D., SecretaryAugust, 2016
DELAWARE 2024Occupation & Industry Projections

Table of ContentsIntroduction ........................................................................................................................................................... 1 Occupation Projections by Occupational Group ............................................................................................. 2 Table 1: Occupation Projections by Occupational Group ....................................................................5
Occupation Projections by Career Cluster .......................................................................................................21 Table 2: Occupation Projections by Career Cluster .............................................................................22
Industry Projections .............................................................................................................................................36 Table 3: Industry Projections .................................................................................................................. 38
Office of Occupational & Labor Market Information Publications ..................................... inside back cover
DELAWARE 2024Occupation & Industry Projections
AcknowledgementsThis report was written by George Sharpley, Ph.D., Chief, Office of Occupational & Labor Market Information (OOLMI). He and Thomas E. Dougherty, Labor Market Economist, generated the projections. Kristie Manley developed the design and layout.
Contact: George Sharpley Delaware Department of Labor Office of Occupational & Labor Market Information Fox Valley Annex 19 West Lea Blvd. Wilmington, DE 19802 Phone: (302) 761-8060 Email: [email protected]

Occupation & Industry Projections 1
Every two years, the federal Bureau of Labor Statistics produces industry and occupation forecasts for a period ten years into the future and the states are asked to do the same for their respective economies. This publication presents Delaware’s efforts for the period 2014 to 2024. It supersedes the last such set of projections, which were generated for the 2012-2022 period and published in July, 2014.
Delaware is projected to have 37,150 more jobs in 2024 than in 2014, for an average annual growth rate of 0.8 percent. Health Care and Social Assistance is again expected to show the most growth, accounting for over one-quarter of the total new jobs projected. This will enhance its stature as the state’s largest industry in terms of employment. By 2024 nearly one-sixth of the jobs in the state will be in Health Care, up from one-seventh in 2014.
At the time of writing (July 2016), Delaware is in the seventh year of an economic expansion that has added 51,300 jobs in the state. A continuation of this expansion unabated through the projection period in 2024 would be unprecedented-therefore, a period of interrupted job growth is included in the ten-year projection. This is explained in a little more detail in the final section of this publication.
Introduction

2 Delaware 2024
Occupation Projections by Occupational Group
Occupations With the Most Annual Openings, 2014–2024
In this section, we present job projections and associated data for 478 specific occupations in Delaware, listed by major occupational group. The data elements provided for each occupation are: the Standard Occupational Classification (SOC) code, an estimate of the total number of filled jobs in the state in 2014, the projection of total filled jobs in 2024, the skill category, wage category, job availability, and usual education, experience, and training requirements. In the following section we present these same occupations arranged by the 16 career clusters used by state educators. There you will find the forecasted annual growth rate, annual openings due to growth, annual openings due to net replacement, and the 2014 estimated average annual wage for each occupation.
Estimates of past employment levels and projections of future employment levels do not refer to the demand
for workers, nor to the supply of workers. They refer to the equilibrium point where the supply and demand for labor are equal-that is, filled jobs. Labor demand and labor supply each have many possible employment levels, depending on the wage level. The wage level adjusts until the supply and demand for any given occupation are the same-that point is the employment estimate or projection for that occupation. Any forecast a decade into the future that predicts shortages or surpluses ignores this fact and is not well grounded in economic theory.
For ease of comparison, this first section presents occupational wages by wage categories. To create the categories, we divided the 464 occupations for which we have wage estimates (there are 14 occupations which are either not covered by wage surveys, or whose wage estimates did not pass validity screening) into quintiles.
Retail Salespersons
Combined Food Preparation/Serving Workers, Inc. Fast Food
Cashiers
Registered Nurses
Waiters and Waitresses
Laborers and Freight, Stock, & Material Movers, Hand
Customer Service Representatives
Janitors and Cleaners, Exc. Maids & Housekeeping Cleaners
Stock Clerks and Order Fillers
Nursing Assistants
Accountants and Auditors
Cooks, Restaurant
Office Clerks, General
General and Operations Managers
Home Health Aides
Elementary School Teachers, Except Special Education
First-Line Supervisors of Retail Sales Workers
Hosts and Hostesses, Restaurant, Lounge, and Coffee Shop
0 100 200 300 400 500 600 700 800
Openings due to growth
Openings due to replacements

Occupation & Industry Projections 3
education, which are intended to describe the typical education level of someone entering the occupation. The education categories range from no formal educational credential (NFE), high school diploma or equivalent (HS), postsecondary vocational training (VocEd), associate’s degree (Assoc), bachelor’s degree (Bach), and master’s degree (Mast) through doctoral or professional degree (PhD/prof). Some occupations typically require experience working in a related field. The work experience measure captures this as one of three possible values: none, less than five years (<5), and over five years (5+). The on-the-job training field has six possible measures for the typical amount of training required to be considered competent in the occupation. These range from none, short-term on-the-job training of one month or less (SOJT), moderate-term on-the-job training of greater than one month to one year (MOJT), long-term on-the-job training of over one year (LOJT), and apprenticeship (App) through internship or residency (Int/res). Those interested in further details on the education, experience, and training requirements should go to: http://www.bls.gov/emp/ep_education_tech.htm
The skill category places each occupation into the high skill (H), middle skill (M), or low skill (L) category based on a combination of education, work experience, training, and formal certification. We worked closely with the Delaware Department of Education’s Career and Technical Education office to develop the categories, which are illustrated in the following table.
There are 92 occupations in the Average category, and 93 in each of the other four categories. These categories are based on the 2014 average annual wage for each occupation. Of course, it should be recognized that some people working in each occupation were paid less than the average, and some were paid more than the average, and that those just entering an occupation should expect to be paid less than this amount. More detailed wage distributions for each of these occupations, including estimates for entry- and experienced level wages, can be obtained by contacting our office.
The lowest-paying 93 occupations (Low) paid below $31,000 per year. The next lowest-paying 93 occupations, those in the Below Average category (-Avg), had average wages between $31,000 and $41,200 per year. The middle category, Average (Avg) paid from $41,201 to $57,000. The second highest-paying category, Above Average (+Avg), had average wages from $57,001 to $75,620, while the 93 highest-paying occupations (High) had average annual wages exceeding $75,620.
The placement of occupations into job availability categories is based on the expected annual openings solely due to growth. An occupation with no expected growth would still be expected to generate openings due to replacement of those who leave employment, but overall job availability would be considered poor compared to occupations with openings due to both growth and replacement. It is through actual expansion of employment within an occupation that potential entrants will find the most opportunity.
There are four categories of job availability: Poor, with no openings due to growth projected; Fair, with from 1 to 3 annual openings due to growth projected; Good, with from 4 to 9 such openings; and Excellent (Excl), with 10 or more annual openings due to growth projected. There are 102 occupations with Excellent job availability, another 102 in the Good category, 140 with Fair job availability prospects, and 134 in the Poor category.
The rest of the data refer to education, experience, and training requirements. There are seven levels of
Wage Category Abbreviation 2014 Average Annual Wage
Low Low Below $31,000
Below Average -Avg $31,001 to $41,200Average Avg $41,201 to $57,000Above Average +Avg $57,001 to $75,620High High Above $75,620
Wage Categories
CategoryAnnual Openings
Due to GrowthNumber of Occupations
in each Category
Poor 0 134
Fair 1 to 3 140
Good 4 to 9 102
Excellent (Excl) 10 or more 102
Job Availability Categories
New Jobs Created by Level of Education, 2014–2024
Bachelor’s Degree or
Higher
More than High School, Less than Bachelor’s
High School
and Below
34%
10%
56%

4 Delaware 2024
Doctoral or professional degree
Master’s degree
Bachelor’s degree
Associate’s degree
Postsecondary vocational training
High School diploma
No Formal Education
Wages by Level of Education, 2014
$140,000
$120,000
$100,000
$80,000
$60,000
$40,000
$20,000
$0
$131,069
$73,166
$83,596
$24,229
$41,470$38,885
$51,481
Projected Openings and Growth by Education Level, 2014–2024
Education
TotalOpenings
2014–2024
Percent of Total
Openings New Jobs
Annual Percent Growth
2015 Unemployment
Rate
Ph.D./Professional 3,560 2.5% 1,120 1.1% 2.6%*
Master’s 3,280 2.3% 1,310 1.3% 2.6%*Bachelor’s 32,940 22.9% 10,860 1.1% 2.6%*Associate’s 3,780 2.6% 1,200 1.0% 4.7% Vocational Education 8,550 6.0% 2,940 1.3% Not AvailableHigh School Graduate 42,150 29.4% 11,170 0.9% 4.9%No Formal Education 49,340 34.4% 10,730 0.8% 7.1%
*Unemployment rate is for Bachelor’s degree or higher
Delaware Skills Categories
Work Experience (years) Training Certification
Education NoneLess than
5 yrsMore than
5 yrsSOJT
(<1 mo.)MOJT
(1-12 mo.)LOJT
(1 yr+)Appren-ticeship
Internship/Residency No Yes
Ph.D./Professional Degree H H H H H H H H H H
Master's H H H H H H H H H HBachelor's H H H H H H H H H HAssociate's M M H M M M M H M MPost-Secondary Certificate/Vocational M M M M M M M M M M
High School or Equivalent L M M L M M M M L MNo Formal Education Credential L L L L L M M M L M
H = High Skill M = Middle Skill L = Low Skill

Occupation Projections by Occupational Group
Occupation & Industry Projections 5
SOCCode Title of Occupation
2014Est.
Empl.
2024Proj.Empl.
WageCat.
Job Avail. Educ.
Work Exp.
JobTraining Skill
SOCCode Title of Occupation
2014Est.
Empl.
2024Proj.Empl.
WageCat.
Job Avail. Educ.
Work Exp.
JobTraining Skill
11-0000 Management Occupations11-1011 Chief Executives 509 499 NA Poor Bach 5+ None H11-1021 General and Operations Managers 4,629 4,950 High Excl Bach 5+ None H11-1031 Legislators 140 144 NA Poor Bach <5 None H11-2011 Advertising and Promotions Managers 61 52 High Poor Bach <5 None H11-2021 Marketing Managers 836 872 High Good Bach 5+ None H11-2022 Sales Managers 790 789 High Poor Bach <5 None H11-2031 Public Relations and Fundraising Managers 193 199 High Fair Bach 5+ None H11-3011 Administrative Services Managers 677 742 High Good Bach <5 None H11-3021 Computer and Information Systems Managers 1,120 1,261 High Excl Bach 5+ None H11-3031 Financial Managers 2,323 2,521 High Excl Bach 5+ None H11-3051 Industrial Production Managers 328 303 High Poor Bach 5+ None H11-3061 Purchasing Managers 101 94 High Poor Bach 5+ None H11-3071 Transportation, Storage, and Distribution
Managers 316 312 High Poor HS 5+ None M11-3111 Compensation and Benefits Managers 52 55 High Poor Bach 5+ None H11-3121 Human Resources Managers 334 353 High Fair Bach 5+ None H11-3131 Training and Development Managers 66 65 High Poor Bach 5+ None H11-9013 Farmers, Ranchers, and Other Agricultural
Managers 3,135 3,128 NA Poor HS 5+ None H11-9021 Construction Managers 640 712 High Good Bach None MOJT H11-9031 Education Administrators, Preschool and
Childcare Center/Program 226 260 Avg Fair Bach <5 None H11-9032 Education Administrators, Elementary and
Secondary School 763 822 High Good Mast 5+ None H11-9033 Education Administrators, Postsecondary 362 401 High Good Mast <5 None H11-9039 Education Administrators, All Other 61 67 High Fair Bach <5 None H11-9041 Architectural and Engineering Managers 488 487 High Poor Bach 5+ None H11-9051 Food Service Managers 482 511 +Avg Fair HS <5 None M11-9061 Funeral Service Managers 82 87 High Poor Assoc <5 None M11-9081 Lodging Managers 89 102 High Fair HS <5 None M11-9111 Medical and Health Services Managers 748 852 High Excl Bach <5 None H11-9121 Natural Sciences Managers 565 539 High Poor Bach 5+ None H11-9141 Property, Real Estate, and Community
Association Managers 686 756 +Avg Good HS <5 None M11-9151 Social and Community Service Managers 918 1,026 +Avg Excl Bach 5+ None H11-9199 Managers, All Other 2,137 2,295 High Excl Bach <5 None H
Table 1: Occupation Projections by Occupational Group

Occupation Projections by Occupational Group
6 Delaware 2024
SOCCode Title of Occupation
2014Est.
Empl.
2024Proj.Empl.
WageCat.
Job Avail. Educ.
Work Exp.
JobTraining Skill
13-0000 Business and Financial Operations Occupations13-1022 Wholesale and Retail Buyers, Except Farm
Products 139 151 Avg Fair Bach None LOJT H13-1023 Purchasing Agents, Except Wholesale, Retail,
and Farm Products 695 698 +Avg Poor Bach None LOJT H13-1031 Claims Adjusters, Examiners, and Investigators 752 801 +Avg Good HS None LOJT M13-1041 Compliance Officers 1,062 1,114 High Good Bach None MOJT H13-1051 Cost Estimators 1,186 1,344 +Avg Excl Bach None None H13-1071 Human Resources Specialists 1,627 1,704 +Avg Good Bach None None H13-1075 Labor Relations Specialists 1,151 1,115 +Avg Poor Bach <5 None H13-1111 Management Analysts 2,214 2,471 High Excl Bach <5 None H13-1121 Meeting, Convention, and Event Planners 300 337 Avg Good Bach None None H13-1131 Fundraisers 419 473 +Avg Good Bach None None H13-1141 Compensation, Benefits, and Job Analysis
Specialists 170 181 +Avg Fair Bach <5 None H13-1151 Training and Development Specialists 908 982 +Avg Good Bach <5 None H13-1161 Market Research Analysts and Marketing
Specialists 1,936 2,281 High Excl Bach None None H13-1199 Business Operations Specialists, All Other 1,589 1,750 +Avg Excl Bach None None H13-2011 Accountants and Auditors 5,081 5,590 +Avg Excl Bach None None H13-2021 Appraisers and Assessors of Real Estate 178 198 Avg Fair Bach None LOJT H13-2031 Budget Analysts 149 159 +Avg Fair Bach None None H13-2041 Credit Analysts 1,157 1,313 +Avg Excl Bach None None H13-2051 Financial Analysts 2,864 3,267 High Excl Bach None None H13-2052 Personal Financial Advisors 1,119 1,450 High Excl Bach None LOJT H13-2053 Insurance Underwriters 422 378 +Avg Poor Bach None MOJT H13-2061 Financial Examiners 583 724 High Excl Bach None MOJT H13-2071 Credit Counselors 131 157 -Avg Fair Bach None MOJT H13-2072 Loan Officers 1,067 1,224 +Avg Excl Bach None MOJT H13-2081 Tax Examiners and Collectors, and Revenue Agents 110 111 +Avg Poor Bach None MOJT H13-2082 Tax Preparers 157 155 NA Poor HS None MOJT H13-2099 Financial Specialists, All Other 682 775 +Avg Good Bach None MOJT H
15-0000 Computer and Mathematical Occupations
15-1111 Computer and Information Research Scientists 88 93 High PoorPhD/prof None None H
15-1121 Computer Systems Analysts 3,282 3,998 High Excl Bach None None H15-1122 Information Security Analysts 249 285 High Good Bach <5 None H15-1131 Computer Programmers 1,266 1,110 High Poor Bach None None H15-1132 Software Developers, Applications 2,581 3,037 High Excl Bach None None H15-1133 Software Developers, Systems Software 1,238 1,367 High Excl Bach None None H15-1134 Web Developers 472 606 High Excl Assoc None None M

Occupation & Industry Projections 7
Occupation Projections by Occupational Group
SOCCode Title of Occupation
2014Est.
Empl.
2024Proj.Empl.
WageCat.
Job Avail. Educ.
Work Exp.
JobTraining Skill
15-1141 Database Administrators 468 521 High Good Bach <5 None H15-1142 Network and Computer Systems Administrators 1,123 1,207 +Avg Good Bach None None H15-1143 Computer Network Architects 604 669 High Good Bach 5+ None H15-1151 Computer User Support Specialists 1,290 1,455 Avg Excl HS None None M15-1152 Computer Network Support Specialists 491 537 +Avg Good Assoc None None M15-1199 Computer Occupations, All Other 190 205 High Fair Bach None None H15-2031 Operations Research Analysts 563 773 High Excl Bach None None H15-2041 Statisticians 98 132 High Fair Mast None None H
17-0000 Architecture and Engineering Occupations
17-1011 Architects, Except Landscape and Naval 198 204 High Fair Bach None Int/res H
17-1012 Landscape Architects 55 54 +Avg Poor Bach None Int/res H17-1022 Surveyors 79 74 +Avg Poor Bach <5 None H17-2041 Chemical Engineers 711 706 High Poor Bach None None H17-2051 Civil Engineers 905 968 High Good Bach None None H17-2071 Electrical Engineers 475 478 High Poor Bach None None H17-2081 Environmental Engineers 166 180 High Fair Bach None None H17-2111 Health and Safety Engineers, Except Mining
Safety Engineers and Inspectors 57 58 High Poor Bach None None H17-2112 Industrial Engineers 524 520 High Poor Bach None None H17-2141 Mechanical Engineers 728 771 High Good Bach None None H17-2199 Engineers, All Other 53 59 High Fair Bach None None H17-3011 Architectural and Civil Drafters 314 293 Avg Poor Assoc None None M17-3012 Electrical and Electronics Drafters 90 95 +Avg Poor Assoc None None M17-3013 Mechanical Drafters 164 159 +Avg Poor Assoc None None M17-3022 Civil Engineering Technicians 437 454 Avg Fair Assoc None None M17-3023 Electrical and Electronics Engineering
Technicians 165 174 Avg Fair Assoc None None M17-3026 Industrial Engineering Technicians 137 141 +Avg Poor Assoc None None M17-3031 Surveying and Mapping Technicians 129 115 -Avg Poor HS None MOJT M
19-0000 Life, Physical, and Social Science Occupations 19-1013 Soil and Plant Scientists 77 82 +Avg Poor Bach None None H
19-1021 Biochemists and Biophysicists 216 221 High PoorPhD/prof None None H
19-1022 Microbiologists 164 169 +Avg Poor Bach None None H19-2031 Chemists 3,469 3,786 High Excl Bach None None H19-2041 Environmental Scientists and Specialists,
Including Health 435 487 NA Good Bach None None H19-2042 Geoscientists, Except Hydrologists and
Geographers 69 76 High Fair Bach None None H19-3022 Survey Researchers 74 81 Avg Fair Mast None None H

8 Delaware 2024
SOCCode Title of Occupation
2014Est.
Empl.
2024Proj.Empl.
WageCat.
Job Avail. Educ.
Work Exp.
JobTraining Skill
Occupation Projections by Occupational Group
19-3031 Clinical, Counseling, and School Psychologists 363 430 High GoodPhD/prof None Int/res H
19-3051 Urban and Regional Planners 211 227 +Avg Fair Mast None None H19-4011 Agricultural and Food Science Technicians 71 75 -Avg Poor Assoc None MOJT M19-4021 Biological Technicians 93 93 -Avg Poor Bach None None H19-4031 Chemical Technicians 945 955 +Avg Fair Assoc None MOJT M19-4091 Environmental Science and Protection
Technicians, Including Health 279 309 -Avg Fair Assoc None None M19-4099 Life, Physical, and Social Science Technicians,
All Other 140 148 Avg Fair Assoc None None M
21-0000 Community and Social Service Occupations21-1011 Substance Abuse and Behavioral Disorder
Counselors 206 246 Avg Good Bach None None H21-1012 Educational, Guidance, School, and Vocational
Counselors 1,010 1,120 +Avg Excl Mast None None H21-1013 Marriage and Family Therapists 253 274 Avg Fair Mast None Int/res H21-1014 Mental Health Counselors 611 722 -Avg Excl Mast None Int/res H21-1015 Rehabilitation Counselors 694 779 -Avg Good Mast None None H21-1021 Child, Family, and School Social Workers 1,244 1,363 -Avg Excl Bach None None H21-1022 Healthcare Social Workers 511 586 Avg Good Mast None None H21-1023 Mental Health and Substance Abuse Social
Workers 358 413 Avg Good Bach None None H
21-1029 Social Workers, All Other 91 95 +Avg Poor Bach None None H21-1091 Health Educators 194 221 +Avg Fair Bach None None H21-1092 Probation Officers and Correctional Treatment
Specialists 395 421 Avg Fair Bach None SOJT H21-1093 Social and Human Service Assistants 489 538 Low Good HS None SOJT L21-1094 Community Health Workers 277 318 -Avg Good HS None SOJT L21-1099 Community and Social Service Specialists, All
Other 748 844 -Avg Excl Mast None None H
23-0000 Legal Occupations
23-1011 Lawyers 3,543 3,663 High ExclPhD/prof None None H
23-1012 Judicial Law Clerks 96 92 Avg PoorPhD/prof None None H
23-1021 Administrative Law Judges, Adjudicators, and Hearing Officers 77 79 +Avg Poor
PhD/prof 5+ SOJT H
23-1022 Arbitrators, Mediators, and Conciliators 23 25 -Avg Poor Bach <5 MOJT H
23-1023 Judges, Magistrate Judges, and Magistrates 119 123 High PoorPhD/prof 5+ SOJT H
23-2011 Paralegals and Legal Assistants 1,301 1,357 Avg Good Assoc None None M23-2099 Legal Support Workers, All Other 363 365 +Avg Poor HS None SOJT L

Occupation Projections by Occupational Group
9Occupation & Industry Projections
SOCCode Title of Occupation
2014Est.
Empl.
2024Proj.Empl.
WageCat.
Job Avail. Educ.
Work Exp.
JobTraining Skill
25-0000 Education, Training, and Library Occupations
25-1011 Business Teachers, Postsecondary 372 411 High GoodPhD/prof None None H
25-1021 Computer Science Teachers, Postsecondary 127 140 High FairPhD/prof None None H
25-1022 Mathematical Science Teachers, Postsecondary 183 216 +Avg Fair
PhD/prof None None H
25-1032 Engineering Teachers, Postsecondary 197 226 +Avg FairPhD/prof None None H
25-1041 Agricultural Sciences Teachers, Postsecondary 62 67 High PoorPhD/prof None None H
25-1042 Biological Science Teachers, Postsecondary 69 81 High FairPhD/prof None None H
25-1051 Atmospheric, Earth, Marine, and Space Sciences Teachers, Postsecondary 54 60 High Fair
PhD/prof None None H
25-1052 Chemistry Teachers, Postsecondary 71 83 +Avg FairPhD/prof None None H
25-1063 Economics Teachers, Postsecondary 67 75 High FairPhD/prof None None H
25-1065 Political Science Teachers, Postsecondary 63 70 High FairPhD/prof None None H
25-1066 Psychology Teachers, Postsecondary 57 67 High FairPhD/prof None None H
25-1067 Sociology Teachers, Postsecondary 79 93 +Avg FairPhD/prof None None H
25-1071 Health Specialties Teachers, Postsecondary 218 264 High GoodPhD/prof <5 None H
25-1072 Nursing Instructors and Teachers, Postsecondary 281 343 High Good Mast <5 None H
25-1081 Education Teachers, Postsecondary 206 229 +Avg FairPhD/prof <5 None H
25-1111 Criminal Justice and Law Enforcement Teachers, Postsecondary 57 70 +Avg Fair
PhD/prof None None H
25-1113 Social Work Teachers, Postsecondary 103 120 +Avg FairPhD/prof None None H
25-1121 Art, Drama, and Music Teachers, Postsecondary 335 378 +Avg Good Mast None None H25-1123 English Language and Literature Teachers,
Postsecondary 260 292 +Avg FairPhD/prof None None H
25-1124 Foreign Language and Literature Teachers, Postsecondary 107 121 +Avg Fair
PhD/prof None None H
25-1125 History Teachers, Postsecondary 51 57 +Avg FairPhD/prof None None H
25-1194 Vocational Education Teachers, Postsecondary 210 229 Avg Fair Bach <5 None H
25-1199 Postsecondary Teachers, All Other 91 101 Avg FairPhD/prof None None H
25-2011 Preschool Teachers, Except Special Education 2,146 2,467 Low Excl Assoc None None M

Occupation Projections by Occupational Group
10 Delaware 2024
SOCCode Title of Occupation
2014Est.
Empl.
2024Proj.Empl.
WageCat.
Job Avail. Educ.
Work Exp.
JobTraining Skill
25-2012 Kindergarten Teachers, Except Special Education 465 502 +Avg Good Bach None Int/res H25-2021 Elementary School Teachers, Except Special
Education 4,427 4,813 +Avg Excl Bach None Int/res H25-2022 Middle School Teachers, Except Special and
Career/Technical Education 2,048 2,224 +Avg Excl Bach None Int/res H25-2031 Secondary School Teachers, Except Special
and Career/Technical Education 3,310 3,594 +Avg Excl Bach None Int/res H25-2032 Career/Technical Education Teachers,
Secondary School 183 187 +Avg Poor Bach <5 Int/res H25-2052 Special Education Teachers, Kindergarten and
Elementary School 1,188 1,280 +Avg Good Bach None Int/res H25-2054 Special Education Teachers, Secondary School 288 309 +Avg Fair Bach None Int/res H25-2059 Special Education Teachers, All Other 141 157 +Avg Fair Bach None Int/res H25-3011 Adult Basic and Secondary Education and
Literacy Teachers and Instructors 364 400 +Avg Good Bach None Int/res H25-3021 Self-Enrichment Education Teachers 509 603 Avg Good HS <5 None M25-3097 Teachers and Instructors, All Other, Except
Substitute Teachers 552 606 -Avg Good Bach None Int/res H25-3098 Substitute Teachers 3,378 3,835 Low Excl Bach None Int/res H25-4011 Archivists 29 30 Avg Poor Mast None None H25-4013 Museum Technicians and Conservators 100 104 Avg Poor Bach None None H25-4021 Librarians 486 501 +Avg Fair Mast None None H25-4031 Library Technicians 215 229 -Avg Fair VocEd None None M25-9011 Audio-Visual and Multimedia Collections
Specialists 75 82 -Avg Fair Bach <5 None H25-9021 Farm and Home Management Advisors 191 196 Avg Poor Mast None None H25-9031 Instructional Coordinators 771 846 +Avg Good Mast 5+ None H25-9041 Teacher Assistants 3,174 3,515 Low Excl HS None None L25-9099 Education, Training, and Library Workers, All
Other 152 165 -Avg Fair Bach None None H
27-0000 Arts, Design, Entertainment, Sports, and Media Occupations27-1011 Art Directors 88 94 High Fair Bach 5+ None H27-1014 Multimedia Artists and Animators 62 68 NA Fair Bach None MOJT H27-1023 Floral Designers 153 155 Low Poor HS None MOJT M27-1024 Graphic Designers 531 531 Avg Poor Bach None None H27-1025 Interior Designers 171 185 +Avg Fair Bach None None H27-1026 Merchandise Displayers and Window Trimmers 534 515 Low Poor HS None MOJT M
27-2012 Producers and Directors 140 163 +Avg Fair Bach <5 None H27-2022 Coaches and Scouts 775 842 -Avg Good Bach None None H27-2023 Umpires, Referees, and Other Sports Officials 205 218 -Avg Fair HS None MOJT M27-3031 Public Relations Specialists 738 800 +Avg Good Bach None None H27-3041 Editors 200 191 +Avg Poor Bach <5 None H27-3042 Technical Writers 151 163 +Avg Fair Bach <5 SOJT H

Occupation Projections by Occupational Group
11Occupation & Industry Projections
SOCCode Title of Occupation
2014Est.
Empl.
2024Proj.Empl.
WageCat.
Job Avail. Educ.
Work Exp.
JobTraining Skill
27-3043 Writers and Authors 180 207 +Avg Fair Bach None MOJT H27-4011 Audio and Video Equipment Technicians 75 83 Avg Fair VocEd None SOJT M27-4012 Broadcast Technicians 67 72 NA Poor Assoc None SOJT M27-4021 Photographers 180 187 Avg Fair HS None LOJT M
29-0000 Healthcare Practitioners and Technical Occupations
29-1011 Chiropractors 120 126 High FairPhD/prof None None H
29-1021 Dentists, General 355 376 High FairPhD/prof None None H
29-1031 Dietitians and Nutritionists 162 188 +Avg Fair Bach None Int/res H
29-1041 Optometrists 147 174 High FairPhD/prof None None H
29-1051 Pharmacists 814 862 High GoodPhD/prof None None H
29-1062 Family and General Practitioners 597 607 High FairPhD/prof None Int/res H
29-1063 Internists, General 104 107 High PoorPhD/prof None Int/res H
29-1064 Obstetricians and Gynecologists 135 147 High FairPhD/prof None Int/res H
29-1065 Pediatricians, General 79 81 High PoorPhD/prof None Int/res H
29-1066 Psychiatrists 118 133 High FairPhD/prof None Int/res H
29-1067 Surgeons 203 225 NA FairPhD/prof None Int/res H
29-1069 Physicians and Surgeons, All Other 1,475 1,665 High ExclPhD/prof None Int/res H
29-1071 Physician Assistants 424 525 High Excl Mast None None H29-1122 Occupational Therapists 235 289 High Good Mast None None H
29-1123 Physical Therapists 652 847 High ExclPhD/prof None None H
29-1124 Radiation Therapists 64 73 High Fair Assoc None None M29-1125 Recreational Therapists 89 99 -Avg Fair Bach None None H29-1126 Respiratory Therapists 366 423 +Avg Good Assoc None None M29-1127 Speech-Language Pathologists 442 549 High Excl Mast None None H
29-1131 Veterinarians 285 301 High FairPhD/prof None None H
29-1141 Registered Nurses 10,467 12,211 +Avg Excl Bach None None H29-1151 Nurse Anesthetists 369 416 High Good Mast None None H29-1171 Nurse Practitioners 527 677 High Excl Mast None None H29-2011 Medical and Clinical Laboratory Technologists 443 500 +Avg Good Bach None None H29-2012 Medical and Clinical Laboratory Technicians 189 216 Avg Fair Assoc None None M29-2021 Dental Hygienists 715 758 +Avg Good Assoc None None M

Occupation Projections by Occupational Group
12 Delaware 2024
SOCCode Title of Occupation
2014Est.
Empl.
2024Proj.Empl.
WageCat.
Job Avail. Educ.
Work Exp.
JobTraining Skill
29-2031 Cardiovascular Technologists and Technicians 380 474 Avg Good Assoc None None M29-2032 Diagnostic Medical Sonographers 170 212 +Avg Good Assoc None None M29-2033 Nuclear Medicine Technologists 90 93 +Avg Poor Assoc None None M29-2034 Radiologic Technologists 629 679 +Avg Good Assoc None None M29-2035 Magnetic Resonance Imaging Technologists 271 296 +Avg Fair Assoc <5 None M
29-2041 Emergency Medical Technicians and Paramedics 1,343 1,508 -Avg Excl VocEd None None M29-2051 Dietetic Technicians 133 152 Low Fair Assoc None None M29-2052 Pharmacy Technicians 1,037 1,178 Low Excl HS None MOJT M29-2055 Surgical Technologists 342 390 Avg Good VocEd None None M29-2056 Veterinary Technologists and Technicians 364 416 -Avg Good Assoc None None M29-2057 Ophthalmic Medical Technicians 268 301 -Avg Fair VocEd None None M29-2061 Licensed Practical and Licensed Vocational
Nurses 2,042 2,253 Avg Excl VocEd None None M29-2071 Medical Records and Health Information
Technicians 440 498 -Avg Good VocEd None None M29-2081 Opticians, Dispensing 394 477 -Avg Good HS None LOJT M29-2099 Health Technologists and Technicians, All Other 268 343 Avg Good HS None None L29-9011 Occupational Health and Safety Specialists 361 382 +Avg Fair Bach None None H29-9091 Athletic Trainers 84 102 Avg Fair Bach None None H
31-0000 Healthcare Support Occupations31-1011 Home Health Aides 2,785 3,630 Low Excl NFE None SOJT M31-1013 Psychiatric Aides 135 155 Low Fair HS None SOJT M31-1014 Nursing Assistants 5,638 6,392 Low Excl VocEd None None M31-1015 Orderlies 313 349 Low Good HS None SOJT L31-2011 Occupational Therapy Assistants 82 109 Avg Fair Assoc None None M31-2021 Physical Therapist Assistants 210 278 Avg Good Assoc None None M31-2022 Physical Therapist Aides 416 543 Low Excl HS None SOJT L31-9011 Massage Therapists 228 280 Avg Good VocEd None None M31-9091 Dental Assistants 749 797 -Avg Good VocEd None None M31-9092 Medical Assistants 1,913 2,175 -Avg Excl VocEd None None M31-9093 Medical Equipment Preparers 167 192 -Avg Fair HS None MOJT M31-9094 Medical Transcriptionists 161 151 -Avg Poor VocEd None None M31-9096 Veterinary Assistants and Laboratory Animal
Caretakers 204 204 Low Poor HS None SOJT M31-9097 Phlebotomists 481 573 -Avg Good VocEd None None M
33-0000 Protective Service Occupations33-1011 First-Line Supervisors of Correctional Officers 206 219 Avg Fair HS <5 MOJT M33-1012 First-Line Supervisors of Police and Detectives 314 334 High Fair HS <5 MOJT M33-1099 First-Line Supervisors of Protective Service
Workers, All Other 346 374 Avg Fair HS <5 None M33-3011 Bailiffs 72 77 Low Poor HS None MOJT M

Occupation Projections by Occupational Group
13Occupation & Industry Projections
SOCCode Title of Occupation
2014Est.
Empl.
2024Proj.Empl.
WageCat.
Job Avail. Educ.
Work Exp.
JobTraining Skill
33-3012 Correctional Officers and Jailers 1,653 1,759 -Avg Excl HS None MOJT M33-3021 Detectives and Criminal Investigators 87 93 High Fair HS <5 MOJT M33-3031 Fish and Game Wardens 53 56 Avg Poor Bach None MOJT H33-3051 Police and Sheriff's Patrol Officers 1,745 1,863 +Avg Excl HS None MOJT M33-9011 Animal Control Workers 109 124 -Avg Fair HS None MOJT M33-9031 Gaming Surveillance Officers and Gaming
Investigators 85 86 -Avg Poor HS None SOJT L33-9032 Security Guards 3,637 3,885 Low Excl HS None SOJT L33-9091 Crossing Guards 349 378 -Avg Fair NFE None SOJT L33-9092 Lifeguards and Other Recreational Protective
Service Workers 499 546 Low Good NFE None SOJT L33-9099 Protective Service Workers, All Other 322 352 Low Fair HS None SOJT L
35-0000 Food Preparation and Serving-Related Occupations35-1011 Chefs and Head Cooks 238 264 Avg Fair HS 5+ None M35-1012 First-Line Supervisors of Food Preparation
and Serving Workers 3,030 3,374 -Avg Excl HS <5 None M35-2011 Cooks, Fast Food 565 493 Low Poor NFE None SOJT L35-2012 Cooks, Institution and Cafeteria 2,722 2,770 Low Good NFE None SOJT L35-2014 Cooks, Restaurant 4,017 4,684 Low Excl NFE <5 MOJT M35-2015 Cooks, Short Order 363 348 Low Poor NFE None SOJT L35-2021 Food Preparation Workers 2,152 2,355 Low Excl NFE None SOJT L35-3011 Bartenders 1,753 1,972 Low Excl NFE None SOJT L35-3021 Combined Food Preparation and Serving
Workers, Including Fast Food 11,705 13,231 Low Excl NFE None SOJT L35-3022 Counter Attendants, Cafeteria, Food
Concession, and Coffee Shop 875 942 Low Good NFE None SOJT L35-3031 Waiters and Waitresses 7,678 8,052 Low Excl NFE None SOJT L35-3041 Food Servers, Nonrestaurant 939 1,038 Low Excl NFE None SOJT L35-9011 Dining Room and Cafeteria Attendants and
Bartender Helpers 775 839 Low Good NFE None SOJT L35-9021 Dishwashers 1,855 1,795 Low Poor NFE None SOJT L35-9031 Hosts and Hostesses, Restaurant, Lounge,
and Coffee Shop 1,730 1,844 Low Excl NFE None None L35-9099 Food Preparation and Serving Related Workers,
All Other 107 120 Low Fair NFE None SOJT L
37-0000 Building and Grounds Cleaning and Maintenance Occupations37-1011 First-Line Supervisors of Housekeeping and
Janitorial Workers 826 892 Avg Good HS <5 None M37-1012 First-Line Supervisors of Landscaping, Lawn
Service, and Groundskeeping Workers 509 551 Avg Good HS <5 None M37-2011 Janitors and Cleaners, Except Maids and
Housekeeping Cleaners 8,166 8,794 Low Excl NFE None SOJT L37-2012 Maids and Housekeeping Cleaners 3,241 3,613 Low Excl NFE None SOJT L

Occupation Projections by Occupational Group
14 Delaware 2024
SOCCode Title of Occupation
2014Est.
Empl.
2024Proj.Empl.
WageCat.
Job Avail. Educ.
Work Exp.
JobTraining Skill
37-2019 Building Cleaning Workers, All Other 87 97 Avg Fair NFE None SOJT L37-2021 Pest Control Workers 204 203 -Avg Poor HS None MOJT M37-3011 Landscaping and Groundskeeping Workers 3,837 4,143 Low Excl NFE None SOJT L
39-0000 Personal Care and Service Occupations39-1021 First-Line Supervisors of Personal Service
Workers 946 1,060 Avg Excl HS <5 None M39-2011 Animal Trainers 117 124 -Avg Fair HS None MOJT M39-2021 Nonfarm Animal Caretakers 1,033 1,144 Low Excl HS None SOJT L39-3012 Gaming and Sports Book Writers and Runners 87 93 NA Fair HS None SOJT L39-3031 Ushers, Lobby Attendants, and Ticket Takers 212 213 Low Poor NFE None SOJT L39-3091 Amusement and Recreation Attendants 984 1,077 Low Good NFE None SOJT L39-3093 Locker Room, Coatroom, and Dressing Room
Attendants 70 72 Low Poor HS None SOJT L39-4021 Funeral Attendants 143 140 Low Poor HS None SOJT L
39-5012 Hairdressers, Hairstylists, and Cosmetologists 2,717 3,000 -Avg Excl VocEd None None M39-5093 Shampooers 326 363 Low Good NFE None SOJT L39-7011 Tour Guides and Escorts 234 235 Low Poor HS None MOJT M39-9011 Childcare Workers 2,217 2,520 Low Excl HS None SOJT M39-9021 Personal Care Aides 1,355 1,753 Low Excl NFE None SOJT M39-9031 Fitness Trainers and Aerobics Instructors 1,346 1,496 -Avg Excl HS None SOJT L39-9032 Recreation Workers 998 1,130 Low Excl HS None SOJT L
41-0000 Sales and Related Occupations41-1011 First-Line Supervisors of Retail Sales Workers 4,787 5,067 Avg Excl HS <5 None M41-1012 First-Line Supervisors of Non-Retail Sales
Workers 887 968 High Good HS <5 None M41-2011 Cashiers 10,579 10,774 Low Excl NFE None SOJT L41-2021 Counter and Rental Clerks 1,383 1,423 -Avg Good NFE None SOJT L41-2031 Retail Salespersons 17,969 19,644 Low Excl NFE None SOJT L41-3011 Advertising Sales Agents 353 366 Avg Fair HS None MOJT M41-3021 Insurance Sales Agents 1,190 1,321 +Avg Excl HS None MOJT M41-3031 Securities, Commodities, and Financial
Services Sales Agents 1,778 2,004 High Excl Bach None MOJT H41-3041 Travel Agents 181 159 Avg Poor HS None MOJT M41-3099 Sales Representatives, Services, All Other 2,463 2,761 +Avg Excl HS None MOJT M41-4011 Sales Representatives, Wholesale and
Manufacturing, Technical and Scientific Products 1,314 1,269 High Poor Bach None MOJT H41-4012 Sales Representatives, Wholesale and
Manufacturing, Except Technical and Scientific Products 3,167 3,254 +Avg Good HS None MOJT M
41-9011 Demonstrators and Product Promoters 116 126 Low Fair HS None SOJT L41-9021 Real Estate Brokers 119 119 +Avg Poor HS <5 None M

Occupation Projections by Occupational Group
15Occupation & Industry Projections
SOCCode Title of Occupation
2014Est.
Empl.
2024Proj.Empl.
WageCat.
Job Avail. Educ.
Work Exp.
JobTraining Skill
41-9022 Real Estate Sales Agents 1,312 1,418 +Avg Excl HS None MOJT M41-9031 Sales Engineers 66 70 High Poor Bach None MOJT H41-9099 Sales and Related Workers, All Other 285 312 NA Fair HS None None L
43-0000 Office and Administrative Support Occupations43-1011 First-Line Supervisors of Office and
Administrative Support Workers 5,015 5,489 Avg Excl HS <5 None M43-2011 Switchboard Operators, Including Answering
Service 288 198 Low Poor HS None SOJT L43-3011 Bill and Account Collectors 1,092 1,031 NA Poor HS None MOJT M43-3021 Billing and Posting Clerks 2,406 2,668 -Avg Excl HS None MOJT M43-3031 Bookkeeping, Accounting, and Auditing Clerks 6,736 6,253 -Avg Poor HS None MOJT M43-3041 Gaming Cage Workers 143 160 Low Fair HS None SOJT L43-3051 Payroll and Timekeeping Clerks 449 437 Avg Poor HS None MOJT M43-3061 Procurement Clerks 215 196 -Avg Poor HS None MOJT M43-3071 Tellers 2,231 2,215 Low Poor HS None SOJT L43-3099 Financial Clerks, All Other 195 222 Avg Fair HS None SOJT L43-4011 Brokerage Clerks 292 321 Avg Fair HS None MOJT M43-4031 Court, Municipal, and License Clerks 813 866 -Avg Good HS None MOJT M43-4041 Credit Authorizers, Checkers, and Clerks 1,882 1,888 -Avg Fair HS None MOJT M43-4051 Customer Service Representatives 6,610 7,360 -Avg Excl HS None SOJT L43-4061 Eligibility Interviewers, Government Programs 161 177 -Avg Fair HS None MOJT M43-4071 File Clerks 606 554 Low Poor HS None SOJT L43-4081 Hotel, Motel, and Resort Desk Clerks 647 733 Low Good HS None SOJT L43-4111 Interviewers, Except Eligibility and Loan 685 738 -Avg Good HS None SOJT L43-4121 Library Assistants, Clerical 460 494 Low Fair HS None SOJT L43-4131 Loan Interviewers and Clerks 1,003 1,163 -Avg Excl HS None SOJT L43-4141 New Accounts Clerks 296 292 -Avg Poor HS None MOJT M43-4151 Order Clerks 452 425 -Avg Poor HS None SOJT L43-4161 Human Resources Assistants, Except Payroll
and Timekeeping 453 442 -Avg Poor Assoc None None M43-4171 Receptionists and Information Clerks 2,666 2,760 Low Good HS None SOJT L43-4199 Information and Record Clerks, All Other 262 279 -Avg Fair HS None SOJT L43-5011 Cargo and Freight Agents 105 102 NA Poor HS None SOJT L43-5021 Couriers and Messengers 236 252 Low Fair HS None SOJT L43-5031 Police, Fire, and Ambulance Dispatchers 226 218 -Avg Poor HS None MOJT M43-5032 Dispatchers, Except Police, Fire, and Ambulance 696 751 -Avg Good HS None MOJT M43-5041 Meter Readers, Utilities 115 98 Avg Poor HS None SOJT L43-5051 Postal Service Clerks 228 220 Avg Poor HS None SOJT L43-5052 Postal Service Mail Carriers 991 952 Avg Poor HS None SOJT L43-5053 Postal Service Mail Sorters, Processors, and
Processing Machine Operators 415 360 Avg Poor HS None SOJT L

Occupation Projections by Occupational Group
16 Delaware 2024
SOCCode Title of Occupation
2014Est.
Empl.
2024Proj.Empl.
WageCat.
Job Avail. Educ.
Work Exp.
JobTraining Skill
43-5061 Production, Planning, and Expediting Clerks 380 378 Avg Poor HS None MOJT M43-5071 Shipping, Receiving, and Traffic Clerks 1,979 2,024 -Avg Good HS None SOJT L43-5081 Stock Clerks and Order Fillers 5,979 6,320 Low Excl NFE None SOJT L43-5111 Weighers, Measurers, Checkers, and
Samplers, Recordkeeping 145 149 -Avg Poor HS None SOJT L43-6011 Executive Secretaries and Executive
Administrative Assistants 1,255 1,189 +Avg Poor HS <5 None M43-6012 Legal Secretaries 1,307 1,203 Avg Poor HS None MOJT M43-6013 Medical Secretaries 4,356 4,929 -Avg Excl HS None MOJT M43-6014 Secretaries and Administrative Assistants,
Except Legal, Medical, and Executive 7,522 7,709 -Avg Excl HS None SOJT L43-9011 Computer Operators 305 257 Avg Poor HS None MOJT M43-9021 Data Entry Keyers 995 966 Low Poor HS None MOJT M43-9022 Word Processors and Typists 129 110 Avg Poor HS None SOJT L43-9041 Insurance Claims and Policy Processing Clerks 814 879 Avg Good HS None MOJT M43-9051 Mail Clerks and Mail Machine Operators,
Except Postal Service 472 369 Low Poor HS None SOJT L43-9061 Office Clerks, General 6,969 7,172 Low Excl HS None SOJT L43-9071 Office Machine Operators, Except Computer 519 470 Low Poor HS None SOJT L43-9199 Office and Administrative Support Workers, All
Other 557 616 -Avg Good HS None SOJT L
45-0000 Farming, Fishing, and Forestry Occupations45-1011 First-Line Supervisors of Farming, Fishing, and
Forestry Workers 211 188 Avg Poor HS <5 None M45-2011 Agricultural Inspectors 152 156 Avg Poor Bach None MOJT H45-2091 Agricultural Equipment Operators 258 271 Low Fair NFE None SOJT L45-2092 Farmworkers and Laborers, Crop, Nursery,
and Greenhouse 1,563 1,455 Low Poor NFE None SOJT L45-2093 Farmworkers, Farm, Ranch, and Aquacultural
Animals 1,122 1,066 Low Poor NFE None SOJT L45-4011 Forest and Conservation Workers 182 193 Low Fair HS None MOJT M
47-0000 Construction and Extraction Occupations47-1011 First-Line Supervisors of Construction Trades
and Extraction Workers 1,701 1,965 +Avg Excl HS 5+ None M47-2021 Brickmasons and Blockmasons 321 404 Avg Good HS None App M47-2031 Carpenters 2,711 3,193 Avg Excl HS None App M47-2051 Cement Masons and Concrete Finishers 415 470 Avg Good NFE None MOJT L47-2061 Construction Laborers 2,889 3,337 -Avg Excl NFE None SOJT L47-2071 Paving, Surfacing, and Tamping Equipment
Operators 276 291 Avg Fair HS None MOJT M47-2073 Operating Engineers and Other Construction
Equipment Operators 1,169 1,275 -Avg Excl HS None MOJT M

Occupation Projections by Occupational Group
17Occupation & Industry Projections
SOCCode Title of Occupation
2014Est.
Empl.
2024Proj.Empl.
WageCat.
Job Avail. Educ.
Work Exp.
JobTraining Skill
47-2081 Drywall and Ceiling Tile Installers 384 423 Avg Good NFE None MOJT L47-2111 Electricians 2,193 2,594 Avg Excl HS None App M47-2132 Insulation Workers, Mechanical 316 394 Avg Good HS None App M47-2141 Painters, Construction and Maintenance 709 809 -Avg Excl NFE None MOJT L47-2142 Paperhangers 93 94 -Avg Poor NFE None LOJT M47-2151 Pipelayers 90 96 -Avg Fair NFE None SOJT L47-2152 Plumbers, Pipefitters, and Steamfitters 1,013 1,181 Avg Excl HS None App M47-2181 Roofers 209 245 -Avg Good NFE None MOJT L47-2211 Sheet Metal Workers 529 546 Avg Fair HS None App M47-2221 Structural Iron and Steel Workers 158 164 Avg Fair HS None App M47-3012 Helpers--Carpenters 284 343 Low Good NFE None SOJT L47-3013 Helpers--Electricians 211 258 Low Good HS None SOJT L47-3019 Helpers, Construction Trades, All Other 61 68 Low Fair NFE None SOJT L47-4011 Construction and Building Inspectors 592 641 +Avg Good HS 5+ MOJT M47-4051 Highway Maintenance Workers 87 91 -Avg Poor HS None MOJT M47-4099 Construction and Related Workers, All Other 184 194 -Avg Fair HS None MOJT M
49-0000 Installation, Maintenance, and Repair Occupations49-1011 First-Line Supervisors of Mechanics,
Installers, and Repairers 1,446 1,545 +Avg Excl HS <5 None M49-2011 Computer, Automated Teller, and Office
Machine Repairers 496 536 -Avg Good HS None SOJT L49-2021 Radio, Cellular, and Tower Equipment
Installers and Repairs 79 95 Avg Fair Assoc None MOJT M49-2022 Telecommunications Equipment Installers and
Repairers, Except Line Installers 678 771 NA Good VocEd None MOJT M49-2091 Avionics Technicians 99 95 Avg Poor Assoc None None M49-2094 Electrical and Electronics Repairers,
Commercial and Industrial Equipment 266 262 +Avg Poor VocEd None LOJT M49-2095 Electrical and Electronics Repairers,
Powerhouse, Substation, and Relay 236 238 +Avg Poor VocEd None LOJT M49-2098 Security and Fire Alarm Systems Installers 196 225 Avg Fair HS None MOJT M49-3011 Aircraft Mechanics and Service Technicians 469 476 Avg Fair VocEd None None M49-3021 Automotive Body and Related Repairers 388 421 Avg Fair HS None LOJT M49-3023 Automotive Service Technicians and Mechanics 2,066 2,156 -Avg Good VocEd None SOJT M49-3031 Bus and Truck Mechanics and Diesel Engine
Specialists 526 583 Avg Good HS None LOJT M49-3041 Farm Equipment Mechanics and Service
Technicians 174 187 -Avg Fair HS None LOJT M49-3042 Mobile Heavy Equipment Mechanics, Except
Engines 366 388 Avg Fair HS None LOJT M49-3053 Outdoor Power Equipment and Other Small
Engine Mechanics 172 183 -Avg Fair HS None MOJT M

Occupation Projections by Occupational Group
18 Delaware 2024
SOCCode Title of Occupation
2014Est.
Empl.
2024Proj.Empl.
WageCat.
Job Avail. Educ.
Work Exp.
JobTraining Skill
49-9012 Control and Valve Installers and Repairers, Except Mechanical Door 134 136 +Avg Poor HS None MOJT M
49-9021 Heating, Air Conditioning, and Refrigeration Mechanics and Installers 2,000 2,359 Avg Excl VocEd None LOJT M
49-9031 Home Appliance Repairers 136 141 -Avg Poor HS None MOJT M49-9041 Industrial Machinery Mechanics 884 1,020 Avg Excl HS None LOJT M49-9044 Millwrights 60 79 Avg Fair HS None App M49-9051 Electrical Power-Line Installers and Repairers 438 477 +Avg Good HS None LOJT M49-9052 Telecommunications Line Installers and Repairers 414 421 +Avg Fair HS None LOJT M49-9062 Medical Equipment Repairers 101 111 +Avg Fair Assoc None MOJT M49-9069 Precision Instrument and Equipment
Repairers, All Other 109 112 Avg Poor HS None LOJT M49-9071 Maintenance and Repair Workers, General 3,630 3,959 -Avg Excl HS None LOJT M49-9091 Coin, Vending, and Amusement Machine
Servicers and Repairers 56 57 -Avg Poor HS None SOJT L49-9094 Locksmiths and Safe Repairers 104 90 -Avg Poor HS None LOJT M49-9098 Helpers--Installation, Maintenance, and Repair
Workers 547 605 Low Good HS None SOJT L49-9099 Installation, Maintenance, and Repair
Workers, All Other 482 520 -Avg Good HS None MOJT M
51-0000 Production Occupations51-1011 First-Line Supervisors of Production and
Operating Workers 1,286 1,253 +Avg Poor HS <5 None M51-2022 Electrical and Electronic Equipment Assemblers 351 382 Low Fair HS None MOJT M51-2041 Structural Metal Fabricators and Fitters 143 137 -Avg Poor HS None MOJT M51-2099 Assemblers and Fabricators, All Other 523 561 Low Good HS None MOJT M51-3011 Bakers 541 584 Low Good NFE None LOJT M51-3021 Butchers and Meat Cutters 373 393 -Avg Fair NFE None LOJT M51-3022 Meat, Poultry, and Fish Cutters and Trimmers 3,600 3,787 Low Excl NFE None SOJT L51-3023 Slaughterers and Meat Packers 452 479 Low Fair NFE None SOJT L51-3099 Food Processing Workers, All Other 262 281 Low Fair NFE None MOJT L51-4011 Computer-Controlled Machine Tool Operators,
Metal and Plastic 156 172 -Avg Fair HS None MOJT M51-4021 Extruding and Drawing Machine Setters,
Operators, and Tenders, Metal and Plastic 232 177 -Avg Poor HS None MOJT M51-4031 Cutting, Punching, and Press Machine Setters,
Operators, and Tenders, Metal and Plastic 276 227 -Avg Poor HS None MOJT M51-4033 Grinding, Lapping, Polishing, and Buffing
Machine Tool Setters, Operators, and Tenders, Metal and Plastic 116 93 -Avg Poor HS None MOJT M
51-4041 Machinists 487 524 Avg Good HS None LOJT M51-4072 Molding, Coremaking, and Casting Machine
Setters, Operators, and Tenders, Metal and Plastic 108 84 Low Poor HS None MOJT M51-4121 Welders, Cutters, Solderers, and Brazers 511 532 Avg Fair HS None MOJT M

Occupation Projections by Occupational Group
19Occupation & Industry Projections
SOCCode Title of Occupation
2014Est.
Empl.
2024Proj.Empl.
WageCat.
Job Avail. Educ.
Work Exp.
JobTraining Skill
51-5112 Printing Press Operators 384 361 Avg Poor HS None MOJT M51-5113 Print Binding and Finishing Workers 62 58 Low Poor HS None SOJT L51-6011 Laundry and Dry-Cleaning Workers 662 679 Low Fair NFE None SOJT L51-6021 Pressers, Textile, Garment, and Related
Materials 171 161 Low Poor NFE None SOJT L51-7011 Cabinetmakers and Bench Carpenters 138 152 -Avg Fair HS None MOJT M51-7042 Woodworking Machine Setters, Operators, and
Tenders, Except Sawing 79 87 Low Fair HS None SOJT L51-8012 Power Distributors and Dispatchers 116 116 High Poor HS None LOJT M51-8021 Stationary Engineers and Boiler Operators 59 61 +Avg Poor HS None LOJT M51-8031 Water and Wastewater Treatment Plant and
System Operators 261 288 Avg Fair HS None LOJT M51-8091 Chemical Plant and System Operators 167 146 +Avg Poor HS None LOJT M51-9011 Chemical Equipment Operators and Tenders 874 646 Avg Poor HS None MOJT M51-9012 Separating, Filtering, Clarifying, Precipitating, and
Still Machine Setters, Operators, and Tenders 108 111 -Avg Poor HS None MOJT M51-9023 Mixing and Blending Machine Setters,
Operators, and Tenders 173 183 -Avg Fair HS None MOJT M51-9032 Cutting and Slicing Machine Setters,
Operators, and Tenders 93 79 -Avg Poor HS None SOJT L51-9041 Extruding, Forming, Pressing, and Compacting
Machine Setters, Operators, and Tenders 138 103 Avg Poor HS None MOJT M51-9061 Inspectors, Testers, Sorters, Samplers, and
Weighers 1,033 1,032 -Avg Poor HS None MOJT M51-9111 Packaging and Filling Machine Operators and
Tenders 610 592 -Avg Poor HS None MOJT M51-9122 Painters, Transportation Equipment 173 183 Avg Fair HS None MOJT M51-9192 Cleaning, Washing, and Metal Pickling
Equipment Operators and Tenders 262 279 Low Fair NFE None MOJT L51-9195 Molders, Shapers, and Casters, Except Metal
and Plastic 68 73 Low Poor HS None LOJT M51-9198 Helpers--Production Workers 402 365 Low Poor NFE None SOJT L51-9199 Production Workers, All Other 126 123 NA Poor HS None MOJT M
53-0000 Transportation and Material Moving Occupations53-1031 First-Line Supervisors of Transportation and
Material-Moving Machine and Vehicle Operators 703 743 +Avg Good HS <5 None M53-3011 Ambulance Drivers and Attendants, Except
Emergency Medical Technicians 78 96 Low Fair HS None MOJT M53-3021 Bus Drivers, Transit and Intercity 384 410 -Avg Fair HS None MOJT M53-3022 Bus Drivers, School or Special Client 2,033 2,238 -Avg Excl HS None SOJT M53-3031 Driver/Sales Workers 1,621 1,741 Low Excl HS None SOJT L53-3032 Heavy and Tractor-Trailer Truck Drivers 4,133 4,498 Avg Excl VocEd None SOJT M53-3033 Light Truck or Delivery Services Drivers 2,791 3,012 Low Excl HS None SOJT L53-3041 Taxi Drivers and Chauffeurs 543 638 Low Excl NFE None SOJT L

Occupation Projections by Occupational Group
20 Delaware 2024
SOCCode Title of Occupation
2014Est.
Empl.
2024Proj.Empl.
WageCat.
Job Avail. Educ.
Work Exp.
JobTraining Skill
53-3099 Motor Vehicle Operators, All Other 556 586 Low Fair NFE None SOJT L53-6021 Parking Lot Attendants 496 540 Low Good NFE None SOJT L53-6031 Automotive and Watercraft Service Attendants 282 313 Low Fair NFE None SOJT L53-6051 Transportation Inspectors 270 292 -Avg Fair HS None MOJT M53-7021 Crane and Tower Operators 99 102 Avg Poor HS <5 MOJT M53-7032 Excavating and Loading Machine and Dragline
Operators 144 160 Avg Fair HS <5 MOJT M53-7051 Industrial Truck and Tractor Operators 1,230 1,330 -Avg Excl NFE None SOJT M53-7061 Cleaners of Vehicles and Equipment 843 914 Low Good NFE None SOJT L53-7062 Laborers and Freight, Stock, and Material
Movers, Hand 7,515 8,265 Low Excl NFE None SOJT L53-7063 Machine Feeders and Offbearers 305 367 -Avg Good NFE None SOJT L53-7064 Packers and Packagers, Hand 1,492 1,492 Low Poor NFE None SOJT L53-7081 Refuse and Recyclable Material Collectors 459 498 -Avg Good NFE None SOJT L
Annual Mean Wages and Employment for theHighest and Lowest Paying Occupational Groups, 2015
$0 $20,000 $40,000 $60,000 $80,000 $100,000 $120,000 $140,000
Annual Mean Wage
Employment
Management
Legal
Computer and Mathematical
Architecture and Engineering
Healthcare Practitioners and Technical
Life, Physical, and Social Science
STATEWIDE TOTAL ALL-OCCUPATIONS
Transportation and Material Moving
Farming, Fishing, and Forestry
Healthcare Support
Personal Care and Service
Building and Grounds Cleaning and Maintenance
Food Preparation and Serving-Related
18,120
5,190
15,030
5,360
28,220
5,140
433,830
28,090
820
12,290
13,500
15,360
40,740
$136,177
$113,216
$89,691
$84,351
$82,017
$79,725
$50,283
$33,739
$31,624
$30,728
$27,037
$26,799
$23,188
Highest paying groups
All-occupations mean
Lowest paying groups

21Occupation & Industry Projections
Career ClusterAverage
Wage 2014 RankTotal
Openings RankPercent Total
Openings New JobsAnn. Pct. Growth
Agriculture, Food & Natural Resources $45,064 11th 2,520 13th 1.8% 270 0.05%
Architecture & Construction $47,920 10th 8,550 7th 6.2% 3,610 1.20%
Arts, Audio/Video Technology & Communications $53,489 8th 840 16th 0.6% 200 0.47%
Business Management & Administration $54,174 7th 14,150 4th 10.3% 3,850 0.36%
Education & Training $52,476 9th 10,060 5th 7.3% 3,240 1.01%
Finance $73,965 3rd 6,260 9th 4.6% 2,550 0.89%
Government & Public Administration $59,983 6th 1,250 15th 0.9% 400 0.83%
Health Science $62,313 5th 16,540 3rd 12.1% 6,930 1.45%
Hospitality & Tourism $23,609 16th 24,330 1st 17.7% 5,280 0.85%
Human Services $37,028 14th 6,010 10th 4.4% 2,290 1.24%
Information Technology $87,003 2nd 3,850 12th 2.8% 1,900 1.24%
Law, Public Safety, Corrections & Security $63,122 4th 4,550 11th 3.3% 1,050 0.50%
Manufacturing $43,364 12th 7,100 8th 5.2% 1,280 0.28%
Marketing, Sales & Service $42,907 13th 18,810 2nd 13.7% 3,470 0.63%
Science, Technology, Engineering & Mathematics $98,838 1st 2,470 14th 1.8% 490 0.60%
Transportation, Distribution & Logistics $34,622 15th 9,930 6th 7.2% 2,540 0.79%
Wages, Projected Openings, and Growth by Career Cluster, 2014–2024
Occupation Projections by Career ClusterThis section contains occupations grouped by career clusters. The US Department of Education developed these 16 groupings as a way to link school and work, helping students to choose a curriculum which is best suited to their career plans. The occupations listed here are the same ones displayed in the previous section; they are simply organized differently.
Occupations are arranged alphabetically within each of the 16 career clusters. For each occupation, we provide its SOC code, forecasted average annual growth rate from 2014 to 2024, average annual openings due to growth for that period, average annual openings due to net replacement of workers (the total expected job openings in an average year would be the sum of these two numbers), and the estimated 2014 average annual wage. The SOC code can be used to refer back to the previous section to find the usual education, experience, and training requirements for the occupation.
Once again, the Hospitality & Tourism cluster is expected to generate the most job openings, with 24,330 projected.
This cluster has a great deal of turnover, and most of those jobs are replacements. The Health Science cluster has the most new jobs projected, with 6,930. The clusters where the fewest new jobs are projected are Arts, Audio/Video Technology & Communications, with 200; Agriculture, Food & Natural Resources, with 270; Government & Public Administration, with 400; and Science, Technology, Engineering & Mathematics (STEM), with 490. This last may be surprising, but it is due to Information Technology, which is usually considered part of STEM, having its own cluster.
Science, Technology, Engineering & Mathematics (STEM) is again the highest-paying cluster; its occupations paid an average wage of $98,838 in 2014, a 9.6 percent increase from just two years prior. Hospitality & Tourism had the lowest average wage; this cluster’s occupations paid an average $23,609 in 2014, just 0.9 percent above its average two years ago. The cluster with the next-lowest average pay is Transportation, Distribution & Logistics, at $34,622.

22 Delaware 2024
Table 2: Occupation Projections by Career Cluster
Agriculture, Food, and Natural Resources19-4011 Agricultural and Food Science Technicians 0.5% 0 2 $37,21145-2091 Agricultural Equipment Operators 0.5% 1 7 $30,13919-4021 Biological Technicians 0.0% 0 3 $40,68517-2081 Environmental Engineers 0.8% 1 5 $80,82919-4091 Environmental Science and Protection Technicians, Including Health 1.0% 3 12 $35,69349-3041 Farm Equipment Mechanics and Service Technicians 0.7% 1 4 $37,31511-9013 Farmers, Ranchers, and Other Agricultural Managers 0.0% 0 53 NA45-2092 Farmworkers and Laborers, Crop, Nursery, and Greenhouse -0.7% 0 42 $30,18145-2093 Farmworkers, Farm, Ranch, and Aquacultural Animals -0.5% 0 30 $24,73145-1011 First-Line Supervisors of Farming, Fishing, and Forestry Workers -1.1% 0 5 $54,10145-4011 Forest and Conservation Workers 0.6% 1 4 $29,01011-9121 Natural Sciences Managers -0.5% 0 12 $183,83039-2021 Nonfarm Animal Caretakers 1.0% 11 21 $21,81937-2021 Pest Control Workers 0.0% 0 5 $36,73353-7081 Refuse and Recyclable Material Collectors 0.8% 4 12 $38,21019-1013 Soil and Plant Scientists 0.6% 0 3 $58,53151-8031 Water and Wastewater Treatment Plant and System Operators 1.0% 3 7 $42,578
Architecture and Construction17-1011 Architects, Except Landscape and Naval 0.3% 1 3 $89,69017-3011 Architectural and Civil Drafters -0.7% 0 4 $55,39047-2021 Brickmasons and Blockmasons 2.3% 8 3 $49,87847-2031 Carpenters 1.6% 48 31 $45,05347-2051 Cement Masons and Concrete Finishers 1.3% 6 5 $43,26417-3022 Civil Engineering Technicians 0.4% 2 11 $43,97117-2051 Civil Engineers 0.7% 6 27 $86,71547-4099 Construction and Related Workers, All Other 0.5% 1 3 $40,58147-2061 Construction Laborers 1.5% 45 58 $33,17611-9021 Construction Managers 1.1% 7 9 $110,53149-9012 Control and Valve Installers and Repairers, Except Mechanical Door 0.1% 0 5 $64,85413-1051 Cost Estimators 1.3% 16 34 $68,34953-7021 Crane and Tower Operators 0.3% 0 3 $43,03547-2081 Drywall and Ceiling Tile Installers 1.0% 4 2 $42,39049-9051 Electrical Power-Line Installers and Repairers 0.9% 4 17 $69,68017-1011 Architects, Except Landscape and Naval 0.3% 1 3 $89,69017-3011 Architectural and Civil Drafters -0.7% 0 4 $55,390
SOC Code Title of Occupation
Average Annual Growth
Rate
Average Annual
Openingsdue to Growth
Average Annual
Openings due to
Replacements2014 Average Annual Wage

Occupation & Industry Projections 23
Occupation Projections by Career Cluster
SOC Code Title of Occupation
Average Annual Growth
Rate
Average Annual
Openingsdue to Growth
Average Annual
Openings due to
Replacements2014 Average Annual Wage
47-2021 Brickmasons and Blockmasons 2.3% 8 3 $49,87847-2031 Carpenters 1.6% 48 31 $45,05347-2051 Cement Masons and Concrete Finishers 1.3% 6 5 $43,26417-3022 Civil Engineering Technicians 0.4% 2 11 $43,97117-2051 Civil Engineers 0.7% 6 27 $86,71547-4099 Construction and Related Workers, All Other 0.5% 1 3 $40,58147-2061 Construction Laborers 1.5% 45 58 $33,17611-9021 Construction Managers 1.1% 7 9 $110,53149-9012 Control and Valve Installers and Repairers, Except Mechanical Door 0.1% 0 5 $64,85413-1051 Cost Estimators 1.3% 16 34 $68,34953-7021 Crane and Tower Operators 0.3% 0 3 $43,03547-2081 Drywall and Ceiling Tile Installers 1.0% 4 2 $42,39049-9051 Electrical Power-Line Installers and Repairers 0.9% 4 17 $69,68047-2073 Operating Engineers and Other Construction Equipment Operators 0.9% 11 20 $40,39447-2141 Painters, Construction and Maintenance 1.3% 10 11 $37,91847-2142 Paperhangers 0.1% 0 2 $39,04247-2071 Paving, Surfacing, and Tamping Equipment Operators 0.5% 2 7 $46,69647-2151 Pipelayers 0.6% 1 1 $39,66647-2152 Plumbers, Pipefitters, and Steamfitters 1.5% 17 13 $56,30647-2181 Roofers 1.6% 4 3 $36,62947-2211 Sheet Metal Workers 0.3% 2 11 $50,85651-8021 Stationary Engineers and Boiler Operators 0.3% 0 2 $57,80347-2221 Structural Iron and Steel Workers 0.4% 1 3 $47,19551-2041 Structural Metal Fabricators and Fitters -0.4% 0 2 $40,24817-3031 Surveying and Mapping Technicians -1.1% 0 2 $39,74917-1022 Surveyors -0.7% 0 2 $66,031
Arts, Audio/Visual, and Communications27-1011 Art Directors 0.7% 1 2 $75,73327-4011 Audio and Video Equipment Technicians 1.0% 1 1 $45,05327-4012 Broadcast Technicians 0.7% 0 1 NA27-3041 Editors -0.5% 0 7 $60,40327-1023 Floral Designers 0.1% 0 4 $27,95527-1024 Graphic Designers 0.0% 0 13 $50,75227-1014 Multimedia Artists and Animators 0.9% 1 1 NA27-4021 Photographers 0.4% 1 4 $45,07451-5113 Print Binding and Finishing Workers -0.7% 0 1 $29,39051-5112 Printing Press Operators -0.6% 0 6 $41,53827-2012 Producers and Directors 1.5% 2 4 $68,37027-3042 Technical Writers 0.8% 1 3 $69,077

24 Delaware 2024
Occupation Projections by Career Cluster
SOC Code Title of Occupation
Average Annual Growth
Rate
Average Annual
Openingsdue to Growth
Average Annual
Openings due to
Replacements2014 Average Annual Wage
49-2022 Telecommunications Equipment Installers and Repairers, Except Line Installers 1.3% 9 6 NA
49-9052 Telecommunications Line Installers and Repairers 0.2% 1 8 $63,91827-3043 Writers and Authors 1.4% 3 3 $61,797
Business, Management, and Administration11-3011 Administrative Services Managers 0.9% 6 13 $104,02143-3031 Bookkeeping, Accounting, and Auditing Clerks -0.7% 0 66 $41,16313-1199 Business Operations Specialists, All Other 1.0% 16 19 $69,72211-1011 Chief Executives -0.2% 0 9 NA11-3111 Compensation and Benefits Managers 0.6% 0 2 $130,77013-1141 Compensation, Benefits, and Job Analysis Specialists 0.6% 1 4 $73,69411-3021 Computer and Information Systems Managers 1.2% 14 13 $153,54643-9011 Computer Operators -1.7% 0 2 $45,17843-4051 Customer Service Representatives 1.1% 75 163 $35,92243-9021 Data Entry Keyers -0.3% 0 13 $27,56043-6011 Executive Secretaries and Executive Administrative Assistants -0.5% 0 13 $57,45043-4071 File Clerks -0.9% 0 12 $29,39043-1011 First-Line Supervisors of Office and Administrative Support Workers 0.9% 47 76 $56,57613-1131 Fundraisers 1.2% 5 6 $58,86411-1021 General and Operations Managers 0.7% 32 117 $142,10643-4161 Human Resources Assistants, Except Payroll and Timekeeping -0.2% 0 5 $35,77611-3121 Human Resources Managers 0.6% 2 10 $136,26113-1071 Human Resources Specialists 0.5% 8 40 $64,39711-3051 Industrial Production Managers -0.8% 0 9 $127,19243-4199 Information and Record Clerks, All Other 0.6% 2 7 $40,64343-4111 Interviewers, Except Eligibility and Loan 0.7% 5 16 $35,21413-1075 Labor Relations Specialists -0.3% 0 28 $60,00843-4121 Library Assistants, Clerical 0.7% 3 14 $21,90243-9051 Mail Clerks and Mail Machine Operators, Except Postal Service -2.4% 0 10 $26,83213-1111 Management Analysts 1.1% 26 31 $84,53111-9199 Managers, All Other 0.7% 16 47 $143,12513-1121 Meeting, Convention, and Event Planners 1.2% 4 4 $46,09343-5041 Meter Readers, Utilities -1.6% 0 2 $48,92243-4141 New Accounts Clerks -0.1% 0 7 $39,49943-9199 Office and Administrative Support Workers, All Other 1.0% 6 15 $38,00243-9061 Office Clerks, General 0.3% 20 150 $27,95543-9071 Office Machine Operators, Except Computer -1.0% 0 12 $29,76515-2031 Operations Research Analysts 3.2% 21 10 $82,47243-4151 Order Clerks -0.6% 0 12 $34,00843-3051 Payroll and Timekeeping Clerks -0.3% 0 12 $43,326

Occupation & Industry Projections 25
Occupation Projections by Career Cluster
SOC Code Title of Occupation
Average Annual Growth
Rate
Average Annual
Openingsdue to Growth
Average Annual
Openings due to
Replacements2014 Average Annual Wage
43-5051 Postal Service Clerks -0.4% 0 3 $50,69043-5052 Postal Service Mail Carriers -0.4% 0 19 $51,95843-5053 Postal Service Mail Sorters, Processors, and Processing Machine
Operators -1.4% 0 5 $50,35743-3061 Procurement Clerks -0.9% 0 8 $40,62211-3061 Purchasing Managers -0.7% 0 2 $127,44243-4171 Receptionists and Information Clerks 0.3% 9 72 $25,37643-6014 Secretaries and Administrative Assistants, Except Legal, Medical,
and Executive 0.2% 19 79 $37,045
43-5071 Shipping, Receiving, and Traffic Clerks 0.2% 4 43 $31,99043-5081 Stock Clerks and Order Fillers 0.6% 34 190 $24,25343-2011 Switchboard Operators, Including Answering Service -3.7% 0 3 $27,43511-3131 Training and Development Managers -0.2% 0 2 $128,52313-1151 Training and Development Specialists 0.8% 7 22 $68,99443-9022 Word Processors and Typists -1.6% 0 0 $43,451
Education and Training25-3011 Adult Basic and Secondary Education and Literacy Teachers and
Instructors 0.9% 4 7 $60,79825-1041 Agricultural Sciences Teachers, Postsecondary 0.8% 0 1 $90,25625-4011 Archivists 0.3% 0 1 $44,58825-1121 Art, Drama, and Music Teachers, Postsecondary 1.2% 4 6 $61,60225-1051 Atmospheric, Earth, Marine, and Space Sciences Teachers,
Postsecondary 1.1% 1 1 $88,28825-9011 Audio-Visual and Multimedia Collections Specialists 0.9% 1 1 $40,91425-1042 Biological Science Teachers, Postsecondary 1.6% 1 1 $88,80225-1011 Business Teachers, Postsecondary 1.0% 4 7 $83,17925-2032 Career/Technical Education Teachers, Secondary School 0.2% 0 4 $68,91525-1052 Chemistry Teachers, Postsecondary 1.6% 1 1 $75,61427-2022 Coaches and Scouts 0.8% 7 26 $33,11725-1021 Computer Science Teachers, Postsecondary 1.0% 1 2 $81,09925-1111 Criminal Justice and Law Enforcement Teachers, Postsecondary 2.1% 1 1 $70,82925-1063 Economics Teachers, Postsecondary 1.1% 1 1 $99,13811-9039 Education Administrators, All Other 0.9% 1 2 $113,09011-9032 Education Administrators, Elementary and Secondary School 0.7% 6 22 $109,44711-9033 Education Administrators, Postsecondary 1.0% 4 10 $142,18911-9031 Education Administrators, Preschool and Childcare Center/Program 1.4% 3 7 $49,06725-1081 Education Teachers, Postsecondary 1.1% 2 4 $69,57225-9099 Education, Training, and Library Workers, All Other 0.8% 1 2 $34,48621-1012 Educational, Guidance, School, and Vocational Counselors 1.0% 11 21 $60,36225-2021 Elementary School Teachers, Except Special Education 0.8% 39 98 $58,675

26 Delaware 2024
Occupation Projections by Career Cluster
SOC Code Title of Occupation
Average Annual Growth
Rate
Average Annual
Openingsdue to Growth
Average Annual
Openings due to
Replacements2014 Average Annual Wage
25-1032 Engineering Teachers, Postsecondary 1.4% 3 4 $71,34225-1123 English Language and Literature Teachers, Postsecondary 1.2% 3 5 $64,56925-9021 Farm and Home Management Advisors 0.3% 0 2 $50,91825-1124 Foreign Language and Literature Teachers, Postsecondary 1.2% 1 2 $68,34225-1071 Health Specialties Teachers, Postsecondary 1.9% 5 4 $86,94225-1125 History Teachers, Postsecondary 1.1% 1 1 $73,97325-9031 Instructional Coordinators 0.9% 8 7 $67,01825-2012 Kindergarten Teachers, Except Special Education 0.8% 4 14 $58,51225-4021 Librarians 0.3% 2 9 $66,39425-4031 Library Technicians 0.6% 1 10 $38,79225-1022 Mathematical Science Teachers, Postsecondary 1.7% 3 3 $72,46325-2022 Middle School Teachers, Except Special and Career/Technical
Education 0.8% 18 45 $58,19125-4013 Museum Technicians and Conservators 0.4% 0 3 $41,55825-1072 Nursing Instructors and Teachers, Postsecondary 2.0% 6 5 $75,97025-1065 Political Science Teachers, Postsecondary 1.1% 1 1 $80,08825-1199 Postsecondary Teachers, All Other 1.0% 1 2 $52,87125-2011 Preschool Teachers, Except Special Education 1.4% 32 63 $24,48225-1066 Psychology Teachers, Postsecondary 1.6% 1 1 $77,25625-2031 Secondary School Teachers, Except Special and Career/Technical
Education 0.8% 28 78 $58,92525-3021 Self-Enrichment Education Teachers 1.7% 9 10 $50,79425-1113 Social Work Teachers, Postsecondary 1.5% 2 2 $72,78825-1067 Sociology Teachers, Postsecondary 1.6% 1 1 $70,12925-2059 Special Education Teachers, All Other 1.1% 2 3 $70,36525-2052 Special Education Teachers, Kindergarten and Elementary School 0.7% 9 22 $63,02325-2054 Special Education Teachers, Secondary School 0.7% 2 5 $62,59225-3098 Substitute Teachers 1.3% 46 64 $27,04025-9041 Teacher Assistants 1.0% 34 76 $26,38625-3097 Teachers and Instructors, All Other, Except Substitute Teachers 0.9% 5 10 $37,32725-1194 Vocational Education Teachers, Postsecondary 0.9% 2 4 $55,952
Finance13-2011 Accountants and Auditors 1.0% 51 136 $74,27743-3011 Bill and Account Collectors -0.6% 0 27 NA43-4011 Brokerage Clerks 1.0% 3 7 $50,39813-2031 Budget Analysts 0.7% 1 4 $70,69913-1031 Claims Adjusters, Examiners, and Investigators 0.6% 5 19 $65,47813-2041 Credit Analysts 1.3% 16 50 $66,49843-4041 Credit Authorizers, Checkers, and Clerks 0.0% 1 16 $37,89813-2051 Financial Analysts 1.3% 40 59 $84,074

Occupation & Industry Projections 27
Occupation Projections by Career Cluster
SOC Code Title of Occupation
Average Annual Growth
Rate
Average Annual
Openingsdue to Growth
Average Annual
Openings due to
Replacements2014 Average Annual Wage
43-3099 Financial Clerks, All Other 1.3% 3 5 $48,44311-3031 Financial Managers 0.8% 20 55 $156,64513-2099 Financial Specialists, All Other 1.3% 9 7 $69,55543-9041 Insurance Claims and Policy Processing Clerks 0.8% 6 20 $42,70241-3021 Insurance Sales Agents 1.0% 13 31 $65,25013-2053 Insurance Underwriters -1.1% 0 8 $63,10743-4131 Loan Interviewers and Clerks 1.5% 16 15 $35,11013-2072 Loan Officers 1.4% 16 18 $65,74913-2052 Personal Financial Advisors 2.6% 33 28 $98,23841-3031 Securities, Commodities, and Financial Services Sales Agents 1.2% 23 31 $96,78213-2082 Tax Preparers -0.1% 0 4 NA43-3071 Tellers -0.1% 0 87 $27,373
Government and Public Administration45-2011 Agricultural Inspectors 0.3% 0 4 $44,22113-2021 Appraisers and Assessors of Real Estate 1.1% 2 3 $47,75713-1041 Compliance Officers 0.5% 5 15 $78,72847-4011 Construction and Building Inspectors 0.8% 5 16 $59,46743-4031 Court, Municipal, and License Clerks 0.6% 5 5 $33,96643-4061 Eligibility Interviewers, Government Programs 1.0% 2 2 $36,33813-2061 Financial Examiners 2.2% 14 14 $76,62711-1031 Legislators 0.3% 0 3 NA29-9011 Occupational Health and Safety Specialists 0.6% 2 7 $71,19813-2081 Tax Examiners and Collectors, and Revenue Agents 0.1% 0 4 $62,75453-6051 Transportation Inspectors 0.8% 2 7 $38,97919-3051 Urban and Regional Planners 0.7% 2 4 $67,288
Health Sciences29-9091 Athletic Trainers 2.0% 2 2 $43,62129-2031 Cardiovascular Technologists and Technicians 2.2% 9 7 $55,78629-1011 Chiropractors 0.5% 1 2 $101,75431-9091 Dental Assistants 0.6% 5 18 $37,75229-2021 Dental Hygienists 0.6% 4 12 $70,65829-1021 Dentists, General 0.6% 2 7 $224,82729-2032 Diagnostic Medical Sonographers 2.2% 4 3 $69,88829-2051 Dietetic Technicians 1.3% 2 1 $30,38929-1031 Dietitians and Nutritionists 1.5% 3 1 $60,09129-1062 Family and General Practitioners 0.2% 1 16 $156,97829-2099 Health Technologists and Technicians, All Other 2.5% 8 3 $42,07831-1011 Home Health Aides 2.7% 84 63 $26,33329-1063 Internists, General 0.3% 0 3 $181,147

28 Delaware 2024
Occupation Projections by Career Cluster
SOC Code Title of Occupation
Average Annual Growth
Rate
Average Annual
Openingsdue to Growth
Average Annual
Openings due to
Replacements2014 Average Annual Wage
29-2061 Licensed Practical and Licensed Vocational Nurses 1.0% 21 58 $47,69429-2035 Magnetic Resonance Imaging Technologists 0.9% 2 5 $70,84529-2012 Medical and Clinical Laboratory Technicians 1.3% 3 4 $44,30429-2011 Medical and Clinical Laboratory Technologists 1.2% 6 11 $63,48211-9111 Medical and Health Services Managers 1.3% 10 19 $112,09131-9092 Medical Assistants 1.3% 26 40 $32,01131-9093 Medical Equipment Preparers 1.4% 2 4 $35,48529-2071 Medical Records and Health Information Technicians 1.2% 6 10 $37,50243-6013 Medical Secretaries 1.2% 57 46 $33,59231-9094 Medical Transcriptionists -0.6% 0 3 $32,76029-2033 Nuclear Medicine Technologists 0.3% 0 2 $74,85929-1151 Nurse Anesthetists 1.2% 5 9 $180,56529-1171 Nurse Practitioners 2.5% 15 12 $97,30231-1014 Nursing Assistants 1.3% 75 127 $27,93429-1064 Obstetricians and Gynecologists 0.9% 1 4 $236,60029-1122 Occupational Therapists 2.1% 5 4 $79,04031-2011 Occupational Therapy Assistants 2.9% 3 2 $54,99529-2057 Ophthalmic Medical Technicians 1.2% 3 3 $37,17029-2081 Opticians, Dispensing 1.9% 8 10 $37,58629-1041 Optometrists 1.7% 3 5 $101,52531-1015 Orderlies 1.1% 4 7 $27,10229-1065 Pediatricians, General 0.3% 0 2 $158,85029-1051 Pharmacists 0.6% 5 19 $113,92229-2052 Pharmacy Technicians 1.3% 14 10 $30,34731-9097 Phlebotomists 1.8% 9 10 $36,58731-2022 Physical Therapist Aides 2.7% 13 12 $23,73331-2021 Physical Therapist Assistants 2.8% 7 6 $56,55529-1123 Physical Therapists 2.7% 20 18 $81,20329-1071 Physician Assistants 2.2% 10 10 $105,20629-1069 Physicians and Surgeons, All Other 1.2% 19 40 $204,88031-1013 Psychiatric Aides 1.4% 2 3 $30,53429-1066 Psychiatrists 1.2% 2 3 $160,51429-1124 Radiation Therapists 1.3% 1 2 $88,02629-2034 Radiologic Technologists 0.8% 5 12 $58,88529-1125 Recreational Therapists 1.1% 1 2 $38,87529-1141 Registered Nurses 1.6% 174 247 $70,15829-1126 Respiratory Therapists 1.5% 6 9 $64,85429-1127 Speech-Language Pathologists 2.2% 11 11 $75,62929-1067 Surgeons 1.0% 2 6 NA

Occupation & Industry Projections 29
Occupation Projections by Career Cluster
SOC Code Title of Occupation
Average Annual Growth
Rate
Average Annual
Openingsdue to Growth
Average Annual
Openings due to
Replacements2014 Average Annual Wage
29-2055 Surgical Technologists 1.3% 5 3 $43,72229-1131 Veterinarians 0.5% 2 4 $128,73131-9096 Veterinary Assistants and Laboratory Animal Caretakers 0.0% 0 4 $26,79029-2056 Veterinary Technologists and Technicians 1.3% 5 4 $33,322
Hospitality and Tourism39-3091 Amusement and Recreation Attendants 0.9% 9 41 $20,34239-2011 Animal Trainers 0.6% 1 4 $39,52051-3011 Bakers 0.8% 4 12 $26,62435-3011 Bartenders 1.2% 22 66 $20,73837-2019 Building Cleaning Workers, All Other 1.1% 1 2 $48,21435-1011 Chefs and Head Cooks 1.0% 3 4 $53,41435-3021 Combined Food Preparation and Serving Workers, Including Fast
Food 1.2% 153 378 $18,38735-2011 Cooks, Fast Food -1.4% 0 15 $17,90935-2012 Cooks, Institution and Cafeteria 0.2% 5 72 $29,47435-2014 Cooks, Restaurant 1.5% 67 106 $24,14935-2015 Cooks, Short Order -0.4% 0 10 $22,98435-3022 Counter Attendants, Cafeteria, Food Concession, and Coffee Shop 0.7% 7 53 $19,69835-9011 Dining Room and Cafeteria Attendants and Bartender Helpers 0.8% 6 39 $17,65935-9021 Dishwashers -0.3% 0 80 $19,32335-1012 First-Line Supervisors of Food Preparation and Serving Workers 1.1% 34 90 $37,33637-1011 First-Line Supervisors of Housekeeping and Janitorial Workers 0.8% 7 13 $41,39235-9099 Food Preparation and Serving Related Workers, All Other 1.2% 1 5 $24,79435-2021 Food Preparation Workers 0.9% 20 60 $20,71735-3041 Food Servers, Nonrestaurant 1.0% 10 23 $21,070
11-9051 Food Service Managers 0.6% 3 10 $63,33639-3012 Gaming and Sports Book Writers and Runners 0.7% 1 2 NA43-3041 Gaming Cage Workers 1.1% 2 3 $25,37635-9031 Hosts and Hostesses, Restaurant, Lounge, and Coffee Shop 0.6% 11 123 $18,32543-4081 Hotel, Motel, and Resort Desk Clerks 1.3% 9 34 $23,29637-2011 Janitors and Cleaners, Except Maids and Housekeeping Cleaners 0.7% 63 162 $25,52211-9081 Lodging Managers 1.4% 1 2 $79,41437-2012 Maids and Housekeeping Cleaners 1.1% 37 77 $21,40339-9032 Recreation Workers 1.2% 13 18 $25,85439-7011 Tour Guides and Escorts 0.0% 0 9 $23,69141-3041 Travel Agents -1.3% 0 3 $41,97427-2023 Umpires, Referees, and Other Sports Officials 0.6% 1 7 $31,77539-3031 Ushers, Lobby Attendants, and Ticket Takers 0.0% 0 13 $19,92635-3031 Waiters and Waitresses 0.5% 37 369 $21,029

30 Delaware 2024
Occupation Projections by Career Cluster
SOC Code Title of Occupation
Average Annual Growth
Rate
Average Annual
Openingsdue to Growth
Average Annual
Openings due to
Replacements2014 Average Annual Wage
Human Services21-1021 Child, Family, and School Social Workers 0.9% 12 30 $39,47839-9011 Childcare Workers 1.3% 30 65 $21,13319-3031 Clinical, Counseling, and School Psychologists 1.7% 7 8 $81,01621-1099 Community and Social Service Specialists, All Other 1.2% 10 15 $36,65021-1094 Community Health Workers 1.4% 4 5 $34,42413-2071 Credit Counselors 1.8% 3 2 $39,89439-1021 First-Line Supervisors of Personal Service Workers 1.1% 11 18 $43,78439-9031 Fitness Trainers and Aerobics Instructors 1.1% 15 25 $32,73939-4021 Funeral Attendants -0.2% 0 3 $30,82611-9061 Funeral Service Managers 0.6% 0 2 $103,27239-5012 Hairdressers, Hairstylists, and Cosmetologists 1.0% 28 70 $35,63021-1091 Health Educators 1.3% 3 4 $62,81621-1022 Healthcare Social Workers 1.4% 8 12 $48,81851-6011 Laundry and Dry-Cleaning Workers 0.3% 2 10 $22,96339-3093 Locker Room, Coatroom, and Dressing Room Attendants 0.3% 0 3 $18,72021-1013 Marriage and Family Therapists 0.8% 2 5 $50,83531-9011 Massage Therapists 2.1% 5 2 $53,78921-1023 Mental Health and Substance Abuse Social Workers 1.4% 6 9 $50,12821-1014 Mental Health Counselors 1.7% 11 13 $40,45639-9021 Personal Care Aides 2.6% 40 11 $26,10451-6021 Pressers, Textile, Garment, and Related Materials -0.6% 0 4 $18,67821-1015 Rehabilitation Counselors 1.2% 8 14 $35,83839-5093 Shampooers 1.1% 4 2 $17,41011-9151 Social and Community Service Managers 1.1% 11 24 $65,43721-1093 Social and Human Service Assistants 1.0% 5 10 $30,28521-1029 Social Workers, All Other 0.4% 0 2 $62,48321-1011 Substance Abuse and Behavioral Disorder Counselors 1.8% 4 4 $41,974
Information Technology15-1143 Computer Network Architects 1.0% 6 8 $107,68215-1152 Computer Network Support Specialists 0.9% 5 6 $62,60815-1199 Computer Occupations, All Other 0.8% 2 2 $77,12615-1131 Computer Programmers -1.3% 0 31 $86,54915-1121 Computer Systems Analysts 2.0% 72 42 $89,41915-1151 Computer User Support Specialists 1.2% 16 17 $54,24615-1141 Database Administrators 1.1% 5 10 $88,21315-1122 Information Security Analysts 1.4% 4 3 $99,19515-1142 Network and Computer Systems Administrators 0.7% 8 14 $71,94715-1132 Software Developers, Applications 1.6% 46 37 $97,531

Occupation & Industry Projections 31
Occupation Projections by Career Cluster
SOC Code Title of Occupation
Average Annual Growth
Rate
Average Annual
Openingsdue to Growth
Average Annual
Openings due to
Replacements2014 Average Annual Wage
15-1133 Software Developers, Systems Software 1.0% 13 18 $107,22415-1134 Web Developers 2.5% 13 6 $81,432
Law, Public Safety, Corrections, and Security23-1021 Administrative Law Judges, Adjudicators, and Hearing Officers 0.3% 0 1 $63,83533-9011 Animal Control Workers 1.3% 2 2 $32,11523-1022 Arbitrators, Mediators, and Conciliators 0.8% 0 0 $39,76533-3011 Bailiffs 0.7% 0 2 $30,84333-3012 Correctional Officers and Jailers 0.6% 11 46 $35,92133-9091 Crossing Guards 0.8% 3 6 $33,44633-3021 Detectives and Criminal Investigators 0.7% 1 2 $100,54729-2041 Emergency Medical Technicians and Paramedics 1.2% 16 22 $36,96233-1011 First-Line Supervisors of Correctional Officers 0.6% 1 6 $47,11133-1012 First-Line Supervisors of Police and Detectives 0.6% 2 11 $95,22233-1099 First-Line Supervisors of Protective Service Workers, All Other 0.8% 3 9 $43,78433-3031 Fish and Game Wardens 0.6% 0 2 $47,78433-9031 Gaming Surveillance Officers and Gaming Investigators 0.1% 0 1 $31,05423-1023 Judges, Magistrate Judges, and Magistrates 0.3% 0 2 $138,44523-1012 Judicial Law Clerks -0.4% 0 2 $47,57123-1011 Lawyers 0.3% 12 52 $145,93343-6012 Legal Secretaries -0.8% 0 14 $50,35723-2099 Legal Support Workers, All Other 0.1% 0 8 $75,00533-9092 Lifeguards and Other Recreational Protective Service Workers 0.9% 5 7 $22,25623-2011 Paralegals and Legal Assistants 0.4% 6 29 $55,68233-3051 Police and Sheriff's Patrol Officers 0.7% 12 58 $64,10643-5031 Police, Fire, and Ambulance Dispatchers -0.4% 0 6 $40,99721-1092 Probation Officers and Correctional Treatment Specialists 0.6% 3 8 $42,63833-9099 Protective Service Workers, All Other 0.9% 3 4 $29,49433-9032 Security Guards 0.7% 25 51 $24,794
Manufacturing51-2099 Assemblers and Fabricators, All Other 0.7% 4 11 $26,64551-3021 Butchers and Meat Cutters 0.5% 2 7 $37,23251-7011 Cabinetmakers and Bench Carpenters 1.0% 1 1 $41,03851-9011 Chemical Equipment Operators and Tenders -3.0% 0 28 $52,16651-8091 Chemical Plant and System Operators -1.3% 0 6 $65,47819-4031 Chemical Technicians 0.1% 1 28 $62,27551-9192 Cleaning, Washing, and Metal Pickling Equipment Operators and
Tenders 0.6% 2 7 $23,00549-9091 Coin, Vending, and Amusement Machine Servicers and Repairers 0.2% 0 1 $36,29649-2011 Computer, Automated Teller, and Office Machine Repairers 0.8% 4 10 $37,918

32 Delaware 2024
Occupation Projections by Career Cluster
SOC Code Title of Occupation
Average Annual Growth
Rate
Average Annual
Openingsdue to Growth
Average Annual
Openings due to
Replacements2014 Average Annual Wage
51-4011 Computer-Controlled Machine Tool Operators, Metal and Plastic 1.0% 2 5 $39,56251-9032 Cutting and Slicing Machine Setters, Operators, and Tenders -1.6% 0 2 $36,04651-4031 Cutting, Punching, and Press Machine Setters, Operators, and
Tenders, Metal and Plastic -1.9% 0 4 $34,34151-2022 Electrical and Electronic Equipment Assemblers 0.8% 3 4 $30,68017-3012 Electrical and Electronics Drafters 0.5% 0 1 $59,80017-3023 Electrical and Electronics Engineering Technicians 0.5% 1 4 $55,41149-2094 Electrical and Electronics Repairers, Commercial and Industrial
Equipment -0.2% 0 5 $62,81649-2095 Electrical and Electronics Repairers, Powerhouse, Substation,
and Relay 0.1% 0 4 $71,24051-4021 Extruding and Drawing Machine Setters, Operators, and Tenders,
Metal and Plastic -2.7% 0 6 $37,75251-9041 Extruding, Forming, Pressing, and Compacting Machine Setters,
Operators, and Tenders -2.9% 0 5 $41,76649-1011 First-Line Supervisors of Mechanics, Installers, and Repairers 0.7% 10 29 $69,49351-1011 First-Line Supervisors of Production and Operating Workers -0.3% 0 20 $62,37951-3099 Food Processing Workers, All Other 0.7% 2 5 $25,43851-4033 Grinding, Lapping, Polishing, and Buffing Machine Tool Setters,
Operators, and Tenders, Metal and Plastic -2.2% 0 5 $31,47051-9198 Helpers--Production Workers -1.0% 0 13 $26,00049-9031 Home Appliance Repairers 0.4% 0 4 $34,96517-3026 Industrial Engineering Technicians 0.3% 0 3 $61,44349-9041 Industrial Machinery Mechanics 1.4% 14 23 $51,23051-9061 Inspectors, Testers, Sorters, Samplers, and Weighers 0.0% 0 26 $38,35549-9099 Installation, Maintenance, and Repair Workers, All Other 0.8% 4 7 $40,20649-9094 Locksmiths and Safe Repairers -1.4% 0 5 $36,50453-7063 Machine Feeders and Offbearers 1.9% 6 7 $41,01851-4041 Machinists 0.7% 4 14 $52,43749-9071 Maintenance and Repair Workers, General 0.9% 33 95 $40,81051-3022 Meat, Poultry, and Fish Cutters and Trimmers 0.5% 19 71 $23,54617-3013 Mechanical Drafters -0.3% 0 2 $62,10949-9062 Medical Equipment Repairers 0.9% 1 2 $58,55251-9023 Mixing and Blending Machine Setters, Operators, and Tenders 0.6% 1 4 $38,56351-9195 Molders, Shapers, and Casters, Except Metal and Plastic 0.7% 0 2 $29,84851-4072 Molding, Coremaking, and Casting Machine Setters, Operators,
and Tenders, Metal and Plastic -2.5% 0 2 $28,39249-3053 Outdoor Power Equipment and Other Small Engine Mechanics 0.6% 1 4 $35,48551-9111 Packaging and Filling Machine Operators and Tenders -0.3% 0 22 $36,23451-9122 Painters, Transportation Equipment 0.6% 1 3 $43,03551-8012 Power Distributors and Dispatchers 0.0% 0 4 $79,747

Occupation & Industry Projections 33
Occupation Projections by Career Cluster
SOC Code Title of Occupation
Average Annual Growth
Rate
Average Annual
Openingsdue to Growth
Average Annual
Openings due to
Replacements2014 Average Annual Wage
49-9069 Precision Instrument and Equipment Repairers, All Other 0.3% 0 2 $54,82951-9199 Production Workers, All Other -0.2% 0 3 NA43-5061 Production, Planning, and Expediting Clerks -0.1% 0 10 $52,18713-1023 Purchasing Agents, Except Wholesale, Retail, and Farm Products 0.0% 0 19 $66,53949-2021 Radio, Cellular, and Tower Equipment Installers and Repairs 1.9% 2 1 $45,69849-2098 Security and Fire Alarm Systems Installers 1.4% 3 5 $50,37851-9012 Separating, Filtering, Clarifying, Precipitating, and Still Machine
Setters, Operators, and Tenders 0.3% 0 3 $39,39551-3023 Slaughterers and Meat Packers 0.6% 3 9 $22,94243-5111 Weighers, Measurers, Checkers, and Samplers, Recordkeeping 0.3% 0 4 $32,13651-4121 Welders, Cutters, Solderers, and Brazers 0.4% 2 15 $47,819
51-7042 Woodworking Machine Setters, Operators, and Tenders,Except Sawing 1.0% 1 1 $29,910
Marketing, Sales, and Service11-2011 Advertising and Promotions Managers -1.6% 0 2 $146,03741-3011 Advertising Sales Agents 0.4% 1 10 $48,96341-2011 Cashiers 0.2% 20 450 $20,34241-2021 Counter and Rental Clerks 0.3% 4 34 $32,90641-9011 Demonstrators and Product Promoters 0.8% 1 3 $28,16353-3031 Driver/Sales Workers 0.7% 12 28 $21,00841-1012 First-Line Supervisors of Non-Retail Sales Workers 0.9% 8 10 $97,55241-1011 First-Line Supervisors of Retail Sales Workers 0.6% 28 107 $47,96513-1161 Market Research Analysts and Marketing Specialists 1.7% 34 23 $77,62611-2021 Marketing Managers 0.4% 4 20 $146,82727-1026 Merchandise Displayers and Window Trimmers -0.4% 0 13 $28,01811-9141 Property, Real Estate, and Community Association Managers 1.0% 7 12 $66,49811-2031 Public Relations and Fundraising Managers 0.3% 1 7 $140,04627-3031 Public Relations Specialists 0.8% 6 9 $65,18741-9021 Real Estate Brokers 0.0% 0 1 $66,31041-9022 Real Estate Sales Agents 0.8% 11 9 $60,59041-2031 Retail Salespersons 0.9% 168 623 $25,70941-9099 Sales and Related Workers, All Other 0.9% 3 4 NA41-9031 Sales Engineers 0.6% 0 2 $130,08311-2022 Sales Managers 0.0% 0 19 $162,98941-3099 Sales Representatives, Services, All Other 1.1% 30 52 $60,27841-4012 Sales Representatives, Wholesale and Manufacturing, Except
Technical and Scientific Products 0.3% 9 65 $62,73341-4011 Sales Representatives, Wholesale and Manufacturing, Technical
and Scientific Products -0.3% 0 27 $108,38913-1022 Wholesale and Retail Buyers, Except Farm Products 0.8% 1 4 $56,805

34 Delaware 2024
Occupation Projections by Career Cluster
SOC Code Title of Occupation
Average Annual Growth
Rate
Average Annual
Openingsdue to Growth
Average Annual
Openings due to
Replacements2014 Average Annual Wage
Science, Technology, Engineering, and Mathematics11-9041 Architectural and Engineering Managers 0.0% 0 15 $145,97419-1021 Biochemists and Biophysicists 0.2% 0 6 $92,24817-2041 Chemical Engineers -0.1% 0 20 $128,06619-2031 Chemists 0.9% 32 76 $94,16215-1111 Computer and Information Research Scientists 0.6% 0 1 $83,24217-2071 Electrical Engineers 0.1% 0 10 $94,68217-2199 Engineers, All Other 1.1% 1 1 $100,25619-2041 Environmental Scientists and Specialists, Including Health 1.1% 5 13 NA19-2042 Geoscientists, Except Hydrologists and Geographers 1.0% 1 2 $88,81617-2111 Health and Safety Engineers, Except Mining Safety Engineers
and Inspectors 0.2% 0 2 $104,85317-2112 Industrial Engineers -0.1% 0 15 $90,64619-4099 Life, Physical, and Social Science Technicians, All Other 0.6% 1 6 $51,68817-2141 Mechanical Engineers 0.6% 4 23 $96,67819-1022 Microbiologists 0.3% 0 4 $60,84015-2041 Statisticians 3.0% 3 2 $94,99419-3022 Survey Researchers 0.9% 1 1 $52,250
Transportation, Distribution, and Logistics49-3011 Aircraft Mechanics and Service Technicians 0.1% 1 11 $56,53453-3011 Ambulance Drivers and Attendants, Except Emergency Medical
Technicians 2.1% 2 1 $26,74953-6031 Automotive and Watercraft Service Attendants 1.0% 3 11 $27,85149-3021 Automotive Body and Related Repairers 0.8% 3 9 $44,86649-3023 Automotive Service Technicians and Mechanics 0.4% 9 55 $40,74749-2091 Avionics Technicians -0.4% 0 2 $50,66943-3021 Billing and Posting Clerks 1.0% 26 50 $35,25649-3031 Bus and Truck Mechanics and Diesel Engine Specialists 1.0% 6 9 $48,61053-3022 Bus Drivers, School or Special Client 1.0% 20 27 $31,45053-3021 Bus Drivers, Transit and Intercity 0.7% 3 5 $38,48043-5011 Cargo and Freight Agents -0.3% 0 3 NA53-7061 Cleaners of Vehicles and Equipment 0.8% 7 29 $21,81943-5021 Couriers and Messengers 0.7% 2 3 $26,02143-5032 Dispatchers, Except Police, Fire, and Ambulance 0.8% 6 17 $37,77353-1031 First-Line Supervisors of Transportation and Material-Moving
Machine and Vehicle Operators 0.6% 4 22 $58,69853-3032 Heavy and Tractor-Trailer Truck Drivers 0.8% 36 70 $42,68253-7051 Industrial Truck and Tractor Operators 0.8% 10 31 $34,81953-7062 Laborers and Freight, Stock, and Material Movers, Hand 1.0% 75 224 $27,186

Occupation & Industry Projections 35
Occupation Projections by Career Cluster
SOC Code Title of Occupation
Average Annual Growth
Rate
Average Annual
Openingsdue to Growth
Average Annual
Openings due to
Replacements2014 Average Annual Wage
53-3033 Light Truck or Delivery Services Drivers 0.8% 22 48 $30,90949-3042 Mobile Heavy Equipment Mechanics, Except Engines 0.6% 2 9 $47,38253-3099 Motor Vehicle Operators, All Other 0.5% 3 17 $26,31253-7064 Packers and Packagers, Hand 0.0% 0 40 $22,36053-6021 Parking Lot Attendants 0.9% 4 28 $20,94653-3041 Taxi Drivers and Chauffeurs 1.6% 10 10 $26,85311-3071 Transportation, Storage, and Distribution Managers -0.1% 0 7 $116,106
CareerClusters
Agriculture Architecture
Finance Government
Arts Business Education
Human Information
Health Hospitality
Law Manufacturing Marketing
STEM Transportation

36 Delaware 2024
Industry ProjectionsAverage annual job growth during the 10-year projection period is expected to be 0.8 percent per year, or just over 3,700 jobs. Since this period is assumed to contain at least one recession, it would be misleading to compare this growth to that of recent years, when the Delaware economy has been in an expansionary phase. While below the long run average, 0.8 percent would be the highest 10-year average growth in Delaware since the 1997-2007 period. It is also above the 0.6 percent average annual job growth projected by the US Bureau of Labor Statistics for the US economy over the same 2014-2024 period.
The average business cycle in the state is about eight or nine years. When recessions do occur, it takes about three years for total jobs to reach their previous peak. With the current expansion now over six years old (this is being written in mid-2016), the likelihood of another eight years without a recession is small. That is why three years of zero job growth have been built into the projection. That would bring average job growth per expansionary year to over 5,000 jobs.
The official population projections from the Delaware Population Consortium point to slower growth. Total population growth over the ten-year period for people 16 years old and up, the official labor force, is projected at 71,544 state residents. However, the large majority of that growth is expected to be people over 65, who have much lower labor force participation rates. The state’s population of people 16 to 64 years old is projected to only rise by 14,328 people from 2014 to 2024, an average annual growth rate of only 0.2 percent over the ten years. While changing patterns of workers commuting between states can make the relationship between job growth and working-age population growth less than perfect, there is still a positive relationship between them, so slower growth in population can reduce projected job growth.
The connection between population and jobs comes from the labor force participation rate (LFPR) and the unemployment rate. The LFPR shows how many people are willing and able to work, while the unemployment rate shows how many are not in jobs. The average unemployment rate in the 2014 base year was 5.7 percent. Given the assumption that the unemployment rate will be closer to 4 percent in 2024 (full employment is the only rational assumption that far into the future), the reduction in unemployment itself adds almost 8,000 jobs. Second, labor force participation changes through time. Recent declines in the overall LFPR are well documented, but a
single LFPR for the whole population is too broad to be of much use in projections. As the table opposite shows, we use 14 categories based on gender and age to provide a more complete picture. The drop in the overall labor force participation rate (LFPR) has been attributed to a combination of baby boomers reaching retirement age, and people being displaced in the labor force by the Great Recession. This latter factor is assumed to be temporary, so we expect small increases in the LFPR of most groups by 2024. This accounts for nearly 11,000 of the projected new jobs. Due to the population growth in the upper age categories, the overall LFPR will not reach its late 1990’s peak anytime soon.
Health Care and Social Assistance, already Delaware’s largest industry sector in terms of employment, is projected to add the most jobs and have the second-highest growth rate. By 2024, nearly one in six jobs in the state will be in Health Care. The 10,190 new jobs projected are more than twice that of Finance and Insurance, which is expected to add more jobs than any of the remaining
Industry Sector Net Job Growth
Health Care and Social Assistance 10,190Finance and Insurance 4,940Accommodation and Food Services 3,450Construction 3,420Retail Trade 2,880Educational Services 2,600Self-Employed 2,500Administrative and Waste Services 2,250Professional and Technical Services 1,930Transportation and Warehousing 1,410Other Services, Except Public Administration 1,340Government 1,300Arts, Entertainment, and Recreation 750Information 250Wholesale Trade 160Real Estate and Rental and Leasing 130Utilities 50Agriculture, Forestry, and Fishing -290Manufacturing -520Management of Companies and Enterprises -1,590
Projected Net Job Growth by Industry Sector, 2024

Occupation & Industry Projections 37
Industry Projections
18 sectors. Construction is projected to have the highest growth rate, about double the overall rate.
Industries growing at above average rates will become larger components of the state’s economy, while the slower growing sectors are diminished. Among the major sectors, those projected to grow in relative size are Construction (1.6 percent annual growth), Health Care and Social Assistance (1.5 percent), Finance and Insurance (1.2 percent), Self-Employed (1.1 percent – but not technically an industry sector), Transportation and Warehousing (0.9 percent), Accommodation and Food Services (0.9 percent), and Administrative and Waste Services (0.9 percent). The major industry sectors projected to be a smaller part of Delaware’s economy in 2024 are Arts, Entertainment, and Recreation (0.7 percent), Educational Services (0.7 percent), Other Services (0.7 percent), Professional and Technical Services (0.6 percent), Retail Trade (0.5 percent), Information (0.5 percent), Government (0.4 percent), Real Estate and Rental and Leasing (0.2 percent), Utilities (0.2 percent), Wholesale Trade (0.1 percent), Manufacturing (-0.2 percent), Agriculture, Forestry, and Fishing (-0.6 percent), and Management of Companies and Enterprises (-3.4 percent).
Projected Annual Rate of Growth by Industry Sector, 2014–2024
Construction
Health Care and Social Assistance
Finance and Insurance
Transportation and Warehousing
Accommodation and Food Services
Administrative and Waste Services
Overall Economy
Arts, Entertainment, and Recreation
Educational Services
Other Services, except Public Administration
Professional and Technical Services
Retail Trade
Information
Government
Utilities
Real Estate and Rental and Leasing
Wholesale Trade
Manufacturing
Agriculture, Forestry, and Fishing
Management of Companies and Enterprises
-3.5% -3.0% -2.5% -2.0% -1.5% -1.0% -0.5% 0.0% 0.5% 1.0% 1.5% 2.0%
2014 2024Group LFPR (%) Pop. LF LFPR (%) Pop. LF
Male 16-19 30.6 24,223 7,412 33 24,830 8,194
Male 20-24 72.4 34,061 24,660 70 31,240 21,868
Male 25-34 90.2 60,138 54,244 92 65,892 60,621
Male 35-44 90.2 56,417 50,888 92 62,128 57,158
Male 45-54 86.7 63,182 54,779 88.5 57,857 51,203
Male 55-64 66.4 56,755 37,685 68 62,741 42,664
Male 65+ 20.5 64,338 13,189 23 89,817 20,658
Female 16-19 35.9 23,452 8,419 40 24,040 9,616
Female 20-24 72.9 34,301 25,005 74 30,213 22,358
Female 25-34 77.6 59,789 46,396 78 65,419 51,027
Female 35-44 77.0 59,120 45,522 79 62,660 49,501
Female 45-54 77.3 67,673 52,311 78 61,285 47,802
Female 55-64 58.4 63,379 37,013 61 68,513 41,793
Female 65+ 16.7 82,871 13,839 16 14,608 18,337
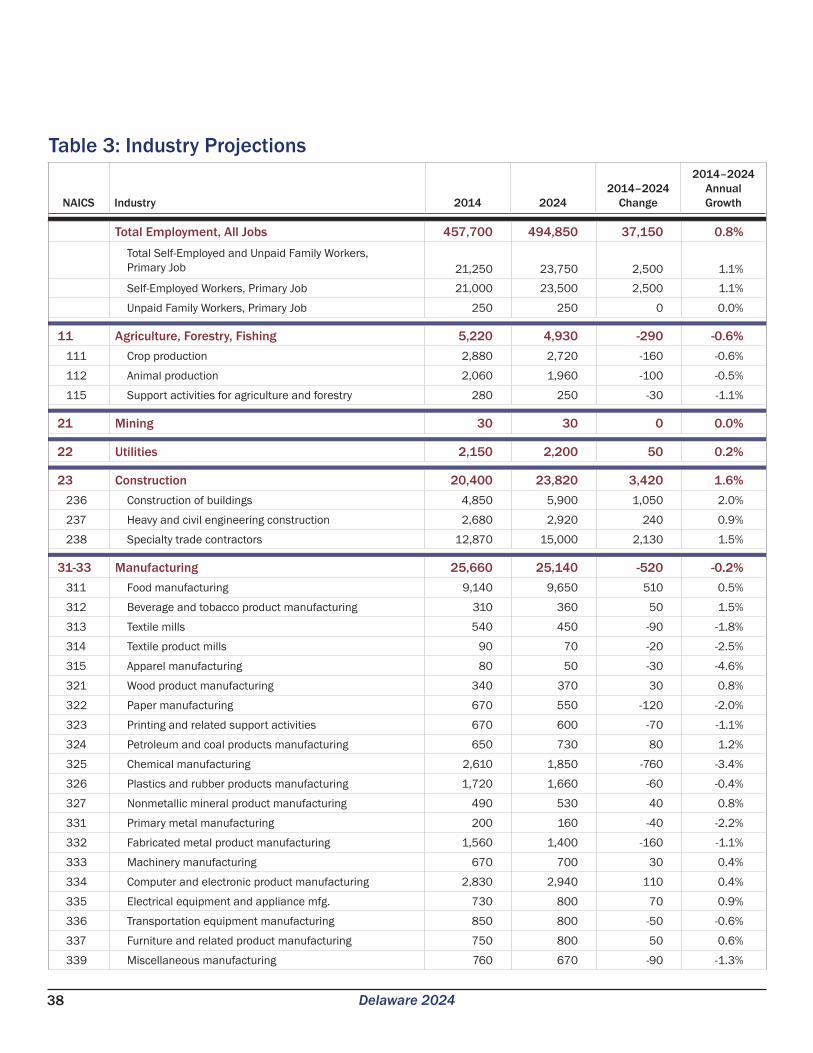
38 Delaware 2024
NAICS Industry 2014 20242014–2024
Change
2014–2024 Annual Growth
Table 3: Industry Projections
Total Employment, All Jobs 457,700 494,850 37,150 0.8%Total Self-Employed and Unpaid Family Workers, Primary Job 21,250 23,750 2,500 1.1%
Self-Employed Workers, Primary Job 21,000 23,500 2,500 1.1%
Unpaid Family Workers, Primary Job 250 250 0 0.0%
11 Agriculture, Forestry, Fishing 5,220 4,930 -290 -0.6%111 Crop production 2,880 2,720 -160 -0.6%
112 Animal production 2,060 1,960 -100 -0.5%
115 Support activities for agriculture and forestry 280 250 -30 -1.1%
21 Mining 30 30 0 0.0%
22 Utilities 2,150 2,200 50 0.2%
23 Construction 20,400 23,820 3,420 1.6%236 Construction of buildings 4,850 5,900 1,050 2.0%
237 Heavy and civil engineering construction 2,680 2,920 240 0.9%
238 Specialty trade contractors 12,870 15,000 2,130 1.5%
31-33 Manufacturing 25,660 25,140 -520 -0.2%311 Food manufacturing 9,140 9,650 510 0.5%
312 Beverage and tobacco product manufacturing 310 360 50 1.5%
313 Textile mills 540 450 -90 -1.8%
314 Textile product mills 90 70 -20 -2.5%
315 Apparel manufacturing 80 50 -30 -4.6%
321 Wood product manufacturing 340 370 30 0.8%
322 Paper manufacturing 670 550 -120 -2.0%
323 Printing and related support activities 670 600 -70 -1.1%
324 Petroleum and coal products manufacturing 650 730 80 1.2%
325 Chemical manufacturing 2,610 1,850 -760 -3.4%
326 Plastics and rubber products manufacturing 1,720 1,660 -60 -0.4%
327 Nonmetallic mineral product manufacturing 490 530 40 0.8%
331 Primary metal manufacturing 200 160 -40 -2.2%
332 Fabricated metal product manufacturing 1,560 1,400 -160 -1.1%
333 Machinery manufacturing 670 700 30 0.4%
334 Computer and electronic product manufacturing 2,830 2,940 110 0.4%
335 Electrical equipment and appliance mfg. 730 800 70 0.9%
336 Transportation equipment manufacturing 850 800 -50 -0.6%
337 Furniture and related product manufacturing 750 800 50 0.6%
339 Miscellaneous manufacturing 760 670 -90 -1.3%

39Occupation & Industry Projections
NAICS Industry 2014 20242014–2024
Change
2014–2024 Annual Growth
Industry Projections
42 Wholesale Trade 11,990 12,150 160 0.1%423 Merchant wholesalers, durable goods 5,230 5,550 320 0.6%
424 Merchant wholesalers, nondurable goods 4,880 4,700 -180 -0.4%
425 Electronic markets and agents and brokers 1,880 1,900 20 0.1%
44-45 Retail Trade 52,420 55,300 2,880 0.5%441 Motor vehicle and parts dealers 6,930 7,350 420 0.6%
442 Furniture and home furnishings stores 1,920 2,100 180 0.9%
443 Electronics and appliance stores 2,140 2,280 140 0.6%
444 Building material and garden supply stores 4,560 4,850 290 0.6%
445 Food and beverage stores 9,960 10,350 390 0.4%
446 Health and personal care stores 3,660 4,200 540 1.4%
447 Gasoline stations 2,330 2,420 90 0.4%
448 Clothing and clothing accessories stores 5,450 5,800 350 0.6%
451 Sporting goods, hobby, book and music stores 1,880 1,950 70 0.4%
452 General merchandise stores 9,730 9,850 120 0.1%
453 Miscellaneous store retailers 2,720 2,900 180 0.6%
454 Nonstore retailers 1,140 1,250 110 0.9%
48-49 Transportation and Warehousing 14,750 16,160 1,410 0.9%481 Air transportation 110 150 40 3.2%
482 Rail transportation 1,290 1,400 110 0.8%
484 Truck transportation 2,210 2,400 190 0.8%
485 Transit and ground passenger transportation 1,940 2,060 120 0.6%
488 Support activities for transportation 1,870 1,800 -70 -0.4%
491 Postal Service 1,910 1,800 -110 -0.6%
492 Couriers and messengers 1,350 1,550 200 1.4%
493 Warehousing and storage 4,070 5,000 930 2.1%
51 Information 4,890 5,140 250 0.5%511 Publishing industries, except Internet 860 750 -110 -1.4%
512 Motion picture and sound recording industries 340 360 20 0.6%
515 Broadcasting, except Internet 330 360 30 0.9%
517 Telecommunications 1,990 2,220 230 1.1%
518 ISPs, search portals, and data processing 1,050 1,100 50 0.5%
519 Other information services 320 350 30 0.9%
52 Finance and Insurance 39,780 44,720 4,940 1.2%522 Credit intermediation and related activities 26,600 29,800 3,200 1.1%
523 Securities, commodity contracts, investments 6,470 7,700 1,230 1.8%
524 Insurance carriers and related activities 6,690 7,200 510 0.7%
525 Funds, trusts, and other financial vehicles 20 20 0 0.0%

Delaware 2024
NAICS Industry 2014 20242014–2024
Change
2014–2024 Annual Growth
40
Industry Projections
53 Real Estate and Rental and Leasing 5,280 5,410 130 0.2%531 Real estate 3,970 4,150 180 0.4%
532 Rental and leasing services 1,310 1,260 -50 -0.4%
54 Professional and Technical Services 28,970 30,900 1,930 0.6%
55 Management of Companies and Enterprises 5,490 3,900 -1,590 -3.4%
56 Administrative and Waste Services 25,320 27,570 2,250 0.9%561 Administrative and support services 24,050 26,200 2,150 0.9%
562 Waste management and remediation services 1,270 1,370 100 0.8%
61 Educational Services 34,650 37,250 2,600 0.7%
62 Health Care and Social Assistance 61,220 71,200 9,980 1.5%621 Ambulatory health care services 19,290 23,000 3,710 1.8%
622 Hospitals 23,280 26,400 3,120 1.3%
623 Nursing and residential care facilities 11,370 13,000 1,630 1.3%
624 Social assistance 11,570 13,300 1,730 1.4%
71 Arts, Entertainment, and Recreation 9,840 10,590 750 0.7%711 Performing arts and spectator sports 630 570 -60 -1.0%
712 Museums, historical sites, zoos, and parks 880 920 40 0.4%
713 Amusements, gambling, and recreation 8,330 9,100 770 0.9%
72 Accommodation and Food Services 37,100 40,550 3,450 0.9%721 Accommodation 3,350 3,750 400 1.1%
722 Food services and drinking places 33,750 36,800 3,050 0.9%
81 Other Services, Except Public Administration 18,450 19,790 1,340 0.7%811 Repair and maintenance 3,280 3,440 160 0.5%
812 Personal and laundry services 4,520 4,800 280 0.6%
813 Membership associations and organizations 10,250 11,100 850 0.8%
814 Private households 400 450 50 1.2%
Government 28,550 29,850 1,300 0.4%Federal government, excluding postal service 3,580 3,650 70 0.2%
State government, excluding education and hospitals 17,890 18,750 860 0.5%
Local government, excluding education and hospitals 7,080 7,450 370 0.5%

Access our publications onlineAll OOLMI publications can be viewed or downloaded at the following website:https://lmi.delawareworks.com/Content/Publications/
This workforce product was funded by a grant awarded by the U.S. Department of Labor’s Employment and Training Administration. The product was created by the recipient and does not necessarily reflect the official position of the U.S. Department of Labor. The Department of Labor makes no guarantees, warranties, or assurances of any kind, express or implied, with respect to such information, including any information on linked sites and including, but not limited to, accuracy of the information or its completeness, timeliness, usefulness, adequacy, continued availability, or ownership. This product is copyrighted by the institution that created it. Internal use by an organization and/or personal use by an individual for non-commercial purposes is permissible. All other uses require the prior authorization of the copyright owner.”
The Delaware Career Compass is a step-by-step guide to career planning for students. Learn about yourself, the world of work,
and how you can reach your goals.
2015 - 2016 Edition
www.delawareworks.com/oolmi
Explore Your Options
What’s Out There?Who Am I?How Do I Do It?How Do I Decide?
Your Future...Your Way!
The Teacher’s Guide is a companion to the Delaware Career Compass
and is designed to supplement and enhance the use of the Compass in
the classroom.
TEACHER’S INSTRUCTIONAL GUIDE
The Delaware Annual Economic Report is a comprehensive look at the state’s economy and workforce.
The estimates in this publication were derived from the Occupational Employment Statistics (OES) survey.
This valuable tool is made possible by the hundreds of Delaware employers who
responded to the survey. Data are published only if there are enough responses to
ensure both quality and confidentiality.
The Career Heroes Activity Book is a career awareness workbook for elementary students. It is designed to be used in conjunction with the
Career Heroes Trading Cards and the Career Heroes Teacher’s Guide.
The coloring pages and activities in this book are intended to be fun for children
in the Pre-K to 3rd grade age groups. They have been designed around the 16 Career Clusters that were developed by
the U.S. Department of Education.
Published by the Delaware Department of Labor Office of Occupational & Labor Market Informationand the Delaware Career Resource Network
The Delaware Career Guide is a job-search workbook for adults. Use it to learn more
about yourself, to organize your job-search resources, and to develop the skills you will
need to navigate the job market.
A Job-Search Workbook For Adults
https://joblink.delaware.gov
Red is c over y ourse l f !
DelawareCAREER GUIDE
Delaware Department of LaborDivision of Employment and Training
A proud partner of the networkamericanjobcenter
Students and job seekers who complete and carry this handy guide will always be
prepared for success.
References
This workforce product was funded by a grant awarded by the U.S. Department of Labor’s Employment and Training Administration. The
product was created by the recipient and does not necessarily reflect the official position of the U.S. Department of Labor. The Department of Labor makes no guarantees, warranties, or assurances of any kind, express or implied, with respect to such information, including any
information on linked sites and including, but not limited to, accuracy of the information or its completeness, timeliness, usefulness, adequacy, continued availability, or ownership. This product is copyrighted by the institution that created it. Internal use by an organization and/or personal
use by an individual for non-commercial purposes is permissible. All other uses require the prior authorization of the copyright owner.
http://lmi.delawareworks.com
Pocket Resume & Interview Guide
This bookmark lists websites for personal assessment,
labor market information, job preparation, and job search.
UsU e your findings from Stepepss 11 & 2to nnararrorow w yoyourur occupational chhoioiceces.s. MMyMyM 11st cchohoicicee isis: : t
____________________________
MyMy 22ndnn cchoohoicicice e iisisis:::d
________________________________
Job SeSeSeearara chch httpps:s:s:///// jojoblb ink.deelaware.govov http://dellawwararesestatatetejojobsbs.c. omom www.Wilmington.TweeettMyMyJoJobsbs.com
www.jobbankusa.coomm wwwwwwwww.ammerricasa joobebexxchahangn e.com www.ww.cacacareererbubuilildeder.coomwww.flipdogg.c.comom hth tp://jobsearch.momonsn teter.r.com//wwww.w careermag.com www.inindedeede .comResumes anndd Coover Letters hthttpp://msn.careerbrbuiu lder.com/MSN //CaCategory.aspx?catateggoryid=CL
EdEducucatioon/n/Traininghththttptps:////jojoblini kk.dedelaware.gov/adada///
seservrviciceses/s/schoolsls/s/schsearch.cfmwwwww.w.w ededuccatatioionpnplannerer..org www.prprprinincecetoonrnreveview.commFiF nance YoYoYoururu EEduuccatit on
hth tp://studentttaiaiaiid.d.d ede .govvwwww.finaid.com///scscschohoh lal rsshihipsps
Lost YYouo r Job?www.careeereronestop.org/
reemployoymem ntFiinanancial Literar cy wwww.w practicalmononeyskillslss.com
3 Make a Decisiioonn
4 Plan forr SSuccceessf
YoYourur SSkikills www.iseek.org/sv/12398.jsp www.acinet.org/acinet/skills
YYoYourur IIntnterreststs www.onetcenter.org/CIP.html YoYourur WWWWororrrkk k k ImImImImpoportrttana ce Vallueu s www.onetcenter.org/WIP.html
OcOcOcccuccupationss www.onetonline.org www.acinet.org www.bls.gov/ooh www.bls.gov/k12Career Videos www.acinet.org/videosLabor MaMarkrket Information www.delawareworks.com/oolmi www.bls.gov
Voluntnteeeer Opportunities www.volunteerdelaware.org www.volunteer.govInI teernnshs ips http://www.indeed.com/q-intern ship-l-Delaware-jobs.html www.internships.comAppprprprenentiticecec shships http://dia.delawareworks.com/ labor-law/apprenticeship- and-training.phpMiilil tary www.todaysmilitary.com www.careersinthemilitary.comEntrepreneeurship www.sba.gov www.score.org
1 KKKKnoww YYoouurrrssseelllfff
SSSSSSTTTTTTTTTTTTEEEEEEEEEEEEPPPPPPPPSSSSS TTTTTTTTOOOOOOOOOO AAAAAAANNNNNNNNNN IIIIIIINNNNNNNNNNNNNNFFFFFFFFFOOOOOOOORRRRRRRRMMMMMMMMMMMMEEEEEEEEDDDDDDDD
CAAAAAARRRRRRRREEEEEEEEEEEEEEEEEEEEEEERRRRRRR DDDDDDDDEEEEEEEECCCCCCCCCCIIIISSSSSIIIIIOOOOOOOOOONNNNNNNNN4
2 EExploree tthhe Opttiioonns
FRONT BACK

Office of Occupational & Labor Market Information19 West Lea Boulevard
Wilmington, Delaware 19802https://lmi.delawareworks.com
www.delawareworks.com
Delaware Department of Labor