Validation and assessment of energy models
268
NBS PUBLICATIONS NBS SPECIAL PUBLICATION U.S. DEPARTMENT OF COMMERCE / National Bureau of Standards
-
Upload
khangminh22 -
Category
Documents
-
view
1 -
download
0
Transcript of Validation and assessment of energy models
NBS
PUBLICATIONS
NBS SPECIAL PUBLICATION
U.S. DEPARTMENT OF COMMERCE / National Bureau of Standards
NATIONAL BUREAU OF STANDARDS
The National Bureau of Standards' was established by an act of Congress on March 3, 1901.
The Bureau's overall goal is to strengthen and advance the Nation's science and technology
and facilitate their effective application for public benefit. To this end, the Bureau conducts
research and provides: (1) a basis for the Nation's physical measurement system, (2) scientific
and technological services for industry and government, (3) a technical basis for equity in
trade, and (4) technical services to promote public safety. The Bureau's technical work is per-
formed by the National Measurement Laboratory, the National Engineering Laboratory, and
the Institute for Computer Sciences and Technology.
THE NATIONAL MEASUREMENT LABORATORY provides the national system of
physical and chemical and materials measurement; coordinates the system with measurement
systems of other nations and furnishes essential services leading to accurate and uniform
physical and chemical measurement throughout the Nation's scientific community, industry,
and commerce; conducts materials research leading to improved methods of measurement,
standards, and data on the properties of materials needed by industry, commerce, educational
institutions, and Government; provides advisory and research services to other Government
agencies; develops, produces, and distributes Standard Reference Materials; and provides
calibration services. The Laboratory consists of the following centers:
Absolute Physical Quantities' — Radiation Research — Thermodynamics and
Molecular Science — Analytical Chemistry — Materials Science.
THE NATIONAL ENGINEERING LABORATORY provides technology and technical ser-
vices to the public and private sectors to address national needs and to solve national
problems; conducts research in engineering and applied science in support of these efforts;
builds and maintains competence in the necessary disciplines required to carry out this
research and technical service; develops engineering data and measurement capabilities;
provides engineering measurement traceability services; develops test methods and proposes
engineering standards and code changes; develops and proposes new engineering practices;
and develops and improves mechanisms to transfer results of its research to the ultimate user.
The Laboratory consists of the following centers:
Applied Mathematics — Electronics and Electrical Engineering- — Mechanical
Engineering and Process Technology' — Building Technology — Fire Research —Consumer Product Technology — Field Methods.
THE INSTITUTE FOR COMPUTER SCIENCES AND TECHNOLOGY conducts
research and provides scientific and technical services to aid Federal agencies in the selection,
acquisition, application, and use of computer technology to improve effectiveness and
economy in Government operations in accordance with Public Law 89-306 (40 U.S.C. 759),
relevant Executive Orders, and other directives; carries out this mission by managing the
Federal Information Processing Standards Program, developing Federal ADP standards
guidelines, and managing Federal participation in ADP voluntary standardization activities;
provides scientific and technological advisory services and assistance to Federal agencies; and
provides the technical foundation for computer-related policies of the Federal Government.
The Institute consists of the following centers:
Programming Science and Technology — Computer Systems Engineering.
'Headquarters and Laboratories at Gaithersburg, MD, unless otherwise noted;
mailing address Washington, DC 20234.
'Some divisions within the center are located at Boulder, CO 80303.
Validation and Assessment
of Energy Models
OF STAK»AXOfUBRABT
OCT 2 3 1981
Proceedings of a Symposiumheld at the National Bureau of Standards,
Gaithersburg, MD
May 19-21, 1980
Edited by:
Saul I. Gass
National Engineering LaboratoryNational Bureau of Standards
Washington, DC 20234
Sponsored by:
Energy Information Administration
Department of EnergyWashington, DC 20461
and
Operations Research Division
Center for Apphed MathematicsNational Engineering LaboratoryNational Bureau of StandardsWashington, DC 20234
DATE DUE
m 1
;
5 1986
CAYLORO PRINTEO IN U.S.A.
U.S. DEPARTMENT OF COMMERCE, Malcolm Baldrige, Secretary
NATIONAL BUREAU OF STANDARDS, Ernest Ambler, Director
Issued October 1981

Library of Congress Catalog Card Number: 81-600087
National Bureau of Standards Special Publication 616Nat. Bur. Stand. (U.S.), Spec. Publ.616, 248 pages (Oct. 1981)
CODEN; XNBSAV
U.S. GOVERNMENT PRINTING OFFICE
WASHINGTON: 1981
For sale by the Superintendent of Documents, U.S. Government Printing Office, Washington, D.C. 20402
Price $7.50
(Add 25 percent for other than U.S. mailing)

ABSTRACT
The Symposium on Validation and Assessment of Energy Models, held at the Na-tional Bureau of Standards (NBS) ,
Gaithersburg , MD (May 19-21, 1980), was
sponsored by the Energy Information Administration (EIA), of the Depart-ment of Energy (DOE), Washington, DC. The symposium was organized by NBS' Op
erations Research Division with a two-fold agenda: (1) to summarize the re-
cent ideas and advances of model validation and assessment that have been ap-plied to DOE energy models, and (2) to hold workshops on key open questionsthat are of concern to the validation and assessment research community.Speakers addressed current and future practices, the EIA model validation program, model structure and data, and model credibility. Full-day workshop ses
sions were held on the following topics: validating composite models, the
measurement of model confidence, model structure and assessment, sensitivityand statistical analysis of models, and model assessment methodologies. This
volume documents the symposium proceedings and includes the formal papers presented, discussant comments, panel discussions and questions and answers, andsummaries of the issues and conclusions reached in the workshops.
Key words: Assessment; composite models; data quality; energy models; mathe-matical models; model confidence; model credibility; policy modelssensitivity analysis; validation.
iii

CONTENTS
Introductary RemarksSaul I. Gass 1
Welcoming RemarksLincoln E. Moses 3
Burton H. Colvin 5
Energy Model Evaluation and Analysis: Current PracticeDavid 0. Wood 7
Humanizing Policy Analysis: Confronting the Paradox in Energy ModelingMartin Greenberger 25
Remarks on Wood and Greenberger PapersKen Hoffman 43
Building Good Models is not EnoughRichard Richels 49
Quality Control for AnalysisGeorge M. Lady 65
Validation and Assessment Procedures for Energy ModelsJerry A. Hausman 79
Energy Model Assessment Procedure Development ProjectRichard H. F. Jackson 87
Comments on Validation and Assessment ProceduresAllen L. Soyster 91
Are Energy Models Credible?David Freedman 93
Model Credibility: How Much Does it Depend Upon Data Quality?C. Roger Glass ey and Harvey J. Greenberg 117
Remarks on Freedman and Glassey-Greenberg PapersDouglas R. Hale 121
David A. Pilati 125Discussion 129
A Note on the Human Factors Associated with Model Validation and ConfidenceDavid A. Pilati 137
Workshop Report 1—Composite Model ValidationAndy S. Kydes and Lewis Rubin 139
Workshop Report 2—The Measurement of Model ConfidenceLambert S. Joel and John S. Maybee 149
V

Workshop Report 3—Model Standards to Aid AssessmentMilton L. Holloway 159
Workshop Report 4—Sensitivity and Statistical Analysis of ModelsCarl Harris and David Hirshfeld 171
Workshop Report 5—Model Assessment MethodologiesPART A: Enumeration of Validation Methodologies
James Gruhl and David 0. Wood 183
PART B: Model Assessment MethodologiesThomas J. Woods 201
Panel Discussion on Workshop Reports , 205
Reflections on Modeling and Modeling AssessmentAlan J. Goldman 217
Symposium Program and Attendees 243
Papers in this volume, except those by National Bureau of
Standards authors, have not been edited or altered by the National
Bureau of Standards. Opinions expressed in non-NBS papers are
those of the authors, and not necessarily those of the National
Bureau of Standards. Non-NBS authors are solely responsible for
the content and quality of their submissions.
The mention of trade names in the volume is in no sense an
endorsement or recommendation by the National Bureau of
Standards.
vi
INTRODUCTORY REMARKS
Saul I. GassSymposium Chairperson
Good morning. I would like to welcome you to the Second Symposium on Valida-
tion and Assessment of Energy Models sponsored by the Department of Energy and
the National Bureau of Standards.
The first symposium, which many of you were at, was held in January of 1979.
That symposium emphasized the open issues and research aspects of energy model
validation and assessment.
This symposium highlights the advances, new directions, and major researchactivities of the last year and a half. We have attempted to do this by lim-
iting the invited paper sessions to a few specific topics and to spend almosttwo full days on research workshops.
I think I can best explain why we are here and why 1 think these sjrmposiums
are of great importance by quoting from the May 16, 1980 editorial that
appeared in Science Magazine . It was written by Judge David L. Bazelon,
Senior Circuit Judge of the U. S. Court of Appeals for the District of Colum-bia Circuit. The title of the editorial is "Science, Technology^ and the
Court." I quote:
"I believe that the judicial responsibility is to monitor and scru-tinize the administrative process. Our task is to ensure that the
agency's decision-making is thorough and within bounds of reason.
The agency's decisional record oust disclose the evidence heard,policies considered and the agency's precise reasons for resolvingconflicts in the evidence. This includes the basis for selectingone scientific point of view rather than another. This permits
quality checks through peer review, legislative oversight, and pub-
lic attention.
"Only if decision-makers disclose assumptions, doubts, and moral and
political tradeoffs can experts and citizens evaluate the adminis-
trative action. Only then can professional peer review bring to
light new data or challenge faulty assumptions. Only then can Con-
gress and the people gain sufficient understanding to permit mean-ingful debate of the valued choices implicit in regulatory action.
"Acting independently about expert and political debate, courts can ,
compel full ventilation of the issues on the record, as well as ac-custom decision-makers to the discipline of explaining their ac-tions.
1

"Finally, courts can ensure that all persons affected have opportu-nities to participate. The results should be an open process thatcan reveal gaps, stimulate research and thereby inspire more confi-dence in those affected, including the scientifically untutored."
I believe the work we are doing in validation and assessment of energy models,specifically, and models, in general, will go a long way in helping us achieveJudge Bazelon's goals.
This symposium is jointly sponsored by the Energy Information Administrationof the Department of Energy and the Center for Applied Mathematics of the Na-tional Bureau of Standards. To offer a welcome from DOE, I would like to
first introduce Dr. Lincoln E. Moses, Administrator of the Energy InformationAdministration of DOE. Then, on behalf of the National Bureau of Standards,Dr. Burton H. Colvin, Director of the Center for Applied Mathematics, will of-fer a few words of welcome.
2

WELCOMING REMARKS
Dr. Lincoln E. MosesAdministrator
Energy Information AdministrationDepartment of Energy
My words are quite brief. I am here mainly as a listener. It is a pleasureto express the hopes for and the importance attached to this kind of work bythe Energy Information Administration and to bid you welcome on behalf of oneof the sponsoring organizations.
The conference itself gives good reason for hope because of the topics chosenand because of the participants who have been invited. Again, I bid you allwelcome.
3


WELCOMING REMARKS
Dr. Burton H. ColvinDirector
Center for Applied MathematicsNational Bureau of Standards
On behalf of NBS and its Center for Applied Mathematics, T am happy to add mywords of greeting and welcome to you.
This symposium is of special interest to NBS, generally, as all of our tech-nical centers are rather deeply involved in collaborative work with all partsof the Department of Energy. In fact, these efforts constitute a relativelymajor and important fraction of NBS' other agency work. Also, interest in
large scale mathematical modeling and methods to evaluate and assess such mod-els has been a major thrust, in recent years, of the Applied Mathematics Cen-ter. We expect that to continue.
It is especially pleasant to have this collaboration between NBS and DOE. We
share your thoughts that these are important problems, and our relationshipwith DOE has been pleasant and productive. It involves university organiza-tions and a number of non-academic organizations, many of which are represent-ed here. These are the kinds of collaborations which NBS has found extremelyvaluable.
I have a very special interest in adding my words of greeting. T wish youwell in accomplishing the goals of this sjnnposium.
5

ENERGY MODEL EVALUATION AND ANALYSIS:
CURRENT PRACTICE
by
David 0. Wood*
1 . Introduction
Formal efforts to improve the credibility and usefulness of energypolicy models have proliferated since the first DOE/NBS Workshop on
Validation and Assessment Issues of Energy Models .' That workshopwai relatively unstructured, providing wide scope for presentation anddiscussion of both current activities and related issues , including therole of evaluation in policy modeling and research; the meaning ofvalidation for policy models; and guidelines and standards for effectivedocumentation of policy models and model -based studies. In contrast, thepresent Workshop emphasizes indepth collaboration of working groupsmeeting in parallel sessions. Such collaboration of workshopparticipants is obtained at the cost of reduced opportunities for projectreports and open discussion by the full workshop. In partialcompensation, Saul Gass has asked me to provide a brief survey of newactivities and developments over the past year.
A convenient way to organize such a survey is to first mention new
organizational initiatives and then to describe new projects anddevelopments in agencies most prominently concerned with energy policymodel development, application, and evaluation. These include the DOEEnergy Information Administration (EIA) and the Electric Power ResearchInstitute (EPRI). We conclude with a discussion of two significantactivities in the past year: the EIA/DOE Workshop on the Measurement andInterpretation of Model Confidence and publication of the Texas NationalEnergy Modeling Project (TNEMP) evaluation of the EIA Midterm EnergyMarket Model
.
2. Organizational Initiatives
There have been several organizational developments in the past yearrelating to energy policy model evaluation and analysis including;
Energy Modeling Forum (EMF): The sponsorship of the EMF has beenexpanded to include the Gas Research Institute (GRI) and the Departmentof Energy in addition to EPRI, the founding sponsor.
Utility Modeling Forum (UMF): The EMF has spawned its first progenyin the EPRI-sponsored UMF, a development previewed by Cherry [1980] atthe first Workshop. The UMF, administered by Booz-Allen, will employ thesame approach to the organization and conduct of model comparison studiesas the EMF, concentrating on such issues as load forecasting and
7
management, expansion planning and dispatch, and financial management.An early contribution of the UMF will be the publication of a UtilityModel Notebook providing summary descriptions of utility based models.
Wharton Analysis Center: The University of Pennsylvania WhartonSchool has organized the Analysis Center for research in statistical andanalytical methods relating to data and model development andevaluation. The Center, directed by Professor Larry Mayer, is presentlyconcentrating upon energy models and associated data vn'th sponsorship ofthe EIA Office of Validation Analysis.
M.I.T. Energy Model Analysis Program (EMAP): The M.I.T. EnergyLaboratory has organized the EMAP for research in policy modeling anddata analysis and to conduct policy model evaluations. The activities ofEMAP are presently sponsored by EPRI , the Office of Analysis Oversightand Access (EIA) and the Office of Validation Analysis (EIA). In
addition to conducting evaluation projects and related research, the EMAPwill prepare the EPRI Energy Model Analysis Notebook as a source documentfor communicating results of evaluation projects, as well as modeldescriptions.
Texas Energy Policy Project (TEPP): The Texas Energy and NaturalResources Advisory Council (TENRAC) has organized the TEPP to support thecouncil in various analytical and policy research activities. Theobjectives of the TEPP are summarized in Holloway [1980b, chapter 3], Ofparticular interest is the objective of conducting an annual review and
evaluation of the EIA's Annual Report to Congress and of national energyplans. The review and evaluation will be based in part upon use of the
EIA Midterm Energy Forecasting Model, a current version of which is to be
maintained by the TEPP. This model is presently used in supportingpreparation of the Annual Report to Congress and of various energyinformation and policy studies requested of, or sponsored by, the EIA.
3. Energy Information Administration (EIA)
As has often been noted, much of the impetus for energy policy model
evaluation derives frcMn the Congressional concern as to the objectivityof the FEA's PIES applications. One product of this concern was the
creation of the Professional Audit Review Team (PART).^ The firstPART report was extremely critical of the EIA's efforts to establish the
credibility of their models. Thus,
The credibility of OEIA's [now Energy InformationAdministration] models has not been established becausedocumentation, verification, and validation have been
neglected. Furthermore, publications describing the currentmodels are scarce and procedures for public access to them are
almost nonexistent. As a result, it is practically impossiblefor interested parties outside FEA to know whether OEIA'scurrent models have been constructed properly and used correctlyand thus whether OEIA's analytical products and forecasts can be
used with confidence. (PART [1977, p. 31-32])
Partly in response to these concerns and findings, the EIA formed two
offices, including the Office of Analysis Oversight and Access (OAOA)
8

under the Assistant Administrator for Applied Analysis, and the Office ofValidation Analysis (OVA) under the Assistant Administrator for EnergyInformation Validation.^ jhe functions and objectives of the two
offices are complementary and serve the specific interests of the tv/o
Assistant Administrators. Thus, according to the 1978 Administrator'sReport to Congress ,
The Office of Analysis Oversight and Access provides standardsand procedures governing access, documentation, and technicalreview of applied analysis models and products. Primaryattention is directed to evaluation of the data and methodologyof analysis, and to the assessment and validation of models.
The Office of Validation Analysis analyzes and evaluates the
requirements for, and the consistency of, energy informationsystems and plans for specific validation studies. This officealso is responsible for validations of projections and models.
3.1 Office of Analysis Oversight and Access (OAOA)
At the first Workshop, Lady [1980] described three broad classes ofactivities comprising the responsibilities of OAOA. These includedocumentation, evaluation projects, and improving public access to EIAmodels and associated data bases. OAOA has undertaken projects in eachof these areas and, in addition, has sponsored a series of workshops to
increase understanding of EIA models and modeling problems, and toimprove credibility of EIA models and model applications.
Documentation Standards: The OAOA has formulated a system of
standards for documentation of EIA-sponsored models and model
applications. A preliminary set of standards was described in Lady[1980], and a revised standards are presently being developed. They are
based upon OAOA's evaluation of the documentation needs of its variousclients, supported by independent case studies.^
Archiving and Public Access: The OAOA has developed procedures for
archiving the results of all analysis studies and associated models and
data. These procedures are intended to ensure that any quantitativeanalysis conducted by the Office of Applied Analysis may be reproducedand verified either within EIA or independently. At present, archivalfiles are maintained under the control of EIA. However, efforts are
underway to develop an institutional capability at the Argonne NationalEnergy Software Center.
5
Evaluation Projects: OAOA has conducted or sponsored several
evaluation projects. Projects recently completed include:
An indepth evaluation of the Midrange Energy ForecastingSystem's econometric energy demand model (Freedman, et al
.
[1980]);
An evaluation of the DOE Midterm Oil and Gas Supply ModelingSystem (NBS [1980]); 6
9
An Evaluation of the Coal and Electric Utilities ModelDocumentation and Recommendations for Documentation Guidelines(Goldman, et al . [1979]);
Overview evaluation of the Short Term Integrated ForecastingSystem (Expert Panel, no report).
New and continuing evaluation projects of the OAOA include:
Indepth evaluation of the Short Term Integrated ForecastingSystem (NBS);
Review and evaluation of the PIES documentation (ProfessorsJerry Hausman and Carl Harris);
Comparative evaluation of the coal production cost functions for
the National Coal Model and the Zimmerman Coal Supply Model
(EMAP);
Comparative evaluation of the Baughman-Joskow RegionalizedElectricity Model and the MEFS Electricity Submodel (EMAP).
In addition to evaluation projects, OAOA is conducting research on
developing computer assisted methods for model analysis and evaluation.This research v/as previewed in Greenberg [1980] and provided the basisfor a recent OAOA sponsored Workshop on Computer Assisted Analysis and
Model simplification. Workshops were also organized to review the
state-of-the-art of oil and gas exploration and production modeling, and
to review and discuss issues in the measurement and interpretation of
model confidence (discussed in section 5).
Analysis Review Procedures: The OAOA is responsible for organizing
and conducting a review process for all analysis studies conducted by the
Office of Applied Analysis. The process involves a combination of
internal and external review and evaluation and is patterned on the peer
review paradigm. The most ambitious review effort to date is the
evaluation of the component models used in preparing the Annual
Administrators Report for 1978, the subject of a separate session at this
workshop.
Taken altogether, then, the OAOA has organized and implemented an
extensive program of activities to evaluate and improve both the modelsand model -based studies of the Office of Applied Analysis. This program
addresses all the issues raised in the original PART report [1977] —including documentation, public access, and involvement of non-agency
peers in evaluation -- and represents a serious committment to
establishing the credibility of EIA models and model-based studies.
3.2 Office of Validation Analysis (OVA)
The Office of Validation Analysis (OVA) is organized under the
Assistant Administrator for Energy Information Validation. Activities of
OVA complement those of OAOA, emphasizing research on methods of data and
10
model evaluation. Current activities of OVA in energy information systemevaluation include the following projects.
Princeton University Resource Estimation and Validation Project: A
major effort at the Princeton University Department of Statistics andGeology over the past three years has been an indepth review ofalternative methods for estimating the productivity of oil and gas
exploration activity. This project has been of special importancebecause of EIA's legislated responsibility to develop independentestimates of oil and gas reserves. Approaches to survey design, dataacquisition, and data validation must reflect an understanding of howsuch data may be used in developing informed projections. The objectivesof the Princeton project include an analysis of the relation between thesource data measurement system and the requirements and maintainedhypotheses of alternative modeling methodologies.'
Wharton Analysis Center Evaluation of the Short-Term IntegratedForecasting System (STIFS): The underlying objectives of this recentlyinitiated project are to develop and illustrate methods of data and modelvalidation and evaluation using STIFS as a test model. STIFS is similarin concept to the Project Independence Evaluation System (PIES) in thatdemand relations are estimated statistically v/hile supply and conversionactivities are characterized by process submodels, all related via an
Integrating mechanism providing for the determination of equilibriumprices and quantities in energy markets. Initially, effort is
concentrating on the demand submodels beginning with the demand forgasoline. Each model component is being examined in detail regardingsuch issues as a relation between underlying data measurement and the
requirements of the model specification, and appropriateness of parameterestimation and calibration methods. Also, the consistency of the
integrating mechanism will be evaluated in terms of the measurementsystem and accounting structure underlying the model. All these resultswill be combined and considered in developing formal measures of model
confidence in relevant applications.
Oak Ridge National Laboratory Evaluation of the Long-Term EnergyAnalysis Program (LEAP): The objectives of this project are similar to
those of the STIFS evaluation project, v/ith LEAP serving as a test model
to assist in "...development and demonstration of a methodology forevaluating energy-economic modeling codes and important results derivedfrom these codes." (Alsmiller, et al. [1980], p.xi) While the objectiveis methodological, the focus differs somewhat from STIFS, with heavyemphasis on developing formal methods of sensitivity analysis forevaluating uncertainties in important data, and in measuring confidencelimits of model forecasts. This latter problem is especially interestingsince the methods of calibration used in LEAP ~ engineering data andjudgment — do not provide a direct means of constructing probabilisticconfidence limits for forecasts. To date an interim report has beenprepared providing a detailed exposition of research objectives, and
preliminary results for each of the main lines of research (Alsmiller, etal. 1980). This project represents perhaps the most ambitious anddetailed research program yet conceived for developing methods of modelanalysis and evaluation.
11
M.I.T. Project in Model Evaluation and Data Validation: Theobjectives of this recently initiated project focus on validationtechniques relating to the data/model interface. The emphasis of theresearch is to develop diagnostic techniques applicable to parameterestimation and system analysis, and to illustrate these methods on one ormore EIA models. The diagnostic techniques for estimation are based inpart upon Belsley, Kuh and Welsch [1980], extended to include estimationin simultaneous equation systems. System diagnostics methods will alsobe developed to measure relative importance of equations and specificparameters in model predictions, as v/ell as summary measures of modelforecasting performance. A third aspect of the research is source/modeldata transformations, and the implications for model specification andestimation in a particular model.
3.3 Summary
We began this section with reference to the congressional concernsabout objectivity and "good practice" in the modeling and modelingapplications of the EIA and its predecessor agencies, and to the findingspresented in the first PART Report [1977]. The OAOA and OVA were in partcreated to address the congressional concerns and the combined programsrepresent a major effort. The success of their efforts may be partlyjudged from the second PART Report [1979] which finds things muchimproved regarding documentation, public access and evaluation. Thus,
During 1978, EIA has taken various actions to improve the
credibility of its energy models. PART believes that the
development of a program plan for Applied Analysis and intermdocumentation standards are a major step in the rightd1 recti on. ETT^ Ts also establishing controls over modelchanges, and it is sponsoring development of a model validationprocedure, development efforts for model assessment whichencompass validation, verification, and sensitivity testingprocedures for models. It is also establishing procedures forpublic access to its models. (PART [1979, p. 40])^
4.0 Electric Power Research Institute (EPRI)
The EPRI Energy Analysis and Environment Division has conducted,supported, and encouraged a variety of projects and organizationalinitiatives concerned with increasing the understanding and use of energypolicy models, and in developing models which are oriented towardparticular problems and issues of EPRI's sponsors, the U.S= electricutility industry. 5 While EPRI has been somev/hat less concerned than
EIA with developing procedures for documentation standards and public
access, they have made substantial progress in internal organization of
the model development, evaluation, and application process, and in
institutionalizing and supporting groups pursuing objectives of energypolicy model analysis and application.
In a recent paper. Peck [1979] characterizes the program in terms of
six "bridges" between research and mo.deling activities, and the clientsof these efforts. The bridges include:
12
Energy Modeling Forum,Model Assessment Laboratory,Heuristic Models,Transfer Projects,The Scenario Approach, and
Decision Analysis.
Energy Modeling Forum (EMF): Perhaps the best known of EPRI'sinitiatives to build bridges between modelers and model users is the
EMF. Begun in 1976 with EPRI sponsorship, the EMF has producedfive major studies applying relevant models to specific policy issues,contributing understanding of the issue, improving user understanding ofthe models and increasing modeler sensitivity to the needs of policyanalysts and decision makers.
The objectives, organization, and style of the EMF v/ere described bySweeney [1980a] at the first workshop. Studies completed to datainclude:
Energy and the Economy (EMF 1)
Coal in Transition: 1980-2000 '(EMF 2),
Electric Load Forecasting: Probing the Issues with Models (EMF 3),Aggregate Elasticity of Energy Demand (EMF 4) andU.S. Oil and Gas Supply (EMF 5).
Currently EMF 6, a study of world oil exploration and production modelsis underway, and a study of the macroeconomic effects of oil price shocksis being planned.
Energy Model Analysis Program (EMAP): In parallel v/ith the EMF, EPRIhas sponsored third party model evaluations by M.I.T. and others^ Atan early EPRI workshop, the relation between EMF and third partyanalysis was described as follows:
The panel described the role of third-party model analysis as a
complement to Forum studies. The Forum must exploit the
backroom concept of Forum operations, relying on the model
developers to implement and translate the scenariospecifications. The significant practical advantages of the
procedure are achieved at the loss of the advantage of
constructive independent investigation of model structure and
operation. This activity supports the objectives of the Forumeffort, but requires a different environment with intenseinvolvement of individual analysts. The contributions ofthird-party assessment can be pursued independently . (EPRI [1977]
p. 11-19).
Subsequently, EPRI sponsored the M.I.T. Energy Laboratory in thirdparty assessments of the Baughman-Joskow Regionalized Electricity Model,
the Wharton Annual Energy Model , and the ICF Coal and ElectricityUtilities Model, in analyzing the process of organizing and conductingthird party model analysis.
Recently EPRI's support of third party model analysis at M.I.T. hasbeen expanded from a project to a program basis. The objectives of the
13
expanded activity include conducting evaluation studies and preparing anEPRI Model Assessment Notebook. Tv/o projects are underway including anevaluation of the DFI Over/Under Capacity Planning Model, and of theHirst Residential Energy Demand Model.
Transfer Projects: The organization, transfer, and application ofknowledge in the form of research models and data is a difficult problemfor EPRI managers. In 1978, EPRI asked a distinguished group ofresearchers to consider the problem and to recommend one or moreapproaches. 13 jy^^ group identified two approaches including :
The iterative, problem-directed strategy, [in which]emphasis is on assembling information to meet a specific clientneed, using as necessary analytical tools tailored to the
specific problem; and
the comprehensive modeling strategy. .[ which], .emphasizeslinking together a broad spectrum of information in order tomeet needs arising from a broad range of client problems.(Baughman, et al,[1978], p. 1-2).
Noting that in practice a mixture of both approaches would occur, thegroup recommended moving tov/ard the iterative, problem-directed strategy.
Persuaded by the analysis underlying this recommendation and theirown experience, EPRI Systems Program staff have developed the concept ofthe transfer project . In a transfer project, the analyst assemblesinformation from existing research projects, may build a new model to
integrate the information, and then transfers it to the client in a formtailored to the client's needs. The client provides feedback onimportant problems and information requirements which can then be used to
guide the direction of future research and future transfer projects.
According to Peck, the ingredients for a successful transfer projectare (a) to find a client with a problem that he is very interested in
solving, (b) to include the client in a v/orking group whose aim is the
solution of that problem, and (c) to build a model which, although in its
first phase may be somewhat crude, does nevertheless address the entireproblem of the client. Peck [1979] cites as a mature instance of a
successful transfer project the EPRI study, "Integrated Analysis of LoadShapes and Energy Storage." Another example would be the DFI Over/UnderCapacity Planning Model. Although not originally conceived as a transferproject, the implementation of this model reflects important elements of
the transfer project paradigm, especially planned interaction with model
users in the model development phase. Several other projects are beingplanned as transfer projects, and experience with this approach is
accumulati ng.
Success of the transfer project concept as a means of organizingapplied modeling projects and studies will depend on several factors.Perhaps most importantly, transfer projects will require modelers andanalysts with facility in moving between research and problem solvingmodels. Models developed as part of a transfer project must be well
14
grounded in scientific knowledge and data, but because the emphasis is
problem solving the resulting model may not be expressible in a
scientifically refutable form. This suggests that an important aspect ofsuccessful transfer projects will be communicating to clients informationabout the confidence that should attach to model results.
A related concern is that the emphasis on transfer of knowledge and
data to problem solving does not obscure the need to ensure the feedbackfrom clients to modelers. The long run interests of clients will not be
well served if modelers in transfer projects are primarily problemsolvers as contrasted vrith agents of transfer and application of newknowledge and understanding. Of course it might be argued that this is
preferable to a situation when knowledge is increased but no effectivemechanism for the transfer exists. Clearly balance is required, and thesuccess of the EPRI transfer project concept will depend upon the skill
of its managers and clients in ensuring that this balance is achieved.
Modeling Approach and Study Organization: Under this heading I
include the final three of Peck's bridges: heuristic modeling, thescenario approach, and decision analysis, by heuristic modeling Peckmeans the development and application of simple models which highlight an
essential feature of some underlying process, perhaps characterized by a
more detailed model. The simple model may be useful in providing insightinto a key relationship as well as a basis for model comparison. Twoprominent examples are the Hogan-Manne "elephant-rabbit" model of EMF 1,
highlighting the relation betv/een energy prices and economic growth, andSweeney's simple model of oil exploration productivity in EMF. 5,highlighting the essential relation between the shape of the oil findingcurve, quantities discovered, and the price elasticity of cumulativediscoveries.
The System Group's orm work (Peck [1979]) provides still anotherexample of the uses of simple models. An important policy question in
regulating sulphur dioxide emissions from new coal burning power plantsis the cost of stricter regulation. EMF. 2 considered this issue, amongothers, with the result that increased costs were not likely to belarge, although the variance among the models was significant. TheSystems Group extended the results of the EMF. 2, employing ICF Coal andElectric Utility model results in a graphical summary. The graphicalmodel both summarizes detailed results, and highlights certain counter-intuitive results requiring further explanation.
Finally Peck identifies the scenario approach and formal decisionanalysis as important means of improving the effectiveness of model basedpolicy studies. The scenario approach provides a structured method forthe treatment of uncertain events and independent variables, eitherbecause of uncertainty in the realization for that variable (world priceof oil in 1985), or because of controversy between study participantsand/or clients. A decision tree framework provides both a means ofstructuring the process of scenario construction, and of organizing andpresenting results as they bear on contentious points. Peck provides as
illustration of this technique a study by Dale W. Jorgenson Associates[1979] of the economic consequences of a nuclear moratorium underalternative assumptions about several uncertain cost variables.
15
When the uncertainty in important variables can be objectivelyquantified in terms of probabilities, and when the study problem may be
cast in terms of a particular decision, then decision analysis is a
natural methodology to employ. As an important instance, Peck cites the
efforts of Manne and Richels [1980] in conducting an economic analysisfor the NASAP (Nonprol i feration Alternatives Systems AssessmentProgram). One conclusion from the Manne-Richel ' s study is the difficultyof obtaining objective probability assessments from experts. Ofcourse, lack of confidence in the objectivity of probability estimatesfrom experts who can "solve the problem backwards" does not affect theuse of the decision tree framev/ork for structuring studies, or the use ofdecision analysis as a means of identifying the critical uncertainties in
a decision, regardless of their resol ution.^
Summary: Cummulating experience suggests that EPRI's generalapproach to organizing problem oriented studies is successful, servingthe needs of its constituency. Hov/ the EPRI approach evolves and the
extent to which it is "transportable" to other organizations will be
interesting to observe. Certainly groups with similar problems such as
EIA, the Texas Energy Policy Project, GRI , EEI, and others would be well
advised to study the EPRI process.
5. Measuring Model Confdence
During the past year, EIA and NBS have collaborated in sponsoring a
workshop on measuring confidence in model predictions. The central
importance of this issue to EIA is v«ll summarized by the Administrator,Lincoln Moses, as follow:
An energy model may have hundreds of equations and thousands of
variables, constants, parameters. The formal structure of a
forecast made from such a model is "lf_ these thousands of
details are correct, and if these equations correctly representreality then the following consequent forecasts are correct."
But some of those details have to be wrong, and some of the
equations also. Then the forecasts have to be "wrong."... Why
then offer them at all? The answer must be because we bel ieye
they are not seriously wrong. And suddenly their useTulness is
seen to depend on assessing the likely degree of error. Thus,giving a useful idea of the uncertainty of a forecast is not a
"refinement" -- it is central to the first order usefulness and
meaning of the forecast. (Moses [1979], p.6).
A normative approach to sunmarizing information about the confidence
to attach to a model has recently been proposed by Gass and Joel [1979]
in an issue paper for consideration at an EIA/NBS Workshop on
Establishing Model Confidence (October 4, 1979). Gass and Joel [GJ]
propose four criteria and a scaling procedure to indicate the degree of
confidence a client should attach to a model's predictions. The GJ
criteria -Qare documentation, verification, validation, and
usability.^° The scaling procedure is based on statements expressing
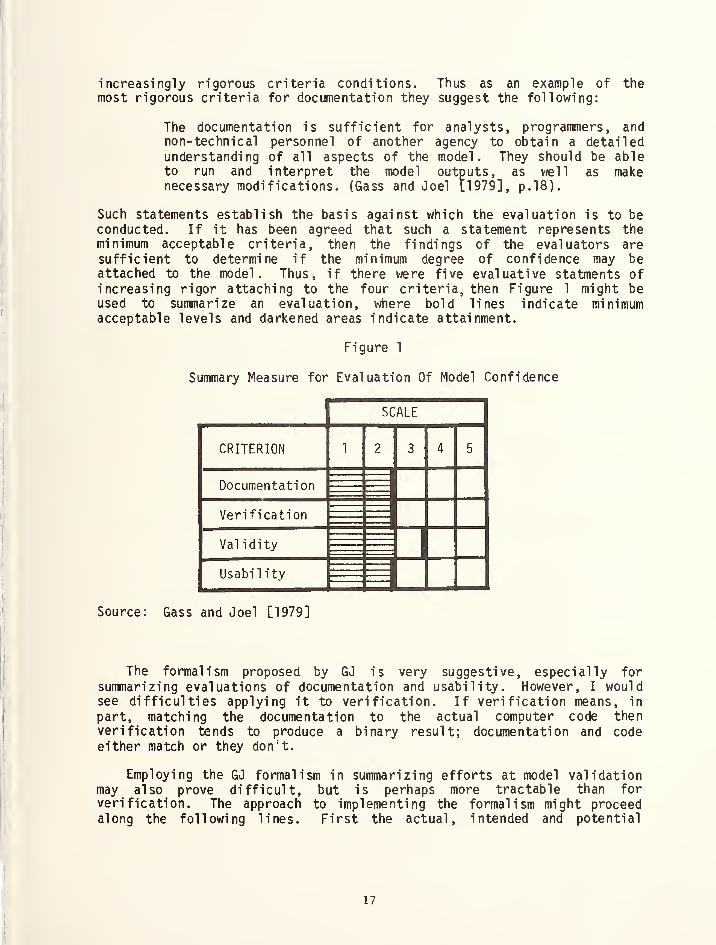
increasingly rigorous criteria conditions. Thus as an example of themost rigorous criteria for documentation they suggest the following:
The documentation is sufficient for analysts, programmers, andnon- technical personnel of another agency to obtain a detailedunderstanding of all aspects of the model. They should be ableto run and interpret the model outputs, as v/ell as makenecessary modifications, (Gass and Joel [1979], p. 18).
Such statements establish the basis against v/hich the evaluation is to beconducted. If it has been agreed that such a statement represents theminimum acceptable criteria, then the findings of the evaluators aresufficient to determine if the minimum degree of confidence may beattached to the model. Thus, if there v/ere five evaluative statments ofincreasing rigor attaching to the four criteria, then Figure 1 might beused to summarize an evaluation, where bold lines indicate minimumacceptable levels and darkened areas indicate attainment.
Figure 1
Summary Measure for Evaluation Of Model Confidence
SCALE
CRITERION 1 2 3 4 5
Documentation
Veri fi cation
Val idity
Usabi 1 ity wSource: Gass and Joel [1979]
The formalism proposed by GJ is very suggestive, especially forsummarizing evaluations of documentation and usability. However, I wouldsee difficulties applying it to verification. If verification means, in
part, matching the documentation to the actual computer code thenverification tends to produce a binary result; documentation and codeeither match or they don't.
Employing the GJ formalism in summarizing efforts at model validationmay also prove difficult, but is perhaps more tractable than forverification. The approach to implementing the formalism might proceedalong the following lines. First the actual, intended and potential
17
applications of the model are described in sufficient detail to makeclear the model accuracy required to provide sufficient discriminatingpower. Then the model is characterized in terms of structure, content,and information on predictive uncertainty. The requirements foraccuracy, given the actual and intended applications, might be used to
construct explicit and increasingly rigorous statements about modelperformance. The analysis of structure, content, and predictionuncertainty provide the source material for applying the criteria
Suima ry: The GJ proposal for summarizing informtion on modelevaluation in a compact format, readily related to particular modelapplications, is very suggestive. We require experience v/ith thisapproach to see how useful it will prove in practice, both to implementand to interpret.
6. Texas National Energy Modeling Project (TNEMP ).
At the first workshop, Holloway [1980a] described the TNEMP, andpresented a summary of the main results of that independent evaluation ofthe EIA Midrange Energy Forecasting System (MEFS). Since then, the final
report has been published in two parts (Holloway [1979, 1980b]. Part II
presents the detailed study results summarized by Holloway. Part I
presents new material on:
further modeling and evaluation for Texas,a report of the TNEMP National Advisory Board,DOE review and comments, andresults of a TNEMP/EIA Workshop on substantive issues.
These materials represent an important contribution to theorganization and practice of model evaluation. In a situation which atits beginning had a high probability of being:
acrimonious and adversarial,a political rather than scientific exercise,
fragmented in terms of timing and location of published resultsand rebuttals, anduninterpreted for those outside the process,
TNEMP, with EIA's cooperation, organized and implemented a process which:
maintained constructive tension between the EIA and TNEMPanalysts,maintained a scientific orientation,ensured an outside evaluation of the process,provided for rebuttal and discussion of controversial issues,and published all resul ts—eval uative, interpretive, andrebuttals— together.
There is no substitute for studying Part I of the TNEMP report(Holloway [1980b]) to appreciate how such a constructive outcome wasachieved. In my view, however, there are five keys to the TNEMPsuccess. First, the competence and scientific integrity of the
18
evaluation group was of high quality. Such a group v/ould not lend theirprofessional reputations to a non-scientific evaluation.
Second, considerable effort was devoted to establishing a
constructive relationship between TNEMP and EIA, primarily via assignmentof a technically competent, mature, and articulate EIA representative to
provide liaison, and to prepare/coordinate coiranents and rebuttals to the
findings of the evaluation group. This representative participated in
all TNEMP review meetings. Thus the TNEMP process and intermediateresults were v/ell known to EIA, and so there were no surprises in thefinal report.
Third, the TNEMP organized an advisory group composed of personsknowledgeable about energy issues and modeling, with a majority of the
memebers from organizations outside Texas. This group v/as responsiblefor advising the TNEMP director on matters of process; for preparing an
interpretive report on the integrity of that process; and for preparingrecommendations to the sponsoring organization, the Texas Energy andNatural Resources Advisory Council. In part this group served as a
representative for those outside the process v/ho v/ere interested andconcerned with the models and issues being evaluated and discussed.
Fourth, the TNEMP provided EIA the opportunity to prepare formal
comments on the evaluation results, and published these comments in PartI of the report.
Finally TNEMP and EIA collaborated in sponsoring a workshop in whichanalysts in both groups made presentations and discussed the substantiveissues of the evaluation, as v-zell as more general research problems. Asummary of the workshop presentations and discussion is also published in
the TNEMP report.
All this attention to organizing and implementing a process whichconcentrated on both the form and substance of the evaluation hasresulted in a study v/hich is as self-contained and fair as possible.Regardless of ones views on the substance of the evaluation, the projectserves as a model for organizing future independent model evaluationstudies.
Summary: The TNEMP represents the most detailed and comprehensiveindependent model evaluation study to date. The organization of the
project is worthy of careful study, providing a paradigm for futureprojects. Further experience with this effort is assured by the factthat independent evaluations of subsequent EIA Annual AdministatorReports and modeling efforts are to be conducted as part of the on-goingactivities of the TEPP.
19
Notes
* Associate Director, Energy Laboratory, and Senior Lecturer in the
Sloan School, Massachusetts Institute of Technology. This survey
has benefitted from discussions with Saul Gass, James Gruhl,Douglas
Hale, Kenneth Hoffman, George Lady, Martha Mason, and James Sweeney.
1. See Gass [1980] for the papers presented at that Workshop, and for
transcripts of the discussions.
2. For a survey of congressional concerns and their impact upon energylegislation, see Mason [1979].
3. Dr. George Lady, Director of the Office of Analysis Oversight andAccess, and Dr. Douglas Hale, Director of the Office of ValidationAnalysis, v/ere both very helpful in providing materials andinformation relating to the activities of their respective offices.
4. Case studies include Gass [1979] and Goldman, et al.[1979].
5. Also a suggestion has been made to the EIA that it considercooperating vdth the Texas Energy Policy Project (TEPP) in
maintaining a current version of the modeling system underlying the
EIA Administrators Annual Report to Congress , since TEPP is
responsible for provi di ng an evaluation oT each such report. Fordiscussion of this idea, see Holloway [1980, p. 65-66].
6. The NBS Energy Model Assessment project was organized "...to develop
and apply standards and procedures for the assessment of analysissystems (models) utilized by the Energy Information Agency of the
Department of Energy" (Gass, et al. [1980], p. 1). MOGSM was used as
a test case for developing assessment methodologies for possible use
by DOE and other modeling groups. The results of this effort are
presented in ten reports submitted to EIA, and summarized in Gass, et
al, [1980].
7. The results of the project are to be reported in nine technical
reports and a summary final report. At this time three of these
technical reports have been released including Mayer, et al. [1979a],Mayer, et al. [1979b], and Mayer, et al. [1980].
8. Italics in the original.
9. Earlier efforts are summarized in Wood [1979].
10. To this group we should add the Utility Modeling Forum.
11. As noted, sponsors now include DOE and GRI.
12. The REM and WAEM analyses are presented in Boshier, et al.[1979], with
modeler comments in Chapter 4, and in Baughman [1980]. The
perspective of EPRI is presented in Richels [1980]. An overview
20
of the CEUM is presented in Gruhl and Goldman [1980] v/ith comments
in Stauffer [1980].
13. The group included Martin L. Baughman, Edv/ard Cazalet, Edward A.
Hudson, Dale W. Jorgenson, David T. Kresge, Edwin Kuh, and
D. Warner North.
14. In Sweeney's simple model, discoveries per unit of additionalexploration are proportional to undiscovered reserves raisedto some power, B. According to Sweeney [1980b], the value of B
can not be closely bounded based upon current information, and
so equally plausible values provide estimates of explorationproductivity and price elasticity which bound the results fromthe more complex models.
15. The median cost increase for models participating in EMF.2 fora 9% SO2 removal plus washing credit standard was 3% in 1985.
16. Manne and Richels find that probabilities relating to key events,such as consumer supply and demand growth, tend to be correlatedwith whether one is for or against plutonium fuel cycles.
17 See Cazalet [1980] for an elaboration of this point, and for a
discussion of the application of decision analysis in modelevaluation.
18. Gass and Joel [1980] later extended the criteria to includemodel definition, model structure, and model data. Documentationis now combined vrith usability. The essential features oftheir approach remain the same.
21
References
Alsmiller, R.G., et al.Cl980], "Interim Report on Model EvaluationMethodology and the Evaluation of LEAP," (ORNL/TM-7245) Oak RidgeNational Laboratory, Oak Ridge, Tennessee, April.
Baughman, M.L., E.G. Cazalett, E.A Hudson, D.W. Jorgenson, D.T. Kresge,E. Kuh, and D.W. North [1978], "Initiation of Integration," (EPRI
EA-837) Electric Power Research Institute, July.
Baughman, M.L. [1980], "Reflections on the Model Assessment Process: A
Modelers Perspective," in S.I. Gass [1980].
Bellesley, D., E. Kuh, and R. Welsch [1980], Reg re s s io n D i a gno s ti c s
:
Identifying Influential Data and Sources of Co1 1 ineari ty , John Wileyand Sons.
Boshier, J., J. Gruhl , R. Hartman, D. Kresge, E. Kuh, F. Schweppe, andD. Wood [1979], "Independent Assessment of Energy Policy Models,"(EPRI EA-1071) Electric Power Research Institute, May.
Cazalet, E.G. [1980], "A Decision Analysts View of Model Assessment,"in S.I. Gass [1980].
Cherry, B. H. [1980], "Electric Load Forecasting: Probing the Issueswith Models," in S.I. Gass [1980].
Dale W. Jorgenson Associates [1979], "Industry and Economic Impacts of
Restrictions on Generating Capacity," (Draft Report) Electric PowerResearch Institute.
Freedman, D., T. Rottemberg, and R. Sutch [1980], "The Demand for Energyin the Year 1990: An Assessment of the Regional Demand ForecastingModel," University of California, Berkeley, CA, May.
Gass, S.I. [1979], "Computer Model Documentation: A Review and An
Approach," NBS Special Publication 500-39, U.S. Government PrintingOffice, Washington, D.C., February.
(ed) [1980], Validation and Assessment Issues of Energy Models,
Proceedings of a Workshop held at the National Bureau of standards,
Gaithersburg, Maryland, January 10-11, 1971. NBS Special Publication569, February.
Gass, S.I. and L.S. Joel [1979], "Discussion Paper for the Workshop on
the Measurement and Interpretation of Model Confidence," Presented atWorkshop, October 4, 1979, NBS, Gai thersberg, Maryland.
_[1980], "Concepts of Model Confidence," (NBSIRw-zubi) National Bureau of Standards, June.
Gass, S.I., K.L. Hoffman, R.H.F. Jackson, L.S. Joel, and P.B. Saunders
[1980], "The NBS Energy Model Assessment Project: Summary Overview,"(NBSIR 80-2128) National Bureau of Standards, September.
22

Goldman, N.G., M.J. Mason, and D.O. Wood [1979] "An Evaluation of the
Coal and Electric Utilities Model Documentation," Report to the EIAOffice of Analysis Oversight and Access, MIT Energy Laboratory,September.
Goldman, N.L. and J. Gruhl [1980], "Assessing the ICF Coal and ElectricUtilities Model," in S.I. Gass [1980].
Greenberg, H.J. [1980], "A Nev/ Approach to Analyze Information Containedin a Model ," in S.I. Gass [1980]
Greenberger, M. [1980], "Humanizing Policy Analysis: Confronting the
Paradox in Energy Policy Modeling," (Forthcoming in the Proceedingsof this Workshop).
Holloway, M.L. (ed) [1979], Texas National Energy Modeling Project: AnExperience in Large-Scale Model Transfer and Evaluation, Part II.
Texas Energy and Natural Resources Advisory Council, Austin, Texas,August.
[1980a], "The Texas National Energy Modeling Project: AnEvaluation of EIA's Midrange Energy Forecasting System," in S.I. Gass[1980].
(ed) [1980b], Texas National Energy Modeling Project: AnExperience in Large-Scale Model Transfer and Evaluation, Fart l.
Academic Press, iy«u.
Lady, G.M. [1980], "Model Assessment and Validation: Issues, Structures,and Energy Information Administration Program Goals," in S.I. Gass[1980].
Manne, A.S. and R.G. Richels [1980], "Probability Assessments and DecisionAnalysis of Alternative Nuclear Fuel Cycles," Energy Policy , March.
Mason, M.J. [1979], "Legislative Mandates for Energy Model Documentationand Access: A Historical Analysis," (MIT-EL 79-067WP), MIT Energy
Laboratory, October.
Mayer, L.S., B. Silverman, S.L. Zeger, and A.G. Bruce [1979a], Assessingthe Hubbert Approach to Modeling the Rate of Domestic Oil
Production," Department of Statistics and Geology, PrincetonUniversity, September.
Mayer, L.S., K.L. Bell, E.S. Perwin, and P.C. Tittman, [1979b] "On the
Use of Crude Oil Initial Production Statistics to Estimate UltimateProduction," Department of Statistics and Geology, PrincetonUniversity, October.
Mayer, L.S., R.A. Stine, B.W. Silverman, D.M. Snyder, S.L. Zeger, D.J.
Venzon, and A.G. Bruce [1980], "The Use of Field Size Distributionsin Resource Estimation," Department of Statistics and Geology,Princeton University, January.
23

Moses, L. E. [1979], "One Statistician's Observations Concerning EnergyModeling," Keynote Address to NATO Conference on Energy Modeling,Brookhaven National Laboratory.
Peck, S.C. [1979], "Six Bridges Between the Builders and Users of EnergyModels," IGT Symposium on Energy Modeling, Colorado Springs,Colorado, August.
Professional Audit Review Team [1977], Report to the President and the
Congress: Activities of the O^Jicg Energy Intormation andAnalysi
s
, u.J>. tienerai Accounting Uttice, Washington D.C., December.
[1979], Report to the President and the
Congress: Activities of~the Energy Information Administration , U.S.
General Accounting Office, Washington, D.C., May.
Richels, R. [1980], "Third Party Model Assessment: A SponsorsPerspective," in S.I. Gass [1980].
Stauffer, C.H., Jr [1980], "Developing, Improving, and Assessing the ICFCoal and Electric Utilities Model," in S.I. Gass [1980].
Sweeney, J.L. [1980a], "Energy Model Comparison, An Overview,"Prepared for Symposium on the Outlook for Large-Seal e Energy Models,AAAS Annual Meetings, San Fransisco, CA, January 4-5.
[1980b], "The Energy Modeling Forum: An Overview," in S.I.
Gass [1980].
Wood, D.O. [1980], "Model Assessment and the Policy Research Process:Current Practice and Future Promise," in S.I. Gass [1980].
24

HUMANIZING POLICY ANALYSIS: CONFRONTING THE PARADOXIN ENERGY POLICY MODELING
Martin GreenbergerJohns Hopkins University
Baltimore, Maryland
SUMMARY
Energy policy models (and energy policy studies generally) are much in evi-dence in Washington and State capitals these days. Their presence grows witheach advancing year. The needs of policymakers for analytical assistance in
the face of complex, raultifaceted policy problems have never been greater.Yet policy analysis is still young in its development and has a difficult time
living up to the expectations and requirements of its users. Like mathemati-cally precocious youngsters, policy models— the most structured form of policyanalysis—are not well understood by even sophisticated nontechnicians and a
mystique surrounds them, t'lany of those with most to gain from policy models—and with the real-world wisdom needed to bring them to maturation and practi-cal usefulness—view these analytical prodigies with discomfort and even dis-dain. The high degree of currency which policy models enjoy is matched by the
considerable skepticism (and sometimes contempt) with which they are regarded.
We examine the reasons for this apparent paradox and consider how to deal withit. Several organized activities have recently begun to appear aimed at dis-solving the mystique surrounding policy models and making them generally moreintelligible and useful. After reviewing these activities and describing the
forms they take, we ask whether their benefits are being perceived and ap-preciated by policymakers. The efforts are clearly of educational value to
the technical participants. We explore what can be done to ensure that theirvalue is extended to decisionmakers as well, and to others whose interestswould be served by having policy models play a more natural and easily assimi-lated role in human affairs.
INTRODUCTION
"When the history of economic policymaking in the turbulent late1970' s is written, an important part of the story will be about the
ever-widening impact of econometric models on Federal policy deci-sions. The wondrous computerized models—and the economists whorun them—have become new rages on the Washington scene.
But what are "rages" one year can become passe and be discarded the next.
Policy models are in their adolescence, their popularity is tempered by doubtand questioning, and their footing is not secure. What is to become of themin the future?
25
The fact is that policy models, despite their "ever-widening impact," are notyet accepted and understood in realistic terms by policymakers—their ultimateusers. Whether this is an innate and inevitable characteristic, or a defi-ciency that may be corrected by further development, can better be decidedafter a review of the nature of policy models and the images they convey.
MODELING IN PERSPECTIVE
Modeling for policy decisions had its origins in the 1930' s.^ As practiced atthe present time, policy modeling is a confluence of several separate branchesof methodological development, of which econometric modeling is one. Eachbranch has had its own rich and interesting history. ^ Policy modeling borrowsfrom modeling in the sciences—using some of the same ideas and mathematicalparaphernalia. But the differences between these two types of creative activ-ities are more significant than the similarities.
The purpose of modeling in the sciences is typically to express the theoriesand understanding of the modeling investigator in a well-phrased form (oftenmathematical, but not necessarily so) that facilitates testing , exploration
,
and communication in order to develop or reinforce the conceptual structure ofa discipline. Modeling in a policy context has a different purpose. It is
oriented toward decisions rather than disciplines. Policy modeling is funda-mentally pragmatic , not theoretical. Its primary goal is not building up thestructure of knowledge in a field of learning; its overriding objective is
forming a basis for policymaking.
The specific intent of policy modeling is to provide an instrument for compar-ing the effects of alternative policy actions. Policy modeling is designed in
a general sense to lay the groundwork for the intelligent and informed makingof decisions. But to achieve this aim, policy modeling must lend itself to
testing and exploration by others than its developers. It must be possible to
communicate the rationale of policy models as well as the results. Policymodeling shares these obligations with modeling in the sciences. Both formsof modeling ultimately should be outward-facing and intuitively understandableto nonmodelers.
If a policy model cannot be tested, explored, and comprehended by persons notpart of its development, one might expect its future to be brief and its userestricted. Yet, in their adolescence, policy models have often been objectsof blind reverence and admiration or equally blind awe and mistrust. Theyhave been accepted or rejected because of the personal qualities and standingof the person presenting the results—and because of the predisposition of theperson receiving the results—more than because of characteristics of the
models themselves. And their role is expanding.
26

"Just this year some costly farm bills were strangled in their
cradles after the econometric models pronounced them expensive and
inflationary.... Nearly every section of the $18. 7-blllion tax cut
passed by Congress last month was tested in models for its effect on
revenues and economic growth. The controversial reduction in
capital-gains taxes was buoyed up against strong White House oppo-
sition by computer printouts showing that it would have a positiveeffect on investment, stock prices, and even Treasury receipts."^
With maturity comes the call for greater accountability. Policymakers and
their staffs are starting to ask why models produce the results they do.
"The first phase was an open-faced deference to the precise raulti-
digited descriptions of the future that the models poured forth;
the second phase was anger when favorite oxen got gored by the sharp
numbers from the computers.... In the third phase, the legislatorsand bureaucrats have begun questioning the assumptions and even the
ideological biases built into the models."^
In the energy field, policy problems are diverse and intertwined, with aspectsof economics, technology, resources, and regulation all having a bearing. En-
ergy is a ripe field for modeling, and many energy policy models have beenactively developed and used since the days of the Mideast oil embargo.
"On more than one occasion, the models have contradicted pronounce-ments by senior government figures. A small model at the Council of
Economic Advisers, for instance, indicated that . . . the Secretaryof Energy was talking through his hat . . . when he predicted that
disastrous consequences would flow from last winter's coal strike .
M 1
. . The model, it turned out, was correct.
What was "correct," of course, was not the model, but a particular conclusiondrawn from the model. Models may be clever, illuminating, perceptive, anduseful, but they are never "correct" in any absolute sense. As deliberatesimplifications and reductions of reality, they must always fall short in
their representations of the systems they serve as proxies.
COUNTER MODELING
Policy models are products of the assumptions that go into them. As with anysource of policy advice, they should be checked and challenged. Lyndon John-son was said to probe the reasoning of his policy advisors by asking them to
present the most persuasive argument they could supporting the opposite sideof the position they espoused.-^ Policy models are well suited for this exer-cise. The practice of altering the assumptions of a model—or using a differ-ent model—to challenge the conclusions reached in a modeling study is known
as "counter modeling."^ More than a logical exercise, it is becoming a seri-
ous tactic in courtroom cases and policy debates.
27

To cite one example, the same model used in a policy study of nuclear energyto question the necessity for the breeder reactor program and reprocessing wassubsequently used with different assumptions to show the high risk to the
economy to be incurred by suspension of breeder development.^ What becameclear from the exchange was the extent to which the conclusions depended uponassumptions about the availability of uranium, the future demand for electric-ity, and the use of coal.
Some decisionmakers are not so eager to have both sides of an argument laidout before them. Just as they may prefer the "one-handed" lawyer who does notinvariably interrupt a line of reasoning with "on the other hand," so theylook for the analysis that leads unequivocably to the conclusions with whichthey feel most comfortable. Tracing the results of alternative assumptionsmakes them impatient or confused. Similarly, a judge trying a case into whichcounter modeling is introduced may have trouble understanding how one modelcan produce two very different outcomes. A congressional committee holdinghearings on proposed new energy legislation could have conflicting stories of
a half dozen models read before it. The Congressmen may not be disposed to
believe any of the models. In the political climate of Capitol Hill, dis-agreeing modelers seem to be "grinding their axes" like everyone else.
These realities appear paradoxical. There is need for policy analysis and a
desire to reach for its most sophisticated and highly developed form—policymodeling. But policy models are "many-handed" tools that can be adopted,adapted, or rejected. They are useful in making a case, supporting an argu-ment, or defending a position. Yet their very versatility sows the seeds notonly of their propagation but of possible skepticism as well. Policy modelsare versatile but explicit, and therefore very vulnerable. They become sub-jects of attack and misunderstanding. Their intrinsic dependence onassumptions—and therefore on the "spirit of the times"—causes them to be
mistrusted, dismissed, or impugned.^ At the same time that modeling studiesare growing in number the uncertainties surrounding them are increasing apace.
CREDIBILITY
In a paraphrase of a modern commercial, it may seem nowadays policymakers are"using model analysis more and believing it less." In some ways, this is
true. But it is not the complete picture. Credibility is a problem, but notan insurmountable one. When an analysis is viewed in appropriate perspectiveand clearly centered on the key elements of a question or disagreement, it canbe helpful to both sides of a dispute in clarifying the issues between themand providing a framework for discussion. This is illustrated by the
following vignette, based on a current matter of great interest in electricutility capacity planning.^
Focusing the Argument . Members of a regional pool of electric utilitieshave been at odds with their local public utility commissions about the
amount of expansion needed in generating capacity to meet the anticipatedpower needs of the region. Two nuclear base-load plants have been can-celed and there has been a three to four year delay in construction of
12 other plants. The argument has taken the form of ad hominem attacks
28

on opponents, with accusations of greed and obstructionism clouding the
issues. Recently, a model was developed under the aegis of the ElectricPower Research Institute (EPRI) by a private consulting firm. DecisionFocus, Incorporated, in an attempt to structure and quantify the dispute.Both the individual utilities and the public utility commission are usingthe model, and it is helping them to clarify their points of difference.The model's two key assumptions have to do with the expected load in the
1980' s and the implicit cost of not being able to supply electricity to
customers. The model provides a means for calculating the probability of
service interruptions at different reserve margins under uncertainloads, and assigns a consumer cost to this probability. Despite a recentfall-off in electricity demand, the utility members predict a seriousshortage in generating capacity during the 1980' s. Federal energyofficials basically agree with this outlook. The utilities maintain thatit is much more costly for them to be caught short in generating capacitythan to be oversupplied. Both sides are using the model to explore theirassumptions about future load growth and the impact of under-capacity.They are now investigating the validity of the model and its response to
various parameter settings. The argument is taking on a more reasonedtone and there is the beginning of cooperative planning.
Crucial to the success of the capacity planning model is its credibility andacceptance by the users. An analysis that has had more difficulty gaining ac-ceptance is the reactor safety study produced in 1975 for the Atomic EnergyCommission. The results of that study, cited often by proponents of nuclearenergy to reassure the public about the safety of nuclear reactors, were drawninto question four years after its release by the Nuclear Regulatory Commis-sion (NRC) for being overly confident on its low estimates of the probabilityof reactor failure.' Coming just months before the Three Mile Island inci-dent, the NRC action may seem prophetic and timely. But Harold Lewis, the
scientist who led the review group critique that was the basis for the NRC
action, faulted the NRC for not using the original study appropriately.
"The N'RC should have jumped at the opportunity of knowing for the
first time what most accident sequences were, what the relativeimportance was, what they ought to be doing with inspection time,
regulatory time, rule-making, research . . .
In fact, the original study had pointed out that a high-risk source of troublewith reactors were small-break, loss-of-coolant , and transient-initiated acci-dents, the kind of minor problems that can lead to a major problem of the va-riety that occurred at Three Mile Island. Yet the study was never signifi-cantly used as a diagnostic tool. Nuclear critics claim that it was used in-stead as a tranquilizer, and they charge that was its intent from the start.It is not necessary to be this cynical to conclude that a valuable opportunitywas missed in not applying the study to identify problem areas. The conse-quences were costly. To its credit, and consistent with the findings of boththe Lewis review group and the Kemeny Commission that investigated the causesof the Three Mile Island incident,^ the NRC began conducting a program to ap-ply the probability risk assessment methods of the original Nuclear ReactorSafety study to identify "risk outliers" or weak points in the design andoperation of reactor systems.
29

SCAPEGOATING
Sometimes a policy analysis is given more credit for producing an attitude oraction than is warranted, especially when the subject of study is unpopular orcontroversial. A policy model presents an easy, impersonal target, like thecomputer blamed for a breakdown in customer service. "The computer must havefouled up." The following vignette presents an example of this modern-dayform of scapegoating drawn from the early days of U. S. reaction to the "ener-
gy crisis" invoked by the Arab oil embargo of 1973-74.
A Charge of Bias . The Energy Research and Development Administration(ERDA), set up to fund programs to reduce the nation's dependence on for-eign oil, issued its first planning document urging major support for ad-vanced technologies. The report, hardly mentioning conservation, is at-tacked vociferously by those who consider conservation as a first orderof business in dealing with the energy problem. They charge that the re-port caters to the interests of the energy industries and the nuclear es-tablishment in promoting high technology options to the exclusion of con-servation. ERDA responds that it was under great time pressure in pro-ducing its plan, and the neglect of conservation was inadvertent.
ERDA used an energy system model developed at the Brookhaven NationalLaboratory as an aid in drafting the plan. One outspoken critic claimsthat the model was misused to buttress ERDA's position. The analysis as-sumed a fixed set of end-use demands for such energy services as the
number of dwellings to be heated, passenger miles of travel, and squarefeet of commercial floor space. End-use efficiencies, such as for homefurnaces and building shells, were increased in a conservation scenariothat was run to reflect energy reductions from possible improvements.Kenneth Hoffman, the model's developer, notes that this conservationscenario had the largest impact of any of the scenarios used in the
analysis by a wide margin. The conservation runs were reported in an ap-pendix to the report. Hoffman comments on ERDA's downgrading of theseruns. "It is quite common in policymaking for other important considera-tions to outweigh those treated in a quantitative analysis. This doesnot necessarily indicate a misuse or deliberate manipulation of analy-sis." Hoffman believes the government's position is that R & D in the
conservation (end-use) area is a private sector responsibility and doesnot require new government initiatives.'^^
After a lively exchange, Hoffman and the critic agree on the desirabilityof holding a workshop to air the issues. One of the important questionsis the extent to which the model, by its nature and content, itself in-
fluenced the conclusions and coverage of the report.
The workshop agreed to by the two never took place as it turned out, but a
meeting similar to what they had in mind did convene shortly before to consid-er another modeling study. The background for this meeting is outlined in the
following vignette. It is an illustration of the bewilderment that can resultfrom the subtleties and versatility of a model.
30
The Effect of Energy on the Economy . The Hudson-Jorgenson model was the
first to combine energy price substitution effects with a representationof the national economy. It has been used in a wide variety of applica-tions. The model can portray, for example, higher energy prices leadingto reduced energy consumption through a shift to energy-conserving tech-nologies. Some observers wonder how it is that the model's results seemto change from one application to the next. The Ford Energy Policy Pro-ject cited runs of the model to show that a major reduction in energyconsumption was possible without seriously injuring the growth prospectsof the national economy or increasing unemployment.^-^ Yet in anindustry-sponsored study, the model displayed substantial energy cutbacksaccompanying a fall in national productivity and a retreat in economicgrowth. Jorgenson argues that there is no inconsistency. The resultsare entirely reasonable, he explains, in terms of the different ways the
model was applied and the different variables held constant in the two
sets of runs. A meeting is called by EPRI to examine the applications in
detail and to obtain a better understanding of the model. Some of thoseinvited get the mistaken impression that the meeting is to be a "kangaroocourt" and decline to participate. Many others come prepared to supportthe model and its uses.
MODEL ASSESSMENT
The EPRI meeting, held in early 1976, was one of the first attempts to bringexperts together to probe the workings and examine the uses of an energy mod-el. The idea was new and a less than diplomatic approach was taken in assem-bling the group and organizing the meeting. It led to misunderstanding, irri-tation, and a loyal defense of the model and its creators. But the notion of
model assessment was taking hold, and awareness of the need for this kind of
activity was growing.
A much more extensive attempt at model assessment occurred two years later in
the State of Texas. The lieutenant governor was unhappy with Federal projec-tions of the supply response likely from the deregulation of natural gasprices and the emphasis given to conservation over production incentives in
President Carter's National Energy Plan (NEP). The large and complex Depart-ment of Energy (DOE) model (PIES) that had produced the projections justifyingNEP was made the subject of an assessment designed to scrutinize the proper-ties of the model and expose its limitations.^^ A second purpose of the as-sessment was to provide information and possibly counter models for the
State's own use in the adversarial debate over national energy policy. The
debate goes back 25 years. At issue were the appropriateness of Federal well-head price ceilings for natural gas sold in interstate commerce and the abili-ty of state utilities to continue using state-produced natural gas to generateelectricity. The stakes were high and so were the feelings.
The Texas assessment was well organized, with researchers from several Texasuniversities working under the aegis of a State office and a national advisoryboard. In preparation for the evaluation, the PIES model was successfully"transferred" to a computer center at Texas A&M University for operationthere. A manuscript reviewing the model was prepared for publication. ^'^^ One
31

outcome of the assessment was a strong recommendation for continuing reviewof DOE modeling work in the public interest. '^^ The desirability and feasibil-ity of model transfer was the subject of a symposium organized at an annualmeeting of the American Association for the Advancement of Science. '^
THIRD-PARTY MODEL ANALYSIS
Model assessments are only one of the means adopted in attempting to addressquestions such as those posed in the preceding vignettes. These questions canto a certain extent be answered by the developers and users of the modelsthemselves. But developers and users cannot be entirely objective and dis-criminating critics. The developers want to get their models working and ac-cepted. They are understandably admirers of their creations and are not al-ways in the best position to perceive the shortcomings of what they havewrought
.
Similarly, users of a model may feel a special allegiance or commitment to it,
particularly if they have borne the costs of its development. They will be
influenced by their association with the developers and by any support the,
model lends to their policy positions.
The vignettes portray models being used in policy debates and being perceivedby some of the parties in these debates as a threat or challenge. The injuredor perplexed parties want to have a closer look at the models and find outmore about how they came to produce such alien and puzzling results. The mod-els become targets for investigation. "Third-party" model analysts, alignedorganizationally neither with the model builder nor model user, are in a goodposition to undertake these investigations.
Model analyses by "third-party" model analysts (sometimes working togetherwith model developers and users) fall into two categories: 1) model assess-ments focusing primarily on the model, and 2) forum analyses focusing more on
policy issues and uses of the model. ^' An example of model assessment is the
work of the Model Assessment Group at the Massachusetts Institute of Technolo-
gy under an EPRI-funded project.^" An example of forum analysis are the
studies of the Energy Modeling Forum (EMF), set up by EPRI and Stanford Uni-versity in 1976, with funding now coming from several sources.
In a typical model assessment, a single model such as PIES is examined in its
many ramifications. A series of computer runs is made to explore and evaluatethe model's capabilities, limitations, adequacy, and realism. One model is
run over several issues, in a manner of speaking. The model may contain nu-merous components or sub-models with different characteristics.
In the forum analysis, on the other hand, a number of models are applied to
one set of questions relating to a single subject of inquiry. That is, manymodels are run on a single issue. The first EMF study on "Energy and the Eco-nomy," for example, explored the effects of reduced energy consumption on the
performance of the national economy by running the Hudson-Jorgenson model andfour other models under a set of common assumptions agreed to by the model-ers. Later EMF studies took up successively the issues of: coal in transi-
oi 99 9*^tion,"^^ electric load forecasting,^^ energy demand elasticities,''-' oil and gassupplies, and the price of world oil.^^
32

Model assessment examines a model over the full range of its capability. For-
um analysis, in contrast, concentrates on a focused set of questions, appliesa set of models to these questions, compares the results, and probes the dif-ferences. Model assessment is designed specifically to evaluate a model and
understand it. Users are not a necessary part of the operation, although they
may prove helpful. In forum analysis, they are essential. The aim of forumanalysis is to broaden user insights and understanding, not only of the mod-els, but of the issues as well. As a by-product, modelers who participatealong with the users in the forum process gain a fuller awareness of what
their models can and cannot do and what the user does and does not need. The
forum provides a comparative commentary on the models it employs. But evalu-ation of these models is not its primary purpose.
Both kinds of analysis focus on specific policy issues. It makes little senseto analyze a model in the abstract, divorced from the concrete uses for whichit is intended or could be applied. The two forms of analysis are complemen-tary. Their differences are a matter of degree and style. Each has its ownset of objectives and each contributes in its own way to answering questionsabout the models as well as the issues to which the models are applied.
Awareness of the need for third-party model analysis is significant and grow-ing. There is by now a large number of model analyzing activities underway.Model analysis appears to be taking root. It could become a recognized, valu-ed, and permanent element in policy research over the long term, not only in
the energy field, but in other policy areas as well.
Whether an institutionalization of model analysis will come about is an inter-esting question. There are indications that the development is heading thatway. Experience with model analysis to date has served to reinforce the con-viction that the role it plays will be "central ... in efforts to make poli-cy models more useful."^
EMERGING FROM ADOLESCENCE
The adolescence of energy policy modeling may be coming to an end with the
call for greater accountability reflected in the growth of third-party modelanalysis. But more is needed before policy modeling can reach healthy maturi-ty. The seeming contradiction between increasing popularity and increasingskepticism points up the fact that policy modeling has yet to become well-adjusted and at ease with its complementary culture, policjmiaking.
It is naive to expect policymakers to speak the specialized language and adoptthe technique-oriented criteria of policy modelers. These two cultures are
different—in background, values, and operating styles. Policy analysis is
disciplined, exacting, and tends to be highly stylized. Policymkaing is
outward-looking, intuitive, and can be myopic. But both activities are integ-rative and problem-directed. They should be mutually supporting, rather than
at odds or competitive. They can learn from each other and can take advantageof one another's insights and expertise.
33

Many countries of the world do not experience the tension and communicationproblem between policy analysts and policymakers found in the United States.The reason is that policy analysts in other countries often work directly forpolicymakers who initiate the work and establish its parameters. This is not
to say there is not direct reporting in the United States as well. But muchof the most influential policy analysis done in this Nation of highly frag-mented, multifarious interest groups takes place in universities, research or-ganizations, and "outside studies" removed from the point of decision andwithout organizational ties to the decisionmakers. Even policy research armsof the Federal Government are often called upon to serve a multiplicity of
masters inside and outside of government.
Understanding between policymakers and policy analysts is aided by the con-struction of tunnels and bridges between them, e.g., the Energy Modeling Forumand the capacity planning study discussed earlier.'^' It is as though therewere a dense thicket or a hard mountain through which both policymakers andanalysts must cut to find their way. The two groups begin penetrating on op-posite sides. If they meet in the middle, they have one tunnel that leadsthem through. If they do not meet, they have either no tunnel or two separatetunnels likely to take them in divergent directions and accentuate the gap be-tween them.
Why must the two groups work from opposite sides? The two cultures are una-like in many ways. But there are people with the knowledge and temperament to
be able to operate effectively in both cultures: policymakers with strong an-alytical bent and solid technical training, and policy analysts who have car-ried executive responsibility and have a special sensitivity for the concernsand constraints of the decisionmaker. In addition, there are many people be-tween these polar stereotypes who are able and well-equipped to perform an in-
termediating role.
There are enough such people to make it possible to launch a cooperative ef-fort starting from the same side, drawing on expertise as needed from bothcultures. From which side should such an effort begin?
The Energy Modeling Forum was an approach to the tunneling project from the
modeling side. It has produced substantial benefits for its technically ori-ented participants. But it has had only partial success in engaging the in-
terest and participation of nontechnlcally oriented policymakers. This is notto say that policymakers have not been involved and influential in EMF activi-ties. They have. A senior advisory panel of top-level policymakers overseesthe Forum and has been a strong force in guiding and proposing EMF studies.The insights and wisdom of members of this panel have had a decisive Impact onmore than one occasion. It was their critique, for example, of the prelimin-ary results of the first EMF study on "Energy and the Economy" that focusedattention on the effects of energy consumption on capital formation. This
concern turned out to have major significance in the later findings. ^'^
34
But the senior advisory panel, by design, functions separately from the work-ing groups who conduct the EMF studies, and it meets much less frequently.The advisors are sounding boards and idea generators more than participants.When nontechnical people do attend the meetings of the working groups, theyare often overwhelmed by the technical discussions replete with professionaljargon and attention to methodological detail. This poses a barrier to theirbecoming meaningfully involved. In one meeting, because of the evident driftof such people toward the exit, an intermission was called, a rump sessionheld, and a decision made to redirect the discussion after reconvening to the
interests of the "users." This can be done—and can be helpful—but it runscounter to the normal way that the EMF working group tends to operate.
Analysts, and modelers especially, are solution-directed. They devote them-selves primarily to finding ways to deal with problems, rather than in explor-ing the nature of the problem and making sure that the right questions are be-ing asked and the correct assumptions being made. They will understandably(and usually unconsciously) favor formulation and assumptions for which theirmethods work best. Their tools can be limiting and their technical skills canbecome blinders. A modeler, viewing a problem as a control system, for exam-ple, may think in terms of "optimal paths," even though this notion may not beespecially appropriate in the context being considered.
Policymakers are somewhat similar in this regard. Although they are not typi-cally beholden to any one particular methodology or means of seeking answers,they are (like everyone else) inclined to see things and do things in the man-ner that feels most comfortable. Yet policymakers have a clear responsibilityto identify issues as well as they can. They are readier and better equippedthan analysts to handle political and qualitative aspects of a problem (whichthe analysts may be tempted to assume away), and they have more experiencehandling people, finding compromises, and balancing the conflicting interestsof a highly diversified society. Attention to the question-asking and
assumption-setting phase of policy analysis falls principally to the policy-maker.
For these reasons, the following suggested steps for making policy models moreintelligible and useful to policymakers start not with the policy modeler, but
with the policymaker. The goal is first and foremost to involve decision-makers in policy analysis in a meaningful way and to make policy models easierfor those without a technical orientation to use, understand, and accept.
HUMANIZING POLICY ANALYSIS
The initial step is informal and indirect. It seeks to engage policymakers inhelping to frame an analysis without their necessarily knowing they are play-ing that role. This can be accomplished by one-to-one visits, small seminars,and short, simply-worded questionnaires. The focus is on identifying centralissues, important points of view, and major points of contention.
35
The second step is to locate existing or ongoing studies applicable to the
issues identified. In evaluating and comparing alternative approaches to a
problem and the assumptions made, the work of the Energy Modeling Forum andthe MIT Model Assessment Group can be very helpful.
The third step is to rephrase or interpret the reasoning and results of se-lected studies so as to make the essence of their arguments transparent to thedecisionmaker. Policymakers will not be ready to believe answers that runcounter to their intuition or policy position if they have no way of checkingthese answers or of understanding how they were derived.
The typical policy model is not designed for ease of communication with thedecisionmaker. Even the model builder may have difficulty comprehending fullythe essential workings of the model. Ideally, the model should be presentedto the polic3Tnaker , not as a "black box" with assumptions and data feeding in-to the left and results coming out from the right, but as an "open box" whoseinner workings are sufficiently simplified, exposed, and elucidated to enablethe policymaker to trace the chain of causality from input to output on at
least an elementary and fundamental level.
Models are rarely presented as open boxes. It would be a research project of
considerable intellectual content and practical significance to develop open-box versions of selected models of greatest potential interest to policy-makers. These would be both models that address questions that policymakersare asking and models that would help policymakers determine which questionsthey should be asking.
An open-box model should be as simple and transparent as possible. For a
large regionally disaggregated model, the open-box version might consist of
little more than a description of the accounting conventions, component rela-tionships, and linkage mechanism. For a more intricately structured or nestedmodel, the open-box version might be the logical inner kernel of the model
—
the part that generates the dominant modes of behavior. Once these basicproperties are understood, additional layers of complication can be added in a
deliberate manner so that the changing character of the model and its implica-tions can be followed. -^^
In presentation before a group of decisionmakers, the open-box strategy wouldbe to start out with the simplest version of an analysis that captures its
basics, and use this partly as a straw man to stimulate interest, disagree-ment, and questioning; then add further elements as the discussion developsand circumstances dictate, always being careful not to go beyond the point of
feasible comprehension and effective communication.
This strategy sounds Utopian, but a version of it was in fact used very suc-cessfully (albeit unintentionally) in the meeting of the EMF senior advisorypanel that drew attention to the importance of capital investment in tracingthe effects of energy on the economy. -^^ Formulating the right questions to
ask—rather than finding answers—should be the central objective.
36
GETTING ORGANIZED
Experience to date is sufficiently encouraging to recommend formation of a
group (or groups) of interested executives and policymakers set up specific-ally to explore and implement the proposed initiatives. Such a group wouldmeet regularly for policy discussion and analysis of timely issues. Call it
an Energy Policy Analysis Review (EPAR) group. There are several endeavorswith some similarities to EPAR, including the international WAES and WOCOLstudies organized by Carroll Wilson, ^2, 33 activities of the Committee for Eco-nomic Development,^^ and the Energy Research Group of utility executives(ERG), which comes together to discuss problems facing the electric utilityindustry. Critical to the success of such efforts is the skill of the sup-porting staffs. In the case of ERG, support is provided by a private consult-ing firm (NERA) working with the utility companies. For the international ef-forts, staff was made available largely by the members themselves. For EPAR,
one would want a staff of creative third-party model analysts with perceptiveunderstanding of the policymaker, as well as the modeler and the methods of
analysis.
EPAR would bring selected policy analysts into its discussions as guests andresource lecturers. The staff members of EPAR would work closely with theseanalysts in advance of a meeting to help them phrase their studies in "open-box" form to facilitate discussion and communication. EPAR could provide animportant new communication medium for policy analysts and would give them the
kind of valuable exposure and feedback many of them now lack.
Forum analysis and model assessment have so far been paying the largest directdividends to the technically minded community of modelers and sophisticatedmodel users, who have been learning a great deal about models and the uses of
models through this process. One of the lessons learned is that posing policyquestions to a model, studying its answers, comparing these answers with those
supplied by other models (including simplified and complicated versions of the
given model), and understanding the reasons for the differences is a powerfulmeans for learning about the model. It is also a very good way to deepen in-sights about the policy questions to which the model is being applied.
These insights would be as useful and important to the policymaker as they areto the modelers and analysts, and at least as germane to their work. A signi-ficant advance in the usefulness and application of policy analysis will comewith the development of means for including the policymaker more naturally in
the analytic process. Bringing policy analysis firmly into the mainstream of
human affairs should be a first order of business for those concerned aboutthe health of the policy establishment and its ability to cope with worldproblems. It is a good way to deal with the skepticism about policy analysis
—
not by public relations but in the only truly effective manner: by construc-tive action and new initiatives—with policymakers as the initiators.
37
ACKNOWLEDGEiMENTS
This paper has benefited from the suggestions of several friends andcolleagues, William Hogan, Alan Manne, and Philip Sisson among them. The
author takes full responsibility for the views expressed.
REFERENCES
1. Cameron, J., "The Economic Modelers Vie for Washington's Ear," Fortune,November 20, 1978, pp. 102-104.
2. Greenberger, M.,Crenson, M. A., and Crissey, B. L. , Models in the Policy
Process; Public Decision Making in the Computer Era , New York:
Russell Sage Foundation, 1976.
3. Greenberger, M. (ed.). Computers, Communications, and the Public InterestBaltimore: The Johns Hopkins University Press, 1972.
4. Males, R. and Richesl, R. , "Economic Value of the Breeder Technology:A Comment on the Ford-MITRE Study," Palo Alto: Electric Power Re-search Institute, April 12, 1977.
5. "Energy: An Uncertain Future, An Analysis of U. S. and World EnergyProjections through 1990," prepared at the request of the Committeeon Energy and Natural Resources, U. S. Senate, Washington, D. C.
:
U. S. Government Printing Office, Publication No. 95-157, December1978.
6. Cazalet, E. G. ,Clark, C. E. , and Keelin, T. W. , "Costs and Benefits of
Over/Under Capacity in Electric Power System Planning," Palo Alto:
Decision Focus, Incorporated, EPRI EA-927, October 1978.
7. U. S. Nuclear Regulatory Commission, "Nuclear Regulatory CommissionIssues Policy Statement on Reactor Safety Study and Review by LewisPanel," Office of Public Affairs Press Release No. 79-19, Washington,D. C. : January 19, 1979. Also, H. W. Lewis, et al , Risk AssessmentReview Report to the U. S. Nuclear Regulatory Commission, NUREG/CR-0400, available from National Technical Information Servbice, Spring-field, Virginia, 22161.
8. Testimony of H. W. Lewis before the Subcommittee on Energy and the
Environment of the House Committee on Interior and Insular Affairs,U. S. Congress, Washington, D. C. , February 26, 1979.
9. Kemeny, J. G., £l . , The Need for Change: The Legacy of TMI
,Report
of the President's Commission on the Accident at Three Mile Island,Washington, D. C. : October 1979.
10. U. S. Energy Research and Development Administration, "A National Planfor Energy Research, Development, and Demonstration: Creating EnergyChoices for the Future," ERDA 48, Washington, D. C. : U. S. Govern-ment Printing Office, 1975.
38

I
11. Personal correspondence with author, 1976 and 1980.
12. Khazzoom, J. D. (ed.), "Workshop on Modeling Interrelationships betweenthe Energy Sector and the General Economy," Palo Alto: Electric Power
Research Institute, No. 75-51, 1976.
12a. Hudson, E. A. and Jorgenson, D. W. , "U. S. Energy Policy and EconomicGrowth, 1975-2000," Bell Journal of Economics and Management Science
,
Vol. 5, No. 2, Autumn 1974, pp. 461-514.
13. A Time to Choose; America's Energy Future , A Report to the Energy PolicyProject of the Ford Foundation, Cambridge: Ballinger Press, 1974,
pp. 493-511.
14. Holloway, M. L. , "The Importance of Transfer in Understanding Large ScaleModels," paper presented at the annual meeting of the American Associ-ation for the Advancement of Science, San Francisco, January 1980.
14a. The book on the PIES evaluation is being published in two parts. Part I
is scheduled for release in the Spring of 1980 by Academic Press.
Part II containing 11 detailed studies will be made available as a
companion book at the same time by the Texas Energy and NaturalResources Advisory Council.
15. National Advisory Board, Texas National Energy Modeling Program, minutesof meeting, Washington, D. C. June 11-12, 1979.
16. Thrall, R.,
e_t al . , Transfer and Alternatives to Transfer for Large ScaleModels, session at the annual meeting of the American Associationfor the Advancement of Science, San Francisco, January 5, 1980.
17. Greenberger, M.,Richels, R.
,"Assessing Energy Policy Models; Current
State and Future Directions," Annual Review of Energy 4 , 1979. Also,Greenberger, M. , "A Way of Thinking About Model Analysis," Proc
.
Workshop on Validation and Assessment Issues of Energy Models,
Gaithersburg , Maryland: National Bureau of Standards, 1979.
18. MIT Model Assessment Group, "Independent Assessment of Energy PolicyModels: Two Case Studies," Report No. 78-011, Cambridge, Massachu-setts: MIT Energy Laboratory and Center for Computational Researchin Economics and Management Science, 1978. Also, Model AssessmentLaboratory, First Year Report, 1978.
19. Sweeney, J. W. and Weyant, J. P., "The Energy Modeling Forum: Past,Present, and Future," Energy Policy , 1979. Also, Hogan, W. W.
,
"The Energy Modeling Forum: A Communication Bridge," paper presentedat the 8th Trienniel IFORS Conference, Toronto, June 20, 1978. Also,Hogan W. W.
, "Energy Models: Building Understanding for Better Use,"paper presented at the Second Lawrence Symposium on Systems and De-cision Sciences, Berkeley, October 3-4, 1978. Also, Koopmans, T. C.
,
e£ al . ,"Energy Modeling for an Uncertain Future," Report of the
Modeling Resources Group, Synthesis Panel of the Committee on Nuclearand Alternative Energy Systems, National Research Council, Washington,D. C: 1978.
39

20. Energy Modeling Forum,Energy and the Economy , EMF 1, Stanford Univer-
sity, Stanford: September 1977.
21. Energy Modeling Forum, Coal in Transition; 1980-2000 , EMF 2, StanfordUniversity, Stanford: July 1978.
22. Energy Modeling Forum, Electric Load Forecasting; Probing the Issueswith Models , EMF 3, Stanford University, Stanford; April 1979.
23. Energy Modeling Forum, "Aggregate Elasticity of Energy Demand," WorkingPaper, EMF 4.4, Stanford University, Stanford: January 1980.
24. Energy Modeling Forum, "U. S. Oil and Gas Supply Summary Report," WorkingPaper, EMF 5.4, Stanford University, Stanford: November 1979.
25. Energy Modeling Forum, World Oil; Supply, Demand, and Price, Agendafor Study, Stanford University, Stanford: January 1980.
26. Greenberger, M.,"Closing the Circuit Between Modelers and Decision
Makers," EPRl Journal , Palo Alto: Electric Power Research Institute,October 6-13, 1977. Also, NATO Advanced Research Institute, Pro-ceedings on the Application of Systems Science to National EnergyPolicy Planning, Report of Working Group 4, "The Communication Prob-lem in Energy Policy Analysis," Islip, New York; Brookhaven NationalLaboratory, November 1979.
27. Peck, S. , "Six Bridges Between the Developers and Users of EnergyModels," Proceedings, Second IGT Symposium , 1979. Also, Greenberger,M.
,"Closing the Circuit Between Modelers and Decision Makers,"
EPRI Journal , Palo Alto: Electric Power Research Institute, October3-6, 1977.
28. The concept of an "optimal path" is adopted in much of the economic mod-eling work on the world price of oil. See, for example, Hnyilicza, E.
,
and Pindyck, R. S. , "Pricing Policies for a Two-Part ExhaustibleResource Cartel: The Case of OPEC," European Economic Review
, 8, pp.139-154, Cambridge, Massachusetts; M.I.T., 1976. Critics of suchwork say that petroleum exporting countries are not making their de-cisions so as to optimize their future stream of revenues. Politicalfactors and short-term domestic requirements are seen by these criticsas dominant in determining pricing and production behavior.
29. Points of contention are discussed in Crissey, B. L. , "A Rational Frame-work for the Use of Computer Simulation Models in a Policy Context,"Ph.D. Dissertation, Baltimore: The Johns Hopkins University, No-
vember 1975. The problem of identifying important issues for consid-eration by decision makers is treated in Greenberger, M.
,"Improving
the Analysis of International Energy Issues," Report to the Rocke-feller Foundation, New York; 1979.
40

30. An analogy to the strategy of gradually increasing complexity is found
in applied mathematics in the development of continuation methods.See Kolata, G. B. , "Continuation Methods: New Ways to Solve Equa-tions," Science 204, pp. 488-489, May 4, 1979.
31. The "straw man" that stimulated discussion in the EMF senior advisorypanel meeting was from Hogan, W. W. , and Manne, A. S. ,
"Energy Econo-my Interactions: The Fable of the Elephant and the Rabbit?," in
Hitch, C. J. (ed.). Modeling Energy-Economy Interactions: FiveApproaches , Resources for the Future, Washington, D. C. : 1977.
32. Wilson, C. L.,
e_t al . ,Workshop on Alternative Energy Strategies (WAES)
,
Energy; Global Prospects 1985-2000 , New York: McGraw Hill, 1977.
33. Wilson, C. L., _et al . , World Coal Study (WOCOL): Global Perspectives to
2000,Cambridge, Massachusetts: MIT, November 1979.
34. The Committee for Economic Development convenes world leaders to considerinternational problems of timely interest. For an example of a CEDreport, see "Redefining Government's Role in the Market System,"New York: Committee for Economic Development, July 1979.
35. The Energy Research Group was organized by Irwin Stelzer of NationalEconomic Research Associates, Inc. (NERA). NERA performs studies and
provides discussion papers for consideration by the ERG group. See,
for example, the Executive Summary to the Report on "The Impact of
Alternative Policy Reactions to Three Mile Island," National Impacts ,
Volume 1, New York: June 12, 1979.
41

REMARKS ON WOOD AND GREENBERGER PAPERS
KEN HOFFMAN, SENIOR VICE PRESIDENT
MATHTECH, Inc.
There are many useful insights in both of these papers,and I could spend a couple of hours agreeing with most of thematerial covered. I think I would rather address some of themore controversial statements and the areas of disagreementthat may exist. There were several statements that weredesigned to be provocative, to get us to think about and discussthe issues in greater depth.
Starting with Dave Wood's paper, I think his discussionof measures of model confidence gave us a good state-of-the-art review of where things stand on rating documentation, veri-fication, validation, and the usability of models. He mentionedthe difficulty in applying these criteria to the steps ofverification and validation. I feel strongly that one of thecontributors to that difficulty is our failure to make a sharpdistinction between the purposes that different models serve.
Some applications require normative or prescriptive modelsthat do not claim to simulate all of the problems or marketimperfections that can arise, but look at an idealized solutionto a policy or an idealized implementation of some technology.This kind of modeling is something like the Carnot cycle analysisin thermodynamics, where one is not concerned about the practi-calities of friction and irreversabilities that arise in the pro-cess, but is concerned about what is the best one could do in anidealized system. I think that a lot of the normative andprescriptive modeling is of that classification and gives muchuseful insight. It may not be a good simulation, but it doesgive a lot of useful information concerning which direction onemight move in.
Going down through the purposes of modeling, there aresome models that are purely descriptive in nature. They aremeant simply to make sure that known relationships are capturedand are reflected in the analysis. This is an important feature,but we should not expect such models to provide forecasts or togive good normative perspectives on the problem; they are morelike the design methods used in engineering.
There is also the direct simulation model that attempts to deawith a very complex set of interrelationships for forecastingpurposes, or perhaps for more narrow purposes. This type of modelrequires a very different set of validation and verificationcriteria
.
43

I think we have to keep these different purposes ofmodeling in mind when we ask the validation and verificationquestions. Such discipline would go a long way toward organiz-ing classes of questions that one might ask and perhaps makeit a bit easier to deal with these measures of model confidence.
I believe that all of these classes of modeling are veryimportant, but often there is competition and the viewpoint thatonly one of these classes ought to be done and not the other.In some of the models we often mix the approaches used—forexample, taking a normative approach and mixing it with abehavioral simulation approach--and we end up with somethingthat is trying to cover both of these aspects and really doesnot do any one very well.
I think the sociology of modeling, as described by MartinGreenberger, is very interesting. A historical record shouldbe maintained and there should be some place to which everyonecan send their latest experiences and stories to be kept on fileso that we all can learn from them. We can learn a lot from theproblems of misapplication and misinterpretation of models, andretrospective analysis of their usefulness.
I do want to take strong disagreement with one of MartinGreenberger ' s points dealing with the differences between policymodeling and science. I think such differences may have existedin the past, but if we allow these differences to persist we arelosing a lot of the strengths and experience that we have learnedover a long period of time from applications of the scientificmethod. I do not think we should let go of that connection and loseall of the difficulties that science has suffered in poor documen-tation and poor verification of scientific results. We mustlook into the things we have learned from applications of thescientific method and even bend our own perspectives and view-points on modeling and policy analyses to make them fit thescientific paradigm. If we let go of that connection and saythat policy analysis is very different, I think we loose toomuch and are destined to suffer the same mistakes that have beenmade throughout the years in the field of science.
To clarify my viewpoint, what we are dealing with in bothpolicy analysis and in the more traditional technical fields isthe application of knowledge and basic information by users ordecision makers. This is not a new problem. In science we arelooking to learn basic information— the fundamentals that applyto a technical problem. There is a whole group of people betweenscience and its application who traditionally have applied scienceto real problems for real users; that is the engineering profes-sion. We can learn a lot from the way the engineering professionfulfills its role in the application of science to real world

problems, to provide that same bridge between the basic dataand theory of models and their application to real policy issues.In policy analysis vie too often blur the distinction betweenthose people who seek basic information and theory, and thosewho apply that information to problems for users.
Dave Wood paraphrased a debate that went on at the lastmeeting of this group. There was apparently one claim thatwe should not go beyond the limits of science in answeringquestions that policy makers ask, while the other position claimedthe questions always are more complicated than the informationwe have to deal with, and that we must invariably stretch beyondthe available information. In fact, in the real applications ofscience, we have always stretched beyond the available infor-mation. Bridges were built and structures were built beforethe nature of their materials was really understood. Thingslike "fudge" factors, ignorance factors, safety factors, and fail-safe analyses all came into the terminology and into practicaluse. I think these same mechanisms and procedures are veryappropriate in policy analysis. Decisions are going to have tobe made that stretch well beyond the information that is availableto us. The practical problem, then, is how to provide analysisrelevant to such decisions and arrive at policies that are failsafe and have proper ignorance factors built into them. That isthe challenge, and it is a very different function from thescience of modeling.
Talking about distinctions being blurred, I am remindedthat most of those here are, or have been, model builders. I
used to be a model builder; I now consider mysef to be a modeluser. Considering the research emphasis that is being placed onevaluation, I guess I ought to become a model evaluator. Wemust remember, however, that these are three very differentfunctions. We have examples from other areas. In the arts, forexample, we have performers, we have the audience, and we havethe critics. It is very rare that you find someone who is allthree, or even two out of the three, because of obvious conflictsof interest and the loss of credibility.
It seems that in modeling we very frequently findpeople who are all three, or who claim to be all three. Can welet people get away with that, or should there be a more defini-tive statement about what that individual is really trying toaccomplish in his or her research, and about the role that heor she is really playing?
I have two more generic issues that I would like to raise.In these discussions we have heard some good examples of whathas gone on in the past, and we can learn much from those examples.I think it would also be interesting to look at some obviousneeds and gaps in what has gone on over the last few years andsee if we can learn from these situations as well. Everyone will
45

have his favorite idea of a gap, or of something that has notbeen dealt with particularly well in modeling, analysis, orin the gathering of basic information.
One of my high priority problems is the important need for atechnology data base. Many of the mid-term and long-termmodels rely on some characterization or description of technolo-gies. It turns out that when you evaluate each model, eachcontains its own technology data base, and I think it would bea great step forward to at least come up with some uniformtechnological descriptions that are related to current andplanned research and development programs. The characterizationof emerging technologies, I believe, is an important piece ofinformation and ought to be dealt with.
Another critically important information need deals withend use stock and turnover and its relation to energy demandanalysis. We have read that energy demand turned down in 1979.Is that attributed to changes in economic structure, or can itbe attributed to a response of consumers to install more efficientdevices and to use the devices that are currently installed moreefficiently? I think the whole area of end use data and informa-tion needs further development, and this topic would be worthsome discussion.
The last problem area that I want to mention deals withregional analysis and forecasting. We have seen some progressand interaction between Federal level analysis and regionalanalysis. I think that this workshop should explore how thatcould be strengthened, and how that work should proceed in a waythat meets some of the measures of confidence that have beenoutlined
.
The last formal comment I have on the two papers presentedin this session deals with the proper utilization of the creativetalent that is assembled here to discuss validation and veri-fication questions. We see a situation where the large institu-tionalized models and the essentially defensive questions ofvalidation and verification seem to be soaking up a substantialportion of the funds available in the energy modeling and analysisfield. Any time that I want to feel depressed, I look at theamount of basic and applied research money devoted to new modelingapproaches. We know that the approaches we have now overemphazizeperfect markets and perfect decisions. Others take differentapproaches, but we know none of them are really entirely validfor good forecasting or decision making. What are we now doingabout the next generation of models to improve the situation?I think this is a challenge to a workshop like this: out ofthis workshop and the overall validation process should come someresearch directions in energy analysis. I hope that this needis not lost in the discussion and in the results of the proceedings
46

I have seen some interesting new things lately, like appli-cations of game theory and some further analysis with nonequi-librium economics. We held a workshop at Brookhaven on worldoil pricing about three years ago and had to look awfully hardto find someone who was looking at nonequilibrium behavior tooil pricing, even though we had excellent examples that indicatedthis mode of decision making. Someone called the work of DermotGately at New York University to our attention. He is an econo-mist who produced curves and future projections of prices thathave discontinuities and jumps, and all of those characteristicsof nonequilibrium behavior. That field has grown since, but I
think there is even more to be done there.
I should finish up with the story behind that ERDA analysisthat Martin referred to and asked me to address. It is describedvery well in Martin's paper, but since it takes nine to twelvemonths to get these papers out, I think I should discuss it nowand not leave the record with a void on this issue.
The claim in the mild controversy following release of theERDA plan was that conservation was overlooked in the supportinganalysis and that it v/as the fault of the model used. Further,it was said that this led to an underemphasis on conservation inthe R&D plan.
In fact, the model used was really the first one to includeend use devices and the end use part of the system at the samelevel of detail as the supply technologies. Further^ the conser-vation scenario described in an Appendix to the ERD/ R&D plan hadthe largest beneficial impact in terms of environmental emissions,cost, capital cost, and resource utilization. It looked like areal winner.
The decision on v/hether more R&D would be sponsored inthose areas, and to what extent, was the next question, but asomev/hat different one. As I understand that policy decision,given all the information that came out of the analysis on thevalue of conservation, it was felt that the actual R&D was theresponsibility of the private sector. The private sector builtthe furnaces, automobiles, heat exchangers, and other end usedevices, and it was probably felt that this area was much tooconsumer oriented and not the responsibility of the government.The answer then, or the decision, was that conservation R&D wasnot the highest priority area for government funds, but uas amatter to be dealt with through standards. In a subsequent plan,conservation R&D was raised to the highest priority; however,the debate over what is an appropriate government role in con-servation continues today. Even now, pricing mechanisms andstandards are given the primary role in encouraging conservation.
To return to the issue of possible misapplication of amodel, I would recommend you read the section dealing with thatanalysis and the subsequent debate. There is a lot that may belearned from that case, as well as the others Martin hasdescribed
.
47


BUILDING GOOD MODELS IS NOT ENOUGH
Richard RichelsElectric Power Research Institute
The potential advantages of policy modeling are many. The verydiscipline of constructing a model can help us get our thinkingstraight. Models can provide a bookkeeping mechanism, tell uswhat kinds of information are desirable and when we need it,allow for the possibility of experimenting with the model ratherthan the system itself, and facilitate communication among thoseconcerned with a policy issue. Perhaps, most importantly, modelscan have an enormous educational value, helping us develop gen-eral insights into a problem that can serve as a basis for theintelligent and informed making of decisions
(J^). Yet, in the
case of energy policy modeling, many of these advantages have notbeen realized. As a group of researchers on policy modelingobserved, "...there is one thing that policy models have in com-mon. Most fall short of their potential as instruments for theclarification of policy issues and the enlightenment of policy-makers" {2). The failure of models to live up to the expecta-tions and demands of the user community has led to increasingskepticism from policymakers about the usefulness of policy mod-eling. This paper examines two reasons for this growing dis-satisfaction and considers ways to deal with it.
Sources of the Dissatisfaction
General Glen Kent, formerly head of studies and analysis for theU.S. Air Force, noted several years ago that "decisionmakers arebecoming increasingly annoyed that different analysts get quitedifferent answers to the same problem" (_3_) . When this happens,it is natural to want to take a closer look at the models andfind out more about how they come to produce such puzzlingresults. Until recently, however, there was very little evalua-tive information available concerning the quality and appropriateuses of individual models. Policymakers were forced to relyalmost entirely on the experience and judgment of the modelbuilder for an evaluation of the strengths and weaknesses of aparticular model. As model users have become more sophisticatedthey have begun to question the ability of the model builder tobe an objective critic of the fruits of his own labor. The lackof independent evaluative information has led some to worry thatmodelers may be obscuring deficiencies of major concern in modelapplication. The problem has become compounded as the number ofmodels has increased and policymakers have become deluged withconflicting claims from model developers anxious to convinceusers and would-be users of the value of their creations.
Users have also found themselves thrust into the uncomfortableposition of model defender. Once a model begins to be used as an
49

instrument of debate, it will be seen by some as a threat orchallenge and become the subject of investigation (4). Typicalof such challenges is the American Public Gas Association'sattempt to discredit the Federal Power Commission's use of amodel in establishing natural gas rates. APGA argued that "the'economic models' dreamed up by producer-sponsored consultantsand untested by cross-examination, do not begin to rise to thestatus of 'substantial evidence'" (_5_) . The FPC found itself inthe position of having to defend its choice of models in court.
Such situations have led to calls from the user community forindependent evaluative information regarding the overall qualityand applicability of energy policy models. As a result, organi-zations that have been sponsoring model development, such as theDepartment of Energy and the Electric Power Research Institute,have begun shifting substantial resources to assessment activi-ties. There has been a growing realization that independent orthird-party assessment is critical if policymakers are to haveconfidence in model results. The nature of these activities willbe discussed in the next section.
But quality control is only part of the problem. Stokey andZeckhauser, in their primer on policy modeling, caution theaspiring modeler that "the world will never beat a pathway toyour door just because you build a better model; analysis isworthless if it can't be communicated to others" (J^) • Even withexcellent communication it is hard to imagine anyone beating apath to a modeler's door; nevertheless, the above quotation iden-tifies a basic weakness with policy analyses. Each year, count-less studies, many containing useful and timely information^gather dust {6). Sometimes the fault is with the policymaker forfailing to take advantage of readily accessible information. Butmore often the blame is with the modeler. Analyses are presentedin such a way that they are more likely to confuse and overwhelmthan inform. This failure to communicate seriously impedes theprocess of providing policymakers with important tools for policymaking. The result is a situation where analyses are used moreto rationalize policy decisions than to serve as a basis forrational decisionmaking.
Policy modeling can be enormously valuable in providing generalinsights into a problem. Unfortunately, the educational benefitsup to now have accrued almost entirely to the modelers and havefailed to reach the policy arena where they are most needed.This is a major weakness with policy modeling. Hogan hit themark when he wrote that "the purpose of energy modeling isinsight, not numbers" (_7_) . The problem is that policymakers arebeing presented with numbers, not insights . Without the ration-ale to support these numbers, it is small wonder that they havelittle use for results that do not conform with their own intui-tion. If models are to reach their full potential, more atten-tion must be placed on communicating the rationale of policymodels and not just the results.
50
Independent Model Assessment
The first step to making policy models more useful in policy hasalready been taken. The last few years have seen tremendousgrowth in the area of independent model assessment. A number ofassessment projects have been established and are providing valu-able information essential for the intelligent use of mod-els (_4 ) . The work done by the Energy Model Analysis Program atthe Massachusetts Institute of Technology is an example of thismodel oriented type of analysis ( 8_)
.
With third-party assessment, the work is done by individualsindependent, organizationally, of both model developers andusers. The evaluation responsibilities do not fall on the mod-,eler whose incentives are chiefly to get the model working andused. Nor do they fall on the model sponsors, who may have asense of commitment to the model through their association withthe developers (_4_) . Greenberger et al . describes the model ana-lyzer as a new breed of researcher/pragmatist— "a highly skilledprofessional and astute practitioner of third-party model analy-sis" {2).
In a typical evaluation, the model is examined over the fullrange of its capability. The assessors begin by going throughthe computer code line by line to verify that the model is asadvertized. The validity of the model is then examined in thecontext of the purposes for which the model was constructed or isto be used. The assessors attempt through a series of validitychecks to assess the agreement between the behavior of the modeland the real world system being modeled (9).
Verification and validation are intended to give the user someindication of the "usefulness" of a model. The assessors arealso concerned with the "usability" of the model. "A model isusable if it is understandable and plausible to others than itsdevelopers, economic to run on a computer, and accessible tothose who wish to use it ( 10 )
." The usability of a model depends
on such factors as the quality of its documentation, operatingcharacteristics and overall portability--all of which areassessed by the model analyzers.
The best time for third-party evaluation is an open question.Independent assessment can and does take place at each stage inthe modeling process--at the creation stage, at the applicationstage, and even as the model is being used as an instrument ofdebate. What is clear, though, is that if careful examination isput off too long, the results are apt to be disappointing. Modelusers need evaluative information before selecting a model for apolicy debate. Without the careful scrutiny of highly trainedanalysts, users can only speculate about a model's capabilities,limitations, adequacy and realism. The likelihood of a poorchoice is high. As Figure 1 suggests, independent assessmentshould first occur early on in the modeling process, before themodel is brought to the policy arena.
51
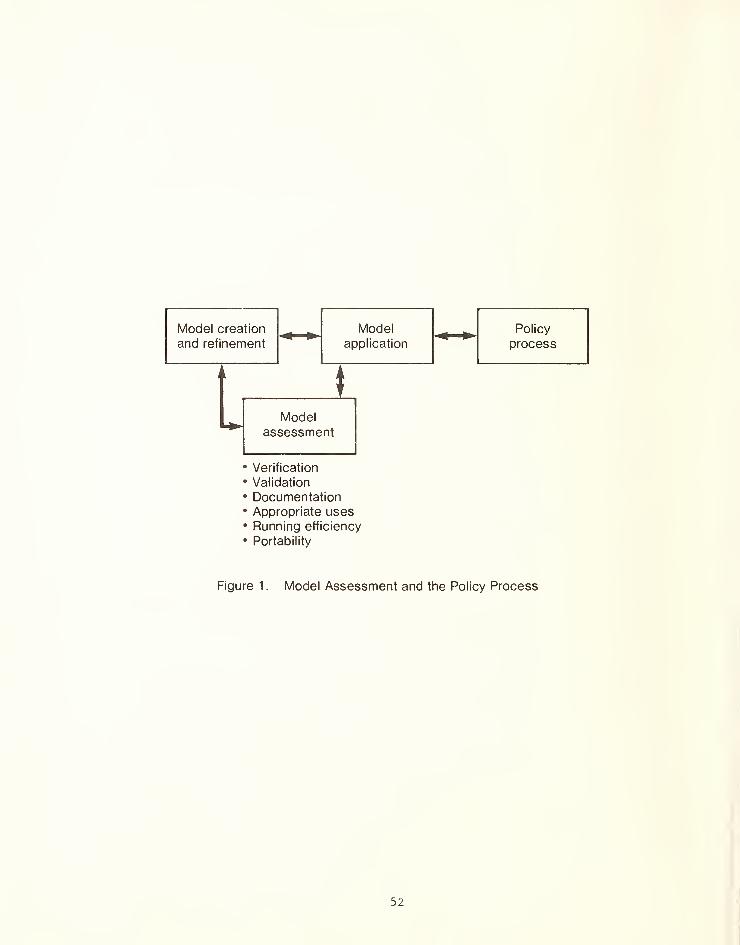
Model creation
and refinement
Modelapplication
Policy
process
IModel
assessment
Verification
Validation
DocumentationAppropriate usesRunning efficiency
Portability
Figure 1 . Model Assessment and the Policy Process
52

Independent assessment should not be considered a "one-shot"activity. An active model is in a constant state of evolution.As it is brought to new applications it is modified andrefined. Careful examination by third-parties also leads tomodifications as the model builder is provided with valuablefeed-back signals helpful in correcting and improving themodel. If an assessment is to remain timely it must not ignorethe changing nature of the model. Frequent assessment "updates"will be necessary as long as the model remains active. For thisreason model assessment is depicted as an iterative activity inFigure 1.
A great deal has been learned about the nature, problems, andpossibilities of independent model assessment over the last fewyears. Activities such as those underway at MIT have reinforcedthe conviction that third-party assessment is essential if pol-icymakers are to begin to have confidence in policy models (_8_)
.
But model assessment is only part of the answer. Experience hasshown that even when a model is perceived as "useful" and "usa-ble, " it still may not be "used. " This brings us to the secondreason why models have failed to live up to the hopes and expec-tations of the user community; the model builder is not communi-cating effectively to decisionmakers the insights, structure, andunderstanding available from the model. In the next section, welook at ways to bridge the "communication gap" between the modelbuilder and user.
User Analysis
The purpose of policy analysis is to help policymakers make bet-ter decisions. Decisionmaking can be aided by using the model asa tool for education and exploration. There is considerableevidence that models can be effectively used to improve under-standing. Examples abound as to how a model result which ini-tially appeared anomalous and implausible led to reassessment ofideas and a deepening of insights ( 11 ) . Modelers encounter suchinstances daily. The problem is in making the insights availableto those responsible for policymaking. It is not sufficient toproduce a technical report only understandable to the trainedanalyst. A primary reason why policy analyses go unread is thatthey are too long or too hard to understand by the lay reader(_1_) . Converting technical results into a language comprehensibleto policymakers is essential if model results are to be used.
The difficulty with bringing together people with such diversityin backgrounds as modelers and policymakers is illustrated by thefollowing amusing anecdote:
A congressman who had been persuaded to favor a"soft-technology" approach to the energy needs ofthe United States was discussing projections ofdemand for electricity with a modeler. He pointedout that with adequate conservation measures, alittle modesty in our life-style, and other steps
53

emphasized by the soft-technologists, the rate ofgrowth of electrical demand could easily be helddown to 2 percent per year. "But Mr. Congressman,even at the low rate of 2 percent per year, elec-trical demand will double in thirty-five years,
"
said the modeler. "That's your opinion 1" repliedthe Congressman ( 12 ).
Although the story may seem somewhat extreme, it is indicative ofa very serious communication gulf. To bridge this gap, it may benecessary to add a user oriented activity to our earlier, dia-gram. To connote the intended beneficiary, we will refer to itas "user analysis. " Whereas model assessment focuses primarilyon quality-related issues, the emphasis here is on transferringthe insights of a policy analysis to the policymaker. The inten-tion is to insure that the communication of a policy analysisreceives as much attention as its design and implementation.
User analysis, as portrayed on the right side of Figure 2, hasseveral components. The first, the presentation of results inthe context of the policy problem under study, may seem obvious,but it is all too often overlooked. The modeler should highlightthose aspects of his model or analysis that are relevant to thedecision problem of interest to the policymaker. To do this hemay wish to employ the techniques of decision analysis, a metho-dology designed specifically for aiding decisionmaking ( 13 )
.
Decision analysis forces the analyst to focus on the decision.The heart of the methodology is the decision tree which lays outthe relevant sequences of decisions and outcomes. For example,the decision tree of Figure 3 was used by the Synfuels Inter-agency Task Force in 1975 to examine alternatives for implement-ing a synthetic fuel program in the U.S. ( 14 ) . The squaresdenote decision nodes and the circles denote chance nodes. Theinitial decision was a choice among four alternative governmentfinanced synthetic fuel programs.
The advantage of a decision tree is that it focuses on thesequential nature of the decision problem. In structuring alter-native strategies in a decision tree framework, the analyst workswith the decisionmaker to identify those decisions that must bemade today and separates them from those which can wait and con-sequently benefit from the inflow of additional information. Inthe synf uel analysis, the decision was not whether the U. S.
should commit itself to full scale synfuel production, but one ofthe size of the initial program. Prior to the work of theSynfuel Task Force, the debate had focused on the desirability ofa full scale synfuel industry. The work of the Synfuel TaskForce is credited with focusing the Government debate on the realdecision at hand. The analysis was regarded as a key factor inpersuading the Ford Administration to cut back from the Presi-dent's original goal of a million barrels down to 350,000 barrelsa day in 1985 (15).
54
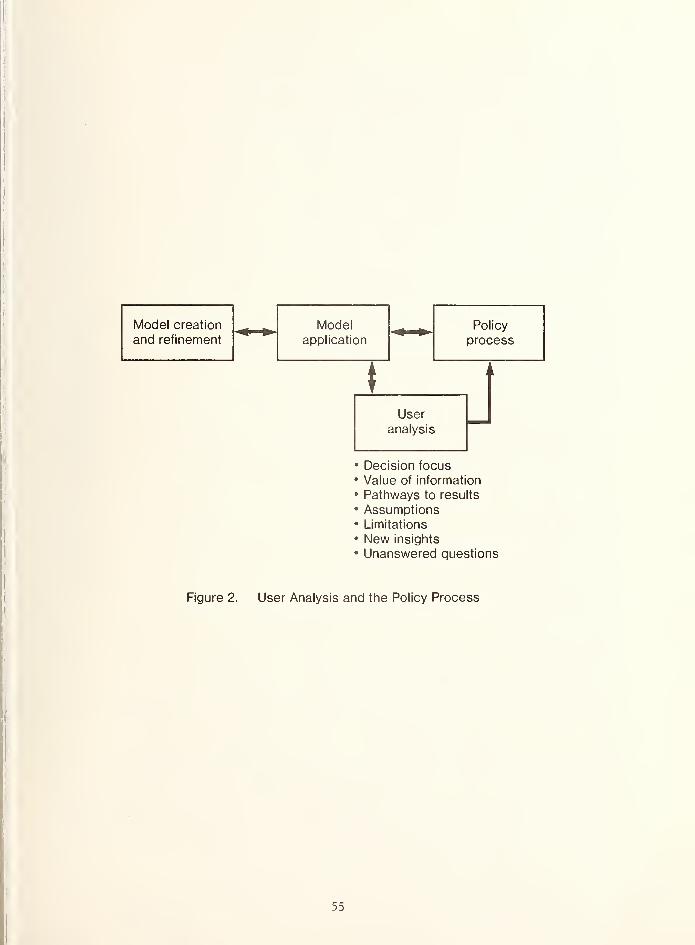
Model creation Model Policy
and refinement application process
IUser
analysis
Decision focus
Value of information
Pathways to results
AssumptionsLimitations
New insights
Unanswered questions
Figure 2. User Analysis and the Policy Process
55
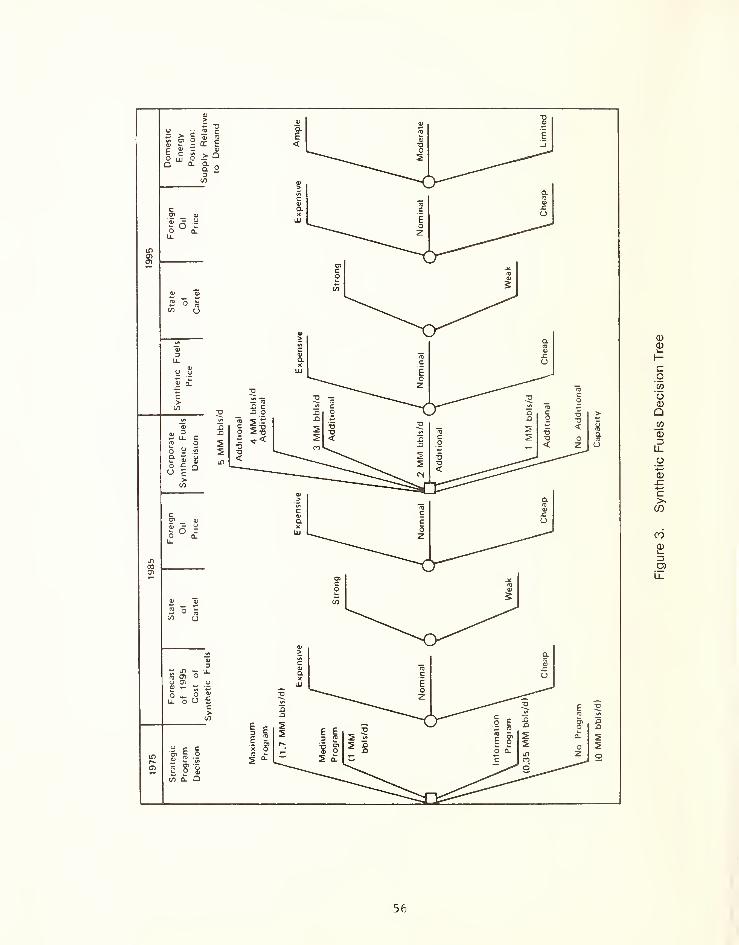
56
In presenting the results of a policy analysis, the modelershould also indicate the sensitivity of the decision being stud-ied to the basic assumptions underlying the analysis. In thesynfuel decision analysis, the Task Force assumed that the prob-ability of a strong oil producers' cartel in 1985 is 50 per-cent. Figure 4 shows the sensitivity of the optimal program tothis assumption ( 15 ) . If the decisionmaker feels that the prob-ability of a strong cartel in 1985 exceeds 76 percent, theexpected net benefits of a synfuel program become positive.Sensitivity analysis provides the policymaker with valuableinsight into the relative importance of the uncertainties compli-cating his decision. If it turns out that a decision is verysensitive to a particular variable, the value of better informa-tion regarding that variable is high, and the policymaker maywish to allocate resources to reducing the level of uncertainty.
When discussing the value of information it is also useful togive some indication as to how accurate information must be, tobe of value. For example, it is well known that assumptionsabout uranium resources can affect the desirability of advancednuclear technologies. For this reason, the government is spend-ing millions of dollars to reduce uncertainty regarding the uran-ium resource base. Recent analysis has shown, however, thatattaining the large potential benefits from better informationwill be difficult, since the information must be extraordinarilyaccurate to have a significant impact on the choice of nuclearpolicy options ( 16 ) . Such insight can be helpful in determiningthe potential value of information gathering efforts.
Often model results which appear puzzling at first glance canlead to a reassessment of ideas and a deepening of insights. Thecommunication of interesting results is the modelers biggestchallenge. To do this it is not only necessary to present theresults, but also the "pathways" to results. At this stage inthe presentation, the original model moves to the background andthe focus is on telling an intelligible, intuitive story—onethat stands apart from the model. Sometimes the modeler may findit useful to rely on a simplified version of the original modelto tell the story. The Hogan-Manne fable of the elephant and therabbit is one such example ( 17 ) . A simple highly aggregatedmodel was used to illustrate the key concepts that determine theeconomic impacts of energy policies. The simple model whichabstracted from the class of large energy economic models wasused quite effectively in communicating the significant energy-economic interactions to policymakers.
In describing the pathways to results, it is essential to trans-late from specialized modeling jargon into a form that is acces-sible to a wide audience of potential users. Once the essence ofthe story is conveyed as clearly and concisely as possible, themodeler can then start adding to its complexity by injecting thenecessary caveats about critical assumptions and model limita-tions and explaining how they may affect the conclusions.
57
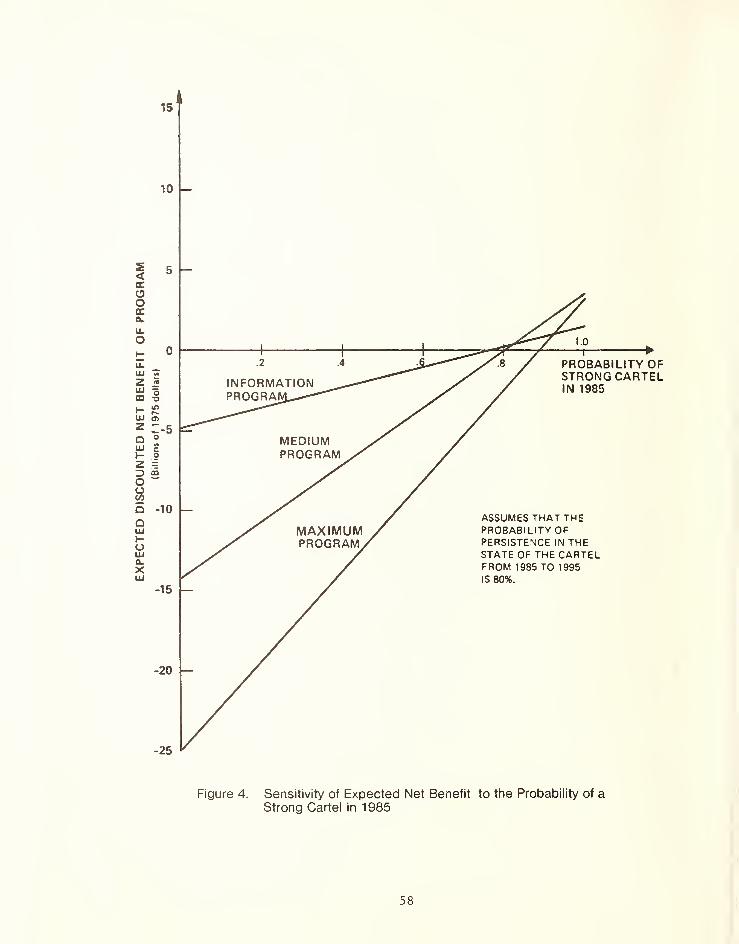
15
This is what Greenberger had in mind when he proposed an "openbox" approach to communicating model results to policymakers:
The typical policy model is not designed for easeof communication with the decisionmaker. Even themodel builder may have difficulty comprehendingfully the essential workings of the model. Ide-ally, the model should be presented to the policy-maker, not as a "black box" with assumptions anddata feeding into the left and results coming outfrom the right, but as an "open box" whose innerworkings are sufficiently simplified, exposed, andelucidated to enable the policymaker to trace thechain of causality from input to output on at leastan elementary fundamental level ( 18 )
.
He goes on to point out that "it would be a research project ofconsiderable intellectual content and practical significance todevelop open box versions of selected models of greatest poten-tial interest to policymakers" ( 18 ) . It would also be a researchproject of enormous challenge. The true art to model buildinghas always been in keeping the model as simple as possible whilestill capturing the essence of the system under study. The addi-tional constraint of not exceeding the policymakers comprehensionmay make the building of the simple model more intellectuallytaxing than the building of the more intricately structured modelfrom which it is derived. Nonetheless, an open box strategyoffers the modeler a vehicle for making the essence of his argu-ment transparent to the policymaker. If such an approach couldbe successfully implemented, the payoff in terms of more effec-tive communication would more than justify the investment.
The final component to user analysis, identification of importantunanswered questions, should define the modeler's agenda for newresearch. User analysis like model assessment is an iterativeactivity. It is rare that the resolution of one set of issuesdoes not lead to a whole set of new ones. If the debate is ongo-ing, the modeler will have a new opportunity to aid decisionmak-ers. In fact, if he did a good job the first time around, he mayeven have a mandate for new research
1
Final Comments
Figure 5 shows the two kinds of model analysis described above,their relationship to each other, and to the various stages inthe modeling process. Model assessment and user analysis are twovery different types of activities. Whereas model assessment isbest carried out by individuals independent organizationally ofboth model builders and model users, user analysis should be doneas a normal part of the modeler's work assignment. To allocatethe activity to third parties is not only inefficient, it breaksthe vital link between modeler and policymaker.
59
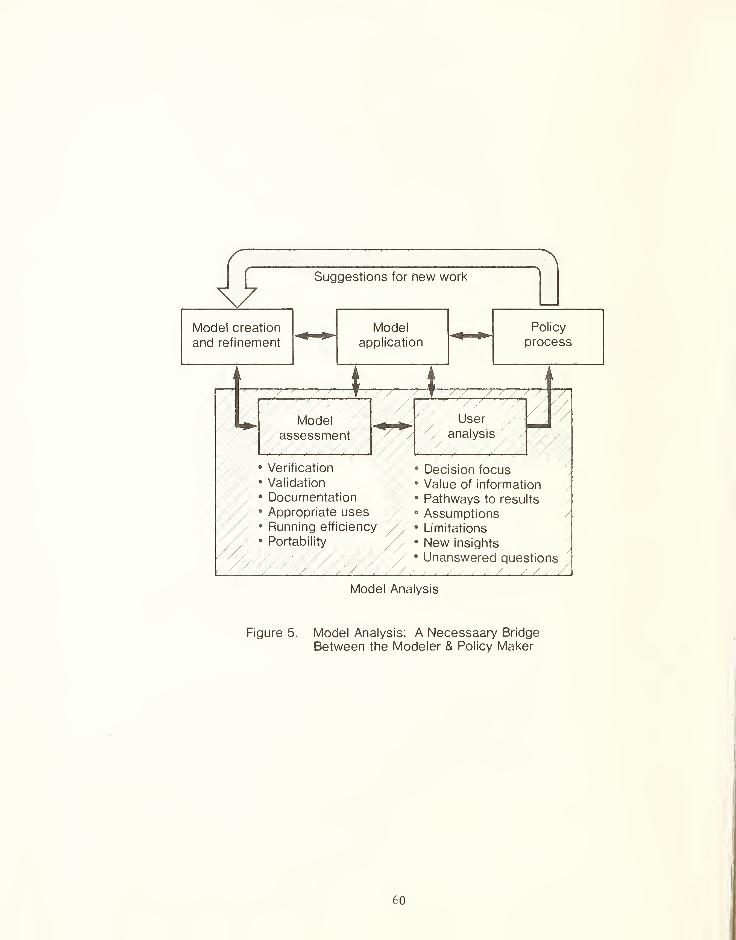
Suggestions for new work
Model creation
and refinement
Modelapplication
Policy
process
Verification
Validation
DocumentationAppropriate usesRunning efficiency
Portability
Decision focus
Value of information
Pathways to results
AssumptionsLimitations
New insights
Unanswered questions
Model Analysis
Figure 5. Model Analysis: A Necessaary Bridge
Between the Modeler & Policy Maker
60
with the support and encouragement of model sponsors and users,these activities can become permanent and important parts of thepolicy process. In the case of model assessment, support isneeded for the institutionalization of a new professional disci-pline. More laboratories and centers are needed where modelanalysts can come together to practice the art and science ofthird party model analysis. Ideally, independent model assess-ment will be set up as recurring activities and the continuingwork of permanently funded facilities.
In the case of user analysis, no new institutional framework iscalled for. Nor do we need to establish a new professional dis-cipline. What is needed is more professional discipline. Model-ers must pay more attention to converting technical results intolanguage comprehensible to policymakers. They must put moreeffort into translating from the specialized jargon of economicsand operations research into a form that is meaningful to thenonmodeler. This will not happen, however, until the incentivesthat the modeler faces reward effective communication. Under-standably, modelers do not receive the same feelings of elationand accomplishment in writing a report that come with a model'sfinally producing plausible results. Sponsors must provide themotivation for more effective communication. From the outset ofa study, they must be specific as to what is expected and shouldfrequently review whether standards are being met. "If helpfulguidance is what policymakers desire from the modeling project,then helpful guidance is what they must supply to the modelersduring the conduct of the effort (_2_) .
"
Acknowledgment
I am grateful to Martin Greenberger, Stephen Peck and StanSussman for helpful comments and suggestions. The faults andomissions are my responsibility.
61
REFERENCES
1. Stokey, E. , Zeckhauser, R. 1978. A Primer for Policy Analy-sis . New York: W. W. Norton & Company.
2. Greenberger, M. Crenson, M. , Crissey, B. 1976. Models in thePolicy Process . New York: Russell Sage Foundation.
3. Brewer, G. 1980. "On Duplicity in the Modeling of PublicProblems." Simulation . April 1980.
4. Greenberger, M. , Richels, R. 1979. Assessing Energy PolicyModels: Current State and Future Directions. Annual Revenueof Energy . 4:467-500.
5. United States Court of Appeals. 1977. The Second NationalNatural Gas Rate Cases. American Public Gas Association,et al. , Petitioners v. Federal Power Commission, Respondent.No. 76-2000, et_ al^.
6. Fromm, G. , Hamilton, W. , Hamilton, D. 1974. "Federally Spon-sored Mathematical Models: Survey and Analysis."Washington, D.C. : Report to the National Science Foundation.
7. Hogan, W. 1978. "Energy Models: Building Understanding forBetter Use. " Presented at 2nd Lawrence Symposium on Systemsand Decision Sciences. Berkeley, Calif. , Oct. 1978.
8. Massachusetts Institute of Technology, Energy Laboratory1978. Independent Assessment of Energy Policy Models: TwoCase Studies. Rep. No. 78-011. Cambridge, Mass: MIT EnergyLab.
9. Gass, S. 1977. "Evaluation of Complex Models. " Computersand Operations Research 4:27-35.
10. Committee on Merchant Marine and Fisheries 1975. "ComputerSimulation Methods to Aid National Growth Policy. " 94thCongress, Washington, D.C. : GPO.
11. Hogan, W. 1978. "The Role of Models in Energy InformationActivities. " Energy Information . Proceedings of a Workshopheld at Stanford University, Stanford, CA. Dec. 1977.
12. Sachs, R. 1980. "National Energy Policy - A View from theUnderside. " National Energy Issues - How Do We Decide .
Cambridge, Mass. : Ballinger Publishing Company.
13. Raiffa, H. 1968. Decision Analysis. Reading, Mass:Add ison-Wesley.
14. Synfuels Interagency Task Force. 1975. "Recommendations fora Synthetic Fuels Commercialization Program. " Washington,D. C. : GPO.
j
I
62

15. Weyant, J. 1978. "Energy Modeling in the Policy Process:Oil Price Decontrol and Synthetic Fuels Commercialization. "
Presented at 2nd Lawrence Symposium on Systems and DecisionSciences. Berkeley, Calif. Oct. 1978.
16. Gilbert, R. , Richels, R. 1980. "Reducing Uranium ResourseUncertainty: Is It Worth the Cost?" Energy Modeling III:Dealing With Energy Uncertainty, Chicago, 111. Institute ofGas Technology. Forthcoming.
17. Energy Modeling Forum. 1977. "Energy and the Economy. " EMFReport 1. Stanford University, Stanford, CA.
18. Greenberger, M. 1980. "Humanizing Policy Analysis: Con-fronting the Paradox in Energy Policy Modeling. " Presentedat the 1980 DOE/NBS Symposium on Validation and Assessment ofEnergy Models. Gaithersburg, MD. May 1980.
63

Quality Control for Analysis
George M. Lady"*"
INTRODUCTION
This paper is written as a sequel to that written for the firstDepartment of Energy/National Bureau of Standards symposium onmodel assessment and validation. ^ Not only is the passage oftime and events since that first symposium an advantage, but thispaper is being written late in the time allowed for preparingthese Proceedings . As a result, I can cite a recent reportprepared at the Oak Ridge National Laboratory [2], which providesa sufficient bibliography of papers on model quality control andrelated topics. I refer the reader to this bibliography ratherthan reiterate many of those references here.
It should be immediately acknowledged that analysis quality controlactivities within the Energy Information Administration (EIA) were(and are) also sponsored by the Office of Energy InformationValidation, an organization parallel to the Office of AppliedAnalysis. These activities will not be discussed here. Thisomission should not be taken in any respect to indicate therelevance or success of the two programs. Instead, this emphasissimply reflects the author's personal experience; further, itrepresents an account of activities within the modeling enterpriseitself. 3 This latter circumstance involves both advantages anddisadvantages
.
Quality control initiatives proposed (organizationally speaking)within the same budget unit as the associated analysis must survivean essentially continuing evaluation of costs and benefits inrelationship to the overall goal of producing analysis results.Accordingly, "more" quality control has an immediate opportunitycost which entails "less" product. It is easy to imagine that themanagers who are evaluated in terms of their evident productivity(i.e., quantity and timeliness) do not always accept that measureswhich reduce this productivity well represent their interests. I
consider this circumstance an advantage . The requirement to bespecific about the relative value of quality control measures is auseful and proper discipline.
The disadvantages of this arrangement are no more complicated thanthe problems of myopic planning. A concern over practicality inthe heat of decision tends to dramatically discount future benefits.
65
Resources proposed for expenditure now, but which provide nobenefits now, or soon ("soon" sometimes means very soon), mighteasily be perceived as better spent some other way. The problemof a proper planning horizon pervades resource allocation problemsin general and I will not contend that it has been atypicallysevere for model quality control planning.
The purpose of this paper is to report upon the Department ofEnergy's program for analysis quality control as developed withinEIA's Office of Applied Analysis. This report will not be adetailed accounting of program components, activities, and expendi-tures, rather, a general statement of issues, the manner of theirpursuit and the kinds of problems and outcomes which emerged. TheseProceedings and those of the first symposium can leave the impressionthat the analysis quality control "problem" is to be found in ahost of technical issues and associated uncertainties aboutprocess... What is to be done? Who is to do it? Who is it to bedone for? What form should it take? My intention in writing thispaper is to take sharp exception with this view of the "problem."While many issues remain to be resolved, based upon my experiencewith the EIA quality control program, it is my impression that thequality control problem is in the first order a deficiency in theprofessional perception of good practice. To be clear, there aremany quality control measures which are beyond dispute, but whichare not undertaken because they are not professionally satisfyingand compete for resources which might otherwise be allocated toprofessionally more attractice activities. The quality controlproblem is a problem of professional mores.
THE QUALITY CONTROL PROBLEM: NEEDS VS. REQUIREMENTS
The EIA publishes projections of energy production, consumption andprices for future time periods: for next year, 20 years or morehence, and times in between. These projections propose to accountfor a host of relevant factors: geology, technology, internationalevents and the nature of specific markets for energy products; thegeneral performance of the domestic economy in terms of production,price levels and finance; stocks of energy producing and consumingcapital, their location and changes in these; a variety of govern-ment initiatives, both those in place and those proposed.
These projections can support the Government's propensity to managethe energy system today in response to sudden developments such asembargoes, strikes and severe weather. They can help evaluate theconsequences of legislative alternatives with impacts spread overmany future years. They can inform private sector planning as itneeds to take such future events into account. And, they can helpevaluate the economic implications or desirability of technologicalchange as it pertains to energy.
66
The usefulness of such projections seems self-evident; however,the projections prepared by the EIA and its predecessor organiza-tions have never been entirely free of dispute. In part, theissues raised have been of the most normal and natural kind: acritical scrutiny of assumptions and methods. Any complex or atleast detailed analysis can be carried out more than one way. Ofthe alternatives available there would usually be relative strengthsand weaknesses among them. To select one alternative among severalwould necessarily entail some form of compromise and an opinionabout the relative importance of the various attributes of theanalysis problem. Since opinions will differ, the actual conductof an analysis will always suffer in some respect in comparisonto alternatives foregone. The continual review of alternativesand relative strengths of available methods is entirely proper;indeed, it is the hallmark of good professional practice.
As a matter of events, the Applied Analysis quality control programwas not developed due to a pressure to establish a system of com-monly agreed to professional review. Instead, the program hasgrown in response to a need for disclosure: the documentation ofmodels and analyses and the establishment of a means for others toreplicate analysis results. Of course, disclosure in this senseis a prerequisite to professional review: so that there is noinconsistency. The point of these particular remarks is thatdisclosure itself is expensive, very expensive; perhaps on theorder of 3 0 percent of the cost of developing a model and using itin an analysis. The need to budget for such nonproduct-relatedactivities has been difficult to accommodate. To be clear, budgetingfor disclosure occurs prior to budgeting for assessment: assessmentcosts perhaps another 30 percent, verification and access yet more(see the next section for definitions of these terms).
^
The first paragraph of this section enumerates a number of importantfactors that (potentially) ought to be taken into account whenprojecting energy prices and quantities. How to do so? Theanalysis strategy chosen by Applied Analysis has been to constructan integrated model which takes the factors at issue into accountsimultaneously . This is difficult (i.e., expensive) to do. Theresult is large in the sense of embodying many numerical elements;the model is detailed (even complex) in the sense of embodying ahost of mathematical structures that represent the attributes andrationale of energy market performance and the technologies ofenergy conversion and distribution; the model is naturally on acomputer; the model is computationally ambitious in the sense thatit may take a long time to solve relative to the total time avail-able for an analysis (by "solve" I refer to the time—days andweeks--taken until the model is viewed as executing "properly"rather than the computing time taken to execute the model in amechanical sense) ; and finally, the model solution is difficult to
67

interpret in the sense that the "answer" embodies many numericalelements (thousands upon thousands) which all vary with respectto the detail and complexity of the system.
The point here is that there is rather a lot to disclose.
In terms of needs it is agreed that the large, simultaneousapproach is necessary in order to account for the host of factorsthat could potentially be important to an analysis. Further, itis self-evident that if an analysis capability is to be useful(e.g., sustained as an expense to the analysis process) then itneeds to be responsive... results must be available in a form andat a time that will actually serve those seeking to make a decision.Alternatively, as an absolute minimum, it would seem that a require-
ment is that the nature of the analysis process must be disclosed.There remains a legitimate dispute as to what, exactly, is to bemeant by disclosure; in what form and disclosed to whom? However,it is difficult to argue that the precise nature of an analysisshould not be known to anybody.
These ideas should communicate a substantial problem. In principle,most agree that an analysis system and its use should be welldocumented. As a practical matter, such disclosure is veryexpensive, and from the standpoint of limited budgets, decisivelycompetitive for the resources otherwise to be utilized in producingresults. The needs and requirements of conducting good, demon-strable analysis are in conflict.
A TAXONOMY OF ISSUES
It is worth reviewing briefly what the issues to be resolved byquality control activities are, presenting some jargon withrespect to these and, as a result, providing a frame of referencewithin which to place quality control activities to be discussedin the next section. Terms to be discussed are: documentation,verification, validation, the credibility of a model, access andcomputer aids for analysts.
Documentation — this refers to written materials which describea system in place (model documentation) and how a system is used(analysis documentation) . Issues sometimes in dispute concernlevel of detail, intended audience and contents, such as alsodescribing a model's rationale, precedents, and sources of data.
Verification — the activity of determining if an analysis performedby the computer (or otherwise) is what was intended. If an analysisis to be verified, a separate statement of "what was intended" tobe compared to a computer program prospectively or to some otherstatement describing what was (is to be) done is, seemingly,required. There is some dispute here since some argue that computercode is iteslf sufficient documentation.
68
Validation (viz: assessment or evaluation) — the activity ofdetermining the "correspondence" between a model and "reality.
"
Many concepts can be at issue here. I find it useful to thinkof "validation" as the enterprise of determining how a modelperforms ... what is (and is not) taken into account and a model'sstrengths, weaknesses, and sensitivities.
Credibility of a Model -- given that a model is documented,verified and validated, I believe a further issue remains: whatuses of a model so described are appropriate and what uses arenot? I will use the term "credibility" in this sense.
Access — a reference to the ability of a third party to reproduceanalysis results.
Computer Aids for Analysts -- a variety of automated proceduresdesigned to help analysts work with large systems. Techniques inplace or under development include the ability to query solutionfiles, express, work with and audit model structure, and form apriori expectations about solutions (e.g., automated "laugh tests").
THE EIA QUALITY CONTROL PROGRAM
The EIA quality control program for analysis is intended to cover allof the issues in the taxonomy. The program is briefly described below.
Documentation (Models)
Models are to be documented in terms of three categories of informa-tion: Model Summary , Model Description , and Model Data BaseDescription . The "model summary" is a brief, several-page descrip-tion in a unified format for all models which is periodicallypublished by EIA. In addition to a summary description, informationon such as the computing environment and official EIA contacts isalso given. The "model description" is a statement of the model'sstructure, processes, rationale, and precedents prepared for aprofessional audience. The "model data base documentation" is acomplete statement of the data upon which a model depends, sources,internal transformations (e.g., aggregation), statistical attributes,and naming conventions prepared for a professional audience.Generally, documentation is required for any other quality controlactivity. The central problem, particularly for models under develop-ment and in evolution, is the availability of current documentation.Given that documentation is expensive, the availability of current,complete model documentation continues to be a pressing problem.
Documentation (Analysis)
The concept of a "model" compared to all substantive activities atstake in producing analysis results is necessarily artificial insome respects. The use of a model will entail some form of
69

manipulation in order to represent assumptions or other specialcharacteristics of the problem being addressed. Intuitively,model refers to the enduring features of an analysis capability(presumably automated) in contrast to all of the actions (whetheror not automated) embodied in an "analysis." The dividing linebetween the model and these other activities should, be taken asa convention rather than something sharp and self evident. EIArequires that each analysis be documented. Such analysis documenta-tion calls for citations to the appropriate model documentationreports as well as a description of how the models were used andwhat else was done.
Ver if ication
The verification of a model must in part refer to auditing computercode. For large systems, the state-of-the-art for this activity isin early development. In addition to a line-by-line audit of theentire code, possibilities include sampling the code, running testproblems with known outcomes and testing the ability to detect"errors" purposefully placed in the model. Verification is con-ducted routinely by model operators, but as yet there is no uniformstructure for procedures or protocol for reporting results. As itstands, the EIA program in model verification is just beginning.
Validation
The many strategies for evaluating a model fall under this category.Since knowing what a model i^, is required in order to evaluate amodel, model documentation is a prerequisite to model validation.A fair proportion of model validation efforts initiated by EIA havebeen frustrated to one degree or another by documentation problems.The results have been beneficial in terms of a more precise under-standing of documentation problems; however, validation results havebeen delayed therefore.
Given the model validation results that were achieved, a furtherissue concerns the degree to which such results actually make adifference. In this usage "difference" refers to consequentchanges in modeling practices and/or an enhanced ability to under-stand and communicate analysis results. In order to be successful,validation activities must be conducted in close collaborationwith those responsible for producing analysis and be supported inpractice by the management to which both the validation and analysisenterprise are jointly responsible. Since the goals of thoseinvolved are different, such collaboration and support are notautomatic. A process of learning and working together is necessary.At EIA this process is still underway.
70
Credibility of a Model
As a logical matter, I have always thought that if everythingabout a model were known, there remained the residual issueof what, given all of this information, the model should beused for versus what not. If documentation, verification,and validation may be viewed as a process of disclosure,some systematic way to us.e this process should existin order to reach conclusions about a model's range ofapplication and attendant risks. EIA is beginning an inquiryinto this issue. Not surprisingly, raising this issue had toawait a tempo of progress in the areas of documentation andval idation.
Access
Programatically, "access" refers to arrangements for trans-porting a model via computer programs on tape and suppportingwritten materials to others. The basic idea is to enable othersto reproduce analysis results. A variety of purposes are servedthrough such access. Published results can be double checkedby those interested. The basis for results can be inspected indetail and alternative results can be derived from the samesystem for comparative purposes (comparisons of particularinterest to a third party, but not of sufficient general interestto have been prepared by EIA). Finally, an analysis capabilitydeveloped at public expense can be made available to the public.Although there are difficulties in access due to differences incomputing environments, subject to these, the EIA access programis in place and successful.
Computer Aids for Analysts
In many ways the EIA has been a pioneer in using large, automatedsystems for policy analysis. It has developed that the use oflarge systems is constrained by their ability to be understood .
Retrospectively this problem seems straight forward; however, itwas not anticipated and there is very little state-of-the-art todraw upon for its resolution. Simply put, it is difficult tofully comprehend an analysis result with thousands of numericalelements based upon tens of thousands of lines of computer coderepresenting a (bewildering) host of assumptions, parameters andmathematical structures. The EIA initiated pilot projects andsolicited professional interest in developing the theory, andits means of application, in what has been termed "computer-assisted analysis and model simplification."^ As appropriate toa new field results are, as yet, tentative and suggestive ratherthan decisive. Unhappily, this program has been especiallysensitive to retrenchment due to budget constraints.
71
other Quality Control Activities
The activities above stand as programs . The emphasis of theirdevelopment has been that of initiating institutional change;that is, codifying, and from a budgetary standpoint defendinga set of "quality control activities" which would routinely bepart of the analysis process. To be entirely specific, the ideais that of developing activities which are agreed to in advanceto be conducted for any analysis product and in relation towhich there is (within reason) prior agreement about next actionsgiven alternative outcomes of the quality control activities.For example, to agree that models are to be documented subject tocertain guidelines, and if they are found not to be, to refrainfrom using them until they are.
An alternative is "professional review." Perhaps "analysis" is sospecial that its evaluation in terms of a priori criteria is notreally sensible, or even possible. Instead, "quality control"might be viewed simply in terms of its proportion of the totalanalysis budget and in practice constitute the involvement of anappropriate group of (independent) specialists who would reviewan analysis effort (or a model proposed for use) and in thespirit of confronting specialized (nonrecurring) problems wouldreach tailored, specialized conclusions.
I do not subscribe to this approach in general; however, there aremany advantages and certainly instances where such is proper. Tobegin with, reviews can be initiated immediately, and hence,results can be achieved quickly. Further, constructive inter-action among all involved (reviewers, modelers, sponsors, ...)is not all that difficult to arrange. As a result, the outcomeand implication of the review should be relatively understandableto those responsible for taking actions based upon the outcome ofthe review. Due to interaction with modelers and sponsors thereviewers would not tend to dwell upon issues whose resolutionwas essentially infeasible for one reason or another. Finally,all involved would be out of the (apparently unpleasant) businessof deriving generic "standards," "guidelines," or "procedures" foranalysis quality control.
These are very substantial strong points. The EIA and itspredecessor organizations have sponsored numerous professionalreviews which have been successful and of great benefit to theorganization. Professional review as a program is now part ofthe clearance process for Model Documentation Reports.
Without arguing against these advantages, I will neverthelessclaim that they are deceptive. I believe that quality controlshould be programmatic and structured in advance to the highestdegree possible. I try to make this case in the section tofollow.
72
QUALITY CONTROL FOR ANALYSIS
If an analysis result is published by a professional organization ,
what should it be taken to represent? What, just exactly, shouldbe meant by the term "good professional practice?" For energyanalysis the "profession" at issue is some blend of computerscience, economics, mathematics, operations research, andstatistics with rather explicit dependence upon geology,engineering and other "harder" sciences. The basic problem atissue is that of analyzing resource allocation through the mixedenterprise of a private ownership economy and government manage-ment. To a high degree, the techniques involved and the expertiserequired are generic and not particularly specific to energycompared to other allocation problems (energy as an exhaustibleresource does call for differences in analytical approach comparedto resources which are not exhaustible) . Due to advances incomputer technology, the ability to conduct detailed integratedanalyses of market systems and their management is somewhat new.(I refer to micro- rather than macroeconomic systems.) It wouldseem that for this new application of (nonexperimental) quantita-tive methods there is little precedent for professional practice.
I believe that the generic analytical enterprise implemented forthe case of energy as an exceptional effort will ultimatelybecome a standard analysis technology to be utilized in manyproblem areas. The professional issue now unresolved is whatas a professional matter should such a technology be taken torepresent? What, precisely, should be taken to stand behind theresults so derived? What do the results embody? Professionalreview as a quality control strategy, even in the ideal, willonly serve to inform about a particular use of the analysis tech-nology. Such review per se does not resolve the professionalissue of what analysis results are supposed to represent.
Without resolution of this professional issue, it will be (andcertainly has been) difficult to manage the results of qualitycontrol activities. In particular, "modeling" versus (such as)"validating" does not refer to different types of individuals,but rather, refers to different assignments made to the sameprofessional cadre. Accordingly, a dispute between modelersand validators cannot be resolved decisively by managementunless the issues at stake can be clearly related to an admin-istrative structure agreed to in advance . An ample variety ofissues exist, professional and otherwise, which will surviveany administrative filter; it is these that should occupy thediscretionary professional and managerial resources. As itstands, quality control issues are almost always exceptionaland represent an excessive burden on managerial resources if theyare consistently raised and are, likely as not, not raised at all.
73
The problem is, thus, the professions' concept of professionalism,I have every confidence that the basic intent of EIA's qualitycontrol program is in its main attributes beyond professionaldispute. It is self-evident that models and analyses should bedocumented; that some systematic and demonstrable care shouldbe taken to verify that the model on the computer is what isintended; that a model's precedents, rationale, sensitivities,and attributes important to its interpretation and use should beunderstood; that a model's use for a given purpose be in somesense demonstrably proper with consequent limitations well under-stood; and, if the resources are otherwise available, reproduci-bility through access is the hallmark of good science. It isdifficult to imagine a graduate seminar at which these issueswere somehow encountered spending very much time in their debate.They would surely be acknowledged and the proceedings move on toother topics. Yet, I am unaware of any professional groupadvocating that their (no doubt very good) analysis results bewithheld due to a deficiency in any or all of these qualitycontrol issues. If the profession cannot take a stand on theseissues, management cannot either.
I make my case on this last point if in no other way. Analysisresults (produced as a best effort) are routinely presented forrelease although some or all of the following prevail:
their basis may not (ever) be demonstrable to othersor even recoverable from the analysis process thattook place;
what was actually done on the computer is not auditedagainst what was intended (hard to do if there is noseparate statement of intentions)
;
the methods utilized are untried and associatedstrengths, weaknesses and sensitivities areessentially unknown; and
there is no systematic determination by anyone thatthe methods used are the "best" available and in factare sensibly useable for the purpose they were prepared.
I am as aware as anyone of the time and other resource pressuresthat constrain what analysts can do. If the profession willaccept assignments with budgets that necessitate omissions suchas the above, management will suppose that such practices arereputable. Quality control thus becomes a set of good ideas tobe accommodated if time and money allow. This is unacceptable.
The solution to this problem requires collective rather thanindividual action. No professional directing an analysis effort
74

can preemptively suspend productivity due to a quality controlrequirement not generally practiced elsewhere. Given the con-straints on analysis that sometimes are truely unavoidable, I
do not question the actual merit of the results achieved. Inmany instances, quality control thus becomes the process ofdemonstrating merit. Without such a demonstration, goodanalysis results are often easily dismissed by those who wishto advocate conclusions rather than discover them. Of all thecosts of insufficient quality control, perhaps this last is themost alarming: good advice going unheeded because its basisand nature are not disclosed.
The profession must take a stand on the manner in which we areto do our work if we are to do it at all. Such a stand was nottaken at this symposium nor the last. We should do it soon. Anext symposium should decisively resolve this issue at the veryleast.
75
NOTES
iThe author is Director, Office of Analysis Oversight andAccess, Office of Applied Analysis, Energy Information Admin-istration (EIA), U.S. Department of Energy. The views expressedin this paper are the author's and do not necessarily reflectthose of the U.S. government.
2see [1] .
•^I emphasize this point again: the views expressed in thispaper receive their emphasis entirely due to my own personalexperience. Notice for example that the Oak Ridge NationalLaboratory report, [2], cited in the first paragraph was sponsoredby the Office of Energy Information Validation.
^See Public Law 94-385, "Energy Conservation and ProductionAct," Title I, Part A, Section 113, (August 1976). The pointhere is that critics of the analysis process did not maintainthat the quality of the analysis was low; instead, they observedthat an assessment of quality was not possible due to documenta-tion problems.
^These percentages are rough estimates based upon experienceand conversations of the author with those responsible for "codeassessment" at the Idaho National Laboratory. The dividing linebetween "modeling" and "assessment" (i.e., "validation") is dueto convention rather than inescapable logic. Some assessmentprojects have cost as much as developing the model at issue. Asa rule of thumb, given current practice in terms of the stage atwhich a model is "ready for use," all related quality controlmeasures probably should cost as much as bringing the model tothis state of "readiness." This cost would be reduced as qualitycontrol becomes more routine and as certain "assessment" activi-ties become part of the "model development" process.
6l emphasize again that I refer only to activities withinEIA's Office of Applied Analysis.
"^The EIA sponsored a symposium on these issues at theUniversity of Colorado (Boulder) in March 1980. The Proceedingsare scheduled for release in May 1981.
76

REFERENCES
[1] Lady, George M. , "Model Assessment and Validation: IssuesStructure and Energy Information Administration ProgramGoals," Validation and Assessment Issues of Energy Models ,
Saul I. Gass, Editor, NBS Special Publication 569, U.S.Department of Commerce, National Bureau of Standards,Washington, D.C., February 1980.
[ 2 ] Weisbin, C.R., et al
.
, "An Approach to Evaluating Energy-Economy Models," ORNL-5742, Oak Ridge National Laboratory,Oak Ridge, Tennessee, March 1981.
77


VALIDATION AND ASSESSMENT PROCEDURES FOR ENERGY MODELS
Jerry A. HausmanMIT
A few years ago when a colleague and I were discussing a recent book by a
well known sociologist, my colleague somewhat derisively characterized his
work with the phrase, "he is a person who writes books about books about books."My paper today has that aspect to it: I am considering the assessment and vali-dation by groups of researchers of yet other groups of researchers' energy models.Perhaps a step back from direct scientific involvement adds perspective, so thatI have tried to think about the important issues which arise in the assessmentand validation of energy models. Although I am two times removed today fromthe real scene of the action, creation and testing of the models, I will drawon my previous experience being once removed as an assessor of energy modelsand also being at the scene of the action as a creator of energy models.
My main focus will be on that part of the EIA assessment and validationprogram which deals with the PIES/MFS model. [1] I must admit to my role asone of the initial assessors of PIES in my 1975 Bell Journal article. [2]
I have maintained an ongoing interest in the progress of the PIES model. Thus,I feel that it is a good point in time after five additional years have elapsedto see what additional knowledge we have about PIES. Of course, PIES itselfhas undergone some significant changes in that period. Since I intend to
limit my remarks to assessment and validation of the PIES model, the reportswhich I consider are:
(1) National Bureau of Standards (NBS) , "An Annotated Restatement of theMethodological Description of the Midterm Oil and Gas Modelling System"
;
(2) Carl Harris and Associates (CHA) : "A Sensitivity Analysis of theDomestic Oil and Gas Supply Forecasts Published in the Department of Energy 's^
1978 ARC";
(3) D. Freedman, T. Rothenberg, and R. Sutch (Berkeley): "Midterm EnergyDemand: The RDFOR Model"; and
(4) MIT Energy Lab (MIT) : "An Evaluation of the Coal and ElectricUtilities (CEUM) Model" [3].
I found each of these reports to be of interest, and I feel that each reportincreased my knowledge about PIES. The NBS report is almost solely an effortin validation. I will consider the issues that it raises first. The otherthree reports have varying proportions of validation but are more concernedwith assessment. I will consider questions of assessment of energy modelsat greater length since the scope of inquiry is considerably larger than invalidation of energy models.
2. Energy model validation : A recurring confusion arises when validationprocedures are discussed because of the meaning of the word "valid". Validarises from the Latin word to be strong or powerful. Thus, valid is usuallytaken to mean able to withstand criticism or objection with accompanyinglegal connotations. But, we know that no model, even in physics or astronomy,is a perfect description of reality. Thus, every model depends on approxi-mations. How good these approximations are and problems which may arise because
79

of the approximations belong to the realm of assessment procedures. If the EIAor other Government agencies attempt to validate energy models in the sense ofdeciding whether they are true descriptions then we know the outcome on a. priorigrounds. Even if they adopt seemingly more modest goals of deciding whetherthe models are "good enough" to withstand criticism or objection, I feel that
the effect will become hopelessly entangled in the establishment of standards.Consider the degree of accuracy possible and even needed in models of populationprojections from HHS and models of satellite performance by NASA. Similarlywide deviations exist in energy models. Thus, to establish standards forvalidation which depend on the quality of the model is misguided. Qualitydecisions belong to the realm of model assessment where sets of standards wouldbe much more flexible. We need to establish much more narrow and rigorousstandards for model validation procedures.
Thus, I propose that model validation efforts concentrate on two mainareas: (1) data, (2) the correspondence of the logical and mathematical structureas described by the model's creators with the actual computer code which imple-ments the model. Here we would look only at the validity of the model as
designed and described in its documentation. [4] Questions of the appropriatenessof the logical and mathematical structures, statistical methods, judgementsof model uncertainty, and the appropriateness of the data would all enter theassessment program. In validation procedures we would consider model performanceconditional on acceptance of modd. structure. Within the restricted confines of
such an analysis, I will propose some possible cases for performance standards.
A. Data Validation ; Almost all models (except perhaps for systems dynamicsmodels) are based on data. Many energy models have much greater data requirementsthan the average model because of their attempts at fine geographical resolution.Thus, questions of data validity become quite important. First, validation pro-cedures should undertake obvious tasks of source validation. Data items fromGovernment agency sources need to be checked. Changes in definition of dataelements over time and procedures to account for them need to be validated.Units of account also need to be checked, e.g., constant dollars or currentdollars for a price series. Note that this requirement leads to certain standardsin documentation which have not been met in all areas of the PIES model. Nextexogenous parameters of the model, sometimes referred to as engineering constants,need to be checked. Procedures might also be developed to do computer checkingof data in order to catch certain gross errors. These errors seem to enter datasets in transcriptions and are usually, but not always, discovered in the modelbuilding process.
These procedures are relatively uncontroversial. My next suggestion ondata validation may be less well received. Much data used in energy models doesnot have a truly precise definition. For instance, "the price" of gasolinein a given area for a given time period does not exist for reasons of geographicaland temporal variability. Thus, even on a theoretical level index number problemsarise. Various weighted averages are used as index numbers where the theoreticallycorrect weight function usually depends on the particular demand or supply func-tional form which is being estimated. [5] The description of the data should con-tain a mathematical or descriptive statement, e.g., Divisia index, so that theindex formula which has been used can be checked. Part of the validation processwould involve checking for the correct use of the mathematical formulae of thevarious index numbers. Now I reach the somewhat controversial aspect of data
80

validation. A significant proportion of the desired data for a given energymodel may not exist. Synthetic procedures, usually based on regression analysis,are often used to create the data which does not exist. Thus, the price of
a particular fuel in Region 2 for the years 1960-1965 say may be the conditionalexpectation of the fuel price from a regression specification estimated overthe years 1965-1975 when the data does exist. Questions of the appropriatenessof such data creation techniques usually have no standard answer. I suggestwe leave a discussion of questions of appropriateness to the model assessmentprocedure phase of evaluation. However, the model validation proceduresshould check on how all such synthetic data were created. They should furtherinsist that the documentation of the model explicitly state, in mathematicalform, all procedures used to create the synthetic data. A possible user ofthe model data would then know explicitly that he does not have the price of
fuel; but instead, he has a synthetic data element created by a procedureincluded in the documentation. Caveat emptor. The standard which should beaimed at would permit a reconstruction of all data elements by use of theformulae contained in the documentation on the original sources. Then, eventhough the user really does not have the 1963 price of jet fuel in Region 2, hewill have access to the formulae for what he does in fact have from the dataused in the model creation.
B. Model Validation : Again, I believe we need to eschew questions of modelappropriateness if we hope to establish standards for validation. What I feelthat model validation should concentrate on is whether the computer code doeswhat the documentation claims it does. In building large models it is inevitablethat mistakes enter the code. Especially with a model as large and complex as
PIES where many revisions and patches have been made over the years, it is
quite important that users be able to assume that model output is valid withinthe confines of the model structure. It is quite interesting that three of
the reports which I reviewed, the NBS study, the CHA study, and the MIT studyall discovered mistakes in the implementation of the model in the computer code.
I do not believe that the computer code for an energy model can be taken as
valid in the sense of being the statement of the model builders intentions.Internal contradictions within a model are a certain sign of mistakes, e.g.,
use of current dollar prices in one section of a model and constant dollar pricesin another section. Many other types of problems are found when a model'scomputer code is scrutinized by outside reviewers. For instance, if the modeldocumentation claims to enforce a certain type of regulation on energy markets,the validation procedure would check the computer code directly to see if the
regulations have been implemented in all parts of the model correctly. As a
model builder I have found this type of validation review to be extremely valuable.Too often under the pressure of deadlines, mistakes enter models but are notdiscovered by the model creators. I foresee an important role for validationprocedures which test the computer code for internal consistency and absencefrom mistakes.
To briefly review the four reports on PIES that I listed previously,I found the MIT Energy Lab evaluation of the CEUM model to be best in modelvalidation. However, it did not pay particular attention to data validationquestions since it focused more on assessment procedures which I will discussin the next section. I found the NBS study of the MOGMS study, which is
closest to a pure validation exercise, to be somewhat disappointing. So faras I can see, except for a single exception, the NBS study did not turn upmuch new about the operation of the model from how it has been described in
81

EIA documentation. Almost no data validation was undertaken, and the modelvalidation is too limited in size to be a conclusive validation study ofthe MOGMS model.
3. Energy Model Assessment ; I have tried to keep the scope of validationprocedures narrowly defined. The reason for the restricted scope is the ideathat standards could be established for validation. Government agencies couldthen judge models as valid. But, I think a more important exercise, which I
want to keep distinct from validation, is model assessment. Here all thequestions of model adequacy would be discussed. Even if a model is technicallycorrect in its execution, we might still not find it to be adequate due to
data, model assumptions, or model structure. Model assessment proceduresoften lead to model improvements when the model builders receive suggestionsof better ways to look at problems. But since questions of model adequacyare based primarily on value judgements, I believe it is unlikely that the
Government could set standards for certification of model quality. In fact,some models are adequate for a certain use but become inadequate when used forproblems that the model builders did not intend them for. Thus, I will suggesta set of areas that model assessments might well consider. But in no sensedo I put them forward as standards. Some excellent model assessments can bequite broad in scope like the MIT assessment of the CEUM model or more narrowin scope like the CHA assessment of the MOGMS model. I feel both reports contri-buted significantly new information to our understanding of the respective models.
A. Data Assessment ; I begin again with data; but I now consider dataassessment rather than data validity. In the review process for the READ modelwhich I took part in for EIA last year, the data might have been judged valid.
However, it seemed to the review panel to be grossly inadequate. In fact, the
READ review led to one of my favorite exam questions of recent years. By creatingsynthetic data the model creators had supposedly discovered a superior estimationmethod to least squares estimation, even when the Gauss-Markov assumptions heldtrue. But the READ case was almost too easy since the attempted level of
geographical resolution was counties. More difficult cases arise in judgingdata adequacy within PIES. For instance, the Berkeley group judges the datafor the RDFOR demand model of PIES to be inadequate. I agree with theirjudgement in many respects. Yet, I feel that they are unduly harsh in other
respects. For instance, if we consider gasoline demand models at almost anylevel of aggregation, problems arise with the data. Suppose we have accuratequantity data by state, which is reasonable since tax revenues are collectedon all gasoline sold for motor vehicle use. [6] No matter what type of pricedata we attempt to use, problems of aggregation will arise. For less aggregation,problems of quantity data arise while price aggregation problems worsen as
we move to larger geographical regions. Nor do I see how the problem will beresolved unless some misguided DOE regulator finally suceeds in forcing a
uniform price of gasoline in the entire U.S. But my judgement is that wecould still estimate a useful gasoline demand relationship so long as the
price data has been consistently constructed over the time span of our model.
Questions of data adequacy will always be present, but I do not feel that a
nihilistic approach to energy models is proper. Overall I do not feel that
the PIES model has attempted excessive geographical resolution in the demandand supply sub-models. Many of the problems which exist in PIES would not be
82

alleviated by going to a model with less resolution, while other new problemswould certainly occur.
B. Economic Structure : I use the term economic structure to encompassall the methodology used in a particular energy model to depict the workingsof the various markets. I feel that evaluation of the economic structureof a model is the most important part of an assessment study. Models rely onsimplifying assumptions. Assessors need to decide if the model assumptionsare sensible, and if the model structure is adequate to study the problemsit is designed for. For instance, I would like to list a few of the question-able assumptions of the original PIES model which I identified in my BellJournal article and consider their possible importance with 5 years of
hindsight
:
(1) The energy model is not integrated within a macroeconomic model.Subsequent events have shown that the raising of the oil price can have verylarge effects on the macro economy through inflation induced by rising energyprices and subsequent government policy measures. In fact, some economistsattach an extremely high shadow price to marginal barrels of oil, on theorder of $75, because of the inflationary consequences of repeated OPEC priceescalations. These macro effects then feed back into demand for energy viathe level of economic activity. Since 1980 will probably see an acuterecession, I doubt that the structure of PIES can adequately capture whatwill happen to energy demand this year.
(2) Electric power production through increased coal and nuclear gener-ation was assumed to play an important role because environmental and regu-latory constraints were not assumed to be especially binding. These assumptionswere remarkable because even in 1974 when the model was constructed theywere having an important effect. In fact, these constraints have becomeeven more binding, bringing nuclear construction to a virtual halt. Also,use of coal burning plants has not proceeded to the degree expected by themodel.
(3) The oil and natural gas supply models used average rather thanmarginal decisions and basically set nonassociated natural gas supply to betotally price inelastic because of exogenously assumed target rates. As it
has turned out, large amounts of new exploration and drilling for both oiland nonassociated natural gas have occured in response to the higher prices.
My point of this brief review is to demonstrate that certain key assumptionsare usually more important than exact details of data quality, statisticalmethods, and other factors which receive the majority of attention in assessmentstudies. I think that assessment of the adequacy of these assumptions is
vital to a good understanding and judgement of model quality. Unfortunately,many key assumptions cannot really be tested within the confines of the modelsince they form defining aspects of the model structure. Still, to have an
informed judgement on how good the models are, we need to examine theireconomic structure.
83

The MIT Energy Lab report does an excellent job of evaluating the economicstructure of the CEUM model. I was somewhat disappointed to find how littleattention economic structure received in the other reports. The CHA reportexplicitly stated that it did not feel this type of evaluation to be withinits scope of work. I would like to encourage EIA to sponsor more evaluationin this area. The results are likely to be less clear cut than more narrowtechnical evaluations. Still, I feel that our knowledge of model capabilityand quality may be increased most by just such studies xvhich evaluate thestructure and assumptions of the energy models.
C. Statistical and Computational Methods ; These methods are more narrowlytechnical than the previous two categories, but still important questions canarise. I will concentrate on statistical methods since I have more knowledgeabout their application than I do about computational methods. The Berkeleyreport on the RDFOR model makes numerous criticisms about the techniques usedto estimate the model. They claim that the model has vastly too many parametersand that simultaneous equation estimation techniques should have been usedrather than least squares methods. The first criticism is a matter of judgement,and the authors might have done more to buttress their claim than count unknownparameters. The second criticism could be quite important since the identi-fication problem only allows us to separate a supply from a demand curveusing simultaneous equation estimation techniques. But again no evidenceis provided to allow us to judge how serious this problem may be. Othercriticisms of the Berkeley report such as incorrect stochastic specificationmay also raise problmes with RDFOR. But in this area I feel that a good assess-ment report should be expected to reestimate the models to see how importanttheir criticisms turn out to be. [7] In the areas of statistical and compu-tational methods, the data exist to try out different ideas. By attemptingdifferent methods of estimation or different stochastic specifications, thechange in model coefficients and forecasting ability can be assessed directly.Also, formal statistical tests can be performed to decide whether the differencesattain statistical significance for a given size of test.
D. Sensitivity Analysis : I would immediately like to commend the CHAanalysis of the MOGMS system. I feel they have conducted a well designedassessment of an energy model which would serve as a good starting point forfurther efforts. The intelligent use of Monte Carlo simulation techniquesand response curve analysis indicated how some key uncertainties can beresolved and important parameter assumptions can be found through sensitivityanalysis. [8] Too often sensitivity analysis appears to be a random walktype procedure in first one set of parameters is changed, then a secondset of parameters is changed, and so on without an over-riding analyticalapproach to the problem. A well organized attack on the problem seems to offera much higher probability of success. For instance, one of the key findingsof the CHA report is the importance of the economic parameters assumed in the
model. To date considerable attention has been focussed on the geological uncertaintywhile too little attention has been given to the economic situation. To the
best of my knowledge no oil or gas supply model accounts correctly for the
economics of drilling and exploration. The CHA results indicate that research
effort in this direction might be highly rewarded. Such a finding is what
we hope for in a well conducted assessment study.
84

Thus, in the area of sensitivity analysis I recommend adoption of a morestructured approach than many studies have taken. The cost of sensitivitystudies can be decreased by remarkable amounts if well designed Monte Carlotechniques are used. Also, response surface analysis is an important toolwhich should be used more often. Both techniques are widely used in statisticsand econometrics. They have seen an increasingly wide use in econometricswhere certain mathematically intractable problems have been well analyzedwith Monte Carlo and response surface techniques. Many of the problemsbear a close resemblance to problems which arise in sensitivity analysisof energy models.
E. Benchmark on Real Data ; Perhaps the most astounding deficiencyof assessment studies is the almost total neglect of what is happening inthe real world. This criticism is extremely important for PIES. The originalmodel was run for 1977, 1980, and 1985. We have passed 1977 and in 14 monthstime will have 1980 data. How well PIES can do using available data up to
1975? I would permit alteration of assumptions within the current PIESframework and not hold it to the 1974 assumptions. But where would themodel go seriously wrong for a real year in the future? I feel we couldlearn an enormous amount from just such an exercise. I strongly recommendthat EIA sponsor this type of assessment.
Otherwise, I cannot see valid alternative methods to assess how goodenergy models are. Each quarter the macro models are put to the test. Yet,in energy models much research is comprised of running different models onthe same energy market far off into the future. I see little use in suchan exercise. It may well be the model which gives outlying forecasts whichis the most valuable. If it turns out to be more nearly correct, the requiredchanges will be all that much greater. Running three models together andfinding that two are close together and one far apart tells me little informationexcept that I should examine the model structure closely to identify the reasonsfor the differences. The exercise is quite unlikely to convince me thatthe outlier model is less good than the other two models.
I would like to end on this point. Because of lack of data, many energymodels have resorted to techniques of data synthesis. Thus, some of theirvariables are unobservable independent data series. But at some level of
aggregation they should be producing forecasts of available data. Other-wise, they are rather uninteresting models. I see a crucial neglect inanalyzing how well the models do perform in reality. I need some informationhere to decide if, in fact, energy models are credible.
85

FOOTNOTES
My chosen acronym for the overall model will be PIES which I know isofficially outdated but has that advantage of easy recognition from theplethora of other model designations.
2Jerry Hausman, "Project Independence Report: An Appraisal of U.S.
Energy Needs up to 1985", Bell Journal of Economics, 6, 1975.
3I am associated with the MIT Energy Labortaory, but I have not been
involved in their energy model review program since 1975.
4I realize that a problem may arise because documentation is often
not done by model builders. But, I feel that model builders should be heldresponsible for the accuracy of the documentation. Thus, the descriptionof the model, either verbally or mathematically, should be the primarydocument to consult.
^A recent exploration of these issues is contained in E. Diewert,"Exact and Superlative Index Numbers", Journal of Econometrics , 8, 1978.
Even here problems arise because taxes are not levied on gasolinefor recreational use like motor boats. But some compromises are necessary.
^The Berkeley authors promise such a study in the next phase of theirasessment
.
I do have two minor quibbles. First the method of antithetical variabledid not seem to be used which can further reduce computer time. Second, the
use of (-1,0, +1) for functional changes in the response model seems incorrectTwo separate variables corresponding to the -1 and +1 cases seems a prefer-able specification.
86
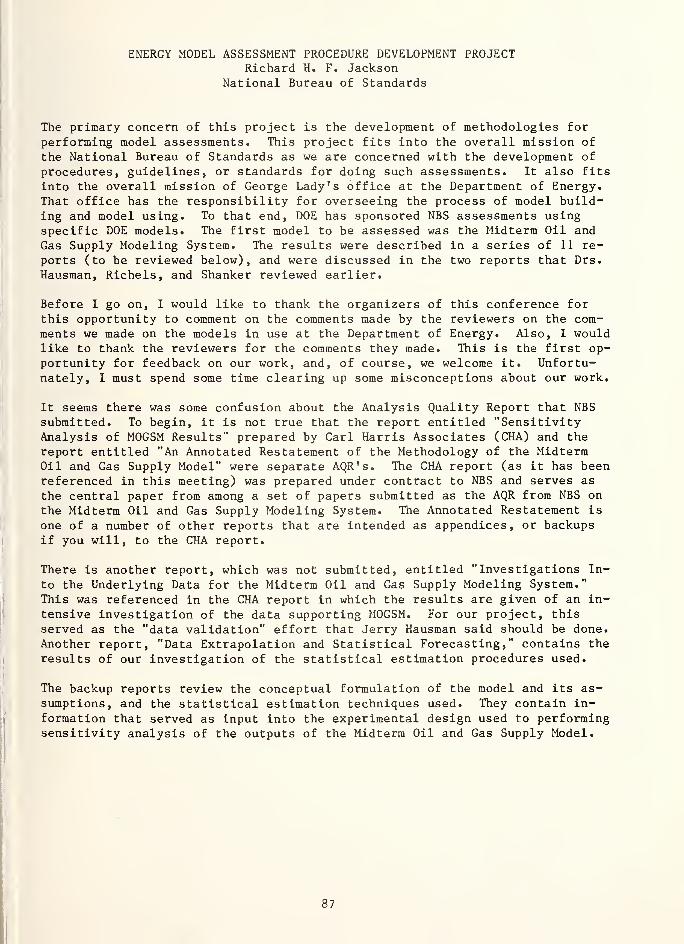
ENERGY MODEL ASSESSMENT PROCEDURE DEVELOPMENT PROJECTRichard H. F. Jackson
National Bureau of Standards
The primary concern of this project is the development of methodologies for
performing model assessments. This project fits into the overall mission of
the National Bureau of Standards as we are concerned with the development of
procedures, guidelines, or standards for doing such assessments. It also fits
into the overall mission of George Lady's office at the Department of Energy.That office has the responsibility for overseeing the process of model build-ing and model using. To that end, DOE has sponsored NBS assessments usingspecific DOE models. The first model to be assessed was the Midterm Oil andGas Supply Modeling System. The results were described in a series of 11 re-ports (to be reviewed below), and were discussed in the two reports that Drs.
Hausman, Richels, and Shanker reviewed earlier.
Before I go on, I would like to thank the organizers of this conference for
this opportunity to comment on the comments made by the reviewers on the com-ments we made on the models in use at the Department of Energy. Also, I wouldlike to thank the reviewers for che comments they made. This is the first op-portunity for feedback on our work, and, of course, we welcome it. Unfortu-nately, 1 must spend some time clearing up some misconceptions about our work.
It seems there was some confusion about the Analysis Quality Report that NBSsubmitted. To begin, it is not true that the report entitled "SensitivityAnalysis of MOGSM Results" prepared by Carl Harris Associates (CHA) and the
report entitled "An Annotated Restatement of the Methodology of the MidtermOil and Gas Supply Model" were separate AQR's. The CHA report (as it has beenreferenced in this meeting) was prepared under contract to NBS and serves as
the central paper from among a set of papers submitted as the AQR from NBS on
the Midterm Oil and Gas Supply Modeling System. The Annotated Restatement is
one of a number of other reports that are intended as appendices, or backupsif you will, to the CHA report.
There is another report, which was not submitted, entitled "Investigations In-
to the Underlying Data for the Midterm Oil and Gas Supply Modeling System."This was referenced in the CHA report in which the results are given of an in-
tensive investigation of the data supporting MOGSM. For our project, this
served as the "data validation" effort that Jerry Hausman said should be done.
Another report, "Data Extrapolation and Statistical Forecasting," contains the
results of our investigation of the statistical estimation procedures used.
The backup reports review the conceptual formulation of the model and its as-sumptions, and the statistical estimation techniques used. They contain in-formation that served as input into the experimental design used to performingsensitivity analysis of the outputs of the Midterm Oil and Gas Supply Model.
87

Only the two reports, the "Sensitivity Analysis" and the "Restatement of the
Methodology," were submitted for review as it was unclear how many of the re-ports I just mentioned would be useful to the reviewers. Since the purpose of
the AQR's was to assist George Lady's office in identifying the degree of con-fidence one can have in the numbers published in the Annual Report to Con-gress, 1 felt the reviewers would be more interested in our efforts to discussthose numbers and that confidence, and less interested in reviewing our ef-forts to assess the model and develop a methodology for model assessment. Myintent, therefore, was for the reviewers to see the central report, which pre-sents our sensitivity analysis of those numbers, and, if they were interested,to provide copies of the backup reports later.
1 would like now to respond to a few of the specific comments made by the re-viewers. Dr. Hausman felt that a serious omission in the NBS work was the
lack of a data validation effort. 1 hope my comments above clarify this mat-ter. He also reviewed the Annotated Restatement as a model validation reportand discussed ways to improve it. I consider this a compliment because the
report, as 1 mentioned above, was not intended to be a model validation re-port. Our goal in writing it was to discuss the methodology more completelythan it was discussed in the documentation provided us, and also to discusssome of the assumptions made in the model. This report was written becausesuch a description did not exist and we needed it to ensure that we understoodthe model as it existed, not as it was documented years earlier. We studiedthe documentation and held a series of meetings with the staff of DOE and the
contractors responsible for building the Midterm Model. Our report began as
an internal working paper and continued to grow in size and stature to the
point that we felt it was a worthwhile addition to the documentation of thismodel. We thus chose to publish it.
Dr. Hausman also commented that he felt validation should be the act of com-paring model documentation with computer code. I do not think the term "vali-dation" should be restricted in this way. 1 would perhaps call that verifica-tion, but I don't want here to get into a discussion of taxonomy. 1 do, how-ever, believe strongly that such an effort (whatever we call it) is necessary.It is unfortunate that we were unable to do more of it, but it is very diffi-cult to compare code with documentation when documentation does not exist.
We began our project believing that assessors should not be required to readcode in order to understand what a model is. The models in question changemuch faster than the documentation, making code reading mandatory. It is per-haps boring, pains-taking, and time consuming, but we discovered a number ofsimple coding errors in the process, thus improving the model.
Dr. Richels commented that the Analysis Quality Reports are too technical to
be used by the policy makers for whom they are being written. I cannot com-ment on the technical background of policy makers, I have yet to be introducedto one.
88

At NBS our efforts to develop methodologies and to produce AQR's have beenlimited to techniques for model assessment. We believe that this is a neces-sary first step in the development of approaches for presenting the results of
such model assessments. Perhaps these can be done pari passu , but we have not
concentrated on this problem. We have conducted workshops on the meaning of
model confidence. We have conducted workshops on model documentation. But we
have not spent time with the policy makers for whom these reports are writtenin order to learn what their needs and desires are. Perhaps when we havelearned more about how to conduct model assessments we will be in a positionto condense the results into a format suitable for presentation to policymakers.
Dr. Richels also felt unsure about the value of efforts to make models porta-ble. He said that model portability was perhaps an unattainable goal, sincesponsors rely so much on the original developers of the model for their properuse, application, and interpretation. I agree with him that this is a diffi-cult task; the state-of-the-art is such that models are not stand-alone enti-ties. We have, for example, a report coming out describing our efforts to
convert the Midterm Oil and Gas Supply Model from the DOE computer system to
the NBS computer system; two very different machines. It is not an easy taskeven to perform the physical act of converting from one machine to another.Also, we have not addressed the question of the intelligent use of that modelwhen it is separated from the original model developers. Nevertheless, I feelstrongly that we must continue to require that models be made portable. In
fact, this ties in with comments I had on another of Dr. Richels' points. He
said that in his view policy analysis is more art than science. I feel thatthere are components, certainly, of policy analysis that are more art thanscience. But I feel that there are many other components that are very sci-entific in nature. While perhaps we might not be able to subject the artfulaspects of policy analysis to peer review and scientific experimentation, wecan certainly subject those other scientific aspects to the same rigorous re-quirements of scientific reproducibility and investigations that we all weretrained to respect. Viewed in this light, model portability is an absolutenecessity. That which is to be subjected to peer review must be capable of
being viewed, reviewed, and reproduced by outsiders.
Large scale mathematical models are currently being used to help set nationalpolicy. They are here to stay. I think it is no longer possible to hide be-hind claims of "art," "too complicated," and "no time." We must recognizethat these are scientific tools and techniques that must be subjected to the
rigorous requirements of scientific reproducibility and experimentation, andso conduct ourselves as the professionals we claim to be.
89


COMMENTS ON VALIDATION AND ASSESSMENT PROCEDURES
Allen L. SoysterVPI & SU
I have had some first-hand experience with many of thethings that have been discussed here today. These experiences are not onlywith energy models but with some other models which I will mention.
To begin, I would like to make a couple general comments, and
a couple of specific ones related to some issues that have surfaced here.
This morning. Ken Hoffman suggested that it was difficult to be boththe performing artist, a member of the audience and a critic and that thesetasks may well be separated and maybe should be separated.
I feel differently. I feel that to be a model developer and a modelbuilder that one has to do all three of these things.
When one develops a model one doesn't develop the model for six monthsand then attempt to verify or validate it the following three months. I
think it is an on-going back and forth procedure and there is a continualvalidation.
Just a short time ago at Virginia Tech we have been involved with thebuilding of a non-fuels mineral model of the world copper market. It hasnothing to do specifically with energy but the same issues relative tovalidation processes are applicable. Recently the Bureau of Mines' forecastU.S. copper production will be 3.2 million tons by the year 2000. We arecurrently producing at about a rate of 1.6 million tons per year.
In support of this non-fuel minerals model we have collected data onevery individual mine, smelter and refinery in the U.S. plus information onother countries' supply of copper — Zambia, Zaire, Chile, Peru — a numberof them.
Our own forecast developed from the non-fuel minerals model, developedmuch like the PIES model, is that there is no way under current technologythat the U.S. can economically produce more than about 2.4 million tons of
copper.
The 2.4 million ton estimate was not arrived at overnight. This numberhas been under scrutiny for well over a year. In terms of the model development,the verification was a day-by-day thing and I never really thought that at
any particular time we were doing validation versus model development. Theyhappen simultaneously. Preliminary results are followed by model modificationswhich are followed by further tests and so on. Hence, I feel that a modeluser should take some solace in the sense that in many cases model validationis an inherent part of the model building task.
It was also pointed out this morning that Saul Gass and Lambert Joelhad a four-fold evaluation of model assessment. And, as I recall, it was
documentation, verification, validation, and usability. The first, second
and fourth, it seems to me, can be done in a fairly straightforward way. It
is just a matter of resources and time.
91
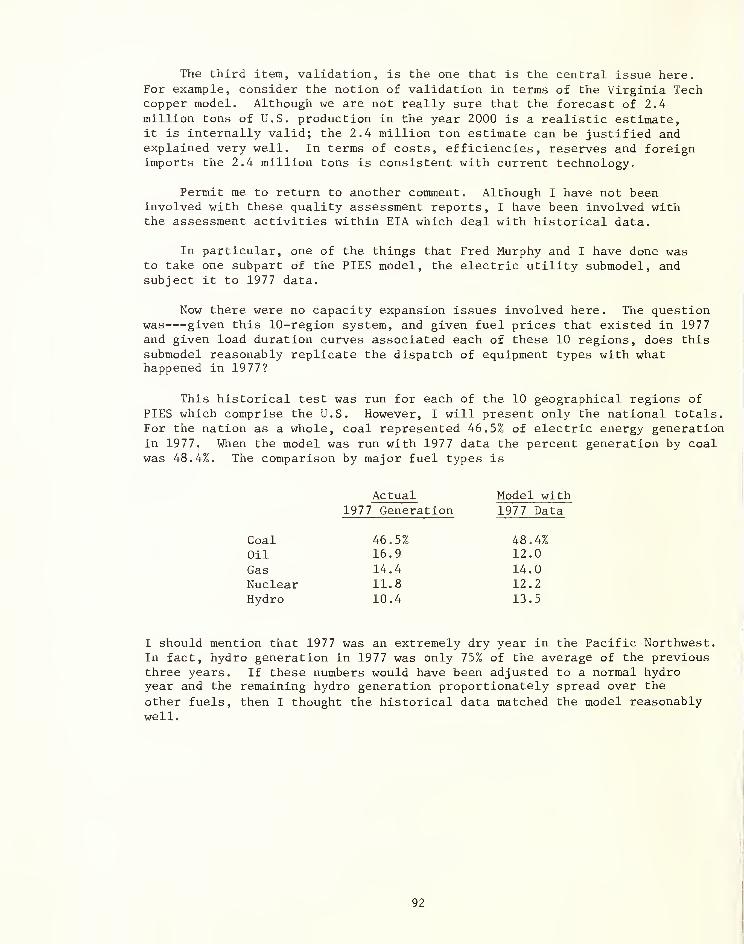
The third item, validation, is the one that is the central issue here.For example, consider the notion of validation in terms of the Virginia Techcopper model. Although we are not really sure that the forecast of 2.4million tons of U.S. production in the year 2000 is a realistic estimate,it is internally valid; the 2.4 million ton estimate can be justified andexplained very well. In terms of costs, efficiencies, reserves and foreignimports the 2.4 million tons is consistent with current technology.
Permit me to return to another comment . Although I have not beeninvolved with these quality assessment reports, I have been involved withthe assessment activities within EIA which deal with historical data.
In particular, one of the things that Fred Murphy and I have done wasto take one subpart of the PIES model, the electric utility submodel, andsubject it to 1977 data.
Now there were no capacity expansion issues involved here. The questionwas given this 10-region system, and given fuel prices that existed in 1977and given load duration curves associated each of these 10 regions, does thissubmodel reasonably replicate the dispatch of equipment types with whathappened in 1977?
This historical test was run for each of the 10 geographical regions of
PIES which comprise the U.S. However, I will present only the national totals.For the nation as a whole, coal represented 46.5% of electric energy generationin 1977. When the model was run with 1977 data the percent generation by coalwas 48.4%. The comparison by major fuel types is
Actual Model with1977 Generation 1977 Data
Coal 46.5% 48.4%Oil 16.9 12.0
Gas 14.4 14.0Nuclear 11.8 12.2
Hydro 10.4 13.5
I should mention that 1977 was an extremely dry year in the Pacific Northwest.In fact, hydro generation in 1977 was only 75% of the average of the previousthree years. If these numbers would have been adjusted to a normal hydroyear and the remaining hydro generation proportionately spread over the
other fuels, then I thought the historical data matched the model reasonablywell.
92
ARE ENERGY MODELS CREDIBLE?
by
David FreedmanStatistics Department
University of California, Berkeley
1. Introduction
In this paper, I argue that the forecasts from current energy modelscannot be relied upon. Indeed, there is little hard evidence to show thatsuch models work. And on a priori grounds, skepticism seems justified. Thequality of the data inputs is often poor or uncertain, and in some cases theinternal logic of the models is open to question.
Before developing these points, I have some comments to make about theinstitutional setting. A major part of the analytical effort at the EIA(Energy Information Administration) is devoted to making forecasts for theAnnual Report to Congress. These are made for the short term (a year or twoahead), the midterm (five to twenty years ahead), and the long term (the
year 2000 and beyond). These forecasts are produced with the help of verylarge mathematical models, for instance, the Midterm Energy Forecasting
2System. A single forecasting run with this system takes several hours ofcomputer time.
EIA models require very detailed data on energy production and consump-tion. In fact, their demand for data far outstrips the supply, despite theextensive data collection efforts at EIA and other governmental statisticalagencies. (Of course, most of these data collection efforts were not designedto support modelling.) As a result, much data used by EIA model s are synthetic
,
meaning that most of the numbers result from imputation rather than measurement.
Despite their complexity, EIA models are often unable to answer thepolicy questions of current interest. This is partly because the questionsevolve faster than the models. Furthermore, if left to their own devicesthe models often produce unreasonable forecasts. To answer relevant policy
This paper was written for the DOE/NBS symposium on validation and assessmentof energy models. May 19-21, 1980. It grows out of an extended collaborationwith Thomas Rothenberg and Richard Sutch of the Economics Department,
University of California, Berkeley, on a project to assess RDFOR. Thisproject was funded by the Office of Analysis Oversight and Access, EIA.
Sections 3 and 5 of the present paper are abridged from project technical
reports.
This is a successor to PIES (Project Independence Evaluation System).
93

questions, and to keep forecasts on track, EIA analysts have to make numeroussubjective adjustments to model inputs and outputs. Perhaps for reasonsalready given, EIA models are in a continuous state of development. Thereare always new questions that must be answered: the pressure is for moredetail in the forecasts. Periodically the models must be reworked to givemore sensible forecasts: an unreasonable forecast is usually construed to
result from the model's failure to capture some detail of the energy market.EIA models start big, and they are growing.
What are the consequences for the credibility of EIA forecasts? To begi
with, the accuracy of synthetic data is usually difficult to assess. Thestandard statistical procedures, like regression analysis, were designed foruse with real data--and may behave differently when run on synthetic'data.In particular, degrees of freedom and standard errors become very difficultto interpret. Worse, errors in variables can lead to serious bias in coeffi-cient estimates--without any way to estimate this bias. This complicatesthe task of assessing models built on synthetic data.
Next, there is a tension between the idea of modelling and the idea of
subjective adjustments. I do not for a moment suggest that EIA should be
publishing silly forecasts just because they come out of a model. But this
inconsistency in EIA's modelling philosophy is worth thinking about. And
there is some impact on the credibility of the forecasts, because it is hard
to assess the quality of judgment involved in changing intercepts betweenmodel runs, or splicing models together.
Another consequence of EIA's modelling philosophy is a shortfall in
quality control work, and this too is quite damaging to the credibility of
the forecasts. What kind of track record do the models have in forecasting?What are the statistical properties of the data? the equations? the fitting
procedures? How do the models respond in simulation studies, or sensitivityanalysis? Before they trust the forecasts, analysts outside the EIA will
want answers to such questions. A start on sensitivity analysis was made in
the 1978 Annual Report, and this is an encouraging sign. Varying the assump-
tions in the scenarios, in the forecasts of key exogenous variables, is an
important thing to do. But as I will show later, EIA models embody manytechnical assumptions about the energy market. A lot of hard work needs to
be done, to see how the forecasts depend on such assumptions.
A final point on quality control. Proper documentation is crucial in
establishing the credibility of any analytical enterprise. For example, it
seems possible to recreate the 1970 Census of Population from the printedrecord. Furthermore, census publications openly acknowledge the problems
with the data; they report serious efforts at quality control, and at quanti-fication of errors. This can be quite disarming, for it demonstrates that
the problems have been considered. By way of comparison, it seems impossibleto reconstruct the forecasting procedure used in the 1978 Annual Report fromthe accompanying documentation. EIA is in the awkward position of usingmodels to make forecasts, but being unable to say just what those models are.
94

In large part, I ascribe the shortfall in quality control work and in
documentation to the way the modelling enterprise is managed. EIA analystsare required to produce forecasts in great detail, and with considerablefrequency. They are required to use very complicated technology in makingthe forecasts. They are required to elaborate that technology from year toyear. Not unnaturally, quality control and documentation come to be seen asdispensable. So do the statistical proprieties. The nitty-gritty is gettingthe numbers out. This seems curiously impractical. The numbers do get out,but nobody quite knows what they mean, or how far to trust them.
2. The case against the models
In the previous section, I suggested that energy models lack credibilitybecause they run on synthetic data, and because they are not documented atall well. I must also tell you that at least in some cases, the models them-selves are seriously flawed. Even with good data and good documentation,such models could not compel conviction. This opinion is based on a carefulassessment of a very small sample of energy models, and not a random sampleeither. As a statistician, I want to be cautious about extrapolating fromsuch a sample. However, it may be useful to draw some general --if tentative--conclusions. To keep the discussion in focus, I will concentrate on econo-metric demand models. There are some major sources of uncertainty about suchmodels. These are well known, but it may be useful to review them here, as weconsider the strategy of using models in forecasting.
First, there are major events which influence energy markets but whichare beyond the ken of econometric demand models. Recent examples include theArab oil embargo and the Iranian revolution. Unforeseen events of thismagnitude are apt to occur in the future, and are likely to throw the fore-casts well off the track. This point is obvious, and the inside front coverof volume III of the 1978 Annual Report insists on it. Obviousness does not
detract from importance.^
A second source of uncertainty about econometric demand models is that
they have quite weak theoretical underpinnings. This is because economic
As an interesting sidelight, I suggest that it is impossible to make useful
estimates of the variance caused by rare events, because the fitting periodsof the models are too short. For instance, let us make the assumption--whichis quite favorable to the possibility of estimating variance by statisticalmethods--that rare events of a certain type follow a Poisson process, witha rate which is unknown and to be estimated. To get some idea of the ordersof magnitude involved, supposed that in fact, events of this type occur at
an average rate of one every ten years. In a fitting period of ten years,we have a 37% chance of seeing no such events, and estimating the rate of
occurrence as zero--not a useful estimate. There is a 37% chance of seeingexactly one such event, and getting the estimate right. Finally, there is
a 26% chance of seeing two or more such events, and hence being off by a
factor of two or more in our estimate.
95
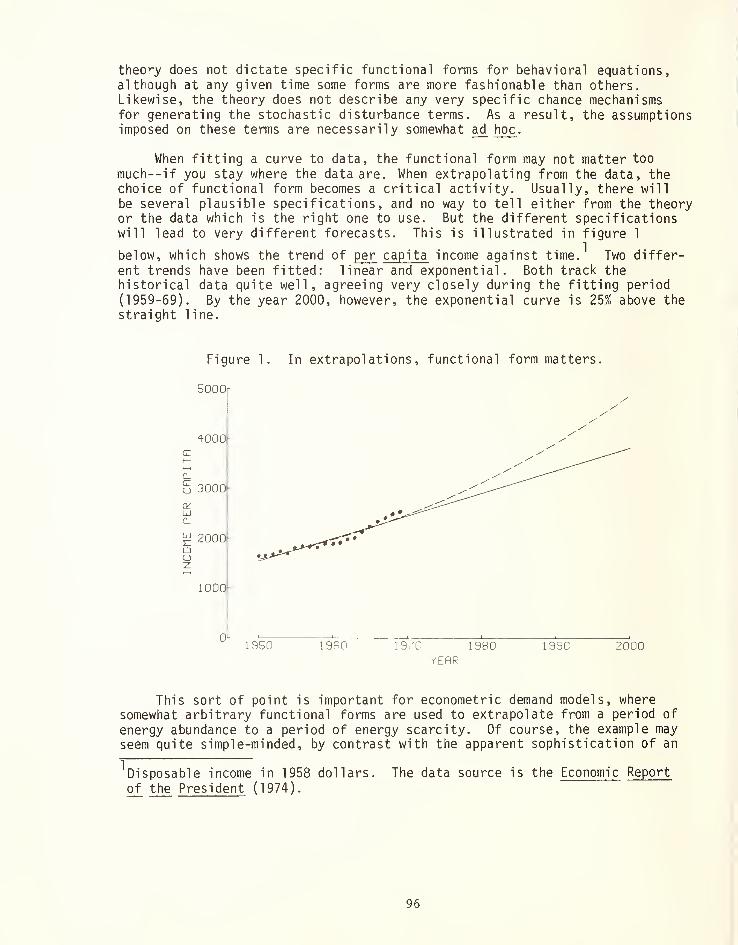
theov'y does not dictate specific functional forms for behavioral equations,although at any given time some forms are more fashionable than others.Likewise, the theory does not describe any very specific chance mechanismsfor generating the stochastic disturbance terms. As a result, the assumptionsimposed on these terms are necessarily somewhat ad hoc .
When fitting a curve to data, the functional form may not matter too
much--if you stay where the data are. When extrapolating from the data, thechoice of functional form becomes a critical activity. Usually, there will
be several plausible specifications, and no way to tell either from the theoryor the data which is the right one to use. But the different specificationswill lead to very different forecasts. This is illustrated in figure 1
below, which shows the trend of per capita income against time.^ Two differ-ent trends have been fitted: linear and exponential. Both track thehistorical data quite well, agreeing very closely during the fitting period
(1959-69). By the year 2000, however, the exponential curve is 25% above thestraight line.
Figure 1. In extrapolations, functional form matters.
SOOOr
"{000
CL
5 3000
uCL
^ 2000-a
1000-
1950 19B0 1970 1980VEflP
1990 2000
This sort of point is important for econometric demand models, wheresomewhat arbitrary functional forms are used to extrapolate from a period of
energy abundance to a period of energy scarcity. Of course, the example mayseem quite simple-minded, by contrast with the apparent sophistication of an
Disposable income in 1958 dollars. The data source is the Economic Report
of the President (1974).
96
econometric model. However, putting in more variables and more equationswill not help matters, when each equation just represents an additional postu-late. In fact, multiplying assumptions may make matters distinctly worse,because sorting out the consequences of the specification becomes very difficult.
The extrapolation problem is crucial too, when a model is used to
estimate the impact of a proposed policy change. Indeed, the policy initia-tive is apt to change the rules of the game, pushing the model into completelynew territory. For this sort of reason, statisticians are quite suspiciousabout estimating the effects of interventions, on the basis of curve-fittingto observational data.
Of course, most of the time the world changes quite slowly. Regressionanalysis and the computer are powerful tools for discovering relationshipsin data, especially when there are few constraints about which variables to
put in the equations, how to transform them, or what kind of lag structurescan be tried. As a result, newly-fitted models are apt to track very well,for a while. And then they are apt to stop working, because the regressionequations turn out to be artifacts of data processing, rather than laws ofnature. (See Appendix A.)
Let me now summarize. At the EIA, generating forecasts with big modelsconsumes a lot of resources: little is left over for proper quality controlor documentation. Furthermore, much expert judgment is needed to keep the
forecasts on track, and to do policy analysis. This judgment must be exercisedthrough the back door, when intercepts get changed, or it is decided to use
one equation from one model and another from another model. The quality ofthis kind of judgment is very hard to appraise.
At a more basic level, big models need lots of data, often on variables
which are not measured. As a result, the models are often fitted to syntheticdata of doubtful quality. Furthermore, the models involve the introductionof many somewhat arbitrary technical assumptions, about the functional formsof the equations, and about the behavior of the stochastic disturbance terms.
To get the model going, it is usually necessary to compromise on thestatistical niceties.
The subjective adjustments, the synthetic data, the technical assumptions,and the statistical compromises proceed to interact in bewildering ways, and
the documentation just adds another layer of confusion.
3. An example
It may be useful to illustrate some of these points on RDFOR (Reduced
Form Demand Forecasting Model). This model played a key role in the 1977
and 1978 midterm demand forecasts.
97
3.1 An overview of RDFOR
RDFOR computes a demand surface for use in MEFS (Midrange EnergyForecasting System); this surface foretells what demand would be in e.g. 1990for each type of fuel by consumption sector and geographical region, as a
function of sector- and region-specific 1990 prices. The demand surface hasa constant matrix of own- and cross-price elasticities. Thus, the demandsurface can be defined by specifying one point on it, together with a matrixof elasticities.
RDFOR has three component parts:
(a) There is a system of log-linear demand equations, whose parametershave been estimated using econometric regression techniques fromhistorical data.
(b) There is a procedure which employs these demand equations to fixone point on the forecasted 1990 demand surface.
(c) There is another procedure which employs the same demand equationsto derive the matrix of own- and cross-price elasticities definingthe shape of the forecasted 1990 demand surface.
3.2 The demand model
The demand model--point (a) above--is the structural heart of RDFOR. It
consists of equations which set the log of quantity of fuel "demanded"(i.e., apparent consumption) equal to a linear function of the log of priceand other variables. The RDFOR demand model recognizes the ten DoE regions,the four consumption sectors of the Annual Report (residential, commercial,industrial, transportation), and 13 types of fuel (coal, natural gas,electricity, gasoline, distillate, residual oil, etc.). Estimates of theparameters are made for each sector and region. The total fuel demanded in
each sector and region is predicted first, as a function of the average priceof energy for that sector and region and certain other explanatory variables(like population and income). The total is then shared out to individualfuels, with the share for each fuel depending on the price of that fuel
2relative to the average price of energy. Fuel prices are exogenous to
RDFOR, although they are endogenous to MEFS as a whole.
This section is based on the reports by Parhizgari, and on interviews withEIA personnel. However, with respect to some critical issues, I have had
to guess how things were done, due to the ambiguities in the documentation.
Strictly speaking this discussion applies only to the "major" fuels in the
residential, commercial, and industrial sectors. "Total" is something of a
misnomer: RDFOR works with divisia indices. The transportation sector is
different, but its structure cannot be deduced from the documentation.There is also a "fifth" factor, for feedstocks and the like. These are
treated as "minor" fuels, and demand for them does not seem to be consideredprice-elastic.
98
The system of equations in RDFOR is large because of the extensiveregional, sectoral, and product detail. There are many minor differences in
the specifications of the various equations in the model. However, theequations used in the residential, commercial , and industrial sectors are allsimilar and identical in form across the ten DoE regions. I focus on theequations for total demand and pass over the equations used to share total
demand out among the individual fuels. ^ The equation for total demand by a
sector (residential, commercial, industrial) in DoE region r = 1,...,10 andyear t = 1 961 , . . . ,1 977 is
\t ~-
^ K^rt ^ S^rt ' S^t " SSt
where
is the logarithm of an index of fuel consumption.
Prtis the logarithm of a fuel price index,
•^rti s the logarithm of permanent income per capita.
^t is the logarithm of heating degree days.
St is the logarithm of cooling degree days.
\t is a stochastic disturbance, and
S' br
. cr
. d^, e^, f^. c^, d^, e^ are parameters to
More specifically, in the residential and commercial sectors.
(2) = loglq^/N^) ,
where N^^ is population, and Q^^ is a divisia index of fuel consumption.
Similarly, in the industrial sector,
Vor the 1978 report, the sharing-procedure was as follows. In the residen-tial sector, the Hirst-Carney model was used, but its elasticities wereconstrained to match regional elasticities computed from RDFOR. In thecommercial sector, RDFOR was used to estimate total demand. Then thenational -level Jackson model was used to share this demand out among elec-tricity, natural gas, and "oil". Finally, RDFOR was used to share thedemand for these fuels down to the regional level, and to split "oil" intodistillate and residual. In the industrial sector, RDFOR was used to esti-mate total demand, as well as the demand for electricity and liquid gas.The (undocumented) IFCAM model was used to share the remaining demand outamong natural gas, distillate, residual, and coal. The main difference I
can see between this and the proverbial back-of-the-envelope is that the
old-fashioned method is self-documenting. After all, when you've finisheddoing the calculation, you've still got the envelope.
99
(3) = iog(Qrt/v,j) .
where V^^ is value-added in manufacturing; the income coefficients c and
c' in equation (1) are constrained to zero. For all three sectors,
(4) P,t= log(P^^) ,
where P^^ is a divisia price index. "Permanent" income is a three-period
moving average, with weights 4/7, 2/7, and 1/7. Money variables are in
constant dollars.^
The stochastic disturbance terms in (1) are taken to be autoregressive,the parameter depending on the region:
(5) v.=Xv.i+w.rt r rt-1 rt
Here, the 10-vectors (w^^: l^r^lO) are assumed to be stochastically inde-
pendent of one another, prices, incomes, weather variables, and quantitiesconsumed in previous years. The distribution of (w^^: Igr^lO) is assumed
to be constant over time, with mean 0, but the 10 x 10 covariance matrix is
not constrained. These assumptions are not defended in the documentation.In fact, they are not even spelled out.
This completes the specification of (1), with one major lacuna . The
coefficients in (l)--but not the intercept a , or the autoregressive para-
meter in (5)--are constrained in RDFOR to be equal, or to vanish, across
arbitrary groups of regions. In the residential sector, for example, the
coefficients in (1) are constrained to be equal on the following "super-regions"
{1,2}, {3}, {4}, {5,6,7,8,9,10}
This was for total residential energy use. By way of comparison, in the
corresponding equation for residential use of electricity, the super-regionsare
{1,2}, {3}, {4}, {5}, {6,7}, {8}, {9,10}
So RDFOR considers that regions 5 through 10 behave the same when it comes
to total residential energy use, but differently when it comes to turning on
the electricity!
This crucial fact is not stated in the documentation--the SYNERGY reportsby Parhizgari. Likewise, from the documentation, it is impossible to tell
whether the three-period moving average is applied to income, income per
capita, log income, or log income per capita. I believe it is applied to
income per capita. The functional form of the industrial demand equationis not specified in the documentation.
100
At the risk of anticlimax, in the equation for total commercial energyuse, the coefficients are constrained to be equal across all ten regions.But when it comes to commercial use of electricity, different super-regionsare used for different variables. For instances, regions 9 and 10 arerequired to show the same response to price changes, but are also requiredto show different responses to income changes: the coefficient for income is
constrained to vanish in region 9, but not in region 10.^ The RDFOR documen-tation does not even make these constraints explicit, let alone justify them.
Once the specification is completed, i.e., the linear constraints onthe coefficients have been imposed, the system is estimated with the regressionpackage TSP (Time Series Processor). This uses the Cochran-Orcutt methodto handle the autoregression, and Zellner's method to handle the inter-regional covariances. These are both iterative procedures of the "generalizedleast squares" type. In effect, each equation in (1) is fitted separatelyby ordinary least squares. Then the residuals are examined, to estimatethe autoregressi ve parameters and the inter-regional covariances in (5). Thenthe data are transformed to remove the estimated autoregressions and covariancesand to equalize the variances. The transformed dataareused to re-estimatethe equation and the revised results are used to re-estimate the autoregressionand covariances. The process is repeated until some standard of convergencehas been met.
The equation system was estimated using data contained in the FEDS
(Federal Energy Data System) data base. This source contains most of the
annual data required by the model for the period 1960-1977. The fittingperiod, however, runs from 1962-1977: two years of data are lost due to the
lags.
3.3 Forecasting with RDFOR
The forecasted 1990 demand surface used in MEFS has constant elasticity,
so it can be defined by specifying one point on it, together with a matrixof elasticities. The specified point is of the form (Q,P), where Q is a
vector of quantities, and P a vector of prices. The P is simply the
vector of 1990 prices determined by the last MEFS run on a comparable scenario.
The Q is the forecasted vector of fuel quantities to be demanded in 1990
at prices P, computed from the RDFOR demand equations like (1) above.
Of course, to implement this idea it is necessary to forecast the exo-
genous variables in the demand equations, for every year between the present
and 1990. For prices, this is done by a linear interpolation between the
This discussion applies to the 1977 version; in 1978, quite a different
pattern of constraints was imposed!
The RDFOR documentation does not define its variables in terms of FEDS
variables. In fact, it does not even specify FEDS as the data source.
101
current (e.g., 1977) prices and the 1990 prices P described above. Thisinterpolation defines the "price path". Some of the other exogenous variablesin the demand equations (1), like population and income, are projected into
2the future by other agencies: the Census Bureau for population, Data Resources
3 4Incorporated for income. The variables describing the weather are droppedfrom the demand equation (1). The intercepts a^ in (1) are now quite a bit
off, but they are discarded and replaced by new estimates deirived from"benchmarking": in effect, the intercepts of the demand equations are adjustedso that, for the latest year in which data are available, energy consumption
5in that year estimated from the equations matches the data exactly.
The modified demand equations can then be iterated out to 1990, alongthe price-path and the trajectory of forecasts for the other exogenous variablesiteration is needed due to the presence of the lagged variable q^^ ^
on
the right hand side of (1). The resulting projection Q of quantitiesdemanded in 1990, and the assumed 1990 prices P, define the (Q,P)-point on
the 1990 demand surface, and hence the position of that surface. In someruns, the position of the 1990 demand surface is changed by EIA forecasters.These adjustments are called "demand offsets" and are used to model the
replacement of traditional fuels by solar and geothermal sources of energyand, as the documentation says, the "exogenous reduction in the underlyingenergy demand that results from. . .conservation initiatives." This completesan overview of the procedure used to fix one point on the forecasted demandsurface for 1990.
The next topic is the procedure used to define the shape of the demandsurface: namely, its matrix of elasticities. The modified demand equationsdescribed above do have a constant matrix of own- and cross-price elasticities:constant over time, as well as over prices. However, this "short-run"matrix is not the one used in MEFS. Instead, RDFOR computes a matrix of
"long-run" elasticities. These are constant over prices, but interestinglyenough, they are time-dependent. Their computation will now be explained.
This is the description in the documentation. However, EIA personnel
inform me that the interpolation is log linear.
Consumption is modelled per capita , as in equation (2).I
'The Data Resources forecast is national. It is shared down to regions using
1974 shares derived from Bureau of Economic Analysis data. Thus, MEFScannot predict changes in regional income shares, or relate such changes to
energy variables.
The count of gas service customers is dropped from the sharing equations,
and the autoregression in (5) is also dropped. Dropping variables, of
course, may introduce a substantial bias into the forecasts.
'The consumption data for the current year is "adjusted" to be what it would
have been if the weather had been average. Even without this wrinkle, esti-
mating the intercept from one data point is bound to cause large variances
in the forecasts.
102
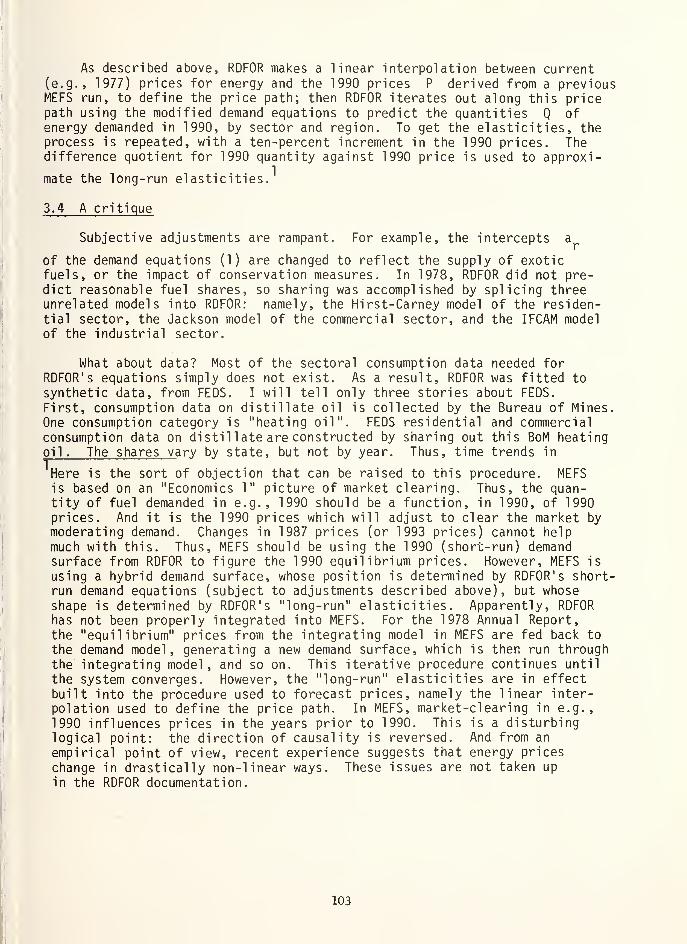
As described above, RDFOR makes a linear interpolation between current(e.g., 1977) prices for energy and the 1990 prices P derived from a previousMEFS run, to define the price path; then RDFOR iterates out along this pricepath using the modified demand equations to predict the quantities Q ofenergy demanded in 1990, by sector and region. To get the elasticities, theprocess is repeated, with a ten-percent increment in the 1990 prices. Thedifference quotient for 1990 quantity against 1990 price is used to approxi-
mate the long-run elasticities.^
3.4 A critique
Subjective adjustments are rampant. For example, the intercepts a^
of the demand equations (1) are changed to reflect the supply of exoticfuels, or the impact of conservation measures. In 1978, RDFOR did not pre-dict reasonable fuel shares, so sharing was accomplished by splicing threeunrelated models into RDFOR: namely, the Hirst-Carney model of the residen-tial sector, the Jackson model of the commercial sector, and the IFCAM modelof the industrial sector.
What about data? Most of the sectoral consumption data needed forRDFOR' s equations simply does not exist. As a result, RDFOR was fitted to
synthetic data, from FEDS. I will tell only three stories about FEDS.
First, consumption data on distillate oil is collected by the Bureau of Mines.
One consumption category is "heating oil". FEDS residential and commercialconsumption data on distillate are constructed by sharing out this BoM heatingoil . The shares va ry by state, but not by year. Thus, time trends in
^Here is the sort of objection that can be raised to this procedure. MEFSis based on an "Economics 1" picture of market clearing. Thus, the quan-tity of fuel demanded in e.g., 1990 should be a function, in 1990, of 1990prices. And it is the 1990 prices which will adjust to clear the market bymoderating demand. Changes in 1987 prices (or 1993 prices) cannot helpmuch with this. Thus, MEFS should be using the 1990 (short-run) demandsurface from RDFOR to figure the 1990 equilibrium prices. However, MEFS is
using a hybrid demand surface, whose position is determined by RDFOR 's short-run demand equations (subject to adjustments described above), but whoseshape is determined by RDFOR's "long-run" elasticities. Apparently, RDFORhas not been properly integrated into MEFS. For the 1978 Annual Report,the "equilibrium" prices from the integrating model in MEFS are fed back to
the demand model, generating a new demand surface, which is then run throughthe integrating model, and so on. This iterative procedure continues until
the system converges. However, the "long-run" elasticities are in effectbuilt into the procedure used to forecast prices, namely the linear inter-polation used to define the price path. In MEFS, market-clearing in e.g.,
1990 influences prices in the years prior to 1990. This is a disturbinglogical point: the direction of causality is reversed. And from an
empirical point of view, recent experience suggests that energy prices
change in drastically non-linear ways. These issues are not taken up
in the RDFOR documentation.
103

sectoral shares--surely of considerable policy interest--do not appear in thedata. Separate price elasticities are estimated in the residential andcommercial demand equations for distillate. Clearly, however, the datadoes not support such an endeavor.
Second: FEDS consumption data on electricity are derived from the EdisonElectric Institute. But Edison Electric reports "commercial and industrial"use together, in the aggregate only. Within this category, consumption is
broken out separately for "large" and "small" users, although the break-pointis undefined. FEDS takes the "large" users for its industrial consumers ofelectricity, and the "small" ones as its commercial consumers. Apparently,when Macy's turns on the lights, it goes into FEDS as an industrial concern.
The third example is on price data: specifically, the price of liquifiedgas. The data source is Piatt's Oilmanac , which collects price quotes in
only 11 cities. FEDS gives a price for each of the 50 states. How is thisdone? The idea is to surround each state, to the extent possible, by somesubset of the 11 cities with price quotes. Then the average over the subsetis imputed to the state.
I turn now from data to the logic of the model itself--the equations.These equations are not derived from economic theory, or from a detailedknowledge of the fine structure of the energy market. They represent a setof simplifying assumptions, needed to get on with the job of estimating andforecasting. So we have to ask whether these assumptions are reasonable,and what their implications are for the forecasts.
One key hypothesis in equation (1) is that price elasticities areconstant. This may be a reasonable first-cut description of the energy marketduring RDFOR's fitting period (1962-77). But as the economy moves from a
period of energy abundance to a period of energy scarcity, this hypothesismakes less and less sense. As the cost-share of energy goes up, its priceelasticity should change. A forecasting procedure which assumes constantelasticity is likely to be too pessimistic about the possibilities of sub-stituting capital, labor, and technology for energy. The technical assump-tion of constant elasticity is exerting an influence on the forecasts, andthis influence gets stronger as the scenarios diverge from the circumstanceswhich obtained during the fitting period.
Another assumption embedded in equation (1): in the industrial sector,the dependent variable is quantity demanded per dollar of value added, whichresponds only to prices and the weather. In particular, with prices and the
weather held constant, the demand for energy is independent of the industrialmix. Again, this may be a reasonable first-cut description of the energymarket during the fitting period. But as a statement about the future it is
unrealistic, since energy is so widely used as a factor of production. A
substantial change in the price of energy will sharply disturb the entirestructure of relative factor prices. Some products take relatively little
energy to manufacture, while others require relatively large amounts. If
the relative price of energy goes up, U.S. industry should be substituting
energy-efficient products for energy-inefficient ones: in other countries
104
this already seems to have happened. The equations do not contemplate suchsubstitutions, and this make make RDFOR too pessimistic about the impact ofrising energy prices on the economy, just as the assumption of constant
elasticity did J
I will bypass some aspects of the specification, like the arbitrariness2
of the inter-regional constraints, or the crudeness of the assumptions about3
the stochastic disturbance terms. However, some of the fine structure doescall out for attention. For example, why does equation (1) use a divisiaindex for quantity and price, rather than total btu's and btu-weightedaverage price? Why have lagged weather variables, and three-period movingaverages of income? In the nature of things, these questions are unanswerable;the hope is that such choices do not matter. However, in RDFOR they seem to
matter a lot. In preliminary experiments with RDFOR-like equations, droppingthe lagged income and weather variables tripled the estimated long-runown-price elasticity. These equations were fitted using btu-totals forquantities, and btu-weighted averages on prices. Moving to divisia indices
tripled the elasticity again. Technical assumptions matter.
Over the fitting period, Q/V and P show little inter-temporal variation,except for the post-embargo run-up in prices. There is cross-sectionalvariation, but this is confounded with the effect of omitted variables.After all, the ten DoE regions differ among themselves in important waysother than energy prices and the weather. The mix of industries differsfrom region to region, influencing efficiency--Q/V on the left hand side of
equation (1). The industrial mix also affects the distribution of thedemand for energy among different fuels--and hence the price index P on theright hand side, for this represents an average over the different fuel
types. The coefficients in RDFOR' s industrial demand equation are heavilyinfluenced by the cross-sectional variation in the mix of industries. Thisequation is therefore not a reliable guide to the behavior of these regionsover time, in response to exogenous price changes.
For example, in the industrial total demand equation, the coefficients are
constrained to be equal across all ten DoE regions. Since the industrialmix is so different from region to region, this constraint violateseconomic common sense.
'correlations are allowed across regions, but not across fuels or sectors.
This is rationalized on the basis of "measurement error" in the data. But
the imputations used to create FEDS are unlikely to correlate errors acrossregions; they are very likely to correlate errors across sectors. If theerrors are correlated across sectors or fuels, the coefficient estimates in
RDFOR may be compromised. Likewise, any remaining autocorrelation in the
w^^ of equation (5) will become entangled with the lagged dependent variable
in equation (1), and bias may result in the estimated speed of adjustment.
^For some discussion of the impact of choice of indices, see the papers by
Hausman or Nguyen-Barnes.
105
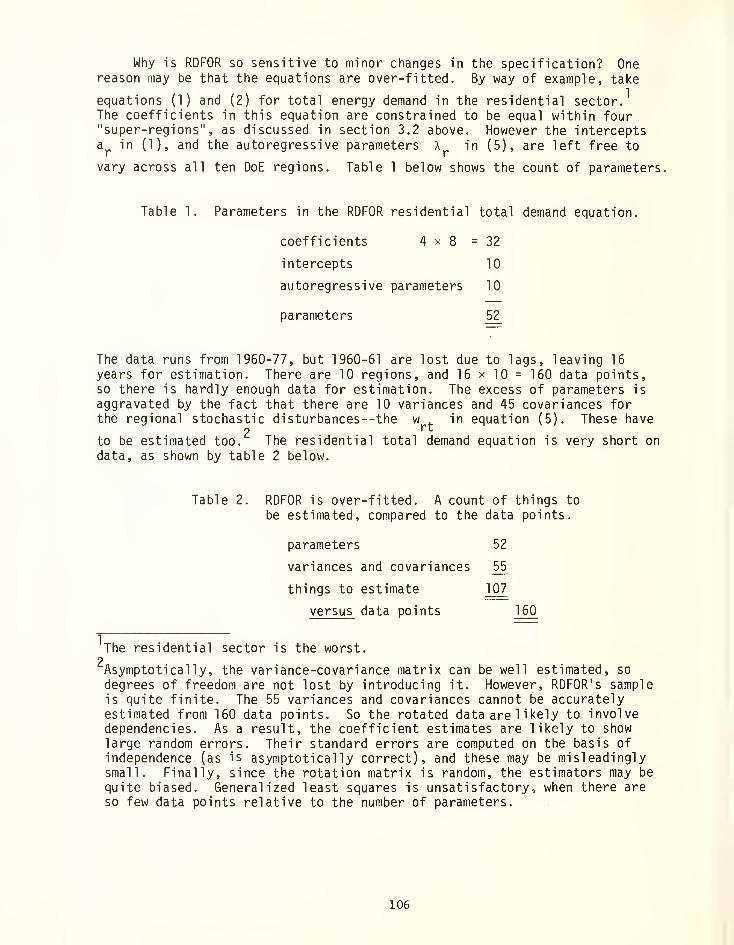
Why is RDFOR so sensitive to minor changes in the specification? Onereason may be that the equations are over-fitted. By way of example, take
equations (1) and (2) for total energy demand in the residential sector
J
The coefficients in this equation are constrained to be equal within four"super-regions", as discussed in section 3,2 above. However the interceptsa^ in (1), and the autoregressi ve parameters \^ in (5), are left free to
vary across all ten DoE regions. Table 1 below shows the count of parameters.
Table 1. Parameters in the RDFOR residential total demand equation.
coefficients 4x8 =32
intercepts 10
autoregressi ve parameters 10
parameters 52
The data runs from 1960-77, but 1960-61 are lost due to lags, leaving 16
years for estimation. There are 10 regions, and 16 x 10 = 160 data points,so there is hardly enough data for estimation. The excess of parameters is
aggravated by the fact that there are 10 variances and 45 covariances forthe regional stochastic disturbances--the w . in equation (5). These have
o rtto be estimated too. The residential total demand equation is very short on
data, as shown by table 2 below.
Table 2. RDFOR is over-fitted. A count of things to
be estimated, compared to the data points.
parameters 52
variances and covariances 55^
things to estimate 107
versus data points 1 60
The residential sector is the worst.I
Asymptotically, the variance-covariance matrix can be well estimated, so
degrees of freedom are not lost by introducing it. However, RDFOR' s sampleis quite finite. The 55 variances and covariances cannot be accuratelyestimated from 160 data points. So the rotated data are 1 ikely to involvedependencies. As a result, the coefficient estimates are likely to showlarge random errors. Their standard errors are computed on the basis ofindependence (as is asymptotically correct), and these may be misleadinglysmall. Finally, since the rotation matrix is random, the estimators may be
quite biased. Generalized least squares is unsatisfactory, when there areso few data points relative to the number of parameters.
106
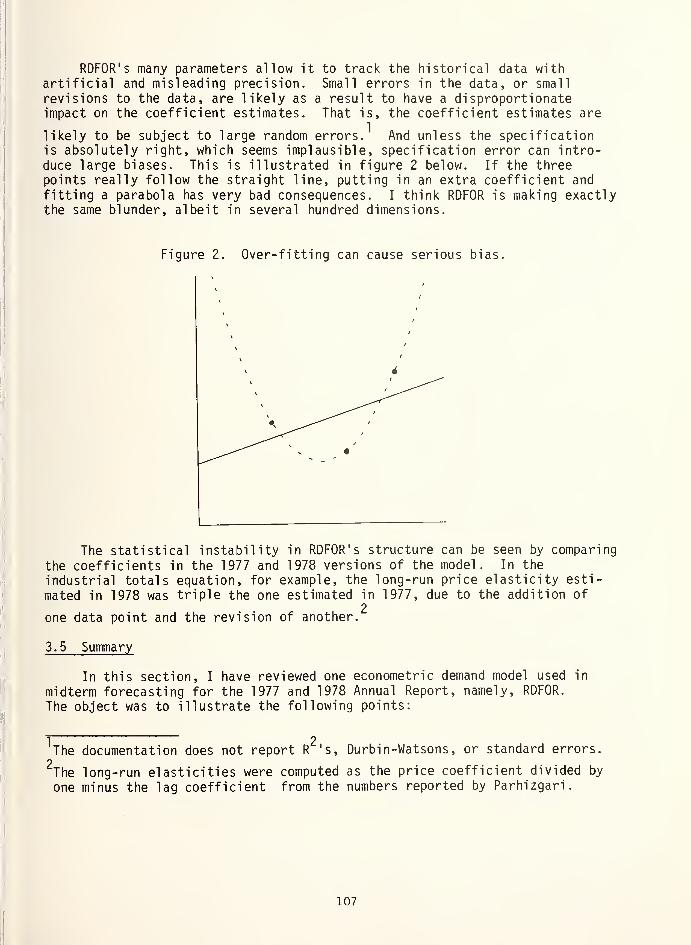
RDFOR's many parameters allow it to track the historical data withartificial and misleading precision. Small errors in the data, or small
revisions to the data, are likely as a result to have a disproportionateimpact on the coefficient estimates. That is, the coefficient estimates are
likely to be subject to large random errors.^ And unless the specificationis absolutely right, which seems implausible, specification error can intro-duce large biases. This is illustrated in figure 2 below. If the threepoints really follow the straight line, putting in an extra coefficient and
fitting a parabola has very bad consequences. I think RDFOR is making exactlythe same blunder, albeit in several hundred dimensions.
Figure 2. Over-fitting can cause serious bias.
The statistical instability in RDFOR's structure can be seen by comparing
the coefficients in the 1977 and 1978 versions of the model. In the
industrial totals equation, for example, the long-run price elasticity esti-
mated in 1978 was triple the one estimated in 1977, due to the addition of2
one data point and the revision of another.
3.5 Summary
In this section, I have reviewed one econometric demand model used in
midterm forecasting for the 1977 and 1978 Annual Report, namely, RDFOR.
The object was to illustrate the following points:
The documentation does not report R 's, Durbin-Watsons , or standard errors.I
The long-run elasticities were computed as the price coefficient divided by
one minus the lag coefficient from the numbers reported by Parhizgari.
107

• The documentation is quite inadequate.
® Many subjective elements go into the forecasts.
• The data are largely synthetic and the imputations questionable.
• The model embodies many somewhat arbitrary technical assumptions,which may have a lot of leverage on the forecasts.
• The fitting procedure is not well justified.
4. Some empirical evidence
So far, I have not addressed the question of whether the models mightwork, despite their shortcomings. For energy models, I have no empiricalevidence to offer, one way or the other. However, I can speak about demogra-phic projections and economic forecasting. Something can be learnedfrom experience in these other fields.
To begin with demographics, recent work by Keyfitz and Stoto indicatesthat:
• Complicated population models do no better at forecasting thensimple ones.
• No models forecast well.
For example, take the Census "median" projections for the U.S. populationover the period 1945-1975. The root-mean-square error in the forecasted
growth rates is about 5 per 1,000 per year.^ Over the same period of time,the observed annual growth rates ranged from a low of 7 per 1,000 to a high
of 19 per 1,000. As a result, a confidence interval for the forecasts ofpi us-or-minus one r.m.s. error is comparable in length to the entire range of
2historical experience for the period. Clearly, population forecasting is a
hazardous experience. Keyfitz gives only the following advice: quote a
68%-confidence interval around the forecast, a 95%-interval will be toodiscouraging.
The record in economic forecasting is difficult to read. There are
many models, each forecasting numerous variables, over different time hori-zons. There are various measures of accuracy, and several conventions for
handling data revisions. However, McNees (1980) offers a useful comparisonof the accuracy of forecasts made by the groups at Chase, Data Resources
3Incorporated, General Electric, and Wharton over the period 1970-79.
The look-ahead period ranges from 5 to 30 years. In e.g., 1945 we have
forecasts for 1950, 1955, 1960, 1965, 1970, and 1975. In 1970, only the
forecast for 1975 is used.I
The record for other forecasting agencies and other countries is verysimilar. The results do not seem to depend much on the look-ahead period.
'General Electric does not use a simultaneous-equation model. This groupuses some identities, some econometric equations, and a lot of intuition.
Such mixed forecasting systems will be discussed again below.
108
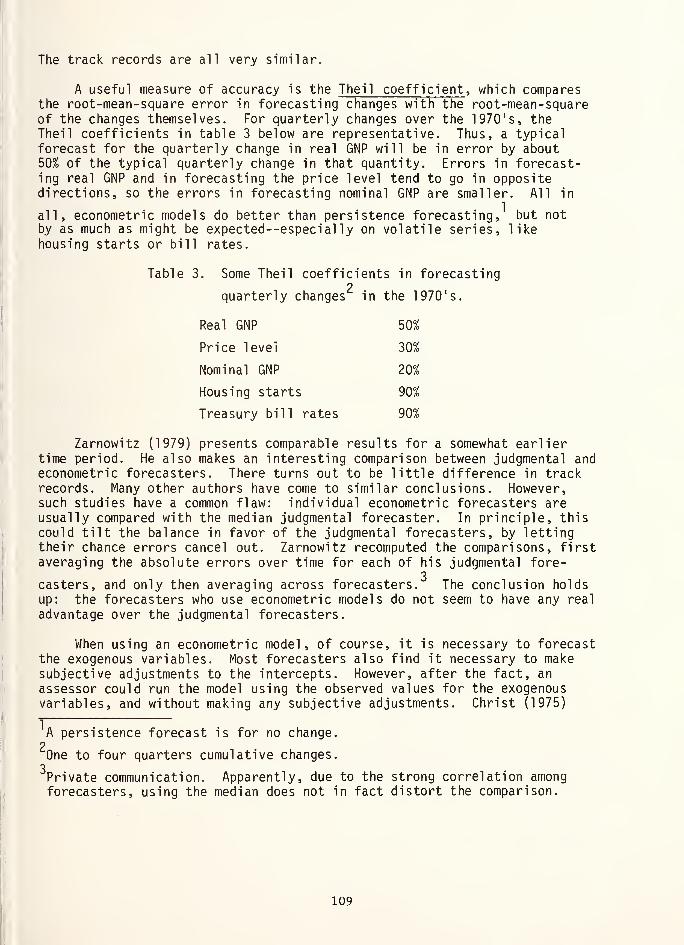
The track records are all very similar.
A useful measure of accuracy is the Theil coefficient , which comparesthe root-mean-square error in forecasting changes with the root-mean-squareof the changes themselves. For quarterly changes over the 1970's, theTheil coefficients in table 3 below are representative. Thus, a typicalforecast for the quarterly change in real GNP will be in error by about50% of the typical quarterly change in that quantity. Errors in forecast-ing real GNP and in forecasting the price level tend to go in oppositedirections, so the errors in forecasting nominal GNP are smaller. All in
all, econometric models do better than persistence forecasting,^ but notby as much as might be expected--especial ly on volatile series, likehousing starts or bill rates.
Table 3. Some Theil coefficients in forecasting2
quarterly changes in the 1970's.
Real GNP 50%
Price level - 30%
Nominal GNP 20%
Housing starts 90%
Treasury bill rates 90%
Zarnowitz (1979) presents comparable results for a somewhat earliertime period. He also makes an interesting comparison between judgmental andeconometric forecasters. There turns out to be little difference in trackrecords. Many other authors have come to similar conclusions. However,such studies have a common flaw: individual econometric forecasters areusually compared with the median judgmental forecaster. In principle, thiscould tilt the balance in favor of the judgmental forecasters, by lettingtheir chance errors cancel out. Zarnowitz recomputed the comparisons, firstaveraging the absolute errors over time for each of his judgmental fore-
3casters, and only then averaging across forecasters. The conclusion holds
up: the forecasters who use econometric models do not seem to have any real
advantage over the judgmental forecasters.
When using an econometric model, of course, it is necessary to forecastthe exogenous variables. Most forecasters also find it necessary to makesubjective adjustments to the intercepts. However, after the fact, an
assessor could run the model using the observed values for the exogenousvariables, and without making any subjective adjustments. Christ (1975)
A persistence forecast is for no change.
One to four quarters cumulative changes.
'Private communication. Apparently, due to the strong correlation amongforecasters, using the median does not in fact distort the comparison.
109
reports that this can easily triple the average size of the errors. Now a
model Is useful in policy analysis only if we believe it captures some eco-nomic structure, so the equations describe stable relationships among thevariables of interest. To assess such a claim, it is the forecasts madewith the observed values of the exogenous variables, and without the sub-jective adjustments, which seem relevant. Christ's results suggest thatsomeone can make quite good forecasts based on econometric model, withoutestablishing much of a case for its usefulness in policy analysis.
Even if the absolute predictions are quite inaccurate, it is oftenargued that a model may be useful in policy analysis, for comparing scenarios.What matters is not the absolute predictions, but relative comparisons.
Christ reports the results of policy simulations, using several modelswhose absolute predictions agreed closely among themselves and were in rea-sonable agreement with the data. Impact multipl iers--relative comparisons--for fiscal and monetary policy were computed from the different models and
showed little agreement.^ As Christ says,
...Though the models forecast well over horizons of four to sixquarters, they disagree so strongly about the effects of importantmonetary and fiscal policies that they cannot be considered reliableguides to such policy effects, until it can be determined which ofthem are wrong in this respect, and which (if any) are right.
Finally, I report two provocative conclusions from Ascher (1978):
• Econometric forecasts have not been improving over time.
• There is no systematic advantage to big models, or to little ones,in forecasting accuracy.
5. Recommendations
• More effort should be invested in the collection of data for analyticalpurposes: part of the task here is to decide what kind of data are
needed.
• More effort should be invested in quality control and in documentation.
• Forecasts should be made in much less detail.
• Simpler, more robust, and more stable forecasting technologiesshould be developed.
I make these suggestions in the belief that many questions do not haveanswers, and that all concerned would do well to recognize this. EIA mayeven have a responsibility to educate its clientele on this score. Further-more, I think that there is of necessity a large subjective component in any
forecasting exercise. Frank recognition of these facts may enable EIA to
In part, this is due to the arbitrariness of the identifying restrictions;see Lucas and Sargent (1979).
110

dispense with a lot of complexity, allowing judgment to be brought to bearopenly and directly on the important issues. This could enhance the credi-bility of the forecasts--and might improve their accuracy.
I will now sketch three alternatives to forecasting with big models,each based on a different view of the statistical realities, and then makea general comment.
Statistical engineering . On this view, there are no stable structuralrelationships among the economic quantities of interest. However, there maybe fairly stable empirical correlations which could be discovered and usedfor forecasting. The regression equation is just a smooth estimate for someconditional expectation and is not a structural relationship: thus, policyanalysis by regression equations is not feasible.
Constrained econometrics . The premise is that a stable economic struc-ture underlies the data, but there aren ' t enough data to estimate this struc-ture. There are too many goods, prices, and regions, and not enough years.The solution is to constrain some of the key elasticities to a priori valuesor intervals and make the estimates subject to these constraints.
Mixed forecasting . The idea here is to use judgment, guided by observedempirical regularities and a priori knowledge, to forecast the main aggre-gates. If necessary, such forecasts could then be shared out (e.g., to
regions) by some mechanical regression procedure. An eminent Governmentstatistician of my acquaintance has recently proposed the concept of"ignorance-oriented modelling". The terminology is pretty awful, but I
think the idea is a good one. Basically, it is to identify the major uncer-tain factors affecting the forecast which is made in some simple and explicitway depending on these factors. The uncertainty can then be traced throughto the final result. His kind of projection is one example of the sort of
technique I have in mind.
Here is another example. When I worked at the Bank of Canada in 1970,they had a very good judgmental forecaster. used the traditional smoke-filled-room method to forecast the main aggregates. But then, he would runthe numbers through a computer program. This program did the routine arith-metic, verified the accounting identities, and checked on the plausibilityof some key relationships among the aggregates: for instance, the savingsratio had to fall in some reasonable range and so did labor productivity.If the numbers didn't balance, they went back to the smoke-filled roomfor repairs. This system seemed to me to have many of the desirable featuresclaimed for econometric models: the numbers had to add up and be consistent
with the past.^
Still another mixed forecasting system is the one used by General Electric.As discussed above, these forecasts are quite comparable in accuracy to the
ones from large models at Chase, Data Resources and Wharton.
Ill

A general comment . The three approaches sketched above are quitedifferent, but do have one thing in common: they would be far simpler touse than the present forecasting technology. This seems to me to bring real
advantages. Using a simpler forecasting technology would free up resourcesfor collection of data relevant to modelling, for quality control, and fordocumentation. It might even give EIA analysts some time to do analysis in-
between the annual convulsions over the report to Congress.
112
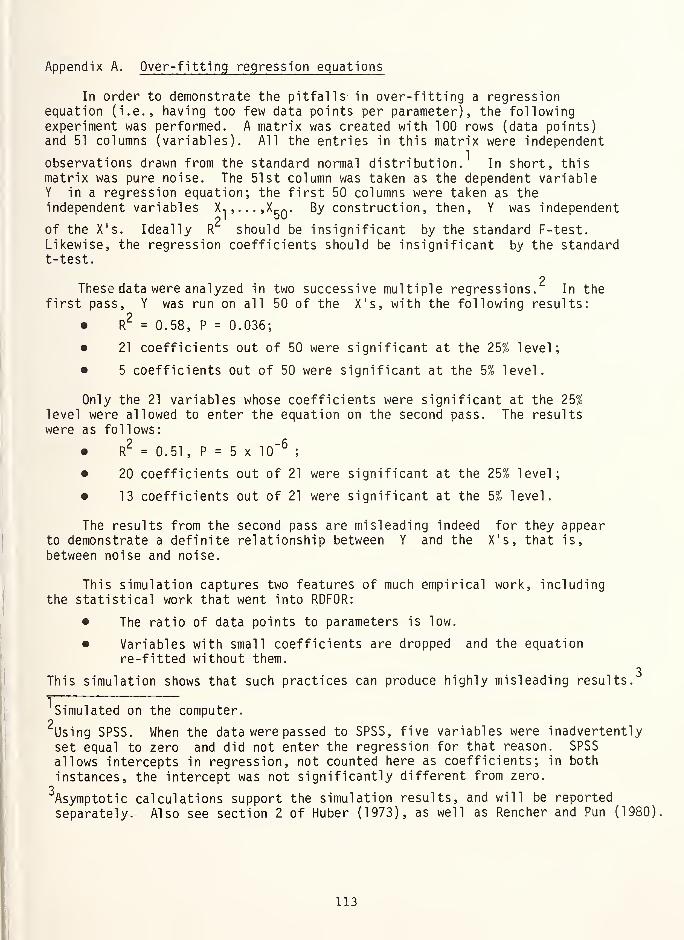
Appendix A. Over-fitting regression equations
In order to demonstrate the pitfalls in over-fitting a regressionequation (i.e., having too few data points per parameter), the followingexperiment was performed. A matrix was created with 100 rows (data points)and 51 columns (variables). All the entries in this matrix were independent
observations drawn from the standard normal distribution.^ In short, thismatrix was pure noise. The 51st column was taken as the dependent variableY in a regression equation; the first 50 columns were taken as theindependent variables X^,...,XgQ. By construction, then, Y was independent
of the X's. Ideally should be insignificant by the standard F-test.Likewise, the regression coefficients should be insignificant by the standardt-test.
2These data were analyzed in two successive multiple regressions. In the
first pass, Y was run on all 50 of the X's, with the following results:
• = 0.58, P = 0.036;
• 21 coefficients out of 50 were significant at the 25% level;
• 5 coefficients out of 50 were significant at the 5% level.
Only the 21 variables whose coefficients were significant at the 25%level were allowed to enter the equation on the second pass. The resultswere as follows:
• R^ = 0.51 , P = 5 X 10"^;
• 20 coefficients out of 21 were significant at the 25% level;
• 13 coefficients out of 21 were significant at the 5% level.
The results from the second pass are misleading indeed for they appearto demonstrate a definite relationship between Y and the X's, that is,
between noise and noise.
This simulation captures two features of much empirical work, includingthe statistical work that went into RDFOR:
The ratio of data points to parameters is low.
• Variables with small coefficients are dropped and the equationre-fitted without them.
This simulation shows that such practices can produce highly misleading results,3
Simulated on the computer.2Using SPSS. When the data were passed to SPSS, five variables were inadvertently
set equal to zero and did not enter the regression for that reason. SPSS
allows intercepts in regression, not counted here as coefficients; in both
instances, the intercept was not significantly different from zero.3Asymptotic calculations support the simulation results, and will be reported
separately. Also see section 2 of Huber (1973), as well as Rencher and Pun (1980)
113
References
J. S. Armstrong (1978a). Forecasting with econometric models: folkloreversus facts. Journal of Business , Vol. 51, pp. 549-600.
J. S. Armstrong (1978b). Long-range Forecasting: From Crystal Ball toComputer . Wiley, New York.
W. Ascher (1978). Forecasting: An Appraisal for Policy-makers and Planners .
Johns Hopkins, Baltimore.
C. Christ (1975). Judging the performance of econometric models of theU.S. economy. International Economic Review , Vol. 16, pp. 54-74.
R. Fair (1979a). An analysis of the accuracy of four macroeconometricmodels. Cowles Foundation Discussion Paper, to appear in the Journalof Political Economy .
R. Fair (1979b). Estimating the expected predictive accuracy of econometricmodels. Cowles Foundation Discussion Paper, to appear in theInternational Economic Review .
D. Freedman (1979). An assessment of the READ model. Validation andAssessment Iss ues of Energy Models^ National Bureau of Standardsspecial publication 569, ed. by Saul Gass.
D. Freedman (1980). On uncertainties in model forecasts. Technical report,Lawrence Berkeley Laboratory. In progress.
D. Freedman, T. Rothenberg and R. Sutch (1980a). An assessment of the
Federal Energy Data System. Technical report, Lawrence BerkeleyLaboratory.
D. Freedman, T. Rothenberg and R. Sutch (1980b). The demand for energy in
the year 1990: An assessment of the Regional Demand Forecasting model.Technical report, Lawrence Berkeley Laboratory.
A. Goldberger, A. L. Nagar, and H. S. Odeh (1961). The covariance matricesof reduced-form coefficients and of forecasts for a structural econo-
metric model. Econometrica , Vol. 29, pp. 556-573.
J. Hausman (1975). Project Independence Report: An appraisal of U.S.
energy needs up to 1985. Bell Journal of Economics , Vol. 6, pp. 517-551.
P. Ruber (1973). Robust regression: asymptotics, conjectures, and Monte
Carlo, Annals of Statistics, Vol. 1, No. 5, pp. 799-821, especiallysection 2.
D. Kahnemann and, A. Tversky (1974). Judgment under uncertainty: heuristics
and bias. Science , Vol. 185, pp. 1124-1131.
E. Kuh and J. Neese (1979). Parameter sensitivity and model reliability.
Technical report. Center for Computational Research in Economics and
Management Science, M.I.T.
1J.4

E. Kuh and R. E. Welsch (1979). Econometric models and their assessmentfor policy. Validation and Assessment Issues of Energy Models
,
National Bureau of Standards special publication 569, ed. by Saul Gass.
W. Leontieff (1971). Theoretical assumptions and nonobserved facts.American Economic Review , Vol. 61, pp. 1-7.
R. E. Lucas and T. J. Sargent (1979), After Keynesian Macroeconomics,Federal Reserve Bank of Minneapolis, Quarterly Review, Spring.
S. Makridakis and M. Hibon (1979). Accuracy of forecasting: an empiricalinvestigation. JRSS Ser. A , Vol. 142, pp. 97-145.
S. McNees (1973). The predictive accuracy of econometric forecasts. NewEngland Economic Review , Federal Reserve Bank of Boston.
S. McNees (1974). How accurate are economic forecasts? New England EconomicReview , Federal Reserve Bank of Boston.
S. McNees (1975). An evaluation of economic forecasts. New England EconomicReview , Federal Reserve Bank of Boston.
S. McNees (1977). An assessment of the Council of Economic Advisers'Forecasts of 1977. New England Economic Review , Federal Reserve Bankof Boston.
S. McNees (1979). The forecasting record for the 1970's. New EnglandEconomic Review , Federal Reserve Bank of Boston.
J. Mincer, ed. (1969). Economic Forecasts and Expectations . NBER, ColumbiaUniversity Press, New York.
0. Morgenstern (1963). On the Accuracy of Economic Observations . 2nd ed.
Princeton University Press, Princeton.
L. E. Moses (1980). One statistician's observations concerning energy
model 1 ing.
H. D. Nguyen and R. W, Barnes (1979). An evaluation of the Midrange EnergyForecasting System. Oak Ridge National Laboratory, EIA/DOE ContractNo. W-7405-ENG-26.
A. Parhizgari (1978a). Final documentation report on the Regional Demand
Forecasting Model 1977 and 1978 versions. SYNERGY, Washington, DOE
Contract No. EC-77-C-01 -8560.
A. Parhizgari (1978b). Final report: Regional Demand Forecasting and
Simulation Model User's Manual. SYNERGY, Washington, DOE Contract
No. EC-77-C-01-8560.
A. Parghizgari (1979). Draft documentation report on the Demand Analysis
System. SYNERGY, Washington, DOE Contract No. EC-78-C-01 -8560 M0D(20).
2A. C. Rencher and F.C. Pun (1980). Inflation of R in Best Subset Regression,
Technometrics, Vol. 22, No. 1, pp. 49-53.
115

H. 0. Stekler (1970). Economic Forecasting . Praeger, New York.
V. and J. Su (1975). An evaluation of ASA/NBER Business Outlook SurveyForecasts. Explorations in Economic Research , Vol. 2, pp. 588-618.
V. Zarnowitz (1979). An analysis of annual and multiperiod quarterly forecasts of aggregate income, output, and the price level. Journal ofBusiness , Vol. 52, pp. 1-34.
116
MODEL CREDIBILITY: HOW MUCH DOES IT DEPEtJD
UPON DATA QUALITY?
C. PvOger GlasseyHarvey J. Greenberg
Energy Information AdministrationDepartment of EnergyWashington, D.C.
Credibility, like beauty, is in the eye or perhaps the mind of thebeholder. Credibility depends upon many things, and data quality is
only one of them. Furthermore, the credibility of a model is somethingthat does not exist in an absolute sense, but rather within the contextof the particular use to which the model ^s being put. For example, thesimple model that says x(t)=x(0) - 1/2 gt is quite credible for describ-ing the trajectory of a cannonball dropped by Galileo from the LeaningTower of Pisa. However, it is not a good model for the trajectory of a
goose feather because it neglects the effects of air friction. We shouldfocus our attention not on the question of credibility of models, but onthe question of the credibility of analytical results. A model is merelythat part of an analysis that has been captured in the form of a computerprogram, usually because it is repetitive and algorithmic.
The credibility of analysis results seem to be a prerequisite fortheir use in a decision-making process. It seems to us that an analysisis credible if one of three conditions hold: (1) we agree with the con-clusions; (2) the analysis is accompanied by a simple, logical explana-tion that uses a credible behavioral theory; and (3) we understand whatassumptions and data were used in the analysis and the process by whichthey were manipulated to derive the conclusions—furthermore, we believethat the assumptions are plausible and the data are of sufficiently highquality for the purpose. This last condition, you notice, is full of
qualitative statements. For example, how well do we need to understandthe methodology of the analysis? Do we need to understand it well enoughso we can replicate it? How plausible is plausible enough for the assump-tions? How accurate is accurate enough for the data? The less disposedwe are a priori to accept the conclusions of the analysis, the morestringent will be our standards in answering each of these questions.
All model users hope that there is more correspondence between the
model and the real world system of interest. However, in not all modelsis this correspondence equally strong. At the strongest end of the spec-trum are the models that are mathematical representations of the naturallaw. For example, the system of differential equations that is used to
calculate space vehicle trajectories has great predictive power and restsupon theory that has been developed over centuries of careful observation,experimentation, and testing. These models are sufficiently credible for
decision-making purposes that vast sums of money and many human lives are.
entrusted to the accuracy of their results.
117

There are weaker models that claim to be only crude approximationsto a small number of allegedly significant features of a complex system.Log-linear models for energy demand as a function of income and price,for example, fall into this category. Such models do not claim to repre-sent natural law; they merely rest upon two apparently plausible assump-tions: (1) if the price of a good increases, people will tend to buyless of it, other things being equal, and (2) if people have more money,other things being equal, they will tend to spend more. There is, how-ever, as far as we know, neither empirical nor theoretical justificationfor the particular form of the equations used. It is as much a matterof convenience as anything else.
At the weakest end of the spectrum are models that are used primari-ly to maintain internal consistency in the process of scenario building.The simple accounting structure used in the Short-Term Integrated Forecasting System comes to mind. By forcing both historical data and projectionssome of which are essentially subjective assumptions, into this account-ing framework, we can at least guarantee that consumption equals net pro-duction plus imports minus stock change. We go to this trouble inspiredby the belief that an internally consistent set of forecasts is morecredible than a collection of inconsistent forecasts.
All of this discussion is to suggest that there are several sourcesof uncertainty in model output. For the weaker models, it may be thatuncertainty about model structure, uncertainty about the effects of the
omitted variables, may be the dominant source of output uncertainty, andthe data uncertainties are relatively unimportant. When the models arebased on scientific law, the accuracy of the output depends largely uponthe accuracy with which the coefficients of the model can be estimated.That is to say, the data uncertainties then dominant the uncertaintiesin the model output.
We have all used, or at least heard, the expression "garbage-in-garbage-out (GIGO)." Generally, this means we cannot expect usefulresults if the data are "bad. " This poses a dilemma: How should polic-ies be evaluated? As scientitst, we all prefer the apparent rigor of
using a model; as scientists we prefer to reject the use of models whosedata requirements put us into GIGO. Here are two ways to deal with this
dilemma
:
1. Refuse to evaluate, stating the reason and specifyingthe data requirement; or,
2. Temper the model results with expert analysis.
In practice, option 1 is rarely fully exercised. If refusal is
feasible, it is generally not accompanied by a full explanation of why
the data are unacceptable. At least as often, option 1 is not feasible.
In this paper, we consider: (1) how the dilemma may be avoided for some
cases, and (2) tempering model results.
118

A major reason for the dilemma is the persistent separation of datacollection and modeling. What data to collect and in what form are detach-ed from modeling and analysis. There is virtually no opportunity formodelers/analysts to participate in data collection, even to the extentof stating present or anticipated data requirements. No notion of "cost-effectiveness" seems to have been applied to the data collection decisions.Instead, data are collected to measure compliance with a law, not to aidanalysis
.
Thus, a preventative measure for the future is to have something likea "Data Acquisition Administrator," analogous to a Database Administrator.The Data Acquisition Administrator is responsible to all users of data,including modelers/analysts. Presently, EIA does not have such a functionto the extent where data requirements are specified with a measure of "value"to be traded-off against data acquisition and maintenance costs. There is,
however, a move towards this form of cooperative assessment. The NationalEnergy Information System is being developed with reviews from AppliedAnalysis. Also, the task force for assessing the Oil and Gas ReportingSystem includes representation of the Office of Applied Analysis. This
now brings us to how model results may be tempered, and why this optionis in concert with having a measure of value to influence data acquisition.
The quality of analysis pertains to how well we can answer a posedquestion, generally to evaluate some policy or anticipate a preventabledisruption in our economy. Thus, we analysts affect the quality—not
just the model we use as a tool. Credibility pertains to how well wereport the quality, preferably by some measure of uncertainty. Our basicthesis is this: working with "soft data" intrinsically identifies its
importance. One example of this is the prominent Oak Ridge ResidentialConsumption Model, built by Eric Hirst. During its development. Dr. Hirsthad to estimate some of the data, which are now collected.
As we use an imperfect model, we learn which data are decisive, which
are moderately important and which have little effect on certain questions.
It is the ongoing use of such imperfection, accompanied by "exploratory
modeling," that provides a measure of value to specific data requirements.
Furthermore, if we do not use models, tempered by expert analysis, then
we rely on unstated assumptions, inconsistent projections and an amalga-
mation of cause versus effect.
We have all experienced a Delphi method approach, relying on assembledexperts to reach a consensus. It often does not work; it is almost alwaysprohibitively time-consuming and it is virtually impossible to document.Moreover, such an exercise does not collect wisdom and pass it on to othersfor subsequent advancement. Models, evolving to remain relevant and improve
the quality of analysis, inherently provide a record of collected wisdom,and it can be subjected to critical review—a form of validation/assessment
—
in order to make it better.
119

Thus, we propose that GIGO is an overused cliche, ignoring three basicfacts: (1) we must respond, with or without a model; (2) we can institutionalize intellectual growth; and, (3) we can evaluate data requirements with a
cost-effectiveness perspective. The bottom line, therefore, is that weshould not reject a model's usefulness solely because the data are presentlyunreliable or nonexistent.
120

REMARKS ON FREEDMAN AND GLASSEY-GREENBERG PAPERS
Douglas R. HaleDirector
Validation AnalysisEnergy Information Administration
It is late in the day; and I have to review the work of anAssistant Administrator. I hope to be brief and, on occasion,vague. Please don't press me on vagueness.
Roger and David Freedman have suggested that EIA energy modelsand forecasts have credibility problems because:
o the data base often does not support the model's needs;
o the models and their forecasts are poorly documented;
o some models are not competent; and
o the models are big and complex.
They also suggest that these problems can be partially attri-buted to deeper issues of EIA's structure and to the environmentin which EIA operates.
Roger and David Nissen have stressed the fact that there isno well established process for the modelers to influencedata collection. I agree this is a serious issue. I amwilling to spend several years making sure that data collec-tion supports analysis needs.
David has pointed out that a combination of excessive demandsfor forecasts and the size and complexity of the models havecontributed to poor documentation and uneven quality. He goesso far as to suggest that less ambitious questions and simplermodels "... might even give EIA analysts some time to doanalysis I've been a Government analyst for seven yearsand have served in some of the best analysis and policy shopsin town. Now I'm a bureaucrat. If David has found a way tolet Government analysts do analysis, I'll go straight.
David Freedman also notes that the skill mix is not appropriateto the task. He mumbled something about statisticians: I
would have added economists. It may seem strange to raisethe personnel issue as a serious organizational concern—itmay seem more an issue for middle management. I disagree.Government hiring and firing rules, together with inflexibleentering salary schedules, virtually ensure that the skill mixwill be suboptimal. Moreover, having personally interviewedover 150 job candidates since October, I am convinced that theGovernment barely competes for superior, entry level talentin a large number of fields. Unless the Government changes,we will always face skill mix problems.
121
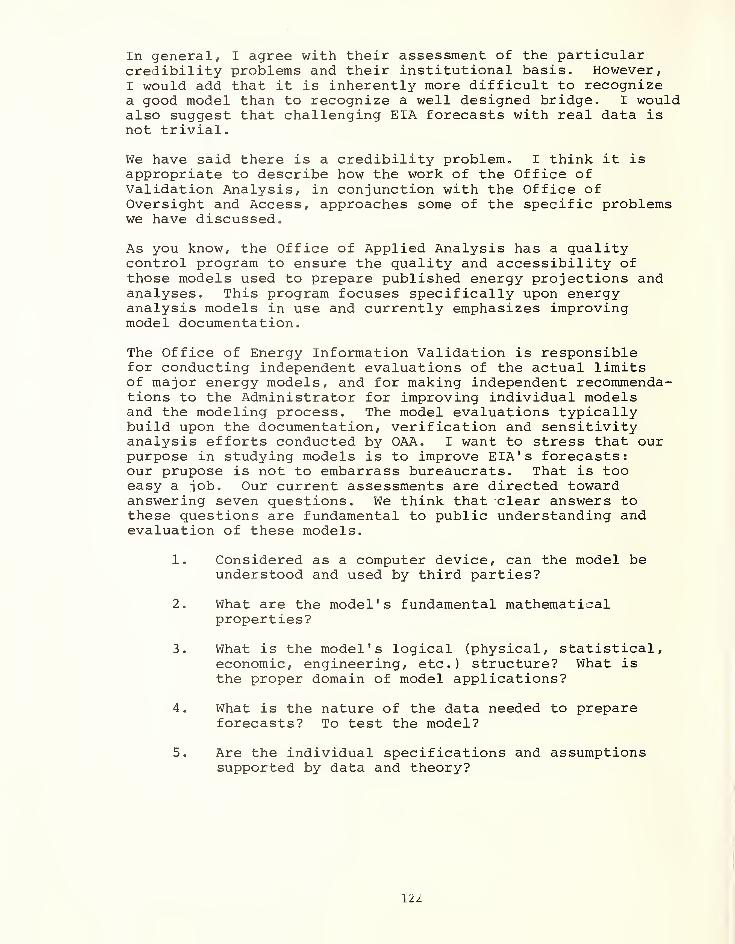
In general, I agree with their assessment of the particularcredibility problems and their institutional basis. However,I would add that it is inherently more difficult to recognizea good model than to recognize a well designed bridge. I wouldalso suggest that challenging EIA forecasts with real data isnot trivial.
We have said there is a credibility problem. I think it isappropriate to describe how the work of the Office ofValidation Analysis, in conjunction with the Office ofOversight and Access, approaches some of the specific problemswe have discussed.
As you know, the Office of Applied Analysis has a qualitycontrol program to ensure the quality and accessibility ofthose models used to prepare published energy projections andanalyses. This program focuses specifically upon energyanalysis models in use and currently emphasizes improvingmodel documentation.
The Office of Energy Information Validation is responsiblefor conducting independent evaluations of the actual limitsof major energy models, and for making independent recommenda-tions to the Administrator for improving individual modelsand the modeling process. The model evaluations typicallybuild upon the documentation, verification and sensitivityanalysis efforts conducted by OAA. I want to stress that ourpurpose in studying models is to improve EIA's forecasts:our prupose is not to embarrass bureaucrats. That is tooeasy a job. Our current assessments are directed towardanswering seven questions. We think that clear answers tothese questions are fundamental to public understanding andevaluation of these models.
1. Considered as a computer device, can the model beunderstood and used by third parties?
2. What are the model's fundamental mathematicalproperties?
3. What is the model's logical (physical, statistical,economic, engineering, etc.) structure? What isthe proper domain of model applications?
4 . What is the nature of the data needed to prepareforecasts? To test the model?
5. Are the individual specifications and assumptionssupported by data and theory?
I
I
122

6. What can be said about the reliability or uncertaintyof the forecasts?
7. Given the above, for what purposes is the modelsuited? How is it actually used?
We have three model evaluation projects in process: theLong-Term Economic Analysis Package, the Short-Term IntegratedForecasting System, and the most recent Sweeney TransportationModel
.
We have found that these questions need to be addressedin the context of the model. For example, I'm having dif-ficulty saying anything about the statistical validity ofnon-statistical, deterministic models like LEAP. Testingthat model in its own terms is problematic because there areno explicit questions of statistical formulation and method:one cannot, for example, contrast estimation techniques.Testing against real data is confounded by the five-year gapbetween equilibrium solutions.
This emphasis on fundamentals - Does the model solve? Cansolutions be replicated? Is it stable? Do the data make adifference? - enables us to examine issues that are bothimportant and less subjective. However, these seeminglymundane issues of objective performance have proven extra-ordinarily difficult to resolve. Consequently, relativelylittle attention is currently being paid to model comparisonsand other measures of overall model quality.
These efforts will not solve the credibility problem. I
believe, however, that without this work we'll never raisethe level of the debate above that which we heard today.
123


REMARKS ON FREEDMAN AND GLASSEY-GREENBERG PAPERS
David A. PilatiNational Center for Analysis of Energy Systems
Brookhaven National LaboratoryUpton, New York
I wholeheartedly agree with David Freedman's paper, but I suspect that DavidNissen and I have a lot of disagreements at certain points.
Professor Freedman attempted to look at a general question but really provideda specific application by looking at the RD4 model and answering "Are EnergyModels Credible?" He was only addressing one particular model, not the wholeclass of energy models.
He made a serious accusation as to the validity of that model, one that I
don't think I can take lightly. However, judging from the comments of others,my perception may be a minority opinion. I was trained as an engineer and I
think that engineers look at the world very differently than social scientistsand particularly economists.
David Freedman also noted (and I don't believe this was in the formal paper)that there was another important perception that we should be looking at, too.
This was the perception that institutional setting drives the technical de-tails in the approach that is used. This hasn't been mentioned by any of the
other discussants but it seems to me that, once recognized, it is a very im-portant area. What is the solution?
Do you try to outguess the institutional framework and the institutional re-sponse to technological change in using new technologies, in particular, in
using new modeling technologies? Or do you just live with the situation?
Although I strongly agreed with Professor Freedman's position, he did make two
technical errors that deserve some discussion.
His paper berated large-scale economic models for their inability to predictdiscontinuities. For example, you can't predict embargoes. However, this
problem exists for all modelers. There are no models of physical phenomenonthat I know that can predict precisely when a discontinuity can occur. The
inability to predict a discontinuity is a generic problem and should be under-stood as such.
At best, models can only tell you what the probability of a discontinuity oc-curring is. In the energy field, we have a lot of possible discontinuitiesthat one can think of, all with (hopefully) low probability. However, no per-son or model can calculate the probabilities associated with these possibili-ties.
125

He accused RDA of having weak theoretical underpinnings and then went on to
say that one of these weaknesses was the assumption of constant priceelasticity in the industrial demand area, an area that I am very familiarwith. Dr. Freedman implied that as energy prices increase, price elasticitiesmust obviously increase, too. That statement is based on technological faithand, given our existing technological base, this is not going to occur.
In fact, using the industry process models at Brookhaven, we have shown thatthe energy price elasticity declines as the energy price increases because yousoon run out of known technological devices that can further reduce energydemand. There are two sides to this coin; one is the thermodynamiclimitations to conserving energy, and the other is lack of foresight in R&Dplanning.
It is somewhat reassuring that the Long-Term Conservation Technology Officehas been reopened. Someone mentioned it earlier this morning. Why in theworld it is in the Storage Division I will never know.
The second paper by Glassey and Greenberg asked the question, "How Much DoesModel credibility Depend on Data Quality?" And then they skirted the questionand really talked about ways of improving data quality.
Models can be conceptually divided into structure and data. You cannot expectthe numbers that come out to be any better than the numbers that went in, evenif the structure was 100 percent correct.
However, it is certainly conceivable that models can have a lot of use even if
the data are poor because they can display behavioral relationships of a
particular system that increases one's intuition and understanding of the
modeled system.
Let me cite an example from the Brookhaven industry process models which usesome questionable data like any other models. The process models show that as
you increase the investment tax credit on conservation technologies, you startsaving energy and then things sort of level off, and all of a sudden (at a taxcredit level of approximately 60 percent in the paper industry) you startsaving a lot of energy.
The analysts ask, "Well, what in the hell is going on?" Detailed analyses of
model results show that the tax credit causes premature retirement of
equipment. Other people might call that "overdue" retirement for many of ourproduction facilities. Sooner or later, many of today's inefficient plantswill have to be shut down and replaced with modern energy-conservingproduction facilities. Rising energy prices and conservation tax credits canhasten the day for such changes.
The equation on the board (equation for a falling body with no friction, for
people who are not trained in engineering) is not a model. A model has
assumptions. An equation has assumptions. Galileo was no doubt aware of
friction, but he did not know how to model it. Otherwise, why did he dropcannon balls instead of feathers?
126

And any good engineer would not write down this equation and say it is the
equation of motion for a falling body. He would have several explicit assump-tions. This is something that doesn't seem to exist in most policy models.
I think it is obvious to me from David Nissen's discussion and David Freedmanand my point of view that there is a growing split between science and pragma-tism. Those that are more of a scientific bent are going to become more and
more frustrated because it is fairly obvious that there are going to be tight-er monetary problems in doing this kind of work and that pragmatism is goingto ultimately win out.
127


DISCUSSION ON FREEDMAN AND GLASSEY-GREENBERG PAPERS
DR. GREENBERG: Just a few thoughts that came to mind in listening to thediscussants. It has to do with the way in which we misuse the computer in do-ing some of this work.
Let me begin with a discussion of when I went to FEA in 1976. Bill Hogan saidit would be a lot of fun, which it was for a while.
I stayed on after the reorganization, through the new regime. There have beena lot of changes from 1976 to 1980. But, I'm looking at the two recent annualreports to Congress and the past National Energy Outlook report, along withother studies. There is not evidence that the quality of analysis that hascome out in the past two years is better than the quality of analysis thatcame out the first two years I was at FEA. It does seem different, and it
does seem much more subjected to peer review.
It would be very hard to go back to some of the things that took place thenand try to impose on them this kind of review process or try to pick out thoseelements that could be called science. I think what Larry [Mayer] meant is
that it is not binary. It doesn't have to be science or non-science. Partsof it could be subjected to scientific scrutiny, while other parts may not.
I think very little of it was subjectable in the earlier days, but if you mea-sure outputs instead of inputs, it is not clear that we are doing better. It
is clear we are doing things differently.
The best of the two eras can be combined in what I think is EIA's singlemostimportant mandate, which has not yet come to pass. That is, the developmentof a National Energy Information System. Here information is not to be takensynonymous with data.
I think, properly constructed, the quality of the analyses that took place in'76 and '77 could be regained if we didn't spend half our computing resourcesreformatting data. This is done to accommodate outside assessor requests forour system and the multitude of software systems to be used by them, and the
proliferation of files that don't increase information but only obscure the
core of information.
What was good about the earlier analysis—the speed of execution, the quickturnaround, the ability not just on the computer but the ability to capturethe thought processes—enabled us to communicate with a hand-full of analystsand so on—and go quickly think through an issue. Also, the support that was
leant to the enterprise that I think made the quality difference was betterbefore than now, in my judgement. The interference that we get, that the com-puter is more of an obstacle than a help at the present, tends to be more dis-couraging than helpful.
129

Standards and guidelines and the talk about documentation tends to interfererather than help. It used to be that documentation was viewed as an assist to
communication. Until you get the computer doing the documentation for you,
which we used to do to some extent, you can't have the documentation keep upwith the modeling and the data. It is going to be out of phase by one or twoyears. It takes that long to do it by hand.
Ideally, you would like to be able to push a button and get all the tediousstuff done like documentation, and let the talented analysts spend their timethinking about the substantative matters, and let the computer work for themrather than the other way around. A lot of analysts spend more than halftheir time writing JCL's or other kinds of non-interesting tasks. One of the
consequences of this is you don't retain very many high-quality analysts.They tend to go to work for some obscure bank or something like that, anddon't tend to hang around to add to the quality of the analysis.
DR. GASS: Thank you. I would like to have a question from the floor.Please use a microphone and identify yourself.
MR. BARNES: I am Dick Barnes, from Oak Ridge.
There has been a lot of talk here today about acquiring data for analysis,with the intention of reducing the uncertainty of the analysis. It seems to
me, however, that there are elements in our society or economy whose best in-
terest lie in maintaining the uncertainty of these analyses. They don't want
big brother up there looking at all their private data and drawing inferencesand telling them what they should be doing in the future.
I am wondering if there has been any consideration of the problem of reallytrying to develop this information bank and to obtain all of the data neces-sary to prepare these forecasts and policies with the uncertainty that theythink they need.
DR. GASS: Thank you. Doug Hale, do you want to try that one?
DR. HALE: We have certainly given the problem consideration. I am not
aware that we have come to any solutions. One thing that I can say is that
the financial reporting system which we are examining now is a system to pro-vide the very, very detailed accounts from the energy companies.
That system may, in fact, be a test bed for how far we really can go. As a
policy analyst, I caused it to happen that similar data were required or willsoon be required of major smelters. I was told by an executive vice presidentof the largest copper consortium in the world that he will close down everyone of his smelters before turning over such data.
I think the progress of FRS is going to go a long way to answering questionsabout the most highly sensitive data available from corporations. I am not
convinced that our problems are all of that sensitive. I am having peoplerunning around trying to figure out what heating oil is selling for. That is
a big problem.
130

Well David has told stories about the regional data. Most of that data is not
of the trade secret variety. We have also been having some problems in coaldata, the production data of coal.
Basically, I think there is a lot of mileage to be had from carefully thinkingthrough what analysis needs in terms of data and then going after it. I
really doubt that most of us are going to be as sensitive as we can.
CHAIRMAN GASS: Thank you. Another question from the floor? Yes, Fred?
MR. MURPHY: I am Fred Murphy from DOE. In the energy discussions today,in terras of worrying about synthetic data which are essentially data that are
output (supposed data which are the output of the model), I have a basic ques-tion.
Is there such a thing as data, or are all data synthetic? It seems that a
good example is EIA's completed first survey of the oil and gas reserves of
the country. Now what is the information that EIA has there that is the out-put of a set of differential equation models that you ultimately use to trans-form to what they have under the ground?
I would like to address this to David Freedman. Is there anything other thansynthetic data?
DR. FREEDMAN: Yes.
DR. GASS: Could you give us an example, David?
DR. FREEDMAN: I think, for example, when the Bureau of the Census goesout and takes the current population survey every month you are not getting100 percent response. There is some imputation involved. But the data are a
lot closer to the real end of the spectrum than when you take LPG prices in 1
1
cities and spread them out to different states.
That is, you know pretty much how the Bureau of the Census went out into the
field and you know how they took their household sample. You also know the
interview procedures they follow. You even know in some detail the imputationprocedures they used and you even know their quality control studies on those
imputation procedures.
MR. MURPHY: Now what you are arguing is a case of degree, not a case of
difference. A true distinction.
DR. FREEDMAN: Sure.
DR. MAYER: I think what is important to say on that, Fred, is going backto my point about making important discoveries. ^-Jhat have we learned in last
seven years about energy?
131

The important point is that in these other related areas—population, healthcare—it is not that their data were of good quality or bad quality, but is
that whatever their data were they discovered something.
It seems to rae that the real question is what are we discovering with all thismoney. Instead of the assessment side saying the modelers don't deservetheirs and the modelers saying the assessors don't deserve theirs, do any of
us deserve ours?
DR. GREENBERG: I think we learned a little bit about the affects ofprice controls. I think we know a lot more now than we knew seven years agoabout the impacts of oil and gas controls.
DR. MAYER: Well I would be interested— I will take what David Freedmancoined if he doesn't mind the embarassment . That is, I would be interested in
someone sending me some testable; empirical statements about the energy worldthat some of our modeling and analytic efforts are based on. Then I can goout and do something very simple, as I can in physics or chemistry and healthcare, I can test it.
Just like I had a chemstry set when I was a little kid, I could see that if
you mixed X and Y, you blew up most of your bedroom. I would like to knowwhat simple statements we have learned.
DR. NISSEN: I thought I had provided an example of that.
DR. MAYER: Did you provide a model or not, David?
DR. NISSEN: No. This stage of the discussion always puts my teeth on
edge. For any of us who have actually sat in a room late at night with guystrying to figure out energy policy, the point is that the modeling effort is
essential.
This is a silly kind of discussion. We said they are not going to buildthe damn generating plants because they don't need them. And we were right.
They didn't need them.
DR. FREEDMAN: I would like to make a brief rejoinder to some of the com-ments that Dave Nissen made.
I guess the first thing is to make another public confession of failure. I
guess I didn't convince him. There is one thing he said that I would reallylike to agree with, and that is let the data have a vote.
That seems to rae to be a crucial idea and I fully endorse it. But there is, I
think, a major difference between the two of us in that it is precisely myview that making large-scale mathematical models of the kind we have talkedabout today prevents the data from getting the vote.
What you want to do is you want to take the 10 numbers you have. You take the
10 numbers you have and look at them, inventing another 100 numbers and fit-ting a giant regression equation with 50 parameters by some complicated fit-ting procedurec I don't think that lets the data have a vote. That lets themodel and the assumptions in the model vote.
132

Now I don't want to go on much longer. I want to ask a question of Dave andit is going to be different from the question Larry asked me because it is notrhetorical, it is a genuine one.
I want to preface it by reviewing your review of our debate. All right? 1
say the data are poor and you agree. 1 say the method of estimation is poorand you don't disagree. I mean you call it a quibble but you did not disagreewith me.
I had some serious questions about the specifications of the model and youdidn't mention that. And I also said that there is no track record of successin this game and you didn't really take that up either.
And now the question I want to ask you is why should we believe the resultsfrom the model?
DR. NISSEN: Why would somebody who wanted to make energy policy deci-sions use models which are different than in what they believe? You persistin evaluating the model as a piece of science. And I, again, persist in
claiming that that shows an institutional ignorance of what models are usedfor.
Models are used to mechanize the image of the world that the decision makerhas. You explain to him as simply as you can, "Look, this piece over heresays that if you double the price, the demand is going to go down 60 percent.Do you believe that?"
He will say, "Well, should I?" Then you get into a discussion of whether ornot it is believable. Or he says, "No. Run it with zero." We will say, "All
right. That happens to be something that is probably a debatable scientificposition but it is something that we will do for you in terras of assistingyour evaluation of your choices."
So the problem isn't the believability of the model as a representation of re-ality. That is part of the problem but that is not the problem. The problemis does the model serve a use in organizing the available community of sharedinformation or supposition about states of the world and modes of behavior;can the model then perform the arithmetic so that it calculates the mass bal-ance stuff, that it gets the valuation equilibrium straight, and all thatstuff which is hard to do in a 10-equation model. Or it is hard to do in yourhead. Does it come up with an internally consistent set of results?
I want to say something about the difference between big models and big database estimations. I, myself, am not too cheered up by big data base estima-tions. But 1 think that big models are a fabulous substitution of capital for
labor. The reason is that intelligent aggregation that is appropriate for a
specific problem is much more difficult to do than to deal directly with dis-aggregated data and disaggregated phenomenon.
133

Think about the problem of building a national one-region supply-demand modelfor coal as a simple model versus using a 50 or 100-region model which is com-plex. The multi-region model is big dimensionally but not complex because it
is simple behaviorally. You can see the explicit workings out of the very im-portant transportation phenomena which are, in fact, decisive in the economicsof coal supply and demand.
So let me say again that people don't believe models. That is not the issue.People use models to organize the impression they have in their heads to geton with sorting out the consequences of decisions.
DR. MAYER: I want to say something, Saul, that is in David Freedman'sdefense.
We in the Analysis Center have looked very thoroughly at the national gas de-bate over deregulation that was referred to. We have a list of quotationsfrom Federal public officials, including people from the Department of Energy,endorsing models as scientific apparati.
The fact of the matter is that these models are presented as the latest inscientific analysis, particularly to the public. Now the fact that you and I
know better, David, particularly since you build them, doesn't alter the factthat they are presented that way; the public believes it, the New York Timesbelieves it, the Atlantic Monthly believes it, the New Yorker believes it,
congressional staffs believe it, or some congressional staffs. The claim for
these as science goes on repeatedly, particularly when the heat is on.
DR. GLASSEY: Let me pick up on the last two points that have been madehere. David Nissen points out that models, if they are used by a decisionmaker, can be used by the decision maker almost in an interactive mode. And
if the decision maker doesn't like the negative .60 elasticity, he can put in
zero. He believes that more and then can use the model for designing hispolicy.
I don't think that anybody would argue about that particular use of models. I
think where we get in trouble is when, as Larry said, the decisionmaker says,
"I like zero better than minus .6" He then makes his decision and uses the
computer printout that was produced with his explicit assumption of zero as
allegedly scientific evidence to support the decision that he made.
At that point, the modeling community goes along with the story. I think we
are not making the sort of contribution or rational debate that we should.
DR. MOSES: Well I wondered if any member of the panel thought that mo-deling was giving science a bad name.
DR. GASS: We will have Harvey's comment and then we will have one last
question from George.
134

DR. GREENBERG: I wanted to briefly comment on this exchange. I wantedto state, in another way what I think is agreement with Dave Nissen, and thatis that I think the statistical perception and approach to this kind of thingis that statistics is mostly about the data and that modeling is mostly aboutthe relationships among the data and what they represent. The way in whichmodels are used is to understand the relations and the implied relations that
are not well understood at the outset, but get understood during the analysisprocess.
With reference to Dave Nissen' s presentation on the electric utility example,if you took the simpleminded approach that I think would have been recommendedby David Freedman in 1975, you would have used the historic growth rate of 7.2
percent, which is what was being used to justify the $100 billion subsidy bythe Federal Government. But the modeling—despite its inequities—was stillable to surface some of the understandings that led to the lower growth rateprojection.
DR. GASS: One last question. George, did you want to comment or do youhave a question?
DR. LADY: I agree with David Nissen, so I can ask him the hard ques-tions. Many of the remarks that have been made about why it is all right,even if the data are no good or other things are no good, seem to me to referto "modeling as an enterprise" which is conducted in a close staff relation-ship to a decision maker.
There has been a fair amount of emphasis of having the use of the model wellunderstood and having the fact that we are supporting decisions willy-nilly of
the apparent inaccuracies and so forth.
It is my insight that now, if not always, that most of the resources that havebeen spent have not been spent in that mode. And, indeed, for applied analy-sis nowadays we are producing a report that uses more than half of the re-sources on an annual basis and which presumably is being established as an in-formation product report that stands as a grandchild of the Project Indepen-dence Report.
I don't understand it. It is a legitimate inability of me to understand howthat information product can be offered without the degree to which it can be
believed, somehow understood, and communicated because the decision maker thatwould be the recipient of the report is unknown and faceless in general.
I just don't know how we can— I agree with you that you have to go on, I un-derstand all of the advantages of bringing the discipline of the modeling to
the data that we have, but I don't understand how we can say that believing or
understanding the accuracy can be ignored.
DR. NISSEN: No, I didn't mean to say that, George.
DR. LADY: That is what you said the data would be.
135

MR. NISSEN: Let me restate what I said. In fact, I have elsewhere ar-gued, or argued previously here a year ago, that the modeling process had beenused in mystical ways to bully people; that the emphasis on assessment withinan independent EIA was an institutional response by the Congress to preciselythat class of bullying and that assessment was stipulated and wisely, produc-tively stipulated to be part of the modeling process.
I don't object to more assessment. I don't object to good science. In fact,I do some on occasion. But what I object to is the false syllogism that if
the science isn't very good, then the modeling effort isn't worthwhile.
So I think that the assessment process ought to report the state of the sci-ence.
DR. LADY: Oh, I agree entirely. I said I agree with you. Yes, abso-lutely.
DR. GASS: With that happy note of agreement which I didn't think wewould get to, I would like to call this afternoon's session to a close.
136
A Note on the Human Factors Associated with ModelValidation and Confidence
David A. PilatiNational Center for Analysis of Energy Systems
Brookhaven National LaboratoryUpton, New York
As a participant in the NBS Model Validation Workshop, I felt a
great deal of dissonance about its approach and neglect for what I wouldterm the human factors associated with modeling and beliefs in model con-fidence. Our cultural tendency to objectify all endeavors was certainlyin evidence at the NBS meeting. However, issues related to the more sub-jective nature of reality were raised on occasion but skirted and not
seen as primary issues. Perhaps a similar conference in the future couldexplicitly treat these issues, however vaguely treated here.
On one level it seems that the V'/orkshop's goals are to "scientif-ically" validate a process (i.e., energy modeling) that may have not beenundertaken as a scientific endeavor in the first place. For example, the
discussions on model validation raised the question of whether science orpragmatism rules in model development. I concluded that with increaseddemands for model results and limited resources pragmatism will governmodel development more than science. If this accusation were true, howdoes one justify a scientific validation of such a process? This paradoxlead one prominent economic modeler at the workshop to state that "vali-
dators are whiners," If we are indeed trying to scientifically validatenon-scientific modeling efforts, this perception should be expected.
In the discussion on model confidence the human factor was raisedagain. Figure 1 is a schematic displaying a computer model and variouslevels of human interaction with that model. Conceptually, any model has
an objectively measurable degree of confidence that could be quantifiedin some appropriate manner. However, this is rarely done in practice and
confidence in a model stems from an individual's perception of the modelbased mostly on interactions with other model users and/or developers.These individuals are associated with institutions that color their per-
ceptions and responses concerning their confidence in a particularmodel. When an individual is trying to promote the use of a model, howdoes their expressed confidence differ from what they actually believe?How does belonging to a particular institution color a person's percep-tion or responses? For example, the model developers (inner ring of
Figure 1) are usually aware of many model limitations or distortions that
never are transmitted to other users. Model developers generally promotetheir products by emphasizing the positive aspects of their approachrather than its negative aspects.
Future workshops on model validation might explicitly consider the
more subjective aspects of this topic. What are the institutional forces
acting on the individual to decrease his/her honesty in appraising the
quality of a model? How much of an individual's confidence in a model is
obtained from documentation, personal use of the model and word-of-mouth
assessments? What are the institutional pressures on a model developer
or user that result in distortions of a model's appraisal? How can a
model user correct for these biases in assessing a particular model?
137
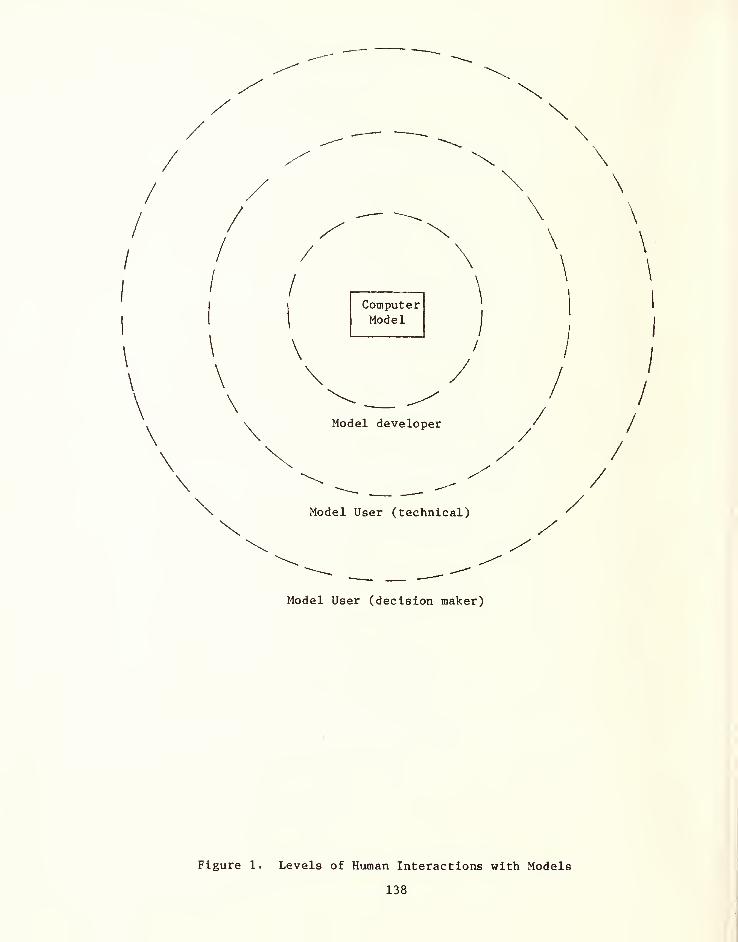
Model User (decision maker)
Figure 1. Levels of Human Interactions with Models
138
REPORT ON WORKSHOP 1
CO>[POSITE MODEL VALIDATION
ANDY S. KYDES .AN'D LEWIS Rl'BIN
Abstract
This paper summarizes the ideas and conclusions reached by the partici-pants of the National Bureau of Standards workshop on Composite Model Valida-tion held in May 1980. The focus of the discussion centers around the ques-tion: "Eto composite models cause unique problems in achieving the objectivesof the assessment process?" The participants included in the workshop were:
Robert Aster, Jet Propulsion Laboratory;
Neil Gamson, Energy Information Administration (EIA);
Rodney Green, EIA;David Hack, Library of Congress
;
Malcolm Handte, Wharton Analysis Center;Andy S. Kydes, Brookhaven National Laboratory, co-chairman;Norman Miller, Federal Energy Regulatory Commission
;
Lewis Rubin, Electric Power Research Institute, co-chairman;Jeff Sohl, Largo, Maryland;David Strom, Conservation Foundation-Chuck Weisbin, Oaik Ridge National Laboratory; andDavid 0. Wood, Massachusets Institute of Technology.
I. Introduction
The intent of this paper is to focus on unique problems and issuesrelated to composite model validation. This working group discussion focuseson the distinction between composite and non-composite models and the uniqueproblems related to validation which composite models may introduce.
Methodologies developed for energy systems analysis have continued toevolve toward greater complexity and detail, reflecting in part the greatersophistication and understanding of the energy planning and analysis commu-nity. Since energy policies can ultimately affect the future patterns of
energy production and utilization, planning, analysis and evaluation activi-ties must be executed in sufficient detail to exhibit the effects of thesechanges on the supply and end-use sides of the corresponding energy systemsand on the economic and environmental systems of which they are components.Further, choices among various policies and programs must be analyzed in thecontext of social, economic, environmental, and security objectives so that a
balanced and diverse set of options may be identified and implemented. Themulti-dimensionality of the planning objectives governing these choices has
necessitated the integration of detailed process/product-oriented energy andenvironmental systems models and traditional stock-flow economic models.
These integrated methodologies, which loosely speaking are composite models,have introduced a higher level of complexity for model assessment since theinformation flow within the model structures is usually more difficult to
trace.
The major issues debated in this workshop were:
o What is a composite model?o What are the objectives of model assessment?
o How do composite models create unique problems for assessment?
5C'
* *Brookhaven National Laboratory Electric Power Research InstituteUpton, Nev; York Palo Alto, California
139

The need to develop an appropriate research agenda for composite modelvalidation was also identified and remains an open issue.
Section II provides a working definition of a composite model and aworking hypothesis to be proven or disproven. Section III discusses theobjectives of assessment and Section IV deals with the unique assessmentproblems associated with composite models.
II. What is a Composite Model?
Any discussion focusing on the \inique characteristics of composite modelvalidation must presuppose unique properties of the composite model. Thefirst step in the discussion, therefore, is to decide upon the boundaries.V«?here do composite models begin? Where do they end? What makes them unique?
In the course of ongoing debate, numerous attempts to answer these ques-tions have been advanced. These can be summarized in three major lines ofargument:
o A composite model involves the flow of information in more than onedirection. More specifically, it involves the simultaneous determination of
prices and quantities, each depending on the other. As an example, note thatall integrated models of supply and demand, such as the Long-Range EnergyAnalysis Program (LEAP) of the Energy Information Administration (EIA), arecomposite in this sense. The Sweeney Auto Model, developed for the FederalEnergy Administration (FEA), is not by this definition.
o A composite model is a hybrid, constructed by joining a number of
other, less comprehensive models which describe subsets of the hybrid's uni-verse. Independent development of the sub-models is usual but not neces-sary. Examples include the Mid-Term Energy Forecasting System (MEFS) of the
EIA or the TESOM/LITM models of Brookhaven National Laboratory (BNL) and DaleJorgenson Associates (DJA). The ICF coal and electric utility model, however,
is not composite under this definition.
o A composite model is any model which explicitly represents more than
one distinct activity. This notion is conceptually broader than the previous
two in that it need not involve model linking, simultaneity, or independentdevelopment. It addresses the difference between a single-equation, price-quantity description of gasoline demand and a multi-equation, stock-adjust-ment, efficiency-weighted approach. Examples of composite models under thisdefinition would include the Sweeney Auto Model and the Hirst ResidentialEnergy Use Model of Oak Ridge National Laboratory (ORNL). Very early energydemand models, such as the FEA ' s short-term petroleum demand model, are not
composite under this criterion.
Clearly, these arguments are not all-encompassing nor are they mutuallyexclusive. F\irther, it is not clear from the debate that an absolute state-
ment is necessary or even helpful. A working definition, however, was adopted
for the purpose of advancing the discussion. It is stated as follows:
lAO

Working Uefinition - A composite model, for th<^ purposesof this discussion, is considered to be any model whichis:
a) made up of separate components, independently devel-oped, which were not originally designed to becompatible, and ;
b) built by integrating (i.e. linking) two or moreseparate, dissimilar types of methodologies.
To help focus and discipline subsequent discussion we incorporate thedefinition in a working hypothesis:
"Mixed methodologies and overlapping components do notcause unique problems in reaching the objectives of theassessment process."
Before proceeding with a discussion of whether or not the hypothesis is
acceptable under the working definition of a composite model, it is necessaryto also characterize the objectives of the assessment process. This discus-sion is presented in the next section.
III. The Objectives of Assessment
Three broad objectives of assessment are clearly identifiable for allmodels:
o to determine the appropriate uses of the modeling system;o to quantitatively estimate uncertainties in model results when the
model is used appropriately; ando to communicate the information from the first two items to users
outside the immediate analytical circle.
The first objective identifies the appropriate uses of a particular modelby analyzing the problems and questions it was designed to address. Modelscannot be analyzed before their appropriate uses are identified. Further,they should be judged by what they were designed to do. Misuse and misappli-cation of models is usually an error in judgement by the users; it may alsoreflect poor model documentation.
The second objective attempts to estimate quantitatively the conditionaluncertainties that are associated with the results of a particular model.
There are two aspects to the second objective. The first includes the scien-tific aspects which are often characterized by the more formal statisticalprocedures. The second includes the nonscientif ic or judgmental approaches.Although the uses and questions addressable by models are broadly defined andnon-technical in nature, the analysis portion of the assessment process is
more narrowly and technically defined The assessment of energypolicy models seems to require a combination of both scientific and judgemen-tal aspects. The appropriate mix is unknown, however, and does depend on theparticular model. In this sense, model assessment is both art and science.
The third objective requires the dissemination of the information beyondthe scientific community to potential users in a less technical but more
141

communicative way. The communication, to be effective, must occur in the
natural language of the users. Two questions which must be answered are:
"Does the nodel address user needs?" and "What is the importance of uncertain-ties in data input or model structure on the designated uses of the model?"In addition, suggestions for model improvements useful for a particular classof users or questions are important to communicate. Figure 1 illustrates thethree phases of the assessment process.
Since the words "users of energy policy models" are often used, it may be
helpful to identify them. Table 1 provides a comprehensive list.
Having categorized the assessment process, it is now necessary to examinethe original hypothesis as applied to each of these categories. A judgementcan then be made eibout the unique problems associated with the composite modelin each phase of the assessment. The next section discusses these issues.
IV. Unique Assessment Problems Created by Composite Models
The working hypothesis of this discussion is that composite models do notcreate unique problems for assessment. As the previous section has illus-trated, the assessment process has three distinctively different elements;thus it is important to examine each element in turn in order to decide whe-ther or not to accept the hypothesis.
The first phase of the assessment process requires education of the
assessor. It involves determining the intended functions of the model.
Discussions have indicated clearly that composite models pose no specialproblems for this phase of the assessment. Although no specific reasons wereadvanced to explain this, one possibility does come to mind. As stated in theworking definition, the composite model is characterized by structural andmethodological incompatibilities, both of which are technical or even mechan-ical in nature. The concept of the model, the story it tells, is notaffected; and it is generally the concept - not the mechanics - which deter-mines the function.
With regard to the second phase of the assessment process, however, thetechnical aspect is everything. The objective of this phase is specificallydefined as the quantitative estimation of xincertainties associated with modelresults. The measurement and interpretation of such uncertainties arestrongly affected by the mechanics of model linking; thus composite models maypose special problems here.
Discussions indicate, for example, that there are interpretive difficul-ties in combining uncertainties from a linear programming component and an
econometric component in a composite model. Should they simply be added?
Why? What other algorithm can be justified? Modelers and assessors do not
yet know the answers to such questions, but nevertheless agree that the prob-lems are a particular outgrowth of model linking considerations.
Similar problems arise in adding uncertainties generated by models out-side the model of primary interest. For example, most energy demand modelsare driven by models of economic activity; thus part of the uncertainty asso-ciated with energy demand forecasts can be attributed to uncertainty in GNP
142
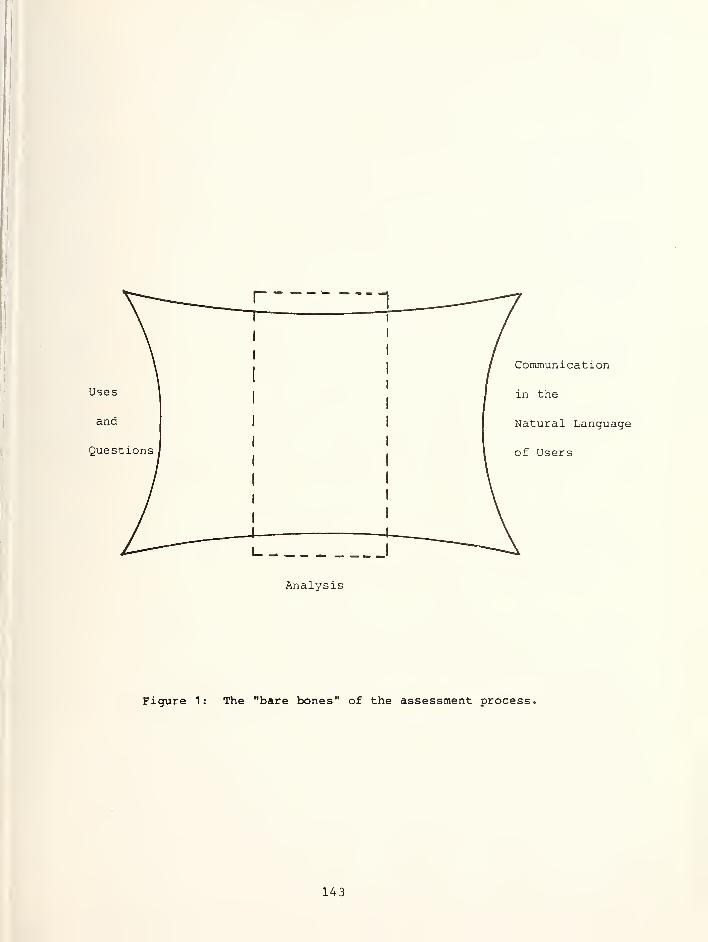
Analysis
Figure 1: The "bare bones" of the assessment process.
143

MODEL USERS
Modelers
Peer Community
Model Sponsor
Assessment Sponsor
Model User
Analyst
Operator of Software
Other Analysts who Use or Interpret the Results
Decision Maker
Advisor to the Decision Maker
Constituencies Influenced by Model Based Analysis
Table 1 : List of Potential Users of Energy Policy Models
144
estimates. This represents a linked system but one about which the assessormay have no information because the model of economic activity is outside the
scope of his work. In general, the problem of measxiring uncertainty in inputvariables which have been generated by other models outside of the currentmandate is a composite model phenomenon.
Even in the eubsence of interpretive difficulty, however, administrativeproblems can confound the effort. If components of a composite model havebeen developed by different modelers, the assessor is forced to work with allof them in order to understand the entire model. This puts added burdens ofcoordination and interaction on the assessor.
As mentioned previously, limits in the scope of the assessment processalso create problems for assessors. Such limits proscribe the assessor'sability to xincover and quantify all contributing influences to uncertainty ofresults. Further the proprietary nature of many component sub-models effec-tively limits the scope of the assessment in simileu: ways.
The third phase of the assessment process involves communication of theinsights gained to the general population of model users. Discussions hereindicate that composite models perhaps pose more difficult problems in thatthey themselves are more complex.
The linkages among sutanodels create an interactive representation of the
world, which is perhaps more accurate but which also makes communication of
concept and insights more difficult for assessors. It is noted, however, thatit is precisely the complexity, interaction and comprehensiveness of compositemodels which makes them so attractive to policy makers and users. It seemsthat the problems experienced in communicating composite model insights areformidable but the results are worth the effort.
In summary, there appears to be very little evidence that compositemodels create a unique kind of problem for the assessment process. In generalthe degree of difficulty is greater for a composite model assessment, but thisis perfectly reasonable for a larger model. A recap of these conclusions is
given in a more familiar model assessment context in the final section.
V. Summary and Conclusions
Three major conclusions were reached in the discussions which providedmaterial for this paper:
o It is not at all clear where one should draw the line between compo-
site and non-composite models. In fact, one would be hard-pressed to identify
a non-composite model being used seriously in the energy analysis communitytoday, because almost all models have elements of "compositeness" about them.
o With the exception of a very specific, albeit quite important, problemconcerning the combining of uncertainty estimates, it appears that compositemodels pose no unique assessment difficulties. In general, the problems are
more difficult but not different.
o In general, composite models are the preferred tools of most model
users, because of their comprehensiveness and feedback effects.
145
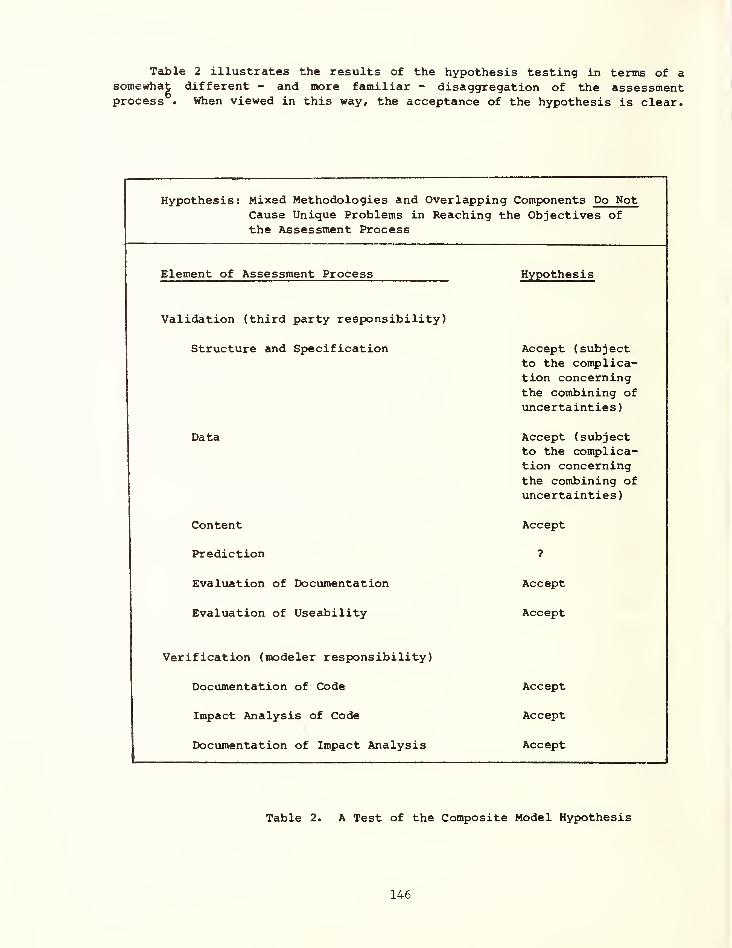
Table 2 illustrates the results of the hypothesis testing in terms of asomewha^ different - and more familiar - disaggregation of the assessmentprocess . When viewed in this way, the acceptance of the hypothesis is clear.
Hypothesis: Mixed Methodologies and Overlapping Components Do NotCause Unique Problems in Reaching the Objectives of
the Assessment Process
Element of Assessment Process Hypothesis
Validation (third party responsibility)
Structure and Specification Accept (subjectto the complica-tion concerningthe combining ofuncertainties
)
Data Accept (subjectto the complica-tion concerningthe combining ofuncertainties
)
Content Accept
Prediction ?
Evaluation of Documentation Accept
Evaluation of Useability Accept
Verification (modeler responsibility)
Documentation of Code Accept
Impact Analysis of Code Accept
Documentation of Impact Analysis Accept
Table 2. A Test of the Composite Model Hypothesis
146
References
1. Fred Schweppe and James Gruhl, "Systematic Sensitivity Analysis UsingDescribing Functions", NBS Special Publication 569, January 10-11, 1979,
pp. 497-515, Saul Gass, editor.
2. R.G. Alsmiller, et al., "Interim Report on Model Evaluation Methodologyand the Evaluation of LEAP," Oak Ridge National Laboratory (ORNL/TM-7245 )
,
April, 1980.
3. Yvonne Draper, Andy S. Kydes, and Steve J. Finch, "A Statistical Approachto Model Simplification and Multiobjective Analysis", to Appear in Energy .
4. E. Kuh and D.O. Wood, Independent Assessment of Energy Policy Models , EPRI
EA-1071, May 1979.
5. Martin Greenberger and Richard Richels, "Assessing Energy Policy Models:
Current State and Future Directions", Annual Review of Energy, 1979,
pp. 467-500.
6. Saul Gass. "Evaluation of Complex Models", Computers and OperationsResearch, Vol. 1, No. 4, March 1977.
147


REPORT ON WORKSHOP 2
THE MEASUREMENT OF MODEL CONFIDENCE
Lambert S. Joel*John S. Maybee**
Although the workshop was nominally intended to explore methods for the mea-surement of confidence in models, the discussion ranged over various topicsfrom defining "model confidence" through measuring it, to establishing and in-
creasing it, with major emphasis on the last of these. The workshop's initialdiscussion paper (which follows this report) is substantially devoted to ques-tions of confidence enhancement through conventionally regarded sound prac-tices in model formulation and documentation. This approach, ignoring pro-blems of definition and measurement, involves the reasonable (tacit) as-sumption that confidence is directly related to quality. A consensus ident-ified six areas suitable as reference points for consideration of questions of
confidence. These six subjects comprise a checklist for confidence building,that intersects strongly with the independently derived ideas in the dis-cussion paper.
Prior to elaborating the checklist, we review the workshop discussion of thenature of models and confidence in models that established a background forjoint adoption of the confidence list.
(1) Confidence can be defined informally as the belief (or degree of
belief) that a given model can furnish information that will be
useful in solving some problem. Rather than attempting to makethis simple notion precise, we can give a few recognizably commonexamples to clarify the decision context: willingness of managersto condition courses of actions on weather forecasts known to be
based on large scale models; reliance on statistical demand fore-cast models in marketing and production planning; and (confident) useof instrument navigation and landing aids by commercial airlinepilots
.
(2) Confidence is affected by the experiences and prejudices of pro-spective users of models and model results, and people have in-
dividual standards for acceptance. Moreover, acceptance sometimesseems to reflect preferences rather than judgment: almost every-body will always place much greater reliance on model outputs that
support their opinions than on those which tend to refute them.
(3) The role of understanding is not clear relative to confidence.The "public" doesn't understand models in general and is skepticalof model results. In contrast, there is rather universal ac-ceptance of sampling and estimates acknowledged to come from
sampling, but the degree of public understanding of sampling meth-odology is no greater than the understanding of models in gen-
eral .
*National Bureau of Standards, Washington, DC.
**University of Colorado, Boulder, Colorado
149
(4) It can be argued that models can not be judged objectively by policymakers who are too close to the decision problems. But it must benoted that "conventional" assessments by professional analysts areusually couched in narrative terms, and that apparently mechanisticmethods of evaluation of model characteristics and model outputs aresubject to sufficient leeway in execution and interpretation that thedifferences in subjectivity of treatment between analysts on the onehand and everyone else on the other may not be very great.
(5) "Dumb luck" plays a role in model acceptance. "Good looking" inter-mediate outputs can promote a bad model; a good model with a singleconspicuously false assumption might be rejected.
(6) If a model has been in existence long enough to have been appliedseveral times, the "track record" might furnish a basis for deter-mination of confidence. If data are very scanty or uncertain, thequality of previous model results may not be significant. The exis-tence of a large number of models for which details of structure andoutputs are not publicized—those produced within corporations forinternal application—might seriously distort any judgment of
collective track record of models as an indicator of state-of-the-art .
(7) There is widespread resistance In the "user community" to modificationof models in use, irrespective of quality, possibly because previousapplications are perceived as furnishing a basis for comparison of
output. This implies that users would prefer to post-process,(massage), model outputs in the light of new information than to
employ a revised model.
(8) An interesting "third-party" method for evaluation, or determiningdegree of confidence in a model if you have a lot of money: TheNuclear Regulatory Commission has on occasion parceled out to minorcontractors portions of the analysis for which a large model had beendeveloped. The contractors were required to generate independentlysolutions to these small problems. The results were then compared to
the relevant big model outputs. In the instances described, agreementwas said to be satisfactory.
(9) Parsimony is important, up to a point: models that are "too big"hinder confidence, while exceedingly simple models are dismissedfrequently as being "back of the envelope" analysis,
(10) Concern was expressed for the lack of measures of model "confidence
worthiness" similar to measures of forecast accuracy. Oddly, partic-
ipants whose stated professional assignment is assessment said they
had come to our workshop in search of approaches to assessment de-
emphasizing quantitative methods, which had been unsatisfying. The
role of measurement was discussed briefly. A claim that it relates
only to validity "which differs from confidence" was countered by
arguments that validity is a factor in confidence and that "speed of
response," e.g., is quantitative, and affects confidence but not
validity.
150

(11) The possibility of ordinal measures for acceptance was mentioned, buta statement that an ordinal approach might serve to compare models andnot provide a means for acceptance or rejection of a model in iso-lation foreclosed further discussion.
(12) There was not universal agreement in the group about the degree ofimportance of tests. A claim that tests were an absolute prerequisiteto establishment of model confidence was countered by an argument thatsometimes tests can't be made (e.g., long range forecasts) and thattests themselves can be defective. (Note: Clearly both viewpointsare valid with some hedging. This matter was not pursued further, butas can be seen below, testing is an entry on the consensus check-list).
This is a committee report. The foregoing material is a freely edited trans-cript of ideas that were set forth and discussed by the session participants.What follows here, however, represents consensus that there are at least sixmatters of great importance to the establishment of model confidence, i.e.,six areas in which one could profitably investigate questions of confidence.What results is a sort of checklist that can be of benefit to model makers,model users, or model assessors. It resembles, in fact, a typical assessmentchecklist, but as will be clear in the elaboration of individual components,it diverges somewhat from conventional assessment orientation.
The six confidence related areas are:• Algorithmic Integrity• Software Quality• Quality of Data• Benchmarking• Scenario Support• Model Management /Data Base Administration
No importance ranking is attached to positions in this list. The notion thatsome attributes may affect confidence more than others was not discussed in
the one-day session. The labels for the six subject areas were assigned for
convenience. This extended descriptions below will clarify the intendedmeaning of each.
Algorithmic Integrity ; Refers to how input is to be transformed intooutput, i.e., the conceptual methodologies of the model and their mathe-matization, or the algorithms of the transformation. Whatever methods are
used, e.g. exploratory curve fitting, extrapolation by time series analysis,static equilibrium descriptions, or detailed dynamic process simulations,several natural confidence oriented questions arise: Why was the methodchosen? How is it situated in terms of state-of-the-art? Under these head-ings are a host of issues related to mathematics, statistics, numerical anal-ysis, and systems analysis; robustness, flexibility, breadth of focus,
numerical stability, etc. which can be addressed in informal as well as tech-nical terminology.
151

Software Quality ; Involves numerical precision and reliability (an areaof overlap with algorithmic integrity), as well as portability of computermodels, the extent of built-in facility for modifications, and the convenienceof input/output procedures.
Quality of Data ; All of the data for a model, the nominal inputs formodel runs, as well as data for determination of the values of model para-meters, can affect the performance and utility of a model. A brief catalogueof quality factors includes identification of sources, relative completeness,uniformity of precision and procedures for accomodating outliers and missingvalues
.
Benchmarking
;
This term is used in computer software management todenote test computations made for reference purposes. Here we include allsorts of output recording and/or testing procedures, a few of which are; (1)Sensitivity analysis and stress testing (by abstract mathematical methods as
well as computationally); (2) Freezing a model with associated data at variousstages of development; (3) Comparison of ex ante and ex post forecasts.Sensitivity analysis measures the reponse of a model to changes in data andparameter values, or computational methods. Stress testing probes the
"elastic limits" of a model by sensitivity analysis using extreme values.Sensitivity analysis of big models is tricky because the straightforwardmethod of varying one parameter, say, at a time while holding everything elseconstant, (analogous to partial differentiation) sometimes fails to yieldenough pertinent conformation. Then, sophisticated methods of selecting the"right" groups of variables and parameters must be used in order to avoid thecomputational expense of testing all possible combinations. Ex post and exante are terms used in econometrics. Ex ante means that I use today's modelto forecast, say, one year into the future. Ex post , sometimes called "back-casting" means that at the end of the year I correct the parameters of the
model according to the end of the year data and then "forecast." Of course,the dependent variable cannot be used as a datum for correcting the values of
parameters, whereas in constructing the model originally, all data, includingavailable time series of observed values for the dependent variable, couldhave been used in setting parameter values. Such a comparison helps to
identify the relative effect of the structure of the model and the adequacy of
support data on the accuracy of the forecast.
Scenario Support ; Several ideas form this area. The first is extractionof intermediates. This idea is related to the following question: "If a
model gives results which are unexpected or counterintuitive, you would liketo be able to explain why this happened?" Presumably your ability to recoverintermediate steps will help to do this. Organization of a model that wouldallow you to extract intermediate results would be extremely useful andcertainly can be expected to enhance confidence in the model. Next, we would
152

like to know really, for what sets of inputs you can expect the model to giveyou worthwhile results. Information about this sort of thing is clearly con-fidence related particularly for the users of models. There is some overlaphere with Benchmarking and with Quality of Data. The frame of reference underthose headings, however, was basically undifferentiated, "abstract" questionsof accuracy and model system characteristics; here the emphasis is on the pur-poses of the model. Another subhead under scenario support is baseline andalternative scenarios. The principal notion here is that of analysis and ex-planation. Thus, we are interested in transparency in formulation that willpermit convenient correspondence between narrative description of scenariosand the sets of parameter values which define the scenarios formally, (i.e.,mathematical "state space" specifications). Assessors (and users) will wantto run a variety of scenarios and be able to tell a good story about the out-puts .
Model Management /Data Base Administration ; This refers principally to
the environment in which a model is operated. If a model is to be used on a
daily basis, or at least, "frequently", the operational environment is ex-tremely important. The extent to which this environment is systematic andorderly has strong confidence implications. Model maintenance is a criticalcomponent of model management for models amenable to continued application.It involves planning for archival procedures and updating of all components of
a model and associated data, as the analysis of a subject system evolves inresponse to "exogenous" information growth and feedback from prior operationof the model. An associated issue in management/maintenance is the establish-ment of a directory of who knows what, or who has been responsible for what,during model development or operation. This sort of information facilitatesmodification of a model by persons other than the original developers, and
provides a means in general for redressing lacunae that always exist in doc-umentation of a complex model. Directory information may be embedded in a
history of the model, a category of information of perceived importanceroughly related to the frequency, duration and range of actual applications.(That is, for complex models in heavy use, a history is more readilyacknowledged as an aid in interpretation of model results, while a history for
record purposes of a once or twice-employed model may be considered merelycosmetic). A directory or a history are instances of a central confidence-related notion; that of an audit trail, which indicates the provenance of
various entities of the model. It is especially useful as a trace of the
sources and organization of data, and this tells part of the story of how the
model results came about.
Documentation, a general confidence related area for models, has not beenaccorded a separate listing here. Its importance can be gauged by noting that
it is threaded, at least tacitly, through all six of the items in the check-list, and invoked under several aliases in the sixth. The session heard a
brief statement on a significant intersection between computers and docu-mentation. Dr. Harvey Greenberg of DOE cited work under way in OAOA aimed at
automating the production of portions of audit trails and other aspects of
model documentation.
153

We close this account with some remarks by the session co-chairman Dr.John Maybee given at the end of his oral report of the session discussion:"This, I think, summarizes the things we have to say, that I want to reportabout. I want to exercise the chairman's prerogative at this point, and makeone or two comments of my own feeling about what was done in our workshop at
least.
"
"We did a lot of talking and we came up with a list of things which are I
think fairly obvious things, but I suspect that of the people in our workshop,there was really only one present who has done any serious assessment of
models. It seems to me that what we've done, up to this point, is probablyuseful, but we've been talking about all of this for a year or two; now it'stime to get down and do some of it. We must do some hard analysis on somemodels and quit talking so much, because we can make these nice lists, and wecan enhance these lists—I'm sure we could flesh out what was on that chart(the checklist) to a considerable extent, but I really feel that the realchallenge at this point is to get busy and make precise and apply some of
these slippery philosophical notions. I hope that if and when there's anothersymposium or conference of this type that we will have some reports and papersof assessing and confidence building actually addressed to specific models and
we'll see something more than just talk about how we think it might be done."
MODEL CONFIDENCE DISCUSSION PAPER
We begin with five postulates cast firmly in sand:
(1) Confidence in a model is subjective , in contrast to its majoringredient—validity;
(2) Validity is objective , but context dependent;
(3) For the analyst , confidence in and validity of a model are so
intimately intertwined (read correlated) that they are not worthdistinguishing;
(4) For the non-analyst model user , smart but no technician (readmathematician/statistician) , confidence in a model comes from a
variety of factors beside validity (which has a different meaningthan it has for an analyst, anyway). User confidence is a core
subject of this position paper;
(5) Analysts can enhance "legitimate" confidence for users only by
exercise of a model and lucid exposition of model analysis to a "user
community.
"
154

The remainder of our paper will elaborate these assertions:
(1) Is merely a tautology as stated, but its importance here is that wewill not attempt to define nor seek measurements of "confidence-worthiness" as
an objective attribute of a model. We feel that a talented (sophisticated)user will usually have more confidence in the employment of a model than anuntalented user; but, on the other hand, an untalented user may respond to in-
dicators of model worth that can be spurious, such as the presence of a largepopulation of his peers who are "satisfied customers;"
(2) Although no precise definition of model validity has yet appeared, wefind it convenient to consider all those attributes of a model and its perfor-mance which are measurable (if only in principle), as the constituents of va-lidity. Although many of these will depend on the purposes of a model's em-ployment and the milieu in which that occurs, they are not transformed by thepersonality or attitudes of the user. Hence, the notion of context dependenceand the distinction between "subjective" confidence and "objective" validity;
(3) Is a moral ideal, reflecting the belief that a "compleat analyst" istotally free from bias or emotional commitment to (or against) any model, so
that subjective confidence does not obtrude onto the analyst's evaluations. Wethus dismiss further consideration of analyst confidence;
(4) Reasserts the idea that the user (policy maker, e.g.) responds to a
variety of signals relating to how a model has satisfied or appears likely to
satisfy information requirements for his purposes;
(5) We can't see any way to tell a user how confident he should be of a
model through bare recitals of our objective criteria.
Ultimately, the utility of a particular modeling structure or algorithm de-pends upon the insight and understanding of the user. Thus the utility of a
model is a subjective matter and may be expected to vary from one user to
another. We will devote the sequel to aids for disseminating insight. Some
will object to the above assertions on the grounds that a model designed to
make forecasts can be compared with reality and a "track record" established.This may in fact be true for short-range forecasting, but for longer-rangeforecasting the utility of a model as a predictor may be understood in a dif-ferent sense. In the long run, its future is not necessarily likely to close-ly resemble the past. In fact, policy decisions based upon forecasts madeusing raid- and long-range models may act to insure that the future is quitedifferent from the past. Thus, such models may prove extremely useful even in
situations where their track record would turn out to be very poor. The fact
of the matter is that such longer-range forecasts often only need to be quali-tatively correct. Policy decisions are apt to be based upon the followingtypes of information:
155
(1) An increase in x leads to a decrease (an increase) in y;
(2) If both X and y decrease, then z will also decrease;
(3) A large increase in x leads to at least so much of a decrease in y.
The statements labeled 1 and 2 are purely qualitative in character. Usually,we expect our models to provide more than just such simple-minded qualitativeinformation. The statement 3 is an example of such a more robust piece of in-formation. It thus represents the kind of forecast we might expect to obtainfrom longer-range models.
We do not wish our point here to be misunderstood. Nearly all models actuallylead to quantitative forecasts, i.e., to real numbers. The users must under-stand how to translate a set of such quantitative forecasts into statementssuch as 3. This is one of the ideas we had in mind above when we assertedthat the utility of a model depends upon the skill of the user.
If we are correct in our assertion that confidence in a model is subjective,then it seems likely that the way to transmit confidence is through analysis.Therefore, let us turn next to our second basic position.
We shall take the fundamental position that analysis of a model consists of
documentation of the model together with the application of any procedure de-signed to evaluate some aspect of the utility of a model or to detect a defi-ciency in it,
A careful description of this position would begin by separating the analysismethodology into several distinct categories and proceed with a lengthy and
detailed investigation of each such category. But this is a position paperdesigned to provoke discussion so we shall keep it short and simply enumeratein shotgun fashion a list of points. Our hope is that participants will bringup additional points and/or show us where we are incorrect.
(i) One must have a description of the assumptions made by the modeler,with reference to the "world" that is modeled. One must try to decide whetheror not the model is plausible and to what extent it has experimental support.
(ii) A description of the modeling methodology used in the formulation ofthe mathematical model is required. It is important to try to decide if the
choice of the methodology is adequately justified. Also we must know to whatextent the structure and equations of the mathematical model are consistentwith the theory and methodology,
(iii) A logical decomposition of the model into convenient and recogni-zable submodels with flow charts indicating clearly the variables of the model(input variables and output variables) and the parameters is required. We
must try to determine whether or not the parameter values set by the modelerare plausible.
156
(iv) For e^ach submodel, a list of the equations needed to produce theoutput vector y given the point vector x is required.
(v) For each submodel aiid also for the entire model, a definition of thedomain, i.e., the region in x-space for which the model is claimed to performsatisfactorily, must be stated. We must then ask, if when the output from onesubmodel acts as the input for another, will the former always be inside thedomain of the latter? We must also ask, does a unique solution to theequations in each submodel and in the entire model exist for every x in thedomain?
(vi) For the parameters fixed by the modeler, we must know both theirnominal values and some quantification of uncertainty (preferably a probabili-ty distribution or some properties of it).
(vii) We must have a statement concerning the existence and uniqueness of
the solutions to the equations used in each submodel and in the entire model.
(viii) We must have descriptions of, or references to documentation for,the algorithms used to solve the model equations, and a statement regardingthe convergence properties of these algorithms. We must know if "state of the
art" algorithms have been used to solve the model equations. We must know if
there are portions of the programs that could be designed better in the senseof reducing roundoff error.
(ix) We require a quantitative description of the approximation (conver-gence rules, mesh sizes, discretizations) built into the algorithms.
(x) We must have a documented listing of the computer program and the in-structions for its use.
(xi) We require a description of all parameter estimation procedures, in-cluding (a) the way the data were obtained and (b) the method of estimationincluding both the statistical and numerical assumptions underlying the
method. We must ask, are the uncertainties given for parameters that wereformally estimated consistent with the statistical results of the estimationprocedure? Are the parameter estimation procedures and the demonstration of
goodness-of-f it statistically valid under the assumptions given?
(xii) We must have a description of real world data presented in supportof the model including (a) how the data were obtained, (b) quantification of
uncertainties in the data in probabilistic form, (c) the settings of the x-variables and the parameters used in computing the output, (d) a descriptionof any formal statistical goodness-of-f it tests done together with the under-lying assumptions of the tests, and (e) the role of these data in the develop-ment of the model.
157

(xiii) We must attempt to analyze the structure of large models and dis-cover methods for simplifying and/or approximating them. This should be doneon the theory that "small is beautiful" if it will work nearly as well aslarge. Qualitative analysis should be applied wherever possible. Experimentsshould be made with model output applying the principles of response surfacemethodology.
(xiv) Discretization techniques used to generate algorithms should be re-viewed and the size of all truncation errors identified. The interplay be-tween roundoff errors and discretization errors should be analyzed when appro-priate with a view toward optimizing the total error. Stability problems,both mathematical and numerical, should be identified if possible. Alterna-tive methods must be investigated where lack of stability occurs or is sus-pected. Sensitivity issues should also be studied.
(xv) Where possible, such techniques as Monte Carlo methods, stratifiedsampling, latin hypercube sampling, etc. should be applied to the analysis of
uncertainties in models. An attempt should be made to fomulate general meth-ods for assessing uncertainties in model outputs in terms of known or assumeduncertainties in model inputs and parameters.
(xvi) Attention should be given to the performance testing and finetuning of any algorithms used in the model. Questions of proper data basemanagement for the regular use of the model and to answer queries regardingthe model should be answered and improvements made where appropriate. If
state of the art algorithms have not been used and do in fact exist, theyshould be brought in-house and used to replace the algorithms in the model.
Now let us explain how we can use the above list of activities as a prescrip-tion for enhancing confidence. In the first place, not all of the above acti-vities will be appropriate to a given model so that a sublist should be de-vised in each case. Then a small group of experts can be assembled and as-signed the task of analyzing the model. This group would then report backtheir findings. How would such a report be useful?
Two groups of people might be identified as being concerned with confidenceissues. First we have other potential users of the model. Presumably, they
will be expert enough to understand the significance of some parts of the re-
port made by the analyzing task force. Their level of confidence may then be
enhanced to the extent that they can understand the report and to the extent
that the report is itself satisfactory.
A second group of people concerned with confidence issues consists of policymakers who rely upon the output of a model to help them make policy decisions.The level of confidence such people have in the model must be a derived levelof confidence dependent upon their confidence in the scientific ability of the
analyzing task force. The seems to imply that the report should contain anexecutive summary in which the significance of the findings is explained inlaj^an's language.
158

REPORT ON WORKSHOP 3
MODEL STANDARDS TO AID ASSESSMENTDR. MILTON L. HOLLOWAY
EXECUTIVE DIRECTORTEXAS ENERGY AND NATURAL RESOURCES ADVISORY COUNCIL
In our workshop we were concerned with the standards that aid assess-ment. We built our discussion loosely around questions raised in the pre-
pared issue paper. I wrote the issue paper and it reflects the major con-
clusions of a year-long assessment of EIA's Midterm Energy ForecastingSystem by a team in Texas which I directed. ' The issue paper makes threemajor points. The first is that we should recognize that there are three
basic kinds of models, and that when we talk about assessment, and about
standards or guidelines to aid assessment, we need to recognize which kindof model is being assessed. The three types of models identified are
disciplinary, subject matter, and problem solving models.
The second point made in the issue paper was that in this NBS confer-ence and the one that preceded it, we were primarily concerned with the
problem solving type model, and furthermore, that we are and have been con-cerned with large-scaled computer models and their use in the public policyprocess. My perception is that this conference, the model assessmentactivities at MIT, the Energy Modeling Forum, and the Texas National Energy
Modeling Project are primarily responses to conditions that arose out of the
use of large-scale models in the public energy policy process; therefore, weare and have been primarily concerned with that kind of model—large-scale
models that are used in public policy decision making. In my classificationsystem these are problem solving models.
The third point in the issue paper was that, given the problem solving,
large-scale model orientation, the focus on assessment (and therefore on
standards specifying to model builders what to provide to model assessors)
needs to shift emphasis somewhat from the computer based model kinds of
information to more information about the process—the way in which models
are used in the public policy decision making process. This is because the
process—the way problems are designed, the kinds of time frames that one
has to operate in, the disciplinary backgrounds required by a particularproblem—has a great deal to do with the choice of models, the choice of
techniques, whether you build a model, or whether you use an existing one,
and so on. The process needs assessment and models need to be assessed in
the context of the decision making setting. This last point turned out to
be highly controversial in our workshop.
We spent most of the day debating whether or not it is appropriate for
assessment to get into the process, per se; I argued that is should. Some
people felt that this was getting out of assessment of models into assess-
ment of policy analysis, per se, and that that was a different kind of
1 Milton L. Holloway, ed., Texas National Energy Modeling Project; An
Experience in Large-Scale Model Transfer and Evaluation , Academic
Press, New York, 1980.
159

animal outside the scope of this conference. Others felt that assessing theprocess constitutes an evaluation of whether something called "due process"was really working right or not. And still others thought that to move inthat direction was something that a political scientist might do, but thatmodel assessors ought not to do.
So we did not reach any firm consensus on this point. However, therewere several in the group who were supportive of including the process inassessment. The emphasis given in the issue paper was recognized as a
needed part of assessment, but several of us came out of the workshop withdifferent ideas of how strong the emphasis ought to be.
A set of charts helped focus the workshop discussion. If you ask thequestion, "What should be evaluated in assessment?" then my claim is thatthere are at least three classes of models—disciplinary, subject matter,and problem solving models—and that what is appropriate to assess in eachof those cases is different. This outline is shown in Table 1.
Let us focus first on disciplinary models. Those are the kinds ofmodels with which you and I are most familiar because the disciplines arewhere our formal training came from. Most of us come out of a particulardiscipline, and the process for assessment as practiced in graduate schoolprograms and related professional societies is fairly well defined.
Disciplines are reasonably well self-policed so far as assessment is
concerned, so I do not think this conference is very much concerned withstrict disciplinary models.
The purpose of disciplinary models is to push back the frontiers ofknowledge in a particular discipline. They are designed for educationalpurposes and so on, and not very much for problem solving.
Subject matter models (Table 1) include more than one discipline. Theyare models built around various subject matter areas—energy, water resources,population, so on. They collect techniques and methods—approaches fromseveral disciplines—and focus on a subject matter area. But they are notproblem specific. That is, they are designed to address a class of problems,not a specific problem.
The kinds of things that we worry about or ought to worry about, in myopinion, in subject matter models are pretty much the same as in disciplinarymodels. That is, we should examine primarily (1) the data, (2) the logic(or the theory), and (3) the actual behavior of the model in our assessmentactivities, but we should also pay some attention to comprehensiveness,because subject matter models have to address more questions than strictdisciplinary models.
But I believe the primary concern of this conference should be withproblem solving models, and therefore we have to look at a much broaderrange of issues in deciding what to evaluate and what kinds of standardspeople ought to adopt and use for purposes of aiding assessment. Hereto-
[
fore, our concern has been primarily with the first three areas; the data,
the logic, the behavior of the model—things that are tightly centered
i
160
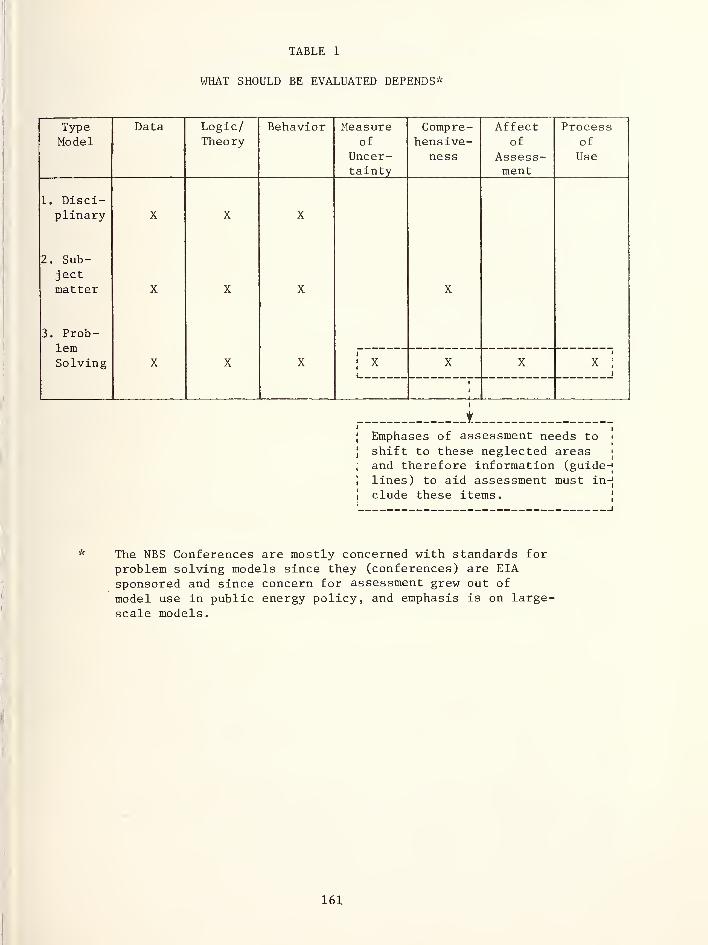
TABLE 1
WHAT SHOULD BE EVALUATED DEPENDS*
TypeModel
Data Logic/Theory
Behavior Measureof
Uncer-tainty
Compre-hensive-
ness
Affectof
Assess-ment
Processof
Use
1 Disci-plinary X X X
2 Sub-jectmatter X X X X
3 . Prob-lemSolving X X X
!X X X
1
X;
1
*
Emphases of assessment needs to '
shift to these neglected areasj
and therefore information (guide-;
lines) to aid assessment must in-|
elude these items. !
The NBS Conferences are mostly concerned with standards for
problem solving models since they (conferences) are EIAsponsored and since concern for assessment grew out of
model use in public energy policy, and emphasis is on large-
scale models.
161
around a computer code. The emphasis needs to move more to the latter fourareas (Table 1), which are equally the concern of problem solving models usedin the public policymaking process. These include some measure of certainty,which is more important in public policy and problem solving situations thanit is in disciplinary models.
Comprehensiveness is a key measure of the adequacy of a problem solvingmodel. If the model is poor in this way it is leaving out much information thatthe decision maker knows is important. Assessment of problem solving modelsought to look closely at comprehensiveness.
We spent a good deal of time in the workshop discussing the effect of
assessment itself as an assessment concern. That is, if we are going to beconcerned with assessment, then one of the things we ought to pay attentionto is the effect of assessment on the evolution of the model over time
—
this should be evaluated. As a model built for a particular purpose evolves
—
as they always do if they are successful— the question is how have assess-ments by various groups affected the changes made to the model to make it
more useful?
Finally, the thing that generated the most controversy in our group,was the idea that assessment should include an examination of the decisionmaking process and the use of the model in this decision making setting(Table 1). In the issue paper I claim that the NBS conferences—this year'sand last year's—were mostly concerned with standards for problem solvingmodels, since these conferences are EIA sponsored, and since the concern forassessment grew out of model use in public policymaking, and the emphasis hasbeen on large-scale models.
The last column of Table 1 suggests that assessment should be concernedwith the evaluation of the process in the case of problem solving models.Therefore we should ask model developers to supply a set of informationrelated to the process in order to complete the assessment task; this informa-tion will be just as important as documentation of a mathematical model.
As shown in Figure 1 there are essentially three classes of participantsin the public policy problem solving situation. First is the set of decisionmakers. Some people at the conference say they have never seen one of thosecharacters. If that is the case, they are evidently not involved closely in
policy work.
As the policy process operates in Texas, I certainly know who the decisionmakers are and I answer to them. And I believe the lines of authority are
clearly defined in the power structure of government, whether it is in Austinor Washington. Although we may work for many clients, and there are many playersin the final decision making process, those players are usually uniquelyidentified. They are primarily elected officials and appointees of electedofficials; they are the center of power in the U.S. governmental decisionmaking process.
A second group involved in the process is the analysts (Figure 1)
.
Analysts are investigators, and most of the people in this conference fall into
that category. Investigators include not only advisors and directors of
research programs, but modelers themselves.
162
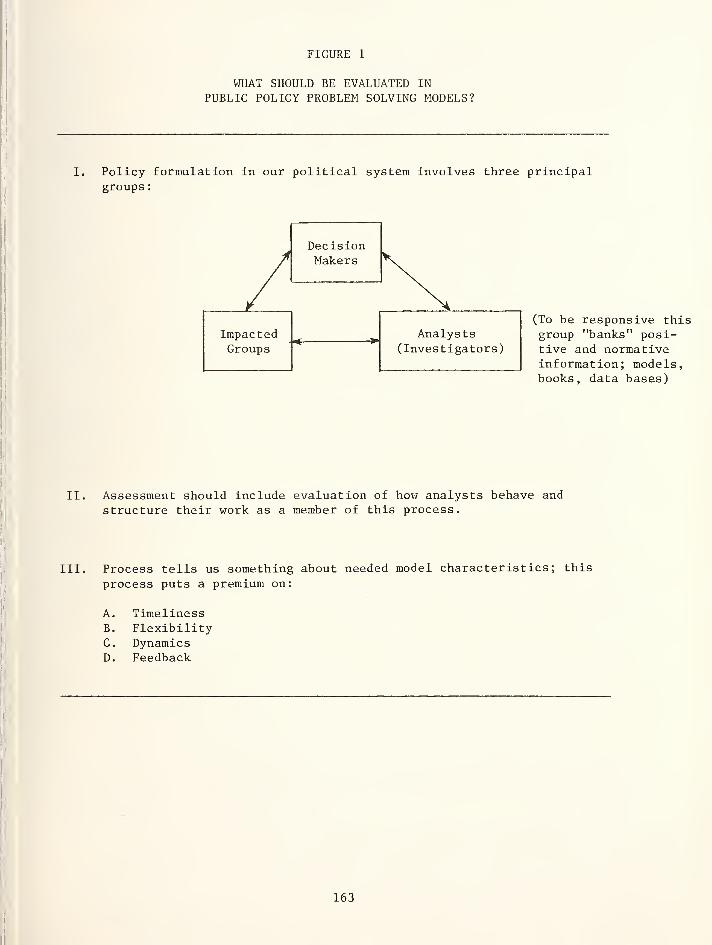
FIGURE 1
WHAT SHOULD BE EVALUATED IN
PUBLIC POLICY PROBLEM SOLVING MODELS?
I. Policy formulation in our political system involves three principalgroups
:
DecisionMakers
Impacted AnalystsGroups (Investigators)
(To be responsive th
group "banks" posi-tive and normativeinformation; modelsbooks, data bases)
II. Assessment should include evaluation of how analysts behave and
structure their work as a member of this process.
III. Process tells us something about needed model characteristics; this
process puts a premium on:
A. TimelinessB. FlexibilityC. DynamicsD. Feedback
163

The third important group involved in the public policy decision makingprocess is impacted groups—representatives of those people impacted bypolicy decisions. If you observe the process at work, this group certainlygets involved and decision makers always consult with them. And in my opinion,if we are going to do a good job as analysts in this setting, then we ought to
interact with these people too, because such interaction is a great source oflearning about which values different groups hold; that is, whether the variousoutcomes of policy decisions are going to be taken as good or bad by particulargroups. And that has a lot to do with what is worth analyzing or modeling.Figure 1 indicates that there is, in the policy process, a three-way interac-tion between these three groups. Assessment should examine the adequacy of
model use in this process.
The other point of Figure 1 is that in our behavior as analysts in thissetting (in order to be responsive) we have learned to create "banks" of
information. I mean that we create computer models and data bases, booksand publications, including a set of normative information about good and badoutcomes that reflect the values of people impacted by decisions. Decisionmakers, especially elected officials, reflect these values if they get re-elected. Much of this positive and normative information can be banked, andin order to operate efficiently, that is what we do. A computer model thatis the concern of this conference, for example, is a bank of informationabout relationships between important parts of the energy, economic andenvironmental systems.
To follow the argument a step further, assessment should include the evalua-tion of how analysts behave and structure their work as a member of thisprocess (Figure 1). And my point is that one really cannot appropriatelyanalyze a model—a computer model—and formalize assessment of models, unlessthe process is included. I will say more about the specifics of this part of
assessment later in the paper.
The third major point of Figure 1 discussed in our workshop is that the
policy process tells us something about desirable model characteristics. Whenwe consider formalizing part of the process in the form of a computer model,then certain characteristics fit better than others. The first characteristicthat should guide model selection is timeliness. In many situations, if youcannot get the answer by next week, or three months down the road, it is not
worth getting. The political policy process puts a high premium on timeliness.
The second characteristic is flexibility. In order to be efficient one
should structure and bank information so that it is flexible; one needs to
use what is needed and leave the rest. Everyone knows that in a dynamic worldeverything is potentially related to everything else, implying a need for large
integrated models. But at some point the value of impacts on remote parts of
the system is very small. Models should be structured to allow flexibility.
The third characteristic is dynamics. All who have been involved in
public policy know that the systems we try to model are dynamic, and that
people are not worried about just today, but about tomorrow. Further, the
decisions that they make take tomorrow into account. Models should capturetime-dependent relationships. A policy solution involves "when" as well as
"what" to do.
The fourth characteristic is feedback. In the political policy process a
great deal of feedback occurs among the groups. There is feedback from
16^

various places at various times. When we structure some of the relevantinformation in the form of a computer model, these feedback loops ought to berepresented so that we can make changes appropriately.
The issue paper prepared for our workshop contained a checklist for modeldocumentation. John Mcleod originally published this check list in SimulationToday . We did not spend as much time on this list as I intended but in
general, 1 think people agree that Mcleod's list contains the right elementsbut there was considerable discussion about balance. Generally, there wasagreement that Mcleod's list includes many items that a model developer oughtto supply for purposes of an assessment. The outline of Mcleod's list is shownin Table 2. The first set is project information. This is very simple,straightforward information, but it is surprising how much of this is nowincluded when one tries to assess someone else's model. The title for themodel, the organization who sponsored it, a contact person, the objectives of
the project, project duration, etc. should be included.
Second is model development information—the names of the modelersinvolved, purpose for which the model was developed, disciplines involved in
the development of the model, the data required, methods of development, costof development, availability, compatibility with other kinds of similar models,and the extent of use—should be made available.
In the workshop we did not think Mcleod's list contained two items every-one considers very important in examining and trying to understand a model.Explicit information should be given as to how the choice of parameters cameabout. Did the modeler use regression techniques, someone else's estimates, or
some other procedure? Second, there needs to be an explicit equation specifica-tion. One cannot easily untangle a computer program without such information.
The third item on the checklist is model description. Classification of a
model helps immediately to gain an understanding of the model. For example,one should describe whether a component is an econometric model, an LP model,a systems dynamics model or some other type.
Other needed model descriptions include a block diagram of how the modelsystem works, the computer program itself, the notation used in the program,attempts to validate the model, reference information, the distinctive featuresof the model as to how it may differ from the usual approach, the model ante-cedents and the relationship to other models.
Our workshop thought that the Mcleod list ought to add a number of items
including the definition of validity, or validation, because there is not com-mon agreement on the meaning of these terms. If an assessor wants to know howwell a model is validated by its developer, we ought to ask for such definitions.
Our workshop group thought it very important to add to a checklist two
basic documents relating to the computer model: (1) the code itself, and
(2) the code description. The modeler should provide the list of mathematicalequations describing the system, and there ought to be clear pointers in the
model documentation identifying which sections of the code apply to a particular
section of code. This is almost essential if one is to have a reasonable chance
of understanding the code.
165

TABLE 2
MODEL DOCUMENTATION CHECKLIST TO AID ASSESSMENT(due to John Mcleod, Simulation Today)*
1. Project Informationtitle, organization, contact person, project objective, projectduration
2. Model Development Informationname of model, name of modelers, purpose for which modeldeveloped, disciplines involved, data required, method of
development, cost of development, availability, compatibility,extent of use
add : choice of parameters, equation specification
3. Model Descriptionclassification, block diagram, program, notation, validation,reference information, distinctive features, model antecedents,relation to other models
add ; definition of validation, put pointers in model documenta-tion to identify sections of code
4. Simulations (experiments)title, purpose, assumptions, experimental design, data requirements,data used, run time, cost/run, results, analysis
add : verification history
5. Discussioncomments, conclusions
6. Literatureproject reports, references, bibliography
*John Mcleod, Simulation: From Art to Science for Society, Simulation Today,
No. 20, Decmber 1973.
166

The fourth item in Mcleod's list is simulations or experiments done withthe model and he would like to see a title for each experiment, the purpose for
which it was done, the assumptions used, the experimental design, exactly howthe experiment was set up, data requirements, the data used, the run time, thecost of the run, results, and an analysis of the results. Our workshop thoughtthat one ought to expand this list to include verification history; that is,
how many of these kinds of experiments have been done over the complete historyof the model, and how has the model been changed to reflect the learning fromsuch experiments.
The fifth item on Mcleod's list is discussion. This item should providefor the drawing of some conclusions and insights that the model developer cangive
.
Sixth on the list is literature, which includes project reports, refer-ences, and bibliography information. This information is very essential forunderstanding the model.
The other information about the process which I argue we need for assess-ment is described in Table 3. The listing in Table 3 is a first attempt to
itemize a set of information that modelers ought to supply about the process,if the model is a problem solving model.
The first on the list is the definition of problems. The modeler shoulddescribe what kind of interaction occurred between analysts and the decisionmakers. This is a very essential part of the policy process, and if it is
ignored then analysts are not apt to do a very good job of selecting theappropriate tools, making the appropriate modifications to the existing modelsto be used, and so on. So assessors ought to know something about what kindof interaction occurred.
Secondly the modeler should provide information about who was involved,and I mean by that the different players in the process, not necessarily indi-viduals. It would be useful to know whether interaction on problem definitionhappened in formal meetings, or whether it occurred by written correspondence,and lastly whether there was some refinement that took place. This set of
information would give an assessor a good feel for whether the model develop-ment and use occurred as a result of a modeler's isolated attempt, as a resultof interaction with the mid-management level of an organization, or if it grewout of interactions with the organization's chief executives. One should knowif models were built as the result of a presidential decree that some newpolicy is to be adopted, the result of an organized attempt to identify keypolicy issues, etc. This information is very important in understandingexactly why a particular model was chosen, why certain modifications were madeto it, and so on.
The second major item in Table 3 is a description of the kind of inter-
action which took place with the groups to be impacted by policy decisions.
This information is important because it tells an assessor the extent to
which the selection of models and the definition of the problem reflected the
values of people who are going to be impacted by the decisions.
It may be, for example, that the analyst's first attempt to define a set
of policy options leads to the conclusion that absolutely no one would support
If7
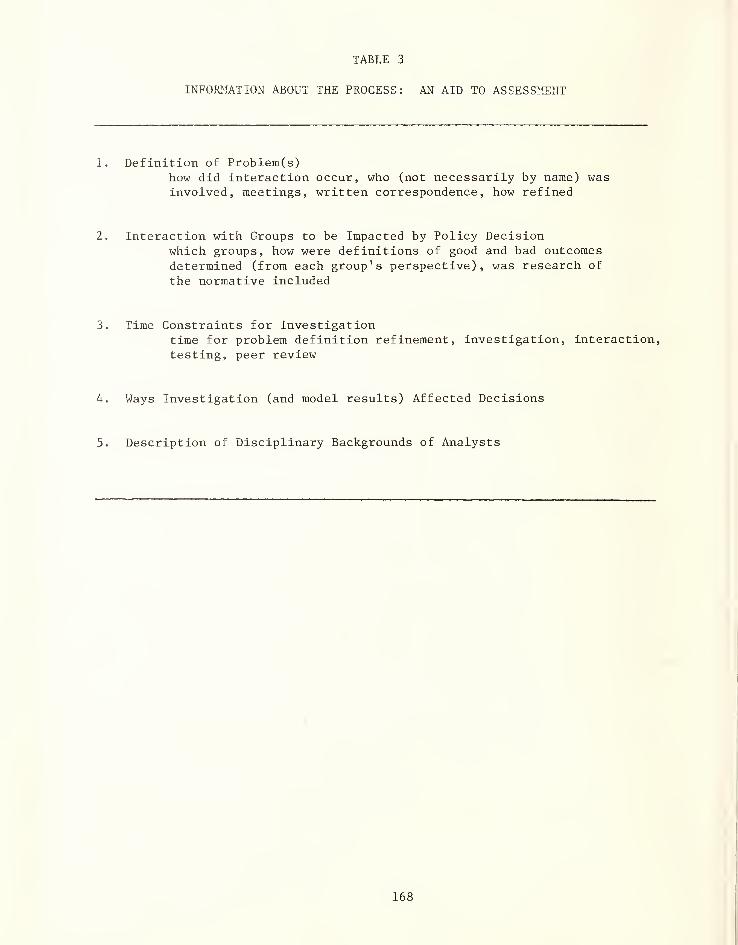
TABLE 3
INFORMATION ABOUT THE PROCESS: AN AID TO ASSESSHIENT
1. Definition of Problem(s)how did interaction occur, who (not necessarily by name) wasinvolved, meetings, written correspondence, how refined
2. Interaction with Groups to be Impacted by Policy Decisionwhich groups, how were definitions of good and bad outcomesdetermined (from each group's perspective), was research of
the normative included
Time Constraints for Investigationtime for problem definition refinement, investigation, interaction,
testing, peer review
4. Ways Investigation (and model results) Affected Decisions
5. Description of Disciplinary Backgrounds of Analysts
168
a policy initiative in that direction because all principal groups believe thepolicy would yield a bad outcome. In this case, the process generally redefinesthe problem; this is a very important part of the process. And assessors oughtto know the essential information about the use of models in the process
—
which groups were involved, how the definitions of good and bad outcomes weredetermined from each group's perspective, and if there was explicit researchdone on normative issues.
The third item in Table 3 calls for information on the time constraints for
investigation. This is very crucial information. Timeliness is of the essencein the political decision making process, and much of what is done is greatlyaffected by the time constraint. So a modeler should provide to assessorsinformation concerning how much time was allowed for problem definition, refine-ment, the investigation itself, interaction among groups, testing, and peerreview group functions.
In some cases, when the importance of items listed in Table 3 are notunderstood and appreciated and when an organization is not structured to achieveinteraction, the investigation process may take virtually all the time availableand be ill-conceived because the problem was not defined very well. Assessorsneed to spend time examining this kind of information in order to judge the
good and bad qualities of models. Results may be criticized because there areno peer reviews, and so on. So analysts need and assessors need that kind of
information.
The fourth item in Table 3 is difficult but necessary. Assessors oughtto know the extent to which the modeling results actually affected decisions.Assessors need some feedback about how models in particular investigationswere used, and how they affected final decisions.
The last item in Table 3—and this received much discussion in ourgroup—calls for a description of disciplinary backgrounds of the analysts
involved in the modeling. Many felt that such information is irrelevant and
assessors ought to be able to do the job without it. I think it adds a great
deal of understanding on the part of the assessors. Disciplines are
accustomed to dealing with modeling approaches in different ways and such back-ground information provides clues to the values and orientation of the modelers.
This concludes the summary of our workshop discussion. Again, I think
that the best I can say is that we got loose agreement about the essentialinformation which should be provided in order to aid assessment. We had
varied opinions about how much emphasis ought to be given to descriptions of
the process as opposed to the model itself.
169

REPORT ON WORKSHOP 4
SENSITIVITY ANDSTATISTICAL ANALYSIS OF MODELS
*Carl M. Harris
David S. Hirshfeld1. INTRODUCTION
This panel was a relatively small one, but it was very active. The group wasmade i:ip of people with diverse backgrounds, both fron the inethodological point ofview and with respect to day-to-day professional perspectives. There were univer-sity people. Government people, and industry people, including a number from theNational Energy Laboratories. As a result, we had a variety of opinions that rangedover many areas. But we were able to reach a moderate consensus on the major issues.Our discussion inclijded possible new research areas, future ventures, and very specificindividual project recjuirements
.
It was felt that explicit treatment of the \jncertainty associated with energysupply and demand projections can improve their usefulness in policy analysis.Unfortunately, relatively few energy modeling efforts to date have enjoyed thisenhancement of their utility.
The workshop agreed to define "uncertainty" broadly, to include both: (1) truerandomness in input data and parameters; and (2) potential errors residing in modellogic, model structure, or cotputational procedures. Sensitivity analysis, in turn,is the formal investigation of how and to what extent changes in a model's numericaldata, assiitptions , logic, and mathematical struct\ire affect (1) the results generatedby the model and (2) the inferences that one can properly draw from such results.
Most energy modelers have relied almost exclusively on deterministic sensitivityapproaches to uncertainty assessment (for exanple, see r^lanne, Richels, and Weyant,1979) . To quote Manne, et aL, "Economic assessments typically contain benefit-costcalculations for a large number of scenarios, with each scenario representing theuncertainties as though they could be all resolved before any actual choices had tobe made." For short-range models they point out that long-term randomness may havelittle or no impact on output measures and thus a non-random model might suffice. Buteven here, if alternative scenarios (varying according to some underlying probabilisticstructure) lead to very different model outputs, deterministic approaches cannot pro-vide a ccirpletely satisfactory picture. In mid- or long-term cases, some key inputelements will quite likely behave in a random fashion, and thus suggest a non-deter-ministic strategy for assessing the range of model outputs.
It was of interest to the workshop to note the sensitivity analysis that has beendone for the Midterm Oil and Gas Supply Modeling System (IVDGSMS) by the Department of
Energy (DOE) . An assessment of the sensitivity of these models to its key input vari- •
ables has been made, and shown in recent data validations and updates (for exanple,
see Office of Energy Information and Analysis, 1976, PIES Documentation , Volume IV)
.
Clearly, those variables specified should be the major focus for any sensitivityanalysis. Of special concern might be the high sensitivity variables that may properly
be viewed as stochastic (since these inpact the model's basic randcxn character)
.
There is also, of course, the issue of model randomness caused by the estimation of the
parameters from data v±iere there is scatter about sane nominal or "true" value. Froma modeling perspective, this data uncertainty is as much a source of randomness as the
model's stochastic variables, and its consideration may well be part of a data vali-
dation effort.
*Center for Management and Policy Research, Inc., Washington, D.C.
**Hirshfeld Associates, Potomac, Maryland171

Additional sensitivity work on MOGSMS has been done atDOE by a (deterministic) analysis of changes in projected crudeoil and natural gas production. Some of the key endogenouscomponents have been selectively varied over small ranges,within each of a number of exogenous, preset scenarios.
An integral part of the National Bureau of Standards (NBS)Energy Model Validation project for DOE in 197 9 was a task todetermine "the sensitivity of MOGSMS results associated withthe particular choices (of data values) which make up themodel". This task called for a sensitivity assessment of themodel by comparing alternatives to key model inputs.Particular emphasis was placed on an evaluation of modelsensitivity and stability relative to such alternatives. Themajor finding of this task was that there indeed has been aninadequate approach to the assessment of uncertainty in thesupply projections generated by the Midterm Oil and Gas SupplyModeling System. Probabilistic strategies were in fact indicatedhere for passing alternative scenarios through the models ina statistically correct and meaningful manner. The majortechnique used was model sampling , details of which are providedin a number of NBS project technical reports.
In a follow-on NBS study, the results of this priorsensitivity work and related tasks v;ere applied in early 1980to a quantitative assessment of "the quality and usefulness"of those MOGSMS results that are a part of the forecasts ofmidterm oil and gas supply in the 1978 DOE Annual Report toCongress . Specifically, this assessment is in the form of asensitivity analysis (as defined above) of these MOGSMS results,with respect to uncertainty (or possible errors) in:
• Input data
• Logical structure
• Statistical methods
This sensitivity analysis does not address two other areas ofuncertainty or possible error:
• Mathematical structure
• Computational procedures
Sensitivity analysis is especially pertinent for MOGSMSbecause its results are widely distributed, and these resultsappear to be sensitive to key input data elements, parameters,and assumptions. The 1978 ARC , for example, makes frequentreference to the effects of alternative input scenarios,uncertainties in parameters and variables, and even alternativeprocedures for making the forecasts. This emphasis on sensitivityis not surprising, because MOGSMS is a static model, generatingdeterministic results that become forecasts of time-dynamic,highly uncertain phenomena.
172
2. PROBABILISTIC VS. DETERMINISTIC SENSITIVITY ANALYSIS
It was agreed by all that sensitivity methods are basicto effective operations research study. Presentation of theeffects of perturbations of model variables and parameters isa principal way of conveying to decision makers an understandingof the environment in which they operate. Indeed, careful andcomprehensive sensitivity analysis should be a backbone of anyplanning-oriented modeling project, because policy or decisionmakers usually want more than single numbers or simple sets ofnumbers as answers. They desire a credible assessment of therange of possible outputs and how these can vary with differentactions. How, for example, can desirable end results be reachedby altering some of the decision variables and what are extremepossible outcomes if circumstances do not evolve quite asoriginally perceived?
It may well be that a policy maker wants to set values ofmodel parameters at any of a number of alternative levels, allof which may be feasible choices, though only one set may becomethe basis for action. The modeler must be able to test theeffect of each such alternatives. Another policy maker maywish to choose key elements in a system from a range of practicalalternatives. The effects of all such possible changes mustthus be assessed in a comprehensive fashion. We refer to thesekinds of uses as Deterministic Sensitivity Analysis . On theother hand, the explicit recognition of uncertainty in a modelleads to a more comprehensive sensitivity testing, includingthat of the manner in which the output reflects the inputrandomness. We refer to this usage area as ProbabilisticSensitivity Analysis . In a sense, in this latter case, the samestrategies for putting alternative scenarios through the modelare used, but the process involves a comprehensive approach,including
:
(1) determination of input probabilities and(particulc .y) joint probability distributions,as necessary;
(2) an experimental design for selecting specificvalues of input elements for analysis ^
;
(3) a statistical format for analyzing and presentingthe results.
A quote from Sisson (1974) reinforces these points:
"...If the moriel is an optimizing form, then itis now ready for use; the data are input and theprogram run to produce the outputs. Most suchprograms not only produce the optimum values
As a practical manner, an equivalent method of selection mustbe used in the deterministic case if model runs are costly.
173
of the decision variables, but also sensitivityinformation. This might include an indicationof the costs of deviating from the optimum, andthe benefits that might be derived by relaxingconstraints; that is, by changing factors originallyassumed to be 'uncontrollable'. If the model isonly a predictive model, then one more step isneeded: it is necessary to decide hov; it will beused to search for the best decision. The searchprocess may be:
• try several alternatives, or
• design a simulated 'experiment' to tryalternatives in a controlled way, whichinsures trying a wide range of them, or
• use a formal search process in which the nextalternative to try is computed so as tolead to a higher utility.
"
It is also interesting to look back at some of the earlytexts on OR to see what was said about these and related questions.Churchman, Ackoff, and Arnoff (1957) considered six majorphases of an operations research problem:
(1) Problem formulation;
(2) Construction of mathematical model;
(3) Deriving solution;
(4) Testing the model and its solution;
(5) Establishing controls over the solution;
(6) Implementation.
Item (5) is of special interest to us /from page 14 of thequoted citation— see also Ackoff (19562^/:
" Establishing Controls Over the Solution
A solution derived from a model remains asolution only as long as the uncontrolledvariables retain their values and therelationship between the variables inthe model remains constant. The solutionitself goes "out of control" when thevalue of one or more of the uncontrolledvariables and/or one or more of therelationships between variables has changedsignificantly. The significance of the
174
change depends on the amount by v/hich the solutionis made to deviate from the true optimum underthe changed conditions."
3. ANALYSIS TECHNIQUES
A key technical issue is the selection of the propermethods for assessing the effects of uncertainty in energymodel parameters. We are able to identify four broad meth-odlogies in frequent use by members of this workshop.
The first and possibly most important, is called modelsampling . This is a procedure for sampling from a stochasticprocess (even a single random variable in the simplest case)to determine through multiple trials (generally via Monte-Carlo methods) the nature and effects of a probability distri-bution that would be difficult or impossible to determineby standard statistical arguments. The second method,called the adjoint method, builds on procedures borrowedfrom matrix theory for determining the matrix characteristicpolynomial and the adjoint matrix. The third method can becharacterized as response surface analysis , typically carriedout under a factorial experimental design. The term "responsesurface" refers to a formal mathematical relationship expressingthe anticipated value of the dependent variable in an experi-ment as a function of the experiment's independent variables.The relationship is derived by statistical analysis of theresults (typically) of designed factorial experiments. Aneffort of this type is often completed by distribution samplingof the variables found important and thought to be random.Finally, there is a fourth class of methods in which genericanalytic methods are used for each calculation and presentationof rates of change of model outputs with respect to modelinputs and the regions of validity of these rates. An exampleis standard postoptimality analysis in linear programming.
3 . 1 Model Sampling
We now return to the first of these four methodologies -
model sampling. As noted before, model sampling utilizes theMonte-Carlo method--random sampling from a probability distribu-tion—but does not include observation of the behavior ofa process through time. Consequently, it does not quite fitthe narrower definition of simulation as normally used. Modelsampling, or distribution sampling as it is also called, hasa long history of use by statisticians to derive empiricallydistributions that are difficult or impossible to derive byother means. An excellent illustration of the application ofmodel sampling can be found in the analysis of PERT and criticalpath networks (see Fishman, 1973)
.
To illustrate this point, let us consider a PERT network.
The basic idea here is to view a project as a series of activities
which must be accomplished consistent with a prescribed set of
175

precedences, typically represented by a network-type diagram.Precedences are established by a specification of the activitieswhich must be completed before any other may begin. Estimatesare made of the time needed by each activity, and the critical-path method then locates one or more paths through the networkwhich determine the shortest time in which the total projectmay be completed. PERT builds on this concept by requiringa probability distribution (generally assumed to be a beta)for each activity time. The critical-path method is thenapplied using the mean activity times. The stochasticcharacter of the activities is not addressed until after thecritical path is derived. The assumption is then made thatthe sum of the activity times on the critical path is normallydistributed (by virtue of central limit theory) with meanequal to the sum of expected activity means and varianceequal to the sum of the variances.
From a probabilistic point of view, two serious problemsmay exist with this approach, even if we can accept the funda-mental critical path structure. Convergence to a central limitmay not be achieved—networks are often small and made up ofa dependent sequence of random variables. Second, and even moreserious, is that situations exist where noncritical paths maybecome critical (and vice versa) because of the interaction ofthe various probability distributions of activities both o'n
and off the critical path. As a result, the deterministicallycalculated project-completion-time distribution is biased onthe low side. The degree of bias depends upon whether thereare any paths that are close to the PERT-calculated criticalpath in length and upon the variability of activity times bothon and off the critical path.
Various methods for approximately determining the amountof bias and some analytic methods for finding the exact distribu-tion have been suggested in the literature; but simulationaffords an efficient and relatively easy way of determiningthe distribution of the project completion time. The simulationprocedure consists of the selection of one random time fromeach of the activity-time distributions in the network, and thecalculation of the critical path and project completion timebased on this sample of activity times. The process is repeatedover and over and results in the generation of the project-completion-time distribution. In addition, the frequency withwhich different activities appear on the critical path can bedetermined, if desired. Although this is a relatively popularuse of simulation, it is not quite the standard one.
The Monte-Carlo method, of course, is used to selecttimes from the probability distributions of activity times;but the technique does not involve observing the operation ofthe network through time in quite the same sense that behaviorof systems such as queueing systems are observed through timeby simulation. Rather, times are selected by the Monte-Carlomethod for each of the activities, and calculation of the projectcompletion time is then an arithmetic computation. This use
176
of the Monte-Carlo method to determine through multiple trialsa probability distribution that would be difficult or impossibleto get by analytical methods is an example of v;hat is popularlycalled model sampling.
Another example of model sampling is the examination ofthe characteristics of techniques for parameter estimation ineconometric models. Let us assume we have a model comprisinga large set of simultaneous, linear equations, including someterms related to each other as a sequence of variables indexedover a finite time horizon. Suppose now that some of thecoefficients of this system are random variables, possiblydependent upon each other. For each realization of the setof random coefficients, there is a solution to the linearequations. Thus, the joint probability function governing theconstants imputes a probability function onto the solutionspace. In a sense then, this is analogous to trying to solvea stochastic programming problem in which the A-matrix entriesare determined as a sample from a multi-dimensional randompopulation
.
It is interesting to note that there are well-establishedcomputing techniques for handling model sampling. Since modelsampling does not involve the dynamic tracking of a modelthrough time, we do not need a timing routine in any simulationlanguage that may be selected for such analysis. The choiceof a language is instead based on ease of programming, availa-bility of random-number generation routines, and ease ofcalculating statistics. In SIMSCRIPT, for example, the timingroutine can be suppressed, and built-in routines for generatingrandom variables with desired frequency distributions androutines for calculating statistical quantities are usefulfeatures from the standpoint of model sampling applications.Also, GPSS has excellent mechanisms for gathering statistics,and this can be an important positive factor in its use formodel sampling.
3 . 2 Adjoint Method
The adjoint method is grounded in classical tools ofmathematics (see Tomovic and Vukobratovic , 1972). The methodcan best be described in the context of control theory. Letus assume that we are dealing with a linear multivariate systemformed by the differential equation
X(t) = AX(t) + BU(t)
together with the input/output relation:
Y(t) = CX(t),
177
where
XuYABC
is ah n-dimenstional state vector;is the m-dimenstional control vector;is a q-dimensional output vector;is a constant matrix of order nis an nXm input matrix; andis a qXn constant matrix.
If we take Laplace transforms (with argument s) of the differ-ential equation, assuming that initial conditions are all zero,we find that:
-1Y (s) = C/Is - a7 B U(s) .
Determination of the system transfer function:_-l
P (s) = C/Is - A/ B
is however a very complex procedure.
The key issue in the sensitivity analysis context isdetermining the variation of the matrix P(s) in response toparameter changes. To do this, it is necessary first todetermine precisely and completely the matrix of the transfer functioiitself. This is accomplished using relations from matrixalgebra in which the system adjoint matrix plays a key role.Ultimately, a closed-form expression is obtained for the transferfunction matrix, P(s), as a matrix polynomial. After P(s) isdetermined, it is feasible to derive relations for computingits sensitivity to variations in parameters.
This method is now being applied to a very large energy marketmodel (LEAP) , with details given to the workshop by a participant(C. Weisbin, ORNL)
.
4. USE OF A MODEL FOR EXAMINING POLICY ALTERNATIVES
Any single run of a model reflects a particular set ofassumptions about how various factors will impact on a futureenergy supply or demand system. The results of each runsuggest how the system will react to particular assumptionsand input elements. Each model run is therefore a particular"What if?" question about the future. Some of the "What if?"questions that are asked with the model concern impacts ofexternal forces. Other questions are likely to concern theimpacts of programs that could be developed or encouraged bythe Government and activities of various other players. Changesare made in the model's numerical values to reflect a particular"What if?" question and results of a run made with these changedvalues project the model definition of possible effects impact.Results of any individual runs defining a particular "What if?"
178
question have little meaning in isolation. Rather, comparisonof a set of such results to one another and against some base-line results is necessary for judging the relative impact ofthe changes being investigated. The runs usually best suited forserving as baselines are those that assume a fairly neutralfuture in which very little change takes place or those whichseem to be most likely. The family of model outputs to be usedin comparing other results to the baseline case is one forwhich a reasonably large number of alternative input or para-meter settings have been analyzed to cover a broad range ofpossible model outputs. This is particularly valuable inassessing the effect of possible surprise events or shocks onthe system being modeled.
5. ON SENSITIVITY ANALYSIS IN MODEL ASSESSMENT
From the perspective of model assessment, sensitivityanalysis may be thought to be in large the study of changesin model output induced by varying the inputs. As such, itbecomes a primary area of concern in model assessment. Itsuses may include the determination of rates of output changewith respect to the input changes, importance ranking of theinputs from a sensitivity standpoint, assessment of outputvariability attributable to the inputs, or exploration ofquestions such as: What causes unexpected results, what areimportant inputs, and what is the output range of variability?One of the natural consequences of such statistical quantifi-cation of the variability of the model's outputs is the develop-ment of tools useful for the decision maker in employing thetarget model in the analysis of measures for dealing with anuncertain environment.
6. CONCLUDING REMARKS
In general, sensitivity analysis and the direct treatmentof uncertainty should be integral to a model's use, beginningwith sensitivity studies during model development to supportthe early identification of critical input data elements -
those which can be characterized as uncertain and of substantialimpact. Sensitivity analysis experiments support the identificationand sharpening of technical assumption. As a result, they canprovide guidance in the direction of data collection efforts.
At the usage level, sensitivity analysis can highlightfor the end users what the critical data elements and technicalassumptions are, which are often not at all obvious to peopleother than the model developers. Another role for sensitivityanalysis is in identifying what might be called the regions ofinvariance in sets of model solutions. As various inputelements are perturbed and different scenarios run with a givenmodel, certain elements of forecasted future circumstances can
179
be found that are invariant to such changes. Formal sensitivityanalysis facilitates the identification of these regions ofinvariance. The complementary problem, in which sensitivityanalysis has a key role, identifying the regions of highuncertainty or high rates of change in solution values underimposed changes in inputs. Another area of model applicationthat could benefit from some sensitivity analysis is thedefinition and selection of scenarios. Some fairly technicalsensitivity analysis can provide guidance in what sets ofscenarios will provide the greatest range of decision-supportinginformation when the various outputs are assembled and analyzed.
Finally, at the model assessment stage, sensitivityanalysis has obvious roles. It is probably one of the bestways that we have available to implement systematic searchesfor discontinuities, anomalies, and inconsistencies in modelresults. It is also useful in defining the domain of appli-cability or reasonableness of the model.
7. REFERENCES
1. Ackoff, R.L. (1956). "The Development of OperationsResearch as a Science," Operations Research , Vol. 4,
pp. 256-295.
2. Churchman, C.W., Ackoff, R.L., and Arnoff, E.L. (1957).Introduction to Operations Research . Wiley, New York.
3. Federal Energy Administration (1974). Project IndependenceReport , GPO, Washington, D.C.
4. Federal Energy Administration (1976). National EnergyOutlook. GPO, Washington, D.C.
5. Fishman, G. (1973) . Concepts and Methods in Discrete EventDigital Simulation . Wiley, New York.
6. Hillier, F.S. and Lieberman, G.J. (1967). Introduction toOperations Research . Holden Day, San Francisco.
7. Manne, A.S., Richels, R.G., and Weyant, J.D. (1979)."Energy Policy Modeling: A Survey," OperationsResearch, Vol. 27, pp. 1-36.
8. Meier, R.C., Newell, W.T., and Pazer, H.L. (1969).Simulation in Business and Economics . Prentice-Hall,Englewood Cliffs, N.J.
9. Naylor, T. (1971) . Computer Simulation Experiments withModels of Economic Systems . Wiley, New York.
10. Office of Energy Information and Analysis (1976) . PIESDocumentation . U.S. Department of Energy, Washington,D.C.
180

11. Office of Energy Information and Analysis (1977) . Medium-RunOil and Gas Supply Model 1977 Data Update . U.S.Department of Energy Research Memorandum No. 78-015.Washington, D.C.
12. Pritsker, A.A.B., and Kiviat, P.J. (1969). Simulation withGASP II . Prentice-Hall, Englewood Cliffs, N.J.
13. Sisson, R.L. (1974). "Introduction to Decision Models,"in A Guide to Models in Governmental Planning andOperations , U.S. Environmental Protection Agency,Washington, D.C.
14. Tomovic, R. , and Vukobratovic , M. (1972). GeneralSensitivity Theory , Elsevier, New York (originalversion published in Serbo-croatian in 1970).
181

REPORT OF WORKSHOP 5 - Part A
Enumeration of Validation Methodologies
by James Gruhl and David 0. WoodEnergy Model Analysis Program
M.IoT. Energy Laboratory
1. INTRODUCTION
This report provides an enumeration of a large number of potential
assessment/validation methodologies. It is a summary of some of the
authors' preparations for, and the participant activities at, one half of
the conference Workshop 5. The first portion of this report attempts to
formalize some aspects of the assessment process. To the extent to which
it succeeds, it presents a logical framework for the investigation of
assessment techniques. This framework is developed, and involves
fl) defining the detailed stages of the modeling process,
(2) listing the possible assessment actions that could be madeat each stage,
(3) enumerating the possible evaluations of the effects of
those changes,
(4) describing the alternative models and data, and the
judgments that could be a basis for evaluating those
changes, and
(5) developing strategic guidelines for the selection of the
most effective assessment methodologies.
Finally, using this informational framework some important assessment
issues are addressed. The most significant issues identified are the
areas where further research is needed. Of equal importance, but due to
the enormity of the task they are left for some future review, is the
discussion of the current gaps between the analytic tools needed for
assessment and the available applied mathematical techniques.
2. VALIDATION HYPOTHESES
There have not yet been developed any formalisms for the studly of
modeling. Likewise, no scientific theories or formalisms have yet been
developed that can provide guidance in the enumeration of model
validation techniques/strategies. Here, in order to begin in a very
informal way to develop some of the necessary groundwork, suppose that we
start with a very simple hypothesis:
183
Hypothe SI
s
1: Systematic validation/assessment approaches are themost effectfve
.
Although 'systematic' (which probably should mean something like
'well- organized' rather than 'brute force') and 'effective' (includingtime-, cost-, and manpower-effectiveness) are somewhat vague terms, itseems likely that this hypothesis is true. Models, especially policymodels, tend to be so complex and multi-disciplinary that systematicapproaches would seem essential in order that important assessment issues(that may not be of particular interest to anyone on the assessment team)not be missed. In addition, a systematic approach is most likely toproduce an appropriate balance of good and bad assessment issues.Finally, it seems likely that there is such a huge number of potentialvalidation/assessment techniques that a systematic approach for sortingout those that are most effective would be very advantageous.
This first hypothesis, will be left aside until the later discussionsin Section 5
,however, its suggestion to attempt systemi zation will be
followed in the pursuit of validation techniques. The second hypothesisis somewhat more subtle, attempting to identify a decomposition of everyvalidation technique into its component parts:
Hypothesis 2: Every validation technique involves the performance ofsome acfTon (perturbation) at one stage in the modeling process, a
transfer of that action's effects to another stage, and then an
examination or evaluation of the results with respect to some(external) basis for compari son .
It appears that the only way to evaluate this hypothesis is to examineall available validation techniques to see if they all can in fact bedecomposed in this manner. Preliminary surveys show that this seems to
be the case. However, whether or not this hypothesis is preciselycorrect, even its presumptive use will later be seen to be valuable in
the process of displaying all potential validation techniques. The valueof working solely with the val idation components is a consequence of thelikelihood that the separate enumeration oT" all possible action ,
transfer, examination , and comparative validation components will be
easier and more meaningful than tTie enumeration of all possibleva"" idation techniques. This will especially be the case if it happensthat:
Hypothesis 3: All possible combinations of validation components arein fact bona fide validation techniques.
Continuing this very informal statement of conjectures, consider onefinal proposition:
Hypothesis 4: There is no validation technique that could not be partof a model developer's "good modeling practice."
Of course, certification that validation techniques have actually beenundertaken can only credibly be performed by some party independent of
the model builders. This certification, however, is probably more
184

accurately classified as an assessment activity, rather than a validationtechnique. The consequence of hypotheses 2, 3, and 4, if they are true,is that an validation techniques may be discovered and displayed byidentifying all of the potential action, transfer, examination, andcomparative components that could be undertaken at each modeling stage.Such a display could be made as a matrix, with the validation componentsas the matrix columns and the modeling stages as the matrix rows. Afirst attempt at putting together this matrix is what is accomplished inthe following sections.
3. MODELING STAGES
There have been any number of formulations of the various stages ofmodel development and model utilization. Several of these formulationshave been collected together in one reference (Gruhl, Wood, Goldman,l^'ftO), with the resultant formulations shown in Figures 1 and 2. Thereare obviously significant variations that could be made in thedevelopment of these formulations, depending upon the type of model and
the style of its development or use. In addition, there are moredetailed levels of resolution that could be incorporated in theseformulations. For example, the last three stages in Figure 1 have beenfurther resolved into fourteen substages to accommodate an emphasis on
verification activities that was intended in one particular researchproject fGruhl, Wood, Goldman, 1980). In any event, although it is clearthat any number of subdivisions of modeling stages may be possible, it is
not always apparent that such subdivisions will aid in the identificationof addi tional validation components.
4. VALIPATIOM COMPONENTS
As previously mentioned, this section contains the development of thematrix that has the modeling stages as rows, and for columns has thecollection of some of the validation components that have appeared in the
literature ^the literature listed in Section 7 References andBibliography, as well as some additional articles of less generalinterest). Table 1 presents the collections of the validation componentsconcerned with the validation actions, transfers and examinations. Thebases for comparison are listed separately, in Table 2, partly due to
space limitations in Table 1 and partly due to the repetiti veness oftheir use at the various stages. It should be apparent that a great deal
of judgment must be used in "the selection of validation components thatwould be most useful for particular types of models. To aide in this
judgmental selection, another area that may be worth future investigationwould be the collection of those comparative techniques that have in the
past been most useful for certain types of validation examinations.
Simple input/output sensitivity analysis will now be used as an
example of how to go about identifying known validation techniques on
this matrix. This technique resides entirely in the "Utilization"portion of Table 1. The validation action involves a systematic
perturbation of "Input Scenario Specifications" . The validation
examination is performed on the set of values that result in the "Output
foUection/presentation ." The transfer mode is more or less the default.
185

AnalyzeTheoreticalRequirements
IImplementStructuralMethods
Objectives,IntendedApplications
IIsolateSystem
CollectData
IT
AnalyzeDataRequirements
DecideResolution
Aggregate orSynthesize Data
Calibration,Definition ofFixed Parameters
IComplete the
MathematicalFormulation
IDevelopComputerProgram
T"Debug ComputerProgram, ConductVerification
Develop ModelMaintenanceProcedures
TTo Utilization
Figure 1 The modeling stages that take place during
model development (Gruhl, Wood, Goldman, 1980).
186
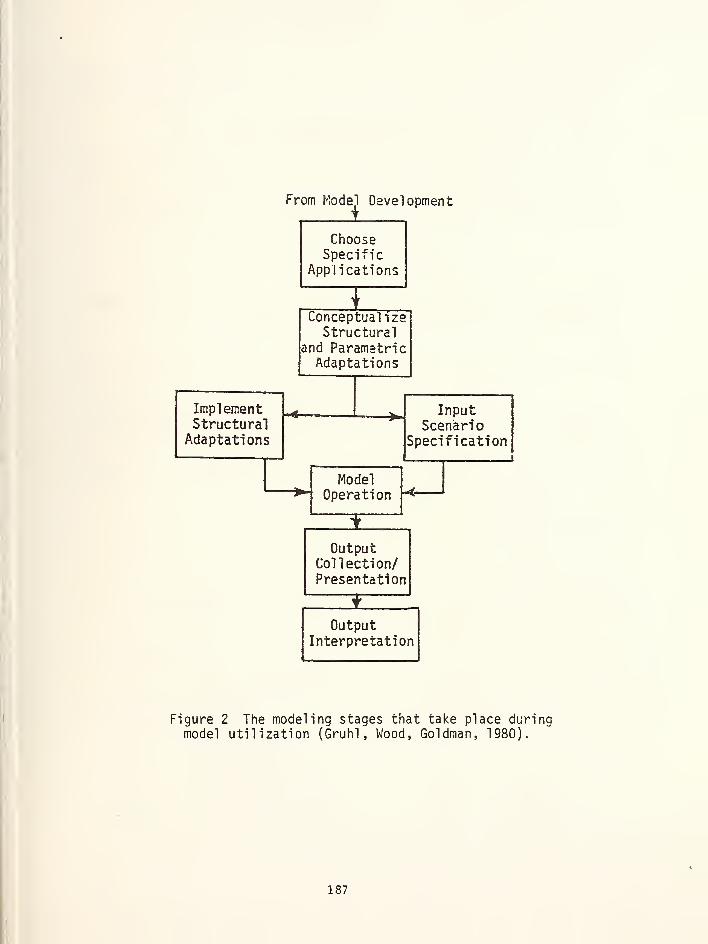
From Model Development
ChooseSpecific
Appi ications
Conceptual izeStructural
and ParametricAdaptations
ImplementStructural
Adaptations
InputScenario
Specification
ModelOperation
OutputCollection/Presentation
OutputInterpretation
Figure 2 The modeling stages that take place durimodel utilization (Gruhl , Wood, Goldman, 1980).
187
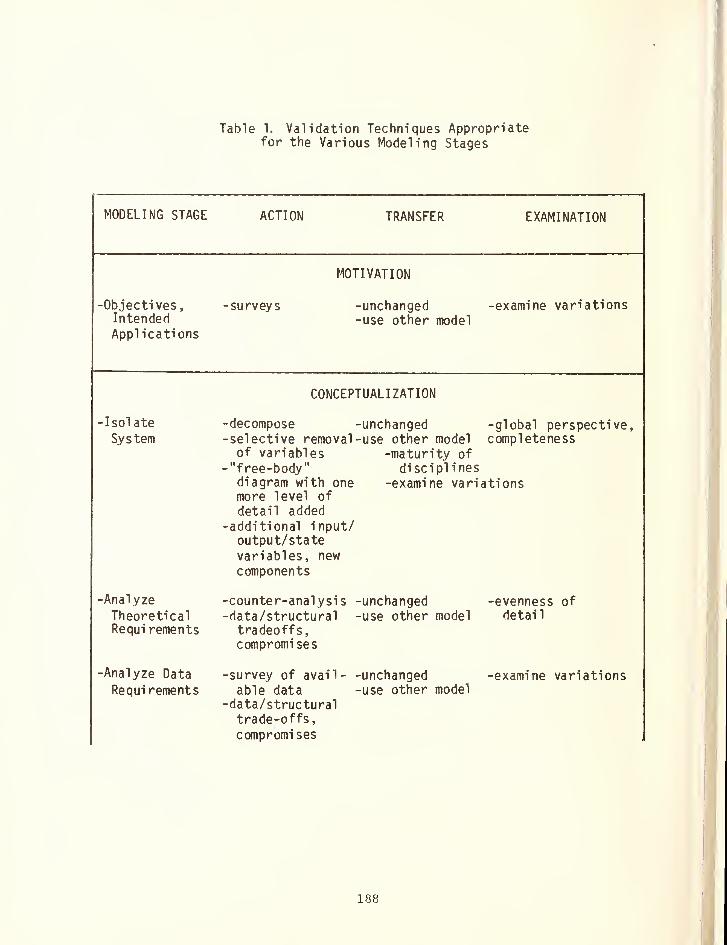
Table 1. Validation Techniques Appropriatefor the Various Modeling Stages
—MODELING STAGE ACTION TRANSFER EXAMINATION
MOTIVATION
-Objectives, -surveys -unchanged -examine variationsIntended -use other modelApplications
CONCEPTUALIZATION
Isol ate
System
-Analyze
TheoreticalRequi rements
-Analyze Data
Requirements
decompose -unchangedselective removal -use other model
-maturity ofdisci pi ines
-examine variations
of variables"free-body"diagram with onemore level of
detail added-additional input/output/statevariables, new
components
counter-analysis -unchanged-data/structural -use other modeltradeoffs,compromi ses
-global perspective,completeness
evennessdetail
of
-survey of avail-able data
-data/structuraltrade-offs,
compromi ses
-unchanged-use other model
examine variations
188
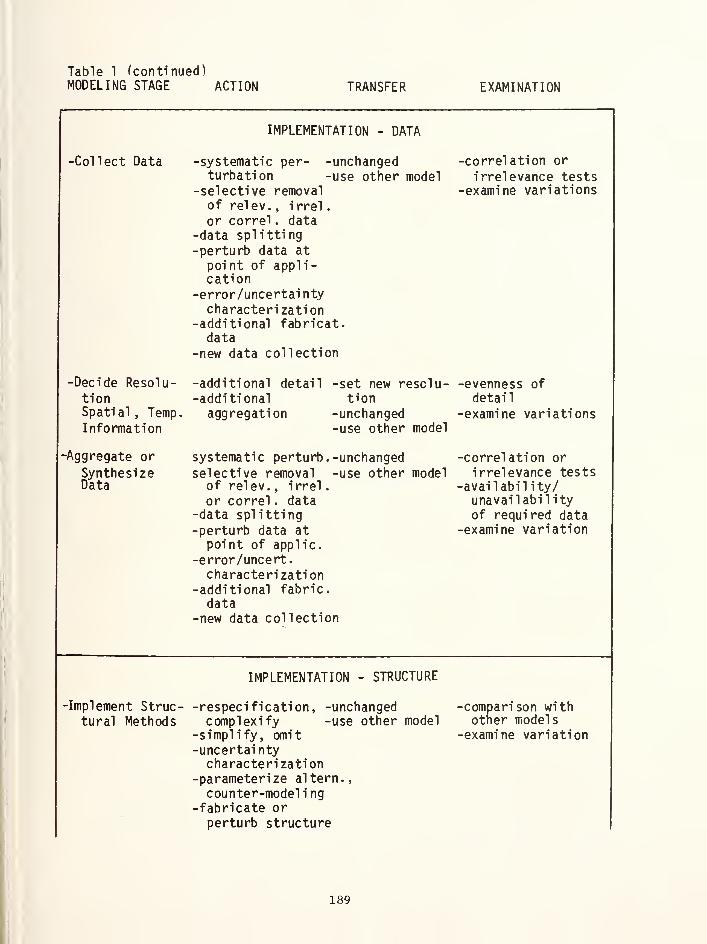
Table 1 (continued)MODELING STAGE ACTION TRANSFER EXAMINATION
IMPLEMENTATION - DATA
-Collect Data -systematic per- -unchanged -correlation or
turbation -use other model irrelevance tests-selective removal -examine variationsof rel ev. i rrel
.
or correl . data-data splitting-nprtiirh data at
nni nt nf nnl i ~
cation-error/uncertai nty
characterization-additional fabricat.data
-new data collection
-Decide Resolu- -additional detail -set new resclu- -evenness of
tion -additional tion detai
1
Spati al . TeiTiD. aaarpoation -imrhanopH -pyaminp variatinn?T n K*mA t "i nn -iicp n+hpr mndpl
-Aggregate or systematic perturb. -unchanaed -corrplation nr
Synthesize selective removal -use other model irrelevance testsData of rel ev
., i rrel
.
-avai 1 abi 1 i tv/or correl . data unavailabil ity
-data splitting of requi red data-DPrturb data at -examine variation
point of applic.-error/uncert
.
characterization-additional fabric.
data-new data collection
IMPLEMENTATION - STRUCTURE
-Imnlpmpnf ^triir- —rnmnaricnn withf-iiv>al MpthnHc rnmnlpyi'fv -n^p nt'hpr mndpl other models
-si iTiD 1 1 fV omi t -examine variation-uncertaintycharacterization
-parameterize altern..
counter-modeling-fabricate or
perturb structure
189
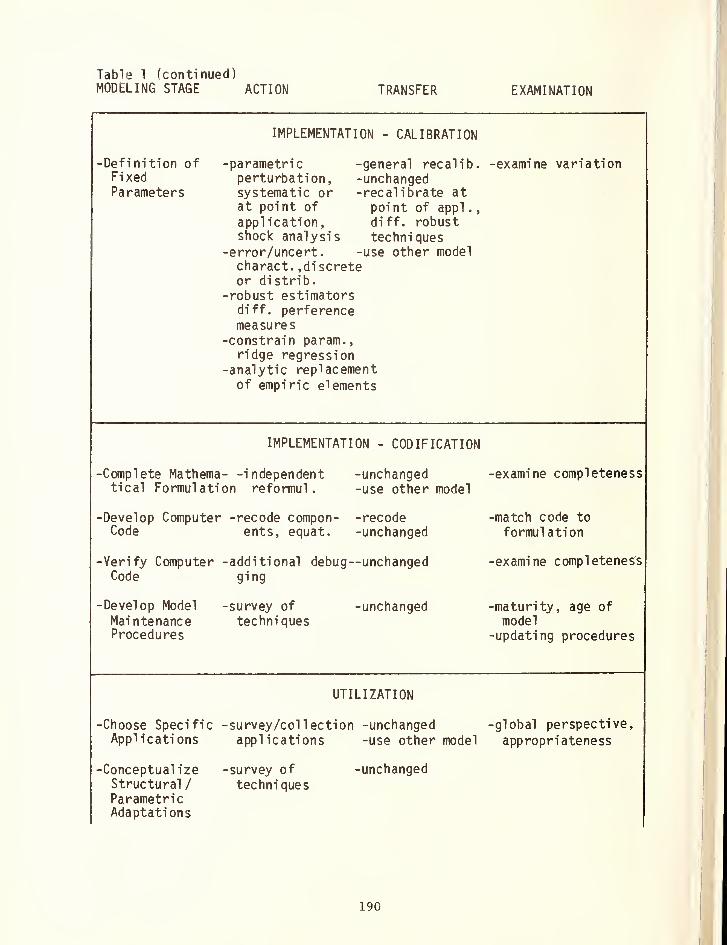
Table 1 (continued)MODELING STAGE ACTION TRANSFER EXAMINATION
IMPLEMENTATION - CALIBRATION
-Definition ofFi xed
Parameters
-parametric -general recalib.perturbation, -unchangedsystematic or -recalibrate atat point of point of appl
.
,
application, diff. robustshock analysis techniques
-error/uncert . -use other modelcharact. , discreteor distrib.
-robust estimatorsdiff. perferencemeasures
ridge regression-analytic replacementof empiric elements
-examine variation
IMPLEMENTATION - CODIFICATION
-Complete Mathema- -independent -unchangedtical Formulation reformul . -use other model
-examine completeness
-Develop ComputerCode
-recode compon- -recodeents, equat. -unchanged
-match code to
formul ation
-Verify ComputerCode
-additional debug--unchangedging
-examine completeness
-Develop Model
MaintenanceProcedures
-survey of -unchangedtechniques
-maturity, age ofmodel
-updating procedures
UTILIZATION
-Choose SpecificApplications
-survey /col lection -unchangedapplications -use other model
-global perspective,
appropriateness
-ConceptualizeStructural
/
ParametricAdaptations
-survey of -unchanged
techniques
190
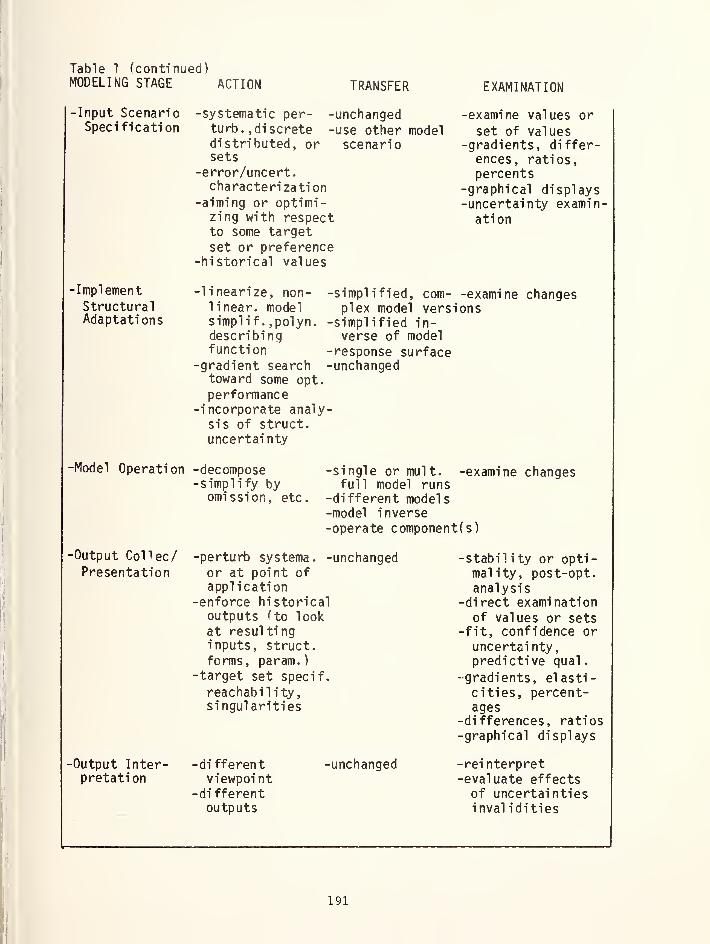
Table 1 (continued)MODELING STAGE ACTION TRANSFER
Input ScenarioSpecification
-systematic per- -unchangedturb. , discrete -use other modeldistributed, or scenariosets
-error/uncert.characterization
-aiming or optimi-zing with respectto some target
set or preference-historical values
EXAMINATION
-examine values or
set of values-gradients, differ-
ences, ratios,percents
-graphical displays-uncertainty examin-
ation
ImplementStructuralAdaptations
-Model
-linearize, non-linear, modelsimplif
. ,polyn.describingfunction
-gradient searchtoward some opt.
performance-incorporate analy
sis of struct,
uncertainty
Operation -decompose-simplify by
omission, etc.
-simplified, com- -examine changesplex model versions
-simplified in-verse of model
-response surface-unchanged
-single or mult, -examine changesfull model runs
-different model
s
-model inverse-operate component(s)
Output CoHec/Presentation
-perturb systema. -unchangedor at point ofapplication
-enforce historicaloutputs (to lookat resultinginputs, struct.
forms, param.)-target set specif.
reachabil ity
,
singularities
Output Inter-pretation
-di fferentviewpoint
-di fferentoutputs
unchanged
-stability or opti-mal ity, post-opt.analysis
-direct examinationof values or sets
-fit, confidence or
uncertainty,predictive qual
.
-gradients, elasti-cities, percent-ages
-differences, ratios-graphical displays
-reinterpret-evaluate effects
of uncertaintiesinval idities
191
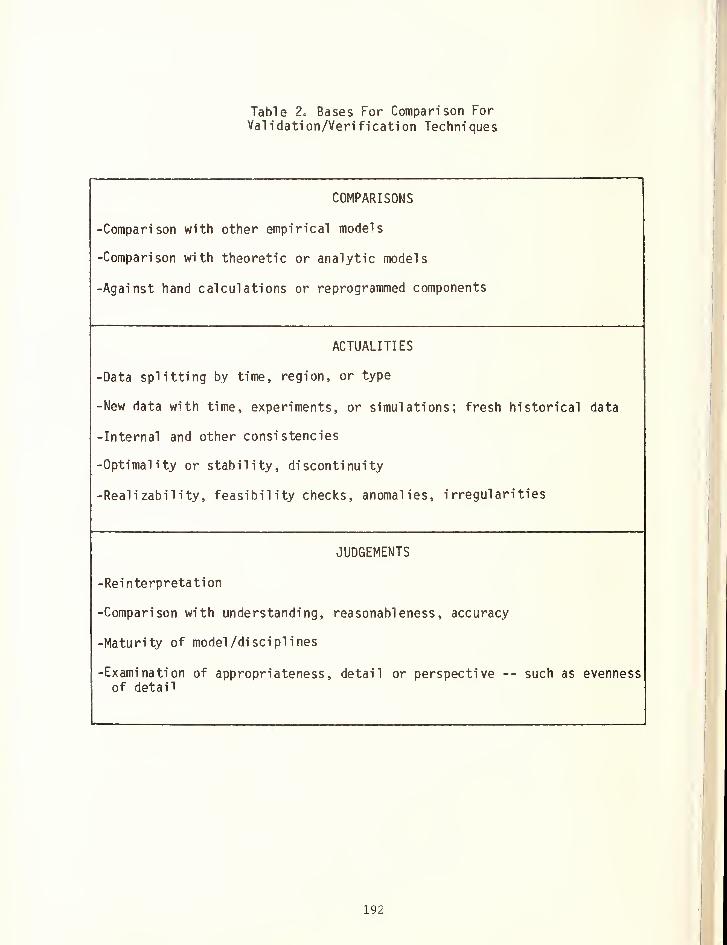
Table 2. Bases For Comparison ForVal idation/Verification Techniques
COMPARISONS
-Comparison with other empirical models
-Comparison with theoretic or analytic models
-Against hand calculations or reprogrammed components
ACTUALITIES
-Data splitting by time, region, or type
-New data with time, experiments, or simulations; fresh historical data
-Internal and other consistencies
-Optimal ity or stability, discontinuity
-Realizability, feasibility checks, anomalies, irregularities
JUDGEMENTS
-Reinterpretation
-Comparison with understanding, reasonableness, accuracy
-Maturity of model /disciplines
-Examination of appropriateness, detail or perspective -- such as evennessof detail
192

unchanged, or business-as-usual, type of transfer. In this case it is
single or multiple full model runs. The basis for compari son is the
assessor's understanding about the reasonableness of TFie 'response ' to
the 'stimulus'.
There appears to be no reason why two or more actions, or in facttwo or more points of examination, could not be used in a singlevalidation technique. It is also possible, and frequently has beenimplemented, to begin with an action at a stage such as the Output andtransfer this action backwards through inverses of the model to someearlier stage for examination. For example, outputs could be perturbed,transferred through a "model inverse" to be examined as input variationsor resultant variations in pieces of collected data. This is an exampleof a 'non-default' type of transfer mode.
It seems as though there might be a couple of extra benefits from
the matrix form of presentation in Table 1. One of these bonuses is thatperhaps a new validation technique can be generated from the careful
combination of different elements of this table. An example of one suchnewly generated validation technique, that has actually been applied in
an assessment exercise, involved: (1) the use of additional fabricateddata (perturbed from the point of application of the model) in "Aggregateor Synthesize Data", (2) the use of recal ibration of the model as thetransfer mode, and (3) the use of 'ratios of the changes' examined in the"Output Collection/Presentation." This is then a new measure of the
strength of the calibration of a model.
5. GENERALITIES ABOUT VALIDATION STRATEGIES
The two most important portions of any assessment program are: (1)
the quality, disciplines, and organizational structure of the assessmentteam, and (2) the strategy selected for the validation and otherassessment activities. There are a great many different types of
information that can be brought to the process of choosing a
cost-effective validation strategy. The first consideration ought to be
the objectives of the assessors and their sponsors. Some of these
objectives (Gruhl, 1979, DOE) include:
(1) validate specific past applications,
(2) validate generic future applications,
(3) suggest model improvements,(4) create a resource group with model expertise,(5^ establish credibility among users and observers,(6) test model transferability, and
(7) further the art of model assessment.
Each of these objectives ought to be carefully considered, and furtherclarified. For example, does the model require "improvements" in its
construction, utilization, credibility, accessibility, efficiency,
penetrability, or flexibility.
Next there is a whole set of model characteristics that must be kept
in mind;
193
fi) perceived importance of model, half-life of its usefulness,(2) model size, complexity, and types of analytic methodologies,(3) cost and time per run,
(4) operational transferability, including extent and availabilityof documentation,
(5) range of intended applications,(6) previous model use and assessments,(7) stage of model development and maturity,(8) maturity of subcomponents, and assessment history of those
components, and(9) use of existing data bases, and the assessment history of
those data.
These characteristics of the model must be carefully weighed so that the
validation effort can work comfortably and effectively within the
limitations of the manpower, time, and funding constraints of theassessment effort. The precise orchestration of assessments, withmilestones, seminars, and so on, is a difficult but necessary task if
cost-effectiveness is to be achieved.
Aside from these general assessment strategic considerations, thereis the question of how to choose among the myriad of enumeratedvalidation techniques (including individual and comparativeassessments^ A general strategy which has received some limited testingh*n some assessments at the M. I.T. Energy Model Analysis Program)involves three steps: (1) screening to identify problem areas, (2)
focusing on individual critical issues, then (3) bringing those issuesinto the broad perspective of the whole model and its areas ofapplication.
The broad screening requires an evaluation of not only the wholemodel (or seveTal o7 its components) but also, as an additional
dimension, all (or several) of the modeling stages. The process of
focusing involves tracking down to individual stages and components (and
later equations) any counterintuitive or irregular results. The broad
perspective is then built up through comparative techniques, with arra"
wi tnout ^e resolutions or alternatives to specifically identifiedvalidation issues. This is the point at which the matrix in Table 1
offers an additional possible bonus. Assessment techniques can be
identified or even generated that span large portions of the modelingprocess or that focus on individual stages. This can be accomplished by
adjusting the span between the initiated validation actions and the
points of exami nation .
Implementing the process of screening-focusing-perspective is still
very much an art. In (Gruhl, Wood, Goldman, 1980) there is an initial
effort at collecting and prioritizing techniques that have met withvarious levels of success in past assessments. There seems to be enough
pattern to that listing to warrant further comprehensive investigation.The development and choice of the most effective validation techniquesfor a particular model assessment is virtually a new field and is likely
to be an exciting research area for some time.
194

A number of research topics other than those previously mentionedwere topics for discussion at the workshop meeting. Some of these futureresearch topics included:
(1) the need for a procedure that could be used to take a setof intended model applications and from it develop theoverall global perspective within which the model can beimbedded (defining the exogenous, endogenous, anduntreated effects),
(2) the development of methods for expressing: data errors andthe extent of synthetically developed data, structuralspecification assumptions and alternative structuralforms, calibration errors and compromises, and outputuncertainties,
(3) the most appropriate validation techniques for use on
modeling components that use static optimization,dynamic optimization, simulation, or non-modelingtechniques,
f4) the extent to which, and how, the assessment process canbe formalized as a methodology so that assessment can toa great extent be part of 'good modeling practice,'
(5) the circumstances under which validation methodologiesshould best be undertaken in the context of othermodels, as opposed to the context of reality,
(6) the definition of the fine line between counteranalysis,which is so necessary for assessments, andcountermodel i ng, which is inappropriate for assessmentsbecause it can create competition for the original
modelers, and
(7) the creation of assessment methodologies that will give
a proper balance between the strong and weak points ofany particular modeling approach.
6. ACKNOWLEDGMENTS
In addition to Tom Woods, the other co-chairman of this workshop,
there were several others in the workshop that made contributions to this
presentation. Participants from the Department of Energy included:Cecilia Chu, Harvey Greenberg, John H. Herbert, Peter Holihan, B^enda
Jorgensen, Fred Murphy, Mark Seidel, Susan Shaw, Scott Sutton, and Bruce
Wing. Also from the U.S. government were Bruce Murphy and Ric Jackson of
the Department of Commerce, Robert Bell from Lawrence Livermore Lab, and
Robert L. Bivens of the Los Alamos Scientific Lab.
Participants from the Wharton School Analysis Center included: Susan
T. Cheng, Diana Gibbons, Jill Goldman, Colleen Kirby, Lawrence S. Mayer,
Suzanne Mitchell, Randi Ryterman, and Peter Tittman. Also from an
academic institution was Hamid Habib-agahi of the Jet Propulsion Lab,
195
California Institute of Technology.
In addition there were some contributors from the private sector:Dave Andress of Science Management Corp., Richard Collier from SystemsTechnology Inc., Byron G. Keep of the Bonneville Power Administration,Richard Shapiro from Kappa Systems, and David Strom of ConservationFoundation. Finally, there were other occasional workshop participantswho contributed criticisms and additions, all of which are appreciated.
7. REFERENCES AND BIBLIOGRAPHY
Aigner, D.J., 1972. "Note on Verification of Computer Simulation
Models," Management Science Series A. Theory , 18,(11), pp. 615-619.
Apostel,L., 1960. "Formal Study of Models," Chap. 1 in The Concept and
the Role of the Model in Mathematics and Natural and Social Sciencesedited by~Fr.TFedenthal , Gordon and Breach Publishers, N.Y., January.
Berman, M.B., 1972. "Notes on Validating/Verifying Computer SimulationModels," Rand Report P-4891 , The Rand Corp., Santa Monica, Ca.,August.
Boshier, J.F., and Schweppe, F.C., 1977. "Energy Model Validation:Systematic Sensitivity Analysis," Paper presented at the LawrenceSymposium on Systems and Decisions Sciences , October 3-4.
Boshier, J.F., Schweppe, F.C., and Gruhl, J., 1978. "Validity and
Uncertainty of Predictive Energy Models," M.I.T. Energy Laboratory,Proceedings of the Sixth Power Systems Computation Conference ,
Darmstadt, Germany, August.
Chattergy, P., and Pooch, U.W., 1977. "Integrated Design andVerification of Simulation Programs," Computer 10, pp. 40-45.
Curnow, R., McLean, M., and Shepherd, P., 2976. "Techniques For Analysisof System Structure," SPRU Occasional Papers No. 1, Science PolicyResearch Unit, University of Sussex, U.K., January.
Deeter, C.R., and Hoffman, A.A.J. , 1978. "A Survey and Classification of^^
Methods of Analysis of Error Propagation in Mathematical Models,"NSF, Texas Christian University, Dallas.
Deeter, C.R. and Hoffman, A. A. J., 1978. "An Annotated Bibliography of
Mathematical Models Classified by Validation and Error AnalysisMethods,' NSF, Texas Christian University, Dallas, April.
Dhrymes, P.J., et al
.
, 1972. "Criteria for Evaluation of EconometricModels," Arinals of Economic and Social Measurement ,
I, pp. 291-324,Summer.
Fishman, G.S., 1973. "On Validation of Simulation Models," ProceedingsAFIPS National Computer Conference, 42, pp. 51.
196
Fitzsimm, J. A., 1974. "Use of Spectral Analysis to Validate PlanningModels," Socio-Economic Planning Sciences , 8(3), pp. 123-128.
Garratt, M., 1974. "Statistical Validation of Simulation Models,"Proceedings 1974 Summer Computer Simulation Conference, Houston, TX.
pp. 915-926.
Gass, S.I., 1977. "Evaluation of Complex Models," Computers andOperations Research
, 4(1), pp. 27-35, March.
Gass, S.I., 1977. "A Procedure For the Evaluation of Complex Models,"paper presented at the First International Conference on
Mathematical Modeling , St. Louis, Missouri , August 29 - September 1.
Gass, S.I., 1976. "Modeling and Validation in the Federal Government,"Proceedings Winter Simulation Conference
, pp. 558.
Gilmour, P., 1973. "A General Validation Procedure for Computer
Simulation Models," Australian Computer J. 5, pp. 127-131.
Greenberger, M., Crenson, M.A., and Crissey,B.L. , 1976. Models in
the Policy Process , Russell Sage Foundation, N.Y.
Greig, I.D., 1979. "Validation, Statistical Testing, and the Decision to
Model," Simulation , Vol. 33, No. 2, pp. 55-60, August.
Griner, G.M., Mango, J. A., and Pastrick, H.L., 1978. "Validation ofSimulation Models Using Statistical Techniques," Proceedings SummerComputer Simulation Conference, Newport Beach, CA^ pp. b4-by, duiy24-2b.
Gruhl, J., 1979. "Model Validation," Proceedings 1979 International
Conference on Cybernetics and Society, IEEE Systems, Wan, and
uybernetics ^ciety, IEEE 79ClTnr24-l SMC , October.
Gruhl, J., 1979. "Strategies for Model Evaluation," Proceedings 1979 DOE
Statistical Symposium , U.S. Department of Energy, U.S. G. P.O.,October.
Gruhl, J., and Wood, D., 1978. "Independent Assessment of ComplexModels," Proceedi ngs Val idation of Mathematical Models in EnergyRei ated Research and Development ,
NSF^ Texas Christian University,Dallas, June.
Gruhl, J., Wood, D., and Goldman, N.L., 1980. "Verification Strategies
for Socio-Economic Simulation Models," Presented at the 1980 SummerComputer Simulation Conference, "Success Through Simulation,"
Seattle, Washington, available through MIT Energy Lab., Cambridge,
MA, August 25-27.
Henize, J., 1979. "Evaluating Policy Models," Proceedings 1979 Summer
Computer Simulation Conference , Toronto, Canada, pp. bb0-bb6, JulyITvTC
197
Hoffman, A. A. J., and Deeter, C.R., 1979. Proceedings of the Workshop onVal 1 dati'on of Compute r-Based Mathematical Model
s
iTT^nergy RelatedResearch and Development , Fort Worth, TX, June 21-237 19/B.
Hoffman, A.A.J. , and Deeter, C.R., feds.), 1978. Proceedings Validationof Mathematical Model s i n Energy Related Research and Ueve lopment ,
N3F, lexas Christian Uni versity, Dallas, June
.
House, P.W., 1974. "Diogenes Revisited — The Search for a Valid Model,"Simulation
, 22, pp. 117-125, October.
Hsu, D.A., and Hunter, J.S., 1974. "Validation of Computer SimulationModels Using Parametric Time Series Analysis," Proc. Winter
Simulation Conf
.
Hunt, A.W., 1979. "Statistical Evaluation and Verification of DigitalSimulation Models," Computer and Industrial Engineering , Vol. 3,
No. 1, pp. 75-88.
Judge, G.G., Bock, M.E., and Yancey, T.A., 1974. "Post Data ModelEvaluation," Review of Economics and Statistics , 56(2), pp. 245-253.
Kahne, S. , 1976. "Model Credibility for Large-Scale Systems," IEEE
Transactions on Systems, Man, and Cybernetics , 6, pp. 586-3907
Kennish, W.J., 1978. "Approach to the Validation of Computer SimulationCodes," ERDA/140901
, 23p., March.
Mazur, A., 1973. "Simulation Validation," Simulation and Games , 4.
McKay, M., 1978. "Overview of Sensitivity Analysis at LASL with CoalII Example," Proceedings Val idation of Mathematical Model
s
in EnergyRelated Research and Development , NSF, Texas Christian University,uai las, June.
McKay, M.D., Conover, W.J., and Beckman, R.J., 1978. "A Comparisonof Three Methods for Selecting Values of INput Variables in theAnalysis of Output from a Computer Code," Technometrics .
McLeod, J., 1980. "Verification, Validation and Transfer of SocietalModels," Simul ation , Vol. 7, February.
Mihram, G.A., 1972. "Some Practical Aspects of the Verification and
Simulation Models," Operations Research Quarterly , Vol. 23, No. 1,
pp. 17-29, March. -
Mihram, G.A., et al.
, 1974. "What Makes a Simulation Credible?" Proc.
5th Annual Pittsburgh Conference .
Miller, D.R., 1974. "Model Validation Through Sensitivity Analysis,"Proceedings Summer Computer Simulation Conference , Houston, TX, July.
198
Miller, D.R., 1974. "Sensitivity Analysis and Validation of SimulationModels," Journal of Theoretical Biology
, 48(2), pp. 345-360.
Miller, F.L., 1978. "Validation of Time Series Models," ProceedingsVal idation of Mathematical Model
s
in Energy Related Research andDevelopment ,
NSF, Texas Christian University, Dallas, June.
M.I.T. Model Assessment Laboratory, 1979. "Independent Assessment of
Energy Policy Models: Two Case Studies," M.I.T. Energy Lab, E.P.R.I.Report EPRI EA-1071, Palo Alto, CA, May.
Naylor, T.H., and Finger, J.M., 1967. "Verification of Computer
Simulation Models," Management Science , 14(2), pp. 13-92 to 13-101,October.
Pugh, R.E., 1977. Evaluation of Policy Simulation Models , InformationResources Press, Washington, D.u.
Reggiani, M.G., and Marchett, F.E., 1975. "On Assessing Model Adequacy,"IEEE Transactions on Systems, Man and Cybernetics , SMC5(3), pp.IZT^ZW.
^
Sargent, R.G., 1978. "Validation of Discrete Event Simulation Models,"
Proceedings Val idation of Mathematical Model s in Energy Related
Kesearch and Development ,NSF, Texas Christian University, Dallas,
June.
Schaefer, B.M., 1975. "Model Validation Using Simulation and SequentialDecision Theory," Operations Research , 23(2), pp. 365.
Schel lenberger, R.E., 1974. "Criteria for Assessing Model Validity forManagerial Purposes," Decisions Science , 5(4), pp. 644-653, October.
Schlesinger, S. , Buyan, J.R., Callender, E.D., Clarkson, W.K., and
Perkins, F.M., 1974. "Developing Standard Procedures for
Simulation, Validation and Verification," Proceedings SummerComputer Simulation Conference , Houston, TX., July.
Smith, J.M., 1972. "Proof and Validation of Program Correctness,"
Computer , 15, pp. 130-131.
Snee, R.D., 1977. "Validation of Regression Models - Methods and
Examples," Technometrics , 19(4), pp. 415-428.
Stone, M. , 1974. "Cross-Validating Choice and Assessment of Statistical
Predictions," J. Royal Statistical Soc. B, 36, pp. 111-147.
Thissen, W. , 1978. "Investigations Into the World 3 Model: Lessons for
Understanding Complicated Models," IEEE Transactions on Systems, Man
and Cybernetics . SMC 8(3), March.
U.S. General Accounting Office, 1979. "Guidelines for Model Evaluation,"
PAD-79-17, U.S.G.P.O., Washington D.C., January.
199

Van Horn, R.L., 1971. "Validation of Simulation Results," ManagementScience
, 17(5), January.
Van Horn, R.L., 1969. "Validation," Chapter in The Design of ComputerExperiments , T.H. Naylor, (Ed.), Duke University Press, Durham, N.C.
Welsch, R.E., 1974. "Validation and the Jackknife," M.I.T. Sloan Schoolof Management, Course Notes, Cambridge, MA, September.
Wigan, M.R., 1972. "The Fitting, Calibration, and Validation ofSimulation Models," Simulation , 18, pp. 188-192.
Wood, D.O., 1978. "Assessment of Energy Policy Models — Report of an
Experiment," Presented at the American Institute for DecisionSciences (AIDS) Conference
, Washington, D.C., June.
200

REPORT OF WORKSHOP 5 - Part B
Model Assessment MethodologiesThomas J. Woods
General Accounting OfficeEnergy and Minerals Division
Washington, D.C. 20548
The role models can plan in policy and program discussionsspan a spectrum ranging from after-the-fact illustrations ofdecisions already made to active independent contributions tothe decision process itself. Unfortunately, in the energyarea the use of models has tended to be more in the illustrativeend of the spectrum. This situation is due in no small part toa fundamental lack of confidence in the model results on thepart of the users. The growing attention given to model assess-ment, of which this symposium is but one example, is a recognitionon the part of the modeling community that the continued use ofmodels as expensive illustrations of decisions is highlyundesirable, both for the user and the modeler.
In our workshop session we discussed a somewhat broaderperspective of model assessment. Model assessments usuallyfocus on the mechanics of the model itself, that is, checkingthe data, the logic, and the methodologies used. However,there are two perspectives from which the assessments must bemade
.
The first is the assessment from the perspective of themodel itself. This assessment is already being undertakenby many analysts. The second is from the perspective of theuser, something which the workshop agreed was done veryseldom, if ever. The workshop agreed that it was necessaryto assess models from the perspectives of both the userand the model or modeler. The question is: how do we goabout doing this?
There are three questions model assessments attempt toanswer. The first is, "What does or can the model say?" Thesecond question is^ "Does the model or can the model say it well?"And the third question is, "Does the model or can the m.odel
say it 'correctly'?" In short, the user will generally ask"does it?" while the modeler will ask "can it?"
We concluded that assessing models from these two per-spectives will enhance the confidence that users will havein models. And, in the end, it is the user who determineswhether the modeling is something more than an academicexcecise or is actually relevant to real world decisions.
These two perspectives imply differing assessmentmethodologies, but they are complementary to each other. Modelassessment from the user perspective will tend to be rathersensitive to the particular user but rather insensitive to theindividual model in the sense of methodologies, the data base,
201
etc. On the other hand, model assessment from the perspectiveof the model itself is very sensitive to the model (e.g. LPprograms, econometrics, Monte Carlo) but relatively insensitiveto the user. Putting together the two assessment perspectivesshould maximize user confidence in the model.
The assessment perspectives can be better understoodwithin the context of overall model development and use.We broke model development and use into four general stages.They are:
—motivation, or why we do the model,
—conceptualization, or how, in very broad blackbox terms, we attempt to implement what we aretrying to do in the model,
—actual model development, and
—model utilization.
We tried to determine which assessment perspective woulddominate each stage. Motivation is assessed almost totally froma user perspective. Conceptualization is an iterative processbetween what the user wants and what the modeler thinks he cangive him. From the standpoint of model development, modelassessment is almost totally from the modeler perspective.Lastly, assessment of model utilization will take into accountboth user and modeler perspectives.
The user assessment techniques will be largely based onrules of thumb which provide the user an understanding of thesituation the model is trying to depict. These rules of thumbtend to be mechanical in the sense that they describe whathas to occur to obtain a particular result, not why or howit occurs. In a sense these rules of thumb provide the usera quasi-model of the system. With these rules of thumb, theuser can assess the believability of the detailed modelresults. For example, any sustained production of naturalgas at current levels would require the discovery of largegas fields or their equivalent at a rate unprecendented inthe U.S. gas exploration history. If a model resultindicated such a sustained level of production, the userwould be able to discuss with the modeler/analyst what factorsallowed him to be so confident about natural gas discoveryrates
.
This quasi-model concept raised some questions in theworkshop because it appeared that we would be using a model,albeit a very primitive one, to assess another, moresophisticated model. And this is true, but model assessmenttechniques in use today are often comparisons of the model
202

mechanics with some paradigm (essentially a model) of howdata should be analyzed, equations written, etc. The majorproblem with model assessment from user perspectives is thatthe "model-like" nature is more readily apparent than withassessments from the model perspective.
To date we have largely neglected to develop these rule;of thumb which users, such as Congress, Government agencies,and industry, need to really utilize the results and theinsights that come out of the models. To a certain extentthese user assessments require the modeler to ask himself,"If I were to use the results of this model, what would I
really want to know? What general rules of thumb would I
use if I did not have the model to give me the detailedanswers I am looking for?" In essence, the goal of theserules of thumb is to create an educated user, a user whocan truly use the richness of detail and insight that modelscan provide to the decision-making process.
203

r

PANEL DISCUSSION ON WORKSHOP REPORTS
MR. JACKSON: I'd like to ask all of the chairmen and cochalrmen to takea seat up front so we can begin the question-answer period. While they'redoing that, I'd like to add that some of the slides that Jim Gruhl was usingcame from a very nice paper of his that appeared in the IEEE Proceedings of
the International Conference on Cybernetics and Society, 1979. The report is
titled "Model Validation," and does an admirable job of bring together manyaspects of model validation. Are there any questions from the floor?
DR. WEISBIN: I'm Chuck Weisbin from Oak Ridge. My questions relate to
Workshop No. 4 on sensitivity analysis. I did not attend that workshop. I
was with another one, so my question might have already been discussed. How-ever, I did not get clarification from the workshop summaries.
There really are two questions. The first is that you alluded to some fourdifferent types of techniques for sensitivity analysis (or an apparent batteryof tools just ready to be used) and there wasn't very much discussion in termsof the limitations and appropriateness of these techniques for particulartypes of models.
If one talks about large-scale models—large meaning the code runs an hour us-ing several thousand data elements—my question has to do with the appropri-ateness of the statistical approach. In particular, how do you screen out
what elements to sample from, and so forth, and how much time does it take to
do an analysis?
And I have one more question. It was also alluded that the sensitivity analy-sis can be used to address problems in model specification, i.e. , if the equa-tions were just out and out wrong. I know of no sensitivity analysis method-ology which deals comprehensively with this case. Do you know of such a tech-
nique?
You cited input data, noise in the system, shocks, and model specification as
areas of applicability for sensitivity analysis. I am wondering if you mean
the latter.
DR. HARRIS: I'll take the first part of the question.
I think David Freedman did make a number of comments in his presentation addressing
the issues of time, resources, and available computer fire power.
Those are all key issues. I apologize if the points did not come across, but
the panel certainly focused on the relationship of these kinds of activities
to available resources—personnel, project size, and model size. They are all
relevant and they play a role. One cannot be terribly more definitive than
that.
205

We did talk, for example, about screening designs. When one has a very largenumber of variables (forgetting everything else) and is concerned about doingsome sort of fairly global sensitivity analysis, you do not really want to
deal with 3,000 variables if analytic structure is really not present. If it
is a question of learning which of 3,000 variables are critical, you betterget to a screening design; otherwise, you are going to be working forever.
These are all issues that we did talk about. We will focus on them in moredetail when we write up our report for the Proceedings. For example, in ourwork Dave Hirshfeld and I discuss the run time of our model compared to othermodels. We realized that our model was not a very big one based on criteriaone normally uses. We were able to do a lot of the things we did because we
had structure on our side, and we understand that that may not always be the
case.
MR. HIRSHFELD: I would like to add a couple of things.
First, we had on our agenda to talk about how particular model attributes
—
such as sheer volume or size, as well as methodology—determine what the
feasible methods of sensitivity analysis were, if indeed any existed. In
other words, we wanted to get into those issues of how you can do it in indi-vidual settings, and we just flat ran out of time to really delve into it.
That was why I didn't address it.
We were certainly aware of the fact that in a given setting—like an enormousLP model or like LEAP, to take an example of a large-scale model of anotherkind—that considerations such as volume make the doing of this stuff a lotharder than just a good presentation would suggest.
On the other hand, I guess we found out that with computer hardware and soft-ware technology advancing, as well as methodology advancing, that in fact youcan tackle, in some settings, bigger mathematical constructs than you mightthink initially.
DR. HARRIS: Let me further respond to the question about model specifi-cation. We really have no technology available to look at the role of modelmisspecif ication. Clearly, that is a source of uncertainty. We recognizethat, and I think this must ultimately be included with data uncertainty andthe others.
There are, of course, uncertainties that arise from the fundamental randomnessexisting in model variables and parameters, and certainly the model specifiedplays a role in determining how much there is. I have absolutely no idea howto measure such effects, nor do I really want to push too hard on that, exceptto agree that one has to recognize it. I think it is indeed important to re-member that model specification or misspecif ication does play a role in uncer-tainty, but the quantification of such a concept would be difficult at best.
205

DR. LADY: I have questions for John Maybee and Lambert Joel.
Did I understand that model confidence, as it evolved in your session, was anordinal idea? Did you say that? If you didn't say that, I don't have a ques-tion.
MR. JOEL: No, no. As a matter of fact, that question arose and was es-sentially ignored.
DR. LADY: What did John Maybee say? Didn't John just say that that wasso? Or not?
DR. MAYBEE: I said that this question had been brought up by Alan Gold-man, and it had been discussed very briefly. I was disappointed that we
didn't have further discussion of it, but somehow or another the discussiondrifted away and we never got back to it. I myself feel that all there is is
an ordinal concept, but—and I had the impression that Alan felt the same way.
DR. LADY: All right, now you've said it.
DR. MAYBEE: If I'm misquoting Alan, he's here to defend himself.
DR. LADY: It would seem to me if you took that position that whateveryou mean by confidence could not be related to specific results, it would haveto be only related to a comparison of results. So, for example, if I had a
large annual report and an ordinal notion of confidence, I couldn't tell any-body about the confidence, whatever that means in terms of those results,without having some strawman or something to compare it with. Wouldn't that
be right? It seems like a fearsome limitation.
MR. JOEL: There is a fearsome limitation, but I think you misstated it,
in a sense. We don't really believe that it's possible to specify some quan-titative measure of confidence, or confidence-worthiness of a model.
It's necessary, of course, to have two models to compare, if you want to rankthem ordinally, but you don't have to look at outputs at all. You could cer-tainly rank two models—or two anything—on the basis of what we think of themas a result of any kind of test you want to impose on them.
If I want to rank—if I think that red is better than blue and you give me two
objects— I don't care if they're models or whatever— I can say that the red
one is better than the blue one, and that's an ordinal relationship and it
doesn't require any outputs.
DR. LADY: Well, let me put the question another way. Was there anythingthat happened at any point during the workshop that would be promising in
terms of some notion of confidence actually being brought into being in a way
that would do anybody some good, e.g., someone who actually had a report and
wonders about its quality?
207
DR. MAYBEE: Yes, there was, but I forget all the details of it, but Johnhad a , . . . .
MR. JOEL: John Dearien.
DR. MAYBEE: John Dearien had an idea which he had explored with engi-neers in his company, and had attempted to develop a scale with the help ofan industrial psychologist. I got the impression that he hadn't succeeded inconvincing anybody that this could be used.
MR. JACKSON: John, you have a question or a comment? Would you identifyyourself first.
MR. DEARIEN: John Dearien, EG&G, Idaho.
The research that John Maybee was talking about was involved with the assess-ment of thermal hydraulic computer codes. ^Vhat I did there was to take somegeneric-type comparisons of data and computer code predictions and had 150 en-gineers, who were supposedly competent in assessing the comparisons betweenpredictions and data, and had them rank it. I then tried to compare this withcomparisons that we were making of codes and data.
The results I got were taken to an industrial psychologist or behavioral psy-chologist. He told me that basically this was typical human behavior and it
was of an ordinal type—the only way you can express it is as an ordinal-typecomparison.
I was able to take these results, based on his recommendations, and plot them.I got a very good comparison between people's concept of worth and the actualnumerical data that I got.
As John said, I was not able to convince my regulatory agency that this wasfeasible, but the comparison was very good. Basically, what it said was that
if you get this type of results and get enough back-up data from competentpeople, that you can expect a certain percentage of people to agree that this
is an adequate representation of the data. The next step is getting the
policymaker to go along that this means something, but it can be done.
MR. JOEL: Let me respond to the question you raise, particularly in
light of what John just said.
Although we were very unhappy with the notion that confidence was a public re-lations kind of problem, I think it is important to recognize that it exists.If you believe that the results of analysis are useful and should be used, andyou are faced with certain kinds of prejudice and you have concluded—as I
think John and I have—that confidence in a model has a lot less to do withthe objective virtues of the model itself as they have to do with people's im-
pressions of them, then although you might find it distasteful, you need to
sell the model or the analysis, in the sense that you are putting somethingover on a client. I made a list of remarks that were made in our sessionyesterday, which I looked at this morning, and realized that they were givingme a message of some sort. I'll read the list very fast. This is a list of
things that affects confidence in a model. They're really unjust, in a sense.
208

Number one, confidence in a model can be affected in a positive way by a band-wagon effect. If a group of users had to use the model because they havenothing better available and this now becomes part of the lore of the model,subsequent users will be found just because the model existed and was used andtherefore must be good; or at least gives the impression of being good.
On the other hand, there's a whole collection of things that can deleteriouslyaffect model confidence. They really don't have a hell of a lot to do withthe objective virtues in the model. One of them looks as if it might be ob-jective, that is that there is a single assumption in a model developmentwhich is palpably false, or can be demonstrated to be false. If it's 1 out of
50, and the rest of the model really is very good, people will just pay no at-tention to the model once they've learned that it has this tragic defect.
Another aspect is what I called tendentious tinkering with a model by a userother than the developer, or other than the sponsor's people. We have ananecdote: a model was transported somewhere else and that the second userdidn't really understand how to get it running, but after a lot of work, did.
He additionally made, sub rosa, some changes—surreptiously he made changes in
the model structure, knowingly. Then, not admitting it, got different re-sults, different outputs, and different conclusions than the original user,
and published these results and said, "Well, we used your model and we didn'tget the same results." That sort of thing, once it's aired, will also reduceconfidence in a model.
I won't waste a lot of time going through this. What I'm suggesting is thatthere is a need for good assessment of models. There is also a requirement to
pay attention to the non-objective factors that influence the degree to whicha model is used and respected; if you have to call it public relations, that's
too bad, but you really have to pay attention to that sort of thing.
DR. LADY: You guys are sure that you want to have all of this relate to
the states of mind of individuals, rather than the nature of the mind.
MR. JOEL: Yes.
DR. MAYBEE: I'm not sure I'll buy that. I think Lambert is more willingto think along those lines than I am.
DR. LADY: Well, let me ask a corollary question of everyone. In any of
the workshops, did anything come up which struck you as being appropriate or
indicated that we needed something that would be appropriate for helping some-
body understand what they've got, quality-wise, when they get model results?
MR. HOLLOWAY: We didn't discuss this in our workshop, but maybe the fol-
lowing would help clarify it.
I've seen some work done to expose the explanatory power of the model. The
procedure is to classify a set of exogenous variables, the things that are
specified outside the model, as opposed to those that are endogenous, and then
do some perturbations on the model, and analyze the results.
209

One takes the key outputs of the model, perturbs the inputs—the exogenousvariables as opposed to the endogenous ones—and you get a measure, some ag-gregate measure of the explanatory power of the model.
I don't know if any of the workshop groups discussed this kind of approach.Results of such experimentation is very useful information to have in assess-ment.
MR. LADY: That's sort of like writing scenarios, in a sense.
MR. HOLLOWAY: Yes, in a way, but you tend to get some standardized mea-sure like percentage changes in the variables that are exogenous to the modeland then look at the results and see if that's a lot more important than thethings that are supposed to be explained by the model.
I'd like to know whether anybody discussed that kind of a thing, or not.
MR. WOODS: We didn't discuss that, but we said that you had to assessthe model from two standpoints: from the standpoint of the user, to give himconfidence in what the results are, and from the standpoint of the modelers,to give them the confidence to use the model subsequently.
At GAO, we continually get bombarded by Congress with questions like, "Some-body just did this analysis. Is it reasonable? Somebody else says that
there's a range of scenarios in this analysis. What is the correct or reason-able answer?" As a result, we are developing a codified set of rules of thumbof various issues like production of oil and gas, residential energy demands,and so on.
They are not meant to give precise forecasts. They're meant to say, "Here'show the system fits together in a mechanical sense." In other words, A plus B
plus C. No causal relationships. If you put these things together the waythey are, this is what's happening. If somebody comes up and presents an
analysis to Congress, then the congressmen have the ability to use these rulesof thumb to begin to ask intelligent questions of the analyst to determine whyhe came up with a particular conclusion?
For example, what if somebody says, "We can hold oil production level through1990 by increasing production in the lower 48?" There are certain rules of
thumb based on the physical realities of how oil is produced which, if you ed-ucated the user to look at, provides him the ability to identify very quicklyhow such a production level could be achieved. He would be able to say, "I
see you're going to rely very heavily on enhanced oil recovery, or your 're re-
lying very heavily on the Overthrust Belt. Why is it that you are so confi-dent about these factors?" As a result, on that basis, he has the ability to
begin an intelligent dialogue with the analyst.
I think the reason that there's a question of confidence in models goes backto what Lambert Joel says. He doesn't like the idea of selling the product.Unfortunately, none of the models that we have here that we're "peddling" are
being peddled as elegant artistic forms for their own sake. Art for its ownsake doesn't justify multimillion dollar contracts.
210

These people are spending good money to hire us to use models because they ex-pect something useful, and on that basis we have to assess the models on thebasis of making the models useful for them. This is not necessarily confi-dence but we're trying to give insight, not just numbers, to give them theability to truly understand the insights that are coming from those results.
DR. LADY: But there isn't a "them," necessarily.
MR. WOODS: There isn't a what?
DR. LADY: A "them." In other words, the annual report, which is themajor product of the EIA, must consume easily more than half on a annual bud-get of all the resources, and the audience is indeterminate.
The problem is to have something which communicates generically what these re-sults represent, rather than get into a tailored discussion of a particularindividual and to prompt his state of mind on the confidence data.
This is not a staff function. It's an information function.
DR. GREENBERG: Harvey Greenberg of DOE.
I was in John and Lambert's session, and I have some recollections of the dis-cussion that addressed George's question. We essentially brought up the ques-tion that George raised on Monday and at least two other occasions over thepast year and a half about the nameless, faceless clientele that aren't reallyusing the model, but are using tables of numbers that were published that cameout of the model.
In various forms George has asked, "Is there any possibility that every numbercould be accompanied by some indicant to the confidence interval? Is thereanything like that that's possible?" This would be the final confidence
—
quantitative confidence—measure, if you could do it, that would address thetables of numbers.
Well, in this session, as I recall, we brought that up. First, we need to
consider the clientele who are nameless, faceless people and who are basicallyusing tables of numbers, rather than the model directly. They aren't lookingfor insights from the model directly, but are looking at the numbers and maybewill read the texts surrounding those numbers—maybe. I think we reached a
conclusion—mostly by silence—that suggests that we don't know how to do
quantitative confidence; so the answer is no for this client group.
Then there's another clientele that are identifiable. These are people
—
so-called users, clients, decision makers, policjmiakers , whatever they're
called—for whom you're going to use the model directly. You're going to try
to provide an insight. The way you get to use the model depends on how a
question is asked. That is, rather than "What is the price of oil in 1995 and
give me some measure of confidence around that number?", the question shouldbe "Which of the Alaskan pipeline proposals seems like the best thing for us
to be engaged in, and when do we negotiate with Canada? What should the
timing look like? Is 1985 a good year to bring it in? Or is 1990 better?"
211
So it is in the form of the questions. There the confidence Issue has to
do with how well the analyst has used the model. There's a lot of talk aboutwhether you can analyze the model apart from the analyst. I don't think therewas a consensus reached, and we did dwell on the debate that might have en-sued. The Chair kept us on the track.
Well, we wound up producing a checklist which, if it were followed, third-party assessors could look at that checklist and see what you did in operatingthe model and in establishing controls over the model. The data base adminis-tration, the algorithmic integrity, and all the other things that were listedand summarized this morning were actually discussed at great length yester-day.
I think the summary stops short of some of the insights that were gotten outof the discussions, because almost be definition summaries do that. But the
expanded version that I hope will get into the proceedings will convey how we
think we have advanced our knowledge of confidence building for that secondclientele. For example, if annual forecasts are accompanied by stacks of
documents and appendices that describe the operational controls and the othermeasures taken to support the generation of those tables, then the presence of
those documents will be confidence building for the nameless persons as wellas the identifiable clients.
But the answer to the quantitative question, as I recall the discussions, is
that we can't do that. We can't say if the table number is five, we couldhave something like 95 percent confidence that it's really between four and
six. I believe our consensus was we can't do that, but that we can build con-fidence by these other things.
DR. LADY: Well, we ought to be able to say it's five and not 25,000.There has to be some cutoff. I don't accept the idea it's impossible.
MR. OSANZ: George Osanz, Science Management Corporation. I, too, was a
member of this workshop, and I believe that although we could not identify a
quantitative measure of confidence, in many cases we could measure a quantita-tive value for disconf idence. That is, we could exclude quantitatively a lot
of bad models, but anything that passed through the exclusion process we wouldbe at a loss to assign a quantitative measure.
DR. MAYBEE: In what you said, George, I detected some misinterpretationof what Harvey said. I don't think Harvey is trying to imply that it was im-
possible to obtain confidence intervals, we just don't have the technology to
do it at this point.
DR. LADY: I interpreted what Harvey said to mean that we wouldn't.
PARTICIPANT: Harvey said they can't do it. Harvey did not say it wasn'tpossible to be done—although I think it is, personally, but I'm not suggest-ing the group said that.
212

DR. GREENBERG: What I'm suggesting is that as far as we know, except for
ranges that are useless—certainly if it's over five, I think we can say thatit's not 25,000—and if that inspires confidence in our forecasting, then I
question the intelligence of the reader.
I don't think we interpreted your question as addressing the useless rangecategory. 1 interpreted the question to address whether there are usefulranges of confidence that could be quantified, akin to a confidence interval.It's not between minus infinity and plus infinity, or whatever the machineprecision range is, but rather some useful range—between four and six, maybe.Something like that.
But what I did say a few minutes ago is that we don't know how to do it to geta useful range with a number that is defensible. That it is beyond our col-lected state of the art to do that.
MR. JOEL: I'd like to add to that. Just so you won't be throwing it atme, George.
To say that we can't find a quantitative measure of how good a number is
doesn't mean that we propose to
—
DR. LADY: Harvey says we can, but only useless ones.
MR. JOEL: That's true. I believe that's true.
On the other hand, that doesn't mean we're going to leave a space blank forthe number in a report. If you're dealing with a physical constant, you fre-quently are required to write down how you measured it. Numbers that appearin the report should be accompanied by whatever information you can give to
measure.
Then the reader can make up his own mind how to Interpret that as a quantita-tive measure of how good it is.
MR. GRUHL: Let me just give one example about a case where in fact someconfidence limits have been developed.
There's a technology assessment model that's been used by EPA and some utili-ties and oil industries which essentially involves mass balance as its func-tional forms, and therefore, only has uncertainty in the input data and in the
coefficients of the model. And these have been sent through as distributions,so that you actually get a distribution on the output. That particular modelhas been useful for a use in reverse, where you want to do some R&D funding
exercises and want to find out where the critical uncertainties are and whatthe coefficients of the inputs are that are causing the uncertainty.
But I think where the methodological problems occur is that we don't have any
reasonable techniques for characterizing uncertainty in structure. I think
almost all of the policy models have enormous uncertainties in the structureand I think that's where the methodological block is at this point.
213

DR. GREENBERG: Let me suggest a way of doing it and then tell you whyit's not really a way of doing it. It's only a way of appearing to be able todo it.
We could randomly sample the universe of inputs to our model—like MEMM orPIES, whatever you want to call it—and we could run a Monte Carlo and samplethe output. We can even write computer programs to process the output and pro-duce a report and thereby obtain things that would appear to be ranges of un-certainty around output numbers.
The reason why that's only apparently good, and not really good, is that youcan't really do that because the number of numbers and the correlation amongthe number of input numbers are a big factor in designing that experiment, andyou really can't do it right.
If you understood all of the correlations really well for the thousands of num-bers that go in, I suggest you try them in the model in the first place. If
you want to go public and say this is a 95 percent confidence interval, theknowledgeable reader presumes that's a technical phrase and has a very specificmeaning and it's not intended to be colloquial. Now, if you want to say well,it's kind of, sort of in this range, then you have to define "sort of."
A lot of the reports that we're talking about, I think, are picked up by a
technical readership and may be used in work that they do, just like we do cen-sus data. Other people may use EIA's reports in that way. Because it's a
technical readership, you can't have some ambiguous notion of probability or
confidence interval; it has to conform to understood concepts. I don't thinkyou could produce that, except in a misleading way.
DR. HARRIS: I agree, strongly.
MR. WOODS: I would add one thing. If you really wanted to try to inspireconfidence, when you publish your results, just bet your job on it. This woulddemonstrate the extent to which our confidence is there. I think we are mixingup the confidence required for energy models with the confidence that a userhas in a model used to design this building.
There's a fundamental difference between the models we're talking about, namelyenergy models and the models that designed this building in terms of the kindof world they deal with.
If, for instance, I want to model how I'm going to send a ship to the moon, I
build a model to describe how it will get there, and I know that everything is
fixed or determined. If my moon environment were like the energy environmentrequiring an equivalent moon-energy or policy model, I might get my policy
rocket to the moon only to find that somebody picked up the moon and moved it
50,000 miles. As a result, my rocket would miss the moon.
There's a fundamental theorem in thermodynamics that says entropy tends to in-
crease. Unfortunately, in a human system, you can get one person who reducesentropy, and it completely turns things around. And that's the one thing that
you can't give a confidence interval to, and that's why I think I agree withHarvey's problem that you can't really develop confidence intervals because an
individual or set of individuals could decrease entropy in your system.
214

MR. HIRSHFELD: In that regard, if what you're trying to do is inspiresome measure of confidence in a reader, if you can assert comparable confidencein the assumptions not changing, or in a real world failing to conform to yourassumptions—and I don't think we can ever do that—then all you can say is ifthese assumptions don't change—and I can make no statement about the like-lihood of those assumptions not changing—then I can impute this kind of confi-dence.
Having said that, if you could ever get to that, what have you said? The wholepoint is that any forecast can be knocked down if the assumed conditions areproven not to happen in the real world. Any forecast.
DR. LADY: Well conceivably that means that we have to be simplerainded interms of what we do, rather than giving up entirely. There are some things wecan explain and some things we can't.
I would be interested if we could explain the ones we can. The idea that wecan't explain any I find to be disappointing.
DR. RUBIN: I just have a comment about this discussion.
We talked around these kinds of issues in our workshop as well, and we alsodidn't come up with any conclusions. It occurs to me, as I listen to this dis-cussion, that there's a difference between doing analysis and communicatinganalysis to a specific individual where you can work with him on a one-to-onebasis and doing something like the annual report, which is for a more facelessmass of users.
The question that occurs to me—and I certainly don't know the answer and don'thave a position—is that on the one hand, where you communicate directly with a
user and provide him with insight, then this analysis for a policymaking pur-pose is a useful activity.
But on the other hand, I am not so sure that the annual report type is, and I
raise that question. I don't know if it's an appropriate activity for allthese resources to produce an analysis which is unfocused.
DR. WEISBIN: I guess I want to go counter to the bandwagon and reversedirection a little bit. First, let me say I think I agree totally with Mr.
Gruhl (and I hadn't previously met him). However, after he started talking we
had five speakers in a row who attempted to refute his original position.
Hence, I'd like to come back and say what I think was said, since I think sev-eral things were misstated in the follow-up replies.
First, Mr. Gruhl said that he thought that we could estimate a component of the
uncertainty—that which is due to data—and propagate it through codes, l^ere
the technology is now weak is in the uncertainty due to the model specifica-
tion. I agree with this position totally and will try and review why I think
that was argued with.
215

First it was said that the codes are very large and there is no way that we canget sensitivity to all of the data involved. I assert that I believe that is
incorrect. There are ways (e.g., adjoint perturbation theory) to get sensitiv-
ities to the entire data field. We can discuss that later in more detail, if
you desire, at another time.
It was then said that there is no way that you can get correlations in the un-certainties in the data. I also disagree with that statement. In fact, if youcan estimate uncertainties in the data, I would ask what is your confidence in
the nominal number to begin with? It is a formidable job to get those uncer-tainties and correlations, make no mistake about it, but there was an implica-tion of technological infeasibility , which I think is absolutely incorrect.
Furthermore, there is this whole bandwagon movement that to be quantitative is
taboo. \'/hat do we have left? Let me take the opposing position and say thatif you cannot do this, what you have left may not be worth very much.
In this conference I've heard just lots and lots of words about collecting dataand analyzing data and models, and it's very, very hard to walk out of the
meeting with something that you can call tangible. For example, when would—if
there were no monetary constraints—anyone on the panel vote when an evaluationcould be declared finished? Would anyone know, once standards were met? It
seems that our experience is that the only time that you can do something whichis constructive and finite is when you can begin to estimate uncertainties, if
you will, quantitatively.
Do not confuse that with the fact that uncertainties do not have to be small.If your estimate says "I don't know very much about that data," these couldlead to very large uncertainties. If you just think about correlations, youcan begin to write down what is known about them. The values of the numbershave nothing to do with the fact of whether you can get a hold of these numbersand whether you need them.
So I'm just saying in summary, I do not want to take the total opposite posi-tion, but I do believe you can estimate uncertainties due to data, and I do be-lieve that the main weakness in the field now is still in the model specifica-tion.
MR. JACKSON: Thank you. There are a number of questions here—we couldgo on—but we've run out of time. I'd like to thank all of the panel membersfor appearing before us this morning, for taking the lead in chairing the dis-cussions last night, and for going through the pain and agony of preparing the
presentations late last night.
DR. GRUHL: Can I just make one comment.
Not to bicker about semantics, but I think the argument about correlation of
uncertainties can be viewed as a structural problem within the model, as op-posed to an input specification problem.
MR. JACKSON: Now I'd like to close the morning's session. Thank you verymuch.
216
REFLECTIONS ON MODELING AND MODEL ASSESSMENT
by
A . J . GolcJman
1. Introduction
It was a little over three years ago, in April of 1977, that I
had the privilege of welcoming to the National Bureau of Standardsthe attendees at our workshop on the utility and use of large-scalemathematical models [26] . That was a profound pleasure, because ofmy strong and continuing conviction that much greater attention needsto be devoted — both by the professional modeling community and bythe user community — to working towards better understanding of andbetter practices in the development, assessment and use of large-scaledecision-aiding mathematical models.
Eighteen months later, thanks to the support and initiative of ourcolleagues in DOE's Energy Information Administration, I found myselfwith the equally pleasant charge of greeting the participants in a
second workshop, one devoted more specifically to issues of model
validation and assessment [28].
It is good to be here today on this third occasion, though nowin a valedictory position on the program rather than my previoussalutatory post. One temptingly simple approach, to estimating therate of progress in the field we're discussing, would be to compare thetitle of the previous workshop with that of the symposium we're nowconcluding. The only change is that the phrase "Validation and Assess-ment Issues" has been replaced by "Validation and Assessment." The
"Issues" have vanished! Can they all have been resolved since the
January 1979 date of the last conference?
Not likely . The area of model assessment and analysis is still
very richly endowed with deep and difficult and challenging problems,
perplexing issues of all kinds — practical, theoretical, conceptual,philosophical, even ethical. And I hope to touch briefly on a few of
them today.
Department of Mathematical Sciences, The Johns Hopkins University;
Center for Applied Mathematics, National Bureau of Standards. The
text contains the author's personal views of the topics discussed,
rather than any kind of "official position."
217

But fortunately, settling of these foundational difficulties is
not a prerequisite for beginning and moving along smartly on a numberof useful and necessary tasks. I think most of us sense that there hasbeen a real start towards meeting the call formulated by Martin Greenbergerand his fellow-authors in their 1976 book Models in the Policy Process[34; p. 399] , a call for "the development of a new breed of researcher/pragmatist — the model analyzer — a highly skilled professionaland astute practitioner of the art and science of third-party modelanalysis." We can see the slow emergence of a concept of model analysisas a serious professional specialization, rather than an activity
carried out as a temporary aberration or diversion or perversion orshort-term special assignment by persons whose true calling is modeldevelopment. I suspect, though, that for a long time to come we willhave a pecking-order in the modeling community with status-rulesincluding "Those who can, model. Those who can't, assess," and "It
is more blessed to model than to evaluate." An interesting question,which might well be addressed at a subsequent conference in this series,is that of what education is appropriate for the new breed of analyst;this seems even more difficult than the corresponding question formodel-builders (cf. [63]). Training like that offered in [42] mightwell bo a requirement in such a curriculum.
2. Documentation and Standards
One of the areas in which it was especially easy to perceivewidespread failings in current practice was that of model documentation .
It was a sobering reminder of the passage of time to find, on checkingthe files, that my own first public diatribe on this scandalous subjecttook place more than fourteen years ago [32]. But of course that wasnot the earliest such jeremiad; here, for example, is a curiously current-
sounding quotation from a War Gaming Symposium held in 1961 [56]: "Thereare already some good simulation models which are essentially lost becausethe teams which created them were dissolved before making sufficientlydetailed records — waste also occurs when proper records are not madebecause new teams must resolve many of the same problems over and over."
Quite naturally, there is talk of documentation standards, and a
body of work underway (e.g. [25, 27]) which may lead to their develop-ment and use. You will recall, no doubt, the passage near the end ofGeorge Lady's address on Monday in which George bared his fangs andobserved — in charmingly low-key fashion — that standards and idealsof good practice only really take force once some profferred projects or
reports are actually rejected for failing to meet them. The modeling
218

community does recognize a need for greater discipline about documenta-tion [26, pp. 211-212; 29], though perhaps preferring greater opportunity
and incentive for self-discipline . But there is also an entirelyreasonable concern about imposing a set of inflexible and rigidly-administered standards upon any part of a creative and varied processlike modeling (e
.g .
, Greenberg [33], Nissen [55; p. 282] on a "dangerof totalitarianism"), and in particular some nervousness about theactive role of the National Bureau of Standards in this model-assessment field (cf . Hogan [37] )
.
It is therefore worth saying, explicitly, that the NationalBureau of Standards is not populated by wild-eyed "standards freaks."At the NBS the scientific staff is terribly aware of how demanding itis to develop standards well , with a solid technical rationale, andin a cooperative way that truly merits and receives the acceptanceand appreciation of most users. The job becomes even harder, inmany ways, when what is sought is a functional standard (e.g., "noiseabove a certain threshold shall not pass through the apartment'swalls") rather than a material or structural one (e.g., "the wallsshall be constructed of Material X and shall be at least yea thick").But functional standards are what's really needed, if ingenuityand creativeness are not to be restricted.
With few and partial exceptions (e.g., Shaw [60]), the model-ing profession has not as yet seriously approached the issue of modeldocumentation standards from this rigorous "functional" viewpoint.Doing so requires more than reaching a consensus that all good modelingefforts, of a certain size and complexity, should produce such-and-suchdocuments at certain stages of their progress. It would involve, first,thinking through very carefully what it is that documentation is supposedto accomplish in terms of transfer of information, ability for newpeople to get a model up and running, ability to modify it, ability tounderstand its assumptions, etc. Then one wants to develop means(measures, and measurement methods) for determining to what extent a
given body of documentation succeeds in performing these functions
.
One needs a deliberate articulation of alternative documentation andtraining approaches, and testing of these approaches against theperformance measures so that design guidelines can be built up.
I do not mean to imply that current efforts, to apply good senseand professional judgement to the development of interim dociamentationstandards, are in any way inappropriate. But I do suggest that the
type of conceptual , theoretical and experimental research programdescribed above should lead to a next generation of better-based andmore flexible standards, and also to some fundamentally importantknowledge about communication of and through models.
219

Let me give just one example (perhaps not a terribly good one) ofthe }:ind of problem I see lurking in the documentation thicket. Oneinjunction on everybody's list of documentation advice is: list allsignificant assumptions of the model. And so let us suppose that ourmodel assumes a certain relationship and has the nice simple formY = AX. Now, mathematics is an extremely powerful language for ex-pressing assumptions. Once Y and X have been defined and explained,when you write down that equation it states exactly what is beingassumed, nothing more and nothing less. But it seems to me thatthis leaves out a kind of information that some users would need,namely what might you plausibly have assiomed instead (but didn't)?Was the real point that you assumed a zero intercept? That the rela-tionship was linear rather than quadratic? Rather than exponential?It appears by no means trivial, in a document of finite length, toconvey to varied readers with varied needs the significance (ratherthan just the statement and justification) of the model's containingone particular set of assumptions rather than some other. (An interestingearly example of assumption-exposition is given in Chapter 5 of [35].)
A change of subject: during the last few months I've had occasionto do a little reading about university libraries. Standards for suchlibraries are set by appropriate professional associations, and thesestandards display an interesting gradation [65] worth reporting here.
First, there are accreditation standards. They are regarded as
minimum thresholds: a library not meeting them has no real right to
call itself a college library at all . Next, there are benchmark anddiagnostic standards. These are supposed to represent roughly the
canons of good practice — what is generally achieved by decently-regarded university libraries.
The third and most intriguing category is that of projective standards.These represent, and in fact go somewhat beyond, what is done by the"forefront" academic libraries. They are goals, desires. They'reintended to stretch existing practice, to stand ahead of it far enoughto be inspiring but not so far as to be hopelessly discouraging.
Perhaps such a hierarchy of classes of standards, each class
with its own distinctive role, is worth keeping in mind as we thinkabout the development of standards and guidelines for the planning,conduct and documentation of modeling and model-using activities.
220

3. Targets, Unicorns, Elephants and Icebergs
In the process of learning about model analysis and assessment through
real experience rather than anticipatory speculation, we find ourselvesin confrontation with some sticky problems — problems we were awareof earlier at an intellectual level, but sensed to be so unpleasantthat we tended to dismiss them from attention until actual practiceplunged our noses smack into them. I'm going to mention just threeof these now, and I'll refer to them as
— the Moving Target Problem— the Unicorn Problem,— the Elephant/Iceberg Problem.
3 . 1 The Moving Target Problem
The moving target problem has been mentioned, sometimes under thatvery name, in several past papers in this workshop-series (e.g. Lady[47, p. 9], Wood [68, p. 40], Richels [57, p. 176], Baughman [5,
pp. 200-201]). The issue is that of what procedures are fair, practicaland appropriate in trying to evaluate a model that is so impolite as to
refuse to stand still in its evolution so the assessor can get a firmgrip on it. Perhaps one might call it the "Protean model quandary";Freedman [23] speaks of "model fluidity".
Well, that sort of problem has a long history among hunters andmilitary marksmen, and there is a well-developed procedure for dealingwith it. That procedure will surely come to mind if you recall howmodern computers arose from the needs of anti-aircraft gunnery in WorldWar II.
The way you handle a moving target is to lead it, and that principleis the basis for my proposed solution of the problem. In traditionalfashion, I lay it out as a 3-step process:
(a) Gather and analyze data on the evolution of Model M prior to
the present time tg . Also gather and analyze relevant data on the
evolution over time of past models of similar type, past modeling ef-
forts by the same group, etc.
(b) From this rich data base, develop a model M' predicting the
evolution of Model M between now, MUq), and the time (t^) when the assess-
ment is due.
221

(c) Apply your assessment techniques to the predicted versionof M(ta).
For ease of presentation, I have omitted some minor technicalcomplications from this description. One of them is the need for aproper assessment of step (b)'s Model M' , a thought suggestive of thewhole fascinating field of meta-assessment , complete with Russell-typeparadoxes about the class of all assessment models which do not assessthemselves, etc. (cf. Smullyan [62]). But you get the general idea.
Homework problem — essay type. Is there something serious andworthwhile in this facetious prescription? (I really believe thatthere is.) Please turn in your answers before the next symposium.
3 . 2 The Unicorn Problem
To introduce this problem, let me tell a little story. Imaginethat, one sunny afternoon, a father takes his son to the art museum.There they are, and they stroll through the various rooms, and after a
while they get to the sculpture exhibits . The little boy is especially
attracted by one particular objet d'art in that room; he walks roundand round this piece of sculpture, views it from different angles, bendsdown and reads the plaque that gives its title, and then looks up at
his father and asks
"Daddy, is that really what a unicorn looks like?"
I submit to you that, as model assessors, our situation is muchlike that of this parent. We ask ourselves, for example, "Does this
model really portray how the economy behaves?" Folks, there ain't no
such thing as "the economy". There simply is no well-defined physicalobject or set of objects, clearly distinguished from all other objectsand with behavior clearly distinguished from everything else that'sgoing on in the world, which can serve as the referent for that question.
"The economy" is an extremely high-order intellectual construct,the details of the construction differing among economic scholars andphilosophers. It is , like the unicorn, a myth — an extraordinarilyuseful myth, but a myth nevertheless. To ask what a myth "really" is
or does, is to ask a very difficult kind of question, and even under-standing what we might mean by an "answer" poses a difficult task ofconceptual analysis. (That is, the task of system identification,which is usually thought of as a necessary precursor to system analysisand prediction, is here more a matter of system definition and (mental)
creation . Cf. Emery [21; pp. 43-44].) In like vein, to assess a
model's ability to forecast "correctly" the interactions between theenergy sector and the (rest of the) economy is to be concerned withpredictions on the nature of the progeny spawned by the mating of two

myths, a project which might well daunt even the least inhibited ofthe medieval compilers of bestiaries.
In this context, I invite your attention to Hollaway's [38] iden-tification of such down-to-earth phenomena as price and income levelsas having normative rather than exclusively positive significance.And I cannot resist citing one pertinent though controversial passagefrom Kenneth Boulding's brilliant presidential lecture at the January1980 annual meeting of the AAAS [7] : "A widespread illusion aboutscience is that its basic theoretical images and paradigms are theresult of inductive reasoning and experiments. It would be truer tosay that science is the product of organized fantasy about the realworld, tested constantly by an internal logic of necessity and anexternal public record of expectations, both realized and disappointed."Here is further corroboration from a distinguished bioscientist(de Duve [17; p. 3]): "As scientists we do not merely read the bookof Nature. We write it — that is the way our science progresses. Butwe must accept our concepts for what they are, provisional approxima-tions that are as much fictions of our minds as they are faithfuldepictions of facts."
Obviously I do not mean, with all this talk of myths and fantasiesand fictions, to imply that applied modeling is impossible or useless,any more than Boulding or de Duve would infer the fruitlessness ofscientific activity. But I do suggest that hopes for better under-standing of the modeling enterprise and its products can only be
clouded, if a faulty viewpoint of naive Realism goes unchallenged.
3 . 3 The Elephant/Iceberg Problem
There is a whole nest of problems squirming here, which I will try
to encapsulate in the following bit of pidgin-Zen: the elephant is
only the tip of the iceberg . Let me explain.
When one sets out to appraise one of today's significant decision-
aid models, the first property that is perfectly clear is that the thing
is big , a veritable elephant of size and complexity to get hold of and
understand. But we bravely say, "Well, this is our job," and proceed
to plan somehow to assess this elephant. We will dissect it and check
that its vital organs are properly connected, we will assay tne quality
of the ivory in its tusks, we will observe whether it follows the
mahout's instructions properly rather than running rogue in response to
any unfamiliar type of goad, and so forth.
But as we really get into the job, we find that indeed the elephant,
massive though it be, is only the tip of the iceberg that defines our
true proper responsible area of concern. Another piece of that iceberg
223

(metaphors are about to be mixed into a fine froth) is the elephant'sdiet, the data on which it is fed. Typically a major part of thatfood is synthetic — or, more forthrightly , concocted — so that itsnutritive value may be dubious (see, e.g. [24], Sections 5 and 7 ofFreedman [22] together with Section V of Hopkins [39], also pp. 150-151 of [28] ) . Tracing such feed back through its intermediate proces-sing stages to its raw ingredients, though clearly necessary for theindependent-verification virtue of a "data audit", can be a formidabletask (cf. Hirschfeld [36]). And I suspect that the particular concoctionprocedures employed (for estimation or aggregation or allocation orwhatever) were not in general explicitly chosen to be optimal relativeto the way those particular concoctions were going to be used in thelatter stages of the modeling process. The development and use ofdata-transformation techniques deliberately tuned (e.g., in terms of"best-fit" criteria) to the error-cost structure of their products'intended use, seems to me an important technical area for modelingscience
.
Another chunk of the iceberg involves scenario formulation.Policy problems, in vivo , do not generally arise nicely formulated interms of particular settings for the parameters of a model. If I
would like to influence what answers a model gives, let me be the onewho formulates for that model the scenario describing the decisionproblem at hand. Grant me that privilege, and (in the words of oneparticipant in the discussion-session I attended) I can probably makethat model dance to pretty well any tune that is desired. Cf. Kresge[46; p. 193]. The situation is, alas, quite different from thatheld up by Arthus [2, p. 20] as an ideal for scientific investigation:"The question raised must be such that it permits an answer, andthat this answer may be clear and may if ever possible be expressed
by yes or no. Ambiguous, approximate answers, full of reservationsand double meaning are not conducive to progress and must be condemned
But the question, of course, must have been put in a certain way. If
a discussion remains confused it is not always because somebody answersin vague terms but often because the questions have been wrongly put."
But if the input channels to the model are too well-guarded for
any flimflammery there, then let me be the one who interprets the
model's outputs for the user, reading the entrails through appropriatelytinted lenses, applying "subjective adjustments" in what Freedman [24]
calls "the exercise of judgement through the back door," and standingwell-poised to exploit what Arthus [2, p. 11] describes as the "contrast(of) the rigidity of the fact with the plasticity of its interpretation."And this area, that of the provisions for judgemental adjustment and
communication and explication of model results, is yet another pieceof the iceberg that requires exploration if the model's performance and
merits in actual use as a decision-aid are to be well understood.
224

It has been extremely reassuring to me to see, in last year'sworkshop and this one, increased and more sophisticated recognition ofthe need for extending assessment activity from just the elephant itselfto the rest of the iceberg (e.g. Cazalet [12], Marcuse et al [49], Mayers[52], Hogan [37]). It is going to be terribly difficult, but it hasto be done.
For example it is simply not enough, in my opinion, merelyto assess a model as a mechanical object without regard for what themodelers' insights and expertise can contribute to its performance.(Cf. Greenberger e;t aJ [34; pp. 335-7], Ascher [3; pp. 64-70],Nissen [55; p. 272] and pp. 203-204 of [28]). To do so is like goingdown to the end of the block to look for the key you dropped, becausethe street lights are brighter there; it ignores the reality that thepublic and its representatives are (or should be) concerned for thequality of what flows from the entire model-use process.
But please don't misunderstand me; I said that such "depersonalized"analyses were by themselves insufficient , not that they were meaninglessor (properly interpreted) misleading. In fact, I think they are necessaryfor an understanding of what the model per se does, and whether (as mywine-fancying friends might say) it is likely to travel well; cf. Lady[47; p. 10]. And there may be good reasons, such as those proposed byKresge [45] , why a part of such analysis should even be performed at a
considerable remove from the modelers.
I agree with those (e.g. Mulvey [53; p. 188]) who find that modelingtoday is still largely an art form. (Cf. Klein's contrast [44; p. 9] ofmodern progress with the "artistic, subjective and personal" nature ofearlier economic prediction.) Yet this element of artistry does notimply that no useful discussion of the product is possible without refer-ence to the artist. For instance, musical scholars and musicologistscan and do undertake technical analyses and aesthetic evaluations of
Chopin's etudes despite having no recording of Chopin playing them. Partof what composing is all about is the creation of musical works thatwill continue to display beauty and give pleasure when performed by others ,
in different places and at different times. (It could prove interestingto attempt a "contrast and compare" discussion of the respective roles
of a composer's immediate patron and a modeler's immediate client.)
The case of Paganini might be raised as a possible counterexample.
It would indeed be especially difficult to make any judgements about
his compositions without the maestro himself at hand to perform them. But
Paganini was composing not for the sake of the ideals described above,
but rather to provide showcases for his own virtuostic talents. I
don't think the leading modelers today are operating under that particular
225

motivation, though the intrinsic fascination of the modeling gamecreates some real temptations for the ego (cf. Massarik [51; pp. 16-18]on "The Model Builder's Culture"). At any rate, I continue to ascribevalue to the traditional scientific criteria of reproducibility andportability, while acknowledging that full-scale assessment must extendbeyond these properties of the model to include the human elements ofthe modeling/analysis system.
In their paper at last year's workshop, Peter House and Roger Ball[40; p. 159] assert that while the scientist can "punt" when he or shecomes to the end of what the available models and analytical methodologiessay, the (decision) analyst cannot. To which Roger Glassey in the ensuingdiscussion [28; p. 167] rejoined, "The modeler, when he reaches the endof the limits of his science, at that point should confess that he hascome to the end of his knowledge as a modeler, and then fall silent."(Possible second thoughts appear in the "—we must respond, with orwithout a model" of Glassey and Greenberg [31]
.
Surely, whether the analyst can or can't (or, must or musn't) punt,depends on what game is being played. If, like a geometer trying to
construct the regular n-gon using straight-edge and compasses only, themodeler is only permitted to communicate that which has been estab-lished by "a scientific method" — presumably the formalized reproducableapproach of or akin to the model itself — then indeed, after thiscommunication is made, the rest must be silence. And if, as Glassey(op. cit . ) explicitly opines, the modeler really has nothing more to
say that is worth hearing, then such a restriction is prudent. But in
the absence of experimental evidence (perhaps well worth pursuing)
,
I am dubious of the "nothing else worth hearing" hypothesis. It seemsmore likely to me that the analyst is bright, has built up a highlytrained intuition in the course of working and playing with the modeland its data, and should not be forbidden to contributethe benefits of that informed though unformalized intuition to the
cogitations of the decisionmaker.
What is essential to maintain is truth in labeling. And so these"extracurricular" contributions need to be labeled explicitly as outputsof the modeler's intuition, not of the model itself. Professional ethicsdemand that the modeler make this distinction very clear to the client.
Now a more delicate point arises. If the decisionmaker, in present-ing recommendations derived in part from such intuition-based input,
clouds over the distinction, what is the modeler to do? If the witnessgiving testimony before Congress says in effect, like the principal in
an E.F. Hutton commercial, "My model says ," when in fact the modeleroperating in intuitive mode said it — or even worse, the model "said it"
in the sense of a confession extorted in the police station's back room,with its inputs twisted and its logic "adjusted" to produce a desiredresult — if this is what's going on, does the modeler have a professional
226
responsibility to blow the whistle and try to set the record straight?My own answer is "yes". It is an unpleasant question, that I thoughtneeded ventilation.
4. Credibility in an Age of Mistrust
The currently popular term "credibility" seems to me a rather goodchoice for expressing, in a single word, that property of a model ormodel-application at which assessment for decision- aid capability isaimed. But it's sxibject to serious ambiguity if not qualified withcare, and it is all too easy — speaking from one's own institutionalsetting, own viewpoint — to skimp those qualifications, therebyconfusing or misleading listeners who don't share the same preconceptions.
For example, does "credibility" refer to the degree to which beliefor confidence i£ elicited, or the degree to which it should be elicitedin an ideal world with an ideally well-informed and open-mindedpopulation of potential believers?
Credibility to whom? An immediate client? The Congress? Awider public? To assessors? That important distinctions hinge on theanswer has been noted by prior speakers in this symposium; see alsoGass and Joel [30]
.
Credibility of what ? Of a model? An entire modeling system?Particular applications of such a system? "Analytical results"? [31]
.
We really need to be careful both to specify which of these we mean ata given moment, and to keep the full range of possibilities in mind(cf. Joel and Maybee [43]) as we work towards methods for estimatingand enhancing credibility.
Churchman [14] , discussing the assessment and validation of scientifictheories, observes that "a whole set of problems as to measures of
relevance and confirmation must be considered," and goes on to posesharply one of the basic issues: "Some, like Carnap, believe the
degree of confirmation of a hypothesis can be expressed independent of
the use to which a hypothesis is to be put. For them, the degree of
confirmation expresses merely a relationship between the set of obser-vation sentences and the hypothesis. Others, like Wald and many statisti-cal decision theorists, believe that a weight function which helps to
define the seriousness of a mistake is essential."
It seems to me that Wald's stance, though intrinsically more dif-
ficult to implement because of its requirement for a weight function, is
227

the more appropriate in considering the reliability of a model in a
particular decision context. Going beyond the limits of my own technicalcompetence, I would urge that in grappling with the terribly difficultconceptual problems of credibility (cf. House and Ball, [40]), wenot neglect the intellectual resources that may be available from thescholarly community most closely involved with such questions: thelogicians and philosophers of science specializing in the area describedby such terms as "inductive logic" and "confirmation theory." Someof this work goes further, explicitly linking degree-of-belief withdecision and choice. The "classical names" in the field are thoseof Carnap and Reichenbach; its nature can be sampled by examining suchworks as Burks [8] , Carnap and Jeffrey [10] , and Shafer [59]
.
When credibility is being spoken of, just what is it that someoneis supposed to be believing about the model? That particular numericaloutputs are right on the head? Surely not. As one discussant at anearlier panel said, "One thing we know about the numbers that come out,is that they're wrong." It is inconceivable that they would beliterally, exactly correct. Accurate enough , with high enough confidence -
that seems more like it. But how much is "enough"?
My own feeling, about what it is that ought to be believed, is
this: that use of this particular model or modeling approach, thisparticular system, gives the decision-maker a good chance — a betterchance than the available alternatives — of correctly identifying the
better policy or policies among the range of accessable alternatives.And I would like to see at least part of our assessment and assessment-method development programs aimed explicitly and directly at this sort
of functional ordinal-flavored criterion, rather than at intermediatecardinal-flavored desiderata.
Under some of its interpretations, credibility can depend a greatdeal on the amount of credulity, or even just plain trust , that's around.It seems a rather scarce commodity today, partly because of healthyskepticism by a more alert and better-informed public, and partly for
uglier reasons that I'll touch on later. This is one of the reasons,I think, why the originators of some of the leading models find them-
selves suffering under a particular and cruel kind of burden.
Let me speak, for example, of PIES. The operations research com-munity is forever and with good reason bemoaning the infrequency withwhich its contributions achieve relevance, responsiveness, end use, and
significant impact. The PIES makers, operating under extraordinarilystressful conditions
,performed mighty feats of analysis, intellectual
integration, model creation, and persuasiveness, and succeeded admirablyat achieving many of these goals that the O.R- profession sets up as
lofty standards. But instead of being awarded medals they find themselves,
in the context of "assessment", being berated for failing to satisfy
228

criteria they feel are irrelevant, ultra purist, and the like. (See,
e.g., the discussions interpersed in [33].) It is not unnatural, in
such circumstances, for a certain bitterness to result. We have heard
it surface, quite unmistakably, at this symposium and its predecessors.
Some of it arises because the fault-finding is (or is perceived as)
directed at the individuals involved, rather than the situation or
institutional setting in which the work was done. The closestanalogy — and it isn't a terribly good one — is with the responses
to returning Vietnam-war veterans by those revolted by or disgusted with
that conflict, and with those veterans' reaction to these responses.
But there is another point to be made. Sure, it's terrific if
an analyst working hard and smart, or an analysis team or a modeling
team, can give decision-makers very good advice and insights about
hard problems. That by itself used to be the name of the game, but the
game has changed over the last decade or so, in what I call "an age
of mistrust."
It is fact rather than opinion that, during this period, the public
has been betrayed by holders of high office and esteem in the governmental
sector, the private sector, and, some feel, in the professions. Moreover,
the informed public knows this in many cases, and siispects it in many
more (probably not always the right ones) . That p\iblic, for darned goodreasons, will no longer give ready trust or even grudging trust to pro-nouncements by authority figures. (Cf. Cantlon's reference [9] to "thepublic's post-Watergate, post-Vietnam sag in confidence about nationalinstitutions — and decisions.")
It follows that if the analyst-modeler can not only provide good advicefor the client, the decisionmaker, but can also provide means for demonstratingto a concerned and skeptical public that this advice is indeed well-founded —or, better still, provide tools which that public can apply itself to verifythat the advice is good — then that analyst-modeler has performed an evenmore notable, extraordinary and praiseworthy feat. I subrr \ that the require-ments for laurel wreaths, in this suspecting era, have been raised to the
level of accomplishment just described, one we are still a very long wayfrom being able to attain.
(This course of events has historical parallels, as in Beth's account
[6; p. 58] of the origin of formal logic: "It arose out of the needs of
argxamentation. In the oldest thinkers we never find a deductively coherentargumentation; they restrict themselves to a dogmatic exposition of their views.
Formal reasoning only occurs when the need is felt to refute an opponent or
to defend one's own views against the views of others.")
229

A mundane but very real contributor to generalized distrust, iswidespread disappointment over the quality and performance of manyconsumer products. Some desultory reading [16, 54] on the "theory" of
fraud, in consumer goods and services, turned up an interesting three-way
classification of certain qualities of such products.
One class consists of "search" qualities, those that can be ascertainedwithout purchase. For example, the style of a suit — I can look at thesuit in the store or store-window and make a reasonably good judgementon how well I'd like it. Then there's what's called "experience" qualities,not discoverable by mere inspection, but only through purchase and use —e.g., the taste of a can of tunafish. The third and last categoryconsists of "credence" properties. They may be very important, but arenot revealed through normal use of the product; rather, they can be assessedonly by costly information-gathering perhaps involving the consultationof experts. For example, whether or not you really needed that expensiveauto repair, or to have your appendix taken out.
Of course model products are not consumer goods, and I hope we willnever need to be talking about "modeling fraud" (cf., however, the dispute[11] over ballistic-missile defense analysis) . But it still seems to methat this trichotomy provides one useful analytical framework for thinkingabout why model assessment is needed, why calls for it have arisen, and
what forms and gradations it may take.
5. Decisions; Responsibilities and Strategies
I spoke earlier about the need to develop techniques , for modelanalysis, which explicitly reflect the context of the decision processes
in which those models are supposed to be useful. Now I'd like to say just
a bit more about that context, beginning with the following quotation
(Young [70; p. 2 ]) :
"It has become accepted that decision-makers, especially in govern-ment, have a duty to cope with changes and control them. This they canhardly do unless they make an attempt to foresee them. This is of coursean extremely hazardous undertaking since it is — part of the definitionof the future that it is unknown. The job becomes more difficult — and
more necessary — just because men have gained increasing control overtheir environment."
It is exactly this difficult and necessary job that the modeler seeks
to assist. In past centuries, when technologies and social institutions
230

changed much more slowly, the principal uncertainties and hazards of lifeinvolved famine, illness and the like — things that operated on a personallevel or had "Act of God" status, so that one couldn't very well expectgovernment to do much about them. (The two principal exceptions — warsand taxes — were in fact major causes of piiblic unrest.) Today we arelonger-lived; harvests are more predictable and crop failures lessdisastrous — the vicissitudes of life arise less at the individual leveland more at the regional and national scale where the foresight and wisdomof government leaders can make a difference. But at the same time,"because men have gained increasing control over their environment," thatforesight must extend beyond the forces of Nature to what otherdecisionmakers, in our own nation and in others, may do. Such contingenciesconstitute significant "singularities of uncertainty" poorly suited tostatistical treatment (cf. Freedman [23], Bassie [4; p. 8]), so that it is
hard to suggest alternatives — but see Emery [21] — to oracular (i.e.,
Delphi) techniques. (It will be interesting to follow the fate ofAscher's suggestion [3; p. 211] of specialized "surprise-sensitiveforecasting" to combat the problem of "assumption drag"; re the latter,cf . Simon [61] .
)
The easy choices are rarely even dignified with the term "decision".That's the real point of Ron Howard's statement [41] in a recent issue ofOperations Research , that "Decision making is what you do when you don'tknow what to do." There are many choice situations in which your previously-developed ethical or religious or ideological system delivers a snap answer;having principles is — among other things — an invaluable device forefficiency of choice. There are other cases where the issues are trivialor simple enough, and you're expert enough, that you can settle the matterright off without even a conscious act of "deciding". So when the phrase"decision making" does arise, you can be pretty sure the question involvedis both significant and perplexing.
That "part of the definition of the future is that it is unknown" is,
I think, the fundamental point that tortures many of us concerned withmodeling and model assessment. In trying to develop validation conceptsand assessment techniques, our minds are deeply colored by past immersionin the value schemes of the sciences, with their incredible predictivepower utilizing "the unreasonable effectiveness of mathematics" (Wigner
[67] ) . And so we keep trying to find some way of strictly holding decisionmodels, policy-aid models, to standards comparable to those traditionalfor scientific theories. And when the pain finally drives us to recognizethe futility of such insistence, we lurch to the opposite extreme and declaim
that rigor and notions of "scientific method" make no sense whatever in
such appraisals. It is basically the unknowability of the future that
gnaws at our vitals and inflicts the emotional and philosophical tensions
that send us careening between such irrational extremes.
231

You'll recall that Larry Mayer, in his talk earlier in this symposium,offered us a theorem: all models are optimal . In the same spirit ofhyperbole, I offer a countertheorem: all models are crummy .
The proof is very short. What we want, what we desperately long for,what we genuinely need, is an ability successfully to forecast well intothe future the course of the complex and uncertain matters on which policydecisions are required. Relative to this heart's desire, no model comesanywhere near to measuring up, and since the future is unknowable, mostlikely none possibly can. (Is there an axiom scheme, like some of thosefor quantum mechanics, in which this can be formally demonstrated?) Ergo,all models are crummy.
But still, we must try to develop some ways to distinguish degreesof criomminess, to help the decisionmaker (and the citizen) assess therelative utilities of the various modeling tools that might be present onthe stage. And — once again — I think that more of that effort shouldinvolve explicit consideration of the model's context in a decision or
policy process. One source of useful ideas about such processes is the
writings of Charles Lindblom, e.g. [48].
I suspect that many of my contemporaries in Operations Research werebrought up, as I was, to view Lindblom as a bete noire . He was accusedof being the champion of "muddling through" — the champion not of the
sort of bold, rationally-derived optimal decisions we were taught to revere,but rather of a cowardly and unesthetic policy of incremental change. But
as we went on and encountered a bit more of the world, and found outthrough personal experience a little more about what responsible decision-making is like, we may have become rather more sympathetic to what he hadto say.
One of his most striking points, if I may paraphrase it loosely in
modern lingo, is that significant decision problems are NP-hard. Fullexecution of the traditional paradigm of rational decision-making is not
just difficult, it's impossible. It is literally never possible to
carry out all of that paradigm's prescriptions. Here is the exact passage
[48; p. 6]:
"For a complex problem it is never possible to be clear about all the
values affected by a decision, including their relative weights, neverpossible in fact to ascertain all possible means of achieving the objective,
never possible exhaustively to trace through the chain of consequences that
are attached to each possible means."
One response to these realities, the traditional one, is to recognize
the unattainability of the ideal decision process but to seek to approximate
that ideal as well as possible under limitations of time, information and
resources. A quite different approach, which Lindblom espouses and claimsto observe in the behavior of superior decision-makers, he calls "strategic
problem solving."
232

Again I quote, "The decision maker has to acknowledge that he musttake short cuts, must leave important aspects of his problem out of hisanalysis, must make judgements on the basis of values only roughly perceived,
and must make do with dodges and stratagems that are not scientificallyrespectable — He can out corners, omit, improvise amateurishly and intuitively .
Or he can try to develop a well studied and thought out strategy to guide himin his shortcuts, omissions and dodges. (The strategic analyst) choosesthe latter. He takes seriously the need for developing a strategy for copingwith problems on which conventional scientific prescriptions give himinadequate guidance .
"
Lindblom goes on to identify a number of elements of such a strategy.One of them is indeed incrementalism; incremental changes are typicallythose for which you have enough information to do some sensible analysis.Also, they are likely to be the changes most likely of acceptance andimplementation, so that more rapid progress may be possible through actualexecution of a sequence of such changes than through opting for the boldand radical new step.
A second guideline is to stay reversible, or at least flexible;more information will be gained as time proceeds, and the decision-maker should try to preserve the ability to make revisions in the lightof that information. This strikes a very responsive chord in me; I thinka major theoretical shortcoming in most of today's policy-aid models is
that their basic framework is that of "the good decision, now", ratherthan one of developing good decision rules that explicitly take intoaccount the availability of further information as events unfold, andof giving guidance on the proper balance between (i) full commitmentand (ii) hanging loose so as to be better able to exploit what will belearned later. (For a somewhat dated sampler on these themes of decision-rules and "stochastic programming with recourse," see, e.g., Charnesand Kirby [13], Sengupta [58], Theil [64], VValkup and Wets [65].)
A third of Lindblom 's maxims (I will not list them all) is: Be
remedial! That is, if the task of gaining consensus on desirablevalues and ends proves unmanageable (as well it may) , it may prove easierto secure agreement as to what in present trends promises undesirableconsequences and what can be done to avoid them — trying "to define not
the goal to be sought but the situation from which escape is desired."This idea of negative steering seems to me a very interesting one in
our picture of the policy process as the milieu for model application.
I was quite sorry to see it in Lindblom 's list, because I'd thought of
it on my own some years ago and had been rather proud of myself for
doing so. But that's life.
To return to the point which prompted this excursion: if those who studypublic-sector decisionmakers have observed significant regularities in the
processes they follow, should not our model-assessment activities evolve to
take more direct and explicit account of those regularities than is now done?
233

6. Load-Sharing and MODELWORLD
Most of what I've said this morning, most of what we've discussedduring this symposium, is by no means peculiar to the field of energy.It's natural to consider why it's been the Department of Energy which,in an admirable exercise in masochism, has made available the substantialfunding and internal effort that have been invested both in assessmentof its own models and in advancing the general art of model analysis.
One might, for example, note the unique role of PIES in energy policydeliberations at a crucial time. One might recall the particular skep-ticism and hostility displaced from the policy recommendations to thesupporting models themselves. There are several first-hand accounts ofthis background (e.g., Nissen [55]), so I needn't belabor it. Butthough aware of the many factors uncongenial to evaluation and analysisefforts in the public sector (cf . Dye [18; pp. 97-98, 103-107] , Greenbergeret. al_ [34] ) , I am disappointed that more departments of the governmentare not developing comparable pangs of conscience and beginning comparableefforts in the assessment of their own considerable modeling activities.
I have heard it said that modeling is more critical in the energypolicy area because of the big investments and long lead times involved.But surely much the same can be said for transportation: when you pourconcrete for highways, that concrete is going to be there for a longtime. In a way the situation is even worse: you cannot very well trans-fer highway capacity from one region or corridor to another if you havemisestimated where the big jump in demand is going to be, but the
corresponding problem for energy can be accomodated at least in partthrough use of fuel shipments and energy transmission grids.
Perhaps later workshops in this series will, through their speakersand invited attendees, be able to promote a wider exchange of informationabout — and hopefully, a wider spread of activity in — model assess-ment work in agencies outside DOE. Energy is carrying a considerableload of investment and nose-bloodying in an effort that's of value to
a much larger community, and there really ought to be more load-sharing.
In particular, there are some more basic kinds of research that I
think should be attempted. Efforts to understand better how to do model-ing, how to assess modeling, necessarily suffer somewhat by being thrustimmediately into the battleground of the very largest models operatingon the most controversial policy problems. Sure, that's the way to
attract a lot of interest right off. It's the context in which funds
are most likely to be available from mission-oriented agencies. But
it does not represent all that's needed for an orderly sustained develop-ment of basic knowledge. Modeling science is in many ways still in
its infancy, and a battleground is not the ideal environment for aninfant
.
234
Looking only or primarily at the biggest models dealing with thehottest issues is a little like starting, in physics, with the nuclearreactor rather than the simple pendulum. So my mottos, for now, are"Small is informative!" and "Cool it!" I suggest that as part of ourefforts to learn about the effectiveness (in terms of predictive qualityand usefulness to decisionmakers) of alternative approaches in modeling,there is need for a line of systematic research that starts with simplersituations.
It would begin with historical and synthetic studies of smallermodeling systems dealing with issues which are "cool" at present.(Ascher [3] and Greehberger et_ a2 [34] can be viewed, in part, as
contributions to the historical branch of this work.) It woulddevelop a taxonomy of alternative ways of planning and conducting modeldevelopment projects and model applications. It would attempt to developtheories to predict in which kinds of settings which of these alternativesare preferable. And it would proceed to test these theories, initiallyby small-scale experiments and then if they prove promising, by a largerkind of experimental activity.
Let me refer to that larger activity or facility as Modelworld . Thisis an idea stimulated by the RAND Corporation's former Logistics SystemsLaboratory, which did some very notable work. The essential notion is
to develop a synthetic little world with which to challenge the would-bemodeler or modeling approach. It would include random processes, perhapssome human interventions, but all of them controlled, recorded, andreproducible. It would include information instruments analogous to the
Census and other common or special real-world data sources. And in thatcontrolled environment one would experiment with different approaches to
modeling efforts aimed at learning about how that synthetic world operatesand (most important) how to make good decisions about "policy" questionsposed in its context. One would try to determine how these approaches
compare under different settings of the experimental factors: time
limitations for the modeling effort, resource constraints, quality of the
data probes and measurement devices available to the modeler for exploring
Modelworld, complexity of the underlying problem, etc. A natural test-bed
would be at hand for the previously described research on the developmentof functional documentation standards.
Modelworld would not be a trivial or inexpensive undertaking. But
I think that something like it is, quite literally, indispensable to the
growth of a modeling science.
235

7 . Concluding Remarks
Most of my comments today were prepared prior to this meeting. I am
not equal to the task of quickly synthesizing and reacting to the richnessof the intellectual stimuli that have bombarded me during these threedays
.
I did, however, note with interest two particular remarks made bytwo of our distinguished colleagues from the EIA. George Lady, speakingabout the need for measures of credibility of DOE's in-use modeling systems,described that need as a requirement for "quality control for this aircraftwhich is in flight right now." And Harvey Greenberg, looking back to thegood old days, said (I have added one piece of underlining), "Much ofour best work was done in a crash mode."
Perhaps the apposition of those two remarks speaks for itself, althoughI'm not totally sure what it's saying.
At the Operations Research Society meeting just a couple of weeks ago,
Dave Wood gave a paper [59] in which he said, "We all know that in orderto aid decisions, models have to leap beyond the data, and one of the
difficult issues in assessment is judging whether or not the leaps are art-fully made." From this I conclude — and concur — that the assessor hasto be somewhat of a ballet critic.
Combining this idea with the previous ones, I get a picture of a giantairplane operating in crash mode, over a sea of icebergs, with unicornsand elephants milling about in the cargo hold, and with the pilot doingjetes and pirouettes in the control room. One is certainly tempted to
prefer the train. But for this trip, there is no train .
It's risky to invite someone to present his "reflections" on a topicabout which he's been reflecting for a long time. This has been a longtalk, but the end is near. To provide a further target for your reflectionsI'd like to go back to the 1961 War Gaming Symposium mentioned earlier, andto recall the discussion of "success" offered by one of its speakers,Hebron Adams [1; pp. 52-53] . (I have changed some language from "game"
to "model" to better fit the present setting.)
"Despite appearances, a model is not successful just because it
provides technological employment for modelers and programmers. It is
not necessarily successful because it has gained customer acceptance (to
date, few have), and it is not necessarily a failure because it has not.
It is most emphatically not successful simply because it has seconded expertopinion.
"A model is partially successful if it extends human knowledge a little
if it is right when the experts are wrong. It will never be self-evidently
236

right and it may never be completely right. But if, after unbiased exam-ination of the course of a model run and after further analysis promptedby its output, expert opinion is changed in whole or in part, the model is
partially successful.
"A model is completely successful only if it is right. With war gamesone never knows until the shooting is over and the real world's resultscan be compared with the synthetic world's predictions. If the model is
a failure, the results may be disastrous. That is the shadow under which
the modeler must always work."
And finally, I thought I would close with words more eloquent thanany I myself could muster, to remind us once again of the limitationsof modeling applied to a world exhibiting the blessing and curse of ever-surprising change, and of how those limitations make the job of modelassessment so difficult, so treacherous, yet so important. The words arethose of T.S. Eliot in one of his Four Quartets ([19; p. 10], see also theopening of [20]):
"There is , it seems to us
,
At best, only a limited valueIn the knowledge derived from experience.The knowledge imposes a pattern, and falsifies.For the pattern is new in every momentAnd every moment is a new and shockingValuation of all we have been."
and hostsThank you, Mr. Eliot. Thank you. Symposium sponsors and organizerslosts. And thank you, audience, for your attention and patience.
237
8. References
1. H. E. Adams, "Machine-Played Games," pp. 35-53 in [56].
2. M. Arthus, Philosophy of Scientific Investigation (H. E. Sigerist,trans.), The Johns Hopkins Press, Baltimore, 1943.
3. W. Ascher, Forecasting ; An Appraisal for Policy-Makers and Planners ,
Johns Hopkins University Press, Baltimore, 1978.
4. V. L. Bassie, Uncertainty in Forecasting and Policy Formation , 1958-1959 J. Anderson Fitzgerald Lecture in the Dynamics of BusinessEnterprise, University of Texas, Austin, 1959.
5. M. L. Baughman, "Reflections on the Model Assessment Process:A Modeler's Perspective," pp. 197-210 in [28].
6. E. W. Beth, Science, A Road to Wisdom: Collected PhilosophicalEssays , D. Reidel, Dordrech, Holland, 1968.
7. K. E, Boulding, "Science: Our Common Heritage," Science 207
(22 February 1980), 831-836.
8. A. W. Burks, Chance, Choice, Reason , University of Chicago Press,
Chicago, 1977.
9. J. Cantlon, "Summary of the Workshop," in Long-Range EnvironmentalOutlook , National Academy of Sciences, Washington, D.C., 1980.
10. R. Carnap and R. C, Jeffrey, Studies in Inductive Logic and Probability(vol. 1), University of California Press, Berkeley, 1971.
11. T. E. Caywood et al, Guidelines for the Practice of Operations Research ,
Oper. Res. 19 (1971), entire No. 5.
12. E. G. Cazalet, "A Decision Analyst's View of Model Assessment,"
pp. 325-326 in [28]
.
13. A. Charnes and M. Kirby, "Optimal Decision Rules for the E-Model
of Chance-Constrained Programming," Cah. Centre Etudes Rech. Oper.
8 (1966) , 5-44.
14. C. W. Churchman, "Towards a Mathematics of Social Science," pp. 29-36
in [50].
15. A. E. Daniels, "The User's Viewpoint on the Creation and Use of a
Large Simulation Model," pp. 84-96 in [56].
238
16. M. R. Darby and E. Karni, "Free Competition and the Optimal Amountof Fraud," J. Law and Economics 16 (1973), 67-88.
17. C. de Duve, "The Lysosome in Retrospect," pp. 3-40 in Lysosomes inBiology and Pathology (vol. 1), J. T. Dingle and H. B, Fell (ed. ;
,
North-Holland, Amsterdam and London, 1969.
18. T. R. Dye, Policy Analysis, University of Alabama Press, 1976.
19. T. S. Eliot, East Coker, Faber and Faber, London, 1940.
20. T. S. Eliot, Burnt Norton, Faber and Faber, London, 1943.
21. F. E . Emery
,
"Concepts, Methods and Anticipations," pp. 41-70 in
22. D. Freedman, "Assessment of the READ Model," pp. 365-395 of [28]
23. D. Freedman, "Uncertainties in Model Forecasts," working paper.September 1979.
24. D. Freedman, "Are Energy Models Credible?", these Proceedings.
25. S. I. Gass, Computer Model Documentation; A Review and an Approach ,
National Bureau of Standards Special Publication 500-39, Washington,D.C., February 1979.
26. S. I. Gass (ed.). Utility and Use of Large-Scale Mathematical Models ,
National Bureau of Standards Special Publication 534, Washington, D.CMay 1979.
27. S. I. Gass et_ al_, Interim Report on Model Assessment Methodology ;
Documentation Assessment , National Bureau of Standards Technical
Report NBSIR 80-1971, January 1980.
28. S. I. Gass (ed.). Validation and Assessment Issues of Energy Models ,
National Bureau of Standards Special Publication 569, Washington, D.CFebruary 1980.
29. S. I. Gass, "Assessing Ways to Improve the Utility of Large-ScaleModels," pp. 273-254 in [28].
30. S. I. Gass and L. S. Joel, Concepts of Model Confidence , NationalBureau of Standards Technical Report NBSIR 80-2053, June 1980.
31. C. R. Glassey and H. J. Greenberg, "Model Credibility: How Much Doesit Depend on Data Quality?", these Proceedings.
32. A. J. Goldman, "Operations Research Research and Governmental O.R.,"
pp. 13-18 in Operations Research: Proceedings of a Conference for
Washington Area Government Agencies , J. A. Joseph (ed.). NationalBureau of Standards Miscellaneous Publication 294, Washington, D.C,December 1957.
239

33. H. Greenberg, "The FEA Project Independence Experiment," pp. 111-222in [26]
.
34. M. Greenberger, M. A.Crenson and B. L. Crissey, Models in thePolicy Process , Russell Sage Foundation, New York, 1976.
35. H. Guetzkow et^ al^. Simulation in International Relations: Develop-ments for Research and Teaching , Prentice-Hall, Englewood Cliffs,N.J., 1963.
36. D. S. Hirschfeld, Investigation of Underlying Data; Midterm Oil andGas Supply Modeling System , Report No. KFR245-79 (to National Bureauof Standards), Ketron, Inc., Arlington, VA, January 1980.
37. W. W. Hogan, "Discussant's Remarks," pp. 63-64 in [28].
38. M. L. Hollaway, "Issue Paper on Model Standards to Aid Assessments,"this Symposium.
39. F. Hopkins, "A Modeler's View of the READ Model Assessment Process,"
pp. 397-429 in [28]
.
40. P. W. House and R. H. Ball, "Validation: A Modern Day Snipe Hunt?
Conceptual Difficulties of Validating Models," pp. 153-165 in [28].
41. R. A. Howard, "An Assessment of Decision Analysis," Oper. Res. 28^
(1980), 4-27.
42. S. W. Huck and H. M. Sandler, Rival Hypotheses; Alternative Interpre-tations of Data Based Conclusions , Harper and Row, New York, 1979.
43. L. S. Joel and J. S. Maybee, "Model Confidence," this Symposium.
44. L. R. Klein, An Essay on the Theory of Economic Prediction , Markham,
Chicago, 1971.
45. D. Kresge, "The EPRI/NBER Energy Model Assessment Project," pp. 123-
136 in [26]
.
46- D. Kresge, "An Approach to Independent Model Assessment," pp. 183-196
of [28].
47. G. L. Lady, "Model Assessment and Validation: Issues, Structures,
and Energy Information Administration Program Goals," pp. 5-22
in [28]
.
48. C. E. Lindblom, Strategies for Decision Making , Thirty-fifth Edmund
J. James Lecture on Government, University of Illinois, 1972.
240
49. W. Marcuse et al^ "Validation Issues - A View from the Trenches,"pp. 337-353 in [28]
.
50. Fo Massarik and P. Ratoosh (ed.). Mathematical Explorations inBehavioral Science , Richard D. Irwin, Inc. and the Dorsey Press,Homewood, IL, 1965.
51. F. Massarik, "Magic, Models, Man and the Cultures of Mathematics,"pp. 7-21 of [50]
.
52. L. S. Mayer , "A Perspective for Energy Model Validation," pp. 477-496 in [28]
.
53. J. Mulvey, "Strategies in Model Management," pp. 177-194 in [26].
54. P. Nelson, "Information and Consumer Behavior," J. Pol. Econ. 78^
(1970), 311-329.
55. D. Nissen, "The Impact of Assessment on the Modeling Process,"pp. 267-283 in [28]
.
56. J. Overholt (ed.). First War Gaming Symposium Proceedings, Washington
Operations Research Council, Washington, D.C., 1962.
57. R. Richels, "Third Party Model Assessment: A Sponsor's Perspective,"pp. 171-181 in [28] .
58. J. K. Sengupta, Stochastic Programming: Methods and Applications ,
North-Holland and Elsevier, Amsterdam and New York, 1972.
59. G. Shafer, A Mathematical Theory of Evidence , Princeton UniversityPress, Princeton, 1975.
60. M. E. Shaw, "Model Access and Dociamentation ," pp. 355-363 in [28].
61. J. L. Simon, "Resources, Population, Environment: An Oversupply ofFalse Bad News," Science 208 (27 June 1980), 1431-1437.
62. R. M. Smullyan, What is the Name of This Book? The Riddle of Draculaand Other Logical Puzzles , Prentice-Hall, Englewood Cliffs, NJ, 1978.
63. S. L. Solomon, "Building Modelers: Teaching the Art of Simulation,"Interfaces 10^ (1980), 65-72.
64. H. Theil, Optimal Decision Rules for Government and Industry , North-Holland and Rand-McNally , Amsterdam and Chicago, 1968.
55. D. W. Walkup and R. J. B. Wets, "Stochastic Programming with Recourse,"
SIAM J. Appl. Math. 15. (1967), 1299-1314.
241

66- J. O. Wallace, "The Practical Meaning of Library Standards" and "TheHistory and Philosophy of Library Standards," pp. 31-56 in QuantitativeMethods in Librarianship; Standards, Research, Measurement , I. B.
Hoadley and A. S. Clark (ed.). Greenwood Press, Westport, CN, 1972.
67. E. P. Wigner, "The Unreasonable Effectiveness of Mathematics in theNatural Sciences," Comm. Pure and Appl. Math. 13^ (I960), 1-14.
68. D. O. Wood, "Model Assessment and the Policy Research Process: CurrentPractice and Future Promise," pp. 23-62 in [28].
69. D. O. Wood, "Energy Policy Model Evaluation: A Summary of Methodsand Current Practice," Paper WD01.5, Abstract in TIMS/ORSA BulletinNo. 9, Joint National Meeting, Washington, D.C., May 5-7, 1980.
70. M. Young (ed.). Forecasting and the Social Sciences , Social ScienceResearch Council, Heinemann Educational Books Ltd., London, 1968.
242
PROGRAM
DOE/NBS SYMPOSIUM
VALIDATION AND ASSESSMENT OF ENERGY MODELS
May 19-20-21, 1980Administration Building
National Bureau of StandardsGalthersburg, MD
Monday, May 19, 1980—Green Auditorium
9:00 a.m. - 9:15 a.m.:
WELCOME Saul I. Gass, U. of MD/NBSSymposium Chairman
Lincoln E. MosesAdministrator, EIA/DOE
Burton H. ColvlnDirector, CAM/NBS
9:15 a.m. - 12:00 p.m.:
MODEL ANALYSIS—19 80 AND BEYOND
Speakers : "Energy Model Evaluation andAnalysis: Current Practice" David 0. Wood, MIT
"Humanizing Policy Analysis: Confronting the ParadoxIn Energy Policy Modeling" Martin Greenberger, JHU
Discussants : Ken Hoffman, MathtechGeorge Lady, DOE
James Sweeney, EMF
243
12:00 p.m. - 3:30 p.m.: (Lunch will be from 1:15 - 2:00 in the Main Cafeteria)
THE EIA MODEL VALIDATION PROGRAM
TOPIC : This session will review EIA's activities in evaluating the energysystem projections and analyses published in the EIA Annual Report to Congress1978, Volume III (ARC 1978) . The speakers will critique the reports producedby the individuals and organizations represented on the panel.
Speakers : Richard Richels, EPRIJerry Hausraan, MITRoy Shanker, Resource Planning
Panel ; David Freedman, UCal at BerkeleyRichard Jackson, NBSJohn Maybee, UColAlan Soyster, VPI&SUDavid Wood, MIT
3:30 p.m. ~ 6:00 p.m.
MODEL STRUCTURE AND DATA
Speakers ; "Are Energy Models Credible?" David Freedman, UCal at
Berkeley"Model Credibility; How Much Does it
Depend on Data Quality?" Roger Glassey, DOE and
Harvey Greenberg, DOE
Discussants: Douglas Hale, DOELawrence Mayer, UPennDavid Nissen, Chase ManhattanDavid Pilati, Brookhaven
244
Tuesday. May 20, 1980
WORKSHOP DAY
There are five workshops as noted below. Each registrant of the Symposium Is
requested to sign up and participate In only one workshop . Workshop sign-upsheets will be available on May 19, along with the issue papers that describethe five workshop topic areas. These papers review the current state-of-the-art of an area and questions to be resolved. The purpose of a workshop is to
obtain a consensus, if possible, of each topic's open issues and recommenda-tions for future research. The chairmen will present a workshop summary onMay 21, and prepare a report for the proceedings. The only way these work-shops can be a success is by your active participation . The workshops are anall-day affair and are the only activities scheduled. They afford each par-ticipant an opportunity to meet other researchers, to Influence futureresearch, and to discuss their research and ideas in an informal and congenialforum.
WORKSHOP 1 — Validating Composite ModelsChairmen: Andy Kydes, Brookhaven
Lewis Rubin, EPRI
WORKSHOP 2 — The Measurement of Model ConfidenceChairmen: Lambert Joel, NBS
John Maybee, UCol
WORKSHOP 3 — Model Standards to Aid AssessmentChairman: Milton Holloway, TEAC
WORKSHOP 4 — Sensitivity and Statistical Analysis of ModelsChairmen: Carl Harris, Ctr. for Mgmt. & Policy Research
Dave Hirshfeld, DSH Assoc.
WORKSHOP 5 — Model Assessment MethodologiesChairmen: James Gruhl, MIT
Thomas Woods, U. S. GAO
All workshops will be held In the Administration Building—^Lecture Rooms A and
B, Dining Room C, lOth Floor Conference Room, and the Green Auditorium. Roomassignments will be posted and announced late Monday, May 19.
245
Wednesday. May 21, 1980
y:00 a.m. - 12:00 p.m.
:
WORKSHOP REPORTS AND DISCUSSIONS
1. Validating Composite Models
2. The Measurement of Model Confidence
3. Model Standards to Aid Assessment
4. Sensitivity and Statistical Analysis of Models
3. Model Assessment Methodologies
12:00 p.m. - 1:00 p.m.:
FINAL SESSION
Speaker: "Reflections on Modeling" Alan J. Goldman, JHU/NBS
Note: There is no registration fee . There will be no scheduled coffee breaks;
coffee may be obtained in the main cafeteria from 9 - 10:30 a.m. and2 - 3:30 p.m. Breakfast is served until 8:30 a.m.; lunch is served from11:30 a.m. to 1:30 p.m. The employees' lounge, across from the cafe-teria, is available each day for informal discussions.
246
SYMPOSIUM PARTICIPANTS
Susan R. AbbasiEnvironment & Natural ResourcesDivision, Library of Congress425 Madison Bldg.
Washington, D. C. 20540
Gary B. AckermanSystems Control, Inc.
1801 Page Mill RoadPalo Alto, California 94304
R. G. Alsmiller, Jr.
Oak Ridge National LaboratoryP. 0. Box X
Oak Ridge, Tennessee 37830
Carl J. AndersonLawrence Livermore LaboratoryBox 808, MS L-216Livermore, California 94550
David AndressScience Management Corporation8300 Professional PlaceLandover, Maryland 20785
Anthony ApostolidesJack Faucett Associates5454 Wisconsin Ave., #1150Chevy Chase, Maryland 20015
Robert AsterJet Propulsion Laboratory, MS 506
4800 Oak GrovePasadena, California 91103
M. BalasubramaniamTRW, Inc.
8301 Greensboro DriveMcLean, Virginia 22102
Richard W. BarnesOak Ridge National LaboratoryP. 0. Box X
Oak Ridge, Tennessee 37830
Jerry BellWashington Gas Light Co.
6801 Industrial RoadSpringfield, Virginia 22151
Robert BellLawrence Livermore LaboratoryBox 808, L-216Livermore, California 94550
Yoav Benjamin!U. of Pennsylvania, Analysis Center414-D Devereux Ave.
Princeton, New Jersey 08540
Javier BernalNational Bureau of StandardsCenter for Applied MathematicsWashington, D. C. 20234
Robert L. BivinsLos Alamos Scientific LaboratoryMail Stop 605Los Alamos, New Mexico 87545
K. 0. BowmanUnion Carbide Corporation
316 Nuclear Division, 9704-1, Y-12P. 0. Box Y
Oak Ridge, Tennessee 37830
Tom S. BuckmeyerLibrary of Congress/Congressional
Research Service423 James Madison BuildingWashington, D. C. 20540
247
Paul Bugg
Deptartment of the InteriorOffice of Min. Policy & Res. Anal.
Washington, D. C. 20240
B. H. BurzlaffKentron International, Inc.
11317 Smallwood DriveBurleson, Texas 76028
Charles CarpinellaSouthern Connecticut Gas Co.
880 Broad StreetBridgeport, Connecticut 06609
Robert T. CatlinFERC, DOE, Room 7411
825 N. Capitol StreetWashington, D. C. 20426
Susan T. ChengU. of Pennsylvania, Analysis Center3609 Locust WalkPhiladelphia, Pennsylvania 19104
Patrick D. CheungAtlantic Richfield Company515 S. Flower StreetLos Angeles, California 90071
J. Phillip ChildressDepartment of Energy, Room 4324C12th & Pennsylvania Ave., N. W.
Washington, D. C. 20461
Harry ChmelynskiJack Faucett Associates5454 Wisconsin Ave., Suite 1150Chevy Chase, Maryland 20015
Cecelia ChuDepartment of Energy, Room 4324
12th & Pennsylvania Ave., N. W.
Washington, D. C. 20461
Richard CollierSystems Tech*-
P. 0. Box 459Paonia, Colorado 81428
Dr. Burton H. ColvinDir. , Center for Applied MathematicsNational Bureau of StandardsWashington, D. C . 20234
Thomas J. Cooney3609 Locust Walk/C9Wharton Analysis Center, U. of Penna.Philadelphia, Pennsylvania 19104
Colleen M. CornettDepartment of Energy, Room 5317
12th & Pennsylvania Ave. , N. W.
Washington, D. C. 20461
Thomas A. CurranWharton Analysis Center3609 Locust WalkPhiladelphia, Pennsylvania 19104
Ned DearbornDOE/EIA, M. S. 4530NPO Bldg.
Washington, D. C. 20461
John A. DearienEG&G IdahoBox 1625
Idaho Falls, Idaho 83401
Patricia R. DevineDepartment of the Interior1800 E Street, Room 4452Washington, D. C. 20240
Paul DomichNational Bureau of StandardsCenter for Applied MathematicsWashington, D. C. 20234
Darryl J. DowningOak Ridge National LaboratoryP. 0. Box X
Oak Ridge, Tennessee 37830
248

Anna M. S. DuncanAmerican Gas Association1515 Wilson Blvd.Arlington, Virginia 22209
Richard F. DutcherThe Analysis Center3609 Locust WalkPhiladelphia, Pennsylvania 19104
James A. EdmondsOak Ridge Associated Universities11 DuPont Circle, N. W. , Suite 805Washington, D. C. 20036
Jane Ehrhardt-JohnsonUniversity of ColoradoBoulder, Colorado 80309
Frank C. EmersonEIA, Applied AnalysisDepartment of Energy, MS 4530Washington, D. C. 20545
Robert T. EynonDepartment of Energy, Room 45301200 Pennsylvania Ave. , N. W.
Washington, D. C. 20461
James FalkNational Bureau of StandardsCenter for Applied MathematicsWashington, D. C. 20234
Dr. Gene FinnSEC500 N. Capitol StreetWashington, D. C. 20549
J. S. FinucaneEIARoom 7413 Federal BuildingWashington, D. C. 20461
Dr. Eric C. FrankelScience Management Corp.
8300 Professional PlaceLandover, Maryland 20785
David FreedmanStatistics DepartmentUniversity of CaliforniaBerkeley, California 94720
Neil GamsonEIA, Department of EnergyShort-Term Division, Rm. 4324Washington, D. C, 20461
Dr. Saul I. GassCollege of Business & ManagementUniversity of MarylandCollege Park, Maryland 20742
William M. GaynorPres. , William M. Gaynor & Co. , Inc.
10411 Tullymore DriveAdelphi, Maryland 20783
Diana C. GibbonsWharton School Analysis Center3609 Locust Walk, U. of PennsylvaniaPhiladelphia, Pennsylvania 19104
Phyllis Gilraore
Department of Energy12th & Pennsylvania Ave., N. W.
Washington, D. C. 20461
Roger GlasseyEIA, U. of CaliforniaDept. of Ind. Eng. & 0. R.
Berkeley, California 94720
Alan J. GoldmanJohns Hopkins UniversityMathematical Sciences DepartmentBaltimore, Maryland 21218
Jill GoldmanWharton School Analysis Center3609 Locust Walk, U. of Penna.Philadelphia, Pennsylvania 19104
John W. GreenU. S. Dept. of AgricultureEconomics Dept. , Colo. State Univ.
Ft. Collins, Colorado 80520
249
Rodney D. GreenDepartment of Energy1811 Wyoming Ave., Room 28
Washington, D. C. 20009
Harvey GreenbergDepartment of Energy, EIA1200 Pennsylvania Ave., N. W.
Washington, D. C. 20461
Dr. Martin GreenbergerMathematical Sciences DepartmentJohns Hopkins UniversityBaltimore, Maryland 21218
Rodney D. GreenDepartment of Energy1811 Wyoming Ave. , 21
Washington, D. C. 20009
Frank J. GrossU. S. GAG441 G Street, N. W. , Room 5124Washington, D. C.
James GruhlMIT, E38-43677 Massachusetts Ave.
Cambridge, Massachusetts 02139
Hamid Habib-AgahiJPL-Caltech, MS 506-3164800 Oak GrovePasadena, California 91103
David HackCongressional Research ServiceU. S. Library of CongressWashington, D. C. 20540
Douglas R. HaleEIA, Dept. of Energy, Rm. 740912th & Pennsylvania Ave., N. W.
Washington, D. C. 20461
Malcolm R. Handte *
Wharton Analysis Center3609 Locust WalkPhiladelphia, Pennsylvania 19104
Carl M. HarrisCenter for Management & Policy Res.1625 I Street, N. W.
Washington, D. C. 20006
Jerry A. HausmanMITE52-271ACambridge, Massachusetts 02139
John H. HerbertOAOA/EIA/Applied Analysis2929 Rosemary LaneFalls Church, Virginia 22042
David S. HirshfeldDavid S. Hirshfeld Associates, Inc.
11057 Powder Horn DrivePotomac, Maryland 20854
David HochmanWharton Analysis Center3609 Locust Walk, U. of Penna.Philadelphia, Pennsylvania 19104
Karla L. HoffmanNational Bureau of StandardsCenter for Applied MathematicsWashington, D. C. 20234
Kenneth C. HoffmanMathtech, Inc.
1611 N. Kent StreetArlington, Virginia 22209
Peter HolihanDepartment of Energy/CSlH-031, Forrestal Bldg.
Washington, D. C.
Milton L. HollowayDir. , Texas Energy Advisory Council200 East 18th Street, Suite 513
Austin, Texas 78701
250

William A. Horn3115 S. Hayes StreetArlington, Virginia 22202
Paul F. HultquistU. of Colorado at Denver1100 14th StreetDenver, Colorado 80202
Bruce G. HumphreyDepartment of CommerceOffice of Regulatory Policy, Rm, 76
Washington, D. C. 20230
Howard K. HungNational Bureau of StandardsCenter for Applied ttathematics
Washington, D. C. 20234
Richard H. F. JacksonNational Bureau of StandardsCenter for Applied MathematicsWashington, D. C. 20234
Lambert JoelNational Bureau of StandardsCenter for Applied MathematicsWashington, D. C. 20234
Charles R. JohnsonUniversity of MarylandInst, for Physical Science & Tech.College Park, Maryland 20742
Kent B. JoscelynHSRl Policy AnalysisUniversity of MichiganAnn Arbor, Michigan 48109
Byron G. KeepBonneville Power Administration1500 NE Holliday StreetPortland, Oregon 97726
W. C. KilgoreEIA8506 Bromley Ct.
Annandale, Virginia 22003
Colleen KirbyAnalysis Center3609 Locust Walk/C9Philadelphia, Pennsylvania 19104
Andy S. KydesBrookhaven National LaboratoryNCAES, Bldg. 475Upton, New York 11973
George M. LadyDepartment of Energy11307 Soward DriveKensington, Maryland 20795
Alexander H. LevisMIT35-410/LIDSCambridge, Massachusetts 02139
Andrew S. LoeblOak Ridge National LaboratoryP. 0. Box X
Oak Ridge, Tennessee 37830
Maurice LongThe Orkand Corporation8630 Fenton Street, Suite 938Silver Spring, Maryland
Masood MalikAppalachian Regional Commission1666 Connecticut Ave. , N. W.
Washington, D. C. 20235
Parvin MansoureOrkand Corp.
8630 Fenton StreetSilver Spring, Maryland 20910
William MarcuseBrookhaven National LaboratoryBuilding 475
Upton, New York 11973
Martha MasonMIT Energy Model Analysis ProgramE38-570Cambridge, Massachusetts 02138
251

John S. MaybeeUniversity of ColoradoDept. of MathematicsBoulder, Colorado 80309
Dr. Lawrence S. MayerAnalysis CenterWharton SchoolPhiladelphia, Pennsylvania 19104
Norman MillerFERC825 North Capitol StreetWashington, D. C.
Keith C. MitchellScience Management Corporation15416 Durant St.
Silver Spring, Maryland 20904
Suzanne MitchellUniversity of Pennsylvania3609 Locust Walk/C9Philadelphia, Pennsylvania 19104
Ellis A. MonashU. S. Geological Survey2080 Newcombe DriveLakewood, California 80215
Terry H. MorlanDepartment of Energy, EIA24309 Ridge RoadDamascus, Maryland 20750
Lincoln E. MosesDepartment of Energy, EIASequoia HallStanford, California 94305
Frederic H. MurphyDepartment of Energy, EIAM. S. 4530Washington, D. C. 20461
W. Charles MylanderDepartment of Energy, EIARoom 4530, Federal Bldg.Washington, D. C. 20461
Nathaniel K. NgDepartment of Energy, Rm. 451712th & Pennsylvania Ave., N. W.
Washington, D. C. 20461
David NissenChase Manhattan BankOne Chase Manhattan PlazaNew York, New York 10081
S. B. Noble127 7th Street, S. E.
Washington, D. C. 20003
Robert NoorigianTRW-Energy Systems8301 Greensboro DriveMcLean, Virginia 22102
Richard P. O'NeillDepartment of Energy, EIA1200 Pennsylvania Ave., N. W.
Washington, D. C. 20461
Ramesh ParameshwaranTRW Energy Systems Planning Division8301 Greensboro Drive, ^/734
McLean, Virginia 22102
Shall ParikhOak Ridge National LaboratoryIntegrative Energy-Economic AnalysisEnergy DivisionOak Ridge, Tennessee 37830
Larry ParkerCongressional Research ServiceLibrary of Congress, CRS/ENRWashington, D. C. 20540
252

John D. Pearson
Department of Energy, EIA2007 Franklin Ave.
McLean, Virginia 22101
David PilatiBrookhaven National LaboratoryBldg. 475Upton, New York 11973
Clark PrichardNRC, Mail Stop 1130 SS
Office of ResearchWashington, D. C.
George W. ReinhartNTISSpringfield, Virginia 22161
David ReisterORAV-IEAP. 0. Box 117
Oak Ridge, Tennessee 37830
Barbara C. RichardsonUniversity of MichiganHighway Safety Research InstituteAnn Arbor, Michigan 48109
Richard RichelsElectric Power Research Institute3412 Hillview Ave.
Palo Alto, California 94303
Mark RodekohrDepartment of Energy, Room 4551
12th & Pennsylvania Ave., N. W.
Washington, D. C. 20461
Paul F. RothDepartment of Energy, MS 453012th & Pennsylvania Ave., N. W.
Washington, D. C. 20461
Lewis J. Rubin
EPRI, P. 0. Box 104123412 Hillview DrivePalo Alto, California 94303
Randi S. RytermanWharton Analysis Center3609 Locust Walk/C9Philadelphia, Pennsylvania 19104
Prakash B. SanghuiJack Faucett Associates5454 Wisconsin Avenue, Suite 1150Chevy Chase, Maryland 20015
Rama SastryOffice of EnvironmentDepartment of EnergyWashington, D. C.
Patsy SaundersNational Bureau of StandardsCenter for Applied MathematicsWashington, D. C. 20234
J. S. SeelyDepartment of Energy, EIA1902 Bargo Ct.
McLean, Virginia 22101
Marquis R. SeidelDepartment of Energy, FERC825 N. Capitol StreetWashington, D. C. 20426
Roy ShankerHagler, Bailly & Co., Suite 350
2020 K Street, N. W.
Washington, D. C. 20006
Richard ShapiroKappa Systems1409 Potter DriveColorado Springs, Colorado 80907
253
Susan H. ShawDepartment of Energy, M. S. 4530
I12th & Pennsylvania Ave., N. W.
Washington, D. C. 20461
Jeffrey E. SohlUniversity of Maryland10901 New Salem Ave.
Largo, Maryland 20870
A. Soyster270 Whitteraore
Virginia Tech, Department of lEORBlacksburg, Virginia 24061
Peter StapletonSouthern Connecticut Gas
880 Broad StreetBridgeport, Connecticut 06609
Martin M. SteinABT Associates55 Wheeler StreetCambridge, Massachusetts 02138
Leona StewartOak Ridge National LaboratoryBldg. GOlO, Rm. 203, P. 0. Box XOak Ridge, Tennessee 37830
David StromConservation Foundation1717 Massachusetts Ave., N. W.
Washington, D. C. 20036
S. Scott SuttonDepartment of Energy, EIAM. S. 4530Washington, D. C. 20461
James L. SweeneyStanford UniversityEnergy Modeling Forum, Terman 406Stanford, California 94025
T. TakayamaDepartment of Energy, EIAFederal Building, MS 4530Washington, D. C. 20641
Peter C. Tittraann
Analysis Center, Wharton SchoolU. of Pennsylvania, 3609 Locust WalkPhiladelphia, Pennsylvania 19104
John L. TrimbleOak Ridge National LaboratoryP. 0. Box X
Oak Ridge, Tennessee 37830
Leon L. TuckerAmerican Gas Association1515 Wilson Blvd.Arlington, Virginia 22209
Noel UriDepartment of EnergyOAOA/EIAWashington, D. C. 20461
Christian Van SchaykMVMA300 New Center Bldg.
Detroit, Michigan 48202
Norman WagonerDept. of Energy, FERC, Room 7102
825 N. Capitol Street, N. E.
Washington, D. C. 20426
Carol WegrzynowiczDepartment of Energy, EIA12th & Pennsvylania Ave., N. W.
Washington, D. C. 20585
254

William I. Weinig
Department of Energy, EIA, Appl. Analysis12th & Pennsylvania Ave., N. W.
Washington, D. C. 20461
Charles WeisbinORNL, P. 0. Box X
Bldg. B025, Room 20WOak Ridge, Tennessee 37830
Paul John VJerbos
DOE, Room 7413, OEIV/EIAFederal Bldg.
Washington, D. C. 20461
William B. WidhelmUniversity of MarylandCollege of Business & ManagementCollege Park, Maryland 20742
Bradford J. WingDepartment of Energy, MS 453012th & Pennsylvania Ave., N. W.
Washington, D. C. 20461
Christoph WitzgallNational Bureau of StandardsCenter for Applied MathematicsWashington, D. C. 20234
David 0. WoodMITMIT Energy Lab.
Cambridge, Massachusetts 02139
Thomas J. WoodsGeneral Accounting OfficeEnergy & Minerals Division, Rm. 5108Washington, D. C. 20548
Douglas YorkEEA, Inc.
nil N. 19th StreetArlington, Virginia 22204
Julie ZalkindEIA, Applied Analysis, Rm. 453012th & Pennsylvania Ave., N. W.
Washington, D. C. 20461
NBS-114A (REV. 2.8C)
U.S. DEPT. OF COMM.
BIBLIOGRAPHIC DATASHEET (See instructions)
1. PUBLICATION ORREPORT NO.
SP 616
2. Performing Organ. Report No. 3. Publication Date
October 1981
4. TITLE AND SUBTITLE
Validation and Assessment of Enercv ModelsProceedings of a Symposium held at theNational Bureau of Standards, Gaithersburg , MD, May 19-21, 1980
5. AUTHOR(S)Saul I. Gass (Editor)
6. PERFORMING ORGANIZATION (If joint or other than NBS. see instruct/onsj
NATIONAL BUREAU OF STANDARDSDEPARTMENT OF COMMERCEWASHINGTON, D.C. 20234
7. Contract/Grant No.
8. Type of Report & Period Covered
Final
f. SPONSORING ORGANIZATION NAME AND COMPLETE ADDRESS (Street. City. State, ZIP)
Energy Information AdministrationDepartment of EnergyWashington, DC 20461
10. SUPPLEMENTARY NOTES
Library of Congress Catalog Card Number: 81-600087
Document describes a computer program; SF-185, PIPS Software Summary, is attached.
11 If document includes a significantABSTRACT (A 200-word or less factual summary of most si gnificant informationbi bl iography or literature survey, mention it here)
The Symposium on Validation and Assessment of Energy Models, held at the NationalBureau of Standards (NBS), Gaithersburg, ^MD (May 19-21, 1980), was sponsoredby the 'Energy Information Administration (EIA), of the Department of Energy (DOE),Washington , DC. The symposium was organized by NBS' Operations Research Divisionwith a two-fold agenda: (1) to summarize the recent ideas and advances of modelvalidation and assessment that have been applied to DOE energy models, and (2) to holdworkshops on key open questions that are of concern to the validationresearch comnunity. Speakers addressed current and future practices,validation program, model structure and data, and model credibility,shop sessions were held on the following topics: validating composite models, the
measurement of model confidence, model structure and assessment, sensitivity and sta-tistical analysis of models, and model assessment methodologies. This volume documentsthe symposium proceedings and includes the formal papers presented, discussant commentspanel discussions and questions and answers, and summaries of the issues and conclu-sions reached in the workshops.
and assessmentthe EIA modelFull -day work-
12. KEY WORDS (Six to twelve entries; alphabetical order; capitalize only proper names; and separate key words by semicolon s)
Assessment; composite models; data quality; energy models; mathematical models; model
confidence; model credibility; policy models; sensitivity analysis; validation.
13. AVAILABILITY
[X)J Unl imited
I I
For Official Distribution. Do Not Release to NTIS
[XX Order From Superintendent of Documents, U.S. Government Printing Office, Washington, D.C.20402.
Order From National Technical Information Service (NTIS), Springfield, VA. 22161
14. NO. OFPRINTED PAGES
248
15. Price
$7.50
USCOMM-DC 6043-P80
lill.S. GOVERNMENT PRINTING OFFICE: 19 8 1-340-997/1839


/

NBS TECHNICAL PUBLICATIONS
PERIODICALS
JOURNAL OF RESEARCH—The Journal of Research of the
National Bureau of Standards reports NBS research and develop-
ment in those disciplines of the physical and engineering sciences in
which the Bureau is active. These include physics, chemistry,
engineering, mathematics, and computer sciences. Papers cover a
broad range of subjects, with major emphasis on measurement
methodology and the basic technology underlying standardization.
Also included from time to time are survey articles on topics
closely related to the Bureau's technical and scientific programs.
As a special service to subscribers each issue contains complete
citations to all recent Bureau publications in both NBS and non-
NBS media. Issued six times a year. Annual subscription: domestic
$13; foreign $16.25. Single copy, $3 domestic; $3.75 foreign.
NOTE: The Journal was formerly published in two sections: Sec-
tion A "Physics and Chemistry" and Section B "Mathematical
Sciences."
DIMENSIONS/NBS—This monthly magazine is published to in-
form scientists, engineers, business and industry leaders, teachers,
students, and consumers of the latest advances in science and
technology, with primary emphasis on work at NBS. The magazine
highlights and reviews such issues as energy research, fire protec-
tion, building technology, metric conversion, pollution abatement,
health and safety, and consumer product performance. In addi-
tion, it reports the results of Bureau programs in measurement
standards and techniques, properties of matter and materials,
engineering standards and services, instrumentation, and
automatic data processing. Annual subscription: domestic $11;
foreign S13.75.
NONPERIODICALS
Monographs—Major contributions to the technical literature on
various subjects related to the Bureau's scientific and technical ac-
tivities.
Handbooks—Recommended codes of engineering and industrial
practice (including safety codes) developed in cooperation with in-
terested industries, professional organizations, and regulatory
bodies.
Special Publications—Include proceedings of conferences spon-
sored by NBS, NBS annual reports, and other special publications
appropriate to this grouping such as wall charts, pocket cards, and
bibliographies.
Applied Mathematics Series— Mathematical tables, manuals, and
studies of special interest to physicists, engineers, chemists,
biologists, mathematicians, computer programmers, and others
engaged in scientific and technical work.
National Standard Reference Data Series— Provides quantitative
data on the physical and chemical properties of materials, com-piled from the world's literature and critically evaluated.
Developed under a worldwide program coordinated by NBS under
the authority of the National Standard Data Act (Public Law90-396).
NOTE: The principal publication outlet for the foregoing data is
the Journal of Physical and Chemical Reference Data (JPCRD)published quarterly for NBS by the American Chemical Society
(ACS) and the American Institute of Physics (AIP). Subscriptions,
reprints, and supplements available from ACS, 1 155 Sixteenth St.,
NW, Washington, DC 20056.
Building Science Series—Disseminates technical information
developed at the Bureau on building materials, components,
systems, and whole structures. The series presents research results,
test methods, and performance criteria related to the structural and
environmental functions and the durability and safety charac-
teristics of building elements and systems.
Technical Notes—Studies or reports which are complete in them-
selves but restrictive in their treatment of a subject. Analogous to
monographs but not so comprehensive in scope or definitive in
treatment of the subject area. Often serve as a vehicle for final
reports of work performed at NBS under the sponsorship of other
government agencies.
Voluntary Product Standards— Developed under procedures
published by the Department of Commerce in Part 10, Title 15, of
the Code of Federal Regulations. The standards establish
nationally recognized requirements for products, and provide all
concerned interests with a basis for common understanding of the
characteristics of the products. NBS administers this program as a
supplement to the activities of the private sector standardizing
organizations.
Consumer Information Series— Practical information, based on
NBS research and experience, covering areas of interest to the con-
sumer. Easily understandable language and illustrations provide
useful background knowledge for shopping in today's tech-
nological marketplace.
Order the above NBS publications from: Superintendent of Docu-
ments, Government Printing Office, Washington. DC 20402.
Order the following NBS publications—FIPS and NBSIR's—fromthe National Technical Information Services. Springfield. VA 22161
.
Federal Information Processing Standards Publications (FIPS
PUB)—Publications m this series collectively constitute the
Federal Information Processing Standards Register. The Register
serves as the official source of information in the Federal Govern-
ment regarding standards issued by NBS pursuant to the Federal
Property and Administrative Services Act of 1949 as amendti'
Public Law 89-306 (79 Stat. 1127), and as implemented by T -
ecutive Order 11717(38 FR 12315, dated May II, 1973) and Pan 6
of Title 15 CFR (Code of Federal Regulations).
NBS Interagency Reports (NBSIR)—A special series of interim or
final reports on work performed by NBS for outside sponsors
(both government and non-government). In general, initial dis-
tribution is handled by the sponsor; public distribution is by the
National Technical Information Services, Springfield, VA 22161,
in paper copy or microfiche form.

U.S. DEPARTMENT OF COMMERCENational Bureau of StandardsWashington, D C. 20234
OFFICIAL BUSINESS
Penalty for Private Use, $300
POSTAGE AND FEES PAIDU.S. DEPARTMENT OF COMMERCE
COM-2 1 5
SPECIAL FOURTH-CLASS RATEBOOK