
Validation and development of models using clinical ...
290
Journals Library DOI 10.3310/hta24720 Validation and development of models using clinical, biochemical and ultrasound markers for predicting pre-eclampsia: an individual participant data meta-analysis John Allotey, Kym IE Snell, Melanie Smuk, Richard Hooper, Claire L Chan, Asif Ahmed, Lucy C Chappell, Peter von Dadelszen, Julie Dodds, Marcus Green, Louise Kenny, Asma Khalil, Khalid S Khan, Ben W Mol, Jenny Myers, Lucilla Poston, Basky Thilaganathan, Anne C Staff, Gordon CS Smith, Wessel Ganzevoort, Hannele Laivuori, Anthony O Odibo, Javier A Ramírez, John Kingdom, George Daskalakis, Diane Farrar, Ahmet A Baschat, Paul T Seed, Federico Prefumo, Fabricio da Silva Costa, Henk Groen, Francois Audibert, Jacques Massé, Ragnhild B Skråstad, Kjell Å Salvesen, Camilla Haavaldsen, Chie Nagata, Alice R Rumbold, Seppo Heinonen, Lisa M Askie, Luc JM Smits, Christina A Vinter, Per M Magnus, Kajantie Eero, Pia M Villa, Anne K Jenum, Louise B Andersen, Jane E Norman, Akihide Ohkuchi, Anne Eskild, Sohinee Bhattacharya, Fionnuala M McAuliffe, Alberto Galindo, Ignacio Herraiz, Lionel Carbillon, Kerstin Klipstein-Grobusch, SeonAe Yeo, Helena J Teede, Joyce L Browne, Karel GM Moons, Richard D Riley and Shakila Thangaratinam on behalf of the IPPIC Collaborative Network Health Technology Assessment Volume 24 • Issue 72 • December 2020 ISSN 1366-5278
-
Upload
khangminh22 -
Category
Documents
-
view
1 -
download
0
Transcript of Validation and development of models using clinical ...
Journals Library
DOI 10.3310/hta24720
Validation and development of models using clinical, biochemical and ultrasound markers for predicting pre-eclampsia: an individual participant data meta-analysis John Allotey, Kym IE Snell, Melanie Smuk, Richard Hooper, Claire L Chan, Asif Ahmed, Lucy C Chappell, Peter von Dadelszen, Julie Dodds, Marcus Green, Louise Kenny, Asma Khalil, Khalid S Khan, Ben W Mol, Jenny Myers, Lucilla Poston, Basky Thilaganathan, Anne C Staff, Gordon CS Smith, Wessel Ganzevoort, Hannele Laivuori, Anthony O Odibo, Javier A Ramírez, John Kingdom, George Daskalakis, Diane Farrar, Ahmet A Baschat, Paul T Seed, Federico Prefumo, Fabricio da Silva Costa, Henk Groen, Francois Audibert, Jacques Massé, Ragnhild B Skråstad, Kjell Å Salvesen, Camilla Haavaldsen, Chie Nagata, Alice R Rumbold, Seppo Heinonen, Lisa M Askie, Luc JM Smits, Christina A Vinter, Per M Magnus, Kajantie Eero, Pia M Villa, Anne K Jenum, Louise B Andersen, Jane E Norman, Akihide Ohkuchi, Anne Eskild, Sohinee Bhattacharya, Fionnuala M McAuliffe, Alberto Galindo, Ignacio Herraiz, Lionel Carbillon, Kerstin Klipstein-Grobusch, SeonAe Yeo, Helena J Teede, Joyce L Browne, Karel GM Moons, Richard D Riley and Shakila Thangaratinam on behalf of the IPPIC Collaborative Network
Health Technology AssessmentVolume 24 • Issue 72 • December 2020
ISSN 1366-5278

Validation and development of models usingclinical, biochemical and ultrasound markersfor predicting pre-eclampsia: an individualparticipant data meta-analysis
John Allotey ,1,2† Kym IE Snell ,3*† Melanie Smuk ,2
Richard Hooper ,2 Claire L Chan ,2 Asif Ahmed ,4
Lucy C Chappell ,5 Peter von Dadelszen ,5
Julie Dodds ,1,2 Marcus Green ,6 Louise Kenny ,7
Asma Khalil ,8 Khalid S Khan ,1,2 Ben W Mol ,9
Jenny Myers ,10 Lucilla Poston ,5
Basky Thilaganathan ,8 Anne C Staff ,11,12
Gordon CS Smith ,13 Wessel Ganzevoort ,14 et al.‡
on behalf of the IPPIC Collaborative Network§
1Barts Research Centre for Women’s Health (BARC), Barts and the London School ofMedicine and Dentistry, Queen Mary University of London, London, UK
2Pragmatic Clinical Trials Unit, Barts and the London School of Medicine andDentistry, Queen Mary University of London, London, UK
3Centre for Prognosis Research, School of Primary, Community and Social Care,Keele University, Keele, UK
4Aston Medical Research Institute, Aston Medical School, Aston University,Birmingham, UK
5Department of Women & Children’s Health, School of Life Course Sciences,Faculty of Life Sciences & Medicine, King’s College London, London, UK
6Action on Pre-eclampsia (APEC), Evesham, UK7Vice Chancellor’s Office, Faculty of Health & Life Sciences, University of Liverpool,Liverpool, UK
8Fetal Medicine Unit, St George’s University Hospitals NHS Foundation Trust andMolecular and Clinical Sciences Research Institute, St George’s University ofLondon, London, UK
9Department of Obstetrics and Gynaecology, Monash University, Monash MedicalCentre, Clayton, VIC, Australia
10Maternal and Fetal Health Research Centre, Manchester Academic Health ScienceCentre, University of Manchester, Manchester University NHS Foundation Trust,Manchester, UK
11Division of Obstetrics and Gynaecology, Oslo University Hospital, Oslo, Norway12Faculty of Medicine, University of Oslo, Oslo, Norway
13Department of Obstetrics and Gynaecology, NIHR Biomedical Research Centre,University of Cambridge, Cambridge, UK
14Department of Obstetrics, Amsterdam UMC, University of Amsterdam, Amsterdam,the Netherlands
*Corresponding author†Joint first authors (both contributed equally)‡The full list of authors can be found in Appendix 1.§The full list of partners in the IPPIC Collaborative Network can be found in Acknowledgements.
Declared competing interests of authors: Gordon CS Smith has received research support fromRoche Holding AG (Basel, Switzerland) (supply of equipment and reagents for biomarker studies of≈£600,000 in value) and Sera Prognostics (Salt Lake City, UT, USA) (≈£100,000), and has been paid byRoche to attend an advisory board and to present at a meeting. He is a named inventor on a patentfiled by Cambridge Enterprise (UK Patent Application Number 1808489.7, ‘Novel Biomarkers’) for theprediction of pre-eclampsia and fetal growth restriction. Ignacio Herraiz reports personal fees fromRoche Diagnostics and Thermo Fisher Scientific (Waltham, MA, USA). John Kingdom reports personalfees from Roche Canada (Mississauga, ON, Canada). Lucy C Chappell is chairperson of the NationalInstitute for Health Research (NIHR) Health Technology Assessment (HTA) CET Committee (January2019 to present). Asma Khalil is a member of the NIHR HTA Board (November 2018 to present).Jane E Norman is a member of the NIHR HTA MNCH Panel, and she reports grants from NIHR andChief Scientist Office Scotland, as well as consultancy fees from and participation in data monitoringcommittees for Dilafor AB (Solna, Sweden) and GlaxoSmithKline (Brentford, UK). Kajantie Eeroreports grants from the Academy of Finland, the Foundation for Paediatric Research, the Signe andAne Gyllenberg Foundation (Helsinki, Finland), the Sigrid Jusélius Foundation (Helsinki, Finland), theJuho Vainio Foundation (Helsinki, Finland), the European Commission, the NORFACE DIAL Programme,the Novo Nordisk Foundation (Hellerup, Denmark), the Yrjö Jahnsson Foundation (Helsinki, Finland),Foundation for Cardiovascular Research (Zürich, Switzerland) and the Diabetes Research Foundation.Ben W Mol reports fellowship from the National Health and Medical Research Council (Canberra, ACT,Australia), personal fees from ObsEva (Plan-les-Ouates, Switzerland), personal fees and consultancyfees from Merck Sharp & Dohme (Kenilworth, NJ, USA), personal fees from Guerbet (Villepinte,France), travel funds from Guerbet and grants from Merck Sharp & Dohme. Richard D Riley reportspersonal fees from the British Medical Journal for statistical reviews, and from Roche and theuniversities of Leeds, Edinburgh and Exeter for training on individual participant data meta-analysismethods. Jacques Massé reports grants from National Health Research and Development Program,Health and Welfare Canada, during the conduct of the study. Paul T Seed is partly funded by King’sHealth Partners Institute of Women and Children’s Health, Tommy’s (registered charity number 1060508)and ARC South London (NIHR). The views expressed are not necessarily those of KHP, Tommy’s, the NHS,the NIHR or the Department of Health.

Published December 2020DOI: 10.3310/hta24720
This report should be referenced as follows:
Allotey J, Snell KIE, Smuk M, Hooper R, Chan CL, Ahmed A, et al. Validation and development
of models using clinical, biochemical and ultrasound markers for predicting pre-eclampsia:
an individual participant data meta-analysis. Health Technol Assess 2020;24(72).
Health Technology Assessment is indexed and abstracted in Index Medicus/MEDLINE, Excerpta
Medica/EMBASE, Science Citation Index Expanded (SciSearch®) and Current Contents®/
Clinical Medicine.


Health Technology Assessment HTA/HTA TAR
ISSN 1366-5278 (Print)
ISSN 2046-4924 (Online)
Impact factor: 3.370
Health Technology Assessment is indexed in MEDLINE, CINAHL, EMBASE, the Cochrane Library and Clarivate AnalyticsScience Citation Index.
This journal is a member of and subscribes to the principles of the Committee on Publication Ethics (COPE)(www.publicationethics.org/).
Editorial contact: [email protected]
The full HTA archive is freely available to view online at www.journalslibrary.nihr.ac.uk/hta. Print-on-demand copies can bepurchased from the report pages of the NIHR Journals Library website: www.journalslibrary.nihr.ac.uk
Criteria for inclusion in the Health Technology Assessment journalReports are published in Health Technology Assessment (HTA) if (1) they have resulted from work for the HTA programme,and (2) they are of a sufficiently high scientific quality as assessed by the reviewers and editors.
Reviews in Health Technology Assessment are termed ‘systematic’ when the account of the search appraisal and synthesismethods (to minimise biases and random errors) would, in theory, permit the replication of the review by others.
HTA programmeHealth Technology Assessment (HTA) research is undertaken where some evidence already exists to show that a technology canbe effective and this needs to be compared to the current standard intervention to see which works best. Research can evaluateany intervention used in the treatment, prevention or diagnosis of disease, provided the study outcomes lead to findings thathave the potential to be of direct benefit to NHS patients. Technologies in this context mean any method used to promotehealth; prevent and treat disease; and improve rehabilitation or long-term care. They are not confined to new drugs and includeany intervention used in the treatment, prevention or diagnosis of disease.
The journal is indexed in NHS Evidence via its abstracts included in MEDLINE and its Technology Assessment Reports informNational Institute for Health and Care Excellence (NICE) guidance. HTA research is also an important source of evidence forNational Screening Committee (NSC) policy decisions.
This reportThe research reported in this issue of the journal was funded by the HTA programme as project number 14/158/02. Thecontractual start date was in December 2015. The draft report began editorial review in March 2019 and was accepted forpublication in March 2020. The authors have been wholly responsible for all data collection, analysis and interpretation, and forwriting up their work. The HTA editors and publisher have tried to ensure the accuracy of the authors’ report and would like tothank the reviewers for their constructive comments on the draft document. However, they do not accept liability for damagesor losses arising from material published in this report.
This report presents independent research funded by the National Institute for Health Research (NIHR). The views and opinionsexpressed by authors in this publication are those of the authors and do not necessarily reflect those of the NHS, the NIHR,NETSCC, the HTA programme or the Department of Health and Social Care. If there are verbatim quotations included in thispublication the views and opinions expressed by the interviewees are those of the interviewees and do not necessarily reflectthose of the authors, those of the NHS, the NIHR, NETSCC, the HTA programme or the Department of Health and Social Care.
© Queen’s Printer and Controller of HMSO 2020. This work was produced by Allotey et al. under the terms of a commissioningcontract issued by the Secretary of State for Health and Social Care. This issue may be freely reproduced for the purposes ofprivate research and study and extracts (or indeed, the full report) may be included in professional journals provided thatsuitable acknowledgement is made and the reproduction is not associated with any form of advertising. Applications forcommercial reproduction should be addressed to: NIHR Journals Library, National Institute for Health Research, Evaluation,Trials and Studies Coordinating Centre, Alpha House, University of Southampton Science Park, Southampton SO16 7NS, UK.
Published by the NIHR Journals Library (www.journalslibrary.nihr.ac.uk), produced by Prepress Projects Ltd, Perth, Scotland(www.prepress-projects.co.uk).

NIHR Journals Library Editor-in-Chief
NIHR Journals Library Editors
Professor Ken Stein Professor of Public Health, University of Exeter Medical School, UK
Professor John Powell Chair of HTA and EME Editorial Board and Editor-in-Chief of HTA and EME journals.Consultant Clinical Adviser, National Institute for Health and Care Excellence (NICE), UK, and Professor of Digital Health Care, Nuffield Department of Primary Care Health Sciences, University of Oxford, UK
Professor Andrée Le May Chair of NIHR Journals Library Editorial Group (HS&DR, PGfAR, PHR journals) and Editor-in-Chief of HS&DR, PGfAR, PHR journals
Professor Matthias Beck Professor of Management, Cork University Business School, Department of Managementand Marketing, University College Cork, Ireland
Dr Tessa Crilly Director, Crystal Blue Consulting Ltd, UK
Dr Eugenia Cronin Senior Scientific Advisor, Wessex Institute, UK
Dr Peter Davidson Consultant Advisor, Wessex Institute, University of Southampton, UK
Ms Tara Lamont Senior Scientific Adviser (Evidence Use), Wessex Institute, University of Southampton, UK
Dr Catriona McDaid Senior Research Fellow, York Trials Unit, Department of Health Sciences, University of York, UK
Professor William McGuire Professor of Child Health, Hull York Medical School, University of York, UK
Professor Geoffrey Meads Emeritus Professor of Wellbeing Research, University of Winchester, UK
Professor James Raftery Professor of Health Technology Assessment, Wessex Institute, Faculty of Medicine, University of Southampton, UK
Dr Rob Riemsma Reviews Manager, Kleijnen Systematic Reviews Ltd, UK
Professor Helen Roberts Professor of Child Health Research, UCL Great Ormond Street Institute of Child Health, UK
Professor Jonathan Ross Professor of Sexual Health and HIV, University Hospital Birmingham, UK
Professor Helen Snooks Professor of Health Services Research, Institute of Life Science, College of Medicine, Swansea University, UK
Professor Ken Stein Professor of Public Health, University of Exeter Medical School, UK
Professor Jim Thornton Professor of Obstetrics and Gynaecology, Faculty of Medicine and Health Sciences, University of Nottingham, UK
Please visit the website for a list of editors: www.journalslibrary.nihr.ac.uk/about/editors
Editorial contact: [email protected]
NIHR Journals Library www.journalslibrary.nihr.ac.uk

Abstract
Validation and development of models using clinical,biochemical and ultrasound markers for predictingpre-eclampsia: an individual participant data meta-analysis
John Allotey ,1,2† Kym IE Snell ,3*† Melanie Smuk ,2 Richard Hooper ,2
Claire L Chan ,2 Asif Ahmed ,4 Lucy C Chappell ,5
Peter von Dadelszen ,5 Julie Dodds ,1,2 Marcus Green ,6
Louise Kenny ,7 Asma Khalil ,8 Khalid S Khan ,1,2 Ben W Mol ,9
Jenny Myers ,10 Lucilla Poston ,5 Basky Thilaganathan ,8
Anne C Staff ,11,12 Gordon CS Smith 13 Wessel Ganzevoort ,14 et al.‡
on behalf of the IPPIC Collaborative Network§
1Barts Research Centre for Women’s Health (BARC), Barts and the London School of Medicine andDentistry, Queen Mary University of London, London, UK
2Pragmatic Clinical Trials Unit, Barts and the London School of Medicine and Dentistry, Queen MaryUniversity of London, London, UK
3Centre for Prognosis Research, School of Primary, Community and Social Care, Keele University,Keele, UK
4Aston Medical Research Institute, Aston Medical School, Aston University, Birmingham, UK5Department of Women & Children’s Health, School of Life Course Sciences, Faculty of Life Sciences& Medicine, King’s College London, London, UK
6Action on Pre-eclampsia (APEC), Evesham, UK7Vice Chancellor’s Office, Faculty of Health & Life Sciences, University of Liverpool, Liverpool, UK8Fetal Medicine Unit, St George’s University Hospitals NHS Foundation Trust and Molecular andClinical Sciences Research Institute, St George’s University of London, London, UK
9Department of Obstetrics and Gynaecology, Monash University, Monash Medical Centre, Clayton,VIC, Australia
10Maternal and Fetal Health Research Centre, Manchester Academic Health Science Centre,University of Manchester, Manchester University NHS Foundation Trust, Manchester, UK
11Division of Obstetrics and Gynaecology, Oslo University Hospital, Oslo, Norway12Faculty of Medicine, University of Oslo, Oslo, Norway13Department of Obstetrics and Gynaecology, NIHR Biomedical Research Centre, University ofCambridge, Cambridge, UK
14Department of Obstetrics, Amsterdam UMC, University of Amsterdam, Amsterdam, the Netherlands
*Corresponding author [email protected]†Joint first authors (both contributed equally)‡The full list of authors can be found in Appendix 1.§The full list of partners in the IPPIC Collaborative Network can be found in Acknowledgements.
DOI: 10.3310/hta24720 Health Technology Assessment 2020 Vol. 24 No. 72
© Queen’s Printer and Controller of HMSO 2020. This work was produced by Allotey et al. under the terms of a commissioning contract issued by the Secretary of Statefor Health and Social Care. This issue may be freely reproduced for the purposes of private research and study and extracts (or indeed, the full report) may be included inprofessional journals provided that suitable acknowledgement is made and the reproduction is not associated with any form of advertising. Applications for commercialreproduction should be addressed to: NIHR Journals Library, National Institute for Health Research, Evaluation, Trials and Studies Coordinating Centre, Alpha House,University of Southampton Science Park, Southampton SO16 7NS, UK.
vii
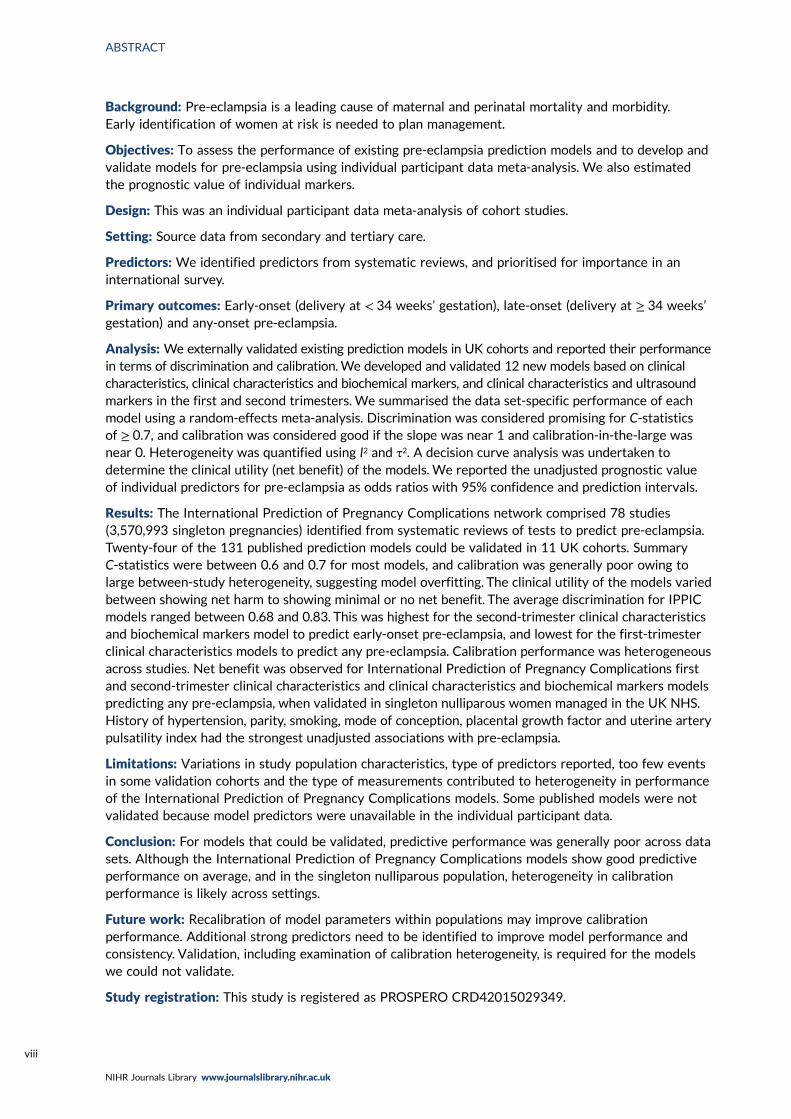
Background: Pre-eclampsia is a leading cause of maternal and perinatal mortality and morbidity.Early identification of women at risk is needed to plan management.
Objectives: To assess the performance of existing pre-eclampsia prediction models and to develop andvalidate models for pre-eclampsia using individual participant data meta-analysis. We also estimatedthe prognostic value of individual markers.
Design: This was an individual participant data meta-analysis of cohort studies.
Setting: Source data from secondary and tertiary care.
Predictors: We identified predictors from systematic reviews, and prioritised for importance in aninternational survey.
Primary outcomes: Early-onset (delivery at < 34 weeks’ gestation), late-onset (delivery at ≥ 34 weeks’gestation) and any-onset pre-eclampsia.
Analysis: We externally validated existing prediction models in UK cohorts and reported their performancein terms of discrimination and calibration.We developed and validated 12 new models based on clinicalcharacteristics, clinical characteristics and biochemical markers, and clinical characteristics and ultrasoundmarkers in the first and second trimesters. We summarised the data set-specific performance of eachmodel using a random-effects meta-analysis. Discrimination was considered promising for C-statisticsof ≥ 0.7, and calibration was considered good if the slope was near 1 and calibration-in-the-large wasnear 0. Heterogeneity was quantified using I2 and τ2. A decision curve analysis was undertaken todetermine the clinical utility (net benefit) of the models. We reported the unadjusted prognostic valueof individual predictors for pre-eclampsia as odds ratios with 95% confidence and prediction intervals.
Results: The International Prediction of Pregnancy Complications network comprised 78 studies(3,570,993 singleton pregnancies) identified from systematic reviews of tests to predict pre-eclampsia.Twenty-four of the 131 published prediction models could be validated in 11 UK cohorts. SummaryC-statistics were between 0.6 and 0.7 for most models, and calibration was generally poor owing tolarge between-study heterogeneity, suggesting model overfitting. The clinical utility of the models variedbetween showing net harm to showing minimal or no net benefit. The average discrimination for IPPICmodels ranged between 0.68 and 0.83. This was highest for the second-trimester clinical characteristicsand biochemical markers model to predict early-onset pre-eclampsia, and lowest for the first-trimesterclinical characteristics models to predict any pre-eclampsia. Calibration performance was heterogeneousacross studies. Net benefit was observed for International Prediction of Pregnancy Complications firstand second-trimester clinical characteristics and clinical characteristics and biochemical markers modelspredicting any pre-eclampsia, when validated in singleton nulliparous women managed in the UK NHS.History of hypertension, parity, smoking, mode of conception, placental growth factor and uterine arterypulsatility index had the strongest unadjusted associations with pre-eclampsia.
Limitations: Variations in study population characteristics, type of predictors reported, too few eventsin some validation cohorts and the type of measurements contributed to heterogeneity in performanceof the International Prediction of Pregnancy Complications models. Some published models were notvalidated because model predictors were unavailable in the individual participant data.
Conclusion: For models that could be validated, predictive performance was generally poor across datasets. Although the International Prediction of Pregnancy Complications models show good predictiveperformance on average, and in the singleton nulliparous population, heterogeneity in calibrationperformance is likely across settings.
Future work: Recalibration of model parameters within populations may improve calibrationperformance. Additional strong predictors need to be identified to improve model performance andconsistency. Validation, including examination of calibration heterogeneity, is required for the modelswe could not validate.
Study registration: This study is registered as PROSPERO CRD42015029349.
ABSTRACT
NIHR Journals Library www.journalslibrary.nihr.ac.uk
viii

Funding: This project was funded by the National Institute for Health Research (NIHR) HealthTechnology Assessment programme and will be published in full in Health Technology Assessment;Vol. 24, No. 72. See the NIHR Journals Library website for further project information.
DOI: 10.3310/hta24720 Health Technology Assessment 2020 Vol. 24 No. 72
© Queen’s Printer and Controller of HMSO 2020. This work was produced by Allotey et al. under the terms of a commissioning contract issued by the Secretary of Statefor Health and Social Care. This issue may be freely reproduced for the purposes of private research and study and extracts (or indeed, the full report) may be included inprofessional journals provided that suitable acknowledgement is made and the reproduction is not associated with any form of advertising. Applications for commercialreproduction should be addressed to: NIHR Journals Library, National Institute for Health Research, Evaluation, Trials and Studies Coordinating Centre, Alpha House,University of Southampton Science Park, Southampton SO16 7NS, UK.
ix

Contents
List of tables xv
List of figures xix
List of supplementary material xxiii
List of abbreviations xxv
Plain English summary xxvii
Scientific summary xxix
Chapter 1 Background 1
Chapter 2 Objectives 3Primary objectives 3Secondary objectives 3
Chapter 3 Methods 5Eligibility criteria 5
Criteria for including relevant cohorts and studies in the individual participant data 5Literature search and study identification 5The IPPIC pre-eclampsia network 7Study selection, individual participant data collection and harmonisation 7
Data extraction 8Data harmonisation and recovery 8Data quality 8
Prioritisation of predictors 10Quality assessment 10Sample size considerations 10Data synthesis 10
External validation of existing pre-eclampsia prediction models 10Development and validation of pre-eclampsia prediction models 12Summarising the prognostic effect of individual predictors of pre-eclampsia 15
Chapter 4 Characteristics and quality of data sets included in the individualparticipant data meta-analysis 17Study identification and individual participant data acquisition 17Characteristics of data sets in the IPPIC data repository 17Prioritisation of predictors of pre-eclampsia 20Quality of the IPPIC data sets 20Characteristics of identified prediction models 20
Chapter 5 External validation of existing pre-eclampsia prediction models 23Characteristics of included prediction models 23Characteristics of the IPPIC-UK validation cohorts 25External validation and meta-analysis of predictive performance 26
Performance of the models 26
DOI: 10.3310/hta24720 Health Technology Assessment 2020 Vol. 24 No. 72
© Queen’s Printer and Controller of HMSO 2020. This work was produced by Allotey et al. under the terms of a commissioning contract issued by the Secretary of Statefor Health and Social Care. This issue may be freely reproduced for the purposes of private research and study and extracts (or indeed, the full report) may be included inprofessional journals provided that suitable acknowledgement is made and the reproduction is not associated with any form of advertising. Applications for commercialreproduction should be addressed to: NIHR Journals Library, National Institute for Health Research, Evaluation, Trials and Studies Coordinating Centre, Alpha House,University of Southampton Science Park, Southampton SO16 7NS, UK.
xi
Decision curve analysis 39Any-onset pre-eclampsia 41Early-onset pre-eclampsia 41Late-onset pre-eclampsia 41
Summary 46
Chapter 6 Development and validation of pre-eclampsia prediction models 47Summary of international data sets and predictor availability 47Missingness and multiple imputation 48Models including clinical characteristics only 52Models including clinical characteristics and biochemical markers 56Models including clinical characteristics and ultrasound markers 58Shrinkage and final models 58Decision curve analysis 58Summary 68
Chapter 7 Predictive performance of individual risk factors for pre-eclampsia 69Any-onset pre-eclampsia 69Early-onset pre-eclampsia 71Late-onset pre-eclampsia 73Summary 75
Chapter 8 Discussion 77Summary of the findings 77Strengths and limitations 77Comparison with existing evidence 78Relevance to clinical practice 80Relevance to research 80Conclusion 80
Acknowledgements 81
References 85
Appendix 1 Full list of authors 103
Appendix 2 Search strategies 107
Appendix 3 Individual participant data extracted on the IPPIC project 109
Appendix 4 Participant summary from data sets contributing to the IPPIC project 117
Appendix 5 Detailed study characteristics of IPPIC data sets 123
Appendix 6 Summary of missing data for prioritised predictors and eachpre-eclampsia outcome for all pregnancies 137
Appendix 7 International Prediction of Pregnancy Complications Collaboratorspre-eclampsia predictors prioritisation survey 145
Appendix 8 Risk-of-bias assessment of data sets on the IPPIC project 151
Appendix 9 Prediction models and equations identified from the literature search 175
CONTENTS
NIHR Journals Library www.journalslibrary.nihr.ac.uk
xii
Appendix 10 Patient characteristics of IPPIC-UK individual participant data sets 183
Appendix 11 Number and proportion missing (or not recorded) for each predictor ineach data set used for external validation 185
Appendix 12 Summary of linear predictor and predicted probability values fromexternal validation 189
Appendix 13 Predictive performance statistics for models in the individual IPPIC-UKdata sets 197
Appendix 14 Decision curves for prediction models of early-onset pre-eclampsia in(a) SCOPE UK, (b) Poston et al. 2015 and (c) POP 203
Appendix 15 Imputation checking for model development 205
Appendix 16 Comparison of clinical characteristics models in data imputed with BMI,ln(BMI) or BMI–2 217
Appendix 17 Forest plots of predictive performance estimates in the individual datasets for the second-trimester model for any-onset pre-eclampsia 225
Appendix 18 Comparison of clinical characteristic and biochemical marker modelsin data imputed with original biochemical markers or natural log-transformedbiochemical markers 227
Appendix 19 Predictive performance of final shrunken prediction models for any-,early- and late-onset pre-eclampsia in the individual data sets used for modeldevelopment and validation 235
Appendix 20 Calibration plots for final shrunken prediction models for any- andlate-onset pre-eclampsia 241
Appendix 21 Decision curve analysis for developed models in each data set 245
DOI: 10.3310/hta24720 Health Technology Assessment 2020 Vol. 24 No. 72
© Queen’s Printer and Controller of HMSO 2020. This work was produced by Allotey et al. under the terms of a commissioning contract issued by the Secretary of Statefor Health and Social Care. This issue may be freely reproduced for the purposes of private research and study and extracts (or indeed, the full report) may be included inprofessional journals provided that suitable acknowledgement is made and the reproduction is not associated with any form of advertising. Applications for commercialreproduction should be addressed to: NIHR Journals Library, National Institute for Health Research, Evaluation, Trials and Studies Coordinating Centre, Alpha House,University of Southampton Science Park, Southampton SO16 7NS, UK.
xiii

List of tables
TABLE 1 Structured question for IPD meta-analysis on prediction of pre-eclampsia 6
TABLE 2 Review of reviews on predictors of pre-eclampsia 18
TABLE 3 Predictors of pre-eclampsia prioritised by online survey and consensus meeting 21
TABLE 4 Pre-eclampsia prediction model equations externally validated in the IPPIC-UKdata sets 23
TABLE 5 Summary meta-analysis estimates of predictive performance for eachmodel across validation data sets 27
TABLE 6 Predictive performance statistics for models in the individual IPPIC datasets with > 100 events 30
TABLE 7 Ranked clinical characteristics as potential predictors and mean of scoresfrom the clinical consensus group 47
TABLE 8 Patient characteristics in the 12 IPPIC data sets used for modeldevelopment, using all available data for each variable (excluding missing observations) 49
TABLE 9 Number and proportion of observations missing values for each variable ineach data set included in model development 50
TABLE 10 Summary of sample size and number of events used for model development 52
TABLE 11 Summary of clinical characteristics retained in the models for any-,early- and late-onset pre-eclampsia 53
TABLE 12 Parameter estimates for initial prediction models developed using first-trimester clinical characteristics to predict any-, early- or late-onset pre-eclampsia 54
TABLE 13 Parameter estimates for initial prediction models developed using second-trimester clinical characteristics to predict any-, early- or late-onset pre-eclampsia 55
TABLE 14 Average (pooled) predictive performance statistics for each clinicalcharacteristics model, and estimates of heterogeneity (between-study variance, τ2;proportion of total variability due to between-study variance, I2) in performance, asobtained from a meta-analysis of data set-specific performance statistics 57
TABLE 15 Summary of biochemical markers retained in the models (alongside clinicalcharacteristics) for any-, early- and late-onset pre-eclampsia using first- or second-trimester measurements 58
TABLE 16 Parameter estimates for initial prediction models using first-trimesterclinical characteristics and biochemical markers to predict any-, early- or late-onsetpre-eclampsia 59
DOI: 10.3310/hta24720 Health Technology Assessment 2020 Vol. 24 No. 72
© Queen’s Printer and Controller of HMSO 2020. This work was produced by Allotey et al. under the terms of a commissioning contract issued by the Secretary of Statefor Health and Social Care. This issue may be freely reproduced for the purposes of private research and study and extracts (or indeed, the full report) may be included inprofessional journals provided that suitable acknowledgement is made and the reproduction is not associated with any form of advertising. Applications for commercialreproduction should be addressed to: NIHR Journals Library, National Institute for Health Research, Evaluation, Trials and Studies Coordinating Centre, Alpha House,University of Southampton Science Park, Southampton SO16 7NS, UK.
xv
TABLE 17 Parameter estimates for initial prediction models using second-trimesterclinical characteristics and biochemical markers to predict any-, early- or late-onsetpre-eclampsia 60
TABLE 18 Average (pooled) predictive performance statistics for clinicalcharacteristics and clinical and biochemical marker models, and estimates ofheterogeneity in performance (between-study variance, τ2; proportion of totalvariability due to between-study variance, I2), as derived from a meta-analysis of dataset-specific performance estimates 61
TABLE 19 Final model equations for each outcome, predictor type and trimester ofmeasurement after shrinkage to adjust for optimism (overfitting) 62
TABLE 20 Two-stage IPD meta-analysis for any-onset pre-eclampsia 69
TABLE 21 Two-stage IPD meta-analysis for early-onset pre-eclampsia 71
TABLE 22 Two-stage IPD meta-analysis for late-onset pre-eclampsia 73
TABLE 23 Search strategies for the review of reviews 107
TABLE 24 Search strategies for pre-eclampsia prediction models 108
TABLE 25 Risk-of-bias assessment for participant selection 151
TABLE 26 Risk-of-bias assessment for predictors 154
TABLE 27 Risk-of-bias assessment for outcome 160
TABLE 28 Summary of LP values and predicted probabilities for each model in eachdata set 190
TABLE 29 First-trimester models for any-onset pre-eclampsia 218
TABLE 30 Performance statistics for first-trimester models for any-onset pre-eclampsia 219
TABLE 31 First-trimester models for early-onset pre-eclampsia 219
TABLE 32 Performance statistics for first-trimester models for early-onset pre-eclampsia 220
TABLE 33 Comparison of first-trimester models for late-onset pre-eclampsia 220
TABLE 34 Performance statistics for first-trimester models for late-onset pre-eclampsia 221
TABLE 35 Second-trimester models for any-onset pre-eclampsia 221
TABLE 36 Performance statistics for second-trimester models for any-onset pre-eclampsia 222
TABLE 37 Second-trimester models for early-onset pre-eclampsia 222
TABLE 38 Performance statistics for second-trimester models for early-onsetpre-eclampsia 223
LIST OF TABLES
NIHR Journals Library www.journalslibrary.nihr.ac.uk
xvi
TABLE 39 Second-trimester models for late-onset pre-eclampsia 223
TABLE 40 Performance statistics for second-trimester models for late-onsetpre-eclampsia 224
TABLE 41 First-trimester models for any pre-eclampsia 228
TABLE 42 Performance statistics for first-trimester models for any pre-eclampsia 228
TABLE 43 First-trimester models for early pre-eclampsia 229
TABLE 44 Performance statistics for first-trimester models for early pre-eclampsia 229
TABLE 45 First-trimester models for late pre-eclampsia 230
TABLE 46 Performance statistics for first-trimester models for late pre-eclampsia 230
TABLE 47 Second-trimester models for any pre-eclampsia 231
TABLE 48 Performance statistics for second-trimester models for any pre-eclampsia 231
TABLE 49 Second-trimester models for early pre-eclampsia 232
TABLE 50 Performance statistics for second-trimester models for early pre-eclampsia 232
TABLE 51 Second-trimester models for late pre-eclampsia 233
TABLE 52 Performance statistics for second-trimester models for late pre-eclampsia 233
DOI: 10.3310/hta24720 Health Technology Assessment 2020 Vol. 24 No. 72
© Queen’s Printer and Controller of HMSO 2020. This work was produced by Allotey et al. under the terms of a commissioning contract issued by the Secretary of Statefor Health and Social Care. This issue may be freely reproduced for the purposes of private research and study and extracts (or indeed, the full report) may be included inprofessional journals provided that suitable acknowledgement is made and the reproduction is not associated with any form of advertising. Applications for commercialreproduction should be addressed to: NIHR Journals Library, National Institute for Health Research, Evaluation, Trials and Studies Coordinating Centre, Alpha House,University of Southampton Science Park, Southampton SO16 7NS, UK.
xvii


List of figures
FIGURE 1 Flow diagram of harmonisation of variables in the IPD data sets 9
FIGURE 2 Flow diagram of studies included in the IPD meta-analysis, showingreasons why IPD were not obtained 17
FIGURE 3 Flow chart of pre-eclampsia prediction model selection for externalvalidation in IPPIC-UK data set using IPD meta-analysis 22
FIGURE 4 Plot of the summary meta-analysis estimates and CIs of the C-statistic(pooled across IPPIC-UK validation data sets) for each prediction model 31
FIGURE 5 Plot of the summary meta-analysis estimates and CIs of calibration(pooled across IPPIC-UK validation data sets) for each prediction model 35
FIGURE 6 Plot of the summary meta-analysis estimates and CIs of calibration-in-the-large (pooled across IPPIC-UK validation datasets) for each prediction model 37
FIGURE 7 Calibration plots for models predicting any-onset pre-eclampsia usingfirst-trimester clinical characteristics and biochemical markers in data sets with> 100 outcome events 39
FIGURE 8 Calibration plots for models predicting early-onset pre-eclampsia usingfirst-trimester clinical characteristics marker in data sets with > 100 outcome events 40
FIGURE 9 Calibration plots for models predicting late-onset pre-eclampsia usingfirst-trimester clinical characteristics marker in data sets with > 100 outcome events 40
FIGURE 10 Decision curves for prediction models of any-onset pre-eclampsia in the(a) SCOPE UK, (b) Allen et al., (c) Poston et al. 2015 and (d) POP data sets 42
FIGURE 11 Decision curves for prediction models of late-onset pre-eclampsia in(a) SCOPE UK, (b) Allen et al., (c) Poston et al. 2015 and (d) POP data sets 44
FIGURE 12 Relationship between first-trimester BMI and risk of early-onsetpre-eclampsia when using (BMI/10)–2 transformation 53
FIGURE 13 Calibration plots for the final (shrunken) model predicting any-onsetpre-eclampsia using first-trimester clinical characteristics, in data sets (with > 100 events)used in the development and validation of the model 64
FIGURE 14 Decision curves for the final (shrunken) model predicting any pre-eclampsiausing first-trimester clinical characteristics, in data sets used in the development andvalidation of the model 64
FIGURE 15 Decision curves for the final (shrunken) model predicting anypre-eclampsia using second-trimester clinical characteristics, in data sets used in thedevelopment and validation of the model 66
DOI: 10.3310/hta24720 Health Technology Assessment 2020 Vol. 24 No. 72
© Queen’s Printer and Controller of HMSO 2020. This work was produced by Allotey et al. under the terms of a commissioning contract issued by the Secretary of Statefor Health and Social Care. This issue may be freely reproduced for the purposes of private research and study and extracts (or indeed, the full report) may be included inprofessional journals provided that suitable acknowledgement is made and the reproduction is not associated with any form of advertising. Applications for commercialreproduction should be addressed to: NIHR Journals Library, National Institute for Health Research, Evaluation, Trials and Studies Coordinating Centre, Alpha House,University of Southampton Science Park, Southampton SO16 7NS, UK.
xix
FIGURE 16 Decision curves for the final (shrunken) model predicting anypre-eclampsia using first-trimester clinical characteristics and biochemical markers,in data sets used in the development and validation of the model 67
FIGURE 17 Decision curves for the final (shrunken) model predicting any pre-eclampsiausing second-trimester clinical characteristics and biochemical markers, in data setsused in the development and validation of the model 67
FIGURE 18 Median (dot) and range (bar) of values for (a) LP and (b) predictedprobabilities across validation data sets for each model being externally validated 195
FIGURE 19 Median and range of BMI values in imputed data set for cohortsincluded in the development of models with trimester 1 clinical characteristics 205
FIGURE 20 Median and range of ln(BMI) values in imputed data set for cohortsincluded in the development of models with trimester 1 clinical characteristics 206
FIGURE 21 Median and range of (BMI/10)–2 values in imputed data set for cohortsincluded in the development of models with trimester 1 clinical characteristics 207
FIGURE 22 Median and range of DBP values in imputed data set for cohortsincluded in the development of models with trimester 2 clinical characteristics 209
FIGURE 23 Median and range of SBP values in imputed data set for cohorts includedin the development of models with trimester 2 clinical characteristics 210
FIGURE 24 Median and range of BMI values in imputed data set for cohortsincluded in the development of models with trimester 2 clinical characteristics 211
FIGURE 25 Median and range of ln(BMI) values in imputed data set for cohortsincluded in the development of models with trimester 2 clinical characteristics 213
FIGURE 26 Median and range of (BMI/10)–2 values in imputed data set for cohortsincluded in the development of models with trimester 2 clinical characteristics 214
FIGURE 27 Median and range of ln(PAPP-A) values in imputed data set for cohortsincluded in the development of models with trimester 2 clinical characteristics 215
FIGURE 28 Forest plot of logit C-statistics for the second-trimester modelpredicting any-onset pre-eclampsia in data sets used for model development andinternal validation 225
FIGURE 29 Forest plot of calibration slope for the second-trimester modelpredicting any-onset pre-eclampsia in data sets used for model development andinternal validation 225
FIGURE 30 Forest plot of calibration-in-the-large for the second-trimester modelpredicting any-onset pre-eclampsia in data sets used for model development andinternal validation 226
FIGURE 31 Calibration plots for model 3, which includes first-trimester clinicalcharacteristics for predicting late-onset pre-eclampsia 241
LIST OF FIGURES
NIHR Journals Library www.journalslibrary.nihr.ac.uk
xx

FIGURE 32 Calibration plots for model 4, which includes second-trimester clinicalcharacteristics for predicting any-onset pre-eclampsia 241
FIGURE 33 Calibration plots for model 6, which includes second-trimester clinicalcharacteristics for predicting late-onset pre-eclampsia 242
FIGURE 34 Calibration plots for model 7 which includes first-trimester clinicalcharacteristics and biochemical markers for predicting any-onset pre-eclampsia 242
FIGURE 35 Calibration plots for model 9, which includes first-trimester clinicalcharacteristics and biochemical markers for predicting late-onset pre-eclampsia 243
FIGURE 36 Calibration plots for model 10, which includes second-trimester clinicalcharacteristics and biochemical markers for predicting any-onset pre-eclampsia 243
FIGURE 37 Calibration plots for model 12, which includes second-trimester clinicalcharacteristics and biochemical markers for predicting late-onset pre-eclampsia 244
FIGURE 38 Decision curves for the final (shrunken) model predicting early-onsetpre-eclampsia using first-trimester clinical characteristics, in data sets used in thedevelopment and validation of the model 245
FIGURE 39 Decision curves for the final (shrunken) model predicting early-onsetpre-eclampsia using second-trimester clinical characteristics, in data sets used in thedevelopment and validation of the model 246
FIGURE 40 Decision curves for the final (shrunken) model predicting early-onsetpre-eclampsia using first-trimester clinical characteristics and biochemical markers,in data sets used in the development and validation of the model 247
FIGURE 41 Decision curves for the final (shrunken) model predicting early-onsetpre-eclampsia using second-trimester clinical characteristics and biochemical markers,in data sets used in the development and validation of the model 248
FIGURE 42 Decision curves for the final (shrunken) model predicting late-onsetpre-eclampsia using first-trimester clinical characteristics, in data sets used in thedevelopment and validation of the model 248
FIGURE 43 Decision curves for the final (shrunken) model predicting late-onsetpre-eclampsia using second-trimester clinical characteristics, in data sets used in thedevelopment and validation of the model 250
FIGURE 44 Decision curves for the final (shrunken) model predicting late-onsetpre-eclampsia using first-trimester clinical characteristics and biochemical markers,in data sets used in the development and validation of the model 251
FIGURE 45 Decision curves for the final (shrunken) model predicting late-onsetpre-eclampsia using second-trimester clinical characteristics and biochemical markers,in data sets used in the development and validation of the model 251
DOI: 10.3310/hta24720 Health Technology Assessment 2020 Vol. 24 No. 72
© Queen’s Printer and Controller of HMSO 2020. This work was produced by Allotey et al. under the terms of a commissioning contract issued by the Secretary of Statefor Health and Social Care. This issue may be freely reproduced for the purposes of private research and study and extracts (or indeed, the full report) may be included inprofessional journals provided that suitable acknowledgement is made and the reproduction is not associated with any form of advertising. Applications for commercialreproduction should be addressed to: NIHR Journals Library, National Institute for Health Research, Evaluation, Trials and Studies Coordinating Centre, Alpha House,University of Southampton Science Park, Southampton SO16 7NS, UK.
xxi


List of supplementary material
Report Supplementary Material 1 Supplementary figures
Supplementary material can be found on the NIHR Journals Library report page(https://doi.org/10.3310/hta24720).
Supplementary material has been provided by the authors to support the report and any filesprovided at submission will have been seen by peer reviewers, but not extensively reviewed.Any supplementary material provided at a later stage in the process may not have beenpeer reviewed.
DOI: 10.3310/hta24720 Health Technology Assessment 2020 Vol. 24 No. 72
© Queen’s Printer and Controller of HMSO 2020. This work was produced by Allotey et al. under the terms of a commissioning contract issued by the Secretary of Statefor Health and Social Care. This issue may be freely reproduced for the purposes of private research and study and extracts (or indeed, the full report) may be included inprofessional journals provided that suitable acknowledgement is made and the reproduction is not associated with any form of advertising. Applications for commercialreproduction should be addressed to: NIHR Journals Library, National Institute for Health Research, Evaluation, Trials and Studies Coordinating Centre, Alpha House,University of Southampton Science Park, Southampton SO16 7NS, UK.
xxiii

List of abbreviations
AMND Aberdeen Maternity and NeonatalDatabank
BMI body mass index
CI confidence interval
CRP C-reactive protein
DBP diastolic blood pressure
HELLP haemolysis, elevated liverenzymes and low platelet count
IPD individual participant data
IPPIC International Prediction ofPregnancy Complications
IQR interquartile range
LP linear predictor
MAP mean arterial blood pressure
OR odds ratio
PAPP-A pregnancy-associated plasmaprotein A
PCR protein–creatinine ratio
PlGF placental growth factor
POP Pregnancy Outcome Prediction
PROBAST Prediction study Risk of BiasAssessment Tool
SBP systolic blood pressure
SCOPE Screening for PregnancyEndpoints
sFlt-1 soluble fms-like tyrosine kinase-1
WHO World Health Organization
DOI: 10.3310/hta24720 Health Technology Assessment 2020 Vol. 24 No. 72
© Queen’s Printer and Controller of HMSO 2020. This work was produced by Allotey et al. under the terms of a commissioning contract issued by the Secretary of Statefor Health and Social Care. This issue may be freely reproduced for the purposes of private research and study and extracts (or indeed, the full report) may be included inprofessional journals provided that suitable acknowledgement is made and the reproduction is not associated with any form of advertising. Applications for commercialreproduction should be addressed to: NIHR Journals Library, National Institute for Health Research, Evaluation, Trials and Studies Coordinating Centre, Alpha House,University of Southampton Science Park, Southampton SO16 7NS, UK.
xxv

Plain English summary
What is the problem?
Pre-eclampsia, a condition in pregnancy that results in raised blood pressure and protein in the urine,is a major cause of complications for the mother and baby.
What is needed?
A way of accurately identifying women at high risk of pre-eclampsia to allow clinicians to startpreventative interventions such as administering aspirin or frequently monitoring women during pregnancy.
Where are the research gaps?
Although over 100 tools (models) have been reported worldwide to predict pre-eclampsia, to date theirperformance in women managed in the UK NHS is unknown.
What did we plan to do?
We planned to comprehensively identify all published models that predict the risk of pre-eclampsiaoccurring at any time during pregnancy and to assess if this prediction is accurate in the UK population.If the existing models did not perform satisfactorily, we aimed to develop new prediction models.
What did we find?
We formed the International Prediction of Pregnancy Complications network, which provided datafrom a large number of studies (78 studies, 25 countries, 125 researchers, 3,570,993 singletonpregnancies). We were able to assess the performance of 24 out of the 131 models published topredict pre-eclampsia in 11 UK data sets. The models did not accurately predict the risk of pre-eclampsia across all UK data sets, and their performance varied within individual data sets. Wedeveloped new prediction models that showed promising performance on average across all data sets,but their ability to correctly identify women who develop pre-eclampsia varied between populations.The models were more clinically useful when used in the care of first-time mothers pregnant with onechild, compared to a strategy of treating them all as if they were at high-risk of pre-eclampsia.
What does this mean?
Before using the International Prediction of Pregnancy Complications models in various populations,they need to be adjusted for characteristics of the particular population and the setting of application.
DOI: 10.3310/hta24720 Health Technology Assessment 2020 Vol. 24 No. 72
© Queen’s Printer and Controller of HMSO 2020. This work was produced by Allotey et al. under the terms of a commissioning contract issued by the Secretary of Statefor Health and Social Care. This issue may be freely reproduced for the purposes of private research and study and extracts (or indeed, the full report) may be included inprofessional journals provided that suitable acknowledgement is made and the reproduction is not associated with any form of advertising. Applications for commercialreproduction should be addressed to: NIHR Journals Library, National Institute for Health Research, Evaluation, Trials and Studies Coordinating Centre, Alpha House,University of Southampton Science Park, Southampton SO16 7NS, UK.
xxvii

Scientific summary
Background
Pre-eclampsia is a leading cause of maternal and perinatal mortality and morbidity. Current methods ofrisk assessment for pre-eclampsia are based mainly on clinical history alone and have limited accuracy.Prediction models that incorporate additional information on biochemical and ultrasound markerscould improve the predictive performance. Numerous multivariable pre-eclampsia models have beendeveloped to date, but only a few have been externally validated, and none is recommended for use inroutine clinical practice. Robust data are needed to externally validate existing models to determinetheir transportability across new populations and their clinical utility.
Objectives
PrimaryThe primary objectives were to use individual participant data meta-analysis:
l to validate (across multiple populations and settings) existing models for predicting early-onset,late-onset and any-onset pre-eclampsia based on clinical characteristics only, clinical and biochemicalmarkers, clinical and ultrasound markers, and clinical, biochemical and ultrasound markers
l to develop and validate (across multiple populations and settings) multivariable prediction modelsfor early-onset, late-onset and any-onset pre-eclampsia where existing prediction models havelimited performance, or where no such models exist for the relevant pre-eclampsia outcomes
l to estimate the net benefit (clinical utility) of existing and new models to inform clinical decisionmaking based on thresholds of predicted risk
l to estimate the prognostic value of individual clinical, biochemical and ultrasound markers forpredicting pre-eclampsia.
Secondary
l To assess the differential performance of the existing models in various predefined subgroups basedon population characteristics (unselected; selected) and timing of model use (first trimester;second trimester).
l To study the added accuracy when novel metabolic and microRNA-based biochemical markers areadded to the developed model based on clinical, ultrasound and biochemical markers.
Methods
We undertook an individual participant data meta-analysis in line with existing recommendations onprognostic research model development and validation and complied with reporting guidelines forprediction models and individual participant data meta-analysis. We undertook relevant systematicreviews to identify systematic reviews on clinical characteristics, biochemical and ultrasound markersfor prediction of pre-eclampsia; prediction models for pre-eclampsia; and relevant studies, birth cohortsor data sets. Primary studies and large birth and population-based cohorts that provided relevantinformation for assessing the accuracy of clinical, biochemical and ultrasound predictors of pre-eclampsia were included. The primary outcomes were early-onset (delivery at < 34 weeks’ gestation),late-onset (delivery at ≥ 34 weeks’ gestation) and any-onset pre-eclampsia. We established theInternational Prediction of Pregnancy Complications collaborative network, and researchers from thisgroup shared their primary data, which required extensive cleaning, standardisation and quality checking.
DOI: 10.3310/hta24720 Health Technology Assessment 2020 Vol. 24 No. 72
© Queen’s Printer and Controller of HMSO 2020. This work was produced by Allotey et al. under the terms of a commissioning contract issued by the Secretary of Statefor Health and Social Care. This issue may be freely reproduced for the purposes of private research and study and extracts (or indeed, the full report) may be included inprofessional journals provided that suitable acknowledgement is made and the reproduction is not associated with any form of advertising. Applications for commercialreproduction should be addressed to: NIHR Journals Library, National Institute for Health Research, Evaluation, Trials and Studies Coordinating Centre, Alpha House,University of Southampton Science Park, Southampton SO16 7NS, UK.
xxix

We externally validated published pre-eclampsia prediction models that reported the full modelequation in International Prediction of Pregnancy Complications UK data sets. Partially missingpredictors or outcome values missing for < 95% of individuals in a data set were multiply imputedunder the missing at random assumption using multiple imputation by chained equations. Imputationwas carried out separately in each dataset to account for the clustering of individuals within a data set.The predictive performance of each model was examined using measures of discrimination (C-statistics;no discrimination 0.5 to perfect discrimination 1, with values of ≥ 0.7 deemed most promising) andcalibration of predicted to observed risks (calibration slope, with an ideal value of 1; and calibration-in-the-large, with an ideal value of 0) first in the individual participant data for each available data set andthen across data sets at the meta-analysis level. We also compared the clinical utility (net benefit) ofvalidated prediction models for each pre-eclampsia outcome using a decision curve analysis.
We then developed and validated new prediction models for early-onset, late-onset and any-onsetpre-eclampsia based on clinical characteristic variables alone, clinical characteristics and biochemicalmarkers, and clinical characteristics and ultrasound markers. For each model developed, we summarisedthe data set-specific performance (C-statistic, calibration slope and calibration-in-the-large), using arandom-effects meta-analysis, in terms of the average performance and (to examine potentialgeneralisability across settings) the heterogeneity in performance. We also assessed the clinical utilityof developed models using a decision curve analysis.
Outside model development, we also used the full International Prediction of Pregnancy Complicationsdata set to obtain summary-unadjusted estimates of the prognostic effects of prioritised candidatepredictors for early-onset, late-onset and any-onset pre-eclampsia, along with 95% confidence intervalsand 95% prediction intervals, using a two-stage individual participant data meta-analysis of completecases of singleton pregnancies. The two-stage approach involves first fitting a logistic regression modelfor each study and then pooling the log-odds ratios using a conventional random-effects meta-analysis.Clustering of participants within data sets was accounted for by analysing each data set separately inthe first stage.
Results
One hundred and twenty-five researchers from 73 teams in 25 countries joined the InternationalPrediction of Pregnancy Complications network (by October 2017) and provided access to anonymisedindividual data of 3,674,684 pregnancies (78 data sets). More than half of the data sets (58%, 45/78)were prospective cohort studies, 15% (12/78) were randomised controlled trials and 17% (13/78) werelarge prospective registry data sets or birth cohorts. One data set included individual participant datafrom 31 randomised controlled trials.
External validation of existing pre-eclampsia prediction modelsOf the 131 models identified, 24 could be validated in one or more of the 11 International Predictionof Pregnancy Complications UK data sets. Eight models predicted any-onset pre-eclampsia (three onclinical characteristics only, three with additional biochemical markers and two with additional ultrasoundmarkers), nine predicted early-onset pre-eclampsia (seven included clinical characteristics only, and oneeach included additional biochemical or ultrasound markers), and seven predicted late-onset pre-eclampsia(five included clinical characteristics only, and one each included additional biochemical and ultrasoundmarkers). Discrimination performance of the models was modest, with summary C-statistics of around0.6–0.7 for most models. Calibration was generally poor across the data sets, with large heterogeneityin performance across different International Prediction of Pregnancy Complications data sets, withmost of the models demonstrating signs of overfitting (summary calibration slope of < 1) and predictionsthat were systematically too high or too low (calibration-in-the-large ≠ 0, suggesting poor prediction ofoverall risk across populations). In most of the data sets, the net benefit of using the models was onlyslightly greater than the strategy of considering all women to have pre-eclampsia.
SCIENTIFIC SUMMARY
NIHR Journals Library www.journalslibrary.nihr.ac.uk
xxx
Development and validation of International Prediction of Pregnancy Complicationspre-eclampsia prediction modelsTwelve International Prediction of Pregnancy Complications pre-eclampsia models were developed:four each to predict any-onset, early-onset and late-onset pre-eclampsia (two models each in thefirst and second trimesters using clinical characteristics, and with additional biochemical markers).We developed each model by meta-analysing 3–11 International Prediction of Pregnancy Complicationsdata sets. The clinical characteristics only models comprised maternal age, body mass index, parity,history of pre-eclampsia, hypertension, diabetes or autoimmune disease and systolic or diastolic bloodpressure. In addition to the clinical characteristic predictors, the biochemical marker models includedsoluble fms-like tyrosine kinase-1, pregnancy-associated plasma protein A and placental growth factor.
For predicting any pre-eclampsia, all second-trimester models (clinical only, clinical and biochemicalpredictors) showed promising discrimination (average C-statistics of ≥ 0.7); first trimester clinical only,and clinical and biochemical models had summary C-statistics of 0.68 and 0.70, respectively. All modelsto predict early-onset pre-eclampsia had promising discrimination; the first trimester (clinical only,clinical and biochemical) models had summary C-statistics of 0.72 (95% confidence interval 0.59 to0.82) and 0.76 (95% confidence interval 0.58 to 0.88) respectively; the corresponding values forsecond-trimester clinical only and clinical and biochemical models were 0.72 (95% confidence interval0.60 to 0.82) and 0.83 (95% confidence interval 0.63 to 0.93). For predicting late-onset pre-eclampsia,the second-trimester models (clinical only, clinical and biochemical predictors) showed promisingdiscrimination (average C-statistics ≥ 0.7); the first-trimester models’ C-statistics ranged from 0.68 to0.69. Summary calibration measures often had wide confidence intervals, and there was often largebetween-study heterogeneity in the calibration performance, particularly for clinical and biochemicalmarker models. The net benefit of the models varied across individual data sets, ranging from harm tovery little benefit to no benefit.
When validated in individual cohorts with over 100 pre-eclampsia events, the first-trimester clinicalmodel for any pre-eclampsia was well calibrated in the Baschat study (any pregnant women in theUSA) (Baschat AA, Magder LS, Doyle LE, Atlas RO, Jenkins CB, Blitzer MG. Prediction of preeclampsiautilizing the first trimester screening examination. Am J Obstet Gynecol 2014;211:514.e1–7); thepredictions were too high for individuals in the World Health Organization study (women with riskfactors for pre-eclampsia from low-, middle- and high-income countries) (Widmer M, Cuesta C,Khan KS, Conde-Agudelo A, Carroli G, Fusey S, et al. Accuracy of angiogenic biomarkers at 20 weeks'gestation in predicting the risk of pre-eclampsia: a WHO multicentre study. Pregnancy Hypertens2015;5:330–8) and low for those at high risk in the Pregnancy Outcome Prediction (POP) (nulliparous,singleton pregnancies in the UK) [Sovio U, White IR, Dacey A, Pasupathy D, Smith GCS. Screening forfetal growth restriction with universal third trimester ultrasonography in nulliparous women in thePregnancy Outcome Prediction (POP) study: a prospective cohort study. Lancet 2015;386:2089–97].We observed a consistent net benefit for all International Prediction of Pregnancy Complicationsmodels when validated in the POP cohort for probability thresholds of ≥ 5%. Very little or no netbenefit was observed in other data sets.
Summarising the unadjusted prognostic effect of individual predictors of pre-eclampsia
Any-onset pre-eclampsiaWe observed a strong unadjusted association between any-onset pre-eclampsia and history ofhypertension (odds ratio 4.76, 95% confidence interval 3.56 to 6.35; I2 = 98.39%), multiparity (oddsratio 0.88, 95% confidence interval 0.79 to 0.99; I2 = 96.6%), smoking during pregnancy (odds ratio0.84, 95% confidence interval 0.76 to 0.93; I2 = 86.46%) and spontaneous mode of conception (oddsratio 0.73, 95% confidence interval 0.64 to 0.84; I2 = 58.67%), and increasing placental growth factorin the first (odds ratio 0.22, 95% confidence interval 0.09 to 0.50, I2 = 85.44), second (odds ratio 0.66,95% confidence interval 0.53 to 0.83; I2 = 87.27%) or third trimester (odds ratio 0.59, 95% confidenceinterval 0.45 to 0.77; I2 = 96.78%) showed a reduction in the odds of any-onset pre-eclampsia.
DOI: 10.3310/hta24720 Health Technology Assessment 2020 Vol. 24 No. 72
© Queen’s Printer and Controller of HMSO 2020. This work was produced by Allotey et al. under the terms of a commissioning contract issued by the Secretary of Statefor Health and Social Care. This issue may be freely reproduced for the purposes of private research and study and extracts (or indeed, the full report) may be included inprofessional journals provided that suitable acknowledgement is made and the reproduction is not associated with any form of advertising. Applications for commercialreproduction should be addressed to: NIHR Journals Library, National Institute for Health Research, Evaluation, Trials and Studies Coordinating Centre, Alpha House,University of Southampton Science Park, Southampton SO16 7NS, UK.
xxxi
Early-onset pre-eclampsiaIncreasing second-trimester measurement of uterine artery pulsatility index values had the strongestassociation with early-onset pre-eclampsia (odds ratio 14.73, 95% confidence interval 8.12 to 26.72;I2 = 60.11%). All statistically significant predictors had evidence of an increase in the odds of early-onsetpre-eclampsia with increasing values, except placental growth factor measured in the first (odds ratio 0.08,95% confidence interval 0.02 to 0.35; I2 = 55.69%) or second trimester (odds ratio 0.07; 95% confidenceinterval 0.01 to 0.43; I2 = 97.18%), which showed a decrease in odds with increasing values.
Late-onset pre-eclampsiaThe strongest association with late-onset pre-eclampsia was observed for increasing uterine arterypulsatility index values measured in the second trimester (odds ratio 2.95, 95% confidence interval2.31 to 3.76; I2 = 20.77%). Multiparity (odds ratio 0.87, 95% confidence interval 0.78 to 0.97;I2 = 95.16%) and increasing values of first (odds ratio 0.33, 95% confidence interval 0.16 to 0.68;I2 = 82.67%), second (odds ratio 0.81, 95% confidence interval 0.69 to 0.94; I2 = 76.39%) or third(odds ratio 0.68, 95% confidence interval 0.57 to 0.81; I2 = 93.60%) trimester measurement of placentalgrowth factor and first-trimester soluble fms-like tyrosine kinase-1 (odds ratio 0.98, 95% confidenceinterval 0.97 to 0.99; I2 = 37.07%) showed a decrease in the odds of late-onset pre-eclampsia.
There was considerable heterogeneity for most prognostic effects, with wide 95% prediction intervalsfor the potential prognostic effect of factors in new populations.
Conclusions
Among the 24 existing prediction models that could be validated in individual participant datameta-analysis, their predictive performance was generally poor across data sets (both on averageand in terms of heterogeneity in calibration of predicted risks with observed risks), with very limitedevidence of clinical utility. Some of the heterogeneity in predictive performance of the models islikely due to different methods and timing of measurement, for example in blood pressure andbiochemical marker values. Although the International Prediction of Pregnancy Complications modelsshow promising predictive performance on average across data sets, heterogeneity across settings islikely in calibration performance. Ultrasound markers did not improve the predictive performance ofthe developed International Prediction of Pregnancy Complications clinical characteristic only models.The International Prediction of Pregnancy Complications pre-eclampsia models show consistent netbenefit when applied to a cohort of singleton, nulliparous women in the UK. Before application inpractice, calibration performance may need to be improved by recalibrating model parameters, suchas the intercept, to particular populations and settings.
Recommendations for further research
Going forward, standardisation of measurement methods, for example across laboratories andhospitals, might reduce heterogeneity in calibration performance. A related point is that predictionmodels in this field need to be clearer with regard to how included predictors should be measured andexactly when this should occur. Validation, including examination of calibration heterogeneity, is stillrequired for the models that we could not validate. The transportability of these and the InternationalPrediction of Pregnancy Complications models needs to be assessed in multiple large data setsacross different settings and populations, as does their acceptability to both women and health-careprofessionals. The impact of using the models in clinical practice needs to be evaluated beyond pre-eclampsia prediction to include the identification of women most at risk of other severe pregnancycomplications. Updated models may be needed in local populations, using recalibration of theInternational Prediction of Pregnancy Complications models in local data sets, to improve calibrationperformance. Furthermore, additional strong predictors need to be identified to improve model
SCIENTIFIC SUMMARY
NIHR Journals Library www.journalslibrary.nihr.ac.uk
xxxii

performance and consistency. New cohorts must standardise the predictors and outcomes measured,including their timing and measurement methods, to enable more homogenous data sets to becombined in individual participant data meta-analyses. In terms of the prognostic ability of particularfactors, further analysis of the International Prediction of Pregnancy Complications data usingmultilevel multiple imputation for missing data and adjusting for confounders would provide a betterevaluation of prognostic association.
Study registration
This study is registered as PROSPERO CRD42015029349.
Funding
This project was funded by the National Institute for Health Research (NIHR) Health TechnologyAssessment programme and will be published in full in Health Technology Assessment; Vol. 24, No. 72.See the NIHR Journals Library website for further project information.
DOI: 10.3310/hta24720 Health Technology Assessment 2020 Vol. 24 No. 72
© Queen’s Printer and Controller of HMSO 2020. This work was produced by Allotey et al. under the terms of a commissioning contract issued by the Secretary of Statefor Health and Social Care. This issue may be freely reproduced for the purposes of private research and study and extracts (or indeed, the full report) may be included inprofessional journals provided that suitable acknowledgement is made and the reproduction is not associated with any form of advertising. Applications for commercialreproduction should be addressed to: NIHR Journals Library, National Institute for Health Research, Evaluation, Trials and Studies Coordinating Centre, Alpha House,University of Southampton Science Park, Southampton SO16 7NS, UK.
xxxiii

Chapter 1 Background
Pre-eclampsia is a pregnancy-specific condition associated with hypertension and multiorgandysfunction such as proteinuria, renal or hepatic impairment and fetal growth restriction.1–5 It is a
heterogeneous disorder with a wide spectrum of multiorgan involvement, which reflects its variouspathophysiological pathways. Pre-eclampsia affects between 2% and 8% of pregnancies worldwide6
and is a leading cause of both maternal and perinatal morbidity and mortality.7–10 Each year, 18% of allmaternal deaths can be attributed to pre-eclampsia and its complications, with most of these occurringin low- and middle-income countries.11,12 In the long term, pre-eclampsia is associated with an increasedmaternal risk of ischaemic heart disease, chronic hypertension, stroke and end-stage renal disease.13,14
Children from pre-eclamptic pregnancies also have higher risks of cardiovascular diseases,15,16 mentalhealth disorders and cognitive impairment.17,18
Two subgroups of pre-eclampsia are well recognised: early-onset, requiring delivery before 34 weeks’gestation, and late-onset, with delivery occurring at or after 34 weeks’ gestation.19–21 Early-onsetpre-eclampsia is considered to be a pathophysiologically different disease from late-onset pre-eclampsiain the mechanism leading to placental dysfunction and clinical timing during pregnancy.22 Early-onsetpre-eclampsia is associated with a considerably higher increased risk of maternal complications, such asa 20-fold higher rate of mortality, than the late-onset type, and early delivery is the only treatment.23–25
In addition to the prematurity-related complications, the risks of stillbirth and adverse perinataloutcomes are much higher in women with early-onset disease.26
Although the proportion of women with early-onset pre-eclampsia is < 1% of all pregnancies, thecomplexity of treatment gives rise to high health-care costs.27,28 Affected women are often admittedto a tertiary care facility, and 30% experience complications that may necessitate management inan intensive care unit.29 Infants usually need prolonged care for the management of complications,including lifelong disabilities, arising as a result of premature delivery. The additional NHS costsincurred in caring for a baby born at or before 28 weeks and a baby born between 28 and 33 weeksare £94,190 and £61,509, respectively.30 The cost to the NHS of caring for preterm babies, linked toneonatal care, such as incubation, and hospital readmissions, has been estimated at £939M annually.30
Late-onset pre-eclampsia, including pre-eclampsia at term, also poses a significant health burden.It accounts for the majority of pre-eclampsia diagnoses in pregnancy. One-fifth of all women withlate-onset disease have maternal complications such as HELLP (haemolysis, elevated liver enzymesand low platelet count) syndrome, and more than half of eclamptic seizures occur at term.28,31,32
Pregnant women who are at high risk of pre-eclampsia require close monitoring and are usuallystarted on prophylactic aspirin in early pregnancy to reduce the risk of development of pre-eclampsiaand occurrence of adverse outcomes. Early commencement of this has the potential for maximumbenefit,33 which may be limited to early-onset disease.34 It is important to be able to quantify awoman’s risk of developing pre-eclampsia during the course of pregnancy to help guide clinicaldecisions and monitoring strategies. The National Institute for Health and Care Excellence prioritisesscreening for early-onset pre-eclampsia in its research recommendations on antenatal care of women.35
Currently, the assessment of a woman’s risk of developing pre-eclampsia is based mainly on clinicalhistory,36 but such risk-based predictions have been shown to have limited accuracy.37 Risk factorsbased on clinical characteristics have also been shown to have quantitatively different associationswith early- and late-onset pre-eclampsia,26 and, similarly, biochemical and ultrasound markers havevariations in their performance in predicting the two types of pre-eclampsia.37–39 Prediction modelsincorporating additional tests for biochemical and ultrasound markers may improve the predictiveperformance of models.40–42 It is, however, unlikely that a single model will accurately predict bothearly- and late-onset pre-eclampsia.26
DOI: 10.3310/hta24720 Health Technology Assessment 2020 Vol. 24 No. 72
© Queen’s Printer and Controller of HMSO 2020. This work was produced by Allotey et al. under the terms of a commissioning contract issued by the Secretary of Statefor Health and Social Care. This issue may be freely reproduced for the purposes of private research and study and extracts (or indeed, the full report) may be included inprofessional journals provided that suitable acknowledgement is made and the reproduction is not associated with any form of advertising. Applications for commercialreproduction should be addressed to: NIHR Journals Library, National Institute for Health Research, Evaluation, Trials and Studies Coordinating Centre, Alpha House,University of Southampton Science Park, Southampton SO16 7NS, UK.
1
There are more than 60 multivariable prediction models developed to predict pre-eclampsia, usingvarious combinations of clinical, biochemical and ultrasound risk factors.43 Such models and tests forpredicting pre-eclampsia have been based on findings from aggregate meta-analysis and primarystudies, and none is recommended for use in routine clinical practice. This is because there is anabsence of information about the reproducibility of the models or their predictive performance indifferent settings.
Although interventions such as aspirin have been found to significantly reduce the risk of early-onsetpre-eclampsia in women predicted to be at ‘high risk’ of pre-eclampsia using a model, lack of robustinformation on the accuracy of this model means that we could not rule out potential benefit inwomen considered to be ‘low risk’. Before they can be used in clinical practice, prediction modelsneed to be appropriately validated in multiple data sets external to that used to develop the model.This often takes many years to accomplish in a primary study, and, as a result, very few models havebeen externally validated to date.43–46 Individual studies also often have an insufficient sample size toexternally validate the relatively rare but serious condition of early-onset pre-eclampsia.26
Meta-analysis of individual participant data (IPD), whereby the raw participant-level information isobtained and synthesised across multiple data sets, overcomes the limitations above.47–50 The availabilityof the raw data substantially increases the sample size beyond what is achievable in a single study, andoffers a unique opportunity to evaluate the generalisability of predictive performance of existing modelsacross a range of clinical settings. Using IPD meta-analysis allows the standardisation of predictorsand outcome definitions, takes into account the performance of many candidate prognostic variables,directly handles missing predictors and outcomes data, accounts for heterogeneity in baseline risks,and, most importantly, develops, validates and tailors the use of the most accurate prediction models tothe appropriate population.
The unmet need for prediction models for pre-eclampsia, particularly early-onset pre-eclampsia, ismainly a result of lack of information on the generalisability of the models and their performances inexternal cohorts. Hence, before more resources are spent on developing further models, what isneeded is external validation of existing models. If existing models’ performances are suboptimal,then further development of new models is warranted with sufficient sample size.
BACKGROUND
NIHR Journals Library www.journalslibrary.nihr.ac.uk
2

Chapter 2 Objectives
Material in this chapter has been adapted from Allotey et al.51 This is an Open Access articledistributed in accordance with the terms of the Creative Commons Attribution (CC BY 4.0)
license, which permits others to distribute, remix, adapt and build upon this work, for commercial use,provided the original work is properly cited. See: http://creativecommons.org/licenses/by/4.0/. The textbelow includes minor additions and formatting changes to the original text.
We planned to externally validate and update prediction models for (1) early-onset (delivery at< 34 weeks’ gestation), (2) late-onset (delivery at ≥ 34 weeks’ gestation) and (3) any-onsetpre-eclampsia, and to further develop new prediction models for the above outcomes, if required,using IPD meta-analysis.
Primary objectives
l To validate and improve or tailor the performance of existing models in relevant population groupsfor predicting early-onset, late-onset and any-onset pre-eclampsia in our IPD data set based on:
¢ clinical characteristics only¢ clinical and biochemical markers¢ clinical and ultrasound markers¢ clinical, biochemical and ultrasound markers.
l Using IPD meta-analysis, to develop and externally validate (using internal–external cross-validation)multivariable prediction models for early, late and any-onset pre-eclampsia in the followingcircumstances:
¢ where existing predictive strategies cannot be adjusted for the target population¢ where no such models exist for the relevant pre-eclampsia outcomes.
l To estimate the prognostic value of individual clinical, biochemical and ultrasound markers forpredicting pre-eclampsia by IPD meta-analysis.
Secondary objectives
l To assess the differential performance of the existing models in various predefined subgroups basedon population characteristics (unselected; selected) and timing of model use (first trimester;second trimester).
l To study the added accuracy when novel metabolic and microRNA-based biochemical markers areadded to the developed model based on clinical, ultrasound and biochemical markers.
DOI: 10.3310/hta24720 Health Technology Assessment 2020 Vol. 24 No. 72
© Queen’s Printer and Controller of HMSO 2020. This work was produced by Allotey et al. under the terms of a commissioning contract issued by the Secretary of Statefor Health and Social Care. This issue may be freely reproduced for the purposes of private research and study and extracts (or indeed, the full report) may be included inprofessional journals provided that suitable acknowledgement is made and the reproduction is not associated with any form of advertising. Applications for commercialreproduction should be addressed to: NIHR Journals Library, National Institute for Health Research, Evaluation, Trials and Studies Coordinating Centre, Alpha House,University of Southampton Science Park, Southampton SO16 7NS, UK.
3


Chapter 3 Methods
Material in this chapter has been adapted from Allotey et al.51 This is an Open Access articledistributed in accordance with the terms of the Creative Commons Attribution (CC BY 4.0)
license, which permits others to distribute, remix, adapt and build upon this work, for commercial use,provided the original work is properly cited. See: http://creativecommons.org/licenses/by/4.0/. The textbelow includes minor additions and formatting changes to the original text.
Part of this chapter have been reproduced from Snell et al.52 Open Access This article is licensed undera Creative Commons Attribution 4.0 International License, which permits use, sharing, adaptation,distribution and reproduction in any medium or format, as long as you give appropriate credit to theoriginal author(s) and the source, provide a link to the Creative Commons licence, and indicate ifchanges were made. The images or other third party material in this article are included in the article'sCreative Commons licence, unless indicated otherwise in a credit line to the material. If material is notincluded in the article's Creative Commons licence and your intended use is not permitted by statutoryregulation or exceeds the permitted use, you will need to obtain permission directly from the copyrightholder. To view a copy of this licence, visit http://creativecommons.org/licenses/by/4.0/. The CreativeCommons Public Domain Dedication waiver (http://creativecommons.org/publicdomain/zero/1.0/)applies to the data made available in this article, unless otherwise stated in a credit line to the data.
Our IPD meta-analysis followed existing recommendations on prognostic research model developmentand validation53–55 and adhered to reporting guidelines for prediction models and IPD meta-analysis.56,57
We used a prospective protocol51 registered on the International Prospective Register of SystematicReviews (PROSPERO) as CRD42015029349.58
Eligibility criteria
Criteria for including relevant cohorts and studies in the individual participant dataWe included primary studies (prospective and retrospective cohort studies, as well as cohorts nestedwithin randomised trials), and large birth and population-based cohorts with information to assess theaccuracy of clinical, biochemical and ultrasound predictors in women at low, high or any risk to predictearly-, late- or any-onset pre-eclampsia and its associated complications. The process of identifying andselecting studies to invite to form the IPPIC network is described in detail in our published protocol,as well as in the following sections (see Literature search and study identification, The IPPIC pre-eclampsianetwork and Study selection, individual participant data collection and harmonisation). Studies or cohortsthat addressed the structured question in Table 1 were included in the IPD. The predictors consideredfor evaluation were chosen a priori and were clearly defined and standardised.39,60–72
The primary outcomes were early-onset (delivery at < 34 weeks’ gestation), late-onset (delivery at≥ 34 weeks’ gestation) and any-onset pre-eclampsia. The authors reported the definition of the primaryoutcome of pre-eclampsia along with gestational age at delivery, which was used to define early- andlate-onset disease. Definitions of pre-eclampsia included proteinuric and non-proteinuric pre-eclampsia.35,73
The secondary outcomes were composite adverse maternal or fetal and neonatal outcomes.
Literature search and study identification
We undertook a systematic review of reviews to identify relevant systematic reviews on clinicalcharacteristics, biochemical and ultrasound markers for prediction of pre-eclampsia.37 We adheredto the PRISMA (Preferred Reporting Items for Systematic Reviews and Meta-Analyses) guidelines on
DOI: 10.3310/hta24720 Health Technology Assessment 2020 Vol. 24 No. 72
© Queen’s Printer and Controller of HMSO 2020. This work was produced by Allotey et al. under the terms of a commissioning contract issued by the Secretary of Statefor Health and Social Care. This issue may be freely reproduced for the purposes of private research and study and extracts (or indeed, the full report) may be included inprofessional journals provided that suitable acknowledgement is made and the reproduction is not associated with any form of advertising. Applications for commercialreproduction should be addressed to: NIHR Journals Library, National Institute for Health Research, Evaluation, Trials and Studies Coordinating Centre, Alpha House,University of Southampton Science Park, Southampton SO16 7NS, UK.
5

reporting, and the review was based on a prospective protocol. The systematic review methods havebeen published elsewhere, but, briefly, two reviewers independently screened abstracts, extracted dataand carried out quality assessment.37 We defined the inclusion and exclusion criteria for the systematicreviews, the outcome of interest (pre-eclampsia) and the predictors. We also updated our previousliterature search of prediction models for pre-eclampsia43 (July 2012–December 2017) to identifyadditional models. We searched the following databases: MEDLINE, EMBASE, Bioscience InformationServices (BIOSIS), Latin American and Caribbean Health Sciences Literature (LILACS), PASCAL, ScienceCitation Index, Cochrane Database of Systematic Reviews, Cochrane Central Register of Controlled
TABLE 1 Structured question for IPD meta-analysis on prediction of pre-eclampsia
Question components Definition
Population Pregnant women
Predictors Maternal clinical characteristics at antenatal booking
Maternal characteristics: age, BMI, height, weight, ethnicity, smoking, alcohol or substance misuse
Medical history: pre-existing chronic kidney disease, heritable thrombophilias, autoimmunedisease such as systemic lupus erythematosus and antiphospholipid syndrome, type 1 and 2diabetes and hypertensive diseases
Obstetric history: parity, previous pre-eclampsia, gestational diabetes, pregnancy interval of> 10 years, family history of pre-eclampsia, family history of cardiovascular disease, previousmiscarriages, preterm birth, stillbirth or SGA fetus
Current pregnancy: multiple pregnancy, mode of conception, early pregnancy bleeding, MAP,SBP and DBP, socioeconomic status, new partner, diet or exercise in pregnancy, urinedipstick, PCR, 24-hour protein
Biochemical markers (first or second trimester): PAPP-A, sFlt-1, PlGF, AFP, human chorionicgonadotropin, sENG, CRP, hypertriglyceridaemia and PAI-1
Ultrasound markers (first or second trimester)
CRL, abdominal circumference, expected fetal weight centile, uterine and umbilical arteryDoppler (resistance index, pulsatility index, unilateral or bilateral notching)
Outcomes Primary outcomes
Early-onset (delivery at < 34 weeks’ gestation), late-onset (delivery at ≥ 34 weeks’ gestation)and any-onset pre-eclampsia
Secondary outcomes
Maternal complications: eclampsia, HELLP syndrome, abruption, hepatic and renal failure,cortical blindness, pulmonary oedema, postpartum haemorrhage, disseminated intravascularcoagulation, preterm delivery, admission to high-dependency unit/intensive care unit,maternal death, caesarean section, gestational diabetes mellitus
Fetal and neonatal complications: birthweight in kg and centile (using the Gestation Networkbulk centile calculator59), SGA fetus, stillbirth, neonatal death, hypoxic-ischaemicencephalopathy, respiratory distress syndrome, septicaemia, admission to neonatal unit
Study design Observational studies and cohorts nested within randomised trials
AFP, alpha-fetoprotein; BMI, body mass index; CRL, crown–rump length; CRP, C-reactive protein; DBP, diastolic bloodpressure; MAP, mean arterial blood pressure; PAI-1, plasminogen activator inhibitor-1; PAPP-A, pregnancy-associatedplasma protein A; PCR, protein–creatinine ratio; PIGF, placental growth factor; SBP, systolic blood pressure;sENG, soluble endoglin; sFlt-1, soluble fms-like tyrosine kinase-1; SGA, small for gestational age.Adapted from Allotey et al.51 This is an Open Access article distributed in accordance with the terms of the CreativeCommons Attribution (CC BY 4.0) license, which permits others to distribute, remix, adapt and build upon this work,for commercial use, provided the original work is properly cited. See: http://creativecommons.org/licenses/by/4.0/.The table includes minor additions and formatting changes to the original table.
METHODS
NIHR Journals Library www.journalslibrary.nihr.ac.uk
6

Trials (CENTRAL), National Institute of Child and Human Development Data and Specimen Hub,Database of Abstracts of Reviews of Effects (DARE) and Health Technology Assessment databasewithout any language restrictions. Research reported in grey literature was sought by searching arange of relevant databases including the Inside Conferences, Systems for Information in Grey Literature,MotherChild Link Registry (www.linkregistry.org/search.aspx), Dissertation Abstracts and ClinicalTrials.gov.Data extraction following the update of our literature search for prediction models for pre-eclampsiawas carried out by two reviewers independently.
We used additional sources such as internet searches using general search engines (e.g. Google;www.google.co.uk/) and meta-search engines (e.g. Copernic; www.copernic.com/), and directly contactedresearchers to identify relevant studies, birth cohorts or data sets that may have been missed. Collaborativegroups such as the Global Pregnancy Collaboration (CoLab), Pre-eclampsia and Eclampsia Monitoring,Prevention and Treatment (PRE-EMPT) and the Global Obstetrics Network (GONet) were also approachedto identify primary studies, unpublished research and birth cohorts.74–76 We did not include studies, birthcohorts or data sets after October 2017, as we needed time to clean and format the data prior to anyanalysis. The details of the search strategy are provided in Appendix 2.
The IPPIC pre-eclampsia network
We established a collaborative network of investigators (IPPIC) from research groups that haveundertaken studies on clinical characteristics, biochemical and ultrasound markers in the prediction ofearly- and any-onset pre-eclampsia. The network is a global effort bringing together 125 researchers,clinicians and epidemiologists from 25 countries and is supported by the World Health Organization(WHO). We invited authors of all primary studies identified from this review and also invitedinvestigators of primary studies and large birth and population-based cohorts that were not includedin existing reviews but were identified through our links with other collaborative groups74–76 if theseprovided relevant information to assess the accuracy of clinical, biochemical and ultrasound predictorsof pre-eclampsia.
Study selection, individual participant data collection and harmonisation
The collaborative group agreed the minimum data to be requested for the IPD meta-analysis, and acustom-built database was set up based on these specifications. The minimum data requested werepre-eclampsia outcome with gestational age at delivery, as well as any of the clinical, biochemical andultrasound predictors of pre-eclampsia listed in Table 1. Authors of the primary studies and data setswere contacted to ask if they would share their IPD in any format, along with data dictionaries ordescriptions. We identified and invited authors and investigators from 180 data sets to join the projectand share their IPD, with at least two further reminders to share data for the project. We continued tocontact authors to request that they share their data until the October 2017 deadline for receivingnew data sets was reached. When a data set received contained IPD from multiple studies, we checkedthe identity of each study to avoid duplication.
Original pseudonymised data sets were uploaded to a secure data storage environment (SafeHaven)at the Pragmatic Clinical Trials Unit, Queen Mary University of London, accessible only from a virtualdesktop where manipulation of the data along with relevant data checks and documentation took place.The final merged data set, individual formatted files and documentation of all the transformations madewere securely transferred to a web-based server at Centro Rosarino de Estudios Perinatales, Rosario,Argentina, a WHO Collaborative Centre in Child and Maternal Health. An independent Data AccessCommittee and data access process were established to facilitate access to and use of the data forfuture research.
DOI: 10.3310/hta24720 Health Technology Assessment 2020 Vol. 24 No. 72
© Queen’s Printer and Controller of HMSO 2020. This work was produced by Allotey et al. under the terms of a commissioning contract issued by the Secretary of Statefor Health and Social Care. This issue may be freely reproduced for the purposes of private research and study and extracts (or indeed, the full report) may be included inprofessional journals provided that suitable acknowledgement is made and the reproduction is not associated with any form of advertising. Applications for commercialreproduction should be addressed to: NIHR Journals Library, National Institute for Health Research, Evaluation, Trials and Studies Coordinating Centre, Alpha House,University of Southampton Science Park, Southampton SO16 7NS, UK.
7
Data extractionWe considered all recorded variables for inclusion, including those not reported in the publishedstudies. At the study level, we extracted data on the providing collaborator, study design, data source,study period and study inclusion and exclusion criteria. At the participant level, we extractedinformation on individual participant characteristics and outcome data, as specified in Table 1.
Data harmonisation and recoveryMaternal age at baseline was recorded as a continuous variable in years in all data sets except three, inwhich age was calculated using the date of study or booking visit and the date of birth. Data on parity,defined as the number of pregnancies > 24 weeks’ gestation, were mostly recorded in the binary format(nulliparous/multiparous). Any continuous data for parity were therefore also transformed to the binaryform. However, we retained the continuous data for any relevant analyses. Assumptions were made whenharmonising the ethnicity variable, and this was recoded as white, black, Asian, Hispanic, mixed and other.Pre-gestational diabetes, type 1 diabetes and type 2 diabetes were harmonised as history of diabetes,and history of systemic lupus, multiple sclerosis, idiopathic thrombocytopenia, rheumatoid arthritis orantiphospholipid syndrome were harmonised as history of autoimmune disease. We also harmonisedhistory of glomerulonephritis, nephrotic syndrome, nephritis or nephropathy as history of renal disease.
Maternal characteristic data, such as history of disease and previous pregnancy, were recovered byscreening the participant inclusion and exclusion criteria of published articles when this informationhad not been provided in the original data set. We added data based on existing information containedin the data set and from published articles. For example, we inputted the data as ‘no previous historyof pre-eclampsia’ if all participants in the data set were nulliparous.
Body mass index (BMI) (measured in kg/m2), systolic blood pressure (SBP), diastolic blood pressure (DBP)and mean arterial blood pressure (MAP) were recorded as continuous measures.Where MAP was notprovided but SBP and DBP were, we derived MAP using the formula MAP = (SBP+ 2 × DBP)/3. WhereBMI was not provided in the data set it was derived using weight (kg)/height (m2). We derived theestimated fetal and birth weight centiles using the Perinatal Institute GROW centile calculator.77 Meanvalues of uterine and umbilical artery pulsatility index were mostly reported in data sets. When thesewere not available, we derived mean uterine and umbilical artery pulsatility index by averaging the leftand right pulsatility index measurements. Data on biochemical marker platform, assay and measurementrange were obtained for each relevant recorded biochemical marker in the data sets. Conversion factorswere applied where necessary to harmonise the units of measurement. Placental growth factor (PlGF)was mostly reported in the data sets as pg/ml and standardised as such, pregnancy-associated plasmaprotein A (PAPP-A) was standardised as mIU/l and soluble fms-like tyrosine kinase-1 (sFlt-1) wasstandardised as pg/ml. The authors’ reported definition of the primary outcome of pre-eclampsia alongwith gestational age at delivery was used to define early- and late-onset disease.
Clinical examinations, biochemical and ultrasound markers were further categorised into the trimesterin which they were measured. We defined first-trimester values as ≤ 14 weeks, second-trimestervalues as > 14–28 weeks and third-trimester values as > 28 weeks. Where more than one variablemeasurement was available for a woman in a trimester, we chose the first or the earliest measurement.Harmonisation of the data sets followed the predefined process shown in Figure 1. A final list of thevariables collected and harmonised for the project is provided in Appendix 3.
Data qualityRange and consistency checks were carried out on all data sets received, and summary tables wereproduced. Missing data > 10% for each variable, range checks for continuous variable measures,obvious errors, and inconsistencies between pre-identified variables or outlying values were queriedand rectified with input from the original authors. Two reminders were sent to the original author torespond to queries, and if no response was received, a decision to exclude the variable in question wasmade by the project team.
METHODS
NIHR Journals Library www.journalslibrary.nihr.ac.uk
8
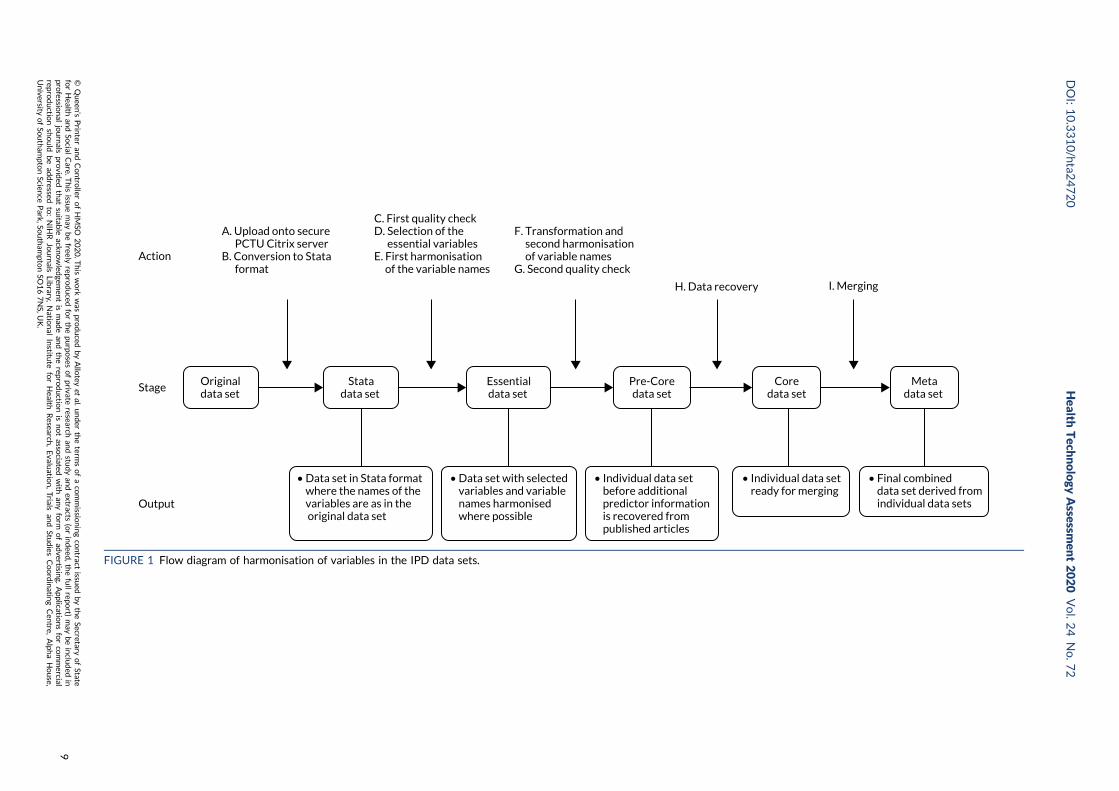
• Data set in Stata format where the names of the variables are as in the original data set
I. Merging
A. Upload onto secure PCTU Citrix serverB. Conversion to Stata format
Stage
Action
Output
F. Transformation and second harmonisation of variable namesG. Second quality check
• Data set with selected variables and variable names harmonised where possible
Originaldata set
C. First quality checkD. Selection of the essential variablesE. First harmonisation of the variable names
Essentialdata set
Pre-Coredata set
• Individual data set before additional predictor information is recovered from published articles
Statadata set
Metadata set
• Individual data set ready for merging
Coredata set
H. Data recovery
• Final combined data set derived from individual data sets
FIGURE 1 Flow diagram of harmonisation of variables in the IPD data sets.
DOI:10.3310/hta2
4720
Health
Tech
nology
Assessm
ent2020
Vol.2
4No.7
2
©Queen
’sPrin
teran
dContro
llerofHMSO
2020.T
his
work
was
produced
byAllo
teyet
al.under
theterm
sofaco
mmissio
ningco
ntract
issued
bytheSecretary
ofState
forHealth
andSo
cialCare.T
his
issuemay
befreely
reproduced
forthepu
rposes
ofprivate
researchan
dstu
dyan
dextracts
(orindeed
,thefullrepo
rt)may
beinclu
ded
inpro
fessional
journals
provid
edthat
suitab
leackn
owled
gemen
tis
mad
ean
dtherepro
ductio
nis
notasso
ciatedwith
anyform
ofad
vertising.
Applicatio
nsforco
mmercial
reproductio
nshould
bead
dressed
to:NIH
RJournals
Library,
Natio
nal
Institu
teforHealth
Research
,Evalu
ation,Trials
and
Studies
Coordinatin
gCen
tre,Alph
aHouse,
University
ofSo
utham
ptonScien
cePark,So
utham
ptonSO
167NS,U
K.
9
Prioritisation of predictors
We carried out a prospective online prioritisation survey of IPPIC Network collaborators to identifythe most clinically relevant predictors of pre-eclampsia for consideration in the development of theprediction models. Collaborators ranked the importance of the predictor variables identified on a scalefrom one (not important) to five (very important). The results were analysed as mode and interquartilerange (IQR) to show variability and consensus in opinions. We a priori identified an IQR of ≤ 1 asindicating consensus between responders. Variables with mode of ≥ 4 and IQR of ≤ 1 were categorisedas important, and those with mode of < 4 and IQR > 1 were categorised as unimportant. Variables withmode of 3 and IQR of ≤ 1 were reviewed and recategorised for importance at a consensus meeting.
Quality assessment
We assessed the risk of bias in individual studies and data sets using a modified version of thePrediction study Risk of Bias Assessment Tool (PROBAST).78 The tool assessed the quality of datasets and individual studies across three domains: participant selection, predictors and outcomes. Weclassified the risk of bias to be low, high or unclear for each of the relevant domains. Each domainincluded signalling questions that were rated as ‘yes’, ‘probably yes’, ‘probably no’, ‘no’ or ‘no information’.Any signalling question rated as ‘probably no’ or ‘no’ indicated a potential for bias in the IPD receivedfor that study, which was therefore classed as having a high risk of bias in that domain. The overall riskof bias of an IPD data set was considered low if the data set scored low in all domains, high if any onedomain had a high risk of bias, and unclear for any other classifications.
Sample size considerations
No formal sample size requirements were necessary for the meta-analysis. However, to develop asound prediction model, as a rule of thumb, 10 events are required for each candidate predictor variable.Early-onset pre-eclampsia is uncommon, occurring in only about 0.25–0.50% of all pregnancies. Weconservatively estimated that our IPD data set of > 3 million pregnancies would allow us access toabout 7500 women with pregnancies complicated by early-onset pre-eclampsia if they all recorded allof the predictors of interest. This would enable us to develop and robustly validate prediction modelsfor the outcomes of any-onset, early-onset and late-onset pre-eclampsia.
Data synthesis
Analysis for prioritisation of pre-eclampsia predictors was carried out using SPSS version 24 (IBM SPSSStatistics for Windows, IBM Corporation, Armonk, NY, USA). IPD meta-analysis to estimate theprognostic value of individual predictors was carried out using Stata® version 12.1 (StataCorp LP,College Station, TX, USA) and R version 3.4.3 (The R Foundation for Statistical Computing, Vienna,Austria). External validation of existing models and model development were carried out using StataMP version 15 (StataCorp LP, College Station, TX, USA) and R version 3.4.3. The combination ofStata and R was over a single software package to utilise the appropriate packages for each task.For example, multilevel imputation across data sets can be carried out using the ‘jomo’ package in R,which currently has no equivalent package in Stata.
External validation of existing pre-eclampsia prediction modelsWe validated each published pre-eclampsia prediction model that reported the full model equationwith intercept and predictor effects in IPD from the UK. Analysis was restricted to the IPPIC-UK datasets to allow for the determination of the predictive performance of available models in the contextof the UK health-care system and to reduce the heterogeneity in the definition of the outcome, whichcan vary across IPPIC data sets for different countries.4,35 We included UK data sets or subsets of
METHODS
NIHR Journals Library www.journalslibrary.nihr.ac.uk
10
international data sets with UK participants if country of recruitment was recorded. We validated aprediction model only if at least one IPD data set contained values of all the predictors included in themodel. We excluded data sets with no variation in the model predictions across individuals (i.e. everyindividual had the same predicted probability as a result of strict eligibility criteria). Smaller data setswith no outcome event or a single outcome event were also excluded, as were women with multifetalpregnancies, as the published models were intended to predict the risk of pre-eclampsia in women withsingleton pregnancies only.
Missing dataSecond-trimester measurements of BMI and MAP were used for model validation if the first-trimestervalues were missing from the data set.
Any predictors partially missing or outcome values missing for < 95% of individuals in a data set weremultiply imputed under the missing at random assumption using multiple imputation by chainedequations.79,80 Imputation was carried out separately in each UK data set, which acknowledged theclustering of individuals within a data set. We generated 100 imputed data sets for each data set withany missing predictor or outcome values. Linear regression was used to impute for approximatelynormally distributed continuous variables, predictive mean matching for skewed continuous variables,logistic regression for binary variables, and multinomial logistic regression for categorical variables.Complete predictors were also included in the imputation models as auxiliary variables. To retaincongeniality between the imputation and predictive models, the scale used to impute the continuouspredictors was chosen to match the prediction models.81 We undertook imputation checks by lookingat histograms, summary statistics and tables of values across imputations, as well as by checking thetrace plots for convergence issues.
We summarised the total number of participants, the number of events for each data set, and theoverall numbers available for each model validation. We applied the model to each individual i in each(imputed) data set by calculating the linear predictor (LPi = α + β1 × x1 + β2 × x2 + . . .), and the predictedprobability of pre-eclampsia,
pi =eLPi
1 + eLPi, (1)
for logistic regression equations; others detailed separately). For each prediction model, we summarisedthe overall distribution of the LP by data set using the median, IQR and full range, averaging statisticsacross imputations.82
The predictive performance of each model was examined using measures of discrimination andcalibration, first in the IPD for each available data set and then across data sets at the meta-analysislevel. Discrimination is the ability of the model to separate between women who develop pre-eclampsia and those who do not, and was summarised using the C-statistic (equivalent to the areaunder the receiver operating characteristic curve for a logistic regression prediction model), with avalue of 1 indicating perfect discrimination and a value of 0.5 indicating no discrimination beyondchance. We considered values > 0.7 to be most promising, given previously reported values in theliterature, while noting the width of the confidence intervals (CIs).83 Calibration refers to how well therisk predictions from the model agree with the observed outcome risks for individuals in a data set.Calibration was assessed using two measures: calibration slope, which is the slope of the regressionline fitted to the relationship between predicted and observed risk probabilities on the logit scale (idealvalue of 1); and calibration-in-the-large, which indicates whether risk predictions are systematically toohigh or too low (ideal value of 0). We produced calibration plots in each data set to visually compareobserved and predicted probabilities when there were enough events to categorise participants intorisk groups. The predicted probability of pre-eclampsia for each individual was obtained by pooling theimputation-specific estimates of the model’s LP and then applying the logit transformation.82
DOI: 10.3310/hta24720 Health Technology Assessment 2020 Vol. 24 No. 72
© Queen’s Printer and Controller of HMSO 2020. This work was produced by Allotey et al. under the terms of a commissioning contract issued by the Secretary of Statefor Health and Social Care. This issue may be freely reproduced for the purposes of private research and study and extracts (or indeed, the full report) may be included inprofessional journals provided that suitable acknowledgement is made and the reproduction is not associated with any form of advertising. Applications for commercialreproduction should be addressed to: NIHR Journals Library, National Institute for Health Research, Evaluation, Trials and Studies Coordinating Centre, Alpha House,University of Southampton Science Park, Southampton SO16 7NS, UK.
11
Where data had been imputed in a particular IPD data set, the predictive performance measures werecalculated in each of the imputed data sets, and Rubin’s rules were then applied to combine statistics(and corresponding standard errors) across imputations.84 As the C-statistic is a proportion, it is unlikelyto be normally distributed. Hence, we combined C-statistics across imputations on the logit scale,85 andstandard errors for logit C-statistics were calculated using the delta method, as recommended.86
When it was possible to validate a model in multiple data sets, we summarised the performancemeasures across data sets using a random-effects meta-analysis estimated using restricted maximumlikelihood (for each performance measure separately).86,87 Summary (average) performance statisticswere reported with 95% CI (derived using the Hartung–Knapp–Sidik–Jonkman variance correction).88
We also reported the estimate of between-study heterogeneity (τ2) and the proportion of variabilitydue to between-study heterogeneity (I2). We generated plots to show and compare the averageperformance (across data sets) of multiple models, along with CIs.
For each pre-eclampsia outcome (early, late or any onset), we compared prediction models usingdecision curve analysis in the data sets used most frequently in the external validation of theprediction models, enabling within-data set comparison of the models.89,90 Decision curves show the netbenefit (i.e. the benefit versus the harm) over a range of threshold probabilities (i.e. for treating womenwith a predicted risk above the threshold value) and can be compared with treat-all and treat-nonestrategies. For a probability threshold (pt), the net benefit is calculated as:
True positivesN
−False positives
N×
pt
1− pt
, (2)
where ‘true positives’ and ‘false positives’ represent the numbers of individuals with a predictedprobability ≥ pt who have and do not have the outcome of interest, respectively, and N is the totalsample size.89,90 Probability thresholds of between 5% and 20% will be clinically meaningful for makingdecisions about preventative interventions such as aspirin, including commencement of high-dose(150 mg) aspirin in the first trimester. Therefore, the model with the greatest net benefit for aparticular threshold is considered to have the greatest clinical value.
Development and validation of pre-eclampsia prediction modelsTo develop new pre-eclampsia prediction models, non-UK data sets were considered in addition to theUK-only data sets. Prospective cohorts and trials were considered for inclusion in the development set.We excluded case–control studies as they cannot be used to estimate the baseline risk (intercept).
The number and proportion of missing values for each potential predictor and outcome weresummarised by data set. Predictors were considered to be systematically missing for a data set if theywere not recorded for any individuals or were recorded for very few individuals (< 10%) in that dataset. No data sets included all potential predictors of interest; therefore, it was necessary to use asubset of predictors thought to be most predictive and of most interest.
A prioritised list of predictors was drawn up based on consensus among clinical experts in thecollaborative group (see Prioritisation of predictors). To select data sets for development of a newprediction model (including maternal characteristics and clinical examination variables), it wasnecessary to compromise between the number of data sets included and the potential predictors thatcould be considered for inclusion in the models. The aim was to do this in such a way as to maximiseboth. We undertook the following process:
1. Ranked the prioritised predictors from the most to least relevant based on the scores from theclinical consensus meeting.
2. Excluded predictors that were rarely recorded across data sets (predictors recorded in data setsthat total ≤ 5% of all events).
METHODS
NIHR Journals Library www.journalslibrary.nihr.ac.uk
12
3. Summarised the number of data sets, total sample size and number of events included if allremaining predictors were included.
4. If no data sets or very few data sets included all remaining predictors, the lowest-ranking predictorfrom the set of predictors was dropped.
5. Repeated steps 3 and 4 until a reasonable number of data sets, sample size and number of eventswere achieved and, ideally, when excluding further predictors would not mean a significant gain indata sets included.
Subsets of the development data identified for models with clinical and maternal characteristics were usedto develop models additionally including biochemical markers or ultrasound markers. These models builton the clinical models, and therefore they required the same clinical variables plus biochemical markers orultrasound markers.When fitting the biochemical marker models, data sets were included only if bothPlGF and sFlt-1 were recorded; however, each biochemical marker could be measured at either trimester1 or trimester 2. These two biochemical markers were most commonly recorded together, so ensuring thatboth PlGF and sFlt-1 were recorded in the data sets meant that the relationship between biochemicalmarkers (and trimester of measurement) could be better estimated and used in the imputation models,thereby reducing some uncertainty in the imputed values and reducing the risk of convergence issues.
Missing dataMultiple imputation was implemented using multivariable joint modelling to account for missing dataand clustering of participants within data sets. This approach was selected (rather than imputationwithin data sets, as in External validation of existing pre-eclampsia models) to increase the number of datasets used for model development, as many of the potential predictors of interest were systematicallymissing (i.e. not recorded for anyone) in one or more data sets. The ‘jomo’91 package in R was designedto impute for multilevel (clustered) data and can therefore be used to impute for variables that aresystematically missing in some IPPIC data sets, as well as for partially missing variables.92 This packageuses a Bayesian approach (Markov chain Monte Carlo sampling), so it is necessary to allow a burn-infor the chain to converge before sampling an imputed data set. Rather than repeating the whole process(including the burn-in) for each imputation, imputed data sets are sampled from the same chain byspecifying the number of iterations to be left between the samples taken. Prior to running the fullimputation, a dummy run was performed to check the chains for signs of non-convergence and todetermine a suitable burn-in and sampling interval. Based on these checks, a burn-in of 20,000 wasused for imputation of the data used to develop clinical characteristics models and was increased to30,000 for data used to develop models additionally including biochemical markers or ultrasoundmarkers. After the burn-in, imputations were sampled every 1000 iterations, until 25 imputed data setshad been sampled.
The imputation model included all potential predictors (for trimesters 1 and 2) and outcomes(early- and late-onset pre-eclampsia). Data were imputed separately (using different sets of data setsand predictors) for developing models including only maternal and clinical characteristics, and then formodels additionally including biochemical markers or ultrasound markers.
For models with maternal and clinical characteristics, data were imputed for SBP and DBP rather thanMAP, as MAP simply combines SBP and DBP and, therefore, imputing them separately would providemore flexibility in how they can be modelled subsequently. A preliminary complete-case analysis wasperformed to look for potential non-linear relationships between potential predictors and outcomesusing multivariable fractional polynomial models. This led to BMI being considered on the originalscale, as well as non-linearly using the natural logarithm transformation [ln(BMI)] and BMI–2. Data setswere imputed assuming each of these functions for BMI to enable non-linearity to be considered duringmodel development. Biochemical markers and ultrasound markers were considered on their originalscale and on the log-transformed scale (which was decided a priori), and therefore data sets wereimputed separately for the transformed and the original biochemical markers or ultrasound markers.
DOI: 10.3310/hta24720 Health Technology Assessment 2020 Vol. 24 No. 72
© Queen’s Printer and Controller of HMSO 2020. This work was produced by Allotey et al. under the terms of a commissioning contract issued by the Secretary of Statefor Health and Social Care. This issue may be freely reproduced for the purposes of private research and study and extracts (or indeed, the full report) may be included inprofessional journals provided that suitable acknowledgement is made and the reproduction is not associated with any form of advertising. Applications for commercialreproduction should be addressed to: NIHR Journals Library, National Institute for Health Research, Evaluation, Trials and Studies Coordinating Centre, Alpha House,University of Southampton Science Park, Southampton SO16 7NS, UK.
13
After imputation, the distributions of values for variables were checked by plotting the mean ± SD forcontinuous variables against the imputation number (including the original complete data, imputation0, for reference). For categorical variables, the proportions in each category were compared acrossimputations and with the original complete data. Methods for imputing for systematically missingpredictors are still relatively new and therefore a cautious approach was taken. If the distribution ofimputed values for a systematically missing predictor was unusual or extreme, then further examinationwas done to check the plausibility of the imputation. Alongside this, convergence of the Markov chainMonte Carlo samples was checked. If systematically missing predictor values could not reliably beimputed for a variable in a particular data set (e.g. adequate convergence was not achieved even aftera long burn-in), then that data set was excluded from model development when that predictor wouldbe considered (e.g. first-trimester BMI in a first-trimester prediction model).
Model development and validationPrediction models were developed using random intercept logistic regression with backward eliminationfor variable selection. The random intercept was used to account for clustering of women withinindividual data sets. At each stage of the variable selection process, the same model (i.e. including thesame predictors) was fitted to all imputations, and pooled Wald tests (using Rubin’s rules) were used forbackwards elimination, with a p-value of > 0.157 (proxy for Akaike information criterion) for exclusion.93,94
Models were developed separately for each pre-eclampsia outcome (any, early and late onset) usingpredictors recorded at trimester 1 and separately at trimester 2. Furthermore, for each outcomepredicted at each trimester, three models were considered: using only clinical characteristics, usingclinical characteristics plus biochemical markers, and using clinical characteristics plus ultrasoundmarkers. Therefore, we aimed to develop 18 models in total (one for each combination of the threeoutcomes, two trimesters and three predictor sets). We were unable to develop models that includedclinical characteristics, biochemical and ultrasound markers as no data sets included all relevantpredictors of interest.
For each model developed, its predictive performance was assessed in an internal validation usingstudy-specific and overall estimates of discrimination and calibration. After model development, thefitted model (with the average intercept) was applied back into each individual data set to obtain,for each participant, values of the LP and predicted probability of the pre-eclampsia outcome from thedeveloped model. These were then used to calculate the performance statistics described in Externalvalidation of existing pre-eclampsia prediction models. For each data set, the ‘pool last’ approach wasfollowed, whereby imputation-specific performance statistics were calculated and then pooled acrossimputations using Rubin’s rules and using a transformed scale where necessary (such as pooling logitC-statistics).95 Calibration plots were also produced for data sets that had more than 100 events.The predicted probability of pre-eclampsia for each individual was obtained by pooling the imputation-specific estimates of the model’s LP and then applying the logit transformation.82
Summarising study-specific performance after model development is recommended by Royston et al.96
and Debray et al.,47 and gives an indication of how the model will perform with new data frompopulations represented by the included studies. For each model developed, the data set-specificperformance statistics were summarised across the data sets using a random-effects meta-analysis,in the same way as described in External validation of existing pre-eclampsia prediction models.
The performance statistics of models developed using different functional forms of BMI werecompared (in terms of overall predictive performance and homogeneity of performance across datasets) after repeating the model development process in the imputed data sets for each functional form.The model that provided the best overall predictive performance across the different statistics wasselected, thereby also selecting the functional form for BMI (if it remained in the model). The samestrategy of comparing performance statistics was used for models with biochemical markers andultrasound markers, to determine whether they should be modelled on their original scale or using anatural logarithm transformation.
METHODS
NIHR Journals Library www.journalslibrary.nihr.ac.uk
14
For each developed model, to correct for optimism during model development (also known as overfitting),the predictor effects (beta estimates) were shrunk by multiplying each beta estimate by a global shrinkagefactor.97–99 The shrinkage factor was taken to be the summary calibration slope from the internal validationprocess (i.e. the pooled calibration slope from the meta-analysis of data set-specific calibration slopeestimates). Bootstrapping was not practical computationally given the need to incorporate both non-linear trend examinations, backwards selection, and multiple imputation (including for systematicallymissing predictors). Following application of shrinkage, the model’s intercept was re-estimated to ensurethat predictions were correct on average. This then provided the final model equation.
For each of the final models, decision curves were produced within each data set included in modeldevelopment and validation. This shows the net benefit across different probability thresholds andcompares the use of the model with treat-all and treat-none strategies.
Summarising the prognostic effect of individual predictors of pre-eclampsiaFor each outcome (early-onset pre-eclampsia, late-onset pre-eclampsia and any-onset pre-eclampsia)and each candidate predictor (clinical, biochemical, and ultrasound marker) prioritised in Prioritisation ofpredictors, we separately performed an unadjusted two-stage IPD meta-analysis of the prognostic effectto obtain a summary estimate, 95% CI and 95% prediction interval for that predictor. The 95% predictioninterval presents the heterogeneity on the same scale as the original outcome and estimates where thetrue effects are to be expected for similar exchangeable studies.100 We used the two-stage approachbecause of the large numbers of studies.
The two-step approach first involves fitting a logistic regression model for each study to obtain theodds ratio (OR) for the prognostic effect, and then pooling the log ORs using a conventional random-effects meta-analysis. The random-effects model allows for heterogeneity between studies, and wasestimated using restricted maximum likelihood. The 95% CI of the pooled effect was derived using theHartung–Knapp approach.101,102 Heterogeneity was summarised using the I2-statistic (which provides theproportion of total variability due to between-study heterogeneity) and 95% prediction intervals.100
The trend across multiple categories and continuous variables was considered linear.
A pragmatic decision was made to perform all analyses on complete cases of singleton pregnancies on theIPPIC international data set only, that is, no statistical imputation method was carried out for missingoutcome or predictor data. This was because of the length of time it would take to impute and performpre- and post-imputation checks for the 78 data sets of the IPPIC international IPD, with differentcombinations of predictors in each data set, with some data sets as large as 600,000 pregnancies. Theclustering of participants within data sets was accounted for by analysing each data set separately in thefirst stage. Clustering of pregnancies by women was not accounted for because of the small number ofclusters of women who had been pregnant multiple times. Models were univariable and thus predictorswere not adjusted for. Adjustment would have reduced statistical power owing to missing observationsand would have distorted the combining of associations in the IPD second stage due to differentavailability of adjustable variables by data set. The analysis excluded all women with multifetal pregnancies(e.g. twins/triplets); however, we also explored the relationships between multiple birth as a predictor andall pre-eclampsia outcomes.
DOI: 10.3310/hta24720 Health Technology Assessment 2020 Vol. 24 No. 72
© Queen’s Printer and Controller of HMSO 2020. This work was produced by Allotey et al. under the terms of a commissioning contract issued by the Secretary of Statefor Health and Social Care. This issue may be freely reproduced for the purposes of private research and study and extracts (or indeed, the full report) may be included inprofessional journals provided that suitable acknowledgement is made and the reproduction is not associated with any form of advertising. Applications for commercialreproduction should be addressed to: NIHR Journals Library, National Institute for Health Research, Evaluation, Trials and Studies Coordinating Centre, Alpha House,University of Southampton Science Park, Southampton SO16 7NS, UK.
15


Chapter 4 Characteristics and quality of datasets included in the individual participant datameta-analysis
Study identification and individual participant data acquisition
One hundred and twenty-five researchers from 73 teams in 25 countries had joined the IPPICnetwork by October 2017 and provided access to pseudonymised individual data for 3,674,684pregnancies.42,103–178 The most common reason for not obtaining the IPD was not receiving a responsefrom the author to the request to share data (28/180) (Figure 2).
Our search up to September 2014 of reviews that evaluated the performance of single or combinedtests for predicting pre-eclampsia identified 73 citations. After evaluation of the abstracts, we included62 published reviews evaluating one or more tests for predicting pre-eclampsia (Table 2). Clinicalcharacteristics were studied in 32.3% (20/62) of published reviews, biochemical markers were studiedin 59.7% (37/62) and ultrasound markers were studied in 8.1% (5/62).
Characteristics of data sets in the IPPIC data repository
Seventy-eight data sets contributed data to the IPPIC data repository.42,103–178 More than half of thedata sets received (58%, 45/78) were prospective cohort studies; 15% (12/78) were randomisedcontrolled trials and 17% (13/78) were large prospective registry data sets or birth cohorts. One data set
IPD obtained(n = 78)
IPPIC UK(n = 15)
IPPIC International(n = 63)
Total number of studies identified from systematic reviewof clinical characteristics, biochemical and ultrasoundmarkers in the prediction of early and any onset pre-
eclampsia and recommendation from collaborative groups(n = 180)
Studies for which IPD were not obtained(n = 102)
• No response, n = 28• IPD still being processed for transfer by October 2017 deadline, n = 25• Mail delivery failure, n = 18• Study still ongoing, n = 9• Contact lost, n = 7• IPD part of another cohort, n = 6• Refused to share IPD, n = 4• Lack of time to share IPD, n = 3• Data from IPD lost, n = 2
FIGURE 2 Flow diagram of studies included in the IPD meta-analysis, showing reasons why IPD were not obtained.
DOI: 10.3310/hta24720 Health Technology Assessment 2020 Vol. 24 No. 72
© Queen’s Printer and Controller of HMSO 2020. This work was produced by Allotey et al. under the terms of a commissioning contract issued by the Secretary of Statefor Health and Social Care. This issue may be freely reproduced for the purposes of private research and study and extracts (or indeed, the full report) may be included inprofessional journals provided that suitable acknowledgement is made and the reproduction is not associated with any form of advertising. Applications for commercialreproduction should be addressed to: NIHR Journals Library, National Institute for Health Research, Evaluation, Trials and Studies Coordinating Centre, Alpha House,University of Southampton Science Park, Southampton SO16 7NS, UK.
17
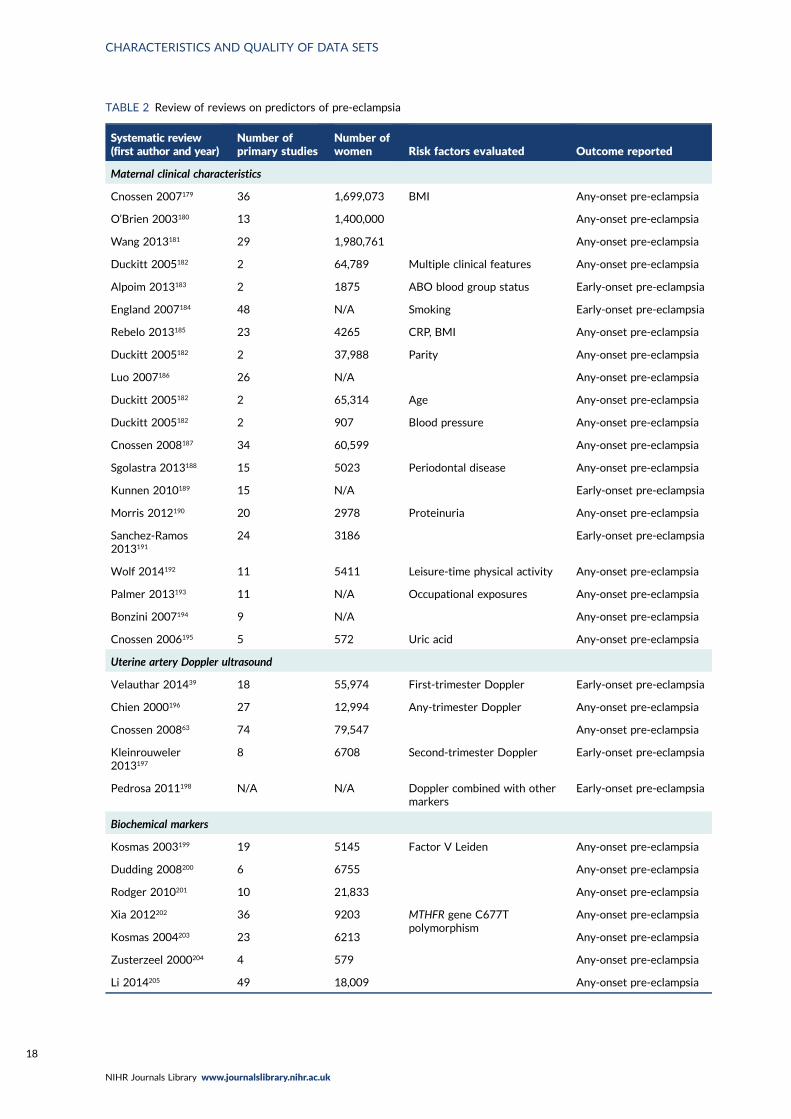
TABLE 2 Review of reviews on predictors of pre-eclampsia
Systematic review(first author and year)
Number ofprimary studies
Number ofwomen Risk factors evaluated Outcome reported
Maternal clinical characteristics
Cnossen 2007179 36 1,699,073 BMI Any-onset pre-eclampsia
O’Brien 2003180 13 1,400,000 Any-onset pre-eclampsia
Wang 2013181 29 1,980,761 Any-onset pre-eclampsia
Duckitt 2005182 2 64,789 Multiple clinical features Any-onset pre-eclampsia
Alpoim 2013183 2 1875 ABO blood group status Early-onset pre-eclampsia
England 2007184 48 N/A Smoking Early-onset pre-eclampsia
Rebelo 2013185 23 4265 CRP, BMI Any-onset pre-eclampsia
Duckitt 2005182 2 37,988 Parity Any-onset pre-eclampsia
Luo 2007186 26 N/A Any-onset pre-eclampsia
Duckitt 2005182 2 65,314 Age Any-onset pre-eclampsia
Duckitt 2005182 2 907 Blood pressure Any-onset pre-eclampsia
Cnossen 2008187 34 60,599 Any-onset pre-eclampsia
Sgolastra 2013188 15 5023 Periodontal disease Any-onset pre-eclampsia
Kunnen 2010189 15 N/A Early-onset pre-eclampsia
Morris 2012190 20 2978 Proteinuria Any-onset pre-eclampsia
Sanchez-Ramos2013191
24 3186 Early-onset pre-eclampsia
Wolf 2014192 11 5411 Leisure-time physical activity Any-onset pre-eclampsia
Palmer 2013193 11 N/A Occupational exposures Any-onset pre-eclampsia
Bonzini 2007194 9 N/A Any-onset pre-eclampsia
Cnossen 2006195 5 572 Uric acid Any-onset pre-eclampsia
Uterine artery Doppler ultrasound
Velauthar 201439 18 55,974 First-trimester Doppler Early-onset pre-eclampsia
Chien 2000196 27 12,994 Any-trimester Doppler Any-onset pre-eclampsia
Cnossen 200863 74 79,547 Any-onset pre-eclampsia
Kleinrouweler2013197
8 6708 Second-trimester Doppler Early-onset pre-eclampsia
Pedrosa 2011198 N/A N/A Doppler combined with othermarkers
Early-onset pre-eclampsia
Biochemical markers
Kosmas 2003199 19 5145 Factor V Leiden Any-onset pre-eclampsia
Dudding 2008200 6 6755 Any-onset pre-eclampsia
Rodger 2010201 10 21,833 Any-onset pre-eclampsia
Xia 2012202 36 9203 MTHFR gene C677Tpolymorphism
Any-onset pre-eclampsia
Kosmas 2004203 23 6213 Any-onset pre-eclampsia
Zusterzeel 2000204 4 579 Any-onset pre-eclampsia
Li 2014205 49 18,009 Any-onset pre-eclampsia
CHARACTERISTICS AND QUALITY OF DATA SETS
NIHR Journals Library www.journalslibrary.nihr.ac.uk
18
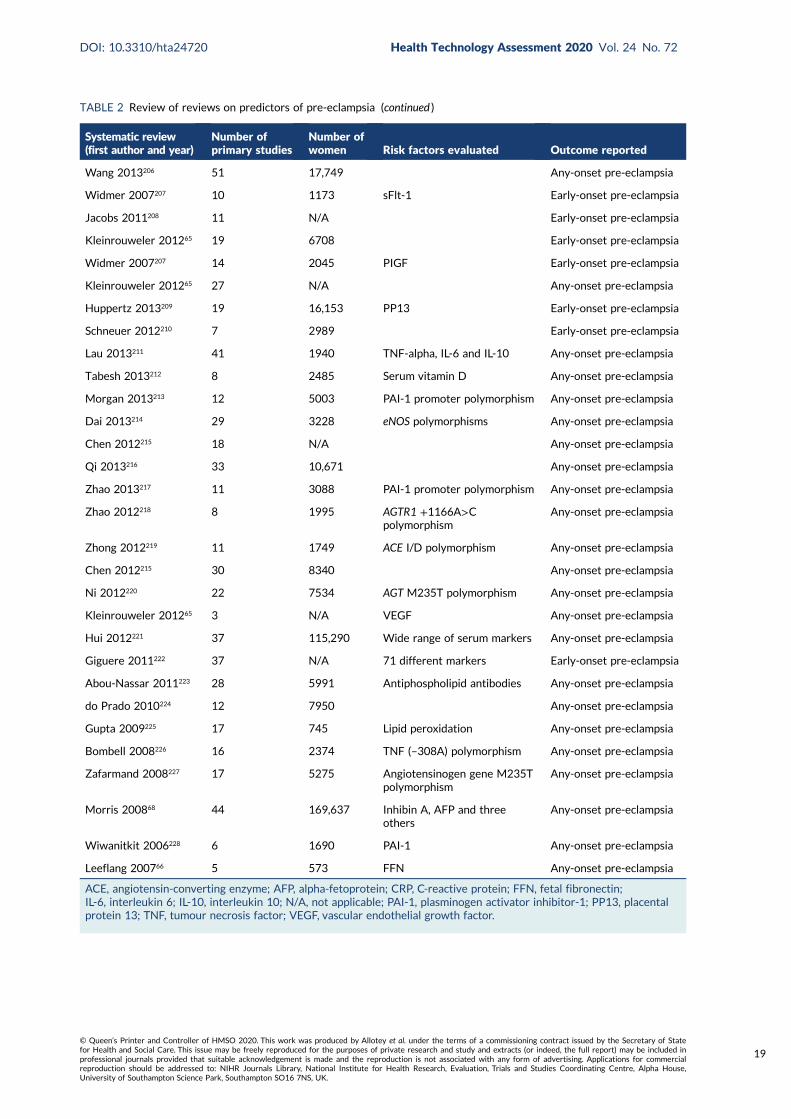
TABLE 2 Review of reviews on predictors of pre-eclampsia (continued )
Systematic review(first author and year)
Number ofprimary studies
Number ofwomen Risk factors evaluated Outcome reported
Wang 2013206 51 17,749 Any-onset pre-eclampsia
Widmer 2007207 10 1173 sFlt-1 Early-onset pre-eclampsia
Jacobs 2011208 11 N/A Early-onset pre-eclampsia
Kleinrouweler 201265 19 6708 Early-onset pre-eclampsia
Widmer 2007207 14 2045 PIGF Early-onset pre-eclampsia
Kleinrouweler 201265 27 N/A Any-onset pre-eclampsia
Huppertz 2013209 19 16,153 PP13 Early-onset pre-eclampsia
Schneuer 2012210 7 2989 Early-onset pre-eclampsia
Lau 2013211 41 1940 TNF-alpha, IL-6 and IL-10 Any-onset pre-eclampsia
Tabesh 2013212 8 2485 Serum vitamin D Any-onset pre-eclampsia
Morgan 2013213 12 5003 PAI-1 promoter polymorphism Any-onset pre-eclampsia
Dai 2013214 29 3228 eNOS polymorphisms Any-onset pre-eclampsia
Chen 2012215 18 N/A Any-onset pre-eclampsia
Qi 2013216 33 10,671 Any-onset pre-eclampsia
Zhao 2013217 11 3088 PAI-1 promoter polymorphism Any-onset pre-eclampsia
Zhao 2012218 8 1995 AGTR1 +1166A>Cpolymorphism
Any-onset pre-eclampsia
Zhong 2012219 11 1749 ACE I/D polymorphism Any-onset pre-eclampsia
Chen 2012215 30 8340 Any-onset pre-eclampsia
Ni 2012220 22 7534 AGT M235T polymorphism Any-onset pre-eclampsia
Kleinrouweler 201265 3 N/A VEGF Any-onset pre-eclampsia
Hui 2012221 37 115,290 Wide range of serum markers Any-onset pre-eclampsia
Giguere 2011222 37 N/A 71 different markers Early-onset pre-eclampsia
Abou-Nassar 2011223 28 5991 Antiphospholipid antibodies Any-onset pre-eclampsia
do Prado 2010224 12 7950 Any-onset pre-eclampsia
Gupta 2009225 17 745 Lipid peroxidation Any-onset pre-eclampsia
Bombell 2008226 16 2374 TNF (–308A) polymorphism Any-onset pre-eclampsia
Zafarmand 2008227 17 5275 Angiotensinogen gene M235Tpolymorphism
Any-onset pre-eclampsia
Morris 200868 44 169,637 Inhibin A, AFP and threeothers
Any-onset pre-eclampsia
Wiwanitkit 2006228 6 1690 PAI-1 Any-onset pre-eclampsia
Leeflang 200766 5 573 FFN Any-onset pre-eclampsia
ACE, angiotensin-converting enzyme; AFP, alpha-fetoprotein; CRP, C-reactive protein; FFN, fetal fibronectin;IL-6, interleukin 6; IL-10, interleukin 10; N/A, not applicable; PAI-1, plasminogen activator inhibitor-1; PP13, placentalprotein 13; TNF, tumour necrosis factor; VEGF, vascular endothelial growth factor.
DOI: 10.3310/hta24720 Health Technology Assessment 2020 Vol. 24 No. 72
© Queen’s Printer and Controller of HMSO 2020. This work was produced by Allotey et al. under the terms of a commissioning contract issued by the Secretary of Statefor Health and Social Care. This issue may be freely reproduced for the purposes of private research and study and extracts (or indeed, the full report) may be included inprofessional journals provided that suitable acknowledgement is made and the reproduction is not associated with any form of advertising. Applications for commercialreproduction should be addressed to: NIHR Journals Library, National Institute for Health Research, Evaluation, Trials and Studies Coordinating Centre, Alpha House,University of Southampton Science Park, Southampton SO16 7NS, UK.
19
was IPD made up of 31 RCTs. Most of the data sets were from participants in Europe (60%, 47/78),18% (14/78) were from North America, 6% (5/78) were from South America, 5% (4/78) were fromAsia and Australia, and one (1%) was from Africa. Three of the data sets provided included participantsfrom multiple countries, such as Argentina, Colombia, Kenya, India, Peru, Thailand and New Zealand.Ninety-seven per cent (3,570,993) of the 3,674,684 pregnancies in the IPPIC repository were singletonpregnancies. Individual data set size ranged from 42 to 1,663,167 pregnancies, and the total number ofreported pre-eclampsia outcomes in each data set ranged from 0 to 4252 for early-onset pre-eclampsia,from 0 to 38,305 for late-onset pre-eclampsia and from 3 to 42,608 for any-onset pre-eclampsia(see Appendix 4). About one-third of the data sets received were on women with high-risk pregnanciesonly (29%, 23/78), 14% (11/78) of the data sets were on women with low-risk pregnancies and morethan half (55%, 43/78) of the data sets included women with pregnancies of any risk. Detailed studycharacteristics of all IPPIC data sets are provided in Appendix 5 and a summary of the missing data forprioritised predictors and each pre-eclampsia outcome is provided in Appendix 6.
Prioritisation of predictors of pre-eclampsia
In April 2017, the online survey was designed and run using smartsurvey.co.uk (see Appendix 7).Ninety-eight members of the IPPIC collaborative network who had agreed to share data by this datewere sent an e-mail introducing the survey and explaining the participation requirements and surveyobjectives. Collaborators had 7 days within which to complete the online survey.
Fifty-four candidate predictor variables were identified (37 clinical characteristics, nine biochemicalmarkers and eight ultrasound markers) and ranked by 33 (34%) IPPIC collaborators. Seventy per cent(23/33) of responders were from Europe, 12% were from both the American (4/33) and Asian (4/33)continents, and 6% (2/33) were from Africa. A consensus group made up of five clinical academicsreviewed 13 candidate predictor variables ranked by the online survey participants as being ‘moderatelyimportant’. This included eight clinical characteristic variables, two biochemical markers and threeultrasound markers. Two each of the clinical characteristic variables and ultrasound markers reviewedby the consensus group (mode of conception, substance misuse in current pregnancy, umbilical arterypulsatility index and estimated fetal weight centile) were included following assessment by the group.
Overall, fewer than half (48%, 26/54) of all assessed predictors were ranked as being important, with54% (20/37) of clinical characteristics, 33% (3/9) of biochemical markers and 38% (3/8) of ultrasoundmarkers being prioritised as important in predicting pre-eclampsia (Table 3).
Quality of the IPPIC data sets
Risk-of-bias assessment using the PROBAST resulted in 77% (60/78) of the included IPD data setsbeing classified as having an overall low risk of bias, while 22% (17/78) were classified as having anunclear risk of bias. Only one data set (1%, 1/78) received an overall high risk of bias assessment. All ofthe included data sets had a low risk of bias in the domain of participant selection. For the domain ofpredictors, 94% (73/78) had a low risk of bias, while 1% (1/78) had a high and 5% (4/78) an unclearrisk of bias assessment. The risk of bias in the outcome domain was unclear for 22% (17/78) of theincluded data sets and low in the rest (78%, 61/78). Detailed assessment of the risk of bias for theIPPIC data sets is presented in Appendix 8.
Characteristics of identified prediction models
From our updated literature search (up to December 2017), we identified 131 models developed topredict pre-eclampsia. About half of these (53%, 70/131) reported the model equation in the publication,
CHARACTERISTICS AND QUALITY OF DATA SETS
NIHR Journals Library www.journalslibrary.nihr.ac.uk
20
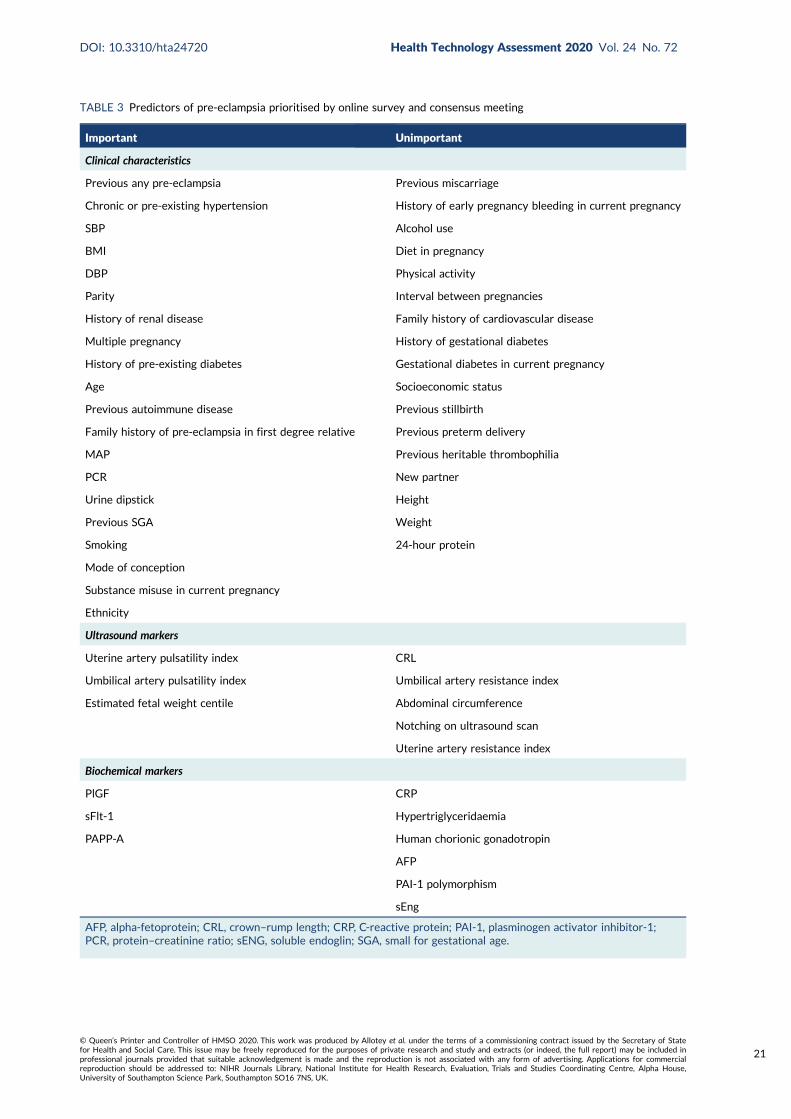
TABLE 3 Predictors of pre-eclampsia prioritised by online survey and consensus meeting
Important Unimportant
Clinical characteristics
Previous any pre-eclampsia Previous miscarriage
Chronic or pre-existing hypertension History of early pregnancy bleeding in current pregnancy
SBP Alcohol use
BMI Diet in pregnancy
DBP Physical activity
Parity Interval between pregnancies
History of renal disease Family history of cardiovascular disease
Multiple pregnancy History of gestational diabetes
History of pre-existing diabetes Gestational diabetes in current pregnancy
Age Socioeconomic status
Previous autoimmune disease Previous stillbirth
Family history of pre-eclampsia in first degree relative Previous preterm delivery
MAP Previous heritable thrombophilia
PCR New partner
Urine dipstick Height
Previous SGA Weight
Smoking 24-hour protein
Mode of conception
Substance misuse in current pregnancy
Ethnicity
Ultrasound markers
Uterine artery pulsatility index CRL
Umbilical artery pulsatility index Umbilical artery resistance index
Estimated fetal weight centile Abdominal circumference
Notching on ultrasound scan
Uterine artery resistance index
Biochemical markers
PlGF CRP
sFlt-1 Hypertriglyceridaemia
PAPP-A Human chorionic gonadotropin
AFP
PAI-1 polymorphism
sEng
AFP, alpha-fetoprotein; CRL, crown–rump length; CRP, C-reactive protein; PAI-1, plasminogen activator inhibitor-1;PCR, protein–creatinine ratio; sENG, soluble endoglin; SGA, small for gestational age.
DOI: 10.3310/hta24720 Health Technology Assessment 2020 Vol. 24 No. 72
© Queen’s Printer and Controller of HMSO 2020. This work was produced by Allotey et al. under the terms of a commissioning contract issued by the Secretary of Statefor Health and Social Care. This issue may be freely reproduced for the purposes of private research and study and extracts (or indeed, the full report) may be included inprofessional journals provided that suitable acknowledgement is made and the reproduction is not associated with any form of advertising. Applications for commercialreproduction should be addressed to: NIHR Journals Library, National Institute for Health Research, Evaluation, Trials and Studies Coordinating Centre, Alpha House,University of Southampton Science Park, Southampton SO16 7NS, UK.
21

and only one-fifth of all models (18%, 24/131) from 12 publications met the inclusion criteria for theexternal validation of their predictive performance in the IPPIC-UK data sets.115,128,147,229–237 The primaryreasons for not including a model for external validation were the full prediction formula not beingreported in the publication (47%, 61/131) and the absence of the predictor information in the IPPIC-UKdata sets (27%, 35/131). Other reasons for not validating the models include pre-eclampsia being poorlydefined in the study (8%, 10/131) and not enough events in the IPPIC-UK data set to validate the model(1%, 1/131). Figure 3 is the flow chart of prediction model selection for external validation, and Appendix 9shows published pre-eclampsia prediction models reporting a model equation.
Previous systematic review ofpre-eclampsia prediction models
(MEDLINE up to 1 July 2012)(n = 45 articles; 76 models)
Prediction models identified for external validation(n = 24)
• Any-onset pre-eclampsia, n = 8• Early-onset pre-eclampsia, n = 9• Late-onset pre-eclampsia, n = 7
Update of search (MEDLINEJuly 2012–December 2017)
(n = 1673 articles)
Full-text articles assessed foreligibility
(n = 57)
Prediction models identified(n = 55 models)
Excluded after screening full-text articles
(n = 31)
Excluded after screening titles and abstract
(n = 1616)
Articles included(n = 26)
Total number of models identified(n = 131 models)
Models excluded (n = 107)
• Pre-eclampsia outcome poorly defined, n = 10• Full model equation not reported in article, n = 61• Models with predictors systematically missing in IPD, n = 35• Too few events in IPPIC-UK data sets for validation, n = 1
FIGURE 3 Flow chart of pre-eclampsia prediction model selection for external validation in IPPIC-UK data set usingIPD meta-analysis. Reproduced from Snell et al.52 Open Access This article is licensed under a Creative CommonsAttribution 4.0 International License, which permits use, sharing, adaptation, distribution and reproduction in any mediumor format, as long as you give appropriate credit to the original author(s) and the source, provide a link to the CreativeCommons licence, and indicate if changes were made. The images or other third party material in this article are includedin the article's Creative Commons licence, unless indicated otherwise in a credit line to the material. If material is notincluded in the article's Creative Commons licence and your intended use is not permitted by statutory regulation orexceeds the permitted use, you will need to obtain permission directly from the copyright holder. To view a copy of thislicence, visit http://creativecommons.org/licenses/by/4.0/. The Creative Commons Public Domain Dedication waiver(http://creativecommons.org/publicdomain/zero/1.0/) applies to the data made available in this article, unless otherwisestated in a credit line to the data.
CHARACTERISTICS AND QUALITY OF DATA SETS
NIHR Journals Library www.journalslibrary.nihr.ac.uk
22
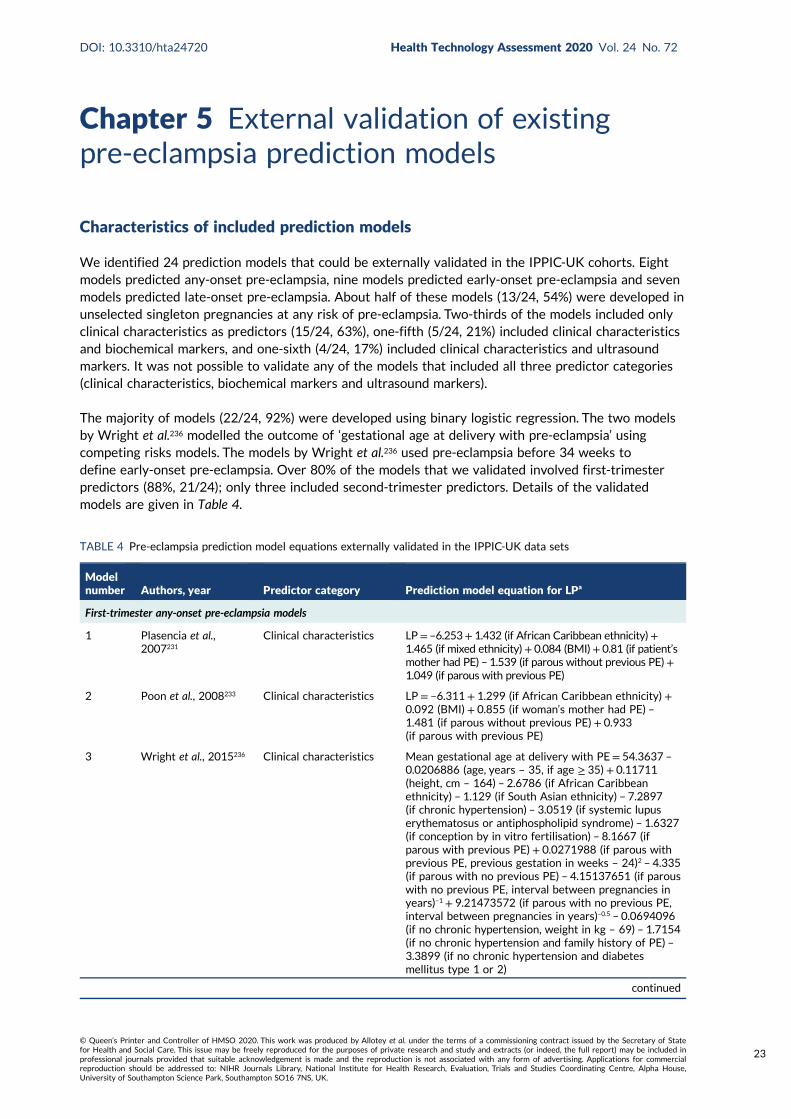
Chapter 5 External validation of existingpre-eclampsia prediction models
Characteristics of included prediction models
We identified 24 prediction models that could be externally validated in the IPPIC-UK cohorts. Eightmodels predicted any-onset pre-eclampsia, nine models predicted early-onset pre-eclampsia and sevenmodels predicted late-onset pre-eclampsia. About half of these models (13/24, 54%) were developed inunselected singleton pregnancies at any risk of pre-eclampsia. Two-thirds of the models included onlyclinical characteristics as predictors (15/24, 63%), one-fifth (5/24, 21%) included clinical characteristicsand biochemical markers, and one-sixth (4/24, 17%) included clinical characteristics and ultrasoundmarkers. It was not possible to validate any of the models that included all three predictor categories(clinical characteristics, biochemical markers and ultrasound markers).
The majority of models (22/24, 92%) were developed using binary logistic regression. The two modelsby Wright et al.236 modelled the outcome of ‘gestational age at delivery with pre-eclampsia’ usingcompeting risks models. The models by Wright et al.236 used pre-eclampsia before 34 weeks todefine early-onset pre-eclampsia. Over 80% of the models that we validated involved first-trimesterpredictors (88%, 21/24); only three included second-trimester predictors. Details of the validatedmodels are given in Table 4.
TABLE 4 Pre-eclampsia prediction model equations externally validated in the IPPIC-UK data sets
Modelnumber Authors, year Predictor category Prediction model equation for LPa
First-trimester any-onset pre-eclampsia models
1 Plasencia et al.,2007231
Clinical characteristics LP= –6.253+ 1.432 (if African Caribbean ethnicity)+1.465 (if mixed ethnicity)+ 0.084 (BMI)+ 0.81 (if patient’smother had PE) – 1.539 (if parous without previous PE)+1.049 (if parous with previous PE)
2 Poon et al., 2008233 Clinical characteristics LP = –6.311 + 1.299 (if African Caribbean ethnicity) +0.092 (BMI) + 0.855 (if woman’s mother had PE) –1.481 (if parous without previous PE) + 0.933(if parous with previous PE)
3 Wright et al., 2015236 Clinical characteristics Mean gestational age at delivery with PE= 54.3637 –
0.0206886 (age, years – 35, if age ≥ 35) + 0.11711(height, cm – 164) – 2.6786 (if African Caribbeanethnicity) – 1.129 (if South Asian ethnicity) – 7.2897(if chronic hypertension) – 3.0519 (if systemic lupuserythematosus or antiphospholipid syndrome) – 1.6327(if conception by in vitro fertilisation) – 8.1667 (ifparous with previous PE) + 0.0271988 (if parous withprevious PE, previous gestation in weeks – 24)2 – 4.335(if parous with no previous PE) – 4.15137651 (if parouswith no previous PE, interval between pregnancies inyears)–1 + 9.21473572 (if parous with no previous PE,interval between pregnancies in years)–0.5 – 0.0694096(if no chronic hypertension, weight in kg – 69) – 1.7154(if no chronic hypertension and family history of PE) –3.3899 (if no chronic hypertension and diabetesmellitus type 1 or 2)
continued
DOI: 10.3310/hta24720 Health Technology Assessment 2020 Vol. 24 No. 72
© Queen’s Printer and Controller of HMSO 2020. This work was produced by Allotey et al. under the terms of a commissioning contract issued by the Secretary of Statefor Health and Social Care. This issue may be freely reproduced for the purposes of private research and study and extracts (or indeed, the full report) may be included inprofessional journals provided that suitable acknowledgement is made and the reproduction is not associated with any form of advertising. Applications for commercialreproduction should be addressed to: NIHR Journals Library, National Institute for Health Research, Evaluation, Trials and Studies Coordinating Centre, Alpha House,University of Southampton Science Park, Southampton SO16 7NS, UK.
23

TABLE 4 Pre-eclampsia prediction model equations externally validated in the IPPIC-UK data sets (continued )
Modelnumber Authors, year Predictor category Prediction model equation for LPa
4 Baschat et al.,2014115
Clinical characteristicsand biochemical markers
LP = –8.72 + 0.157 (if nulliparous) + 0.341 (if history ofhypertension) + 0.635 (if prior PE)+ 0.064 (MAP) –0.186 (PAPP-A, Ln MoM)
5 Goetzinger et al.,2010128
Clinical characteristicsand biochemical markers
LP = –3.25 + 0.51 (if PAPP-A < 10th percentile)+ 0.93(if BMI > 25) + 0.94 (if chronic hypertension)+ 0.97(if diabetes) + 0.61 (if African American ethnicity)
6 Odibo et al., 2011147 Clinical characteristicsand biochemical markers
LP = –3.389 – 0.716 (PAPP-A, MoM) + 0.05 (BMI)+0.319 (if black ethnicity) + 1.57 (if history of chronichypertension)
7 Odibo et al., 2011147 Clinical characteristicsand ultrasound markers
LP = –3.895 – 0.593 (mean uterine artery PI) + 0.944(if pre-gestational diabetes) + 0.059 (BMI) + 1.532(if history of chronic hypertension)
First-trimester early-onset pre-eclampsia models
8 Baschat et al.,2014115
Clinical characteristics LP= –5.803+ 0.302 (if diabetes)+ 0.767 (if hypertension)+ 0.00948 (MAP)
9 Crovetto et al.,2015229
Clinical characteristics LP = –5.177 + 2.383 (if black ethnicity) – 1.105(if nulliparous)+ 3.543 (if parous with previousPE) + 2.229 (if chronic hypertension) + 2.201(if renal disease)
10 Kuc et al., 2013230 Clinical characteristics LP = –6.790 – 0.119 (maternal height, cm)+ 4.8565(maternal weight, Ln kg) + 1.845 (if nulliparous) +0.086 (maternal age, years)+ 1.353 (if smoker)
11 Plasencia et al.,2007231
Clinical characteristics LP = –6.431 + 1.680 (if African Caribbean ethnicity)+ 1.889 (if mixed ethnicity) + 2.822 (if parous withprevious PE)
12 Poon et al., 2010232 Clinical characteristics LP = –5.674 + 1.267 (if black ethnicity) + 2.193(if history of chronic hypertension) – 1.184 (if parouswithout previous PE) + 1.362 (if parous with previousPE) + 1.537 (if conceived with ovulation induction)
13 Scazzocchio et al.,2013235
Clinical characteristics LP = –7.703 + 0.086 (BMI)+ 1.708 (if chronichypertension) + 4.033 (if renal disease)+ 1.931(if parous with previous PE) + 0.005 (if parous withno previous PE)
14 Wright et al., 2015236 Clinical characteristics Same as model 3
15 Poon et al., 2009234 Clinical characteristicsand biochemical markers
LP = –6.413 – 3.612 (PAPP-A, Ln MoM) + 1.803(if history of chronic hypertension)+ 1.564 (if blackethnicity) – 1.005 (if parous without previous PE) +1.491 (if parous with previous PE)
First-trimester late-onset pre-eclampsia models
16 Crovetto et al.,2015229
Clinical characteristics LP = –5.873 – 0.462 (if white ethnicity) + 0.109(BMI) – 0.825 (if nulliparous) + 2.726 (if parous withprevious PE) + 1.956 (if chronic hypertension) – 0.575(if smoker)
17 Kuc et al., 2013230 Clinical characteristics LP = –14.374 + 2.300 (maternal weight, Ln kg) + 1.303(if nulliparous)+ 0.068 (maternal age, years)
18 Plasencia et al.,2007231
Clinical characteristics LP = –6.585 + 1.368 (if African Caribbean ethnicity)+ 1.311 (if mixed ethnicity) + 0.091 (BMI)+ 0.960(if woman’s mother had PE) – 1.663 (if parous withoutprevious PE)
19 Poon et al., 2010232 Clinical characteristics LP = –7.860 + 0.034 (maternal age, years)+ 0.096(BMI) + 1.089 (if black ethnicity) + 0.980 (if Indian orPakistani ethnicity) + 1.196 (if mixed ethnicity) + 1.070(if woman’s mother had PE) – 1.413 (if parous withoutprevious PE) + 0.780 (if parous with previous PE)
EXTERNAL VALIDATION OF EXISTING PRE-ECLAMPSIA PREDICTION MODELS
NIHR Journals Library www.journalslibrary.nihr.ac.uk
24
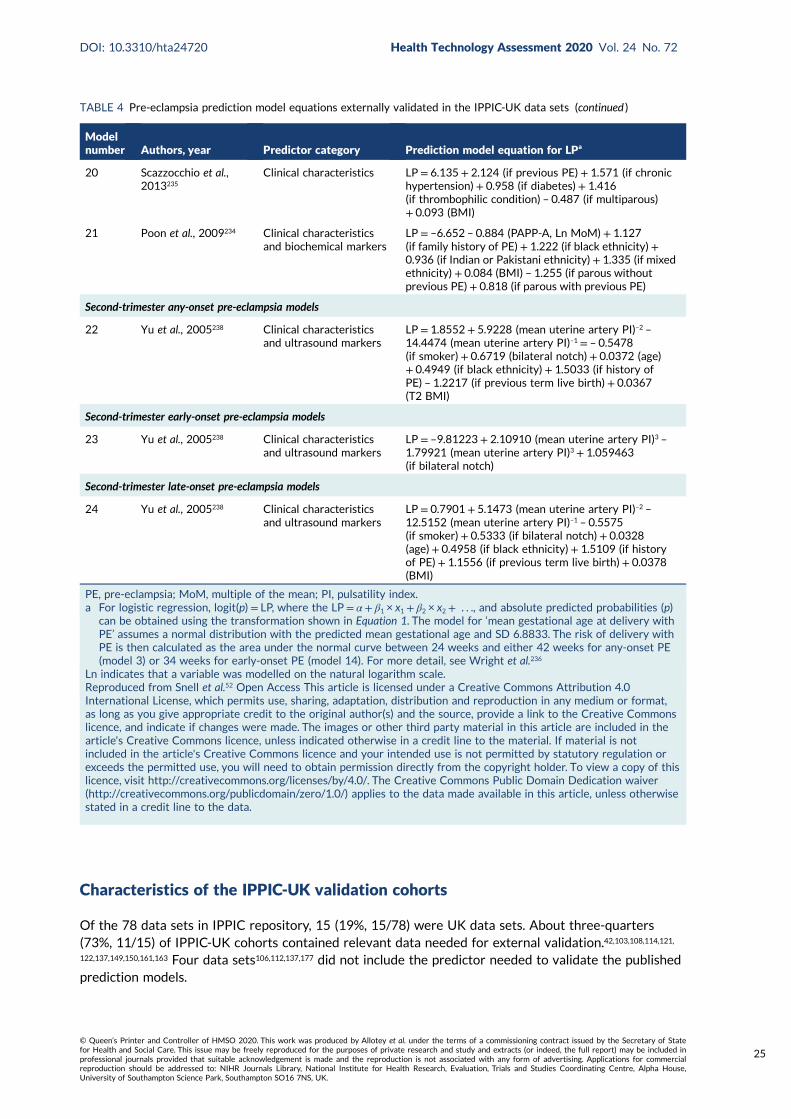
Characteristics of the IPPIC-UK validation cohorts
Of the 78 data sets in IPPIC repository, 15 (19%, 15/78) were UK data sets. About three-quarters(73%, 11/15) of IPPIC-UK cohorts contained relevant data needed for external validation.42,103,108,114,121,122,137,149,150,161,163 Four data sets106,112,137,177 did not include the predictor needed to validate the publishedprediction models.
TABLE 4 Pre-eclampsia prediction model equations externally validated in the IPPIC-UK data sets (continued )
Modelnumber Authors, year Predictor category Prediction model equation for LPa
20 Scazzocchio et al.,2013235
Clinical characteristics LP = 6.135 + 2.124 (if previous PE) + 1.571 (if chronichypertension) + 0.958 (if diabetes) + 1.416(if thrombophilic condition) – 0.487 (if multiparous)+ 0.093 (BMI)
21 Poon et al., 2009234 Clinical characteristicsand biochemical markers
LP = –6.652 – 0.884 (PAPP-A, Ln MoM) + 1.127(if family history of PE)+ 1.222 (if black ethnicity) +0.936 (if Indian or Pakistani ethnicity) + 1.335 (if mixedethnicity) + 0.084 (BMI) – 1.255 (if parous withoutprevious PE)+ 0.818 (if parous with previous PE)
Second-trimester any-onset pre-eclampsia models
22 Yu et al., 2005238 Clinical characteristicsand ultrasound markers
LP = 1.8552 + 5.9228 (mean uterine artery PI)–2 –14.4474 (mean uterine artery PI)–1 = – 0.5478(if smoker) + 0.6719 (bilateral notch) + 0.0372 (age)+ 0.4949 (if black ethnicity) + 1.5033 (if history ofPE) – 1.2217 (if previous term live birth) + 0.0367(T2 BMI)
Second-trimester early-onset pre-eclampsia models
23 Yu et al., 2005238 Clinical characteristicsand ultrasound markers
LP = –9.81223 + 2.10910 (mean uterine artery PI)3 –1.79921 (mean uterine artery PI)3 + 1.059463(if bilateral notch)
Second-trimester late-onset pre-eclampsia models
24 Yu et al., 2005238 Clinical characteristicsand ultrasound markers
LP = 0.7901 + 5.1473 (mean uterine artery PI)–2 –12.5152 (mean uterine artery PI)–1 – 0.5575(if smoker) + 0.5333 (if bilateral notch) + 0.0328(age)+ 0.4958 (if black ethnicity) + 1.5109 (if historyof PE) + 1.1556 (if previous term live birth) + 0.0378(BMI)
PE, pre-eclampsia; MoM, multiple of the mean; PI, pulsatility index.a For logistic regression, logit(p) = LP, where the LP = α + β1 × x1 + β2 × x2 + . . ., and absolute predicted probabilities (p)
can be obtained using the transformation shown in Equation 1. The model for ‘mean gestational age at delivery withPE’ assumes a normal distribution with the predicted mean gestational age and SD 6.8833. The risk of delivery withPE is then calculated as the area under the normal curve between 24 weeks and either 42 weeks for any-onset PE(model 3) or 34 weeks for early-onset PE (model 14). For more detail, see Wright et al.236
Ln indicates that a variable was modelled on the natural logarithm scale.Reproduced from Snell et al.52 Open Access This article is licensed under a Creative Commons Attribution 4.0International License, which permits use, sharing, adaptation, distribution and reproduction in any medium or format,as long as you give appropriate credit to the original author(s) and the source, provide a link to the Creative Commonslicence, and indicate if changes were made. The images or other third party material in this article are included in thearticle's Creative Commons licence, unless indicated otherwise in a credit line to the material. If material is notincluded in the article's Creative Commons licence and your intended use is not permitted by statutory regulation orexceeds the permitted use, you will need to obtain permission directly from the copyright holder. To view a copy of thislicence, visit http://creativecommons.org/licenses/by/4.0/. The Creative Commons Public Domain Dedication waiver(http://creativecommons.org/publicdomain/zero/1.0/) applies to the data made available in this article, unless otherwisestated in a credit line to the data.
DOI: 10.3310/hta24720 Health Technology Assessment 2020 Vol. 24 No. 72
© Queen’s Printer and Controller of HMSO 2020. This work was produced by Allotey et al. under the terms of a commissioning contract issued by the Secretary of Statefor Health and Social Care. This issue may be freely reproduced for the purposes of private research and study and extracts (or indeed, the full report) may be included inprofessional journals provided that suitable acknowledgement is made and the reproduction is not associated with any form of advertising. Applications for commercialreproduction should be addressed to: NIHR Journals Library, National Institute for Health Research, Evaluation, Trials and Studies Coordinating Centre, Alpha House,University of Southampton Science Park, Southampton SO16 7NS, UK.
25
Four of the included IPPIC-UK studies were prospective cohorts,42,108,161 three were prospective registrydata sets103,114,163 and four were cohorts (control arm) from randomised trials.121,122,149,150 All studiesreported on early-, late- and any-onset pre-eclampsia. About half of the included IPPIC-UK cohortsconsisted of unselected pregnant women (6/11); four included high-risk women such as those withabnormal uterine artery Doppler measurement,121,137 history of pre-eclampsia or underlying medicalconditions150 and maternal obesity;122,149 one42 included only low-risk nulliparous women, and one161
included all nulliparous singleton pregnancies.
All women in the Screening for Pregnancy Endpoints (SCOPE)42 and Pregnancy Outcome Prediction(POP)161 studies were nulliparous. The percentage of nulliparous women in the other data sets rangedfrom 43% to 65%. Among the nine data sets with multiparous women, five recorded previous pre-eclampsia with percentages ranging from 0%122 to 27%.150 The mean age was similar across studies.The median BMI was higher in EMPOWaR,122 Poston et al. 2006150 and Poston et al. 2015149 than inother studies. Most data sets that recorded ethnicity predominantly consisted of white women, apartfrom Allen et al.108 and Velauthar et al.39 (47% and 50% Asian women, respectively). All data sets wereconsidered to be at low risk of bias for quality of participant selection (11/11, 100%); 91% (10/11) wereconsidered to be at low risk and 9% (1/11) were considered to be at unclear risk of bias for predictorreporting; and 45% (5/11) were considered to be at low risk and 55% (6/11) were considered to be atunclear risk of bias for outcome reporting (see Appendix 8).
Detailed study characteristics (see Appendix 5) and summary statistics for the data sets used forexternal validation, along with a summary of the missing data for each predictor and outcome,are provided in Appendices 10 and 11, respectively.
External validation and meta-analysis of predictive performance
We were able to externally validate each of the 24 published models in at least one and in up to eightdata sets. Initially, we could use only one data set of nulliparous women (SCOPE UK42) to validatemodels 3 (Wright et al.236) and 14 (Wright et al.236) owing to a lack of information on ‘interval betweenpregnancies’ in data sets. However, to increase the sample size available for validation (and the numberof events), we included nulliparous subgroups in other data sets for validating these models if all otherpredictors were recorded. Models 3 (Wright et al.236) and 14 (Wright et al.236) were ‘competing risk’models and did not provide LP values. Therefore, where necessary (e.g. for the assessment of calibration),we used logit probabilities for validation and for comparison with the other models. We were able tovalidate only models (22–24)238 with second-trimester predictors (Yu et al.238 for all three models) in thePOP study.161 We did not impute second-trimester predictors in the other data sets as these were notrecorded or were missing for a large proportion of individuals.
A summary of the LP and predicted probability distributions for each model and validation data set isgiven in Appendix 12. Median predicted probabilities were generally low for models, which is expectedfor a rare outcome. However, the median predicted probability in validation data sets was higher formodel 10 for early-onset pre-eclampsia and for model 17 for late-onset pre-eclampsia (Kuc et al.230
for both). The median predicted probability was 0.034–0.367 across validation data sets for model 10(Kuc et al.230) and 0.063–0.310 across validation data sets for model 17 (Kuc et al.230).
Performance of the modelsThe summary (average) performance statistics across all validation data sets for each model are givenin Table 5 and data set-specific performance statistics in data sets with > 100 pre-eclampsia events areprovided for each model in Table 6. The summary performance statistics are also shown graphically forall models in Figure 4. Direct comparison of the prediction models is difficult owing to different datasets (and numbers of individuals and outcomes) contributing to the validation of each prediction model(see Appendix 13).
EXTERNAL VALIDATION OF EXISTING PRE-ECLAMPSIA PREDICTION MODELS
NIHR Journals Library www.journalslibrary.nihr.ac.uk
26
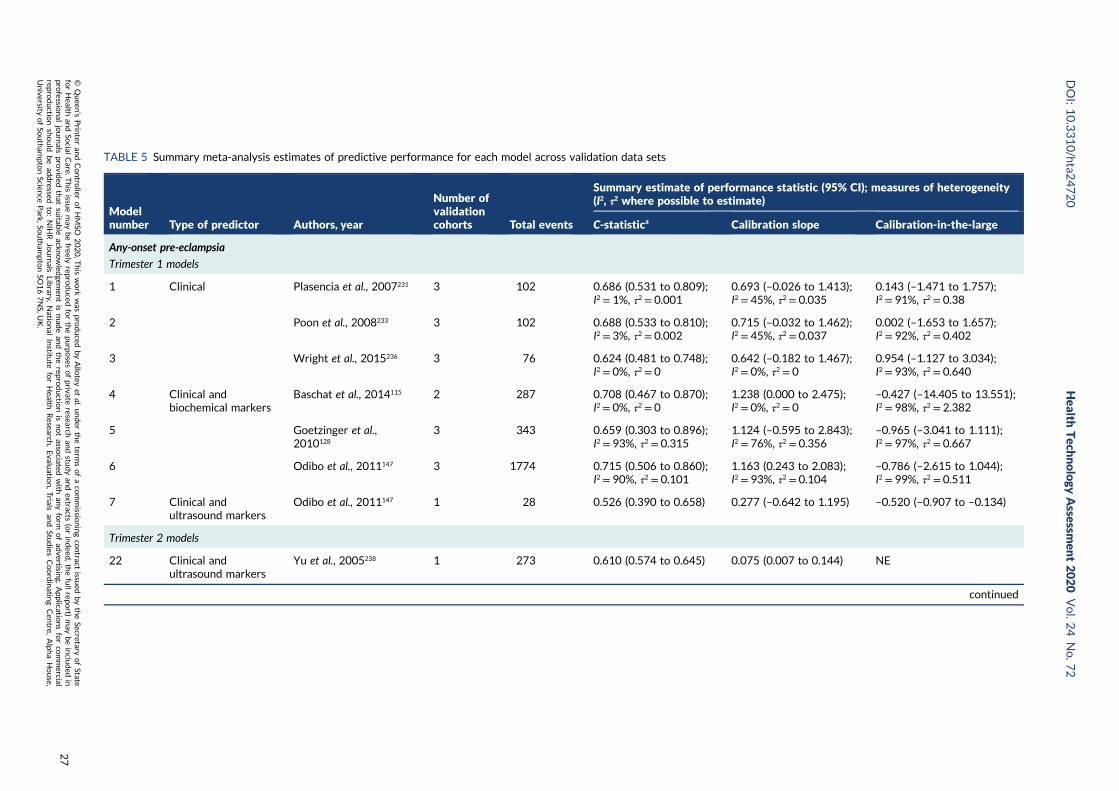
TABLE 5 Summary meta-analysis estimates of predictive performance for each model across validation data sets
Modelnumber Type of predictor Authors, year
Number ofvalidationcohorts Total events
Summary estimate of performance statistic (95% CI); measures of heterogeneity(I2, τ2 where possible to estimate)
C-statistica Calibration slope Calibration-in-the-large
Any-onset pre-eclampsia
Trimester 1 models
1 Clinical Plasencia et al., 2007231 3 102 0.686 (0.531 to 0.809);I2 = 1%, τ2 = 0.001
0.693 (–0.026 to 1.413);I2 = 45%, τ2 = 0.035
0.143 (–1.471 to 1.757);I2 = 91%, τ2 = 0.38
2 Poon et al., 2008233 3 102 0.688 (0.533 to 0.810);I2 = 3%, τ2 = 0.002
0.715 (–0.032 to 1.462);I2 = 45%, τ2 = 0.037
0.002 (–1.653 to 1.657);I2 = 92%, τ2 = 0.402
3 Wright et al., 2015236 3 76 0.624 (0.481 to 0.748);I2 = 0%, τ2 = 0
0.642 (–0.182 to 1.467);I2 = 0%, τ2 = 0
0.954 (–1.127 to 3.034);I2 = 93%, τ2 = 0.640
4 Clinical andbiochemical markers
Baschat et al., 2014115 2 287 0.708 (0.467 to 0.870);I2 = 0%, τ2 = 0
1.238 (0.000 to 2.475);I2 = 0%, τ2 = 0
–0.427 (–14.405 to 13.551);I2 = 98%, τ2 = 2.382
5 Goetzinger et al.,2010128
3 343 0.659 (0.303 to 0.896);I2 = 93%, τ2 = 0.315
1.124 (–0.595 to 2.843);I2 = 76%, τ2 = 0.356
–0.965 (–3.041 to 1.111);I2 = 97%, τ2 = 0.667
6 Odibo et al., 2011147 3 1774 0.715 (0.506 to 0.860);I2 = 90%, τ2 = 0.101
1.163 (0.243 to 2.083);I2 = 93%, τ2 = 0.104
–0.786 (–2.615 to 1.044);I2 = 99%, τ2 = 0.511
7 Clinical andultrasound markers
Odibo et al., 2011147 1 28 0.526 (0.390 to 0.658) 0.277 (–0.642 to 1.195) –0.520 (–0.907 to –0.134)
Trimester 2 models
22 Clinical andultrasound markers
Yu et al., 2005238 1 273 0.610 (0.574 to 0.645) 0.075 (0.007 to 0.144) NE
continued
DOI:10.3310/hta2
4720
Health
Tech
nology
Assessm
ent2020
Vol.2
4No.7
2
©Queen
’sPrin
teran
dContro
llerofHMSO
2020.T
his
work
was
produced
byAllo
teyet
al.under
theterm
sofaco
mmissio
ningco
ntract
issued
bytheSecretary
ofState
forHealth
andSo
cialCare.T
his
issuemay
befreely
reproduced
forthepu
rposes
ofprivate
researchan
dstu
dyan
dextracts
(orindeed
,thefullrepo
rt)may
beinclu
ded
inpro
fessional
journals
provid
edthat
suitab
leackn
owled
gemen
tis
mad
ean
dtherepro
ductio
nis
notasso
ciatedwith
anyform
ofad
vertising.
Applicatio
nsforco
mmercial
reproductio
nshould
bead
dressed
to:NIH
RJournals
Library,
Natio
nal
Institu
teforHealth
Research
,Evalu
ation,Trials
and
Studies
Coordinatin
gCen
tre,Alph
aHouse,
University
ofSo
utham
ptonScien
cePark,So
utham
ptonSO
167NS,U
K.
27
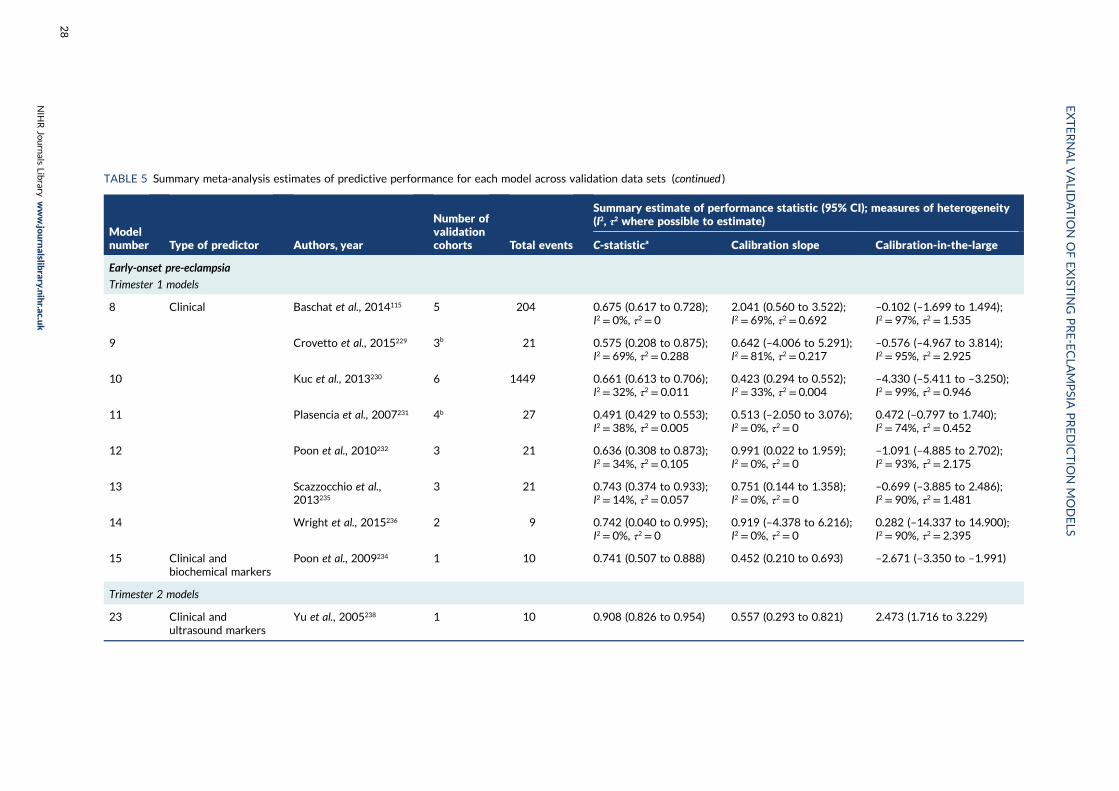
TABLE 5 Summary meta-analysis estimates of predictive performance for each model across validation data sets (continued )
Modelnumber Type of predictor Authors, year
Number ofvalidationcohorts Total events
Summary estimate of performance statistic (95% CI); measures of heterogeneity(I2, τ2 where possible to estimate)
C-statistica Calibration slope Calibration-in-the-large
Early-onset pre-eclampsia
Trimester 1 models
8 Clinical Baschat et al., 2014115 5 204 0.675 (0.617 to 0.728);I2 = 0%, τ2 = 0
2.041 (0.560 to 3.522);I2 = 69%, τ2 = 0.692
–0.102 (–1.699 to 1.494);I2 = 97%, τ2 = 1.535
9 Crovetto et al., 2015229 3b 21 0.575 (0.208 to 0.875);I2 = 69%, τ2 = 0.288
0.642 (–4.006 to 5.291);I2 = 81%, τ2 = 0.217
–0.576 (–4.967 to 3.814);I2 = 95%, τ2 = 2.925
10 Kuc et al., 2013230 6 1449 0.661 (0.613 to 0.706);I2 = 32%, τ2 = 0.011
0.423 (0.294 to 0.552);I2 = 33%, τ2 = 0.004
–4.330 (–5.411 to –3.250);I2 = 99%, τ2 = 0.946
11 Plasencia et al., 2007231 4b 27 0.491 (0.429 to 0.553);I2 = 38%, τ2 = 0.005
0.513 (–2.050 to 3.076);I2 = 0%, τ2 = 0
0.472 (–0.797 to 1.740);I2 = 74%, τ2 = 0.452
12 Poon et al., 2010232 3 21 0.636 (0.308 to 0.873);I2 = 34%, τ2 = 0.105
0.991 (0.022 to 1.959);I2 = 0%, τ2 = 0
–1.091 (–4.885 to 2.702);I2 = 93%, τ2 = 2.175
13 Scazzocchio et al.,2013235
3 21 0.743 (0.374 to 0.933);I2 = 14%, τ2 = 0.057
0.751 (0.144 to 1.358);I2 = 0%, τ2 = 0
–0.699 (–3.885 to 2.486);I2 = 90%, τ2 = 1.481
14 Wright et al., 2015236 2 9 0.742 (0.040 to 0.995);I2 = 0%, τ2 = 0
0.919 (–4.378 to 6.216);I2 = 0%, τ2 = 0
0.282 (–14.337 to 14.900);I2 = 90%, τ2 = 2.395
15 Clinical andbiochemical markers
Poon et al., 2009234 1 10 0.741 (0.507 to 0.888) 0.452 (0.210 to 0.693) –2.671 (–3.350 to –1.991)
Trimester 2 models
23 Clinical andultrasound markers
Yu et al., 2005238 1 10 0.908 (0.826 to 0.954) 0.557 (0.293 to 0.821) 2.473 (1.716 to 3.229)
EXTERNALVALID
ATIO
NOFEXIST
ING
PRE-ECLA
MPSIA
PREDICTIO
NMODELS
NIH
RJournals
Library
www.jo
urnalslib
rary.nihr.ac.u
k
28
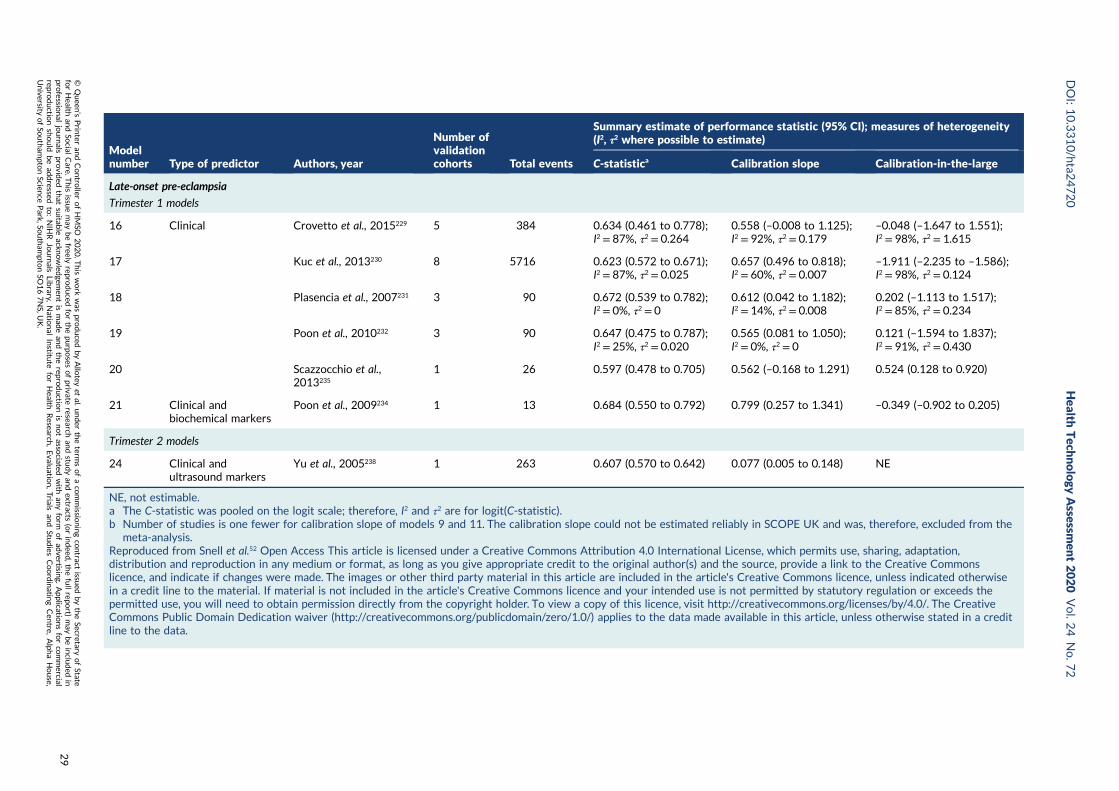
Modelnumber Type of predictor Authors, year
Number ofvalidationcohorts Total events
Summary estimate of performance statistic (95% CI); measures of heterogeneity(I2, τ2 where possible to estimate)
C-statistica Calibration slope Calibration-in-the-large
Late-onset pre-eclampsia
Trimester 1 models
16 Clinical Crovetto et al., 2015229 5 384 0.634 (0.461 to 0.778);I2 = 87%, τ2 = 0.264
0.558 (–0.008 to 1.125);I2 = 92%, τ2 = 0.179
–0.048 (–1.647 to 1.551);I2 = 98%, τ2 = 1.615
17 Kuc et al., 2013230 8 5716 0.623 (0.572 to 0.671);I2 = 87%, τ2 = 0.025
0.657 (0.496 to 0.818);I2 = 60%, τ2 = 0.007
–1.911 (–2.235 to –1.586);I2 = 98%, τ2 = 0.124
18 Plasencia et al., 2007231 3 90 0.672 (0.539 to 0.782);I2 = 0%, τ2 = 0
0.612 (0.042 to 1.182);I2 = 14%, τ2 = 0.008
0.202 (–1.113 to 1.517);I2 = 85%, τ2 = 0.234
19 Poon et al., 2010232 3 90 0.647 (0.475 to 0.787);I2 = 25%, τ2 = 0.020
0.565 (0.081 to 1.050);I2 = 0%, τ2 = 0
0.121 (–1.594 to 1.837);I2 = 91%, τ2 = 0.430
20 Scazzocchio et al.,2013235
1 26 0.597 (0.478 to 0.705) 0.562 (–0.168 to 1.291) 0.524 (0.128 to 0.920)
21 Clinical andbiochemical markers
Poon et al., 2009234 1 13 0.684 (0.550 to 0.792) 0.799 (0.257 to 1.341) –0.349 (–0.902 to 0.205)
Trimester 2 models
24 Clinical andultrasound markers
Yu et al., 2005238 1 263 0.607 (0.570 to 0.642) 0.077 (0.005 to 0.148) NE
NE, not estimable.a The C-statistic was pooled on the logit scale; therefore, I2 and τ2 are for logit(C-statistic).b Number of studies is one fewer for calibration slope of models 9 and 11. The calibration slope could not be estimated reliably in SCOPE UK and was, therefore, excluded from the
meta-analysis.Reproduced from Snell et al.52 Open Access This article is licensed under a Creative Commons Attribution 4.0 International License, which permits use, sharing, adaptation,distribution and reproduction in any medium or format, as long as you give appropriate credit to the original author(s) and the source, provide a link to the Creative Commonslicence, and indicate if changes were made. The images or other third party material in this article are included in the article's Creative Commons licence, unless indicated otherwisein a credit line to the material. If material is not included in the article's Creative Commons licence and your intended use is not permitted by statutory regulation or exceeds thepermitted use, you will need to obtain permission directly from the copyright holder. To view a copy of this licence, visit http://creativecommons.org/licenses/by/4.0/. The CreativeCommons Public Domain Dedication waiver (http://creativecommons.org/publicdomain/zero/1.0/) applies to the data made available in this article, unless otherwise stated in a creditline to the data.
DOI:10.3310/hta2
4720
Health
Tech
nology
Assessm
ent2020
Vol.2
4No.7
2
©Queen
’sPrin
teran
dContro
llerofHMSO
2020.T
his
work
was
produced
byAllo
teyet
al.under
theterm
sofaco
mmissio
ningco
ntract
issued
bytheSecretary
ofState
forHealth
andSo
cialCare.T
his
issuemay
befreely
reproduced
forthepu
rposes
ofprivate
researchan
dstu
dyan
dextracts
(orindeed
,thefullrepo
rt)may
beinclu
ded
inpro
fessional
journals
provid
edthat
suitab
leackn
owled
gemen
tis
mad
ean
dtherepro
ductio
nis
notasso
ciatedwith
anyform
ofad
vertising.
Applicatio
nsforco
mmercial
reproductio
nshould
bead
dressed
to:NIH
RJournals
Library,
Natio
nal
Institu
teforHealth
Research
,Evalu
ation,Trials
and
Studies
Coordinatin
gCen
tre,Alph
aHouse,
University
ofSo
utham
ptonScien
cePark,So
utham
ptonSO
167NS,U
K.
29
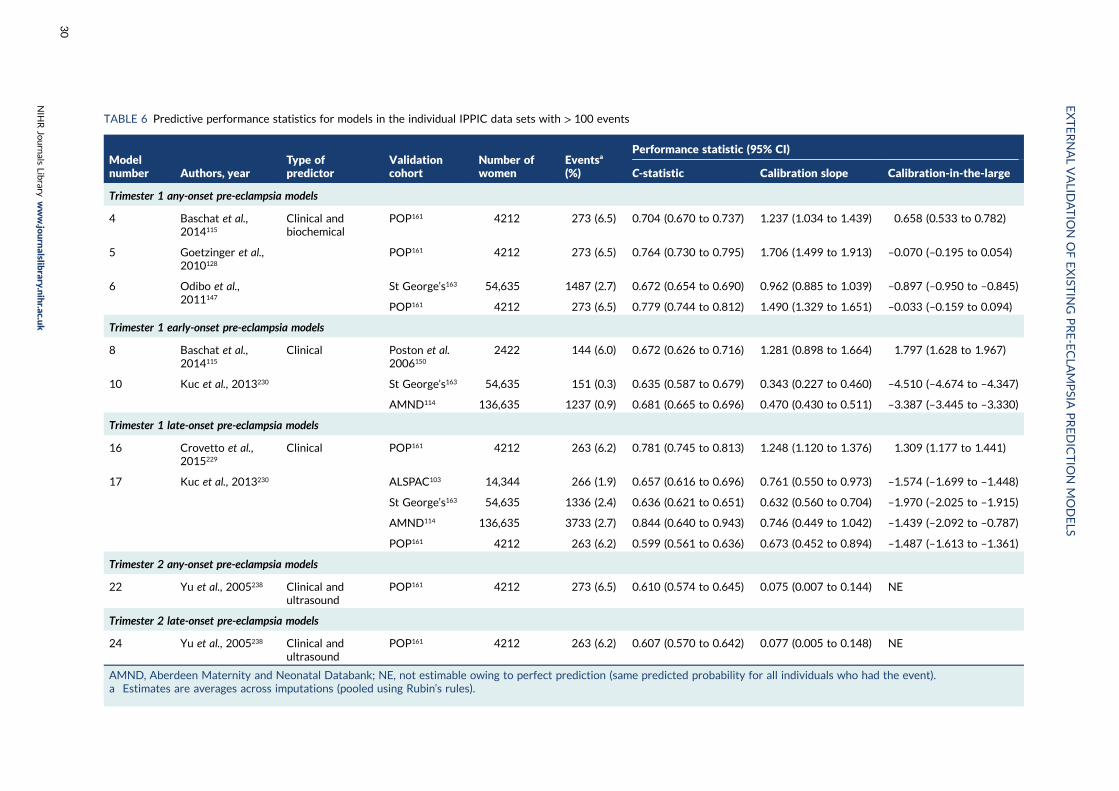
TABLE 6 Predictive performance statistics for models in the individual IPPIC data sets with > 100 events
Modelnumber Authors, year
Type ofpredictor
Validationcohort
Number ofwomen
Eventsa
(%)
Performance statistic (95% CI)
C-statistic Calibration slope Calibration-in-the-large
Trimester 1 any-onset pre-eclampsia models
4 Baschat et al.,2014115
Clinical andbiochemical
POP161 4212 273 (6.5) 0.704 (0.670 to 0.737) 1.237 (1.034 to 1.439) 0.658 (0.533 to 0.782)
5 Goetzinger et al.,2010128
POP161 4212 273 (6.5) 0.764 (0.730 to 0.795) 1.706 (1.499 to 1.913) –0.070 (–0.195 to 0.054)
6 Odibo et al.,2011147
St George’s163 54,635 1487 (2.7) 0.672 (0.654 to 0.690) 0.962 (0.885 to 1.039) –0.897 (–0.950 to –0.845)
POP161 4212 273 (6.5) 0.779 (0.744 to 0.812) 1.490 (1.329 to 1.651) –0.033 (–0.159 to 0.094)
Trimester 1 early-onset pre-eclampsia models
8 Baschat et al.,2014115
Clinical Poston et al.2006150
2422 144 (6.0) 0.672 (0.626 to 0.716) 1.281 (0.898 to 1.664) 1.797 (1.628 to 1.967)
10 Kuc et al., 2013230 St George’s163 54,635 151 (0.3) 0.635 (0.587 to 0.679) 0.343 (0.227 to 0.460) –4.510 (–4.674 to –4.347)
AMND114 136,635 1237 (0.9) 0.681 (0.665 to 0.696) 0.470 (0.430 to 0.511) –3.387 (–3.445 to –3.330)
Trimester 1 late-onset pre-eclampsia models
16 Crovetto et al.,2015229
Clinical POP161 4212 263 (6.2) 0.781 (0.745 to 0.813) 1.248 (1.120 to 1.376) 1.309 (1.177 to 1.441)
17 Kuc et al., 2013230 ALSPAC103 14,344 266 (1.9) 0.657 (0.616 to 0.696) 0.761 (0.550 to 0.973) –1.574 (–1.699 to –1.448)
St George’s163 54,635 1336 (2.4) 0.636 (0.621 to 0.651) 0.632 (0.560 to 0.704) –1.970 (–2.025 to –1.915)
AMND114 136,635 3733 (2.7) 0.844 (0.640 to 0.943) 0.746 (0.449 to 1.042) –1.439 (–2.092 to –0.787)
POP161 4212 263 (6.2) 0.599 (0.561 to 0.636) 0.673 (0.452 to 0.894) –1.487 (–1.613 to –1.361)
Trimester 2 any-onset pre-eclampsia models
22 Yu et al., 2005238 Clinical andultrasound
POP161 4212 273 (6.5) 0.610 (0.574 to 0.645) 0.075 (0.007 to 0.144) NE
Trimester 2 late-onset pre-eclampsia models
24 Yu et al., 2005238 Clinical andultrasound
POP161 4212 263 (6.2) 0.607 (0.570 to 0.642) 0.077 (0.005 to 0.148) NE
AMND, Aberdeen Maternity and Neonatal Databank; NE, not estimable owing to perfect prediction (same predicted probability for all individuals who had the event).a Estimates are averages across imputations (pooled using Rubin’s rules).
EXTERNALVALID
ATIO
NOFEXIST
ING
PRE-ECLA
MPSIA
PREDICTIO
NMODELS
NIH
RJournals
Library
www.jo
urnalslib
rary.nihr.ac.u
k
30
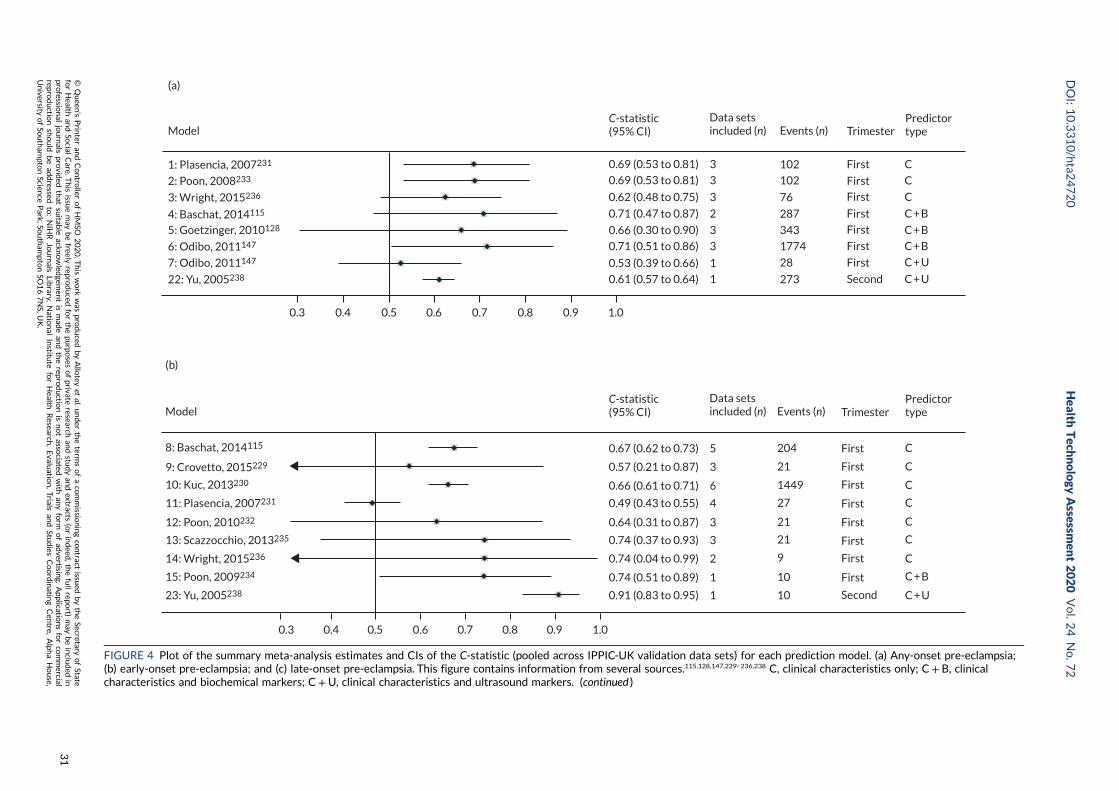
Model
(a)
0.3 0.4 0.5 0.6 0.7 0.8 0.9 1.0
1: Plasencia, 2007231
2: Poon, 2008233
3: Wright, 2015236
4: Baschat, 2014115
5: Goetzinger, 2010128
6: Odibo, 2011147
7: Odibo, 2011147
22: Yu, 2005238 0.61 (0.57 to 0.64) 1
0.53 (0.39 to 0.66) 1
0.71 (0.51 to 0.86) 3
0.66 (0.30 to 0.90) 3
0.71 (0.47 to 0.87) 2
0.62 (0.48 to 0.75) 3
0.69 (0.53 to 0.81) 3
0.69 (0.53 to 0.81) 3
C-statistic(95% CI)
Data setsincluded (n) Events (n) Trimester
Predictortype
C
C
C
C + B
C + B
C + B
C + U
C + USecond
First
First
First
First
First
First
First102
102
76
287
343
1774
28
273
Model
(b)
0.3 0.4 0.5 0.6 0.7 0.8 0.9 1.0
8: Baschat, 2014115
9: Crovetto, 2015229
10: Kuc, 2013230
11: Plasencia, 2007231
12: Poon, 2010232
13: Scazzocchio, 2013235
14: Wright, 2015236
15: Poon, 2009234
23: Yu, 2005238
0.67 (0.62 to 0.73) 5
0.57 (0.21 to 0.87) 3
0.66 (0.61 to 0.71) 6
0.49 (0.43 to 0.55) 4
0.64 (0.31 to 0.87) 3
0.74 (0.37 to 0.93) 3
0.74 (0.04 to 0.99) 2
0.74 (0.51 to 0.89) 1
0.91 (0.83 to 0.95) 1
204
21
1449
27
21
21
9
10
10
First
First
First
First
First
First
First
First
Second
C
C
C
C
C
C
C
C + B
C + U
Events (n) TrimesterC-statistic(95% CI)
Data setsincluded (n)
Predictortype
FIGURE 4 Plot of the summary meta-analysis estimates and CIs of the C-statistic (pooled across IPPIC-UK validation data sets) for each prediction model. (a) Any-onset pre-eclampsia;(b) early-onset pre-eclampsia; and (c) late-onset pre-eclampsia. This figure contains information from several sources.115,128,147,229–236,238 C, clinical characteristics only; C + B, clinicalcharacteristics and biochemical markers; C+U, clinical characteristics and ultrasound markers. (continued )
DOI:10.3310/hta2
4720
Health
Tech
nology
Assessm
ent2020
Vol.2
4No.7
2
©Queen
’sPrin
teran
dContro
llerofHMSO
2020.T
his
work
was
produced
byAllo
teyet
al.under
theterm
sofaco
mmissio
ningco
ntract
issued
bytheSecretary
ofState
forHealth
andSo
cialCare.T
his
issuemay
befreely
reproduced
forthepu
rposes
ofprivate
researchan
dstu
dyan
dextracts
(orindeed
,thefullrepo
rt)may
beinclu
ded
inpro
fessional
journals
provid
edthat
suitab
leackn
owled
gemen
tis
mad
ean
dtherepro
ductio
nis
notasso
ciatedwith
anyform
ofad
vertising.
Applicatio
nsforco
mmercial
reproductio
nshould
bead
dressed
to:NIH
RJournals
Library,
Natio
nal
Institu
teforHealth
Research
,Evalu
ation,Trials
and
Studies
Coordinatin
gCen
tre,Alph
aHouse,
University
ofSo
utham
ptonScien
cePark,So
utham
ptonSO
167NS,U
K.
31
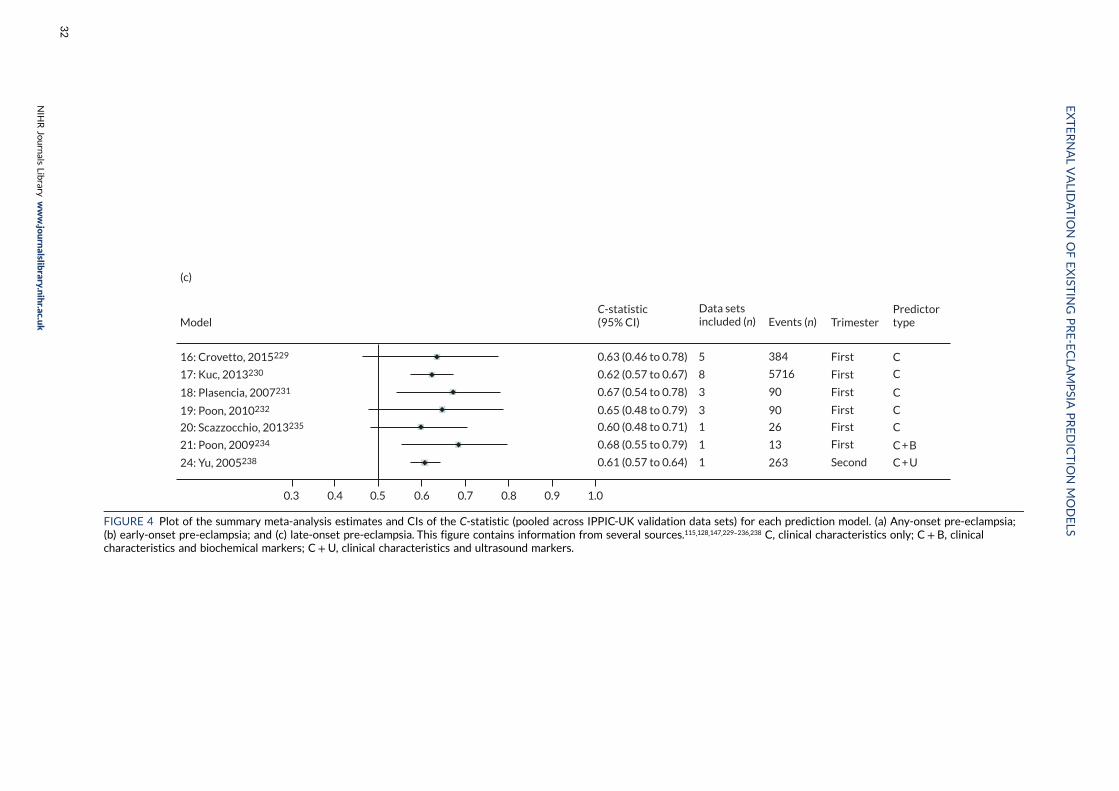
Model
(c)
0.3 0.4 0.5 0.6 0.7 0.8 0.9 1.0
16: Crovetto, 2015229
17: Kuc, 2013230
18: Plasencia, 2007231
19: Poon, 2010232
20: Scazzocchio, 2013235
21: Poon, 2009234
24: Yu, 2005238
Events (n) Trimester
C
C
C
C
C
C + B
C + U
First
First
First
First
First
First
Second
384
5716
90
90
26
13
263
0.63 (0.46 to 0.78) 5
0.62 (0.57 to 0.67) 8
0.67 (0.54 to 0.78) 3
0.65 (0.48 to 0.79) 3
0.60 (0.48 to 0.71) 1
0.68 (0.55 to 0.79) 1
0.61 (0.57 to 0.64) 1
C-statistic(95% CI)
Data setsincluded (n)
Predictortype
FIGURE 4 Plot of the summary meta-analysis estimates and CIs of the C-statistic (pooled across IPPIC-UK validation data sets) for each prediction model. (a) Any-onset pre-eclampsia;(b) early-onset pre-eclampsia; and (c) late-onset pre-eclampsia. This figure contains information from several sources.115,128,147,229–236,238 C, clinical characteristics only; C + B, clinicalcharacteristics and biochemical markers; C+U, clinical characteristics and ultrasound markers.
EXTERNALVALID
ATIO
NOFEXIST
ING
PRE-ECLA
MPSIA
PREDICTIO
NMODELS
NIH
RJournals
Library
www.jo
urnalslib
rary.nihr.ac.u
k
32
Any-onset pre-eclampsia
First-trimester clinical characteristics only modelsTwo (Plasencia et al., model 1;231 Poon et al., model 2233) of the three first-trimester clinicalcharacteristics models were validated in three cohorts with total pre-eclampsia events > 100. Thesummary C-statistics were low (< 0.7), and the summary calibration slopes were < 1 for both models.
First-trimester clinical and biochemical modelsThere was a sufficient number of pre-eclampsia events in total (> 100) for all three clinical and biochemicalfirst-trimester models (Baschat et al., model 4;115 Goetzinger et al., model 5;128 Odibo et al., model 6147).Of these, only two models had summary C-statistics > 0.7; but only one model’s (Odibo et al., model 6147)C-statistic had a lower limit of the 95% CI > 0.50. Their summary calibration slopes were > 1, indicatingpotential underfitting with predictions that do not span a wide enough range of probabilities comparedwith what is observed in the validation data sets. One model (Odibo et al., model 7147) including first-trimester clinical and ultrasound predictors could be validated only in a data set with a very small numberof events (i.e. 28 pre-eclampsia outcomes).
When validated in individual cohorts that had at least 100 pre-eclampsia events, promising discriminationwas observed for all three models with C-statistics of 0.70 (Baschat et al., model 4115), 0.76 (Goetzingeret al., model 5128) and 0.78 (Odibo et al., model 6147) in the POP study161 cohort of singleton nulliparouswomen; the corresponding calibration slopes were 1.24, 1.71 and 1.49, indicating underfitting of risks(range of predictions too narrow). Models 5 (Goetzinger et al.128) and 6 (Odibo et al.147) systematicallypredicted risks that were too high in all of the validation data sets (calibration-in-the-large < 0).
Second-trimester modelsOnly one model (Yu et al., model 22238), which comprised clinical and ultrasound predictors, could bevalidated. Both discrimination (C-statistic 0.61) and calibration slope were poor (0.075).
Early-onset pre-eclampsia
First-trimester clinical modelsOf the seven models, only two (Baschat et al., model 8;115 Kuc et al., model 10230) could be validated indata sets with adequate total numbers of pre-eclampsia events (> 100). Both had low discrimination,with summary C-statistics < 0.7; the calibration was poor, with calibration slopes of 2.04 and 0.42,respectively.
The performance of the two models (Baschat et al., model 8;115 Kuc et al., model 10230) in individualcohorts with event size > 100 was low, with C-statistics ranging from 0.63 to 0.68; the calibrationslope estimate was either too high (1.28) or too low (0.34, 0.47), respectively. Model 10230
systematically predicted too high in all their validation data sets (calibration-in-the-large < 0).
First-trimester clinical and biochemical modelsThe one model (Poon et al., model 15234) with clinical and biochemical first-trimester predictors had aninsufficient number of events (n = 10) to provide adequate validation.
Second-trimester modelsOne model (Yu et al., model 23238) comprising clinical and ultrasound markers had an insufficientnumber of events (n = 10) to provide adequate validation.
DOI: 10.3310/hta24720 Health Technology Assessment 2020 Vol. 24 No. 72
© Queen’s Printer and Controller of HMSO 2020. This work was produced by Allotey et al. under the terms of a commissioning contract issued by the Secretary of Statefor Health and Social Care. This issue may be freely reproduced for the purposes of private research and study and extracts (or indeed, the full report) may be included inprofessional journals provided that suitable acknowledgement is made and the reproduction is not associated with any form of advertising. Applications for commercialreproduction should be addressed to: NIHR Journals Library, National Institute for Health Research, Evaluation, Trials and Studies Coordinating Centre, Alpha House,University of Southampton Science Park, Southampton SO16 7NS, UK.
33
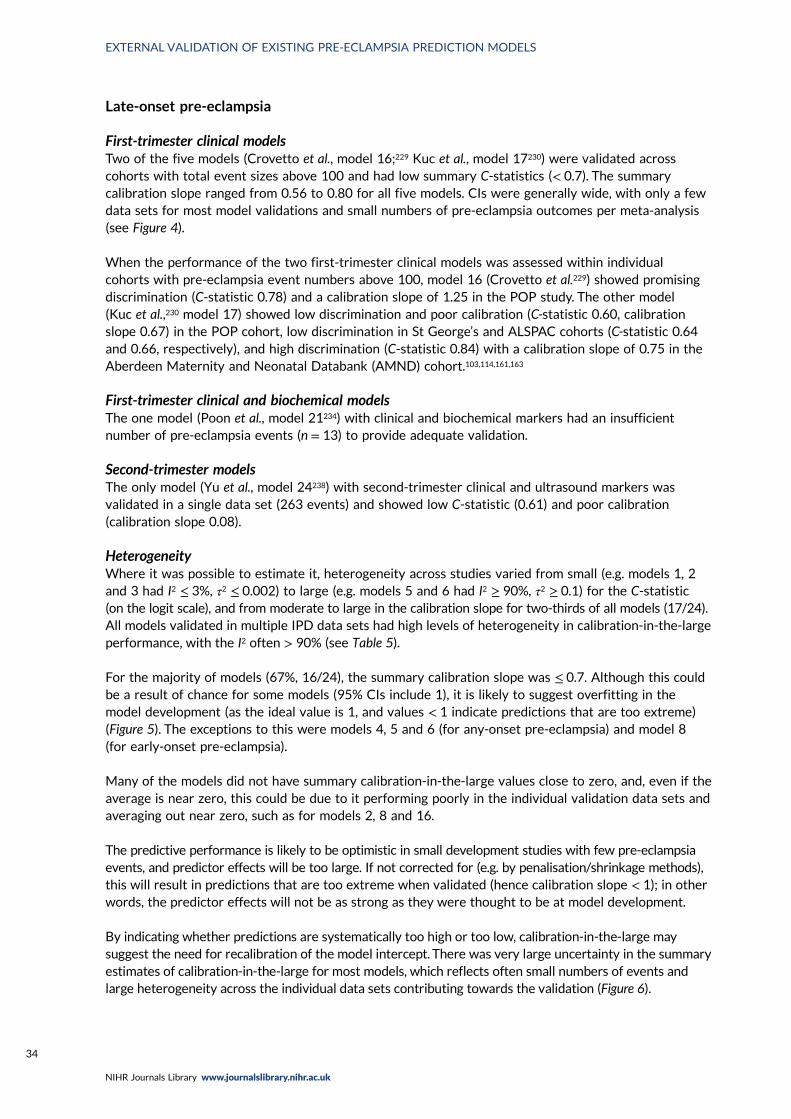
Late-onset pre-eclampsia
First-trimester clinical modelsTwo of the five models (Crovetto et al., model 16;229 Kuc et al., model 17230) were validated acrosscohorts with total event sizes above 100 and had low summary C-statistics (< 0.7). The summarycalibration slope ranged from 0.56 to 0.80 for all five models. CIs were generally wide, with only a fewdata sets for most model validations and small numbers of pre-eclampsia outcomes per meta-analysis(see Figure 4).
When the performance of the two first-trimester clinical models was assessed within individualcohorts with pre-eclampsia event numbers above 100, model 16 (Crovetto et al.229) showed promisingdiscrimination (C-statistic 0.78) and a calibration slope of 1.25 in the POP study. The other model(Kuc et al.,230 model 17) showed low discrimination and poor calibration (C-statistic 0.60, calibrationslope 0.67) in the POP cohort, low discrimination in St George’s and ALSPAC cohorts (C-statistic 0.64and 0.66, respectively), and high discrimination (C-statistic 0.84) with a calibration slope of 0.75 in theAberdeen Maternity and Neonatal Databank (AMND) cohort.103,114,161,163
First-trimester clinical and biochemical modelsThe one model (Poon et al., model 21234) with clinical and biochemical markers had an insufficientnumber of pre-eclampsia events (n = 13) to provide adequate validation.
Second-trimester modelsThe only model (Yu et al., model 24238) with second-trimester clinical and ultrasound markers wasvalidated in a single data set (263 events) and showed low C-statistic (0.61) and poor calibration(calibration slope 0.08).
HeterogeneityWhere it was possible to estimate it, heterogeneity across studies varied from small (e.g. models 1, 2and 3 had I2 ≤ 3%, τ2 ≤ 0.002) to large (e.g. models 5 and 6 had I2 ≥ 90%, τ2 ≥ 0.1) for the C-statistic(on the logit scale), and from moderate to large in the calibration slope for two-thirds of all models (17/24).All models validated in multiple IPD data sets had high levels of heterogeneity in calibration-in-the-largeperformance, with the I2 often > 90% (see Table 5).
For the majority of models (67%, 16/24), the summary calibration slope was ≤ 0.7. Although this couldbe a result of chance for some models (95% CIs include 1), it is likely to suggest overfitting in themodel development (as the ideal value is 1, and values < 1 indicate predictions that are too extreme)(Figure 5). The exceptions to this were models 4, 5 and 6 (for any-onset pre-eclampsia) and model 8(for early-onset pre-eclampsia).
Many of the models did not have summary calibration-in-the-large values close to zero, and, even if theaverage is near zero, this could be due to it performing poorly in the individual validation data sets andaveraging out near zero, such as for models 2, 8 and 16.
The predictive performance is likely to be optimistic in small development studies with few pre-eclampsiaevents, and predictor effects will be too large. If not corrected for (e.g. by penalisation/shrinkage methods),this will result in predictions that are too extreme when validated (hence calibration slope < 1); in otherwords, the predictor effects will not be as strong as they were thought to be at model development.
By indicating whether predictions are systematically too high or too low, calibration-in-the-large maysuggest the need for recalibration of the model intercept. There was very large uncertainty in the summaryestimates of calibration-in-the-large for most models, which reflects often small numbers of events andlarge heterogeneity across the individual data sets contributing towards the validation (Figure 6).
EXTERNAL VALIDATION OF EXISTING PRE-ECLAMPSIA PREDICTION MODELS
NIHR Journals Library www.journalslibrary.nihr.ac.uk
34
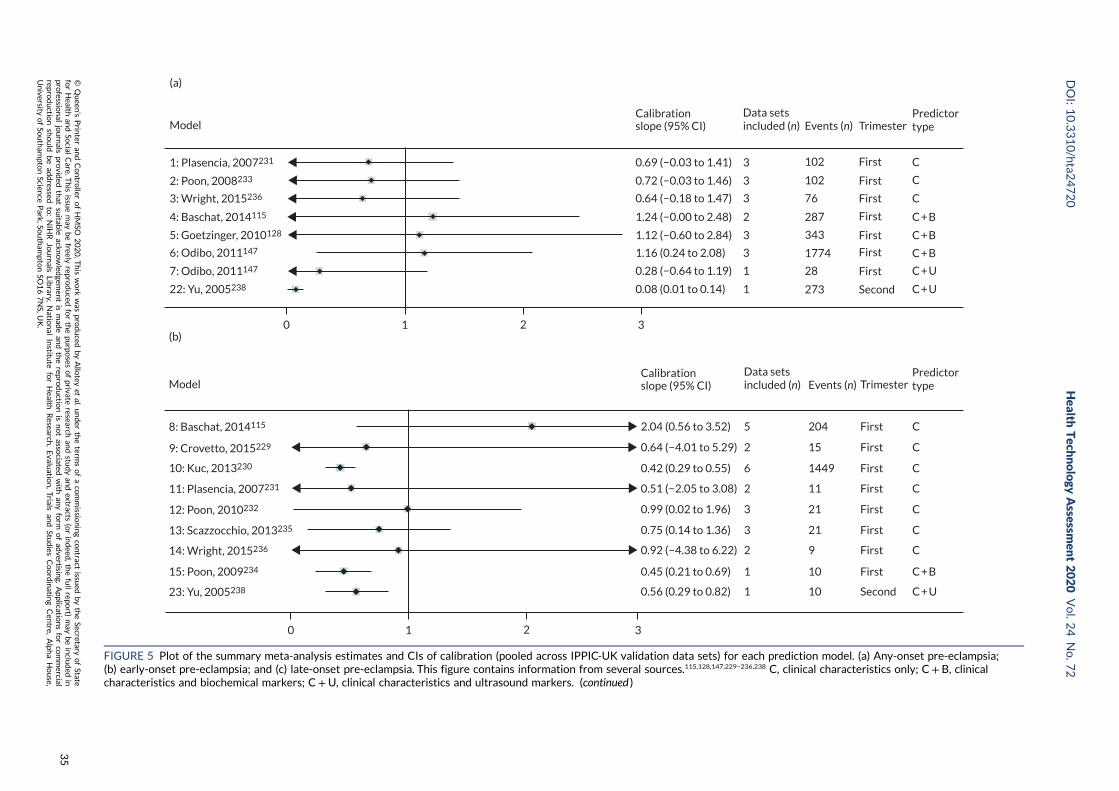
Model
1: Plasencia, 2007231
2: Poon, 2008233
3: Wright, 2015236
4: Baschat, 2014115
5: Goetzinger, 2010128
6: Odibo, 2011147
7: Odibo, 2011147
22: Yu, 2005238
(a)
Events (n) Trimester
C
C
C
C + B
C + B
C + B
C + U
C + U
First
First
First
First
First
First
First
Second
102
102
76
287
343
1774
28
273
0.69 (−0.03 to 1.41) 3
0.72 (−0.03 to 1.46) 3
0.64 (−0.18 to 1.47) 3
1.24 (−0.00 to 2.48) 2
1.12 (−0.60 to 2.84) 3
1.16 (0.24 to 2.08) 3
0.28 (−0.64 to 1.19) 1
0.08 (0.01 to 0.14) 1
0 1 2 3
Calibrationslope (95% CI)
Data setsincluded (n)
Predictortype
8: Baschat, 2014115
9: Crovetto, 2015229
10: Kuc, 2013230
11: Plasencia, 2007231
12: Poon, 2010232
13: Scazzocchio, 2013235
14: Wright, 2015236
15: Poon, 2009234
23: Yu, 2005238
(b)
0 2 31
Events (n) Trimester
C
C
C
C
C
C
C
C + B
C + U
First
First
First
First
First
First
First
First
Second
204
15
1449
11
21
21
9
10
10
Model
2.04 (0.56 to 3.52) 5
0.42 (0.29 to 0.55) 6
0.99 (0.02 to 1.96) 3
0.75 (0.14 to 1.36) 3
0.45 (0.21 to 0.69) 1
0.56 (0.29 to 0.82) 1
0.92 (−4.38 to 6.22) 2
0.64 (−4.01 to 5.29) 2
0.51 (−2.05 to 3.08) 2
Calibrationslope (95% CI)
Data setsincluded (n)
Predictortype
FIGURE 5 Plot of the summary meta-analysis estimates and CIs of calibration (pooled across IPPIC-UK validation data sets) for each prediction model. (a) Any-onset pre-eclampsia;(b) early-onset pre-eclampsia; and (c) late-onset pre-eclampsia. This figure contains information from several sources.115,128,147,229–236,238 C, clinical characteristics only; C + B, clinicalcharacteristics and biochemical markers; C+U, clinical characteristics and ultrasound markers. (continued )
DOI:10.3310/hta2
4720
Health
Tech
nology
Assessm
ent2020
Vol.2
4No.7
2
©Queen
’sPrin
teran
dContro
llerofHMSO
2020.T
his
work
was
produced
byAllo
teyet
al.under
theterm
sofaco
mmissio
ningco
ntract
issued
bytheSecretary
ofState
forHealth
andSo
cialCare.T
his
issuemay
befreely
reproduced
forthepu
rposes
ofprivate
researchan
dstu
dyan
dextracts
(orindeed
,thefullrepo
rt)may
beinclu
ded
inpro
fessional
journals
provid
edthat
suitab
leackn
owled
gemen
tis
mad
ean
dtherepro
ductio
nis
notasso
ciatedwith
anyform
ofad
vertising.
Applicatio
nsforco
mmercial
reproductio
nshould
bead
dressed
to:NIH
RJournals
Library,
Natio
nal
Institu
teforHealth
Research
,Evalu
ation,Trials
and
Studies
Coordinatin
gCen
tre,Alph
aHouse,
University
ofSo
utham
ptonScien
cePark,So
utham
ptonSO
167NS,U
K.
35

16: Crovetto, 2015229
17: Kuc, 2013230
18: Plasencia, 2007231
19: Poon, 2010232
20: Scazzocchio, 2013235
21: Poon, 2009234
24: Yu, 2005238
(c)
10 2 3
Events (n) Trimester
C
C
C
C
C
C + B
C + U
First
First
First
First
First
First
Second
384
5716
90
90
26
13
263
0.56 (−0.01 to 1.12) 5
0.66 (0.50 to 0.82) 8
0.61 (0.04 to 1.18) 3
0.57 (0.08 to 1.05) 3
0.80 (0.26 to 1.34) 1
0.08 (0.01 to 0.15) 1
0.56 (−0.17 to 1.29) 1
ModelCalibrationslope (95% CI)
Data setsincluded (n)
Predictortype
FIGURE 5 Plot of the summary meta-analysis estimates and CIs of calibration (pooled across IPPIC-UK validation data sets) for each prediction model. (a) Any-onset pre-eclampsia;(b) early-onset pre-eclampsia; and (c) late-onset pre-eclampsia. This figure contains information from several sources.115,128,147,229–236,238 C, clinical characteristics only; C + B, clinicalcharacteristics and biochemical markers; C+U, clinical characteristics and ultrasound markers.
EXTERNALVALID
ATIO
NOFEXIST
ING
PRE-ECLA
MPSIA
PREDICTIO
NMODELS
NIH
RJournals
Library
www.jo
urnalslib
rary.nihr.ac.u
k
36
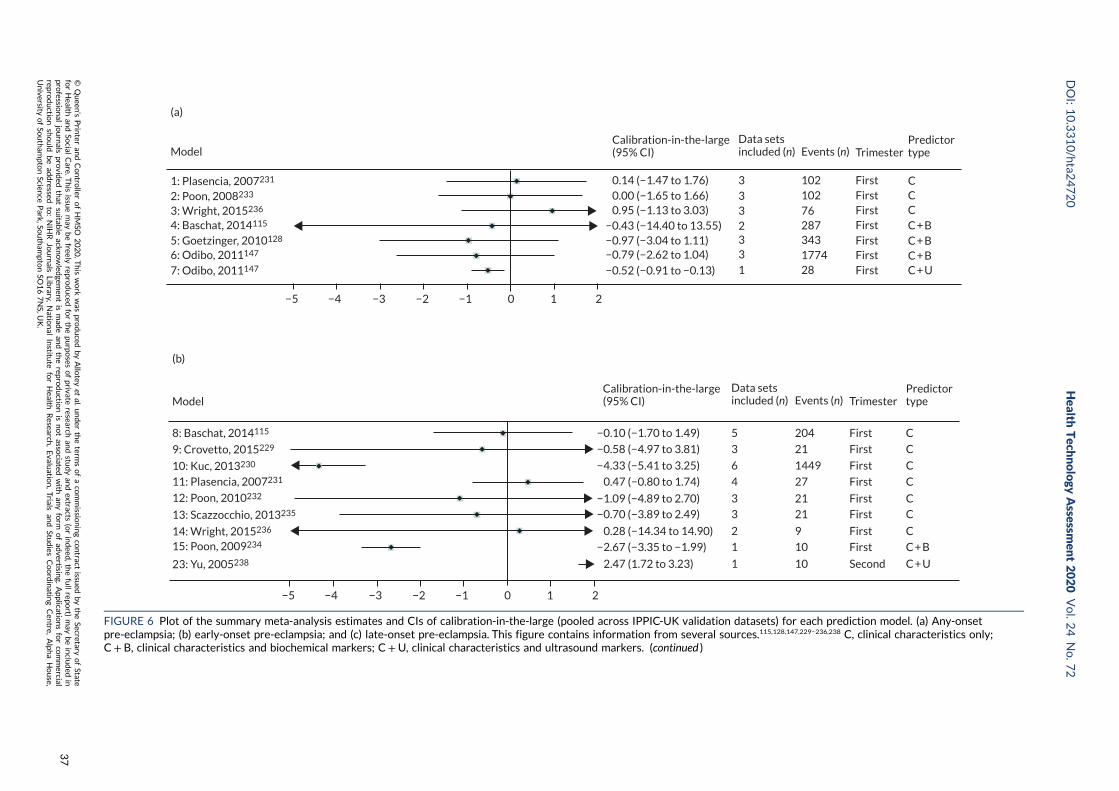
Model
(a)
1: Plasencia, 2007231
2: Poon, 2008233
3: Wright, 2015236
4: Baschat, 2014115
5: Goetzinger, 2010128
6: Odibo, 2011147
7: Odibo, 2011147
Calibration-in-the-large(95% CI)
Data setsincluded (n) Events (n) Trimester
Predictortype
−5 −4 −3 −2 −1 0 1 2
30.14 (−1.47 to 1.76)0.00 (−1.65 to 1.66)0.95 (−1.13 to 3.03)
−0.43 (−14.40 to 13.55)−0.97 (−3.04 to 1.11)−0.79 (−2.62 to 1.04)
−0.52 (−0.91 to −0.13)
102 FirstFirstFirstFirstFirstFirstFirst
10276287343177428
33
33
1
2
CCCC + BC + BC + BC + U
(b)
8: Baschat, 2014115
9: Crovetto, 2015229
10: Kuc, 2013230
11: Plasencia, 2007231
12: Poon, 2010232
13: Scazzocchio, 2013235
14: Wright, 2015236
15: Poon, 2009234
23: Yu, 2005238
Model Events (n) Trimester
C
C
C
C
C
C
C
C + B
C + USecond
First
First
First
First
First
First
First
First204
21
1449
27
21
21
9
10
10
5
3
6
4
3
3
2
1
1
−0.10 (−1.70 to 1.49)
−0.58 (−4.97 to 3.81)
−4.33 (−5.41 to 3.25)
0.47 (−0.80 to 1.74)
0.28 (−14.34 to 14.90)
2.47 (1.72 to 3.23)
−2.67 (−3.35 to −1.99)
−0.70 (−3.89 to 2.49)
−1.09 (−4.89 to 2.70)
−5 −4 −3 −2 −1 0 1 2
Calibration-in-the-large(95% CI)
Data setsincluded (n)
Predictortype
FIGURE 6 Plot of the summary meta-analysis estimates and CIs of calibration-in-the-large (pooled across IPPIC-UK validation datasets) for each prediction model. (a) Any-onsetpre-eclampsia; (b) early-onset pre-eclampsia; and (c) late-onset pre-eclampsia. This figure contains information from several sources.115,128,147,229–236,238 C, clinical characteristics only;C+ B, clinical characteristics and biochemical markers; C +U, clinical characteristics and ultrasound markers. (continued )
DOI:10.3310/hta2
4720
Health
Tech
nology
Assessm
ent2020
Vol.2
4No.7
2
©Queen
’sPrin
teran
dContro
llerofHMSO
2020.T
his
work
was
produced
byAllo
teyet
al.under
theterm
sofaco
mmissio
ningco
ntract
issued
bytheSecretary
ofState
forHealth
andSo
cialCare.T
his
issuemay
befreely
reproduced
forthepu
rposes
ofprivate
researchan
dstu
dyan
dextracts
(orindeed
,thefullrepo
rt)may
beinclu
ded
inpro
fessional
journals
provid
edthat
suitab
leackn
owled
gemen
tis
mad
ean
dtherepro
ductio
nis
notasso
ciatedwith
anyform
ofad
vertising.
Applicatio
nsforco
mmercial
reproductio
nshould
bead
dressed
to:NIH
RJournals
Library,
Natio
nal
Institu
teforHealth
Research
,Evalu
ation,Trials
and
Studies
Coordinatin
gCen
tre,Alph
aHouse,
University
ofSo
utham
ptonScien
cePark,So
utham
ptonSO
167NS,U
K.
37
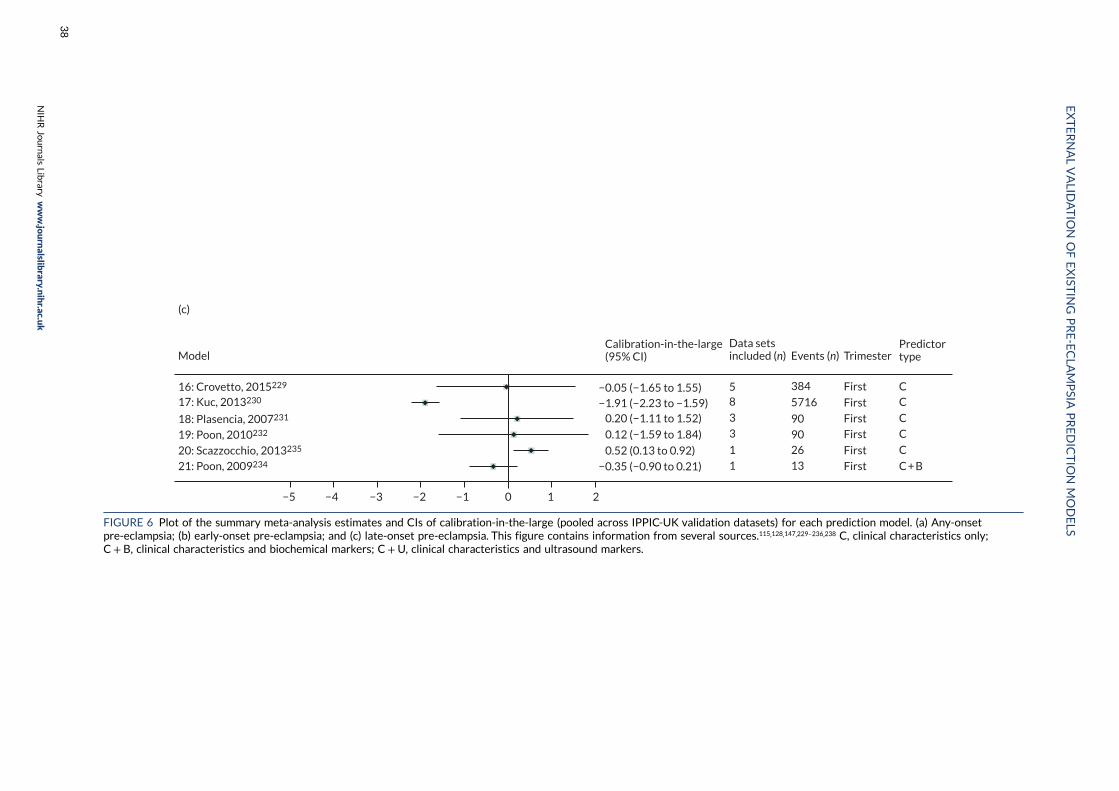
(c)
16: Crovetto, 2015229
17: Kuc, 2013230
18: Plasencia, 2007231
19: Poon, 2010232
20: Scazzocchio, 2013235
21: Poon, 2009234
Model Events (n) Trimester
−5 −4 −3 −2 −1 0 1 2
58
3
3
1
1
384
5716
90
9026
13
First
First
First
First
First
First
CC
C
C
C
C + B
−0.05 (−1.65 to 1.55)−1.91 (−2.23 to −1.59)
0.20 (−1.11 to 1.52)
0.12 (−1.59 to 1.84)
0.52 (0.13 to 0.92)
−0.35 (−0.90 to 0.21)
Calibration-in-the-large(95% CI)
Data setsincluded (n)
Predictortype
FIGURE 6 Plot of the summary meta-analysis estimates and CIs of calibration-in-the-large (pooled across IPPIC-UK validation datasets) for each prediction model. (a) Any-onsetpre-eclampsia; (b) early-onset pre-eclampsia; and (c) late-onset pre-eclampsia. This figure contains information from several sources.115,128,147,229–236,238 C, clinical characteristics only;C+ B, clinical characteristics and biochemical markers; C+U, clinical characteristics and ultrasound markers.
EXTERNALVALID
ATIO
NOFEXIST
ING
PRE-ECLA
MPSIA
PREDICTIO
NMODELS
NIH
RJournals
Library
www.jo
urnalslib
rary.nihr.ac.u
k
38

To illustrate the general concern about poor calibration, calibration plots are presented for modelsvalidated in data sets with > 100 events (Figures 7–9). These clearly show the extent of miscalibration,with predicted outcome risk from the models being far greater than the observed probabilities acrossthe entire range of predicted risk in most cases. For any-onset pre-eclampsia, the exceptions to thisare model 4 (Baschat et al., 2014115) and model 5 (Goetzinger et al., 2010128), when validated in POP(see Figure 7).161 Model 4 and model 5 predictions are too low for those at greatest risk. For early-onsetpre-eclampsia, model 8 (Baschat et al., 2014115), validated in Poston 2006150 (see Figure 8), shows thatpredictions were all very low (all predicted probabilities < 3%) but the observed frequency of eventswas higher (up to around 20%). Model 10 (Kuc et al., 2013230), validated in the St George’s cohort,163
predicted an average of near 50% for the highest risk group; however, their observed risk was stillvery close to zero. For late-onset pre-eclampsia, model 16 (Crovetto et al., 2015229) underpredicted risk,particularly in those at highest risk in POP,161 and model 17 (Kuc et al., 2013230) overpredicted risk inboth St George’s163 and AMND114 (see Figure 9).
Decision curve analysis
Comparisons of models for any-, early- and late-onset pre-eclampsia using decision curve analysis werecarried out in the SCOPE,42 Allen et al.,108 Poston et al. 2015149 and POP161 data sets. Net benefit valuesare often best multiplied by 1000 to reveal the extra number of women who would be correctlytreated per 1000 women who used the model, with none treated incorrectly.
0.0 0.2 0.4 0.6 0.8 1.0
Predicted probability
Ob
serv
ed fr
equ
ency
1.0
0.8
0.6
0.4
0.2
0.0
Reference line (ideal)Risk groups95% ClsLowess smootherOutcome distribution
(a)
10
0.0 0.2 0.4 0.6 0.8 1.0
Predicted probability
Ob
serv
ed fr
equ
ency
1.0
0.8
0.6
0.4
0.2
0.0
Reference line (ideal)Risk groups95% ClsLowess smootherOutcome distribution
(b)
10
0.0 0.2 0.4 0.6 0.8 1.0
Predicted probability
Ob
serv
ed fr
equ
ency
1.0
0.8
0.6
0.4
0.2
0.0
Reference line (ideal)Risk groups95% ClsLowess smootherOutcome distribution
(c)
10
0.0 0.2 0.4 0.6 0.8 1.0
Predicted probability
Ob
serv
ed fr
equ
ency
1.0
0.8
0.6
0.4
0.2
0.0
Reference line (ideal)Risk groups95% ClsLowess smootherOutcome distribution
(d)
10
FIGURE 7 Calibration plots for models predicting any-onset pre-eclampsia using first-trimester clinical characteristicsand biochemical markers in data sets with > 100 outcome events. (a) Model 4115 in POP;161 (b) model 5128 in POP;161
(c) model 6147 in St George’s;163 and (d) model 6147 in POP.161 Reproduced from Snell et al.52 Open Access This articleis licensed under a Creative Commons Attribution 4.0 International License, which permits use, sharing, adaptation,distribution and reproduction in any medium or format, as long as you give appropriate credit to the original author(s)and the source, provide a link to the Creative Commons licence, and indicate if changes were made. The images or otherthird party material in this article are included in the article's Creative Commons licence, unless indicated otherwise in acredit line to the material. If material is not included in the article's Creative Commons licence and your intended use isnot permitted by statutory regulation or exceeds the permitted use, you will need to obtain permission directly from thecopyright holder. To view a copy of this licence, visit http://creativecommons.org/licenses/by/4.0/. The Creative CommonsPublic Domain Dedication waiver (http://creativecommons.org/publicdomain/zero/1.0/) applies to the data made availablein this article, unless otherwise stated in a credit line to the data.
DOI: 10.3310/hta24720 Health Technology Assessment 2020 Vol. 24 No. 72
© Queen’s Printer and Controller of HMSO 2020. This work was produced by Allotey et al. under the terms of a commissioning contract issued by the Secretary of Statefor Health and Social Care. This issue may be freely reproduced for the purposes of private research and study and extracts (or indeed, the full report) may be included inprofessional journals provided that suitable acknowledgement is made and the reproduction is not associated with any form of advertising. Applications for commercialreproduction should be addressed to: NIHR Journals Library, National Institute for Health Research, Evaluation, Trials and Studies Coordinating Centre, Alpha House,University of Southampton Science Park, Southampton SO16 7NS, UK.
39
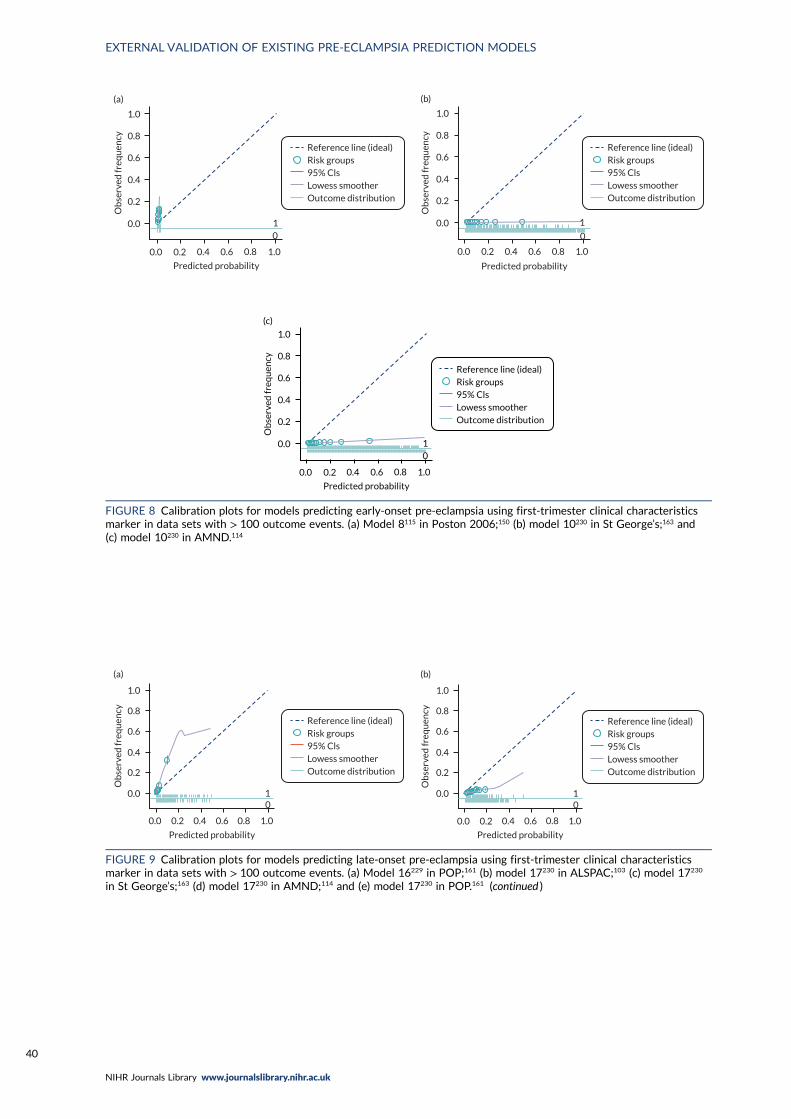
1.0
0.8
0.6
0.4
0.2
0.0
Ob
serv
ed fr
equ
ency
0.0 0.2 0.4 0.6 0.8 1.0
Predicted probability
01
(a)
Reference line (ideal)Risk groups95% ClsLowess smootherOutcome distribution
Predicted probability
1.0
0.8
0.6
0.4
0.2
0.0
Ob
serv
ed fr
equ
ency
0.0 0.2 0.4 0.6 0.8 1.0
(b)
1
0
Reference line (ideal)Risk groups95% ClsLowess smootherOutcome distribution
1.0
0.8
0.6
0.4
0.2
0.0
Ob
serv
ed fr
equ
ency
0.0 0.2 0.4 0.6 0.8 1.0
Predicted probability
1
(c)
0
Reference line (ideal)Risk groups95% ClsLowess smootherOutcome distribution
FIGURE 8 Calibration plots for models predicting early-onset pre-eclampsia using first-trimester clinical characteristicsmarker in data sets with > 100 outcome events. (a) Model 8115 in Poston 2006;150 (b) model 10230 in St George’s;163 and(c) model 10230 in AMND.114
1.0
0.8
0.6
0.4
0.2
0.0
Ob
serv
ed fr
equ
ency
0.0 0.2 0.4 0.6 0.8 1.0
Predicted probability
01
(a)
Reference line (ideal)Risk groups95% ClsLowess smootherOutcome distribution
1.0
0.8
0.6
0.4
0.2
0.0
Ob
serv
ed fr
equ
ency
0.0 0.2 0.4 0.6 0.8 1.0
Predicted probability
01
(b)
Reference line (ideal)Risk groups95% ClsLowess smootherOutcome distribution
FIGURE 9 Calibration plots for models predicting late-onset pre-eclampsia using first-trimester clinical characteristicsmarker in data sets with > 100 outcome events. (a) Model 16229 in POP;161 (b) model 17230 in ALSPAC;103 (c) model 17230
in St George’s;163 (d) model 17230 in AMND;114 and (e) model 17230 in POP.161 (continued )
EXTERNAL VALIDATION OF EXISTING PRE-ECLAMPSIA PREDICTION MODELS
NIHR Journals Library www.journalslibrary.nihr.ac.uk
40
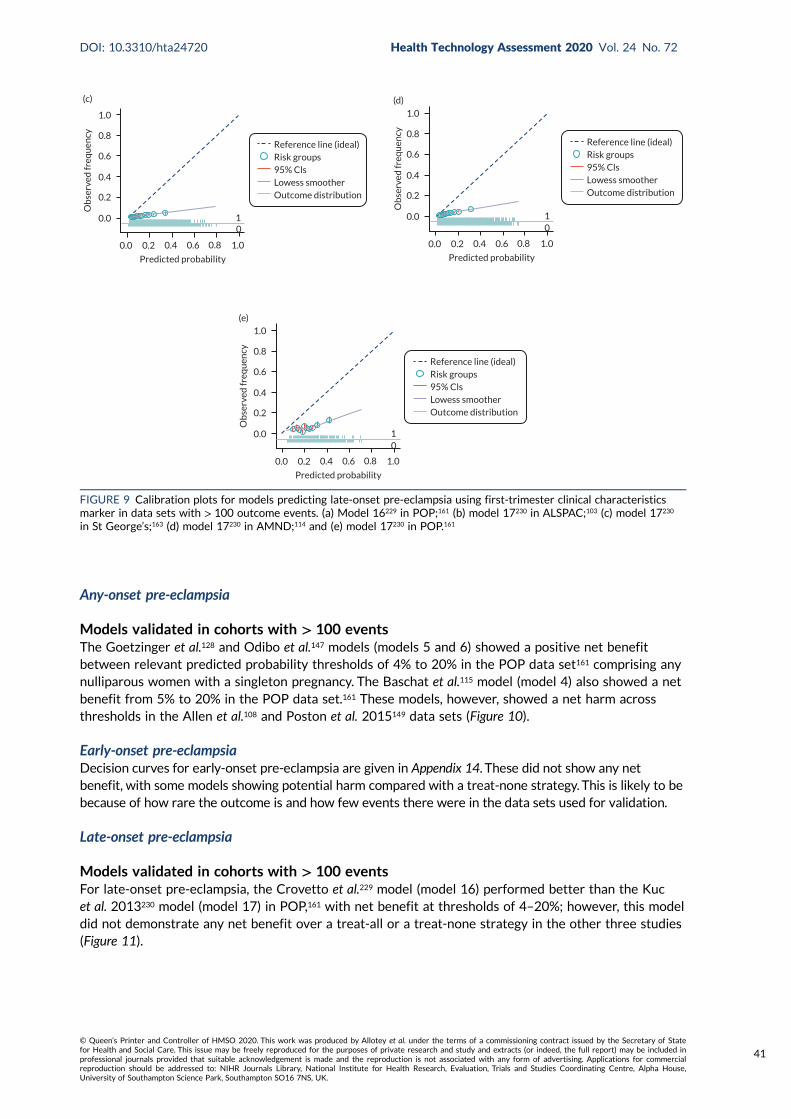
Any-onset pre-eclampsia
Models validated in cohorts with > 100 eventsThe Goetzinger et al.128 and Odibo et al.147 models (models 5 and 6) showed a positive net benefitbetween relevant predicted probability thresholds of 4% to 20% in the POP data set161 comprising anynulliparous women with a singleton pregnancy. The Baschat et al.115 model (model 4) also showed a netbenefit from 5% to 20% in the POP data set.161 These models, however, showed a net harm acrossthresholds in the Allen et al.108 and Poston et al. 2015149 data sets (Figure 10).
Early-onset pre-eclampsiaDecision curves for early-onset pre-eclampsia are given in Appendix 14. These did not show any netbenefit, with some models showing potential harm compared with a treat-none strategy. This is likely to bebecause of how rare the outcome is and how few events there were in the data sets used for validation.
Late-onset pre-eclampsia
Models validated in cohorts with > 100 eventsFor late-onset pre-eclampsia, the Crovetto et al.229 model (model 16) performed better than the Kucet al. 2013230 model (model 17) in POP,161 with net benefit at thresholds of 4–20%; however, this modeldid not demonstrate any net benefit over a treat-all or a treat-none strategy in the other three studies(Figure 11).
1.0
0.8
0.6
0.4
0.2
0.0
Ob
serv
ed fr
equ
ency
0.0 0.2 0.4 0.6 0.8 1.0
Predicted probability
10
(c)
Reference line (ideal)Risk groups95% ClsLowess smootherOutcome distribution
1.0
0.8
0.6
0.4
0.2
0.0
Ob
serv
ed fr
equ
ency
0.0 0.2 0.4 0.6 0.8 1.0
Predicted probability
10
(d)
Reference line (ideal)Risk groups95% ClsLowess smootherOutcome distribution
1.0
0.8
0.6
0.4
0.2
0.0
Ob
serv
ed fr
equ
ency
0.0 0.2 0.4 0.6 0.8 1.0
Predicted probability
10
(e)
Reference line (ideal)Risk groups95% ClsLowess smootherOutcome distribution
FIGURE 9 Calibration plots for models predicting late-onset pre-eclampsia using first-trimester clinical characteristicsmarker in data sets with > 100 outcome events. (a) Model 16229 in POP;161 (b) model 17230 in ALSPAC;103 (c) model 17230
in St George’s;163 (d) model 17230 in AMND;114 and (e) model 17230 in POP.161
DOI: 10.3310/hta24720 Health Technology Assessment 2020 Vol. 24 No. 72
© Queen’s Printer and Controller of HMSO 2020. This work was produced by Allotey et al. under the terms of a commissioning contract issued by the Secretary of Statefor Health and Social Care. This issue may be freely reproduced for the purposes of private research and study and extracts (or indeed, the full report) may be included inprofessional journals provided that suitable acknowledgement is made and the reproduction is not associated with any form of advertising. Applications for commercialreproduction should be addressed to: NIHR Journals Library, National Institute for Health Research, Evaluation, Trials and Studies Coordinating Centre, Alpha House,University of Southampton Science Park, Southampton SO16 7NS, UK.
41
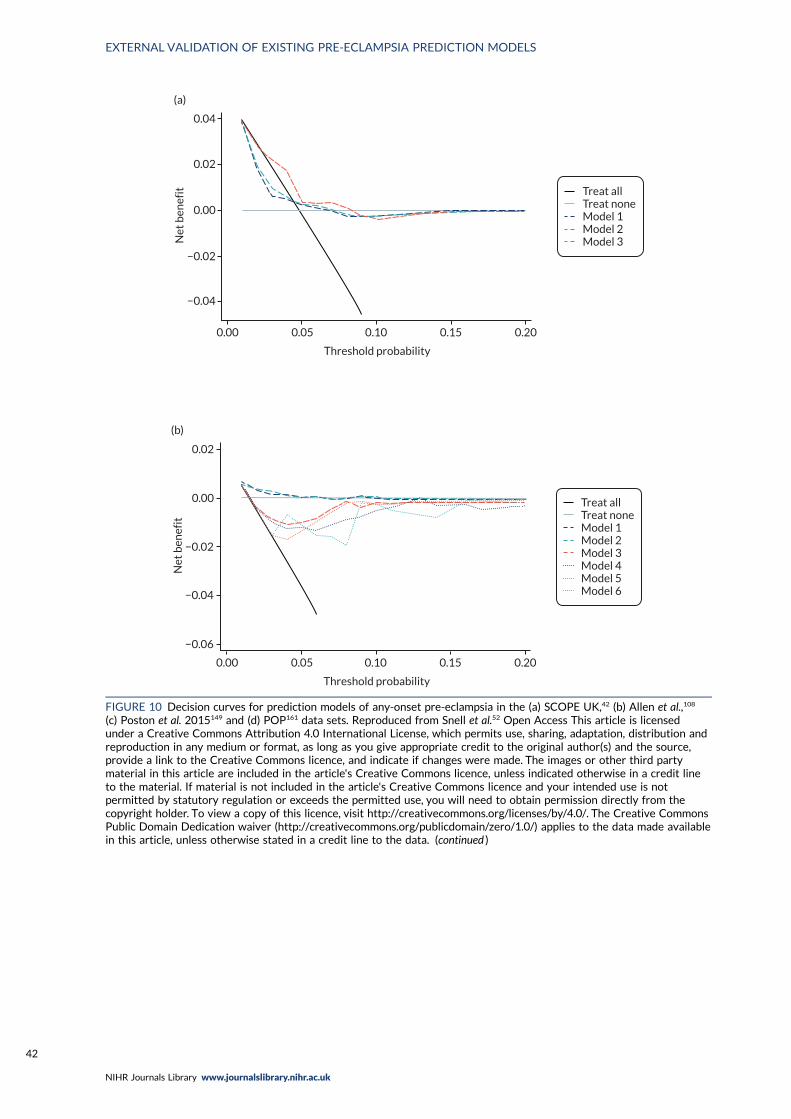
Threshold probability
0.00 0.05 0.10 0.15 0.20
(a)
0.04
0.02
0.00
−0.02
−0.04
Net
ben
efit Treat all
Treat noneModel 1Model 2Model 3
Threshold probability
0.00 0.05 0.10 0.15 0.20
(b)
0.02
0.00
−0.02
−0.04
Net
ben
efit
−0.06
Treat allTreat noneModel 1Model 2Model 3Model 4Model 5Model 6
FIGURE 10 Decision curves for prediction models of any-onset pre-eclampsia in the (a) SCOPE UK,42 (b) Allen et al.,108
(c) Poston et al. 2015149 and (d) POP161 data sets. Reproduced from Snell et al.52 Open Access This article is licensedunder a Creative Commons Attribution 4.0 International License, which permits use, sharing, adaptation, distribution andreproduction in any medium or format, as long as you give appropriate credit to the original author(s) and the source,provide a link to the Creative Commons licence, and indicate if changes were made. The images or other third partymaterial in this article are included in the article's Creative Commons licence, unless indicated otherwise in a credit lineto the material. If material is not included in the article's Creative Commons licence and your intended use is notpermitted by statutory regulation or exceeds the permitted use, you will need to obtain permission directly from thecopyright holder. To view a copy of this licence, visit http://creativecommons.org/licenses/by/4.0/. The Creative CommonsPublic Domain Dedication waiver (http://creativecommons.org/publicdomain/zero/1.0/) applies to the data made availablein this article, unless otherwise stated in a credit line to the data. (continued )
EXTERNAL VALIDATION OF EXISTING PRE-ECLAMPSIA PREDICTION MODELS
NIHR Journals Library www.journalslibrary.nihr.ac.uk
42

0.04
0.02
(c)
0.00
–0.02
–0.04
0.05 0.10 0.15 0.200.00
Net
ben
efit
Threshold probability
Treat allTreat noneModel 1Model 2Model 3Model 5
Threshold probability
0.00 0.05 0.10 0.15 0.20
(d)
0.04
0.02
0.00
−0.02
−0.04
Net
ben
efit
0.06
Treat allTreat noneModel 4Model 5Model 6
FIGURE 10 Decision curves for prediction models of any-onset pre-eclampsia in the (a) SCOPE UK,42 (b) Allen et al.,108
(c) Poston et al. 2015149 and (d) POP161 data sets. Reproduced from Snell et al.52 Open Access This article is licensed undera Creative Commons Attribution 4.0 International License, which permits use, sharing, adaptation, distribution andreproduction in any medium or format, as long as you give appropriate credit to the original author(s) and the source,provide a link to the Creative Commons licence, and indicate if changes were made. The images or other third partymaterial in this article are included in the article's Creative Commons licence, unless indicated otherwise in a credit lineto the material. If material is not included in the article's Creative Commons licence and your intended use is notpermitted by statutory regulation or exceeds the permitted use, you will need to obtain permission directly from thecopyright holder. To view a copy of this licence, visit http://creativecommons.org/licenses/by/4.0/. The Creative CommonsPublic Domain Dedication waiver (http://creativecommons.org/publicdomain/zero/1.0/) applies to the data made availablein this article, unless otherwise stated in a credit line to the data.
DOI: 10.3310/hta24720 Health Technology Assessment 2020 Vol. 24 No. 72
© Queen’s Printer and Controller of HMSO 2020. This work was produced by Allotey et al. under the terms of a commissioning contract issued by the Secretary of Statefor Health and Social Care. This issue may be freely reproduced for the purposes of private research and study and extracts (or indeed, the full report) may be included inprofessional journals provided that suitable acknowledgement is made and the reproduction is not associated with any form of advertising. Applications for commercialreproduction should be addressed to: NIHR Journals Library, National Institute for Health Research, Evaluation, Trials and Studies Coordinating Centre, Alpha House,University of Southampton Science Park, Southampton SO16 7NS, UK.
43
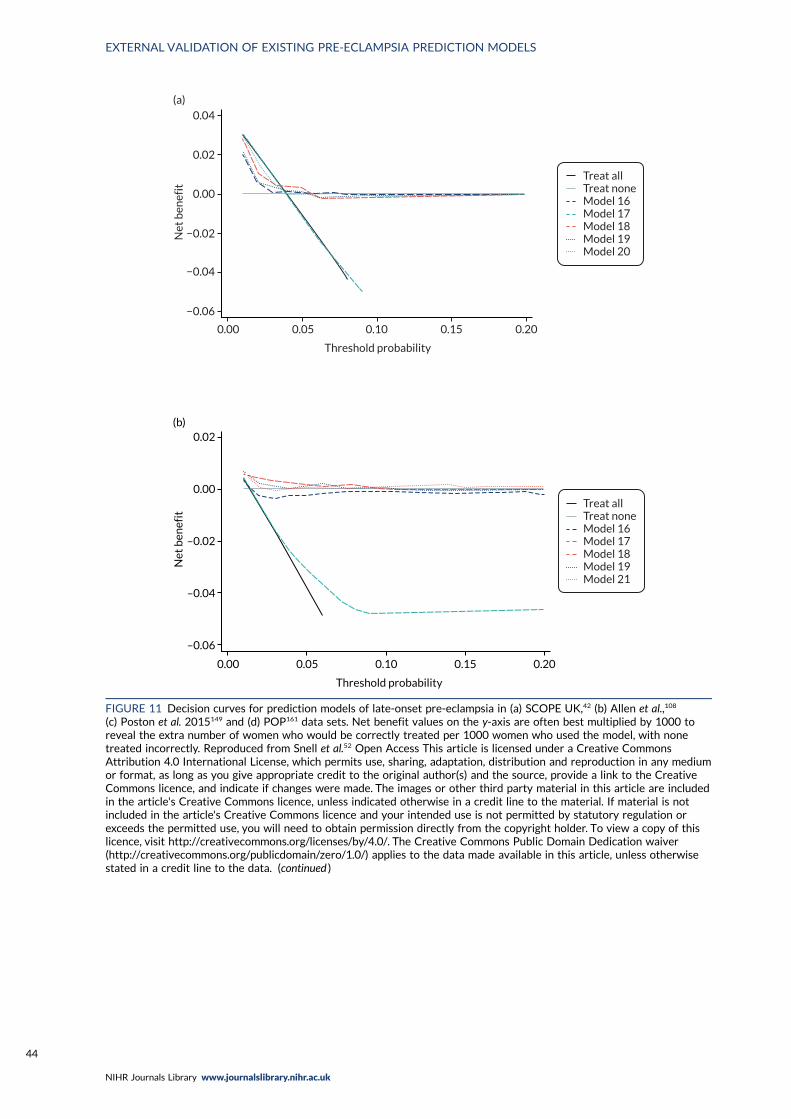
Threshold probability
0.00 0.05 0.10 0.15 0.20
0.04
0.02
0.00
−0.02
−0.04
−0.06
Net
ben
efit
(a)
Treat allTreat noneModel 16Model 17Model 18Model 19Model 20
0.02(b)
0.00
–0.02
–0.04
–0.06
Net
ben
efit
0.00 0.05 0.10 0.15 0.20
Threshold probability
Treat allTreat noneModel 16Model 17Model 18Model 19Model 21
FIGURE 11 Decision curves for prediction models of late-onset pre-eclampsia in (a) SCOPE UK,42 (b) Allen et al.,108
(c) Poston et al. 2015149 and (d) POP161 data sets. Net benefit values on the y-axis are often best multiplied by 1000 toreveal the extra number of women who would be correctly treated per 1000 women who used the model, with nonetreated incorrectly. Reproduced from Snell et al.52 Open Access This article is licensed under a Creative CommonsAttribution 4.0 International License, which permits use, sharing, adaptation, distribution and reproduction in any mediumor format, as long as you give appropriate credit to the original author(s) and the source, provide a link to the CreativeCommons licence, and indicate if changes were made. The images or other third party material in this article are includedin the article's Creative Commons licence, unless indicated otherwise in a credit line to the material. If material is notincluded in the article's Creative Commons licence and your intended use is not permitted by statutory regulation orexceeds the permitted use, you will need to obtain permission directly from the copyright holder. To view a copy of thislicence, visit http://creativecommons.org/licenses/by/4.0/. The Creative Commons Public Domain Dedication waiver(http://creativecommons.org/publicdomain/zero/1.0/) applies to the data made available in this article, unless otherwisestated in a credit line to the data. (continued )
EXTERNAL VALIDATION OF EXISTING PRE-ECLAMPSIA PREDICTION MODELS
NIHR Journals Library www.journalslibrary.nihr.ac.uk
44
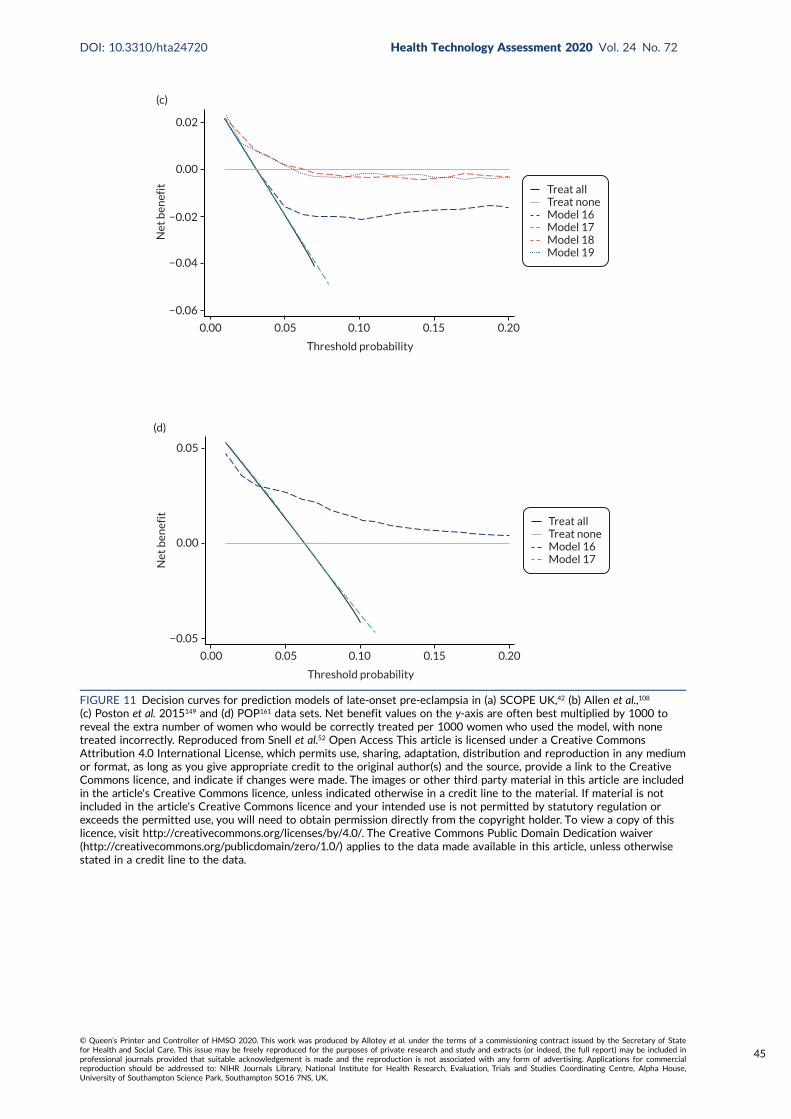
0.02
0.00
−0.02
−0.04
−0.06
Net
ben
efit
Threshold probability
0.00 0.05 0.10 0.15 0.20
(c)
Treat allTreat noneModel 16Model 17Model 18Model 19
Net
ben
efit
−0.05
0.00
0.05
Threshold probability
0.00 0.05 0.10 0.15 0.20
(d)
Treat allTreat noneModel 16Model 17
FIGURE 11 Decision curves for prediction models of late-onset pre-eclampsia in (a) SCOPE UK,42 (b) Allen et al.,108
(c) Poston et al. 2015149 and (d) POP161 data sets. Net benefit values on the y-axis are often best multiplied by 1000 toreveal the extra number of women who would be correctly treated per 1000 women who used the model, with nonetreated incorrectly. Reproduced from Snell et al.52 Open Access This article is licensed under a Creative CommonsAttribution 4.0 International License, which permits use, sharing, adaptation, distribution and reproduction in any mediumor format, as long as you give appropriate credit to the original author(s) and the source, provide a link to the CreativeCommons licence, and indicate if changes were made. The images or other third party material in this article are includedin the article's Creative Commons licence, unless indicated otherwise in a credit line to the material. If material is notincluded in the article's Creative Commons licence and your intended use is not permitted by statutory regulation orexceeds the permitted use, you will need to obtain permission directly from the copyright holder. To view a copy of thislicence, visit http://creativecommons.org/licenses/by/4.0/. The Creative Commons Public Domain Dedication waiver(http://creativecommons.org/publicdomain/zero/1.0/) applies to the data made available in this article, unless otherwisestated in a credit line to the data.
DOI: 10.3310/hta24720 Health Technology Assessment 2020 Vol. 24 No. 72
© Queen’s Printer and Controller of HMSO 2020. This work was produced by Allotey et al. under the terms of a commissioning contract issued by the Secretary of Statefor Health and Social Care. This issue may be freely reproduced for the purposes of private research and study and extracts (or indeed, the full report) may be included inprofessional journals provided that suitable acknowledgement is made and the reproduction is not associated with any form of advertising. Applications for commercialreproduction should be addressed to: NIHR Journals Library, National Institute for Health Research, Evaluation, Trials and Studies Coordinating Centre, Alpha House,University of Southampton Science Park, Southampton SO16 7NS, UK.
45
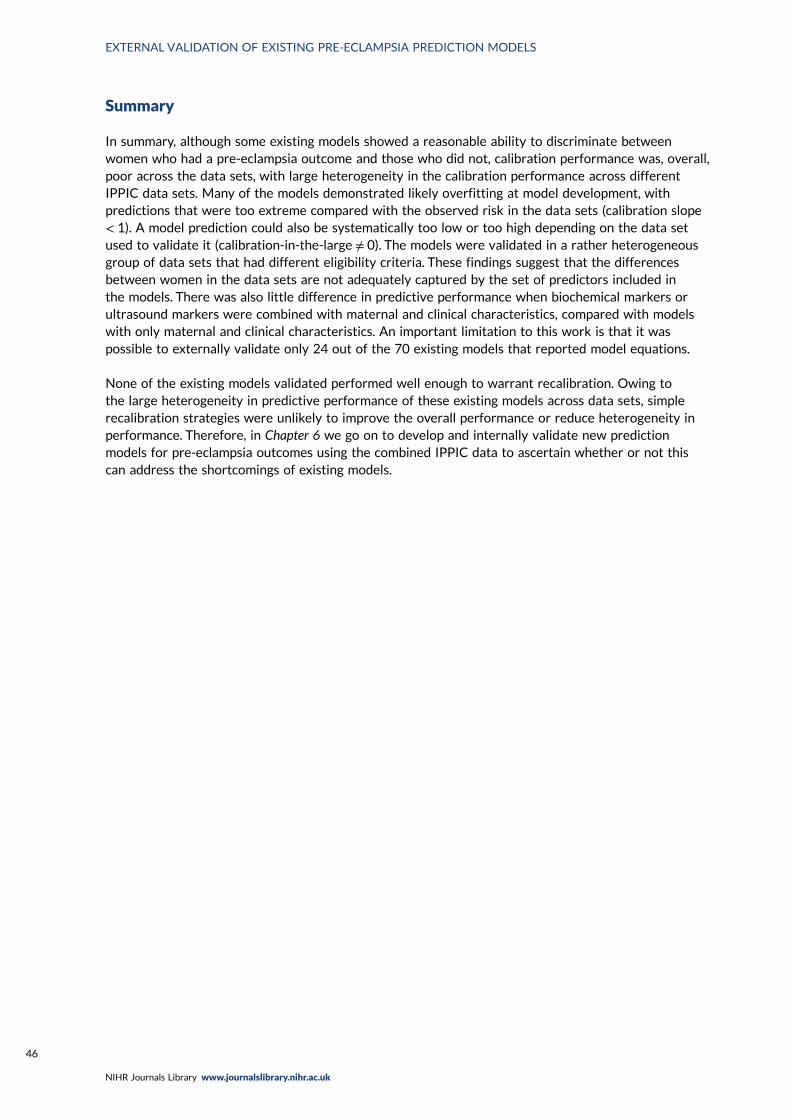
Summary
In summary, although some existing models showed a reasonable ability to discriminate betweenwomen who had a pre-eclampsia outcome and those who did not, calibration performance was, overall,poor across the data sets, with large heterogeneity in the calibration performance across differentIPPIC data sets. Many of the models demonstrated likely overfitting at model development, withpredictions that were too extreme compared with the observed risk in the data sets (calibration slope< 1). A model prediction could also be systematically too low or too high depending on the data setused to validate it (calibration-in-the-large ≠ 0). The models were validated in a rather heterogeneousgroup of data sets that had different eligibility criteria. These findings suggest that the differencesbetween women in the data sets are not adequately captured by the set of predictors included inthe models. There was also little difference in predictive performance when biochemical markers orultrasound markers were combined with maternal and clinical characteristics, compared with modelswith only maternal and clinical characteristics. An important limitation to this work is that it waspossible to externally validate only 24 out of the 70 existing models that reported model equations.
None of the existing models validated performed well enough to warrant recalibration. Owing tothe large heterogeneity in predictive performance of these existing models across data sets, simplerecalibration strategies were unlikely to improve the overall performance or reduce heterogeneity inperformance. Therefore, in Chapter 6 we go on to develop and internally validate new predictionmodels for pre-eclampsia outcomes using the combined IPPIC data to ascertain whether or not thiscan address the shortcomings of existing models.
EXTERNAL VALIDATION OF EXISTING PRE-ECLAMPSIA PREDICTION MODELS
NIHR Journals Library www.journalslibrary.nihr.ac.uk
46
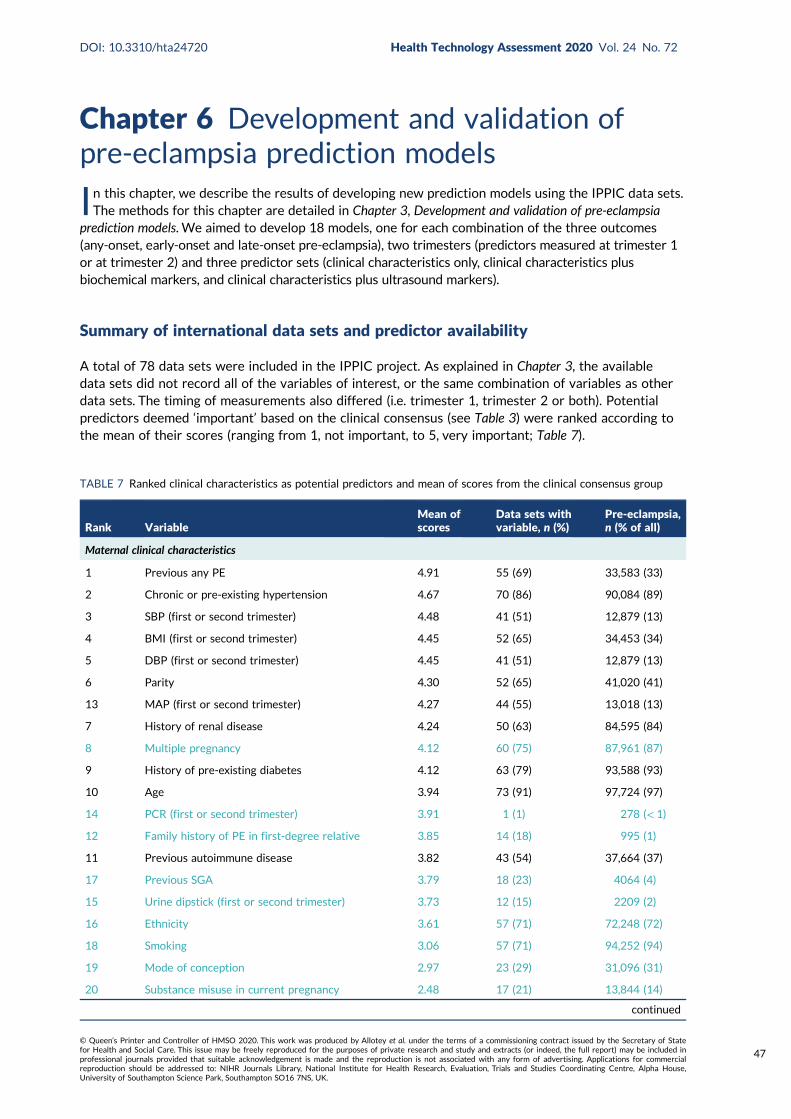
Chapter 6 Development and validation ofpre-eclampsia prediction models
In this chapter, we describe the results of developing new prediction models using the IPPIC data sets.The methods for this chapter are detailed in Chapter 3, Development and validation of pre-eclampsia
prediction models. We aimed to develop 18 models, one for each combination of the three outcomes(any-onset, early-onset and late-onset pre-eclampsia), two trimesters (predictors measured at trimester 1or at trimester 2) and three predictor sets (clinical characteristics only, clinical characteristics plusbiochemical markers, and clinical characteristics plus ultrasound markers).
Summary of international data sets and predictor availability
A total of 78 data sets were included in the IPPIC project. As explained in Chapter 3, the availabledata sets did not record all of the variables of interest, or the same combination of variables as otherdata sets. The timing of measurements also differed (i.e. trimester 1, trimester 2 or both). Potentialpredictors deemed ‘important’ based on the clinical consensus (see Table 3) were ranked according tothe mean of their scores (ranging from 1, not important, to 5, very important; Table 7).
TABLE 7 Ranked clinical characteristics as potential predictors and mean of scores from the clinical consensus group
Rank VariableMean ofscores
Data sets withvariable, n (%)
Pre-eclampsia,n (% of all)
Maternal clinical characteristics
1 Previous any PE 4.91 55 (69) 33,583 (33)
2 Chronic or pre-existing hypertension 4.67 70 (86) 90,084 (89)
3 SBP (first or second trimester) 4.48 41 (51) 12,879 (13)
4 BMI (first or second trimester) 4.45 52 (65) 34,453 (34)
5 DBP (first or second trimester) 4.45 41 (51) 12,879 (13)
6 Parity 4.30 52 (65) 41,020 (41)
13 MAP (first or second trimester) 4.27 44 (55) 13,018 (13)
7 History of renal disease 4.24 50 (63) 84,595 (84)
8 Multiple pregnancy 4.12 60 (75) 87,961 (87)
9 History of pre-existing diabetes 4.12 63 (79) 93,588 (93)
10 Age 3.94 73 (91) 97,724 (97)
14 PCR (first or second trimester) 3.91 1 (1) 278 (< 1)
12 Family history of PE in first-degree relative 3.85 14 (18) 995 (1)
11 Previous autoimmune disease 3.82 43 (54) 37,664 (37)
17 Previous SGA 3.79 18 (23) 4064 (4)
15 Urine dipstick (first or second trimester) 3.73 12 (15) 2209 (2)
16 Ethnicity 3.61 57 (71) 72,248 (72)
18 Smoking 3.06 57 (71) 94,252 (94)
19 Mode of conception 2.97 23 (29) 31,096 (31)
20 Substance misuse in current pregnancy 2.48 17 (21) 13,844 (14)
continued
DOI: 10.3310/hta24720 Health Technology Assessment 2020 Vol. 24 No. 72
© Queen’s Printer and Controller of HMSO 2020. This work was produced by Allotey et al. under the terms of a commissioning contract issued by the Secretary of Statefor Health and Social Care. This issue may be freely reproduced for the purposes of private research and study and extracts (or indeed, the full report) may be included inprofessional journals provided that suitable acknowledgement is made and the reproduction is not associated with any form of advertising. Applications for commercialreproduction should be addressed to: NIHR Journals Library, National Institute for Health Research, Evaluation, Trials and Studies Coordinating Centre, Alpha House,University of Southampton Science Park, Southampton SO16 7NS, UK.
47
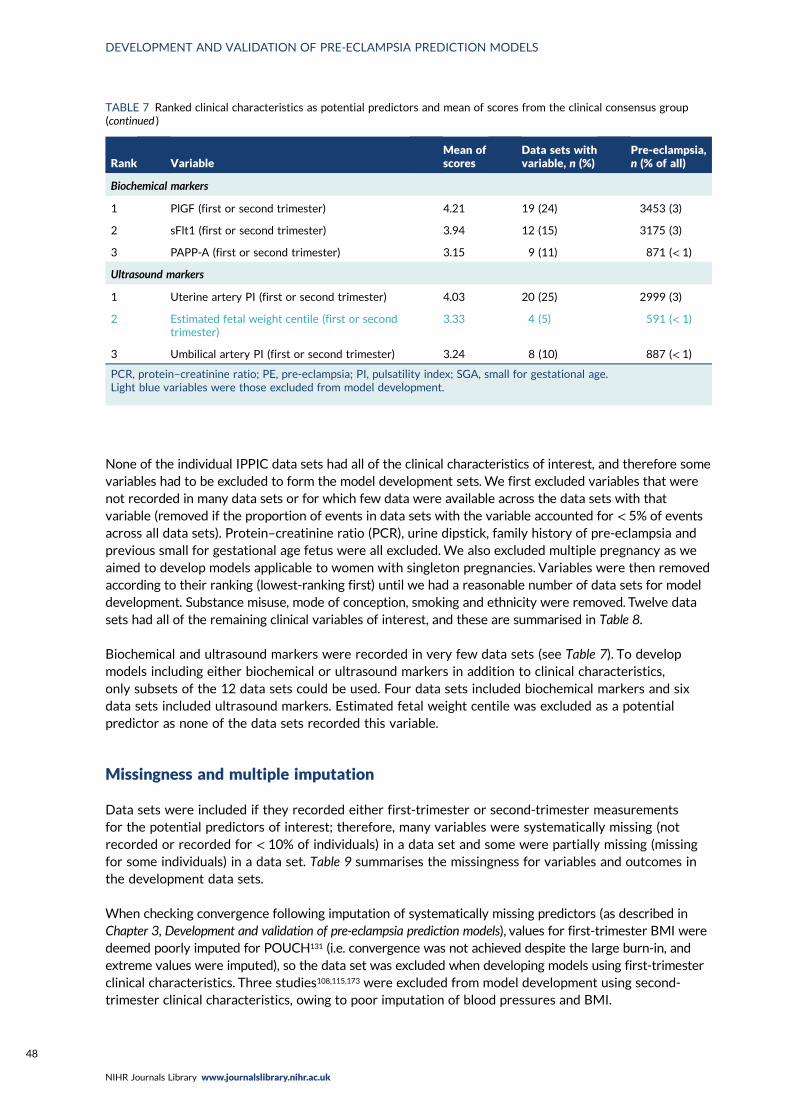
None of the individual IPPIC data sets had all of the clinical characteristics of interest, and therefore somevariables had to be excluded to form the model development sets. We first excluded variables that werenot recorded in many data sets or for which few data were available across the data sets with thatvariable (removed if the proportion of events in data sets with the variable accounted for < 5% of eventsacross all data sets). Protein–creatinine ratio (PCR), urine dipstick, family history of pre-eclampsia andprevious small for gestational age fetus were all excluded. We also excluded multiple pregnancy as weaimed to develop models applicable to women with singleton pregnancies. Variables were then removedaccording to their ranking (lowest-ranking first) until we had a reasonable number of data sets for modeldevelopment. Substance misuse, mode of conception, smoking and ethnicity were removed. Twelve datasets had all of the remaining clinical variables of interest, and these are summarised in Table 8.
Biochemical and ultrasound markers were recorded in very few data sets (see Table 7). To developmodels including either biochemical or ultrasound markers in addition to clinical characteristics,only subsets of the 12 data sets could be used. Four data sets included biochemical markers and sixdata sets included ultrasound markers. Estimated fetal weight centile was excluded as a potentialpredictor as none of the data sets recorded this variable.
Missingness and multiple imputation
Data sets were included if they recorded either first-trimester or second-trimester measurementsfor the potential predictors of interest; therefore, many variables were systematically missing (notrecorded or recorded for < 10% of individuals) in a data set and some were partially missing (missingfor some individuals) in a data set. Table 9 summarises the missingness for variables and outcomes inthe development data sets.
When checking convergence following imputation of systematically missing predictors (as described inChapter 3, Development and validation of pre-eclampsia prediction models), values for first-trimester BMI weredeemed poorly imputed for POUCH131 (i.e. convergence was not achieved despite the large burn-in, andextreme values were imputed), so the data set was excluded when developing models using first-trimesterclinical characteristics. Three studies108,115,173 were excluded from model development using second-trimester clinical characteristics, owing to poor imputation of blood pressures and BMI.
TABLE 7 Ranked clinical characteristics as potential predictors and mean of scores from the clinical consensus group(continued )
Rank VariableMean ofscores
Data sets withvariable, n (%)
Pre-eclampsia,n (% of all)
Biochemical markers
1 PlGF (first or second trimester) 4.21 19 (24) 3453 (3)
2 sFlt1 (first or second trimester) 3.94 12 (15) 3175 (3)
3 PAPP-A (first or second trimester) 3.15 9 (11) 871 (< 1)
Ultrasound markers
1 Uterine artery PI (first or second trimester) 4.03 20 (25) 2999 (3)
2 Estimated fetal weight centile (first or secondtrimester)
3.33 4 (5) 591 (< 1)
3 Umbilical artery PI (first or second trimester) 3.24 8 (10) 887 (< 1)
PCR, protein–creatinine ratio; PE, pre-eclampsia; PI, pulsatility index; SGA, small for gestational age.Light blue variables were those excluded from model development.
DEVELOPMENT AND VALIDATION OF PRE-ECLAMPSIA PREDICTION MODELS
NIHR Journals Library www.journalslibrary.nihr.ac.uk
48
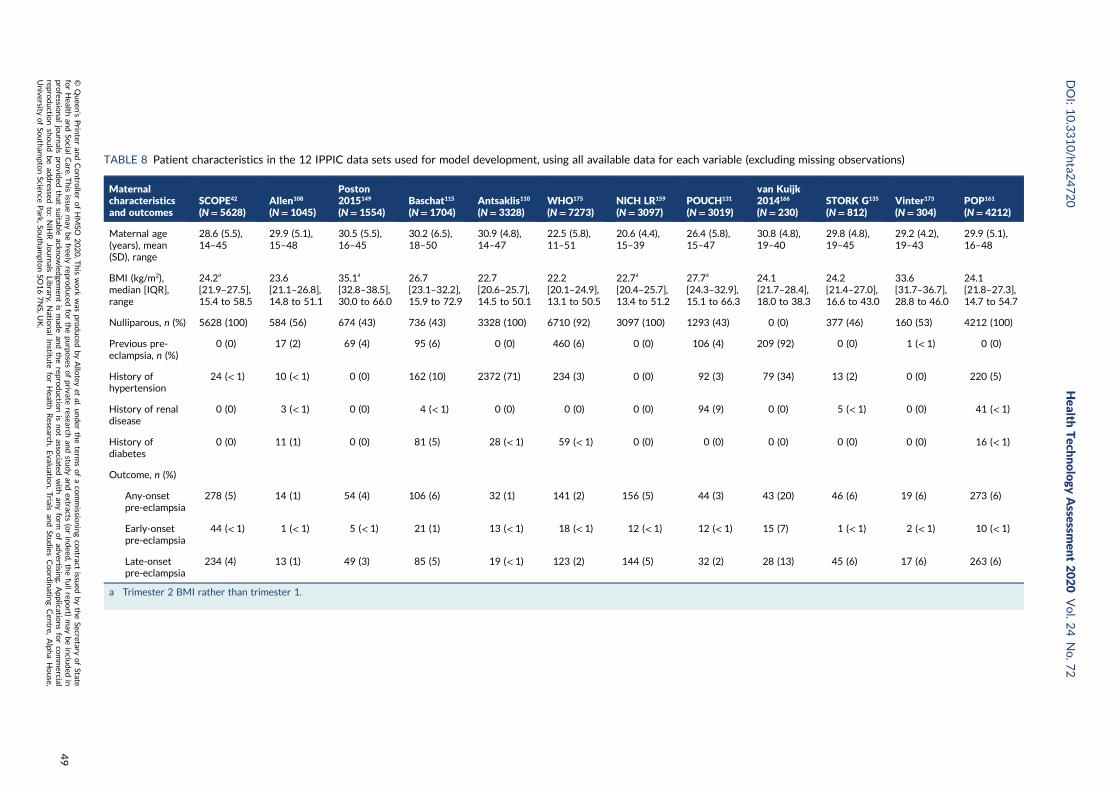
TABLE 8 Patient characteristics in the 12 IPPIC data sets used for model development, using all available data for each variable (excluding missing observations)
Maternalcharacteristicsand outcomes
SCOPE42
(N= 5628)Allen108
(N= 1045)
Poston2015149
(N= 1554)Baschat115
(N= 1704)Antsaklis110
(N= 3328)WHO175
(N= 7273)NICH LR159
(N= 3097)POUCH131
(N= 3019)
van Kuijk2014166
(N= 230)STORK G135
(N= 812)Vinter173
(N= 304)POP161
(N= 4212)
Maternal age(years), mean(SD), range
28.6 (5.5),14–45
29.9 (5.1),15–48
30.5 (5.5),16–45
30.2 (6.5),18–50
30.9 (4.8),14–47
22.5 (5.8),11–51
20.6 (4.4),15–39
26.4 (5.8),15–47
30.8 (4.8),19–40
29.8 (4.8),19–45
29.2 (4.2),19–43
29.9 (5.1),16–48
BMI (kg/m2),median [IQR],range
24.2a
[21.9–27.5],15.4 to 58.5
23.6[21.1–26.8],14.8 to 51.1
35.1a
[32.8–38.5],30.0 to 66.0
26.7[23.1–32.2],15.9 to 72.9
22.7[20.6–25.7],14.5 to 50.1
22.2[20.1–24.9],13.1 to 50.5
22.7a
[20.4–25.7],13.4 to 51.2
27.7a
[24.3–32.9],15.1 to 66.3
24.1[21.7–28.4],18.0 to 38.3
24.2[21.4–27.0],16.6 to 43.0
33.6[31.7–36.7],28.8 to 46.0
24.1[21.8–27.3],14.7 to 54.7
Nulliparous, n (%) 5628 (100) 584 (56) 674 (43) 736 (43) 3328 (100) 6710 (92) 3097 (100) 1293 (43) 0 (0) 377 (46) 160 (53) 4212 (100)
Previous pre-eclampsia, n (%)
0 (0) 17 (2) 69 (4) 95 (6) 0 (0) 460 (6) 0 (0) 106 (4) 209 (92) 0 (0) 1 (< 1) 0 (0)
History ofhypertension
24 (< 1) 10 (< 1) 0 (0) 162 (10) 2372 (71) 234 (3) 0 (0) 92 (3) 79 (34) 13 (2) 0 (0) 220 (5)
History of renaldisease
0 (0) 3 (< 1) 0 (0) 4 (< 1) 0 (0) 0 (0) 0 (0) 94 (9) 0 (0) 5 (< 1) 0 (0) 41 (< 1)
History ofdiabetes
0 (0) 11 (1) 0 (0) 81 (5) 28 (< 1) 59 (< 1) 0 (0) 0 (0) 0 (0) 0 (0) 0 (0) 16 (< 1)
Outcome, n (%)
Any-onsetpre-eclampsia
278 (5) 14 (1) 54 (4) 106 (6) 32 (1) 141 (2) 156 (5) 44 (3) 43 (20) 46 (6) 19 (6) 273 (6)
Early-onsetpre-eclampsia
44 (< 1) 1 (< 1) 5 (< 1) 21 (1) 13 (< 1) 18 (< 1) 12 (< 1) 12 (< 1) 15 (7) 1 (< 1) 2 (< 1) 10 (< 1)
Late-onsetpre-eclampsia
234 (4) 13 (1) 49 (3) 85 (5) 19 (< 1) 123 (2) 144 (5) 32 (2) 28 (13) 45 (6) 17 (6) 263 (6)
a Trimester 2 BMI rather than trimester 1.
DOI:10.3310/hta2
4720
Health
Tech
nology
Assessm
ent2020
Vol.2
4No.7
2
©Queen
’sPrin
teran
dContro
llerofHMSO
2020.T
his
work
was
produced
byAllo
teyet
al.under
theterm
sofaco
mmissio
ningco
ntract
issued
bytheSecretary
ofState
forHealth
andSo
cialCare.T
his
issuemay
befreely
reproduced
forthepu
rposes
ofprivate
researchan
dstu
dyan
dextracts
(orindeed
,thefullrepo
rt)may
beinclu
ded
inpro
fessional
journals
provid
edthat
suitab
leackn
owled
gemen
tis
mad
ean
dtherepro
ductio
nis
notasso
ciatedwith
anyform
ofad
vertising.
Applicatio
nsforco
mmercial
reproductio
nshould
bead
dressed
to:NIH
RJournals
Library,
Natio
nal
Institu
teforHealth
Research
,Evalu
ation,Trials
and
Studies
Coordinatin
gCen
tre,Alph
aHouse,
University
ofSo
utham
ptonScien
cePark,So
utham
ptonSO
167NS,U
K.
49
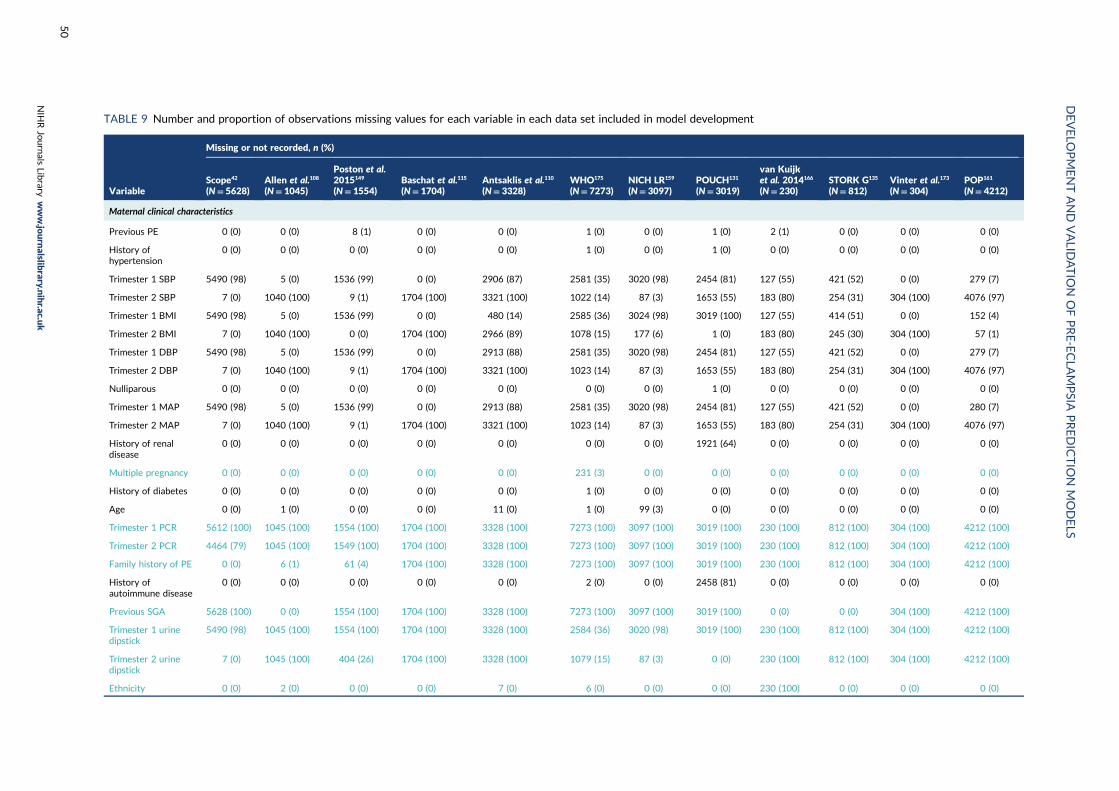
TABLE 9 Number and proportion of observations missing values for each variable in each data set included in model development
Variable
Missing or not recorded, n (%)
Scope42
(N= 5628)Allen et al.108
(N= 1045)
Poston et al.2015149
(N= 1554)Baschat et al.115
(N= 1704)Antsaklis et al.110
(N= 3328)WHO175
(N= 7273)NICH LR159
(N= 3097)POUCH131
(N= 3019)
van Kuijket al. 2014166
(N= 230)STORK G135
(N= 812)Vinter et al.173
(N= 304)POP161
(N= 4212)
Maternal clinical characteristics
Previous PE 0 (0) 0 (0) 8 (1) 0 (0) 0 (0) 1 (0) 0 (0) 1 (0) 2 (1) 0 (0) 0 (0) 0 (0)
History ofhypertension
0 (0) 0 (0) 0 (0) 0 (0) 0 (0) 1 (0) 0 (0) 1 (0) 0 (0) 0 (0) 0 (0) 0 (0)
Trimester 1 SBP 5490 (98) 5 (0) 1536 (99) 0 (0) 2906 (87) 2581 (35) 3020 (98) 2454 (81) 127 (55) 421 (52) 0 (0) 279 (7)
Trimester 2 SBP 7 (0) 1040 (100) 9 (1) 1704 (100) 3321 (100) 1022 (14) 87 (3) 1653 (55) 183 (80) 254 (31) 304 (100) 4076 (97)
Trimester 1 BMI 5490 (98) 5 (0) 1536 (99) 0 (0) 480 (14) 2585 (36) 3024 (98) 3019 (100) 127 (55) 414 (51) 0 (0) 152 (4)
Trimester 2 BMI 7 (0) 1040 (100) 0 (0) 1704 (100) 2966 (89) 1078 (15) 177 (6) 1 (0) 183 (80) 245 (30) 304 (100) 57 (1)
Trimester 1 DBP 5490 (98) 5 (0) 1536 (99) 0 (0) 2913 (88) 2581 (35) 3020 (98) 2454 (81) 127 (55) 421 (52) 0 (0) 279 (7)
Trimester 2 DBP 7 (0) 1040 (100) 9 (1) 1704 (100) 3321 (100) 1023 (14) 87 (3) 1653 (55) 183 (80) 254 (31) 304 (100) 4076 (97)
Nulliparous 0 (0) 0 (0) 0 (0) 0 (0) 0 (0) 0 (0) 0 (0) 1 (0) 0 (0) 0 (0) 0 (0) 0 (0)
Trimester 1 MAP 5490 (98) 5 (0) 1536 (99) 0 (0) 2913 (88) 2581 (35) 3020 (98) 2454 (81) 127 (55) 421 (52) 0 (0) 280 (7)
Trimester 2 MAP 7 (0) 1040 (100) 9 (1) 1704 (100) 3321 (100) 1023 (14) 87 (3) 1653 (55) 183 (80) 254 (31) 304 (100) 4076 (97)
History of renaldisease
0 (0) 0 (0) 0 (0) 0 (0) 0 (0) 0 (0) 0 (0) 1921 (64) 0 (0) 0 (0) 0 (0) 0 (0)
Multiple pregnancy 0 (0) 0 (0) 0 (0) 0 (0) 0 (0) 231 (3) 0 (0) 0 (0) 0 (0) 0 (0) 0 (0) 0 (0)
History of diabetes 0 (0) 0 (0) 0 (0) 0 (0) 0 (0) 1 (0) 0 (0) 0 (0) 0 (0) 0 (0) 0 (0) 0 (0)
Age 0 (0) 1 (0) 0 (0) 0 (0) 11 (0) 1 (0) 99 (3) 0 (0) 0 (0) 0 (0) 0 (0) 0 (0)
Trimester 1 PCR 5612 (100) 1045 (100) 1554 (100) 1704 (100) 3328 (100) 7273 (100) 3097 (100) 3019 (100) 230 (100) 812 (100) 304 (100) 4212 (100)
Trimester 2 PCR 4464 (79) 1045 (100) 1549 (100) 1704 (100) 3328 (100) 7273 (100) 3097 (100) 3019 (100) 230 (100) 812 (100) 304 (100) 4212 (100)
Family history of PE 0 (0) 6 (1) 61 (4) 1704 (100) 3328 (100) 7273 (100) 3097 (100) 3019 (100) 230 (100) 812 (100) 304 (100) 4212 (100)
History ofautoimmune disease
0 (0) 0 (0) 0 (0) 0 (0) 0 (0) 2 (0) 0 (0) 2458 (81) 0 (0) 0 (0) 0 (0) 0 (0)
Previous SGA 5628 (100) 0 (0) 1554 (100) 1704 (100) 3328 (100) 7273 (100) 3097 (100) 3019 (100) 0 (0) 0 (0) 304 (100) 4212 (100)
Trimester 1 urinedipstick
5490 (98) 1045 (100) 1554 (100) 1704 (100) 3328 (100) 2584 (36) 3020 (98) 3019 (100) 230 (100) 812 (100) 304 (100) 4212 (100)
Trimester 2 urinedipstick
7 (0) 1045 (100) 404 (26) 1704 (100) 3328 (100) 1079 (15) 87 (3) 0 (0) 230 (100) 812 (100) 304 (100) 4212 (100)
Ethnicity 0 (0) 2 (0) 0 (0) 0 (0) 7 (0) 6 (0) 0 (0) 0 (0) 230 (100) 0 (0) 0 (0) 0 (0)
DEVELO
PMENTAND
VALID
ATIO
NOFPRE-ECLA
MPSIA
PREDICTIO
NMODELS
NIH
RJournals
Library
www.jo
urnalslib
rary.nihr.ac.u
k
50

Variable
Missing or not recorded, n (%)
Scope42
(N= 5628)Allen et al.108
(N= 1045)
Poston et al.2015149
(N= 1554)Baschat et al.115
(N= 1704)Antsaklis et al.110
(N= 3328)WHO175
(N= 7273)NICH LR159
(N= 3097)POUCH131
(N= 3019)
van Kuijket al. 2014166
(N= 230)STORK G135
(N= 812)Vinter et al.173
(N= 304)POP161
(N= 4212)
Smoking 0 (0) 0 (0) 0 (0) 0 (0) 6 (0) 2 (0) 6 (0) 6 (0) 230 (100) 0 (0) 0 (0) 0 (0)
Spontaneousconception
0 (0) 0 (0) 4 (0) 0 (0) 3328 (100) 7273 (100) 3097 (100) 3019 (100) 20 (9) 0 (0) 304 (100) 0 (0)
Substance misuse 0 (0) 0 (0) 1554 (100) 0 (0) 3328 (100) 7273 (100) 3097 (100) 7 (0) 230 (100) 812 (100) 304 (100) 4212 (100)
Biochemical markers
Trimester 1 PlGF 5628 (100) 5 (0) 1554 (100) 704 (41) 3328 (100) 4842 (67) 3097 (100) 3019 (100) 230 (100) 812 (100) 304 (100) 135 (3)
Trimester 2 PlGF 51 (1) 966 (92) 445 (29) 1704 (100) 3328 (100) 4026 (55) 3097 (100) 1715 (57) 230 (100) 812 (100) 304 (100) 191 (5)
Trimester 1 sFlt-1 5628 (100) 1045 (100) 1554 (100) 1704 (100) 3328 (100) 4989 (69) 3097 (100) 3019 (100) 230 (100) 812 (100) 304 (100) 134 (3)
Trimester 2 sFlt-1 48 (1) 1045 (100) 1554 (100) 1704 (100) 3328 (100) 4125 (57) 3097 (100) 1712 (57) 230 (100) 812 (100) 304 (100) 191 (5)
Trimester 1 PAPP-A 5628 (100) 119 (11) 1554 (100) 704 (41) 3328 (100) 7273 (100) 3097 (100) 3019 (100) 230 (100) 812 (100) 304 (100) 134 (3)
Trimester 2 PAPP-A 48 (1) 1040 (100) 1554 (100) 1704 (100) 3328 (100) 7273 (100) 3097 (100) 3019 (100) 230 (100) 812 (100) 304 (100) 4212 (100)
Ultrasound markers
Trimester 1 uterineartery PI
5628 (100) 5 (0) 1554 (100) 266 (16) 2895 (87) 7273 (100) 3097 (100) 3019 (100) 230 (100) 812 (100) 304 (100) 4212 (100)
Trimester 2 uterineartery PI
5628 (100) 1040 (100) 1554 (100) 1704 (100) 3204 (96) 7273 (100) 3097 (100) 3019 (100) 230 (100) 812 (100) 304 (100) 133 (3)
Trimester 1 estimatedfetal weight
5628 (100) 1045 (100) 1554 (100) 1704 (100) 3328 (100) 7273 (100) 3097 (100) 3019 (100) 230 (100) 812 (100) 304 (100) 4212 (100)
Trimester 2 estimatedfetal weight
5628 (100) 1045 (100) 1554 (100) 1704 (100) 3328 (100) 7273 (100) 3097 (100) 3019 (100) 230 (100) 144 (18) 304 (100) 43 (1)
Trimester 1 umbilicalartery PI
5628 (100) 1045 (100) 1554 (100) 1704 (100) 3328 (100) 7273 (100) 3097 (100) 3019 (100) 230 (100) 812 (100) 304 (100) 4212 (100)
Trimester 2 umbilicalartery PI
3102 (55) 1045 (100) 1554 (100) 1704 (100) 3328 (100) 7273 (100) 3097 (100) 3019 (100) 230 (100) 187 (23) 304 (100) 70 (2)
Outcomes
Any-onset PE 5 (0) 0 (0) 47 (3) 0 (0) 985 (30) 0 (0) 150 (5) 1648 (55) 13 (6) 0 (0) 0 (0) 5 (0)
Early-onset PE 5 (0) 0 (0) 47 (3) 0 (0) 1007 (30) 0 (0) 150 (5) 1648 (55) 13 (6) 0 (0) 0 (0) 5 (0)
Late-onset PE 5 (0) 0 (0) 47 (3) 0 (0) 1007 (30) 0 (0) 150 (5) 1648 (55) 13 (6) 0 (0) 0 (0) 5 (0)
PE, pre-eclampsia; PI, pulsatility index.Light blue variables were excluded from model development; subsets of the data were used for model development including biochemical or ultrasound markers and therefore data sets that were excluded fromdevelopment for these models have light blue values.
DOI:10.3310/hta2
4720
Health
Tech
nology
Assessm
ent2020
Vol.2
4No.7
2
©Queen
’sPrin
teran
dContro
llerofHMSO
2020.T
his
work
was
produced
byAllo
teyet
al.under
theterm
sofaco
mmissio
ningco
ntract
issued
bytheSecretary
ofState
forHealth
andSo
cialCare.T
his
issuemay
befreely
reproduced
forthepu
rposes
ofprivate
researchan
dstu
dyan
dextracts
(orindeed
,thefullrepo
rt)may
beinclu
ded
inpro
fessional
journals
provid
edthat
suitab
leackn
owled
gemen
tis
mad
ean
dtherepro
ductio
nis
notasso
ciatedwith
anyform
ofad
vertising.
Applicatio
nsforco
mmercial
reproductio
nshould
bead
dressed
to:NIH
RJournals
Library,
Natio
nal
Institu
teforHealth
Research
,Evalu
ation,Trials
and
Studies
Coordinatin
gCen
tre,Alph
aHouse,
University
ofSo
utham
ptonScien
cePark,So
utham
ptonSO
167NS,U
K.
51
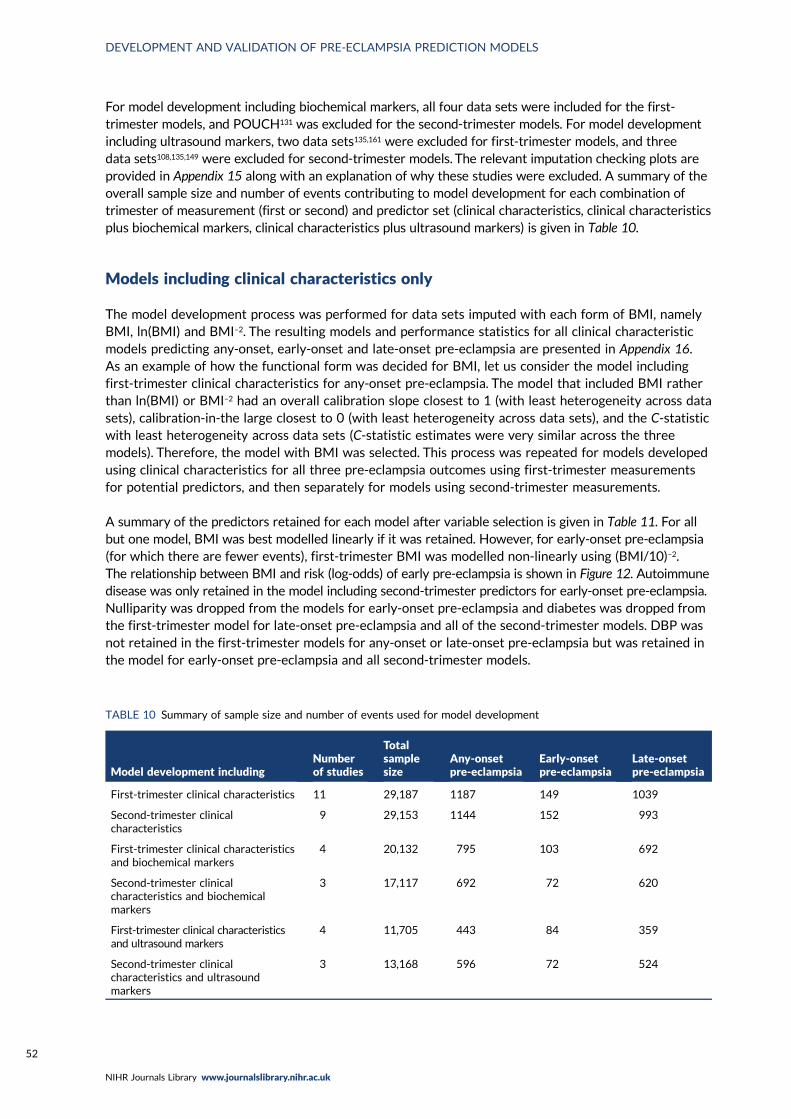
For model development including biochemical markers, all four data sets were included for the first-trimester models, and POUCH131 was excluded for the second-trimester models. For model developmentincluding ultrasound markers, two data sets135,161 were excluded for first-trimester models, and threedata sets108,135,149 were excluded for second-trimester models. The relevant imputation checking plots areprovided in Appendix 15 along with an explanation of why these studies were excluded. A summary of theoverall sample size and number of events contributing to model development for each combination oftrimester of measurement (first or second) and predictor set (clinical characteristics, clinical characteristicsplus biochemical markers, clinical characteristics plus ultrasound markers) is given in Table 10.
Models including clinical characteristics only
The model development process was performed for data sets imputed with each form of BMI, namelyBMI, ln(BMI) and BMI–2. The resulting models and performance statistics for all clinical characteristicmodels predicting any-onset, early-onset and late-onset pre-eclampsia are presented in Appendix 16.As an example of how the functional form was decided for BMI, let us consider the model includingfirst-trimester clinical characteristics for any-onset pre-eclampsia. The model that included BMI ratherthan ln(BMI) or BMI–2 had an overall calibration slope closest to 1 (with least heterogeneity across datasets), calibration-in-the large closest to 0 (with least heterogeneity across data sets), and the C-statisticwith least heterogeneity across data sets (C-statistic estimates were very similar across the threemodels). Therefore, the model with BMI was selected. This process was repeated for models developedusing clinical characteristics for all three pre-eclampsia outcomes using first-trimester measurementsfor potential predictors, and then separately for models using second-trimester measurements.
A summary of the predictors retained for each model after variable selection is given in Table 11. For allbut one model, BMI was best modelled linearly if it was retained. However, for early-onset pre-eclampsia(for which there are fewer events), first-trimester BMI was modelled non-linearly using (BMI/10)–2.The relationship between BMI and risk (log-odds) of early pre-eclampsia is shown in Figure 12. Autoimmunedisease was only retained in the model including second-trimester predictors for early-onset pre-eclampsia.Nulliparity was dropped from the models for early-onset pre-eclampsia and diabetes was dropped fromthe first-trimester model for late-onset pre-eclampsia and all of the second-trimester models. DBP wasnot retained in the first-trimester models for any-onset or late-onset pre-eclampsia but was retained inthe model for early-onset pre-eclampsia and all second-trimester models.
TABLE 10 Summary of sample size and number of events used for model development
Model development includingNumberof studies
Totalsamplesize
Any-onsetpre-eclampsia
Early-onsetpre-eclampsia
Late-onsetpre-eclampsia
First-trimester clinical characteristics 11 29,187 1187 149 1039
Second-trimester clinicalcharacteristics
9 29,153 1144 152 993
First-trimester clinical characteristicsand biochemical markers
4 20,132 795 103 692
Second-trimester clinicalcharacteristics and biochemicalmarkers
3 17,117 692 72 620
First-trimester clinical characteristicsand ultrasound markers
4 11,705 443 84 359
Second-trimester clinicalcharacteristics and ultrasoundmarkers
3 13,168 596 72 524
DEVELOPMENT AND VALIDATION OF PRE-ECLAMPSIA PREDICTION MODELS
NIHR Journals Library www.journalslibrary.nihr.ac.uk
52
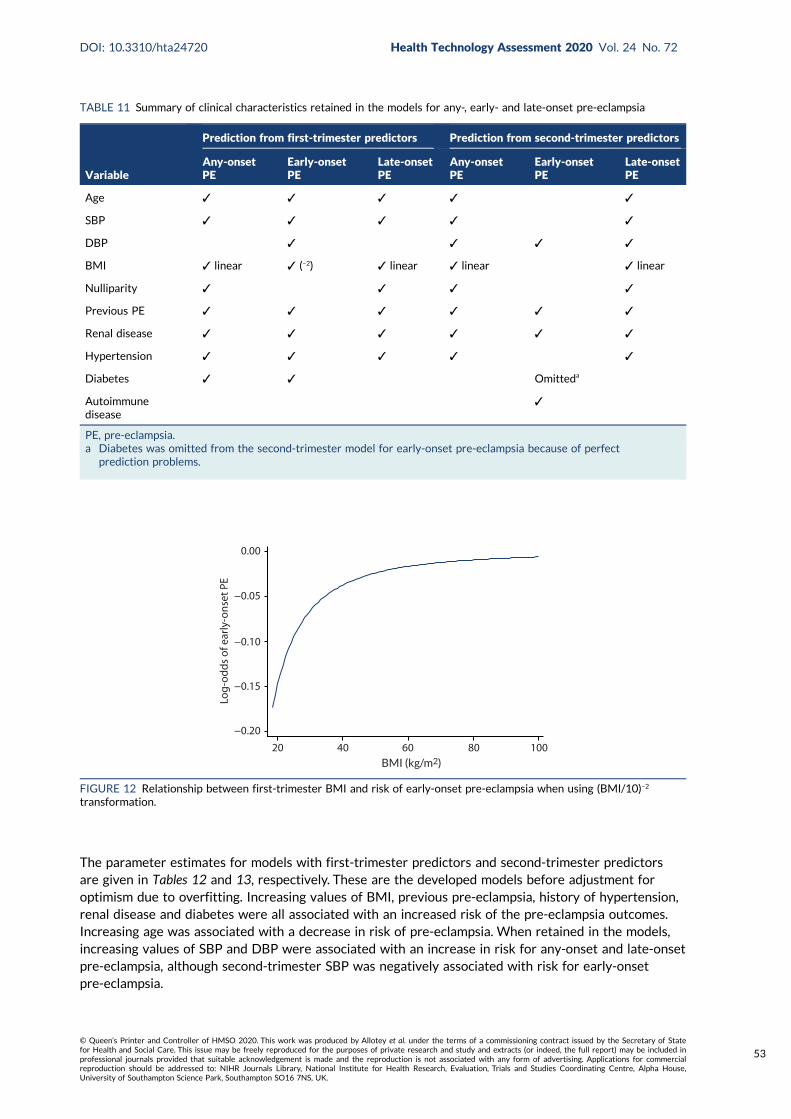
The parameter estimates for models with first-trimester predictors and second-trimester predictorsare given in Tables 12 and 13, respectively. These are the developed models before adjustment foroptimism due to overfitting. Increasing values of BMI, previous pre-eclampsia, history of hypertension,renal disease and diabetes were all associated with an increased risk of the pre-eclampsia outcomes.Increasing age was associated with a decrease in risk of pre-eclampsia. When retained in the models,increasing values of SBP and DBP were associated with an increase in risk for any-onset and late-onsetpre-eclampsia, although second-trimester SBP was negatively associated with risk for early-onsetpre-eclampsia.
TABLE 11 Summary of clinical characteristics retained in the models for any-, early- and late-onset pre-eclampsia
Variable
Prediction from first-trimester predictors Prediction from second-trimester predictors
Any-onsetPE
Early-onsetPE
Late-onsetPE
Any-onsetPE
Early-onsetPE
Late-onsetPE
Age ✓ ✓ ✓ ✓ ✓
SBP ✓ ✓ ✓ ✓ ✓
DBP ✓ ✓ ✓ ✓
BMI ✓ linear ✓ (–2) ✓ linear ✓ linear ✓ linear
Nulliparity ✓ ✓ ✓ ✓
Previous PE ✓ ✓ ✓ ✓ ✓ ✓
Renal disease ✓ ✓ ✓ ✓ ✓ ✓
Hypertension ✓ ✓ ✓ ✓ ✓
Diabetes ✓ ✓ Omitteda
Autoimmunedisease
✓
PE, pre-eclampsia.a Diabetes was omitted from the second-trimester model for early-onset pre-eclampsia because of perfect
prediction problems.
BMI (kg/m2)
20 40 60 80 100
−0.20
−0.15
−0.10
−0.05
0.00
Log-
odds
of e
arly
-ons
et P
E
FIGURE 12 Relationship between first-trimester BMI and risk of early-onset pre-eclampsia when using (BMI/10)–2
transformation.
DOI: 10.3310/hta24720 Health Technology Assessment 2020 Vol. 24 No. 72
© Queen’s Printer and Controller of HMSO 2020. This work was produced by Allotey et al. under the terms of a commissioning contract issued by the Secretary of Statefor Health and Social Care. This issue may be freely reproduced for the purposes of private research and study and extracts (or indeed, the full report) may be included inprofessional journals provided that suitable acknowledgement is made and the reproduction is not associated with any form of advertising. Applications for commercialreproduction should be addressed to: NIHR Journals Library, National Institute for Health Research, Evaluation, Trials and Studies Coordinating Centre, Alpha House,University of Southampton Science Park, Southampton SO16 7NS, UK.
53
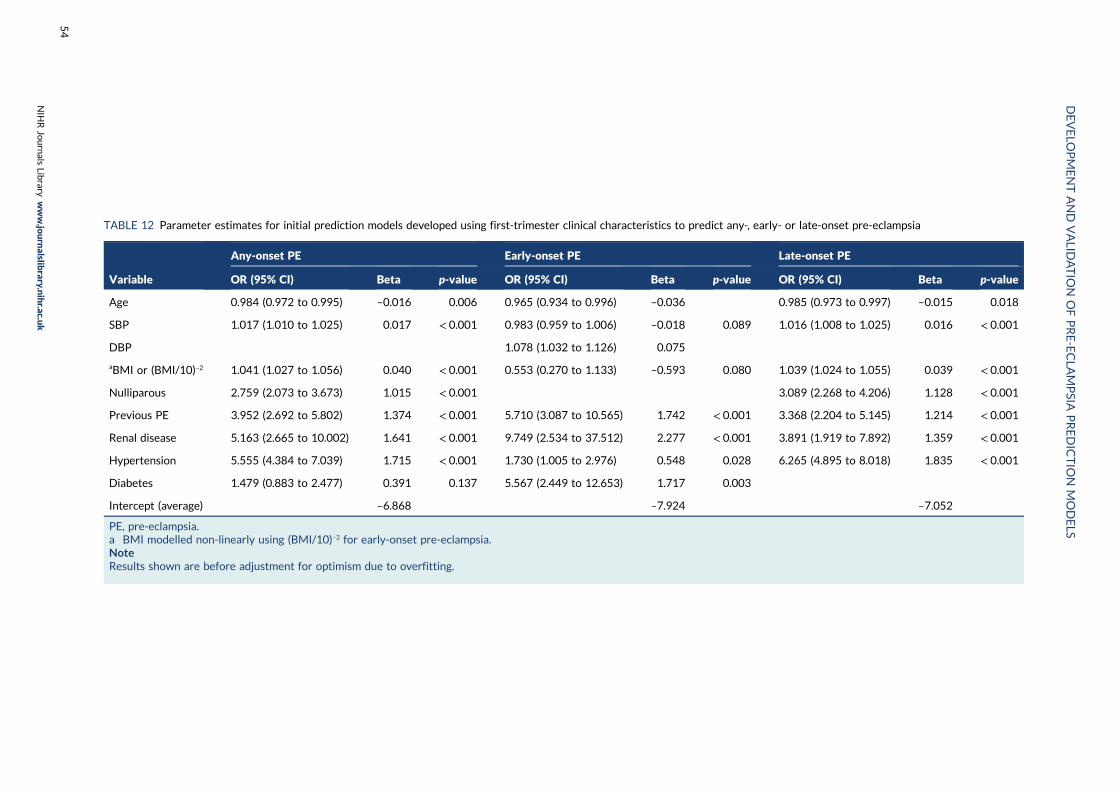
TABLE 12 Parameter estimates for initial prediction models developed using first-trimester clinical characteristics to predict any-, early- or late-onset pre-eclampsia
Variable
Any-onset PE Early-onset PE Late-onset PE
OR (95% CI) Beta p-value OR (95% CI) Beta p-value OR (95% CI) Beta p-value
Age 0.984 (0.972 to 0.995) –0.016 0.006 0.965 (0.934 to 0.996) –0.036 0.985 (0.973 to 0.997) –0.015 0.018
SBP 1.017 (1.010 to 1.025) 0.017 < 0.001 0.983 (0.959 to 1.006) –0.018 0.089 1.016 (1.008 to 1.025) 0.016 < 0.001
DBP 1.078 (1.032 to 1.126) 0.075
aBMI or (BMI/10)–2 1.041 (1.027 to 1.056) 0.040 < 0.001 0.553 (0.270 to 1.133) –0.593 0.080 1.039 (1.024 to 1.055) 0.039 < 0.001
Nulliparous 2.759 (2.073 to 3.673) 1.015 < 0.001 3.089 (2.268 to 4.206) 1.128 < 0.001
Previous PE 3.952 (2.692 to 5.802) 1.374 < 0.001 5.710 (3.087 to 10.565) 1.742 < 0.001 3.368 (2.204 to 5.145) 1.214 < 0.001
Renal disease 5.163 (2.665 to 10.002) 1.641 < 0.001 9.749 (2.534 to 37.512) 2.277 < 0.001 3.891 (1.919 to 7.892) 1.359 < 0.001
Hypertension 5.555 (4.384 to 7.039) 1.715 < 0.001 1.730 (1.005 to 2.976) 0.548 0.028 6.265 (4.895 to 8.018) 1.835 < 0.001
Diabetes 1.479 (0.883 to 2.477) 0.391 0.137 5.567 (2.449 to 12.653) 1.717 0.003
Intercept (average) –6.868 –7.924 –7.052
PE, pre-eclampsia.a BMI modelled non-linearly using (BMI/10)–2 for early-onset pre-eclampsia.NoteResults shown are before adjustment for optimism due to overfitting.
DEVELO
PMENTAND
VALID
ATIO
NOFPRE-ECLA
MPSIA
PREDICTIO
NMODELS
NIH
RJournals
Library
www.jo
urnalslib
rary.nihr.ac.u
k
54
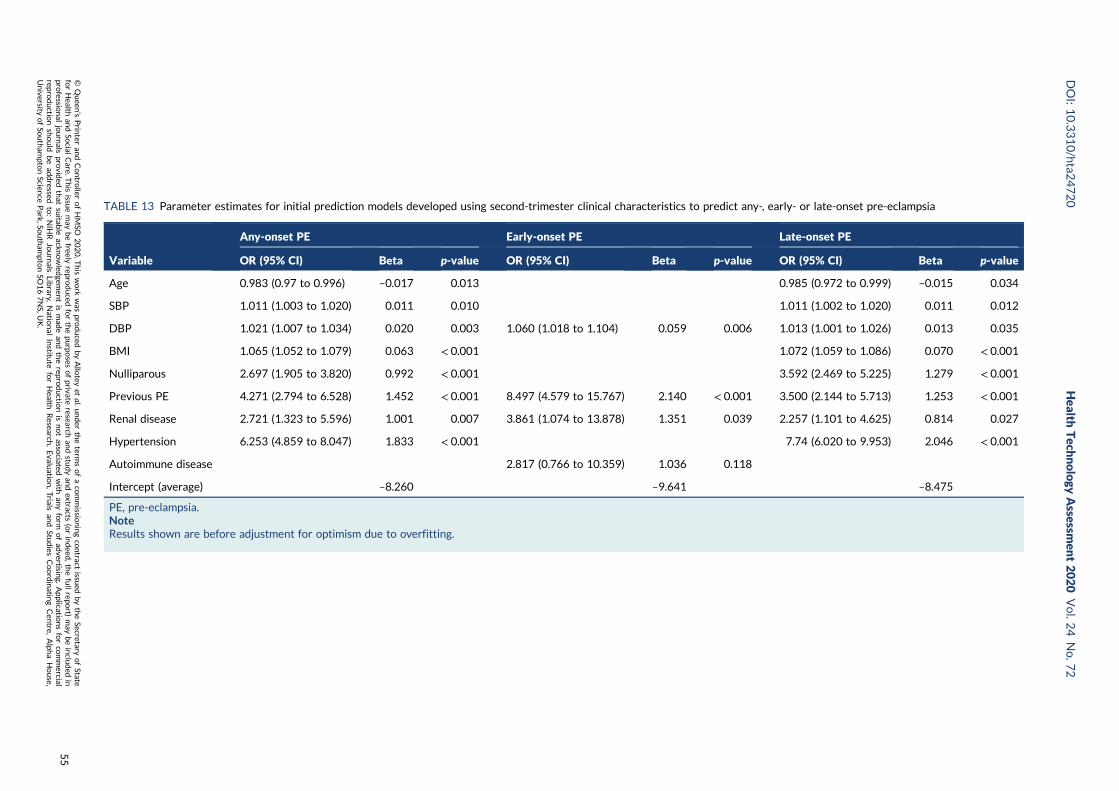
TABLE 13 Parameter estimates for initial prediction models developed using second-trimester clinical characteristics to predict any-, early- or late-onset pre-eclampsia
Variable
Any-onset PE Early-onset PE Late-onset PE
OR (95% CI) Beta p-value OR (95% CI) Beta p-value OR (95% CI) Beta p-value
Age 0.983 (0.97 to 0.996) –0.017 0.013 0.985 (0.972 to 0.999) –0.015 0.034
SBP 1.011 (1.003 to 1.020) 0.011 0.010 1.011 (1.002 to 1.020) 0.011 0.012
DBP 1.021 (1.007 to 1.034) 0.020 0.003 1.060 (1.018 to 1.104) 0.059 0.006 1.013 (1.001 to 1.026) 0.013 0.035
BMI 1.065 (1.052 to 1.079) 0.063 < 0.001 1.072 (1.059 to 1.086) 0.070 < 0.001
Nulliparous 2.697 (1.905 to 3.820) 0.992 < 0.001 3.592 (2.469 to 5.225) 1.279 < 0.001
Previous PE 4.271 (2.794 to 6.528) 1.452 < 0.001 8.497 (4.579 to 15.767) 2.140 < 0.001 3.500 (2.144 to 5.713) 1.253 < 0.001
Renal disease 2.721 (1.323 to 5.596) 1.001 0.007 3.861 (1.074 to 13.878) 1.351 0.039 2.257 (1.101 to 4.625) 0.814 0.027
Hypertension 6.253 (4.859 to 8.047) 1.833 < 0.001 7.74 (6.020 to 9.953) 2.046 < 0.001
Autoimmune disease 2.817 (0.766 to 10.359) 1.036 0.118
Intercept (average) –8.260 –9.641 –8.475
PE, pre-eclampsia.NoteResults shown are before adjustment for optimism due to overfitting.
DOI:10.3310/hta2
4720
Health
Tech
nology
Assessm
ent2020
Vol.2
4No.7
2
©Queen
’sPrin
teran
dContro
llerofHMSO
2020.T
his
work
was
produced
byAllo
teyet
al.under
theterm
sofaco
mmissio
ningco
ntract
issued
bytheSecretary
ofState
forHealth
andSo
cialCare.T
his
issuemay
befreely
reproduced
forthepu
rposes
ofprivate
researchan
dstu
dyan
dextracts
(orindeed
,thefullrepo
rt)may
beinclu
ded
inpro
fessional
journals
provid
edthat
suitab
leackn
owled
gemen
tis
mad
ean
dtherepro
ductio
nis
notasso
ciatedwith
anyform
ofad
vertising.
Applicatio
nsforco
mmercial
reproductio
nshould
bead
dressed
to:NIH
RJournals
Library,
Natio
nal
Institu
teforHealth
Research
,Evalu
ation,Trials
and
Studies
Coordinatin
gCen
tre,Alph
aHouse,
University
ofSo
utham
ptonScien
cePark,So
utham
ptonSO
167NS,U
K.
55
Following internal validation, the predictive performance of the models is summarised in Table 14.The average (pooled) C-statistic for the models was close to 0.7, with considerable heterogeneity in theC-statistic across individual data sets. C-statistics were slightly higher for second-trimester modelsthan for first-trimester models. The calibration slope was generally around 0.9 for models of any-onsetand late-onset pre-eclampsia but was greater than 1 for early-onset pre-eclampsia (1.001 and 1.105).Again, there was large heterogeneity in the calibration slope across data sets for most models.Average calibration-in-the-large was close to zero but, again, there was large heterogeneity acrossdata sets, suggesting that the baseline risk differs across the individual data sets and is not being fullycaptured by the predictors included in the models.
To illustrate the heterogeneity in predictive performance across individual data sets, Appendix 17 providesthe forest plots of predictive performance measures for the second-trimester any-onset pre-eclampsiamodel. It is evident that there is large variability around the average values; for example, the observedcalibration slope varies from 0.45 to 1.57 across data sets, and CIs often do not overlap.
Models including clinical characteristics and biochemical markers
Next, we examined whether or not biochemical markers should be included in the prediction models, inaddition to the clinical characteristics identified for each outcome in the previous section (seeModelsincluding clinical characteristics only). Therefore, the clinical characteristics were forced into the models andonly the biochemical markers were eligible for removal in the backwards elimination process. First-trimesterBMI was previously modelled as (BMI/10)–2 for early pre-eclampsia; however, this transformation was notselected for any of the other clinical characteristic models and therefore may be a result of overfitting in datafor which we have the fewest events. Therefore, for comparability and consistency across models, we usedBMI rather than (BMI/10)–2 for early pre-eclampsia in the clinical plus biochemical marker models.
In the same way as for BMI in the clinical characteristics models, we considered non-normality forthe biochemical markers by developing prediction models with biochemical markers on their originalscale and compared this with models developed using natural logarithm-transformed biochemicalmarker values. Comparisons of biochemical marker and ln(biochemical marker) models are given inAppendix 18. For the first-trimester model for early pre-eclampsia, the model with better predictiveperformance came from the data with log-transformed biochemical markers; however, all biochemicalmarkers were dropped from the model. Therefore, in this case, we selected the model that retained abiochemical marker in the model (see Table 16).
Table 15 shows which biochemical markers were included in each model and if they were log-transformed.PAPP-A was not retained in any of the models, whereas sFlt-1 was retained in all first-trimester predictionmodels and the second-trimester model for early pre-eclampsia. PlGF was retained in all models except thefirst-trimester model for early pre-eclampsia. Models included the original biochemical marker values apartfrom the second-trimester model for early pre-eclampsia, which used ln(biochemical marker) values. For allbut the second-trimester model for early pre-eclampsia, biochemical markers were negatively associated withthe pre-eclampsia outcomes, so risk decreased with increasing biochemical marker values (Tables 16 and 17).
Table 18 shows the average predictive performance for the models, obtained through internalvalidation using meta-analysis of the data set-specific performance statistics. Models with the clinicalcharacteristics identified in Models including clinical characteristics only were also refitted in the samedata so that it was possible to compare the predictive performance of models with and models withoutthe biochemical markers in the same data sets. For all models, the average predictive performanceimproved with the addition of biochemical markers, and, for most models and performance statistics,heterogeneity across data sets was reduced (lower I2 and τ2 values). The average calibration slope wasgenerally < 1 (between 0.857 and 0.961), except for the early-onset pre-eclampsia models, which hadcalibration slopes of 1.038 and 1.079 for the first- and second-trimester models, respectively.
DEVELOPMENT AND VALIDATION OF PRE-ECLAMPSIA PREDICTION MODELS
NIHR Journals Library www.journalslibrary.nihr.ac.uk
56
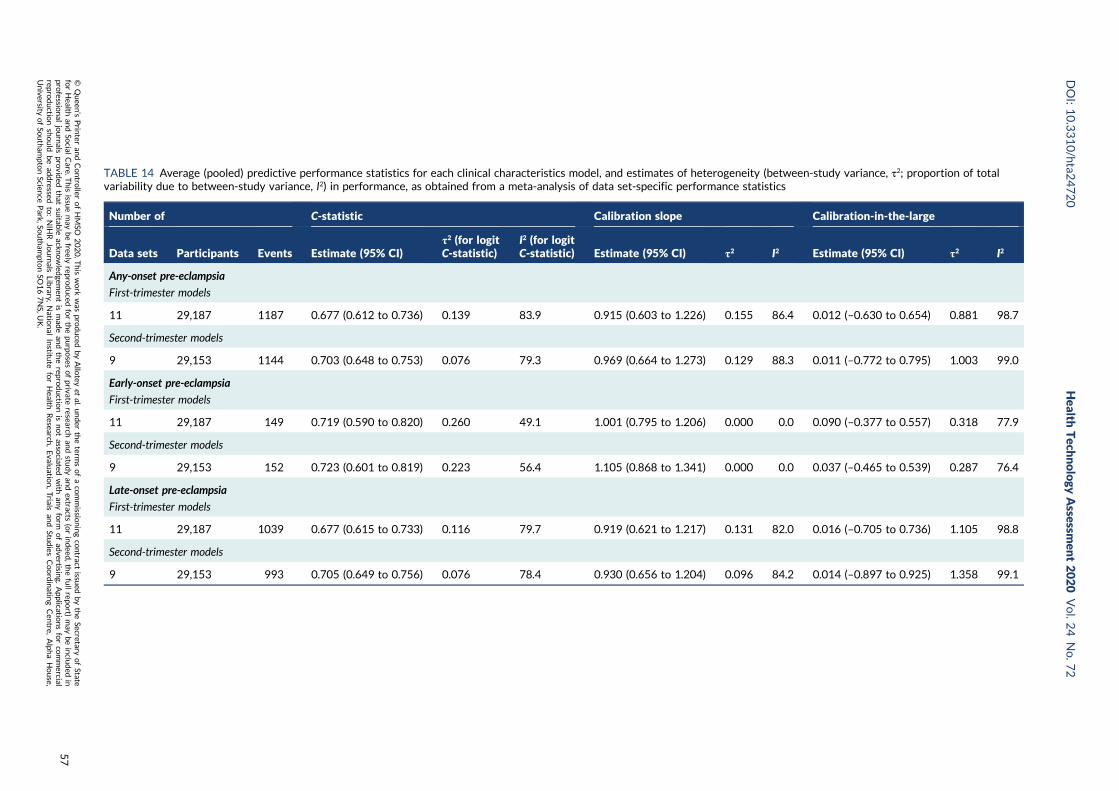
TABLE 14 Average (pooled) predictive performance statistics for each clinical characteristics model, and estimates of heterogeneity (between-study variance, τ2; proportion of totalvariability due to between-study variance, I2) in performance, as obtained from a meta-analysis of data set-specific performance statistics
Number of C-statistic Calibration slope Calibration-in-the-large
Data sets Participants Events Estimate (95% CI)τ2 (for logitC-statistic)
I2 (for logitC-statistic) Estimate (95% CI) τ2 I2 Estimate (95% CI) τ2 I2
Any-onset pre-eclampsia
First-trimester models
11 29,187 1187 0.677 (0.612 to 0.736) 0.139 83.9 0.915 (0.603 to 1.226) 0.155 86.4 0.012 (–0.630 to 0.654) 0.881 98.7
Second-trimester models
9 29,153 1144 0.703 (0.648 to 0.753) 0.076 79.3 0.969 (0.664 to 1.273) 0.129 88.3 0.011 (–0.772 to 0.795) 1.003 99.0
Early-onset pre-eclampsia
First-trimester models
11 29,187 149 0.719 (0.590 to 0.820) 0.260 49.1 1.001 (0.795 to 1.206) 0.000 0.0 0.090 (–0.377 to 0.557) 0.318 77.9
Second-trimester models
9 29,153 152 0.723 (0.601 to 0.819) 0.223 56.4 1.105 (0.868 to 1.341) 0.000 0.0 0.037 (–0.465 to 0.539) 0.287 76.4
Late-onset pre-eclampsia
First-trimester models
11 29,187 1039 0.677 (0.615 to 0.733) 0.116 79.7 0.919 (0.621 to 1.217) 0.131 82.0 0.016 (–0.705 to 0.736) 1.105 98.8
Second-trimester models
9 29,153 993 0.705 (0.649 to 0.756) 0.076 78.4 0.930 (0.656 to 1.204) 0.096 84.2 0.014 (–0.897 to 0.925) 1.358 99.1
DOI:10.3310/hta2
4720
Health
Tech
nology
Assessm
ent2020
Vol.2
4No.7
2
©Queen
’sPrin
teran
dContro
llerofHMSO
2020.T
his
work
was
produced
byAllo
teyet
al.under
theterm
sofaco
mmissio
ningco
ntract
issued
bytheSecretary
ofState
forHealth
andSo
cialCare.T
his
issuemay
befreely
reproduced
forthepu
rposes
ofprivate
researchan
dstu
dyan
dextracts
(orindeed
,thefullrepo
rt)may
beinclu
ded
inpro
fessional
journals
provid
edthat
suitab
leackn
owled
gemen
tis
mad
ean
dtherepro
ductio
nis
notasso
ciatedwith
anyform
ofad
vertising.
Applicatio
nsforco
mmercial
reproductio
nshould
bead
dressed
to:NIH
RJournals
Library,
Natio
nal
Institu
teforHealth
Research
,Evalu
ation,Trials
and
Studies
Coordinatin
gCen
tre,Alph
aHouse,
University
ofSo
utham
ptonScien
cePark,So
utham
ptonSO
167NS,U
K.
57

Models including clinical characteristics and ultrasound markers
When considered in addition to clinical characteristics, ultrasound markers were not retained in anyof the models fitted, whether using the original values or using the logarithm-transformed values.Therefore, the models reverted to the clinical characteristic models, which were reported in moredetail and using more data sets in Models including clinical characteristics only.
Shrinkage and final models
Following model development and internal validation, shrinkage was applied to the beta coefficientsand the final model equations are given in Table 19, along with the average performance statistics frommeta-analysis across data sets for these models, including 95% CIs for the average performance and95% prediction intervals for the performance of the model in a new but similar data set. Performanceof the models in the individual data sets can be found in Appendix 19.
After shrinkage and recalibration of the intercept, each model is, on average, perfectly calibratedacross data sets. However, as was observed for existing models in Chapter 5, large heterogeneityremains in all of the performance statistics across data sets. The prediction intervals for potentialperformance in new settings are generally very wide. For example, the prediction interval for thecalibration slope of model 4 ranges from 0.07 to 1.93. Therefore, although IPPIC models may predictwell on average across populations, they may not be as accurate in particular populations. Figure 13presents the calibration plots for model 1 (first-trimester clinical characteristics for the prediction ofany pre-eclampsia) by data set. The model is fairly well calibrated for Baschat et al.;115 however, thepredictions are too high for pregnant women in the WHO cohort,175 but not high enough for those athigh risk in the POP cohort.161 Calibration plots for the other models (excluding for early pre-eclampsia,which had too few events in individual data sets) are given in Appendix 20. Heterogeneity in calibrationperformance could be reduced if, when applying the models in practice, model parameters (e.g. intercept)could be recalibrated to each population and setting. This would require local data for recalibration andmodel updating.
Decision curve analysis
Figures 14–17 are the decision curves in each data set for models predicting any pre-eclampsia. Thedecision curves show the net benefit or harm across different probability thresholds of the model andcompared with the ‘treat-all’ and ‘treat-none’ strategies. Net benefit values are often best multiplied by1000 to reveal the extra number of women who would be correctly treated per 1000 women whoused the model, with none treated incorrectly.
TABLE 15 Summary of biochemical markers retained in the models (alongside clinical characteristics) for any-, early- andlate-onset pre-eclampsia using first- or second-trimester measurements
Variable
Prediction from first-trimester predictors Prediction from second-trimester predictors
Any-onset PE Early-onset PE Late-onset PE Any-onset PE Early-onset PE Late-onset PE
sFlt-1 ✓ ✓ ✓ ✓ (ln)
PAPP-A
PlGF ✓ ✓ ✓ ✓ (ln) ✓
PE, pre-eclampsia.
DEVELOPMENT AND VALIDATION OF PRE-ECLAMPSIA PREDICTION MODELS
NIHR Journals Library www.journalslibrary.nihr.ac.uk
58
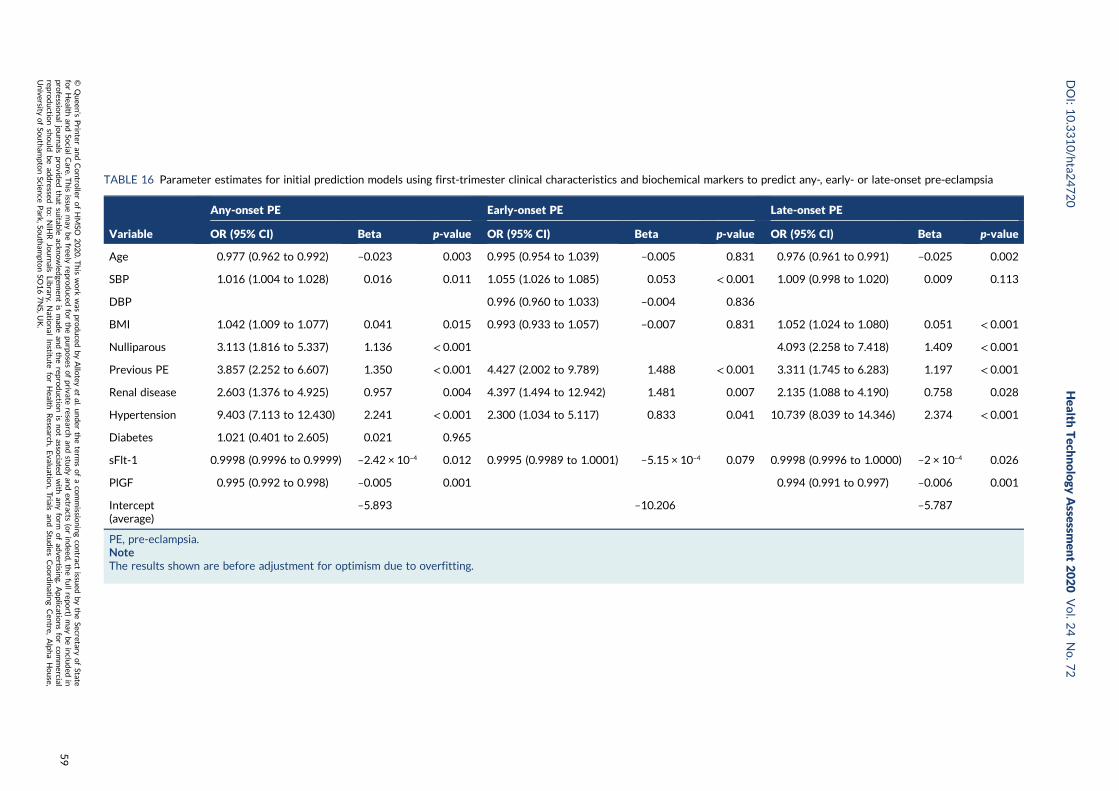
TABLE 16 Parameter estimates for initial prediction models using first-trimester clinical characteristics and biochemical markers to predict any-, early- or late-onset pre-eclampsia
Variable
Any-onset PE Early-onset PE Late-onset PE
OR (95% CI) Beta p-value OR (95% CI) Beta p-value OR (95% CI) Beta p-value
Age 0.977 (0.962 to 0.992) –0.023 0.003 0.995 (0.954 to 1.039) –0.005 0.831 0.976 (0.961 to 0.991) –0.025 0.002
SBP 1.016 (1.004 to 1.028) 0.016 0.011 1.055 (1.026 to 1.085) 0.053 < 0.001 1.009 (0.998 to 1.020) 0.009 0.113
DBP 0.996 (0.960 to 1.033) –0.004 0.836
BMI 1.042 (1.009 to 1.077) 0.041 0.015 0.993 (0.933 to 1.057) –0.007 0.831 1.052 (1.024 to 1.080) 0.051 < 0.001
Nulliparous 3.113 (1.816 to 5.337) 1.136 < 0.001 4.093 (2.258 to 7.418) 1.409 < 0.001
Previous PE 3.857 (2.252 to 6.607) 1.350 < 0.001 4.427 (2.002 to 9.789) 1.488 < 0.001 3.311 (1.745 to 6.283) 1.197 < 0.001
Renal disease 2.603 (1.376 to 4.925) 0.957 0.004 4.397 (1.494 to 12.942) 1.481 0.007 2.135 (1.088 to 4.190) 0.758 0.028
Hypertension 9.403 (7.113 to 12.430) 2.241 < 0.001 2.300 (1.034 to 5.117) 0.833 0.041 10.739 (8.039 to 14.346) 2.374 < 0.001
Diabetes 1.021 (0.401 to 2.605) 0.021 0.965
sFlt-1 0.9998 (0.9996 to 0.9999) –2.42 × 10⁻⁴ 0.012 0.9995 (0.9989 to 1.0001) –5.15 × 10⁻⁴ 0.079 0.9998 (0.9996 to 1.0000) –2 × 10⁻⁴ 0.026
PlGF 0.995 (0.992 to 0.998) –0.005 0.001 0.994 (0.991 to 0.997) –0.006 0.001
Intercept(average)
–5.893 –10.206 –5.787
PE, pre-eclampsia.NoteThe results shown are before adjustment for optimism due to overfitting.
DOI:10.3310/hta2
4720
Health
Tech
nology
Assessm
ent2020
Vol.2
4No.7
2
©Queen
’sPrin
teran
dContro
llerofHMSO
2020.T
his
work
was
produced
byAllo
teyet
al.under
theterm
sofaco
mmissio
ningco
ntract
issued
bytheSecretary
ofState
forHealth
andSo
cialCare.T
his
issuemay
befreely
reproduced
forthepu
rposes
ofprivate
researchan
dstu
dyan
dextracts
(orindeed
,thefullrepo
rt)may
beinclu
ded
inpro
fessional
journals
provid
edthat
suitab
leackn
owled
gemen
tis
mad
ean
dtherepro
ductio
nis
notasso
ciatedwith
anyform
ofad
vertising.
Applicatio
nsforco
mmercial
reproductio
nshould
bead
dressed
to:NIH
RJournals
Library,
Natio
nal
Institu
teforHealth
Research
,Evalu
ation,Trials
and
Studies
Coordinatin
gCen
tre,Alph
aHouse,
University
ofSo
utham
ptonScien
cePark,So
utham
ptonSO
167NS,U
K.
59

TABLE 17 Parameter estimates for initial prediction models using second-trimester clinical characteristics and biochemical markers to predict any-, early- or late-onset pre-eclampsia
Variable
Any-onset PE Early-onset PE Late-onset PE
OR (95% CI) Beta p-value OR (95% CI) Beta p-value OR (95% CI) Beta p-value
Age 0.981 (0.966 to 0.996) –0.019 0.012 0.980 (0.965 to 0.996) –0.020 0.012
SBP 1.019 (1.009 to 1.030) 0.019 < 0.001 1.018 (1.008 to 1.029) 0.018 0.001
DBP 0.991 (0.979 to 1.004) –0.009 0.167 1.068 (1.039 to 1.096) 0.065 < 0.001 0.986 (0.973 to 0.999) –0.014 0.031
BMI 1.072 (1.057 to 1.088) 0.069 < 0.001 1.076 (1.060 to 1.093) 0.073 < 0.001
Nulliparous 8.156 (3.534 to 18.820) 2.099 < 0.001 12.673 (4.777 to 33.622) 2.539 < 0.001
Previous PE 6.237 (2.755 to 14.123) 1.831 < 0.001 10.594 (4.615 to 24.318) 2.360 < 0.001 5.664 (2.223 to 14.431) 1.734 < 0.001
Renal disease 4.150 (1.838 to 9.368) 1.423 0.001 23.285 (2.613 to 207.474) 3.148 0.005 3.680 (1.588 to 8.524) 1.303 0.002
Hypertension 11.034 (8.334 to 14.608) 2.401 < 0.001 11.380 (8.531 to 15.180) 2.432 < 0.001
Autoimmune disease 3.169 (0.397 to 25.315) 1.154 0.277
sFlt-1 or In(sFlt-1 + 0.5)a 1.581 (1.100 to 2.271) 0.458 0.013
PlGF or In(PlGF + 0.5)a 0.997 (0.996 to 0.998) –0.003 < 0.001 0.372 (0.277 to 0.500) –0.988 < 0.001 0.997 (0.996 to 0.998) –0.003 < 0.001
Intercept (average) –7.895 –9.343 –8.054
PE, pre-eclampsia.a Biochemical markers modelled non-linearly using ln(biochemical marker + 0.5) for early-onset pre-eclampsia.NoteThe results shown are before adjustment for optimism due to overfitting.
DEVELO
PMENTAND
VALID
ATIO
NOFPRE-ECLA
MPSIA
PREDICTIO
NMODELS
NIH
RJournals
Library
www.jo
urnalslib
rary.nihr.ac.u
k
60
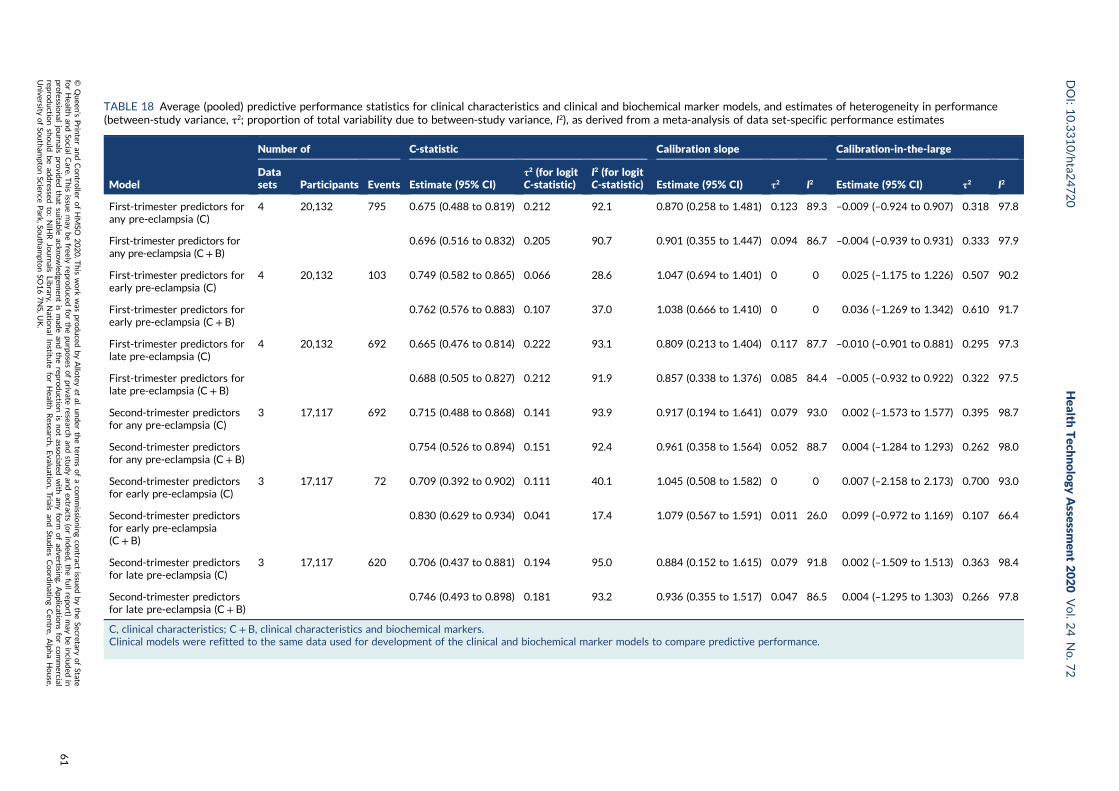
TABLE 18 Average (pooled) predictive performance statistics for clinical characteristics and clinical and biochemical marker models, and estimates of heterogeneity in performance(between-study variance, τ2; proportion of total variability due to between-study variance, I2), as derived from a meta-analysis of data set-specific performance estimates
Model
Number of C-statistic Calibration slope Calibration-in-the-large
Datasets Participants Events Estimate (95% CI)
τ2 (for logitC-statistic)
I2 (for logitC-statistic) Estimate (95% CI) τ2 I2 Estimate (95% CI) τ2 I2
First-trimester predictors forany pre-eclampsia (C)
4 20,132 795 0.675 (0.488 to 0.819) 0.212 92.1 0.870 (0.258 to 1.481) 0.123 89.3 –0.009 (–0.924 to 0.907) 0.318 97.8
First-trimester predictors forany pre-eclampsia (C+B)
0.696 (0.516 to 0.832) 0.205 90.7 0.901 (0.355 to 1.447) 0.094 86.7 –0.004 (–0.939 to 0.931) 0.333 97.9
First-trimester predictors forearly pre-eclampsia (C)
4 20,132 103 0.749 (0.582 to 0.865) 0.066 28.6 1.047 (0.694 to 1.401) 0 0 0.025 (–1.175 to 1.226) 0.507 90.2
First-trimester predictors forearly pre-eclampsia (C+ B)
0.762 (0.576 to 0.883) 0.107 37.0 1.038 (0.666 to 1.410) 0 0 0.036 (–1.269 to 1.342) 0.610 91.7
First-trimester predictors forlate pre-eclampsia (C)
4 20,132 692 0.665 (0.476 to 0.814) 0.222 93.1 0.809 (0.213 to 1.404) 0.117 87.7 –0.010 (–0.901 to 0.881) 0.295 97.3
First-trimester predictors forlate pre-eclampsia (C+ B)
0.688 (0.505 to 0.827) 0.212 91.9 0.857 (0.338 to 1.376) 0.085 84.4 –0.005 (–0.932 to 0.922) 0.322 97.5
Second-trimester predictorsfor any pre-eclampsia (C)
3 17,117 692 0.715 (0.488 to 0.868) 0.141 93.9 0.917 (0.194 to 1.641) 0.079 93.0 0.002 (–1.573 to 1.577) 0.395 98.7
Second-trimester predictorsfor any pre-eclampsia (C+ B)
0.754 (0.526 to 0.894) 0.151 92.4 0.961 (0.358 to 1.564) 0.052 88.7 0.004 (–1.284 to 1.293) 0.262 98.0
Second-trimester predictorsfor early pre-eclampsia (C)
3 17,117 72 0.709 (0.392 to 0.902) 0.111 40.1 1.045 (0.508 to 1.582) 0 0 0.007 (–2.158 to 2.173) 0.700 93.0
Second-trimester predictorsfor early pre-eclampsia(C+ B)
0.830 (0.629 to 0.934) 0.041 17.4 1.079 (0.567 to 1.591) 0.011 26.0 0.099 (–0.972 to 1.169) 0.107 66.4
Second-trimester predictorsfor late pre-eclampsia (C)
3 17,117 620 0.706 (0.437 to 0.881) 0.194 95.0 0.884 (0.152 to 1.615) 0.079 91.8 0.002 (–1.509 to 1.513) 0.363 98.4
Second-trimester predictorsfor late pre-eclampsia (C+ B)
0.746 (0.493 to 0.898) 0.181 93.2 0.936 (0.355 to 1.517) 0.047 86.5 0.004 (–1.295 to 1.303) 0.266 97.8
C, clinical characteristics; C+ B, clinical characteristics and biochemical markers.Clinical models were refitted to the same data used for development of the clinical and biochemical marker models to compare predictive performance.
DOI:10.3310/hta2
4720
Health
Tech
nology
Assessm
ent2020
Vol.2
4No.7
2
©Queen
’sPrin
teran
dContro
llerofHMSO
2020.T
his
work
was
produced
byAllo
teyet
al.under
theterm
sofaco
mmissio
ningco
ntract
issued
bytheSecretary
ofState
forHealth
andSo
cialCare.T
his
issuemay
befreely
reproduced
forthepu
rposes
ofprivate
researchan
dstu
dyan
dextracts
(orindeed
,thefullrepo
rt)may
beinclu
ded
inpro
fessional
journals
provid
edthat
suitab
leackn
owled
gemen
tis
mad
ean
dtherepro
ductio
nis
notasso
ciatedwith
anyform
ofad
vertising.
Applicatio
nsforco
mmercial
reproductio
nshould
bead
dressed
to:NIH
RJournals
Library,
Natio
nal
Institu
teforHealth
Research
,Evalu
ation,Trials
and
Studies
Coordinatin
gCen
tre,Alph
aHouse,
University
ofSo
utham
ptonScien
cePark,So
utham
ptonSO
167NS,U
K.
61
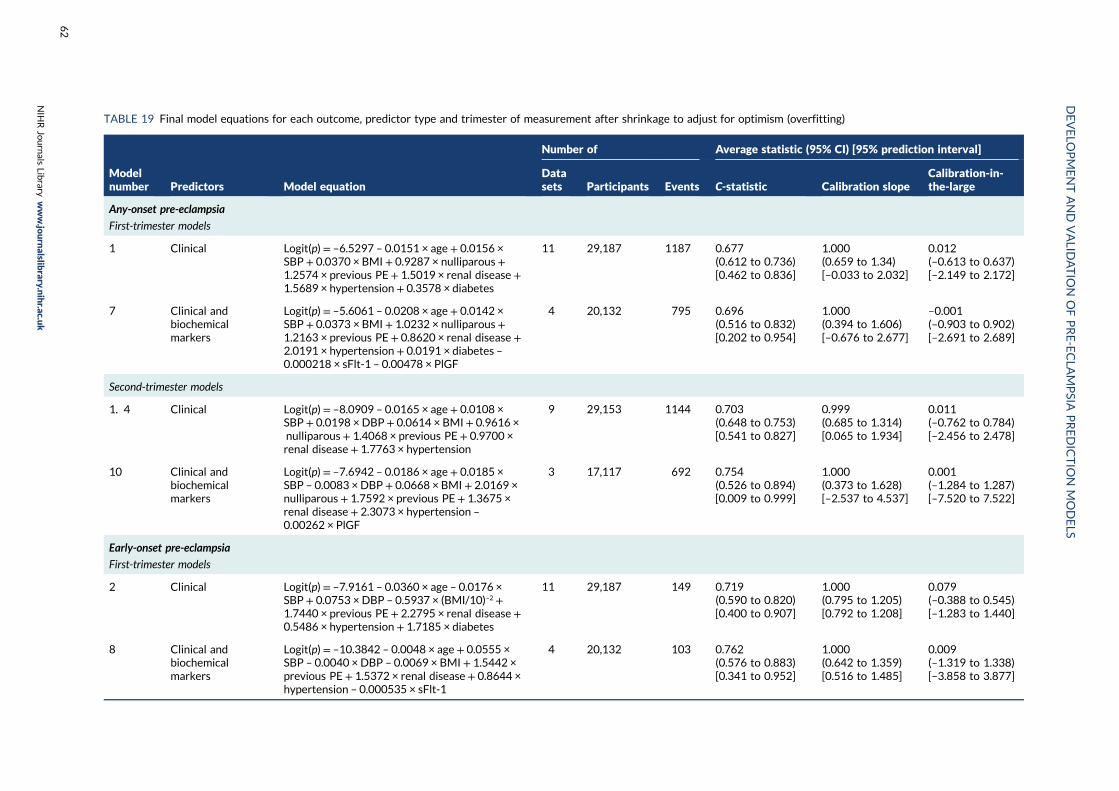
TABLE 19 Final model equations for each outcome, predictor type and trimester of measurement after shrinkage to adjust for optimism (overfitting)
Modelnumber Predictors Model equation
Number of Average statistic (95% CI) [95% prediction interval]
Datasets Participants Events C-statistic Calibration slope
Calibration-in-the-large
Any-onset pre-eclampsia
First-trimester models
1 Clinical Logit(p)= –6.5297 – 0.0151 × age + 0.0156 ×SBP + 0.0370 × BMI + 0.9287 × nulliparous+1.2574 × previous PE + 1.5019 × renal disease +1.5689 × hypertension + 0.3578 × diabetes
11 29,187 1187 0.677(0.612 to 0.736)[0.462 to 0.836]
1.000(0.659 to 1.34)[–0.033 to 2.032]
0.012(–0.613 to 0.637)[–2.149 to 2.172]
7 Clinical andbiochemicalmarkers
Logit(p)= –5.6061 – 0.0208 × age + 0.0142 ×SBP + 0.0373 × BMI + 1.0232 × nulliparous+1.2163 × previous PE + 0.8620 × renal disease +2.0191 × hypertension + 0.0191 × diabetes –0.000218 × sFlt-1 – 0.00478 × PlGF
4 20,132 795 0.696(0.516 to 0.832)[0.202 to 0.954]
1.000(0.394 to 1.606)[–0.676 to 2.677]
–0.001(–0.903 to 0.902)[–2.691 to 2.689]
Second-trimester models
1. 4 Clinical Logit(p)= –8.0909 – 0.0165 × age + 0.0108 ×SBP + 0.0198 × DBP+ 0.0614 × BMI + 0.9616 ×nulliparous+ 1.4068 × previous PE + 0.9700 ×renal disease + 1.7763 × hypertension
9 29,153 1144 0.703(0.648 to 0.753)[0.541 to 0.827]
0.999(0.685 to 1.314)[0.065 to 1.934]
0.011(–0.762 to 0.784)[–2.456 to 2.478]
10 Clinical andbiochemicalmarkers
Logit(p)= –7.6942 – 0.0186 × age + 0.0185 ×SBP – 0.0083 × DBP + 0.0668 × BMI + 2.0169 ×nulliparous + 1.7592 × previous PE + 1.3675 ×renal disease + 2.3073 × hypertension –
0.00262 × PlGF
3 17,117 692 0.754(0.526 to 0.894)[0.009 to 0.999]
1.000(0.373 to 1.628)[–2.537 to 4.537]
0.001(–1.284 to 1.287)[–7.520 to 7.522]
Early-onset pre-eclampsia
First-trimester models
2 Clinical Logit(p)= –7.9161 – 0.0360 × age – 0.0176 ×SBP + 0.0753 × DBP – 0.5937 × (BMI/10)–2 +1.7440 × previous PE + 2.2795 × renal disease +0.5486 × hypertension + 1.7185 × diabetes
11 29,187 149 0.719(0.590 to 0.820)[0.400 to 0.907]
1.000(0.795 to 1.205)[0.792 to 1.208]
0.079(–0.388 to 0.545)[–1.283 to 1.440]
8 Clinical andbiochemicalmarkers
Logit(p)= –10.3842 – 0.0048 × age+ 0.0555 ×SBP – 0.0040 × DBP – 0.0069 × BMI + 1.5442 ×previous PE + 1.5372 × renal disease + 0.8644 ×hypertension – 0.000535 × sFlt-1
4 20,132 103 0.762(0.576 to 0.883)[0.341 to 0.952]
1.000(0.642 to 1.359)[0.516 to 1.485]
0.009(–1.319 to 1.338)[–3.858 to 3.877]
DEVELO
PMENTAND
VALID
ATIO
NOFPRE-ECLA
MPSIA
PREDICTIO
NMODELS
NIH
RJournals
Library
www.jo
urnalslib
rary.nihr.ac.u
k
62
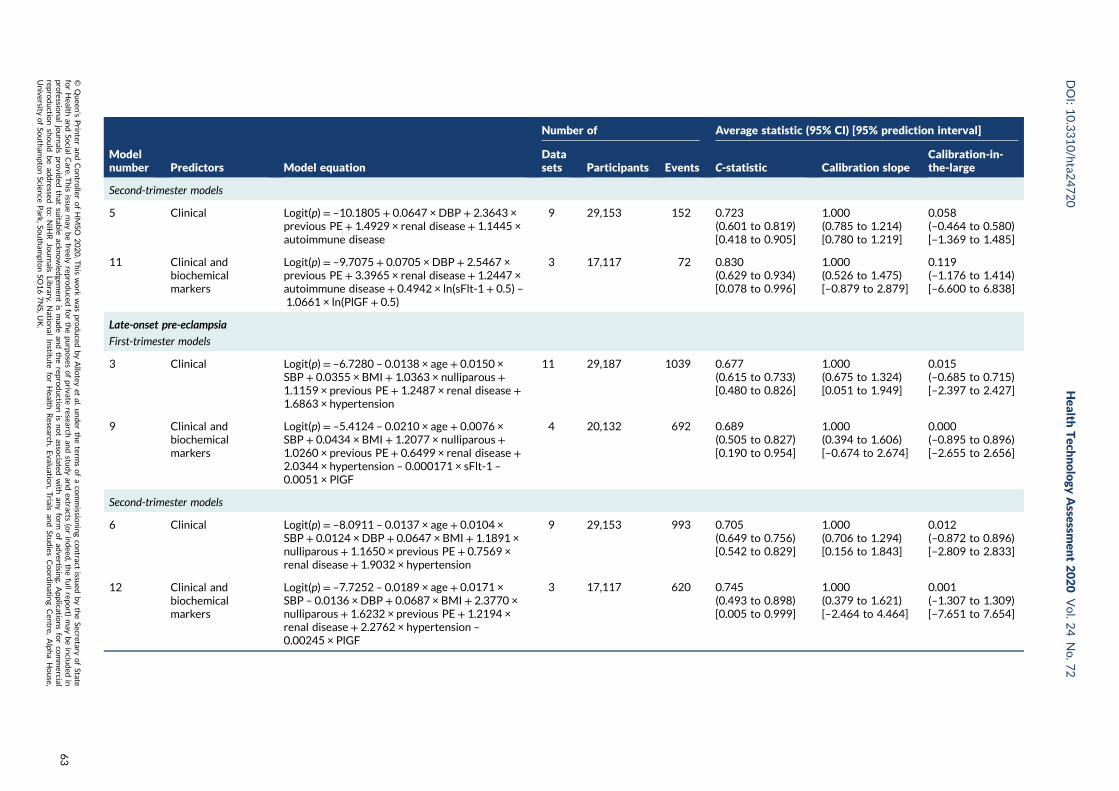
Modelnumber Predictors Model equation
Number of Average statistic (95% CI) [95% prediction interval]
Datasets Participants Events C-statistic Calibration slope
Calibration-in-the-large
Second-trimester models
5 Clinical Logit(p)= –10.1805 + 0.0647 × DBP+ 2.3643 ×previous PE + 1.4929 × renal disease + 1.1445 ×autoimmune disease
9 29,153 152 0.723(0.601 to 0.819)[0.418 to 0.905]
1.000(0.785 to 1.214)[0.780 to 1.219]
0.058(–0.464 to 0.580)[–1.369 to 1.485]
11 Clinical andbiochemicalmarkers
Logit(p)= –9.7075 + 0.0705 × DBP+ 2.5467 ×previous PE + 3.3965 × renal disease + 1.2447 ×autoimmune disease + 0.4942 × ln(sFlt-1 + 0.5) –1.0661 × ln(PlGF + 0.5)
3 17,117 72 0.830(0.629 to 0.934)[0.078 to 0.996]
1.000(0.526 to 1.475)[–0.879 to 2.879]
0.119(–1.176 to 1.414)[–6.600 to 6.838]
Late-onset pre-eclampsia
First-trimester models
3 Clinical Logit(p)= –6.7280 – 0.0138 × age + 0.0150 ×SBP + 0.0355 × BMI + 1.0363 × nulliparous+1.1159 × previous PE + 1.2487 × renal disease +1.6863 × hypertension
11 29,187 1039 0.677(0.615 to 0.733)[0.480 to 0.826]
1.000(0.675 to 1.324)[0.051 to 1.949]
0.015(–0.685 to 0.715)[–2.397 to 2.427]
9 Clinical andbiochemicalmarkers
Logit(p)= –5.4124 – 0.0210 × age + 0.0076 ×SBP + 0.0434 × BMI + 1.2077 × nulliparous+1.0260 × previous PE + 0.6499 × renal disease +2.0344 × hypertension – 0.000171 × sFlt-1 –
0.0051 × PlGF
4 20,132 692 0.689(0.505 to 0.827)[0.190 to 0.954]
1.000(0.394 to 1.606)[–0.674 to 2.674]
0.000(–0.895 to 0.896)[–2.655 to 2.656]
Second-trimester models
6 Clinical Logit(p)= –8.0911 – 0.0137 × age + 0.0104 ×SBP + 0.0124 × DBP+ 0.0647 × BMI + 1.1891 ×nulliparous + 1.1650 × previous PE + 0.7569 ×renal disease + 1.9032 × hypertension
9 29,153 993 0.705(0.649 to 0.756)[0.542 to 0.829]
1.000(0.706 to 1.294)[0.156 to 1.843]
0.012(–0.872 to 0.896)[–2.809 to 2.833]
12 Clinical andbiochemicalmarkers
Logit(p)= –7.7252 – 0.0189 × age + 0.0171 ×SBP – 0.0136 × DBP + 0.0687 × BMI + 2.3770 ×nulliparous + 1.6232 × previous PE + 1.2194 ×renal disease + 2.2762 × hypertension –
0.00245 × PlGF
3 17,117 620 0.745(0.493 to 0.898)[0.005 to 0.999]
1.000(0.379 to 1.621)[–2.464 to 4.464]
0.001(–1.307 to 1.309)[–7.651 to 7.654]
DOI:10.3310/hta2
4720
Health
Tech
nology
Assessm
ent2020
Vol.2
4No.7
2
©Queen
’sPrin
teran
dContro
llerofHMSO
2020.T
his
work
was
produced
byAllo
teyet
al.under
theterm
sofaco
mmissio
ningco
ntract
issued
bytheSecretary
ofState
forHealth
andSo
cialCare.T
his
issuemay
befreely
reproduced
forthepu
rposes
ofprivate
researchan
dstu
dyan
dextracts
(orindeed
,thefullrepo
rt)may
beinclu
ded
inpro
fessional
journals
provid
edthat
suitab
leackn
owled
gemen
tis
mad
ean
dtherepro
ductio
nis
notasso
ciatedwith
anyform
ofad
vertising.
Applicatio
nsforco
mmercial
reproductio
nshould
bead
dressed
to:NIH
RJournals
Library,
Natio
nal
Institu
teforHealth
Research
,Evalu
ation,Trials
and
Studies
Coordinatin
gCen
tre,Alph
aHouse,
University
ofSo
utham
ptonScien
cePark,So
utham
ptonSO
167NS,U
K.
63
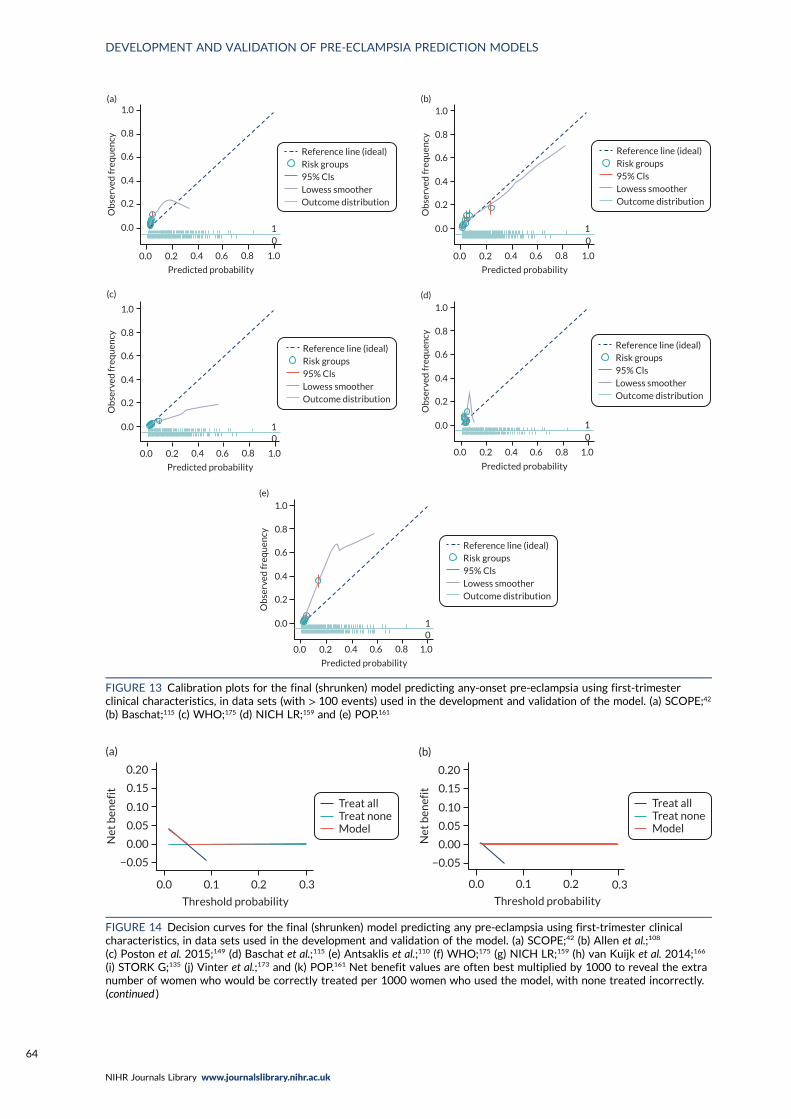
1.0
0.8
0.6
0.4
0.2
0.0
Ob
serv
ed fr
equ
ency
0.0 0.2 0.4 0.6 0.8 1.0
Predicted probability
(a)
10
Reference line (ideal)Risk groups95% ClsLowess smootherOutcome distribution
1.0
0.8
0.6
0.4
0.2
0.0
Ob
serv
ed fr
equ
ency
0.0 0.2 0.4 0.6 0.8 1.0
Predicted probability
(b)
10
Reference line (ideal)Risk groups95% ClsLowess smootherOutcome distribution
1.0
0.8
0.6
0.4
0.2
0.0
Ob
serv
ed fr
equ
ency
0.0 0.2 0.4 0.6 0.8 1.0
Predicted probability
(c)
10
Reference line (ideal)Risk groups95% ClsLowess smootherOutcome distribution
1.0
0.8
0.6
0.4
0.2
0.0O
bse
rved
freq
uen
cy
0.0 0.2 0.4 0.6 0.8 1.0
Predicted probability
(d)
10
Reference line (ideal)Risk groups95% ClsLowess smootherOutcome distribution
1.0
0.8
0.6
0.4
0.2
0.0
Ob
serv
ed fr
equ
ency
0.0 0.2 0.4 0.6 0.8 1.0
Predicted probability
(e)
10
Reference line (ideal)Risk groups95% ClsLowess smootherOutcome distribution
FIGURE 13 Calibration plots for the final (shrunken) model predicting any-onset pre-eclampsia using first-trimesterclinical characteristics, in data sets (with > 100 events) used in the development and validation of the model. (a) SCOPE;42
(b) Baschat;115 (c) WHO;175 (d) NICH LR;159 and (e) POP.161
Treat allTreat noneModel
Threshold probability
0.0 0.1 0.2 0.3
0.20
0.15
0.10
0.05
0.00
−0.05
Net
ben
efit
(a)
Treat allTreat noneModel
0.3
Threshold probability
0.0 0.1 0.2
0.20
0.15
0.10
0.05
0.00
−0.05
Net
ben
efit
(b)
FIGURE 14 Decision curves for the final (shrunken) model predicting any pre-eclampsia using first-trimester clinicalcharacteristics, in data sets used in the development and validation of the model. (a) SCOPE;42 (b) Allen et al.;108
(c) Poston et al. 2015;149 (d) Baschat et al.;115 (e) Antsaklis et al.;110 (f) WHO;175 (g) NICH LR;159 (h) van Kuijk et al. 2014;166
(i) STORK G;135 (j) Vinter et al.;173 and (k) POP.161 Net benefit values are often best multiplied by 1000 to reveal the extranumber of women who would be correctly treated per 1000 women who used the model, with none treated incorrectly.(continued )
DEVELOPMENT AND VALIDATION OF PRE-ECLAMPSIA PREDICTION MODELS
NIHR Journals Library www.journalslibrary.nihr.ac.uk
64
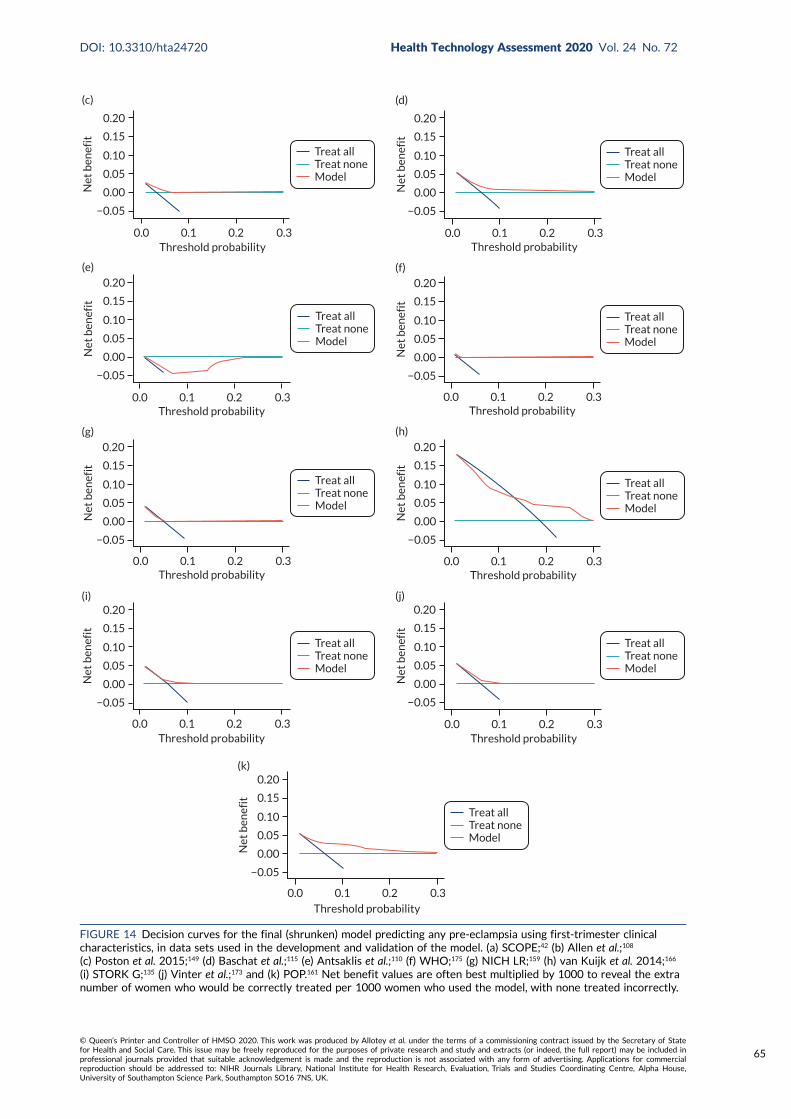
Treat allTreat noneModel
Threshold probability0.0 0.1 0.2 0.3
0.20
0.15
0.10
0.05
0.00
−0.05
Net
ben
efit
(c)
Treat allTreat noneModel
Threshold probability0.0 0.1 0.2 0.3
0.20
0.15
0.10
0.05
0.00
−0.05
Net
ben
efit
(d)
Threshold probability0.0 0.1 0.2 0.3
Treat allTreat noneModel
0.20
0.15
0.10
0.05
0.00
−0.05
Net
ben
efit
(e)
Threshold probability0.0 0.1 0.2 0.3
Treat allTreat noneModel
0.20
0.15
0.10
0.05
0.00
−0.05
Net
ben
efit
(f)
Treat allTreat noneModel
Threshold probability0.0 0.1 0.2 0.3
0.20
0.15
0.10
0.05
0.00
−0.05
Net
ben
efit
(g)
Treat allTreat noneModel
Threshold probability0.0 0.1 0.2 0.3
0.20
0.15
0.10
0.05
0.00
−0.05
Net
ben
efit
(h)
Threshold probability0.0 0.1 0.2 0.3
Treat allTreat noneModel
0.20
0.15
0.10
0.05
0.00
−0.05
Net
ben
efit
(i)
Threshold probability0.0 0.1 0.2 0.3
Treat allTreat noneModel
0.20
0.15
0.10
0.05
0.00
−0.05
Net
ben
efit
(j)
Treat allTreat noneModel
Threshold probability
0.0 0.1 0.2 0.3
0.20
0.15
0.10
0.05
0.00
−0.05
Net
ben
efit
(k)
FIGURE 14 Decision curves for the final (shrunken) model predicting any pre-eclampsia using first-trimester clinicalcharacteristics, in data sets used in the development and validation of the model. (a) SCOPE;42 (b) Allen et al.;108
(c) Poston et al. 2015;149 (d) Baschat et al.;115 (e) Antsaklis et al.;110 (f) WHO;175 (g) NICH LR;159 (h) van Kuijk et al. 2014;166
(i) STORK G;135 (j) Vinter et al.;173 and (k) POP.161 Net benefit values are often best multiplied by 1000 to reveal the extranumber of women who would be correctly treated per 1000 women who used the model, with none treated incorrectly.
DOI: 10.3310/hta24720 Health Technology Assessment 2020 Vol. 24 No. 72
© Queen’s Printer and Controller of HMSO 2020. This work was produced by Allotey et al. under the terms of a commissioning contract issued by the Secretary of Statefor Health and Social Care. This issue may be freely reproduced for the purposes of private research and study and extracts (or indeed, the full report) may be included inprofessional journals provided that suitable acknowledgement is made and the reproduction is not associated with any form of advertising. Applications for commercialreproduction should be addressed to: NIHR Journals Library, National Institute for Health Research, Evaluation, Trials and Studies Coordinating Centre, Alpha House,University of Southampton Science Park, Southampton SO16 7NS, UK.
65
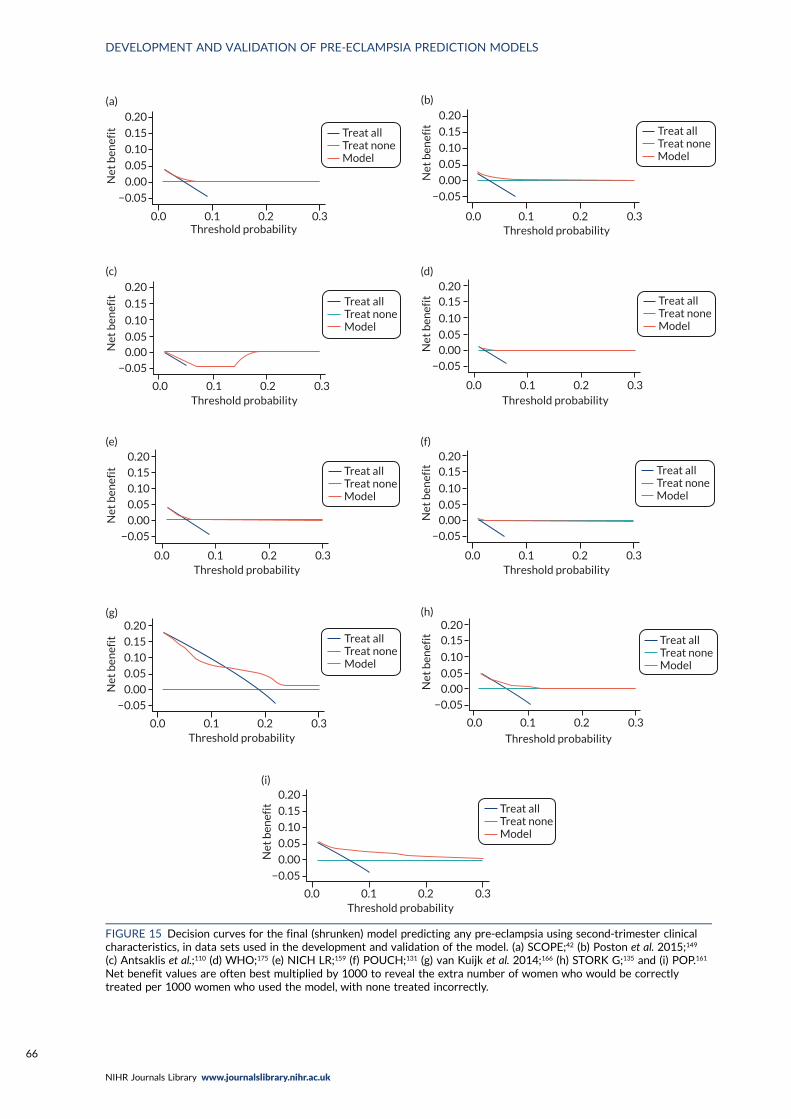
Treat allTreat noneModel
Threshold probability0.0 0.1 0.2 0.3
0.20
0.15
0.10
0.05
0.00
−0.05
Net
ben
efit
(a)
Treat allTreat noneModel
Threshold probability0.0 0.1 0.2 0.3
0.20
0.15
0.10
0.05
0.00
−0.05
Net
ben
efit
(b)
Treat allTreat noneModel
Threshold probability0.0 0.1 0.2 0.3
0.20
0.15
0.10
0.050.00
−0.05
Net
ben
efit
(c)
Treat allTreat noneModel
Threshold probability0.0 0.1 0.2 0.3
0.200.15
0.10
0.050.00
−0.05
Net
ben
efit
(d)
Treat allTreat noneModel
Threshold probability0.0 0.1 0.2 0.3
0.20
0.15
0.10
0.05
0.00
−0.05
Net
ben
efit
(e)
Treat allTreat noneModel
Threshold probability0.0 0.1 0.2 0.3
0.200.15
0.10
0.050.00
−0.05
Net
ben
efit
(f)
Treat allTreat noneModel
Threshold probability0.0 0.1 0.2 0.3
0.20
0.15
0.10
0.05
0.00
−0.05
Net
ben
efit
(g)
Treat allTreat noneModel
Threshold probability
0.0 0.1 0.2 0.3
0.200.15
0.10
0.050.00
−0.05
Net
ben
efit
(h)
Treat allTreat noneModel
Threshold probability0.0 0.1 0.2 0.3
0.20
0.15
0.10
0.05
0.00
−0.05
Net
ben
efit
(i)
FIGURE 15 Decision curves for the final (shrunken) model predicting any pre-eclampsia using second-trimester clinicalcharacteristics, in data sets used in the development and validation of the model. (a) SCOPE;42 (b) Poston et al. 2015;149
(c) Antsaklis et al.;110 (d) WHO;175 (e) NICH LR;159 (f) POUCH;131 (g) van Kuijk et al. 2014;166 (h) STORK G;135 and (i) POP.161
Net benefit values are often best multiplied by 1000 to reveal the extra number of women who would be correctlytreated per 1000 women who used the model, with none treated incorrectly.
DEVELOPMENT AND VALIDATION OF PRE-ECLAMPSIA PREDICTION MODELS
NIHR Journals Library www.journalslibrary.nihr.ac.uk
66
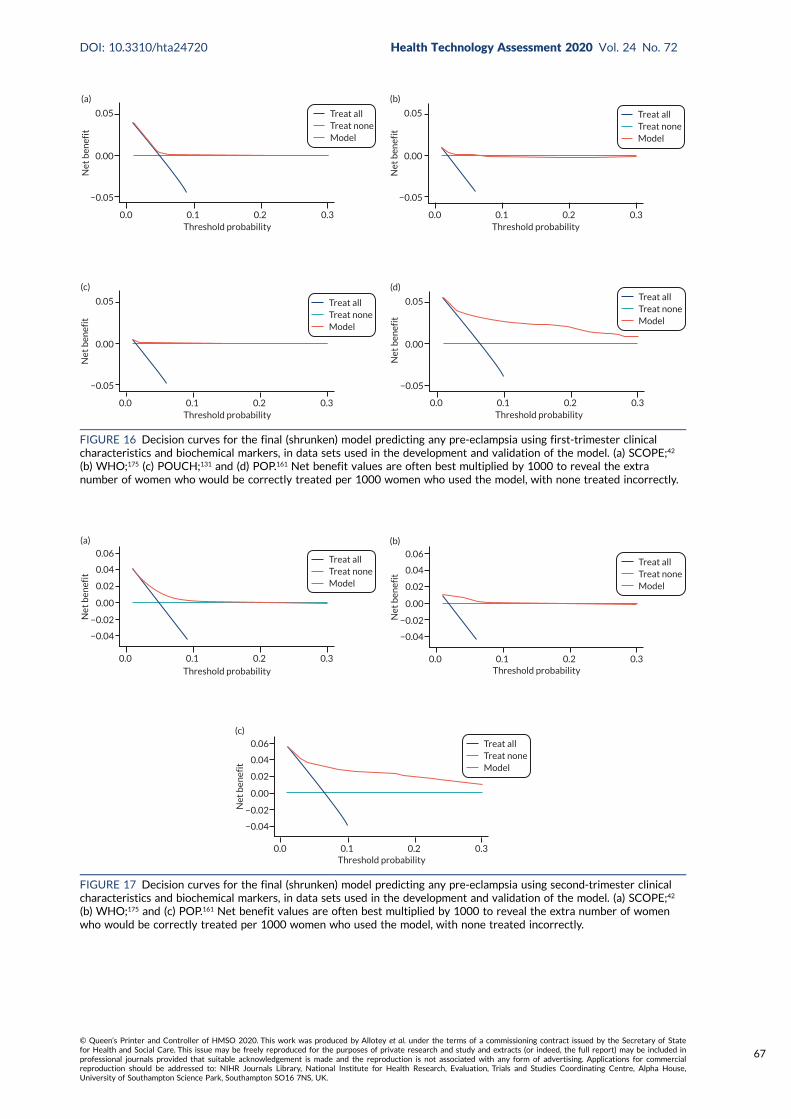
Treat allTreat noneModel
Threshold probability0.0 0.1 0.2 0.3
Net
ben
efit
0.05
0.00
−0.05
(a)
Treat allTreat noneModel
Threshold probability0.0 0.1 0.2 0.3
Net
ben
efit
0.05
0.00
−0.05
(b)
Treat allTreat noneModel
Threshold probability0.0 0.1 0.2 0.3
Net
ben
efit
0.05
0.00
−0.05
(c)Treat allTreat noneModel
Threshold probability0.0 0.1 0.2 0.3
Net
ben
efit
0.05
0.00
−0.05
(d)
FIGURE 16 Decision curves for the final (shrunken) model predicting any pre-eclampsia using first-trimester clinicalcharacteristics and biochemical markers, in data sets used in the development and validation of the model. (a) SCOPE;42
(b) WHO;175 (c) POUCH;131 and (d) POP.161 Net benefit values are often best multiplied by 1000 to reveal the extranumber of women who would be correctly treated per 1000 women who used the model, with none treated incorrectly.
Treat allTreat noneModel
Threshold probability0.0 0.1 0.2 0.3
(a)
Net
ben
efit
0.06
0.04
0.02
0.00
−0.02
−0.04
Treat allTreat noneModel
Threshold probability0.0 0.1 0.2 0.3
(b)
Net
ben
efit
0.06
0.04
0.02
0.00
−0.02
−0.04
Treat allTreat noneModel
Threshold probability0.0 0.1 0.2 0.3
(c)
Net
ben
efit
0.06
0.04
0.02
0.00
−0.02
−0.04
FIGURE 17 Decision curves for the final (shrunken) model predicting any pre-eclampsia using second-trimester clinicalcharacteristics and biochemical markers, in data sets used in the development and validation of the model. (a) SCOPE;42
(b) WHO;175 and (c) POP.161 Net benefit values are often best multiplied by 1000 to reveal the extra number of womenwho would be correctly treated per 1000 women who used the model, with none treated incorrectly.
DOI: 10.3310/hta24720 Health Technology Assessment 2020 Vol. 24 No. 72
© Queen’s Printer and Controller of HMSO 2020. This work was produced by Allotey et al. under the terms of a commissioning contract issued by the Secretary of Statefor Health and Social Care. This issue may be freely reproduced for the purposes of private research and study and extracts (or indeed, the full report) may be included inprofessional journals provided that suitable acknowledgement is made and the reproduction is not associated with any form of advertising. Applications for commercialreproduction should be addressed to: NIHR Journals Library, National Institute for Health Research, Evaluation, Trials and Studies Coordinating Centre, Alpha House,University of Southampton Science Park, Southampton SO16 7NS, UK.
67
Using first-trimester clinical characteristics (model 1; see Figure 14) shows some net benefit atthresholds around 0.05 in the Poston et al. 2015,149 Baschat et al.,115 STORK G,135 Vinter et al.173 andPOP161 cohorts. The model shows little benefit or harm in SCOPE,42 Allen et al.,108 Antsaklis et al.,110
WHO175 and NICH LR.159 Using second-trimester clinical characteristics (model 4) shows someimprovement in net benefit in SCOPE161 but little improvement in the other data sets (see Figure 15).In the data sets used for developing and validating models with first-trimester clinical characteristicsand biochemical markers (model 7), there may be greater net benefit in POP161 but little improvementin the SCOPE42 or WHO175 cohorts (see Figure 16) compared with using clinical characteristics alone.Using second-trimester clinical characteristics and biochemical markers (model 10) shows a slightimprovement in the SCOPE42 and POP161 cohorts (compared with first-trimester predictors), and theaddition of second-trimester biochemical markers has slightly greater net benefit than in modelsincluding only second-trimester clinical characteristics (see Figure 17 ).
Decision curves for models predicting early-onset pre-eclampsia show no net benefit in most of thedata sets, and decision curves for models predicting late-onset pre-eclampsia are similar to those forany-onset pre-eclampsia (see Appendix 21, Figures 38–45).
Summary
We used IPD from the IPPIC data sets to develop and validate new prediction models for early-onset,late-onset and any-onset pre-eclampsia using clinical characteristics alone or with the addition ofbiochemical markers. The IPPIC data sets used for model development and validation are heterogeneous,with different case mix in different data sets (e.g. owing to different inclusion and exclusion criteria).When the models were validated using an average intercept across data sets, the model performedbetter in some IPPIC data sets than in others even if the average performance was good. The same wasobserved in terms of net benefit in the individual data sets. In some data sets, there was potential fornet benefit at certain thresholds, whereas there was very little or no net benefit when the models wereapplied in other data sets.
In summary, these prediction models have the potential to be useful in predicting pre-eclampsiain some populations; however, additional predictors may be needed, or the models may need to betailored to improve the predictive performance across different settings and populations.
DEVELOPMENT AND VALIDATION OF PRE-ECLAMPSIA PREDICTION MODELS
NIHR Journals Library www.journalslibrary.nihr.ac.uk
68
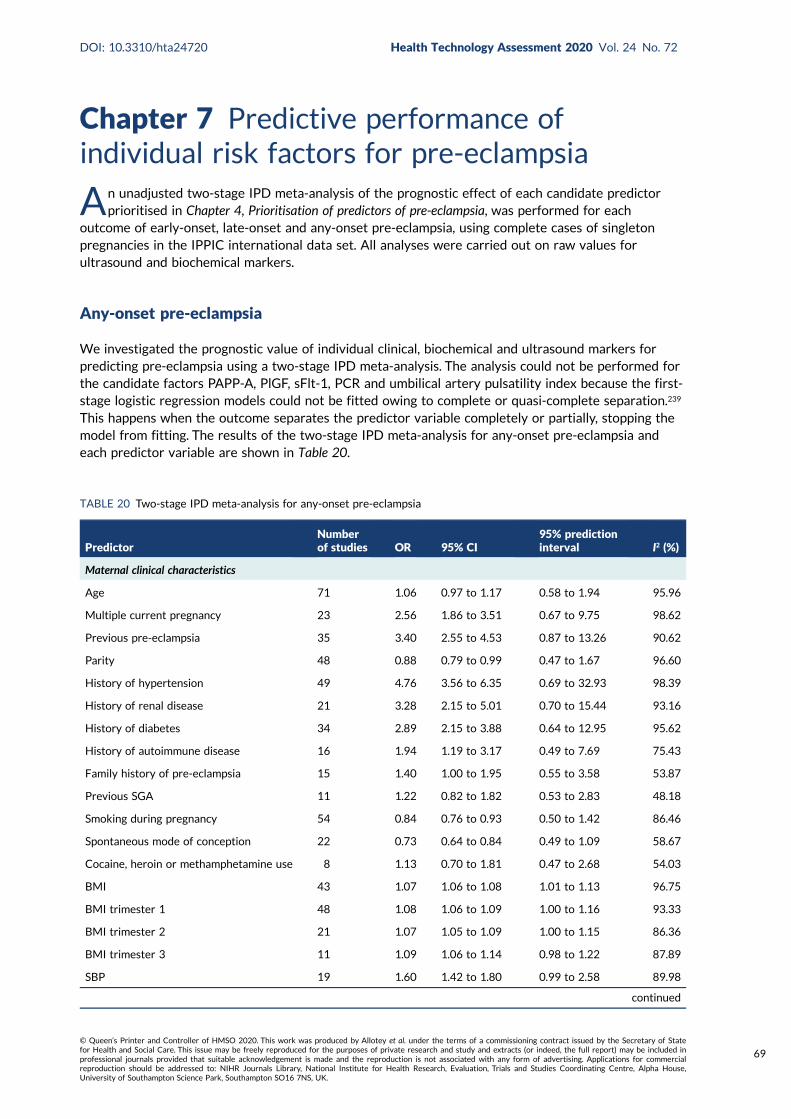
Chapter 7 Predictive performance ofindividual risk factors for pre-eclampsia
An unadjusted two-stage IPD meta-analysis of the prognostic effect of each candidate predictorprioritised in Chapter 4, Prioritisation of predictors of pre-eclampsia, was performed for each
outcome of early-onset, late-onset and any-onset pre-eclampsia, using complete cases of singletonpregnancies in the IPPIC international data set. All analyses were carried out on raw values forultrasound and biochemical markers.
Any-onset pre-eclampsia
We investigated the prognostic value of individual clinical, biochemical and ultrasound markers forpredicting pre-eclampsia using a two-stage IPD meta-analysis. The analysis could not be performed forthe candidate factors PAPP-A, PlGF, sFlt-1, PCR and umbilical artery pulsatility index because the first-stage logistic regression models could not be fitted owing to complete or quasi-complete separation.239
This happens when the outcome separates the predictor variable completely or partially, stopping themodel from fitting. The results of the two-stage IPD meta-analysis for any-onset pre-eclampsia andeach predictor variable are shown in Table 20.
TABLE 20 Two-stage IPD meta-analysis for any-onset pre-eclampsia
PredictorNumberof studies OR 95% CI
95% predictioninterval I2 (%)
Maternal clinical characteristics
Age 71 1.06 0.97 to 1.17 0.58 to 1.94 95.96
Multiple current pregnancy 23 2.56 1.86 to 3.51 0.67 to 9.75 98.62
Previous pre-eclampsia 35 3.40 2.55 to 4.53 0.87 to 13.26 90.62
Parity 48 0.88 0.79 to 0.99 0.47 to 1.67 96.60
History of hypertension 49 4.76 3.56 to 6.35 0.69 to 32.93 98.39
History of renal disease 21 3.28 2.15 to 5.01 0.70 to 15.44 93.16
History of diabetes 34 2.89 2.15 to 3.88 0.64 to 12.95 95.62
History of autoimmune disease 16 1.94 1.19 to 3.17 0.49 to 7.69 75.43
Family history of pre-eclampsia 15 1.40 1.00 to 1.95 0.55 to 3.58 53.87
Previous SGA 11 1.22 0.82 to 1.82 0.53 to 2.83 48.18
Smoking during pregnancy 54 0.84 0.76 to 0.93 0.50 to 1.42 86.46
Spontaneous mode of conception 22 0.73 0.64 to 0.84 0.49 to 1.09 58.67
Cocaine, heroin or methamphetamine use 8 1.13 0.70 to 1.81 0.47 to 2.68 54.03
BMI 43 1.07 1.06 to 1.08 1.01 to 1.13 96.75
BMI trimester 1 48 1.08 1.06 to 1.09 1.00 to 1.16 93.33
BMI trimester 2 21 1.07 1.05 to 1.09 1.00 to 1.15 86.36
BMI trimester 3 11 1.09 1.06 to 1.14 0.98 to 1.22 87.89
SBP 19 1.60 1.42 to 1.80 0.99 to 2.58 89.98
continued
DOI: 10.3310/hta24720 Health Technology Assessment 2020 Vol. 24 No. 72
© Queen’s Printer and Controller of HMSO 2020. This work was produced by Allotey et al. under the terms of a commissioning contract issued by the Secretary of Statefor Health and Social Care. This issue may be freely reproduced for the purposes of private research and study and extracts (or indeed, the full report) may be included inprofessional journals provided that suitable acknowledgement is made and the reproduction is not associated with any form of advertising. Applications for commercialreproduction should be addressed to: NIHR Journals Library, National Institute for Health Research, Evaluation, Trials and Studies Coordinating Centre, Alpha House,University of Southampton Science Park, Southampton SO16 7NS, UK.
69

TABLE 20 Two-stage IPD meta-analysis for any-onset pre-eclampsia (continued )
PredictorNumberof studies OR 95% CI
95% predictioninterval I2 (%)
SBP trimester 1 39 1.46 1.39 to 1.53 1.15 to 1.85 76.57
SBP trimester 2 28 1.55 1.46 to 1.64 1.24 to 1.94 73.11
SBP trimester 3 19 2.04 1.76 to 2.36 1.13 to 3.66 92.86
DBP 19 1.78 1.55 to 2.05 0.99 to 3.20 88.45
DBP trimester 1 39 1.70 1.57 to 1.85 1.19 to 2.45 79.61
DBP trimester 2 28 1.80 1.62 to 1.99 1.18 to 2.75 84.16
DBP trimester 3 18 2.59 2.04 to 3.29 1.06 to 6.30 94.44
MAP 25 2.00 1.75 to 2.30 1.08 to 3.71 89.06
MAP trimester 1 41 1.79 1.65 to 1.93 1.24 to 2.58 80.57
MAP trimester 2 29 1.92 1.74 to 2.11 1.27 to 2.89 83.52
MAP trimester 3 19 2.71 2.19 to 3.34 1.17 to 6.24 93.89
PCR 3 1.11 0.72 to 1.73 0.48 to 2.60 99.92
PCR trimester 1 1 0.75 0.34 to 1.67 N/A N/A
PCR trimester 2 1 0.98 0.93 to 1.03 N/A N/A
Urine dipstick 7 2.72 0.83 to 8.87 0.10 to 75.23 98.34
Urine dipstick trimester 1 6 2.27 1.52 to 3.38 1.20 to 4.29 27.67
Urine dipstick trimester 2 10 1.82 1.30 to 2.54 0.73 to 4.52 74.77
Urine dipstick trimester 3 6 3.46 1.83 to 6.55 0.74 to 16.18 92.92
Ultrasound markers
Uterine artery PI 11 3.11 1.86 to 5.18 0.71 to 13.66 74.32
Uterine artery PI trimester 1 12 1.67 1.18 to 2.38 0.64 to 4.37 70.27
Uterine artery PI trimester 2 13 4.18 3.25 to 5.38 2.27 to 7.70 47.16
Uterine artery PI trimester 3 3 3.99 0.02 to 688.38 0.00 to 37,752.95 75.04
Umbilical artery PI 5 1.08 0.44 to 2.65 0.44 to 2.65 0.00
Umbilical artery PI trimester 2 8 1.94 0.89 to 4.23 0.52 to 7.26 33.52
Umbilical artery PI trimester 3 5 1.60 0.48 to 5.38 0.21 to 12.31 37.99
Biochemical markers
PIGF trimester 1 17 0.22 0.09 to 0.50 0.01 to 4.34 85.44
PIGF trimester 2 16 0.66 0.53 to 0.83 0.34 to 1.29 87.27
PIGF trimester 3 12 0.59 0.45 to 0.77 0.25 to 1.36 96.78
sFlt-1 trimester 1 12 0.98 0.97 to 1.00 0.96 to 1.01 51.24
sFlt-1 trimester 2 13 1.02 0.99 to 1.04 0.96 to 1.08 89.91
sFlt-1 trimester 3 9 1.03 1.02 to 1.04 1.00 to 1.06 85.70
PAPP-A trimester 1 11 0.83 0.54 to 1.29 0.21 to 3.24 99.99
PAPP-A trimester 2 4 1.00 0.99 to 1.02 0.98 to 1.02 65.03
N/A, not applicable (only one study); PI, pulsatility index; SGA, small for gestational age.NoteContinuous variables are 1-unit increments, except maternal age, SBP, DBP and MAP, which are 10-unit increments,and PIGF, sFlt-1 and PAPP-A, which are 100-unit increments.
PREDICTIVE PERFORMANCE OF INDIVIDUAL RISK FACTORS FOR PRE-ECLAMPSIA
NIHR Journals Library www.journalslibrary.nihr.ac.uk
70
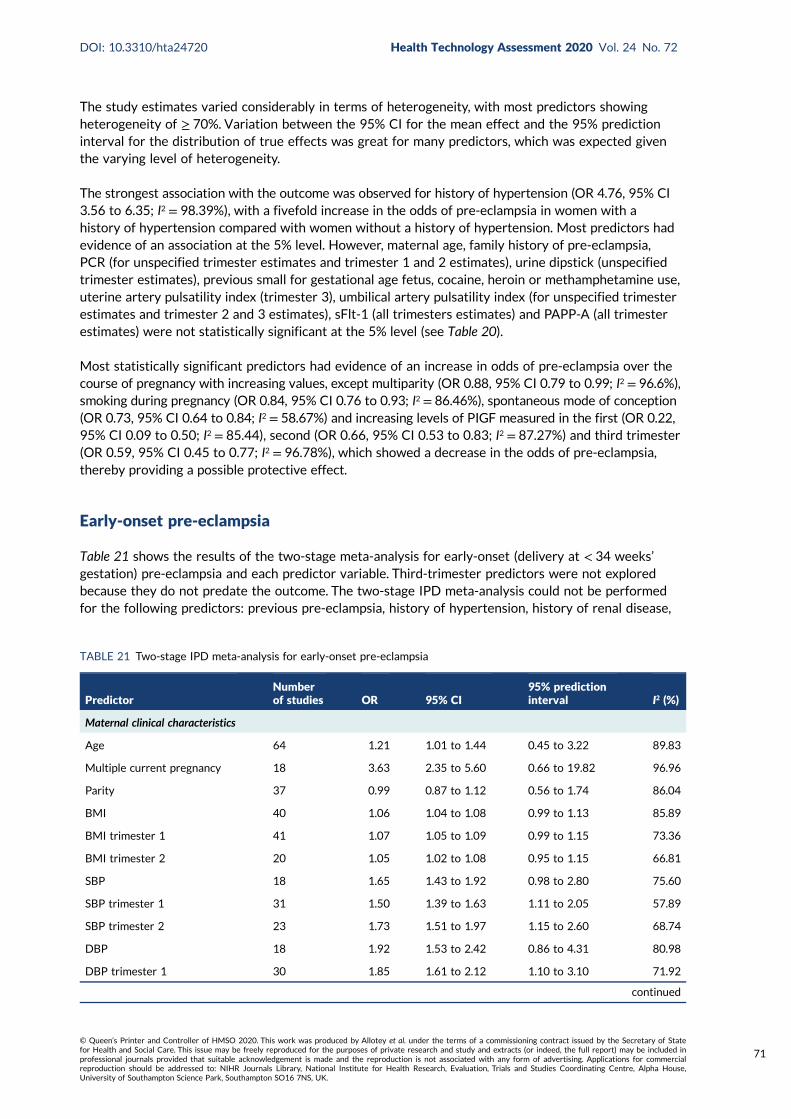
The study estimates varied considerably in terms of heterogeneity, with most predictors showingheterogeneity of ≥ 70%. Variation between the 95% CI for the mean effect and the 95% predictioninterval for the distribution of true effects was great for many predictors, which was expected giventhe varying level of heterogeneity.
The strongest association with the outcome was observed for history of hypertension (OR 4.76, 95% CI3.56 to 6.35; I2 = 98.39%), with a fivefold increase in the odds of pre-eclampsia in women with ahistory of hypertension compared with women without a history of hypertension. Most predictors hadevidence of an association at the 5% level. However, maternal age, family history of pre-eclampsia,PCR (for unspecified trimester estimates and trimester 1 and 2 estimates), urine dipstick (unspecifiedtrimester estimates), previous small for gestational age fetus, cocaine, heroin or methamphetamine use,uterine artery pulsatility index (trimester 3), umbilical artery pulsatility index (for unspecified trimesterestimates and trimester 2 and 3 estimates), sFlt-1 (all trimesters estimates) and PAPP-A (all trimesterestimates) were not statistically significant at the 5% level (see Table 20).
Most statistically significant predictors had evidence of an increase in odds of pre-eclampsia over thecourse of pregnancy with increasing values, except multiparity (OR 0.88, 95% CI 0.79 to 0.99; I2 = 96.6%),smoking during pregnancy (OR 0.84, 95% CI 0.76 to 0.93; I2 = 86.46%), spontaneous mode of conception(OR 0.73, 95% CI 0.64 to 0.84; I2 = 58.67%) and increasing levels of PIGF measured in the first (OR 0.22,95% CI 0.09 to 0.50; I2 = 85.44), second (OR 0.66, 95% CI 0.53 to 0.83; I2 = 87.27%) and third trimester(OR 0.59, 95% CI 0.45 to 0.77; I2 = 96.78%), which showed a decrease in the odds of pre-eclampsia,thereby providing a possible protective effect.
Early-onset pre-eclampsia
Table 21 shows the results of the two-stage meta-analysis for early-onset (delivery at < 34 weeks’gestation) pre-eclampsia and each predictor variable. Third-trimester predictors were not exploredbecause they do not predate the outcome. The two-stage IPD meta-analysis could not be performedfor the following predictors: previous pre-eclampsia, history of hypertension, history of renal disease,
TABLE 21 Two-stage IPD meta-analysis for early-onset pre-eclampsia
PredictorNumberof studies OR 95% CI
95% predictioninterval I2 (%)
Maternal clinical characteristics
Age 64 1.21 1.01 to 1.44 0.45 to 3.22 89.83
Multiple current pregnancy 18 3.63 2.35 to 5.60 0.66 to 19.82 96.96
Parity 37 0.99 0.87 to 1.12 0.56 to 1.74 86.04
BMI 40 1.06 1.04 to 1.08 0.99 to 1.13 85.89
BMI trimester 1 41 1.07 1.05 to 1.09 0.99 to 1.15 73.36
BMI trimester 2 20 1.05 1.02 to 1.08 0.95 to 1.15 66.81
SBP 18 1.65 1.43 to 1.92 0.98 to 2.80 75.60
SBP trimester 1 31 1.50 1.39 to 1.63 1.11 to 2.05 57.89
SBP trimester 2 23 1.73 1.51 to 1.97 1.15 to 2.60 68.74
DBP 18 1.92 1.53 to 2.42 0.86 to 4.31 80.98
DBP trimester 1 30 1.85 1.61 to 2.12 1.10 to 3.10 71.92
continued
DOI: 10.3310/hta24720 Health Technology Assessment 2020 Vol. 24 No. 72
© Queen’s Printer and Controller of HMSO 2020. This work was produced by Allotey et al. under the terms of a commissioning contract issued by the Secretary of Statefor Health and Social Care. This issue may be freely reproduced for the purposes of private research and study and extracts (or indeed, the full report) may be included inprofessional journals provided that suitable acknowledgement is made and the reproduction is not associated with any form of advertising. Applications for commercialreproduction should be addressed to: NIHR Journals Library, National Institute for Health Research, Evaluation, Trials and Studies Coordinating Centre, Alpha House,University of Southampton Science Park, Southampton SO16 7NS, UK.
71
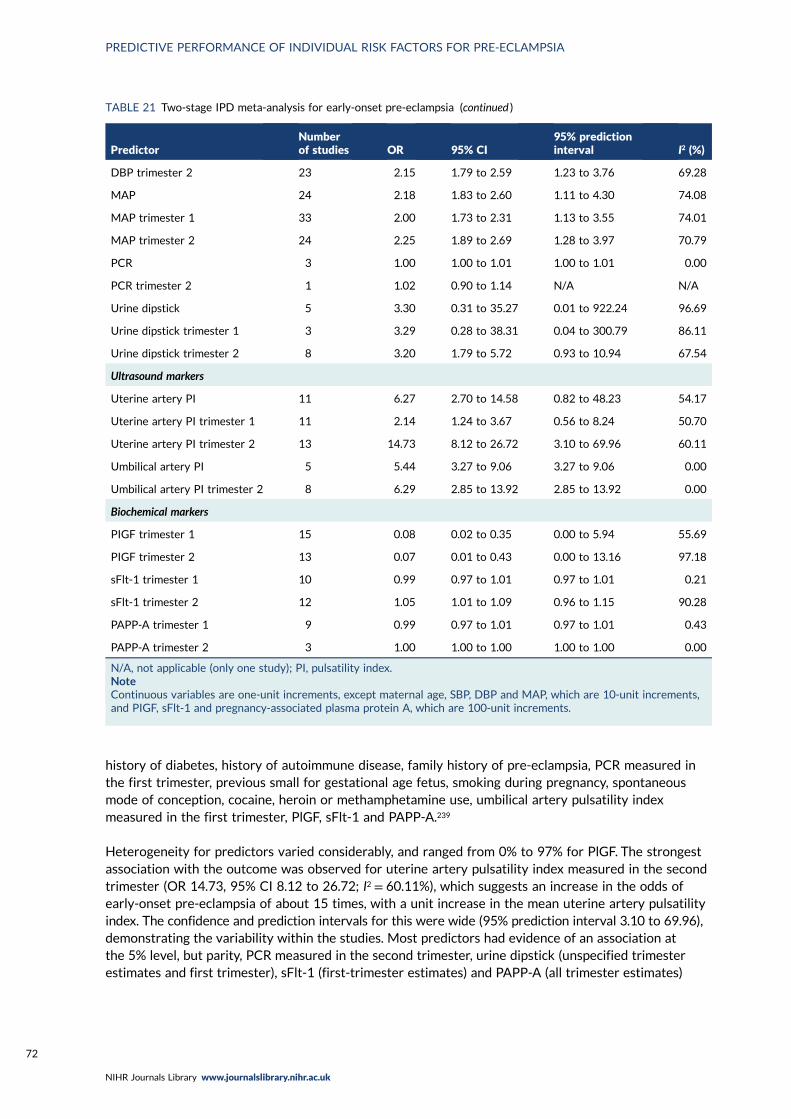
history of diabetes, history of autoimmune disease, family history of pre-eclampsia, PCR measured inthe first trimester, previous small for gestational age fetus, smoking during pregnancy, spontaneousmode of conception, cocaine, heroin or methamphetamine use, umbilical artery pulsatility indexmeasured in the first trimester, PlGF, sFlt-1 and PAPP-A.239
Heterogeneity for predictors varied considerably, and ranged from 0% to 97% for PlGF. The strongestassociation with the outcome was observed for uterine artery pulsatility index measured in the secondtrimester (OR 14.73, 95% CI 8.12 to 26.72; I2 = 60.11%), which suggests an increase in the odds ofearly-onset pre-eclampsia of about 15 times, with a unit increase in the mean uterine artery pulsatilityindex. The confidence and prediction intervals for this were wide (95% prediction interval 3.10 to 69.96),demonstrating the variability within the studies. Most predictors had evidence of an association atthe 5% level, but parity, PCR measured in the second trimester, urine dipstick (unspecified trimesterestimates and first trimester), sFlt-1 (first-trimester estimates) and PAPP-A (all trimester estimates)
TABLE 21 Two-stage IPD meta-analysis for early-onset pre-eclampsia (continued )
PredictorNumberof studies OR 95% CI
95% predictioninterval I2 (%)
DBP trimester 2 23 2.15 1.79 to 2.59 1.23 to 3.76 69.28
MAP 24 2.18 1.83 to 2.60 1.11 to 4.30 74.08
MAP trimester 1 33 2.00 1.73 to 2.31 1.13 to 3.55 74.01
MAP trimester 2 24 2.25 1.89 to 2.69 1.28 to 3.97 70.79
PCR 3 1.00 1.00 to 1.01 1.00 to 1.01 0.00
PCR trimester 2 1 1.02 0.90 to 1.14 N/A N/A
Urine dipstick 5 3.30 0.31 to 35.27 0.01 to 922.24 96.69
Urine dipstick trimester 1 3 3.29 0.28 to 38.31 0.04 to 300.79 86.11
Urine dipstick trimester 2 8 3.20 1.79 to 5.72 0.93 to 10.94 67.54
Ultrasound markers
Uterine artery PI 11 6.27 2.70 to 14.58 0.82 to 48.23 54.17
Uterine artery PI trimester 1 11 2.14 1.24 to 3.67 0.56 to 8.24 50.70
Uterine artery PI trimester 2 13 14.73 8.12 to 26.72 3.10 to 69.96 60.11
Umbilical artery PI 5 5.44 3.27 to 9.06 3.27 to 9.06 0.00
Umbilical artery PI trimester 2 8 6.29 2.85 to 13.92 2.85 to 13.92 0.00
Biochemical markers
PIGF trimester 1 15 0.08 0.02 to 0.35 0.00 to 5.94 55.69
PIGF trimester 2 13 0.07 0.01 to 0.43 0.00 to 13.16 97.18
sFlt-1 trimester 1 10 0.99 0.97 to 1.01 0.97 to 1.01 0.21
sFlt-1 trimester 2 12 1.05 1.01 to 1.09 0.96 to 1.15 90.28
PAPP-A trimester 1 9 0.99 0.97 to 1.01 0.97 to 1.01 0.43
PAPP-A trimester 2 3 1.00 1.00 to 1.00 1.00 to 1.00 0.00
N/A, not applicable (only one study); PI, pulsatility index.NoteContinuous variables are one-unit increments, except maternal age, SBP, DBP and MAP, which are 10-unit increments,and PIGF, sFlt-1 and pregnancy-associated plasma protein A, which are 100-unit increments.
PREDICTIVE PERFORMANCE OF INDIVIDUAL RISK FACTORS FOR PRE-ECLAMPSIA
NIHR Journals Library www.journalslibrary.nihr.ac.uk
72
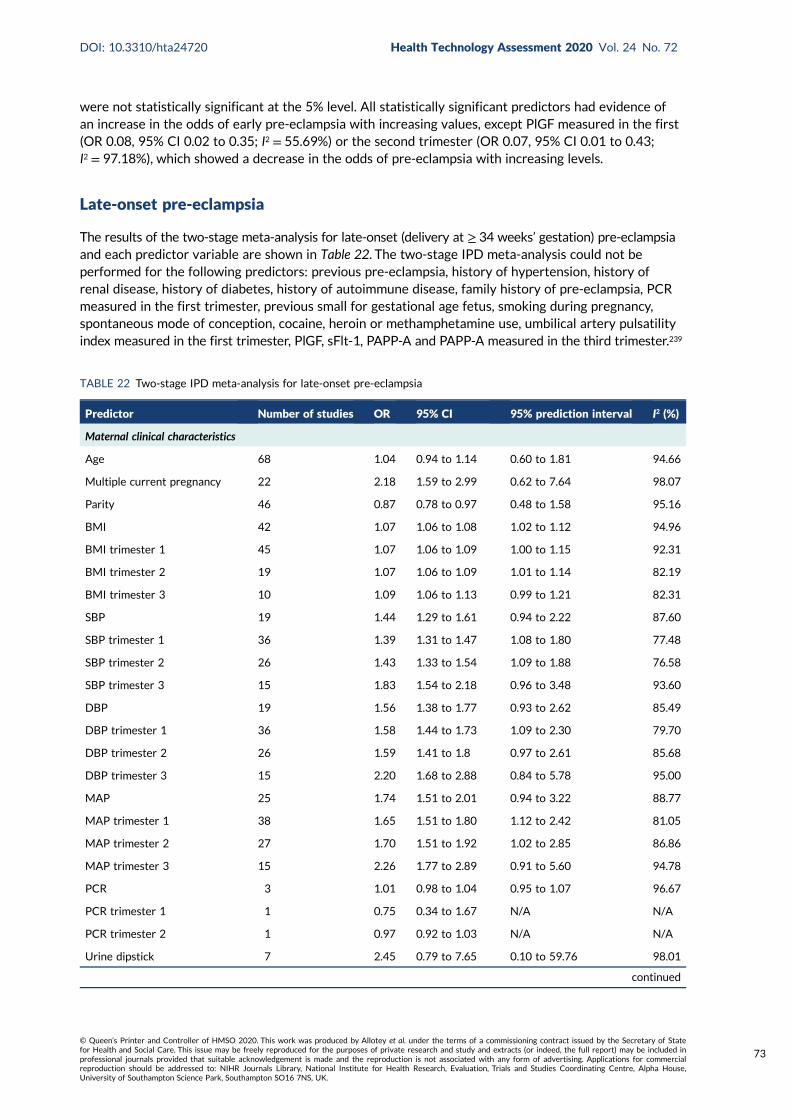
were not statistically significant at the 5% level. All statistically significant predictors had evidence ofan increase in the odds of early pre-eclampsia with increasing values, except PlGF measured in the first(OR 0.08, 95% CI 0.02 to 0.35; I2 = 55.69%) or the second trimester (OR 0.07, 95% CI 0.01 to 0.43;I2 = 97.18%), which showed a decrease in the odds of pre-eclampsia with increasing levels.
Late-onset pre-eclampsia
The results of the two-stage meta-analysis for late-onset (delivery at ≥ 34 weeks’ gestation) pre-eclampsiaand each predictor variable are shown in Table 22. The two-stage IPD meta-analysis could not beperformed for the following predictors: previous pre-eclampsia, history of hypertension, history ofrenal disease, history of diabetes, history of autoimmune disease, family history of pre-eclampsia, PCRmeasured in the first trimester, previous small for gestational age fetus, smoking during pregnancy,spontaneous mode of conception, cocaine, heroin or methamphetamine use, umbilical artery pulsatilityindex measured in the first trimester, PlGF, sFlt-1, PAPP-A and PAPP-A measured in the third trimester.239
TABLE 22 Two-stage IPD meta-analysis for late-onset pre-eclampsia
Predictor Number of studies OR 95% CI 95% prediction interval I2 (%)
Maternal clinical characteristics
Age 68 1.04 0.94 to 1.14 0.60 to 1.81 94.66
Multiple current pregnancy 22 2.18 1.59 to 2.99 0.62 to 7.64 98.07
Parity 46 0.87 0.78 to 0.97 0.48 to 1.58 95.16
BMI 42 1.07 1.06 to 1.08 1.02 to 1.12 94.96
BMI trimester 1 45 1.07 1.06 to 1.09 1.00 to 1.15 92.31
BMI trimester 2 19 1.07 1.06 to 1.09 1.01 to 1.14 82.19
BMI trimester 3 10 1.09 1.06 to 1.13 0.99 to 1.21 82.31
SBP 19 1.44 1.29 to 1.61 0.94 to 2.22 87.60
SBP trimester 1 36 1.39 1.31 to 1.47 1.08 to 1.80 77.48
SBP trimester 2 26 1.43 1.33 to 1.54 1.09 to 1.88 76.58
SBP trimester 3 15 1.83 1.54 to 2.18 0.96 to 3.48 93.60
DBP 19 1.56 1.38 to 1.77 0.93 to 2.62 85.49
DBP trimester 1 36 1.58 1.44 to 1.73 1.09 to 2.30 79.70
DBP trimester 2 26 1.59 1.41 to 1.8 0.97 to 2.61 85.68
DBP trimester 3 15 2.20 1.68 to 2.88 0.84 to 5.78 95.00
MAP 25 1.74 1.51 to 2.01 0.94 to 3.22 88.77
MAP trimester 1 38 1.65 1.51 to 1.80 1.12 to 2.42 81.05
MAP trimester 2 27 1.70 1.51 to 1.92 1.02 to 2.85 86.86
MAP trimester 3 15 2.26 1.77 to 2.89 0.91 to 5.60 94.78
PCR 3 1.01 0.98 to 1.04 0.95 to 1.07 96.67
PCR trimester 1 1 0.75 0.34 to 1.67 N/A N/A
PCR trimester 2 1 0.97 0.92 to 1.03 N/A N/A
Urine dipstick 7 2.45 0.79 to 7.65 0.10 to 59.76 98.01
continued
DOI: 10.3310/hta24720 Health Technology Assessment 2020 Vol. 24 No. 72
© Queen’s Printer and Controller of HMSO 2020. This work was produced by Allotey et al. under the terms of a commissioning contract issued by the Secretary of Statefor Health and Social Care. This issue may be freely reproduced for the purposes of private research and study and extracts (or indeed, the full report) may be included inprofessional journals provided that suitable acknowledgement is made and the reproduction is not associated with any form of advertising. Applications for commercialreproduction should be addressed to: NIHR Journals Library, National Institute for Health Research, Evaluation, Trials and Studies Coordinating Centre, Alpha House,University of Southampton Science Park, Southampton SO16 7NS, UK.
73

There was considerable variation in the heterogeneity for predictors, and the strongest associationwith the outcome was observed for uterine artery pulsatility index measured in the second trimester(OR 2.95, 95% CI 2.31 to 3.76; I2 = 20.77%), which suggests that a 1-unit increase in the uterineartery pulsatility index will lead to an approximate increase of three times in the odds of late-onsetpre-eclampsia. Most predictors assessed showed evidence of an association at the 5% level. However,maternal age, PCR (for all trimester estimates), urine dipstick (unspecified trimester), third-trimesteruterine artery pulsatility index, umbilical artery pulsatility index (unspecified trimester and third trimester),second-trimester sFlt-1 and PAPP-A (all trimesters estimates) were not statistically significant at the5% level. All statistically significant predictors had evidence of an increase in odds of late-onsetpre-eclampsia except parity (OR 0.87, 95% CI 0.78 to 0.97; I2 = 95.16%), first-trimester (OR 0.33, 95% CI0.16 to 0.68; I2 = 82.67%), second-trimester (OR 0.81, 95% CI 0.69 to 0.94; I2 = 76.39%) or third-trimester(OR 0.68, 95% CI 0.57 to 0.81; I2 = 93.60%) measurement of PlGF and sFlt-1 measured in the firsttrimester (OR 0.98, 95% CI 0.97 to 0.99; I2 = 37.07%), which showed a reduction in the odds oflate-onset pre-eclampsia.
Forest plots for each predictor assessed and for each outcome are presented in Report SupplementaryMaterial 1.
TABLE 22 Two-stage IPD meta-analysis for late-onset pre-eclampsia (continued )
Predictor Number of studies OR 95% CI 95% prediction interval I2 (%)
Urine dipstick trimester 1 5 1.85 1.48 to 2.32 1.48 to 2.32 0.00
Urine dipstick trimester 2 9 1.44 1.04 to 1.99 0.63 to 3.27 59.56
Urine dipstick trimester 3 5 2.73 1.47 to 5.04 0.72 to 10.34 81.85
Ultrasound markers
Uterine artery PI 11 2.19 1.36 to 3.54 0.59 to 8.12 64.30
Uterine artery PI trimester 1 12 1.61 1.09 to 2.39 0.54 to 4.83 71.53
Uterine artery PI trimester 2 12 2.95 2.31 to 3.76 1.94 to 4.48 20.77
Uterine artery PI trimester 3 3 3.98 0.04 to 403.56 0.00 to 11,096.61 67.65
Umbilical artery PI 5 0.91 0.05 to 15.46 0.00 to 375.27 88.83
Umbilical artery PI trimester 2 8 1.25 0.56 to 2.78 0.48 to 3.25 8.11
Umbilical artery PI trimester 3 5 0.91 0.26 to 3.25 0.11 to 7.36 32.31
Biochemical markers
PIGF trimester 1 17 0.33 0.16 to 0.68 0.03 to 3.93 82.67
PIGF trimester 2 16 0.81 0.69 to 0.94 0.52 to 1.25 76.39
PIGF trimester 3 12 0.68 0.57 to 0.81 0.38 to 1.20 93.60
sFlt-1 trimester 1 11 0.98 0.97 to 0.99 0.95 to 1.01 37.07
sFlt-1 trimester 2 13 1.00 0.99 to 1.00 0.99 to 1.01 8.29
sFlt-1 trimester 3 9 1.02 1.00 to 1.03 0.99 to 1.04 91.03
PAPP-A trimester 1 10 0.83 0.53 to 1.31 0.22 to 3.18 99.99
PAPP-A trimester 2 4 1.00 0.99 to 1.02 0.98 to 1.02 57.98
N/A, not applicable (only one study); PI, pulsatility index.NoteContinuous variables are 1-unit increments, except maternal age, SBP, DBP and MAP, which are 10-unit increments,and PIGF, sFlt-1 and PAPP-A, which are 100-unit increments.
PREDICTIVE PERFORMANCE OF INDIVIDUAL RISK FACTORS FOR PRE-ECLAMPSIA
NIHR Journals Library www.journalslibrary.nihr.ac.uk
74
Summary
This unadjusted two-stage IPD meta-analysis of the prognostic effect of candidate predictors of early-,late- and any-onset pre-eclampsia was limited to complete singleton records only and included all78 studies in the IPPIC database, with missing data assumed to be missing completely at random.84
Most predictors had evidence of an association at the 5% level for each outcome. Increasing the valuesof second-trimester measurement of uterine artery pulsatility index had the strongest statisticallysignificant association with early-onset (OR 14.73, 95% CI 8.12 to 26.72; I2 = 60.11%) or late-onset(OR 2.95, 95% CI 2.31 to 3.76; I2 = 20.77%) pre-eclampsia. The predictor with the strongest statisticallysignificant association with any-onset pre-eclampsia was history of hypertension (OR 4.76, 95% CI3.56 to 6.35; I2 = 98.39%). Smoking during pregnancy and spontaneous mode of conception wereassociated with a reduction in odds of any-onset pre-eclampsia only; however, parity was associatedwith reduced odds of late-onset and any-onset pre-eclampsia. Increases in PlGF measurements wereassociated with a reduction in the odds of early-, late- and any-onset pre-eclampsia, whereas sFlt-1was associated with a reduction in the odds of late-onset pre-eclampsia only. Conclusions drawn aboutthe association of predictors with outcomes should take into account the uncertainty resulting frommultiple testing type I errors. Further research should consider imputing for missing data to control forthe introduction of bias, and this would also allow associations to be adjusted for potential confounders,giving a better evaluation of associations.
DOI: 10.3310/hta24720 Health Technology Assessment 2020 Vol. 24 No. 72
© Queen’s Printer and Controller of HMSO 2020. This work was produced by Allotey et al. under the terms of a commissioning contract issued by the Secretary of Statefor Health and Social Care. This issue may be freely reproduced for the purposes of private research and study and extracts (or indeed, the full report) may be included inprofessional journals provided that suitable acknowledgement is made and the reproduction is not associated with any form of advertising. Applications for commercialreproduction should be addressed to: NIHR Journals Library, National Institute for Health Research, Evaluation, Trials and Studies Coordinating Centre, Alpha House,University of Southampton Science Park, Southampton SO16 7NS, UK.
75

Chapter 8 Discussion
Summary of the findings
Existing prediction models for any-, early- and late-onset pre-eclampsia IPD have poor to averagepredictive performance when externally validated in the combined IPPIC-UK data sets. All models thatcould be validated showed suboptimal predictive performance across data sets. The clinical utility ofthe published models was poor.
Most of the IPPIC pre-eclampsia models showed good to average discrimination across data sets; all hadgood to average calibration across data sets. The models varied in the predictive performance betweendata sets. The clinical characteristics only and the clinical and biochemical first- and second-trimestermodels to predict any pre-eclampsia showed consistent net benefit over a strategy of considering allwomen to have pre-eclampsia for a wide range of probability thresholds beyond 5% in cohort ofnulliparous women with singleton pregnancies in the UK. Very few risk factors were associated withpre-eclampsia, with significance in both the CIs and the prediction intervals including BMI, SBP and DBPand MAP for any-, early- and late-onset pre-eclampsia; and urine dipstick, uterine artery pulsatilityindex and umbilical artery pulsatility index for any- and early-onset pre-eclampsia.
Strengths and limitations
We used the largest data set to date to validate existing prediction models for pre-eclampsia, and tofurther develop models when required. The IPPIC data set consists of information on predictor variablesat various trimesters. We used raw data to determine the presence or absence of pre-eclampsia andthe type of onset, ensuring the reliability of the findings. Our comprehensive search identified all publishedmodels. By validating them in UK data sets, we were able to assess the extent of transportability ofexisting models to women managed in the NHS. We assessed the quality of the data sets and studiesusing robust tools. Rather than develop further models, we ensured that the performances of theexisting models were robustly evaluated. The models were validated not only using evidence synthesis,but also within individual data sets. The large sample size provided us with sufficient events for therare but important outcome of early-onset pre-eclampsia. In addition to reporting the performances ofthe models in terms of discrimination and calibration, we determined their clinical utility using decisioncurve analysis.
Prior to the development of the IPPIC pre-eclampsia models, we prioritised the predictors for importanceto clinical practice by consensus to ensure face validity. We used multiple imputation to deal with missingvalues for both predictors and outcomes to avoid the loss of useful information84,240 and explored complexassociations such as the non-linearity of predictor effects. We were able to report the associationbetween individual clinical, biochemical and ultrasound predictors, measured in the first, second or thirdtrimester, and rates of early-, late- and any-onset pre-eclampsia with very precise estimates. We pooleddata from a very large sample size using IPD meta-analysis, and explored a considerable number of riskfactors thought to be predictors of pre-eclampsia. We did not dichotomise any of the continuous predictivefactors and we also considered the predictive accuracy of these risk factors along with their association.
Our findings were limited by the variations in population mix, the definitions of the predictors in eachstudy and the outcomes reported. Some studies included only nulliparous women, some strictly includedlow-risk pregnancies and some included all pregnancies. The prioritisation of predictors of pre-eclampsiaby members of the collaborative network who contributed data to the project could also be considereda limitation in the identification of predictors to be considered for model development. It was possible
DOI: 10.3310/hta24720 Health Technology Assessment 2020 Vol. 24 No. 72
© Queen’s Printer and Controller of HMSO 2020. This work was produced by Allotey et al. under the terms of a commissioning contract issued by the Secretary of Statefor Health and Social Care. This issue may be freely reproduced for the purposes of private research and study and extracts (or indeed, the full report) may be included inprofessional journals provided that suitable acknowledgement is made and the reproduction is not associated with any form of advertising. Applications for commercialreproduction should be addressed to: NIHR Journals Library, National Institute for Health Research, Evaluation, Trials and Studies Coordinating Centre, Alpha House,University of Southampton Science Park, Southampton SO16 7NS, UK.
77

that participants in the survey would rank predictors as important based on their particular researchinterest, and this method could potentially hamper the identification of new candidate predictors.However, we had a good representation of responses to the survey, and respondents were able tosuggest possible factors not already assessed in the survey to be considered as predictors. There wasalso good consensus among respondents about the importance of predictors assessed, and no newcandidate predictors were identified. The individual UK data sets measured different sets of variables(potential predictors) and measured them at different times (e.g. first, second or third trimester). Ourvalidation was carried out considering only UK data sets to reduce the heterogeneity in the outcomedefinition and to allow existing models’ predictive performance to be assessed in the UK health-caresystem context. However, this limited our ability to validate many of the existing prediction models andmeant that we could validate models across the studies only if all of them reported the same variables.We were, therefore, also unable to validate all existing models in our IPD because of the unavailabilityof predictors in the models in our UK IPD. It is possible that a significant predictor may not have beenevaluated if it was not provided across varied data sets. Some studies used data from the same cohortof women to report various prediction models in multiple combinations. The sources of the data alsodiffered across data sets. Some were collected prospectively with the explicit purpose of predictingpre-eclampsia, whereas others were routine registry data. All of the above accounted for theheterogeneity observed in the performance of the models across the data sets. We validated theperformances of published models across only UK data sets, but included all data sets for modeldevelopment. It is likely that the transportability performances may have differed if all available data hadbeen included. Furthermore, some models, such as the North et al. model42 for any-onset pre-eclampsia,the Poon 2009 model234 for early-onset pre-eclampsia and the Akolekar et al. model241 for late-onsetpre-eclampsia, could not be validated as the predictor variables in the models were not available in anyof the IPPIC-UK data sets.
To ensure that the relevant data were included in the analysis, we dealt with missing data by imputingboth within and between studies. We also made assumptions such as using early second-trimestervalues of BMI and MAP if the first-trimester values were missing. Our analysis of the association of riskfactors and the different pre-eclampsia outcomes was limited to complete records only. Our assumptionthat data missing were missing completely at random is unlikely to be true. Applying multilevel multipleimputation would reduce this bias, and also allow estimates to be adjusted for potential confounders,giving a better evaluation of associations. However, the complexity of modelling the missing datamechanism would make this demanding (or impossible). We therefore present this as the most robustlyavailable assessment of risk factors for pre-eclampsia.
Comparison with existing evidence
Current guidelines such as those by the National Institute for Health and Care Excellence242 in the UKand by the American College of Obstetricians and Gynecologists73 in the USA provide a list of riskfactors rather than a prediction model to determine an individual’s risk of pre-eclampsia. The predictiveperformance of both approaches has been shown to be inferior to that of multivariable predictionmodels.236,243,244 However, these models had not been externally validated in multiple data sets untilnow, with resulting suboptimal predictive performance.
Until now, only a small fraction of the 131 pre-eclampsia prediction models identified have beenexternally validated (11%, 15/131), and an even smaller proportion (4%, 5/131) have been evaluatedfor their clinical utility.44,108,160,245,246 Studies reporting on the external validation of these models oftenhave not reported performance measures in terms of calibration, which has more value in assessing thepredictive performance of the model than discrimination estimates or detection rates.247 Some existingmodels also used multiples of the mean to standardise biochemical and ultrasound markers, but this isof limited use in real-world settings as the estimates of adjustment factors used to standardise these
DISCUSSION
NIHR Journals Library www.journalslibrary.nihr.ac.uk
78
measurements to multiple of the mean values in the models are not always known in the population inwhich the model is to be used. For some of the models that we could validate, the summary performancemeasures have a lot of uncertainty (wide CIs), reflecting the small numbers of events and/or theheterogeneity. Even with larger numbers of events, CIs can be wide, especially for calibration, so it ispossible that, for some of the models, miscalibration is due to chance. However, we must also lookat the broader picture emerging across all of the validations. For most models, the majority of summaryresults for calibration, and the study-specific results for calibration, are suggestive of overfitting(slopes < 1). This is something that the field needs to address as whole. In our IPPIC models, we haveexamined overfitting in our model development, and adjusted for it.
Recently, the ASPRE trial34 showed that women at high risk of preterm pre-eclampsia who werestarted on 150 mg of aspirin early in pregnancy had their risk lowered, and their high-risk status wasdetermined using a prediction model. However, a few questions need to be answered before thisapproach is implemented. First, the extent to which the model over- or underpredicted women’spre-eclampsia risk is not reported in the study, because women assessed as being at low risk ofpre-eclampsia using the model were not followed up further. This is also shown by the significantdifference in the incidence of preterm pre-eclampsia between the placebo group and the populationused to develop the model. Second, it is likely that some women in the group categorised as ‘low risk’using the model may have benefited from the intervention. In the absence of follow-up of this groupfor pre-eclampsia outcomes, we cannot robustly confirm that they would not have benefited from theintervention. Third, the clinical utility of the prediction model has not been assessed, limiting our abilityto recommend its routine use in clinical practice. We were unable to validate the exact model usedin the ASPRE trial because the multiple of the mean predictors were unavailable in our IPD data set.The authors who developed this model recently validated it in three data sets with ‘appropriatelytrained staff and quality control of measurement’.248 This showed that the model discriminated well,with a large C-statistic in all three validation data sets. However, further independent validation ofthis model is needed to evaluate its performance in ‘real-world’ settings.
Although some of the published models showed a promising ability to discriminate between womenwho had a pre-eclampsia outcome and those who did not, calibration performance was generally pooracross the data sets and there was large heterogeneity in the calibration performance across differentIPPIC data sets. Although the CIs (e.g. for calibration slope) were sometimes very wide, a generalpicture is that most models demonstrated overfitting at model development with predictions thatwere too extreme compared with the observed risk in the data sets (calibration slope < 1). Modelpredictions were also systematically too low or too high depending on the data set used to validatethe model (calibration-in-the-large ≠ 0). The models were validated in a rather heterogeneous groupof data sets with different eligibility criteria. These findings suggest that the differences betweenwomen in the data sets were not adequately captured by the set of predictors included in the models.There was also little difference in predictive performance when biochemical markers or ultrasoundmarkers were combined with maternal and clinical characteristics, compared with models with onlymaternal and clinical characteristics. Some of the heterogeneity in predictive performance of themodels is likely to be due to different methods and timing of measurement, for example in bloodpressure and biochemical marker values. Going forward, standardisation of measurement methods,for example across laboratories and hospitals, might reduce heterogeneity in calibration performance.A related point is that prediction models in this field need to be clearer with regard to how andexactly when included predictors should be measured.
For IPPIC models, summary predictive performance was promising, and net benefit was demonstratedin some data sets across clinically relevant thresholds of predicted risk. However, large heterogeneityremained in all performance statistics across data sets. Heterogeneity in calibration performancecould be reduced if, when applying the models in practice, model parameters (e.g. intercept) couldbe recalibrated to each population and setting. This would require local data for recalibration andmodel updating.
DOI: 10.3310/hta24720 Health Technology Assessment 2020 Vol. 24 No. 72
© Queen’s Printer and Controller of HMSO 2020. This work was produced by Allotey et al. under the terms of a commissioning contract issued by the Secretary of Statefor Health and Social Care. This issue may be freely reproduced for the purposes of private research and study and extracts (or indeed, the full report) may be included inprofessional journals provided that suitable acknowledgement is made and the reproduction is not associated with any form of advertising. Applications for commercialreproduction should be addressed to: NIHR Journals Library, National Institute for Health Research, Evaluation, Trials and Studies Coordinating Centre, Alpha House,University of Southampton Science Park, Southampton SO16 7NS, UK.
79
Relevance to clinical practice
Existing models that were externally validated had poor calibration performance and their utility waslimited, with no model identified that can be recommended for clinical use. The IPPIC models showedpromising performance for predicting pre-eclampsia, in particular in both low- and middle-incomecountries where only clinical characteristics may be available, and in high-income countries wherethere is access to additional biochemical markers. However, on application, the predictive performanceof the models needs to be improved by recalibration to particular settings and populations; thiswould require local data. Ultrasound markers did not add any additional information or improve theperformance of the prediction models beyond the clinical characteristic only models. This suggests alack of need for additional time or resources in carrying out these assessments for screening of womenat risk of pre-eclampsia. The thresholds of risk on which decision-making is based are likely to varywith the planned intervention (aspirin or calcium), as well as following shared decision-making throughdiscussions between the clinician and the woman.
Relevance to research
Validation, including examination of calibration heterogeneity, is still required for the models we could notvalidate. For these and the IPPIC models, we need validation in multiple large data sets across differentsettings and populations to properly assess their transportability.249 The impact of using the models inclinical practice needs to be evaluated beyond predicting pre-eclampsia, but also in the identificationof women with pre-eclampsia who are also most likely to have severe complications such as HELLPsyndrome, eclampsia, abruption or renal failure. The acceptability of the models to both women andhealth-care professionals needs to be assessed, including elucidation of their preferred thresholdprobability for treatment decisions. A decision-analytic model of resource implications, including thecost utilities of consequences of decisions for various false-positive and false-negative cases, is alsoneeded. Updated models may be needed in local populations, for example using recalibration of theIPPIC models in local data sets, to improve calibration performance. Furthermore, additional strongpredictors need to be identified to improve model performance and consistency. New cohorts need tostandardise the predictors and outcomes measured, including their timing and measurement methods,to enable more homogenous data sets to be combined in IPD meta-analyses.
Conclusion
Among the 24 existing prediction models that could be validated in the IPD meta-analysis, generallytheir predictive performance was poor across data sets. To address this, IPPIC models were developedwith adjustment for overfitting, which show good predictive performance on average across data setsand may have net benefit in singleton nulliparous populations in the UK. However, heterogeneityacross settings is likely in calibration performance, and thus the models need to be recalibrated in localsettings and populations of application. Ultrasound markers did not improve the predictive performanceof the developed IPPIC clinical characteristic-only models. We did not identify any new predictorsfor our model development that were not considered previously in existing models. Further work istherefore needed to validate other models, identify new predictors and improve calibration performancein all settings of intended use.
DISCUSSION
NIHR Journals Library www.journalslibrary.nihr.ac.uk
80
Acknowledgements
We would like to acknowledge all researchers who contributed data to this IPD meta-analysis,including the original teams involved in the collection of the data, and the participants who took
part in the research studies.
We are extremely grateful to all of the families who took part in this study, the midwives for their helpin recruiting them, and the whole ALSPAC team, which includes interviewers, computer and laboratorytechnicians, clerical workers, research scientists, volunteers, managers, receptionists and nurses.
We acknowledge the National Institute of Child and Human Development Data and Specimen Hubfor providing the MFMU HRA and MFMU LRA studies data that were used for this research, thecontribution of the principal investigator(s) who conducted the original study from which the data weregenerated, and NICHD and other funding organisations, if applicable, that supported the original study.
We are thankful to members of the Independent Steering Committee, which included ProfessorArri Coomarasamy (Chairperson, University of Birmingham), Dr Aris Papageorghiou (St George’sUniversity Hospital), Mrs Ngawai Moss (Katie’s Team), Professor Sarosh Rana (University of Chicago)and Dr Thomas Debray (University Medical Center Utrecht), for their guidance and supportthroughout the project.
Members of the IPPIC Collaborative Network
Alex Kwong, University of Bristol; Ary I Savitri, University Medical Center Utrecht; Kjell ÅsmundSalvesen, Norwegian University of Science and Technology; Sohinee Bhattacharya, University ofAberdeen; Cuno SPM Uiterwaal, University Medical Center Utrecht; Annetine C Staff, Universityof Oslo; Louise Bjoerkholt Andersen, University of Southern Denmark; Elisa Llurba Olive, HospitalUniversitari Vall d’Hebron; Christopher Redman, University of Oxford; George Daskalakis, University ofAthens; Maureen Macleod, University of Dundee; Baskaran Thilaganathan, St George’s Universityof London; Javier Arenas Ramírez, University Hospital de Cabueñes; Jacques Massé, Laval University;Asma Khalil, St George’s University of London; Francois Audibert, Université de Montréal; Per MinorMagnus, Norwegian Institute of Public Health; Anne Karen Jenum, University of Oslo; Ahmet Baschat,Johns Hopkins University School of Medicine; Akihide Ohkuchi, University School of Medicine,Shimotsuke-shi; Fionnuala M. McAuliffe, University College Dublin; Jane West, University of Bristol;Lisa M Askie, University of Sydney; Fionnuala Mone, University College Dublin; Diane Farrar, BradfordTeaching Hospitals; Peter A Zimmerman, Päijät-Häme Central Hospital; Luc JM Smits, Maastricht UniversityMedical Centre; Catherine Riddell, Better Outcomes Registry & Network (BORN); John C Kingdom,University of Toronto; Joris van de Post, Academisch Medisch Centrum; Sebastián E Illanes, Universityof the Andes; Claudia Holzman, Michigan State University; Sander MJ van Kuijk, Maastricht UniversityMedical Centre; Lionel Carbillon, Assistance Publique-Hôpitaux de Paris Université; Pia M Villa,University of Helsinki and Helsinki University Hospital; Anne Eskild, University of Oslo; Lucy Chappell,King’s College London; Federico Prefumo, University of Brescia; Luxmi Velauthar, Queen MaryUniversity of London; Paul Seed, King’s College London; Miriam van Oostwaard, IJsselland Hospital;Stefan Verlohren, Charité University Medicine; Lucilla Poston, King’s College London; Enrico Ferrazzi,University of Milan; Christina A Vinter, University of Southern Denmark; Chie Nagata, National Centerfor Child Health and Development; Mark Brown, University of New South Wales; Karlijn C Vollebregt,Academisch Medisch Centrum; Satoru Takeda, Juntendo University; Josje Langenveld, Atrium MedischCentrum Parkstad; Mariana Widmer, WHO; Shigeru Saito, University of Toyama; Camilla Haavaldsen,Akershus University Hospital; Guillermo Carroli, Centro Rosarino De Estudios Perinatales; Jørn Olsen,
DOI: 10.3310/hta24720 Health Technology Assessment 2020 Vol. 24 No. 72
© Queen’s Printer and Controller of HMSO 2020. This work was produced by Allotey et al. under the terms of a commissioning contract issued by the Secretary of Statefor Health and Social Care. This issue may be freely reproduced for the purposes of private research and study and extracts (or indeed, the full report) may be included inprofessional journals provided that suitable acknowledgement is made and the reproduction is not associated with any form of advertising. Applications for commercialreproduction should be addressed to: NIHR Journals Library, National Institute for Health Research, Evaluation, Trials and Studies Coordinating Centre, Alpha House,University of Southampton Science Park, Southampton SO16 7NS, UK.
81
Aarhus University; Hans Wolf, Academisch Medisch Centrum; Nelly Zavaleta, Instituto Nacional De Salud;Inge Eisensee, Aarhus University; Patrizia Vergani, University of Milano-Bicocca; Pisake Lumbiganon,Khon Kaen University; Maria Makrides, South Australian Health and Medical Research Institute;Fabio Facchinetti, Università degli Studi di Modena e Reggio Emilia; Evan Sequeira, Aga Khan University;Robert Gibson, University of Adelaide; Sergio Ferrazzani, Università Cattolica del Sacro Cuore; TizianaFrusca, Università degli Studi di Parma; Jane E Norman, University of Edinburgh; Ernesto A Figueiró-Filho,Mount Sinai Hospital; Olav Lapaire, Universitätsspital Basel; Hannele Laivuori, University of Helsinki andHelsinki University Hospital; Jacob A Lykke, Rigshospitalet; Agustin Conde-Agudelo, Eunice KennedyShriver National Institute of Child Health and Human Development; Alberto Galindo, UniversidadComplutense de Madrid; Alfred Mbah, University of South Florida; Ana Pilar Betran,WHO; Ignacio Herraiz,Universidad Complutense de Madrid; Lill Trogstad, Norwegian Institute of Public Health; Gordon GS Smith,University of Cambridge; Eric AP Steegers, University Hospital Nijmegen; Read Salim, HaEmek MedicalCenter; Tianhua Huang, North York General Hospital; Annemarijne Adank, Erasmus Medical Centre;Jun Zhang, National Institute of Child Health and Human Development; Wendy S Meschino, North YorkGeneral Hospital; Joyce L Browne, University Medical Centre Utrecht; Rebecca E Allen, Queen MaryUniversity of London; Fabricio Da Silva Costa, University of São Paulo; Kerstin Klipstein-GrobuschBrowne, University Medical Center Utrecht; Caroline A Crowther, University of Adelaide; Jan StenerJørgensen, Syddansk Universitet; Jean-Claude Forest, Centre hospitalier universitaire de Québec;Alice R Rumbold, University of Adelaide; Ben W Mol, Monash University; Yves Giguère, Laval University;Louise C Kenny, University of Liverpool; Wessel Ganzevoort, Academisch Medisch Centrum;Anthony O Odibo, University of South Florida; Jenny Myers, University of Manchester; SeonAe Yeo,University of North Carolina at Chapel Hill; Helena J Teede, Monash University and Monash Health;Francois Goffinet, Assistance Publique, Hôpitaux de Paris; Lesley McCowan, University of Auckland;Eva Pajkrt, Academisch Medisch Centrum; Bassam G Haddad, Portland State University; Gustaaf Dekker,University of Adelaide; Emily C Kleinrouweler, Academisch Medisch Centrum; Édouard LeCarpentier,Centre Hospitalier Intercommunal de Créteil; Claire T Roberts, University of Adelaide; Henk Groen,University Medical Center Groningen; Ragnhild Bergene Skråstad, St Olav’s Hospital; Seppo Heinonen,University of Helsinki and Helsinki University Hospital; and Kajantie Eero, University of Helsinki andHelsinki University Hospital.
Contributions of authors
Shakila Thangaratinam (https://orcid.org/0000-0002-4254-460X) (Professor, Maternal and PerinatalHealth), Richard D Riley (https://orcid.org/0000-0001-8699-0735) (Professor, Biostatistics),Khalid S Khan (https://orcid.org/0000-0001-5084-7312) (Professor, Women’s Health & ClinicalEpidemiology), Karel GM Moons (https://orcid.org/0000-0003-2118-004X) (Professor, ClinicalEpidemiology), Richard Hooper (https://orcid.org/0000-0002-1063-0917) (Professor, MedicalStatistics), Basky Thilaganathan (https://orcid.org/0000-0002-5531-4301) (Professor, Fetal Medicine)and Asma Khalil (https://orcid.org/0000-0003-2802-7670) (Professor, Obstetrics and Maternal–FetalMedicine) developed the protocol. John Allotey (https://orcid.org/0000-0003-4134-6246) (SeniorResearch Fellow, Women’s Health), Shakila Thangaratinam, Melanie Smuk (https://orcid.org/0000-0002-1594-1458) (Lecturer, Medical Statistics) and Kym IE Snell (https://orcid.org/0000-0001-9373-6591) (Lecturer, Biostatistics) undertook the literature searches, study selection, drafted themanuscript, acquired IPD and led the project.
Asif Ahmed (https://orcid.org/0000-0002-8755-8546) (Pro-Vice Chancellor for Health, Medicine),Lucy C Chappell (https://orcid.org/0000-0001-6219-3379) (Professor, Obstetrics), Peter von Dadelszen(https://orcid.org/0000-0003-4136-3070) (Professor, Global Women’s Health), Lucilla Poston (https://orcid.org/0000-0003-1100-2821) (Professor, Maternal & Fetal Health), Marcus Green (https://orcid.org/0000-0002-4561-8256) (CEO APEC, PPI), Louise Kenny (https://orcid.org/0000-0002-9011-759X)(Executive Pro-Vice Chancellor, Health and Life Sciences), Jenny Myers (https://orcid.org/0000-0003-0913-2096) (Clinical Senior Lecturer, Maternal & Fetal Health), Anne C Staff (https://orcid.org/0000-
ACKNOWLEDGEMENTS
NIHR Journals Library www.journalslibrary.nihr.ac.uk
82
0001-9247-5721) (Professor, Obstetrics and Gynaecology), Ben WMol (https://orcid.org/0000-0001-8337-550X) (Professor, Obstetrics & Gynaecology), Gordon CS Smith (https://orcid.org/0000-0003-2124-0997) (Professor and Head of the Department, Obstetrics and Gynaecology), Wessel Ganzevoort(https://orcid.org/0000-0002-7243-2115) (Specialist, Obstetrician and Gynaecologist), Hannele Laivuori(https://orcid.org/0000-0003-3212-7826) (Professor, Clinical Genetics), Anthony O Odibo(https://orcid.org/0000-0003-4340-450X) (Professor, Obstetrics and Gynaecology), Ahmet A Baschat(https://orcid.org/0000-0003-1927-2084) (Professor, Gynaecology and Obstetrics), Paul T Seed(https://orcid.org/0000-0001-7904-7933) (Senior Lecturer, Medical Statistician), Federico Prefumo(https://orcid.org/0000-0001-7793-714X) (Specialist, Gynaecology and Obstetrics), Fabricio da Silva Costa(https://orcid.org/0000-0002-0765-7780) (Adjunct Clinical Assistant Professor, Obstetrics andGynaecology), Henk Groen (https://orcid.org/0000-0002-6629-318X) (Assistant Professor,Epidemiology), Francois Audibert (https://orcid.org/0000-0002-2697-3826) (Professor, Obstetrics &Gynaecology), Camilla Haavaldsen (https://orcid.org/0000-0002-4708-3267) (Scientist, Obstetrics &Gynaecology), Chie Nagata (https://orcid.org/0000-0003-4897-2119) (Chief of Clinical Research,Maternal and Child Health), Alice R Rumbold (https://orcid.org/0000-0002-4453-9425) (AssociateProfessor, Reproductive Epidemiology), Seppo Heinonen (https://orcid.org/0000-0001-5949-0874)(Professor, Obstetrics and Gynaecology), Lisa M Askie (https://orcid.org/0000-0002-8934-5544)(Professorial Research Fellow, Medicine), Luc JM Smits (https://orcid.org/0000-0003-0785-1345)(Professor, Epidemiology), Christina AVinter (https://orcid.org/0000-0001-5084-6053) (ClinicalAssociate Professor, Gynaecology and Obstetrics), Per M Magnus (https://orcid.org/0000-0002-6427-4735) (Professor, Community Medicine and Global Health), Pia M Villa (https://orcid.org/0000-0002-0317-0713) (Researcher, Obstetrics and Gynaecology), Anne K Jenum (https://orcid.org/0000-0003-0304-7800) (Professor, General Practice), Julie Dodds (https://orcid.org/0000-0002-6041-1456)(Senior Research Manager,Women’s Health), Louise B Andersen (https://orcid.org/0000-0002-3331-7149)(Researcher, Obstetrics and Gynaecology), Jane E Norman (https://orcid.org/0000-0001-6031-6953)(Professor, Health Sciences), Akihide Ohkuchi (https://orcid.org/0000-0002-8861-1572) (Professor,Obstetrics and Gynaecology), Anne Eskild (https://orcid.org/0000-0002-2756-1583) (Professor, ClinicMedicine), Sohinee Bhattacharya (https://orcid.org/0000-0002-2358-5860) (Senior Lecturer, Medicine),Fionnuala M McAuliffe (https://orcid.org/0000-0002-3477-6494) (Professor, Obstetrics andGynaecology), Alberto Galindo (https://orcid.org/0000-0002-1308-1474) (Researcher, Obstetrics andGynaecology), Ignacio Herraiz (https://orcid.org/0000-0001-6807-4944) (Researcher, Obstetrics andGynaecology), Lionel Carbillon (https://orcid.org/0000-0001-6367-4828) (Researcher, Obstetricsand Gynaecology), Kerstin Klipstein-Grobusch (https://orcid.org/0000-0002-5462-9889) (AssociateProfessor, Global Health) and SeonAe Yeo (https://orcid.org/0000-0002-0721-0997) (Professor, Nursing)provided input into the protocol development and the drafting of the initial manuscript.
Basky Thilaganathan, Asma Khalil, Louise Kenny, Lucy C Chappell, Jacques Massé (https://orcid.org/0000-0002-8257-5478), Anne C Staff, Gordon CS Smith, Wessel Ganzevoort, Hannelle Laivuori,Anthony O Odibo, Ahmet A Baschat, Paul T Seed, Federico Profumo, Fabricio da Silva Costa,Henk Groen, Francois Audibert, Chie Nagata, Alice R Rumbold, Seppo Heinonen, Lisa M Askie,Luc JM Smits, Christina A Vinter, Ben W Mol, Lucilla Poston, Javier A Ramírez (https://orcid.org/0000-0003-2291-720X) (Researcher, Obstetrics and Gynaecology), John Kingdom (https://orcid.org/0000-0002-7411-5535) (Professor, Maternal-Fetal Medicine), George Daskalakis (https://orcid.org/0000-0001-7108-211X) (Researcher, Obstetrics and Gynaecology), Dianne Farrar (https://orcid.org/0000-0002-5625-761X) (NIHR Post-doctoral Research Fellow, Maternal Health), Helena J Teede(https://orcid.org/0000-0001-7609-577X) (Director, Monash Centre for Health Research, Women’sand Children’s Health), Kjell Å Salvesen (https://orcid.org/0000-0002-1788-4063) (Professor, Clinicaland Molecular Medicine), Joyce L Browne (https://orcid.org/0000-0001-7048-3245) (AssistantProfessor, Maternal and Global Health), Kajantie Eero (https://orcid.org/0000-0001-7081-8391)(Professor, Clinical Research), Ragnhild B Skråstad (https://orcid.org/0000-0003-3810-0413)(Associate Professor, Clinical and Molecular Medicine) and Camilla Haavaldsen contributed data to theproject and provided input at all stages of the project.
DOI: 10.3310/hta24720 Health Technology Assessment 2020 Vol. 24 No. 72
© Queen’s Printer and Controller of HMSO 2020. This work was produced by Allotey et al. under the terms of a commissioning contract issued by the Secretary of Statefor Health and Social Care. This issue may be freely reproduced for the purposes of private research and study and extracts (or indeed, the full report) may be included inprofessional journals provided that suitable acknowledgement is made and the reproduction is not associated with any form of advertising. Applications for commercialreproduction should be addressed to: NIHR Journals Library, National Institute for Health Research, Evaluation, Trials and Studies Coordinating Centre, Alpha House,University of Southampton Science Park, Southampton SO16 7NS, UK.
83
John Allotey and Melanie Smuk mapped the variables in the available data sets, and cleaned andquality checked the data.
Melanie Smuk and Claire Chan (https://orcid.org/0000-0002-0821-4068) (Statistician, Statistics)harmonised the data.
Kym IE Snell, Melanie Smuk, Richard D Riley and Richard Hooper conducted the data analysis.
All authors critically appraised and provided feedback and input into the drafts and final version ofthe report.
Publications
Allotey J, Snell KIE, Chan C, Hooper R, Dodds J, Rogozinska E, et al. External validation, update anddevelopment of prediction models for pre-eclampsia using an individual participant data (IPD)meta-analysis: the International Prediction of Pregnancy Complication Network (IPPIC pre-eclampsia)protocol. Diagn Progn Res 2017;1:16.
Snell KIE, Allotey J, Smuk M, Hooper R, Chan C, Ahmed A, et al. External validation of prognosticmodels predicting pre-eclampsia: individual participant data meta-analysis. BMC Med 2020;18:302.
Data-sharing statement
All data requests should be submitted to the corresponding author for consideration. Access to availableanonymised data may be granted following review and appropriate agreements being in place.
ACKNOWLEDGEMENTS
NIHR Journals Library www.journalslibrary.nihr.ac.uk
84
References
1. Brown MA, Hague WM, Higgins J, Lowe S, McCowan L, Oats J, et al. The detection, investigationand management of hypertension in pregnancy: executive summary. Aust N Z J Obstet Gynaecol2000;40:133–8. https://doi.org/10.1111/j.1479-828x.2000.tb01136.x
2. Sibai B, Dekker G, Kupferminc M. Pre-eclampsia. Lancet 2005;365:785–99. https://doi.org/10.1016/S0140-6736(05)17987-2
3. Sibai BM. Diagnosis and management of gestational hypertension and preeclampsia. ObstetGynecol 2003;102:181–92. https://doi.org/10.1097/00006250-200307000-00033
4. Tranquilli AL, Dekker G, Magee L, Roberts J, Sibai BM, Steyn W, et al. The classification, diagnosisand management of the hypertensive disorders of pregnancy: a revised statement from theISSHP. Pregnancy Hypertens 2014;4:97–104. https://doi.org/10.1016/j.preghy.2014.02.001
5. Staff AC, Benton SJ, von Dadelszen P, Roberts JM, Taylor RN, Powers RW, et al. Redefiningpreeclampsia using placenta-derived biomarkers. Hypertension 2013;61:932–42. https://doi.org/10.1161/HYPERTENSIONAHA.111.00250
6. Duley L. The global impact of pre-eclampsia and eclampsia. Semin Perinatol 2009;33:130–7.https://doi.org/10.1053/j.semperi.2009.02.010
7. Gardosi J, Kady SM, McGeown P, Francis A, Tonks A. Classification of stillbirth by relevantcondition at death (ReCoDe): population based cohort study. BMJ 2005;331:1113–17.https://doi.org/10.1136/bmj.38629.587639.7C
8. Iams JD, Goldenberg RL, Mercer BM, Moawad A, Thom E, Meis PJ, et al. The Preterm PredictionStudy: recurrence risk of spontaneous preterm birth. National Institute of Child Health and HumanDevelopment Maternal-Fetal Medicine Units Network. Am J Obstet Gynecol 1998;178:1035–40.https://doi.org/10.1016/S0002-9378(98)70544-7
9. Davies EL, Bell JS, Bhattacharya S. Preeclampsia and preterm delivery: a population-basedcase–control study. Hypertens Pregnancy 2016;35:510–19. https://doi.org/10.1080/10641955.2016.1190846
10. Tang LC, Kwok AC, Wong AY, Lee YY, Sun KO, So AP. Critical care in obstetrical patients:an eight-year review. Chin Med J 1997;110:936–41.
11. Khan KS, Wojdyla D, Say L, Gülmezoglu AM, Van Look PF. WHO analysis of causes of maternaldeath: a systematic review. Lancet 2006;367:1066–74. https://doi.org/10.1016/S0140-6736(06)68397-9
12. World Health Organization. The World Health Report: 2005 –Make Every Mother and Child Count.Geneva: WHO; 2005. URL: www.who.int/whr/2005/whr2005_en.pdf (accessed 6 December 2018).
13. Carty DM, Delles C, Dominiczak AF. Preeclampsia and future maternal health. J Hypertens2010;28:1349–55. https://doi.org/10.1097/HJH.0b013e32833a39d0
14. Bellamy L, Casas JP, Hingorani AD, Williams DJ. Pre-eclampsia and risk of cardiovasculardisease and cancer in later life: systematic review and meta-analysis. BMJ 2007;335:974.https://doi.org/10.1136/bmj.39335.385301.BE
15. Thoulass JC, Robertson L, Denadai L, Black C, Crilly M, Iversen L, et al. Hypertensive disordersof pregnancy and adult offspring cardiometabolic outcomes: a systematic review of theliterature and meta-analysis. J Epidemiol Community Health 2016;70:414–22. https://doi.org/10.1136/jech-2015-205483
DOI: 10.3310/hta24720 Health Technology Assessment 2020 Vol. 24 No. 72
© Queen’s Printer and Controller of HMSO 2020. This work was produced by Allotey et al. under the terms of a commissioning contract issued by the Secretary of Statefor Health and Social Care. This issue may be freely reproduced for the purposes of private research and study and extracts (or indeed, the full report) may be included inprofessional journals provided that suitable acknowledgement is made and the reproduction is not associated with any form of advertising. Applications for commercialreproduction should be addressed to: NIHR Journals Library, National Institute for Health Research, Evaluation, Trials and Studies Coordinating Centre, Alpha House,University of Southampton Science Park, Southampton SO16 7NS, UK.
85

16. Davis EF, Lazdam M, Lewandowski AJ, Worton SA, Kelly B, Kenworthy Y, et al. Cardiovascularrisk factors in children and young adults born to preeclamptic pregnancies: a systematic review.Pediatrics 2012;129:e1552–61. https://doi.org/10.1542/peds.2011-3093
17. Tuovinen S, Eriksson JG, Kajantie E, Lahti J, Pesonen AK, Heinonen K, et al. Maternalhypertensive disorders in pregnancy and self-reported cognitive impairment of the offspring70 years later: the Helsinki Birth Cohort Study. Am J Obstet Gynecol 2013;208:200.e1–9.https://doi.org/10.1016/j.ajog.2012.12.017
18. Tuovinen S, Räikkönen K, Kajantie E, Pesonen AK, Heinonen K, Osmond C, et al. Depressivesymptoms in adulthood and intrauterine exposure to pre-eclampsia: the Helsinki Birth CohortStudy. BJOG 2010;117:1236–42. https://doi.org/10.1111/j.1471-0528.2010.02634.x
19. Crispi F, Domínguez C, Llurba E, Martín-Gallán P, Cabero L, Gratacós E. Placental angiogenicgrowth factors and uterine artery Doppler findings for characterization of different subsetsin preeclampsia and in isolated intrauterine growth restriction. Am J Obstet Gynecol2006;195:201–7. https://doi.org/10.1016/j.ajog.2006.01.014
20. Crispi F, Llurba E, Domínguez C, Martín-Gallán P, Cabero L, Gratacós E. Predictive value ofangiogenic factors and uterine artery Doppler for early- versus late-onset pre-eclampsia andintrauterine growth restriction. Ultrasound Obstet Gynecol 2008;31:303–9. https://doi.org/10.1002/uog.5184
21. Valensise H, Vasapollo B, Gagliardi G, Novelli GP. Early and late preeclampsia: two differentmaternal hemodynamic states in the latent phase of the disease. Hypertension 2008;52:873–80.https://doi.org/10.1161/HYPERTENSIONAHA.108.117358
22. Redman CW, Sargent IL, Staff AC. IFPA Senior Award Lecture: making sense of pre-eclampsia –
two placental causes of preeclampsia? Placenta 2014;(Suppl.):S20–5. https://doi.org/10.1016/j.placenta.2013.12.008
23. MacKay AP, Berg CJ, Atrash HK. Pregnancy-related mortality from preeclampsia and eclampsia.Obstet Gynecol 2001;97:533–8. https://doi.org/10.1097/00006250-200104000-00011
24. von Dadelszen P, Payne B, Li J, Ansermino JM, Broughton Pipkin F, Côté AM, et al. Prediction ofadverse maternal outcomes in pre-eclampsia: development and validation of the fullPIERS model.Lancet 2011;377:219–27. https://doi.org/10.1016/S0140-6736(10)61351-7
25. von Dadelszen P, Magee LA, Roberts JM. Subclassification of preeclampsia. Hypertens Pregnancy2003;22:143–8. https://doi.org/10.1081/PRG-120021060
26. Lisonkova S, Joseph KS. Incidence of preeclampsia: risk factors and outcomes associated withearly- versus late-onset disease. Am J Obstet Gynecol 2013;209:544.e1–544.e12. https://doi.org/10.1016/j.ajog.2013.08.019
27. Murphy DJ, Stirrat GM. Mortality and morbidity associated with early-onset preeclampsia.Hypertens Pregnancy 2000;19:221–31. https://doi.org/10.1081/PRG-100100138
28. Sibai BM, Ramadan MK, Usta I, Salama M, Mercer BM, Friedman SA. Maternal morbidityand mortality in 442 pregnancies with hemolysis, elevated liver enzymes, and low platelets(HELLP syndrome) Am J Obstet Gynecol 1993;169:1000–6. https://doi.org/10.1016/0002-9378(93)90043-I
29. Churchill D, Duley L. Interventionist versus expectant care for severe pre-eclampsia before term.Cochrane Database Syst Rev 2002;3:CD003106. https://doi.org/10.1002/14651858.CD003106
30. Mangham LJ, Petrou S, Doyle LW, Draper ES, Marlow N. The cost of preterm birth throughoutchildhood in England and Wales. Pediatrics 2009;123:e312–27. https://doi.org/10.1542/peds.2008-1827
REFERENCES
NIHR Journals Library www.journalslibrary.nihr.ac.uk
86
31. Douglas KA, Redman CW. Eclampsia in the United Kingdom. BMJ 1994;309:1395–400.https://doi.org/10.1136/bmj.309.6966.1395
32. Sibai BM. Management of late preterm and early-term pregnancies complicated by mildgestational hypertension/pre-eclampsia. Semin Perinatol 2011;35:292–6. https://doi.org/10.1053/j.semperi.2011.05.010
33. Bujold E, Roberge S, Lacasse Y, Bureau M, Audibert F, Marcoux S, et al. Prevention of preeclampsiaand intrauterine growth restriction with aspirin started in early pregnancy: a meta-analysis.Obstet Gynecol 2010;116:402–14. https://doi.org/10.1097/AOG.0b013e3181e9322a
34. Rolnik DL, Wright D, Poon LC, O’Gorman N, Syngelaki A, de Paco Matallana C, et al. Aspirin versusplacebo in pregnancies at high risk for preterm preeclampsia. N Engl J Med 2017;377:613–22.https://doi.org/10.1056/NEJMoa1704559
35. National Institute for Health and Care Excellence. Hypertension in Pregnancy: The Managementof Hypertensive Disorders During Pregnancy. Clinical Guideline 107. London: National Institutefor Health and Care Excellence; 2010. URL: www.nice.org.uk/guidance/cg107 (accessed31 March 2016).
36. National Institute for Health and Care Excellence. Hypertension in Pregnancy: Diagnosis andManagement. NICE Guideline 133. London: National Institute for Health and Care Excellence;2019. URL: www.nice.org.uk/guidance/cg107
37. Townsend R, Khalil A, Premakumar Y, Allotey J, Snell KIE, Chan C, et al. Prediction ofpre-eclampsia: review of reviews. Ultrasound Obstet Gynecol 2019;54:16–27. https://doi.org/10.1002/uog.20117
38. Allen RE, Rogozinska E, Cleverly K, Aquilina J, Thangaratinam S. Abnormal blood biomarkersin early pregnancy are associated with preeclampsia: a meta-analysis. Eur J Obstet GynecolReprod Biol 2014;182:194–201. https://doi.org/10.1016/j.ejogrb.2014.09.027
39. Velauthar L, Plana MN, Kalidindi M, Zamora J, Thilaganathan B, Illanes SE, et al. First-trimesteruterine artery Doppler and adverse pregnancy outcome: a meta-analysis involving 55,974 women.Ultrasound Obstet Gynecol 2014;43:500–7. https://doi.org/10.1002/uog.13275
40. Conde-Agudelo A, Villar J, Lindheimer M. World Health Organization systematic review ofscreening tests for preeclampsia. Obstet Gynecol 2004;104:1367–91. https://doi.org/10.1097/01.AOG.0000147599.47713.5d
41. Giguère Y, Charland M, Bujold E, Bernard N, Grenier S, Rousseau F, et al. Combining biochemicaland ultrasonographic markers in predicting preeclampsia: a systematic review. Clin Chem2010;56:361–75. https://doi.org/10.1373/clinchem.2009.134080
42. North RA, McCowan LM, Dekker GA, Poston L, Chan EH, Stewart AW, et al. Clinical riskprediction for pre-eclampsia in nulliparous women: development of model in internationalprospective cohort. BMJ 2011;342:d1875. https://doi.org/10.1136/bmj.d1875
43. Kleinrouweler CE, Cheong-See FM, Collins GS, Kwee A, Thangaratinam S, Khan KS,et al. Prognostic models in obstetrics: available, but far from applicable. Am J Obstet Gynecol2016;214:79–90. https://doi.org/10.1016/j.ajog.2015.06.013
44. Meertens LJE, Scheepers HCJ, van Kuijk SMJ, Aardenburg R, van Dooren IMA, Langenveld J,et al. External validation and clinical usefulness of first trimester prediction models for the riskof preeclampsia: a prospective cohort study. Fetal Diagn Ther 2019;45:381–93. https://doi.org/10.1159/000490385
45. Farina A, Rapacchia G, Freni Sterrantino A, Pula G, Morano D, Rizzo N. Prospective evaluationof ultrasound and biochemical-based multivariable models for the prediction of late pre-eclampsia.Prenat Diagn 2011;31:1147–52. https://doi.org/10.1002/pd.2849
DOI: 10.3310/hta24720 Health Technology Assessment 2020 Vol. 24 No. 72
© Queen’s Printer and Controller of HMSO 2020. This work was produced by Allotey et al. under the terms of a commissioning contract issued by the Secretary of Statefor Health and Social Care. This issue may be freely reproduced for the purposes of private research and study and extracts (or indeed, the full report) may be included inprofessional journals provided that suitable acknowledgement is made and the reproduction is not associated with any form of advertising. Applications for commercialreproduction should be addressed to: NIHR Journals Library, National Institute for Health Research, Evaluation, Trials and Studies Coordinating Centre, Alpha House,University of Southampton Science Park, Southampton SO16 7NS, UK.
87
46. Herraiz I, Arbués J, Camaño I, Gómez-Montes E, Grañeras A, Galindo A. Application of afirst-trimester prediction model for pre-eclampsia based on uterine arteries and maternal historyin high-risk pregnancies. Prenat Diagn 2009;29:1123–9. https://doi.org/10.1002/pd.2383
47. Debray TP, Moons KG, Ahmed I, Koffijberg H, Riley RD. A framework for developing,implementing, and evaluating clinical prediction models in an individual participant datameta-analysis. Stat Med 2013;32:3158–80. https://doi.org/10.1002/sim.5732
48. Riley RD, Ensor J, Snell KI, Debray TP, Altman DG, Moons KG, Collins GS. External validationof clinical prediction models using big datasets from e-health records or IPD meta-analysis:opportunities and challenges. BMJ 2016;353:i3140. https://doi.org/10.1136/bmj.i3140
49. Debray TP, Riley RD, Rovers MM, Reitsma JB, Moons KG, Cochrane IPD Meta-analysisMethods group. Individual participant data (IPD) meta-analyses of diagnostic and prognosticmodelling studies: guidance on their use. PLOS Med 2015;12:e1001886. https://doi.org/10.1371/journal.pmed.1001886
50. Riley RD, Lambert PC, Abo-Zaid G. Meta-analysis of individual participant data: rationale,conduct, and reporting. BMJ 2010;340:c221. https://doi.org/10.1136/bmj.c221
51. Allotey J, Snell KIE, Chan C, Hooper R, Dodds J, Rogozinska E, et al. External validation, updateand development of prediction models for pre-eclampsia using an Individual Participant Data(IPD) meta-analysis: the International Prediction of Pregnancy Complication Network (IPPICpre-eclampsia) protocol. Diagn Progn Res 2017;1:16. https://doi.org/10.1186/s41512-017-0016-z
52. Snell KIE, Allotey J, Smuk M, Hooper R, Chan C, Ahmed A, et al. External validation ofprognostic models predicting pre-eclampsia: individual participant data meta-analysis.BMC Med 2020;18:302. https://doi.org/10.1186/s12916-020-01766-9
53. Altman DG, Vergouwe Y, Royston P, Moons KG. Prognosis and prognostic research: validatinga prognostic model. BMJ 2009;338:b605. https://doi.org/10.1136/bmj.b605
54. Moons KG, Royston P, Vergouwe Y, Grobbee DE, Altman DG. Prognosis and prognostic research:what, why, and how? BMJ 2009;338:b375. https://doi.org/10.1136/bmj.b375
55. Royston P, Moons KG, Altman DG, Vergouwe Y. Prognosis and prognostic research: developing aprognostic model. BMJ 2009;338:b604. https://doi.org/10.1136/bmj.b604
56. Moons KG, Altman DG, Reitsma JB, Ioannidis JP, Macaskill P, Steyerberg EW, et al. TransparentReporting of a multivariable prediction model for Individual Prognosis or Diagnosis (TRIPOD):explanation and elaboration. Ann Intern Med 2015;162:W1–73. https://doi.org/10.7326/M14-0698
57. Stewart LA, Clarke M, Rovers M, Riley RD, Simmonds M, Stewart G, Tierney JF, PRISMA-IPDDevelopment Group. Preferred Reporting Items for Systematic Review and Meta-Analysesof individual participant data: the PRISMA-IPD statement. JAMA 2015;313:1657–65.https://doi.org/10.1001/jama.2015.3656
58. Accuracy of Clinical Characteristics, Biochemical and Ultrasound Markers in the Prediction ofPre-eclampsia: an Individual Participant Data (IPD) Meta-analysis. PROSPERO CRD42015029349.2015. URL: www.crd.york.ac.uk/PROSPERO/display_record.asp?ID=CRD42015029349(accessed 27 March 2017).
59. Gardosi J, Clausson B, Francis A. The value of customised centiles in assessing perinatal mortalityrisk associated with parity and maternal size. BJOG 2009;116:1356–63. https://doi.org/10.1111/j.1471-0528.2009.02245.x
60. Ahmed A. New insights into the etiology of preeclampsia: identification of key elusive factorsfor the vascular complications. Thromb Res 2011;127(Suppl. 3):72–5. https://doi.org/10.1016/S0049-3848(11)70020-2
REFERENCES
NIHR Journals Library www.journalslibrary.nihr.ac.uk
88
61. Bloomenthal D, von Dadelszen P, Liston R, Magee L, Tsang P. The effect of factor V Leidencarriage on maternal and fetal health. CMAJ 2002;167:48–54.
62. Bramham K, Parnell B, Nelson-Piercy C, Seed PT, Poston L, Chappell LC. Chronic hypertensionand pregnancy outcomes: systematic review and meta-analysis. BMJ 2014;348:g2301.https://doi.org/10.1136/bmj.g2301
63. Cnossen JS, Morris RK, ter Riet G, Mol BW, van der Post JA, Coomarasamy A, et al. Use ofuterine artery Doppler ultrasonography to predict pre-eclampsia and intrauterine growthrestriction: a systematic review and bivariable meta-analysis. CMAJ 2008;178:701–11.https://doi.org/10.1503/cmaj.070430
64. Gallos ID, Sivakumar K, Kilby MD, Coomarasamy A, Thangaratinam S, Vatish M. Pre-eclampsiais associated with, and preceded by, hypertriglyceridaemia: a meta-analysis. BJOG2013;120:1321–32. https://doi.org/10.1111/1471-0528.12375
65. Kleinrouweler CE, Wiegerinck MM, Ris-Stalpers C, Bossuyt PM, van der Post JA, vonDadelszen P, et al. Accuracy of circulating placental growth factor, vascular endothelial growthfactor, soluble fms-like tyrosine kinase 1 and soluble endoglin in the prediction of pre-eclampsia:a systematic review and meta-analysis. BJOG 2012;119:778–87. https://doi.org/10.1111/j.1471-0528.2012.03311.x
66. Leeflang MM, Cnossen JS, van der Post JA, Mol BW, Khan KS, ter Riet G. Accuracy offibronectin tests for the prediction of pre-eclampsia: a systematic review. Eur J Obstet GynecolReprod Biol 2007;133:12–19. https://doi.org/10.1016/j.ejogrb.2007.01.003
67. Meads CA, Cnossen JS, Meher S, Juarez-Garcia A, ter Riet G, Duley L, et al. Methods of predictionand prevention of pre-eclampsia: systematic reviews of accuracy and effectiveness literaturewith economic modelling. Health Technol Assess 2008;12(6). https://doi.org/10.3310/hta12060
68. Morris RK, Cnossen JS, Langejans M, Robson SC, Kleijnen J, Ter Riet G, et al. Serum screeningwith Down’s syndrome markers to predict pre-eclampsia and small for gestational age: systematicreview and meta-analysis. BMC Pregnancy Childbirth 2008;8:33. https://doi.org/10.1186/1471-2393-8-33
69. Steegers EA, von Dadelszen P, Duvekot JJ, Pijnenborg R. Pre-eclampsia. Lancet 2010;376:631–44.https://doi.org/10.1016/S0140-6736(10)60279-6
70. Thangaratinam S, Langenveld J, Mol BW, Khan KS. Prediction and primary prevention ofpre-eclampsia. Best Pract Res Clin Obstet Gynaecol 2011;25:419–33. https://doi.org/10.1016/j.bpobgyn.2011.02.008
71. van der Tuuk K, Koopmans CM, Groen H, Aarnoudse JG, van den Berg PP, van Beek JJ, et al.Prediction of progression to a high risk situation in women with gestational hypertensionor mild pre-eclampsia at term. Aust N Z J Obstet Gynaecol 2011;51:339–46. https://doi.org/10.1111/j.1479-828X.2011.01311.x
72. von Dadelszen P, Firoz T, Donnay F, Gordon R, Justus Hofmeyr G, Lalani S, et al. Preeclampsiain low and middle income countries-health services lessons learned from the PRE-EMPT(PRE-Eclampsia-Eclampsia Monitoring, Prevention and Treatment) project. J Obstet Gynaecol Can2012;34:917–26. https://doi.org/10.1016/S1701-2163(16)35405-6
73. American College of Obstetricians and Gynecologists; Task Force on Hypertension inPregnancy. Hypertension in pregnancy. Report of the American College of Obstetricians andGynecologists’ Task Force on Hypertension in Pregnancy. Obstet Gynecol 2013;122:1122–31.
DOI: 10.3310/hta24720 Health Technology Assessment 2020 Vol. 24 No. 72
© Queen’s Printer and Controller of HMSO 2020. This work was produced by Allotey et al. under the terms of a commissioning contract issued by the Secretary of Statefor Health and Social Care. This issue may be freely reproduced for the purposes of private research and study and extracts (or indeed, the full report) may be included inprofessional journals provided that suitable acknowledgement is made and the reproduction is not associated with any form of advertising. Applications for commercialreproduction should be addressed to: NIHR Journals Library, National Institute for Health Research, Evaluation, Trials and Studies Coordinating Centre, Alpha House,University of Southampton Science Park, Southampton SO16 7NS, UK.
89

74. von Dadelszen P, Sawchuck D, Justus Hofmeyr G, Magee LA, Bracken H, Mathai M, et al.PRE-EMPT (PRE-eclampsia-Eclampsia Monitoring, Prevention and Treatment): a low andmiddle income country initiative to reduce the global burden of maternal, fetal and infantdeath and disease related to pre-eclampsia. Pregnancy Hypertens 2013;3:199–202.https://doi.org/10.1016/j.preghy.2013.06.002
75. GONet: The Global Obstetrics Network. URL: www.globalobstetricsnetwork.org/(accessed 14 March 2019).
76. Myatt L, Redman CW, Staff AC, Hansson S, Wilson ML, Laivuori H, et al. Strategy forstandardization of preeclampsia research study design. Hypertension 2014;63:1293–301.https://doi.org/10.1161/HYPERTENSIONAHA.113.02664
77. Gardosi J, Francis A. Customised Centile Calculator. GROW version 8.0.4. Gestation Network;2018. URL: www.gestation.net (accessed 14 February 2018).
78. Wolff RF, Moons KGM, Riley RD, Whiting PF, Westwood M, Collins GS, et al. PROBAST:a tool to assess the risk of bias and applicability of prediction model studies. Ann Intern Med2019;170:51–8. https://doi.org/10.7326/M18-1376
79. Resche-Rigon M, White IR. Multiple imputation by chained equations for systematically andsporadically missing multilevel data. Stat Methods Med Res 2018;27:1634–49. https://doi.org/10.1177/0962280216666564
80. Jolani S, Debray TP, Koffijberg H, van Buuren S, Moons KG. Imputation of systematicallymissing predictors in an individual participant data meta-analysis: a generalized approachusing MICE. Stat Med 2015;34:1841–63. https://doi.org/10.1002/sim.6451
81. Meng XL. Multiple-imputation inferences with uncongenial sources of input. Statist Sci1994;9:538–58. https://doi.org/10.1214/ss/1177010269
82. Little RJA, Rubin DB. Statistical Analysis with Missing Data. 2nd edn. New York, NY: John Wiley;2002. https://doi.org/10.1002/9781119013563
83. Hosmer DW, Lemeshow S. Applied Logistic Regression. 2nd edn. Hoboken, NJ: John Wiley &Sons; 2000. https://doi.org/10.1002/0471722146
84. Rubin DB. Multiple Imputation for Nonresponse in Surveys. New York, NY: Wiley; 1987.https://doi.org/10.1002/9780470316696
85. Snell KI, Ensor J, Debray TP, Moons KG, Riley RD. Meta-analysis of prediction modelperformance across multiple studies: which scale helps ensure between-study normalityfor the C-statistic and calibration measures? Stat Methods Med Res 2018;27:3505–22.https://doi.org/10.1177/0962280217705678
86. Debray TP, Damen JA, Snell KI, Ensor J, Hooft L, Reitsma JB, et al. A guide to systematicreview and meta-analysis of prediction model performance. BMJ 2017;356:i6460.https://doi.org/10.1136/bmj.i6460
87. Snell KI, Hua H, Debray TP, Ensor J, Look MP, Moons KG, Riley RD. Multivariate meta-analysisof individual participant data helped externally validate the performance and implementation of aprediction model. J Clin Epidemiol 2016;69:40–50. https://doi.org/10.1016/j.jclinepi.2015.05.009
88. Hartung J, Knapp G. A refined method for the meta-analysis of controlled clinical trials withbinary outcome. Stat Med 2001;20:3875–89. https://doi.org/10.1002/sim.1009
89. Vickers AJ, Elkin EB. Decision curve analysis: a novel method for evaluating prediction models.Med Decis Making 2006;26:565–74. https://doi.org/10.1177/0272989X06295361
90. Vickers AJ, Van Calster B, Steyerberg EW. Net benefit approaches to the evaluation of predictionmodels, molecular markers, and diagnostic tests. BMJ 2016;352:i6. https://doi.org/10.1136/bmj.i6
REFERENCES
NIHR Journals Library www.journalslibrary.nihr.ac.uk
90
91. Quartagno M, Carpenter J. Multilevel Joint Modelling Multiple Imputation: Package ‘jomo’,Version 2.6–6, License GPL-2. URL: https://cran.r-project.org/web/packages/jomo/jomo.pdf(accessed 3 May 2018).
92. Quartagno M, Carpenter JR. Multiple imputation for IPD meta-analysis: allowing for heterogeneityand studies with missing covariates. Stat Med 2016;35:2938–54. https://doi.org/10.1002/sim.6837
93. Sauerbrei W. The use of resampling methods to simplify regression models in medicalstatistics. J Royal Stat Soc 1999;48:313–29. https://doi.org/10.1111/1467-9876.00155
94. Heinze G, Wallisch C, Dunkler D. Variable selection – a review and recommendations forthe practicing statistician. Biom J 2018;60:431–49. https://doi.org/10.1002/bimj.201700067
95. Wood AM, Royston P, White IR. The estimation and use of predictions for the assessment ofmodel performance using large samples with multiply imputed data. Biom J 2015;57:614–32.https://doi.org/10.1002/bimj.201400004
96. Royston P, Parmar MK, Sylvester R. Construction and validation of a prognostic model acrossseveral studies, with an application in superficial bladder cancer. Stat Med 2004;23:907–26.https://doi.org/10.1002/sim.1691
97. Harrell FE. Regression Modeling Strategies, with Applications to Linear Models, Logistic Regression,and Survival Analysis. 2nd edn. New York, NY: Springer; 2015. https://doi.org/10.1007/978-3-319-19425-7_10
98. Steyerberg EW. Clinical Prediction Models. A Practical Approach to Development, Validation, andUpdating. New York, NY: Springer; 2009.
99. Riley RD, van der Windt D, Croft P, Moons KGM, editors. Prognosis Research in Healthcare:Concepts, Methods and Impact. Oxford: Oxford University Press; 2019. https://doi.org/10.1093/med/9780198796619.001.0001
100. IntHout J, Ioannidis JP, Rovers MM, Goeman JJ. Plea for routinely presenting prediction intervalsin meta-analysis. BMJ Open 2016;6:e010247. https://doi.org/10.1136/bmjopen-2015-010247
101. IntHout J, Ioannidis JP, Borm GF. The Hartung-Knapp-Sidik-Jonkman method for random effectsmeta-analysis is straightforward and considerably outperforms the standard DerSimonian-Lairdmethod. BMC Med Res Methodol 2014;14:25. https://doi.org/10.1186/1471-2288-14-25
102. Knapp G, Hartung J. Improved tests for a random effects meta-regression with a single covariate.Stat Med 2003;22:2693–710. https://doi.org/10.1002/sim.1482
103. Fraser A, Macdonald-Wallis C, Tilling K, Boyd A, Golding J, Davey Smith G, et al. Cohort profile:the Avon Longitudinal Study of Parents and Children: ALSPAC mothers cohort. Int J Epidemiol2013;42:97–110. https://doi.org/10.1093/ije/dys066
104. Better Outcomes Registry & Network (BORN) Ontario. URL: www.bornontario.ca/en/about-born/(accessed 14 March 2019).
105. Japan Society of Obstetrics and Gynecology. URL: www.jsog.or.jp/modules/en/index.php?content_id=1 (accessed 14 March 2019).
106. Carter J, Seed PT, Tribe RM, David A, Lachelin G, Shennan AH, et al. Saliva progesterone forprediction of spontaneous preterm birth: the POPPY study. Pregnancy Outcome Poster Abstracts.BJOG 2017;124:122–54. https://doi.org/10.1111/1471-0528.14589
107. Al-Amin A, Rolnik DL, Black C, White A, Stolarek C, Brennecke S, da Silva Costa F. Accuracyof second trimester prediction of preterm preeclampsia by three different screening algorithms.Aust N Z J Obstet Gynaecol 2018;58:192–6. https://doi.org/10.1111/ajo.12689
DOI: 10.3310/hta24720 Health Technology Assessment 2020 Vol. 24 No. 72
© Queen’s Printer and Controller of HMSO 2020. This work was produced by Allotey et al. under the terms of a commissioning contract issued by the Secretary of Statefor Health and Social Care. This issue may be freely reproduced for the purposes of private research and study and extracts (or indeed, the full report) may be included inprofessional journals provided that suitable acknowledgement is made and the reproduction is not associated with any form of advertising. Applications for commercialreproduction should be addressed to: NIHR Journals Library, National Institute for Health Research, Evaluation, Trials and Studies Coordinating Centre, Alpha House,University of Southampton Science Park, Southampton SO16 7NS, UK.
91
108. Allen RE, Zamora J, Arroyo-Manzano D, Velauthar L, Allotey J, Thangaratinam S, Aquilina J.External validation of preexisting first trimester preeclampsia prediction models. Eur J ObstetGynecol Reprod Biol 2017;217:119–25. https://doi.org/10.1016/j.ejogrb.2017.08.031
109. Andersen LB, Dechend R, Jørgensen JS, Luef BM, Nielsen J, Barington T, Christesen HT.Prediction of preeclampsia with angiogenic biomarkers. Results from the prospectiveOdense Child Cohort. Hypertens Pregnancy 2016;35:405–19. https://doi.org/10.3109/10641955.2016.1167219
110. Antsaklis A, Daskalakis G, Tzortzis E, Michalas S. The effect of gestational age and placentallocation on the prediction of pre-eclampsia by uterine artery Doppler velocimetry inlow-risk nulliparous women. Ultrasound Obstet Gynecol 2000;16:635–9. https://doi.org/10.1046/j.1469-0705.2000.00288.x
111. Arenas J, Fernández-iñarea J, Rodríguez-mon C, Duplá B, Díez E, González-garcía A. Cribadocon doppler de las arterias uterinas para la predicción de complicaciones de la gestación.Clínicae Investigación en Ginecología y Obstetricia 2003;30:178–84. https://doi.org/10.1016/S0210-573X(03)77255-4
112. Askie LM, Duley L, Henderson-Smart DJ, Stewart LA, PARIS Collaborative Group. Antiplateletagents for prevention of pre-eclampsia: a meta-analysis of individual patient data. Lancet2007;369:1791–8. https://doi.org/10.1016/S0140-6736(07)60712-0
113. Audibert F, Boucoiran I, An N, Aleksandrov N, Delvin E, Bujold E, Rey E. Screening forpreeclampsia using first-trimester serum markers and uterine artery Doppler in nulliparouswomen. Am J Obstet Gynecol 2010;203:383.e1–8. https://doi.org/10.1016/j.ajog.2010.06.014
114. Ayorinde AA, Wilde K, Lemon J, Campbell D, Bhattacharya S. Data resource profile:the Aberdeen Maternity and Neonatal Databank (AMND). Int J Epidemiol 2016;45:389–94.https://doi.org/10.1093/ije/dyv356
115. Baschat AA, Magder LS, Doyle LE, Atlas RO, Jenkins CB, Blitzer MG. Prediction of preeclampsiautilizing the first trimester screening examination. Am J Obstet Gynecol 2014;211:514.e1–7.https://doi.org/10.1016/j.ajog.2014.04.018
116. Brown MA, Mackenzie C, Dunsmuir W, Roberts L, Ikin K, Matthews J, et al. Can wepredict recurrence of pre-eclampsia or gestational hypertension? BJOG 2007;114:984–93.https://doi.org/10.1111/j.1471-0528.2007.01376.x
117. Cameroni I, Roncaglia N, Crippa I, Orsenigo F, Locatelli A, Vergani P, et al. P32.05: Uterineartery Doppler in a risk population: what’s its role in the prediction of severe pregnancycomplications? Ultrasound Obstet Gynecol 2008;32:421–2. https://doi.org/10.1002/uog.5992
118. Caradeux J, Serra R, Nien JK, Pérez-Sepulveda A, Schepeler M, Guerra F, et al. First trimesterprediction of early onset preeclampsia using demographic, clinical, and sonographic data:a cohort study. Prenat Diagn 2013;33:732–6. https://doi.org/10.1002/pd.4113
119. Carbillon L. The imbalance of circulating angiogenic/antiangiogenic factors is mild or absentin obese women destined to develop preeclampsia. Hypertens Pregnancy 2014;33:524.https://doi.org/10.3109/10641955.2013.872252
120. Caritis S, Sibai B, Hauth J, Lindheimer MD, Klebanoff M, Thom E, et al. Low-dose aspirin toprevent preeclampsia in women at high risk. National Institute of Child Health and HumanDevelopment Network of Maternal-Fetal Medicine Units. N Engl J Med 1998;338:701–5.https://doi.org/10.1056/NEJM199803123381101
121. Chappell LC, Seed PT, Briley AL, Kelly FJ, Lee R, Hunt BJ, et al. Effect of antioxidants onthe occurrence of pre-eclampsia in women at increased risk: a randomised trial. Lancet1999;354:810–16. https://doi.org/10.1016/S0140-6736(99)80010-5
REFERENCES
NIHR Journals Library www.journalslibrary.nihr.ac.uk
92

122. Chiswick C, Reynolds RM, Denison F, Drake AJ, Forbes S, Newby DE, et al. Effect of metformin onmaternal and fetal outcomes in obese pregnant women (EMPOWaR): a randomised, double-blind,placebo-controlled trial. Lancet Diabetes Endocrinol 2015;3:778–86. https://doi.org/10.1016/S2213-8587(15)00219-3
123. Conserva V, Muggiasca M, Arrigoni L, Mantegazza V, Rossi E, Ferrazzi E. Recurrence andseverity of abnormal pregnancy outcome in patients treated by low-molecular-weight heparin:a prospective pilot study. J Matern Fetal Neonatal Med 2012;25:1467–73. https://doi.org/10.3109/14767058.2011.643326
124. Facchinetti F, Marozio L, Frusca T, Grandone E, Venturini P, Tiscia GL, et al. Maternalthrombophilia and the risk of recurrence of preeclampsia. Am J Obstet Gynecol 2009;200:46.e1–5.https://doi.org/10.1016/j.ajog.2008.07.032
125. Figueiró-Filho EA, Oliveira VMd, Coelho LR, Breda I. Marcadores séricos de trombofiliashereditárias e anticorpos antifosfolípides em gestantes com antecedentes de pré-eclâmpsiagrave. Revista Brasileira de Ginecologia e Obstetrícia 2012;34:40–6. https://doi.org/10.1590/S0100-72032012000100008
126. Giguère Y, Massé J, Thériault S, Bujold E, Lafond J, Rousseau F, Forest JC. Screening forpre-eclampsia early in pregnancy: performance of a multivariable model combining clinicalcharacteristics and biochemical markers. BJOG 2015;122:402–10. https://doi.org/10.1111/1471-0528.13050
127. Girchenko P, Lahti M, Tuovinen S, Savolainen K, Lahti J, Binder EB, et al. Cohort profile:prediction and prevention of preeclampsia and intrauterine growth restriction (PREDO) study.Int J Epidemiol 2017;46:1380–1381g. https://doi.org/10.1093/ije/dyw154
128. Goetzinger KR, Singla A, Gerkowicz S, Dicke JM, Gray DL, Odibo AO. Predicting the risk ofpre-eclampsia between 11 and 13 weeks’ gestation by combining maternal characteristicsand serum analytes, PAPP-A and free β-hCG. Prenat Diagn 2010;30:1138–42. https://doi.org/10.1002/pd.2627
129. Goffinet F, Aboulker D, Paris-Llado J, Bucourt M, Uzan M, Papiernik E, Bréart G. Screeningwith a uterine Doppler in low risk pregnant women followed by low dose aspirin in womenwith abnormal results: a multicenter randomised controlled trial. BJOG 2001;108:510–18.https://doi.org/10.1111/j.1471-0528.2001.00116.x
130. Gurgel Alves JA, Praciano de Sousa PC, Bezerra Maia e Holanda Moura S, Kane SC,da Silva Costa F. First-trimester maternal ophthalmic artery Doppler analysis for prediction ofpre-eclampsia. Ultrasound Obstet Gynecol 2014;44:411–18. https://doi.org/10.1002/uog.13338
131. Holzman C, Bullen B, Fisher R, Paneth N, Reuss L, Prematurity Study Group. Pregnancyoutcomes and community health: the POUCH study of preterm delivery. Paediatr PerinatEpidemiol 2001;15(Suppl. 2):136–58. https://doi.org/10.1046/j.1365-3016.2001.00014.x
132. Huang T, Hoffman B, Meschino W, Kingdom J, Okun N. Prediction of adverse pregnancyoutcomes by combinations of first and second trimester biochemistry markers used in theroutine prenatal screening of Down syndrome. Prenat Diagn 2010;30:471–7. https://doi.org/10.1002/pd.2505
133. Jääskeläinen T, Heinonen S, Hämäläinen E, Pulkki K, Romppanen J, Laivuori H, FINNPEC.Angiogenic profile in the Finnish Genetics of Pre-Eclampsia Consortium (FINNPEC) cohort.Pregnancy Hypertens 2018;14:252–9. https://doi.org/10.1016/j.preghy.2018.03.004
134. Jaddoe VW, van Duijn CM, Franco OH, van der Heijden AJ, van Iizendoorn MH, de Jongste JC,et al. The Generation R Study: design and cohort update 2012. Eur J Epidemiol 2012;27:739–56.https://doi.org/10.1007/s10654-012-9735-1
DOI: 10.3310/hta24720 Health Technology Assessment 2020 Vol. 24 No. 72
© Queen’s Printer and Controller of HMSO 2020. This work was produced by Allotey et al. under the terms of a commissioning contract issued by the Secretary of Statefor Health and Social Care. This issue may be freely reproduced for the purposes of private research and study and extracts (or indeed, the full report) may be included inprofessional journals provided that suitable acknowledgement is made and the reproduction is not associated with any form of advertising. Applications for commercialreproduction should be addressed to: NIHR Journals Library, National Institute for Health Research, Evaluation, Trials and Studies Coordinating Centre, Alpha House,University of Southampton Science Park, Southampton SO16 7NS, UK.
93

135. Jenum AK, Sletner L, Voldner N, Vangen S, Mørkrid K, Andersen LF, et al. The STORKGroruddalen research programme: a population-based cohort study of gestational diabetes,physical activity, and obesity in pregnancy in a multiethnic population. Rationale, methods,study population, and participation rates. Scand J Public Health 2010;38(Suppl. 5):60–70.https://doi.org/10.1177/1403494810378921
136. Olsen J, Melbye M, Olsen SF, Sørensen TI, Aaby P, Andersen AM, et al. The Danish NationalBirth Cohort – its background, structure and aim. Scand J Public Health 2001;29:300–7.https://doi.org/10.1177/14034948010290040201
137. Khan F, Belch JJ, MacLeod M, Mires G. Changes in endothelial function precede the clinicaldisease in women in whom preeclampsia develops. Hypertension 2005;46:1123–8. https://doi.org/10.1161/01.HYP.0000186328.90667.95
138. Langenveld J, Buttinger A, van der Post J, Wolf H, Mol BW, Ganzevoort W. Recurrence riskand prediction of a delivery under 34 weeks of gestation after a history of a severe hypertensivedisorder. BJOG 2011;118:589–95. https://doi.org/10.1111/j.1471-0528.2010.02842.x
139. Lecarpentier E, Tsatsaris V, Goffinet F, Cabrol D, Sibai B, Haddad B. Risk factors ofsuperimposed preeclampsia in women with essential chronic hypertension treated beforepregnancy. PLOS ONE 2013;8:e62140. https://doi.org/10.1371/journal.pone.0062140
140. Llurba E, Carreras E, Gratacós E, Juan M, Astor J, Vives A, et al. Maternal history and uterineartery Doppler in the assessment of risk for development of early- and late-onset preeclampsiaand intrauterine growth restriction. Obstet Gynecol Int 2009;2009:275613. https://doi.org/10.1155/2009/275613
141. Lykke JA, Paidas MJ, Langhoff-Roos J. Recurring complications in second pregnancy. ObstetGynecol 2009;113:1217–24. https://doi.org/10.1097/AOG.0b013e3181a66f2d
142. Magnus P, Irgens LM, Haug K, Nystad W, Skjaerven R, Stoltenberg C, MoBa Study Group.Cohort profile: the Norwegian Mother and Child cohort study (MoBa). Int J Epidemiol2006;35:1146–50. https://doi.org/10.1093/ije/dyl170
143. Makrides M, Gibson RA, McPhee AJ, Yelland L, Quinlivan J, Ryan P, DOMInO InvestigativeTeam. Effect of DHA supplementation during pregnancy on maternal depression andneurodevelopment of young children: a randomized controlled trial. JAMA 2010;304:1675–83.https://doi.org/10.1001/jama.2010.1507
144. Massé J, Forest JC, Moutquin JM, Marcoux S, Brideau NA, Bélanger M. A prospective studyof several potential biologic markers for early prediction of the development of preeclampsia.Am J Obstet Gynecol 1993;169:501–8. https://doi.org/10.1016/0002-9378(93)90608-L
145. Mbah AK, Sharma PP, Alio AP, Fombo DW, Bruder K, Salihu HM. Previous cesarean section,gestational age at first delivery and subsequent risk of pre-eclampsia in obese mothers.Arch Gynecol Obstet 2012;285:1375–81. https://doi.org/10.1007/s00404-011-2161-x
146. Mone F, Mulcahy C, McParland P, Stanton A, Culliton M, Downey P, et al. An open-labelrandomized-controlled trial of low dose aspirin with an early screening test for pre-eclampsiaand growth restriction (TEST): trial protocol. Contemp Clin Trials 2016;49:143–8. https://doi.org/10.1016/j.cct.2016.07.003
147. Odibo AO, Zhong Y, Goetzinger KR, Odibo L, Bick JL, Bower CR, Nelson DM. First-trimesterplacental protein 13, PAPP-A, uterine artery Doppler and maternal characteristics in theprediction of pre-eclampsia. Placenta 2011;32:598–602. https://doi.org/10.1016/j.placenta.2011.05.006
REFERENCES
NIHR Journals Library www.journalslibrary.nihr.ac.uk
94
148. Ohkuchi A, Minakami H, Sato I, Mori H, Nakano T, Tateno M. Predicting the risk of pre-eclampsiaand a small-for-gestational-age infant by quantitative assessment of the diastolic notch in uterineartery flow velocity waveforms in unselected women. Ultrasound Obstet Gynecol 2000;16:171–8.https://doi.org/10.1046/j.1469-0705.2000.00192.x
149. Poston L, Bell R, Croker H, Flynn AC, Godfrey KM, Goff L, et al. Effect of a behavioural interventionin obese pregnant women (the UPBEAT study): a multicentre, randomised controlled trial.Lancet Diabetes Endocrinol 2015;3:767–77. https://doi.org/10.1016/S2213-8587(15)00227-2
150. Poston L, Briley AL, Seed PT, Kelly FJ, Shennan AH, Vitamins in Pre-eclampsia (VIP) TrialConsortium. Vitamin C and vitamin E in pregnant women at risk for pre-eclampsia (VIP trial):randomised placebo-controlled trial. Lancet 2006;367:1145–54. https://doi.org/10.1016/S0140-6736(06)68433-X
151. Prefumo F, Fratelli N, Ganapathy R, Bhide A, Frusca T, Thilaganathan B. First trimester uterineartery Doppler in women with previous pre-eclampsia. Acta Obstet Gynecol Scand 2008;87:1271–5.https://doi.org/10.1080/00016340802460347
152. Rang S, van Montfrans GA, Wolf H. Serial hemodynamic measurement in normal pregnancy,preeclampsia, and intrauterine growth restriction. Am J Obstet Gynecol 2008;198:519.e1–9.https://doi.org/10.1016/j.ajog.2007.11.014
153. Rocha RS, Gurgel Alves JA, Bezerra Maia e Holanda Moura S, Araujo Júnior E, Peixoto AB,Santana EFM, et al. Simple approach based on maternal characteristics and mean arterialpressure for the prediction of preeclampsia in the first trimester of pregnancy. J Perinat Med2017;45:843–9. https://doi.org/10.1515/jpm-2016-0418
154. Rocha RS, Gurgel Alves JA, Bezerra Maia e Holanda Moura S, Araujo Júnior E, Martins WP,Vasconcelos CTM, et al. Comparison of three algorithms for prediction preeclampsia in thefirst trimester of pregnancy. Pregnancy Hypertens 2017;10:113–17. https://doi.org/10.1016/j.preghy.2017.07.146
155. Rumbold AR, Crowther CA, Haslam RR, Dekker GA, Robinson JS, ACTS Study Group.Vitamins C and E and the risks of preeclampsia and perinatal complications. N Engl J Med2006;354:1796–806. https://doi.org/10.1056/NEJMoa054186
156. Salim R, Czarnowicki T, Nachum Z, Shalev E. The impact of close surveillance on pregnancyoutcome among women with a prior history of antepartum complications attributed tothrombosis: a cohort study. Reprod Biol Endocrinol 2008;6:55. https://doi.org/10.1186/1477-7827-6-55
157. Savitri AI, Zuithoff P, Browne JL, Amelia D, Baharuddin M, Grobbee DE, Uiterwaal CS. Doespre-pregnancy BMI determine blood pressure during pregnancy? A prospective cohort study.BMJ Open 2016;6:e011626. https://doi.org/10.1136/bmjopen-2016-011626
158. Ferrazzani S, D’Alessio MC, Fatigante G, Soreca G, De Carolis S, Paradisi G, et al. Prophylaxisof recurrent preeclampsia: low-molecular-weight heparin plus low-dose aspirin versuslow-dose aspirin alone. Hypertens Pregnancy 2006;25:115–27. https://doi.org/10.1080/10641950600745517
159. Sibai BM, Caritis SN, Thom E, Klebanoff M, McNellis D, Rocco L, et al. Prevention ofpreeclampsia with low-dose aspirin in healthy, nulliparous pregnant women. The NationalInstitute of Child Health and Human Development Network of Maternal-Fetal Medicine Units.N Engl J Med 1993;329:1213–8. https://doi.org/10.1056/NEJM199310213291701
160. Skråstad RB, Hov GG, Blaas HG, Romundstad PR, Salvesen KÅ. Risk assessment forpreeclampsia in nulliparous women at 11–13 weeks gestational age: prospective evaluationof two algorithms. BJOG 2015;122:1781–8. https://doi.org/10.1111/1471-0528.13194
DOI: 10.3310/hta24720 Health Technology Assessment 2020 Vol. 24 No. 72
© Queen’s Printer and Controller of HMSO 2020. This work was produced by Allotey et al. under the terms of a commissioning contract issued by the Secretary of Statefor Health and Social Care. This issue may be freely reproduced for the purposes of private research and study and extracts (or indeed, the full report) may be included inprofessional journals provided that suitable acknowledgement is made and the reproduction is not associated with any form of advertising. Applications for commercialreproduction should be addressed to: NIHR Journals Library, National Institute for Health Research, Evaluation, Trials and Studies Coordinating Centre, Alpha House,University of Southampton Science Park, Southampton SO16 7NS, UK.
95

161. Sovio U, White IR, Dacey A, Pasupathy D, Smith GCS. Screening for fetal growth restrictionwith universal third trimester ultrasonography in nulliparous women in the PregnancyOutcome Prediction (POP) study: a prospective cohort study. Lancet 2015;386:2089–97.https://doi.org/10.1016/S0140-6736(15)00131-2
162. Staff AC, Braekke K, Harsem NK, Lyberg T, Holthe MR. Circulating concentrations of sFlt1(soluble fms-like tyrosine kinase 1) in fetal and maternal serum during pre-eclampsia. Eur JObstet Gynecol Reprod Biol 2005;122:33–9. https://doi.org/10.1016/j.ejogrb.2004.11.015
163. Stirrup OT, Khalil A, D’Antonio F, Thilaganathan B, Southwest Thames Obstetric ResearchCollaborative (STORK). Fetal growth reference ranges in twin pregnancy: analysis of theSouthwest Thames Obstetric Research Collaborative (STORK) multiple pregnancy cohort.Ultrasound Obstet Gynecol 2015;45:301–7. https://doi.org/10.1002/uog.14640
164. Trogstad L, Skrondal A, Stoltenberg C, Magnus P, Nesheim BI, Eskild A. Recurrence riskof preeclampsia in twin and singleton pregnancies. Am J Med Genet A 2004;126A:41–5.https://doi.org/10.1002/ajmg.a.20512
165. Van Der Linden EL, Browne JL, Vissers KM, Antwi E, Agyepong IA, Grobbee DE,Klipstein-Grobusch K. Maternal body mass index and adverse pregnancy outcomes:a Ghanaian cohort study. Obesity 2016;24:215–22. https://doi.org/10.1002/oby.21210
166. van Kuijk SM, Delahaije DH, Dirksen CD, Scheepers HC, Spaanderman ME, Ganzevoort W, et al.External validation of a model for periconceptional prediction of recurrent early-onsetpreeclampsia. Hypertens Pregnancy 2014;33:265–76. https://doi.org/10.3109/10641955.2013.872253
167. van Kuijk SM, Nijdam ME, Janssen KJ, Sep SJ, Peeters LL, Delahaije DH, et al. A model forpreconceptional prediction of recurrent early-onset preeclampsia: derivation and internalvalidation. Reprod Sci 2011;18:1154–9. https://doi.org/10.1177/1933719111410708
168. van Oostwaard MF, Langenveld J, Bijloo R, Wong KM, Scholten I, Loix S, et al. Prediction ofrecurrence of hypertensive disorders of pregnancy between 34 and 37 weeks of gestation:a retrospective cohort study. BJOG 2012;119:840–7. https://doi.org/10.1111/j.1471-0528.2012.03312.x
169. van Oostwaard MF, Langenveld J, Schuit E, Wigny K, Van Susante H, Beune I, et al.Prediction of recurrence of hypertensive disorders of pregnancy in the term period, aretrospective cohort study. Pregnancy Hypertens 2014;4:194–202. https://doi.org/10.1016/j.preghy.2014.04.001
170. Vatten LJ, Eskild A, Nilsen TI, Jeansson S, Jenum PA, Staff AC. Changes in circulating levelof angiogenic factors from the first to second trimester as predictors of preeclampsia.Am J Obstet Gynecol 2007;196:239.e1–6. https://doi.org/10.1016/j.ajog.2006.10.909
171. Verlohren S, Galindo A, Schlembach D, Zeisler H, Herraiz I, Moertl MG, et al. An automatedmethod for the determination of the sFlt-1/PIGF ratio in the assessment of preeclampsia.Am J Obstet Gynecol 2010;202:161.e1–161.e11. https://doi.org/10.1016/j.ajog.2009.09.016
172. Verlohren S, Herraiz I, Lapaire O, Schlembach D, Moertl M, Zeisler H, et al. The sFlt-1/PlGFratio in different types of hypertensive pregnancy disorders and its prognostic potentialin preeclamptic patients. Am J Obstet Gynecol 2012;206:58.e1–8. https://doi.org/10.1016/j.ajog.2011.07.037
173. Vinter CA, Jensen DM, Ovesen P, Beck-Nielsen H, Jørgensen JS. The LiP (Lifestyle in Pregnancy)study: a randomized controlled trial of lifestyle intervention in 360 obese pregnant women.Diabetes Care 2011;34:2502–7. https://doi.org/10.2337/dc11-1150
REFERENCES
NIHR Journals Library www.journalslibrary.nihr.ac.uk
96
174. Vollebregt KC, Gisolf J, Guelen I, Boer K, van Montfrans G, Wolf H. Limited accuracy ofthe hyperbaric index, ambulatory blood pressure and sphygmomanometry measurementsin predicting gestational hypertension and preeclampsia. J Hypertens 2010;28:127–34.https://doi.org/10.1097/HJH.0b013e32833266fc
175. Widmer M, Cuesta C, Khan KS, Conde-Agudelo A, Carroli G, Fusey S, et al. Accuracy of angiogenicbiomarkers at ≤ 20 weeks’ gestation in predicting the risk of pre-eclampsia: a WHO multicentrestudy. Pregnancy Hypertens 2015;5:330–8. https://doi.org/10.1016/j.preghy.2015.09.004
176. Wright E, Audette MC, Ye XY, Keating S, Hoffman B, Lye SJ, et al. Maternal vascularmalperfusion and adverse perinatal outcomes in low-risk nulliparous women. Obstet Gynecol2017;130:1112–20. https://doi.org/10.1097/AOG.0000000000002264
177. Wright J, Small N, Raynor P, Tuffnell D, Bhopal R, Cameron N, et al. Cohort Profile: the Bornin Bradford multi-ethnic family cohort study. Int J Epidemiol 2013;42:978–91. https://doi.org/10.1093/ije/dys112
178. Zhang J, Troendle JF, Levine RJ. Risks of hypertensive disorders in the second pregnancy.Paediatr Perinat Epidemiol 2001;15:226–31. https://doi.org/10.1046/j.1365-3016.2001.00347.x
179. Cnossen JS, Leeflang MM, de Haan EE, Mol BW, van der Post JA, Khan KS, ter Riet G.Accuracy of body mass index in predicting pre-eclampsia: bivariate meta-analysis. BJOG2007;114:1477–85. https://doi.org/10.1111/j.1471-0528.2007.01483.x
180. O’Brien TE, Ray JG, Chan WS. Maternal body mass index and the risk of preeclampsia:a systematic overview. Epidemiology 2003;14:368–74. https://doi.org/10.1097/00001648-200305000-00020
181. Wang Z, Wang P, Liu H, He X, Zhang J, Yan H, et al. Maternal adiposity as an independentrisk factor for pre-eclampsia: a meta-analysis of prospective cohort studies. Obes Rev2013;14:508–21. https://doi.org/10.1111/obr.12025
182. Duckitt K, Harrington D. Risk factors for pre-eclampsia at antenatal booking: systematic reviewof controlled studies. BMJ 2005;330:565. https://doi.org/10.1136/bmj.38380.674340.E0
183. Alpoim PN, de Barros Pinheiro M, Junqueira DR, Freitas LG, das Graças Carvalho M,Fernandes AP, et al. Preeclampsia and ABO blood groups: a systematic review and meta-analysis.Mol Biol Rep 2013;40:2253–61. https://doi.org/10.1007/s11033-012-2288-2
184. England L, Zhang J. Smoking and risk of preeclampsia: a systematic review. Front Biosci2007;12:2471–83. https://doi.org/10.2741/2248
185. Rebelo F, Schlüssel MM, Vaz JS, Franco-Sena AB, Pinto TJ, Bastos FI, et al. C-reactive proteinand later preeclampsia: systematic review and meta-analysis taking into account the weight status.J Hypertens 2013;31:16–26. https://doi.org/10.1097/HJH.0b013e32835b0556
186. Luo ZC, An N, Xu HR, Larante A, Audibert F, Fraser WD. The effects and mechanisms ofprimiparity on the risk of pre-eclampsia: a systematic review. Paediatr Perinat Epidemiol2007;21(Suppl. 1):36–45. https://doi.org/10.1111/j.1365-3016.2007.00836.x
187. Cnossen JS, Vollebregt KC, de Vrieze N, ter Riet G, Mol BW, Franx A, et al. Accuracy of meanarterial pressure and blood pressure measurements in predicting pre-eclampsia: systematic reviewand meta-analysis. BMJ 2008;336:1117–20. https://doi.org/10.1136/bmj.39540.522049.BE
188. Sgolastra F, Petrucci A, Severino M, Gatto R, Monaco A. Relationship between periodontitisand pre-eclampsia: a meta-analysis. PLOS ONE 2013;8:e71387. https://doi.org/10.1371/journal.pone.0071387
189. Kunnen A, van Doormaal JJ, Abbas F, Aarnoudse JG, van Pampus MG, Faas MM. Periodontaldisease and pre-eclampsia: a systematic review. J Clin Periodontol 2010;37:1075–87.https://doi.org/10.1111/j.1600-051X.2010.01636.x
DOI: 10.3310/hta24720 Health Technology Assessment 2020 Vol. 24 No. 72
© Queen’s Printer and Controller of HMSO 2020. This work was produced by Allotey et al. under the terms of a commissioning contract issued by the Secretary of Statefor Health and Social Care. This issue may be freely reproduced for the purposes of private research and study and extracts (or indeed, the full report) may be included inprofessional journals provided that suitable acknowledgement is made and the reproduction is not associated with any form of advertising. Applications for commercialreproduction should be addressed to: NIHR Journals Library, National Institute for Health Research, Evaluation, Trials and Studies Coordinating Centre, Alpha House,University of Southampton Science Park, Southampton SO16 7NS, UK.
97

190. Morris RK, Riley RD, Doug M, Deeks JJ, Kilby MD. Diagnostic accuracy of spot urinary proteinand albumin to creatinine ratios for detection of significant proteinuria or adverse pregnancyoutcome in patients with suspected pre-eclampsia: systematic review and meta-analysis.BMJ 2012;345:e4342. https://doi.org/10.1136/bmj.e4342
191. Sanchez-Ramos L, Gillen G, Zamora J, Stenyakina A, Kaunitz AM. The protein-to-creatinine ratiofor the prediction of significant proteinuria in patients at risk for preeclampsia: a meta-analysis.Ann Clin Lab Sci 2013;43:211–20.
192. Wolf HT, Owe KM, Juhl M, Hegaard HK. Leisure time physical activity and the risk ofpre-eclampsia: a systematic review. Matern Child Health J 2014;18:899–910. https://doi.org/10.1007/s10995-013-1316-8
193. Palmer KT, Bonzini M, Harris EC, Linaker C, Bonde JP. Work activities and risk of prematurity,low birth weight and pre-eclampsia: an updated review with meta-analysis. Occup Environ Med2013;70:213–22. https://doi.org/10.1136/oemed-2012-101032
194. Bonzini M, Coggon D, Palmer KT. Risk of prematurity, low birthweight and pre-eclampsia inrelation to working hours and physical activities: a systematic review. Occup Environ Med2007;64:228–43. https://doi.org/10.1136/oem.2006.026872
195. Cnossen JS, de Ruyter-Hanhijärvi H, van der Post JA, Mol BW, Khan KS, ter Riet G. Accuracyof serum uric acid determination in predicting pre-eclampsia: a systematic review. Acta ObstetGynecol Scand 2006;85:519–25. https://doi.org/10.1080/00016340500342037
196. Chien PF, Arnott N, Gordon A, Owen P, Khan KS. How useful is uterine artery Doppler flowvelocimetry in the prediction of pre-eclampsia, intrauterine growth retardation and perinataldeath? An overview. BJOG 2000;107:196–208. https://doi.org/10.1111/j.1471-0528.2000.tb11690.x
197. Kleinrouweler CE, Bossuyt PM, Thilaganathan B, Vollebregt KC, Arenas Ramírez J, Ohkuchi A,et al. Value of adding second-trimester uterine artery Doppler to patient characteristics inidentification of nulliparous women at increased risk for pre-eclampsia: an individual patient datameta-analysis. Ultrasound Obstet Gynecol 2013;42:257–67. https://doi.org/10.1002/uog.12435
198. Pedrosa AC, Matias A. Screening for pre-eclampsia: a systematic review of tests combininguterine artery Doppler with other markers. J Perinat Med 2011;39:619–35. https://doi.org/10.1515/JPM.2011.077
199. Kosmas IP, Tatsioni A, Ioannidis JP. Association of Leiden mutation in factor V gene withhypertension in pregnancy and pre-eclampsia: a meta-analysis. J Hypertens 2003;21:1221–8.https://doi.org/10.1097/00004872-200307000-00002
200. Dudding T, Heron J, Thakkinstian A, Nurk E, Golding J, Pembrey M, et al. Factor V Leiden isassociated with pre-eclampsia but not with fetal growth restriction: a genetic associationstudy and meta-analysis. J Thromb Haemost 2008;6:1869–75. https://doi.org/10.1111/j.1538-7836.2008.03134.x
201. Rodger MA, Betancourt MT, Clark P, Lindqvist PG, Dizon-Townson D, Said J, et al. The associationof factor V leiden and prothrombin gene mutation and placenta-mediated pregnancycomplications: a systematic review and meta-analysis of prospective cohort studies. PLOS Med2010;7:e1000292. https://doi.org/10.1371/journal.pmed.1000292
202. Xia XP, Chang WW, Cao YX. Meta-analysis of the methylenetetrahydrofolate reductaseC677T polymorphism and susceptibility to pre-eclampsia. Hypertens Res 2012;35:1129–34.https://doi.org/10.1038/hr.2012.117
203. Kosmas IP, Tatsioni A, Ioannidis JP. Association of C677T polymorphism in themethylenetetrahydrofolate reductase gene with hypertension in pregnancy and pre-eclampsia:a meta-analysis. J Hypertens 2004;22:1655–62. https://doi.org/10.1097/00004872-200409000-00004
REFERENCES
NIHR Journals Library www.journalslibrary.nihr.ac.uk
98
204. Zusterzeel PL, Visser W, Blom HJ, Peters WH, Heil SG, Steegers EA. Methylenetetrahydrofolatereductase polymorphisms in preeclampsia and the HELLP syndrome. Hypertens Pregnancy2000;19:299–307. https://doi.org/10.1081/PRG-100101991
205. Li X, Shen L, Tan H. Polymorphisms and plasma level of transforming growth factor-Beta 1 andrisk for preeclampsia: a systematic review. PLOS ONE 2014;9:e97230. https://doi.org/10.1371/journal.pone.0097230
206. Wang XM, Wu HY, Qiu XJ. Methylenetetrahydrofolate reductase (MTHFR) gene C677Tpolymorphism and risk of preeclampsia: an updated meta-analysis based on 51 studies.Arch Med Res 2013;44:159–68. https://doi.org/10.1016/j.arcmed.2013.01.011
207. Widmer M, Villar J, Benigni A, Conde-Agudelo A, Karumanchi SA, Lindheimer M. Mapping thetheories of preeclampsia and the role of angiogenic factors: a systematic review. Obstet Gynecol2007;109:168–80. https://doi.org/10.1097/01.AOG.0000249609.04831.7c
208. Jacobs M, Nassar N, Roberts CL, Hadfield R, Morris JM, Ashton AW. Levels of soluble fms-liketyrosine kinase one in first trimester and outcomes of pregnancy: a systematic review. ReprodBiol Endocrinol 2011;9:77. https://doi.org/10.1186/1477-7827-9-77
209. Huppertz B, Meiri H, Gizurarson S, Osol G, Sammar M. Placental protein 13 (PP13): a newbiological target shifting individualized risk assessment to personalized drug design combatingpre-eclampsia. Hum Reprod Update 2013;19:391–405. https://doi.org/10.1093/humupd/dmt003
210. Schneuer FJ, Nassar N, Khambalia AZ, Tasevski V, Guilbert C, Ashton AW, et al. First trimesterscreening of maternal placental protein 13 for predicting preeclampsia and small for gestationalage: in-house study and systematic review. Placenta 2012;33:735–40. https://doi.org/10.1016/j.placenta.2012.05.012
211. Lau SY, Guild SJ, Barrett CJ, Chen Q, McCowan L, Jordan V, Chamley LW. Tumour necrosisfactor-alpha, interleukin-6, and interleukin-10 levels are altered in preeclampsia: a systematicreview and meta-analysis. Am J Reprod Immunol 2013;70:412–27. https://doi.org/10.1111/aji.12138
212. Tabesh M, Salehi-Abargouei A, Tabesh M, Esmaillzadeh A. Maternal vitamin D status and risk ofpre-eclampsia: a systematic review and meta-analysis. J Clin Endocrinol Metab 2013;98:3165–73.https://doi.org/10.1210/jc.2013-1257
213. Morgan JA, Bombell S, McGuire W. Association of plasminogen activator inhibitor-type 1(–675 4G/5G) polymorphism with pre-eclampsia: systematic review. PLOS ONE 2013;8:e56907.https://doi.org/10.1371/journal.pone.0056907
214. Dai B, Liu T, Zhang B, Zhang X, Wang Z. The polymorphism for endothelial nitric oxidesynthase gene, the level of nitric oxide and the risk for pre-eclampsia: a meta-analysis.Gene 2013;519:187–93. https://doi.org/10.1016/j.gene.2013.01.004
215. Chen Z, Xu F, Wei Y, Liu F, Qi H. Angiotensin-converting enzyme insertion/deletion polymorphismand risk of pregnancy hypertensive disorders: a meta-analysis. J Renin Angiotensin Aldosterone Syst2012;13:184–95. https://doi.org/10.1177/1470320311427755
216. Qi HP, Fraser WD, Luo ZC, Julien P, Audibert F, Wei SQ. Endothelial nitric oxide synthase genepolymorphisms and risk of preeclampsia. Am J Perinatol 2013;30:795–804. https://doi.org/10.1055/s-0032-1333406
217. Zhao L, Bracken MB, Dewan AT, Chen S. Association between the SERPINE1 (PAI-1) 4G/5Ginsertion/deletion promoter polymorphism (rs1799889) and pre-eclampsia: a systematic reviewand meta-analysis. Mol Hum Reprod 2013;19:136–43. https://doi.org/10.1093/molehr/gas056
DOI: 10.3310/hta24720 Health Technology Assessment 2020 Vol. 24 No. 72
© Queen’s Printer and Controller of HMSO 2020. This work was produced by Allotey et al. under the terms of a commissioning contract issued by the Secretary of Statefor Health and Social Care. This issue may be freely reproduced for the purposes of private research and study and extracts (or indeed, the full report) may be included inprofessional journals provided that suitable acknowledgement is made and the reproduction is not associated with any form of advertising. Applications for commercialreproduction should be addressed to: NIHR Journals Library, National Institute for Health Research, Evaluation, Trials and Studies Coordinating Centre, Alpha House,University of Southampton Science Park, Southampton SO16 7NS, UK.
99
218. Zhao L, Dewan AT, Bracken MB. Association of maternal AGTR1 polymorphisms and preeclampsia:a systematic review and meta-analysis. J Matern Fetal Neonatal Med 2012;25:2676–80.https://doi.org/10.3109/14767058.2012.708370
219. Zhong WG, Wang Y, Zhu H, Zhao X. Meta analysis of angiotensin-converting enzyme I/Dpolymorphism as a risk factor for preeclampsia in Chinese women. Genet Mol Res2012;11:2268–76. https://doi.org/10.4238/2012.May.21.1
220. Ni S, Zhang Y, Deng Y, Gong Y, Huang J, Bai Y, Zhou R. AGT M235T polymorphism contributesto risk of preeclampsia: evidence from a meta-analysis. J Renin Angiotensin Aldosterone Syst2012;13:379–86. https://doi.org/10.1177/1470320312440903
221. Hui D, Okun N, Murphy K, Kingdom J, Uleryk E, Shah PS. Combinations of maternal serummarkers to predict preeclampsia, small for gestational age, and stillbirth: a systematic review.J Obstet Gynaecol Can 2012;34:142–53. https://doi.org/10.1016/S1701-2163(16)35157-X
222. Giguère Y, Charland M, Bujold E, Bernard N, Grenier S, Rousseau F, et al. [Combiningbiochemical and ultrasonographic markers in predicting preeclampsia: a systematic review.]Ann Biol Clin 2011;69:257–71. https://doi.org/10.1684/abc.2011.0572
223. Abou-Nassar K, Carrier M, Ramsay T, Rodger MA. The association between antiphospholipidantibodies and placenta mediated complications: a systematic review and meta-analysis.Thromb Res 2011;128:77–85. https://doi.org/10.1016/j.thromres.2011.02.006
224. do Prado AD, Piovesan DM, Staub HL, Horta BL. Association of anticardiolipin antibodieswith preeclampsia: a systematic review and meta-analysis. Obstet Gynecol 2010;116:1433–43.https://doi.org/10.1097/AOG.0b013e3181fe02ec
225. Gupta S, Aziz N, Sekhon L, Agarwal R, Mansour G, Li J, Agarwal A. Lipid peroxidation andantioxidant status in preeclampsia: a systematic review. Obstet Gynecol Surv 2009;64:750–9.https://doi.org/10.1097/OGX.0b013e3181bea0ac
226. Bombell S, McGuire W. Tumour necrosis factor (–308A) polymorphism in pre-eclampsia:meta-analysis of 16 case–control studies. Aust N Z J Obstet Gynaecol 2008;48:547–51.https://doi.org/10.1111/j.1479-828X.2008.00924.x
227. Zafarmand MH, Nijdam ME, Franx A, Grobbee DE, Bots ML. The angiotensinogen geneM235T polymorphism and development of preeclampsia/eclampsia: a meta-analysis andmeta-regression of observational studies. J Hypertens 2008;26:1726–34. https://doi.org/10.1097/HJH.0b013e3283009ca5
228. Wiwanitkit V. Correlation between plasminogen activator inhibitor-1 4G/5G polymorphismand pre-eclampsia: an appraisal. Arch Gynecol Obstet 2006;273:322–4. https://doi.org/10.1007/s00404-005-0117-8
229. Crovetto F, Figueras F, Triunfo S, Crispi F, Rodriguez-Sureda V, Dominguez C, et al. Firsttrimester screening for early and late preeclampsia based on maternal characteristics,biophysical parameters, and angiogenic factors. Prenat Diagn 2015;35:183–91. https://doi.org/10.1002/pd.4519
230. Kuc S, Koster MP, Franx A, Schielen PC, Visser GH. Maternal characteristics, mean arterialpressure and serum markers in early prediction of preeclampsia. PLOS ONE 2013;8:e63546.https://doi.org/10.1371/journal.pone.0063546
231. Plasencia W, Maiz N, Bonino S, Kaihura C, Nicolaides KH. Uterine artery Doppler at 11 + 0 to13 + 6 weeks in the prediction of pre-eclampsia. Ultrasound Obstet Gynecol 2007;30:742–9.https://doi.org/10.1002/uog.5157
REFERENCES
NIHR Journals Library www.journalslibrary.nihr.ac.uk
100
232. Poon LC, Kametas NA, Chelemen T, Leal A, Nicolaides KH. Maternal risk factors forhypertensive disorders in pregnancy: a multivariate approach. J Hum Hypertens 2010;24:104–10.https://doi.org/10.1038/jhh.2009.45
233. Poon LC, Kametas NA, Pandeva I, Valencia C, Nicolaides KH. Mean arterial pressure at11(+0) to 13(+6) weeks in the prediction of preeclampsia. Hypertension 2008;51:1027–33.https://doi.org/10.1161/HYPERTENSIONAHA.107.104646
234. Poon LC, Maiz N, Valencia C, Plasencia W, Nicolaides KH. First-trimester maternal serumpregnancy-associated plasma protein-A and pre-eclampsia. Ultrasound Obstet Gynecol2009;33:23–33. https://doi.org/10.1002/uog.6280
235. Scazzocchio E, Figueras F, Crispi F, Meler E, Masoller N, Mula R, Gratacos E. Performance of afirst-trimester screening of preeclampsia in a routine care low-risk setting. Am J Obstet Gynecol2013;208:203.e1–203.e10. https://doi.org/10.1016/j.ajog.2012.12.016
236. Wright D, Syngelaki A, Akolekar R, Poon LC, Nicolaides KH. Competing risks model inscreening for preeclampsia by maternal characteristics and medical history. Am J ObstetGynecol 2015;213:62.e1–62.e10. https://doi.org/10.1016/j.ajog.2015.02.018
237. Yu CK, Smith GC, Papageorghiou AT, Cacho AM, Nicolaides KH, Fetal Medicine FoundationSecond Trimester Screening Group. An integrated model for the prediction of pre-eclampsiausing maternal factors and uterine artery Doppler velocimetry in unselected low-risk women.Am J Obstet Gynecol 2006;195:330. https://doi.org/10.1016/j.ajog.2006.06.010
238. Yu CK, Smith GC, Papageorghiou AT, Cacho AM, Nicolaides KH, Fetal Medicine FoundationSecond Trimester Screening Group. An integrated model for the prediction of preeclampsiausing maternal factors and uterine artery Doppler velocimetry in unselected low-risk women.Am J Obstet Gynecol 2005;193:429–36. https://doi.org/10.1016/j.ajog.2004.12.014
239. Albert A, Anderson JA. On the existence of maximum likelihood estimates in logisticregression models. Biometrika 1984;71:1. https://doi.org/10.1093/biomet/71.1.1
240. White IR, Royston P, Wood AM. Multiple imputation using chained equations: issues andguidance for practice. Stat Med 2011;30:377–99. https://doi.org/10.1002/sim.4067
241. Akolekar R, Zaragoza E, Poon LC, Pepes S, Nicolaides KH. Maternal serum placental growthfactor at 11 + 0 to 13 + 6 weeks of gestation in the prediction of pre-eclampsia. UltrasoundObstet Gynecol 2008;32:732–9. https://doi.org/10.1002/uog.6244
242. National Institute for Health and Care Excellence. Hypertension in Pregnancy: The Managementof Hypertensive Disorders During Pregnancy. Clinical Guideline 107. London: National Institutefor Health and Care Excellence; 2010. URL: www.nice.org.uk/guidance/cg107 (accessed12 February 2015).
243. O’Gorman N, Wright D, Syngelaki A, Akolekar R, Wright A, Poon LC, Nicolaides KH.Competing risks model in screening for preeclampsia by maternal factors and biomarkersat 11–13 weeks gestation. Am J Obstet Gynecol 2016;214:103.e1–103.e12. https://doi.org/10.1016/j.ajog.2015.08.034
244. O’Gorman N, Wright D, Poon LC, Rolnik DL, Syngelaki A, de Alvarado M, et al. Multicenterscreening for pre-eclampsia by maternal factors and biomarkers at 11–13 weeks’ gestation:comparison with NICE guidelines and ACOG recommendations. Ultrasound Obstet Gynecol2017;49:756–60. https://doi.org/10.1002/uog.17455
245. Oliveira N, Magder LS, Blitzer MG, Baschat AA. First-trimester prediction of pre-eclampsia:external validity of algorithms in a prospectively enrolled cohort. Ultrasound Obstet Gynecol2014;44:279–85. https://doi.org/10.1002/uog.13435
DOI: 10.3310/hta24720 Health Technology Assessment 2020 Vol. 24 No. 72
© Queen’s Printer and Controller of HMSO 2020. This work was produced by Allotey et al. under the terms of a commissioning contract issued by the Secretary of Statefor Health and Social Care. This issue may be freely reproduced for the purposes of private research and study and extracts (or indeed, the full report) may be included inprofessional journals provided that suitable acknowledgement is made and the reproduction is not associated with any form of advertising. Applications for commercialreproduction should be addressed to: NIHR Journals Library, National Institute for Health Research, Evaluation, Trials and Studies Coordinating Centre, Alpha House,University of Southampton Science Park, Southampton SO16 7NS, UK.
101

246. Park FJ, Leung CH, Poon LC, Williams PF, Rothwell SJ, Hyett JA. Clinical evaluation of a firsttrimester algorithm predicting the risk of hypertensive disease of pregnancy. Aust N Z J ObstetGynaecol 2013;53:532–9. https://doi.org/10.1111/ajo.12126
247. Steyerberg EW, Vickers AJ, Cook NR, Gerds T, Gonen M, Obuchowski N, et al. Assessing theperformance of prediction models: a framework for traditional and novel measures. Epidemiology2010;21:128–38. https://doi.org/10.1097/EDE.0b013e3181c30fb2
248. Wright D, Tan MY, O’Gorman N, Poon LC, Syngelaki A, Wright A, Nicolaides KH. Predictiveperformance of the competing risk model in screening for preeclampsia. Am J Obstet Gynecol2019;220:199.e1–199.e13. https://doi.org/10.1016/j.ajog.2018.11.1087
249. Debray TP, Vergouwe Y, Koffijberg H, Nieboer D, Steyerberg EW, Moons KG. A new frameworkto enhance the interpretation of external validation studies of clinical prediction models.J Clin Epidemiol 2015;68:279–89. https://doi.org/10.1016/j.jclinepi.2014.06.018
REFERENCES
NIHR Journals Library www.journalslibrary.nihr.ac.uk
102

Appendix 1 Full list of authors
John Allotey ,1,2† Kym IE Snell ,3*† Melanie Smuk ,2
Richard Hooper ,2 Claire L Chan ,2 Asif Ahmed ,4 Lucy C Chappell ,5
Peter von Dadelszen ,5 Julie Dodds ,1,2 Marcus Green ,6
Louise Kenny ,7 Asma Khalil ,8 Khalid S Khan ,1,2 Ben WMol ,9
Jenny Myers ,10 Lucilla Poston ,5 Basky Thilaganathan ,8
Anne C Staff ,11,12 Gordon CS Smith ,13 Wessel Ganzevoort ,14
Hannele Laivuori ,15,16,17,18 Anthony O Odibo ,19 Javier A Ramírez ,20
John Kingdom ,21 George Daskalakis ,22 Diane Farrar ,23
Ahmet A Baschat ,24 Paul T Seed ,5 Federico Prefumo ,25
Fabricio da Silva Costa ,26 Henk Groen ,27 Francois Audibert ,28
Jacques Massé ,29 Ragnhild B Skråstad ,30,31 Kjell Å Salvesen ,32,33
Camilla Haavaldsen ,34 Chie Nagata ,35 Alice R Rumbold ,36
Seppo Heinonen ,37 Lisa M Askie ,38 Luc JM Smits ,39
Christina AVinter ,40 Per M Magnus ,41 Kajantie Eero ,42,43
Pia M Villa ,37 Anne K Jenum ,44 Louise B Andersen ,45,46
Jane E Norman ,47 Akihide Ohkuchi ,48 Anne Eskild ,34,49
Sohinee Bhattacharya ,50 Fionnuala MMcAuliffe ,51 Alberto Galindo ,52,53
Ignacio Herraiz ,54 Lionel Carbillon ,55 Kerstin Klipstein-Grobusch ,56
SeonAe Yeo ,57 Helena J Teede ,58 Joyce L Browne ,56
Karel GMMoons ,56,59 Richard D Riley 3 and Shakila Thangaratinam 1,2
on behalf of the IPPIC Collaborative Network§
1Barts Research Centre for Women’s Health (BARC), Barts and the London School of Medicine andDentistry, Queen Mary University of London, London, UK
2Pragmatic Clinical Trials Unit, Barts and the London School of Medicine and Dentistry, Queen MaryUniversity of London, London, UK
3Centre for Prognosis Research, School of Primary, Community and Social Care, Keele University,Keele, UK
4Aston Medical Research Institute, Aston Medical School, Aston University, Birmingham, UK5Department of Women & Children’s Health, School of Life Course Sciences, Faculty of Life Sciences& Medicine, King’s College London, London, UK
6Action on Pre-eclampsia (APEC), Evesham, UK7Vice Chancellor’s Office, Faculty of Health & Life Sciences, University of Liverpool, Liverpool, UK8Fetal Medicine Unit, St George’s University Hospitals NHS Foundation Trust and Molecular andClinical Sciences Research Institute, St George’s University of London, London, UK
9Department of Obstetrics and Gynaecology, Monash University, Monash Medical Centre, Clayton,VIC, Australia
10Maternal and Fetal Health Research Centre, Manchester Academic Health Science Centre, Universityof Manchester, Manchester University NHS Foundation Trust, Manchester, UK
11Division of Obstetrics and Gynaecology, Oslo University Hospital, Oslo, Norway12Faculty of Medicine, University of Oslo, Oslo, Norway
DOI: 10.3310/hta24720 Health Technology Assessment 2020 Vol. 24 No. 72
© Queen’s Printer and Controller of HMSO 2020. This work was produced by Allotey et al. under the terms of a commissioning contract issued by the Secretary of Statefor Health and Social Care. This issue may be freely reproduced for the purposes of private research and study and extracts (or indeed, the full report) may be included inprofessional journals provided that suitable acknowledgement is made and the reproduction is not associated with any form of advertising. Applications for commercialreproduction should be addressed to: NIHR Journals Library, National Institute for Health Research, Evaluation, Trials and Studies Coordinating Centre, Alpha House,University of Southampton Science Park, Southampton SO16 7NS, UK.
103

13Department of Obstetrics and Gynaecology, NIHR Biomedical Research Centre, University ofCambridge, Cambridge, UK
14Department of Obstetrics, Amsterdam UMC, University of Amsterdam, Amsterdam, the Netherlands15Medical and Clinical Genetics, University of Helsinki and Helsinki University Hospital, Helsinki, Finland16Institute of Molecular Medicine Finland, Helsinki Institute of Life Science, University of Helsinki,Helsinki, Finland
17Department of Obstetrics and Gynaecology, Tampere University Hospital, Tampere, Finland18Faculty of Medicine and Health Technology, Tampere University, Tampere, Finland19University of South Florida, Tampa, FL, USA20Department of Obstetrics and Gynaecology, University Hospital de Cabueñes, Gijón, Spain21Maternal-Fetal Medicine Division, Department of Obstetrics and Gynaecology, Mount Sinai Hospital,University of Toronto, Toronto, ON, Canada
22Department of Obstetrics and Gynaecology, National and Kapodistrian University of Athens,Alexandra Hospital, Athens, Greece
23Bradford Institute for Health Research, Bradford Teaching Hospitals, Bradford, UK24Johns Hopkins Center for Fetal Therapy, Department of Gynecology & Obstetrics, Johns HopkinsUniversity School of Medicine, Baltimore, MD, USA
25Department of Obstetrics and Gynaecology, University of Brescia, Brescia, Italy26Department of Gynaecology and Obstetrics, Ribeirão Preto Medical School, University of São Paulo,Ribeirão Preto, Brazil
27Department of Epidemiology, University of Groningen, University Medical Center Groningen,Groningen, the Netherlands
28Department of Obstetrics and Gynaecology, CHU Sainte-Justine, Université de Montréal, Montréal,QC, Canada
29Department of Molecular Biology, Medical Biochemistry and Pathology, Université Laval, QuébecCity, QC, Canada
30Department of Clinical and Molecular Medicine, Faculty of Medicine and Health Sciences, NorwegianUniversity of Science and Technology, Trondheim, Norway
31Department of Clinical Pharmacology, St Olav’s University Hospital, Trondheim, Norway32Department of Laboratory Medicine, Children’s and Women’s Health, Norwegian University ofScience and Technology, Trondheim, Norway
33Department of Obstetrics and Gynecology, St Olav’s University Hospital, Trondheim, Norway34Department of Obstetrics and Gynacology, Akershus University Hospital, Lørenskog, Norway35Department of Education for Clinical Research, National Center for Child Health and Development,Tokyo, Japan
36South Australian Health and Medical Research Institute, Adelaide, SA, Australia37Department of Obstetrics and Gynaecology, University of Helsinki and Helsinki University Hospital,Helsinki, Finland
38NHMRC Clinical Trials Centre, University of Sydney, NSW, Australia39Care and Public Health Research Institute, Maastricht University Medical Centre, Maastricht,the Netherlands
40Department of Gynaecology and Obstetrics, Odense University Hospital, University of SouthernDenmark, Odense, Denmark
41Centre for Fertility and Health, Norwegian Institute of Public Health, Oslo, Norway42Finnish Institute for Health and Welfare, Helsinki, Finland43Children’s Hospital, University of Helsinki and Helsinki University Hospital, Helsinki, Finland44General Practice Research Unit (AFE), Department of General Practice, Institute of Health andSociety, University of Oslo, Oslo, Norway
45Institute for Clinical Research, University of Southern Denmark, Odense, Denmark46Department of Obstetrics and Gynecology, Odense University Hospital, Odense, Denmark47MRC Centre for Reproductive Health, University of Edinburgh, Edinburgh, UK48Department of Obstetrics and Gynecology, School of Medicine, Jichi Medical University,Shimotsuke-shi, Tochigi, Japan
49Institute of Clinical Medicine, University of Oslo, Oslo, Norway50Obstetrics & Gynaecology, Institute of Applied Health Sciences, School of Medicine, Medical Sciencesand Nutrition, University of Aberdeen, Aberdeen, UK
APPENDIX 1
NIHR Journals Library www.journalslibrary.nihr.ac.uk
104

51UCD Perinatal Research Centre, UCD School of Medicine, University College Dublin, NationalMaternity Hospital, Dublin, Ireland
52Fetal Medicine Unit, Maternal and Child Health and Development Network (SAMID), Department ofObstetrics and Gynecology, Hospital Universitario 12 de Octubre, Instituto de Investigación Hospital12 de Octubre (imas12), Universidad Complutense de Madrid, Madrid, Spain
53Universidad Complutense de Madrid, Madrid, Spain54Department of Obstetrics and Gynaecology, Hospital Universitario 12 de Octubre, Madrid, Spain55Department of Obstetrics and Gynecology, Assistance Publique-Hôpitaux de Paris, Université de Paris,Paris, France
56Julius Center for Health Sciences and Primary Care, University Medical Centre Utrecht, UtrechtUniversity, Utrecht, the Netherlands
57School of Nursing, University of North Carolina at Chapel Hill, Chapel Hill, NC, USA58Monash Partners Academic Health Sciences Centre, Monash University and Monash Health,Melbourne, VIC, Australia
59Cochrane Netherlands, Utrecht, the Netherlands
*Corresponding author†Joint first authors (both contributed equally)§The full list of partners in the IPPIC Collaborative Network can be found in Acknowledgements.
DOI: 10.3310/hta24720 Health Technology Assessment 2020 Vol. 24 No. 72
© Queen’s Printer and Controller of HMSO 2020. This work was produced by Allotey et al. under the terms of a commissioning contract issued by the Secretary of Statefor Health and Social Care. This issue may be freely reproduced for the purposes of private research and study and extracts (or indeed, the full report) may be included inprofessional journals provided that suitable acknowledgement is made and the reproduction is not associated with any form of advertising. Applications for commercialreproduction should be addressed to: NIHR Journals Library, National Institute for Health Research, Evaluation, Trials and Studies Coordinating Centre, Alpha House,University of Southampton Science Park, Southampton SO16 7NS, UK.
105

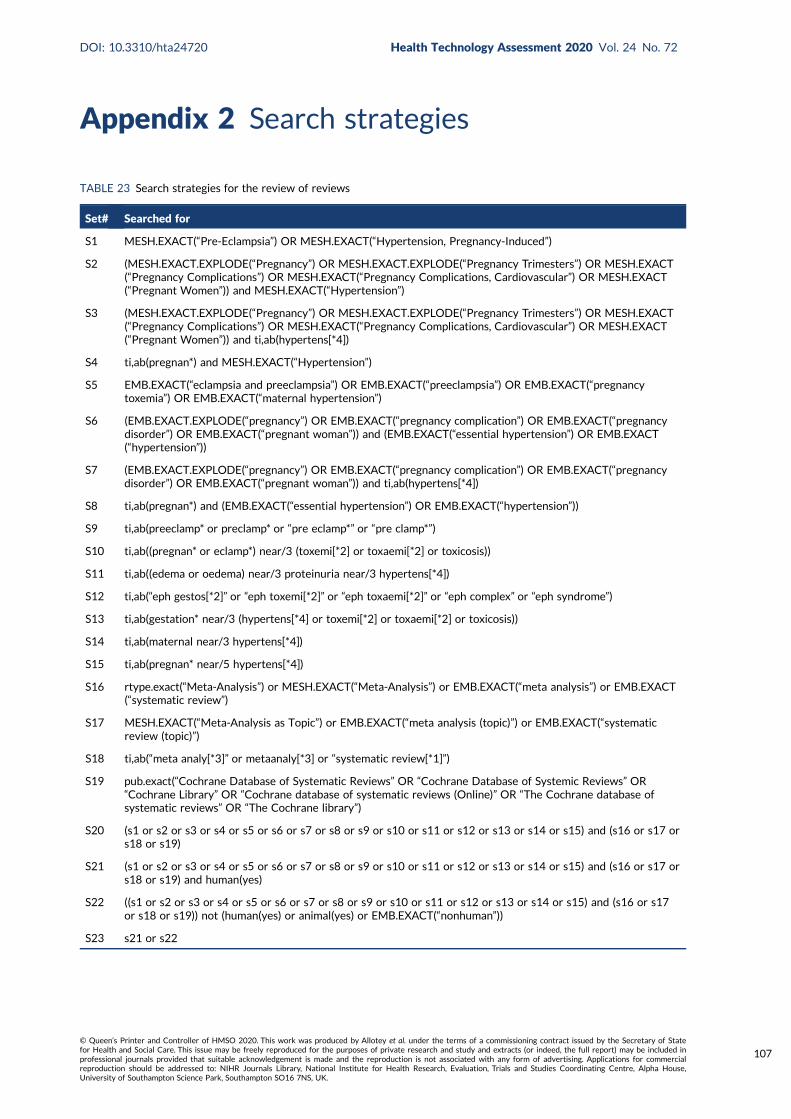
Appendix 2 Search strategies
TABLE 23 Search strategies for the review of reviews
Set# Searched for
S1 MESH.EXACT(“Pre-Eclampsia”) OR MESH.EXACT(“Hypertension, Pregnancy-Induced”)
S2 (MESH.EXACT.EXPLODE(“Pregnancy”) OR MESH.EXACT.EXPLODE(“Pregnancy Trimesters”) OR MESH.EXACT(“Pregnancy Complications”) OR MESH.EXACT(“Pregnancy Complications, Cardiovascular”) OR MESH.EXACT(“Pregnant Women”)) and MESH.EXACT(“Hypertension”)
S3 (MESH.EXACT.EXPLODE(“Pregnancy”) OR MESH.EXACT.EXPLODE(“Pregnancy Trimesters”) OR MESH.EXACT(“Pregnancy Complications”) OR MESH.EXACT(“Pregnancy Complications, Cardiovascular”) OR MESH.EXACT(“Pregnant Women”)) and ti,ab(hypertens[*4])
S4 ti,ab(pregnan*) and MESH.EXACT(“Hypertension”)
S5 EMB.EXACT(“eclampsia and preeclampsia”) OR EMB.EXACT(“preeclampsia”) OR EMB.EXACT(“pregnancytoxemia”) OR EMB.EXACT(“maternal hypertension”)
S6 (EMB.EXACT.EXPLODE(“pregnancy”) OR EMB.EXACT(“pregnancy complication”) OR EMB.EXACT(“pregnancydisorder”) OR EMB.EXACT(“pregnant woman”)) and (EMB.EXACT(“essential hypertension”) OR EMB.EXACT(“hypertension”))
S7 (EMB.EXACT.EXPLODE(“pregnancy”) OR EMB.EXACT(“pregnancy complication”) OR EMB.EXACT(“pregnancydisorder”) OR EMB.EXACT(“pregnant woman”)) and ti,ab(hypertens[*4])
S8 ti,ab(pregnan*) and (EMB.EXACT(“essential hypertension”) OR EMB.EXACT(“hypertension”))
S9 ti,ab(preeclamp* or preclamp* or “pre eclamp*” or “pre clamp*”)
S10 ti,ab((pregnan* or eclamp*) near/3 (toxemi[*2] or toxaemi[*2] or toxicosis))
S11 ti,ab((edema or oedema) near/3 proteinuria near/3 hypertens[*4])
S12 ti,ab(“eph gestos[*2]” or “eph toxemi[*2]” or “eph toxaemi[*2]” or “eph complex” or “eph syndrome”)
S13 ti,ab(gestation* near/3 (hypertens[*4] or toxemi[*2] or toxaemi[*2] or toxicosis))
S14 ti,ab(maternal near/3 hypertens[*4])
S15 ti,ab(pregnan* near/5 hypertens[*4])
S16 rtype.exact(“Meta-Analysis”) or MESH.EXACT(“Meta-Analysis”) or EMB.EXACT(“meta analysis”) or EMB.EXACT(“systematic review”)
S17 MESH.EXACT(“Meta-Analysis as Topic”) or EMB.EXACT(“meta analysis (topic)”) or EMB.EXACT(“systematicreview (topic)”)
S18 ti,ab(“meta analy[*3]” or metaanaly[*3] or “systematic review[*1]”)
S19 pub.exact(“Cochrane Database of Systematic Reviews” OR “Cochrane Database of Systemic Reviews” OR“Cochrane Library” OR “Cochrane database of systematic reviews (Online)” OR “The Cochrane database ofsystematic reviews” OR “The Cochrane library”)
S20 (s1 or s2 or s3 or s4 or s5 or s6 or s7 or s8 or s9 or s10 or s11 or s12 or s13 or s14 or s15) and (s16 or s17 ors18 or s19)
S21 (s1 or s2 or s3 or s4 or s5 or s6 or s7 or s8 or s9 or s10 or s11 or s12 or s13 or s14 or s15) and (s16 or s17 ors18 or s19) and human(yes)
S22 ((s1 or s2 or s3 or s4 or s5 or s6 or s7 or s8 or s9 or s10 or s11 or s12 or s13 or s14 or s15) and (s16 or s17or s18 or s19)) not (human(yes) or animal(yes) or EMB.EXACT(“nonhuman”))
S23 s21 or s22
DOI: 10.3310/hta24720 Health Technology Assessment 2020 Vol. 24 No. 72
© Queen’s Printer and Controller of HMSO 2020. This work was produced by Allotey et al. under the terms of a commissioning contract issued by the Secretary of Statefor Health and Social Care. This issue may be freely reproduced for the purposes of private research and study and extracts (or indeed, the full report) may be included inprofessional journals provided that suitable acknowledgement is made and the reproduction is not associated with any form of advertising. Applications for commercialreproduction should be addressed to: NIHR Journals Library, National Institute for Health Research, Evaluation, Trials and Studies Coordinating Centre, Alpha House,University of Southampton Science Park, Southampton SO16 7NS, UK.
107
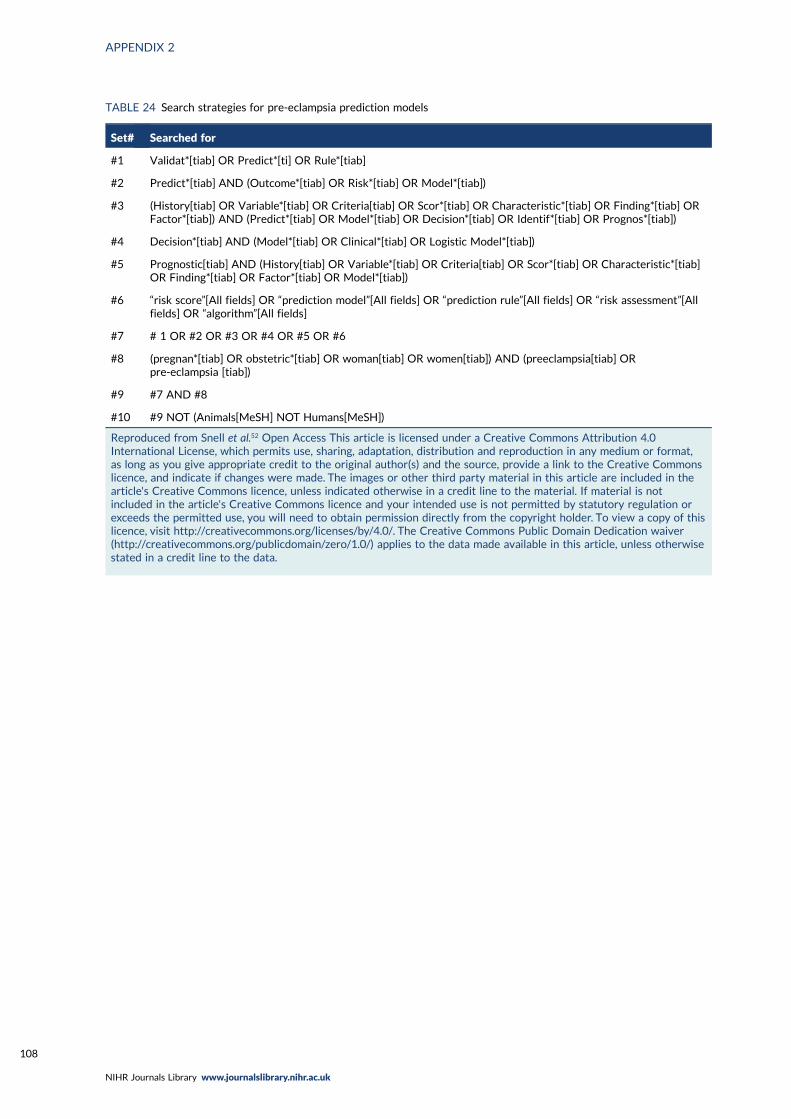
TABLE 24 Search strategies for pre-eclampsia prediction models
Set# Searched for
#1 Validat*[tiab] OR Predict*[ti] OR Rule*[tiab]
#2 Predict*[tiab] AND (Outcome*[tiab] OR Risk*[tiab] OR Model*[tiab])
#3 (History[tiab] OR Variable*[tiab] OR Criteria[tiab] OR Scor*[tiab] OR Characteristic*[tiab] OR Finding*[tiab] ORFactor*[tiab]) AND (Predict*[tiab] OR Model*[tiab] OR Decision*[tiab] OR Identif*[tiab] OR Prognos*[tiab])
#4 Decision*[tiab] AND (Model*[tiab] OR Clinical*[tiab] OR Logistic Model*[tiab])
#5 Prognostic[tiab] AND (History[tiab] OR Variable*[tiab] OR Criteria[tiab] OR Scor*[tiab] OR Characteristic*[tiab]OR Finding*[tiab] OR Factor*[tiab] OR Model*[tiab])
#6 “risk score”[All fields] OR “prediction model”[All fields] OR “prediction rule”[All fields] OR “risk assessment”[Allfields] OR “algorithm”[All fields]
#7 # 1 OR #2 OR #3 OR #4 OR #5 OR #6
#8 (pregnan*[tiab] OR obstetric*[tiab] OR woman[tiab] OR women[tiab]) AND (preeclampsia[tiab] ORpre-eclampsia [tiab])
#9 #7 AND #8
#10 #9 NOT (Animals[MeSH] NOT Humans[MeSH])
Reproduced from Snell et al.52 Open Access This article is licensed under a Creative Commons Attribution 4.0International License, which permits use, sharing, adaptation, distribution and reproduction in any medium or format,as long as you give appropriate credit to the original author(s) and the source, provide a link to the Creative Commonslicence, and indicate if changes were made. The images or other third party material in this article are included in thearticle's Creative Commons licence, unless indicated otherwise in a credit line to the material. If material is notincluded in the article's Creative Commons licence and your intended use is not permitted by statutory regulation orexceeds the permitted use, you will need to obtain permission directly from the copyright holder. To view a copy of thislicence, visit http://creativecommons.org/licenses/by/4.0/. The Creative Commons Public Domain Dedication waiver(http://creativecommons.org/publicdomain/zero/1.0/) applies to the data made available in this article, unless otherwisestated in a credit line to the data.
APPENDIX 2
NIHR Journals Library www.journalslibrary.nihr.ac.uk
108
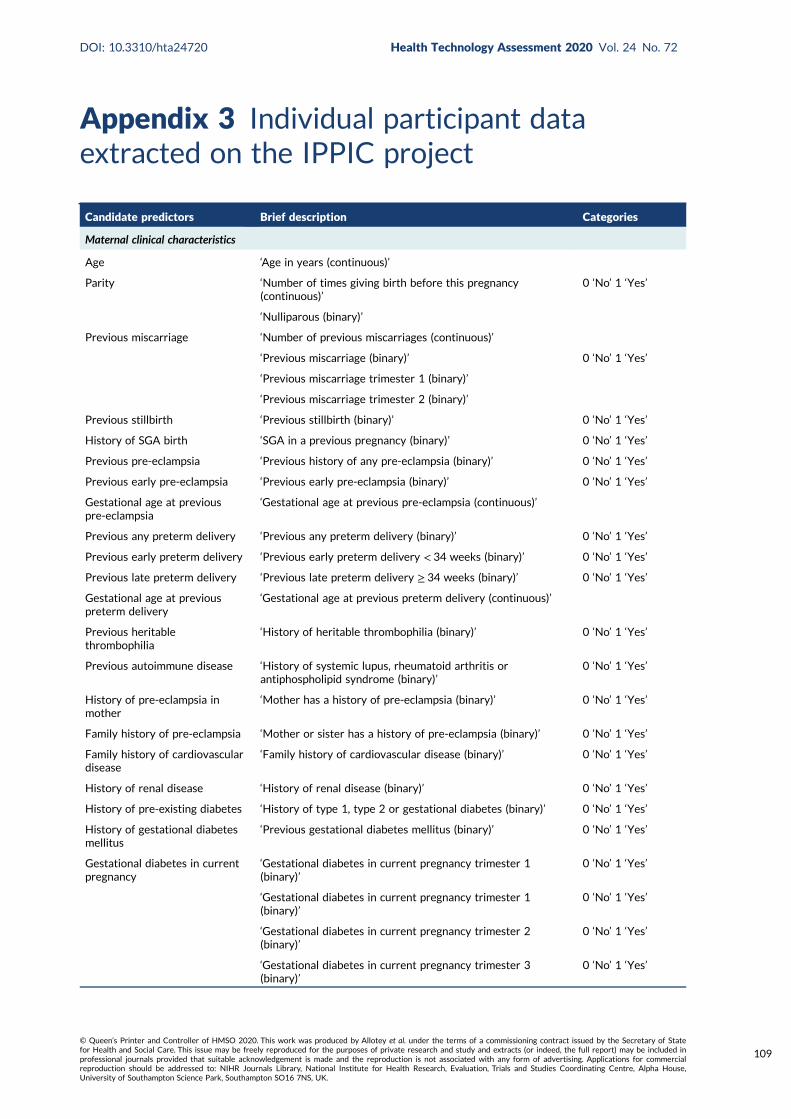
Appendix 3 Individual participant dataextracted on the IPPIC project
Candidate predictors Brief description Categories
Maternal clinical characteristics
Age ‘Age in years (continuous)’
Parity ‘Number of times giving birth before this pregnancy(continuous)’
0 ‘No’ 1 ‘Yes’
‘Nulliparous (binary)’
Previous miscarriage ‘Number of previous miscarriages (continuous)’
‘Previous miscarriage (binary)’ 0 ‘No’ 1 ‘Yes’
‘Previous miscarriage trimester 1 (binary)’
‘Previous miscarriage trimester 2 (binary)’
Previous stillbirth ‘Previous stillbirth (binary)’ 0 ‘No’ 1 ‘Yes’
History of SGA birth ‘SGA in a previous pregnancy (binary)’ 0 ‘No’ 1 ‘Yes’
Previous pre-eclampsia ‘Previous history of any pre-eclampsia (binary)’ 0 ‘No’ 1 ‘Yes’
Previous early pre-eclampsia ‘Previous early pre-eclampsia (binary)’ 0 ‘No’ 1 ‘Yes’
Gestational age at previouspre-eclampsia
‘Gestational age at previous pre-eclampsia (continuous)’
Previous any preterm delivery ‘Previous any preterm delivery (binary)’ 0 ‘No’ 1 ‘Yes’
Previous early preterm delivery ‘Previous early preterm delivery < 34 weeks (binary)’ 0 ‘No’ 1 ‘Yes’
Previous late preterm delivery ‘Previous late preterm delivery ≥ 34 weeks (binary)’ 0 ‘No’ 1 ‘Yes’
Gestational age at previouspreterm delivery
‘Gestational age at previous preterm delivery (continuous)’
Previous heritablethrombophilia
‘History of heritable thrombophilia (binary)’ 0 ‘No’ 1 ‘Yes’
Previous autoimmune disease ‘History of systemic lupus, rheumatoid arthritis orantiphospholipid syndrome (binary)’
0 ‘No’ 1 ‘Yes’
History of pre-eclampsia inmother
‘Mother has a history of pre-eclampsia (binary)’ 0 ‘No’ 1 ‘Yes’
Family history of pre-eclampsia ‘Mother or sister has a history of pre-eclampsia (binary)’ 0 ‘No’ 1 ‘Yes’
Family history of cardiovasculardisease
‘Family history of cardiovascular disease (binary)’ 0 ‘No’ 1 ‘Yes’
History of renal disease ‘History of renal disease (binary)’ 0 ‘No’ 1 ‘Yes’
History of pre-existing diabetes ‘History of type 1, type 2 or gestational diabetes (binary)’ 0 ‘No’ 1 ‘Yes’
History of gestational diabetesmellitus
‘Previous gestational diabetes mellitus (binary)’ 0 ‘No’ 1 ‘Yes’
Gestational diabetes in currentpregnancy
‘Gestational diabetes in current pregnancy trimester 1(binary)’
0 ‘No’ 1 ‘Yes’
‘Gestational diabetes in current pregnancy trimester 1(binary)’
0 ‘No’ 1 ‘Yes’
‘Gestational diabetes in current pregnancy trimester 2(binary)’
0 ‘No’ 1 ‘Yes’
‘Gestational diabetes in current pregnancy trimester 3(binary)’
0 ‘No’ 1 ‘Yes’
DOI: 10.3310/hta24720 Health Technology Assessment 2020 Vol. 24 No. 72
© Queen’s Printer and Controller of HMSO 2020. This work was produced by Allotey et al. under the terms of a commissioning contract issued by the Secretary of Statefor Health and Social Care. This issue may be freely reproduced for the purposes of private research and study and extracts (or indeed, the full report) may be included inprofessional journals provided that suitable acknowledgement is made and the reproduction is not associated with any form of advertising. Applications for commercialreproduction should be addressed to: NIHR Journals Library, National Institute for Health Research, Evaluation, Trials and Studies Coordinating Centre, Alpha House,University of Southampton Science Park, Southampton SO16 7NS, UK.
109

Candidate predictors Brief description Categories
Early pregnancy bleeding ‘Early pregnancy bleeding in current pregnancy (binary)’ 0 ‘No’ 1 ‘Yes’
Chronic or pre-existinghypertension
‘History of chronic, essential or pre-existing hypertension(binary)’
0 ‘No’ 1 ‘Yes’
Smoking ‘Smoked during current pregnancy (binary)’ 0 ‘No’ 1 ‘Yes’
Number of cigarettes smokedper day
‘Number of cigarettes smoked per day (continuous)’
Alcohol use ‘Drank Alcohol (binary)’ 0 ‘No’ 1 ‘Yes’
Substance misuse in currentpregnancy
‘Cocaine, heroin or methamphetamine use in currentpregnancy (binary)’
0 ‘No’ 1 ‘Yes’
Mode of conception ‘Spontaneous mode of conception (binary)’ 0 ‘No’ 1 ‘Yes’
Multiple pregnancy ‘Multiple pregnancy in current pregnancy (binary)’ 0 ‘No’ 1 ‘Yes’
Number of years betweenpregnancies
‘Number of years between pregnancies (continuous)’
Maternal education ‘Highest level of maternal education attained (categorical)’ 1 ‘Primary’
2 ‘Secondary’
3 ‘Tertiary’
‘Maternal years in education primary school (continuous)’
New partner ‘New partner (binary)’ 0 ‘No’ 1 ‘Yes’
Healthy diet in pregnancy ‘On healthy diet in pregnancy (binary)’ 0 ‘No’ 1 ‘Yes’
Planned physical activity ‘Planned physical activity (categorical)’ 1 ‘Sedentary’
2 ‘Moderate’
3 ‘Severe’
Ethnicity ‘Ethnicity (categorical)’ 1 ‘White’
2 ‘Black’
3 ‘Asian’
4 ‘Hispanic’
5 ‘Mixed’
6 ‘Other’
BMI ‘BMI in kg/m2 (continuous)’
‘BMI in kg/m2 trimester 1 (continuous)’
‘BMI in kg/m2 trimester 2 (continuous)‘
‘BMI in kg/m2 trimester 3 (continuous)’
Height ‘Height in cm (continuous)’
Weight ‘Weight in kg (continuous)’
‘Weight in kg trimester 1 (continuous)’
‘Weight in kg trimester 2 (continuous)’
‘Weight in kg trimester 3 (continuous)’
SBP ‘SBP in mmHg (continuous)’
‘SBP in mmHg trimester 1 (continuous)’
‘SBP in mmHg trimester 2 (continuous)’
‘SBP in mmHg trimester 3 (continuous)’
APPENDIX 3
NIHR Journals Library www.journalslibrary.nihr.ac.uk
110
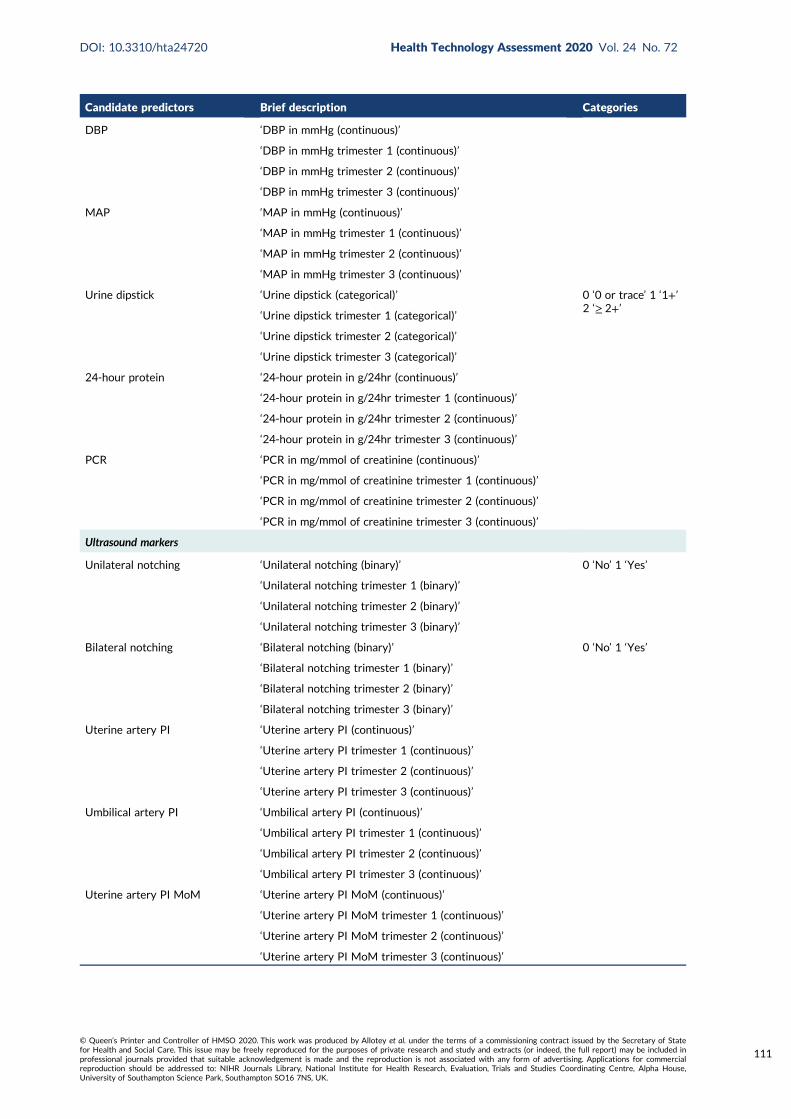
Candidate predictors Brief description Categories
DBP ‘DBP in mmHg (continuous)’
‘DBP in mmHg trimester 1 (continuous)’
‘DBP in mmHg trimester 2 (continuous)’
‘DBP in mmHg trimester 3 (continuous)’
MAP ‘MAP in mmHg (continuous)’
‘MAP in mmHg trimester 1 (continuous)’
‘MAP in mmHg trimester 2 (continuous)’
‘MAP in mmHg trimester 3 (continuous)’
Urine dipstick ‘Urine dipstick (categorical)’ 0 ‘0 or trace’ 1 ‘1+’2 ‘≥ 2+’
‘Urine dipstick trimester 1 (categorical)’
‘Urine dipstick trimester 2 (categorical)’
‘Urine dipstick trimester 3 (categorical)’
24-hour protein ‘24-hour protein in g/24hr (continuous)’
‘24-hour protein in g/24hr trimester 1 (continuous)’
‘24-hour protein in g/24hr trimester 2 (continuous)’
‘24-hour protein in g/24hr trimester 3 (continuous)’
PCR ‘PCR in mg/mmol of creatinine (continuous)’
‘PCR in mg/mmol of creatinine trimester 1 (continuous)’
‘PCR in mg/mmol of creatinine trimester 2 (continuous)’
‘PCR in mg/mmol of creatinine trimester 3 (continuous)’
Ultrasound markers
Unilateral notching ‘Unilateral notching (binary)’ 0 ‘No’ 1 ‘Yes’
‘Unilateral notching trimester 1 (binary)’
‘Unilateral notching trimester 2 (binary)’
‘Unilateral notching trimester 3 (binary)’
Bilateral notching ‘Bilateral notching (binary)’ 0 ‘No’ 1 ‘Yes’
‘Bilateral notching trimester 1 (binary)’
‘Bilateral notching trimester 2 (binary)’
‘Bilateral notching trimester 3 (binary)’
Uterine artery PI ‘Uterine artery PI (continuous)’
‘Uterine artery PI trimester 1 (continuous)’
‘Uterine artery PI trimester 2 (continuous)’
‘Uterine artery PI trimester 3 (continuous)’
Umbilical artery PI ‘Umbilical artery PI (continuous)’
‘Umbilical artery PI trimester 1 (continuous)’
‘Umbilical artery PI trimester 2 (continuous)’
‘Umbilical artery PI trimester 3 (continuous)’
Uterine artery PI MoM ‘Uterine artery PI MoM (continuous)’
‘Uterine artery PI MoM trimester 1 (continuous)’
‘Uterine artery PI MoM trimester 2 (continuous)’
‘Uterine artery PI MoM trimester 3 (continuous)’
DOI: 10.3310/hta24720 Health Technology Assessment 2020 Vol. 24 No. 72
© Queen’s Printer and Controller of HMSO 2020. This work was produced by Allotey et al. under the terms of a commissioning contract issued by the Secretary of Statefor Health and Social Care. This issue may be freely reproduced for the purposes of private research and study and extracts (or indeed, the full report) may be included inprofessional journals provided that suitable acknowledgement is made and the reproduction is not associated with any form of advertising. Applications for commercialreproduction should be addressed to: NIHR Journals Library, National Institute for Health Research, Evaluation, Trials and Studies Coordinating Centre, Alpha House,University of Southampton Science Park, Southampton SO16 7NS, UK.
111
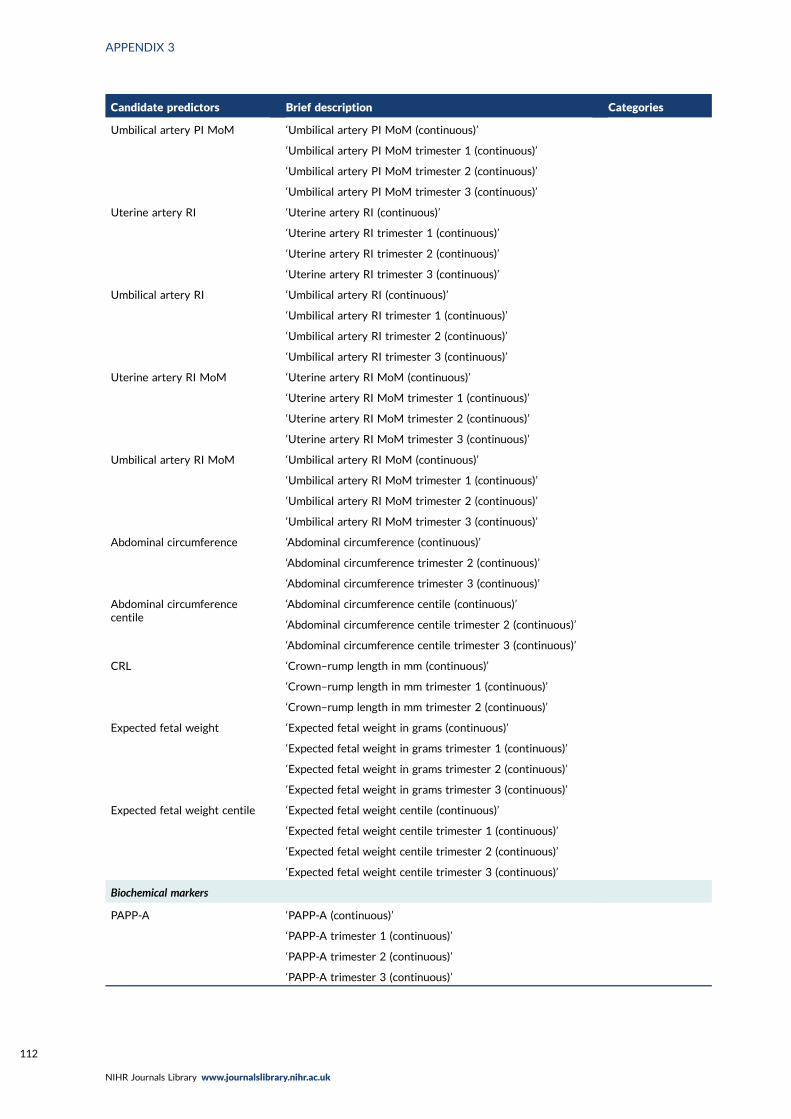
Candidate predictors Brief description Categories
Umbilical artery PI MoM ‘Umbilical artery PI MoM (continuous)’
‘Umbilical artery PI MoM trimester 1 (continuous)’
‘Umbilical artery PI MoM trimester 2 (continuous)’
‘Umbilical artery PI MoM trimester 3 (continuous)’
Uterine artery RI ‘Uterine artery RI (continuous)’
‘Uterine artery RI trimester 1 (continuous)’
‘Uterine artery RI trimester 2 (continuous)’
‘Uterine artery RI trimester 3 (continuous)’
Umbilical artery RI ‘Umbilical artery RI (continuous)’
‘Umbilical artery RI trimester 1 (continuous)’
‘Umbilical artery RI trimester 2 (continuous)’
‘Umbilical artery RI trimester 3 (continuous)’
Uterine artery RI MoM ‘Uterine artery RI MoM (continuous)’
‘Uterine artery RI MoM trimester 1 (continuous)’
‘Uterine artery RI MoM trimester 2 (continuous)’
‘Uterine artery RI MoM trimester 3 (continuous)’
Umbilical artery RI MoM ‘Umbilical artery RI MoM (continuous)’
‘Umbilical artery RI MoM trimester 1 (continuous)’
‘Umbilical artery RI MoM trimester 2 (continuous)’
‘Umbilical artery RI MoM trimester 3 (continuous)’
Abdominal circumference ‘Abdominal circumference (continuous)’
‘Abdominal circumference trimester 2 (continuous)’
‘Abdominal circumference trimester 3 (continuous)’
Abdominal circumferencecentile
‘Abdominal circumference centile (continuous)’
‘Abdominal circumference centile trimester 2 (continuous)’
‘Abdominal circumference centile trimester 3 (continuous)’
CRL ‘Crown–rump length in mm (continuous)’
‘Crown–rump length in mm trimester 1 (continuous)’
‘Crown–rump length in mm trimester 2 (continuous)’
Expected fetal weight ‘Expected fetal weight in grams (continuous)’
‘Expected fetal weight in grams trimester 1 (continuous)’
‘Expected fetal weight in grams trimester 2 (continuous)’
‘Expected fetal weight in grams trimester 3 (continuous)’
Expected fetal weight centile ‘Expected fetal weight centile (continuous)’
‘Expected fetal weight centile trimester 1 (continuous)’
‘Expected fetal weight centile trimester 2 (continuous)’
‘Expected fetal weight centile trimester 3 (continuous)’
Biochemical markers
PAPP-A ‘PAPP-A (continuous)’
‘PAPP-A trimester 1 (continuous)’
‘PAPP-A trimester 2 (continuous)’
‘PAPP-A trimester 3 (continuous)’
APPENDIX 3
NIHR Journals Library www.journalslibrary.nihr.ac.uk
112
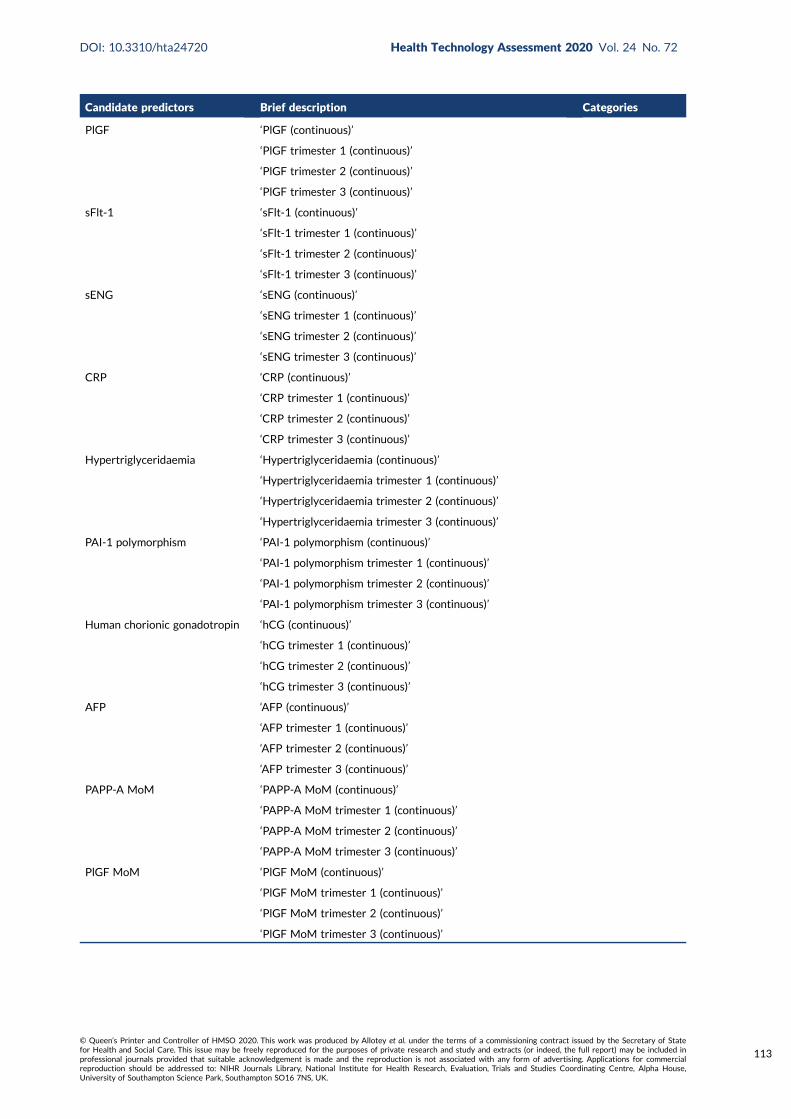
Candidate predictors Brief description Categories
PlGF ‘PlGF (continuous)’
‘PlGF trimester 1 (continuous)’
‘PlGF trimester 2 (continuous)’
‘PlGF trimester 3 (continuous)’
sFlt-1 ‘sFlt-1 (continuous)’
‘sFlt-1 trimester 1 (continuous)’
‘sFlt-1 trimester 2 (continuous)’
‘sFlt-1 trimester 3 (continuous)’
sENG ‘sENG (continuous)’
‘sENG trimester 1 (continuous)’
‘sENG trimester 2 (continuous)’
‘sENG trimester 3 (continuous)’
CRP ‘CRP (continuous)’
‘CRP trimester 1 (continuous)’
‘CRP trimester 2 (continuous)’
‘CRP trimester 3 (continuous)’
Hypertriglyceridaemia ‘Hypertriglyceridaemia (continuous)’
‘Hypertriglyceridaemia trimester 1 (continuous)’
‘Hypertriglyceridaemia trimester 2 (continuous)’
‘Hypertriglyceridaemia trimester 3 (continuous)’
PAI-1 polymorphism ‘PAI-1 polymorphism (continuous)’
‘PAI-1 polymorphism trimester 1 (continuous)’
‘PAI-1 polymorphism trimester 2 (continuous)’
‘PAI-1 polymorphism trimester 3 (continuous)’
Human chorionic gonadotropin ‘hCG (continuous)’
‘hCG trimester 1 (continuous)’
‘hCG trimester 2 (continuous)’
‘hCG trimester 3 (continuous)’
AFP ‘AFP (continuous)’
‘AFP trimester 1 (continuous)’
‘AFP trimester 2 (continuous)’
‘AFP trimester 3 (continuous)’
PAPP-A MoM ‘PAPP-A MoM (continuous)’
‘PAPP-A MoM trimester 1 (continuous)’
‘PAPP-A MoM trimester 2 (continuous)’
‘PAPP-A MoM trimester 3 (continuous)’
PlGF MoM ‘PlGF MoM (continuous)’
‘PlGF MoM trimester 1 (continuous)’
‘PlGF MoM trimester 2 (continuous)’
‘PlGF MoM trimester 3 (continuous)’
DOI: 10.3310/hta24720 Health Technology Assessment 2020 Vol. 24 No. 72
© Queen’s Printer and Controller of HMSO 2020. This work was produced by Allotey et al. under the terms of a commissioning contract issued by the Secretary of Statefor Health and Social Care. This issue may be freely reproduced for the purposes of private research and study and extracts (or indeed, the full report) may be included inprofessional journals provided that suitable acknowledgement is made and the reproduction is not associated with any form of advertising. Applications for commercialreproduction should be addressed to: NIHR Journals Library, National Institute for Health Research, Evaluation, Trials and Studies Coordinating Centre, Alpha House,University of Southampton Science Park, Southampton SO16 7NS, UK.
113
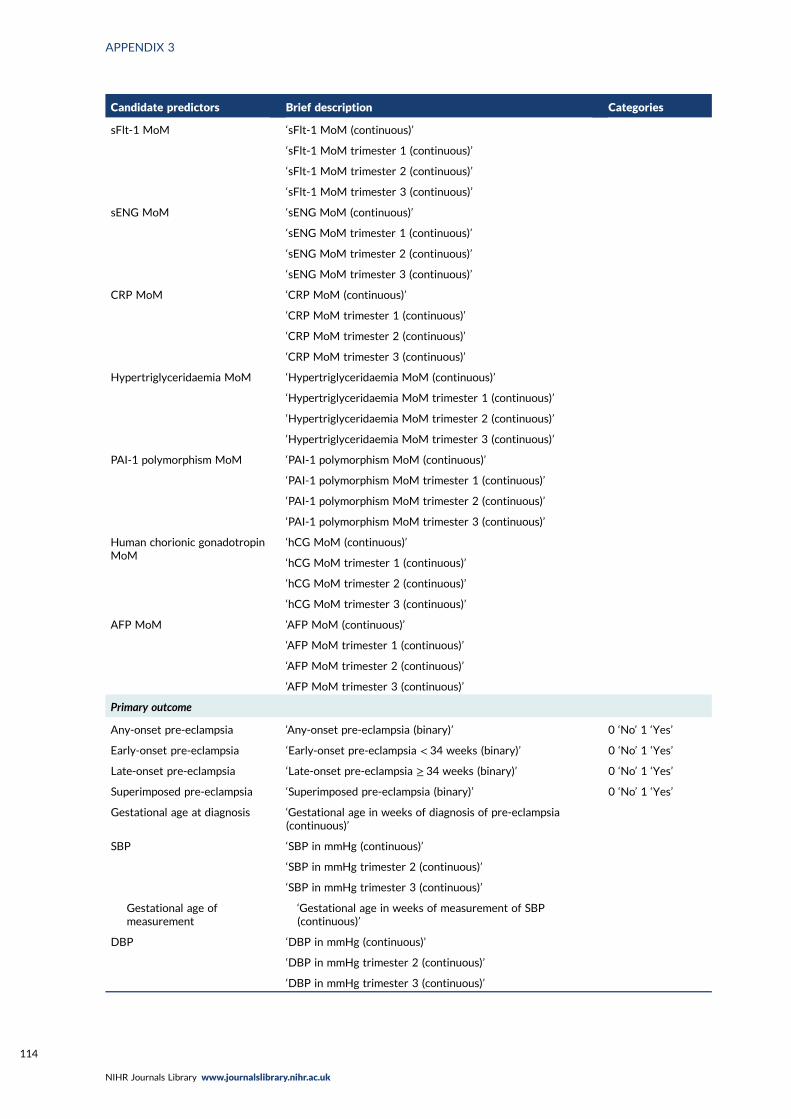
Candidate predictors Brief description Categories
sFlt-1 MoM ‘sFlt-1 MoM (continuous)’
‘sFlt-1 MoM trimester 1 (continuous)’
‘sFlt-1 MoM trimester 2 (continuous)’
‘sFlt-1 MoM trimester 3 (continuous)’
sENG MoM ‘sENG MoM (continuous)’
‘sENG MoM trimester 1 (continuous)’
‘sENG MoM trimester 2 (continuous)’
‘sENG MoM trimester 3 (continuous)’
CRP MoM ‘CRP MoM (continuous)’
‘CRP MoM trimester 1 (continuous)’
‘CRP MoM trimester 2 (continuous)’
‘CRP MoM trimester 3 (continuous)’
Hypertriglyceridaemia MoM ‘Hypertriglyceridaemia MoM (continuous)’
‘Hypertriglyceridaemia MoM trimester 1 (continuous)’
‘Hypertriglyceridaemia MoM trimester 2 (continuous)’
‘Hypertriglyceridaemia MoM trimester 3 (continuous)’
PAI-1 polymorphism MoM ‘PAI-1 polymorphism MoM (continuous)’
‘PAI-1 polymorphism MoM trimester 1 (continuous)’
‘PAI-1 polymorphism MoM trimester 2 (continuous)’
‘PAI-1 polymorphism MoM trimester 3 (continuous)’
Human chorionic gonadotropinMoM
‘hCG MoM (continuous)’
‘hCG MoM trimester 1 (continuous)’
‘hCG MoM trimester 2 (continuous)’
‘hCG MoM trimester 3 (continuous)’
AFP MoM ‘AFP MoM (continuous)’
‘AFP MoM trimester 1 (continuous)’
‘AFP MoM trimester 2 (continuous)’
‘AFP MoM trimester 3 (continuous)’
Primary outcome
Any-onset pre-eclampsia ‘Any-onset pre-eclampsia (binary)’ 0 ‘No’ 1 ‘Yes’
Early-onset pre-eclampsia ‘Early-onset pre-eclampsia < 34 weeks (binary)’ 0 ‘No’ 1 ‘Yes’
Late-onset pre-eclampsia ‘Late-onset pre-eclampsia ≥ 34 weeks (binary)’ 0 ‘No’ 1 ‘Yes’
Superimposed pre-eclampsia ‘Superimposed pre-eclampsia (binary)’ 0 ‘No’ 1 ‘Yes’
Gestational age at diagnosis ‘Gestational age in weeks of diagnosis of pre-eclampsia(continuous)’
SBP ‘SBP in mmHg (continuous)’
‘SBP in mmHg trimester 2 (continuous)’
‘SBP in mmHg trimester 3 (continuous)’
Gestational age ofmeasurement
‘Gestational age in weeks of measurement of SBP(continuous)’
DBP ‘DBP in mmHg (continuous)’
‘DBP in mmHg trimester 2 (continuous)’
‘DBP in mmHg trimester 3 (continuous)’
APPENDIX 3
NIHR Journals Library www.journalslibrary.nihr.ac.uk
114

Candidate predictors Brief description Categories
Gestational age atmeasurement
‘Gestational age in weeks of measurement of DBP(continuous)’
PCR ‘PCR in mg/mmol of creatinine (continuous)’
‘PCR in mg/mmol of creatinine trimester 2 (continuous)’
‘PCR in mg/mmol of creatinine trimester 3 (continuous)’
24-hour protein ‘24-hour protein in g/24hr (continuous)’
‘24-hour protein in g/24hr trimester 2 (continuous)’
‘24-hour protein in g/24hr trimester 3 (continuous)’
Urine dipstick ‘Urine dipstick (categorical)’ 0 ‘0 or trace’ 1 ‘1+’2 ‘≥ 2+’
‘Urine dipstick trimester 2 (categorical)’
‘Urine dipstick trimester 3 (categorical)’
Gestational age ofmeasurement
‘Gestational age in weeks of measurement of urine dipstick(continuous)’
Birthweight ‘Birth weight in grams (continuous)’
‘Birth weight in grams trimester 2 (continuous)’
‘Birth weight in grams trimester 3 (continuous)’
Birthweight centile ‘Birth weight centile (continuous)’
‘Birth weight centile trimester 2 (continuous)’
‘Birth weight centile trimester 3 (continuous)’
Gestational age at delivery ‘Gestational age at delivery in weeks (continuous)’
‘Gestational age at delivery in weeks (categorical)’ 0 ‘≥ 37’
1 ‘34–36+ 6’
2 ‘30–33+ 6’
3 ‘26–29+ 6’
4 ‘23–25+ 6’
5 ‘< 23’
Secondary outcome
Eclampsia ‘Eclampsia (binary)’ 0 ‘No’ 1 ‘Yes’
HELLP syndrome ‘HELLP syndrome (binary)’ 0 ‘No’ 1 ‘Yes’
Placental abruption ‘Placental abruption (binary)’ 0 ‘No’ 1 ‘Yes’
Hepatic failure ‘Hepatic failure (binary)’ 0 ‘No’ 1 ‘Yes’
Renal failure ‘Renal failure (binary)’ 0 ‘No’ 1 ‘Yes’
Cortical blindness ‘Cortical blindness (binary)’ 0 ‘No’ 1 ‘Yes’
Pulmonary oedema ‘Pulmonary oedema (binary)’ 0 ‘No’ 1 ‘Yes’
Postpartum haemorrhage ‘Postpartum haemorrhage (binary)’ 0 ‘No’ 1 ‘Yes’
Disseminated intravascularcoagulation
‘Disseminated intravascular coagulation (binary)’ 0 ‘No’ 1 ‘Yes’
Preterm delivery ‘Preterm delivery (binary)’ 0 ‘No’ 1 ‘Yes’
‘Preterm delivery < 34 weeks (binary)’
‘Preterm delivery ≥ 34 weeks (binary)’
Admission to high-dependencyunit
‘Admission to high-dependency unit (binary)’ 0 ‘No’ 1 ‘Yes’
Maternal death ‘Maternal death (binary)’ 0 ‘No’ 1 ‘Yes’
DOI: 10.3310/hta24720 Health Technology Assessment 2020 Vol. 24 No. 72
© Queen’s Printer and Controller of HMSO 2020. This work was produced by Allotey et al. under the terms of a commissioning contract issued by the Secretary of Statefor Health and Social Care. This issue may be freely reproduced for the purposes of private research and study and extracts (or indeed, the full report) may be included inprofessional journals provided that suitable acknowledgement is made and the reproduction is not associated with any form of advertising. Applications for commercialreproduction should be addressed to: NIHR Journals Library, National Institute for Health Research, Evaluation, Trials and Studies Coordinating Centre, Alpha House,University of Southampton Science Park, Southampton SO16 7NS, UK.
115

Candidate predictors Brief description Categories
Caesarean section ‘Caesarean section (binary)’ 0 ‘No’ 1 ‘Yes’
Stillbirth ‘Stillbirth (binary)’ 0 ‘No’ 1 ‘Yes’
‘Stillbirth trimester 2 (binary)’
‘Stillbirth trimester 3 (binary)’
Neonatal death ‘Neonatal death (binary)’ 0 ‘No’ 1 ‘Yes’
Hypoxic-ischaemicencephalopathy
‘Hypoxic ischaemic encephalopathy (binary)’ 0 ‘No’ 1 ‘Yes’
Respiratory distress syndrome ‘Respiratory distress syndrome (binary)’ 0 ‘No’ 1 ‘Yes’
Septicaemia ‘Septicaemia (binary)’ 0 ‘No’ 1 ‘Yes’
Admission to neonatal unit ‘Admission to neonatal unit (binary)’ 0 ‘No’ 1 ‘Yes’
Treatment
Aspirin ‘Aspirin use (binary)’ 0 ‘No’ 1 ‘Yes’
‘Aspirin dose in mg (continuous)’
‘Aspirin use in trimester 1 (binary)’ 0 ‘No’ 1 ‘Yes’
‘Aspirin use in mg trimester 1 (continuous)’
‘Aspirin use in trimester 2 (binary)’ 0 ‘No’ 1 ‘Yes’
‘Aspirin use in mg trimester 2 (continuous)’
‘Aspirin use in trimester 3 (binary)’ 0 ‘No’ 1 ‘Yes’
‘Aspirin use in mg trimester 3 (continuous)’
Calcium supplement ‘Calcium supplement (binary)’ 0 ‘No’ 1 ‘Yes’
Vitamin supplement ‘Vitamin supplement (binary)’ 0 ‘No’ 1 ‘Yes’
AFP, alpha-fetoprotein; CRL, crown–rump length; CRP, C-reactive protein; hCG, human chorionic gonadotropin;MoM, multiple of the mean; PAI-1, plasminogen activator inhibitor-1; PI, pulsatility index; RI, resistance index;sENG, soluble endoglin.
APPENDIX 3
NIHR Journals Library www.journalslibrary.nihr.ac.uk
116
Appendix 4 Participant summary from datasets contributing to the IPPIC project
DOI: 10.3310/hta24720 Health Technology Assessment 2020 Vol. 24 No. 72
© Queen’s Printer and Controller of HMSO 2020. This work was produced by Allotey et al. under the terms of a commissioning contract issued by the Secretary of Statefor Health and Social Care. This issue may be freely reproduced for the purposes of private research and study and extracts (or indeed, the full report) may be included inprofessional journals provided that suitable acknowledgement is made and the reproduction is not associated with any form of advertising. Applications for commercialreproduction should be addressed to: NIHR Journals Library, National Institute for Health Research, Evaluation, Trials and Studies Coordinating Centre, Alpha House,University of Southampton Science Park, Southampton SO16 7NS, UK.
117

Study/data set
Maternal characteristics and outcomes
Total numberof pregnancies
Number ofsingletonpregnancies
Age (years),mean (SD),range
First BMImeasured,median[IQR], range
Ethnicity, n (%)
Nulliparous,n (%)
Previous PE,n (%)
Outcome, n (%)
White Black Asian Hispanic Mixed OtherAny-onsetPE
Early-onsetPE
Late-onsetPE
SCOPE42 5628 5628 28.7 (5.5),14–45
24.2 [5.6],15.4–58.5
5061 (89.9) 65 (1.2) 304 (5.4) 24 (0.4) 0 (0) 174 (3.1) 5628 (100) 0 (0) 278 (4.9) 44 (0.8) 234 (4.2)
Allen108 1045 1045 29.9 (5.1),15–48
23.6 [5.7],14.8–51.1
398 (38.2) 108 (10.4) 495 (47.5) 0 (0) 12 (1.2) 30 (2.9) 584 (55.9) 17 (1.6) 14 (1.3) 1 (0.1) 13 (1.2)
ALSPAC103 15,242 15,038 27.7 (4.9),13–46
21.5 [4],11.7–61.3
11,769 (97.4) 127 (1.1) 113 (0.9) 0 (0) 0 (0) 76 (0.6) 5704 (45.3) 0 (0) 297 (2.2) 37 (0.3) 260 (1.9)
Chappell121 316 316 29.6 (5.9),16.3–43
24.2 [5.3],16.4–56.5
215 (68) 91 (28.8) 6 (1.9) 3 (0.9) 0 (0) 1 (0.3) 202 (63.9) 56 (17.7) 35 (12.4) 6 (2.1) 29 (10.2)
EMPOWaR122 449 449 28.7 (5.4),17–43
38 [6.8],30.6–59.7
449 (100) 0 (0) 0 (0) 0 (0) 0 (0) 0 (0) 291 (65) 0 (0) 10 (4.9) 0 (0) 10 (4.8)
POPPY106 1216 1216 32.1 (5.4),17–51
24.6 [6.8],14.5–57.9
881 (72.5) 193 (15.9) 85 (7) 0 (0) 0 (0) 57 (4.7) 206 (16.9) 0 (0) 22 (1.8) 2 (0.2) 20 (1.7)
Poston 2006150 2422 2040 30.8 (5.9),16–45
31.2 [9.8],16.6–65.4
– – – – – – – 657 (27.1) 371 (15.3) 144 (5.9) 227 (9.4)
Poston 2015149 1554 1554 30.5 (5.5),16–45
35.1 [5.8],30–66
954 (61.4) 395 (25.4) 97 (6.2) 0 (0) 0 (0) 108 (6.9) 674 (43.4) 69 (4.5) 54 (3.6) 5 (0.3) 49 (3.3)
Khan137 222 222 – 25.3 [6.6],18–46.1
– – – – – – 146 (65.8) 0 (0) 27 (12.2) 11 (5) 16 (7.2)
St George’s163 54,656 54,635 30.5 (5.6),13–54
23.5 [5.5],11.9–79.8
33,257 (62.1) 7820 (14.6) 10388 (19.4) 5 (0) 1528 (2.9) 555 (1) 29318 (53.8) 0 (0) 1492 (2.7) 152 (0.3) 1340 (2.5)
PARIS112 35,955 34,609 23.6 (6.1),11–48
– – – – – – – 19793 (57.5) 6086 (18.5) 2928 (8.8) 498 (1.5) 2403 (7.2)
AMND114 138,967 136,635 28.4 (5.6),13–56
23.9 [5.5],10–72.1
– – – – – – 65206 (47.7) 0 (0) 5194 (3.7) 1329 (1) 3865 (2.8)
Born in Bradford177 13,279 13,118 27.5 (5.6),15–49
25.1 [7.3],12.9–57
4443 (42.4) 212 (2) 5380 (51.4) 0 (0) 158 (1.5) 278 (2.7) 5034 (39.6) 0 (0) 334 (2.7) 0 (0) 0 (0)
Velauthar39 1208 1206 – 23.9 [6],13.8–46.6
402 (35.3) 90 (7.9) 565 (49.6) 0 (0) 0 (0) 82 (7.2) 598 (52.2) 0 (0) 26 (2.3) 3 (0.3) 23 (2.1)
POP161 4212 4212 29.9 (5.1),16.1–48.4
24.1 [5.5],14.7–54.7
3900 (92.6) 25 (0.6) 91 (2.2) 0 (0) 1 (0) 195 (4.6) 4212 (100) 0 (0) 273 (6.5) 10 (0.2) 263 (6.3)
Baschat115 1704 1704 30.2 (6.5),18–50
26.7 [9.1],15.9–72.9
775 (45.5) 803 (47.1) 88 (5.2) 27 (1.6) 0 (0) 11 (0.6) 736 (43.2) 92 (5.4) 106 (6.2) 21 (1.2) 85 (5)
Audibert113 893 893 29.5 (4.5),18–43
22.6 [4.4],16.9–50
720 (80.6) 62 (6.9) 14 (1.6) 26 (2.9) 44 (4.9) 27 (3) 893 (100) 0 (0) 40 (4.5) 9 (1) 31 (3.5)
APPENDIX
4
NIH
RJournals
Library
www.jo
urnalslib
rary.nihr.ac.u
k
118
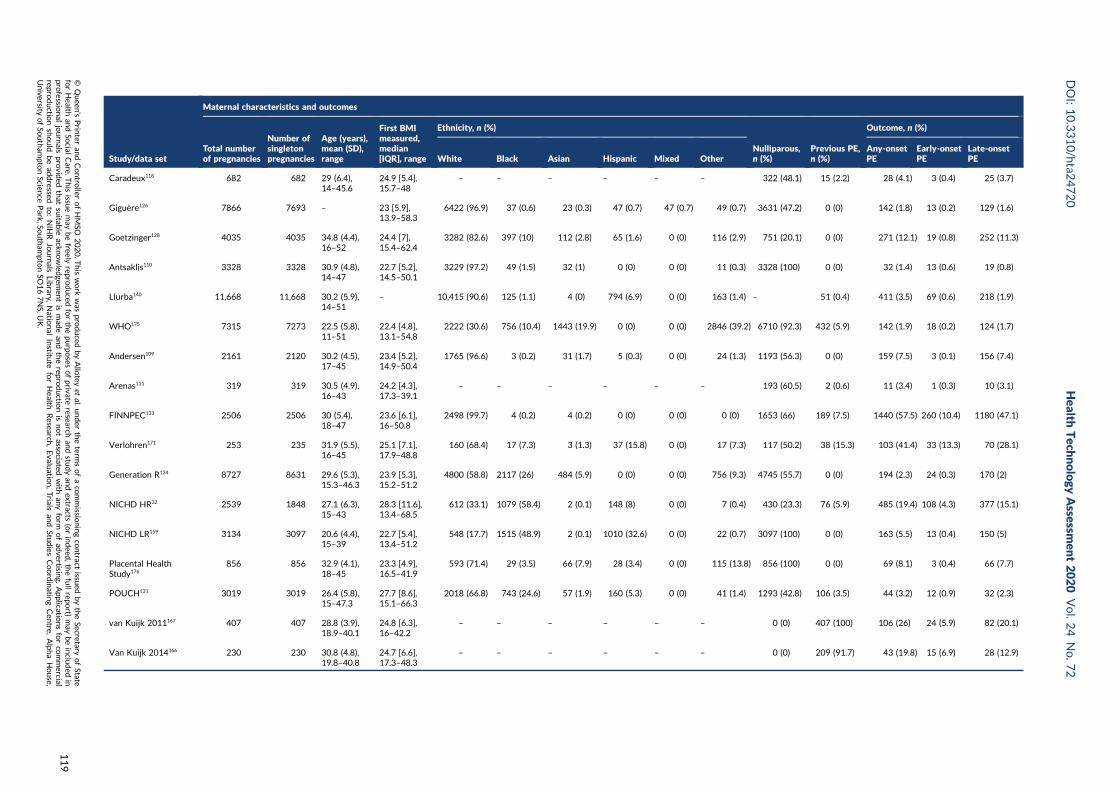
Study/data set
Maternal characteristics and outcomes
Total numberof pregnancies
Number ofsingletonpregnancies
Age (years),mean (SD),range
First BMImeasured,median[IQR], range
Ethnicity, n (%)
Nulliparous,n (%)
Previous PE,n (%)
Outcome, n (%)
White Black Asian Hispanic Mixed OtherAny-onsetPE
Early-onsetPE
Late-onsetPE
Caradeux118 682 682 29 (6.4),14–45.6
24.9 [5.4],15.7–48
– – – – – – 322 (48.1) 15 (2.2) 28 (4.1) 3 (0.4) 25 (3.7)
Giguère126 7866 7693 – 23 [5.9],13.9–58.3
6422 (96.9) 37 (0.6) 23 (0.3) 47 (0.7) 47 (0.7) 49 (0.7) 3631 (47.2) 0 (0) 142 (1.8) 13 (0.2) 129 (1.6)
Goetzinger128 4035 4035 34.8 (4.4),16–52
24.4 [7],15.4–62.4
3282 (82.6) 397 (10) 112 (2.8) 65 (1.6) 0 (0) 116 (2.9) 751 (20.1) 0 (0) 271 (12.1) 19 (0.8) 252 (11.3)
Antsaklis110 3328 3328 30.9 (4.8),14–47
22.7 [5.2],14.5–50.1
3229 (97.2) 49 (1.5) 32 (1) 0 (0) 0 (0) 11 (0.3) 3328 (100) 0 (0) 32 (1.4) 13 (0.6) 19 (0.8)
Llurba140 11,668 11,668 30.2 (5.9),14–51
– 10,415 (90.6) 125 (1.1) 4 (0) 794 (6.9) 0 (0) 163 (1.4) – 51 (0.4) 411 (3.5) 69 (0.6) 218 (1.9)
WHO175 7315 7273 22.5 (5.8),11–51
22.4 [4.8],13.1–54.8
2222 (30.6) 756 (10.4) 1443 (19.9) 0 (0) 0 (0) 2846 (39.2) 6710 (92.3) 432 (5.9) 142 (1.9) 18 (0.2) 124 (1.7)
Andersen109 2161 2120 30.2 (4.5),17–45
23.4 [5.2],14.9–50.4
1765 (96.6) 3 (0.2) 31 (1.7) 5 (0.3) 0 (0) 24 (1.3) 1193 (56.3) 0 (0) 159 (7.5) 3 (0.1) 156 (7.4)
Arenas111 319 319 30.5 (4.9),16–43
24.2 [4.3],17.3–39.1
– – – – – – 193 (60.5) 2 (0.6) 11 (3.4) 1 (0.3) 10 (3.1)
FINNPEC133 2506 2506 30 (5.4),18–47
23.6 [6.1],16–50.8
2498 (99.7) 4 (0.2) 4 (0.2) 0 (0) 0 (0) 0 (0) 1653 (66) 189 (7.5) 1440 (57.5) 260 (10.4) 1180 (47.1)
Verlohren171 253 235 31.9 (5.5),16–45
25.1 [7.1],17.9–48.8
160 (68.4) 17 (7.3) 3 (1.3) 37 (15.8) 0 (0) 17 (7.3) 117 (50.2) 38 (15.3) 103 (41.4) 33 (13.3) 70 (28.1)
Generation R134 8727 8631 29.6 (5.3),15.3–46.3
23.9 [5.3],15.2–51.2
4800 (58.8) 2117 (26) 484 (5.9) 0 (0) 0 (0) 756 (9.3) 4745 (55.7) 0 (0) 194 (2.3) 24 (0.3) 170 (2)
NICHD HR32 2539 1848 27.1 (6.3),15–43
28.3 [11.6],13.4–68.5
612 (33.1) 1079 (58.4) 2 (0.1) 148 (8) 0 (0) 7 (0.4) 430 (23.3) 76 (5.9) 485 (19.4) 108 (4.3) 377 (15.1)
NICHD LR159 3134 3097 20.6 (4.4),15–39
22.7 [5.4],13.4–51.2
548 (17.7) 1515 (48.9) 2 (0.1) 1010 (32.6) 0 (0) 22 (0.7) 3097 (100) 0 (0) 163 (5.5) 13 (0.4) 150 (5)
Placental HealthStudy176
856 856 32.9 (4.1),18–45
23.3 [4.9],16.5–41.9
593 (71.4) 29 (3.5) 66 (7.9) 28 (3.4) 0 (0) 115 (13.8) 856 (100) 0 (0) 69 (8.1) 3 (0.4) 66 (7.7)
POUCH131 3019 3019 26.4 (5.8),15–47.3
27.7 [8.6],15.1–66.3
2018 (66.8) 743 (24.6) 57 (1.9) 160 (5.3) 0 (0) 41 (1.4) 1293 (42.8) 106 (3.5) 44 (3.2) 12 (0.9) 32 (2.3)
van Kuijk 2011167 407 407 28.8 (3.9),18.9–40.1
24.8 [6.3],16–42.2
– – – – – – 0 (0) 407 (100) 106 (26) 24 (5.9) 82 (20.1)
Van Kuijk 2014166 230 230 30.8 (4.8),19.8–40.8
24.7 [6.6],17.3–48.3
– – – – – – 0 (0) 209 (91.7) 43 (19.8) 15 (6.9) 28 (12.9)
DOI:10.3310/hta2
4720
Health
Tech
nology
Assessm
ent2020
Vol.2
4No.7
2
©Queen
’sPrin
teran
dContro
llerofHMSO
2020.T
his
work
was
produced
byAllo
teyet
al.under
theterm
sofaco
mmissio
ningco
ntract
issued
bytheSecretary
ofState
forHealth
andSo
cialCare.T
his
issuemay
befreely
reproduced
forthepu
rposes
ofprivate
researchan
dstu
dyan
dextracts
(orindeed
,thefullrepo
rt)may
beinclu
ded
inpro
fessional
journals
provid
edthat
suitab
leackn
owled
gemen
tis
mad
ean
dtherepro
ductio
nis
notasso
ciatedwith
anyform
ofad
vertising.
Applicatio
nsforco
mmercial
reproductio
nshould
bead
dressed
to:NIH
RJournals
Library,
Natio
nal
Institu
teforHealth
Research
,Evalu
ation,Trials
and
Studies
Coordinatin
gCen
tre,Alph
aHouse,
University
ofSo
utham
ptonScien
cePark,So
utham
ptonSO
167NS,U
K.
119
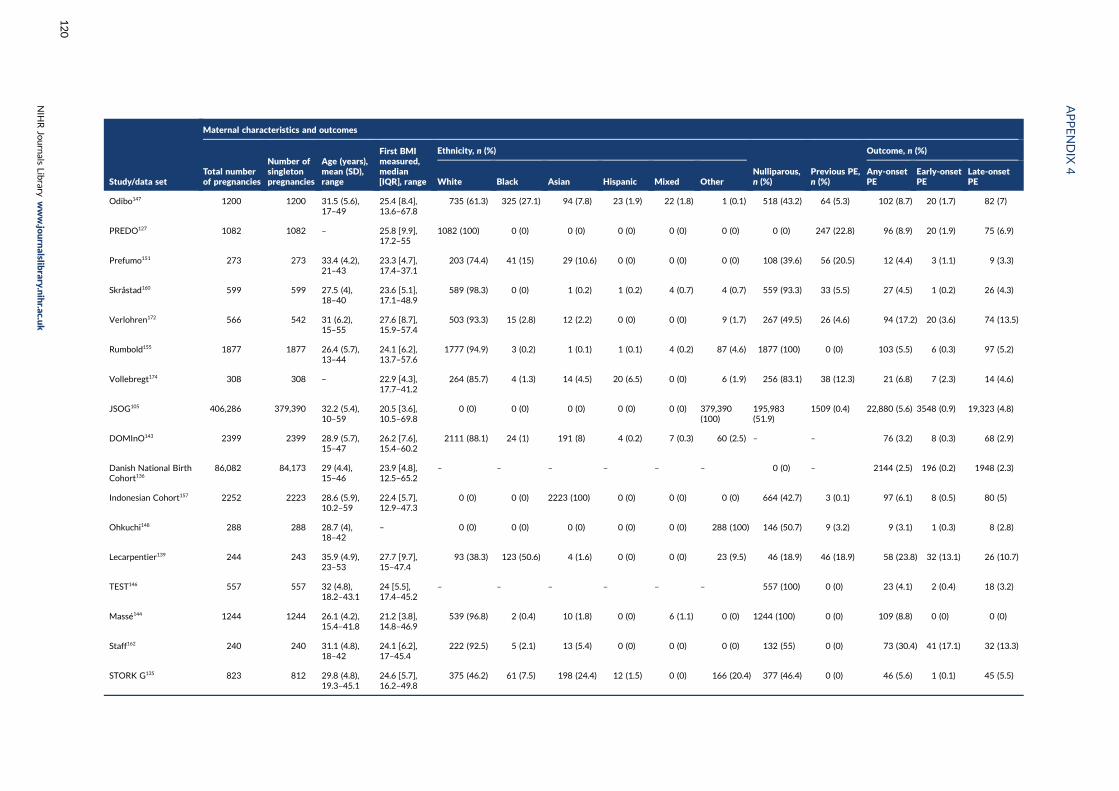
Study/data set
Maternal characteristics and outcomes
Total numberof pregnancies
Number ofsingletonpregnancies
Age (years),mean (SD),range
First BMImeasured,median[IQR], range
Ethnicity, n (%)
Nulliparous,n (%)
Previous PE,n (%)
Outcome, n (%)
White Black Asian Hispanic Mixed OtherAny-onsetPE
Early-onsetPE
Late-onsetPE
Odibo147 1200 1200 31.5 (5.6),17–49
25.4 [8.4],13.6–67.8
735 (61.3) 325 (27.1) 94 (7.8) 23 (1.9) 22 (1.8) 1 (0.1) 518 (43.2) 64 (5.3) 102 (8.7) 20 (1.7) 82 (7)
PREDO127 1082 1082 – 25.8 [9.9],17.2–55
1082 (100) 0 (0) 0 (0) 0 (0) 0 (0) 0 (0) 0 (0) 247 (22.8) 96 (8.9) 20 (1.9) 75 (6.9)
Prefumo151 273 273 33.4 (4.2),21–43
23.3 [4.7],17.4–37.1
203 (74.4) 41 (15) 29 (10.6) 0 (0) 0 (0) 0 (0) 108 (39.6) 56 (20.5) 12 (4.4) 3 (1.1) 9 (3.3)
Skråstad160 599 599 27.5 (4),18–40
23.6 [5.1],17.1–48.9
589 (98.3) 0 (0) 1 (0.2) 1 (0.2) 4 (0.7) 4 (0.7) 559 (93.3) 33 (5.5) 27 (4.5) 1 (0.2) 26 (4.3)
Verlohren172 566 542 31 (6.2),15–55
27.6 [8.7],15.9–57.4
503 (93.3) 15 (2.8) 12 (2.2) 0 (0) 0 (0) 9 (1.7) 267 (49.5) 26 (4.6) 94 (17.2) 20 (3.6) 74 (13.5)
Rumbold155 1877 1877 26.4 (5.7),13–44
24.1 [6.2],13.7–57.6
1777 (94.9) 3 (0.2) 1 (0.1) 1 (0.1) 4 (0.2) 87 (4.6) 1877 (100) 0 (0) 103 (5.5) 6 (0.3) 97 (5.2)
Vollebregt174 308 308 – 22.9 [4.3],17.7–41.2
264 (85.7) 4 (1.3) 14 (4.5) 20 (6.5) 0 (0) 6 (1.9) 256 (83.1) 38 (12.3) 21 (6.8) 7 (2.3) 14 (4.6)
JSOG105 406,286 379,390 32.2 (5.4),10–59
20.5 [3.6],10.5–69.8
0 (0) 0 (0) 0 (0) 0 (0) 0 (0) 379,390(100)
195,983(51.9)
1509 (0.4) 22,880 (5.6) 3548 (0.9) 19,323 (4.8)
DOMInO143 2399 2399 28.9 (5.7),15–47
26.2 [7.6],15.4–60.2
2111 (88.1) 24 (1) 191 (8) 4 (0.2) 7 (0.3) 60 (2.5) – – 76 (3.2) 8 (0.3) 68 (2.9)
Danish National BirthCohort136
86,082 84,173 29 (4.4),15–46
23.9 [4.8],12.5–65.2
– – – – – – 0 (0) – 2144 (2.5) 196 (0.2) 1948 (2.3)
Indonesian Cohort157 2252 2223 28.6 (5.9),10.2–59
22.4 [5.7],12.9–47.3
0 (0) 0 (0) 2223 (100) 0 (0) 0 (0) 0 (0) 664 (42.7) 3 (0.1) 97 (6.1) 8 (0.5) 80 (5)
Ohkuchi148 288 288 28.7 (4),18–42
– 0 (0) 0 (0) 0 (0) 0 (0) 0 (0) 288 (100) 146 (50.7) 9 (3.2) 9 (3.1) 1 (0.3) 8 (2.8)
Lecarpentier139 244 243 35.9 (4.9),23–53
27.7 [9.7],15–47.4
93 (38.3) 123 (50.6) 4 (1.6) 0 (0) 0 (0) 23 (9.5) 46 (18.9) 46 (18.9) 58 (23.8) 32 (13.1) 26 (10.7)
TEST146 557 557 32 (4.8),18.2–43.1
24 [5.5],17.4–45.2
– – – – – – 557 (100) 0 (0) 23 (4.1) 2 (0.4) 18 (3.2)
Massé144 1244 1244 26.1 (4.2),15.4–41.8
21.2 [3.8],14.8–46.9
539 (96.8) 2 (0.4) 10 (1.8) 0 (0) 6 (1.1) 0 (0) 1244 (100) 0 (0) 109 (8.8) 0 (0) 0 (0)
Staff162 240 240 31.1 (4.8),18–42
24.1 [6.2],17–45.4
222 (92.5) 5 (2.1) 13 (5.4) 0 (0) 0 (0) 0 (0) 132 (55) 0 (0) 73 (30.4) 41 (17.1) 32 (13.3)
STORK G135 823 812 29.8 (4.8),19.3–45.1
24.6 [5.7],16.2–49.8
375 (46.2) 61 (7.5) 198 (24.4) 12 (1.5) 0 (0) 166 (20.4) 377 (46.4) 0 (0) 46 (5.6) 1 (0.1) 45 (5.5)
APPENDIX
4
NIH
RJournals
Library
www.jo
urnalslib
rary.nihr.ac.u
k
120
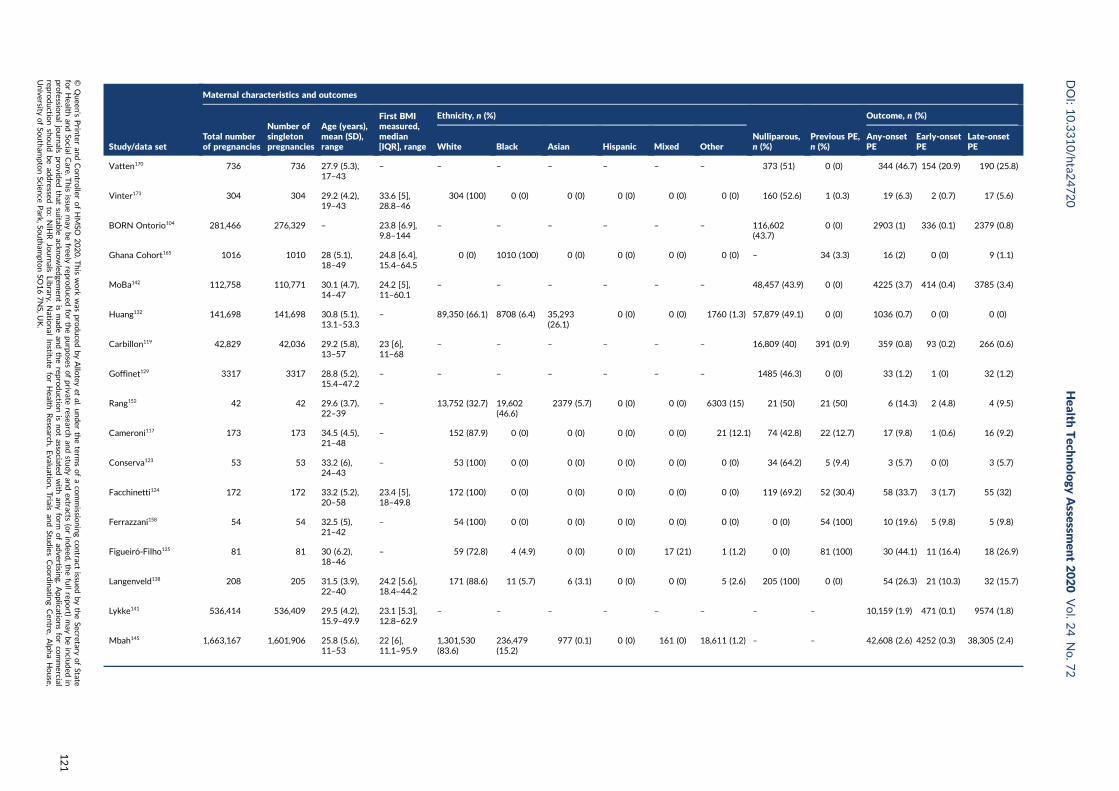
Study/data set
Maternal characteristics and outcomes
Total numberof pregnancies
Number ofsingletonpregnancies
Age (years),mean (SD),range
First BMImeasured,median[IQR], range
Ethnicity, n (%)
Nulliparous,n (%)
Previous PE,n (%)
Outcome, n (%)
White Black Asian Hispanic Mixed OtherAny-onsetPE
Early-onsetPE
Late-onsetPE
Vatten170 736 736 27.9 (5.3),17–43
– – – – – – – 373 (51) 0 (0) 344 (46.7) 154 (20.9) 190 (25.8)
Vinter173 304 304 29.2 (4.2),19–43
33.6 [5],28.8–46
304 (100) 0 (0) 0 (0) 0 (0) 0 (0) 0 (0) 160 (52.6) 1 (0.3) 19 (6.3) 2 (0.7) 17 (5.6)
BORN Ontorio104 281,466 276,329 – 23.8 [6.9],9.8–144
– – – – – – 116,602(43.7)
0 (0) 2903 (1) 336 (0.1) 2379 (0.8)
Ghana Cohort165 1016 1010 28 (5.1),18–49
24.8 [6.4],15.4–64.5
0 (0) 1010 (100) 0 (0) 0 (0) 0 (0) 0 (0) – 34 (3.3) 16 (2) 0 (0) 9 (1.1)
MoBa142 112,758 110,771 30.1 (4.7),14–47
24.2 [5],11–60.1
– – – – – – 48,457 (43.9) 0 (0) 4225 (3.7) 414 (0.4) 3785 (3.4)
Huang132 141,698 141,698 30.8 (5.1),13.1–53.3
– 89,350 (66.1) 8708 (6.4) 35,293(26.1)
0 (0) 0 (0) 1760 (1.3) 57,879 (49.1) 0 (0) 1036 (0.7) 0 (0) 0 (0)
Carbillon119 42,829 42,036 29.2 (5.8),13–57
23 [6],11–68
– – – – – – 16,809 (40) 391 (0.9) 359 (0.8) 93 (0.2) 266 (0.6)
Goffinet129 3317 3317 28.8 (5.2),15.4–47.2
– – – – – – – 1485 (46.3) 0 (0) 33 (1.2) 1 (0) 32 (1.2)
Rang152 42 42 29.6 (3.7),22–39
– 13,752 (32.7) 19,602(46.6)
2379 (5.7) 0 (0) 0 (0) 6303 (15) 21 (50) 21 (50) 6 (14.3) 2 (4.8) 4 (9.5)
Cameroni117 173 173 34.5 (4.5),21–48
– 152 (87.9) 0 (0) 0 (0) 0 (0) 0 (0) 21 (12.1) 74 (42.8) 22 (12.7) 17 (9.8) 1 (0.6) 16 (9.2)
Conserva123 53 53 33.2 (6),24–43
– 53 (100) 0 (0) 0 (0) 0 (0) 0 (0) 0 (0) 34 (64.2) 5 (9.4) 3 (5.7) 0 (0) 3 (5.7)
Facchinetti124 172 172 33.2 (5.2),20–58
23.4 [5],18–49.8
172 (100) 0 (0) 0 (0) 0 (0) 0 (0) 0 (0) 119 (69.2) 52 (30.4) 58 (33.7) 3 (1.7) 55 (32)
Ferrazzani158 54 54 32.5 (5),21–42
– 54 (100) 0 (0) 0 (0) 0 (0) 0 (0) 0 (0) 0 (0) 54 (100) 10 (19.6) 5 (9.8) 5 (9.8)
Figueiró-Filho125 81 81 30 (6.2),18–46
– 59 (72.8) 4 (4.9) 0 (0) 0 (0) 17 (21) 1 (1.2) 0 (0) 81 (100) 30 (44.1) 11 (16.4) 18 (26.9)
Langenveld138 208 205 31.5 (3.9),22–40
24.2 [5.6],18.4–44.2
171 (88.6) 11 (5.7) 6 (3.1) 0 (0) 0 (0) 5 (2.6) 205 (100) 0 (0) 54 (26.3) 21 (10.3) 32 (15.7)
Lykke141 536,414 536,409 29.5 (4.2),15.9–49.9
23.1 [5.3],12.8–62.9
– – – – – – – – 10,159 (1.9) 471 (0.1) 9574 (1.8)
Mbah145 1,663,167 1,601,906 25.8 (5.6),11–53
22 [6],11.1–95.9
1,301,530(83.6)
236,479(15.2)
977 (0.1) 0 (0) 161 (0) 18,611 (1.2) – – 42,608 (2.6) 4252 (0.3) 38,305 (2.4)
DOI:10.3310/hta2
4720
Health
Tech
nology
Assessm
ent2020
Vol.2
4No.7
2
©Queen
’sPrin
teran
dContro
llerofHMSO
2020.T
his
work
was
produced
byAllo
teyet
al.under
theterm
sofaco
mmissio
ningco
ntract
issued
bytheSecretary
ofState
forHealth
andSo
cialCare.T
his
issuemay
befreely
reproduced
forthepu
rposes
ofprivate
researchan
dstu
dyan
dextracts
(orindeed
,thefullrepo
rt)may
beinclu
ded
inpro
fessional
journals
provid
edthat
suitab
leackn
owled
gemen
tis
mad
ean
dtherepro
ductio
nis
notasso
ciatedwith
anyform
ofad
vertising.
Applicatio
nsforco
mmercial
reproductio
nshould
bead
dressed
to:NIH
RJournals
Library,
Natio
nal
Institu
teforHealth
Research
,Evalu
ation,Trials
and
Studies
Coordinatin
gCen
tre,Alph
aHouse,
University
ofSo
utham
ptonScien
cePark,So
utham
ptonSO
167NS,U
K.
121
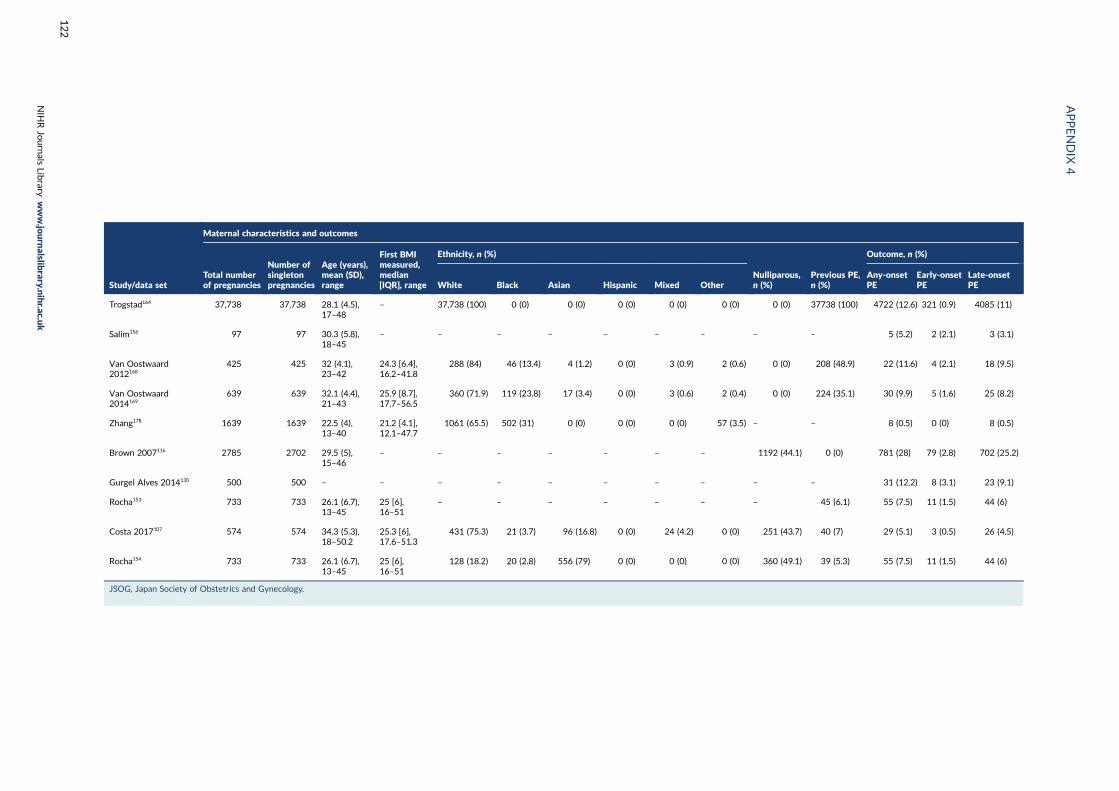
Study/data set
Maternal characteristics and outcomes
Total numberof pregnancies
Number ofsingletonpregnancies
Age (years),mean (SD),range
First BMImeasured,median[IQR], range
Ethnicity, n (%)
Nulliparous,n (%)
Previous PE,n (%)
Outcome, n (%)
White Black Asian Hispanic Mixed OtherAny-onsetPE
Early-onsetPE
Late-onsetPE
Trogstad164 37,738 37,738 28.1 (4.5),17–48
– 37,738 (100) 0 (0) 0 (0) 0 (0) 0 (0) 0 (0) 0 (0) 37738 (100) 4722 (12.6) 321 (0.9) 4085 (11)
Salim156 97 97 30.3 (5.8),18–45
– – – – – – – – – 5 (5.2) 2 (2.1) 3 (3.1)
Van Oostwaard2012168
425 425 32 (4.1),23–42
24.3 [6.4],16.2–41.8
288 (84) 46 (13.4) 4 (1.2) 0 (0) 3 (0.9) 2 (0.6) 0 (0) 208 (48.9) 22 (11.6) 4 (2.1) 18 (9.5)
Van Oostwaard2014169
639 639 32.1 (4.4),21–43
25.9 [8.7],17.7–56.5
360 (71.9) 119 (23.8) 17 (3.4) 0 (0) 3 (0.6) 2 (0.4) 0 (0) 224 (35.1) 30 (9.9) 5 (1.6) 25 (8.2)
Zhang178 1639 1639 22.5 (4),13–40
21.2 [4.1],12.1–47.7
1061 (65.5) 502 (31) 0 (0) 0 (0) 0 (0) 57 (3.5) – – 8 (0.5) 0 (0) 8 (0.5)
Brown 2007116 2785 2702 29.5 (5),15–46
– – – – – – – 1192 (44.1) 0 (0) 781 (28) 79 (2.8) 702 (25.2)
Gurgel Alves 2014130 500 500 – – – – – – – – – – 31 (12.2) 8 (3.1) 23 (9.1)
Rocha153 733 733 26.1 (6.7),13–45
25 [6],16–51
– – – – – – – 45 (6.1) 55 (7.5) 11 (1.5) 44 (6)
Costa 2017107 574 574 34.3 (5.3),18–50.2
25.3 [6],17.6–51.3
431 (75.3) 21 (3.7) 96 (16.8) 0 (0) 24 (4.2) 0 (0) 251 (43.7) 40 (7) 29 (5.1) 3 (0.5) 26 (4.5)
Rocha154 733 733 26.1 (6.7),13–45
25 [6],16–51
128 (18.2) 20 (2.8) 556 (79) 0 (0) 0 (0) 0 (0) 360 (49.1) 39 (5.3) 55 (7.5) 11 (1.5) 44 (6)
JSOG, Japan Society of Obstetrics and Gynecology.
APPENDIX
4
NIH
RJournals
Library
www.jo
urnalslib
rary.nihr.ac.u
k
122
Appendix 5 Detailed study characteristics ofIPPIC data sets
DOI: 10.3310/hta24720 Health Technology Assessment 2020 Vol. 24 No. 72
© Queen’s Printer and Controller of HMSO 2020. This work was produced by Allotey et al. under the terms of a commissioning contract issued by the Secretary of Statefor Health and Social Care. This issue may be freely reproduced for the purposes of private research and study and extracts (or indeed, the full report) may be included inprofessional journals provided that suitable acknowledgement is made and the reproduction is not associated with any form of advertising. Applications for commercialreproduction should be addressed to: NIHR Journals Library, National Institute for Health Research, Evaluation, Trials and Studies Coordinating Centre, Alpha House,University of Southampton Science Park, Southampton SO16 7NS, UK.
123
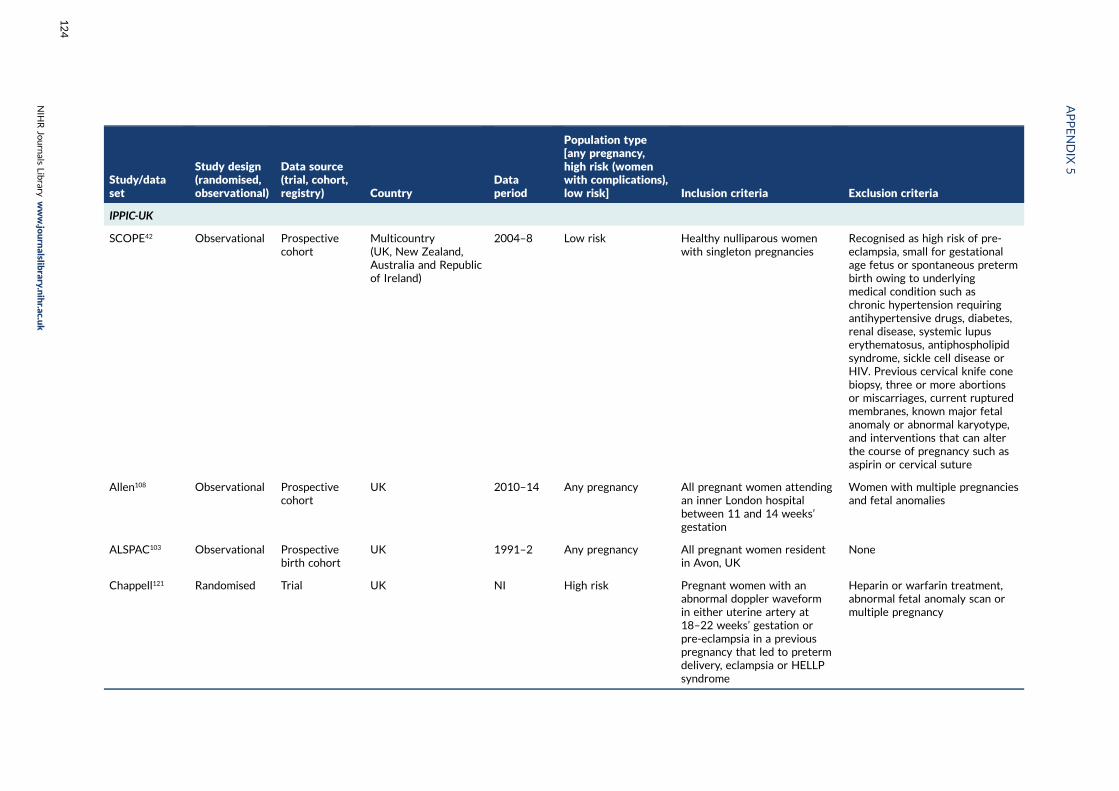
Study/dataset
Study design(randomised,observational)
Data source(trial, cohort,registry) Country
Dataperiod
Population type[any pregnancy,high risk (womenwith complications),low risk] Inclusion criteria Exclusion criteria
IPPIC-UK
SCOPE42 Observational Prospectivecohort
Multicountry(UK, New Zealand,Australia and Republicof Ireland)
2004–8 Low risk Healthy nulliparous womenwith singleton pregnancies
Recognised as high risk of pre-eclampsia, small for gestationalage fetus or spontaneous pretermbirth owing to underlyingmedical condition such aschronic hypertension requiringantihypertensive drugs, diabetes,renal disease, systemic lupuserythematosus, antiphospholipidsyndrome, sickle cell disease orHIV. Previous cervical knife conebiopsy, three or more abortionsor miscarriages, current rupturedmembranes, known major fetalanomaly or abnormal karyotype,and interventions that can alterthe course of pregnancy such asaspirin or cervical suture
Allen108 Observational Prospectivecohort
UK 2010–14 Any pregnancy All pregnant women attendingan inner London hospitalbetween 11 and 14 weeks’gestation
Women with multiple pregnanciesand fetal anomalies
ALSPAC103 Observational Prospectivebirth cohort
UK 1991–2 Any pregnancy All pregnant women residentin Avon, UK
None
Chappell121 Randomised Trial UK NI High risk Pregnant women with anabnormal doppler waveformin either uterine artery at18–22 weeks’ gestation orpre-eclampsia in a previouspregnancy that led to pretermdelivery, eclampsia or HELLPsyndrome
Heparin or warfarin treatment,abnormal fetal anomaly scan ormultiple pregnancy
APPENDIX
5
NIH
RJournals
Library
www.jo
urnalslib
rary.nihr.ac.u
k
124
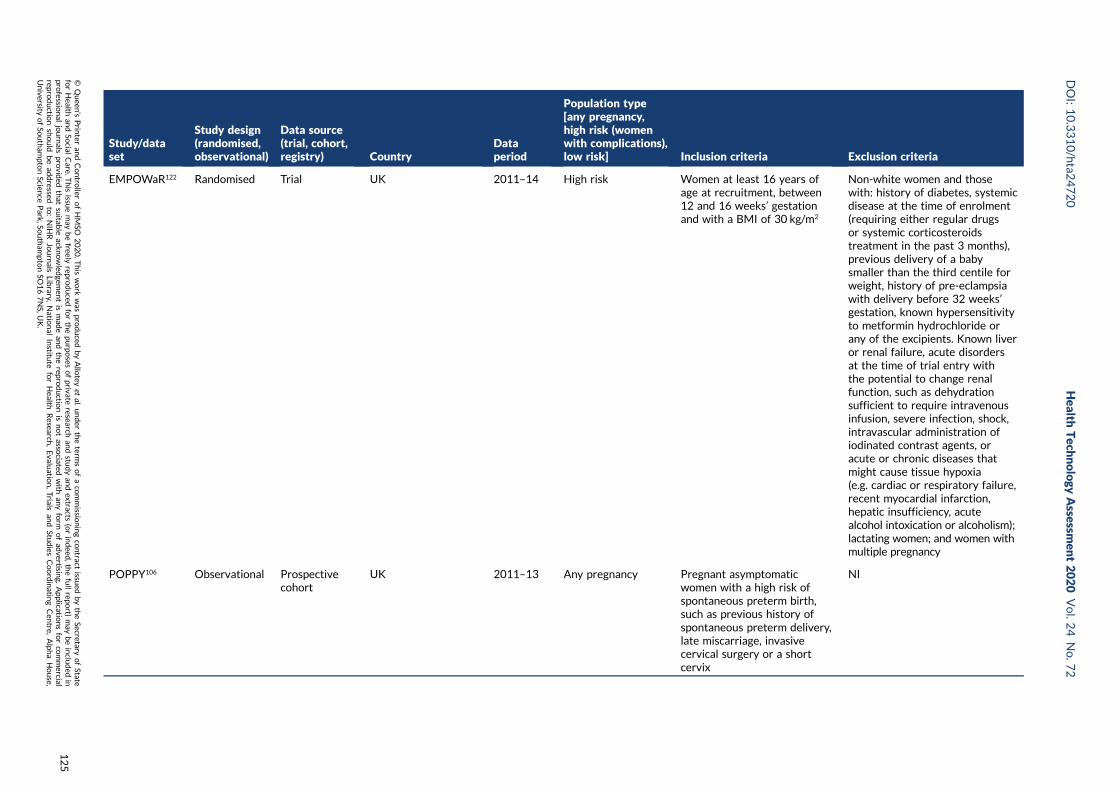
Study/dataset
Study design(randomised,observational)
Data source(trial, cohort,registry) Country
Dataperiod
Population type[any pregnancy,high risk (womenwith complications),low risk] Inclusion criteria Exclusion criteria
EMPOWaR122 Randomised Trial UK 2011–14 High risk Women at least 16 years ofage at recruitment, between12 and 16 weeks’ gestationand with a BMI of 30 kg/m2
Non-white women and thosewith: history of diabetes, systemicdisease at the time of enrolment(requiring either regular drugsor systemic corticosteroidstreatment in the past 3 months),previous delivery of a babysmaller than the third centile forweight, history of pre-eclampsiawith delivery before 32 weeks’gestation, known hypersensitivityto metformin hydrochloride orany of the excipients. Known liveror renal failure, acute disordersat the time of trial entry withthe potential to change renalfunction, such as dehydrationsufficient to require intravenousinfusion, severe infection, shock,intravascular administration ofiodinated contrast agents, oracute or chronic diseases thatmight cause tissue hypoxia(e.g. cardiac or respiratory failure,recent myocardial infarction,hepatic insufficiency, acutealcohol intoxication or alcoholism);lactating women; and women withmultiple pregnancy
POPPY106 Observational Prospectivecohort
UK 2011–13 Any pregnancy Pregnant asymptomaticwomen with a high risk ofspontaneous preterm birth,such as previous history ofspontaneous preterm delivery,late miscarriage, invasivecervical surgery or a shortcervix
NI
DOI:10.3310/hta2
4720
Health
Tech
nology
Assessm
ent2020
Vol.2
4No.7
2
©Queen
’sPrin
teran
dContro
llerofHMSO
2020.T
his
work
was
produced
byAllo
teyet
al.under
theterm
sofaco
mmissio
ningco
ntract
issued
bytheSecretary
ofState
forHealth
andSo
cialCare.T
his
issuemay
befreely
reproduced
forthepu
rposes
ofprivate
researchan
dstu
dyan
dextracts
(orindeed
,thefullrepo
rt)may
beinclu
ded
inpro
fessional
journals
provid
edthat
suitab
leackn
owled
gemen
tis
mad
ean
dtherepro
ductio
nis
notasso
ciatedwith
anyform
ofad
vertising.
Applicatio
nsforco
mmercial
reproductio
nshould
bead
dressed
to:NIH
RJournals
Library,
Natio
nal
Institu
teforHealth
Research
,Evalu
ation,Trials
and
Studies
Coordinatin
gCen
tre,Alph
aHouse,
University
ofSo
utham
ptonScien
cePark,So
utham
ptonSO
167NS,U
K.
125
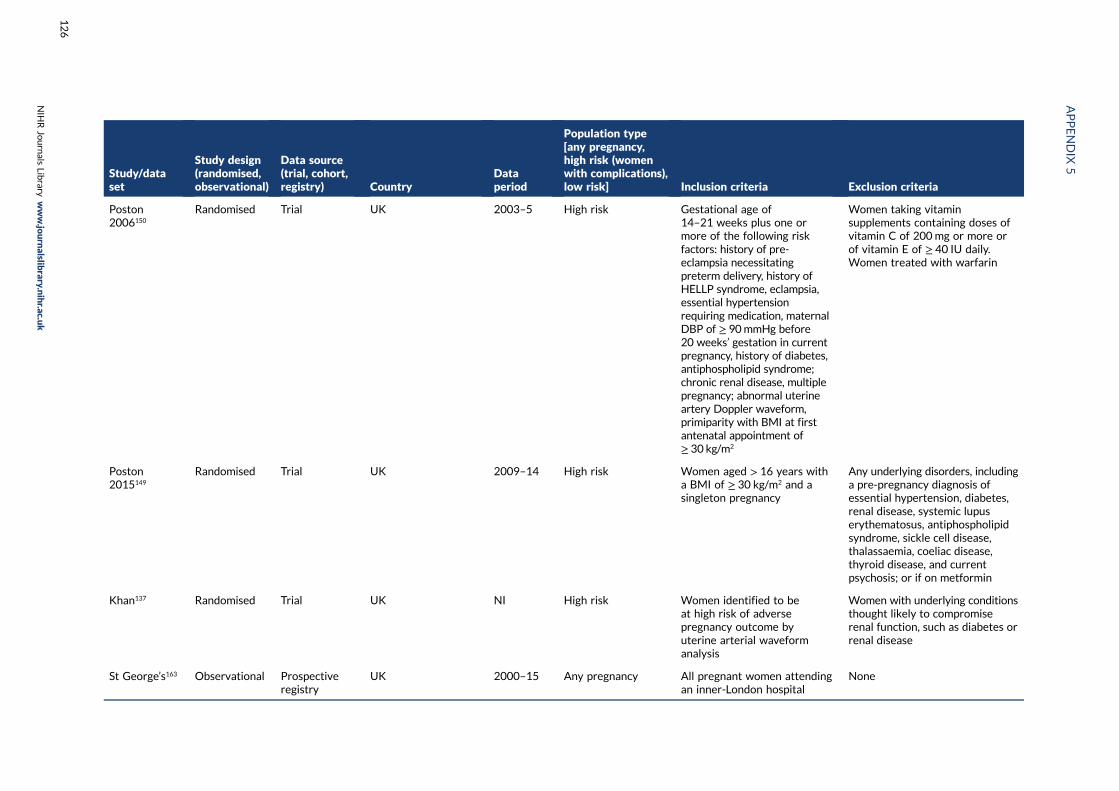
Study/dataset
Study design(randomised,observational)
Data source(trial, cohort,registry) Country
Dataperiod
Population type[any pregnancy,high risk (womenwith complications),low risk] Inclusion criteria Exclusion criteria
Poston2006150
Randomised Trial UK 2003–5 High risk Gestational age of14–21 weeks plus one ormore of the following riskfactors: history of pre-eclampsia necessitatingpreterm delivery, history ofHELLP syndrome, eclampsia,essential hypertensionrequiring medication, maternalDBP of ≥ 90mmHg before20 weeks’ gestation in currentpregnancy, history of diabetes,antiphospholipid syndrome;chronic renal disease, multiplepregnancy; abnormal uterineartery Doppler waveform,primiparity with BMI at firstantenatal appointment of≥ 30 kg/m2
Women taking vitaminsupplements containing doses ofvitamin C of 200mg or more orof vitamin E of ≥ 40 IU daily.Women treated with warfarin
Poston2015149
Randomised Trial UK 2009–14 High risk Women aged > 16 years witha BMI of ≥ 30 kg/m2 and asingleton pregnancy
Any underlying disorders, includinga pre-pregnancy diagnosis ofessential hypertension, diabetes,renal disease, systemic lupuserythematosus, antiphospholipidsyndrome, sickle cell disease,thalassaemia, coeliac disease,thyroid disease, and currentpsychosis; or if on metformin
Khan137 Randomised Trial UK NI High risk Women identified to beat high risk of adversepregnancy outcome byuterine arterial waveformanalysis
Women with underlying conditionsthought likely to compromiserenal function, such as diabetes orrenal disease
St George’s163 Observational Prospectiveregistry
UK 2000–15 Any pregnancy All pregnant women attendingan inner-London hospital
None
APPENDIX
5
NIH
RJournals
Library
www.jo
urnalslib
rary.nihr.ac.u
k
126
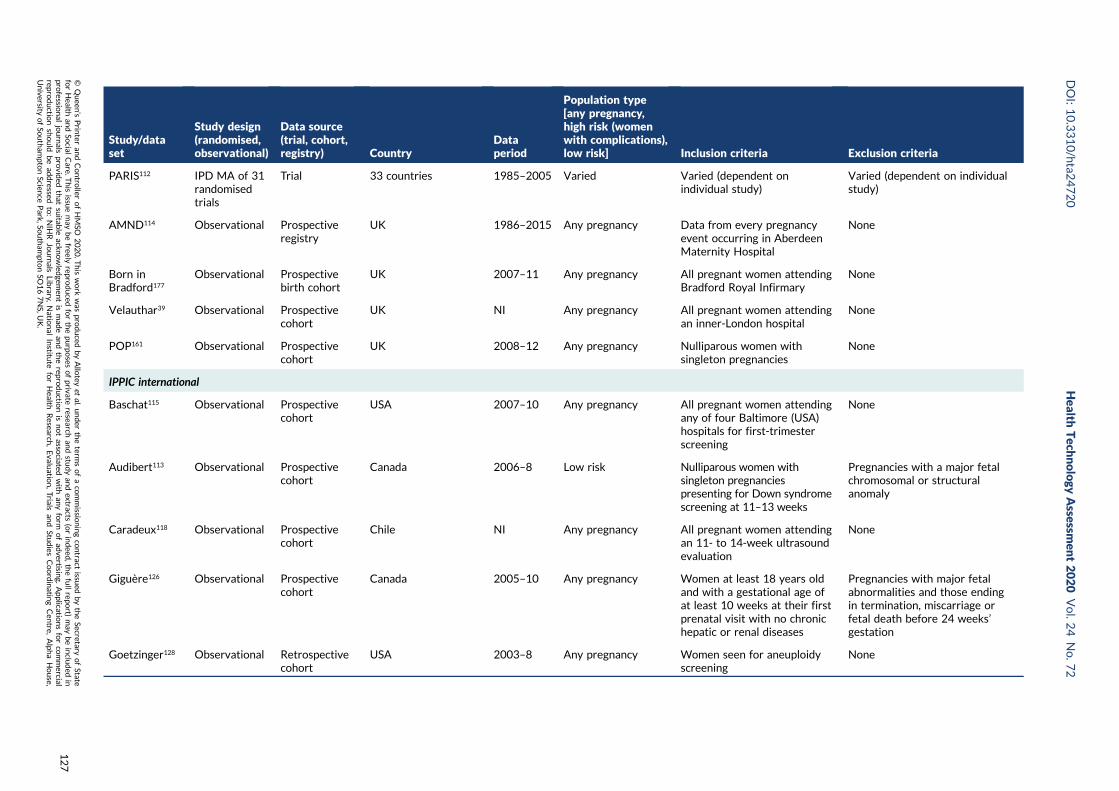
Study/dataset
Study design(randomised,observational)
Data source(trial, cohort,registry) Country
Dataperiod
Population type[any pregnancy,high risk (womenwith complications),low risk] Inclusion criteria Exclusion criteria
PARIS112 IPD MA of 31randomisedtrials
Trial 33 countries 1985–2005 Varied Varied (dependent onindividual study)
Varied (dependent on individualstudy)
AMND114 Observational Prospectiveregistry
UK 1986–2015 Any pregnancy Data from every pregnancyevent occurring in AberdeenMaternity Hospital
None
Born inBradford177
Observational Prospectivebirth cohort
UK 2007–11 Any pregnancy All pregnant women attendingBradford Royal Infirmary
None
Velauthar39 Observational Prospectivecohort
UK NI Any pregnancy All pregnant women attendingan inner-London hospital
None
POP161 Observational Prospectivecohort
UK 2008–12 Any pregnancy Nulliparous women withsingleton pregnancies
None
IPPIC international
Baschat115 Observational Prospectivecohort
USA 2007–10 Any pregnancy All pregnant women attendingany of four Baltimore (USA)hospitals for first-trimesterscreening
None
Audibert113 Observational Prospectivecohort
Canada 2006–8 Low risk Nulliparous women withsingleton pregnanciespresenting for Down syndromescreening at 11–13 weeks
Pregnancies with a major fetalchromosomal or structuralanomaly
Caradeux118 Observational Prospectivecohort
Chile NI Any pregnancy All pregnant women attendingan 11- to 14-week ultrasoundevaluation
None
Giguère126 Observational Prospectivecohort
Canada 2005–10 Any pregnancy Women at least 18 years oldand with a gestational age ofat least 10 weeks at their firstprenatal visit with no chronichepatic or renal diseases
Pregnancies with major fetalabnormalities and those endingin termination, miscarriage orfetal death before 24 weeks’gestation
Goetzinger128 Observational Retrospectivecohort
USA 2003–8 Any pregnancy Women seen for aneuploidyscreening
None
DOI:10.3310/hta2
4720
Health
Tech
nology
Assessm
ent2020
Vol.2
4No.7
2
©Queen
’sPrin
teran
dContro
llerofHMSO
2020.T
his
work
was
produced
byAllo
teyet
al.under
theterm
sofaco
mmissio
ningco
ntract
issued
bytheSecretary
ofState
forHealth
andSo
cialCare.T
his
issuemay
befreely
reproduced
forthepu
rposes
ofprivate
researchan
dstu
dyan
dextracts
(orindeed
,thefullrepo
rt)may
beinclu
ded
inpro
fessional
journals
provid
edthat
suitab
leackn
owled
gemen
tis
mad
ean
dtherepro
ductio
nis
notasso
ciatedwith
anyform
ofad
vertising.
Applicatio
nsforco
mmercial
reproductio
nshould
bead
dressed
to:NIH
RJournals
Library,
Natio
nal
Institu
teforHealth
Research
,Evalu
ation,Trials
and
Studies
Coordinatin
gCen
tre,Alph
aHouse,
University
ofSo
utham
ptonScien
cePark,So
utham
ptonSO
167NS,U
K.
127
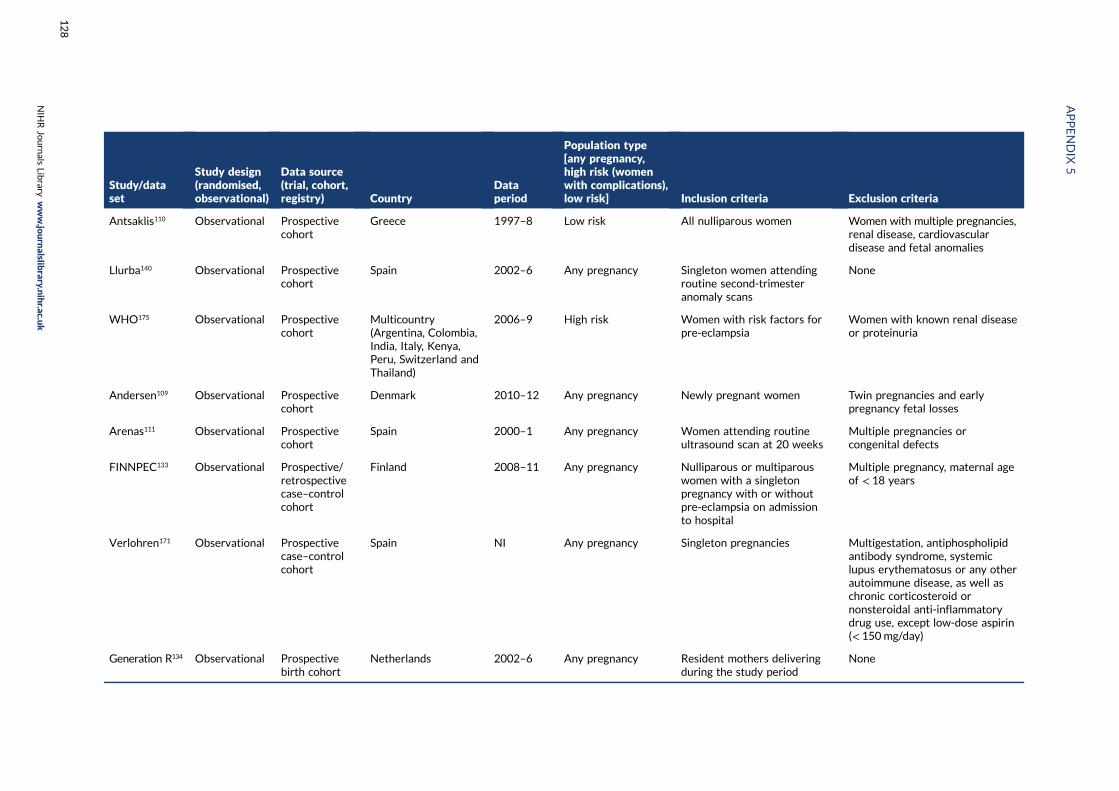
Study/dataset
Study design(randomised,observational)
Data source(trial, cohort,registry) Country
Dataperiod
Population type[any pregnancy,high risk (womenwith complications),low risk] Inclusion criteria Exclusion criteria
Antsaklis110 Observational Prospectivecohort
Greece 1997–8 Low risk All nulliparous women Women with multiple pregnancies,renal disease, cardiovasculardisease and fetal anomalies
Llurba140 Observational Prospectivecohort
Spain 2002–6 Any pregnancy Singleton women attendingroutine second-trimesteranomaly scans
None
WHO175 Observational Prospectivecohort
Multicountry(Argentina, Colombia,India, Italy, Kenya,Peru, Switzerland andThailand)
2006–9 High risk Women with risk factors forpre-eclampsia
Women with known renal diseaseor proteinuria
Andersen109 Observational Prospectivecohort
Denmark 2010–12 Any pregnancy Newly pregnant women Twin pregnancies and earlypregnancy fetal losses
Arenas111 Observational Prospectivecohort
Spain 2000–1 Any pregnancy Women attending routineultrasound scan at 20 weeks
Multiple pregnancies orcongenital defects
FINNPEC133 Observational Prospective/retrospectivecase–controlcohort
Finland 2008–11 Any pregnancy Nulliparous or multiparouswomen with a singletonpregnancy with or withoutpre-eclampsia on admissionto hospital
Multiple pregnancy, maternal ageof < 18 years
Verlohren171 Observational Prospectivecase–controlcohort
Spain NI Any pregnancy Singleton pregnancies Multigestation, antiphospholipidantibody syndrome, systemiclupus erythematosus or any otherautoimmune disease, as well aschronic corticosteroid ornonsteroidal anti-inflammatorydrug use, except low-dose aspirin(< 150mg/day)
Generation R134 Observational Prospectivebirth cohort
Netherlands 2002–6 Any pregnancy Resident mothers deliveringduring the study period
None
APPENDIX
5
NIH
RJournals
Library
www.jo
urnalslib
rary.nihr.ac.u
k
128
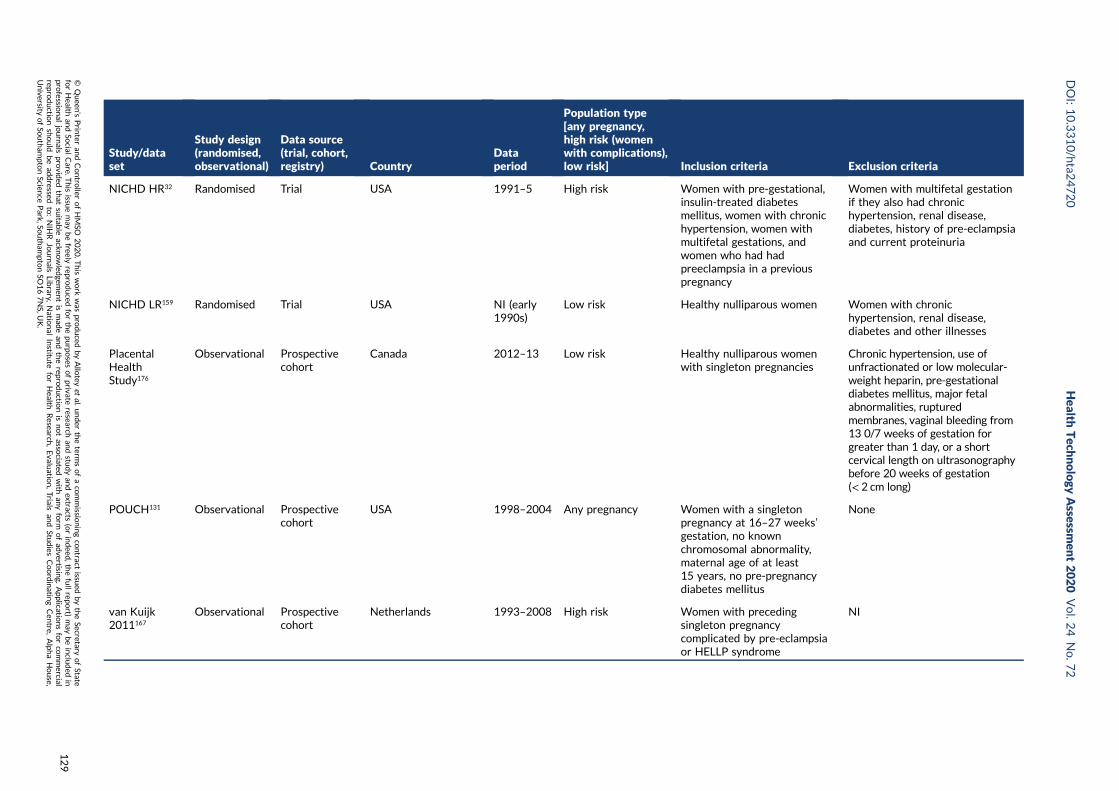
Study/dataset
Study design(randomised,observational)
Data source(trial, cohort,registry) Country
Dataperiod
Population type[any pregnancy,high risk (womenwith complications),low risk] Inclusion criteria Exclusion criteria
NICHD HR32 Randomised Trial USA 1991–5 High risk Women with pre-gestational,insulin-treated diabetesmellitus, women with chronichypertension, women withmultifetal gestations, andwomen who had hadpreeclampsia in a previouspregnancy
Women with multifetal gestationif they also had chronichypertension, renal disease,diabetes, history of pre-eclampsiaand current proteinuria
NICHD LR159 Randomised Trial USA NI (early1990s)
Low risk Healthy nulliparous women Women with chronichypertension, renal disease,diabetes and other illnesses
PlacentalHealthStudy176
Observational Prospectivecohort
Canada 2012–13 Low risk Healthy nulliparous womenwith singleton pregnancies
Chronic hypertension, use ofunfractionated or low molecular-weight heparin, pre-gestationaldiabetes mellitus, major fetalabnormalities, rupturedmembranes, vaginal bleeding from13 0/7 weeks of gestation forgreater than 1 day, or a shortcervical length on ultrasonographybefore 20 weeks of gestation(< 2 cm long)
POUCH131 Observational Prospectivecohort
USA 1998–2004 Any pregnancy Women with a singletonpregnancy at 16–27 weeks’gestation, no knownchromosomal abnormality,maternal age of at least15 years, no pre-pregnancydiabetes mellitus
None
van Kuijk2011167
Observational Prospectivecohort
Netherlands 1993–2008 High risk Women with precedingsingleton pregnancycomplicated by pre-eclampsiaor HELLP syndrome
NI
DOI:10.3310/hta2
4720
Health
Tech
nology
Assessm
ent2020
Vol.2
4No.7
2
©Queen
’sPrin
teran
dContro
llerofHMSO
2020.T
his
work
was
produced
byAllo
teyet
al.under
theterm
sofaco
mmissio
ningco
ntract
issued
bytheSecretary
ofState
forHealth
andSo
cialCare.T
his
issuemay
befreely
reproduced
forthepu
rposes
ofprivate
researchan
dstu
dyan
dextracts
(orindeed
,thefullrepo
rt)may
beinclu
ded
inpro
fessional
journals
provid
edthat
suitab
leackn
owled
gemen
tis
mad
ean
dtherepro
ductio
nis
notasso
ciatedwith
anyform
ofad
vertising.
Applicatio
nsforco
mmercial
reproductio
nshould
bead
dressed
to:NIH
RJournals
Library,
Natio
nal
Institu
teforHealth
Research
,Evalu
ation,Trials
and
Studies
Coordinatin
gCen
tre,Alph
aHouse,
University
ofSo
utham
ptonScien
cePark,So
utham
ptonSO
167NS,U
K.
129
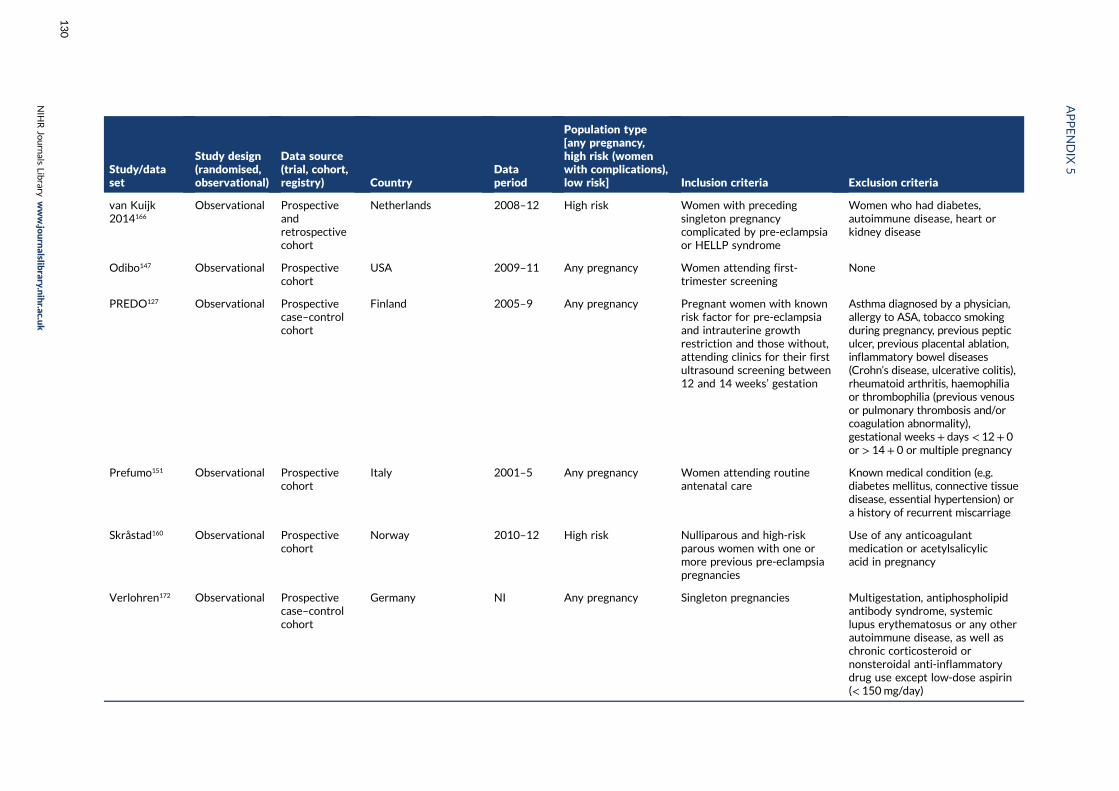
Study/dataset
Study design(randomised,observational)
Data source(trial, cohort,registry) Country
Dataperiod
Population type[any pregnancy,high risk (womenwith complications),low risk] Inclusion criteria Exclusion criteria
van Kuijk2014166
Observational Prospectiveandretrospectivecohort
Netherlands 2008–12 High risk Women with precedingsingleton pregnancycomplicated by pre-eclampsiaor HELLP syndrome
Women who had diabetes,autoimmune disease, heart orkidney disease
Odibo147 Observational Prospectivecohort
USA 2009–11 Any pregnancy Women attending first-trimester screening
None
PREDO127 Observational Prospectivecase–controlcohort
Finland 2005–9 Any pregnancy Pregnant women with knownrisk factor for pre-eclampsiaand intrauterine growthrestriction and those without,attending clinics for their firstultrasound screening between12 and 14 weeks’ gestation
Asthma diagnosed by a physician,allergy to ASA, tobacco smokingduring pregnancy, previous pepticulcer, previous placental ablation,inflammatory bowel diseases(Crohn’s disease, ulcerative colitis),rheumatoid arthritis, haemophiliaor thrombophilia (previous venousor pulmonary thrombosis and/orcoagulation abnormality),gestational weeks+ days < 12+ 0or > 14+ 0 or multiple pregnancy
Prefumo151 Observational Prospectivecohort
Italy 2001–5 Any pregnancy Women attending routineantenatal care
Known medical condition (e.g.diabetes mellitus, connective tissuedisease, essential hypertension) ora history of recurrent miscarriage
Skråstad160 Observational Prospectivecohort
Norway 2010–12 High risk Nulliparous and high-riskparous women with one ormore previous pre-eclampsiapregnancies
Use of any anticoagulantmedication or acetylsalicylicacid in pregnancy
Verlohren172 Observational Prospectivecase–controlcohort
Germany NI Any pregnancy Singleton pregnancies Multigestation, antiphospholipidantibody syndrome, systemiclupus erythematosus or any otherautoimmune disease, as well aschronic corticosteroid ornonsteroidal anti-inflammatorydrug use except low-dose aspirin(< 150mg/day)
APPENDIX
5
NIH
RJournals
Library
www.jo
urnalslib
rary.nihr.ac.u
k
130
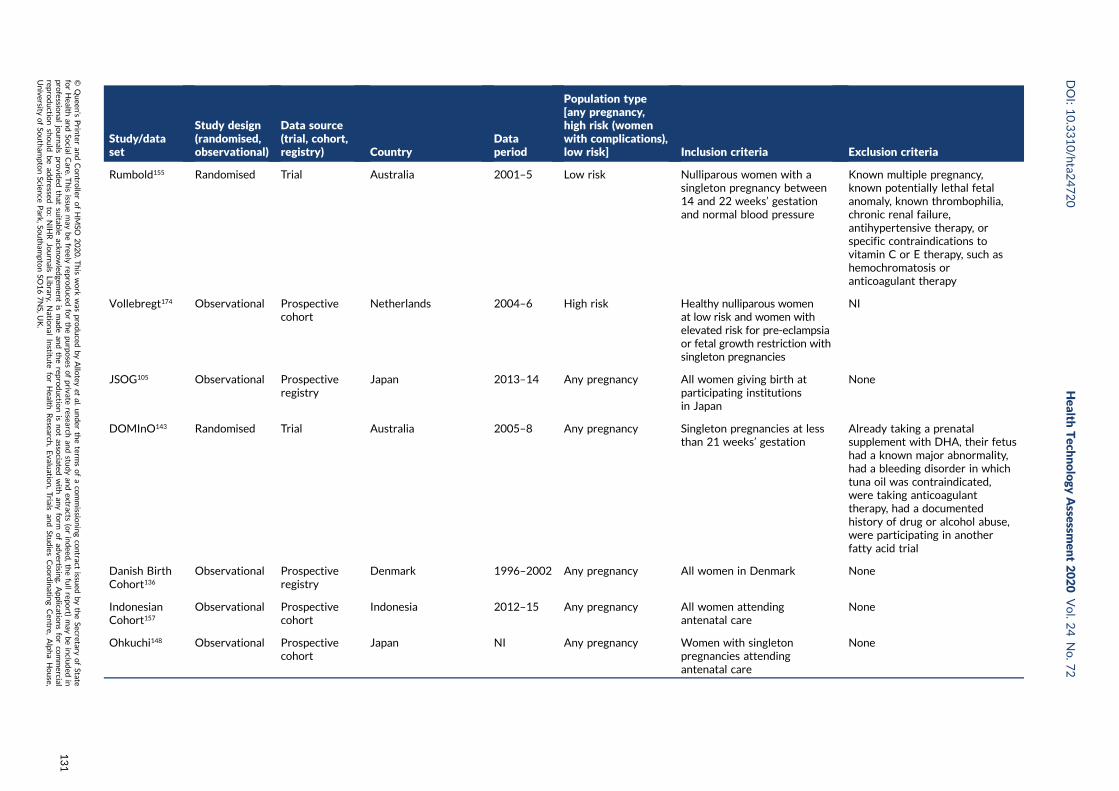
Study/dataset
Study design(randomised,observational)
Data source(trial, cohort,registry) Country
Dataperiod
Population type[any pregnancy,high risk (womenwith complications),low risk] Inclusion criteria Exclusion criteria
Rumbold155 Randomised Trial Australia 2001–5 Low risk Nulliparous women with asingleton pregnancy between14 and 22 weeks’ gestationand normal blood pressure
Known multiple pregnancy,known potentially lethal fetalanomaly, known thrombophilia,chronic renal failure,antihypertensive therapy, orspecific contraindications tovitamin C or E therapy, such ashemochromatosis oranticoagulant therapy
Vollebregt174 Observational Prospectivecohort
Netherlands 2004–6 High risk Healthy nulliparous womenat low risk and women withelevated risk for pre-eclampsiaor fetal growth restriction withsingleton pregnancies
NI
JSOG105 Observational Prospectiveregistry
Japan 2013–14 Any pregnancy All women giving birth atparticipating institutionsin Japan
None
DOMInO143 Randomised Trial Australia 2005–8 Any pregnancy Singleton pregnancies at lessthan 21 weeks’ gestation
Already taking a prenatalsupplement with DHA, their fetushad a known major abnormality,had a bleeding disorder in whichtuna oil was contraindicated,were taking anticoagulanttherapy, had a documentedhistory of drug or alcohol abuse,were participating in anotherfatty acid trial
Danish BirthCohort136
Observational Prospectiveregistry
Denmark 1996–2002 Any pregnancy All women in Denmark None
IndonesianCohort157
Observational Prospectivecohort
Indonesia 2012–15 Any pregnancy All women attendingantenatal care
None
Ohkuchi148 Observational Prospectivecohort
Japan NI Any pregnancy Women with singletonpregnancies attendingantenatal care
None
DOI:10.3310/hta2
4720
Health
Tech
nology
Assessm
ent2020
Vol.2
4No.7
2
©Queen
’sPrin
teran
dContro
llerofHMSO
2020.T
his
work
was
produced
byAllo
teyet
al.under
theterm
sofaco
mmissio
ningco
ntract
issued
bytheSecretary
ofState
forHealth
andSo
cialCare.T
his
issuemay
befreely
reproduced
forthepu
rposes
ofprivate
researchan
dstu
dyan
dextracts
(orindeed
,thefullrepo
rt)may
beinclu
ded
inpro
fessional
journals
provid
edthat
suitab
leackn
owled
gemen
tis
mad
ean
dtherepro
ductio
nis
notasso
ciatedwith
anyform
ofad
vertising.
Applicatio
nsforco
mmercial
reproductio
nshould
bead
dressed
to:NIH
RJournals
Library,
Natio
nal
Institu
teforHealth
Research
,Evalu
ation,Trials
and
Studies
Coordinatin
gCen
tre,Alph
aHouse,
University
ofSo
utham
ptonScien
cePark,So
utham
ptonSO
167NS,U
K.
131
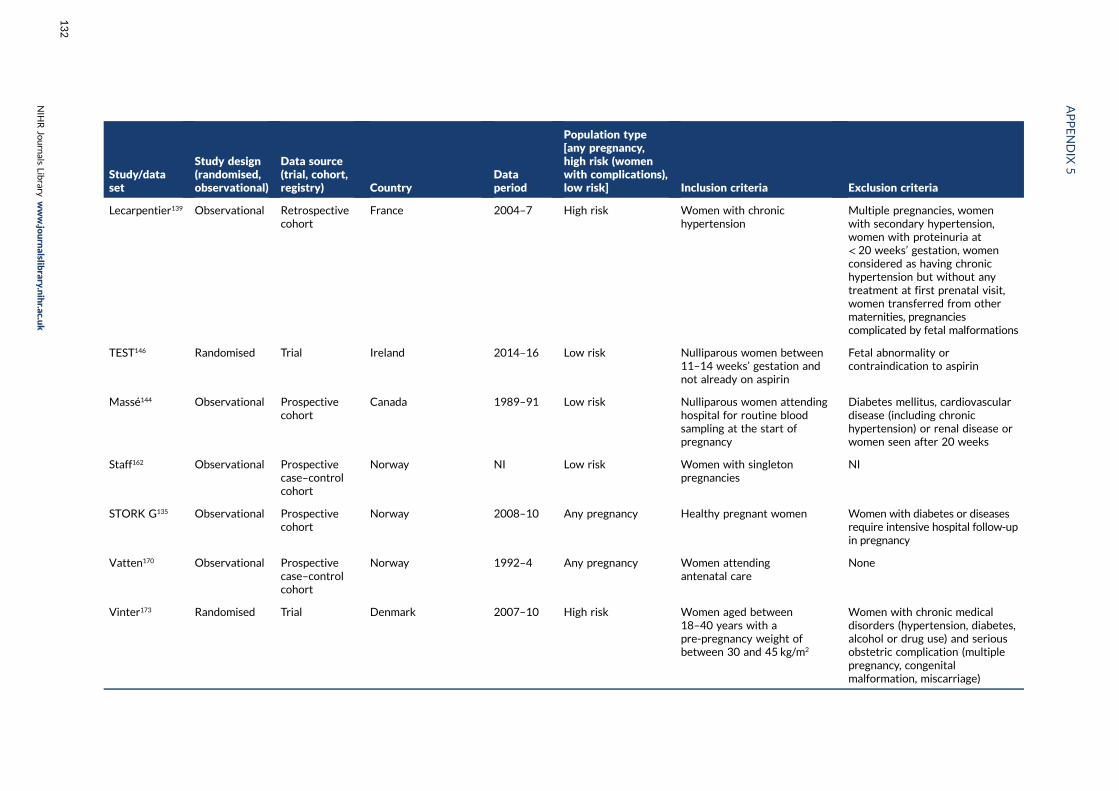
Study/dataset
Study design(randomised,observational)
Data source(trial, cohort,registry) Country
Dataperiod
Population type[any pregnancy,high risk (womenwith complications),low risk] Inclusion criteria Exclusion criteria
Lecarpentier139 Observational Retrospectivecohort
France 2004–7 High risk Women with chronichypertension
Multiple pregnancies, womenwith secondary hypertension,women with proteinuria at< 20 weeks’ gestation, womenconsidered as having chronichypertension but without anytreatment at first prenatal visit,women transferred from othermaternities, pregnanciescomplicated by fetal malformations
TEST146 Randomised Trial Ireland 2014–16 Low risk Nulliparous women between11–14 weeks’ gestation andnot already on aspirin
Fetal abnormality orcontraindication to aspirin
Massé144 Observational Prospectivecohort
Canada 1989–91 Low risk Nulliparous women attendinghospital for routine bloodsampling at the start ofpregnancy
Diabetes mellitus, cardiovasculardisease (including chronichypertension) or renal disease orwomen seen after 20 weeks
Staff162 Observational Prospectivecase–controlcohort
Norway NI Low risk Women with singletonpregnancies
NI
STORK G135 Observational Prospectivecohort
Norway 2008–10 Any pregnancy Healthy pregnant women Women with diabetes or diseasesrequire intensive hospital follow-upin pregnancy
Vatten170 Observational Prospectivecase–controlcohort
Norway 1992–4 Any pregnancy Women attendingantenatal care
None
Vinter173 Randomised Trial Denmark 2007–10 High risk Women aged between18–40 years with apre-pregnancy weight ofbetween 30 and 45 kg/m2
Women with chronic medicaldisorders (hypertension, diabetes,alcohol or drug use) and seriousobstetric complication (multiplepregnancy, congenitalmalformation, miscarriage)
APPENDIX
5
NIH
RJournals
Library
www.jo
urnalslib
rary.nihr.ac.u
k
132
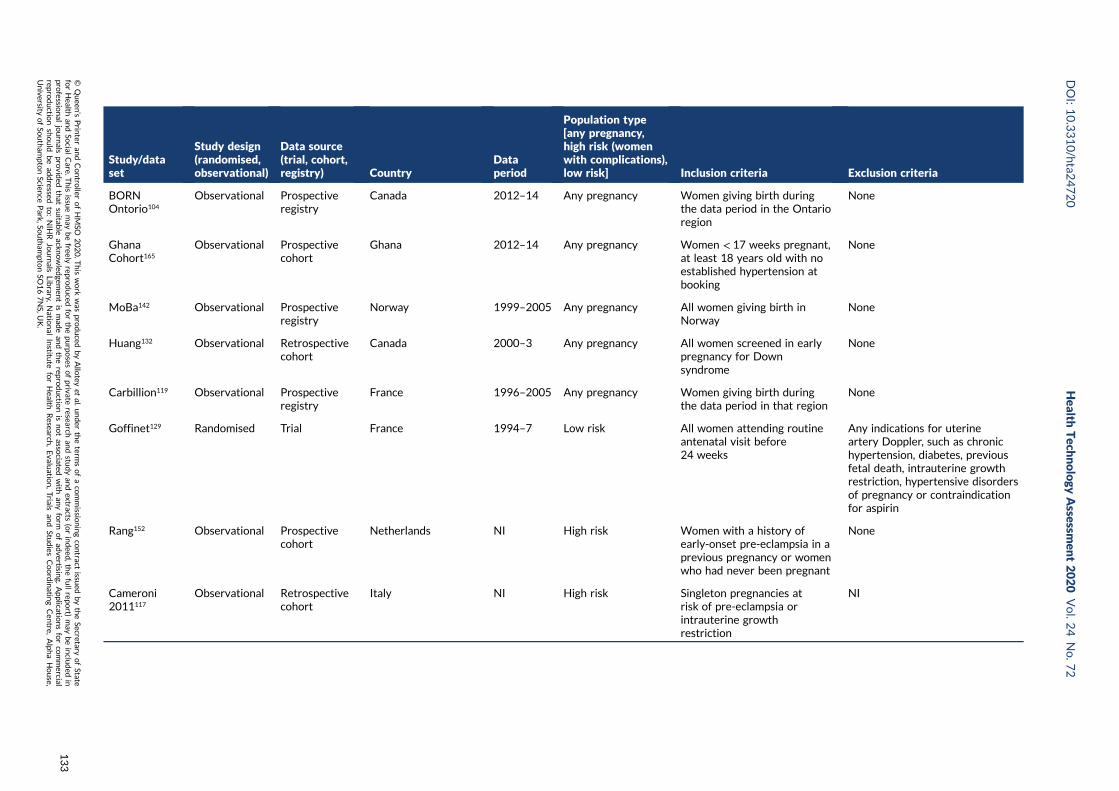
Study/dataset
Study design(randomised,observational)
Data source(trial, cohort,registry) Country
Dataperiod
Population type[any pregnancy,high risk (womenwith complications),low risk] Inclusion criteria Exclusion criteria
BORNOntorio104
Observational Prospectiveregistry
Canada 2012–14 Any pregnancy Women giving birth duringthe data period in the Ontarioregion
None
GhanaCohort165
Observational Prospectivecohort
Ghana 2012–14 Any pregnancy Women < 17 weeks pregnant,at least 18 years old with noestablished hypertension atbooking
None
MoBa142 Observational Prospectiveregistry
Norway 1999–2005 Any pregnancy All women giving birth inNorway
None
Huang132 Observational Retrospectivecohort
Canada 2000–3 Any pregnancy All women screened in earlypregnancy for Downsyndrome
None
Carbillion119 Observational Prospectiveregistry
France 1996–2005 Any pregnancy Women giving birth duringthe data period in that region
None
Goffinet129 Randomised Trial France 1994–7 Low risk All women attending routineantenatal visit before24 weeks
Any indications for uterineartery Doppler, such as chronichypertension, diabetes, previousfetal death, intrauterine growthrestriction, hypertensive disordersof pregnancy or contraindicationfor aspirin
Rang152 Observational Prospectivecohort
Netherlands NI High risk Women with a history ofearly-onset pre-eclampsia in aprevious pregnancy or womenwho had never been pregnant
None
Cameroni2011117
Observational Retrospectivecohort
Italy NI High risk Singleton pregnancies atrisk of pre-eclampsia orintrauterine growthrestriction
NI
DOI:10.3310/hta2
4720
Health
Tech
nology
Assessm
ent2020
Vol.2
4No.7
2
©Queen
’sPrin
teran
dContro
llerofHMSO
2020.T
his
work
was
produced
byAllo
teyet
al.under
theterm
sofaco
mmissio
ningco
ntract
issued
bytheSecretary
ofState
forHealth
andSo
cialCare.T
his
issuemay
befreely
reproduced
forthepu
rposes
ofprivate
researchan
dstu
dyan
dextracts
(orindeed
,thefullrepo
rt)may
beinclu
ded
inpro
fessional
journals
provid
edthat
suitab
leackn
owled
gemen
tis
mad
ean
dtherepro
ductio
nis
notasso
ciatedwith
anyform
ofad
vertising.
Applicatio
nsforco
mmercial
reproductio
nshould
bead
dressed
to:NIH
RJournals
Library,
Natio
nal
Institu
teforHealth
Research
,Evalu
ation,Trials
and
Studies
Coordinatin
gCen
tre,Alph
aHouse,
University
ofSo
utham
ptonScien
cePark,So
utham
ptonSO
167NS,U
K.
133

Study/dataset
Study design(randomised,observational)
Data source(trial, cohort,registry) Country
Dataperiod
Population type[any pregnancy,high risk (womenwith complications),low risk] Inclusion criteria Exclusion criteria
Conserva2012123
Observational Prospectivecohort
Italy 2001–8 High risk Women with previous adversepregnancy outcomes
Multiple gestation; a previousuneventful pregnancy; a previouspregnancy treated with low-molecular-weight heparin orunfractionated heparin; patientswith clinical immune disease andacquired thrombophilia − lupus-likeanticoagulant or APL syndrome;patients with positive antinuclear,antimitochondria, anti-smoothmuscle antibodies; postnatal orpostmortem diagnosis ofcongenital fetal anomaly or fetalinfection; women of non-Caucasianethnicity; alcohol or illicit drug use;early pregnancy loss was notconsidered an abnormal pregnancyoutcome
Facchinetti124 Observational Prospectivecohort
Italy 2001–6 High risk Previous singleton pregnanciescomplicated by pre-eclampsiaand received evaluation forthrombophilia
History of thromboembolicdiseases, renal and/orcardiovascular disorder, systemiclupus erythematosus, diabetesand any ethnic group otherthan white
Ferrazzani158 Observational Prospectivecohort
Italy 1990–2001 High risk Previous severe pretermpre-eclampsia
Previous HELLP syndrome
Figueiró-Filho125
Observational Prospectivecase–controlcohort
Brazil 2007–10 High risk Women with severepre-eclampsia in previouspregnancies
Antiphospholipid antibodies andthrombophilia
APPENDIX
5
NIH
RJournals
Library
www.jo
urnalslib
rary.nihr.ac.u
k
134
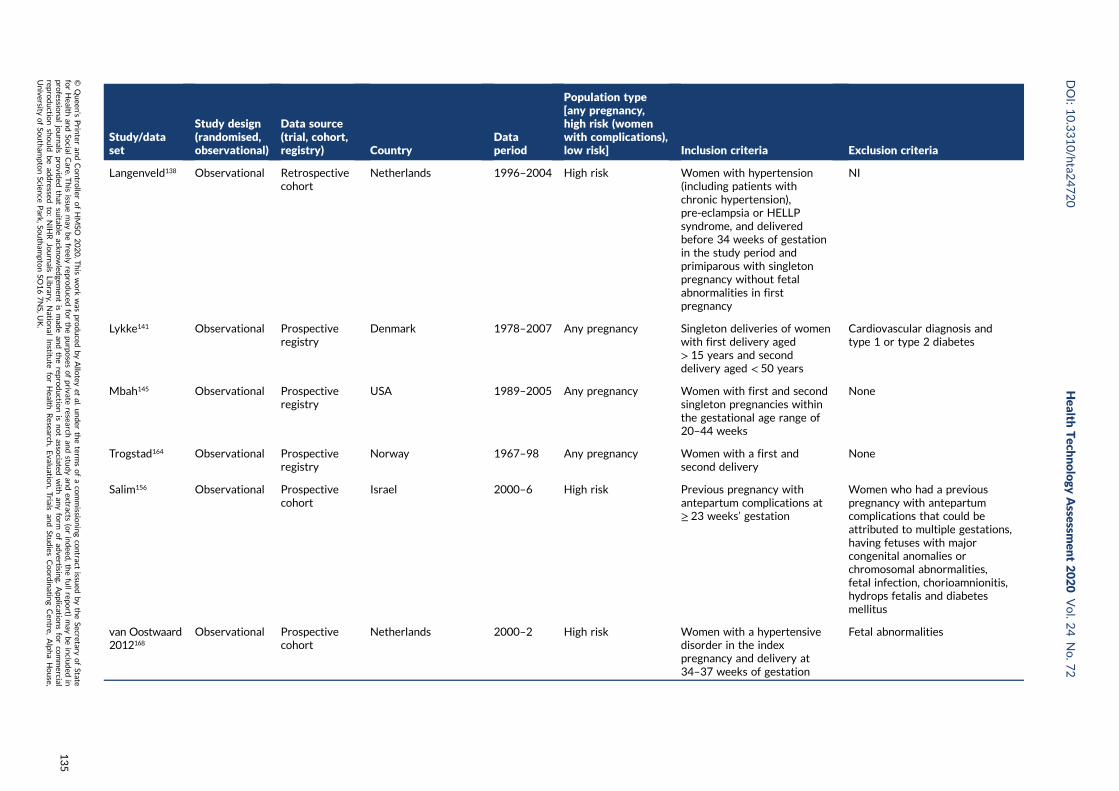
Study/dataset
Study design(randomised,observational)
Data source(trial, cohort,registry) Country
Dataperiod
Population type[any pregnancy,high risk (womenwith complications),low risk] Inclusion criteria Exclusion criteria
Langenveld138 Observational Retrospectivecohort
Netherlands 1996–2004 High risk Women with hypertension(including patients withchronic hypertension),pre-eclampsia or HELLPsyndrome, and deliveredbefore 34 weeks of gestationin the study period andprimiparous with singletonpregnancy without fetalabnormalities in firstpregnancy
NI
Lykke141 Observational Prospectiveregistry
Denmark 1978–2007 Any pregnancy Singleton deliveries of womenwith first delivery aged> 15 years and seconddelivery aged < 50 years
Cardiovascular diagnosis andtype 1 or type 2 diabetes
Mbah145 Observational Prospectiveregistry
USA 1989–2005 Any pregnancy Women with first and secondsingleton pregnancies withinthe gestational age range of20–44 weeks
None
Trogstad164 Observational Prospectiveregistry
Norway 1967–98 Any pregnancy Women with a first andsecond delivery
None
Salim156 Observational Prospectivecohort
Israel 2000–6 High risk Previous pregnancy withantepartum complications at≥ 23 weeks’ gestation
Women who had a previouspregnancy with antepartumcomplications that could beattributed to multiple gestations,having fetuses with majorcongenital anomalies orchromosomal abnormalities,fetal infection, chorioamnionitis,hydrops fetalis and diabetesmellitus
van Oostwaard2012168
Observational Prospectivecohort
Netherlands 2000–2 High risk Women with a hypertensivedisorder in the indexpregnancy and delivery at34–37 weeks of gestation
Fetal abnormalities
DOI:10.3310/hta2
4720
Health
Tech
nology
Assessm
ent2020
Vol.2
4No.7
2
©Queen
’sPrin
teran
dContro
llerofHMSO
2020.T
his
work
was
produced
byAllo
teyet
al.under
theterm
sofaco
mmissio
ningco
ntract
issued
bytheSecretary
ofState
forHealth
andSo
cialCare.T
his
issuemay
befreely
reproduced
forthepu
rposes
ofprivate
researchan
dstu
dyan
dextracts
(orindeed
,thefullrepo
rt)may
beinclu
ded
inpro
fessional
journals
provid
edthat
suitab
leackn
owled
gemen
tis
mad
ean
dtherepro
ductio
nis
notasso
ciatedwith
anyform
ofad
vertising.
Applicatio
nsforco
mmercial
reproductio
nshould
bead
dressed
to:NIH
RJournals
Library,
Natio
nal
Institu
teforHealth
Research
,Evalu
ation,Trials
and
Studies
Coordinatin
gCen
tre,Alph
aHouse,
University
ofSo
utham
ptonScien
cePark,So
utham
ptonSO
167NS,U
K.
135
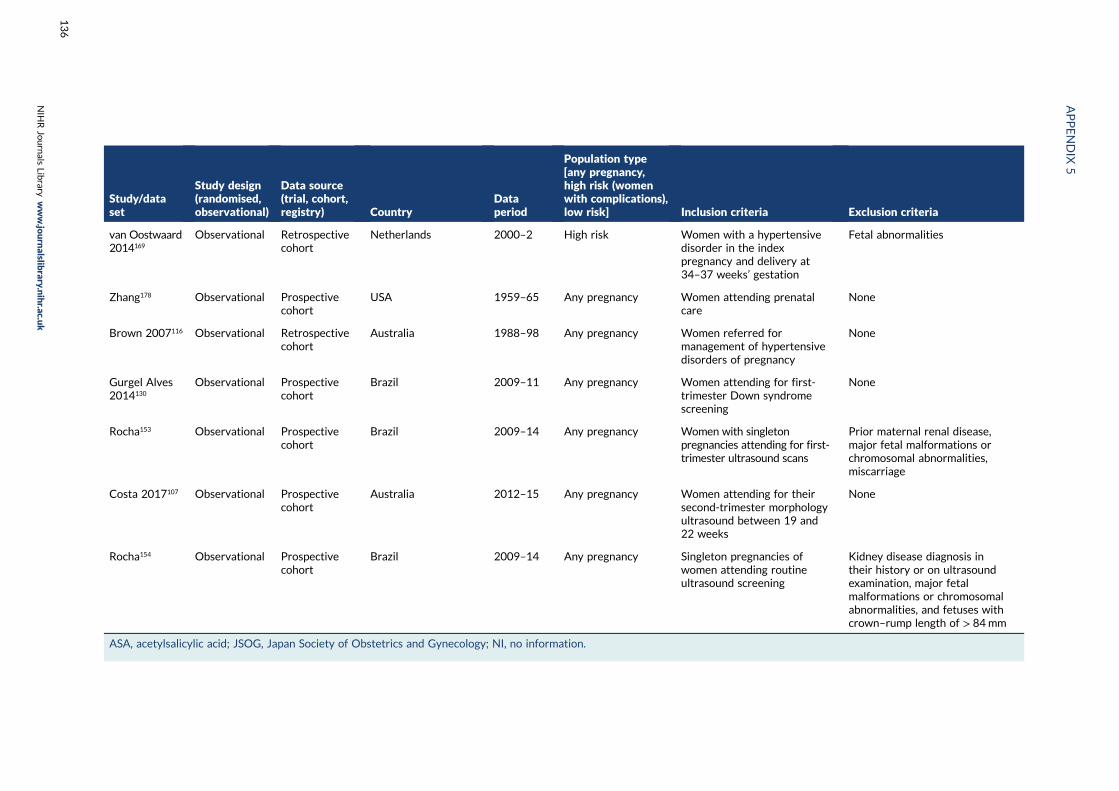
Study/dataset
Study design(randomised,observational)
Data source(trial, cohort,registry) Country
Dataperiod
Population type[any pregnancy,high risk (womenwith complications),low risk] Inclusion criteria Exclusion criteria
van Oostwaard2014169
Observational Retrospectivecohort
Netherlands 2000–2 High risk Women with a hypertensivedisorder in the indexpregnancy and delivery at34–37 weeks’ gestation
Fetal abnormalities
Zhang178 Observational Prospectivecohort
USA 1959–65 Any pregnancy Women attending prenatalcare
None
Brown 2007116 Observational Retrospectivecohort
Australia 1988–98 Any pregnancy Women referred formanagement of hypertensivedisorders of pregnancy
None
Gurgel Alves2014130
Observational Prospectivecohort
Brazil 2009–11 Any pregnancy Women attending for first-trimester Down syndromescreening
None
Rocha153 Observational Prospectivecohort
Brazil 2009–14 Any pregnancy Women with singletonpregnancies attending for first-trimester ultrasound scans
Prior maternal renal disease,major fetal malformations orchromosomal abnormalities,miscarriage
Costa 2017107 Observational Prospectivecohort
Australia 2012–15 Any pregnancy Women attending for theirsecond-trimester morphologyultrasound between 19 and22 weeks
None
Rocha154 Observational Prospectivecohort
Brazil 2009–14 Any pregnancy Singleton pregnancies ofwomen attending routineultrasound screening
Kidney disease diagnosis intheir history or on ultrasoundexamination, major fetalmalformations or chromosomalabnormalities, and fetuses withcrown–rump length of > 84mm
ASA, acetylsalicylic acid; JSOG, Japan Society of Obstetrics and Gynecology; NI, no information.
APPENDIX
5
NIH
RJournals
Library
www.jo
urnalslib
rary.nihr.ac.u
k
136

Appendix 6 Summary of missing data forprioritised predictors and each pre-eclampsiaoutcome for all pregnancies
DOI: 10.3310/hta24720 Health Technology Assessment 2020 Vol. 24 No. 72
© Queen’s Printer and Controller of HMSO 2020. This work was produced by Allotey et al. under the terms of a commissioning contract issued by the Secretary of Statefor Health and Social Care. This issue may be freely reproduced for the purposes of private research and study and extracts (or indeed, the full report) may be included inprofessional journals provided that suitable acknowledgement is made and the reproduction is not associated with any form of advertising. Applications for commercialreproduction should be addressed to: NIHR Journals Library, National Institute for Health Research, Evaluation, Trials and Studies Coordinating Centre, Alpha House,University of Southampton Science Park, Southampton SO16 7NS, UK.
137
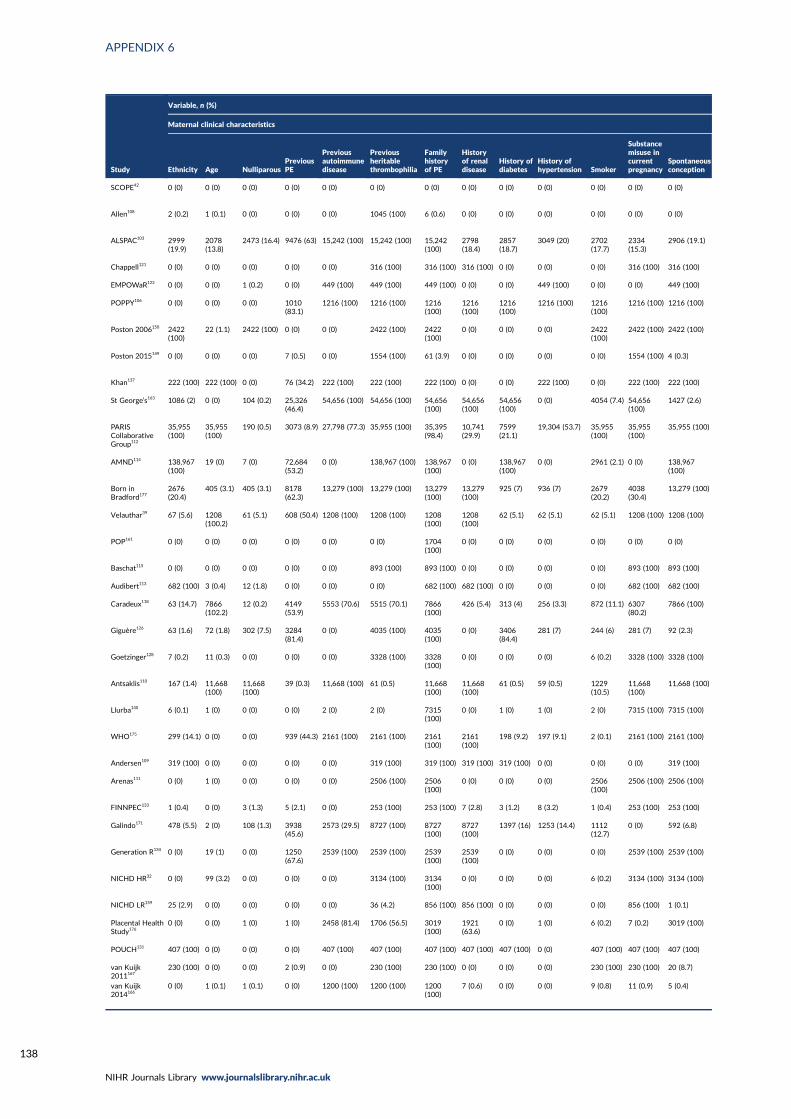
APPENDIX 6
NIHR Journals Library www.journalslibrary.nihr.ac.uk
138
Study
Variable, n (%)
Maternal clinical characteristics
Ethnicity Age NulliparousPreviousPE
Previousautoimmunedisease
Previousheritablethrombophilia
Familyhistoryof PE
Historyof renaldisease
History ofdiabetes
History ofhypertension Smoker
Substancemisuse incurrentpregnancy
Spontaneousconception
SCOPE42 0 (0) 0 (0) 0 (0) 0 (0) 0 (0) 0 (0) 0 (0) 0 (0) 0 (0) 0 (0) 0 (0) 0 (0) 0 (0)
Allen108 2 (0.2) 1 (0.1) 0 (0) 0 (0) 0 (0) 1045 (100) 6 (0.6) 0 (0) 0 (0) 0 (0) 0 (0) 0 (0) 0 (0)
ALSPAC103 2999(19.9)
2078(13.8)
2473 (16.4) 9476 (63) 15,242 (100) 15,242 (100) 15,242(100)
2798(18.4)
2857(18.7)
3049 (20) 2702(17.7)
2334(15.3)
2906 (19.1)
Chappell121 0 (0) 0 (0) 0 (0) 0 (0) 0 (0) 316 (100) 316 (100) 316 (100) 0 (0) 0 (0) 0 (0) 316 (100) 316 (100)
EMPOWaR122 0 (0) 0 (0) 1 (0.2) 0 (0) 449 (100) 449 (100) 449 (100) 0 (0) 0 (0) 449 (100) 0 (0) 0 (0) 449 (100)
POPPY106 0 (0) 0 (0) 0 (0) 1010(83.1)
1216 (100) 1216 (100) 1216(100)
1216(100)
1216(100)
1216 (100) 1216(100)
1216 (100) 1216 (100)
Poston 2006150 2422(100)
22 (1.1) 2422 (100) 0 (0) 0 (0) 2422 (100) 2422(100)
0 (0) 0 (0) 0 (0) 2422(100)
2422 (100) 2422 (100)
Poston 2015149 0 (0) 0 (0) 0 (0) 7 (0.5) 0 (0) 1554 (100) 61 (3.9) 0 (0) 0 (0) 0 (0) 0 (0) 1554 (100) 4 (0.3)
Khan137 222 (100) 222 (100) 0 (0) 76 (34.2) 222 (100) 222 (100) 222 (100) 0 (0) 0 (0) 222 (100) 0 (0) 222 (100) 222 (100)
St George’s163 1086 (2) 0 (0) 104 (0.2) 25,326(46.4)
54,656 (100) 54,656 (100) 54,656(100)
54,656(100)
54,656(100)
0 (0) 4054 (7.4) 54,656(100)
1427 (2.6)
PARISCollaborativeGroup112
35,955(100)
35,955(100)
190 (0.5) 3073 (8.9) 27,798 (77.3) 35,955 (100) 35,395(98.4)
10,741(29.9)
7599(21.1)
19,304 (53.7) 35,955(100)
35,955(100)
35,955 (100)
AMND114 138,967(100)
19 (0) 7 (0) 72,684(53.2)
0 (0) 138,967 (100) 138,967(100)
0 (0) 138,967(100)
0 (0) 2961 (2.1) 0 (0) 138,967(100)
Born inBradford177
2676(20.4)
405 (3.1) 405 (3.1) 8178(62.3)
13,279 (100) 13,279 (100) 13,279(100)
13,279(100)
925 (7) 936 (7) 2679(20.2)
4038(30.4)
13,279 (100)
Velauthar39 67 (5.6) 1208(100.2)
61 (5.1) 608 (50.4) 1208 (100) 1208 (100) 1208(100)
1208(100)
62 (5.1) 62 (5.1) 62 (5.1) 1208 (100) 1208 (100)
POP161 0 (0) 0 (0) 0 (0) 0 (0) 0 (0) 0 (0) 1704(100)
0 (0) 0 (0) 0 (0) 0 (0) 0 (0) 0 (0)
Baschat115 0 (0) 0 (0) 0 (0) 0 (0) 0 (0) 893 (100) 893 (100) 0 (0) 0 (0) 0 (0) 0 (0) 893 (100) 893 (100)
Audibert113 682 (100) 3 (0.4) 12 (1.8) 0 (0) 0 (0) 0 (0) 682 (100) 682 (100) 0 (0) 0 (0) 0 (0) 682 (100) 682 (100)
Caradeux118 63 (14.7) 7866(102.2)
12 (0.2) 4149(53.9)
5553 (70.6) 5515 (70.1) 7866(100)
426 (5.4) 313 (4) 256 (3.3) 872 (11.1) 6307(80.2)
7866 (100)
Giguère126 63 (1.6) 72 (1.8) 302 (7.5) 3284(81.4)
0 (0) 4035 (100) 4035(100)
0 (0) 3406(84.4)
281 (7) 244 (6) 281 (7) 92 (2.3)
Goetzinger128 7 (0.2) 11 (0.3) 0 (0) 0 (0) 0 (0) 3328 (100) 3328(100)
0 (0) 0 (0) 0 (0) 6 (0.2) 3328 (100) 3328 (100)
Antsaklis110 167 (1.4) 11,668(100)
11,668(100)
39 (0.3) 11,668 (100) 61 (0.5) 11,668(100)
11,668(100)
61 (0.5) 59 (0.5) 1229(10.5)
11,668(100)
11,668 (100)
Llurba140 6 (0.1) 1 (0) 0 (0) 0 (0) 2 (0) 2 (0) 7315(100)
0 (0) 1 (0) 1 (0) 2 (0) 7315 (100) 7315 (100)
WHO175 299 (14.1) 0 (0) 0 (0) 939 (44.3) 2161 (100) 2161 (100) 2161(100)
2161(100)
198 (9.2) 197 (9.1) 2 (0.1) 2161 (100) 2161 (100)
Andersen109 319 (100) 0 (0) 0 (0) 0 (0) 0 (0) 319 (100) 319 (100) 319 (100) 319 (100) 0 (0) 0 (0) 0 (0) 319 (100)
Arenas111 0 (0) 1 (0) 0 (0) 0 (0) 0 (0) 2506 (100) 2506(100)
0 (0) 0 (0) 0 (0) 2506(100)
2506 (100) 2506 (100)
FINNPEC133 1 (0.4) 0 (0) 3 (1.3) 5 (2.1) 0 (0) 253 (100) 253 (100) 7 (2.8) 3 (1.2) 8 (3.2) 1 (0.4) 253 (100) 253 (100)
Galindo171 478 (5.5) 2 (0) 108 (1.3) 3938(45.6)
2573 (29.5) 8727 (100) 8727(100)
8727(100)
1397 (16) 1253 (14.4) 1112(12.7)
0 (0) 592 (6.8)
Generation R134 0 (0) 19 (1) 0 (0) 1250(67.6)
2539 (100) 2539 (100) 2539(100)
2539(100)
0 (0) 0 (0) 0 (0) 2539 (100) 2539 (100)
NICHD HR32 0 (0) 99 (3.2) 0 (0) 0 (0) 0 (0) 3134 (100) 3134(100)
0 (0) 0 (0) 0 (0) 6 (0.2) 3134 (100) 3134 (100)
NICHD LR159 25 (2.9) 0 (0) 0 (0) 0 (0) 0 (0) 36 (4.2) 856 (100) 856 (100) 0 (0) 0 (0) 0 (0) 856 (100) 1 (0.1)
Placental HealthStudy176
0 (0) 0 (0) 1 (0) 1 (0) 2458 (81.4) 1706 (56.5) 3019(100)
1921(63.6)
0 (0) 1 (0) 6 (0.2) 7 (0.2) 3019 (100)
POUCH131 407 (100) 0 (0) 0 (0) 0 (0) 407 (100) 407 (100) 407 (100) 407 (100) 407 (100) 0 (0) 407 (100) 407 (100) 407 (100)
van Kuijk2011167
230 (100) 0 (0) 0 (0) 2 (0.9) 0 (0) 230 (100) 230 (100) 0 (0) 0 (0) 0 (0) 230 (100) 230 (100) 20 (8.7)
van Kuijk2014166
0 (0) 1 (0.1) 1 (0.1) 0 (0) 1200 (100) 1200 (100) 1200(100)
7 (0.6) 0 (0) 0 (0) 9 (0.8) 11 (0.9) 5 (0.4)
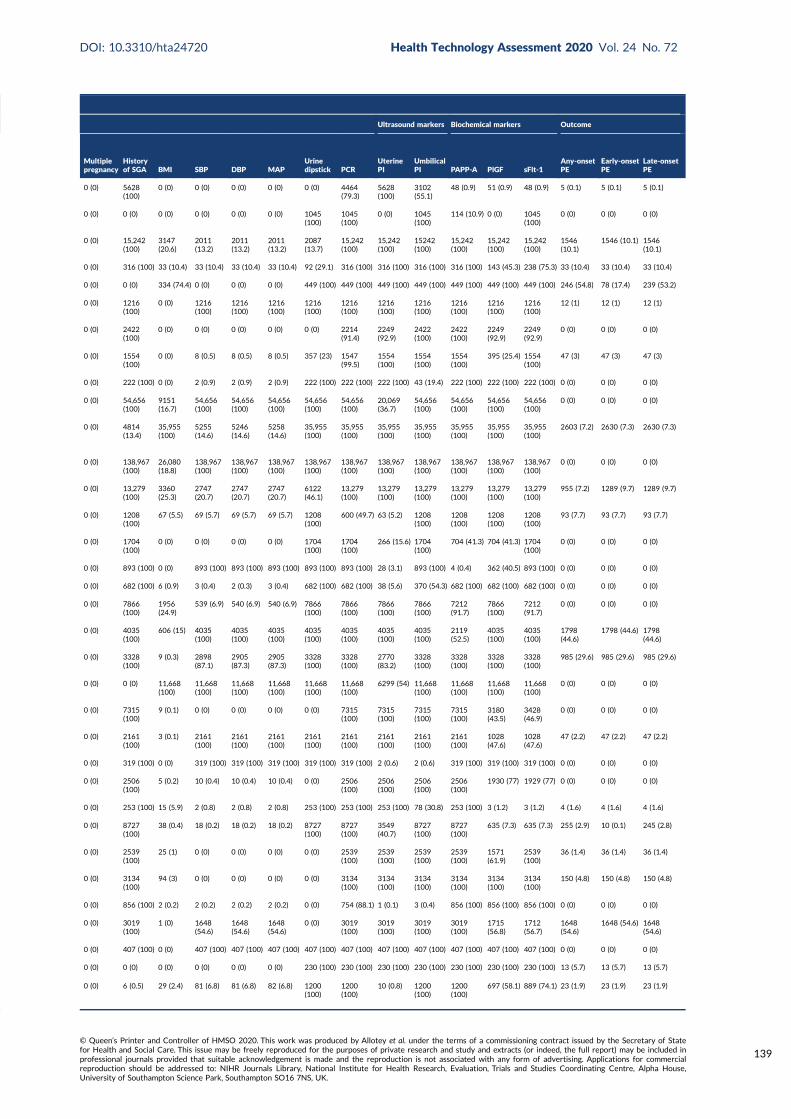
Ultrasound markers Biochemical markers Outcome
Multiplepregnancy
Historyof SGA BMI SBP DBP MAP
Urinedipstick PCR
UterinePI
UmbilicalPI PAPP-A PlGF sFlt-1
Any-onsetPE
Early-onsetPE
Late-onsetPE
0 (0) 5628(100)
0 (0) 0 (0) 0 (0) 0 (0) 0 (0) 4464(79.3)
5628(100)
3102(55.1)
48 (0.9) 51 (0.9) 48 (0.9) 5 (0.1) 5 (0.1) 5 (0.1)
0 (0) 0 (0) 0 (0) 0 (0) 0 (0) 0 (0) 1045(100)
1045(100)
0 (0) 1045(100)
114 (10.9) 0 (0) 1045(100)
0 (0) 0 (0) 0 (0)
0 (0) 15,242(100)
3147(20.6)
2011(13.2)
2011(13.2)
2011(13.2)
2087(13.7)
15,242(100)
15,242(100)
15242(100)
15,242(100)
15,242(100)
15,242(100)
1546(10.1)
1546 (10.1) 1546(10.1)
0 (0) 316 (100) 33 (10.4) 33 (10.4) 33 (10.4) 33 (10.4) 92 (29.1) 316 (100) 316 (100) 316 (100) 316 (100) 143 (45.3) 238 (75.3) 33 (10.4) 33 (10.4) 33 (10.4)
0 (0) 0 (0) 334 (74.4) 0 (0) 0 (0) 0 (0) 449 (100) 449 (100) 449 (100) 449 (100) 449 (100) 449 (100) 449 (100) 246 (54.8) 78 (17.4) 239 (53.2)
0 (0) 1216(100)
0 (0) 1216(100)
1216(100)
1216(100)
1216(100)
1216(100)
1216(100)
1216(100)
1216(100)
1216(100)
1216(100)
12 (1) 12 (1) 12 (1)
0 (0) 2422(100)
0 (0) 0 (0) 0 (0) 0 (0) 0 (0) 2214(91.4)
2249(92.9)
2422(100)
2422(100)
2249(92.9)
2249(92.9)
0 (0) 0 (0) 0 (0)
0 (0) 1554(100)
0 (0) 8 (0.5) 8 (0.5) 8 (0.5) 357 (23) 1547(99.5)
1554(100)
1554(100)
1554(100)
395 (25.4) 1554(100)
47 (3) 47 (3) 47 (3)
0 (0) 222 (100) 0 (0) 2 (0.9) 2 (0.9) 2 (0.9) 222 (100) 222 (100) 222 (100) 43 (19.4) 222 (100) 222 (100) 222 (100) 0 (0) 0 (0) 0 (0)
0 (0) 54,656(100)
9151(16.7)
54,656(100)
54,656(100)
54,656(100)
54,656(100)
54,656(100)
20,069(36.7)
54,656(100)
54,656(100)
54,656(100)
54,656(100)
0 (0) 0 (0) 0 (0)
0 (0) 4814(13.4)
35,955(100)
5255(14.6)
5246(14.6)
5258(14.6)
35,955(100)
35,955(100)
35,955(100)
35,955(100)
35,955(100)
35,955(100)
35,955(100)
2603 (7.2) 2630 (7.3) 2630 (7.3)
0 (0) 138,967(100)
26,080(18.8)
138,967(100)
138,967(100)
138,967(100)
138,967(100)
138,967(100)
138,967(100)
138,967(100)
138,967(100)
138,967(100)
138,967(100)
0 (0) 0 (0) 0 (0)
0 (0) 13,279(100)
3360(25.3)
2747(20.7)
2747(20.7)
2747(20.7)
6122(46.1)
13,279(100)
13,279(100)
13,279(100)
13,279(100)
13,279(100)
13,279(100)
955 (7.2) 1289 (9.7) 1289 (9.7)
0 (0) 1208(100)
67 (5.5) 69 (5.7) 69 (5.7) 69 (5.7) 1208(100)
600 (49.7) 63 (5.2) 1208(100)
1208(100)
1208(100)
1208(100)
93 (7.7) 93 (7.7) 93 (7.7)
0 (0) 1704(100)
0 (0) 0 (0) 0 (0) 0 (0) 1704(100)
1704(100)
266 (15.6) 1704(100)
704 (41.3) 704 (41.3) 1704(100)
0 (0) 0 (0) 0 (0)
0 (0) 893 (100) 0 (0) 893 (100) 893 (100) 893 (100) 893 (100) 893 (100) 28 (3.1) 893 (100) 4 (0.4) 362 (40.5) 893 (100) 0 (0) 0 (0) 0 (0)
0 (0) 682 (100) 6 (0.9) 3 (0.4) 2 (0.3) 3 (0.4) 682 (100) 682 (100) 38 (5.6) 370 (54.3) 682 (100) 682 (100) 682 (100) 0 (0) 0 (0) 0 (0)
0 (0) 7866(100)
1956(24.9)
539 (6.9) 540 (6.9) 540 (6.9) 7866(100)
7866(100)
7866(100)
7866(100)
7212(91.7)
7866(100)
7212(91.7)
0 (0) 0 (0) 0 (0)
0 (0) 4035(100)
606 (15) 4035(100)
4035(100)
4035(100)
4035(100)
4035(100)
4035(100)
4035(100)
2119(52.5)
4035(100)
4035(100)
1798(44.6)
1798 (44.6) 1798(44.6)
0 (0) 3328(100)
9 (0.3) 2898(87.1)
2905(87.3)
2905(87.3)
3328(100)
3328(100)
2770(83.2)
3328(100)
3328(100)
3328(100)
3328(100)
985 (29.6) 985 (29.6) 985 (29.6)
0 (0) 0 (0) 11,668(100)
11,668(100)
11,668(100)
11,668(100)
11,668(100)
11,668(100)
6299 (54) 11,668(100)
11,668(100)
11,668(100)
11,668(100)
0 (0) 0 (0) 0 (0)
0 (0) 7315(100)
9 (0.1) 0 (0) 0 (0) 0 (0) 0 (0) 7315(100)
7315(100)
7315(100)
7315(100)
3180(43.5)
3428(46.9)
0 (0) 0 (0) 0 (0)
0 (0) 2161(100)
3 (0.1) 2161(100)
2161(100)
2161(100)
2161(100)
2161(100)
2161(100)
2161(100)
2161(100)
1028(47.6)
1028(47.6)
47 (2.2) 47 (2.2) 47 (2.2)
0 (0) 319 (100) 0 (0) 319 (100) 319 (100) 319 (100) 319 (100) 319 (100) 2 (0.6) 2 (0.6) 319 (100) 319 (100) 319 (100) 0 (0) 0 (0) 0 (0)
0 (0) 2506(100)
5 (0.2) 10 (0.4) 10 (0.4) 10 (0.4) 0 (0) 2506(100)
2506(100)
2506(100)
2506(100)
1930 (77) 1929 (77) 0 (0) 0 (0) 0 (0)
0 (0) 253 (100) 15 (5.9) 2 (0.8) 2 (0.8) 2 (0.8) 253 (100) 253 (100) 253 (100) 78 (30.8) 253 (100) 3 (1.2) 3 (1.2) 4 (1.6) 4 (1.6) 4 (1.6)
0 (0) 8727(100)
38 (0.4) 18 (0.2) 18 (0.2) 18 (0.2) 8727(100)
8727(100)
3549(40.7)
8727(100)
8727(100)
635 (7.3) 635 (7.3) 255 (2.9) 10 (0.1) 245 (2.8)
0 (0) 2539(100)
25 (1) 0 (0) 0 (0) 0 (0) 0 (0) 2539(100)
2539(100)
2539(100)
2539(100)
1571(61.9)
2539(100)
36 (1.4) 36 (1.4) 36 (1.4)
0 (0) 3134(100)
94 (3) 0 (0) 0 (0) 0 (0) 0 (0) 3134(100)
3134(100)
3134(100)
3134(100)
3134(100)
3134(100)
150 (4.8) 150 (4.8) 150 (4.8)
0 (0) 856 (100) 2 (0.2) 2 (0.2) 2 (0.2) 2 (0.2) 0 (0) 754 (88.1) 1 (0.1) 3 (0.4) 856 (100) 856 (100) 856 (100) 0 (0) 0 (0) 0 (0)
0 (0) 3019(100)
1 (0) 1648(54.6)
1648(54.6)
1648(54.6)
0 (0) 3019(100)
3019(100)
3019(100)
3019(100)
1715(56.8)
1712(56.7)
1648(54.6)
1648 (54.6) 1648(54.6)
0 (0) 407 (100) 0 (0) 407 (100) 407 (100) 407 (100) 407 (100) 407 (100) 407 (100) 407 (100) 407 (100) 407 (100) 407 (100) 0 (0) 0 (0) 0 (0)
0 (0) 0 (0) 0 (0) 0 (0) 0 (0) 0 (0) 230 (100) 230 (100) 230 (100) 230 (100) 230 (100) 230 (100) 230 (100) 13 (5.7) 13 (5.7) 13 (5.7)
0 (0) 6 (0.5) 29 (2.4) 81 (6.8) 81 (6.8) 82 (6.8) 1200(100)
1200(100)
10 (0.8) 1200(100)
1200(100)
697 (58.1) 889 (74.1) 23 (1.9) 23 (1.9) 23 (1.9)
DOI: 10.3310/hta24720 Health Technology Assessment 2020 Vol. 24 No. 72
© Queen’s Printer and Controller of HMSO 2020. This work was produced by Allotey et al. under the terms of a commissioning contract issued by the Secretary of Statefor Health and Social Care. This issue may be freely reproduced for the purposes of private research and study and extracts (or indeed, the full report) may be included inprofessional journals provided that suitable acknowledgement is made and the reproduction is not associated with any form of advertising. Applications for commercialreproduction should be addressed to: NIHR Journals Library, National Institute for Health Research, Evaluation, Trials and Studies Coordinating Centre, Alpha House,University of Southampton Science Park, Southampton SO16 7NS, UK.
139
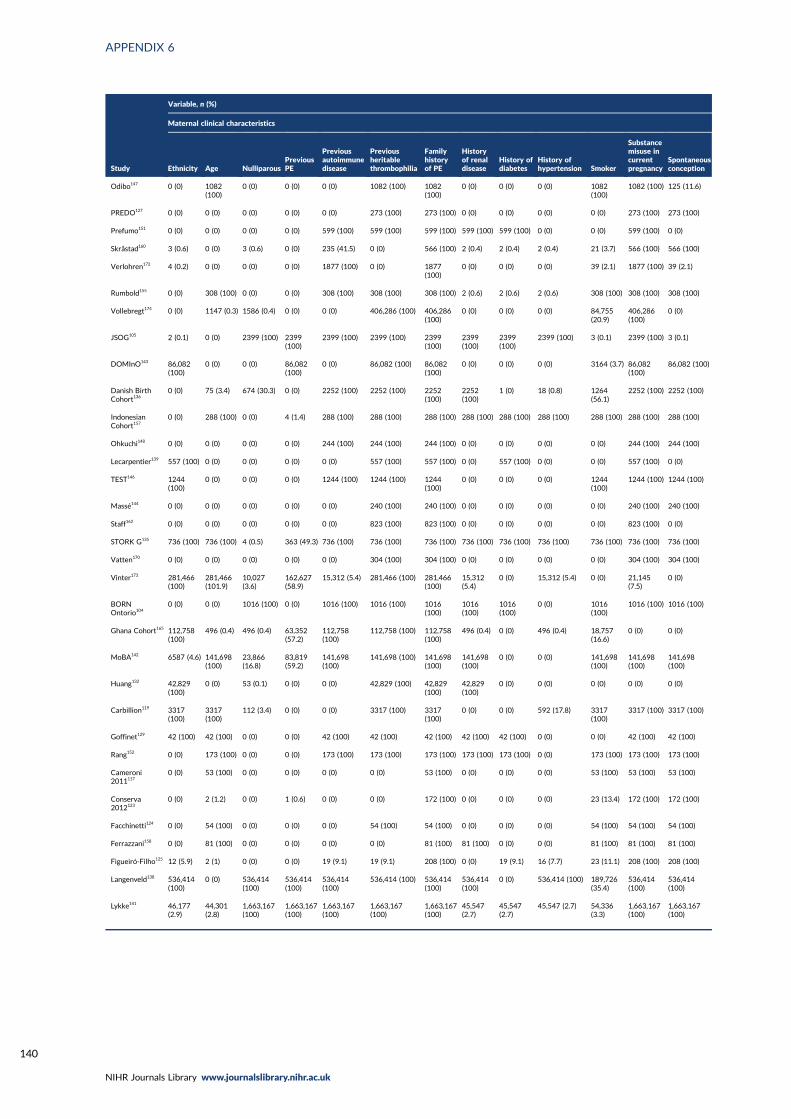
APPENDIX 6
NIHR Journals Library www.journalslibrary.nihr.ac.uk
140
Study
Variable, n (%)
Maternal clinical characteristics
Ethnicity Age NulliparousPreviousPE
Previousautoimmunedisease
Previousheritablethrombophilia
Familyhistoryof PE
Historyof renaldisease
History ofdiabetes
History ofhypertension Smoker
Substancemisuse incurrentpregnancy
Spontaneousconception
Odibo147 0 (0) 1082(100)
0 (0) 0 (0) 0 (0) 1082 (100) 1082(100)
0 (0) 0 (0) 0 (0) 1082(100)
1082 (100) 125 (11.6)
PREDO127 0 (0) 0 (0) 0 (0) 0 (0) 0 (0) 273 (100) 273 (100) 0 (0) 0 (0) 0 (0) 0 (0) 273 (100) 273 (100)
Prefumo151 0 (0) 0 (0) 0 (0) 0 (0) 599 (100) 599 (100) 599 (100) 599 (100) 599 (100) 0 (0) 0 (0) 599 (100) 0 (0)
Skråstad160 3 (0.6) 0 (0) 3 (0.6) 0 (0) 235 (41.5) 0 (0) 566 (100) 2 (0.4) 2 (0.4) 2 (0.4) 21 (3.7) 566 (100) 566 (100)
Verlohren172 4 (0.2) 0 (0) 0 (0) 0 (0) 1877 (100) 0 (0) 1877(100)
0 (0) 0 (0) 0 (0) 39 (2.1) 1877 (100) 39 (2.1)
Rumbold155 0 (0) 308 (100) 0 (0) 0 (0) 308 (100) 308 (100) 308 (100) 2 (0.6) 2 (0.6) 2 (0.6) 308 (100) 308 (100) 308 (100)
Vollebregt174 0 (0) 1147 (0.3) 1586 (0.4) 0 (0) 0 (0) 406,286 (100) 406,286(100)
0 (0) 0 (0) 0 (0) 84,755(20.9)
406,286(100)
0 (0)
JSOG105 2 (0.1) 0 (0) 2399 (100) 2399(100)
2399 (100) 2399 (100) 2399(100)
2399(100)
2399(100)
2399 (100) 3 (0.1) 2399 (100) 3 (0.1)
DOMInO143 86,082(100)
0 (0) 0 (0) 86,082(100)
0 (0) 86,082 (100) 86,082(100)
0 (0) 0 (0) 0 (0) 3164 (3.7) 86,082(100)
86,082 (100)
Danish BirthCohort136
0 (0) 75 (3.4) 674 (30.3) 0 (0) 2252 (100) 2252 (100) 2252(100)
2252(100)
1 (0) 18 (0.8) 1264(56.1)
2252 (100) 2252 (100)
IndonesianCohort157
0 (0) 288 (100) 0 (0) 4 (1.4) 288 (100) 288 (100) 288 (100) 288 (100) 288 (100) 288 (100) 288 (100) 288 (100) 288 (100)
Ohkuchi148 0 (0) 0 (0) 0 (0) 0 (0) 244 (100) 244 (100) 244 (100) 0 (0) 0 (0) 0 (0) 0 (0) 244 (100) 244 (100)
Lecarpentier139 557 (100) 0 (0) 0 (0) 0 (0) 0 (0) 557 (100) 557 (100) 0 (0) 557 (100) 0 (0) 0 (0) 557 (100) 0 (0)
TEST146 1244(100)
0 (0) 0 (0) 0 (0) 1244 (100) 1244 (100) 1244(100)
0 (0) 0 (0) 0 (0) 1244(100)
1244 (100) 1244 (100)
Massé144 0 (0) 0 (0) 0 (0) 0 (0) 0 (0) 240 (100) 240 (100) 0 (0) 0 (0) 0 (0) 0 (0) 240 (100) 240 (100)
Staff162 0 (0) 0 (0) 0 (0) 0 (0) 0 (0) 823 (100) 823 (100) 0 (0) 0 (0) 0 (0) 0 (0) 823 (100) 0 (0)
STORK G135 736 (100) 736 (100) 4 (0.5) 363 (49.3) 736 (100) 736 (100) 736 (100) 736 (100) 736 (100) 736 (100) 736 (100) 736 (100) 736 (100)
Vatten170 0 (0) 0 (0) 0 (0) 0 (0) 0 (0) 304 (100) 304 (100) 0 (0) 0 (0) 0 (0) 0 (0) 304 (100) 304 (100)
Vinter173 281,466(100)
281,466(101.9)
10,027(3.6)
162,627(58.9)
15,312 (5.4) 281,466 (100) 281,466(100)
15,312(5.4)
0 (0) 15,312 (5.4) 0 (0) 21,145(7.5)
0 (0)
BORNOntorio104
0 (0) 0 (0) 1016 (100) 0 (0) 1016 (100) 1016 (100) 1016(100)
1016(100)
1016(100)
0 (0) 1016(100)
1016 (100) 1016 (100)
Ghana Cohort165 112,758(100)
496 (0.4) 496 (0.4) 63,352(57.2)
112,758(100)
112,758 (100) 112,758(100)
496 (0.4) 0 (0) 496 (0.4) 18,757(16.6)
0 (0) 0 (0)
MoBA142 6587 (4.6) 141,698(100)
23,866(16.8)
83,819(59.2)
141,698(100)
141,698 (100) 141,698(100)
141,698(100)
0 (0) 0 (0) 141,698(100)
141,698(100)
141,698(100)
Huang132 42,829(100)
0 (0) 53 (0.1) 0 (0) 0 (0) 42,829 (100) 42,829(100)
42,829(100)
0 (0) 0 (0) 0 (0) 0 (0) 0 (0)
Carbillion119 3317(100)
3317(100)
112 (3.4) 0 (0) 0 (0) 3317 (100) 3317(100)
0 (0) 0 (0) 592 (17.8) 3317(100)
3317 (100) 3317 (100)
Goffinet129 42 (100) 42 (100) 0 (0) 0 (0) 42 (100) 42 (100) 42 (100) 42 (100) 42 (100) 0 (0) 0 (0) 42 (100) 42 (100)
Rang152 0 (0) 173 (100) 0 (0) 0 (0) 173 (100) 173 (100) 173 (100) 173 (100) 173 (100) 0 (0) 173 (100) 173 (100) 173 (100)
Cameroni2011117
0 (0) 53 (100) 0 (0) 0 (0) 0 (0) 0 (0) 53 (100) 0 (0) 0 (0) 0 (0) 53 (100) 53 (100) 53 (100)
Conserva2012123
0 (0) 2 (1.2) 0 (0) 1 (0.6) 0 (0) 0 (0) 172 (100) 0 (0) 0 (0) 0 (0) 23 (13.4) 172 (100) 172 (100)
Facchinetti124 0 (0) 54 (100) 0 (0) 0 (0) 0 (0) 54 (100) 54 (100) 0 (0) 0 (0) 0 (0) 54 (100) 54 (100) 54 (100)
Ferrazzani158 0 (0) 81 (100) 0 (0) 0 (0) 0 (0) 0 (0) 81 (100) 81 (100) 0 (0) 0 (0) 81 (100) 81 (100) 81 (100)
Figueiró-Filho125 12 (5.9) 2 (1) 0 (0) 0 (0) 19 (9.1) 19 (9.1) 208 (100) 0 (0) 19 (9.1) 16 (7.7) 23 (11.1) 208 (100) 208 (100)
Langenveld138 536,414(100)
0 (0) 536,414(100)
536,414(100)
536,414(100)
536,414 (100) 536,414(100)
536,414(100)
0 (0) 536,414 (100) 189,726(35.4)
536,414(100)
536,414(100)
Lykke141 46,177(2.9)
44,301(2.8)
1,663,167(100)
1,663,167(100)
1,663,167(100)
1,663,167(100)
1,663,167(100)
45,547(2.7)
45,547(2.7)
45,547 (2.7) 54,336(3.3)
1,663,167(100)
1,663,167(100)
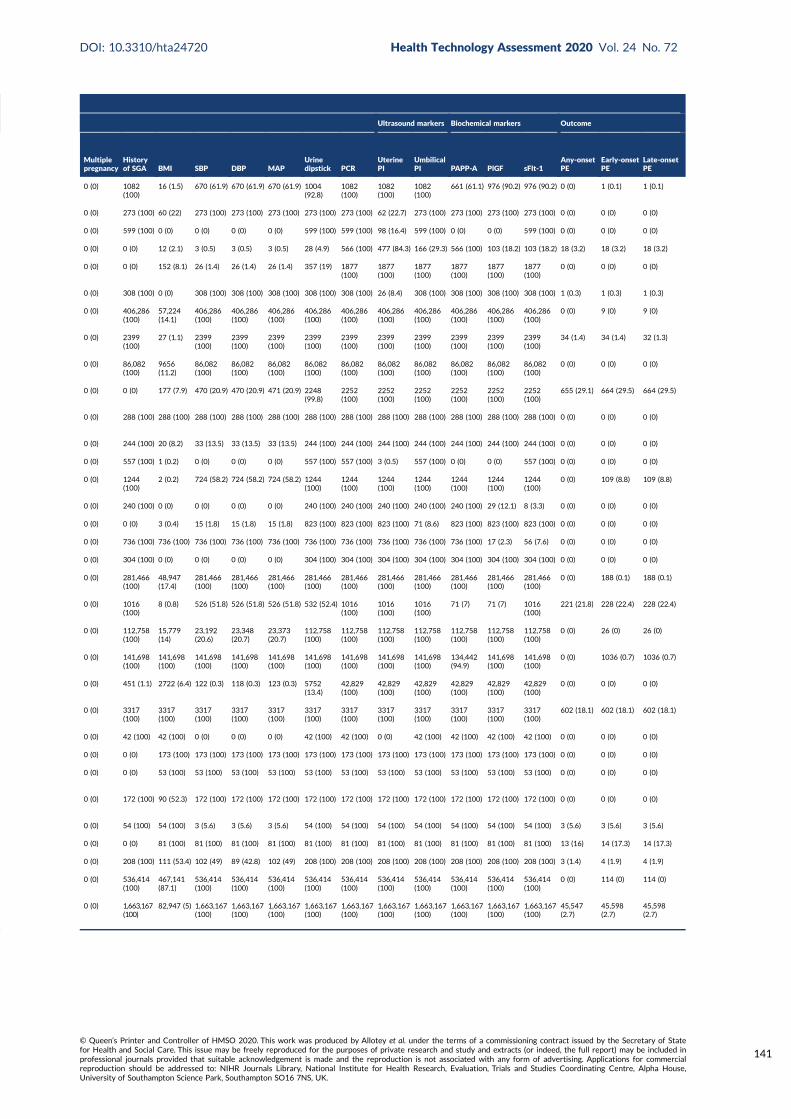
Ultrasound markers Biochemical markers Outcome
Multiplepregnancy
Historyof SGA BMI SBP DBP MAP
Urinedipstick PCR
UterinePI
UmbilicalPI PAPP-A PlGF sFlt-1
Any-onsetPE
Early-onsetPE
Late-onsetPE
0 (0) 1082(100)
16 (1.5) 670 (61.9) 670 (61.9) 670 (61.9) 1004(92.8)
1082(100)
1082(100)
1082(100)
661 (61.1) 976 (90.2) 976 (90.2) 0 (0) 1 (0.1) 1 (0.1)
0 (0) 273 (100) 60 (22) 273 (100) 273 (100) 273 (100) 273 (100) 273 (100) 62 (22.7) 273 (100) 273 (100) 273 (100) 273 (100) 0 (0) 0 (0) 0 (0)
0 (0) 599 (100) 0 (0) 0 (0) 0 (0) 0 (0) 599 (100) 599 (100) 98 (16.4) 599 (100) 0 (0) 0 (0) 599 (100) 0 (0) 0 (0) 0 (0)
0 (0) 0 (0) 12 (2.1) 3 (0.5) 3 (0.5) 3 (0.5) 28 (4.9) 566 (100) 477 (84.3) 166 (29.3) 566 (100) 103 (18.2) 103 (18.2) 18 (3.2) 18 (3.2) 18 (3.2)
0 (0) 0 (0) 152 (8.1) 26 (1.4) 26 (1.4) 26 (1.4) 357 (19) 1877(100)
1877(100)
1877(100)
1877(100)
1877(100)
1877(100)
0 (0) 0 (0) 0 (0)
0 (0) 308 (100) 0 (0) 308 (100) 308 (100) 308 (100) 308 (100) 308 (100) 26 (8.4) 308 (100) 308 (100) 308 (100) 308 (100) 1 (0.3) 1 (0.3) 1 (0.3)
0 (0) 406,286(100)
57,224(14.1)
406,286(100)
406,286(100)
406,286(100)
406,286(100)
406,286(100)
406,286(100)
406,286(100)
406,286(100)
406,286(100)
406,286(100)
0 (0) 9 (0) 9 (0)
0 (0) 2399(100)
27 (1.1) 2399(100)
2399(100)
2399(100)
2399(100)
2399(100)
2399(100)
2399(100)
2399(100)
2399(100)
2399(100)
34 (1.4) 34 (1.4) 32 (1.3)
0 (0) 86,082(100)
9656(11.2)
86,082(100)
86,082(100)
86,082(100)
86,082(100)
86,082(100)
86,082(100)
86,082(100)
86,082(100)
86,082(100)
86,082(100)
0 (0) 0 (0) 0 (0)
0 (0) 0 (0) 177 (7.9) 470 (20.9) 470 (20.9) 471 (20.9) 2248(99.8)
2252(100)
2252(100)
2252(100)
2252(100)
2252(100)
2252(100)
655 (29.1) 664 (29.5) 664 (29.5)
0 (0) 288 (100) 288 (100) 288 (100) 288 (100) 288 (100) 288 (100) 288 (100) 288 (100) 288 (100) 288 (100) 288 (100) 288 (100) 0 (0) 0 (0) 0 (0)
0 (0) 244 (100) 20 (8.2) 33 (13.5) 33 (13.5) 33 (13.5) 244 (100) 244 (100) 244 (100) 244 (100) 244 (100) 244 (100) 244 (100) 0 (0) 0 (0) 0 (0)
0 (0) 557 (100) 1 (0.2) 0 (0) 0 (0) 0 (0) 557 (100) 557 (100) 3 (0.5) 557 (100) 0 (0) 0 (0) 557 (100) 0 (0) 0 (0) 0 (0)
0 (0) 1244(100)
2 (0.2) 724 (58.2) 724 (58.2) 724 (58.2) 1244(100)
1244(100)
1244(100)
1244(100)
1244(100)
1244(100)
1244(100)
0 (0) 109 (8.8) 109 (8.8)
0 (0) 240 (100) 0 (0) 0 (0) 0 (0) 0 (0) 240 (100) 240 (100) 240 (100) 240 (100) 240 (100) 29 (12.1) 8 (3.3) 0 (0) 0 (0) 0 (0)
0 (0) 0 (0) 3 (0.4) 15 (1.8) 15 (1.8) 15 (1.8) 823 (100) 823 (100) 823 (100) 71 (8.6) 823 (100) 823 (100) 823 (100) 0 (0) 0 (0) 0 (0)
0 (0) 736 (100) 736 (100) 736 (100) 736 (100) 736 (100) 736 (100) 736 (100) 736 (100) 736 (100) 736 (100) 17 (2.3) 56 (7.6) 0 (0) 0 (0) 0 (0)
0 (0) 304 (100) 0 (0) 0 (0) 0 (0) 0 (0) 304 (100) 304 (100) 304 (100) 304 (100) 304 (100) 304 (100) 304 (100) 0 (0) 0 (0) 0 (0)
0 (0) 281,466(100)
48,947(17.4)
281,466(100)
281,466(100)
281,466(100)
281,466(100)
281,466(100)
281,466(100)
281,466(100)
281,466(100)
281,466(100)
281,466(100)
0 (0) 188 (0.1) 188 (0.1)
0 (0) 1016(100)
8 (0.8) 526 (51.8) 526 (51.8) 526 (51.8) 532 (52.4) 1016(100)
1016(100)
1016(100)
71 (7) 71 (7) 1016(100)
221 (21.8) 228 (22.4) 228 (22.4)
0 (0) 112,758(100)
15,779(14)
23,192(20.6)
23,348(20.7)
23,373(20.7)
112,758(100)
112,758(100)
112,758(100)
112,758(100)
112,758(100)
112,758(100)
112,758(100)
0 (0) 26 (0) 26 (0)
0 (0) 141,698(100)
141,698(100)
141,698(100)
141,698(100)
141,698(100)
141,698(100)
141,698(100)
141,698(100)
141,698(100)
134,442(94.9)
141,698(100)
141,698(100)
0 (0) 1036 (0.7) 1036 (0.7)
0 (0) 451 (1.1) 2722 (6.4) 122 (0.3) 118 (0.3) 123 (0.3) 5752(13.4)
42,829(100)
42,829(100)
42,829(100)
42,829(100)
42,829(100)
42,829(100)
0 (0) 0 (0) 0 (0)
0 (0) 3317(100)
3317(100)
3317(100)
3317(100)
3317(100)
3317(100)
3317(100)
3317(100)
3317(100)
3317(100)
3317(100)
3317(100)
602 (18.1) 602 (18.1) 602 (18.1)
0 (0) 42 (100) 42 (100) 0 (0) 0 (0) 0 (0) 42 (100) 42 (100) 0 (0) 42 (100) 42 (100) 42 (100) 42 (100) 0 (0) 0 (0) 0 (0)
0 (0) 0 (0) 173 (100) 173 (100) 173 (100) 173 (100) 173 (100) 173 (100) 173 (100) 173 (100) 173 (100) 173 (100) 173 (100) 0 (0) 0 (0) 0 (0)
0 (0) 0 (0) 53 (100) 53 (100) 53 (100) 53 (100) 53 (100) 53 (100) 53 (100) 53 (100) 53 (100) 53 (100) 53 (100) 0 (0) 0 (0) 0 (0)
0 (0) 172 (100) 90 (52.3) 172 (100) 172 (100) 172 (100) 172 (100) 172 (100) 172 (100) 172 (100) 172 (100) 172 (100) 172 (100) 0 (0) 0 (0) 0 (0)
0 (0) 54 (100) 54 (100) 3 (5.6) 3 (5.6) 3 (5.6) 54 (100) 54 (100) 54 (100) 54 (100) 54 (100) 54 (100) 54 (100) 3 (5.6) 3 (5.6) 3 (5.6)
0 (0) 0 (0) 81 (100) 81 (100) 81 (100) 81 (100) 81 (100) 81 (100) 81 (100) 81 (100) 81 (100) 81 (100) 81 (100) 13 (16) 14 (17.3) 14 (17.3)
0 (0) 208 (100) 111 (53.4) 102 (49) 89 (42.8) 102 (49) 208 (100) 208 (100) 208 (100) 208 (100) 208 (100) 208 (100) 208 (100) 3 (1.4) 4 (1.9) 4 (1.9)
0 (0) 536,414(100)
467,141(87.1)
536,414(100)
536,414(100)
536,414(100)
536,414(100)
536,414(100)
536,414(100)
536,414(100)
536,414(100)
536,414(100)
536,414(100)
0 (0) 114 (0) 114 (0)
0 (0) 1,663,167(100)
82,947 (5) 1,663,167(100)
1,663,167(100)
1,663,167(100)
1,663,167(100)
1,663,167(100)
1,663,167(100)
1,663,167(100)
1,663,167(100)
1,663,167(100)
1,663,167(100)
45,547(2.7)
45,598(2.7)
45,598(2.7)
DOI: 10.3310/hta24720 Health Technology Assessment 2020 Vol. 24 No. 72
© Queen’s Printer and Controller of HMSO 2020. This work was produced by Allotey et al. under the terms of a commissioning contract issued by the Secretary of Statefor Health and Social Care. This issue may be freely reproduced for the purposes of private research and study and extracts (or indeed, the full report) may be included inprofessional journals provided that suitable acknowledgement is made and the reproduction is not associated with any form of advertising. Applications for commercialreproduction should be addressed to: NIHR Journals Library, National Institute for Health Research, Evaluation, Trials and Studies Coordinating Centre, Alpha House,University of Southampton Science Park, Southampton SO16 7NS, UK.
141
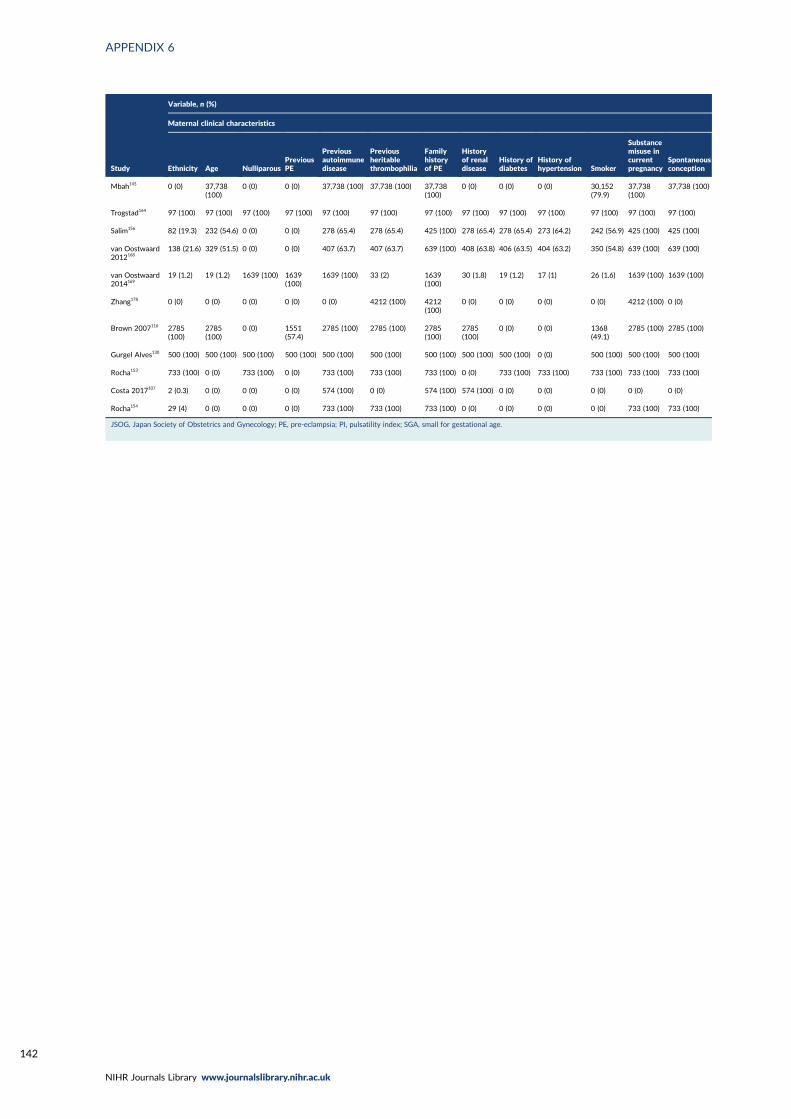
APPENDIX 6
NIHR Journals Library www.journalslibrary.nihr.ac.uk
142
Study
Variable, n (%)
Maternal clinical characteristics
Ethnicity Age NulliparousPreviousPE
Previousautoimmunedisease
Previousheritablethrombophilia
Familyhistoryof PE
Historyof renaldisease
History ofdiabetes
History ofhypertension Smoker
Substancemisuse incurrentpregnancy
Spontaneousconception
Mbah145 0 (0) 37,738(100)
0 (0) 0 (0) 37,738 (100) 37,738 (100) 37,738(100)
0 (0) 0 (0) 0 (0) 30,152(79.9)
37,738(100)
37,738 (100)
Trogstad164 97 (100) 97 (100) 97 (100) 97 (100) 97 (100) 97 (100) 97 (100) 97 (100) 97 (100) 97 (100) 97 (100) 97 (100) 97 (100)
Salim156 82 (19.3) 232 (54.6) 0 (0) 0 (0) 278 (65.4) 278 (65.4) 425 (100) 278 (65.4) 278 (65.4) 273 (64.2) 242 (56.9) 425 (100) 425 (100)
van Oostwaard2012168
138 (21.6) 329 (51.5) 0 (0) 0 (0) 407 (63.7) 407 (63.7) 639 (100) 408 (63.8) 406 (63.5) 404 (63.2) 350 (54.8) 639 (100) 639 (100)
van Oostwaard2014169
19 (1.2) 19 (1.2) 1639 (100) 1639(100)
1639 (100) 33 (2) 1639(100)
30 (1.8) 19 (1.2) 17 (1) 26 (1.6) 1639 (100) 1639 (100)
Zhang178 0 (0) 0 (0) 0 (0) 0 (0) 0 (0) 4212 (100) 4212(100)
0 (0) 0 (0) 0 (0) 0 (0) 4212 (100) 0 (0)
Brown 2007116 2785(100)
2785(100)
0 (0) 1551(57.4)
2785 (100) 2785 (100) 2785(100)
2785(100)
0 (0) 0 (0) 1368(49.1)
2785 (100) 2785 (100)
Gurgel Alves130 500 (100) 500 (100) 500 (100) 500 (100) 500 (100) 500 (100) 500 (100) 500 (100) 500 (100) 0 (0) 500 (100) 500 (100) 500 (100)
Rocha153 733 (100) 0 (0) 733 (100) 0 (0) 733 (100) 733 (100) 733 (100) 0 (0) 733 (100) 733 (100) 733 (100) 733 (100) 733 (100)
Costa 2017107 2 (0.3) 0 (0) 0 (0) 0 (0) 574 (100) 0 (0) 574 (100) 574 (100) 0 (0) 0 (0) 0 (0) 0 (0) 0 (0)
Rocha154 29 (4) 0 (0) 0 (0) 0 (0) 733 (100) 733 (100) 733 (100) 0 (0) 0 (0) 0 (0) 0 (0) 733 (100) 733 (100)
JSOG, Japan Society of Obstetrics and Gynecology; PE, pre-eclampsia; PI, pulsatility index; SGA, small for gestational age.
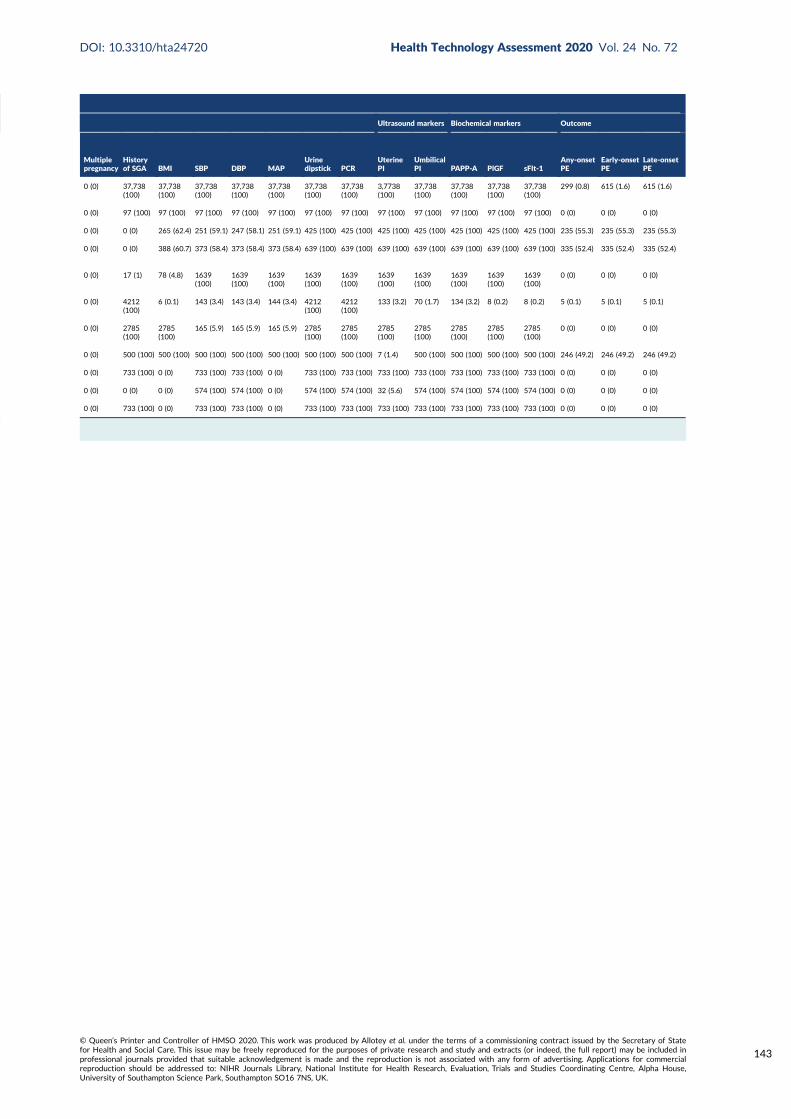
Ultrasound markers Biochemical markers Outcome
Multiplepregnancy
Historyof SGA BMI SBP DBP MAP
Urinedipstick PCR
UterinePI
UmbilicalPI PAPP-A PlGF sFlt-1
Any-onsetPE
Early-onsetPE
Late-onsetPE
0 (0) 37,738(100)
37,738(100)
37,738(100)
37,738(100)
37,738(100)
37,738(100)
37,738(100)
3,7738(100)
37,738(100)
37,738(100)
37,738(100)
37,738(100)
299 (0.8) 615 (1.6) 615 (1.6)
0 (0) 97 (100) 97 (100) 97 (100) 97 (100) 97 (100) 97 (100) 97 (100) 97 (100) 97 (100) 97 (100) 97 (100) 97 (100) 0 (0) 0 (0) 0 (0)
0 (0) 0 (0) 265 (62.4) 251 (59.1) 247 (58.1) 251 (59.1) 425 (100) 425 (100) 425 (100) 425 (100) 425 (100) 425 (100) 425 (100) 235 (55.3) 235 (55.3) 235 (55.3)
0 (0) 0 (0) 388 (60.7) 373 (58.4) 373 (58.4) 373 (58.4) 639 (100) 639 (100) 639 (100) 639 (100) 639 (100) 639 (100) 639 (100) 335 (52.4) 335 (52.4) 335 (52.4)
0 (0) 17 (1) 78 (4.8) 1639(100)
1639(100)
1639(100)
1639(100)
1639(100)
1639(100)
1639(100)
1639(100)
1639(100)
1639(100)
0 (0) 0 (0) 0 (0)
0 (0) 4212(100)
6 (0.1) 143 (3.4) 143 (3.4) 144 (3.4) 4212(100)
4212(100)
133 (3.2) 70 (1.7) 134 (3.2) 8 (0.2) 8 (0.2) 5 (0.1) 5 (0.1) 5 (0.1)
0 (0) 2785(100)
2785(100)
165 (5.9) 165 (5.9) 165 (5.9) 2785(100)
2785(100)
2785(100)
2785(100)
2785(100)
2785(100)
2785(100)
0 (0) 0 (0) 0 (0)
0 (0) 500 (100) 500 (100) 500 (100) 500 (100) 500 (100) 500 (100) 500 (100) 7 (1.4) 500 (100) 500 (100) 500 (100) 500 (100) 246 (49.2) 246 (49.2) 246 (49.2)
0 (0) 733 (100) 0 (0) 733 (100) 733 (100) 0 (0) 733 (100) 733 (100) 733 (100) 733 (100) 733 (100) 733 (100) 733 (100) 0 (0) 0 (0) 0 (0)
0 (0) 0 (0) 0 (0) 574 (100) 574 (100) 0 (0) 574 (100) 574 (100) 32 (5.6) 574 (100) 574 (100) 574 (100) 574 (100) 0 (0) 0 (0) 0 (0)
0 (0) 733 (100) 0 (0) 733 (100) 733 (100) 0 (0) 733 (100) 733 (100) 733 (100) 733 (100) 733 (100) 733 (100) 733 (100) 0 (0) 0 (0) 0 (0)
DOI: 10.3310/hta24720 Health Technology Assessment 2020 Vol. 24 No. 72
© Queen’s Printer and Controller of HMSO 2020. This work was produced by Allotey et al. under the terms of a commissioning contract issued by the Secretary of Statefor Health and Social Care. This issue may be freely reproduced for the purposes of private research and study and extracts (or indeed, the full report) may be included inprofessional journals provided that suitable acknowledgement is made and the reproduction is not associated with any form of advertising. Applications for commercialreproduction should be addressed to: NIHR Journals Library, National Institute for Health Research, Evaluation, Trials and Studies Coordinating Centre, Alpha House,University of Southampton Science Park, Southampton SO16 7NS, UK.
143

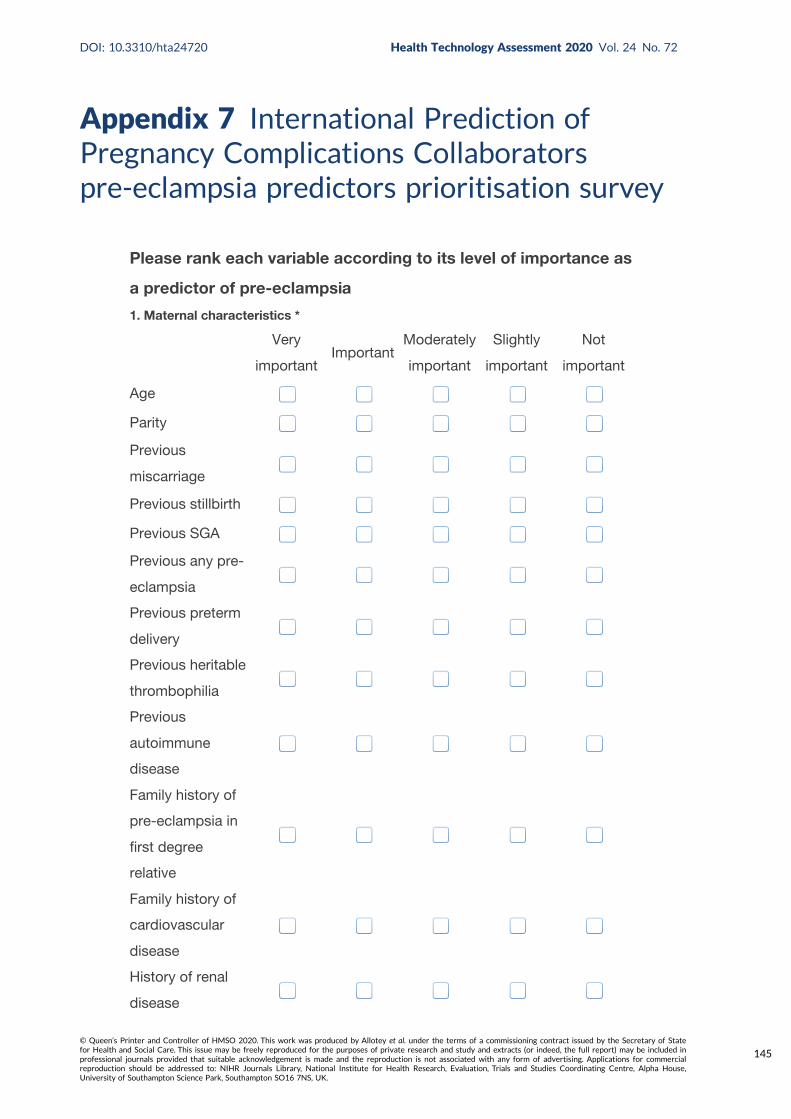
Appendix 7 International Prediction ofPregnancy Complications Collaboratorspre-eclampsia predictors prioritisation survey
Please rank each variable according to its level of importance as
a predictor of pre-eclampsia
1. Maternal characteristics *
Very
importantImportant
Moderately
important
Slightly
important
Not
important
Age
Parity
Previous
miscarriage
Previous stillbirth
Previous SGA
Previous any pre-
eclampsia
Previous preterm
delivery
Previous heritable
thrombophilia
Previous
autoimmune
disease
Family history of
pre-eclampsia in
first degree
relative
Family history of
cardiovascular
disease
History of renal
disease
DOI: 10.3310/hta24720 Health Technology Assessment 2020 Vol. 24 No. 72
© Queen’s Printer and Controller of HMSO 2020. This work was produced by Allotey et al. under the terms of a commissioning contract issued by the Secretary of Statefor Health and Social Care. This issue may be freely reproduced for the purposes of private research and study and extracts (or indeed, the full report) may be included inprofessional journals provided that suitable acknowledgement is made and the reproduction is not associated with any form of advertising. Applications for commercialreproduction should be addressed to: NIHR Journals Library, National Institute for Health Research, Evaluation, Trials and Studies Coordinating Centre, Alpha House,University of Southampton Science Park, Southampton SO16 7NS, UK.
145

Chronic or pre-
existing
hypertension
History of pre-
existing diabetes
Previous history
of gestational
diabetes (GDM)
Gestational
diabetes (GDM) in
current
pregnancy
History of early
pregnancy
bleeding in
current
pregnancy
Multiple
pregnancy
Interval between
pregnancies
Mode of
conception
Smoking
Alcohol use
Substance
misuse in current
pregnancy
Socioeconomic
status
New partner
APPENDIX 7
NIHR Journals Library www.journalslibrary.nihr.ac.uk
146
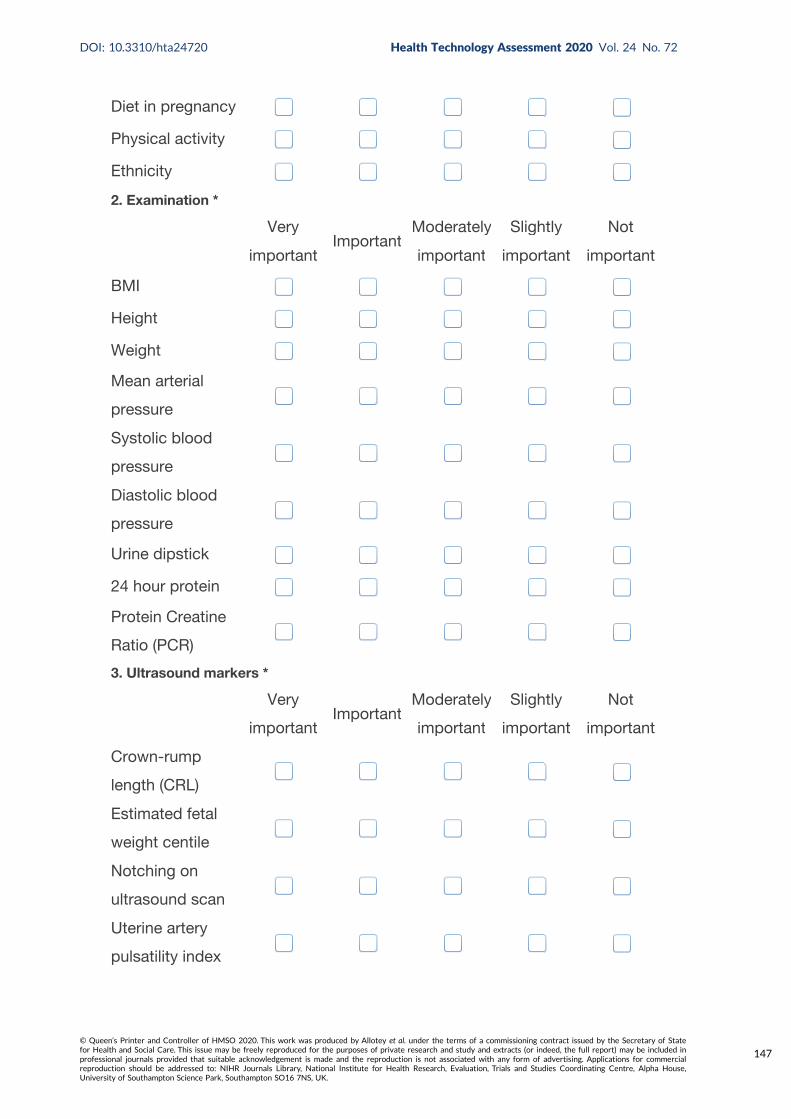
Diet in pregnancy
Physical activity
Ethnicity
2. Examination *
Very
importantImportant
Moderately
important
Slightly
important
Not
important
BMI
Height
Weight
Mean arterial
pressure
Systolic blood
pressure
Diastolic blood
pressure
Urine dipstick
24 hour protein
Protein Creatine
Ratio (PCR)
3. Ultrasound markers *
Very
importantImportant
Moderately
important
Slightly
important
Not
important
Crown-rump
length (CRL)
Estimated fetal
weight centile
Notching on
ultrasound scan
Uterine artery
pulsatility index
Very
portantImportant
Moderately
important
Slightly
important
Not
importa
Very
portantImportant
Moderately
important
Slightly
important
Not
importa
DOI: 10.3310/hta24720 Health Technology Assessment 2020 Vol. 24 No. 72
© Queen’s Printer and Controller of HMSO 2020. This work was produced by Allotey et al. under the terms of a commissioning contract issued by the Secretary of Statefor Health and Social Care. This issue may be freely reproduced for the purposes of private research and study and extracts (or indeed, the full report) may be included inprofessional journals provided that suitable acknowledgement is made and the reproduction is not associated with any form of advertising. Applications for commercialreproduction should be addressed to: NIHR Journals Library, National Institute for Health Research, Evaluation, Trials and Studies Coordinating Centre, Alpha House,University of Southampton Science Park, Southampton SO16 7NS, UK.
147
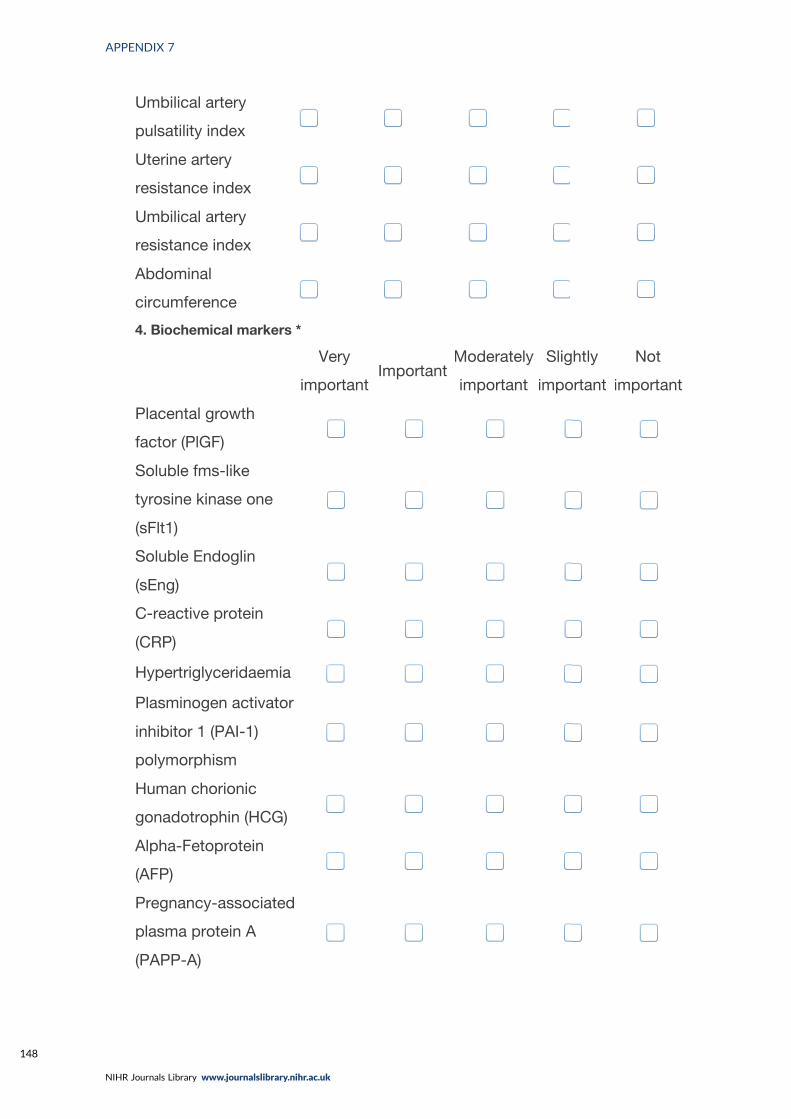
Umbilical artery
pulsatility index
Uterine artery
resistance index
Umbilical artery
resistance index
Abdominal
circumference
4. Biochemical markers *
Very
importantImportant
Moderately
important
Slightly
important
Not
important
Placental growth
factor (PlGF)
Soluble fms-like
tyrosine kinase one
(sFlt1)
Soluble Endoglin
(sEng)
C-reactive protein
(CRP)
Hypertriglyceridaemia
Plasminogen activator
inhibitor 1 (PAI-1)
polymorphism
Human chorionic
gonadotrophin (HCG)
Alpha-Fetoprotein
(AFP)
Pregnancy-associated
plasma protein A
(PAPP-A)
*
Very
importantImportant
Moderately
important
Slightly
important
Not
importa
APPENDIX 7
NIHR Journals Library www.journalslibrary.nihr.ac.uk
148

5. Please suggest any other predictor not listed which you think might be important
to consider.
DOI: 10.3310/hta24720 Health Technology Assessment 2020 Vol. 24 No. 72
© Queen’s Printer and Controller of HMSO 2020. This work was produced by Allotey et al. under the terms of a commissioning contract issued by the Secretary of Statefor Health and Social Care. This issue may be freely reproduced for the purposes of private research and study and extracts (or indeed, the full report) may be included inprofessional journals provided that suitable acknowledgement is made and the reproduction is not associated with any form of advertising. Applications for commercialreproduction should be addressed to: NIHR Journals Library, National Institute for Health Research, Evaluation, Trials and Studies Coordinating Centre, Alpha House,University of Southampton Science Park, Southampton SO16 7NS, UK.
149

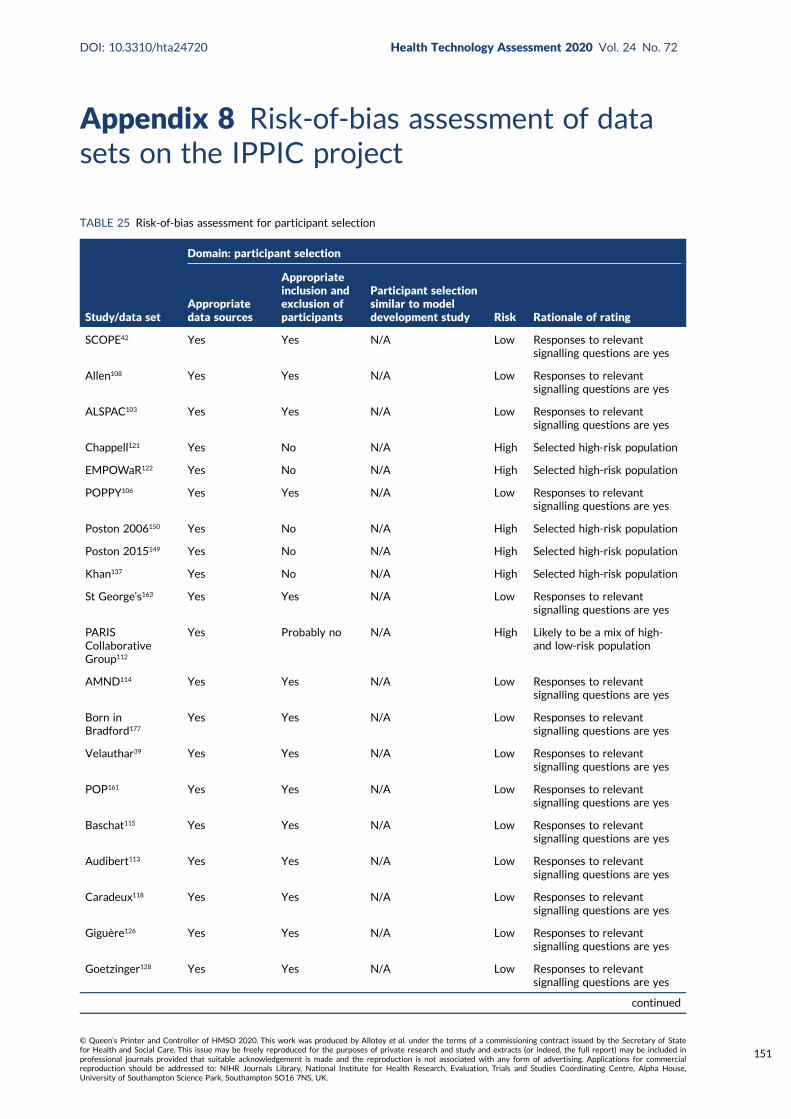
Appendix 8 Risk-of-bias assessment of datasets on the IPPIC project
TABLE 25 Risk-of-bias assessment for participant selection
Study/data set
Domain: participant selection
Appropriatedata sources
Appropriateinclusion andexclusion ofparticipants
Participant selectionsimilar to modeldevelopment study Risk Rationale of rating
SCOPE42 Yes Yes N/A Low Responses to relevantsignalling questions are yes
Allen108 Yes Yes N/A Low Responses to relevantsignalling questions are yes
ALSPAC103 Yes Yes N/A Low Responses to relevantsignalling questions are yes
Chappell121 Yes No N/A High Selected high-risk population
EMPOWaR122 Yes No N/A High Selected high-risk population
POPPY106 Yes Yes N/A Low Responses to relevantsignalling questions are yes
Poston 2006150 Yes No N/A High Selected high-risk population
Poston 2015149 Yes No N/A High Selected high-risk population
Khan137 Yes No N/A High Selected high-risk population
St George’s163 Yes Yes N/A Low Responses to relevantsignalling questions are yes
PARISCollaborativeGroup112
Yes Probably no N/A High Likely to be a mix of high-and low-risk population
AMND114 Yes Yes N/A Low Responses to relevantsignalling questions are yes
Born inBradford177
Yes Yes N/A Low Responses to relevantsignalling questions are yes
Velauthar39 Yes Yes N/A Low Responses to relevantsignalling questions are yes
POP161 Yes Yes N/A Low Responses to relevantsignalling questions are yes
Baschat115 Yes Yes N/A Low Responses to relevantsignalling questions are yes
Audibert113 Yes Yes N/A Low Responses to relevantsignalling questions are yes
Caradeux118 Yes Yes N/A Low Responses to relevantsignalling questions are yes
Giguère126 Yes Yes N/A Low Responses to relevantsignalling questions are yes
Goetzinger128 Yes Yes N/A Low Responses to relevantsignalling questions are yes
continued
DOI: 10.3310/hta24720 Health Technology Assessment 2020 Vol. 24 No. 72
© Queen’s Printer and Controller of HMSO 2020. This work was produced by Allotey et al. under the terms of a commissioning contract issued by the Secretary of Statefor Health and Social Care. This issue may be freely reproduced for the purposes of private research and study and extracts (or indeed, the full report) may be included inprofessional journals provided that suitable acknowledgement is made and the reproduction is not associated with any form of advertising. Applications for commercialreproduction should be addressed to: NIHR Journals Library, National Institute for Health Research, Evaluation, Trials and Studies Coordinating Centre, Alpha House,University of Southampton Science Park, Southampton SO16 7NS, UK.
151
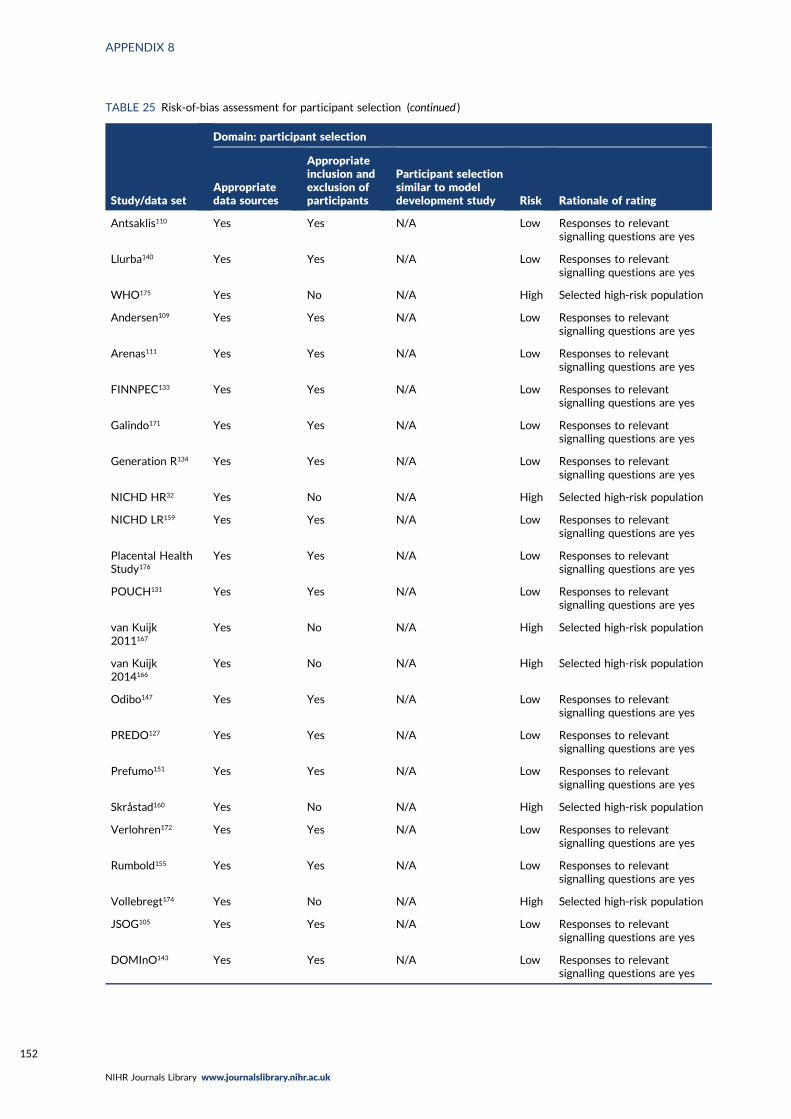
TABLE 25 Risk-of-bias assessment for participant selection (continued )
Study/data set
Domain: participant selection
Appropriatedata sources
Appropriateinclusion andexclusion ofparticipants
Participant selectionsimilar to modeldevelopment study Risk Rationale of rating
Antsaklis110 Yes Yes N/A Low Responses to relevantsignalling questions are yes
Llurba140 Yes Yes N/A Low Responses to relevantsignalling questions are yes
WHO175 Yes No N/A High Selected high-risk population
Andersen109 Yes Yes N/A Low Responses to relevantsignalling questions are yes
Arenas111 Yes Yes N/A Low Responses to relevantsignalling questions are yes
FINNPEC133 Yes Yes N/A Low Responses to relevantsignalling questions are yes
Galindo171 Yes Yes N/A Low Responses to relevantsignalling questions are yes
Generation R134 Yes Yes N/A Low Responses to relevantsignalling questions are yes
NICHD HR32 Yes No N/A High Selected high-risk population
NICHD LR159 Yes Yes N/A Low Responses to relevantsignalling questions are yes
Placental HealthStudy176
Yes Yes N/A Low Responses to relevantsignalling questions are yes
POUCH131 Yes Yes N/A Low Responses to relevantsignalling questions are yes
van Kuijk2011167
Yes No N/A High Selected high-risk population
van Kuijk2014166
Yes No N/A High Selected high-risk population
Odibo147 Yes Yes N/A Low Responses to relevantsignalling questions are yes
PREDO127 Yes Yes N/A Low Responses to relevantsignalling questions are yes
Prefumo151 Yes Yes N/A Low Responses to relevantsignalling questions are yes
Skråstad160 Yes No N/A High Selected high-risk population
Verlohren172 Yes Yes N/A Low Responses to relevantsignalling questions are yes
Rumbold155 Yes Yes N/A Low Responses to relevantsignalling questions are yes
Vollebregt174 Yes No N/A High Selected high-risk population
JSOG105 Yes Yes N/A Low Responses to relevantsignalling questions are yes
DOMInO143 Yes Yes N/A Low Responses to relevantsignalling questions are yes
APPENDIX 8
NIHR Journals Library www.journalslibrary.nihr.ac.uk
152
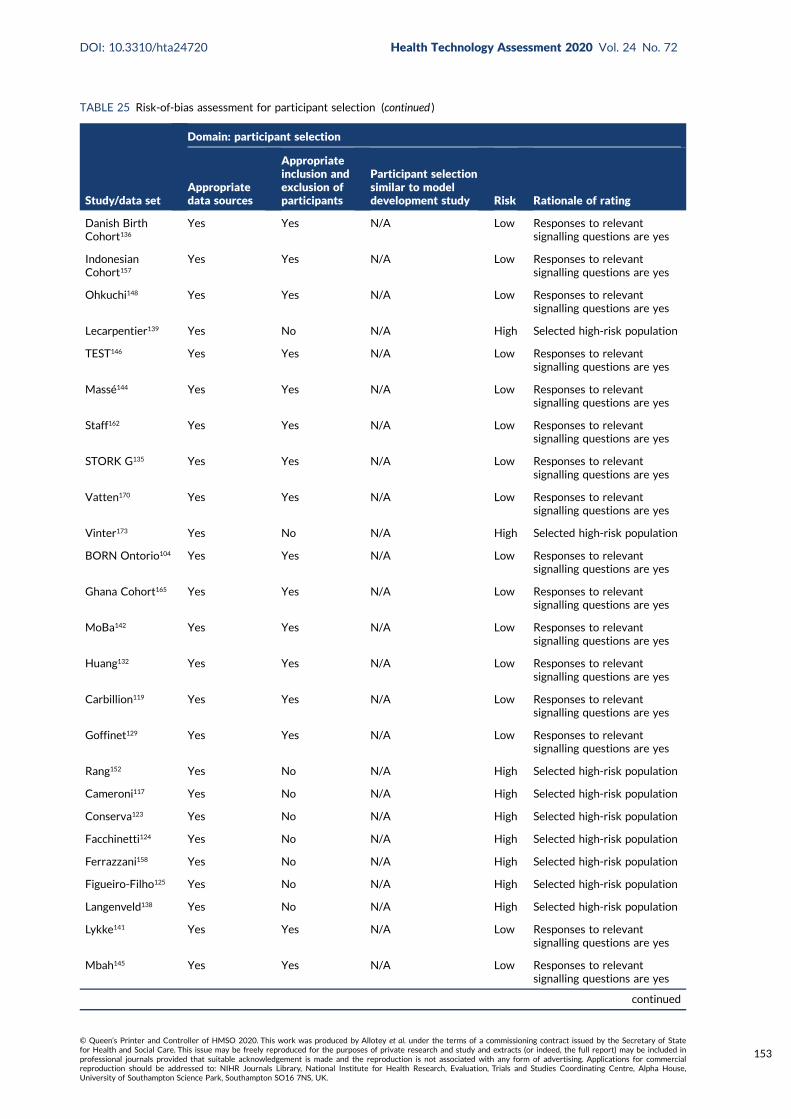
TABLE 25 Risk-of-bias assessment for participant selection (continued )
Study/data set
Domain: participant selection
Appropriatedata sources
Appropriateinclusion andexclusion ofparticipants
Participant selectionsimilar to modeldevelopment study Risk Rationale of rating
Danish BirthCohort136
Yes Yes N/A Low Responses to relevantsignalling questions are yes
IndonesianCohort157
Yes Yes N/A Low Responses to relevantsignalling questions are yes
Ohkuchi148 Yes Yes N/A Low Responses to relevantsignalling questions are yes
Lecarpentier139 Yes No N/A High Selected high-risk population
TEST146 Yes Yes N/A Low Responses to relevantsignalling questions are yes
Massé144 Yes Yes N/A Low Responses to relevantsignalling questions are yes
Staff162 Yes Yes N/A Low Responses to relevantsignalling questions are yes
STORK G135 Yes Yes N/A Low Responses to relevantsignalling questions are yes
Vatten170 Yes Yes N/A Low Responses to relevantsignalling questions are yes
Vinter173 Yes No N/A High Selected high-risk population
BORN Ontorio104 Yes Yes N/A Low Responses to relevantsignalling questions are yes
Ghana Cohort165 Yes Yes N/A Low Responses to relevantsignalling questions are yes
MoBa142 Yes Yes N/A Low Responses to relevantsignalling questions are yes
Huang132 Yes Yes N/A Low Responses to relevantsignalling questions are yes
Carbillion119 Yes Yes N/A Low Responses to relevantsignalling questions are yes
Goffinet129 Yes Yes N/A Low Responses to relevantsignalling questions are yes
Rang152 Yes No N/A High Selected high-risk population
Cameroni117 Yes No N/A High Selected high-risk population
Conserva123 Yes No N/A High Selected high-risk population
Facchinetti124 Yes No N/A High Selected high-risk population
Ferrazzani158 Yes No N/A High Selected high-risk population
Figueiro-Filho125 Yes No N/A High Selected high-risk population
Langenveld138 Yes No N/A High Selected high-risk population
Lykke141 Yes Yes N/A Low Responses to relevantsignalling questions are yes
Mbah145 Yes Yes N/A Low Responses to relevantsignalling questions are yes
continued
DOI: 10.3310/hta24720 Health Technology Assessment 2020 Vol. 24 No. 72
© Queen’s Printer and Controller of HMSO 2020. This work was produced by Allotey et al. under the terms of a commissioning contract issued by the Secretary of Statefor Health and Social Care. This issue may be freely reproduced for the purposes of private research and study and extracts (or indeed, the full report) may be included inprofessional journals provided that suitable acknowledgement is made and the reproduction is not associated with any form of advertising. Applications for commercialreproduction should be addressed to: NIHR Journals Library, National Institute for Health Research, Evaluation, Trials and Studies Coordinating Centre, Alpha House,University of Southampton Science Park, Southampton SO16 7NS, UK.
153
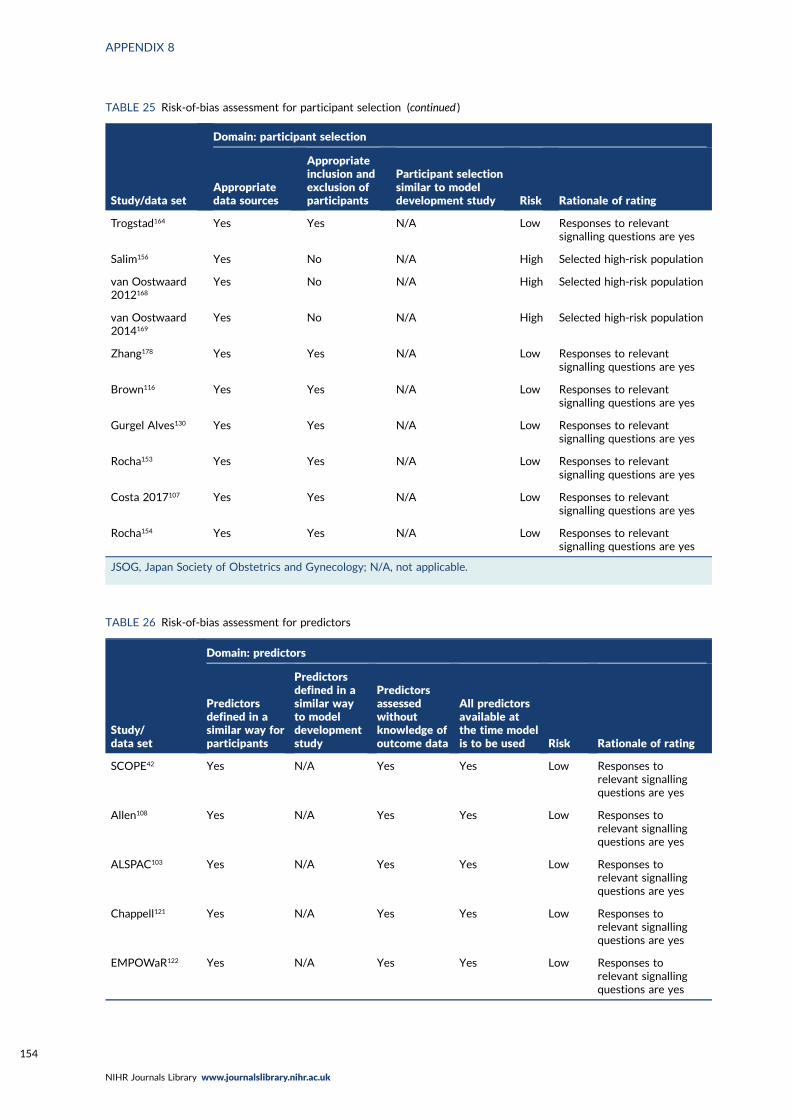
TABLE 25 Risk-of-bias assessment for participant selection (continued )
Study/data set
Domain: participant selection
Appropriatedata sources
Appropriateinclusion andexclusion ofparticipants
Participant selectionsimilar to modeldevelopment study Risk Rationale of rating
Trogstad164 Yes Yes N/A Low Responses to relevantsignalling questions are yes
Salim156 Yes No N/A High Selected high-risk population
van Oostwaard2012168
Yes No N/A High Selected high-risk population
van Oostwaard2014169
Yes No N/A High Selected high-risk population
Zhang178 Yes Yes N/A Low Responses to relevantsignalling questions are yes
Brown116 Yes Yes N/A Low Responses to relevantsignalling questions are yes
Gurgel Alves130 Yes Yes N/A Low Responses to relevantsignalling questions are yes
Rocha153 Yes Yes N/A Low Responses to relevantsignalling questions are yes
Costa 2017107 Yes Yes N/A Low Responses to relevantsignalling questions are yes
Rocha154 Yes Yes N/A Low Responses to relevantsignalling questions are yes
JSOG, Japan Society of Obstetrics and Gynecology; N/A, not applicable.
TABLE 26 Risk-of-bias assessment for predictors
Study/data set
Domain: predictors
Predictorsdefined in asimilar way forparticipants
Predictorsdefined in asimilar wayto modeldevelopmentstudy
Predictorsassessedwithoutknowledge ofoutcome data
All predictorsavailable atthe time modelis to be used Risk Rationale of rating
SCOPE42 Yes N/A Yes Yes Low Responses torelevant signallingquestions are yes
Allen108 Yes N/A Yes Yes Low Responses torelevant signallingquestions are yes
ALSPAC103 Yes N/A Yes Yes Low Responses torelevant signallingquestions are yes
Chappell121 Yes N/A Yes Yes Low Responses torelevant signallingquestions are yes
EMPOWaR122 Yes N/A Yes Yes Low Responses torelevant signallingquestions are yes
APPENDIX 8
NIHR Journals Library www.journalslibrary.nihr.ac.uk
154
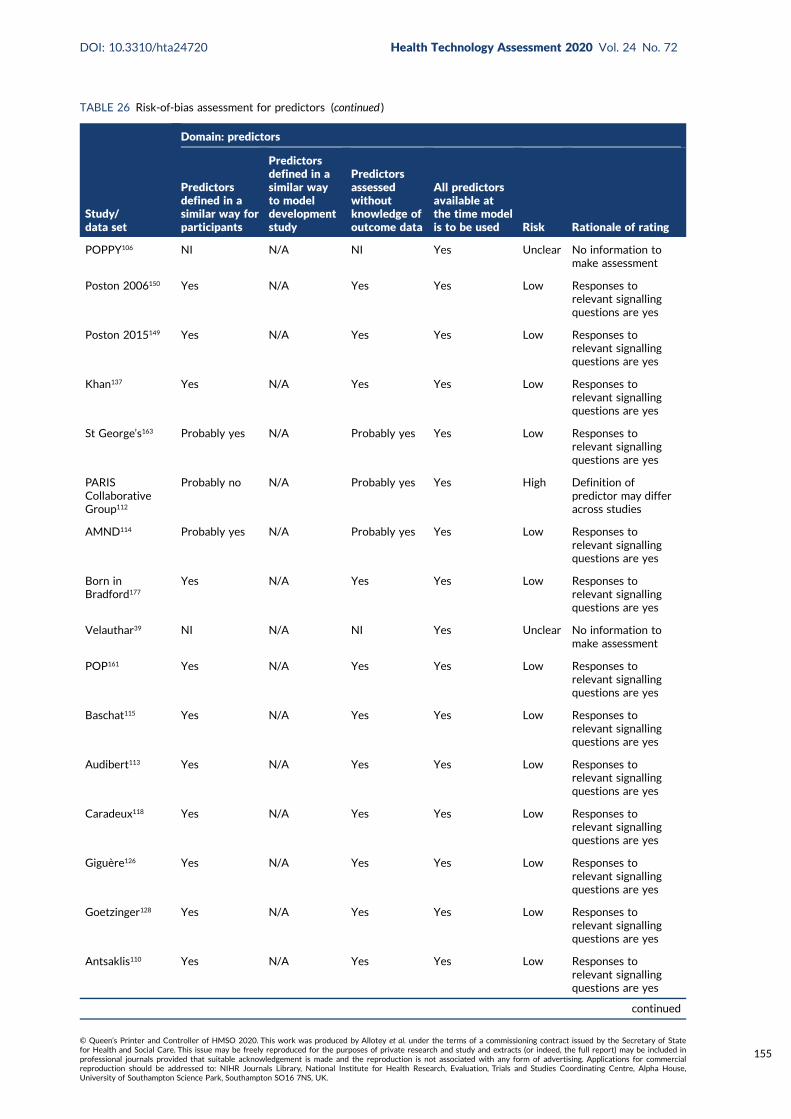
TABLE 26 Risk-of-bias assessment for predictors (continued )
Study/data set
Domain: predictors
Predictorsdefined in asimilar way forparticipants
Predictorsdefined in asimilar wayto modeldevelopmentstudy
Predictorsassessedwithoutknowledge ofoutcome data
All predictorsavailable atthe time modelis to be used Risk Rationale of rating
POPPY106 NI N/A NI Yes Unclear No information tomake assessment
Poston 2006150 Yes N/A Yes Yes Low Responses torelevant signallingquestions are yes
Poston 2015149 Yes N/A Yes Yes Low Responses torelevant signallingquestions are yes
Khan137 Yes N/A Yes Yes Low Responses torelevant signallingquestions are yes
St George’s163 Probably yes N/A Probably yes Yes Low Responses torelevant signallingquestions are yes
PARISCollaborativeGroup112
Probably no N/A Probably yes Yes High Definition ofpredictor may differacross studies
AMND114 Probably yes N/A Probably yes Yes Low Responses torelevant signallingquestions are yes
Born inBradford177
Yes N/A Yes Yes Low Responses torelevant signallingquestions are yes
Velauthar39 NI N/A NI Yes Unclear No information tomake assessment
POP161 Yes N/A Yes Yes Low Responses torelevant signallingquestions are yes
Baschat115 Yes N/A Yes Yes Low Responses torelevant signallingquestions are yes
Audibert113 Yes N/A Yes Yes Low Responses torelevant signallingquestions are yes
Caradeux118 Yes N/A Yes Yes Low Responses torelevant signallingquestions are yes
Giguère126 Yes N/A Yes Yes Low Responses torelevant signallingquestions are yes
Goetzinger128 Yes N/A Yes Yes Low Responses torelevant signallingquestions are yes
Antsaklis110 Yes N/A Yes Yes Low Responses torelevant signallingquestions are yes
continued
DOI: 10.3310/hta24720 Health Technology Assessment 2020 Vol. 24 No. 72
© Queen’s Printer and Controller of HMSO 2020. This work was produced by Allotey et al. under the terms of a commissioning contract issued by the Secretary of Statefor Health and Social Care. This issue may be freely reproduced for the purposes of private research and study and extracts (or indeed, the full report) may be included inprofessional journals provided that suitable acknowledgement is made and the reproduction is not associated with any form of advertising. Applications for commercialreproduction should be addressed to: NIHR Journals Library, National Institute for Health Research, Evaluation, Trials and Studies Coordinating Centre, Alpha House,University of Southampton Science Park, Southampton SO16 7NS, UK.
155
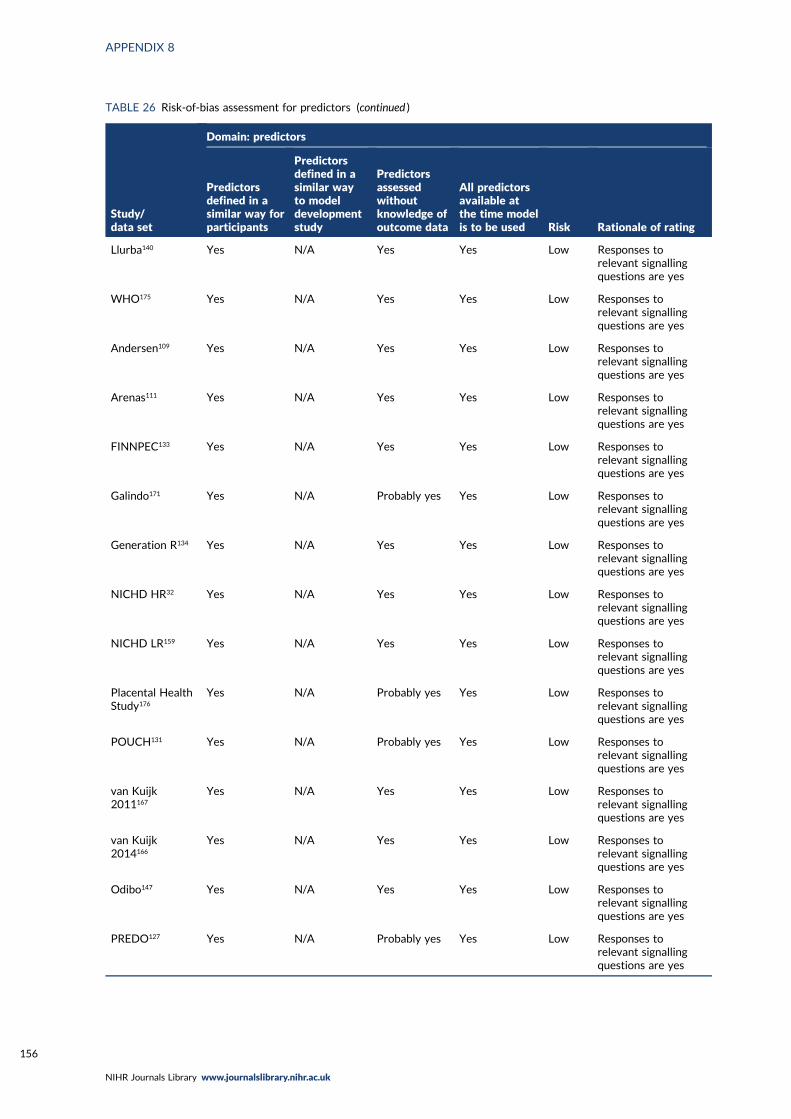
TABLE 26 Risk-of-bias assessment for predictors (continued )
Study/data set
Domain: predictors
Predictorsdefined in asimilar way forparticipants
Predictorsdefined in asimilar wayto modeldevelopmentstudy
Predictorsassessedwithoutknowledge ofoutcome data
All predictorsavailable atthe time modelis to be used Risk Rationale of rating
Llurba140 Yes N/A Yes Yes Low Responses torelevant signallingquestions are yes
WHO175 Yes N/A Yes Yes Low Responses torelevant signallingquestions are yes
Andersen109 Yes N/A Yes Yes Low Responses torelevant signallingquestions are yes
Arenas111 Yes N/A Yes Yes Low Responses torelevant signallingquestions are yes
FINNPEC133 Yes N/A Yes Yes Low Responses torelevant signallingquestions are yes
Galindo171 Yes N/A Probably yes Yes Low Responses torelevant signallingquestions are yes
Generation R134 Yes N/A Yes Yes Low Responses torelevant signallingquestions are yes
NICHD HR32 Yes N/A Yes Yes Low Responses torelevant signallingquestions are yes
NICHD LR159 Yes N/A Yes Yes Low Responses torelevant signallingquestions are yes
Placental HealthStudy176
Yes N/A Probably yes Yes Low Responses torelevant signallingquestions are yes
POUCH131 Yes N/A Probably yes Yes Low Responses torelevant signallingquestions are yes
van Kuijk2011167
Yes N/A Yes Yes Low Responses torelevant signallingquestions are yes
van Kuijk2014166
Yes N/A Yes Yes Low Responses torelevant signallingquestions are yes
Odibo147 Yes N/A Yes Yes Low Responses torelevant signallingquestions are yes
PREDO127 Yes N/A Probably yes Yes Low Responses torelevant signallingquestions are yes
APPENDIX 8
NIHR Journals Library www.journalslibrary.nihr.ac.uk
156
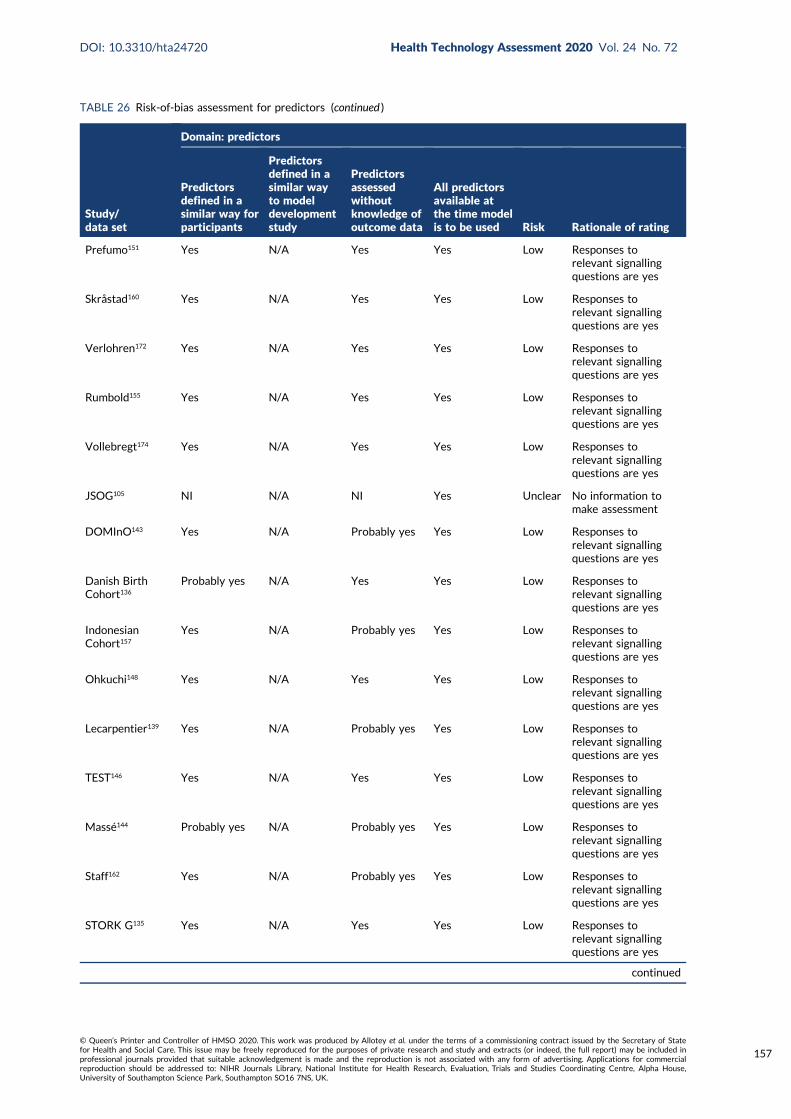
TABLE 26 Risk-of-bias assessment for predictors (continued )
Study/data set
Domain: predictors
Predictorsdefined in asimilar way forparticipants
Predictorsdefined in asimilar wayto modeldevelopmentstudy
Predictorsassessedwithoutknowledge ofoutcome data
All predictorsavailable atthe time modelis to be used Risk Rationale of rating
Prefumo151 Yes N/A Yes Yes Low Responses torelevant signallingquestions are yes
Skråstad160 Yes N/A Yes Yes Low Responses torelevant signallingquestions are yes
Verlohren172 Yes N/A Yes Yes Low Responses torelevant signallingquestions are yes
Rumbold155 Yes N/A Yes Yes Low Responses torelevant signallingquestions are yes
Vollebregt174 Yes N/A Yes Yes Low Responses torelevant signallingquestions are yes
JSOG105 NI N/A NI Yes Unclear No information tomake assessment
DOMInO143 Yes N/A Probably yes Yes Low Responses torelevant signallingquestions are yes
Danish BirthCohort136
Probably yes N/A Yes Yes Low Responses torelevant signallingquestions are yes
IndonesianCohort157
Yes N/A Probably yes Yes Low Responses torelevant signallingquestions are yes
Ohkuchi148 Yes N/A Yes Yes Low Responses torelevant signallingquestions are yes
Lecarpentier139 Yes N/A Probably yes Yes Low Responses torelevant signallingquestions are yes
TEST146 Yes N/A Yes Yes Low Responses torelevant signallingquestions are yes
Massé144 Probably yes N/A Probably yes Yes Low Responses torelevant signallingquestions are yes
Staff162 Yes N/A Probably yes Yes Low Responses torelevant signallingquestions are yes
STORK G135 Yes N/A Yes Yes Low Responses torelevant signallingquestions are yes
continued
DOI: 10.3310/hta24720 Health Technology Assessment 2020 Vol. 24 No. 72
© Queen’s Printer and Controller of HMSO 2020. This work was produced by Allotey et al. under the terms of a commissioning contract issued by the Secretary of Statefor Health and Social Care. This issue may be freely reproduced for the purposes of private research and study and extracts (or indeed, the full report) may be included inprofessional journals provided that suitable acknowledgement is made and the reproduction is not associated with any form of advertising. Applications for commercialreproduction should be addressed to: NIHR Journals Library, National Institute for Health Research, Evaluation, Trials and Studies Coordinating Centre, Alpha House,University of Southampton Science Park, Southampton SO16 7NS, UK.
157

TABLE 26 Risk-of-bias assessment for predictors (continued )
Study/data set
Domain: predictors
Predictorsdefined in asimilar way forparticipants
Predictorsdefined in asimilar wayto modeldevelopmentstudy
Predictorsassessedwithoutknowledge ofoutcome data
All predictorsavailable atthe time modelis to be used Risk Rationale of rating
Vatten170 Yes N/A Yes Yes Low Responses torelevant signallingquestions are yes
Vinter173 Yes N/A Yes Yes Low Responses torelevant signallingquestions are yes
BORN Ontorio104 Yes N/A Probably yes Yes Low Responses torelevant signallingquestions are yes
Ghana Cohort165 Yes N/A Yes Yes Low Responses torelevant signallingquestions are yes
MoBa142 Probably yes N/A Probably yes Yes Low Responses torelevant signallingquestions are yes
Huang132 Probably yes N/A Probably yes Yes Low Responses torelevant signallingquestions are yes
Carbillion119 Probably yes N/A NI Yes Unclear No information tomake assessment
Goffinet129 Yes N/A Yes Yes Low Responses torelevant signallingquestions are yes
Rang152 Yes N/A Yes Yes Low Responses torelevant signallingquestions are yes
Cameroni117 Yes N/A Yes Yes Low Responses torelevant signallingquestions are yes
Conserva123 Yes N/A Yes Yes Low Responses torelevant signallingquestions are yes
Facchinetti124 Yes N/A Yes Yes Low Responses torelevant signallingquestions are yes
Ferrazzani158 Yes N/A Yes Yes Low Responses torelevant signallingquestions are yes
Figueiró-Filho125 Yes N/A Yes Yes Low Responses torelevant signallingquestions are yes
Langenveld138 Yes N/A Yes Yes Low Responses torelevant signallingquestions are yes
Lykke141 Probably yes N/A Yes Yes Low Responses torelevant signallingquestions are yes
APPENDIX 8
NIHR Journals Library www.journalslibrary.nihr.ac.uk
158

TABLE 26 Risk-of-bias assessment for predictors (continued )
Study/data set
Domain: predictors
Predictorsdefined in asimilar way forparticipants
Predictorsdefined in asimilar wayto modeldevelopmentstudy
Predictorsassessedwithoutknowledge ofoutcome data
All predictorsavailable atthe time modelis to be used Risk Rationale of rating
Mbah145 Probably yes N/A Yes Yes Low Responses torelevant signallingquestions are yes
Trogstad164 Probably yes N/A Yes Yes Low Responses torelevant signallingquestions are yes
Salim156 Yes N/A Yes Yes Low Responses torelevant signallingquestions are yes
van Oostwaard2012168
Yes N/A Yes Yes Low Responses torelevant signallingquestions are yes
van Oostwaard2014169
Yes N/A Yes Yes Low Responses torelevant signallingquestions are yes
Zhang178 Yes N/A Yes Yes Low Responses torelevant signallingquestions are yes
Brown 2007116 Yes N/A Yes Yes Low Responses torelevant signallingquestions are yes
Gurgel Alves130 Yes N/A Yes Yes Low Responses torelevant signallingquestions are yes
Rocha153 Yes N/A Yes Yes Low Responses torelevant signallingquestions are yes
Costa 2017107 Yes N/A Yes Yes Low Responses torelevant signallingquestions are yes
Rocha154 Yes N/A Yes Yes Low Responses torelevant signallingquestions are yes
JSOG, Japan Society of Obstetrics and Gynecology; N/A, not applicable; NI, no information.
DOI: 10.3310/hta24720 Health Technology Assessment 2020 Vol. 24 No. 72
© Queen’s Printer and Controller of HMSO 2020. This work was produced by Allotey et al. under the terms of a commissioning contract issued by the Secretary of Statefor Health and Social Care. This issue may be freely reproduced for the purposes of private research and study and extracts (or indeed, the full report) may be included inprofessional journals provided that suitable acknowledgement is made and the reproduction is not associated with any form of advertising. Applications for commercialreproduction should be addressed to: NIHR Journals Library, National Institute for Health Research, Evaluation, Trials and Studies Coordinating Centre, Alpha House,University of Southampton Science Park, Southampton SO16 7NS, UK.
159
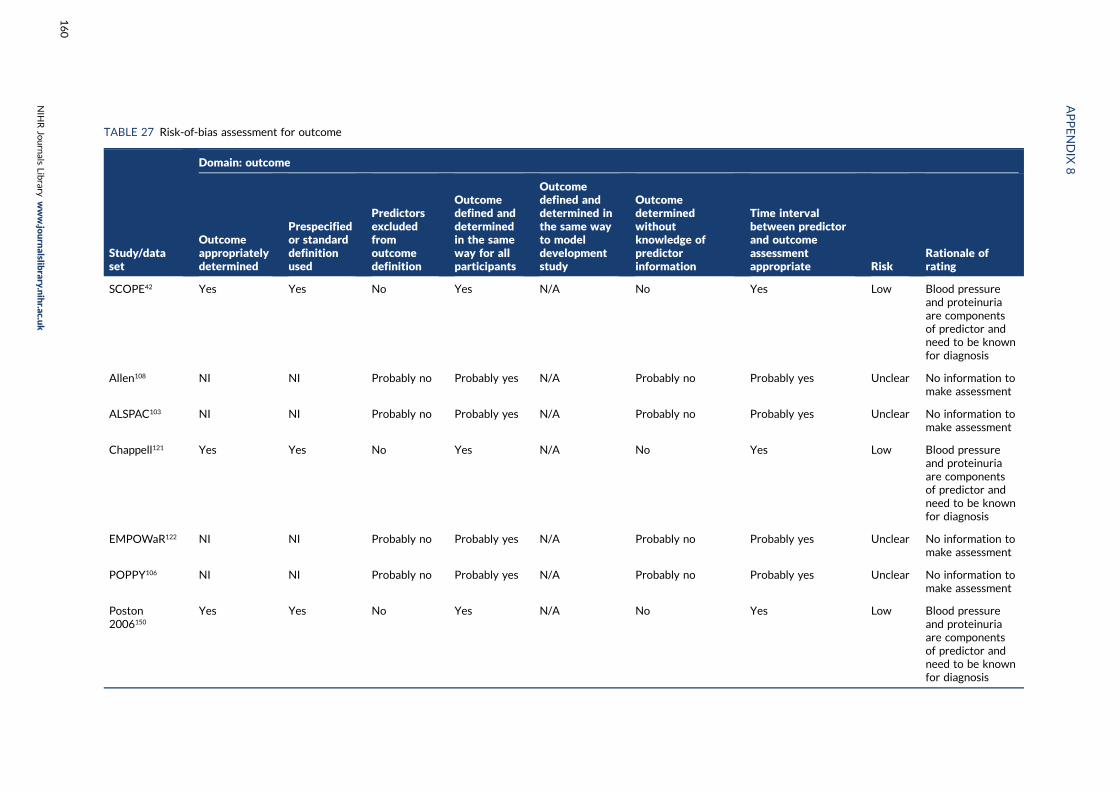
TABLE 27 Risk-of-bias assessment for outcome
Study/dataset
Domain: outcome
Outcomeappropriatelydetermined
Prespecifiedor standarddefinitionused
Predictorsexcludedfromoutcomedefinition
Outcomedefined anddeterminedin the sameway for allparticipants
Outcomedefined anddetermined inthe same wayto modeldevelopmentstudy
Outcomedeterminedwithoutknowledge ofpredictorinformation
Time intervalbetween predictorand outcomeassessmentappropriate Risk
Rationale ofrating
SCOPE42 Yes Yes No Yes N/A No Yes Low Blood pressureand proteinuriaare componentsof predictor andneed to be knownfor diagnosis
Allen108 NI NI Probably no Probably yes N/A Probably no Probably yes Unclear No information tomake assessment
ALSPAC103 NI NI Probably no Probably yes N/A Probably no Probably yes Unclear No information tomake assessment
Chappell121 Yes Yes No Yes N/A No Yes Low Blood pressureand proteinuriaare componentsof predictor andneed to be knownfor diagnosis
EMPOWaR122 NI NI Probably no Probably yes N/A Probably no Probably yes Unclear No information tomake assessment
POPPY106 NI NI Probably no Probably yes N/A Probably no Probably yes Unclear No information tomake assessment
Poston2006150
Yes Yes No Yes N/A No Yes Low Blood pressureand proteinuriaare componentsof predictor andneed to be knownfor diagnosis
APPENDIX
8
NIH
RJournals
Library
www.jo
urnalslib
rary.nihr.ac.u
k
160

Study/dataset
Domain: outcome
Outcomeappropriatelydetermined
Prespecifiedor standarddefinitionused
Predictorsexcludedfromoutcomedefinition
Outcomedefined anddeterminedin the sameway for allparticipants
Outcomedefined anddetermined inthe same wayto modeldevelopmentstudy
Outcomedeterminedwithoutknowledge ofpredictorinformation
Time intervalbetween predictorand outcomeassessmentappropriate Risk
Rationale ofrating
Poston2015149
Yes Yes No Yes N/A No Yes Low Blood pressureand proteinuriaare componentsof predictor andneed to be knownfor diagnosis
Khan137 Yes Yes No Yes N/A No Yes Low Blood pressureand proteinuriaare componentsof predictor andneed to be knownfor diagnosis
St George’s163 NI NI Probably no Probably yes N/A Probably no Probably yes Unclear No information tomake assessment
PARISCollaborativeGroup112
Yes Yes No Yes N/A No Yes Low Blood pressureand proteinuriaare componentsof predictor andneed to be knownfor diagnosis
AMND114 NI NI Probably no Probably yes N/A Probably no Probably yes Unclear No information tomake assessment
Born inBradford177
NI NI Probably no Probably yes N/A Probably no Probably yes Unclear No information tomake assessment
Velauthar39 NI NI Probably no Probably yes N/A Probably no Probably yes Unclear No information tomake assessment
continued
DOI:10.3310/hta2
4720
Health
Tech
nology
Assessm
ent2020
Vol.2
4No.7
2
©Queen
’sPrin
teran
dContro
llerofHMSO
2020.T
his
work
was
produced
byAllo
teyet
al.under
theterm
sofaco
mmissio
ningco
ntract
issued
bytheSecretary
ofState
forHealth
andSo
cialCare.T
his
issuemay
befreely
reproduced
forthepu
rposes
ofprivate
researchan
dstu
dyan
dextracts
(orindeed
,thefullrepo
rt)may
beinclu
ded
inpro
fessional
journals
provid
edthat
suitab
leackn
owled
gemen
tis
mad
ean
dtherepro
ductio
nis
notasso
ciatedwith
anyform
ofad
vertising.
Applicatio
nsforco
mmercial
reproductio
nshould
bead
dressed
to:NIH
RJournals
Library,
Natio
nal
Institu
teforHealth
Research
,Evalu
ation,Trials
and
Studies
Coordinatin
gCen
tre,Alph
aHouse,
University
ofSo
utham
ptonScien
cePark,So
utham
ptonSO
167NS,U
K.
161
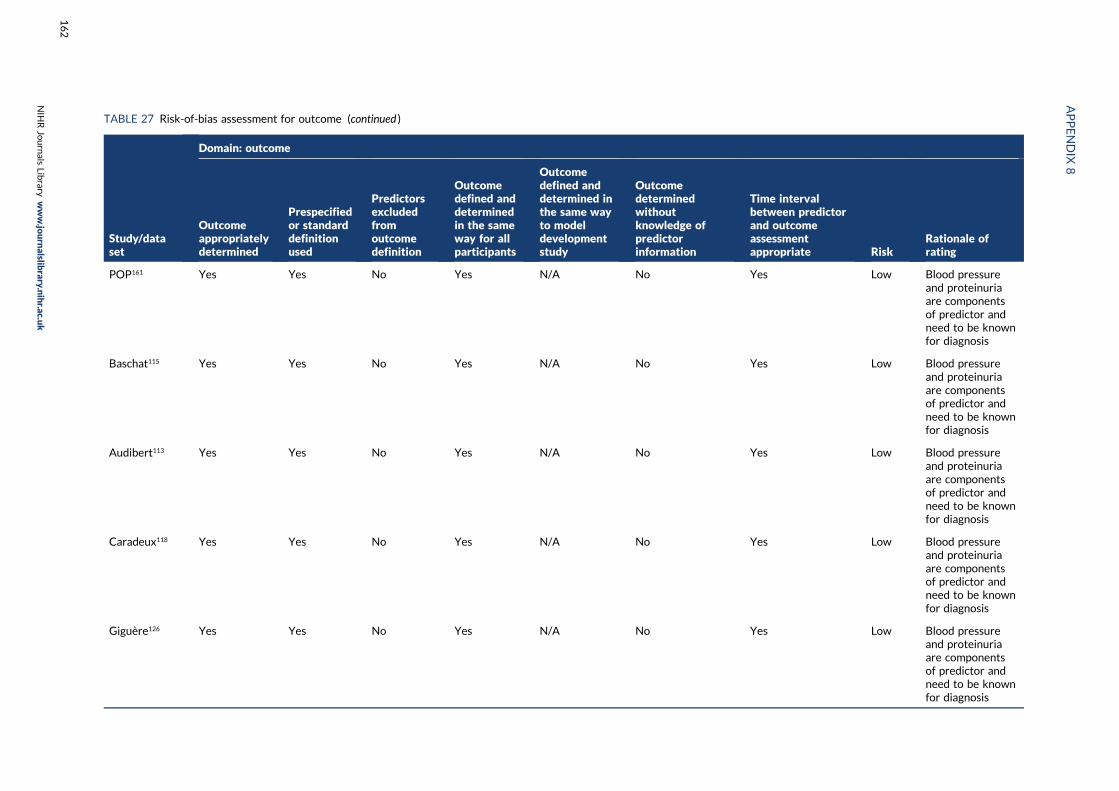
TABLE 27 Risk-of-bias assessment for outcome (continued )
Study/dataset
Domain: outcome
Outcomeappropriatelydetermined
Prespecifiedor standarddefinitionused
Predictorsexcludedfromoutcomedefinition
Outcomedefined anddeterminedin the sameway for allparticipants
Outcomedefined anddetermined inthe same wayto modeldevelopmentstudy
Outcomedeterminedwithoutknowledge ofpredictorinformation
Time intervalbetween predictorand outcomeassessmentappropriate Risk
Rationale ofrating
POP161 Yes Yes No Yes N/A No Yes Low Blood pressureand proteinuriaare componentsof predictor andneed to be knownfor diagnosis
Baschat115 Yes Yes No Yes N/A No Yes Low Blood pressureand proteinuriaare componentsof predictor andneed to be knownfor diagnosis
Audibert113 Yes Yes No Yes N/A No Yes Low Blood pressureand proteinuriaare componentsof predictor andneed to be knownfor diagnosis
Caradeux118 Yes Yes No Yes N/A No Yes Low Blood pressureand proteinuriaare componentsof predictor andneed to be knownfor diagnosis
Giguère126 Yes Yes No Yes N/A No Yes Low Blood pressureand proteinuriaare componentsof predictor andneed to be knownfor diagnosis
APPENDIX
8
NIH
RJournals
Library
www.jo
urnalslib
rary.nihr.ac.u
k
162
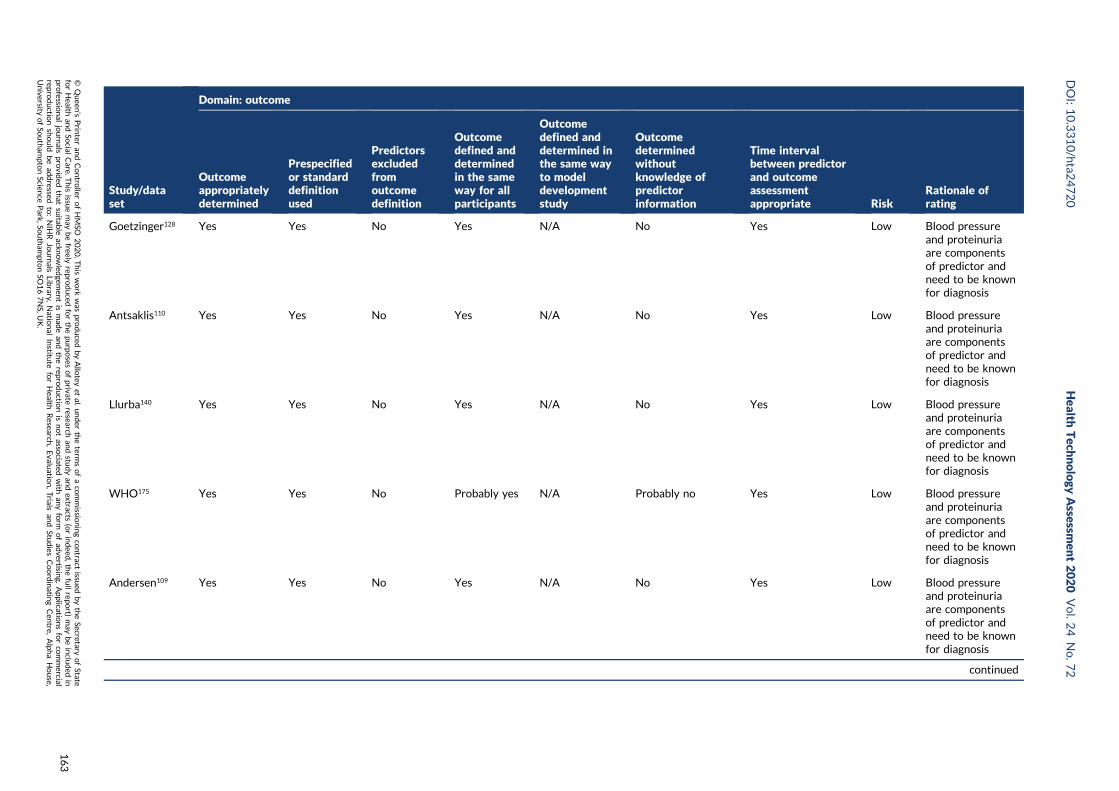
Study/dataset
Domain: outcome
Outcomeappropriatelydetermined
Prespecifiedor standarddefinitionused
Predictorsexcludedfromoutcomedefinition
Outcomedefined anddeterminedin the sameway for allparticipants
Outcomedefined anddetermined inthe same wayto modeldevelopmentstudy
Outcomedeterminedwithoutknowledge ofpredictorinformation
Time intervalbetween predictorand outcomeassessmentappropriate Risk
Rationale ofrating
Goetzinger128 Yes Yes No Yes N/A No Yes Low Blood pressureand proteinuriaare componentsof predictor andneed to be knownfor diagnosis
Antsaklis110 Yes Yes No Yes N/A No Yes Low Blood pressureand proteinuriaare componentsof predictor andneed to be knownfor diagnosis
Llurba140 Yes Yes No Yes N/A No Yes Low Blood pressureand proteinuriaare componentsof predictor andneed to be knownfor diagnosis
WHO175 Yes Yes No Probably yes N/A Probably no Yes Low Blood pressureand proteinuriaare componentsof predictor andneed to be knownfor diagnosis
Andersen109 Yes Yes No Yes N/A No Yes Low Blood pressureand proteinuriaare componentsof predictor andneed to be knownfor diagnosis
continued
DOI:10.3310/hta2
4720
Health
Tech
nology
Assessm
ent2020
Vol.2
4No.7
2
©Queen
’sPrin
teran
dContro
llerofHMSO
2020.T
his
work
was
produced
byAllo
teyet
al.under
theterm
sofaco
mmissio
ningco
ntract
issued
bytheSecretary
ofState
forHealth
andSo
cialCare.T
his
issuemay
befreely
reproduced
forthepu
rposes
ofprivate
researchan
dstu
dyan
dextracts
(orindeed
,thefullrepo
rt)may
beinclu
ded
inpro
fessional
journals
provid
edthat
suitab
leackn
owled
gemen
tis
mad
ean
dtherepro
ductio
nis
notasso
ciatedwith
anyform
ofad
vertising.
Applicatio
nsforco
mmercial
reproductio
nshould
bead
dressed
to:NIH
RJournals
Library,
Natio
nal
Institu
teforHealth
Research
,Evalu
ation,Trials
and
Studies
Coordinatin
gCen
tre,Alph
aHouse,
University
ofSo
utham
ptonScien
cePark,So
utham
ptonSO
167NS,U
K.
163
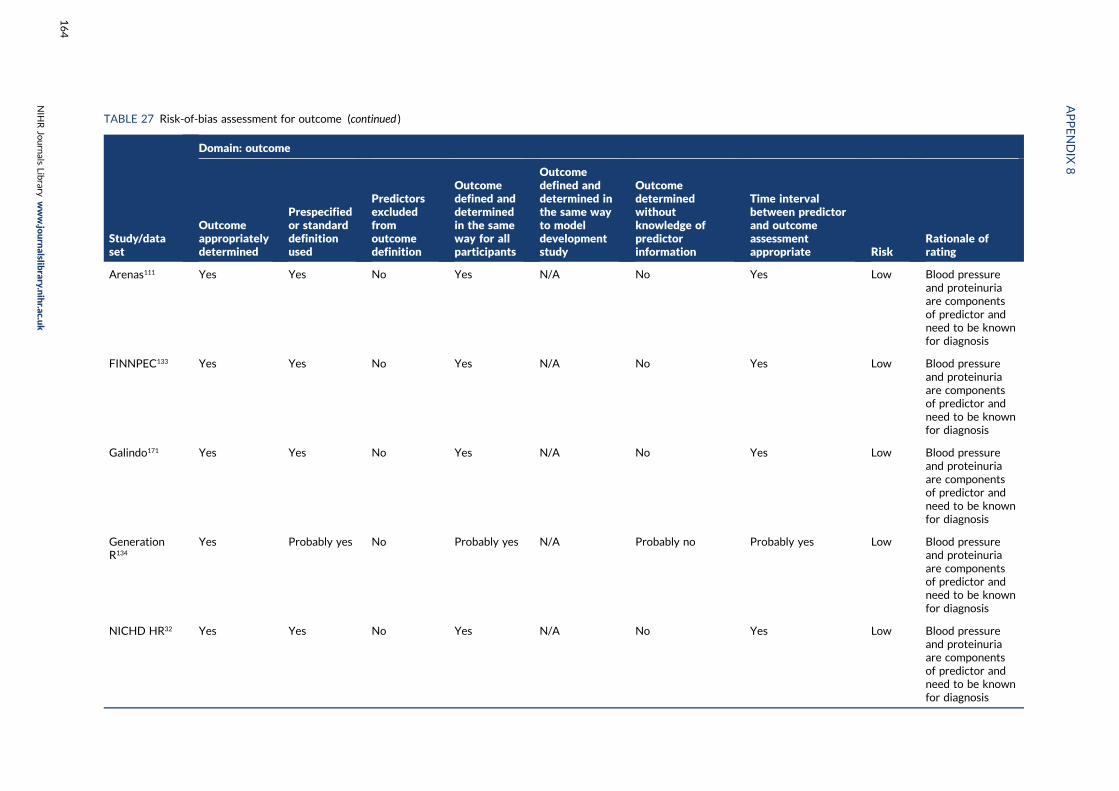
TABLE 27 Risk-of-bias assessment for outcome (continued )
Study/dataset
Domain: outcome
Outcomeappropriatelydetermined
Prespecifiedor standarddefinitionused
Predictorsexcludedfromoutcomedefinition
Outcomedefined anddeterminedin the sameway for allparticipants
Outcomedefined anddetermined inthe same wayto modeldevelopmentstudy
Outcomedeterminedwithoutknowledge ofpredictorinformation
Time intervalbetween predictorand outcomeassessmentappropriate Risk
Rationale ofrating
Arenas111 Yes Yes No Yes N/A No Yes Low Blood pressureand proteinuriaare componentsof predictor andneed to be knownfor diagnosis
FINNPEC133 Yes Yes No Yes N/A No Yes Low Blood pressureand proteinuriaare componentsof predictor andneed to be knownfor diagnosis
Galindo171 Yes Yes No Yes N/A No Yes Low Blood pressureand proteinuriaare componentsof predictor andneed to be knownfor diagnosis
GenerationR134
Yes Probably yes No Probably yes N/A Probably no Probably yes Low Blood pressureand proteinuriaare componentsof predictor andneed to be knownfor diagnosis
NICHD HR32 Yes Yes No Yes N/A No Yes Low Blood pressureand proteinuriaare componentsof predictor andneed to be knownfor diagnosis
APPENDIX
8
NIH
RJournals
Library
www.jo
urnalslib
rary.nihr.ac.u
k
164
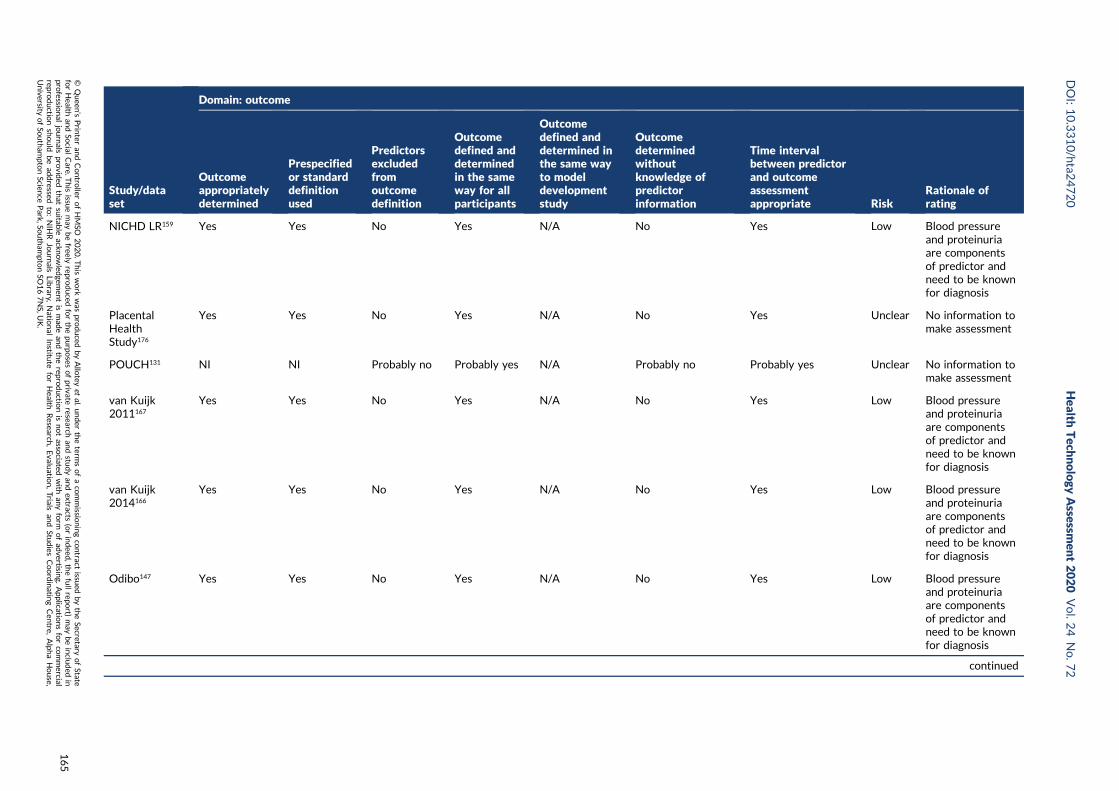
Study/dataset
Domain: outcome
Outcomeappropriatelydetermined
Prespecifiedor standarddefinitionused
Predictorsexcludedfromoutcomedefinition
Outcomedefined anddeterminedin the sameway for allparticipants
Outcomedefined anddetermined inthe same wayto modeldevelopmentstudy
Outcomedeterminedwithoutknowledge ofpredictorinformation
Time intervalbetween predictorand outcomeassessmentappropriate Risk
Rationale ofrating
NICHD LR159 Yes Yes No Yes N/A No Yes Low Blood pressureand proteinuriaare componentsof predictor andneed to be knownfor diagnosis
PlacentalHealthStudy176
Yes Yes No Yes N/A No Yes Unclear No information tomake assessment
POUCH131 NI NI Probably no Probably yes N/A Probably no Probably yes Unclear No information tomake assessment
van Kuijk2011167
Yes Yes No Yes N/A No Yes Low Blood pressureand proteinuriaare componentsof predictor andneed to be knownfor diagnosis
van Kuijk2014166
Yes Yes No Yes N/A No Yes Low Blood pressureand proteinuriaare componentsof predictor andneed to be knownfor diagnosis
Odibo147 Yes Yes No Yes N/A No Yes Low Blood pressureand proteinuriaare componentsof predictor andneed to be knownfor diagnosis
continued
DOI:10.3310/hta2
4720
Health
Tech
nology
Assessm
ent2020
Vol.2
4No.7
2
©Queen
’sPrin
teran
dContro
llerofHMSO
2020.T
his
work
was
produced
byAllo
teyet
al.under
theterm
sofaco
mmissio
ningco
ntract
issued
bytheSecretary
ofState
forHealth
andSo
cialCare.T
his
issuemay
befreely
reproduced
forthepu
rposes
ofprivate
researchan
dstu
dyan
dextracts
(orindeed
,thefullrepo
rt)may
beinclu
ded
inpro
fessional
journals
provid
edthat
suitab
leackn
owled
gemen
tis
mad
ean
dtherepro
ductio
nis
notasso
ciatedwith
anyform
ofad
vertising.
Applicatio
nsforco
mmercial
reproductio
nshould
bead
dressed
to:NIH
RJournals
Library,
Natio
nal
Institu
teforHealth
Research
,Evalu
ation,Trials
and
Studies
Coordinatin
gCen
tre,Alph
aHouse,
University
ofSo
utham
ptonScien
cePark,So
utham
ptonSO
167NS,U
K.
165
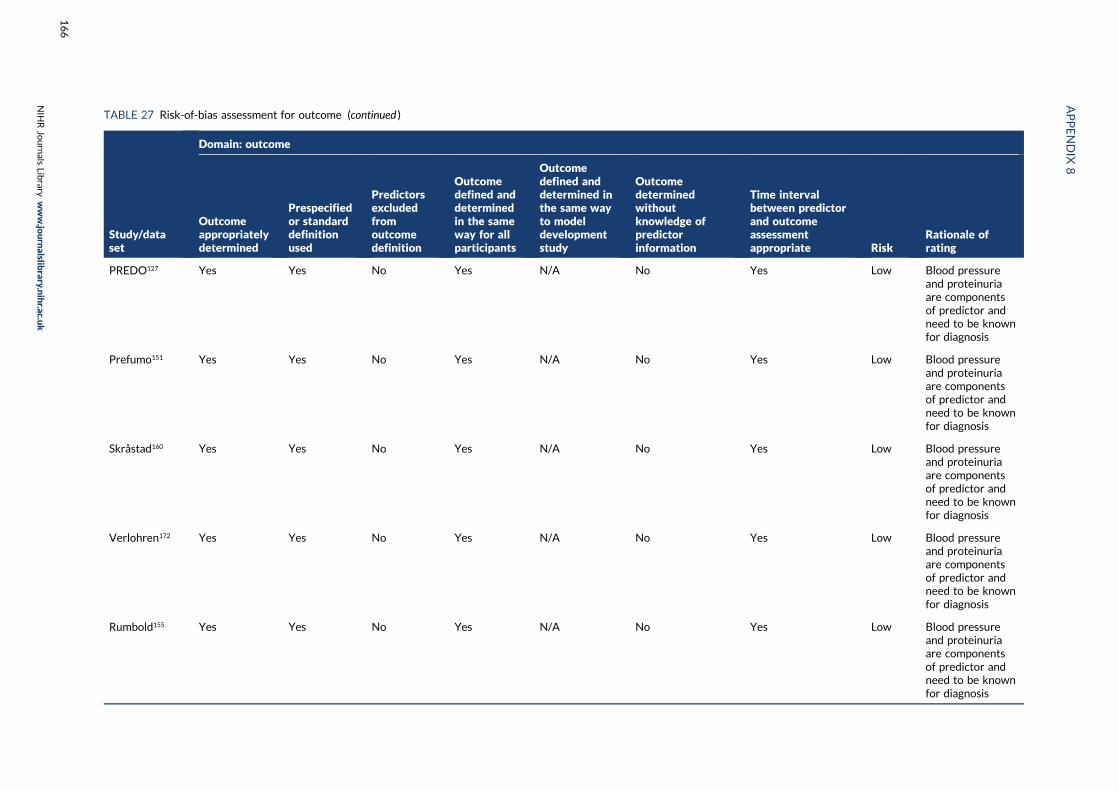
TABLE 27 Risk-of-bias assessment for outcome (continued )
Study/dataset
Domain: outcome
Outcomeappropriatelydetermined
Prespecifiedor standarddefinitionused
Predictorsexcludedfromoutcomedefinition
Outcomedefined anddeterminedin the sameway for allparticipants
Outcomedefined anddetermined inthe same wayto modeldevelopmentstudy
Outcomedeterminedwithoutknowledge ofpredictorinformation
Time intervalbetween predictorand outcomeassessmentappropriate Risk
Rationale ofrating
PREDO127 Yes Yes No Yes N/A No Yes Low Blood pressureand proteinuriaare componentsof predictor andneed to be knownfor diagnosis
Prefumo151 Yes Yes No Yes N/A No Yes Low Blood pressureand proteinuriaare componentsof predictor andneed to be knownfor diagnosis
Skråstad160 Yes Yes No Yes N/A No Yes Low Blood pressureand proteinuriaare componentsof predictor andneed to be knownfor diagnosis
Verlohren172 Yes Yes No Yes N/A No Yes Low Blood pressureand proteinuriaare componentsof predictor andneed to be knownfor diagnosis
Rumbold155 Yes Yes No Yes N/A No Yes Low Blood pressureand proteinuriaare componentsof predictor andneed to be knownfor diagnosis
APPENDIX
8
NIH
RJournals
Library
www.jo
urnalslib
rary.nihr.ac.u
k
166

Study/dataset
Domain: outcome
Outcomeappropriatelydetermined
Prespecifiedor standarddefinitionused
Predictorsexcludedfromoutcomedefinition
Outcomedefined anddeterminedin the sameway for allparticipants
Outcomedefined anddetermined inthe same wayto modeldevelopmentstudy
Outcomedeterminedwithoutknowledge ofpredictorinformation
Time intervalbetween predictorand outcomeassessmentappropriate Risk
Rationale ofrating
Vollebregt174 Yes Yes No Yes N/A No Yes Low Blood pressureand proteinuriaare componentsof predictor andneed to be knownfor diagnosis
JSOG105 NI NI Probably no Probably yes N/A Probably no Probably yes Unclear No information tomake assessment
DOMInO143 Yes Yes No Yes N/A No Yes Low Blood pressureand proteinuriaare componentsof predictor andneed to be knownfor diagnosis
Danish BirthCohort136
Yes Probably yes No Probably yes N/A Probably no Probably yes Low Blood pressureand proteinuriaare componentsof predictor andneed to be knownfor diagnosis
Indonesiancohort157
Yes Yes No Yes N/A No Yes Low Blood pressureand proteinuriaare componentsof predictor andneed to be knownfor diagnosis
continued
DOI:10.3310/hta2
4720
Health
Tech
nology
Assessm
ent2020
Vol.2
4No.7
2
©Queen
’sPrin
teran
dContro
llerofHMSO
2020.T
his
work
was
produced
byAllo
teyet
al.under
theterm
sofaco
mmissio
ningco
ntract
issued
bytheSecretary
ofState
forHealth
andSo
cialCare.T
his
issuemay
befreely
reproduced
forthepu
rposes
ofprivate
researchan
dstu
dyan
dextracts
(orindeed
,thefullrepo
rt)may
beinclu
ded
inpro
fessional
journals
provid
edthat
suitab
leackn
owled
gemen
tis
mad
ean
dtherepro
ductio
nis
notasso
ciatedwith
anyform
ofad
vertising.
Applicatio
nsforco
mmercial
reproductio
nshould
bead
dressed
to:NIH
RJournals
Library,
Natio
nal
Institu
teforHealth
Research
,Evalu
ation,Trials
and
Studies
Coordinatin
gCen
tre,Alph
aHouse,
University
ofSo
utham
ptonScien
cePark,So
utham
ptonSO
167NS,U
K.
167
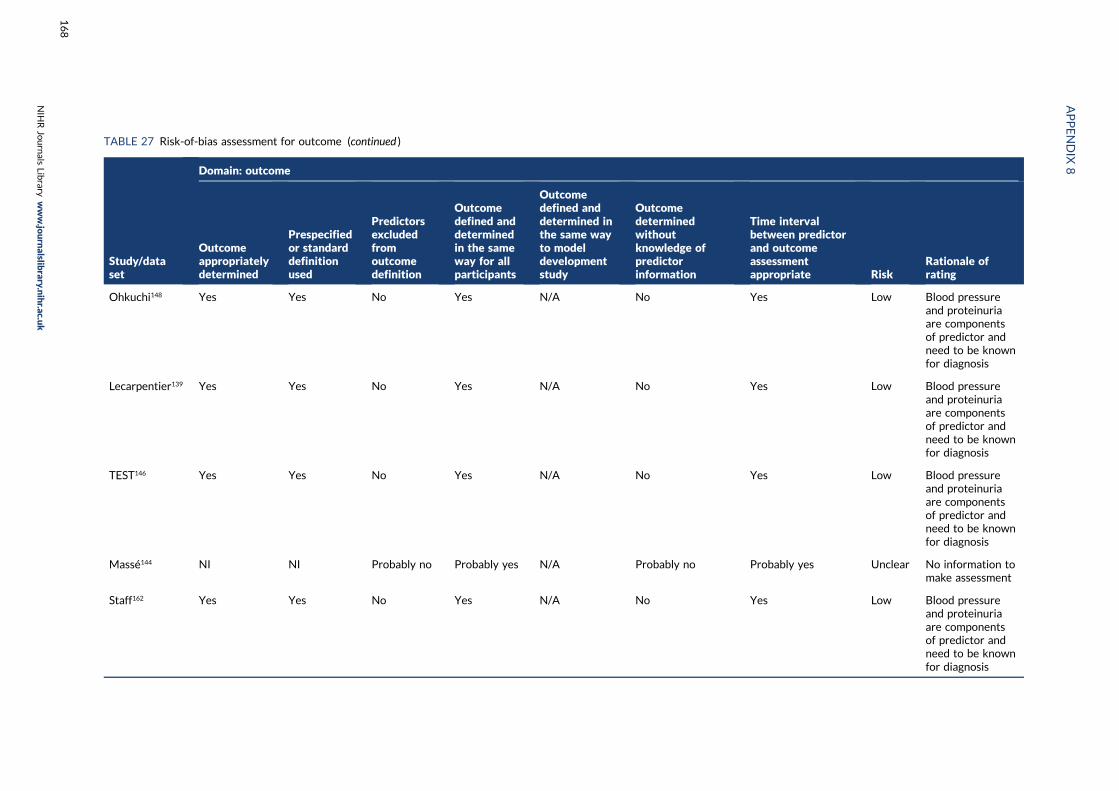
TABLE 27 Risk-of-bias assessment for outcome (continued )
Study/dataset
Domain: outcome
Outcomeappropriatelydetermined
Prespecifiedor standarddefinitionused
Predictorsexcludedfromoutcomedefinition
Outcomedefined anddeterminedin the sameway for allparticipants
Outcomedefined anddetermined inthe same wayto modeldevelopmentstudy
Outcomedeterminedwithoutknowledge ofpredictorinformation
Time intervalbetween predictorand outcomeassessmentappropriate Risk
Rationale ofrating
Ohkuchi148 Yes Yes No Yes N/A No Yes Low Blood pressureand proteinuriaare componentsof predictor andneed to be knownfor diagnosis
Lecarpentier139 Yes Yes No Yes N/A No Yes Low Blood pressureand proteinuriaare componentsof predictor andneed to be knownfor diagnosis
TEST146 Yes Yes No Yes N/A No Yes Low Blood pressureand proteinuriaare componentsof predictor andneed to be knownfor diagnosis
Massé144 NI NI Probably no Probably yes N/A Probably no Probably yes Unclear No information tomake assessment
Staff162 Yes Yes No Yes N/A No Yes Low Blood pressureand proteinuriaare componentsof predictor andneed to be knownfor diagnosis
APPENDIX
8
NIH
RJournals
Library
www.jo
urnalslib
rary.nihr.ac.u
k
168
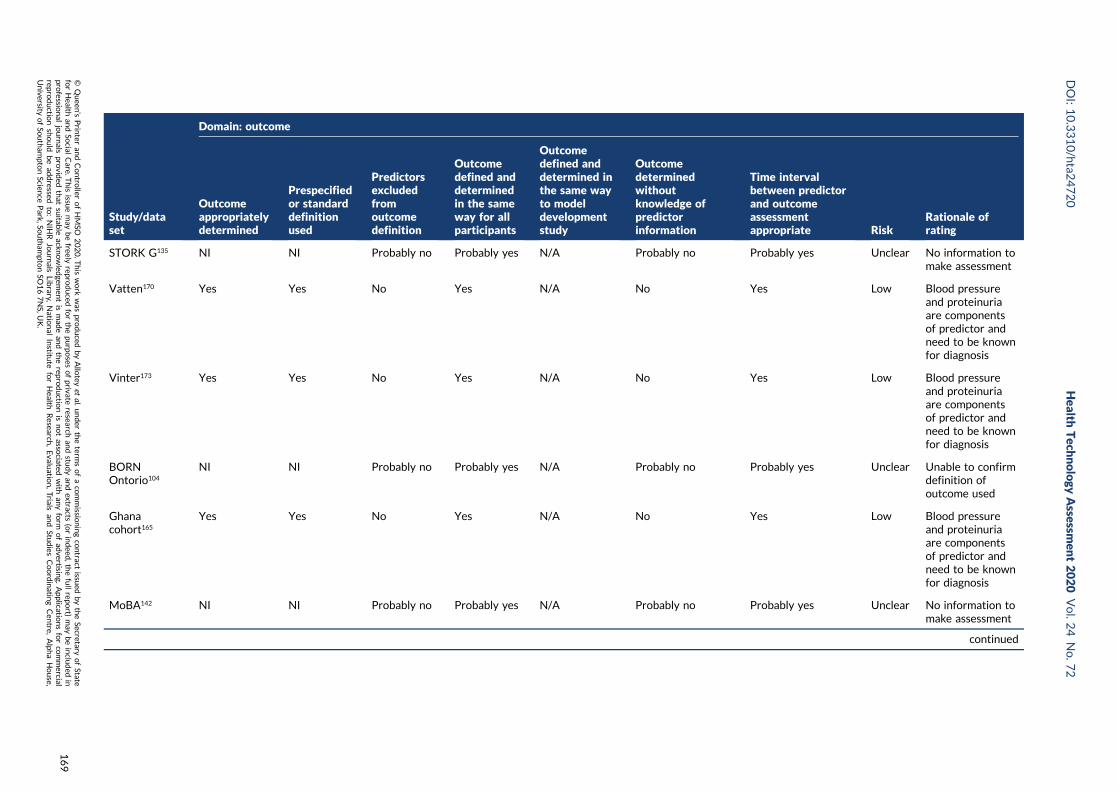
Study/dataset
Domain: outcome
Outcomeappropriatelydetermined
Prespecifiedor standarddefinitionused
Predictorsexcludedfromoutcomedefinition
Outcomedefined anddeterminedin the sameway for allparticipants
Outcomedefined anddetermined inthe same wayto modeldevelopmentstudy
Outcomedeterminedwithoutknowledge ofpredictorinformation
Time intervalbetween predictorand outcomeassessmentappropriate Risk
Rationale ofrating
STORK G135 NI NI Probably no Probably yes N/A Probably no Probably yes Unclear No information tomake assessment
Vatten170 Yes Yes No Yes N/A No Yes Low Blood pressureand proteinuriaare componentsof predictor andneed to be knownfor diagnosis
Vinter173 Yes Yes No Yes N/A No Yes Low Blood pressureand proteinuriaare componentsof predictor andneed to be knownfor diagnosis
BORNOntorio104
NI NI Probably no Probably yes N/A Probably no Probably yes Unclear Unable to confirmdefinition ofoutcome used
Ghanacohort165
Yes Yes No Yes N/A No Yes Low Blood pressureand proteinuriaare componentsof predictor andneed to be knownfor diagnosis
MoBA142 NI NI Probably no Probably yes N/A Probably no Probably yes Unclear No information tomake assessment
continued
DOI:10.3310/hta2
4720
Health
Tech
nology
Assessm
ent2020
Vol.2
4No.7
2
©Queen
’sPrin
teran
dContro
llerofHMSO
2020.T
his
work
was
produced
byAllo
teyet
al.under
theterm
sofaco
mmissio
ningco
ntract
issued
bytheSecretary
ofState
forHealth
andSo
cialCare.T
his
issuemay
befreely
reproduced
forthepu
rposes
ofprivate
researchan
dstu
dyan
dextracts
(orindeed
,thefullrepo
rt)may
beinclu
ded
inpro
fessional
journals
provid
edthat
suitab
leackn
owled
gemen
tis
mad
ean
dtherepro
ductio
nis
notasso
ciatedwith
anyform
ofad
vertising.
Applicatio
nsforco
mmercial
reproductio
nshould
bead
dressed
to:NIH
RJournals
Library,
Natio
nal
Institu
teforHealth
Research
,Evalu
ation,Trials
and
Studies
Coordinatin
gCen
tre,Alph
aHouse,
University
ofSo
utham
ptonScien
cePark,So
utham
ptonSO
167NS,U
K.
169
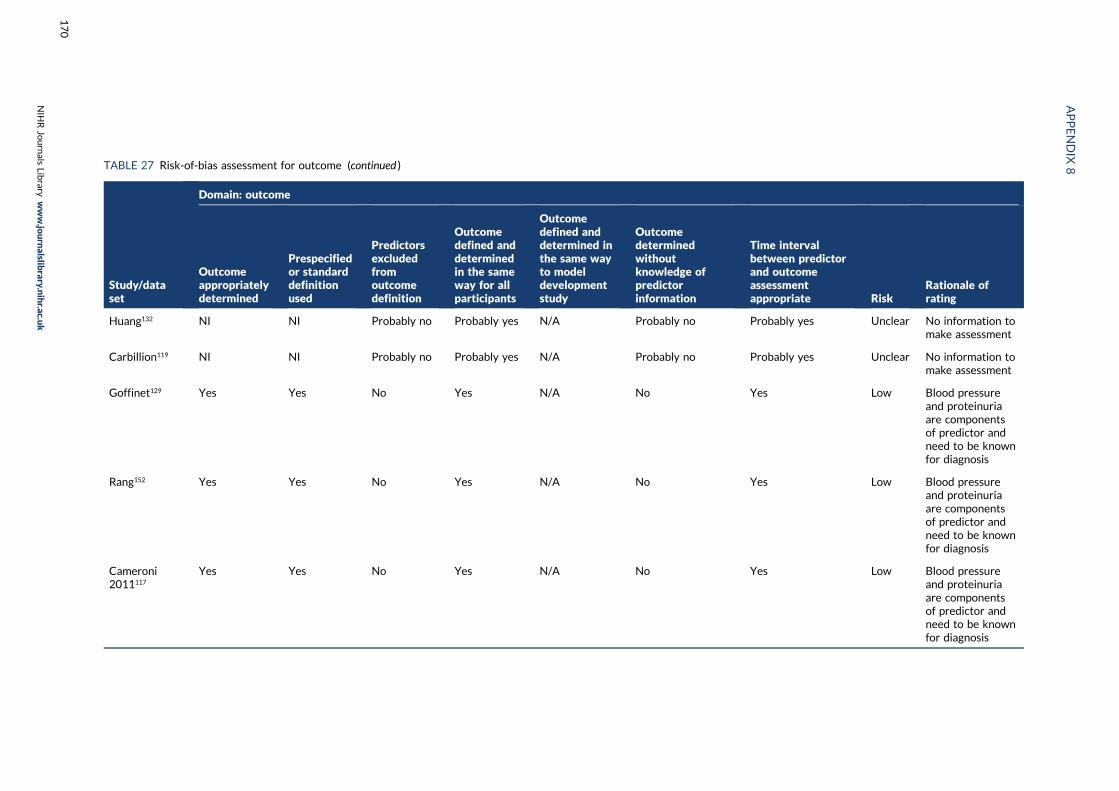
TABLE 27 Risk-of-bias assessment for outcome (continued )
Study/dataset
Domain: outcome
Outcomeappropriatelydetermined
Prespecifiedor standarddefinitionused
Predictorsexcludedfromoutcomedefinition
Outcomedefined anddeterminedin the sameway for allparticipants
Outcomedefined anddetermined inthe same wayto modeldevelopmentstudy
Outcomedeterminedwithoutknowledge ofpredictorinformation
Time intervalbetween predictorand outcomeassessmentappropriate Risk
Rationale ofrating
Huang132 NI NI Probably no Probably yes N/A Probably no Probably yes Unclear No information tomake assessment
Carbillion119 NI NI Probably no Probably yes N/A Probably no Probably yes Unclear No information tomake assessment
Goffinet129 Yes Yes No Yes N/A No Yes Low Blood pressureand proteinuriaare componentsof predictor andneed to be knownfor diagnosis
Rang152 Yes Yes No Yes N/A No Yes Low Blood pressureand proteinuriaare componentsof predictor andneed to be knownfor diagnosis
Cameroni2011117
Yes Yes No Yes N/A No Yes Low Blood pressureand proteinuriaare componentsof predictor andneed to be knownfor diagnosis
APPENDIX
8
NIH
RJournals
Library
www.jo
urnalslib
rary.nihr.ac.u
k
170

Study/dataset
Domain: outcome
Outcomeappropriatelydetermined
Prespecifiedor standarddefinitionused
Predictorsexcludedfromoutcomedefinition
Outcomedefined anddeterminedin the sameway for allparticipants
Outcomedefined anddetermined inthe same wayto modeldevelopmentstudy
Outcomedeterminedwithoutknowledge ofpredictorinformation
Time intervalbetween predictorand outcomeassessmentappropriate Risk
Rationale ofrating
Conserva2012123
Yes Yes No Yes N/A No Yes Low Blood pressureand proteinuriaare componentsof predictor andneed to be knownfor diagnosis
Facchinetti124 Yes Yes No Yes N/A No Yes Low Blood pressureand proteinuriaare componentsof predictor andneed to be knownfor diagnosis
Ferrazzani158 Yes Yes No Yes N/A No Yes Low Blood pressureand proteinuriaare componentsof predictor andneed to be knownfor diagnosis
Figueiró-Filho125
Yes Yes No Yes N/A No Yes Low Blood pressureand proteinuriaare componentsof predictor andneed to be knownfor diagnosis
Langenveld138 Yes Yes No Probably yes N/A Probably no Probably yes Low Blood pressureand proteinuriaare componentsof predictor andneed to be knownfor diagnosis
continued
DOI:10.3310/hta2
4720
Health
Tech
nology
Assessm
ent2020
Vol.2
4No.7
2
©Queen
’sPrin
teran
dContro
llerofHMSO
2020.T
his
work
was
produced
byAllo
teyet
al.under
theterm
sofaco
mmissio
ningco
ntract
issued
bytheSecretary
ofState
forHealth
andSo
cialCare.T
his
issuemay
befreely
reproduced
forthepu
rposes
ofprivate
researchan
dstu
dyan
dextracts
(orindeed
,thefullrepo
rt)may
beinclu
ded
inpro
fessional
journals
provid
edthat
suitab
leackn
owled
gemen
tis
mad
ean
dtherepro
ductio
nis
notasso
ciatedwith
anyform
ofad
vertising.
Applicatio
nsforco
mmercial
reproductio
nshould
bead
dressed
to:NIH
RJournals
Library,
Natio
nal
Institu
teforHealth
Research
,Evalu
ation,Trials
and
Studies
Coordinatin
gCen
tre,Alph
aHouse,
University
ofSo
utham
ptonScien
cePark,So
utham
ptonSO
167NS,U
K.
171
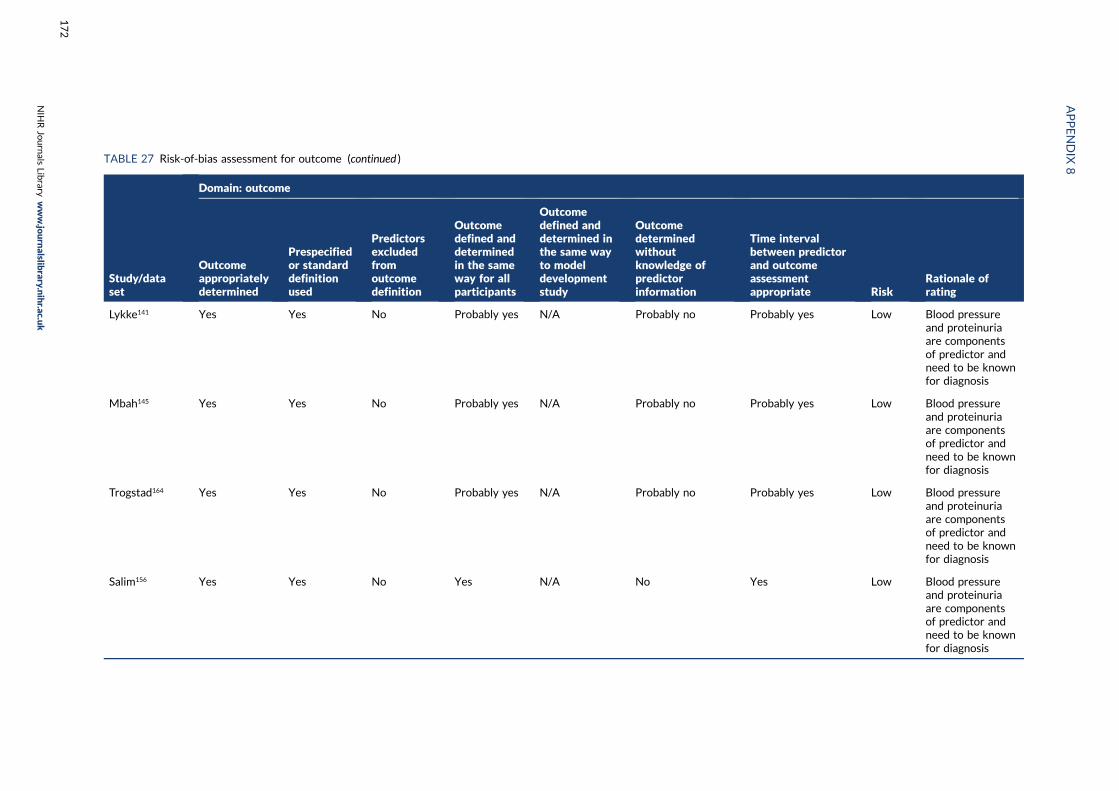
TABLE 27 Risk-of-bias assessment for outcome (continued )
Study/dataset
Domain: outcome
Outcomeappropriatelydetermined
Prespecifiedor standarddefinitionused
Predictorsexcludedfromoutcomedefinition
Outcomedefined anddeterminedin the sameway for allparticipants
Outcomedefined anddetermined inthe same wayto modeldevelopmentstudy
Outcomedeterminedwithoutknowledge ofpredictorinformation
Time intervalbetween predictorand outcomeassessmentappropriate Risk
Rationale ofrating
Lykke141 Yes Yes No Probably yes N/A Probably no Probably yes Low Blood pressureand proteinuriaare componentsof predictor andneed to be knownfor diagnosis
Mbah145 Yes Yes No Probably yes N/A Probably no Probably yes Low Blood pressureand proteinuriaare componentsof predictor andneed to be knownfor diagnosis
Trogstad164 Yes Yes No Probably yes N/A Probably no Probably yes Low Blood pressureand proteinuriaare componentsof predictor andneed to be knownfor diagnosis
Salim156 Yes Yes No Yes N/A No Yes Low Blood pressureand proteinuriaare componentsof predictor andneed to be knownfor diagnosis
APPENDIX
8
NIH
RJournals
Library
www.jo
urnalslib
rary.nihr.ac.u
k
172

Study/dataset
Domain: outcome
Outcomeappropriatelydetermined
Prespecifiedor standarddefinitionused
Predictorsexcludedfromoutcomedefinition
Outcomedefined anddeterminedin the sameway for allparticipants
Outcomedefined anddetermined inthe same wayto modeldevelopmentstudy
Outcomedeterminedwithoutknowledge ofpredictorinformation
Time intervalbetween predictorand outcomeassessmentappropriate Risk
Rationale ofrating
vanOostwaard2012168
Yes Yes No Yes N/A No Yes Low Blood pressureand proteinuriaare componentsof predictor andneed to be knownfor diagnosis
vanOostwaard2014169
Yes Yes No Yes N/A No Yes Low Blood pressureand proteinuriaare componentsof predictor andneed to be knownfor diagnosis
Zhang178 Yes Yes No Yes N/A No Yes Low Blood pressureand proteinuriaare componentsof predictor andneed to be knownfor diagnosis
Brown 2007116 Yes Yes No Yes N/A No Yes Low Blood pressureand proteinuriaare componentsof predictor andneed to be knownfor diagnosis
GurgelAlves130
Yes Yes No Yes N/A No Yes Low Blood pressureand proteinuriaare componentsof predictor andneed to be knownfor diagnosis
continued
DOI:10.3310/hta2
4720
Health
Tech
nology
Assessm
ent2020
Vol.2
4No.7
2
©Queen
’sPrin
teran
dContro
llerofHMSO
2020.T
his
work
was
produced
byAllo
teyet
al.under
theterm
sofaco
mmissio
ningco
ntract
issued
bytheSecretary
ofState
forHealth
andSo
cialCare.T
his
issuemay
befreely
reproduced
forthepu
rposes
ofprivate
researchan
dstu
dyan
dextracts
(orindeed
,thefullrepo
rt)may
beinclu
ded
inpro
fessional
journals
provid
edthat
suitab
leackn
owled
gemen
tis
mad
ean
dtherepro
ductio
nis
notasso
ciatedwith
anyform
ofad
vertising.
Applicatio
nsforco
mmercial
reproductio
nshould
bead
dressed
to:NIH
RJournals
Library,
Natio
nal
Institu
teforHealth
Research
,Evalu
ation,Trials
and
Studies
Coordinatin
gCen
tre,Alph
aHouse,
University
ofSo
utham
ptonScien
cePark,So
utham
ptonSO
167NS,U
K.
173
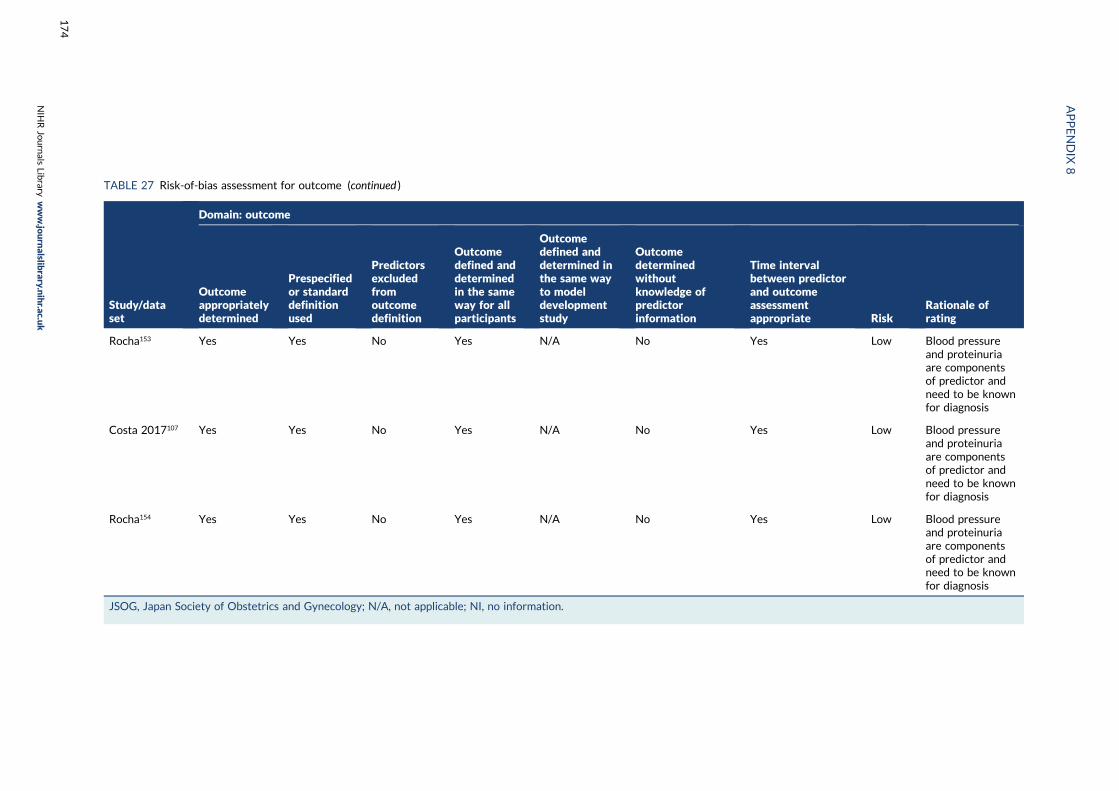
TABLE 27 Risk-of-bias assessment for outcome (continued )
Study/dataset
Domain: outcome
Outcomeappropriatelydetermined
Prespecifiedor standarddefinitionused
Predictorsexcludedfromoutcomedefinition
Outcomedefined anddeterminedin the sameway for allparticipants
Outcomedefined anddetermined inthe same wayto modeldevelopmentstudy
Outcomedeterminedwithoutknowledge ofpredictorinformation
Time intervalbetween predictorand outcomeassessmentappropriate Risk
Rationale ofrating
Rocha153 Yes Yes No Yes N/A No Yes Low Blood pressureand proteinuriaare componentsof predictor andneed to be knownfor diagnosis
Costa 2017107 Yes Yes No Yes N/A No Yes Low Blood pressureand proteinuriaare componentsof predictor andneed to be knownfor diagnosis
Rocha154 Yes Yes No Yes N/A No Yes Low Blood pressureand proteinuriaare componentsof predictor andneed to be knownfor diagnosis
JSOG, Japan Society of Obstetrics and Gynecology; N/A, not applicable; NI, no information.
APPENDIX
8
NIH
RJournals
Library
www.jo
urnalslib
rary.nihr.ac.u
k
174
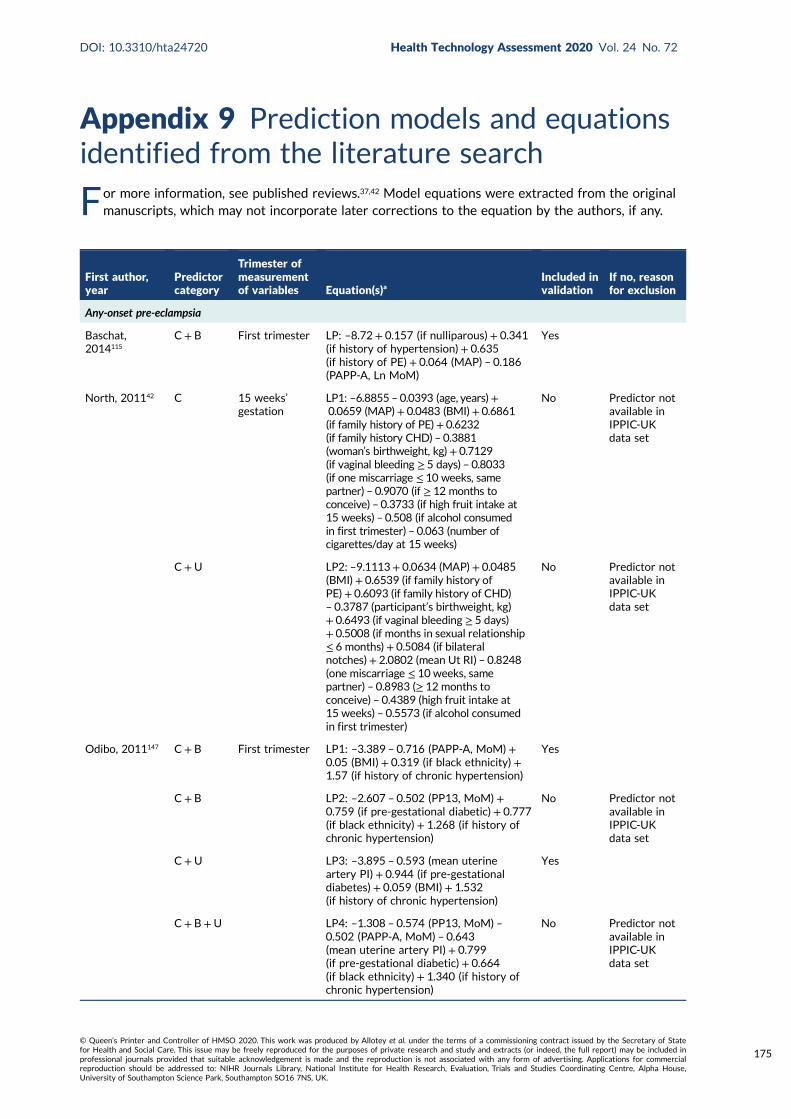
Appendix 9 Prediction models and equationsidentified from the literature search
For more information, see published reviews.37,42 Model equations were extracted from the originalmanuscripts, which may not incorporate later corrections to the equation by the authors, if any.
First author,year
Predictorcategory
Trimester ofmeasurementof variables Equation(s)a
Included invalidation
If no, reasonfor exclusion
Any-onset pre-eclampsia
Baschat,2014115
C+ B First trimester LP: –8.72 + 0.157 (if nulliparous) + 0.341(if history of hypertension)+ 0.635(if history of PE) + 0.064 (MAP) – 0.186(PAPP-A, Ln MoM)
Yes
North, 201142 C 15 weeks’gestation
LP1: –6.8855 – 0.0393 (age, years)+0.0659 (MAP)+ 0.0483 (BMI)+ 0.6861(if family history of PE)+ 0.6232(if family history CHD) – 0.3881(woman’s birthweight, kg)+ 0.7129(if vaginal bleeding ≥ 5 days) – 0.8033(if one miscarriage ≤ 10 weeks, samepartner) – 0.9070 (if ≥ 12 months toconceive) – 0.3733 (if high fruit intake at15 weeks) – 0.508 (if alcohol consumedin first trimester) – 0.063 (number ofcigarettes/day at 15 weeks)
No Predictor notavailable inIPPIC-UKdata set
C+U LP2: –9.1113+ 0.0634 (MAP)+ 0.0485(BMI)+ 0.6539 (if family history ofPE)+ 0.6093 (if family history of CHD)– 0.3787 (participant’s birthweight, kg)+ 0.6493 (if vaginal bleeding ≥ 5 days)+ 0.5008 (if months in sexual relationship≤ 6 months)+ 0.5084 (if bilateralnotches)+ 2.0802 (mean Ut RI) – 0.8248(one miscarriage ≤ 10 weeks, samepartner) – 0.8983 (≥ 12 months toconceive) – 0.4389 (high fruit intake at15 weeks) – 0.5573 (if alcohol consumedin first trimester)
No Predictor notavailable inIPPIC-UKdata set
Odibo, 2011147 C+ B First trimester LP1: –3.389 – 0.716 (PAPP-A, MoM)+0.05 (BMI) + 0.319 (if black ethnicity) +1.57 (if history of chronic hypertension)
Yes
C+ B LP2: –2.607 – 0.502 (PP13, MoM) +0.759 (if pre-gestational diabetic) + 0.777(if black ethnicity) + 1.268 (if history ofchronic hypertension)
No Predictor notavailable inIPPIC-UKdata set
C+U LP3: –3.895 – 0.593 (mean uterineartery PI) + 0.944 (if pre-gestationaldiabetes) + 0.059 (BMI) + 1.532(if history of chronic hypertension)
Yes
C+ B+U LP4: –1.308 – 0.574 (PP13, MoM) –0.502 (PAPP-A, MoM) – 0.643(mean uterine artery PI) + 0.799(if pre-gestational diabetic) + 0.664(if black ethnicity) + 1.340 (if history ofchronic hypertension)
No Predictor notavailable inIPPIC-UKdata set
DOI: 10.3310/hta24720 Health Technology Assessment 2020 Vol. 24 No. 72
© Queen’s Printer and Controller of HMSO 2020. This work was produced by Allotey et al. under the terms of a commissioning contract issued by the Secretary of Statefor Health and Social Care. This issue may be freely reproduced for the purposes of private research and study and extracts (or indeed, the full report) may be included inprofessional journals provided that suitable acknowledgement is made and the reproduction is not associated with any form of advertising. Applications for commercialreproduction should be addressed to: NIHR Journals Library, National Institute for Health Research, Evaluation, Trials and Studies Coordinating Centre, Alpha House,University of Southampton Science Park, Southampton SO16 7NS, UK.
175
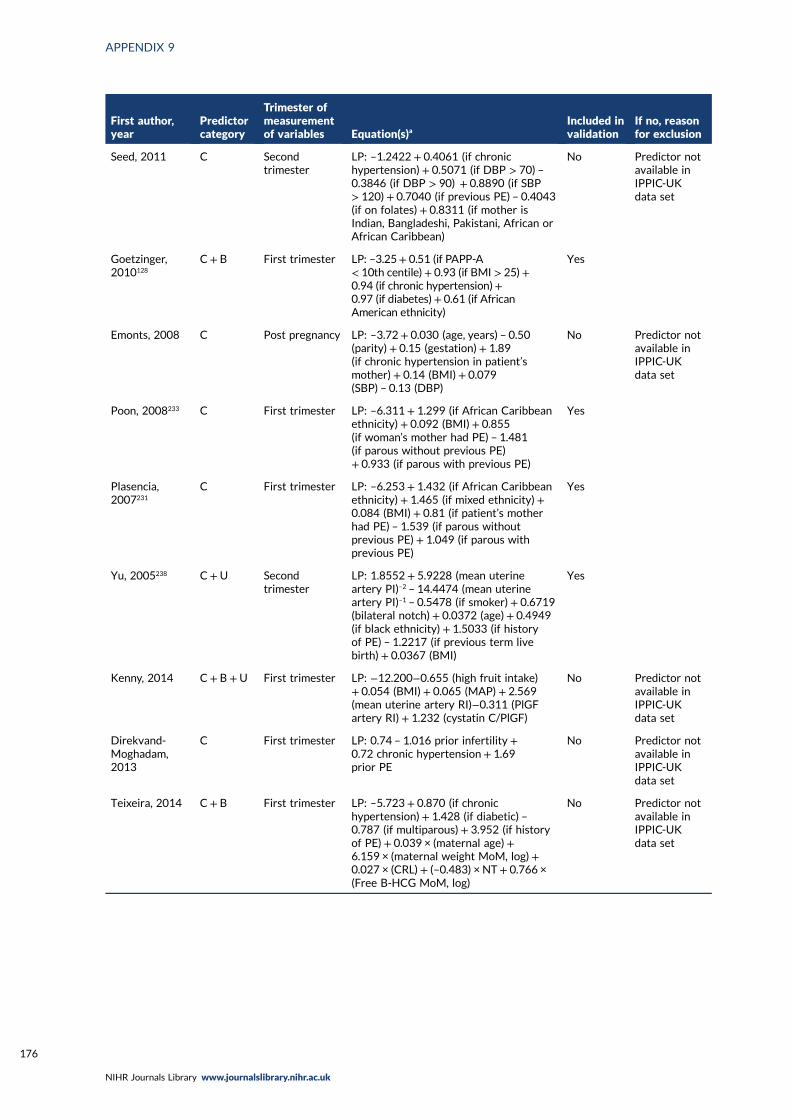
First author,year
Predictorcategory
Trimester ofmeasurementof variables Equation(s)a
Included invalidation
If no, reasonfor exclusion
Seed, 2011 C Secondtrimester
LP: –1.2422 + 0.4061 (if chronichypertension) + 0.5071 (if DBP > 70) –0.3846 (if DBP > 90) + 0.8890 (if SBP> 120) + 0.7040 (if previous PE) – 0.4043(if on folates) + 0.8311 (if mother isIndian, Bangladeshi, Pakistani, African orAfrican Caribbean)
No Predictor notavailable inIPPIC-UKdata set
Goetzinger,2010128
C+ B First trimester LP: –3.25+ 0.51 (if PAPP-A< 10th centile)+ 0.93 (if BMI > 25)+0.94 (if chronic hypertension)+0.97 (if diabetes)+ 0.61 (if AfricanAmerican ethnicity)
Yes
Emonts, 2008 C Post pregnancy LP: –3.72 + 0.030 (age, years) – 0.50(parity) + 0.15 (gestation) + 1.89(if chronic hypertension in patient’smother) + 0.14 (BMI)+ 0.079(SBP) – 0.13 (DBP)
No Predictor notavailable inIPPIC-UKdata set
Poon, 2008233 C First trimester LP: –6.311 + 1.299 (if African Caribbeanethnicity) + 0.092 (BMI)+ 0.855(if woman’s mother had PE) – 1.481(if parous without previous PE)+ 0.933 (if parous with previous PE)
Yes
Plasencia,2007231
C First trimester LP: –6.253 + 1.432 (if African Caribbeanethnicity) + 1.465 (if mixed ethnicity) +0.084 (BMI) + 0.81 (if patient’s motherhad PE) – 1.539 (if parous withoutprevious PE) + 1.049 (if parous withprevious PE)
Yes
Yu, 2005238 C+U Secondtrimester
LP: 1.8552 + 5.9228 (mean uterineartery PI)–2 – 14.4474 (mean uterineartery PI)–1 – 0.5478 (if smoker) + 0.6719(bilateral notch) + 0.0372 (age)+ 0.4949(if black ethnicity) + 1.5033 (if historyof PE) – 1.2217 (if previous term livebirth) + 0.0367 (BMI)
Yes
Kenny, 2014 C+ B +U First trimester LP: −12.200−0.655 (high fruit intake)+ 0.054 (BMI) + 0.065 (MAP) + 2.569(mean uterine artery RI)−0.311 (PlGFartery RI) + 1.232 (cystatin C/PlGF)
No Predictor notavailable inIPPIC-UKdata set
Direkvand-Moghadam,2013
C First trimester LP: 0.74 – 1.016 prior infertility +0.72 chronic hypertension+ 1.69prior PE
No Predictor notavailable inIPPIC-UKdata set
Teixeira, 2014 C + B First trimester LP: –5.723 + 0.870 (if chronichypertension) + 1.428 (if diabetic) –0.787 (if multiparous) + 3.952 (if historyof PE) + 0.039 × (maternal age)+6.159 × (maternal weight MoM, log)+0.027 × (CRL) + (–0.483) × NT+ 0.766 ×(Free B-HCG MoM, log)
No Predictor notavailable inIPPIC-UKdata set
APPENDIX 9
NIHR Journals Library www.journalslibrary.nihr.ac.uk
176
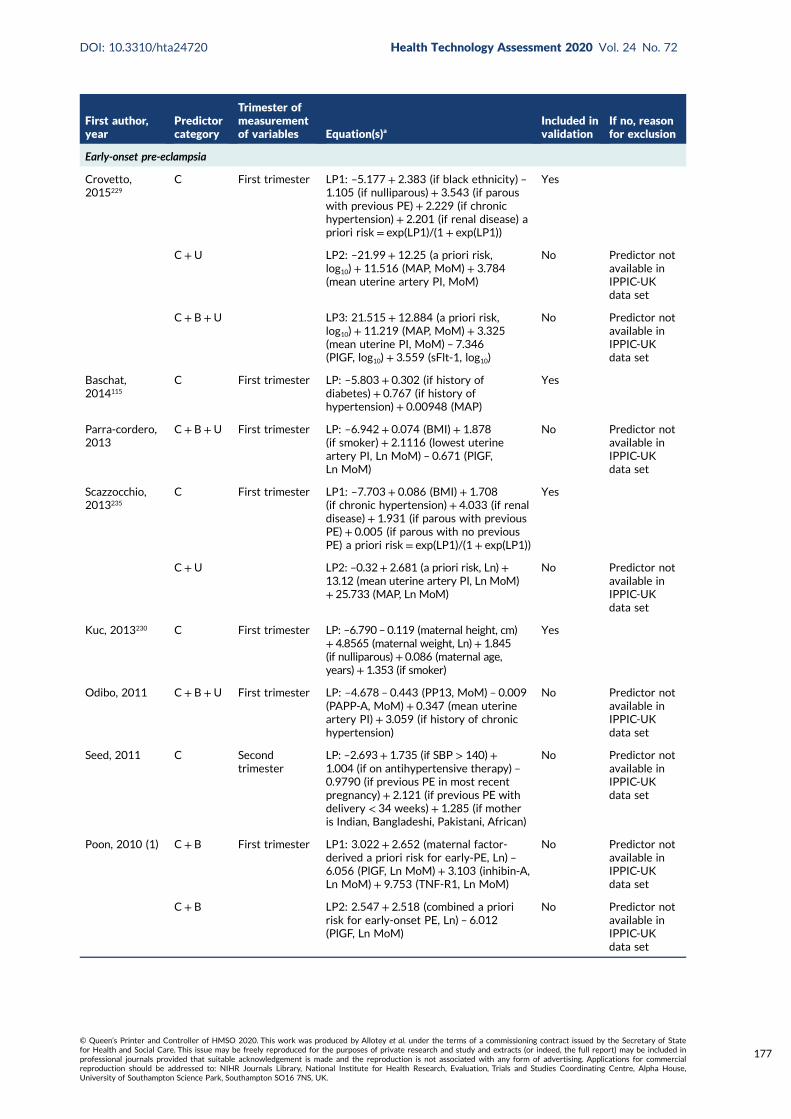
First author,year
Predictorcategory
Trimester ofmeasurementof variables Equation(s)a
Included invalidation
If no, reasonfor exclusion
Early-onset pre-eclampsia
Crovetto,2015229
C First trimester LP1: –5.177 + 2.383 (if black ethnicity) –1.105 (if nulliparous) + 3.543 (if parouswith previous PE)+ 2.229 (if chronichypertension)+ 2.201 (if renal disease) apriori risk= exp(LP1)/(1 + exp(LP1))
Yes
C+U LP2: –21.99 + 12.25 (a priori risk,log10)+ 11.516 (MAP, MoM) + 3.784(mean uterine artery PI, MoM)
No Predictor notavailable inIPPIC-UKdata set
C+ B+U LP3: 21.515 + 12.884 (a priori risk,log10)+ 11.219 (MAP, MoM) + 3.325(mean uterine PI, MoM) – 7.346(PlGF, log10) + 3.559 (sFlt-1, log10)
No Predictor notavailable inIPPIC-UKdata set
Baschat,2014115
C First trimester LP: –5.803 + 0.302 (if history ofdiabetes) + 0.767 (if history ofhypertension)+ 0.00948 (MAP)
Yes
Parra-cordero,2013
C+ B+U First trimester LP: –6.942 + 0.074 (BMI)+ 1.878(if smoker) + 2.1116 (lowest uterineartery PI, Ln MoM) – 0.671 (PlGF,Ln MoM)
No Predictor notavailable inIPPIC-UKdata set
Scazzocchio,2013235
C First trimester LP1: –7.703 + 0.086 (BMI)+ 1.708(if chronic hypertension)+ 4.033 (if renaldisease)+ 1.931 (if parous with previousPE) + 0.005 (if parous with no previousPE) a priori risk= exp(LP1)/(1 + exp(LP1))
Yes
C+U LP2: –0.32+ 2.681 (a priori risk, Ln)+13.12 (mean uterine artery PI, Ln MoM)+ 25.733 (MAP, Ln MoM)
No Predictor notavailable inIPPIC-UKdata set
Kuc, 2013230 C First trimester LP: –6.790 – 0.119 (maternal height, cm)+ 4.8565 (maternal weight, Ln)+ 1.845(if nulliparous)+ 0.086 (maternal age,years)+ 1.353 (if smoker)
Yes
Odibo, 2011 C+ B+U First trimester LP: –4.678 – 0.443 (PP13, MoM) – 0.009(PAPP-A, MoM) + 0.347 (mean uterineartery PI) + 3.059 (if history of chronichypertension)
No Predictor notavailable inIPPIC-UKdata set
Seed, 2011 C Secondtrimester
LP: –2.693+ 1.735 (if SBP > 140)+1.004 (if on antihypertensive therapy) –0.9790 (if previous PE in most recentpregnancy) + 2.121 (if previous PE withdelivery < 34 weeks)+ 1.285 (if motheris Indian, Bangladeshi, Pakistani, African)
No Predictor notavailable inIPPIC-UKdata set
Poon, 2010 (1) C + B First trimester LP1: 3.022 + 2.652 (maternal factor-derived a priori risk for early-PE, Ln) –6.056 (PlGF, Ln MoM) + 3.103 (inhibin-A,Ln MoM) + 9.753 (TNF-R1, Ln MoM)
No Predictor notavailable inIPPIC-UKdata set
C+ B LP2: 2.547 + 2.518 (combined a prioririsk for early-onset PE, Ln) – 6.012(PlGF, Ln MoM)
No Predictor notavailable inIPPIC-UKdata set
DOI: 10.3310/hta24720 Health Technology Assessment 2020 Vol. 24 No. 72
© Queen’s Printer and Controller of HMSO 2020. This work was produced by Allotey et al. under the terms of a commissioning contract issued by the Secretary of Statefor Health and Social Care. This issue may be freely reproduced for the purposes of private research and study and extracts (or indeed, the full report) may be included inprofessional journals provided that suitable acknowledgement is made and the reproduction is not associated with any form of advertising. Applications for commercialreproduction should be addressed to: NIHR Journals Library, National Institute for Health Research, Evaluation, Trials and Studies Coordinating Centre, Alpha House,University of Southampton Science Park, Southampton SO16 7NS, UK.
177
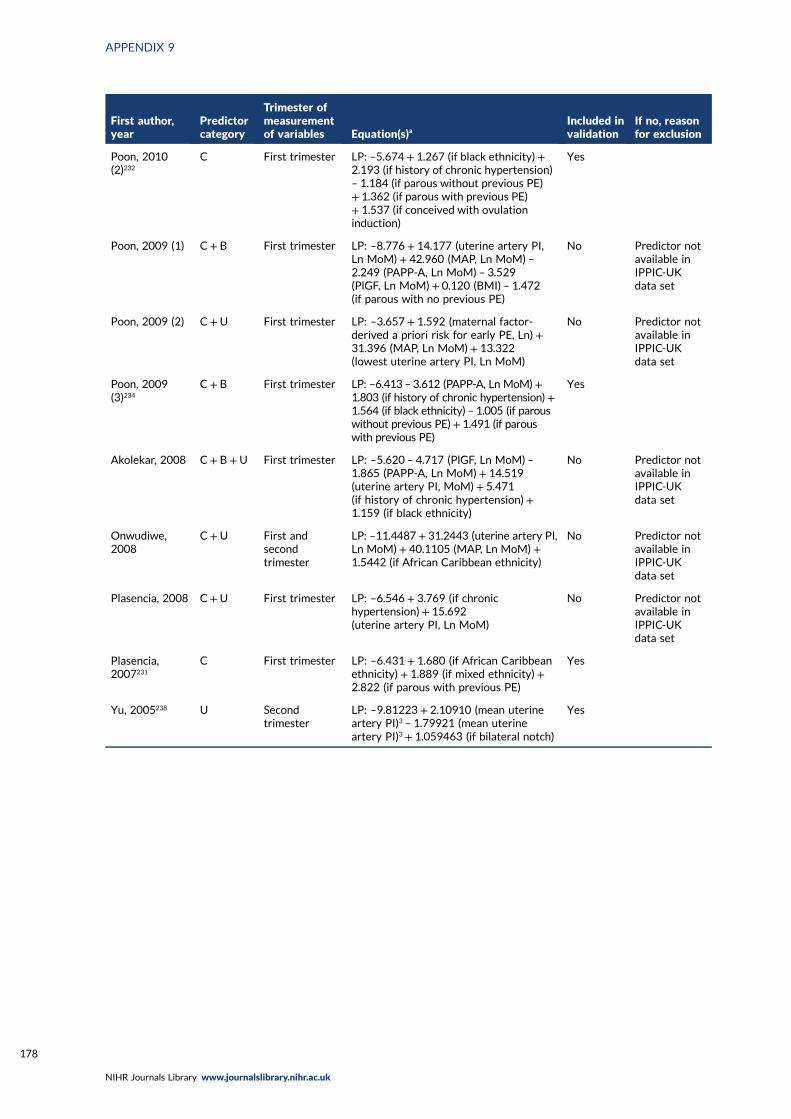
First author,year
Predictorcategory
Trimester ofmeasurementof variables Equation(s)a
Included invalidation
If no, reasonfor exclusion
Poon, 2010(2)232
C First trimester LP: –5.674 + 1.267 (if black ethnicity) +2.193 (if history of chronic hypertension)– 1.184 (if parous without previous PE)+ 1.362 (if parous with previous PE)+ 1.537 (if conceived with ovulationinduction)
Yes
Poon, 2009 (1) C + B First trimester LP: –8.776 + 14.177 (uterine artery PI,Ln MoM)+ 42.960 (MAP, Ln MoM) –2.249 (PAPP-A, Ln MoM) – 3.529(PlGF, Ln MoM) + 0.120 (BMI) – 1.472(if parous with no previous PE)
No Predictor notavailable inIPPIC-UKdata set
Poon, 2009 (2) C +U First trimester LP: –3.657 + 1.592 (maternal factor-derived a priori risk for early PE, Ln) +31.396 (MAP, Ln MoM)+ 13.322(lowest uterine artery PI, Ln MoM)
No Predictor notavailable inIPPIC-UKdata set
Poon, 2009(3)234
C+ B First trimester LP: –6.413 – 3.612 (PAPP-A, Ln MoM)+1.803 (if history of chronic hypertension)+1.564 (if black ethnicity) – 1.005 (if parouswithout previous PE)+ 1.491 (if parouswith previous PE)
Yes
Akolekar, 2008 C+ B +U First trimester LP: –5.620 – 4.717 (PlGF, Ln MoM) –1.865 (PAPP-A, Ln MoM) + 14.519(uterine artery PI, MoM) + 5.471(if history of chronic hypertension)+1.159 (if black ethnicity)
No Predictor notavailable inIPPIC-UKdata set
Onwudiwe,2008
C+U First andsecondtrimester
LP: –11.4487+ 31.2443 (uterine artery PI,Ln MoM) + 40.1105 (MAP, Ln MoM) +1.5442 (if African Caribbean ethnicity)
No Predictor notavailable inIPPIC-UKdata set
Plasencia, 2008 C+U First trimester LP: –6.546 + 3.769 (if chronichypertension) + 15.692(uterine artery PI, Ln MoM)
No Predictor notavailable inIPPIC-UKdata set
Plasencia,2007231
C First trimester LP: –6.431 + 1.680 (if African Caribbeanethnicity) + 1.889 (if mixed ethnicity) +2.822 (if parous with previous PE)
Yes
Yu, 2005238 U Secondtrimester
LP: –9.81223 + 2.10910 (mean uterineartery PI)3 – 1.79921 (mean uterineartery PI)3 + 1.059463 (if bilateral notch)
Yes
APPENDIX 9
NIHR Journals Library www.journalslibrary.nihr.ac.uk
178
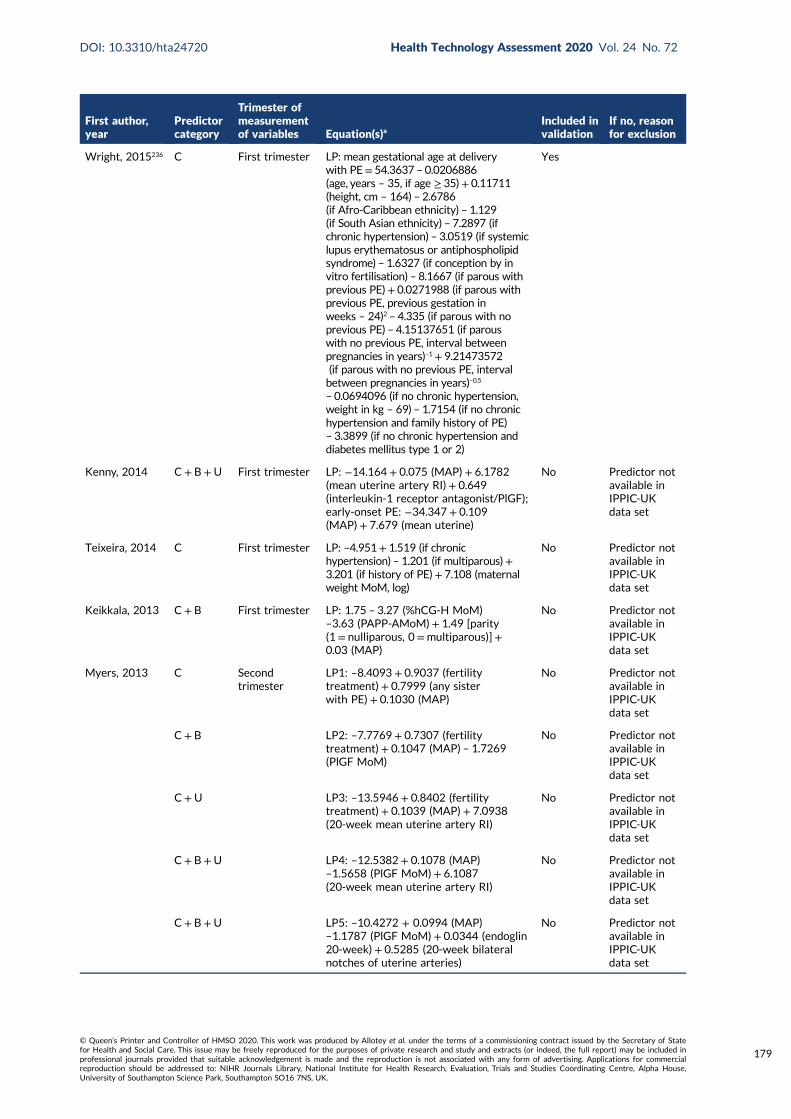
First author,year
Predictorcategory
Trimester ofmeasurementof variables Equation(s)a
Included invalidation
If no, reasonfor exclusion
Wright, 2015236 C First trimester LP: mean gestational age at deliverywith PE= 54.3637 – 0.0206886(age, years – 35, if age ≥ 35)+ 0.11711(height, cm – 164) – 2.6786(if Afro-Caribbean ethnicity) – 1.129(if South Asian ethnicity) – 7.2897 (ifchronic hypertension) – 3.0519 (if systemiclupus erythematosus or antiphospholipidsyndrome) – 1.6327 (if conception by invitro fertilisation) – 8.1667 (if parous withprevious PE)+ 0.0271988 (if parous withprevious PE, previous gestation inweeks – 24)2 – 4.335 (if parous with noprevious PE) – 4.15137651 (if parouswith no previous PE, interval betweenpregnancies in years)–1+ 9.21473572(if parous with no previous PE, intervalbetween pregnancies in years)–0.5
– 0.0694096 (if no chronic hypertension,weight in kg – 69) – 1.7154 (if no chronichypertension and family history of PE)– 3.3899 (if no chronic hypertension anddiabetes mellitus type 1 or 2)
Yes
Kenny, 2014 C+ B+U First trimester LP: −14.164 + 0.075 (MAP) + 6.1782(mean uterine artery RI)+ 0.649(interleukin-1 receptor antagonist/PlGF);early-onset PE: −34.347 + 0.109(MAP) + 7.679 (mean uterine)
No Predictor notavailable inIPPIC-UKdata set
Teixeira, 2014 C First trimester LP: –4.951+ 1.519 (if chronichypertension) – 1.201 (if multiparous)+3.201 (if history of PE)+ 7.108 (maternalweight MoM, log)
No Predictor notavailable inIPPIC-UKdata set
Keikkala, 2013 C + B First trimester LP: 1.75 – 3.27 (%hCG-H MoM)–3.63 (PAPP-AMoM)+ 1.49 [parity(1 = nulliparous, 0=multiparous)] +0.03 (MAP)
No Predictor notavailable inIPPIC-UKdata set
Myers, 2013 C Secondtrimester
LP1: –8.4093 + 0.9037 (fertilitytreatment) + 0.7999 (any sisterwith PE) + 0.1030 (MAP)
No Predictor notavailable inIPPIC-UKdata set
C+ B LP2: –7.7769 + 0.7307 (fertilitytreatment) + 0.1047 (MAP) – 1.7269(PlGF MoM)
No Predictor notavailable inIPPIC-UKdata set
C+U LP3: –13.5946 + 0.8402 (fertilitytreatment) + 0.1039 (MAP) + 7.0938(20-week mean uterine artery RI)
No Predictor notavailable inIPPIC-UKdata set
C+ B+U LP4: –12.5382 + 0.1078 (MAP)–1.5658 (PlGF MoM) + 6.1087(20-week mean uterine artery RI)
No Predictor notavailable inIPPIC-UKdata set
C+ B+U LP5: –10.4272 + 0.0994 (MAP)–1.1787 (PlGF MoM) + 0.0344 (endoglin20-week) + 0.5285 (20-week bilateralnotches of uterine arteries)
No Predictor notavailable inIPPIC-UKdata set
DOI: 10.3310/hta24720 Health Technology Assessment 2020 Vol. 24 No. 72
© Queen’s Printer and Controller of HMSO 2020. This work was produced by Allotey et al. under the terms of a commissioning contract issued by the Secretary of Statefor Health and Social Care. This issue may be freely reproduced for the purposes of private research and study and extracts (or indeed, the full report) may be included inprofessional journals provided that suitable acknowledgement is made and the reproduction is not associated with any form of advertising. Applications for commercialreproduction should be addressed to: NIHR Journals Library, National Institute for Health Research, Evaluation, Trials and Studies Coordinating Centre, Alpha House,University of Southampton Science Park, Southampton SO16 7NS, UK.
179
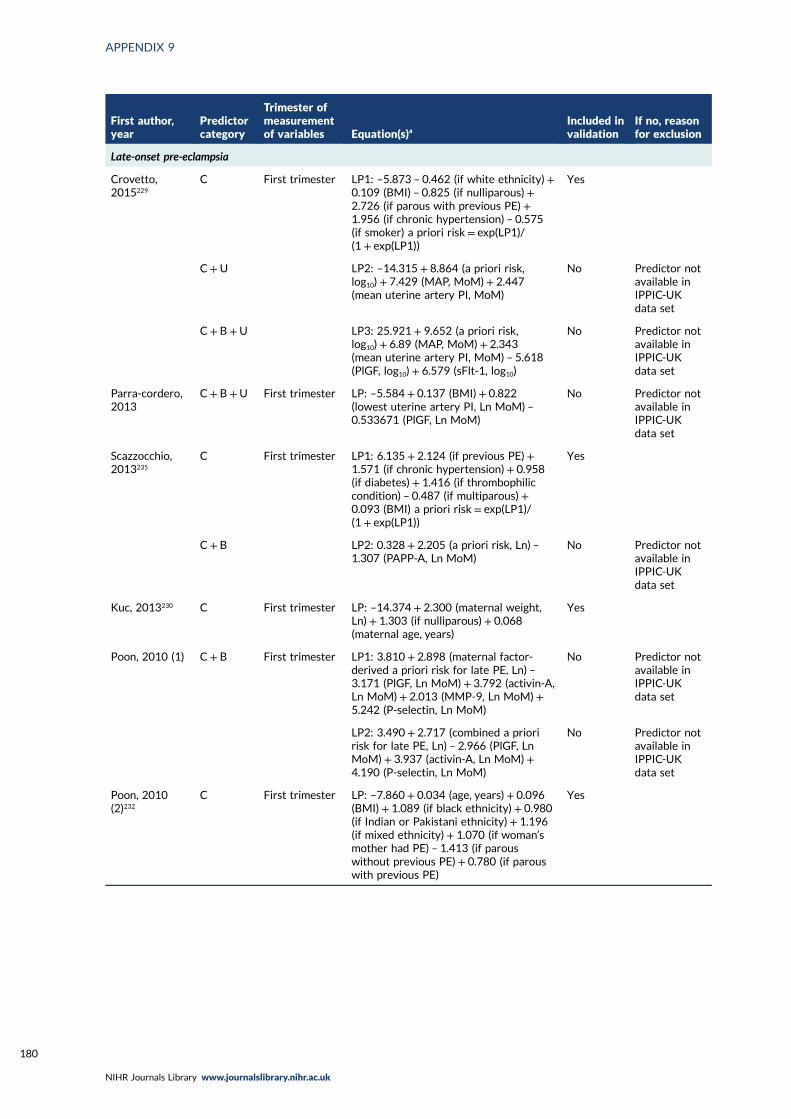
First author,year
Predictorcategory
Trimester ofmeasurementof variables Equation(s)a
Included invalidation
If no, reasonfor exclusion
Late-onset pre-eclampsia
Crovetto,2015229
C First trimester LP1: –5.873 – 0.462 (if white ethnicity) +0.109 (BMI) – 0.825 (if nulliparous) +2.726 (if parous with previous PE) +1.956 (if chronic hypertension) – 0.575(if smoker) a priori risk= exp(LP1)/(1 + exp(LP1))
Yes
C+U LP2: –14.315 + 8.864 (a priori risk,log10)+ 7.429 (MAP, MoM)+ 2.447(mean uterine artery PI, MoM)
No Predictor notavailable inIPPIC-UKdata set
C+ B +U LP3: 25.921 + 9.652 (a priori risk,log10)+ 6.89 (MAP, MoM) + 2.343(mean uterine artery PI, MoM) – 5.618(PlGF, log10) + 6.579 (sFlt-1, log10)
No Predictor notavailable inIPPIC-UKdata set
Parra-cordero,2013
C+ B +U First trimester LP: –5.584 + 0.137 (BMI)+ 0.822(lowest uterine artery PI, Ln MoM) –0.533671 (PlGF, Ln MoM)
No Predictor notavailable inIPPIC-UKdata set
Scazzocchio,2013235
C First trimester LP1: 6.135 + 2.124 (if previous PE)+1.571 (if chronic hypertension)+ 0.958(if diabetes) + 1.416 (if thrombophiliccondition) – 0.487 (if multiparous) +0.093 (BMI) a priori risk= exp(LP1)/(1 + exp(LP1))
Yes
C+ B LP2: 0.328 + 2.205 (a priori risk, Ln) –1.307 (PAPP-A, Ln MoM)
No Predictor notavailable inIPPIC-UKdata set
Kuc, 2013230 C First trimester LP: –14.374 + 2.300 (maternal weight,Ln) + 1.303 (if nulliparous) + 0.068(maternal age, years)
Yes
Poon, 2010 (1) C + B First trimester LP1: 3.810 + 2.898 (maternal factor-derived a priori risk for late PE, Ln) –3.171 (PlGF, Ln MoM)+ 3.792 (activin-A,Ln MoM)+ 2.013 (MMP-9, Ln MoM) +5.242 (P-selectin, Ln MoM)
No Predictor notavailable inIPPIC-UKdata set
LP2: 3.490 + 2.717 (combined a prioririsk for late PE, Ln) – 2.966 (PlGF, LnMoM) + 3.937 (activin-A, Ln MoM) +4.190 (P-selectin, Ln MoM)
No Predictor notavailable inIPPIC-UKdata set
Poon, 2010(2)232
C First trimester LP: –7.860 + 0.034 (age, years)+ 0.096(BMI) + 1.089 (if black ethnicity) + 0.980(if Indian or Pakistani ethnicity) + 1.196(if mixed ethnicity) + 1.070 (if woman’smother had PE) – 1.413 (if parouswithout previous PE) + 0.780 (if parouswith previous PE)
Yes
APPENDIX 9
NIHR Journals Library www.journalslibrary.nihr.ac.uk
180
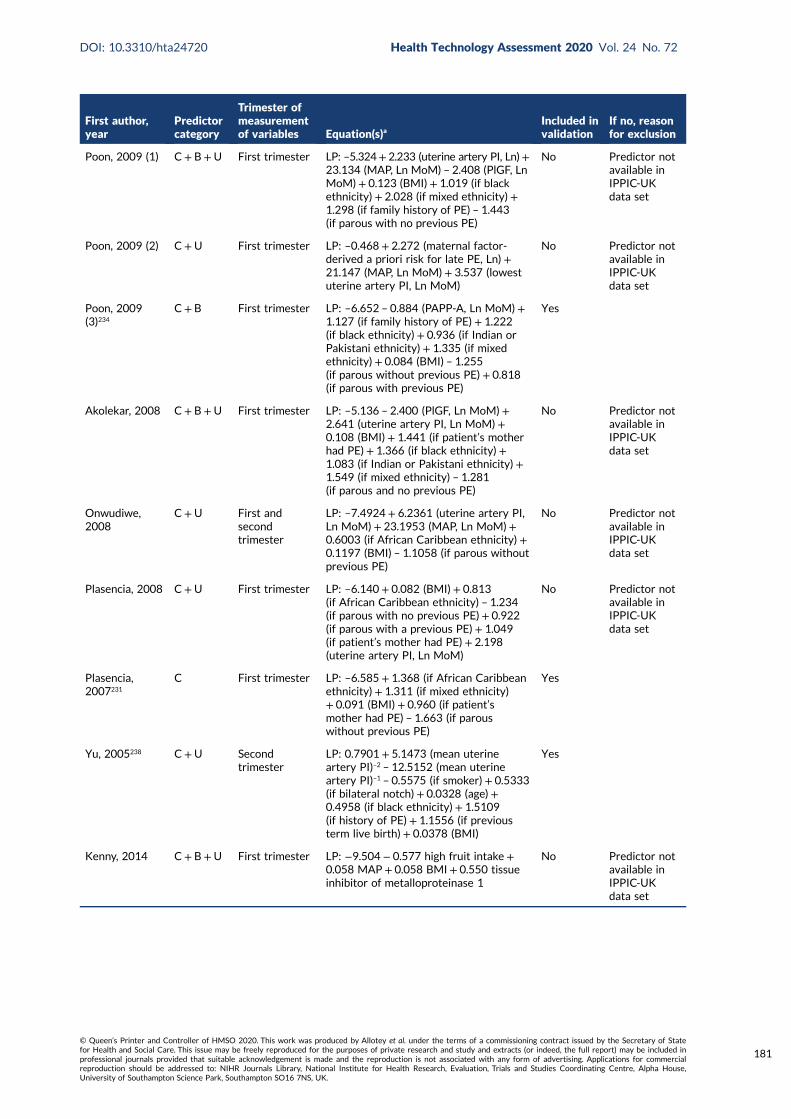
First author,year
Predictorcategory
Trimester ofmeasurementof variables Equation(s)a
Included invalidation
If no, reasonfor exclusion
Poon, 2009 (1) C + B+U First trimester LP: –5.324+ 2.233 (uterine artery PI, Ln)+23.134 (MAP, Ln MoM) – 2.408 (PlGF, LnMoM) + 0.123 (BMI) + 1.019 (if blackethnicity) + 2.028 (if mixed ethnicity) +1.298 (if family history of PE) – 1.443(if parous with no previous PE)
No Predictor notavailable inIPPIC-UKdata set
Poon, 2009 (2) C +U First trimester LP: –0.468 + 2.272 (maternal factor-derived a priori risk for late PE, Ln) +21.147 (MAP, Ln MoM) + 3.537 (lowestuterine artery PI, Ln MoM)
No Predictor notavailable inIPPIC-UKdata set
Poon, 2009(3)234
C+ B First trimester LP: –6.652 – 0.884 (PAPP-A, Ln MoM) +1.127 (if family history of PE) + 1.222(if black ethnicity) + 0.936 (if Indian orPakistani ethnicity) + 1.335 (if mixedethnicity) + 0.084 (BMI) – 1.255(if parous without previous PE) + 0.818(if parous with previous PE)
Yes
Akolekar, 2008 C+ B+U First trimester LP: –5.136 – 2.400 (PlGF, Ln MoM) +2.641 (uterine artery PI, Ln MoM) +0.108 (BMI)+ 1.441 (if patient’s motherhad PE)+ 1.366 (if black ethnicity) +1.083 (if Indian or Pakistani ethnicity) +1.549 (if mixed ethnicity) – 1.281(if parous and no previous PE)
No Predictor notavailable inIPPIC-UKdata set
Onwudiwe,2008
C+U First andsecondtrimester
LP: –7.4924 + 6.2361 (uterine artery PI,Ln MoM) + 23.1953 (MAP, Ln MoM)+0.6003 (if African Caribbean ethnicity) +0.1197 (BMI) – 1.1058 (if parous withoutprevious PE)
No Predictor notavailable inIPPIC-UKdata set
Plasencia, 2008 C+U First trimester LP: –6.140 + 0.082 (BMI)+ 0.813(if African Caribbean ethnicity) – 1.234(if parous with no previous PE)+ 0.922(if parous with a previous PE) + 1.049(if patient’s mother had PE) + 2.198(uterine artery PI, Ln MoM)
No Predictor notavailable inIPPIC-UKdata set
Plasencia,2007231
C First trimester LP: –6.585 + 1.368 (if African Caribbeanethnicity) + 1.311 (if mixed ethnicity)+ 0.091 (BMI) + 0.960 (if patient’smother had PE) – 1.663 (if parouswithout previous PE)
Yes
Yu, 2005238 C+U Secondtrimester
LP: 0.7901 + 5.1473 (mean uterineartery PI)–2 – 12.5152 (mean uterineartery PI)–1 – 0.5575 (if smoker) + 0.5333(if bilateral notch) + 0.0328 (age) +0.4958 (if black ethnicity) + 1.5109(if history of PE) + 1.1556 (if previousterm live birth) + 0.0378 (BMI)
Yes
Kenny, 2014 C+ B+U First trimester LP: −9.504 − 0.577 high fruit intake +0.058 MAP + 0.058 BMI + 0.550 tissueinhibitor of metalloproteinase 1
No Predictor notavailable inIPPIC-UKdata set
DOI: 10.3310/hta24720 Health Technology Assessment 2020 Vol. 24 No. 72
© Queen’s Printer and Controller of HMSO 2020. This work was produced by Allotey et al. under the terms of a commissioning contract issued by the Secretary of Statefor Health and Social Care. This issue may be freely reproduced for the purposes of private research and study and extracts (or indeed, the full report) may be included inprofessional journals provided that suitable acknowledgement is made and the reproduction is not associated with any form of advertising. Applications for commercialreproduction should be addressed to: NIHR Journals Library, National Institute for Health Research, Evaluation, Trials and Studies Coordinating Centre, Alpha House,University of Southampton Science Park, Southampton SO16 7NS, UK.
181

First author,year
Predictorcategory
Trimester ofmeasurementof variables Equation(s)a
Included invalidation
If no, reasonfor exclusion
Teixeira, 2014 C + B First trimester LP: –8.248+ 0.050 (if chronichypertension)+ 1.649 (if diabetic) –0.623 (if multiparous)+ 3.668 (if historyof PE)+ 5.834 × (maternal weight MoM,log)+ 0.036 × (CRL)+ (–0.592) ×NT+1.046 × (free B-HCG MoM, log)
No Predictor notavailable inIPPIC-UKdata set
CHD, coronary heart disease; CRL, crown–rump length; hCG, human chorionic gonadotropin; hCG-H, hyperglycosylatedhuman chronic gonadotropin; MoM, multiple of the mean; PE, pre-eclampsia; PI, pulsatility index; PP13, placentalprotein 13; RI, resistance index; SGA, small for gestational age.a For logistic regression, logit(p) = LP where the LP= α + β1 × x1 + β2 × x2 + . . ., and absolute predicted probabilities (p)
can be obtained using the transformation p = eLP/(1+ eLP). The model for ‘mean gestational age at delivery with PE’assumes a normal distribution with the predicted mean gestational age and SD 6.8833. The risk of delivery withPE is then calculated as the area under the normal curve between 24 weeks and either 42 weeks for any-onset PE(model 3) or 34 weeks for early-onset PE (model 14). For more detail, see Wright et al.236
NoteLn and log10 indicate that a variable was modelled on the natural logarithm scale or logarithm with base 10scale, respectively.
APPENDIX 9
NIHR Journals Library www.journalslibrary.nihr.ac.uk
182
Appendix 10 Patient characteristics ofIPPIC-UK individual participant data sets
DOI: 10.3310/hta24720 Health Technology Assessment 2020 Vol. 24 No. 72
© Queen’s Printer and Controller of HMSO 2020. This work was produced by Allotey et al. under the terms of a commissioning contract issued by the Secretary of Statefor Health and Social Care. This issue may be freely reproduced for the purposes of private research and study and extracts (or indeed, the full report) may be included inprofessional journals provided that suitable acknowledgement is made and the reproduction is not associated with any form of advertising. Applications for commercialreproduction should be addressed to: NIHR Journals Library, National Institute for Health Research, Evaluation, Trials and Studies Coordinating Centre, Alpha House,University of Southampton Science Park, Southampton SO16 7NS, UK.
183
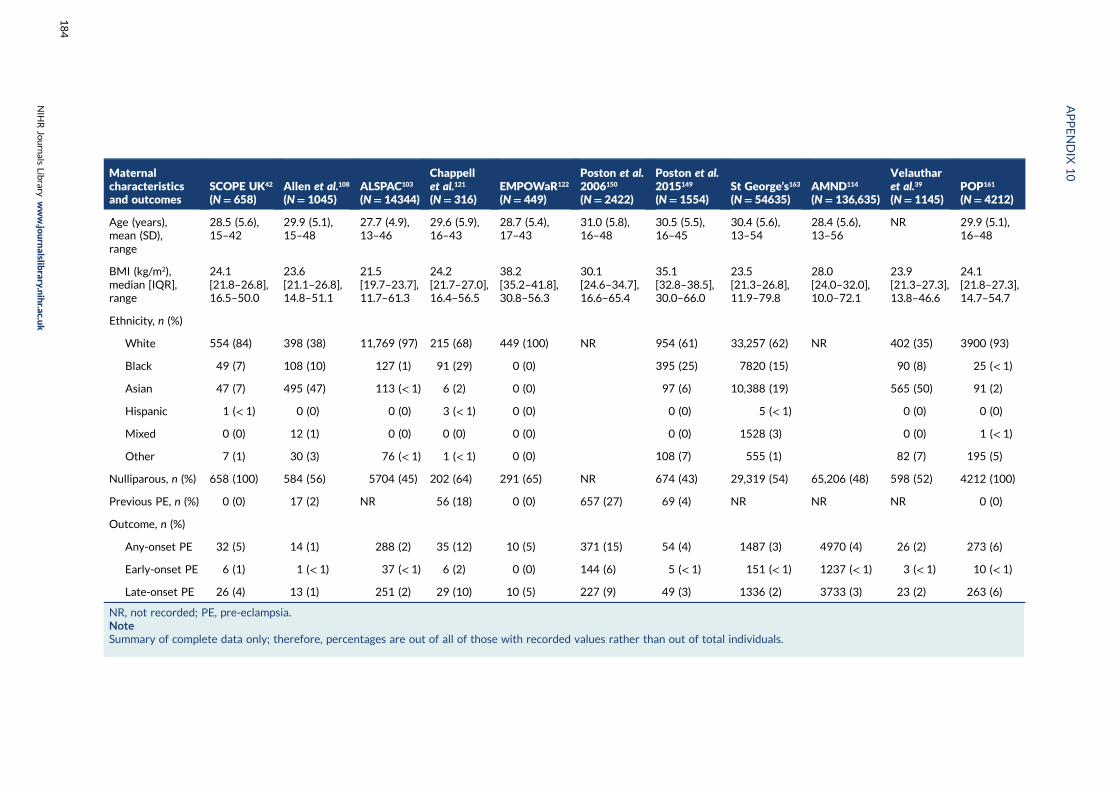
Maternalcharacteristicsand outcomes
SCOPE UK42
(N= 658)Allen et al.108
(N= 1045)ALSPAC103
(N= 14344)
Chappellet al.121
(N= 316)EMPOWaR122
(N= 449)
Poston et al.2006150
(N= 2422)
Poston et al.2015149
(N= 1554)St George’s163
(N= 54635)AMND114
(N= 136,635)
Velautharet al.39
(N= 1145)POP161
(N= 4212)
Age (years),mean (SD),range
28.5 (5.6),15–42
29.9 (5.1),15–48
27.7 (4.9),13–46
29.6 (5.9),16–43
28.7 (5.4),17–43
31.0 (5.8),16–48
30.5 (5.5),16–45
30.4 (5.6),13–54
28.4 (5.6),13–56
NR 29.9 (5.1),16–48
BMI (kg/m2),median [IQR],range
24.1[21.8–26.8],16.5–50.0
23.6[21.1–26.8],14.8–51.1
21.5[19.7–23.7],11.7–61.3
24.2[21.7–27.0],16.4–56.5
38.2[35.2–41.8],30.8–56.3
30.1[24.6–34.7],16.6–65.4
35.1[32.8–38.5],30.0–66.0
23.5[21.3–26.8],11.9–79.8
28.0[24.0–32.0],10.0–72.1
23.9[21.3–27.3],13.8–46.6
24.1[21.8–27.3],14.7–54.7
Ethnicity, n (%)
White 554 (84) 398 (38) 11,769 (97) 215 (68) 449 (100) NR 954 (61) 33,257 (62) NR 402 (35) 3900 (93)
Black 49 (7) 108 (10) 127 (1) 91 (29) 0 (0) 395 (25) 7820 (15) 90 (8) 25 (< 1)
Asian 47 (7) 495 (47) 113 (< 1) 6 (2) 0 (0) 97 (6) 10,388 (19) 565 (50) 91 (2)
Hispanic 1 (< 1) 0 (0) 0 (0) 3 (< 1) 0 (0) 0 (0) 5 (< 1) 0 (0) 0 (0)
Mixed 0 (0) 12 (1) 0 (0) 0 (0) 0 (0) 0 (0) 1528 (3) 0 (0) 1 (< 1)
Other 7 (1) 30 (3) 76 (< 1) 1 (< 1) 0 (0) 108 (7) 555 (1) 82 (7) 195 (5)
Nulliparous, n (%) 658 (100) 584 (56) 5704 (45) 202 (64) 291 (65) NR 674 (43) 29,319 (54) 65,206 (48) 598 (52) 4212 (100)
Previous PE, n (%) 0 (0) 17 (2) NR 56 (18) 0 (0) 657 (27) 69 (4) NR NR NR 0 (0)
Outcome, n (%)
Any-onset PE 32 (5) 14 (1) 288 (2) 35 (12) 10 (5) 371 (15) 54 (4) 1487 (3) 4970 (4) 26 (2) 273 (6)
Early-onset PE 6 (1) 1 (< 1) 37 (< 1) 6 (2) 0 (0) 144 (6) 5 (< 1) 151 (< 1) 1237 (< 1) 3 (< 1) 10 (< 1)
Late-onset PE 26 (4) 13 (1) 251 (2) 29 (10) 10 (5) 227 (9) 49 (3) 1336 (2) 3733 (3) 23 (2) 263 (6)
NR, not recorded; PE, pre-eclampsia.NoteSummary of complete data only; therefore, percentages are out of all of those with recorded values rather than out of total individuals.
APPENDIX
10
NIH
RJournals
Library
www.jo
urnalslib
rary.nihr.ac.u
k
184

Appendix 11 Number and proportion missing(or not recorded) for each predictor in eachdata set used for external validation
DOI: 10.3310/hta24720 Health Technology Assessment 2020 Vol. 24 No. 72
© Queen’s Printer and Controller of HMSO 2020. This work was produced by Allotey et al. under the terms of a commissioning contract issued by the Secretary of Statefor Health and Social Care. This issue may be freely reproduced for the purposes of private research and study and extracts (or indeed, the full report) may be included inprofessional journals provided that suitable acknowledgement is made and the reproduction is not associated with any form of advertising. Applications for commercialreproduction should be addressed to: NIHR Journals Library, National Institute for Health Research, Evaluation, Trials and Studies Coordinating Centre, Alpha House,University of Southampton Science Park, Southampton SO16 7NS, UK.
185
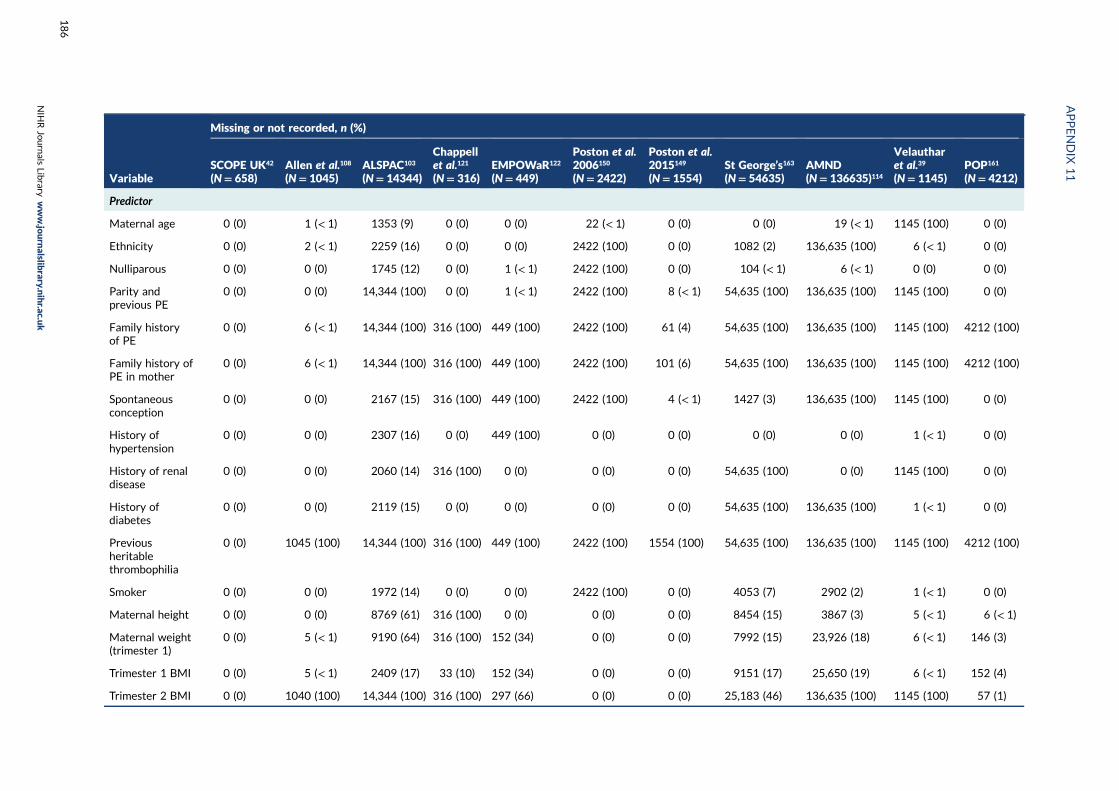
Variable
Missing or not recorded, n (%)
SCOPE UK42
(N= 658)Allen et al.108
(N= 1045)ALSPAC103
(N= 14344)
Chappellet al.121
(N= 316)EMPOWaR122
(N= 449)
Poston et al.2006150
(N= 2422)
Poston et al.2015149
(N= 1554)St George’s163
(N= 54635)AMND(N= 136635)114
Velautharet al.39
(N= 1145)POP161
(N= 4212)
Predictor
Maternal age 0 (0) 1 (< 1) 1353 (9) 0 (0) 0 (0) 22 (< 1) 0 (0) 0 (0) 19 (< 1) 1145 (100) 0 (0)
Ethnicity 0 (0) 2 (< 1) 2259 (16) 0 (0) 0 (0) 2422 (100) 0 (0) 1082 (2) 136,635 (100) 6 (< 1) 0 (0)
Nulliparous 0 (0) 0 (0) 1745 (12) 0 (0) 1 (< 1) 2422 (100) 0 (0) 104 (< 1) 6 (< 1) 0 (0) 0 (0)
Parity andprevious PE
0 (0) 0 (0) 14,344 (100) 0 (0) 1 (< 1) 2422 (100) 8 (< 1) 54,635 (100) 136,635 (100) 1145 (100) 0 (0)
Family historyof PE
0 (0) 6 (< 1) 14,344 (100) 316 (100) 449 (100) 2422 (100) 61 (4) 54,635 (100) 136,635 (100) 1145 (100) 4212 (100)
Family history ofPE in mother
0 (0) 6 (< 1) 14,344 (100) 316 (100) 449 (100) 2422 (100) 101 (6) 54,635 (100) 136,635 (100) 1145 (100) 4212 (100)
Spontaneousconception
0 (0) 0 (0) 2167 (15) 316 (100) 449 (100) 2422 (100) 4 (< 1) 1427 (3) 136,635 (100) 1145 (100) 0 (0)
History ofhypertension
0 (0) 0 (0) 2307 (16) 0 (0) 449 (100) 0 (0) 0 (0) 0 (0) 0 (0) 1 (< 1) 0 (0)
History of renaldisease
0 (0) 0 (0) 2060 (14) 316 (100) 0 (0) 0 (0) 0 (0) 54,635 (100) 0 (0) 1145 (100) 0 (0)
History ofdiabetes
0 (0) 0 (0) 2119 (15) 0 (0) 0 (0) 0 (0) 0 (0) 54,635 (100) 136,635 (100) 1 (< 1) 0 (0)
Previousheritablethrombophilia
0 (0) 1045 (100) 14,344 (100) 316 (100) 449 (100) 2422 (100) 1554 (100) 54,635 (100) 136,635 (100) 1145 (100) 4212 (100)
Smoker 0 (0) 0 (0) 1972 (14) 0 (0) 0 (0) 2422 (100) 0 (0) 4053 (7) 2902 (2) 1 (< 1) 0 (0)
Maternal height 0 (0) 0 (0) 8769 (61) 316 (100) 0 (0) 0 (0) 0 (0) 8454 (15) 3867 (3) 5 (< 1) 6 (< 1)
Maternal weight(trimester 1)
0 (0) 5 (< 1) 9190 (64) 316 (100) 152 (34) 0 (0) 0 (0) 7992 (15) 23,926 (18) 6 (< 1) 146 (3)
Trimester 1 BMI 0 (0) 5 (< 1) 2409 (17) 33 (10) 152 (34) 0 (0) 0 (0) 9151 (17) 25,650 (19) 6 (< 1) 152 (4)
Trimester 2 BMI 0 (0) 1040 (100) 14,344 (100) 316 (100) 297 (66) 0 (0) 0 (0) 25,183 (46) 136,635 (100) 1145 (100) 57 (1)
APPENDIX
11
NIH
RJournals
Library
www.jo
urnalslib
rary.nihr.ac.u
k
186
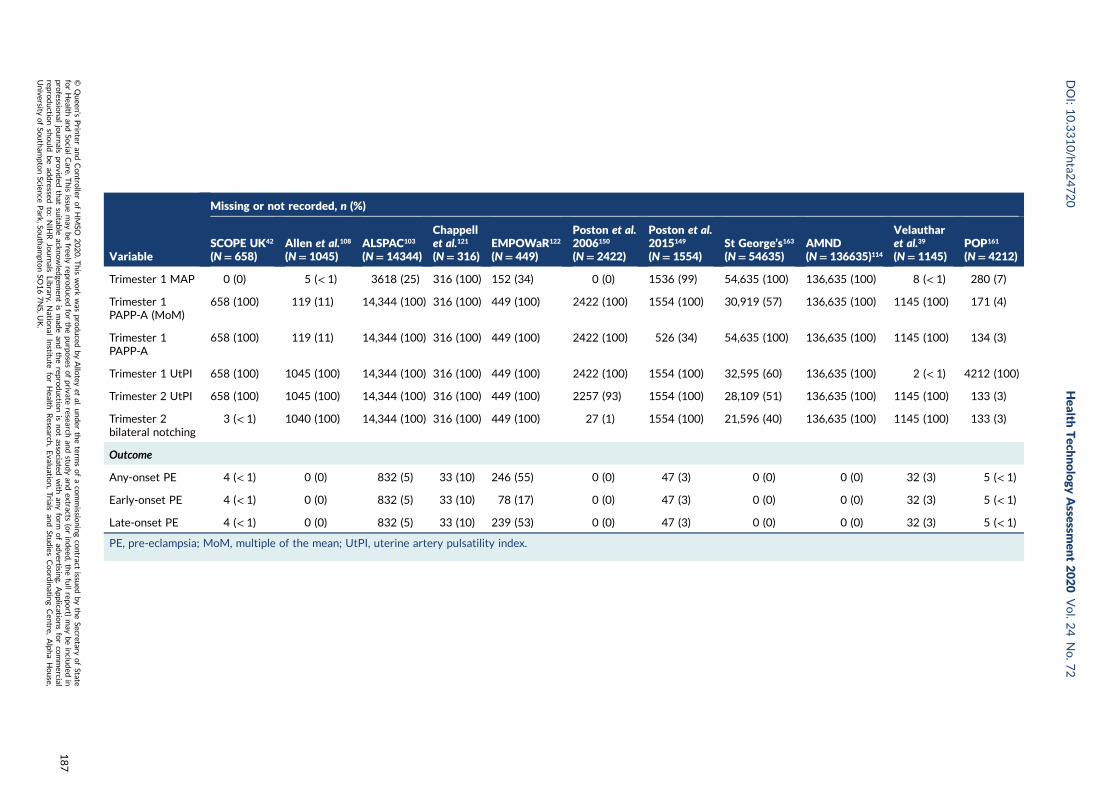
Variable
Missing or not recorded, n (%)
SCOPE UK42
(N= 658)Allen et al.108
(N= 1045)ALSPAC103
(N= 14344)
Chappellet al.121
(N= 316)EMPOWaR122
(N= 449)
Poston et al.2006150
(N= 2422)
Poston et al.2015149
(N= 1554)St George’s163
(N= 54635)AMND(N= 136635)114
Velautharet al.39
(N= 1145)POP161
(N= 4212)
Trimester 1 MAP 0 (0) 5 (< 1) 3618 (25) 316 (100) 152 (34) 0 (0) 1536 (99) 54,635 (100) 136,635 (100) 8 (< 1) 280 (7)
Trimester 1PAPP-A (MoM)
658 (100) 119 (11) 14,344 (100) 316 (100) 449 (100) 2422 (100) 1554 (100) 30,919 (57) 136,635 (100) 1145 (100) 171 (4)
Trimester 1PAPP-A
658 (100) 119 (11) 14,344 (100) 316 (100) 449 (100) 2422 (100) 526 (34) 54,635 (100) 136,635 (100) 1145 (100) 134 (3)
Trimester 1 UtPI 658 (100) 1045 (100) 14,344 (100) 316 (100) 449 (100) 2422 (100) 1554 (100) 32,595 (60) 136,635 (100) 2 (< 1) 4212 (100)
Trimester 2 UtPI 658 (100) 1045 (100) 14,344 (100) 316 (100) 449 (100) 2257 (93) 1554 (100) 28,109 (51) 136,635 (100) 1145 (100) 133 (3)
Trimester 2bilateral notching
3 (< 1) 1040 (100) 14,344 (100) 316 (100) 449 (100) 27 (1) 1554 (100) 21,596 (40) 136,635 (100) 1145 (100) 133 (3)
Outcome
Any-onset PE 4 (< 1) 0 (0) 832 (5) 33 (10) 246 (55) 0 (0) 47 (3) 0 (0) 0 (0) 32 (3) 5 (< 1)
Early-onset PE 4 (< 1) 0 (0) 832 (5) 33 (10) 78 (17) 0 (0) 47 (3) 0 (0) 0 (0) 32 (3) 5 (< 1)
Late-onset PE 4 (< 1) 0 (0) 832 (5) 33 (10) 239 (53) 0 (0) 47 (3) 0 (0) 0 (0) 32 (3) 5 (< 1)
PE, pre-eclampsia; MoM, multiple of the mean; UtPI, uterine artery pulsatility index.
DOI:10.3310/hta2
4720
Health
Tech
nology
Assessm
ent2020
Vol.2
4No.7
2
©Queen
’sPrin
teran
dContro
llerofHMSO
2020.T
his
work
was
produced
byAllo
teyet
al.under
theterm
sofaco
mmissio
ningco
ntract
issued
bytheSecretary
ofState
forHealth
andSo
cialCare.T
his
issuemay
befreely
reproduced
forthepu
rposes
ofprivate
researchan
dstu
dyan
dextracts
(orindeed
,thefullrepo
rt)may
beinclu
ded
inpro
fessional
journals
provid
edthat
suitab
leackn
owled
gemen
tis
mad
ean
dtherepro
ductio
nis
notasso
ciatedwith
anyform
ofad
vertising.
Applicatio
nsforco
mmercial
reproductio
nshould
bead
dressed
to:NIH
RJournals
Library,
Natio
nal
Institu
teforHealth
Research
,Evalu
ation,Trials
and
Studies
Coordinatin
gCen
tre,Alph
aHouse,
University
ofSo
utham
ptonScien
cePark,So
utham
ptonSO
167NS,U
K.
187

Appendix 12 Summary of linear predictorand predicted probability values fromexternal validation
DOI: 10.3310/hta24720 Health Technology Assessment 2020 Vol. 24 No. 72
© Queen’s Printer and Controller of HMSO 2020. This work was produced by Allotey et al. under the terms of a commissioning contract issued by the Secretary of Statefor Health and Social Care. This issue may be freely reproduced for the purposes of private research and study and extracts (or indeed, the full report) may be included inprofessional journals provided that suitable acknowledgement is made and the reproduction is not associated with any form of advertising. Applications for commercialreproduction should be addressed to: NIHR Journals Library, National Institute for Health Research, Evaluation, Trials and Studies Coordinating Centre, Alpha House,University of Southampton Science Park, Southampton SO16 7NS, UK.
189
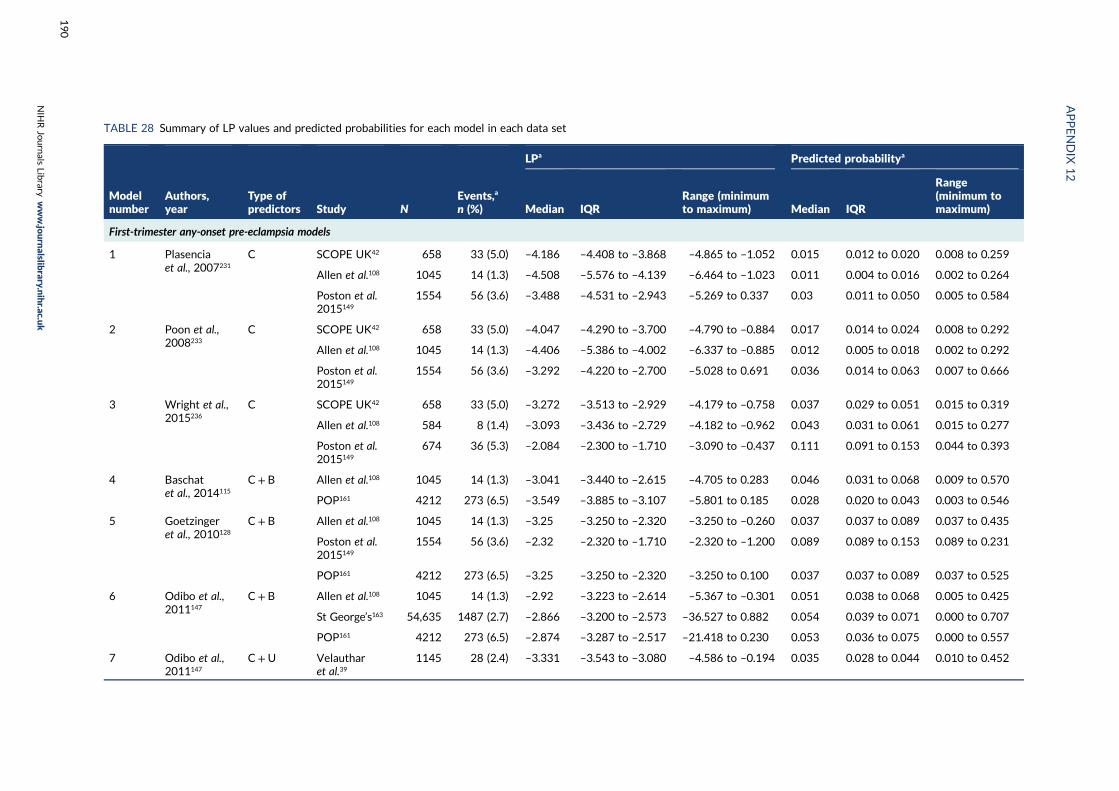
TABLE 28 Summary of LP values and predicted probabilities for each model in each data set
Modelnumber
Authors,year
Type ofpredictors Study N
Events,a
n (%)
LPa Predicted probabilitya
Median IQRRange (minimumto maximum) Median IQR
Range(minimum tomaximum)
First-trimester any-onset pre-eclampsia models
1 Plasenciaet al., 2007231
C SCOPE UK42 658 33 (5.0) –4.186 –4.408 to –3.868 –4.865 to –1.052 0.015 0.012 to 0.020 0.008 to 0.259
Allen et al.108 1045 14 (1.3) –4.508 –5.576 to –4.139 –6.464 to –1.023 0.011 0.004 to 0.016 0.002 to 0.264
Poston et al.2015149
1554 56 (3.6) –3.488 –4.531 to –2.943 –5.269 to 0.337 0.03 0.011 to 0.050 0.005 to 0.584
2 Poon et al.,2008233
C SCOPE UK42 658 33 (5.0) –4.047 –4.290 to –3.700 –4.790 to –0.884 0.017 0.014 to 0.024 0.008 to 0.292
Allen et al.108 1045 14 (1.3) –4.406 –5.386 to –4.002 –6.337 to –0.885 0.012 0.005 to 0.018 0.002 to 0.292
Poston et al.2015149
1554 56 (3.6) –3.292 –4.220 to –2.700 –5.028 to 0.691 0.036 0.014 to 0.063 0.007 to 0.666
3 Wright et al.,2015236
C SCOPE UK42 658 33 (5.0) –3.272 –3.513 to –2.929 –4.179 to –0.758 0.037 0.029 to 0.051 0.015 to 0.319
Allen et al.108 584 8 (1.4) –3.093 –3.436 to –2.729 –4.182 to –0.962 0.043 0.031 to 0.061 0.015 to 0.277
Poston et al.2015149
674 36 (5.3) –2.084 –2.300 to –1.710 –3.090 to –0.437 0.111 0.091 to 0.153 0.044 to 0.393
4 Baschatet al., 2014115
C+ B Allen et al.108 1045 14 (1.3) –3.041 –3.440 to –2.615 –4.705 to 0.283 0.046 0.031 to 0.068 0.009 to 0.570
POP161 4212 273 (6.5) –3.549 –3.885 to –3.107 –5.801 to 0.185 0.028 0.020 to 0.043 0.003 to 0.546
5 Goetzingeret al., 2010128
C+ B Allen et al.108 1045 14 (1.3) –3.25 –3.250 to –2.320 –3.250 to –0.260 0.037 0.037 to 0.089 0.037 to 0.435
Poston et al.2015149
1554 56 (3.6) –2.32 –2.320 to –1.710 –2.320 to –1.200 0.089 0.089 to 0.153 0.089 to 0.231
POP161 4212 273 (6.5) –3.25 –3.250 to –2.320 –3.250 to 0.100 0.037 0.037 to 0.089 0.037 to 0.525
6 Odibo et al.,2011147
C+ B Allen et al.108 1045 14 (1.3) –2.92 –3.223 to –2.614 –5.367 to –0.301 0.051 0.038 to 0.068 0.005 to 0.425
St George’s163 54,635 1487 (2.7) –2.866 –3.200 to –2.573 –36.527 to 0.882 0.054 0.039 to 0.071 0.000 to 0.707
POP161 4212 273 (6.5) –2.874 –3.287 to –2.517 –21.418 to 0.230 0.053 0.036 to 0.075 0.000 to 0.557
7 Odibo et al.,2011147
C+U Velautharet al.39
1145 28 (2.4) –3.331 –3.543 to –3.080 –4.586 to –0.194 0.035 0.028 to 0.044 0.010 to 0.452
APPENDIX
12
NIH
RJournals
Library
www.jo
urnalslib
rary.nihr.ac.u
k
190
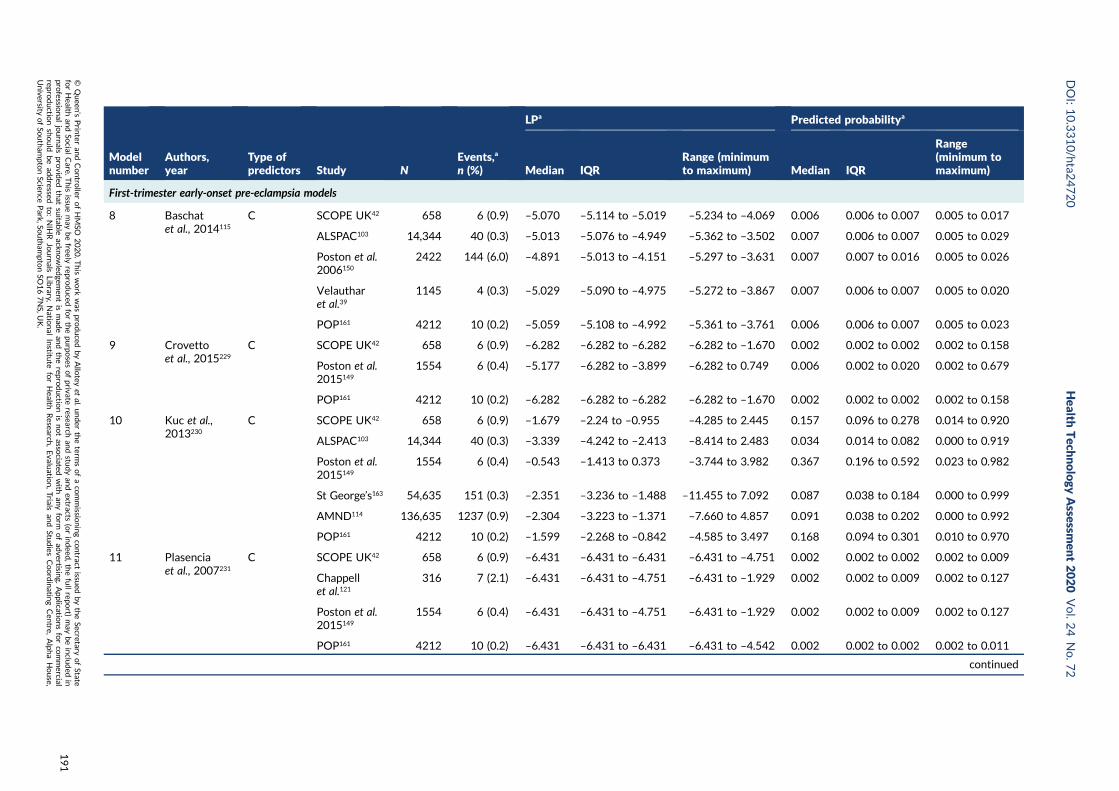
Modelnumber
Authors,year
Type ofpredictors Study N
Events,a
n (%)
LPa Predicted probabilitya
Median IQRRange (minimumto maximum) Median IQR
Range(minimum tomaximum)
First-trimester early-onset pre-eclampsia models
8 Baschatet al., 2014115
C SCOPE UK42 658 6 (0.9) –5.070 –5.114 to –5.019 –5.234 to –4.069 0.006 0.006 to 0.007 0.005 to 0.017
ALSPAC103 14,344 40 (0.3) –5.013 –5.076 to –4.949 –5.362 to –3.502 0.007 0.006 to 0.007 0.005 to 0.029
Poston et al.2006150
2422 144 (6.0) –4.891 –5.013 to –4.151 –5.297 to –3.631 0.007 0.007 to 0.016 0.005 to 0.026
Velautharet al.39
1145 4 (0.3) –5.029 –5.090 to –4.975 –5.272 to –3.867 0.007 0.006 to 0.007 0.005 to 0.020
POP161 4212 10 (0.2) –5.059 –5.108 to –4.992 –5.361 to –3.761 0.006 0.006 to 0.007 0.005 to 0.023
9 Crovettoet al., 2015229
C SCOPE UK42 658 6 (0.9) –6.282 –6.282 to –6.282 –6.282 to –1.670 0.002 0.002 to 0.002 0.002 to 0.158
Poston et al.2015149
1554 6 (0.4) –5.177 –6.282 to –3.899 –6.282 to 0.749 0.006 0.002 to 0.020 0.002 to 0.679
POP161 4212 10 (0.2) –6.282 –6.282 to –6.282 –6.282 to –1.670 0.002 0.002 to 0.002 0.002 to 0.158
10 Kuc et al.,2013230
C SCOPE UK42 658 6 (0.9) –1.679 –2.24 to –0.955 –4.285 to 2.445 0.157 0.096 to 0.278 0.014 to 0.920
ALSPAC103 14,344 40 (0.3) –3.339 –4.242 to –2.413 –8.414 to 2.483 0.034 0.014 to 0.082 0.000 to 0.919
Poston et al.2015149
1554 6 (0.4) –0.543 –1.413 to 0.373 –3.744 to 3.982 0.367 0.196 to 0.592 0.023 to 0.982
St George’s163 54,635 151 (0.3) –2.351 –3.236 to –1.488 –11.455 to 7.092 0.087 0.038 to 0.184 0.000 to 0.999
AMND114 136,635 1237 (0.9) –2.304 –3.223 to –1.371 –7.660 to 4.857 0.091 0.038 to 0.202 0.000 to 0.992
POP161 4212 10 (0.2) –1.599 –2.268 to –0.842 –4.585 to 3.497 0.168 0.094 to 0.301 0.010 to 0.970
11 Plasenciaet al., 2007231
C SCOPE UK42 658 6 (0.9) –6.431 –6.431 to –6.431 –6.431 to –4.751 0.002 0.002 to 0.002 0.002 to 0.009
Chappellet al.121
316 7 (2.1) –6.431 –6.431 to –4.751 –6.431 to –1.929 0.002 0.002 to 0.009 0.002 to 0.127
Poston et al.2015149
1554 6 (0.4) –6.431 –6.431 to –4.751 –6.431 to –1.929 0.002 0.002 to 0.009 0.002 to 0.127
POP161 4212 10 (0.2) –6.431 –6.431 to –6.431 –6.431 to –4.542 0.002 0.002 to 0.002 0.002 to 0.011
continued
DOI:10.3310/hta2
4720
Health
Tech
nology
Assessm
ent2020
Vol.2
4No.7
2
©Queen
’sPrin
teran
dContro
llerofHMSO
2020.T
his
work
was
produced
byAllo
teyet
al.under
theterm
sofaco
mmissio
ningco
ntract
issued
bytheSecretary
ofState
forHealth
andSo
cialCare.T
his
issuemay
befreely
reproduced
forthepu
rposes
ofprivate
researchan
dstu
dyan
dextracts
(orindeed
,thefullrepo
rt)may
beinclu
ded
inpro
fessional
journals
provid
edthat
suitab
leackn
owled
gemen
tis
mad
ean
dtherepro
ductio
nis
notasso
ciatedwith
anyform
ofad
vertising.
Applicatio
nsforco
mmercial
reproductio
nshould
bead
dressed
to:NIH
RJournals
Library,
Natio
nal
Institu
teforHealth
Research
,Evalu
ation,Trials
and
Studies
Coordinatin
gCen
tre,Alph
aHouse,
University
ofSo
utham
ptonScien
cePark,So
utham
ptonSO
167NS,U
K.
191
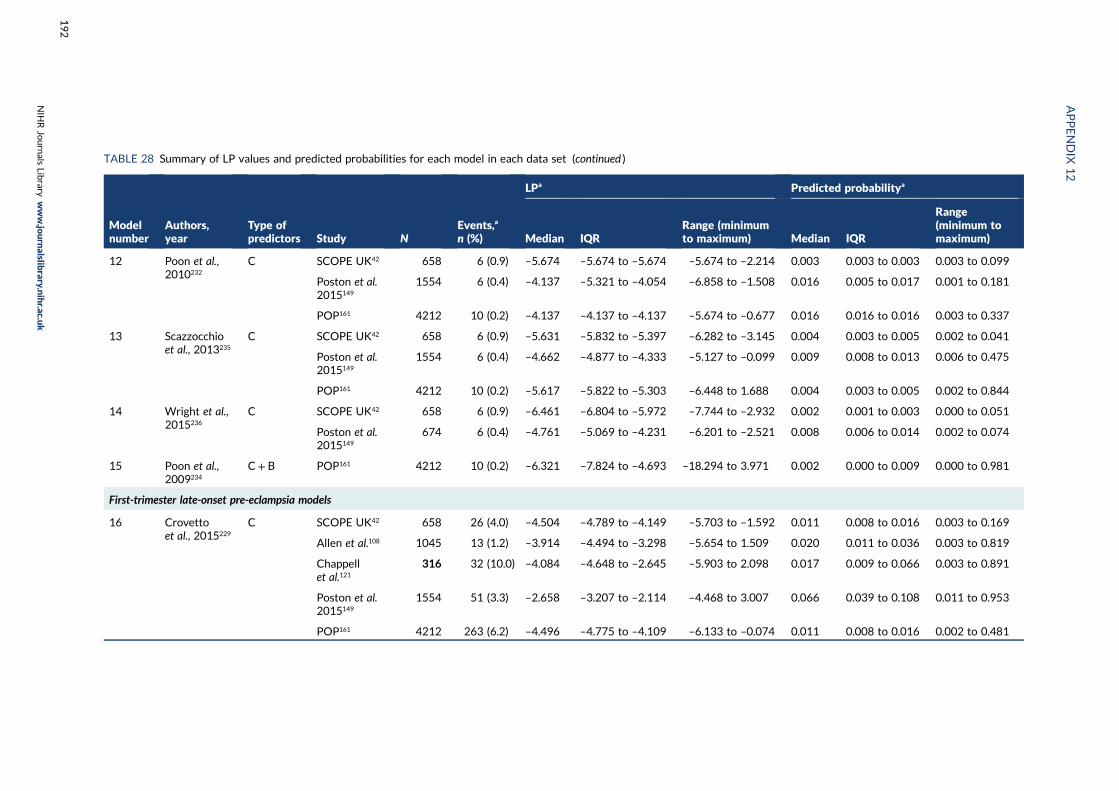
TABLE 28 Summary of LP values and predicted probabilities for each model in each data set (continued )
Modelnumber
Authors,year
Type ofpredictors Study N
Events,a
n (%)
LPa Predicted probabilitya
Median IQRRange (minimumto maximum) Median IQR
Range(minimum tomaximum)
12 Poon et al.,2010232
C SCOPE UK42 658 6 (0.9) –5.674 –5.674 to –5.674 –5.674 to –2.214 0.003 0.003 to 0.003 0.003 to 0.099
Poston et al.2015149
1554 6 (0.4) –4.137 –5.321 to –4.054 –6.858 to –1.508 0.016 0.005 to 0.017 0.001 to 0.181
POP161 4212 10 (0.2) –4.137 –4.137 to –4.137 –5.674 to –0.677 0.016 0.016 to 0.016 0.003 to 0.337
13 Scazzocchioet al., 2013235
C SCOPE UK42 658 6 (0.9) –5.631 –5.832 to –5.397 –6.282 to –3.145 0.004 0.003 to 0.005 0.002 to 0.041
Poston et al.2015149
1554 6 (0.4) –4.662 –4.877 to –4.333 –5.127 to –0.099 0.009 0.008 to 0.013 0.006 to 0.475
POP161 4212 10 (0.2) –5.617 –5.822 to –5.303 –6.448 to 1.688 0.004 0.003 to 0.005 0.002 to 0.844
14 Wright et al.,2015236
C SCOPE UK42 658 6 (0.9) –6.461 –6.804 to –5.972 –7.744 to –2.932 0.002 0.001 to 0.003 0.000 to 0.051
Poston et al.2015149
674 6 (0.4) –4.761 –5.069 to –4.231 –6.201 to –2.521 0.008 0.006 to 0.014 0.002 to 0.074
15 Poon et al.,2009234
C+ B POP161 4212 10 (0.2) –6.321 –7.824 to –4.693 –18.294 to 3.971 0.002 0.000 to 0.009 0.000 to 0.981
First-trimester late-onset pre-eclampsia models
16 Crovettoet al., 2015229
C SCOPE UK42 658 26 (4.0) –4.504 –4.789 to –4.149 –5.703 to –1.592 0.011 0.008 to 0.016 0.003 to 0.169
Allen et al.108 1045 13 (1.2) –3.914 –4.494 to –3.298 –5.654 to 1.509 0.020 0.011 to 0.036 0.003 to 0.819
Chappellet al.121
316 32 (10.0) –4.084 –4.648 to –2.645 –5.903 to 2.098 0.017 0.009 to 0.066 0.003 to 0.891
Poston et al.2015149
1554 51 (3.3) –2.658 –3.207 to –2.114 –4.468 to 3.007 0.066 0.039 to 0.108 0.011 to 0.953
POP161 4212 263 (6.2) –4.496 –4.775 to –4.109 –6.133 to –0.074 0.011 0.008 to 0.016 0.002 to 0.481
APPENDIX
12
NIH
RJournals
Library
www.jo
urnalslib
rary.nihr.ac.u
k
192
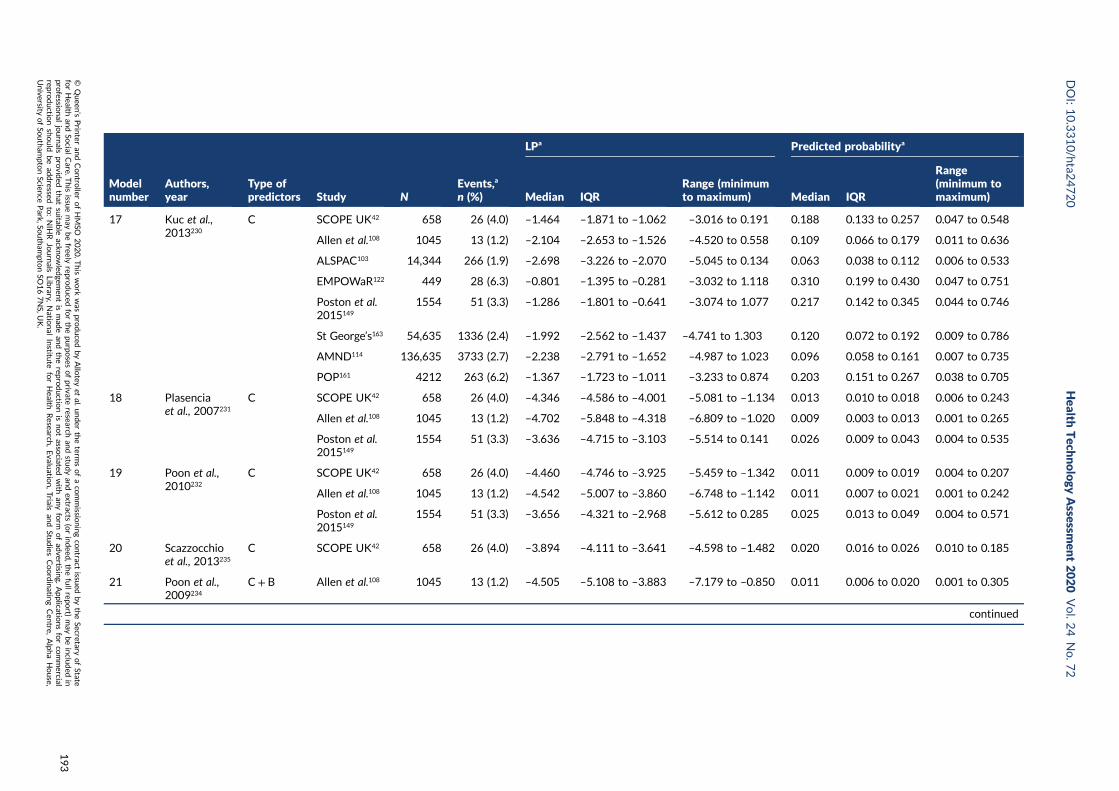
Modelnumber
Authors,year
Type ofpredictors Study N
Events,a
n (%)
LPa Predicted probabilitya
Median IQRRange (minimumto maximum) Median IQR
Range(minimum tomaximum)
17 Kuc et al.,2013230
C SCOPE UK42 658 26 (4.0) –1.464 –1.871 to –1.062 –3.016 to 0.191 0.188 0.133 to 0.257 0.047 to 0.548
Allen et al.108 1045 13 (1.2) –2.104 –2.653 to –1.526 –4.520 to 0.558 0.109 0.066 to 0.179 0.011 to 0.636
ALSPAC103 14,344 266 (1.9) –2.698 –3.226 to –2.070 –5.045 to 0.134 0.063 0.038 to 0.112 0.006 to 0.533
EMPOWaR122 449 28 (6.3) –0.801 –1.395 to –0.281 –3.032 to 1.118 0.310 0.199 to 0.430 0.047 to 0.751
Poston et al.2015149
1554 51 (3.3) –1.286 –1.801 to –0.641 –3.074 to 1.077 0.217 0.142 to 0.345 0.044 to 0.746
St George’s163 54,635 1336 (2.4) –1.992 –2.562 to –1.437 –4.741 to 1.303 0.120 0.072 to 0.192 0.009 to 0.786
AMND114 136,635 3733 (2.7) –2.238 –2.791 to –1.652 –4.987 to 1.023 0.096 0.058 to 0.161 0.007 to 0.735
POP161 4212 263 (6.2) –1.367 –1.723 to –1.011 –3.233 to 0.874 0.203 0.151 to 0.267 0.038 to 0.705
18 Plasenciaet al., 2007231
C SCOPE UK42 658 26 (4.0) –4.346 –4.586 to –4.001 –5.081 to –1.134 0.013 0.010 to 0.018 0.006 to 0.243
Allen et al.108 1045 13 (1.2) –4.702 –5.848 to –4.318 –6.809 to –1.020 0.009 0.003 to 0.013 0.001 to 0.265
Poston et al.2015149
1554 51 (3.3) –3.636 –4.715 to –3.103 –5.514 to 0.141 0.026 0.009 to 0.043 0.004 to 0.535
19 Poon et al.,2010232
C SCOPE UK42 658 26 (4.0) –4.460 –4.746 to –3.925 –5.459 to –1.342 0.011 0.009 to 0.019 0.004 to 0.207
Allen et al.108 1045 13 (1.2) –4.542 –5.007 to –3.860 –6.748 to –1.142 0.011 0.007 to 0.021 0.001 to 0.242
Poston et al.2015149
1554 51 (3.3) –3.656 –4.321 to –2.968 –5.612 to 0.285 0.025 0.013 to 0.049 0.004 to 0.571
20 Scazzocchioet al., 2013235
C SCOPE UK42 658 26 (4.0) –3.894 –4.111 to –3.641 –4.598 to –1.482 0.020 0.016 to 0.026 0.010 to 0.185
21 Poon et al.,2009234
C+ B Allen et al.108 1045 13 (1.2) –4.505 –5.108 to –3.883 –7.179 to –0.850 0.011 0.006 to 0.020 0.001 to 0.305
continued
DOI:10.3310/hta2
4720
Health
Tech
nology
Assessm
ent2020
Vol.2
4No.7
2
©Queen
’sPrin
teran
dContro
llerofHMSO
2020.T
his
work
was
produced
byAllo
teyet
al.under
theterm
sofaco
mmissio
ningco
ntract
issued
bytheSecretary
ofState
forHealth
andSo
cialCare.T
his
issuemay
befreely
reproduced
forthepu
rposes
ofprivate
researchan
dstu
dyan
dextracts
(orindeed
,thefullrepo
rt)may
beinclu
ded
inpro
fessional
journals
provid
edthat
suitab
leackn
owled
gemen
tis
mad
ean
dtherepro
ductio
nis
notasso
ciatedwith
anyform
ofad
vertising.
Applicatio
nsforco
mmercial
reproductio
nshould
bead
dressed
to:NIH
RJournals
Library,
Natio
nal
Institu
teforHealth
Research
,Evalu
ation,Trials
and
Studies
Coordinatin
gCen
tre,Alph
aHouse,
University
ofSo
utham
ptonScien
cePark,So
utham
ptonSO
167NS,U
K.
193
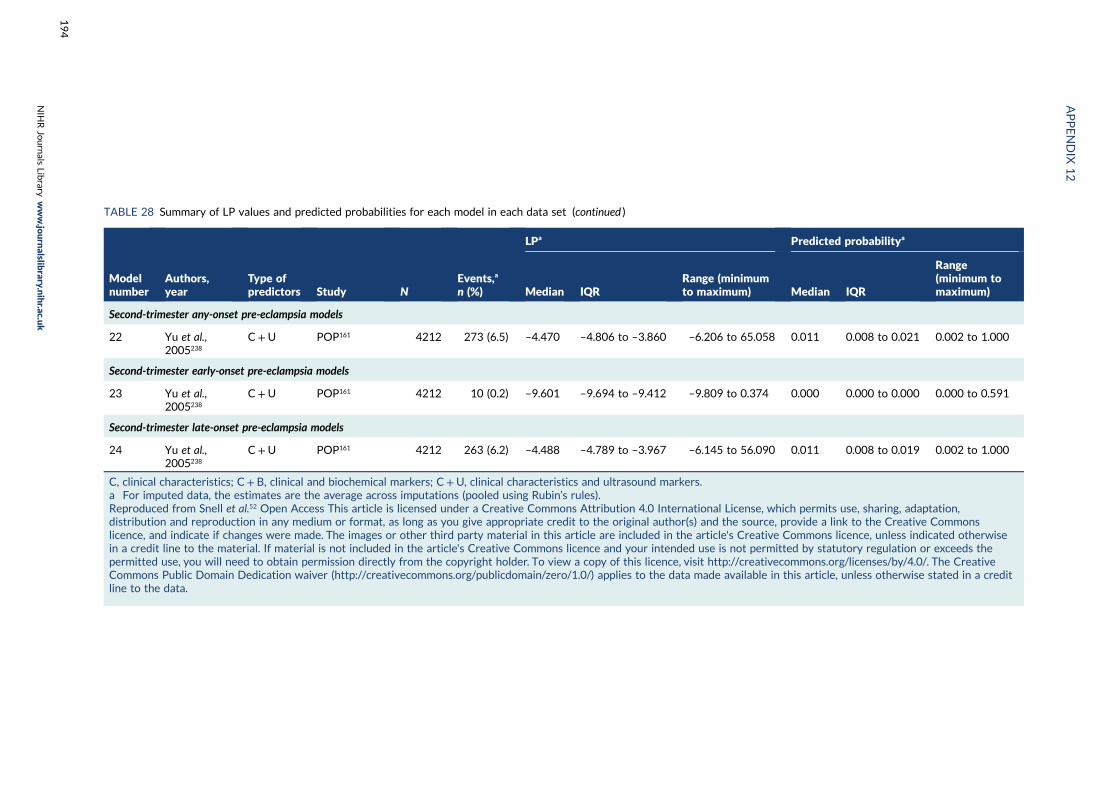
TABLE 28 Summary of LP values and predicted probabilities for each model in each data set (continued )
Modelnumber
Authors,year
Type ofpredictors Study N
Events,a
n (%)
LPa Predicted probabilitya
Median IQRRange (minimumto maximum) Median IQR
Range(minimum tomaximum)
Second-trimester any-onset pre-eclampsia models
22 Yu et al.,2005238
C+U POP161 4212 273 (6.5) –4.470 –4.806 to –3.860 –6.206 to 65.058 0.011 0.008 to 0.021 0.002 to 1.000
Second-trimester early-onset pre-eclampsia models
23 Yu et al.,2005238
C+U POP161 4212 10 (0.2) –9.601 –9.694 to –9.412 –9.809 to 0.374 0.000 0.000 to 0.000 0.000 to 0.591
Second-trimester late-onset pre-eclampsia models
24 Yu et al.,2005238
C+U POP161 4212 263 (6.2) –4.488 –4.789 to –3.967 –6.145 to 56.090 0.011 0.008 to 0.019 0.002 to 1.000
C, clinical characteristics; C+ B, clinical and biochemical markers; C+U, clinical characteristics and ultrasound markers.a For imputed data, the estimates are the average across imputations (pooled using Rubin’s rules).Reproduced from Snell et al.52 Open Access This article is licensed under a Creative Commons Attribution 4.0 International License, which permits use, sharing, adaptation,distribution and reproduction in any medium or format, as long as you give appropriate credit to the original author(s) and the source, provide a link to the Creative Commonslicence, and indicate if changes were made. The images or other third party material in this article are included in the article's Creative Commons licence, unless indicated otherwisein a credit line to the material. If material is not included in the article's Creative Commons licence and your intended use is not permitted by statutory regulation or exceeds thepermitted use, you will need to obtain permission directly from the copyright holder. To view a copy of this licence, visit http://creativecommons.org/licenses/by/4.0/. The CreativeCommons Public Domain Dedication waiver (http://creativecommons.org/publicdomain/zero/1.0/) applies to the data made available in this article, unless otherwise stated in a creditline to the data.
APPENDIX
12
NIH
RJournals
Library
www.jo
urnalslib
rary.nihr.ac.u
k
194
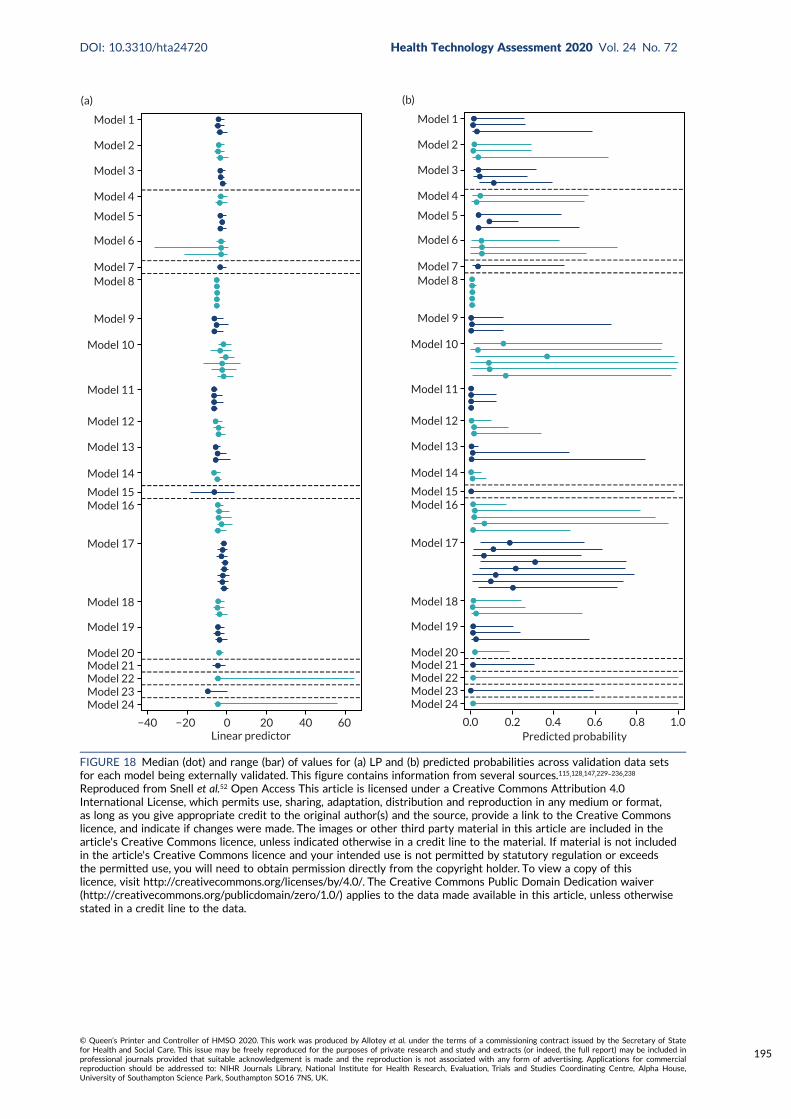
Model 1
Model 2
Model 3
Model 4
Model 5
Model 6
Model 7Model 8
Model 9
Model 10
Model 11
Model 12
Model 13
Model 14
Model 15Model 16
Model 17
Model 18
Model 19
Model 20Model 21Model 22Model 23Model 24
−40 −20 0 20 40 60Linear predictor
(a)
Model 1
Model 2
Model 3
Model 4
Model 5
Model 6
Model 7Model 8
Model 9
Model 10
Model 11
Model 12
Model 13
Model 14
Model 15Model 16
Model 17
Model 18
Model 19
Model 20Model 21Model 22Model 23Model 24
0.0 0.2 0.4 0.6 0.8 1.0Predicted probability
(b)
FIGURE 18 Median (dot) and range (bar) of values for (a) LP and (b) predicted probabilities across validation data setsfor each model being externally validated. This figure contains information from several sources.115,128,147,229–236,238
Reproduced from Snell et al.52 Open Access This article is licensed under a Creative Commons Attribution 4.0International License, which permits use, sharing, adaptation, distribution and reproduction in any medium or format,as long as you give appropriate credit to the original author(s) and the source, provide a link to the Creative Commonslicence, and indicate if changes were made. The images or other third party material in this article are included in thearticle's Creative Commons licence, unless indicated otherwise in a credit line to the material. If material is not includedin the article's Creative Commons licence and your intended use is not permitted by statutory regulation or exceedsthe permitted use, you will need to obtain permission directly from the copyright holder. To view a copy of thislicence, visit http://creativecommons.org/licenses/by/4.0/. The Creative Commons Public Domain Dedication waiver(http://creativecommons.org/publicdomain/zero/1.0/) applies to the data made available in this article, unless otherwisestated in a credit line to the data.
DOI: 10.3310/hta24720 Health Technology Assessment 2020 Vol. 24 No. 72
© Queen’s Printer and Controller of HMSO 2020. This work was produced by Allotey et al. under the terms of a commissioning contract issued by the Secretary of Statefor Health and Social Care. This issue may be freely reproduced for the purposes of private research and study and extracts (or indeed, the full report) may be included inprofessional journals provided that suitable acknowledgement is made and the reproduction is not associated with any form of advertising. Applications for commercialreproduction should be addressed to: NIHR Journals Library, National Institute for Health Research, Evaluation, Trials and Studies Coordinating Centre, Alpha House,University of Southampton Science Park, Southampton SO16 7NS, UK.
195

Appendix 13 Predictive performancestatistics for models in the individualIPPIC-UK data sets
DOI: 10.3310/hta24720 Health Technology Assessment 2020 Vol. 24 No. 72
© Queen’s Printer and Controller of HMSO 2020. This work was produced by Allotey et al. under the terms of a commissioning contract issued by the Secretary of Statefor Health and Social Care. This issue may be freely reproduced for the purposes of private research and study and extracts (or indeed, the full report) may be included inprofessional journals provided that suitable acknowledgement is made and the reproduction is not associated with any form of advertising. Applications for commercialreproduction should be addressed to: NIHR Journals Library, National Institute for Health Research, Evaluation, Trials and Studies Coordinating Centre, Alpha House,University of Southampton Science Park, Southampton SO16 7NS, UK.
197
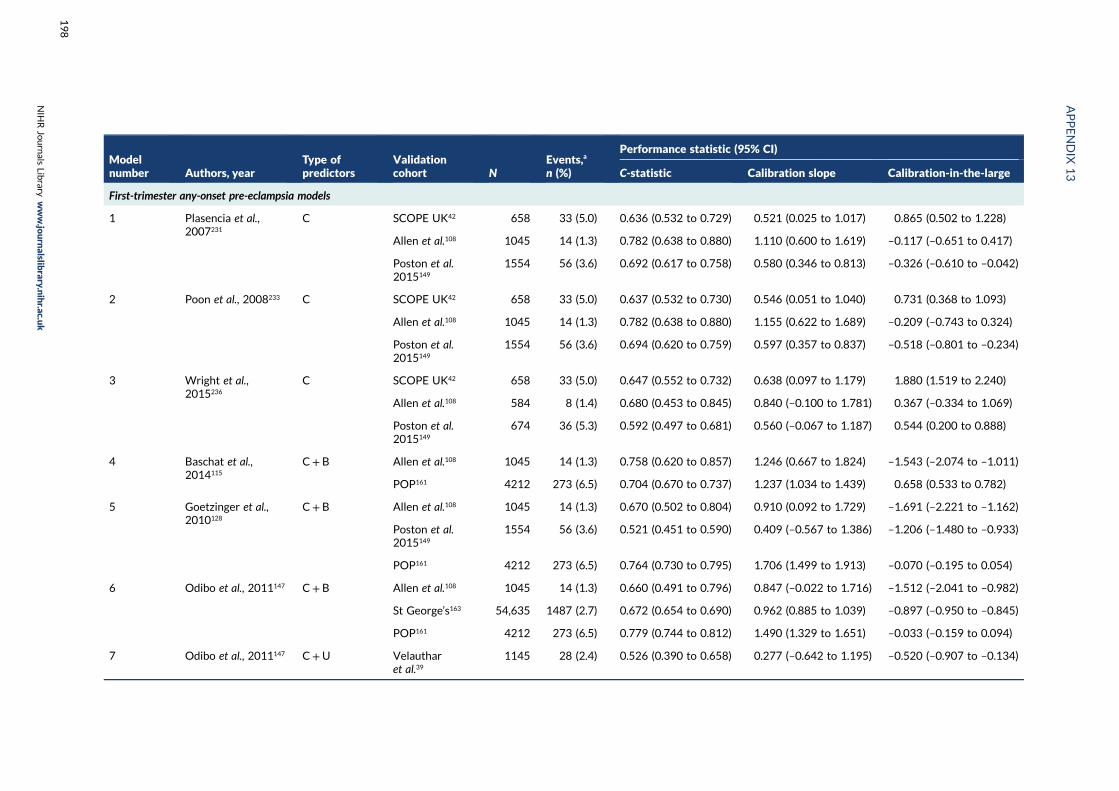
Modelnumber Authors, year
Type ofpredictors
Validationcohort N
Events,a
n (%)
Performance statistic (95% CI)
C-statistic Calibration slope Calibration-in-the-large
First-trimester any-onset pre-eclampsia models
1 Plasencia et al.,2007231
C SCOPE UK42 658 33 (5.0) 0.636 (0.532 to 0.729) 0.521 (0.025 to 1.017) 0.865 (0.502 to 1.228)
Allen et al.108 1045 14 (1.3) 0.782 (0.638 to 0.880) 1.110 (0.600 to 1.619) –0.117 (–0.651 to 0.417)
Poston et al.2015149
1554 56 (3.6) 0.692 (0.617 to 0.758) 0.580 (0.346 to 0.813) –0.326 (–0.610 to –0.042)
2 Poon et al., 2008233 C SCOPE UK42 658 33 (5.0) 0.637 (0.532 to 0.730) 0.546 (0.051 to 1.040) 0.731 (0.368 to 1.093)
Allen et al.108 1045 14 (1.3) 0.782 (0.638 to 0.880) 1.155 (0.622 to 1.689) –0.209 (–0.743 to 0.324)
Poston et al.2015149
1554 56 (3.6) 0.694 (0.620 to 0.759) 0.597 (0.357 to 0.837) –0.518 (–0.801 to –0.234)
3 Wright et al.,2015236
C SCOPE UK42 658 33 (5.0) 0.647 (0.552 to 0.732) 0.638 (0.097 to 1.179) 1.880 (1.519 to 2.240)
Allen et al.108 584 8 (1.4) 0.680 (0.453 to 0.845) 0.840 (–0.100 to 1.781) 0.367 (–0.334 to 1.069)
Poston et al.2015149
674 36 (5.3) 0.592 (0.497 to 0.681) 0.560 (–0.067 to 1.187) 0.544 (0.200 to 0.888)
4 Baschat et al.,2014115
C+ B Allen et al.108 1045 14 (1.3) 0.758 (0.620 to 0.857) 1.246 (0.667 to 1.824) –1.543 (–2.074 to –1.011)
POP161 4212 273 (6.5) 0.704 (0.670 to 0.737) 1.237 (1.034 to 1.439) 0.658 (0.533 to 0.782)
5 Goetzinger et al.,2010128
C+ B Allen et al.108 1045 14 (1.3) 0.670 (0.502 to 0.804) 0.910 (0.092 to 1.729) –1.691 (–2.221 to –1.162)
Poston et al.2015149
1554 56 (3.6) 0.521 (0.451 to 0.590) 0.409 (–0.567 to 1.386) –1.206 (–1.480 to –0.933)
POP161 4212 273 (6.5) 0.764 (0.730 to 0.795) 1.706 (1.499 to 1.913) –0.070 (–0.195 to 0.054)
6 Odibo et al., 2011147 C+ B Allen et al.108 1045 14 (1.3) 0.660 (0.491 to 0.796) 0.847 (–0.022 to 1.716) –1.512 (–2.041 to –0.982)
St George’s163 54,635 1487 (2.7) 0.672 (0.654 to 0.690) 0.962 (0.885 to 1.039) –0.897 (–0.950 to –0.845)
POP161 4212 273 (6.5) 0.779 (0.744 to 0.812) 1.490 (1.329 to 1.651) –0.033 (–0.159 to 0.094)
7 Odibo et al., 2011147 C+U Velautharet al.39
1145 28 (2.4) 0.526 (0.390 to 0.658) 0.277 (–0.642 to 1.195) –0.520 (–0.907 to –0.134)
APPENDIX
13
NIH
RJournals
Library
www.jo
urnalslib
rary.nihr.ac.u
k
198

Modelnumber Authors, year
Type ofpredictors
Validationcohort N
Events,a
n (%)
Performance statistic (95% CI)
C-statistic Calibration slope Calibration-in-the-large
First-trimester early-onset pre-eclampsia models
8 Baschat et al.,2014115
C SCOPE UK42 658 6 (0.9) 0.513 (0.291 to 0.73) 0.212 (–8.468 to 8.892) 0.399 (–0.407 to 1.205)
ALSPAC103 14,344 40 (0.3) 0.706 (0.600 to 0.794) 2.070 (1.234 to 2.905) –1.029 (–1.352 to –0.705)
Poston et al.2006150
2422 144 (6.0) 0.672 (0.626 to 0.716) 1.281 (0.898 to 1.664) 1.797 (1.628 to 1.967)
Velautharet al.39
1145 4 (0.3) 0.698 (0.434 to 0.876) 1.639 (–4.040 to 7.319) –0.755 (–1.875 to 0.365)
POP161 4212 10 (0.2) 0.739 (0.494 to 0.891) 3.403 (2.017 to 4.789) –1.054 (–1.674 to –0.433)
9 Crovetto et al.,2015229
C SCOPE UK42 658 6 (0.9) 0.464 (0.428 to 0.500) NE 1.039 (0.218 to 1.861)
Poston et al.2015149
1554 6 (0.4) 0.596 (0.278 to 0.850) 0.264 (–0.216 to 0.743) –2.484 (–3.401 to –1.567)
POP161 4212 10 (0.2) 0.721 (0.532 to 0.855) 0.996 (0.596 to 1.395) –0.317 (–0.943 to 0.309)
10 Kuc et al., 2013230 C SCOPE UK42 658 6 (0.9) 0.762 (0.520 to 0.905) 0.682 (0.050 to 1.314) –3.709 (–4.530 to –2.889)
ALSPAC103 14,344 40 (0.3) 0.664 (0.484 to 0.812) 0.442 (–0.025 to 0.909) –3.458 (–3.786 to –3.130)
Poston et al.2015149
1554 6 (0.4) 0.519 (0.323 to 0.710) 0.010 (–0.705 to 0.726) –5.978 (–6.861 to –5.094)
St George’s163 54,635 151 (0.3) 0.635 (0.587 to 0.679) 0.343 (0.227 to 0.460) –4.510 (–4.674 to –4.347)
AMND114 136,635 1237 (0.9) 0.681 (0.665 to 0.696) 0.470 (0.430 to 0.511) –3.387 (–3.445 to –3.330)
POP161 4212 10 (0.2) 0.656 (0.518 to 0.772) 0.450 (–0.069 to 0.969) –5.191 (–5.815 to –4.567)
11 Plasencia et al.,2007231
C SCOPE UK42 658 6 (0.9) 0.465 (0.429 to 0.501) NE 1.500 (0.691 to 2.309)
Chappell et al.121 316 7 (2.1) 0.706 (0.463 to 0.872) 0.510 (0.013 to 1.007) 0.462 (–0.402 to 1.327)
Poston et al.2015149
1554 6 (0.4) 0.667 (0.391 to 0.863) 0.517 (–0.135 to 1.170) –0.478 (–1.367 to 0.411)
POP161 4212 10 (0.2) 0.497 (0.496 to 0.498) NE 0.365 (–0.256 to 0.985)
DOI:10.3310/hta2
4720
Health
Tech
nology
Assessm
ent2020
Vol.2
4No.7
2
©Queen
’sPrin
teran
dContro
llerofHMSO
2020.T
his
work
was
produced
byAllo
teyet
al.under
theterm
sofaco
mmissio
ningco
ntract
issued
bytheSecretary
ofState
forHealth
andSo
cialCare.T
his
issuemay
befreely
reproduced
forthepu
rposes
ofprivate
researchan
dstu
dyan
dextracts
(orindeed
,thefullrepo
rt)may
beinclu
ded
inpro
fessional
journals
provid
edthat
suitab
leackn
owled
gemen
tis
mad
ean
dtherepro
ductio
nis
notasso
ciatedwith
anyform
ofad
vertising.
Applicatio
nsforco
mmercial
reproductio
nshould
bead
dressed
to:NIH
RJournals
Library,
Natio
nal
Institu
teforHealth
Research
,Evalu
ation,Trials
and
Studies
Coordinatin
gCen
tre,Alph
aHouse,
University
ofSo
utham
ptonScien
cePark,So
utham
ptonSO
167NS,U
K.
199
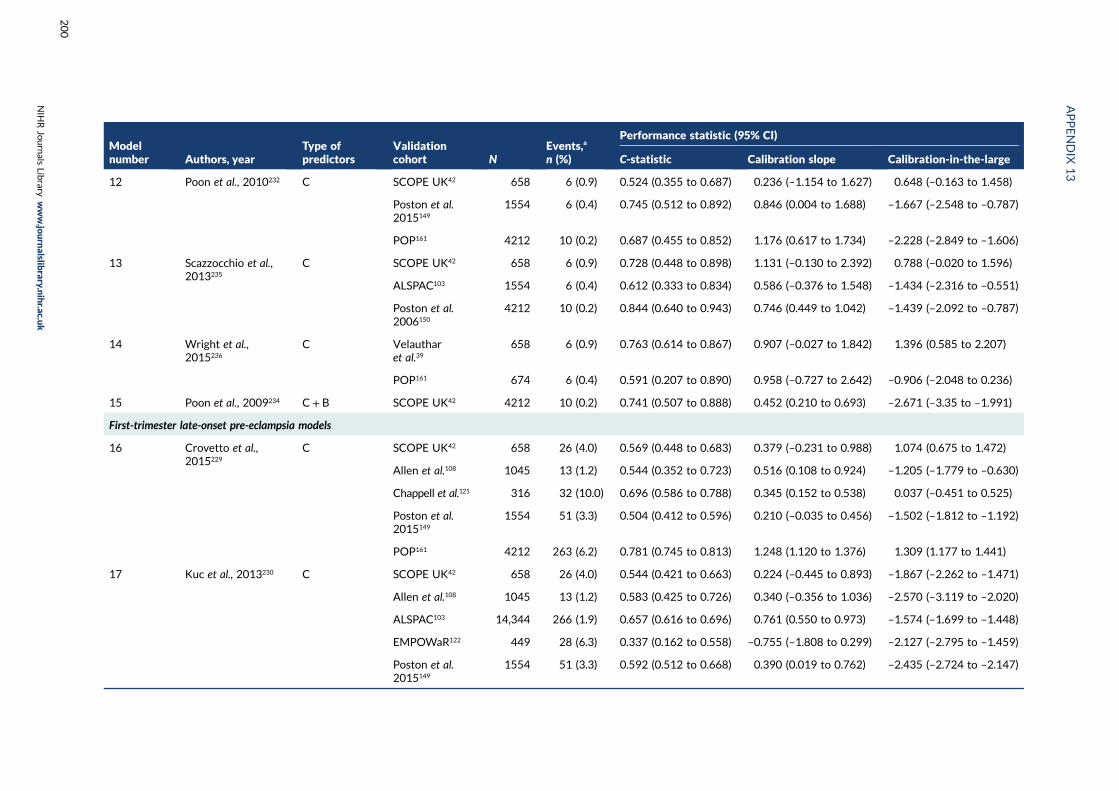
Modelnumber Authors, year
Type ofpredictors
Validationcohort N
Events,a
n (%)
Performance statistic (95% CI)
C-statistic Calibration slope Calibration-in-the-large
12 Poon et al., 2010232 C SCOPE UK42 658 6 (0.9) 0.524 (0.355 to 0.687) 0.236 (–1.154 to 1.627) 0.648 (–0.163 to 1.458)
Poston et al.2015149
1554 6 (0.4) 0.745 (0.512 to 0.892) 0.846 (0.004 to 1.688) –1.667 (–2.548 to –0.787)
POP161 4212 10 (0.2) 0.687 (0.455 to 0.852) 1.176 (0.617 to 1.734) –2.228 (–2.849 to –1.606)
13 Scazzocchio et al.,2013235
C SCOPE UK42 658 6 (0.9) 0.728 (0.448 to 0.898) 1.131 (–0.130 to 2.392) 0.788 (–0.020 to 1.596)
ALSPAC103 1554 6 (0.4) 0.612 (0.333 to 0.834) 0.586 (–0.376 to 1.548) –1.434 (–2.316 to –0.551)
Poston et al.2006150
4212 10 (0.2) 0.844 (0.640 to 0.943) 0.746 (0.449 to 1.042) –1.439 (–2.092 to –0.787)
14 Wright et al.,2015236
C Velautharet al.39
658 6 (0.9) 0.763 (0.614 to 0.867) 0.907 (–0.027 to 1.842) 1.396 (0.585 to 2.207)
POP161 674 6 (0.4) 0.591 (0.207 to 0.890) 0.958 (–0.727 to 2.642) –0.906 (–2.048 to 0.236)
15 Poon et al., 2009234 C+ B SCOPE UK42 4212 10 (0.2) 0.741 (0.507 to 0.888) 0.452 (0.210 to 0.693) –2.671 (–3.35 to –1.991)
First-trimester late-onset pre-eclampsia models
16 Crovetto et al.,2015229
C SCOPE UK42 658 26 (4.0) 0.569 (0.448 to 0.683) 0.379 (–0.231 to 0.988) 1.074 (0.675 to 1.472)
Allen et al.108 1045 13 (1.2) 0.544 (0.352 to 0.723) 0.516 (0.108 to 0.924) –1.205 (–1.779 to –0.630)
Chappell et al.121 316 32 (10.0) 0.696 (0.586 to 0.788) 0.345 (0.152 to 0.538) 0.037 (–0.451 to 0.525)
Poston et al.2015149
1554 51 (3.3) 0.504 (0.412 to 0.596) 0.210 (–0.035 to 0.456) –1.502 (–1.812 to –1.192)
POP161 4212 263 (6.2) 0.781 (0.745 to 0.813) 1.248 (1.120 to 1.376) 1.309 (1.177 to 1.441)
17 Kuc et al., 2013230 C SCOPE UK42 658 26 (4.0) 0.544 (0.421 to 0.663) 0.224 (–0.445 to 0.893) –1.867 (–2.262 to –1.471)
Allen et al.108 1045 13 (1.2) 0.583 (0.425 to 0.726) 0.340 (–0.356 to 1.036) –2.570 (–3.119 to –2.020)
ALSPAC103 14,344 266 (1.9) 0.657 (0.616 to 0.696) 0.761 (0.550 to 0.973) –1.574 (–1.699 to –1.448)
EMPOWaR122 449 28 (6.3) 0.337 (0.162 to 0.558) –0.755 (–1.808 to 0.299) –2.127 (–2.795 to –1.459)
Poston et al.2015149
1554 51 (3.3) 0.592 (0.512 to 0.668) 0.390 (0.019 to 0.762) –2.435 (–2.724 to –2.147)
APPENDIX
13
NIH
RJournals
Library
www.jo
urnalslib
rary.nihr.ac.u
k
200
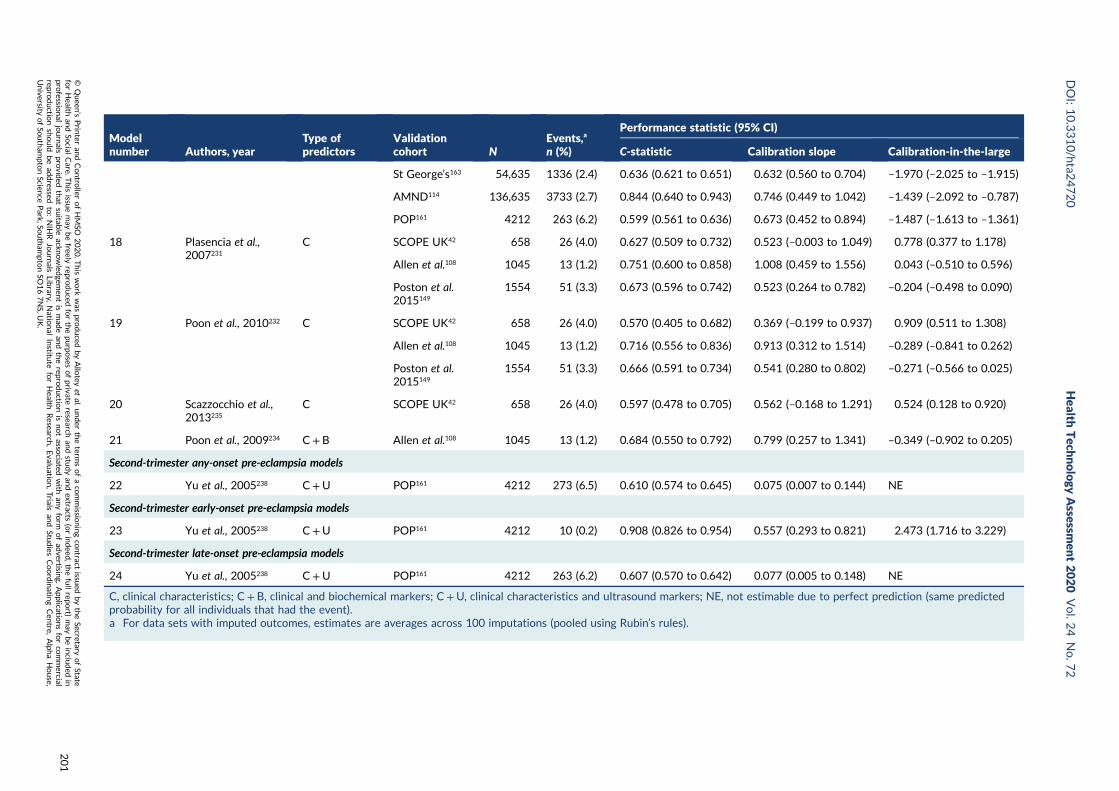
Modelnumber Authors, year
Type ofpredictors
Validationcohort N
Events,a
n (%)
Performance statistic (95% CI)
C-statistic Calibration slope Calibration-in-the-large
St George’s163 54,635 1336 (2.4) 0.636 (0.621 to 0.651) 0.632 (0.560 to 0.704) –1.970 (–2.025 to –1.915)
AMND114 136,635 3733 (2.7) 0.844 (0.640 to 0.943) 0.746 (0.449 to 1.042) –1.439 (–2.092 to –0.787)
POP161 4212 263 (6.2) 0.599 (0.561 to 0.636) 0.673 (0.452 to 0.894) –1.487 (–1.613 to –1.361)
18 Plasencia et al.,2007231
C SCOPE UK42 658 26 (4.0) 0.627 (0.509 to 0.732) 0.523 (–0.003 to 1.049) 0.778 (0.377 to 1.178)
Allen et al.108 1045 13 (1.2) 0.751 (0.600 to 0.858) 1.008 (0.459 to 1.556) 0.043 (–0.510 to 0.596)
Poston et al.2015149
1554 51 (3.3) 0.673 (0.596 to 0.742) 0.523 (0.264 to 0.782) –0.204 (–0.498 to 0.090)
19 Poon et al., 2010232 C SCOPE UK42 658 26 (4.0) 0.570 (0.405 to 0.682) 0.369 (–0.199 to 0.937) 0.909 (0.511 to 1.308)
Allen et al.108 1045 13 (1.2) 0.716 (0.556 to 0.836) 0.913 (0.312 to 1.514) –0.289 (–0.841 to 0.262)
Poston et al.2015149
1554 51 (3.3) 0.666 (0.591 to 0.734) 0.541 (0.280 to 0.802) –0.271 (–0.566 to 0.025)
20 Scazzocchio et al.,2013235
C SCOPE UK42 658 26 (4.0) 0.597 (0.478 to 0.705) 0.562 (–0.168 to 1.291) 0.524 (0.128 to 0.920)
21 Poon et al., 2009234 C+ B Allen et al.108 1045 13 (1.2) 0.684 (0.550 to 0.792) 0.799 (0.257 to 1.341) –0.349 (–0.902 to 0.205)
Second-trimester any-onset pre-eclampsia models
22 Yu et al., 2005238 C+U POP161 4212 273 (6.5) 0.610 (0.574 to 0.645) 0.075 (0.007 to 0.144) NE
Second-trimester early-onset pre-eclampsia models
23 Yu et al., 2005238 C+U POP161 4212 10 (0.2) 0.908 (0.826 to 0.954) 0.557 (0.293 to 0.821) 2.473 (1.716 to 3.229)
Second-trimester late-onset pre-eclampsia models
24 Yu et al., 2005238 C+U POP161 4212 263 (6.2) 0.607 (0.570 to 0.642) 0.077 (0.005 to 0.148) NE
C, clinical characteristics; C+ B, clinical and biochemical markers; C+U, clinical characteristics and ultrasound markers; NE, not estimable due to perfect prediction (same predictedprobability for all individuals that had the event).a For data sets with imputed outcomes, estimates are averages across 100 imputations (pooled using Rubin’s rules).
DOI:10.3310/hta2
4720
Health
Tech
nology
Assessm
ent2020
Vol.2
4No.7
2
©Queen
’sPrin
teran
dContro
llerofHMSO
2020.T
his
work
was
produced
byAllo
teyet
al.under
theterm
sofaco
mmissio
ningco
ntract
issued
bytheSecretary
ofState
forHealth
andSo
cialCare.T
his
issuemay
befreely
reproduced
forthepu
rposes
ofprivate
researchan
dstu
dyan
dextracts
(orindeed
,thefullrepo
rt)may
beinclu
ded
inpro
fessional
journals
provid
edthat
suitab
leackn
owled
gemen
tis
mad
ean
dtherepro
ductio
nis
notasso
ciatedwith
anyform
ofad
vertising.
Applicatio
nsforco
mmercial
reproductio
nshould
bead
dressed
to:NIH
RJournals
Library,
Natio
nal
Institu
teforHealth
Research
,Evalu
ation,Trials
and
Studies
Coordinatin
gCen
tre,Alph
aHouse,
University
ofSo
utham
ptonScien
cePark,So
utham
ptonSO
167NS,U
K.
201

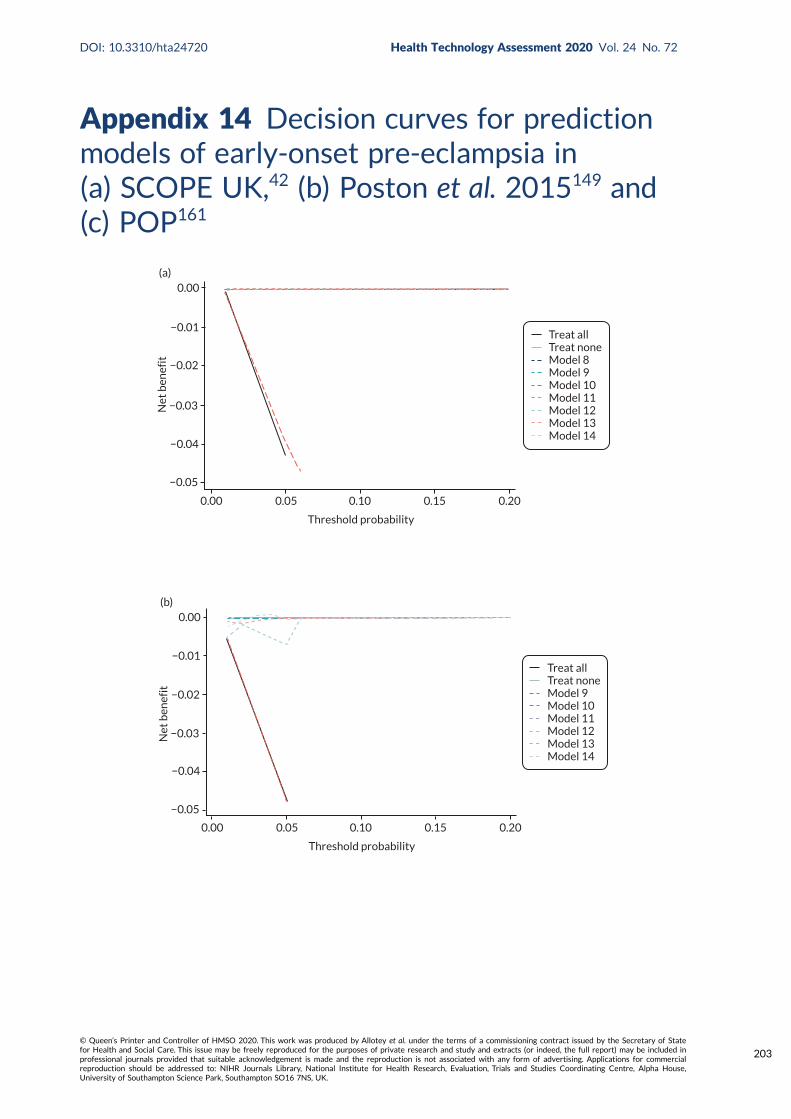
Appendix 14 Decision curves for predictionmodels of early-onset pre-eclampsia in(a) SCOPE UK,42 (b) Poston et al. 2015149 and(c) POP161
Threshold probability
0.00 0.05 0.10 0.15 0.20
(a)0.00
−0.01
−0.02
−0.03
−0.04
Net
ben
efit
−0.05
Treat allTreat noneModel 8Model 9Model 10Model 11Model 12Model 13Model 14
Threshold probability
0.00 0.05 0.10 0.15 0.20
(b)0.00
−0.01
−0.02
−0.03
−0.04
Net
ben
efit
−0.05
Treat allTreat noneModel 9Model 10Model 11Model 12Model 13Model 14
DOI: 10.3310/hta24720 Health Technology Assessment 2020 Vol. 24 No. 72
© Queen’s Printer and Controller of HMSO 2020. This work was produced by Allotey et al. under the terms of a commissioning contract issued by the Secretary of Statefor Health and Social Care. This issue may be freely reproduced for the purposes of private research and study and extracts (or indeed, the full report) may be included inprofessional journals provided that suitable acknowledgement is made and the reproduction is not associated with any form of advertising. Applications for commercialreproduction should be addressed to: NIHR Journals Library, National Institute for Health Research, Evaluation, Trials and Studies Coordinating Centre, Alpha House,University of Southampton Science Park, Southampton SO16 7NS, UK.
203
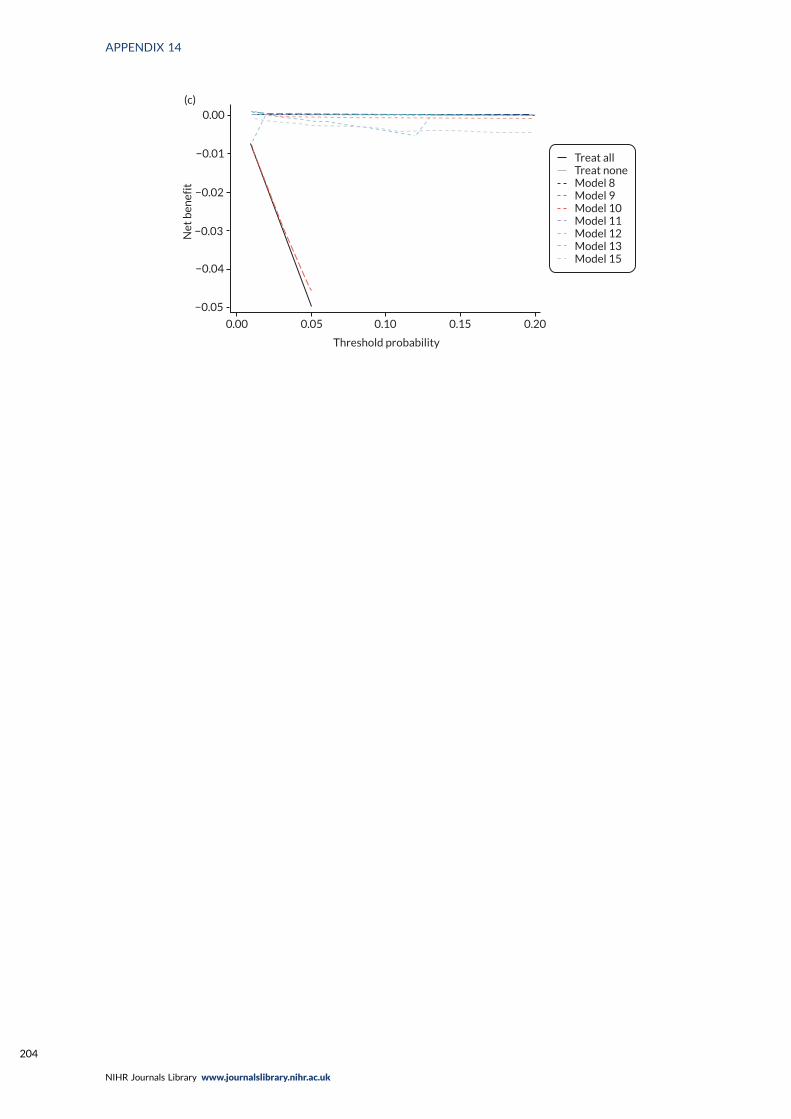
Threshold probability
0.00 0.05 0.10 0.15 0.20
(c)0.00
−0.01
−0.02
−0.03
−0.04
Net
ben
efit
−0.05
Treat allTreat noneModel 8Model 9Model 10Model 11Model 12Model 13Model 15
APPENDIX 14
NIHR Journals Library www.journalslibrary.nihr.ac.uk
204
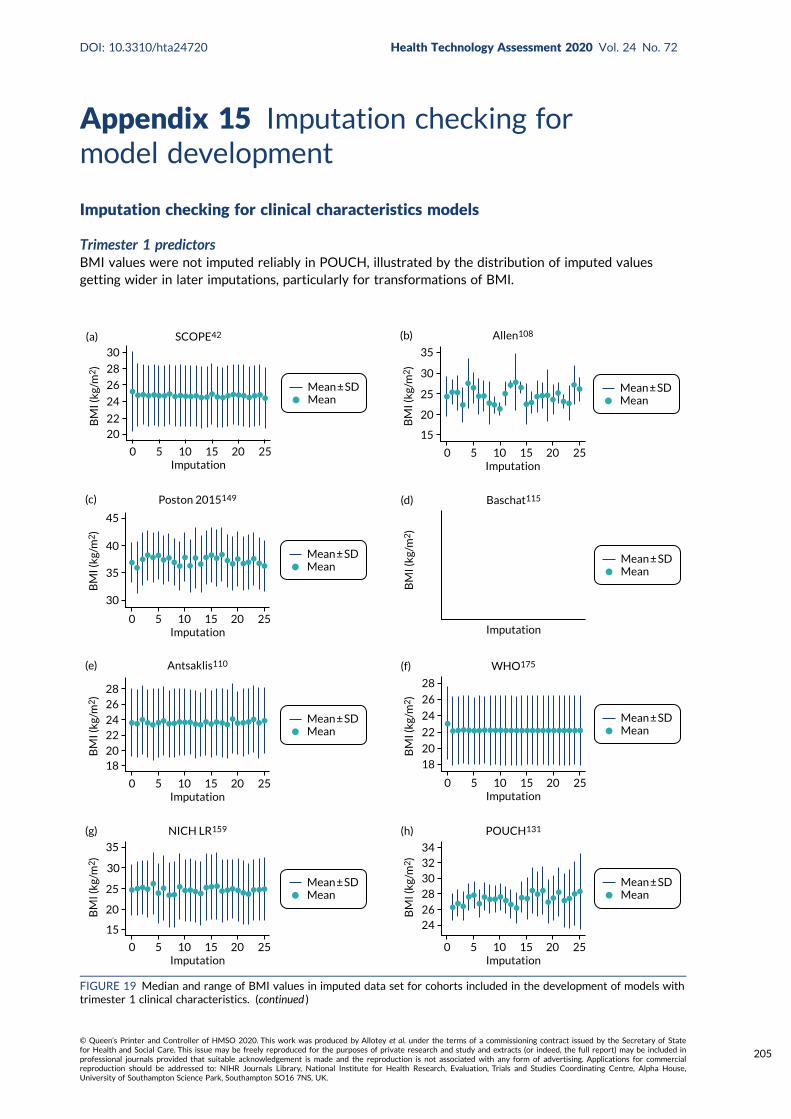
Appendix 15 Imputation checking formodel development
Imputation checking for clinical characteristics models
Trimester 1 predictorsBMI values were not imputed reliably in POUCH, illustrated by the distribution of imputed valuesgetting wider in later imputations, particularly for transformations of BMI.
Mean ± SDMean
0 5 10 15 20 25Imputation
30
28
26
24
2220
(a) SCOPE42
BM
I (kg
/m2
)
Mean ± SDMean
0 5 10 15 20 25Imputation
15
25
30
35
20
(b) Allen108
BM
I (kg
/m2
)
Mean ± SDMean
0 5 10 15 20 25Imputation
30
35
40
45
Poston 2015149
BM
I (kg
/m2
)
(c)
Mean ± SDMean
Imputation
(d) Baschat115
BM
I (kg
/m2
)
Mean ± SDMean
0 5 10 15 20 25Imputation
1820
2224
2628
(e) Antsaklis110
BM
I (kg
/m2
)
Mean ± SDMean
0 5 10 15 20 25Imputation
18
20
22
24
26
28
(f) WHO175
BM
I (kg
/m2
)
Mean ± SDMean
0 5 10 15 20 25Imputation
15
25
30
35
20
(g) NICH LR159
BM
I (kg
/m2
)
Mean ± SDMean
0 5 10 15 20 25Imputation
34323028
2624
(h) POUCH131
BM
I (kg
/m2
)
FIGURE 19 Median and range of BMI values in imputed data set for cohorts included in the development of models withtrimester 1 clinical characteristics. (continued )
DOI: 10.3310/hta24720 Health Technology Assessment 2020 Vol. 24 No. 72
© Queen’s Printer and Controller of HMSO 2020. This work was produced by Allotey et al. under the terms of a commissioning contract issued by the Secretary of Statefor Health and Social Care. This issue may be freely reproduced for the purposes of private research and study and extracts (or indeed, the full report) may be included inprofessional journals provided that suitable acknowledgement is made and the reproduction is not associated with any form of advertising. Applications for commercialreproduction should be addressed to: NIHR Journals Library, National Institute for Health Research, Evaluation, Trials and Studies Coordinating Centre, Alpha House,University of Southampton Science Park, Southampton SO16 7NS, UK.
205

Mean ± SDMean
0 5 10 15 20 25Imputation
15
25
30
35
20
(i) Van Kuijk 2014166
BM
I (kg
/m2
)
Mean ± SDMean
0 5 10 15 20 25Imputation
15
20
25
30
(j) STORK G135
BM
I (kg
/m2
)
Mean ± SDMean
Imputation
(k) Vinter173
BM
I (kg
/m2
)
Mean ± SDMean
0 5 10 15 20 25Imputation
302826242220
(l) POP161
BM
I (kg
/m2
)FIGURE 19 Median and range of BMI values in imputed data set for cohorts included in the development of models withtrimester 1 clinical characteristics.
Mean ± SDMean
3.0
3.1
3.2
3.3
3.4
SCOPE42
0 5 10 15 20 25Imputation
(a)
Ln(B
MI)
Mean ± SDMean
4.0
3.5
3.0
2.5
Allen108
0 5 10 15 20 25Imputation
(b)
Ln(B
MI)
Mean ± SDMean
5.0
4.5
4.0
3.5
3.0
2.5
Poston 2015149
0 5 10 15 20 25Imputation
(c)
Ln(B
MI)
Mean ± SDMean
Baschat115
Imputation
(d)
Ln(B
MI)
Mean ± SDMean
2.8
3.0
3.2
3.4
3.6
Antsaklis110
0 5 10 15 20 25Imputation
(e)
Ln(B
MI)
Mean ± SDMean
3.6
3.4
3.2
3.0
2.8
2.6
WHO175
0 5 10 15 20 25Imputation
(f)
Ln(B
MI)
FIGURE 20 Median and range of ln(BMI) values in imputed data set for cohorts included in the development of modelswith trimester 1 clinical characteristics. (continued )
APPENDIX 15
NIHR Journals Library www.journalslibrary.nihr.ac.uk
206
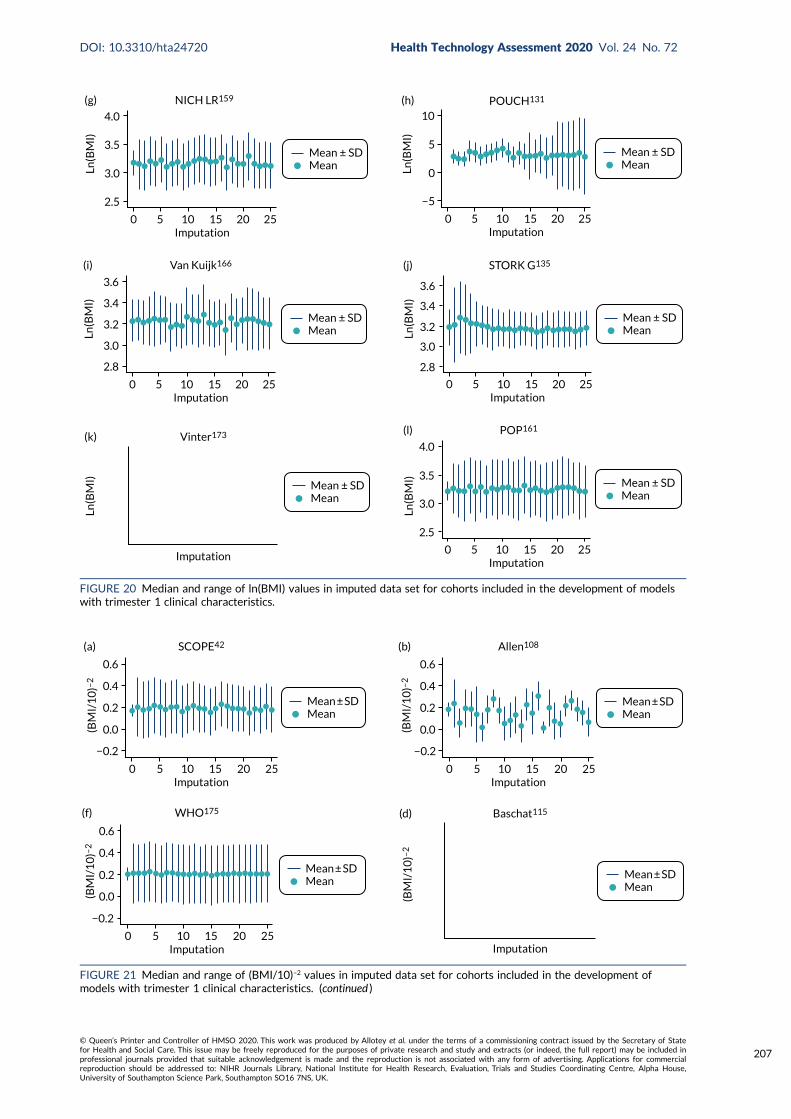
Mean ± SDMean
4.0
3.5
3.0
2.5
NICH LR159
0 5 10 15 20 25Imputation
(g)Ln
(BM
I)
Mean ± SDMean
−5
0
5
10POUCH131
0 5 10 15 20 25Imputation
(h)
Ln(B
MI)
Mean ± SDMean
2.8
3.0
3.2
3.4
3.6
Van Kuijk166
0 5 10 15 20 25Imputation
(i)
Ln(B
MI)
3.6
3.4
3.2
3.0
2.8
STORK G135
0 5 10 15 20 25Imputation
(j)
Mean ± SDMeanLn
(BM
I)
Mean ± SDMean
Vinter173
Imputation
(k)
Ln(B
MI) Mean ± SD
Mean
4.0
3.5
3.0
2.5
POP161
0 5 10 15 20 25Imputation
(l)
Ln(B
MI)
FIGURE 20 Median and range of ln(BMI) values in imputed data set for cohorts included in the development of modelswith trimester 1 clinical characteristics.
Mean ± SDMean
0 5 10 15 20 25Imputation
(a) SCOPE42
−0.2
0.0
0.2
0.4
0.6
(BM
I/1
0)–
2
Mean ± SDMean
0 5 10 15 20 25Imputation
(b) Allen108
−0.2
0.0
0.2
0.4
0.6
(BM
I/1
0)–
2
Mean ± SDMean
0 5 10 15 20 25Imputation
(f) WHO175
0.6
0.4
0.2
0.0
−0.2
(BM
I/1
0)–
2
Mean ± SDMean
Imputation
(d) Baschat115
(BM
I/1
0)–
2
FIGURE 21 Median and range of (BMI/10)–2 values in imputed data set for cohorts included in the development ofmodels with trimester 1 clinical characteristics. (continued )
DOI: 10.3310/hta24720 Health Technology Assessment 2020 Vol. 24 No. 72
© Queen’s Printer and Controller of HMSO 2020. This work was produced by Allotey et al. under the terms of a commissioning contract issued by the Secretary of Statefor Health and Social Care. This issue may be freely reproduced for the purposes of private research and study and extracts (or indeed, the full report) may be included inprofessional journals provided that suitable acknowledgement is made and the reproduction is not associated with any form of advertising. Applications for commercialreproduction should be addressed to: NIHR Journals Library, National Institute for Health Research, Evaluation, Trials and Studies Coordinating Centre, Alpha House,University of Southampton Science Park, Southampton SO16 7NS, UK.
207
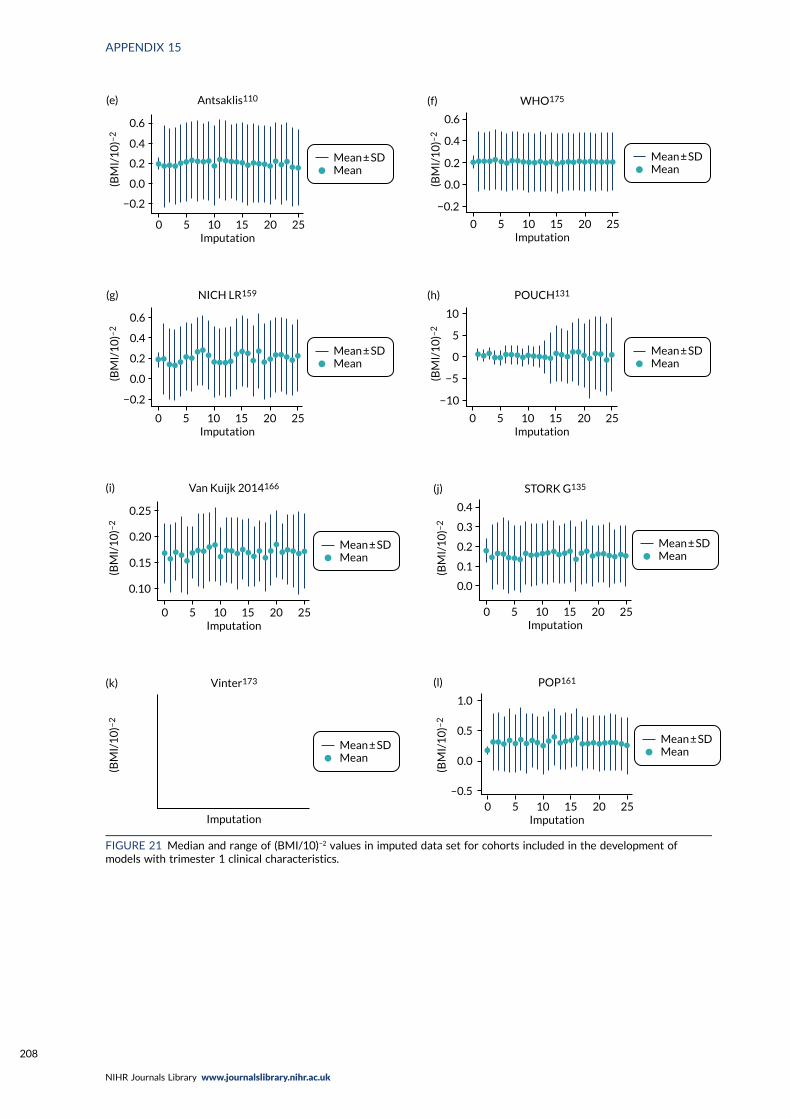
Mean ± SDMean
0 5 10 15 20 25Imputation
(e) Antsaklis110
−0.2
0.0
0.2
0.4
0.6(B
MI/
10
)–2
Mean ± SDMean
0 5 10 15 20 25Imputation
(f) WHO175
0.6
0.4
0.2
0.0
−0.2
(BM
I/1
0)–
2
Mean ± SDMean
0 5 10 15 20 25Imputation
(g) NICH LR159
0.6
0.4
0.2
0.0
−0.2
(BM
I/1
0)–
2
Mean ± SDMean
0 5 10 15 20 25Imputation
(h) POUCH131
−10
−5
0
5
10
(BM
I/1
0)–
2
Mean ± SDMean
0 5 10 15 20 25Imputation
0.10
0.15
0.20
0.25
(i) Van Kuijk 2014166
(BM
I/1
0)–
2
0 5 10 15 20 25Imputation
(j) STORK G135
0.0
0.1
0.2
0.3
0.4
Mean ± SDMean
(BM
I/1
0)–
2
Mean ± SDMean
Imputation
(k) Vinter173
(BM
I/1
0)–
2
Mean ± SDMean
0
1.0
0.5
0.0
–0.5
5 10 15 20 25Imputation
(l) POP161
(BM
I/1
0)–
2
FIGURE 21 Median and range of (BMI/10)–2 values in imputed data set for cohorts included in the development ofmodels with trimester 1 clinical characteristics.
APPENDIX 15
NIHR Journals Library www.journalslibrary.nihr.ac.uk
208
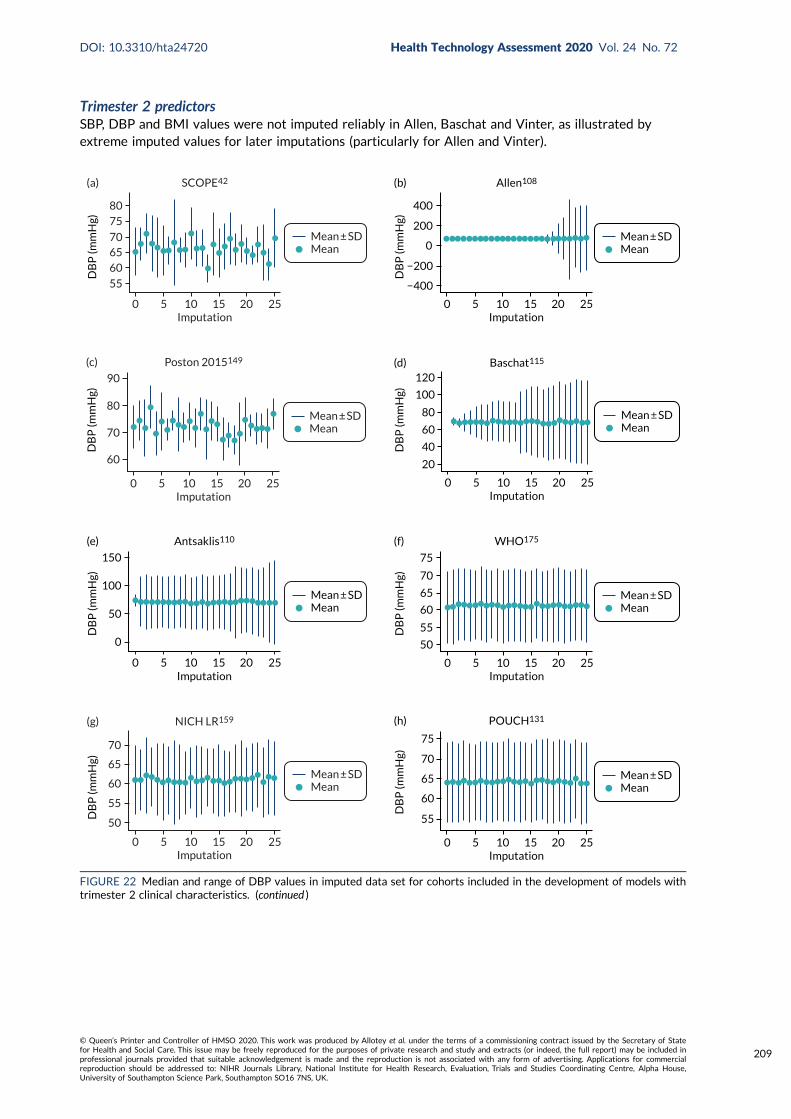
Trimester 2 predictorsSBP, DBP and BMI values were not imputed reliably in Allen, Baschat and Vinter, as illustrated byextreme imputed values for later imputations (particularly for Allen and Vinter).
Mean ± SDMean
0 5 10 15 20 25Imputation
8075
706560
55
(a) SCOPE42
DB
P (m
mH
g)
Mean ± SDMean
0 5 10 15 20 25Imputation
400
200
0
−200
−400
(b) Allen108
DB
P (m
mH
g)
Mean ± SDMean
0 5 10 15 20 25Imputation
90
80
70
60
(c) Poston 2015149
DB
P (m
mH
g)
Mean ± SDMean
0 5 10 15 20 25Imputation
120
100
80
60
40
20
(d) Baschat115
DB
P (m
mH
g)
Mean ± SDMean
0 5 10 15 20 25Imputation
(e) Antsaklis110
0
50
100
150
DB
P (m
mH
g)
Mean ± SDMean
0 5 10 15 20 25Imputation
(f) WHO175
75
70
65
60
55
50
DB
P (m
mH
g)
Mean ± SDMean
0 5 10 15 20 25Imputation
70
65
60
55
50
(g) NICH LR159
DB
P (m
mH
g)
Mean ± SDMean
0 5 10 15 20 25Imputation
75
70
65
60
55
(h) POUCH131
DB
P (m
mH
g)
FIGURE 22 Median and range of DBP values in imputed data set for cohorts included in the development of models withtrimester 2 clinical characteristics. (continued )
DOI: 10.3310/hta24720 Health Technology Assessment 2020 Vol. 24 No. 72
© Queen’s Printer and Controller of HMSO 2020. This work was produced by Allotey et al. under the terms of a commissioning contract issued by the Secretary of Statefor Health and Social Care. This issue may be freely reproduced for the purposes of private research and study and extracts (or indeed, the full report) may be included inprofessional journals provided that suitable acknowledgement is made and the reproduction is not associated with any form of advertising. Applications for commercialreproduction should be addressed to: NIHR Journals Library, National Institute for Health Research, Evaluation, Trials and Studies Coordinating Centre, Alpha House,University of Southampton Science Park, Southampton SO16 7NS, UK.
209

Mean ± SDMean
0 5 10 15 20 25Imputation
(i) Van Kuijk 2014166
70
60
50
80
90D
BP
(mm
Hg)
Mean ± SDMean
0 5 10 15 20 25Imputation
(j) STORK G135
75
70
65
60
55
DB
P (m
mH
g)
Mean ± SDMean
0 5 10 15 20 25Imputation
(k) Vinter173
1 × 10⁷
–1 × 10⁷
5 × 10⁶
–5 × 10⁶
0
DB
P (m
mH
g)
Mean ± SDMean
0 5 10 15 20 25Imputation
75
70
65
60
55
(l) POP161
DB
P (m
mH
g)FIGURE 22 Median and range of DBP values in imputed data set for cohorts included in the development of models withtrimester 2 clinical characteristics.
Mean ± SDMean
0 5 10 15 20 25Imputation
(a) SCOPE42
130
120
110
100
90
SBP
(mm
Hg)
Mean ± SDMean
0 5 10 15 20 25Imputation
(b) Allen108
600
400
200
−200
0SBP
(mm
Hg)
Mean ± SDMean
0 5 10 15 20 25Imputation
(c) Poston 2015149
100
110
120
130
140
SBP
(mm
Hg)
Mean ± SDMean
0 5 10 15 20 25Imputation
(d) Baschat115
50
100
150
200
SBP
(mm
Hg)
Mean ± SDMean
0 5 10 15 20 25Imputation
(e) Antsaklis110
160
140
120
100
80
SBP
(mm
Hg)
Mean ± SDMean
0 5 10 15 20 25Imputation
(f) WHO175
120
110
100
90
SBP
(mm
Hg)
FIGURE 23 Median and range of SBP values in imputed data set for cohorts included in the development of models withtrimester 2 clinical characteristics. (continued )
APPENDIX 15
NIHR Journals Library www.journalslibrary.nihr.ac.uk
210
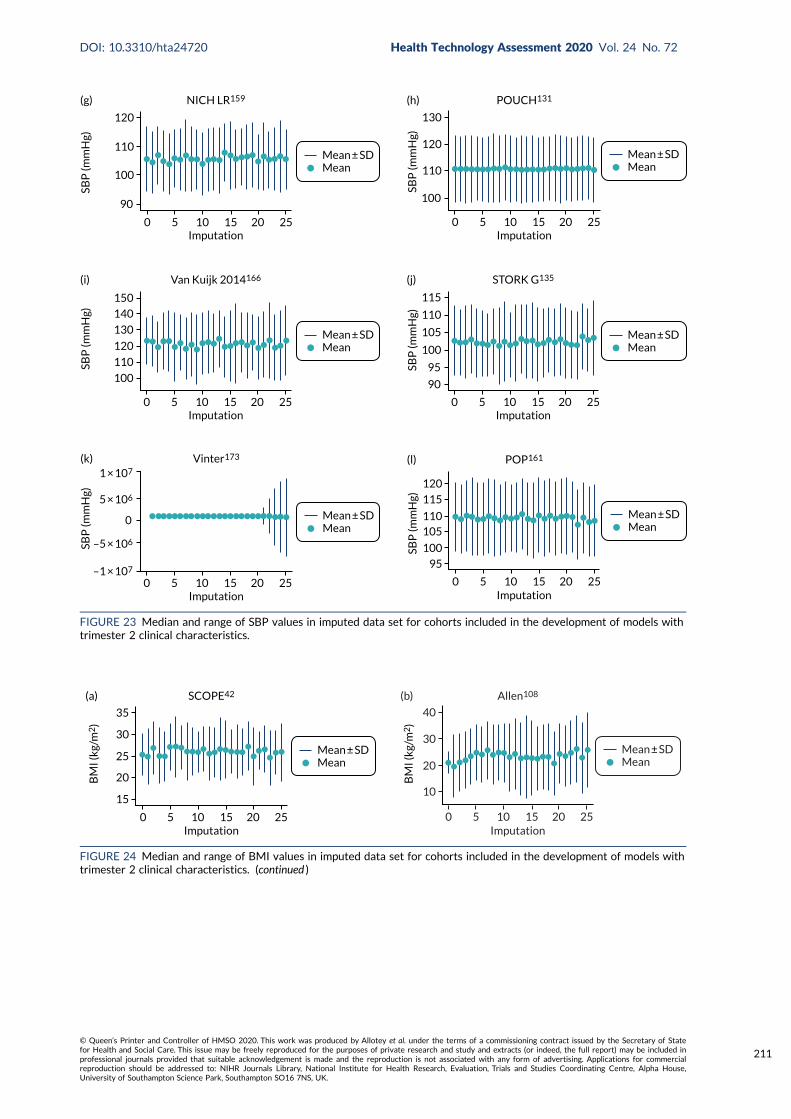
Mean ± SDMean
0 5 10 15 20 25Imputation
(g) NICH LR159
120
110
100
90
SBP
(mm
Hg)
Mean ± SDMean
0 5 10 15 20 25Imputation
(h) POUCH131
130
120
110
100
SBP
(mm
Hg)
Mean ± SDMean
0 5 10 15 20 25Imputation
(i) Van Kuijk 2014166
100
110
120
130
140
150
SBP
(mm
Hg)
Mean ± SDMean
0 5 10 15 20 25Imputation
(j) STORK G135
90
95
100
105
110
115
SBP
(mm
Hg)
Mean ± SDMean
0 5 10 15 20 25Imputation
(k) Vinter173
1 × 10⁷
–1 × 10⁷
5 × 10⁶
–5 × 10⁶
0
SBP
(mm
Hg)
Mean ± SDMean
0 5 10 15 20 25Imputation
(l) POP161
120
115
110105
100
95
SBP
(mm
Hg)
FIGURE 23 Median and range of SBP values in imputed data set for cohorts included in the development of models withtrimester 2 clinical characteristics.
Mean ± SDMean
0 5 10 15 20 25Imputation
(a) SCOPE42
30
25
20
15
35
BM
I (kg
/m2
)
Mean ± SDMean
0 5 10 15 20 25Imputation
(b) Allen108
30
40
20
10
BM
I (kg
/m2
)
FIGURE 24 Median and range of BMI values in imputed data set for cohorts included in the development of models withtrimester 2 clinical characteristics. (continued )
DOI: 10.3310/hta24720 Health Technology Assessment 2020 Vol. 24 No. 72
© Queen’s Printer and Controller of HMSO 2020. This work was produced by Allotey et al. under the terms of a commissioning contract issued by the Secretary of Statefor Health and Social Care. This issue may be freely reproduced for the purposes of private research and study and extracts (or indeed, the full report) may be included inprofessional journals provided that suitable acknowledgement is made and the reproduction is not associated with any form of advertising. Applications for commercialreproduction should be addressed to: NIHR Journals Library, National Institute for Health Research, Evaluation, Trials and Studies Coordinating Centre, Alpha House,University of Southampton Science Park, Southampton SO16 7NS, UK.
211
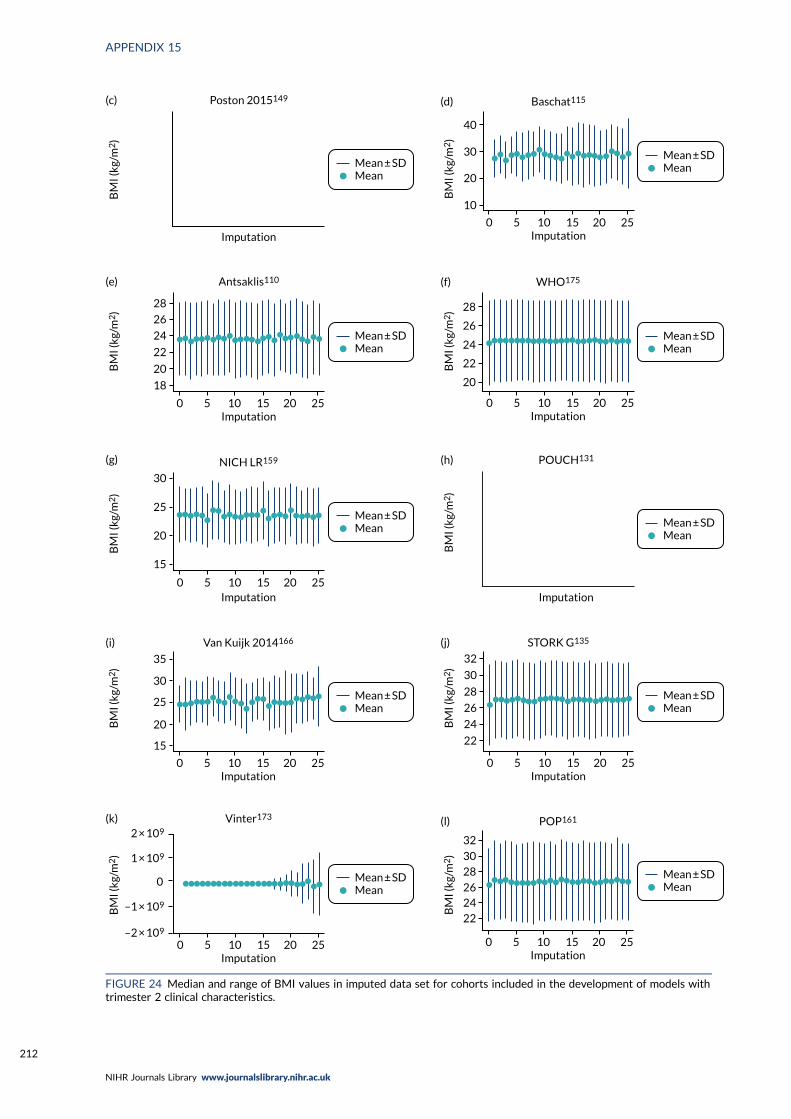
Mean ± SDMean
Imputation
(c) Poston 2015149
BM
I (kg
/m2
)
Mean ± SDMean
(d) Baschat115
0 5 10 15 20 25Imputation
10
20
30
40
BM
I (kg
/m2
)
Mean ± SDMean
(e) Antsaklis110
0 5 10 15 20 25Imputation
28
26
24
22
20
18
BM
I (kg
/m2
)
Mean ± SDMean
(f) WHO175
0 5 10 15 20 25Imputation
28
26
24
22
20
BM
I (kg
/m2
)
Mean ± SDMean
(g) NICH LR159
Imputation0 5 10 15 20 25
20
25
30
15
BM
I (kg
/m2
)
Mean ± SDMean
(h) POUCH131
Imputation
BM
I (kg
/m2
)
Mean ± SDMean
(i) Van Kuijk 2014166
0 5 10 15 20 25Imputation
35
30
25
20
15
BM
I (kg
/m2
)
Mean ± SDMean
(j) STORK G135
0 5 10 15 20 25Imputation
30
28
26
24
22
32
BM
I (kg
/m2
)
Mean ± SDMean
(k) Vinter173
0 5 10 15 20 25Imputation
2 × 10⁹
–2 × 10⁹
1 × 10⁹
–1 × 10⁹
0
BM
I (kg
/m2
)
Mean ± SDMean
(l) POP161
0 5 10 15 20 25Imputation
30
28
2624
22
32
BM
I (kg
/m2
)
FIGURE 24 Median and range of BMI values in imputed data set for cohorts included in the development of models withtrimester 2 clinical characteristics.
APPENDIX 15
NIHR Journals Library www.journalslibrary.nihr.ac.uk
212
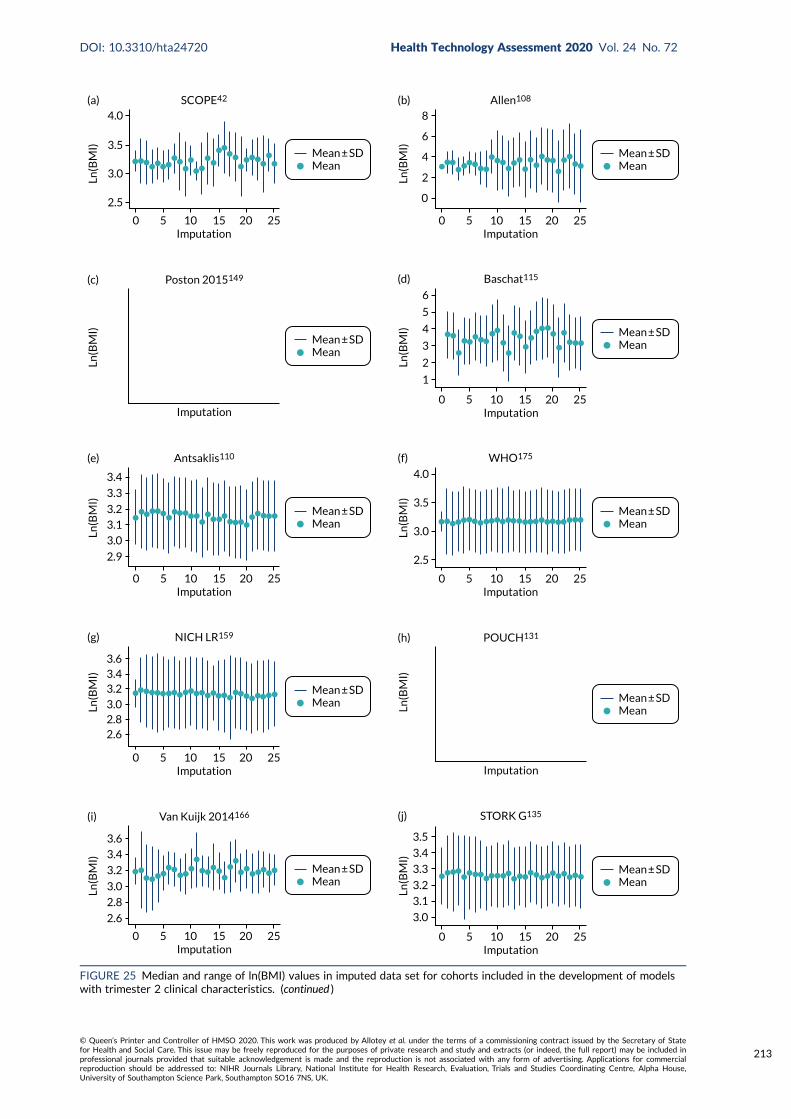
Mean ± SDMean
(a) SCOPE42
0 5 10 15 20 25Imputation
4.0
3.5
3.0
2.5
Ln(B
MI)
Mean ± SDMean
(b) Allen108
0 5 10 15 20 25Imputation
0
2
4
6
8
Ln(B
MI)
Mean ± SDMean
(c) Poston 2015149
Imputation
Ln(B
MI) Mean ± SD
Mean
(d) Baschat115
0 5 10 15 20 25Imputation
6
5
4
3
2
1
Ln(B
MI)
Mean ± SDMean
(e) Antsaklis110
0 5 10 15 20 25Imputation
3.4
3.3
3.2
3.1
3.0
2.9
Ln(B
MI)
Mean ± SDMean
(f) WHO175
0 5 10 15 20 25Imputation
2.5
3.0
3.5
4.0
Ln(B
MI)
Mean ± SDMean
(g) NICH LR159
0 5 10 15 20 25Imputation
3.63.43.2
3.02.82.6
Ln(B
MI)
Mean ± SDMean
(h) POUCH131
Imputation
Ln(B
MI)
Mean ± SDMean
(i) Van Kuijk 2014166
0 5 10 15 20 25Imputation
3.6
3.4
3.2
3.0
2.8
2.6
Ln(B
MI)
Mean ± SDMean
(j) STORK G135
0 5 10 15 20 25Imputation
3.0
3.1
3.2
3.3
3.4
3.5
Ln(B
MI)
FIGURE 25 Median and range of ln(BMI) values in imputed data set for cohorts included in the development of modelswith trimester 2 clinical characteristics. (continued )
DOI: 10.3310/hta24720 Health Technology Assessment 2020 Vol. 24 No. 72
© Queen’s Printer and Controller of HMSO 2020. This work was produced by Allotey et al. under the terms of a commissioning contract issued by the Secretary of Statefor Health and Social Care. This issue may be freely reproduced for the purposes of private research and study and extracts (or indeed, the full report) may be included inprofessional journals provided that suitable acknowledgement is made and the reproduction is not associated with any form of advertising. Applications for commercialreproduction should be addressed to: NIHR Journals Library, National Institute for Health Research, Evaluation, Trials and Studies Coordinating Centre, Alpha House,University of Southampton Science Park, Southampton SO16 7NS, UK.
213
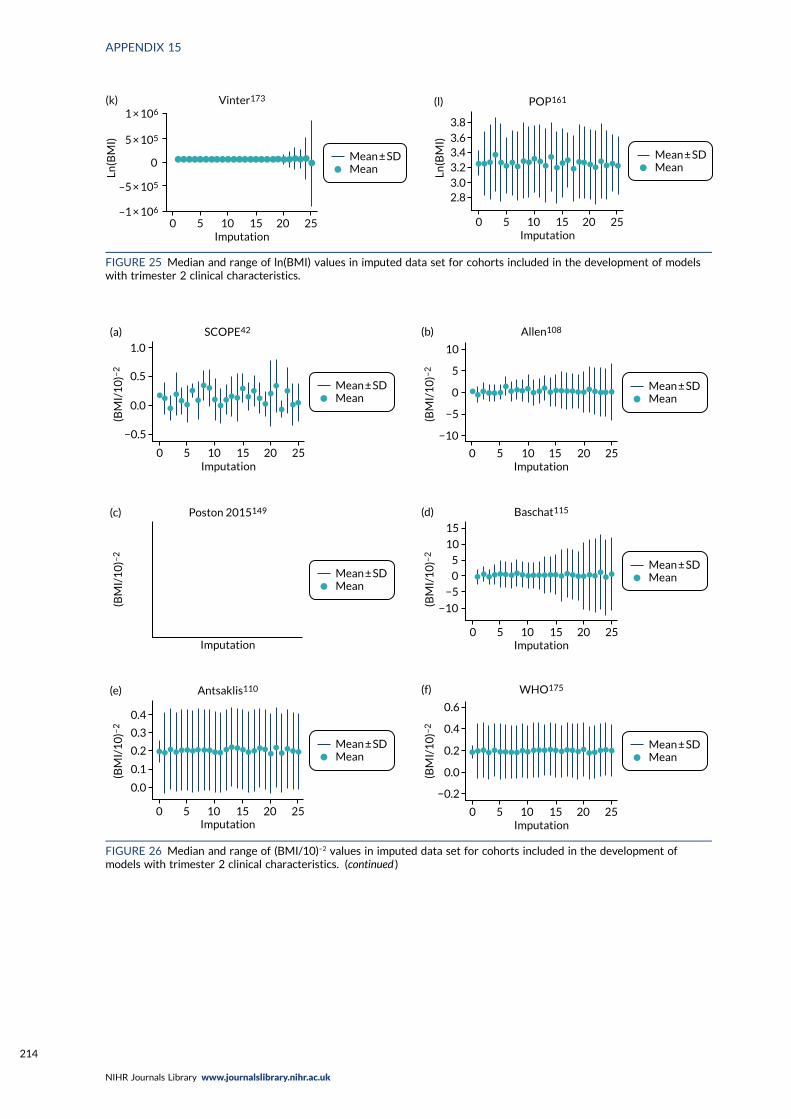
Mean ± SDMean
(k) Vinter173
0 5 10 15 20 25Imputation
1 × 10⁶
–1 × 10⁶
5 × 10⁵
–5 × 10⁵
0
Ln(B
MI)
Mean ± SDMean
(l) POP161
0 5 10 15 20 25Imputation
3.8
3.63.43.23.02.8
Ln(B
MI)
FIGURE 25 Median and range of ln(BMI) values in imputed data set for cohorts included in the development of modelswith trimester 2 clinical characteristics.
Mean ± SDMean
0 5 10 15 20 25Imputation
1.0
0.5
0.0
−0.5
(a) SCOPE42
(BM
I/1
0)–
2
Mean ± SDMean
0 5 10 15 20 25Imputation
−10
−5
0
5
10
(b) Allen108
(BM
I/1
0)–
2
Mean ± SDMean
Imputation
(c) Poston 2015149
(BM
I/1
0)–
2
Mean ± SDMean
0 5 10 15 20 25Imputation
(d) Baschat115
−10
−5
0
5
10
15
(BM
I/1
0)–
2
Mean ± SDMean
0 5 10 15 20 25Imputation
0.4
0.3
0.2
0.1
0.0
(e) Antsaklis110
(BM
I/1
0)–
2
Mean ± SDMean
0 5 10 15 20 25Imputation
−0.2
0.0
0.2
0.4
0.6
(f) WHO175
(BM
I/1
0)–
2
FIGURE 26 Median and range of (BMI/10)–2 values in imputed data set for cohorts included in the development ofmodels with trimester 2 clinical characteristics. (continued )
APPENDIX 15
NIHR Journals Library www.journalslibrary.nihr.ac.uk
214
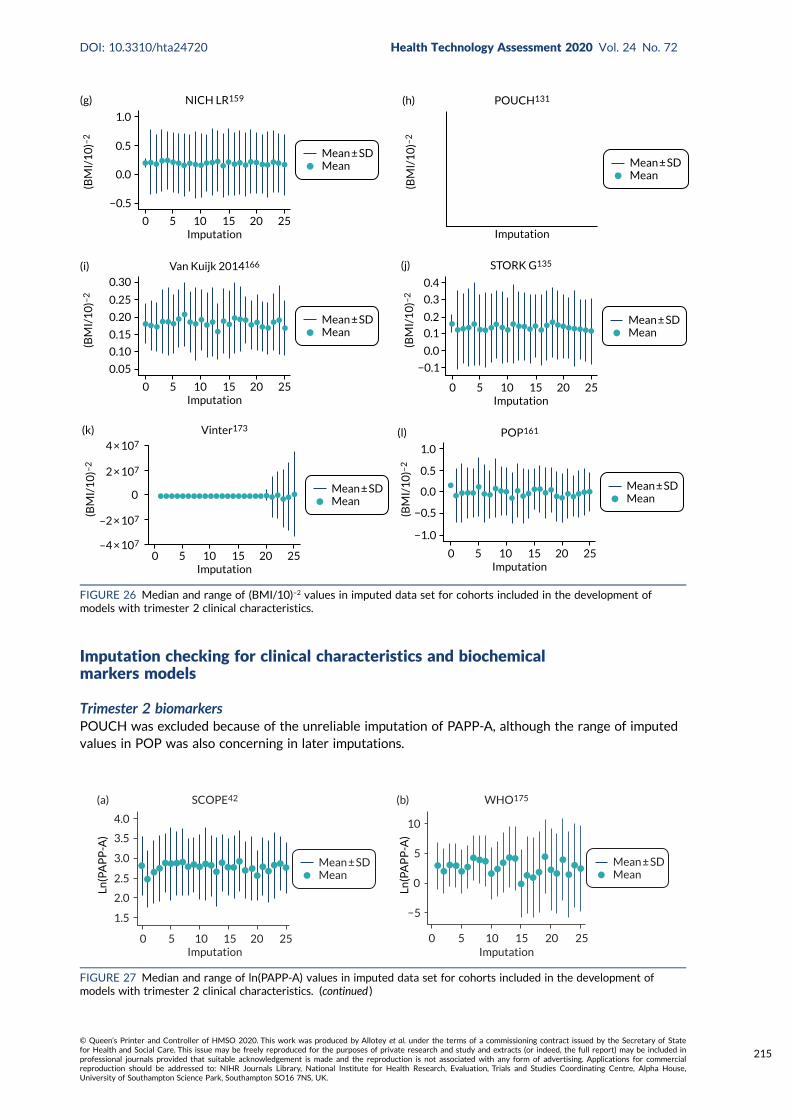
Imputation checking for clinical characteristics and biochemicalmarkers models
Trimester 2 biomarkersPOUCH was excluded because of the unreliable imputation of PAPP-A, although the range of imputedvalues in POP was also concerning in later imputations.
0 5 10 15 20 25Imputation
−0.5
0.0
0.5
1.0
(g) NICH LR159
Mean ± SDMean
(BM
I/1
0)–
2
Mean ± SDMean
Imputation
(h) POUCH131
(BM
I/1
0)–
2
0 5 10 15 20 25Imputation
0.30
0.25
0.20
0.15
0.10
0.05
(i)
Mean ± SDMean
Van Kuijk 2014166
(BM
I/1
0)–
2
Mean ± SDMean
0 5 10 15 20 25Imputation
0.4
0.3
0.2
0.1
0.0
−0.1
(j) STORK G135
(BM
I/1
0)–
2
Mean ± SDMean
0 5 10 15 20 25Imputation
(k) Vinter173
4 × 10⁷
–4 × 10⁷
2 × 10⁷
–2 × 10⁷
0
(BM
I/1
0)–
2
Mean ± SDMean
0 5 10 15 20 25Imputation
−0.5
−1.0
0.0
0.5
1.0
(l) POP161
(BM
I/1
0)–
2
FIGURE 26 Median and range of (BMI/10)–2 values in imputed data set for cohorts included in the development ofmodels with trimester 2 clinical characteristics.
Mean ± SDMean
0 5 10 15 20 25Imputation
4.0
3.5
3.0
2.5
2.0
1.5
(a) SCOPE42
Ln(P
AP
P-A
)
Mean ± SDMean
0 5 10 15 20 25Imputation
−5
0
5
10
(b) WHO175
Ln(P
AP
P-A
)
FIGURE 27 Median and range of ln(PAPP-A) values in imputed data set for cohorts included in the development ofmodels with trimester 2 clinical characteristics. (continued )
DOI: 10.3310/hta24720 Health Technology Assessment 2020 Vol. 24 No. 72
© Queen’s Printer and Controller of HMSO 2020. This work was produced by Allotey et al. under the terms of a commissioning contract issued by the Secretary of Statefor Health and Social Care. This issue may be freely reproduced for the purposes of private research and study and extracts (or indeed, the full report) may be included inprofessional journals provided that suitable acknowledgement is made and the reproduction is not associated with any form of advertising. Applications for commercialreproduction should be addressed to: NIHR Journals Library, National Institute for Health Research, Evaluation, Trials and Studies Coordinating Centre, Alpha House,University of Southampton Science Park, Southampton SO16 7NS, UK.
215
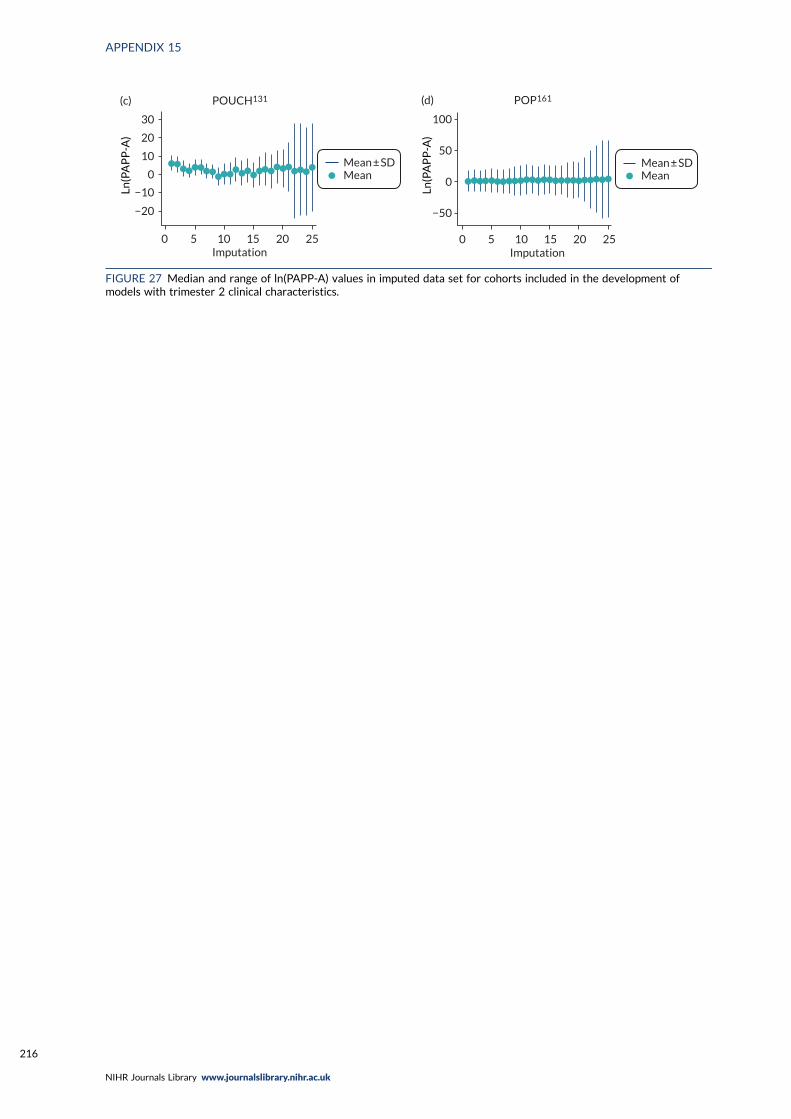
Mean ± SDMean
0 5 10 15 20 25Imputation
30
20
10
−10
−20
0
(c) POUCH131
Ln(P
AP
P-A
)
Mean ± SDMean
0 5 10 15 20 25Imputation
−50
0
50
100
(d) POP161
Ln(P
AP
P-A
)
FIGURE 27 Median and range of ln(PAPP-A) values in imputed data set for cohorts included in the development ofmodels with trimester 2 clinical characteristics.
APPENDIX 15
NIHR Journals Library www.journalslibrary.nihr.ac.uk
216
Appendix 16 Comparison of clinicalcharacteristics models in data imputed withBMI, ln(BMI) or BMI–2
DOI: 10.3310/hta24720 Health Technology Assessment 2020 Vol. 24 No. 72
© Queen’s Printer and Controller of HMSO 2020. This work was produced by Allotey et al. under the terms of a commissioning contract issued by the Secretary of Statefor Health and Social Care. This issue may be freely reproduced for the purposes of private research and study and extracts (or indeed, the full report) may be included inprofessional journals provided that suitable acknowledgement is made and the reproduction is not associated with any form of advertising. Applications for commercialreproduction should be addressed to: NIHR Journals Library, National Institute for Health Research, Evaluation, Trials and Studies Coordinating Centre, Alpha House,University of Southampton Science Park, Southampton SO16 7NS, UK.
217
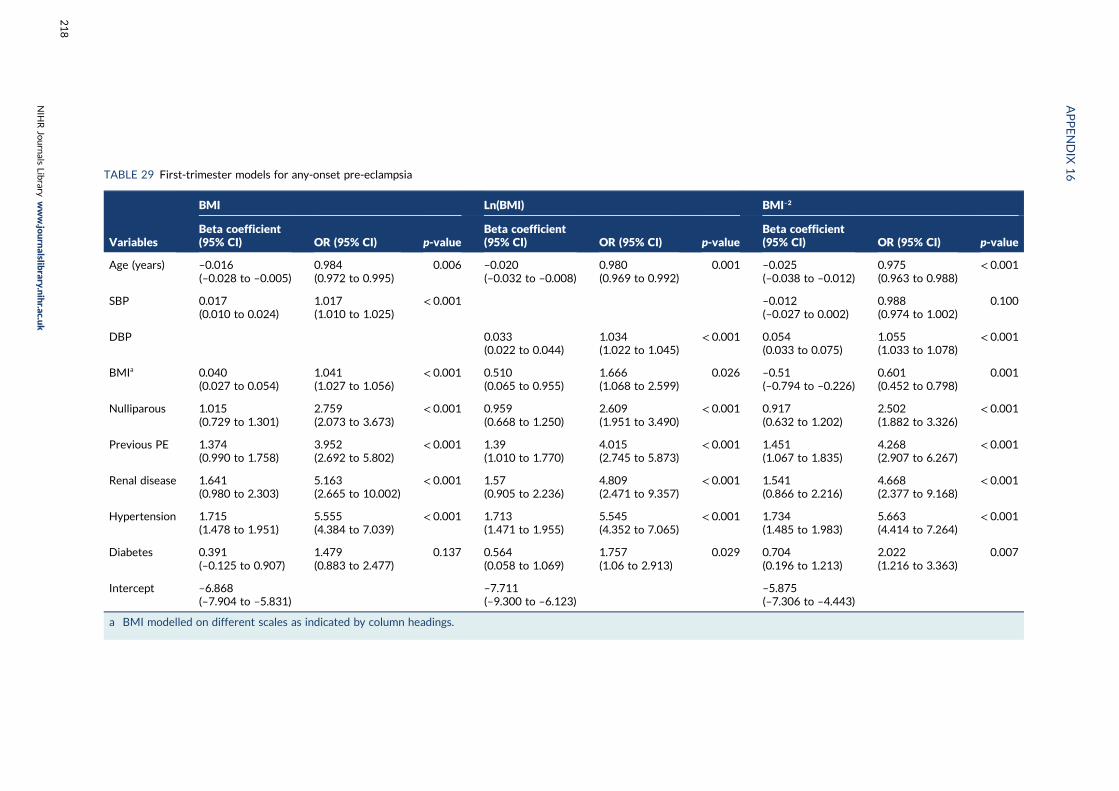
TABLE 29 First-trimester models for any-onset pre-eclampsia
Variables
BMI Ln(BMI) BMI–2
Beta coefficient(95% CI) OR (95% CI) p-value
Beta coefficient(95% CI) OR (95% CI) p-value
Beta coefficient(95% CI) OR (95% CI) p-value
Age (years) –0.016(–0.028 to –0.005)
0.984(0.972 to 0.995)
0.006 –0.020(–0.032 to –0.008)
0.980(0.969 to 0.992)
0.001 –0.025(–0.038 to –0.012)
0.975(0.963 to 0.988)
< 0.001
SBP 0.017(0.010 to 0.024)
1.017(1.010 to 1.025)
< 0.001 –0.012(–0.027 to 0.002)
0.988(0.974 to 1.002)
0.100
DBP 0.033(0.022 to 0.044)
1.034(1.022 to 1.045)
< 0.001 0.054(0.033 to 0.075)
1.055(1.033 to 1.078)
< 0.001
BMIa 0.040(0.027 to 0.054)
1.041(1.027 to 1.056)
< 0.001 0.510(0.065 to 0.955)
1.666(1.068 to 2.599)
0.026 –0.51(–0.794 to –0.226)
0.601(0.452 to 0.798)
0.001
Nulliparous 1.015(0.729 to 1.301)
2.759(2.073 to 3.673)
< 0.001 0.959(0.668 to 1.250)
2.609(1.951 to 3.490)
< 0.001 0.917(0.632 to 1.202)
2.502(1.882 to 3.326)
< 0.001
Previous PE 1.374(0.990 to 1.758)
3.952(2.692 to 5.802)
< 0.001 1.39(1.010 to 1.770)
4.015(2.745 to 5.873)
< 0.001 1.451(1.067 to 1.835)
4.268(2.907 to 6.267)
< 0.001
Renal disease 1.641(0.980 to 2.303)
5.163(2.665 to 10.002)
< 0.001 1.57(0.905 to 2.236)
4.809(2.471 to 9.357)
< 0.001 1.541(0.866 to 2.216)
4.668(2.377 to 9.168)
< 0.001
Hypertension 1.715(1.478 to 1.951)
5.555(4.384 to 7.039)
< 0.001 1.713(1.471 to 1.955)
5.545(4.352 to 7.065)
< 0.001 1.734(1.485 to 1.983)
5.663(4.414 to 7.264)
< 0.001
Diabetes 0.391(–0.125 to 0.907)
1.479(0.883 to 2.477)
0.137 0.564(0.058 to 1.069)
1.757(1.06 to 2.913)
0.029 0.704(0.196 to 1.213)
2.022(1.216 to 3.363)
0.007
Intercept –6.868(–7.904 to –5.831)
–7.711(–9.300 to –6.123)
–5.875(–7.306 to –4.443)
a BMI modelled on different scales as indicated by column headings.
APPENDIX
16
NIH
RJournals
Library
www.jo
urnalslib
rary.nihr.ac.u
k
218
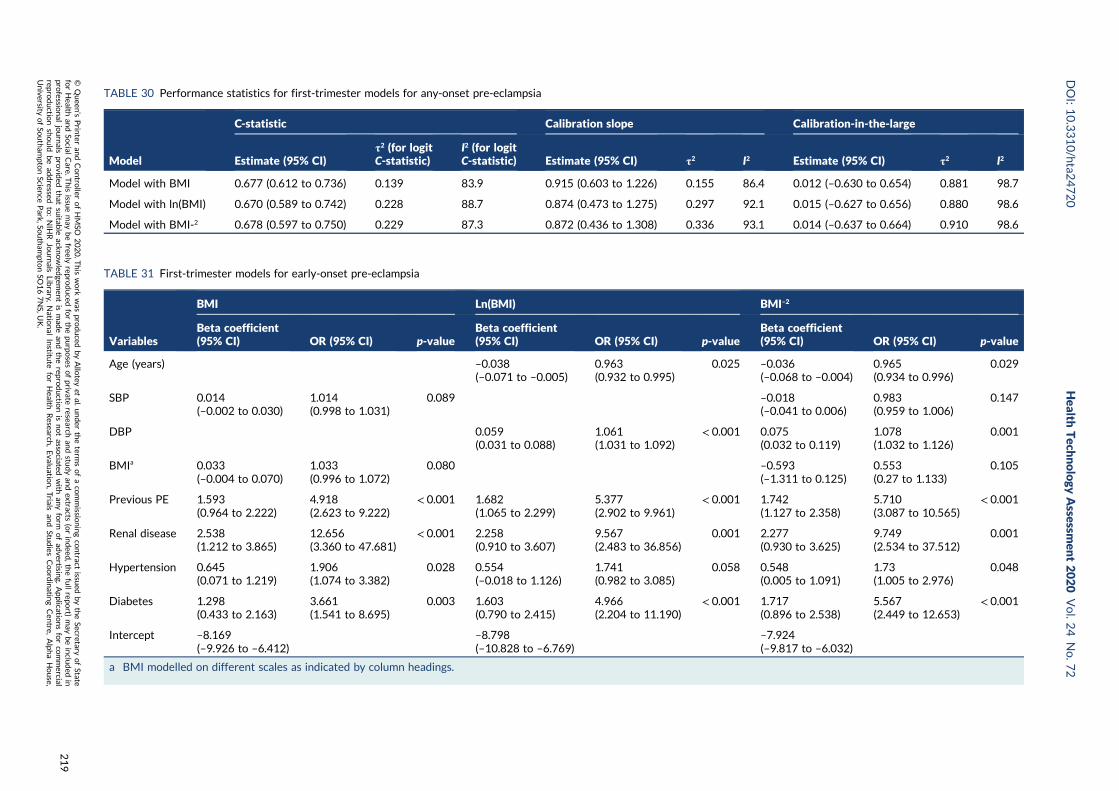
TABLE 30 Performance statistics for first-trimester models for any-onset pre-eclampsia
Model
C-statistic Calibration slope Calibration-in-the-large
Estimate (95% CI)τ2 (for logitC-statistic)
I2 (for logitC-statistic) Estimate (95% CI) τ2 I2 Estimate (95% CI) τ2 I2
Model with BMI 0.677 (0.612 to 0.736) 0.139 83.9 0.915 (0.603 to 1.226) 0.155 86.4 0.012 (–0.630 to 0.654) 0.881 98.7
Model with ln(BMI) 0.670 (0.589 to 0.742) 0.228 88.7 0.874 (0.473 to 1.275) 0.297 92.1 0.015 (–0.627 to 0.656) 0.880 98.6
Model with BMI-2 0.678 (0.597 to 0.750) 0.229 87.3 0.872 (0.436 to 1.308) 0.336 93.1 0.014 (–0.637 to 0.664) 0.910 98.6
TABLE 31 First-trimester models for early-onset pre-eclampsia
Variables
BMI Ln(BMI) BMI–2
Beta coefficient(95% CI) OR (95% CI) p-value
Beta coefficient(95% CI) OR (95% CI) p-value
Beta coefficient(95% CI) OR (95% CI) p-value
Age (years) –0.038(–0.071 to –0.005)
0.963(0.932 to 0.995)
0.025 –0.036(–0.068 to –0.004)
0.965(0.934 to 0.996)
0.029
SBP 0.014(–0.002 to 0.030)
1.014(0.998 to 1.031)
0.089 –0.018(–0.041 to 0.006)
0.983(0.959 to 1.006)
0.147
DBP 0.059(0.031 to 0.088)
1.061(1.031 to 1.092)
< 0.001 0.075(0.032 to 0.119)
1.078(1.032 to 1.126)
0.001
BMIa 0.033(–0.004 to 0.070)
1.033(0.996 to 1.072)
0.080 –0.593(–1.311 to 0.125)
0.553(0.27 to 1.133)
0.105
Previous PE 1.593(0.964 to 2.222)
4.918(2.623 to 9.222)
< 0.001 1.682(1.065 to 2.299)
5.377(2.902 to 9.961)
< 0.001 1.742(1.127 to 2.358)
5.710(3.087 to 10.565)
< 0.001
Renal disease 2.538(1.212 to 3.865)
12.656(3.360 to 47.681)
< 0.001 2.258(0.910 to 3.607)
9.567(2.483 to 36.856)
0.001 2.277(0.930 to 3.625)
9.749(2.534 to 37.512)
0.001
Hypertension 0.645(0.071 to 1.219)
1.906(1.074 to 3.382)
0.028 0.554(–0.018 to 1.126)
1.741(0.982 to 3.085)
0.058 0.548(0.005 to 1.091)
1.73(1.005 to 2.976)
0.048
Diabetes 1.298(0.433 to 2.163)
3.661(1.541 to 8.695)
0.003 1.603(0.790 to 2.415)
4.966(2.204 to 11.190)
< 0.001 1.717(0.896 to 2.538)
5.567(2.449 to 12.653)
< 0.001
Intercept –8.169(–9.926 to –6.412)
–8.798(–10.828 to –6.769)
–7.924(–9.817 to –6.032)
a BMI modelled on different scales as indicated by column headings.
DOI:10.3310/hta2
4720
Health
Tech
nology
Assessm
ent2020
Vol.2
4No.7
2
©Queen
’sPrin
teran
dContro
llerofHMSO
2020.T
his
work
was
produced
byAllo
teyet
al.under
theterm
sofaco
mmissio
ningco
ntract
issued
bytheSecretary
ofState
forHealth
andSo
cialCare.T
his
issuemay
befreely
reproduced
forthepu
rposes
ofprivate
researchan
dstu
dyan
dextracts
(orindeed
,thefullrepo
rt)may
beinclu
ded
inpro
fessional
journals
provid
edthat
suitab
leackn
owled
gemen
tis
mad
ean
dtherepro
ductio
nis
notasso
ciatedwith
anyform
ofad
vertising.
Applicatio
nsforco
mmercial
reproductio
nshould
bead
dressed
to:NIH
RJournals
Library,
Natio
nal
Institu
teforHealth
Research
,Evalu
ation,Trials
and
Studies
Coordinatin
gCen
tre,Alph
aHouse,
University
ofSo
utham
ptonScien
cePark,So
utham
ptonSO
167NS,U
K.
219
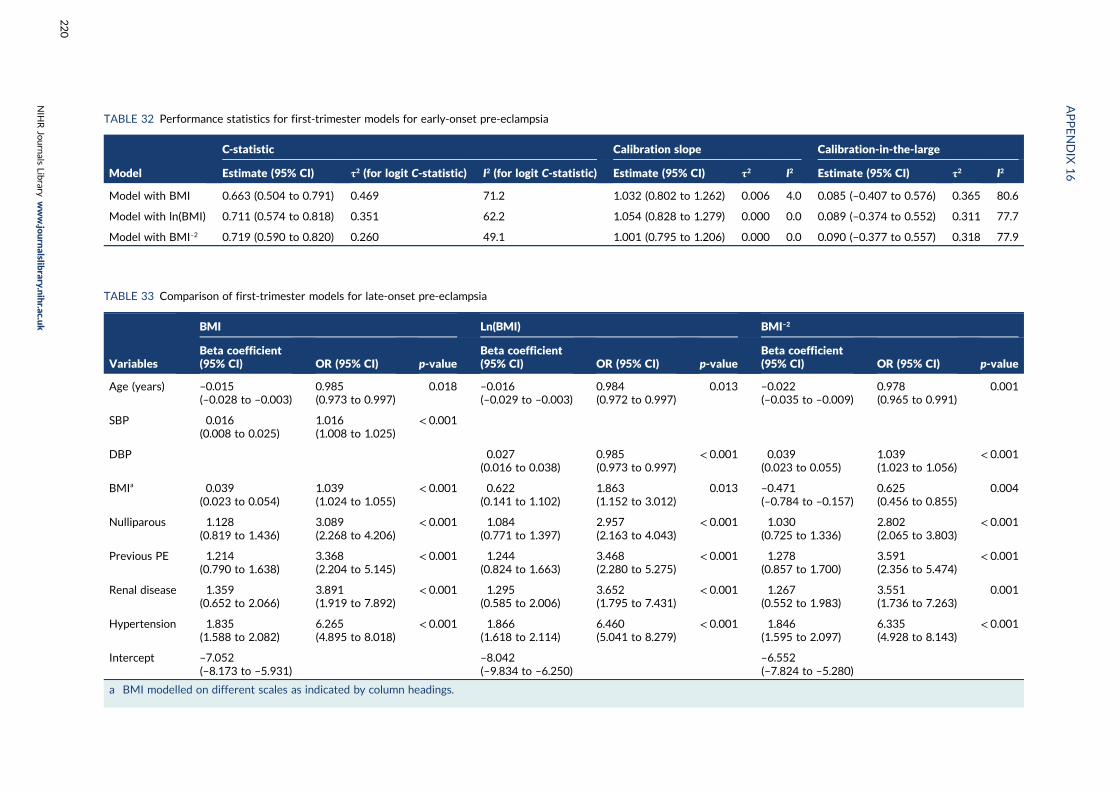
TABLE 32 Performance statistics for first-trimester models for early-onset pre-eclampsia
Model
C-statistic Calibration slope Calibration-in-the-large
Estimate (95% CI) τ2 (for logit C-statistic) I2 (for logit C-statistic) Estimate (95% CI) τ2 I2 Estimate (95% CI) τ2 I2
Model with BMI 0.663 (0.504 to 0.791) 0.469 71.2 1.032 (0.802 to 1.262) 0.006 4.0 0.085 (–0.407 to 0.576) 0.365 80.6
Model with ln(BMI) 0.711 (0.574 to 0.818) 0.351 62.2 1.054 (0.828 to 1.279) 0.000 0.0 0.089 (–0.374 to 0.552) 0.311 77.7
Model with BMI–2 0.719 (0.590 to 0.820) 0.260 49.1 1.001 (0.795 to 1.206) 0.000 0.0 0.090 (–0.377 to 0.557) 0.318 77.9
TABLE 33 Comparison of first-trimester models for late-onset pre-eclampsia
Variables
BMI Ln(BMI) BMI–2
Beta coefficient(95% CI) OR (95% CI) p-value
Beta coefficient(95% CI) OR (95% CI) p-value
Beta coefficient(95% CI) OR (95% CI) p-value
Age (years) –0.015(–0.028 to –0.003)
0.985(0.973 to 0.997)
0.018 –0.016(–0.029 to –0.003)
0.984(0.972 to 0.997)
0.013 –0.022(–0.035 to –0.009)
0.978(0.965 to 0.991)
0.001
SBP 0.016(0.008 to 0.025)
1.016(1.008 to 1.025)
< 0.001
DBP 0.027(0.016 to 0.038)
0.985(0.973 to 0.997)
< 0.001 0.039(0.023 to 0.055)
1.039(1.023 to 1.056)
< 0.001
BMIa 0.039(0.023 to 0.054)
1.039(1.024 to 1.055)
< 0.001 0.622(0.141 to 1.102)
1.863(1.152 to 3.012)
0.013 –0.471(–0.784 to –0.157)
0.625(0.456 to 0.855)
0.004
Nulliparous 1.128(0.819 to 1.436)
3.089(2.268 to 4.206)
< 0.001 1.084(0.771 to 1.397)
2.957(2.163 to 4.043)
< 0.001 1.030(0.725 to 1.336)
2.802(2.065 to 3.803)
< 0.001
Previous PE 1.214(0.790 to 1.638)
3.368(2.204 to 5.145)
< 0.001 1.244(0.824 to 1.663)
3.468(2.280 to 5.275)
< 0.001 1.278(0.857 to 1.700)
3.591(2.356 to 5.474)
< 0.001
Renal disease 1.359(0.652 to 2.066)
3.891(1.919 to 7.892)
< 0.001 1.295(0.585 to 2.006)
3.652(1.795 to 7.431)
< 0.001 1.267(0.552 to 1.983)
3.551(1.736 to 7.263)
0.001
Hypertension 1.835(1.588 to 2.082)
6.265(4.895 to 8.018)
< 0.001 1.866(1.618 to 2.114)
6.460(5.041 to 8.279)
< 0.001 1.846(1.595 to 2.097)
6.335(4.928 to 8.143)
< 0.001
Intercept –7.052(–8.173 to –5.931)
–8.042(–9.834 to –6.250)
–6.552(–7.824 to –5.280)
a BMI modelled on different scales as indicated by column headings.
APPENDIX
16
NIH
RJournals
Library
www.jo
urnalslib
rary.nihr.ac.u
k
220
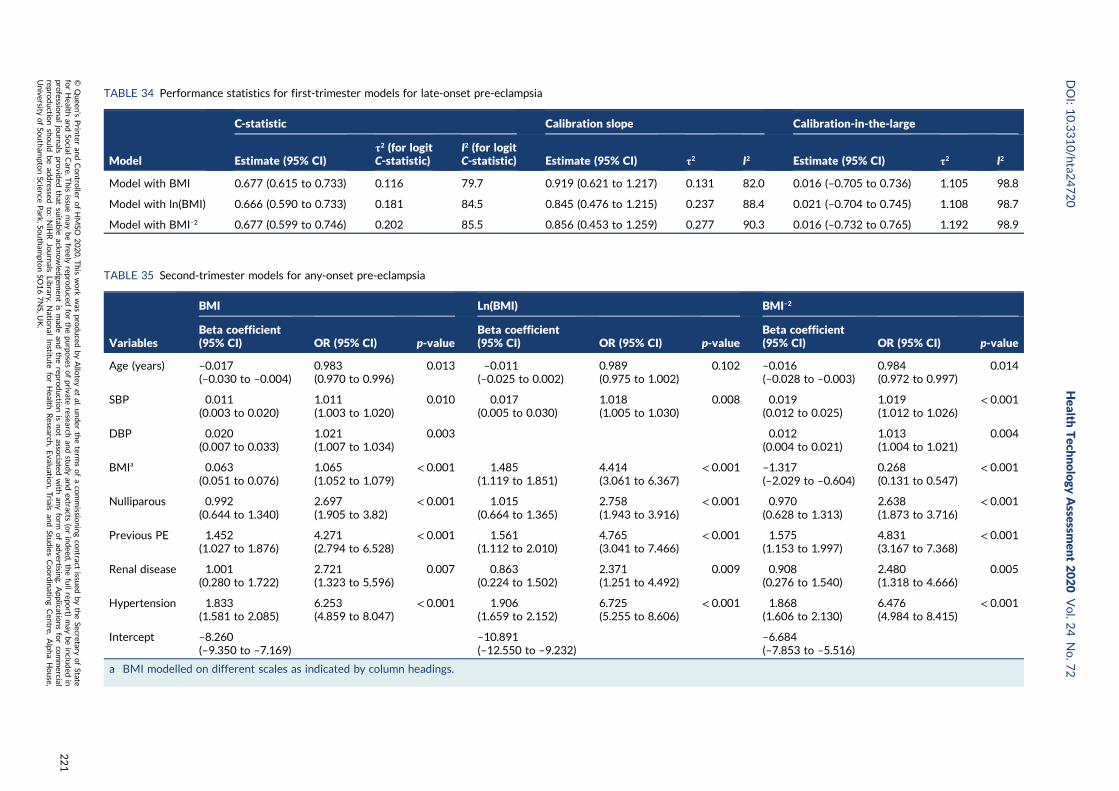
TABLE 34 Performance statistics for first-trimester models for late-onset pre-eclampsia
Model
C-statistic Calibration slope Calibration-in-the-large
Estimate (95% CI)τ2 (for logitC-statistic)
I2 (for logitC-statistic) Estimate (95% CI) τ2 I2 Estimate (95% CI) τ2 I2
Model with BMI 0.677 (0.615 to 0.733) 0.116 79.7 0.919 (0.621 to 1.217) 0.131 82.0 0.016 (–0.705 to 0.736) 1.105 98.8
Model with ln(BMI) 0.666 (0.590 to 0.733) 0.181 84.5 0.845 (0.476 to 1.215) 0.237 88.4 0.021 (–0.704 to 0.745) 1.108 98.7
Model with BMI–2 0.677 (0.599 to 0.746) 0.202 85.5 0.856 (0.453 to 1.259) 0.277 90.3 0.016 (–0.732 to 0.765) 1.192 98.9
TABLE 35 Second-trimester models for any-onset pre-eclampsia
Variables
BMI Ln(BMI) BMI–2
Beta coefficient(95% CI) OR (95% CI) p-value
Beta coefficient(95% CI) OR (95% CI) p-value
Beta coefficient(95% CI) OR (95% CI) p-value
Age (years) –0.017(–0.030 to –0.004)
0.983(0.970 to 0.996)
0.013 –0.011(–0.025 to 0.002)
0.989(0.975 to 1.002)
0.102 –0.016(–0.028 to –0.003)
0.984(0.972 to 0.997)
0.014
SBP 0.011(0.003 to 0.020)
1.011(1.003 to 1.020)
0.010 0.017(0.005 to 0.030)
1.018(1.005 to 1.030)
0.008 0.019(0.012 to 0.025)
1.019(1.012 to 1.026)
< 0.001
DBP 0.020(0.007 to 0.033)
1.021(1.007 to 1.034)
0.003 0.012(0.004 to 0.021)
1.013(1.004 to 1.021)
0.004
BMIa 0.063(0.051 to 0.076)
1.065(1.052 to 1.079)
< 0.001 1.485(1.119 to 1.851)
4.414(3.061 to 6.367)
< 0.001 –1.317(–2.029 to –0.604)
0.268(0.131 to 0.547)
< 0.001
Nulliparous 0.992(0.644 to 1.340)
2.697(1.905 to 3.82)
< 0.001 1.015(0.664 to 1.365)
2.758(1.943 to 3.916)
< 0.001 0.970(0.628 to 1.313)
2.638(1.873 to 3.716)
< 0.001
Previous PE 1.452(1.027 to 1.876)
4.271(2.794 to 6.528)
< 0.001 1.561(1.112 to 2.010)
4.765(3.041 to 7.466)
< 0.001 1.575(1.153 to 1.997)
4.831(3.167 to 7.368)
< 0.001
Renal disease 1.001(0.280 to 1.722)
2.721(1.323 to 5.596)
0.007 0.863(0.224 to 1.502)
2.371(1.251 to 4.492)
0.009 0.908(0.276 to 1.540)
2.480(1.318 to 4.666)
0.005
Hypertension 1.833(1.581 to 2.085)
6.253(4.859 to 8.047)
< 0.001 1.906(1.659 to 2.152)
6.725(5.255 to 8.606)
< 0.001 1.868(1.606 to 2.130)
6.476(4.984 to 8.415)
< 0.001
Intercept –8.260(–9.350 to –7.169)
–10.891(–12.550 to –9.232)
–6.684(–7.853 to –5.516)
a BMI modelled on different scales as indicated by column headings.
DOI:10.3310/hta2
4720
Health
Tech
nology
Assessm
ent2020
Vol.2
4No.7
2
©Queen
’sPrin
teran
dContro
llerofHMSO
2020.T
his
work
was
produced
byAllo
teyet
al.under
theterm
sofaco
mmissio
ningco
ntract
issued
bytheSecretary
ofState
forHealth
andSo
cialCare.T
his
issuemay
befreely
reproduced
forthepu
rposes
ofprivate
researchan
dstu
dyan
dextracts
(orindeed
,thefullrepo
rt)may
beinclu
ded
inpro
fessional
journals
provid
edthat
suitab
leackn
owled
gemen
tis
mad
ean
dtherepro
ductio
nis
notasso
ciatedwith
anyform
ofad
vertising.
Applicatio
nsforco
mmercial
reproductio
nshould
bead
dressed
to:NIH
RJournals
Library,
Natio
nal
Institu
teforHealth
Research
,Evalu
ation,Trials
and
Studies
Coordinatin
gCen
tre,Alph
aHouse,
University
ofSo
utham
ptonScien
cePark,So
utham
ptonSO
167NS,U
K.
221
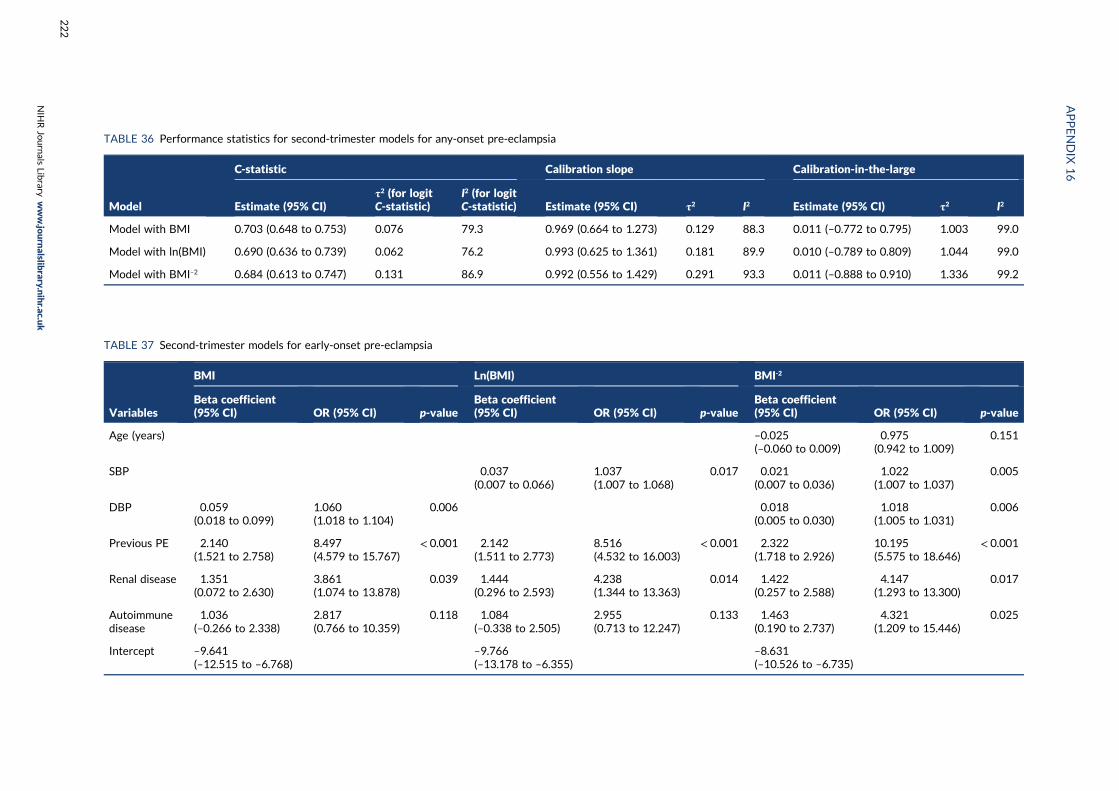
TABLE 36 Performance statistics for second-trimester models for any-onset pre-eclampsia
Model
C-statistic Calibration slope Calibration-in-the-large
Estimate (95% CI)τ2 (for logitC-statistic)
I2 (for logitC-statistic) Estimate (95% CI) τ2 I2 Estimate (95% CI) τ2 I2
Model with BMI 0.703 (0.648 to 0.753) 0.076 79.3 0.969 (0.664 to 1.273) 0.129 88.3 0.011 (–0.772 to 0.795) 1.003 99.0
Model with ln(BMI) 0.690 (0.636 to 0.739) 0.062 76.2 0.993 (0.625 to 1.361) 0.181 89.9 0.010 (–0.789 to 0.809) 1.044 99.0
Model with BMI–2 0.684 (0.613 to 0.747) 0.131 86.9 0.992 (0.556 to 1.429) 0.291 93.3 0.011 (–0.888 to 0.910) 1.336 99.2
TABLE 37 Second-trimester models for early-onset pre-eclampsia
Variables
BMI Ln(BMI) BMI-2
Beta coefficient(95% CI) OR (95% CI) p-value
Beta coefficient(95% CI) OR (95% CI) p-value
Beta coefficient(95% CI) OR (95% CI) p-value
Age (years) –0.025(–0.060 to 0.009)
0.975(0.942 to 1.009)
0.151
SBP 0.037(0.007 to 0.066)
1.037(1.007 to 1.068)
0.017 0.021(0.007 to 0.036)
1.022(1.007 to 1.037)
0.005
DBP 0.059(0.018 to 0.099)
1.060(1.018 to 1.104)
0.006 0.018(0.005 to 0.030)
1.018(1.005 to 1.031)
0.006
Previous PE 2.140(1.521 to 2.758)
8.497(4.579 to 15.767)
< 0.001 2.142(1.511 to 2.773)
8.516(4.532 to 16.003)
< 0.001 2.322(1.718 to 2.926)
10.195(5.575 to 18.646)
< 0.001
Renal disease 1.351(0.072 to 2.630)
3.861(1.074 to 13.878)
0.039 1.444(0.296 to 2.593)
4.238(1.344 to 13.363)
0.014 1.422(0.257 to 2.588)
4.147(1.293 to 13.300)
0.017
Autoimmunedisease
1.036(–0.266 to 2.338)
2.817(0.766 to 10.359)
0.118 1.084(–0.338 to 2.505)
2.955(0.713 to 12.247)
0.133 1.463(0.190 to 2.737)
4.321(1.209 to 15.446)
0.025
Intercept –9.641(–12.515 to –6.768)
–9.766(–13.178 to –6.355)
–8.631(–10.526 to –6.735)
APPENDIX
16
NIH
RJournals
Library
www.jo
urnalslib
rary.nihr.ac.u
k
222
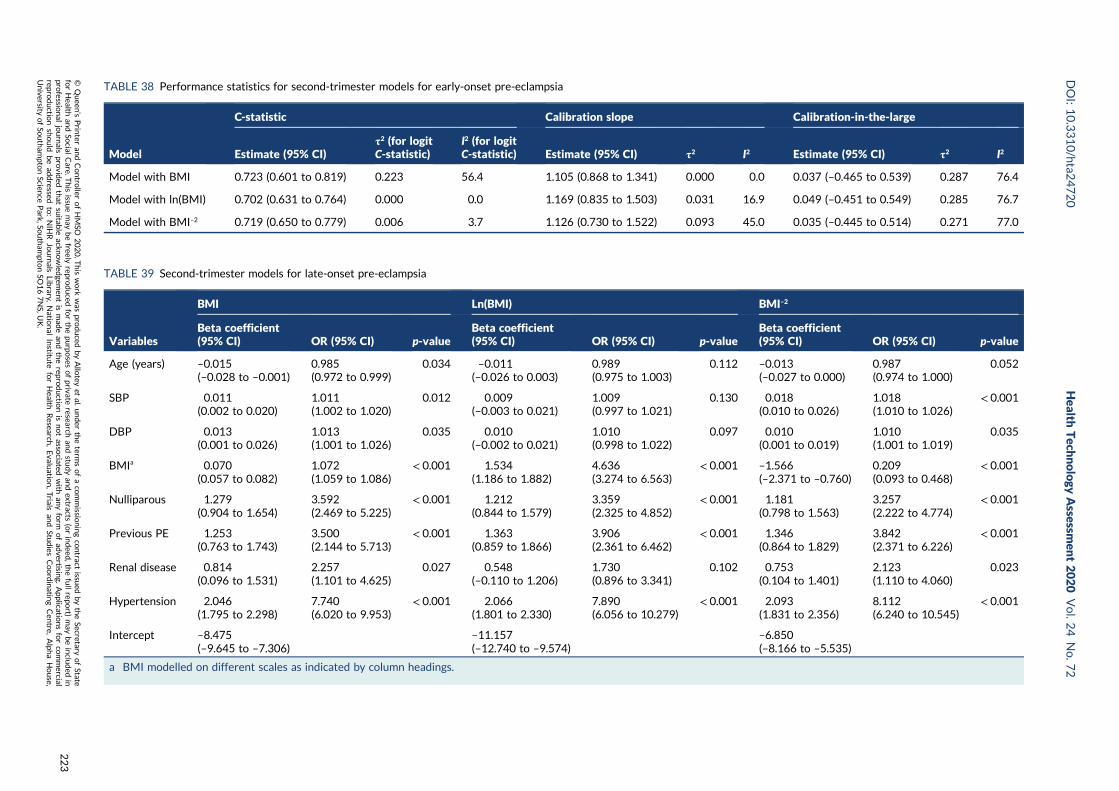
TABLE 38 Performance statistics for second-trimester models for early-onset pre-eclampsia
Model
C-statistic Calibration slope Calibration-in-the-large
Estimate (95% CI)τ2 (for logitC-statistic)
I2 (for logitC-statistic) Estimate (95% CI) τ2 I2 Estimate (95% CI) τ2 I2
Model with BMI 0.723 (0.601 to 0.819) 0.223 56.4 1.105 (0.868 to 1.341) 0.000 0.0 0.037 (–0.465 to 0.539) 0.287 76.4
Model with ln(BMI) 0.702 (0.631 to 0.764) 0.000 0.0 1.169 (0.835 to 1.503) 0.031 16.9 0.049 (–0.451 to 0.549) 0.285 76.7
Model with BMI–2 0.719 (0.650 to 0.779) 0.006 3.7 1.126 (0.730 to 1.522) 0.093 45.0 0.035 (–0.445 to 0.514) 0.271 77.0
TABLE 39 Second-trimester models for late-onset pre-eclampsia
Variables
BMI Ln(BMI) BMI–2
Beta coefficient(95% CI) OR (95% CI) p-value
Beta coefficient(95% CI) OR (95% CI) p-value
Beta coefficient(95% CI) OR (95% CI) p-value
Age (years) –0.015(–0.028 to –0.001)
0.985(0.972 to 0.999)
0.034 –0.011(–0.026 to 0.003)
0.989(0.975 to 1.003)
0.112 –0.013(–0.027 to 0.000)
0.987(0.974 to 1.000)
0.052
SBP 0.011(0.002 to 0.020)
1.011(1.002 to 1.020)
0.012 0.009(–0.003 to 0.021)
1.009(0.997 to 1.021)
0.130 0.018(0.010 to 0.026)
1.018(1.010 to 1.026)
< 0.001
DBP 0.013(0.001 to 0.026)
1.013(1.001 to 1.026)
0.035 0.010(–0.002 to 0.021)
1.010(0.998 to 1.022)
0.097 0.010(0.001 to 0.019)
1.010(1.001 to 1.019)
0.035
BMIa 0.070(0.057 to 0.082)
1.072(1.059 to 1.086)
< 0.001 1.534(1.186 to 1.882)
4.636(3.274 to 6.563)
< 0.001 –1.566(–2.371 to –0.760)
0.209(0.093 to 0.468)
< 0.001
Nulliparous 1.279(0.904 to 1.654)
3.592(2.469 to 5.225)
< 0.001 1.212(0.844 to 1.579)
3.359(2.325 to 4.852)
< 0.001 1.181(0.798 to 1.563)
3.257(2.222 to 4.774)
< 0.001
Previous PE 1.253(0.763 to 1.743)
3.500(2.144 to 5.713)
< 0.001 1.363(0.859 to 1.866)
3.906(2.361 to 6.462)
< 0.001 1.346(0.864 to 1.829)
3.842(2.371 to 6.226)
< 0.001
Renal disease 0.814(0.096 to 1.531)
2.257(1.101 to 4.625)
0.027 0.548(–0.110 to 1.206)
1.730(0.896 to 3.341)
0.102 0.753(0.104 to 1.401)
2.123(1.110 to 4.060)
0.023
Hypertension 2.046(1.795 to 2.298)
7.740(6.020 to 9.953)
< 0.001 2.066(1.801 to 2.330)
7.890(6.056 to 10.279)
< 0.001 2.093(1.831 to 2.356)
8.112(6.240 to 10.545)
< 0.001
Intercept –8.475(–9.645 to –7.306)
–11.157(–12.740 to –9.574)
–6.850(–8.166 to –5.535)
a BMI modelled on different scales as indicated by column headings.
DOI:10.3310/hta2
4720
Health
Tech
nology
Assessm
ent2020
Vol.2
4No.7
2
©Queen
’sPrin
teran
dContro
llerofHMSO
2020.T
his
work
was
produced
byAllo
teyet
al.under
theterm
sofaco
mmissio
ningco
ntract
issued
bytheSecretary
ofState
forHealth
andSo
cialCare.T
his
issuemay
befreely
reproduced
forthepu
rposes
ofprivate
researchan
dstu
dyan
dextracts
(orindeed
,thefullrepo
rt)may
beinclu
ded
inpro
fessional
journals
provid
edthat
suitab
leackn
owled
gemen
tis
mad
ean
dtherepro
ductio
nis
notasso
ciatedwith
anyform
ofad
vertising.
Applicatio
nsforco
mmercial
reproductio
nshould
bead
dressed
to:NIH
RJournals
Library,
Natio
nal
Institu
teforHealth
Research
,Evalu
ation,Trials
and
Studies
Coordinatin
gCen
tre,Alph
aHouse,
University
ofSo
utham
ptonScien
cePark,So
utham
ptonSO
167NS,U
K.
223
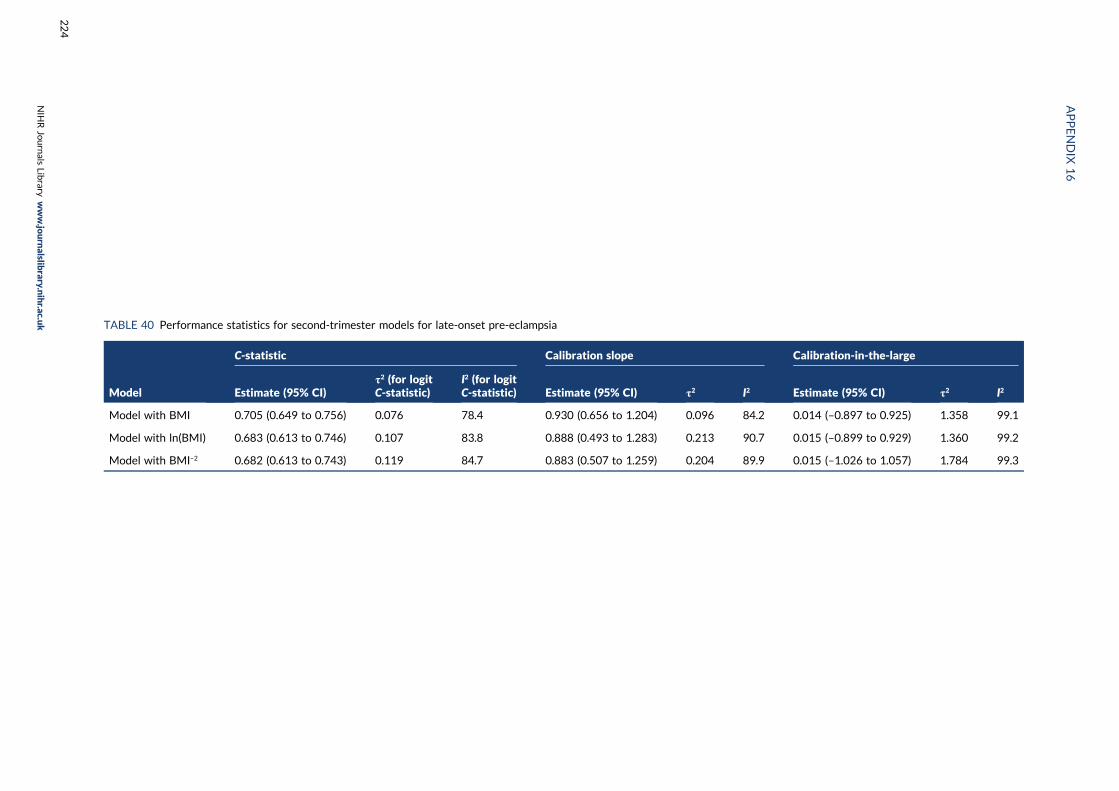
TABLE 40 Performance statistics for second-trimester models for late-onset pre-eclampsia
Model
C-statistic Calibration slope Calibration-in-the-large
Estimate (95% CI)τ2 (for logitC-statistic)
I2 (for logitC-statistic) Estimate (95% CI) τ2 I2 Estimate (95% CI) τ2 I2
Model with BMI 0.705 (0.649 to 0.756) 0.076 78.4 0.930 (0.656 to 1.204) 0.096 84.2 0.014 (–0.897 to 0.925) 1.358 99.1
Model with ln(BMI) 0.683 (0.613 to 0.746) 0.107 83.8 0.888 (0.493 to 1.283) 0.213 90.7 0.015 (–0.899 to 0.929) 1.360 99.2
Model with BMI–2 0.682 (0.613 to 0.743) 0.119 84.7 0.883 (0.507 to 1.259) 0.204 89.9 0.015 (–1.026 to 1.057) 1.784 99.3
APPENDIX
16
NIH
RJournals
Library
www.jo
urnalslib
rary.nihr.ac.u
k
224
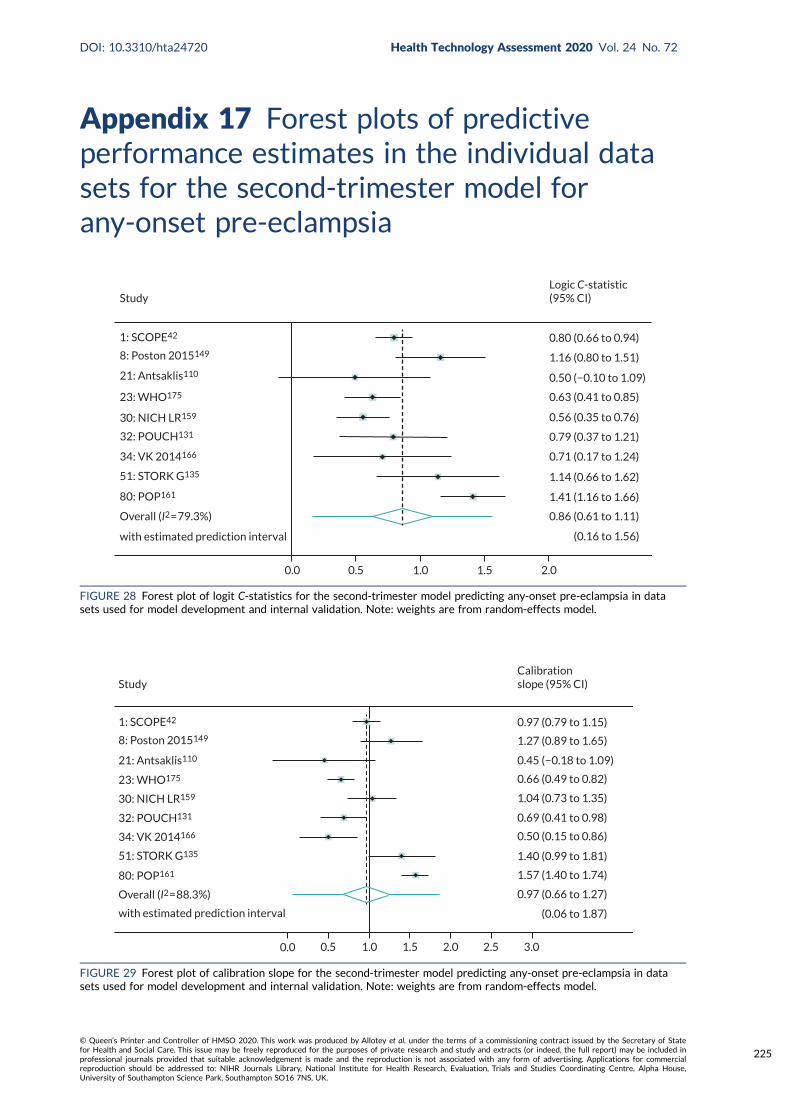
Appendix 17 Forest plots of predictiveperformance estimates in the individual datasets for the second-trimester model forany-onset pre-eclampsia
1: SCOPE42
8: Poston 2015149
21: Antsaklis110
23: WHO175
30: NICH LR159
32: POUCH131
34: VK 2014166
51: STORK G135
80: POP161
Overall (I2 = 79.3%)
with estimated prediction interval
StudyLogic C-statistic(95% CI)
0.80 (0.66 to 0.94)
1.16 (0.80 to 1.51)
0.50 (−0.10 to 1.09)
0.63 (0.41 to 0.85)
0.56 (0.35 to 0.76)
0.79 (0.37 to 1.21)
0.71 (0.17 to 1.24)
1.14 (0.66 to 1.62)
1.41 (1.16 to 1.66)
0.86 (0.61 to 1.11)
(0.16 to 1.56)
0.0 0.5 1.0 1.5 2.0
FIGURE 28 Forest plot of logit C-statistics for the second-trimester model predicting any-onset pre-eclampsia in datasets used for model development and internal validation. Note: weights are from random-effects model.
Study
1: SCOPE42
8: Poston 2015149
21: Antsaklis110
23: WHO175
30: NICH LR159
32: POUCH131
34: VK 2014166
51: STORK G135
80: POP161
Overall (I2 = 88.3%)
with estimated prediction interval
0.0 0.5 1.0 1.5 2.0 2.5 3.0
(0.06 to 1.87)
0.97 (0.66 to 1.27)
1.57 (1.40 to 1.74)
1.40 (0.99 to 1.81)
0.50 (0.15 to 0.86)
0.69 (0.41 to 0.98)
1.04 (0.73 to 1.35)
0.66 (0.49 to 0.82)
0.45 (−0.18 to 1.09)
1.27 (0.89 to 1.65)
0.97 (0.79 to 1.15)
Calibrationslope (95% CI)
FIGURE 29 Forest plot of calibration slope for the second-trimester model predicting any-onset pre-eclampsia in datasets used for model development and internal validation. Note: weights are from random-effects model.
DOI: 10.3310/hta24720 Health Technology Assessment 2020 Vol. 24 No. 72
© Queen’s Printer and Controller of HMSO 2020. This work was produced by Allotey et al. under the terms of a commissioning contract issued by the Secretary of Statefor Health and Social Care. This issue may be freely reproduced for the purposes of private research and study and extracts (or indeed, the full report) may be included inprofessional journals provided that suitable acknowledgement is made and the reproduction is not associated with any form of advertising. Applications for commercialreproduction should be addressed to: NIHR Journals Library, National Institute for Health Research, Evaluation, Trials and Studies Coordinating Centre, Alpha House,University of Southampton Science Park, Southampton SO16 7NS, UK.
225
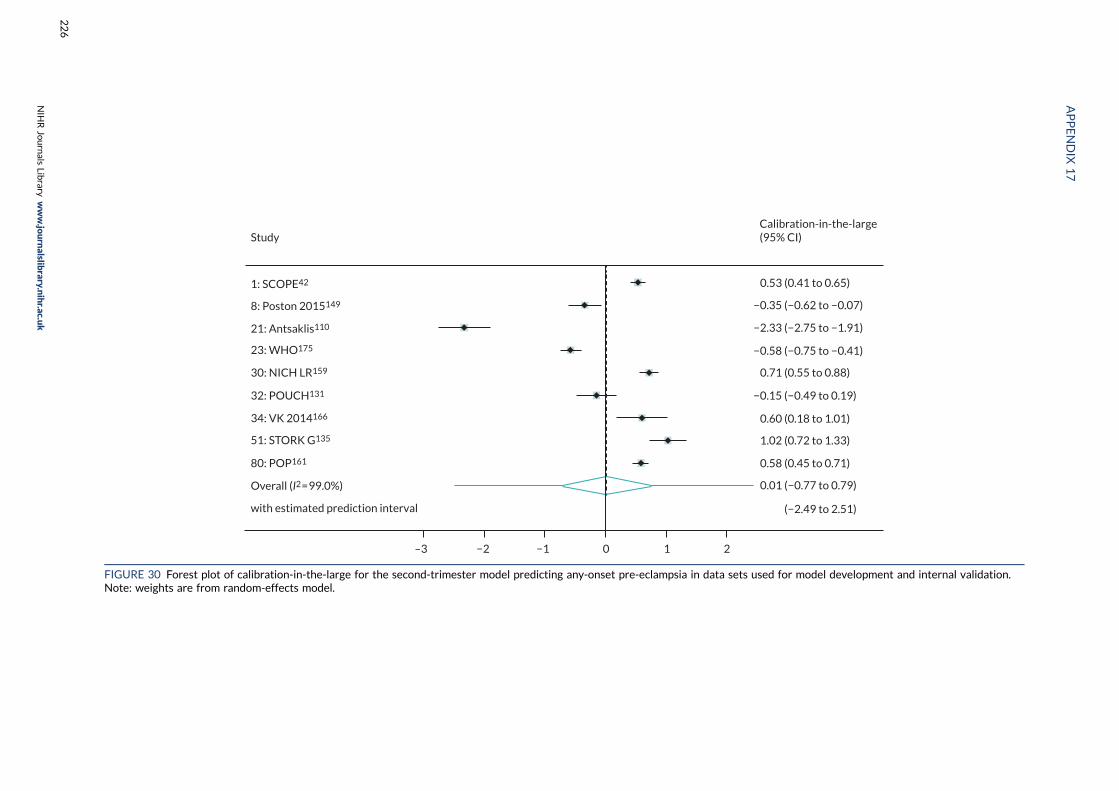
1: SCOPE42
8: Poston 2015149
21: Antsaklis110
23: WHO175
30: NICH LR159
32: POUCH131
34: VK 2014166
51: STORK G135
80: POP161
Overall (I2 = 99.0%)
with estimated prediction interval
Study
–3 −2 −1 0 1 2
Calibration-in-the-large(95% CI)
0.53 (0.41 to 0.65)
−0.35 (−0.62 to −0.07)
−2.33 (−2.75 to −1.91)
−0.58 (−0.75 to −0.41)
−0.15 (−0.49 to 0.19)
0.71 (0.55 to 0.88)
0.60 (0.18 to 1.01)
1.02 (0.72 to 1.33)
0.58 (0.45 to 0.71)
0.01 (−0.77 to 0.79)
(−2.49 to 2.51)
FIGURE 30 Forest plot of calibration-in-the-large for the second-trimester model predicting any-onset pre-eclampsia in data sets used for model development and internal validation.Note: weights are from random-effects model.
APPENDIX
17
NIH
RJournals
Library
www.jo
urnalslib
rary.nihr.ac.u
k
226

Appendix 18 Comparison of clinicalcharacteristic and biochemical marker modelsin data imputed with original biochemicalmarkers or natural log-transformedbiochemical markers
DOI: 10.3310/hta24720 Health Technology Assessment 2020 Vol. 24 No. 72
© Queen’s Printer and Controller of HMSO 2020. This work was produced by Allotey et al. under the terms of a commissioning contract issued by the Secretary of Statefor Health and Social Care. This issue may be freely reproduced for the purposes of private research and study and extracts (or indeed, the full report) may be included inprofessional journals provided that suitable acknowledgement is made and the reproduction is not associated with any form of advertising. Applications for commercialreproduction should be addressed to: NIHR Journals Library, National Institute for Health Research, Evaluation, Trials and Studies Coordinating Centre, Alpha House,University of Southampton Science Park, Southampton SO16 7NS, UK.
227

TABLE 41 First-trimester models for any pre-eclampsia
Variable
Original biochemical markers Ln(biochemical markers)
Beta coefficient (95% CI) OR (95% CI) p-value Beta coefficient (95% CI) OR (95% CI) p-value
Age (years) –0.023 (–0.038 to –0.008) 0.977 (0.962 to 0.992) 0.003 –0.023 (–0.039 to –0.007) 0.977 (0.962 to 0.993) 0.006
SBP 0.016 (0.004 to 0.028) 1.016 (1.004 to 1.028) 0.011 0.024 (0.014 to 0.034) 1.024 (1.014 to 1.034) < 0.001
BMI 0.041 (0.009 to 0.074) 1.042 (1.009 to 1.077) 0.015 0.036 (0.016 to 0.056) 1.037 (1.016 to 1.057) < 0.001
Nulliparous 1.136 (0.597 to 1.675) 3.113 (1.816 to 5.337) < 0.001 1.267 (0.703 to 1.831) 3.551 (2.020 to 6.241) < 0.001
Previous PE 1.350 (0.812 to 1.888) 3.857 (2.252 to 6.607) < 0.001 1.488 (0.901 to 2.076) 4.430 (2.461 to 7.973) < 0.001
Renal disease 0.957 (0.319 to 1.594) 2.603 (1.376 to 4.925) 0.004 1.058 (0.449 to 1.667) 2.880 (1.566 to 5.296) 0.001
Hypertension 2.241 (1.962 to 2.520) 9.403 (7.113 to 12.430) < 0.001 2.215 (1.949 to 2.482) 9.165 (7.024 to 11.960) < 0.001
Diabetes 0.021 (–0.915 to 0.957) 1.021 (0.401 to 2.605) 0.965 0.178 (–0.737 to 1.094) 1.195 (0.479 to 2.985) 0.702
sFlt-1 –2.42 × 10⁻⁴ (–4.3 × 10⁻⁴ to –5.5 × 10⁻⁵) 0.9998 (0.9996 to 0.9999) 0.012 –0.052 (–0.109 to 0.005) 0.949 (0.897 to 1.005) 0.071
PlGF –0.005 (–0.008 to –0.002) 0.995 (0.992 to 0.998) 0.001 –0.030 (–0.062 to 0.002) 0.970 (0.940 to 1.002) 0.064
Intercept –5.893 (–7.478 to –4.309) –7.022 (–8.515 to –5.530)
TABLE 42 Performance statistics for first-trimester models for any pre-eclampsia
Model
C-statistic Calibration slope Calibration-in-the-large
Estimate (95% CI)τ2 (for logitC-statistic)
I2 (for logitC-statistic) Estimate (95% CI) τ2 I2 Estimate (95% CI) τ2 I2
Original biochemical markers 0.696 (0.516 to 0.832) 0.205 90.7 0.901 (0.355 to 1.447) 0.094 86.7 –0.004 (–0.939 to 0.931) 0.333 97.9
Ln(biochemical markers) 0.693 (0.538 to 0.814) 0.150 88.8 0.896 (0.302 to 1.491) 0.120 90.5 0.008 (–0.874 to 0.889) 0.291 97.1
APPENDIX
18
NIH
RJournals
Library
www.jo
urnalslib
rary.nihr.ac.u
k
228
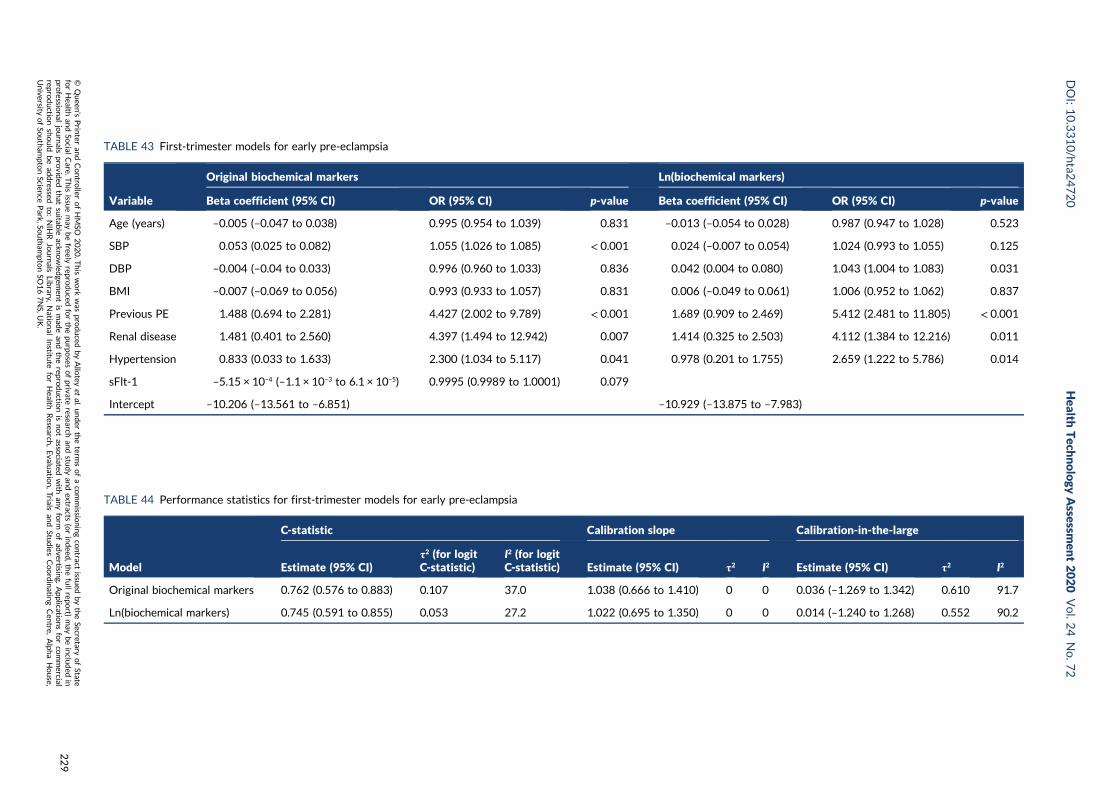
TABLE 43 First-trimester models for early pre-eclampsia
Variable
Original biochemical markers Ln(biochemical markers)
Beta coefficient (95% CI) OR (95% CI) p-value Beta coefficient (95% CI) OR (95% CI) p-value
Age (years) –0.005 (–0.047 to 0.038) 0.995 (0.954 to 1.039) 0.831 –0.013 (–0.054 to 0.028) 0.987 (0.947 to 1.028) 0.523
SBP 0.053 (0.025 to 0.082) 1.055 (1.026 to 1.085) < 0.001 0.024 (–0.007 to 0.054) 1.024 (0.993 to 1.055) 0.125
DBP –0.004 (–0.04 to 0.033) 0.996 (0.960 to 1.033) 0.836 0.042 (0.004 to 0.080) 1.043 (1.004 to 1.083) 0.031
BMI –0.007 (–0.069 to 0.056) 0.993 (0.933 to 1.057) 0.831 0.006 (–0.049 to 0.061) 1.006 (0.952 to 1.062) 0.837
Previous PE 1.488 (0.694 to 2.281) 4.427 (2.002 to 9.789) < 0.001 1.689 (0.909 to 2.469) 5.412 (2.481 to 11.805) < 0.001
Renal disease 1.481 (0.401 to 2.560) 4.397 (1.494 to 12.942) 0.007 1.414 (0.325 to 2.503) 4.112 (1.384 to 12.216) 0.011
Hypertension 0.833 (0.033 to 1.633) 2.300 (1.034 to 5.117) 0.041 0.978 (0.201 to 1.755) 2.659 (1.222 to 5.786) 0.014
sFlt-1 –5.15 × 10⁻⁴ (–1.1 × 10⁻³ to 6.1 × 10⁻⁵) 0.9995 (0.9989 to 1.0001) 0.079
Intercept –10.206 (–13.561 to –6.851) –10.929 (–13.875 to –7.983)
TABLE 44 Performance statistics for first-trimester models for early pre-eclampsia
Model
C-statistic Calibration slope Calibration-in-the-large
Estimate (95% CI)τ2 (for logitC-statistic)
I2 (for logitC-statistic) Estimate (95% CI) τ2 I2 Estimate (95% CI) τ2 I2
Original biochemical markers 0.762 (0.576 to 0.883) 0.107 37.0 1.038 (0.666 to 1.410) 0 0 0.036 (–1.269 to 1.342) 0.610 91.7
Ln(biochemical markers) 0.745 (0.591 to 0.855) 0.053 27.2 1.022 (0.695 to 1.350) 0 0 0.014 (–1.240 to 1.268) 0.552 90.2
DOI:10.3310/hta2
4720
Health
Tech
nology
Assessm
ent2020
Vol.2
4No.7
2
©Queen
’sPrin
teran
dContro
llerofHMSO
2020.T
his
work
was
produced
byAllo
teyet
al.under
theterm
sofaco
mmissio
ningco
ntract
issued
bytheSecretary
ofState
forHealth
andSo
cialCare.T
his
issuemay
befreely
reproduced
forthepu
rposes
ofprivate
researchan
dstu
dyan
dextracts
(orindeed
,thefullrepo
rt)may
beinclu
ded
inpro
fessional
journals
provid
edthat
suitab
leackn
owled
gemen
tis
mad
ean
dtherepro
ductio
nis
notasso
ciatedwith
anyform
ofad
vertising.
Applicatio
nsforco
mmercial
reproductio
nshould
bead
dressed
to:NIH
RJournals
Library,
Natio
nal
Institu
teforHealth
Research
,Evalu
ation,Trials
and
Studies
Coordinatin
gCen
tre,Alph
aHouse,
University
ofSo
utham
ptonScien
cePark,So
utham
ptonSO
167NS,U
K.
229
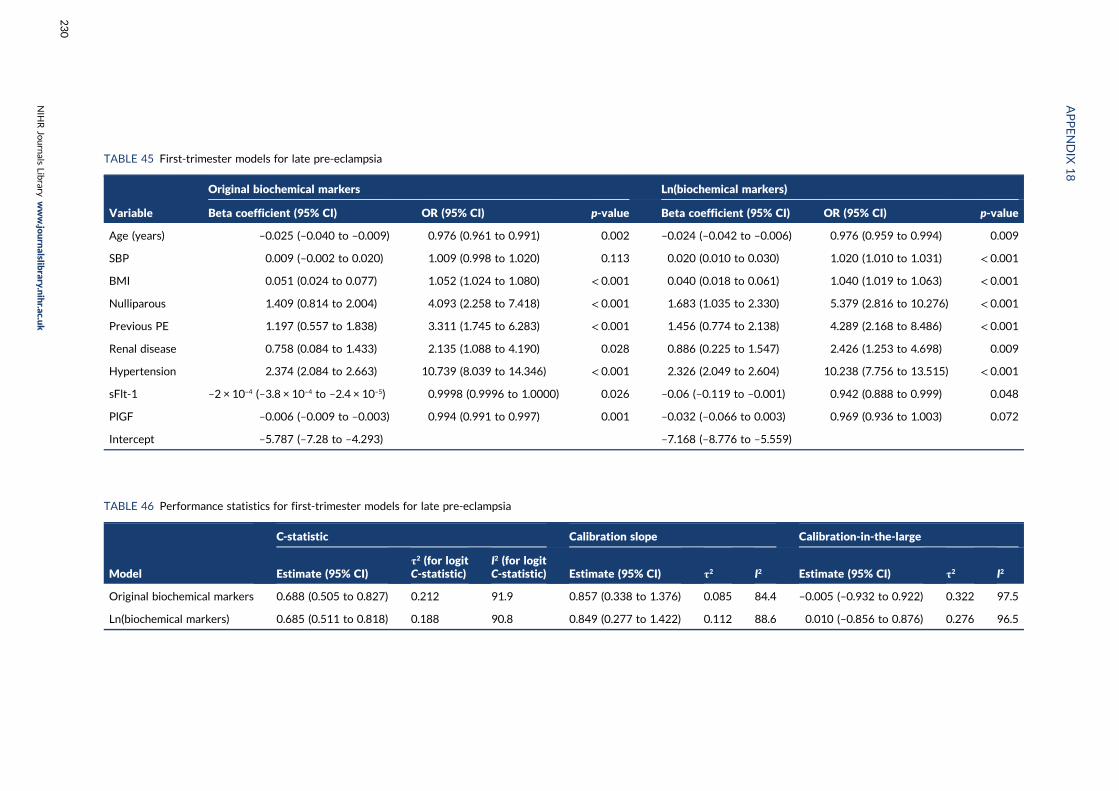
TABLE 45 First-trimester models for late pre-eclampsia
Variable
Original biochemical markers Ln(biochemical markers)
Beta coefficient (95% CI) OR (95% CI) p-value Beta coefficient (95% CI) OR (95% CI) p-value
Age (years) –0.025 (–0.040 to –0.009) 0.976 (0.961 to 0.991) 0.002 –0.024 (–0.042 to –0.006) 0.976 (0.959 to 0.994) 0.009
SBP 0.009 (–0.002 to 0.020) 1.009 (0.998 to 1.020) 0.113 0.020 (0.010 to 0.030) 1.020 (1.010 to 1.031) < 0.001
BMI 0.051 (0.024 to 0.077) 1.052 (1.024 to 1.080) < 0.001 0.040 (0.018 to 0.061) 1.040 (1.019 to 1.063) < 0.001
Nulliparous 1.409 (0.814 to 2.004) 4.093 (2.258 to 7.418) < 0.001 1.683 (1.035 to 2.330) 5.379 (2.816 to 10.276) < 0.001
Previous PE 1.197 (0.557 to 1.838) 3.311 (1.745 to 6.283) < 0.001 1.456 (0.774 to 2.138) 4.289 (2.168 to 8.486) < 0.001
Renal disease 0.758 (0.084 to 1.433) 2.135 (1.088 to 4.190) 0.028 0.886 (0.225 to 1.547) 2.426 (1.253 to 4.698) 0.009
Hypertension 2.374 (2.084 to 2.663) 10.739 (8.039 to 14.346) < 0.001 2.326 (2.049 to 2.604) 10.238 (7.756 to 13.515) < 0.001
sFlt-1 –2 × 10⁻⁴ (–3.8 × 10⁻⁴ to –2.4 × 10⁻⁵) 0.9998 (0.9996 to 1.0000) 0.026 –0.06 (–0.119 to –0.001) 0.942 (0.888 to 0.999) 0.048
PlGF –0.006 (–0.009 to –0.003) 0.994 (0.991 to 0.997) 0.001 –0.032 (–0.066 to 0.003) 0.969 (0.936 to 1.003) 0.072
Intercept –5.787 (–7.28 to –4.293) –7.168 (–8.776 to –5.559)
TABLE 46 Performance statistics for first-trimester models for late pre-eclampsia
Model
C-statistic Calibration slope Calibration-in-the-large
Estimate (95% CI)τ2 (for logitC-statistic)
I2 (for logitC-statistic) Estimate (95% CI) τ2 I2 Estimate (95% CI) τ2 I2
Original biochemical markers 0.688 (0.505 to 0.827) 0.212 91.9 0.857 (0.338 to 1.376) 0.085 84.4 –0.005 (–0.932 to 0.922) 0.322 97.5
Ln(biochemical markers) 0.685 (0.511 to 0.818) 0.188 90.8 0.849 (0.277 to 1.422) 0.112 88.6 0.010 (–0.856 to 0.876) 0.276 96.5
APPENDIX
18
NIH
RJournals
Library
www.jo
urnalslib
rary.nihr.ac.u
k
230
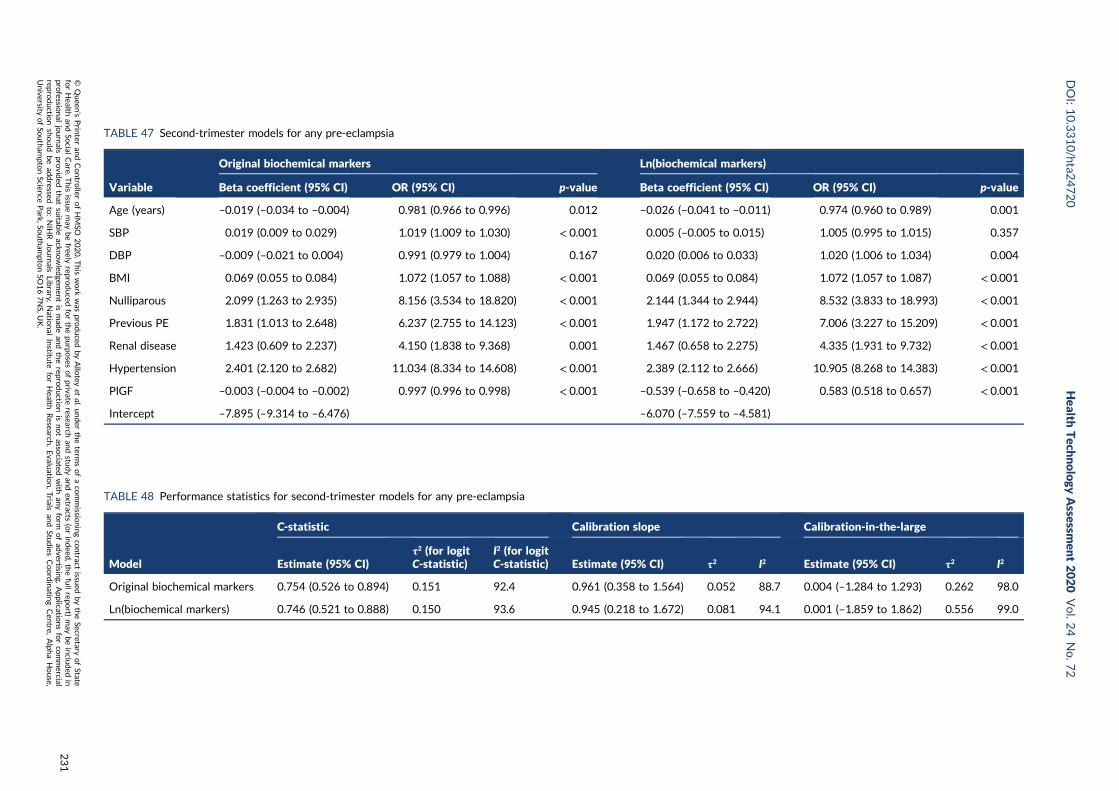
TABLE 47 Second-trimester models for any pre-eclampsia
Variable
Original biochemical markers Ln(biochemical markers)
Beta coefficient (95% CI) OR (95% CI) p-value Beta coefficient (95% CI) OR (95% CI) p-value
Age (years) –0.019 (–0.034 to –0.004) 0.981 (0.966 to 0.996) 0.012 –0.026 (–0.041 to –0.011) 0.974 (0.960 to 0.989) 0.001
SBP 0.019 (0.009 to 0.029) 1.019 (1.009 to 1.030) < 0.001 0.005 (–0.005 to 0.015) 1.005 (0.995 to 1.015) 0.357
DBP –0.009 (–0.021 to 0.004) 0.991 (0.979 to 1.004) 0.167 0.020 (0.006 to 0.033) 1.020 (1.006 to 1.034) 0.004
BMI 0.069 (0.055 to 0.084) 1.072 (1.057 to 1.088) < 0.001 0.069 (0.055 to 0.084) 1.072 (1.057 to 1.087) < 0.001
Nulliparous 2.099 (1.263 to 2.935) 8.156 (3.534 to 18.820) < 0.001 2.144 (1.344 to 2.944) 8.532 (3.833 to 18.993) < 0.001
Previous PE 1.831 (1.013 to 2.648) 6.237 (2.755 to 14.123) < 0.001 1.947 (1.172 to 2.722) 7.006 (3.227 to 15.209) < 0.001
Renal disease 1.423 (0.609 to 2.237) 4.150 (1.838 to 9.368) 0.001 1.467 (0.658 to 2.275) 4.335 (1.931 to 9.732) < 0.001
Hypertension 2.401 (2.120 to 2.682) 11.034 (8.334 to 14.608) < 0.001 2.389 (2.112 to 2.666) 10.905 (8.268 to 14.383) < 0.001
PlGF –0.003 (–0.004 to –0.002) 0.997 (0.996 to 0.998) < 0.001 –0.539 (–0.658 to –0.420) 0.583 (0.518 to 0.657) < 0.001
Intercept –7.895 (–9.314 to –6.476) –6.070 (–7.559 to –4.581)
TABLE 48 Performance statistics for second-trimester models for any pre-eclampsia
Model
C-statistic Calibration slope Calibration-in-the-large
Estimate (95% CI)τ2 (for logitC-statistic)
I2 (for logitC-statistic) Estimate (95% CI) τ2 I2 Estimate (95% CI) τ2 I2
Original biochemical markers 0.754 (0.526 to 0.894) 0.151 92.4 0.961 (0.358 to 1.564) 0.052 88.7 0.004 (–1.284 to 1.293) 0.262 98.0
Ln(biochemical markers) 0.746 (0.521 to 0.888) 0.150 93.6 0.945 (0.218 to 1.672) 0.081 94.1 0.001 (–1.859 to 1.862) 0.556 99.0
DOI:10.3310/hta2
4720
Health
Tech
nology
Assessm
ent2020
Vol.2
4No.7
2
©Queen
’sPrin
teran
dContro
llerofHMSO
2020.T
his
work
was
produced
byAllo
teyet
al.under
theterm
sofaco
mmissio
ningco
ntract
issued
bytheSecretary
ofState
forHealth
andSo
cialCare.T
his
issuemay
befreely
reproduced
forthepu
rposes
ofprivate
researchan
dstu
dyan
dextracts
(orindeed
,thefullrepo
rt)may
beinclu
ded
inpro
fessional
journals
provid
edthat
suitab
leackn
owled
gemen
tis
mad
ean
dtherepro
ductio
nis
notasso
ciatedwith
anyform
ofad
vertising.
Applicatio
nsforco
mmercial
reproductio
nshould
bead
dressed
to:NIH
RJournals
Library,
Natio
nal
Institu
teforHealth
Research
,Evalu
ation,Trials
and
Studies
Coordinatin
gCen
tre,Alph
aHouse,
University
ofSo
utham
ptonScien
cePark,So
utham
ptonSO
167NS,U
K.
231
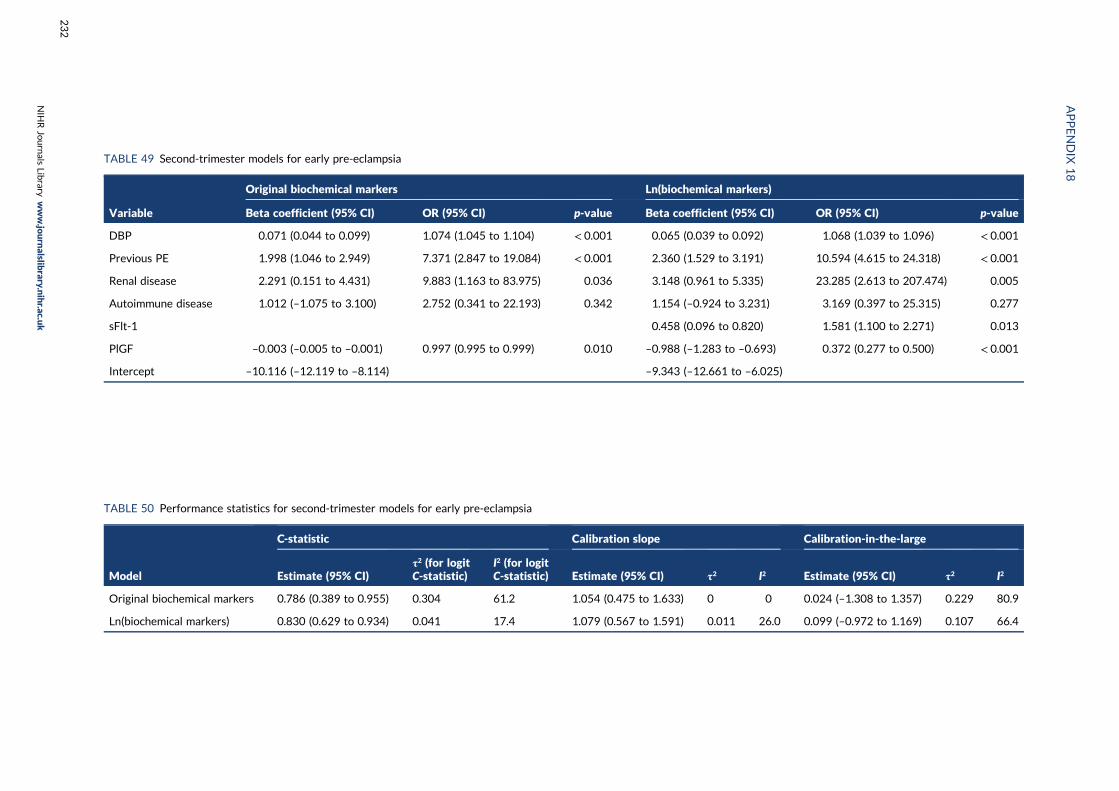
TABLE 49 Second-trimester models for early pre-eclampsia
Variable
Original biochemical markers Ln(biochemical markers)
Beta coefficient (95% CI) OR (95% CI) p-value Beta coefficient (95% CI) OR (95% CI) p-value
DBP 0.071 (0.044 to 0.099) 1.074 (1.045 to 1.104) < 0.001 0.065 (0.039 to 0.092) 1.068 (1.039 to 1.096) < 0.001
Previous PE 1.998 (1.046 to 2.949) 7.371 (2.847 to 19.084) < 0.001 2.360 (1.529 to 3.191) 10.594 (4.615 to 24.318) < 0.001
Renal disease 2.291 (0.151 to 4.431) 9.883 (1.163 to 83.975) 0.036 3.148 (0.961 to 5.335) 23.285 (2.613 to 207.474) 0.005
Autoimmune disease 1.012 (–1.075 to 3.100) 2.752 (0.341 to 22.193) 0.342 1.154 (–0.924 to 3.231) 3.169 (0.397 to 25.315) 0.277
sFlt-1 0.458 (0.096 to 0.820) 1.581 (1.100 to 2.271) 0.013
PlGF –0.003 (–0.005 to –0.001) 0.997 (0.995 to 0.999) 0.010 –0.988 (–1.283 to –0.693) 0.372 (0.277 to 0.500) < 0.001
Intercept –10.116 (–12.119 to –8.114) –9.343 (–12.661 to –6.025)
TABLE 50 Performance statistics for second-trimester models for early pre-eclampsia
Model
C-statistic Calibration slope Calibration-in-the-large
Estimate (95% CI)τ2 (for logitC-statistic)
I2 (for logitC-statistic) Estimate (95% CI) τ2 I2 Estimate (95% CI) τ2 I2
Original biochemical markers 0.786 (0.389 to 0.955) 0.304 61.2 1.054 (0.475 to 1.633) 0 0 0.024 (–1.308 to 1.357) 0.229 80.9
Ln(biochemical markers) 0.830 (0.629 to 0.934) 0.041 17.4 1.079 (0.567 to 1.591) 0.011 26.0 0.099 (–0.972 to 1.169) 0.107 66.4
APPENDIX
18
NIH
RJournals
Library
www.jo
urnalslib
rary.nihr.ac.u
k
232
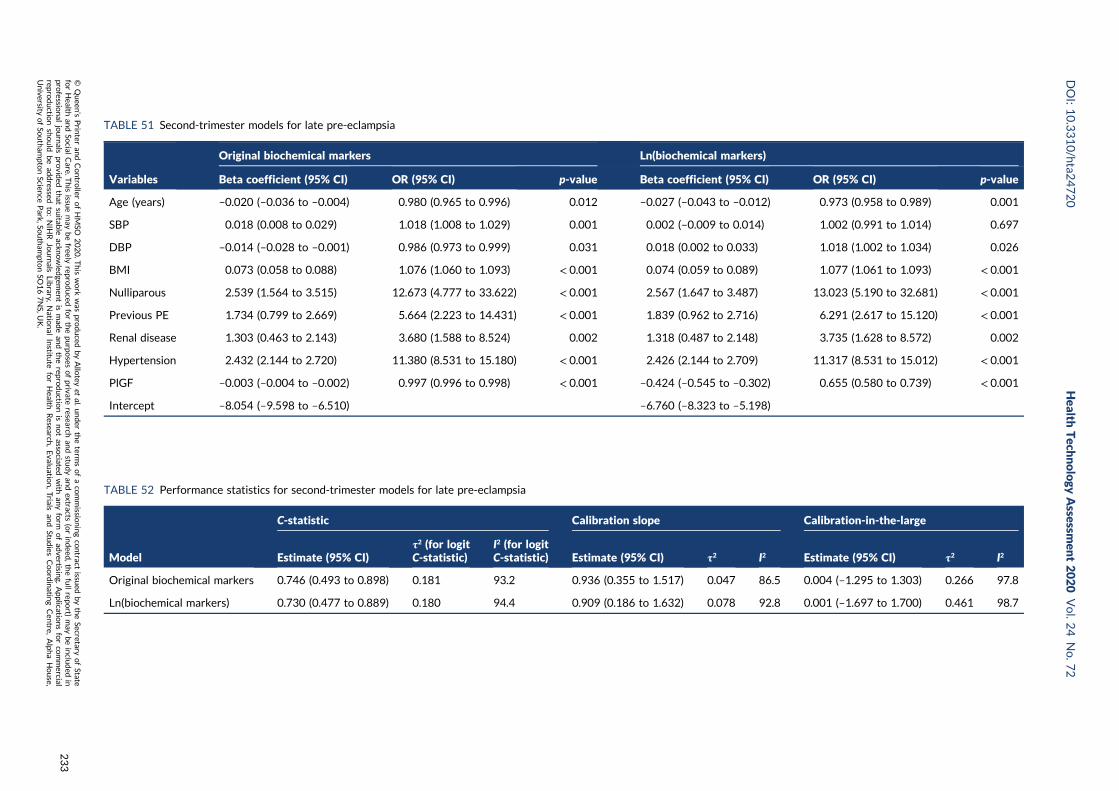
TABLE 51 Second-trimester models for late pre-eclampsia
Variables
Original biochemical markers Ln(biochemical markers)
Beta coefficient (95% CI) OR (95% CI) p-value Beta coefficient (95% CI) OR (95% CI) p-value
Age (years) –0.020 (–0.036 to –0.004) 0.980 (0.965 to 0.996) 0.012 –0.027 (–0.043 to –0.012) 0.973 (0.958 to 0.989) 0.001
SBP 0.018 (0.008 to 0.029) 1.018 (1.008 to 1.029) 0.001 0.002 (–0.009 to 0.014) 1.002 (0.991 to 1.014) 0.697
DBP –0.014 (–0.028 to –0.001) 0.986 (0.973 to 0.999) 0.031 0.018 (0.002 to 0.033) 1.018 (1.002 to 1.034) 0.026
BMI 0.073 (0.058 to 0.088) 1.076 (1.060 to 1.093) < 0.001 0.074 (0.059 to 0.089) 1.077 (1.061 to 1.093) < 0.001
Nulliparous 2.539 (1.564 to 3.515) 12.673 (4.777 to 33.622) < 0.001 2.567 (1.647 to 3.487) 13.023 (5.190 to 32.681) < 0.001
Previous PE 1.734 (0.799 to 2.669) 5.664 (2.223 to 14.431) < 0.001 1.839 (0.962 to 2.716) 6.291 (2.617 to 15.120) < 0.001
Renal disease 1.303 (0.463 to 2.143) 3.680 (1.588 to 8.524) 0.002 1.318 (0.487 to 2.148) 3.735 (1.628 to 8.572) 0.002
Hypertension 2.432 (2.144 to 2.720) 11.380 (8.531 to 15.180) < 0.001 2.426 (2.144 to 2.709) 11.317 (8.531 to 15.012) < 0.001
PlGF –0.003 (–0.004 to –0.002) 0.997 (0.996 to 0.998) < 0.001 –0.424 (–0.545 to –0.302) 0.655 (0.580 to 0.739) < 0.001
Intercept –8.054 (–9.598 to –6.510) –6.760 (–8.323 to –5.198)
TABLE 52 Performance statistics for second-trimester models for late pre-eclampsia
Model
C-statistic Calibration slope Calibration-in-the-large
Estimate (95% CI)τ2 (for logitC-statistic)
I2 (for logitC-statistic) Estimate (95% CI) τ2 I2 Estimate (95% CI) τ2 I2
Original biochemical markers 0.746 (0.493 to 0.898) 0.181 93.2 0.936 (0.355 to 1.517) 0.047 86.5 0.004 (–1.295 to 1.303) 0.266 97.8
Ln(biochemical markers) 0.730 (0.477 to 0.889) 0.180 94.4 0.909 (0.186 to 1.632) 0.078 92.8 0.001 (–1.697 to 1.700) 0.461 98.7
DOI:10.3310/hta2
4720
Health
Tech
nology
Assessm
ent2020
Vol.2
4No.7
2
©Queen
’sPrin
teran
dContro
llerofHMSO
2020.T
his
work
was
produced
byAllo
teyet
al.under
theterm
sofaco
mmissio
ningco
ntract
issued
bytheSecretary
ofState
forHealth
andSo
cialCare.T
his
issuemay
befreely
reproduced
forthepu
rposes
ofprivate
researchan
dstu
dyan
dextracts
(orindeed
,thefullrepo
rt)may
beinclu
ded
inpro
fessional
journals
provid
edthat
suitab
leackn
owled
gemen
tis
mad
ean
dtherepro
ductio
nis
notasso
ciatedwith
anyform
ofad
vertising.
Applicatio
nsforco
mmercial
reproductio
nshould
bead
dressed
to:NIH
RJournals
Library,
Natio
nal
Institu
teforHealth
Research
,Evalu
ation,Trials
and
Studies
Coordinatin
gCen
tre,Alph
aHouse,
University
ofSo
utham
ptonScien
cePark,So
utham
ptonSO
167NS,U
K.
233

Appendix 19 Predictive performance of finalshrunken prediction models for any-, early-and late-onset pre-eclampsia in the individualdata sets used for model developmentand validation
DOI: 10.3310/hta24720 Health Technology Assessment 2020 Vol. 24 No. 72
© Queen’s Printer and Controller of HMSO 2020. This work was produced by Allotey et al. under the terms of a commissioning contract issued by the Secretary of Statefor Health and Social Care. This issue may be freely reproduced for the purposes of private research and study and extracts (or indeed, the full report) may be included inprofessional journals provided that suitable acknowledgement is made and the reproduction is not associated with any form of advertising. Applications for commercialreproduction should be addressed to: NIHR Journals Library, National Institute for Health Research, Evaluation, Trials and Studies Coordinating Centre, Alpha House,University of Southampton Science Park, Southampton SO16 7NS, UK.
235

Model Data set N Events (n)
Performance statistic (95% CI)
C-statistic Calibration slope Calibration-in-the-large
Any-onset pre-eclampsia
First-trimester clinical characteristics SCOPE42 5628 278 0.597 (0.547 to 0.645) 1.165 (0.722 to 1.608) 0.458 (0.335 to 0.581)
Allen et al.108 1045 14 0.757 (0.633 to 0.849) 1.253 (0.618 to 1.887) –0.888 (–1.421 to –0.356)
Poston et al. 2015149 1554 54 0.694 (0.565 to 0.799) 1.340 (0.491 to 2.189) –0.175 (–0.458 to 0.107)
Baschat et al.115 1704 106 0.738 (0.688 to 0.783) 0.747 (0.585 to 0.909) 0.291 (0.079 to 0.503)
Antsaklis et al.110 3328 32 0.585 (0.467 to 0.694) 0.291 (–0.264 to 0.846) –2.201 (–2.559 to –1.843)
WHO175 7273 141 0.637 (0.577 to 0.693) 0.808 (0.569 to 1.047) –0.638 (–0.806 to –0.469)
NICH LR159 3097 156 0.506 (0.425 to 0.587) 0.024 (–0.858 to 0.906) 0.411 (0.243 to 0.578)
van Kuijk et al. 2014166 230 43 0.684 (0.581 to 0.772) 0.705 (0.302 to 1.108) 0.780 (0.413 to 1.147)
STORK G135 812 46 0.723 (0.624 to 0.805) 1.466 (0.957 to 1.975) 1.064 (0.762 to 1.366)
Vinter et al.173 304 19 0.679 (0.549 to 0.786) 1.244 (0.260 to 2.227) 0.442 (–0.026 to 0.910)
POP161 4212 273 0.799 (0.765 to 0.829) 1.744 (1.578 to 1.909) 0.515 (0.389 to 0.642)
First-trimester clinical characteristicsand biochemical markers
SCOPE42 5628 278 0.583 (0.516 to 0.646) 0.891 (0.423 to 1.359) 0.354 (0.228 to 0.479)
WHO175 7273 141 0.687 (0.624 to 0.744) 0.778 (0.565 to 0.992) –0.835 (–1.007 to –0.664)
POUCH131 3019 44 0.674 (0.553 to 0.775) 0.737 (0.247 to 1.227) 0.204 (–0.138 to 0.545)
POP161 4212 273 0.807 (0.773 to 0.837) 1.464 (1.328 to 1.600) 0.282 (0.154 to 0.411)
Second-trimester clinical characteristics SCOPE42 5628 278 0.689 (0.658 to 0.719) 1.004 (0.819 to 1.190) 0.514 (0.391 to 0.636)
Poston et al. 2015149 1554 54 0.761 (0.691 to 0.819) 1.310 (0.914 to 1.706) –0.342 (–0.617 to –0.067)
Antsaklis et al.110 3328 32 0.621 (0.475 to 0.748) 0.468 (–0.191 to 1.128) –2.293 (–2.707 to –1.879)
WHO175 7273 141 0.653 (0.602 to 0.700) 0.677 (0.506 to 0.847) –0.585 (–0.756 to –0.414)
NICH LR159 3097 156 0.635 (0.586 to 0.682) 1.076 (0.755 to 1.396) 0.693 (0.531 to 0.856)
POUCH131 3019 44 0.688 (0.592 to 0.770) 0.714 (0.419 to 1.008) –0.15 (–0.487 to 0.186)
van Kuijk et al. 2014166 230 43 0.67 (0.543 to 0.776) 0.519 (0.151 to 0.887) 0.632 (0.222 to 1.041)
STORK G135 812 46 0.757 (0.659 to 0.835) 1.443 (1.019 to 1.867) 0.998 (0.693 to 1.303)
POP161 4212 273 0.804 (0.762 to 0.840) 1.621 (1.446 to 1.795) 0.573 (0.444 to 0.703)
APPENDIX
19
NIH
RJournals
Library
www.jo
urnalslib
rary.nihr.ac.u
k
236
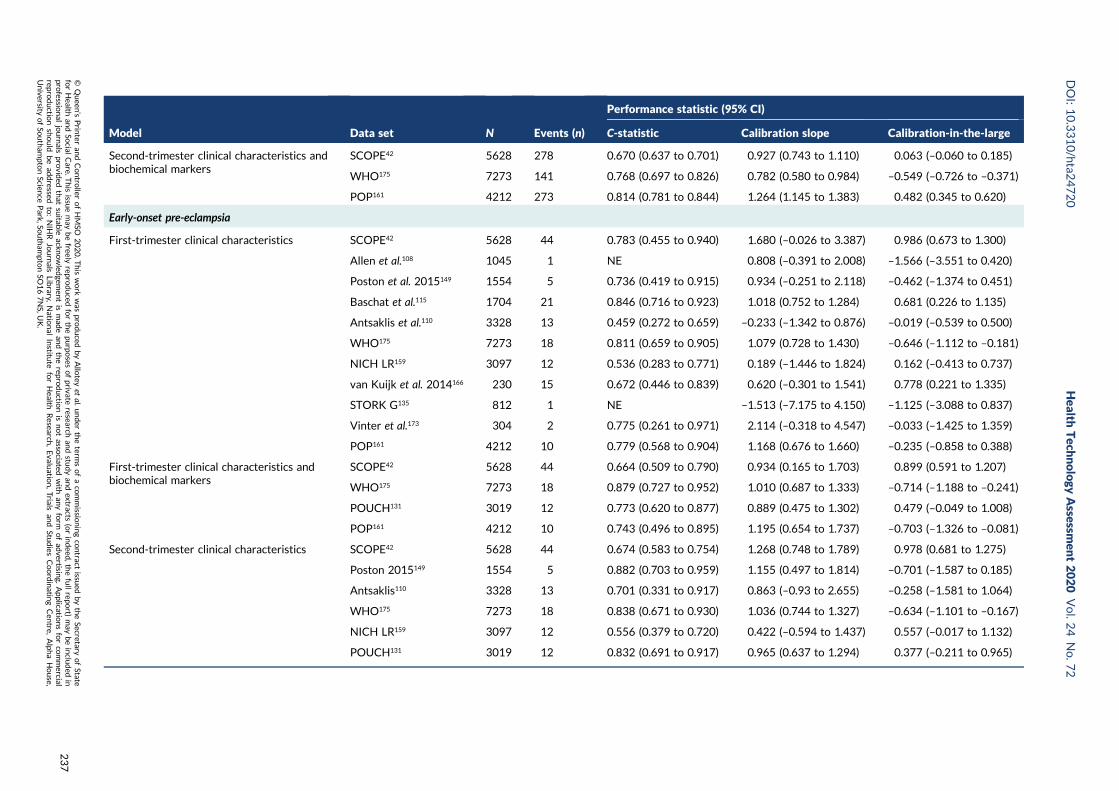
Model Data set N Events (n)
Performance statistic (95% CI)
C-statistic Calibration slope Calibration-in-the-large
Second-trimester clinical characteristics andbiochemical markers
SCOPE42 5628 278 0.670 (0.637 to 0.701) 0.927 (0.743 to 1.110) 0.063 (–0.060 to 0.185)
WHO175 7273 141 0.768 (0.697 to 0.826) 0.782 (0.580 to 0.984) –0.549 (–0.726 to –0.371)
POP161 4212 273 0.814 (0.781 to 0.844) 1.264 (1.145 to 1.383) 0.482 (0.345 to 0.620)
Early-onset pre-eclampsia
First-trimester clinical characteristics SCOPE42 5628 44 0.783 (0.455 to 0.940) 1.680 (–0.026 to 3.387) 0.986 (0.673 to 1.300)
Allen et al.108 1045 1 NE 0.808 (–0.391 to 2.008) –1.566 (–3.551 to 0.420)
Poston et al. 2015149 1554 5 0.736 (0.419 to 0.915) 0.934 (–0.251 to 2.118) –0.462 (–1.374 to 0.451)
Baschat et al.115 1704 21 0.846 (0.716 to 0.923) 1.018 (0.752 to 1.284) 0.681 (0.226 to 1.135)
Antsaklis et al.110 3328 13 0.459 (0.272 to 0.659) –0.233 (–1.342 to 0.876) –0.019 (–0.539 to 0.500)
WHO175 7273 18 0.811 (0.659 to 0.905) 1.079 (0.728 to 1.430) –0.646 (–1.112 to –0.181)
NICH LR159 3097 12 0.536 (0.283 to 0.771) 0.189 (–1.446 to 1.824) 0.162 (–0.413 to 0.737)
van Kuijk et al. 2014166 230 15 0.672 (0.446 to 0.839) 0.620 (–0.301 to 1.541) 0.778 (0.221 to 1.335)
STORK G135 812 1 NE –1.513 (–7.175 to 4.150) –1.125 (–3.088 to 0.837)
Vinter et al.173 304 2 0.775 (0.261 to 0.971) 2.114 (–0.318 to 4.547) –0.033 (–1.425 to 1.359)
POP161 4212 10 0.779 (0.568 to 0.904) 1.168 (0.676 to 1.660) –0.235 (–0.858 to 0.388)
First-trimester clinical characteristics andbiochemical markers
SCOPE42 5628 44 0.664 (0.509 to 0.790) 0.934 (0.165 to 1.703) 0.899 (0.591 to 1.207)
WHO175 7273 18 0.879 (0.727 to 0.952) 1.010 (0.687 to 1.333) –0.714 (–1.188 to –0.241)
POUCH131 3019 12 0.773 (0.620 to 0.877) 0.889 (0.475 to 1.302) 0.479 (–0.049 to 1.008)
POP161 4212 10 0.743 (0.496 to 0.895) 1.195 (0.654 to 1.737) –0.703 (–1.326 to –0.081)
Second-trimester clinical characteristics SCOPE42 5628 44 0.674 (0.583 to 0.754) 1.268 (0.748 to 1.789) 0.978 (0.681 to 1.275)
Poston 2015149 1554 5 0.882 (0.703 to 0.959) 1.155 (0.497 to 1.814) –0.701 (–1.587 to 0.185)
Antsaklis110 3328 13 0.701 (0.331 to 0.917) 0.863 (–0.93 to 2.655) –0.258 (–1.581 to 1.064)
WHO175 7273 18 0.838 (0.671 to 0.930) 1.036 (0.744 to 1.327) –0.634 (–1.101 to –0.167)
NICH LR159 3097 12 0.556 (0.379 to 0.720) 0.422 (–0.594 to 1.437) 0.557 (–0.017 to 1.132)
POUCH131 3019 12 0.832 (0.691 to 0.917) 0.965 (0.637 to 1.294) 0.377 (–0.211 to 0.965)
DOI:10.3310/hta2
4720
Health
Tech
nology
Assessm
ent2020
Vol.2
4No.7
2
©Queen
’sPrin
teran
dContro
llerofHMSO
2020.T
his
work
was
produced
byAllo
teyet
al.under
theterm
sofaco
mmissio
ningco
ntract
issued
bytheSecretary
ofState
forHealth
andSo
cialCare.T
his
issuemay
befreely
reproduced
forthepu
rposes
ofprivate
researchan
dstu
dyan
dextracts
(orindeed
,thefullrepo
rt)may
beinclu
ded
inpro
fessional
journals
provid
edthat
suitab
leackn
owled
gemen
tis
mad
ean
dtherepro
ductio
nis
notasso
ciatedwith
anyform
ofad
vertising.
Applicatio
nsforco
mmercial
reproductio
nshould
bead
dressed
to:NIH
RJournals
Library,
Natio
nal
Institu
teforHealth
Research
,Evalu
ation,Trials
and
Studies
Coordinatin
gCen
tre,Alph
aHouse,
University
ofSo
utham
ptonScien
cePark,So
utham
ptonSO
167NS,U
K.
237

Model Data set N Events (n)
Performance statistic (95% CI)
C-statistic Calibration slope Calibration-in-the-large
van Kuijk et al. 2014166 230 15 0.672 (0.428 to 0.848) 0.659 (–0.270 to 1.588) 0.293 (–0.308 to 0.894)
STORK G135 812 1 NE 0.311 (–3.395 to 4.018) –0.970 (–2.932 to 0.991)
POP161 4212 10 0.558 (0.311 to 0.779) 0.404 (–0.806 to 1.613) –0.286 (–0.911 to 0.339)
Second-trimester clinical characteristics andbiochemical markers
SCOPE42 5628 44 0.805 (0.728 to 0.865) 1.175 (0.891 to 1.458) –0.159 (–0.458 to 0.141)
WHO175 7273 18 0.912 (0.778 to 0.968) 0.876 (0.598 to 1.153) –0.128 (–0.61 to 0.354)
POP161 4212 10 0.810 (0.575 to 0.931) 0.905 (0.453 to 1.356) 0.805 (0.156 to 1.455)
Late-onset pre-eclampsia
First-trimester clinical characteristics SCOPE42 5628 234 0.630 (0.578 to 0.679) 1.266 (0.844 to 1.688) 0.432 (0.298 to 0.565)
Allen et al.108 1045 13 0.738 (0.599 to 0.842) 1.258 (0.596 to 1.921) –0.757 (–1.308 to –0.205)
Poston et al. 2015149 1554 49 0.682 (0.548 to 0.791) 1.208 (0.388 to 2.027) –0.048 (–0.342 to 0.246)
Baschat et al.115 1704 85 0.701 (0.646 to 0.751) 0.601 (0.417 to 0.785) 0.281 (0.050 to 0.513)
Antsaklis et al.110 3328 19 0.676 (0.527 to 0.796) 0.781 (–0.075 to 1.637) –2.669 (–3.128 to –2.211)
WHO175 7273 123 0.606 (0.541 to 0.668) 0.672 (0.374 to 0.970) –0.588 (–0.768 to –0.409)
NICH LR159 3097 144 0.506 (0.42 to 0.591) 0.025 (–0.948 to 0.998) 0.495 (0.323 to 0.668)
van Kuijk et al. 2014166 230 28 0.686 (0.574 to 0.780) 0.674 (0.242 to 1.106) 0.536 (0.110 to 0.961)
STORK G135 812 45 0.733 (0.634 to 0.813) 1.442 (0.947 to 1.937) 1.226 (0.921 to 1.532)
Vinter et al.173 304 17 0.659 (0.521 to 0.774) 0.954 (0.026 to 1.883) 0.532 (0.039 to 1.026)
POP161 4212 263 0.798 (0.763 to 0.828) 1.667 (1.508 to 1.827) 0.621 (0.493 to 0.750)
First-trimester clinical characteristics andbiochemical markers
SCOPE42 5628 234 0.576 (0.521 to 0.630) 0.854 (0.435 to 1.274) 0.304 (0.169 to 0.438)
WHO175 7273 123 0.679 (0.612 to 0.739) 0.810 (0.540 to 1.08) –0.804 (–0.985 to –0.622)
POUCH131 3019 32 0.662 (0.555 to 0.755) 0.717 (0.224 to 1.211) 0.109 (–0.314 to 0.531)
POP161 4212 263 0.805 (0.771 to 0.835) 1.468 (1.331 to 1.606) 0.396 (0.265 to 0.526)
APPENDIX
19
NIH
RJournals
Library
www.jo
urnalslib
rary.nihr.ac.u
k
238
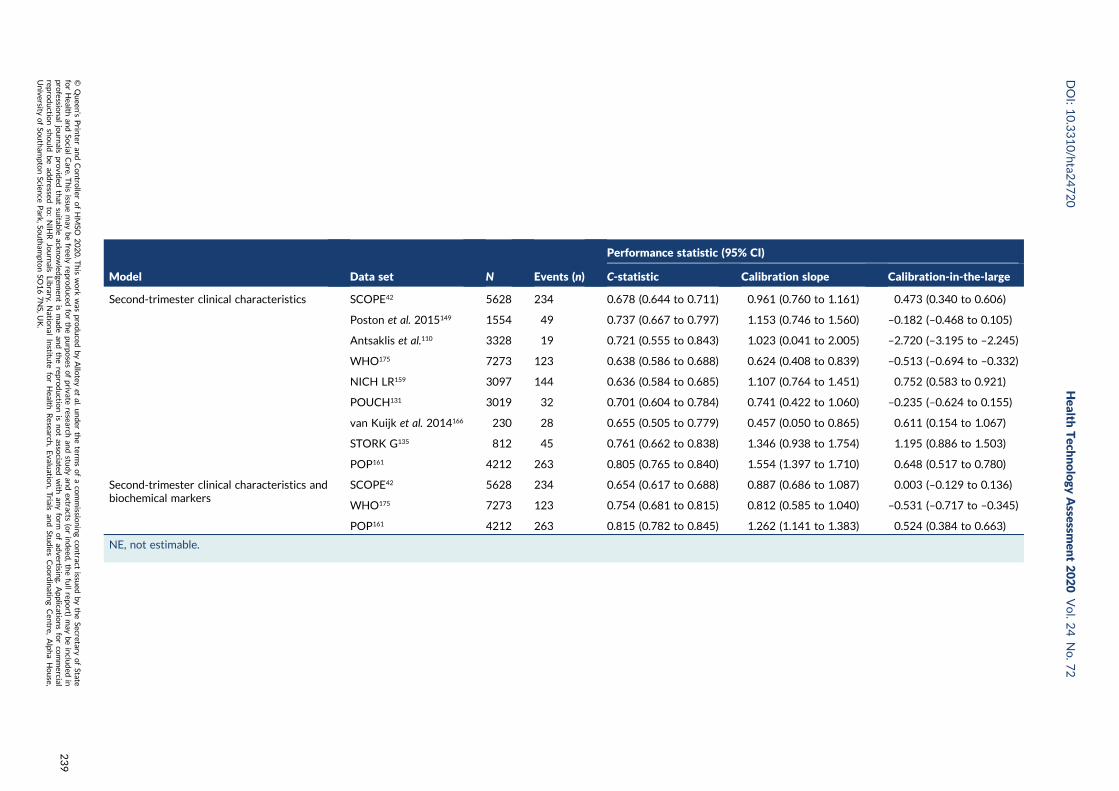
Model Data set N Events (n)
Performance statistic (95% CI)
C-statistic Calibration slope Calibration-in-the-large
Second-trimester clinical characteristics SCOPE42 5628 234 0.678 (0.644 to 0.711) 0.961 (0.760 to 1.161) 0.473 (0.340 to 0.606)
Poston et al. 2015149 1554 49 0.737 (0.667 to 0.797) 1.153 (0.746 to 1.560) –0.182 (–0.468 to 0.105)
Antsaklis et al.110 3328 19 0.721 (0.555 to 0.843) 1.023 (0.041 to 2.005) –2.720 (–3.195 to –2.245)
WHO175 7273 123 0.638 (0.586 to 0.688) 0.624 (0.408 to 0.839) –0.513 (–0.694 to –0.332)
NICH LR159 3097 144 0.636 (0.584 to 0.685) 1.107 (0.764 to 1.451) 0.752 (0.583 to 0.921)
POUCH131 3019 32 0.701 (0.604 to 0.784) 0.741 (0.422 to 1.060) –0.235 (–0.624 to 0.155)
van Kuijk et al. 2014166 230 28 0.655 (0.505 to 0.779) 0.457 (0.050 to 0.865) 0.611 (0.154 to 1.067)
STORK G135 812 45 0.761 (0.662 to 0.838) 1.346 (0.938 to 1.754) 1.195 (0.886 to 1.503)
POP161 4212 263 0.805 (0.765 to 0.840) 1.554 (1.397 to 1.710) 0.648 (0.517 to 0.780)
Second-trimester clinical characteristics andbiochemical markers
SCOPE42 5628 234 0.654 (0.617 to 0.688) 0.887 (0.686 to 1.087) 0.003 (–0.129 to 0.136)
WHO175 7273 123 0.754 (0.681 to 0.815) 0.812 (0.585 to 1.040) –0.531 (–0.717 to –0.345)
POP161 4212 263 0.815 (0.782 to 0.845) 1.262 (1.141 to 1.383) 0.524 (0.384 to 0.663)
NE, not estimable.
DOI:10.3310/hta2
4720
Health
Tech
nology
Assessm
ent2020
Vol.2
4No.7
2
©Queen
’sPrin
teran
dContro
llerofHMSO
2020.T
his
work
was
produced
byAllo
teyet
al.under
theterm
sofaco
mmissio
ningco
ntract
issued
bytheSecretary
ofState
forHealth
andSo
cialCare.T
his
issuemay
befreely
reproduced
forthepu
rposes
ofprivate
researchan
dstu
dyan
dextracts
(orindeed
,thefullrepo
rt)may
beinclu
ded
inpro
fessional
journals
provid
edthat
suitab
leackn
owled
gemen
tis
mad
ean
dtherepro
ductio
nis
notasso
ciatedwith
anyform
ofad
vertising.
Applicatio
nsforco
mmercial
reproductio
nshould
bead
dressed
to:NIH
RJournals
Library,
Natio
nal
Institu
teforHealth
Research
,Evalu
ation,Trials
and
Studies
Coordinatin
gCen
tre,Alph
aHouse,
University
ofSo
utham
ptonScien
cePark,So
utham
ptonSO
167NS,U
K.
239

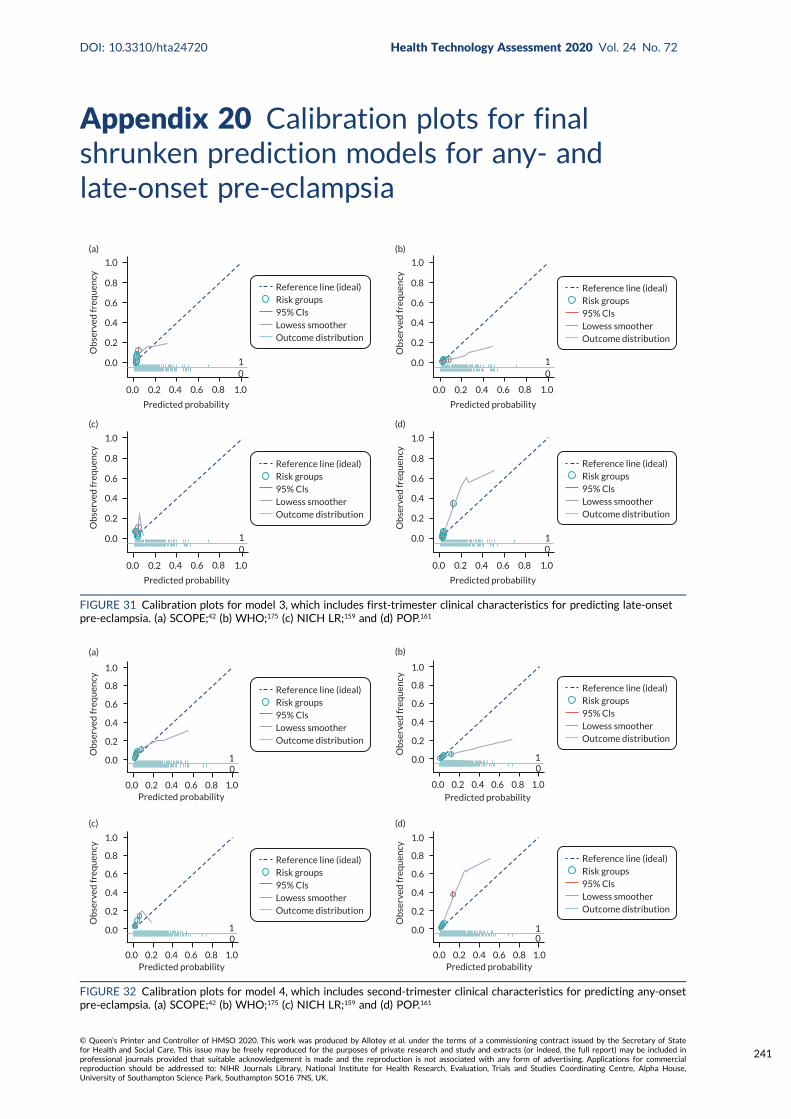
Appendix 20 Calibration plots for finalshrunken prediction models for any- andlate-onset pre-eclampsia
1.0
0.8
0.6
0.4
0.2
0.0
Ob
serv
ed fr
equ
ency
0.0 0.2 0.4 0.6 0.8 1.0
Predicted probability
(a)
10
Reference line (ideal)Risk groups95% ClsLowess smootherOutcome distribution
1.0
0.8
0.6
0.4
0.2
0.0
Ob
serv
ed fr
equ
ency
0.0 0.2 0.4 0.6 0.8 1.0
Predicted probability
(b)
10
Reference line (ideal)Risk groups95% ClsLowess smootherOutcome distribution
1.0
0.8
0.6
0.4
0.2
0.0
Ob
serv
ed fr
equ
ency
0.0 0.2 0.4 0.6 0.8 1.0
Predicted probability
(c)
10
Reference line (ideal)Risk groups95% ClsLowess smootherOutcome distribution
1.0
0.8
0.6
0.4
0.2
0.0
Ob
serv
ed fr
equ
ency
0.0 0.2 0.4 0.6 0.8 1.0
Predicted probability
(d)
10
Reference line (ideal)Risk groups95% ClsLowess smootherOutcome distribution
FIGURE 31 Calibration plots for model 3, which includes first-trimester clinical characteristics for predicting late-onsetpre-eclampsia. (a) SCOPE;42 (b) WHO;175 (c) NICH LR;159 and (d) POP.161
Ob
serv
ed fr
equ
ency
0.0
0.2
0.4
0.6
0.8
1.0
Predicted probability
10
0.0 0.2 0.4 0.6 0.8 1.0
(a)
Reference line (ideal)Risk groups95% ClsLowess smootherOutcome distribution
Ob
serv
ed fr
equ
ency
0.0
0.2
0.4
0.6
0.8
1.0
Predicted probability
10
0.0 0.2 0.4 0.6 0.8 1.0
(b)
Reference line (ideal)Risk groups95% ClsLowess smootherOutcome distribution
Ob
serv
ed fr
equ
ency
0.0
0.2
0.4
0.6
0.8
1.0
Predicted probability
10
0.0 0.2 0.4 0.6 0.8 1.0
(c)
Reference line (ideal)Risk groups95% ClsLowess smootherOutcome distribution
Ob
serv
ed fr
equ
ency
0.0
0.2
0.4
0.6
0.8
1.0
Predicted probability0.0 0.2 0.4 0.6 0.8 1.0
(d)
Reference line (ideal)Risk groups95% ClsLowess smootherOutcome distribution
10
FIGURE 32 Calibration plots for model 4, which includes second-trimester clinical characteristics for predicting any-onsetpre-eclampsia. (a) SCOPE;42 (b) WHO;175 (c) NICH LR;159 and (d) POP.161
DOI: 10.3310/hta24720 Health Technology Assessment 2020 Vol. 24 No. 72
© Queen’s Printer and Controller of HMSO 2020. This work was produced by Allotey et al. under the terms of a commissioning contract issued by the Secretary of Statefor Health and Social Care. This issue may be freely reproduced for the purposes of private research and study and extracts (or indeed, the full report) may be included inprofessional journals provided that suitable acknowledgement is made and the reproduction is not associated with any form of advertising. Applications for commercialreproduction should be addressed to: NIHR Journals Library, National Institute for Health Research, Evaluation, Trials and Studies Coordinating Centre, Alpha House,University of Southampton Science Park, Southampton SO16 7NS, UK.
241
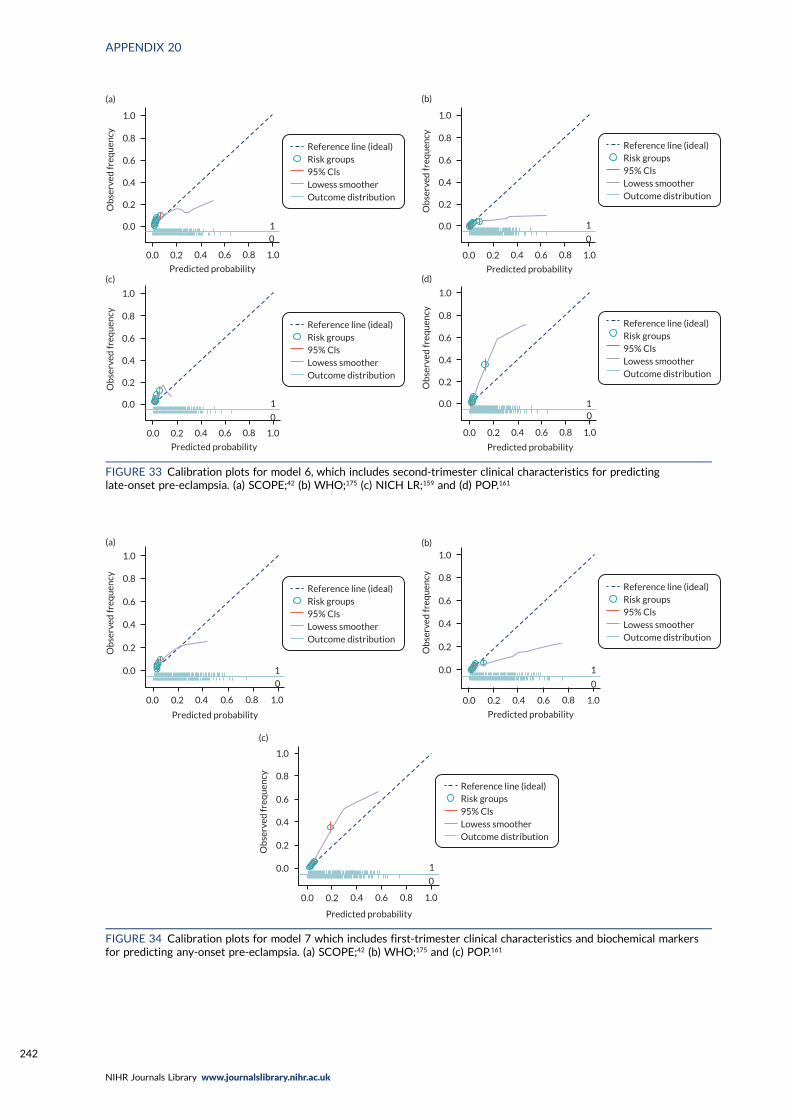
1.0
0.8
0.6
0.4
0.2
0.0
Ob
serv
ed fr
equ
ency
0.0 0.2 0.4 0.6 0.8 1.0
Predicted probability
10
(a)
Reference line (ideal)Risk groups95% ClsLowess smootherOutcome distribution
1.0
0.8
0.6
0.4
0.2
0.0
Ob
serv
ed fr
equ
ency
0.0 0.2 0.4 0.6 0.8 1.0
Predicted probability
(b)
1
0
Reference line (ideal)Risk groups95% ClsLowess smootherOutcome distribution
1.0
0.8
0.6
0.4
0.2
0.0
Ob
serv
ed fr
equ
ency
0.0 0.2 0.4 0.6 0.8 1.0
Predicted probability
1
0
(c)
Reference line (ideal)Risk groups95% ClsLowess smootherOutcome distribution
1.0
0.8
0.6
0.4
0.2
0.0
Ob
serv
ed fr
equ
ency
0.0 0.2 0.4 0.6 0.8 1.0
Predicted probability
(d)
10
Reference line (ideal)Risk groups95% ClsLowess smootherOutcome distribution
FIGURE 33 Calibration plots for model 6, which includes second-trimester clinical characteristics for predictinglate-onset pre-eclampsia. (a) SCOPE;42 (b) WHO;175 (c) NICH LR;159 and (d) POP.161
1.0
0.8
0.6
0.4
0.2
0.0
Ob
serv
ed fr
equ
ency
0.0 0.2 0.4 0.6 0.8 1.0
Predicted probability
(a)
1
0
Reference line (ideal)Risk groups95% ClsLowess smootherOutcome distribution
Reference line (ideal)Risk groups95% ClsLowess smootherOutcome distribution
1.0
0.8
0.6
0.4
0.2
0.0
Ob
serv
ed fr
equ
ency
0.0 0.2 0.4 0.6 0.8 1.0
Predicted probability
(b)
1
0
1.0
0.8
0.6
0.4
0.2
0.0
Ob
serv
ed fr
equ
ency
0.0 0.2 0.4 0.6 0.8 1.0
Predicted probability
(c)
1
0
Reference line (ideal)Risk groups95% ClsLowess smootherOutcome distribution
FIGURE 34 Calibration plots for model 7 which includes first-trimester clinical characteristics and biochemical markersfor predicting any-onset pre-eclampsia. (a) SCOPE;42 (b) WHO;175 and (c) POP.161
APPENDIX 20
NIHR Journals Library www.journalslibrary.nihr.ac.uk
242
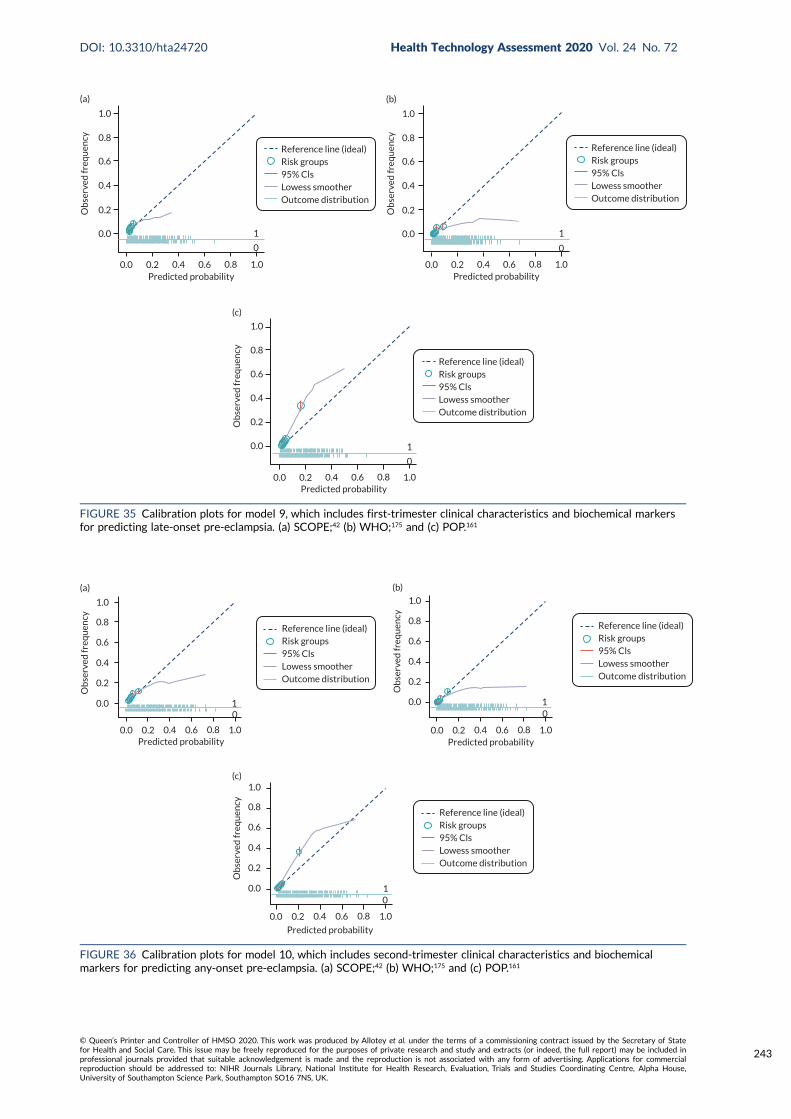
1.0
0.8
0.6
0.4
0.2
0.0
Ob
serv
ed fr
equ
ency
0.0 0.2 0.4 0.6 0.8 1.0Predicted probability
(a)
1
0
Reference line (ideal)Risk groups95% ClsLowess smootherOutcome distribution
1.0
0.8
0.6
0.4
0.2
0.0
Ob
serv
ed fr
equ
ency
0.0 0.2 0.4 0.6 0.8 1.0Predicted probability
(b)
1
0
Reference line (ideal)Risk groups95% ClsLowess smootherOutcome distribution
1.0
0.8
0.6
0.4
0.2
0.0
Ob
serv
ed fr
equ
ency
0.0 0.2 0.4 0.6 0.8 1.0Predicted probability
(c)
1
0
Reference line (ideal)Risk groups95% ClsLowess smootherOutcome distribution
FIGURE 35 Calibration plots for model 9, which includes first-trimester clinical characteristics and biochemical markersfor predicting late-onset pre-eclampsia. (a) SCOPE;42 (b) WHO;175 and (c) POP.161
0.0 0.2 0.4 0.6 0.8 1.0Predicted probability
1.0
0.8
0.6
0.4
0.2
0.0
Ob
serv
ed fr
equ
ency
10
(a)
Reference line (ideal)Risk groups95% ClsLowess smootherOutcome distribution
0.0 0.2 0.4 0.6 0.8 1.0Predicted probability
1.0
0.8
0.6
0.4
0.2
0.0
Ob
serv
ed fr
equ
ency
(b)
10
Reference line (ideal)Risk groups95% ClsLowess smootherOutcome distribution
0.0 0.2 0.4 0.6 0.8 1.0
Predicted probability
1.0
0.8
0.6
0.4
0.2
0.0
Ob
serv
ed fr
equ
ency
10
(c)
Reference line (ideal)Risk groups95% ClsLowess smootherOutcome distribution
FIGURE 36 Calibration plots for model 10, which includes second-trimester clinical characteristics and biochemicalmarkers for predicting any-onset pre-eclampsia. (a) SCOPE;42 (b) WHO;175 and (c) POP.161
DOI: 10.3310/hta24720 Health Technology Assessment 2020 Vol. 24 No. 72
© Queen’s Printer and Controller of HMSO 2020. This work was produced by Allotey et al. under the terms of a commissioning contract issued by the Secretary of Statefor Health and Social Care. This issue may be freely reproduced for the purposes of private research and study and extracts (or indeed, the full report) may be included inprofessional journals provided that suitable acknowledgement is made and the reproduction is not associated with any form of advertising. Applications for commercialreproduction should be addressed to: NIHR Journals Library, National Institute for Health Research, Evaluation, Trials and Studies Coordinating Centre, Alpha House,University of Southampton Science Park, Southampton SO16 7NS, UK.
243
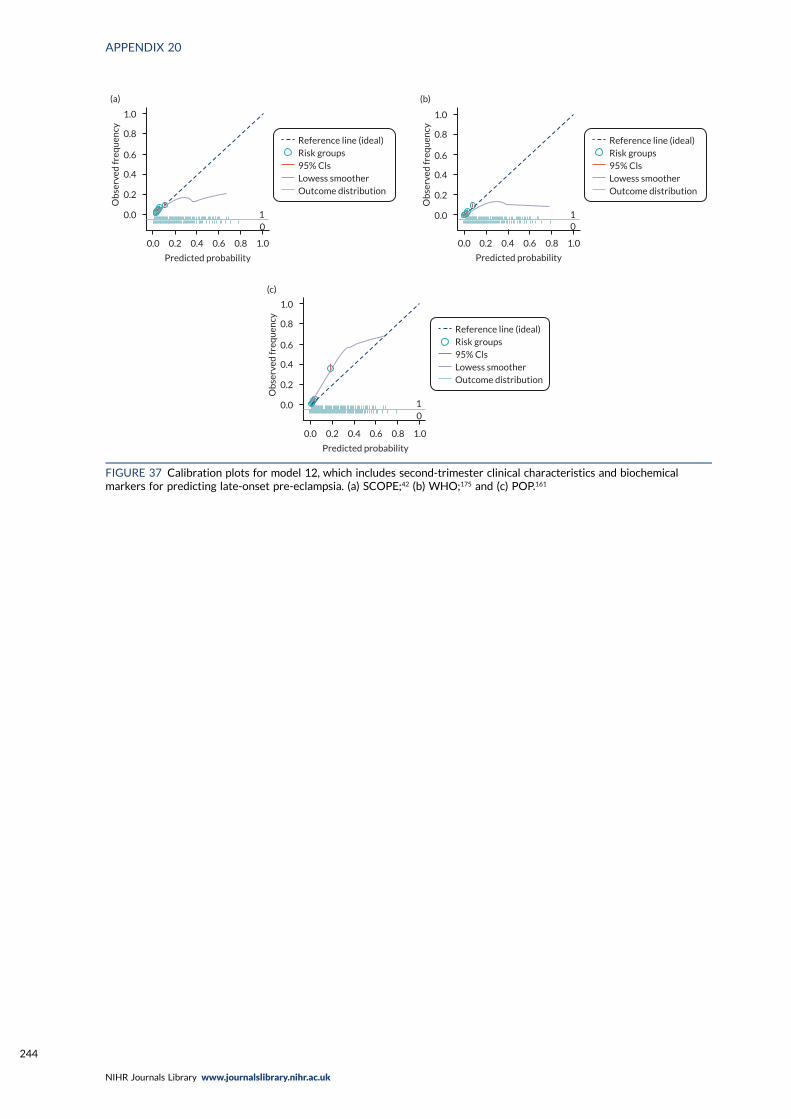
Reference line (ideal)Risk groups95% ClsLowess smootherOutcome distribution
Predicted probability
0.0 0.2 0.4 0.6 0.8 1.0
1.0
0.8
0.6
0.4
0.2
0.0
Ob
serv
ed fr
equ
ency
10
(a)
Reference line (ideal)Risk groups95% ClsLowess smootherOutcome distribution
Predicted probability
0.0 0.2 0.4 0.6 0.8 1.0
10
1.0
0.8
0.6
0.4
0.2
0.0
Ob
serv
ed fr
equ
ency
(b)
Reference line (ideal)Risk groups95% ClsLowess smootherOutcome distribution
10
Predicted probability
0.0 0.2 0.4 0.6 0.8 1.0
1.0
0.8
0.6
0.4
0.2
0.0
Ob
serv
ed fr
equ
ency
(c)
FIGURE 37 Calibration plots for model 12, which includes second-trimester clinical characteristics and biochemicalmarkers for predicting late-onset pre-eclampsia. (a) SCOPE;42 (b) WHO;175 and (c) POP.161
APPENDIX 20
NIHR Journals Library www.journalslibrary.nihr.ac.uk
244
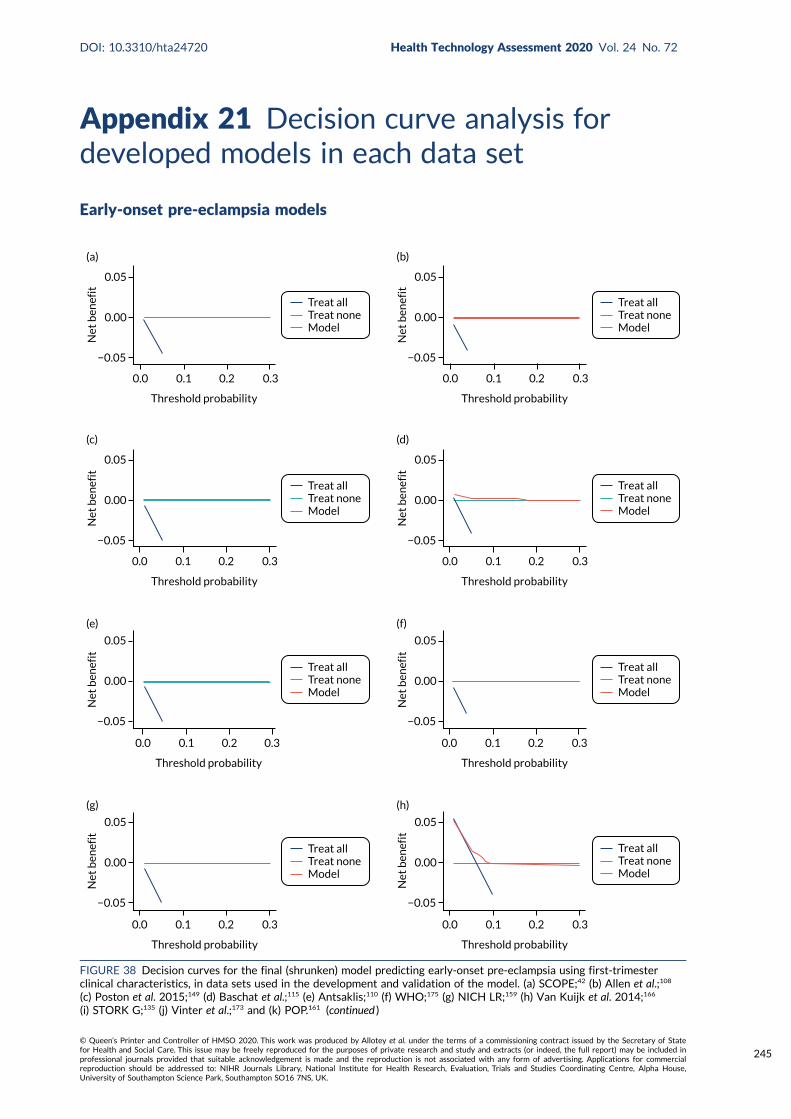
Appendix 21 Decision curve analysis fordeveloped models in each data set
Early-onset pre-eclampsia models
Threshold probability
0.0 0.1 0.2 0.3
Treat allTreat noneModel
Net
ben
efit
0.05
0.00
−0.05
(a)
Treat allTreat noneModel
Threshold probability
0.0 0.1 0.2 0.3
Net
ben
efit
0.05
0.00
−0.05
(b)
Treat allTreat noneModel
Threshold probability
0.0 0.1 0.2 0.3
Net
ben
efit
0.05
0.00
−0.05
(c)
Treat allTreat noneModel
Threshold probability
0.0 0.1 0.2 0.3
Net
ben
efit
0.05
0.00
−0.05
(d)
Treat allTreat noneModel
0.3
Threshold probability
0.0 0.1 0.2
Net
ben
efit
0.05
0.00
−0.05
(e)
Treat allTreat noneModel
Threshold probability
0.0 0.1 0.2 0.3
Net
ben
efit
0.05
0.00
−0.05
(f)
Treat allTreat noneModel
Threshold probability
0.0 0.1 0.2 0.3
Net
ben
efit
0.05
0.00
−0.05
(g)
Treat allTreat noneModel
Threshold probability
0.0 0.1 0.2 0.3
Net
ben
efit
0.05
0.00
−0.05
(h)
FIGURE 38 Decision curves for the final (shrunken) model predicting early-onset pre-eclampsia using first-trimesterclinical characteristics, in data sets used in the development and validation of the model. (a) SCOPE;42 (b) Allen et al.;108
(c) Poston et al. 2015;149 (d) Baschat et al.;115 (e) Antsaklis;110 (f) WHO;175 (g) NICH LR;159 (h) Van Kuijk et al. 2014;166
(i) STORK G;135 (j) Vinter et al.;173 and (k) POP.161 (continued )
DOI: 10.3310/hta24720 Health Technology Assessment 2020 Vol. 24 No. 72
© Queen’s Printer and Controller of HMSO 2020. This work was produced by Allotey et al. under the terms of a commissioning contract issued by the Secretary of Statefor Health and Social Care. This issue may be freely reproduced for the purposes of private research and study and extracts (or indeed, the full report) may be included inprofessional journals provided that suitable acknowledgement is made and the reproduction is not associated with any form of advertising. Applications for commercialreproduction should be addressed to: NIHR Journals Library, National Institute for Health Research, Evaluation, Trials and Studies Coordinating Centre, Alpha House,University of Southampton Science Park, Southampton SO16 7NS, UK.
245
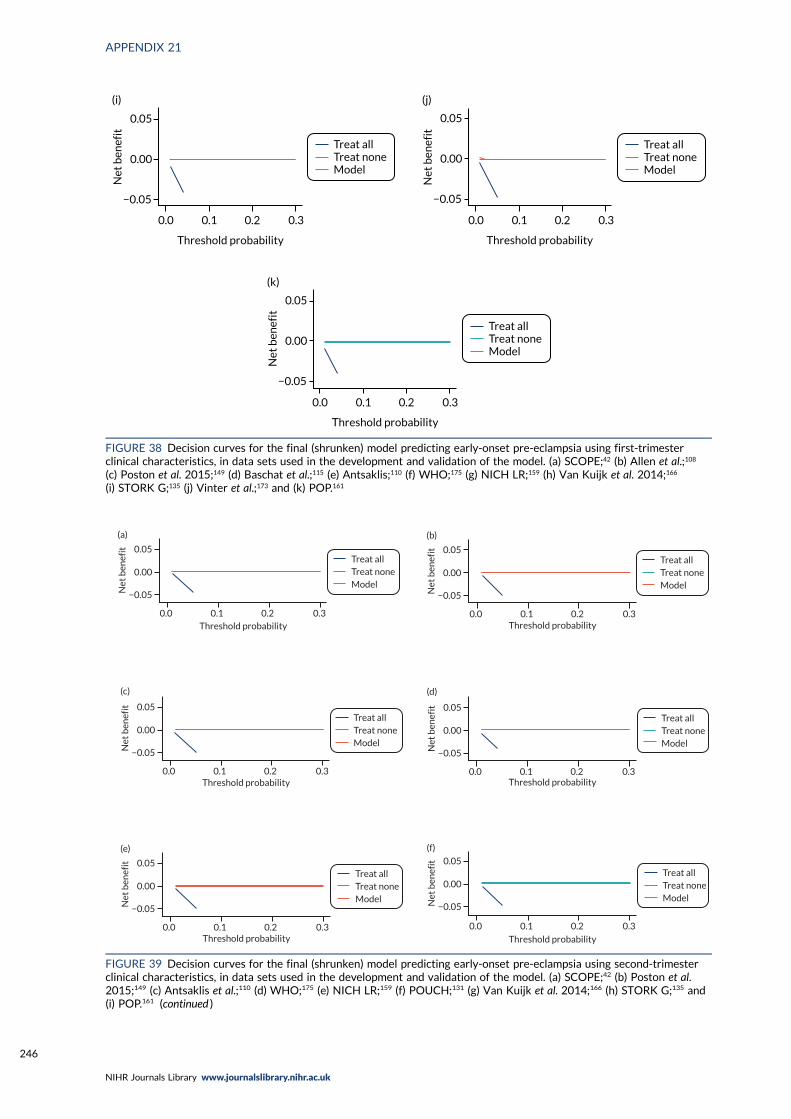
Treat allTreat noneModel
Threshold probability
0.0 0.1 0.2 0.3
Net
ben
efit
0.05
0.00
−0.05
(i)
Treat allTreat noneModel
Threshold probability
0.0 0.1 0.2 0.3
Net
ben
efit
0.05
0.00
−0.05
(j)
Treat allTreat noneModel
Threshold probability
0.0 0.1 0.2 0.3
Net
ben
efit
0.05
0.00
−0.05
(k)
FIGURE 38 Decision curves for the final (shrunken) model predicting early-onset pre-eclampsia using first-trimesterclinical characteristics, in data sets used in the development and validation of the model. (a) SCOPE;42 (b) Allen et al.;108
(c) Poston et al. 2015;149 (d) Baschat et al.;115 (e) Antsaklis;110 (f) WHO;175 (g) NICH LR;159 (h) Van Kuijk et al. 2014;166
(i) STORK G;135 (j) Vinter et al.;173 and (k) POP.161
Treat allTreat noneModel
(a)
Net
ben
efit 0.05
0.00
−0.05
Threshold probability0.0 0.1 0.2 0.3
Treat allTreat noneModel
(b)
Net
ben
efit 0.05
0.00
−0.05
Threshold probability0.0 0.1 0.2 0.3
Treat allTreat noneModel
(c)
Net
ben
efit 0.05
0.00
−0.05
Threshold probability0.0 0.1 0.2 0.3
Treat allTreat noneModel
(d)
Net
ben
efit 0.05
0.00
−0.05
Threshold probability0.0 0.1 0.2 0.3
Treat allTreat noneModel
(e)
Net
ben
efit 0.05
0.00
−0.05
Threshold probability0.0 0.1 0.2 0.3
Treat allTreat noneModel
(f)
Net
ben
efit 0.05
0.00
−0.05
Threshold probability
0.0 0.1 0.2 0.3
FIGURE 39 Decision curves for the final (shrunken) model predicting early-onset pre-eclampsia using second-trimesterclinical characteristics, in data sets used in the development and validation of the model. (a) SCOPE;42 (b) Poston et al.2015;149 (c) Antsaklis et al.;110 (d) WHO;175 (e) NICH LR;159 (f) POUCH;131 (g) Van Kuijk et al. 2014;166 (h) STORK G;135 and(i) POP.161 (continued )
APPENDIX 21
NIHR Journals Library www.journalslibrary.nihr.ac.uk
246
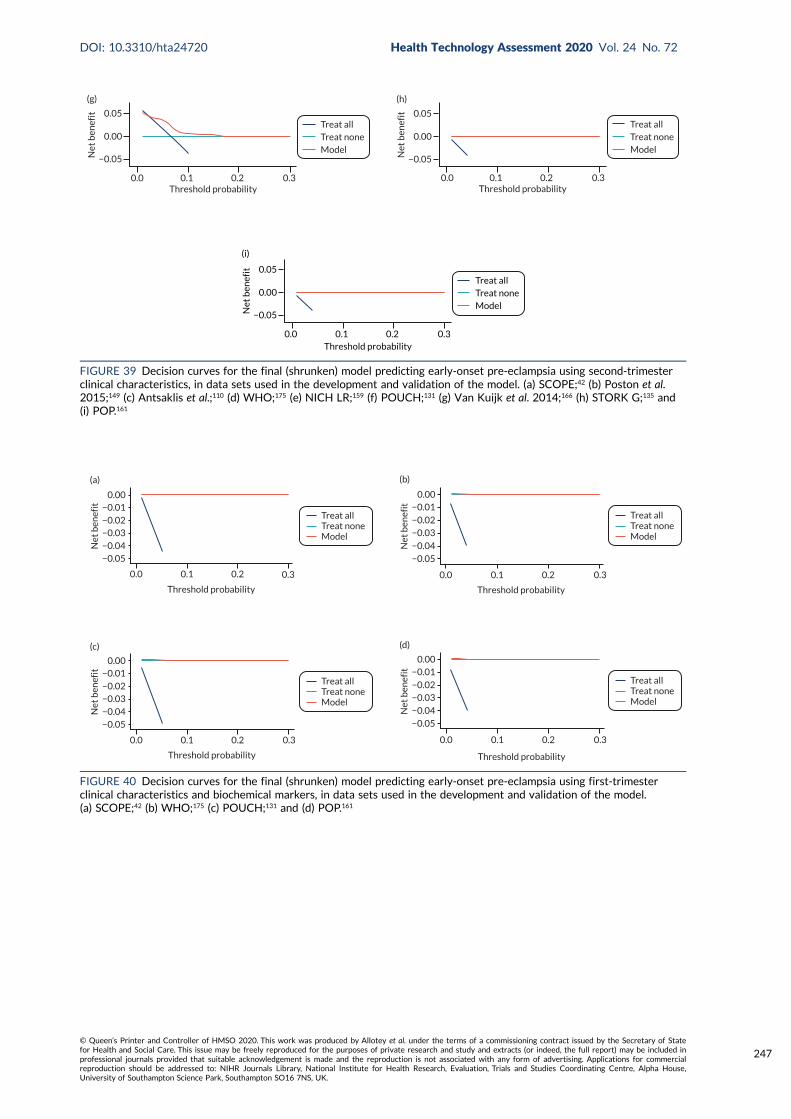
Treat allTreat noneModel
0.0Threshold probability
0.1 0.2 0.3
(g)N
et b
enef
it 0.05
0.00
−0.05
Treat allTreat noneModel
0.0Threshold probability
0.1 0.2 0.3
(h)
Net
ben
efit 0.05
0.00
−0.05
Treat allTreat noneModel
Threshold probability0.0 0.1 0.2 0.3
(i)N
et b
enef
it 0.05
0.00
−0.05
FIGURE 39 Decision curves for the final (shrunken) model predicting early-onset pre-eclampsia using second-trimesterclinical characteristics, in data sets used in the development and validation of the model. (a) SCOPE;42 (b) Poston et al.2015;149 (c) Antsaklis et al.;110 (d) WHO;175 (e) NICH LR;159 (f) POUCH;131 (g) Van Kuijk et al. 2014;166 (h) STORK G;135 and(i) POP.161
Treat allTreat noneModel
0.3
Threshold probability
0.0 0.1 0.2
Net
ben
efit
−0.05−0.04
−0.03−0.02
−0.010.00
(a)
Treat allTreat noneModel
Threshold probability
0.0 0.1 0.2 0.3
Net
ben
efit
−0.05
−0.04
−0.03−0.02
−0.010.00
(b)
Treat allTreat noneModel
Threshold probability
0.0 0.1 0.2 0.3
−0.05
Net
ben
efit
−0.04
−0.03−0.02
−0.010.00
(c)
Treat allTreat noneModel
Threshold probability
0.0 0.1 0.2 0.3
−0.05
Net
ben
efit
−0.04
−0.03−0.02
−0.010.00
(d)
FIGURE 40 Decision curves for the final (shrunken) model predicting early-onset pre-eclampsia using first-trimesterclinical characteristics and biochemical markers, in data sets used in the development and validation of the model.(a) SCOPE;42 (b) WHO;175 (c) POUCH;131 and (d) POP.161
DOI: 10.3310/hta24720 Health Technology Assessment 2020 Vol. 24 No. 72
© Queen’s Printer and Controller of HMSO 2020. This work was produced by Allotey et al. under the terms of a commissioning contract issued by the Secretary of Statefor Health and Social Care. This issue may be freely reproduced for the purposes of private research and study and extracts (or indeed, the full report) may be included inprofessional journals provided that suitable acknowledgement is made and the reproduction is not associated with any form of advertising. Applications for commercialreproduction should be addressed to: NIHR Journals Library, National Institute for Health Research, Evaluation, Trials and Studies Coordinating Centre, Alpha House,University of Southampton Science Park, Southampton SO16 7NS, UK.
247
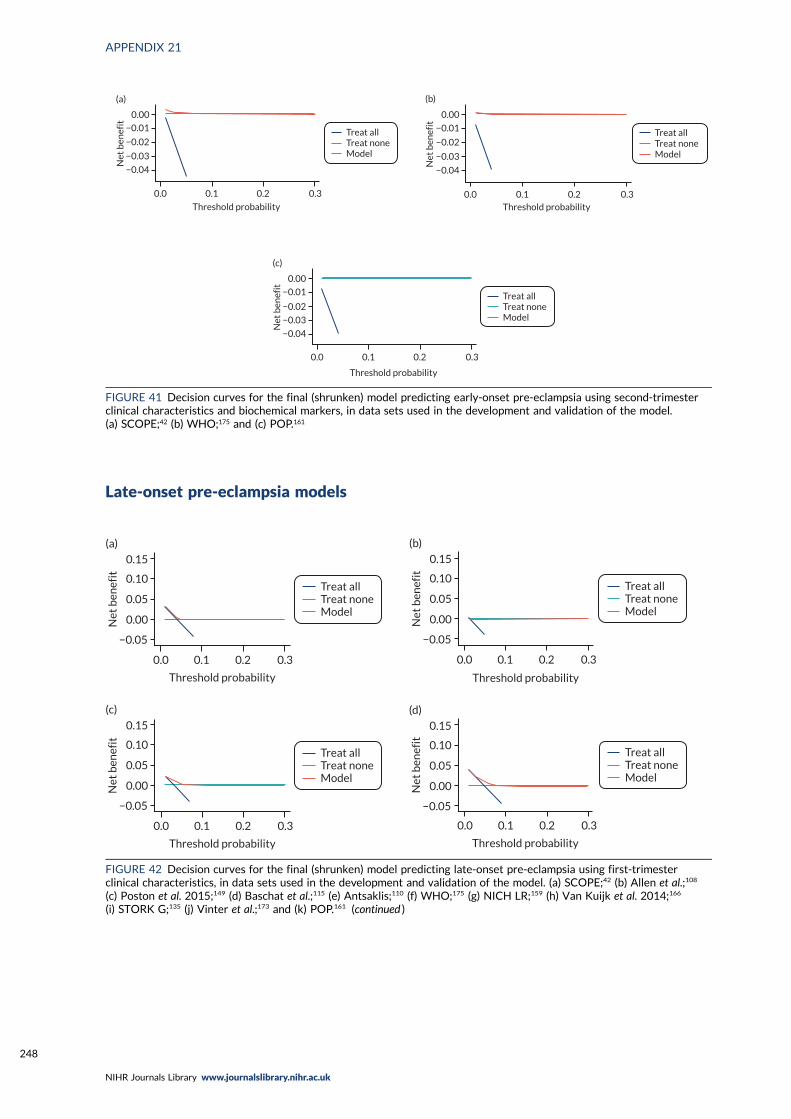
Late-onset pre-eclampsia models
Treat allTreat noneModel
Threshold probability
0.0 0.1 0.2 0.3
Net
ben
efit
−0.04
−0.03
−0.02
−0.01
0.00
(a)
Treat allTreat noneModel
Threshold probability0.0 0.1 0.2 0.3
Net
ben
efit
−0.04
−0.03
−0.02
−0.01
0.00
(b)
Treat allTreat noneModel
Threshold probability
0.0 0.1 0.2 0.3
Net
ben
efit
−0.04
−0.03
−0.02
−0.01
0.00
(c)
FIGURE 41 Decision curves for the final (shrunken) model predicting early-onset pre-eclampsia using second-trimesterclinical characteristics and biochemical markers, in data sets used in the development and validation of the model.(a) SCOPE;42 (b) WHO;175 and (c) POP.161
Threshold probability
0.0 0.1 0.2 0.3
Treat allTreat noneModel
0.15
0.10
0.05
0.00
−0.05
Net
ben
efit
(a)
Threshold probability
0.0 0.1 0.2 0.3
Treat allTreat noneModel
0.15
0.10
0.05
0.00
−0.05
Net
ben
efit
(b)
Treat allTreat noneModel
Threshold probability
0.0 0.1 0.2 0.3
0.15
0.10
0.05
0.00
−0.05
Net
ben
efit
(c)
Treat allTreat noneModel
Threshold probability
0.0 0.1 0.2 0.3
0.15
0.10
0.05
0.00
−0.05
Net
ben
efit
(d)
FIGURE 42 Decision curves for the final (shrunken) model predicting late-onset pre-eclampsia using first-trimesterclinical characteristics, in data sets used in the development and validation of the model. (a) SCOPE;42 (b) Allen et al.;108
(c) Poston et al. 2015;149 (d) Baschat et al.;115 (e) Antsaklis;110 (f) WHO;175 (g) NICH LR;159 (h) Van Kuijk et al. 2014;166
(i) STORK G;135 (j) Vinter et al.;173 and (k) POP.161 (continued )
APPENDIX 21
NIHR Journals Library www.journalslibrary.nihr.ac.uk
248

Treat allTreat noneModel
0.3
Threshold probability
0.0 0.1 0.2
0.15
0.10
0.05
0.00
−0.05
Net
ben
efit
(e)
Treat allTreat noneModel
0.3
Threshold probability
0.0 0.1 0.2
0.15
0.10
0.05
0.00
−0.05
Net
ben
efit
(f)
Treat allTreat noneModel
Threshold probability
0.0 0.1 0.2 0.3
0.15
0.10
0.05
0.00
−0.05
Net
ben
efit
(g)
Treat allTreat noneModel
Threshold probability
0.0 0.1 0.2 0.3
0.15
0.10
0.05
0.00
−0.05
Net
ben
efit
(h)
Treat allTreat noneModel
Threshold probability
0.0 0.1 0.2 0.3
0.15
0.10
0.05
0.00
−0.05
Net
ben
efit
(i)
Treat allTreat noneModel
Threshold probability
0.0 0.1 0.2 0.3
0.15
0.10
0.05
0.00
−0.05
Net
ben
efit
(j)
Treat allTreat noneModel
Threshold probability
0.0 0.1 0.2 0.3
0.15
0.10
0.05
0.00
−0.05
Net
ben
efit
(k)
FIGURE 42 Decision curves for the final (shrunken) model predicting late-onset pre-eclampsia using first-trimesterclinical characteristics, in data sets used in the development and validation of the model. (a) SCOPE;42 (b) Allen et al.;108
(c) Poston et al. 2015;149 (d) Baschat et al.;115 (e) Antsaklis;110 (f) WHO;175 (g) NICH LR;159 (h) Van Kuijk et al. 2014;166
(i) STORK G;135 (j) Vinter et al.;173 and (k) POP.161
DOI: 10.3310/hta24720 Health Technology Assessment 2020 Vol. 24 No. 72
© Queen’s Printer and Controller of HMSO 2020. This work was produced by Allotey et al. under the terms of a commissioning contract issued by the Secretary of Statefor Health and Social Care. This issue may be freely reproduced for the purposes of private research and study and extracts (or indeed, the full report) may be included inprofessional journals provided that suitable acknowledgement is made and the reproduction is not associated with any form of advertising. Applications for commercialreproduction should be addressed to: NIHR Journals Library, National Institute for Health Research, Evaluation, Trials and Studies Coordinating Centre, Alpha House,University of Southampton Science Park, Southampton SO16 7NS, UK.
249
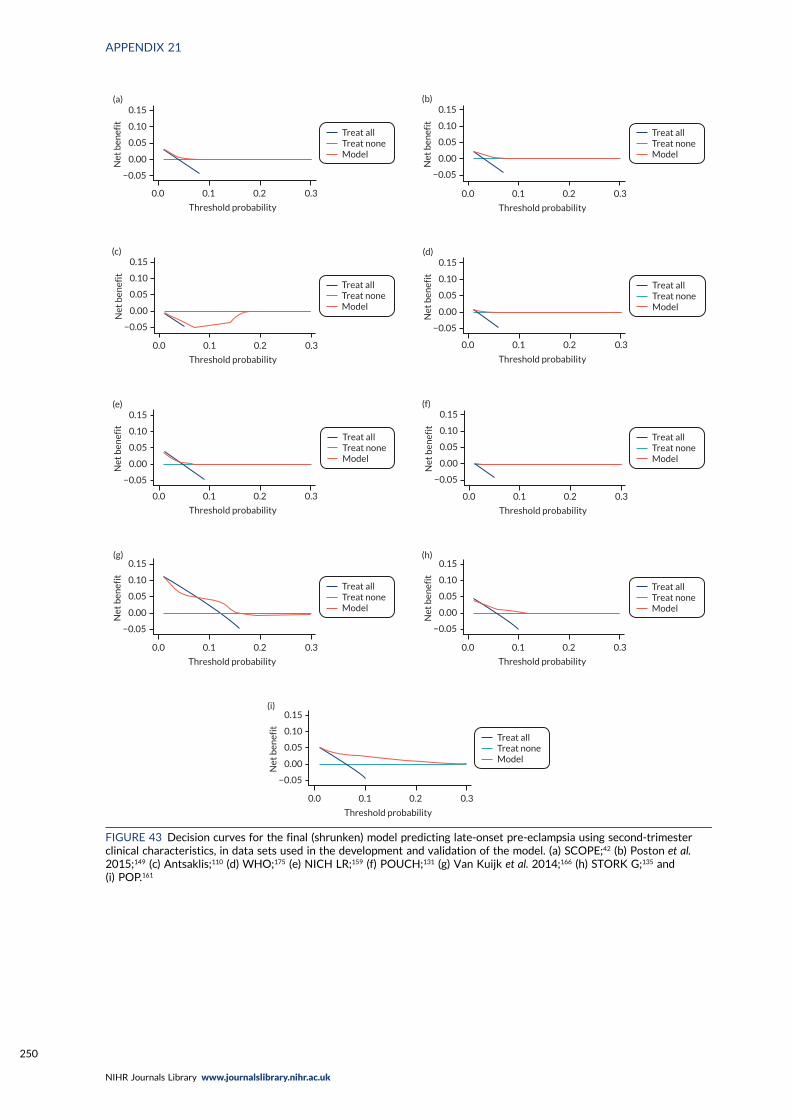
Threshold probability
0.0 0.1 0.2 0.3
Treat allTreat noneModel
−0.05
Net
ben
efit
0.00
0.05
0.10
0.15(a)
Threshold probability
0.0 0.1 0.2 0.3
Treat allTreat noneModel
−0.05
Net
ben
efit
0.00
0.05
0.10
0.15(b)
Treat allTreat noneModel
Threshold probability
0.0 0.1 0.2 0.3
−0.05
Net
ben
efit
0.00
0.05
0.10
0.15(c)
Threshold probability
0.0
−0.05
0.1 0.2 0.3
Treat allTreat noneModel
Net
ben
efit
0.00
0.05
0.10
0.15(d)
Threshold probability
0.0 0.1 0.2 0.3
Treat allTreat noneModel
−0.05
Net
ben
efit
0.00
0.05
0.10
0.15(e)
Treat allTreat noneModel
Threshold probability
0.0 0.1 0.2 0.3
−0.05
Net
ben
efit
0.00
0.05
0.10
0.15(f)
Treat allTreat noneModel
Threshold probability
0.0 0.1 0.2 0.3
−0.05
Net
ben
efit
0.00
0.05
0.10
0.15(g)
Treat allTreat noneModel
Threshold probability
0.0 0.1 0.2 0.3
−0.05
Net
ben
efit
0.00
0.05
0.10
0.15(h)
Treat allTreat noneModel
Threshold probability
0.0 0.1 0.2 0.3
−0.05
Net
ben
efit
0.00
0.05
0.10
0.15(i)
FIGURE 43 Decision curves for the final (shrunken) model predicting late-onset pre-eclampsia using second-trimesterclinical characteristics, in data sets used in the development and validation of the model. (a) SCOPE;42 (b) Poston et al.2015;149 (c) Antsaklis;110 (d) WHO;175 (e) NICH LR;159 (f) POUCH;131 (g) Van Kuijk et al. 2014;166 (h) STORK G;135 and(i) POP.161
APPENDIX 21
NIHR Journals Library www.journalslibrary.nihr.ac.uk
250
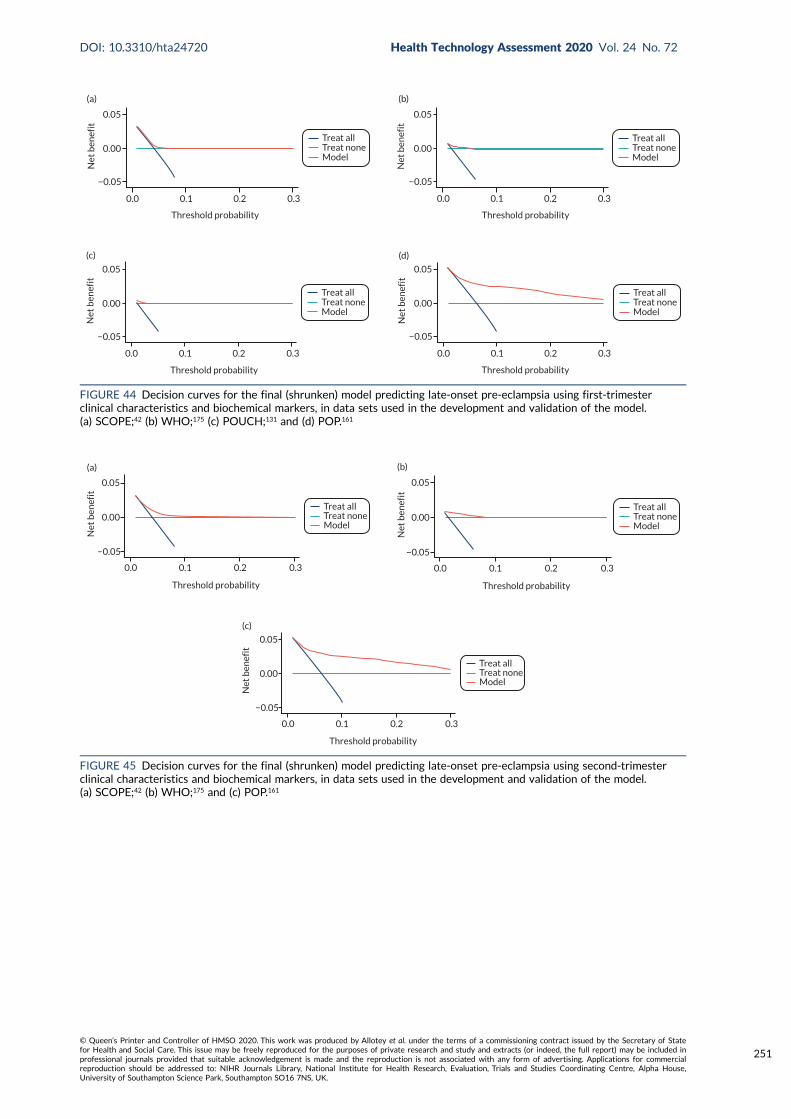
Treat allTreat noneModel
Threshold probability
0.0 0.1 0.2 0.3
(a)
−0.05
0.00
0.05
Net
ben
efit
Treat allTreat noneModel
Threshold probability
0.0 0.1 0.2 0.3
(b)
−0.05
0.00
0.05
Net
ben
efit
Treat allTreat noneModel
Threshold probability
0.0 0.1 0.2 0.3
(c)
−0.05
0.00
0.05
Net
ben
efit
Treat allTreat noneModel
Threshold probability
0.0 0.1 0.2 0.3
(d)
−0.05
0.00
0.05
Net
ben
efit
FIGURE 44 Decision curves for the final (shrunken) model predicting late-onset pre-eclampsia using first-trimesterclinical characteristics and biochemical markers, in data sets used in the development and validation of the model.(a) SCOPE;42 (b) WHO;175 (c) POUCH;131 and (d) POP.161
Treat allTreat noneModel
Threshold probability
0.0 0.1 0.2 0.3
(a)
Net
ben
efit
0.05
0.00
−0.05
Treat allTreat noneModel
Threshold probability
0.0 0.1 0.2 0.3
(b)
Net
ben
efit
0.05
0.00
−0.05
Treat allTreat noneModel
Threshold probability
0.0 0.1 0.2 0.3
(c)
Net
ben
efit
0.05
0.00
−0.05
FIGURE 45 Decision curves for the final (shrunken) model predicting late-onset pre-eclampsia using second-trimesterclinical characteristics and biochemical markers, in data sets used in the development and validation of the model.(a) SCOPE;42 (b) WHO;175 and (c) POP.161
DOI: 10.3310/hta24720 Health Technology Assessment 2020 Vol. 24 No. 72
© Queen’s Printer and Controller of HMSO 2020. This work was produced by Allotey et al. under the terms of a commissioning contract issued by the Secretary of Statefor Health and Social Care. This issue may be freely reproduced for the purposes of private research and study and extracts (or indeed, the full report) may be included inprofessional journals provided that suitable acknowledgement is made and the reproduction is not associated with any form of advertising. Applications for commercialreproduction should be addressed to: NIHR Journals Library, National Institute for Health Research, Evaluation, Trials and Studies Coordinating Centre, Alpha House,University of Southampton Science Park, Southampton SO16 7NS, UK.
251


EMEHS&DRHTAPGfARPHRPart of the NIHR Journals Librarywww.journalslibrary.nihr.ac.uk
This report presents independent research funded by the National Institute for Health Research (NIHR). The views expressed are those of the author(s) and not necessarily those of the NHS, the NIHR or the Department of Health and Social Care
Published by the NIHR Journals Library